Embed Size (px)
Citation preview
POLITECNICO DI MILANO School of Architecture, Urban Planning and Construction
Engineering MASTER’S IN BUILDING AND ARCHITECTURAL
ENGINEERING
FIGHTING PERUVIAN ENERGY POVERTY IN A TYPICAL PERUVIAN RURAL HOUSE
Supervisor: Prof. Enrico de angelis Master dissertation by: Gino Emerson Gutierrez Contreras 879087
Academic Year 2018/2019

POLITECNICO DI MILANO
1
ÍNDICE
LIST OF FIGURES ............................................................................................................ 3
LIST OF TABLES .............................................................................................................. 6
LIST OF SYMBOLS AND ACRONYMS ............................................................................ 7
CHAPTER I: INTRODUCTION .......................................................................................... 8
1.1. PROBLEM STATEMENT: ......................................................................................... 8
1.2. AIMS: ........................................................................................................................ 9
CHAPTER II: PERUVIAN SITUATION ............................................................................ 10
2.1. VERNACULAR ARCHITECTURE .......................................................................... 10
2.1.1. Selection of architecture ....................................................................................... 14
2.2. ENERGY EFFICIENCY REQUIREMENTS IN PERU .............................................. 16
2.2.1. Peruvian energy consumption: ............................................................................. 16
2.2.2. Peruvian energy regulation .................................................................................. 18
2.2.3. Peruvian code requirements: ............................................................................... 19
CHAPTER III: THEORETICAL BACKGROUND: ............................................................ 24
3.1. PASSIVE STRATEGIES ......................................................................................... 24
3.1.1. Building shape ..................................................................................................... 24
3.1.2. Shading................................................................................................................ 25
3.1.3. Natural Ventilation ................................................................................................ 27
3.1.4. Airtightness .......................................................................................................... 28
3.1.5. Thermal Mass: ..................................................................................................... 29
3.1.6. Thermal insulation ................................................................................................ 31
3.1.7. Thermal bridges ................................................................................................... 34
CHAPTER IV: BASE MODEL ......................................................................................... 35
4.1. METODOLOGY ...................................................................................................... 35
4.2. CLIMATE DESCRIPTION ....................................................................................... 35
4.3. IESVE MODELLING ............................................................................................... 38
4.3.1. Model description: ................................................................................................ 38
4.3.2. Construction layers: ............................................................................................. 39

POLITECNICO DI MILANO
2
4.3.3. Time Schedule ..................................................................................................... 41
4.3.4. Thermal layers ..................................................................................................... 44
4.3.5. Thermal comfort zones definitions........................................................................ 47
4.3.6. Results: ................................................................................................................ 50
CHAPTER V: MODEL OPTIMIZATION ........................................................................... 51
5.1. DEFINITION OF STRATEGIES .............................................................................. 51
5.1.1. Roofs: .................................................................................................................. 51
5.1.2. Floors: .................................................................................................................. 54
5.1.3. Walls: ................................................................................................................... 56
5.1.4. Windows: ............................................................................................................. 59
5.2. INSULATION OPTIMIZATION: ............................................................................... 61
5.2.1. Roof strategies selection – Step 1 ........................................................................ 62
5.2.2. Roof-floor strategies selection – Step 2 ................................................................ 64
5.2.3. Roof-floor-wall strategies selection – Step 3 ........................................................ 66
5.2.4. Roof-floor-wall-window strategies selection – Step 4............................................ 69
5.2.5. Door insulation strategy – Step 5 ......................................................................... 71
5.2.6. Ground-contact floorplan correction – Step 6 ....................................................... 73
5.3. THERMAL BRIDGE REDUCTION: ......................................................................... 75
5.3.1. Thermal bridge reduction – Step 7 ....................................................................... 75
5.4. INVESMENT – ENERGY COST EVALUATION: ..................................................... 78

POLITECNICO DI MILANO
3
LIST OF FIGURES
Figure 1. Bioclimatic Peruvian zones ................................................................................................ 10
Figure 2. Wooden house ................................................................................................................... 11
Figure 3. Reinforced masonry building ............................................................................................. 11
Figure 4. Massive adobe house ........................................................................................................ 11
Figure 5. Floating totora houses........................................................................................................ 11
Figure 6. Precarious adobe houses .................................................................................................. 11
Figure 7. Pile-dwelling houses .......................................................................................................... 12
Figure 8. Amount of houses in Peruvian department ........................................................................ 12
Figure 9. Main floor material in Peruvian houses .............................................................................. 13
Figure 10. Main wall material in Peruvian houses ............................................................................. 13
Figure 11. Main roof material in Peruvian houses ............................................................................. 13
Figure 12. Typical adobe brick construction ...................................................................................... 15
Figure 13. Typical confined masonry construction ............................................................................ 16
Figure 14. Total final energy consumption by source ....................................................................... 17
Figure 15. Total final energy consumption by sector ........................................................................ 17
Figure 16. Peruvian code timeline advances .................................................................................... 19
Figure 17. Example of recommended design angle.......................................................................... 21
Figure 18. Peruvian code scope........................................................................................................ 22
Figure 19. Plan of a pair of vertical devices (fins) and their shading mask ....................................... 26
Figure 20. A horizontal device (a canopy) and its shading mask. ..................................................... 26
Figure 21. An egg-crate device and its shading masks. ................................................................... 27
Figure 22. Capacity insulation effects ............................................................................................... 33
Figure 23. Climate analysis-psychometric chart ............................................................................... 36
Figure 24. Dry bulb temperature-24h moving average and montly average .................................... 36
Figure 25. Relative humidity-24h moving average and monthly average ......................................... 37
Figure 26. Global horizontal radiation-24h moving average and monthly average .......................... 37
Figure 27. . Typical Peruvian rural house-3D IESVE model ............................................................. 38
Figure 28. Defined thermal zones ..................................................................................................... 38
Figure 29. Thermal transmittance distribution - percentage ............................................................. 39
Figure 30. Base model - Roof construction layer .............................................................................. 40
Figure 31. Base model - Floor construction layer ............................................................................. 40
Figure 32. Base model - Wall construction layer ............................................................................... 40
Figure 33. Base model - Window construction layer ......................................................................... 41
Figure 34. Bedroom 1 and 2 - Daily profile ....................................................................................... 42

POLITECNICO DI MILANO
4
Figure 35. Living room - Daily profile ................................................................................................ 42
Figure 36. Bedroom 1 and 2 - Weekly profile .................................................................................... 43
Figure 37. Living room - Weekly profile ............................................................................................. 43
Figure 38. Rates of heat gains - ASHRAE fundamental handbook .................................................. 44
Figure 39. Power densities by space - ASHRAE Standard 90.1-2007 ............................................. 45
Figure 40. Acceptable operative temperature ranges for naturally conditioned spaces ................... 49
Figure 41. Hours distribution for thermal zone .................................................................................. 50
Figure 42. Yearly boiler Load ............................................................................................................ 50
Figure 43. Roof 1 detail and thermal transmittance distribution ........................................................ 52
Figure 44. Roof 2 detail and thermal transmittance distribution ........................................................ 53
Figure 45. Roof 3 detail and thermal transmittance distribution ........................................................ 53
Figure 46. Roof 4 detail and thermal transmittance distribution ........................................................ 53
Figure 47. Floor 1 detail and thermal transmittance distribution ....................................................... 55
Figure 48. Floor 2 detail and thermal transmittance distribution ....................................................... 55
Figure 49. Floor 3 detail and thermal transmittance distribution ....................................................... 55
Figure 50. Floor 4 detail and thermal transmittance distribution ....................................................... 56
Figure 51. Wall 1 detail and thermal transmittance distribution ........................................................ 57
Figure 52. Wall 2 detail and thermal transmittance distribution ........................................................ 58
Figure 53. Wall 3 detail and thermal transmittance distribution ........................................................ 58
Figure 54. Window 1 detail and thermal transmittance distribution .................................................. 60
Figure 55. Window 2 detail and thermal transmittance distribution .................................................. 60
Figure 56. Window 3 detail and thermal transmittance distribution .................................................. 60
Figure 57. Step 1 (roofs) energy-cost results .................................................................................... 63
Figure 58. Step 1 yearly boiler loads ................................................................................................. 63
Figure 59. Step 1 area and thermal transmittance distribution - percentage .................................... 64
Figure 60. Step 2 (roofs-floors) energy-cost results .......................................................................... 65
Figure 61. Step 2 yearly boiler loads ................................................................................................. 65
Figure 62. Step 2 area and thermal transmittance distribution - percentage .................................... 66
Figure 63. Step 2 (roofs-floors-wall) energy-cost results .................................................................. 67
Figure 64. Step 3 yearly boiler loads ................................................................................................. 68
Figure 65. Step 3 area and thermal transmittance distribution - percentage .................................... 68
Figure 66. Step 4 (roofs-floors-walls-windows) energy-cost results ................................................. 69
Figure 67. Step 4 yearly boiler loads ................................................................................................. 70
Figure 68. Step 4 area and thermal transmittance distribution - percentage .................................... 70
Figure 69. Step 5 Door insulation combinations-energy cost results ................................................ 71
POLITECNICO DI MILANO
5
Figure 70. Step 5 yearly boiler loads ................................................................................................. 72
Figure 71. Step 5 area and thermal transmittance distribution - percentage .................................... 72
Figure 72. Step 6 ground-contact floorplan correction combinations-energy cost results ................ 73
Figure 73. Step 6 yearly boiler loads ................................................................................................. 74
Figure 74. Step 6 area and thermal transmittance distribution - percentage .................................... 74
Figure 75. Step 7 Thermal bridge reduction combinations - energy cost results .............................. 75
Figure 76. Step 6 yearly boiler loads ................................................................................................. 75
Figure 77. Step 7 yearly boiler loads ................................................................................................. 76
Figure 78. Step 7 area and thermal transmittance distribution - percentage .................................... 76
Figure 79. Ground-contact floorplan insulation detail........................................................................ 77
Figure 80. Investment – energy cost evaluation ............................................................................... 78

POLITECNICO DI MILANO
6
LIST OF TABLES
Table 1. Wall material used along the time [39] ................................................................................ 14
Table 2. Wall material used in urban and rural houses ..................................................................... 15
Table 3. Maximum thermal transmittance allowance ........................................................................ 20
Table 4. Climatic characteristics for the Middle Andean zones ........................................................ 20
Table 5. Recommended design angle .............................................................................................. 21
Table 6. Mass effect boundaries ....................................................................................................... 30
Table 7. Thermal mass strategies ..................................................................................................... 30
Table 8. Thermal transmittance distribution ...................................................................................... 39
Table 9. Sensible and latent heat gains for people ........................................................................... 44
Table 10. Selected values ................................................................................................................. 45
Table 11. Air exchanges considered ................................................................................................. 46
Table 12. Fanger and adaptive model - levels of expectation .......................................................... 47
Table 13. Recommended desing values for indoor temperature ...................................................... 49
Table 14. Selected roof strategies description .................................................................................. 52
Table 15. Selected floor strategies description ................................................................................. 54
Table 16. Selected wall strategies description .................................................................................. 57
Table 17. Selected window strategies description ............................................................................ 59
Table 18. Considered air infiltrations ................................................................................................. 62
Table 19. Selected roof strategies..................................................................................................... 62
Table 20. Selected floor strategies .................................................................................................... 64
Table 21. Selected wall strategies..................................................................................................... 67
Table 22. Selected window strategies ............................................................................................... 69
Table 23. Selected door strategy ...................................................................................................... 71
Table 24. Step 5 Door insulation combinations ................................................................................. 71
Table 25. Step 6 ground-contact floorplan correction combinations ................................................. 73
Table 26. Step 7 Thermal bridge reduction combinations ................................................................ 75

POLITECNICO DI MILANO
7
LIST OF SYMBOLS AND ACRONYMS
UNFCCC, United Nations Framework Convention on Climate Change
TCSC, Technical Code of Sustainable Construction (Peruvian)
GBC, Green building council
CO2, carbon dioxide
NZEB, nearly zero energy building
WWR, window to wall ratio
HVAC, heating, ventilation and air conditioning
IAQ, Indoor air quality
IEQ, Indoor environmental quality

POLITECNICO DI MILANO
8
CHAPTER I: INTRODUCTION
The present work has as main aim to develop an optimized model in order to find out which
are the best passive strategies for a vernacular Peruvian construction located in the
highlands characterized for cold temperatures.
The Location selected is Cuzco due to the fact that, in terms of Temperature, relative
humidity and meters above sea level (approx. 3400), is a representative city, for the kind of
climate that is desired to be evaluated in our building,
To carry out this study a masonry house made of adobe will be evaluated with the Integrated
Environmental Solution – Virtual Environment (IESVE) software and the data will come from
the energy plus weather data.
1.1. PROBLEM STATEMENT:
The first problem is the reduction of the Greenhouse Gas (GHG) emissions. this is a problem
around the world since today, 55% of the world’s population lives in urban areas, a
proportion that is expected to increase to 68% by 2050, Today, the most urbanized regions
include Northern America (with 82% of its population living in urban areas in 2018), Latin
America and the Caribbean (81%), Europe (74%) and Oceania (68%). On the other hand,
the level of urbanization in Asia is now approximating 50% and Africa remains mostly rural,
with 43% of its population living in urban areas [1].
In Peru, it is estimated that 70% of the population lives in cities [2] and during the following
decades, this will increase to 90% [3]. This urbanization process has been accompanied by
a remarkable environmental deterioration, that is why Peru has been actively taking part
since the 90’s in the Clean Development Mechanism.
Peru is a country with low per capita and total emissions, with a global share of emissions
of only 0.3%, of which approximately half of them generate through land use, land-use
change and forestry sector activities (LULUCF).
The Peruvian INDC (September 2015) envisages a reduction of emissions equivalent to
30% in relation to the Greenhouse Gas (GHG) emissions of the projected Business as Usual
scenario (BaU) in 2030.
The Peruvian State considers that a 20% reduction will be implemented through domestic
investment and expenses, from public and private resources (non-conditional proposal), and
the remaining 10% is subject to the availability of international financing and the existence
of favorable conditions (conditional proposal)

POLITECNICO DI MILANO
9
The main GHGs considered are Carbon Dioxide (CO2), Methane (CH4) and Nitrous Oxide
(N2O) baseline scenario starting in 2010, as reference year, and ending in 2030.
Therefore, the first problem is to reduce the amount of Greenhouse Gas (GHG) emissions.
Reduce of (GHG) emissions and improve of thermal comfort in constructions are directly
related, so this improvement will be our second problem, to explain the magnitude of this
problem it can be pointed out that cold season in Peru cause a wide range of losses in zones
above 3000 meters above sea level. The main of them, the loss of human lives that reach
around to 700 deaths every year and approximately 200 of them are children under 5 years
[4] [5].
Most of this losses account for poor and vulnerable people that not only can’t afford HVAC
systems more than that they struggle economically which generates other problems such
as several health issues such, malnutrition, etc. Because of this, the only feasible possibility
for them is to find out and provide them some affordable options in order to be protected
from the severe temperatures.
Due to this economic problem, the strategies selected to be evaluated are all passive, also,
an estimated cost will be calculated to evaluate them.
1.2. AIMS:
Evaluate the optimization of a Peruvian building in a hierarchical pathway, evaluating
the comfort improvements, the energy savings and the cost of every strategy.
A final cost evaluation will be done by evaluating the cost of every strategy
Contribute to the knowledge of possible strategies that can be feasible and proper for
cities with similar climates or with similar resources by the evaluation of strategies
mainly done with local resources.
Finding out the best options for the typical Peruvian rural house by developing an optimized
model for the average Peruvian climate in the highlands, this study because a humble guide.
Therefore, the options of insulations, improve of solar gains and all the others related to
comfort can be taken from here.
POLITECNICO DI MILANO
10
CHAPTER II: PERUVIAN SITUATION
2.1. VERNACULAR ARCHITECTURE
When it comes down to history, we can divide the Peruvian architecture in 3 main periods:
Pre-Columbian Peru Architecture
Colonial Peru Architecture
Contemporary Architecture in Peru
In addition, Peru has 84 out of the 117 life zones of the world [6], because of this, along its
history several kinds of vernacular designs have been developed.
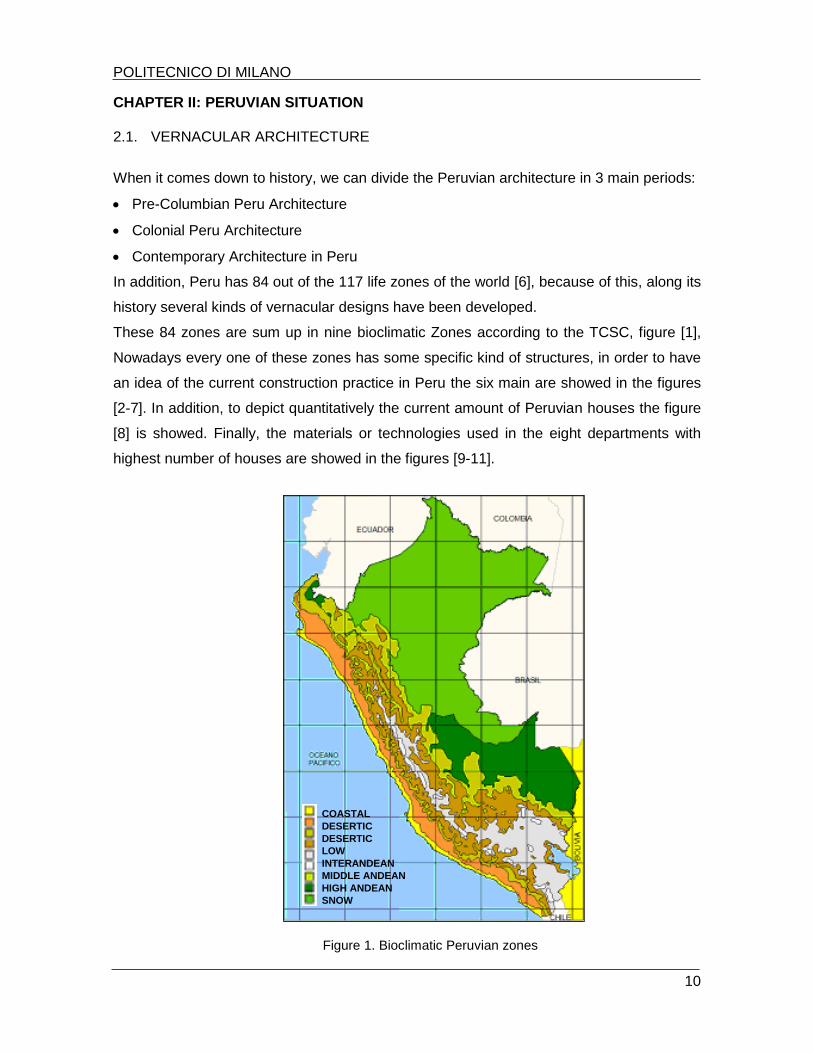
These 84 zones are sum up in nine bioclimatic Zones according to the TCSC, figure [1],
Nowadays every one of these zones has some specific kind of structures, in order to have
an idea of the current construction practice in Peru the six main are showed in the figures
[2-7]. In addition, to depict quantitatively the current amount of Peruvian houses the figure
[8] is showed. Finally, the materials or technologies used in the eight departments with
highest number of houses are showed in the figures [9-11].
COASTAL
DESERTIC
DESERTIC
LOW
INTERANDEAN
MIDDLE ANDEAN
HIGH ANDEAN
SNOW
MONTAIN
Figure 1. Bioclimatic Peruvian zones

POLITECNICO DI MILANO
11
Bioclimatic Zone:
- Coastal desertic
Technology:
- Floor: Soil, Walls: Wood
- Roof: Corrugated
calamine sheets
Active/passive
strategies:
Bioclimatic Zone:
- Desertic
Technology:
-Floor: Concrete, Walls:
Clay brick
- Roof: Reinforced
concrete
Active/passive
strategies:
Shading and natural
vent.
Bioclimatic Zone:
- Low Interandean
- Middle Andean
Technology:
-Floor: Soil, Walls: Adobe
- Roof: Straw
Active/passive
strategies:
Thermal mass
Bioclimatic Zone:
- Middle Andean
Technology:
-Floor: Totora, Walls:
Totora
- Roof: Totora
Active/passive
strategies:
Bioclimatic Zone:
- Middle Andean
- High Andean
- Snow
Technology:
-Floor: Soil, Walls: Stone,
adobe
- Roof: Corrugated
calamine.
Active/passive
strategies:
Figure 2. Wooden house
Figure 3. Reinforced masonry building
Figure 4. Massive adobe house
Figure 5. Floating totora houses
Figure 6. Precarious adobe houses

POLITECNICO DI MILANO
12
Bioclimatic Zone:
- Border of mountain
- Subtropical humid
- Tropical wet
Technology:
-Floor: Wood, Walls:
Wood
- Roof: Woven palms
Active/passive
strategies:
Shading and natural
ventilation Figure 7. Pile-dwelling houses
Figure 8. Amount of houses in Peruvian department

POLITECNICO DI MILANO
13
Figure 9. Main floor material in Peruvian houses
Figure 10. Main wall material in Peruvian houses
Figure 11. Main roof material in Peruvian houses

POLITECNICO DI MILANO
14
2.1.1. Selection of architecture
Despite of the fact that, as we have seen, Peruvian houses can be of many vernacular types,
in this section, we will review just the two most important in the highlands, which are adobe
bricks constructions and confined masonry constructions, Also will explain why in the end
adobe constructions were the one selected to be evaluated.
To explain how this two kind of structures became the most used in the country it can be
explained historically. Since the beginning of the twentieth century, most buildings, (single-
family and multi-family homes with 1 to 5 floors), were done using simple solid brick masonry
with high density and thickness of walls.
The 1970 earthquake caused the collapse of this type of simple masonry buildings (without
columns). This earthquake clearly showed the need to incorporate reinforcements to these
buildings. The confined masonry became the most popular construction system for low and
medium-height buildings in cities.
However, in the highlands adobe brick constructions are still widely used due the fact that
this is a considerable less seismic zone than the coastal one.
The use of this two kind of constructions along the time can be depicted quantitatively
comparing the last three housing censuses; it is observed that brick and block walls have
displaced adobe as the predominant material [7].
As we can see, adobe and confined masonry are the two main structures used in Peru and
they will be explained in the following lines:
Adobe bricks constructions
The first kind of construction is the one most used in rural regions of Peru; in these regions,
architectural traditions have remained largely unchanged for centuries. Adobe bricks are still
used in dwellings today, combined with roofs constructed from wood, straw or hand-made
clay tiles [8].
Table 1. Wall material used along the time [39]
Wall material 1993 2007 2017
bricks or blocks 35.70% 46.70% 55.80%
Adobe 43.30% 34.80% 27.90%
Others: wood, stone, quincha, etc. 21% 18.50% 16.30%

POLITECNICO DI MILANO
15
Despite of the fact that this is not the main kind of structure used nowadays in Peru (table
1). This will be the selected one to be evaluated due to the fact that is the one most used in
rural zones (table 2), it means for the Peruvians with lowest income, since brick clay masonry
can be more seen in urban areas than in rural areas as well as the differences of price are
really high.
So by selecting this kind of construction this study will be more effective to accomplish the
aims indicated previously. An image of this kind of construction is showed in figure 12.
Wall material 2007 2017
bricks or blocks 63.90% 70.60%
Adobe 20.50% 15.10%
Others: wood, stone, quincha, etc. 15.60% 14.30%
bricks or blocks 4.60% 8%
Adobe 69.90% 69.50%
Others: wood, stone, quincha, etc. 25.50% 22.50%
Urban
Rural
Table 2. Wall material used in urban and rural houses
Figure 12. Typical adobe brick construction

POLITECNICO DI MILANO
16
Confined masonry constructions
The second kind of vernacular construction is a typical self-construction in zones of low-
income people, nowadays it is estimated that 70% of these houses are produced informally.
which implies non-formal occupation of urban space, building without professional
assistance and the use of poor quality materials [9], focusing only on the economy these
constructions leave aside a correct structural design and totally disregard any concept of
sustainability.
Besides the social and economic issues, the sited plots and houses are not adequate to
capture solar energy, the fresh daily winds, then are thermally uncomfortable. In addition,
there is a use of industrial materials, not suitable for indoor comfort, and producing too much
material waste [12].
This second kind of construction will not be the one evaluated in this study, but it is important
to point out the relevance of the evaluation of this kind of structure, due to the fact that is the
most used in Peru. An image of this kind construction is showed in figure 13.
[10]
2.2. ENERGY EFFICIENCY REQUIREMENTS IN PERU
2.2.1. Peruvian energy consumption:
This section has the aim to have an small review of the Peruvian energy consumption, in
order to have an idea of the current situation, figure 14 shows the source of the final energy
consumption and as we can see, Peru still has its main energy consumption based on oil
products. So by reducing energy consumptions GHG emissions will be directly reduced,
Figure 13. Typical confined masonry construction

POLITECNICO DI MILANO
17
Figure 15 shows the total final consumption by sector. The industry sector includes the
construction sector, so it can be seen the considerable share of this sector in Peruvian
energy consumption, due to this the use of local materials in the selected strategies is
implemented. The residential sector has a share similar to the industry, this show the
importance of improving thermal comfort and with this reducing the final energy needs for
residence.
All in all these two graphics show the importance of improve the energy savings during
construction and service life of the residences.
Figure 14. Total final energy consumption by source
Figure 15. Total final energy consumption by sector

POLITECNICO DI MILANO
18
2.2.2. Peruvian energy regulation
When it comes, down to sustainability, the Peruvian situation is just at the beginning but at
least it has started. To reach the Goal of 30% reduction on GHG emissions, stated in the
Peruvian INDC (September 2015). Peruvian government through the Ministry of
Environment (MINAM), as the national focal point for the UNFCCC, designed a process
since 2014 in which three levels of dialogue were included:
a) "Technical and scientific" with experts for the calculation of emissions, based on technical
parameters and the estimation of the costs of mitigation options;
b) "Technical and political" with representatives of the Ministries linked to the emission
sources and mitigation options in order to gather technical opinions in the framework of
political and sectoral plans; and,
c) "High political level", for which a Multisectoral Commission (9) was established at the level
of Ministers or Deputy Ministers, responsible to develop the technical report containing the
proposed Peruvian INDC (Supreme Resolution No 129-2015-PCM) [6].
In order to achieve these goals in January 2014 the Standing Committee of Sustainable
Construction was created [11], conformed mainly by:
The Ministry of Housing, Construction and Sanitation.
The Ministry of Environment
The Peruvian Chamber of Construction.
The International Finance Corporation (IFC)
The National University of Engineering (UNI)
The Peru Green Building Council (Peru GBC)
This committee reached to create the first Technical Code of Sustainable Construction
approved by the Peruvian Government on August 28th 2015.
The code focus on three main impact categories:
Water saving
Energy saving
The users’ thermal comfort inside the buildings.
For water savings, it is sought to generate a saving of 30% through efficient sanitary
equipment and innovative solutions such as gray water treatment. On the other hand, in
terms of energy saving and thermal comfort the goal is to comply with the standard of energy
efficiency, thermal comfort and lighting EM 110.

POLITECNICO DI MILANO
19
Peruvian code is still at the beginning and it is not as stringent as codes from others countries
in the region, i.e. Colombia [12], But still it exists.
2.2.3. Peruvian code requirements:
The aim of this section is to review the current Peruvian code in order to see in which
situation it is now, how stringent it is and if it can be used to have an effective and proper
evaluation of the thermal performance in buildings.
According to the TCSC the following fields are taken into account
2.2.3.1. Energy efficiency:
Thermal transmittance
Scope: New buildings
Main regulation: Technical Standard EM.110 "Thermal and Light Comfort with Energy
Efficiency"
Main requirements:
Climate zone definition: Middle Andean
Maximum thermal transmittance
Figure 16. Peruvian code timeline advances

POLITECNICO DI MILANO
20
Climatic characteristics of each bioclimatic zone (Middle Andean)
Lighting and cooling
Scope: New buildings (but cultural heritage buildings and emergency lighting are
exceptions).
Main regulation: Technical Standard EM.010 “Indoor Electrical Installations"
Main requirements:
Minimum lighting by use according to the RNE, And verified according to the following
formula: Eint = Eext x FLDc
Solar control: Sun protection design angle
Table 3. Maximum thermal transmittance allowance
Table 4. Climatic characteristics for the Middle Andean zones
Bioclimatic peruvian
zones
Maximum thermal
transmittance (wall)
W/m2K
Maximum thermal
transmittance (roof)
W/m2K
Maximum thermal
transmittance (floor)
W/m2K
4. Middle Andean 2.36 2.21 2.63
Solar radiation Hours of sun Annual rainfall AltitudeEquivalent in the
Koppen classification
2 a 7,5 kWh/m2
North: 6h
Center: 8-10h
South: 7-8h
150-2500mm 3000-4000 masl Dwb
Bioclimatic peruvian
zones
Average annual
temperature
Average relative
humidityWind speed
Predominant wind
direction
4. Middle Andean 12 C° 30-50%
North: 10m/s
Center: 7.5m/s
South: 4m/s
South-East: 7m/s
S-SW-SE

POLITECNICO DI MILANO
21
Example of sun protection design angle:
[13]
Thermal solar energy
Scope: New buildings with the following uses (Residential, Education, Health, Lodging)
Main regulation: Technical Standard EM.080 “Installations with Solar Energy”
Main requirements:
Any medium density (RDM) and low density (RDB) housing unit, which is located in the
bioclimatic zones called Coastal Desert, Desert, Low Interandean, Middle Andean, High
Andean and Snow, must include a water heating system with solar energy.
The buildings contained in Technical Standards A.030 Lodging, A.040 Education and
A.050 Health of the National Building Regulations must include a solar water heating
system.
All solar heaters must be dual and comply with the Peruvian Technical Standards
indicated in the Regulatory Framework [14].
Orientation South Latitude Angle
North 13.3° 45°
South 13.3° 71°
East 13.3° 40°
West 13.3° 48°
North-East 13.3° 53.5°
South-East 13.3° 60.5°
South-West 13.3° 69.5°
North-West 13.3° 47.5°
Table 5. Recommended design angle
Figure 17. Example of recommended design angle

POLITECNICO DI MILANO
22
Stationary photovoltaic panels should be oriented to the north and maintain an inclination
angle equivalent to the latitude of the installation site plus 10 degrees [15].
2.2.3.1. Water Efficiency:
Scope: New buildings
Main regulation: Technical Standard IS.010 "Sanitary Installations for Buildings"
Main requirements:
Toda edificación nueva debe ser entregada a su propietario con aparatos sanitarios que
incluyan tecnologías de ahorro de agua.
La grifería de los urinarios, lavaderos, lavatorios o duchas deben ser ahorradores, con
dispositivos que reduzcan el consumo de agua en un 30% como mínimo, en
comparación con aparatos sanitarios convencionales existentes en el mercado.
Las aguas residuales domesticas de lavatorios, lavaderos, urinarios, duchas, tinas e
inodoros serán tratadas para su reúso, en forma tal que no generen conexiones
cruzadas o interferencias con los sistemas de agua de consumo humano.
It is important to mention that due to the TCSC is at the beginning it is still optional in every
field and is supported in other previous Peruvians codes. On the other hand, it is also
important to mention that the Peruvian code does not focus just in the requirements for
buildings; it also takes into account other intervention areas showed in the following image:
.[16] Figure 18. Peruvian code scope
POLITECNICO DI MILANO
23
When it comes down to energy efficiency we can see that Peruvian code is not stringent at
all in terms of thermal transmittance, on the other hand present a practical but simplified
advice in solar control by indicating a sun protection design angle and in thermal solar
energy requirements it presents some interesting indications.
Talking about water efficiency it presents also some good advices yet really general, given
that not more technical indications are given or how this technical advices should be verified.
Overall, Peruvian code requirements are still at the beginning, it can be considered that its
main interest is to be the base for further improvements and in this way to have a applicable
and useful national regulation adapted to the country conditions and resources.

POLITECNICO DI MILANO
24
CHAPTER III: THEORETICAL BACKGROUND:
3.1. PASSIVE STRATEGIES
Global warming generates a higher cooling and heating energy loads in buildings and at the
same time its production generates higher carbon emissions, which in the end increase the
global warming closing a vicious circle. Because of this a near zero energy or carbon building
design start with the passive strategies and the remaining needs are covered by active
strategies.
In this study, we will evaluate just passive strategies due to the fact that the inhabitants of
the construction to evaluate will not be able to afford active strategies and at the same time,
passive strategies are the ones that does not generate energy loads.
This section has the aim to give some basic concepts for passive strategies and in this way
to give the lector a base in order to understand better the practical part.
3.1.1. Building shape
Sometimes disregard and sometimes not possible to be implemented (due to previous
decisions or due to the fact that land borders are already defined), building shape have
actually a really important impact in our building performance and are our first passive
strategies to be implemented.
Building's stretch affects the heating and cooling energy consumption of buildings. In
addition, changing the depth of a building leads to changing in the amount of daylight'
penetration in the inner spaces of buildings. Hence, this will have impact on the consuming
electricity for providing the building's light. As it's said, the building's stretch is one of the
effective factors for building's energy consumption [17].
3.1.1.1. Compactness
According to the Biot number theory it is know that a body will be thermally more stable if
the Volume-Area ratio will be as high as possible, from this point of view the hemisphere is
the most efficient shape [18]. However, in real design it is not a common shape, to say so,
that is why a compact plan is the advisable thing to do in order to take advantage of this
physical property.
On the other hand a high surface to volume ratio represent the amount of exposed “skin” of
the buildings and therefore, their potential for interacting with the climate through natural
ventilation, day lighting, etc. [19].
POLITECNICO DI MILANO
25
Due to this, it is always important to define when it is convenient to have a compact shape
or to have a shape that interacts more with the environment.
3.1.1.2. Orientation
Depending on the hemisphere we are, north and south will be the best options to orientate
the building and to place windows given that in these positions, It will be possible to protect
the building of the high solar heat intensities that occur in the middle of the day during hot
seasons and also it will be possible to take advantage of the mentioned heat during the cold
season.
In addition, it is important to say that low altitude sun is more difficult to deal with [20], so it
is important to protect the glazing located in the east and west positions with adequate
shadings or reduce their dimensions.
In this study this considerations will be taking into account by orientating the biggest surface
to the north and placing windows on it.
3.1.2. Shading
When it comes down to solar control, we can see how wise nature can be because in
summer we will have sun in a higher position than in winter. Therefore, due to this it can be
designed in a way that we can define covers in order to avoid the heat in summer and allow
it in winter.
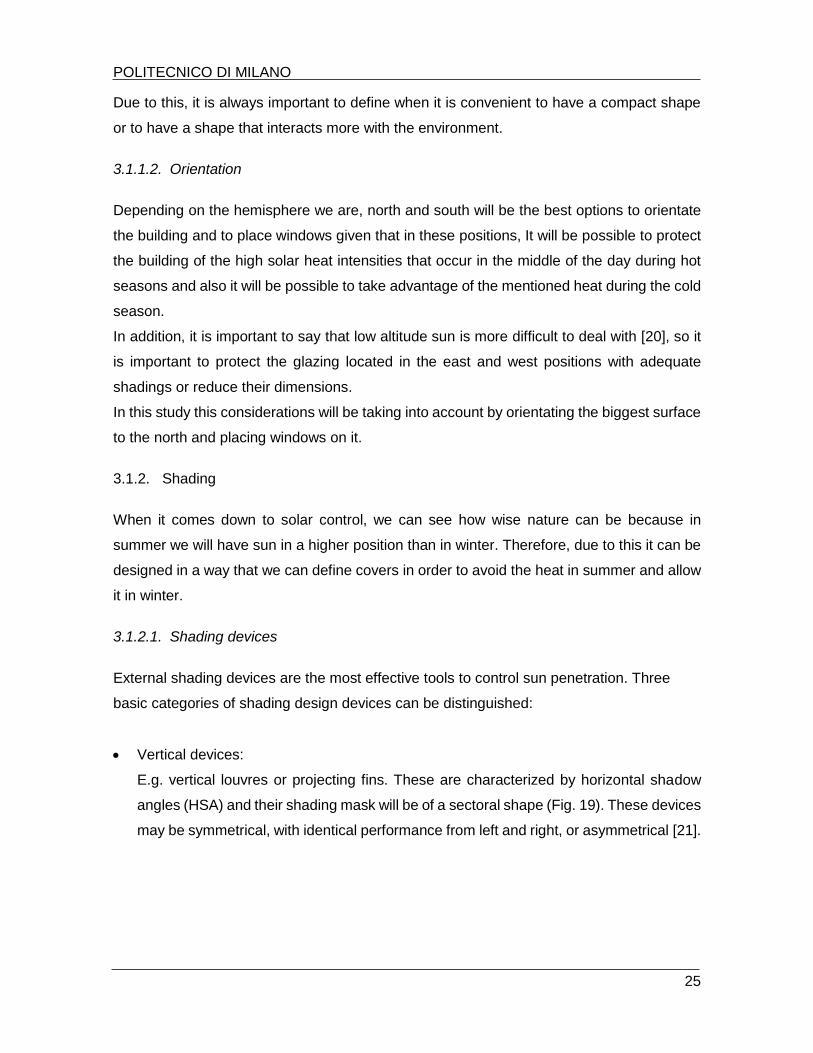
3.1.2.1. Shading devices
External shading devices are the most effective tools to control sun penetration. Three
basic categories of shading design devices can be distinguished:
Vertical devices:
E.g. vertical louvres or projecting fins. These are characterized by horizontal shadow
angles (HSA) and their shading mask will be of a sectoral shape (Fig. 19). These devices
may be symmetrical, with identical performance from left and right, or asymmetrical [21].

POLITECNICO DI MILANO
26
Horizontal devices:
E.g. projecting eaves, a horizontal canopy or awning, or horizontal louvres and slats.
These are characterized by a vertical shadow angle (VSA) and their shading mask,
constructed by using the shadow angle protractor, will be of a segmental shape (Fig.
20). The next figure also shows a canopy with a “device VSA” OF 60° [21].
Egg-crate devices:
E.g., concrete grille-blocks, metal grilles, have a complex behavior because of this they
cannot be characterized by a shadow angle and their shading mask will have a complex
shape. An example of these devices is shown in Fig. 1.44 [22].
Figure 19. Plan of a pair of vertical devices (fins) and their shading mask
Figure 20. A horizontal device (a canopy) and its shading mask.

POLITECNICO DI MILANO
27
In this study, no shading device will be implemented because in our cold climate solar gains
are always useful, a hangover is defined in the roof but its purpose is to protect walls from
rain.
3.1.3. Natural Ventilation
Natural ventilation is the strategy of supplying and subsequently removing air through the
building openings by natural means without the use of fan or any mechanical systems.
Natural Ventilation is ventilation provided by thermal, wind, or diffusion effects through
doors, windows, or other intentional openings in the building [23].
3.1.3.1. Driving forces:
There are two driving forces:
Wind pressure: Wind is the result of a difference in air pressure. Wind-driven ventilation
within a space is accomplished when there is a pressure differential between the indoors
and the outdoors.
Thermal buoyancy: sometimes referred as the stack effect or the chimney effect,
Buoyancy force is generated by the different densities in warm and cold air, which
increase with the height between the openings [24].
These two kind independently or in combination are used in the different kind of strategies
for ventilation in buildings.
Figure 21. An egg-crate device and its shading masks.

POLITECNICO DI MILANO
28
3.1.3.2. Air Infiltration:
This kind of air is included in this section because can be considered as part of the effects
of air, however as opposite than air ventilation air infiltration just cause detrimental effects.
To quantify its effect it can be point out that Incidental air infiltration in a poorly built house
can be as much as N = 3 air changes per hour, but with careful detailing and construction it
can be reduced to N = 0.5 [25].
This study will consider a conditional natural ventilation, it means its implementation will be
done just when the inside temperature is higher than 26°C.
When it comes down to infiltration it will be used values less conservative than the ones
defined above, considering one air change per hour for the baseline reducing it progressively
until 0.25 air change per hour for the final optimized combination.
3.1.4. Airtightness
Indoor air has generally a higher water content than outside air, in a cold climate the airflow
will be dominated in the direction inside-outside (exfiltration). The colder air will not be able
to keep the high amount of water vapor, so condensation will appear at some parts of the
construction, whereas in hot and humid climates the airflow will be dominated in the direction
outside-inside (infiltration) and will cause the same moisture problem.
These two processes show that airtightness is always useful.
And despite of the fact that a too well airtight building will be detrimental for the IAQ, in a
passive house you don’t have to worry about this, because to ensure an adequate IAQ a
heat recovery system will be taken into account.
Also is important to point out that:
It is essential that only a single airtight layer is planned and implemented, two nearly
airtight layer will be pointless.
Built examples of Passive Houses constructions have demonstrated that airtightness is
not about the specific construction method, it has been proved that standard values from
0.2 to 0.6 ach can be obtained with any construction method.
Airtightness can be measured with the air pressure test, or the n50-value, which
describes the air changes at a differential pressure of 50 Pa between the outside and
the inside of the building. More than that an air pressure test is essential for passive
house, it is a part of the certification procedure [26].

POLITECNICO DI MILANO
29
Since airtightness and infiltration are directly related in this study, airtightness will be taken
into account by reducing progressively the air changes per hour as stated in the previous
section.
3.1.5. Thermal Mass:
In building design, thermal mass is a property of the mass of a building, which enables it to
store heat, providing "inertia" against temperature fluctuations.
When outside temperatures are fluctuating throughout the day, a large thermal mass within
the insulated portion of a house can serve to reduce the daily temperature fluctuations, since
the thermal mass will absorb thermal energy when the surroundings are higher in
temperature than the mass, and give thermal energy back at night when the surroundings
are cooler. because of this thermal mass is effective in improving building comfort in any
place that experiences these types of daily temperature fluctuations, both in winter as well
as in summer [27].
It is also important to point out that more stable internal conditions are achieved if the thermal
mass is located inside the resistive insulation [28].
Properties required for good thermal mass:
1. High specific heat capacity.
2. High density.
3.1.5.1. The mass effect
The mass effect is the effect generated by the thermal mass when heavy constructions are
provided.
In a cold climate, for a continuously occupied building (e.g. a house or a hospital), where it
would allow the use of intermittent heating and still keep a stable temperature, on the other
hand in an intermittently used and heated building (an office or a school) lightweight
(insulated) construction may be better.
When it comes to down to the mass effect the definition of a ‘massive, heavyweight’ and a
‘lightweight’ building is useful and can be defined with the following criterion denominated
SM (Specific Mass) [29]:
𝑆𝑀 = 𝑇𝑜𝑡𝑎𝑙 𝑚𝑎𝑠𝑠 𝑜𝑓 𝑡ℎ𝑒 𝑏𝑢𝑖𝑙𝑑𝑖𝑛𝑔
𝐹𝑙𝑜𝑜𝑟 𝑎𝑟𝑒𝑎 𝑜𝑓 𝑡ℎ𝑒 𝑏𝑢𝑖𝑙𝑑𝑖𝑛𝑔 𝑘𝑔/𝑚2

POLITECNICO DI MILANO
30
Alternatively, the CIBSE “response factor” (f), which is defined as:
𝑓 = 𝑞𝑎 + 𝑞𝑣
𝑞𝑐 + 𝑞𝑣
Where:
qa = total admittance
qc = envelope conductance
qv = the ventilation conductance
The boundaries for three divisions are:
3.1.5.2. Strategies
The use of the different strategies depend on the prevailing climate and implies the use of
thermal mass with other passive strategies, which enhance its effect.
The different strategies can be summarized in the following table:
Classification SM f
Light < 150 kg/m2 < 3
Medium 150–400 3–5
Heavy >400 >5
Table 6. Mass effect boundaries
ClimateExposed to
sunlight
Insulated from
heat lossNight cooling Notes
Winter YES YES -
Summer NO - YES
Hot, arid climates - YES -
Hot humid climates - NO - YES
Temperate and cold
temperate climates
Table 7. Thermal mass strategies

POLITECNICO DI MILANO
31
As we can see in temperate and cold temperate climates, thermal mass is combined with
the passive solar design, which means that the building will be exposed to sunlight in winter
but not in summer.
For hot, arid climates normally the differences of temperatures between the day and night
are considerable because of this the construction will be exposed to sunlight to store the
heat and released at night, in addition massive walls are normally used in order to enhance
this effect.
Finally, for hot humid climates the temperatures are high along day and night because of
this, the sunlight exposition must be avoided and the elements must be not massive as well.
3.1.5.3. Seasonal energy storage
If enough mass is used it can create a seasonal advantage. That is, it can heat in the winter
and cool in the summer. This is sometimes called passive annual heat storage or PAHS.
The PAHS system has been successfully used at 7000 ft. in Colorado and in a number of
homes in Montana, It has also been used successfully in the UK at Hockerton Housing
Project [27].
It is opportune to indicate that some adobe brick constructions have the mass effect due to
the fact that they have massive external walls, these walls were intended just to bear seismic
actions but in the end, they also generate this beneficial effect.
In this study, this will be not considered due to the fact that most of the adobe construction
has normally just a single adobe layer, so this will be the option selected.
Thermal mass will not be implemented instead external insulation will be the one evaluated.
3.1.6. Thermal insulation
During summer it is important to reduce the heat gains in order to avoid high temperatures
in the place and to reduce or avoid cooling loads, on the other hand in winter is important to
reduce the heat losses in order to do not have low temperatures and reduce or avoid the
heating loads as well. Therefore, thermal insulation is useful in any climate.
It is estimated that up to 70% of the total heat losses are through external walls and roof, so
this indicate how important can be to improve the thermal insulation.
Thermal transmittance values from 0.10 to 0.15 [W/m2k] have showed to allow negligible
heat losses and to prevent moisture build up [30], this values will be taken into account for
our design.

POLITECNICO DI MILANO
32
3.1.6.1. Mechanisms
Three different mechanisms can be distinguished:
Reflective: Used when the heat transfer is mainly radiant, i.e. across a cavity or through
an attic space, so the heat flow will be determined by the emittance of the warmer surface
and the absorptance of the receiving surface.
I.e. a shiny aluminium foil has both a low emittance and a low absorptance, it is therefore
a good reflective insulator, but it will be effective only if it is facing a cavity, because it
does not have and R-value itself, but modifies the R-value of the cavity.
This kind of insulation (reflective foil facing a cavity) is advisable in hot climates since in
this period the low emittance will work due to the fact that heat is transmitted mainly by
radiation, while in cold climates is almost useless because the heat will be transmitted
by convection.
Also in hot climates it will be more effective than resistive insulation because reflective
insulation will reduce the downward heat flow but also will allow the escape of heat at
night [31].
Resistive: Of all the common materials, air has the lowest thermal conductivity: 0.025
W/m2.K, as long as it is still, that is why the purpose of resistive insulation is just to keep
the air still, dividing the space in small cells with the minimum amount of actual material.
Such materials are often referred to as ’bulk insulation’.
The most often used insulating materials are:
Expanded or extruded plastic foams, such as: polystyrene or polyurethane
Fibrous materials in the form of batts or blankets, such as mineral wool, glass
fibers or even natural wool.
Loose cellulose fibers or loose exfoliated vermiculite can be used as cavity fills
or poured over a ceiling.
While a second class of insulators include:
Wood wool slabs (wood shavings loosely bonded by cement)
wood fiber soft boards
And various types of lightweight concrete (either using lightweight aggregate or
autoclaved aerated concrete) [31].
Capacitive: Both reflective and resistive insulation respond to temperature changes
instantaneously, but no capacitive insulation, which affect not only the magnitude of heat
flow, but also its timing.

POLITECNICO DI MILANO
33
In a non-steady, randomly varying thermal environment the tracing of heat flows requires
sophisticated and lengthy calculation methods, fortunately, most meteorological
variables (temperature, solar radiation) show a regular variation, a repetitive 24-h cycle
which correspond to a sub-set of non-steady heat flow regimes, the periodic heat flow,
the analysis of which is quite easy.
In order to explain the capacitive effects and what is a periodic heat flow, the following
figure is showed over a 24-h period. The solid line is the heat flow through an actual
masonry wall and the dashed line is the heat flow through a ‘zero-mass’ wall of the same
U-value [32].
[33]
Two main effects can be explain from the figure
There is a delay for the heat flow in the masonry wall respect to the dashed line,
this delay is referred to as the time lag, (or phase-shift, denoted Ø) measured in
hours.
The amplitude for the daily average heat flow is smaller for the solid line; the ratio
between the two amplitudes is referred to as the decrement factor, or amplitude
decrement, denoted μ.
The benefits of capacitive insulation (or mass effect) will be greatest in hot-dry climates,
which show large diurnal temperature variations [34].
Finally, it is of paramount importance to point out that the order of the layers with respect
to the direction of the heat flow, would affect our dynamic properties (time lag, decrement
factor and admittance). For the mass inside the resistive insulation, we will have a higher
time lag, which means the heat gain will be more delayed; also, we will have a smaller
Figure 22. Capacity insulation effects

POLITECNICO DI MILANO
34
decrement factor which means the heat gain will be more reduced and result in a more
stable indoor temperature
In this study reflective insulation is not considered due to it is convenient just for hot climates,
neither capacitive insulation because we decided to evaluate just a wall layer of 30cm which
is more representative of a typical Peruvian rural house.
The option selected for walls will be the resistive insulation, due to the fact that totora will be
selected as insulation material and this present an structure with small cells which remain
the air still reaching a thermal conductivity of 0.06 (W/m.k).
3.1.7. Thermal bridges
The effect of thermal bridges can increase the final U value from 1% until even more than
100%, there lies the importance of a correct sealing in the linear contacts of our components.
Programs as THERM are used in order to take into account and quantify the effects of this
not ideal situation in not sealed construction.
In our case, the not sealed contacts will be taken into account by considering infiltration,
which will be reduced in every step of the optimization process from 1ach for the baseline
model to 0.25 for the final optimized model.
Finally yet importantly, also natural soil can be considered as a pathway for heat and
because of that be considered a kind of thermal bridge, due to this in the final step a border
insulation inside the ground will be defined and its effect will be quantified by defining our
selected floor as a ground-contact floorplan in the IESVE software.

POLITECNICO DI MILANO
35
CHAPTER IV: BASE MODEL
4.1. METODOLOGY
In this section, the base model to be evaluated will be developed. First, a brief climate
description is done and then the base model will be defined following the indicated
procedure:
Definition of model dimensions, thermal zones, and its creation in the IESVE software.
Definition of the basic construction layers for every component of the envelope
Definition of the time schedule, by a daily and weekly profile, for the thermal zones which
will be useful for the implementation of the internal gains
Definition of internal gains (people and lightning).
Definition of air exchanges, which are a progressively reduced infiltration and a
conditional natural ventilation, which will be, activated just when the internal T° is higher
than 26°C.
Definition of the comfort zones for indoor conditions and for the energy calculations.
Finally, after all of these steps, the performance of the base model will be evaluated with
the percentage of comfort hours and with the total boiler load in the year.
4.2. CLIMATE DESCRIPTION
Location: Cuzco (Peru) - Latitude: 13°31’ S
Altitude: 3400 m - Longitude: 71°58’ W
Cuzco is a city located in the southeast part of Peru in the valley formed by the Huatanay
River, which influences the climate of the town.
The psychometric chart reported below shows the annual climatic behavior of Cuzco: the
data “cloud” is large and spreads along the axes directions. As we can see, the values of
dry bulb temperature vary from -3°C to 24°C approximately; the relative humidity is between
the 20% and 100% lines, and the humidity ratio spreads from 2.0 gr/kgda to 9.0 gr/kgda.

POLITECNICO DI MILANO
36
Figure 23. Climate analysis-psychometric chart
Figure 24. Dry bulb temperature-24h moving average and montly average

POLITECNICO DI MILANO
37
Figure 25. Relative humidity-24h moving average and monthly average
Figure 26. Global horizontal radiation-24h moving average and monthly average

POLITECNICO DI MILANO
38
4.3. IESVE MODELLING
4.3.1. Model description:
Our construction is a typical Peruvian rural house in the highlands with an area of 69 m2;
the house is just 1 floor and 2.5m high but has a pitched roof of 1.5m, so the highest point
reaches 4 m. In order to do our model we simplify its shape to do faster the evaluations:
A typical Peruvian rural house in the highlands counts with two bedrooms and a dining-
kitchen room. That is why In order to be evaluated; three different thermal zones are defined:
bedroom1, bedroom2 and living room, zones indicated in the following figure.
The respective volume and areas for every thermal zone are reported in the following table:
VolumeFloor
Area
Ext. Wall
Area
Ext. Opening
Area
m3 m2 m2 m2
Bedroom 1 38.68 11.90 19.88 1.08
Bedroom 2 38.68 11.90 19.88 1.08
Living room 127.4 39.2 50.75 4.26
Total 204.75 63.00 90.50 6.42
Room Type
Figure 27. . Typical Peruvian rural house-3D IESVE model
Figure 28. Defined thermal zones

POLITECNICO DI MILANO
39
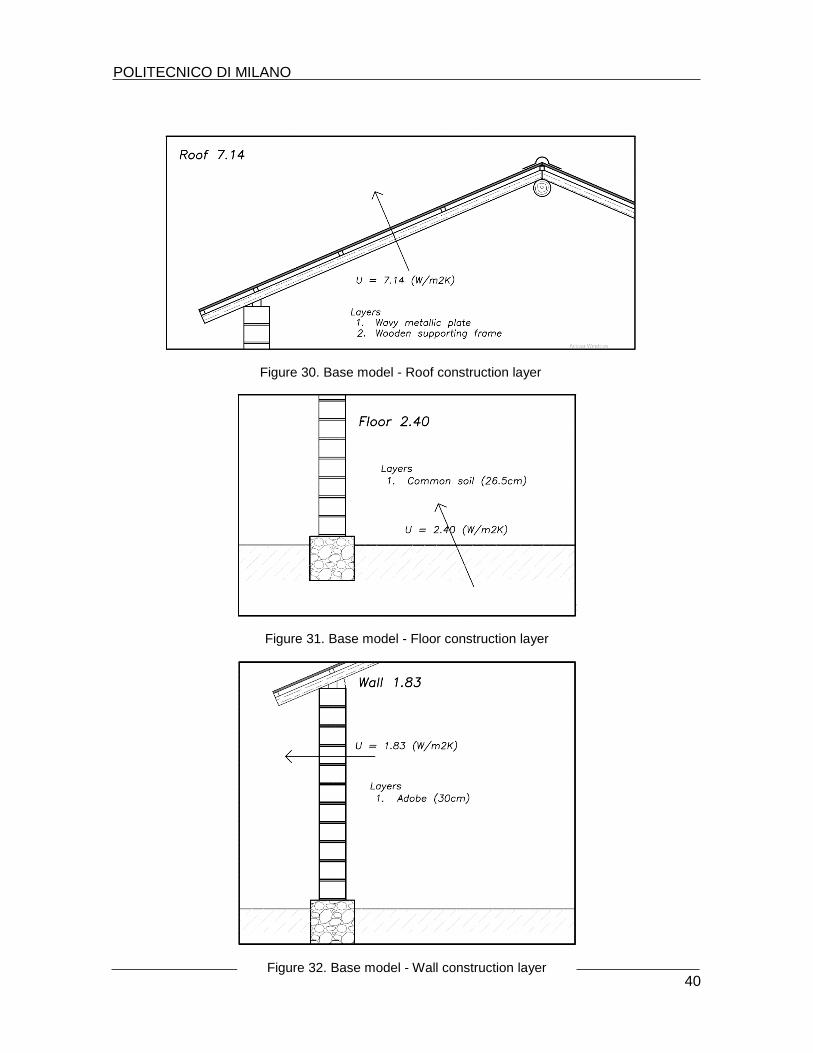
4.3.2. Construction layers:
Our base model represent a typical Peruvian rural house, the base model components are
the following:
Baseline roof: Wavy metallic plate supported by a wooden frame structure.
Baseline floor: Common soil, considering a thickness of 26.5cm.
Baseline wall: Wall made of adobe with a thickness of 30cm.
Baseline window: one layer of 3mm glass window, supported by a 5cm wooden
frame.
Baseline door: Wavy metallic plate supported by a wooden frame structure.
The baseline thermal transmittance share in showed in the next table and in figure 29, the
baseline components are showed from figure 30 to figure 33:
COMPONENT A (m2)U
(W/m2.K)
AxU
(W/K)
Floor 63.00 2.40 151.07
Walls 84.08 1.83 154.28
Windows 4.32 4.96 21.45
Door 2.10 5.88 12.35
Roof 68.54 7.14 489.39
Total 222.04 22.22 828.53
Table 8. Thermal transmittance distribution
Figure 29. Thermal transmittance distribution - percentage
POLITECNICO DI MILANO
40
Figure 30. Base model - Roof construction layer
Figure 31. Base model - Floor construction layer
Figure 32. Base model - Wall construction layer

POLITECNICO DI MILANO
41
4.3.3. Time Schedule
First, we have to say that given that this project is a rural house located in Cuzco we have
chosen schedules according to a residential way of living, so we can summarize these
schedules in the following way:
These time schedules will be assigned to the internal gains generated due to the people
presence and lightning, two kind of time schedules were designed one for bedroom 1and 2
and one for the living room.
Daily: Bedrooms 1 and 2: 21:00 – 7:00 – on
Living room : 7:00 – 21:00 – on
Weekly: Monday – Friday – on
Saturday – Sunday – on
Annual: Continuously on
4.3.3.1. Daily profiles:
In addition, given that we have different thermal zones, for weekdays we defined different
time schedules according to the kind of use along the day.
Figure 33. Base model - Window construction layer

POLITECNICO DI MILANO
42
Bedroom 1 and 2:
Living room:
Figure 34. Bedroom 1 and 2 - Daily profile
Figure 35. Living room - Daily profile

POLITECNICO DI MILANO
43
4.3.3.2. Weekly profile:
A constant day profile was considered for both spaces.
Bedroom 1 and 2:
Living room:
Figure 36. Bedroom 1 and 2 - Weekly profile
Figure 37. Living room - Weekly profile
POLITECNICO DI MILANO
44
4.3.4. Thermal layers
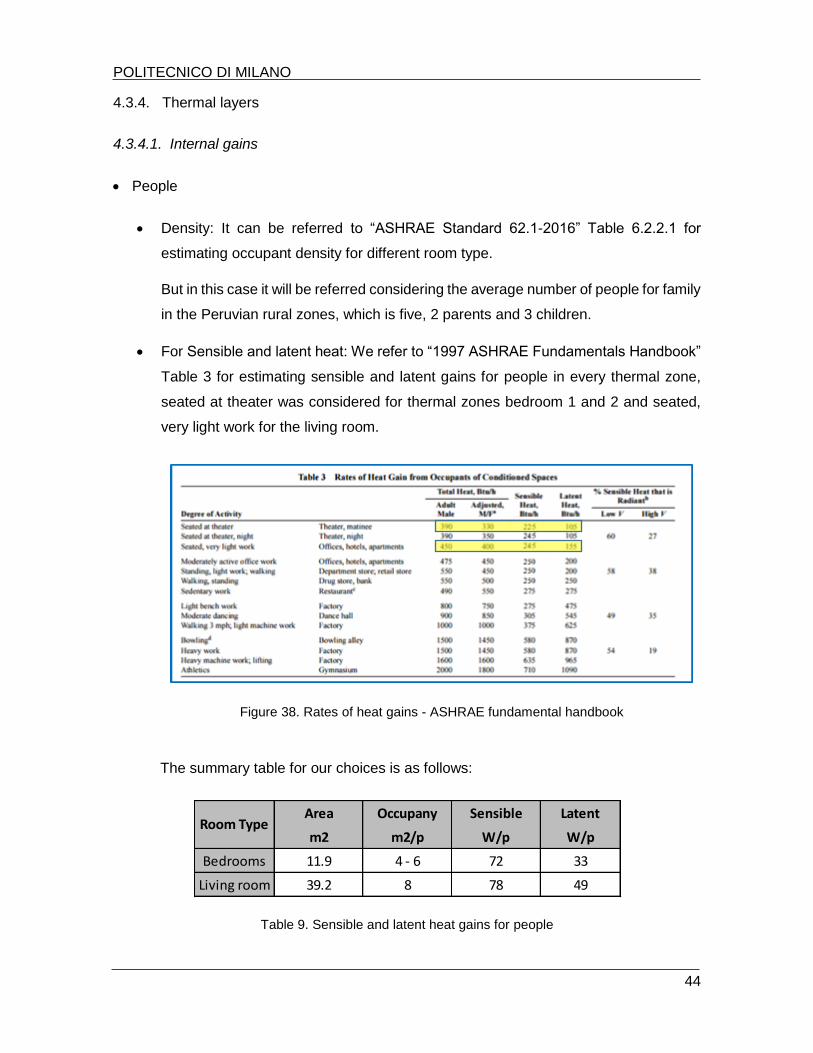
4.3.4.1. Internal gains
People
Density: It can be referred to “ASHRAE Standard 62.1-2016” Table 6.2.2.1 for
estimating occupant density for different room type.
But in this case it will be referred considering the average number of people for family
in the Peruvian rural zones, which is five, 2 parents and 3 children.
For Sensible and latent heat: We refer to “1997 ASHRAE Fundamentals Handbook”
Table 3 for estimating sensible and latent gains for people in every thermal zone,
seated at theater was considered for thermal zones bedroom 1 and 2 and seated,
very light work for the living room.
The summary table for our choices is as follows:
Area Occupany Sensible Latent
m2 m2/p W/p W/p
Bedrooms 11.9 4 - 6 72 33
Living room 39.2 8 78 49
Room Type
Figure 38. Rates of heat gains - ASHRAE fundamental handbook
Table 9. Sensible and latent heat gains for people

POLITECNICO DI MILANO
45
Light
We refer to “ASHRAE Standard 90.1-2007” for estimating lighting heat gains for each
room type.
The values are in W/ft2, so changing the units, selecting spaces similar to ours and
summarizing them, the following table is presented:
Figure 39. Power densities by space - ASHRAE Standard 90.1-2007
W/m2
Kitchen 12.92
Corridor 5.382
Patio 5.382
Toilet 5.382
Room TypeFluorescent
lighting
Table 10. Selected values

POLITECNICO DI MILANO
46
As we can see, the average lighting values for normal spaces are around 10, in our
case for a typical Peruvian house, we will consider just 5w/m2, due to its precarious
condition and also by taking this value we will be conservative in the design.
4.3.4.2. Air exchanges
First of all, we have to say that ventilation has two main aims the first one is to try to keep
the inside temperature between the comfort limits, the second one is try to keep a good
indoor air quality.
In order to achieve this we could refer to “ASHRAE Standard 62.1-2016” Table 6.2.2.1, but
given that no mechanical devices will be implemented, no auxiliary ventilation will be
considered, and so this code requirement will not be followed.
What will be implemented is a progressively reduced infiltration, given that it will be
considered that in every insulation step the infiltrations will be reduced. In addition, a
conditional ventilation will be implemented when the inside temperature will be higher than
26°C, representing in this way the fact that people open the fenestrations when this value is
reached, all of this is indicated in the following table:
Steps Description Infiltration Cond. Ventilation
Step 0 Baseline 1.0 ach 0.25 ach
Insulation optimization
Step 1 Roof 0.5 ach 0.25 ach
Step 2 Roof + Floor 0.5 ach 0.25 ach
Step 3 Roof + Floor + Wall 0.35 ach 0.25 ach
Step 4 Roof + Floor + Wall + Window 0.25 ach 0.25 ach
Table 11. Air exchanges considered

POLITECNICO DI MILANO
47
4.3.5. Thermal comfort zones definitions
It is of paramount importance to make a correct definition of the thermal comfort zones,
given that the boundaries defined by the thermal zones are the base to quantify the
parameters to be evaluated.
It is important to indicate that thermal zones are not a stablished range of temperatures on
the contrary they individualize the requirement for every particular building. As a matter of
fact a thermal comfort zone definition require a process because it depends on several
issues such as season comfort, global warming trends and the age of the people that
occupied the building [35].
In this study, the parameters to be evaluated are the comfort hours and the energy loads.
Between the codes used to define the thermal comfort zones one the most used or maybe
the most important is the ISO 17772-1, according to this code, thermal comfort zones can
be defined depending if the building will be mechanically cooled, PMV method, or non-
mechanically cooled, the adaptive method.
In addition, both methods have four categories, showed in figure 40, which correspond to
the level of expectation by the users:
[36]
Despite of the fact that the adaptive method defined in ISO 17772-1 is a good method to be
implemented, in this study, the method implemented to evaluate indoor conditions will be
Table 12. Fanger and adaptive model - levels of expectation

POLITECNICO DI MILANO
48
the one defined for ASHRAE 55 given that has a broader range of applicability having its
temperatures limits from 10 to 33.5°C.
Also for the energy calculations for mechanically heated/cooled buildings, EN 15251 will
be the one used.
4.3.5.1. For indoor conditions
For indoor conditions, the parameter to be evaluated will be the percentage of comfort hours
in a year, because our model just work on passive strategies it is a building without
mechanical cooling. Therefore, for this case, as stated above, the method to be implemented
will be the one defined in section 5.4 of ASHRAE 55: Adaptability method for non-
conditioned spaces.
The procedure will be the following:
Prevailing mean outdoor air temperature Tpma (out) calculation by the following
formula:
𝑇𝑝𝑚𝑎 (𝑜𝑢𝑡) = (1 − 𝛼)[𝑡𝑒(𝑑 − 1) + 𝛼𝑡𝑒(𝑑 − 2) + 𝛼2𝑡𝑒(𝑑 − 3) + 𝛼3𝑡𝑒(𝑑 − 4)+. ..
Alpha value setting, since alpha can be considered equal to:
- 0.8 (slower responding/heavy mass)
- 0.6 (faster responding/low mass building)
α could arrive to 0.9 for climates in which synoptic-scale (day to day) temperature
dynamics are relative minor, in our case considering the house characteristics and
the climate characteristics, the taken value will 0.7.
After defining the alpha value this will give us a Tpma value which will change
continuously due to the fact that this value depends on the values gotten from the
last seven days, this continuously changing Tpma will be used to define the upper
and lower limit for the acceptable operative temperature by using the following
formulas:
- Upper 80% acceptability limit (°C) = 0.31 Tpma (out) + 21.3 - Lower 80% acceptability limit (°C) = 0.31 Tpma (out) + 14.3

POLITECNICO DI MILANO
49
Finally, it is important to indicate that this limits are for the indoor operative
temperature (°C), as it is indicated in figure 40.
[37]
4.3.5.2. For energy calculations
In order to get the energy needs with IESVE software mechanically systems has to be
activated in the software options, that is why in order to be consistent with this the thermal
zone has to be defined for mechanically heated/cooled buildings. So in order to implement
this the EN 15251 Code will be considered by using the following table.
[38]
For this design considering category II, the limits defined will be from 20 to 26°C.
Figure 40. Acceptable operative temperature ranges for naturally conditioned spaces
Table 13. Recommended desing values for indoor temperature

POLITECNICO DI MILANO
50
4.3.6. Results:
The values gotten from the base model are the beginning step and will be the point of
comparison for the following strategies implemented in the next chapter.
Figure 41. Hours distribution for thermal zone
Figure 42. Yearly boiler Load

POLITECNICO DI MILANO
51
CHAPTER V: MODEL OPTIMIZATION
5.1. DEFINITION OF STRATEGIES
The strategies were selected from several options developed for well-known institutions in
Peru; these are the German-Peruvian cooperation, Department of housing, construction and
sanitation, national rural housing program and the National University of Engineering to
mention some of them.
The strategies were selected taking into consideration mainly their thermal and physical
characteristics and thinking on how they could interact together, in other words, how some
characteristics could enhance or be detrimental for the characteristics of the other elements
of the envelope.
The construction feasibility is already ensure due to the fact that they use mainly local
products, more than that some of them are already used, even though in an empirical way,
by the locals.
5.1.1. Roofs:
Four roofs were selected to be evaluated. The first one has 6cm of straw insulation layer
(0.06W/m.k) which help us with the insulation as well as with the price, while on the other
hand has a plywood layer which give us a better finishing but increase the price, all in all this
roof has an average cost and an average thermal transmittance.
The second option is the cheapest one due to the fact that consist just on putting a cover of
jute or any kind of burlap fabric below the wooden frame structure. This second option is
interesting because shows how a small detail or apparently not meaningful component of a
layer can decrease significantly the final thermal transmittance, from 7.14 to 2.97. This roof
has a low cost and a considerable thermal transmittance.
The third option is more expensive due to the fact that a wool layer and a totora layer are
included and accommodate inside the wooden frame structure. This roof has a high cost
and a low thermal transmittance.
The final option is based in the previous one having the same firsts layers and including a
totora insulation layer supported by a burlap fabric layer, the characteristic to be mentioned
in this case is the fact that this option reduce considerable the space to be heated, reducing
considerably the energy needs. Simulations will indicate if this characteristic as well as its
low thermal transmittance compensate the construction costs.

POLITECNICO DI MILANO
52
Roof Description U value Cost S/.
Baseline:
Wavy metallic plate supported by a wooden frame
structure.
7.14 0.00
Roof 1
Straw insulation-roof:
baseline case plus 6cm of totora as insulation supported
by plywood.
0.74 3100.53
Roof 2
Burlap fabric roof:
baseline case plus burlap fabric cover in the roof
bottom.
2.97 1340.13
Roof 3
Wool and totora insulation-roof:
baseline case plus 6cm of sheep wool and 10cm of totora
as insulation supported by a burlap fabric.
0.36 4251.20
Roof 4
Wool and totora insulation-burlap fabric roof:
Previous case plus 5cm of totora as insulation supported
by a burlap fabric horizontanly placed as ceiling.
0.26 5375.12
Table 14. Selected roof strategies description
Figure 43. Roof 1 detail and thermal transmittance distribution

POLITECNICO DI MILANO
53
Figure 44. Roof 2 detail and thermal transmittance distribution
Figure 45. Roof 3 detail and thermal transmittance distribution
Figure 46. Roof 4 detail and thermal transmittance distribution

POLITECNICO DI MILANO
54
5.1.2. Floors:
Four floors were selected to be evaluated all of them have a bed stone layer of 10cm which
was decided to be used due to the fact that this layer would avoid the water raise by
permeability.
The first option has also a wooden frame structure to generate a cavity that will increase
thermal resistance; finally, it has a wooden board to give a better finishing.
The next option is based in the previous one but in this case, a mud mortar of 5cm will be
included in order to reduce the thermal transmittance.
The final two options consider also the mud mortar in order to reduce the thermal
transmittance, but does not consider the wooden frame structure and board as finishing,
reducing in this way the price but keeping reasonable thermal transmittance.
The simulations will indicate if just the thermal transmittance is the factor to take into account
in the floor evaluation or some other characteristic could make a floor more effective than a
well-insulated floor.
Floor Description U value Cost S/.
Baseline:
Common soil, considering a thickness of 26.5cm2.40 0.00
Floor 1
Anti-humidity floor with wooden board finish 1:
Stone bed of 10cm with a wooden frame of 5cm and a
wooden board finish which generates a cavity.
1.60 6554.72
Floor 2
Anti-humidity floor with wooden board finish 2:
Same layers than in the previous case plus 5cm of mud
mortar as insulation located above the stone bed.
1.45 6821.44
Floor 3
Anti-humidity floor with polished mud finish 1:
Same stone bed layer than in the previous cases, but this
time there is no a wooden frame, and the insulation
layer above the stone bed change from 5cm to 10cm and
is improved mixing the mud mortar with straw.
1.99 1173.16
Floor 3.1
Anti-humidity floor with polished mud finish 2:
Same layers than in the previous case, but the mud
mortar layer changes from 5cm to 10cm.
1.36 2078.94
Table 15. Selected floor strategies description

POLITECNICO DI MILANO
55
Figure 47. Floor 1 detail and thermal transmittance distribution
Figure 48. Floor 2 detail and thermal transmittance distribution
Figure 49. Floor 3 detail and thermal transmittance distribution

POLITECNICO DI MILANO
56
5.1.3. Walls:
Three walls were selected to be evaluated all of them have a mud and straw mortar layer of
2.5cm as finishing in order to protect the totora insulation layer and increase its durability.
The wall thermal transmittance improvement generated by the three options lies mainly in
the thermal insulation given by the totora layers. Every option increase gradually the totora
thickness having 5cm for the first option, 10cm for the second option and 20cm for the last
option.
From the beginning, we can see that the thermal transmittance is not reduced proportionally
to the increase of the totora thickness while on the other hand the costs does increase
proportionally to the totora thickness.
Simulations will indicate if these thermal transmittance reductions compensate the
construction costs in every case.
Figure 50. Floor 4 detail and thermal transmittance distribution

POLITECNICO DI MILANO
57
Wall Description U value Cost S/.
Baseline:
Wall made of adobe with a thickness of 30cm.1.83 0.00
Wall 1
Wall insulated with 5cm of totora:
Baseline plus 5cm of totora insulation and 2.5cm of mud
and straw mortar as finishing.
0.70 2412.39
Wall 2
Wall insulated with 10cm of totora:
Baseline plus 10cm of totora insulation and 2.5cm of
mud and straw mortar as finishing.
0.44 4562.64
Wall 3
Wall insulated with 20cm of totora:
Baseline plus 20cm of totora insulation and 2.5cm of
mud and straw mortar as finishing.
0.25 8863.13
Table 16. Selected wall strategies description
Figure 51. Wall 1 detail and thermal transmittance distribution

POLITECNICO DI MILANO
58
Figure 52. Wall 2 detail and thermal transmittance distribution
Figure 53. Wall 3 detail and thermal transmittance distribution

POLITECNICO DI MILANO
59
5.1.4. Windows:
Three windows were selected to be evaluated, the first one has a manually operable cover
that has the schedule defined for the bedroom thermal zone, it means that it will open from
7am to 9pm and closed on the other hours.
The second option does not have a cover but includes a second glass layer, which as we
can see has a meaningful effect in the thermal transmittance reduction, changing it from
4.96 to 1.47.
Finally, the third option contains both elements a cover and a second glass layer, reducing
the even more the thermal transmittance but on the other hand increasing also the price.
Simulations will give us a clearer idea of the windows effects and if these thermal
transmittance reductions compensate the construction costs in every case.
Window Description U value Cost S/.
Baseline:
1 layer of 3mm glass window. 4.96 0.00
Window 1 Simple window with totora cover:
Baseline plus a manually operable cover of 2cm of wood
and 6cm of totora.4.96-0.75 124.60
Window 2 double window:
Baseline plus another layer of 3mm glass window. 1.47 347.49
Window 3 double window with totora cover:
previous case plus the same manually operable cover of
the first case.1.47-0.53 782.27
Table 17. Selected window strategies description

POLITECNICO DI MILANO
60
Figure 54. Window 1 detail and thermal transmittance distribution
Figure 55. Window 2 detail and thermal transmittance distribution
Figure 56. Window 3 detail and thermal transmittance distribution

POLITECNICO DI MILANO
61
5.2. INSULATION OPTIMIZATION:
Our strategies will be simulated in seven steps adding in every one of them a strategy to be
evaluated, the order of the strategies to be evaluated is the following: Roof, floor, walls,
windows, doors, ground-contact floorplan correction and thermal bridge reduction.
The aim of this procedure is to have a progressively evolution of the optimization and in this
way to see how the best options change in every step.
In addition, we will be able to see which strategies work better together or in the contrary
result detrimental.
To select the best combination of strategies the following procedure will be followed:
It will be defined the energy consumption (Boiler load) and the price of the strategy
and will be represented in a graphic.
The first group of simulations will be the roofs, then the combination of roofs and
floors, then the walls will be added and finally the windows, having in the end 144
combinations.
In every step, the best combination of strategies will be the one that lies in the Pareto
optimal surface and has the lowest energy consumption.
Finally, the best combination selected for every step will be showed in terms of the
final thermal transmittance share of the selected strategies and the saved energy
respect to the base case.
Therefore, in the end combining all the strategies together it will be ensured that the best
combination will be selected. as opposite if just the ones that give the best results working
alone are combined is highly probable that the best options could be missed, due to the fact
that thermal performance just not depend on the individual performance of their components
or on some characteristic of the stratigraphy of a component.
Thermal performance depend also in the interaction of the components, due to the fact the
size, stratigraphy, shape, position, thickness, thermal mass, finishing, in summary
everything, of a component can enhance or be detrimental for the performance of other
component of the envelope.
Finally yet importantly, also the improvements in infiltration will be taken into account
because in the implementation of every component it will be considered that the linear
contacts between the elements will be sealed, this infiltration reduction in every step will be
considered in the evaluations as showed in the following chart:

POLITECNICO DI MILANO
62
5.2.1. Roof strategies selection – Step 1
Seeing the list of selected strategies to be evaluated it can be considered that the last two
will be the ones that will give the smaller energy needs, also the fact that the last one reduce
considerable the volume to be heated can generate a considerable difference between this
one and the third one, this has to be verify with the simulations. Simulations will also show
if the energy savings compensate the costs.
List of defined strategies to be evaluated:
Roof Description U value Cost S/.
Roof 1 Straw insulation-roof: 0.74 3100.53
Roof 2 Burlap fabric roof: 2.97 1340.13
Roof 3 Wool and totora insulation-roof: 0.36 4251.20
Roof 4 Wool and totora insulation-burlap fabric roof: 0.26 5375.12
Roof Description Infiltration
Step 0 Baseline 1.0 ach
Step 1 Roof 0.5 ach
Step 2 Roof + Floor 0.5 ach
Step 3 Roof + Floor + Wall 0.35 ach
Step 4 Roof + Floor + Wall + Window 0.25 ach
Table 18. Considered air infiltrations
Table 19. Selected roof strategies

POLITECNICO DI MILANO
63
Results:
Figure 57. Step 1 (roofs) energy-cost results
Figure 58. Step 1 yearly boiler loads

POLITECNICO DI MILANO
64
Results description:
The fourth roof is the one with better performance but given that this analysis also consider
the cost the second roof will be considered the best option in this step due to the high
difference in price with the fourth roof.
Despite of the fact that second roof has the highest U value it gave better results than the
first and third roof, it can be explained considering that this low U value allows a higher
heat transmittance and this in the end resulted positive by allowing energy gains during the
hours of daylight.
5.2.2. Roof-floor strategies selection – Step 2
Seeing the list of selected strategies to be evaluated it can be expected that the energy
needs, boiler loads, will be higher for the floors with a high thermal transmittance and lower
for the ones with a smaller thermal transmittance, another important issue is to see how
floors will interact with roofs.
List of defined strategies to be evaluated:
Floor Description U value Cost S/.
Floor 1 Anti-humidity floor with wooden board finish 1: 1.60 6554.72
Floor 2 Anti-humidity floor with wooden board finish 2: 1.45 6821.44
Floor 3 Anti-humidity floor with polished mud finish 1: 1.99 1173.16
Floor 4 Anti-humidity floor with polished mud finish 2: 1.36 2078.94
Figure 59. Step 1 area and thermal transmittance distribution - percentage
Table 20. Selected floor strategies

POLITECNICO DI MILANO
65
Results:
Floor 1.36
Floor 1.45 Floor 1.60
Floor 1.99
Figure 60. Step 2 (roofs-floors) energy-cost results
Figure 61. Step 2 yearly boiler loads

POLITECNICO DI MILANO
66
Results description:
The base model floor has a U value equal to 2.4, in step 1 it generates that roof 2 (the with
the highest thermal transmittance) has a better performance than roof 1 and 3.
However in this step it can be seen that a lower floor thermal transmittance, do generate
lower energy loads but the issue to point out is that it also generate that the performance
goes in accordance with the roof thermal transmittance.
In fact as we can see for the third option (floor U: 1.99W/m.k), the trend seen in step 1
remain, however progressively this change until option 4 (floor U: 1.36W/m.k) where we
can see how energy loads are lower as lower are the roof thermal transmittance.
5.2.3. Roof-floor-wall strategies selection – Step 3
Seeing the list of selected strategies to be evaluated it can be expected that the energy
needs (boiler loads), will be higher for the walls with a high thermal transmittance and lower
for the ones with a smaller thermal transmittance. As we can see from table 21, the reduction
on thermal transmittance is not proportional to the increase of insulation and also it implies
that is not proportional to the increase of price. However, in the end the simulations will
indicate if the energy savings are proportional or compensate the expenses.
Figure 62. Step 2 area and thermal transmittance distribution - percentage

POLITECNICO DI MILANO
67
List of defined strategies to be evaluated:
Results:
Wall Description U value Cost S/.
Wall 1 Wall insulated with 5cm of totora: 0.70 2412.39
Wall 2 Wall insulated with 10cm of totora: 0.44 4562.64
Wall 3 Wall insulated with 20cm of totora: 0.25 8863.13
Wall 0.70
Wall 0.44
Wall 0.25
Figure 63. Step 2 (roofs-floors-wall) energy-cost results
Table 21. Selected wall strategies

POLITECNICO DI MILANO
68
Results description:
First, here we can see how the trend founded in the second step remains, but with a variation
in the proportion of energy needs between the combinations with roof 2.97 and all the others.
On the other hand, the other three options depicts approximately the same energy needs
with a small advantage for roof 0.36 over roof 0.26, which is interesting. Finally, from these
results, it can be seen how the differences in energy needs between wall 0.70 and wall 0.44
is higher than the differences between wall 0.44 and wall 0.25. Which correspond to the
differences in thermal transmittance.
Figure 64. Step 3 yearly boiler loads
Figure 65. Step 3 area and thermal transmittance distribution - percentage

POLITECNICO DI MILANO
69
5.2.4. Roof-floor-wall-window strategies selection – Step 4
Seeing the list of selected strategies to be evaluated it can be expected that, as well as in
all the other cases, the energy needs, boiler loads, will be higher for the walls with a high
thermal transmittance and lower for the ones with a smaller thermal transmittance. If this
assumption is correct the third option, double glass with a manually operable cover will be
the most effective in terms of energy savings. However there is an important detail here due
to the fact that windows also help us with solar gains, in this sense while at night it is
necessary to have a smaller thermal transmittance during the day it is better to have a higher
thermal transmittance in order to increase the solar gains, due to this maybe option 1 will be
the best in the end.
List of defined strategies to be evaluated:
Results:
Window Description U value Cost S/.
Window 1 Simple window with totora cover: 4.96-0.75 124.60
Window 2 double window: 1.47 347.49
Window 3 double window with totora cover: 1.47-0.53 782.27
Figure 66. Step 4 (roofs-floors-walls-windows) energy-cost results
Window 0.53
Window 1.47
Window 0.75
Table 22. Selected window strategies

POLITECNICO DI MILANO
70
Results description:
First, here we can see how the trend founded in the third step remains and this time without
any variation. Second it can be seen that the assumptions considered were correct since
the first option shows the lower energy needs allowing the solar gains along the day and
having a low thermal transmittance at night. Finally, what is a surprise is to see how the third
option has the higher energy needs, it is especially surprising when it is compared to the
second option because the third option has an insulating cover implemented at nights, so
supposedly this should have a better performance than the second one, but it is not.
Figure 67. Step 4 yearly boiler loads
Figure 68. Step 4 area and thermal transmittance distribution - percentage

POLITECNICO DI MILANO
71
5.2.5. Door insulation strategy – Step 5
As we can see in figure 68 the thermal mass participation for the door is much higher than
its area participation due to this door is an element to be improved, in the next step an
insulated door will be implemented in order to manage this issue.
List of defined strategies to be evaluated:
List of combinations to be evaluated: door 0.54
Results:
Figure 69. Step 5 Door insulation combinations-energy cost results
Table 24. Step 5 Door insulation combinations
Combinations Strategies
Combinaton 1 Roof 0.74 + Floor 1.36+ Wall 0.70 + Window 0.75 + Door 0.54
Combinaton 2 Roof 0.74 + Floor 1.36+ Wall 0.44 + Window 0.75 + Door 0.54
Combinaton 3 Roof 0.74 + Floor 1.36+ Wall 0.25 + Window 0.75 + Door 0.54
Combinaton 4 Roof 0.36 + Floor 1.36+ Wall 0.70 + Window 0.75 + Door 0.54
Combinaton 5 Roof 0.36 + Floor 1.36+ Wall 0.44 + Window 0.75 + Door 0.54
Combinaton 6 Roof 0.36 + Floor 1.36+ Wall 0.25 + Window 0.75 + Door 0.54
Combinaton 7 Roof 2.97 + Floor 1.36+ Wall 0.70 + Window 0.75 + Door 0.54
Window Description U value Cost S/.
Door 1 Simple door with 5cm of totora cover inside and ofside 0.54 352.68
Table 23. Selected door strategy

POLITECNICO DI MILANO
72
Results description:
Due to the thermal mass participation for the door indicated in figure 68 it had been expected
that its improvement generated a higher impact in the energy loads.
In any case despite of the fact that door improvement doesn’t generate high energy savings,
it is worth it to be applied since the implementation costs are not high neither.
Figure 70. Step 5 yearly boiler loads
Figure 71. Step 5 area and thermal transmittance distribution - percentage

POLITECNICO DI MILANO
73
5.2.6. Ground-contact floorplan correction – Step 6
In this point it is important to indicate that IESVE allow us to take into account the floor-soil
interaction, getting in this way a more realistic and accurate evaluation.
This option is available for floors in contact with soil, and can be done by two methods the
EN-ISO 13370 and the F-factor; in this case, the first one will be used.
To carry out these evaluations the seven best combinations from the previous step will be
evaluated.
List of combinations to be evaluated:
Results:
Combinations Strategies
Combinaton 1 Roof 0.74 + Floor 0.79+ Wall 0.70 + Window 0.75 + Door 0.54
Combinaton 2 Roof 0.74 + Floor 0.79+ Wall 0.44 + Window 0.75 + Door 0.54
Combinaton 3 Roof 0.74 + Floor 0.79+ Wall 0.25 + Window 0.75 + Door 0.54
Combinaton 4 Roof 0.36 + Floor 0.79+ Wall 0.70 + Window 0.75 + Door 0.54
Combinaton 5 Roof 0.36 + Floor 0.79+ Wall 0.44 + Window 0.75 + Door 0.54
Combinaton 6 Roof 0.36 + Floor 0.79+ Wall 0.25 + Window 0.75 + Door 0.54
Combinaton 7 Roof 2.97 + Floor 0.79+ Wall 0.70 + Window 0.75 + Door 0.54
Table 25. Step 6 ground-contact floorplan correction combinations
Figure 72. Step 6 ground-contact floorplan correction combinations-energy cost results

POLITECNICO DI MILANO
74
Results description:
First of all the results show us how important was to correct the floor thermal transmittance
because as we can see the differences in energy loads are high, arriving to have a best
option that expend less than half energy than the best option found in the previous step.
Second in this step it can be seen how a good insulated floor enhance the effect on the
insulation of other components, making it bigger the differences in energy savings.
Figure 73. Step 6 yearly boiler loads
Figure 74. Step 6 area and thermal transmittance distribution - percentage

POLITECNICO DI MILANO
75
5.3. THERMAL BRIDGE REDUCTION:
5.3.1. Thermal bridge reduction – Step 7
In this point it is important to indicate that IESVE also allow us to take into account a possible
underground insulation, this kind of insulation is useful because block the thermal bridge
between our floor border and the external soil. Also this step is applied because as we can
see in figure 74 floor still has a thermal transmittance participation higher than its area
participation. To carry out these evaluations the seven best combinations from the previous
step will be evaluated.
List of combinations to be evaluated:
Results:
Combinations Strategies
Combinaton 1 Roof 0.74 + Floor 0.50+ Wall 0.70 + Window 0.75 + Door 0.54
Combinaton 2 Roof 0.74 + Floor 0.49+ Wall 0.44 + Window 0.75 + Door 0.54
Combinaton 3 Roof 0.74 + Floor 0.48+ Wall 0.25 + Window 0.75 + Door 0.54
Combinaton 4 Roof 0.36 + Floor 0.50+ Wall 0.70 + Window 0.75 + Door 0.54
Combinaton 5 Roof 0.36 + Floor 0.49+ Wall 0.44 + Window 0.75 + Door 0.54
Combinaton 6 Roof 0.36 + Floor 0.48+ Wall 0.25 + Window 0.75 + Door 0.54
Combinaton 7 Roof 2.97 + Floor 0.50+ Wall 0.70 + Window 0.75 + Door 0.54
Table 26. Step 7 Thermal bridge reduction combinations
Figure 75. Step 7 Thermal bridge reduction combinations - energy cost results

POLITECNICO DI MILANO
76
Results description:
An external thermal underground insulation generates substantial energy savings, arriving
to have a best option that expend less than half energy than the best option found in the
previous step.
The increment in cost is considerable but because of the energy savings generated,
considering the slope showed in the graphic and given that the cost of energy in Peru is
0.533 S./Kwh, they can be recovered in approximately 4 years.
Figure 77. Step 7 yearly boiler loads
Figure 78. Step 7 area and thermal transmittance distribution - percentage

POLITECNICO DI MILANO
77
Figure 79. Ground-contact floorplan insulation detail

POLITECNICO DI MILANO
78
5.4. INVESMENT – ENERGY COST EVALUATION:
The Following figure shows the sums of the cost of implementation of the strategies and of
the energy for 1, 2.5, 5, 7.5 and 10 years, as we can see with time higher values of
investment in strategies is convenient, given that the lowest total cost value moves towards
the left in every case.
Going more in detail the study shows that the implementation costs are not recovered for
the first case which is the line that represents 1 year of energy cost, which implies that in
economic terms it will be better do not implement any strategy for this case.
However, since the second year we can see that the cost of implementation can be
recovered which are encouraging results.
As stated before in the long run highest investment depict higher savings, but more than
that a well insulated house will generate a better quality of life, better physical and mental
health, to say just some of the advantages of these implementations.
Overall, economic factor should not be the only one to take into account when it comes down
to invest in house thermal performance improvement.
Figure 80. Investment – energy cost evaluation

POLITECNICO DI MILANO
79
Bibliography
[1] “No Title.” [Online]. Available:
https://www.un.org/development/desa/publications/2018-revision-of-world-
urbanization-prospects.html.
[2] M. A. Pallares and P. Y. Objetivos, Presentación 1, no. Plan 2001. 2007.
[3] A. L. Miranda and A. L. Marulanda, “Sustainable construction in developing
countries - A Peruvian perspective,” Challenges, pp. 1–17, 2002.
[4] “No Title.” [Online]. Available:
https://inversionenlainfancia.net/?blog/entrada/noticia/184.
[5] “No Title.” [Online]. Available: https://www.telesurtv.net/news/ola-frio-peru-700-
muertos-20180712-0018.html.
[6] Republic of Kiribati, “Republic of Kiribati Intended Nationally Determined
Contribution,” no. November, pp. 1–27, 2015.
[7] “No Title.” [Online]. Available:
https://www.academia.edu/7623155/Pontificia_Universidad_Cat%25C3%25B3lica_
del_Per%25C3%25B
A_CRITERIOS_PARA_CONSTRUCCIONES_DE_LADRILLO_MAS_SEGURAS.
[8] “No Title.” [Online]. Available: http://www.canin.com/three-architectural-periods-in-
peru/.
[9] R. Arbulú, IEC Informe Económico de la Construcción. Vol. Número 5. CAPECO,
2015.
[10] “No Title.” [Online]. Available: https://www.researchgate.net/figure/Figura-1-
Izquierda-Vista-general-de-la-edificacion-Derecha-Planta-tipica-donde-
se_fig1_228832123.
[11] F. DUMLER CUYA Viceministro de Construcción Saneamiento, “SEMINARIO
INTERNACIONAL: CIUDADES SOSTENIBLES Y CAMBIO CLIMÁTICO Panel
Construcción sostenible y eficiencia energética,” 2014.
[12] “No Title.” [Online]. Available: http://stakeholders.com.pe/francesca-mayer/el-
codigo-tecnico-de-construccion-sostenible-y-otras-normativas-a-nivel-nacional/.
[13] Código Nacional de Electricidad, “Norma técnica EM.010 Instalaciones eléctricas
interiores,” p. 11.
[14] Comité permanente de construcción sostenible, Código Técnico Peruano de
Construcción Sostenible. 2015.
[15] I. Con and E. Solar, “Norma Tecnica De Edificacion Em080 Instalaciones Con

POLITECNICO DI MILANO
80
Energia.”
[16] J. Fernández-baca, “NAMA de Construcción Sostenible con Visión de Ciudad en el
Perú.”
[17] Nasrollahi, “Energy Efficient Buildings. Papers on The Young cities Projects- 11th
Ed.,” 2013.
[18] N. Zealand et al., “Introduction to architectural science the basis of sustainable
design,” p. 64, 2004.
[19] C. Ratti, D. Raydan, and K. Steemers, “Building form and environmental
performance: Archetypes, analysis and an arid climate,” Energy Build., vol. 35, no.
1, pp. 49–59, 2003.
[20] Mumovic, “A handbook of sustainable building design and engineering.” p. 66.
[21] N. Zealand et al., Introduction to architectural science the basis of sustainable
design, p 35. 1995.
[22] N. Zealand et al., Introduction to architectural science the basis of sustainable
design, p 36. 2004.
[23] ANSI/ASHRAE, Standard 62.1 Ventilation for Acceptable Indoor Air Quality. 2013.
[24] P. D. I. Milano, “School of Architecture , Urban Planning and Construction
Engineering MASTER ’ S IN BUILDING AND ARCHITECTURAL ENGINEERING
EVALUATION OF NATURAL VENTILATION.”
[25] N. Z. et Al., Introduction to architectural science the basis of sustainable design, p
40. 2004.
[26] E. D. A. Prof and S. A. Course, “Development of Benchmark Models for Nearly Zero
Energy Schools In Belgium,” no. April, p. 16, 2019.
[27] “No Title.” [Online]. Available: https://en.wikipedia.org/wiki/Thermal_mass.
[28] N. Zealand et al., Introduction to architectural science the basis of sustainable
design, p 63. 2004.
[29] N. Zealand et al., Introduction to architectural science the basis of sustainable
design, p 58. 2004.
[30] E. D. A. Prof and S. A. Course, “Development of Benchmark Models for Nearly Zero
Energy Schools In Belgium, p 15,” 2019.
[31] N. Zealand et al., Introduction to architectural science the basis of sustainable
design, p 42, 43. 2004.
[32] N. Zealand et al., Introduction to architectural science the basis of sustainable
design, p 45. 2004.

POLITECNICO DI MILANO
81
[33] N. Zealand et al., Introduction to architectural science the basis of sustainable
design, p 46. 2004.
[34] N. Zealand et al., Introduction to architectural science the basis of sustainable
design, p 48. 2004.
[35] D. Teli, L. Bourikas, P. A. B. James, and A. S. Bahaj, “Thermal Performance
Evaluation of School Buildings using a Children-based Adaptive Comfort Model,”
Procedia Environ. Sci., vol. 38, no. 0, pp. 844–851, 2017.
[36] L. Pagliano, P. Zangheri, and R. Armani, “En 15251 : 2007,” 2011.
[37] ASHRAE-55, “Thermal environmental conditions for human occupancy,”
ANSI/ASHRAE Stand. - 55, vol. 7, p. 6, 2017.
[38] B. W. Olesen, “Indoor Environmental Input Parameters for Design and Assessment
of Energy Performance of Buildings Addressing Indoor Air Quality, Thermal
Environment, Lighting and Acoustics,” Cense, vol. 3, 2010.
[39] INEI, “Endes 2017,” pp. 1–644, 2017.