Embed Size (px)
Citation preview
Development Planning on Optimal Power Generation for Peak Demand in Sri LankaFinal Report
(Source: JICA Study Team)
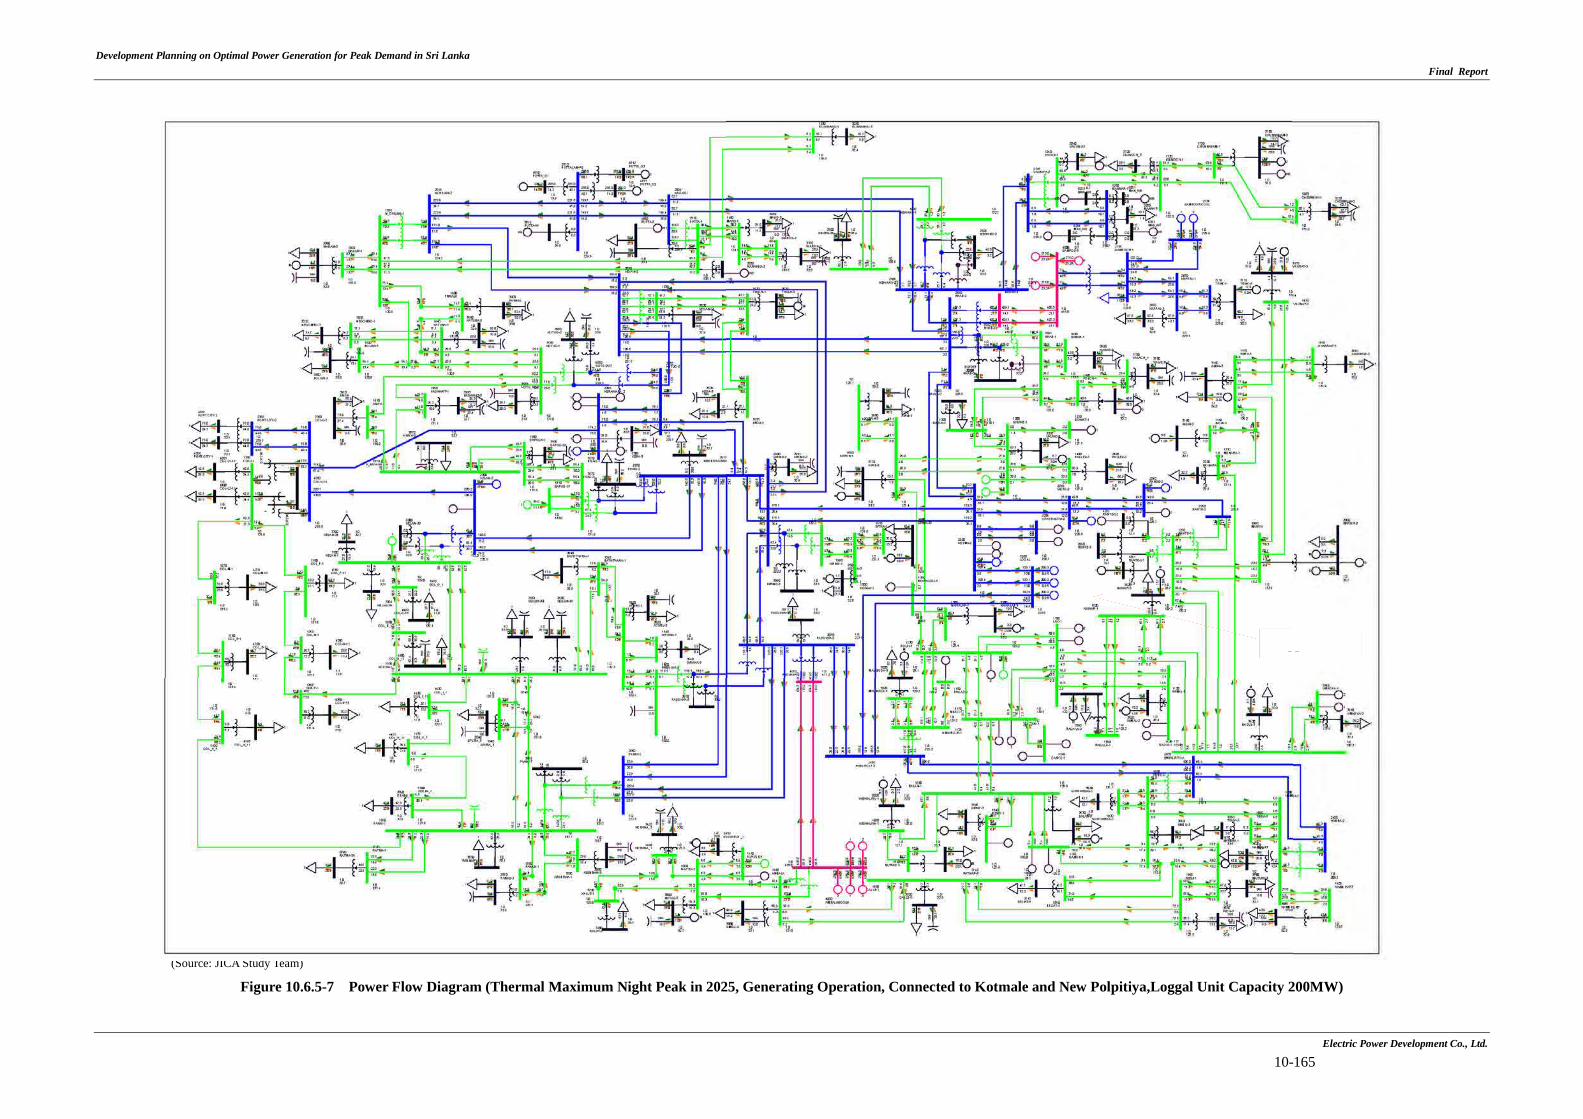
Figure 10.6.5-7 Power Flow Diagram (Thermal Maximum Night Peak in 2025, Generating Operation, Connected to Kotmale and New Polpitiya,Loggal Unit Capacity 200MW)
Loggal PSPP
Electric Power Development Co., Ltd.
10-165
(Source: JICA Study Team)
Loggal PSPP
Development Planning on Optimal Power Generation for Peak Demand in Sri LankaFinal Report
(Source: JICA Study Team)
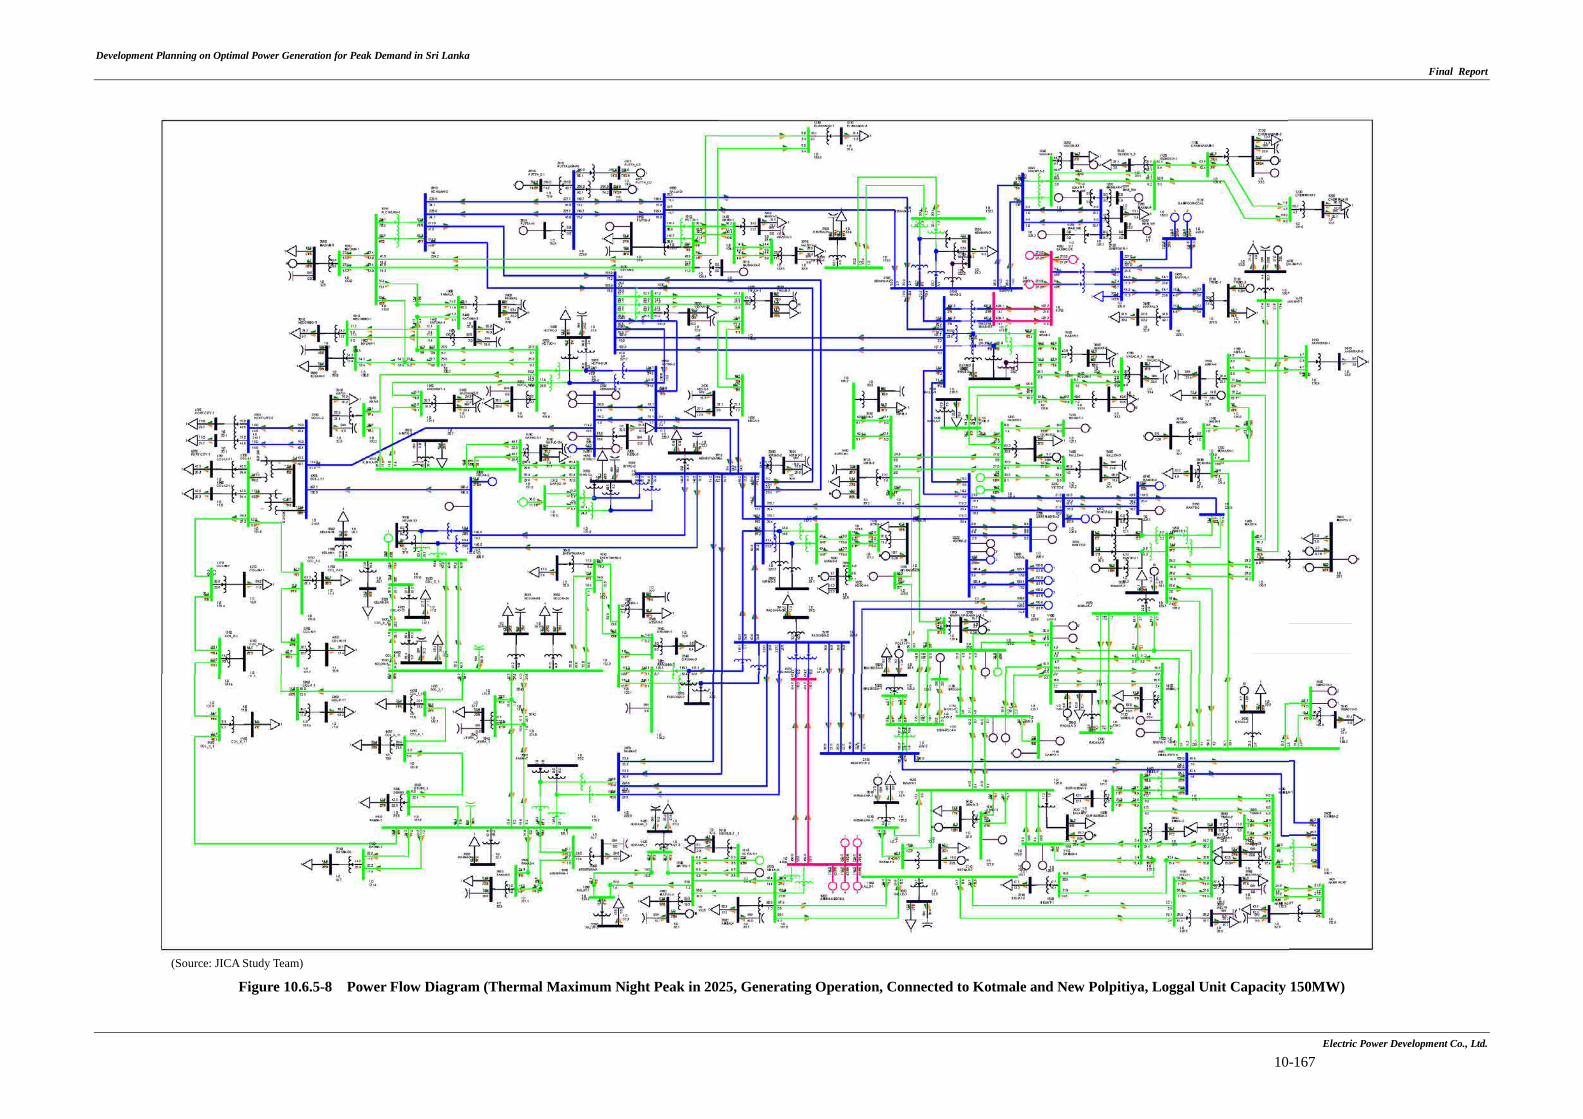
Figure 10.6.5-8 Power Flow Diagram (Thermal Maximum Night Peak in 2025, Generating Operation, Connected to Kotmale and New Polpitiya, Loggal Unit Capacity 150MW)
Loggal PSPP
Electric Power Development Co., Ltd.
10-167
Loggal PSPP
Development Planning on Optimal Power Generation for Peak Demand in Sri LankaFinal Report
(Source: JICA Study Team)
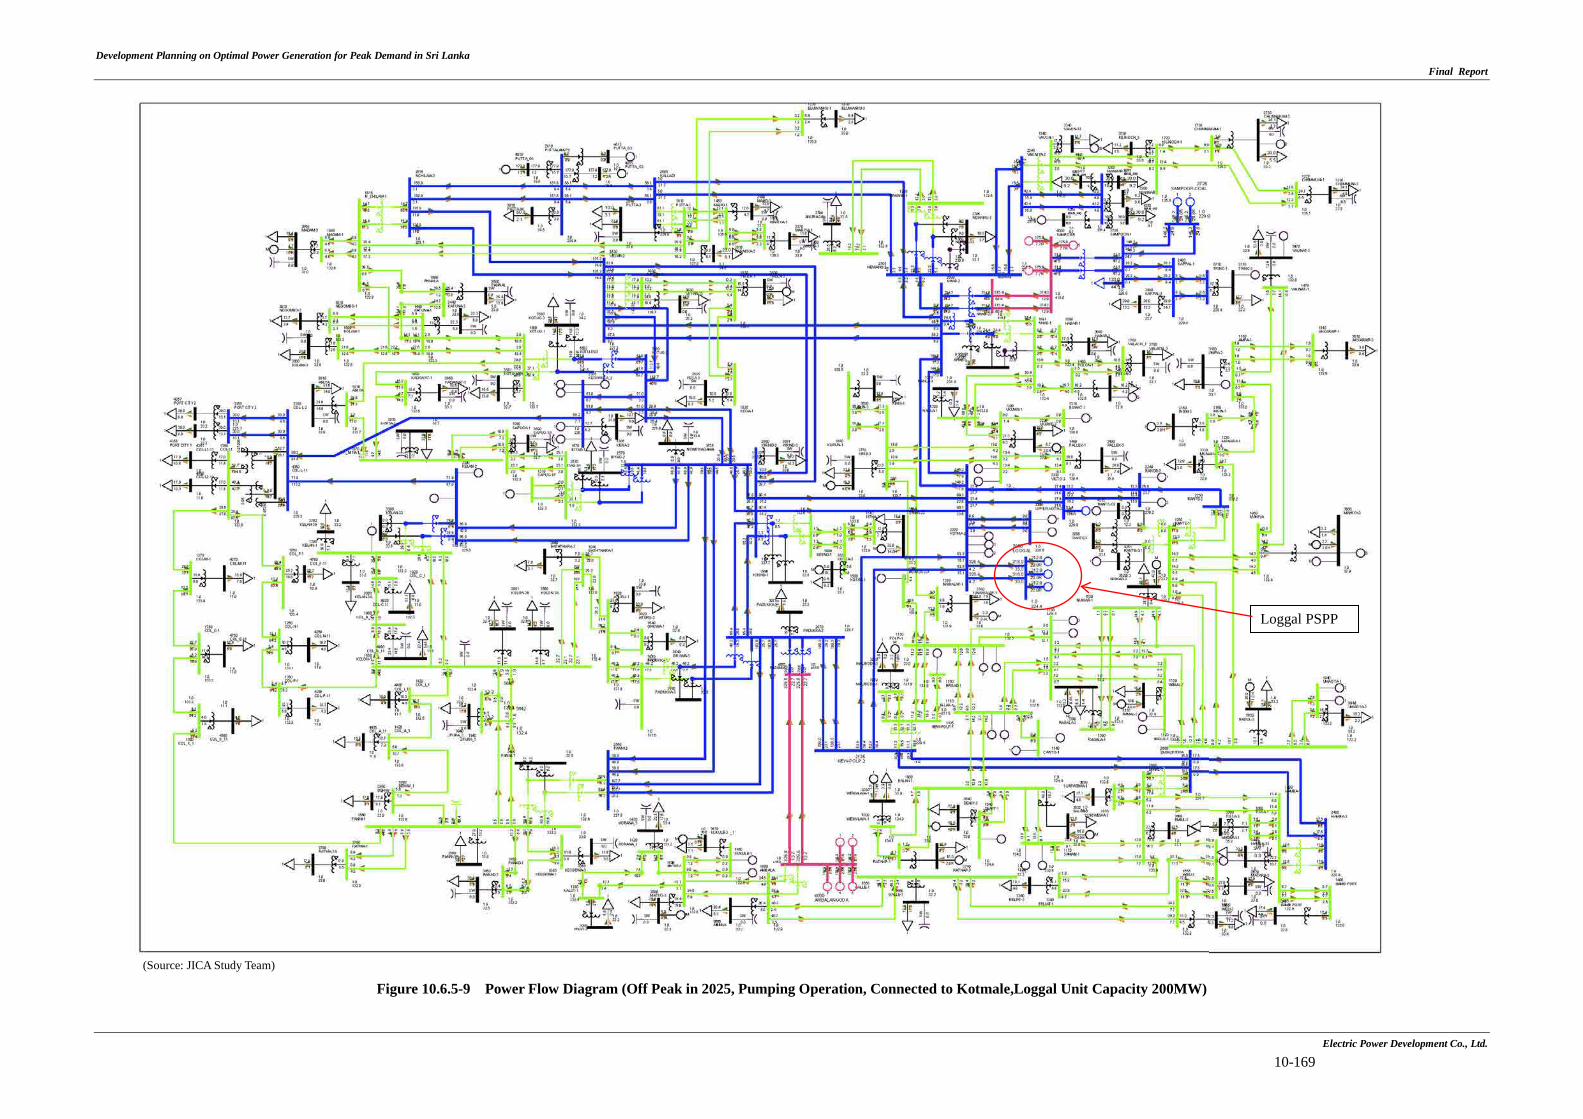
Figure 10.6.5-9 Power Flow Diagram (Off Peak in 2025, Pumping Operation, Connected to Kotmale,Loggal Unit Capacity 200MW)
Loggal PSPP
Electric Power Development Co., Ltd.
10-169
Development Planning on Optimal Power Generation for Peak Demand in Sri LankaFinal Report
(Source: JICA Study Team)
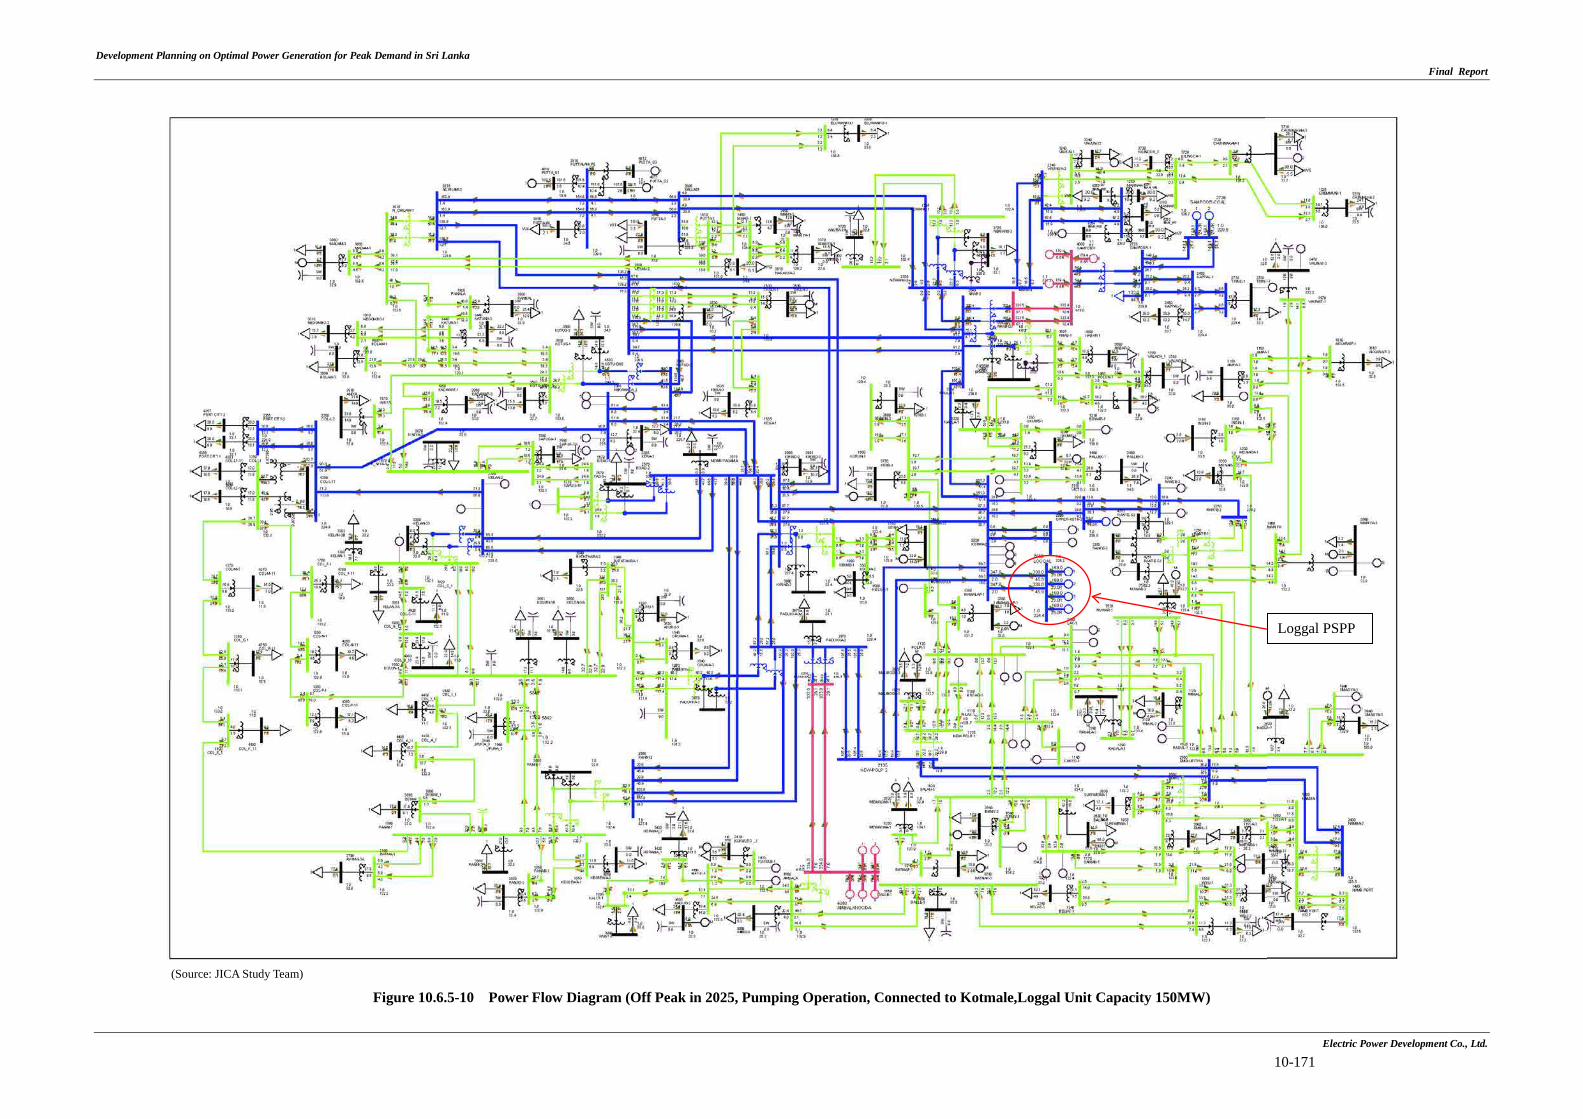
Figure 10.6.5-10 Power Flow Diagram (Off Peak in 2025, Pumping Operation, Connected to Kotmale,Loggal Unit Capacity 150MW)
Loggal PSPP
Electric Power Development Co., Ltd.
10-171
Development Planning on Optimal Power Generation for Peak Demand in Sri LankaFinal Report
(Source: JICA Study Team)
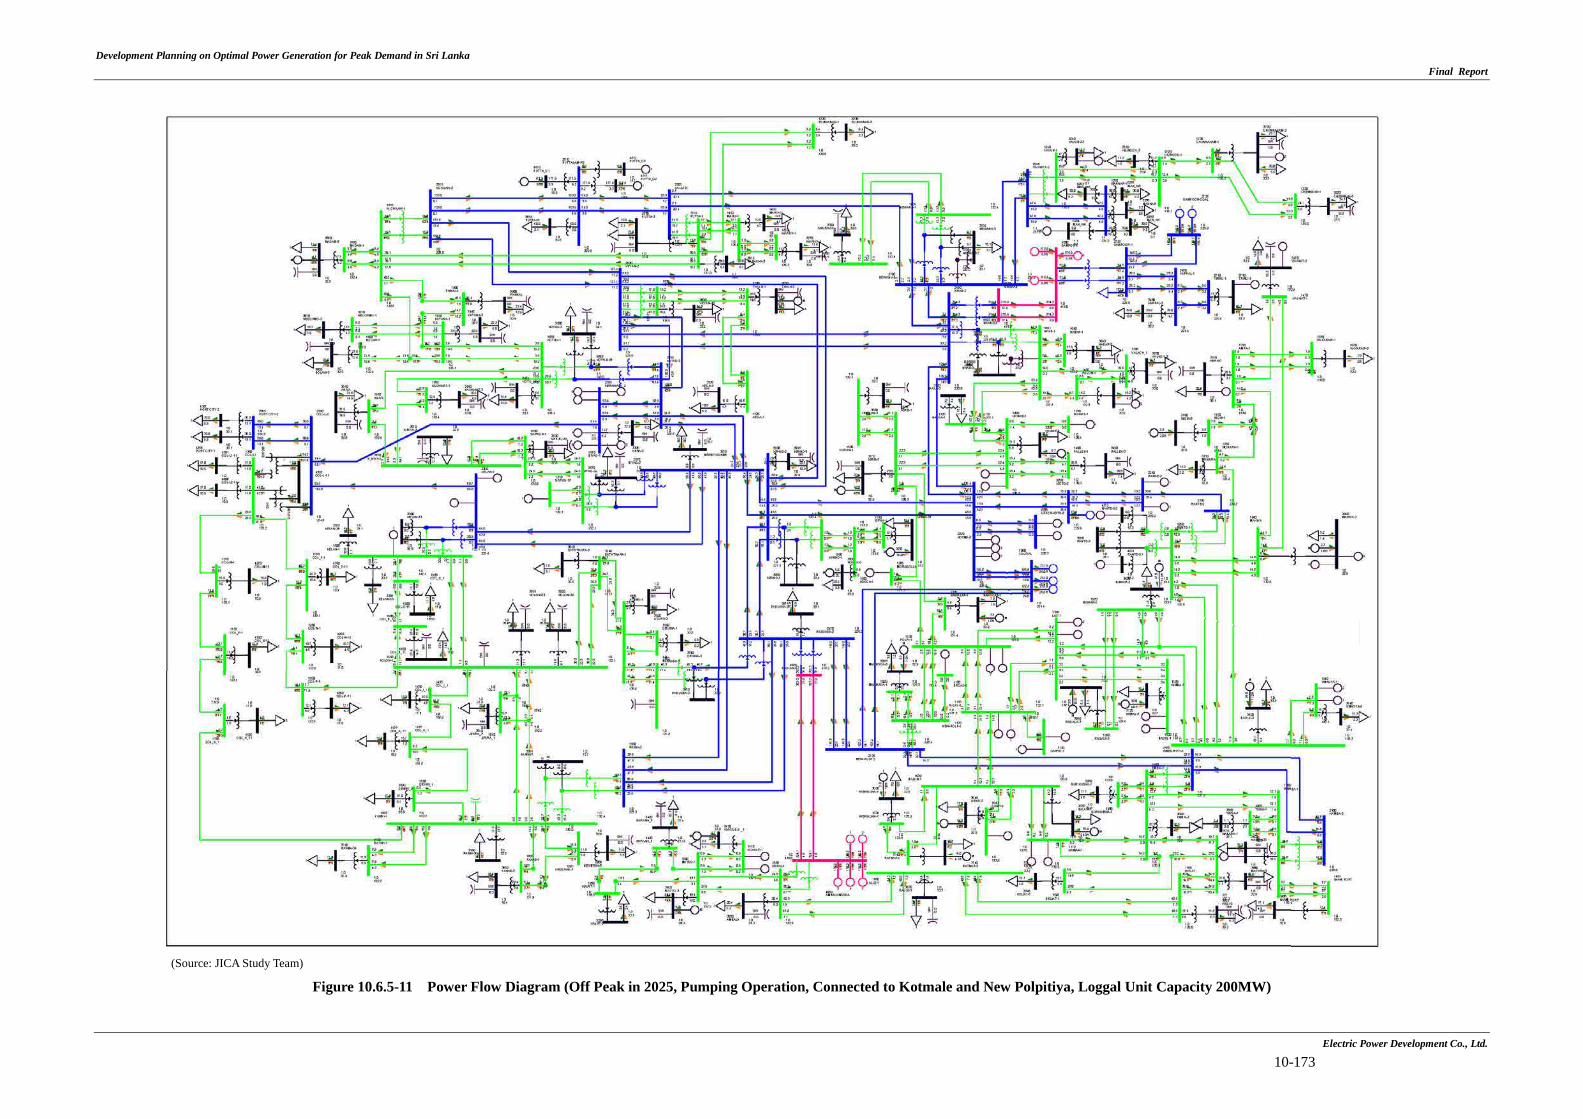
Figure 10.6.5-11 Power Flow Diagram (Off Peak in 2025, Pumping Operation, Connected to Kotmale and New Polpitiya, Loggal Unit Capacity 200MW)
Loggal PSPP
Electric Power Development Co., Ltd.
10-173
Loggal PSPP
Development Planning on Optimal Power Generation for Peak Demand in Sri LankaFinal Report
(Source: JICA Study Team)
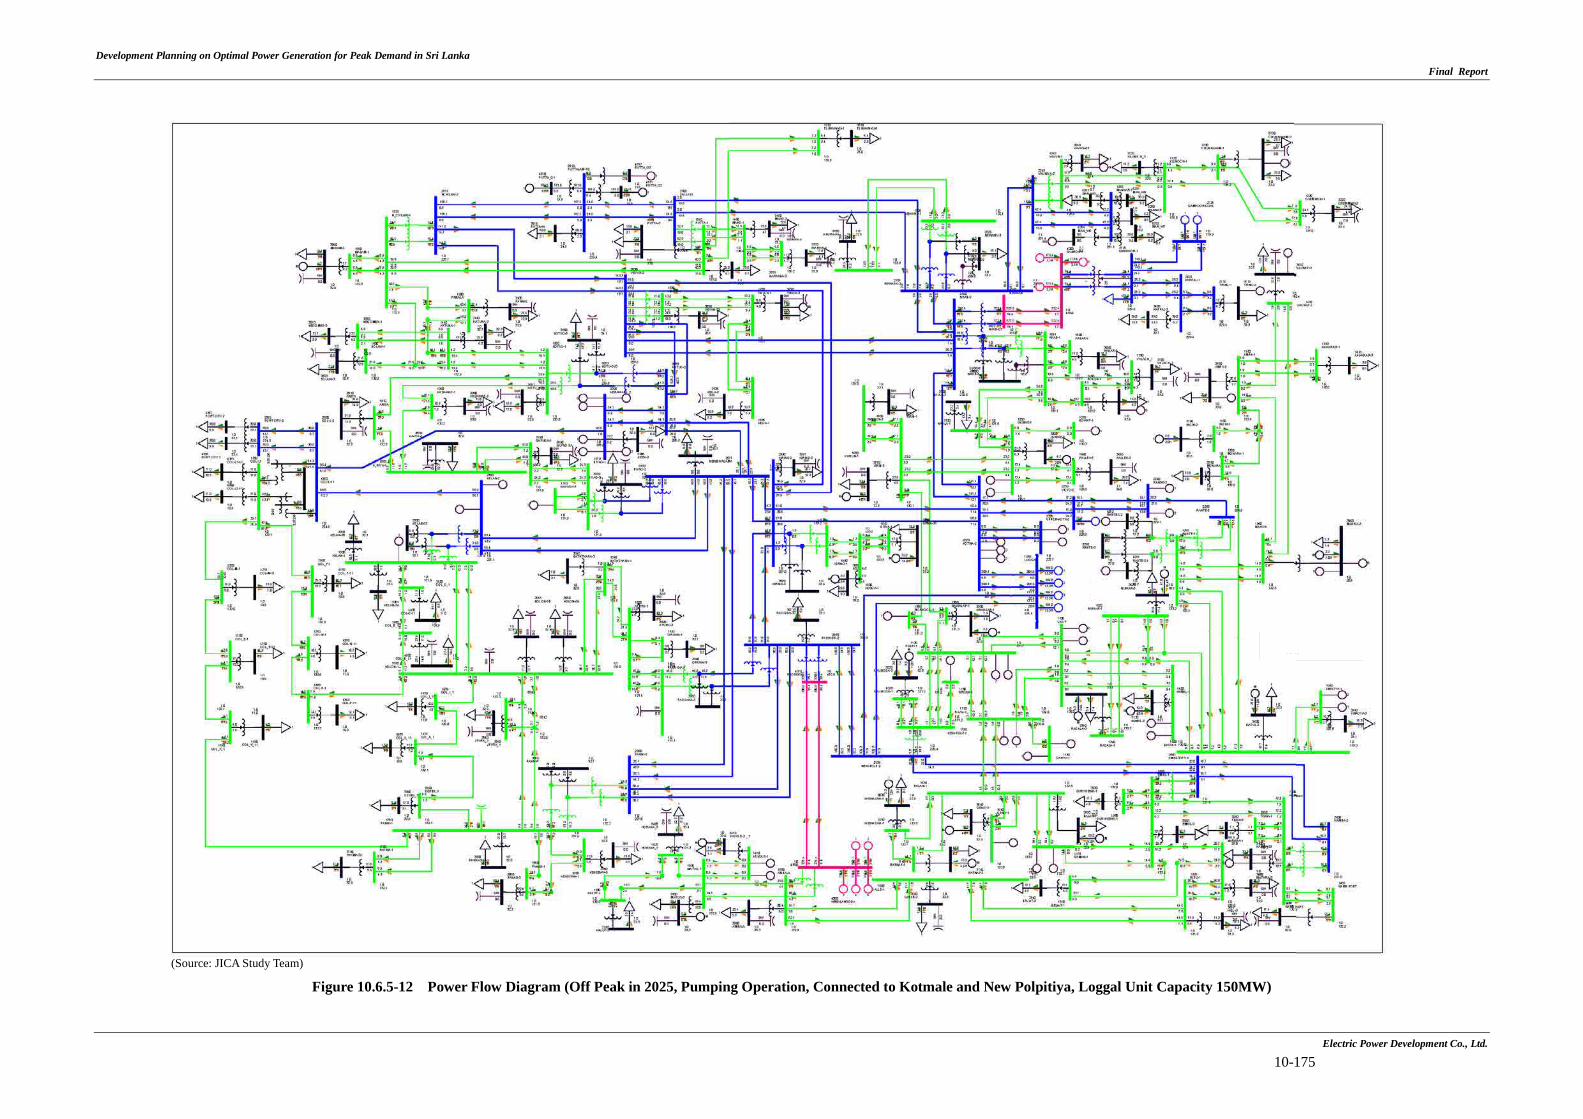
Figure 10.6.5-12 Power Flow Diagram (Off Peak in 2025, Pumping Operation, Connected to Kotmale and New Polpitiya, Loggal Unit Capacity 150MW)
Loggal PSPP
Electric Power Development Co., Ltd.
10-175
Loggal PSPP
Development Planning on Optimal Power Generation for Peak Demand in Sri Lanka Final Report
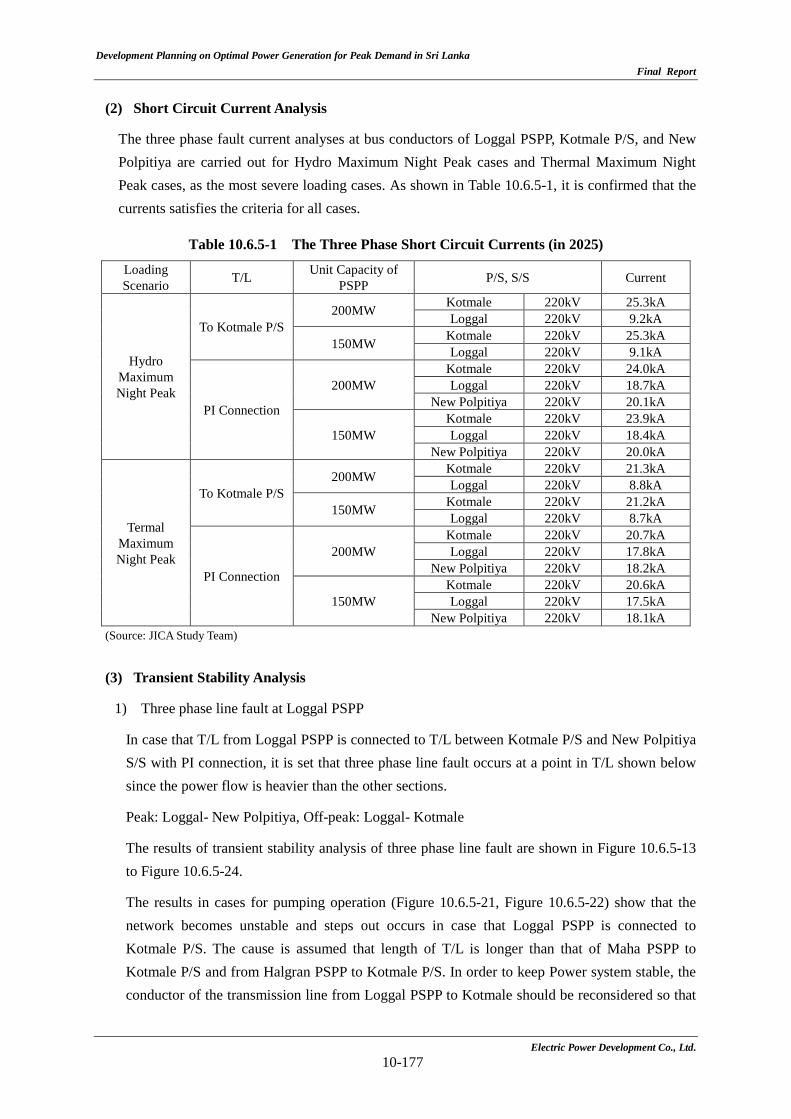
(2) Short Circuit Current Analysis
The three phase fault current analyses at bus conductors of Loggal PSPP, Kotmale P/S, and New Polpitiya are carried out for Hydro Maximum Night Peak cases and Thermal Maximum Night Peak cases, as the most severe loading cases. As shown in Table 10.6.5-1, it is confirmed that the currents satisfies the criteria for all cases.
Table 10.6.5-1 The Three Phase Short Circuit Currents (in 2025)
Loading Scenario T/L Unit Capacity of
PSPP P/S, S/S Current
Hydro Maximum Night Peak
To Kotmale P/S 200MW Kotmale 220kV 25.3kA
Loggal 220kV 9.2kA
150MW Kotmale 220kV 25.3kA Loggal 220kV 9.1kA
PI Connection
200MW Kotmale 220kV 24.0kA Loggal 220kV 18.7kA
New Polpitiya 220kV 20.1kA
150MW Kotmale 220kV 23.9kA Loggal 220kV 18.4kA
New Polpitiya 220kV 20.0kA
Termal Maximum Night Peak
To Kotmale P/S 200MW Kotmale 220kV 21.3kA
Loggal 220kV 8.8kA
150MW Kotmale 220kV 21.2kA Loggal 220kV 8.7kA
PI Connection
200MW Kotmale 220kV 20.7kA Loggal 220kV 17.8kA
New Polpitiya 220kV 18.2kA
150MW Kotmale 220kV 20.6kA Loggal 220kV 17.5kA
New Polpitiya 220kV 18.1kA (Source: JICA Study Team)
(3) Transient Stability Analysis
1) Three phase line fault at Loggal PSPP
In case that T/L from Loggal PSPP is connected to T/L between Kotmale P/S and New Polpitiya S/S with PI connection, it is set that three phase line fault occurs at a point in T/L shown below since the power flow is heavier than the other sections.
Peak: Loggal- New Polpitiya, Off-peak: Loggal- Kotmale
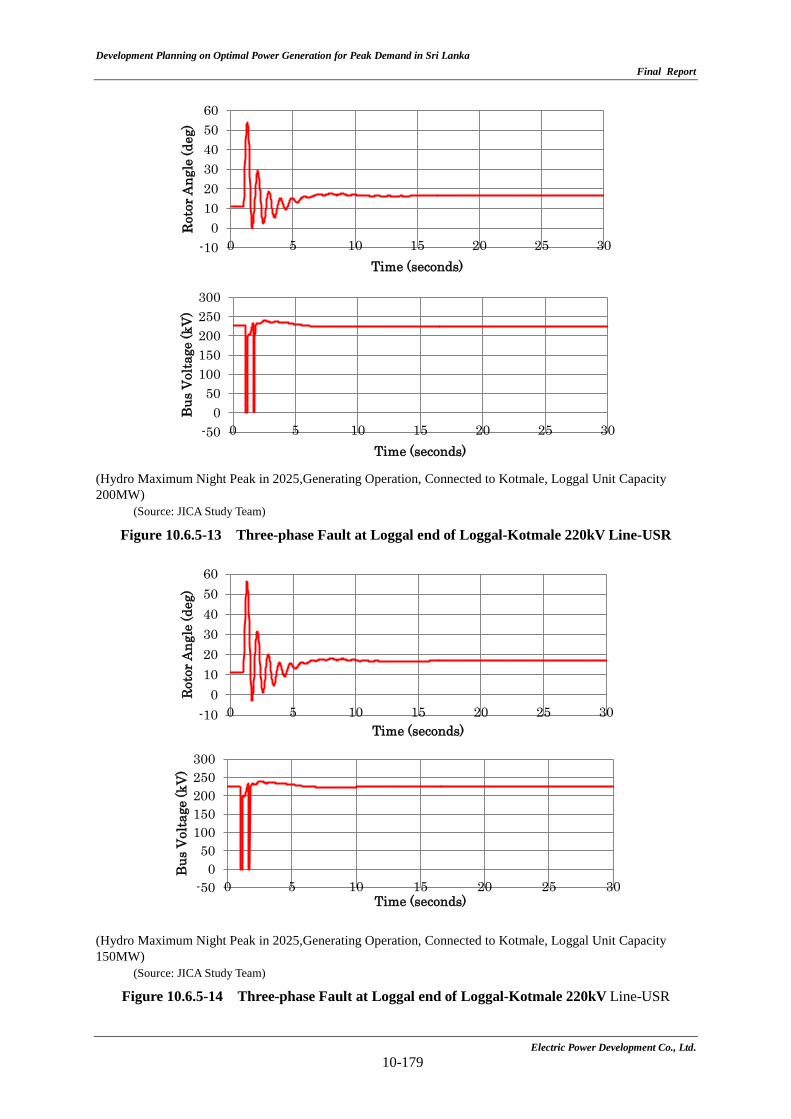
The results of transient stability analysis of three phase line fault are shown in Figure 10.6.5-13 to Figure 10.6.5-24.
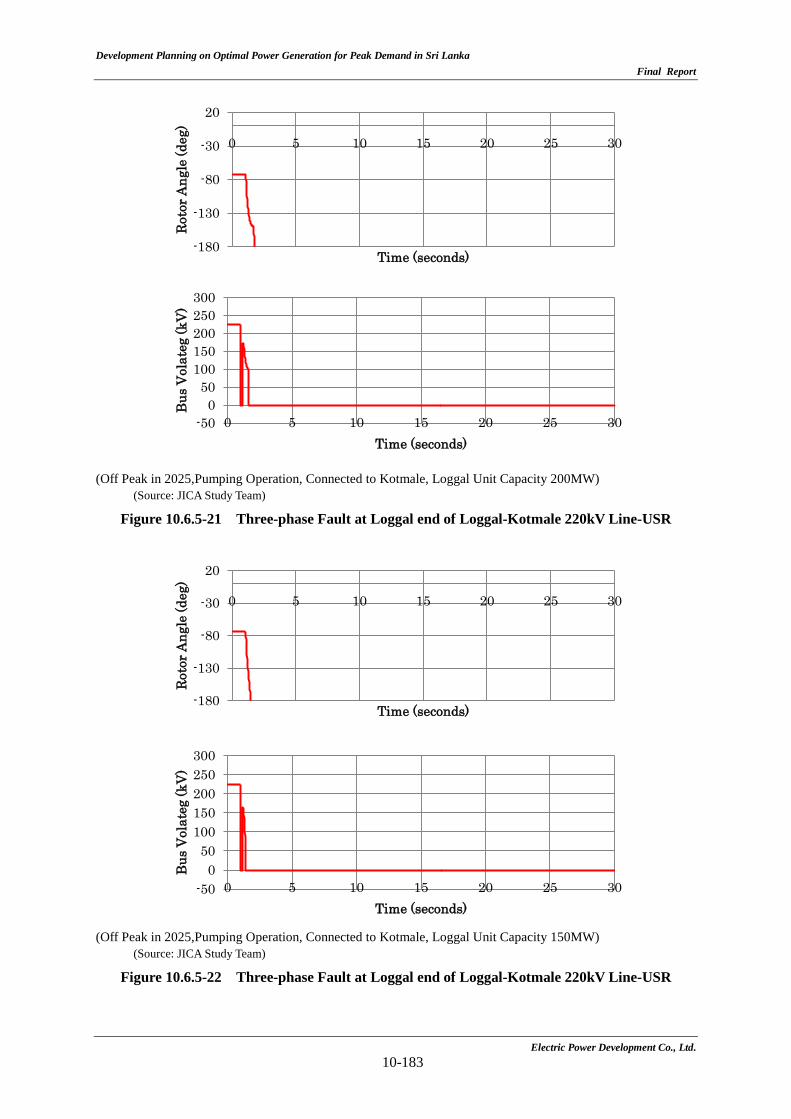
The results in cases for pumping operation (Figure 10.6.5-21, Figure 10.6.5-22) show that the network becomes unstable and steps out occurs in case that Loggal PSPP is connected to Kotmale P/S. The cause is assumed that length of T/L is longer than that of Maha PSPP to Kotmale P/S and from Halgran PSPP to Kotmale P/S. In order to keep Power system stable, the conductor of the transmission line from Loggal PSPP to Kotmale should be reconsidered so that
Electric Power Development Co., Ltd. 10-177
Development Planning on Optimal Power Generation for Peak Demand in Sri Lanka Final Report
the impedance of T/L can be reduced.
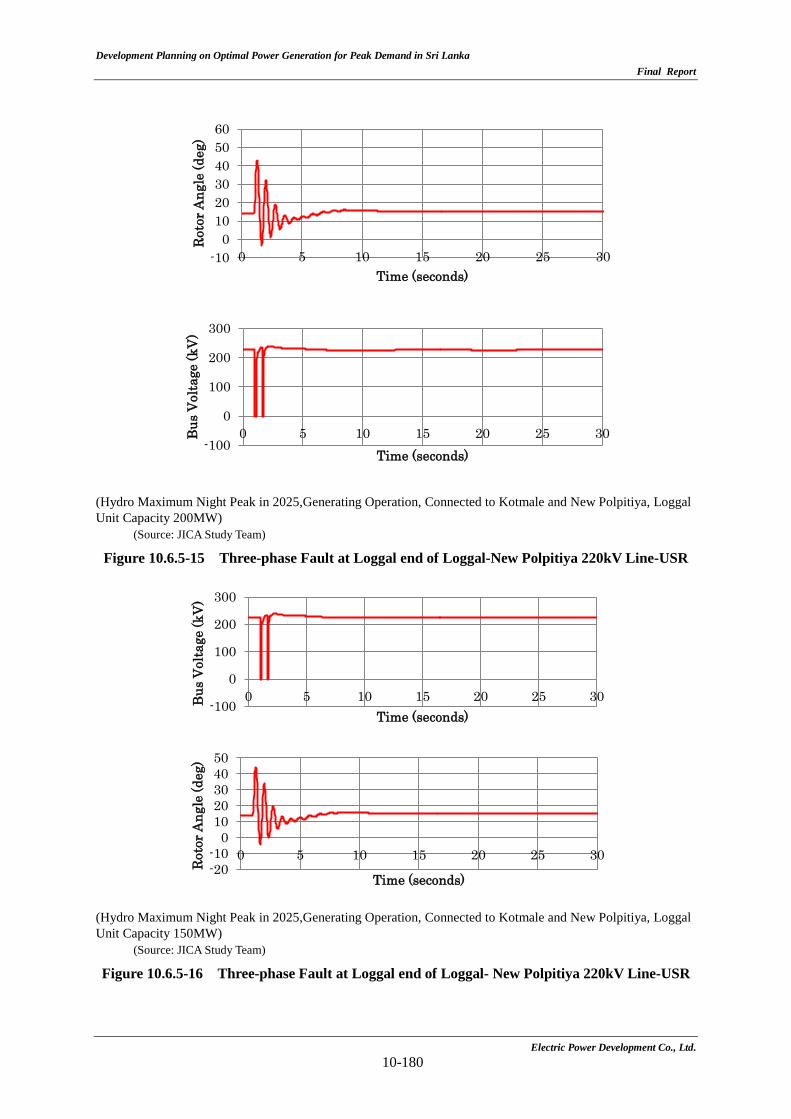
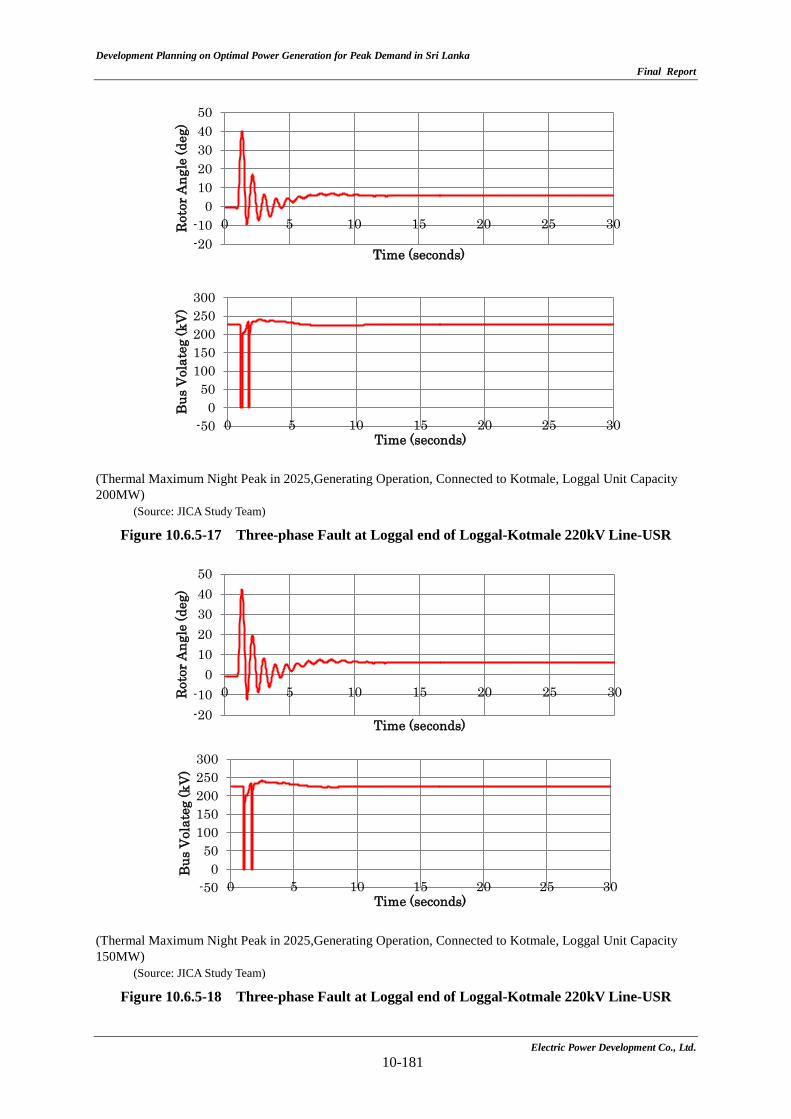
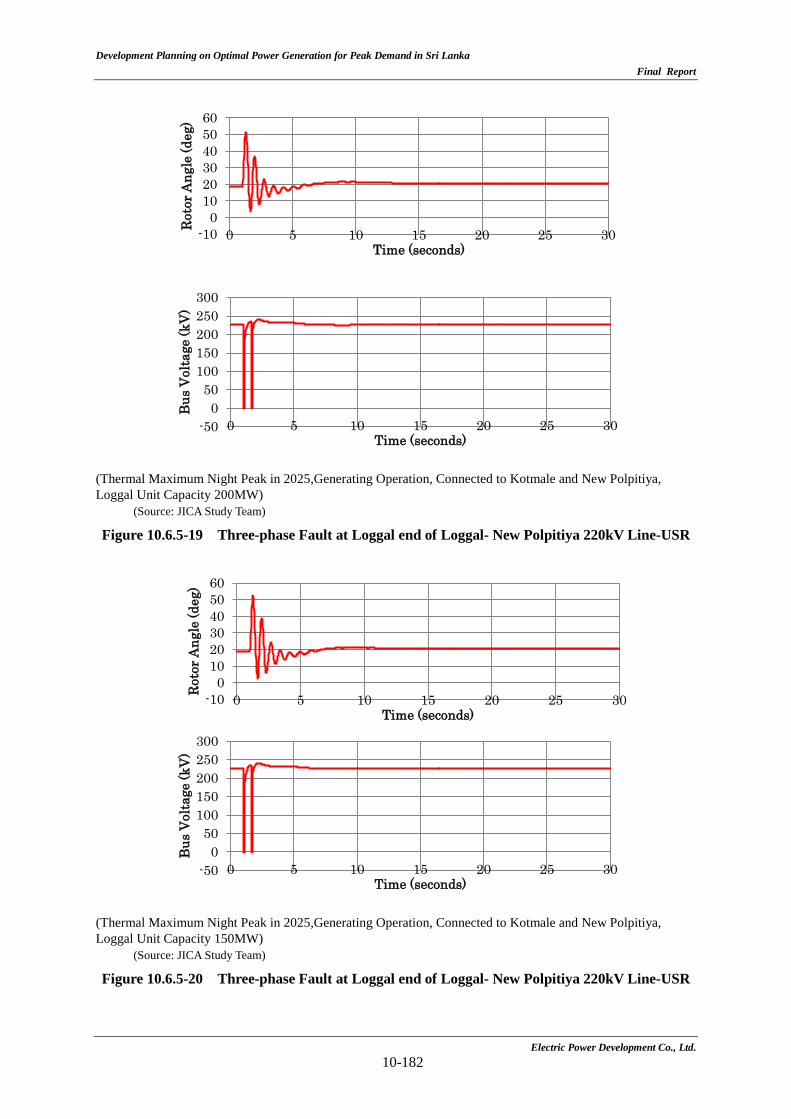
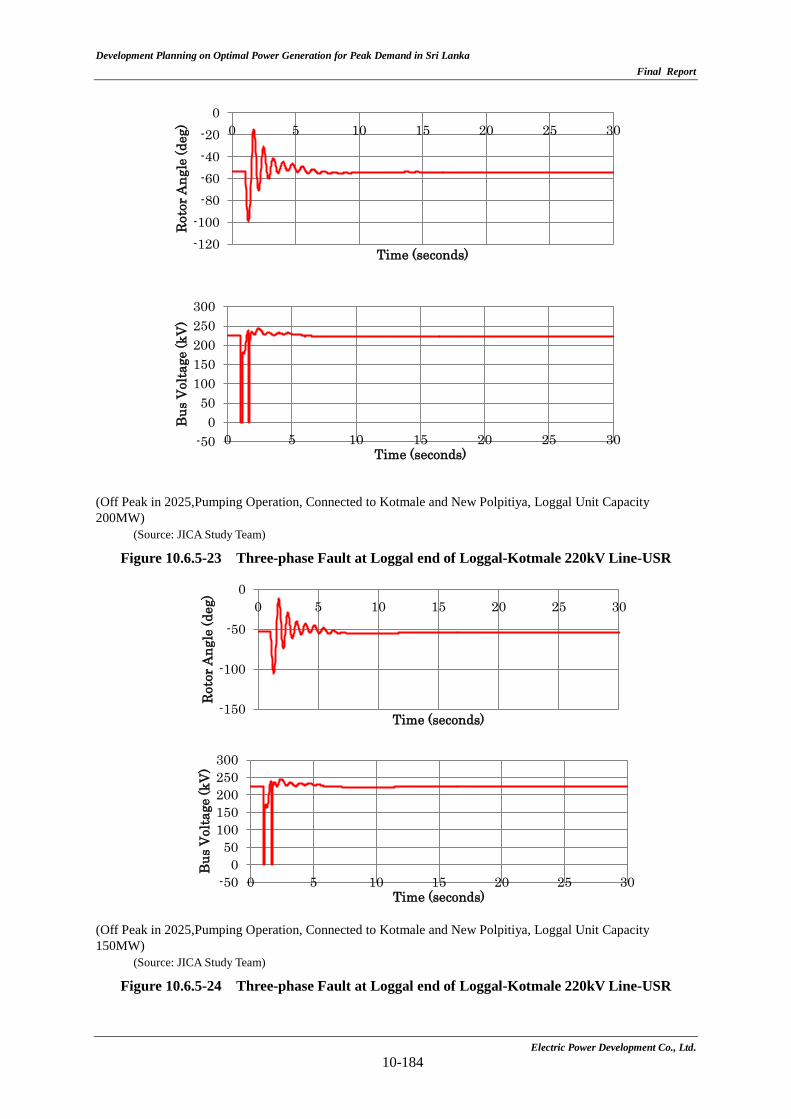
The other results of transient stability analysis show that network can be in stable. However, the weak damping phenomena are observed within around initial 10 seconds. From the results of these, it is suggested that the power system stabilizer is to be equipped with large size units to be developed in the future.
2) One Unit Tripping at Loggal PSPP
a) Frequency drop followed by loss of generator
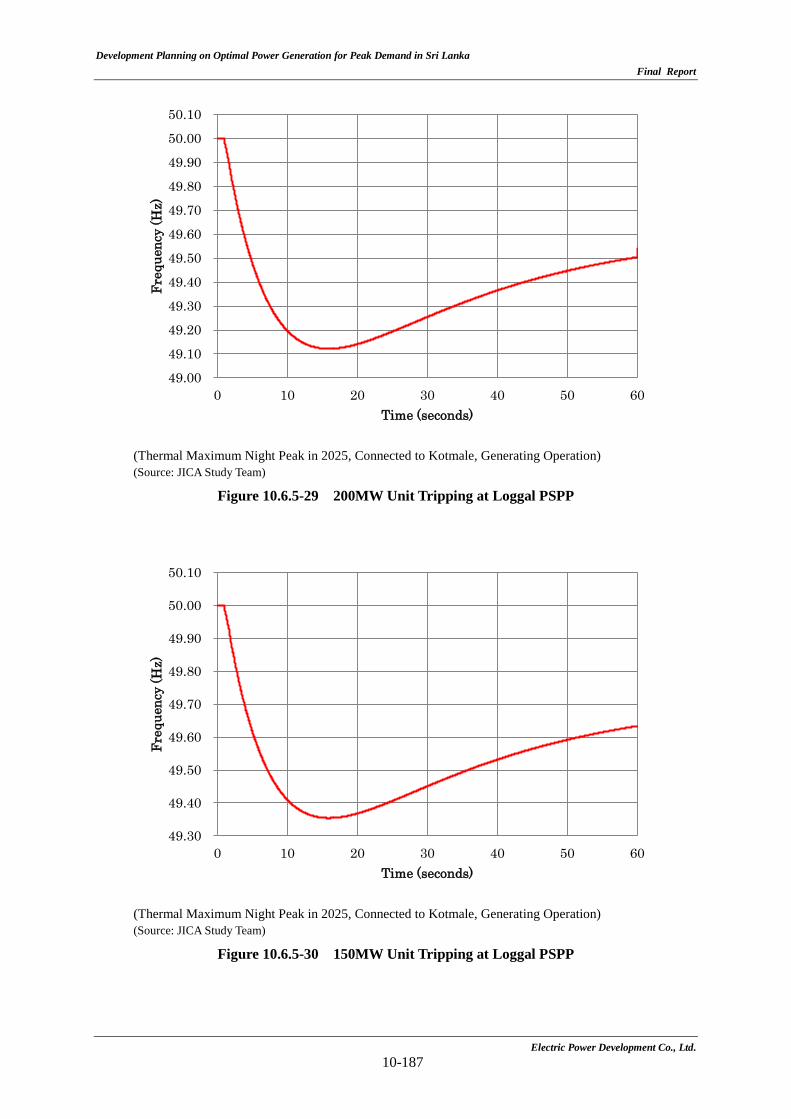
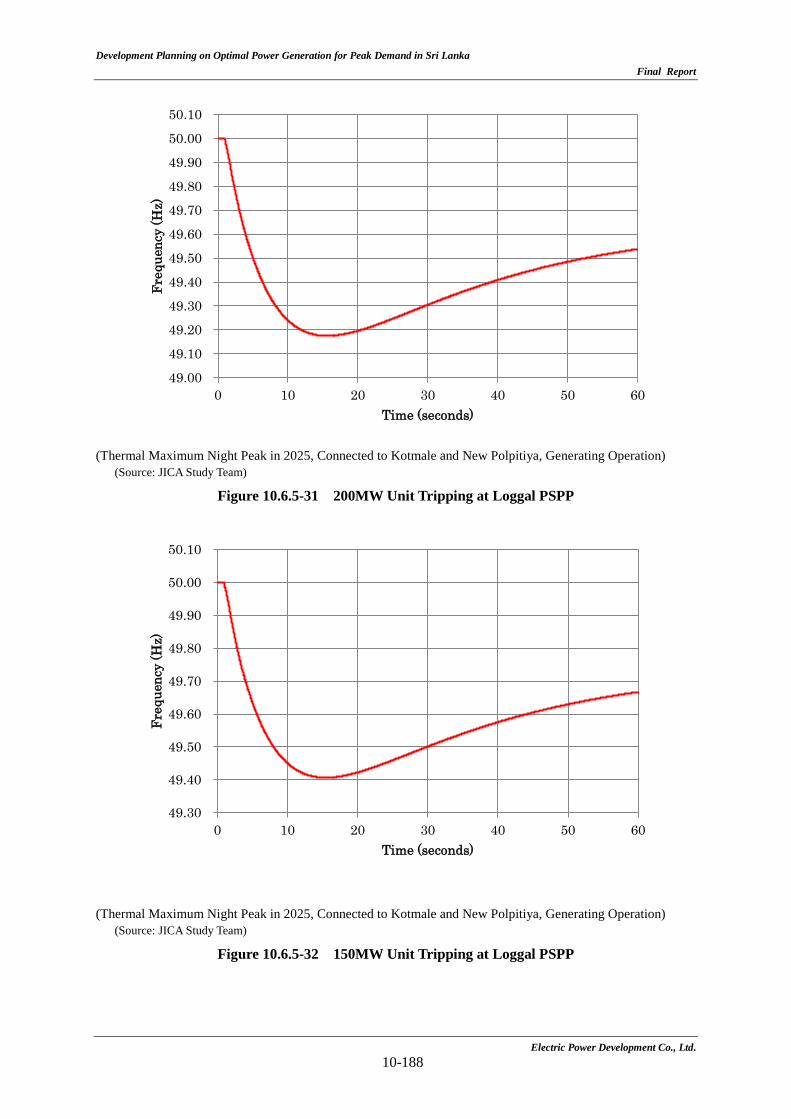
The results of the dynamic simulation for one unit tripping Loggal PSPP are shown in Figure 10.6.5-25 to Figure 10.6.5-32.
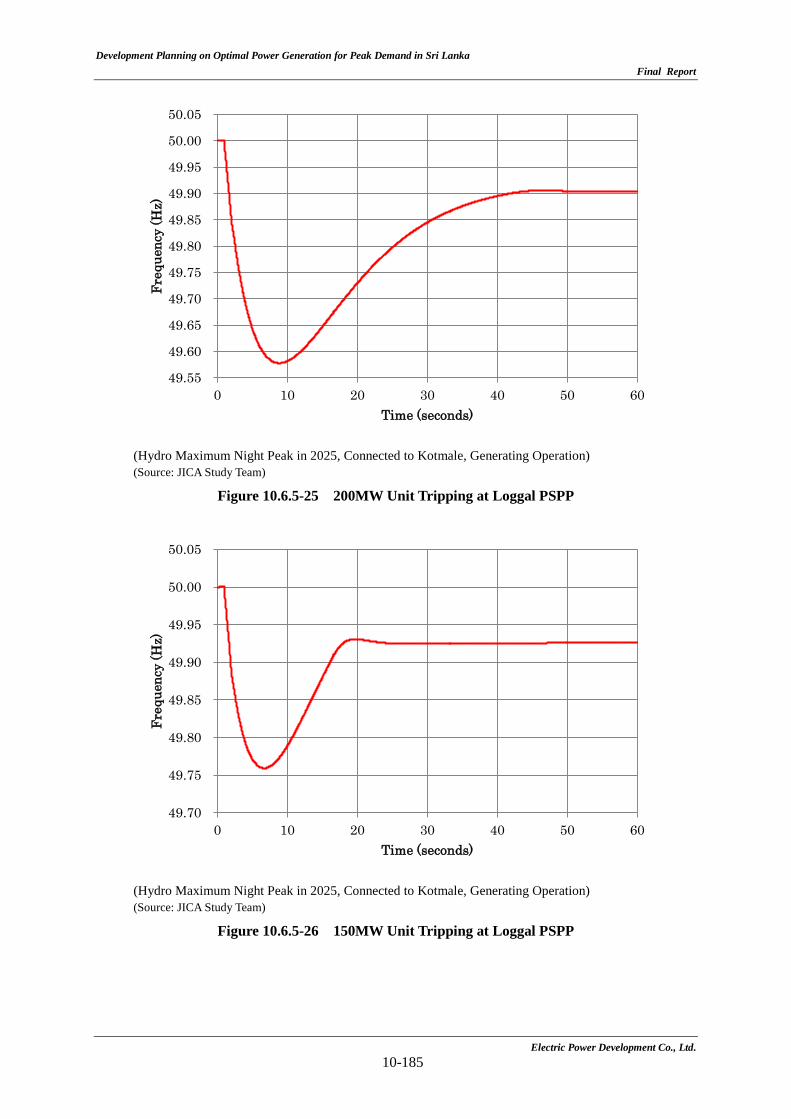
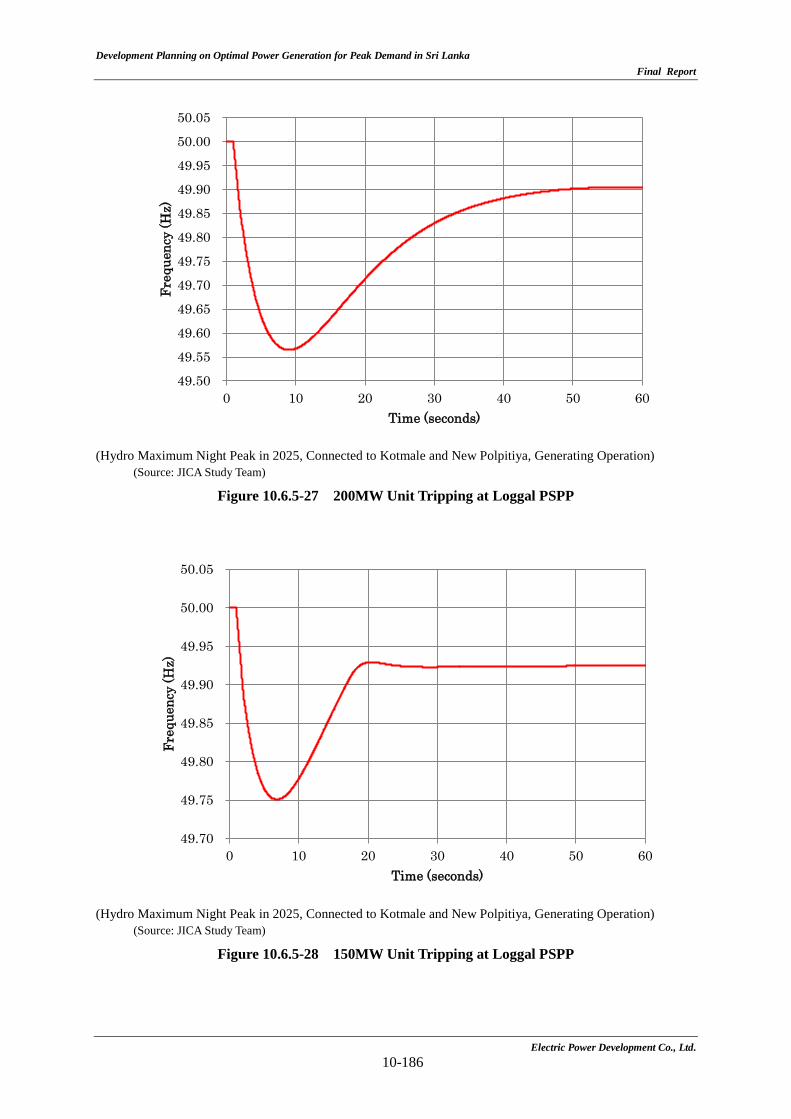
The results of the study show in all cases that the system frequency drops to 48.75Hz which is the criteria; the load shedding is taken place.
In this regard, it is calculated that the system frequency dropping in Thermal maximum scenario is larger than that in Hydro maximum scenario. This is because there is difference of the number of power plants operated with free governor mode in Hydro Maximum cases (HMNP) and in Thermal Maximum cases (TMNP).
HMNP: Samanalawewa, Bowathenna, Kotmale, Upper Kotmale, Victoria, Puttalam, Ambalangoda, Sampoor
TMNP: Victoria, Kotmale, Kelanitissa
Considered the above-mentioned calculation results, it is assumed that the mumber of power plants with governor free mode has considerable impact on the power system stability. Therefore, it is suggested that free governor operation system should be considered for relatively large plants to be constructed in the future.
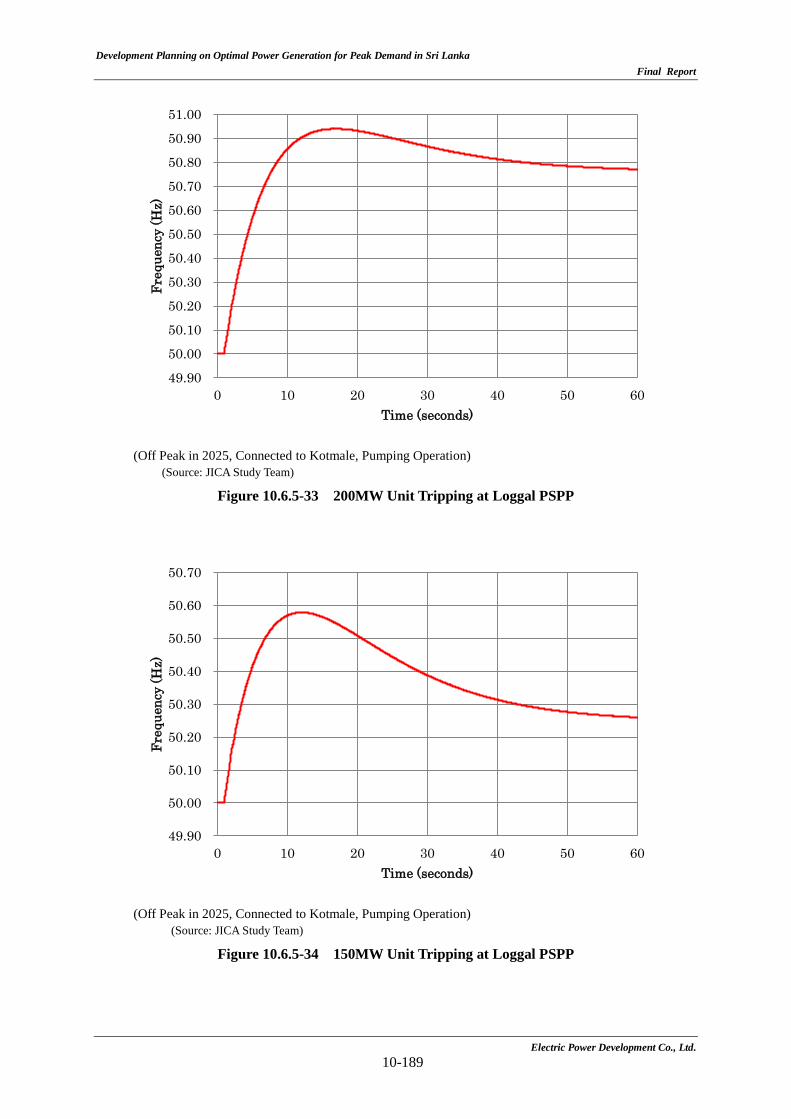
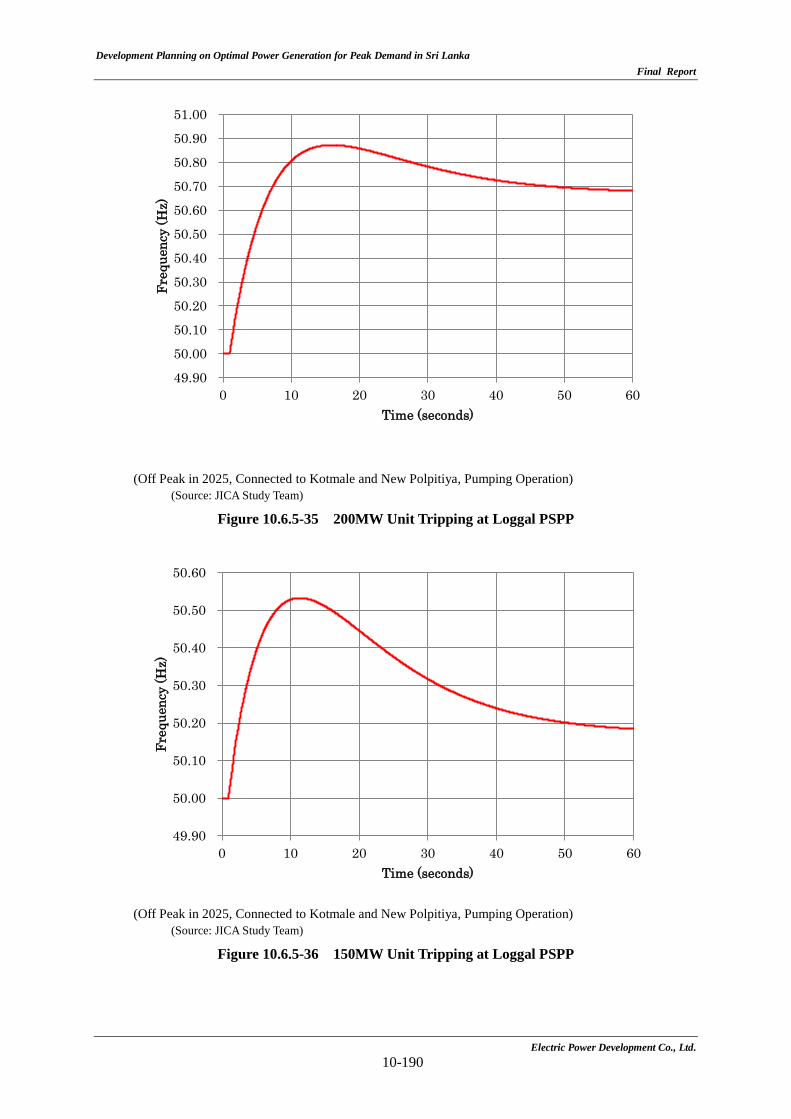
b) Frequency rise by loss of generator of pumping operation
The results of the dynamic simulation for one unit tripping Loggal PSPP are shown in Figure 10.6.5-33 to Figure 10.6.5-36.
The results show that in very case, the system frequency does not excess 51.5Hz which is the criteria; the alarm of thermal power plants occurs for the system frequency rise.
In this regard, in the simulation, it is set that the coal power plants in the power grid (Puttalam, Ambalangoda, and Sampoor) are operated with free governor mode in the same manner as “a) Frequency drop followed by loss of generator”.
Therefore, it is suggested that free governor operation system should be considered for relatively large plants to be constructed in the future.
Electric Power Development Co., Ltd. 10-178
Development Planning on Optimal Power Generation for Peak Demand in Sri Lanka Final Report
(Hydro Maximum Night Peak in 2025,Generating Operation, Connected to Kotmale, Loggal Unit Capacity 200MW)
(Source: JICA Study Team)
Figure 10.6.5-13 Three-phase Fault at Loggal end of Loggal-Kotmale 220kV Line-USR
(Hydro Maximum Night Peak in 2025,Generating Operation, Connected to Kotmale, Loggal Unit Capacity 150MW)
(Source: JICA Study Team)
Figure 10.6.5-14 Three-phase Fault at Loggal end of Loggal-Kotmale 220kV Line-USR
-100
102030405060
0 5 10 15 20 25 30
Rot
or A
ngle
(deg
)
Time (seconds)
-500
50100150200250300
0 5 10 15 20 25 30
Bus
Vol
tage
(kV
)
Time (seconds)
-100
102030405060
0 5 10 15 20 25 30
Rot
or A
ngle
(deg
)
Time (seconds)
-500
50100150200250300
0 5 10 15 20 25 30
Bus
Vol
tage
(kV
)
Time (seconds)
Electric Power Development Co., Ltd. 10-179
Development Planning on Optimal Power Generation for Peak Demand in Sri Lanka Final Report
(Hydro Maximum Night Peak in 2025,Generating Operation, Connected to Kotmale and New Polpitiya, Loggal Unit Capacity 200MW)
(Source: JICA Study Team)
Figure 10.6.5-15 Three-phase Fault at Loggal end of Loggal-New Polpitiya 220kV Line-USR
(Hydro Maximum Night Peak in 2025,Generating Operation, Connected to Kotmale and New Polpitiya, Loggal Unit Capacity 150MW)
(Source: JICA Study Team)
Figure 10.6.5-16 Three-phase Fault at Loggal end of Loggal- New Polpitiya 220kV Line-USR
-100
102030405060
0 5 10 15 20 25 30
Rot
or A
ngle
(deg
)
Time (seconds)
-100
0
100
200
300
0 5 10 15 20 25 30Bus
Vol
tage
(kV
)
Time (seconds)
-100
0
100
200
300
0 5 10 15 20 25 30Bus
Vol
tage
(kV
)
Time (seconds)
-20-10
01020304050
0 5 10 15 20 25 30
Rot
or A
ngle
(deg
)
Time (seconds)
Electric Power Development Co., Ltd. 10-180
Development Planning on Optimal Power Generation for Peak Demand in Sri Lanka Final Report
(Thermal Maximum Night Peak in 2025,Generating Operation, Connected to Kotmale, Loggal Unit Capacity 200MW)
(Source: JICA Study Team)
Figure 10.6.5-17 Three-phase Fault at Loggal end of Loggal-Kotmale 220kV Line-USR
(Thermal Maximum Night Peak in 2025,Generating Operation, Connected to Kotmale, Loggal Unit Capacity 150MW)
(Source: JICA Study Team)
Figure 10.6.5-18 Three-phase Fault at Loggal end of Loggal-Kotmale 220kV Line-USR
-20-10
01020304050
0 5 10 15 20 25 30Rot
or A
ngle
(deg
)
Time (seconds)
-500
50100150200250300
0 5 10 15 20 25 30
Bus
Vol
ateg
(kV
)
Time (seconds)
-20-10
01020304050
0 5 10 15 20 25 30Rot
or A
ngle
(deg
)
Time (seconds)
-500
50100150200250300
0 5 10 15 20 25 30
Bus
Vol
ateg
(kV
)
Time (seconds)
Electric Power Development Co., Ltd. 10-181
Development Planning on Optimal Power Generation for Peak Demand in Sri Lanka Final Report
(Thermal Maximum Night Peak in 2025,Generating Operation, Connected to Kotmale and New Polpitiya, Loggal Unit Capacity 200MW)
(Source: JICA Study Team)
Figure 10.6.5-19 Three-phase Fault at Loggal end of Loggal- New Polpitiya 220kV Line-USR
(Thermal Maximum Night Peak in 2025,Generating Operation, Connected to Kotmale and New Polpitiya, Loggal Unit Capacity 150MW)
(Source: JICA Study Team)
Figure 10.6.5-20 Three-phase Fault at Loggal end of Loggal- New Polpitiya 220kV Line-USR
-100
102030405060
0 5 10 15 20 25 30Rot
or A
ngle
(deg
)
Time (seconds)
-500
50100150200250300
0 5 10 15 20 25 30
Bus
Vol
tage
(kV
)
Time (seconds)
-500
50100150200250300
0 5 10 15 20 25 30
Bus
Vol
tage
(kV
)
Time (seconds)
-100
102030405060
0 5 10 15 20 25 30Rot
or A
ngle
(deg
)
Time (seconds)
Electric Power Development Co., Ltd. 10-182
Development Planning on Optimal Power Generation for Peak Demand in Sri Lanka Final Report
(Off Peak in 2025,Pumping Operation, Connected to Kotmale, Loggal Unit Capacity 200MW)
(Source: JICA Study Team)
Figure 10.6.5-21 Three-phase Fault at Loggal end of Loggal-Kotmale 220kV Line-USR
(Off Peak in 2025,Pumping Operation, Connected to Kotmale, Loggal Unit Capacity 150MW)
(Source: JICA Study Team)
Figure 10.6.5-22 Three-phase Fault at Loggal end of Loggal-Kotmale 220kV Line-USR
-180
-130
-80
-30
20
0 5 10 15 20 25 30
Rot
or A
ngle
(deg
)
Time (seconds)
-500
50100150200250300
0 5 10 15 20 25 30
Bus
Vol
ateg
(kV
)
Time (seconds)
-180
-130
-80
-30
20
0 5 10 15 20 25 30
Rot
or A
ngle
(deg
)
Time (seconds)
-500
50100150200250300
0 5 10 15 20 25 30
Bus
Vol
ateg
(kV
)
Time (seconds)
Electric Power Development Co., Ltd. 10-183
Development Planning on Optimal Power Generation for Peak Demand in Sri Lanka Final Report
(Off Peak in 2025,Pumping Operation, Connected to Kotmale and New Polpitiya, Loggal Unit Capacity 200MW)
(Source: JICA Study Team)
Figure 10.6.5-23 Three-phase Fault at Loggal end of Loggal-Kotmale 220kV Line-USR
(Off Peak in 2025,Pumping Operation, Connected to Kotmale and New Polpitiya, Loggal Unit Capacity 150MW)
(Source: JICA Study Team)
Figure 10.6.5-24 Three-phase Fault at Loggal end of Loggal-Kotmale 220kV Line-USR
-120-100
-80-60-40-20
00 5 10 15 20 25 30
Rot
or A
ngle
(deg
)
Time (seconds)
-500
50100150200250300
0 5 10 15 20 25 30
Bus
Vol
tage
(kV
)
Time (seconds)
-150
-100
-50
00 5 10 15 20 25 30
Rot
or A
ngle
(deg
)
Time (seconds)
-500
50100150200250300
0 5 10 15 20 25 30
Bus
Vol
tage
(kV
)
Time (seconds)
Electric Power Development Co., Ltd. 10-184
Development Planning on Optimal Power Generation for Peak Demand in Sri Lanka Final Report
(Hydro Maximum Night Peak in 2025, Connected to Kotmale, Generating Operation) (Source: JICA Study Team)
Figure 10.6.5-25 200MW Unit Tripping at Loggal PSPP
(Hydro Maximum Night Peak in 2025, Connected to Kotmale, Generating Operation) (Source: JICA Study Team)
Figure 10.6.5-26 150MW Unit Tripping at Loggal PSPP
49.55
49.60
49.65
49.70
49.75
49.80
49.85
49.90
49.95
50.00
50.05
0 10 20 30 40 50 60
Freq
uenc
y (H
z)
Time (seconds)
49.70
49.75
49.80
49.85
49.90
49.95
50.00
50.05
0 10 20 30 40 50 60
Freq
uenc
y (H
z)
Time (seconds)
Electric Power Development Co., Ltd. 10-185
Development Planning on Optimal Power Generation for Peak Demand in Sri Lanka Final Report
(Hydro Maximum Night Peak in 2025, Connected to Kotmale and New Polpitiya, Generating Operation) (Source: JICA Study Team)
Figure 10.6.5-27 200MW Unit Tripping at Loggal PSPP
(Hydro Maximum Night Peak in 2025, Connected to Kotmale and New Polpitiya, Generating Operation) (Source: JICA Study Team)
Figure 10.6.5-28 150MW Unit Tripping at Loggal PSPP
49.50
49.55
49.60
49.65
49.70
49.75
49.80
49.85
49.90
49.95
50.00
50.05
0 10 20 30 40 50 60
Freq
uenc
y (H
z)
Time (seconds)
49.70
49.75
49.80
49.85
49.90
49.95
50.00
50.05
0 10 20 30 40 50 60
Freq
uenc
y (H
z)
Time (seconds)
Electric Power Development Co., Ltd. 10-186
Development Planning on Optimal Power Generation for Peak Demand in Sri Lanka Final Report
(Thermal Maximum Night Peak in 2025, Connected to Kotmale, Generating Operation) (Source: JICA Study Team)
Figure 10.6.5-29 200MW Unit Tripping at Loggal PSPP
(Thermal Maximum Night Peak in 2025, Connected to Kotmale, Generating Operation) (Source: JICA Study Team)
Figure 10.6.5-30 150MW Unit Tripping at Loggal PSPP
49.00
49.10
49.20
49.30
49.40
49.50
49.60
49.70
49.80
49.90
50.00
50.10
0 10 20 30 40 50 60
Freq
uenc
y (H
z)
Time (seconds)
49.30
49.40
49.50
49.60
49.70
49.80
49.90
50.00
50.10
0 10 20 30 40 50 60
Freq
uenc
y (H
z)
Time (seconds)
Electric Power Development Co., Ltd. 10-187
Development Planning on Optimal Power Generation for Peak Demand in Sri Lanka Final Report
(Thermal Maximum Night Peak in 2025, Connected to Kotmale and New Polpitiya, Generating Operation)
(Source: JICA Study Team)
Figure 10.6.5-31 200MW Unit Tripping at Loggal PSPP
(Thermal Maximum Night Peak in 2025, Connected to Kotmale and New Polpitiya, Generating Operation)
(Source: JICA Study Team)
Figure 10.6.5-32 150MW Unit Tripping at Loggal PSPP
49.00
49.10
49.20
49.30
49.40
49.50
49.60
49.70
49.80
49.90
50.00
50.10
0 10 20 30 40 50 60
Freq
uenc
y (H
z)
Time (seconds)
49.30
49.40
49.50
49.60
49.70
49.80
49.90
50.00
50.10
0 10 20 30 40 50 60
Freq
uenc
y (H
z)
Time (seconds)
Electric Power Development Co., Ltd. 10-188
Development Planning on Optimal Power Generation for Peak Demand in Sri Lanka Final Report
(Off Peak in 2025, Connected to Kotmale, Pumping Operation)
(Source: JICA Study Team)
Figure 10.6.5-33 200MW Unit Tripping at Loggal PSPP
(Off Peak in 2025, Connected to Kotmale, Pumping Operation)
(Source: JICA Study Team)
Figure 10.6.5-34 150MW Unit Tripping at Loggal PSPP
49.90
50.00
50.10
50.20
50.30
50.40
50.50
50.60
50.70
50.80
50.90
51.00
0 10 20 30 40 50 60
Freq
uenc
y (H
z)
Time (seconds)
49.90
50.00
50.10
50.20
50.30
50.40
50.50
50.60
50.70
0 10 20 30 40 50 60
Freq
uenc
y (H
z)
Time (seconds)
Electric Power Development Co., Ltd. 10-189
Development Planning on Optimal Power Generation for Peak Demand in Sri Lanka Final Report
(Off Peak in 2025, Connected to Kotmale and New Polpitiya, Pumping Operation) (Source: JICA Study Team)
Figure 10.6.5-35 200MW Unit Tripping at Loggal PSPP
(Off Peak in 2025, Connected to Kotmale and New Polpitiya, Pumping Operation)
(Source: JICA Study Team)
Figure 10.6.5-36 150MW Unit Tripping at Loggal PSPP
49.90
50.00
50.10
50.20
50.30
50.40
50.50
50.60
50.70
50.80
50.90
51.00
0 10 20 30 40 50 60
Freq
uenc
y (H
z)
Time (seconds)
49.90
50.00
50.10
50.20
50.30
50.40
50.50
50.60
0 10 20 30 40 50 60
Freq
uenc
y (H
z)
Time (seconds)
Electric Power Development Co., Ltd. 10-190
Development Planning on Optimal Power Generation for Peak Demand in Sri Lanka Final Report
(9) Conclusion of Power System Analysis
- Under the normal condition and N-1 condition, no thermal criteria violations and no voltage violations are observed in case that T/L (the conductor is Low Loss ACSR/AS 550 × 2) from Loggal PSPP is connected to Kotmale P/S.
- Under the normal condition and N-1 condition, no thermal criteria violations and no voltage violations are observed in case that T/L from Loggal PSPP is connected to T/L between Kotmale P/S and New Polpitiya S/S with PI connection, which is constructed in the future.
- In generating mode, the results of the transient stability study show that the network envisaged in 2025 can be kept in stable in all cases. In pumping mode, however, the results show that the network cannot be kept in stable in case that T/L from Loggal PSPP is connected to Kotmale P/S. In order to keep the network in stable, the conductor of T/L from Loggal PSPP should be reconsidered. Also, since weak damping phenomena are seen in around the initial 10 seconds in several cases, it is suggested that relatively large plants should be equipped with power system stabilizers.
- The results of the dynamic simulation for one unit tripping show that no frequency violations are resulted. However, it is suggested to operate plants considering frequency controlling, and to equip with free governor system for relatively large plants to be developed in the future.
10.6.6 Construction Cost
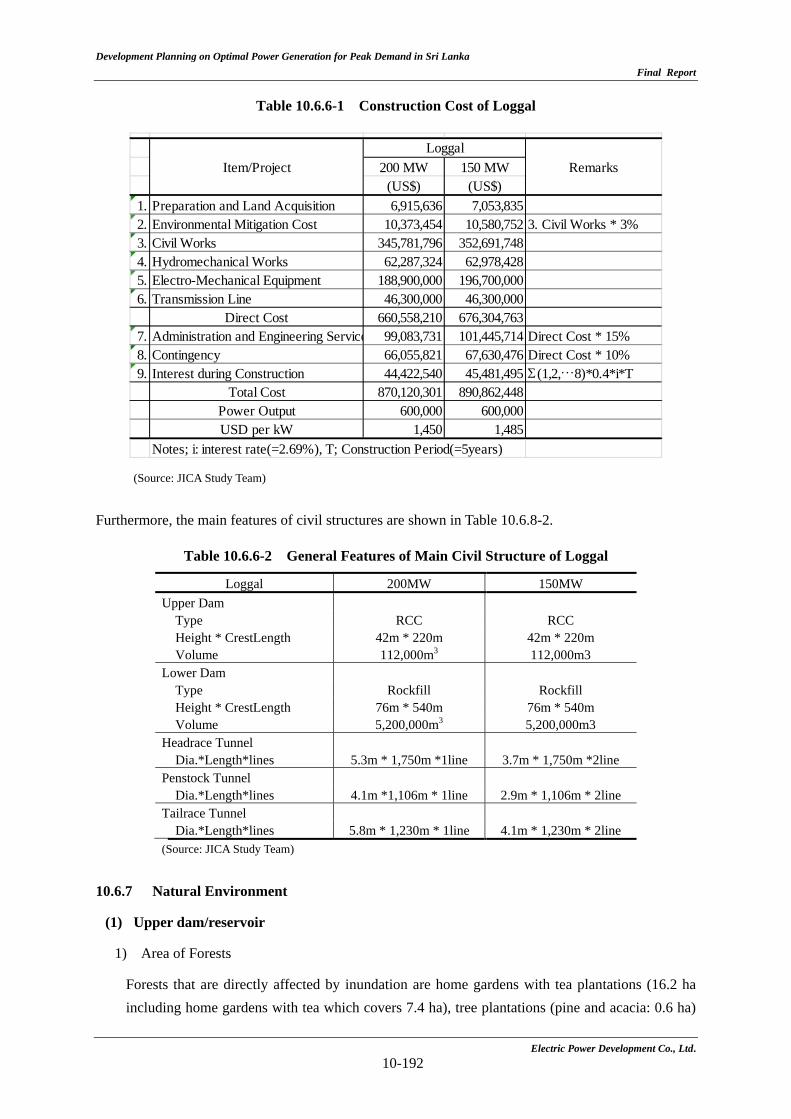
Table 10.6.6-1 shows construction cost of Loggal. As mentioned in the sub-chapter 10.6.1, since the topographic survey of scale 1/5,000 was not be able to be carried out, shown construction cost is same as that of the chapter 9; however, cost of the transmission line, the route of which the construction is calculated is Loggal to Kotmale P/S, and the interest during construction period are include in it.
Furthermore, this site is applicable for unit capacity of 200 MW and 150 MW; therefore construction costs of the both scheme; 200 MW/unit * 3 units and 150 MW/unit * 4 units are calculated.
Electric Power Development Co., Ltd. 10-191
Development Planning on Optimal Power Generation for Peak Demand in Sri Lanka
Final Report
Electric Power Development Co., Ltd. 10-192
Table 10.6.6-1 Construction Cost of Loggal
(Source: JICA Study Team)
Furthermore, the main features of civil structures are shown in Table 10.6.8-2.
Table 10.6.6-2 General Features of Main Civil Structure of Loggal
Loggal 200MW 150MW Upper Dam Type RCC RCC Height * CrestLength 42m * 220m 42m * 220m Volume 112,000m3 112,000m3 Lower Dam Type Rockfill Rockfill Height * CrestLength 76m * 540m 76m * 540m Volume 5,200,000m3 5,200,000m3 Headrace Tunnel Dia.*Length*lines 5.3m * 1,750m *1line 3.7m * 1,750m *2line Penstock Tunnel Dia.*Length*lines 4.1m *1,106m * 1line 2.9m * 1,106m * 2line Tailrace Tunnel Dia.*Length*lines 5.8m * 1,230m * 1line 4.1m * 1,230m * 2line (Source: JICA Study Team)
10.6.7 Natural Environment
(1) Upper dam/reservoir
1) Area of Forests
Forests that are directly affected by inundation are home gardens with tea plantations (16.2 ha including home gardens with tea which covers 7.4 ha), tree plantations (pine and acacia: 0.6 ha)
200 MW 150 MW(US$) (US$)
1. Preparation and Land Acquisition 6,915,636 7,053,8352. Environmental Mitigation Cost 10,373,454 10,580,752 3. Civil Works * 3%3. Civil Works 345,781,796 352,691,7484. Hydromechanical Works 62,287,324 62,978,4285. Electro-Mechanical Equipment 188,900,000 196,700,0006. Transmission Line 46,300,000 46,300,000
Direct Cost 660,558,210 676,304,7637. Administration and Engineering Service 99,083,731 101,445,714 Direct Cost * 15%8. Contingency 66,055,821 67,630,476 Direct Cost * 10%9. Interest during Construction 44,422,540 45,481,495 (1,2,…8)*0.4*i*T
Total Cost 870,120,301 890,862,448Power Output 600,000 600,000USD per kW 1,450 1,485
Notes; i: interest rate(=2.69%), T; Construction Period(=5years)
Item/ProjectLoggal
Remarks
Development Planning on Optimal Power Generation for Peak Demand in Sri Lanka Final Report
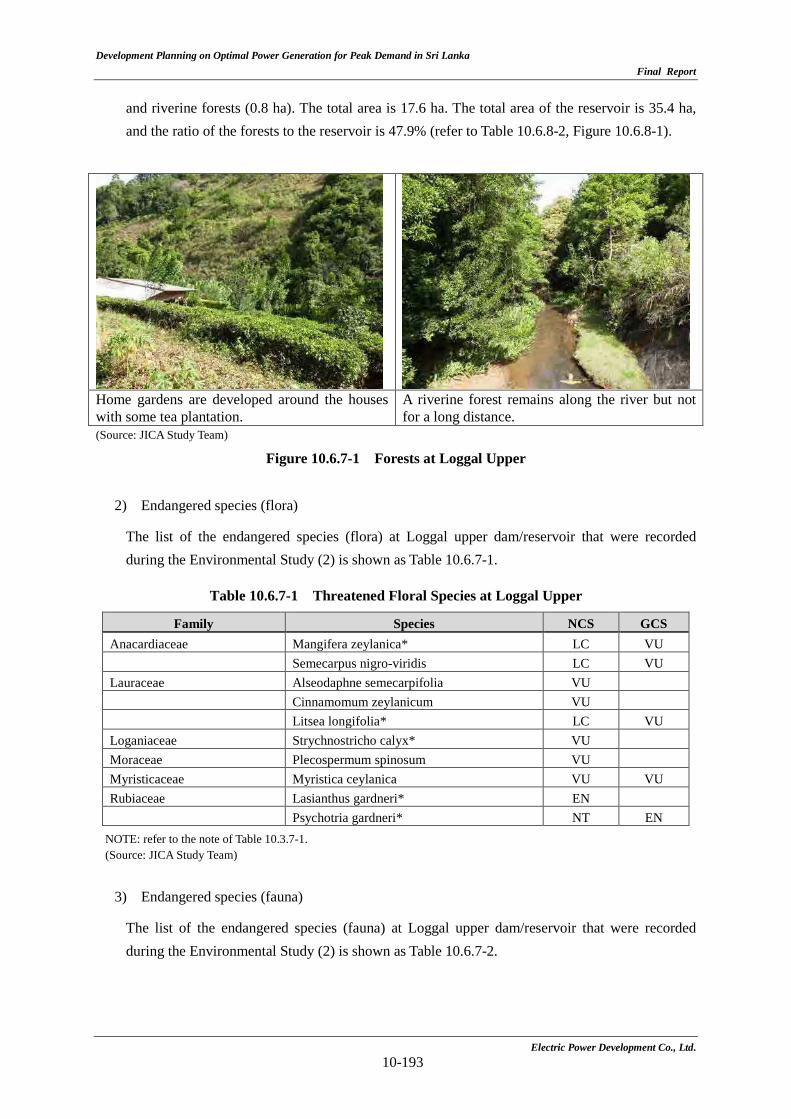
and riverine forests (0.8 ha). The total area is 17.6 ha. The total area of the reservoir is 35.4 ha, and the ratio of the forests to the reservoir is 47.9% (refer to Table 10.6.8-2, Figure 10.6.8-1).
Home gardens are developed around the houses with some tea plantation.
A riverine forest remains along the river but not for a long distance.
(Source: JICA Study Team)
Figure 10.6.7-1 Forests at Loggal Upper
2) Endangered species (flora)
The list of the endangered species (flora) at Loggal upper dam/reservoir that were recorded during the Environmental Study (2) is shown as Table 10.6.7-1.
Table 10.6.7-1 Threatened Floral Species at Loggal Upper
Family Species NCS GCS Anacardiaceae Mangifera zeylanica* LC VU
Semecarpus nigro-viridis LC VU
Lauraceae Alseodaphne semecarpifolia VU Cinnamomum zeylanicum VU Litsea longifolia* LC VU
Loganiaceae Strychnostricho calyx* VU Moraceae Plecospermum spinosum VU Myristicaceae Myristica ceylanica VU VU
Rubiaceae Lasianthus gardneri* EN
Psychotria gardneri* NT EN
NOTE: refer to the note of Table 10.3.7-1. (Source: JICA Study Team)
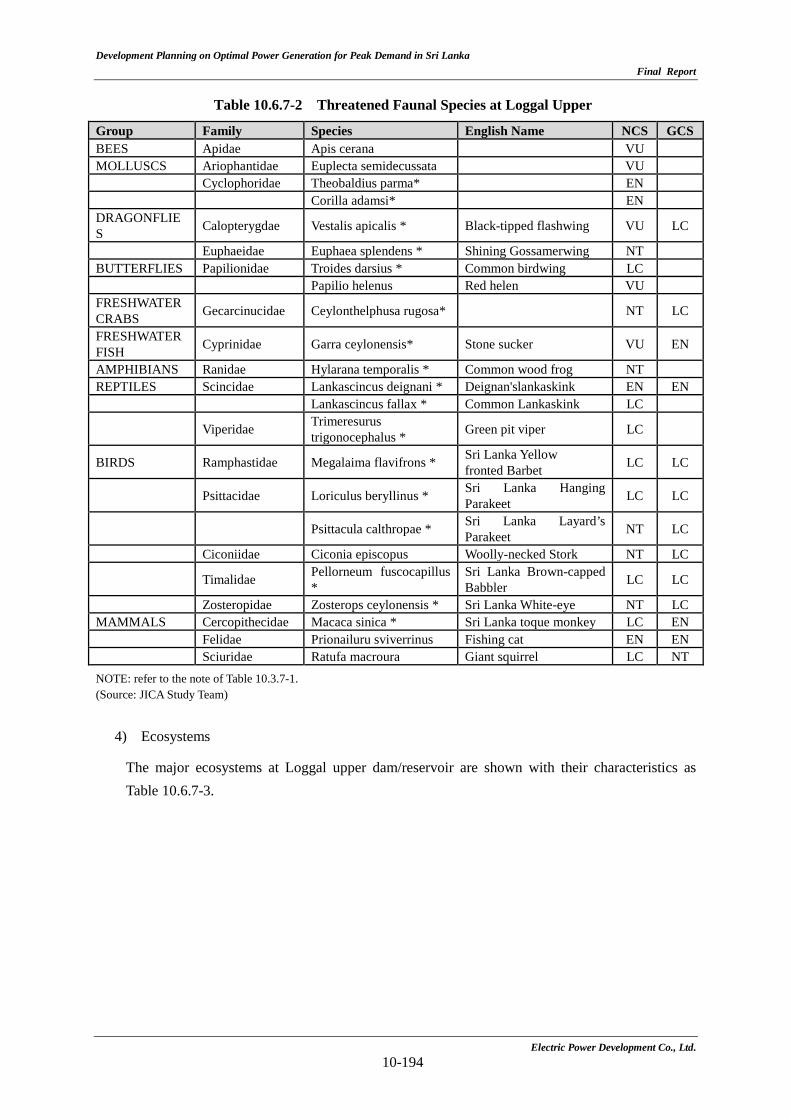
3) Endangered species (fauna)
The list of the endangered species (fauna) at Loggal upper dam/reservoir that were recorded during the Environmental Study (2) is shown as Table 10.6.7-2.
Electric Power Development Co., Ltd. 10-193
Development Planning on Optimal Power Generation for Peak Demand in Sri Lanka Final Report
Table 10.6.7-2 Threatened Faunal Species at Loggal Upper
Group Family Species English Name NCS GCS BEES Apidae Apis cerana VU MOLLUSCS Ariophantidae Euplecta semidecussata VU Cyclophoridae Theobaldius parma* EN Corilla adamsi* EN DRAGONFLIES Calopterygdae Vestalis apicalis * Black-tipped flashwing VU LC
Euphaeidae Euphaea splendens * Shining Gossamerwing NT BUTTERFLIES Papilionidae Troides darsius * Common birdwing LC Papilio helenus Red helen VU FRESHWATER CRABS Gecarcinucidae Ceylonthelphusa rugosa* NT LC
FRESHWATER FISH Cyprinidae Garra ceylonensis* Stone sucker VU EN
AMPHIBIANS Ranidae Hylarana temporalis * Common wood frog NT REPTILES Scincidae Lankascincus deignani * Deignan'slankaskink EN EN Lankascincus fallax * Common Lankaskink LC Viperidae Trimeresurus
trigonocephalus * Green pit viper LC
BIRDS Ramphastidae Megalaima flavifrons * Sri Lanka Yellow fronted Barbet LC LC
Psittacidae Loriculus beryllinus * Sri Lanka Hanging Parakeet LC LC
Psittacula calthropae * Sri Lanka Layard’s Parakeet NT LC
Ciconiidae Ciconia episcopus Woolly-necked Stork NT LC
Timalidae Pellorneum fuscocapillus *
Sri Lanka Brown-capped Babbler LC LC
Zosteropidae Zosterops ceylonensis * Sri Lanka White-eye NT LC MAMMALS Cercopithecidae Macaca sinica * Sri Lanka toque monkey LC EN Felidae Prionailuru sviverrinus Fishing cat EN EN Sciuridae Ratufa macroura Giant squirrel LC NT NOTE: refer to the note of Table 10.3.7-1. (Source: JICA Study Team)
4) Ecosystems
The major ecosystems at Loggal upper dam/reservoir are shown with their characteristics as Table 10.6.7-3.
Electric Power Development Co., Ltd. 10-194
Development Planning on Optimal Power Generation for Peak Demand in Sri Lanka Final Report
Table 10.6.7-3 Ecosystems of Loggal Upper
Ecosystem Characteristics Reservoir area Paddy fields The valley bottom with gentle slope, especially the upstream area from the
backwater area is covered by paddy fields. They occupy 41.2 % of the reservoir. Tree plantations They are pine and acacia plantations. They occupy 2% of the reservoir. Shrubs There are savanna type shrubs on the steep slopes. They occupy 1% of the
reservoir. Home gardens There two types of home gardens: home gardens with tea, and home gardens
with multi-layer structure. Multi-layer type ones are located around houses, and usually have canopy, middle and shrubs layers, but each layer is not developed well. They occupy 45.8% of the reservoir.
Riverine forests The forests have received interferences from the local people, and they only remain along the river as secondary forests. They have three layers but only some native species are found. They occupy 2.2 % of the reservoir.
Others There is a temple. Buffer Zone There is a cemetery other than paddy fields, tree plantations, home gardens and riverine forests. Aquatic ecosystem At the bottom of the valley, there is a river with the width of a few meters. There are small tributaries into the river. (Source: JICA Study Team)
(2) Lower dam/reservoir
1) Area of Forests
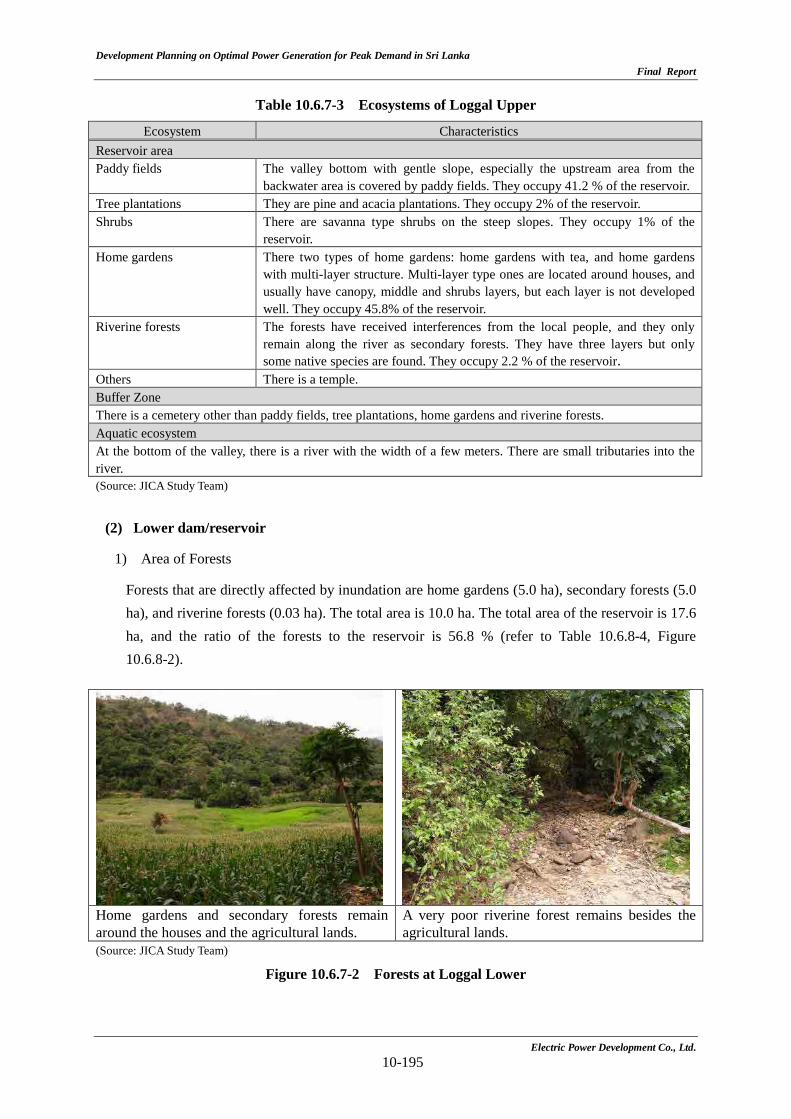
Forests that are directly affected by inundation are home gardens (5.0 ha), secondary forests (5.0 ha), and riverine forests (0.03 ha). The total area is 10.0 ha. The total area of the reservoir is 17.6 ha, and the ratio of the forests to the reservoir is 56.8 % (refer to Table 10.6.8-4, Figure 10.6.8-2).
Home gardens and secondary forests remain around the houses and the agricultural lands.
A very poor riverine forest remains besides the agricultural lands.
(Source: JICA Study Team)
Figure 10.6.7-2 Forests at Loggal Lower
Electric Power Development Co., Ltd. 10-195
Development Planning on Optimal Power Generation for Peak Demand in Sri Lanka Final Report
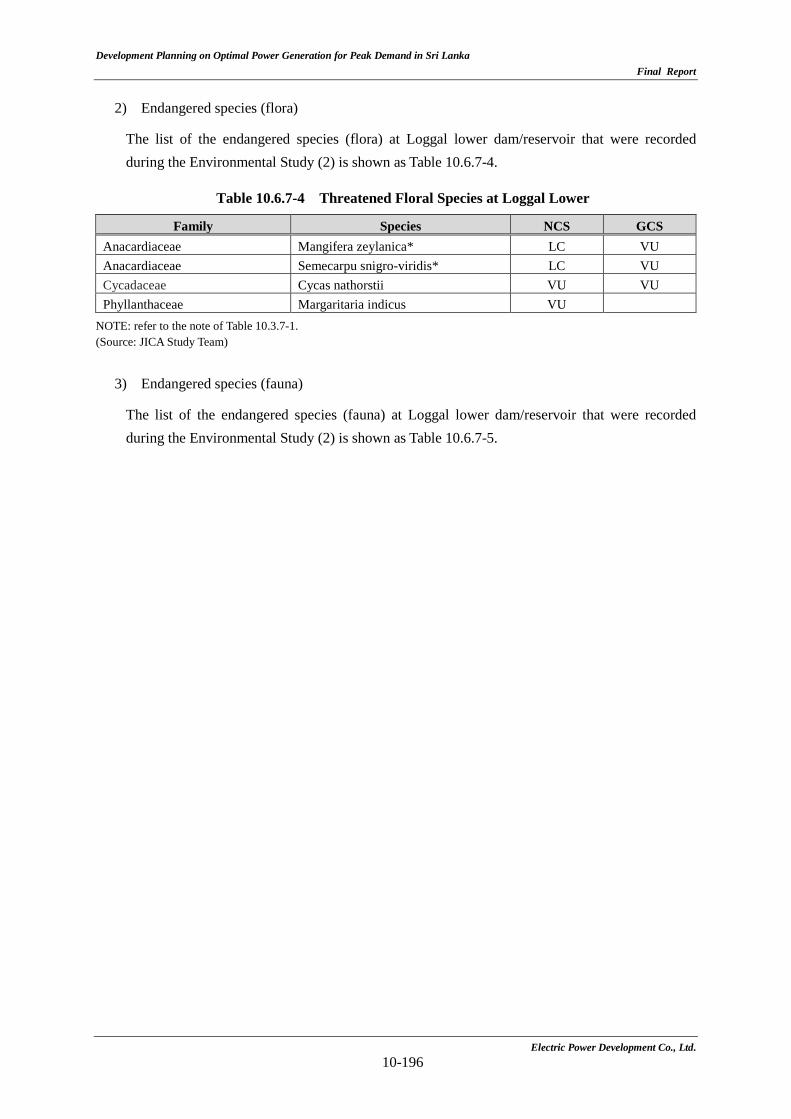
2) Endangered species (flora)
The list of the endangered species (flora) at Loggal lower dam/reservoir that were recorded during the Environmental Study (2) is shown as Table 10.6.7-4.
Table 10.6.7-4 Threatened Floral Species at Loggal Lower
Family Species NCS GCS Anacardiaceae Mangifera zeylanica* LC VU Anacardiaceae Semecarpu snigro-viridis* LC VU Cycadaceae Cycas nathorstii VU VU Phyllanthaceae Margaritaria indicus VU
NOTE: refer to the note of Table 10.3.7-1. (Source: JICA Study Team)
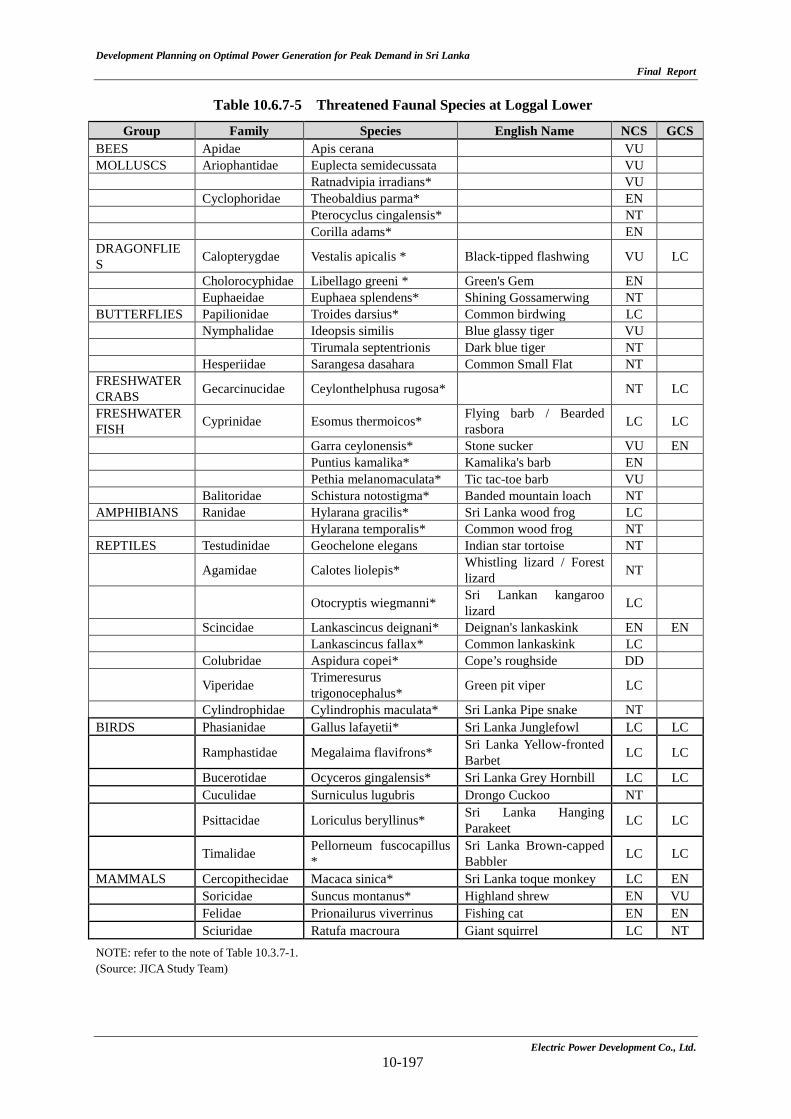
3) Endangered species (fauna)
The list of the endangered species (fauna) at Loggal lower dam/reservoir that were recorded during the Environmental Study (2) is shown as Table 10.6.7-5.
Electric Power Development Co., Ltd. 10-196
Development Planning on Optimal Power Generation for Peak Demand in Sri Lanka Final Report
Table 10.6.7-5 Threatened Faunal Species at Loggal Lower
Group Family Species English Name NCS GCS BEES Apidae Apis cerana VU MOLLUSCS Ariophantidae Euplecta semidecussata VU Ratnadvipia irradians* VU Cyclophoridae Theobaldius parma* EN Pterocyclus cingalensis* NT Corilla adams* EN DRAGONFLIES Calopterygdae Vestalis apicalis * Black-tipped flashwing VU LC
Cholorocyphidae Libellago greeni * Green's Gem EN Euphaeidae Euphaea splendens* Shining Gossamerwing NT BUTTERFLIES Papilionidae Troides darsius* Common birdwing LC Nymphalidae Ideopsis similis Blue glassy tiger VU Tirumala septentrionis Dark blue tiger NT Hesperiidae Sarangesa dasahara Common Small Flat NT FRESHWATER CRABS Gecarcinucidae Ceylonthelphusa rugosa* NT LC
FRESHWATER FISH Cyprinidae Esomus thermoicos* Flying barb / Bearded
rasbora LC LC
Garra ceylonensis* Stone sucker VU EN Puntius kamalika* Kamalika's barb EN Pethia melanomaculata* Tic tac-toe barb VU Balitoridae Schistura notostigma* Banded mountain loach NT AMPHIBIANS Ranidae Hylarana gracilis* Sri Lanka wood frog LC Hylarana temporalis* Common wood frog NT REPTILES Testudinidae Geochelone elegans Indian star tortoise NT Agamidae Calotes liolepis* Whistling lizard / Forest
lizard NT
Otocryptis wiegmanni* Sri Lankan kangaroo lizard LC
Scincidae Lankascincus deignani* Deignan's lankaskink EN EN Lankascincus fallax* Common lankaskink LC Colubridae Aspidura copei* Cope’s roughside DD Viperidae Trimeresurus
trigonocephalus* Green pit viper LC Cylindrophidae Cylindrophis maculata* Sri Lanka Pipe snake NT BIRDS Phasianidae Gallus lafayetii* Sri Lanka Junglefowl LC LC
Ramphastidae Megalaima flavifrons* Sri Lanka Yellow-fronted Barbet LC LC
Bucerotidae Ocyceros gingalensis* Sri Lanka Grey Hornbill LC LC
Cuculidae Surniculus lugubris Drongo Cuckoo NT
Psittacidae Loriculus beryllinus* Sri Lanka Hanging Parakeet LC LC
Timalidae Pellorneum fuscocapillus *
Sri Lanka Brown-capped Babbler LC LC
MAMMALS Cercopithecidae Macaca sinica* Sri Lanka toque monkey LC EN Soricidae Suncus montanus* Highland shrew EN VU Felidae Prionailurus viverrinus Fishing cat EN EN Sciuridae Ratufa macroura Giant squirrel LC NT NOTE: refer to the note of Table 10.3.7-1. (Source: JICA Study Team)
Electric Power Development Co., Ltd. 10-197
Development Planning on Optimal Power Generation for Peak Demand in Sri Lanka Final Report
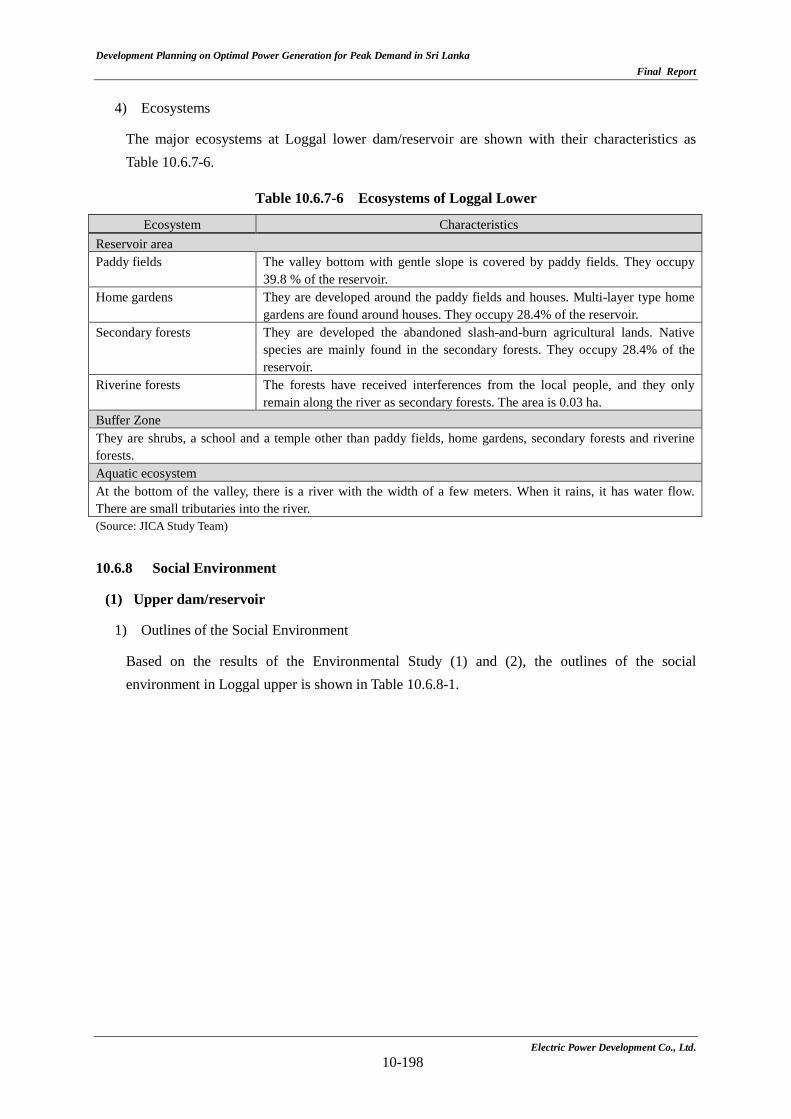
4) Ecosystems
The major ecosystems at Loggal lower dam/reservoir are shown with their characteristics as Table 10.6.7-6.
Table 10.6.7-6 Ecosystems of Loggal Lower
Ecosystem Characteristics Reservoir area Paddy fields The valley bottom with gentle slope is covered by paddy fields. They occupy
39.8 % of the reservoir. Home gardens They are developed around the paddy fields and houses. Multi-layer type home
gardens are found around houses. They occupy 28.4% of the reservoir. Secondary forests They are developed the abandoned slash-and-burn agricultural lands. Native
species are mainly found in the secondary forests. They occupy 28.4% of the reservoir.
Riverine forests The forests have received interferences from the local people, and they only remain along the river as secondary forests. The area is 0.03 ha.
Buffer Zone They are shrubs, a school and a temple other than paddy fields, home gardens, secondary forests and riverine forests. Aquatic ecosystem At the bottom of the valley, there is a river with the width of a few meters. When it rains, it has water flow. There are small tributaries into the river. (Source: JICA Study Team) 10.6.8 Social Environment
(1) Upper dam/reservoir
1) Outlines of the Social Environment
Based on the results of the Environmental Study (1) and (2), the outlines of the social environment in Loggal upper is shown in Table 10.6.8-1.
Electric Power Development Co., Ltd. 10-198
Development Planning on Optimal Power Generation for Peak Demand in Sri Lanka Final Report
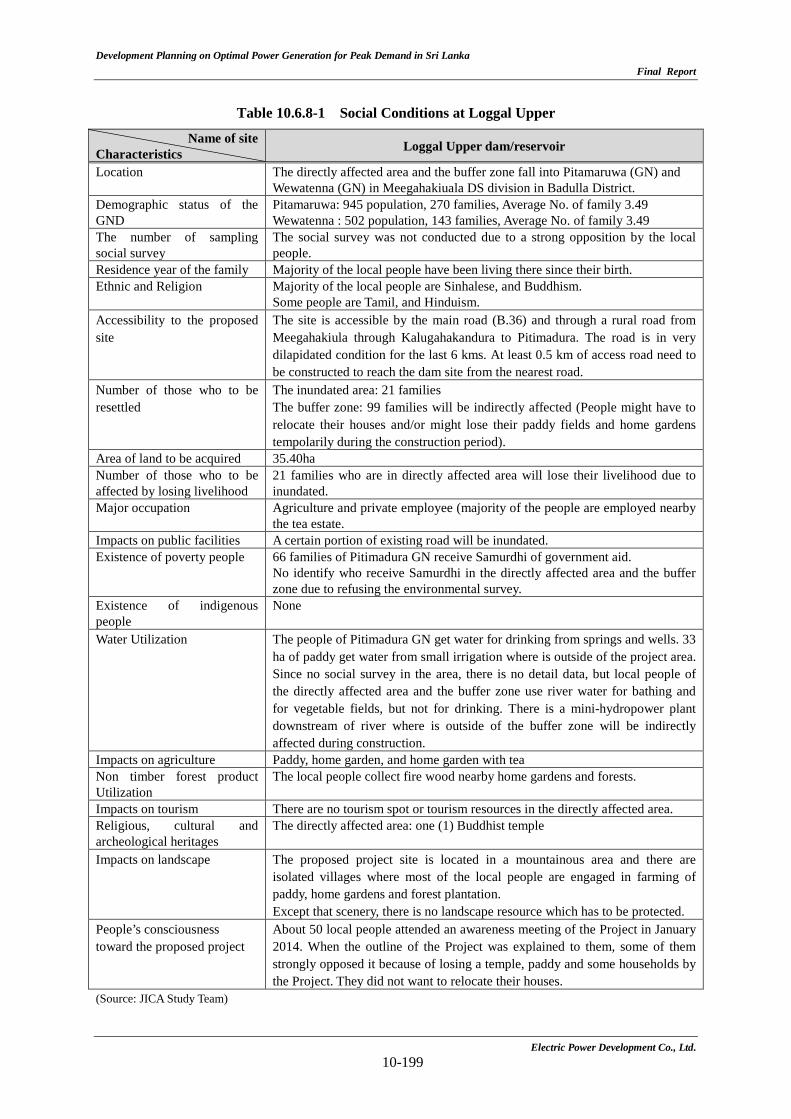
Table 10.6.8-1 Social Conditions at Loggal Upper
Name of site Characteristics Loggal Upper dam/reservoir
Location The directly affected area and the buffer zone fall into Pitamaruwa (GN) and Wewatenna (GN) in Meegahakiuala DS division in Badulla District.
Demographic status of the GND
Pitamaruwa: 945 population, 270 families, Average No. of family 3.49 Wewatenna : 502 population, 143 families, Average No. of family 3.49
The number of sampling social survey
The social survey was not conducted due to a strong opposition by the local people.
Residence year of the family Majority of the local people have been living there since their birth. Ethnic and Religion Majority of the local people are Sinhalese, and Buddhism.
Some people are Tamil, and Hinduism. Accessibility to the proposed site
The site is accessible by the main road (B.36) and through a rural road from Meegahakiula through Kalugahakandura to Pitimadura. The road is in very dilapidated condition for the last 6 kms. At least 0.5 km of access road need to be constructed to reach the dam site from the nearest road.
Number of those who to be resettled
The inundated area: 21 families The buffer zone: 99 families will be indirectly affected (People might have to relocate their houses and/or might lose their paddy fields and home gardens tempolarily during the construction period).
Area of land to be acquired 35.40ha Number of those who to be affected by losing livelihood
21 families who are in directly affected area will lose their livelihood due to inundated.
Major occupation Agriculture and private employee (majority of the people are employed nearby the tea estate.
Impacts on public facilities A certain portion of existing road will be inundated. Existence of poverty people 66 families of Pitimadura GN receive Samurdhi of government aid.
No identify who receive Samurdhi in the directly affected area and the buffer zone due to refusing the environmental survey.
Existence of indigenous people
None
Water Utilization The people of Pitimadura GN get water for drinking from springs and wells. 33 ha of paddy get water from small irrigation where is outside of the project area. Since no social survey in the area, there is no detail data, but local people of the directly affected area and the buffer zone use river water for bathing and for vegetable fields, but not for drinking. There is a mini-hydropower plant downstream of river where is outside of the buffer zone will be indirectly affected during construction.
Impacts on agriculture Paddy, home garden, and home garden with tea Non timber forest product Utilization
The local people collect fire wood nearby home gardens and forests.
Impacts on tourism There are no tourism spot or tourism resources in the directly affected area. Religious, cultural and archeological heritages
The directly affected area: one (1) Buddhist temple
Impacts on landscape The proposed project site is located in a mountainous area and there are isolated villages where most of the local people are engaged in farming of paddy, home gardens and forest plantation. Except that scenery, there is no landscape resource which has to be protected.
People’s consciousness toward the proposed project
About 50 local people attended an awareness meeting of the Project in January 2014. When the outline of the Project was explained to them, some of them strongly opposed it because of losing a temple, paddy and some households by the Project. They did not want to relocate their houses.
(Source: JICA Study Team)
Electric Power Development Co., Ltd. 10-199
Development Planning on Optimal Power Generation for Peak Demand in Sri Lanka Final Report
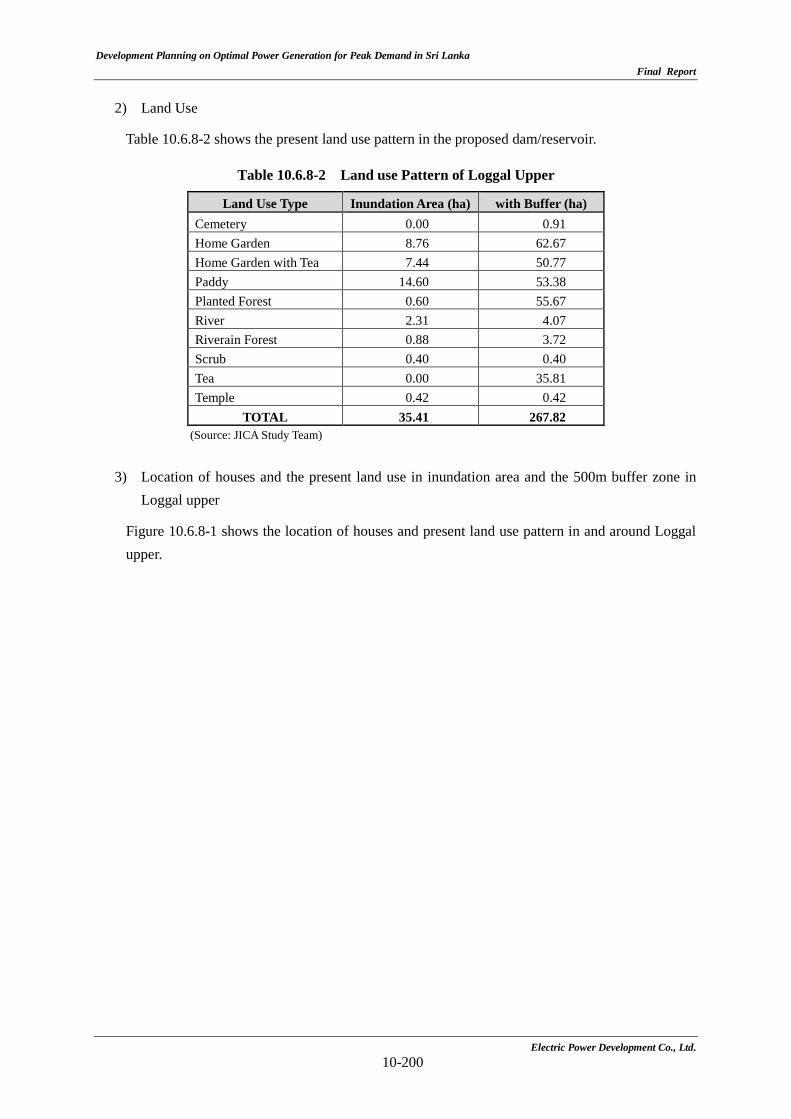
2) Land Use
Table 10.6.8-2 shows the present land use pattern in the proposed dam/reservoir.
Table 10.6.8-2 Land use Pattern of Loggal Upper
Land Use Type Inundation Area (ha) with Buffer (ha) Cemetery 0.00 0.91 Home Garden 8.76 62.67 Home Garden with Tea 7.44 50.77 Paddy 14.60 53.38 Planted Forest 0.60 55.67 River 2.31 4.07 Riverain Forest 0.88 3.72 Scrub 0.40 0.40 Tea 0.00 35.81 Temple 0.42 0.42
TOTAL 35.41 267.82 (Source: JICA Study Team)
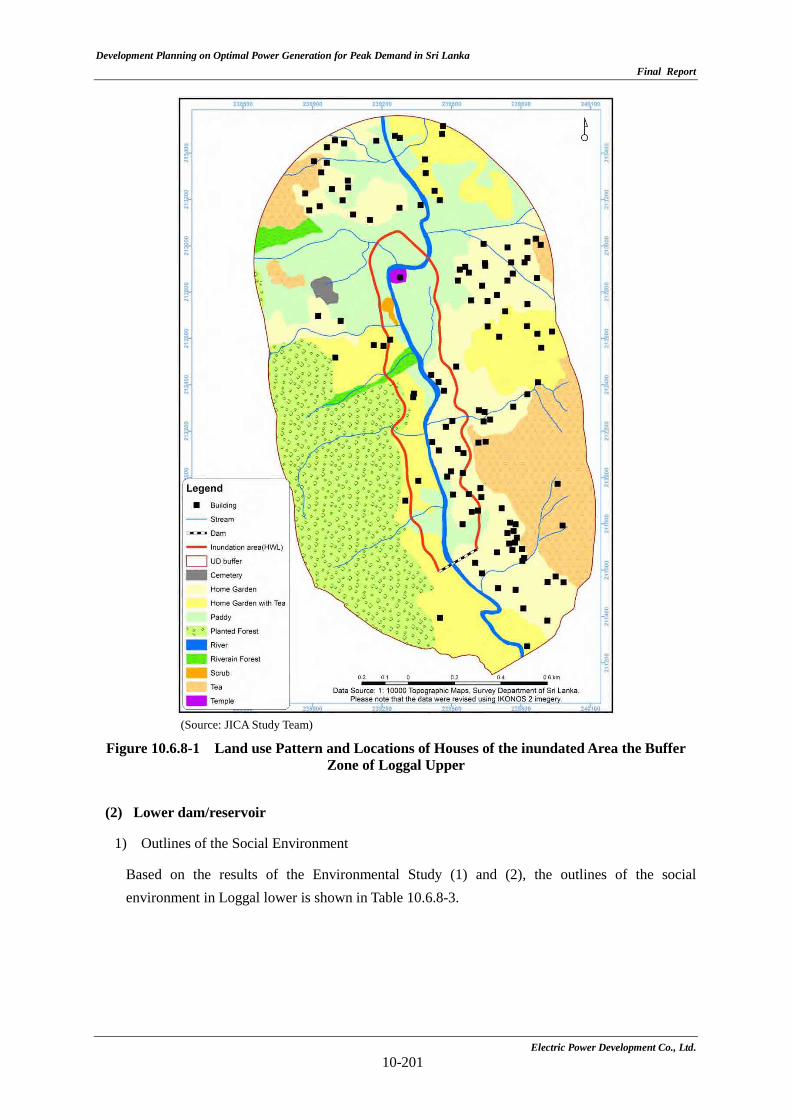
3) Location of houses and the present land use in inundation area and the 500m buffer zone in
Loggal upper
Figure 10.6.8-1 shows the location of houses and present land use pattern in and around Loggal upper.
Electric Power Development Co., Ltd. 10-200
Development Planning on Optimal Power Generation for Peak Demand in Sri Lanka Final Report
(Source: JICA Study Team)
Figure 10.6.8-1 Land use Pattern and Locations of Houses of the inundated Area the Buffer Zone of Loggal Upper
(2) Lower dam/reservoir
1) Outlines of the Social Environment
Based on the results of the Environmental Study (1) and (2), the outlines of the social environment in Loggal lower is shown in Table 10.6.8-3.
Electric Power Development Co., Ltd. 10-201
Development Planning on Optimal Power Generation for Peak Demand in Sri Lanka Final Report
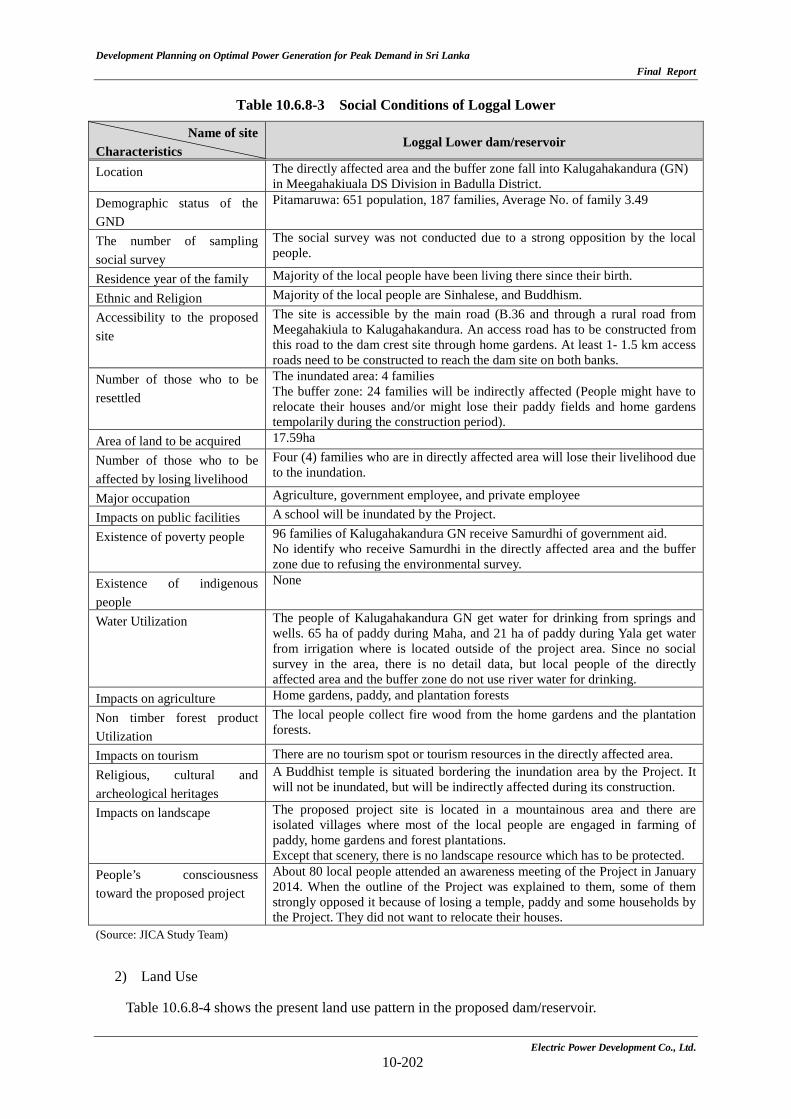
Table 10.6.8-3 Social Conditions of Loggal Lower
Name of site Characteristics
Loggal Lower dam/reservoir
Location The directly affected area and the buffer zone fall into Kalugahakandura (GN) in Meegahakiuala DS Division in Badulla District.
Demographic status of the GND
Pitamaruwa: 651 population, 187 families, Average No. of family 3.49
The number of sampling social survey
The social survey was not conducted due to a strong opposition by the local people.
Residence year of the family Majority of the local people have been living there since their birth.
Ethnic and Religion Majority of the local people are Sinhalese, and Buddhism.
Accessibility to the proposed site
The site is accessible by the main road (B.36 and through a rural road from Meegahakiula to Kalugahakandura. An access road has to be constructed from this road to the dam crest site through home gardens. At least 1- 1.5 km access roads need to be constructed to reach the dam site on both banks.
Number of those who to be resettled
The inundated area: 4 families The buffer zone: 24 families will be indirectly affected (People might have to relocate their houses and/or might lose their paddy fields and home gardens tempolarily during the construction period).
Area of land to be acquired 17.59ha
Number of those who to be affected by losing livelihood
Four (4) families who are in directly affected area will lose their livelihood due to the inundation.
Major occupation Agriculture, government employee, and private employee
Impacts on public facilities A school will be inundated by the Project.
Existence of poverty people 96 families of Kalugahakandura GN receive Samurdhi of government aid. No identify who receive Samurdhi in the directly affected area and the buffer zone due to refusing the environmental survey.
Existence of indigenous people
None
Water Utilization The people of Kalugahakandura GN get water for drinking from springs and wells. 65 ha of paddy during Maha, and 21 ha of paddy during Yala get water from irrigation where is located outside of the project area. Since no social survey in the area, there is no detail data, but local people of the directly affected area and the buffer zone do not use river water for drinking.
Impacts on agriculture Home gardens, paddy, and plantation forests
Non timber forest product Utilization
The local people collect fire wood from the home gardens and the plantation forests.
Impacts on tourism There are no tourism spot or tourism resources in the directly affected area. Religious, cultural and archeological heritages
A Buddhist temple is situated bordering the inundation area by the Project. It will not be inundated, but will be indirectly affected during its construction.
Impacts on landscape The proposed project site is located in a mountainous area and there are isolated villages where most of the local people are engaged in farming of paddy, home gardens and forest plantations. Except that scenery, there is no landscape resource which has to be protected.
People’s consciousness toward the proposed project
About 80 local people attended an awareness meeting of the Project in January 2014. When the outline of the Project was explained to them, some of them strongly opposed it because of losing a temple, paddy and some households by the Project. They did not want to relocate their houses.
(Source: JICA Study Team)
2) Land Use
Table 10.6.8-4 shows the present land use pattern in the proposed dam/reservoir.
Electric Power Development Co., Ltd. 10-202
Development Planning on Optimal Power Generation for Peak Demand in Sri Lanka Final Report
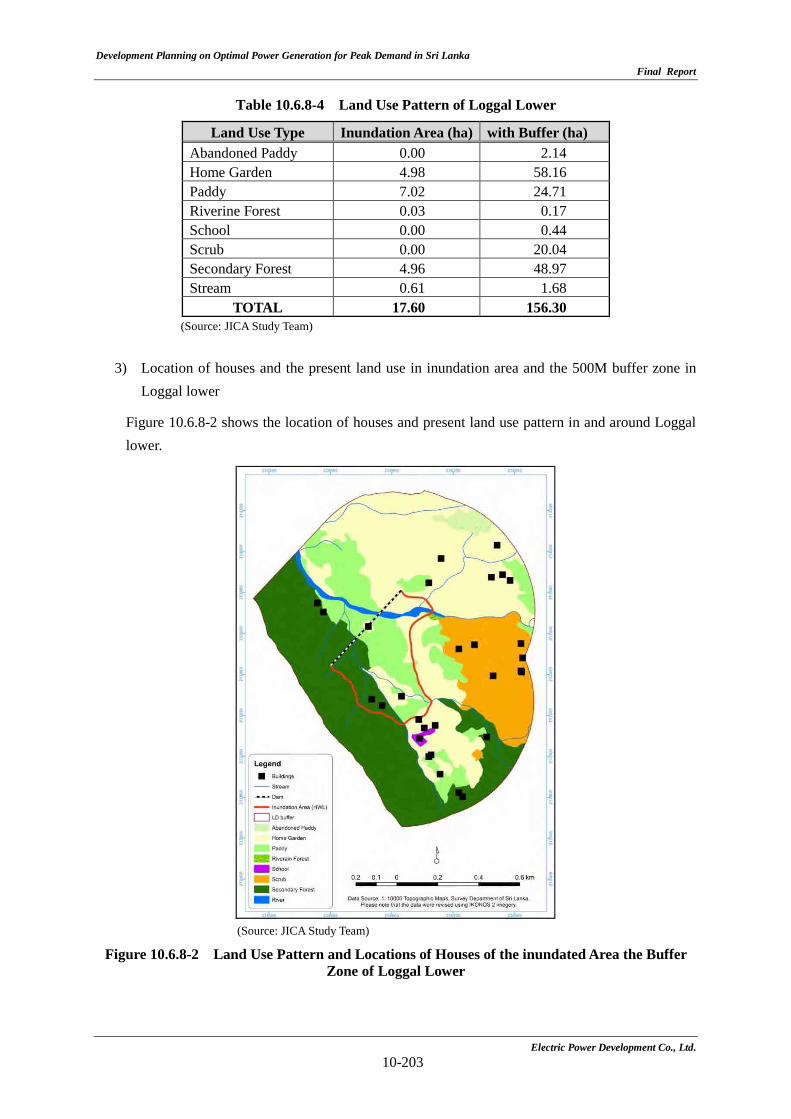
Table 10.6.8-4 Land Use Pattern of Loggal Lower
Land Use Type Inundation Area (ha) with Buffer (ha) Abandoned Paddy 0.00 2.14 Home Garden 4.98 58.16 Paddy 7.02 24.71 Riverine Forest 0.03 0.17 School 0.00 0.44 Scrub 0.00 20.04 Secondary Forest 4.96 48.97 Stream 0.61 1.68
TOTAL 17.60 156.30 (Source: JICA Study Team)
3) Location of houses and the present land use in inundation area and the 500M buffer zone in
Loggal lower
Figure 10.6.8-2 shows the location of houses and present land use pattern in and around Loggal lower.
(Source: JICA Study Team)
Figure 10.6.8-2 Land Use Pattern and Locations of Houses of the inundated Area the Buffer Zone of Loggal Lower
Electric Power Development Co., Ltd. 10-203
Development Planning on Optimal Power Generation for Peak Demand in Sri Lanka Final Report
10.7 Selection of the Most Promising Site
10.7.1 Outline
In the promising candidate 3 sites, (4 schemes: Halgran 3, Maha 2, Maha 3, and Loggal), 1/5,000 topographic surveys were planned to be conducted by the local consultant. In the primary site selection as mentioned in the chapter 9 (the selection of the promising candidate sites), 1/10,000 topographic maps (published by Survey Department of Sri Lanka) was utilized for pumped storage planning. Therefore, the topographical survey as the above-mentioned was planned to improve precision of the pumped storage planning for the most promising site selection. In Loggal, however, due to strong opposition for the environmental survey, which was also planned to be conducted in every promising site, the planned topographic survey was canceled by consultation with CEB. Accordingly, review of the pumped storage planning by 1/5,000 topographic map, as mentioned in the sub-chapter 10.2.3, has been carried out in following 3 sites; Halgran 3, Maha 2, and Maha 3.
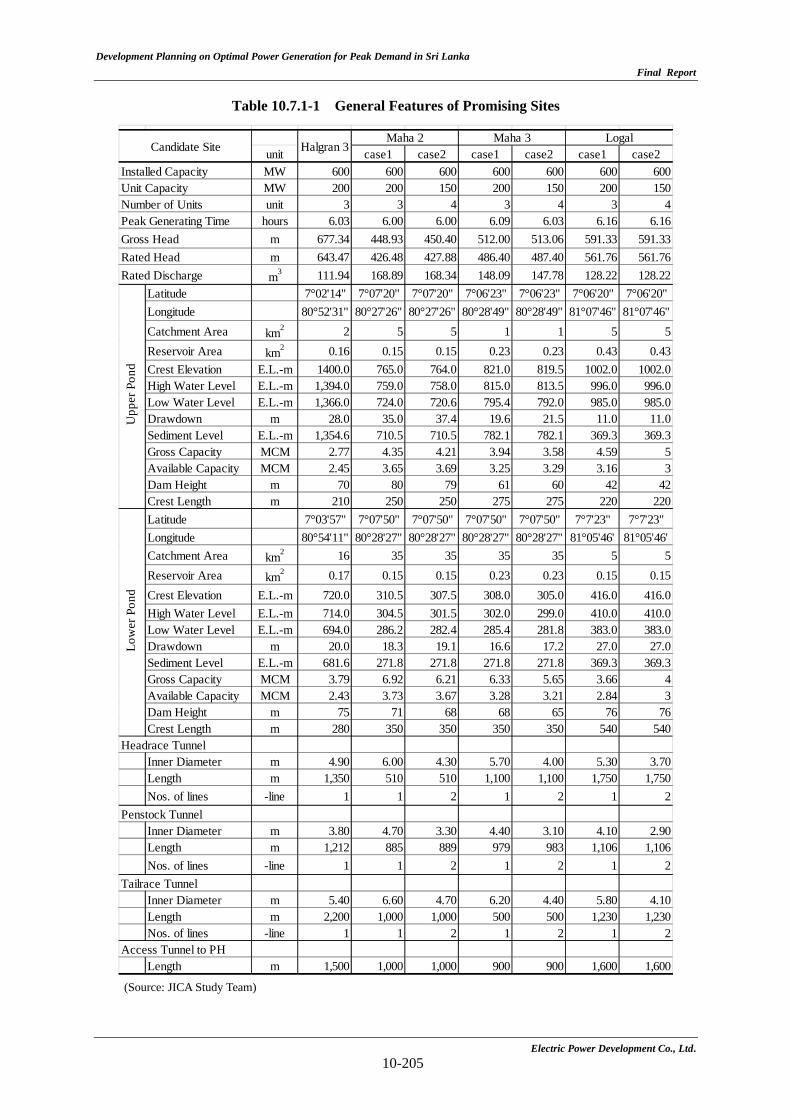
Table 10.7.1-1 shows reviewed general features of the promising candidate sites.
As mentioned in the sub-chapters from 10.2 to 10.6, every 4 reviewed pumped storage scheme is evaluated from geological condition, easy of construction works, transmission line, impact on the power system, construction cost, and natural/social environmental impacts. In this sub-chapter, ranking study is conducted based on results of evaluation from various aspects as the above-mentioned in order to select the most promising site in 4 promising sites. Evaluation results from every aspect, which are utilized for the ranking study, are summarized in the following sub-chapters.
Electric Power Development Co., Ltd. 10-204
Development Planning on Optimal Power Generation for Peak Demand in Sri Lanka
Final Report
Electric Power Development Co., Ltd. 10-205
Table 10.7.1-1 General Features of Promising Sites
(Source: JICA Study Team)
unit case1 case2 case1 case2 case1 case2Installed Capacity MW 600 600 600 600 600 600 600Unit Capacity MW 200 200 150 200 150 200 150Number of Units unit 3 3 4 3 4 3 4Peak Generating Time hours 6.03 6.00 6.00 6.09 6.03 6.16 6.16Gross Head m 677.34 448.93 450.40 512.00 513.06 591.33 591.33Rated Head m 643.47 426.48 427.88 486.40 487.40 561.76 561.76Rated Discharge m3 111.94 168.89 168.34 148.09 147.78 128.22 128.22
Latitude 7°02'14" 7°07'20" 7°07'20" 7°06'23" 7°06'23" 7°06'20" 7°06'20"Longitude 80°52'31" 80°27'26" 80°27'26" 80°28'49" 80°28'49" 81°07'46" 81°07'46"Catchment Area km2 2 5 5 1 1 5 5Reservoir Area km2 0.16 0.15 0.15 0.23 0.23 0.43 0.43Crest Elevation E.L.-m 1400.0 765.0 764.0 821.0 819.5 1002.0 1002.0High Water Level E.L.-m 1,394.0 759.0 758.0 815.0 813.5 996.0 996.0Low Water Level E.L.-m 1,366.0 724.0 720.6 795.4 792.0 985.0 985.0Drawdown m 28.0 35.0 37.4 19.6 21.5 11.0 11.0Sediment Level E.L.-m 1,354.6 710.5 710.5 782.1 782.1 369.3 369.3Gross Capacity MCM 2.77 4.35 4.21 3.94 3.58 4.59 5Available Capacity MCM 2.45 3.65 3.69 3.25 3.29 3.16 3Dam Height m 70 80 79 61 60 42 42Crest Length m 210 250 250 275 275 220 220Latitude 7°03'57" 7°07'50" 7°07'50" 7°07'50" 7°07'50" 7°7'23" 7°7'23"Longitude 80°54'11" 80°28'27" 80°28'27" 80°28'27" 80°28'27" 81°05'46' 81°05'46'Catchment Area km2 16 35 35 35 35 5 5Reservoir Area km2 0.17 0.15 0.15 0.23 0.23 0.15 0.15Crest Elevation E.L.-m 720.0 310.5 307.5 308.0 305.0 416.0 416.0High Water Level E.L.-m 714.0 304.5 301.5 302.0 299.0 410.0 410.0Low Water Level E.L.-m 694.0 286.2 282.4 285.4 281.8 383.0 383.0Drawdown m 20.0 18.3 19.1 16.6 17.2 27.0 27.0Sediment Level E.L.-m 681.6 271.8 271.8 271.8 271.8 369.3 369.3Gross Capacity MCM 3.79 6.92 6.21 6.33 5.65 3.66 4Available Capacity MCM 2.43 3.73 3.67 3.28 3.21 2.84 3Dam Height m 75 71 68 68 65 76 76Crest Length m 280 350 350 350 350 540 540
Headrace TunnelInner Diameter m 4.90 6.00 4.30 5.70 4.00 5.30 3.70Length m 1,350 510 510 1,100 1,100 1,750 1,750Nos. of lines -line 1 1 2 1 2 1 2
Penstock TunnelInner Diameter m 3.80 4.70 3.30 4.40 3.10 4.10 2.90Length m 1,212 885 889 979 983 1,106 1,106Nos. of lines -line 1 1 2 1 2 1 2
Tailrace TunnelInner Diameter m 5.40 6.60 4.70 6.20 4.40 5.80 4.10Length m 2,200 1,000 1,000 500 500 1,230 1,230Nos. of lines -line 1 1 2 1 2 1 2
Access Tunnel to PHLength m 1,500 1,000 1,000 900 900 1,600 1,600
Maha 3Candidate Site
Upp
er P
ond
Low
er P
ond
Halgran 3Maha 2 Logal
Development Planning on Optimal Power Generation for Peak Demand in Sri Lanka
Final Report
Electric Power Development Co., Ltd. 10-206
10.7.2 Geological Evaluation
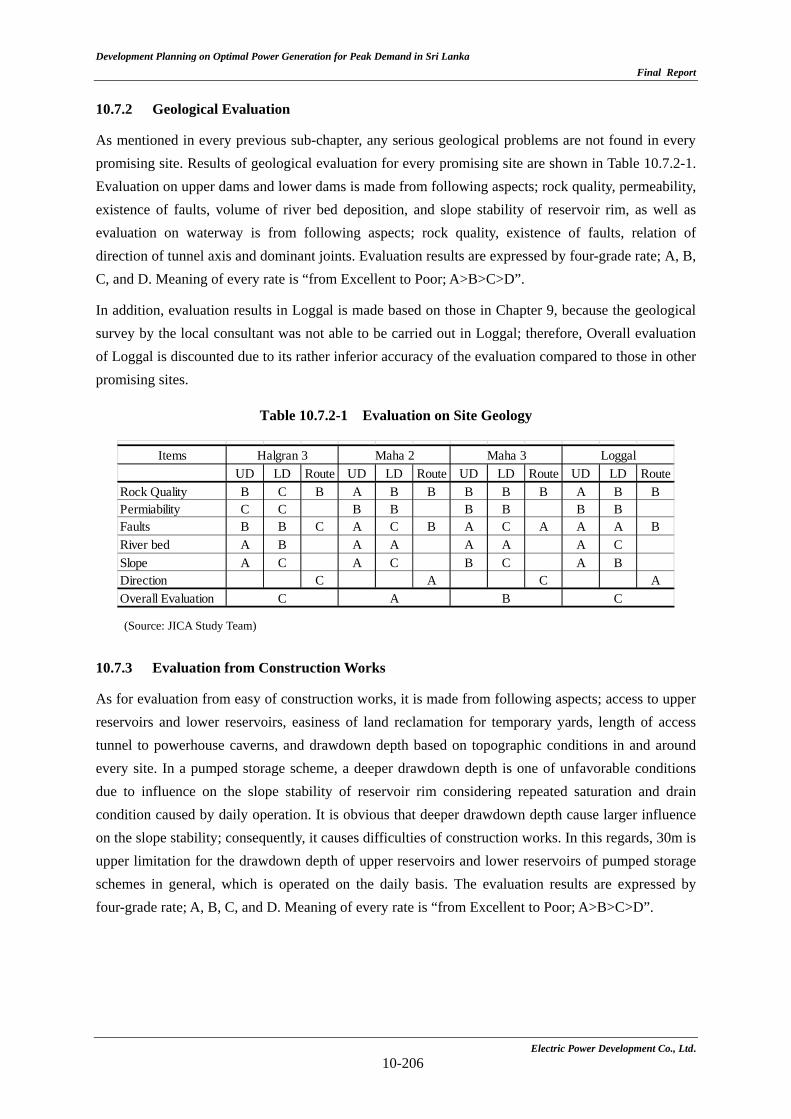
As mentioned in every previous sub-chapter, any serious geological problems are not found in every promising site. Results of geological evaluation for every promising site are shown in Table 10.7.2-1. Evaluation on upper dams and lower dams is made from following aspects; rock quality, permeability, existence of faults, volume of river bed deposition, and slope stability of reservoir rim, as well as evaluation on waterway is from following aspects; rock quality, existence of faults, relation of direction of tunnel axis and dominant joints. Evaluation results are expressed by four-grade rate; A, B, C, and D. Meaning of every rate is “from Excellent to Poor; A>B>C>D”.
In addition, evaluation results in Loggal is made based on those in Chapter 9, because the geological survey by the local consultant was not able to be carried out in Loggal; therefore, Overall evaluation of Loggal is discounted due to its rather inferior accuracy of the evaluation compared to those in other promising sites.
Table 10.7.2-1 Evaluation on Site Geology
(Source: JICA Study Team)
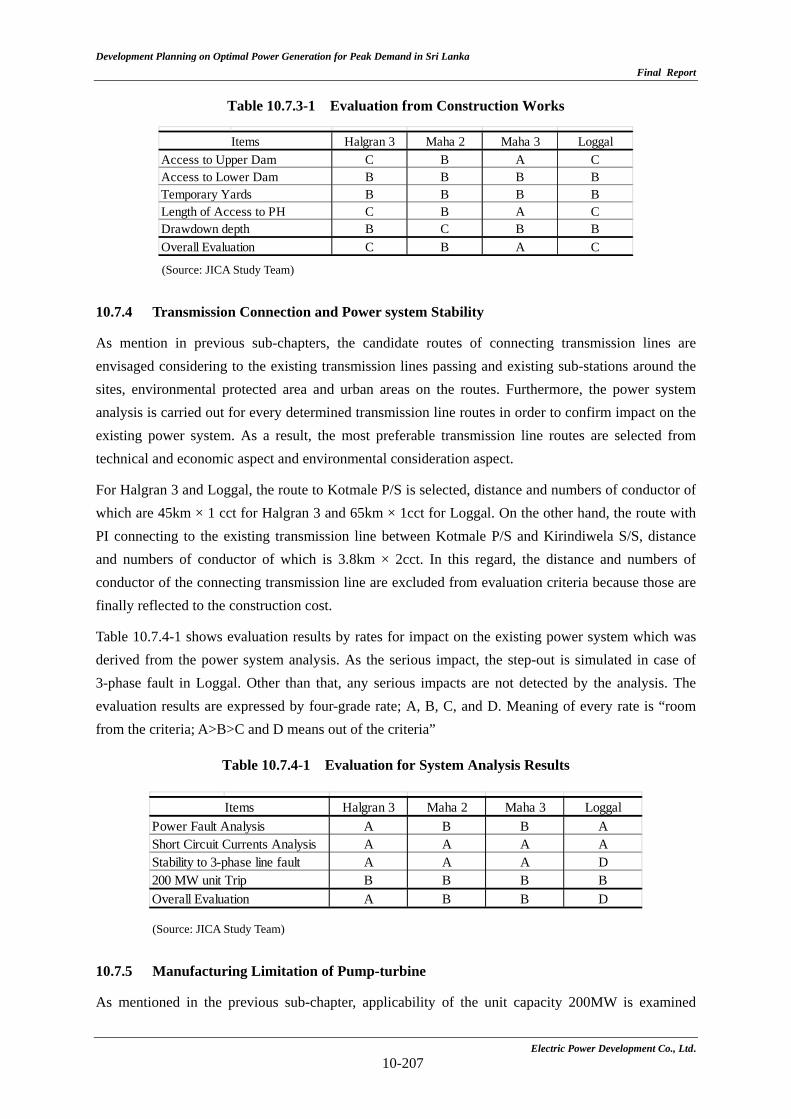
10.7.3 Evaluation from Construction Works
As for evaluation from easy of construction works, it is made from following aspects; access to upper reservoirs and lower reservoirs, easiness of land reclamation for temporary yards, length of access tunnel to powerhouse caverns, and drawdown depth based on topographic conditions in and around every site. In a pumped storage scheme, a deeper drawdown depth is one of unfavorable conditions due to influence on the slope stability of reservoir rim considering repeated saturation and drain condition caused by daily operation. It is obvious that deeper drawdown depth cause larger influence on the slope stability; consequently, it causes difficulties of construction works. In this regards, 30m is upper limitation for the drawdown depth of upper reservoirs and lower reservoirs of pumped storage schemes in general, which is operated on the daily basis. The evaluation results are expressed by four-grade rate; A, B, C, and D. Meaning of every rate is “from Excellent to Poor; A>B>C>D”.
ItemsUD LD Route UD LD Route UD LD Route UD LD Route
Rock Quality B C B A B B B B B A B BPermiability C C B B B B B BFaults B B C A C B A C A A A BRiver bed A B A A A A A CSlope A C A C B C A BDirection C A C AOverall Evaluation
Halgran 3 Maha 2 Maha 3 Loggal
C A B C
Development Planning on Optimal Power Generation for Peak Demand in Sri Lanka
Final Report
Electric Power Development Co., Ltd. 10-207
Table 10.7.3-1 Evaluation from Construction Works
(Source: JICA Study Team)
10.7.4 Transmission Connection and Power system Stability
As mention in previous sub-chapters, the candidate routes of connecting transmission lines are envisaged considering to the existing transmission lines passing and existing sub-stations around the sites, environmental protected area and urban areas on the routes. Furthermore, the power system analysis is carried out for every determined transmission line routes in order to confirm impact on the existing power system. As a result, the most preferable transmission line routes are selected from technical and economic aspect and environmental consideration aspect.
For Halgran 3 and Loggal, the route to Kotmale P/S is selected, distance and numbers of conductor of which are 45km × 1 cct for Halgran 3 and 65km × 1cct for Loggal. On the other hand, the route with PI connecting to the existing transmission line between Kotmale P/S and Kirindiwela S/S, distance and numbers of conductor of which is 3.8km × 2cct. In this regard, the distance and numbers of conductor of the connecting transmission line are excluded from evaluation criteria because those are finally reflected to the construction cost.
Table 10.7.4-1 shows evaluation results by rates for impact on the existing power system which was derived from the power system analysis. As the serious impact, the step-out is simulated in case of 3-phase fault in Loggal. Other than that, any serious impacts are not detected by the analysis. The evaluation results are expressed by four-grade rate; A, B, C, and D. Meaning of every rate is “room from the criteria; A>B>C and D means out of the criteria”
Table 10.7.4-1 Evaluation for System Analysis Results
(Source: JICA Study Team)
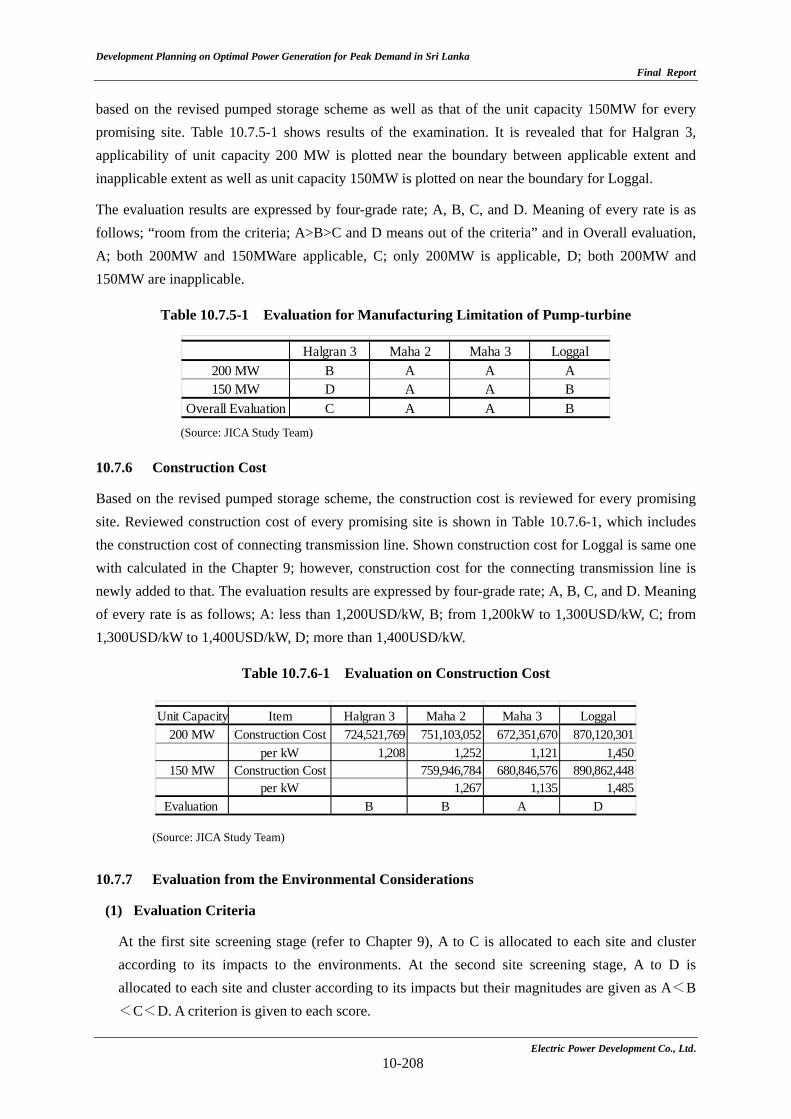
10.7.5 Manufacturing Limitation of Pump-turbine
As mentioned in the previous sub-chapter, applicability of the unit capacity 200MW is examined
Halgran 3 Maha 2 Maha 3 LoggalAccess to Upper Dam C B A CAccess to Lower Dam B B B BTemporary Yards B B B BLength of Access to PH C B A CDrawdown depth B C B BOverall Evaluation C B A C
Items
Halgran 3 Maha 2 Maha 3 LoggalPower Fault Analysis A B B AShort Circuit Currents Analysis A A A AStability to 3-phase line fault A A A D200 MW unit Trip B B B BOverall Evaluation A B B D
Items
Development Planning on Optimal Power Generation for Peak Demand in Sri Lanka
Final Report
Electric Power Development Co., Ltd. 10-208
based on the revised pumped storage scheme as well as that of the unit capacity 150MW for every promising site. Table 10.7.5-1 shows results of the examination. It is revealed that for Halgran 3, applicability of unit capacity 200 MW is plotted near the boundary between applicable extent and inapplicable extent as well as unit capacity 150MW is plotted on near the boundary for Loggal.
The evaluation results are expressed by four-grade rate; A, B, C, and D. Meaning of every rate is as follows; “room from the criteria; A>B>C and D means out of the criteria” and in Overall evaluation, A; both 200MW and 150MWare applicable, C; only 200MW is applicable, D; both 200MW and 150MW are inapplicable.
Table 10.7.5-1 Evaluation for Manufacturing Limitation of Pump-turbine
(Source: JICA Study Team)
10.7.6 Construction Cost
Based on the revised pumped storage scheme, the construction cost is reviewed for every promising site. Reviewed construction cost of every promising site is shown in Table 10.7.6-1, which includes the construction cost of connecting transmission line. Shown construction cost for Loggal is same one with calculated in the Chapter 9; however, construction cost for the connecting transmission line is newly added to that. The evaluation results are expressed by four-grade rate; A, B, C, and D. Meaning of every rate is as follows; A: less than 1,200USD/kW, B; from 1,200kW to 1,300USD/kW, C; from 1,300USD/kW to 1,400USD/kW, D; more than 1,400USD/kW.
Table 10.7.6-1 Evaluation on Construction Cost
(Source: JICA Study Team) 10.7.7 Evaluation from the Environmental Considerations
(1) Evaluation Criteria
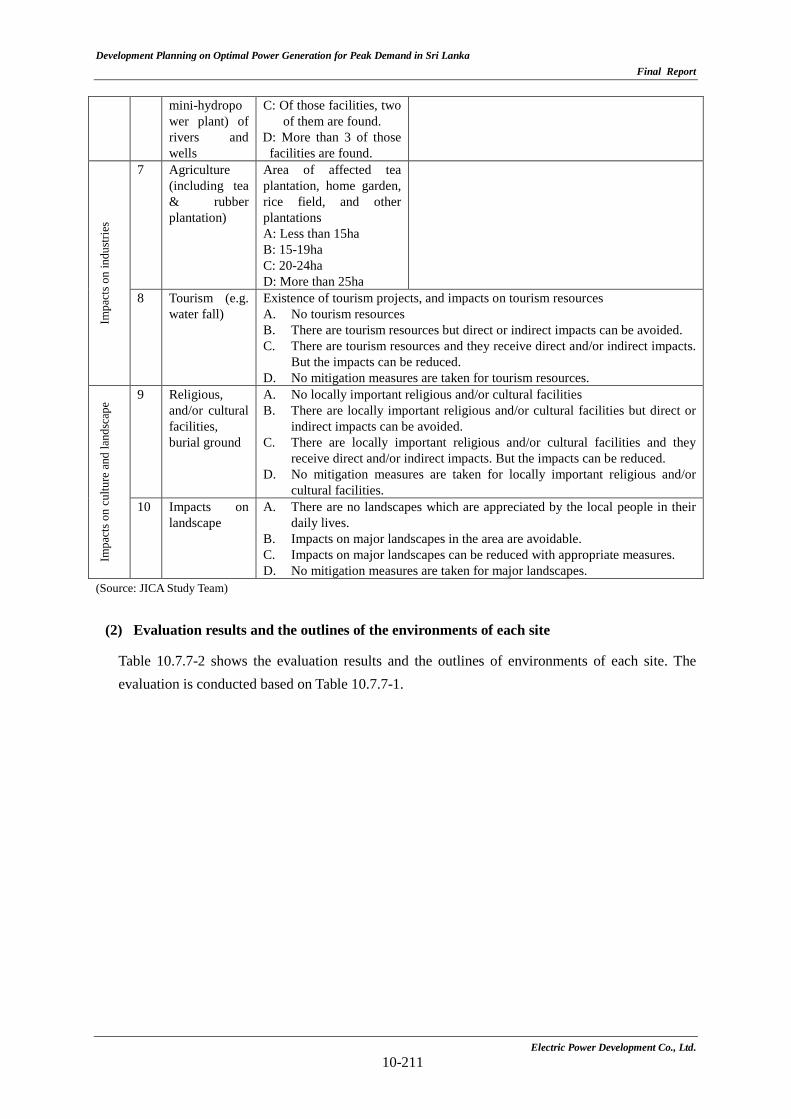
At the first site screening stage (refer to Chapter 9), A to C is allocated to each site and cluster according to its impacts to the environments. At the second site screening stage, A to D is allocated to each site and cluster according to its impacts but their magnitudes are given as A<B<C<D. A criterion is given to each score.
Halgran 3 Maha 2 Maha 3 Loggal200 MW B A A A150 MW D A A B
Overall Evaluation C A A B
Unit Capacity Item Halgran 3 Maha 2 Maha 3 Loggal200 MW Construction Cost 724,521,769 751,103,052 672,351,670 870,120,301
per kW 1,208 1,252 1,121 1,450150 MW Construction Cost 759,946,784 680,846,576 890,862,448
per kW 1,267 1,135 1,485Evaluation B B A D
Development Planning on Optimal Power Generation for Peak Demand in Sri Lanka Final Report
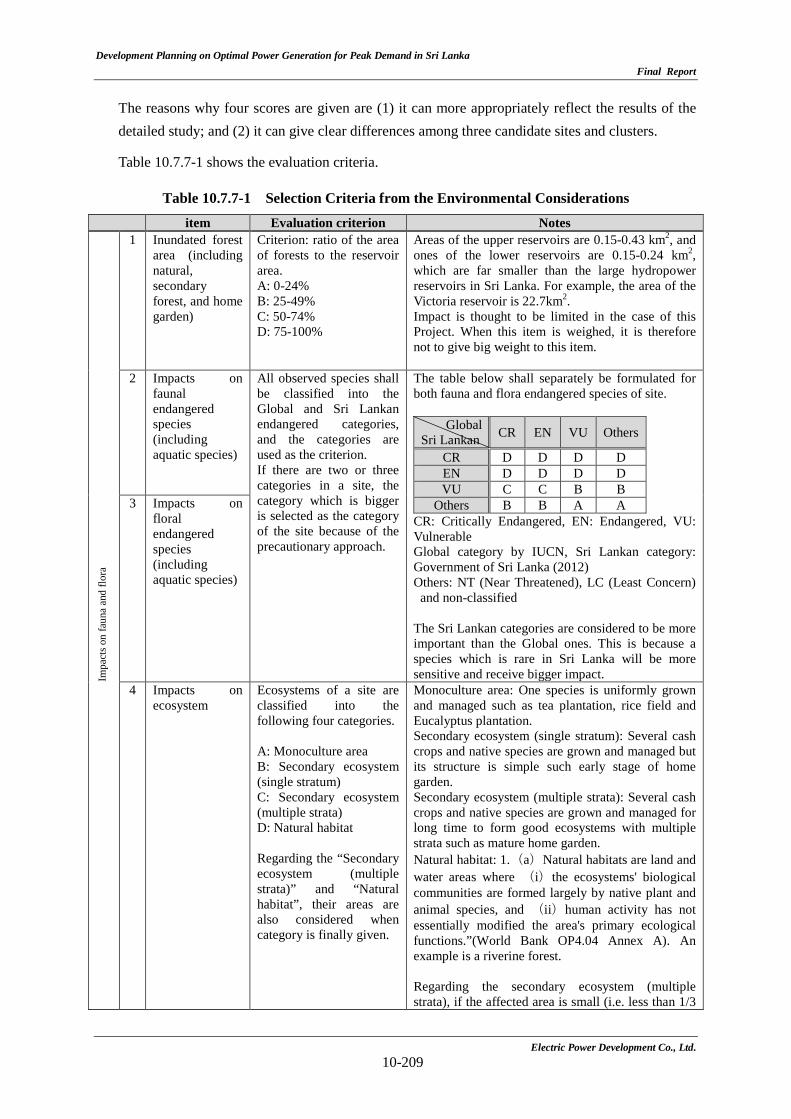
The reasons why four scores are given are (1) it can more appropriately reflect the results of the detailed study; and (2) it can give clear differences among three candidate sites and clusters.
Table 10.7.7-1 shows the evaluation criteria.
Table 10.7.7-1 Selection Criteria from the Environmental Considerations item Evaluation criterion Notes
Impa
cts o
n fa
una
and
flora
1 Inundated forest area (including natural, secondary forest, and home garden)
Criterion: ratio of the area of forests to the reservoir area. A: 0-24% B: 25-49% C: 50-74% D: 75-100%
Areas of the upper reservoirs are 0.15-0.43 km2, and ones of the lower reservoirs are 0.15-0.24 km2, which are far smaller than the large hydropower reservoirs in Sri Lanka. For example, the area of the Victoria reservoir is 22.7km2. Impact is thought to be limited in the case of this Project. When this item is weighed, it is therefore not to give big weight to this item.
2 Impacts on faunal endangered species (including aquatic species)
All observed species shall be classified into the Global and Sri Lankan endangered categories, and the categories are used as the criterion. If there are two or three categories in a site, the category which is bigger is selected as the category of the site because of the precautionary approach.
The table below shall separately be formulated for both fauna and flora endangered species of site.
Global Sri Lankan CR EN VU Others
CR D D D D EN D D D D VU C C B B
Others B B A A CR: Critically Endangered, EN: Endangered, VU: Vulnerable Global category by IUCN, Sri Lankan category: Government of Sri Lanka (2012) Others: NT (Near Threatened), LC (Least Concern)
and non-classified The Sri Lankan categories are considered to be more important than the Global ones. This is because a species which is rare in Sri Lanka will be more sensitive and receive bigger impact.
3 Impacts on floral endangered species (including aquatic species)
4 Impacts on ecosystem
Ecosystems of a site are classified into the following four categories. A: Monoculture area B: Secondary ecosystem (single stratum) C: Secondary ecosystem (multiple strata) D: Natural habitat Regarding the “Secondary ecosystem (multiple strata)” and “Natural habitat”, their areas are also considered when category is finally given.
Monoculture area: One species is uniformly grown and managed such as tea plantation, rice field and Eucalyptus plantation. Secondary ecosystem (single stratum): Several cash crops and native species are grown and managed but its structure is simple such early stage of home garden. Secondary ecosystem (multiple strata): Several cash crops and native species are grown and managed for long time to form good ecosystems with multiple strata such as mature home garden. Natural habitat: 1.(a)Natural habitats are land and water areas where (i)the ecosystems' biological communities are formed largely by native plant and animal species, and (ii)human activity has not essentially modified the area's primary ecological functions.”(World Bank OP4.04 Annex A). An example is a riverine forest. Regarding the secondary ecosystem (multiple strata), if the affected area is small (i.e. less than 1/3
Electric Power Development Co., Ltd. 10-209
Development Planning on Optimal Power Generation for Peak Demand in Sri Lanka Final Report
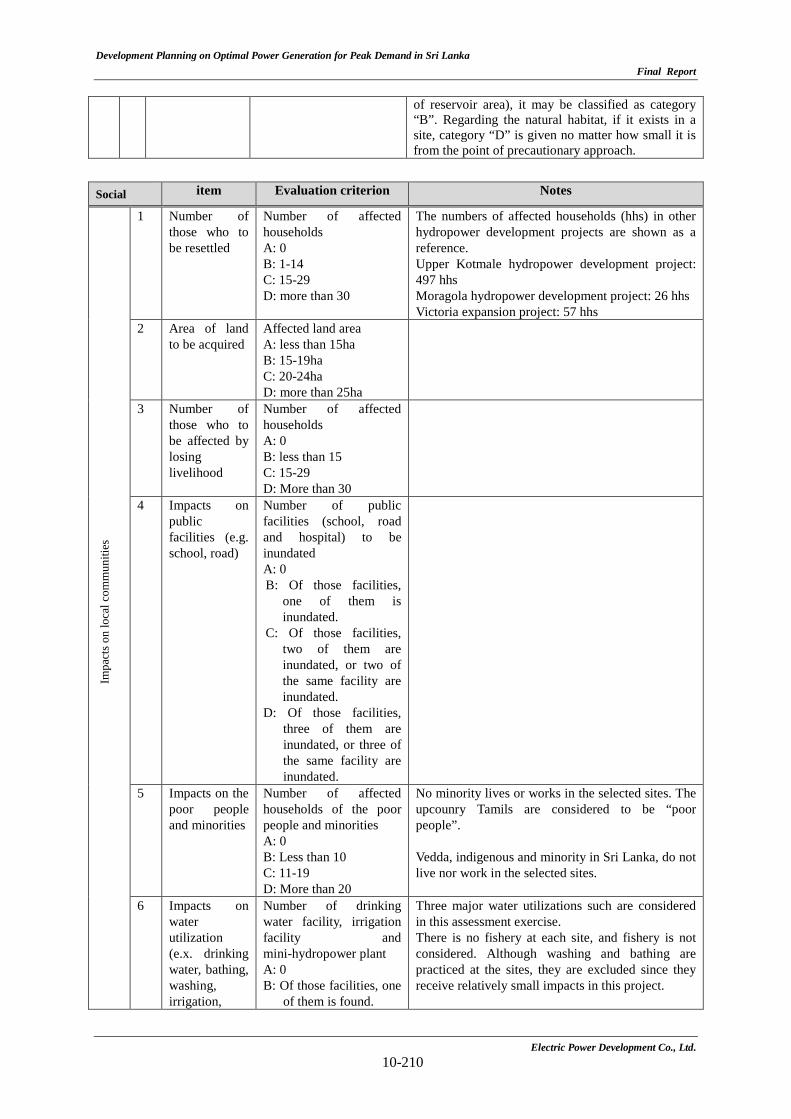
of reservoir area), it may be classified as category “B”. Regarding the natural habitat, if it exists in a site, category “D” is given no matter how small it is from the point of precautionary approach.
Social item Evaluation criterion Notes
Impa
cts o
n lo
cal c
omm
uniti
es
1 Number of those who to be resettled
Number of affected households A: 0 B: 1-14 C: 15-29 D: more than 30
The numbers of affected households (hhs) in other hydropower development projects are shown as a reference. Upper Kotmale hydropower development project: 497 hhs Moragola hydropower development project: 26 hhs Victoria expansion project: 57 hhs
2 Area of land to be acquired
Affected land area A: less than 15ha B: 15-19ha C: 20-24ha D: more than 25ha
3 Number of those who to be affected by losing livelihood
Number of affected households A: 0 B: less than 15 C: 15-29 D: More than 30
4 Impacts on public facilities (e.g. school, road)
Number of public facilities (school, road and hospital) to be inundated A: 0 B: Of those facilities,
one of them is inundated.
C: Of those facilities, two of them are inundated, or two of the same facility are inundated.
D: Of those facilities, three of them are inundated, or three of the same facility are inundated.
5 Impacts on the poor people and minorities
Number of affected households of the poor people and minorities A: 0 B: Less than 10 C: 11-19 D: More than 20
No minority lives or works in the selected sites. The upcounry Tamils are considered to be “poor people”. Vedda, indigenous and minority in Sri Lanka, do not live nor work in the selected sites.
6 Impacts on water utilization (e.x. drinking water, bathing, washing, irrigation,
Number of drinking water facility, irrigation facility and mini-hydropower plant A: 0 B: Of those facilities, one
of them is found.
Three major water utilizations such are considered in this assessment exercise. There is no fishery at each site, and fishery is not considered. Although washing and bathing are practiced at the sites, they are excluded since they receive relatively small impacts in this project.
Electric Power Development Co., Ltd. 10-210
Development Planning on Optimal Power Generation for Peak Demand in Sri Lanka Final Report
mini-hydropower plant) of rivers and wells
C: Of those facilities, two of them are found.
D: More than 3 of those facilities are found.
Impa
cts o
n in
dust
ries
7 Agriculture (including tea & rubber plantation)
Area of affected tea plantation, home garden, rice field, and other plantations A: Less than 15ha B: 15-19ha C: 20-24ha D: More than 25ha
8 Tourism (e.g. water fall)
Existence of tourism projects, and impacts on tourism resources A. No tourism resources B. There are tourism resources but direct or indirect impacts can be avoided. C. There are tourism resources and they receive direct and/or indirect impacts.
But the impacts can be reduced. D. No mitigation measures are taken for tourism resources.
Impa
cts o
n cu
lture
and
land
scap
e
9 Religious, and/or cultural facilities, burial ground
A. No locally important religious and/or cultural facilities B. There are locally important religious and/or cultural facilities but direct or
indirect impacts can be avoided. C. There are locally important religious and/or cultural facilities and they
receive direct and/or indirect impacts. But the impacts can be reduced. D. No mitigation measures are taken for locally important religious and/or
cultural facilities. 10 Impacts on
landscape A. There are no landscapes which are appreciated by the local people in their
daily lives. B. Impacts on major landscapes in the area are avoidable. C. Impacts on major landscapes can be reduced with appropriate measures. D. No mitigation measures are taken for major landscapes.
(Source: JICA Study Team)
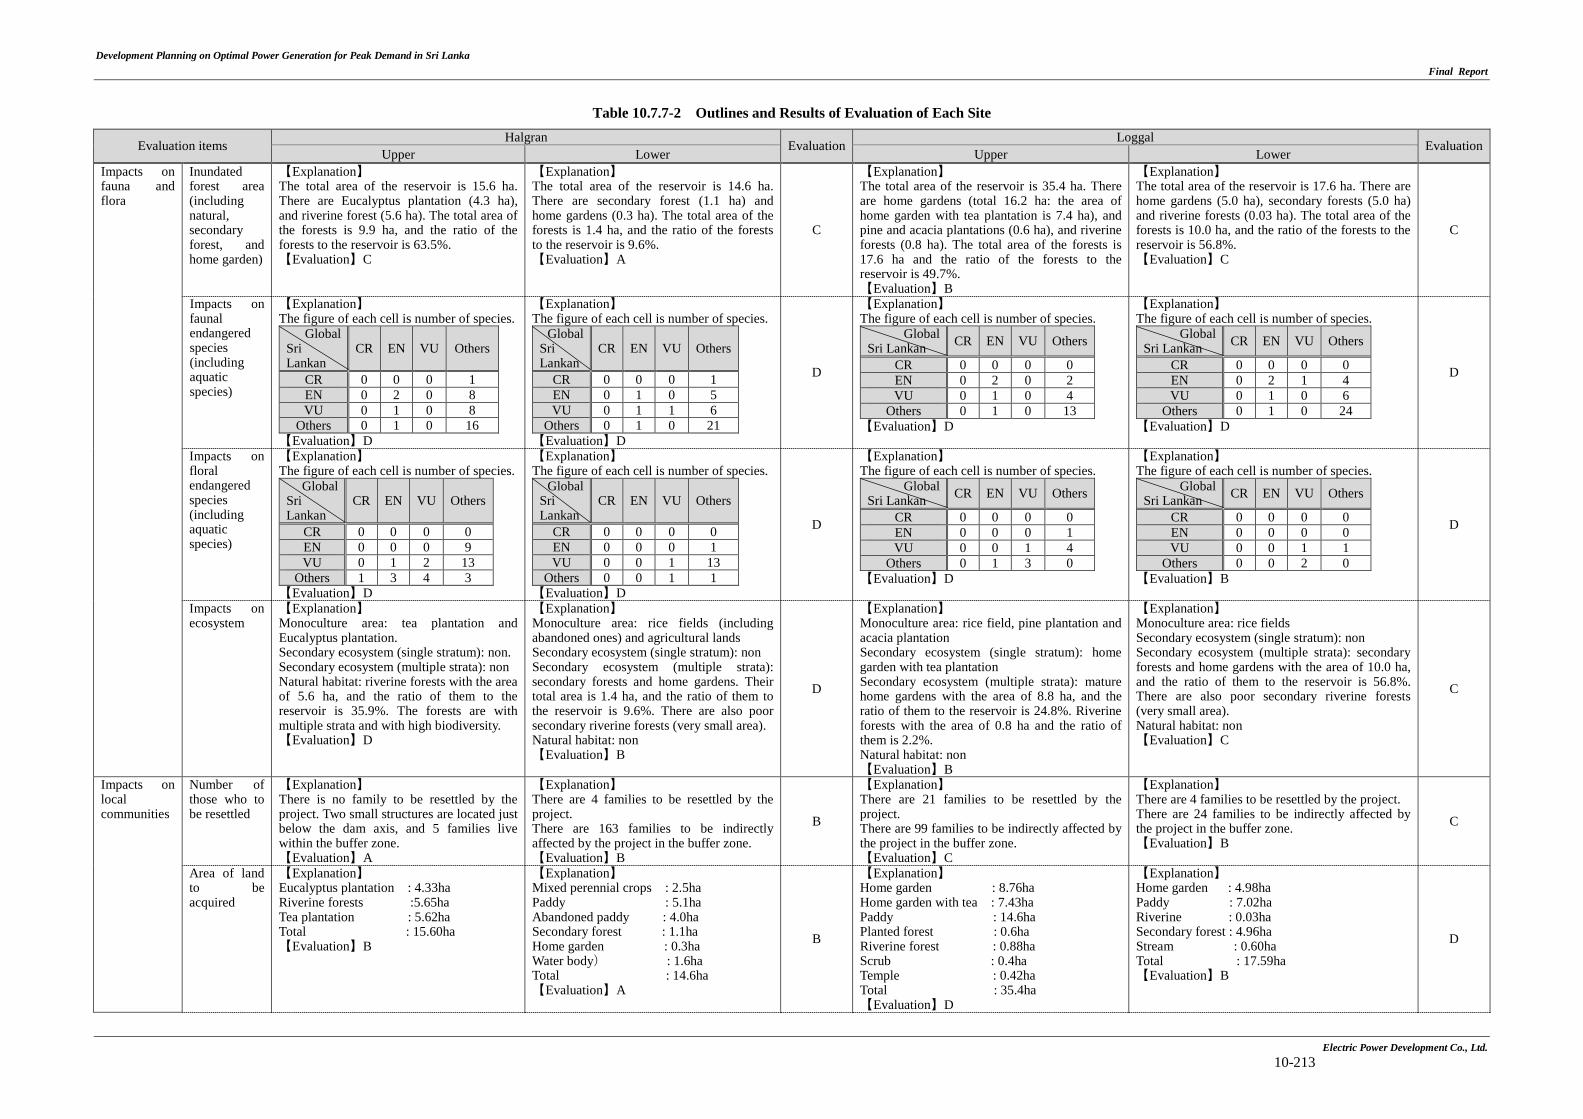
(2) Evaluation results and the outlines of the environments of each site
Table 10.7.7-2 shows the evaluation results and the outlines of environments of each site. The evaluation is conducted based on Table 10.7.7-1.
Electric Power Development Co., Ltd. 10-211
Development Planning on Optimal Power Generation for Peak Demand in Sri Lanka Final Report
Table 10.7.7-2 Outlines and Results of Evaluation of Each Site
Evaluation items Halgran Evaluation Loggal Evaluation Upper Lower Upper Lower Impacts on fauna and flora
Inundated forest area (including natural, secondary forest, and home garden)
【Explanation】 The total area of the reservoir is 15.6 ha. There are Eucalyptus plantation (4.3 ha), and riverine forest (5.6 ha). The total area of the forests is 9.9 ha, and the ratio of the forests to the reservoir is 63.5%. 【Evaluation】C
【Explanation】 The total area of the reservoir is 14.6 ha. There are secondary forest (1.1 ha) and home gardens (0.3 ha). The total area of the forests is 1.4 ha, and the ratio of the forests to the reservoir is 9.6%. 【Evaluation】A
C
【Explanation】 The total area of the reservoir is 35.4 ha. There are home gardens (total 16.2 ha: the area of home garden with tea plantation is 7.4 ha), and pine and acacia plantations (0.6 ha), and riverine forests (0.8 ha). The total area of the forests is 17.6 ha and the ratio of the forests to the reservoir is 49.7%. 【Evaluation】B
【Explanation】 The total area of the reservoir is 17.6 ha. There are home gardens (5.0 ha), secondary forests (5.0 ha) and riverine forests (0.03 ha). The total area of the forests is 10.0 ha, and the ratio of the forests to the reservoir is 56.8%. 【Evaluation】C
C
Impacts on faunal endangered species (including aquatic species)
【Explanation】 The figure of each cell is number of species.
Global Sri Lankan
CR EN VU Others
CR 0 0 0 1 EN 0 2 0 8 VU 0 1 0 8
Others 0 1 0 16 【Evaluation】D
【Explanation】 The figure of each cell is number of species.
Global Sri Lankan
CR EN VU Others
CR 0 0 0 1 EN 0 1 0 5 VU 0 1 1 6
Others 0 1 0 21 【Evaluation】D
D
【Explanation】 The figure of each cell is number of species.
Global Sri Lankan CR EN VU Others
CR 0 0 0 0 EN 0 2 0 2 VU 0 1 0 4
Others 0 1 0 13 【Evaluation】D
【Explanation】 The figure of each cell is number of species.
Global Sri Lankan CR EN VU Others
CR 0 0 0 0 EN 0 2 1 4 VU 0 1 0 6
Others 0 1 0 24 【Evaluation】D
D
Impacts on floral endangered species (including aquatic species)
【Explanation】 The figure of each cell is number of species.
Global Sri Lankan
CR EN VU Others
CR 0 0 0 0 EN 0 0 0 9 VU 0 1 2 13
Others 1 3 4 3 【Evaluation】D
【Explanation】 The figure of each cell is number of species.
Global Sri Lankan
CR EN VU Others
CR 0 0 0 0 EN 0 0 0 1 VU 0 0 1 13
Others 0 0 1 1 【Evaluation】D
D
【Explanation】 The figure of each cell is number of species.
Global Sri Lankan CR EN VU Others
CR 0 0 0 0 EN 0 0 0 1 VU 0 0 1 4
Others 0 1 3 0 【Evaluation】D
【Explanation】 The figure of each cell is number of species.
Global Sri Lankan CR EN VU Others
CR 0 0 0 0 EN 0 0 0 0 VU 0 0 1 1
Others 0 0 2 0 【Evaluation】B
D
Impacts on ecosystem
【Explanation】 Monoculture area: tea plantation and Eucalyptus plantation. Secondary ecosystem (single stratum): non. Secondary ecosystem (multiple strata): non Natural habitat: riverine forests with the area of 5.6 ha, and the ratio of them to the reservoir is 35.9%. The forests are with multiple strata and with high biodiversity. 【Evaluation】D
【Explanation】 Monoculture area: rice fields (including abandoned ones) and agricultural lands Secondary ecosystem (single stratum): non Secondary ecosystem (multiple strata): secondary forests and home gardens. Their total area is 1.4 ha, and the ratio of them to the reservoir is 9.6%. There are also poor secondary riverine forests (very small area). Natural habitat: non 【Evaluation】B
D
【Explanation】 Monoculture area: rice field, pine plantation and acacia plantation Secondary ecosystem (single stratum): home garden with tea plantation Secondary ecosystem (multiple strata): mature home gardens with the area of 8.8 ha, and the ratio of them to the reservoir is 24.8%. Riverine forests with the area of 0.8 ha and the ratio of them is 2.2%. Natural habitat: non 【Evaluation】B
【Explanation】 Monoculture area: rice fields Secondary ecosystem (single stratum): non Secondary ecosystem (multiple strata): secondary forests and home gardens with the area of 10.0 ha, and the ratio of them to the reservoir is 56.8%. There are also poor secondary riverine forests (very small area). Natural habitat: non 【Evaluation】C
C
Impacts on local communities
Number of those who to be resettled
【Explanation】 There is no family to be resettled by the project. Two small structures are located just below the dam axis, and 5 families live within the buffer zone. 【Evaluation】A
【Explanation】 There are 4 families to be resettled by the project. There are 163 families to be indirectly affected by the project in the buffer zone. 【Evaluation】B
B
【Explanation】 There are 21 families to be resettled by the project. There are 99 families to be indirectly affected by the project in the buffer zone. 【Evaluation】C
【Explanation】 There are 4 families to be resettled by the project. There are 24 families to be indirectly affected by the project in the buffer zone. 【Evaluation】B
C
Area of land to be acquired
【Explanation】 Eucalyptus plantation : 4.33ha Riverine forests :5.65ha Tea plantation : 5.62ha Total : 15.60ha 【Evaluation】B
【Explanation】 Mixed perennial crops : 2.5ha Paddy : 5.1ha Abandoned paddy : 4.0ha Secondary forest : 1.1ha Home garden : 0.3ha Water body) : 1.6ha Total : 14.6ha 【Evaluation】A
B
【Explanation】 Home garden : 8.76ha Home garden with tea : 7.43ha Paddy : 14.6ha Planted forest : 0.6ha Riverine forest : 0.88ha Scrub : 0.4ha Temple : 0.42ha Total : 35.4ha 【Evaluation】D
【Explanation】 Home garden : 4.98ha Paddy : 7.02ha Riverine : 0.03ha Secondary forest : 4.96ha Stream : 0.60ha Total : 17.59ha 【Evaluation】B
D
Electric Power Development Co., Ltd. 10-213
Development Planning on Optimal Power Generation for Peak Demand in Sri Lanka Final Report
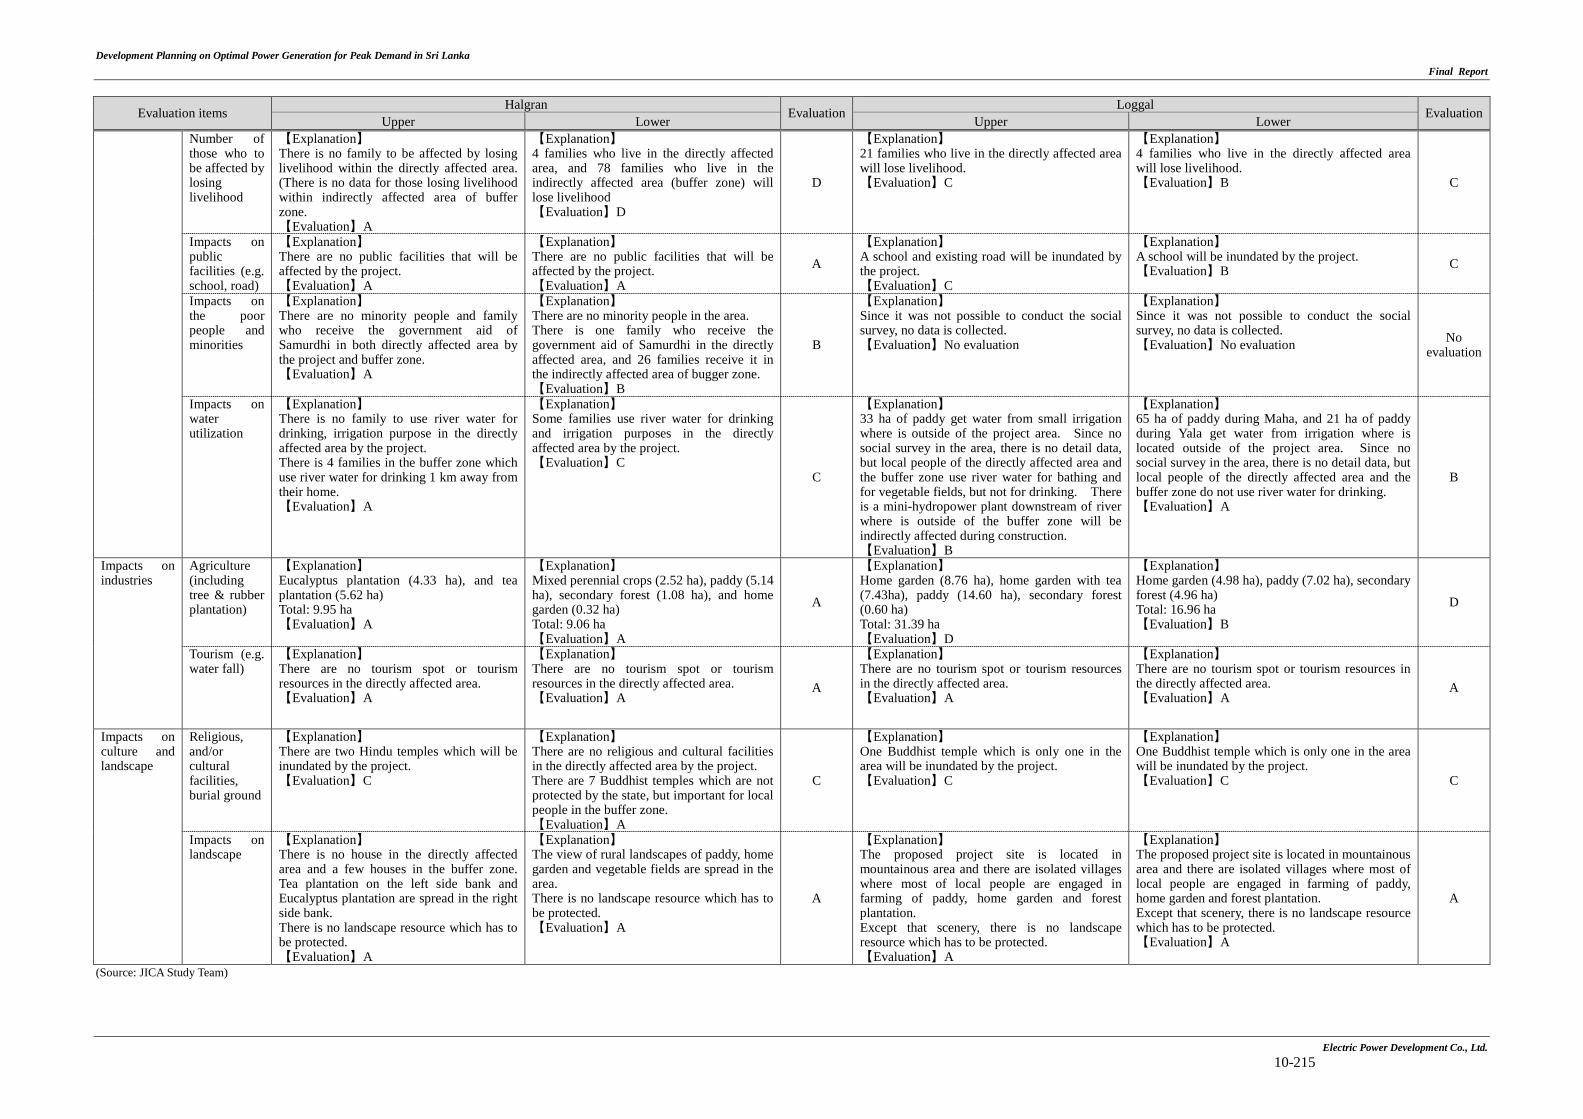
Evaluation items Halgran Evaluation Loggal Evaluation Upper Lower Upper Lower Number of
those who to be affected by losing livelihood
【Explanation】 There is no family to be affected by losing livelihood within the directly affected area. (There is no data for those losing livelihood within indirectly affected area of buffer zone. 【Evaluation】A
【Explanation】 4 families who live in the directly affected area, and 78 families who live in the indirectly affected area (buffer zone) will lose livelihood 【Evaluation】D
D
【Explanation】 21 families who live in the directly affected area will lose livelihood. 【Evaluation】C
【Explanation】 4 families who live in the directly affected area will lose livelihood. 【Evaluation】B C
Impacts on public facilities (e.g. school, road)
【Explanation】 There are no public facilities that will be affected by the project. 【Evaluation】A
【Explanation】 There are no public facilities that will be affected by the project. 【Evaluation】A
A
【Explanation】 A school and existing road will be inundated by the project. 【Evaluation】C
【Explanation】 A school will be inundated by the project. 【Evaluation】B C
Impacts on the poor people and minorities
【Explanation】 There are no minority people and family who receive the government aid of Samurdhi in both directly affected area by the project and buffer zone. 【Evaluation】A
【Explanation】 There are no minority people in the area. There is one family who receive the government aid of Samurdhi in the directly affected area, and 26 families receive it in the indirectly affected area of bugger zone. 【Evaluation】B
B
【Explanation】 Since it was not possible to conduct the social survey, no data is collected. 【Evaluation】No evaluation
【Explanation】 Since it was not possible to conduct the social survey, no data is collected. 【Evaluation】No evaluation No
evaluation
Impacts on water utilization
【Explanation】 There is no family to use river water for drinking, irrigation purpose in the directly affected area by the project. There is 4 families in the buffer zone which use river water for drinking 1 km away from their home. 【Evaluation】A
【Explanation】 Some families use river water for drinking and irrigation purposes in the directly affected area by the project. 【Evaluation】C
C
【Explanation】 33 ha of paddy get water from small irrigation where is outside of the project area. Since no social survey in the area, there is no detail data, but local people of the directly affected area and the buffer zone use river water for bathing and for vegetable fields, but not for drinking. There is a mini-hydropower plant downstream of river where is outside of the buffer zone will be indirectly affected during construction. 【Evaluation】B
【Explanation】 65 ha of paddy during Maha, and 21 ha of paddy during Yala get water from irrigation where is located outside of the project area. Since no social survey in the area, there is no detail data, but local people of the directly affected area and the buffer zone do not use river water for drinking. 【Evaluation】A
B
Impacts on industries
Agriculture (including tree & rubber plantation)
【Explanation】 Eucalyptus plantation (4.33 ha), and tea plantation (5.62 ha) Total: 9.95 ha 【Evaluation】A
【Explanation】 Mixed perennial crops (2.52 ha), paddy (5.14 ha), secondary forest (1.08 ha), and home garden (0.32 ha) Total: 9.06 ha 【Evaluation】A
A
【Explanation】 Home garden (8.76 ha), home garden with tea (7.43ha), paddy (14.60 ha), secondary forest (0.60 ha) Total: 31.39 ha 【Evaluation】D
【Explanation】 Home garden (4.98 ha), paddy (7.02 ha), secondary forest (4.96 ha) Total: 16.96 ha 【Evaluation】B
D
Tourism (e.g. water fall)
【Explanation】 There are no tourism spot or tourism resources in the directly affected area. 【Evaluation】A
【Explanation】 There are no tourism spot or tourism resources in the directly affected area. 【Evaluation】A
A
【Explanation】 There are no tourism spot or tourism resources in the directly affected area. 【Evaluation】A
【Explanation】 There are no tourism spot or tourism resources in the directly affected area. 【Evaluation】A
A
Impacts on culture and landscape
Religious, and/or cultural facilities, burial ground
【Explanation】 There are two Hindu temples which will be inundated by the project. 【Evaluation】C
【Explanation】 There are no religious and cultural facilities in the directly affected area by the project. There are 7 Buddhist temples which are not protected by the state, but important for local people in the buffer zone. 【Evaluation】A
C
【Explanation】 One Buddhist temple which is only one in the area will be inundated by the project. 【Evaluation】C
【Explanation】 One Buddhist temple which is only one in the area will be inundated by the project. 【Evaluation】C C
Impacts on landscape
【Explanation】 There is no house in the directly affected area and a few houses in the buffer zone. Tea plantation on the left side bank and Eucalyptus plantation are spread in the right side bank. There is no landscape resource which has to be protected. 【Evaluation】A
【Explanation】 The view of rural landscapes of paddy, home garden and vegetable fields are spread in the area. There is no landscape resource which has to be protected. 【Evaluation】A
A
【Explanation】 The proposed project site is located in mountainous area and there are isolated villages where most of local people are engaged in farming of paddy, home garden and forest plantation. Except that scenery, there is no landscape resource which has to be protected. 【Evaluation】A
【Explanation】 The proposed project site is located in mountainous area and there are isolated villages where most of local people are engaged in farming of paddy, home garden and forest plantation. Except that scenery, there is no landscape resource which has to be protected. 【Evaluation】A
A
(Source: JICA Study Team)
Electric Power Development Co., Ltd. 10-215
Development Planning on Optimal Power Generation for Peak Demand in Sri Lanka Final Report
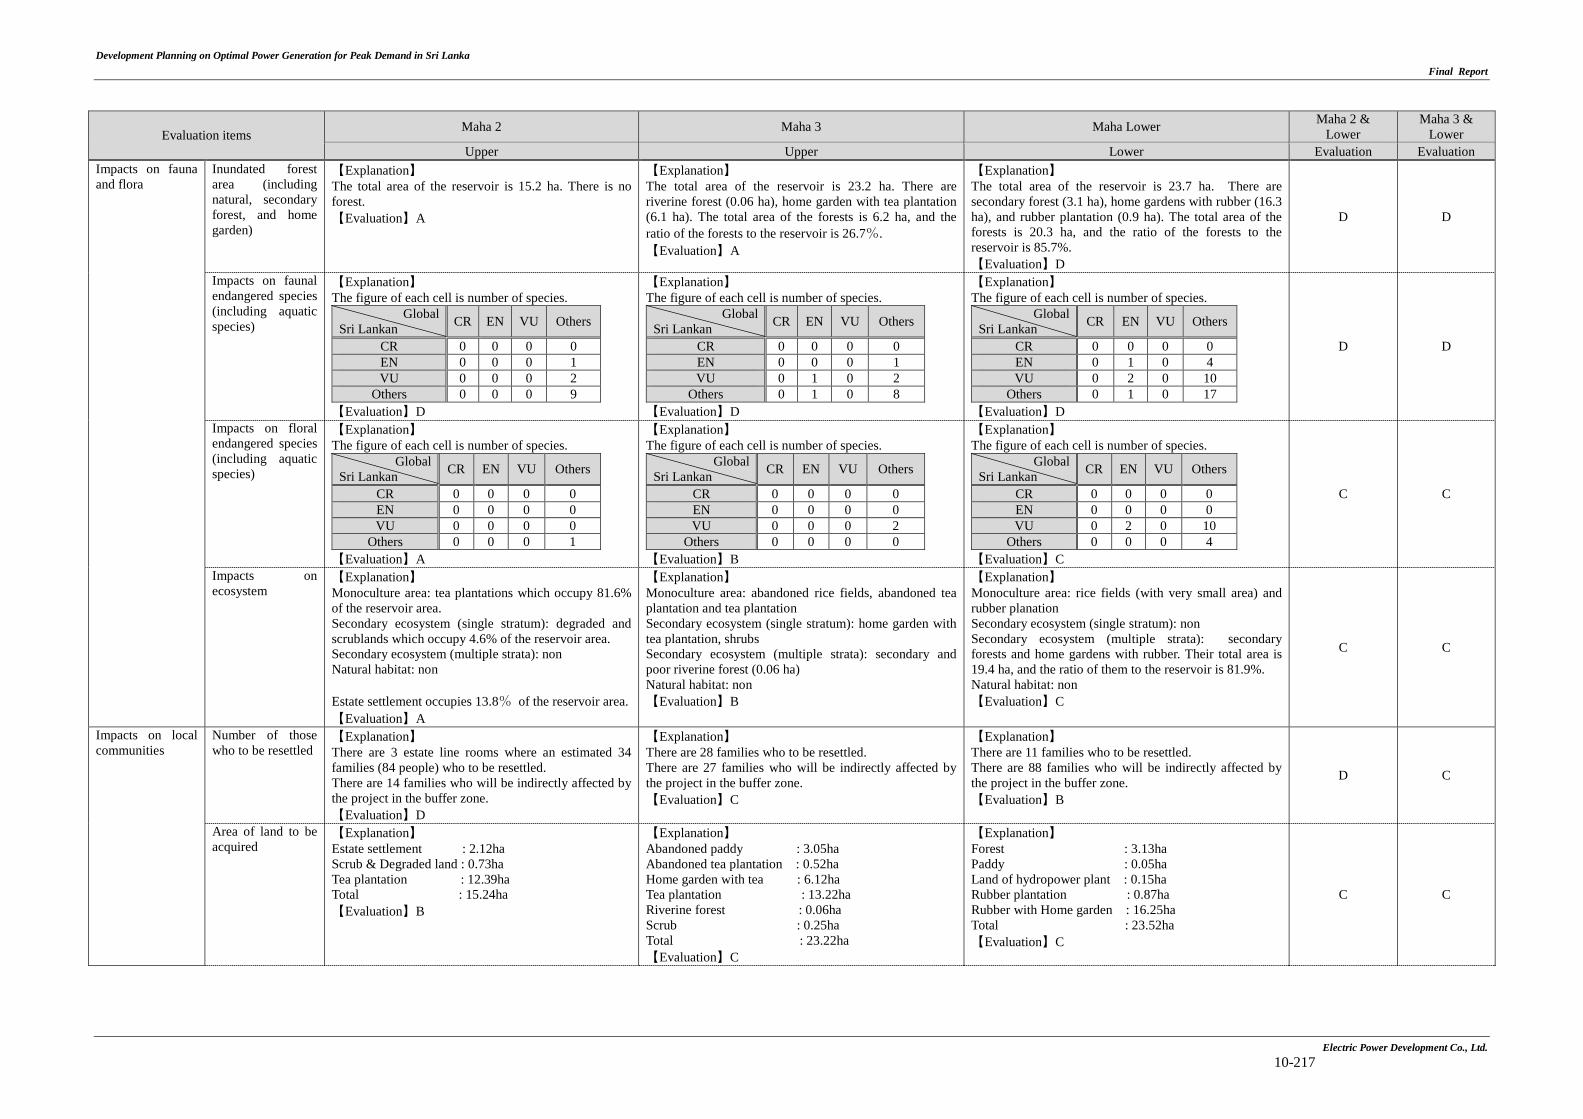
Evaluation items Maha 2 Maha 3 Maha Lower Maha 2 & Lower
Maha 3 & Lower
Upper Upper Lower Evaluation Evaluation Impacts on fauna and flora
Inundated forest area (including natural, secondary forest, and home garden)
【Explanation】 The total area of the reservoir is 15.2 ha. There is no forest. 【Evaluation】A
【Explanation】 The total area of the reservoir is 23.2 ha. There are riverine forest (0.06 ha), home garden with tea plantation (6.1 ha). The total area of the forests is 6.2 ha, and the ratio of the forests to the reservoir is 26.7%. 【Evaluation】A
【Explanation】 The total area of the reservoir is 23.7 ha. There are secondary forest (3.1 ha), home gardens with rubber (16.3 ha), and rubber plantation (0.9 ha). The total area of the forests is 20.3 ha, and the ratio of the forests to the reservoir is 85.7%. 【Evaluation】D
D D
Impacts on faunal endangered species (including aquatic species)
【Explanation】 The figure of each cell is number of species.
Global Sri Lankan CR EN VU Others
CR 0 0 0 0 EN 0 0 0 1 VU 0 0 0 2
Others 0 0 0 9 【Evaluation】D
【Explanation】 The figure of each cell is number of species.
Global Sri Lankan CR EN VU Others
CR 0 0 0 0 EN 0 0 0 1 VU 0 1 0 2
Others 0 1 0 8 【Evaluation】D
【Explanation】 The figure of each cell is number of species.
Global Sri Lankan CR EN VU Others
CR 0 0 0 0 EN 0 1 0 4 VU 0 2 0 10
Others 0 1 0 17 【Evaluation】D
D D
Impacts on floral endangered species (including aquatic species)
【Explanation】 The figure of each cell is number of species.
Global Sri Lankan CR EN VU Others
CR 0 0 0 0 EN 0 0 0 0 VU 0 0 0 0
Others 0 0 0 1 【Evaluation】A
【Explanation】 The figure of each cell is number of species.
Global Sri Lankan CR EN VU Others
CR 0 0 0 0 EN 0 0 0 0 VU 0 0 0 2
Others 0 0 0 0 【Evaluation】B
【Explanation】 The figure of each cell is number of species.
Global Sri Lankan CR EN VU Others
CR 0 0 0 0 EN 0 0 0 0 VU 0 2 0 10
Others 0 0 0 4 【Evaluation】C
C C
Impacts on ecosystem
【Explanation】 Monoculture area: tea plantations which occupy 81.6% of the reservoir area. Secondary ecosystem (single stratum): degraded and scrublands which occupy 4.6% of the reservoir area. Secondary ecosystem (multiple strata): non Natural habitat: non Estate settlement occupies 13.8% of the reservoir area. 【Evaluation】A
【Explanation】 Monoculture area: abandoned rice fields, abandoned tea plantation and tea plantation Secondary ecosystem (single stratum): home garden with tea plantation, shrubs Secondary ecosystem (multiple strata): secondary and poor riverine forest (0.06 ha) Natural habitat: non 【Evaluation】B
【Explanation】 Monoculture area: rice fields (with very small area) and rubber planation Secondary ecosystem (single stratum): non Secondary ecosystem (multiple strata): secondary forests and home gardens with rubber. Their total area is 19.4 ha, and the ratio of them to the reservoir is 81.9%. Natural habitat: non 【Evaluation】C
C C
Impacts on local communities
Number of those who to be resettled
【Explanation】 There are 3 estate line rooms where an estimated 34 families (84 people) who to be resettled. There are 14 families who will be indirectly affected by the project in the buffer zone. 【Evaluation】D
【Explanation】 There are 28 families who to be resettled. There are 27 families who will be indirectly affected by the project in the buffer zone. 【Evaluation】C
【Explanation】 There are 11 families who to be resettled. There are 88 families who will be indirectly affected by the project in the buffer zone. 【Evaluation】B
D C
Area of land to be acquired
【Explanation】 Estate settlement : 2.12ha Scrub & Degraded land : 0.73ha Tea plantation : 12.39ha Total : 15.24ha 【Evaluation】B
【Explanation】 Abandoned paddy : 3.05ha Abandoned tea plantation : 0.52ha Home garden with tea : 6.12ha Tea plantation : 13.22ha Riverine forest : 0.06ha Scrub : 0.25ha Total : 23.22ha 【Evaluation】C
【Explanation】 Forest : 3.13ha Paddy : 0.05ha Land of hydropower plant : 0.15ha Rubber plantation : 0.87ha Rubber with Home garden : 16.25ha Total : 23.52ha 【Evaluation】C
C C
Electric Power Development Co., Ltd. 10-217
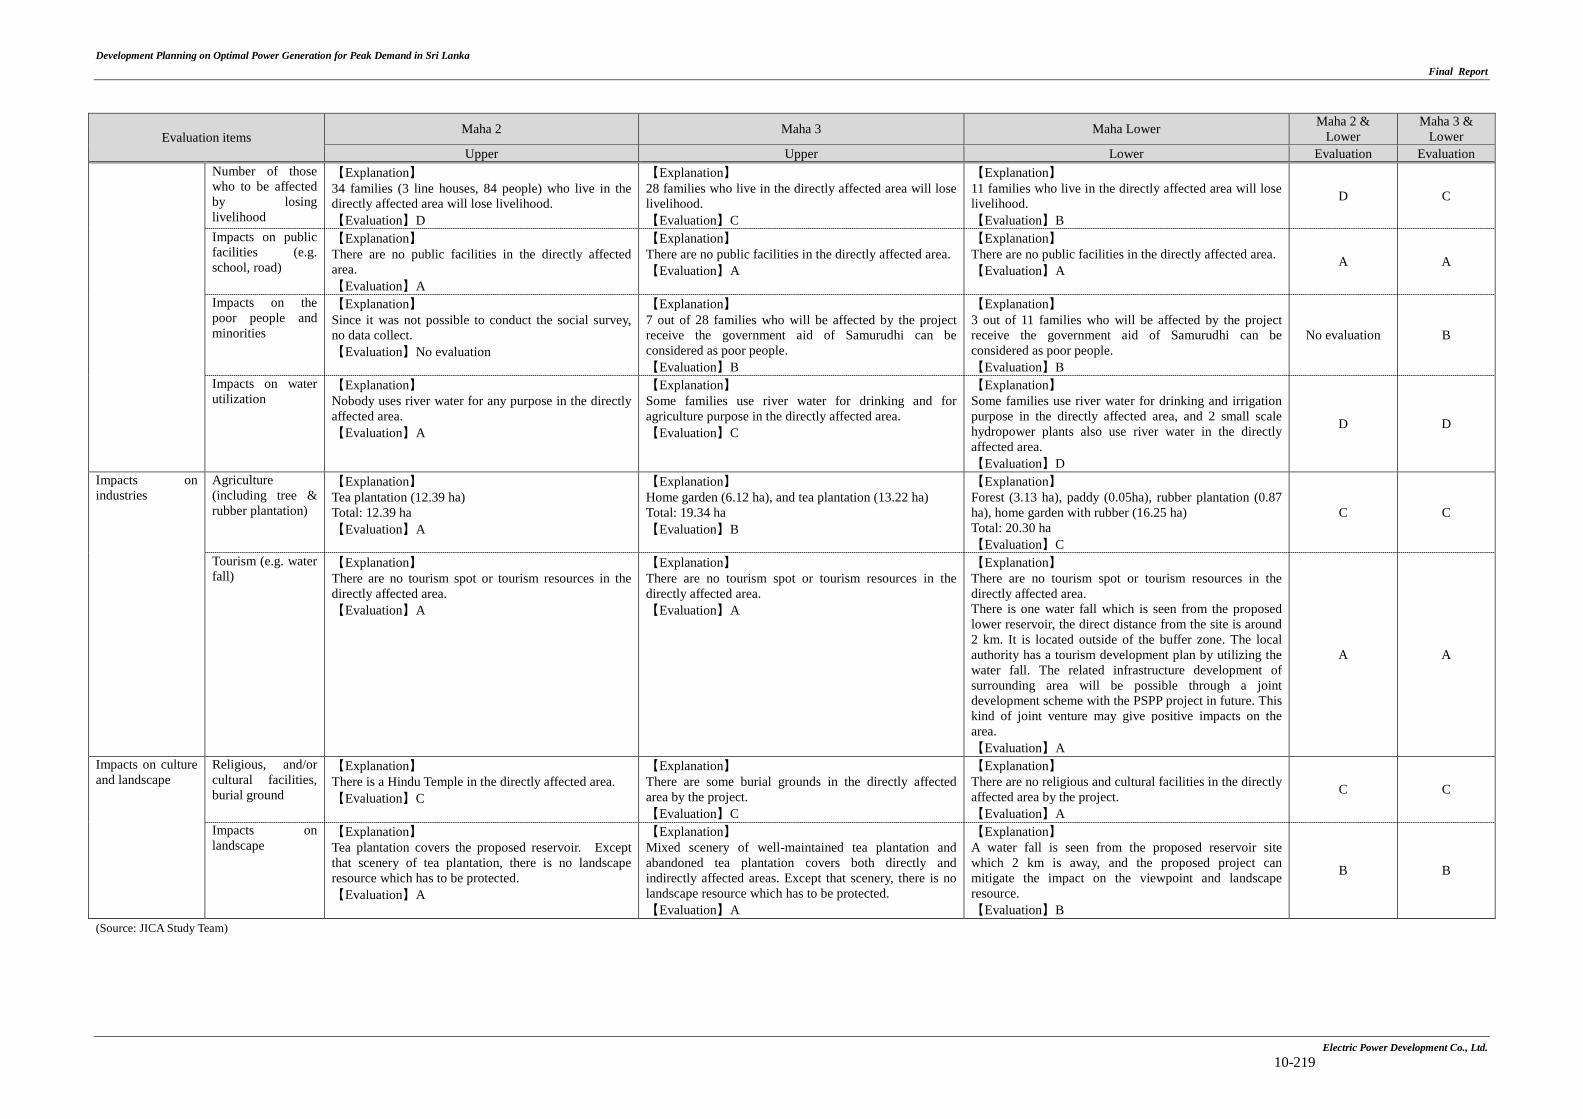
Development Planning on Optimal Power Generation for Peak Demand in Sri Lanka Final Report
Evaluation items Maha 2 Maha 3 Maha Lower Maha 2 & Lower
Maha 3 & Lower
Upper Upper Lower Evaluation Evaluation Number of those
who to be affected by losing livelihood
【Explanation】 34 families (3 line houses, 84 people) who live in the directly affected area will lose livelihood. 【Evaluation】D
【Explanation】 28 families who live in the directly affected area will lose livelihood. 【Evaluation】C
【Explanation】 11 families who live in the directly affected area will lose livelihood. 【Evaluation】B
D C
Impacts on public facilities (e.g. school, road)
【Explanation】 There are no public facilities in the directly affected area. 【Evaluation】A
【Explanation】 There are no public facilities in the directly affected area. 【Evaluation】A
【Explanation】 There are no public facilities in the directly affected area. 【Evaluation】A
A A
Impacts on the poor people and minorities
【Explanation】 Since it was not possible to conduct the social survey, no data collect. 【Evaluation】No evaluation
【Explanation】 7 out of 28 families who will be affected by the project receive the government aid of Samurudhi can be considered as poor people. 【Evaluation】B
【Explanation】 3 out of 11 families who will be affected by the project receive the government aid of Samurudhi can be considered as poor people. 【Evaluation】B
No evaluation B
Impacts on water utilization
【Explanation】 Nobody uses river water for any purpose in the directly affected area. 【Evaluation】A
【Explanation】 Some families use river water for drinking and for agriculture purpose in the directly affected area. 【Evaluation】C
【Explanation】 Some families use river water for drinking and irrigation purpose in the directly affected area, and 2 small scale hydropower plants also use river water in the directly affected area. 【Evaluation】D
D D
Impacts on industries
Agriculture (including tree & rubber plantation)
【Explanation】 Tea plantation (12.39 ha) Total: 12.39 ha 【Evaluation】A
【Explanation】 Home garden (6.12 ha), and tea plantation (13.22 ha) Total: 19.34 ha 【Evaluation】B
【Explanation】 Forest (3.13 ha), paddy (0.05ha), rubber plantation (0.87 ha), home garden with rubber (16.25 ha) Total: 20.30 ha 【Evaluation】C
C C
Tourism (e.g. water fall)
【Explanation】 There are no tourism spot or tourism resources in the directly affected area. 【Evaluation】A
【Explanation】 There are no tourism spot or tourism resources in the directly affected area. 【Evaluation】A
【Explanation】 There are no tourism spot or tourism resources in the directly affected area. There is one water fall which is seen from the proposed lower reservoir, the direct distance from the site is around 2 km. It is located outside of the buffer zone. The local authority has a tourism development plan by utilizing the water fall. The related infrastructure development of surrounding area will be possible through a joint development scheme with the PSPP project in future. This kind of joint venture may give positive impacts on the area. 【Evaluation】A
A A
Impacts on culture and landscape
Religious, and/or cultural facilities, burial ground
【Explanation】 There is a Hindu Temple in the directly affected area. 【Evaluation】C
【Explanation】 There are some burial grounds in the directly affected area by the project. 【Evaluation】C
【Explanation】 There are no religious and cultural facilities in the directly affected area by the project. 【Evaluation】A
C C
Impacts on landscape
【Explanation】 Tea plantation covers the proposed reservoir. Except that scenery of tea plantation, there is no landscape resource which has to be protected. 【Evaluation】A
【Explanation】 Mixed scenery of well-maintained tea plantation and abandoned tea plantation covers both directly and indirectly affected areas. Except that scenery, there is no landscape resource which has to be protected. 【Evaluation】A
【Explanation】 A water fall is seen from the proposed reservoir site which 2 km is away, and the proposed project can mitigate the impact on the viewpoint and landscape resource. 【Evaluation】B
B B
(Source: JICA Study Team)
Electric Power Development Co., Ltd. 10-219
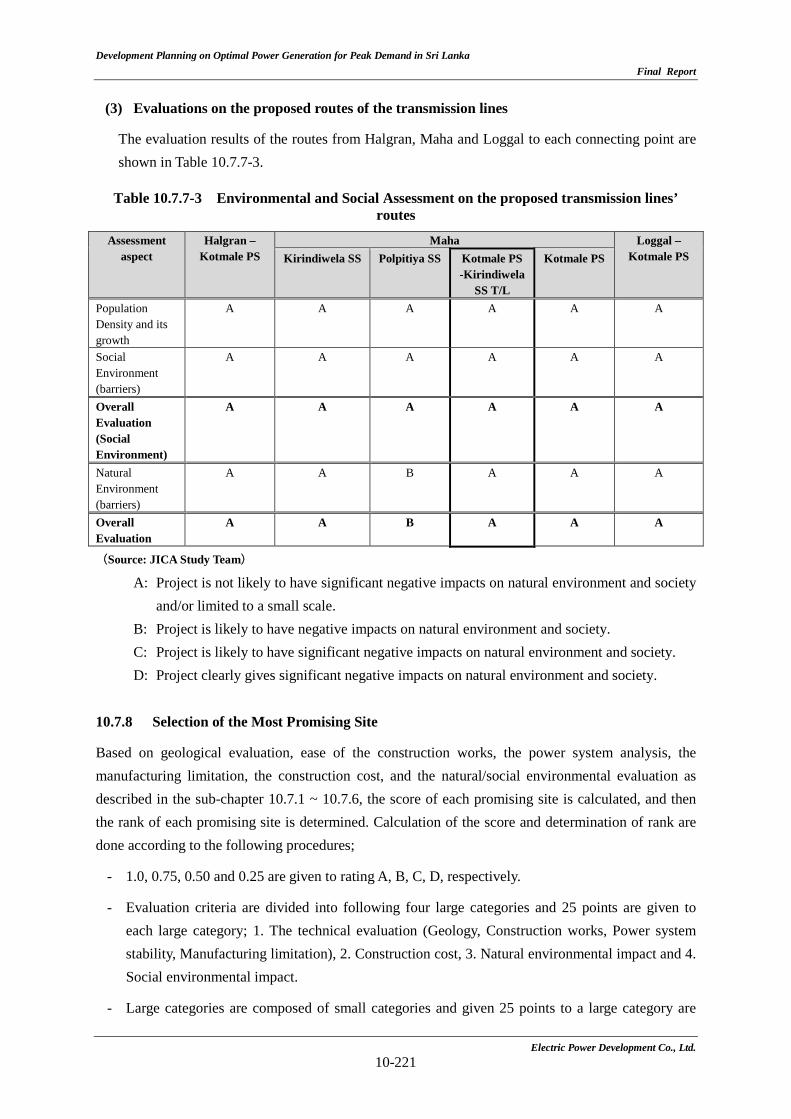
Development Planning on Optimal Power Generation for Peak Demand in Sri Lanka Final Report
(3) Evaluations on the proposed routes of the transmission lines
The evaluation results of the routes from Halgran, Maha and Loggal to each connecting point are shown in Table 10.7.7-3.
Table 10.7.7-3 Environmental and Social Assessment on the proposed transmission lines’ routes
Assessment aspect
Halgran – Kotmale PS
Maha Loggal – Kotmale PS Kirindiwela SS Polpitiya SS Kotmale PS
-Kirindiwela SS T/L
Kotmale PS
Population Density and its growth
A A A A A A
Social Environment (barriers)
A A A A A A
Overall Evaluation (Social Environment)
A A A A A A
Natural Environment (barriers)
A A B A A A
Overall Evaluation
A A B A A A
(Source: JICA Study Team)
A: Project is not likely to have significant negative impacts on natural environment and society and/or limited to a small scale.
B: Project is likely to have negative impacts on natural environment and society. C: Project is likely to have significant negative impacts on natural environment and society. D: Project clearly gives significant negative impacts on natural environment and society.
10.7.8 Selection of the Most Promising Site
Based on geological evaluation, ease of the construction works, the power system analysis, the manufacturing limitation, the construction cost, and the natural/social environmental evaluation as described in the sub-chapter 10.7.1 ~ 10.7.6, the score of each promising site is calculated, and then the rank of each promising site is determined. Calculation of the score and determination of rank are done according to the following procedures;
- 1.0, 0.75, 0.50 and 0.25 are given to rating A, B, C, D, respectively.
- Evaluation criteria are divided into following four large categories and 25 points are given to each large category; 1. The technical evaluation (Geology, Construction works, Power system stability, Manufacturing limitation), 2. Construction cost, 3. Natural environmental impact and 4. Social environmental impact.
- Large categories are composed of small categories and given 25 points to a large category are
Electric Power Development Co., Ltd. 10-221
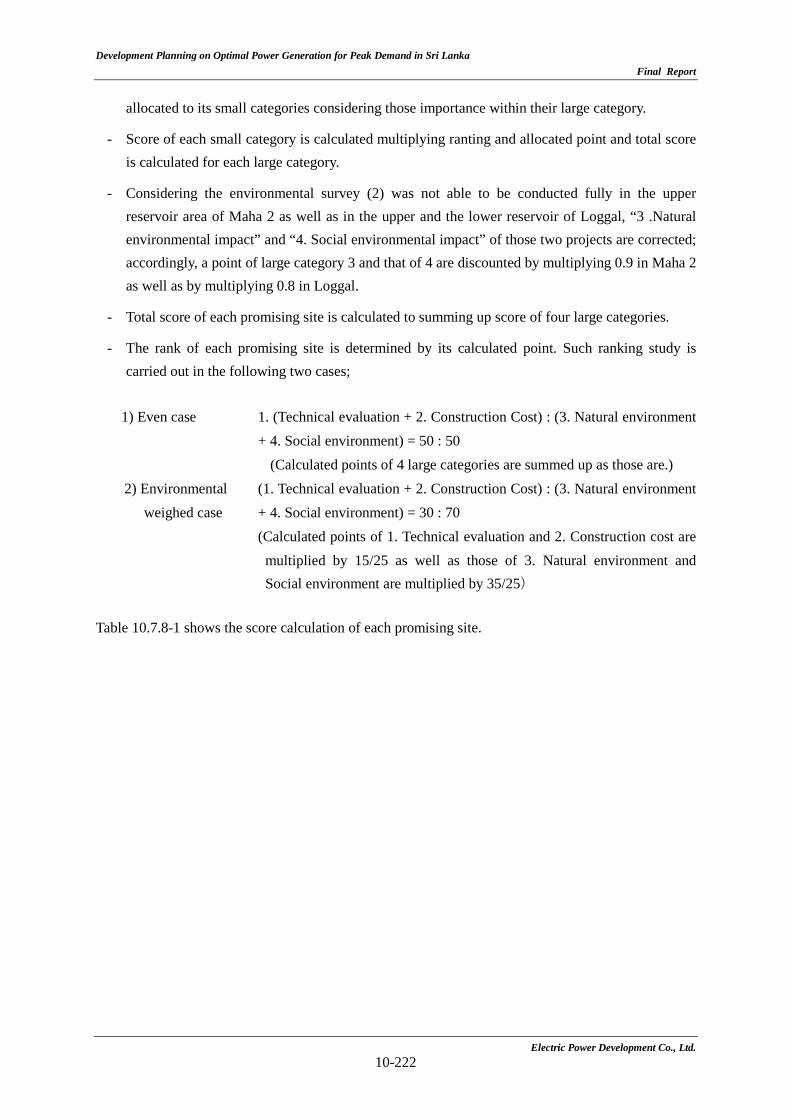
Development Planning on Optimal Power Generation for Peak Demand in Sri Lanka Final Report
allocated to its small categories considering those importance within their large category.
- Score of each small category is calculated multiplying ranting and allocated point and total score is calculated for each large category.
- Considering the environmental survey (2) was not able to be conducted fully in the upper reservoir area of Maha 2 as well as in the upper and the lower reservoir of Loggal, “3 .Natural environmental impact” and “4. Social environmental impact” of those two projects are corrected; accordingly, a point of large category 3 and that of 4 are discounted by multiplying 0.9 in Maha 2 as well as by multiplying 0.8 in Loggal.
- Total score of each promising site is calculated to summing up score of four large categories.
- The rank of each promising site is determined by its calculated point. Such ranking study is carried out in the following two cases;
1) Even case 1. (Technical evaluation + 2. Construction Cost) : (3. Natural environment
+ 4. Social environment) = 50 : 50 (Calculated points of 4 large categories are summed up as those are.)
2) Environmental weighed case
(1. Technical evaluation + 2. Construction Cost) : (3. Natural environment + 4. Social environment) = 30 : 70 (Calculated points of 1. Technical evaluation and 2. Construction cost are
multiplied by 15/25 as well as those of 3. Natural environment and Social environment are multiplied by 35/25)
Table 10.7.8-1 shows the score calculation of each promising site.
Electric Power Development Co., Ltd. 10-222
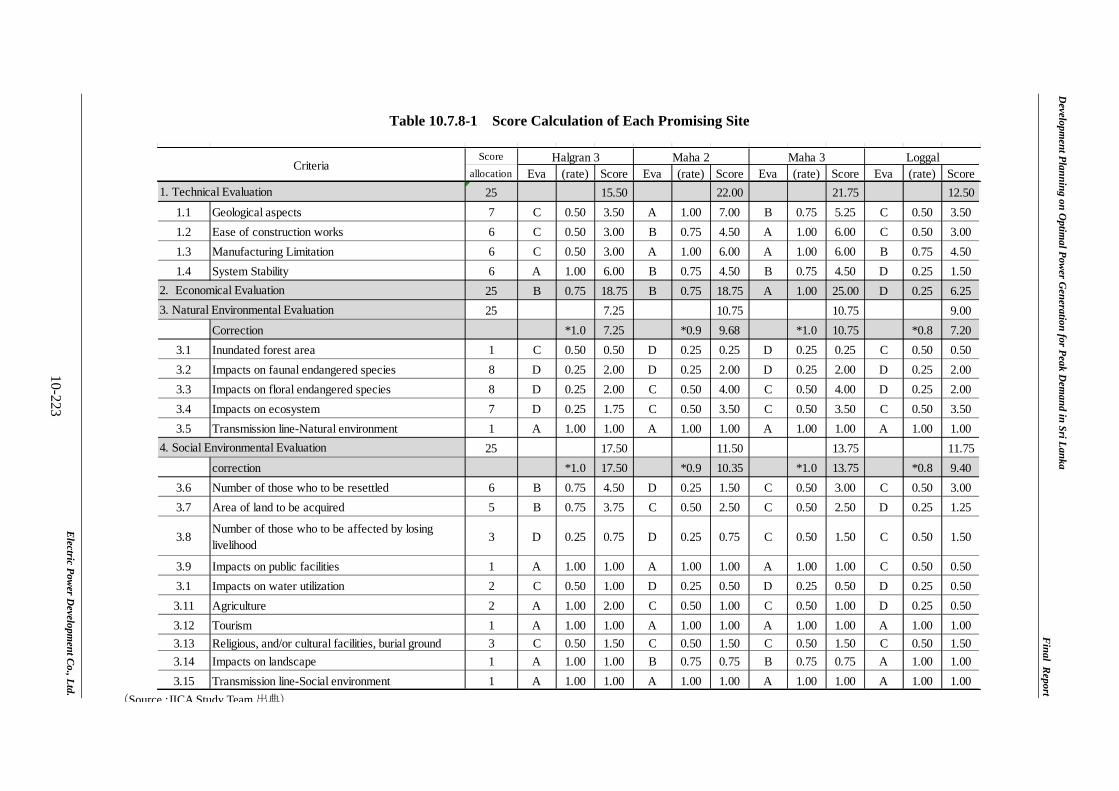
Developm
ent P
lann
ing on
Optim
al Pow
er Gen
eration for P
eak Dem
and in
Sri L
anka
Fin
al Report
Electric P
ower D
evelopmen
t Co., L
td.
10-223
Table 10.7.8-1 Score Calculation of Each Promising Site
(Source :JICA Study Team 出典)
Scoreallocation Eva (rate) Score Eva (rate) Score Eva (rate) Score Eva (rate) Score
25 15.50 22.00 21.75 12.501.1 Geological aspects 7 C 0.50 3.50 A 1.00 7.00 B 0.75 5.25 C 0.50 3.501.2 Ease of construction works 6 C 0.50 3.00 B 0.75 4.50 A 1.00 6.00 C 0.50 3.001.3 Manufacturing Limitation 6 C 0.50 3.00 A 1.00 6.00 A 1.00 6.00 B 0.75 4.501.4 System Stability 6 A 1.00 6.00 B 0.75 4.50 B 0.75 4.50 D 0.25 1.50
25 B 0.75 18.75 B 0.75 18.75 A 1.00 25.00 D 0.25 6.2525 7.25 10.75 10.75 9.00
Correction *1.0 7.25 *0.9 9.68 *1.0 10.75 *0.8 7.203.1 Inundated forest area 1 C 0.50 0.50 D 0.25 0.25 D 0.25 0.25 C 0.50 0.503.2 Impacts on faunal endangered species 8 D 0.25 2.00 D 0.25 2.00 D 0.25 2.00 D 0.25 2.003.3 Impacts on floral endangered species 8 D 0.25 2.00 C 0.50 4.00 C 0.50 4.00 D 0.25 2.003.4 Impacts on ecosystem 7 D 0.25 1.75 C 0.50 3.50 C 0.50 3.50 C 0.50 3.503.5 Transmission line-Natural environment 1 A 1.00 1.00 A 1.00 1.00 A 1.00 1.00 A 1.00 1.00
25 17.50 11.50 13.75 11.75correction *1.0 17.50 *0.9 10.35 *1.0 13.75 *0.8 9.40
3.6 Number of those who to be resettled 6 B 0.75 4.50 D 0.25 1.50 C 0.50 3.00 C 0.50 3.003.7 Area of land to be acquired 5 B 0.75 3.75 C 0.50 2.50 C 0.50 2.50 D 0.25 1.25
3.8Number of those who to be affected by losinglivelihood
3 D 0.25 0.75 D 0.25 0.75 C 0.50 1.50 C 0.50 1.50
3.9 Impacts on public facilities 1 A 1.00 1.00 A 1.00 1.00 A 1.00 1.00 C 0.50 0.503.1 Impacts on water utilization 2 C 0.50 1.00 D 0.25 0.50 D 0.25 0.50 D 0.25 0.503.11 Agriculture 2 A 1.00 2.00 C 0.50 1.00 C 0.50 1.00 D 0.25 0.503.12 Tourism 1 A 1.00 1.00 A 1.00 1.00 A 1.00 1.00 A 1.00 1.003.13 Religious, and/or cultural facilities, burial ground 3 C 0.50 1.50 C 0.50 1.50 C 0.50 1.50 C 0.50 1.503.14 Impacts on landscape 1 A 1.00 1.00 B 0.75 0.75 B 0.75 0.75 A 1.00 1.003.15 Transmission line-Social environment 1 A 1.00 1.00 A 1.00 1.00 A 1.00 1.00 A 1.00 1.00
Maha 2 Maha 3 Loggal
1. Technical Evaluation
2. Economical Evaluation3. Natural Environmental Evaluation
4. Social Environmental Evaluation
CriteriaHalgran 3
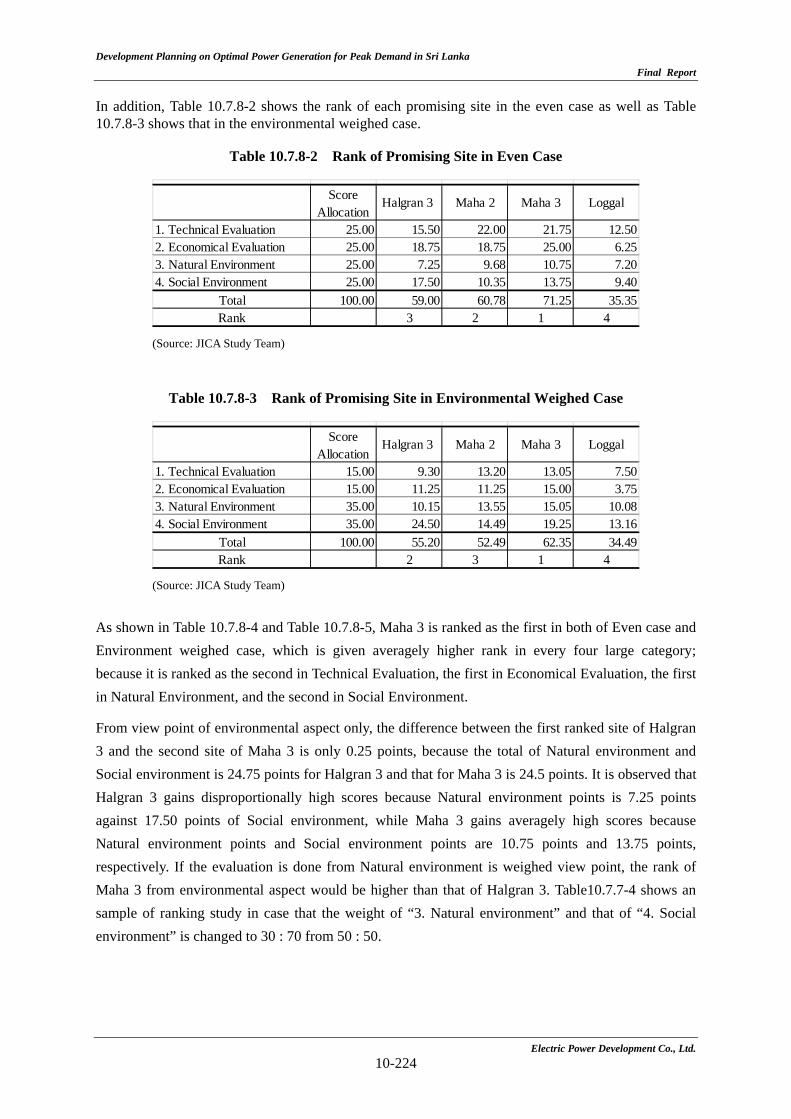
Development Planning on Optimal Power Generation for Peak Demand in Sri Lanka
Final Report
Electric Power Development Co., Ltd.
10-224
In addition, Table 10.7.8-2 shows the rank of each promising site in the even case as well as Table 10.7.8-3 shows that in the environmental weighed case.
Table 10.7.8-2 Rank of Promising Site in Even Case
(Source: JICA Study Team)
Table 10.7.8-3 Rank of Promising Site in Environmental Weighed Case
(Source: JICA Study Team)
As shown in Table 10.7.8-4 and Table 10.7.8-5, Maha 3 is ranked as the first in both of Even case and Environment weighed case, which is given averagely higher rank in every four large category; because it is ranked as the second in Technical Evaluation, the first in Economical Evaluation, the first in Natural Environment, and the second in Social Environment.
From view point of environmental aspect only, the difference between the first ranked site of Halgran 3 and the second site of Maha 3 is only 0.25 points, because the total of Natural environment and Social environment is 24.75 points for Halgran 3 and that for Maha 3 is 24.5 points. It is observed that Halgran 3 gains disproportionally high scores because Natural environment points is 7.25 points against 17.50 points of Social environment, while Maha 3 gains averagely high scores because Natural environment points and Social environment points are 10.75 points and 13.75 points, respectively. If the evaluation is done from Natural environment is weighed view point, the rank of Maha 3 from environmental aspect would be higher than that of Halgran 3. Table10.7.7-4 shows an sample of ranking study in case that the weight of “3. Natural environment” and that of “4. Social environment” is changed to 30 : 70 from 50 : 50.
1. Technical Evaluation 25.00 15.50 22.00 21.75 12.502. Economical Evaluation 25.00 18.75 18.75 25.00 6.253. Natural Environment 25.00 7.25 9.68 10.75 7.204. Social Environment 25.00 17.50 10.35 13.75 9.40
Total 100.00 59.00 60.78 71.25 35.35Rank 3 2 1 4
Halgran 3 Maha 2 Maha 3 LoggalScoreAllocation
1. Technical Evaluation 15.00 9.30 13.20 13.05 7.502. Economical Evaluation 15.00 11.25 11.25 15.00 3.753. Natural Environment 35.00 10.15 13.55 15.05 10.084. Social Environment 35.00 24.50 14.49 19.25 13.16
Total 100.00 55.20 52.49 62.35 34.49Rank 2 3 1 4
Halgran 3 Maha 2 Maha 3 LoggalScoreAllocation
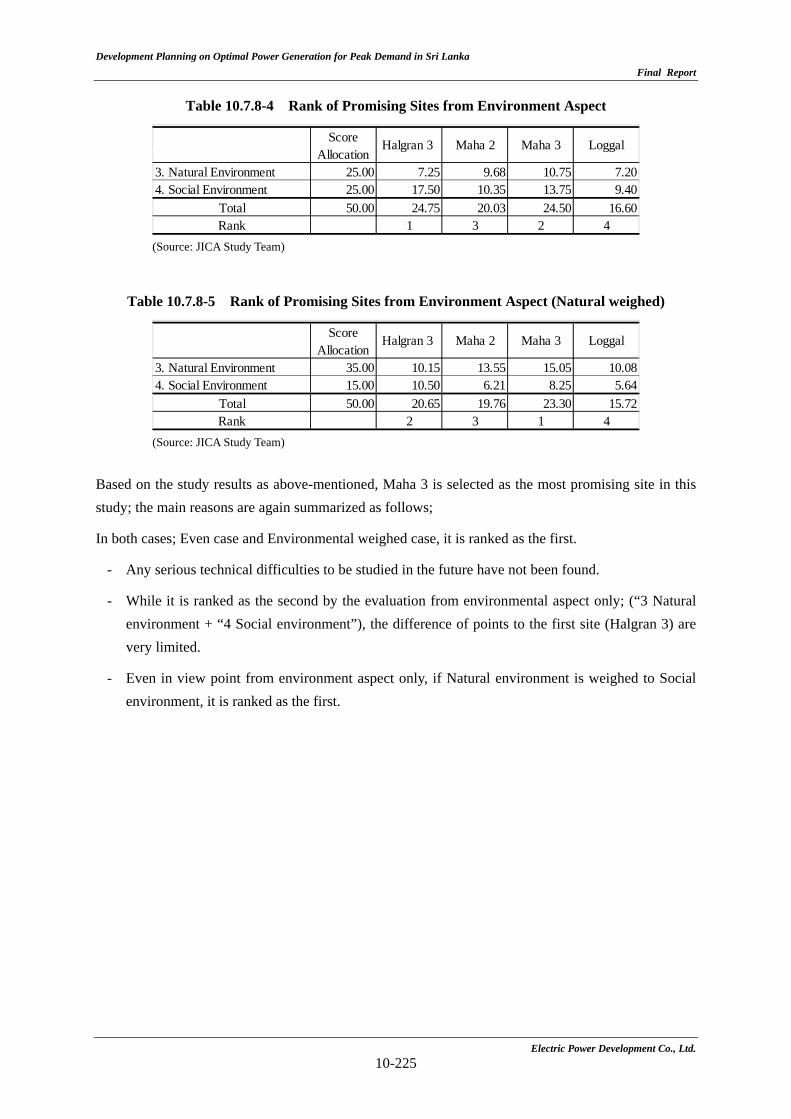
Development Planning on Optimal Power Generation for Peak Demand in Sri Lanka
Final Report
Electric Power Development Co., Ltd.
10-225
Table 10.7.8-4 Rank of Promising Sites from Environment Aspect
(Source: JICA Study Team)
Table 10.7.8-5 Rank of Promising Sites from Environment Aspect (Natural weighed)
(Source: JICA Study Team)
Based on the study results as above-mentioned, Maha 3 is selected as the most promising site in this study; the main reasons are again summarized as follows;
In both cases; Even case and Environmental weighed case, it is ranked as the first.
- Any serious technical difficulties to be studied in the future have not been found.
- While it is ranked as the second by the evaluation from environmental aspect only; (“3 Natural environment + “4 Social environment”), the difference of points to the first site (Halgran 3) are very limited.
- Even in view point from environment aspect only, if Natural environment is weighed to Social environment, it is ranked as the first.
3. Natural Environment 25.00 7.25 9.68 10.75 7.204. Social Environment 25.00 17.50 10.35 13.75 9.40
Total 50.00 24.75 20.03 24.50 16.60Rank 1 3 2 4
ScoreAllocation
Halgran 3 Maha 2 Maha 3 Loggal
3. Natural Environment 35.00 10.15 13.55 15.05 10.084. Social Environment 15.00 10.50 6.21 8.25 5.64
Total 50.00 20.65 19.76 23.30 15.72Rank 2 3 1 4
ScoreAllocation
Halgran 3 Maha 2 Maha 3 Loggal

Chapter 11
Economic and Financial Evaluation
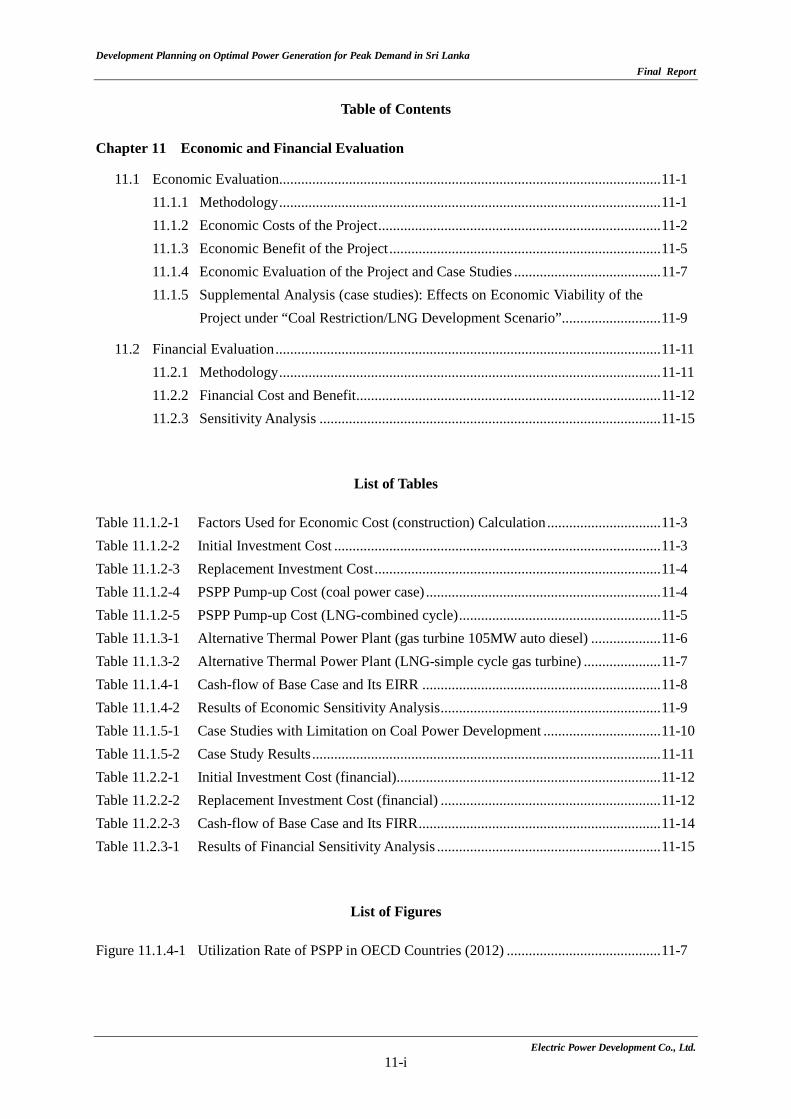
Development Planning on Optimal Power Generation for Peak Demand in Sri Lanka Final Report
Table of Contents
Chapter 11 Economic and Financial Evaluation
11.1 Economic Evaluation ........................................................................................................ 11-1 11.1.1 Methodology ........................................................................................................ 11-1 11.1.2 Economic Costs of the Project ............................................................................. 11-2 11.1.3 Economic Benefit of the Project .......................................................................... 11-5 11.1.4 Economic Evaluation of the Project and Case Studies ........................................ 11-7 11.1.5 Supplemental Analysis (case studies): Effects on Economic Viability of the
Project under “Coal Restriction/LNG Development Scenario” ........................... 11-9
11.2 Financial Evaluation ......................................................................................................... 11-11 11.2.1 Methodology ........................................................................................................ 11-11 11.2.2 Financial Cost and Benefit ................................................................................... 11-12 11.2.3 Sensitivity Analysis ............................................................................................. 11-15
List of Tables
Table 11.1.2-1 Factors Used for Economic Cost (construction) Calculation ............................... 11-3 Table 11.1.2-2 Initial Investment Cost ......................................................................................... 11-3 Table 11.1.2-3 Replacement Investment Cost .............................................................................. 11-4 Table 11.1.2-4 PSPP Pump-up Cost (coal power case) ................................................................ 11-4 Table 11.1.2-5 PSPP Pump-up Cost (LNG-combined cycle) ....................................................... 11-5 Table 11.1.3-1 Alternative Thermal Power Plant (gas turbine 105MW auto diesel) ................... 11-6 Table 11.1.3-2 Alternative Thermal Power Plant (LNG-simple cycle gas turbine) ..................... 11-7 Table 11.1.4-1 Cash-flow of Base Case and Its EIRR ................................................................. 11-8 Table 11.1.4-2 Results of Economic Sensitivity Analysis ............................................................ 11-9 Table 11.1.5-1 Case Studies with Limitation on Coal Power Development ................................ 11-10 Table 11.1.5-2 Case Study Results ............................................................................................... 11-11 Table 11.2.2-1 Initial Investment Cost (financial) ........................................................................ 11-12 Table 11.2.2-2 Replacement Investment Cost (financial) ............................................................ 11-12 Table 11.2.2-3 Cash-flow of Base Case and Its FIRR .................................................................. 11-14 Table 11.2.3-1 Results of Financial Sensitivity Analysis ............................................................. 11-15
List of Figures
Figure 11.1.4-1 Utilization Rate of PSPP in OECD Countries (2012) .......................................... 11-7
Electric Power Development Co., Ltd. 11-i
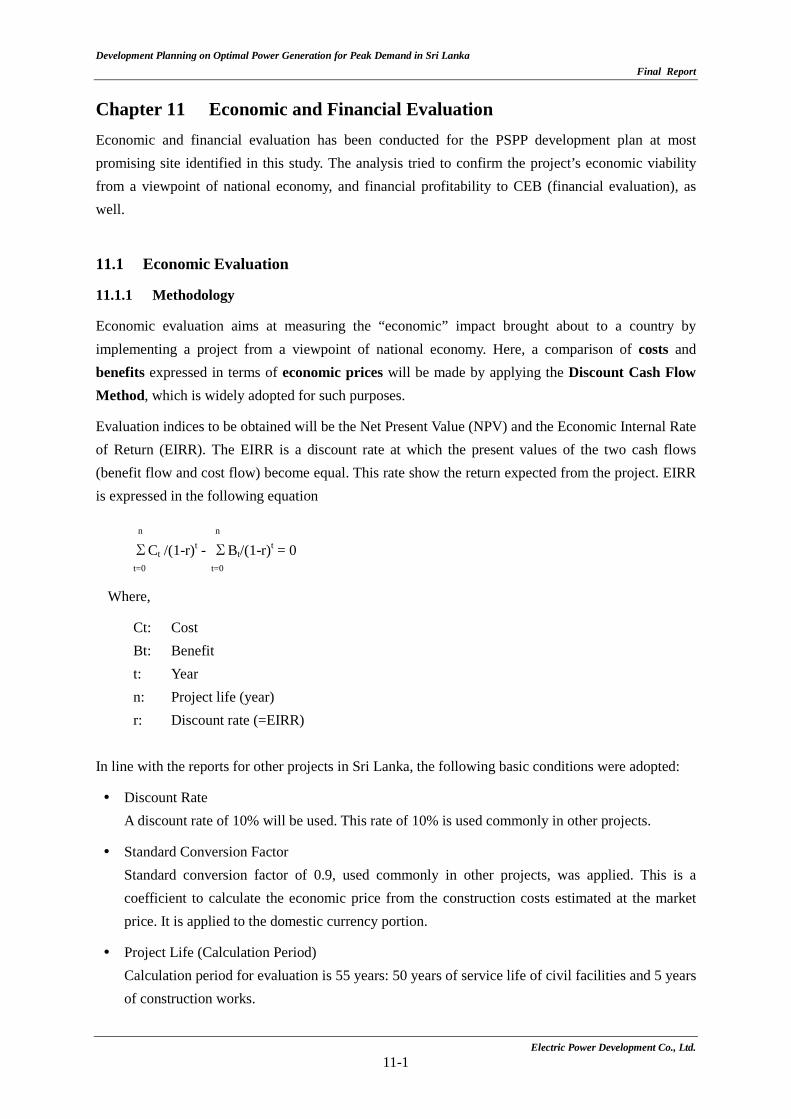
Development Planning on Optimal Power Generation for Peak Demand in Sri Lanka Final Report
Chapter 11 Economic and Financial Evaluation Economic and financial evaluation has been conducted for the PSPP development plan at most promising site identified in this study. The analysis tried to confirm the project’s economic viability from a viewpoint of national economy, and financial profitability to CEB (financial evaluation), as well.
11.1 Economic Evaluation
11.1.1 Methodology
Economic evaluation aims at measuring the “economic” impact brought about to a country by implementing a project from a viewpoint of national economy. Here, a comparison of costs and benefits expressed in terms of economic prices will be made by applying the Discount Cash Flow Method, which is widely adopted for such purposes.
Evaluation indices to be obtained will be the Net Present Value (NPV) and the Economic Internal Rate of Return (EIRR). The EIRR is a discount rate at which the present values of the two cash flows (benefit flow and cost flow) become equal. This rate show the return expected from the project. EIRR is expressed in the following equation
n n ΣCt /(1-r)t - ΣBt/(1-r)t = 0 t=0 t=0
Where,
Ct: Cost Bt: Benefit t: Year n: Project life (year) r: Discount rate (=EIRR)
In line with the reports for other projects in Sri Lanka, the following basic conditions were adopted:
Discount Rate A discount rate of 10% will be used. This rate of 10% is used commonly in other projects.
Standard Conversion Factor Standard conversion factor of 0.9, used commonly in other projects, was applied. This is a coefficient to calculate the economic price from the construction costs estimated at the market price. It is applied to the domestic currency portion.
Project Life (Calculation Period) Calculation period for evaluation is 55 years: 50 years of service life of civil facilities and 5 years of construction works.
Electric Power Development Co., Ltd. 11-1
Development Planning on Optimal Power Generation for Peak Demand in Sri Lanka Final Report
Economic Life
Economic life of each facility, according to the experience of the Consultant, was determined as follows:
- 50 years for civil works
- 35 years for hydro-mechanical and electro-mechanical equipment
Cost Estimate Estimation of cost was based on the price level of May 2014.
Price Escalation No escalation was considered, therefore, a constant price will be used.
Tax Taxes and duties, including VAT, were excluded from the economic analysis, being a transfer item
11.1.2 Economic Costs of the Project
The economic costs (initial construction and replacement) of the Project were calculated from the market price as presented in Chapter 10. The method of economic pricing is (1) Exclusion of transfer items such as tax (import tax, value added tax) and subsidies; and (2) Conversion of market prices applying standard conversion factor of 0.9 for local currency. Construction costs for initial investment and replacement is summarized in Table 11.1.2-1.
Electric Power Development Co., Ltd. 11-2
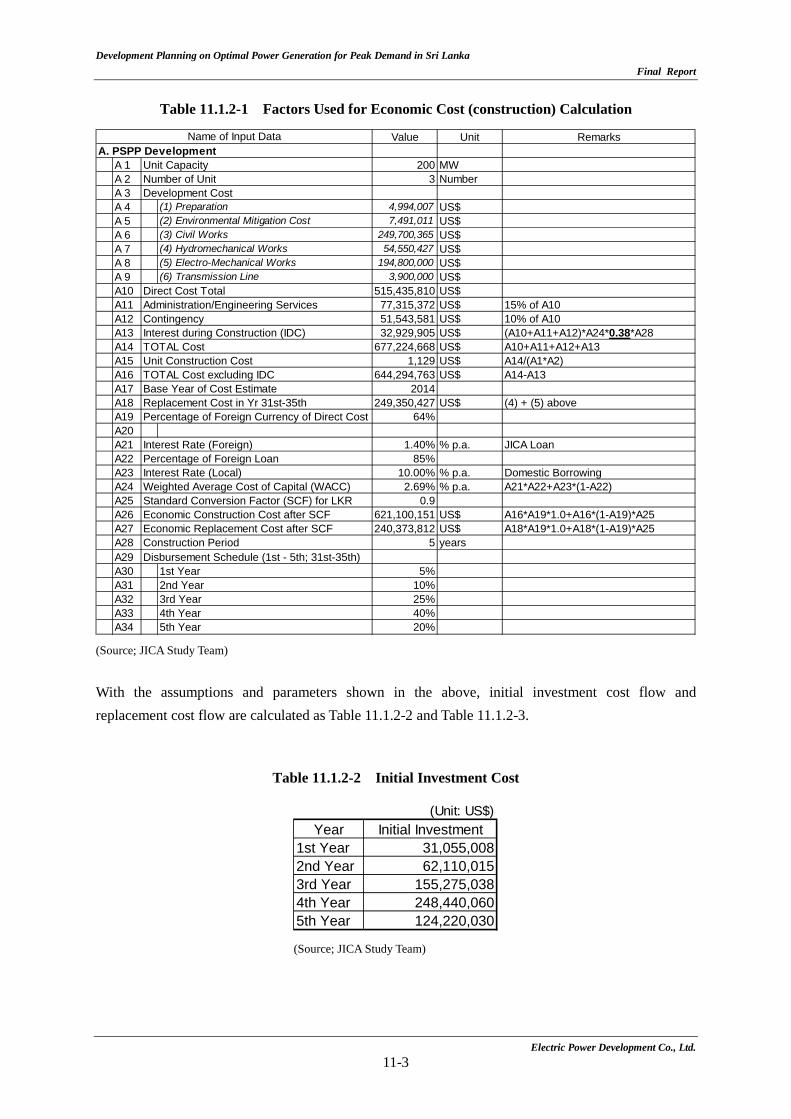
Development Planning on Optimal Power Generation for Peak Demand in Sri Lanka Final Report
Table 11.1.2-1 Factors Used for Economic Cost (construction) Calculation
(Source; JICA Study Team) With the assumptions and parameters shown in the above, initial investment cost flow and replacement cost flow are calculated as Table 11.1.2-2 and Table 11.1.2-3.
Table 11.1.2-2 Initial Investment Cost
(Source; JICA Study Team)
Value Unit RemarksA. PSPP Development
A 1 Unit Capacity 200 MWA 2 Number of Unit 3 NumberA 3 Development CostA 4 (1) Preparation 4,994,007 US$A 5 (2) Environmental Mitigation Cost 7,491,011 US$A 6 (3) Civil Works 249,700,365 US$A 7 (4) Hydromechanical Works 54,550,427 US$A 8 (5) Electro-Mechanical Works 194,800,000 US$A 9 (6) Transmission Line 3,900,000 US$A10 Direct Cost Total 515,435,810 US$A11 Administration/Engineering Services 77,315,372 US$ 15% of A10A12 Contingency 51,543,581 US$ 10% of A10A13 Interest during Construction (IDC) 32,929,905 US$ (A10+A11+A12)*A24*0.38*A28A14 TOTAL Cost 677,224,668 US$ A10+A11+A12+A13A15 Unit Construction Cost 1,129 US$ A14/(A1*A2)A16 TOTAL Cost excluding IDC 644,294,763 US$ A14-A13A17 Base Year of Cost Estimate 2014A18 Replacement Cost in Yr 31st-35th 249,350,427 US$ (4) + (5) aboveA19 Percentage of Foreign Currency of Direct Cost 64%A20A21 Interest Rate (Foreign) 1.40% % p.a. JICA LoanA22 Percentage of Foreign Loan 85%A23 Interest Rate (Local) 10.00% % p.a. Domestic BorrowingA24 Weighted Average Cost of Capital (WACC) 2.69% % p.a. A21*A22+A23*(1-A22)A25 Standard Conversion Factor (SCF) for LKR 0.9A26 Economic Construction Cost after SCF 621,100,151 US$ A16*A19*1.0+A16*(1-A19)*A25A27 Economic Replacement Cost after SCF 240,373,812 US$ A18*A19*1.0+A18*(1-A19)*A25A28 Construction Period 5 yearsA29 Disbursement Schedule (1st - 5th; 31st-35th)A30 1st Year 5%A31 2nd Year 10%A32 3rd Year 25%A33 4th Year 40%A34 5th Year 20%
Name of Input Data
(Unit: US$)Year Initial Investment
1st Year 31,055,0082nd Year 62,110,0153rd Year 155,275,0384th Year 248,440,0605th Year 124,220,030
Electric Power Development Co., Ltd. 11-3
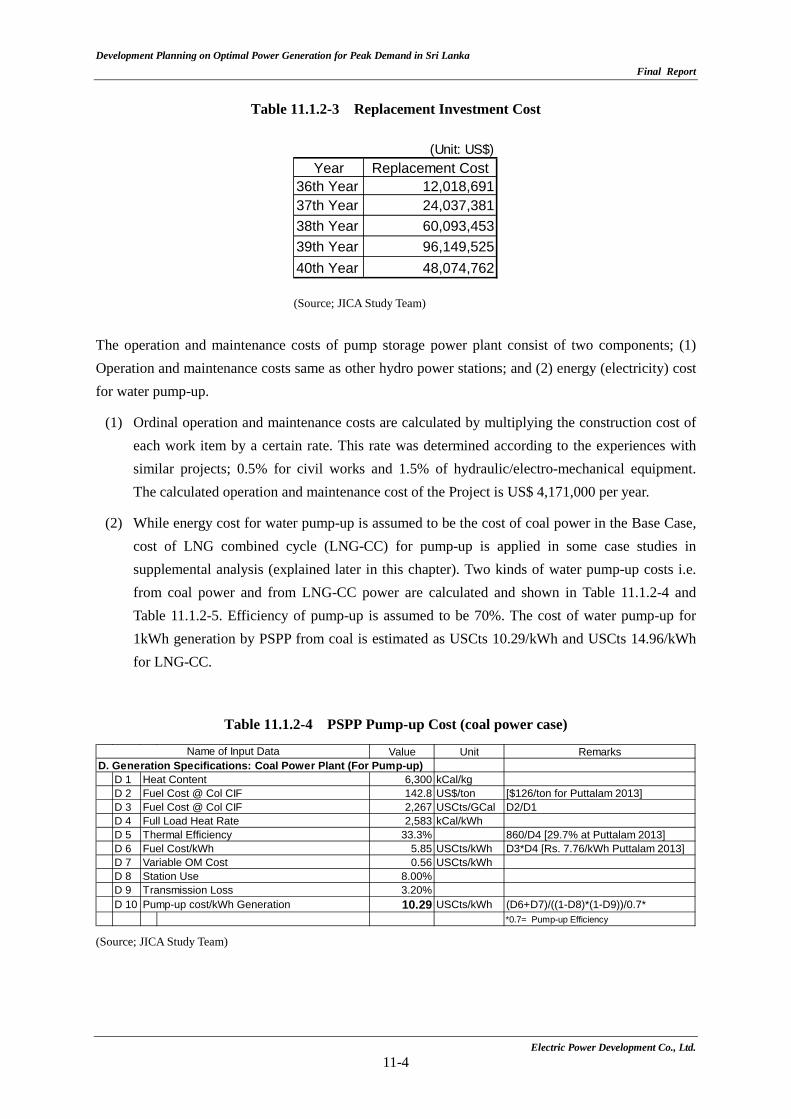
Development Planning on Optimal Power Generation for Peak Demand in Sri Lanka Final Report
Table 11.1.2-3 Replacement Investment Cost
(Source; JICA Study Team) The operation and maintenance costs of pump storage power plant consist of two components; (1) Operation and maintenance costs same as other hydro power stations; and (2) energy (electricity) cost for water pump-up.
(1) Ordinal operation and maintenance costs are calculated by multiplying the construction cost of each work item by a certain rate. This rate was determined according to the experiences with similar projects; 0.5% for civil works and 1.5% of hydraulic/electro-mechanical equipment. The calculated operation and maintenance cost of the Project is US$ 4,171,000 per year.
(2) While energy cost for water pump-up is assumed to be the cost of coal power in the Base Case, cost of LNG combined cycle (LNG-CC) for pump-up is applied in some case studies in supplemental analysis (explained later in this chapter). Two kinds of water pump-up costs i.e. from coal power and from LNG-CC power are calculated and shown in Table 11.1.2-4 and Table 11.1.2-5. Efficiency of pump-up is assumed to be 70%. The cost of water pump-up for 1kWh generation by PSPP from coal is estimated as USCts 10.29/kWh and USCts 14.96/kWh for LNG-CC.
Table 11.1.2-4 PSPP Pump-up Cost (coal power case)
(Source; JICA Study Team)
(Unit: US$)Year Replacement Cost
36th Year 12,018,69137th Year 24,037,38138th Year 60,093,45339th Year 96,149,52540th Year 48,074,762
Value Unit RemarksD. Generation Specifications: Coal Power Plant (For Pump-up)
D 1 Heat Content 6,300 kCal/kgD 2 Fuel Cost @ Col CIF 142.8 US$/ton [$126/ton for Puttalam 2013]D 3 Fuel Cost @ Col CIF 2,267 USCts/GCal D2/D1D 4 Full Load Heat Rate 2,583 kCal/kWhD 5 Thermal Efficiency 33.3% 860/D4 [29.7% at Puttalam 2013]D 6 Fuel Cost/kWh 5.85 USCts/kWh D3*D4 [Rs. 7.76/kWh Puttalam 2013]D 7 Variable OM Cost 0.56 USCts/kWhD 8 Station Use 8.00%D 9 Transmission Loss 3.20%D 10 Pump-up cost/kWh Generation 10.29 USCts/kWh (D6+D7)/((1-D8)*(1-D9))/0.7*
*0.7= Pump-up Efficiency
Name of Input Data
Electric Power Development Co., Ltd. 11-4
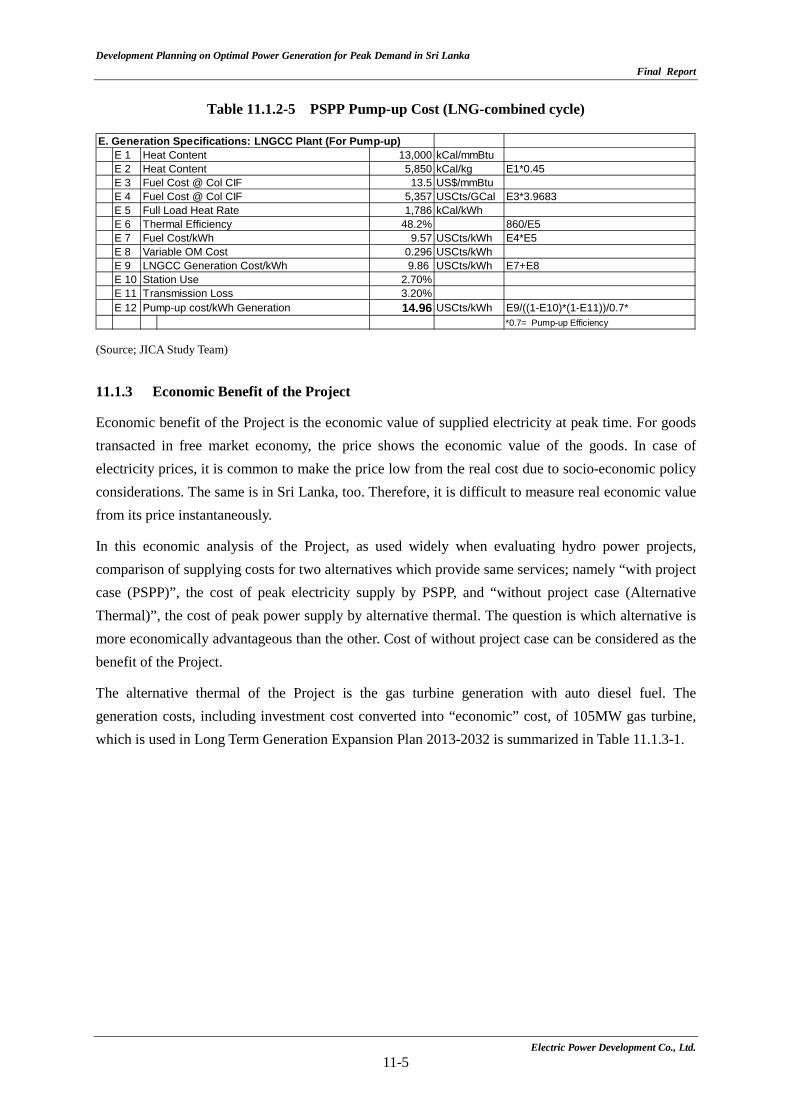
Development Planning on Optimal Power Generation for Peak Demand in Sri Lanka Final Report
Table 11.1.2-5 PSPP Pump-up Cost (LNG-combined cycle)
(Source; JICA Study Team) 11.1.3 Economic Benefit of the Project
Economic benefit of the Project is the economic value of supplied electricity at peak time. For goods transacted in free market economy, the price shows the economic value of the goods. In case of electricity prices, it is common to make the price low from the real cost due to socio-economic policy considerations. The same is in Sri Lanka, too. Therefore, it is difficult to measure real economic value from its price instantaneously.
In this economic analysis of the Project, as used widely when evaluating hydro power projects, comparison of supplying costs for two alternatives which provide same services; namely “with project case (PSPP)”, the cost of peak electricity supply by PSPP, and “without project case (Alternative Thermal)”, the cost of peak power supply by alternative thermal. The question is which alternative is more economically advantageous than the other. Cost of without project case can be considered as the benefit of the Project.
The alternative thermal of the Project is the gas turbine generation with auto diesel fuel. The generation costs, including investment cost converted into “economic” cost, of 105MW gas turbine, which is used in Long Term Generation Expansion Plan 2013-2032 is summarized in Table 11.1.3-1.
E. Generation Specifications: LNGCC Plant (For Pump-up)E 1 Heat Content 13,000 kCal/mmBtuE 2 Heat Content 5,850 kCal/kg E1*0.45E 3 Fuel Cost @ Col CIF 13.5 US$/mmBtuE 4 Fuel Cost @ Col CIF 5,357 USCts/GCal E3*3.9683E 5 Full Load Heat Rate 1,786 kCal/kWhE 6 Thermal Efficiency 48.2% 860/E5E 7 Fuel Cost/kWh 9.57 USCts/kWh E4*E5E 8 Variable OM Cost 0.296 USCts/kWhE 9 LNGCC Generation Cost/kWh 9.86 USCts/kWh E7+E8E 10 Station Use 2.70%E 11 Transmission Loss 3.20%E 12 Pump-up cost/kWh Generation 14.96 USCts/kWh E9/((1-E10)*(1-E11))/0.7*
*0.7= Pump-up Efficiency
Electric Power Development Co., Ltd. 11-5
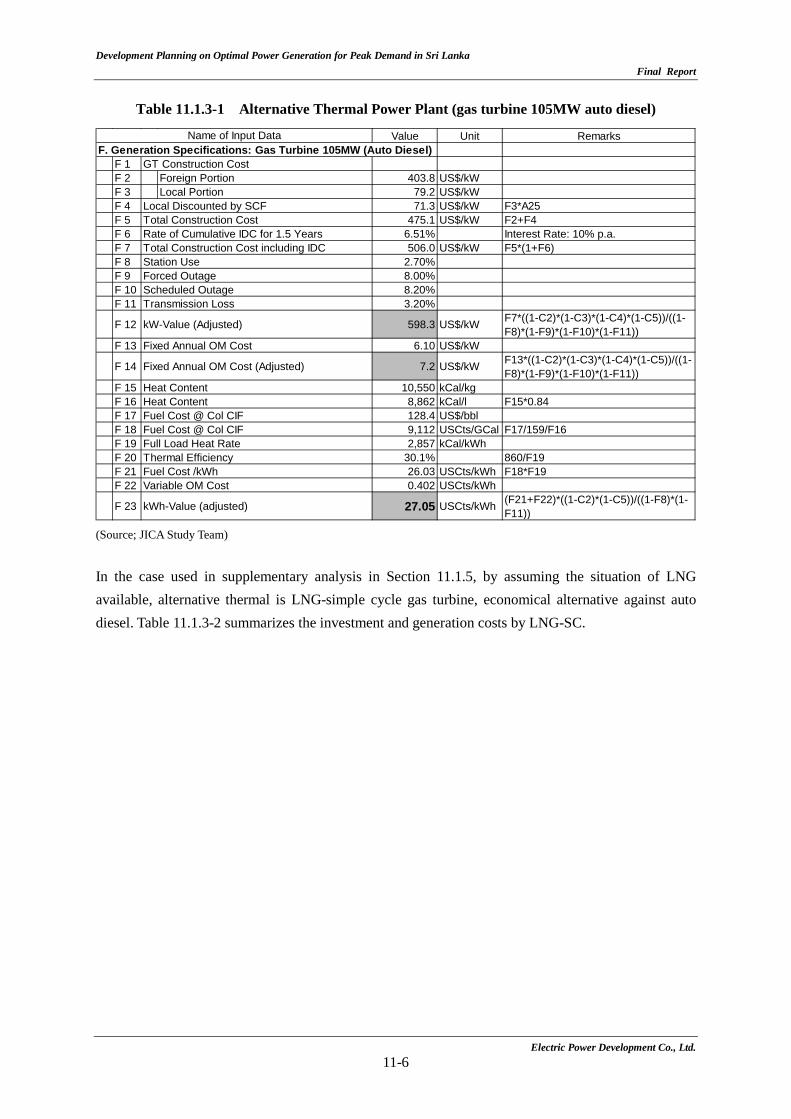
Development Planning on Optimal Power Generation for Peak Demand in Sri Lanka Final Report
Table 11.1.3-1 Alternative Thermal Power Plant (gas turbine 105MW auto diesel)
(Source; JICA Study Team) In the case used in supplementary analysis in Section 11.1.5, by assuming the situation of LNG available, alternative thermal is LNG-simple cycle gas turbine, economical alternative against auto diesel. Table 11.1.3-2 summarizes the investment and generation costs by LNG-SC.
Value Unit RemarksF. Generation Specifications: Gas Turbine 105MW (Auto Diesel)
F 1 GT Construction CostF 2 Foreign Portion 403.8 US$/kWF 3 Local Portion 79.2 US$/kWF 4 Local Discounted by SCF 71.3 US$/kW F3*A25F 5 Total Construction Cost 475.1 US$/kW F2+F4F 6 Rate of Cumulative IDC for 1.5 Years 6.51% Interest Rate: 10% p.a.F 7 Total Construction Cost including IDC 506.0 US$/kW F5*(1+F6)F 8 Station Use 2.70%F 9 Forced Outage 8.00%F 10 Scheduled Outage 8.20%F 11 Transmission Loss 3.20%
F 12 kW-Value (Adjusted) 598.3 US$/kW F7*((1-C2)*(1-C3)*(1-C4)*(1-C5))/((1-F8)*(1-F9)*(1-F10)*(1-F11))
F 13 Fixed Annual OM Cost 6.10 US$/kW
F 14 Fixed Annual OM Cost (Adjusted) 7.2 US$/kW F13*((1-C2)*(1-C3)*(1-C4)*(1-C5))/((1-F8)*(1-F9)*(1-F10)*(1-F11))
F 15 Heat Content 10,550 kCal/kgF 16 Heat Content 8,862 kCal/l F15*0.84F 17 Fuel Cost @ Col CIF 128.4 US$/bblF 18 Fuel Cost @ Col CIF 9,112 USCts/GCal F17/159/F16F 19 Full Load Heat Rate 2,857 kCal/kWhF 20 Thermal Efficiency 30.1% 860/F19F 21 Fuel Cost /kWh 26.03 USCts/kWh F18*F19F 22 Variable OM Cost 0.402 USCts/kWh
F 23 kWh-Value (adjusted) 27.05 USCts/kWh (F21+F22)*((1-C2)*(1-C5))/((1-F8)*(1-F11))
Name of Input Data
Electric Power Development Co., Ltd. 11-6
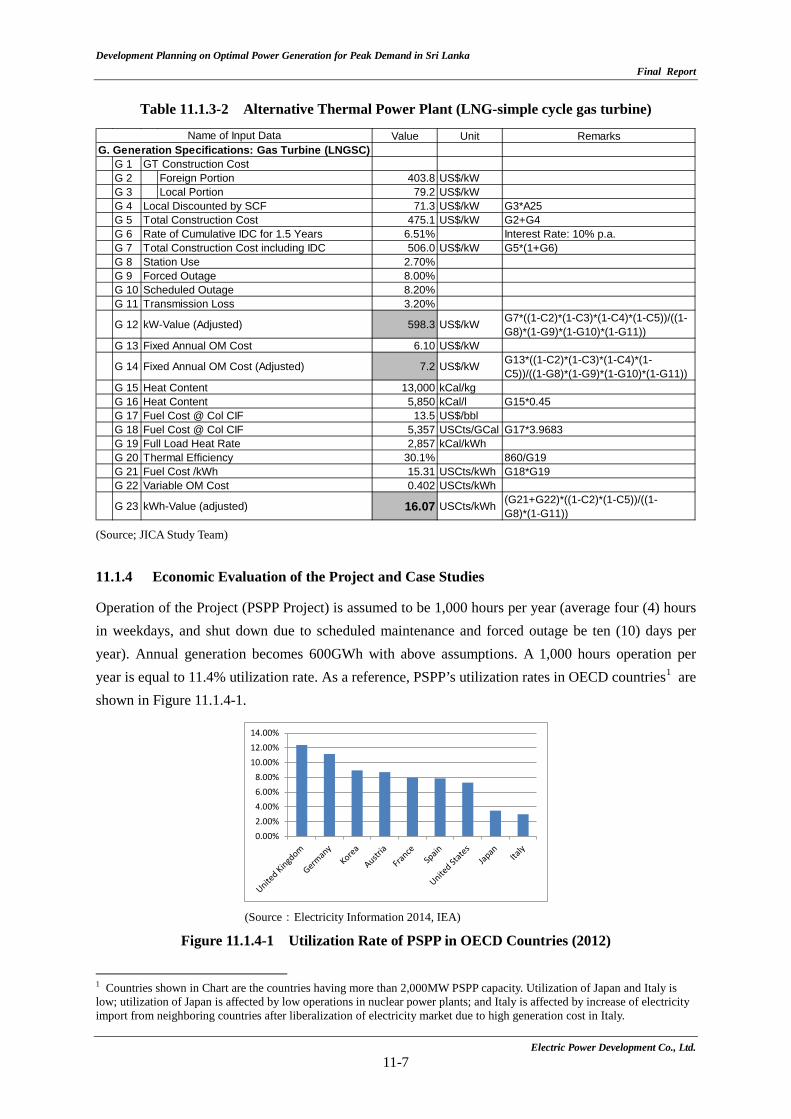
Development Planning on Optimal Power Generation for Peak Demand in Sri Lanka Final Report
Table 11.1.3-2 Alternative Thermal Power Plant (LNG-simple cycle gas turbine)
(Source; JICA Study Team) 11.1.4 Economic Evaluation of the Project and Case Studies
Operation of the Project (PSPP Project) is assumed to be 1,000 hours per year (average four (4) hours in weekdays, and shut down due to scheduled maintenance and forced outage be ten (10) days per year). Annual generation becomes 600GWh with above assumptions. A 1,000 hours operation per year is equal to 11.4% utilization rate. As a reference, PSPP’s utilization rates in OECD countries1 are shown in Figure 11.1.4-1.
(Source:Electricity Information 2014, IEA)
Figure 11.1.4-1 Utilization Rate of PSPP in OECD Countries (2012)
1 Countries shown in Chart are the countries having more than 2,000MW PSPP capacity. Utilization of Japan and Italy is low; utilization of Japan is affected by low operations in nuclear power plants; and Italy is affected by increase of electricity import from neighboring countries after liberalization of electricity market due to high generation cost in Italy.
Value Unit RemarksG. Generation Specifications: Gas Turbine (LNGSC)
G 1 GT Construction CostG 2 Foreign Portion 403.8 US$/kWG 3 Local Portion 79.2 US$/kWG 4 Local Discounted by SCF 71.3 US$/kW G3*A25G 5 Total Construction Cost 475.1 US$/kW G2+G4G 6 Rate of Cumulative IDC for 1.5 Years 6.51% Interest Rate: 10% p.a.G 7 Total Construction Cost including IDC 506.0 US$/kW G5*(1+G6)G 8 Station Use 2.70%G 9 Forced Outage 8.00%G 10 Scheduled Outage 8.20%G 11 Transmission Loss 3.20%
G 12 kW-Value (Adjusted) 598.3 US$/kW G7*((1-C2)*(1-C3)*(1-C4)*(1-C5))/((1-G8)*(1-G9)*(1-G10)*(1-G11))
G 13 Fixed Annual OM Cost 6.10 US$/kW
G 14 Fixed Annual OM Cost (Adjusted) 7.2 US$/kW G13*((1-C2)*(1-C3)*(1-C4)*(1-C5))/((1-G8)*(1-G9)*(1-G10)*(1-G11))
G 15 Heat Content 13,000 kCal/kgG 16 Heat Content 5,850 kCal/l G15*0.45G 17 Fuel Cost @ Col CIF 13.5 US$/bblG 18 Fuel Cost @ Col CIF 5,357 USCts/GCal G17*3.9683G 19 Full Load Heat Rate 2,857 kCal/kWhG 20 Thermal Efficiency 30.1% 860/G19G 21 Fuel Cost /kWh 15.31 USCts/kWh G18*G19G 22 Variable OM Cost 0.402 USCts/kWh
G 23 kWh-Value (adjusted) 16.07 USCts/kWh (G21+G22)*((1-C2)*(1-C5))/((1-G8)*(1-G11))
Name of Input Data
0.00%2.00%4.00%6.00%8.00%
10.00%12.00%14.00%
Electric Power Development Co., Ltd. 11-7
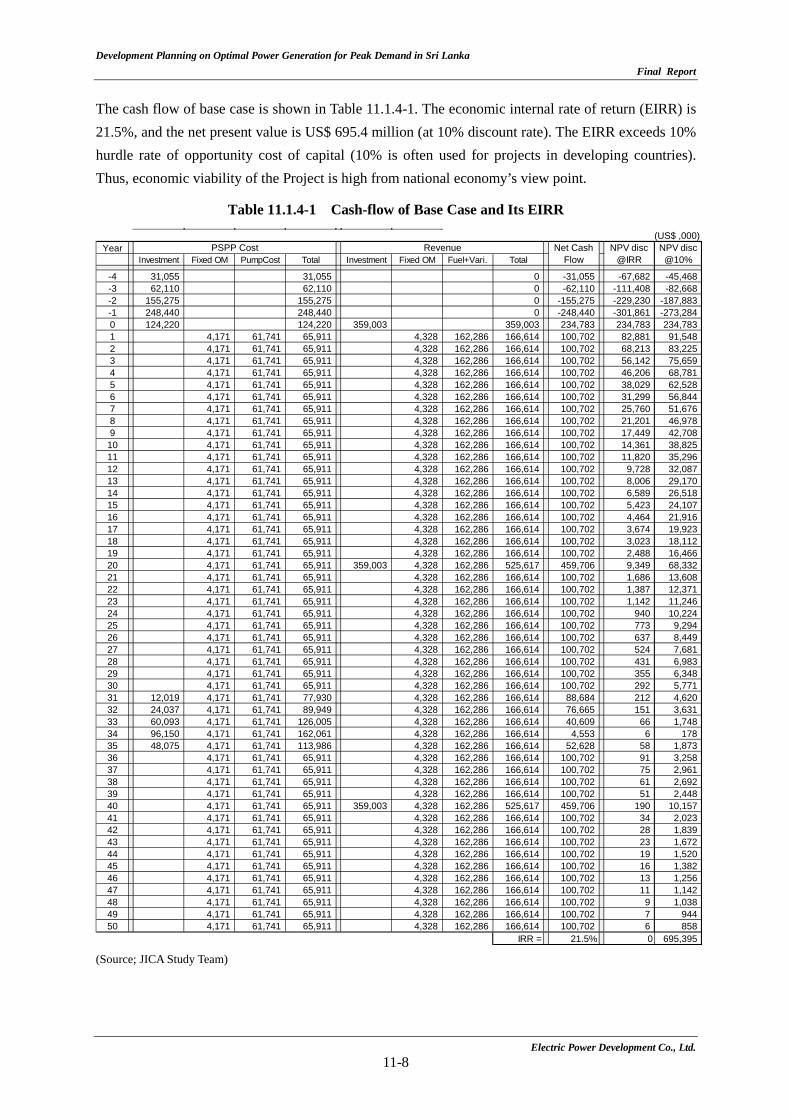
Development Planning on Optimal Power Generation for Peak Demand in Sri Lanka Final Report
The cash flow of base case is shown in Table 11.1.4-1. The economic internal rate of return (EIRR) is 21.5%, and the net present value is US$ 695.4 million (at 10% discount rate). The EIRR exceeds 10% hurdle rate of opportunity cost of capital (10% is often used for projects in developing countries). Thus, economic viability of the Project is high from national economy’s view point.
Table 11.1.4-1 Cash-flow of Base Case and Its EIRR
(Source; JICA Study Team)
(US$ ,000)Year
Investment Fixed OM PumpCost Total Investment Fixed OM Fuel+Vari. Total
-4 31,055 31,055 0 -31,055 -67,682 -45,468-3 62,110 62,110 0 -62,110 -111,408 -82,668-2 155,275 155,275 0 -155,275 -229,230 -187,883-1 248,440 248,440 0 -248,440 -301,861 -273,2840 124,220 124,220 359,003 359,003 234,783 234,783 234,7831 4,171 61,741 65,911 4,328 162,286 166,614 100,702 82,881 91,5482 4,171 61,741 65,911 4,328 162,286 166,614 100,702 68,213 83,2253 4,171 61,741 65,911 4,328 162,286 166,614 100,702 56,142 75,6594 4,171 61,741 65,911 4,328 162,286 166,614 100,702 46,206 68,7815 4,171 61,741 65,911 4,328 162,286 166,614 100,702 38,029 62,5286 4,171 61,741 65,911 4,328 162,286 166,614 100,702 31,299 56,8447 4,171 61,741 65,911 4,328 162,286 166,614 100,702 25,760 51,6768 4,171 61,741 65,911 4,328 162,286 166,614 100,702 21,201 46,9789 4,171 61,741 65,911 4,328 162,286 166,614 100,702 17,449 42,708
10 4,171 61,741 65,911 4,328 162,286 166,614 100,702 14,361 38,82511 4,171 61,741 65,911 4,328 162,286 166,614 100,702 11,820 35,29612 4,171 61,741 65,911 4,328 162,286 166,614 100,702 9,728 32,08713 4,171 61,741 65,911 4,328 162,286 166,614 100,702 8,006 29,17014 4,171 61,741 65,911 4,328 162,286 166,614 100,702 6,589 26,51815 4,171 61,741 65,911 4,328 162,286 166,614 100,702 5,423 24,10716 4,171 61,741 65,911 4,328 162,286 166,614 100,702 4,464 21,91617 4,171 61,741 65,911 4,328 162,286 166,614 100,702 3,674 19,92318 4,171 61,741 65,911 4,328 162,286 166,614 100,702 3,023 18,11219 4,171 61,741 65,911 4,328 162,286 166,614 100,702 2,488 16,46620 4,171 61,741 65,911 359,003 4,328 162,286 525,617 459,706 9,349 68,33221 4,171 61,741 65,911 4,328 162,286 166,614 100,702 1,686 13,60822 4,171 61,741 65,911 4,328 162,286 166,614 100,702 1,387 12,37123 4,171 61,741 65,911 4,328 162,286 166,614 100,702 1,142 11,24624 4,171 61,741 65,911 4,328 162,286 166,614 100,702 940 10,22425 4,171 61,741 65,911 4,328 162,286 166,614 100,702 773 9,29426 4,171 61,741 65,911 4,328 162,286 166,614 100,702 637 8,44927 4,171 61,741 65,911 4,328 162,286 166,614 100,702 524 7,68128 4,171 61,741 65,911 4,328 162,286 166,614 100,702 431 6,98329 4,171 61,741 65,911 4,328 162,286 166,614 100,702 355 6,34830 4,171 61,741 65,911 4,328 162,286 166,614 100,702 292 5,77131 12,019 4,171 61,741 77,930 4,328 162,286 166,614 88,684 212 4,62032 24,037 4,171 61,741 89,949 4,328 162,286 166,614 76,665 151 3,63133 60,093 4,171 61,741 126,005 4,328 162,286 166,614 40,609 66 1,74834 96,150 4,171 61,741 162,061 4,328 162,286 166,614 4,553 6 17835 48,075 4,171 61,741 113,986 4,328 162,286 166,614 52,628 58 1,87336 4,171 61,741 65,911 4,328 162,286 166,614 100,702 91 3,25837 4,171 61,741 65,911 4,328 162,286 166,614 100,702 75 2,96138 4,171 61,741 65,911 4,328 162,286 166,614 100,702 61 2,69239 4,171 61,741 65,911 4,328 162,286 166,614 100,702 51 2,44840 4,171 61,741 65,911 359,003 4,328 162,286 525,617 459,706 190 10,15741 4,171 61,741 65,911 4,328 162,286 166,614 100,702 34 2,02342 4,171 61,741 65,911 4,328 162,286 166,614 100,702 28 1,83943 4,171 61,741 65,911 4,328 162,286 166,614 100,702 23 1,67244 4,171 61,741 65,911 4,328 162,286 166,614 100,702 19 1,52045 4,171 61,741 65,911 4,328 162,286 166,614 100,702 16 1,38246 4,171 61,741 65,911 4,328 162,286 166,614 100,702 13 1,25647 4,171 61,741 65,911 4,328 162,286 166,614 100,702 11 1,14248 4,171 61,741 65,911 4,328 162,286 166,614 100,702 9 1,03849 4,171 61,741 65,911 4,328 162,286 166,614 100,702 7 94450 4,171 61,741 65,911 4,328 162,286 166,614 100,702 6 858
IRR = 21.5% 0 695,395
NPV disc@10%
PSPP Cost Revenue Net CashFlow
NPV disc@IRR
Electric Power Development Co., Ltd. 11-8
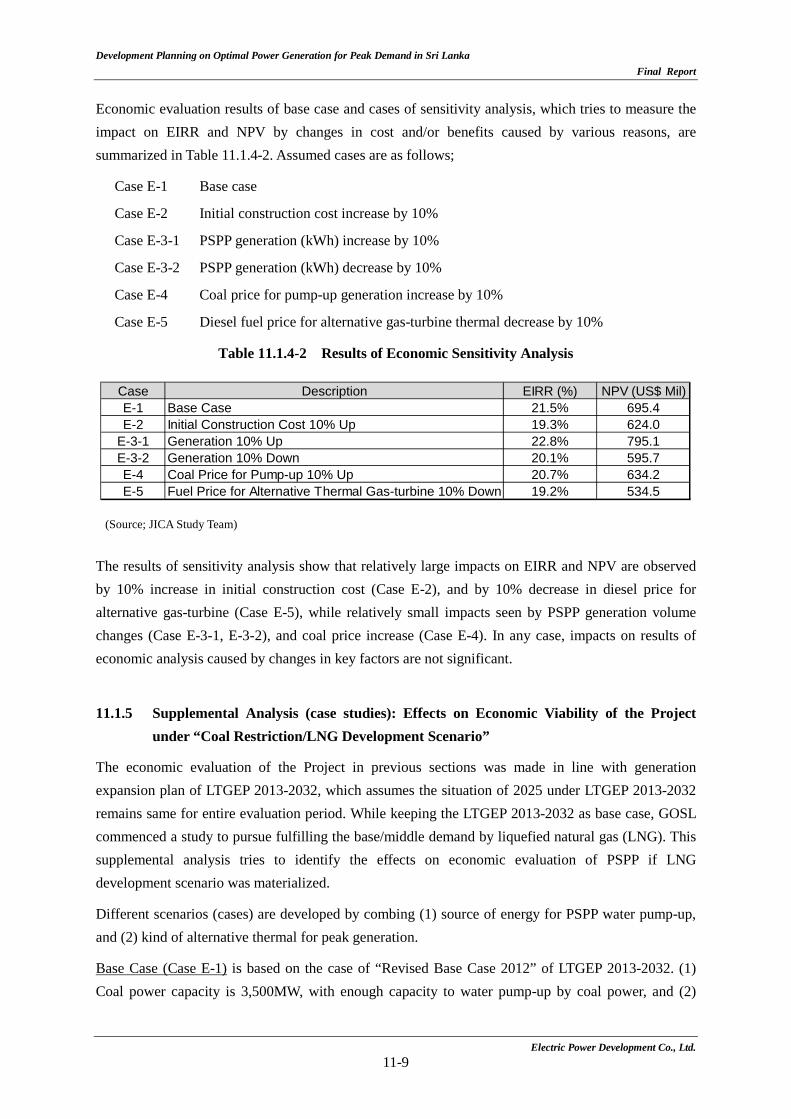
Development Planning on Optimal Power Generation for Peak Demand in Sri Lanka Final Report
Economic evaluation results of base case and cases of sensitivity analysis, which tries to measure the impact on EIRR and NPV by changes in cost and/or benefits caused by various reasons, are summarized in Table 11.1.4-2. Assumed cases are as follows;
Case E-1 Base case
Case E-2 Initial construction cost increase by 10%
Case E-3-1 PSPP generation (kWh) increase by 10%
Case E-3-2 PSPP generation (kWh) decrease by 10%
Case E-4 Coal price for pump-up generation increase by 10%
Case E-5 Diesel fuel price for alternative gas-turbine thermal decrease by 10%
Table 11.1.4-2 Results of Economic Sensitivity Analysis
(Source; JICA Study Team) The results of sensitivity analysis show that relatively large impacts on EIRR and NPV are observed by 10% increase in initial construction cost (Case E-2), and by 10% decrease in diesel price for alternative gas-turbine (Case E-5), while relatively small impacts seen by PSPP generation volume changes (Case E-3-1, E-3-2), and coal price increase (Case E-4). In any case, impacts on results of economic analysis caused by changes in key factors are not significant.
11.1.5 Supplemental Analysis (case studies): Effects on Economic Viability of the Project
under “Coal Restriction/LNG Development Scenario”
The economic evaluation of the Project in previous sections was made in line with generation expansion plan of LTGEP 2013-2032, which assumes the situation of 2025 under LTGEP 2013-2032 remains same for entire evaluation period. While keeping the LTGEP 2013-2032 as base case, GOSL commenced a study to pursue fulfilling the base/middle demand by liquefied natural gas (LNG). This supplemental analysis tries to identify the effects on economic evaluation of PSPP if LNG development scenario was materialized.
Different scenarios (cases) are developed by combing (1) source of energy for PSPP water pump-up, and (2) kind of alternative thermal for peak generation.
Base Case (Case E-1) is based on the case of “Revised Base Case 2012” of LTGEP 2013-2032. (1) Coal power capacity is 3,500MW, with enough capacity to water pump-up by coal power, and (2)
Case Description EIRR (%) NPV (US$ Mil)E-1 Base Case 21.5% 695.4E-2 Initial Construction Cost 10% Up 19.3% 624.0
E-3-1 Generation 10% Up 22.8% 795.1E-3-2 Generation 10% Down 20.1% 595.7E-4 Coal Price for Pump-up 10% Up 20.7% 634.2E-5 Fuel Price for Alternative Thermal Gas-turbine 10% Down 19.2% 534.5
Electric Power Development Co., Ltd. 11-9
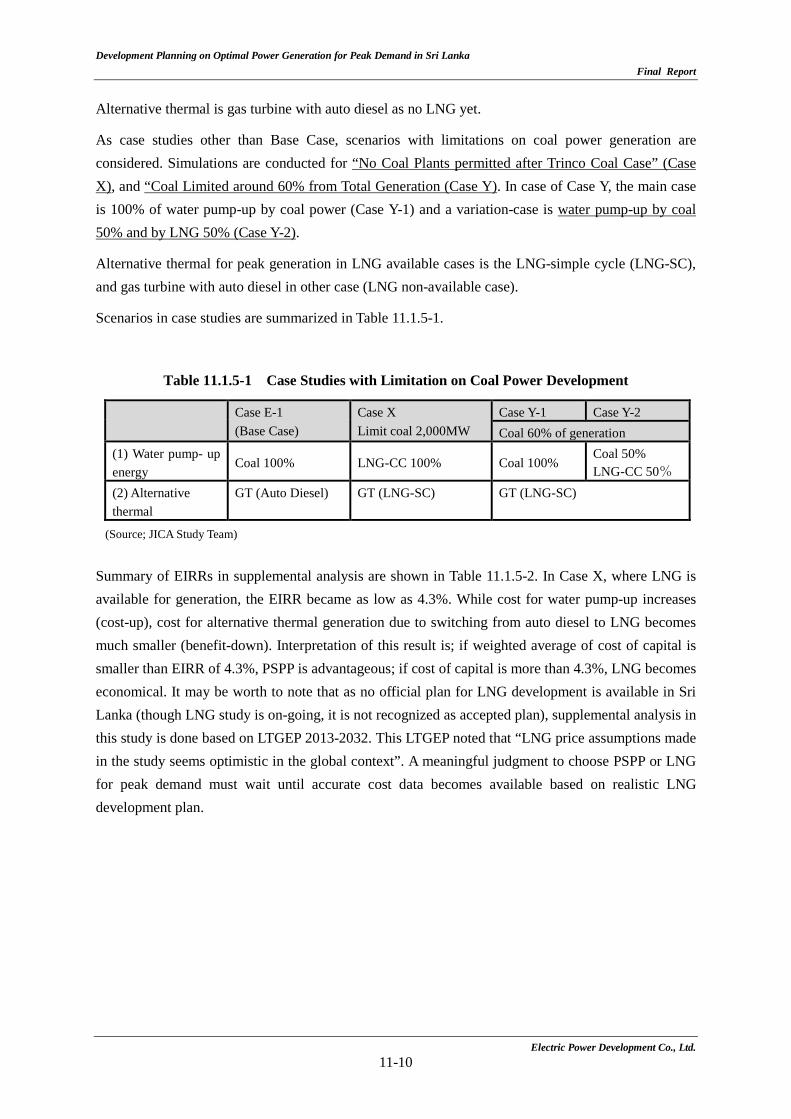
Development Planning on Optimal Power Generation for Peak Demand in Sri Lanka Final Report
Alternative thermal is gas turbine with auto diesel as no LNG yet.
As case studies other than Base Case, scenarios with limitations on coal power generation are considered. Simulations are conducted for “No Coal Plants permitted after Trinco Coal Case” (Case X), and “Coal Limited around 60% from Total Generation (Case Y). In case of Case Y, the main case is 100% of water pump-up by coal power (Case Y-1) and a variation-case is water pump-up by coal 50% and by LNG 50% (Case Y-2).
Alternative thermal for peak generation in LNG available cases is the LNG-simple cycle (LNG-SC), and gas turbine with auto diesel in other case (LNG non-available case).
Scenarios in case studies are summarized in Table 11.1.5-1.
Table 11.1.5-1 Case Studies with Limitation on Coal Power Development
Case E-1 (Base Case)
Case X Limit coal 2,000MW
Case Y-1 Case Y-2 Coal 60% of generation
(1) Water pump- up energy
Coal 100% LNG-CC 100% Coal 100% Coal 50% LNG-CC 50%
(2) Alternative thermal
GT (Auto Diesel) GT (LNG-SC) GT (LNG-SC)
(Source; JICA Study Team) Summary of EIRRs in supplemental analysis are shown in Table 11.1.5-2. In Case X, where LNG is available for generation, the EIRR became as low as 4.3%. While cost for water pump-up increases (cost-up), cost for alternative thermal generation due to switching from auto diesel to LNG becomes much smaller (benefit-down). Interpretation of this result is; if weighted average of cost of capital is smaller than EIRR of 4.3%, PSPP is advantageous; if cost of capital is more than 4.3%, LNG becomes economical. It may be worth to note that as no official plan for LNG development is available in Sri Lanka (though LNG study is on-going, it is not recognized as accepted plan), supplemental analysis in this study is done based on LTGEP 2013-2032. This LTGEP noted that “LNG price assumptions made in the study seems optimistic in the global context”. A meaningful judgment to choose PSPP or LNG for peak demand must wait until accurate cost data becomes available based on realistic LNG development plan.
Electric Power Development Co., Ltd. 11-10
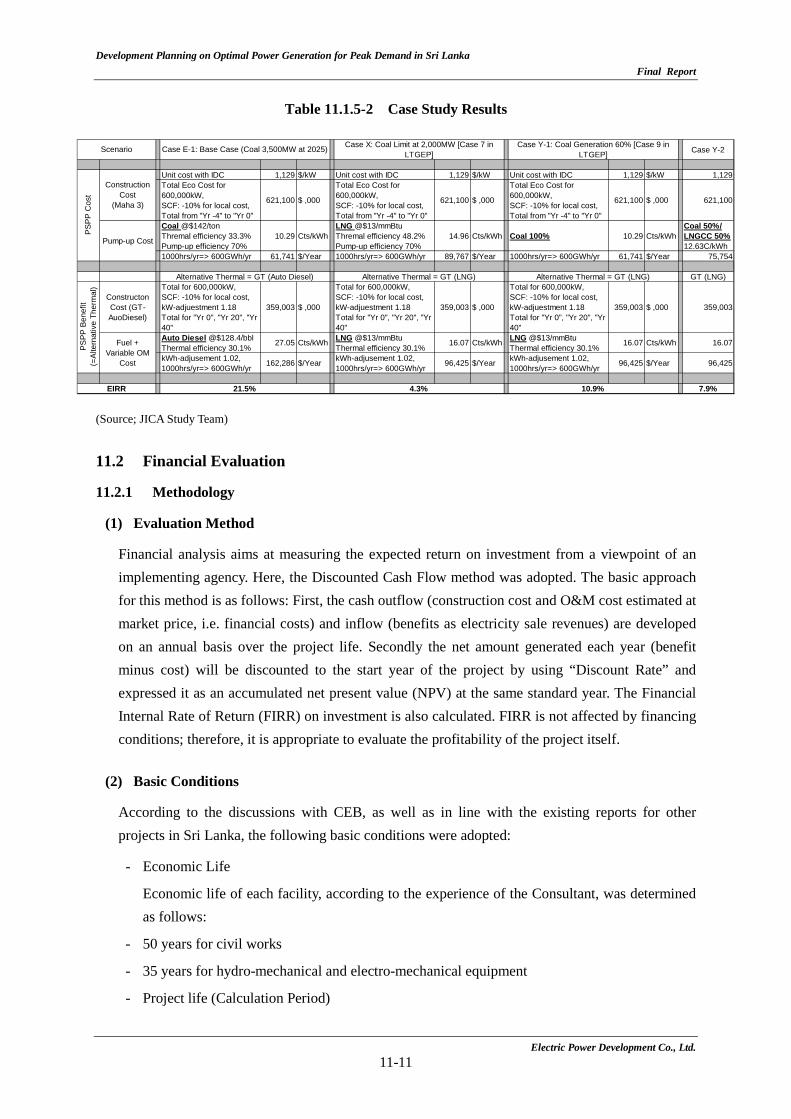
Development Planning on Optimal Power Generation for Peak Demand in Sri Lanka Final Report
Table 11.1.5-2 Case Study Results
(Source; JICA Study Team) 11.2 Financial Evaluation
11.2.1 Methodology
(1) Evaluation Method
Financial analysis aims at measuring the expected return on investment from a viewpoint of an implementing agency. Here, the Discounted Cash Flow method was adopted. The basic approach for this method is as follows: First, the cash outflow (construction cost and O&M cost estimated at market price, i.e. financial costs) and inflow (benefits as electricity sale revenues) are developed on an annual basis over the project life. Secondly the net amount generated each year (benefit minus cost) will be discounted to the start year of the project by using “Discount Rate” and expressed it as an accumulated net present value (NPV) at the same standard year. The Financial Internal Rate of Return (FIRR) on investment is also calculated. FIRR is not affected by financing conditions; therefore, it is appropriate to evaluate the profitability of the project itself.
(2) Basic Conditions
According to the discussions with CEB, as well as in line with the existing reports for other projects in Sri Lanka, the following basic conditions were adopted:
- Economic Life
Economic life of each facility, according to the experience of the Consultant, was determined as follows:
- 50 years for civil works
- 35 years for hydro-mechanical and electro-mechanical equipment
- Project life (Calculation Period)
Case Y-2
Unit cost with IDC 1,129 $/kW Unit cost with IDC 1,129 $/kW Unit cost with IDC 1,129 $/kW 1,129Total Eco Cost for600,000kW,SCF: -10% for local cost,Total from "Yr -4" to "Yr 0"
621,100 $ ,000
Total Eco Cost for600,000kW,SCF: -10% for local cost,Total from "Yr -4" to "Yr 0"
621,100 $ ,000
Total Eco Cost for600,000kW,SCF: -10% for local cost,Total from "Yr -4" to "Yr 0"
621,100 $ ,000 621,100
Coal @$142/tonThremal efficiency 33.3%Pump-up efficiency 70%
10.29 Cts/kWhLNG @$13/mmBtuThremal efficiency 48.2%Pump-up efficiency 70%
14.96 Cts/kWh Coal 100% 10.29 Cts/kWhCoal 50%/LNGCC 50%12.63C/kWh
1000hrs/yr=> 600GWh/yr 61,741 $/Year 1000hrs/yr=> 600GWh/yr 89,767 $/Year 1000hrs/yr=> 600GWh/yr 61,741 $/Year 75,754
GT (LNG)
ConstructonCost (GT-AuoDiesel)
Total for 600,000kW,SCF: -10% for local cost,kW-adjuestment 1.18Total for "Yr 0", "Yr 20", "Yr40"
359,003 $ ,000
Total for 600,000kW,SCF: -10% for local cost,kW-adjuestment 1.18Total for "Yr 0", "Yr 20", "Yr40"
359,003 $ ,000
Total for 600,000kW,SCF: -10% for local cost,kW-adjuestment 1.18Total for "Yr 0", "Yr 20", "Yr40"
359,003 $ ,000 359,003
Auto Diesel @$128.4/bblThermal efficiency 30.1%
27.05 Cts/kWh LNG @$13/mmBtuThermal efficiency 30.1%
16.07 Cts/kWh LNG @$13/mmBtuThermal efficiency 30.1%
16.07 Cts/kWh 16.07
kWh-adjusement 1.02,1000hrs/yr=> 600GWh/yr
162,286 $/Year kWh-adjusement 1.02,1000hrs/yr=> 600GWh/yr
96,425 $/Year kWh-adjusement 1.02,1000hrs/yr=> 600GWh/yr
96,425 $/Year 96,425
7.9%
Alternative Thermal = GT (LNG)
Scenario Case E-1: Base Case (Coal 3,500MW at 2025) Case X: Coal Limit at 2,000MW [Case 7 inLTGEP]
Case Y-1: Coal Generation 60% [Case 9 inLTGEP]
PS
PP
Cos
t
ConstructionCost
(Maha 3)
Pump-up Cost
Alternative Thermal = GT (Auto Diesel) Alternative Thermal = GT (LNG)
10.9%
PS
PP
Ben
efit
(=A
ltern
ativ
e Th
erm
al)
Fuel +Variable OM
Cost
EIRR 21.5% 4.3%
Electric Power Development Co., Ltd. 11-11
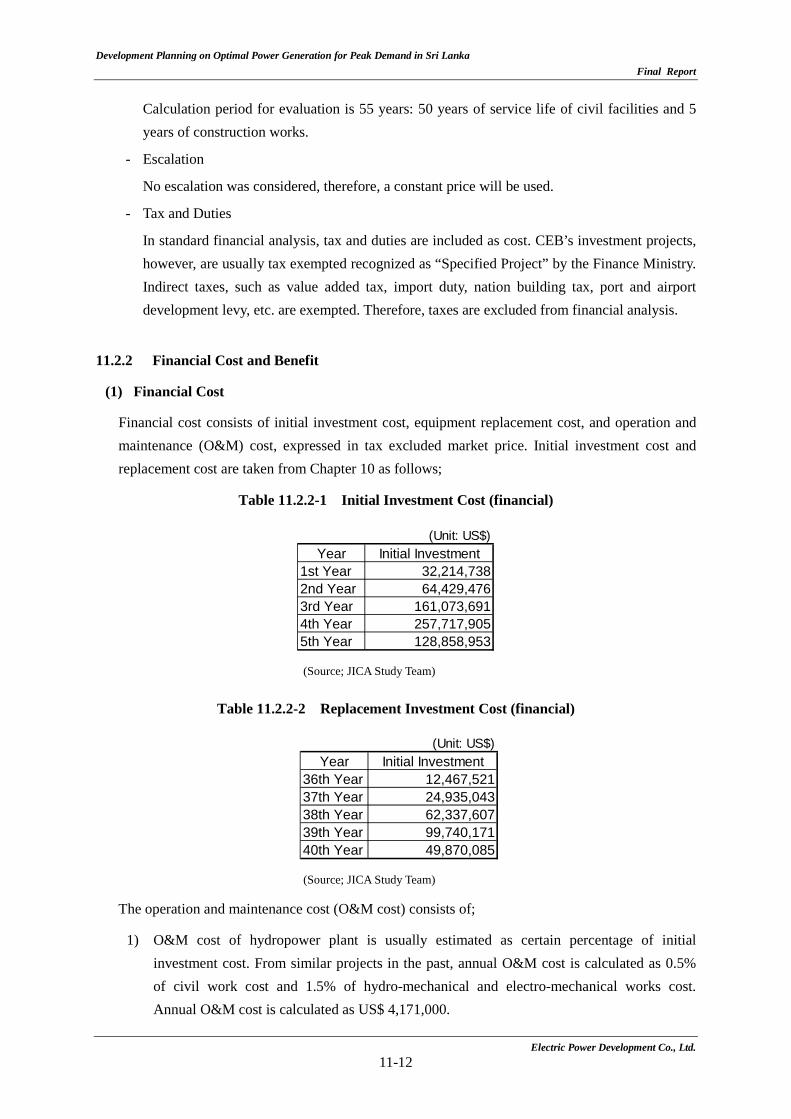
Development Planning on Optimal Power Generation for Peak Demand in Sri Lanka Final Report
Calculation period for evaluation is 55 years: 50 years of service life of civil facilities and 5 years of construction works.
- Escalation
No escalation was considered, therefore, a constant price will be used.
- Tax and Duties
In standard financial analysis, tax and duties are included as cost. CEB’s investment projects, however, are usually tax exempted recognized as “Specified Project” by the Finance Ministry. Indirect taxes, such as value added tax, import duty, nation building tax, port and airport development levy, etc. are exempted. Therefore, taxes are excluded from financial analysis.
11.2.2 Financial Cost and Benefit
(1) Financial Cost
Financial cost consists of initial investment cost, equipment replacement cost, and operation and maintenance (O&M) cost, expressed in tax excluded market price. Initial investment cost and replacement cost are taken from Chapter 10 as follows;
Table 11.2.2-1 Initial Investment Cost (financial)
(Source; JICA Study Team)
Table 11.2.2-2 Replacement Investment Cost (financial)
(Source; JICA Study Team)
The operation and maintenance cost (O&M cost) consists of;
1) O&M cost of hydropower plant is usually estimated as certain percentage of initial investment cost. From similar projects in the past, annual O&M cost is calculated as 0.5% of civil work cost and 1.5% of hydro-mechanical and electro-mechanical works cost. Annual O&M cost is calculated as US$ 4,171,000.
(Unit: US$)Year Initial Investment
1st Year 32,214,7382nd Year 64,429,4763rd Year 161,073,6914th Year 257,717,9055th Year 128,858,953
(Unit: US$)Year Initial Investment
36th Year 12,467,52137th Year 24,935,04338th Year 62,337,60739th Year 99,740,17140th Year 49,870,085
Electric Power Development Co., Ltd. 11-12
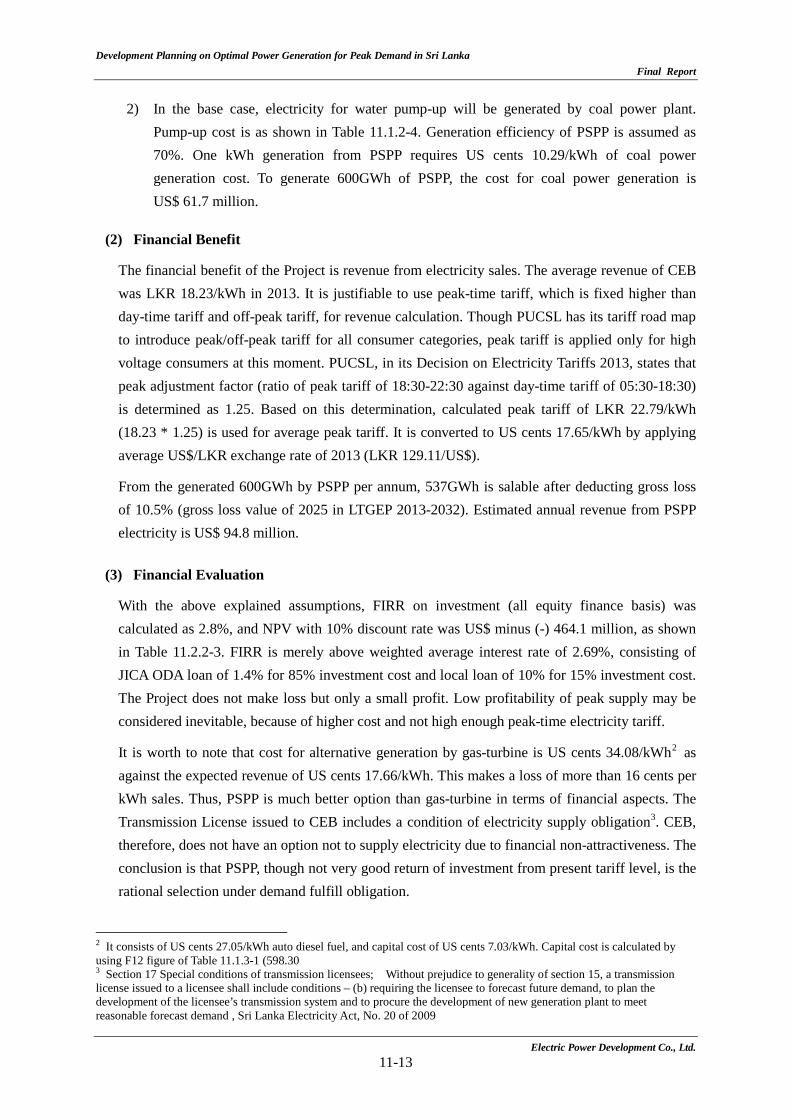
Development Planning on Optimal Power Generation for Peak Demand in Sri Lanka Final Report
2) In the base case, electricity for water pump-up will be generated by coal power plant.
Pump-up cost is as shown in Table 11.1.2-4. Generation efficiency of PSPP is assumed as 70%. One kWh generation from PSPP requires US cents 10.29/kWh of coal power generation cost. To generate 600GWh of PSPP, the cost for coal power generation is US$ 61.7 million.
(2) Financial Benefit
The financial benefit of the Project is revenue from electricity sales. The average revenue of CEB was LKR 18.23/kWh in 2013. It is justifiable to use peak-time tariff, which is fixed higher than day-time tariff and off-peak tariff, for revenue calculation. Though PUCSL has its tariff road map to introduce peak/off-peak tariff for all consumer categories, peak tariff is applied only for high voltage consumers at this moment. PUCSL, in its Decision on Electricity Tariffs 2013, states that peak adjustment factor (ratio of peak tariff of 18:30-22:30 against day-time tariff of 05:30-18:30) is determined as 1.25. Based on this determination, calculated peak tariff of LKR 22.79/kWh (18.23 * 1.25) is used for average peak tariff. It is converted to US cents 17.65/kWh by applying average US$/LKR exchange rate of 2013 (LKR 129.11/US$).
From the generated 600GWh by PSPP per annum, 537GWh is salable after deducting gross loss of 10.5% (gross loss value of 2025 in LTGEP 2013-2032). Estimated annual revenue from PSPP electricity is US$ 94.8 million.
(3) Financial Evaluation
With the above explained assumptions, FIRR on investment (all equity finance basis) was calculated as 2.8%, and NPV with 10% discount rate was US$ minus (-) 464.1 million, as shown in Table 11.2.2-3. FIRR is merely above weighted average interest rate of 2.69%, consisting of JICA ODA loan of 1.4% for 85% investment cost and local loan of 10% for 15% investment cost. The Project does not make loss but only a small profit. Low profitability of peak supply may be considered inevitable, because of higher cost and not high enough peak-time electricity tariff.
It is worth to note that cost for alternative generation by gas-turbine is US cents 34.08/kWh2 as against the expected revenue of US cents 17.66/kWh. This makes a loss of more than 16 cents per kWh sales. Thus, PSPP is much better option than gas-turbine in terms of financial aspects. The Transmission License issued to CEB includes a condition of electricity supply obligation3. CEB, therefore, does not have an option not to supply electricity due to financial non-attractiveness. The conclusion is that PSPP, though not very good return of investment from present tariff level, is the rational selection under demand fulfill obligation.
2 It consists of US cents 27.05/kWh auto diesel fuel, and capital cost of US cents 7.03/kWh. Capital cost is calculated by using F12 figure of Table 11.1.3-1 (598.30 3 Section 17 Special conditions of transmission licensees; Without prejudice to generality of section 15, a transmission license issued to a licensee shall include conditions – (b) requiring the licensee to forecast future demand, to plan the development of the licensee’s transmission system and to procure the development of new generation plant to meet reasonable forecast demand , Sri Lanka Electricity Act, No. 20 of 2009
Electric Power Development Co., Ltd. 11-13
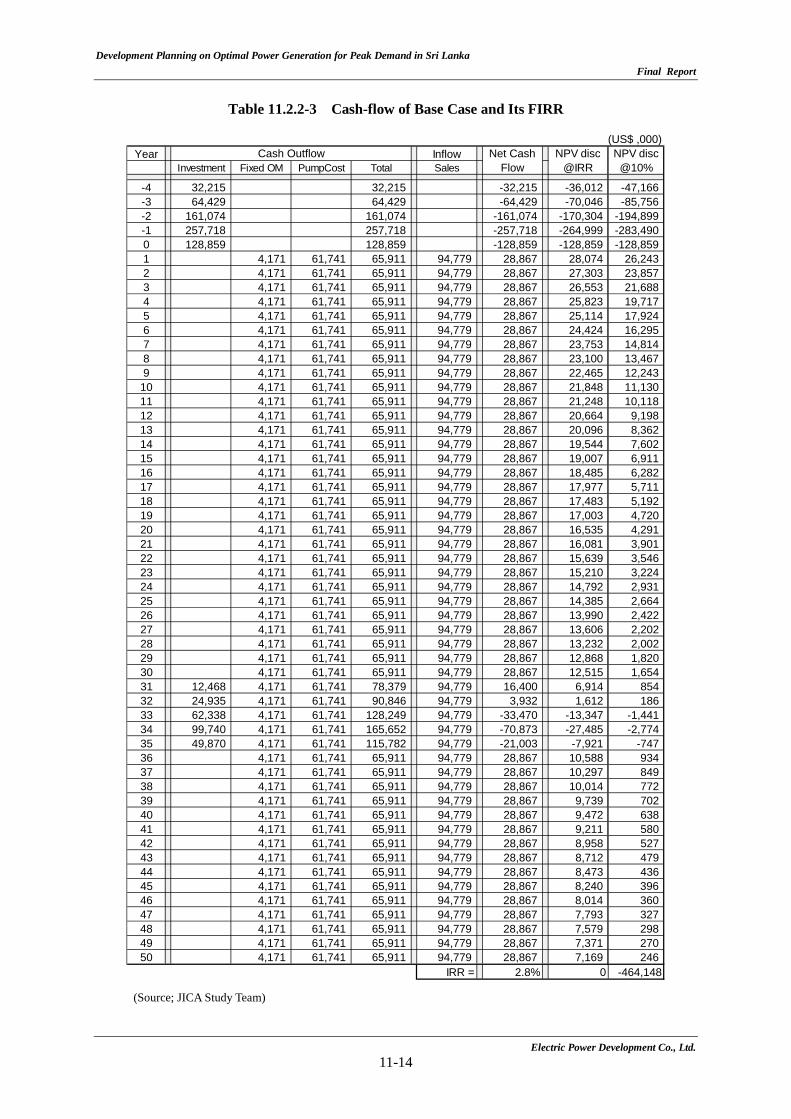
Development Planning on Optimal Power Generation for Peak Demand in Sri Lanka Final Report
Table 11.2.2-3 Cash-flow of Base Case and Its FIRR
(Source; JICA Study Team)
(US$ ,000)Year Inflow
Investment Fixed OM PumpCost Total Sales
-4 32,215 32,215 -32,215 -36,012 -47,166-3 64,429 64,429 -64,429 -70,046 -85,756-2 161,074 161,074 -161,074 -170,304 -194,899-1 257,718 257,718 -257,718 -264,999 -283,4900 128,859 128,859 -128,859 -128,859 -128,8591 4,171 61,741 65,911 94,779 28,867 28,074 26,2432 4,171 61,741 65,911 94,779 28,867 27,303 23,8573 4,171 61,741 65,911 94,779 28,867 26,553 21,6884 4,171 61,741 65,911 94,779 28,867 25,823 19,7175 4,171 61,741 65,911 94,779 28,867 25,114 17,9246 4,171 61,741 65,911 94,779 28,867 24,424 16,2957 4,171 61,741 65,911 94,779 28,867 23,753 14,8148 4,171 61,741 65,911 94,779 28,867 23,100 13,4679 4,171 61,741 65,911 94,779 28,867 22,465 12,24310 4,171 61,741 65,911 94,779 28,867 21,848 11,13011 4,171 61,741 65,911 94,779 28,867 21,248 10,11812 4,171 61,741 65,911 94,779 28,867 20,664 9,19813 4,171 61,741 65,911 94,779 28,867 20,096 8,36214 4,171 61,741 65,911 94,779 28,867 19,544 7,60215 4,171 61,741 65,911 94,779 28,867 19,007 6,91116 4,171 61,741 65,911 94,779 28,867 18,485 6,28217 4,171 61,741 65,911 94,779 28,867 17,977 5,71118 4,171 61,741 65,911 94,779 28,867 17,483 5,19219 4,171 61,741 65,911 94,779 28,867 17,003 4,72020 4,171 61,741 65,911 94,779 28,867 16,535 4,29121 4,171 61,741 65,911 94,779 28,867 16,081 3,90122 4,171 61,741 65,911 94,779 28,867 15,639 3,54623 4,171 61,741 65,911 94,779 28,867 15,210 3,22424 4,171 61,741 65,911 94,779 28,867 14,792 2,93125 4,171 61,741 65,911 94,779 28,867 14,385 2,66426 4,171 61,741 65,911 94,779 28,867 13,990 2,42227 4,171 61,741 65,911 94,779 28,867 13,606 2,20228 4,171 61,741 65,911 94,779 28,867 13,232 2,00229 4,171 61,741 65,911 94,779 28,867 12,868 1,82030 4,171 61,741 65,911 94,779 28,867 12,515 1,65431 12,468 4,171 61,741 78,379 94,779 16,400 6,914 85432 24,935 4,171 61,741 90,846 94,779 3,932 1,612 18633 62,338 4,171 61,741 128,249 94,779 -33,470 -13,347 -1,44134 99,740 4,171 61,741 165,652 94,779 -70,873 -27,485 -2,77435 49,870 4,171 61,741 115,782 94,779 -21,003 -7,921 -74736 4,171 61,741 65,911 94,779 28,867 10,588 93437 4,171 61,741 65,911 94,779 28,867 10,297 84938 4,171 61,741 65,911 94,779 28,867 10,014 77239 4,171 61,741 65,911 94,779 28,867 9,739 70240 4,171 61,741 65,911 94,779 28,867 9,472 63841 4,171 61,741 65,911 94,779 28,867 9,211 58042 4,171 61,741 65,911 94,779 28,867 8,958 52743 4,171 61,741 65,911 94,779 28,867 8,712 47944 4,171 61,741 65,911 94,779 28,867 8,473 43645 4,171 61,741 65,911 94,779 28,867 8,240 39646 4,171 61,741 65,911 94,779 28,867 8,014 36047 4,171 61,741 65,911 94,779 28,867 7,793 32748 4,171 61,741 65,911 94,779 28,867 7,579 29849 4,171 61,741 65,911 94,779 28,867 7,371 27050 4,171 61,741 65,911 94,779 28,867 7,169 246
IRR = 2.8% 0 -464,148
Cash Outflow Net CashFlow
NPV disc@IRR
NPV disc@10%
Electric Power Development Co., Ltd. 11-14
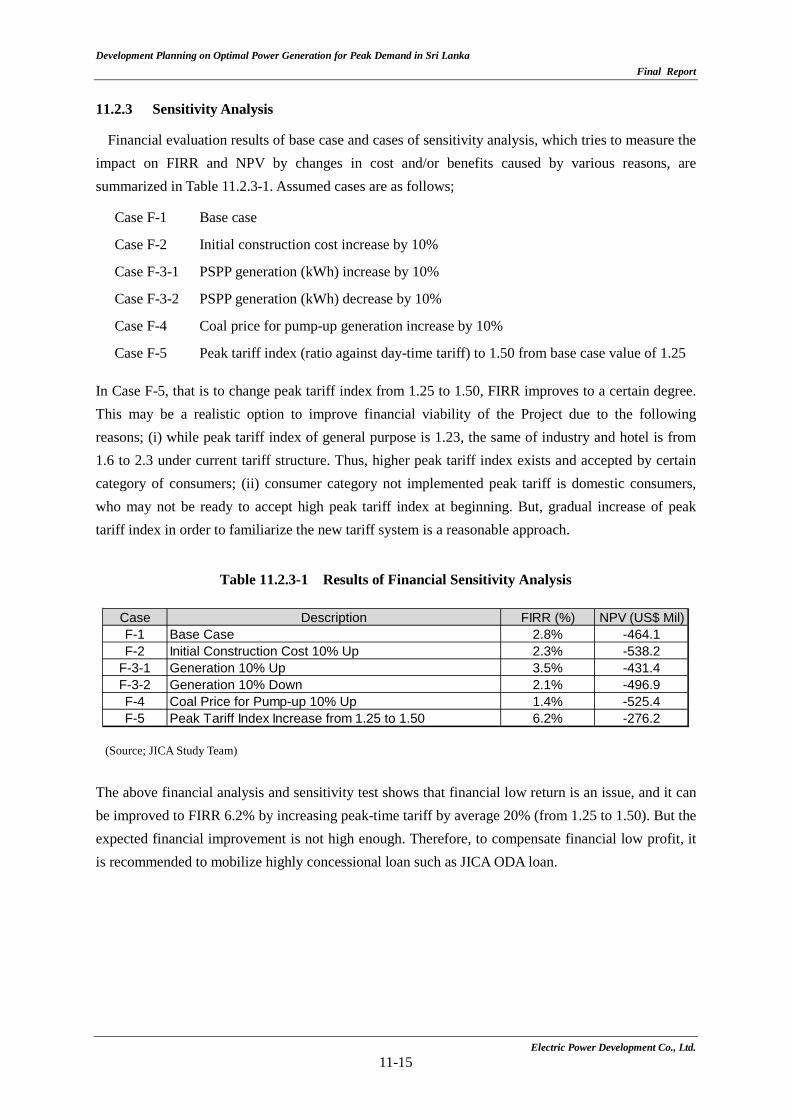
Development Planning on Optimal Power Generation for Peak Demand in Sri Lanka Final Report
11.2.3 Sensitivity Analysis
Financial evaluation results of base case and cases of sensitivity analysis, which tries to measure the impact on FIRR and NPV by changes in cost and/or benefits caused by various reasons, are summarized in Table 11.2.3-1. Assumed cases are as follows;
Case F-1 Base case
Case F-2 Initial construction cost increase by 10%
Case F-3-1 PSPP generation (kWh) increase by 10%
Case F-3-2 PSPP generation (kWh) decrease by 10%
Case F-4 Coal price for pump-up generation increase by 10%
Case F-5 Peak tariff index (ratio against day-time tariff) to 1.50 from base case value of 1.25 In Case F-5, that is to change peak tariff index from 1.25 to 1.50, FIRR improves to a certain degree. This may be a realistic option to improve financial viability of the Project due to the following reasons; (i) while peak tariff index of general purpose is 1.23, the same of industry and hotel is from 1.6 to 2.3 under current tariff structure. Thus, higher peak tariff index exists and accepted by certain category of consumers; (ii) consumer category not implemented peak tariff is domestic consumers, who may not be ready to accept high peak tariff index at beginning. But, gradual increase of peak tariff index in order to familiarize the new tariff system is a reasonable approach.
Table 11.2.3-1 Results of Financial Sensitivity Analysis
(Source; JICA Study Team) The above financial analysis and sensitivity test shows that financial low return is an issue, and it can be improved to FIRR 6.2% by increasing peak-time tariff by average 20% (from 1.25 to 1.50). But the expected financial improvement is not high enough. Therefore, to compensate financial low profit, it is recommended to mobilize highly concessional loan such as JICA ODA loan.
Case Description FIRR (%) NPV (US$ Mil)F-1 Base Case 2.8% -464.1F-2 Initial Construction Cost 10% Up 2.3% -538.2
F-3-1 Generation 10% Up 3.5% -431.4F-3-2 Generation 10% Down 2.1% -496.9F-4 Coal Price for Pump-up 10% Up 1.4% -525.4F-5 Peak Tariff Index Increase from 1.25 to 1.50 6.2% -276.2
Electric Power Development Co., Ltd. 11-15

Chapter 12
Conclusion and Recommendation
Development Planning on Optimal Power Generation for Peak Demand in Sri Lanka
Final Report
Table of Contents
Chapter 12 Conclusion and Recommendation
12.1 Conclusion ........................................................................................................................ 12-1 12.1.1 Necessity of Project ............................................................................................. 12-1 12.1.2 Outline of the Most Promising Site ..................................................................... 12-2 12.1.3 Geology Survey ................................................................................................... 12-6 12.1.4 Construction Costs and Schedule ........................................................................ 12-9 12.1.5 Economic and Financial Evaluation .................................................................... 12-15 12.1.6 Adjustable Speed Pumped Storage System ......................................................... 12-17 12.1.7 Conclusions of Studied Subjects.......................................................................... 12-19
12.2 Recommendations ............................................................................................................ 12-26 12.2.1 Project Implementation Plan ................................................................................ 12-27 12.2.2 Recommendation for the Next Stage Study ......................................................... 12-28
List of Tables
Table 12.1.2-1 General Features of Maha 3 Scheme .................................................................... 12-4 Table 12.1.2-2 Summary of Major Parameters of Pump-turbine, Generator-Motor .................... 12-5 Table 12.1.3-1 The details of Topography and Geology Survey (phase 1) .................................. 12-7 Table 12.1.3-2 The details of Topography and Geology Survey (phase 2) .................................. 12-7 Table 12.1.4-1 Maha 3 Construction Costs .................................................................................. 12-10 Table 12.1.4-2 Maha 3 Construction Costs (Variable-speed one unit) ......................................... 12-10 Table 12.1.5-1 Results of Economic Sensitivity Analysis ............................................................ 12-15 Table 12.1.5-2 Results of Financial Sensitivity Analysis ............................................................. 12-16 Table 12.1.7-1 Ranking Summary of Options .............................................................................. 12-20 Table 12.1.7-2 Result of Scoring and Ranking ............................................................................. 12-22
List of Figures
Figure 12.1.2-1 Location of Maha 3 Site ....................................................................................... 12-2 Figure 12.1.2-2 Flowchart of Pumped Storage Scheme Review ................................................... 12-3 Figure 12.1.4-1 Maha 3 Construction Schedule ............................................................................ 12-13 Figure 12.1.6-1 Pump-turbine Efficiency Characteristics .............................................................. 12-18 Figure 12.2.1-1 Draft Overall Implementation Schedule of Development of PSPP in Sri
Lanka .................................................................................................................... 12-28 Figure 12.2.2-1 Relationship among Equivalent Peaking Duration, Construction Costs, and
EIRR ..................................................................................................................... 12-33
Electric Power Development Co., Ltd.
12-i
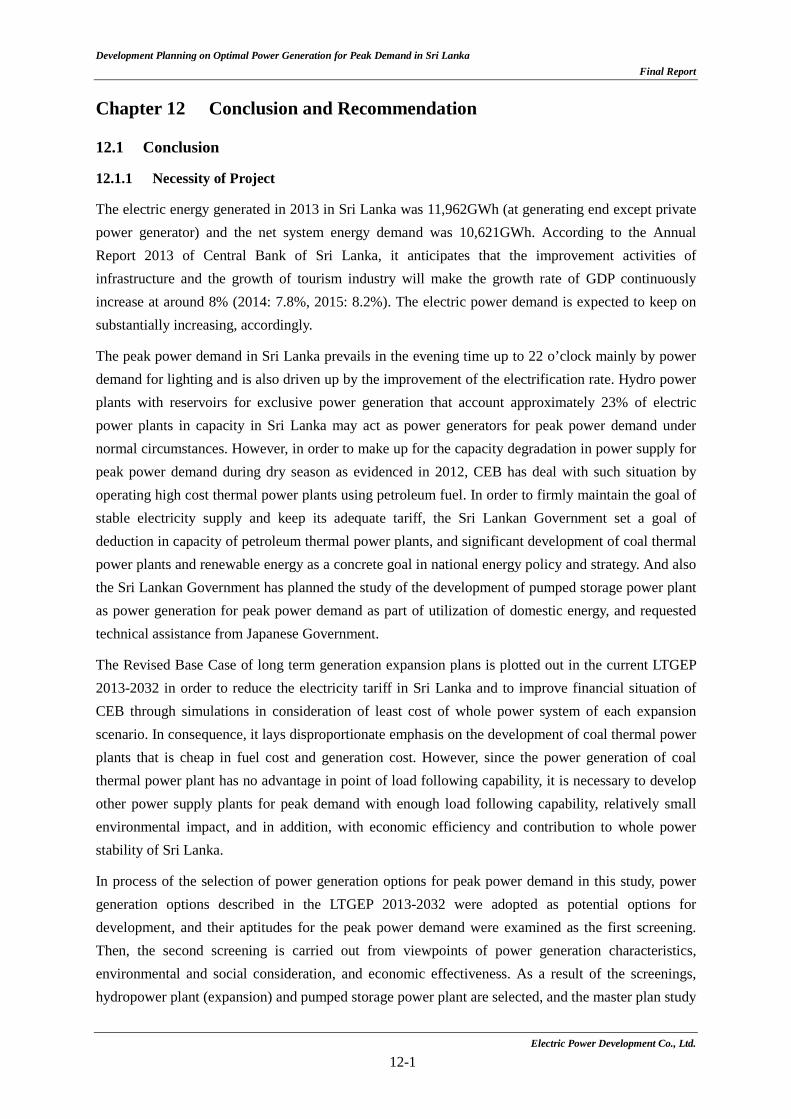
Development Planning on Optimal Power Generation for Peak Demand in Sri Lanka
Final Report
Chapter 12 Conclusion and Recommendation
12.1 Conclusion
12.1.1 Necessity of Project
The electric energy generated in 2013 in Sri Lanka was 11,962GWh (at generating end except private power generator) and the net system energy demand was 10,621GWh. According to the Annual Report 2013 of Central Bank of Sri Lanka, it anticipates that the improvement activities of infrastructure and the growth of tourism industry will make the growth rate of GDP continuously increase at around 8% (2014: 7.8%, 2015: 8.2%). The electric power demand is expected to keep on substantially increasing, accordingly.
The peak power demand in Sri Lanka prevails in the evening time up to 22 o’clock mainly by power demand for lighting and is also driven up by the improvement of the electrification rate. Hydro power plants with reservoirs for exclusive power generation that account approximately 23% of electric power plants in capacity in Sri Lanka may act as power generators for peak power demand under normal circumstances. However, in order to make up for the capacity degradation in power supply for peak power demand during dry season as evidenced in 2012, CEB has deal with such situation by operating high cost thermal power plants using petroleum fuel. In order to firmly maintain the goal of stable electricity supply and keep its adequate tariff, the Sri Lankan Government set a goal of deduction in capacity of petroleum thermal power plants, and significant development of coal thermal power plants and renewable energy as a concrete goal in national energy policy and strategy. And also the Sri Lankan Government has planned the study of the development of pumped storage power plant as power generation for peak power demand as part of utilization of domestic energy, and requested technical assistance from Japanese Government.
The Revised Base Case of long term generation expansion plans is plotted out in the current LTGEP 2013-2032 in order to reduce the electricity tariff in Sri Lanka and to improve financial situation of CEB through simulations in consideration of least cost of whole power system of each expansion scenario. In consequence, it lays disproportionate emphasis on the development of coal thermal power plants that is cheap in fuel cost and generation cost. However, since the power generation of coal thermal power plant has no advantage in point of load following capability, it is necessary to develop other power supply plants for peak demand with enough load following capability, relatively small environmental impact, and in addition, with economic efficiency and contribution to whole power stability of Sri Lanka.
In process of the selection of power generation options for peak power demand in this study, power generation options described in the LTGEP 2013-2032 were adopted as potential options for development, and their aptitudes for the peak power demand were examined as the first screening. Then, the second screening is carried out from viewpoints of power generation characteristics, environmental and social consideration, and economic effectiveness. As a result of the screenings, hydropower plant (expansion) and pumped storage power plant are selected, and the master plan study
Electric Power Development Co., Ltd.
12-1
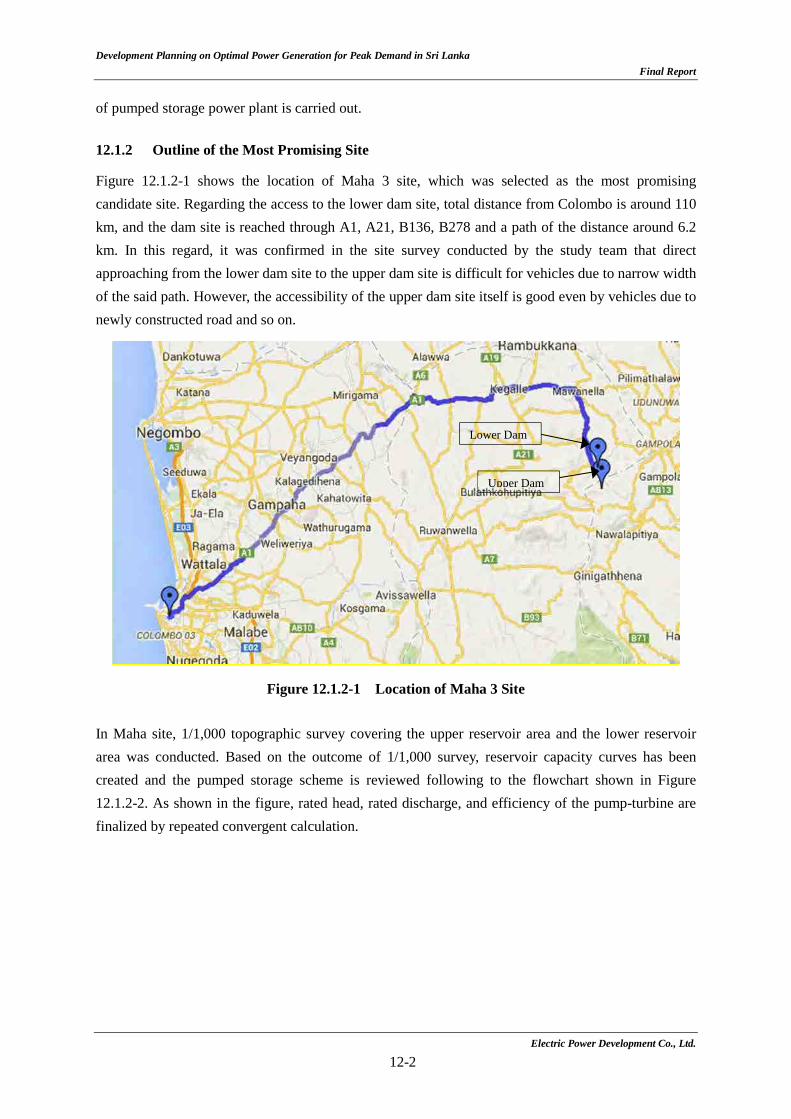
Development Planning on Optimal Power Generation for Peak Demand in Sri Lanka
Final Report
of pumped storage power plant is carried out. 12.1.2 Outline of the Most Promising Site
Figure 12.1.2-1 shows the location of Maha 3 site, which was selected as the most promising candidate site. Regarding the access to the lower dam site, total distance from Colombo is around 110 km, and the dam site is reached through A1, A21, B136, B278 and a path of the distance around 6.2 km. In this regard, it was confirmed in the site survey conducted by the study team that direct approaching from the lower dam site to the upper dam site is difficult for vehicles due to narrow width of the said path. However, the accessibility of the upper dam site itself is good even by vehicles due to newly constructed road and so on.
Figure 12.1.2-1 Location of Maha 3 Site
In Maha site, 1/1,000 topographic survey covering the upper reservoir area and the lower reservoir area was conducted. Based on the outcome of 1/1,000 survey, reservoir capacity curves has been created and the pumped storage scheme is reviewed following to the flowchart shown in Figure 12.1.2-2. As shown in the figure, rated head, rated discharge, and efficiency of the pump-turbine are finalized by repeated convergent calculation.
Lower Dam
Upper Dam
Electric Power Development Co., Ltd.
12-2
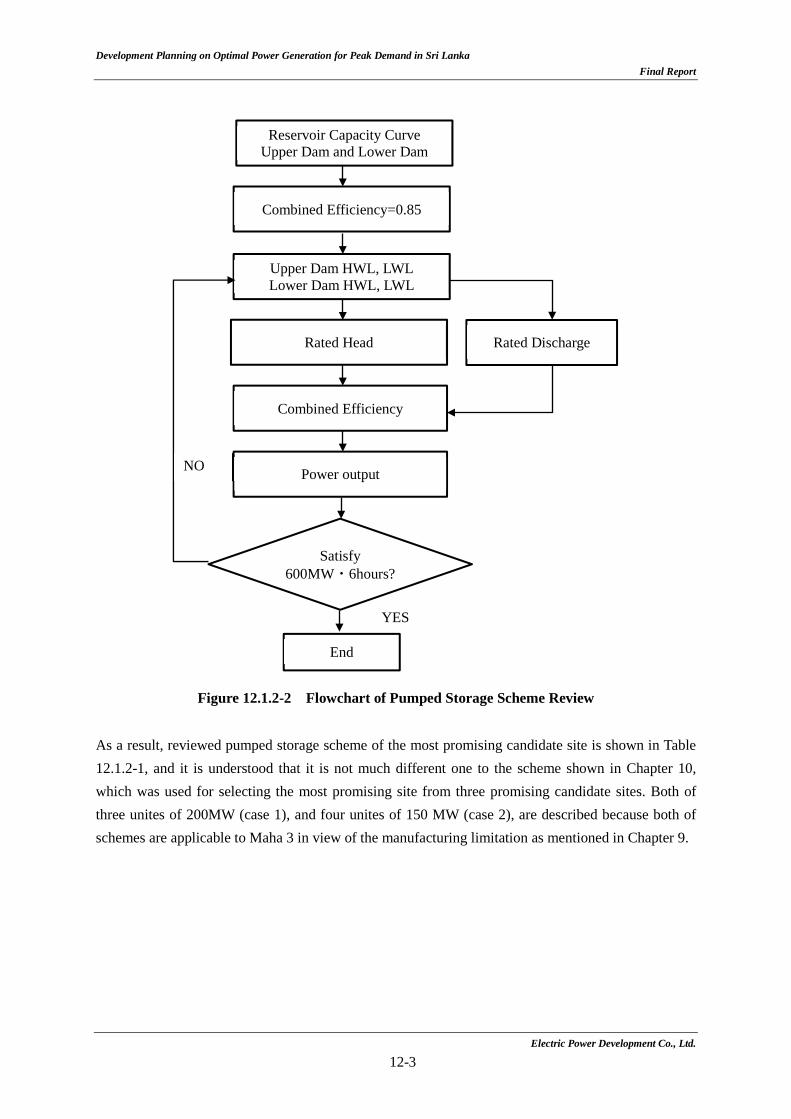
Development Planning on Optimal Power Generation for Peak Demand in Sri Lanka
Final Report
Figure 12.1.2-2 Flowchart of Pumped Storage Scheme Review As a result, reviewed pumped storage scheme of the most promising candidate site is shown in Table 12.1.2-1, and it is understood that it is not much different one to the scheme shown in Chapter 10, which was used for selecting the most promising site from three promising candidate sites. Both of three unites of 200MW (case 1), and four unites of 150 MW (case 2), are described because both of schemes are applicable to Maha 3 in view of the manufacturing limitation as mentioned in Chapter 9.
Reservoir Capacity Curve Upper Dam and Lower Dam
Upper Dam HWL, LWL Lower Dam HWL, LWL
Rated Head
Combined Efficiency
End
Power output
Satisfy 600MW・6hours?
Rated Discharge
YES
NO
Combined Efficiency=0.85
Electric Power Development Co., Ltd.
12-3
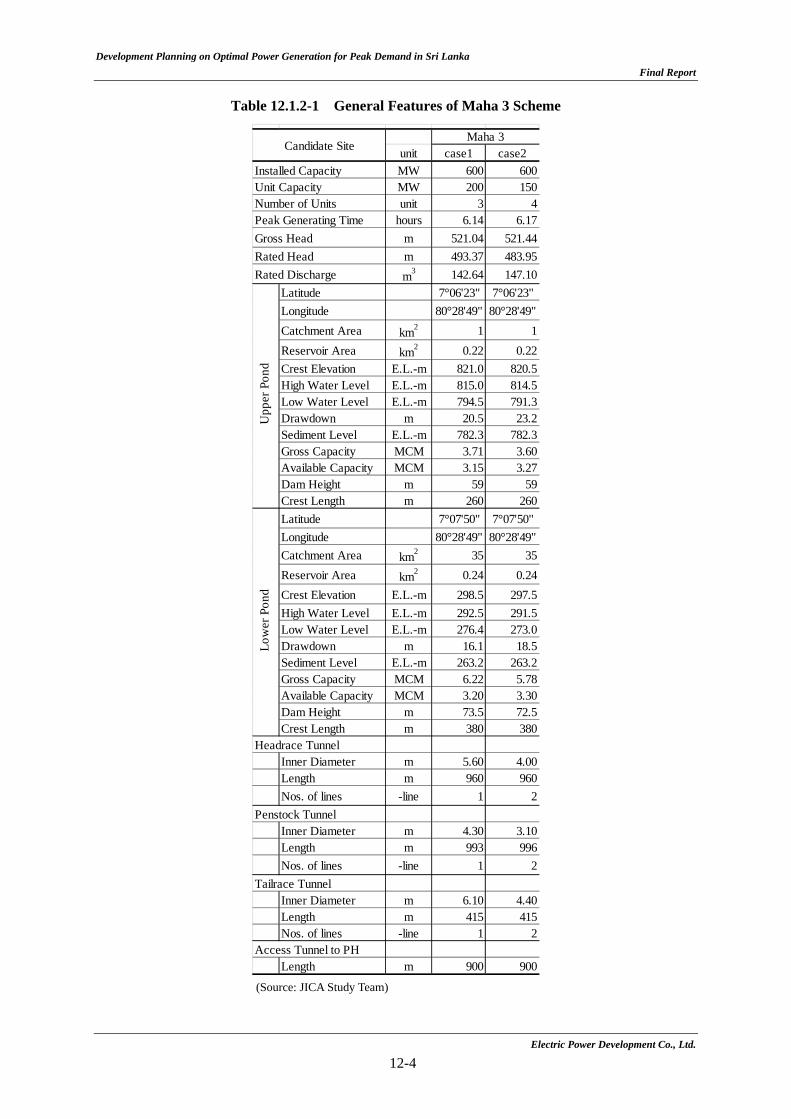
Development Planning on Optimal Power Generation for Peak Demand in Sri Lanka
Final Report
Electric Power Development Co., Ltd.
12-4
Table 12.1.2-1 General Features of Maha 3 Scheme
(Source: JICA Study Team)
unit case1 case2Installed Capacity MW 600 600Unit Capacity MW 200 150Number of Units unit 3 4Peak Generating Time hours 6.14 6.17Gross Head m 521.04 521.44Rated Head m 493.37 483.95Rated Discharge m3 142.64 147.10
Latitude 7°06'23" 7°06'23"Longitude 80°28'49" 80°28'49"Catchment Area km2 1 1Reservoir Area km2 0.22 0.22Crest Elevation E.L.-m 821.0 820.5High Water Level E.L.-m 815.0 814.5Low Water Level E.L.-m 794.5 791.3Drawdown m 20.5 23.2Sediment Level E.L.-m 782.3 782.3Gross Capacity MCM 3.71 3.60Available Capacity MCM 3.15 3.27Dam Height m 59 59Crest Length m 260 260Latitude 7°07'50" 7°07'50"Longitude 80°28'49" 80°28'49"Catchment Area km2 35 35Reservoir Area km2 0.24 0.24Crest Elevation E.L.-m 298.5 297.5High Water Level E.L.-m 292.5 291.5Low Water Level E.L.-m 276.4 273.0Drawdown m 16.1 18.5Sediment Level E.L.-m 263.2 263.2Gross Capacity MCM 6.22 5.78Available Capacity MCM 3.20 3.30Dam Height m 73.5 72.5Crest Length m 380 380
Headrace TunnelInner Diameter m 5.60 4.00Length m 960 960Nos. of lines -line 1 2
Penstock TunnelInner Diameter m 4.30 3.10Length m 993 996Nos. of lines -line 1 2
Tailrace TunnelInner Diameter m 6.10 4.40Length m 415 415Nos. of lines -line 1 2
Access Tunnel to PHLength m 900 900
Maha 3Candidate Site
Upp
er P
ond
Low
er P
ond
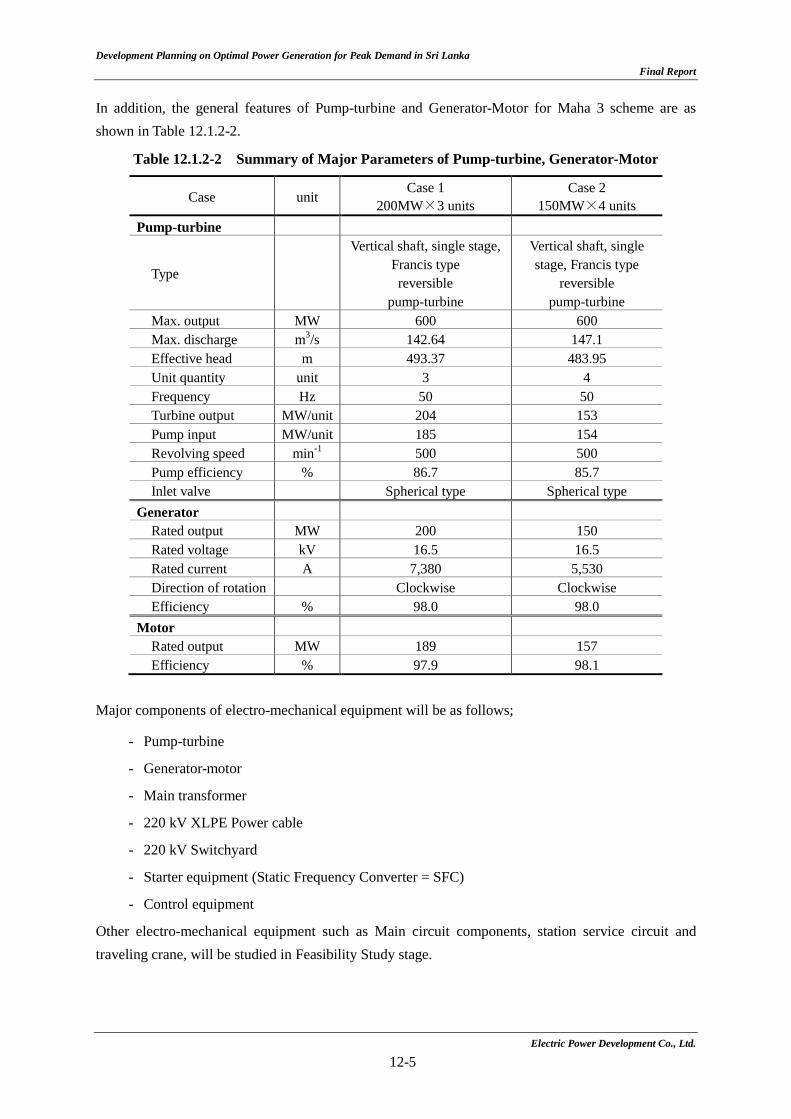
Development Planning on Optimal Power Generation for Peak Demand in Sri Lanka
Final Report
In addition, the general features of Pump-turbine and Generator-Motor for Maha 3 scheme are as shown in Table 12.1.2-2.
Table 12.1.2-2 Summary of Major Parameters of Pump-turbine, Generator-Motor
Case unit Case 1
200MW×3 units Case 2
150MW×4 units Pump-turbine
Type
Vertical shaft, single stage, Francis type reversible
pump-turbine
Vertical shaft, single stage, Francis type
reversible pump-turbine
Max. output MW 600 600 Max. discharge m3/s 142.64 147.1 Effective head m 493.37 483.95 Unit quantity unit 3 4 Frequency Hz 50 50 Turbine output MW/unit 204 153 Pump input MW/unit 185 154 Revolving speed min-1 500 500 Pump efficiency % 86.7 85.7 Inlet valve Spherical type Spherical type
Generator Rated output MW 200 150 Rated voltage kV 16.5 16.5 Rated current A 7,380 5,530 Direction of rotation Clockwise Clockwise Efficiency % 98.0 98.0
Motor Rated output MW 189 157 Efficiency % 97.9 98.1
Major components of electro-mechanical equipment will be as follows;
- Pump-turbine
- Generator-motor
- Main transformer
- 220 kV XLPE Power cable
- 220 kV Switchyard
- Starter equipment (Static Frequency Converter = SFC)
- Control equipment
Other electro-mechanical equipment such as Main circuit components, station service circuit and traveling crane, will be studied in Feasibility Study stage.
Electric Power Development Co., Ltd.
12-5
Development Planning on Optimal Power Generation for Peak Demand in Sri Lanka
Final Report
12.1.3 Geology Survey
The major interest in the geology survey in this master plan survey is to 1) conduct the investigation which contribute to the selection of the most promising site among all, and 2) reveal the geology features and risks lying the candidate sites, most likely in the most promising site Maha 3.
The procedures in geology work is
- 1st grade evaluation of 11 candidate sites for extraction of some promising sites mainly based on the existing materials available (existing geology maps, aeropohotographs, etc.).
- Geology survey (phase 1), evaluation of 3 sites for extraction of most promising site, based on mainly of surface geology survey focused on the promising 3 sites
- Geology survey (phase 2), evaluation of 1 most promising site, based on mainly of drillings.
The outcome of each evaluation has been described in detail at : “9.2.4 Each candidate site geology” to “9.6.4 Evaluation from Geological Aspects” for the 1st evaluation, “10.3.2 Geology (Maha2)”, “10.4.2 Geology (Maha3)”, and “10.5.2 Geology (Halgran 3)” for geology survey (phase1), and “Appendix 12.1, Geology evaluation of the most promising site Maha 3” for the geology survey (phase 2).
The whole work has been carried out by predetermined schedule, and because of the time restraint of the project study timeline, it was so decided that the result of the geology survey (phase 2) does not give effect on the selection of the most promising site. The selection was made on the timing when the survey (phase 1) was completed. So, rather the phase 2 survey was aimed at providing preceding information which can contribute pre FS stage study in advance, making certain if there lays no critical disadvantages with the chosen site to go forward.
In the following paragraphs the major findings in the geology survey (phase 2) are summarized. The detail data is in the Appendix 12.1.
(1) Geology survey
The subcontracted survey in this study was the topography and geology survey (phase 1) and topography and geology survey (phase2).
With regard to geology survey, the phase 1 survey consists surface geological survey, and the phase 2 survey consists drilling survey and laboratory tests. The details are shown in the table below.
Electric Power Development Co., Ltd.
12-6
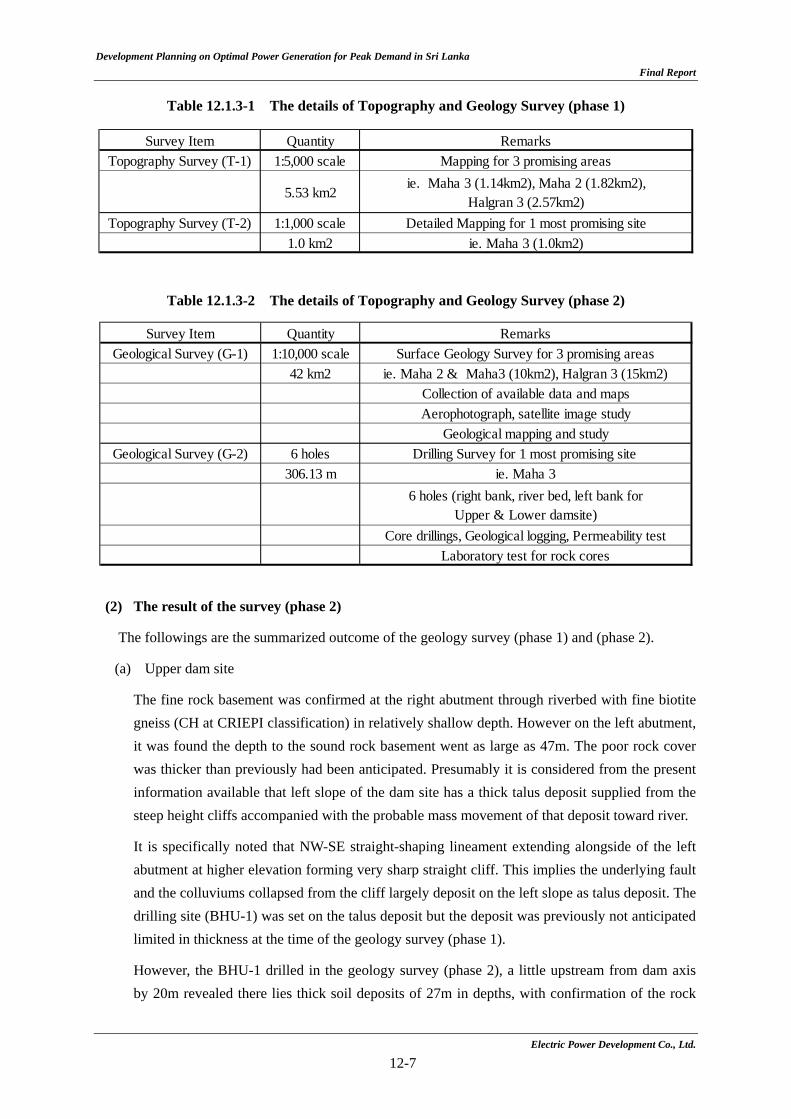
Development Planning on Optimal Power Generation for Peak Demand in Sri Lanka
Final Report
Electric Power Development Co., Ltd.
12-7
Table 12.1.3-1 The details of Topography and Geology Survey (phase 1)
Table 12.1.3-2 The details of Topography and Geology Survey (phase 2)
(2) The result of the survey (phase 2)
The followings are the summarized outcome of the geology survey (phase 1) and (phase 2).
(a) Upper dam site
The fine rock basement was confirmed at the right abutment through riverbed with fine biotite gneiss (CH at CRIEPI classification) in relatively shallow depth. However on the left abutment, it was found the depth to the sound rock basement went as large as 47m. The poor rock cover was thicker than previously had been anticipated. Presumably it is considered from the present information available that left slope of the dam site has a thick talus deposit supplied from the steep height cliffs accompanied with the probable mass movement of that deposit toward river.
It is specifically noted that NW-SE straight-shaping lineament extending alongside of the left abutment at higher elevation forming very sharp straight cliff. This implies the underlying fault and the colluviums collapsed from the cliff largely deposit on the left slope as talus deposit. The drilling site (BHU-1) was set on the talus deposit but the deposit was previously not anticipated limited in thickness at the time of the geology survey (phase 1).
However, the BHU-1 drilled in the geology survey (phase 2), a little upstream from dam axis by 20m revealed there lies thick soil deposits of 27m in depths, with confirmation of the rock
Survey Item Quantity RemarksTopography Survey (T-1) 1:5,000 scale Mapping for 3 promising areas
5.53 km2ie. Maha 3 (1.14km2), Maha 2 (1.82km2),
Halgran 3 (2.57km2)Topography Survey (T-2) 1:1,000 scale Detailed Mapping for 1 most promising site
1.0 km2 ie. Maha 3 (1.0km2)
Survey Item Quantity RemarksGeological Survey (G-1) 1:10,000 scale Surface Geology Survey for 3 promising areas
42 km2 ie. Maha 2 & Maha3 (10km2), Halgran 3 (15km2)Collection of available data and mapsAerophotograph, satellite image study
Geological mapping and studyGeological Survey (G-2) 6 holes Drilling Survey for 1 most promising site
306.13 m ie. Maha 36 holes (right bank, river bed, left bank for
Upper & Lower damsite)Core drillings, Geological logging, Permeability test
Laboratory test for rock cores
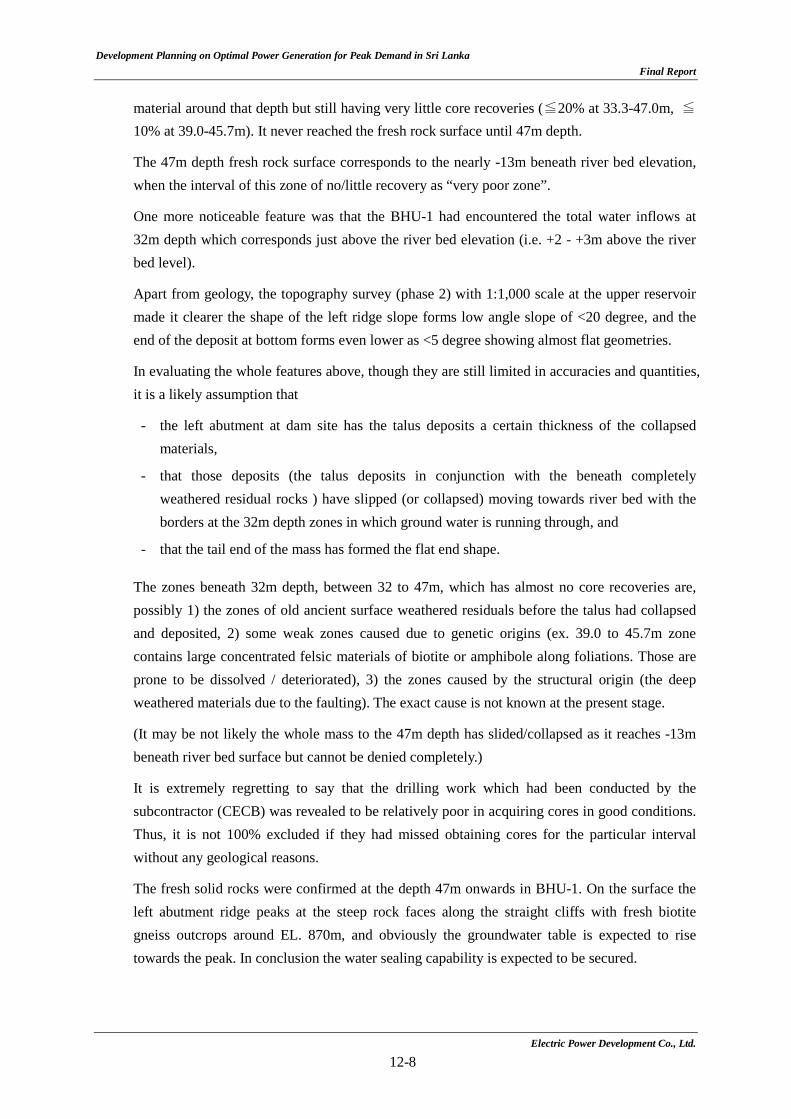
Development Planning on Optimal Power Generation for Peak Demand in Sri Lanka
Final Report
material around that depth but still having very little core recoveries (≦20% at 33.3-47.0m, ≦10% at 39.0-45.7m). It never reached the fresh rock surface until 47m depth.
The 47m depth fresh rock surface corresponds to the nearly -13m beneath river bed elevation, when the interval of this zone of no/little recovery as “very poor zone”.
One more noticeable feature was that the BHU-1 had encountered the total water inflows at 32m depth which corresponds just above the river bed elevation (i.e. +2 - +3m above the river bed level).
Apart from geology, the topography survey (phase 2) with 1:1,000 scale at the upper reservoir made it clearer the shape of the left ridge slope forms low angle slope of <20 degree, and the end of the deposit at bottom forms even lower as <5 degree showing almost flat geometries.
In evaluating the whole features above, though they are still limited in accuracies and quantities, it is a likely assumption that
- the left abutment at dam site has the talus deposits a certain thickness of the collapsed materials,
- that those deposits (the talus deposits in conjunction with the beneath completely weathered residual rocks ) have slipped (or collapsed) moving towards river bed with the borders at the 32m depth zones in which ground water is running through, and
- that the tail end of the mass has formed the flat end shape.
The zones beneath 32m depth, between 32 to 47m, which has almost no core recoveries are, possibly 1) the zones of old ancient surface weathered residuals before the talus had collapsed and deposited, 2) some weak zones caused due to genetic origins (ex. 39.0 to 45.7m zone contains large concentrated felsic materials of biotite or amphibole along foliations. Those are prone to be dissolved / deteriorated), 3) the zones caused by the structural origin (the deep weathered materials due to the faulting). The exact cause is not known at the present stage.
(It may be not likely the whole mass to the 47m depth has slided/collapsed as it reaches -13m beneath river bed surface but cannot be denied completely.)
It is extremely regretting to say that the drilling work which had been conducted by the subcontractor (CECB) was revealed to be relatively poor in acquiring cores in good conditions. Thus, it is not 100% excluded if they had missed obtaining cores for the particular interval without any geological reasons.
The fresh solid rocks were confirmed at the depth 47m onwards in BHU-1. On the surface the left abutment ridge peaks at the steep rock faces along the straight cliffs with fresh biotite gneiss outcrops around EL. 870m, and obviously the groundwater table is expected to rise towards the peak. In conclusion the water sealing capability is expected to be secured.
Electric Power Development Co., Ltd.
12-8
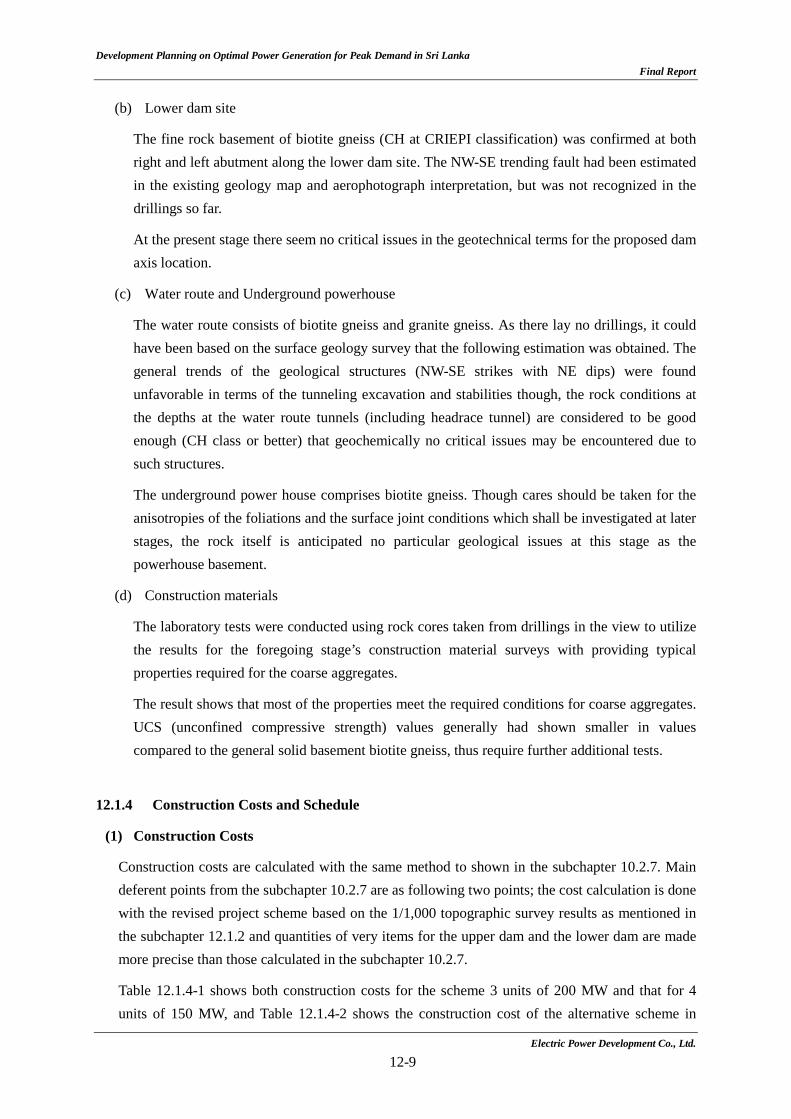
Development Planning on Optimal Power Generation for Peak Demand in Sri Lanka
Final Report
(b) Lower dam site
The fine rock basement of biotite gneiss (CH at CRIEPI classification) was confirmed at both right and left abutment along the lower dam site. The NW-SE trending fault had been estimated in the existing geology map and aerophotograph interpretation, but was not recognized in the drillings so far.
At the present stage there seem no critical issues in the geotechnical terms for the proposed dam axis location.
(c) Water route and Underground powerhouse
The water route consists of biotite gneiss and granite gneiss. As there lay no drillings, it could have been based on the surface geology survey that the following estimation was obtained. The general trends of the geological structures (NW-SE strikes with NE dips) were found unfavorable in terms of the tunneling excavation and stabilities though, the rock conditions at the depths at the water route tunnels (including headrace tunnel) are considered to be good enough (CH class or better) that geochemically no critical issues may be encountered due to such structures.
The underground power house comprises biotite gneiss. Though cares should be taken for the anisotropies of the foliations and the surface joint conditions which shall be investigated at later stages, the rock itself is anticipated no particular geological issues at this stage as the powerhouse basement.
(d) Construction materials
The laboratory tests were conducted using rock cores taken from drillings in the view to utilize the results for the foregoing stage’s construction material surveys with providing typical properties required for the coarse aggregates.
The result shows that most of the properties meet the required conditions for coarse aggregates. UCS (unconfined compressive strength) values generally had shown smaller in values compared to the general solid basement biotite gneiss, thus require further additional tests.
12.1.4 Construction Costs and Schedule
(1) Construction Costs
Construction costs are calculated with the same method to shown in the subchapter 10.2.7. Main deferent points from the subchapter 10.2.7 are as following two points; the cost calculation is done with the revised project scheme based on the 1/1,000 topographic survey results as mentioned in the subchapter 12.1.2 and quantities of very items for the upper dam and the lower dam are made more precise than those calculated in the subchapter 10.2.7.
Table 12.1.4-1 shows both construction costs for the scheme 3 units of 200 MW and that for 4 units of 150 MW, and Table 12.1.4-2 shows the construction cost of the alternative scheme in
Electric Power Development Co., Ltd.
12-9
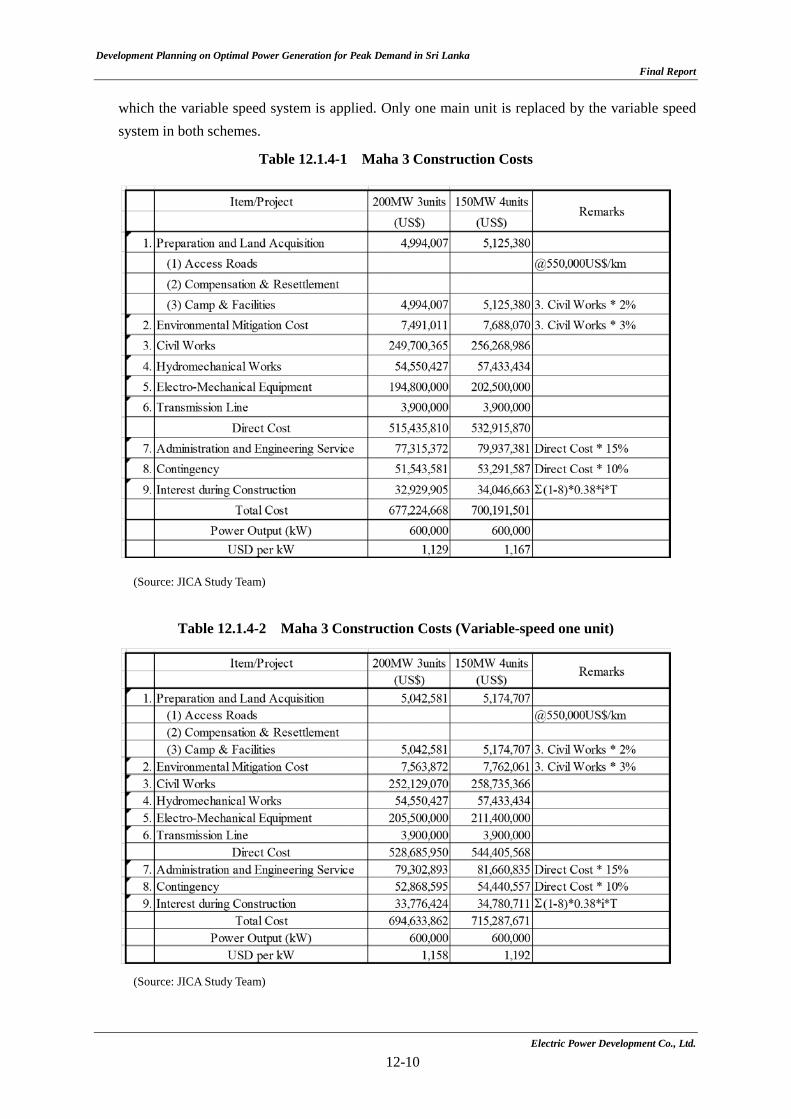
Development Planning on Optimal Power Generation for Peak Demand in Sri Lanka
Final Report
which the variable speed system is applied. Only one main unit is replaced by the variable speed system in both schemes.
Table 12.1.4-1 Maha 3 Construction Costs
(Source: JICA Study Team)
Table 12.1.4-2 Maha 3 Construction Costs (Variable-speed one unit)
(Source: JICA Study Team)
Electric Power Development Co., Ltd.
12-10

Development Planning on Optimal Power Generation for Peak Demand in Sri Lanka
Final Report
(2) Construction Schedule
The construction schedule is shown in Figure 12.1.4-1, which is estimated with the quantities of civil works items calculated for the construction cost estimation of 3 unit of 200 MW scheme. In this schedule, it is assumed that the dam embankment work is suspended from April to May and from October to December considering rainfall in those seasons.
It is identified that the critical path is works in underground powerhouse, and it takes 60 months from the starting of access tunnel excavation to the final commissioning test for unit No. 3. As for the penstock tunnel, 4 excavation faces are to be set in order to complete in the said period.
Electric Power Development Co., Ltd.
12-11
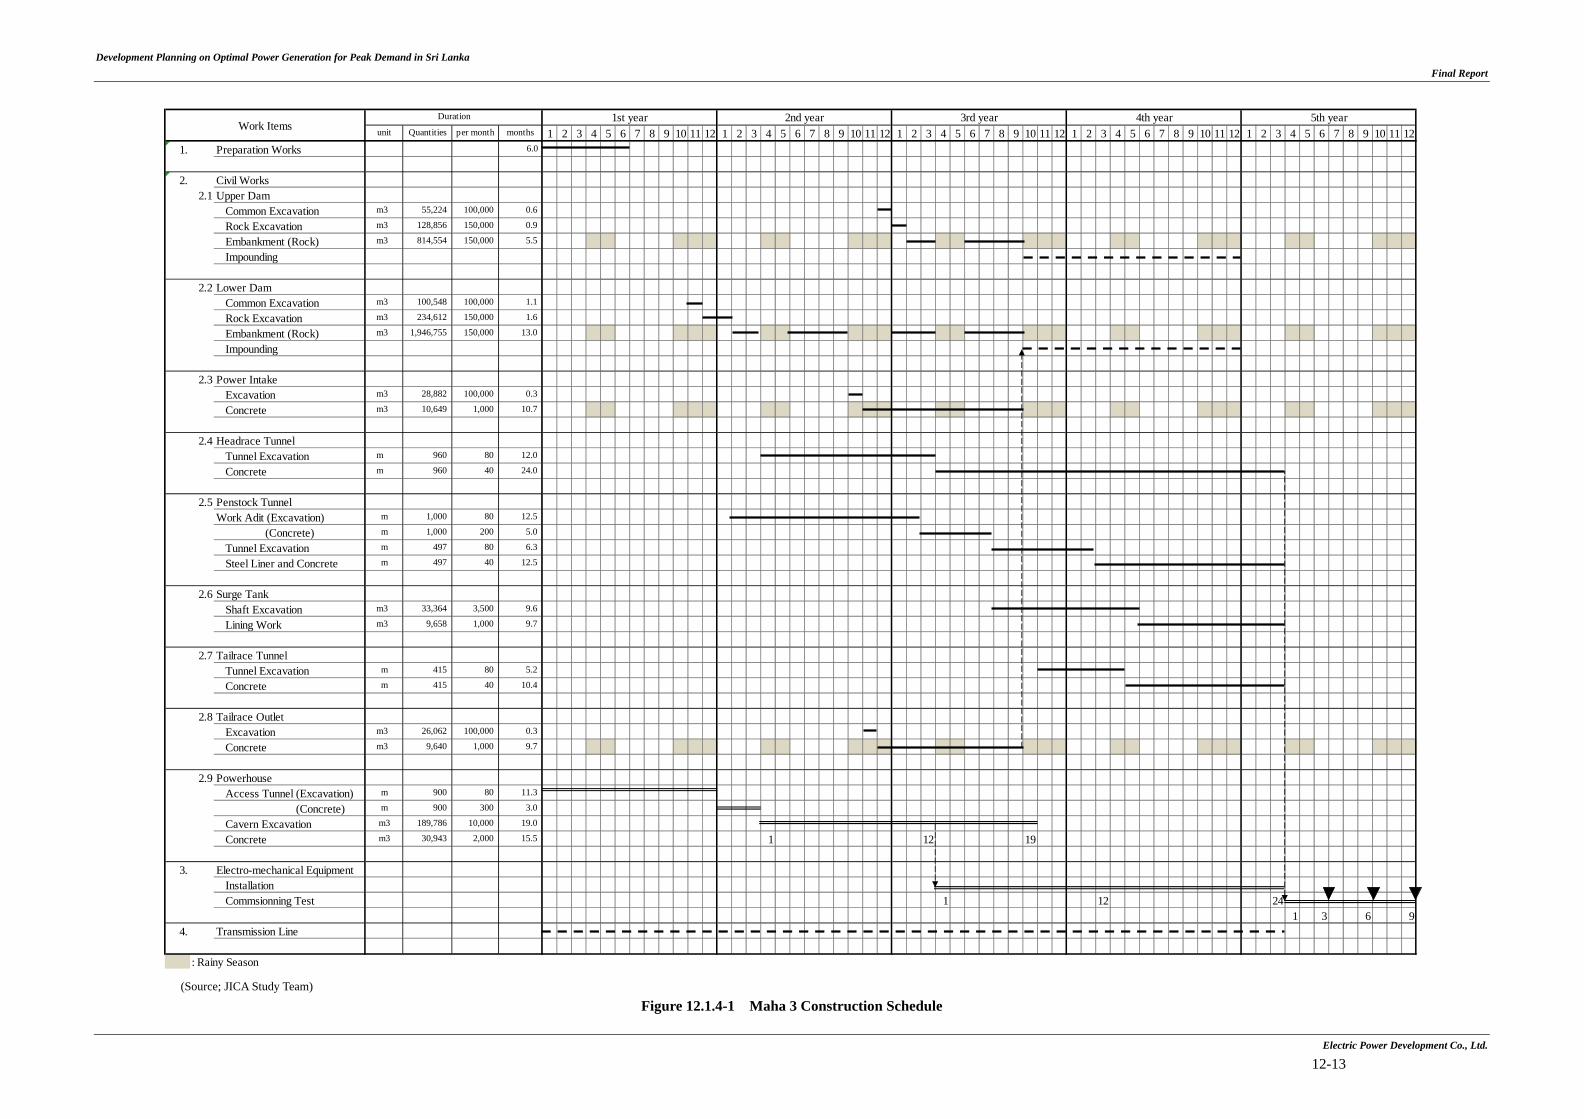
Development Planning on Optimal Power Generation for Peak Demand in Sri Lanka
Final Report
Electric Power Development Co., Ltd.
12-13
(Source; JICA Study Team)
Figure 12.1.4-1 Maha 3 Construction Schedule
unit Quantities per month months 1 2 3 4 5 6 7 8 9 10 11 12 1 2 3 4 5 6 7 8 9 10 11 12 1 2 3 4 5 6 7 8 9 10 11 12 1 2 3 4 5 6 7 8 9 10 11 12 1 2 3 4 5 6 7 8 9 10 11 121. Preparation Works 6.0
2. Civil Works2.1 Upper Dam
Common Excavation m3 55,224 100,000 0.6
Rock Excavation m3 128,856 150,000 0.9
Embankment (Rock) m3 814,554 150,000 5.5
Impounding
2.2 Lower DamCommon Excavation m3 100,548 100,000 1.1
Rock Excavation m3 234,612 150,000 1.6
Embankment (Rock) m3 1,946,755 150,000 13.0
Impounding
2.3 Power IntakeExcavation m3 28,882 100,000 0.3
Concrete m3 10,649 1,000 10.7
2.4 Headrace TunnelTunnel Excavation m 960 80 12.0
Concrete m 960 40 24.0
2.5 Penstock TunnelWork Adit (Excavation) m 1,000 80 12.5
(Concrete) m 1,000 200 5.0
Tunnel Excavation m 497 80 6.3
Steel Liner and Concrete m 497 40 12.5
2.6 Surge TankShaft Excavation m3 33,364 3,500 9.6
Lining Work m3 9,658 1,000 9.7
2.7 Tailrace TunnelTunnel Excavation m 415 80 5.2
Concrete m 415 40 10.4
2.8 Tailrace OutletExcavation m3 26,062 100,000 0.3
Concrete m3 9,640 1,000 9.7
2.9 PowerhouseAccess Tunnel (Excavation) m 900 80 11.3
(Concrete) m 900 300 3.0
Cavern Excavation m3 189,786 10,000 19.0
Concrete m3 30,943 2,000 15.5 1 12 19
3. Electro-mechanical EquipmentInstallationCommsionning Test 1 12 24
1 3 6 94. Transmission Line
: Rainy Season
5th yearWork Items
Duration 1st year 2nd year 3rd year 4th year

Development Planning on Optimal Power Generation for Peak Demand in Sri Lanka
Final Report
12.1.5 Economic and Financial Evaluation
(1) Economic Analysis
Economic evaluation was conducted from a viewpoint of national economy for the optimum project plan identified in this study, by using Economic Internal Rate of Return (EIRR) and Net Present Value (NPV).
Base Case Cost (economic price) - Initial investment cost US$ 621,100,000 - Replacement investment cost US$ 240,374,000 - Annual O&M cost US$ 4,171,000/year - Annual water pump-up cost by coal US$ 61,741,000/year (for 600GWh generation)
Base Case Benefit (saved gas-turbine generation cost, economic price) - Gas-turbine initial investment cost US$ 1,077,009,000 (total of 3 times in 50 year) - Annual O&M cost US$ 4,328,000/year - Fuel cost (auto diesel) US$ 162,286,000/year
Results of economic evaluation (base case and cases of sensitivity analysis, which tries to measure the impact on EIRR and NPV by changes in cost and/or benefits), are summarized in Table 12.1.5-1. Assumed cases are as follows;
- Case E-1 Base case - Case E-2 Initial construction cost increase by 10% - Case E-3-1 PSPP generation (kWh) increase by 10% - Case E-3-2 PSPP generation (kWh) decrease by 10% - Case E-4 Coal price for pump-up generation increase by 10% - Case E-5 Diesel fuel price for alternative gas-turbine thermal decrease by 10%
Table 12.1.5-1 Results of Economic Sensitivity Analysis
Case Description EIRR (%) NPV
(US$ Mil) E-1 Base Case 21.5% 695.4 E-2 Initial Construction Cost 10% Up 19.3% 624.0
E-3-1 Generation 10% Up 22.8% 795.1 E-3-2 Generation 10% Down 20.1% 595.7 E-4 Coal Price for Pump-up 10% Up 20.7% 634.2 E-5 Fuel Price for Alternative Thermal Gas-turbine 10% Down 19.2% 534.5
(Source; JICA Study Team)
The economic internal rate of return (EIRR) is 21.5%. The EIRR exceeds 10% hurdle rate of opportunity cost of capital (10% is often used for projects in developing countries). Thus, economic viability of the Project is high from national economy’s view point. The results of
Electric Power Development Co., Ltd.
12-15
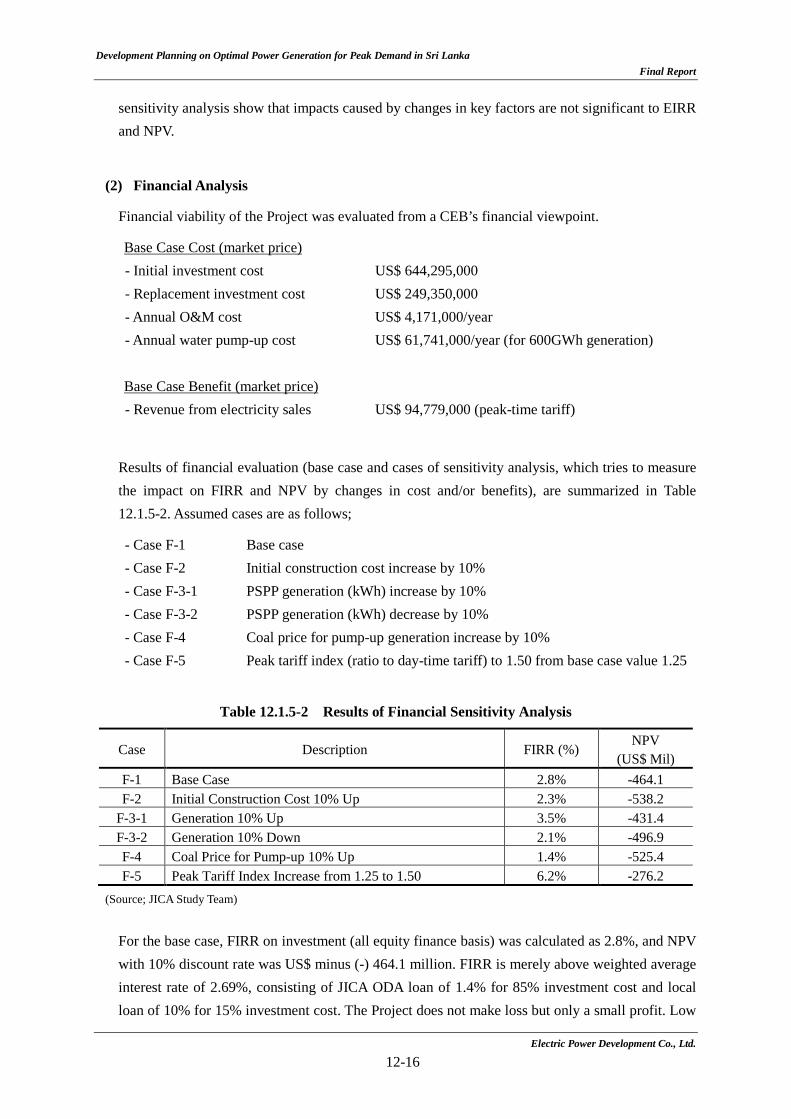
Development Planning on Optimal Power Generation for Peak Demand in Sri Lanka
Final Report
sensitivity analysis show that impacts caused by changes in key factors are not significant to EIRR and NPV.
(2) Financial Analysis
Financial viability of the Project was evaluated from a CEB’s financial viewpoint.
Base Case Cost (market price) - Initial investment cost US$ 644,295,000 - Replacement investment cost US$ 249,350,000 - Annual O&M cost US$ 4,171,000/year - Annual water pump-up cost US$ 61,741,000/year (for 600GWh generation)
Base Case Benefit (market price) - Revenue from electricity sales US$ 94,779,000 (peak-time tariff)
Results of financial evaluation (base case and cases of sensitivity analysis, which tries to measure the impact on FIRR and NPV by changes in cost and/or benefits), are summarized in Table 12.1.5-2. Assumed cases are as follows;
- Case F-1 Base case - Case F-2 Initial construction cost increase by 10% - Case F-3-1 PSPP generation (kWh) increase by 10% - Case F-3-2 PSPP generation (kWh) decrease by 10% - Case F-4 Coal price for pump-up generation increase by 10% - Case F-5 Peak tariff index (ratio to day-time tariff) to 1.50 from base case value 1.25
Table 12.1.5-2 Results of Financial Sensitivity Analysis
Case Description FIRR (%) NPV
(US$ Mil) F-1 Base Case 2.8% -464.1 F-2 Initial Construction Cost 10% Up 2.3% -538.2
F-3-1 Generation 10% Up 3.5% -431.4 F-3-2 Generation 10% Down 2.1% -496.9 F-4 Coal Price for Pump-up 10% Up 1.4% -525.4 F-5 Peak Tariff Index Increase from 1.25 to 1.50 6.2% -276.2
(Source; JICA Study Team)
For the base case, FIRR on investment (all equity finance basis) was calculated as 2.8%, and NPV with 10% discount rate was US$ minus (-) 464.1 million. FIRR is merely above weighted average interest rate of 2.69%, consisting of JICA ODA loan of 1.4% for 85% investment cost and local loan of 10% for 15% investment cost. The Project does not make loss but only a small profit. Low
Electric Power Development Co., Ltd.
12-16
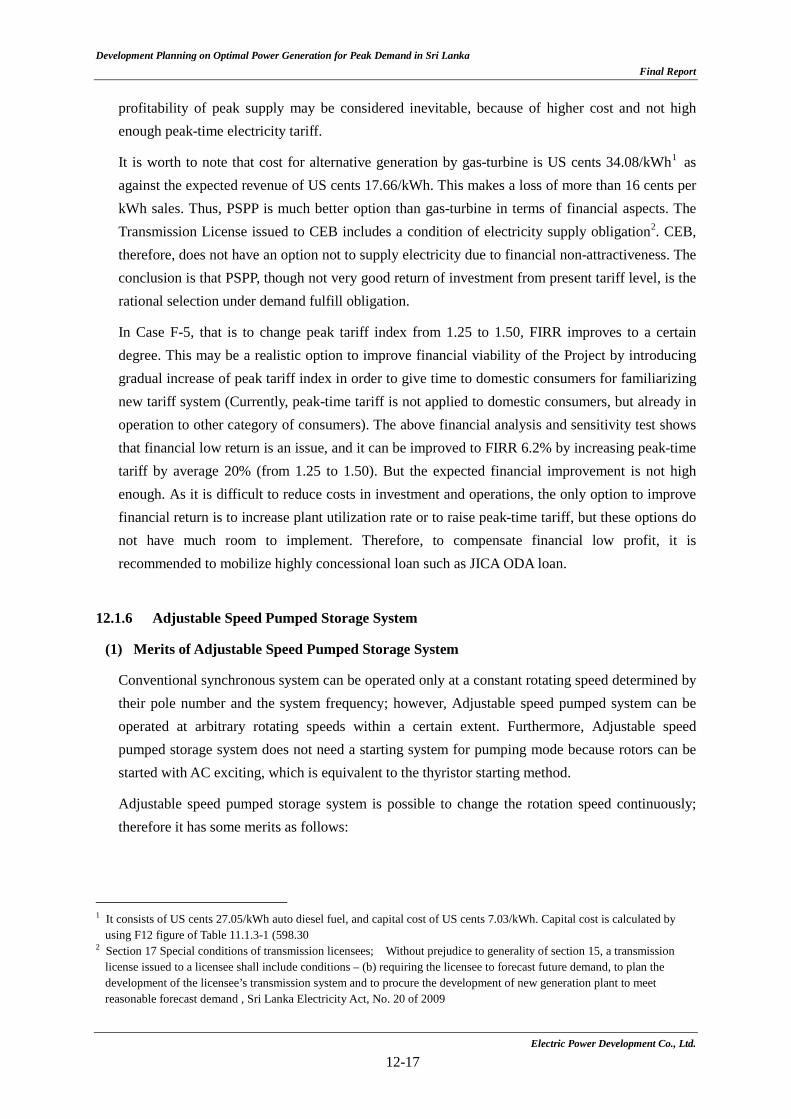
Development Planning on Optimal Power Generation for Peak Demand in Sri Lanka
Final Report
profitability of peak supply may be considered inevitable, because of higher cost and not high enough peak-time electricity tariff.
It is worth to note that cost for alternative generation by gas-turbine is US cents 34.08/kWh1 as against the expected revenue of US cents 17.66/kWh. This makes a loss of more than 16 cents per kWh sales. Thus, PSPP is much better option than gas-turbine in terms of financial aspects. The Transmission License issued to CEB includes a condition of electricity supply obligation2. CEB, therefore, does not have an option not to supply electricity due to financial non-attractiveness. The conclusion is that PSPP, though not very good return of investment from present tariff level, is the rational selection under demand fulfill obligation.
In Case F-5, that is to change peak tariff index from 1.25 to 1.50, FIRR improves to a certain degree. This may be a realistic option to improve financial viability of the Project by introducing gradual increase of peak tariff index in order to give time to domestic consumers for familiarizing new tariff system (Currently, peak-time tariff is not applied to domestic consumers, but already in operation to other category of consumers). The above financial analysis and sensitivity test shows that financial low return is an issue, and it can be improved to FIRR 6.2% by increasing peak-time tariff by average 20% (from 1.25 to 1.50). But the expected financial improvement is not high enough. As it is difficult to reduce costs in investment and operations, the only option to improve financial return is to increase plant utilization rate or to raise peak-time tariff, but these options do not have much room to implement. Therefore, to compensate financial low profit, it is recommended to mobilize highly concessional loan such as JICA ODA loan.
12.1.6 Adjustable Speed Pumped Storage System
(1) Merits of Adjustable Speed Pumped Storage System
Conventional synchronous system can be operated only at a constant rotating speed determined by their pole number and the system frequency; however, Adjustable speed pumped system can be operated at arbitrary rotating speeds within a certain extent. Furthermore, Adjustable speed pumped storage system does not need a starting system for pumping mode because rotors can be started with AC exciting, which is equivalent to the thyristor starting method.
Adjustable speed pumped storage system is possible to change the rotation speed continuously; therefore it has some merits as follows:
1 It consists of US cents 27.05/kWh auto diesel fuel, and capital cost of US cents 7.03/kWh. Capital cost is calculated by using F12 figure of Table 11.1.3-1 (598.30
2 Section 17 Special conditions of transmission licensees; Without prejudice to generality of section 15, a transmission license issued to a licensee shall include conditions – (b) requiring the licensee to forecast future demand, to plan the development of the licensee’s transmission system and to procure the development of new generation plant to meet reasonable forecast demand , Sri Lanka Electricity Act, No. 20 of 2009
Electric Power Development Co., Ltd.
12-17
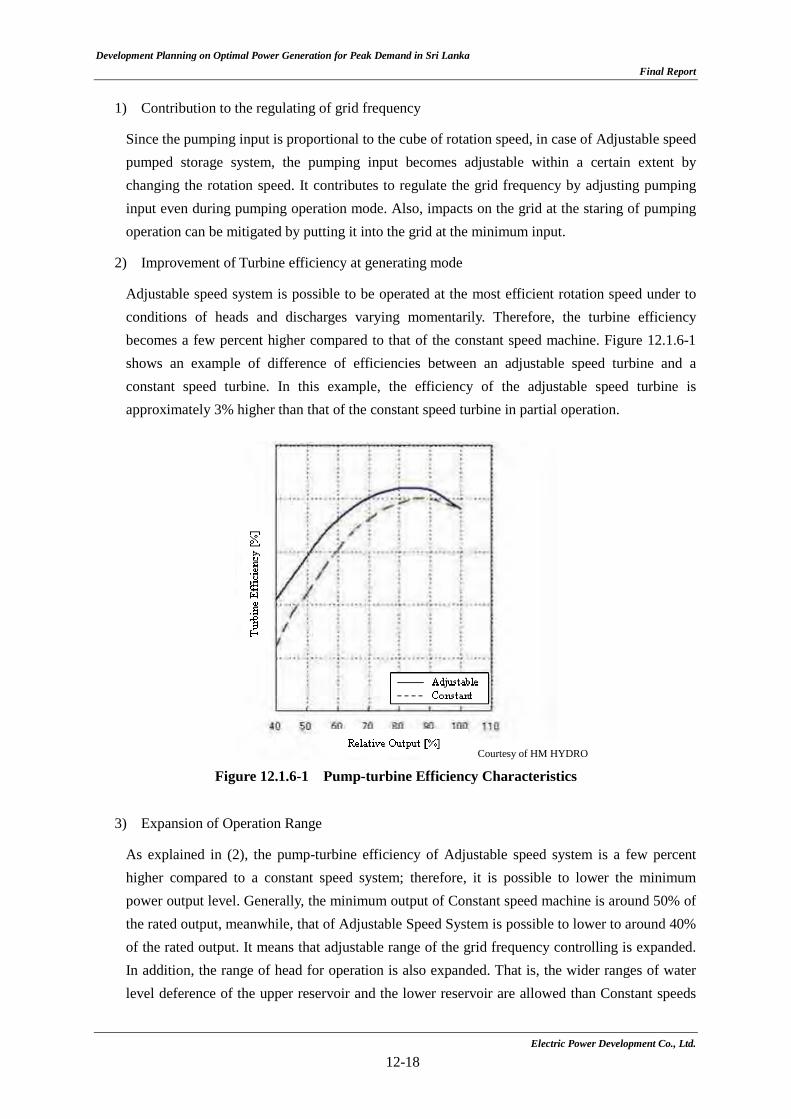
Development Planning on Optimal Power Generation for Peak Demand in Sri Lanka
Final Report
1) Contribution to the regulating of grid frequency
Since the pumping input is proportional to the cube of rotation speed, in case of Adjustable speed pumped storage system, the pumping input becomes adjustable within a certain extent by changing the rotation speed. It contributes to regulate the grid frequency by adjusting pumping input even during pumping operation mode. Also, impacts on the grid at the staring of pumping operation can be mitigated by putting it into the grid at the minimum input.
2) Improvement of Turbine efficiency at generating mode
Adjustable speed system is possible to be operated at the most efficient rotation speed under to conditions of heads and discharges varying momentarily. Therefore, the turbine efficiency becomes a few percent higher compared to that of the constant speed machine. Figure 12.1.6-1 shows an example of difference of efficiencies between an adjustable speed turbine and a constant speed turbine. In this example, the efficiency of the adjustable speed turbine is approximately 3% higher than that of the constant speed turbine in partial operation.
Figure 12.1.6-1 Pump-turbine Efficiency Characteristics
3) Expansion of Operation Range
As explained in (2), the pump-turbine efficiency of Adjustable speed system is a few percent higher compared to a constant speed system; therefore, it is possible to lower the minimum power output level. Generally, the minimum output of Constant speed machine is around 50% of the rated output, meanwhile, that of Adjustable Speed System is possible to lower to around 40% of the rated output. It means that adjustable range of the grid frequency controlling is expanded. In addition, the range of head for operation is also expanded. That is, the wider ranges of water level deference of the upper reservoir and the lower reservoir are allowed than Constant speeds
Courtesy of HM HYDRO
Electric Power Development Co., Ltd.
12-18
Development Planning on Optimal Power Generation for Peak Demand in Sri Lanka
Final Report
system. It is possible to have a longer operation time compared to Constant speed pumped storage system.
4) Improvement of Power System Stability
Internal phase of generator motor is controlled more precisely, so that it contributes to the static stability of synchronous generators on the grid. Enhancement of the dynamic (transient) stability can be expected because fluctuations of the grid is stabilized by the quick adjustment function with the exciter system.
(2) Demerits of Adjustable Speed Pumped Storage System
On the other hand, some demerits are pointed out as follows:
1) High Cost of the System
Adjustable speed system needs the wire-wounded rotor and the secondary exciting system, which is one of causes of higher costs than that of the conventional system. Furthermore, the powerhouse cavern is likely to be larger than that of the conventional system because the size of main machines becomes larger a little and some auxiliary equipment is required which is not needed for the conventional system.
2) Installation Space of System
The rotor of adjustable generator-motor is excited using three phase alternative- current, therefore it is necessary to have three phase collector ring. The collector ring for the adjustable speed machine is far bigger than that of the conventional type and the cooling equipment is generally provided for the exclusive use. From these conditions, height of the generator is higher than the conventional machine. In this regard, since the maximum height of the main hook of the overhead traveling crane is to be designed taking into consideration of the taller generator-motor. Also, more wider space for the secondary exciting system is necessary.
12.1.7 Conclusions of Studied Subjects
(1) Electric Power Demand Forecast
Average annual growth rate of power generation over the past 10 years is 4.6 % in Sri Lanka, and power generation of 2013 was recorded 11,962GWh (generating end, except self-generation). Peak demand also increases firmly with the annual growth rate over the past 10 years of 3.6%, though there were negative impacts of the electricity tariff increases.
Three peaks appear in a daily load profile; in the morning / daytime / evening. Maximum demand is recorded in the evening. There are no significant changes of the load profile in the recent years. It seems that considerable years are needed until the daytime peak demand becomes bigger than that of evening peak demand. Therefore, using current load profile for the demand forecast is appropriate if there are not substantial alterations in the national policy.
Electric Power Development Co., Ltd.
12-19
Development Planning on Optimal Power Generation for Peak Demand in Sri Lanka
Final Report
CEB conducts demand forecast using econometric analysis. Effects of a load factor improvement by the DSM, the energy saving policy, and so on are considered in the forecast; therefore, it seems reasonable to select this analysis model because the coefficient of determination is high.
There is a possibility that the actual demand will not go with the past trend if there is a change of electricity use by a progress of infrastructure development and/or by a change in the industrial structure in the future. Therefore, as a future challenge, it is desired to accumulate the hourly data of power usage of the customers by utilizing smart meters, and to create a user model for each sector based on the collected data, and then to forecast future load profile considering impact of the change of industrial structure and national development plan. In addition to this, establishment of a system, including tallying and legislation for reporting private power generation / self-consumption, is needed for the purpose of optimization study on power supply of the whole country, since there is currently no system to collect information from the private power generation and the self-consumption of large customers.
(2) Selection of Optimal Options
The first screening is conducted being subject to 8 candidate projects of power development and 3 of new policies mentioned in LTGEP 2013-2032 in order to assure reliability and objectivity for the option selection in this study. As a result, 4 power sources are selected; such as the expansion of existing hydropower station, pumped storage power projects, LNG combined cycle thermal power stations, and gas turbine thermal power stations. Subsequently, 2nd screening is conducted from 3 points of view; such as Generation characteristics, Natural & social environmental considerations, and Economic aspects. Moreover, the necessity of combination development options is also studied considering effective peak power supply.
In Chapert 8, 4 of options as the above-mentioned are evaluated from Generation charactrastics; the load folloing capacity, Natural & social environmental considerations, and Economic aspects, and the ranking of options is made as shown in Table 12.1.7-1.
Table 12.1.7-1 Ranking Summary of Options
Hydropower (Extension)
PSPP LNG CC Gas
Turbine Generation Characteristics 2 1 4 3 Natural & Social Environmental Considerations
1 2 3 3
Economic Aspect 1 2 3 4
As shown in Table 12.1.7-1, it is obvious that the expansion of existing hydropower stations option and the pumped storage option are to be selected becuase of higher ranks in every evaluation items.
Electric Power Development Co., Ltd.
12-20
Development Planning on Optimal Power Generation for Peak Demand in Sri Lanka
Final Report
As for the expansion of existing hydropower station option, Victoria hydropower expansion project is expected to be developed in the near future becuase the feasibility study and the environmental study has been already completed under JICA’s asistance . In this regard, this study is aming at projects selection to be developed after 2025 when the peak demand cannot be sustained even if Victoria expansion project is completed. Accordingly, Stage 2 and Stage 3 in this sudy, the master plan study for the pumped storage is done to deal with expanding peak demand after 2025 because those have not ever been studied in detail in spite of their high development potential.
As for the renewable energy and LNG CC, the conbination development with the pumped storage is studied.
According to “National Energy Policy” and “Mahinda Chinthana 10 year development framework”, it is aimed that 10 percents of tatal electricity is to be supplied by the renewable energy. Moreover, Sri Lankan govrnment is expecting that reliable and stable electricity can be supplied through the development of renewable enegy and Sustainable Energy Authority (SEA) was established in October, 2007. However, following problems would arise along with expanding renewable energy sources.
- Fluctuation of the power system voltage - Difficulty for keeping power system frequency stability - Excess electricity
As countermeasures for the above-mentioned problems, installation of backup power stations having a good load following capacity; such as the pumped storage and LNG CC, and/or installation of batteries is expected; although it has still rooms for improvements on its technologies and economy. As for LNG CC, it is not likely to be an economic combination because its operation has to be limited if the renewable energy is prioritized; therefore, the combination with the pumped storage power projects could be the best option.
In the future, it is expected that the combination of the pumped storage and the LNG CC would be economic power sources; although a timing of LNG CC installation has not been cleared yet.
Until LNG CC is developed, hydro-powers and IPP thermals are expected to correspond to the meddle demand; however, CEB has a policy to make IPP thermals retired step by step so as to reduce generation costs in the future. Because costs of those, particularly in case of small scale ones, is tend to be unreasonable and unstable due to rather poor efficiency performance and fluctuation of fuel costs, which is weighing on CEB’s financial condition.
Accordingly, from the view of the best mix of power sources in Sri Lanka, it is recommendable that the pumped storage takes the peak demand and LNG CC takes the middle demand.
Electric Power Development Co., Ltd.
12-21
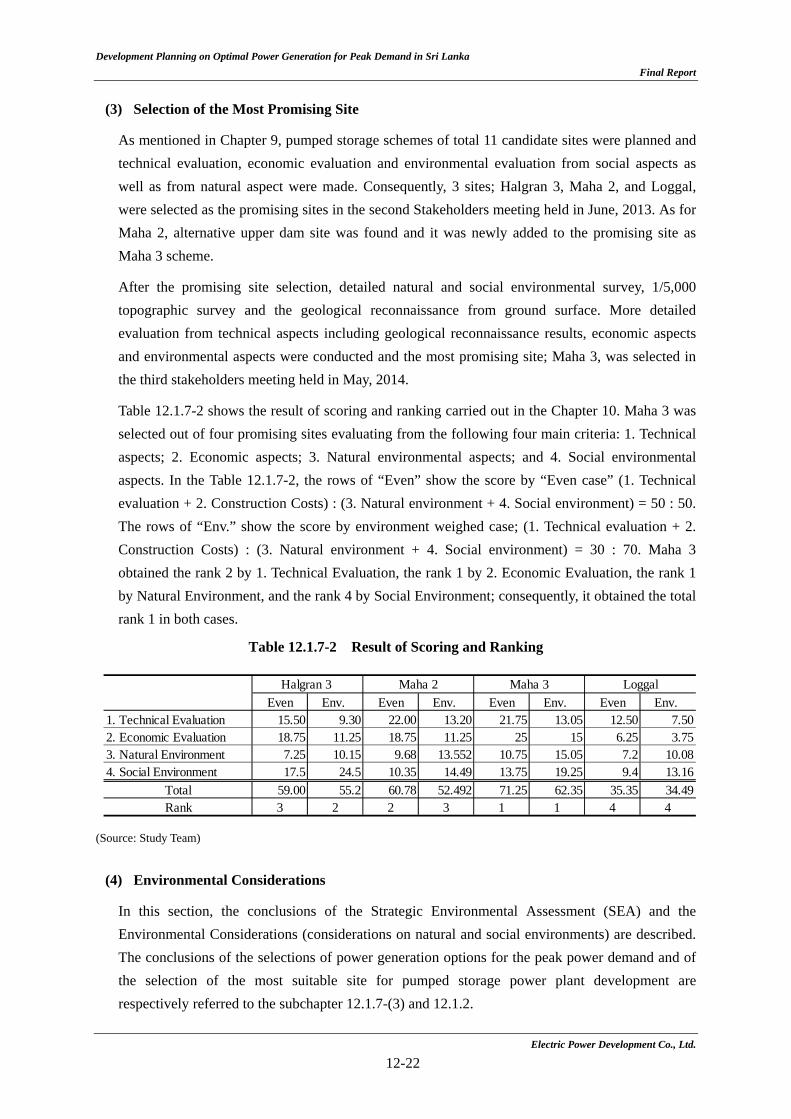
Development Planning on Optimal Power Generation for Peak Demand in Sri Lanka
Final Report
Electric Power Development Co., Ltd.
12-22
(3) Selection of the Most Promising Site
As mentioned in Chapter 9, pumped storage schemes of total 11 candidate sites were planned and technical evaluation, economic evaluation and environmental evaluation from social aspects as well as from natural aspect were made. Consequently, 3 sites; Halgran 3, Maha 2, and Loggal, were selected as the promising sites in the second Stakeholders meeting held in June, 2013. As for Maha 2, alternative upper dam site was found and it was newly added to the promising site as Maha 3 scheme.
After the promising site selection, detailed natural and social environmental survey, 1/5,000 topographic survey and the geological reconnaissance from ground surface. More detailed evaluation from technical aspects including geological reconnaissance results, economic aspects and environmental aspects were conducted and the most promising site; Maha 3, was selected in the third stakeholders meeting held in May, 2014.
Table 12.1.7-2 shows the result of scoring and ranking carried out in the Chapter 10. Maha 3 was selected out of four promising sites evaluating from the following four main criteria: 1. Technical aspects; 2. Economic aspects; 3. Natural environmental aspects; and 4. Social environmental aspects. In the Table 12.1.7-2, the rows of “Even” show the score by “Even case” (1. Technical evaluation + 2. Construction Costs) : (3. Natural environment + 4. Social environment) = 50 : 50. The rows of “Env.” show the score by environment weighed case; (1. Technical evaluation + 2. Construction Costs) : (3. Natural environment + 4. Social environment) = 30 : 70. Maha 3 obtained the rank 2 by 1. Technical Evaluation, the rank 1 by 2. Economic Evaluation, the rank 1 by Natural Environment, and the rank 4 by Social Environment; consequently, it obtained the total rank 1 in both cases.
Table 12.1.7-2 Result of Scoring and Ranking
(Source: Study Team)
(4) Environmental Considerations
In this section, the conclusions of the Strategic Environmental Assessment (SEA) and the Environmental Considerations (considerations on natural and social environments) are described. The conclusions of the selections of power generation options for the peak power demand and of the selection of the most suitable site for pumped storage power plant development are respectively referred to the subchapter 12.1.7-(3) and 12.1.2.
Even Env. Even Env. Even Env. Even Env. 1. Technical Evaluation 15.50 9.30 22.00 13.20 21.75 13.05 12.50 7.502. Economic Evaluation 18.75 11.25 18.75 11.25 25 15 6.25 3.753. Natural Environment 7.25 10.15 9.68 13.552 10.75 15.05 7.2 10.084. Social Environment 17.5 24.5 10.35 14.49 13.75 19.25 9.4 13.16
Total 59.00 55.2 60.78 52.492 71.25 62.35 35.35 34.49Rank 3 2 2 3 1 1 4 4
Halgran 3 Maha 2 Maha 3 Loggal
Development Planning on Optimal Power Generation for Peak Demand in Sri Lanka
Final Report
1) SEA (Strategic Environmental Assessment)
SEA is one of the most suitable environmental assessments at a master plan study stage. It was conducted in the Study at the following two stages; a) selecting power generation options for peak power demand, and b) selecting suitable sites for pumped storage power plant development. At each stage, a comparison study was conducted to select the most suitable one from realistic options (power generation options or plant development sites). The studies utilized technical, economic, and environmental (natural and social) criteria to compare the options.
Information of the SEA were disclosed. In the Study, three (3) Stakeholders Meetings (SHMs) were held inviting related central and local governmental organizations, NGOs and experts. At each SHM, discussions were held, the conclusions were agreed, and the comments from the participants were reflected into the plan as much as possible.
PI (Draft), Draft Scoping Table, and TOR of EIA (Draft) are attached as Appendix 12.2, Appendix 12.3, and Appendix 12.4 respectively.
2) Environmental considerations on the selection of power generation options for the peak power demand
A general and qualitative evaluation on the four (4) power generation options was conducted from 10 points of environmental considerations. The four options are hydro power extension, pumped storage PP, LNG CC PP and Gas turbine thermal PP.
In conclusion, the hydro power extension has the least impacts, and other three options are similar from the point of the environmental considerations.
3) Environmental considerations on the selection of sites for pumped storage power plant development
Pumped storage PP was selected as the power generation option. Two screenings were conducted to select the most suitable site for a precise analysis. At the first screening, 11 candidate sites were examined, and at the second, four (4) sites were examined to select the most suitable site. All examinations were conducted under technical, economic and environmental & social criteria.
The conclusions from environmental considerations are as follows.
- First screening
After site surveys were conducted at 11 sites, five (5) sites were excluded from detailed evaluation because they were technically unfeasible or upper and/or lower ponds were located in Sanctuaries (protected area). The conclusions of the six (6) sites are described as follows.
Regarding the natural environment, impacts especially on endangered species3 are expected but there are no significant differences among the sites. The important point is all sites do not fall
3 For their details, refer to “The National Red List 2012 of Sri Lanka – Conservation Status of the Fauna and Flora (Ministry of Environment, Sri Lanka, 2012)”.
Electric Power Development Co., Ltd.
12-23
Development Planning on Optimal Power Generation for Peak Demand in Sri Lanka
Final Report
into any important areas for the conservation of biological diversity such as protected areas (e.g. national park) designated by the Department of Wildlife Conservation, Forest Department and Central Environment Authority, Biosphere Reserves, World Heritage sites and IBAs. Impacts on the Ramsar sites are not expected. Regarding the social environment, impacts are expected at all sites. Maha 1 (many resettlements are expected) and Loggal (a temple needs relocation) are worse than other sites.
- Second screening
Site surveys were conducted at the selected three (3) sits and newly added Maha 3. Maha 3 does not fall into any important areas for the conservation of biological diversity such as protected areas.
Regarding the natural environment, endangered species are recorded and impacts on them are expected. Regarding the social environments, site surveys were suspended because of protest by the local people at Loggal and Maha 2 sites. Some evaluation cannot be conducted, and the examination of the two sites is less sufficient than others. At Halgran and Maha 3, all survey items were surveyed. Impacts are expected but there are not significant differences between the two sites.
Transmission line routes from the four (4) sites were examined. Regarding the natural environment, they do not go through any important areas for the conservation of biological diversity (e.g. national parks and IBAs) and are not on the migration routes of birds. Regarding the social environment, it is possible to avoid populated areas and there are not big social infrastructures on the routes. It is therefore considered that impacts are not significant and/or limited to a small scale.
(5) Stakeholders Meetings
In this study, total 3 times of the stakeholders’ meetings were held at milestones of the study to confirm their opinions and inclinations. Main agenda of every meeting are shown as follows;
1) The First Stakeholders Meeting (on June 27th, 2013, at Hilton Hotel in Colombo)
- Selection of the optimal power generation for peak power demand and of the justification of Pumped storage power plants.
- Confirmation of candidate sites of pumped storage power projects, Strategic environmental assessment (Phase 1), and its scope.
The total number of participants was 66 excluding JICA Study Team members (8 National Government agencies, and 4 NGOs). Regarding the selection of power generation options for peak demand, the participants had no objections for the process of selecting power generation option, and the evaluation methodology, and they agreed that the best option for peak demand was PSPP. The methodology for optimization process of planning of PSPP, and the draft scoping for the environmental assessment for 10 candidate sites of PSPP were accepted by the
Electric Power Development Co., Ltd.
12-24
Development Planning on Optimal Power Generation for Peak Demand in Sri Lanka
Final Report
participants. The Department of Forest and IUCN had comments for the survey and the Study Team agreed to reflect their advices to the next survey plan. Before the first stakeholders’ meeting, relevant divisional secretariats were visited and the agenda as the above-mentioned were explained to them.
2) The second Stakeholders’ Meeting (on November 22nd, 2013, at Galadari Hotel in Colombo)
- Selection of 3 promising candidate sites out of 11 candidate sites including explanation of project selection process.
- Confirmation of the selection process of the most promising site out of selected 3 promising sites
The total number of participants was 66 excluding JICA Study Team members (9 National Government Agencies including 2 Local Government Administrations, 4 NGOs, and 1 Tea Estate.) The participants agreed the primary screening results from 11 candidate sites to 3 promising sites for the PSPP development after the confirmation of the opinions by the Department of Forest, NGO (social environment) and IUCN. There was no participant against the process of the selection and evaluation. Before the second stakeholders’ meeting, the relevant local government officers were visited and the agenda of the meeting were explained. They expected to hold SHMs at their sites to explain the project to the local communities. The member of the JICA Study Team explained to them that a SHM would be held at the selected site when the detailed study was implemented as a next step.
3) The third stakeholders’ meeting (May 27th, 2014, at Galadari Hotel in Colombo)
- Selection of the most promising candidate sites out of 3 promising candidate sites including explanation of project selection process.
Confirmation of the outlines of the most promising site
The total number of participants was 77 excluding the JICA Study Team members (10 National Government Agencies including 2 Local Governments Administrations, 1 Local Government Authority, 7 NGOs, 1 Tea Estate, and 1 hydropower company). There was no objection to the methodology and the process of evaluation to select the most promising site from the 3 candidates’ sites. Comments from the participants were on the features of each site, and the JICA Study Team explained the conditions of each site in details. The participants agreed that the Maha 3 site was the most promising site for the PSPP development.
(6) Seminar and Training
1) Seminar
The seminar of the theme ”Characteristic Features required to Peak Load Power Stations & Basic Technologies of Pumped Storage Power Station” was held to the government officers of the concerned authorities.
Electric Power Development Co., Ltd.
12-25
Development Planning on Optimal Power Generation for Peak Demand in Sri Lanka
Final Report
Date : April 9, 2013 PM15:00 to PM18:30 Place : Galadari Hotel (Colombo) Participants : total 45 participants (from MOPE, CEA, ERD, SEA, MASL, CEB)
In the seminar, following contents were explained; such as the present situation of peak load in Sri Lanka, technology of the pumped storage system, the method of the strategic environmental assessment to be conducted in this study, etc. And discussions included the necessity of pumped storage systems for the Sri Lankan power grid, the possibility of the existing power stations for the peak power supply, the possibility of contributions of the pumped storage systems for expanding renewable energy development, etc.
2) C/P Training
The counterparts training was conducted in Japan, which took 16 days from August 26 to September 5, 2013. Total number of the participants were 10 officers including AGM (region 1) of CEB, and selected officers from the section charged with power development planning and the existing hydropower power stations. The training program consists of lectures and sites/factories visiting. The lectures themes included “the characteristics, the design, and O&M of pumped storage power plants” as well as “the direct-current transmission system” which was particularly requested by the participants from Sri Lankan side. As for the sites and factories visiting, two of the existing pumped storage plants, and the coal-fired thermal power station having environmental friendly facilities with high specifications.
12.2 Recommendations
In case the electric power development mainly of coal thermal power plants, which have no advantage in load following capability, would be executed in accordance with the LTGEP 2013-2032, the following troubles might occur in the Sri Lankan power supply system.
- Trouble in stable power supply such as power outage during peak demand time - High cost operation of gas turbine and diesel generation using oil for peak power demand
In order to avoid the troubles, it is necessary to line up a dedicated power source at a fair rate for peak demand, and the pumped storage power plant is selected as the optimal power generation for peak power demand in this report (refer to Chapter 8). Consequently, recommendations for project implementation plan and next stage studies toward realization of the project are made in the following clauses.
Meanwhile, the existing hydropower plants are one of available generation option for peak power demand. However, they are affected by meteorological condition, that is wet or dry season, and they can also operate for middle power demand. When the demand is shifting from middle to peak in the evening, only their remaining capacity can be utilize for generation for peak power demand.
In addition, introduction of thermal power generation using LNG and natural gas is considered as an
Electric Power Development Co., Ltd.
12-26
Development Planning on Optimal Power Generation for Peak Demand in Sri Lanka
Final Report
important option for future power demand in Sri Lanka. Since this option is widely-accepted as generation for middle power demand, the development policy of LNG and natural gas should be determined at an early date. In this sense, the national guideline for long term generation expansion plan should be revised as the solution that would resolve the future problems in each base, middle and peak power demand with the best mix of power generation options in mind.
12.2.1 Project Implementation Plan
It is assumed that the demand and supply of Sri Lankan electricity would be kept in a tight situation. Thus, installation of an appropriate peak power source; such as a new pumped storage power project is desired by around 2025; therefore, Maha 3 scheme is planned and selected as the most promising site in this study. In order to implement the project on time, it is recommended to proceed with the implementation schedule as follows;
1) Feasibility Study : from 3rd Quarter in 2015 to 2nd Quarter in 2017 (2 years)
2) Environmental Assessment : from 2nd Quarter in 2016 to 2nd Quarter in 2017 (1.25 years)
3) Environmental Clearance : from 3rd Quarter in 2017 to 4th Quarter in 2017 (6 months)
4) Arrangement of Yen Loan : from 1st Quarter in 2018 to 2nd Quarter in 2018 (6months)
5) Procurement of Consultants : 3rd Quarter in 2018 to 4th Quarter in 2018 年(6 months)
6) Detailed Design : 4th Quarter in 2019 to 4th Quarter in 2020 (2 years)
7) Construction : 1st Quarter in 2021 to 4th Quarter in 2025 (5 years)
8) Commissioning : 3rd Quarter in 2025 to 4th Quarter in 2025 Figure 12.2.1-1 shows the draft overall implementation schedule for development of PSPP in Sri Lanka.
I1) Feasibility study, the construction planning including deployment of temporary facilities, which may has impacts on the environment in the site, is to be studied by the commencement of EIA to reflect it into the environment assessment. Also, the topographical survey and the geological investigation are to be executed in the earlier stage for basic design in the later stage; therefore, total 2 years are estimated as the study period. In addition, the period for supporting environment clearance is added according to CEB’s request.
Total duration of the detailed design is estimated as 2 years, so that the detailed technical study is to be conducted in the earlier stage, and tendering including tender document preparation is to be conducted in later stage.
Electric Power Development Co., Ltd.
12-27
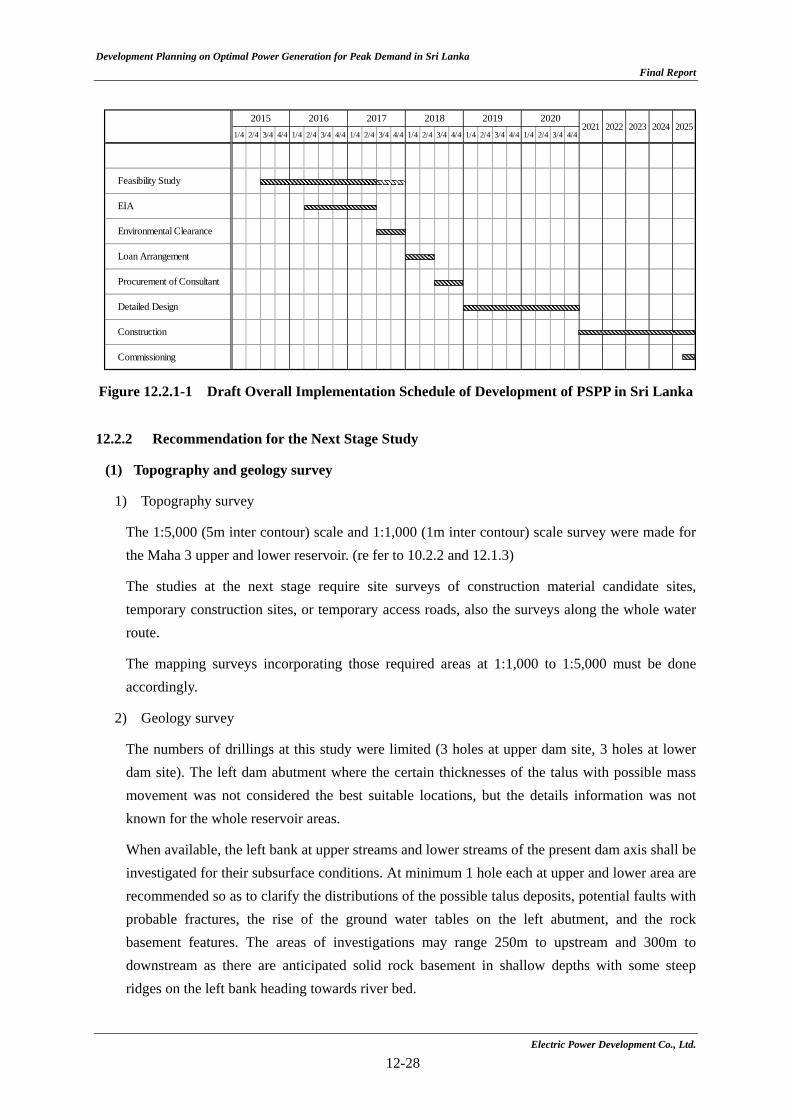
Development Planning on Optimal Power Generation for Peak Demand in Sri Lanka
Final Report
Electric Power Development Co., Ltd.
12-28
Figure 12.2.1-1 Draft Overall Implementation Schedule of Development of PSPP in Sri Lanka 12.2.2 Recommendation for the Next Stage Study
(1) Topography and geology survey
1) Topography survey
The 1:5,000 (5m inter contour) scale and 1:1,000 (1m inter contour) scale survey were made for the Maha 3 upper and lower reservoir. (re fer to 10.2.2 and 12.1.3)
The studies at the next stage require site surveys of construction material candidate sites, temporary construction sites, or temporary access roads, also the surveys along the whole water route.
The mapping surveys incorporating those required areas at 1:1,000 to 1:5,000 must be done accordingly.
2) Geology survey
The numbers of drillings at this study were limited (3 holes at upper dam site, 3 holes at lower dam site). The left dam abutment where the certain thicknesses of the talus with possible mass movement was not considered the best suitable locations, but the details information was not known for the whole reservoir areas.
When available, the left bank at upper streams and lower streams of the present dam axis shall be investigated for their subsurface conditions. At minimum 1 hole each at upper and lower area are recommended so as to clarify the distributions of the possible talus deposits, potential faults with probable fractures, the rise of the ground water tables on the left abutment, and the rock basement features. The areas of investigations may range 250m to upstream and 300m to downstream as there are anticipated solid rock basement in shallow depths with some steep ridges on the left bank heading towards river bed.
1/4 2/4 3/4 4/4 1/4 2/4 3/4 4/4 1/4 2/4 3/4 4/4 1/4 2/4 3/4 4/4 1/4 2/4 3/4 4/4 1/4 2/4 3/4 4/4
Feasibility Study
EIA
Environmental Clearance
Loan Arrangement
Procurement of Consultant
Detailed Design
Construction
Commissioning
20252015 2016 2017 2018 2019 2020
2021 2022 2023 2024
Development Planning on Optimal Power Generation for Peak Demand in Sri Lanka
Final Report
(The site in 250m upstream may be inferior to that of 300m downstream from the comparison of the right ridges shape)
Also, drilling surveys at intake, outlet, water route, seismic surveys along whole water route, drilling surveys at the power house, construction material surveys are required in due course.
(2) Environmental Considerations Study
1) EIA Process for the F/S
The EIA process follows the National Environmental (Amendment) Act No. 56 of 1988. A project proponent submits the Preliminary Information (PI) to CEA for screening. If the project needs an EIA, the Project Approving Agency (PAA) of the project invites relevant organizations to hold the Scoping Committee for the scoping of the project. At the Committee, the project proponent is required to present an outline of the project. Based on the presentation and discussions at the Committee, a Terms of Reference (TOR) of the EIA is formulated and issued to the project proponent. The Project is required to conduct an EIA because of the screening criteria of the Act.
The outline of the Project needs to be presented and explained at the Scoping Committee. A pumped storage power plant development has never been planned and realized in Sri Lanka, and it is advisable for CEB to present the outline of the Project with the support from the JICA Study Team when the outline of the Project is formulated.
Contents of the TOR from the Committee are general. If comments from JICA need to be incorporated in the EIA study, it is suggested to hold a meeting with the PAA and then the contents should be changed. For the Project, it is likely that CEA is the PAA. According to the Act, it takes 30 days to issue a TOR, but it might take two to three months. In conclusion, it could take six to nine months to start the EIA study of the Project after starting the F/S.
The Project site includes dam, reservoir, power plant, dumping site, quarry, switch yard, access road and transmission line.
In Sri Lanka, project alternatives are usually discussed and examined in its EIA study. But the alternatives of the Project have already been examined in its master plan stage. It is therefore sufficient to briefly describe the conclusion of the examination of the alternatives in the EIA report. It is not necessary to discuss and examine the alternatives at the F/S stage.
The PI (draft), scoping (draft) and TOR (draft) for the EIA are attached as appendices.
2) Natural environment
The Project does not give direct impacts to protected areas, and impacts to the natural environment are expected to be less than a project with big dam / reservoir because of the small scale of the Project site, and there are no Ramsar sites in its downstream. Impacts to the natural
Electric Power Development Co., Ltd.
12-29
Development Planning on Optimal Power Generation for Peak Demand in Sri Lanka
Final Report
environment in the downstream area are expected to be small.
It is, however, unavoidable for the endangered species4 recorded in the site to receive impacts of which scale are yet unclear. According to the Asian Development Bank5, an important criterion is whether a development site is a “critical habitat” for an endangered species or not. But it is not known whether the Project site is critical habitats for the recorded endangered species. In addition, there is a possibility that there are more endangered species in the Project site. This is because the survey period is short in its master plan study.
At the F/S of the Project, it is recommended: a) to study the endangered species of the site for at least one year; and, b) to formulate a conservation plan to avoid, mitigate and compensate the impacts to the natural environment (especially the endangered species) based on the results of the study.
It is important to involve the Sri Lankan experts to discuss the conservation plan and to receive constructive suggestions in collaboration with the JICA Study Team, which leads the sustainability of the conservation activities at the site.
3) Social environment
The biggest impact to the social environment is expected to be induced by an involuntary resettlement. The Project formulates a resettlement action plan based on the Sri Lankan National Involuntary Resettlement Policy to mitigate the impacts as much as possible. There are, however, gaps between the Policy and the JICA Guidelines (2010). The Project fulfills the gaps based on the Guidelines. The following points are particularly considered: (a) that the compensation scheme is based replacement costs; that there is a mechanism to compensate persons who do not have the right for the land; that persons who lose livelihoods by the Project receive the compensation; and that there is a grievance redress mechanism. If they are not functional, it is necessary to identify measures to deal with these points.
The more detailed social study is conducted in and around the Project site for an adequate and sufficient resettlement action plan. The Project also studies other cases in Sri Lanka to try to formulate the plan which fits in the current conditions in the country.
4) SHM
In Sri Lanka, comments from the public are collected after the formulation of an EIA report but SHMs at and around the site are not required. In particular, there is not an opportunity to collect comments from local affected persons before project starts. The Project applies the JICA Guidelines (2010) and holds two SHMs at the site – one at the scoping stage, and the other at the
4 For their details, refer to “The National Red List 2012 of Sri Lanka – Conservation Status of the Fauna and Flora (Ministry of Environment, Sri Lanka, 2012)”.
5 Safeguard Policy Statement(Asian Development Bank, 2009)
Electric Power Development Co., Ltd.
12-30
Development Planning on Optimal Power Generation for Peak Demand in Sri Lanka
Final Report
stage of the EIA report (draft). The main objectives of the SHMs are to collect comments from affected persons, local governmental organizations and NGOs and to reflect their comments to the Project as much as possible. At the SHMs, it is important to well explain the Project to the local people to relieve their concerns such as a fear of lack of water in the downstream because of dam construction.
(3) Civil Works
The construction cost in this study was calculated with the method prescribed in Guideline and Manual for Hydropower Development (JICA, 2011) (hereafter the guideline manual), which is prepared for a preliminary study stage as mentioned in the subchapter 9.4.4; therefore, it should be studied more detail in the next stage.
Especially, the cost of dam construction occupies the large part in the civil works, so that economically advantageous dam type was selected comparing a cost of concrete gravity type and that of a rock-fill type. The unit price of concrete was available in Sri Lankan similar projects in recent years; however, the unit price of a rock-fill type was derived from those in Indian similar projects due to non-availability in recent Sri Lankan projects. At the next stage, it is a requisite that advantageous dam type; especially the unit price of a concrete type and that of a rock-fill type, should be studied in more detail. Availability of embankment material in the vicinity of the site will be essential for suitable dam type selection.
As for the waterway and the powerhouse cavern layout, the setting elevation of pump-turbine was determined considering a suction head shown the guideline manual which tends to give more affordable one. The elevation of a pump-turbine affects much the waterway layout, so that suction head and total layout of the waterway should be reviewed more detailed in the next stage. In this regard, if a required suction head is reduced, the setting elevation of pump-turbine; the powerhouse cavern, can be set at more higher; accordingly it affects total construction period because the length of access tunnel to the powerhouse become shorter, which is on the critical path of the overall construction schedule.
(4) Electrical Equipment
According to Long Term Generation Expansion Plan 2013-2032 (LTGEP 2013-2032), the percentage of the installed capacity of coal fired power plants, which cannot change their own output frequently; accordingly those are mainly used for the base load, will increase and reach around 46% of the total power plants capacity in 2025. Under such situation, it possibly occurs that the frequency control of the grid would be tougher that under the present situation.
As mentioned in 12.1.6, the adjustable speed system can bring a lot of benefits on the enhancement of the power system quality with more effective frequency control and voltage control, as well as on reducing the risks which may be caused by unexpected incidents.
Electric Power Development Co., Ltd.
12-31
Development Planning on Optimal Power Generation for Peak Demand in Sri Lanka
Final Report
Even though the cost of the adjustable speed system will be higher than that of the conventional system, it is recommended to study more definitely on application of the adjustable speed system for the project.
(5) Transmission Line
Two-circuit PI connection to Kotmale - Kirindiwela T/L is selected as the connecting transmission lines from Maha site to the power grid. Following i) to iii) will be required to consider in the next stage.
i) Transmission Line Route
Detailed transmission line routes are not decided in this study. Any topographical difficulties and serious environmental issues have not been found on the recommended route from “Maha site” to “Kotmale - Kirindiwela T/L” so far. However, in the next stage, it will be required to consider detailed conditions (such as, topographical conditions, types of land-uses, and locations of houses and other buildings, etc.) under transmission line route area.
ii) Connecting Points to “Kotmale - Kirindiwela T/L”
Specific connecting points are not considered in this study. In the next stage, it will be required to consider conditions of existing transmission line towers, such as locations of tension-type towers, allowable horizontal angles of towers, and design loads of towers, etc. It is also to be considered that whether or not, it can be used existing transmission line towers without any reinforcements.
iii) Construction Works
Outages of Kotmale - Kirindiwela T/L will be required for connecting works of transmission lines from “Maha” site. In the next stage, it will be required to consider planning for construction works of T/L, in consideration with required time periods for outage works, and possible outage periods of Kotmale - Kirindiwela T/L.
(6) Construction Planning
In this study, the detailed construction planning was not studied. In the next stage, it is necessary to study on the layout, scale and development of the temporary facilities, as well as to study the detailed construction plan. In this regards, those studies should be conducted in the early timing in the next study and the results should be reflected to the environmental survey in the next stage. Following temporary facilities should be included in the construction planning;
1) Temporary yards for construction activities (including stock yards for construction materials)
2) Quarries and borrow area
Electric Power Development Co., Ltd.
12-32
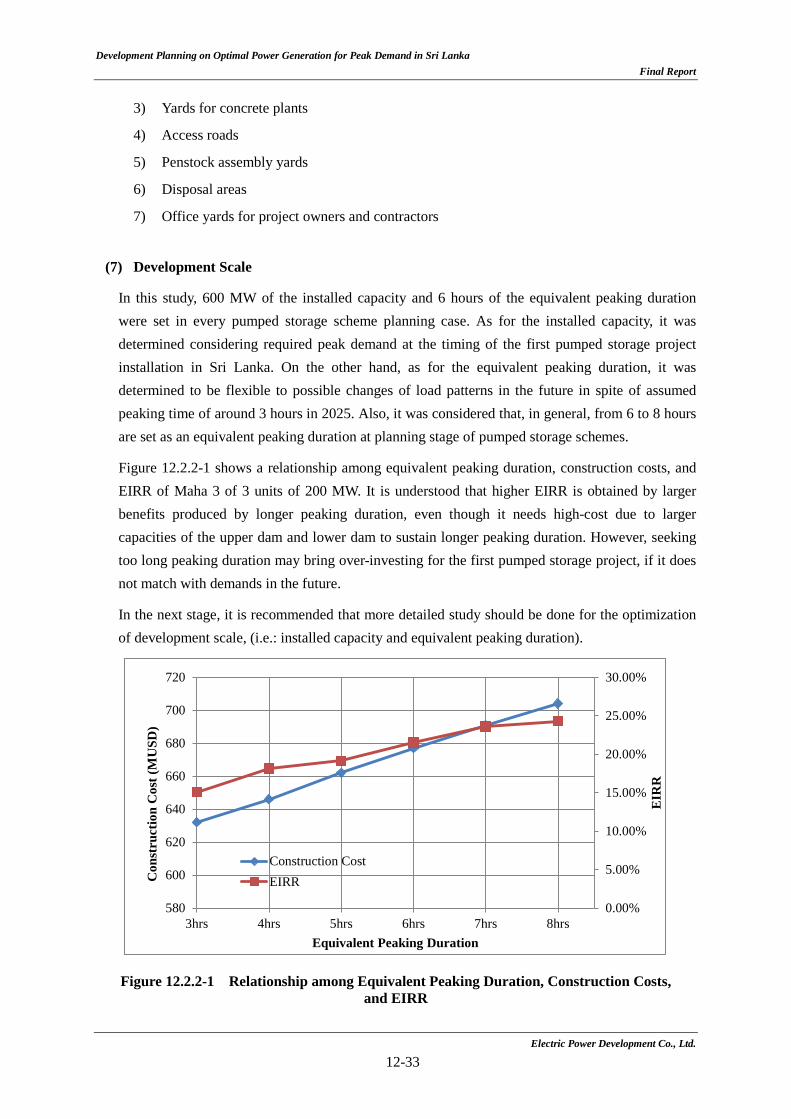
Development Planning on Optimal Power Generation for Peak Demand in Sri Lanka
Final Report
3) Yards for concrete plants
4) Access roads
5) Penstock assembly yards
6) Disposal areas
7) Office yards for project owners and contractors
(7) Development Scale
In this study, 600 MW of the installed capacity and 6 hours of the equivalent peaking duration were set in every pumped storage scheme planning case. As for the installed capacity, it was determined considering required peak demand at the timing of the first pumped storage project installation in Sri Lanka. On the other hand, as for the equivalent peaking duration, it was determined to be flexible to possible changes of load patterns in the future in spite of assumed peaking time of around 3 hours in 2025. Also, it was considered that, in general, from 6 to 8 hours are set as an equivalent peaking duration at planning stage of pumped storage schemes.
Figure 12.2.2-1 shows a relationship among equivalent peaking duration, construction costs, and EIRR of Maha 3 of 3 units of 200 MW. It is understood that higher EIRR is obtained by larger benefits produced by longer peaking duration, even though it needs high-cost due to larger capacities of the upper dam and lower dam to sustain longer peaking duration. However, seeking too long peaking duration may bring over-investing for the first pumped storage project, if it does not match with demands in the future.
In the next stage, it is recommended that more detailed study should be done for the optimization of development scale, (i.e.: installed capacity and equivalent peaking duration).
Figure 12.2.2-1 Relationship among Equivalent Peaking Duration, Construction Costs, and EIRR
0.00%
5.00%
10.00%
15.00%
20.00%
25.00%
30.00%
580
600
620
640
660
680
700
720
3hrs 4hrs 5hrs 6hrs 7hrs 8hrs
EIR
R
Con
stru
ctio
n C
ost (
MU
SD)
Equivalent Peaking Duration
Construction CostEIRR
Electric Power Development Co., Ltd.
12-33

Appendix
No. Title
A 6.1 List of IBAs in Sri Lanka
A 7.1 Participant List of SHM-1
A 7.2 Participant List of SHM-2
A 7.3 Participant List of SHM-3
A 7.4 Presentation Material for SHM-1
A 7.5 Presentation Material for SHM-2
A 7.6 Presentation Material for SHM-3-Session I
A 7.8 Presentation Material for SHM-3-Session II to IV
A 8.1 Trial Calculation of Contribution to Greenhouse Gas Reductionby Pumped Storage Power Project
A 9.1 Flow Gauge Stations in Sri Lanka
A 9.2 Rain Gauge Stations Functioning
A 9.3 Peak Flow Data
A 9.4 Evaporation and Wind Speed Data
A 9.5 Kiriketi 1, Kiriketi 2 Plan
A 9.6 Mausakelle A, Mausakelle B Plan
A 9.7 Hargran 1, Hargran 2 Plan
A 9.8 Hargran 3, Hargran 4 Plan
A 9.9 Maha 1, Maha 2, Maha 3 Plan
A 9.10 Loggal Plan
A 12.1 Geology evaluation of the most promising site Maha 3
A 12.2 Basic Information Questionnaire (PI Draft)
A 12.3 Draft Scoping Table of the Proposed Pumped Storage Power Plant Developmentat Maha area
A 12.4 Terms of Reference Environmental Impact Assessment Study(TENTATIVE AND DRAFT ONLY)
A 12.5 Drawings of the most promising site (Maha 3)
Appendix List
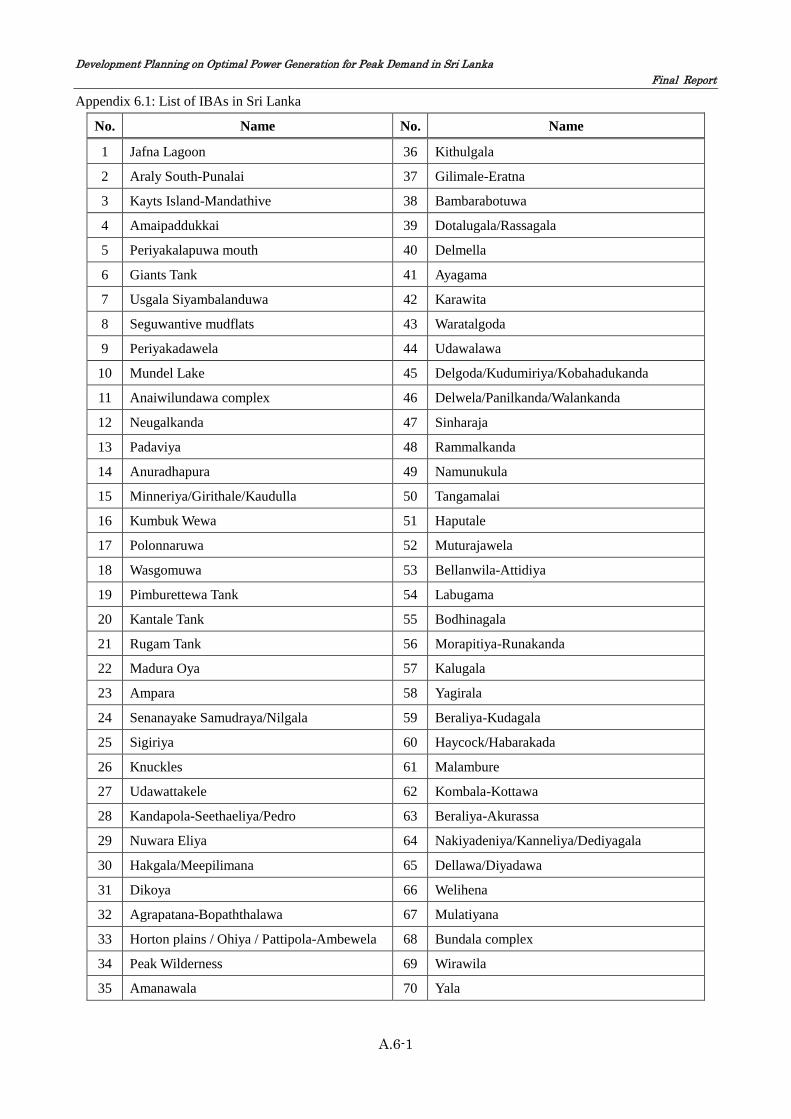
Development Planning on Optimal Power Generation for Peak Demand in Sri Lanka Final Report
Appendix 6.1
Appendix 6.1: List of IBAs in Sri Lanka
No. Name No. Name
1 Jafna Lagoon 36 Kithulgala
2 Araly South-Punalai 37 Gilimale-Eratna
3 Kayts Island-Mandathive 38 Bambarabotuwa
4 Amaipaddukkai 39 Dotalugala/Rassagala
5 Periyakalapuwa mouth 40 Delmella
6 Giants Tank 41 Ayagama
7 Usgala Siyambalanduwa 42 Karawita
8 Seguwantive mudflats 43 Waratalgoda
9 Periyakadawela 44 Udawalawa
10 Mundel Lake 45 Delgoda/Kudumiriya/Kobahadukanda
11 Anaiwilundawa complex 46 Delwela/Panilkanda/Walankanda
12 Neugalkanda 47 Sinharaja
13 Padaviya 48 Rammalkanda
14 Anuradhapura 49 Namunukula
15 Minneriya/Girithale/Kaudulla 50 Tangamalai
16 Kumbuk Wewa 51 Haputale
17 Polonnaruwa 52 Muturajawela
18 Wasgomuwa 53 Bellanwila-Attidiya
19 Pimburettewa Tank 54 Labugama
20 Kantale Tank 55 Bodhinagala
21 Rugam Tank 56 Morapitiya-Runakanda
22 Madura Oya 57 Kalugala
23 Ampara 58 Yagirala
24 Senanayake Samudraya/Nilgala 59 Beraliya-Kudagala
25 Sigiriya 60 Haycock/Habarakada
26 Knuckles 61 Malambure
27 Udawattakele 62 Kombala-Kottawa
28 Kandapola-Seethaeliya/Pedro 63 Beraliya-Akurassa
29 Nuwara Eliya 64 Nakiyadeniya/Kanneliya/Dediyagala
30 Hakgala/Meepilimana 65 Dellawa/Diyadawa
31 Dikoya 66 Welihena
32 Agrapatana-Bopaththalawa 67 Mulatiyana
33 Horton plains / Ohiya / Pattipola-Ambewela 68 Bundala complex
34 Peak Wilderness 69 Wirawila
35 Amanawala 70 Yala
A.6-1

Development Planning on Optimal Power Generation for Peak Demand in Sri Lanka Final Report
Appendix 7.1 Participant List of SHM-1
(omitted due to confidentiality of personal information)
Electric Power Development Co., Ltd.
A7.1-1

Development Planning on Optimal Power Generation for Peak Demand in Sri Lanka Final Report
Appendix 7.2 Participant List of SHM-2
(omitted due to confidentiality of personal information)
Electric Power Development Co., Ltd.
A7.2-1

Development Planning on Optimal Power Generation for Peak Demand in Sri Lanka Final Report
Appendix 7.3 Participant List of SHM-3
(omitted due to confidentiality of personal information)
Electric Power Development Co., Ltd.
A7.3-1
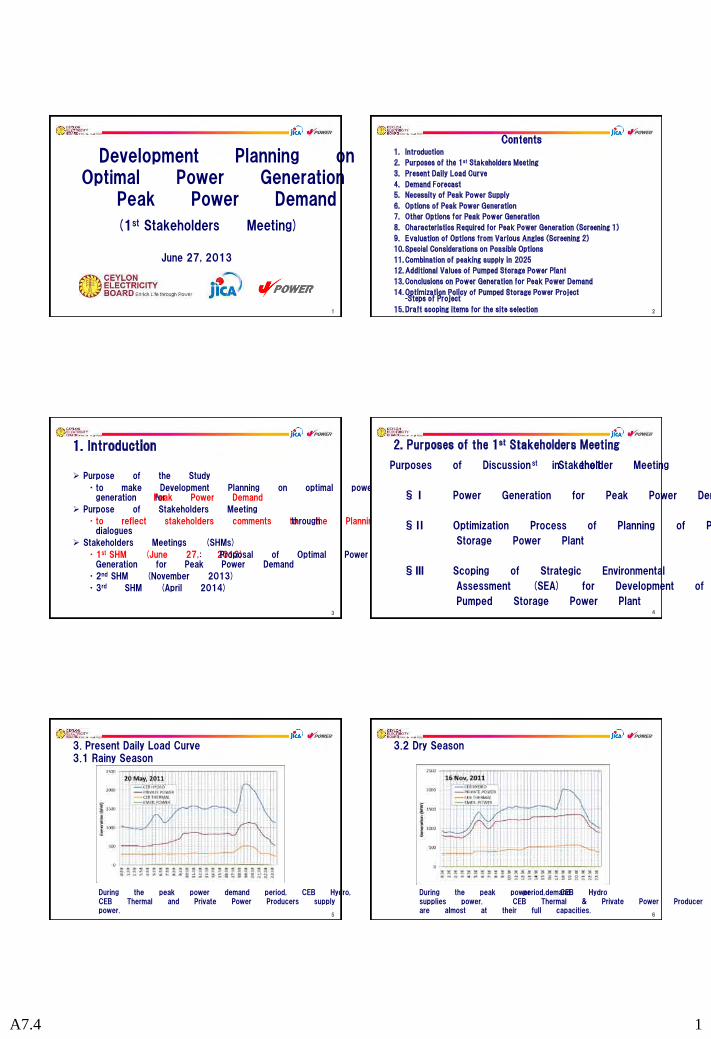
A7.4 1
•
•
•
•
•
§Ⅰ
§Ⅱ
§Ⅲ
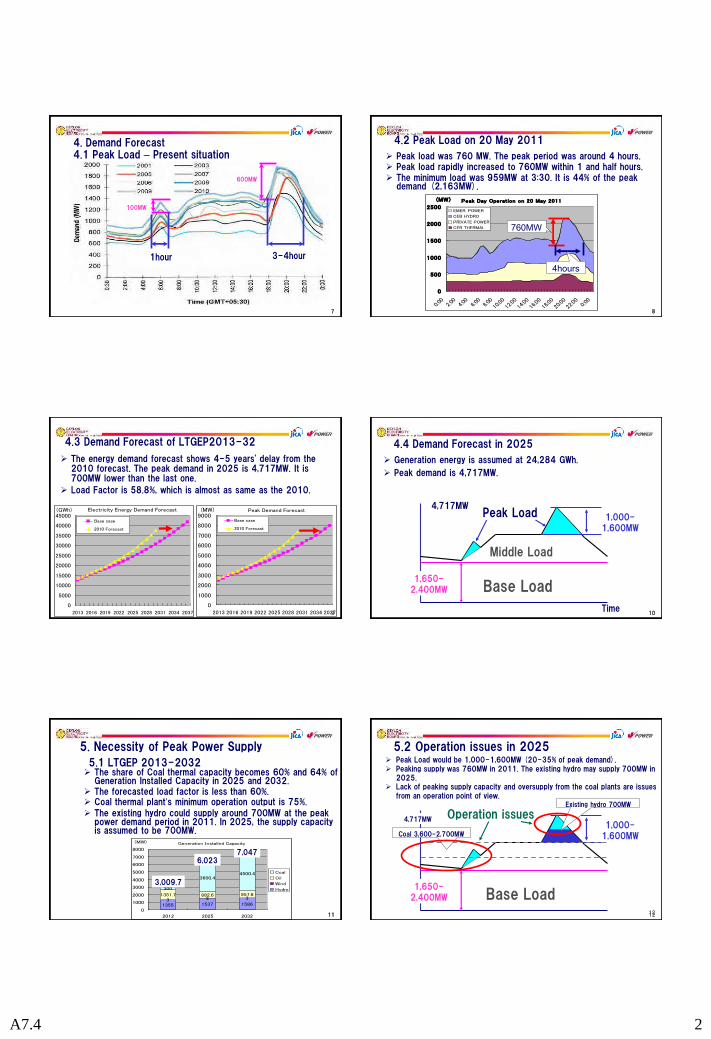
A7.4 2
7
4. Demand Forecast 4.1 Peak Load – Present situation
600MW
100MW
1hour 3-4hour
7
4.2 Peak Load on 20 May 2011
Peak load was 760 MW. The peak period was around 4 hours. Peak load rapidly increased to 760MW within 1 and half hours. The minimum load was 959MW at 3:30. It is 44% of the peak
demand (2,163MW).
Peak Day Operation on 20 May 2011
0
500
1000
1500
2000
2500
0:00
2:00
4:00
6:00
8:00
10:00
12:00
14:00
16:00
18:00
20:00
22:00 0:0
0
(MW)
EMER. POWER
CEB HYDRO
PRIVATE POWER
CEB THERMAL 760MW
4hours
8 8
Electricity Energy Demand Forecast
0
5000
10000
15000
20000
25000
30000
35000
40000
45000
2013 2016 2019 2022 2025 2028 2031 2034 2037
(GWh)
Base case
2010 Forecast
Peak Demand Forecast
0
1000
2000
3000
4000
5000
6000
7000
8000
9000
2013 2016 2019 2022 2025 2028 2031 2034 2037
(MW)
Base case
2010 Forecast
4.3 Demand Forecast of LTGEP2013-32
The energy demand forecast shows 4-5 years' delay from the 2010 forecast. The peak demand in 2025 is 4,717MW. It is 700MW lower than the last one.
Load Factor is 58.8%, which is almost as same as the 2010.
9 10
4.4 Demand Forecast in 2025
Generation energy is assumed at 24,284 GWh.
Peak demand is 4,717MW.
1,650-2,400MW
Time
Base Load
Middle Load
Peak Load 1,000-1,600MW
4,717MW
10
5.1 LTGEP 2013-2032 The share of Coal thermal capacity becomes 60% and 64% of
Generation Installed Capacity in 2025 and 2032. The forecasted load factor is less than 60%. Coal thermal plant’s minimum operation output is 75%.
The existing hydro could supply around 700MW at the peak power demand period in 2011. In 2025, the supply capacity is assumed to be 700MW.
Generation Installed Capacity
1355 1537 15863 3 3
1351.7 882.6 957.6
300
3600.44500.4
0
1000
2000
3000
4000
5000
6000
7000
8000
2012 2025 2032
(MW)
Coal
Oil
Wind
Hydro
3,009.7
6,023 7,047
11
5. Necessity of Peak Power Supply
11 12
5.2 Operation issues in 2025 Peak Load would be 1,000-1,600MW (20-35% of peak demand). Peaking supply was 760MW in 2011. The existing hydro may supply 700MW in
2025. Lack of peaking supply capacity and oversupply from the coal plants are issues
from an operation point of view.
1,650-2,400MW Base Load
Operation issues 1,000-
1,600MW
4,717MW
Coal 3,600-2,700MW
Existing hydro 700MW
12
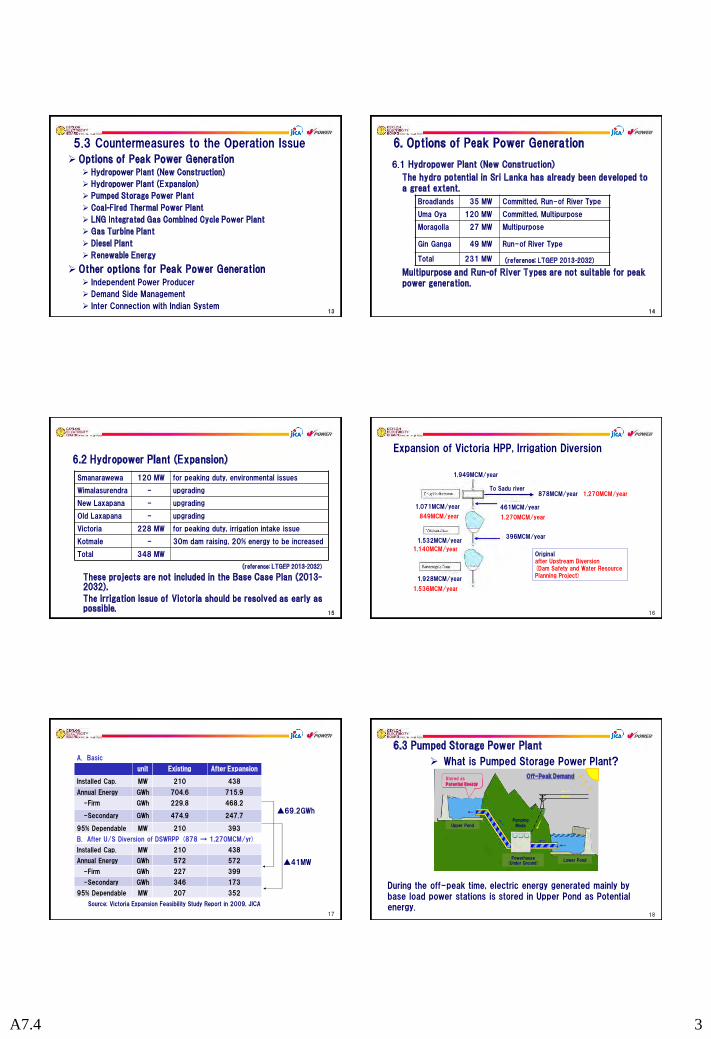
A7.4 3
→
▲
▲
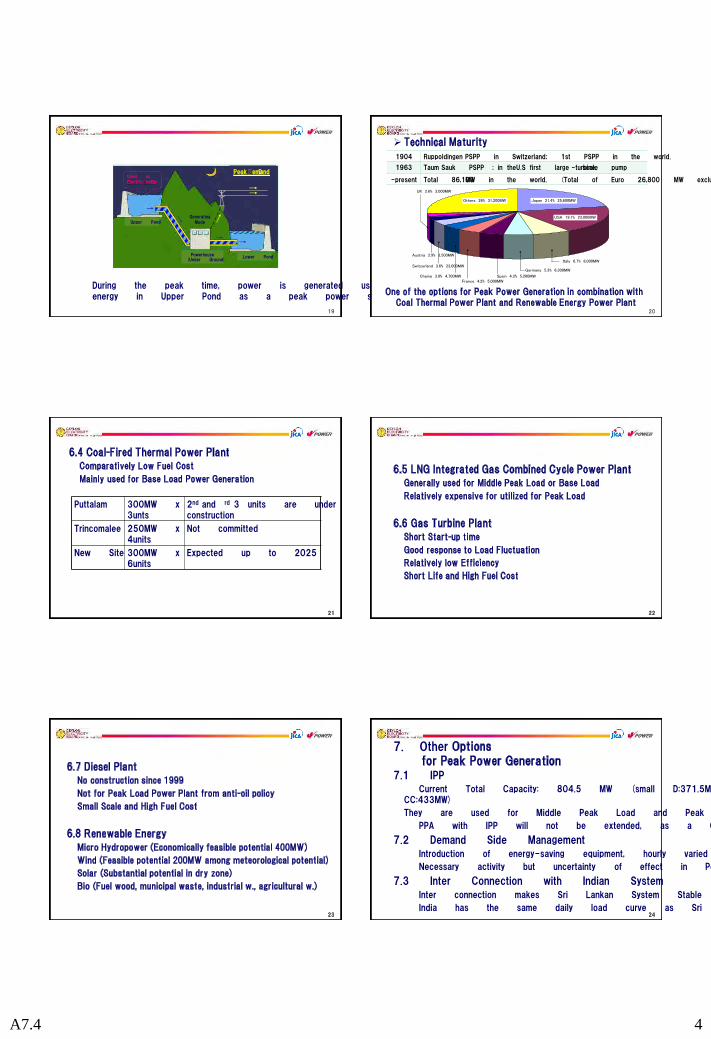
A7.4 4
Japan 21.4% 25,600MW
USA 19.1% 23,000MW
Italy 6.7% 8,000MW
Germany 5.3% 6,300MW
Spain 4.3% 5,200MWChaina 3.9% 4,700MW
Switzerland 3.6% 23,000MW
UK 2.6% 3,000MW
Austria 2.9% 3,500MW
France 4.2% 5,000MW
Others 26% 31,200MW
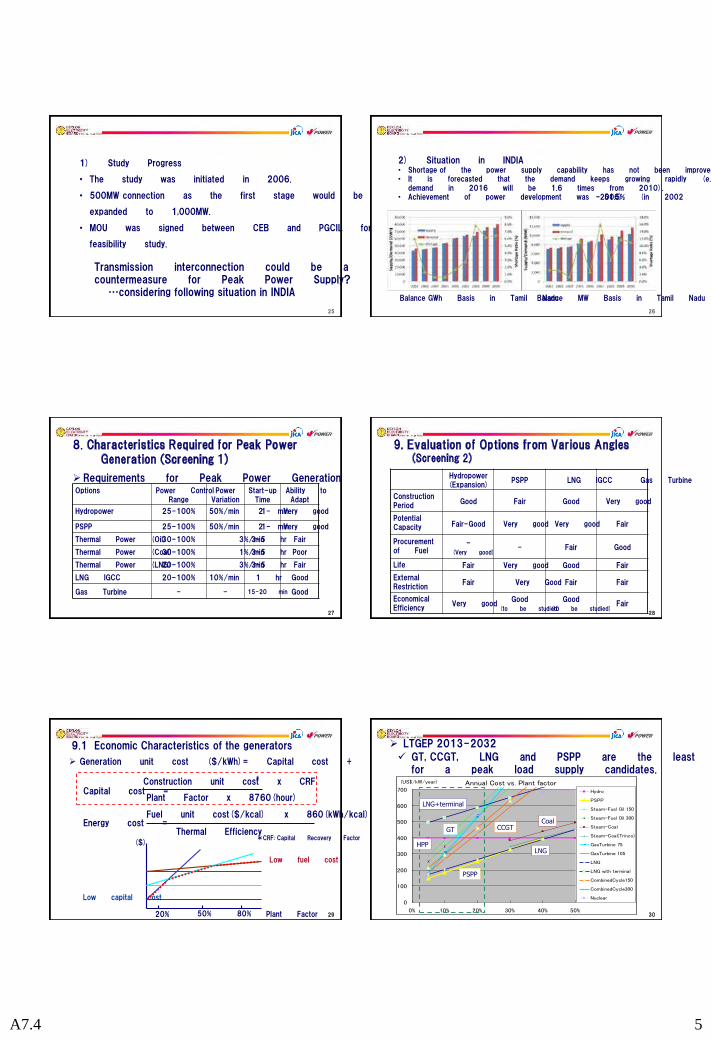
A7.4 5
•
•
•
…considering following situation in INDIA
••
• –
*
PSPP
LNG
Coal CCGT GT
HPP
LNG+terminal
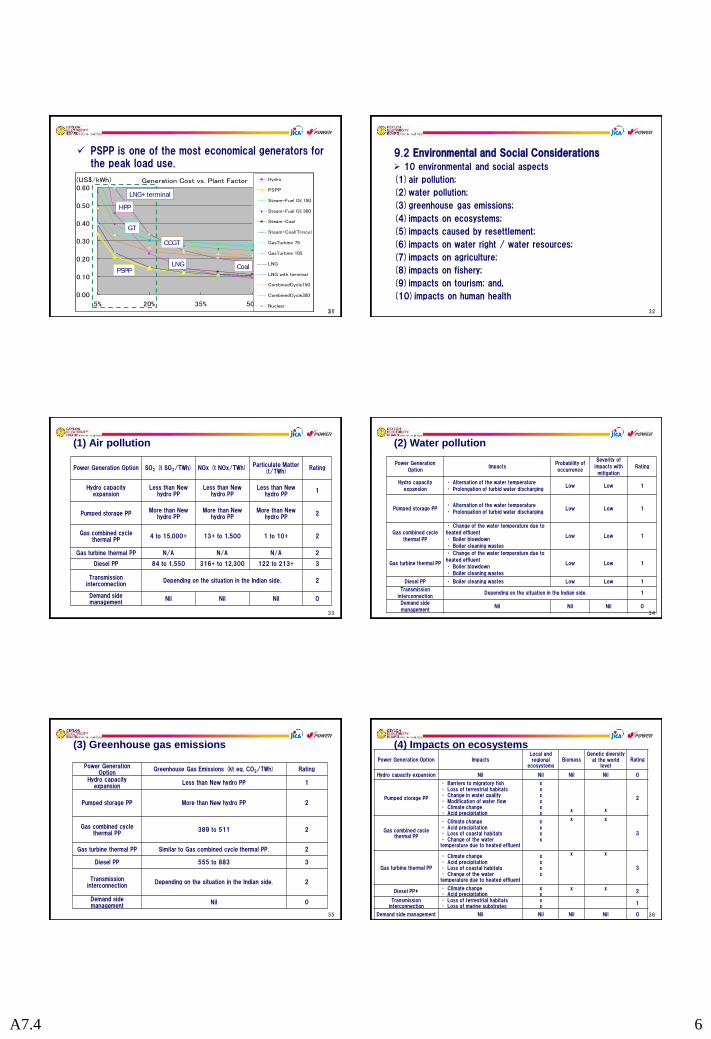
A7.4 6
PSPP is one of the most economical generators for the peak load use.
Generation Cost vs. Plant Factor
0.00
0.10
0.20
0.30
0.40
0.50
0.60
5% 20% 35% 50%
(US$/kWh) Hydro
PSPP
Steam-Fuel Oil 150
Steam-Fuel Oil 300
Steam-Coal
Steam-Coal(Trinco)
GasTurbine 75
GasTurbine 105
LNG
LNG with terminal
CombinedCycle150
CombinedCycle300
Nuclear
LNG
HPP
GT
PSPP Coal
CCGT
LNG+terminal
31 31 32
9.2 Environmental and Social Considerations
10 environmental and social aspects
(1)air pollution;
(2)water pollution;
(3)greenhouse gas emissions;
(4)impacts on ecosystems;
(5)impacts caused by resettlement;
(6)impacts on water right / water resources;
(7)impacts on agriculture;
(8)impacts on fishery;
(9)impacts on tourism; and,
(10)impacts on human health
33
(1) Air pollution
Power Generation Option SO2 (t SO2/TWh) NOx (t NOx/TWh)
Particulate Matter (t/TWh)
Rating
Hydro capacity expansion
Less than New hydro PP
Less than New hydro PP
Less than New hydro PP
1
Pumped storage PP More than New
hydro PP More than New
hydro PP More than New
hydro PP 2
Gas combined cycle thermal PP
4 to 15,000+ 13+ to 1,500 1 to 10+ 2
Gas turbine thermal PP N/A N/A N/A 2
Diesel PP 84 to 1,550 316+ to 12,300 122 to 213+ 3
Transmission interconnection
Depending on the situation in the Indian side. 2
Demand side management
Nil Nil Nil 0
34
(2) Water pollution
Power Generation
Option Impacts
Probability of
occurrence
Severity of
impacts with
mitigation
Rating
Hydro capacity
expansion
• Alternation of the water temperature
• Prolongation of turbid water discharging Low Low 1
Pumped storage PP • Alternation of the water temperature
• Prolongation of turbid water discharging Low Low 1
Gas combined cycle
thermal PP
• Change of the water temperature due to
heated effluent
• Boiler blowdown
• Boiler cleaning wastes
Low Low 1
Gas turbine thermal PP
• Change of the water temperature due to
heated effluent
• Boiler blowdown
• Boiler cleaning wastes
Low Low 1
Diesel PP • Boiler cleaning wastes Low Low 1
Transmission
interconnection Depending on the situation in the Indian side. 1
Demand side
management Nil Nil Nil 0
35
(3) Greenhouse gas emissions
Power Generation
Option Greenhouse Gas Emissions (kt eq. CO2/TWh) Rating
Hydro capacity expansion
Less than New hydro PP 1
Pumped storage PP More than New hydro PP 2
Gas combined cycle thermal PP
389 to 511 2
Gas turbine thermal PP Similar to Gas combined cycle thermal PP. 2
Diesel PP 555 to 883 3
Transmission interconnection
Depending on the situation in the Indian side. 2
Demand side management
Nil 0
36
(4) Impacts on ecosystems
Power Generation Option Impacts Local and regional
ecosystems Biomass
Genetic diversity at the world
level Rating
Hydro capacity expansion Nil Nil Nil Nil 0
Pumped storage PP
• Barriers to migratory fish • Loss of terrestrial habitats • Change in water quality • Modification of water flow • Climate change • Acid precipitation
x x x x x x
x
x
2
Gas combined cycle thermal PP
• Climate change • Acid precipitation • Loss of coastal habitats • Change of the water temperature due to heated effluent
x x x x
x x
3
Gas turbine thermal PP
• Climate change • Acid precipitation • Loss of coastal habitats • Change of the water temperature due to heated effluent
x x x x
x x
3
Diesel PP* • Climate change • Acid precipitation
x x
x
x
2
Transmission interconnection
• Loss of terrestrial habitats • Loss of marine substrates
x x
1
Demand side management Nil Nil Nil Nil 0
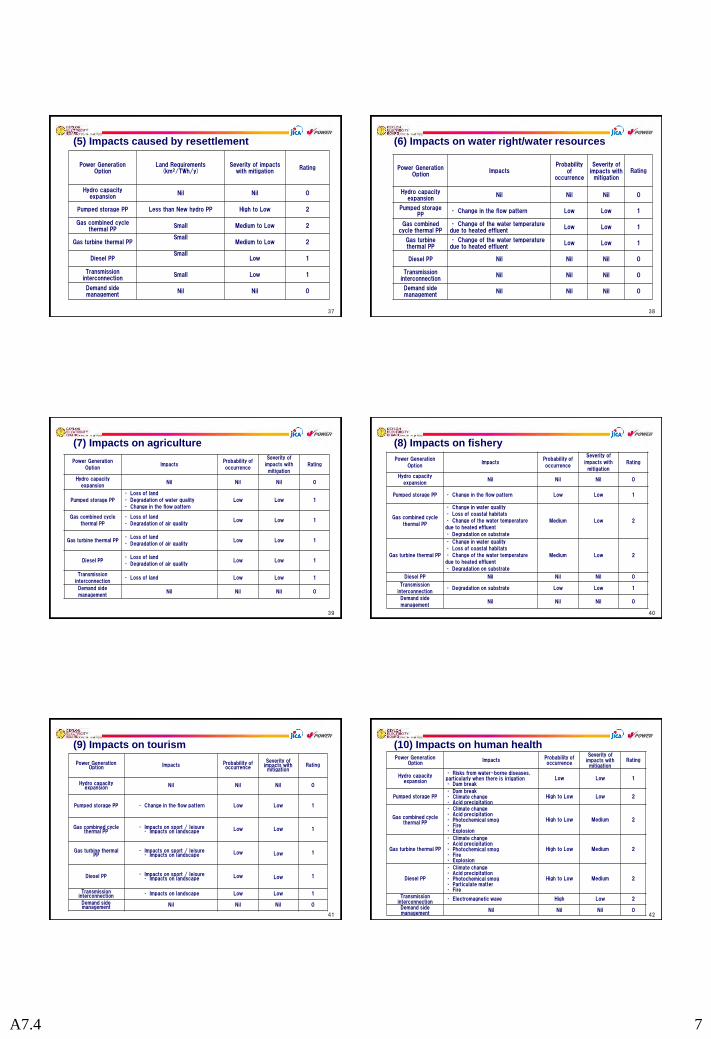
A7.4 7
37
(5) Impacts caused by resettlement
Power Generation
Option Land Requirements
(km2/TWh/y) Severity of impacts
with mitigation Rating
Hydro capacity expansion
Nil Nil 0
Pumped storage PP Less than New hydro PP High to Low 2
Gas combined cycle thermal PP
Small Medium to Low 2
Gas turbine thermal PP Small
Medium to Low 2
Diesel PP Small
Low 1
Transmission interconnection
Small Low 1
Demand side management
Nil Nil 0
38
(6) Impacts on water right/water resources
Power Generation Option
Impacts Probability
of occurrence
Severity of impacts with mitigation
Rating
Hydro capacity expansion
Nil Nil Nil 0
Pumped storage PP
• Change in the flow pattern Low Low 1
Gas combined cycle thermal PP
• Change of the water temperature due to heated effluent
Low Low 1
Gas turbine thermal PP
• Change of the water temperature due to heated effluent
Low Low 1
Diesel PP Nil Nil Nil 0
Transmission interconnection
Nil Nil Nil 0
Demand side management
Nil Nil Nil 0
39
(7) Impacts on agriculture
Power Generation
Option Impacts
Probability of
occurrence
Severity of
impacts with
mitigation
Rating
Hydro capacity
expansion Nil Nil Nil 0
Pumped storage PP
• Loss of land
• Degradation of water quality
• Change in the flow pattern
Low Low 1
Gas combined cycle
thermal PP
• Loss of land
• Degradation of air quality Low Low 1
Gas turbine thermal PP • Loss of land
• Degradation of air quality Low Low 1
Diesel PP • Loss of land
• Degradation of air quality Low Low 1
Transmission
interconnection • Loss of land Low Low 1
Demand side
management Nil Nil Nil 0
40
(8) Impacts on fishery
Power Generation
Option Impacts
Probability of
occurrence
Severity of
impacts with
mitigation
Rating
Hydro capacity
expansion Nil Nil Nil 0
Pumped storage PP • Change in the flow pattern Low Low 1
Gas combined cycle
thermal PP
• Change in water quality
• Loss of coastal habitats
• Change of the water temperature
due to heated effluent
• Degradation on substrate
Medium Low 2
Gas turbine thermal PP
• Change in water quality
• Loss of coastal habitats
• Change of the water temperature
due to heated effluent
• Degradation on substrate
Medium Low 2
Diesel PP Nil Nil Nil 0
Transmission
interconnection • Degradation on substrate Low Low 1
Demand side
management Nil Nil Nil 0
41
(9) Impacts on tourism
Power Generation Option Impacts Probability of
occurrence
Severity of impacts with mitigation
Rating
Hydro capacity expansion Nil Nil Nil 0
Pumped storage PP • Change in the flow pattern Low Low 1
Gas combined cycle thermal PP
• Impacts on sport / leisure • Impacts on landscape Low Low 1
Gas turbine thermal PP
• Impacts on sport / leisure • Impacts on landscape Low Low 1
Diesel PP • Impacts on sport / leisure • Impacts on landscape Low Low 1
Transmission interconnection • Impacts on landscape Low Low 1
Demand side management Nil Nil Nil 0
42
(10) Impacts on human health Power Generation
Option Impacts
Probability of occurrence
Severity of impacts with mitigation
Rating
Hydro capacity expansion
• Risks from water-borne diseases, particularly when there is irrigation • Dam break
Low Low 1
Pumped storage PP • Dam break • Climate change • Acid precipitation
High to Low Low 2
Gas combined cycle thermal PP
• Climate change • Acid precipitation • Photochemical smog • Fire • Explosion
High to Low Medium 2
Gas turbine thermal PP
• Climate change • Acid precipitation • Photochemical smog • Fire • Explosion
High to Low Medium 2
Diesel PP
• Climate change • Acid precipitation • Photochemical smog • Particulate matter • Fire
High to Low Medium 2
Transmission interconnection
• Electromagnetic wave High Low 2
Demand side management
Nil Nil Nil 0
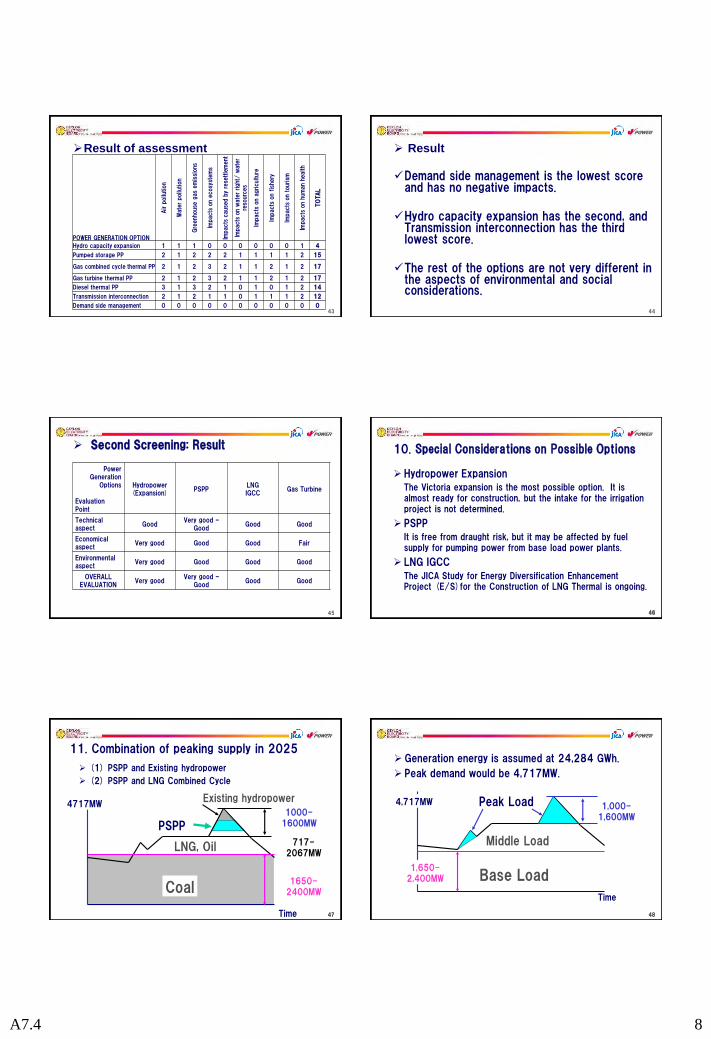
A7.4 8
43
Result of assessment
POWER GENERATION OPTION
Air p
ollu
tion
Wate
r pollu
tion
Gre
enh
ous
e g
as
em
issi
ons
Impacts
on
ecosy
stem
s
Impacts
caus
ed b
y re
settle
ment
Impacts
on
wate
r right
/ w
ate
r re
sour
ces
Impacts
on
agricul
ture
Impacts
on
fish
ery
Impacts
on
tour
ism
Impacts
on
hum
an
health
TO
TAL
Hydro capacity expansion 1 1 1 0 0 0 0 0 0 1 4
Pumped storage PP 2 1 2 2 2 1 1 1 1 2 15
Gas combined cycle thermal PP 2 1 2 3 2 1 1 2 1 2 17
Gas turbine thermal PP 2 1 2 3 2 1 1 2 1 2 17
Diesel thermal PP 3 1 3 2 1 0 1 0 1 2 14
Transmission interconnection 2 1 2 1 1 0 1 1 1 2 12
Demand side management 0 0 0 0 0 0 0 0 0 0 0 44
Result
Demand side management is the lowest score and has no negative impacts.
Hydro capacity expansion has the second, and Transmission interconnection has the third lowest score.
The rest of the options are not very different in the aspects of environmental and social considerations.
45
Second Screening: Result
Power Generation
Options
Evaluation Point
Hydropower (Expansion)
PSPP LNG IGCC
Gas Turbine
Technical aspect
Good Very good –
Good Good Good
Economical aspect
Very good Good Good Fair
Environmental aspect
Very good Good Good Good
OVERALL EVALUATION
Very good Very good –
Good Good Good
10. Special Considerations on Possible Options
Hydropower Expansion The Victoria expansion is the most possible option. It is
almost ready for construction, but the intake for the irrigation project is not determined.
PSPP It is free from draught risk, but it may be affected by fuel
supply for pumping power from base load power plants.
LNG IGCC
The JICA Study for Energy Diversification Enhancement Project (E/S)for the Construction of LNG Thermal is ongoing.
46 46
11. Combination of peaking supply in 2025
(1) PSPP and Existing hydropower
(2) PSPP and LNG Combined Cycle
1650-2400MW
Time
Coal
LNG, Oil
PSPP 1000-
1600MW
4717MW
717-2067MW
Existing hydropower
47 47 48
Generation energy is assumed at 24,284 GWh.
Peak demand would be 4,717MW.
1,650-2,400MW
Time
Base Load
Middle Load
Peak Load 1,000-1,600MW
4,717MW
48
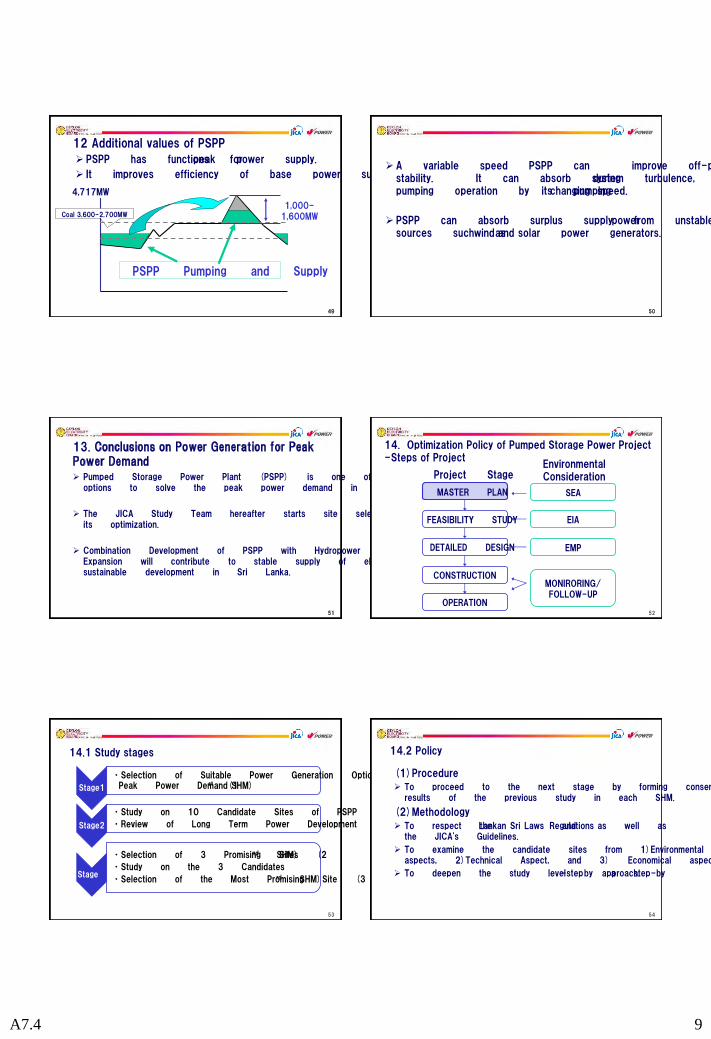
A7.4 9
•
•
•
•
•
•
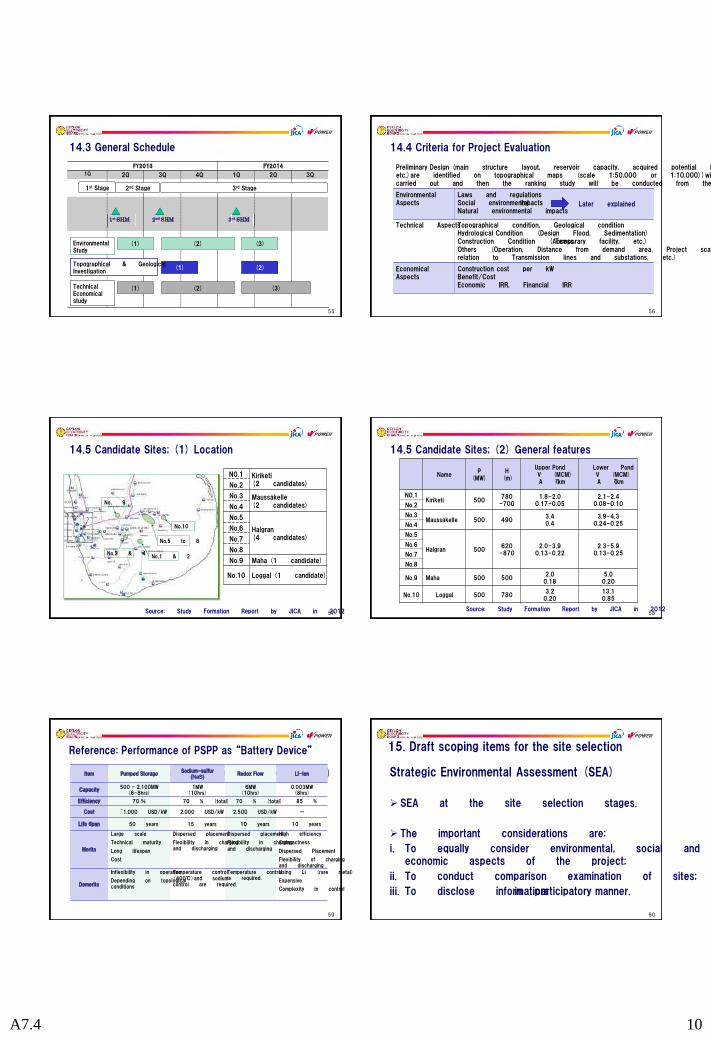
A7.4 10
1st SHM 2nd SHM 3rd SHM
Pumped Storage is a competitive “Battery Device” in existing ones.
%
-
℃
Reference: Performance of PSPP as “Battery Device”
A7.4 11
61
SEA steps at the site selection stage
2nd stage
2nd SEA: Site selection (10 sites) July – Oct. 2013
3rd SEA: Site selection (best 3 sites out of 10)
Nov. 2013 – Apr. 2014
Last SEA: Site selection (the best site out of 3)
May – Jun. 2014
Comments from SHM participants
Comments from SHM participants are collected as absolute requirements and/or priority requirements.
The followings are examples:
“XX site should be excluded because of the previous land disputes”
“a development plan is not allowed in an area where it is likely that endangered species occur”
“a development plan along XX road needs to be given high priority”
62
Initial environmental study
Candidate site Name of DS
division
Jun. 11 Loggal Meegahakiula
Jun. 12 Halgran Walapane
Jun. 13 Maha
Ganga Ihala Korale
Aranayaka
Jun. 18 Kiriketi Imbulpe
Jun19 Maussakelle Ambagamuwa
63
Maussakelle / Ambagamuwa DS Division, June 19
64
Candidate site Present situation
Loggal (Kekale)
- Under construction of mini-hydropower plant
- Mini-hydropower plan
- No protected area
- Tea plantation
Halgran
- Prone to landslides
- Paddy cultivation
- Tea plantation
- Settlements
- Shortage of water for paddies during dry season
Maha
- Tea plantation
- Rock outcrops
- Existing mini-hydropower plants
Kiriketi
- Water shortage during dry season
- Natural forest
- Tea plantation
Maussakelle
- Big waterfalls
- Natural forest
- Tea plantation
65
Inundated forest area
Impacts on protected areas
Impacts on endangered species (especially fish and otheraquatic species)
Number of those who to be resettled
Area of land to be appropriated
Impacts on water utilization (e.g. drinking water)
Impacts on utilization of forest and grassland
Impacts on public facilities (e.g. school)
Agriculture
Forestry
Tourism
Religious and/or cultural facilities
Impacts on landscape
Naturalenvironment
Impacts on fauna and flora
Socialenvironment
Impacts on localcommunities
Impacts on industries
Impacts on culturalheritages
Protected areas
66
A7.4 12
…
…
…
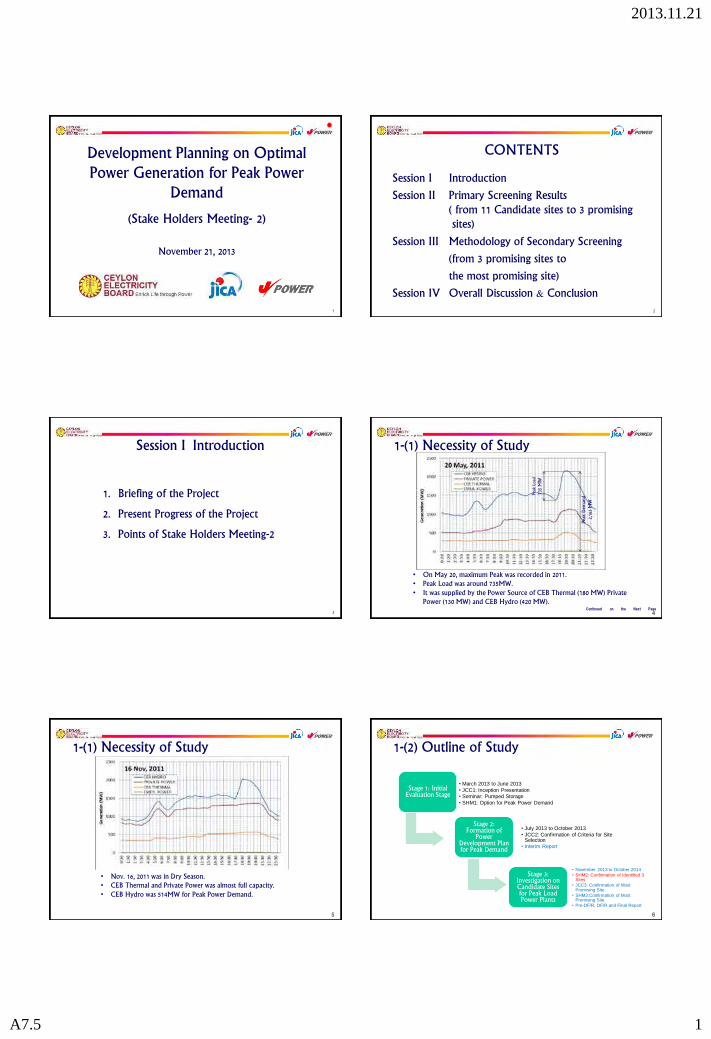
2013.11.21
A7.5 1
1
November 21, 2013
Development Planning on Optimal Power Generation for Peak Power
Demand
(Stake Holders Meeting- 2)
2
Session I Introduction
Session II Primary Screening Results ( from 11 Candidate sites to 3 promising sites)
Session III Methodology of Secondary Screening
(from 3 promising sites to
the most promising site)
Session IV Overall Discussion & Conclusion
CONTENTS
Session I Introduction
1. Briefing of the Project
2. Present Progress of the Project
3. Points of Stake Holders Meeting-2
3
1-(1) Necessity of Study
• On May 20, maximum Peak was recorded in 2011. • Peak Load was around 735MW. • It was supplied by the Power Source of CEB Thermal (180 MW) Private
Power (130 MW) and CEB Hydro (420 MW).
(1) Necessity of Study
Peak
Load
735
MW
Peak
Dem
and
2,16
3 M
W
1-(1) Necessity of Study
• Nov. 16, 2011 was in Dry Season. • CEB Thermal and Private Power was almost full capacity. • CEB Hydro was 514MW for Peak Power Demand.
1-(2) Outline of Study
Stage 1: Initial Evaluation Stage
• March 2013 to June 2013 • JCC1: Inception Presentation • Seminar: Pumped Storage • SHM1: Option for Peak Power Demand
Stage 2: Formation of
Power Development Plan for Peak Demand
• July 2013 to October 2013 • JCC2: Confirmation of Criteria for Site
Selection • Interim Report
Stage 3: Investigation on Candidate Sites for Peak Load Power Plants
• November 2013 to October 2014 • SHM2: Confirmation of Identified 3
Sites • JCC3: Confirmation of Most
Promising Site • SHM3:Confirmation of Most
Promising Site • Pre-DF/R, DF/R and Final Report
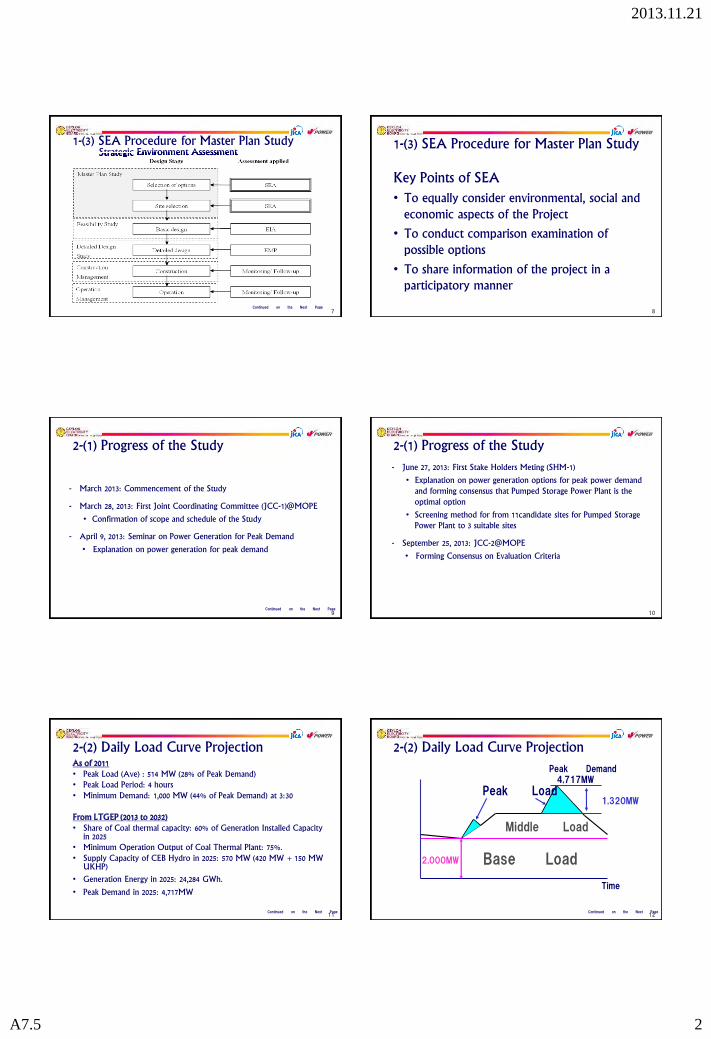
2013.11.21
A7.5 2
1-(3) SEA Procedure for Master Plan Study Strategic Environment Assessment Strategic Environment Assessment
Key Points of SEA
• To equally consider environmental, social and economic aspects of the Project
• To conduct comparison examination of possible options
• To share information of the project in a participatory manner
1-(3) SEA Procedure for Master Plan Study
- March 2013: Commencement of the Study
- March 28, 2013: First Joint Coordinating Committee (JCC-1)@MOPE
• Confirmation of scope and schedule of the Study
- April 9, 2013: Seminar on Power Generation for Peak Demand
• Explanation on power generation for peak demand
2-(1) Progress of the Study 2-(1) Progress of the Study
- June 27, 2013: First Stake Holders Meting (SHM-1)
• Explanation on power generation options for peak power demand and forming consensus that Pumped Storage Power Plant is the optimal option
• Screening method for from 11candidate sites for Pumped Storage Power Plant to 3 suitable sites
- September 25, 2013: JCC-2@MOPE
• Forming Consensus on Evaluation Criteria
As of 2011 • Peak Load (Ave) : 514 MW (28% of Peak Demand) • Peak Load Period: 4 hours • Minimum Demand: 1,000 MW (44% of Peak Demand) at 3:30 From LTGEP (2013 to 2032) • Share of Coal thermal capacity: 60% of Generation Installed Capacity
in 2025 • Minimum Operation Output of Coal Thermal Plant: 75%. • Supply Capacity of CEB Hydro in 2025: 570 MW (420 MW + 150 MW
UKHP)
• Generation Energy in 2025: 24,284 GWh.
• Peak Demand in 2025: 4,717MW
2-(2) Daily Load Curve Projection 2-(2) Daily Load Curve Projection
2013.11.21
A7.5 3
Expected Power Generation for Peak Load
• Supposedly 1,320 MW (Average)
• Existing 570 MW + Victoria Expansion 228 MW + New Power Generation for Peak Load 522 MW
Expected Power Generation for Middle Load
• Supposedly 1,400 MW (Average)
• CEB Oil Fired Thermal + IPP + LNG CC
Expected Power Generation for Base Load
• Supposedly 2,000 MW (Average)
• CEB Coal Fired Thermal
13
2-(2) Daily Load Curve Projection Options of Peak Power Generation
• Hydropower Plant (New Construction)
• Hydropower Plant (Expansion)
• Pumped Storage Power Plant
• Coal-Fired Thermal Power Plant
• LNG Combined Cycle Power Plant
• Gas Turbine Plant
• Diesel Plant
• Renewable Energy
Other Options for Peak Demand
• Independent Power Producer
• Demand Side Management
• Inter Connection with Indian System
14
2-(3) Options for Peak Power Demand
Continued on the Next Page
By Screening of Options in Sheet 14, Following Options are suitable for Peak Power Demand.
• Hydro Power Expansion
• Pumped Storage Power Plant
• LNG CC
• Demand Side Management
• Inter Connection with Indian System
Screening was done by considering perspective of;
• Adaptability to Load Change
• Economical Efficiency
• Environmental Aspect
15
2-(3) Options for Peak Power Demand
Special Comment on Suitable Options for Determination of Most Practical Power Generation for Peak Power Demand
i. Hydro Power Expansion
• Victoria Expansion is an Option of Hydro Power Expansion.
• Its F/S and EIA have already prepared and are ready to implement.
• However, its Capacity is not enough for Peak Load in 2025.
ii. Pumped Storage Power Plant
• Sri Lanka has many Suitable Sites for PSPP.
• It can have big enough capacity for Peak Load in 2025.
16
2-(4) Most Practical Power Generation
Continued on the Next Page
iii. LNG CC
• Available for Peak Power Load
• For its Economic Efficiency, It should be used for Middle Load
• Its Development Schedule has still uncertainty
iv. Demand Side Management
• Peak Demand comes from Domestic Use that cannot be shifted except introducing Battery System
• Hourly Electricity Tariff may not be applied
v. Inter Connection with Indian System
• No merit for Peak Power Load because of Same Peak in India • Substantial merit for power stability
17
2-(4) Most Practical Power Generation
Continued on the Next Page
As a result of Selection of Options
Optimal Power Generation for Peak Power Demand is:
Combination of Victoria Expansion and Pumped Storage Power Plant
• Victoria Expansion (228MW) for Demand in 2020
• Pumped Storage Power Plant for Demand in 2025
18
2-(4) Most Practical Power Generation
2013.11.21
A7.5 4
• Free from Drought Risk
• Enabling coal fired power plants to operate continuously at high efficiency level
• Absorption of Surplus Supply from Unstable Power Sources such as Wind and Solar Power Generators.
• Improvement of Off-peak System Stability in case a Variable Speed PSPP Applied.
2-(5) Special Merits of Pumped Storage Power Plant
2-(6) Outline of PSPP Planning
• 11 Candidates Sites
• Plant Capacity 600 MW
• Generating hours per day 6 hours
and
• Unit Capacity 200 MW * 3 units (as Base Plan)
• Unit Capacity 150 MW * 4 units (additonal Plan)
Maha (2 sites
Mausakelle (2 sites
Kiriketi (2 sites
Loggal (1 site
Halgran (4 sites
Location of 11 candidates sites 2-(6) Outline of PSPP Planning 2-(6) Outline of PSPP Planning
General Features of 11 Candidates Sites
Kir 1 Kiri 2 Mau A Mau B Hal 1 Hal 2
UD reservoir capa. MCM 1.9 0.9 3.6 3.7 2.8 2.3
LD reseroivr capa. MCM 1.5 0.7 3.7 3.5 2.9 2.3
Discharge (generating) m3/s 108 98 156 155 125 106
Gross Head m 700 770 474 488 606 715
Installed capa. MW 600 600 600 600 600 600
Generating hours hrs 3.80 2.52 6.42 6.28 6.19 6.11
Upper Dam H*L m 40*250 85*300 +S200
40*1200 +S1,000
40*1200 85*250 120*500
Lower Dam H*L m 95*320 75*270 60*300 55*350 85*420 85*420
Waterway Length m 2,830 1,630 3,290 2,540 4,370 4,460
Kir; Kiriketi, Mau; Mausakelle, Hal; Halgran, S; Saddle Dam
2-(6) Outline of PSPP Planning General Features of 11 Candidates Sites
Hal 3 Hal 4 Mah 1 Mah 2 Log
UD reservoir capa. MCM 2.4 3.4 3.7 3.7 3.1
LD reservoir capa. MCM 2.5 3.4 3.4 3.6 2.8
Discharge (generating) m3/s 110 155 155 166 128
Gross Head m 692 490 489 458 591
Installed capa. MW 600 600 600 600 600
Generating hours hrs 6.05 6.10 6.03 6.09 6.16
Upper Dam H*L m 60*200 90*550 55*200 80*310 45*220
Lower Dam H*L m 70*220 75*290 80*360 80*360 80*540
Waterway Length m 4,790 3,360 3,360 2,410 4,090
Hal; Halgran, Mah; Maha, Log; Loggal
2-(7) Criteria for Civil Works
• Geological conditions for example; - strength of foundation rock
- water tightness
- major faults - thickness depositions on river beds at dams’ axises - slope stability around reservoirs …etc.
So far, no serious geological problems are identified in candidates sites
2013.11.21
A7.5 5
25
2-(7) Criteria for Civil Works • Ease of construction works
evaluated by accessibility to candidates site
So far, following sites have accessibility problems - Kiriketi 1 Upper Dam - Kiriketi 2 Upper Dam - Mausakelle A, B Upper Dam - Halgran 1 Upper Dam - Halgran 4 Upper Dam
Continued on the Next Page 26
2-(7) Criteria for Civil Works • Drawdown depth of reservoirs
- Water level moves from Maximum water level to minimum water
level basically once a day
- Large drawdown depth may induce slope instability around reservoir
- Generally, maximum drawdown level is set within around 30 m
Identified problems in terms of Drawdown depth:
Kiriketi 2 Upper Dam 38 m
Halgran 4 Upper Dam 52 m
27
2-(8) Criteria for Electromechanical Works
• Manufacturing Limitation Pump-Turbines
Due to stability of the power grid system in case of unit trip, …etc.
unit capacity (MW) limited toless than 200 MW per unit
Generally
- high head and small discharge small turbine
- low head and large discharge large turbine
Continued on the Next Page 28
2-(8) Criteria for Electromechanical Works
Turbine Output (MW)
0
100
200
300
400
500
600
700
800
900
0 50 100 150 200 250 300 350 400 450 500
Turbine Output (MW)
Max
. P
um
p H
ea
d (m
)
Japanese
Others
Japan
Machine size istoo small to bemanufactured.
Machine size isvary large and noteasily transportable.
0
100
200
300
400
500
600
700
800
900
0 50 100 150 200 250 300 350 400 450 500
Turbine Output (MW)
Max
. P
um
p H
ea
d (m
)
Japanese
Others
Japan
Machine size istoo small to bemanufactured.
Machine size isvary large and noteasily transportable.
Max
. Pum
p H
ead
(m)
Turbine size too small for manufacturing
Turbine size too Large for manufacturing
Japan Others
In actual study, Dimension of Turbine, Specific pump speed, etc. are studied at every candidates
Probles has been identified in Kiriketi 2 , Harglan 2
29
2-(9) Economic Evaluation Project cost calculation
• JICA Hydropower Development Guide Manual 2011
• Layout on 1:10,000 topographic map
• Civil Works: unit prices of similar works in Sri Lanka (Upper Kotmale HPP, Umaoya HPP, etc. Some of items referring from other countries)
• Electro-mechanical Works: international prices Including land acquisition and compensation, environmental mitigation, design and engineering services, contingency, etc. and all of those are on standard basis
Economy of every project is evaluated by “Cost per kW”
2-(10) Environmental Study
30
Natural
environment Impacts on fauna and flora
Inundated forest area
Impacts on protected areas
Impacts on endangered species (especially fish and other aquatic
species)
Risk of landslide*
Social
environment
Impacts on local communities
Number of those who to be resettled
Area of land to be acquired
Impacts on water utilization (e.g. drinking water, irrigation)
Impacts on utilization of forest and grassland
Impacts on public facilities (e.g. school)
Impacts on industries
Agriculture
Forestry
Tourism
Impacts on cultural heritages Religious, cultural and/or archeological facilities
Impacts on landscape
The following table was presented at the 1st SHM, and the Environmental Study (1) has been conducted to study these items at the 11 candidate sites.
Continued on the Next Page
2013.11.21
A7.5 6
2-(10) Environmental Study
31
The survey items requested by the participants of the 1st SHM.
1) Protected areas
The candidate sites within the protected area are excluded.
2) Aquatic species (e.g. fresh-water crabs and fresh-water fishes)
They have been surveyed.
3) Transmission lines
It will be considered in the next stage.
Continued on the Next Page
2-(10) Environmental Study
32
1) Environmental Study (1) was undertaken at the 11 candidate sites to collect information on the scoping items.
2) The Environmental Study (1) was conducted by the University of Peradeniya, headed by Prof. Hennayake.
3) Draft Final Report of the study was submitted by end of September 2013, and the findings in the Environmental Study (1) was briefly reported by Prof. Hennayake at CEB.
Continued on the Next Page
2-(10) Environmental Study
33
(2) Methodology
a) Based on the information (existing data, and collected data by brief site surveys), firstly the Sri Lankan experts examined the scale of expected impacts and gave ratings.
b) The following ratings were given to each point:
0: No negative impact, 1: small negative impacts, 2: medium negative impacts, and 3: large negative impacts.
c) Finally the JICA Study Team examined the results.
34
Criteria Rating Allocation Score
1. Technical Evaluation sub-total
1.1 Geological Aspect
1.2 Ease of construction works
1.3 Manufacturing Limitation
2. Economical Evaluation sub-total
3. Environmental Evaluation sub-total
3.1 Impact on fauna and flora
3.2 Impact on local communities
3.3 Impact on industries
3.4 Impact on cultural heritages
Total Score
2-(11) Summary of Project Evaluation sample form of project evaluation
35
3 Points of Stake Holders Meeting-2
Confirmation of 3 Promising Candidate Sites • Hearing of Opinions about 3 Promising Sites • Hearing of Weighing Method for Evaluation
Selection of Most Promising Candidate Site • Hearing of Evaluation Method • Hearing of Priority and/or absolute Condition for site
selection
Section II 4. Primary Screening Result (from 11 sites to 3 promising sites)
1) First screening
2) Evaluation from Geological Aspects
3) Evaluation from Ease of construction works
4) Manufacturing Limitation of Pump Turbine
5) Construction cost
6) Evaluation from Natural and Social Environmental Aspect
7) Ranking of Candidate sites by even evaluation
8) Ranking of Candidates sites by Environment weighed evaluation
9) Selection of 3 Promising sites
10) Discussion
5. Briefing of 3 sites 36
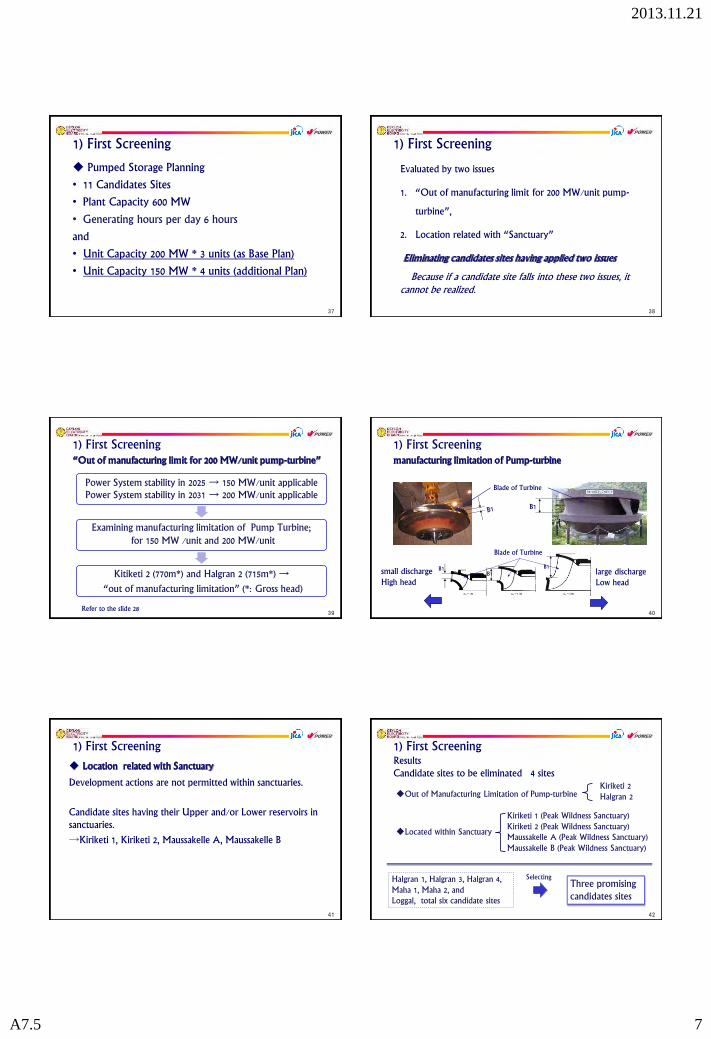
2013.11.21
A7.5 7
1) First Screening
Pumped Storage Planning
• 11 Candidates Sites
• Plant Capacity 600 MW
• Generating hours per day 6 hours
and
• Unit Capacity 200 MW * 3 units (as Base Plan)
• Unit Capacity 150 MW * 4 units (additional Plan)
1) First Screening
Evaluated by two issues
1. “Out of manufacturing limit for 200 MW/unit pump-
turbine”,
2. Location related with “Sanctuary”
Eliminating candidates sites having applied two issues
Because if a candidate site falls into these two issues, it cannot be realized.
1) First Screening 1) First Screening1) First Screening“Out of manufacturing limit for 200 MW/unit pump-turbine”
Power System stability in 2025 → 150 MW/unit applicable Power System stability in 2031 → 200 MW/unit applicable
Examining manufacturing limitation of Pump Turbine;
for 150 MW /unit and 200 MW/unit
Kitiketi 2 (770m*) and Halgran 2 (715m*) →
“out of manufacturing limitation” (*: Gross head)
Refer to the slide 28
1) First Screening 1) First Screeningmanufacturing limitation of Pump-turbine
small discharge High head
large discharge Low head
Blade of Turbine
B1
B1 B1
B1
Blade of Turbine
1) First Screening
Location related with Sanctuary
Development actions are not permitted within sanctuaries.
Candidate sites having their Upper and/or Lower reservoirs in sanctuaries.
→Kiriketi 1, Kiriketi 2, Maussakelle A, Maussakelle B
1) First Screening Results Candidate sites to be eliminated 4 sites
Out of Manufacturing Limitation of Pump-turbine
Kiriketi 2 Halgran 2
Located within Sanctuary
Kiriketi 1 (Peak Wildness Sanctuary) Kiriketi 2 (Peak Wildness Sanctuary) Maussakelle A (Peak Wildness Sanctuary) Maussakelle B (Peak Wildness Sanctuary)
Halgran 1, Halgran 3, Halgran 4, Maha 1, Maha 2, and Loggal, total six candidate sites
Three promising candidates sites
Selecting
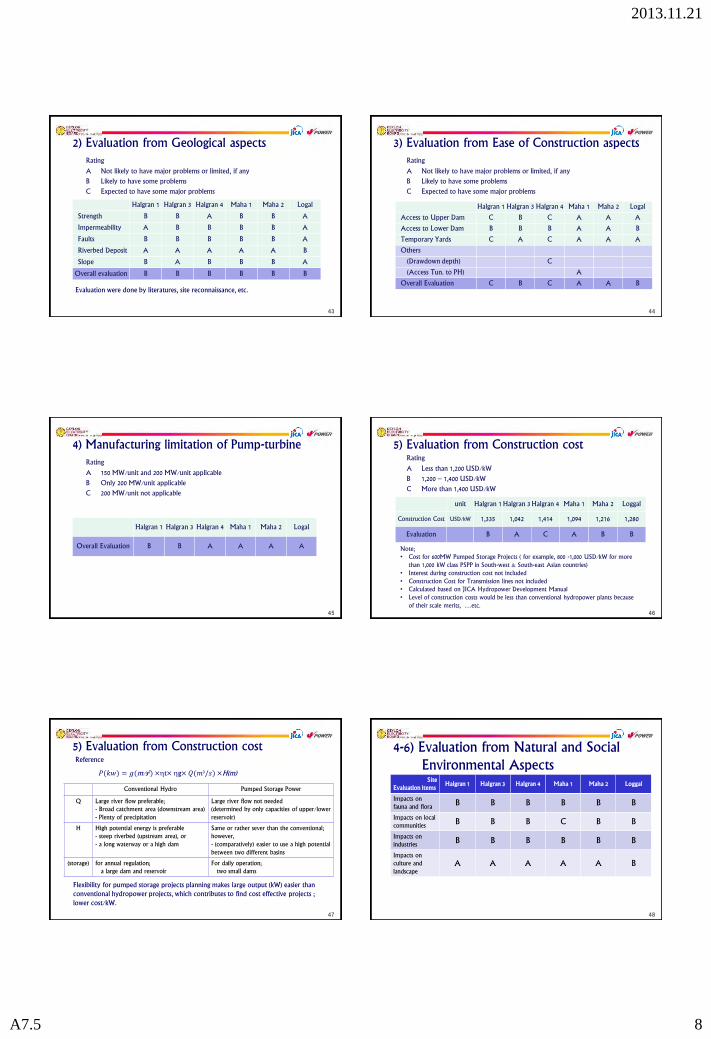
2013.11.21
A7.5 8
43
2) Evaluation from Geological aspects
Rating
A Not likely to have major problems or limited, if any
B Likely to have some problems
C Expected to have some major problems
Halgran 1 Halgran 3 Halgran 4 Maha 1 Maha 2 Logal
Strength B B A B B A
Impermeability A B B B B A
Faults B B B B B A
Riverbed Deposit A A A A A B
Slope B A B B B A
Overall evaluation B B B B B B
Evaluation were done by literatures, site reconnaissance, etc.
44
3) Evaluation from Ease of Construction aspects
Rating
A Not likely to have major problems or limited, if any
B Likely to have some problems
C Expected to have some major problems
Halgran 1 Halgran 3 Halgran 4 Maha 1 Maha 2 Logal
Access to Upper Dam C B C A A A
Access to Lower Dam B B B A A B
Temporary Yards C A C A A A
Others
(Drawdown depth) C
(Access Tun. to PH) A
Overall Evaluation C B C A A B
45
4) Manufacturing limitation of Pump-turbine
Rating
A 150 MW/unit and 200 MW/unit applicable
B Only 200 MW/unit applicable
C 200 MW/unit not applicable
Halgran 1 Halgran 3 Halgran 4 Maha 1 Maha 2 Logal
Overall Evaluation B B A A A A
46
5) Evaluation from Construction cost
Rating
A Less than 1,200 USD/kW
B 1,200 – 1,400 USD/kW
C More than 1,400 USD/kW
unit Halgran 1 Halgran 3 Halgran 4 Maha 1 Maha 2 Loggal
Construction Cost USD/kW 1,335 1,042 1,414 1,094 1,216 1,280
Evaluation B A C A B B
Note; • Cost for 600MW Pumped Storage Projects ( for example, 800 -1,000 USD/kW for more
than 1,000 kW class PSPP in South-west & South-east Asian countries) • Interest during construction cost not included • Construction Cost for Transmission lines not included • Calculated based on JICA Hydropower Development Manual • Level of construction costs would be less than conventional hydropower plants because
of their scale merits, …etc.
47
5) Evaluation from Construction cost Reference
𝑃(𝑘𝑤) = 𝑔(m/s2) ×ht× hg×𝑄(𝑚3/𝑠) ×H(m)
Conventional Hydro Pumped Storage Power
Q Large river flow preferable; - Broad catchment area (downstream area) - Plenty of precipitation
Large river flow not needed (determined by only capacities of upper/lower reservoir)
H High potential energy is preferable - steep riverbed (upstream area), or - a long waterway or a high dam
Same or rather sever than the conventional; however, - (comparatively) easier to use a high potential between two different basins
(storage) for annual regulation; a large dam and reservoir
For daily operation; two small dams
Flexibility for pumped storage projects planning makes large output (kW) easier than conventional hydropower projects, which contributes to find cost effective projects ; lower cost/kW.
4-6) Evaluation from Natural and Social Environmental Aspects
48
Site Evaluation items
Halgran 1 Halgran 3 Halgran 4 Maha 1 Maha 2 Loggal
Impacts on fauna and flora B B B B B B
Impacts on local communities B B B C B B
Impacts on industries
B B B B B B
Impacts on culture and landscape
A A A A A B
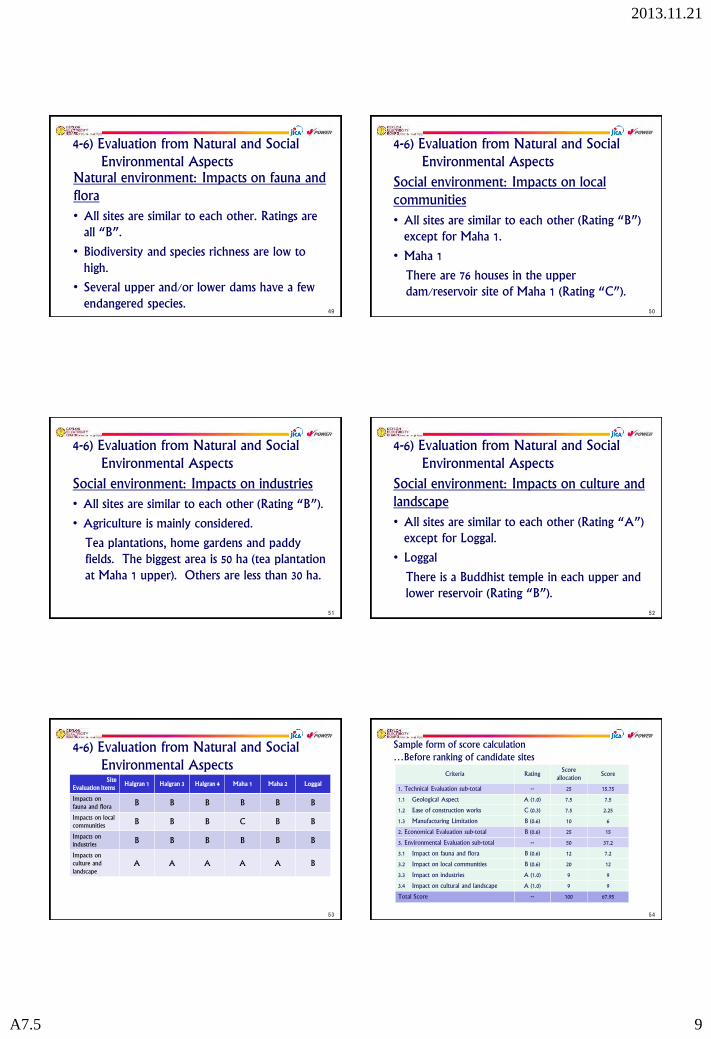
2013.11.21
A7.5 9
4-6) Evaluation from Natural and Social Environmental Aspects
49
Natural environment: Impacts on fauna and flora
• All sites are similar to each other. Ratings are all “B”.
• Biodiversity and species richness are low to high.
• Several upper and/or lower dams have a few endangered species.
4-6) Evaluation from Natural and Social Environmental Aspects
50
Social environment: Impacts on local communities
• All sites are similar to each other (Rating “B”) except for Maha 1.
• Maha 1
There are 76 houses in the upper dam/reservoir site of Maha 1 (Rating “C”).
4-6) Evaluation from Natural and Social Environmental Aspects
51
Social environment: Impacts on industries
• All sites are similar to each other (Rating “B”).
• Agriculture is mainly considered.
Tea plantations, home gardens and paddy fields. The biggest area is 50 ha (tea plantation at Maha 1 upper). Others are less than 30 ha.
4-6) Evaluation from Natural and Social Environmental Aspects
52
Social environment: Impacts on culture and landscape
• All sites are similar to each other (Rating “A”) except for Loggal.
• Loggal
There is a Buddhist temple in each upper and lower reservoir (Rating “B”).
4-6) Evaluation from Natural and Social Environmental Aspects
53
Site Evaluation items
Halgran 1 Halgran 3 Halgran 4 Maha 1 Maha 2 Loggal
Impacts on fauna and flora B B B B B B
Impacts on local communities B B B C B B
Impacts on industries
B B B B B B
Impacts on culture and landscape
A A A A A B
54
Criteria Rating Score
allocation Score
1. Technical Evaluation sub-total -- 25 15.75
1.1 Geological Aspect A (1.0) 7.5 7.5
1.2 Ease of construction works C (0.3) 7.5 2.25
1.3 Manufacturing Limitation B (0.6) 10 6
2. Economical Evaluation sub-total B (0.6) 25 15
3. Environmental Evaluation sub-total -- 50 37.2
3.1 Impact on fauna and flora B (0.6) 12 7.2
3.2 Impact on local communities B (0.6) 20 12
3.3 Impact on industries A (1.0) 9 9
3.4 Impact on cultural and landscape A (1.0) 9 9
Total Score -- 100 67.95
Sample form of score calculation …Before ranking of candidate sites
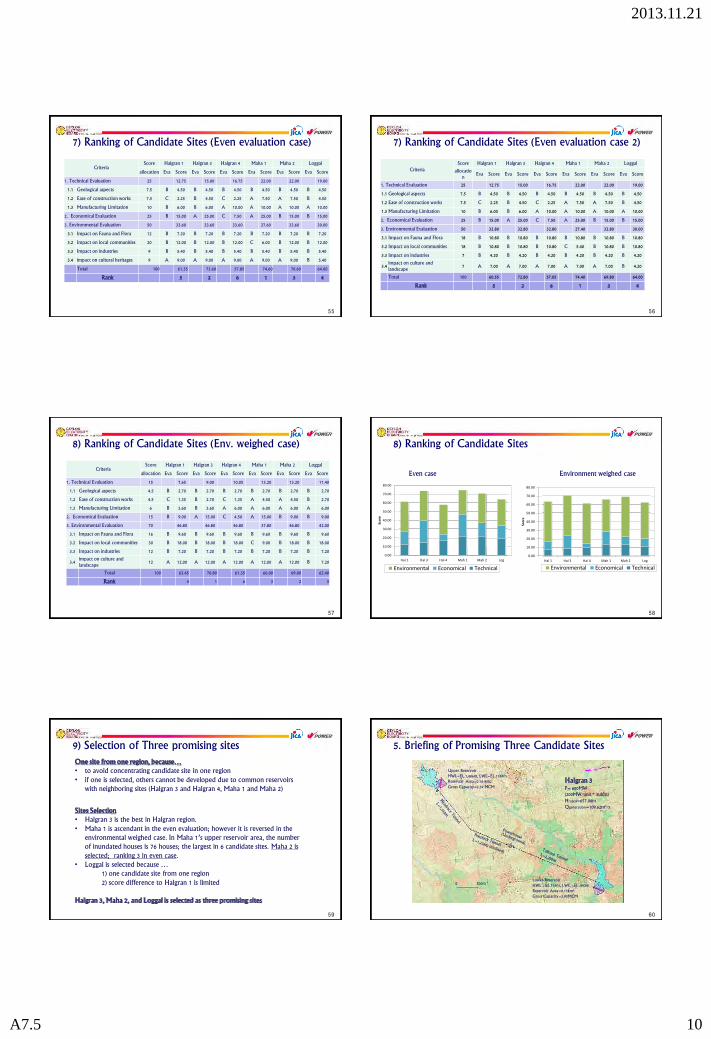
2013.11.21
A7.5 10
7) Ranking of Candidate Sites (Even evaluation case)
Criteria Score Halgran 1 Halgran 3 Halgran 4 Maha 1 Maha 2 Loggal
allocation Eva Score Eva Score Eva Score Eva Score Eva Score Eva Score
1. Technical Evaluation 25 12.75 15.00 16.75 22.00 22.00 19.00
1.1 Geological aspects 7.5 B 4.50 B 4.50 B 4.50 B 4.50 B 4.50 B 4.50
1.2 Ease of construction works 7.5 C 2.25 B 4.50 C 2.25 A 7.50 A 7.50 B 4.50
1.3 Manufacturing Limitation 10 B 6.00 B 6.00 A 10.00 A 10.00 A 10.00 A 10.00
2. Economical Evaluation 25 B 15.00 A 25.00 C 7.50 A 25.00 B 15.00 B 15.00
3. Environmental Evaluation 50 33.60 33.60 33.60 27.60 33.60 30.00
3.1 Impact on Fauna and Flora 12 B 7.20 B 7.20 B 7.20 B 7.20 B 7.20 B 7.20
3.2 Impact on local communities 20 B 12.00 B 12.00 B 12.00 C 6.00 B 12.00 B 12.00
3.3 Impact on industries 9 B 5.40 B 5.40 B 5.40 B 5.40 B 5.40 B 5.40
3.4 impact on cultural heritages 9 A 9.00 A 9.00 A 9.00 A 9.00 A 9.00 B 5.40
Total 100 61.35 73.60 57.85 74.60 70.60 64.00
Rank 5 2 6 1 3 4
7) Ranking of Candidate Sites (Even evaluation case 2)
Criteria Score Halgran 1 Halgran 3 Halgran 4 Maha 1 Maha 2 Loggal
allocation
Eva Score Eva Score Eva Score Eva Score Eva Score Eva Score
1. Technical Evaluation 25 12.75 15.00 16.75 22.00 22.00 19.00
1.1 Geological aspects 7.5 B 4.50 B 4.50 B 4.50 B 4.50 B 4.50 B 4.50
1.2 Ease of construction works 7.5 C 2.25 B 4.50 C 2.25 A 7.50 A 7.50 B 4.50
1.3 Manufacturing Limitation 10 B 6.00 B 6.00 A 10.00 A 10.00 A 10.00 A 10.00
2. Economical Evaluation 25 B 15.00 A 25.00 C 7.50 A 25.00 B 15.00 B 15.00
3. Environmental Evaluation 50 32.80 32.80 32.80 27.40 32.80 30.00
3.1 Impact on Fauna and Flora 18 B 10.80 B 10.80 B 10.80 B 10.80 B 10.80 B 10.80
3.2 Impact on local communities 18 B 10.80 B 10.80 B 10.80 C 5.40 B 10.80 B 10.80
3.3 Impact on industries 7 B 4.20 B 4.20 B 4.20 B 4.20 B 4.20 B 4.20
3.4impact on culture and landscape
7 A 7.00 A 7.00 A 7.00 A 7.00 A 7.00 B 4.20
Total 100 60.55 72.80 57.05 74.40 69.80 64.00
Rank 5 2 6 1 3 4
8) Ranking of Candidate Sites (Env. weighed case)
Criteria Score Halgran 1 Halgran 3 Halgran 4 Maha 1 Maha 2 Loggal
allocation Eva Score Eva Score Eva Score Eva Score Eva Score Eva Score
1. Technical Evaluation 15 7.65 9.00 10.05 13.20 13.20 11.40
1.1 Geological aspects 4.5 B 2.70 B 2.70 B 2.70 B 2.70 B 2.70 B 2.70
1.2 Ease of construction works 4.5 C 1.35 B 2.70 C 1.35 A 4.50 A 4.50 B 2.70
1.3 Manufacturing Limitation 6 B 3.60 B 3.60 A 6.00 A 6.00 A 6.00 A 6.00
2. Economical Evaluation 15 B 9.00 A 15.00 C 4.50 A 15.00 B 9.00 B 9.00
3. Environmental Evaluation 70 46.80 46.80 46.80 37.80 46.80 42.00
3.1 Impact on Fauna and Flora 16 B 9.60 B 9.60 B 9.60 B 9.60 B 9.60 B 9.60
3.2 Impact on local communities 30 B 18.00 B 18.00 B 18.00 C 9.00 B 18.00 B 18.00
3.3 Impact on industries 12 B 7.20 B 7.20 B 7.20 B 7.20 B 7.20 B 7.20
3.4 impact on culture and landscape
12 A 12.00 A 12.00 A 12.00 A 12.00 A 12.00 B 7.20
Total 100 63.45 70.80 61.35 66.00 69.00 62.40
Rank 4 1 6 3 2 5
8) Ranking of Candidate Sites
0.00
10.00
20.00
30.00
40.00
50.00
60.00
70.00
80.00
Hal 1 Hal 3 Hal 4 Mah 1 Mah 2 Log
Scor
e
Environmental Economical Technical
0.00
10.00
20.00
30.00
40.00
50.00
60.00
70.00
80.00
Hal 1 Hal 3 Hal 4 Mah 1 Mah 2 Log
Scor
e
Environmental Economical Technical
Even case Environment weighed case
9) Selection of Three promising sites
One site from one region, because… • to avoid concentrating candidate site in one region • if one is selected, others cannot be developed due to common reservoirs
with neighboring sites (Halgran 3 and Halgran 4, Maha 1 and Maha 2)
Sites Selection • Halgran 3 is the best in Halgran region. • Maha 1 is ascendant in the even evaluation; however it is reversed in the
environmental weighed case. In Maha 1’s upper reservoir area, the number of inundated houses is 76 houses; the largest in 6 candidate sites. Maha 2 is selected; ranking 3 in even case.
• Loggal is selected because … 1) one candidate site from one region 2) score difference to Halgran 1 is limited
Halgran 3, Maha 2, and Loggal is selected as three promising sites
5. Briefing of Promising Three Candidate Sites
0 500m
Upper Reservoir HWL=EL.1,406m, LWL=EL.1384mReservoir Area=0.16 km2 Gross Capacity=2.39 MCM
Lower Reservoir HWL.=EL.714m, LWL.=EL..693m Reservoir Area=0.15km2
Gross Capacity=3.95MCM
Halgran 3 P= 600MW (200MW/unit * 3units) Hrated=657.08m Qgeneration=109.62m3/s
2013.11.21
A7.5 11
5-1) Environments of Halgran 3
61
Upper dam/reservoir
5-1) Environments of Halgran 3
62
Lower dam/reservoir
63
5. Briefing of Promising Three Candidate Sites
0 500m
Maha 2 P=600 MW (200MW/unit * 3units) Hrated=434.78m Qgeneration=165.67m3/s
Upper Reservoir HWL=EL.763m, LWL=EL.729m Reservoir Area=0.15 km2 Gross Capacity=4.35 MCM
Lower Reservoir HWL.=EL.300m, LWL.=EL..282m Reservoir Area=0.24km2
Gross Capacity=6.40MCM
5-2) Environments of Maha 2
64
Upper dam/reservoir
5-2) Environments of Maha 2
65
Lower dam/reservoir
66
5. Briefing of Promising Three Candidate Sites
0 500m
Loggal P=600MW (200MW/unit * 3units) Hrated=561.76m Qgeneration=128.22m3/s
Upper Reservoir HWL=EL.996m, LWL=EL.985m Reservoir Area=0.43 km2 Gross Capacity=4.59 MCM
Lower Reservoir HWL.=EL.410m, LWL.=EL..383m Reservoir Area=0.15km2
Gross Capacity=3.66MCM
2013.11.21
A7.5 12
5-3) Environments of Loggal
67
Upper dam/reservoir
5-3) Environments of Loggal
68
Lower dam/reservoir
Section III
4. Methodology of Secondary Screening
(from 3 promising sites to the most promising sites)
1) Technical and Economical Aspects
2) Environmental Aspects from Results of Detailed Sites Survey
69
2) Assessment from Economic Aspects
By local Consultants,
Topographical survey in three candidates sites
Geological survey on the ground surface
For making three candidate sites
more accurate and attractive
70
1) Assessment from Economic Aspects
Cost & Cost &
Benefit of Benefit of
$$ PSPP Alt. Thernal
$$ $$$$ $$ $$ $$$$ $$ $$ $$$$ $$ $$ $$ >>
$$ $$ $$ $$ >
$$ $$ $$ $$ =
$$ $$ $$ $$ <
$$ $$ $$ $$$$ $$ $$ $$
Opt 1 Opt 2 Opt 3 Opt 2 Alternative Thermal
(US$
/kW
)
Step 1: Select lowest costoption among candidate sites
Step 2: Confirm economic efficieicyof selected PSPP over alternative
thermal power
Construction Cost
71
2) Economic Aspects Cost-Benefit Analysis
Cost Capital cost: Construction, engineering, environment, land
acquisition, compensation OM cost Electricity cost for pump-up by coal power
Benefit (Avoidable cost of thermal power) Capital cost of gas-turbine OM cost Fuel cost for generation
=> Assessment of economic efficiency by B-C, B/C, IRR
72
2013.11.21
A7.5 13
6-1) SEA Procedure for Master Plan Study
Key Points of SEA
• To equally consider environmental, social and economic aspects of the Project
• To conduct comparison examination of options
• To disclose information of the project in a participatory manner
6-1) SEA Procedure for Master Plan Study
6-1) Locations of the three promising sites
KANDY
KEGALLE
NUWARA ELIYA BADULLA
6-1) Hearings from GN Divisions Date Name of site Name of GN Division Divisional
Secretariat District
11th Nov.
Loggal Upper Pitamaruwa Meegahakiula Badulla
Loggal Lower Kalugahakandura
12th Nov.
Halgran 3 Upper
Morabedda Mantreehena
Walapane Nuwara Eliya Halgran 3
Lower
Dambagolla Puranakumbura Denamure
Hagama
13th Nov.
Maha 2 Upper Podape Narangala Aranayake Kegalle Pathithalawa Ganga Ihala
Korale Kandy
Maha 2 Lower Arama Deiyanwela Aranayake Kegalle Uduwella Watakedenya
Ganga Ihala Korale Kandy
6-1) Hearings from GN Divisions
Halgran 3 (5 GNs) Maha 2 (6 GNs) Loggal (2 GNs)
Opinions and concerns for the proposed project
Request to hold consultation meetings when it is realized at the site with local authorities and communities
Afraid of landslide. The local people have never experienced it, though.
Request to hold consultation meetings when it is realized at the site with local authorities and communities.
Compensation should be properly negotiated (lower).
Afraid of landslide. They said that some small stones fell from the mountain (lower).
The monk of Pitamadura (upper) suggested to hold consultation meetings with the local people.
The local people basically do not like to relocate the Buddhist temple, because it is only the one in the area (lower).
6-1) Scoping for the three promising sites
Natural environment Impacts on fauna and flora
Inundated forest area (including natural, secondary, plantation forests, and home garden)
Impacts on faunal endangered species (including aquatic species)
Impacts on floral endangered species (including aquatic species)
Impacts on ecosystems
Social environment
Impacts on local communities
Number of those who to be resettled
Area of land to be acquired
Number of those who to be affected by losing livelihood
Impacts on public facilities (e.g. school, road)
Impacts on the poor people and minority
Impacts on water utilization (e.g. drinking water, bathing, washing, irrigation, mini-hydropower plant) of rivers and wells
Impacts on industries Agriculture (including tree & rubber plantation)
Tourism (e.g. water fall)
Impacts on culture and landscape
Religious, and/or cultural facilities, burial ground
Impacts on landscape

2013.11.21
A7.5 14
6-1) Environmental Study (2)
79
1) Environmental Study (2) will be conducted at the three promising sites to collect information on the scoping items by the University of Peradeniya.
2) The Study will start in December 2013 and finish in May 2014.
6-1) Information collection to identify one site from the environmental point of view
80
(1) Objective
To collect information on the three promising sites from the environmental aspects to identify the most promising site with less impacts on the environments.
(2) Methodology
a) Based on the information (existing data, and collected data by the field surveys), firstly the Sri Lankan experts examine the scale of expected impacts.
b) Secondly the JICA Study Team examines the results with other aspects (technical and economic aspects).
81
Confirmation of 3 Promising Candidate Sites • about 3 promising sites • about applied method for evaluation and selection
Selection of Most Promising Candidate Site
• Evaluation Method • Priority and/or absolute Condition for site selection
Opinions, comments or suggestions we need, Are there any comments or suggestions
1. …
2. …
3. …
82
E-mail address: [email protected], and [email protected]
27/May/2014
A7.6 1
1
May 27, 2014
Development Planning on Optimal Power Generation for Peak Power
Demand
(Stake Holders Meeting- 3)
2
Session I Briefing of the Study
Session II Evaluation of Promising Sites
II-1 Technical/Economic Evaluation of Options
II-2 Environmental Evaluation of Options
Session III Overall Rating & Ranking for Most Promising Site
Session IV Overall Discussion & Conclusion
CONTENTS
Session I Review of the Study
1. Necessity of the Study
2. Progress of the Study to date
3. Review of Prior Stakeholders Meetings
4. Briefing of 3 Promising Sites of PSPP
5. Integrated Development of PSPP with CST & LNGCC
3
Notes PSPP: Pumped Storage Power Plant CST: Coal Steam Thermal LNGCC: LNG Combined Cycle
I-1 Necessity of the Study
• On May 20, maximum Peak was recorded in 2011. • Peak Load was around 735MW. • It was supplied by the Power Source of CEB Thermal (180 MW) Private
Power (130 MW) and CEB Hydro (420 MW).
Peak
Load
735
MW
Peak
Dem
and
2,16
3 M
W
I-1 Necessity of the Study
2,000MW
Time
Base Load
Middle Load
Peak Load 1,320MW
Peak Demand 4,717MW
Daily Load Curve Projection in 2025
Dem
and
How to Manage
I-1 Necessity of the Study Peak Load was supplied by; a) Thermal Power Expensive because of high price of petroleum fuel b) Hydropower Uncertain under the influence of precipitation level
Current Studies in practice in Energy Sector: a) Reduction in Electricity Tariff Coal Fired Steam Thermal b) Diversification of Fuel to generate power LNG Combined Cycle c) Reliable and Economical Power for Peak Load Pumped Storage
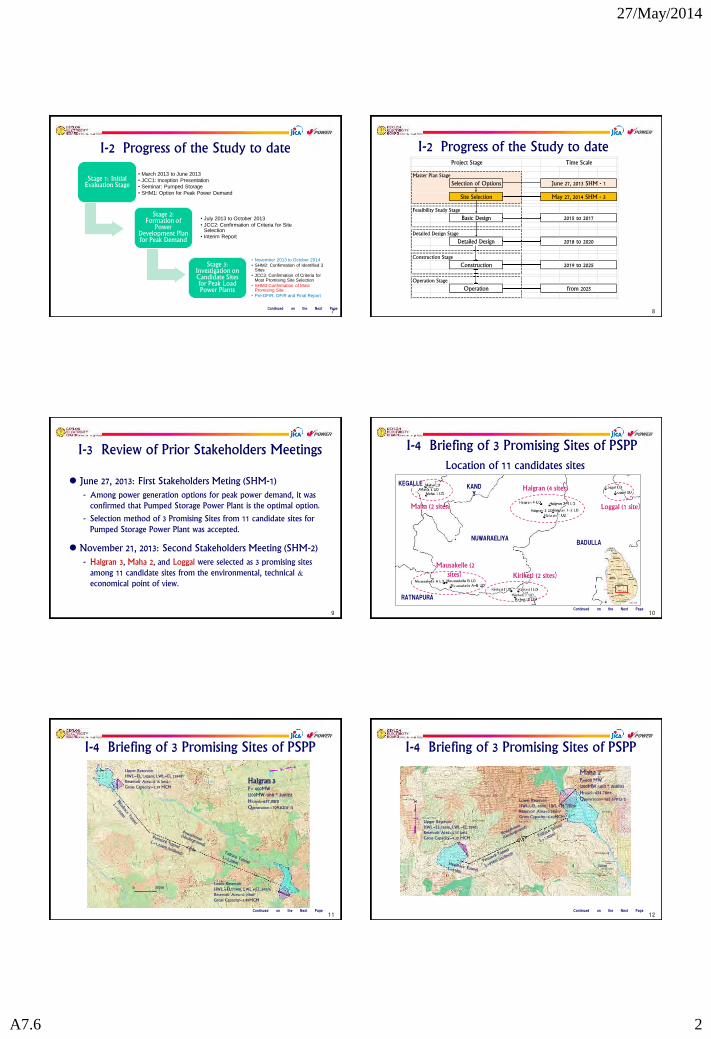
27/May/2014
A7.6 2
I-2 Progress of the Study to date
Stage 1: Initial Evaluation Stage
• March 2013 to June 2013 • JCC1: Inception Presentation • Seminar: Pumped Storage • SHM1: Option for Peak Power Demand
Stage 2: Formation of
Power Development Plan for Peak Demand
• July 2013 to October 2013 • JCC2: Confirmation of Criteria for Site
Selection • Interim Report
Stage 3: Investigation on Candidate Sites for Peak Load Power Plants
• November 2013 to October 2014 • SHM2: Confirmation of Identified 3
Sites • JCC3: Confirmation of Criteria for
Most Promising Site Selection • SHM3:Confirmation of Most
Promising Site • Pre-DF/R, DF/R and Final Report
I-2 Progress of the Study to date
Master Plan Stage
Feasibility Study Stage
Detailed Design Stage
Construction Stage
Operation Stage
2019 to 2025
from 2025
Project Stage Time Scale
June 27, 2013 SHM - 1
2015 to 2017
May 27, 2014 SHM - 3
2018 to 2020
Selection of Options
Site Selection
Basic Design
Detailed Design
Construction
Operation
Construction
Operation
June 27, 2013: First Stakeholders Meting (SHM-1)
- Among power generation options for peak power demand, it was confirmed that Pumped Storage Power Plant is the optimal option.
- Selection method of 3 Promising Sites from 11 candidate sites for Pumped Storage Power Plant was accepted.
November 21, 2013: Second Stakeholders Meeting (SHM-2)
- Halgran 3, Maha 2, and Loggal were selected as 3 promising sites among 11 candidate sites from the environmental, technical & economical point of view.
I-3 Review of Prior Stakeholders Meetings Location of 11 candidates sites
I-4 Briefing of 3 Promising Sites of PSPP
Maha (2 sites
Mausakelle (2 sites Kiriketi (2 sites
Loggal (1 site
Halgran (4 sites
I-4 Briefing of 3 Promising Sites of PSPP
0 500m
Upper Reservoir HWL=EL.1,406m, LWL=EL.1384m Reservoir Area=0.16 km2 Gross Capacity=2.39 MCM
Lower Reservoir HWL.=EL.714m, LWL.=EL..693m Reservoir Area=0.15km2
Gross Capacity=3.95MCM
Halgran 3 P= 600MW (200MW/unit * 3units) Hrated=657.08m Qgeneration=109.62m3/s
I-4 Briefing of 3 Promising Sites of PSPP
0 500m
Maha 2P=600 MW (200MW/unit * 3units) Hrated=434.78m Qgeneration=165.67m3/s
Upper Reservoir HWL=EL.763m, LWL=EL.729m Reservoir Area=0.15 km2 Gross Capacity=4.35 MCM
Lower Reservoir HWL.=EL.300m, LWL.=EL..282m Reservoir Area=0.24km2
Gross Capacity=6.40MCM
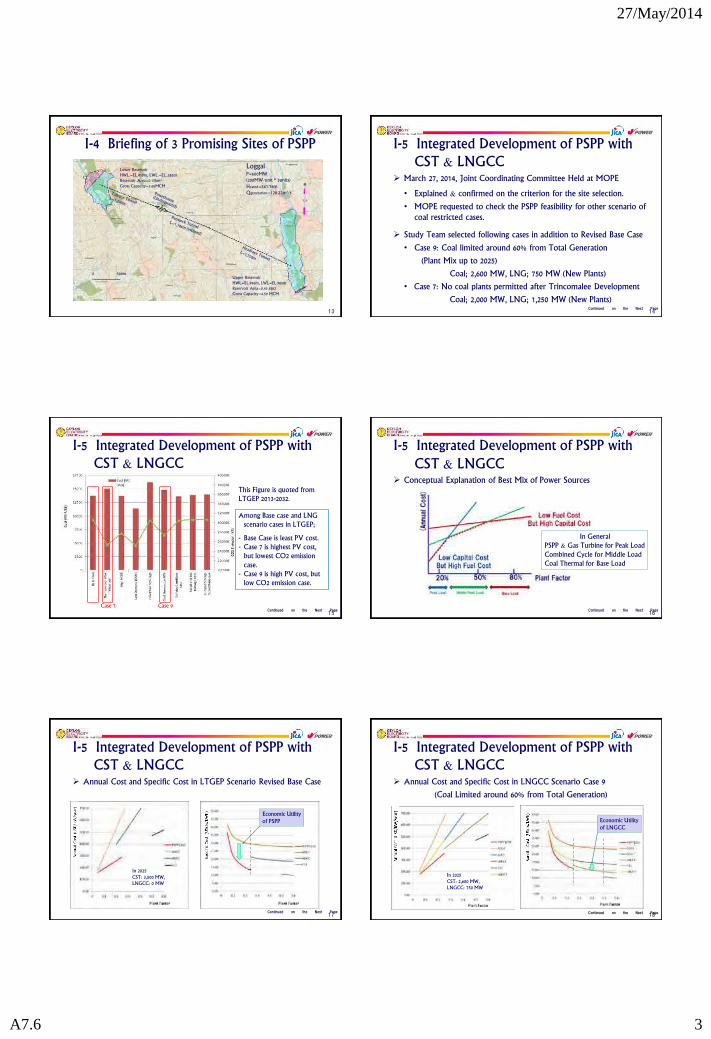
27/May/2014
A7.6 3
I-4 Briefing of 3 Promising Sites of PSPP
0 500m
Loggal P=600MW (200MW/unit * 3units) Hrated=561.76m Qgeneration=128.22m3/s
Upper Reservoir HWL=EL.996m, LWL=EL.985m Reservoir Area=0.43 km2 Gross Capacity=4.59 MCM
Lower ReservoirHWL.=EL.410m, LWL.=EL..383m Reservoir Area=0.15km2
Gross Capacity=3.66MCM
I-5 Integrated Development of PSPP with CST & LNGCC
March 27, 2014, Joint Coordinating Committee Held at MOPE
• Explained & confirmed on the criterion for the site selection.
• MOPE requested to check the PSPP feasibility for other scenario of coal restricted cases.
Study Team selected following cases in addition to Revised Base Case
• Case 9: Coal limited around 60% from Total Generation
(Plant Mix up to 2025)
Coal; 2,600 MW, LNG; 750 MW (New Plants)
• Case 7: No coal plants permitted after Trincomalee Development
Coal; 2,000 MW, LNG; 1,250 MW (New Plants)
I-5 Integrated Development of PSPP with CST & LNGCC
Among Base case and LNG scenario cases in LTGEP;
- Base Case is least PV cost. - Case 7 is highest PV cost,
but lowest CO2 emission case.
- Case 9 is high PV cost, but low CO2 emission case.
This Figure is quoted from LTGEP 2013-2032.
Case 7 Case 9
Conceptual Explanation of Best Mix of Power Sources
I-5 Integrated Development of PSPP with CST & LNGCC
In General PSPP & Gas Turbine for Peak Load Combined Cycle for Middle Load Coal Thermal for Base Load
I-5 Integrated Development of PSPP with CST & LNGCC
Annual Cost and Specific Cost in LTGEP Scenario Revised Base Case
Economic Utility of PSPP
In 2025 CST: 3,500 MW, LNGCC: 0 MW
I-5 Integrated Development of PSPP with CST & LNGCC
Annual Cost and Specific Cost in LNGCC Scenario Case 9
(Coal Limited around 60% from Total Generation)
Economic Utility of LNGCC
In 2025 CST: 2,600 MW, LNGCC: 750 MW
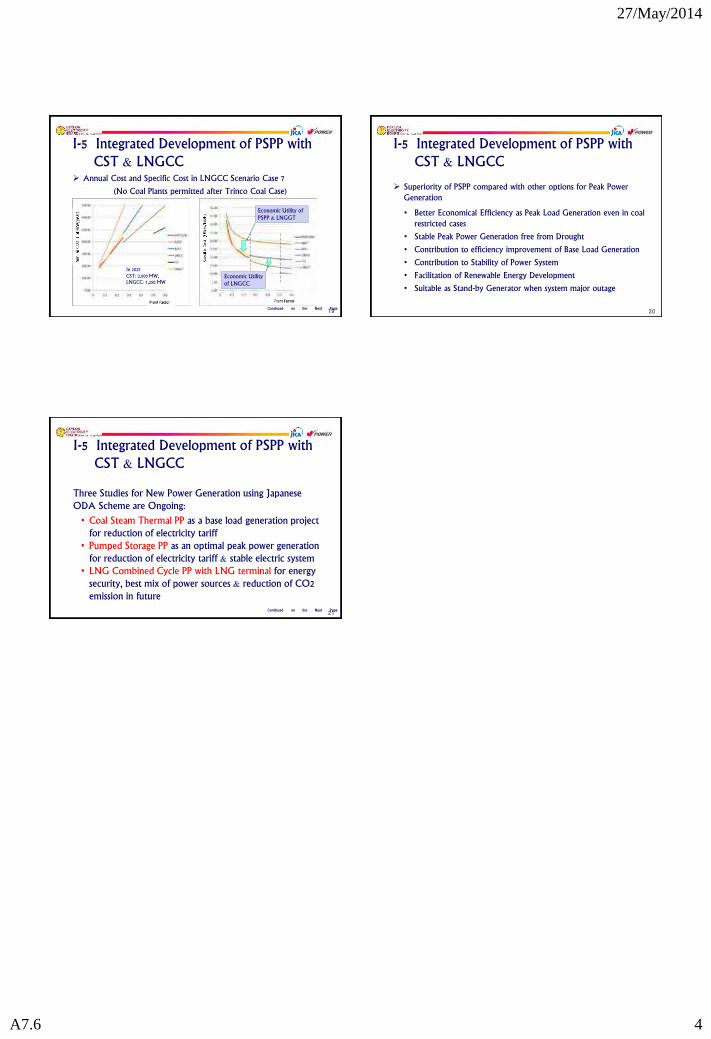
27/May/2014
A7.6 4
I-5 Integrated Development of PSPP with CST & LNGCC
Annual Cost and Specific Cost in LNGCC Scenario Case 7
(No Coal Plants permitted after Trinco Coal Case)
Economic Utility of PSPP & LNGGT
Economic Utility of LNGCC
In 2025 CST: 2,000 MW, LNGCC: 1,250 MW
I-5 Integrated Development of PSPP with CST & LNGCC
Superiority of PSPP compared with other options for Peak Power Generation
• Better Economical Efficiency as Peak Load Generation even in coal restricted cases
• Stable Peak Power Generation free from Drought
• Contribution to efficiency improvement of Base Load Generation
• Contribution to Stability of Power System
• Facilitation of Renewable Energy Development
• Suitable as Stand-by Generator when system major outage
I-5 Integrated Development of PSPP with CST & LNGCC
Three Studies for New Power Generation using Japanese ODA Scheme are Ongoing:
• Coal Steam Thermal PP as a base load generation project for reduction of electricity tariff
• Pumped Storage PP as an optimal peak power generation for reduction of electricity tariff & stable electric system
• LNG Combined Cycle PP with LNG terminal for energy security, best mix of power sources & reduction of CO2 emission in future
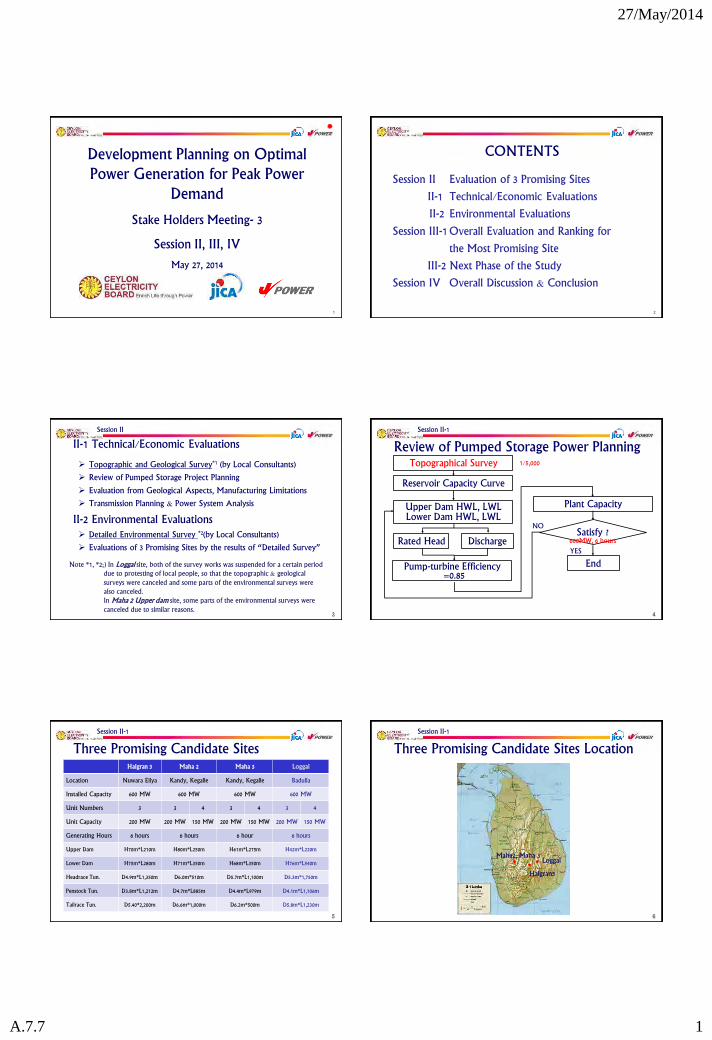
27/May/2014
A.7.7 1
1
May 27, 2014
Development Planning on Optimal Power Generation for Peak Power
Demand
Stake Holders Meeting- 3
Session II, III, IV
2
Session II Evaluation of 3 Promising Sites
II-1 Technical/Economic Evaluations
II-2 Environmental Evaluations
Session III-1 Overall Evaluation and Ranking for
the Most Promising Site
III-2 Next Phase of the Study
Session IV Overall Discussion & Conclusion
CONTENTS
Topographic and Geological Survey*1 (by Local Consultants)
Review of Pumped Storage Project Planning
Evaluation from Geological Aspects, Manufacturing Limitations
Transmission Planning & Power System Analysis
3
II-2 Environmental Evaluations
Session II
II-1 Technical/Economic Evaluations
Detailed Environmental Survey *2(by Local Consultants)
Evaluations of 3 Promising Sites by the results of “Detailed Survey”
Note *1, *2;) In Loggal site, both of the survey works was suspended for a certain period due to protesting of local people, so that the topographic & geological surveys were canceled and some parts of the environmental surveys were also canceled.
In Maha 2 Upper dam site, some parts of the environmental surveys were canceled due to similar reasons.
Review of Pumped Storage Power Planning
4
Reservoir Capacity Curve
Upper Dam HWL, LWL Lower Dam HWL, LWL
Rated Head
Pump-turbine Efficiency =0.85
Discharge Satisfy ?
Plant Capacity
End
YES
NO
600MW, 6 hours
Topographical Survey 1/5,000
Session II-1
5
Three Promising Candidate Sites Halgran 3 Maha 2 Maha 3 Loggal
Location Nuwara Eliya Kandy, Kegalle Kandy, Kegalle Badulla
Installed Capacity 600 MW 600 MW 600 MW 600 MW
Unit Numbers 3 3 4 3 4 3 4
Unit Capacity 200 MW 200 MW 150 MW 200 MW 150 MW 200 MW 150 MW
Generating Hours 6 hours 6 hours 6 hour 6 hours
Upper Dam H70m*L210m H80m*L250m H61m*L275m H42m*L220m
Lower Dam H75m*L280m H71m*L350m H68m*L350m H76m*L540m
Headrace Tun. D4.9m*L1,350m D6.0m*510m D5.7m*L1,100m D5.3m*1,750m
Penstock Tun. D3.8m*L1,212m D4.7m*L885m D4.4m*L979m D4.1m*L1,106m
Tailrace Tun. D5.40*2,200m D6.6m*1,000m D6.2m*500m D5.8m*L1,230m
Session II-1
6
Loggal
Halgran3
Maha2, Maha 3
Three Promising Candidate Sites Location
Session II-1
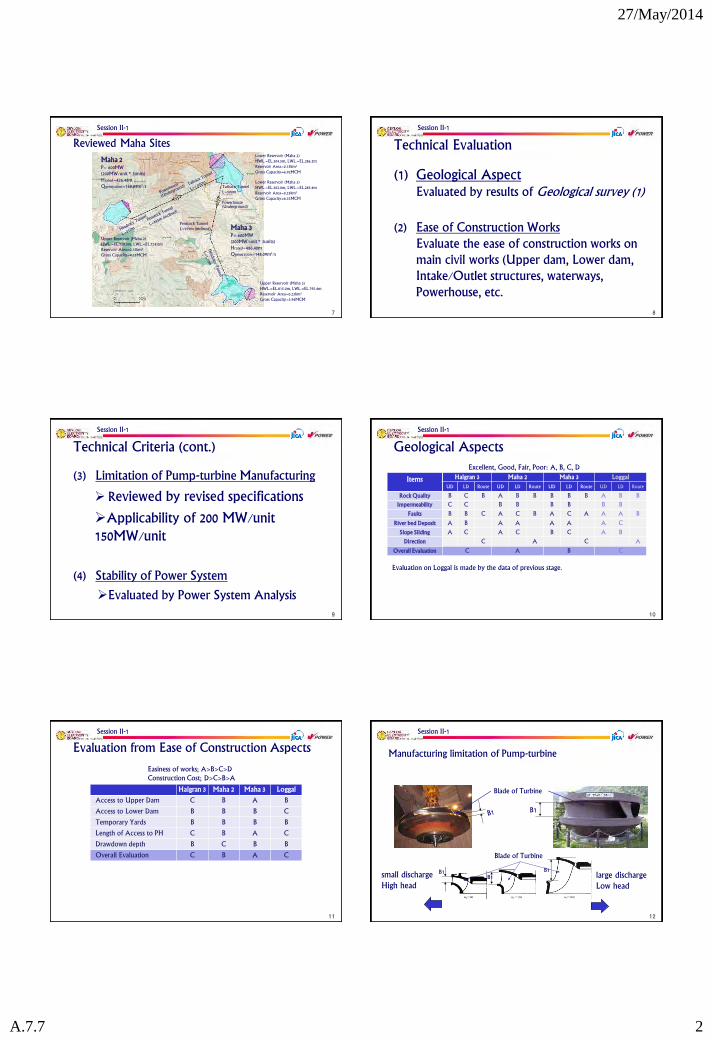
27/May/2014
A.7.7 2
7
Reviewed Maha Sites
Maha 2 P= 600MW (200MW/unit * 3units) Hrated=426.48m Qgeneration=168.89m3/s
Maha 3 P= 600MW (200MW/unit * 3units) Hrated=486.40m Qgeneration=148.09m3/s
Powerhouse (Underground)
Penstock Tunnel L=979m (inclined)
Tailrace Tunnel L=500m
Lower Reservoir (Maha 2) HWL.=EL.304.5m, LWL.=EL.286.2m Reservoir Area=0.15km2
Gross Capacity=6.92MCM
Lower Reservoir (Maha 3) HWL.=EL.302.0m, LWL.=EL.285.4m Reservoir Area=0.23km2
Gross Capacity=6.33MCM
Upper Reservoir (Maha 3) HWL.=EL.815.0m, LWL.=EL.795.4m Reservoir Area=0.23km2
Gross Capacity=3.94MCM
Upper Reservoir (Maha 2) HWL.=EL.759.0m, LWL.=EL.724.0m Reservoir Area=0.15km2
Gross Capacity=4.35MCM
Session II-1
Technical Evaluation
8
(1) Geological Aspect Evaluated by results of Geological survey (1)
(2) Ease of Construction Works Evaluate the ease of construction works on main civil works (Upper dam, Lower dam, Intake/Outlet structures, waterways, Powerhouse, etc.
Session II-1
Technical Criteria (cont.)
9
(3) Limitation of Pump-turbine Manufacturing
Reviewed by revised specifications
Applicability of 200 MW/unit 150MW/unit
(4) Stability of Power System
Evaluated by Power System Analysis
Session II-1
Geological Aspects
10
Items
Halgran 3 Maha 2 Maha 3 Loggal
UD LD Route UD LD Route UD LD Route UD LD Route
Rock Quality B C B A B B B B B A B B
Impermeability C C B B B B B B
Faults B B C A C B A C A A A B
River bed Deposit A B A A A A A C
Slope Sliding A C A C B C A B
Direction C A C A
Overall Evaluation C A B C
Session II-1
Evaluation on Loggal is made by the data of previous stage.
Excellent, Good, Fair, Poor: A, B, C, D
11
Evaluation from Ease of Construction Aspects
Halgran 3 Maha 2 Maha 3 Loggal
Access to Upper Dam C B A B
Access to Lower Dam B B B C
Temporary Yards B B B B
Length of Access to PH C B A C
Drawdown depth B C B B
Overall Evaluation C B A C
Easiness of works; A>B>C>D Construction Cost; D>C>B>A
Session II-1
12
Manufacturing limitation of Pump-turbine
small discharge High head
large discharge Low head
Blade of Turbine
B1
B1 B1
B1
Blade of Turbine
Session II-1
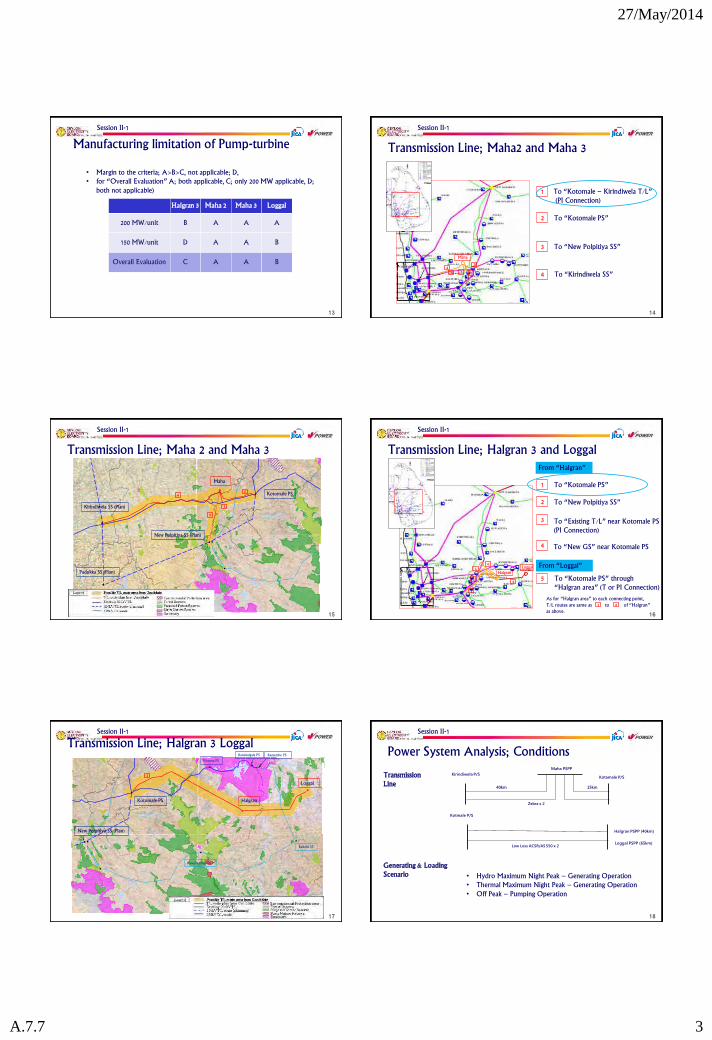
27/May/2014
A.7.7 3
Manufacturing limitation of Pump-turbine
Halgran 3 Maha 2 Maha 3 Loggal
200 MW/unit B A A A
150 MW/unit D A A B
Overall Evaluation C A A B
• Margin to the criteria; A>B>C, not applicable; D, • for “Overall Evaluation” A; both applicable, C; only 200 MW applicable, D;
both not applicable)
Session II-1
Transmission Line; Maha2 and Maha 3
1
2
3 4
1
2
3
4
To “Kotomale – Kirindiwela T/L” (PI Connection)
To “Kotomale PS”
To “New Polpitiya SS”
To “Kirindiwela SS”
Maha
4
Session II-1
Transmission Line; Maha 2 and Maha 3
Maha
Kotomale PS
Kirindiwela SS (Plan)
Padukka SS (Plan)
New Polpitiya SS (Plan)
1
2
3
4
Session II-1
Transmission Line; Halgran 3 and Loggal
1
2
3
4
5
1 To “Kotomale PS”
2 To “New Polpitiya SS”
3 To “Existing T/L” near Kotomale PS (PI Connection)
4 To “New GS” near Kotomale PS
5 To “Kotomale PS” through “Halgran area” (T or PI Connection)
From “Halgran”
From “Loggal”
As for “Halgran area” to each connecting point, T/L routes are same as to of “Halgran” as above.
1 4
Halgran Loggal
Session II-1
Transmission Line; Halgran 3 Loggal
Halgran
Loggal
Kotomale PS
New Polpitiya SS (Plan)
Nuwara Eliya SS
Badulla SS
Victoria PS
Randenigala PS Rantembe PS
1
Session II-1
Power System Analysis; Conditions
Kotmale P/S
Halgran PSPP (40km)
Loggal PSPP (65km) Low Loss ACSR/AS 550 x 2
40km 15km
Kirindiwela P/S Kotamale P/S
Maha PSPP
Zebra x 2
• Hydro Maximum Night Peak – Generating Operation • Thermal Maximum Night Peak – Generating Operation • Off Peak – Pumping Operation
Generating & Loading Scenario
Transmission Line
Session II-1
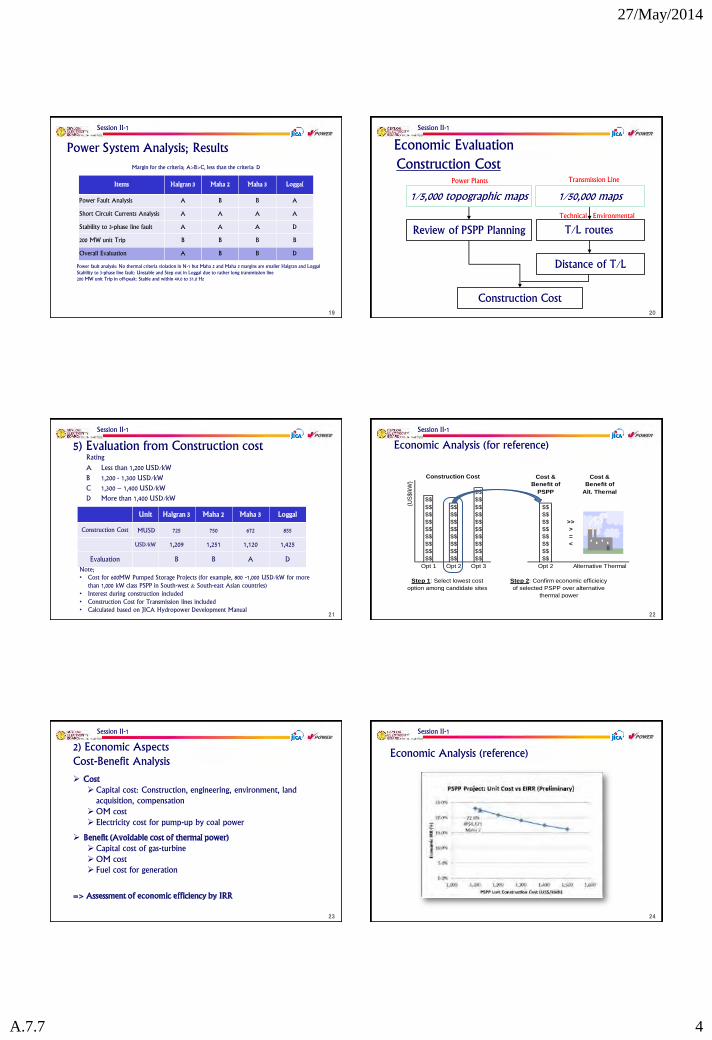
27/May/2014
A.7.7 4
Power System Analysis; Results
Items Halgran 3 Maha 2 Maha 3 Loggal
Power Fault Analysis A B B A
Short Circuit Currents Analysis A A A A
Stability to 3-phase line fault A A A D
200 MW unit Trip B B B B
Overall Evaluation A B B D
Margin for the criteria; A>B>C, less than the criteria: D
Power fault analysis: No thermal criteria violation in N-1 but Maha 2 and Maha 3 margins are smaller Halgran and Loggal Stability to 3-phase line fault: Unstable and Step out in Loggal due to rather long transmission line 200 MW unit Trip in off-peak: Stable and within 49.0 to 51.0 Hz
Session II-1
Economic Evaluation
Construction Cost
Review of PSPP Planning
1/50,000 maps 1/5,000 topographic maps
Distance of T/L
Construction Cost
T/L routes
Power Plants Transmission Line
Technical Environmental
Session II-1
5) Evaluation from Construction cost
Rating
A Less than 1,200 USD/kW
B 1,200 - 1,300 USD/kW
C 1,300 – 1,400 USD/kW
D More than 1,400 USD/kW
Unit Halgran 3 Maha 2 Maha 3 Loggal
Construction Cost MUSD 725 750 672 855
USD/kW 1,209 1,251 1,120 1,425
Evaluation B B A D
Note; • Cost for 600MW Pumped Storage Projects (for example, 800 -1,000 USD/kW for more
than 1,000 kW class PSPP in South-west & South-east Asian countries) • Interest during construction included • Construction Cost for Transmission lines included • Calculated based on JICA Hydropower Development Manual
Session II-1
Economic Analysis (for reference)
Cost & Cost &Benefit of Benefit of
$$ PSPP Alt. Thernal$$ $$$$ $$ $$ $$$$ $$ $$ $$$$ $$ $$ $$ >>$$ $$ $$ $$ >$$ $$ $$ $$ =$$ $$ $$ $$ <$$ $$ $$ $$$$ $$ $$ $$
Opt 1 Opt 2 Opt 3 Opt 2 Alternative Thermal
(US$
/kW
)
Step 1: Select lowest costoption among candidate sites
Step 2: Confirm economic efficieicyof selected PSPP over alternative
thermal power
Construction Cost
Session II-1
2) Economic Aspects Cost-Benefit Analysis
Cost Capital cost: Construction, engineering, environment, land
acquisition, compensation OM cost Electricity cost for pump-up by coal power
Benefit (Avoidable cost of thermal power) Capital cost of gas-turbine OM cost Fuel cost for generation
=> Assessment of economic efficiency by IRR
Session II-1
Economic Analysis (reference)
Session II-1

27/May/2014
A.7.7 5
Environmental Evaluations
25
1) The Environmental Study (2) has been was conducted at the three (3) promising sites to collect information on the scoping items. The scoping items were presented at the 2nd SHM and agreed among the participants.
2) The Study has been undertaken by the University of Peradeniya, headed by Prof. Hennayake.
3) The results have been utilized by the JICA Study Team to compare the three candidate sites to select the most promising site.
Session II-2
Environmental Study (2); 3 Promising Sites
26
The following scoping table was presented at the 2nd SHM, and the Study has been conducted.
Natural
environment
Impacts on fauna and
flora
Inundated forest area (including natural, secondary, plantation forests, and
home garden)
Impacts on faunal endangered species (including aquatic species)
Impacts on floral endangered species (including aquatic species)
Impacts on ecosystems
Social
environment
Impacts on local
communities
Number of those who to be resettled
Area of land to be acquired
Number of those who to be affected by losing livelihood
Impacts on public facilities (e.g. school, road)
Impacts on the poor people and minority
Impacts on water utilization (e.g. drinking water, bathing, washing,
irrigation, mini-hydropower plant) of rivers and wells
Impacts on industries Agriculture (including tree & rubber plantation)
Tourism (e.g. water fall)
Impacts on culture and
landscape
Religious, and/or cultural facilities, burial ground
Impacts on landscape
Session II-2
Environmental Study (2); Transmission Line
27
1) Alternative routes with buffer zones are selected by CEB and the transmission experts considering the following points.
• To connect to the existing and planned facilities
• To avoid major barriers (populated areas, major public facilities, cultural heritages)
• To avoid protected areas, forest reserves and IBAs
2) The routes are assessed by the Study.
An assessment on the transmission lines is conducted as part of the Study.
Session II-2
Evaluation from Environmental Aspects
28
Site Evaluation items
Halgran Maha 2 Maha 3 Loggal
Impacts on fauna and flora Forest area C D D C
Endangered species (fauna) D D D D
Endangered species (flora) D C C D
Ecosystem D C C C
Impacts on local communities Resettlement B D C C
Acquired land B C C D
Losing livelihood D D C C
Public facilities A A A C
Water utilization C D D D
Impacts on industries Agriculture A C C D
Tourism A A A A
Impacts on culture and landscape
Religious and cultural sites A C C C
Landscape A B B A
Session II-2
Evaluation from Environmental Aspects
29
Natural environment • Area of inundated forest at each site is relatively
small.
• All sites have some endangered species. Halgran site has two Critically Endangered species.
• Biodiversity and species richness are moderate to high.
• All sites are outside of the protected areas (e.g. reserved forests and national parks).
Session II-2
Evaluation from Environmental Aspects
30
Social environment: Impacts on local communities
• Families to be resettled
Halgran: 4 families; Maha 2: 45 families; Maha 3: 39 families; and 25 families
• Area to be acquired
Halgran: 30 ha; Maha 2: 38 ha; Maha 3: 46 ha; and Loggal: 53 ha
Session II-2

27/May/2014
A.7.7 6
Evaluation from Environmental Aspects
31
Social environment: Impacts on industries
• Agriculture land to be inundated
Halgran: 19 ha; Maha 2: 32 ha; Maha 3: 39 ha; and Loggal 48 ha.
Session II-2
4-6) Evaluation from Environmental Aspects
32
Social environment: Impacts on culture and landscape
• All clusters have religious temples. They are not registered religious temples, but they are important for the local people.
Session II-2
4-6) Evaluation from Environmental Aspects
33
Transmission lines
• There are no major problems on their routes / buffer zones.
Session II-2
34
Overall Evaluation and Ranking for the Most Promising Site
Rating A, B, C, D (1.0, 0.75, 0.5, 0.25)
Score Allocation
Score of each criterion
Total Score of 1.,2., …, 4
Ranking (Even-case, Environment Weighed-case)
Total Score Corrrection
Session III
35
7) Ranking of Candidate Sites - Even case Tech. Econo.(1+2) : Env.(3+4)=50 : 50
Score
Allocation Halgran 3 Maha 2 Maha 3 Loggal
1. Technical Evaluation 25.00 15.50 22.00 21.75 12.50
2. Economic Evaluation 25.00 18.75 18.75 25.00 6.25
3. Natural Environment 25.00 7.25 9.68 10.75 7.20
4. Social Environment 25.00 17.50 10.35 13.75 9.40
Total 100.00 59.00 60.78 71.25 35.35
Rank 3 2 1 4
Session III-1
36
Score
Allocation Halgran 3 Maha 2 Maha 3 Loggal
1. Technical Evaluation 15.00 9.30 13.20 13.05 7.50
2. Economic Evaluation 15.00 11.25 11.25 15.00 3.75
3. Natural Environment 35.00 10.15 13.55 15.05 10.08
4. Social Environment 35.00 24.50 14.49 19.25 13.16
Total 100.00 55.20 52.49 62.35 34.49
Rank 2 3 1 4
7) Ranking of Candidate Sites - Environmental weighed case (1+2) : (3+4)=30 : 70
Session III-1
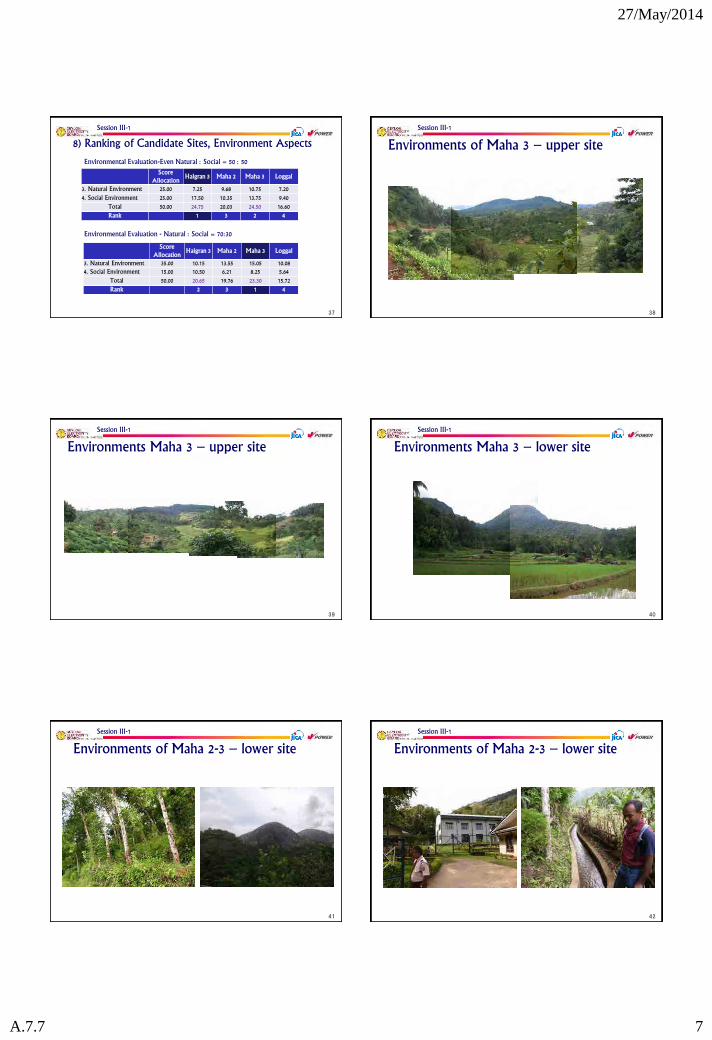
27/May/2014
A.7.7 7
37
8) Ranking of Candidate Sites, Environment Aspects
Score
Allocation Halgran 3 Maha 2 Maha 3 Loggal
3. Natural Environment 25.00 7.25 9.68 10.75 7.20
4. Social Environment 25.00 17.50 10.35 13.75 9.40
Total 50.00 24.75 20.03 24.50 16.60
Rank 1 3 2 4
Score
Allocation Halgran 3 Maha 2 Maha 3 Loggal
3. Natural Environment 35.00 10.15 13.55 15.05 10.08
4. Social Environment 15.00 10.50 6.21 8.25 5.64
Total 50.00 20.65 19.76 23.30 15.72
Rank 2 3 1 4
Environmental Evaluation-Even Natural : Social = 50 : 50
Environmental Evaluation - Natural : Social = 70:30
Session III-1
Environments of Maha 3 – upper site
38
Session III-1
Environments Maha 3 – upper site
39
Session III-1
Environments Maha 3 – lower site
40
Session III-1
Environments of Maha 2-3 – lower site
41
Session III-1
Environments of Maha 2-3 – lower site
42
Session III-1

27/May/2014
A.7.7 8
…Next Phase of the Study
43
For the Most Promising Site, 1. Topographic Survey; Dams Area (1:1,000)
2. Geological Survey ( Drilling Investigations at Upper dam and Lower dam)
3. Preliminary design by 1 to 1,000 topographic map
4. PI preparations
5. Draft Final Report ( on August by the initial schedule)
6. Final Report (on October by the initial schedule)
Session III-2
44
Selection of Most Promising Candidate Site
• Evaluation method applied • Evaluation results, etc.
Confirmation of the Most Promising Site
Suggestions for the next phase study
Overall Discussion & Conclusion
Session IV
Are there any comments or suggestions
1. …
2. …
3. …
45
E-mail address: [email protected], and [email protected]
Session IV
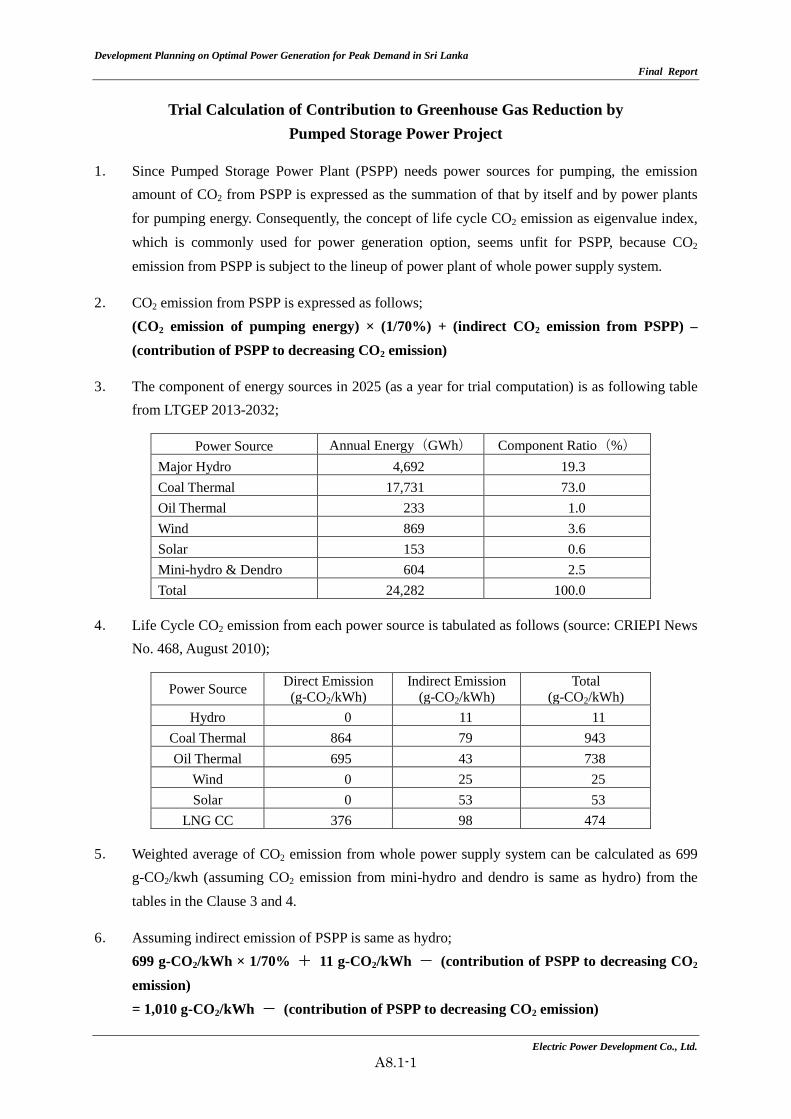
Development Planning on Optimal Power Generation for Peak Demand in Sri Lanka Final Report
Appendix 8.1
Trial Calculation of Contribution to Greenhouse Gas Reduction by Pumped Storage Power Project
1. Since Pumped Storage Power Plant (PSPP) needs power sources for pumping, the emission amount of CO2 from PSPP is expressed as the summation of that by itself and by power plants for pumping energy. Consequently, the concept of life cycle CO2 emission as eigenvalue index, which is commonly used for power generation option, seems unfit for PSPP, because CO2 emission from PSPP is subject to the lineup of power plant of whole power supply system.
2. CO2 emission from PSPP is expressed as follows; (CO2 emission of pumping energy) × (1/70%) + (indirect CO2 emission from PSPP) – (contribution of PSPP to decreasing CO2 emission)
3. The component of energy sources in 2025 (as a year for trial computation) is as following table from LTGEP 2013-2032;
Power Source Annual Energy(GWh) Component Ratio(%) Major Hydro 4,692 19.3 Coal Thermal 17,731 73.0 Oil Thermal 233 1.0 Wind 869 3.6 Solar 153 0.6 Mini-hydro & Dendro 604 2.5 Total 24,282 100.0
4. Life Cycle CO2 emission from each power source is tabulated as follows (source: CRIEPI News
No. 468, August 2010);
Power Source Direct Emission (g-CO2/kWh)
Indirect Emission (g-CO2/kWh)
Total (g-CO2/kWh)
Hydro 0 11 11 Coal Thermal 864 79 943 Oil Thermal 695 43 738
Wind 0 25 25 Solar 0 53 53
LNG CC 376 98 474
5. Weighted average of CO2 emission from whole power supply system can be calculated as 699 g-CO2/kwh (assuming CO2 emission from mini-hydro and dendro is same as hydro) from the tables in the Clause 3 and 4.
6. Assuming indirect emission of PSPP is same as hydro; 699 g-CO2/kWh × 1/70% + 11 g-CO2/kWh - (contribution of PSPP to decreasing CO2 emission) = 1,010 g-CO2/kWh - (contribution of PSPP to decreasing CO2 emission)
Electric Power Development Co., Ltd. A8.1-1
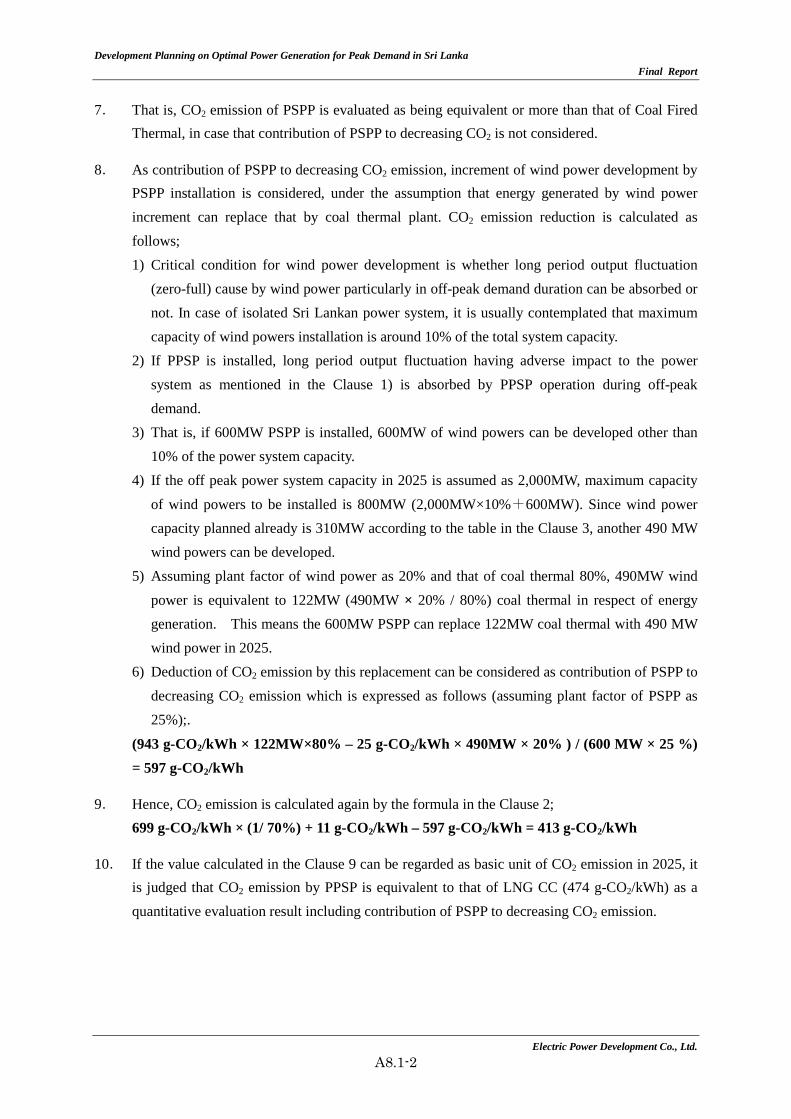
Development Planning on Optimal Power Generation for Peak Demand in Sri Lanka Final Report
Appendix 8.1
7. That is, CO2 emission of PSPP is evaluated as being equivalent or more than that of Coal Fired Thermal, in case that contribution of PSPP to decreasing CO2 is not considered.
8. As contribution of PSPP to decreasing CO2 emission, increment of wind power development by PSPP installation is considered, under the assumption that energy generated by wind power increment can replace that by coal thermal plant. CO2 emission reduction is calculated as follows; 1) Critical condition for wind power development is whether long period output fluctuation
(zero-full) cause by wind power particularly in off-peak demand duration can be absorbed or not. In case of isolated Sri Lankan power system, it is usually contemplated that maximum capacity of wind powers installation is around 10% of the total system capacity.
2) If PPSP is installed, long period output fluctuation having adverse impact to the power system as mentioned in the Clause 1) is absorbed by PPSP operation during off-peak demand.
3) That is, if 600MW PSPP is installed, 600MW of wind powers can be developed other than 10% of the power system capacity.
4) If the off peak power system capacity in 2025 is assumed as 2,000MW, maximum capacity of wind powers to be installed is 800MW (2,000MW×10%+600MW). Since wind power capacity planned already is 310MW according to the table in the Clause 3, another 490 MW wind powers can be developed.
5) Assuming plant factor of wind power as 20% and that of coal thermal 80%, 490MW wind power is equivalent to 122MW (490MW × 20% / 80%) coal thermal in respect of energy generation. This means the 600MW PSPP can replace 122MW coal thermal with 490 MW wind power in 2025.
6) Deduction of CO2 emission by this replacement can be considered as contribution of PSPP to decreasing CO2 emission which is expressed as follows (assuming plant factor of PSPP as 25%);.
(943 g-CO2/kWh × 122MW×80% – 25 g-CO2/kWh × 490MW × 20% ) / (600 MW × 25 %) = 597 g-CO2/kWh
9. Hence, CO2 emission is calculated again by the formula in the Clause 2; 699 g-CO2/kWh × (1/ 70%) + 11 g-CO2/kWh – 597 g-CO2/kWh = 413 g-CO2/kWh
10. If the value calculated in the Clause 9 can be regarded as basic unit of CO2 emission in 2025, it is judged that CO2 emission by PPSP is equivalent to that of LNG CC (474 g-CO2/kWh) as a quantitative evaluation result including contribution of PSPP to decreasing CO2 emission.
Electric Power Development Co., Ltd. A8.1-2
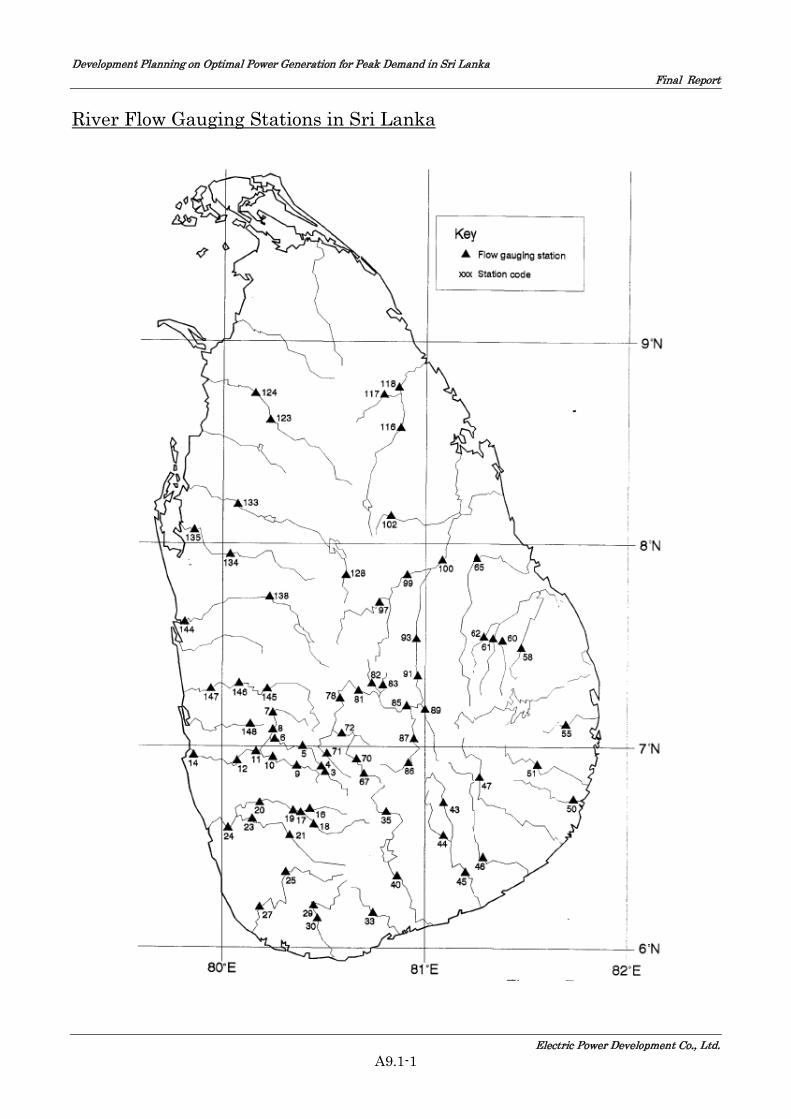
Development Planning on Optimal Power Generation for Peak Demand in Sri Lanka Final Report
Appendix 9.1
River Flow Gauging Stations in Sri Lanka
Electric Power Development Co., Ltd. A9.1-1
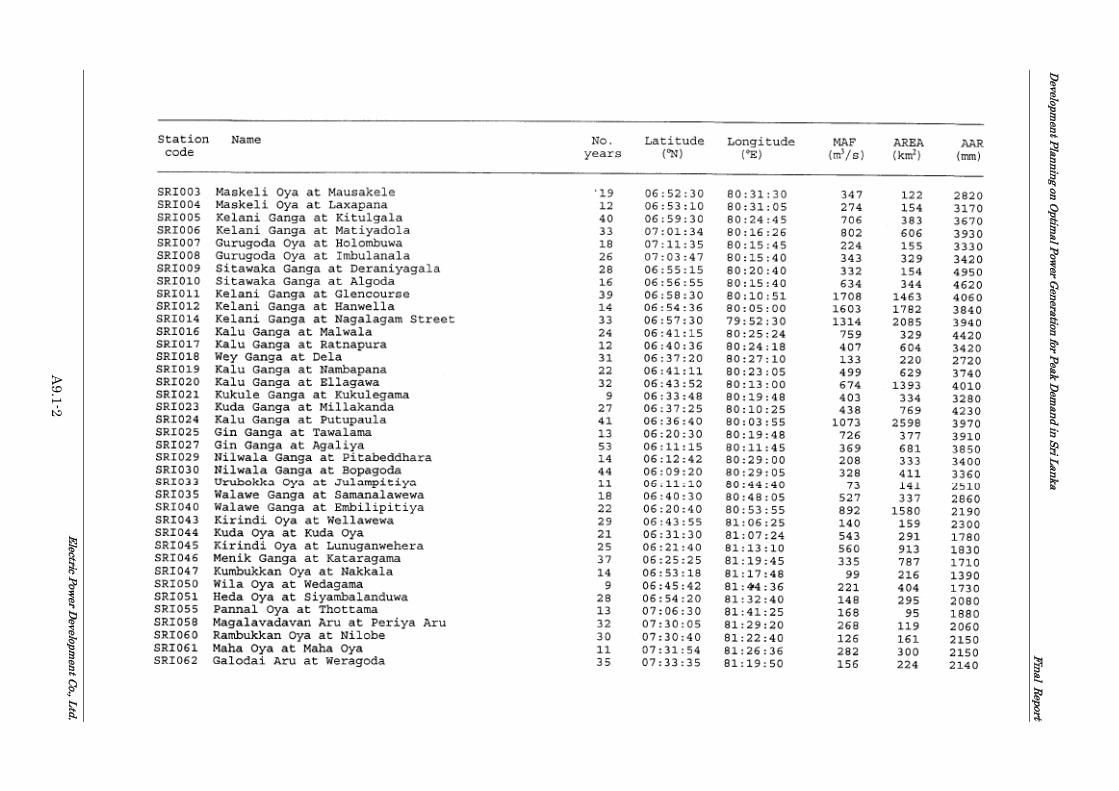
Developm
ent Planning on Optim
al Power G
eneration for Peak Dem
and in Sri Lanka F inal Report
Appendix 9.1
Electric Power D
evelopment Co., Ltd.
A9.1-2
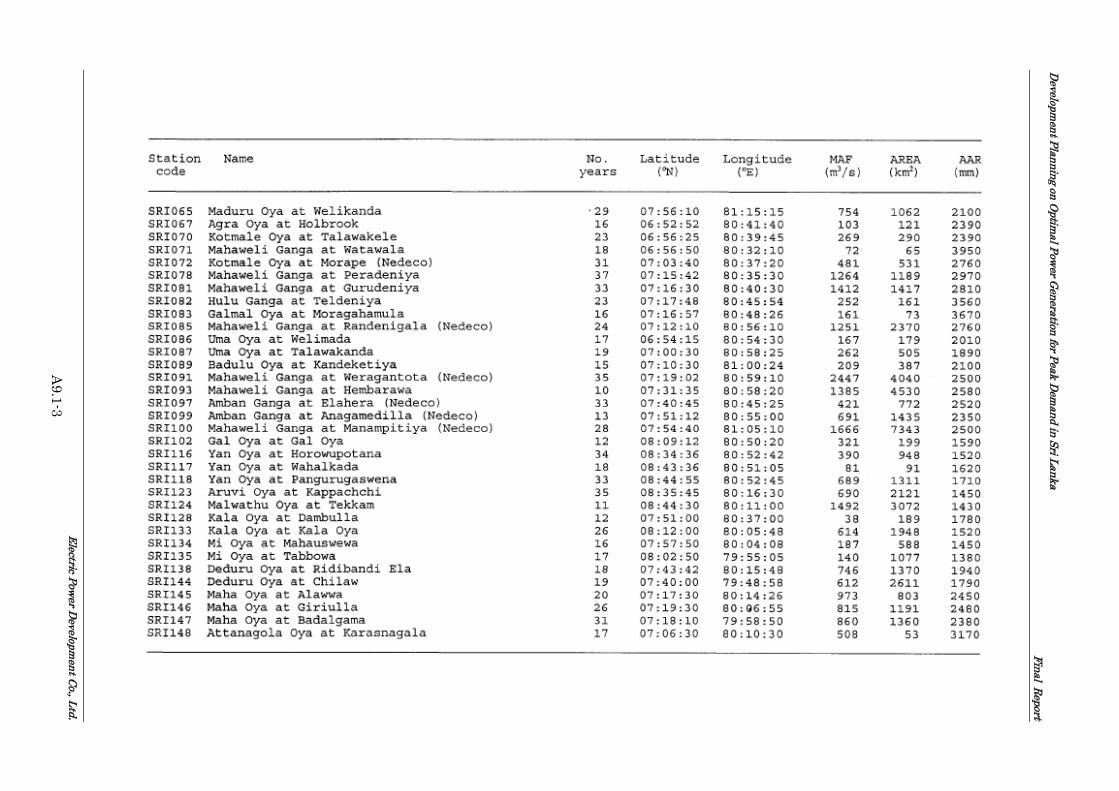
Developm
ent Planning on Optim
al Power G
eneration for Peak Dem
and in Sri Lanka F inal Report
Appendix 9.1
Electric Power D
evelopment Co., Ltd.
A9.1-3
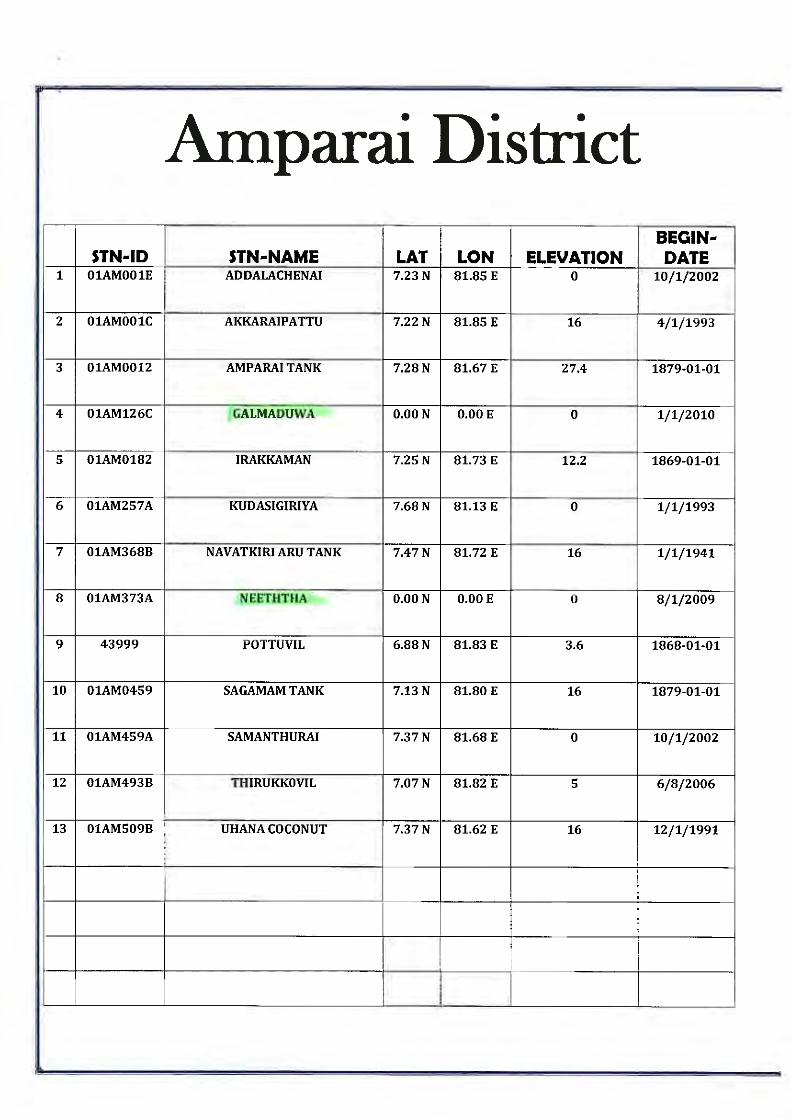
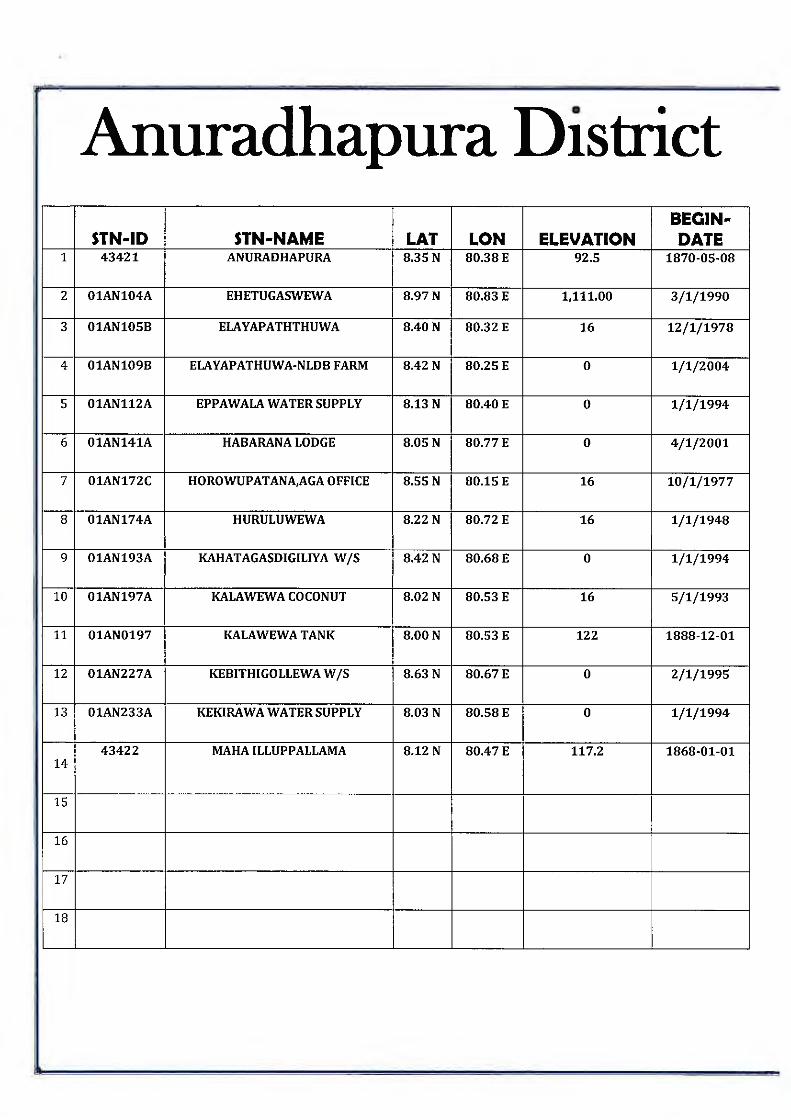
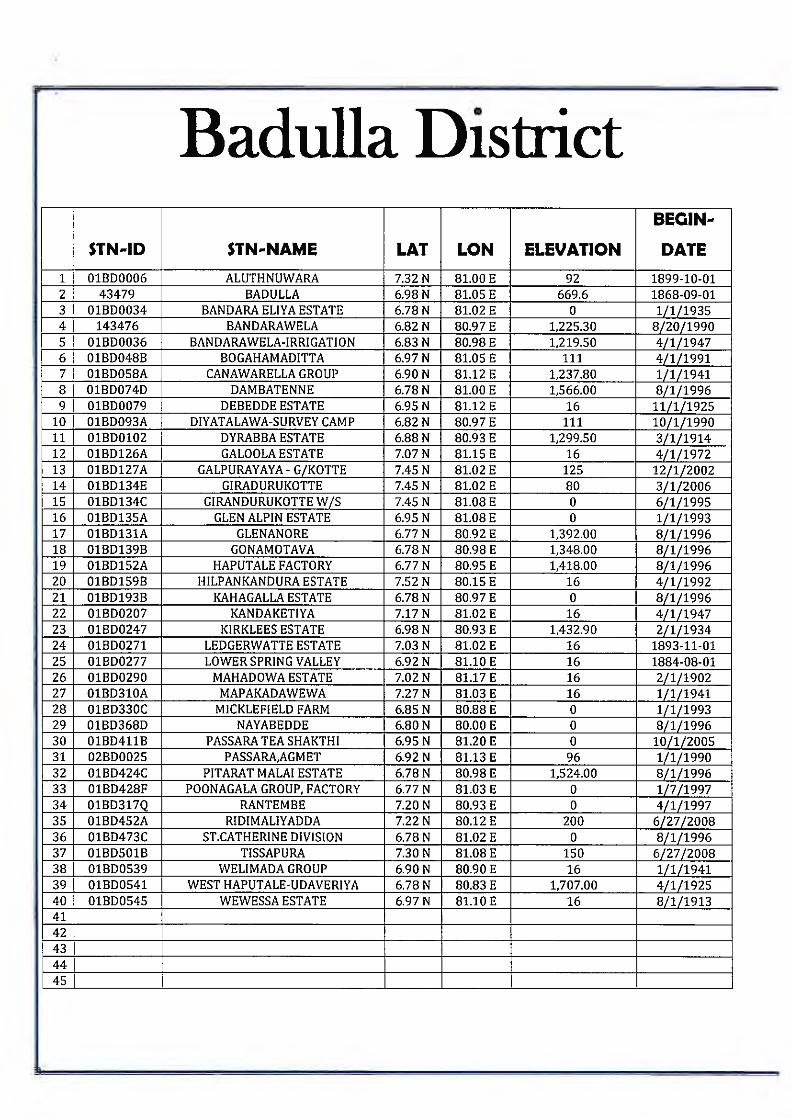
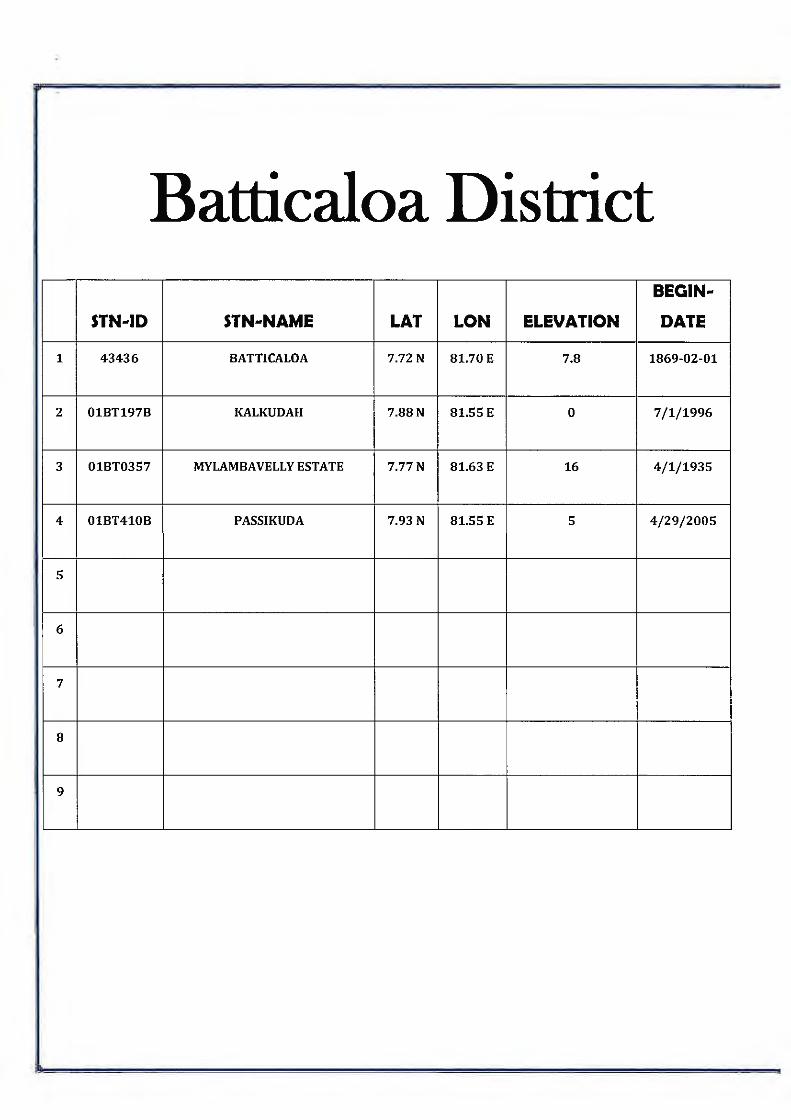
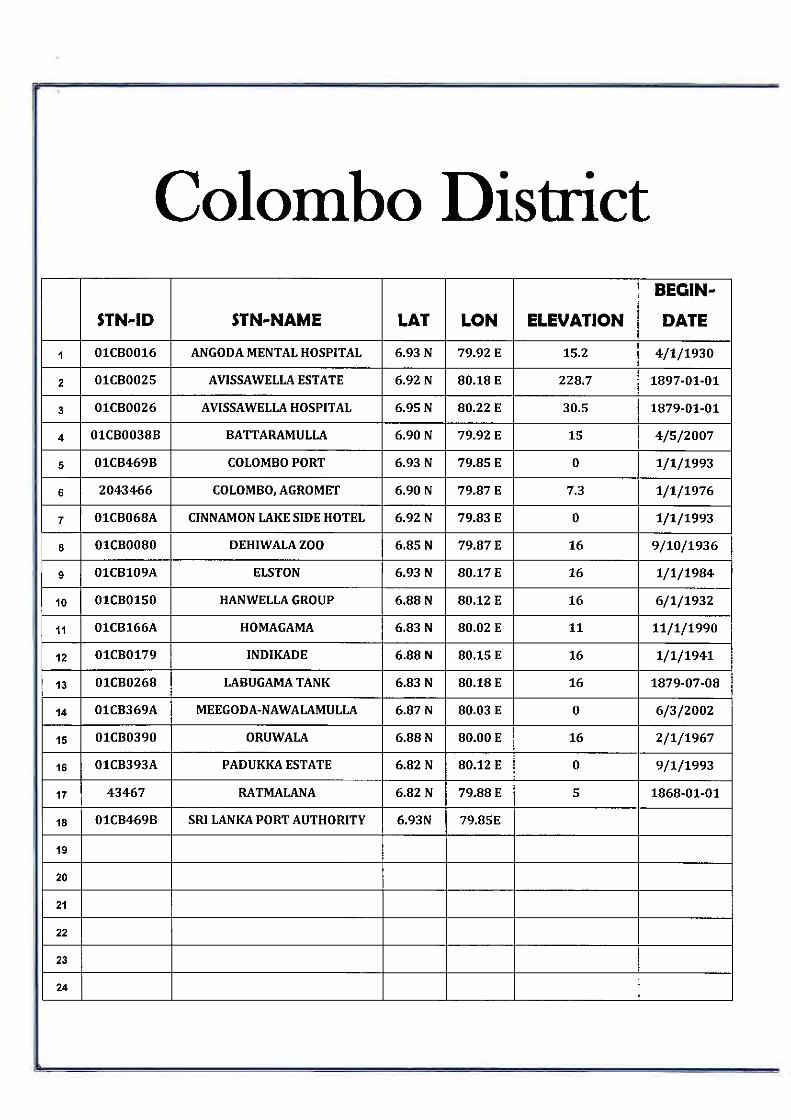
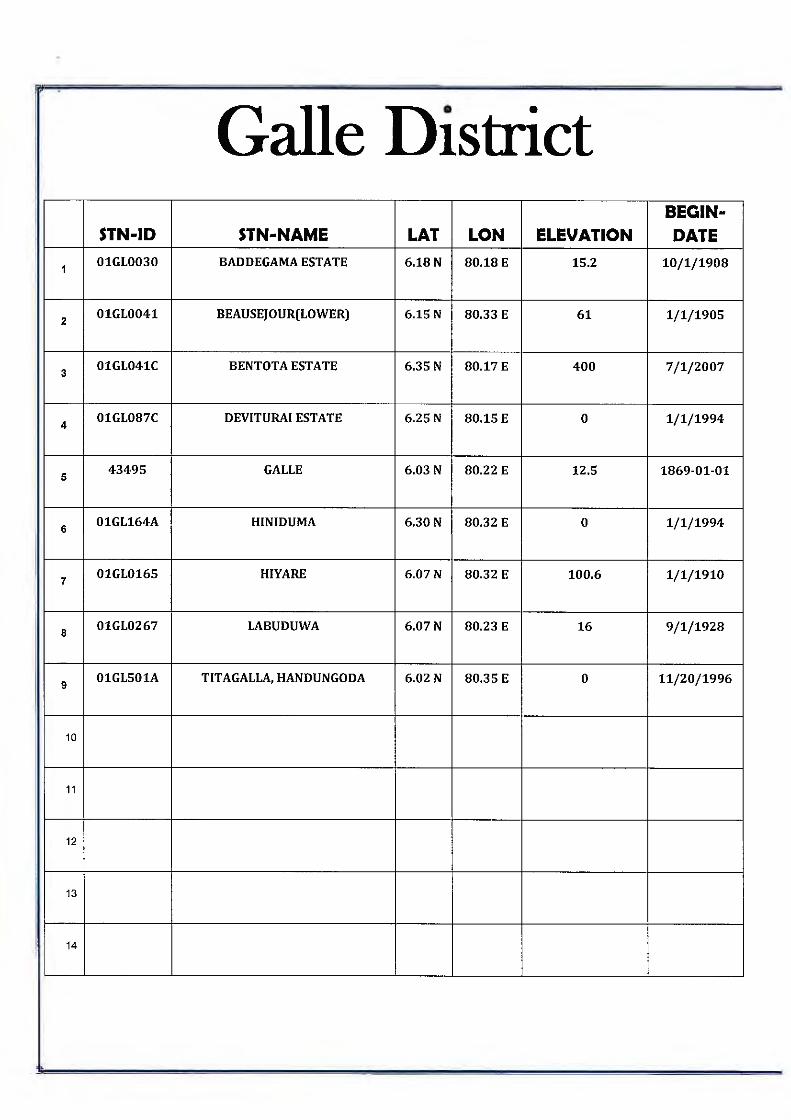
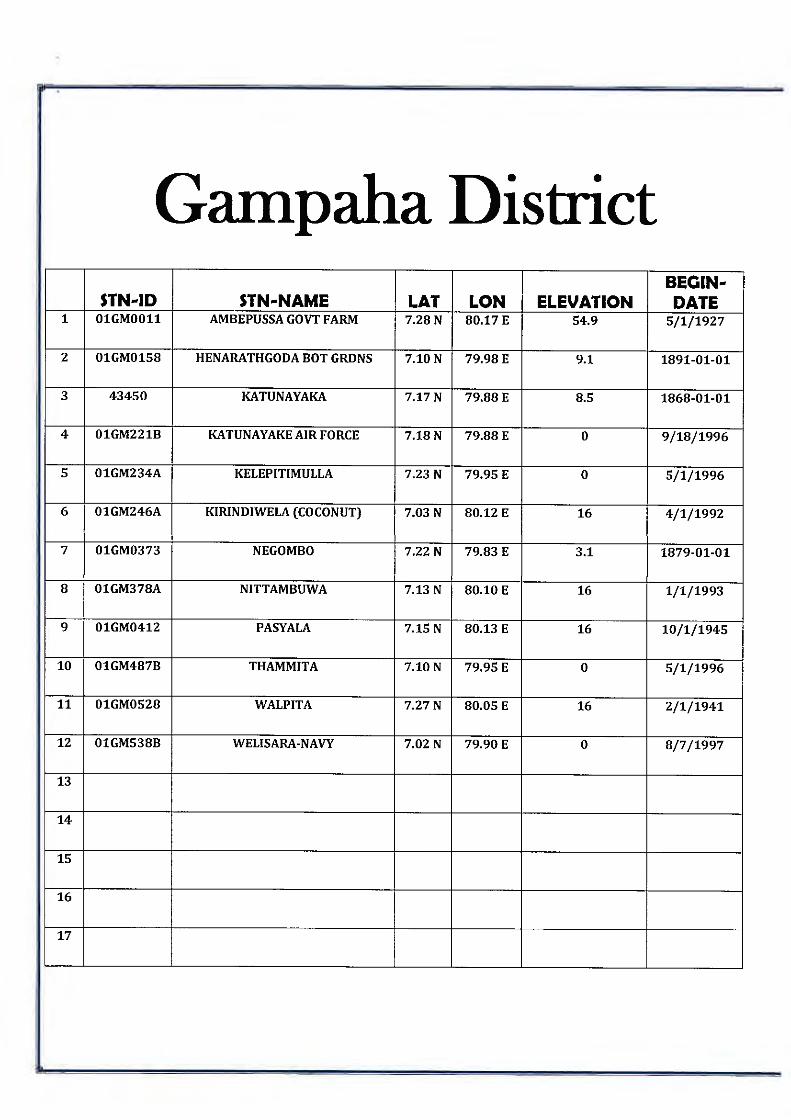
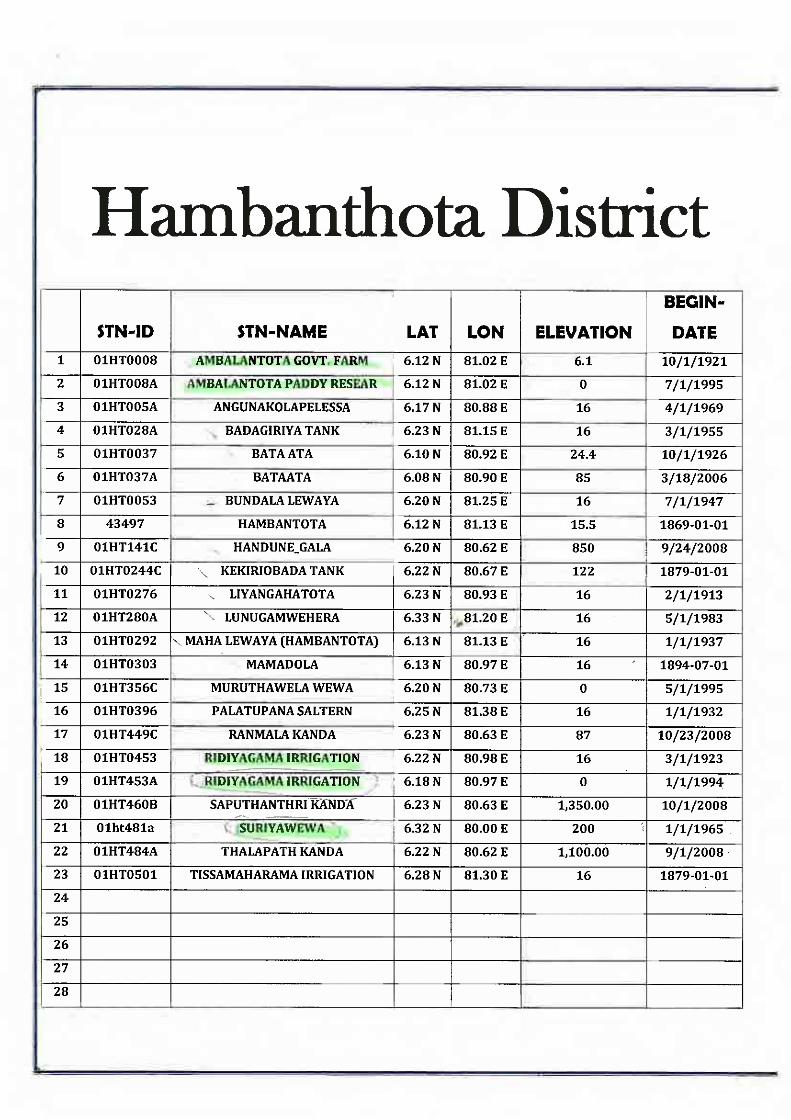
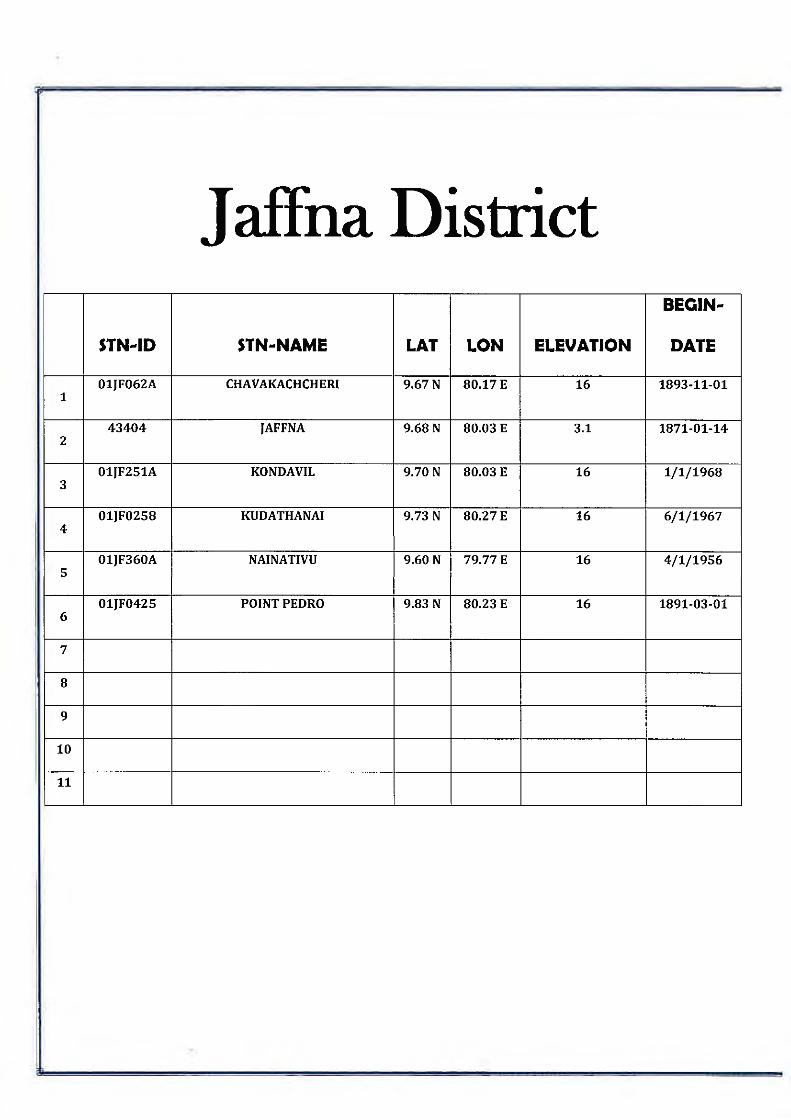
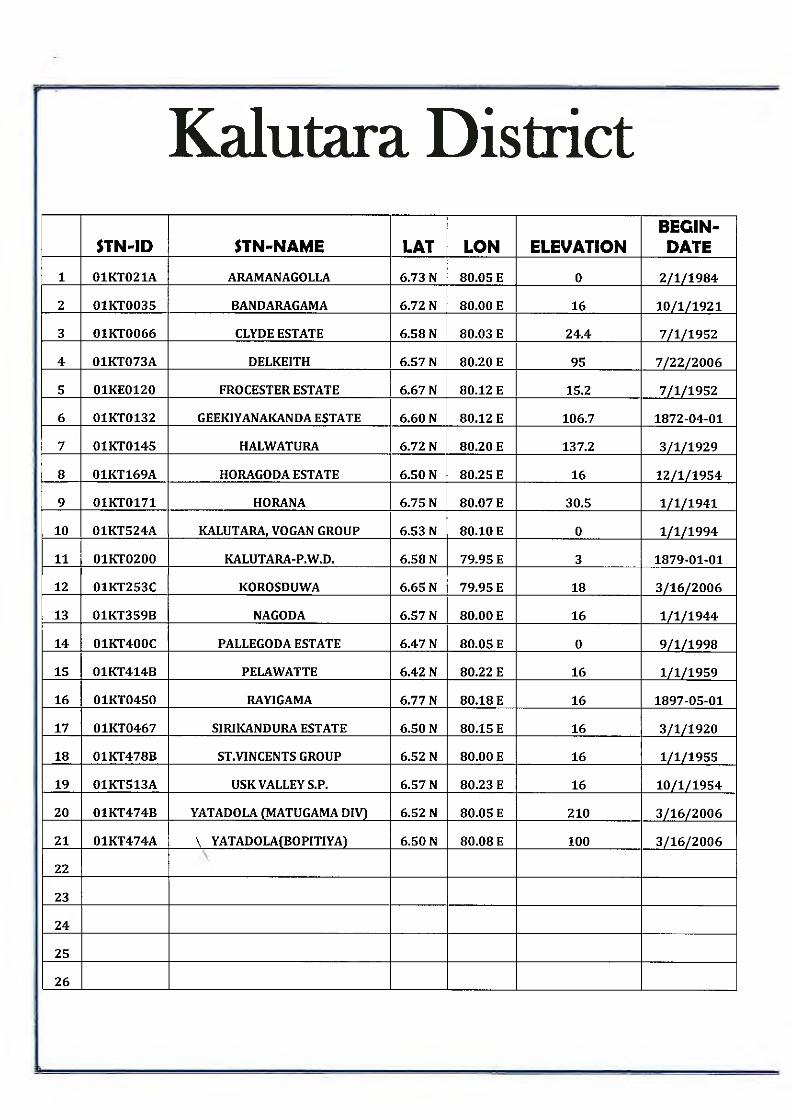
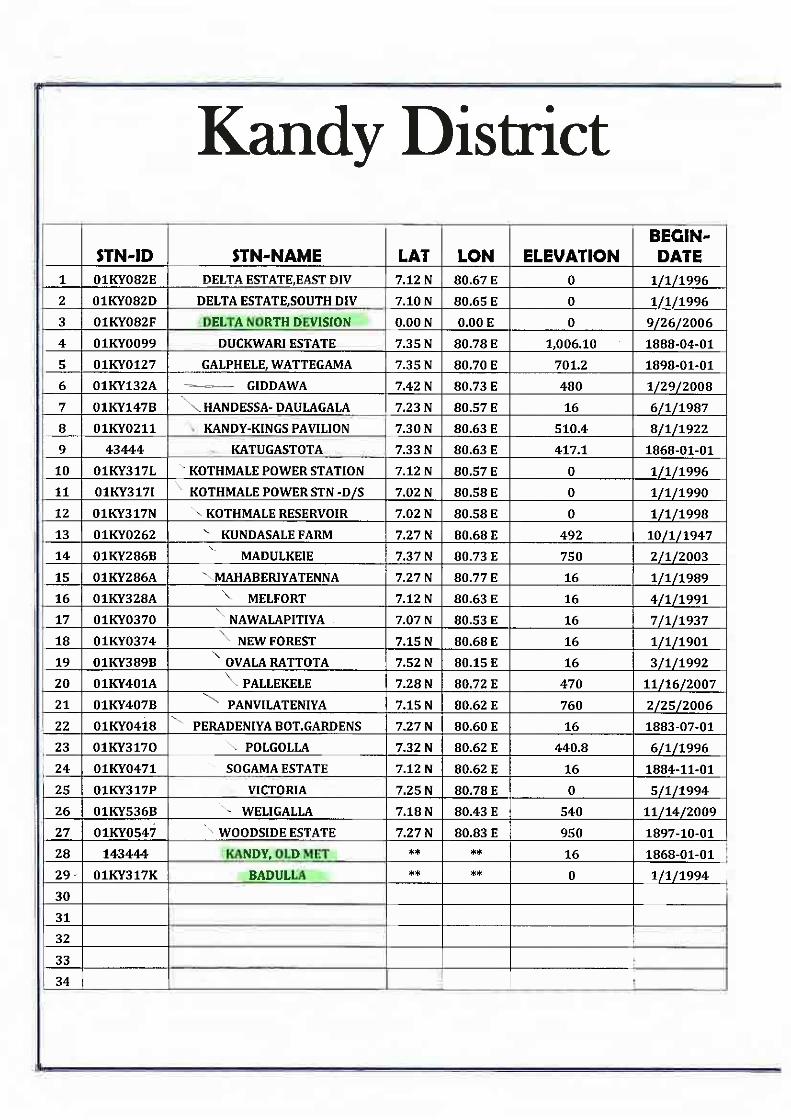
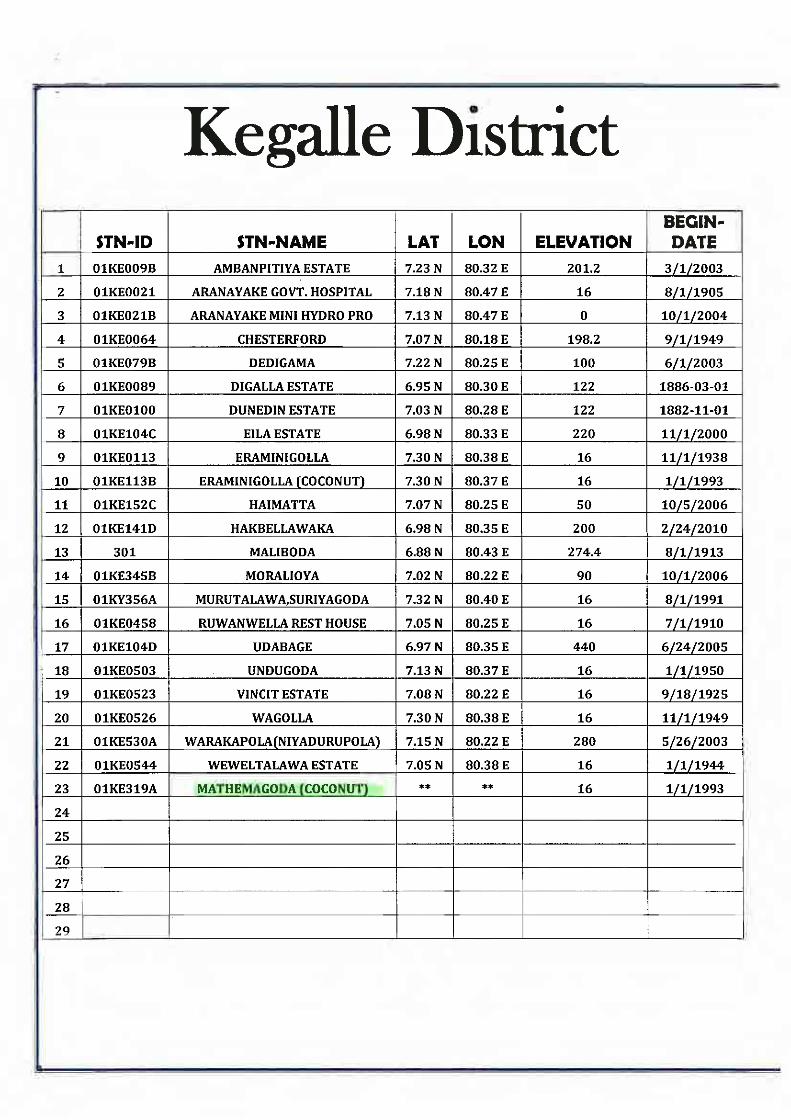
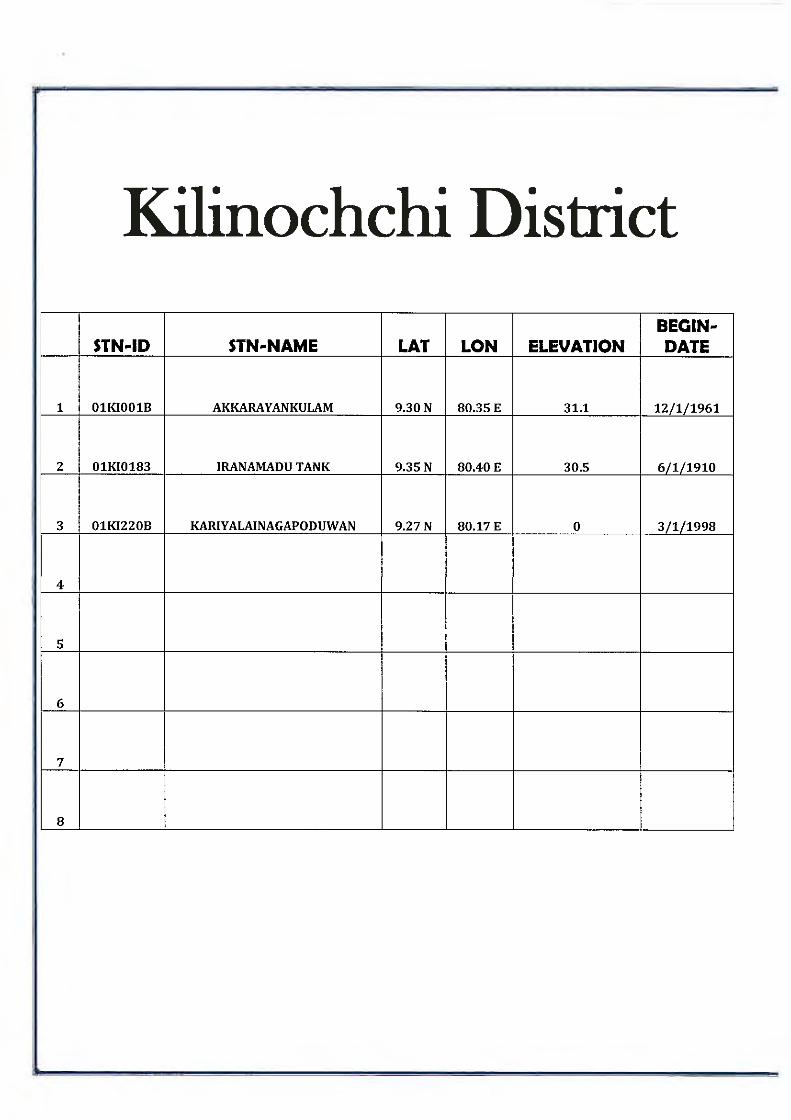
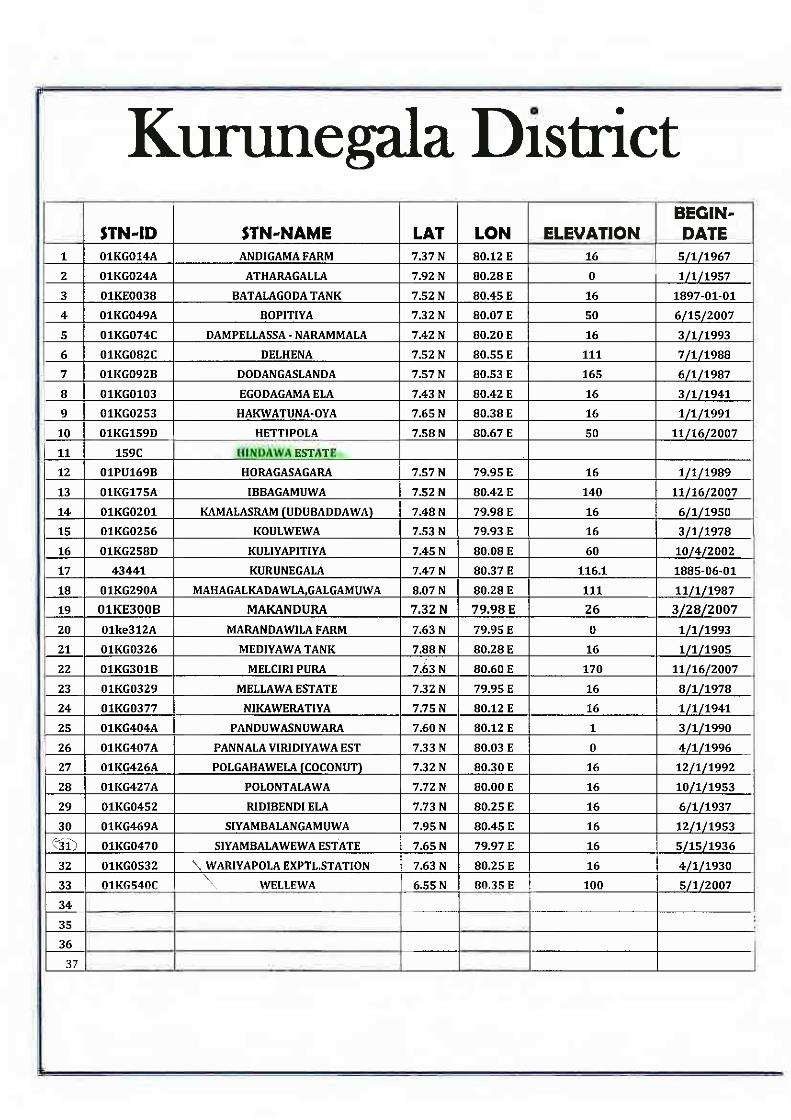
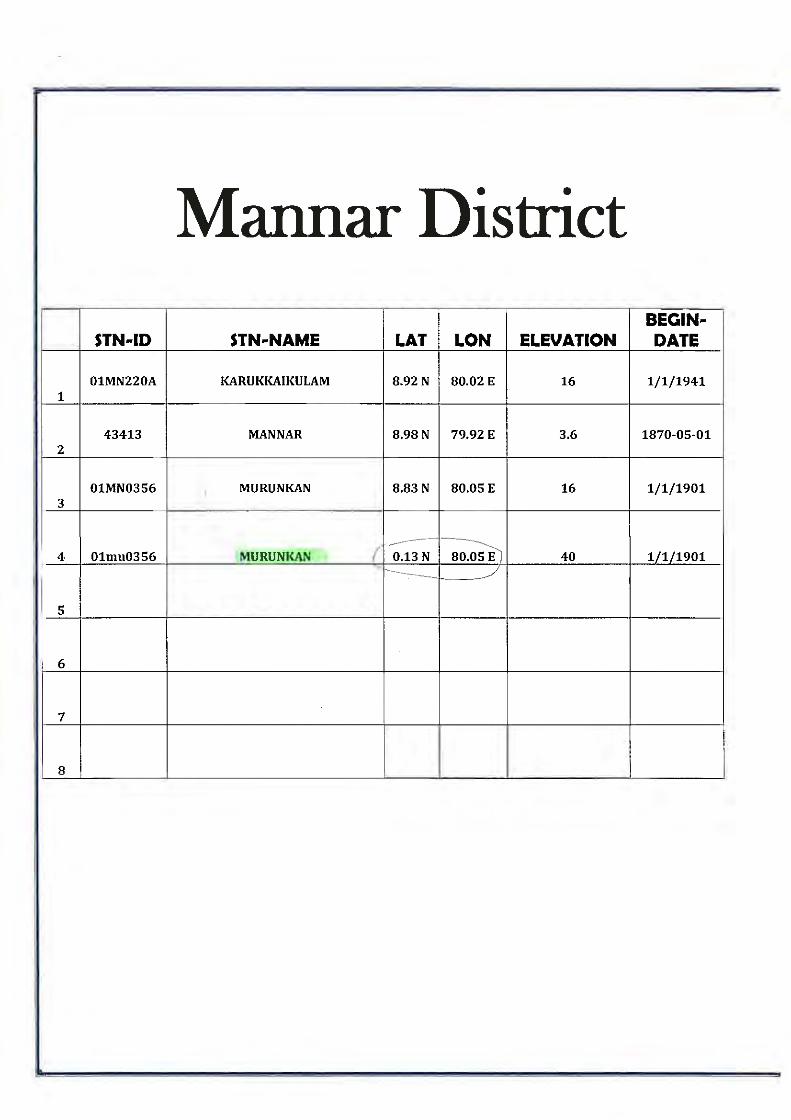
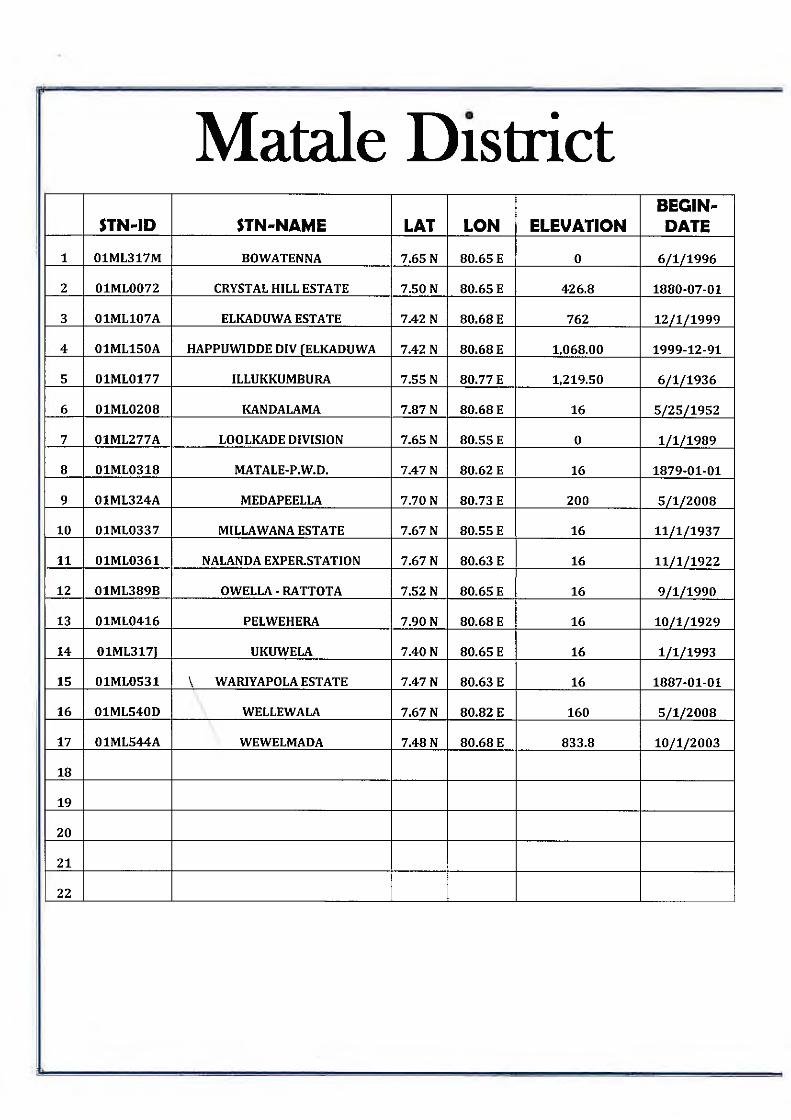
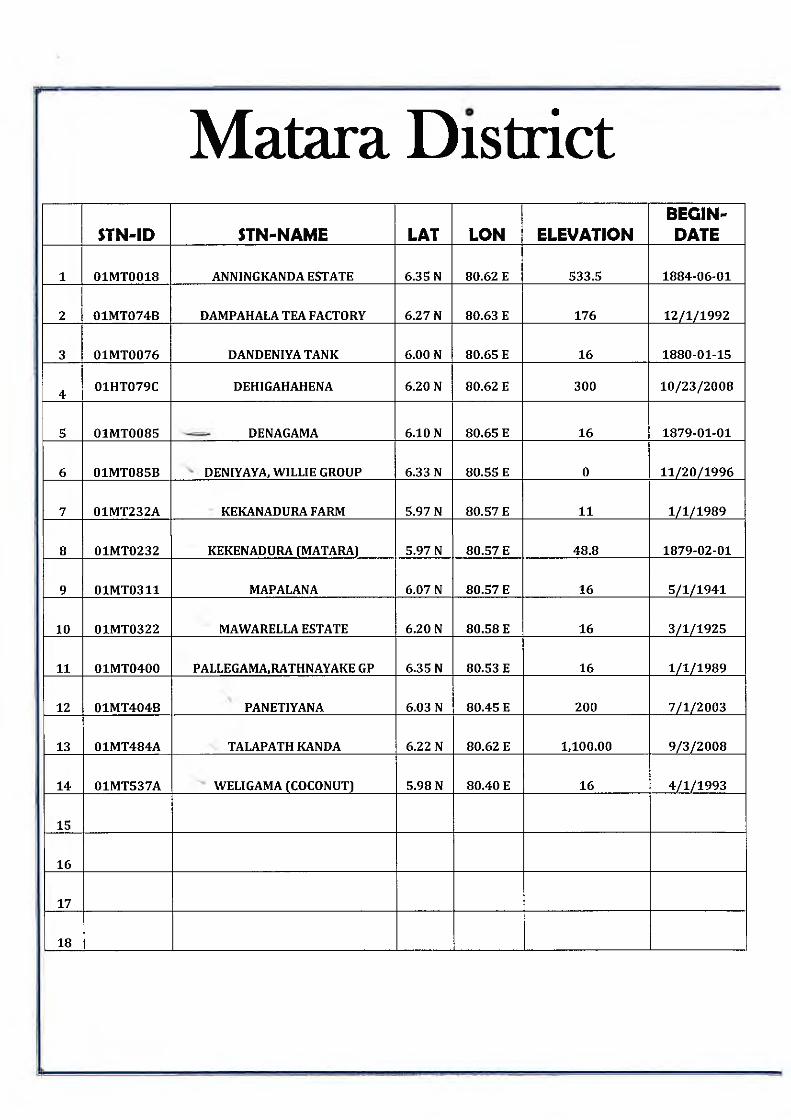
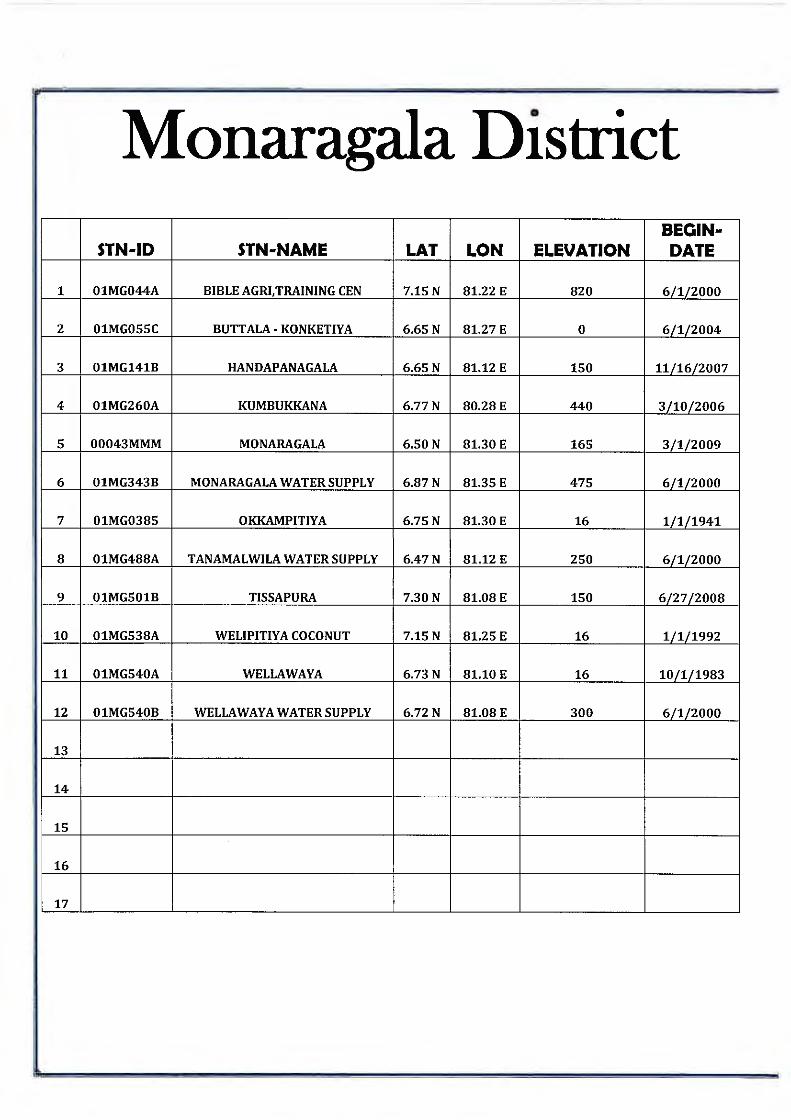

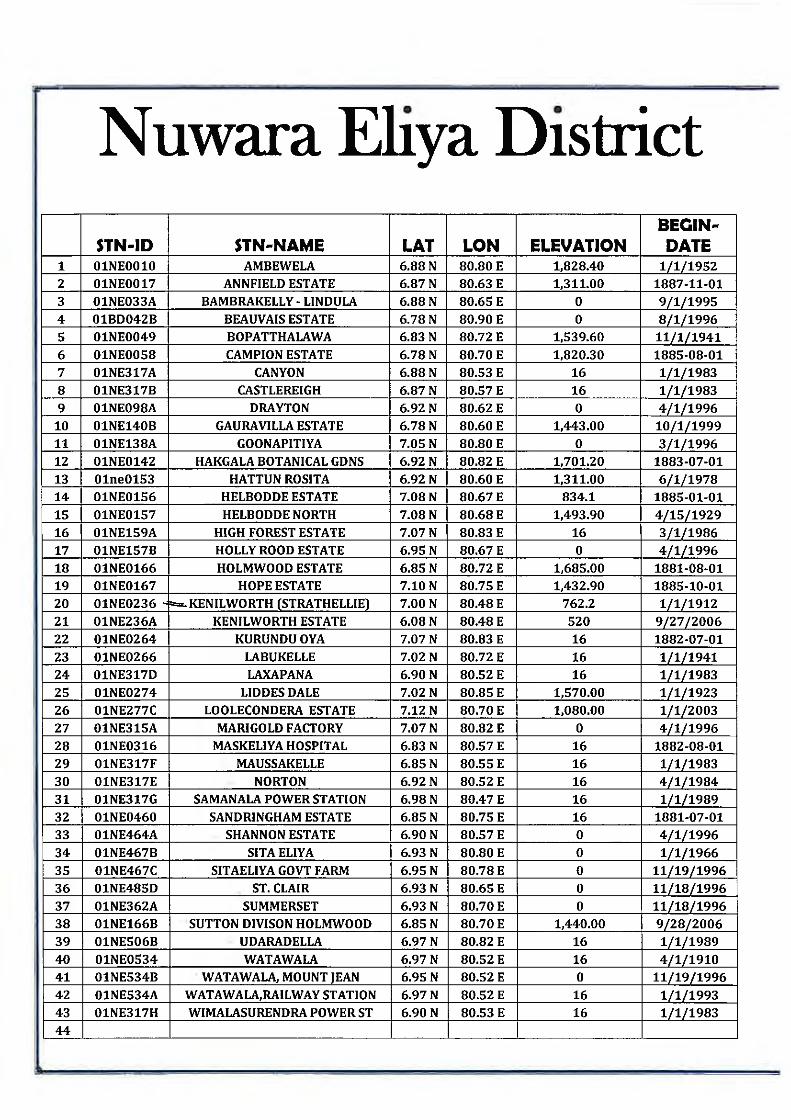
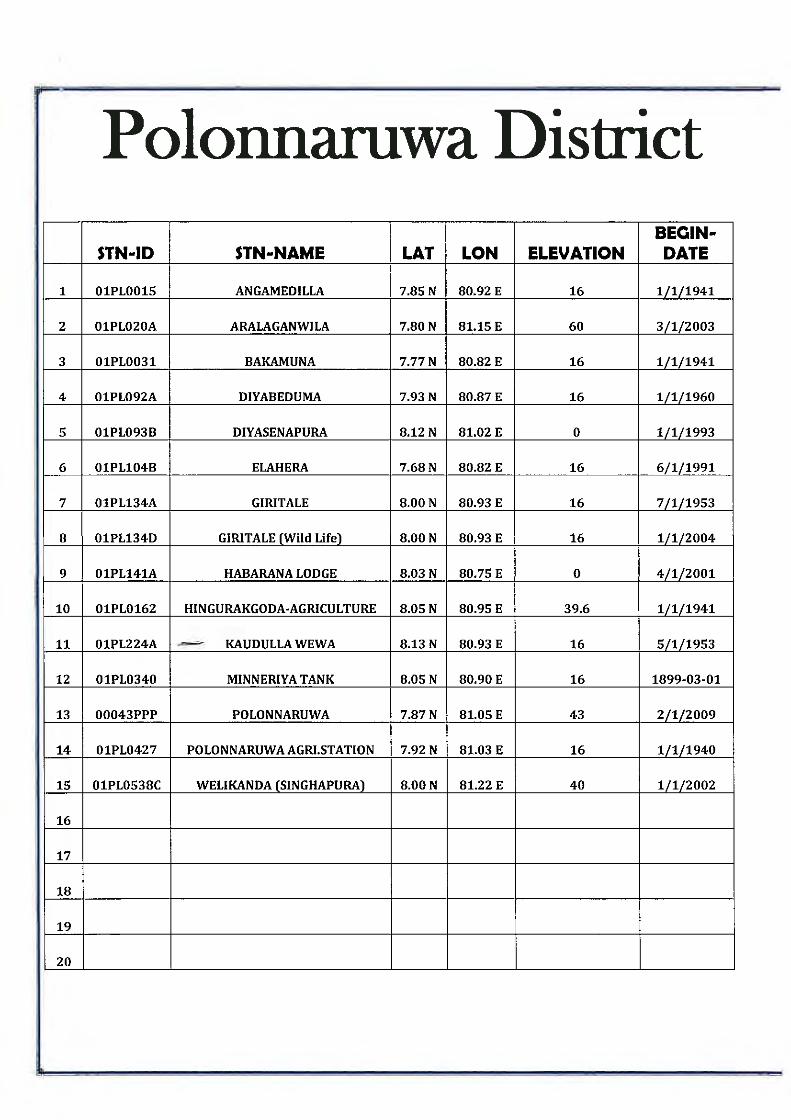
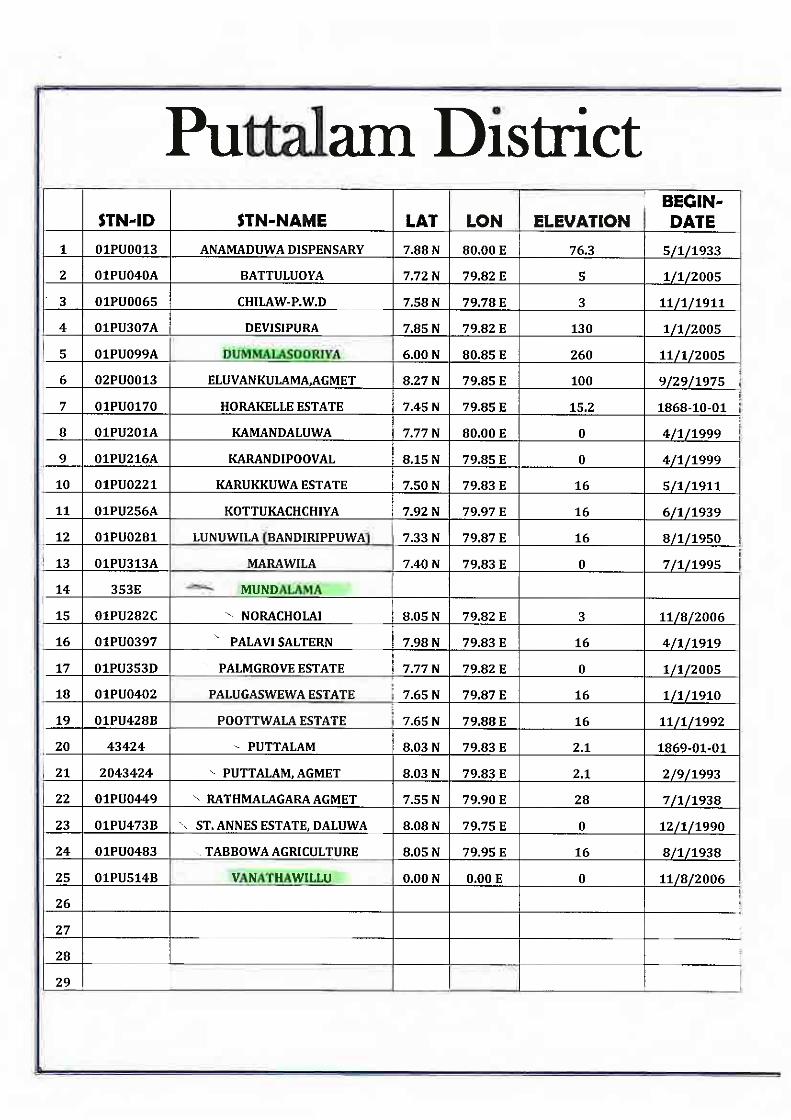
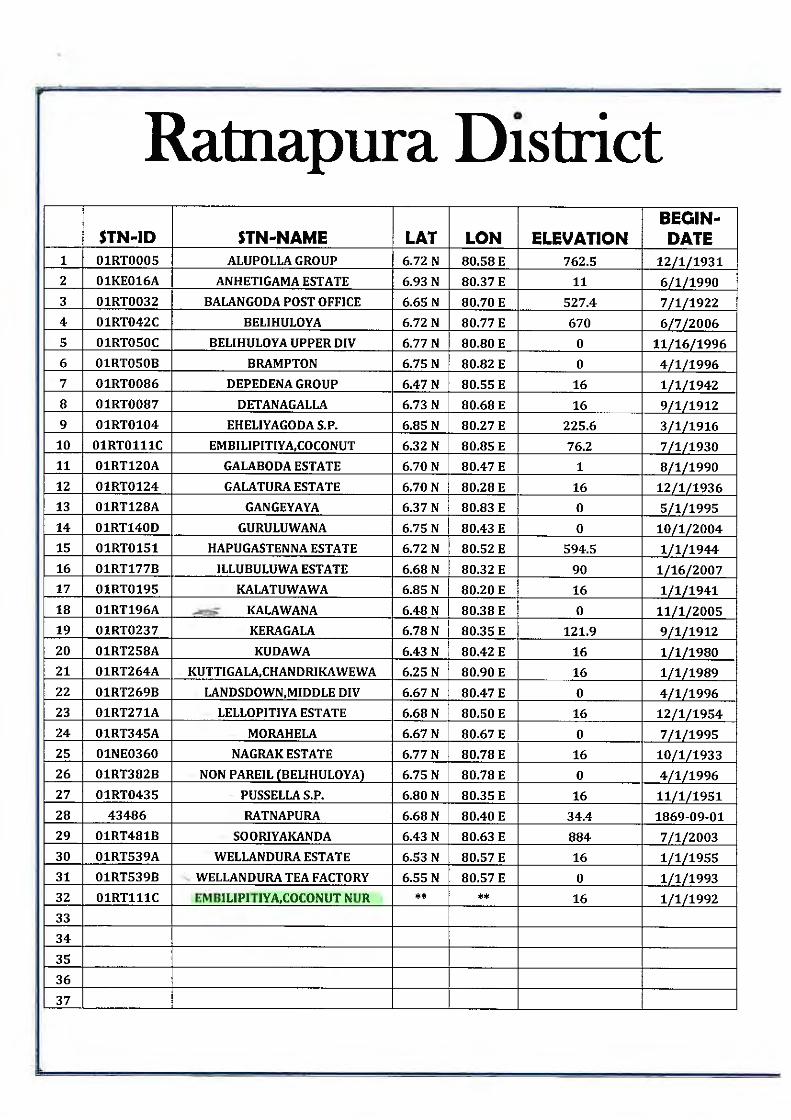
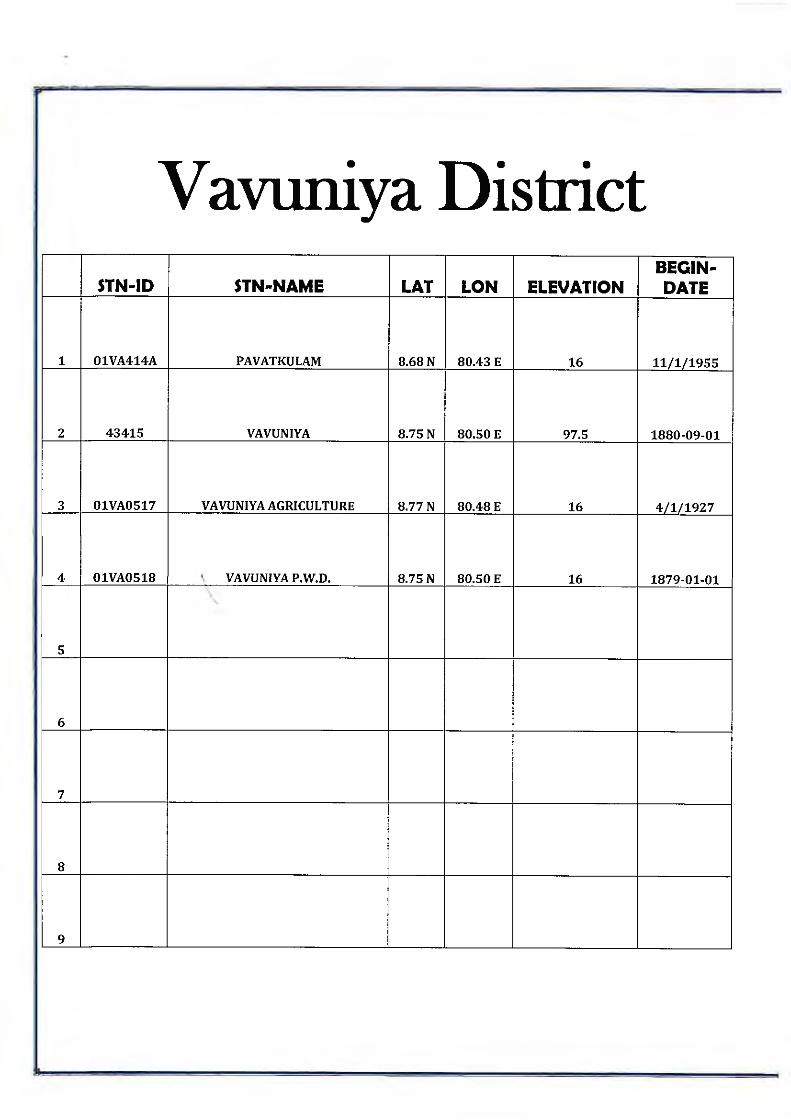
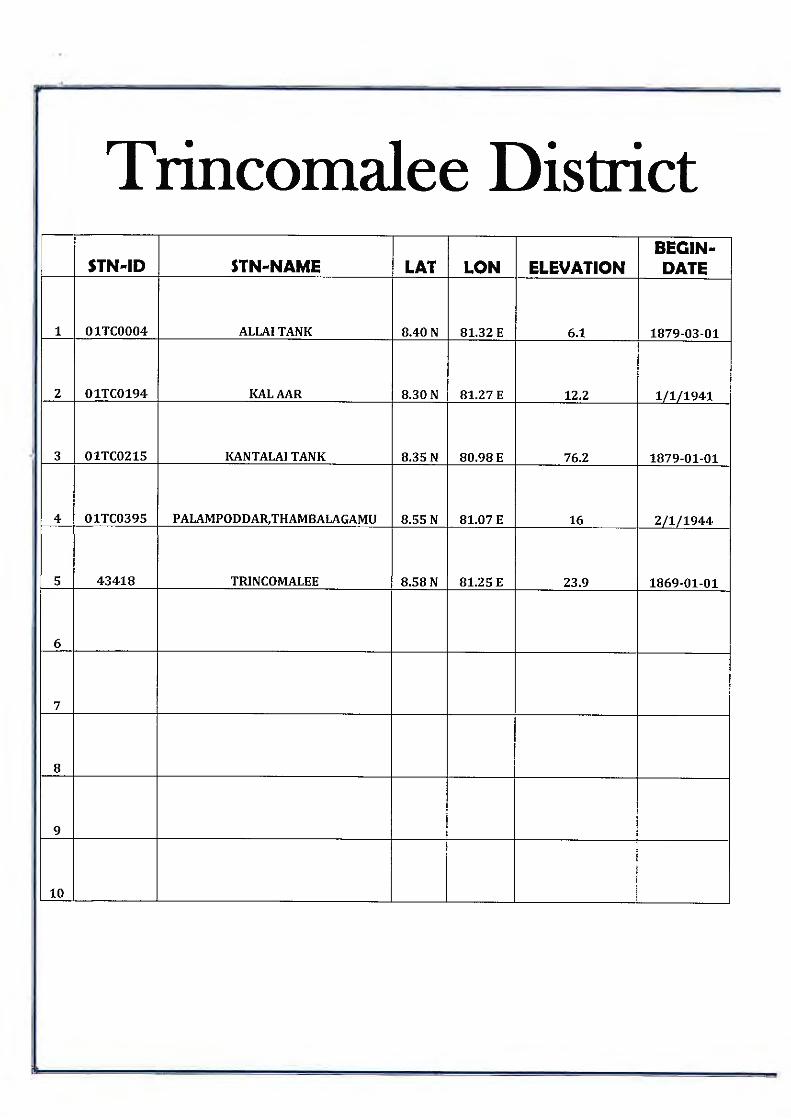
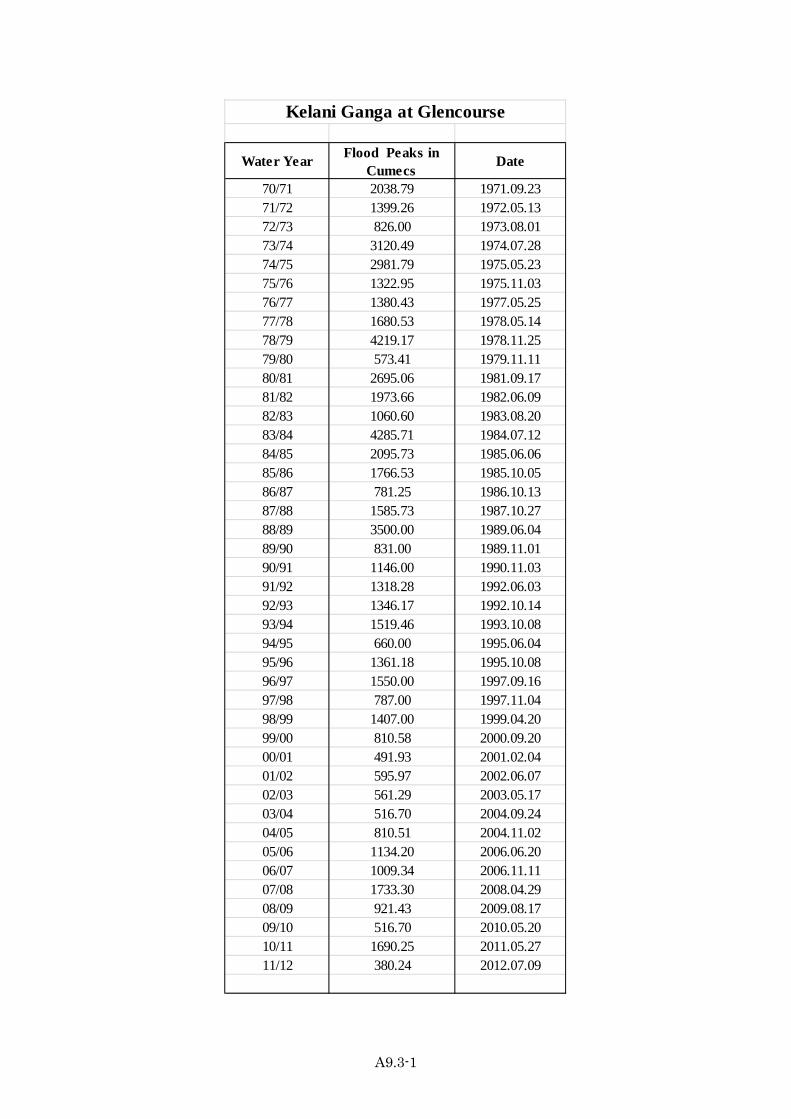
Appendix 9.3
Water Year Flood Peaks inCumecs
Date
70/71 2038.79 1971.09.2371/72 1399.26 1972.05.1372/73 826.00 1973.08.0173/74 3120.49 1974.07.2874/75 2981.79 1975.05.2375/76 1322.95 1975.11.0376/77 1380.43 1977.05.2577/78 1680.53 1978.05.1478/79 4219.17 1978.11.2579/80 573.41 1979.11.1180/81 2695.06 1981.09.1781/82 1973.66 1982.06.0982/83 1060.60 1983.08.2083/84 4285.71 1984.07.1284/85 2095.73 1985.06.0685/86 1766.53 1985.10.0586/87 781.25 1986.10.1387/88 1585.73 1987.10.2788/89 3500.00 1989.06.0489/90 831.00 1989.11.0190/91 1146.00 1990.11.0391/92 1318.28 1992.06.0392/93 1346.17 1992.10.1493/94 1519.46 1993.10.0894/95 660.00 1995.06.0495/96 1361.18 1995.10.0896/97 1550.00 1997.09.1697/98 787.00 1997.11.0498/99 1407.00 1999.04.2099/00 810.58 2000.09.2000/01 491.93 2001.02.0401/02 595.97 2002.06.0702/03 561.29 2003.05.1703/04 516.70 2004.09.2404/05 810.51 2004.11.0205/06 1134.20 2006.06.2006/07 1009.34 2006.11.1107/08 1733.30 2008.04.2908/09 921.43 2009.08.1709/10 516.70 2010.05.2010/11 1690.25 2011.05.2711/12 380.24 2012.07.09
Kelani Ganga at Glencourse
A9.3-1
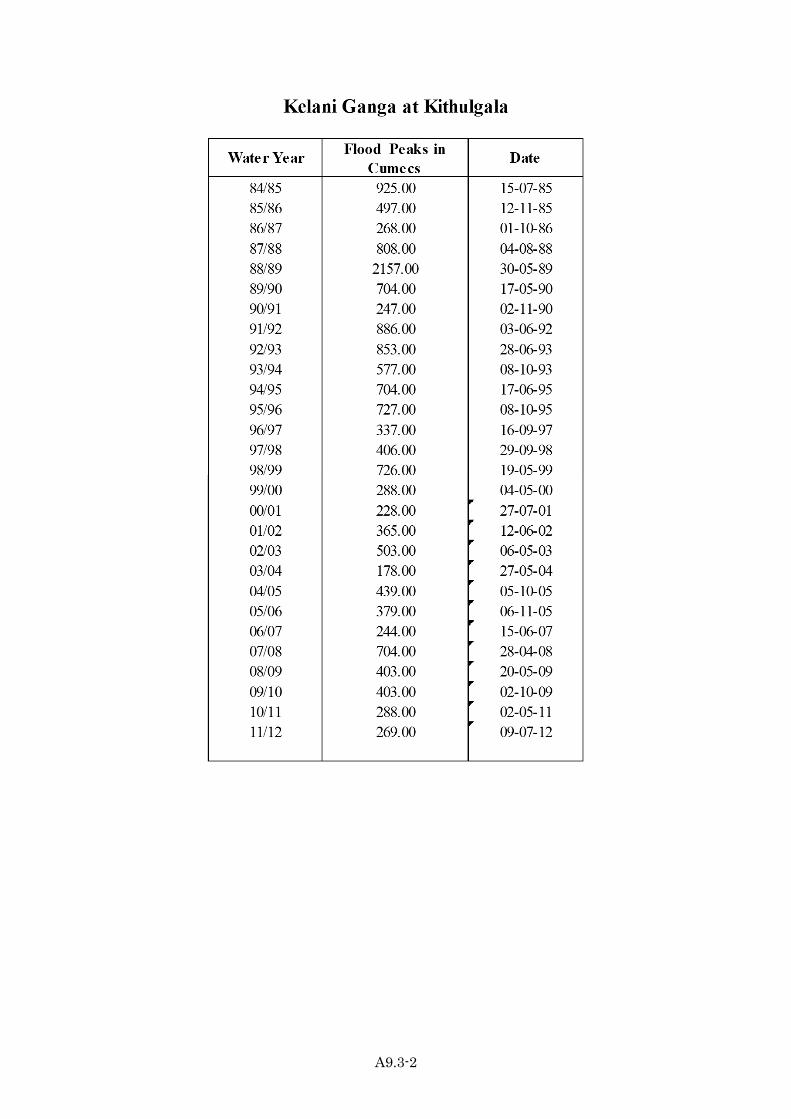
Appendix 9.3
A9.3-2
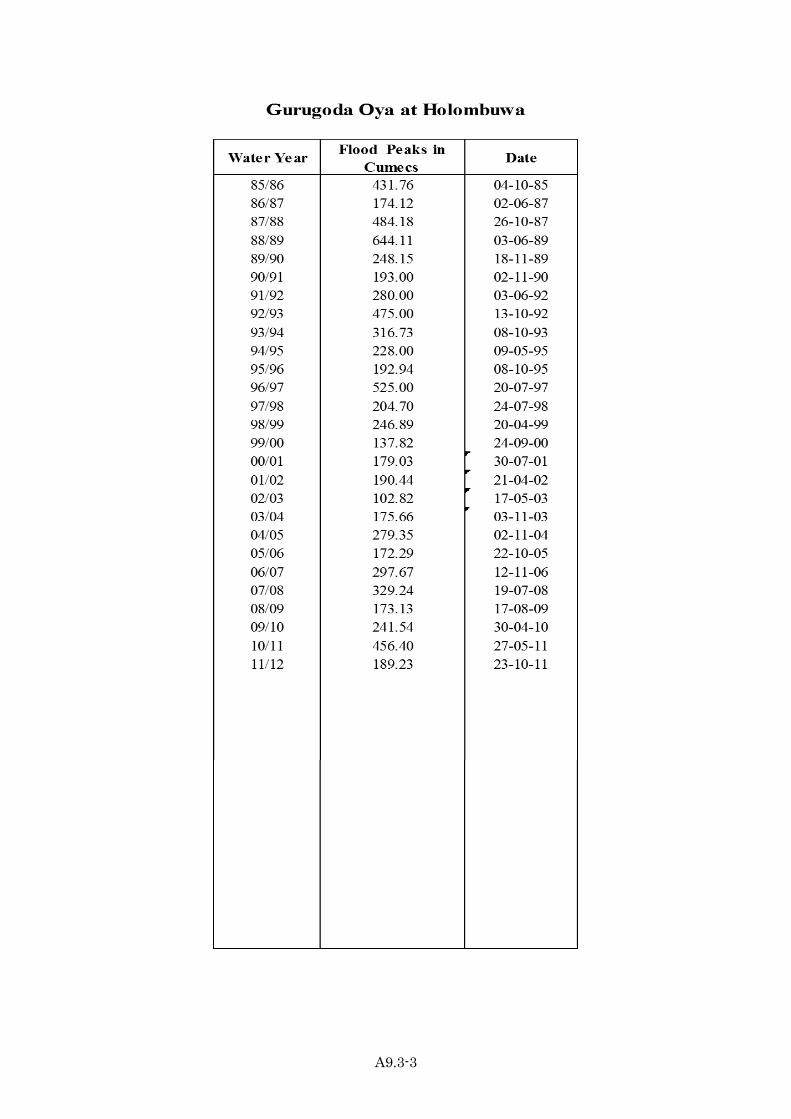
Appendix 9.3
A9.3-3
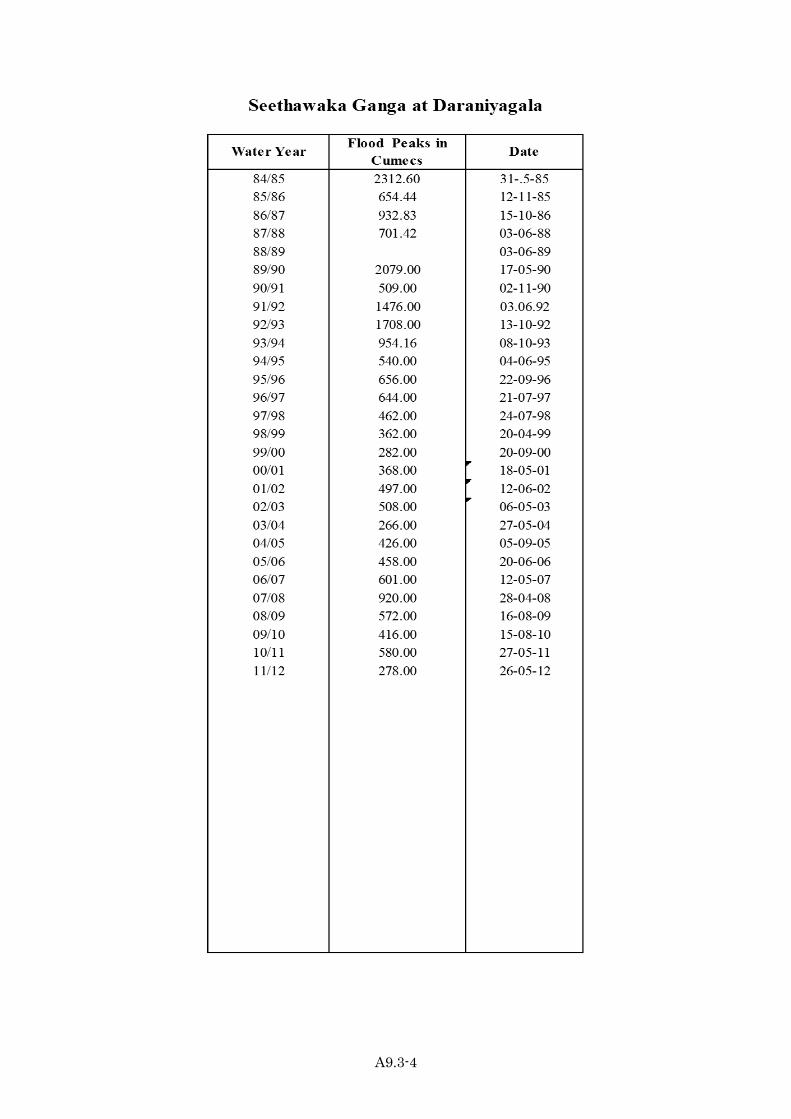
Appendix 9.3
A9.3-4
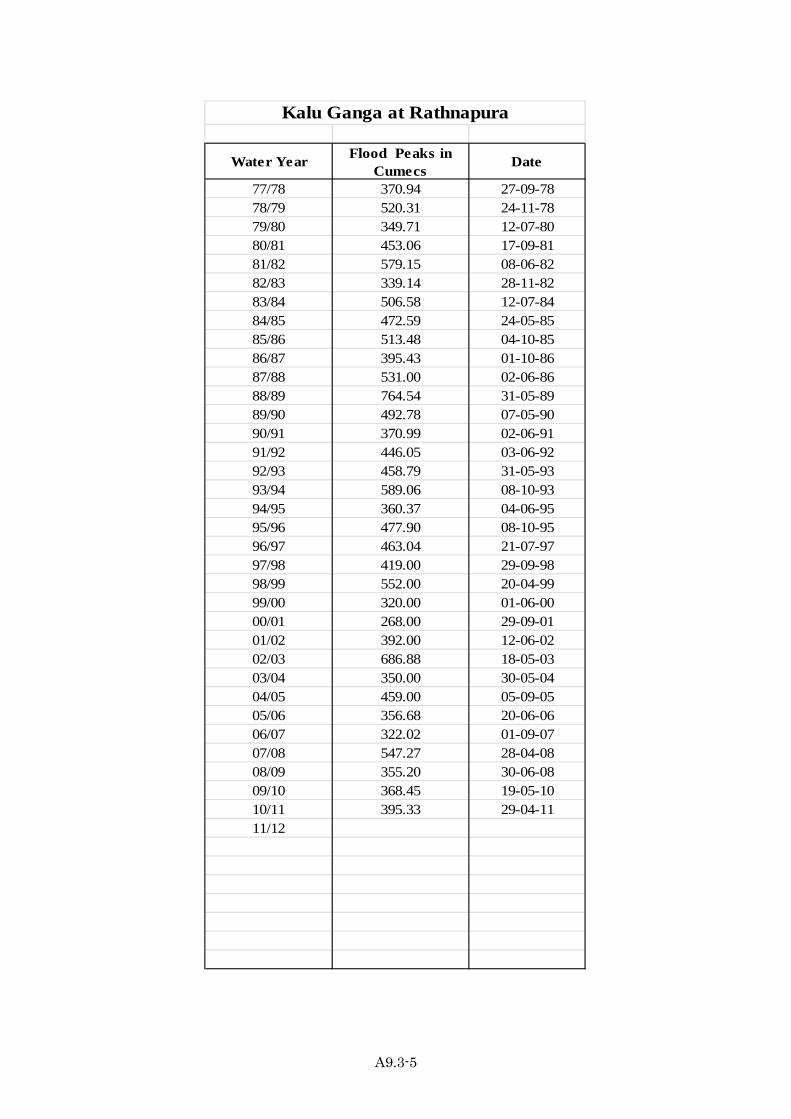
Appendix 9.3
Water Year Flood Peaks inCumecs
Date
77/78 370.94 27-09-7878/79 520.31 24-11-7879/80 349.71 12-07-8080/81 453.06 17-09-8181/82 579.15 08-06-8282/83 339.14 28-11-8283/84 506.58 12-07-8484/85 472.59 24-05-8585/86 513.48 04-10-8586/87 395.43 01-10-8687/88 531.00 02-06-8688/89 764.54 31-05-8989/90 492.78 07-05-9090/91 370.99 02-06-9191/92 446.05 03-06-9292/93 458.79 31-05-9393/94 589.06 08-10-9394/95 360.37 04-06-9595/96 477.90 08-10-9596/97 463.04 21-07-9797/98 419.00 29-09-9898/99 552.00 20-04-9999/00 320.00 01-06-0000/01 268.00 29-09-0101/02 392.00 12-06-0202/03 686.88 18-05-0303/04 350.00 30-05-0404/05 459.00 05-09-0505/06 356.68 20-06-0606/07 322.02 01-09-0707/08 547.27 28-04-0808/09 355.20 30-06-0809/10 368.45 19-05-1010/11 395.33 29-04-1111/12
Kalu Ganga at Rathnapura
A9.3-5
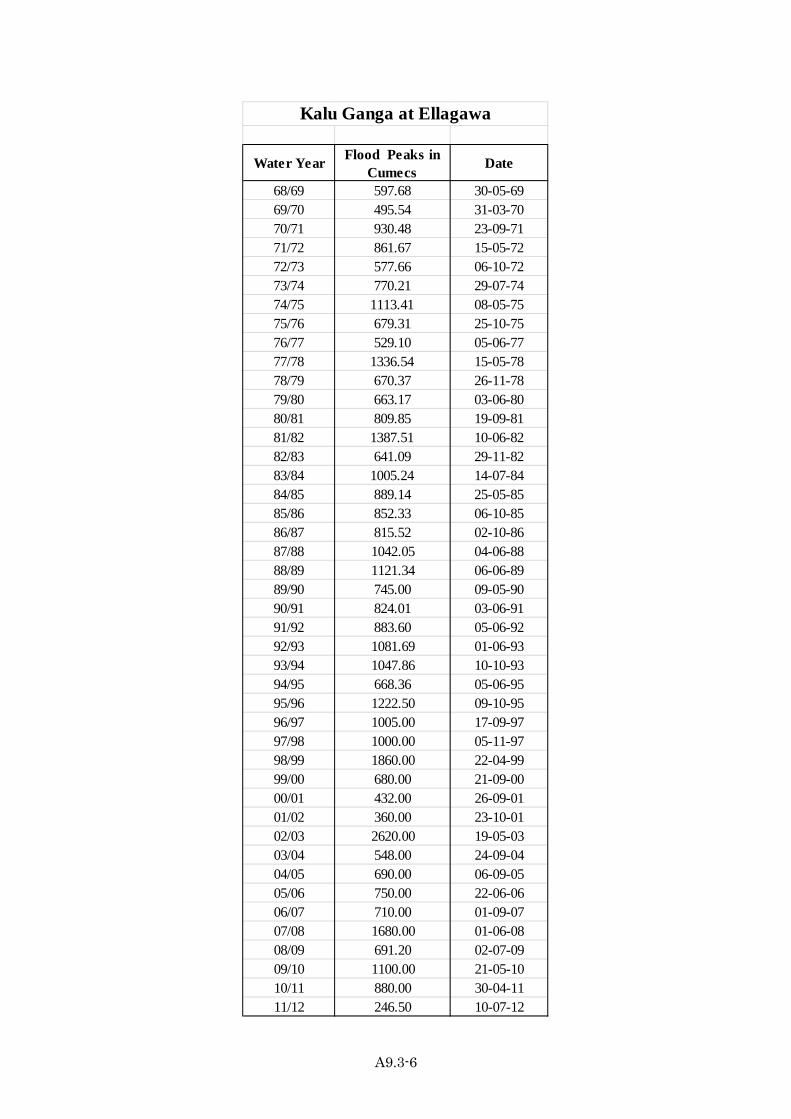
Appendix 9.3
Water Year Flood Peaks inCumecs
Date
68/69 597.68 30-05-6969/70 495.54 31-03-7070/71 930.48 23-09-7171/72 861.67 15-05-7272/73 577.66 06-10-7273/74 770.21 29-07-7474/75 1113.41 08-05-7575/76 679.31 25-10-7576/77 529.10 05-06-7777/78 1336.54 15-05-7878/79 670.37 26-11-7879/80 663.17 03-06-8080/81 809.85 19-09-8181/82 1387.51 10-06-8282/83 641.09 29-11-8283/84 1005.24 14-07-8484/85 889.14 25-05-8585/86 852.33 06-10-8586/87 815.52 02-10-8687/88 1042.05 04-06-8888/89 1121.34 06-06-8989/90 745.00 09-05-9090/91 824.01 03-06-9191/92 883.60 05-06-9292/93 1081.69 01-06-9393/94 1047.86 10-10-9394/95 668.36 05-06-9595/96 1222.50 09-10-9596/97 1005.00 17-09-9797/98 1000.00 05-11-9798/99 1860.00 22-04-9999/00 680.00 21-09-0000/01 432.00 26-09-0101/02 360.00 23-10-0102/03 2620.00 19-05-0303/04 548.00 24-09-0404/05 690.00 06-09-0505/06 750.00 22-06-0606/07 710.00 01-09-0707/08 1680.00 01-06-0808/09 691.20 02-07-0909/10 1100.00 21-05-1010/11 880.00 30-04-1111/12 246.50 10-07-12
Kalu Ganga at Ellagawa
A9.3-6
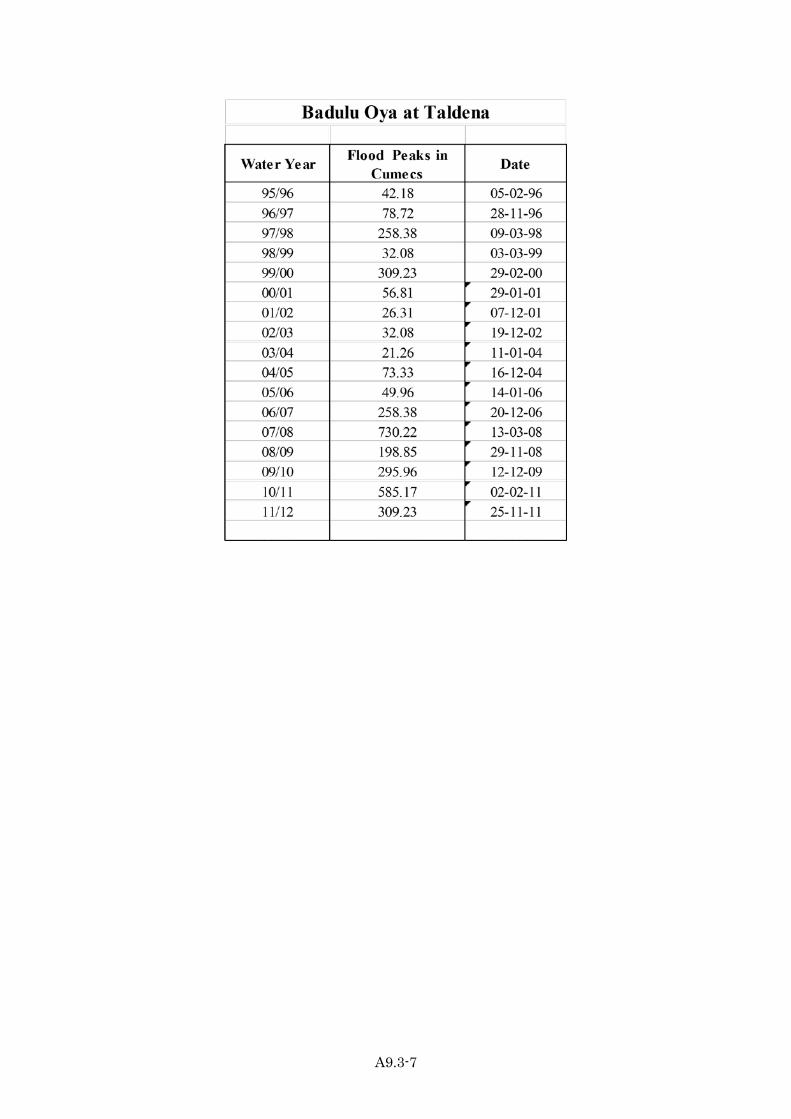
Appendix 9.3
A9.3-7

Appendix 9.3
A9.3-8
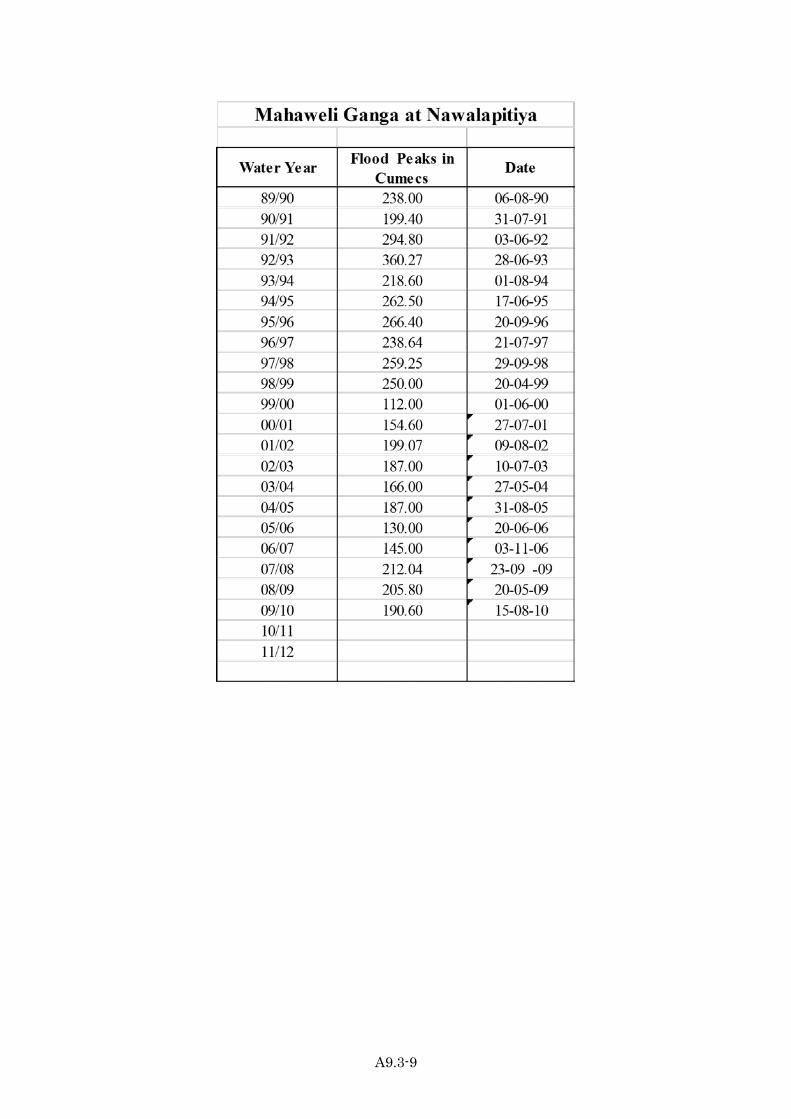
Appendix 9.3
A9.3-9
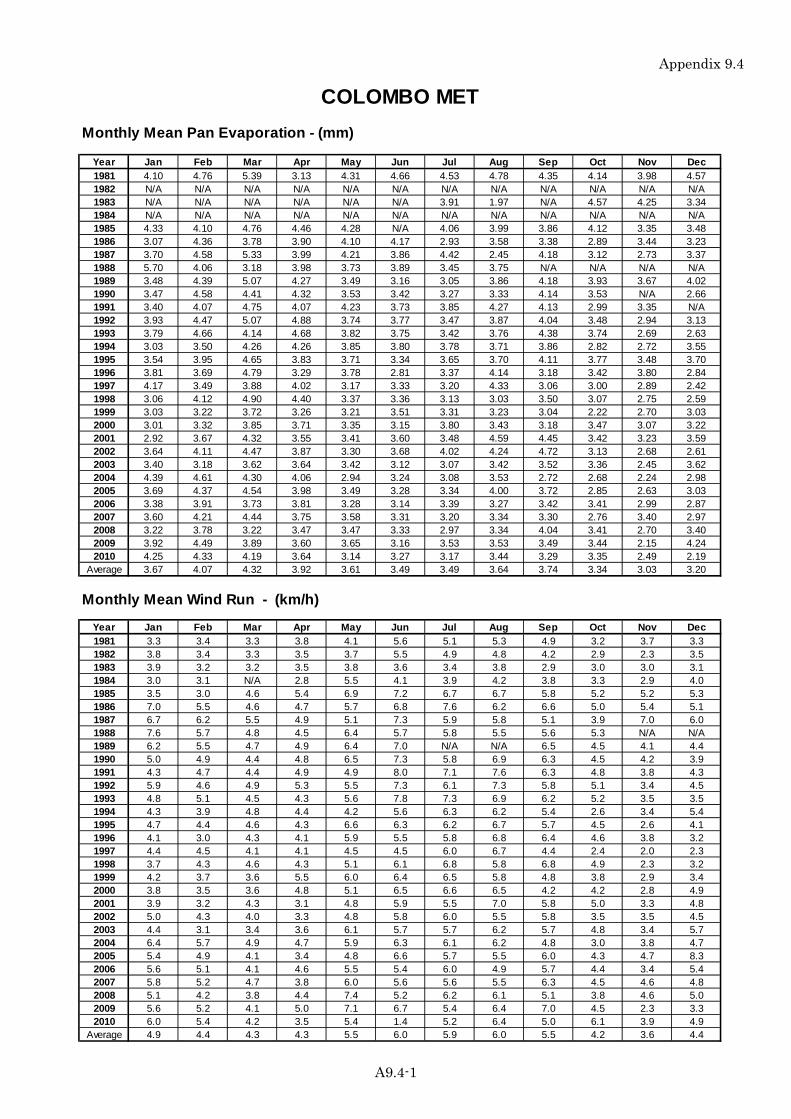
Appendix 9.4
Monthly Mean Pan Evaporation - (mm)
Year Jan Feb Mar Apr May Jun Jul Aug Sep Oct Nov Dec1981 4.10 4.76 5.39 3.13 4.31 4.66 4.53 4.78 4.35 4.14 3.98 4.571982 N/A N/A N/A N/A N/A N/A N/A N/A N/A N/A N/A N/A1983 N/A N/A N/A N/A N/A N/A 3.91 1.97 N/A 4.57 4.25 3.341984 N/A N/A N/A N/A N/A N/A N/A N/A N/A N/A N/A N/A1985 4.33 4.10 4.76 4.46 4.28 N/A 4.06 3.99 3.86 4.12 3.35 3.481986 3.07 4.36 3.78 3.90 4.10 4.17 2.93 3.58 3.38 2.89 3.44 3.231987 3.70 4.58 5.33 3.99 4.21 3.86 4.42 2.45 4.18 3.12 2.73 3.371988 5.70 4.06 3.18 3.98 3.73 3.89 3.45 3.75 N/A N/A N/A N/A1989 3.48 4.39 5.07 4.27 3.49 3.16 3.05 3.86 4.18 3.93 3.67 4.021990 3.47 4.58 4.41 4.32 3.53 3.42 3.27 3.33 4.14 3.53 N/A 2.661991 3.40 4.07 4.75 4.07 4.23 3.73 3.85 4.27 4.13 2.99 3.35 N/A1992 3.93 4.47 5.07 4.88 3.74 3.77 3.47 3.87 4.04 3.48 2.94 3.131993 3.79 4.66 4.14 4.68 3.82 3.75 3.42 3.76 4.38 3.74 2.69 2.631994 3.03 3.50 4.26 4.26 3.85 3.80 3.78 3.71 3.86 2.82 2.72 3.551995 3.54 3.95 4.65 3.83 3.71 3.34 3.65 3.70 4.11 3.77 3.48 3.701996 3.81 3.69 4.79 3.29 3.78 2.81 3.37 4.14 3.18 3.42 3.80 2.841997 4.17 3.49 3.88 4.02 3.17 3.33 3.20 4.33 3.06 3.00 2.89 2.421998 3.06 4.12 4.90 4.40 3.37 3.36 3.13 3.03 3.50 3.07 2.75 2.591999 3.03 3.22 3.72 3.26 3.21 3.51 3.31 3.23 3.04 2.22 2.70 3.032000 3.01 3.32 3.85 3.71 3.35 3.15 3.80 3.43 3.18 3.47 3.07 3.222001 2.92 3.67 4.32 3.55 3.41 3.60 3.48 4.59 4.45 3.42 3.23 3.592002 3.64 4.11 4.47 3.87 3.30 3.68 4.02 4.24 4.72 3.13 2.68 2.612003 3.40 3.18 3.62 3.64 3.42 3.12 3.07 3.42 3.52 3.36 2.45 3.622004 4.39 4.61 4.30 4.06 2.94 3.24 3.08 3.53 2.72 2.68 2.24 2.982005 3.69 4.37 4.54 3.98 3.49 3.28 3.34 4.00 3.72 2.85 2.63 3.032006 3.38 3.91 3.73 3.81 3.28 3.14 3.39 3.27 3.42 3.41 2.99 2.872007 3.60 4.21 4.44 3.75 3.58 3.31 3.20 3.34 3.30 2.76 3.40 2.972008 3.22 3.78 3.22 3.47 3.47 3.33 2.97 3.34 4.04 3.41 2.70 3.402009 3.92 4.49 3.89 3.60 3.65 3.16 3.53 3.53 3.49 3.44 2.15 4.242010 4.25 4.33 4.19 3.64 3.14 3.27 3.17 3.44 3.29 3.35 2.49 2.19
Average 3.67 4.07 4.32 3.92 3.61 3.49 3.49 3.64 3.74 3.34 3.03 3.20
Monthly Mean Wind Run - (km/h)
Year Jan Feb Mar Apr May Jun Jul Aug Sep Oct Nov Dec1981 3.3 3.4 3.3 3.8 4.1 5.6 5.1 5.3 4.9 3.2 3.7 3.31982 3.8 3.4 3.3 3.5 3.7 5.5 4.9 4.8 4.2 2.9 2.3 3.51983 3.9 3.2 3.2 3.5 3.8 3.6 3.4 3.8 2.9 3.0 3.0 3.11984 3.0 3.1 N/A 2.8 5.5 4.1 3.9 4.2 3.8 3.3 2.9 4.01985 3.5 3.0 4.6 5.4 6.9 7.2 6.7 6.7 5.8 5.2 5.2 5.31986 7.0 5.5 4.6 4.7 5.7 6.8 7.6 6.2 6.6 5.0 5.4 5.11987 6.7 6.2 5.5 4.9 5.1 7.3 5.9 5.8 5.1 3.9 7.0 6.01988 7.6 5.7 4.8 4.5 6.4 5.7 5.8 5.5 5.6 5.3 N/A N/A1989 6.2 5.5 4.7 4.9 6.4 7.0 N/A N/A 6.5 4.5 4.1 4.41990 5.0 4.9 4.4 4.8 6.5 7.3 5.8 6.9 6.3 4.5 4.2 3.91991 4.3 4.7 4.4 4.9 4.9 8.0 7.1 7.6 6.3 4.8 3.8 4.31992 5.9 4.6 4.9 5.3 5.5 7.3 6.1 7.3 5.8 5.1 3.4 4.51993 4.8 5.1 4.5 4.3 5.6 7.8 7.3 6.9 6.2 5.2 3.5 3.51994 4.3 3.9 4.8 4.4 4.2 5.6 6.3 6.2 5.4 2.6 3.4 5.41995 4.7 4.4 4.6 4.3 6.6 6.3 6.2 6.7 5.7 4.5 2.6 4.11996 4.1 3.0 4.3 4.1 5.9 5.5 5.8 6.8 6.4 4.6 3.8 3.21997 4.4 4.5 4.1 4.1 4.5 4.5 6.0 6.7 4.4 2.4 2.0 2.31998 3.7 4.3 4.6 4.3 5.1 6.1 6.8 5.8 6.8 4.9 2.3 3.21999 4.2 3.7 3.6 5.5 6.0 6.4 6.5 5.8 4.8 3.8 2.9 3.42000 3.8 3.5 3.6 4.8 5.1 6.5 6.6 6.5 4.2 4.2 2.8 4.92001 3.9 3.2 4.3 3.1 4.8 5.9 5.5 7.0 5.8 5.0 3.3 4.82002 5.0 4.3 4.0 3.3 4.8 5.8 6.0 5.5 5.8 3.5 3.5 4.52003 4.4 3.1 3.4 3.6 6.1 5.7 5.7 6.2 5.7 4.8 3.4 5.72004 6.4 5.7 4.9 4.7 5.9 6.3 6.1 6.2 4.8 3.0 3.8 4.72005 5.4 4.9 4.1 3.4 4.8 6.6 5.7 5.5 6.0 4.3 4.7 8.32006 5.6 5.1 4.1 4.6 5.5 5.4 6.0 4.9 5.7 4.4 3.4 5.42007 5.8 5.2 4.7 3.8 6.0 5.6 5.6 5.5 6.3 4.5 4.6 4.82008 5.1 4.2 3.8 4.4 7.4 5.2 6.2 6.1 5.1 3.8 4.6 5.02009 5.6 5.2 4.1 5.0 7.1 6.7 5.4 6.4 7.0 4.5 2.3 3.32010 6.0 5.4 4.2 3.5 5.4 1.4 5.2 6.4 5.0 6.1 3.9 4.9
Average 4.9 4.4 4.3 4.3 5.5 6.0 5.9 6.0 5.5 4.2 3.6 4.4
COLOMBO MET
A9.4-1
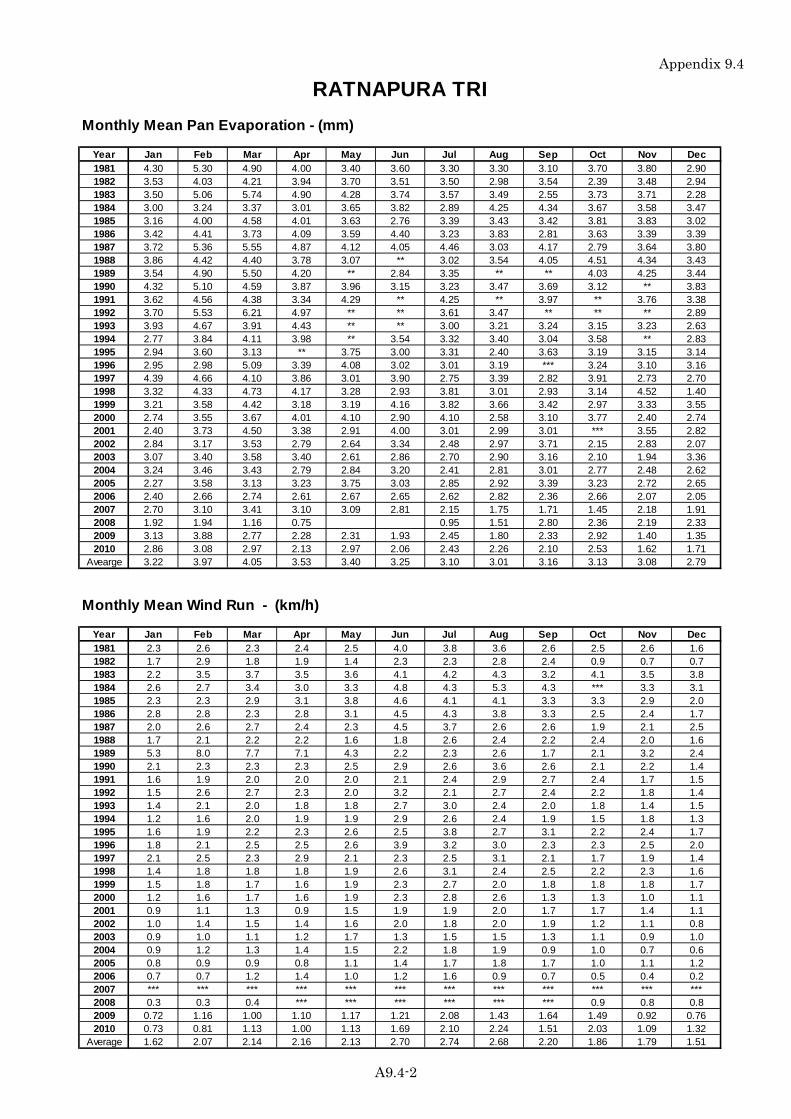
Appendix 9.4
Monthly Mean Pan Evaporation - (mm)
Year Jan Feb Mar Apr May Jun Jul Aug Sep Oct Nov Dec1981 4.30 5.30 4.90 4.00 3.40 3.60 3.30 3.30 3.10 3.70 3.80 2.901982 3.53 4.03 4.21 3.94 3.70 3.51 3.50 2.98 3.54 2.39 3.48 2.941983 3.50 5.06 5.74 4.90 4.28 3.74 3.57 3.49 2.55 3.73 3.71 2.281984 3.00 3.24 3.37 3.01 3.65 3.82 2.89 4.25 4.34 3.67 3.58 3.471985 3.16 4.00 4.58 4.01 3.63 2.76 3.39 3.43 3.42 3.81 3.83 3.021986 3.42 4.41 3.73 4.09 3.59 4.40 3.23 3.83 2.81 3.63 3.39 3.391987 3.72 5.36 5.55 4.87 4.12 4.05 4.46 3.03 4.17 2.79 3.64 3.801988 3.86 4.42 4.40 3.78 3.07 ** 3.02 3.54 4.05 4.51 4.34 3.431989 3.54 4.90 5.50 4.20 ** 2.84 3.35 ** ** 4.03 4.25 3.441990 4.32 5.10 4.59 3.87 3.96 3.15 3.23 3.47 3.69 3.12 ** 3.831991 3.62 4.56 4.38 3.34 4.29 ** 4.25 ** 3.97 ** 3.76 3.381992 3.70 5.53 6.21 4.97 ** ** 3.61 3.47 ** ** ** 2.891993 3.93 4.67 3.91 4.43 ** ** 3.00 3.21 3.24 3.15 3.23 2.631994 2.77 3.84 4.11 3.98 ** 3.54 3.32 3.40 3.04 3.58 ** 2.831995 2.94 3.60 3.13 ** 3.75 3.00 3.31 2.40 3.63 3.19 3.15 3.141996 2.95 2.98 5.09 3.39 4.08 3.02 3.01 3.19 *** 3.24 3.10 3.161997 4.39 4.66 4.10 3.86 3.01 3.90 2.75 3.39 2.82 3.91 2.73 2.701998 3.32 4.33 4.73 4.17 3.28 2.93 3.81 3.01 2.93 3.14 4.52 1.401999 3.21 3.58 4.42 3.18 3.19 4.16 3.82 3.66 3.42 2.97 3.33 3.552000 2.74 3.55 3.67 4.01 4.10 2.90 4.10 2.58 3.10 3.77 2.40 2.742001 2.40 3.73 4.50 3.38 2.91 4.00 3.01 2.99 3.01 *** 3.55 2.822002 2.84 3.17 3.53 2.79 2.64 3.34 2.48 2.97 3.71 2.15 2.83 2.072003 3.07 3.40 3.58 3.40 2.61 2.86 2.70 2.90 3.16 2.10 1.94 3.362004 3.24 3.46 3.43 2.79 2.84 3.20 2.41 2.81 3.01 2.77 2.48 2.622005 2.27 3.58 3.13 3.23 3.75 3.03 2.85 2.92 3.39 3.23 2.72 2.652006 2.40 2.66 2.74 2.61 2.67 2.65 2.62 2.82 2.36 2.66 2.07 2.052007 2.70 3.10 3.41 3.10 3.09 2.81 2.15 1.75 1.71 1.45 2.18 1.912008 1.92 1.94 1.16 0.75 0.95 1.51 2.80 2.36 2.19 2.332009 3.13 3.88 2.77 2.28 2.31 1.93 2.45 1.80 2.33 2.92 1.40 1.352010 2.86 3.08 2.97 2.13 2.97 2.06 2.43 2.26 2.10 2.53 1.62 1.71
Avearge 3.22 3.97 4.05 3.53 3.40 3.25 3.10 3.01 3.16 3.13 3.08 2.79
Monthly Mean Wind Run - (km/h)
Year Jan Feb Mar Apr May Jun Jul Aug Sep Oct Nov Dec1981 2.3 2.6 2.3 2.4 2.5 4.0 3.8 3.6 2.6 2.5 2.6 1.61982 1.7 2.9 1.8 1.9 1.4 2.3 2.3 2.8 2.4 0.9 0.7 0.71983 2.2 3.5 3.7 3.5 3.6 4.1 4.2 4.3 3.2 4.1 3.5 3.81984 2.6 2.7 3.4 3.0 3.3 4.8 4.3 5.3 4.3 *** 3.3 3.11985 2.3 2.3 2.9 3.1 3.8 4.6 4.1 4.1 3.3 3.3 2.9 2.01986 2.8 2.8 2.3 2.8 3.1 4.5 4.3 3.8 3.3 2.5 2.4 1.71987 2.0 2.6 2.7 2.4 2.3 4.5 3.7 2.6 2.6 1.9 2.1 2.51988 1.7 2.1 2.2 2.2 1.6 1.8 2.6 2.4 2.2 2.4 2.0 1.61989 5.3 8.0 7.7 7.1 4.3 2.2 2.3 2.6 1.7 2.1 3.2 2.41990 2.1 2.3 2.3 2.3 2.5 2.9 2.6 3.6 2.6 2.1 2.2 1.41991 1.6 1.9 2.0 2.0 2.0 2.1 2.4 2.9 2.7 2.4 1.7 1.51992 1.5 2.6 2.7 2.3 2.0 3.2 2.1 2.7 2.4 2.2 1.8 1.41993 1.4 2.1 2.0 1.8 1.8 2.7 3.0 2.4 2.0 1.8 1.4 1.51994 1.2 1.6 2.0 1.9 1.9 2.9 2.6 2.4 1.9 1.5 1.8 1.31995 1.6 1.9 2.2 2.3 2.6 2.5 3.8 2.7 3.1 2.2 2.4 1.71996 1.8 2.1 2.5 2.5 2.6 3.9 3.2 3.0 2.3 2.3 2.5 2.01997 2.1 2.5 2.3 2.9 2.1 2.3 2.5 3.1 2.1 1.7 1.9 1.41998 1.4 1.8 1.8 1.8 1.9 2.6 3.1 2.4 2.5 2.2 2.3 1.61999 1.5 1.8 1.7 1.6 1.9 2.3 2.7 2.0 1.8 1.8 1.8 1.72000 1.2 1.6 1.7 1.6 1.9 2.3 2.8 2.6 1.3 1.3 1.0 1.12001 0.9 1.1 1.3 0.9 1.5 1.9 1.9 2.0 1.7 1.7 1.4 1.12002 1.0 1.4 1.5 1.4 1.6 2.0 1.8 2.0 1.9 1.2 1.1 0.82003 0.9 1.0 1.1 1.2 1.7 1.3 1.5 1.5 1.3 1.1 0.9 1.02004 0.9 1.2 1.3 1.4 1.5 2.2 1.8 1.9 0.9 1.0 0.7 0.62005 0.8 0.9 0.9 0.8 1.1 1.4 1.7 1.8 1.7 1.0 1.1 1.22006 0.7 0.7 1.2 1.4 1.0 1.2 1.6 0.9 0.7 0.5 0.4 0.22007 *** *** *** *** *** *** *** *** *** *** *** ***2008 0.3 0.3 0.4 *** *** *** *** *** *** 0.9 0.8 0.82009 0.72 1.16 1.00 1.10 1.17 1.21 2.08 1.43 1.64 1.49 0.92 0.762010 0.73 0.81 1.13 1.00 1.13 1.69 2.10 2.24 1.51 2.03 1.09 1.32
Average 1.62 2.07 2.14 2.16 2.13 2.70 2.74 2.68 2.20 1.86 1.79 1.51
RATNAPURA TRI
A9.4-2
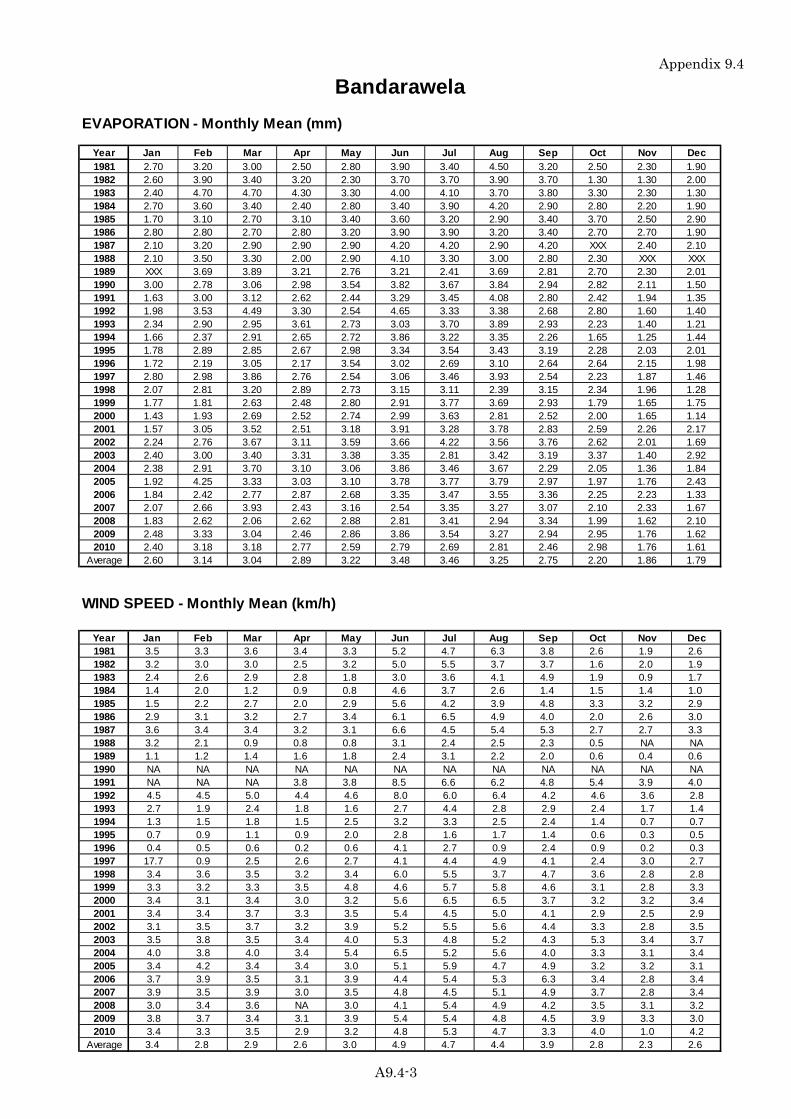
Appendix 9.4
EVAPORATION - Monthly Mean (mm)
Year Jan Feb Mar Apr May Jun Jul Aug Sep Oct Nov Dec1981 2.70 3.20 3.00 2.50 2.80 3.90 3.40 4.50 3.20 2.50 2.30 1.901982 2.60 3.90 3.40 3.20 2.30 3.70 3.70 3.90 3.70 1.30 1.30 2.001983 2.40 4.70 4.70 4.30 3.30 4.00 4.10 3.70 3.80 3.30 2.30 1.301984 2.70 3.60 3.40 2.40 2.80 3.40 3.90 4.20 2.90 2.80 2.20 1.901985 1.70 3.10 2.70 3.10 3.40 3.60 3.20 2.90 3.40 3.70 2.50 2.901986 2.80 2.80 2.70 2.80 3.20 3.90 3.90 3.20 3.40 2.70 2.70 1.901987 2.10 3.20 2.90 2.90 2.90 4.20 4.20 2.90 4.20 XXX 2.40 2.101988 2.10 3.50 3.30 2.00 2.90 4.10 3.30 3.00 2.80 2.30 XXX XXX1989 XXX 3.69 3.89 3.21 2.76 3.21 2.41 3.69 2.81 2.70 2.30 2.011990 3.00 2.78 3.06 2.98 3.54 3.82 3.67 3.84 2.94 2.82 2.11 1.501991 1.63 3.00 3.12 2.62 2.44 3.29 3.45 4.08 2.80 2.42 1.94 1.351992 1.98 3.53 4.49 3.30 2.54 4.65 3.33 3.38 2.68 2.80 1.60 1.401993 2.34 2.90 2.95 3.61 2.73 3.03 3.70 3.89 2.93 2.23 1.40 1.211994 1.66 2.37 2.91 2.65 2.72 3.86 3.22 3.35 2.26 1.65 1.25 1.441995 1.78 2.89 2.85 2.67 2.98 3.34 3.54 3.43 3.19 2.28 2.03 2.011996 1.72 2.19 3.05 2.17 3.54 3.02 2.69 3.10 2.64 2.64 2.15 1.981997 2.80 2.98 3.86 2.76 2.54 3.06 3.46 3.93 2.54 2.23 1.87 1.461998 2.07 2.81 3.20 2.89 2.73 3.15 3.11 2.39 3.15 2.34 1.96 1.281999 1.77 1.81 2.63 2.48 2.80 2.91 3.77 3.69 2.93 1.79 1.65 1.752000 1.43 1.93 2.69 2.52 2.74 2.99 3.63 2.81 2.52 2.00 1.65 1.142001 1.57 3.05 3.52 2.51 3.18 3.91 3.28 3.78 2.83 2.59 2.26 2.172002 2.24 2.76 3.67 3.11 3.59 3.66 4.22 3.56 3.76 2.62 2.01 1.692003 2.40 3.00 3.40 3.31 3.38 3.35 2.81 3.42 3.19 3.37 1.40 2.922004 2.38 2.91 3.70 3.10 3.06 3.86 3.46 3.67 2.29 2.05 1.36 1.842005 1.92 4.25 3.33 3.03 3.10 3.78 3.77 3.79 2.97 1.97 1.76 2.432006 1.84 2.42 2.77 2.87 2.68 3.35 3.47 3.55 3.36 2.25 2.23 1.332007 2.07 2.66 3.93 2.43 3.16 2.54 3.35 3.27 3.07 2.10 2.33 1.672008 1.83 2.62 2.06 2.62 2.88 2.81 3.41 2.94 3.34 1.99 1.62 2.102009 2.48 3.33 3.04 2.46 2.86 3.86 3.54 3.27 2.94 2.95 1.76 1.622010 2.40 3.18 3.18 2.77 2.59 2.79 2.69 2.81 2.46 2.98 1.76 1.61
Average 2.60 3.14 3.04 2.89 3.22 3.48 3.46 3.25 2.75 2.20 1.86 1.79
WIND SPEED - Monthly Mean (km/h)
Year Jan Feb Mar Apr May Jun Jul Aug Sep Oct Nov Dec1981 3.5 3.3 3.6 3.4 3.3 5.2 4.7 6.3 3.8 2.6 1.9 2.61982 3.2 3.0 3.0 2.5 3.2 5.0 5.5 3.7 3.7 1.6 2.0 1.91983 2.4 2.6 2.9 2.8 1.8 3.0 3.6 4.1 4.9 1.9 0.9 1.71984 1.4 2.0 1.2 0.9 0.8 4.6 3.7 2.6 1.4 1.5 1.4 1.01985 1.5 2.2 2.7 2.0 2.9 5.6 4.2 3.9 4.8 3.3 3.2 2.91986 2.9 3.1 3.2 2.7 3.4 6.1 6.5 4.9 4.0 2.0 2.6 3.01987 3.6 3.4 3.4 3.2 3.1 6.6 4.5 5.4 5.3 2.7 2.7 3.31988 3.2 2.1 0.9 0.8 0.8 3.1 2.4 2.5 2.3 0.5 NA NA1989 1.1 1.2 1.4 1.6 1.8 2.4 3.1 2.2 2.0 0.6 0.4 0.61990 NA NA NA NA NA NA NA NA NA NA NA NA1991 NA NA NA 3.8 3.8 8.5 6.6 6.2 4.8 5.4 3.9 4.01992 4.5 4.5 5.0 4.4 4.6 8.0 6.0 6.4 4.2 4.6 3.6 2.81993 2.7 1.9 2.4 1.8 1.6 2.7 4.4 2.8 2.9 2.4 1.7 1.41994 1.3 1.5 1.8 1.5 2.5 3.2 3.3 2.5 2.4 1.4 0.7 0.71995 0.7 0.9 1.1 0.9 2.0 2.8 1.6 1.7 1.4 0.6 0.3 0.51996 0.4 0.5 0.6 0.2 0.6 4.1 2.7 0.9 2.4 0.9 0.2 0.31997 17.7 0.9 2.5 2.6 2.7 4.1 4.4 4.9 4.1 2.4 3.0 2.71998 3.4 3.6 3.5 3.2 3.4 6.0 5.5 3.7 4.7 3.6 2.8 2.81999 3.3 3.2 3.3 3.5 4.8 4.6 5.7 5.8 4.6 3.1 2.8 3.32000 3.4 3.1 3.4 3.0 3.2 5.6 6.5 6.5 3.7 3.2 3.2 3.42001 3.4 3.4 3.7 3.3 3.5 5.4 4.5 5.0 4.1 2.9 2.5 2.92002 3.1 3.5 3.7 3.2 3.9 5.2 5.5 5.6 4.4 3.3 2.8 3.52003 3.5 3.8 3.5 3.4 4.0 5.3 4.8 5.2 4.3 5.3 3.4 3.72004 4.0 3.8 4.0 3.4 5.4 6.5 5.2 5.6 4.0 3.3 3.1 3.42005 3.4 4.2 3.4 3.4 3.0 5.1 5.9 4.7 4.9 3.2 3.2 3.12006 3.7 3.9 3.5 3.1 3.9 4.4 5.4 5.3 6.3 3.4 2.8 3.42007 3.9 3.5 3.9 3.0 3.5 4.8 4.5 5.1 4.9 3.7 2.8 3.42008 3.0 3.4 3.6 NA 3.0 4.1 5.4 4.9 4.2 3.5 3.1 3.22009 3.8 3.7 3.4 3.1 3.9 5.4 5.4 4.8 4.5 3.9 3.3 3.02010 3.4 3.3 3.5 2.9 3.2 4.8 5.3 4.7 3.3 4.0 1.0 4.2
Average 3.4 2.8 2.9 2.6 3.0 4.9 4.7 4.4 3.9 2.8 2.3 2.6
Bandarawela
A9.4-3
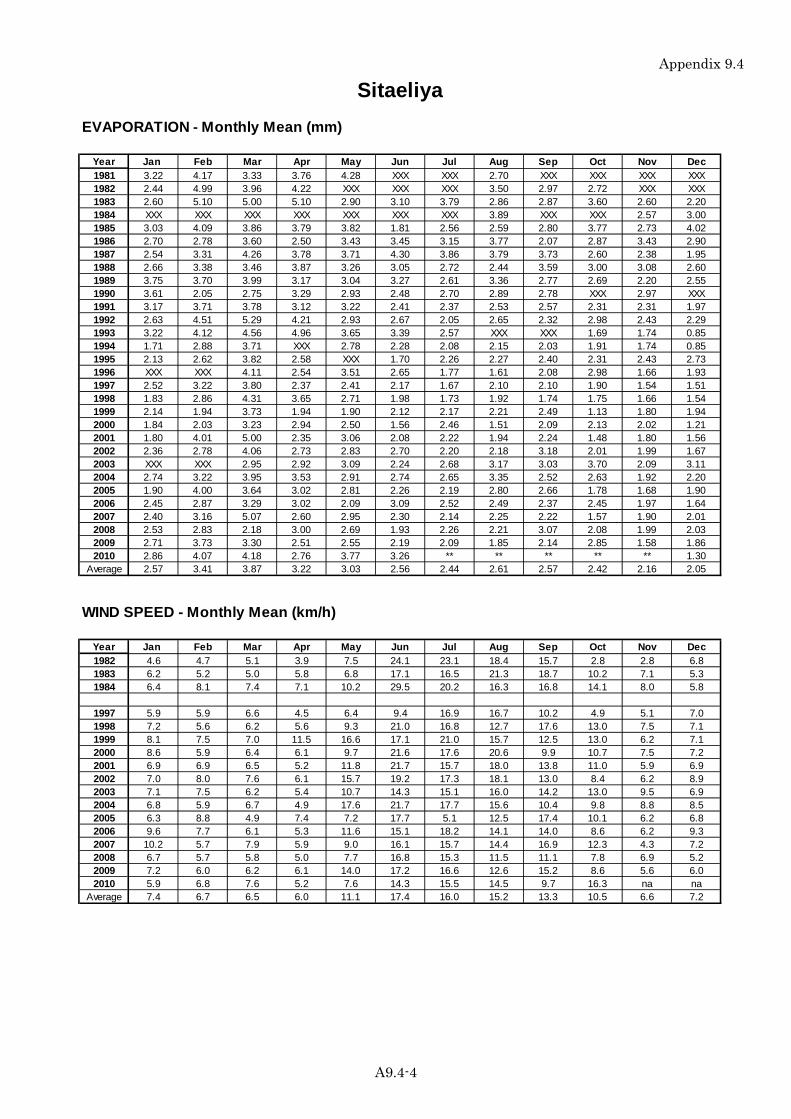
Appendix 9.4
EVAPORATION - Monthly Mean (mm)
Year Jan Feb Mar Apr May Jun Jul Aug Sep Oct Nov Dec1981 3.22 4.17 3.33 3.76 4.28 XXX XXX 2.70 XXX XXX XXX XXX1982 2.44 4.99 3.96 4.22 XXX XXX XXX 3.50 2.97 2.72 XXX XXX1983 2.60 5.10 5.00 5.10 2.90 3.10 3.79 2.86 2.87 3.60 2.60 2.201984 XXX XXX XXX XXX XXX XXX XXX 3.89 XXX XXX 2.57 3.001985 3.03 4.09 3.86 3.79 3.82 1.81 2.56 2.59 2.80 3.77 2.73 4.021986 2.70 2.78 3.60 2.50 3.43 3.45 3.15 3.77 2.07 2.87 3.43 2.901987 2.54 3.31 4.26 3.78 3.71 4.30 3.86 3.79 3.73 2.60 2.38 1.951988 2.66 3.38 3.46 3.87 3.26 3.05 2.72 2.44 3.59 3.00 3.08 2.601989 3.75 3.70 3.99 3.17 3.04 3.27 2.61 3.36 2.77 2.69 2.20 2.551990 3.61 2.05 2.75 3.29 2.93 2.48 2.70 2.89 2.78 XXX 2.97 XXX1991 3.17 3.71 3.78 3.12 3.22 2.41 2.37 2.53 2.57 2.31 2.31 1.971992 2.63 4.51 5.29 4.21 2.93 2.67 2.05 2.65 2.32 2.98 2.43 2.291993 3.22 4.12 4.56 4.96 3.65 3.39 2.57 XXX XXX 1.69 1.74 0.851994 1.71 2.88 3.71 XXX 2.78 2.28 2.08 2.15 2.03 1.91 1.74 0.851995 2.13 2.62 3.82 2.58 XXX 1.70 2.26 2.27 2.40 2.31 2.43 2.731996 XXX XXX 4.11 2.54 3.51 2.65 1.77 1.61 2.08 2.98 1.66 1.931997 2.52 3.22 3.80 2.37 2.41 2.17 1.67 2.10 2.10 1.90 1.54 1.511998 1.83 2.86 4.31 3.65 2.71 1.98 1.73 1.92 1.74 1.75 1.66 1.541999 2.14 1.94 3.73 1.94 1.90 2.12 2.17 2.21 2.49 1.13 1.80 1.942000 1.84 2.03 3.23 2.94 2.50 1.56 2.46 1.51 2.09 2.13 2.02 1.212001 1.80 4.01 5.00 2.35 3.06 2.08 2.22 1.94 2.24 1.48 1.80 1.562002 2.36 2.78 4.06 2.73 2.83 2.70 2.20 2.18 3.18 2.01 1.99 1.672003 XXX XXX 2.95 2.92 3.09 2.24 2.68 3.17 3.03 3.70 2.09 3.112004 2.74 3.22 3.95 3.53 2.91 2.74 2.65 3.35 2.52 2.63 1.92 2.202005 1.90 4.00 3.64 3.02 2.81 2.26 2.19 2.80 2.66 1.78 1.68 1.902006 2.45 2.87 3.29 3.02 2.09 3.09 2.52 2.49 2.37 2.45 1.97 1.642007 2.40 3.16 5.07 2.60 2.95 2.30 2.14 2.25 2.22 1.57 1.90 2.012008 2.53 2.83 2.18 3.00 2.69 1.93 2.26 2.21 3.07 2.08 1.99 2.032009 2.71 3.73 3.30 2.51 2.55 2.19 2.09 1.85 2.14 2.85 1.58 1.862010 2.86 4.07 4.18 2.76 3.77 3.26 ** ** ** ** ** 1.30
Average 2.57 3.41 3.87 3.22 3.03 2.56 2.44 2.61 2.57 2.42 2.16 2.05
WIND SPEED - Monthly Mean (km/h)
Year Jan Feb Mar Apr May Jun Jul Aug Sep Oct Nov Dec1982 4.6 4.7 5.1 3.9 7.5 24.1 23.1 18.4 15.7 2.8 2.8 6.81983 6.2 5.2 5.0 5.8 6.8 17.1 16.5 21.3 18.7 10.2 7.1 5.31984 6.4 8.1 7.4 7.1 10.2 29.5 20.2 16.3 16.8 14.1 8.0 5.8
1997 5.9 5.9 6.6 4.5 6.4 9.4 16.9 16.7 10.2 4.9 5.1 7.01998 7.2 5.6 6.2 5.6 9.3 21.0 16.8 12.7 17.6 13.0 7.5 7.11999 8.1 7.5 7.0 11.5 16.6 17.1 21.0 15.7 12.5 13.0 6.2 7.12000 8.6 5.9 6.4 6.1 9.7 21.6 17.6 20.6 9.9 10.7 7.5 7.22001 6.9 6.9 6.5 5.2 11.8 21.7 15.7 18.0 13.8 11.0 5.9 6.92002 7.0 8.0 7.6 6.1 15.7 19.2 17.3 18.1 13.0 8.4 6.2 8.92003 7.1 7.5 6.2 5.4 10.7 14.3 15.1 16.0 14.2 13.0 9.5 6.92004 6.8 5.9 6.7 4.9 17.6 21.7 17.7 15.6 10.4 9.8 8.8 8.52005 6.3 8.8 4.9 7.4 7.2 17.7 5.1 12.5 17.4 10.1 6.2 6.82006 9.6 7.7 6.1 5.3 11.6 15.1 18.2 14.1 14.0 8.6 6.2 9.32007 10.2 5.7 7.9 5.9 9.0 16.1 15.7 14.4 16.9 12.3 4.3 7.22008 6.7 5.7 5.8 5.0 7.7 16.8 15.3 11.5 11.1 7.8 6.9 5.22009 7.2 6.0 6.2 6.1 14.0 17.2 16.6 12.6 15.2 8.6 5.6 6.02010 5.9 6.8 7.6 5.2 7.6 14.3 15.5 14.5 9.7 16.3 na na
Average 7.4 6.7 6.5 6.0 11.1 17.4 16.0 15.2 13.3 10.5 6.6 7.2
Sitaeliya
A9.4-4


![Good bye, blue sky. UBVRI Night Sky Brightness at ESO-Paranal during sunspot maximum F. Patat - ESO Photo by Leo[p]ardo Vanzi-ESO](https://img.pdfslide.net/doc/110x75/56649e685503460f94b64f5a/good-bye-blue-sky-ubvri-night-sky-brightness-at-eso-paranal-during-sunspot.jpg)