Embed Size (px)
Citation preview
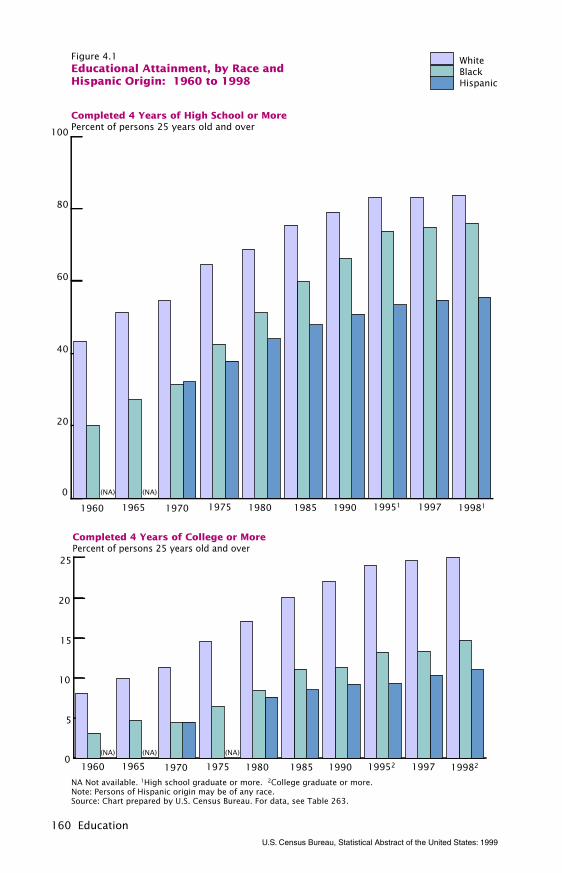
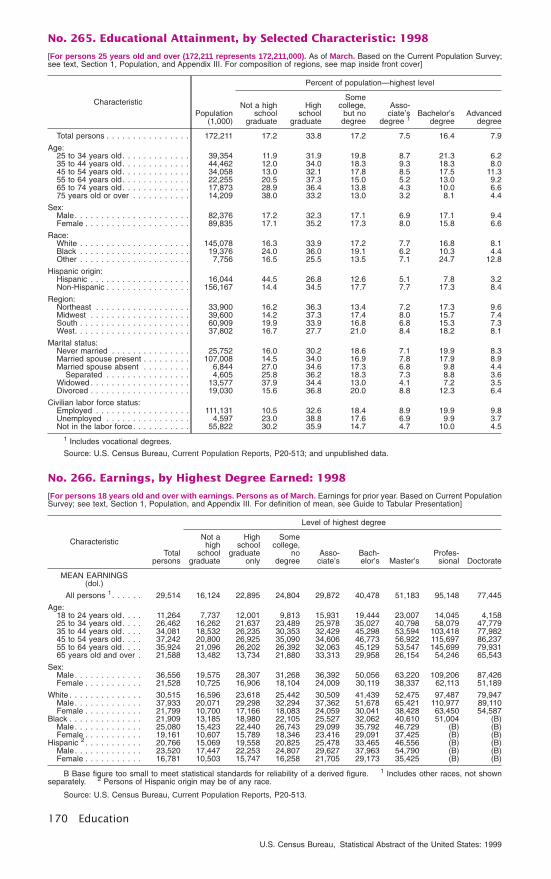
Figure 4.1Educational Attainment, by Race andHispanic Origin: 1960 to 1998
Completed 4 Years of High School or MorePercent of persons 25 years old and over
Completed 4 Years of College or MorePercent of persons 25 years old and over
160 Education
U.S. Census Bureau, Statistical Abstract of the United States: 1999
0
20
40
60
80
100
199811997199511990198519801975197019651960
(NA)(NA)
WhiteBlackHispanic
0
5
10
15
20
25
199821997199521990198519801975197019651960
(NA)(NA) (NA)
NA Not available. 1High school graduate or more. 2College graduate or more. Note: Persons of Hispanic origin may be of any race.Source: Chart prepared by U.S. Census Bureau. For data, see Table 263.
U.S. Census Bureau, Statistical Abstract of the United States: 1999
Education 161
Section 4
Education
This section presents data primarily con-cerning formal education as a whole, atvarious levels, and for public and privateschools. Data shown relate to the school-age population and school enrollment,educational attainment, education person-nel, and financial aspects of education. Inaddition, data are shown for libraries, com-puter usage in schools, and adult educa-tion. The chief sources are the decennialcensus of population and the Current Popu-lation Survey (CPS), both conducted by theU.S. Census Bureau (see text, Section 1,Population); annual, biennial, and otherperiodic surveys conducted by the NationalCenter for Education Statistics, a part of theU.S. Department of Education; and surveysconducted by the National Education Asso-ciation.
The censuses of population have includeddata on school enrollment since 1840 andon educational attainment since 1940.The CPS has reported on school enrollmentannually since 1945 and on educationalattainment periodically since 1947.
The National Center for Education Statisticsis continuing the pattern of statistical stud-ies and surveys conducted by the U.S. Of-fice of Education since 1870. The annualDigest of Education Statistics providessummary data on pupils, staff, finances, in-cluding government expenditures, and or-ganization at the elementary, secondary,and higher education levels. It is also a pri-mary source for detailed information onFederal funds for education, projections ofenrollment, graduates, and teachers. TheCondition of Education, issued annually,presents a summary of information oneducation of particular interest to policy-makers.
Other sources of data include special stud-ies by the National Center for EducationStatistics and annual or biennial reports ofeducation agencies in individual states.
The census of governments, conducted bythe Census Bureau every 5 years (for theyears ending in “2” and “7”), provides dataon school district finances and state andlocal government expenditures for educa-tion. Reports published by the Bureau ofLabor Statistics contain data relating civil-ian labor force experience to educationalattainment (see also Tables 653, 677, and684 in Section 13, Labor Force).
Types and sources of data—The statis-tics in this section are of two generaltypes. One type, exemplified by data fromthe Census Bureau, is based on direct inter-views with individuals to obtain informa-tion about their own and their family mem-bers’ education. Data of this type relate toschool enrollment and level of educationattained, classified by age, sex, and othercharacteristics of the population. Theschool enrollment statistics reflect atten-dance or enrollment in any regular schoolwithin a given period; educational attain-ment statistics reflect the highest gradecompleted by an individual, or beginning1992, the highest diploma or degreereceived.
For enrollment data starting in October1994, the CPS used 1990 census popula-tion controls plus adjustment forundercount. Also the survey changed frompaper to computer assisted technology. Foryears 1981 through 1993, 1980 censuspopulation controls were used; 1971through 1980, 1970 census populationcontrols had been used. These changeshad little impact on summary measures(e.g., medians) and proportional measures(e.g., enrollment rates); however, use ofthe controls may have significant impacton absolute numbers.
Beginning with data for 1986, a new editand tabulation package for school enroll-ment has been introduced. In 1988 a new
U.S. Census Bureau, Statistical Abstract of the United States: 1999
162 Education
edit and tabulation package was intro-duced for educational attainment data.
The second type, generally exemplifiedby data from the National Center for Educa-tion Statistics and the National EducationAssociation, is based on reports from ad-ministrators of educational institutionsand of state and local agencies havingjurisdiction over education. Data of thistype relate to enrollment, attendance, staff,and finances for the Nation, individualstates, and local areas.
Unlike the National Center for EducationStatistics, the Census Bureau does notregularly include specialized vocational,trade, business, or correspondence schoolsin its surveys. The National Center for Edu-cation Statistics includes nursery schoolsand kindergartens that are part of regulargrade schools in their enrollment figures.The Census Bureau includes all nurseryschools and kindergartens. At the highereducation level, the statistics of both agen-cies are concerned with institutions grant-ing degrees or offering work acceptable fordegree-credit, such as junior colleges.
School attendance—All states requirethat children attend school. While statelaws vary as to the ages and circumstancesof compulsory attendance, generally theyrequire that formal schooling begin by age6 and continue to age 16.
Schools—The National Center for Educa-tion Statistics defines a school as “a divi-sion of the school system consisting ofstudents composing one or more gradegroups or other identifiable groups, orga-nized as one unit with one or more teach-ers to give instruction of a defined type,and housed in a school plant of one ormore buildings. More than one school maybe housed in one school plant, as is thecase when the elementary and secondaryprograms are housed in the same schoolplant.”
Regular schools are those which advance aperson toward a diploma or degree. Theyinclude public and private nursery schools,kindergartens, graded schools, colleges,universities, and professional schools.
Public schools are schools controlled andsupported by local, state, or Federal gov-ernmental agencies; private schools arethose controlled and supported mainly byreligious organizations or by private per-sons or organizations.
The Census Bureau defines elementaryschools as including grades 1 through 8;high schools as including grades 9 through12; and colleges as including junior or com-munity colleges, regular 4-year colleges,and universities and graduate or profes-sional schools. Statistics reported by theNational Center for Education Statistics andthe National Education Association by typeof organization, such as elementary leveland secondary level, may not be strictlycomparable with those from the CensusBureau because the grades included at thetwo levels vary, depending on the level as-signed to the middle or junior high schoolby the local school systems.
School year—Except as otherwise indi-cated in the tables, data refer to the schoolyear which, for elementary and secondaryschools, generally begins in September ofthe preceding year and ends in June of theyear stated. For the most part, statisticsconcerning school finances are for a 12-month period, usually July 1 to June 30. En-rollment data generally refer to a specificpoint in time, such as fall, as indicated inthe tables.
Statistical reliability—For a discussion ofstatistical collection, estimation, and sam-pling procedures and measures of statisti-cal reliability applicable to the CensusBureau and the National Center for Educa-tion Statistics data, see Appendix III.

No. 253. School Enrollment: 1965 to 2008
[In thousands (54,394 represents 54,394,000). As of fall]
YearTotal
All levels K throughgrade 8
Grades 9through 12 College
Public Private Public Private Public Private Public Private
1965 . . . . . . . . . . . . . . 54,394 46,143 8,251 30,563 4,900 11,610 1,400 3,970 1,9511970 . . . . . . . . . . . . . . 59,838 52,322 7,516 32,558 4,052 13,336 1,311 6,428 2,1531975 . . . . . . . . . . . . . . 61,004 53,654 7,350 30,515 3,700 14,304 1,300 8,835 2,3501980 . . . . . . . . . . . . . . 58,305 50,335 7,971 27,647 3,992 13,231 1,339 9,457 2,640
1981 . . . . . . . . . . . . . . 57,916 49,691 8,225 27,280 4,100 12,764 1,400 9,647 2,7251982 . . . . . . . . . . . . . . 57,591 49,262 8,330 27,161 4,200 12,405 1,400 9,696 2,7301983 . . . . . . . . . . . . . . 57,432 48,935 8,497 26,981 4,315 12,271 1,400 9,683 2,7821984 . . . . . . . . . . . . . . 57,150 48,686 8,465 26,905 4,300 12,304 1,400 9,477 2,7651985 . . . . . . . . . . . . . . 57,226 48,901 8,325 27,034 4,195 12,388 1,362 9,479 2,768
1986 . . . . . . . . . . . . . . 57,709 49,467 8,242 27,420 4,116 12,333 1,336 9,714 2,7901987 . . . . . . . . . . . . . . 58,254 49,982 8,272 27,933 4,232 12,076 1,247 9,973 2,7931988 . . . . . . . . . . . . . . 58,485 50,349 8,136 28,501 4,036 11,687 1,206 10,161 2,8941989 . . . . . . . . . . . . . . 59,436 51,120 8,316 29,152 4,162 11,390 1,193 10,578 2,9611990 . . . . . . . . . . . . . . 60,267 52,061 8,206 29,878 4,095 11,338 1,137 10,845 2,974
1991 . . . . . . . . . . . . . . 61,605 53,356 8,248 30,506 4,074 11,541 1,125 11,310 3,0491992 . . . . . . . . . . . . . . 62,686 54,208 8,478 31,088 4,212 11,735 1,163 11,385 3,1031993 . . . . . . . . . . . . . . 63,241 54,654 8,587 31,504 4,280 11,961 1,191 11,189 3,1161994 . . . . . . . . . . . . . . 63,986 55,245 8,741 31,898 4,360 12,213 1,236 11,134 3,1451995 . . . . . . . . . . . . . . 64,803 55,933 8,869 32,341 4,431 12,500 1,269 11,092 3,169
1996 . . . . . . . . . . . . . . 65,674 56,682 8,993 32,759 4,486 12,834 1,297 11,090 3,2101997, est. . . . . . . . . . . . 66,170 57,161 9,010 32,951 4,545 13,003 1,322 11,208 3,1431998, proj. . . . . . . . . . . 67,309 58,187 9,121 33,522 4,588 13,270 1,339 11,395 3,1941999, proj. . . . . . . . . . . 67,871 58,668 9,203 33,722 4,616 13,420 1,354 11,525 3,2332000, proj. . . . . . . . . . . 68,334 59,065 9,269 33,903 4,640 13,537 1,366 11,626 3,263
2001, proj. . . . . . . . . . . 68,728 59,402 9,324 34,055 4,661 13,643 1,376 11,705 3,2872002, proj. . . . . . . . . . . 69,040 59,674 9,366 34,124 4,671 13,800 1,392 11,751 3,3032003, proj. . . . . . . . . . . 69,338 59,923 9,413 34,124 4,671 13,951 1,407 11,849 3,3352004, proj. . . . . . . . . . . 69,657 60,195 9,461 33,958 4,648 14,263 1,439 11,975 3,3742005, proj. . . . . . . . . . . 69,942 60,436 9,506 33,756 4,620 14,579 1,471 12,101 3,4152006, proj. . . . . . . . . . . 70,160 60,611 9,549 33,584 4,597 14,785 1,491 12,242 3,4612007, proj. . . . . . . . . . . 70,305 60,721 9,584 33,489 4,584 14,854 1,498 12,378 3,5022008, proj. . . . . . . . . . . 70,351 60,735 9,616 33,455 4,579 14,746 1,488 12,534 3,549
Source: U.S. National Center for Education Statistics, Digest of Education Statistics, annual, and Projections of EducationStatistics, annual.
No. 254. School Expenditures, by Type of Control and Level of Instructionin Constant (1997-98) Dollars: 1960 to 1998
[In millions of dollars (131,342 represents $131,342,000,000). For school years ending in year shown. Total expenditures forpublic elementary and secondary schools include current expenditures, interest on school debt, and capital outlay. Data deflatedby the Consumer Price Index, wage earners, and clerical workers through 1975; thereafter, all urban consumers, on a school yearbasis (supplied by the National Center for Education Statistics). See also Appendix III]
YearTotal
Elementary andsecondary schools Colleges and universities
Total Public Private 1 Total Public Private 1
1960 . . . . . . . . . . . . . . . . . . . . 131,342 92,000 85,945 6,055 39,342 21,488 17,8541970 . . . . . . . . . . . . . . . . . . . . 293,123 184,899 174,195 10,704 108,223 69,510 38,7131975 . . . . . . . . . . . . . . . . . . . . 339,348 215,000 202,508 12,492 124,348 84,214 40,1341980 . . . . . . . . . . . . . . . . . . . . 345,070 214,929 199,928 15,001 130,141 86,324 43,817
1985 . . . . . . . . . . . . . . . . . . . . 378,726 228,467 209,504 18,962 150,259 97,420 52,8391986 . . . . . . . . . . . . . . . . . . . . 400,554 240,494 220,874 19,620 160,059 104,148 55,9111987 . . . . . . . . . . . . . . . . . . . . 424,554 254,755 233,962 20,793 169,799 108,405 61,3941988 . . . . . . . . . . . . . . . . . . . . 437,542 262,490 241,127 21,362 175,052 111,501 63,5511989 . . . . . . . . . . . . . . . . . . . . 462,947 279,434 257,546 21,887 183,513 116,252 67,2611990 . . . . . . . . . . . . . . . . . . . . 485,990 294,211 271,028 23,183 191,779 122,779 69,001
1991 . . . . . . . . . . . . . . . . . . . . 498,390 300,652 277,100 23,552 197,739 126,132 71,6071992 . . . . . . . . . . . . . . . . . . . . 506,716 305,741 282,101 23,640 200,974 127,171 73,8041993 . . . . . . . . . . . . . . . . . . . . 517,563 311,324 287,039 24,285 206,239 130,698 75,5411994 . . . . . . . . . . . . . . . . . . . . 527,909 318,033 293,476 24,557 209,875 132,269 77,606
1995 . . . . . . . . . . . . . . . . . . . . 541,898 325,188 300,024 25,163 216,710 137,209 79,5011996, prel. . . . . . . . . . . . . . . . . 554,382 333,127 307,374 25,753 221,256 138,975 82,2811997, prel. . . . . . . . . . . . . . . . . 569,478 341,992 315,732 26,260 227,486 142,497 84,9891998, est. . . . . . . . . . . . . . . . . . 583,800 351,300 324,300 27,000 232,500 145,500 87,000
1 Estimated.
Source: U.S. National Center for Education Statistics, Digest Education Statistics, annual.
Education 163
U.S. Census Bureau, Statistical Abstract of the United States: 1999
No. 255. School Enrollment, Faculty, Graduates, and Finances, WithProjections: 1990 to 2008
[As of fall, except as indicated (46,448 represents 46,448,000)]
Item Unit 1990 19951997,
est.1998,
proj.2000,
proj.2005,
proj.2008,
proj.
ELEMENTARY AND SECONDARYSCHOOLS
School enrollment, total . . . . . . . . . . . 1,000. . . 46,448 50,540 51,821 52,718 53,445 54,426 54,268Kindergarten through grade 8 . . . . . 1,000. . . 33,973 36,772 37,495 38,110 38,543 38,376 38,034Grades 9 through 12 . . . . . . . . . . . 1,000. . . 12,475 13,769 14,324 14,608 14,902 16,050 16,234
Public . . . . . . . . . . . . . . . . . . . . . 1,000. . . 41,217 44,840 45,953 46,792 47,439 48,335 48,201Kindergarten through grade 8 . . . 1,000. . . 29,878 32,341 32,951 33,522 33,903 33,756 33,455Grades 9 through 12 . . . . . . . . . 1,000. . . 11,338 12,500 13,003 13,270 13,537 14,579 14,746
Private . . . . . . . . . . . . . . . . . . . . 1,000. . . 5,232 5,700 5,867 5,927 6,006 6,091 6,067Kindergarten through grade 8 . . . 1,000. . . 4,095 4,431 4,545 4,588 4,640 4,620 4,579Grades 9 through 12 . . . . . . . . . 1,000. . . 1,137 1,269 1,322 1,339 1,366 1,471 1,488
Enrollment rate:5 and 6 year olds . . . . . . . . . . . . . Percent . 96.5 96.0 96.5 (NA) (NA) (NA) (NA)7 to 13 year olds . . . . . . . . . . . . . Percent . 99.6 98.9 99.1 (NA) (NA) (NA) (NA)14 to 17 year olds. . . . . . . . . . . . . Percent . 95.8 96.3 96.6 (NA) (NA) (NA) (NA)
Classroom teachers, total 1 . . . . . . . . 1,000. . . 2,753 2,975 3,103 3,126 3,211 3,394 3,460Public . . . . . . . . . . . . . . . . . . . . . 1,000. . . 2,398 2,595 2,710 2,728 2,802 2,963 3,022Private . . . . . . . . . . . . . . . . . . . . 1,000. . . 355 380 394 399 409 430 438
High school graduates, total 2. . . . . . . 1,000. . . 2,503 2,548 2,708 2,751 2,875 2,985 (NA)Public . . . . . . . . . . . . . . . . . . . . . 1,000. . . 2,235 2,281 2,433 2,465 2,576 2,675 (NA)
Public schools: 2
Average daily attendance (ADA) . . . 1,000. . . 38,427 41,502 42,924 43,372 43,973 44,803 (NA)Constant (1997-98) dollars:
Teachers’ average salary . . . . . . Dol. . . . . 39,958 39,484 39,385 (NA) (NA) (NA) (NA)Current school expenditure . . . . . Bil. dol. . 244.0 267.0 281.7 (NA) (NA) (NA) (NA)
Per pupil in ADA . . . . . . . . . . Dol. . . . . 6,350 6,434 6,563 (NA) (NA) (NA) (NA)
HIGHER EDUCATION
Enrollment, total . . . . . . . . . . . . . . . . 1,000. . . 13,819 14,262 14,350 14,590 14,889 15,516 16,083Male. . . . . . . . . . . . . . . . . . . . . . 1,000. . . 6,284 6,343 6,239 6,324 6,442 6,684 6,906
Full time. . . . . . . . . . . . . . . . . . 1,000. . . 3,808 3,807 3,667 3,718 3,816 4,010 4,182Part time . . . . . . . . . . . . . . . . . 1,000. . . 2,476 2,535 2,572 2,606 2,626 2,674 2,724
Female . . . . . . . . . . . . . . . . . . . . 1,000. . . 7,535 7,919 8,111 8,266 8,447 8,833 9,177Full time. . . . . . . . . . . . . . . . . . 1,000. . . 4,013 4,321 4,424 4,562 4,727 5,075 5,380Part time . . . . . . . . . . . . . . . . . 1,000. . . 3,521 3,598 3,687 3,704 3,720 3,758 3,797
Public . . . . . . . . . . . . . . . . . . . . . 1,000. . . 10,845 11,092 11,207 11,395 11,626 12,101 12,534Four-year institutions . . . . . . . . . 1,000. . . 5,848 5,815 5,863 5,969 6,114 6,413 6,670Two-year institutions . . . . . . . . . 1,000. . . 4,996 5,278 5,344 5,426 5,512 5,688 5,864
Private . . . . . . . . . . . . . . . . . . . . 1,000. . . 2,974 3,169 3,143 3,195 3,263 3,415 3,549Four-year institutions . . . . . . . . . 1,000. . . 2,730 2,955 2,914 2,961 3,024 3,165 3,288Two-year institutions . . . . . . . . . 1,000. . . 244 215 229 234 239 250 260
Undergraduate . . . . . . . . . . . . . . . 1,000. . . 11,959 12,232 12,357 12,600 12,915 13,511 14,045Graduate. . . . . . . . . . . . . . . . . . . 1,000. . . 1,586 1,732 1,716 1,716 1,706 1,728 1,752First-time professional . . . . . . . . . . 1,000. . . 273 298 277 273 269 278 286
Full-time equivalent . . . . . . . . . . . . 1,000. . . 9,983 10,335 10,346 10,554 10,829 11,401 11,910Public . . . . . . . . . . . . . . . . . . . 1,000. . . 7,558 7,752 7,799 7,959 8,168 8,593 8,974Private. . . . . . . . . . . . . . . . . . . 1,000. . . 2,425 2,583 2,547 2,595 2,661 2,809 2,937
Faculty, total . . . . . . . . . . . . . . . . . . 1,000. . . 817 932 936 952 947 (NA) (NA)Public . . . . . . . . . . . . . . . . . . . . . 1,000. . . 574 657 664 675 673 (NA) (NA)Private . . . . . . . . . . . . . . . . . . . . 1,000. . . 244 275 273 277 274 (NA) (NA)
Degrees conferred, total 2 . . . . . . . . . 1,000. . . 2,025 2,248 2,222 2,226 2,254 2,368 (NA)Associate’s . . . . . . . . . . . . . . . . . 1,000. . . 482 555 520 528 543 565 (NA)Bachelor’s . . . . . . . . . . . . . . . . . . 1,000. . . 1,095 1,165 1,172 1,166 1,173 1,243 (NA)Master’s . . . . . . . . . . . . . . . . . . . 1,000. . . 337 406 406 410 418 438 (NA)Doctorate’s . . . . . . . . . . . . . . . . . 1,000. . . 39 45 45 46 47 49 (NA)First-professional . . . . . . . . . . . . . 1,000. . . 72 77 78 76 73 73 (NA)
NA Not available. 1 Full-time equivalents. 2 For school year ending June the following year.
Source: U.S. National Center for Education Statistics, Digest of Education Statistics, annual, and Projections of EducationalStatistics, annual.
164 Education
U.S. Census Bureau, Statistical Abstract of the United States: 1999

No. 256. Federal Funds for Education and Related Programs: 1996 to 1998
[In millions of dollars (71,327.4 represents $71,327,400,000), except percent. For fiscal years ending in September. Figures represent on-budget funds]
Level, agency, and program 1996 1997 1998 1
Total, all programs . . . . . . . . . . . . . . . . 71,327.4 73,136.8 75,077.5Percent of Federal budget outlays . . . . . . . . . . 4.6 4.6 4.5
Elementary/secondary education programs . . . . 34,391.5 35,478.9 36,818.8Department of Education 2 . . . . . . . . . . . . . . . 14,323.8 14,511.2 14,787.3
Grants for the disadvantaged . . . . . . . . . . . . 7,020.5 7,201.6 6,235.9School improvement programs . . . . . . . . . . . 1,247.4 1,276.6 1,391.1Indian education . . . . . . . . . . . . . . . . . . . . 77.4 56.0 55.0Special education. . . . . . . . . . . . . . . . . . . . 3,222.2 3,305.5 3,812.4Vocational and adult education . . . . . . . . . . . 1,348.1 1,402.4 1,337.9Education reform—Goals 2000 . . . . . . . . . . . 271.5 431.5 668.1
Department of Agriculture 2 . . . . . . . . . . . . . . . 8,408.1 8,830.2 9,320.2Child nutrition programs . . . . . . . . . . . . . . . 37,875.0 38,300.0 38,800.0Agricultural Marketing Service—commodities 4 . . . . . . . . . . . . . . . . . . . . . 400.0 400.0 400.0
Special milk program . . . . . . . . . . . . . . . . . (3) (3) (3)Department of Defense 2 . . . . . . . . . . . . . . . . 1,313.1 1,351.8 1,316.6
Overseas dependents schools . . . . . . . . . . . 813.3 832.6 852.1Section VI schools 5 . . . . . . . . . . . . . . . . . . 336.1 355.0 302.2
Department of Health and Human Services . . . . 5,185.9 5,110.2 5,195.4Head Start . . . . . . . . . . . . . . . . . . . . . . . . 3,570.0 3,980.5 4,355.0Social security student benefits. . . . . . . . . . . 684.9 676.7 680.4
Department of the Interior 2 . . . . . . . . . . . . . . . 486.5 558.4 535.6Mineral Leasing Act and other funds . . . . . . . 56.9 89.0 57.0Indian Education . . . . . . . . . . . . . . . . . . . . 428.5 468.4 477.6
Department of Justice . . . . . . . . . . . . . . . . . . 175.9 191.4 222.2Inmate programs . . . . . . . . . . . . . . . . . . . . 179.4 190.4 221.2
Department of Labor . . . . . . . . . . . . . . . . . . . 4,084.0 4,432.0 4,990.0Job Corps. . . . . . . . . . . . . . . . . . . . . . . . . 1,114.0 1,185.0 1,203.0
Department of Veterans Affairs. . . . . . . . . . . . . 344.3 402.2 347.8Vocational rehab for disabled veterans. . . . . . 349.6 386.0 338.0
Other agencies and programs . . . . . . . . . . . . . 70.0 91.4 103.7Higher education programs . . . . . . . . . . . . . . . 15,775.5 15,959.4 15,990.0
Department of Education 2 . . . . . . . . . . . . . . . 12,257.6 12,377.0 12,406.1Student financial assistance . . . . . . . . . . . . . 6,861.6 7,247.3 8,352.8Federal Family Education Loans . . . . . . . . . . 3,664.0 3,313.8 1,967.8
Department of Agriculture . . . . . . . . . . . . . . . . 32.9 32.6 32.6Department of Commerce . . . . . . . . . . . . . . . . 3.4 3.4 3.4Department of Defense . . . . . . . . . . . . . . . . . 864.9 913.6 923.5
Tuition assistance for military personnel . . . . . 260.3 271.9 275.4Service academies 6. . . . . . . . . . . . . . . . . . 171.7 173.7 191.4Senior ROTC . . . . . . . . . . . . . . . . . . . . . . 218.2 228.6 225.4
Level, agency, and program 1996 1997 1998 1
Professional development education . . . . . . . 214.7 229.3 231.2Department of Health and Human Services 2 . . . 798.6 801.9 793.1
Health professions training programs . . . . . . . 273.5 313.7 291.1National Health Service Corps scholarships . . 28.8 30.0 30.0National Institutes of Health training grants 7 . . 457.0 417.0 429.8
Department of the Interior . . . . . . . . . . . . . . . . 132.5 165.6 167.8Shared revenues, Mineral Leasing Act andother receipts—estimated education share . . 59.0 89.3 86.2
Indian programs. . . . . . . . . . . . . . . . . . . . . 73.5 76.3 81.6Department of Transportation . . . . . . . . . . . . . 53.5 58.3 59.3Department of Veterans Affairs 2 . . . . . . . . . . . 1,074.7 992.7 1,024.8
Post-Vietnam veterans . . . . . . . . . . . . . . . . 44.4 16.3 11.7All-volunteer-force educational assistance. . . . 922.8 863.9 898.8
Other agencies and programs 2 . . . . . . . . . . . . 557.5 614.3 579.4National Endowment for the Humanities . . . . . 30.9 25.8 20.5National Science Foundation . . . . . . . . . . . . 262.0 355.0 358.0United States Information Agency . . . . . . . . . 239.4 204.8 172.0
Other education programs . . . . . . . . . . . . . . . . 4,828.0 5,021.2 5,171.4Department of Education 2 . . . . . . . . . . . . . . . 3,085.6 2,882.3 2,961.8
Administration . . . . . . . . . . . . . . . . . . . . . . 502.9 412.6 437.1Rehabilitative services and handicappedresearch . . . . . . . . . . . . . . . . . . . . . . . . . 2,410.2 2,462.2 2,515.4
Department of Agriculture . . . . . . . . . . . . . . . . 412.9 413.6 408.7Department of Health and Human Services . . . . 117.0 144.0 155.0Department of Justice . . . . . . . . . . . . . . . . . . 35.1 46.1 39.8Department of State. . . . . . . . . . . . . . . . . . . . 53.3 49.4 55.4Department of the Treasury. . . . . . . . . . . . . . . 59.0 51.0 73.0Other agencies and programs 2 . . . . . . . . . . . . 1,065.2 1,434.8 1,477.6
Agency for International Development . . . . . . 307.0 355.6 347.7Library of Congress . . . . . . . . . . . . . . . . . . 252.0 261.0 277.0National Endowment for the Arts . . . . . . . . . . 0.5 2.8 2.3National Endowment for the Humanities . . . . . 62.4 68.7 72.4
Research programs at universities andrelated institutions 2 . . . . . . . . . . . . . . . . . . . 16,332.3 16,677.3 17,097.3Department of Agriculture . . . . . . . . . . . . . . . . 427.2 516.6 417.9Department of Defense . . . . . . . . . . . . . . . . . 1,663.7 1,452.8 1,364.8Department of Energy . . . . . . . . . . . . . . . . . . 3,035.2 3,150.5 3,170.7Department of Health and Human Services . . . . 6,784.9 7,210.2 7,422.1National Aeronautics and SpaceAdministration . . . . . . . . . . . . . . . . . . . . . . . 1,754.6 1,652.2 1,699.0
National Science Foundation . . . . . . . . . . . . . . 2,041.5 2,040.0 2,115.3
1 Estimated. 2 Includes other programs and agencies, not shown separately. 3 The Special Milk Program is included in the Child Nutrition Program. 4 Purchased under Section 32 of the Act of August 1935for use in child nutrition programs. 5 Program provides for the education of dependents of Federal employees residing on Federal property where free public education is unavailable in the nearby community.6 Instructional costs only including academics, audiovisual, academic computer center, faculty training, military training, physical education, and libraries. 7 Includes alcohol, drug abuse, and mental health trainingprograms.
Source: U.S. National Center for Education Statistics, Digest of Education Statistics, 1998.
Educatio
n1
65
U.S
.C
ensusB
ureau,S
tatisticalAbstract
ofthe
United
States:
1999
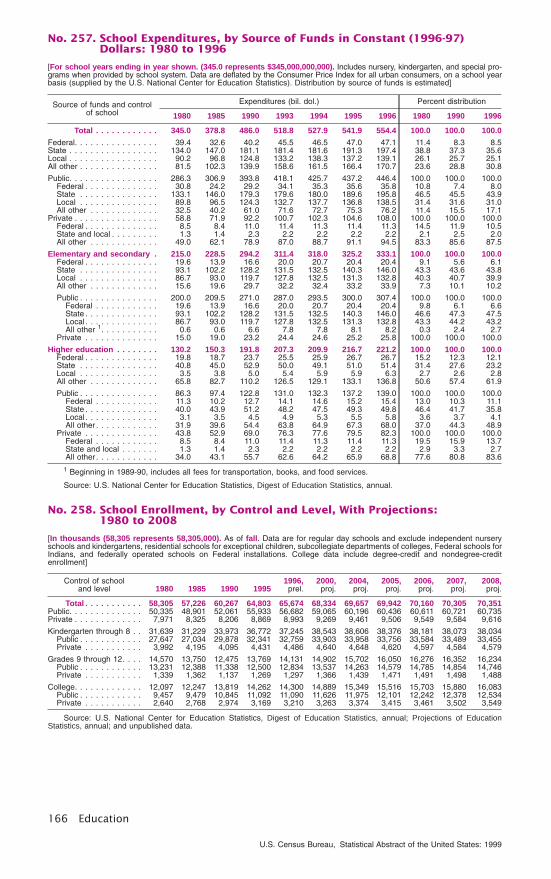
No. 257. School Expenditures, by Source of Funds in Constant (1996-97)Dollars: 1980 to 1996
[For school years ending in year shown. (345.0 represents $345,000,000,000). Includes nursery, kindergarten, and special pro-grams when provided by school system. Data are deflated by the Consumer Price Index for all urban consumers, on a school yearbasis (supplied by the U.S. National Center for Education Statistics). Distribution by source of funds is estimated]
Source of funds and controlof school
Expenditures (bil. dol.) Percent distribution
1980 1985 1990 1993 1994 1995 1996 1980 1990 1996
Total . . . . . . . . . . . . 345.0 378.8 486.0 518.8 527.9 541.9 554.4 100.0 100.0 100.0
Federal. . . . . . . . . . . . . . . . 39.4 32.6 40.2 45.5 46.5 47.0 47.1 11.4 8.3 8.5State . . . . . . . . . . . . . . . . . 134.0 147.0 181.1 181.4 181.6 191.3 197.4 38.8 37.3 35.6Local . . . . . . . . . . . . . . . . . 90.2 96.8 124.8 133.2 138.3 137.2 139.1 26.1 25.7 25.1All other . . . . . . . . . . . . . . . 81.5 102.3 139.9 158.6 161.5 166.4 170.7 23.6 28.8 30.8
Public. . . . . . . . . . . . . . . . . 286.3 306.9 393.8 418.1 425.7 437.2 446.4 100.0 100.0 100.0Federal . . . . . . . . . . . . . . 30.8 24.2 29.2 34.1 35.3 35.6 35.8 10.8 7.4 8.0State . . . . . . . . . . . . . . . 133.1 146.0 179.3 179.6 180.0 189.6 195.8 46.5 45.5 43.9Local . . . . . . . . . . . . . . . 89.8 96.5 124.3 132.7 137.7 136.8 138.5 31.4 31.6 31.0All other . . . . . . . . . . . . . 32.5 40.2 61.0 71.6 72.7 75.3 76.2 11.4 15.5 17.1
Private . . . . . . . . . . . . . . . . 58.8 71.9 92.2 100.7 102.3 104.6 108.0 100.0 100.0 100.0Federal . . . . . . . . . . . . . . 8.5 8.4 11.0 11.4 11.3 11.4 11.3 14.5 11.9 10.5State and local . . . . . . . . . 1.3 1.4 2.3 2.2 2.2 2.2 2.2 2.1 2.5 2.0All other . . . . . . . . . . . . . 49.0 62.1 78.9 87.0 88.7 91.1 94.5 83.3 85.6 87.5
Elementary and secondary . 215.0 228.5 294.2 311.4 318.0 325.2 333.1 100.0 100.0 100.0Federal . . . . . . . . . . . . . . 19.6 13.9 16.6 20.0 20.7 20.4 20.4 9.1 5.6 6.1State . . . . . . . . . . . . . . . 93.1 102.2 128.2 131.5 132.5 140.3 146.0 43.3 43.6 43.8Local . . . . . . . . . . . . . . . 86.7 93.0 119.7 127.8 132.5 131.3 132.8 40.3 40.7 39.9All other . . . . . . . . . . . . . 15.6 19.6 29.7 32.2 32.4 33.2 33.9 7.3 10.1 10.2
Public . . . . . . . . . . . . . . . 200.0 209.5 271.0 287.0 293.5 300.0 307.4 100.0 100.0 100.0Federal . . . . . . . . . . . . 19.6 13.9 16.6 20.0 20.7 20.4 20.4 9.8 6.1 6.6State . . . . . . . . . . . . . . 93.1 102.2 128.2 131.5 132.5 140.3 146.0 46.6 47.3 47.5Local . . . . . . . . . . . . . . 86.7 93.0 119.7 127.8 132.5 131.3 132.8 43.3 44.2 43.2All other 1. . . . . . . . . . . 0.6 0.6 6.6 7.8 7.8 8.1 8.2 0.3 2.4 2.7
Private . . . . . . . . . . . . . . 15.0 19.0 23.2 24.4 24.6 25.2 25.8 100.0 100.0 100.0
Higher education . . . . . . . . 130.2 150.3 191.8 207.3 209.9 216.7 221.2 100.0 100.0 100.0Federal . . . . . . . . . . . . . . 19.8 18.7 23.7 25.5 25.9 26.7 26.7 15.2 12.3 12.1State . . . . . . . . . . . . . . . 40.8 45.0 52.9 50.0 49.1 51.0 51.4 31.4 27.6 23.2Local . . . . . . . . . . . . . . . 3.5 3.8 5.0 5.4 5.9 5.9 6.3 2.7 2.6 2.8All other . . . . . . . . . . . . . 65.8 82.7 110.2 126.5 129.1 133.1 136.8 50.6 57.4 61.9
Public . . . . . . . . . . . . . . . 86.3 97.4 122.8 131.0 132.3 137.2 139.0 100.0 100.0 100.0Federal . . . . . . . . . . . . 11.3 10.2 12.7 14.1 14.6 15.2 15.4 13.0 10.3 11.1State . . . . . . . . . . . . . . 40.0 43.9 51.2 48.2 47.5 49.3 49.8 46.4 41.7 35.8Local . . . . . . . . . . . . . . 3.1 3.5 4.5 4.9 5.3 5.5 5.8 3.6 3.7 4.1All other . . . . . . . . . . . . 31.9 39.6 54.4 63.8 64.9 67.3 68.0 37.0 44.3 48.9
Private . . . . . . . . . . . . . . 43.8 52.9 69.0 76.3 77.6 79.5 82.3 100.0 100.0 100.0Federal . . . . . . . . . . . . 8.5 8.4 11.0 11.4 11.3 11.4 11.3 19.5 15.9 13.7State and local . . . . . . . 1.3 1.4 2.3 2.2 2.2 2.2 2.2 2.9 3.3 2.7All other . . . . . . . . . . . . 34.0 43.1 55.7 62.6 64.2 65.9 68.8 77.6 80.8 83.6
1 Beginning in 1989-90, includes all fees for transportation, books, and food services.
Source: U.S. National Center for Education Statistics, Digest of Education Statistics, annual.
No. 258. School Enrollment, by Control and Level, With Projections:1980 to 2008
[In thousands (58,305 represents 58,305,000). As of fall. Data are for regular day schools and exclude independent nurseryschools and kindergartens, residential schools for exceptional children, subcollegiate departments of colleges, Federal schools forIndians, and federally operated schools on Federal installations. College data include degree-credit and nondegree-creditenrollment]
Control of schooland level 1980 1985 1990 1995
1996,prel.
2000,proj.
2004,proj.
2005,proj.
2006,proj.
2007,proj.
2008,proj.
Total . . . . . . . . . . . 58,305 57,226 60,267 64,803 65,674 68,334 69,657 69,942 70,160 70,305 70,351Public. . . . . . . . . . . . . . 50,335 48,901 52,061 55,933 56,682 59,065 60,196 60,436 60,611 60,721 60,735Private . . . . . . . . . . . . . 7,971 8,325 8,206 8,869 8,993 9,269 9,461 9,506 9,549 9,584 9,616
Kindergarten through 8 . . 31,639 31,229 33,973 36,772 37,245 38,543 38,606 38,376 38,181 38,073 38,034Public . . . . . . . . . . . . 27,647 27,034 29,878 32,341 32,759 33,903 33,958 33,756 33,584 33,489 33,455Private . . . . . . . . . . . 3,992 4,195 4,095 4,431 4,486 4,640 4,648 4,620 4,597 4,584 4,579
Grades 9 through 12. . . . 14,570 13,750 12,475 13,769 14,131 14,902 15,702 16,050 16,276 16,352 16,234Public . . . . . . . . . . . . 13,231 12,388 11,338 12,500 12,834 13,537 14,263 14,579 14,785 14,854 14,746Private . . . . . . . . . . . 1,339 1,362 1,137 1,269 1,297 1,366 1,439 1,471 1,491 1,498 1,488
College. . . . . . . . . . . . . 12,097 12,247 13,819 14,262 14,300 14,889 15,349 15,516 15,703 15,880 16,083Public . . . . . . . . . . . . 9,457 9,479 10,845 11,092 11,090 11,626 11,975 12,101 12,242 12,378 12,534Private . . . . . . . . . . . 2,640 2,768 2,974 3,169 3,210 3,263 3,374 3,415 3,461 3,502 3,549
Source: U.S. National Center for Education Statistics, Digest of Education Statistics, annual; Projections of EducationStatistics, annual; and unpublished data.
166 Education
U.S. Census Bureau, Statistical Abstract of the United States: 1999
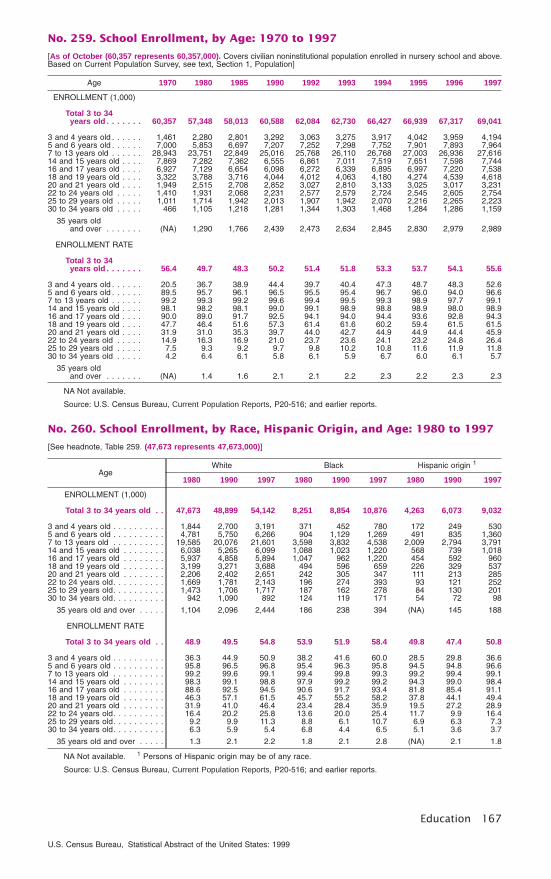
No. 259. School Enrollment, by Age: 1970 to 1997
[As of October (60,357 represents 60,357,000). Covers civilian noninstitutional population enrolled in nursery school and above.Based on Current Population Survey, see text, Section 1, Population]
Age 1970 1980 1985 1990 1992 1993 1994 1995 1996 1997
ENROLLMENT (1,000)
Total 3 to 34years old . . . . . . . 60,357 57,348 58,013 60,588 62,084 62,730 66,427 66,939 67,317 69,041
3 and 4 years old . . . . . . 1,461 2,280 2,801 3,292 3,063 3,275 3,917 4,042 3,959 4,1945 and 6 years old . . . . . . 7,000 5,853 6,697 7,207 7,252 7,298 7,752 7,901 7,893 7,9647 to 13 years old . . . . . . 28,943 23,751 22,849 25,016 25,768 26,110 26,768 27,003 26,936 27,61614 and 15 years old . . . . 7,869 7,282 7,362 6,555 6,861 7,011 7,519 7,651 7,598 7,74416 and 17 years old . . . . 6,927 7,129 6,654 6,098 6,272 6,339 6,895 6,997 7,220 7,53818 and 19 years old . . . . 3,322 3,788 3,716 4,044 4,012 4,063 4,180 4,274 4,539 4,61820 and 21 years old . . . . 1,949 2,515 2,708 2,852 3,027 2,810 3,133 3,025 3,017 3,23122 to 24 years old . . . . . 1,410 1,931 2,068 2,231 2,577 2,579 2,724 2,545 2,605 2,75425 to 29 years old . . . . . 1,011 1,714 1,942 2,013 1,907 1,942 2,070 2,216 2,265 2,22330 to 34 years old . . . . . 466 1,105 1,218 1,281 1,344 1,303 1,468 1,284 1,286 1,159
35 years oldand over . . . . . . . (NA) 1,290 1,766 2,439 2,473 2,634 2,845 2,830 2,979 2,989
ENROLLMENT RATE
Total 3 to 34years old . . . . . . . 56.4 49.7 48.3 50.2 51.4 51.8 53.3 53.7 54.1 55.6
3 and 4 years old . . . . . . 20.5 36.7 38.9 44.4 39.7 40.4 47.3 48.7 48.3 52.65 and 6 years old . . . . . . 89.5 95.7 96.1 96.5 95.5 95.4 96.7 96.0 94.0 96.67 to 13 years old . . . . . . 99.2 99.3 99.2 99.6 99.4 99.5 99.3 98.9 97.7 99.114 and 15 years old . . . . 98.1 98.2 98.1 99.0 99.1 98.9 98.8 98.9 98.0 98.916 and 17 years old . . . . 90.0 89.0 91.7 92.5 94.1 94.0 94.4 93.6 92.8 94.318 and 19 years old . . . . 47.7 46.4 51.6 57.3 61.4 61.6 60.2 59.4 61.5 61.520 and 21 years old . . . . 31.9 31.0 35.3 39.7 44.0 42.7 44.9 44.9 44.4 45.922 to 24 years old . . . . . 14.9 16.3 16.9 21.0 23.7 23.6 24.1 23.2 24.8 26.425 to 29 years old . . . . . 7.5 9.3 9.2 9.7 9.8 10.2 10.8 11.6 11.9 11.830 to 34 years old . . . . . 4.2 6.4 6.1 5.8 6.1 5.9 6.7 6.0 6.1 5.7
35 years oldand over . . . . . . . (NA) 1.4 1.6 2.1 2.1 2.2 2.3 2.2 2.3 2.3
NA Not available.
Source: U.S. Census Bureau, Current Population Reports, P20-516; and earlier reports.
No. 260. School Enrollment, by Race, Hispanic Origin, and Age: 1980 to 1997
[See headnote, Table 259. (47,673 represents 47,673,000)]
AgeWhite Black Hispanic origin 1
1980 1990 1997 1980 1990 1997 1980 1990 1997
ENROLLMENT (1,000)
Total 3 to 34 years old . . 47,673 48,899 54,142 8,251 8,854 10,876 4,263 6,073 9,032
3 and 4 years old . . . . . . . . . . 1,844 2,700 3,191 371 452 780 172 249 5305 and 6 years old . . . . . . . . . . 4,781 5,750 6,266 904 1,129 1,269 491 835 1,3607 to 13 years old . . . . . . . . . . 19,585 20,076 21,601 3,598 3,832 4,538 2,009 2,794 3,79114 and 15 years old . . . . . . . . 6,038 5,265 6,099 1,088 1,023 1,220 568 739 1,01816 and 17 years old . . . . . . . . 5,937 4,858 5,894 1,047 962 1,220 454 592 96018 and 19 years old . . . . . . . . 3,199 3,271 3,688 494 596 659 226 329 53720 and 21 years old . . . . . . . . 2,206 2,402 2,651 242 305 347 111 213 28522 to 24 years old. . . . . . . . . . 1,669 1,781 2,143 196 274 393 93 121 25225 to 29 years old. . . . . . . . . . 1,473 1,706 1,717 187 162 278 84 130 20130 to 34 years old. . . . . . . . . . 942 1,090 892 124 119 171 54 72 98
35 years old and over . . . . . 1,104 2,096 2,444 186 238 394 (NA) 145 188
ENROLLMENT RATE
Total 3 to 34 years old . . 48.9 49.5 54.8 53.9 51.9 58.4 49.8 47.4 50.8
3 and 4 years old . . . . . . . . . . 36.3 44.9 50.9 38.2 41.6 60.0 28.5 29.8 36.65 and 6 years old . . . . . . . . . . 95.8 96.5 96.8 95.4 96.3 95.8 94.5 94.8 96.67 to 13 years old . . . . . . . . . . 99.2 99.6 99.1 99.4 99.8 99.3 99.2 99.4 99.114 and 15 years old . . . . . . . . 98.3 99.1 98.8 97.9 99.2 99.2 94.3 99.0 98.416 and 17 years old . . . . . . . . 88.6 92.5 94.5 90.6 91.7 93.4 81.8 85.4 91.118 and 19 years old . . . . . . . . 46.3 57.1 61.5 45.7 55.2 58.2 37.8 44.1 49.420 and 21 years old . . . . . . . . 31.9 41.0 46.4 23.4 28.4 35.9 19.5 27.2 28.922 to 24 years old. . . . . . . . . . 16.4 20.2 25.8 13.6 20.0 25.4 11.7 9.9 16.425 to 29 years old. . . . . . . . . . 9.2 9.9 11.3 8.8 6.1 10.7 6.9 6.3 7.330 to 34 years old. . . . . . . . . . 6.3 5.9 5.4 6.8 4.4 6.5 5.1 3.6 3.7
35 years old and over . . . . . 1.3 2.1 2.2 1.8 2.1 2.8 (NA) 2.1 1.8
NA Not available. 1 Persons of Hispanic origin may be of any race.
Source: U.S. Census Bureau, Current Population Reports, P20-516; and earlier reports.
Education 167
U.S. Census Bureau, Statistical Abstract of the United States: 1999
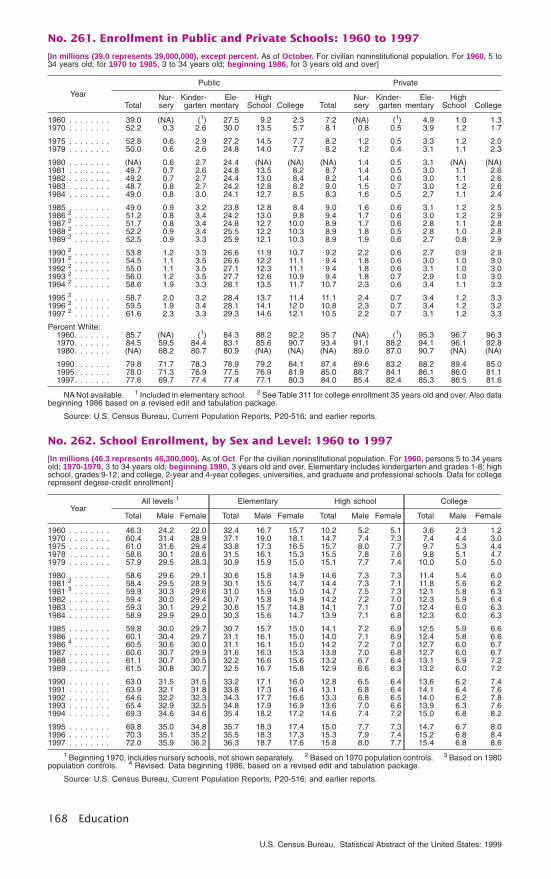
No. 261. Enrollment in Public and Private Schools: 1960 to 1997
[In millions (39.0 represents 39,000,000), except percent. As of October. For civilian noninstitutional population. For 1960, 5 to34 years old; for 1970 to 1985, 3 to 34 years old; beginning 1986, for 3 years old and over]
YearPublic Private
TotalNur-sery
Kinder-garten
Ele-mentary
HighSchool College Total
Nur-sery
Kinder-garten
Ele-mentary
HighSchool College
1960 . . . . . . . . 39.0 (NA) (1) 27.5 9.2 2.3 7.2 (NA) (1) 4.9 1.0 1.31970 . . . . . . . . 52.2 0.3 2.6 30.0 13.5 5.7 8.1 0.8 0.5 3.9 1.2 1.7
1975 . . . . . . . . 52.8 0.6 2.9 27.2 14.5 7.7 8.2 1.2 0.5 3.3 1.2 2.01979 . . . . . . . . 50.0 0.6 2.6 24.8 14.0 7.7 8.2 1.2 0.4 3.1 1.1 2.3
1980 . . . . . . . . (NA) 0.6 2.7 24.4 (NA) (NA) (NA) 1.4 0.5 3.1 (NA) (NA)1981 . . . . . . . . 49.7 0.7 2.6 24.8 13.5 8.2 8.7 1.4 0.5 3.0 1.1 2.61982 . . . . . . . . 49.2 0.7 2.7 24.4 13.0 8.4 8.2 1.4 0.6 3.0 1.1 2.61983 . . . . . . . . 48.7 0.8 2.7 24.2 12.8 8.2 9.0 1.5 0.7 3.0 1.2 2.61984 . . . . . . . . 49.0 0.8 3.0 24.1 12.7 8.5 8.3 1.6 0.5 2.7 1.1 2.4
1985 . . . . . . . . 49.0 0.9 3.2 23.8 12.8 8.4 9.0 1.6 0.6 3.1 1.2 2.51986 2 . . . . . . . 51.2 0.8 3.4 24.2 13.0 9.8 9.4 1.7 0.6 3.0 1.2 2.91987 2 . . . . . . . 51.7 0.8 3.4 24.8 12.7 10.0 8.9 1.7 0.6 2.8 1.1 2.81988 2 . . . . . . . 52.2 0.9 3.4 25.5 12.2 10.3 8.9 1.8 0.5 2.8 1.0 2.81989 2 . . . . . . . 52.5 0.9 3.3 25.9 12.1 10.3 8.9 1.9 0.6 2.7 0.8 2.9
1990 2 . . . . . . . 53.8 1.2 3.3 26.6 11.9 10.7 9.2 2.2 0.6 2.7 0.9 2.91991 2 . . . . . . . 54.5 1.1 3.5 26.6 12.2 11.1 9.4 1.8 0.6 3.0 1.0 3.01992 2 . . . . . . . 55.0 1.1 3.5 27.1 12.3 11.1 9.4 1.8 0.6 3.1 1.0 3.01993 2 . . . . . . . 56.0 1.2 3.5 27.7 12.6 10.9 9.4 1.8 0.7 2.9 1.0 3.01994 2 . . . . . . . 58.6 1.9 3.3 28.1 13.5 11.7 10.7 2.3 0.6 3.4 1.1 3.3
1995 2 . . . . . . . 58.7 2.0 3.2 28.4 13.7 11.4 11.1 2.4 0.7 3.4 1.2 3.31996 2 . . . . . . . 59.5 1.9 3.4 28.1 14.1 12.0 10.8 2.3 0.7 3.4 1.2 3.21997 2 . . . . . . . 61.6 2.3 3.3 29.3 14.6 12.1 10.5 2.2 0.7 3.1 1.2 3.3
Percent White:1960. . . . . . . 85.7 (NA) (1) 84.3 88.2 92.2 95.7 (NA) (1) 95.3 96.7 96.31970. . . . . . . 84.5 59.5 84.4 83.1 85.6 90.7 93.4 91.1 88.2 94.1 96.1 92.81980. . . . . . . (NA) 68.2 80.7 80.9 (NA) (NA) (NA) 89.0 87.0 90.7 (NA) (NA)
1990. . . . . . . 79.8 71.7 78.3 78.9 79.2 84.1 87.4 89.6 83.2 88.2 89.4 85.01995. . . . . . . 78.0 71.3 76.9 77.5 76.9 81.9 85.0 88.7 84.1 86.1 86.0 81.11997. . . . . . . 77.6 69.7 77.4 77.4 77.1 80.3 84.0 85.4 82.4 85.3 86.5 81.6
NA Not available. 1 Included in elementary school. 2 See Table 311 for college enrollment 35 years old and over. Also databeginning 1986 based on a revised edit and tabulation package.
Source: U.S. Census Bureau, Current Population Reports, P20-516; and earlier reports.
No. 262. School Enrollment, by Sex and Level: 1960 to 1997
[In millions (46.3 represents 46,300,000). As of Oct. For the civilian noninstitutional population. For 1960, persons 5 to 34 yearsold; 1970-1979, 3 to 34 years old; beginning 1980, 3 years old and over. Elementary includes kindergarten and grades 1-8; highschool, grades 9-12; and college, 2-year and 4-year colleges, universities, and graduate and professional schools. Data for collegerepresent degree-credit enrollment]
YearAll levels 1 Elementary High school College
Total Male Female Total Male Female Total Male Female Total Male Female
1960 . . . . . . . . 46.3 24.2 22.0 32.4 16.7 15.7 10.2 5.2 5.1 3.6 2.3 1.21970 . . . . . . . . 60.4 31.4 28.9 37.1 19.0 18.1 14.7 7.4 7.3 7.4 4.4 3.01975 . . . . . . . . 61.0 31.6 29.4 33.8 17.3 16.5 15.7 8.0 7.7 9.7 5.3 4.41978 . . . . . . . . 58.6 30.1 28.6 31.5 16.1 15.3 15.5 7.8 7.6 9.8 5.1 4.71979 . . . . . . . . 57.9 29.5 28.3 30.9 15.9 15.0 15.1 7.7 7.4 10.0 5.0 5.0
1980 . . . . . . . . 58.6 29.6 29.1 30.6 15.8 14.9 14.6 7.3 7.3 11.4 5.4 6.01981 2 . . . . . . . 58.4 29.5 28.9 30.1 15.5 14.7 14.4 7.3 7.1 11.8 5.6 6.21981 3 . . . . . . . 59.9 30.3 29.6 31.0 15.9 15.0 14.7 7.5 7.3 12.1 5.8 6.31982 . . . . . . . . 59.4 30.0 29.4 30.7 15.8 14.9 14.2 7.2 7.0 12.3 5.9 6.41983 . . . . . . . . 59.3 30.1 29.2 30.6 15.7 14.8 14.1 7.1 7.0 12.4 6.0 6.31984 . . . . . . . . 58.9 29.9 29.0 30.3 15.6 14.7 13.9 7.1 6.8 12.3 6.0 6.3
1985 . . . . . . . . 59.8 30.0 29.7 30.7 15.7 15.0 14.1 7.2 6.9 12.5 5.9 6.61986 . . . . . . . . 60.1 30.4 29.7 31.1 16.1 15.0 14.0 7.1 6.9 12.4 5.8 6.61986 4 . . . . . . . 60.5 30.6 30.0 31.1 16.1 15.0 14.2 7.2 7.0 12.7 6.0 6.71987 . . . . . . . . 60.6 30.7 29.9 31.6 16.3 15.3 13.8 7.0 6.8 12.7 6.0 6.71988 . . . . . . . . 61.1 30.7 30.5 32.2 16.6 15.6 13.2 6.7 6.4 13.1 5.9 7.21989 . . . . . . . . 61.5 30.8 30.7 32.5 16.7 15.8 12.9 6.6 6.3 13.2 6.0 7.2
1990 . . . . . . . . 63.0 31.5 31.5 33.2 17.1 16.0 12.8 6.5 6.4 13.6 6.2 7.41991 . . . . . . . . 63.9 32.1 31.8 33.8 17.3 16.4 13.1 6.8 6.4 14.1 6.4 7.61992 . . . . . . . . 64.6 32.2 32.3 34.3 17.7 16.6 13.3 6.8 6.5 14.0 6.2 7.81993 . . . . . . . . 65.4 32.9 32.5 34.8 17.9 16.9 13.6 7.0 6.6 13.9 6.3 7.61994 . . . . . . . . 69.3 34.6 34.6 35.4 18.2 17.2 14.6 7.4 7.2 15.0 6.8 8.2
1995 . . . . . . . . 69.8 35.0 34.8 35.7 18.3 17.4 15.0 7.7 7.3 14.7 6.7 8.01996 . . . . . . . . 70.3 35.1 35.2 35.5 18.3 17.3 15.3 7.9 7.4 15.2 6.8 8.41997 . . . . . . . . 72.0 35.9 36.2 36.3 18.7 17.6 15.8 8.0 7.7 15.4 6.8 8.6
1 Beginning 1970, includes nursery schools, not shown separately. 2 Based on 1970 population controls. 3 Based on 1980population controls. 4 Revised. Data beginning 1986, based on a revised edit and tabulation package.
Source: U.S. Census Bureau, Current Population Reports, P20-516; and earlier reports.
168 Education
U.S. Census Bureau, Statistical Abstract of the United States: 1999
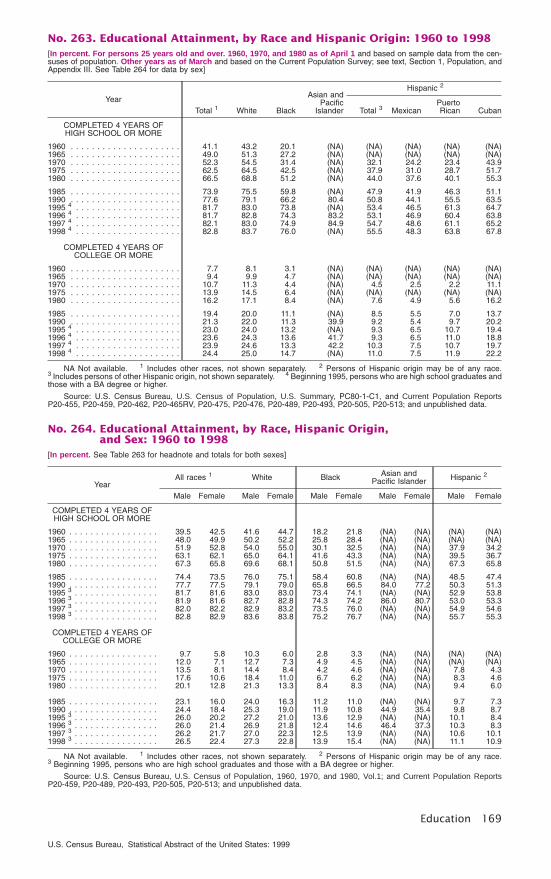
No. 263. Educational Attainment, by Race and Hispanic Origin: 1960 to 1998[In percent. For persons 25 years old and over. 1960, 1970, and 1980 as of April 1 and based on sample data from the cen-suses of population. Other years as of March and based on the Current Population Survey; see text, Section 1, Population, andAppendix III. See Table 264 for data by sex]
YearTotal 1 White Black
Asian andPacific
Islander
Hispanic 2
Total 3 MexicanPuertoRican Cuban
COMPLETED 4 YEARS OFHIGH SCHOOL OR MORE
1960 . . . . . . . . . . . . . . . . . . . . . 41.1 43.2 20.1 (NA) (NA) (NA) (NA) (NA)1965 . . . . . . . . . . . . . . . . . . . . . 49.0 51.3 27.2 (NA) (NA) (NA) (NA) (NA)1970 . . . . . . . . . . . . . . . . . . . . . 52.3 54.5 31.4 (NA) 32.1 24.2 23.4 43.91975 . . . . . . . . . . . . . . . . . . . . . 62.5 64.5 42.5 (NA) 37.9 31.0 28.7 51.71980 . . . . . . . . . . . . . . . . . . . . . 66.5 68.8 51.2 (NA) 44.0 37.6 40.1 55.3
1985 . . . . . . . . . . . . . . . . . . . . . 73.9 75.5 59.8 (NA) 47.9 41.9 46.3 51.11990 . . . . . . . . . . . . . . . . . . . . . 77.6 79.1 66.2 80.4 50.8 44.1 55.5 63.51995 4 . . . . . . . . . . . . . . . . . . . . 81.7 83.0 73.8 (NA) 53.4 46.5 61.3 64.71996 4 . . . . . . . . . . . . . . . . . . . . 81.7 82.8 74.3 83.2 53.1 46.9 60.4 63.81997 4 . . . . . . . . . . . . . . . . . . . . 82.1 83.0 74.9 84.9 54.7 48.6 61.1 65.21998 4 . . . . . . . . . . . . . . . . . . . . 82.8 83.7 76.0 (NA) 55.5 48.3 63.8 67.8
COMPLETED 4 YEARS OFCOLLEGE OR MORE
1960 . . . . . . . . . . . . . . . . . . . . . 7.7 8.1 3.1 (NA) (NA) (NA) (NA) (NA)1965 . . . . . . . . . . . . . . . . . . . . . 9.4 9.9 4.7 (NA) (NA) (NA) (NA) (NA)1970 . . . . . . . . . . . . . . . . . . . . . 10.7 11.3 4.4 (NA) 4.5 2.5 2.2 11.11975 . . . . . . . . . . . . . . . . . . . . . 13.9 14.5 6.4 (NA) (NA) (NA) (NA) (NA)1980 . . . . . . . . . . . . . . . . . . . . . 16.2 17.1 8.4 (NA) 7.6 4.9 5.6 16.2
1985 . . . . . . . . . . . . . . . . . . . . . 19.4 20.0 11.1 (NA) 8.5 5.5 7.0 13.71990 . . . . . . . . . . . . . . . . . . . . . 21.3 22.0 11.3 39.9 9.2 5.4 9.7 20.21995 4 . . . . . . . . . . . . . . . . . . . . 23.0 24.0 13.2 (NA) 9.3 6.5 10.7 19.41996 4 . . . . . . . . . . . . . . . . . . . . 23.6 24.3 13.6 41.7 9.3 6.5 11.0 18.81997 4 . . . . . . . . . . . . . . . . . . . . 23.9 24.6 13.3 42.2 10.3 7.5 10.7 19.71998 4 . . . . . . . . . . . . . . . . . . . . 24.4 25.0 14.7 (NA) 11.0 7.5 11.9 22.2
NA Not available. 1 Includes other races, not shown separately. 2 Persons of Hispanic origin may be of any race.3 Includes persons of other Hispanic origin, not shown separately. 4 Beginning 1995, persons who are high school graduates andthose with a BA degree or higher.
Source: U.S. Census Bureau, U.S. Census of Population, U.S. Summary, PC80-1-C1, and Current Population ReportsP20-455, P20-459, P20-462, P20-465RV, P20-475, P20-476, P20-489, P20-493, P20-505, P20-513; and unpublished data.
No. 264. Educational Attainment, by Race, Hispanic Origin,and Sex: 1960 to 1998
[In percent. See Table 263 for headnote and totals for both sexes]
YearAll races 1 White Black Asian and
Pacific Islander Hispanic 2
Male Female Male Female Male Female Male Female Male Female
COMPLETED 4 YEARS OFHIGH SCHOOL OR MORE
1960 . . . . . . . . . . . . . . . . . 39.5 42.5 41.6 44.7 18.2 21.8 (NA) (NA) (NA) (NA)1965 . . . . . . . . . . . . . . . . . 48.0 49.9 50.2 52.2 25.8 28.4 (NA) (NA) (NA) (NA)1970 . . . . . . . . . . . . . . . . . 51.9 52.8 54.0 55.0 30.1 32.5 (NA) (NA) 37.9 34.21975 . . . . . . . . . . . . . . . . . 63.1 62.1 65.0 64.1 41.6 43.3 (NA) (NA) 39.5 36.71980 . . . . . . . . . . . . . . . . . 67.3 65.8 69.6 68.1 50.8 51.5 (NA) (NA) 67.3 65.8
1985 . . . . . . . . . . . . . . . . . 74.4 73.5 76.0 75.1 58.4 60.8 (NA) (NA) 48.5 47.41990 . . . . . . . . . . . . . . . . . 77.7 77.5 79.1 79.0 65.8 66.5 84.0 77.2 50.3 51.31995 3 . . . . . . . . . . . . . . . . 81.7 81.6 83.0 83.0 73.4 74.1 (NA) (NA) 52.9 53.81996 3 . . . . . . . . . . . . . . . . 81.9 81.6 82.7 82.8 74.3 74.2 86.0 80.7 53.0 53.31997 3 . . . . . . . . . . . . . . . . 82.0 82.2 82.9 83.2 73.5 76.0 (NA) (NA) 54.9 54.61998 3 . . . . . . . . . . . . . . . . 82.8 82.9 83.6 83.8 75.2 76.7 (NA) (NA) 55.7 55.3
COMPLETED 4 YEARS OFCOLLEGE OR MORE
1960 . . . . . . . . . . . . . . . . . 9.7 5.8 10.3 6.0 2.8 3.3 (NA) (NA) (NA) (NA)1965 . . . . . . . . . . . . . . . . . 12.0 7.1 12.7 7.3 4.9 4.5 (NA) (NA) (NA) (NA)1970 . . . . . . . . . . . . . . . . . 13.5 8.1 14.4 8.4 4.2 4.6 (NA) (NA) 7.8 4.31975 . . . . . . . . . . . . . . . . . 17.6 10.6 18.4 11.0 6.7 6.2 (NA) (NA) 8.3 4.61980 . . . . . . . . . . . . . . . . . 20.1 12.8 21.3 13.3 8.4 8.3 (NA) (NA) 9.4 6.0
1985 . . . . . . . . . . . . . . . . . 23.1 16.0 24.0 16.3 11.2 11.0 (NA) (NA) 9.7 7.31990 . . . . . . . . . . . . . . . . . 24.4 18.4 25.3 19.0 11.9 10.8 44.9 35.4 9.8 8.71995 3 . . . . . . . . . . . . . . . . 26.0 20.2 27.2 21.0 13.6 12.9 (NA) (NA) 10.1 8.41996 3 . . . . . . . . . . . . . . . . 26.0 21.4 26.9 21.8 12.4 14.6 46.4 37.3 10.3 8.31997 3 . . . . . . . . . . . . . . . . 26.2 21.7 27.0 22.3 12.5 13.9 (NA) (NA) 10.6 10.11998 3 . . . . . . . . . . . . . . . . 26.5 22.4 27.3 22.8 13.9 15.4 (NA) (NA) 11.1 10.9
NA Not available. 1 Includes other races, not shown separately. 2 Persons of Hispanic origin may be of any race.3 Beginning 1995, persons who are high school graduates and those with a BA degree or higher.
Source: U.S. Census Bureau, U.S. Census of Population, 1960, 1970, and 1980, Vol.1; and Current Population ReportsP20-459, P20-489, P20-493, P20-505, P20-513; and unpublished data.
Education 169
U.S. Census Bureau, Statistical Abstract of the United States: 1999
No. 265. Educational Attainment, by Selected Characteristic: 1998
[For persons 25 years old and over (172,211 represents 172,211,000). As of March. Based on the Current Population Survey;see text, Section 1, Population, and Appendix III. For composition of regions, see map inside front cover]
CharacteristicPopulation
(1,000)
Percent of population—highest level
Not a highschool
graduate
Highschool
graduate
Somecollege,
but nodegree
Asso-ciate’s
degree 1Bachelor’s
degreeAdvanced
degree
Total persons . . . . . . . . . . . . . . . . 172,211 17.2 33.8 17.2 7.5 16.4 7.9
Age:25 to 34 years old. . . . . . . . . . . . . 39,354 11.9 31.9 19.8 8.7 21.3 6.235 to 44 years old. . . . . . . . . . . . . 44,462 12.0 34.0 18.3 9.3 18.3 8.045 to 54 years old. . . . . . . . . . . . . 34,058 13.0 32.1 17.8 8.5 17.5 11.355 to 64 years old. . . . . . . . . . . . . 22,255 20.5 37.3 15.0 5.2 13.0 9.265 to 74 years old. . . . . . . . . . . . . 17,873 28.9 36.4 13.8 4.3 10.0 6.675 years old or over . . . . . . . . . . . 14,209 38.0 33.2 13.0 3.2 8.1 4.4
Sex:Male. . . . . . . . . . . . . . . . . . . . . . 82,376 17.2 32.3 17.1 6.9 17.1 9.4Female . . . . . . . . . . . . . . . . . . . . 89,835 17.1 35.2 17.3 8.0 15.8 6.6
Race:White . . . . . . . . . . . . . . . . . . . . . 145,078 16.3 33.9 17.2 7.7 16.8 8.1Black . . . . . . . . . . . . . . . . . . . . . 19,376 24.0 36.0 19.1 6.2 10.3 4.4Other . . . . . . . . . . . . . . . . . . . . . 7,756 16.5 25.5 13.5 7.1 24.7 12.8
Hispanic origin:Hispanic . . . . . . . . . . . . . . . . . . . 16,044 44.5 26.8 12.6 5.1 7.8 3.2Non-Hispanic . . . . . . . . . . . . . . . . 156,167 14.4 34.5 17.7 7.7 17.3 8.4
Region:Northeast . . . . . . . . . . . . . . . . . . 33,900 16.2 36.3 13.4 7.2 17.3 9.6Midwest . . . . . . . . . . . . . . . . . . . 39,600 14.2 37.3 17.4 8.0 15.7 7.4South . . . . . . . . . . . . . . . . . . . . . 60,909 19.9 33.9 16.8 6.8 15.3 7.3West. . . . . . . . . . . . . . . . . . . . . . 37,802 16.7 27.7 21.0 8.4 18.2 8.1
Marital status:Never married . . . . . . . . . . . . . . . 25,752 16.0 30.2 18.6 7.1 19.9 8.3Married spouse present . . . . . . . . . 107,008 14.5 34.0 16.9 7.8 17.9 8.9Married spouse absent . . . . . . . . . 6,844 27.0 34.6 17.3 6.8 9.8 4.4
Separated . . . . . . . . . . . . . . . . 4,605 25.8 36.2 18.3 7.3 8.8 3.6Widowed . . . . . . . . . . . . . . . . . . . 13,577 37.9 34.4 13.0 4.1 7.2 3.5Divorced . . . . . . . . . . . . . . . . . . . 19,030 15.6 36.8 20.0 8.8 12.3 6.4
Civilian labor force status:Employed . . . . . . . . . . . . . . . . . . 111,131 10.5 32.6 18.4 8.9 19.9 9.8Unemployed . . . . . . . . . . . . . . . . 4,597 23.0 38.8 17.6 6.9 9.9 3.7Not in the labor force. . . . . . . . . . . 55,822 30.2 35.9 14.7 4.7 10.0 4.5
1 Includes vocational degrees.
Source: U.S. Census Bureau, Current Population Reports, P20-513; and unpublished data.
No. 266. Earnings, by Highest Degree Earned: 1998
[For persons 18 years old and over with earnings. Persons as of March. Earnings for prior year. Based on Current PopulationSurvey; see text, Section 1, Population, and Appendix III. For definition of mean, see Guide to Tabular Presentation]
CharacteristicTotal
persons
Level of highest degree
Not ahigh
schoolgraduate
Highschool
graduateonly
Somecollege,
nodegree
Asso-ciate’s
Bach-elor’s Master’s
Profes-sional Doctorate
MEAN EARNINGS(dol.)
All persons 1. . . . . . 29,514 16,124 22,895 24,804 29,872 40,478 51,183 95,148 77,445
Age:18 to 24 years old. . . . 11,264 7,737 12,001 9,813 15,931 19,444 23,007 14,045 4,15825 to 34 years old. . . . 26,462 16,262 21,637 23,489 25,978 35,027 40,798 58,079 47,77935 to 44 years old. . . . 34,081 18,532 26,235 30,353 32,429 45,298 53,594 103,418 77,98245 to 54 years old. . . . 37,242 20,800 26,925 35,090 34,606 46,773 56,922 115,697 86,23755 to 64 years old. . . . 35,924 21,096 26,202 26,392 32,063 45,129 53,547 145,699 79,93165 years old and over . 21,588 13,482 13,734 21,880 33,313 29,958 26,154 54,246 65,543
Sex:Male. . . . . . . . . . . . . 36,556 19,575 28,307 31,268 36,392 50,056 63,220 109,206 87,426Female . . . . . . . . . . . 21,528 10,725 16,906 18,104 24,009 30,119 38,337 62,113 51,189
White . . . . . . . . . . . . . . 30,515 16,596 23,618 25,442 30,509 41,439 52,475 97,487 79,947Male. . . . . . . . . . . . . 37,933 20,071 29,298 32,294 37,362 51,678 65,421 110,977 89,110Female . . . . . . . . . . . 21,799 10,700 17,166 18,083 24,059 30,041 38,428 63,450 54,587
Black . . . . . . . . . . . . . . 21,909 13,185 18,980 22,105 25,527 32,062 40,610 51,004 (B)Male. . . . . . . . . . . . . 25,080 15,423 22,440 26,743 29,099 35,792 46,729 (B) (B)Female . . . . . . . . . . . 19,161 10,607 15,789 18,346 23,416 29,091 37,425 (B) (B)
Hispanic 2 . . . . . . . . . . . 20,766 15,069 19,558 20,825 25,478 33,465 46,556 (B) (B)Male. . . . . . . . . . . . . 23,520 17,447 22,253 24,807 29,627 37,963 54,790 (B) (B)Female . . . . . . . . . . . 16,781 10,503 15,747 16,258 21,705 29,173 35,425 (B) (B)
B Base figure too small to meet statistical standards for reliability of a derived figure. 1 Includes other races, not shownseparately. 2 Persons of Hispanic origin may be of any race.
Source: U.S. Census Bureau, Current Population Reports, P20-513.
170 Education
U.S. Census Bureau, Statistical Abstract of the United States: 1999

No. 267. Educational Attainment, by State: 1990 and 1998
[In percent. As of March 1998 and April 1990. For persons 25 years old and over, except as indicated. Based on the 1990Census of Population and the Current Population Survey; see text, Section 1, Population, and Appendix III]
State
1990 1998
Not a highschool
graduate
Highschool
graduateor more
Bachelors degree or more
Drop-outs 1
Highschool
graduateor more
Collegegraduateor moreTotal
Bachelor’sdegree
Advanceddegree
United States. . . . . . . . 24.8 75.2 20.3 13.1 7.2 11.2 82.8 24.4
Alabama. . . . . . . . . . . . . . . 33.1 66.9 15.7 10.1 5.5 12.6 78.8 20.6Alaska . . . . . . . . . . . . . . . . 13.4 86.6 23.0 15.0 8.0 10.9 90.6 24.2Arizona. . . . . . . . . . . . . . . . 21.3 78.7 20.3 13.3 7.0 14.4 81.9 21.9Arkansas . . . . . . . . . . . . . . 33.7 66.3 13.3 8.9 4.5 11.4 76.8 16.2California . . . . . . . . . . . . . . 23.8 76.2 23.4 15.3 8.1 14.2 80.1 26.4
Colorado. . . . . . . . . . . . . . . 15.6 84.4 27.0 18.0 9.0 9.8 89.6 34.0Connecticut . . . . . . . . . . . . . 20.8 79.2 27.2 16.2 11.0 9.0 83.7 31.4Delaware . . . . . . . . . . . . . . 22.5 77.5 21.4 13.7 7.7 10.4 85.2 25.1District of Columbia . . . . . . . 26.9 73.1 33.3 16.1 17.2 13.9 83.8 36.5Florida . . . . . . . . . . . . . . . . 25.6 74.4 18.3 12.0 6.3 14.3 81.9 22.5
Georgia . . . . . . . . . . . . . . . 29.1 70.9 19.3 12.9 6.4 14.1 80.0 20.7Hawaii . . . . . . . . . . . . . . . . 19.9 80.1 22.9 15.8 7.1 7.5 84.6 24.0Idaho . . . . . . . . . . . . . . . . . 20.3 79.7 17.7 12.4 5.3 10.4 82.7 20.3Illinois . . . . . . . . . . . . . . . . 23.8 76.2 21.0 13.6 7.5 10.6 84.2 25.8Indiana. . . . . . . . . . . . . . . . 24.4 75.6 15.6 9.2 6.4 11.4 83.5 17.7
Iowa . . . . . . . . . . . . . . . . . 19.9 80.1 16.9 11.7 5.2 6.6 87.7 20.3Kansas. . . . . . . . . . . . . . . . 18.7 81.3 21.1 14.1 7.0 8.7 89.2 28.5Kentucky . . . . . . . . . . . . . . 35.4 64.6 13.6 8.1 5.5 13.3 77.9 20.1Louisiana . . . . . . . . . . . . . . 31.7 68.3 16.1 10.5 5.6 12.5 78.6 19.5Maine. . . . . . . . . . . . . . . . . 21.2 78.8 18.8 12.7 6.1 8.3 86.7 19.2
Maryland . . . . . . . . . . . . . . 21.6 78.4 26.5 15.6 10.9 10.9 84.7 31.8Massachusetts. . . . . . . . . . . 20.0 80.0 27.2 16.6 10.6 8.5 85.6 31.0Michigan. . . . . . . . . . . . . . . 23.2 76.8 17.4 10.9 6.4 10.0 85.4 22.1Minnesota. . . . . . . . . . . . . . 17.6 82.4 21.8 15.6 6.3 6.4 89.4 31.0Mississippi . . . . . . . . . . . . . 35.7 64.3 14.7 9.7 5.1 11.8 77.3 19.5
Missouri . . . . . . . . . . . . . . . 26.1 73.9 17.8 11.7 6.1 11.4 82.9 22.4Montana . . . . . . . . . . . . . . . 19.0 81.0 19.8 14.1 5.7 8.1 89.1 23.9Nebraska . . . . . . . . . . . . . . 18.2 81.8 18.9 13.1 5.9 7.0 87.7 20.9Nevada . . . . . . . . . . . . . . . 21.2 78.8 15.3 10.1 5.2 15.2 89.1 20.6New Hampshire . . . . . . . . . . 17.8 82.2 24.4 16.4 7.9 9.4 84.0 26.6
New Jersey. . . . . . . . . . . . . 23.3 76.7 24.9 16.0 8.8 9.6 86.5 30.1New Mexico . . . . . . . . . . . . 24.9 75.1 20.4 12.1 8.3 11.7 79.6 23.1New York . . . . . . . . . . . . . . 25.2 74.8 23.1 13.2 9.9 9.9 81.5 26.8North Carolina . . . . . . . . . . . 30.0 70.0 17.4 12.0 5.4 12.5 81.4 23.3North Dakota. . . . . . . . . . . . 23.3 76.7 18.1 13.5 4.5 4.6 84.3 22.5
Ohio . . . . . . . . . . . . . . . . . 24.3 75.7 17.0 11.1 5.9 8.9 86.2 21.5Oklahoma . . . . . . . . . . . . . . 25.4 74.6 17.8 11.8 6.0 10.4 84.6 20.5Oregon. . . . . . . . . . . . . . . . 18.5 81.5 20.6 13.6 7.0 11.8 85.5 27.7Pennsylvania. . . . . . . . . . . . 25.3 74.7 17.9 11.3 6.6 9.1 84.1 22.1Rhode Island. . . . . . . . . . . . 28.0 72.0 21.3 13.5 7.8 11.1 80.7 27.8
South Carolina. . . . . . . . . . . 31.7 68.3 16.6 11.2 5.4 11.7 78.6 21.3South Dakota . . . . . . . . . . . 22.9 77.1 17.2 12.3 4.9 7.7 86.3 21.8Tennessee . . . . . . . . . . . . . 32.9 67.1 16.0 10.5 5.4 13.4 76.9 16.9Texas. . . . . . . . . . . . . . . . . 27.9 72.1 20.3 13.9 6.5 12.9 78.3 23.3Utah . . . . . . . . . . . . . . . . . 14.9 85.1 22.3 15.4 6.8 8.7 89.3 27.6
Vermont . . . . . . . . . . . . . . . 19.2 80.8 24.3 15.4 8.9 8.0 86.7 27.1Virginia. . . . . . . . . . . . . . . . 24.8 75.2 24.5 15.4 9.1 10.0 82.6 30.3Washington . . . . . . . . . . . . . 16.2 83.8 22.9 15.9 7.0 10.6 92.0 28.1West Virginia . . . . . . . . . . . . 34.0 66.0 12.3 7.5 4.8 10.9 76.4 16.3Wisconsin . . . . . . . . . . . . . . 21.4 78.6 17.7 12.1 5.6 7.1 88.0 22.3Wyoming . . . . . . . . . . . . . . 17.0 83.0 18.8 13.1 5.7 6.9 90.0 19.8
1 For persons 16 to 19 years old. A dropout is a person who is not in regular school and who has not completed the 12th gradeor received a general equivalency degree.
Source: U.S. Census Bureau, 1990 Census of Population, CPH-L-96, and Current Population Reports, P20-513.
Education 171
U.S. Census Bureau, Statistical Abstract of the United States: 1999
No. 268. Nonfatal Crimes Against Students: 1995 and 1996
[For students aged 12 through 18 (3,667.0 represents 3,667,000). For crimes occurring at school or going to or from school.Based on the National Crime Victimization Survey; see Appendix III]
Student characteristic
1995 1996
Total Theft
Violent
Total Theft
Violent
Total Serious 1 Total Serious 1
Total (1,000). . . . . . . . . . . . 3,667.0 2,213.9 1,453.2 273.5 3,347.7 2,075.6 1,272.1 255.0
RATE PER 1,000 STUDENTS
Total 2. . . . . . . . . . . . . . . . 143 86 57 11 128 79 49 10Sex:
Male. . . . . . . . . . . . . . . . . . . 159 93 66 14 144 80 64 13Female . . . . . . . . . . . . . . . . . 125 78 47 7 111 79 32 6
Age:12 to 14 years old. . . . . . . . . . 188 105 83 15 161 94 67 1015 to 18 years old. . . . . . . . . . 105 70 35 7 102 68 34 9
Race/ethnicity:White, non-Hispanic . . . . . . . . 154 95 59 8 137 85 51 7Black, non-Hispanic. . . . . . . . . 127 66 61 21 114 76 38 13Hispanic . . . . . . . . . . . . . . . . 118 69 49 13 112 58 54 17Other, non-Hispanic. . . . . . . . . 108 80 28 311 116 76 40 311
Urbanicity: 4
Urban . . . . . . . . . . . . . . . . . . 136 79 58 18 131 77 55 16Suburban . . . . . . . . . . . . . . . 159 97 62 9 138 84 54 9Rural . . . . . . . . . . . . . . . . . . 117 73 44 6 101 72 29 34
Household income:Less than $7,500 . . . . . . . . . . 91 30 61 25 86 55 31 38$7,500 to $14,999. . . . . . . . . . 113 60 53 16 95 54 41 11$15,000 to $24,999 . . . . . . . . . 139 82 57 10 132 69 63 17$25,000 to $34,999 . . . . . . . . . 164 94 70 15 138 80 57 11$35,000 to $49,999 . . . . . . . . . 146 92 55 8 141 86 55 11$50,000 to $74,999 . . . . . . . . . 157 104 54 10 147 99 48 9$75,000 and over . . . . . . . . . . 180 121 60 35 144 106 38 35
1 Includes rape, sexual assault, robbery, and aggravated assault. 2 Includes unknown household income. 3 Estimatebased on fewer than 10 cases. 4 Urban—the largest city (or groupings of cities) of an MSA; suburban—those portions of metroareas outside central cities; rural—a place outside MSAs.
Source: U.S. National Center for Education Statistics and U.S. Bureau of Justice Statistics, Indicators of School Crime andSafety, 1998.
No. 269. Public Schools Reporting Criminal Incidents to the Police: 1996-97
[In percent. For crimes that took place in school buildings, on school buses or grounds, and places holding school-sponsoredevents. Based on the National Center for Education Statistics’ Fast Response Survey System; see source for details]
School characteristicAny incidents Serious violent incidents 1
Total City 2Urban
fringe 2 Town 2 Rural 2 Total City 2Urban
fringe 2 Town 2 Rural 2
Instructional level:Elementary school . . . . . . . . . . 45.1 46.9 47.0 52.6 34.2 4.2 6.1 3.3 2.0 5.1Middle school . . . . . . . . . . . . . 74.1 86.7 78.8 70.0 62.0 18.7 35.8 21.7 7.0 15.0High school . . . . . . . . . . . . . . 76.9 88.8 84.0 84.2 64.1 20.6 48.0 33.0 12.7 9.4
School enrollment:Less than 300 . . . . . . . . . . . . . 37.8 (B) (B) 44.9 38.0 3.9 (B) (B) 8.8 2.5300 to 999 . . . . . . . . . . . . . . . 59.6 54.2 59.2 67.3 56.8 9.3 12.5 9.0 3.2 13.91,000 or more . . . . . . . . . . . . . 89.1 93.1 86.7 86.5 (B) 32.9 44.2 29.8 15.9 (B)
Minority enrollment:Less than 5 percent . . . . . . . . . 46.7 (B) 47.2 53.9 40.8 5.8 (B) 5.9 3.3 7.35 to 19 percent . . . . . . . . . . . . 57.7 52.0 62.9 64.0 45.0 10.9 14.5 11.3 10.6 6.820 to 49 percent . . . . . . . . . . . 58.1 54.7 58.5 66.7 53.3 11.1 19.1 10.1 5.0 8.050 percent or more . . . . . . . . . 68.3 64.8 62.3 81.5 74.9 14.7 17.6 17.8 4.4 11.6
Free/reduced price lunch eligibility:Less than 20 percent . . . . . . . . 54.4 50.6 57.3 64.2 41.2 8.6 12.2 9.9 7.1 5.621 to 34 percent . . . . . . . . . . . 53.2 56.0 65.5 57.2 39.5 11.7 18.4 13.3 7.1 11.635 to 49 percent . . . . . . . . . . . 59.4 76.1 53.3 63.1 52.5 11.6 34.2 8.6 3.0 8.650 to 74 percent . . . . . . . . . . . 58.8 60.8 54.7 66.6 52.0 8.9 22.9 10.3 2.0 2.375 percent or more . . . . . . . . . 59.2 58.5 (B) (B) (B) 10.2 8.4 (B) (B) (B)
B Base figure too small to meet statistical standards for reliability of a derived figure. 1 Includes murder, rape or other sexualbattery, suicide, physical attack or fight with a weapon, or robbery. 2 City—central city of an MSA; urban fringe—a place withinan MSA but not its central city; town—a place outside an MSA, with a population greater than or equal to 2,500, and defined asurban by the U.S. Census Bureau; rural—a place with a population under 2,500 and defined as urban by the U.S. Census Bureau.
Source: U.S. National Center for Education Statistics and U.S. Bureau of Justice Statistics, Indicators of School Crime andSafety, 1998.
172 Education
U.S. Census Bureau, Statistical Abstract of the United States: 1999

No. 270. Children Whose Parents Are Involved in School Activities: 1996
[In percent, except as indicated (22,920 represents 22,920,000). Based on the National Household Education Survey; see sourcefor details]
Parental involvement
Students in grades K to 5 Students in grades 6 to 8
Total
Two-parent
families
One-parent families
Total
Two-parent
families
One-parent families
Total Mother Father Total Mother Father
Total students (1,000) . . . . . 22,920 16,363 6,557 5,886 671 11,098 7,800 3,298 2,867 431
Any adult attending a meeting . . . . 83.5 87.0 74.8 75.2 71.7 78.4 81.9 70.0 69.6 72.6Only mother attended . . . . . . . . 38.2 26.5 67.5 75.2 (X) 37.0 27.1 60.5 69.6 (X)Only father attended. . . . . . . . . 4.4 3.2 7.3 (X) 71.7 6.2 4.9 9.5 (X) 72.6Both attended . . . . . . . . . . . . . 40.9 57.2 (X) (X) (X) 35.1 49.9 (X) (X) (X)
Any adult attending a conference . . 86.6 88.1 83.0 84.0 74.3 69.8 70.5 68.1 68.7 64.2Only mother attended . . . . . . . . 51.6 42.1 75.4 84.0 (X) 42.3 34.9 59.7 68.7 (X)Only father attended. . . . . . . . . 5.4 4.5 7.6 (X) 74.3 6.3 5.4 8.4 (X) 64.2Both attended . . . . . . . . . . . . . 29.6 41.5 (X) (X) (X) 21.2 30.1 (X) (X) (X)
Any adult attending a class event. . 72.0 74.6 65.6 65.4 66.9 66.4 69.5 58.9 57.7 66.3Only mother attended . . . . . . . . 33.2 23.0 58.7 65.4 (X) 25.5 15.1 50.2 57.7 (X)Only father attended. . . . . . . . . 4.2 3.1 6.9 (X) 66.9 4.7 3.0 8.7 (X) 66.3Both attended . . . . . . . . . . . . . 34.6 48.4 (X) (X) (X) 36.1 51.4 (X) (X) (X)
Any adult acted as a volunteer . . . 49.6 54.9 36.4 37.4 28.1 30.8 34.7 21.5 21.9 18.7Only mother attended . . . . . . . . 37.4 38.9 33.6 37.4 (X) 21.7 22.8 19.0 21.9 (X)Only father attended. . . . . . . . . 3.1 3.2 2.9 (X) 28.1 2.6 2.6 2.5 (X) 18.7Both attended . . . . . . . . . . . . . 9.1 12.8 (X) (X) (X) 6.5 9.2 (X) (X) (X)
Number of activities at leastone parent participated in:None . . . . . . . . . . . . . . . . . . . 3.6 2.4 6.6 6.1 11.1 8.0 5.5 14.0 14.4 10.9One. . . . . . . . . . . . . . . . . . . . 7.3 6.1 10.2 10.3 9.9 12.6 12.1 13.9 13.2 18.5Two. . . . . . . . . . . . . . . . . . . . 19.7 17.9 24.4 24.2 25.9 26.4 26.4 26.6 27.9 17.9Three . . . . . . . . . . . . . . . . . . 32.6 31.8 34.5 34.6 33.2 31.9 32.4 30.8 28.9 43.5Four . . . . . . . . . . . . . . . . . . . 36.8 41.8 24.4 24.9 20.0 21.0 23.7 14.8 15.6 9.3
Number of activities motherparticipated in: 1
None . . . . . . . . . . . . . . . . . . . 4.4 3.9 6.1 6.1 (X) 10.0 8.4 14.4 14.4 (X)One. . . . . . . . . . . . . . . . . . . . 8.4 7.7 10.3 10.3 (X) 13.7 13.9 13.2 13.2 (X)Two. . . . . . . . . . . . . . . . . . . . 20.9 19.7 24.2 24.2 (X) 27.0 26.6 27.9 27.9 (X)Three . . . . . . . . . . . . . . . . . . 32.5 31.7 34.6 34.6 (X) 30.2 30.7 28.9 28.9 (X)Four . . . . . . . . . . . . . . . . . . . 33.8 37.0 24.9 24.9 (X) 19.1 20.3 15.6 15.6 (X)
Number of activities fatherparticipated in: 2
None . . . . . . . . . . . . . . . . . . . 21.9 22.3 11.1 (X) 11.1 24.1 24.9 10.9 (X) 10.9One. . . . . . . . . . . . . . . . . . . . 20.4 20.8 9.9 (X) 9.9 24.4 24.7 18.5 (X) 18.5Two. . . . . . . . . . . . . . . . . . . . 26.7 26.8 25.9 (X) 25.9 25.3 25.7 17.9 (X) 17.9Three . . . . . . . . . . . . . . . . . . 21.3 20.8 33.2 (X) 33.2 19.8 18.5 43.5 (X) 43.5Four . . . . . . . . . . . . . . . . . . . 9.7 9.3 20.0 (X) 20.0 6.4 6.2 9.3 (X) 9.3
Number of activities bothparents participated in:None . . . . . . . . . . . . . . . . . . . 25.3 25.3 (X) (X) (X) 29.0 29.0 (X) (X) (X)One. . . . . . . . . . . . . . . . . . . . 22.3 22.3 (X) (X) (X) 25.9 25.9 (X) (X) (X)Two. . . . . . . . . . . . . . . . . . . . 26.4 26.4 (X) (X) (X) 24.7 24.7 (X) (X) (X)Three . . . . . . . . . . . . . . . . . . 19.2 19.2 (X) (X) (X) 16.3 16.3 (X) (X) (X)Four . . . . . . . . . . . . . . . . . . . 6.8 6.8 (X) (X) (X) 4.2 4.2 (X) (X) (X)
X Not applicable. 1 Regardless if father participated. 2 Regardless if mother participated.
Source: U.S. National Center for Education Statistics, Fathers’ Involvement in Their Children’s School, October 1997.
No. 271. Public Elementary Schools Holding Activities andParental Attendance: 1996
[In percent. For grades K to 8 during school year ending in year shown. Based on survey and subject to sampling error; see sourcefor details]
Type of activitySchoolsholdingactivity
Estimate of typical parental attendance 1
Mostor all
Morethan half
Abouthalf
Lessthan half Few
Open house or back-to-school night . . . . . . . . . . 97 49 31 13 6 1Arts event 2 . . . . . . . . . . . . . . . . . . . . . . . . . . 96 36 30 16 13 5Regularly scheduled school wide parent-teacherconferences . . . . . . . . . . . . . . . . . . . . . . . . . 92 57 21 11 9 3
Sports event 3 . . . . . . . . . . . . . . . . . . . . . . . . 85 12 21 20 30 17Science fairs or other academic demonstrationsor events . . . . . . . . . . . . . . . . . . . . . . . . . . . 84 19 24 20 23 14
1 Estimated by person most knowledgeable about parental involvement programs. 2 Such as a play, dance, or musicalperformance. 3 Or other athletic demonstration.
Source: U.S. National Center for Education Statistics, Fast Response Survey System, NCES 98-032, Parent Involvement inChildren’s Education: Efforts by Public Elementary Schools, January 1998.
Education 173
U.S. Census Bureau, Statistical Abstract of the United States: 1999

No. 272. Children With Difficulty Speaking English: 1979 to 1995
[In percent, except total. For children 5 to 17 years old (1,250 represents 1,250,000). For children reported to speak Englishless than ‘‘very well.’’ Based on the Current Population Survey; see text Section 1, Population, and Appendix III]
Characteristic 1979 1989 1992 1995 1
Total with difficulty speaking English (1,000) . . . . . . . . . . . . . 1,250 1,850 2,178 2,431Percent of children 5 to 17 . . . . . . . . . . . . . . . . . . . . . . . 2.8 4.4 4.9 5.1
Race and Hispanic origin:White, non-Hispanic. . . . . . . . . . . . . . . . . . . . . . . . . . 0.5 0.8 0.6 0.7Black, non-Hispanic . . . . . . . . . . . . . . . . . . . . . . . . . . 0.3 0.5 1.3 0.9Hispanic 2 . . . . . . . . . . . . . . . . . . . . . . . . . . . . . . . . 28.7 27.4 29.9 31.0Other, non-Hispanic 3. . . . . . . . . . . . . . . . . . . . . . . . . 19.8 20.4 21.0 14.1
Region 4:Northeast . . . . . . . . . . . . . . . . . . . . . . . . . . . . . . . . 2.9 4.8 5.3 5.0Midwest . . . . . . . . . . . . . . . . . . . . . . . . . . . . . . . . . 1.1 1.3 1.6 2.3South . . . . . . . . . . . . . . . . . . . . . . . . . . . . . . . . . . . 2.2 3.8 3.5 3.4West. . . . . . . . . . . . . . . . . . . . . . . . . . . . . . . . . . . . 6.5 8.8 10.4 11.4
Percent speaking another language at home . . . . . . . . . . . 32.7 34.9 34.2 36.5White, non-Hispanic. . . . . . . . . . . . . . . . . . . . . . . . . . 17.3 22.6 17.2 19.0Black, non-Hispanic . . . . . . . . . . . . . . . . . . . . . . . . . . 25.6 22.5 31.0 31.8Hispanic 2 . . . . . . . . . . . . . . . . . . . . . . . . . . . . . . . . 38.2 38.5 39.0 41.9Other, non-Hispanic 3. . . . . . . . . . . . . . . . . . . . . . . . . 44.9 38.1 36.1 31.1
1 Reflects revised interviewing techniques and/or change in population controls to the 1990 Census-based estimates.2 Persons of Hispanic origin may be of any race. 3 Includes mostly Asian/Pacific Islanders, but also American Indian/AlaskaNative children. 4 For composition of regions, see map, inside front cover.
Source: Federal Interagency Forum on Child and Family Statistics, America’s Children: National Indicators of Well-Being,1998.
No. 273. Preprimary School Enrollment—Summary: 1970 to 1997
[As of October. Civilian noninstitutional population (10,949 represents 10,949,000). Includes public and nonpublic nurseryschool and kindergarten programs. Excludes 5 year olds enrolled in elementary school. Based on Current Population Survey; seetext, Section 1, Population and Appendix III]
Item 1970 1975 1980 1985 1990 1994 1995 1996 1997
NUMBER OF CHILDREN (1,000)
Population, 3 to 5 years old. . . . . . . 10,949 10,183 9,284 10,733 11,207 12,328 12,518 12,378 12,121
Total enrolled 1 . . . . . . . . . . . . . . 4,104 4,954 4,878 5,865 6,659 7,514 7,739 7,580 7,861Nursery . . . . . . . . . . . . . . . . . . . . . 1,094 1,745 1,981 2,477 3,378 4,162 4,331 4,147 4,438
Public . . . . . . . . . . . . . . . . . . . . . 332 570 628 846 1,202 1,848 1,950 1,830 2,207Private . . . . . . . . . . . . . . . . . . . . 762 1,174 1,353 1,631 2,177 2,314 2,381 2,317 2,231
Kindergarten . . . . . . . . . . . . . . . . . . 3,010 3,211 2,897 3,388 3,281 3,352 3,408 3,433 3,422Public . . . . . . . . . . . . . . . . . . . . . 2,498 2,682 2,438 2,847 2,767 2,819 2,799 2,853 2,847Private . . . . . . . . . . . . . . . . . . . . 511 528 459 541 513 534 608 580 575
White . . . . . . . . . . . . . . . . . . . . . . . 3,443 4,105 3,994 4,757 5,389 5,889 6,144 5,902 6,086Black . . . . . . . . . . . . . . . . . . . . . . . 586 731 725 919 964 1,289 1,236 1,245 1,356
Hispanic 2 . . . . . . . . . . . . . . . . . . . . (NA) (NA) 370 496 642 851 1,040 1,068 1,142
3 years old . . . . . . . . . . . . . . . . . . . 454 683 857 1,035 1,205 1,385 1,489 1,506 1,5294 years old . . . . . . . . . . . . . . . . . . . 1,007 1,418 1,423 1,765 2,086 2,532 2,553 2,454 2,6655 years old . . . . . . . . . . . . . . . . . . . 2,643 2,852 2,598 3,065 3,367 3,597 3,697 3,621 3,667
ENROLLMENT RATE
Total enrolled 1 . . . . . . . . . . . . . . 37.5 48.6 52.5 54.6 59.4 61.0 61.8 61.2 64.8White . . . . . . . . . . . . . . . . . . . . . . . 37.8 48.6 52.7 54.7 59.7 60.9 63.0 61.2 64.1Black . . . . . . . . . . . . . . . . . . . . . . . 34.9 48.1 51.8 55.8 57.8 64.2 58.9 60.8 68.6
Hispanic 2 . . . . . . . . . . . . . . . . . . . . (NA) (NA) 43.3 43.3 49.0 47.7 51.1 52.7 52.5
3 years old . . . . . . . . . . . . . . . . . . . 12.9 21.5 27.3 28.8 32.6 33.9 35.9 37.2 38.74 years old . . . . . . . . . . . . . . . . . . . 27.8 40.5 46.3 49.1 56.0 60.3 61.6 59.2 66.15 years old . . . . . . . . . . . . . . . . . . . 69.3 81.3 84.7 86.5 88.8 88.9 87.5 86.5 88.6
NA Not available. 1 Includes races not shown separately. 2 Persons of Hispanic origin may be of any race. The methodof identifying Hispanic children was changed in 1980 from allocation based on status of mother to status reported for each child.The number of Hispanic children using the new method is larger.
Source: U.S. Census Bureau, Current Population Reports, P20-516.
174 Education
U.S. Census Bureau, Statistical Abstract of the United States: 1999

No. 274. Public Elementary and Secondary Schools—Summary: 1980 to 1998
[For school year ending in year shown, except as indicated (48,041 represents 48,041,000). Data are estimates]
Item Unit 1980 1985 1990 1995 1996 1997 1998
School districts, total . . . . . . . . . . . . . Number . . . 16,044 15,812 15,552 14,947 14,910 14,891 14,822
ENROLLMENT
Population 5-17 years old 1 . . . . . . . . 1,000 . . . . 48,041 44,787 44,949 48,196 49,014 49,807 50,491Percent of resident population . . . . . Percent . . . 21.4 19.0 18.2 18.5 18.7 18.8 18.9
Fall enrollment 2. . . . . . . . . . . . . . . . 1,000 . . . . 41,778 39,354 40,527 43,898 44,649 45,344 45,924Percent of population 5-17years old . . . . . . . . . . . . . . . . . Percent . . . 87.0 87.9 90.2 91.1 91.1 91.0 91.0
Elementary 3 . . . . . . . . . . . . . . . . 1,000 . . . . 24,397 23,830 26,253 28,148 28,581 28,925 29,241Secondary 4. . . . . . . . . . . . . . . . . 1,000 . . . . 17,381 15,524 14,274 15,750 16,068 16,419 16,682
Average daily attendance (ADA) . . . . . 1,000 . . . . 38,411 36,530 37,573 40,794 41,477 42,143 42,764High school graduates . . . . . . . . . . . 1,000 . . . . 2,762 2,424 2,327 2,282 2,283 2,336 2,377
INSTRUCTIONAL STAFF
Total 5 . . . . . . . . . . . . . . . . . . . . . . 1,000 . . . . 2,521 2,473 2,685 2,929 2,970 3,042 3,087Classroom teachers. . . . . . . . . . . . 1,000 . . . . 2,211 2,175 2,362 2,567 2,606 2,668 2,705
Average salaries:Instructional staff. . . . . . . . . . . . . . Dollar . . . . 16,715 24,666 32,638 38,331 39,465 40,562 41,598Classroom teachers. . . . . . . . . . . . Dollar . . . . 15,970 23,600 31,367 36,685 37,716 38,554 39,385
REVENUES
Revenue receipts . . . . . . . . . . . . . . . Mil. dol . . . 97,635 141,013 208,656 273,364 286,927 301,404 314,187Federal . . . . . . . . . . . . . . . . . . . . Mil. dol . . . 9,020 9,533 13,184 18,766 19,323 20,387 21,338State . . . . . . . . . . . . . . . . . . . . . Mil. dol . . . 47,929 69,107 100,787 130,139 138,045 147,396 155,321Local . . . . . . . . . . . . . . . . . . . . . Mil. dol . . . 40,686 62,373 94,685 124,459 129,560 133,621 137,528
Percent of total:Federal . . . . . . . . . . . . . . . . . . . . Percent . . . 9.2 6.8 6.3 6.9 6.7 6.8 6.8State . . . . . . . . . . . . . . . . . . . . . Percent . . . 49.1 49.0 48.3 47.6 48.1 48.9 49.4Local . . . . . . . . . . . . . . . . . . . . . Percent . . . 41.7 44.2 45.4 45.5 45.2 44.3 43.8
EXPENDITURES
Total . . . . . . . . . . . . . . . . . . . . . . . Mil. dol . . . 96,105 139,382 209,698 276,502 292,323 308,077 323,879Current expenditures(day schools) . . . . . . . . . . . . . . . Mil. dol . . . 85,661 127,230 186,583 242,729 254,254 268,026 280,023
Other current expenditures 6 . . . . . . Mil. dol . . . 1,859 2,109 3,341 5,464 5,902 6,397 6,619Capital outlay . . . . . . . . . . . . . . . . Mil. dol . . . 6,504 7,529 16,012 21,904 25,189 25,849 29,132Interest on school debt . . . . . . . . . Mil. dol . . . 2,081 2,514 3,762 6,406 6,978 7,806 8,104
Percent of total:Current expenditures(day schools) . . . . . . . . . . . . . . . Percent . . . 89.1 91.3 89.0 87.8 87.0 87.0 86.5
Other current expenditures 6 . . . . . . Percent . . . 1.9 1.5 1.6 2.0 2.0 2.1 2.0Capital outlay . . . . . . . . . . . . . . . . Percent . . . 6.8 5.4 7.6 7.9 8.6 8.4 9.0Interest on school debt . . . . . . . . . Percent . . . 2.2 1.8 1.8 2.3 2.4 2.5 2.5
In current dollars:Revenue receipts per pupilenrolled . . . . . . . . . . . . . . . . . . . Dollar . . . . 2,337 3,583 5,149 6,227 6,426 6,647 6,842
Current expenditures per pupilenrolled . . . . . . . . . . . . . . . . . . . Dollar . . . . 2,050 3,233 4,604 5,529 5,695 5,911 6,098
In constant (1998) dollars: 7
Revenue receipts per pupilenrolled . . . . . . . . . . . . . . . . . . . Dollar . . . . 4,870 5,476 6,555 6,695 6,726 6,764 6,842
Current expenditures per pupilenrolled . . . . . . . . . . . . . . . . . . . Dollar . . . . 4,273 4,941 5,862 5,945 5,960 6,015 6,098
1 Estimated resident population as of July 1 of the previous year. Estimates reflect revisions based on the 1990 Census ofPopulation. 2 Fall enrollment of the previous year. 3 Kindergarten through grade 6. 4 Grades 7 through 12. 5 Full-timeequivalent. 6 Current expenses for summer schools, adult education, post-high school vocational education, personnelretraining, etc., when operated by local school districts and not part of regular public elementary and secondary day-schoolprogram. 7 Compiled by U.S. Census Bureau. Deflated by the Consumer Price Index, all urban consumers (for school year)supplied by U.S. National Center for Education Statistics.
Source: Except as noted, National Education Association, Washington, DC, Estimates of School Statistics Database(copyright).
Education 175
U.S. Census Bureau, Statistical Abstract of the United States: 1999
No. 275. Elementary and Secondary Schools—Teachers and Pupil-TeacherRatios With Projections: 1960 to 1998
[In thousands (1,600 represents 1,600,000), except ratios. As of fall. Data are for full-time equivalents. Schools are classifiedby type of organization, rather than by grade group; elementary includes kindergarten and secondary includes junior high]
ItemTotal Public Private
TotalElemen-
tarySecond-
ary TotalElemen-
tarySecond-
ary TotalElemen-
tarySecond-
ary
Number of teachers:1960 . . . . . . . . . . . 1,600 991 609 1,408 858 550 192 133 591970 . . . . . . . . . . . 2,292 1,283 1,009 2,059 1,130 929 233 153 801975 . . . . . . . . . . . 2,453 1,353 1,100 2,198 1,181 1,017 255 172 831980 . . . . . . . . . . . 2,485 1,401 1,084 2,184 1,189 995 301 212 891985 . . . . . . . . . . . 2,549 1,483 1,066 2,206 1,237 969 343 246 971988 . . . . . . . . . . . 2,668 1,604 1,064 2,323 1,353 970 345 251 941989 . . . . . . . . . . . 2,734 1,662 1,072 2,357 1,387 970 377 275 102
1990 . . . . . . . . . . . 2,753 1,680 1,073 2,398 1,426 972 355 254 1011991 . . . . . . . . . . . 2,787 1,713 1,074 2,432 1,459 973 355 254 1011992 . . . . . . . . . . . 2,822 1,752 1,070 2,459 1,492 967 363 260 1031993 . . . . . . . . . . . 2,870 1,775 1,095 2,504 1,513 991 366 262 1041994 . . . . . . . . . . . 2,926 1,794 1,132 2,552 1,528 1,024 373 266 1081995 . . . . . . . . . . . 2,978 1,814 1,164 2,598 1,546 1,053 380 269 1111996 . . . . . . . . . . . 3,053 1,856 1,197 2,666 1,582 1,084 387 274 1131997, prel. . . . . . . . 3,103 1,882 1,222 2,710 1,604 1,106 394 278 1161998, proj. . . . . . . . 3,126 1,894 1,233 2,728 1,612 1,116 399 281 117
Pupil-teacher ratio:1960 . . . . . . . . . . . 26.4 29.4 21.4 25.8 28.4 21.7 30.7 36.1 18.61970 . . . . . . . . . . . 22.4 24.6 19.5 22.3 24.3 19.8 23.0 26.5 16.41975 . . . . . . . . . . . 20.3 21.7 18.6 20.4 21.7 18.8 19.6 21.5 15.71980 . . . . . . . . . . . 18.6 20.1 16.6 18.7 20.4 16.8 17.7 18.8 15.01985 . . . . . . . . . . . 17.6 19.1 15.6 17.9 19.5 15.8 16.2 17.1 14.01988 . . . . . . . . . . . 17.0 18.6 14.7 17.3 19.0 14.9 15.2 16.1 12.81989 . . . . . . . . . . . 16.8 18.4 14.3 17.2 19.0 14.6 14.2 15.1 11.7
1990 . . . . . . . . . . . 16.9 18.5 14.3 17.2 19.0 14.6 14.7 16.1 11.31991 . . . . . . . . . . . 17.0 18.5 14.5 17.3 18.9 14.9 14.6 16.0 11.11992 . . . . . . . . . . . 17.1 18.4 14.8 17.4 18.8 15.2 14.8 16.2 11.31993 . . . . . . . . . . . 17.1 18.5 14.7 17.4 18.9 15.1 14.9 16.3 11.51994 . . . . . . . . . . . 17.1 18.6 14.7 17.3 18.9 15.1 15.0 16.4 11.41995 . . . . . . . . . . . 17.0 18.6 14.5 17.3 18.9 14.8 15.0 16.5 11.41996 . . . . . . . . . . . 16.8 18.4 14.3 17.1 18.8 14.6 14.9 16.4 11.51997, prel. . . . . . . . 16.7 18.3 14.2 17.0 18.6 14.5 14.9 16.3 11.41998, proj. . . . . . . . 16.9 18.5 14.4 17.2 18.9 14.7 14.9 16.3 11.4
Source: U.S. National Center for Education Statistics, Digest of Education Statistics, annual.
No. 276. Public Elementary and Secondary Schools, by Type and Size ofSchool: 1996-97
[Enrollment in thousands (45,365 represents 45,365,000). Data reported by schools, rather than school districts]
Enrollment size ofschool
Number of schools Enrollment 1
TotalElemen-
tary 2Second-
ary 3Com-
bined 4 Other 5 TotalElemen-
tary 2Second-
ary 3Com-
bined 4 Other 5
Total . . . . . . . . . . . . 88,223 61,805 21,307 2,980 2,131 45,365 29,572 14,564 1,152 76
PERCENT
Total . . . . . . . . . . . . 100.0 100.0 100.0 100.0 100.0 100.0 100.0 100.0 100.0 100.0Under 100 students. . . . . . 9.2 6.0 14.3 31.5 60.0 0.8 0.6 1.0 3.6 19.4100 to 199 students . . . . . 9.4 8.7 10.5 15.2 18.7 2.7 2.8 2.2 5.7 19.3200 to 299 students . . . . . 11.3 12.2 8.6 10.3 10.8 5.4 6.5 3.0 6.4 19.3300 to 399 students . . . . . 13.2 15.4 7.7 7.8 6.0 8.8 11.2 3.8 7.0 15.1400 to 499 students . . . . . 13.2 15.8 6.9 6.5 2.0 11.3 14.8 4.4 7.5 6.3
500 to 599 students . . . . . 11.8 13.8 6.7 6.5 0.5 12.2 15.8 5.2 9.2 2.1600 to 699 students . . . . . 8.8 9.9 6.2 5.6 - 10.8 13.3 5.8 9.3 -700 to 799 students . . . . . 6.2 6.6 5.2 3.5 0.4 8.7 10.4 5.6 6.7 2.0800 to 999 students . . . . . 7.4 7.1 8.8 5.2 0.5 12.5 13.2 11.2 12.1 3.41,000 to 1,499 students . . . 6.2 4.0 13.3 4.9 0.7 14.1 9.6 23.1 15.2 6.5
1,500 to 1,999 students . . . 2.0 0.4 6.8 1.9 0.2 6.5 1.4 16.7 8.4 2.12,000 to 2,999 students . . . 1.1 0.1 4.3 0.8 - 5.0 0.4 14.3 5.1 -3,000 or more students . . . 0.2 - 0.8 0.3 0.2 1.4 - 3.8 3.8 4.5
Average enrollment . . . . . . (X) (X) (X) (X) (X) 527 478 703 387 135
- Represents zero. X Not applicable. 1 Data for those schools reporting enrollment. 2 Includes schools beginning withgrade 6 or below and with no grade higher than 8. 3 Includes schools with no grade lower than 7. 4 Includes schools with bothelementary and secondary grades. 5 Includes special education, alternative, and other schools not classified by grade span.
Source: U.S. National Center for Education Statistics, Digest of Education Statistics, annual.
176 Education
U.S. Census Bureau, Statistical Abstract of the United States: 1999
No. 277. Public Elementary and Secondary School Enrollment,by State: 1980 to 1996
[In thousands (27,647 represents 27,647,000), except rate. As of fall. Includes unclassified students]
State
EnrollmentEnrollment rate 2
K through grade 8 1 Grades 9 through 12
1980 1985 19901996,
prel. 1980 1985 19901996,
prel. 1980 1985 19901996,
prel.
United States . . . 27,647 27,034 29,878 32,759 13,231 12,388 11,338 12,834 86.2 87.7 91.3 91.7
Alabama. . . . . . . . . 528 517 527 540 231 213 195 208 87.6 89.6 93.3 95.8Alaska . . . . . . . . . . 60 77 85 94 26 30 29 36 94.0 99.4 97.4 95.4Arizona. . . . . . . . . . 357 386 479 588 157 162 161 211 88.9 90.8 93.3 92.5Arkansas . . . . . . . . 310 304 314 324 138 130 123 133 90.3 91.8 95.9 94.8California . . . . . . . . 2,730 2,927 3,615 4,131 1,347 1,329 1,336 1,557 87.1 89.5 92.8 92.4
Colorado. . . . . . . . . 374 379 420 487 172 172 154 186 92.2 92.7 94.6 93.1Connecticut . . . . . . . 364 321 347 389 168 141 122 138 83.3 83.4 90.2 92.6Delaware . . . . . . . . 62 63 73 78 37 30 27 33 79.5 80.1 87.4 87.1District of Columbia . 71 62 61 61 29 25 19 18 91.8 96.8 100.9 105.7Florida . . . . . . . . . . 1,042 1,086 1,370 1,653 468 476 492 589 84.4 86.7 92.6 91.3
Georgia . . . . . . . . . 742 757 849 991 327 323 303 356 86.8 88.2 93.6 96.3Hawaii . . . . . . . . . . 110 113 123 136 55 51 49 51 83.4 84.2 87.6 87.9Idaho . . . . . . . . . . . 144 149 160 169 59 59 61 76 95.4 93.6 96.9 95.4Illinois . . . . . . . . . . 1,335 1,246 1,310 1,412 649 580 512 561 82.6 83.3 86.9 88.1Indiana. . . . . . . . . . 708 654 676 690 347 312 279 294 88.0 88.4 90.4 90.7
Iowa . . . . . . . . . . . 351 324 345 342 183 161 139 161 88.4 89.1 92.1 93.2Kansas. . . . . . . . . . 283 286 320 328 133 125 117 138 88.7 91.0 92.6 92.2Kentucky . . . . . . . . 464 449 459 466 206 195 177 190 83.7 85.8 90.5 92.8Louisiana . . . . . . . . 544 573 586 575 234 215 199 218 80.2 83.9 88.2 89.3Maine. . . . . . . . . . . 153 142 155 156 70 64 60 58 91.6 93.3 96.5 93.8
Maryland . . . . . . . . 493 446 527 597 258 225 188 222 83.9 84.9 89.1 89.8Massachusetts. . . . . 676 559 604 688 346 285 230 246 88.6 86.3 88.8 90.3Michigan. . . . . . . . . 1,227 1,086 1,145 1,222 570 517 440 463 86.9 87.8 90.3 91.1Minnesota. . . . . . . . 482 468 546 589 272 237 211 258 87.2 89.4 91.2 91.6Mississippi . . . . . . . 330 330 372 364 147 141 131 140 79.6 81.0 91.3 91.4
Missouri . . . . . . . . . 567 544 588 643 277 251 228 257 83.8 84.9 86.5 87.7Montana . . . . . . . . . 106 108 111 115 50 46 42 50 92.9 93.8 93.8 93.8Nebraska . . . . . . . . 189 184 198 203 91 82 76 89 86.6 87.7 88.7 89.0Nevada . . . . . . . . . 101 107 150 208 49 48 51 74 93.4 93.3 98.7 96.0New Hampshire . . . . 112 107 126 144 55 54 46 54 85.3 87.5 89.1 90.5
New Jersey. . . . . . . 820 740 784 884 426 376 306 324 81.5 82.9 86.1 85.8New Mexico . . . . . . 186 187 208 230 85 90 94 103 89.5 91.6 94.3 91.9New York . . . . . . . . 1,838 1,703 1,828 2,000 1,033 918 770 843 80.8 82.3 86.6 88.5North Carolina . . . . . 786 749 783 886 343 337 304 324 90.1 91.2 94.8 91.9North Dakota. . . . . . 77 84 85 82 40 35 33 38 85.9 89.2 92.8 95.6
Ohio . . . . . . . . . . . 1,312 1,206 1,258 1,299 645 588 514 546 84.8 85.6 88.0 88.6Oklahoma . . . . . . . . 399 414 425 445 179 178 154 175 92.9 94.3 95.1 95.9Oregon. . . . . . . . . . 319 305 340 380 145 142 132 158 88.5 89.7 90.7 90.9Pennsylvania. . . . . . 1,231 1,093 1,172 1,264 678 591 496 541 80.4 80.3 83.6 85.2Rhode Island. . . . . . 98 90 102 110 51 44 37 41 80.1 81.2 87.3 88.6
South Carolina. . . . . 426 424 452 468 193 183 170 185 88.1 89.6 94.0 94.3South Dakota . . . . . 86 88 95 99 42 37 34 44 87.4 90.7 89.7 95.4Tennessee . . . . . . . 602 575 598 658 252 239 226 248 87.8 88.3 93.5 94.9Texas. . . . . . . . . . . 2,049 2,261 2,511 2,800 851 871 872 1,029 92.4 93.2 98.4 98.7Utah . . . . . . . . . . . 250 299 325 328 93 105 122 154 98.2 96.3 97.7 98.2
Vermont . . . . . . . . . 66 63 71 76 29 27 25 30 87.9 89.3 93.9 96.5Virginia. . . . . . . . . . 703 665 728 796 307 303 270 300 90.7 94.0 94.2 93.5Washington . . . . . . . 515 507 613 687 242 243 227 287 91.7 92.2 94.0 93.1West Virginia . . . . . . 270 249 224 209 113 109 98 95 92.6 92.2 95.7 96.9Wisconsin . . . . . . . . 528 501 566 605 303 267 232 274 82.1 83.8 86.0 87.5Wyoming . . . . . . . . 70 74 71 67 28 29 27 32 97.3 97.0 97.3 97.4
1 Data include a small number of prekindergarten students. 2 Percent of persons 5-17 years old. Based on enumeratedresident population as of April 1, 1980, and 1990, and estimated resident population as of July 1 for other years. Data not adjustedfor revisions based on the 1990 Census of Population.
Source: U.S. National Center for Education Statistics, Digest of Education Statistics, annual.
Education 177
U.S. Census Bureau, Statistical Abstract of the United States: 1999
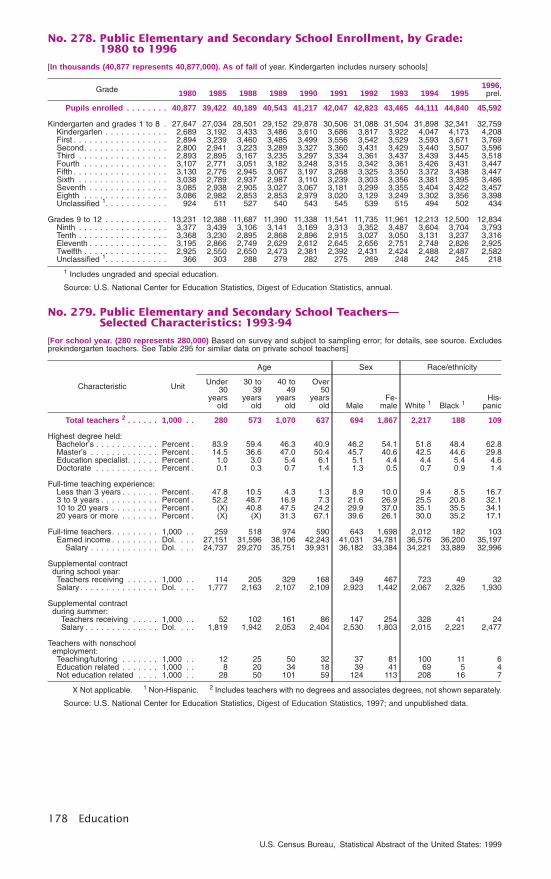
No. 278. Public Elementary and Secondary School Enrollment, by Grade:1980 to 1996
[In thousands (40,877 represents 40,877,000). As of fall of year. Kindergarten includes nursery schools]
Grade 1980 1985 1988 1989 1990 1991 1992 1993 1994 19951996,
prel.
Pupils enrolled . . . . . . . . 40,877 39,422 40,189 40,543 41,217 42,047 42,823 43,465 44,111 44,840 45,592
Kindergarten and grades 1 to 8 . 27,647 27,034 28,501 29,152 29,878 30,506 31,088 31,504 31,898 32,341 32,759Kindergarten . . . . . . . . . . . . 2,689 3,192 3,433 3,486 3,610 3,686 3,817 3,922 4,047 4,173 4,208First . . . . . . . . . . . . . . . . . . 2,894 3,239 3,460 3,485 3,499 3,556 3,542 3,529 3,593 3,671 3,769Second. . . . . . . . . . . . . . . . 2,800 2,941 3,223 3,289 3,327 3,360 3,431 3,429 3,440 3,507 3,596Third . . . . . . . . . . . . . . . . . 2,893 2,895 3,167 3,235 3,297 3,334 3,361 3,437 3,439 3,445 3,518Fourth . . . . . . . . . . . . . . . . 3,107 2,771 3,051 3,182 3,248 3,315 3,342 3,361 3,426 3,431 3,447Fifth . . . . . . . . . . . . . . . . . . 3,130 2,776 2,945 3,067 3,197 3,268 3,325 3,350 3,372 3,438 3,447Sixth . . . . . . . . . . . . . . . . . 3,038 2,789 2,937 2,987 3,110 3,239 3,303 3,356 3,381 3,395 3,486Seventh . . . . . . . . . . . . . . . 3,085 2,938 2,905 3,027 3,067 3,181 3,299 3,355 3,404 3,422 3,457Eighth . . . . . . . . . . . . . . . . 3,086 2,982 2,853 2,853 2,979 3,020 3,129 3,249 3,302 3,356 3,398Unclassified 1. . . . . . . . . . . . 924 511 527 540 543 545 539 515 494 502 434
Grades 9 to 12 . . . . . . . . . . . . 13,231 12,388 11,687 11,390 11,338 11,541 11,735 11,961 12,213 12,500 12,834Ninth . . . . . . . . . . . . . . . . . 3,377 3,439 3,106 3,141 3,169 3,313 3,352 3,487 3,604 3,704 3,793Tenth . . . . . . . . . . . . . . . . . 3,368 3,230 2,895 2,868 2,896 2,915 3,027 3,050 3,131 3,237 3,316Eleventh . . . . . . . . . . . . . . . 3,195 2,866 2,749 2,629 2,612 2,645 2,656 2,751 2,748 2,826 2,925Twelfth . . . . . . . . . . . . . . . . 2,925 2,550 2,650 2,473 2,381 2,392 2,431 2,424 2,488 2,487 2,582Unclassified 1. . . . . . . . . . . . 366 303 288 279 282 275 269 248 242 245 218
1 Includes ungraded and special education.
Source: U.S. National Center for Education Statistics, Digest of Education Statistics, annual.
No. 279. Public Elementary and Secondary School Teachers—Selected Characteristics: 1993-94
[For school year. (280 represents 280,000) Based on survey and subject to sampling error; for details, see source. Excludesprekindergarten teachers. See Table 295 for similar data on private school teachers]
Characteristic Unit
Age Sex Race/ethnicity
Under30
yearsold
30 to39
yearsold
40 to49
yearsold
Over50
yearsold Male
Fe-male White 1 Black 1
His-panic
Total teachers 2 . . . . . . 1,000 . . 280 573 1,070 637 694 1,867 2,217 188 109
Highest degree held:Bachelor’s . . . . . . . . . . . . Percent . 83.9 59.4 46.3 40.9 46.2 54.1 51.8 48.4 62.8Master’s . . . . . . . . . . . . . Percent . 14.5 36.6 47.0 50.4 45.7 40.6 42.5 44.6 29.8Education specialist. . . . . . Percent . 1.0 3.0 5.4 6.1 5.1 4.4 4.4 5.4 4.6Doctorate . . . . . . . . . . . . Percent . 0.1 0.3 0.7 1.4 1.3 0.5 0.7 0.9 1.4
Full-time teaching experience:Less than 3 years . . . . . . . Percent . 47.8 10.5 4.3 1.3 8.9 10.0 9.4 8.5 16.73 to 9 years . . . . . . . . . . . Percent . 52.2 48.7 16.9 7.3 21.6 26.9 25.5 20.8 32.110 to 20 years . . . . . . . . . Percent . (X) 40.8 47.5 24.2 29.9 37.0 35.1 35.5 34.120 years or more . . . . . . . Percent . (X) (X) 31.3 67.1 39.6 26.1 30.0 35.2 17.1
Full-time teachers. . . . . . . . . 1,000 . . 259 518 974 590 643 1,698 2,012 182 103Earned income . . . . . . . . . Dol. . . . 27,151 31,596 38,106 42,243 41,031 34,781 36,576 36,200 35,197
Salary . . . . . . . . . . . . . Dol. . . . 24,737 29,270 35,751 39,931 36,182 33,384 34,221 33,889 32,996
Supplemental contractduring school year:Teachers receiving . . . . . . 1,000 . . 114 205 329 168 349 467 723 49 32Salary . . . . . . . . . . . . . . . Dol. . . . 1,777 2,163 2,107 2,109 2,923 1,442 2,067 2,325 1,930
Supplemental contractduring summer:
Teachers receiving . . . . . 1,000 . . 52 102 161 86 147 254 328 41 24Salary . . . . . . . . . . . . . . Dol. . . . 1,819 1,942 2,053 2,404 2,530 1,803 2,015 2,221 2,477
Teachers with nonschoolemployment:Teaching/tutoring . . . . . . . 1,000 . . 12 25 50 32 37 81 100 11 6Education related . . . . . . . 1,000 . . 8 20 34 18 39 41 69 5 4Not education related . . . . 1,000 . . 28 50 101 59 124 113 208 16 7
X Not applicable. 1 Non-Hispanic. 2 Includes teachers with no degrees and associates degrees, not shown separately.
Source: U.S. National Center for Education Statistics, Digest of Education Statistics, 1997; and unpublished data.
178 Education
U.S. Census Bureau, Statistical Abstract of the United States: 1999

No. 280. Newly Hired Teachers, by Selected Characteristics: 1988 to 1994
[In percent. Based on sample and subject to sampling error; see source for details]
CharacteristicPublic schools Private schools
1988 1991 1994 1988 1991 1994
Total newly hired teachers . . . . . . . . . . . 100.0 100.0 100.0 100.0 100.0 100.0
First-time teachers . . . . . . . . . . . . . . . . . . . . . 30.6 41.7 45.8 25.2 34.0 42.4Transfers. . . . . . . . . . . . . . . . . . . . . . . . . . . . 36.6 34.3 31.4 38.1 36.1 34.3
Within state and sector. . . . . . . . . . . . . . . . . 20.8 21.6 20.2 19.0 18.1 14.6Across state . . . . . . . . . . . . . . . . . . . . . . . . 8.3 7.1 7.1 8.3 7.0 11.5Across sector . . . . . . . . . . . . . . . . . . . . . . . 7.5 5.6 4.1 10.9 11.0 8.1
Reentrants . . . . . . . . . . . . . . . . . . . . . . . . . . 32.8 24.0 22.9 36.7 30.0 23.3
Main previous year activity:First-time teachers. . . . . . . . . . . . . . . . . . . . 100.0 100.0 100.0 100.0 100.0 100.0
Work in education (nonteaching). . . . . . . . . 5.7 5.2 10.7 4.8 7.5 13.6Work outside education. . . . . . . . . . . . . . . 11.0 10.0 11.6 24.5 20.6 19.9College . . . . . . . . . . . . . . . . . . . . . . . . . 66.5 58.4 56.7 51.8 48.7 43.1Homemaking and childrearing . . . . . . . . . . 3.6 4.4 2.1 7.7 5.8 5.8Other . . . . . . . . . . . . . . . . . . . . . . . . . . . 13.3 22.0 18.9 11.3 17.4 17.6
Substitute teaching . . . . . . . . . . . . . . . . (NA) 18.0 17.2 (NA) 12.0 15.2Reentrants . . . . . . . . . . . . . . . . . . . . . . . . . 100.0 100.0 100.0 100.0 100.0 100.0
Work in education (nonteaching). . . . . . . . . 10.3 19.1 15.0 8.9 11.7 19.9Work outside education. . . . . . . . . . . . . . . 17.4 17.9 19.2 21.2 26.1 26.0College . . . . . . . . . . . . . . . . . . . . . . . . . 18.0 10.4 18.1 20.0 5.6 11.9Homemaking and childrearing . . . . . . . . . . 27.8 19.3 14.6 28.6 23.1 21.4Other . . . . . . . . . . . . . . . . . . . . . . . . . . . 26.5 33.3 33.1 21.3 33.6 20.9
Substitute teaching . . . . . . . . . . . . . . . . (NA) 23.8 29.6 (NA) 18.7 18.1
NA Not available.
Source: U.S. Department of Education, National Center for Education Statistics, Condition of Education, 1996.
No. 281. Public Elementary and Secondary Schools—Number and AverageSalary of Classroom Teachers, 1970 to 1998, and by State, 1998
[Estimates for school year ending in June of year shown (2,008 represents 2,008,000). Schools classified by type of organizationrather than by grade-group; elementary includes kindergarten]
Year andstate
Teachers 1 (1,000) Avg. salary ($1,000)
Total
Ele-men-
tary
Sec-ond-
ary
Allteach-
ers
Ele-men-
tary
Sec-ond-
ary
1970 . . . . . . 2,008 1,109 899 8.6 8.4 8.91975 . . . . . . 2,171 1,169 1,001 11.7 11.3 12.01980 . . . . . . 2,211 1,206 1,005 16.0 15.6 16.51985 . . . . . . 2,175 1,212 963 23.6 23.2 24.21988 . . . . . . 2,282 1,308 974 28.0 27.5 28.81989 . . . . . . 2,324 1,354 970 29.6 29.0 30.21990 . . . . . . 2,362 1,390 972 31.4 30.8 32.01991 . . . . . . 2,409 1,435 974 33.1 32.5 33.91992 . . . . . . 2,429 1,466 963 34.1 33.5 34.81993 . . . . . . 2,466 1,496 970 35.0 34.4 35.91994 . . . . . . 2,512 1,517 995 35.7 35.2 36.61995 . . . . . . 2,567 1,535 1,033 36.7 36.2 37.51996 . . . . . . 2,606 1,559 1,047 37.7 37.3 38.41997 . . . . . . 2,668 1,607 1,061 38.6 38.2 39.1
1998, U.S. . 2,705 1,608 1,097 39.4 39.1 39.9AL . . . . . . . . 45.9 27.4 18.6 32.8 32.8 32.8AK. . . . . . . . 8.2 5.2 3.0 51.7 51.7 51.7AZ. . . . . . . . 41.8 32.2 9.6 34.4 33.9 33.9AR. . . . . . . . 27.5 13.5 14.0 30.6 29.7 31.4CA. . . . . . . . 239.6 176.2 63.4 43.7 43.2 45.2CO . . . . . . . 36.8 18.6 18.2 37.1 36.9 37.2CT. . . . . . . . 38.2 27.3 10.9 50.7 50.5 52.3DE. . . . . . . . 6.9 3.4 3.5 42.4 42.5 42.4DC . . . . . . . 5.7 3.4 2.3 46.4 46.8 47.7FL . . . . . . . . 126.4 64.5 61.9 34.5 34.5 34.5GA . . . . . . . 85.6 50.5 35.1 37.4 36.9 38.1HI . . . . . . . . 10.9 6.1 4.9 38.4 38.4 38.4ID . . . . . . . . 13.4 6.8 6.6 32.8 32.7 32.8IL . . . . . . . . 119.6 84.1 35.5 43.9 42.0 48.1IN . . . . . . . . 56.6 30.4 26.2 39.7 39.8 39.5IA . . . . . . . . 33.0 15.3 17.7 34.0 33.2 34.8KS. . . . . . . . 31.5 16.5 15.0 36.8 36.8 36.8KY. . . . . . . . 37.9 26.7 11.1 34.5 34.2 35.8
Year andstate
Teachers 1 (1,000) Avg. salary ($1,000)
Total
Ele-men-
tary
Sec-ond-
ary
Allteach-
ers
Ele-men-
tary
Sec-ond-
ary
LA . . . . . . . . 48.7 34.5 14.2 29.7 29.7 29.7ME . . . . . . . 14.8 10.3 4.6 34.3 34.0 35.2MD . . . . . . . 47.8 27.0 20.8 41.7 40.8 42.9MA . . . . . . . 63.3 27.2 36.1 43.9 43.9 43.9MI . . . . . . . . 87.1 63.3 23.8 49.3 49.3 49.3MN . . . . . . . 49.8 26.8 22.9 39.1 39.3 38.8MS . . . . . . . 29.5 15.5 14.0 29.5 28.3 29.2MO . . . . . . . 60.4 13.4 47.0 34.0 33.5 34.7MT . . . . . . . 10.3 7.0 3.3 30.6 30.3 31.4NE. . . . . . . . 19.9 11.7 8.2 32.7 32.7 32.7NV. . . . . . . . 15.7 9.3 6.4 37.1 36.8 37.5NH . . . . . . . 12.6 8.8 3.9 36.6 36.6 36.6NJ . . . . . . . . 91.2 57.5 33.7 50.4 49.4 52.3NM . . . . . . . 19.8 14.2 5.6 30.2 30.0 31.0NY. . . . . . . . 197.2 98.8 98.4 49.0 48.0 50.3NC . . . . . . . 76.8 47.8 29.0 33.3 33.2 33.6ND . . . . . . . 7.9 5.1 2.9 28.2 28.4 27.9OH . . . . . . . 108.2 72.2 36.1 39.0 38.6 39.8OK . . . . . . . 40.5 21.1 19.3 30.6 30.5 30.8OR . . . . . . . 27.5 18.2 9.3 42.2 41.8 42.7PA. . . . . . . . 106.5 54.7 51.8 47.7 47.1 48.2RI . . . . . . . . 11.1 6.3 4.7 44.3 44.2 44.4SC. . . . . . . . 39.9 27.6 12.3 33.6 33.3 34.2SD. . . . . . . . 9.5 6.7 2.8 27.3 27.4 27.1TN. . . . . . . . 52.0 37.8 14.2 35.3 35.0 36.4TX. . . . . . . . 254.8 132.5 122.2 33.6 32.9 34.5UT. . . . . . . . 21.1 11.0 10.0 33.0 33.1 33.1VT. . . . . . . . 7.7 4.0 3.7 36.3 37.0 35.6VA. . . . . . . . 77.6 47.8 29.9 36.7 35.5 38.2WA . . . . . . . 48.9 28.0 21.0 38.8 38.8 38.8WV . . . . . . . 20.8 12.5 8.3 33.4 33.1 33.8WI . . . . . . . . 53.9 37.6 16.2 39.9 39.5 40.7WY . . . . . . . 6.7 3.3 3.4 32.0 32.2 31.9
1 Full-time equivalent.
Source: National Education Association, Washington, DC, Estimates of School Statistics Database (copyright).
Education 179
U.S. Census Bureau, Statistical Abstract of the United States: 1999
No. 282. Average Salary and Wages Paid in Public School Systems:1980 to 1998
[In dollars. For school year ending in year shown. Data reported by a stratified sample of school systems enrolling 300 or morepupils. Data represent unweighted means of average salaries paid school personnel reported by each school system]
Position 1980 1985 1990 1993 1994 1995 1996 1997 1998
ANNUAL SALARY
Central office administrators:Superintendent (contract salary) . . . 39,344 56,954 75,425 85,120 87,717 90,198 94,229 98,106 101,519Deputy/assoc. superintendent . . . . . 37,440 52,877 69,623 77,057 78,672 81,266 84,077 88,564 90,226Assistant superintendent . . . . . . . . 33,452 48,003 62,698 70,525 72,701 75,236 77,007 80,176 82,339Administrators for—
Finance and business . . . . . . . . 27,147 40,344 52,354 57,864 59,997 61,323 63,840 65,797 67,724Instructional services . . . . . . . . . 29,790 43,452 56,359 62,508 64,676 66,767 68,463 70,788 73,058Public relations/information . . . . . 24,021 35,287 44,926 50,622 52,366 53,263 53,860 55,928 57,224Staff personnel services . . . . . . . 29,623 44,182 56,344 62,162 63,690 65,819 67,760 70,088 71,073
Subject area supervisors . . . . . . . . 23,974 34,422 45,929 51,407 52,837 54,534 56,145 58,776 60,359
School building administrators:Principals:
Elementary. . . . . . . . . . . . . . . . 25,165 36,452 48,431 54,905 56,906 58,589 60,922 62,903 64,653Junior high/middle . . . . . . . . . . . 27,625 39,650 52,163 58,620 60,651 62,311 64,452 66,859 68,740Senior high. . . . . . . . . . . . . . . . 29,207 42,094 55,722 63,054 64,993 66,596 69,277 72,410 74,380
Assistant principals:Elementary. . . . . . . . . . . . . . . . 20,708 30,496 40,916 45,377 47,057 48,491 50,537 52,284 53,206Junior high/middle . . . . . . . . . . . 23,507 33,793 44,570 49,925 51,518 52,942 54,355 56,451 57,768Senior high. . . . . . . . . . . . . . . . 24,816 35,491 46,486 52,348 54,170 55,556 57,555 59,739 60,999
Classroom teachers. . . . . . . . . . . . 15,913 23,587 31,278 35,291 36,531 37,264 38,706 39,580 40,133
Auxiliary professional personnel:Counselors . . . . . . . . . . . . . . . . . 18,847 27,593 35,979 40,413 41,355 42,486 44,073 45,365 46,162Librarians . . . . . . . . . . . . . . . . . . 16,764 24,981 33,469 37,945 39,319 40,418 41,761 43,315 44,310School nurses . . . . . . . . . . . . . . . 13,788 19,944 26,090 29,555 30,630 31,066 32,786 33,720 34,619
Secretarial/clerical personnel:Central office:
Secretaries. . . . . . . . . . . . . . . . 10,331 15,343 20,238 22,770 23,495 23,935 24,809 25,709 26,316Accounting/payroll clerks. . . . . . . 10,479 15,421 20,088 22,605 23,275 24,042 25,009 25,881 26,249Typists/data entry clerks . . . . . . . 8,359 12,481 16,125 17,772 18,296 18,674 19,447 20,726 21,633
School building level:Secretaries. . . . . . . . . . . . . . . . 8,348 12,504 16,184 18,104 18,692 19,170 20,076 20,709 21,215Library clerks . . . . . . . . . . . . . . 6,778 9,911 12,152 13,311 13,809 14,381 14,791 15,349 15,742
HOURLY WAGE RATE
Other support personnel:Teacher aides:
Instructional . . . . . . . . . . . . . . . 4.06 5.89 7.43 8.31 8.50 8.77 9.04 9.25 9.46Noninstructional . . . . . . . . . . . . 3.89 5.60 7.08 7.82 8.14 8.29 8.52 8.88 8.82
Custodians . . . . . . . . . . . . . . . . . 4.88 6.90 8.54 9.51 9.76 10.05 10.35 10.65 10.79Cafeteria workers . . . . . . . . . . . . . 3.78 5.42 6.77 7.56 7.72 7.89 8.15 8.30 8.56Bus drivers . . . . . . . . . . . . . . . . . 5.21 7.27 9.21 10.15 10.35 10.69 11.04 11.50 11.55
Source: Educational Research Service, Arlington, VA, National Survey of Salaries and Wages in Public Schools, annual, Vols.2 and 3. (All rights reserved. Copyright.)
No. 283. Public School Employment: 1982 and 1996
[In thousands (3,082 represents 3,082,000). Covers full-time employment. Excludes Hawaii. 1982 also excludes District ofColumbia and New Jersey. 1982 based on sample survey of school districts with 250 or more students. 1996 based on samplesurvey of school districts with 100 or more employees; see source for sampling variability]
Occupation1982 1996
Total Male Female White 1 Black 1 Total Male Female White 1 Black 1
All occupations . . . . . . . 3,082 1,063 2,019 2,498 432 3,718 1,013 2,705 2,915 506
Officials, administrators . . . . . . . 41 31 10 36 3 47 27 19 39 5Principals and assistantprincipals . . . . . . . . . . . . . . . . 90 72 19 76 11 101 55 45 79 15
Classroom teachers 2 . . . . . . . . 1,680 534 1,146 1,435 186 2,051 522 1,529 1,735 198Elementary schools . . . . . . . . 798 129 669 667 98 1,024 137 887 854 101Secondary schools . . . . . . . . 706 363 343 619 67 755 324 431 651 69
Other professional staff . . . . . . . 235 91 144 193 35 263 60 203 219 30
Teachers aides 3. . . . . . . . . . . . 215 14 200 146 45 365 38 327 238 78Clerical, secretarial staff . . . . . . . 210 4 206 177 19 258 6 252 200 29Service workers 4 . . . . . . . . . . . 611 316 295 434 132 633 304 330 407 151
1 Excludes individuals of Hispanic origin. 2 Includes other classroom teachers, not shown separately. 3 Includestechnicians. 4 Includes craftworkers and laborers.
Source: U.S. Equal Employment Opportunity Commission, Elementary-Secondary Staff Information (EEO-5), biennial.
180 Education
U.S. Census Bureau, Statistical Abstract of the United States: 1999
No. 284. Public Elementary and Secondary School Price Indexes: 1975 to 1997
[1983=100. For years ending June 30. Reflects prices paid by public elementary-secondary schools. For explanation of averageannual percent change, see Guide to Tabular Presentation]
Year
Index,total
Personnel compensation Contracted services, supplies and equipment
Total
Profes-sional
salaries
Nonpro-fessionalsalaries
Fringebenefits Total
Serv-ices
Sup-pliesand
materi-als
Equip-ment
replace-ment
Librarymateri-als and
text-books Utilities
Fixedcosts
1975 . . 52.7 53.4 56.0 55.6 40.9 50.4 55.7 58.0 53.7 53.8 34.5 45.21980 . . 76.6 75.9 76.7 77.8 71.0 79.2 77.4 85.9 79.6 82.1 71.1 77.91984 . . 105.0 106.0 105.7 104.5 108.3 101.7 105.6 99.6 103.4 107.8 94.3 105.41985 . . 112.0 113.7 113.4 111.3 117.1 105.5 112.4 103.2 107.2 111.0 96.1 110.8
1986 . . 118.5 121.1 121.4 117.6 123.3 108.3 117.4 103.0 109.3 120.8 93.7 116.21987 . . 123.3 127.4 128.4 121.9 128.8 107.5 123.7 101.5 112.9 126.5 75.3 122.71988 . . 129.8 134.5 135.5 127.5 137.0 111.8 126.1 105.9 113.4 140.0 78.1 128.41989 . . 136.3 141.6 142.2 133.3 147.0 116.2 131.8 112.0 116.0 149.4 75.1 134.61990 . . 144.3 150.0 150.1 139.4 159.3 122.6 137.7 119.2 121.2 171.7 82.1 140.3
1991 . . 152.3 158.3 158.1 146.5 169.8 129.7 142.5 122.7 125.7 189.4 92.6 144.91992 . . 158.5 165.4 165.8 152.4 175.8 132.0 148.0 122.5 128.5 199.0 90.8 148.91993 . . 162.2 169.6 169.2 155.1 184.5 133.9 151.5 121.9 131.8 205.6 90.4 153.81994 . . 167.1 175.1 175.1 159.3 190.2 136.5 154.0 122.7 135.4 218.4 90.6 158.71995 . . 170.9 179.2 178.9 163.7 194.9 139.3 157.2 124.4 138.7 230.7 89.7 163.91996 . . 177.3 185.6 185.7 169.2 200.3 145.9 161.8 138.7 143.2 227.9 91.0 169.11997 . . 181.7 190.2 190.2 174.5 204.2 149.4 165.2 137.7 145.2 238.0 100.1 172.9
Source: Research Associates of Washington, Arlington, VA, Inflation Measures for Schools, Colleges, and Libraries, annual(copyright).
No. 285. Finances of Public Elementary and Secondary School Systems,by Enrollment-Size Group: 1995-96
[In millions of dollars (289,230 represents $289,230,000,000), except as indicated. Data are estimates subject to samplingvariability. For details, see source. See also Appendix III]
Item Allschool
systems
School systems with enrollment of—
50,000or more
25,000to
49,999
15,000to
24,9997,500 to
14,9995,000 to
7,4993,000 to
4,999Under3,000
Fall enrollment (1,000) . . . . . . . . . . . . . 44,840 8,718 4,883 4,241 6,729 4,217 5,322 10,730
General revenue . . . . . . . . . . . . . . . . . 289,230 56,236 29,657 24,878 42,096 27,428 34,861 74,074From Federal sources. . . . . . . . . . . . 18,605 4,756 2,057 1,539 2,367 1,438 1,742 4,705
Through State . . . . . . . . . . . . . . . 17,039 4,474 1,899 1,438 2,198 1,333 1,610 4,087Compensatory programs . . . . . . 6,307 1,740 697 523 822 491 605 1,429Handicapped programs . . . . . . . 2,255 445 226 190 291 191 218 694Child nutrition programs . . . . . . . 5,229 1,408 646 480 712 425 513 1,045
Direct . . . . . . . . . . . . . . . . . . . . . . 1,566 283 159 101 169 106 131 618
From State sources 1 . . . . . . . . . . . . 139,168 26,468 15,039 13,377 20,970 12,651 15,572 35,090General formula assistance . . . . . . 97,246 16,924 9,897 9,735 14,985 9,094 11,323 25,289Handicapped programs . . . . . . . . . 8,834 1,784 1,142 870 1,225 739 847 2,227
From local sources. . . . . . . . . . . . . . 131,457 25,012 12,560 9,961 18,759 13,338 17,547 34,278Taxes . . . . . . . . . . . . . . . . . . . . . 88,638 13,191 8,605 6,516 13,253 9,655 12,727 24,691Contributions from parent 22,431 8,822 1,923 1,731 2,649 1,809 2,275 3,221From other local governments. . . . . 3,018 406 247 218 243 222 420 1,262Current charges . . . . . . . . . . . . . . 7,876 1,223 799 708 1,152 757 956 2,281
School lunch . . . . . . . . . . . . . . 4,318 598 428 409 692 457 591 1,143Other . . . . . . . . . . . . . . . . . . . . . 9,494 1,370 986 789 1,461 896 1,168 2,823
General expenditure . . . . . . . . . . . . . . 292,807 57,451 30,150 25,236 42,574 27,782 35,154 74,460Current spending . . . . . . . . . . . . . . . 258,089 50,876 26,323 21,971 37,470 24,603 31,097 65,749
By function:Instruction . . . . . . . . . . . . . . . . 156,291 30,914 15,650 13,343 22,925 15,140 19,220 39,098Support services . . . . . . . . . . . . 86,319 16,505 8,915 7,197 12,291 8,115 10,206 23,092Other current spending. . . . . . . . 15,479 3,456 1,758 1,432 2,254 1,348 1,671 3,559
By object:Total salaries and wages . . . . . . 166,431 32,889 17,364 14,497 24,463 16,085 20,172 40,961Total employee benefits . . . . . . . 41,357 8,876 4,075 3,372 6,049 3,833 4,803 10,349Other . . . . . . . . . . . . . . . . . . . 50,301 9,111 4,884 4,102 6,958 4,685 6,122 14,439
Capital outlay . . . . . . . . . . . . . . . . . 27,772 5,458 3,188 2,630 4,032 2,460 3,167 6,838Interest on debt . . . . . . . . . . . . . . . . 5,793 1,084 592 557 885 555 767 1,354Payments to other governments . . . . . 1,154 33 46 78 188 165 124 520
Debt outstanding. . . . . . . . . . . . . . . . . 109,924 21,773 11,139 10,073 16,142 10,273 14,818 25,706Long-term. . . . . . . . . . . . . . . . . . . . 106,419 21,668 10,922 9,911 15,605 9,862 14,278 24,173Short-term . . . . . . . . . . . . . . . . . . . 3,505 105 217 161 538 412 540 1,533
Long-term debt issued . . . . . . . . . . . . . 20,989 5,028 2,541 1,455 2,667 1,780 2,721 4,797Long-term debt retired . . . . . . . . . . . . . 9,207 1,684 895 847 1,381 896 1,226 2,277
1 Includes other sources, not shown separately.
Source: U.S. Census Bureau, Internet site <http://www.census.gov/govs/www/school.html> (released June 1999).
Education 181
U.S. Census Bureau, Statistical Abstract of the United States: 1999

No. 286. Public Elementary and Secondary Estimated Finances, 1980 to 1998,and by State, 1998
[In millions of dollars (101,724 represents $101,724,000,000), except as noted. For school years ending in June of year shown]
Year and state
Receipts Expenditures
Total
Revenue receipts
Non-revenue
re-ceipts 1 Total 2
Percapita 3
(dol.)
Current expenditures
Total
SourceEle-
mentaryand
second-ary dayschools
Average per pupilin ADA 4
Federal State LocalAmount
(dol.) Rank
1980 . . . . . . . . 101,724 97,635 9,020 47,929 40,686 4,089 96,105 428 85,661 2,230 (X)1985 . . . . . . . . 146,976 141,013 9,533 69,107 62,373 5,963 139,382 591 127,230 3,483 (X)1990 . . . . . . . . 218,126 208,656 13,184 100,787 94,685 9,469 209,698 850 186,583 4,966 (X)1993 . . . . . . . . 263,460 247,912 17,381 115,924 114,606 15,548 248,898 976 219,297 5,538 (X)1994 . . . . . . . . 275,121 259,587 18,434 119,443 121,710 15,534 262,485 1,018 230,773 5,749 (X)1995 . . . . . . . . 288,658 273,364 18,766 130,139 124,459 15,294 276,502 1,062 242,729 5,950 (X)1996 . . . . . . . . 306,148 286,927 19,323 138,045 129,560 19,221 292,323 1,112 254,254 6,134 (X)1997 . . . . . . . . 320,046 301,404 20,387 147,396 133,621 18,642 308,077 1,162 268,026 6,360 (X)
1998, total . . 333,149 314,187 21,338 155,321 137,528 18,961 323,879 1,210 280,023 6,548 (X)Alabama. . . . . . 4,125 4,030 380 2,601 1,049 94 4,369 1,011 3,669 5,110 45Alaska . . . . . . . 1,325 1,183 148 752 283 142 1,303 2,138 1,202 10,650 1Arizona. . . . . . . 4,858 4,389 344 2,109 1,936 469 4,843 1,064 3,792 4,937 48Arkansas . . . . . 2,462 2,322 193 1,536 594 139 2,544 1,008 2,230 5,222 42California . . . . . 35,479 35,055 3,108 19,921 12,026 425 34,786 1,081 30,159 5,345 41
Colorado. . . . . . 4,625 4,184 235 1,860 2,089 441 4,423 1,136 3,636 5,704 36Connecticut . . . . 5,117 5,113 236 2,065 2,812 4 5,117 1,566 4,719 9,218 4Delaware . . . . . 983 966 69 650 247 17 984 1,339 878 8,576 5District ofColumbia . . . . 496 452 67 - 385 44 598 1,129 566 8,069 7
Florida . . . . . . . 16,079 14,583 1,058 7,068 6,457 1,496 15,763 1,074 12,646 6,137 30Georgia . . . . . . 9,569 8,580 563 4,485 3,531 989 9,672 1,291 7,922 6,177 29Hawaii . . . . . . . 1,364 1,364 102 1,232 31 - 1,300 1,090 1,075 6,127 31Idaho . . . . . . . . 1,436 1,345 88 870 387 91 1,356 1,122 1,164 4,973 47Illinois . . . . . . . 15,176 13,650 954 3,651 9,044 1,526 13,757 1,147 11,530 6,363 23
Indiana. . . . . . . 7,269 7,007 346 3,759 2,901 262 7,203 1,228 5,997 6,642 18Iowa . . . . . . . . 3,388 3,189 117 1,727 1,345 199 3,074 1,077 2,716 5,713 35Kansas. . . . . . . 3,339 3,091 166 1,815 1,110 248 2,967 1,141 2,659 6,348 24Kentucky . . . . . 3,882 3,882 290 2,563 1,029 - 3,830 979 3,569 6,283 27Louisiana . . . . . 4,811 4,251 511 2,117 1,623 560 4,142 951 3,764 5,194 43
Maine. . . . . . . . 1,562 1,520 95 698 727 42 1,562 1,258 1,463 7,107 15Maryland . . . . . 6,572 6,268 358 2,524 3,385 304 6,454 1,267 5,704 7,375 12Massachusetts. . 7,533 7,533 385 2,720 4,428 - 7,312 1,196 6,931 7,861 9Michigan. . . . . . 14,691 13,579 896 11,102 1,581 1,111 13,400 1,370 11,866 7,673 11Minnesota. . . . . 7,279 6,504 252 3,726 2,526 775 7,073 1,509 5,348 6,727 16
Mississippi . . . . 2,610 2,503 326 1,423 755 107 2,564 939 2,232 4,732 49Missouri . . . . . . 6,168 5,841 345 2,337 3,159 327 5,545 1,025 4,669 5,597 38Montana . . . . . . 1,004 989 98 481 411 15 1,011 1,151 913 6,237 28Nebraska . . . . . 1,703 1,689 66 627 996 15 1,850 1,117 1,598 5,846 33Nevada . . . . . . 2,037 1,755 74 551 1,130 282 2,015 1,200 1,500 5,601 37
New Hampshire . 1,466 1,365 43 84 1,239 100 1,338 1,142 1,194 6,556 20New Jersey. . . . 12,651 12,556 390 4,738 7,428 95 12,663 1,571 12,042 10,427 2New Mexico . . . 2,627 2,328 205 1,639 484 299 2,404 1,394 1,744 5,865 32New York . . . . . 29,881 27,691 1,807 11,165 14,719 2,190 28,610 1,577 25,198 9,812 3North Carolina . . 7,518 7,128 506 4,690 1,932 390 7,530 1,013 6,669 5,830 34
North Dakota. . . 686 669 78 279 312 17 623 972 567 4,978 46Ohio . . . . . . . . 13,793 12,694 858 5,495 6,341 1,099 13,504 1,206 11,084 6,539 21Oklahoma . . . . . 3,373 3,119 302 1,951 866 254 3,132 943 2,705 4,634 50Oregon. . . . . . . 3,930 3,525 250 2,175 1,100 405 3,844 1,185 3,296 6,719 17Pennsylvania. . . 15,337 15,327 844 6,315 8,168 10 13,688 1,140 12,968 7,752 10
Rhode Island. . . 1,272 1,272 66 539 667 - 1,215 1,231 1,177 8,429 6South Carolina. . 4,500 4,157 312 2,176 1,668 344 4,080 1,077 3,488 5,555 40South Dakota . . 788 787 73 250 464 1 765 1,036 660 5,166 44Tennessee . . . . 4,701 4,491 356 2,314 1,822 210 4,847 902 4,670 5,591 39Texas. . . . . . . . 26,362 23,920 1,833 10,282 11,805 2,442 26,102 1,346 22,554 6,291 26
Utah . . . . . . . . 2,250 2,249 141 1,409 699 1 2,197 1,064 1,771 3,900 51Vermont . . . . . . 837 815 39 228 547 22 801 1,360 725 7,925 8Virginia. . . . . . . 6,727 6,662 362 2,469 3,831 65 7,630 1,132 6,797 6,569 19Washington . . . . 7,049 6,723 465 4,588 1,669 326 8,065 1,437 5,994 6,488 22West Virginia . . . 2,226 2,176 187 1,368 622 49 2,220 1,223 1,991 7,110 14Wisconsin . . . . . 7,551 7,054 304 3,881 2,869 497 7,159 1,376 6,041 7,272 13Wyoming . . . . . 681 661 45 318 299 20 647 1,347 570 6,312 25
- Represents or rounds to zero. X Not applicable. 1 Amount received by local education agencies from the sales of bondsand real property and equipment, loans, and proceeds from insurance adjustments. 2 Includes interest on school debt and othercurrent expenditures not shown separately. 3 Based on U.S. Census Bureau estimated resident population, as of July 1, theprevious year. Estimates reflect revisions based on the 1990 Census of Population. 4 Average daily attendance.
Source: National Education Association, Washington, DC, Estimates of School Statistics Database (copyright).
182 Education
U.S. Census Bureau, Statistical Abstract of the United States: 1999
No. 287. Computers for Student Instruction in Elementary andSecondary Schools: 1998-99
[(52,289 represents 52,289,000) Market Data Retrieval collects student use computer information in elementary and secondaryschools nationwide through a comprehensive annual technology survey that utilizes both mail and telephone methods]
Level
Totalschools
Totalenroll-ment
(1,000)
Numberof
comput-ers 2
(1,000)
Studentsper
com-puter
Schools, by location ofcomputer 1 (percent) Schools
withInternetaccess
(percent)
Studentsper
computerwith
Internetaccess
Class-rooms
Com-puter
lab
Library/mediacenter
U.S. total . . . . . . . . . . . 109,174 52,289 8,921 5.9 90.9 78.4 74.3 87.9 13.7
Public schools, total . . . . . . . 87,317 47,155 8,213 5.7 93.2 78.7 79.0 90.4 13.6Elementary . . . . . . . . . . . 51,459 23,681 3,742 6.3 94.4 72.7 78.4 88.4 17.3Middle/Junior High . . . . . . 13,268 8,655 1,497 5.8 91.3 93.0 89.0 94.8 13.0Senior High . . . . . . . . . . . 15,632 12,479 2,437 5.1 91.5 88.5 82.1 95.0 11.0K-12/other . . . . . . . . . . . . 6,958 2,341 536 4.4 90.6 75.1 56.9 88.0 6.5
Catholic schools, total . . . . . . 8,189 2,659 352 7.6 78.7 87.6 56.6 80.1 20.0Elementary . . . . . . . . . . . 6,793 1,972 256 7.7 80.8 86.3 51.1 77.0 27.6Secondary . . . . . . . . . . . . 1,234 632 86 7.3 65.9 96.6 87.5 96.8 13.5K-12/other . . . . . . . . . . . . 162 55 9 6.2 82.7 78.8 69.2 91.4 6.2
Other private schools, total. . . 13,668 2,475 357 6.9 78.2 67.6 40.7 70.1 12.1Elementary . . . . . . . . . . . 6,773 1,069 148 7.2 82.9 61.4 35.2 67.5 13.1Secondary . . . . . . . . . . . . 1,058 220 47 4.7 65.7 87.9 66.4 89.4 6.6K-12/other . . . . . . . . . . . . 5,837 1,186 162 7.3 73.6 72.9 43.8 70.3 14.3
1 Estimates based on responses of those indicating location of computers. Computers may also be in other locations.2 Includes estimates for schools not reporting number of computers.
Source: Market Data Retrieval, Shelton, CT, unpublished data (copyright).
No. 288. Public Schools With Access or Planned Access to the Internet:1994 to 1998
[In percent. As of fall. Excludes special education, vocational education, and alternative schools. Based on sample and subjectto sampling error; see source for details]
School characteristic
Percent of schools withInternet access
Percent of instructionalclassrooms with internet access
Percent ofschools in
1996 havingor expecting
to haveaccess to
the Internetby the year
20001994 1995 1996 1997 1998 1994 1995 1996 1997 1998
Total 1 . . . . . . . . . . . . . . 35 50 65 78 89 3 8 14 27 51 95
Instructional level:Elementary . . . . . . . . . . . . . 30 46 61 75 88 3 8 13 24 51 94Secondary . . . . . . . . . . . . . 49 65 77 89 94 4 8 16 32 52 98
Size of enrollment:Less than 300 . . . . . . . . . . . 30 39 57 75 87 3 9 15 27 54 93300 to 999 . . . . . . . . . . . . . 35 52 66 78 89 3 8 13 28 53 961,000 or more . . . . . . . . . . . 58 69 80 89 95 3 4 16 25 45 97
Percent minority enrollment:Less than 6 percent . . . . . . . 38 52 65 84 91 6 9 18 37 57 956 to 20 percent . . . . . . . . . . 38 58 72 87 93 4 10 18 35 59 9721 to 49 percent . . . . . . . . . 38 54 65 73 91 4 9 12 22 52 9850 percent or more . . . . . . . 27 40 56 63 82 3 3 5 13 37 91
Percent of students eligible forfree or reduced-price lunch:Less than 11 percent . . . . . . 40 62 78 88 87 4 9 18 36 62 9711 to 30 percent . . . . . . . . . 39 59 72 83 94 4 10 16 32 53 9831 to 70 percent . . . . . . . . . 33 47 58 78 91 3 7 14 27 52 9371 percent or more . . . . . . . 19 31 53 63 80 2 3 7 14 39 93
1 Includes combined schools.
Source: U.S. National Center for Education Statistics, ‘‘Internet Access in Public Schools and Classrooms: 1994-98’’, IssueBrief, February 1999.
Education 183
U.S. Census Bureau, Statistical Abstract of the United States: 1999
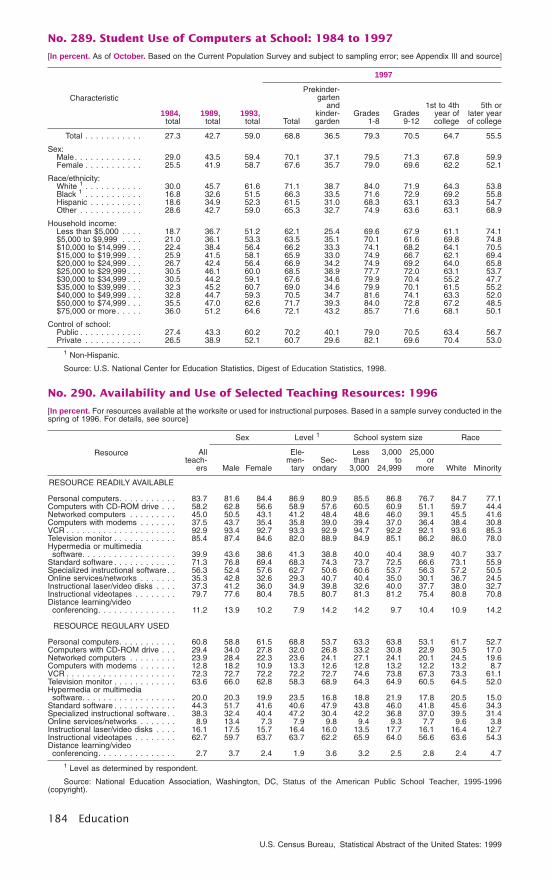
No. 289. Student Use of Computers at School: 1984 to 1997
[In percent. As of October. Based on the Current Population Survey and subject to sampling error; see Appendix III and source]
Characteristic
1984,total
1989,total
1993,total
1997
Total
Prekinder-garten
andkinder-garden
Grades1-8
Grades9-12
1st to 4thyear ofcollege
5th orlater yearof college
Total . . . . . . . . . . . 27.3 42.7 59.0 68.8 36.5 79.3 70.5 64.7 55.5
Sex:Male. . . . . . . . . . . . . 29.0 43.5 59.4 70.1 37.1 79.5 71.3 67.8 59.9Female . . . . . . . . . . . 25.5 41.9 58.7 67.6 35.7 79.0 69.6 62.2 52.1
Race/ethnicity:White 1 . . . . . . . . . . . 30.0 45.7 61.6 71.1 38.7 84.0 71.9 64.3 53.8Black 1 . . . . . . . . . . . 16.8 32.6 51.5 66.3 33.5 71.6 72.9 69.2 55.8Hispanic . . . . . . . . . . 18.6 34.9 52.3 61.5 31.0 68.3 63.1 63.3 54.7Other . . . . . . . . . . . . 28.6 42.7 59.0 65.3 32.7 74.9 63.6 63.1 68.9
Household income:Less than $5,000 . . . . 18.7 36.7 51.2 62.1 25.4 69.6 67.9 61.1 74.1$5,000 to $9,999 . . . . 21.0 36.1 53.3 63.5 35.1 70.1 61.6 69.8 74.8$10,000 to $14,999 . . . 22.4 38.4 56.4 66.2 33.3 74.1 68.2 64.1 70.5$15,000 to $19,999 . . . 25.9 41.5 58.1 65.9 33.0 74.9 66.7 62.1 69.4$20,000 to $24,999 . . . 26.7 42.4 56.4 66.9 34.2 74.9 69.2 64.0 65.8$25,000 to $29,999 . . . 30.5 46.1 60.0 68.5 38.9 77.7 72.0 63.1 53.7$30,000 to $34,999 . . . 30.5 44.2 59.1 67.6 34.6 79.9 70.4 55.2 47.7$35,000 to $39,999 . . . 32.3 45.2 60.7 69.0 34.6 79.9 70.1 61.5 55.2$40,000 to $49,999 . . . 32.8 44.7 59.3 70.5 34.7 81.6 74.1 63.3 52.0$50,000 to $74,999 . . . 35.5 47.0 62.6 71.7 39.3 84.0 72.8 67.2 48.5$75,000 or more . . . . . 36.0 51.2 64.6 72.1 43.2 85.7 71.6 68.1 50.1
Control of school:Public . . . . . . . . . . . . 27.4 43.3 60.2 70.2 40.1 79.0 70.5 63.4 56.7Private . . . . . . . . . . . 26.5 38.9 52.1 60.7 29.6 82.1 69.6 70.4 53.0
1 Non-Hispanic.
Source: U.S. National Center for Education Statistics, Digest of Education Statistics, 1998.
No. 290. Availability and Use of Selected Teaching Resources: 1996
[In percent. For resources available at the worksite or used for instructional purposes. Based in a sample survey conducted in thespring of 1996. For details, see source]
Resource Allteach-
ers
Sex Level 1 School system size Race
Male Female
Ele-men-
tarySec-
ondary
Lessthan
3,000
3,000to
24,999
25,000or
more White Minority
RESOURCE READILY AVAILABLE
Personal computers. . . . . . . . . . . 83.7 81.6 84.4 86.9 80.9 85.5 86.8 76.7 84.7 77.1Computers with CD-ROM drive . . . 58.2 62.8 56.6 58.9 57.6 60.5 60.9 51.1 59.7 44.4Networked computers . . . . . . . . . 45.0 50.5 43.1 41.2 48.4 48.6 46.0 39.1 45.5 41.6Computers with modems . . . . . . . 37.5 43.7 35.4 35.8 39.0 39.4 37.0 36.4 38.4 30.8VCR . . . . . . . . . . . . . . . . . . . . . 92.9 93.4 92.7 93.3 92.9 94.7 92.2 92.1 93.6 85.3Television monitor . . . . . . . . . . . . 85.4 87.4 84.6 82.0 88.9 84.9 85.1 86.2 86.0 78.0Hypermedia or multimediasoftware. . . . . . . . . . . . . . . . . . 39.9 43.6 38.6 41.3 38.8 40.0 40.4 38.9 40.7 33.7
Standard software . . . . . . . . . . . . 71.3 76.8 69.4 68.3 74.3 73.7 72.5 66.6 73.1 55.9Specialized instructional software . . 56.3 52.4 57.6 62.7 50.6 60.6 53.7 56.3 57.2 50.5Online services/networks . . . . . . . 35.3 42.8 32.6 29.3 40.7 40.4 35.0 30.1 36.7 24.5Instructional laser/video disks . . . . 37.3 41.2 36.0 34.9 39.8 32.6 40.0 37.7 38.0 32.7Instructional videotapes . . . . . . . . 79.7 77.6 80.4 78.5 80.7 81.3 81.2 75.4 80.8 70.8Distance learning/videoconferencing. . . . . . . . . . . . . . . 11.2 13.9 10.2 7.9 14.2 14.2 9.7 10.4 10.9 14.2
RESOURCE REGULARY USED
Personal computers. . . . . . . . . . . 60.8 58.8 61.5 68.8 53.7 63.3 63.8 53.1 61.7 52.7Computers with CD-ROM drive . . . 29.4 34.0 27.8 32.0 26.8 33.2 30.8 22.9 30.5 17.0Networked computers . . . . . . . . . 23.9 28.4 22.3 23.6 24.1 27.1 24.1 20.1 24.5 19.6Computers with modems . . . . . . . 12.8 18.2 10.9 13.3 12.6 12.8 13.2 12.2 13.2 8.7VCR . . . . . . . . . . . . . . . . . . . . . 72.3 72.7 72.2 72.2 72.7 74.6 73.8 67.3 73.3 61.1Television monitor . . . . . . . . . . . . 63.6 66.0 62.8 58.3 68.9 64.3 64.9 60.5 64.5 52.0Hypermedia or multimediasoftware. . . . . . . . . . . . . . . . . . 20.0 20.3 19.9 23.5 16.8 18.8 21.9 17.8 20.5 15.0
Standard software . . . . . . . . . . . . 44.3 51.7 41.6 40.6 47.9 43.8 46.0 41.8 45.6 34.3Specialized instructional software . . 38.3 32.4 40.4 47.2 30.4 42.2 36.8 37.0 39.5 31.4Online services/networks . . . . . . . 8.9 13.4 7.3 7.9 9.8 9.4 9.3 7.7 9.6 3.8Instructional laser/video disks . . . . 16.1 17.5 15.7 16.4 16.0 13.5 17.7 16.1 16.4 12.7Instructional videotapes . . . . . . . . 62.7 59.7 63.7 63.7 62.2 65.9 64.0 56.6 63.6 54.3Distance learning/videoconferencing. . . . . . . . . . . . . . . 2.7 3.7 2.4 1.9 3.6 3.2 2.5 2.8 2.4 4.7
1 Level as determined by respondent.
Source: National Education Association, Washington, DC, Status of the American Public School Teacher, 1995-1996(copyright).
184 Education
U.S. Census Bureau, Statistical Abstract of the United States: 1999
No. 291. Technology in Public Schools: 1992 to 1998
[For school year ending in year shown (5,781 represents 5,781,000). Based on surveys of school districts conducted in the springand summer of the school year. For details, see source]
TechnologyNumber Percent of total
1992 1995 1996 1997 1998 1992 1997 1998
Schools with interactive videodiskplayers 1 . . . . . . . . . . . . . . . . . . . . . 6,502 27,059 29,759 30,417 46,804 8 36 54Elementary 2 . . . . . . . . . . . . . . . . . . 2,921 14,594 16,200 16,614 25,907 6 32 49Junior high 3 . . . . . . . . . . . . . . . . . . 1,258 5,460 6,009 6,124 9,202 10 43 64Senior high 4. . . . . . . . . . . . . . . . . . 2,106 6,661 7,195 7,322 10,687 14 42 61
Students represented (1,000) . . . . . . . . 5,781 18,552 20,258 20,706 (NA) 14 45 (NA)
Schools with modems 1 . . . . . . . . . . . . 13,597 35,696 40,147 40,876 61,930 16 48 71Elementary 2 . . . . . . . . . . . . . . . . . . 5,831 18,858 21,733 22,234 35,066 11 43 66Junior high 3 . . . . . . . . . . . . . . . . . . 2,608 6,546 7,286 7,417 10,996 20 53 76Senior high 4. . . . . . . . . . . . . . . . . . 5,001 9,930 10,682 10,781 14,540 30 63 83
Students represented (1,000) . . . . . . . . 10,717 22,372 24,688 25,136 (NA) 25 54 (NA)
Schools with networks 1 . . . . . . . . . . . . 4,184 27,805 31,986 32,299 49,178 5 38 56Elementary 2 . . . . . . . . . . . . . . . . . . 1,583 13,582 16,189 16,441 26,422 3 32 50Junior high 3 . . . . . . . . . . . . . . . . . . 776 5,194 5,971 6,035 9,003 6 43 62Senior high 4. . . . . . . . . . . . . . . . . . 1,736 8,839 9,562 9,565 12,853 10 55 73
Students represented (1,000) . . . . . . . . 3,754 17,540 19,997 20,193 (NA) 9 44 (NA)
Schools with CD-ROMs 1 . . . . . . . . . . . 5,706 40,509 45,918 46,388 64,200 7 54 74Elementary 2 . . . . . . . . . . . . . . . . . . 1,897 22,305 25,965 26,377 37,908 4 51 72Junior high 3 . . . . . . . . . . . . . . . . . . 1,231 7,501 8,341 8,410 11,023 9 60 76Senior high 4. . . . . . . . . . . . . . . . . . 2,543 10,354 11,150 11,140 13,985 15 65 80
Students represented (1,000) . . . . . . . . 5,298 24,121 27,070 27,347 (NA) 12 59 (NA)
Schools with satellite dishes 1 . . . . . . . . 1,129 15,400 16,298 16,232 17,457 1 19 20Elementary 2 . . . . . . . . . . . . . . . . . . 351 5,565 6,014 6,001 6,962 1 11 13Junior high 3 . . . . . . . . . . . . . . . . . . 166 3,214 3,409 3,377 3,255 1 24 23Senior high 4. . . . . . . . . . . . . . . . . . 606 6,550 6,782 6,769 7,052 4 39 40
Students represented (1,000) . . . . . . . . 1,906 8,963 9,270 9,232 (NA) 4 20 (NA)
Schools with cable 1 . . . . . . . . . . . . . . (NA) 63,639 64,310 64,171 66,409 (NA) 75 76Elementary 2 . . . . . . . . . . . . . . . . . . (NA) 38,336 38,714 38,678 39,431 (NA) 74 75Junior high 3 . . . . . . . . . . . . . . . . . . (NA) 11,518 11,575 11,554 11,862 (NA) 82 82Senior high 4. . . . . . . . . . . . . . . . . . (NA) 13,114 13,282 13,208 13,778 (NA) 77 78
Students represented (1,000) . . . . . . . . (NA) 36,284 36,950 36,870 (NA) (NA) 80 (NA)
NA Not available. 1 Includes schools for special education and adult education, not shown separately. 2 Includes K-12,preschool, preschool through 3, K-6, and K-8. 3 Includes schools with grade spans of 4-8, 7-8, and 7-9. 4 Includes 7-12, 9-12,10-12, vocational technical, and alternative high schools.
Source: Quality Education Data, Denver, CO, National Education Database.
No. 292. Student Participation in School Programs: 1993-94
[As of fall. (41,622 represents 41,622,000). Based on survey and subject to sampling error; for details see source]
Control and level
Total students Percent of students participating in program or service
Number(1,000)
Percentdistribu-
tion
Bilin-gual
educa-tion
Englishas a
secondlan-
guage
Reme-dial
reading
Reme-dial
math-ematics
Pro-gramsfor the
dis-abled
Pro-gramsfor thegifted
andtalented
Diag-nostic
andpre-
scrip-tive 1
Ex-tended
day
Public total . . . . . . . . . 41,622 100.0 3.07 3.97 10.88 6.90 6.88 6.43 0.27 2.50School level 2:
Elementary . . . . . . . . . . . 26,886 64.6 3.98 4.75 13.46 7.77 6.76 6.25 0.31 3.58Secondary . . . . . . . . . . . . 13,758 33.1 1.39 2.58 5.63 5.03 6.54 6.90 0.20 0.48Combined . . . . . . . . . . . . 978 2.3 1.80 1.88 13.70 9.39 14.84 4.72 0.44 1.31
Private total. . . . . . . . . 4,971 100.0 0.81 0.58 6.35 4.16 2.98 4.93 0.89 9.20School level 2:
Elementary . . . . . . . . . . . 2,803 56.4 0.77 0.45 7.22 4.33 0.93 3.34 0.94 12.48Secondary . . . . . . . . . . . . 811 16.3 0.19 0.62 4.24 3.06 3.43 8.56 0.47 0.23Combined . . . . . . . . . . . . 1,356 27.3 1.25 0.83 5.82 4.46 6.95 6.05 1.03 7.76
1 Includes testing for reading and cognitive disabilities, for example. 2 Elementary schools have grade 6 or lower and nograde higher than 8. Secondary schools have no grade lower than 7. Combined schools have grades lower than 7 and higherthan 8.
Source: U.S. National Center for Education Statistics, Digest of Education Statistics, 1998.
Education 185
U.S. Census Bureau, Statistical Abstract of the United States: 1999

No. 293. Children and Youth With Disabilities Served by Selected Programs:1990 to 1998
[For school year ending in year shown (4,210.8 represents 4,210,800). Excludes outlying areas. Through 1994, for persons age6 to 21 years old served under IDEA (Individuals with Disabilities Act) Part B and Chapter 1 of ESEA (Elementary and SecondaryEducation Act), SOP (State Operated Programs); beginning 1995, IDEA, Part B only]
Item 1990 1993 1994 1995 1996 1997 1998
All conditions (1,000). . . . . . . . . . . . . . . . . 4,210.8 4,586.2 4,730.4 4,859.1 5,028.7 5,177.6 5,339.4
PERCENT DISTRIBUTION
Specific learning disabilities . . . . . . . . . . . . 48.6 51.3 50.9 51.2 51.3 51.2 51.0Speech or language impairments . . . . . . . . 23.1 21.7 21.4 20.9 20.3 20.1 19.8Mental retardation. . . . . . . . . . . . . . . . . . . 13.0 11.3 11.3 11.4 11.3 11.2 11.0Serious emotional disturbance . . . . . . . . . . 9.0 8.7 8.7 8.8 8.7 8.6 8.5Hearing impairments . . . . . . . . . . . . . . . . . 1.3 1.3 1.3 1.3 1.3 1.3 1.3Orthopedic impairments . . . . . . . . . . . . . . . 1.1 1.1 1.2 1.2 1.2 1.3 1.3Other health impairments . . . . . . . . . . . . . . 1.2 1.4 1.7 2.2 2.6 3.1 3.6Visually impaired . . . . . . . . . . . . . . . . . . . 0.5 0.5 0.5 0.5 0.5 0.5 0.5Multiple disabilities . . . . . . . . . . . . . . . . . . 2.0 2.2 2.3 1.8 1.8 1.9 2.0Deaf-blind . . . . . . . . . . . . . . . . . . . . . . . . (Z) (Z) (Z) (Z) (Z) (Z) (Z)Autism . . . . . . . . . . . . . . . . . . . . . . . . . . (NA) 0.3 0.4 0.5 0.6 0.7 0.8Traumatic brain injury . . . . . . . . . . . . . . . . (NA) 0.1 0.1 0.1 0.2 0.2 0.2
NA Not available. Z less than .05 percent.
Source: U.S. Department of Education, Office of Special Education Programs, Data Analysis System (DANS).
No. 294. Catholic Elementary and Secondary Schools: 1967 to 1998
[As of October 1 (3,860 represents 3,860,000). Regular sessions only]
Item Unit 1967 1970 1975 1980 1985 1990 1995 1996 1997 1998
Elementary schools . . . Number . 10,133 9,362 8,340 8,043 7,811 7,291 7,022 7,005 7,004 6,990Pupils enrolled . . . . 1,000 . . . 3,860 3,355 2,252 2,269 2,061 1,884 2,011 2,014 2,015 2,013Teachers, total 1 . . . 1,000 . . . 110 112 99 97 97 91 119 108 106 106
Religious . . . . . . 1,000 . . . 61 52 35 25 18 11 10 8 7 8Lay . . . . . . . . . . 1,000 . . . 49 60 64 72 78 80 109 99 98 98
Secondary schools . . . Number . 2,192 1,981 1,653 1,516 1,434 1,296 1,228 1,226 1,219 1,227Pupils enrolled . . . . 1,000 . . . 1,081 1,008 890 837 760 592 624 631 634 636Teachers, total 1 . . . 1,000 . . . 51 55 50 49 50 40 48 46 47 47
Religious . . . . . . 1,000 . . . 30 29 20 14 11 7 6 5 5 4Lay . . . . . . . . . . 1,000 . . . 21 26 30 35 39 34 42 41 42 43
1 Beginning 1995, includes part-time teachers.
Source: National Catholic Educational Association, (NCEA) Washington, DC, United States Catholic Elementary andSecondary Schools school year: Annual Statistical Report on Schools, Enrollment & Staffing (copyright.)
No. 295. Private Elementary and Secondary School Teachers—Selected Characteristics: 1993-94
[For school year (65 represents 65,000). Based on survey and subject to sampling error; for details, see source. See Table 279for similar data on public school teachers]
Characteristic Unit
Age Sex Race/ethnicity
Under30 years
old
30 to 39years
old
40 to 49years
old
Over 50years
old MaleFe-
male White 1 Black 1His-
panic
Total teachers 2 . . . 1,000 . . . 65 94 131 88 93 285 348 12 12
Highest degree held:Bachelor’s . . . . . . . Percent . 78.8 63.1 54.0 47.2 47.3 62.8 59.4 55.8 57.4Master’s . . . . . . . . . Percent . 10.8 25.7 35.1 40.5 40.6 26.3 30.2 26.4 19.9Education specialist . Percent . 1.0 2.6 3.4 3.8 2.6 3.0 2.6 4.8 4.4Doctorate . . . . . . . . Percent . 0.2 1.4 2.0 2.6 4.3 0.8 1.6 1.0 2.3
Full-time teachingexperience:Less than 3 years . . Percent . 54.9 21.7 12.6 7.2 21.7 20.6 20.4 26.9 25.53 to 9 years . . . . . . Percent . 44.9 51.2 29.8 13.4 28.2 35.8 33.6 34.9 41.810 to 20 years. . . . . Percent . 0.1 27.1 45.5 30.2 28.7 29.9 30.0 27.9 21.620 years or more . . . Percent . (Z) (Z) 12.1 49.2 21.4 13.7 16.0 10.3 11.1
Full-time teachers . . . . 1,000 . . . 53 82 103 62 70 231 277 9 9Earned income . . . . Dol. . . . . 18,384 21,344 22,190 24,113 27,196 20,007 21,578 23,094 22,912
Salary . . . . . . . . Dol. . . . . 16,062 19,108 20,631 22,500 23,003 18,815 19,717 20,333 20,740
Z Less than .05 percent. 1 Non-Hispanic. 2 Includes teachers with no degrees and associates degrees, not shownseparately.
Source: U.S. National Center for Education Statistics, Digest of Education Statistics, 1997.
186 Education
U.S. Census Bureau, Statistical Abstract of the United States: 1999
No. 296. Scholastic Assessment Test (SAT) Scores and Characteristics of College-Bound Seniors: 1967 to 1998
[The complete publication including this copyright table is available from the U.S. Government Printing Office and the NationalTechnical Information Service]
No. 297. American College Testing (ACT) Program Scores and Characteristicsof College-Bound Students: 1970 to 1998
[For academic year ending in year shown. Except as indicated, test scores and characteristics of college-bound students. Through1980, data based on 10 percent sample; thereafter, based on all ACT tested seniors]
Type of test and characteristic Unit 1970 1975 1980 1985 1990 1 1994 1 1995 1 1996 1 1997 1 1998 1
TEST SCORES 2
Composite . . . . . . . . . . . . . . Point . . . 19.9 18.6 18.5 18.6 20.6 20.8 20.8 20.9 21.0 21.0Male. . . . . . . . . . . . . . . . . Point . . . 20.3 19.5 19.3 19.4 21.0 20.9 21.0 21.0 21.1 21.2Female . . . . . . . . . . . . . . . Point . . . 19.4 17.8 17.9 17.9 20.3 20.7 20.7 20.8 20.8 20.9
English. . . . . . . . . . . . . . . . . Point . . . 18.5 17.7 17.9 18.1 20.5 20.3 20.2 20.3 20.3 20.4Male. . . . . . . . . . . . . . . . . Point . . . 17.6 17.1 17.3 17.6 20.1 19.8 19.8 19.8 19.9 19.9Female . . . . . . . . . . . . . . . Point . . . 19.4 18.3 18.3 18.6 20.9 20.7 20.6 20.7 20.7 20.8
Math . . . . . . . . . . . . . . . . . . Point . . . 20.0 17.6 17.4 17.2 19.9 20.2 20.2 20.2 20.6 20.8Male. . . . . . . . . . . . . . . . . Point . . . 21.1 19.3 18.9 18.6 20.7 20.8 20.9 20.9 21.3 21.5Female . . . . . . . . . . . . . . . Point . . . 18.8 16.2 16.2 16.0 19.3 19.6 19.7 19.7 20.1 20.2
Reading 3 . . . . . . . . . . . . . . . Point . . . 19.7 17.4 17.2 17.4 (NA) 21.2 21.3 21.3 21.3 21.4Male. . . . . . . . . . . . . . . . . Point . . . 20.3 18.7 18.2 18.3 (NA) 21.1 21.1 21.0 21.2 21.1Female . . . . . . . . . . . . . . . Point . . . 19.0 16.4 16.4 16.6 (NA) 21.4 21.4 21.6 21.5 21.6
Science reasoning 4 . . . . . . . . Point . . . 20.8 21.1 21.1 21.2 (NA) 20.9 21.0 21.1 21.1 21.1Male. . . . . . . . . . . . . . . . . Point . . . 21.6 22.4 22.4 22.6 (NA) 21.6 21.6 21.7 21.7 21.8Female . . . . . . . . . . . . . . . Point . . . 20.0 20.0 20.0 20.0 (NA) 20.4 20.5 20.5 20.6 20.6
PARTICIPANTS 5
Total 6 . . . . . . . . . . . . . . 1,000 . . . 788 714 822 739 817 892 945 925 959 995Male . . . . . . . . . . . . . . . . . . Percent . 52 46 45 46 46 45 44 44 44 43White . . . . . . . . . . . . . . . . . . Percent . (NA) 77 83 82 79 76 75 77 74 73Black . . . . . . . . . . . . . . . . . . Percent . 4 7 8 8 9 10 10 10 10 11
Obtaining composite scores 7
of—27 or above . . . . . . . . . . . . Percent . 14 14 13 14 12 13 13 13 14 1418 or below . . . . . . . . . . . . Percent . 21 33 33 32 35 34 34 34 33 33
Planned educational major:Business 8 . . . . . . . . . . . . . Percent . 18 21 20 21 20 14 14 13 11 12Engineering . . . . . . . . . . . . Percent . 8 6 8 9 9 9 9 9 8 7Social science 9 . . . . . . . . . Percent . 10 9 6 7 10 9 9 9 8 9Education . . . . . . . . . . . . . Percent . 16 12 9 6 8 10 9 9 9 10
NA Not available. 1 Beginning 1990, not comparable with previous years because a new version of the ACT was introduced.Estimated average composite scores for prior years: 1989, 20.6; 1988, 1987, and 1986, 20.8. 2 Minimum score, 1; maximumscore, 36. 3 Prior to 1990, social studies; data not comparable with previous years. 4 Prior to 1990, natural sciences; data notcomparable with previous years. 5 Beginning 1985, data are for seniors who graduated in year shown and had taken the ACTin their junior or senior years. Data by race are for those responding to the race question. 6 788 represents 788,000. 7 Priorto 1990, 26 or above and 15 or below. 8 Includes political and persuasive (e.g. sales) fields through 1975; thereafter, businessand commerce. 9 Includes religion through 1975.
Source: The ACT, Inc., Iowa City, IA, High School Profile Report, annual.
Education 187
U.S. Census Bureau, Statistical Abstract of the United States: 1999
No. 298. Proficiency Test Scores for Selected Subjects, by Characteristic:1977 to 1996
[Based on The National Assessment of Educational Progress Tests which are administered to a representative sample of studentsin public and private schools. Test scores can range from 0 to 500. For details, see source]
Test and year
Total
Sex Race
His-panicorigin
Parental education
Male Female White 1 Black 1
Lessthanhigh
schoolHigh
school
More than high school
TotalSome
college
Collegegradu-
ate
READING
9 year olds:1979-80. . . . . . . . . 215 210 220 221 189 190 194 213 226 (NA) (NA)1987-88. . . . . . . . . 212 208 216 218 189 194 193 211 220 (NA) (NA)1993-94. . . . . . . . . 211 207 215 218 185 186 189 207 221 (NA) (NA)1995-96. . . . . . . . . 212 207 218 220 190 194 197 207 220 (NA) (NA)
13 year olds:1979-80. . . . . . . . . 259 254 263 264 233 237 239 254 271 (NA) (NA)1987-88. . . . . . . . . 258 252 263 261 243 240 247 253 265 (NA) (NA)1993-94. . . . . . . . . 258 251 266 265 234 235 237 251 269 (NA) (NA)1995-96. . . . . . . . . 259 253 265 267 236 240 241 252 270 (NA) (NA)
17 year olds:1979-80. . . . . . . . . 286 282 289 293 243 261 262 278 299 (NA) (NA)1987-88. . . . . . . . . 290 286 294 295 274 271 267 282 300 (NA) (NA)1993-94. . . . . . . . . 288 282 295 296 266 263 268 276 299 (NA) (NA)1995-96. . . . . . . . . 287 280 294 294 265 265 267 273 297 (NA) (NA)
WRITING 2
4th graders:1983-84. . . . . . . . . 204 201 208 211 182 189 179 192 217 208 2181987-88. . . . . . . . . 206 199 213 215 173 190 194 199 212 211 2121993-94. . . . . . . . . 205 196 214 214 173 189 188 202 (NA) 212 2121995-96. . . . . . . . . 207 200 214 216 182 191 190 203 (NA) 205 214
8th graders:1983-84. . . . . . . . . 267 258 276 272 247 247 258 261 276 271 2781987-88. . . . . . . . . 264 254 274 269 246 250 254 258 271 275 2711993-94. . . . . . . . . 265 254 278 272 245 252 250 259 (NA) 270 2751995-96. . . . . . . . . 264 251 276 271 242 246 245 258 (NA) 270 274
11th graders:1983-84. . . . . . . . . 290 281 299 297 270 259 274 284 299 298 3001987-88. . . . . . . . . 291 282 299 296 275 274 276 285 298 296 2991993-94. . . . . . . . . 285 276 293 291 267 271 269 279 (NA) 286 2931995-96. . . . . . . . . 283 275 292 289 267 269 260 275 (NA) 287 291
MATHEMATICS9 year olds:
1977-78. . . . . . . . . 219 217 220 224 192 203 200 219 231 230 2311985-86. . . . . . . . . 222 222 222 227 202 205 201 218 231 229 2311993-94. . . . . . . . . 231 232 230 237 212 210 210 225 (NA) 239 2381995-96. . . . . . . . . 231 233 229 237 212 215 220 221 (NA) 238 240
13 year olds:1977-78. . . . . . . . . 264 264 265 272 230 238 245 263 280 273 2841985-86. . . . . . . . . 269 270 268 274 249 254 252 263 278 274 2801993-94. . . . . . . . . 274 276 273 281 252 256 255 266 (NA) 277 2851995-96. . . . . . . . . 274 276 272 281 252 256 254 267 (NA) 278 283
17 year olds:1977-78. . . . . . . . . 300 304 297 306 268 276 280 294 313 305 3171985-86. . . . . . . . . 302 305 299 308 279 283 279 293 310 305 3141993-94. . . . . . . . . 306 309 304 312 286 291 284 295 (NA) 305 3181995-96. . . . . . . . . 307 310 305 313 286 292 281 297 (NA) 307 317
SCIENCE9 year olds:
1976-77. . . . . . . . . 220 222 218 230 175 192 199 223 233 237 2321985-86. . . . . . . . . 224 227 221 232 196 199 204 220 235 236 2351993-94. . . . . . . . . 231 232 230 240 201 201 211 225 (NA) 239 2391995-96. . . . . . . . . 230 232 228 239 201 207 215 222 (NA) 242 240
13 year olds:1976-77. . . . . . . . . 247 251 244 256 208 213 224 245 264 260 2661985-86. . . . . . . . . 251 256 247 259 222 226 229 245 262 258 2641993-94. . . . . . . . . 257 259 254 267 224 232 234 247 (NA) 260 2691995-96. . . . . . . . . 256 261 252 266 226 232 232 248 (NA) 260 266
17 year olds:1976-77. . . . . . . . . 290 297 282 298 240 262 265 284 304 296 3091985-86. . . . . . . . . 289 295 282 298 253 259 258 277 300 295 3041993-94. . . . . . . . . 294 300 289 306 257 261 256 279 (NA) 295 3111995-96. . . . . . . . . 296 300 292 307 260 269 261 282 (NA) 297 308
HISTORY, 1993-944th graders . . . . . . . . 205 203 206 215 177 180 177 197 (NA) 214 2168th graders: . . . . . . . . 259 259 259 267 239 243 241 251 (NA) 264 27012th graders . . . . . . . 286 288 285 292 265 267 263 276 (NA) 287 296
GEOGRAPHY,1993-94
4th graders . . . . . . . . 206 208 203 218 168 183 186 197 (NA) 216 2168th graders . . . . . . . . 260 262 258 270 229 239 238 250 (NA) 265 27212th graders . . . . . . . 285 288 281 291 258 268 263 274 (NA) 286 294
NA Not available. 1 Non-Hispanic. 2 Writing scores revised from previous years; previous writing scores were recordedon a 0 to 400 rather than 0 to 500 scale.
Source: U.S. National Center for Education Statistics, Digest of Education Statistics, annual.
188 Education
U.S. Census Bureau, Statistical Abstract of the United States: 1999
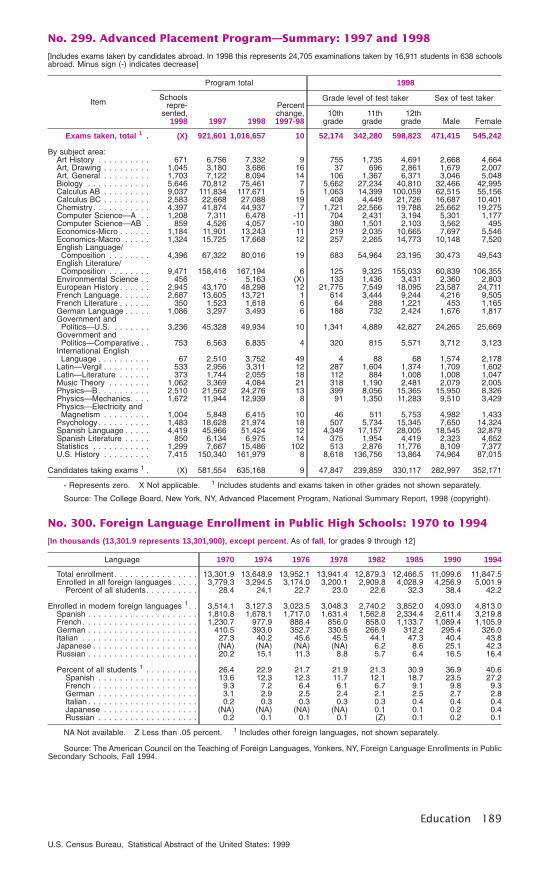
No. 299. Advanced Placement Program—Summary: 1997 and 1998
[Includes exams taken by candidates abroad. In 1998 this represents 24,705 examinations taken by 16,911 students in 638 schoolsabroad. Minus sign (-) indicates decrease]
Item
Program total 1998
Schoolsrepre-
sented,1998 1997 1998
Percentchange,1997-98
Grade level of test taker Sex of test taker
10thgrade
11thgrade
12thgrade Male Female
Exams taken, total 1 . (X) 921,601 1,016,657 10 52,174 342,280 598,823 471,415 545,242
By subject area:Art History . . . . . . . . . . 671 6,756 7,332 9 755 1,735 4,691 2,668 4,664Art, Drawing . . . . . . . . . 1,045 3,180 3,686 16 37 696 2,861 1,679 2,007Art, General . . . . . . . . . 1,703 7,122 8,094 14 106 1,367 6,371 3,046 5,048Biology . . . . . . . . . . . . 5,646 70,812 75,461 7 5,662 27,234 40,810 32,466 42,995Calculus AB . . . . . . . . . 9,037 111,834 117,671 5 1,063 14,399 100,059 62,515 55,156Calculus BC . . . . . . . . . 2,583 22,668 27,088 19 408 4,449 21,726 16,687 10,401Chemistry . . . . . . . . . . . 4,397 41,874 44,937 7 1,721 22,566 19,788 25,662 19,275Computer Science—A . . 1,208 7,311 6,478 -11 704 2,431 3,194 5,301 1,177Computer Science—AB . 859 4,526 4,057 -10 380 1,501 2,103 3,562 495Economics-Micro . . . . . . 1,184 11,901 13,243 11 219 2,035 10,665 7,697 5,546Economics-Macro . . . . . 1,324 15,725 17,668 12 257 2,265 14,773 10,148 7,520English Language/Composition . . . . . . . . 4,396 67,322 80,016 19 683 54,964 23,195 30,473 49,543
English Literature/Composition . . . . . . . . 9,471 158,416 167,194 6 125 9,325 155,033 60,839 106,355
Environmental Science . . 456 - 5,163 (X) 133 1,436 3,431 2,360 2,803European History . . . . . . 2,945 43,170 48,298 12 21,775 7,549 18,095 23,587 24,711French Language. . . . . . 2,687 13,605 13,721 1 614 3,444 9,244 4,216 9,505French Literature . . . . . . 350 1,523 1,618 6 64 288 1,221 453 1,165German Language . . . . . 1,086 3,297 3,493 6 188 732 2,424 1,676 1,817Government andPolitics—U.S. . . . . . . . 3,236 45,328 49,934 10 1,341 4,889 42,827 24,265 25,669
Government andPolitics—Comparative . . 753 6,563 6,835 4 320 815 5,571 3,712 3,123
International EnglishLanguage . . . . . . . . . . 67 2,510 3,752 49 4 88 68 1,574 2,178
Latin—Vergil . . . . . . . . . 533 2,956 3,311 12 287 1,604 1,374 1,709 1,602Latin—Literature . . . . . . 373 1,744 2,055 18 112 884 1,008 1,008 1,047Music Theory . . . . . . . . 1,062 3,369 4,084 21 318 1,190 2,481 2,079 2,005Physics—B . . . . . . . . . . 2,510 21,562 24,276 13 399 8,056 15,365 15,950 8,326Physics—Mechanics. . . . 1,672 11,944 12,939 8 91 1,350 11,283 9,510 3,429Physics—Electricity andMagnetism . . . . . . . . . 1,004 5,848 6,415 10 46 511 5,753 4,982 1,433
Psychology . . . . . . . . . . 1,483 18,628 21,974 18 507 5,734 15,345 7,650 14,324Spanish Language . . . . . 4,419 45,966 51,424 12 4,349 17,157 28,005 18,545 32,879Spanish Literature . . . . . 850 6,134 6,975 14 375 1,954 4,419 2,323 4,652Statistics . . . . . . . . . . . 1,299 7,667 15,486 102 513 2,876 11,776 8,109 7,377U.S. History . . . . . . . . . 7,415 150,340 161,979 8 8,618 136,756 13,864 74,964 87,015
Candidates taking exams 1 . (X) 581,554 635,168 9 47,847 239,859 330,117 282,997 352,171
- Represents zero. X Not applicable. 1 Includes students and exams taken in other grades not shown separately.
Source: The College Board, New York, NY, Advanced Placement Program, National Summary Report, 1998 (copyright).
No. 300. Foreign Language Enrollment in Public High Schools: 1970 to 1994
[In thousands (13,301.9 represents 13,301,900), except percent. As of fall, for grades 9 through 12]
Language 1970 1974 1976 1978 1982 1985 1990 1994
Total enrollment . . . . . . . . . . . . . . . . 13,301.9 13,648.9 13,952.1 13,941.4 12,879.3 12,466.5 11,099.6 11,847.5Enrolled in all foreign languages . . . . . 3,779.3 3,294.5 3,174.0 3,200.1 2,909.8 4,028.9 4,256.9 5,001.9
Percent of all students. . . . . . . . . . 28.4 24.1 22.7 23.0 22.6 32.3 38.4 42.2
Enrolled in modern foreign languages 1 . . 3,514.1 3,127.3 3,023.5 3,048.3 2,740.2 3,852.0 4,093.0 4,813.0Spanish . . . . . . . . . . . . . . . . . . . . . 1,810.8 1,678.1 1,717.0 1,631.4 1,562.8 2,334.4 2,611.4 3,219.8French . . . . . . . . . . . . . . . . . . . . . . 1,230.7 977.9 888.4 856.0 858.0 1,133.7 1,089.4 1,105.9German . . . . . . . . . . . . . . . . . . . . . 410.5 393.0 352.7 330.6 266.9 312.2 295.4 326.0Italian . . . . . . . . . . . . . . . . . . . . . . 27.3 40.2 45.6 45.5 44.1 47.3 40.4 43.8Japanese . . . . . . . . . . . . . . . . . . . . (NA) (NA) (NA) (NA) 6.2 8.6 25.1 42.3Russian . . . . . . . . . . . . . . . . . . . . . 20.2 15.1 11.3 8.8 5.7 6.4 16.5 16.4
Percent of all students 1 . . . . . . . . . . 26.4 22.9 21.7 21.9 21.3 30.9 36.9 40.6Spanish . . . . . . . . . . . . . . . . . . . 13.6 12.3 12.3 11.7 12.1 18.7 23.5 27.2French . . . . . . . . . . . . . . . . . . . . 9.3 7.2 6.4 6.1 6.7 9.1 9.8 9.3German . . . . . . . . . . . . . . . . . . . 3.1 2.9 2.5 2.4 2.1 2.5 2.7 2.8Italian . . . . . . . . . . . . . . . . . . . . . 0.2 0.3 0.3 0.3 0.3 0.4 0.4 0.4Japanese . . . . . . . . . . . . . . . . . . (NA) (NA) (NA) (NA) 0.1 0.1 0.2 0.4Russian . . . . . . . . . . . . . . . . . . . 0.2 0.1 0.1 0.1 (Z) 0.1 0.2 0.1
NA Not available. Z Less than .05 percent. 1 Includes other foreign languages, not shown separately.
Source: The American Council on the Teaching of Foreign Languages, Yonkers, NY, Foreign Language Enrollments in PublicSecondary Schools, Fall 1994.
Education 189
U.S. Census Bureau, Statistical Abstract of the United States: 1999
No. 301. Public High School Graduates, by State: 1980 to 1998
[In thousands (2,747.7 represents 2,747,000). For school year ending in year shown]
State 1980 1990 19951998,
est.
United States . 2,747.7 2,320.3 2,273.5 2,433.4Alabama . . . . . . . . 45.2 40.5 36.3 35.3Alaska . . . . . . . . . 5.2 5.4 5.8 6.1Arizona . . . . . . . . . 28.6 32.1 31.0 36.1Arkansas. . . . . . . . 29.1 26.5 24.6 25.9California. . . . . . . . 249.2 236.3 255.2 282.7Colorado . . . . . . . . 36.8 33.0 32.4 34.7Connecticut . . . . . . 37.7 27.9 26.4 28.8Delaware. . . . . . . . 7.6 5.6 5.2 5.9District of Columbia . 5.0 3.6 3.0 2.7Florida . . . . . . . . . 87.3 88.9 89.8 95.4Georgia . . . . . . . . 61.6 56.6 56.7 63.0Hawaii . . . . . . . . . 11.5 10.3 9.4 9.8Idaho . . . . . . . . . . 13.2 12.0 14.2 15.1Illinois . . . . . . . . . . 135.6 108.1 105.2 113.9Indiana . . . . . . . . . 73.1 60.0 56.1 58.2Iowa. . . . . . . . . . . 43.4 31.8 31.3 33.8Kansas . . . . . . . . . 30.9 25.4 26.1 27.8Kentucky. . . . . . . . 41.2 38.0 37.6 37.0Louisiana . . . . . . . 46.3 36.1 36.5 36.9Maine . . . . . . . . . . 15.4 13.8 11.5 12.6Maryland. . . . . . . . 54.3 41.6 41.4 43.9Massachusetts . . . . 73.8 55.9 47.7 49.9Michigan . . . . . . . . 124.3 93.8 84.6 93.7Minnesota . . . . . . . 64.9 49.1 49.4 54.9Mississippi. . . . . . . 27.6 25.2 23.8 24.2
State 1980 1990 19951998,
est.
Missouri . . . . . . . . 62.3 49.0 48.9 51.9Montana . . . . . . . . 12.1 9.4 10.1 10.6Nebraska . . . . . . . 22.4 17.7 18.0 20.3Nevada. . . . . . . . . 8.5 9.5 10.0 11.6New Hampshire . . . 11.7 10.8 10.1 9.3New Jersey . . . . . . 94.6 69.8 67.4 72.2New Mexico. . . . . . 18.4 14.9 14.9 15.4New York . . . . . . . 204.1 143.3 132.4 140.5North Carolina . . . . 70.9 64.8 59.5 59.4North Dakota . . . . . 9.9 7.7 7.8 8.1Ohio. . . . . . . . . . . 144.2 114.5 109.4 109.0Oklahoma . . . . . . . 39.3 35.6 33.3 33.6Oregon . . . . . . . . . 29.9 25.5 26.7 27.7Pennsylvania . . . . . 146.5 110.5 104.1 111.4Rhode Island . . . . . 10.9 7.8 7.8 7.0South Carolina . . . . 38.7 32.5 30.7 34.0South Dakota. . . . . 10.7 7.7 8.4 12.0Tennessee. . . . . . . 49.8 46.1 43.6 46.0Texas . . . . . . . . . . 171.4 172.5 170.3 185.1Utah. . . . . . . . . . . 20.0 21.2 27.7 32.0Vermont . . . . . . . . 6.7 6.1 5.9 6.2Virginia . . . . . . . . . 66.6 60.6 58.3 64.4Washington . . . . . . 50.4 45.9 49.3 55.0West Virginia . . . . . 23.4 21.9 20.1 20.1Wisconsin . . . . . . . 69.3 52.0 51.7 56.3Wyoming. . . . . . . . 6.1 5.8 5.9 6.1
Source: U.S. National Center for Education Statistics, Digest of Education Statistics, annual.
No. 302. High School Dropouts, by Race and Hispanic Origin: 1975 to 1997
[In percent. As of October]
Item 1975 1980 1985 1989 1 1990 1991 1992 1993 1994 1995 1996 1997
EVENT DROPOUTS 2
Total 3. . . . . . . . . . 5.8 6.0 5.2 4.5 4.0 4.0 4.3 4.2 5.0 5.4 4.7 4.3White . . . . . . . . . . . . . . 5.4 5.6 4.8 3.9 3.8 3.7 4.1 4.1 4.7 5.1 4.5 4.2
Male. . . . . . . . . . . . . 5.0 6.4 4.9 4.1 4.1 3.6 3.8 4.1 4.6 5.4 4.8 4.9Female . . . . . . . . . . . 5.8 4.9 4.7 3.8 3.5 3.8 4.4 4.1 4.9 4.8 4.1 3.5
Black . . . . . . . . . . . . . . 8.7 8.3 7.7 7.7 5.1 6.2 4.9 5.4 6.2 6.1 6.3 4.8Male. . . . . . . . . . . . . 8.3 8.0 8.3 6.9 4.1 5.5 3.3 5.7 6.5 7.9 4.6 4.1Female . . . . . . . . . . . 9.0 8.5 7.2 8.6 6.0 7.0 6.7 5.0 5.7 4.4 7.8 5.7
Hispanic 4 . . . . . . . . . . . 10.9 11.5 9.7 7.7 8.0 7.3 7.9 5.4 9.2 11.6 8.4 8.6Male. . . . . . . . . . . . . 10.1 16.9 9.3 7.6 8.7 10.4 5.8 5.7 8.4 10.9 9.2 10.4Female . . . . . . . . . . . 11.6 6.9 9.8 7.7 7.2 4.8 8.6 5.0 10.1 12.5 7.6 6.7
STATUS DROPOUTS 5
Total 3. . . . . . . . . . 15.6 15.6 13.9 14.4 13.6 14.2 12.7 12.7 13.3 13.9 12.8 13.0White . . . . . . . . . . . . . . 13.9 14.4 13.5 14.1 13.5 14.2 12.2 12.2 12.7 13.6 12.5 12.4
Male. . . . . . . . . . . . . 13.5 15.7 14.7 15.4 14.2 15.4 13.3 13.0 13.6 14.3 12.9 13.8Female . . . . . . . . . . . 14.2 13.2 12.3 12.8 12.8 13.1 11.1 11.5 11.7 13.0 12.1 10.9
Black . . . . . . . . . . . . . . 27.3 23.5 17.6 16.4 15.1 15.6 16.3 16.4 15.5 14.4 16.0 16.7Male. . . . . . . . . . . . . 27.8 26.0 18.8 18.6 13.6 15.4 15.5 15.6 17.5 14.2 17.4 17.5Female . . . . . . . . . . . 26.9 21.5 16.6 14.5 16.2 15.8 17.1 17.2 13.7 14.6 14.7 16.1
Hispanic 4 . . . . . . . . . . . 34.9 40.3 31.5 37.7 37.3 39.6 33.9 32.7 34.7 34.7 34.5 30.6Male. . . . . . . . . . . . . 32.6 42.6 35.8 40.3 39.8 44.4 38.4 34.7 36.1 34.2 36.2 33.2Female . . . . . . . . . . . 36.8 38.1 27.0 35.0 34.5 34.5 29.6 31.0 33.1 35.4 32.7 27.6
1 Beginning 1989 reflects new editing procedures for cases with missing data on school enrollment. 2 Percent of studentswho drop out in a single year without completing high school. For grades 10 to 12. 3 Includes other races, not shownseparately. 4 Persons of Hispanic origin may be of any race. 5 Percent of the population who have not completed high schooland are not enrolled, regardless of when they dropped out. For persons 18 to 24 years old.
Source: U.S. Census Bureau, Current Population Reports, P20-516.
190 Education
U.S. Census Bureau, Statistical Abstract of the United States: 1999
No. 303. High School Dropouts by Age, Race, and Hispanic Origin:1970 to 1997
[As of October (4,670 represents 4,670,000). For persons 14 to 24 years old. See Table 305 for definition of dropouts]
Age and raceNumber of dropouts (1,000) Percent of population
1970 1980 1990 1995 1997 1970 1980 1990 1995 1997
Total dropouts 1 2 . . . . . . . . . 4,670 5,212 3,854 3,963 3,708 12.2 12.0 10.1 9.9 9.116 to 17 years . . . . . . . . . . . . . . 617 709 418 406 387 8.0 8.8 6.3 5.4 4.918 to 21 years . . . . . . . . . . . . . . 2,138 2,578 1,921 1,980 1,929 16.4 15.8 13.4 14.2 13.322 to 24 years . . . . . . . . . . . . . . 1,770 1,798 1,458 1,491 1,307 18.7 15.2 13.8 13.6 12.5
White 2 . . . . . . . . . . . . . . . . . 3,577 4,169 3,127 3,098 2,842 10.8 11.3 10.1 9.7 8.816 to 17 years . . . . . . . . . . . . . . 485 619 334 314 294 7.3 9.2 6.4 5.4 4.718 to 21 years . . . . . . . . . . . . . . 1,618 2,032 1,516 1,530 1,489 14.3 14.7 13.1 13.8 12.722 to 24 years . . . . . . . . . . . . . . 1,356 1,416 1,235 1,181 987 16.3 14.0 14.0 13.4 11.9
Black 2. . . . . . . . . . . . . . . . . . 1,047 934 611 605 693 22.2 16.0 10.9 10.0 11.216 to 17 years . . . . . . . . . . . . . . 125 80 73 70 73 12.8 6.9 6.9 5.8 5.618 to 21 years . . . . . . . . . . . . . . 500 486 345 328 354 30.5 23.0 16.0 15.8 16.922 to 24 years . . . . . . . . . . . . . . 397 346 185 194 257 37.8 24.0 13.5 12.5 16.6
Hispanic 2 3 . . . . . . . . . . . . . . (NA) 919 1,122 1,355 1,196 (NA) 29.5 26.8 24.7 21.016 to 17 years . . . . . . . . . . . . . . (NA) 92 89 94 77 (NA) 16.6 12.9 10.7 7.318 to 21 years . . . . . . . . . . . . . . (NA) 470 502 652 561 (NA) 40.3 32.9 29.9 27.122 to 24 years . . . . . . . . . . . . . . (NA) 323 523 598 542 (NA) 40.6 42.8 37.4 35.3
NA Not available. 1 Includes other groups not shown separately. 2 Includes persons 14 to 15 years, not shownseparately. 3 Persons of Hispanic origin may be of any race.
Source: U.S. Census Bureau, Current Population Reports, P20-516; and earlier reports.
No. 304. Enrollment Status, by Race, Hispanic Origin, and Sex: 1975 and 1997
[As of October (15,693 represents 15,693,000). For persons 18 to 21 years old. For the civilian noninstitutional population.Based on the Current Population Survey; see text, Section 1, Population, and Appendix III]
Characteristic
Totalpersons18 to 21years old(1,000)
Percent distribution
Enrolled inhigh school
High school graduates Not highschool
graduatesTotal In college
1975 1997 1975 1997 1975 1997 1975 1997 1975 1997
Total 1 . . . . . . . . . . . . . . 15,693 14,550 5.7 9.2 78.0 77.5 33.5 44.7 16.3 13.3White . . . . . . . . . . . . . . . . . . . . 13,448 11,706 4.7 8.0 80.6 79.2 34.6 46.1 14.7 12.7Black . . . . . . . . . . . . . . . . . . . . 1,997 2,100 12.5 14.6 60.4 68.7 24.9 33.4 27.0 16.9Hispanic 2 . . . . . . . . . . . . . . . . . 899 2,072 12.0 11.8 57.2 60.7 24.4 27.5 30.8 27.1
Male 1 . . . . . . . . . . . . . . . . 7,584 7,338 7.4 10.7 76.6 74.6 35.4 42.0 15.9 14.7White . . . . . . . . . . . . . . . . . . . . 6,545 5,982 6.2 9.1 79.7 76.5 36.9 43.5 14.1 14.3Black . . . . . . . . . . . . . . . . . . . . 911 992 15.9 18.8 55.0 63.0 23.9 28.1 29.0 18.4Hispanic 2 . . . . . . . . . . . . . . . . . 416 1,108 17.3 12.8 54.6 57.1 25.2 23.9 27.9 30.0
Female 1. . . . . . . . . . . . . . . 8,109 7,212 4.2 7.6 79.2 80.5 31.8 47.5 16.6 11.8White . . . . . . . . . . . . . . . . . . . . 6,903 5,724 3.2 6.9 81.4 82.0 32.4 48.8 15.3 11.1Black . . . . . . . . . . . . . . . . . . . . 1,085 1,107 9.7 10.7 65.0 73.9 25.8 38.1 25.4 15.4Hispanic 2 . . . . . . . . . . . . . . . . . 484 964 7.6 10.8 59.3 65.0 23.6 31.7 33.1 23.8
1 Includes other races not shown separately. 2 Persons of Hispanic origin may be of any race.
Source: U.S. Census Bureau, Current Population Reports, P20-516; and earlier reports.
No. 305. Employment Status of High School Graduates andSchool Dropouts: 1980 to 1998
[In thousands (11,622 represents 11,622,000), except percent. As of October. For civilian noninstitutional population 16 to 24years old. Based on Current Population Survey; see text, Section 1, Population, and Appendix III]
Employment status,sex, and race
Graduates 1 Dropouts 2
1980 1990 1995 3 1998 3 1980 1990 1995 3 1998 3
Civilian population . . . . . . . . . . 11,622 8,370 6,627 6,659 5,254 3,800 3,876 3,942In labor force . . . . . . . . . . . . . . . . . . . 9,795 7,107 5,530 5,668 3,549 2,506 2,443 2,579
Percent of population . . . . . . . . . 84.3 84.9 83.4 85.1 67.5 66.0 63.0 65.4Employed . . . . . . . . . . . . . . . . . . . . 8,567 6,279 4,863 5,147 2,651 1,993 1,894 2,174
Percent of labor force . . . . . . . . 87.5 88.3 87.9 90.8 74.7 79.5 77.5 84.3
Unemployed . . . . . . . . . . . . . . . . . . 1,228 828 667 520 898 513 549 405Unemployment rate, total 4 . . . . . . . 12.5 11.7 12.1 9.2 25.3 20.5 22.5 15.7
Male . . . . . . . . . . . . . . . . . . . . 13.5 11.1 11.7 8.6 23.5 18.8 19.2 13.9Female . . . . . . . . . . . . . . . . . . 11.5 12.3 12.5 9.9 28.7 23.5 28.8 19.3White . . . . . . . . . . . . . . . . . . . 10.8 9.0 10.5 7.2 21.6 17.0 19.1 14.1Black . . . . . . . . . . . . . . . . . . . 26.1 26.0 20.3 18.8 43.9 43.3 48.0 24.5
Not in labor force . . . . . . . . . . . . . . . . 1,827 1,262 1,097 992 1,705 1,294 1,433 1,363Percent of population . . . . . . . . . . . . 15.7 15.1 16.6 14.9 32.5 34.1 37.0 34.6
1 For persons not enrolled in college who have completed 4 years of high school only. 2 For persons not in regular schooland who have not completed the 12th grade nor received a general equivalency degree. 3 See footnote 2, Table 649.4 Includes other races not shown separately.
Source: U.S. Bureau of Labor Statistics, Bulletin 2307; News, USDL 99-175, June 25, 1999; and unpublished data.
Education 191
U.S. Census Bureau, Statistical Abstract of the United States: 1999

No. 306. General Educational Development (GED) Credentials Issued:1974 to 1996
[GEDs issued in thousands (295 represents 295,000). Includes outlying areas]
Year GEDsissued
Percent distribution by age of test taker
Under19 years old
20 to 24years old
25 to 29years old
30 to 34years old
35 years oldand over
1974 . . . . . . . . . . . 295 35 27 13 9 171975 . . . . . . . . . . . 342 33 26 14 9 181980 . . . . . . . . . . . 488 37 27 13 8 151985 . . . . . . . . . . . 427 33 26 15 10 161990 . . . . . . . . . . . 419 35 25 14 10 17
1992 . . . . . . . . . . . 465 32 28 13 11 161993 . . . . . . . . . . . 476 33 27 14 11 161994 . . . . . . . . . . . 499 34 26 13 10 161995 . . . . . . . . . . . 513 37 25 13 10 151996 . . . . . . . . . . . 514 40 25 13 9 15
Source: U.S. National Center for Education Statistics, Digest of Education Statistics, 1998.
No. 307. College Enrollment of Recent High School Graduates: 1960 to 1997
[High school graduates in thousands (1,679 represents 1,679,000). For persons 16 to 24 who graduated from high school inthe preceeding 12 months. Includes persons receiving GEDs. Based on surveys and subject to sampling error]
YearNumber of high school graduates Percent enrolled in college 2
Total 1 Male Female White Black Total 1 Male Female White Black
1960 . . . . . . . . 1,679 756 923 1,565 (NA) 45.1 54.0 37.9 45.8 (NA)1965 . . . . . . . . 2,659 1,254 1,405 2,417 (NA) 50.9 57.3 45.3 51.7 (NA)1970 . . . . . . . . 2,757 1,343 1,414 2,461 (NA) 51.8 55.2 48.5 52.0 (NA)1975 . . . . . . . . 3,186 1,513 1,673 2,825 (NA) 50.7 52.6 49.0 51.2 (NA)
1980 . . . . . . . . 3,089 1,500 1,589 2,682 361 49.3 46.7 51.8 49.9 41.81982 . . . . . . . . 3,100 1,508 1,592 2,644 384 50.6 49.0 52.1 52.0 36.51983 . . . . . . . . 2,964 1,390 1,574 2,496 392 52.7 51.9 53.4 55.0 38.51984 . . . . . . . . 3,012 1,429 1,583 2,514 438 55.2 56.0 54.5 57.9 40.2
1985 . . . . . . . . 2,666 1,286 1,380 2,241 333 57.7 58.6 56.9 59.4 42.31986 . . . . . . . . 2,786 1,331 1,455 2,307 386 53.8 55.9 51.9 56.0 36.51987 . . . . . . . . 2,647 1,278 1,369 2,207 337 56.8 58.4 55.3 56.6 51.91988 . . . . . . . . 2,673 1,334 1,339 2,187 382 58.9 57.0 60.8 60.7 45.01989 . . . . . . . . 2,454 1,208 1,245 2,051 337 59.6 57.6 61.6 60.4 52.8
1990 . . . . . . . . 2,355 1,169 1,185 1,921 341 59.9 57.8 62.0 61.5 46.31991 . . . . . . . . 2,276 1,139 1,137 1,867 320 62.4 57.6 67.1 64.6 45.61992 . . . . . . . . 2,398 1,216 1,182 1,900 353 61.7 59.6 63.8 63.4 47.91993 . . . . . . . . 2,338 1,118 1,219 1,910 302 62.6 59.7 65.4 62.8 55.61994 . . . . . . . . 2,517 1,244 1,273 2,065 318 61.9 60.6 63.2 63.6 50.9
1995 . . . . . . . . 2,599 1,238 1,361 2,088 356 61.9 62.6 61.4 62.6 51.41996 . . . . . . . . 2,660 1,297 1,363 2,092 416 65.0 60.1 69.7 65.8 55.31997 . . . . . . . . 2,769 1,354 1,415 2,228 394 67.0 63.5 70.3 67.5 59.6
NA Not available. 1 Includes other races, not shown separately. 2 As of October.
Source: U.S. National Center for Education Statistics, Digest of Education Statistics, annual.
No. 308. College Enrollment, by Sex and Attendance Status: 1983 to 1997
[As of fall. In thousands (12,465 represents 12,465,000)]
Sex and age1983 1989 1993 1996, prel. 1997, est.
TotalParttime Total
Parttime Total
Parttime Total
Parttime Total
Parttime
Total . . . . . . . . . . . . . . . . . 12,465 5,204 13,539 5,878 14,305 6,177 14,300 6,087 14,350 6,259
Male . . . . . . . . . . . . . . . . . . . . 6,024 2,264 6,190 2,450 6,427 2,537 6,344 2,528 6,239 2,57214 to 17 years old. . . . . . . . . . 102 16 71 12 83 10 92 21 88 1218 to 19 years old. . . . . . . . . . 1,256 158 1,342 113 1,224 138 1,342 231 1,374 20720 to 21 years old. . . . . . . . . . 1,241 205 1,189 198 1,294 209 1,224 263 1,215 26022 to 24 years old. . . . . . . . . . 1,158 382 1,090 367 1,260 392 1,175 323 1,038 35925 to 29 years old. . . . . . . . . . 1,115 624 1,038 639 950 564 993 553 954 54030 to 34 years old. . . . . . . . . . 570 384 603 439 661 484 480 337 561 39035 years old and over . . . . . . . 583 494 857 682 955 739 1,039 801 1,009 805
Female. . . . . . . . . . . . . . . . . . . 6,441 2,940 7,349 3,428 7,877 3,640 7,956 3,558 8,111 3,68714 to 17 years old. . . . . . . . . . 142 16 101 12 93 6 137 45 99 1518 to 19 years old. . . . . . . . . . 1,496 179 1,515 184 1,416 172 1,662 257 1,715 23320 to 21 years old. . . . . . . . . . 1,125 204 1,253 213 1,414 279 1,419 282 1,429 27322 to 24 years old. . . . . . . . . . 884 378 1,104 470 1,263 493 1,141 407 1,101 43625 to 29 years old. . . . . . . . . . 947 658 1,052 732 1,058 689 1,131 669 1,075 66130 to 34 years old. . . . . . . . . . 721 553 750 563 811 575 714 478 688 45535 years old and over . . . . . . . 1,126 953 1,574 1,253 1,824 1,427 1,752 1,421 2,004 1,614
Source: U.S. National Center for Education Statistics, Digest of Education Statistics, annual.
192 Education
U.S. Census Bureau, Statistical Abstract of the United States: 1999
No. 309. College Enrollment, by Selected Characteristics: 1980 to 1996
[In thousands (12,086.8 represents 12,086,800). As of fall. Totals may differ from other tables because of adjustments to underreportedand nonreported racial/ethnic data. Nonresident alien students are not distributed among racial/ethnic groups]
Characteristic 1980 1988 1990 1992 1993 1994 1995, prel. 1996, est.
Total . . . . . . . . 12,086.8 13,819.5 14,359.0 14,487.4 14,304.8 14,278.8 14,261.8 14,300.3
Male . . . . . . . . . . . 5,868.1 6,284.4 6,501.8 6,524.0 6,427.5 6,371.9 6,342.5 6,344.0Female. . . . . . . . . . 6,218.7 7,535.1 7,857.1 7,963.4 7,877.4 7,906.9 7,919.2 7,956.3
Public. . . . . . . . . . . 9,456.4 10,844.7 11,309.6 11,384.6 11,189.1 11,133.7 11,092.4 11,090.2Private . . . . . . . . . . 2,630.4 2,974.8 3,049.4 3,101.7 3,115.7 3,145.1 3,169.4 3,210.1
2-year . . . . . . . . . . 4,521.4 5,240.1 5,651.9 5,722.4 5,565.9 5,529.7 5,492.5 5,497.44-year . . . . . . . . . . 7,565.4 8,579.4 8,707.1 8,765.0 8,738.9 8,749.1 8,769.3 8,802.8
Undergraduate. . . . . 10,469.1 11,959.2 12,439.3 12,537.7 12,324.0 12,262.6 12,232.0 12,259.4Graduate . . . . . . . . 1,340.9 1,586.2 1,639.1 1,668.7 1,688.4 1,721.5 1,732.0 1,743.1First professional . . . 276.8 274.1 280.5 280.9 292.4 294.7 297.6 297.7
White 1 . . . . . . . . 9,833.0 10,723.0 10,989.8 10,875.4 10,600.0 10,427.0 10,311.2 10,226.0Male . . . . . . . . . . . 4,772.9 4,861.3 4,962.2 4,884.6 4,755.0 4,650.7 4,594.1 4,553.0Female. . . . . . . . . . 5,060.1 5,861.7 6,027.6 5,990.8 5,845.1 5,776.3 5,717.2 5,673.1
Public. . . . . . . . . . . 7,656.1 8,385.4 8,622.2 8,492.8 8,226.6 8,056.3 7,945.4 7,848.3Private . . . . . . . . . . 2,176.9 2,337.6 2,367.5 2,382.6 2,373.4 2,370.6 2,365.9 2,377.7
2-year . . . . . . . . . . 3,558.5 3,954.3 4,198.8 4,131.2 3,960.6 3,861.7 3,794.0 3,742.84-year . . . . . . . . . . 6,274.5 6,768.7 6,791.0 6,744.3 6,639.5 6,565.3 6,517.2 6,483.2
Undergraduate. . . . . 8,480.7 9,272.6 9,507.7 9,387.6 9,100.4 8,916.0 8,805.6 8,730.9Graduate . . . . . . . . 1,104.7 1,228.4 1,258.0 1,267.2 1,273.8 1,286.8 1,282.3 1,273.9First professional . . . 247.7 222.0 224.0 220.6 225.9 224.2 223.3 221.2
Black 1 . . . . . . . . 1,106.8 1,247.1 1,335.4 1,392.9 1,412.8 1,448.6 1,473.7 1,499.4Male . . . . . . . . . . . 463.7 484.7 517.0 536.9 543.7 549.7 555.9 563.6Female. . . . . . . . . . 643.0 762.4 818.4 856.0 869.1 898.9 917.8 935.8
Public. . . . . . . . . . . 876.1 976.5 1,053.4 1,100.5 1,114.3 1,144.6 1,160.7 1,177.3Private . . . . . . . . . . 230.7 270.6 281.9 292.3 298.5 304.1 313.0 322.2
2-year . . . . . . . . . . 472.5 524.3 577.6 601.6 599.0 615.0 621.5 629.34-year . . . . . . . . . . 634.3 722.8 757.7 791.2 813.7 833.6 852.2 870.2
Undergraduate. . . . . 1,018.8 1,147.2 1,229.3 1,280.6 1,290.4 1,317.3 1,333.6 1,352.6Graduate . . . . . . . . 75.1 83.9 88.9 94.1 102.2 110.6 118.6 125.5First professional . . . 12.8 16.0 17.2 18.2 20.2 20.7 21.4 21.4
Hispanic . . . . . . . 471.7 782.6 866.6 955.0 988.8 1,045.6 1,093.8 1,152.2Male . . . . . . . . . . . 231.6 354.0 390.5 427.7 441.2 464.0 480.2 501.3Female. . . . . . . . . . 240.1 428.6 476.0 527.3 547.6 581.6 613.7 650.9
Public. . . . . . . . . . . 406.2 671.4 742.1 822.3 851.3 898.7 937.1 987.6Private . . . . . . . . . . 65.5 111.1 124.5 132.7 137.5 146.8 156.8 164.7
2-year . . . . . . . . . . 255.1 424.2 483.7 545.0 556.8 582.9 608.4 644.24-year . . . . . . . . . . 216.6 358.3 382.9 409.9 432.0 462.7 485.5 508.1
Undergraduate. . . . . 433.1 724.6 804.2 887.8 918.1 968.3 1,012.0 1,065.6Graduate . . . . . . . . 32.1 47.2 50.9 55.3 57.9 63.9 68.0 72.7First professional . . . 6.5 10.9 11.4 12.0 12.8 13.4 13.8 14.0
American Indian 1 . 83.9 102.8 113.7 119.3 121.7 127.4 131.3 134.0Male . . . . . . . . . . . 37.8 43.1 47.6 50.2 51.2 53.0 54.8 55.7Female. . . . . . . . . . 46.1 59.7 66.1 69.1 70.5 74.4 76.5 78.2
Public. . . . . . . . . . . 74.2 90.4 100.2 103.3 106.4 110.7 113.8 116.3Private . . . . . . . . . . 9.7 12.4 13.6 15.9 15.3 16.6 17.5 17.7
2-year . . . . . . . . . . 47.0 54.9 62.6 64.4 63.2 66.2 65.6 66.74-year . . . . . . . . . . 36.9 47.9 51.2 54.9 58.5 61.2 65.7 67.2
Undergraduate. . . . . 77.9 95.5 105.8 110.9 112.7 117.4 120.7 122.9Graduate . . . . . . . . 5.2 6.2 6.6 7.0 7.3 8.1 8.5 8.9First professional . . . 0.8 1.1 1.3 1.5 1.7 1.8 2.1 2.2
Asian 1 . . . . . . . . 286.4 572.5 637.2 697.0 724.4 774.3 797.4 823.6Male . . . . . . . . . . . 151.3 294.9 325.1 351.5 363.1 385.0 393.3 403.6Female. . . . . . . . . . 135.2 277.6 312.0 345.6 361.3 389.3 404.1 420.0
Public. . . . . . . . . . . 239.7 461.0 516.3 565.9 586.3 622.1 638.0 657.1Private . . . . . . . . . . 46.7 111.6 120.9 131.1 138.2 152.2 159.4 166.5
2-year . . . . . . . . . . 124.3 215.2 255.7 289.5 295.0 312.5 314.9 322.94-year . . . . . . . . . . 162.1 357.3 381.5 407.5 429.4 461.8 482.4 500.7
Undergraduate. . . . . 248.7 500.5 558.7 613.0 634.2 674.1 692.2 713.2Graduate . . . . . . . . 31.6 53.2 57.6 61.5 65.2 72.6 75.6 79.0First professional . . . 6.1 18.8 20.8 22.5 25.0 27.6 29.6 31.4
Nonresident alien . 305.0 391.5 416.4 447.7 457.1 455.9 454.4 464.9Male . . . . . . . . . . . 210.8 246.3 259.4 273.1 273.4 269.5 264.3 266.7Female. . . . . . . . . . 94.2 145.2 157.0 174.6 183.7 186.4 190.1 198.2
Public. . . . . . . . . . . 204.1 260.0 275.3 299.5 304.3 301.2 297.5 303.7Private . . . . . . . . . . 100.8 131.5 141.0 148.1 152.7 154.7 156.9 161.3
2-year . . . . . . . . . . 64.1 67.1 73.5 90.6 91.2 91.4 88.1 91.54-year . . . . . . . . . . 240.9 324.4 342.8 357.0 365.9 364.5 366.2 373.5
Undergraduate. . . . . 209.9 218.7 233.6 257.9 268.2 269.4 267.6 274.1Graduate . . . . . . . . 92.2 167.3 177.0 183.6 182.0 179.5 179.5 183.2First professional . . . 2.9 5.4 5.8 6.2 6.9 7.0 7.3 7.7
1 Non-Hispanic.
Source: U.S. National Center for Education Statistics, Digest of Education Statistics, annual.
Education 193
U.S. Census Bureau, Statistical Abstract of the United States: 1999

No. 310. Foreign (Nonimmigrant) Student Enrollment in College: 1976 to 1998
[For fall of the previous year. (179 represents 179,000)]
Region of origin
Enrollment (1,000) Percent enrolled in—
1976 1980 1985 1990 1994 1995 1996 1997 1998
Engineering Science1 Business
1980 1996 1980 1996 1980 1996
All regions . . . 179 286 342 387 449 453 454 458 481 25 16 8 8 16 21Africa . . . . . . . . . . . 25 36 40 25 21 21 21 22 23 20 14 9 8 19 20
Nigeria . . . . . . . . 11 16 18 4 2 2 2 2 2 19 11 9 10 22 18
Asia 2. . . . . . . . . . . 97 165 200 245 294 292 290 291 308 32 19 8 9 16 22China: Taiwan . . . 11 18 23 31 37 36 33 30 31 17 18 15 6 17 25Hong Kong . . . . . 12 10 10 11 14 13 12 11 10 22 15 9 4 26 37India. . . . . . . . . . 10 9 15 26 35 34 32 31 34 31 36 16 9 21 15Indonesia . . . . . . 1 2 7 9 11 12 13 12 13 27 21 7 2 21 45Iran . . . . . . . . . . 20 51 17 7 4 3 3 2 2 45 31 7 17 11 7
Japan . . . . . . . . . 7 12 13 30 44 45 46 46 47 7 3 5 4 19 18Malaysia . . . . . . . 2 4 22 14 14 14 14 15 15 13 31 14 3 22 36Saudi Arabia . . . . 3 10 8 4 4 4 4 4 5 30 29 4 4 14 14South Korea . . . . 3 5 16 22 31 34 36 37 43 17 12 11 8 15 16Thailand . . . . . . . 7 7 7 7 9 11 12 13 15 17 17 6 3 26 40
Europe . . . . . . . . . . 14 23 33 46 62 65 67 68 72 15 9 9 9 14 22Latin America 3 . . . . 30 42 49 48 45 47 47 50 51 20 13 8 7 14 23
Mexico . . . . . . . . 5 6 6 7 8 9 9 9 10 16 16 7 6 11 22Venezuela . . . . . . 5 10 10 3 4 4 4 5 5 30 16 8 5 11 25
North America . . . . . 10 16 16 19 23 23 24 24 23 8 5 6 7 13 11Canada. . . . . . . . 10 15 15 18 22 23 23 23 22 8 5 6 7 12 11
Oceania . . . . . . . . . 3 4 4 4 4 4 4 4 4 5 5 7 7 16 16
1 Physical and life sciences. 2 Includes countries not shown separately. 3 Includes Central America, Caribbean, and SouthAmerica.
Source: Institute of International Education, New York, NY, Open Doors, annual (copyright).
No. 311. College Enrollment, by Sex, Age, Race, and Hispanic Origin:1980 to 1997
[In thousands (11,387 represents 11,387,000). As of October for the civilian noninstitutional population, 14 years old and over.Based on the Current Population Survey; see text, Section 1, Population, and Appendix III]
Characteristic 1980 1985 1989 1 1990 1991 1992 1993 1994 1995 1996 1997
Total 2 . . . . . . . . . . . 11,387 12,524 13,180 13,621 14,057 14,035 13,898 15,022 14,715 15,226 15,436Male 3 . . . . . . . . . . . . . . 5,430 5,906 5,950 6,192 6,439 6,192 6,324 6,764 6,703 6,820 6,843
18 to 24 years . . . . . . . 3,604 3,749 3,717 3,922 3,954 3,912 3,994 4,152 4,089 4,187 4,37425 to 34 years . . . . . . . 1,325 1,464 1,443 1,412 1,605 1,392 1,406 1,589 1,561 1,523 1,50935 years old and over . . 405 561 716 772 832 789 873 958 985 1,013 899
Female 3 . . . . . . . . . . . . . 5,957 6,618 7,231 7,429 7,618 7,844 7,574 8,258 8,013 8,406 8,59318 to 24 years . . . . . . . 3,625 3,788 4,085 4,042 4,218 4,429 4,199 4,576 4,452 4,582 4,82925 to 34 years . . . . . . . 1,378 1,599 1,639 1,749 1,680 1,732 1,688 1,830 1,788 1,920 1,76035 years old and over . . 802 1,100 1,396 1,546 1,636 1,575 1,616 1,766 1,684 1,765 1,892
White 3 . . . . . . . . . . . . . . 9,925 10,781 11,243 11,488 11,686 11,710 11,434 12,222 12,021 12,189 12,44218 to 24 years . . . . . . . 6,334 6,500 6,631 6,635 6,813 6,916 6,763 7,118 7,011 7,123 7,49525 to 34 years . . . . . . . 2,328 2,604 2,597 2,698 2,661 2,582 2,505 2,735 2,686 2,644 2,52235 years old and over . . 1,051 1,448 1,868 2,023 2,107 2,053 2,068 2,267 2,208 2,254 2,297Male . . . . . . . . . . . . . . 4,804 5,103 5,136 5,235 5,304 5,210 5,222 5,524 5,535 5,453 5,552Female . . . . . . . . . . . . 5,121 5,679 6,107 6,253 6,382 6,499 6,212 6,698 6,486 6,735 6,890
Black 3 . . . . . . . . . . . . . . 1,163 1,263 1,287 1,393 1,477 1,424 1,545 1,800 1,772 1,901 1,90318 to 24 years . . . . . . . 688 734 835 894 828 886 861 1,001 988 983 1,08525 to 34 years . . . . . . . 289 295 275 258 373 302 386 440 426 519 42335 years old and over . . 156 213 146 207 257 208 284 323 334 354 372Male . . . . . . . . . . . . . . 476 552 480 587 629 527 636 745 710 764 723Female . . . . . . . . . . . . 686 712 807 807 848 897 909 1,054 1,062 1,136 1,180
Hispanic origin 3 4 . . . . . . . 443 580 754 748 830 918 995 1,187 1,207 1,223 1,26018 to 24 years . . . . . . . 315 375 453 435 516 586 602 662 745 706 80625 to 34 years . . . . . . . 118 189 170 168 196 214 249 312 250 310 25435 years old and over . . (NA) (NA) 114 130 109 102 129 205 193 184 151Male . . . . . . . . . . . . . . 222 279 353 364 347 388 442 529 568 529 555Female . . . . . . . . . . . . 221 299 401 384 483 530 553 659 639 693 704
NA Not available. 1 Beginning 1989, based on a revised edit and tabulation package. 2 Includes other races not shownseparately. 3 Includes persons 14 to 17 years old, not shown separately. 4 Persons of Hispanic origin may be of any race.
Source: U.S. Census Bureau, Current Population Reports, P20-516; and earlier reports.
194 Education
U.S. Census Bureau, Statistical Abstract of the United States: 1999
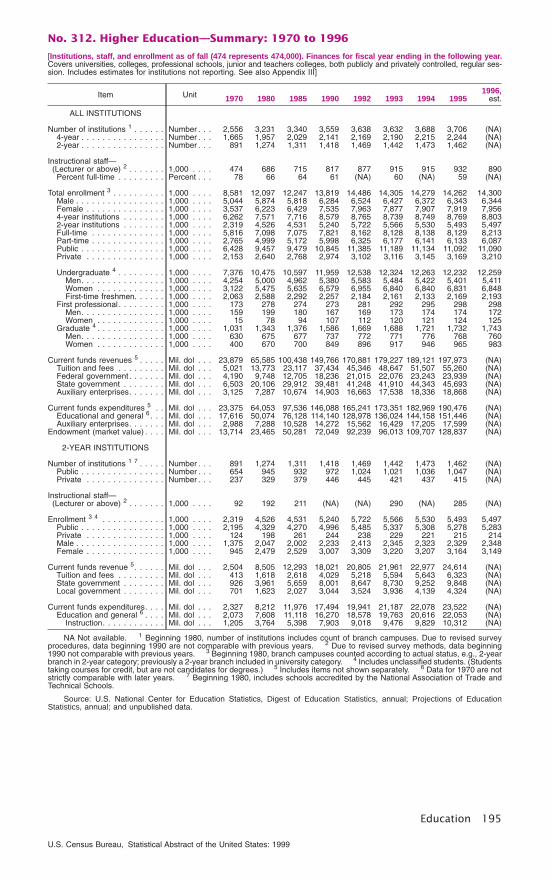
No. 312. Higher Education—Summary: 1970 to 1996
[Institutions, staff, and enrollment as of fall (474 represents 474,000). Finances for fiscal year ending in the following year.Covers universities, colleges, professional schools, junior and teachers colleges, both publicly and privately controlled, regular ses-sion. Includes estimates for institutions not reporting. See also Appendix III]
Item Unit 1970 1980 1985 1990 1992 1993 1994 19951996,
est.
ALL INSTITUTIONS
Number of institutions 1 . . . . . . Number . . . 2,556 3,231 3,340 3,559 3,638 3,632 3,688 3,706 (NA)4-year . . . . . . . . . . . . . . . . Number . . . 1,665 1,957 2,029 2,141 2,169 2,190 2,215 2,244 (NA)2-year . . . . . . . . . . . . . . . . Number . . . 891 1,274 1,311 1,418 1,469 1,442 1,473 1,462 (NA)
Instructional staff—(Lecturer or above) 2 . . . . . . . 1,000 . . . . 474 686 715 817 877 915 915 932 890Percent full-time . . . . . . . . . Percent . . . 78 66 64 61 (NA) 60 (NA) 59 (NA)
Total enrollment 3 . . . . . . . . . . 1,000 . . . . 8,581 12,097 12,247 13,819 14,486 14,305 14,279 14,262 14,300Male . . . . . . . . . . . . . . . . . 1,000 . . . . 5,044 5,874 5,818 6,284 6,524 6,427 6,372 6,343 6,344Female . . . . . . . . . . . . . . . 1,000 . . . . 3,537 6,223 6,429 7,535 7,963 7,877 7,907 7,919 7,9564-year institutions . . . . . . . . 1,000 . . . . 6,262 7,571 7,716 8,579 8,765 8,739 8,749 8,769 8,8032-year institutions . . . . . . . . 1,000 . . . . 2,319 4,526 4,531 5,240 5,722 5,566 5,530 5,493 5,497Full-time . . . . . . . . . . . . . . 1,000 . . . . 5,816 7,098 7,075 7,821 8,162 8,128 8,138 8,129 8,213Part-time . . . . . . . . . . . . . . 1,000 . . . . 2,765 4,999 5,172 5,998 6,325 6,177 6,141 6,133 6,087Public . . . . . . . . . . . . . . . . 1,000 . . . . 6,428 9,457 9,479 10,845 11,385 11,189 11,134 11,092 11,090Private . . . . . . . . . . . . . . . 1,000 . . . . 2,153 2,640 2,768 2,974 3,102 3,116 3,145 3,169 3,210
Undergraduate 4 . . . . . . . . . 1,000 . . . . 7,376 10,475 10,597 11,959 12,538 12,324 12,263 12,232 12,259Men. . . . . . . . . . . . . . . . 1,000 . . . . 4,254 5,000 4,962 5,380 5,583 5,484 5,422 5,401 5,411Women . . . . . . . . . . . . . 1,000 . . . . 3,122 5,475 5,635 6,579 6,955 6,840 6,840 6,831 6,848First-time freshmen. . . . . . 1,000 . . . . 2,063 2,588 2,292 2,257 2,184 2,161 2,133 2,169 2,193
First professional . . . . . . . . . 1,000 . . . . 173 278 274 273 281 292 295 298 298Men. . . . . . . . . . . . . . . . 1,000 . . . . 159 199 180 167 169 173 174 174 172Women . . . . . . . . . . . . . 1,000 . . . . 15 78 94 107 112 120 121 124 125
Graduate 4 . . . . . . . . . . . . . 1,000 . . . . 1,031 1,343 1,376 1,586 1,669 1,688 1,721 1,732 1,743Men. . . . . . . . . . . . . . . . 1,000 . . . . 630 675 677 737 772 771 776 768 760Women . . . . . . . . . . . . . 1,000 . . . . 400 670 700 849 896 917 946 965 983
Current funds revenues 5 . . . . . Mil. dol . . . 23,879 65,585 100,438 149,766 170,881 179,227 189,121 197,973 (NA)Tuition and fees . . . . . . . . . Mil. dol . . . 5,021 13,773 23,117 37,434 45,346 48,647 51,507 55,260 (NA)Federal government . . . . . . . Mil. dol . . . 4,190 9,748 12,705 18,236 21,015 22,076 23,243 23,939 (NA)State government . . . . . . . . Mil. dol . . . 6,503 20,106 29,912 39,481 41,248 41,910 44,343 45,693 (NA)Auxiliary enterprises. . . . . . . Mil. dol . . . 3,125 7,287 10,674 14,903 16,663 17,538 18,336 18,868 (NA)
Current funds expenditures 5 . . Mil. dol . . . 23,375 64,053 97,536 146,088 165,241 173,351 182,969 190,476 (NA)Educational and general 6 . . . Mil. dol . . . 17,616 50,074 76,128 114,140 128,978 136,024 144,158 151,446 (NA)Auxiliary enterprises. . . . . . . Mil. dol . . . 2,988 7,288 10,528 14,272 15,562 16,429 17,205 17,599 (NA)
Endowment (market value) . . . . Mil. dol . . . 13,714 23,465 50,281 72,049 92,239 96,013 109,707 128,837 (NA)
2-YEAR INSTITUTIONS
Number of institutions 1 7 . . . . . Number . . . 891 1,274 1,311 1,418 1,469 1,442 1,473 1,462 (NA)Public . . . . . . . . . . . . . . . . Number . . . 654 945 932 972 1,024 1,021 1,036 1,047 (NA)Private . . . . . . . . . . . . . . . Number . . . 237 329 379 446 445 421 437 415 (NA)
Instructional staff—(Lecturer or above) 2 . . . . . . . 1,000 . . . . 92 192 211 (NA) (NA) 290 (NA) 285 (NA)
Enrollment 3 4 . . . . . . . . . . . . 1,000 . . . . 2,319 4,526 4,531 5,240 5,722 5,566 5,530 5,493 5,497Public . . . . . . . . . . . . . . . . 1,000 . . . . 2,195 4,329 4,270 4,996 5,485 5,337 5,308 5,278 5,283Private . . . . . . . . . . . . . . . 1,000 . . . . 124 198 261 244 238 229 221 215 214Male . . . . . . . . . . . . . . . . . 1,000 . . . . 1,375 2,047 2,002 2,233 2,413 2,345 2,323 2,329 2,348Female . . . . . . . . . . . . . . . 1,000 . . . . 945 2,479 2,529 3,007 3,309 3,220 3,207 3,164 3,149
Current funds revenue 5. . . . . . Mil. dol . . . 2,504 8,505 12,293 18,021 20,805 21,961 22,977 24,614 (NA)Tuition and fees . . . . . . . . . Mil. dol . . . 413 1,618 2,618 4,029 5,218 5,594 5,643 6,323 (NA)State government . . . . . . . . Mil. dol . . . 926 3,961 5,659 8,001 8,647 8,730 9,252 9,848 (NA)Local government . . . . . . . . Mil. dol . . . 701 1,623 2,027 3,044 3,524 3,936 4,139 4,324 (NA)
Current funds expenditures. . . . Mil. dol . . . 2,327 8,212 11,976 17,494 19,941 21,187 22,078 23,522 (NA)Education and general 6 . . . . Mil. dol . . . 2,073 7,608 11,118 16,270 18,578 19,763 20,616 22,053 (NA)
Instruction. . . . . . . . . . . . Mil. dol . . . 1,205 3,764 5,398 7,903 9,018 9,476 9,829 10,312 (NA)
NA Not available. 1 Beginning 1980, number of institutions includes count of branch campuses. Due to revised surveyprocedures, data beginning 1990 are not comparable with previous years. 2 Due to revised survey methods, data beginning1990 not comparable with previous years. 3 Beginning 1980, branch campuses counted according to actual status, e.g., 2-yearbranch in 2-year category; previously a 2-year branch included in university category. 4 Includes unclassified students. (Studentstaking courses for credit, but are not candidates for degrees.) 5 Includes items not shown separately. 6 Data for 1970 are notstrictly comparable with later years. 7 Beginning 1980, includes schools accredited by the National Association of Trade andTechnical Schools.
Source: U.S. National Center for Education Statistics, Digest of Education Statistics, annual; Projections of EducationStatistics, annual; and unpublished data.
Education 195
U.S. Census Bureau, Statistical Abstract of the United States: 1999
No. 313. Colleges—Number, 1995 and Enrollment, 1996, by State
[Number of institutions beginning in academic year. Opening fall enrollment of resident and extension students attending full timeor part time (14,300 represents 14,300,000). Excludes students taking courses for credit by mail, radio, or TV, and students in branchesof U.S. institutions operated in foreign countries. See Appendix III]
State
Num-ber of
institu-tions,
1995 1
1996 Enrollment, prel. (1,000)
Total Male Female Public PrivateFull
time White 2
Minority enrollment Non-resi-dentalienTotal 3 Black 2
His-panic
United States. . 3,706 14,300 6,344 7,956 11,090 3,210 8,213 10,226 3,609 1,499 1,152 465
Alabama. . . . . . . . . 82 219 96 124 197 23 150 157 58 52 2 4Alaska . . . . . . . . . . 9 29 12 17 28 1 12 22 5 1 1 1Arizona. . . . . . . . . . 45 277 125 152 253 23 131 200 69 9 40 8Arkansas . . . . . . . . 38 101 43 58 89 11 68 80 18 15 1 2California . . . . . . . . 348 1,883 841 1,041 1,625 258 887 923 878 144 383 82
Colorado. . . . . . . . . 59 243 111 132 209 34 131 194 43 8 23 6Connecticut . . . . . . . 42 155 68 88 98 58 83 123 26 12 8 6Delaware . . . . . . . . 9 45 19 26 37 8 26 35 8 6 1 1District of Columbia . 19 74 33 41 7 67 49 36 30 22 3 8Florida . . . . . . . . . . 114 641 277 364 531 110 309 418 203 88 92 20
Georgia . . . . . . . . . 120 318 135 183 249 69 214 215 95 81 5 8Hawaii . . . . . . . . . . 17 61 27 34 47 14 35 16 39 1 1 6Idaho . . . . . . . . . . . 12 60 27 33 49 11 41 55 4 (Z) 2 1Illinois . . . . . . . . . . 169 721 316 405 532 189 371 504 199 92 64 18Indiana. . . . . . . . . . 78 286 131 155 221 65 191 246 31 18 7 9
Iowa . . . . . . . . . . . 59 177 81 96 126 51 122 157 13 5 3 7Kansas. . . . . . . . . . 54 172 77 95 155 17 96 146 21 8 6 6Kentucky . . . . . . . . 61 178 74 104 147 30 118 158 17 12 1 3Louisiana . . . . . . . . 36 204 86 118 175 29 145 133 64 54 5 6Maine. . . . . . . . . . . 33 56 22 33 38 18 32 53 2 (Z) (Z) 1
Maryland . . . . . . . . 57 261 108 152 217 43 128 170 81 59 6 10Massachusetts. . . . . 118 410 179 231 173 237 261 317 68 23 18 25Michigan. . . . . . . . . 109 547 239 308 459 88 278 437 93 60 12 18Minnesota. . . . . . . . 107 275 122 154 209 67 164 244 24 8 4 7Mississippi . . . . . . . 46 126 54 72 115 11 93 84 41 38 1 2
Missouri . . . . . . . . . 101 291 127 164 189 101 170 244 39 26 5 8Montana . . . . . . . . . 26 43 20 23 38 5 33 37 5 (Z) 1 1Nebraska . . . . . . . . 35 119 54 66 100 20 68 107 9 3 2 3Nevada . . . . . . . . . 10 73 33 41 72 2 24 55 16 4 6 2New Hampshire . . . . 30 64 27 37 36 28 39 60 3 1 1 1
New Jersey. . . . . . . 61 328 143 186 265 64 177 223 94 39 32 11New Mexico . . . . . . 35 104 43 60 98 6 51 57 45 3 33 2New York . . . . . . . . 311 1,028 437 591 572 455 665 672 312 137 103 44North Carolina . . . . . 121 373 160 213 303 70 241 276 91 75 5 6North Dakota. . . . . . 20 41 20 20 37 4 32 36 3 (Z) (Z) 1
Ohio . . . . . . . . . . . 156 538 240 297 405 132 337 448 73 51 8 16Oklahoma . . . . . . . . 45 177 81 96 154 23 107 134 35 13 4 8Oregon. . . . . . . . . . 45 165 76 89 141 24 92 138 21 3 6 6Pennsylvania. . . . . . 217 622 293 329 335 287 391 519 86 52 12 17Rhode Island. . . . . . 12 72 32 40 37 35 46 61 9 3 3 3
South Carolina. . . . . 59 174 72 102 148 26 111 127 45 40 2 3South Dakota . . . . . 21 35 16 20 29 7 26 31 3 (Z) (Z) 1Tennessee . . . . . . . 76 247 108 139 194 53 162 198 44 37 3 5Texas. . . . . . . . . . . 179 955 437 519 838 117 521 582 347 95 202 27Utah . . . . . . . . . . . 17 152 76 76 114 37 96 137 10 1 4 5
Vermont . . . . . . . . . 22 35 15 20 20 15 24 33 2 (Z) (Z) 1Virginia. . . . . . . . . . 89 354 154 200 292 61 202 260 86 58 8 8Washington . . . . . . . 64 292 129 164 252 40 180 232 51 11 11 9West Virginia . . . . . . 28 86 38 48 75 11 60 79 5 4 1 2Wisconsin . . . . . . . . 66 299 132 167 245 54 182 264 28 13 6 7Wyoming . . . . . . . . 9 31 13 18 30 1 18 28 2 (Z) 1 (Z)
U.S. military 4 . . 10 82 69 13 82 - 20 65 16 11 3 1
- Represents zero. Z Fewer than 500. 1 Branch campuses counted as separate institutions. 2 Non-Hispanic.3 Includes other races not shown separately. 4 Service schools.
Source: U.S. National Center for Education Statistics, Digest of Education Statistics, annual.
196 Education
U.S. Census Bureau, Statistical Abstract of the United States: 1999
No. 314. Higher Education Price Indexes: 1970 to 1997
[1983=100. For years ending June 30. Reflects prices paid by colleges and universities]
YearIndex,
total
Personnel compensation Contracted services, supplies, and equipment
Total
Profes-sional
salaries
Nonpro-fessionalsalaries
Fringebenefits Total
Serv-ices
Suppliesand
materialsEquip-
ment
Libraryacquisi-
tions Utilities
1970 . . 39.5 42.1 47.7 38.8 24.7 31.9 42.8 37.6 41.9 25.7 16.31972 . . 44.3 47.1 52.0 44.9 31.1 36.0 47.8 39.8 45.1 34.9 19.21973 . . 46.7 49.8 54.3 47.6 34.7 37.6 49.9 41.1 46.5 37.7 20.21974 . . 49.9 52.8 57.2 50.6 38.6 41.4 52.2 46.5 49.4 41.6 24.8
1975 . . 54.3 56.3 60.3 54.6 42.9 48.5 56.8 58.0 58.3 46.7 31.81976 . . 57.8 60.0 63.5 59.0 47.8 51.3 59.1 60.7 61.7 52.1 34.41977 . . 61.5 63.5 66.4 63.1 52.8 55.7 62.6 63.8 64.8 56.8 40.51978 . . 65.7 67.6 69.9 68.1 58.4 60.2 66.6 66.6 69.3 63.2 45.91979 . . 70.5 72.4 74.1 73.4 64.5 65.1 71.2 71.7 74.7 70.0 50.3
1980 . . 77.5 78.4 79.4 80.2 72.6 75.0 77.0 84.6 81.6 77.8 64.11981 . . 85.8 85.8 86.3 87.7 81.8 85.9 85.2 95.6 89.6 85.9 79.71982 . . 93.9 93.5 93.7 94.6 91.5 94.9 94.2 100.4 96.4 93.5 92.41983 . . 100.0 100.0 100.0 100.0 100.0 100.0 100.0 100.0 100.0 100.0 100.01984 . . 104.8 105.4 104.7 105.1 108.3 103.0 104.9 99.7 102.3 105.3 102.5
1985 . . 110.8 112.0 111.4 109.2 117.7 107.1 110.8 103.0 104.8 111.3 105.31986 . . 116.3 118.8 118.2 112.8 127.7 109.0 115.1 102.6 107.2 121.2 103.11987 . . 120.9 125.4 125.0 116.3 137.4 107.4 119.7 99.0 108.9 132.9 91.01988 . . 126.1 131.7 130.9 120.6 147.1 109.8 123.0 101.1 120.5 140.5 87.71989 . . 132.8 139.5 138.8 125.3 158.7 112.8 128.8 108.3 115.1 153.5 85.3
1990 . . 140.8 148.3 147.6 130.3 171.3 118.7 134.0 114.3 119.6 167.0 90.11991 . . 148.2 156.5 155.6 135.4 184.4 123.2 139.8 116.4 123.3 179.8 92.21992 . . 153.4 162.4 160.8 140.2 193.8 126.9 145.7 115.2 126.3 193.9 93.31993 . . 157.9 167.6 165.0 144.2 204.2 129.4 149.5 113.2 128.6 204.3 94.71994 . . 163.3 173.4 170.3 148.2 214.1 133.9 154.8 114.3 130.8 216.2 98.71995 . . 168.3 179.1 176.1 152.5 221.4 136.1 158.0 115.7 133.5 228.8 96.81996 . . 173.3 184.1 181.7 157.3 224.5 141.3 163.8 130.1 137.0 245.0 93.31997 . . 178.6 189.0 187.2 162.1 226.7 148.0 167.3 128.6 139.3 260.9 106.1
Source: Research Associates of Washington, Arlington, VA, Inflation Measures for Schools, Colleges, and Libraries, annual(copyright).
No. 315. Institutions of Higher Education—Finances: 1980 to 1996
[In millions of dollars (58,520 represents $58,520,000,000). For fiscal years ending in year shown. For coverage, seeheadnote, Table 312. See also Appendix III]
Item1980 1985 1990 1993 1994 1995
1996
Total Public Private
Current funds revenues. . . . . . . 58,520 92,473 139,635 170,881 179,227 189,121 197,973 123,501 74,472Tuition and fees . . . . . . . . . . . 11,930 21,283 33,926 45,346 48,647 51,507 55,260 23,257 32,003Federal government . . . . . . . . 8,902 11,509 17,255 21,015 22,076 23,243 23,939 13,672 10,267State government . . . . . . . . . . 18,378 27,583 38,349 41,248 41,910 44,343 45,693 44,243 1,450Local government . . . . . . . . . . 1,588 2,387 3,640 4,445 4,998 5,166 5,608 5,075 533
Private gifts, grants, andcontracts 1 . . . . . . . . . . . . . . 2,808 4,896 7,781 9,660 10,203 10,867 11,903 5,089 6,814
Endowment earnings . . . . . . . . 1,177 2,096 3,144 3,628 3,670 3,988 4,562 721 3,841Educational activities 2 . . . . . . . 1,239 2,127 3,632 5,038 5,294 5,603 5,531 3,529 2,002Auxiliary enterprises . . . . . . . . 6,481 10,100 13,938 16,663 17,538 18,336 18,868 11,595 7,272Hospitals . . . . . . . . . . . . . . . . (3) 7,475 13,217 18,124 18,960 19,100 18,612 12,276 6,336Other funds revenues 4 . . . . . . 6,015 3,015 4,753 5,715 5,931 6,967 7,998 4,044 3,954
Current funds expenditures 5. . . 56,914 89,951 134,656 165,241 173,351 182,969 190,476 119,525 70,952Educational and general. . . . . . 44,543 70,061 105,585 128,978 136,023 144,158 151,446 96,086 55,360
Instruction . . . . . . . . . . . . . 18,497 28,777 42,146 50,341 52,776 55,720 57,810 38,653 19,157Institutional support . . . . . . . 5,054 8,587 12,674 15,250 15,926 16,845 18,256 10,710 7,545Research . . . . . . . . . . . . . . 5,099 7,552 12,506 15,291 16,118 17,110 17,518 12,076 5,442Plant operation 6 . . . . . . . . . 4,700 7,345 9,458 10,784 11,368 11,746 12,331 8,005 4,326Academic support . . . . . . . . 3,876 6,074 9,438 11,073 11,678 12,279 13,297 9,004 4,293
Libraries . . . . . . . . . . . . . 1,624 2,362 3,254 3,685 3,908 4,166 4,293 2,691 1,603Student services . . . . . . . . . 2,567 4,178 6,388 8,165 8,563 9,060 9,631 5,810 3,820Scholarships and fellowships . 2,200 3,670 6,656 10,148 11,238 12,285 13,195 5,085 8,110
Unrestricted funds . . . . . . 905 1,962 3,854 5,949 6,645 7,329 8,213 2,457 5,756Restricted funds. . . . . . . . 1,296 1,709 2,802 4,199 4,593 4,956 4,982 2,628 2,355
Public service . . . . . . . . . . . 1,817 2,861 4,690 5,935 6,242 6,691 7,007 5,321 1,686Mandatory transfers . . . . . . . 732 1,016 1,630 1,991 2,115 2,423 2,401 1,420 980
Auxiliary enterprises 5 . . . . . . . 6,486 10,012 13,204 15,562 16,429 17,205 17,599 11,309 6,290Hospitals 5. . . . . . . . . . . . . . . 4,757 8,010 12,679 17,050 17,510 18,071 17,941 11,879 6,062Independent operations 5 . . . . . 1,128 1,868 3,187 3,652 3,387 3,534 3,491 251 3,240
1 Private grants represent nongovernmental revenue for sponsored research and other sponsored programs; includes privatecontracts. 2 Sales and service of educational departments only. 3 Included in other. 4 Includes sales and services of federallyfunded research and development centers, and others sources. 5 Includes mandatory transfers which are primarily currentexpenditures for plant. 6 Includes maintenance.
Source: U.S. National Center for Education Statistics, Digest of Education Statistics, annual.
Education 197
U.S. Census Bureau, Statistical Abstract of the United States: 1999

No. 316. Federal Student Financial Assistance: 1990 to 1999[For award years July 1 of year shown to the following June 30 (19,677 represents ($19,677,000,000). Funds utilized excludeoperating costs, etc., and represent funds given to students]
Award year impact data 1990 1991 1992 1993 1994 1995 1996 19971998,
est.1999,
est.
FUNDS UTILIZED (mil. dol.)
Total. . . . . . . . . . . . . . . . . . . . . . 19,677 20,342 21,926 29,274 32,683 35,477 38,865 38,107 40,451 41,903Federal Pell Grants . . . . . . . . . . . . . . . 4,906 5,793 6,176 5,655 5,520 5,472 5,780 6,326 7,211 7,373Federal Supplemental EducationalOpportunity Grant . . . . . . . . . . . . . . . . 503 586 651 753 755 764 762 811 777 774Federal Work-Study . . . . . . . . . . . . . . . 728 760 780 771 757 764 776 906 1,002 1,044Federal Perkins Loan. . . . . . . . . . . . . . 870 868 892 919 971 1,029 1,022 1,062 1,058 1,058Federal Direct Student Loan (FDSL) . . . . (X) (X) (X) (X) 1,790 8,296 9,796 9,838 10,400 11,363Federal Family Education Loans (FFEL) . 12,669 12,336 13,427 21,177 22,891 19,152 20,729 19,163 20,003 20,291
NUMBER OF AWARDS (1,000)
Total. . . . . . . . . . . . . . . . . . . . . . 10,258 10,312 11,039 12,614 13,082 13,667 14,516 14,355 14,933 15,306Federal Pell Grants . . . . . . . . . . . . . . . 3,562 3,786 4,002 3,756 3,675 3,612 3,666 3,725 3,838 3,811Federal Supplemental EducationalOpportunity Grant . . . . . . . . . . . . . . . . 761 771 976 1,068 1,057 1,083 1,191 1,116 1,109 1,118Federal Work-Study . . . . . . . . . . . . . . . 687 697 714 712 701 702 691 746 892 930Federal Perkins Loan. . . . . . . . . . . . . . 660 654 669 685 663 688 674 679 698 698Federal Direct Student Loan (FDSL) . . . . (X) (X) (X) (X) 474 2,339 2,762 2,864 3,018 3,122Federal Family Education Loans (FFEL) . 4,587 4,403 4,677 6,394 6,512 5,243 5,531 5,225 5,378 5,627
AVERAGE AWARD (dol.)
Total. . . . . . . . . . . . . . . . . . . . . . 1,918 1,973 1,986 2,321 2,498 2,596 2,677 2,655 2,709 2,738Federal Pell Grants . . . . . . . . . . . . . . . 1,377 1,530 1,543 1,506 1,502 1,515 1,577 1,698 1,879 1,935Federal Supplemental EducationalOpportunity Grant . . . . . . . . . . . . . . . . 661 665 667 705 715 706 640 727 701 701Federal Work-Study . . . . . . . . . . . . . . . 1,059 1,090 1,092 1,084 1,081 1,087 1,123 1,215 1,123 1,123Federal Perkins Loan. . . . . . . . . . . . . . 1,318 1,326 1,333 1,342 1,464 1,497 1,516 1,564 1,516 1,516Federal Direct Student Loan (FDSL) . . . . (X) (X) (X) (X) 3,779 3,548 3,547 3,435 3,445 3,639Federal Family Education Loans (FFEL) . 2,762 2,802 2,871 3,312 3,515 3,653 3,748 3,667 3,719 3,606
COHORT DEFAULT RATE 1
Federal Perkins Loan. . . . . . . . . . . . . . (NA) (NA) 12.24 11.42 10.76 12.57 12.95 12.47 (X) (X)FFEL/FDSL Combined Rates 2 . . . . . . . 22.40 17.80 15.00 11.60 10.70 10.40 9.60 (NA) (X) (X)
NA Not available. X Not applicable. 1 As of June 30. Represents the percent of borrowers entering repayment status inyear shown who defaulted in the following year. For the Perkins Loans, prior to 1992-93 the default rate was based on the dollaramount of loans outstanding. 2 Prior to 1995, this rate was FFEL-only.
Source: U.S. Dept. of Education, Office of Postsecondary Education, unpublished data.
No. 317. Finances of Public Colleges, 1990 to 1996, and by State, 1997
[For academic years ending in year shown (7,959.7 represents 7,959,700). Data provided by the state higher education financeofficers, except as noted]
State FTE 1
enrollment(1,000)
Appropria-tions forcurrent
operations 2
(mil. dol.)
Net tuitionrevenues
(mil. dol.)3
Total, 1990 . . . . . . . 7,959.7 33,853.9 11,264.7Total, 1992 . . . . . . . 8,325.4 34,928.8 14,180.6Total, 1993 . . . . . . . 8,397.7 35,172.0 15,746.3Total, 1994 . . . . . . . 8,334.0 36,497.0 16,623.4Total, 1995 . . . . . . . 8,262.7 38,655.2 17,406.8Total, 1996 . . . . . . . 8,267.1 40,077.5 18,465.2
Total, 1997 . . . . . 8,315.2 19,235.2 42,057.0Alabama. . . . . . . . . 170.9 424.7 697.4Alaska . . . . . . . . . . 17.2 38.7 156.9Arizona. . . . . . . . . . 165.7 330.4 827.2Arkansas . . . . . . . . 75.4 164.8 352.2California . . . . . . . . 1,309.2 1,330.9 6,674.5Colorado. . . . . . . . . 136.3 444.9 513.7Connecticut . . . . . . . 56.7 208.9 430.9Delaware . . . . . . . . 27.2 176.2 173.7District of Columbia . 4.8 13.5 37.8Florida . . . . . . . . . . 402.4 518.1 1,849.5Georgia . . . . . . . . . 217.2 417.1 1,314.0Hawaii . . . . . . . . . . 30.6 51.1 210.6Idaho . . . . . . . . . . . 40.6 55.4 232.3Illinois . . . . . . . . . . 357.0 509.7 1,977.2Indiana. . . . . . . . . . 173.5 571.5 846.8Iowa . . . . . . . . . . . 106.1 300.0 589.8Kansas. . . . . . . . . . 100.3 224.7 502.1Kentucky . . . . . . . . 115.0 260.3 456.7Louisiana . . . . . . . . 136.1 330.6 495.5Maine. . . . . . . . . . . 27.2 100.6 165.2Maryland . . . . . . . . 155.2 479.2 732.8Massachusetts. . . . . 114.3 317.3 766.4
State FTE 1
enrollment(1,000)
Appropria-tions forcurrent
operations 2
(mil. dol.)
Net tuitionrevenues
(mil. dol.)3
Michigan. . . . . . . . . 313.8 1,372.5 1,779.5Minnesota. . . . . . . . 157.3 404.4 872.6Mississippi . . . . . . . 117.8 216.0 463.9Missouri . . . . . . . . . 130.2 491.0 729.3Montana . . . . . . . . . 33.1 84.3 117.2Nebraska . . . . . . . . 66.8 124.5 323.6Nevada . . . . . . . . . 37.3 46.7 212.9New Hampshire . . . . 27.9 169.0 84.7New Jersey 4. . . . . . 181.6 576.4 1,155.3New Mexico . . . . . . 62.8 98.6 392.8New York . . . . . . . . 422.1 1,111.2 2,218.8North Carolina . . . . . 237.8 385.9 1,519.9North Dakota. . . . . . 30.9 64.0 120.5Ohio . . . . . . . . . . . 336.1 1,120.4 1,490.4Oklahoma . . . . . . . . 111.5 221.4 562.8Oregon. . . . . . . . . . 99.0 264.7 449.1Pennsylvania. . . . . . 279.7 1,273.4 1,414.8Rhode Island. . . . . . 24.8 108.6 134.9South Carolina. . . . . 125.4 355.0 524.5South Dakota . . . . . 21.4 63.8 87.7Tennessee . . . . . . . 155.5 317.8 727.8Texas. . . . . . . . . . . 628.2 1,174.1 2,976.3Utah . . . . . . . . . . . 83.4 148.1 411.8Vermont . . . . . . . . . 15.2 135.1 37.3Virginia. . . . . . . . . . 217.7 670.8 918.6Washington . . . . . . . 194.8 330.8 954.2West Virginia . . . . . . 60.8 153.5 194.4Wisconsin . . . . . . . . 179.6 441.0 1,030.9Wyoming . . . . . . . . 23.9 43.6 147.0
1 Full-time equivalent (FTE). Credit and noncredit program enrollment including summer session. Excludes medicalenrollments. 2 State and local appropriations. Includes aid to students attending in-state public institutions. Excludes sums forresearch, agriculture stations and cooperative extension, and hospitals and medical schools. 3 Excludes appropriated aid tostudents attending in-state public institutions. 4 Estimated by source.
Source: Research Associates of Washington, Arlington, VA, State Profiles: Financing Public Higher Education, annual(copyright).
198 Education
U.S. Census Bureau, Statistical Abstract of the United States: 1999

No. 318. Institutions of Higher Education—Charges: 1985 to 1998
[In dollars. Estimated. For the entire academic year ending in year shown. Figures are average charges per full-time equiva-lent student. Room and board are based on full-time students]
Academiccontrol and
year
Tuition and required fees 1 Board rates 2 Dormitory charges
Allinstitu-
tions
2-yr.col-
leges
4-yr.col-
leges
Other4-yr.
schools
Allinstitu-
tions
2-yr.col-
leges
4-yr.col-
leges
Other4-yr.
schools
Allinstitu-
tions
2-yr.col-
leges
4-yr.col-
leges
Other4-yr.
schools
Public:1985 . . . . . 971 584 1,386 1,117 1,241 1,302 1,276 1,201 1,196 921 1,237 1,2001990 . . . . . 1,356 756 2,035 1,608 1,635 1,581 1,728 1,561 1,513 962 1,561 1,5541991 . . . . . 1,454 824 2,159 1,707 1,691 1,594 1,767 1,641 1,612 1,050 1,658 1,6551992 . . . . . 1,624 937 2,410 1,933 1,780 1,612 1,852 1,745 1,731 1,074 1,789 1,7821993 . . . . . 1,782 1,025 2,604 2,192 1,841 1,668 1,982 1,761 1,756 1,106 1,856 1,7871994 . . . . . 1,942 1,125 2,820 2,360 1,880 1,681 1,993 1,828 1,873 1,190 1,897 1,9581995 . . . . . 2,057 1,192 2,977 2,499 1,949 1,712 2,108 1,866 1,959 1,232 1,992 2,0441996 . . . . . 2,179 1,239 3,151 2,660 2,020 1,681 2,192 1,937 2,057 1,297 2,104 2,1331997 . . . . . 2,271 1,276 3,323 2,778 2,111 1,789 2,282 2,025 2,148 1,339 2,187 2,2321998 est. . . 2,365 1,318 3,489 2,876 2,180 1,864 2,380 2,076 2,243 1,419 2,280 2,338
Private:1985 . . . . . 5,315 3,485 6,843 5,135 1,462 1,294 1,647 1,405 1,426 1,424 1,753 1,3091990 . . . . . 8,174 5,196 10,348 7,778 1,948 1,811 2,339 1,823 1,923 1,663 2,411 1,7741991 . . . . . 8,772 5,570 11,379 8,389 2,074 1,989 2,470 1,943 2,063 1,744 2,654 1,8891992 . . . . . 9,434 5,752 12,192 9,053 2,252 2,090 2,727 2,098 2,221 1,789 2,860 2,0381993 . . . . . 9,942 6,059 13,055 9,533 2,344 1,875 2,825 2,197 2,348 1,970 3,018 2,1511994 . . . . . 10,572 6,370 13,874 10,100 2,434 1,970 2,946 2,278 2,490 2,067 3,277 2,2611995 . . . . . 11,111 6,914 14,537 10,653 2,509 2,023 3,035 2,362 2,587 2,233 3,469 2,3471996 . . . . . 11,864 7,094 15,605 11,297 2,606 2,098 3,218 2,429 2,738 2,371 3,680 2,4731997 . . . . . 12,498 7,236 16,552 11,871 2,663 2,181 3,142 2,520 2,878 2,537 3,826 2,6021998 est. . . 13,013 7,536 17,197 12,388 2,742 2,321 3,224 2,608 2,990 2,624 4,001 2,717
1 For in-state students. 2 Beginning 1990, rates reflect 20 meals per week, rather than meals served 7 days a week.
Source: U.S. National Center for Education Statistics, Digest of Education Statistics, annual.
No. 319. Voluntary Financial Support of Higher Education: 1970 to 1997
[For school years ending in years shown (1,780 represents $1,780,000,000); enrollment as of fall of preceding year.Voluntary support, as defined in Gift Reporting Standards, excludes income from endowment and other invested funds as well asall support received from Federal, state, and local governments and their agencies and contract research]
Item Unit 1970 1980 1985 1990 1994 1995 1996 1997
Estimated support, total 1 . . . . . Mil. dol . 1,780 3,800 6,320 9,800 12,350 12,750 14,250 16,000Individuals . . . . . . . . . . . . . . . Mil. dol . 822 1,757 2,876 4,770 6,210 6,540 7,440 8,500
Alumni . . . . . . . . . . . . . . . . Mil. dol . 381 910 1,460 2,540 3,410 3,600 4,040 4,650Business corporations . . . . . . . Mil. dol . 269 696 1,574 2,170 2,510 2,560 2,800 3,050Foundations. . . . . . . . . . . . . . Mil. dol . 434 903 1,175 1,920 2,540 2,460 2,815 3,200Religious organizations . . . . . . Mil. dol . 102 155 208 240 240 250 255 250Current operations . . . . . . . . . Mil. dol . 960 2,250 3,800 5,440 6,710 7,230 7,850 8,500Capital purposes. . . . . . . . . . . Mil. dol . 820 1,550 2,520 4,360 5,640 5,520 6,400 7,500
Enrollment, higher education. . . 1,000 . . 8,094 11,570 12,242 13,539 14,306 14,279 14,210 13,917Support per student. . . . . . . . . Dollars . 220 328 516 724 863 893 1,003 1,150
In 1996-97 dollars . . . . . . . . Dollars . 925 672 776 906 939 944 1,031 1,150Expenditures, higher education . Bil. dol . 24.7 62.47 98.26 150.56 189.73 201.53 212.40 224.50Expenditures per student . . . . . Dollars . 3,052 5,399 8,026 11,120 13,262 14,114 14,947 16,131
In 1996-97 dollars . . . . . . . . Dollars . 12,833 11,050 12,065 13,913 14,571 14,920 15,288 16,131
Institutions reporting support . . . . Number. 1,045 1,019 1,114 1,056 992 1,086 1,104 1,061Total support reported . . . . . . . Mil. dol . 1,472 3,055 5,295 8,214 10,326 10,992 12,251 13,801
Private 4-year institutions . . . . . Mil. dol . 1,154 2,178 3,522 5,072 6,103 6,500 7,163 8,023Public 4-year institutions. . . . . . Mil. dol . 292 856 1,728 3,056 4,138 4,382 4,943 5,6542-year colleges. . . . . . . . . . . . Mil. dol . 26 20 45 85 84 110 145 124
1 Includes other contributions, not shown separately.
Source: Council for Aid to Education, New York, NY, Voluntary Support of Education, annual.
No. 320. Average Salaries for College Faculty Members: 1996 to 1998
[In thousands of dollars (50.4 represents $50,400). For academic year ending in year shown. Figures are for 9 monthsteaching for full-time faculty members in 4-year institutions. Fringe benefits averaged in 1996, $12,600 in public institutions and$14,600 in private institutions, in 1997, $12,600 in public institutions and $14,700 in private institutions, and in 1998, $13,200 inpublic institutions and $15,800 in private institutions]
Type of control andacademic rank 1996 1997 1998
Public: All ranks. . . . . . . . . . . . . 50.4 52.0 53.6Professor . . . . . . . . . . . . . . . 63.9 65.8 68.0Associate professor . . . . . . . . 48.2 49.7 51.2Assistant professor . . . . . . . . . 40.2 41.3 42.4Instructor . . . . . . . . . . . . . . . 30.8 31.8 32.4
Type of control andacademic rank 1996 1997 1998
Private: 1 All ranks . . . . . . . . . . . 57.5 59.3 61.5Professor . . . . . . . . . . . . . . . 75.6 78.2 81.8Associate professor . . . . . . . . 51.5 52.7 54.5Assistant professor . . . . . . . . . 42.4 43.4 44.9Instructor . . . . . . . . . . . . . . . 32.9 33.1 34.5
1 Excludes church-related colleges and universities.
Source: American Association of University Professors, Washington, DC, AAUP Annual Report on the Economic Status of theProfession.
Education 199
U.S. Census Bureau, Statistical Abstract of the United States: 1999
No. 321. Employees in Higher Education Institutions, by Sex and Occupation:1976 to 1995
[In thousands (1,863.8 represents 1,863,800). As of fall. Based on survey and subject to sampling error; see source]
Year and status
Total
Professional staff
Nonpro-fessional
staff,totalTotal
Executive,administrative,and managerial
Faculty 1Research/instructionassistants
Other
Male Female Male Female Male Female Male Female
1976, total . . . . . . . 1,863.8 1,073.1 74.6 26.6 460.6 172.7 106.5 53.6 87.5 91.0 790.7Full time . . . . . . . 1,339.9 709.4 72.0 25.0 326.8 107.2 18.6 9.4 76.2 74.1 630.5Part time . . . . . . . 523.9 363.7 2.6 1.7 133.7 65.4 87.9 44.2 11.3 16.9 160.2
1991, total . . . . . . . 2,545.2 1,595.5 85.4 59.3 525.6 300.7 119.1 78.6 165.4 261.3 949.8Full time . . . . . . . 1,812.9 1,031.8 82.9 56.2 366.2 169.4 (NA) (NA) 142.2 214.8 781.1Part time . . . . . . . 732.3 563.7 2.5 3.1 159.4 131.2 119.1 78.6 23.2 46.4 168.7
1993, total . . . . . . . 2,602.6 1,687.3 82.7 60.9 561.1 354.4 120.4 82.4 166.7 258.6 915.3Full time . . . . . . . 1,783.5 1,039.1 80.1 57.7 363.4 182.3 (NA) (NA) 142.7 212.9 744.4Part time . . . . . . . 819.1 648.2 2.7 3.2 197.7 172.1 120.4 82.4 24.0 45.8 170.9
1995, total . . . . . . . 2,662.1 1,744.9 82.1 65.3 562.9 368.8 124.0 91.9 177.2 272.7 917.2Full time . . . . . . . 1,801.4 1,066.5 79.2 61.8 360.2 190.7 (NA) (NA) 151.5 223.2 734.9Part time . . . . . . . 860.7 678.4 2.9 3.6 202.7 178.1 124.0 91.9 25.6 49.5 182.3
NA Not available. 1 Instruction and research.
Source: U.S. Center for Education Statistics, Fall Staff in Postsecondary Institutions, 1995, March 1998.
No. 322. Faculty in Institutions of Higher Education: 1970 to 1995
[In thousands (474 represents 474,000), except percent. As of fall. Based on survey and subject to sampling error; see source]
Year
Total
Employmentstatus Control Level Percent
Fulltime
Parttime Public Private 4-Year 2-Year
Parttime Public 2-Year
1970 . . . . . . . . . . . . . . 474 369 104 314 160 382 92 22 66 191975 . . . . . . . . . . . . . . 628 440 188 443 185 467 161 30 71 261976 . . . . . . . . . . . . . . 633 434 199 449 184 467 166 31 71 261977 . . . . . . . . . . . . . . 678 448 230 492 186 485 193 34 73 281979 . . . . . . . . . . . . . . 675 445 230 488 187 494 182 34 72 27
1980 . . . . . . . . . . . . . . 686 450 236 495 191 494 192 34 72 281981 . . . . . . . . . . . . . . 705 461 244 509 196 493 212 35 72 301982 . . . . . . . . . . . . . . 710 462 248 506 204 493 217 35 71 311983 . . . . . . . . . . . . . . 724 471 254 512 212 504 220 35 71 301984 . . . . . . . . . . . . . . 717 462 255 505 212 504 213 36 70 30
1985 . . . . . . . . . . . . . . 715 459 256 503 212 504 211 36 70 301986 . . . . . . . . . . . . . . 722 459 263 510 212 506 216 36 71 301987 . . . . . . . . . . . . . . 793 523 270 553 240 548 246 34 70 311989 . . . . . . . . . . . . . . 824 524 300 577 247 584 241 36 70 291991 . . . . . . . . . . . . . . 826 536 291 581 245 591 235 35 70 281993 . . . . . . . . . . . . . . 915 546 370 650 265 626 289 40 71 321995 . . . . . . . . . . . . . . 932 551 381 657 275 647 285 41 70 31
Source: U.S. Center for Education Statistics, Fall Staff in Postsecondary Institutions, 1995, March 1998.
No. 323. Higher Education Registrations in Foreign Languages: 1970 to 1995
[As of fall (1,111.5 represents 1,111,500)]
Item 1970 1972 1974 1977 1980 1983 1986 1990 1995
Registrations 1 (1,000) . . . . . . 1,111.5 1,008.9 946.6 933.5 924.8 966.0 1,003.2 1,184.1 1,138.8
Index (1960=100) . . . . . . . . . . . . . . 171.8 155.9 146.3 144.3 142.9 149.3 155.0 183.0 176.0By selected language (1,000):
Spanish . . . . . . . . . . . . . . . . . . 389.2 364.5 362.2 376.7 379.4 386.2 411.3 533.9 606.3French . . . . . . . . . . . . . . . . . . . 359.3 293.1 253.1 246.1 248.4 270.1 275.3 272.5 205.4German . . . . . . . . . . . . . . . . . . 202.6 177.1 152.1 135.4 126.9 128.2 121.0 133.3 96.3Italian . . . . . . . . . . . . . . . . . . . . 34.2 33.3 33.0 33.3 34.8 38.7 40.9 49.7 43.8Japanese . . . . . . . . . . . . . . . . . 6.6 8.3 9.6 10.7 11.5 16.1 23.5 45.7 44.7Russian . . . . . . . . . . . . . . . . . . 36.1 36.4 32.5 27.8 24.0 30.4 34.0 44.6 24.7
Latin . . . . . . . . . . . . . . . . . . . . . 27.6 24.4 25.2 24.4 25.0 24.2 25.0 28.2 25.9Chinese . . . . . . . . . . . . . . . . . . 6.2 10.0 10.6 9.8 11.4 13.2 16.9 19.5 26.5Ancient Greek . . . . . . . . . . . . . . 16.7 20.6 24.4 25.8 22.1 19.4 17.6 16.4 16.3Hebrew . . . . . . . . . . . . . . . . . . . 16.6 21.1 22.4 19.4 19.4 18.2 15.6 13.0 13.1Portuguese . . . . . . . . . . . . . . . . 5.1 4.8 5.1 5.0 4.9 4.4 5.1 6.2 6.5Arabic . . . . . . . . . . . . . . . . . . . . 1.3 1.7 2.0 3.1 3.5 3.4 3.4 3.5 4.412 languages as percent of total . 99.1 98.7 98.5 98.3 98.5 98.6 98.6 98.5 97.8
1 Includes other foreign languages, not shown separately.
Source: Association of Departments of Foreign Languages, New York, NY, ADFL Bulletin, Vol. 28, No. 2, and earlier issues(copyright).
200 Education
U.S. Census Bureau, Statistical Abstract of the United States: 1999
No. 324. College Freshmen—Summary Characteristics: 1970 to 1998
[In percent, except as indicated. As of fall for first-time full-time freshmen. Based on sample survey and subject to sampling error;see source]
Characteristic 1970 1980 1985 1990 1994 1995 1996 1997 1998
Sex:Male. . . . . . . . . . . . . . . . . . . . . . . . . . . . . . . 55 49 48 46 46 46 46 46 46Female . . . . . . . . . . . . . . . . . . . . . . . . . . . . . 45 51 52 54 54 54 54 54 54
Applied to three or more colleges . . . . . . . . . . . . . 115 26 29 36 36 36 37 36 37
Average grade in high school:A- to A+ . . . . . . . . . . . . . . . . . . . . . . . . . . . . 16 21 21 23 28 28 32 32 33B- to B+ . . . . . . . . . . . . . . . . . . . . . . . . . . . . 58 60 59 58 56 56 54 54 54C to C+. . . . . . . . . . . . . . . . . . . . . . . . . . . . . 27 19 20 19 15 15 14 14 13D . . . . . . . . . . . . . . . . . . . . . . . . . . . . . . . . . 1 1 1 - - - - - -
Political orientation:Liberal . . . . . . . . . . . . . . . . . . . . . . . . . . . . . 34 20 21 23 23 21 22 22 21Middle of the road. . . . . . . . . . . . . . . . . . . . . . 45 60 57 55 53 54 53 55 57Conservative . . . . . . . . . . . . . . . . . . . . . . . . . 17 17 19 20 21 20 21 19 19
Probable field of study:Arts and humanities . . . . . . . . . . . . . . . . . . . . 16 9 8 9 8 10 10 9 10Biological sciences . . . . . . . . . . . . . . . . . . . . . 4 4 4 4 7 7 7 6 6Business . . . . . . . . . . . . . . . . . . . . . . . . . . . . 16 24 27 21 16 16 16 16 17Education . . . . . . . . . . . . . . . . . . . . . . . . . . . 11 7 7 10 10 10 11 10 11Engineering . . . . . . . . . . . . . . . . . . . . . . . . . . 9 12 11 8 8 7 8 9 8Physical science . . . . . . . . . . . . . . . . . . . . . . . 2 3 2 2 2 2 2 2 2Social science . . . . . . . . . . . . . . . . . . . . . . . . 14 7 8 10 10 9 9 8 8Professional . . . . . . . . . . . . . . . . . . . . . . . . . . (NA) 15 13 15 19 18 16 15 15Technical . . . . . . . . . . . . . . . . . . . . . . . . . . . . 4 6 5 4 3 4 2 4 4
Data processing/computer programming . . . . . (NA) 2 2 1 1 1 1 2 2Other 2 . . . . . . . . . . . . . . . . . . . . . . . . . . . . . (NA) (NA) 16 16 17 17 19 19 18
Communications . . . . . . . . . . . . . . . . . . . . . (NA) 2 2 2 2 2 2 2 2Computer science . . . . . . . . . . . . . . . . . . . . (NA) 1 2 2 2 2 3 3 4
Recipient of financial aid:Pell grant. . . . . . . . . . . . . . . . . . . . . . . . . . . . (NA) 33 19 23 23 23 20 22 21Supplemental educational opportunity grant . . . . . (NA) 8 5 7 6 6 6 6 6State scholarship or grant. . . . . . . . . . . . . . . . . (NA) 16 14 16 16 16 17 17 17College grant . . . . . . . . . . . . . . . . . . . . . . . . . (NA) 13 19 22 26 26 29 27 29Federal guaranteed student loan . . . . . . . . . . . . (NA) 21 23 23 29 29 26 25 25Perkins loan 3 . . . . . . . . . . . . . . . . . . . . . . . . (NA) 9 6 8 9 9 9 9 9College loan. . . . . . . . . . . . . . . . . . . . . . . . . . (NA) 4 4 6 8 10 9 11 10College work-study grant . . . . . . . . . . . . . . . . . (NA) 15 10 10 13 13 12 12 12
Attitudes—agree or strongly agree:Activities of married women are best confined tohome and family . . . . . . . . . . . . . . . . . . . . . . 48 27 22 25 25 24 24 25 (X)
Capital punishment should be abolished . . . . . . . 56 34 27 22 20 21 22 24 23Legalize marijuana . . . . . . . . . . . . . . . . . . . . . 38 39 22 19 32 34 33 35 32There is too much concern for the rights ofcriminals . . . . . . . . . . . . . . . . . . . . . . . . . . . 52 66 (NA) (NA) 73 73 72 70 73
Abortion should be legalized . . . . . . . . . . . . . . . (NA) 54 55 65 60 58 56 54 51Aspires to an advanced degree . . . . . . . . . . . . . 49 49 51 61 64 64 67 67 65
Male . . . . . . . . . . . . . . . . . . . . . . . . . . . . . 57 50 52 60 62 61 65 63 61Female . . . . . . . . . . . . . . . . . . . . . . . . . . . 41 47 50 62 66 66 68 69 67
Median family income ($1,000) . . . . . . . . . . . . . 12 23 34 43 48 49 53 53 53
- Represents or rounds to zero. NA Not available. X Not applicable. 1 1969 data. 2 Includes other fields, not shownseparately. 3 National Direct Student Loan prior to 1990.
Source: The Higher Education Research Institute, University of California, Los Angeles, CA, The American Freshman:National Norms, annual.
No. 325. Freshman Enrollment in Remedial Courses, by InstitutionalCharacteristic: 1995
[In percent, except number of freshmen (2,128 represents 2,128,000). As of fall. Remedial courses are those developed forstudents lacking skills necessary to perform college-level work as required by the institution. Based on survey and subject tosampling error; for details, see source]
Institutionalcharacteristic
Numberof fresh-
men(1,000)
Institutions offering courses Freshmen taking courses
Total Reading Writing Math Total Reading Writing Math
All institutions. . . . . . . . . . 2,128 78 57 71 72 29 13 17 24
Control:Public, 2 year . . . . . . . . . . 943 100 99 99 99 41 20 25 34Private, 2 year . . . . . . . . . 56 63 29 61 62 26 11 18 23
Public, 4 year . . . . . . . . . . . 726 81 52 71 78 22 8 12 18Private, 4 year . . . . . . . . . . . 403 63 34 52 51 13 7 8 9
Minority enrollment:High 1 . . . . . . . . . . . . . . . 338 94 87 85 93 43 25 29 35Low 2 . . . . . . . . . . . . . . . 1,790 76 53 70 70 26 11 15 21
1 Total enrollment, excluding nonresident aliens, is less than 50% White, non-Hispanic. 2 Total enrollment, excludingnonresident aliens, is more than 50% White, Non-Hispanic.
Source: U.S. National Center for Education Statistics, ‘‘Remedial Education at Higher Education Institutions in Fall of 1995,’’NCES 97-584.
Education 201
U.S. Census Bureau, Statistical Abstract of the United States: 1999
No. 326. College Population, by Selected Characteristics: 1987 and 1997
[In thousands (190,058 represents 190,058,000), except percent. As of October. Based on the Current Population Survey. Seetext, Section 1, Population, and Appendix III]
Characteristic Totalpopula-
tion
Enrolled in college
Total
Type of schoolPercentenrolledfull time
Percent employed
2-year 4-yearGraduate
school Total Full time Part time
Total, 1987 1 . . . . . 190,058 12,719 3,648 6,656 2,415 62.6 60.4 31.7 28.7Male . . . . . . . . . . . . . . 90,610 6,030 1,522 3,356 1,152 67.2 60.6 31.7 28.9Female. . . . . . . . . . . . . 99,449 6,689 2,127 3,299 1,264 58.4 60.1 31.6 28.5
White . . . . . . . . . . . . . . 162,757 10,731 3,039 5,617 2,075 61.6 62.2 32.6 29.6Black . . . . . . . . . . . . . . 21,520 1,351 422 748 181 66.3 50.5 28.6 21.9
Hispanic origin 2. . . . . . . 13,687 739 307 342 90 57.3 65.5 37.0 28.6
14 to 19 years old . . . . . 21,410 3,284 1,111 2,172 1 88.1 44.0 7.6 36.420 and 21 years old . . . . 7,078 2,642 624 1,961 58 84.4 53.3 14.5 38.822 to 24 years old . . . . . 11,712 2,006 457 1,055 494 67.2 62.5 29.8 32.725 to 34 years old . . . . . 42,374 2,985 851 996 1,137 36.4 74.0 55.8 18.235 years and older . . . . . 107,484 1,802 605 471 725 22.3 83.1 62.8 20.3
Total, 1997 1 . . . . . 207,727 15,436 4,078 8,331 3,027 66.3 62.2 33.0 29.2Male . . . . . . . . . . . . . . 100,067 6,843 1,663 3,876 1,304 70.4 59.5 33.9 25.6Female. . . . . . . . . . . . . 107,660 8,593 2,415 4,455 1,723 63.1 64.2 32.2 32.0
White . . . . . . . . . . . . . . 173,542 12,442 3,290 6,745 2,407 65.3 64.3 33.6 30.7Black . . . . . . . . . . . . . . 24,749 1,903 541 1,031 331 67.2 55.0 34.3 20.7
Hispanic origin 2. . . . . . . 21,039 1,260 475 679 105 63.3 61.0 32.0 29.0
15 to 19 years old . . . . . 19,463 3,533 1,178 2,327 30 89.7 43.1 8.8 34.320 and 21 years old . . . . 7,040 3,143 760 2,320 63 87.8 55.5 13.9 41.622 to 24 years old . . . . . 10,423 2,699 528 1,609 562 73.3 65.0 28.9 36.125 to 34 years old . . . . . 39,276 3,270 806 1,164 1,299 47.9 74.0 54.1 19.935 years and older . . . . . 131,526 2,791 807 911 1,073 27.3 77.4 64.4 13.0
1 Includes other races, not shown separately. 2 Persons of Hispanic origin may be of any race.
Source: U.S. Census Bureau, Current Population Reports, P20-443 and P20-516.
No. 327. Salary Offers to Candidates for Degrees: 1996 to 1998
[The complete publication including this copyright table is available from the U.S. Government Printing Office and the NationalTechnical Information Service]
202 Education
U.S. Census Bureau, Statistical Abstract of the United States: 1999
No. 328. Time Spent Earning Bachelor’s Degree, by SelectedCharacteristic: 1993
[As of spring (36,787 represents 36,787,000). Based on Survey of Income and Program Participation; for details, see source]
Characteristic
Total withbache-
lor’sdegrees(1,000)
Years to B.A. degree from end of high school
Number (1,000) PercentMeandura-tion 1
4 yearsor less
5 yearsor less
6 yearsor less
4 yearsor less
5 yearsor less
6 yearsor less
All persons. . . . . . . . . . . . . . . . . . 36,787 15,624 23,810 27,334 42.5 64.7 74.3 6.29Male . . . . . . . . . . . . . . . . . . . . 19,351 7,321 11,695 13,827 37.8 60.4 71.5 6.28Female . . . . . . . . . . . . . . . . . . 17,436 8,302 12,115 13,508 47.6 69.5 77.5 6.30
White . . . . . . . . . . . . . . . . . . . . . 32,279 14,161 21,201 24,235 43.9 65.7 75.1 6.24Male . . . . . . . . . . . . . . . . . . . . 17,258 6,717 10,537 12,411 38.9 61.1 71.9 6.22Female . . . . . . . . . . . . . . . . . . 15,021 7,444 10,664 11,824 49.6 71.0 78.7 6.26
Black . . . . . . . . . . . . . . . . . . . . . 2,314 713 1,258 1,473 30.8 54.4 63.7 7.19Male . . . . . . . . . . . . . . . . . . . . 926 264 493 570 28.5 53.2 61.6 6.98Female . . . . . . . . . . . . . . . . . . 1,388 448 764 904 32.3 55.0 65.1 7.33
Hispanic origin 2 . . . . . . . . . . . . . . 1,367 363 689 852 26.6 50.4 62.3 6.79Male . . . . . . . . . . . . . . . . . . . . 693 187 308 407 27.0 44.4 58.7 7.06Female . . . . . . . . . . . . . . . . . . 674 176 381 445 26.1 56.5 66.0 6.50
Field of bachelor’s degree: 3
Agriculture/Forestry . . . . . . . . . . 395 103 209 293 26.1 52.9 74.2 5.78Biology . . . . . . . . . . . . . . . . . . 624 241 416 471 38.6 66.7 75.5 6.34Business/Management . . . . . . . . 5,282 1,952 3,117 3,628 37.0 59.0 68.7 6.72Economics . . . . . . . . . . . . . . . . 660 321 433 479 48.6 65.6 72.6 6.35Education . . . . . . . . . . . . . . . . . 3,613 1,522 2,338 2,658 42.1 64.7 73.6 7.03Engineering . . . . . . . . . . . . . . . 2,577 729 1,392 1,733 28.3 54.0 67.2 6.66English/Journalism . . . . . . . . . . . 1,137 553 743 854 48.6 65.3 75.1 6.28Home Economics. . . . . . . . . . . . 337 177 262 284 52.5 77.7 84.3 4.71Law. . . . . . . . . . . . . . . . . . . . . 145 73 98 104 (B) (B) (B) 6.33Liberal Arts/Humanities . . . . . . . . 2,188 894 1,413 1,592 40.9 64.6 72.8 6.44Mathematics/Statistics . . . . . . . . 567 283 412 457 49.9 72.7 80.6 5.28Medicine/Dentistry . . . . . . . . . . . 142 39 74 104 (B) (B) (B) 6.32Nursing/Pharmacy/TechnicalHealth . . . . . . . . . . . . . . . . . . 1,626 498 914 1,092 30.6 56.2 67.2 7.10
Physical/Earth Sciences . . . . . . . 614 194 362 470 31.6 59.0 76.5 6.25Police Science/Law Enforcement . 326 95 182 240 29.1 55.8 73.6 6.11Psychology . . . . . . . . . . . . . . . . 815 328 555 619 40.2 68.1 76.0 6.02Religion/Theology . . . . . . . . . . . 138 52 66 71 (B) (B) (B) 7.64Social Sciences . . . . . . . . . . . . . 1,760 683 1,113 1,333 38.8 63.2 75.7 6.44Vo-tech Studies . . . . . . . . . . . . . 181 64 121 135 (B) (B) (B) 7.39Other . . . . . . . . . . . . . . . . . . . . 1,816 735 1,082 1,302 40.5 59.6 71.7 6.63
Advanced degree . . . . . . . . . . . . . 11,843 6,089 8,507 9,417 51.4 71.8 79.5 5.67
B Base is less than 200,000 persons. 1 For definition of mean, see Guide to Tabular Presentation. 2 Persons of Hispanicorigin may be of any race. 3 For persons whose highest degree is the B.A.
Source: U.S. Census Bureau, unpublished data.
No. 329. Earned Degrees Conferred, by Level and Sex: 1960 to 1996
[In thousands (477 represents 477,000), except percent. Includes Alaska and Hawaii]
Year endingAll degrees Associate’s Bachelor’s Master’s First
professional Doctor’s
TotalPercent
male Male Female Male Female Male Female Male Female Male Female
1960 1 . . . . . . . 477 65.8 (NA) (NA) 254 138 51 24 (NA) (NA) 9 11965 . . . . . . . . 660 61.5 (NA) (NA) 282 212 81 40 27 1 15 21970 . . . . . . . . 1,271 59.2 117 89 451 341 126 83 33 2 26 41975 . . . . . . . . 1,666 56.0 191 169 505 418 162 131 49 7 27 7
1980 . . . . . . . . 1,731 51.1 184 217 474 456 151 147 53 17 23 101981 . . . . . . . . 1,752 50.3 189 228 470 465 147 149 53 19 23 101982 . . . . . . . . 1,788 49.8 197 238 473 480 146 150 52 20 22 101983 . . . . . . . . 1,815 49.6 204 246 479 490 145 145 51 22 22 111984 . . . . . . . . 1,819 49.6 203 250 482 492 144 141 51 23 22 11
1985 . . . . . . . . 1,828 49.3 203 252 483 497 143 143 50 25 22 111986 . . . . . . . . 1,830 49.0 196 250 486 502 144 145 49 25 22 121987 . . . . . . . . 1,823 48.4 191 245 481 510 141 148 47 25 22 121988 . . . . . . . . 1,835 48.0 190 245 477 518 145 154 45 25 23 121989 . . . . . . . . 1,873 47.3 186 250 483 535 149 161 45 26 23 13
1990 . . . . . . . . 1,940 46.6 191 264 492 560 154 171 44 27 24 141991 . . . . . . . . 2,025 45.8 199 283 504 590 156 181 44 28 25 151992 . . . . . . . . 2,108 45.6 207 297 521 616 162 191 45 29 26 151993 . . . . . . . . 2,167 45.5 212 303 533 632 169 200 45 30 26 161994 . . . . . . . . 2,206 45.1 215 315 532 637 176 211 45 31 27 171995 . . . . . . . . 2,218 44.9 218 321 526 634 179 219 45 31 27 181996 . . . . . . . . 2,248 44.2 220 336 522 642 179 227 45 32 27 18
NA Not available. 1 First-professional degrees are included with bachelor’s degrees.
Source: U.S. National Center for Education Statistics, Digest of Education Statistics, annual.
Education 203
U.S. Census Bureau, Statistical Abstract of the United States: 1999

No. 330. Degrees and Awards Earned Below Bachelor’s, by Field: 1996
[Covers associate degrees and other awards based on postsecondary curriculums of less than 4 years in institutions of highereducation]
Field of studyLess than
1-year awards1- to less than4-year awards Associate degrees
Total Women Total Women Total Women
Total . . . . . . . . . . . . . . . . . . . . . . . . . . . 100,888 53,530 139,688 83,810 555,216 335,702Agriculture and natural resources . . . . . . . . . . . 1,749 422 1,874 549 6,182 1,964Architecture and related programs . . . . . . . . . . . 2 2 10 9 256 216Area, ethnic, and cultural studies . . . . . . . . . . . . 180 137 133 114 111 83Biological/life sciences . . . . . . . . . . . . . . . . . . . 79 24 529 205 2,037 1,220Business management and administrativeservices 1 . . . . . . . . . . . . . . . . . . . . . . . . . . 17,799 12,644 28,133 23,600 99,447 72,091
Communications and communicationstechnologies. . . . . . . . . . . . . . . . . . . . . . . . . 505 243 557 240 3,944 1,698
Computer and information sciences . . . . . . . . . . 4,349 2,040 3,570 1,868 9,658 4,704Construction trades . . . . . . . . . . . . . . . . . . . . . 4,212 229 4,021 200 2,141 106Consumer and personal services. . . . . . . . . . . . 1,615 1,240 6,460 4,764 7,721 2,754Education . . . . . . . . . . . . . . . . . . . . . . . . . . . 569 423 677 627 9,750 6,641Engineering and engineering technologies. . . . . . 2,581 421 8,325 1,026 35,199 4,414English language and literature/letters . . . . . . . . 128 86 37 26 1,310 839Foreign languages and literatures . . . . . . . . . . . 419 264 29 22 607 444Health professions and related sciences . . . . . . . 33,993 25,893 45,185 38,637 101,872 84,577Home economics and vocational homeeconomics . . . . . . . . . . . . . . . . . . . . . . . . . . 4,144 2,877 4,295 3,879 8,192 7,435
Law and legal studies . . . . . . . . . . . . . . . . . . . 850 707 2,006 1,719 9,106 7,987Liberal/general studies and humanities . . . . . . . . 152 86 481 340 174,970 106,976Library science. . . . . . . . . . . . . . . . . . . . . . . . 117 107 57 49 94 81Mathematics . . . . . . . . . . . . . . . . . . . . . . . . . 1 - 1 - 758 295Mechanics and repairers . . . . . . . . . . . . . . . . . 4,614 322 15,624 754 12,524 801Multi/interdisciplinary studies. . . . . . . . . . . . . . . 439 370 134 60 8,611 4,399Parks, recreation, leisure, and fitness . . . . . . . . . 95 61 130 78 936 391Physical sciences . . . . . . . . . . . . . . . . . . . . . . 86 47 81 30 2,612 1,154Precision production trades . . . . . . . . . . . . . . . 4,009 724 8,104 1,393 10,217 2,098Protective services . . . . . . . . . . . . . . . . . . . . . 10,156 2,202 2,821 813 19,196 5,769Psychology . . . . . . . . . . . . . . . . . . . . . . . . . . 24 18 52 39 1,583 1,177Public administration and services . . . . . . . . . . . 544 361 548 419 4,218 3,453R.O.T.C. and military technologies . . . . . . . . . . . - - - - 556 42Social sciences and history . . . . . . . . . . . . . . . 22 12 29 20 4,021 2,533Theological studies, religion and philosophy . . . . 149 89 561 255 691 332Transportation and material moving . . . . . . . . . . 6,180 826 749 120 1,571 246Visual and performing arts . . . . . . . . . . . . . . . . 831 432 3,861 1,576 13,534 7,728Undistributed and unclassified. . . . . . . . . . . . . . 295 221 614 379 1,591 1,054
- Represents zero. 1 Includes marketing.
Source: U.S. National Center for Education Statistics, Digest of Education Statistics, 1998.
No. 331. Bachelor’s Degrees Earned, by Field: 1971 to 1996
Field of study1971 1980 1990 1995 1996
Percent female
1971 1996
Total . . . . . . . . . . . . . . . . . . . . 839,730 929,417 1,051,344 1,160,134 1,164,792 43.4 55.1Agriculture and natural resources . . . . 12,672 22,802 12,900 19,841 21,431 4.2 36.8Architecture and environmental design . 5,570 9,132 9,364 8,756 8,352 11.9 36.1Area, ethnic and cultural studies . . . . . 2,582 2,840 4,613 5,706 5,786 52.4 65.7Biological sciences/life sciences . . . . . 35,743 46,370 37,204 55,984 60,994 29.1 52.7Business and management . . . . . . . . 114,729 184,867 248,698 234,323 227,102 9.1 48.6
Communications 1 . . . . . . . . . . . . . . 10,802 28,616 51,308 48,803 48,003 35.3 58.8Computer and information sciences . . . 2,388 11,154 27,257 24,404 24,098 13.6 27.5Education . . . . . . . . . . . . . . . . . . . . 176,307 118,038 105,112 106,079 105,509 74.5 75.1Engineering 1 . . . . . . . . . . . . . . . . . 50,046 68,893 81,322 78,154 77,437 0.8 16.1English language and literature/letters . 64,342 32,541 47,519 51,901 50,698 65.6 66.0
Foreign languages and literatures . . . . 20,536 12,089 12,386 13,775 13,952 74.0 69.8Health sciences . . . . . . . . . . . . . . . . 25,226 63,920 58,302 79,855 84,036 77.1 81.6Home economics . . . . . . . . . . . . . . . 11,167 18,411 14,491 15,345 15,803 97.3 88.1Law and legal studies . . . . . . . . . . . . 545 683 1,592 2,032 2,052 5.0 72.9Liberal/general studies . . . . . . . . . . . 7,481 23,196 27,985 33,356 33,997 33.6 60.6
Library and archival sciences . . . . . . . 1,013 398 77 50 58 92.0 86.2Mathematics . . . . . . . . . . . . . . . . . . 24,937 11,872 15,176 13,723 13,143 37.9 45.7Military technologies . . . . . . . . . . . . . 357 38 196 27 7 0.3 -Multi/interdisciplinary studies . . . . . . . 6,286 11,277 16,267 26,033 26,515 22.8 65.0Parks and recreation. . . . . . . . . . . . . 1,621 5,753 4,582 12,889 13,983 34.7 49.3Philosophy, religion, and theology . . . . 11,890 13,276 12,068 12,854 12,746 25.5 30.2
Physical sciences 1. . . . . . . . . . . . . . 21,412 23,410 16,066 19,177 19,647 13.8 36.0Protective services . . . . . . . . . . . . . . 2,045 15,015 15,354 24,157 24,810 9.2 38.4Psychology . . . . . . . . . . . . . . . . . . . 38,187 42,093 53,952 72,083 73,291 44.4 73.0Public affairs . . . . . . . . . . . . . . . . . . 5,466 16,644 13,908 18,586 19,849 68.4 78.8
Social sciences 2 . . . . . . . . . . . . . . . 155,324 103,662 118,083 128,154 126,479 36.8 47.9Visual and performing arts . . . . . . . . . 30,394 40,892 39,934 48,690 49,296 59.7 59.2Unclassified. . . . . . . . . . . . . . . . . . . 662 1,535 5,628 5,397 5,718 0.9 21.9
- Represents zero. 1 Includes technologies. 2 Includes history.
Source: U.S. National Center for Education Statistics, Digest of Education Statistics, annual.
204 Education
U.S. Census Bureau, Statistical Abstract of the United States: 1999

No. 332. Master’s and Doctorate’s Degrees Earned, by Field: 1971 to 1996
Level and field of study1971 1980 1990 1995 1996
Percent female
1971 1996
MASTER’S DEGREES
Total . . . . . . . . . . . . . . . . . . . . . . . 230,509 298,081 324,301 397,629 406,301 40.1 55.9Agriculture and natural resources . . . . . . . 2,457 3,976 3,382 4,252 4,569 5.9 42.0Architecture and related programs. . . . . . . 1,705 3,139 3,499 3,923 3,993 13.8 40.9Area, ethnic and cultural studies . . . . . . . . 1,032 852 1,212 1,639 1,713 38.3 53.4Biological sciences/life sciences . . . . . . . . 5,728 6,510 4,869 5,393 6,157 33.6 52.9Business management and administrativeservices . . . . . . . . . . . . . . . . . . . . . . . 25,977 54,484 76,676 93,809 93,982 3.9 37.6
Communications and technologies . . . . . . 1,856 3,082 4,362 5,609 5,604 34.6 61.3Computer and information sciences . . . . . . 1,588 3,647 9,677 10,326 10,151 10.3 26.7Education . . . . . . . . . . . . . . . . . . . . . . . 87,666 101,819 84,881 101,242 106,253 56.2 76.3Engineering and engineering technologies . 16,443 16,243 24,772 29,670 28,566 1.1 17.2English language and literature/letters . . . . 10,686 6,189 6,567 7,845 7,893 60.6 64.3
Foreign languages . . . . . . . . . . . . . . . . . 5,217 2,854 2,760 3,136 3,124 64.2 67.4Health sciences . . . . . . . . . . . . . . . . . . . 5,749 15,704 20,321 31,243 33,398 55.3 79.0Home economics . . . . . . . . . . . . . . . . . . 1,452 2,690 2,100 2,864 2,917 93.9 83.0Law and legal studies . . . . . . . . . . . . . . . 955 1,817 1,888 2,511 2,751 4.8 36.4Liberal arts and sciences, generalstudies and humanities . . . . . . . . . . . . . 885 2,646 1,999 2,565 2,778 44.6 65.4
Library science . . . . . . . . . . . . . . . . . . . 7,001 5,374 4,341 5,057 5,099 81.3 79.0Mathematics . . . . . . . . . . . . . . . . . . . . . 5,695 3,382 4,146 4,181 4,031 27.1 38.8Military technologies . . . . . . . . . . . . . . . . 2 46 - 124 136 - 2.9Multi/interdisciplinary studies . . . . . . . . . . 821 2,306 2,834 2,457 2,347 25.0 53.9Parks and recreation. . . . . . . . . . . . . . . . 218 647 529 1,755 1,751 29.8 48.0Philosophy, religion, and theology . . . . . . . 4,036 5,126 6,265 6,620 6,409 27.1 39.1
Physical sciences and sciencetechnologies . . . . . . . . . . . . . . . . . . . . 6,367 5,219 5,449 5,753 5,847 13.3 32.2
Protective services . . . . . . . . . . . . . . . . . 194 1,805 1,151 1,706 1,812 10.3 36.5Psychology . . . . . . . . . . . . . . . . . . . . . . 5,717 9,938 10,730 13,921 13,792 40.6 72.4Public administration and services. . . . . . . 7,785 17,560 17,399 23,501 24,229 50.0 71.4
Social sciences 1 . . . . . . . . . . . . . . . . . . 16,539 12,176 11,634 14,845 15,012 28.5 46.1Visual and performing arts . . . . . . . . . . . . 6,675 8,708 8,481 10,277 10,280 47.4 57.6Unclassified. . . . . . . . . . . . . . . . . . . . . . 63 142 2,377 1,405 1,707 - 24.9
DOCTORATE’S DEGREES
Total . . . . . . . . . . . . . . . . . . . . . . . 32,107 32,615 38,371 44,446 44,652 14.3 39.9Agriculture and natural resources . . . . . . . 1,086 991 1,295 1,264 1,271 2.9 26.4Architecture and related programs. . . . . . . 36 79 103 141 141 8.3 31.9Area, ethnic and cultural studies . . . . . . . . 144 151 131 186 184 16.7 48.9Biological sciences/life sciences . . . . . . . . 3,645 3,636 3,844 4,645 4,780 16.3 42.0Business management and administrativeservices . . . . . . . . . . . . . . . . . . . . . . . 757 753 1,093 1,394 1,368 2.8 28.8
Communications and technologies . . . . . . 145 193 273 321 345 13.1 44.9Computer and information sciences . . . . . . 128 240 627 884 867 2.3 14.5Education . . . . . . . . . . . . . . . . . . . . . . . 6,041 7,314 6,502 6,905 6,676 21.0 62.2Engineering and engineering technology . . 3,638 2,507 4,981 6,128 6,380 0.6 12.5English language and literature/letters . . . . 1,650 1,294 1,078 1,561 1,535 28.8 61.6
Foreign languages . . . . . . . . . . . . . . . . . 988 755 724 905 876 34.6 55.8Health sciences . . . . . . . . . . . . . . . . . . . 466 786 1,536 2,069 2,119 16.5 56.6Home economics . . . . . . . . . . . . . . . . . . 123 192 301 388 414 61.0 71.7Law and legal studies . . . . . . . . . . . . . . . 20 40 111 88 91 - 35.2Liberal arts and sciences, generalstudies and humanities . . . . . . . . . . . . . 32 192 63 90 75 31.3 56.0
Library science . . . . . . . . . . . . . . . . . . . 39 73 42 55 53 28.2 81.1Mathematics . . . . . . . . . . . . . . . . . . . . . 1,249 763 966 1,226 1,209 7.6 20.4Multi/interdisciplinary studies . . . . . . . . . . 59 209 272 238 441 6.8 50.6Parks and recreation. . . . . . . . . . . . . . . . 2 21 35 149 104 50.0 37.5Philosophy, religion, and theology . . . . . . . 866 1,693 1,756 2,098 2,070 5.8 18.4
Physical sciences and sciencetechnologies . . . . . . . . . . . . . . . . . . . . 4,390 3,089 4,164 4,483 4,571 5.6 23.1
Protective services . . . . . . . . . . . . . . . . . 1 18 38 26 38 - 42.1Psychology . . . . . . . . . . . . . . . . . . . . . . 2,144 3,395 3,811 3,822 3,711 24.0 66.1Public administration and services. . . . . . . 174 342 508 556 499 24.1 55.9
Social sciences 1 . . . . . . . . . . . . . . . . . . 3,660 3,230 3,010 3,725 3,760 13.9 37.8Visual and performing arts . . . . . . . . . . . . 621 655 849 1,080 1,067 22.2 50.9Unclassified. . . . . . . . . . . . . . . . . . . . . . 3 4 258 19 7 - 28.6
- Represents zero. 1 Includes history.
Source: U.S. National Center for Education Statistics, Digest of Education Statistics, annual.
Education 205
U.S. Census Bureau, Statistical Abstract of the United States: 1999

No. 333. First Professional Degrees Earned in Selected Professions:1970 to 1996
[First professional degrees include degrees which require at least 6 years of college work for completion (including at least 2 yearsof preprofessional training). See Appendix III]
Type of degree and sex of recipient 1970 1975 1980 1985 1990 1992 1993 1994 1995 1996
Medicine (M.D.):Institutions conferring degrees. . . . . 86 104 112 120 124 120 122 121 119 119Degrees conferred, total . . . . . . . . . 8,314 12,447 14,902 16,041 15,075 15,243 15,531 15,368 15,537 15,341
Percent to women . . . . . . . . . . . 8.4 13.1 23.4 30.4 34.2 35.7 37.7 37.9 38.8 40.9
Dentistry (D.D.S. or D.M.D.):Institutions conferring degrees. . . . . 48 52 58 59 57 52 55 53 53 53Degrees conferred, total . . . . . . . . . 3,718 4,773 5,258 5,339 4,100 3,593 3,605 3,787 3,897 3,697
Percent to women . . . . . . . . . . . 0.9 3.1 13.3 20.7 30.9 32.3 33.9 38.5 36.4 35.8
Law (LL.B. or J.D.):Institutions conferring degrees. . . . . 145 154 179 181 182 177 184 185 183 183Degrees conferred, total . . . . . . . . . 14,916 29,296 35,647 37,491 36,485 38,848 40,302 40,044 39,349 39,828
Percent to women . . . . . . . . . . . 5.4 15.1 30.2 38.5 42.2 42.7 42.5 43.0 42.6 43.5
Theological (B.D., M.Div., M.H.L.):Institutions conferring degrees. . . . . (NA) (NA) (NA) (NA) (NA) (NA) (NA) 186 192 184Degrees conferred, total . . . . . . . . . 5,298 5,095 7,115 7,221 5,851 5,251 5,447 5,967 5,978 5,879
Percent to women . . . . . . . . . . . 2.3 6.8 13.8 18.5 24.8 23.3 24.8 24.8 25.7 25.2
NA Not available.
Source: U.S. National Center for Education Statistics, Digest of Education Statistics, annual.
No. 334. Degrees Earned, by Level and Race/Ethnicity: 1981 to 1996
[For school year ending in year shown. Data exclude some institutions not reporting field of study and are slight undercountsof degrees awarded]
Level of degree andrace/ethnicity
Total Percentdistribution
1981 1985 1990 1994 1995 1996 1981 1996
Associate’s degrees, total . . . . . . 410,174 429,815 450,263 529,106 538,545 553,625 100.0 100White, non-Hispanic. . . . . . . . . . . . . . . 339,167 355,343 369,580 418,301 419,323 425,028 82.7 76.8Black, non-Hispanic . . . . . . . . . . . . . . . 35,330 35,791 35,327 45,461 47,142 51,672 8.6 9.3Hispanic . . . . . . . . . . . . . . . . . . . . . . 17,800 19,407 22,195 32,074 36,013 38,163 4.3 6.9Asian or Pacific Islander . . . . . . . . . . . . 8,650 9,914 13,482 18,433 20,717 23,091 2.1 4.2American Indian/Alaskan Native. . . . . . . 2,584 2,953 3,530 4,871 5,492 5,556 0.6 1.0Nonresident alien . . . . . . . . . . . . . . . . 6,643 6,407 6,149 9,966 9,858 10,115 1.6 1.8
Bachelor’s degrees, total . . . . . . . 934,800 968,311 1,048,631 1,165,973 1,158,788 1,163,036 100.0 100.0White, non-Hispanic. . . . . . . . . . . . . . . 807,319 826,106 884,376 936,227 913,377 904,709 86.4 77.8Black, non-Hispanic . . . . . . . . . . . . . . . 60,673 57,473 61,063 83,576 87,203 91,166 6.5 7.8Hispanic . . . . . . . . . . . . . . . . . . . . . . 21,832 25,874 32,844 50,241 54,201 58,288 2.3 5.0Asian or Pacific Islander . . . . . . . . . . . . 18,794 25,395 39,248 55,660 60,478 64,359 2.0 5.5American Indian/Alaskan Native. . . . . . . 3,593 4,246 4,392 6,189 6,606 6,970 0.4 0.6Nonresident alien . . . . . . . . . . . . . . . . 22,589 29,217 26,708 34,080 36,923 37,544 2.4 3.2
Master’s degrees, total . . . . . . . . 294,183 280,421 322,465 385,419 397,052 405,521 100.0 100.0White, non-Hispanic. . . . . . . . . . . . . . . 241,216 223,628 251,690 288,288 292,784 297,558 82.0 73.4Black, non-Hispanic . . . . . . . . . . . . . . . 17,133 13,939 15,446 21,937 24,171 25,801 5.8 6.4Hispanic . . . . . . . . . . . . . . . . . . . . . . 6,461 6,864 7,950 11,913 12,907 14,412 2.2 3.6Asian or Pacific Islander . . . . . . . . . . . . 6,282 7,782 10,577 15,267 16,842 18,161 2.1 4.5American Indian/Alaskan Native. . . . . . . 1,034 1,256 1,101 1,697 1,621 1,778 0.4 0.4Nonresident alien . . . . . . . . . . . . . . . . 22,057 26,952 35,701 46,317 48,727 47,811 7.5 11.8
Doctor’s degrees, total . . . . . . . . 32,839 32,307 38,113 43,149 44,427 44,645 100.0 100.0White, non-Hispanic. . . . . . . . . . . . . . . 25,908 23,934 25,880 27,156 27,826 27,756 78.9 62.2Black, non-Hispanic . . . . . . . . . . . . . . . 1,265 1,154 1,153 1,393 1,667 1,636 3.9 3.7Hispanic . . . . . . . . . . . . . . . . . . . . . . 456 677 788 903 984 999 1.4 2.2Asian or Pacific Islander . . . . . . . . . . . . 877 1,106 1,235 2,025 2,690 2,646 2.7 5.9American Indian/Alaskan Native. . . . . . . 130 119 99 134 130 158 0.4 0.4Nonresident alien . . . . . . . . . . . . . . . . 4,203 5,317 8,958 11,538 11,130 11,450 12.8 25.6
First-professional degrees, total . . 71,340 71,057 70,744 75,418 75,800 76,641 100.0 100.0White, non-Hispanic. . . . . . . . . . . . . . . 64,551 63,219 60,240 60,140 59,402 59,456 90.5 77.6Black, non-Hispanic . . . . . . . . . . . . . . . 2,931 3,029 3,410 4,444 4,747 5,016 4.1 6.5Hispanic . . . . . . . . . . . . . . . . . . . . . . 1,541 1,884 2,427 3,134 3,231 3,476 2.2 4.5Asian or Pacific Islander . . . . . . . . . . . . 1,456 1,816 3,362 5,892 6,397 6,617 2.0 8.6American Indian/Alaskan Native. . . . . . . 192 248 257 371 412 463 0.3 0.6Nonresident alien . . . . . . . . . . . . . . . . 669 861 1,048 1,437 1,611 1,613 0.9 2.1
Source: U.S. National Center for Education Statistics, Digest of Education Statistics, annual.
206 Education
U.S. Census Bureau, Statistical Abstract of the United States: 1999

No. 335. College and University Libraries—Summary: 1975 to 1995
[For school year ending in year shown, except enrollment as of fall of the prior year (10,322 represents 10,322,000). Priorto 1982, includes outlying areas]
Item 1975 1982 1985 1988 1990 1992 1995
Number of libraries . . . . . . . . . . . . . . . 2,972 3,104 3,322 3,438 3,274 3,274 3,639Total enrollment (1,000) . . . . . . . . . . . . 10,322 12,372 12,242 12,767 13,539 14,359 14,279
COLLECTIONS (1,000)
Number of volumes . . . . . . . . . . . . . . . 447,059 567,826 631,727 706,504 717,042 749,429 792,707Volumes added during year. . . . . . . . . . 23,242 19,507 20,658 21,907 19,003 20,982 22,460Number of serial subscriptions. . . . . . . . 4,434 4,890 6,317 6,416 5,748 6,966 6,780
STAFF
Total . . . . . . . . . . . . . . . . . . . . . . . 56,836 58,476 58,476 67,251 69,359 67,166 68,920Librarians and professional . . . . . . . . . . 23,530 23,816 21,822 25,115 26,101 26,341 27,376
OPERATING EXPENDITURES($1,000)
Total 1 . . . . . . . . . . . . . . . . . . . . . . 1,091,784 1,943,769 2,404,524 2,770,075 3,257,813 3,648,654 4,317,847Salaries. . . . . . . . . . . . . . . . . . . . . . . 592,568 1,081,894 1,156,138 1,451,551 1,693,813 1,889,368 2,058,375Collection. . . . . . . . . . . . . . . . . . . . . . 327,904 561,199 750,282 891,281 1,040,928 1,197,293 1,374,407
1 Includes other expenditures, not shown separately.
Source: U.S. National Center for Education Statistics, Digest of Education Statistics, 1997; and Academic Library Survey.
No. 336. Libraries—Number, by Type: 1980 to 1997
Type 1980 1985 1990 1997
Total 1 . . . . . . . 31,564 32,323 34,613 37,591United States. . . . . 28,638 29,843 30,761 33,108
Public . . . . . . . . . . . 8,717 8,849 9,060 9,815Public branches. . . . . 5,936 6,330 5,833 6,435Special 2 . . . . . . . . . 7,649 7,530 9,051 9,898
Medicine. . . . . . . . 1,674 1,667 1,861 1,900Religious. . . . . . . . 913 839 946 1,010Law 3 . . . . . . . . . . 417 435 647 1,153
Academic . . . . . . . . . 4,591 5,034 4,593 4,700
Type 1980 1985 1990 1997
Junior college . . . . 1,191 1,188 1,233 1,270Colleges,universities . . . . . 3,400 3,846 3,360 3,430Departmental . . . 1,489 1,824 1,454 1,452
Law, medicine,religious . . . . 269 531 501 491
Government . . . . . . . 1,260 1,574 1,735 1,897Armed Forces . . . . . . 485 526 489 363
Outlying areas . . . . 113 114 110 (NA)
NA Not available. 1 Includes Canadian libraries and libraries in regions administered by the United States, not shownseparately. Data are exclusive of elementary and secondary school libraries. Law libraries with fewer than 10,000 volumes areincluded only if they specialize in a particular field. 2 Includes other types of special libraries, not shown separately. Increasebetween 1980 and 1990 is due mainly to revised criteria for identifying special libraries and improved methods of counting.3 Increase in 1997 due to increased effort in identifying special libraries.
Source: R.R. Bowker Co., New York, NY, The Bowker Annual: Library and Book Trade Almanac and American LibraryDirectory, annual. (Copyright by Reed Elsevier Inc.)
No. 337. Public Libraries, by Selected Characteristics: 1996
[Based on survey of public libraries (5,905 represents $5,905,000,000). Data are for public libraries in the 50 states and the Districtof Columbia. The response rates for these items are between 97 and 100 percent]
Population ofservice area
Number of— Operating income— Paid staff 3
Booksand serial
volumes(per capita)
Publiclibraries
Stationaryoutlets 1
Total(mil.
dol.) 2
Source (percent)
Total
Librarianswith ALA-
MLS 4
Stategovern-
ment
Localgovern-
ment
Total . . . . . . . . . 8,946 16,047 5,905 12.2 78.1 117,812 27,353 2.8
1,000,000 or more. . . . 20 864 771 10.9 75.2 13,954 4,104.2 2.5500,000 to 999,000 . . . 52 1,132 999 17.2 74.6 17,531 4,674.7 2.6250,000 to 499,999 . . . 90 1,039 688 10.7 82.6 12,526 3,241.4 2.4100,000 to 249,999 . . . 313 1,960 959 10.1 81.9 19,341 4,516.1 2.250,000 to 99,999. . . . . 510 1,573 729 13.5 78.5 15,096 3,420.1 2.5
25,000 to 49,999. . . . . 863 1,662 718 12.3 78.8 15,046 3,436.1 2.910,000 to 24,999. . . . . 1,679 2,162 643 10.2 78.7 13,945 2,843.2 3.55,000 to 9,999 . . . . . . 1,498 1,677 239 11.8 74.4 5,792 804.6 4.22,500 to 4,999 . . . . . . 1,327 1,365 92 7.1 74.2 2,518 220.6 5.31,000 to 2,499 . . . . . . 1,636 1,653 52 5.7 69.9 1,590 76.9 7.7Fewer than 1,000 . . . . 958 960 14 7.3 66.4 473 15.4 13.8
1 The sum of central and branches libraries. The total number of central libraries was 8,923; the total of branch libraries was7,124. 2 Includes income from the Federal Government (1.0%) and other sources (8.7%), not shown separately. 3 Full-timeequivalents. 4 Librarians with master’s degrees from a graduate library education program accredited by the American LibraryAssociation (ALA). Total librarians, including those without ALA-MLS, was 39,096.
Source: U.S. National Center for Education Statistics, Public Libraries in the United States: 1996.
Education 207
U.S. Census Bureau, Statistical Abstract of the United States: 1999

No. 338. Household Use of Public Library Services: 1996[For the 50 states and DC (99,088 represents 99,088,000). Based on a survey conducted between January and April 1996; seesource for details]
ItemAll households
Households withchldren under
18 years old
Households withno chldren under
18 years old
Number of households (1,000) . . . . . . . . . . . . . . . . . . . . . . . . . . . . 99,088 36,225 62,863PERCENT USING PUBLIC LIBRARIES
Used in the past year . . . . . . . . . . . . . . . . . . . . . . . . . . . . . . . . . . 65 82 54Used on the past month . . . . . . . . . . . . . . . . . . . . . . . . . . . . . . . . 44 61 35
Way of using—Borrow or drop off books or tapes . . . . . . . . . . . . . . . . . . . . . . 36 53 26Go for other purpose 1 . . . . . . . . . . . . . . . . . . . . . . . . . . . . . . 18 26 14Called library to renew book or to get information 2 . . . . . . . . . . . 14 18 12Linked to library from home computer . . . . . . . . . . . . . . . . . . . . 4 5 3
Purpose for using—Enjoyment or hobbies 3 . . . . . . . . . . . . . . . . . . . . . . . . . . . . . 32 45 24To get information for personal use. . . . . . . . . . . . . . . . . . . . . . 20 22 18School or class assignment. . . . . . . . . . . . . . . . . . . . . . . . . . . 19 38 7Work assignment or to keep up to date at work . . . . . . . . . . . . . 8 10 7To get information to help find a job . . . . . . . . . . . . . . . . . . . . . 5 5 5For program or activity for children 6 to 12 years old . . . . . . . . . . 4 7 2For activity for children under 6 . . . . . . . . . . . . . . . . . . . . . . . . 4 8 1
1 Including a lecture, story hour, or using equipment. 2 Information other than library hours or directions. 3 Includingborrowing books or tapes or to attend activities.
Source: U.S. Department of Education, National Center for Education Statistics, Use of Public Library Services by Householdsin the United States: 1996, February 1997.
No. 339. Children Who Participated in Various Literacy ProgramsWith a Parent or Family Member: 1991 to 1996
[In percent. For children 3 to 5 years old. Based on the National Household Education Survey; see source for details]
CharacteristicRead to 3 or more times in
the prior weekTold a story at least once in
the prior weekVisited a library in
the past month
1991 1995 1996 1991 1995 1996 1991 1995 1996
Total participating 1 . . . . . . . . 71.4 83.1 82.9 72.0 81.4 82.0 36.6 41.2 38.2School enrollment status:
Not enrolled . . . . . . . . . . . . . . . . 68.8 81.5 80.0 72.3 80.3 80.0 30.5 32.0 31.5Center-based programs 2 . . . . . . . 75.2 85.8 85.2 74.1 82.7 84.0 41.0 46.3 42.6Kindergarten 2. . . . . . . . . . . . . . . 71.1 81.3 83.8 68.8 81.0 81.9 41.7 47.3 42.1
Race/ethnicity:White 3 . . . . . . . . . . . . . . . . . . . 77.7 89.0 88.9 73.8 83.9 83.9 40.7 45.1 42.5Black 3 . . . . . . . . . . . . . . . . . . . 59.0 73.7 75.9 66.0 74.4 76.6 27.8 34.1 34.1Hispanic . . . . . . . . . . . . . . . . . . 53.0 61.5 65.3 68.4 75.1 79.3 24.5 28.0 25.9
Parents highest education level:Less than high school diploma . . . . 53.8 64.4 58.8 67.4 71.9 72.8 18.3 18.3 19.4High school diploma or GED . . . . . 63.5 77.9 77.4 68.2 77.6 79.9 26.0 31.5 30.1Some college/vocational/technical. . 74.0 85.3 86.5 74.2 82.9 84.6 38.5 40.9 37.1Bachelor’s degree . . . . . . . . . . . . 82.1 89.7 90.9 74.7 85.0 83.2 52.0 53.5 51.9Graduate/professional school. . . . . 88.3 94.0 96.1 78.4 88.2 85.8 59.1 62.8 59.5
1 Includes other race/ethnic groups, not shown separately. 2 Center-based includes Head Start, nursery school, andprekindergarten; kindergarten includes transitional kindergarten, kindergarten and pre-first grade. 3 Non-Hispanic.
Source: U.S. Department of Education, National Center for Education Statistics, Condition of Education, 1998.
No. 340. Public Library Use of the Internet: 1998[In percent, except number of outlets. As of spring. Based on sample survey; see source for details]
Item
Total
Metropolitan status 1 Poverty status 2
UrbanSub-
urban Rural
Lessthan 20percent
20 to 40percent
Morethan 40percent
All libraries outlets 3 . . . . . . . . . . . . . . . . . 15,718 2,691 4,933 8,094 12,757 2,644 317Percent of total . . . . . . . . . . . . . . . . . . . . 100.0 17.1 31.4 51.5 81.2 16.8 2.0
Connected to the Internet . . . . . . . . . . . . . . . . . . 83.6 91.0 88.1 78.4 84.1 80.9 83.3Connected with public access. . . . . . . . . . . . . . . . 73.3 84.0 76.7 67.6 73.2 72.8 79.5
Public access services provided—Only text-based terminals . . . . . . . . . . . . . . . 5.8 13.4 5.3 3.2 5.7 5.0 16.1Some graphical workstations . . . . . . . . . . . . . 94.2 86.6 94.7 96.8 94.3 95.0 83.9Speed of access—
Less than 28.8kpbs . . . . . . . . . . . . . . . . . 4.2 3.6 3.7 4.7 4.8 0.9 3.828.8kpbs to 56kpbs . . . . . . . . . . . . . . . . . 28.7 7.7 21.3 42.2 30.6 21.6 11.156kpbs . . . . . . . . . . . . . . . . . . . . . . . . . . 32.7 33.5 35.1 30.7 32.0 34.8 42.6Greater than 56kpbs . . . . . . . . . . . . . . . . . 33.7 53.5 39.1 22.2 31.8 42.4 40.9
Special software/hardware for persons withdisabilities on: all workstations . . . . . . . . . . . 2.9 2.3 1.2 4.2 2.4 5.3 0.8
Some workstations . . . . . . . . . . . . . . . 13.6 24.1 15.1 8.3 12.7 16.9 23.0No workstations . . . . . . . . . . . . . . . . . 83.6 73.8 83.7 87.5 84.9 77.9 76.1
Filtering software not used on workstations . . . 85.3 82.9 83.3 87.9 85.8 83.1 85.4With acceptable use policies . . . . . . . . . . . . . 84.8 87.3 85.9 83.1 84.5 86.6 86.3
1 Urban = inside central city; Suburban = in metro area, outside of a central city; Rural = outside a metro area. 2 Determinedby the 1990 poverty status of the service area of the outlet. 3 Central libraries and branches; excludes bookmobiles.
Source: The American Library Association, Washington, D.C., The 1998 National Survey of U.S. Public Library Outlet InternetConnectivity: Final Report, September 1998, by John Carlo Bartot and Charles R. McClure.
208 Education
U.S. Census Bureau, Statistical Abstract of the United States: 1999

No. 341. Participation in Adult Education: 1994-95
[In thousands (189,543 represents 189,543,000), except percent. For the civilian noninstitutional population 17 years old andover not enrolled full-time in elementary or secondary school at the time of the survey. Adult education is considered any enroll-ment in any educational activity at any time in the prior 12 months. Based on survey and subject to sampling error; source for details]
Characteristic Adultpopu-lation
(1,000)
Participants in adult education
Numbertaking
adult ed.courses(1,000)
Percent oftotal
Reason for taking course (percent) 1
Personal/social
Advanceon the job
Train for anew job
Completedegree or
diploma
Total . . . . . . . . . . . . . . . . . . . . 189,543 76,261 40 44 54 11 10
Age: 17 to 24 years old . . . . . . . . . . . 22,407 10,539 47 39 33 21 1925 to 34 years old. . . . . . . . . . . . . 40,326 19,508 48 41 56 14 835 to 44 years old. . . . . . . . . . . . . 42,304 20,814 49 40 64 10 945 to 54 years old. . . . . . . . . . . . . 31,807 14,592 46 39 65 7 1055 to 64 years old. . . . . . . . . . . . . 21,824 6,117 28 52 54 4 665 years old and over . . . . . . . . . . 30,876 4,691 15 86 14 1 3
Sex: Male . . . . . . . . . . . . . . . . . . . . 90,256 34,450 38 34 60 10 10Female . . . . . . . . . . . . . . . . . . . . 99,287 41,811 42 51 49 12 9
Race/ethnicity:White 2 . . . . . . . . . . . . . . . . . . . . 144,587 59,982 41 44 57 10 9Black 2 . . . . . . . . . . . . . . . . . . . . 20,806 7,704 37 45 48 13 12Hispanic . . . . . . . . . . . . . . . . . . . 15,689 5,281 34 40 37 13 11Other races 2 . . . . . . . . . . . . . . . . 8,461 3,294 39 40 45 16 13
Marital status:Never married . . . . . . . . . . . . . . . 38,627 17,094 44 37 44 20 15Currently married . . . . . . . . . . . . . 114,678 48,200 42 45 58 8 8Other . . . . . . . . . . . . . . . . . . . . . 36,238 10,967 30 48 52 9 8
Children under 18 in household:Yes . . . . . . . . . . . . . . . . . . . . . . 77,787 36,103 46 43 56 11 9No . . . . . . . . . . . . . . . . . . . . . . . 111,756 40,158 36 44 52 11 10
Educational attainment:Up to 8th grade . . . . . . . . . . . . . . 12,808 1,283 10 52 20 8 99th to 12th grade . . . . . . . . . . . . . 16,511 3,332 20 45 27 10 18High school diploma or GED. . . . . . 62,956 19,341 31 44 49 10 6Vocational school after high school . 6,327 2,648 42 44 57 8 8Some college . . . . . . . . . . . . . . . . 34,433 16,978 49 45 47 16 13Associate’s degree . . . . . . . . . . . . 9,975 5,601 56 39 64 9 9Bachelor’s or higher . . . . . . . . . . . 46,535 27,078 58 43 65 9 9
Labor force status:Employed . . . . . . . . . . . . . . . . . . 117,826 59,734 51 37 64 10 10Unemployed . . . . . . . . . . . . . . . . 8,155 2,983 37 39 27 25 13Not in the labor force. . . . . . . . . . . 63,562 13,544 21 72 15 11 8
Occupation: 3
Professional . . . . . . . . . . . . . . . . . 16,814 12,219 73 37 74 8 10Executive, administrative andmanagerial . . . . . . . . . . . . . . . . . 12,500 7,070 57 37 76 8 10
Technical and related support . . . . . 4,812 3,300 69 32 73 9 11Sales workers . . . . . . . . . . . . . . . 15,666 7,131 46 41 53 12 11Administrative support 4 . . . . . . . . . 20,460 10,727 52 43 62 11 6Service . . . . . . . . . . . . . . . . . . . . 17,355 8,238 47 37 51 14 12Agriculture, forestry, and fishing . . . . 1,908 500 26 40 49 6 12Precision production, craftand repair . . . . . . . . . . . . . . . . . 11,441 4,977 43 30 62 8 11
Machine operators, assemblers 5 . . . 8,309 2,515 30 28 58 10 9Transportation and materialsmoving . . . . . . . . . . . . . . . . . . . 4,488 1,295 29 35 60 13 12
Handlers, equipment cleaners,helpers and laborers . . . . . . . . . . 1,989 519 26 33 43 24 5
Nonclassifiable, undetermined . . . . . 2,022 1,194 59 35 71 6 4
Household income:Under $10,000 . . . . . . . . . . . . . . . 30,198 6,883 23 48 25 20 12$10,001 to $15,000 . . . . . . . . . . . . 13,523 3,610 27 51 32 17 10$15,001 to $20,000 . . . . . . . . . . . . 13,116 4,176 32 45 38 15 12$20,001 to $25,000 . . . . . . . . . . . . 13,812 4,339 31 47 44 13 11$25,001 to $30,000 . . . . . . . . . . . . 16,386 6,208 38 45 46 13 11$30,001 to $40,000 . . . . . . . . . . . . 28,628 12,220 43 45 55 11 9$40,001 to $50,000 . . . . . . . . . . . . 20,446 9,567 47 41 61 10 8$50,001 to $75,000 . . . . . . . . . . . . 29,161 15,169 52 39 67 7 8More than $75,000 . . . . . . . . . . . . 24,274 14,089 58 43 64 7 9
1 Reason for taking at least one course. Includes duplication. Excludes ‘‘to improve basic skills,’’ cited by no more than 6percent of participants. 2 Non-Hispanic. 3 For those employed in the 12 months prior to the interview. Excludes thoseparticipating exclusively in full-time credential programs. 4 Includes clerical. 5 Includes inspectors.
Source: U.S. National Center for Education Statistics, 1995 National Household Education Survey.
Education 209
U.S. Census Bureau, Statistical Abstract of the United States: 1999