Embed Size (px)
Citation preview
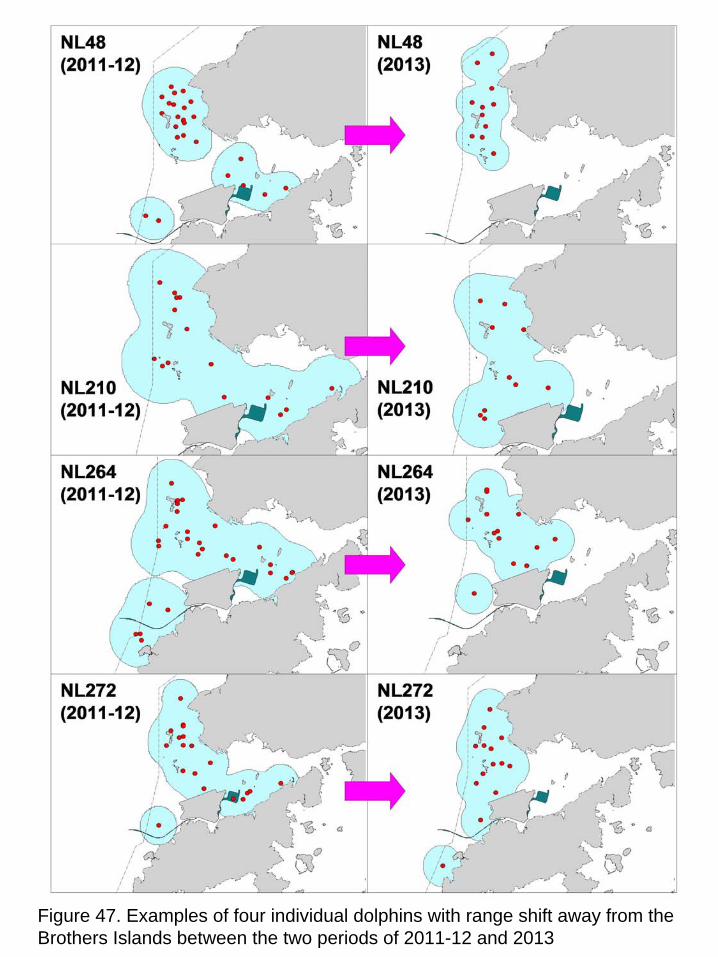
Figure 47. Examples of four individual dolphins with range shift away from the Brothers Islands between the two periods of 2011-12 and 2013

Figure 48. Examples of four individual dolphins with core area shift away from the Brothers Islands between the two periods of 2011-12 and 2013

Figure 49. Examples of three individual dolphins with no apparent core area shift between the two periods of 2011-12 and 2013

Figure 50. Twenty-one focal follow tracks of individual or group of Chinese White Dolphins sighted in 2012-14

Figure 51. Four typical tracks indicating individual movement patterns between NWL, NEL and WL (1: along western boundary of North Lantau; 2: along the northwest shore of Lantau; 3: along the Urmston Road; 4: along the northern edge of airport platform)
1 2
3 4

Figure 52. Fifteen tracks of individual or group of Chinese White Dolphins observed during shore-based theodolite tracking sessions at Sham Wat in 2013 (figure on right: theodolite tracks overlapped with focal follow tracks from Figure 50)

Figure 53. Fix positions under different categories during eight shore-based theodolite tracking sessions at Tai O

Figure 54. Fix positions under different categories during 13 shore-based theodolite tracking sessions at Sham Wat

Figure 55. Fix positions under different categories during nine shore-based theodolite tracking sessions at Fan Lau
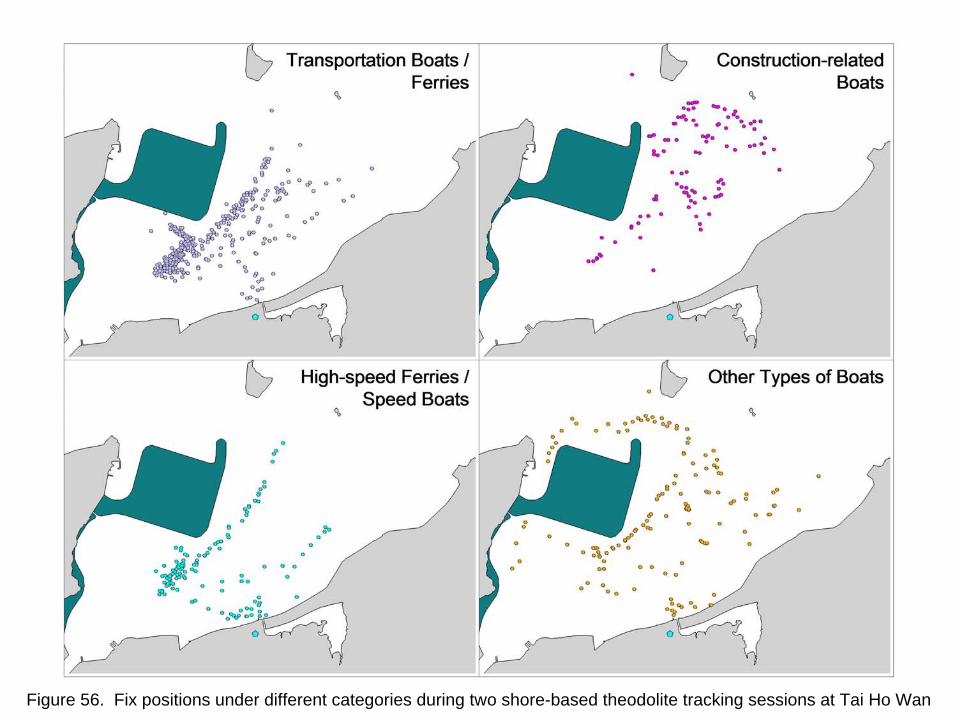
Figure 56. Fix positions under different categories during two shore-based theodolite tracking sessions at Tai Ho Wan

Figure 57. The four locations of C-POD deployments in western waters of Hong Kong in 2013

(a)
(b)
(c)
Figure 58. Daily number of dolphin clicks (a), daily detection positive minutes (b) and daily train duration (c) obtained from the C-POD deployment at Fan Lau

LUNG KWU TAN SIU HO WAN
FAN LAU NEAR SHUM WAT
Figure 59. Number of encounters per day (blue bars) and the mean length of encounters per day (red bars) at the four sites where C-POD were deployed. Error bays represent standard deviation.

(a)
(b)
(c)
Figure 60. Number of dolphin clicks (a), detection positive minutes (b) and total duration of trains (c) as a function of time of day obtained from the C-POD deployment at Fan Lau. The day period is 06:00 to 17:59 and night period is 18:00 to 05:59. Error bars represent standard deviation.

(a)
(b)
(c)
Figure 61. Daily number of dolphin clicks (a), daily detection positive minutes (b) and daily train duration (c) obtained from the C-POD deployment near Sham Wat

(a)
(b)
(c)
Figure 62. Number of dolphin clicks (a), detection positive minutes (b) and total duration of trains (c) as a function of time of day obtained from the C-POD deployment near Sham Wat. The day period is 06:00 to 17:59 and night period is 18:00 to 05:59. Error bars represent standard deviation.

(a)
(b)
(c)
Figure 63. Daily number of dolphin clicks (a), daily detection positive minutes (b) and daily train duration (c) obtained from the C-POD deployment at Lung Kwu Tan

(a)
(b)
(c)
Figure 64. Number of dolphin clicks (a), detection positive minutes (b) and total duration of trains (c) as a function of time of day obtained from the C-POD deployment at Lung Kwu Tan. The day period is 06:00 to 17:59 and night period is 18:00 to 05:59. Error bars represent standard deviation.

(a)
(b)
(c)
Figure 65. Daily number of dolphin clicks (a), daily detection positive minutes (b) and daily train duration (c) obtained from the C-POD deployment at Siu Ho Wan

(a)
(b)
(c)
Figure 66. Number of dolphin clicks (a), detection positive minutes (b) and total duration of trains (c) as a function of time of day obtained from the C-POD deployment at Siu Ho Wan. The day period is 06:00 to 17:59 and night period is 18:00 to 05:59. Error bars represent standard deviation.

Figure 67a. Linear regression between time and average DPSE over entire North Lantau region (error bars display standard error)
Figure 67b. Linear regression between time and cumulative impacts over entire North Lantau region (error bars display standard error)

Figure 68. Study extent displaying areas of substantial dolphin density increase (green grids) and decrease (orange grids).

Figure 69. Four different spatial scales and their respective statistical analyses (error bars display standard error).

Figure 70. Present cumulative human impacts in North Lantau waters (note the ferry route between the marine park and the Brothers Islands.

Figure 71. Regression between scale 3 dolphin DPSE and overall cumulative impacts

Figure 72. Western zone analysis (left: spatial extent; right: graphical assessment, with error bars displaying standard error

Figure 73. Future impacts with the Airport Third Runway project in North Lantau waters.

Figure 74. An example of worldwide monthly chlorophyll-a data (this image for January 2014) recorded by NASA’s AquaMODIS satellite (downloaded from http://www.oceancolor.gsfc.nasa.gov). Each pixel in the image represents a single 4 km x 4 km grid cell.
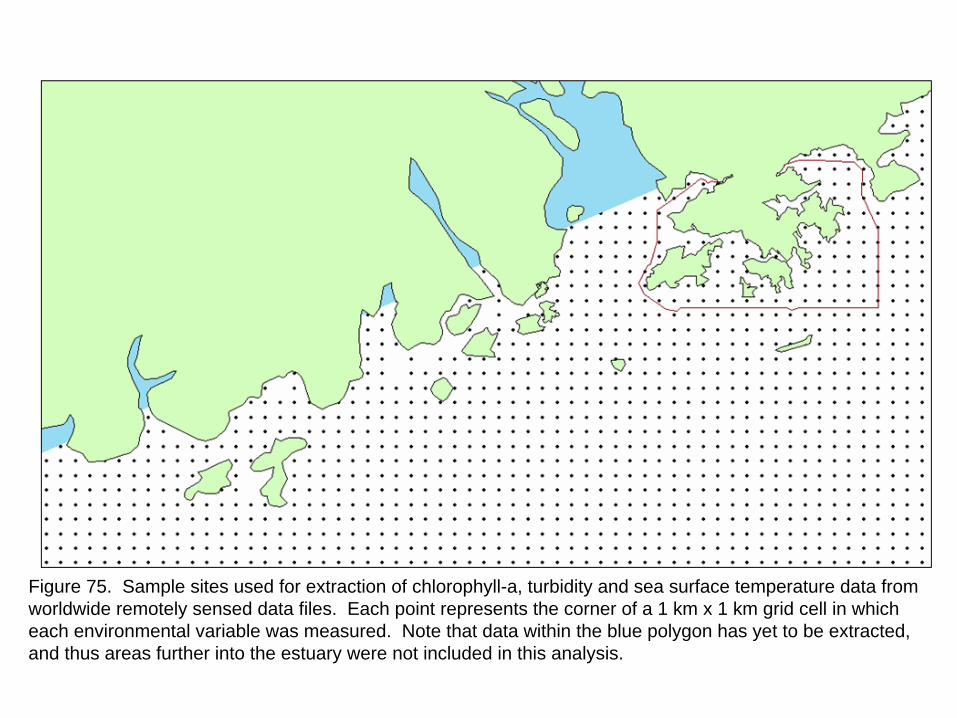
Figure 75. Sample sites used for extraction of chlorophyll-a, turbidity and sea surface temperature data from worldwide remotely sensed data files. Each point represents the corner of a 1 km x 1 km grid cell in which each environmental variable was measured. Note that data within the blue polygon has yet to be extracted, and thus areas further into the estuary were not included in this analysis.

Figure 76. Sightings of Chinese White Dolphins in the Pearl River estuary between 2002 and 2011. Red indicates sightings made during the dry season (October-April), and yellow indicates sightings made during the wet season (May-September). Note that there was a disproportionate amount of survey effort between Hong Kong waters (outlined; surveyed regularly as part of HKCRP’s long-term monitoring project throughout the study period) and waters of mainland China (two 12-month surveys conducted from 2005-2008; see Chen et al. 2010).

a)
c)
b)
d)
Figure 77. Interpolated surfaces for seasonal averages of sea surface temperature (a and b) and chlorophyll- a (c and d) measured from remote sensing reflectance for 2002-2011.

a) b) c)
Wet Dry Wet Dry
Figure 78. Medians, upper and lower quartiles and outliers in seasonal sea surface temperature (a), and chlorophyll-a (b) data. Depth (c) was considered to be a static variable that did not change seasonally.

Dry Season Wet Season
Figure 79. Chinese White Dolphin niche space (pink dots) in wet and dry seasons as defined by measurements of SST, ChA and water depth at sighting locations, compared to measurements of each environmental variable taken across the entire study area (black dots).
Wet Season
Dry Season
Lantau
Shangchuan Island
Lantau
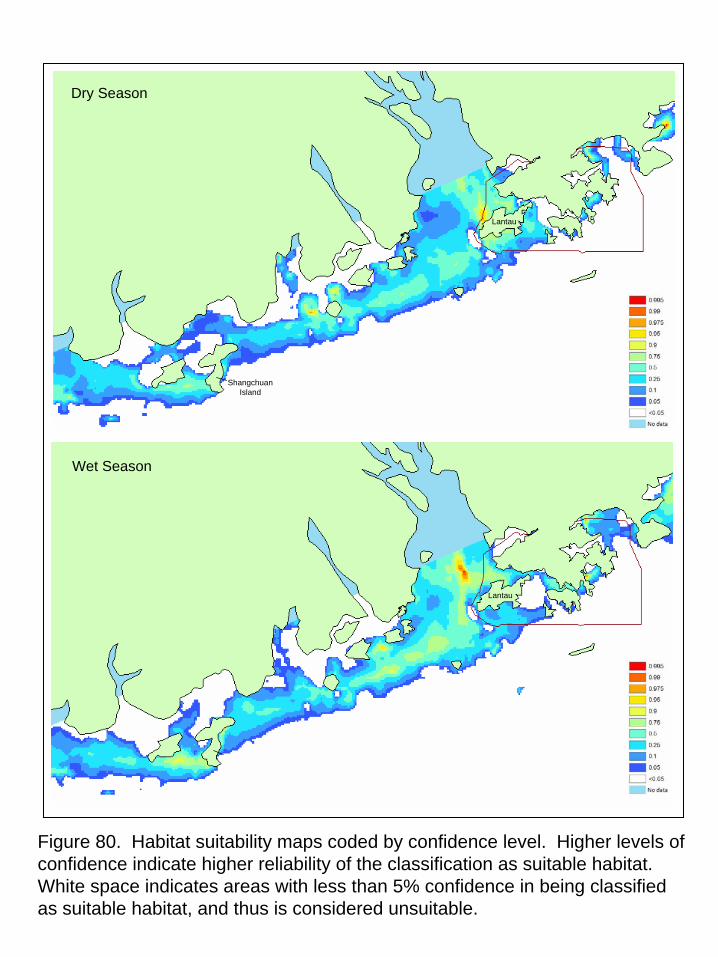
Figure 80. Habitat suitability maps coded by confidence level. Higher levels of confidence indicate higher reliability of the classification as suitable habitat. White space indicates areas with less than 5% confidence in being classified as suitable habitat, and thus is considered unsuitable.

ValueHigh
Low
ValueHigh : 21.1182
Low : 20.018
ValueHigh : 32.6565
Low : 26.2752
Sum
mer
Aut
umn
Mid
Wat
erS
umm
er A
utum
nS
urfa
ce W
ater
Win
ter
Spr
ing
Sur
face
Wat
erW
inte
r S
prin
gM
Id W
ater
Temperature Salinity Chlorophyll A
Value Value ValueHigh High High
Low Low Low
Figure 81. Layers of averaged interpolated environmental data showing values throughout the study area

Value0.774295
0.3766770.00606706
Model 1:Summer - Autumn
Mid Water
Model 2:Winter - Spring
Mid Water
Model 3:Summer - Autumn
Surface Water
Model 4:Winter - SpringSurface Water
High suitability
Low suitability
Value
Figure 82. Predictive habitat suitability maps
Scenario 2: Winter Spring
Scenario 1: Summer Autumn
High conflict
Low conflict SLVF Buffer
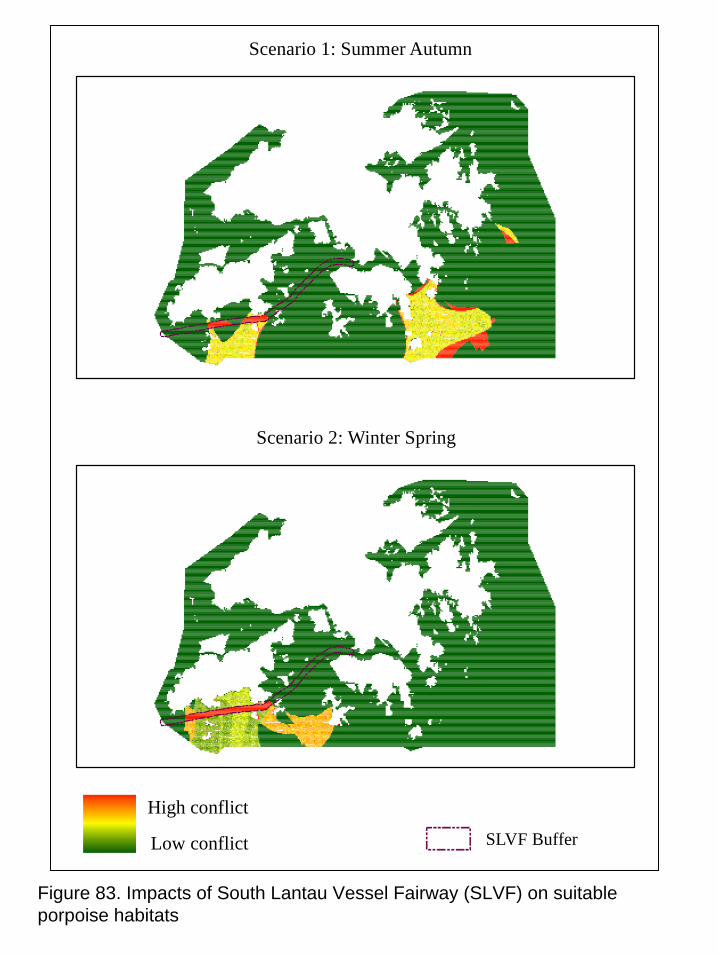
Figure 83. Impacts of South Lantau Vessel Fairway (SLVF) on suitable porpoise habitats