Embed Size (px)
Citation preview

44
2011 State of the future
Figure 9 Global Challenges and SOFI Process
45
2State of the Future Index:
Global Progress and National Applications
In 2001, The Millennium Project began to explore the possibility of creating a quantitative measure, the State of the Future Index, that would depict the global state of the future—measuring, in effect, whether the future seemed to be improving or not over a 10-year period. Inevitably some of the variables included in a SOFI will show the potential for improvement while others show worsening, but the SOFI integrates such changes into a single measure so that the balance between pluses and minuses can be assessed.
The SOFI is unique. Most indexes measure present and past conditions; SOFI provides a projection into the future. Its judgmental aspects are determined by a panel of international experts rather than by a few staff members. It is probabilistic and therefore shows a range rather than a single value of plausible expectations. It is useful in assessing the consequences of contemplated policies. It shows how changes designed to improve one aspect of a complex system can ripple out, affecting others—some favorably and others unfavorably. It shows the net consequences in a way that is easy to understand.
A new global SOFI has been constructed in 2010–11, and a national SOFI has been constructed in Kuwait for the Prime Minister’s Office and another in Australia for Timor-Leste to help plan and track Australia’s aid to that country.

46
2011 State of the future
The variables included in the 2011 SOFI:
• Improved water source (percent of population with access)
• Literacy rate, adult total (percent of people age 15 and above)
• Levels of corruption (15 largest countries)
• School enrollment, secondary (percent gross)
• Poverty headcount ratio at $1.25 a day (PPP) (percent of population)
(low- and mid-income countries)
• Countries having or thought to have plans for nuclear weapons (number)
• Carbon dioxide emissions (global, kt)
• Unemployment, total (percent of total labor force)
• GDP per unit of energy use (constant 2000 PPP $ per kg of oil equivalent)
• Number of major armed conflicts (number of deaths >1,000)
• Population growth (annual percent)
• R&D expenditures (percent of national budget)
• People killed or injured in terrorist attacks (number)
• Non-fossil-fuel consumption (percent of total)
• Undernourishment (percent of population)
• Population in countries that are free (percent of total global population)
• Global surface temperature anomalies
• GDP per capita (constant 2000 US$)
• People voting in elections (percent of population)
• Physicians (per 1,000 people) (surrogate for health care workers)
• Internet users (per 1,000 population)
• Infant mortality (deaths per 1,000 births)
• Forestland (percent of all land area)
• Life expectancy at birth (years)
• Women in parliaments (percent of all members)
• Number of refugees (per 100,000 total population)
• Total debt service (percent of GNI) (low- and mid-income countries)
• Prevalence of HIV (percent of population of age 15–49)
Box 3

47
State of the future Index: Global ProGreSS and natIonal aPPlIcatIonS
Ch
ap
te
r t
wo
This year’s work had several important differences from earlier SOFIs produced by The Millennium Project:
1. SOFI-based projections for scenarios were introduced. By systematically varying the probabilities of the developments included in the analysis, several global projections for scenarios were represented; the SOFIs showed how the state of the future might appear in those futures, providing a quantitative expression.
2. An update of historical data. Changes in data are the result of changes in definitions and data revisions as new information is integrated by the compiling agencies. New series were inserted when old series were discontinued,1 and new interpolations were made for missing data.
3. Revisions to the developments in the SOFI: reassessed probabilities and impacts. The computation of SOFI involves assessing the consequences of future developments on the forecasts of the variables in a process called trend impact analysis. This and previous work included 90 or so developments. Some were dropped, others were added, and the likelihood and impacts of these developments were changed where necessary.
4. A new statistical program was used to extrapolate the historical data to form the baselines for the SOFI variables.
5. Software was developed to collect group
judgments required in assessing the probabilities of the developments and their impacts on the SOFI variables. When used—next year, it is hoped—the software will bring to TIA studies many of the advantages that Real-Time Delphi has provided to Delphi studies: asynchronous participation, worldwide spread, and improved efficiency.
The historical data for each of these variables was fit with time series equations, and the best fit curves that produced plausible future values were used. The statistical software used was CurveExpert Pro (www.curveexpert.net), which attempts to fit more than 50 curve types. The baseline SOFI that resulted from the use of the new data for these variables is shown in Figure 24.
This year’s SOFI forecast compares well with the SOFI prepared in earlier years.
In 2010, the University of Denver’s International Futures econometric model2 introduced a SOFI calculation capability. This provides the ability to compute SOFIs for all countries for which data are available, and it suggests the possibility of producing an annual or biennial publication that tracks the SOFI for countries in a manner similar to the annual Human Development Index of the United Nations Development Programme or Transparency International’s Corruption Index. As an illustration, the IF modeling system was used to compute the SOFI for six countries for this report, as shown in Figure 25.
1 One particular example was the use in 2011 of the variable “undernourishment” which replaced the original series for “food availability (cal/cap).” It became clear in the effort to update food availability that more emphasis today was being placed on the MDG measure undernourishment, a broader measure of world hunger, so the change was made for SOFI.2 Theodore Gordon, Barry Hughes, Jose Solórzano, and Mark Stelzner, “Producing State of the Future Indexes Using the International Futures Model,” Technical Forecasting and Social Change, January 2011, pp. 75–89.
Figure 25. SOFI using IFs for six countriesFigure 24. 2011 State of the Future Index
48
2011 State of the future
The Global SOFIData Sources and Extrapolation
To simplify the data collection activity, a single source of information was used wherever possible—the World Databank,3 which provided about 70% of the required data series. The detailed definition of the variables and the equations used to interpolate and extrapolate the data can be found in the CD, Chapter 2.Calculating the SOFI
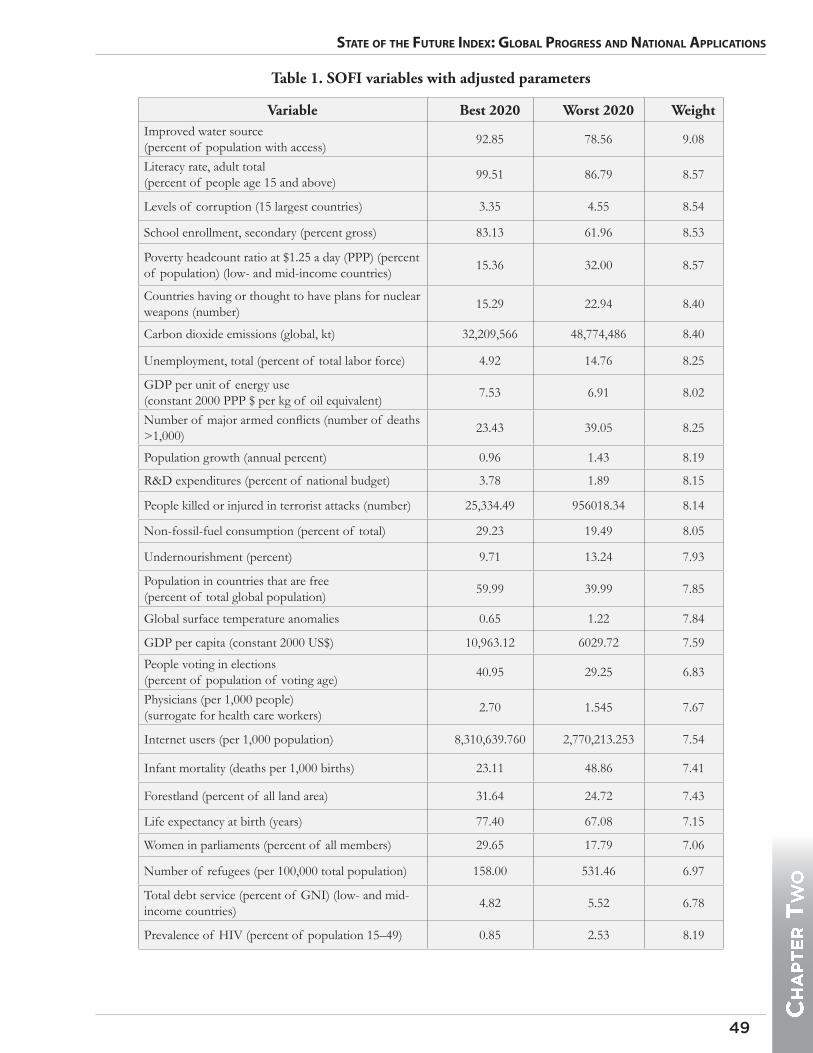
This year’s calculation is based on the Millennium Project’s 2007 RTD produced by global expert panels that provided judgments about the best and worst expectations for the variables in the next 10 years and their weights. These values had to be adjusted to account for changes in definitions and differences between the questions posed in the RTD and the current definitions of the variables. Some of these adjustments involved staff judgments and therefore should be replaced with more recent assessments when the RTD is repeated. Table 1 summarizes the adjusted parameters.Trend Impact Analysis and SOFI Scenarios
The developments included in the trend impact analysis were based on the list of developments generated in the RTD in 2007. The probabilities were adjusted by staff to account for new events and new perceptions about their likelihood. This set is presented in Table 2 (and in the CD) in the column titled Baseline. To the right of this column are four columns under the heading “Scenarios.” These present somewhat different probabilities for the developments under the assumptions of:•Recession: the world is in for a long tedious
recovery, with continuing global recession•Bad Weather: bad weather and natural disasters
prevail•Bellicose: wars and conflicts expand in severity
and frequency•Green: improvements in the probabilities of
promising environmental developments
A table of the sort of Table 2 was prepared for the 93 developments considered; it appears in the CD. The illustration in Table 2 only presents the first 10 developments. The highlighted cells show where changes in the nominal probabilities have been assumed to form the scenarios.
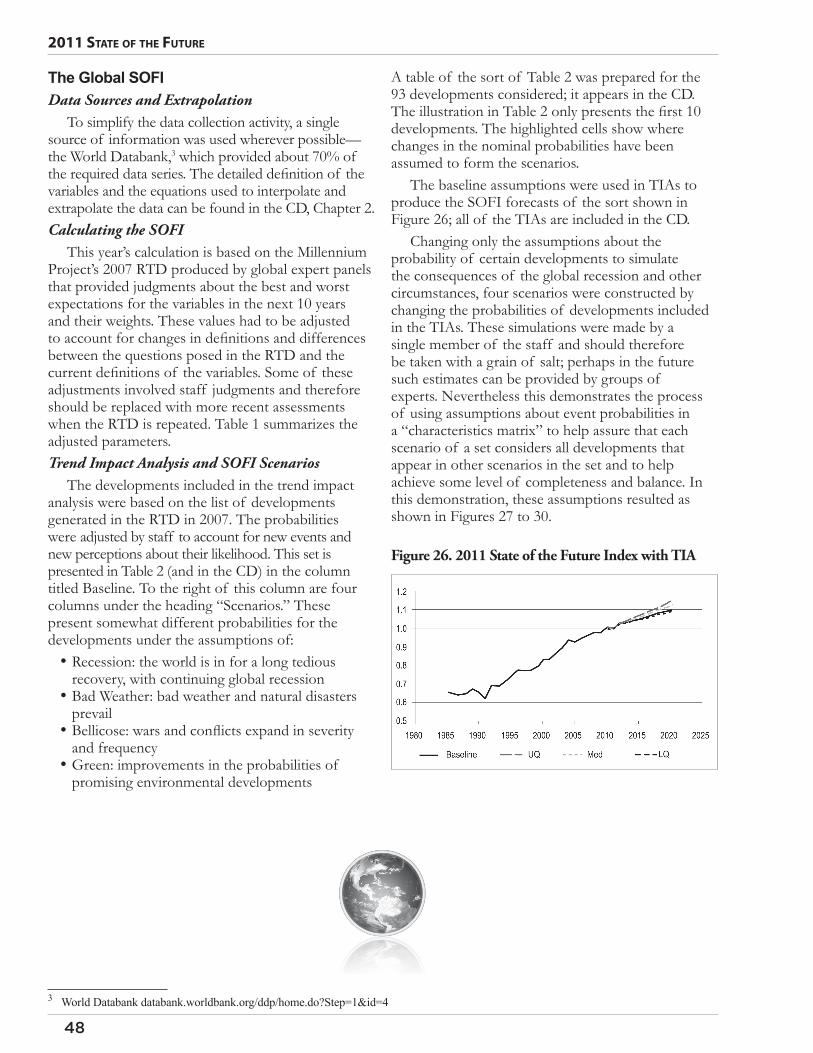
The baseline assumptions were used in TIAs to produce the SOFI forecasts of the sort shown in Figure 26; all of the TIAs are included in the CD.
Changing only the assumptions about the probability of certain developments to simulate the consequences of the global recession and other circumstances, four scenarios were constructed by changing the probabilities of developments included in the TIAs. These simulations were made by a single member of the staff and should therefore be taken with a grain of salt; perhaps in the future such estimates can be provided by groups of experts. Nevertheless this demonstrates the process of using assumptions about event probabilities in a “characteristics matrix” to help assure that each scenario of a set considers all developments that appear in other scenarios in the set and to help achieve some level of completeness and balance. In this demonstration, these assumptions resulted as shown in Figures 27 to 30.
Figure 26. 2011 State of the Future Index with TIA
3 World Databank databank.worldbank.org/ddp/home.do?Step=1&id=4
49
State of the future Index: Global ProGreSS and natIonal aPPlIcatIonS
Ch
ap
te
r t
wo
Variable Best 2020 Worst 2020 WeightImproved water source (percent of population with access)
92.85 78.56 9.08
Literacy rate, adult total (percent of people age 15 and above)
99.51 86.79 8.57
Levels of corruption (15 largest countries) 3.35 4.55 8.54
School enrollment, secondary (percent gross) 83.13 61.96 8.53
Poverty headcount ratio at $1.25 a day (PPP) (percent of population) (low- and mid-income countries)
15.36 32.00 8.57
Countries having or thought to have plans for nuclear weapons (number)
15.29 22.94 8.40
Carbon dioxide emissions (global, kt) 32,209,566 48,774,486 8.40
Unemployment, total (percent of total labor force) 4.92 14.76 8.25
GDP per unit of energy use (constant 2000 PPP $ per kg of oil equivalent)
7.53 6.91 8.02
Number of major armed conflicts (number of deaths >1,000)
23.43 39.05 8.25
Population growth (annual percent) 0.96 1.43 8.19
R&D expenditures (percent of national budget) 3.78 1.89 8.15
People killed or injured in terrorist attacks (number) 25,334.49 956018.34 8.14
Non-fossil-fuel consumption (percent of total) 29.23 19.49 8.05
Undernourishment (percent) 9.71 13.24 7.93
Population in countries that are free (percent of total global population)
59.99 39.99 7.85
Global surface temperature anomalies 0.65 1.22 7.84
GDP per capita (constant 2000 US$) 10,963.12 6029.72 7.59
People voting in elections (percent of population of voting age)
40.95 29.25 6.83
Physicians (per 1,000 people) (surrogate for health care workers)
2.70 1.545 7.67
Internet users (per 1,000 population) 8,310,639.760 2,770,213.253 7.54
Infant mortality (deaths per 1,000 births) 23.11 48.86 7.41
Forestland (percent of all land area) 31.64 24.72 7.43
Life expectancy at birth (years) 77.40 67.08 7.15
Women in parliaments (percent of all members) 29.65 17.79 7.06
Number of refugees (per 100,000 total population) 158.00 531.46 6.97
Total debt service (percent of GNI) (low- and mid-income countries)
4.82 5.52 6.78
Prevalence of HIV (percent of population 15–49) 0.85 2.53 8.19
Table 1. SOFI variables with adjusted parameters

50
2011 State of the future
Item BaselineScenarios
Recession Bad Weather Bellicose GreenThe Fukushima nuclear accident causes many nuclear nations to de-nuclearize
50 25 10 50 75
A very good, fast $150 laptop computer becomes available everywhere
85 85 85 85 85
A “teachers without borders” movement develops (50,000 new teachers in the field)
30 30 30 30 30
A pandemic on the scale of HIV/AIDS occurs 30 30 95 30 30At least 10 countries introduce effective policies designed to increase birth rates to avoid population implosion
75 75 75 75 50
Automation and robotics increase productivity 25% in enough countries to make “jobless” economic growth
50 50 25 50 50
A cheap and effective anti-aging therapy is available
35 35 35 35 35
Bad weather (storms, hurricanes, floods) causes widespread crop failures in at least one year
45 45 100 45 45
Canada begins to export water 35 35 35 35 35Carbon sequestration is used by 25% of carbon-based industries
50 50 25 50 75
Table 2. Developments considered in SOFI with their respective probabilities and potential scenarios(Highlighted cells show where changes in the nominal probabilities have been assumed to form the scenarios.)
Figure 27. 2011 SOFI, Recession Scenario Figure 28. 2011 SOFI, Bad Weather Scenario
Figure 29. 2011 SOFI, Bellicose Scenario Figure 30. 2011 SOFI, Green Scenario

51
State of the future Index: Global ProGreSS and natIonal aPPlIcatIonS
Ch
ap
te
r t
wo
National SOFIsNational SOFIs have been produced for half a
dozen countries (South Korea, Timor-Leste, Turkey, South Africa, and others) to assess progress toward an improved future and to test the consequences of proposed policies on a country’s outlook. In national SOFIs the variables, weights, future developments, and other judgmental aspects of the analysis are chosen specifically for the country of interest. For example, in some countries the variable “population growth rate” might be viewed as a negative factor, but other countries—concerned about a loss of population—would see an increase in this variable as desirable.
SOFI for the Democratic Republic of Timor-LesteA SOFI for the Democratic Republic of Timor-Leste
was produced in Australia. This work included a TIA and was based on The Millennium Project publications and tutorials. In Timor-Leste, three of the central issues are:
• population growth (which according to World Bank data hit 4.7% per year in 2004 but dropped to 3.2% in 2009)
• availability of fresh water (World Bank data indicate that improved water sources were available to 63% of the population in 2005 and 69% in 2008)
• malnutrition (over 50% in 2003, the latest World Bank data, as indicated by height of children under 5 years of age).
These and other SOFI components were the subject of TIAs in computing the Timor-Leste SOFI, which is shown in Figure 31. Generally it was found that the developments considered in the TIAs had the consequence of improving the forecasts, although in some instances the spread was large.
Was the exercise helpful? Michael Martin, who is in the Department of International Relations at Flinders University in Australia and the author of the SOFI paper on Timor-Leste, says that the reasons for choosing Timor-Leste for study include: 1) Timor-Leste is similar to other small, poor, slow growth countries in Australia’s area of strategic interests; 2) availability of historic data; and 3) Timor-Leste’s heavy dependence on foreign aid (Australia being a major supplier of the aid). SOFI served the purpose of monitoring and evaluating needs and effectiveness of Australia’s policies toward that country, particularly since the forecasts of the variables that make
up SOFI can provide perspective on internal changes and future challenges.
The author of the Timor-Leste report said that the SOFI output shows “Timor’s future promises to be marginally better than the present in 2020. The slow, but positive growth is not surprising considering the situation that it currently finds itself in. A rapidly growing population, the result of a high fertility rate is creating a diverse range of problems for Timor including: water supply, food security and basic infrastructure. This information is useful to Australian agencies as it details the drivers of change and allows policy makers to determine where ODA will make the biggest difference in influencing a more positive future in Timor.”4
Furthermore, in evaluating the SOFI itself, the paper concluded that the method was a very useful policy tool providing a means for them to reach a deeper understanding of the relationships among measures of progress within Timor and the interdependence among these measures. It also illustrates how policies designed to accomplish a primary objective can affect other measures usually unintended and affect the system as a whole, well beyond the intended target. Previous measures of success of particular aid policies have been limited to measures of the projects themselves, while SOFI provides the means to view impacts of such policies on donor and recipient nations as a whole. Their judgment was that SOFI “is a useful tool to provide policy makers with a significant degree of insight into what will drive change within developing nations. It is particularly useful in identifying problematic areas that may arise in the future, thus allowing policy makers to address each of the issues.”5
Figure 31. SOFI with TIA for the Democratic Republic of Timor-Leste
4 See Michael Martin, “The Applicability of a National Focus State of the Future Index (SOFI) on Developing Nations and the Implications for Stabilisation Operations—A Case Study of Timor-Leste,” Futures, February 2011, pp. 112–19.5 Ibid.

52
2011 State of the future
6 The material in this section was extracted from “The 2010 Kuwait’s State of the Future Index (K-SOFI),” The Early Warning System Strategy Unit, The Technical and Advisory, Diwan of HH The Prime Minister, October 1, 2010.
SOFI for the State of Kuwait 6The Kuwait’s State of Future Index is prepared to
stimulate strategic thinking about Kuwait’s future and to highlight key areas for strategy and policy reforms to ensure that Kuwait is on track to realize the objectives and targets set in its long-term vision, Vision Kuwait 2035. The complete Kuwait SOFI report is included in Chapter 2 on the CD.
The K-SOFI was constructed using the results of an RTD survey conducted in July 2010 to obtain expert judgments about variables and developments important to the future of Kuwait. About 50 participants provided numerical answers and narrative comments, for a total of 4,199 answers.
The judgments of the experts together with 20 years of historical data (1990-2009) and forecasts up to 2020 for all variables led to the construction of the K-SOFI baseline. This was followed by a trend impact analysis that considered the consequences of 28 future developments. The 20 years of historical data for each variable were derived from the World Bank database and primary sources, when available. A summary of the historical and forecasted values of selected variables is presented in Table 3 and the resulting K-SOFI with trend impact analysis is in Figure 32.
Overall, the K-SOFI baseline curve shows a steady improvement over the past 20 years (1990-2009). The projection for the subsequent decade (2010-2020) forecasts a continuation of this upward trend, but at a lower rate than the one recorded for the preceding years.
Using 28 developments in the TIA led to the production of forecasts for all variables similar to the one showed in Figure 33. The developments that were included in the TIA and judgments about their probabilities, importance, and the readiness of institutions to deal with them are presented in Table 4.
Major conclusions drawn from this study include:•Kuwait should diversify its economy away from the oil
sector.•Health sector reforms should top social sector reform
priorities.•Concrete steps are needed to sustain governance reforms
and to reverse the deteriorating trend in corruption perceptions.
•Research and development spending should be augmented.
•Recent gains in political liberalization and human rights are encouraging; they should be preserved and sustained.
•Electricity consumption rates are alarming and increasing; measures to reduce electricity consumption per capita should be adopted.
As the inaugural SOFI for Kuwait, this report offers a baseline with which to compare future trends and prospects. Adopting the same method, subsequent indices compare progress against the current standing. Thus, it offers policymakers a recognized benchmark to gauge Kuwait’s future path.
Figure 32. The Kuwait State of the Future Index with TIA (2010=1)
Figure 33. Kuwait CO2 emissions with TIA (tons/capita/year)
ConclusionsBecause of the promise of the work accomplished
to date, we believe that SOFI can become a very useful national planning tool. Remaining work includes providing reliable and recent historical data for use in the SOFI calculations, developing a method for automating the trend impact analysis, investigating the use of the Index in sectoral applications (such as for a nano technology or an energy SOFI), and systematically introducing planners to the tool.

53
State of the future Index: Global ProGreSS and natIonal aPPlIcatIonS
Ch
ap
te
r t
wo
Table 3. Historical and forecasted values of selected variables used in K-SOFI Variable 1990 2000 2010 2020
Global demand for oil 65.90 76.20 86.60 98.47Corruption perception index (Kuwait) 5.73 5.42 4.20 3.73Kuwait proven oil reserves (billion barrels) 97.03 96.50 103.81 118.40Global proven oil reserves (billion barrels) 1,003.17 1,104.49 1,278.99 1,443.31General government final consumption expenditure 39.00 21.00 14.84 8.54Electricity consumption (KWh/cap/yr, Kuwait) 8,108.00 13,378.00 17,523.62 20,108.57Gross national income per capita (PPP) Kuwait 24,274.73 35,000.00 57,241.00 70,977.00Adult literacy rate 77.95 86.89 94.03 94.13Secondary school enrollments 82.62 93.57 90.82 90.92Physicians 1.57 1.62 1.88 2.03Global food availability 2,709.00 2,790.00 2,868.54 2,962.57Number of major global armed conflicts 35.00 23.00 15.00 11.00Kuwait CO2 emissions 40,711.00 71,049.00 95,395.60 113,068.60Military expenditures 48.71 7.15 4.09 2.73Number of internet users 0.00 150,000.00 1,200,000 2,250,000
Table 4 Developments included in the TIA and judgments about their probabilities, importance, and institutional readiness to deal with them
Developments Probability(1-100)
Importance(1-10)
Readiness(1-10)
Massive financial crisis triggers a world depression as large as in the 1930s 42.39 7.56 7.14
New technology displaces carbon fuel as cheapest energy source 30.7 7.33 6.43Gulf Cooperation Council moves countries in the region toward EU-like agreements 46.43 7.22 7.04
Extremist political religious groups change the current direction of the region 47.25 7.21 7.42Aging population doubles government social costs 65.42 7.16 6.44Water scarcity problems are essentially solved (e.g., through low-cost desalination) 27.69 7.08 6.77Renewable energy sources, like wind and solar, provide 50% of the world’s power 26.3 6.84 6.70Electric, hydrogen, and hybrid cars represent 50% of new vehicles sold 32.83 6.18 7.00Genetic manipulation is used in the production of two-thirds of the world’s food 43.98 5.97 6.65Global protectionist movement dramatically reduces world commerce 22.23 6.02 7.00Wireless electricity transmission on Earth at gigawatt levels is proved feasible 33.08 6.06 6.53Extremists detonate nuclear devices, dirty bombs, or other weapons of mass destruction 24.97 7.00 5.92
Iran, Iraq, and Saudi Arabia territorial issues are resolved 21.24 6.00 6.42Stability achieved in Iraq 45.38 7.00 7.60Cyber warfare is more difficult to detect and triples in damages from 2010 levels 63.62 6.54 6.45OPEC’s ability to control oil production dramatically dissipates 41.66 6.65 7.29Middle East oil-producing countries successfully diversify beyond energy production 34.57 6.32 6.17
Human migrations at twice today’s levels occur from causes such as water shortages 45.27 5.86 6.05Carbon sequestration: 25% of all new carbon production is captured and stored 33.81 4.20 6.08Energy companies are found responsible and sued for previous CO2 emissions 18.52 4.81 5.32Conservation efforts throughout the world reduce energy demand by 10% 41.94 6.26 6.52E-Learning reaches tipping point, increasing access to high-quality education 56.07 5.85 6.36Economic growth spike in other global regions limits ability to attract talent 73.46 6.44 6.79Gender parity in employment is achieved 46.62 6.14 6.79Artificial bacteria and algae are used to produce 20% of fuels 23.52 5.26 6.09Most glaciers melt twice as fast as in the decade 2000 – 09 51.19 6.67 6.21Global pandemic kills over 100 million people 18.22 4.75 6.86Megawatt levels of power are beamed from solar collectors in orbit to Earth 18.95 4.47 4.71