Embed Size (px)
Citation preview
Group Investor Relations | Frankfurt am Main | 3 August 2015
Overview Commerzbank Group
Figures – Facts – Targets
2Group Investor Relations | Frankfurt am Main | 3 August 2015
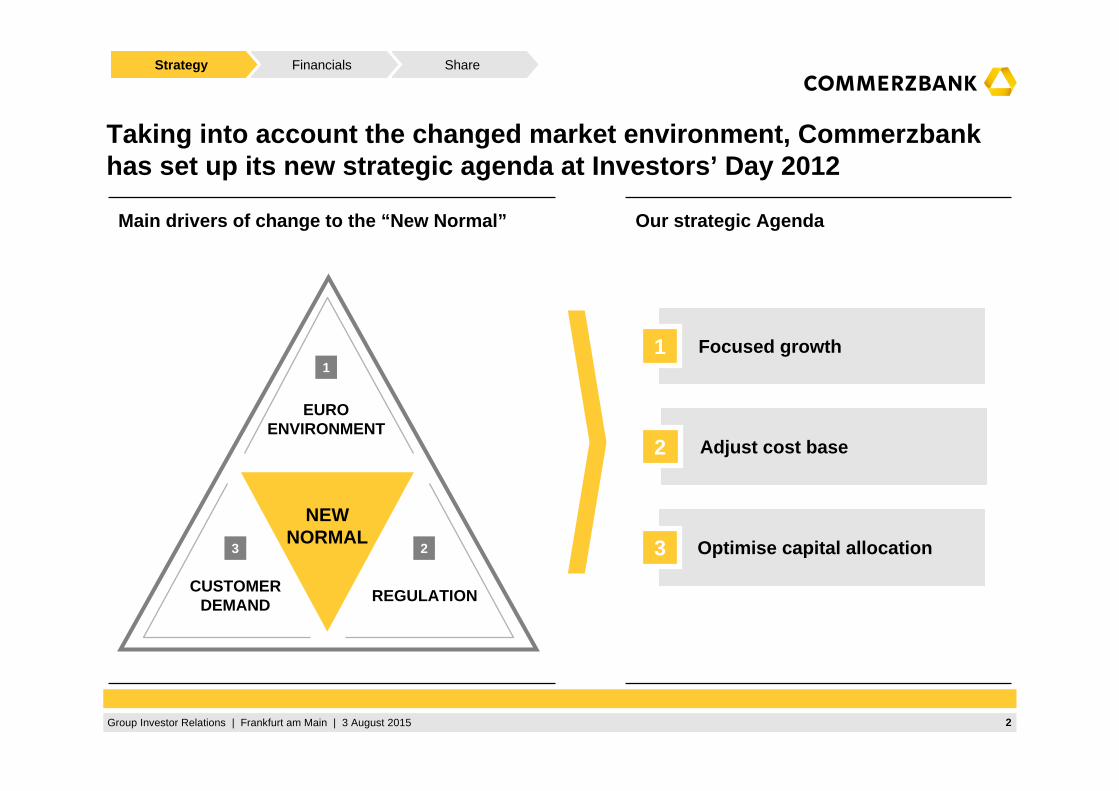
Our strategic AgendaMain drivers of change to the “New Normal”
Taking into account the changed market environment, Commerzbank has set up its new strategic agenda at Investors’ Day 2012
Optimise capital allocation3
Adjust cost base2
Focused growth1
EUROENVIRONMENT
REGULATIONCUSTOMERDEMAND
NEWNORMAL
1
23
ShareFinancialsStrategy
3Group Investor Relations | Frankfurt am Main | 3 August 2015
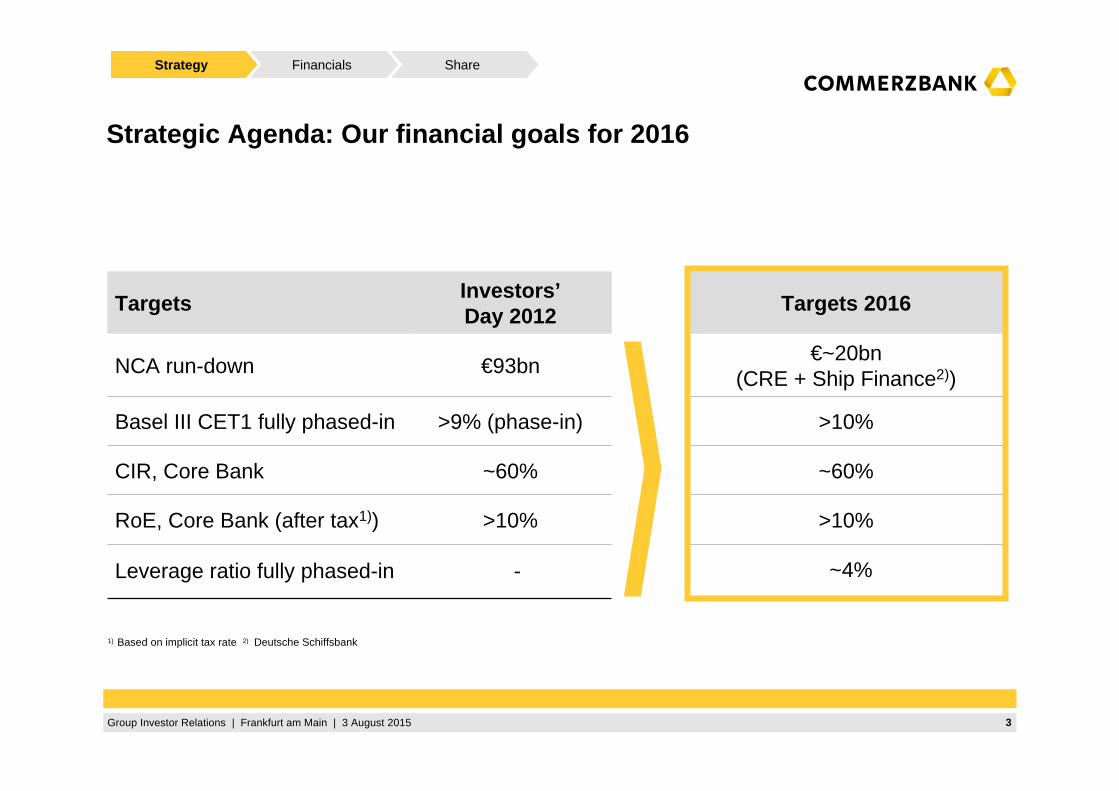
~4%
>10%
Leverage ratio fully phased-in -
Strategic Agenda: Our financial goals for 2016
>10%RoE, Core Bank (after tax1))
€~20bn (CRE + Ship Finance2))€93bnNCA run-down
>10%>9% (phase-in)Basel III CET1 fully phased-in
~60%
Targets 2016
~60%
Investors’Day 2012
CIR, Core Bank
Targets
1) Based on implicit tax rate 2) Deutsche Schiffsbank
ShareFinancialsStrategy
4Group Investor Relations | Frankfurt am Main | 3 August 2015
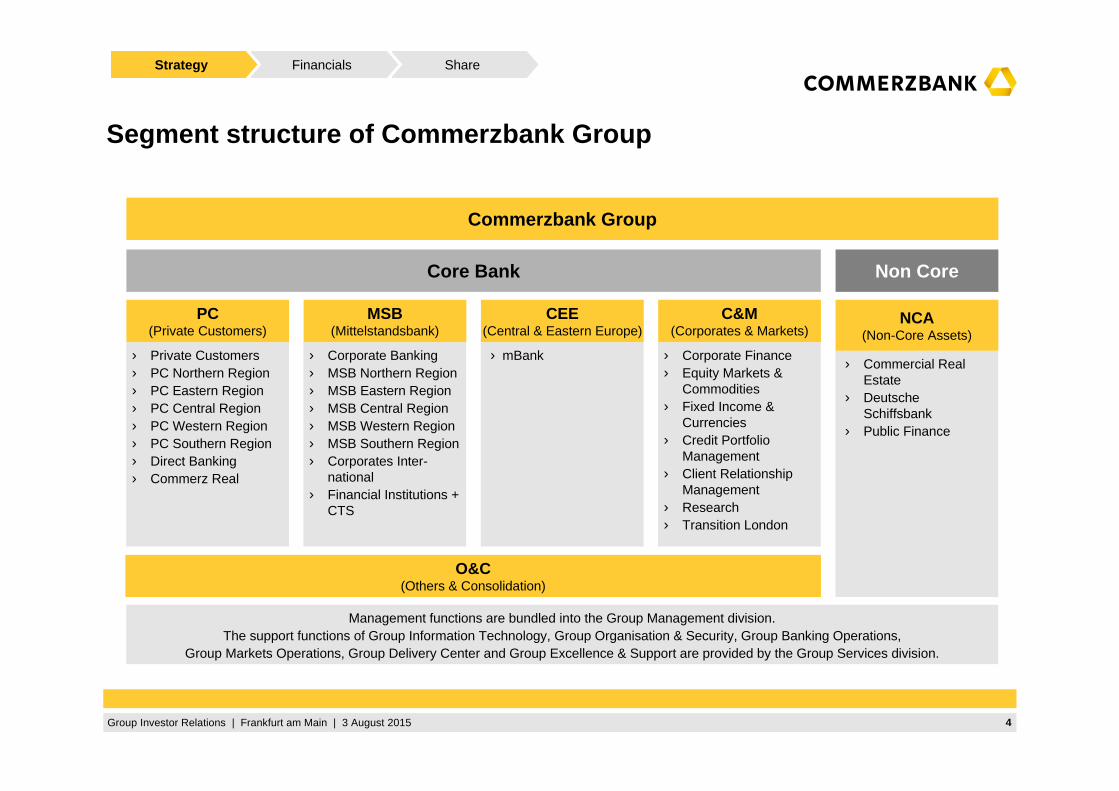
Segment structure of Commerzbank Group
Core Bank Non Core
Commerzbank Group
› Private Customers› PC Northern Region› PC Eastern Region› PC Central Region› PC Western Region› PC Southern Region › Direct Banking› Commerz Real
PC(Private Customers)
› Corporate Banking› MSB Northern Region› MSB Eastern Region› MSB Central Region› MSB Western Region› MSB Southern Region› Corporates Inter-
national› Financial Institutions +
CTS
MSB(Mittelstandsbank)
› mBank
CEE(Central & Eastern Europe)
› Corporate Finance › Equity Markets &
Commodities› Fixed Income &
Currencies› Credit Portfolio
Management› Client Relationship
Management› Research› Transition London
C&M(Corporates & Markets)
› Commercial Real Estate
› Deutsche Schiffsbank
› Public Finance
NCA(Non-Core Assets)
ShareFinancialsStrategy
Management functions are bundled into the Group Management division.The support functions of Group Information Technology, Group Organisation & Security, Group Banking Operations,
Group Markets Operations, Group Delivery Center and Group Excellence & Support are provided by the Group Services division.
O&C(Others & Consolidation)
5Group Investor Relations | Frankfurt am Main | 3 August 2015
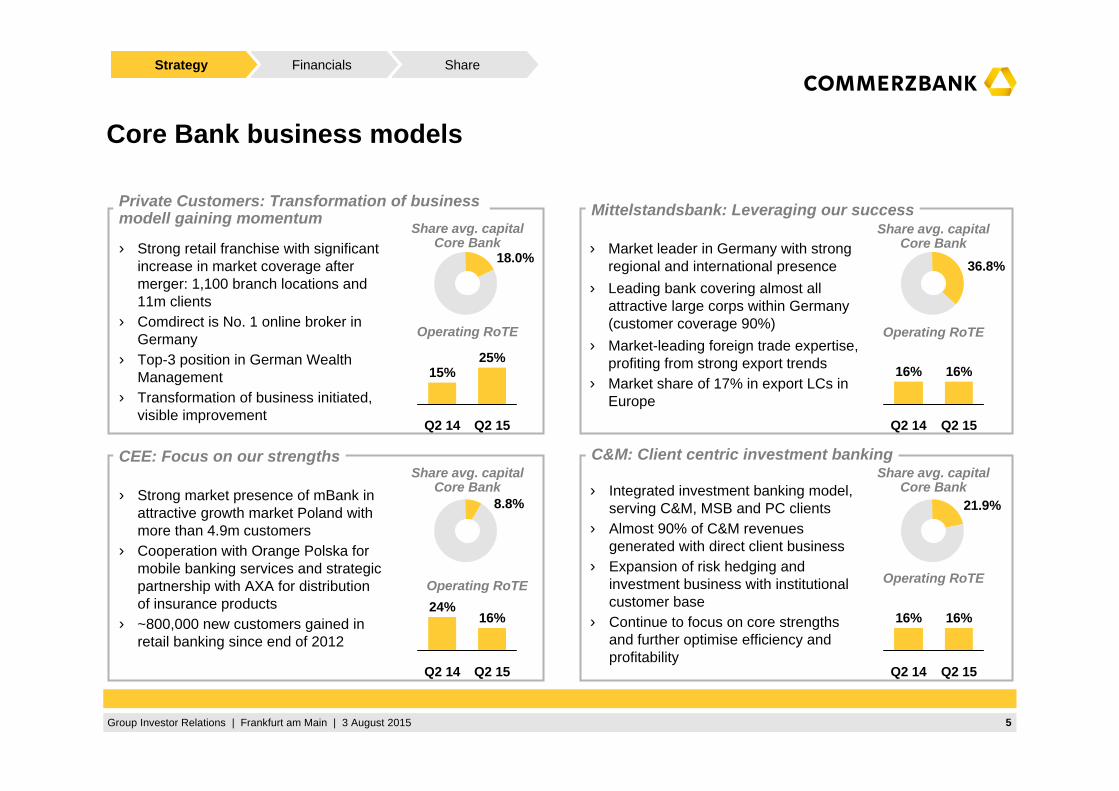
› Strong retail franchise with significant increase in market coverage after merger: 1,100 branch locations and 11m clients
› Comdirect is No. 1 online broker in Germany
› Top-3 position in German Wealth Management
› Transformation of business initiated, visible improvement
Private Customers: Transformation of business modell gaining momentum
CEE: Focus on our strengths
Mittelstandsbank: Leveraging our success
C&M: Client centric investment banking
› Market leader in Germany with strong regional and international presence
› Leading bank covering almost all attractive large corps within Germany (customer coverage 90%)
› Market-leading foreign trade expertise, profiting from strong export trends
› Market share of 17% in export LCs in Europe
Core Bank business models
ShareFinancialsStrategy
Q2 15
25%
Q2 14
15%
18.0%
Operating RoTE
Share avg. capitalCore Bank
Q2 15
16%
Q2 14
16%
36.8%
Operating RoTE
Share avg. capitalCore Bank
Q2 15
16%
Q2 14
24%Operating RoTE
Share avg. capitalCore Bank
Q2 15
16%
Q2 14
16%
Share avg. capitalCore Bank
21.9%
Operating RoTE
8.8%› Strong market presence of mBank in attractive growth market Poland with more than 4.9m customers
› Cooperation with Orange Polska for mobile banking services and strategic partnership with AXA for distribution of insurance products
› ~800,000 new customers gained in retail banking since end of 2012
› Integrated investment banking model, serving C&M, MSB and PC clients
› Almost 90% of C&M revenues generated with direct client business
› Expansion of risk hedging and investment business with institutional customer base
› Continue to focus on core strengths and further optimise efficiency and profitability
6Group Investor Relations | Frankfurt am Main | 3 August 2015
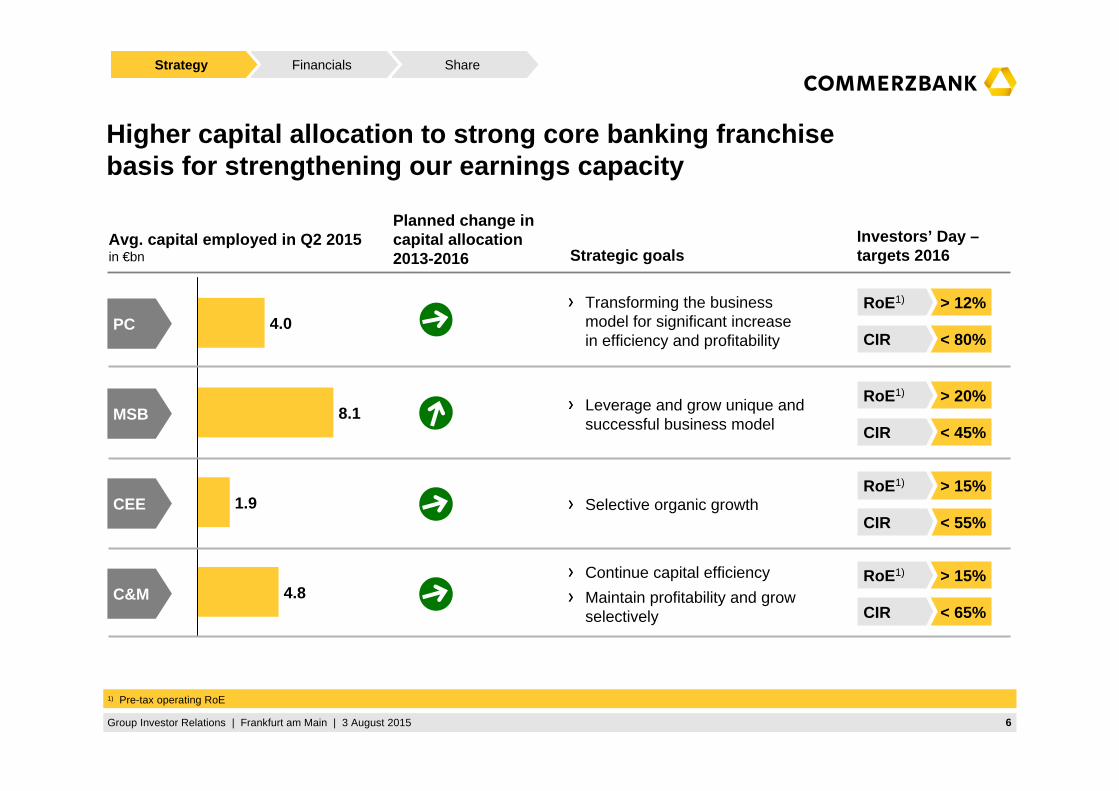
1) Pre-tax operating RoE
Avg. capital employed in Q2 2015in €bn
Planned change in capital allocation2013-2016
Investors’ Day –targets 2016Strategic goals
4.8
4.0
8.1
1.9
Transforming the business model for significant increase in efficiency and profitability
Leverage and grow unique and successful business model
Selective organic growth
Continue capital efficiencyMaintain profitability and grow selectively
> 12%RoE1)
< 80%CIR
> 20%RoE1)
< 45%CIR
> 15%RoE1)
< 55%CIR
> 15%RoE1)
< 65%CIR
PC
MSB
CEE
C&M
Higher capital allocation to strong core banking franchise basis for strengthening our earnings capacity
ShareFinancialsStrategy
7Group Investor Relations | Frankfurt am Main | 3 August 2015
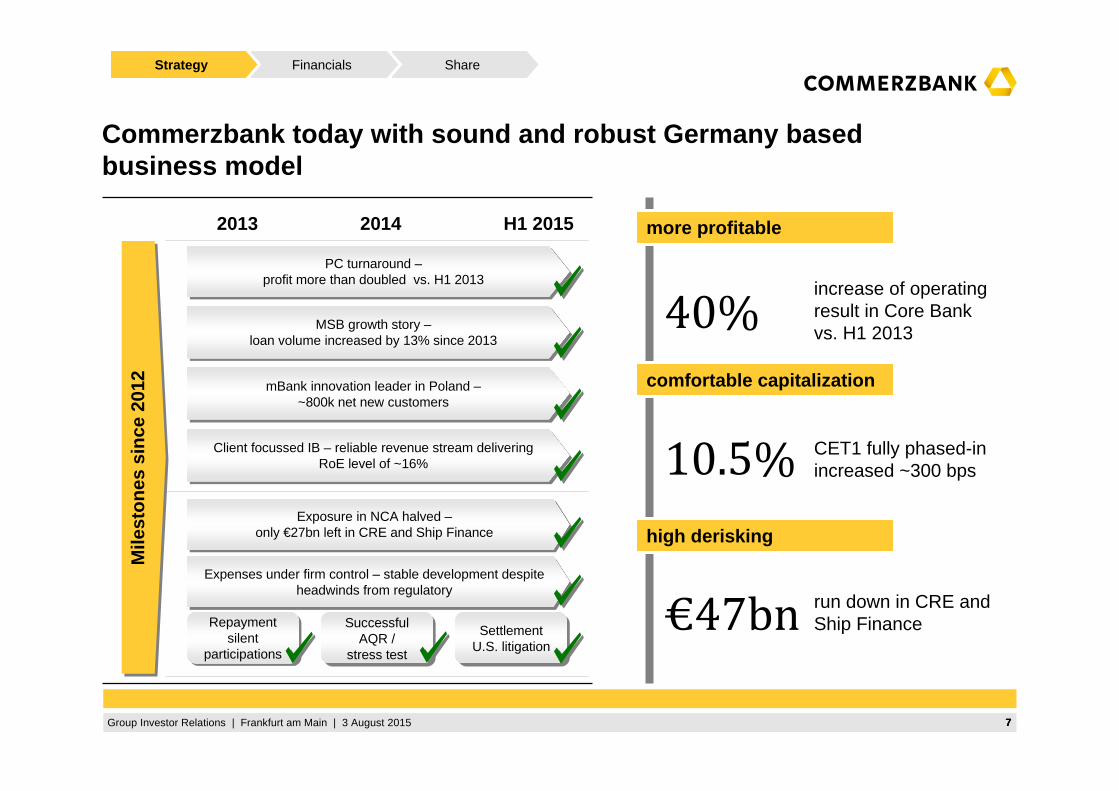
Commerzbank today with sound and robust Germany based business model
7
high derisking
€47bn run down in CRE and Ship Finance
comfortable capitalization
10.5% CET1 fully phased-in increased ~300 bps
more profitable
40%increase of operating result in Core Bank vs. H1 2013
Mile
ston
es s
ince
201
2
SuccessfulAQR /
stress test
SuccessfulAQR /
stress testSettlement
U.S. litigationSettlement
U.S. litigation
PC turnaround –profit more than doubled vs. H1 2013
PC turnaround –profit more than doubled vs. H1 2013
2013 2014 H1 2015
Repaymentsilent
participations
Repaymentsilent
participations
MSB growth story –loan volume increased by 13% since 2013
MSB growth story –loan volume increased by 13% since 2013
mBank innovation leader in Poland –~800k net new customers
mBank innovation leader in Poland –~800k net new customers
Exposure in NCA halved –only €27bn left in CRE and Ship Finance
Exposure in NCA halved –only €27bn left in CRE and Ship Finance
Client focussed IB – reliable revenue stream deliveringRoE level of ~16%
Client focussed IB – reliable revenue stream deliveringRoE level of ~16%
Expenses under firm control – stable development despiteheadwinds from regulatory
Expenses under firm control – stable development despiteheadwinds from regulatory
ShareFinancialsStrategy
8Group Investor Relations | Frankfurt am Main | 3 August 2015
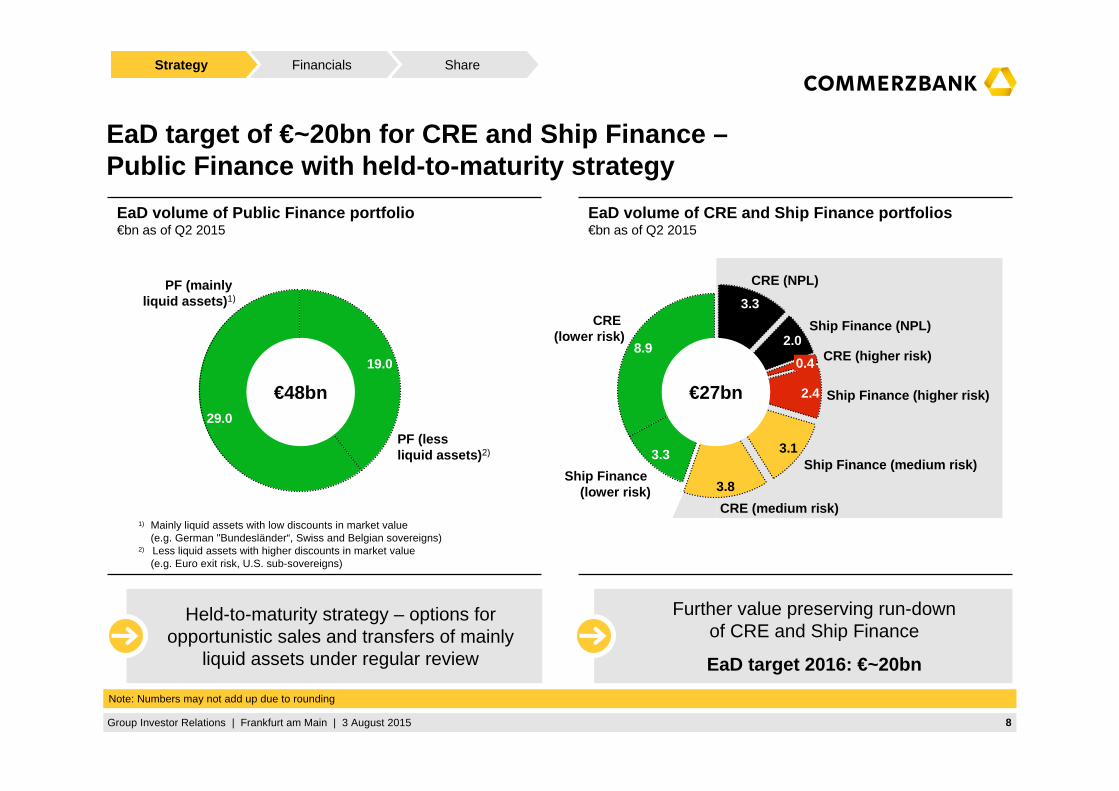
Held-to-maturity strategy – options for opportunistic sales and transfers of mainly
liquid assets under regular review
EaD target of €~20bn for CRE and Ship Finance –Public Finance with held-to-maturity strategy
EaD volume of Public Finance portfolio€bn as of Q2 2015
EaD volume of CRE and Ship Finance portfolios €bn as of Q2 2015
Note: Numbers may not add up due to rounding
Further value preserving run-down of CRE and Ship Finance
EaD target 2016: €~20bn
8.9
Ship Finance (medium risk)3.3
Ship Finance (lower risk) 3.8
CRE (medium risk)
3.1
CRE (lower risk)
2.4
0.42.0
3.3
Ship Finance (higher risk)
CRE (higher risk)
Ship Finance (NPL)
CRE (NPL)
€27bn
PF (less liquid assets)2)
19.0
PF (mainly liquid assets)1)
29.0
€48bn
1) Mainly liquid assets with low discounts in market value (e.g. German "Bundesländer“, Swiss and Belgian sovereigns)
2) Less liquid assets with higher discounts in market value (e.g. Euro exit risk, U.S. sub-sovereigns)
ShareFinancialsStrategy
9Group Investor Relations | Frankfurt am Main | 3 August 2015
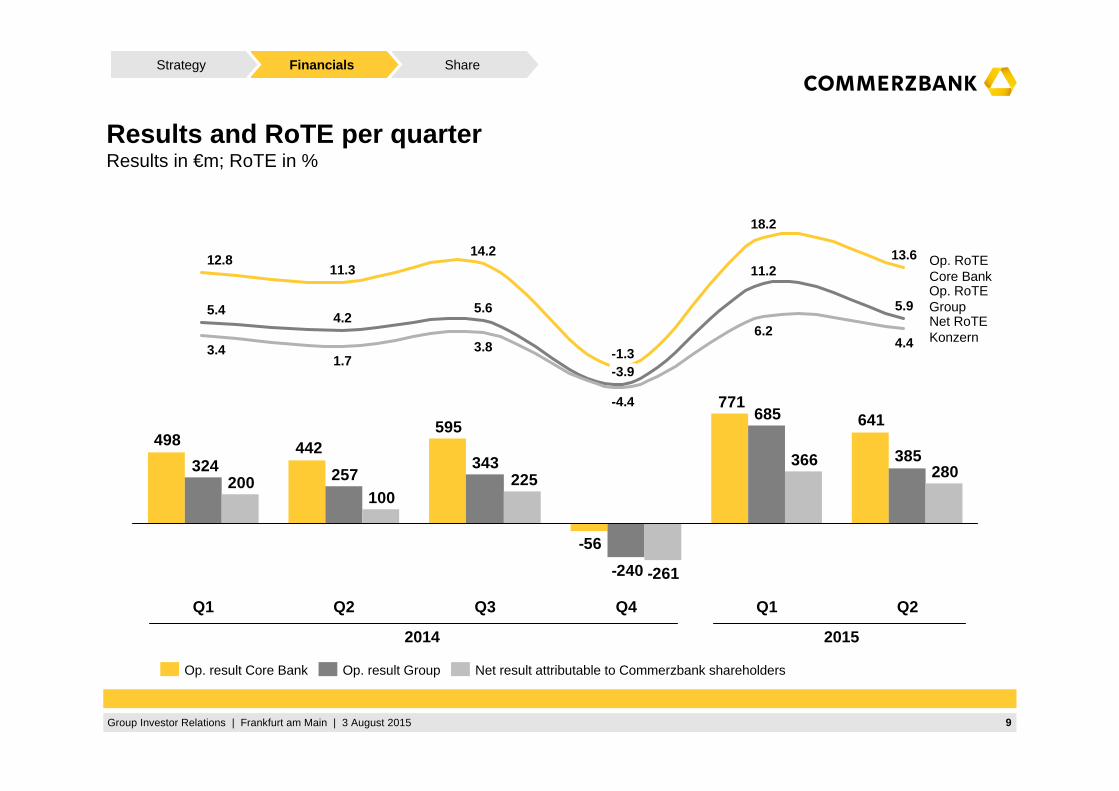
Results and RoTE per quarterResults in €m; RoTE in %
641771
-56
595442498
385
685
-240
343257324 280
366
-261
225100
200
Q1 Q1 Q2Q4Q3Q2
Net result attributable to Commerzbank shareholdersOp. result GroupOp. result Core Bank
ShareFinancialsStrategy
13.6
4.4
5.9
6.2
Op. RoTE Core Bank
Net RoTE Konzern
11.2
4.25.6
1.7
18.2
11.3
3.4
14.2
3.8
5.4
-4.4
-3.9-1.3
12.8
2014 2015
Op. RoTEGroup
10Group Investor Relations | Frankfurt am Main | 3 August 2015
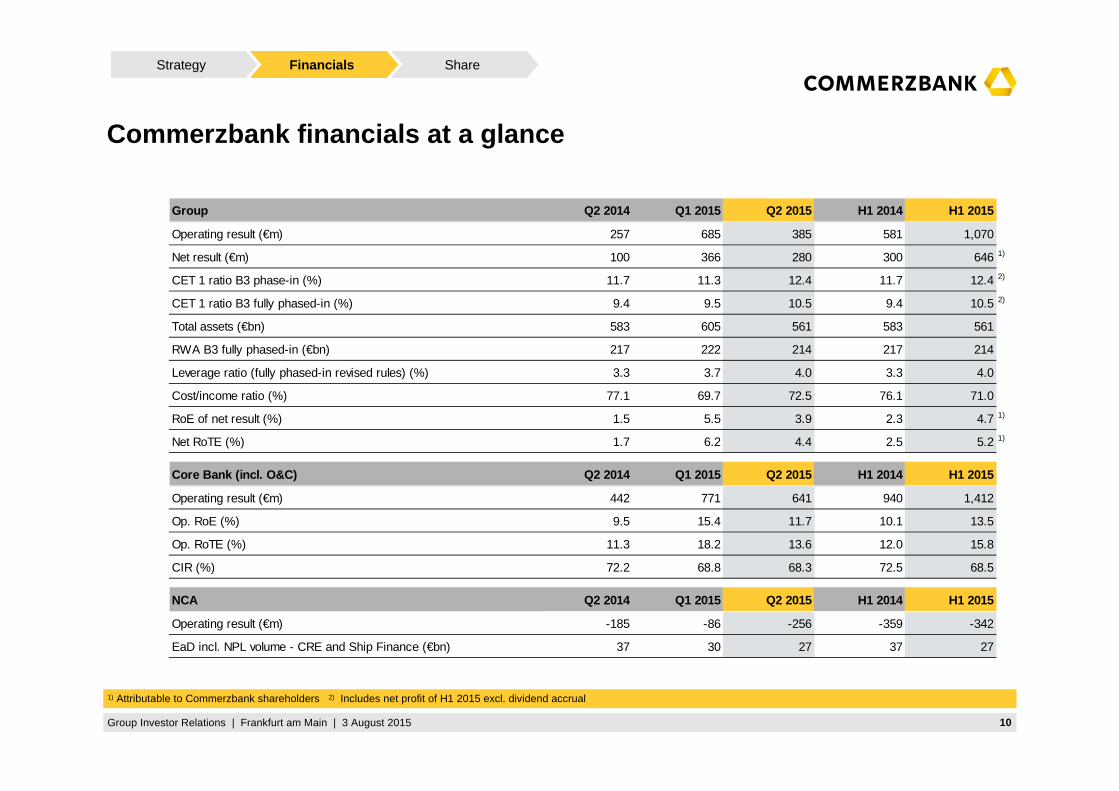
Commerzbank financials at a glance
1) Attributable to Commerzbank shareholders 2) Includes net profit of H1 2015 excl. dividend accrual
Group Q2 2014 Q1 2015 Q2 2015 H1 2014 H1 2015
Operating result (€m) 257 685 385 581 1,070
Net result (€m) 100 366 280 300 646 1)
CET 1 ratio B3 phase-in (%) 11.7 11.3 12.4 11.7 12.4 2)
CET 1 ratio B3 fully phased-in (%) 9.4 9.5 10.5 9.4 10.5 2)
Total assets (€bn) 583 605 561 583 561
RWA B3 fully phased-in (€bn) 217 222 214 217 214
Leverage ratio (fully phased-in revised rules) (%) 3.3 3.7 4.0 3.3 4.0
Cost/income ratio (%) 77.1 69.7 72.5 76.1 71.0
RoE of net result (%) 1.5 5.5 3.9 2.3 4.7 1)
Net RoTE (%) 1.7 6.2 4.4 2.5 5.2 1)
Core Bank (incl. O&C) Q2 2014 Q1 2015 Q2 2015 H1 2014 H1 2015
Operating result (€m) 442 771 641 940 1,412
Op. RoE (%) 9.5 15.4 11.7 10.1 13.5
Op. RoTE (%) 11.3 18.2 13.6 12.0 15.8
CIR (%) 72.2 68.8 68.3 72.5 68.5
NCA Q2 2014 Q1 2015 Q2 2015 H1 2014 H1 2015
Operating result (€m) -185 -86 -256 -359 -342
EaD incl. NPL volume - CRE and Ship Finance (€bn) 37 30 27 37 27 3)
ShareFinancialsStrategy
11Group Investor Relations | Frankfurt am Main | 3 August 2015
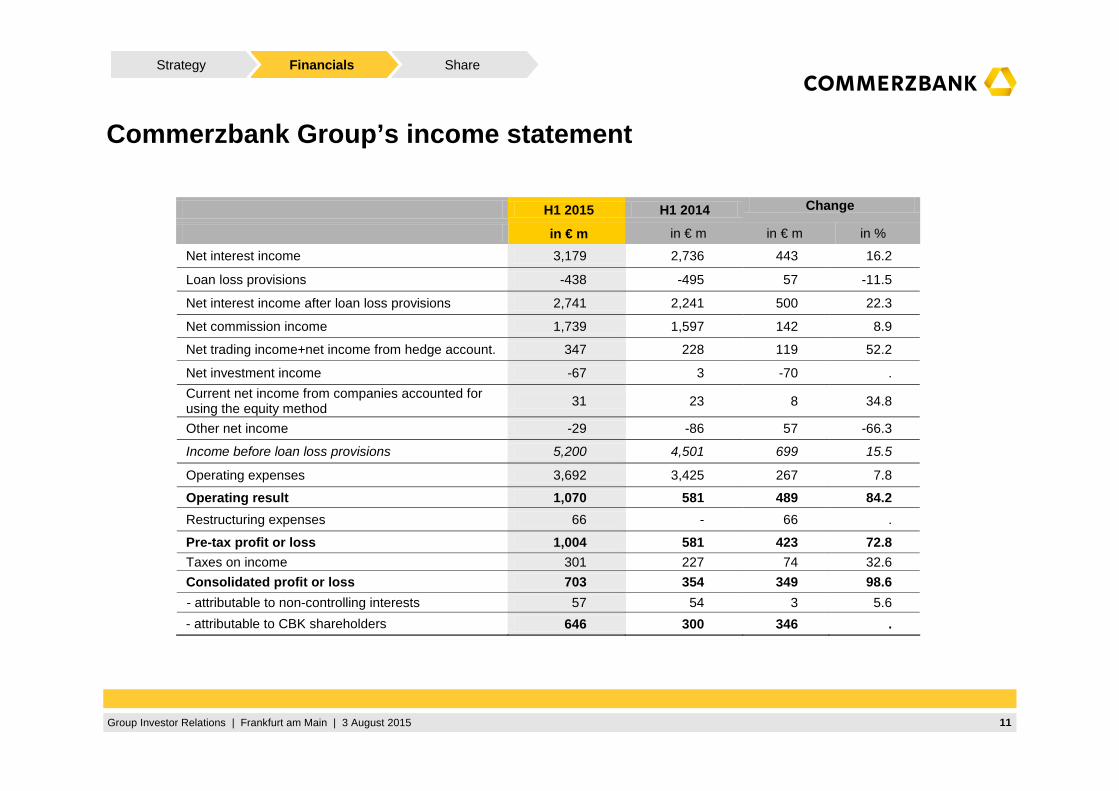
Commerzbank Group’s income statement
H1 2015 H1 2014 Change
in € m in € m in € m in %
Net interest income 3,179 2,736 443 16.2
Loan loss provisions -438 -495 57 -11.5
Net interest income after loan loss provisions 2,741 2,241 500 22.3
Net commission income 1,739 1,597 142 8.9
Net trading income+net income from hedge account. 347 228 119 52.2
Net investment income -67 3 -70 . Current net income from companies accounted for using the equity method 31 23 8 34.8
Other net income -29 -86 57 -66.3
Income before loan loss provisions 5,200 4,501 699 15.5
Operating expenses 3,692 3,425 267 7.8
Operating result 1,070 581 489 84.2 Restructuring expenses 66 - 66 .
Pre-tax profit or loss 1,004 581 423 72.8 Taxes on income 301 227 74 32.6 Consolidated profit or loss 703 354 349 98.6 - attributable to non-controlling interests 57 54 3 5.6 - attributable to CBK shareholders 646 300 346 .
ShareFinancialsStrategy
12Group Investor Relations | Frankfurt am Main | 3 August 2015
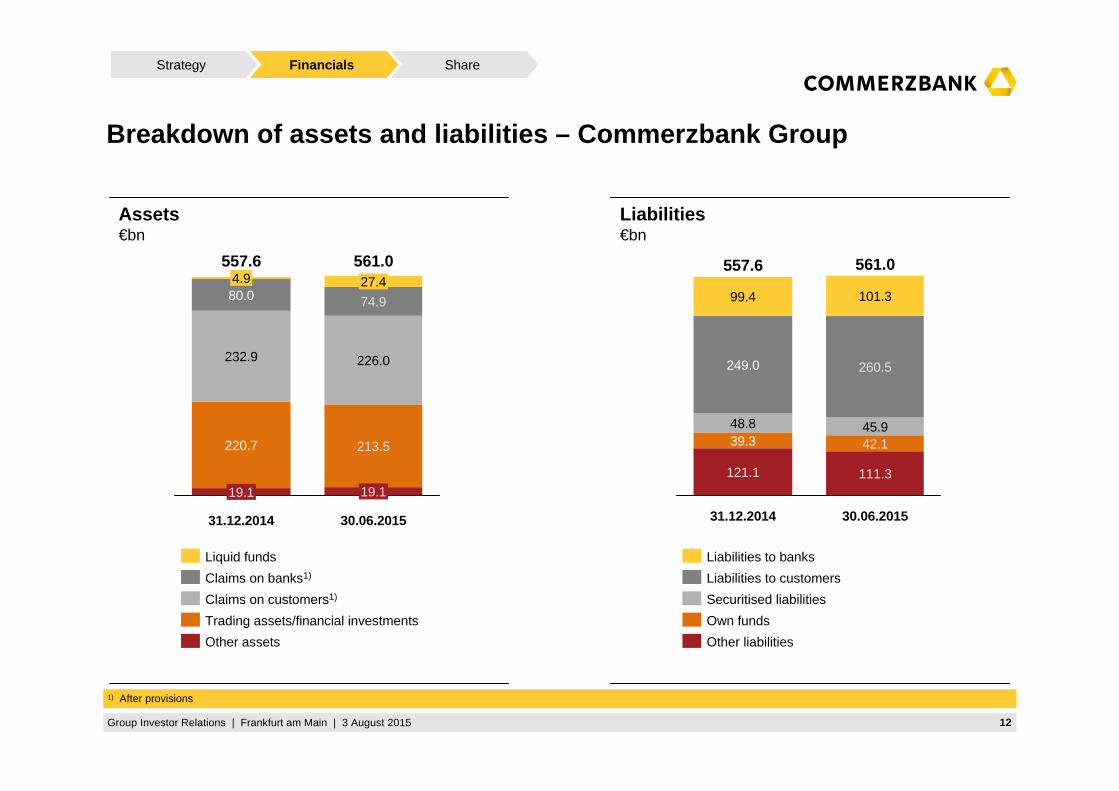
Liabilities€bn
Assets€bn
1) After provisions
ShareFinancialsStrategy
74.927.4
213.5
226.0
19.1
30.06.2015
561.0
31.12.2014
557.6
19.1
220.7
232.9
80.04.9
Other assetsTrading assets/financial investmentsClaims on customers1)
Claims on banks1)
Liquid funds
30.06.2015
101.3
561.0
260.5
42.145.9
31.12.2014
557.6
121.1
39.348.8
249.0
99.4
111.3
Other liabilities
Securitised liabilitiesOwn funds
Liabilities to customersLiabilities to banks
Breakdown of assets and liabilities – Commerzbank Group
13Group Investor Relations | Frankfurt am Main | 3 August 2015
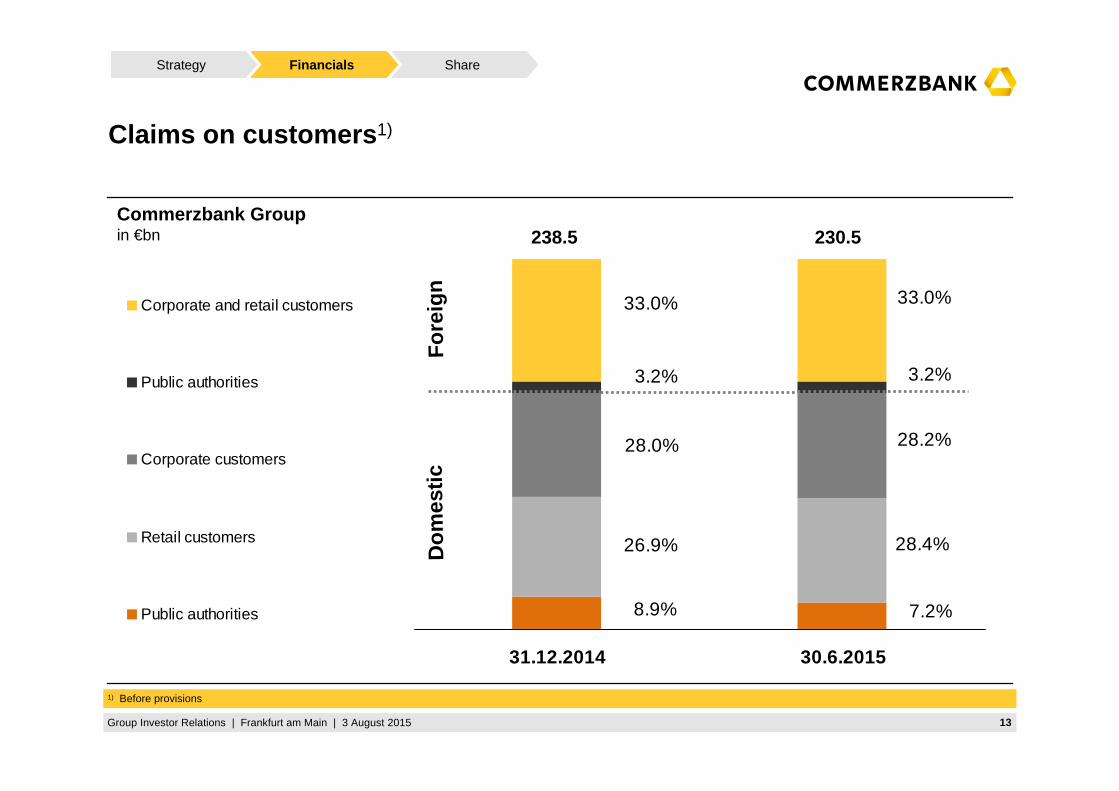
Commerzbank Groupin €bn
Claims on customers1)
7.2%8.9%
28.4%26.9%
28.2%28.0%
3.2%3.2%
33.0%33.0%
31.12.2014 30.6.2015
Corporate and retail customers
Public authorities
Corporate customers
Retail customers
Public authorities
238.5 230.5
Fore
ign
Dom
estic
1) Before provisions
ShareFinancialsStrategy
14Group Investor Relations | Frankfurt am Main | 3 August 2015
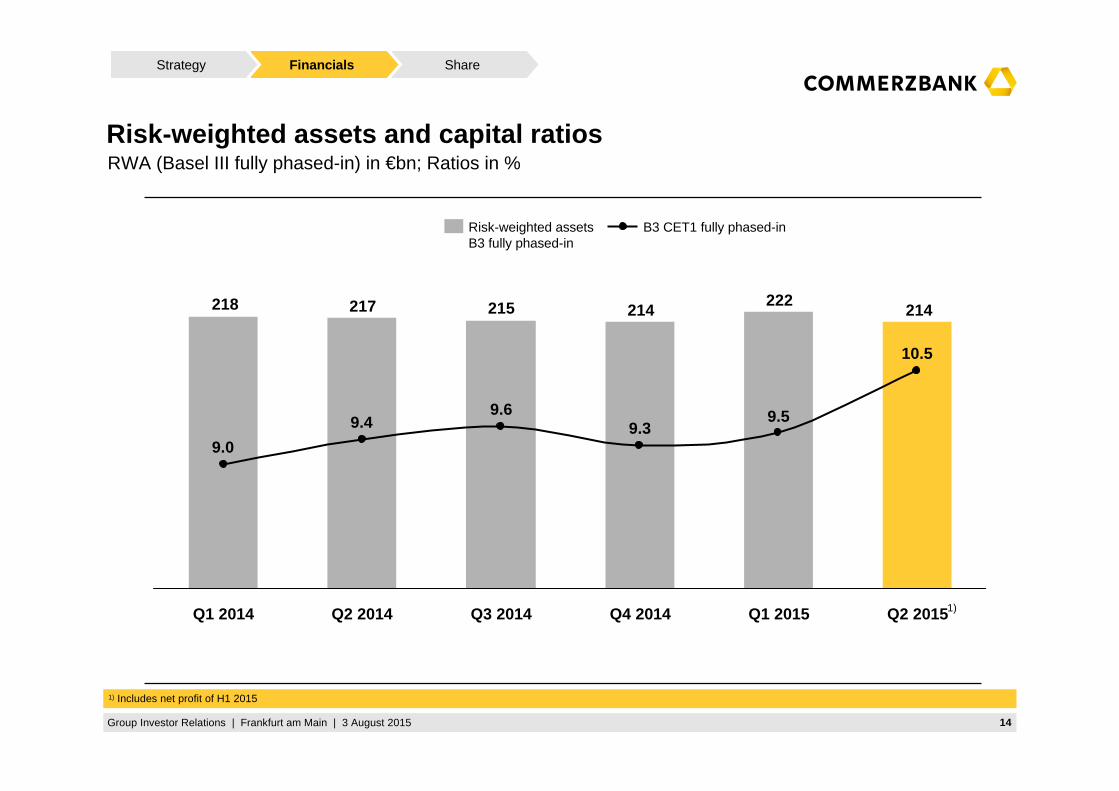
Risk-weighted assets and capital ratios
1) Includes net profit of H1 2015
222214215217218 214
9.4
Q3 2014
9.3
Q2 2014
9.6 9.5
Q4 2014 Q1 2015Q1 2014
9.0
Q2 2015
10.5
B3 CET1 fully phased-inRisk-weighted assetsB3 fully phased-in
ShareFinancialsStrategy
RWA (Basel III fully phased-in) in €bn; Ratios in %
1)
15Group Investor Relations | Frankfurt am Main | 3 August 2015
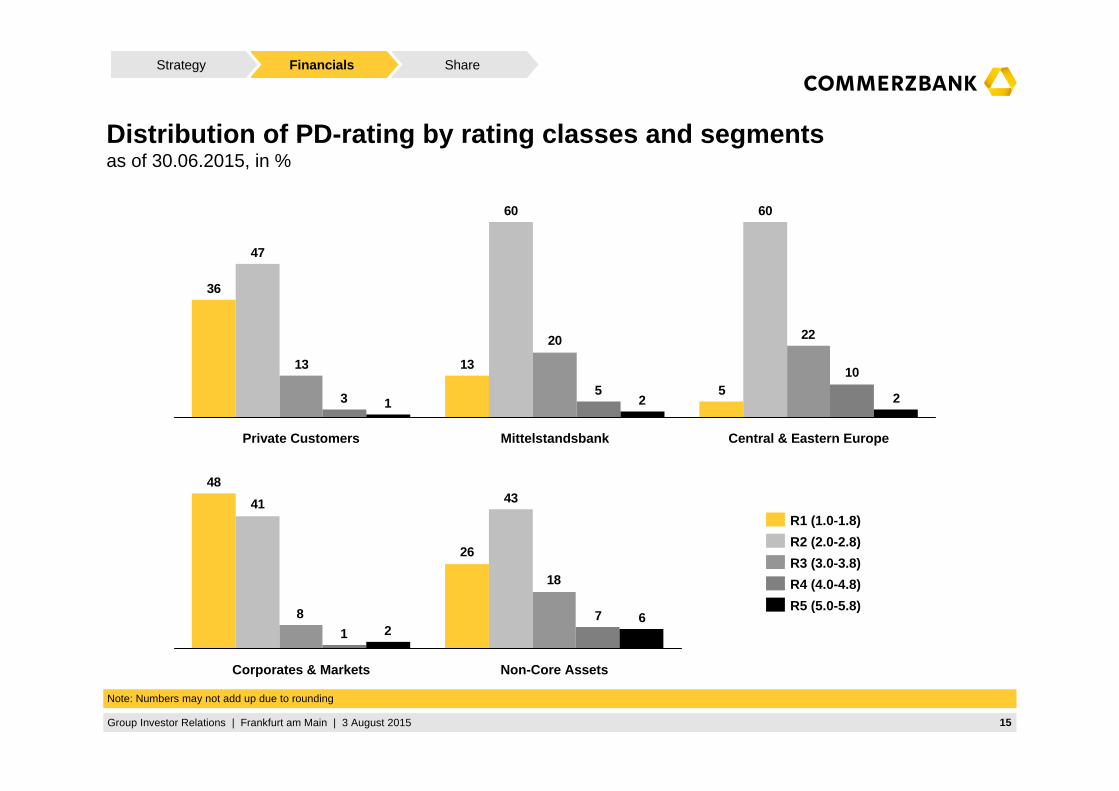
Distribution of PD-rating by rating classes and segmentsas of 30.06.2015, in %
ShareFinancialsStrategy
5
13
36
6060
47
2220
13 1053 221
Central & Eastern EuropeMittelstandsbankPrivate Customers
26
484341
18
8 71
62
Non-Core AssetsCorporates & Markets
R5 (5.0-5.8)
R3 (3.0-3.8)R4 (4.0-4.8)
R2 (2.0-2.8)R1 (1.0-1.8)
Note: Numbers may not add up due to rounding
16Group Investor Relations | Frankfurt am Main | 3 August 2015
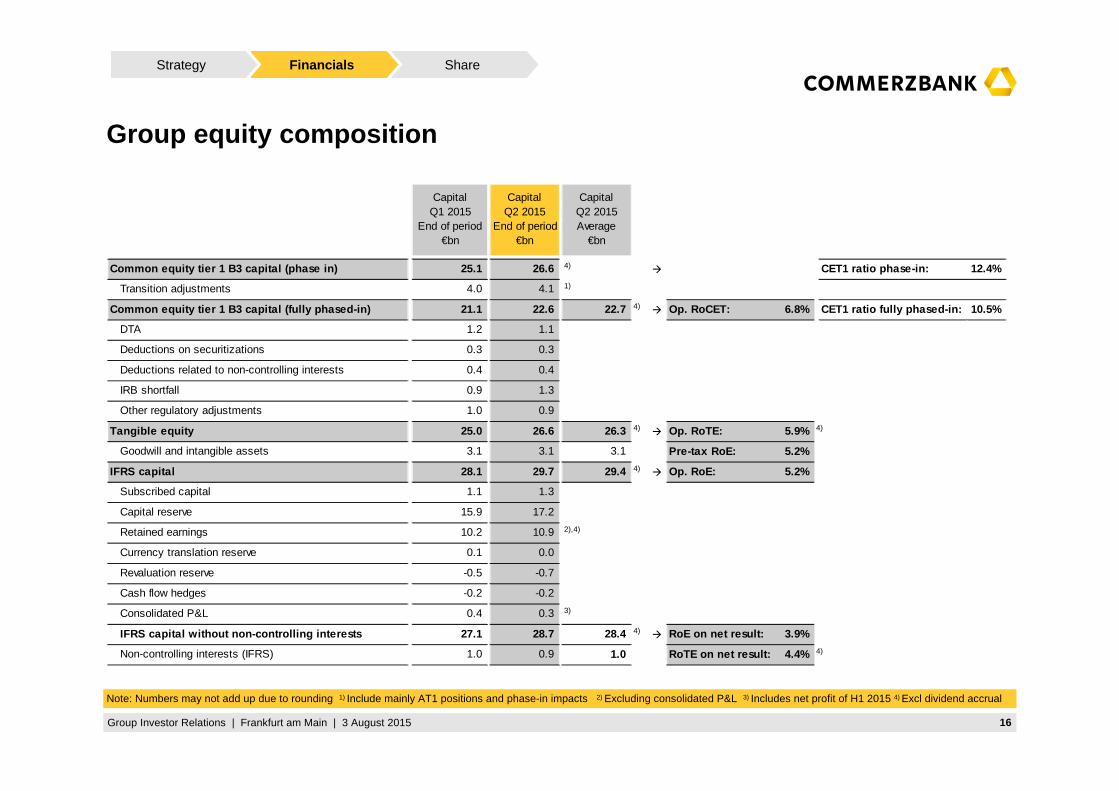
Group equity composition
Note: Numbers may not add up due to rounding 1) Include mainly AT1 positions and phase-in impacts 2) Excluding consolidated P&L 3) Includes net profit of H1 2015 4) Excl dividend accrual
Capital Capital CapitalQ1 2015 Q2 2015 Q2 2015
End of period End of period Average€bn €bn €bn
Common equity tier 1 B3 capital (phase in) 25.1 26.6 4) CET1 ratio phase-in: 12.4%
Transition adjustments 4.0 4.1 1)
Common equity tier 1 B3 capital (fully phased-in) 21.1 22.6 22.7 4) Op. RoCET: 6.8% CET1 ratio fully phased-in: 10.5%
DTA 1.2 1.1
Deductions on securitizations 0.3 0.3
Deductions related to non-controlling interests 0.4 0.4
IRB shortfall 0.9 1.3
Other regulatory adjustments 1.0 0.9
Tangible equity 25.0 26.6 26.3 4) Op. RoTE: 5.9% 4)
Goodwill and intangible assets 3.1 3.1 3.1 Pre-tax RoE: 5.2%
IFRS capital 28.1 29.7 29.4 4) Op. RoE: 5.2%
Subscribed capital 1.1 1.3
Capital reserve 15.9 17.2
Retained earnings 10.2 10.9 2),4)
Currency translation reserve 0.1 0.0
Revaluation reserve -0.5 -0.7
Cash flow hedges -0.2 -0.2
Consolidated P&L 0.4 0.3 3)
IFRS capital without non-controlling interests 27.1 28.7 28.4 4) RoE on net result: 3.9%
Non-controlling interests (IFRS) 1.0 0.9 1.0 RoTE on net result: 4.4% 4)
ShareFinancialsStrategy
17Group Investor Relations | Frankfurt am Main | 3 August 2015
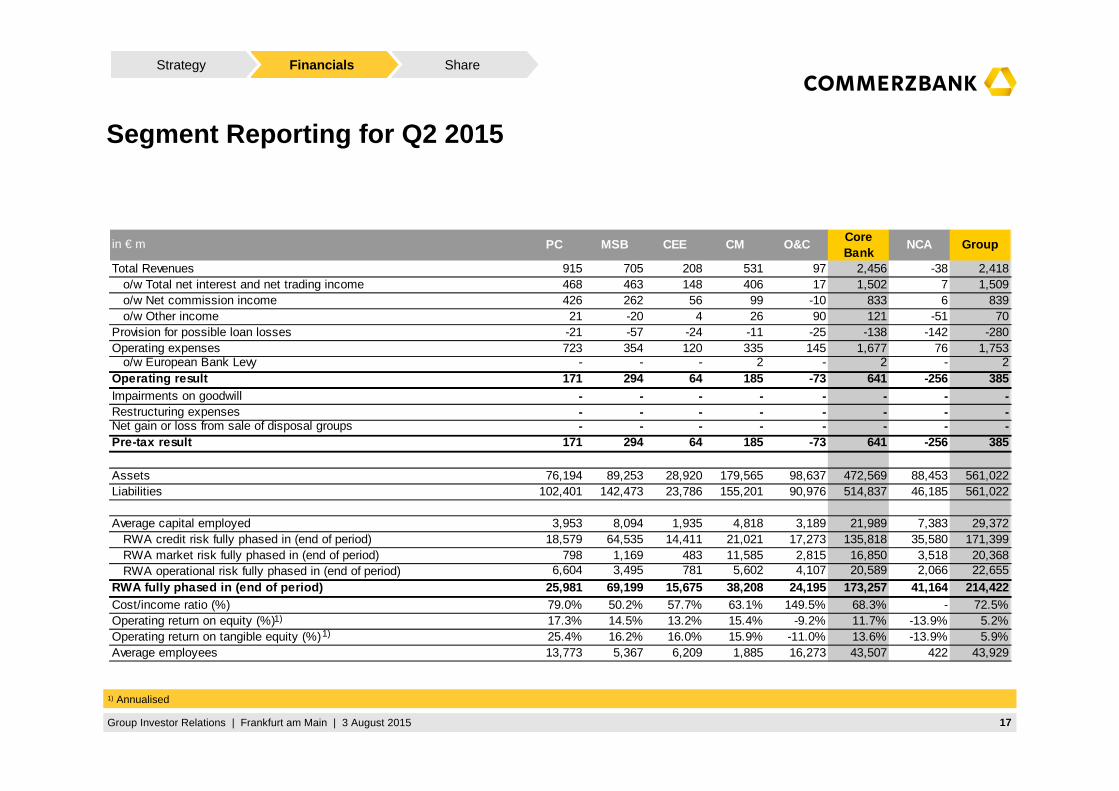
in € m PC MSB CEE CM O&C CoreBank NCA Group
Total Revenues 915 705 208 531 97 2,456 -38 2,418 o/w Total net interest and net trading income 468 463 148 406 17 1,502 7 1,509 o/w Net commission income 426 262 56 99 -10 833 6 839 o/w Other income 21 -20 4 26 90 121 -51 70 Provision for possible loan losses -21 -57 -24 -11 -25 -138 -142 -280 Operating expenses 723 354 120 335 145 1,677 76 1,753 o/w European Bank Levy - - - 2 - 2 - 2 Operating result 171 294 64 185 -73 641 -256 385 Impairments on goodwill - - - - - - - - Restructuring expenses - - - - - - - - Net gain or loss from sale of disposal groups - - - - - - - - Pre-tax result 171 294 64 185 -73 641 -256 385
Assets 76,194 89,253 28,920 179,565 98,637 472,569 88,453 561,022 Liabilities 102,401 142,473 23,786 155,201 90,976 514,837 46,185 561,022
Average capital employed 3,953 8,094 1,935 4,818 3,189 21,989 7,383 29,372 RWA credit risk fully phased in (end of period) 18,579 64,535 14,411 21,021 17,273 135,818 35,580 171,399 RWA market risk fully phased in (end of period) 798 1,169 483 11,585 2,815 16,850 3,518 20,368 RWA operational risk fully phased in (end of period) 6,604 3,495 781 5,602 4,107 20,589 2,066 22,655
RWA fully phased in (end of period) 25,981 69,199 15,675 38,208 24,195 173,257 41,164 214,422 Cost/income ratio (%) 79.0% 50.2% 57.7% 63.1% 149.5% 68.3% - 72.5% Operating return on equity (%) 17.3% 14.5% 13.2% 15.4% -9.2% 11.7% -13.9% 5.2% Operating return on tangible equity (%) 25.4% 16.2% 16.0% 15.9% -11.0% 13.6% -13.9% 5.9% Average employees 13,773 5,367 6,209 1,885 16,273 43,507 422 43,929
Segment Reporting for Q2 2015
1) Annualised
ShareFinancialsStrategy
1)1)
18Group Investor Relations | Frankfurt am Main | 3 August 2015
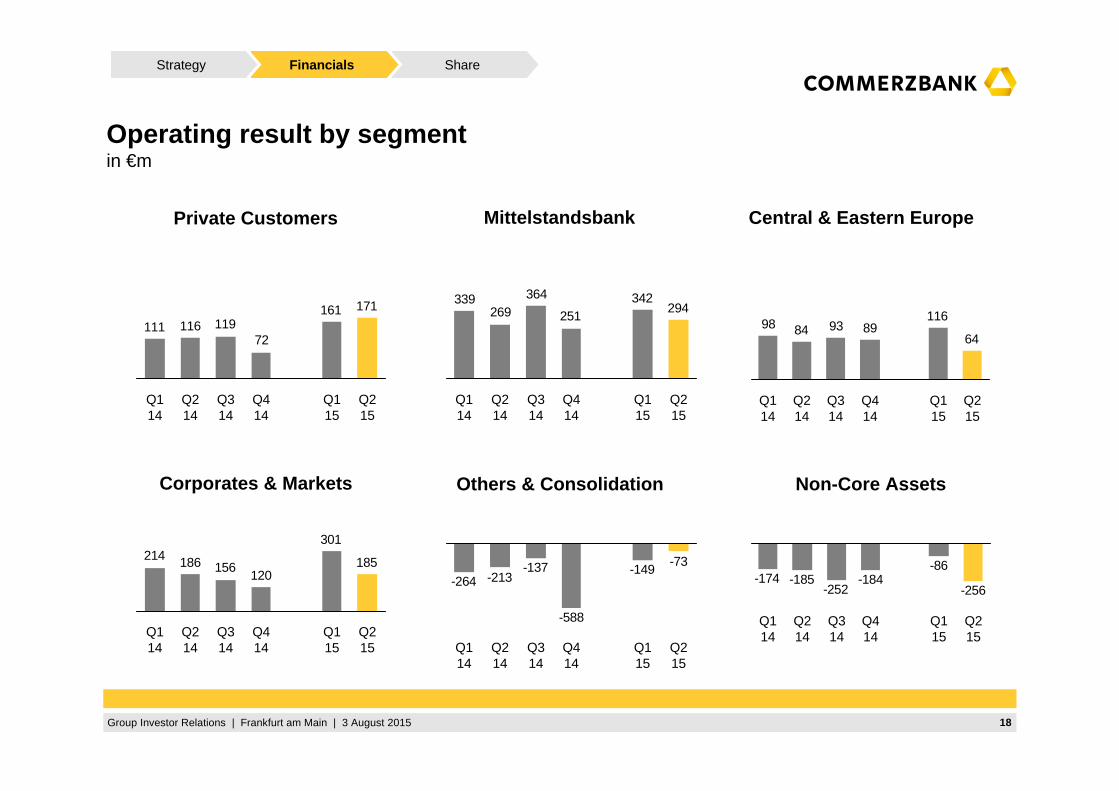
Private Customers
Corporates & Markets Others & Consolidation
Mittelstandsbank Central & Eastern Europe
Non-Core Assets
171161
72119116111
Q2 15
Q1 15
Q4 14
Q3 14
Q2 14
Q1 14
294342
251
364269
339
Q2 15
Q1 14
Q4 14
Q3 14
Q2 14
Q1 15
64
11689938498
Q1 15
Q4 14
Q3 14
Q2 15
Q2 14
Q1 14
185
301
120156186214
Q3 14
Q2 14
Q1 14
Q2 15
Q1 15
Q4 14
-73-149
-588
-137-213-264
Q4 14
Q3 14
Q2 14
Q2 15
Q1 14
Q1 15
-256
-86-184
-252-185-174
Q4 14
Q1 15
Q3 14
Q2 14
Q1 14
Q2 15
ShareFinancialsStrategy
Operating result by segmentin €m
19Group Investor Relations | Frankfurt am Main | 3 August 2015
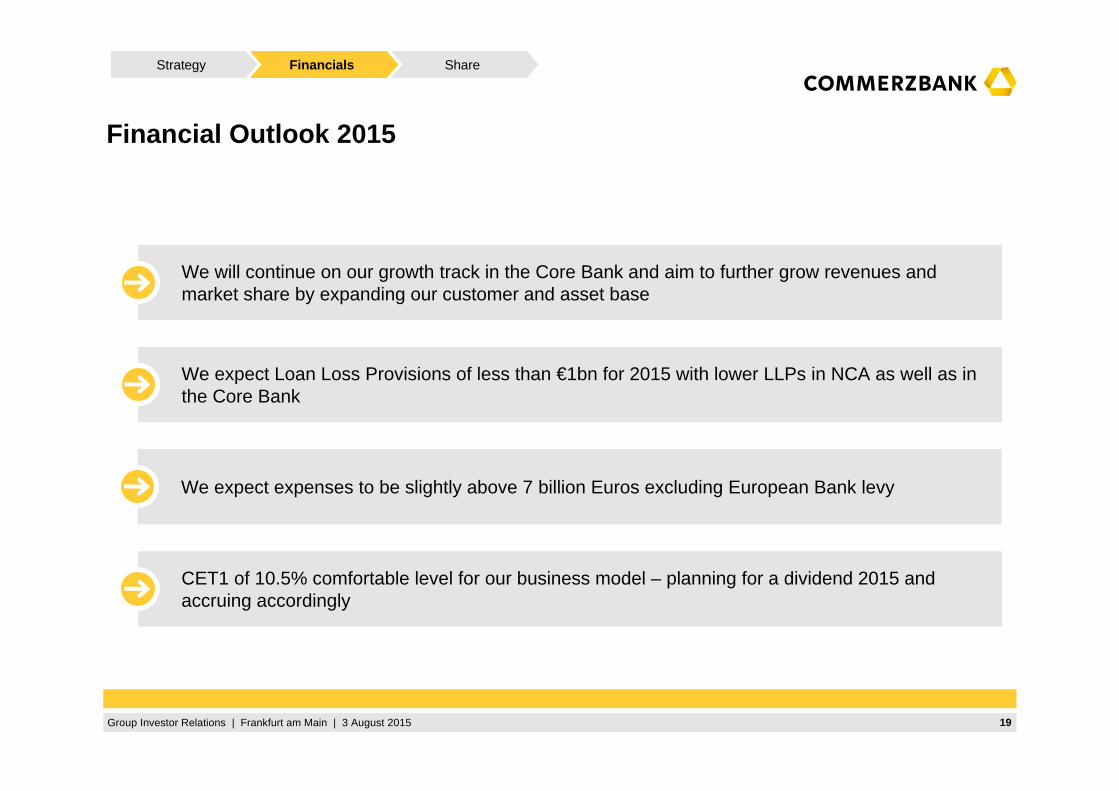
Financial Outlook 2015
CET1 of 10.5% comfortable level for our business model – planning for a dividend 2015 and accruing accordingly
We expect Loan Loss Provisions of less than €1bn for 2015 with lower LLPs in NCA as well as in the Core Bank
We expect expenses to be slightly above 7 billion Euros excluding European Bank levy
We will continue on our growth track in the Core Bank and aim to further grow revenues and market share by expanding our customer and asset base
ShareFinancialsStrategy
20Group Investor Relations | Frankfurt am Main | 3 August 2015
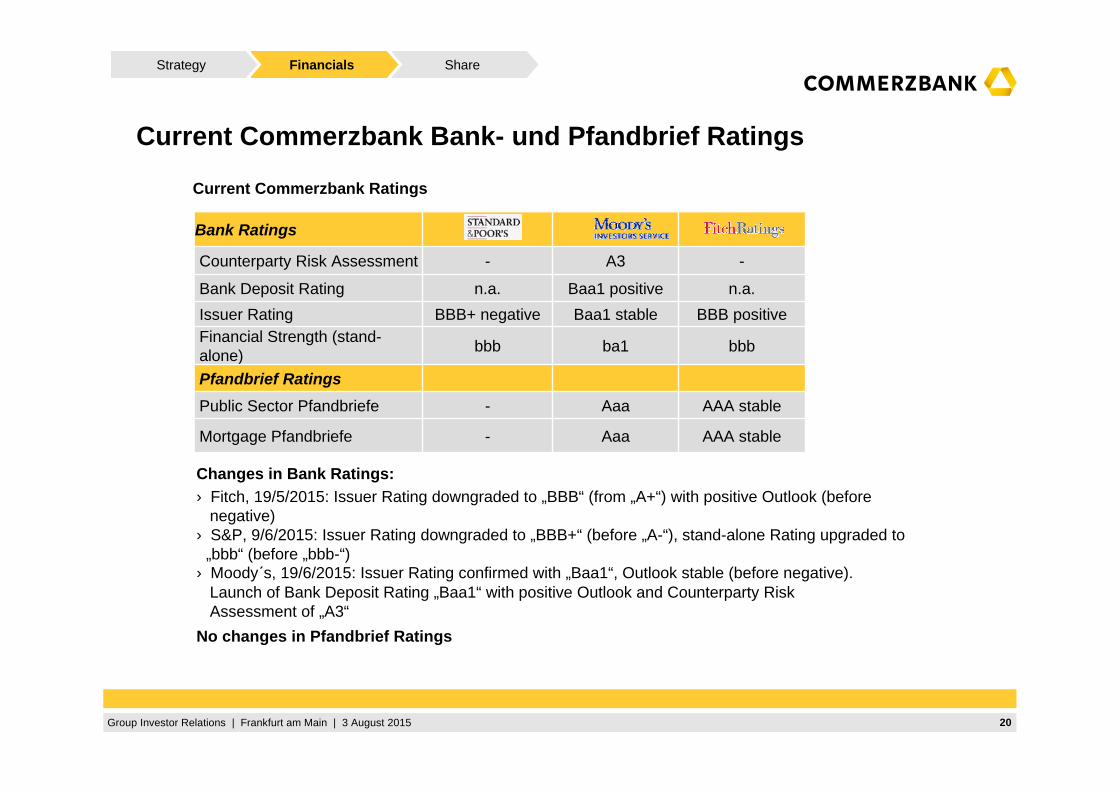
Current Commerzbank Bank- und Pfandbrief Ratings
AAA stable
AAA stable
bbb
BBB positiven.a.
-A3-Counterparty Risk Assessment
Baa1 positiven.a.Bank Deposit Rating
Bank Ratings
Issuer Rating BBB+ negative Baa1 stableFinancial Strength (stand-alone) bbb ba1
Pfandbrief RatingsPublic Sector Pfandbriefe - Aaa
Mortgage Pfandbriefe - Aaa
Current Commerzbank Ratings
Changes in Bank Ratings:› Fitch, 19/5/2015: Issuer Rating downgraded to „BBB“ (from „A+“) with positive Outlook (before
negative)› S&P, 9/6/2015: Issuer Rating downgraded to „BBB+“ (before „A-“), stand-alone Rating upgraded to
„bbb“ (before „bbb-“)› Moody´s, 19/6/2015: Issuer Rating confirmed with „Baa1“, Outlook stable (before negative).
Launch of Bank Deposit Rating „Baa1“ with positive Outlook and Counterparty RiskAssessment of „A3“
No changes in Pfandbrief Ratings
ShareFinancialsStrategy
21Group Investor Relations | Frankfurt am Main | 3 August 2015
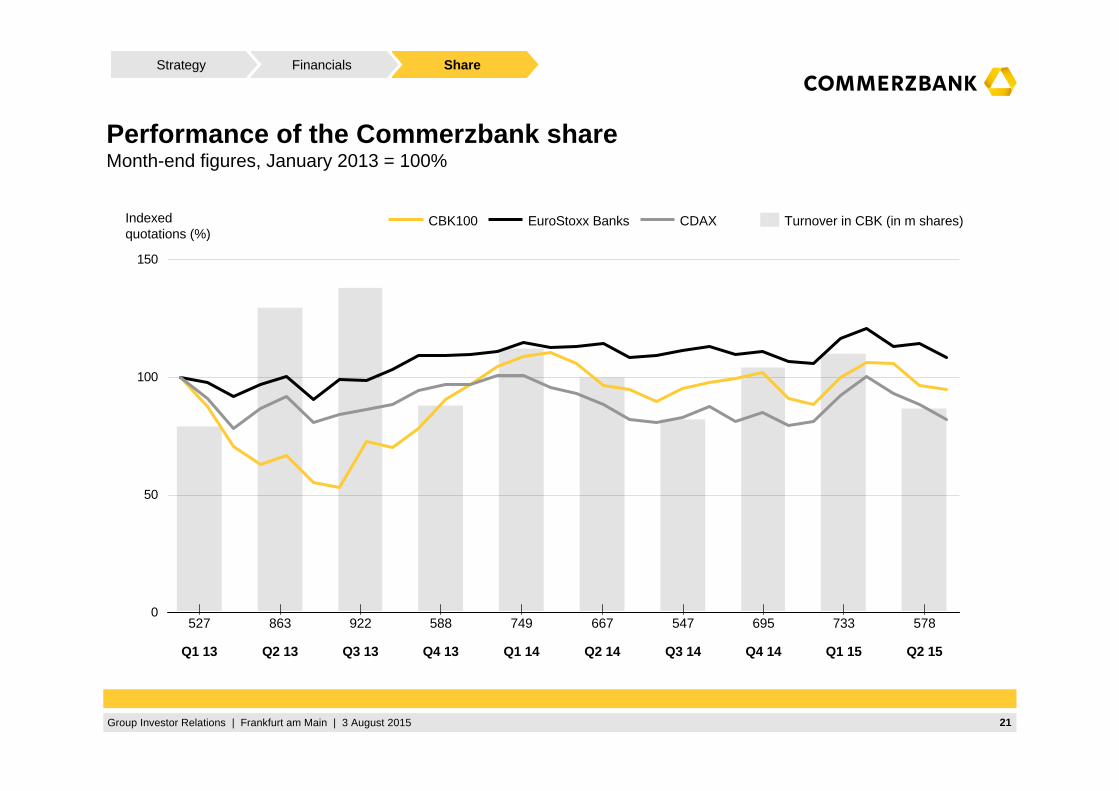
Q2 15
578
Q1 15Q4 14
733695
Q3 14
547
Q2 14
667
Q1 14
749
Q4 13
588
Q3 13
922
Q2 13
863
Q1 13
5270
50
100
150
Indexedquotations (%)
CDAXEuroStoxx BanksCBK100 Turnover in CBK (in m shares)
ShareFinancialsStrategy
Performance of the Commerzbank shareMonth-end figures, January 2013 = 100%
22Group Investor Relations | Frankfurt am Main | 3 August 2015
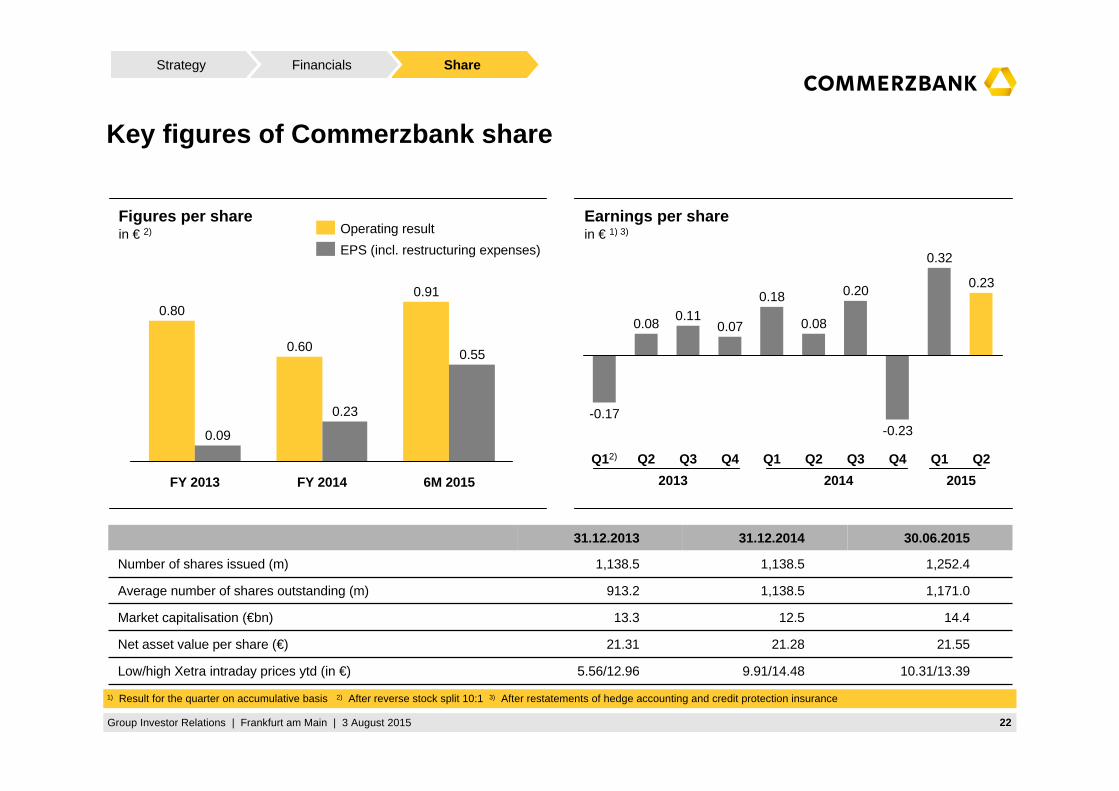
Key figures of Commerzbank share
AktieFinancialsStrategie ShareFinancialsStrategy
Figures per sharein € 2)
Earnings per sharein € 1) 3)
21.5521.2821.31Net asset value per share (€)
10.31/13.399.91/14.485.56/12.96Low/high Xetra intraday prices ytd (in €)
13.3
913.2
1,138.5
31.12.2013
12.5
1,138.5
1,138.5
31.12.2014
1,171.0Average number of shares outstanding (m)
14.4
1,252.4
30.06.2015
Market capitalisation (€bn)
Number of shares issued (m)
1) Result for the quarter on accumulative basis 2) After reverse stock split 10:1 3) After restatements of hedge accounting and credit protection insurance
Q1
0.32
Q4
-0.23
Q3
0.20
Q2
0.08
Q1
0.18
Q4
0.07
Q3
0.11
Q2
0.08
Q12)
-0.17
Q2
0.23
6M 2015
0.55
0.91
FY 2014
0.23
0.60
FY 2013
0.09
0.80
EPS (incl. restructuring expenses)Operating result
2013 2014 2015
23Group Investor Relations | Frankfurt am Main | 3 August 2015
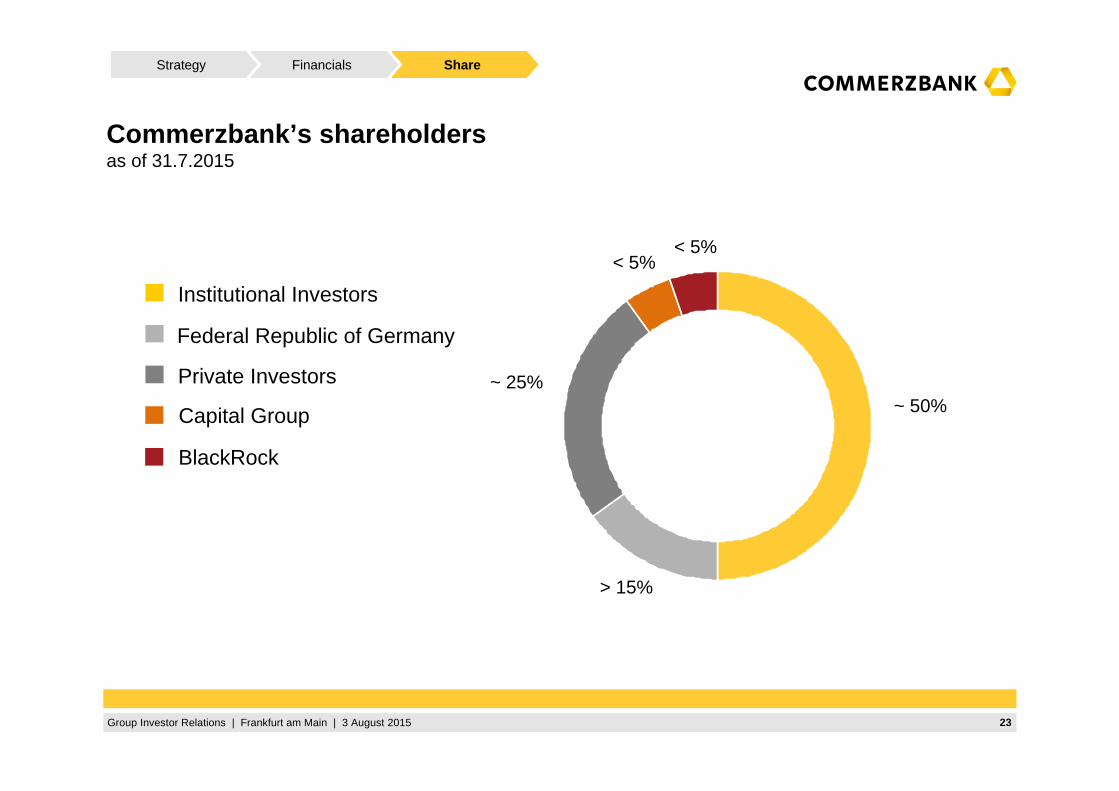
Commerzbank’s shareholdersas of 31.7.2015
Private Investors
Institutional Investors
Federal Republic of Germany
~ 50%
> 15%
~ 25%
< 5%
Capital Group
< 5%
BlackRock
ShareFinancialsStrategy
24Group Investor Relations | Frankfurt am Main | 3 August 2015
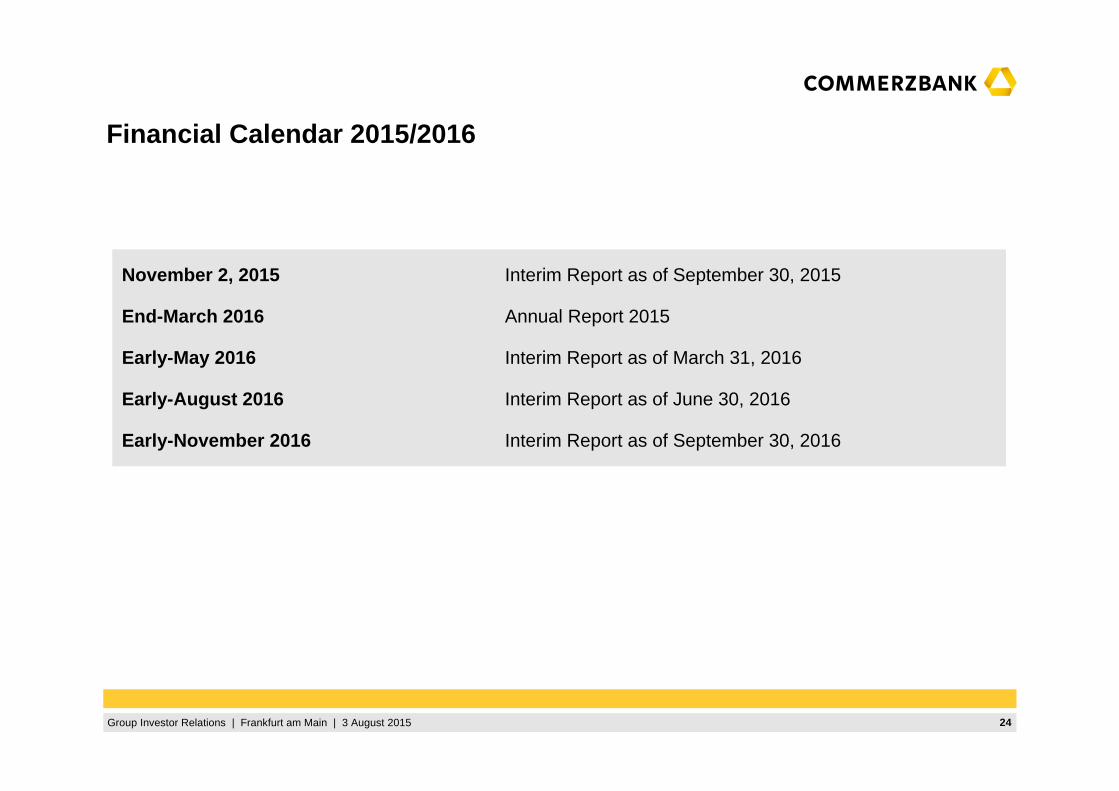
Financial Calendar 2015/2016
November 2, 2015 Interim Report as of September 30, 2015
End-March 2016 Annual Report 2015
Early-May 2016 Interim Report as of March 31, 2016
Early-August 2016 Interim Report as of June 30, 2016
Early-November 2016 Interim Report as of September 30, 2016
25Group Investor Relations | Frankfurt am Main | 3 August 2015
Disclaimer
Investor Relations
This presentation contains forward-looking statements. Forward-looking statements are statements that are not historical facts; they include, inter alia, statements about Commerzbank’s beliefs and expectations and the assumptions underlying them. These statements are based on plans, estimates, projections and targets as they are currently available to the management of Commerzbank. Forward-looking statements therefore speak only as of the date they are made, and Commerzbank undertakes no obligation to update any of them in light of new information or future events. By their very nature, forward-looking statements involve risks and uncertainties. A number of important factors could therefore cause actual results to differ materially from those contained in any forward-looking statement. Such factors include, among others, the conditions in the financial markets in Germany, in Europe, in the United States and elsewhere from which Commerzbank derives a substantial portion of its revenues and in which it hold a substantial portion of its assets, the development of assetprices and market volatility, potential defaults of borrowers or trading counterparties, the implementation of its strategic initiatives and the reliability of its risk management policies.
In addition, this presentation contains financial and other information which has been derived from publicly available information disclosed by persons other than Commerzbank (“external data”). In particular, external data has been derived from industry and customer-related data and other calculations taken or derived from industry reports published by third parties, market research reports and commercial publications. Commercial publications generally state that the information they contain has originated from sources assumed to be reliable, but that the accuracy and completeness of such information is not guaranteed and that the calculations contained therein are based on a series of assumptions. The external data has not been independently verified by Commerzbank. Therefore, Commerzbank cannot assume any responsibility for the accuracy of the external data taken or derived from public sources.
Copies of this document are available upon request or can be downloaded from https://www.commerzbank.com/en/hauptnavigation/aktionaere/publikationen_und_veranstaltungen/praesentationen_1/index.html
26Group Investor Relations | Frankfurt am Main | 3 August 2015
For more information, please contact Commerzbank’s IR team:
Institutional Investors and Financial Analysts
Michael H. KleinP: +49 69 136 24522M: [email protected]
Maximilian BickerP: +49 69 136 28696M: [email protected]
Tanja Birkholz (Head of Investor Relations / Executive Management Board Member)P: +49 69 136 23854M: [email protected]
Retail Investors
Florian Neumann P: +49 69 136 41367M: [email protected]
Simone Nuxoll P: +49 69 136 45660M: [email protected]
Dirk Bartsch (Head of Strategic IR / Rating Agency Relations)P: +49 69 136 22799 M: [email protected]
Christoph Wortig (Head of IR Communications)P: +49 69 136 52668M: [email protected]