Embed Size (px)
Citation preview

© Crown 2016 MHL2467 – 49
Figures
Figure A1: Commonly Stated Effects of Seawalls on Adjacent Shorelines and Beaches
Figure A2: Comparative Beach Erosion for Sloping and Vertical Seawalls, Manly Beach, 11am 6 June 2016
Figure A3: (a) Seawall location according to Weggel classification (b) Laboratory Measurements of Relative Maximum Scour Depth
Figure A4: (a) Schematic Diagram of Excess Seawall End Erosion, Depth and Length (b) Example of Excess Seawall End Erosion – Gold Coast, 1967 (c) Additional Bluff Recession Due to Seawalls Following Hurricane Eloise (d) Excess Depth of Erosion as a Function of Seawall Length
Figure A5: Offshore Bathymetry Collaroy-Narrabeen
Figure A6: Average Wave Overtopping Rates for Different Rock Armour Crest Levels
Figure A7: Representative Rubble Mound Rock Concept Design - Collaroy Carpark
Figure A8: Representative Rubble Mound Rock Concept Design – Frazer St Reserve
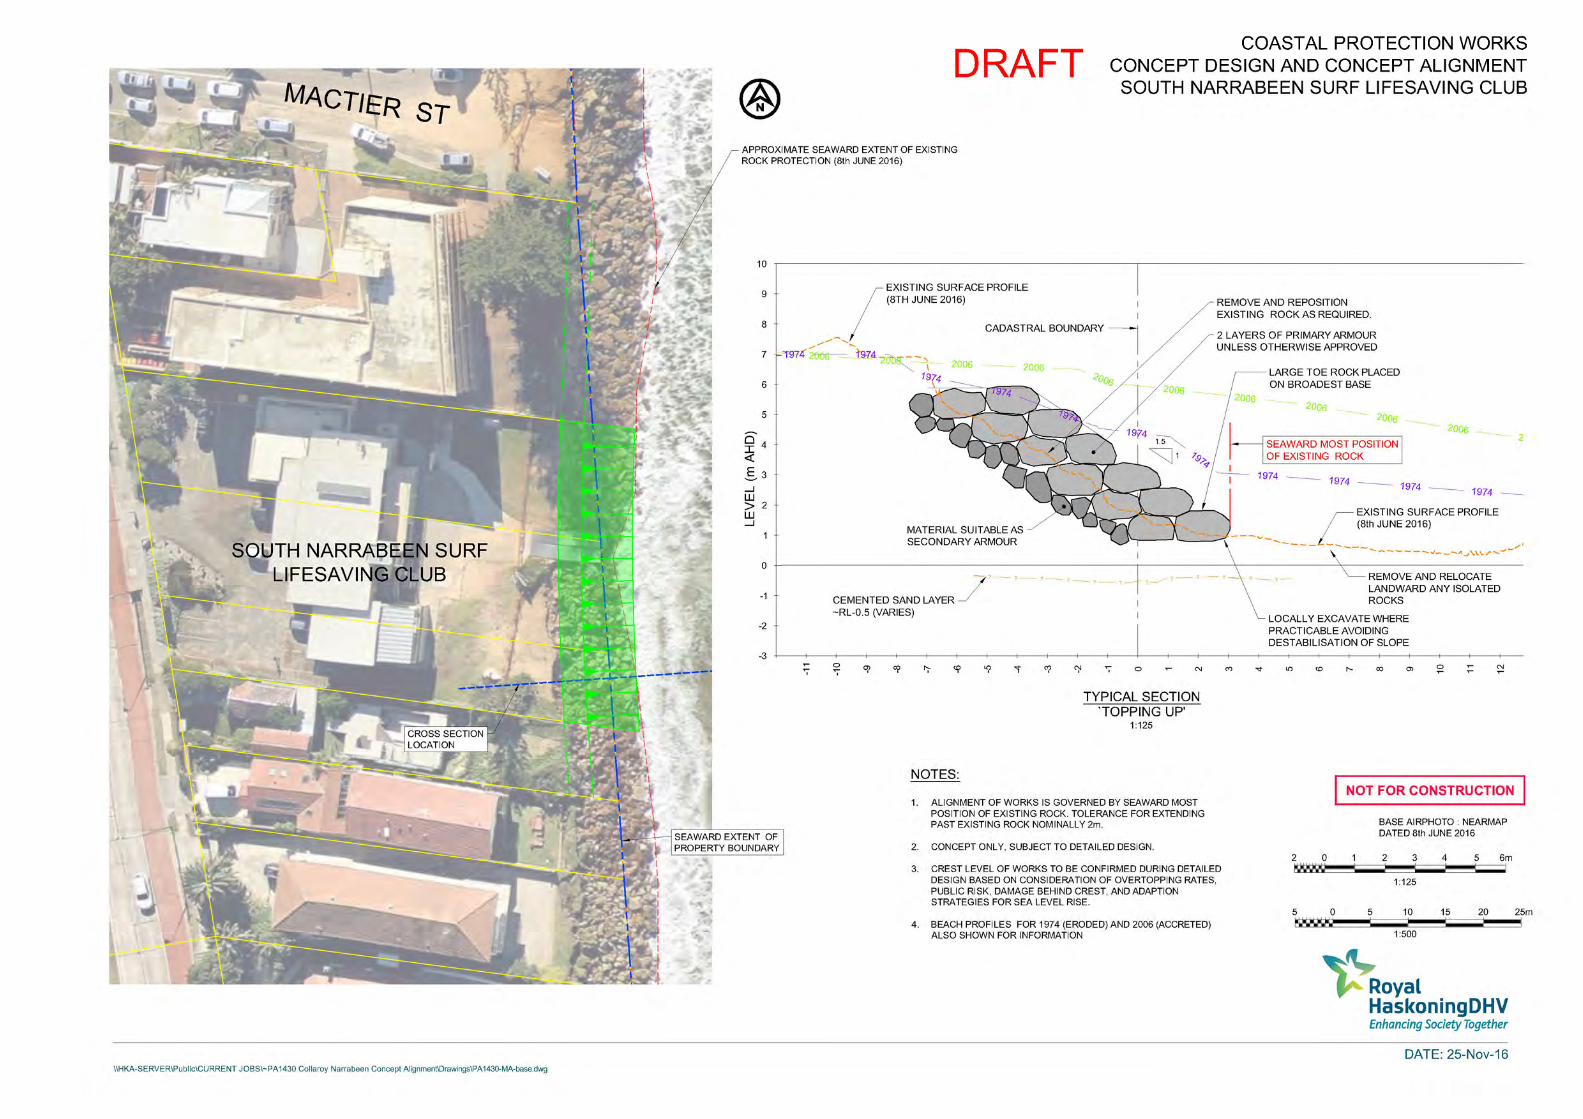
Figure A9: Representative Rubble Mound Rock Concept Design – South Narrabeen SLC
Figure A10: Existing Ad-hoc Rubble Mound Rock Protection – Wetherill St
Figure A11: Example of Beach Recovery
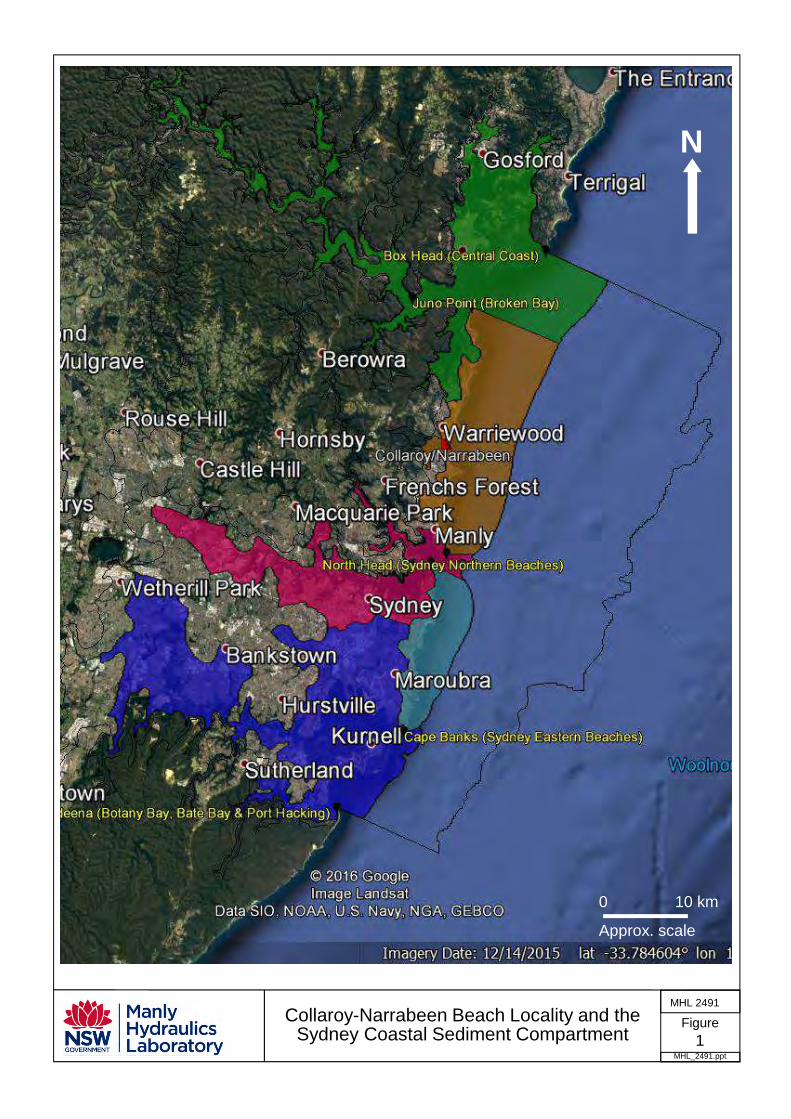
Figure 1
MHL_2491.ppt
MHL 2491Collaroy-Narrabeen Beach Locality and the
Sydney Coastal Sediment Compartment
0 10 km
Approx. scale
N
Figure 2
MHL_2491.ppt
MHL 2491Collaroy-Narrabeen Beach Locality and Northern Beaches
Coastal Sediment Compartment
0 2 km
Approx. scale
N
Fishermans Beach
Turimetta Beach
Long Reef Point
Collaroy/Narrabeen Coastal Sediment Sub-Compartment
Turimetta Head
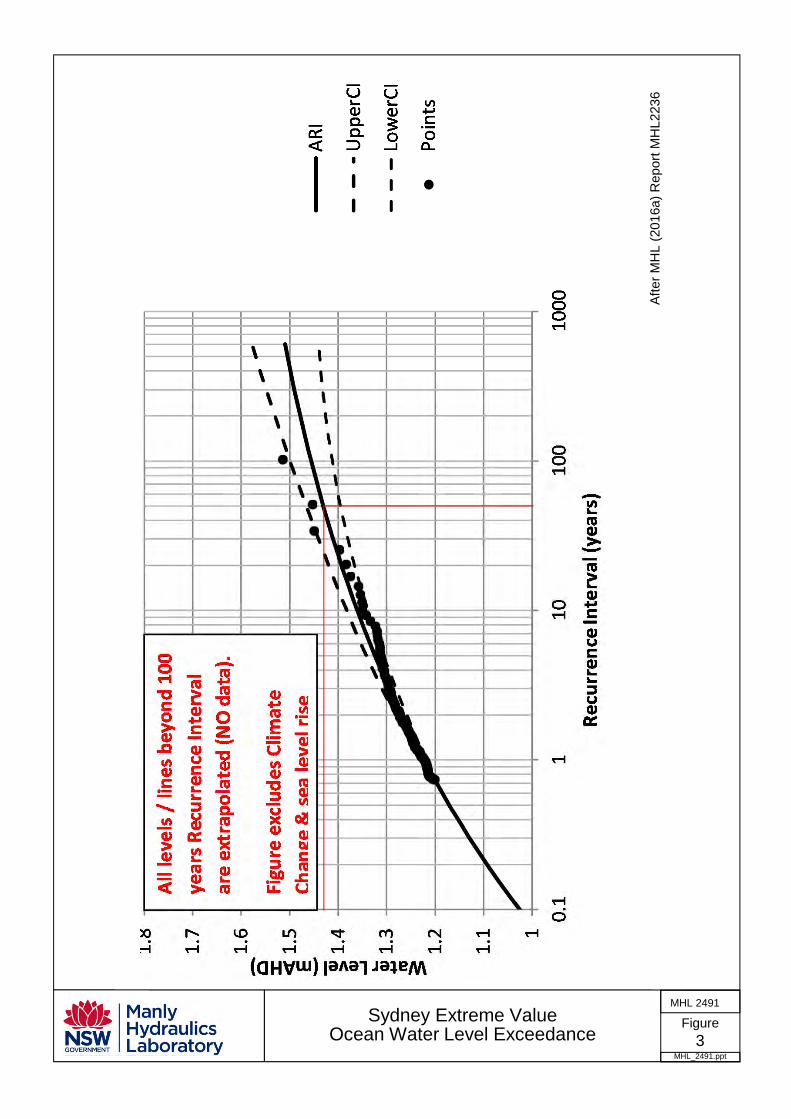
Figure 3
MHL_2491.ppt
MHL 2491Sydney Extreme Value
Ocean Water Level Exceedance
Afte
r M
HL
(201
6a)
Rep
ort M
HL2
236

Figure 4
MHL_2491.ppt
MHL 2491
Sydney Extreme Wave Statistics
Source: Couriel et. al. (2016) – data points observed following the 2010 analysis by WRL are blacked.
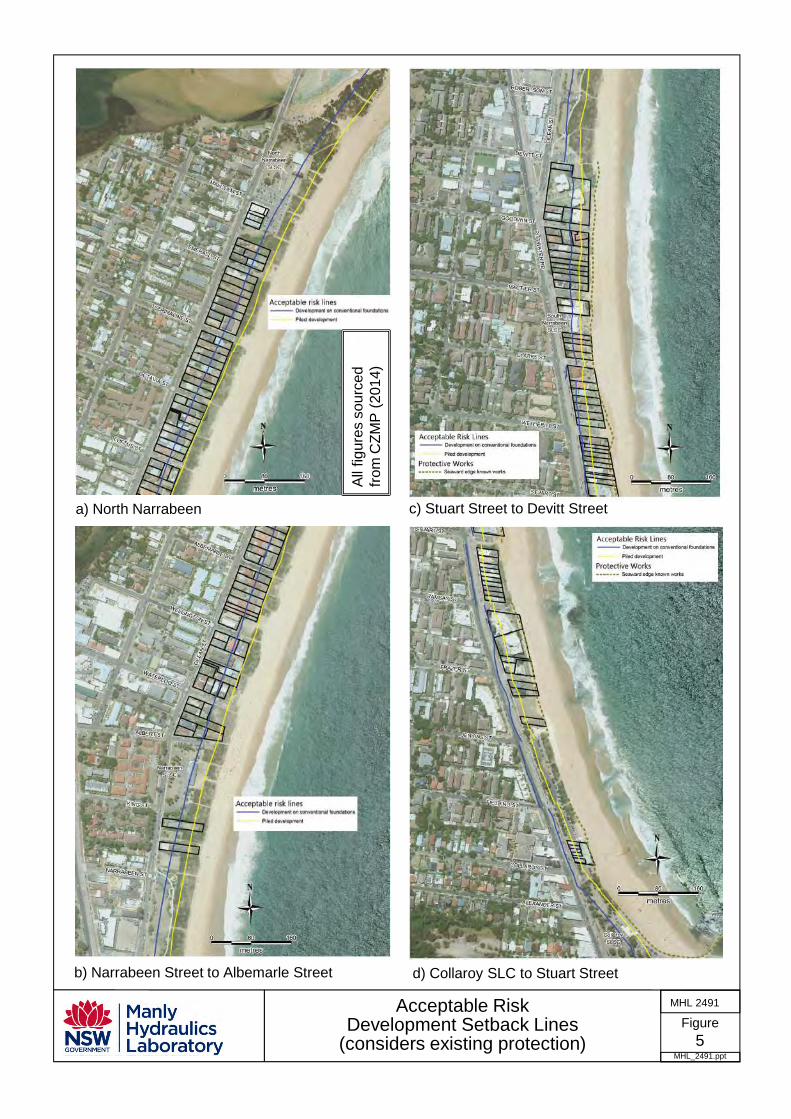
Figure 5
MHL_2491.ppt
MHL 2491Acceptable Risk Development Setback Lines
(considers existing protection)
b) Narrabeen Street to Albemarle Street
a) North Narrabeen
All
figur
es s
ourc
ed
from
CZ
MP
(201
4)
d) Collaroy SLC to Stuart Street
c) Stuart Street to Devitt Street
Figure
MHL_2491_A3.ppt
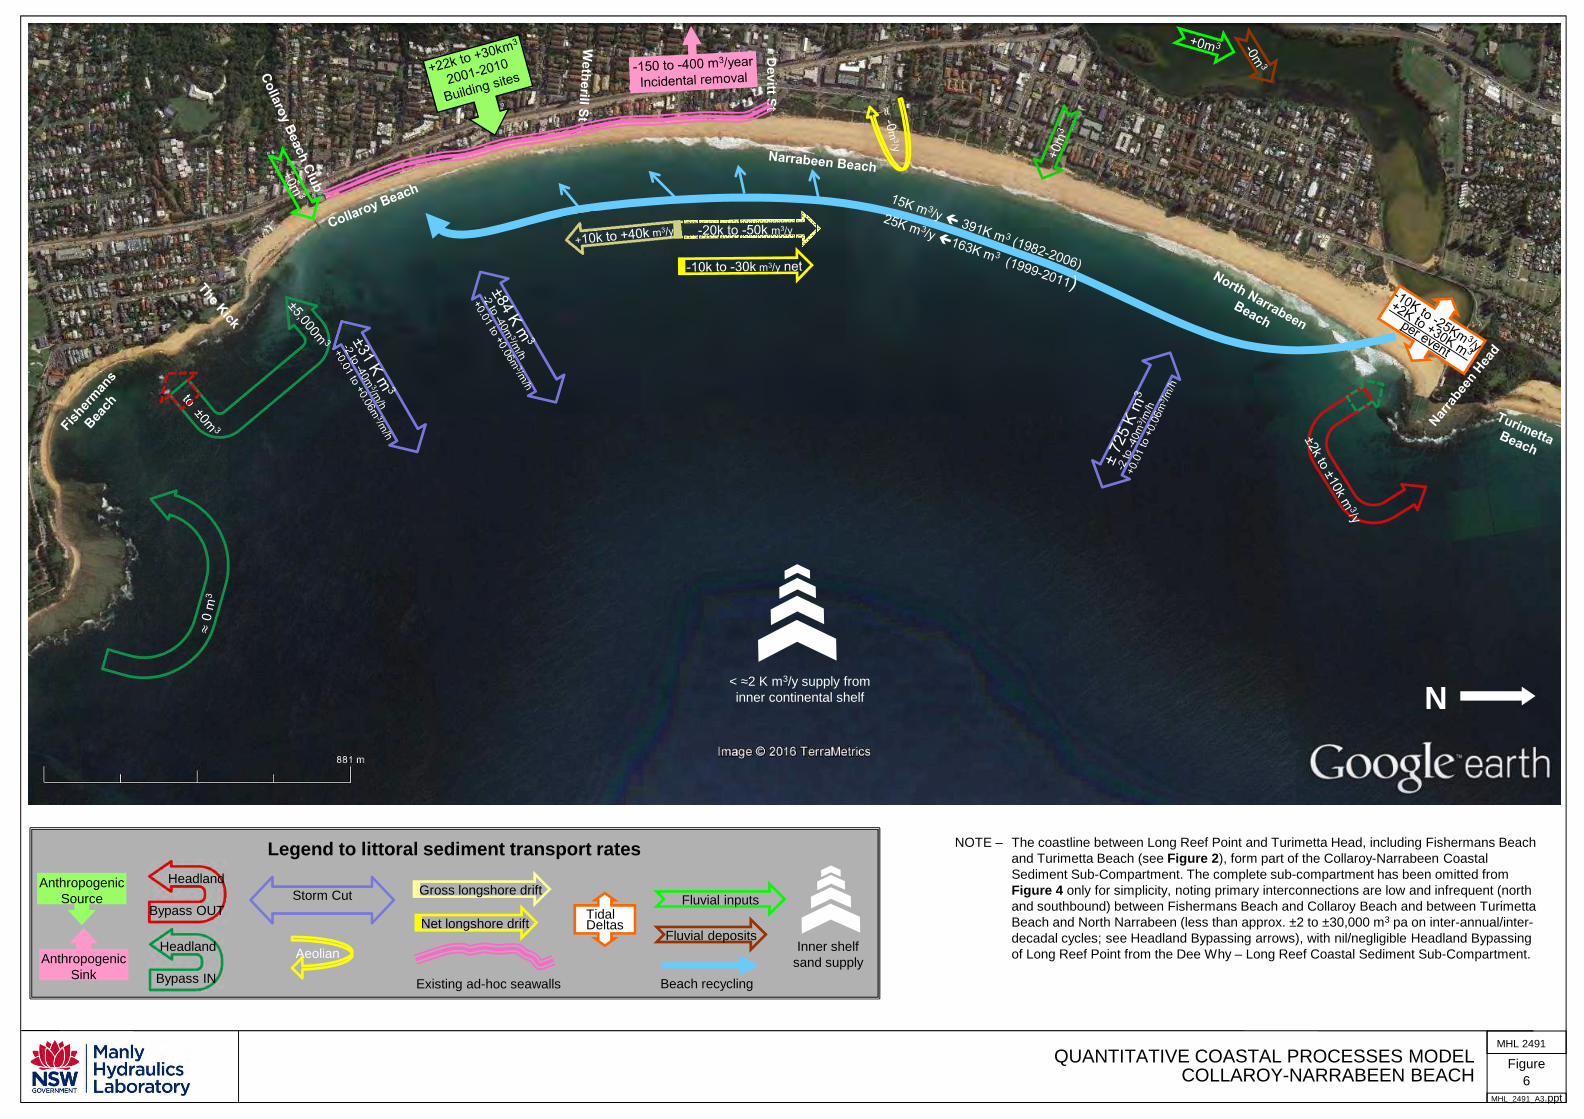
MHL 2491QUANTITATIVE COASTAL PROCESSES MODEL
COLLAROY-NARRABEEN BEACH
Storm Cut
Headland
Bypass IN
Legend to littoral sediment transport ratesHeadland
Bypass OUTNet longshore drift
Anthropogenic Source
Anthropogenic Sink
Gross longshore drift
Tidal Deltas
Inner shelf sand supply
AeolianFluvial deposits
Fluvial inputs
NOTE – The coastline between Long Reef Point and Turimetta Head, including Fishermans Beach and Turimetta Beach (see Figure 2), form part of the Collaroy-Narrabeen Coastal Sediment Sub-Compartment. The complete sub-compartment has been omitted from Figure 4 only for simplicity, noting primary interconnections are low and infrequent (north and southbound) between Fishermans Beach and Collaroy Beach and between Turimetta Beach and North Narrabeen (less than approx. ±2 to ±30,000 m3 pa on inter-annual/inter-decadal cycles; see Headland Bypassing arrows), with nil/negligible Headland Bypassing of Long Reef Point from the Dee Why – Long Reef Coastal Sediment Sub-Compartment.
Beach recycling
6
N< ≈2 K m3/y supply from inner continental shelf
Devitt S
t
Existing ad-hoc seawalls
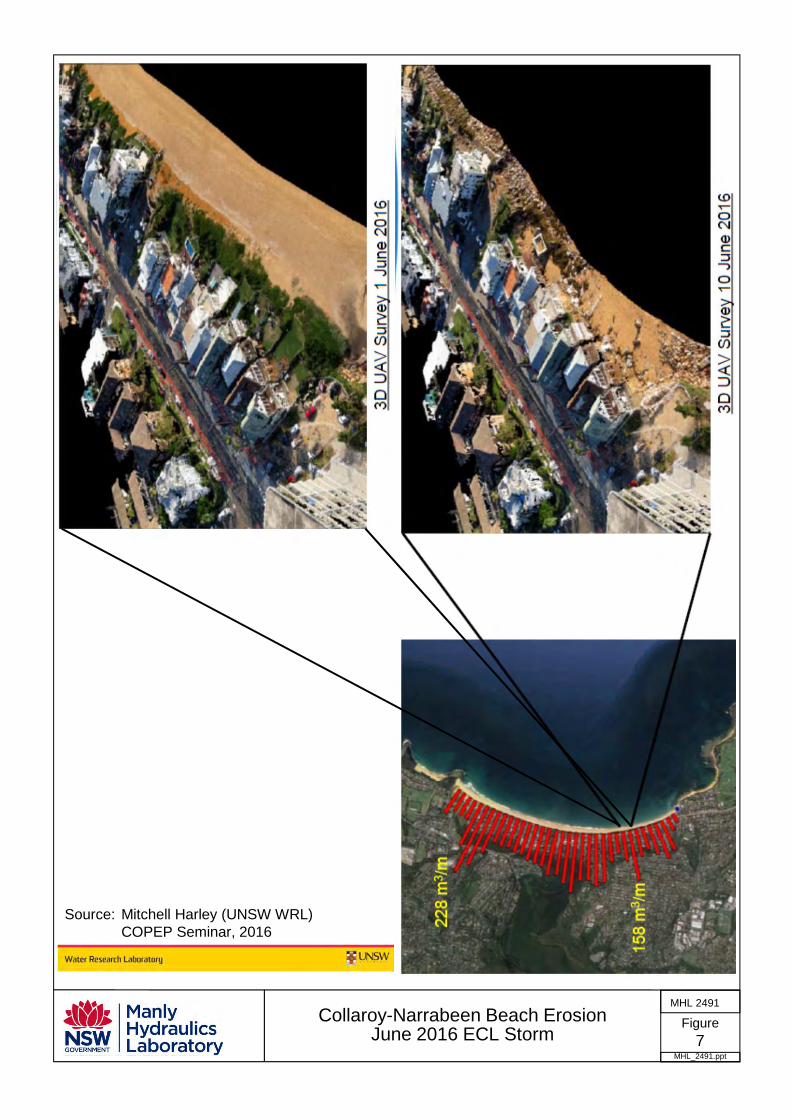
Figure 7
MHL_2491.ppt
MHL 2491Collaroy-Narrabeen Beach Erosion
June 2016 ECL Storm
Source: Mitchell Harley (UNSW WRL) COPEP Seminar, 2016
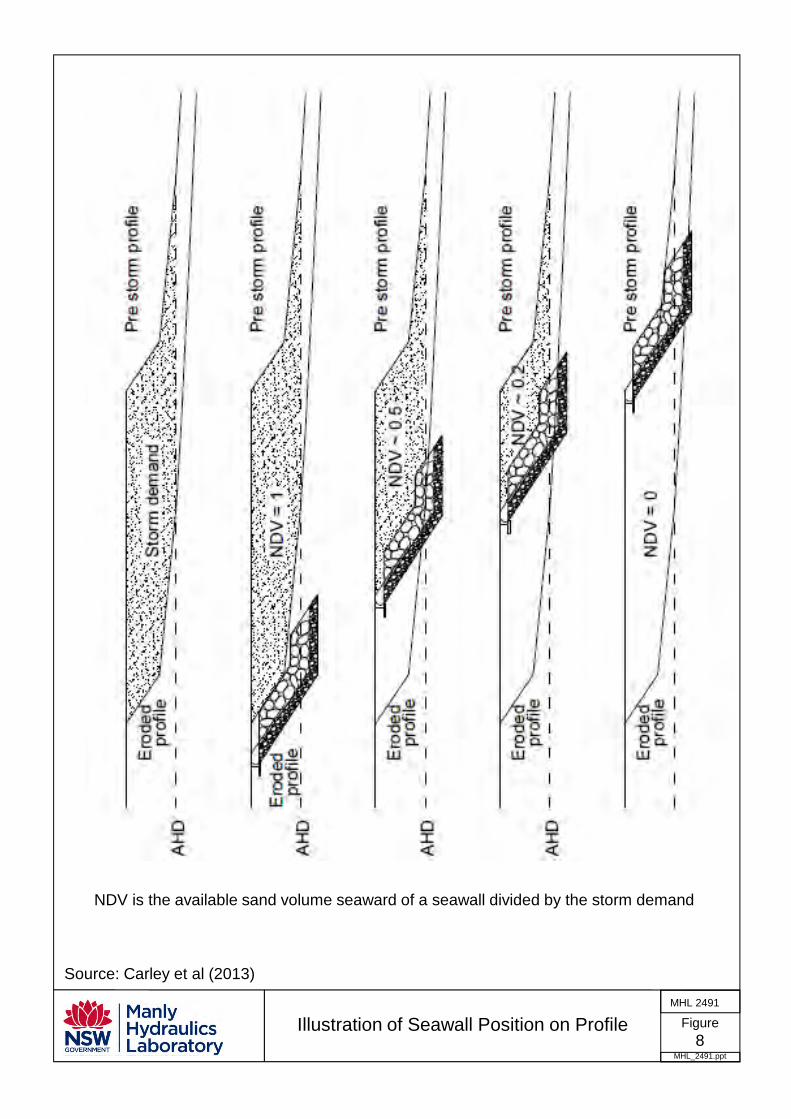
Figure 8
MHL_2491.ppt
MHL 2491
Illustration of Seawall Position on Profile
Source: Carley et al (2013)
NDV is the available sand volume seaward of a seawall divided by the storm demand
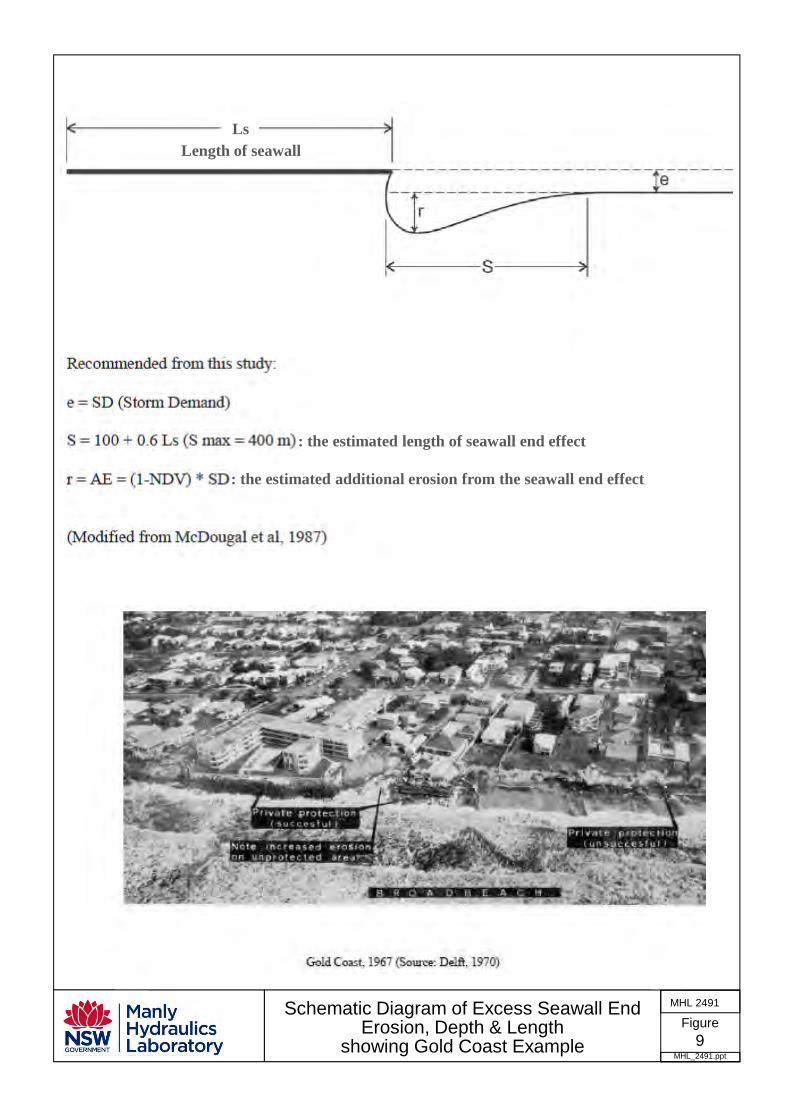
Figure 9
MHL_2491.ppt
MHL 2491Schematic Diagram of Excess Seawall End Erosion, Depth & Length
showing Gold Coast Example
: the estimated length of seawall end effect
: the estimated additional erosion from the seawall end effect
LsLength of seawall
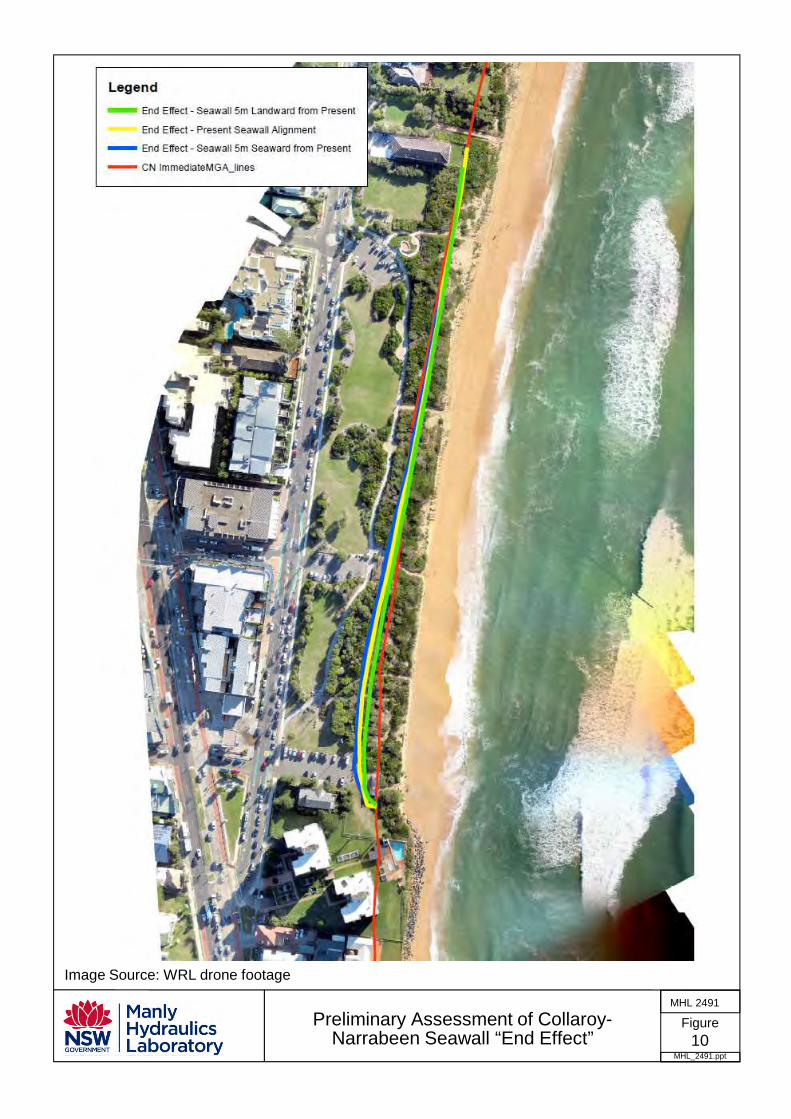
Figure 10
MHL_2491.ppt
MHL 2491
Preliminary Assessment of Collaroy-Narrabeen Seawall “End Effect”
Image Source: WRL drone footage
© Crown 2016 MHL 2491
A1
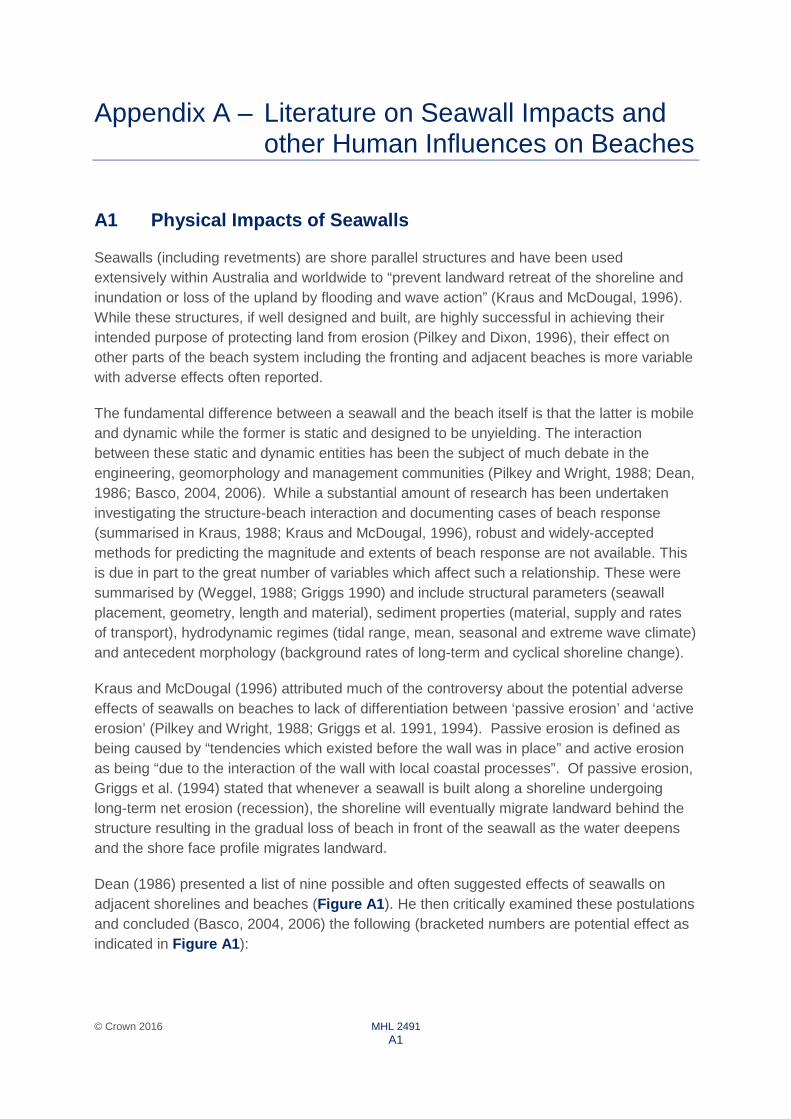
Appendix A – Literature on Seawall Impacts and other Human Influences on Beaches
A1 Physical Impacts of Seawalls
Seawalls (including revetments) are shore parallel structures and have been used extensively within Australia and worldwide to “prevent landward retreat of the shoreline and inundation or loss of the upland by flooding and wave action” (Kraus and McDougal, 1996). While these structures, if well designed and built, are highly successful in achieving their intended purpose of protecting land from erosion (Pilkey and Dixon, 1996), their effect on other parts of the beach system including the fronting and adjacent beaches is more variable with adverse effects often reported.
The fundamental difference between a seawall and the beach itself is that the latter is mobile and dynamic while the former is static and designed to be unyielding. The interaction between these static and dynamic entities has been the subject of much debate in the engineering, geomorphology and management communities (Pilkey and Wright, 1988; Dean, 1986; Basco, 2004, 2006). While a substantial amount of research has been undertaken investigating the structure-beach interaction and documenting cases of beach response (summarised in Kraus, 1988; Kraus and McDougal, 1996), robust and widely-accepted methods for predicting the magnitude and extents of beach response are not available. This is due in part to the great number of variables which affect such a relationship. These were summarised by (Weggel, 1988; Griggs 1990) and include structural parameters (seawall placement, geometry, length and material), sediment properties (material, supply and rates of transport), hydrodynamic regimes (tidal range, mean, seasonal and extreme wave climate) and antecedent morphology (background rates of long-term and cyclical shoreline change).
Kraus and McDougal (1996) attributed much of the controversy about the potential adverse effects of seawalls on beaches to lack of differentiation between ‘passive erosion’ and ‘active erosion’ (Pilkey and Wright, 1988; Griggs et al. 1991, 1994). Passive erosion is defined as being caused by “tendencies which existed before the wall was in place” and active erosion as being “due to the interaction of the wall with local coastal processes”. Of passive erosion, Griggs et al. (1994) stated that whenever a seawall is built along a shoreline undergoing long-term net erosion (recession), the shoreline will eventually migrate landward behind the structure resulting in the gradual loss of beach in front of the seawall as the water deepens and the shore face profile migrates landward.
Dean (1986) presented a list of nine possible and often suggested effects of seawalls on adjacent shorelines and beaches (Figure A1 ). He then critically examined these postulations and concluded (Basco, 2004, 2006) the following (bracketed numbers are potential effect as indicated in Figure A1 ):
© Crown 2016 MHL 2491
A2
Dean found that armouring of a beach does NOT cause:
• Profile steepening (6); • Delayed beach recovery after storms (5); • Increased longshore transport (8); • Sand transport further offshore (9); and • Increase in long-term average erosion rate (3).
Dean found that armouring of the beach CAN contribute to:
• Frontal effects (toe scour, depth increases; 1a); • End-of-wall effects (flanking; 1b); • Blockage of littoral drift when projecting into surf zone (groyne effect; 4); and • Reduced beach width fronting armouring (2).
Pilkey and Wright (1988) refuted the conclusion that armouring does not cause an increase in the long-term average erosion (recession) rate (3) and does not delay beach recovery after storms (5) on the grounds that seawalls intensify surf zone processes including rip currents, longshore currents and wave reflection.
In addition to the potential adverse effects of seawalls on the seaward beach profile, the seawall geometry and make-up as well as the adjacent nearshore morphology and hydrodynamic regimes will affect the serviceability of a seawall in terms of wave run-up and wave overtopping, and hence the level of landward foreshore stability it provides. For a given seawall crest level, higher wave overtopping rates are expected for steeper and/or less permeable (solid) structures. High wave overtopping may cause landward foreshore erosion or undermining and damage to foreshore structures if wave overtopping rates are not adequately accounted for in the seawall and foreshore design. The EurOtop Manual (2007) describes empirically tested methods for the estimation of wave overtopping rates for seawalls and provides suitable preliminary guidance on limits of wave overtopping to avoid unacceptable damage for different development and foreshore types (see Section A6 ).
A2 Mechanisms for Beach Response
Despite the widespread use of seawalls, their interaction with dynamic beach systems are not fully understood and their impacts on fronting and adjacent beaches remain disputed. Several possible mechanisms for beach response have been proposed in the literature (Dean, 1986; Kraus, 1988; Tait and Griggs, 1990; Kraus and McDougal, 1996; Basco, 2004, 2006; CEM, 2006). Such mechanisms either control the sediment supply or influence the hydrodynamic system.
© Crown 2016 MHL 2491
A3
A2.1 Sand Trapping (impoundment)
A2.1.1 Landward entrapment (truncation of active beach)
After seawall construction, sand trapped behind the wall is not available for mobilisation and transport offshore and to adjacent beaches during and after storm events (Basco et al. 1997). This results in excess erosional stress along the front of the structure and on unprotected adjacent beaches (CEM 2006). Dean (1986) proposed the “approximate principle” relating the volume of toe scour at a wall to the volume that might be potentially scoured in the absence of that wall. This principle appears to be supported by a number of physical model tests (Barnett and Wang, 1998; Hughes and Fowler, 1990; Miselis, 1994). It should be noted, however, that restrictions in the preservation of similitude between sediment and wave parameters in small to medium-scale physical model tests is difficult and results should be primarily considered qualitative (Kraus and McDougal, 1996) due to scale effects. Basco (2000) and Ozger (1999) proposed that the amount of sediment impounded behind the seawall as a function of the total active cross-shore volume during a storm event (the wall trap ratio, WTR) better describes the possible impact of a seawall in terms of changes to the cross-shore sediment budget.
A2.1.2 End entrapment (groyne effect)
Where a seawall protrudes seaward of the shoreline, updrift impoundment of wave-driven littoral sediment can result in a deficit (and hence erosion) on the downdrift beach. This was found by Griggs and Tait (1988) on beaches adjacent to seawalls in California and by Toue and Wang (1990) in laboratory studies. This is the classical process response to a groyne, and hence is referred to as the ‘groyne effect’. This mechanism is particularly associated with coasts having a net littoral drift regime. However, all coasts are subject to gross littoral drift, which may induce groyne effects to some extent, even on coasts without net littoral drift.
A2.2 Hydrodynamic Effects
A2.2.1 Wave reflection and turbulence at structure ends
The most obvious mechanism for localised end erosion consists of waves reflecting off the ends of a seawall and the associated turbulence eroding the adjacent coast (Tait and Griggs, 1990). Wave refraction and diffraction enhance this process by increasing the amount of energy reaching the structure’s end/flank once the localised erosion begins to form an embayment alongshore away from the structure’s end.
A2.2.2 Rip currents at structure ends
Rip currents have been observed at wall ends along the USA west coast (Plant, 1990; Plant and Griggs, 1992) and in laboratory experiments (McDougal et al. 1987). In general, upper beach erosion is commonly observed landward of such rips resulting in ‘rip embayments’.
© Crown 2016 MHL 2491
A4
The rip currents associated with seawalls are more likely to be driven by hydrodynamic gradients rather than the topographically/bathymetrically constricted flow (channels) which occur naturally on many oceanic beaches near headlands and reefs (and which have been included in the high energy storm erosion statistics presented by Gordon, 1987).
A2.2.3 Oblique wave reflection off front of structure
Waves reflecting obliquely off the front of a seawall interact with incident waves to produce localised areas of concentrated wave energy (“caustics”) which result in adjacent down coast erosion (Silvester and Hsu 1993). Such an effect was captured on video by Shand (2010) at Kapiti Beach on the West Coast of New Zealand where obliquely aligned waves were generated by reflection from a seawall and propagated down the coast.
A3 Structural Considerations
Structural parameters such as the material, geometry, location and length are variable in each design and can influence beach response. More complete descriptions of seawalls are provided within Thomas and Hall (1992) and USACE (1995; 2003), but are summarised in brief below.
A3.1 Structure Geometry
The slope of seawalls generally range from vertical to gently sloped at 1V:10H to 20H, although flatter structures are generally avoided due to the larger material volumes required and higher cost. The majority of sloping seawalls constructed worldwide have slopes between 1V:1.5H and 1V:2.5H. The slope of a structure may directly influence energy absorption and reflection with flatter sloped structures generally reflecting less energy. Sloping structures (as opposed to vertical) are generally characterised by lower wave run-up levels and lower wave overtopping rates, although very flat impervious slopes can lead to reduced absorption and reduced reflection with resulting increased wave run-up and overtopping (EurOtop , 2007). Structures may be of a constant slope, stepped or include recurved upper portions intended to redirect wave energy offshore to reduce wave overtopping (Thomas and Hall, 1992). For complex geometries, physical model testing may be required to adequately assess wave overtopping rates (refer to Section A6 ).
A3.2 Materials
Seawalls may be constructed of materials including loose rock or loose concrete armour units, interlocking blocks or units, massive concrete, timber, steel sheet pile, gabion baskets or geotextile containers (USACE, 1995; 2003). Flatter revetments generally use more porous, loose rock or armour units, while steeper seawalls tend to be constructed of less porous concrete, timber or steel units. The porosity of the structure affects the way in which it absorbs or reflects wave energy with less porous structures generally reflecting more wave energy or in the case of mild slopes, translating this into increased wave run-up levels and/or
© Crown 2016 MHL 2491
A5
wave overtopping rates. While conventional paradigms suggest that less reflective structures should induce less erosion of fronting beaches, Griggs et al. (1991) found little difference when analysing vertical and sloping, permeable structures in Monterey Bay, California. This has been observed also during recent storms in Sydney where no discernible difference in beach scour levels were observed along adjacent vertical and sloping components of the Manly Beach seawall as shown in Figure A2 ).
A3.3 Location
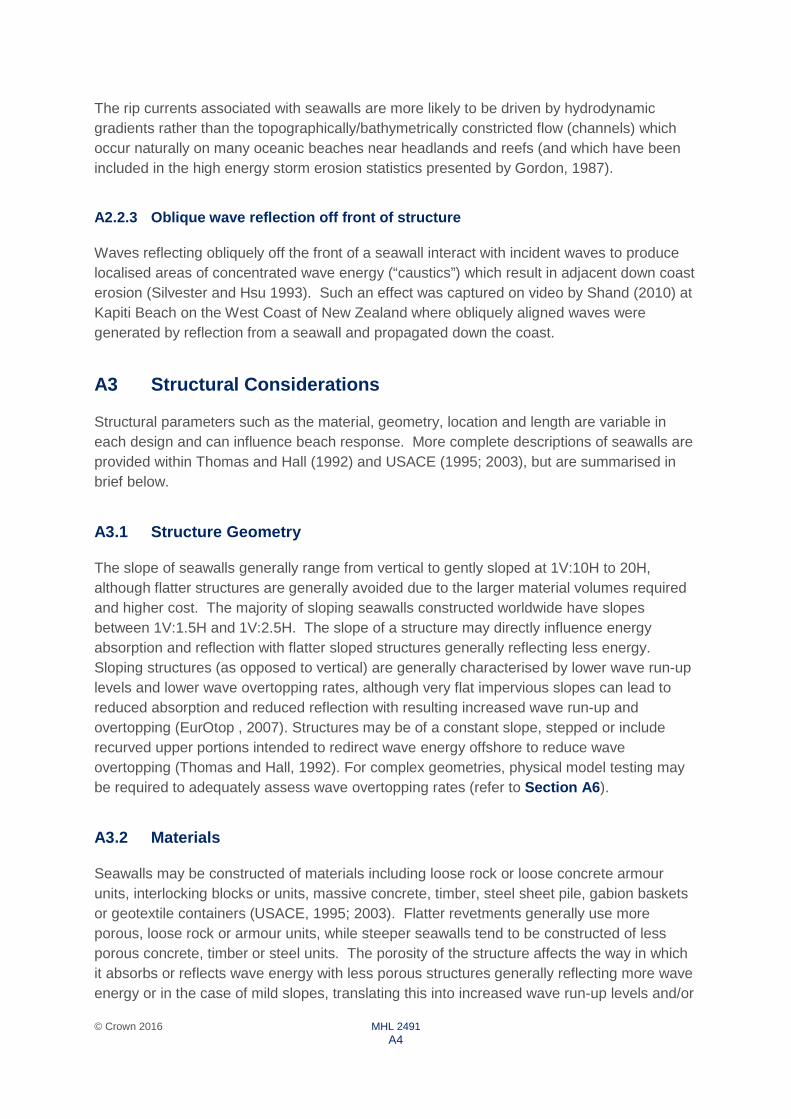
The location of the seawall on the beach system influences the extent to which the structure interacts with the active beach system (Weggel, 1988) and its ability to intensify surf zone processes (Pilkey and Wright, 1988). Structures located high up the beach interact with wave and sediment transport processes infrequently and impound a smaller percentage of the total cross-shore sediment budget. In contrast, structures within the everyday active beach zone interact frequently with hydrodynamic and sediment transport processes and impound large volumes of sediment which are thereafter unavailable for normal cross- or long-shore processes. Weggel (1988) presented six classifications of seawall dependent on their location within the active beach system as shown in Figure A3a and described in Table A1 . The intersection of the structure and beach profile may, however, change over time as beach level and position change. This is particularly relevant on long-term receding beaches where a seawall, originally built as a back-stop wall may, in time, move relatively further into the active beach zone, impound relatively more sediment and induce greater beach response.
Table A1: Weggel Seawall Classification [Source: Wegg el (1988)]
Type Location of Seawall
1 Landward of maximum level of run-up during storms. The wall does not affect either hydraulic or sedimentation processes
under any wave or water level conditions, although may affect aeolian processes.
2 Above still water level of maximum storm surge and below the level of maximum run-up. Exposed only to the run-up of
waves during storm events.
3 Above normal high water and below the still water level of storm surge. Base will be submerged during storms and
during exceptionally high astronomical tides but will normally be above water.
4 Within the normal tide range; base is submerged at high water.
5 Seaward of mean low water; base is always submerged; subjected to breaking and broken waves.
6 So far seaward that incident waves do not break on or seaward [of the wall].
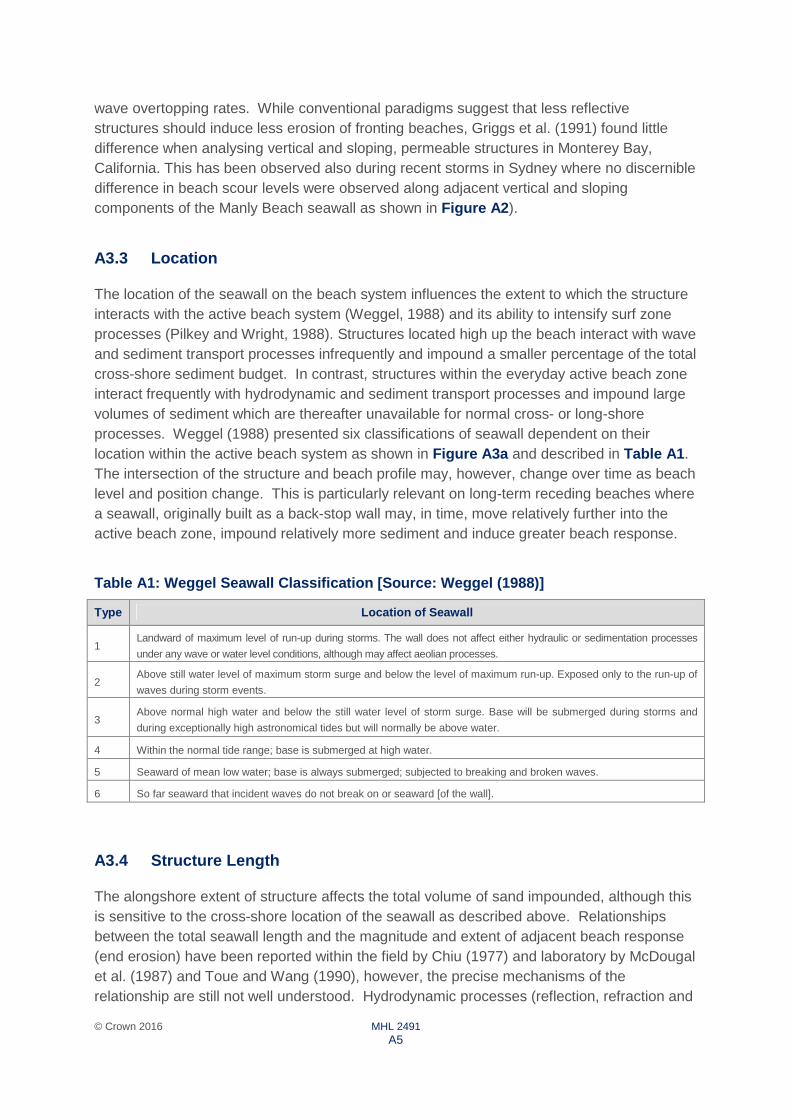
A3.4 Structure Length
The alongshore extent of structure affects the total volume of sand impounded, although this is sensitive to the cross-shore location of the seawall as described above. Relationships between the total seawall length and the magnitude and extent of adjacent beach response (end erosion) have been reported within the field by Chiu (1977) and laboratory by McDougal et al. (1987) and Toue and Wang (1990), however, the precise mechanisms of the relationship are still not well understood. Hydrodynamic processes (reflection, refraction and
© Crown 2016 MHL 2491
A6
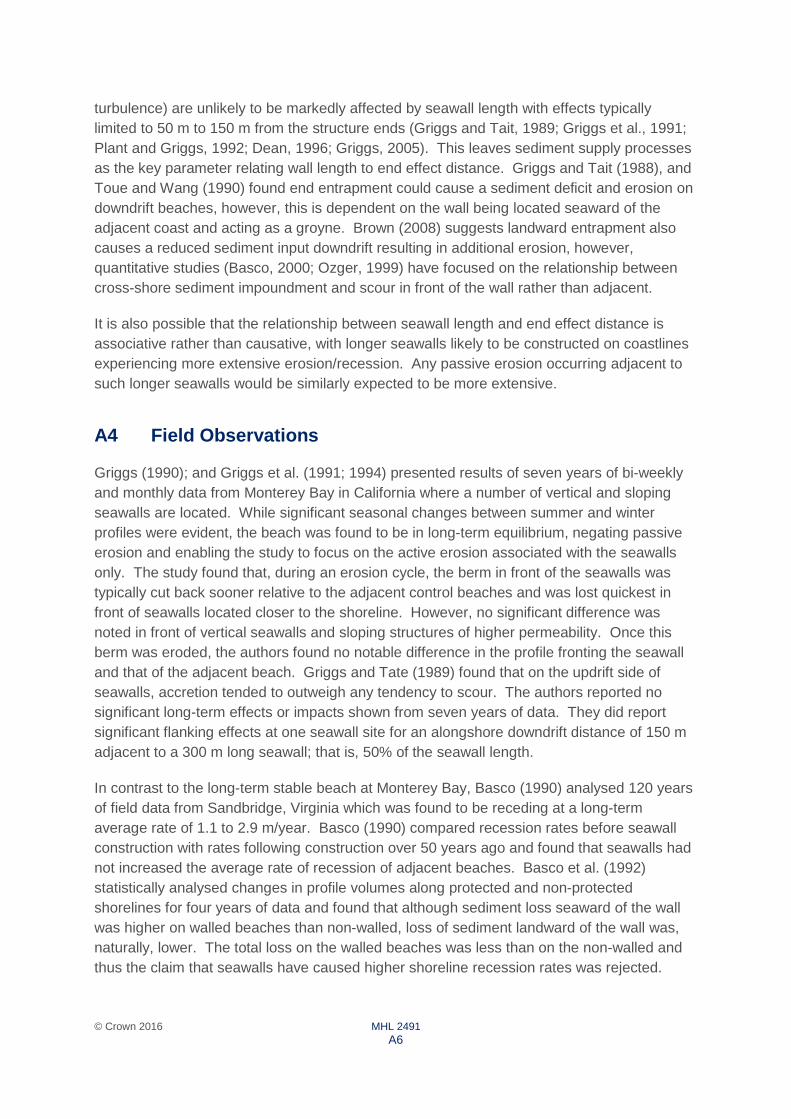
turbulence) are unlikely to be markedly affected by seawall length with effects typically limited to 50 m to 150 m from the structure ends (Griggs and Tait, 1989; Griggs et al., 1991; Plant and Griggs, 1992; Dean, 1996; Griggs, 2005). This leaves sediment supply processes as the key parameter relating wall length to end effect distance. Griggs and Tait (1988), and Toue and Wang (1990) found end entrapment could cause a sediment deficit and erosion on downdrift beaches, however, this is dependent on the wall being located seaward of the adjacent coast and acting as a groyne. Brown (2008) suggests landward entrapment also causes a reduced sediment input downdrift resulting in additional erosion, however, quantitative studies (Basco, 2000; Ozger, 1999) have focused on the relationship between cross-shore sediment impoundment and scour in front of the wall rather than adjacent.
It is also possible that the relationship between seawall length and end effect distance is associative rather than causative, with longer seawalls likely to be constructed on coastlines experiencing more extensive erosion/recession. Any passive erosion occurring adjacent to such longer seawalls would be similarly expected to be more extensive.
A4 Field Observations
Griggs (1990); and Griggs et al. (1991; 1994) presented results of seven years of bi-weekly and monthly data from Monterey Bay in California where a number of vertical and sloping seawalls are located. While significant seasonal changes between summer and winter profiles were evident, the beach was found to be in long-term equilibrium, negating passive erosion and enabling the study to focus on the active erosion associated with the seawalls only. The study found that, during an erosion cycle, the berm in front of the seawalls was typically cut back sooner relative to the adjacent control beaches and was lost quickest in front of seawalls located closer to the shoreline. However, no significant difference was noted in front of vertical seawalls and sloping structures of higher permeability. Once this berm was eroded, the authors found no notable difference in the profile fronting the seawall and that of the adjacent beach. Griggs and Tate (1989) found that on the updrift side of seawalls, accretion tended to outweigh any tendency to scour. The authors reported no significant long-term effects or impacts shown from seven years of data. They did report significant flanking effects at one seawall site for an alongshore downdrift distance of 150 m adjacent to a 300 m long seawall; that is, 50% of the seawall length.
In contrast to the long-term stable beach at Monterey Bay, Basco (1990) analysed 120 years of field data from Sandbridge, Virginia which was found to be receding at a long-term average rate of 1.1 to 2.9 m/year. Basco (1990) compared recession rates before seawall construction with rates following construction over 50 years ago and found that seawalls had not increased the average rate of recession of adjacent beaches. Basco et al. (1992) statistically analysed changes in profile volumes along protected and non-protected shorelines for four years of data and found that although sediment loss seaward of the wall was higher on walled beaches than non-walled, loss of sediment landward of the wall was, naturally, lower. The total loss on the walled beaches was less than on the non-walled and thus the claim that seawalls have caused higher shoreline recession rates was rejected.
© Crown 2016 MHL 2491
A7
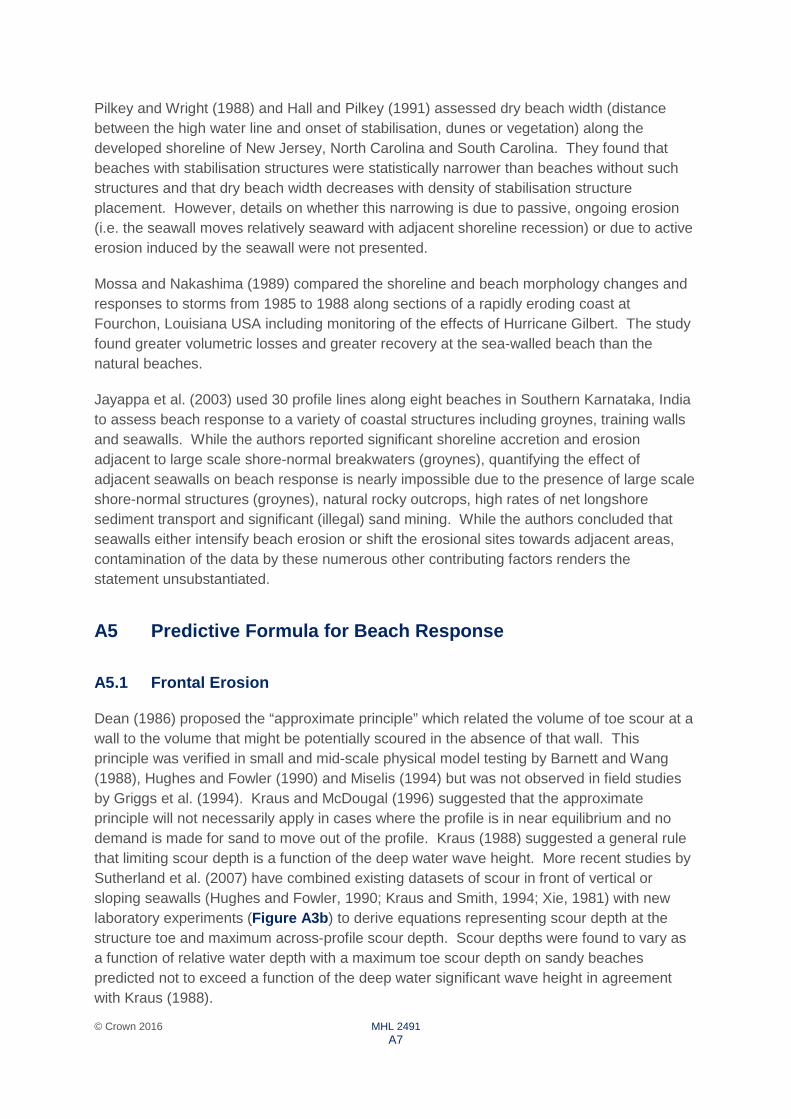
Pilkey and Wright (1988) and Hall and Pilkey (1991) assessed dry beach width (distance between the high water line and onset of stabilisation, dunes or vegetation) along the developed shoreline of New Jersey, North Carolina and South Carolina. They found that beaches with stabilisation structures were statistically narrower than beaches without such structures and that dry beach width decreases with density of stabilisation structure placement. However, details on whether this narrowing is due to passive, ongoing erosion (i.e. the seawall moves relatively seaward with adjacent shoreline recession) or due to active erosion induced by the seawall were not presented.
Mossa and Nakashima (1989) compared the shoreline and beach morphology changes and responses to storms from 1985 to 1988 along sections of a rapidly eroding coast at Fourchon, Louisiana USA including monitoring of the effects of Hurricane Gilbert. The study found greater volumetric losses and greater recovery at the sea-walled beach than the natural beaches.
Jayappa et al. (2003) used 30 profile lines along eight beaches in Southern Karnataka, India to assess beach response to a variety of coastal structures including groynes, training walls and seawalls. While the authors reported significant shoreline accretion and erosion adjacent to large scale shore-normal breakwaters (groynes), quantifying the effect of adjacent seawalls on beach response is nearly impossible due to the presence of large scale shore-normal structures (groynes), natural rocky outcrops, high rates of net longshore sediment transport and significant (illegal) sand mining. While the authors concluded that seawalls either intensify beach erosion or shift the erosional sites towards adjacent areas, contamination of the data by these numerous other contributing factors renders the statement unsubstantiated.
A5 Predictive Formula for Beach Response
A5.1 Frontal Erosion
Dean (1986) proposed the “approximate principle” which related the volume of toe scour at a wall to the volume that might be potentially scoured in the absence of that wall. This principle was verified in small and mid-scale physical model testing by Barnett and Wang (1988), Hughes and Fowler (1990) and Miselis (1994) but was not observed in field studies by Griggs et al. (1994). Kraus and McDougal (1996) suggested that the approximate principle will not necessarily apply in cases where the profile is in near equilibrium and no demand is made for sand to move out of the profile. Kraus (1988) suggested a general rule that limiting scour depth is a function of the deep water wave height. More recent studies by Sutherland et al. (2007) have combined existing datasets of scour in front of vertical or sloping seawalls (Hughes and Fowler, 1990; Kraus and Smith, 1994; Xie, 1981) with new laboratory experiments (Figure A3b ) to derive equations representing scour depth at the structure toe and maximum across-profile scour depth. Scour depths were found to vary as a function of relative water depth with a maximum toe scour depth on sandy beaches predicted not to exceed a function of the deep water significant wave height in agreement with Kraus (1988).

© Crown 2016 MHL 2491
A8
Equations (A.1) and (A.2) present the derived best fit equation for maximum scour depth as a function of deep water wave height (these are Equations 10 and 11 from Sutherland et al. 2007).
������ = �35 ��∗
����.���� (for ht
*/Lm ≤ 0.016) (A.1)
������ = �.���
����(��∗/��)�. (for ht*/Lm > 0.016) (A.2)
Where
Smax is the maximum scour depth following laboratory testing of 3,000 waves;
Hs is the deep water significant wave height;
ht* is the toe depth including wave setup (prior to any scour); and
Lm is the deep water mean wavelength.
It should be noted these expressions are based on values derived in small to medium scale laboratory tests following single storm events from an assumed initial profile and are likely to be subject to scale effects.
A5.2 Excess Seawall End Erosion
The general concept of increased beach erosion at the end of a seawall (hereby termed excess seawall end erosion) is shown in Figure A4a together with a field example Figure A4b from the Gold Coast, Queensland after cyclones in 1967. The shape of the observed embayment due to end effects often resembled the zeta curve or parabolic bay shape (Silvester et al., 1980).
Chiu (1977) presented field data obtained from Walton and Sensabaugh (1978) of the depth of (seawall associated) excess erosion observed adjacent to several seawalls on the Gulf Coast of the United States following Hurricane Eloise in 1975. Their values are presented within Figure A4c and show that while significant scatter is evident, there is a general relationship of increased localised landward depth of erosion adjacent to the seawall end with increased seawall length. Furthermore, the data tends to asymptote towards a limiting erosion depth indicating that as the length of seawall increases, erosion depth does not also linearly increase. The scatter present in the data was attributed by McDougal et al. (1987) to the multitude of site specific variables including pre-storm beach configuration, elevation of the structure toe, size and source of sediment and the intensity, direction and duration of the storm.
McDougal et al. (1987) undertook subsequent laboratory experimentation in a small scale wave basin facility and observed similar excess erosion at the ends of a seawall placed at or above the still water level. A best fit linear trend line was found to give a correlation
© Crown 2016 MHL 2491
A9
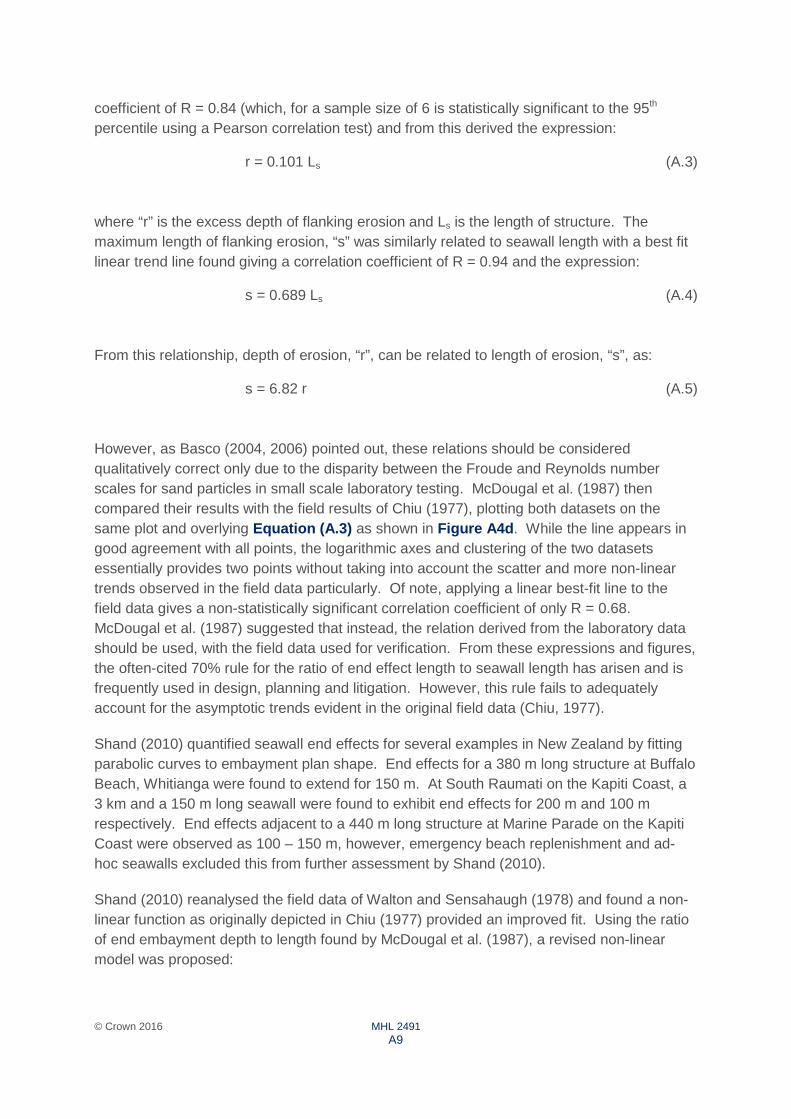
coefficient of R = 0.84 (which, for a sample size of 6 is statistically significant to the 95th percentile using a Pearson correlation test) and from this derived the expression:
r = 0.101 Ls (A.3)
where “r” is the excess depth of flanking erosion and Ls is the length of structure. The maximum length of flanking erosion, “s” was similarly related to seawall length with a best fit linear trend line found giving a correlation coefficient of R = 0.94 and the expression:
s = 0.689 Ls (A.4)
From this relationship, depth of erosion, “r”, can be related to length of erosion, “s”, as:
s = 6.82 r (A.5)
However, as Basco (2004, 2006) pointed out, these relations should be considered qualitatively correct only due to the disparity between the Froude and Reynolds number scales for sand particles in small scale laboratory testing. McDougal et al. (1987) then compared their results with the field results of Chiu (1977), plotting both datasets on the same plot and overlying Equation (A.3) as shown in Figure A4d . While the line appears in good agreement with all points, the logarithmic axes and clustering of the two datasets essentially provides two points without taking into account the scatter and more non-linear trends observed in the field data particularly. Of note, applying a linear best-fit line to the field data gives a non-statistically significant correlation coefficient of only R = 0.68. McDougal et al. (1987) suggested that instead, the relation derived from the laboratory data should be used, with the field data used for verification. From these expressions and figures, the often-cited 70% rule for the ratio of end effect length to seawall length has arisen and is frequently used in design, planning and litigation. However, this rule fails to adequately account for the asymptotic trends evident in the original field data (Chiu, 1977).
Shand (2010) quantified seawall end effects for several examples in New Zealand by fitting parabolic curves to embayment plan shape. End effects for a 380 m long structure at Buffalo Beach, Whitianga were found to extend for 150 m. At South Raumati on the Kapiti Coast, a 3 km and a 150 m long seawall were found to exhibit end effects for 200 m and 100 m respectively. End effects adjacent to a 440 m long structure at Marine Parade on the Kapiti Coast were observed as 100 – 150 m, however, emergency beach replenishment and ad-hoc seawalls excluded this from further assessment by Shand (2010).
Shand (2010) reanalysed the field data of Walton and Sensahaugh (1978) and found a non-linear function as originally depicted in Chiu (1977) provided an improved fit. Using the ratio of end embayment depth to length found by McDougal et al. (1987), a revised non-linear model was proposed:
© Crown 2016 MHL 2491
A10
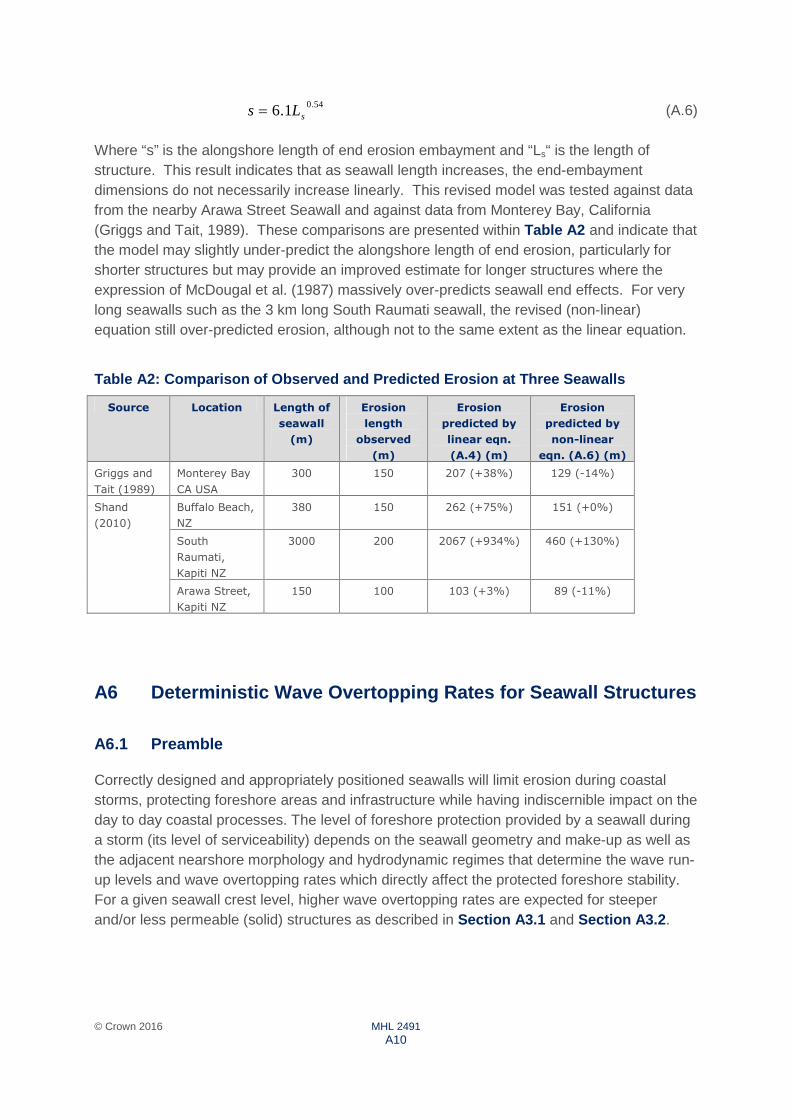
5401.6 .sLs = (A.6)
Where “s” is the alongshore length of end erosion embayment and “Ls“ is the length of structure. This result indicates that as seawall length increases, the end-embayment dimensions do not necessarily increase linearly. This revised model was tested against data from the nearby Arawa Street Seawall and against data from Monterey Bay, California (Griggs and Tait, 1989). These comparisons are presented within Table A2 and indicate that the model may slightly under-predict the alongshore length of end erosion, particularly for shorter structures but may provide an improved estimate for longer structures where the expression of McDougal et al. (1987) massively over-predicts seawall end effects. For very long seawalls such as the 3 km long South Raumati seawall, the revised (non-linear) equation still over-predicted erosion, although not to the same extent as the linear equation.
Table A2: Comparison of Observed and Predicted Erosi on at Three Seawalls
Source Location Length of
seawall
(m)
Erosion
length
observed
(m)
Erosion
predicted by
linear eqn.
(A.4) (m)
Erosion
predicted by
non-linear
eqn. (A.6) (m)
Griggs and
Tait (1989)
Monterey Bay
CA USA
300 150 207 (+38%) 129 (-14%)
Shand
(2010)
Buffalo Beach,
NZ
380 150 262 (+75%) 151 (+0%)
South
Raumati,
Kapiti NZ
3000 200 2067 (+934%) 460 (+130%)
Arawa Street,
Kapiti NZ
150 100 103 (+3%) 89 (-11%)
A6 Deterministic Wave Overtopping Rates for Seawall Structures
A6.1 Preamble
Correctly designed and appropriately positioned seawalls will limit erosion during coastal storms, protecting foreshore areas and infrastructure while having indiscernible impact on the day to day coastal processes. The level of foreshore protection provided by a seawall during a storm (its level of serviceability) depends on the seawall geometry and make-up as well as the adjacent nearshore morphology and hydrodynamic regimes that determine the wave run-up levels and wave overtopping rates which directly affect the protected foreshore stability. For a given seawall crest level, higher wave overtopping rates are expected for steeper and/or less permeable (solid) structures as described in Section A3.1 and Section A3.2 .
© Crown 2016 MHL 2491
A11
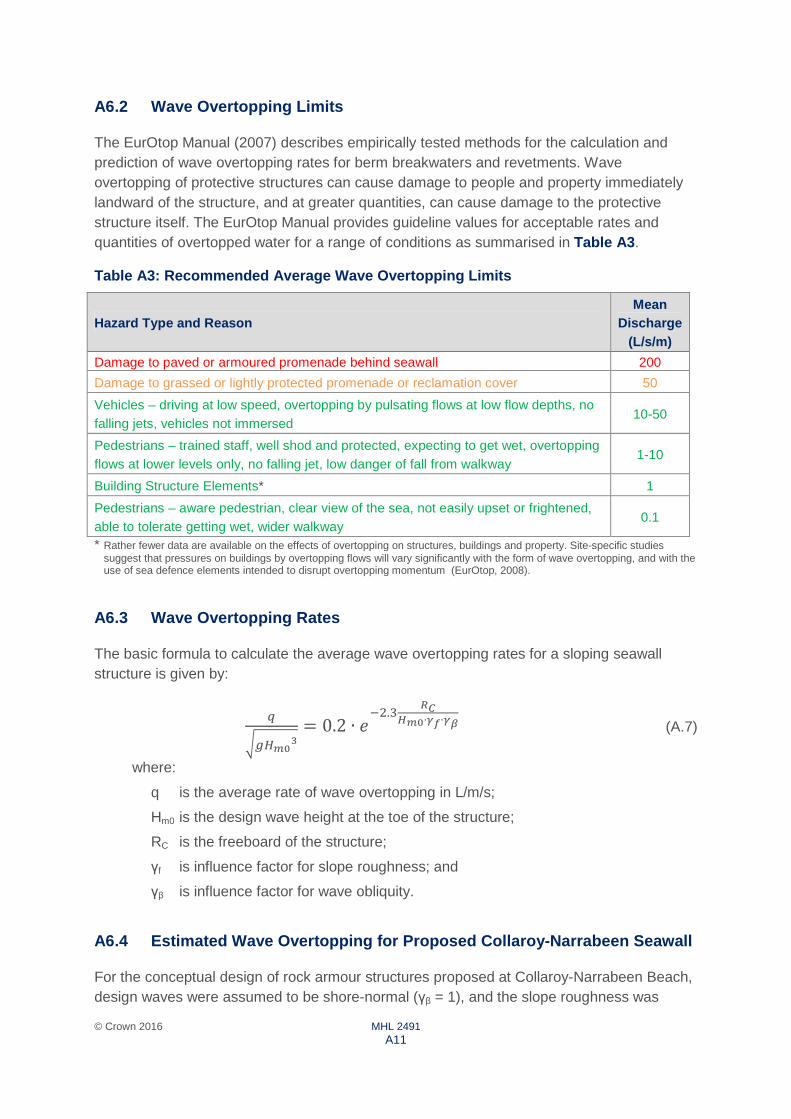
A6.2 Wave Overtopping Limits
The EurOtop Manual (2007) describes empirically tested methods for the calculation and prediction of wave overtopping rates for berm breakwaters and revetments. Wave overtopping of protective structures can cause damage to people and property immediately landward of the structure, and at greater quantities, can cause damage to the protective structure itself. The EurOtop Manual provides guideline values for acceptable rates and quantities of overtopped water for a range of conditions as summarised in Table A3 .
Table A3: Recommended Average Wave Overtopping Limits
Hazard Type and Reason Mean
Discharge (L/s/m)
Damage to paved or armoured promenade behind seawall 200
Damage to grassed or lightly protected promenade or reclamation cover 50
Vehicles – driving at low speed, overtopping by pulsating flows at low flow depths, no falling jets, vehicles not immersed
10-50
Pedestrians – trained staff, well shod and protected, expecting to get wet, overtopping flows at lower levels only, no falling jet, low danger of fall from walkway
1-10
Building Structure Elements* 1
Pedestrians – aware pedestrian, clear view of the sea, not easily upset or frightened, able to tolerate getting wet, wider walkway
0.1
* Rather fewer data are available on the effects of overtopping on structures, buildings and property. Site-specific studies suggest that pressures on buildings by overtopping flows will vary significantly with the form of wave overtopping, and with the use of sea defence elements intended to disrupt overtopping momentum (EurOtop, 2008).
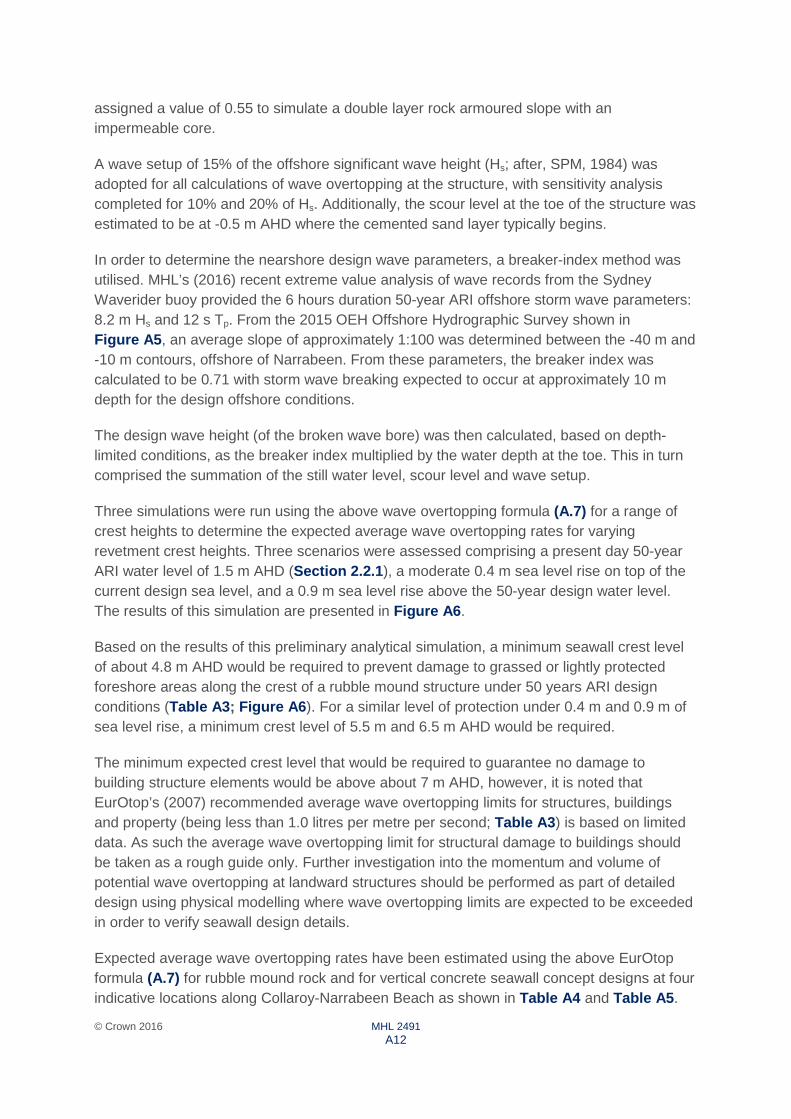
A6.3 Wave Overtopping Rates
The basic formula to calculate the average wave overtopping rates for a sloping seawall structure is given by:
!
"#���$= 0.2 ∙ ()�.�
*+,��∙-.∙-/ (A.7)
where:
q is the average rate of wave overtopping in L/m/s;
Hm0 is the design wave height at the toe of the structure;
RC is the freeboard of the structure;
γf is influence factor for slope roughness; and
γβ is influence factor for wave obliquity.
A6.4 Estimated Wave Overtopping for Proposed Collaroy-Narrabeen Seawall
For the conceptual design of rock armour structures proposed at Collaroy-Narrabeen Beach, design waves were assumed to be shore-normal (γβ = 1), and the slope roughness was
© Crown 2016 MHL 2491
A12
assigned a value of 0.55 to simulate a double layer rock armoured slope with an impermeable core.
A wave setup of 15% of the offshore significant wave height (Hs; after, SPM, 1984) was adopted for all calculations of wave overtopping at the structure, with sensitivity analysis completed for 10% and 20% of Hs. Additionally, the scour level at the toe of the structure was estimated to be at -0.5 m AHD where the cemented sand layer typically begins.
In order to determine the nearshore design wave parameters, a breaker-index method was utilised. MHL’s (2016) recent extreme value analysis of wave records from the Sydney Waverider buoy provided the 6 hours duration 50-year ARI offshore storm wave parameters: 8.2 m Hs and 12 s Tp. From the 2015 OEH Offshore Hydrographic Survey shown in Figure A5 , an average slope of approximately 1:100 was determined between the -40 m and -10 m contours, offshore of Narrabeen. From these parameters, the breaker index was calculated to be 0.71 with storm wave breaking expected to occur at approximately 10 m depth for the design offshore conditions.
The design wave height (of the broken wave bore) was then calculated, based on depth-limited conditions, as the breaker index multiplied by the water depth at the toe. This in turn comprised the summation of the still water level, scour level and wave setup.
Three simulations were run using the above wave overtopping formula (A.7) for a range of crest heights to determine the expected average wave overtopping rates for varying revetment crest heights. Three scenarios were assessed comprising a present day 50-year ARI water level of 1.5 m AHD (Section 2.2.1 ), a moderate 0.4 m sea level rise on top of the current design sea level, and a 0.9 m sea level rise above the 50-year design water level. The results of this simulation are presented in Figure A6 .
Based on the results of this preliminary analytical simulation, a minimum seawall crest level of about 4.8 m AHD would be required to prevent damage to grassed or lightly protected foreshore areas along the crest of a rubble mound structure under 50 years ARI design conditions (Table A3 ; Figure A6 ). For a similar level of protection under 0.4 m and 0.9 m of sea level rise, a minimum crest level of 5.5 m and 6.5 m AHD would be required.
The minimum expected crest level that would be required to guarantee no damage to building structure elements would be above about 7 m AHD, however, it is noted that EurOtop’s (2007) recommended average wave overtopping limits for structures, buildings and property (being less than 1.0 litres per metre per second; Table A3 ) is based on limited data. As such the average wave overtopping limit for structural damage to buildings should be taken as a rough guide only. Further investigation into the momentum and volume of potential wave overtopping at landward structures should be performed as part of detailed design using physical modelling where wave overtopping limits are expected to be exceeded in order to verify seawall design details.
Expected average wave overtopping rates have been estimated using the above EurOtop formula (A.7) for rubble mound rock and for vertical concrete seawall concept designs at four indicative locations along Collaroy-Narrabeen Beach as shown in Table A4 and Table A5 .

© Crown 2016 MHL 2491
A13
The indicative locations and representative rubble mound rock concept design cross-sections are shown in Figure A7 to Figure A10 inclusively. Expected wave overtopping rates for vertical structures are indicated to be significantly higher than for the rubble mound concept designs, necessitating higher seawall crest levels and/or additional drainage design. It is noted further that consideration should be given to the fact that a single wave under storm conditions can result in overtopping rates that are up to 100 times greater than the estimated average wave overtopping rates (van der Meer 1994) shown in Table A4 and Table A5 .
Table A4: Indicative Average* Wave Overtopping Rates for Rubble Mound Seawall
Location Vertical Seawall Overtopping 50-Yr ARI (L/m/s)
1.5 m AHD 1.9 m AHD 2.4 m AHD
Carpark 13 52 208
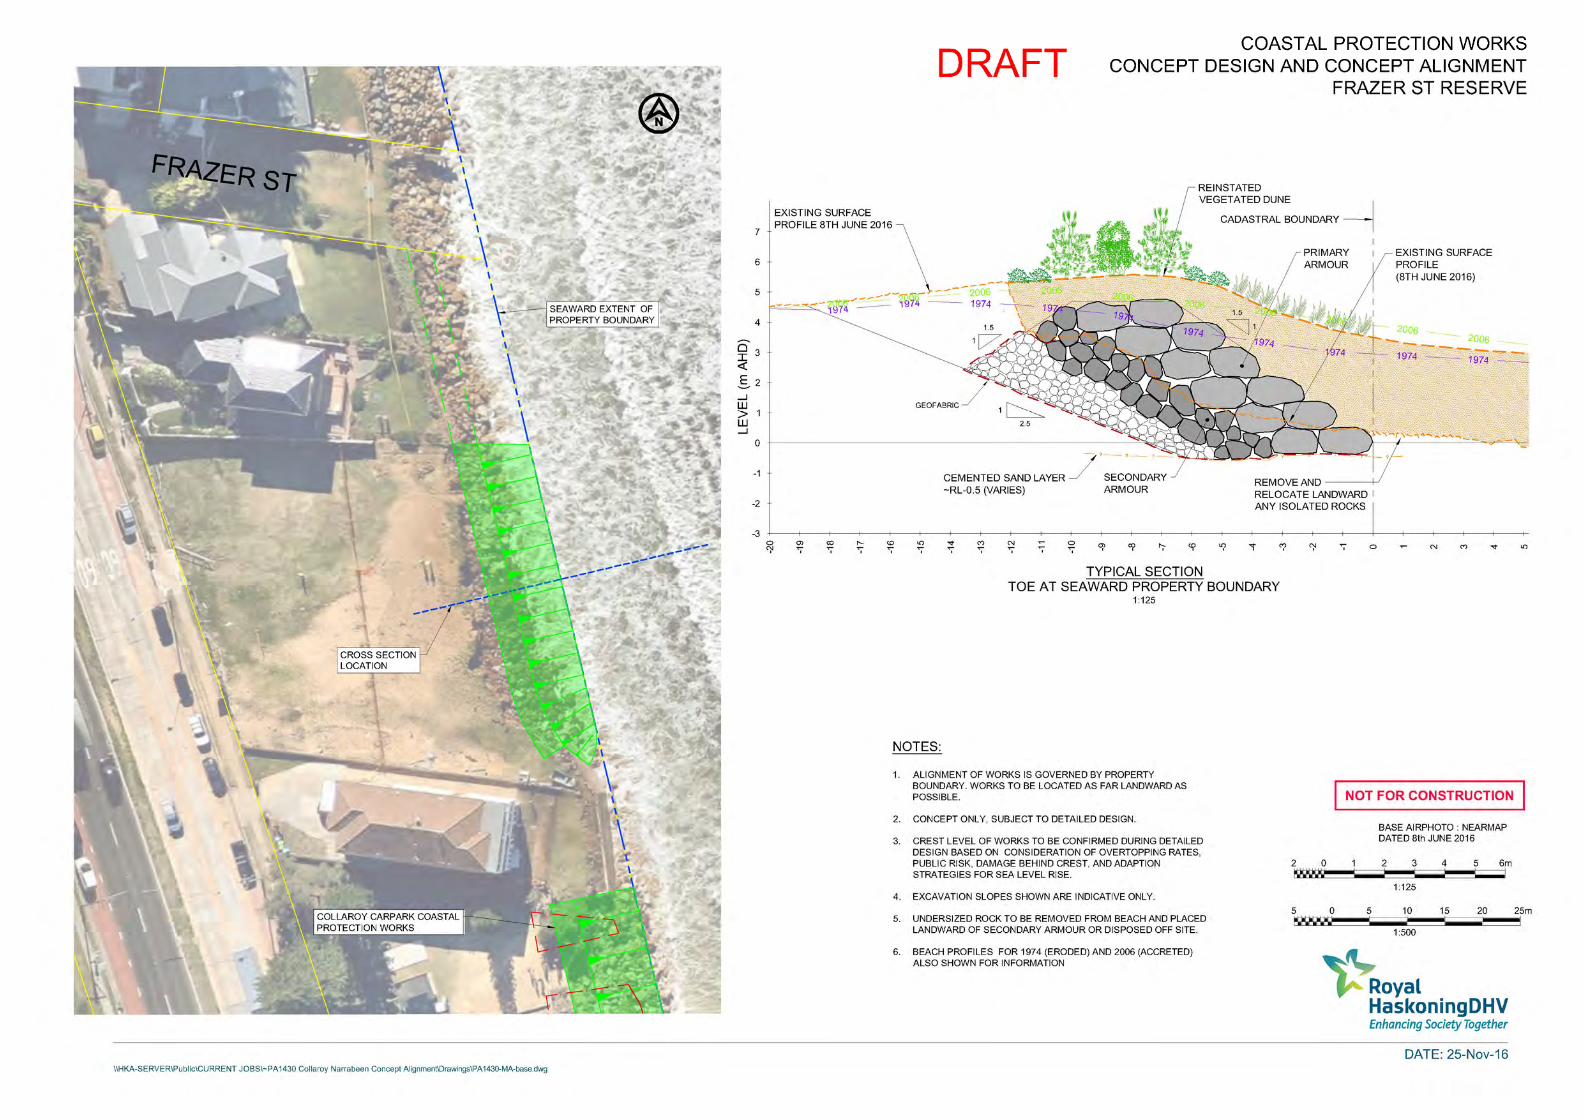
Frazer St Reserve 81 137 873
Surf Lifesaving Club 5 23 101
Wetherill St 5 23 101
* Individual wave overtopping rates may be 100 times higher than indicated average rates
Table A5: Comparative Average* Wave Overtopping Rates for Vertical Seawall
Location Vertical Seawall Overtopping 50-Yr ARI (L/m/s)
1.5 m AHD 1.9 m AHD 2.4 m AHD
Carpark 115 280 915
Frazer St Reserve 457 1511 2266
Surf Lifesaving Club
69 155 441
Wetherill St 69 155 441 * Individual wave overtopping rates may be 100 times higher than indicated average rates
Based on the results of this preliminary analytical simulation (including consideration of sensitivity testing and uncertainty in assumptions and methods) and the EurOtop (2007) recommended thresholds for average wave overtopping (Table A3 ), it is recommended that a minimum crest height of 6.5 m AHD be adopted for conventional 1:1.5 slope, double armour layered rock revetments. It is noted that lower design crest levels may be adopted where adequate allowance for wave overtopping, stability and future climate change adaptation has been adequately considered as part of the detailed design process.
The recommended minimum crest height was selected as a conservative value given the associated uncertainty in selection of simulation parameters and variability of conditions within the surf zone. Furthermore, other pertinent factors such as total volume of wave overtopping and expected velocity of overtopped water have not been taken into consideration at this preliminary concept design stage. These and other factors may contribute to hazard ratings for people and properties above and behind the proposed seawall revetment structures. The final design crest level will depend also on the proposed
© Crown 2016 MHL 2491
A14
seawall make-up. Structures incorporating explicit design allowances and triggers for future sea level rise adaptation may be able to adopt lower initial crest levels.
The minimum recommended crest height for the revetment would nevertheless be subject to site-specific factors, including the capability of the local drainage system, nature (value and construction materials) and proximity of dwellings and other assets landward of the proposed revetment. For non-conventional composite revetment designs or designs that incorporate vertical or near vertical seawalls, higher wave overtopping rates are to be expected, with higher minimum recommended design crest levels as a result. For vertical or composite structures, or where conventional rubble mound crest levels less than 6.5 m AHD are proposed, it is recommended that physical modelling be undertaken to verify wave overtopping rates, overall stability and the suitability of proposed works as part of the detail design process.
It is very difficult to make accurate predictions of wave overtopping rates through calculation alone as small shifts in bathymetry slope, design water level, and rock profile can potentially cause results to change by more than an order of magnitude. Additionally, the overtopping formula used was verified for standard rock slopes only and does not provide contingencies for other types of designs. Comparing Table A5 (vertical wall overtopping table) to the rubble mound overtopping calculations (Table A4 ), it is clear that any proposed vertical structures would require relatively higher crest elevation or additional and carefully designed drainage and protection landward of the crest. Significant benefits may be obtained by incorporating physical modelling as part of the detailed design process to confirm stability and more accurately determine wave overtopping rates, particularly for non-conventional structures. Finally, the offshore bathymetry and proposed concept design alignment for Collaroy Narrabeen is non-uniform; as is the likely final design of the armouring structure behind the beach. It is therefore likely that there will be 3D effects which cannot be accurately predicted with analytical methods alone. This could also benefit from a 3D physical model where such effects could be observed under controlled conditions.
A7 Beach Recovery Rates in Front of Seawalls
A7.1 Preamble
As discussed in Section A3.3 , seawalls located at the back of a beach (above the normal high tides and average wave run-up levels; as is the case at Collaroy-Narrabeen Beach), interact with wave and sediment transport processes infrequently and impound a smaller percentage of the total cross-shore sediment budget during coastal storms. Once the beach berm has re-established in front of such seawalls, they have no discernible effect on the natural beach recovery process. As such, literature relating to natural beach recovery is considered relevant to the study area and relevant also in the evaluation of beach recovery in front of seawalls at the back of a beach as presented below.
© Crown 2016 MHL 2491
A15
A7.2 Background Studies
Beach recovery does not invoke the sense of crisis that major beach erosion does, so studies of beach recovery rates are less common than those for beach erosion. The only known studies on beach recovery for eastern Australia are:
• Thom and Hall (1991) involving 15 years of monthly profile data from 1972 to 1986 for Moruya NSW;
• Carley et al (1998) who analysed 29 years of collected profile data from 1967 to 1996 for the Gold Coast;
• Splinter et al (2011) for the Gold Coast; • Phillips et al (2015) for Collaroy-Narrabeen from 2004 to 2013.
Many of the above studies relied on surveys conducted at intervals of several days to approximately monthly, so may not always capture the true maximum rate of beach recovery. The recovery process is discontinuous as shown in plots in Thom and Hall (1991). Some studies reported beach recovery in terms of sand volume, while others reported it in terms of beach width.
Thom and Hall (1991) analysed beach recovery from June 1978 to November 1981 and found a maximum accretion rate above ISLW (Indian Springs Low Water, approximately -0.9 m AHD) of 0.27 m3/m per day. They did not attempt to parameterise intervening storm events in the recovery process, but rather analysed the period due to the net recovery trend.
Carley et al (1998) identified nine recovery events in the Gold Coast data set, seven of which occurred when wave buoy records indicated significant wave heights of generally less than 2 m for the duration between surveys. Two recovery events occurred in the 1960s for which wave buoy data did not exist. No parameterisation of wind in the intervening periods between surveys was made. They found an average recovery rate above AHD of 0.4 m3/m per day, though this ranged from 0 to 1.0 m3/m per day. The average rate of 0.4 m3/m per day is close to the findings of Thom and Hall (0.27 m3/m per day).
Phillips et al (2015) (Figure A11 ) analysed beach recovery for Collaroy-Narrabeen, by measuring beach width at the 0.7 m AHD (mean high water) elevation. Phillips studied 10 recovery events from 2004 to 2013 and found an average recovery rate of 0.10 m/day and an average maximum recovery rate (based on a fortnightly moving average) of 0.48 m/day. The highest recovery rate (based on a fortnightly moving average) measured was 0.68 m/day. They noted that rapid recovery can occur when a nearshore sand bar welds to the beach face, which may account for the maximum observed short term rate of 6.4 m/day, but this is somewhat damped out by the use of a fortnightly moving average.
A summary of measured beach recovery rates from the above studies is shown in Table A6 . All four data sets measured a similar rate of beach recovery.
© Crown 2016 MHL 2491
A16
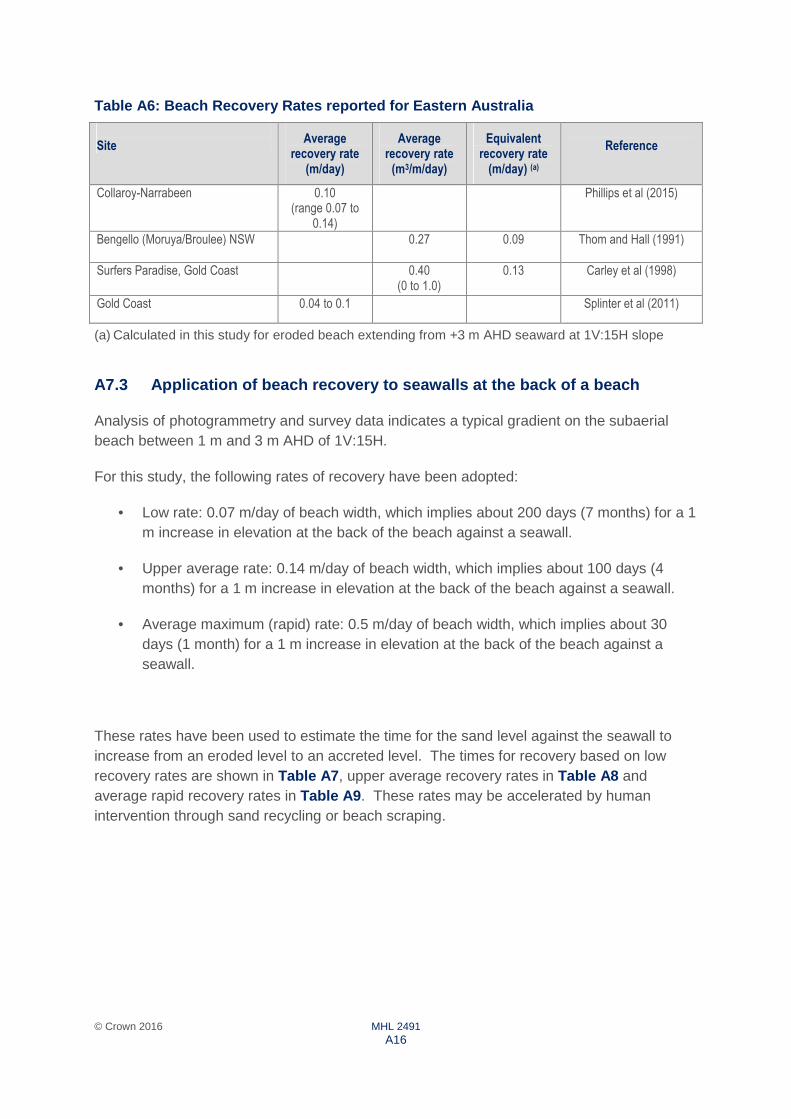
Table A6: Beach Recovery Rates reported for Eastern Australia
Site
Average recovery rate
(m/day)
Average recovery rate
(m3/m/day)
Equivalent recovery rate
(m/day) (a)
Reference
Collaroy-Narrabeen
0.10 (range 0.07 to
0.14)
Phillips et al (2015)
Bengello (Moruya/Broulee) NSW
0.27 0.09 Thom and Hall (1991)
Surfers Paradise, Gold Coast 0.40 (0 to 1.0)
0.13 Carley et al (1998)
Gold Coast 0.04 to 0.1 Splinter et al (2011)
(a) Calculated in this study for eroded beach extending from +3 m AHD seaward at 1V:15H slope
A7.3 Application of beach recovery to seawalls at the back of a beach
Analysis of photogrammetry and survey data indicates a typical gradient on the subaerial beach between 1 m and 3 m AHD of 1V:15H.
For this study, the following rates of recovery have been adopted:
• Low rate: 0.07 m/day of beach width, which implies about 200 days (7 months) for a 1 m increase in elevation at the back of the beach against a seawall.
• Upper average rate: 0.14 m/day of beach width, which implies about 100 days (4 months) for a 1 m increase in elevation at the back of the beach against a seawall.
• Average maximum (rapid) rate: 0.5 m/day of beach width, which implies about 30 days (1 month) for a 1 m increase in elevation at the back of the beach against a seawall.
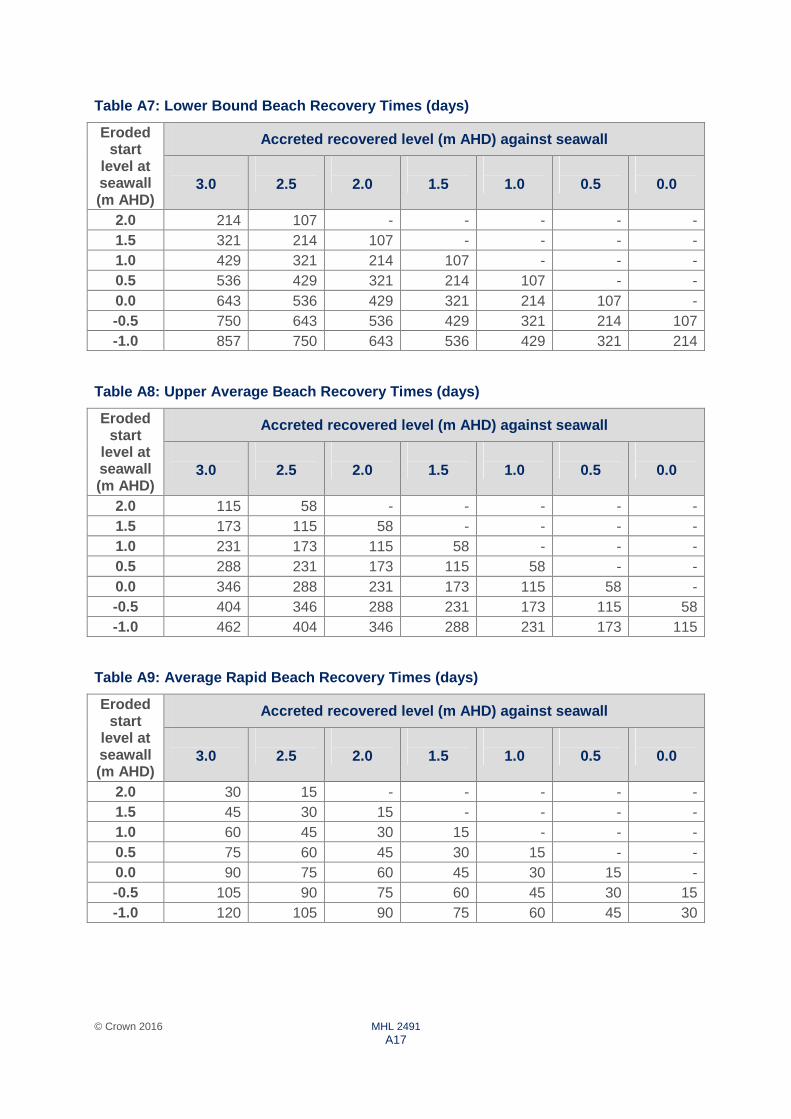
These rates have been used to estimate the time for the sand level against the seawall to increase from an eroded level to an accreted level. The times for recovery based on low recovery rates are shown in Table A7 , upper average recovery rates in Table A8 and average rapid recovery rates in Table A9 . These rates may be accelerated by human intervention through sand recycling or beach scraping.
© Crown 2016 MHL 2491
A17
Table A7: Lower Bound Beach Recovery Times (days)
Eroded start
level at seawall (m AHD)
Accreted recovered level (m AHD) against seawall
3.0
2.5
2.0
1.5
1.0
0.5
0.0
2.0 214 107 - - - - - 1.5 321 214 107 - - - - 1.0 429 321 214 107 - - - 0.5 536 429 321 214 107 - - 0.0 643 536 429 321 214 107 - -0.5 750 643 536 429 321 214 107 -1.0 857 750 643 536 429 321 214
Table A8: Upper Average Beach Recovery Times (days)
Eroded start
level at seawall (m AHD)
Accreted recovered level (m AHD) against seawall
3.0
2.5
2.0
1.5
1.0
0.5
0.0
2.0 115 58 - - - - - 1.5 173 115 58 - - - - 1.0 231 173 115 58 - - - 0.5 288 231 173 115 58 - - 0.0 346 288 231 173 115 58 - -0.5 404 346 288 231 173 115 58 -1.0 462 404 346 288 231 173 115
Table A9: Average Rapid Beach Recovery Times (days)
Eroded start
level at seawall (m AHD)
Accreted recovered level (m AHD) against seawall
3.0
2.5
2.0
1.5
1.0
0.5
0.0
2.0 30 15 - - - - - 1.5 45 30 15 - - - - 1.0 60 45 30 15 - - - 0.5 75 60 45 30 15 - - 0.0 90 75 60 45 30 15 - -0.5 105 90 75 60 45 30 15 -1.0 120 105 90 75 60 45 30
© Crown 2016 MHL 2491
A18
A8 Incidental/Accidental Human Removal of Beach Sand
All users of the beach can attest to sand accidentally leaving the beach with them – stuck to their bodies, swimming costumes, wetsuits and surf-craft. Few quantifications of this are available. Wynne et al (1984) documented and reviewed such losses for the beaches of Adelaide, which comprise approximately 30 km of sandy shore and were estimated to have 500,000 to 1,000,000 person-visits per year. Original calculations done in 1972 estimated that 600 m3 per year was removed inadvertently (or sometimes deliberately) by beach users. Wynne et al (1984) reviewed these calculations and revised this figure down to 100 m3 per year of sand being removed inadvertently by beach users. This is a rate of 0.0001 to 0.0002 m3 per person-visit. Although no direct statistics are available, the higher wave climate and popularity of swimming, bodysurfing and surfing at Collaroy-Narrabeen may make accidental sand removal rates higher than Adelaide.
There are four patrolled areas on the Collaroy Narrabeen embayment, namely North Narrabeen, Narrabeen, South Narrabeen and Collaroy. Northern Beaches Council notes that these beaches are patrolled from the end of September until Anzac Day. All are patrolled seven days a week by professional lifeguards except Narrabeen, which is patrolled on weekends, public holidays and during the school holidays. Volunteer life savers also patrol the beaches on weekends and public holidays from the end of September until Anzac Day. Patrol hours are 9 am to 5 or 6 pm in peak times, with reduced hours during the shoulder seasons.
Based on Northern Beaches Council data collected by professional lifeguards, Collaroy-Narrabeen Beach usage was:
• 2014-15: 948,985 person-visits for the patrol season;
• 2015-16: 825,129 person-visits for the patrol season.
With additional allowances by WRL for use outside of patrol hours and during winter, a plausible order of magnitude estimate is:
• 1.5 to 2 million person-visits per year.
This equates to 150 to 400 m3 of sand per year inadvertently removed by humans from Collaroy-Narrabeen Beach. For a beach length of 3600 m and an active profile height of 18 m (+6 m to -12 m AHD), this would result in up to 0.006 m/year recession, or about 12% of the underlying recession and 15% of the historic sea level rise recession estimated in the CZMP (2014).
A9 References to Appendices
See Report Section 6 .

Figure 11
MHL_2491.ppt
MHL 2491
Commonly Stated Effects of Seawalls on Adjacent Shorelines and Beaches A1
[Basco, 2004 based on Dean, 1986]
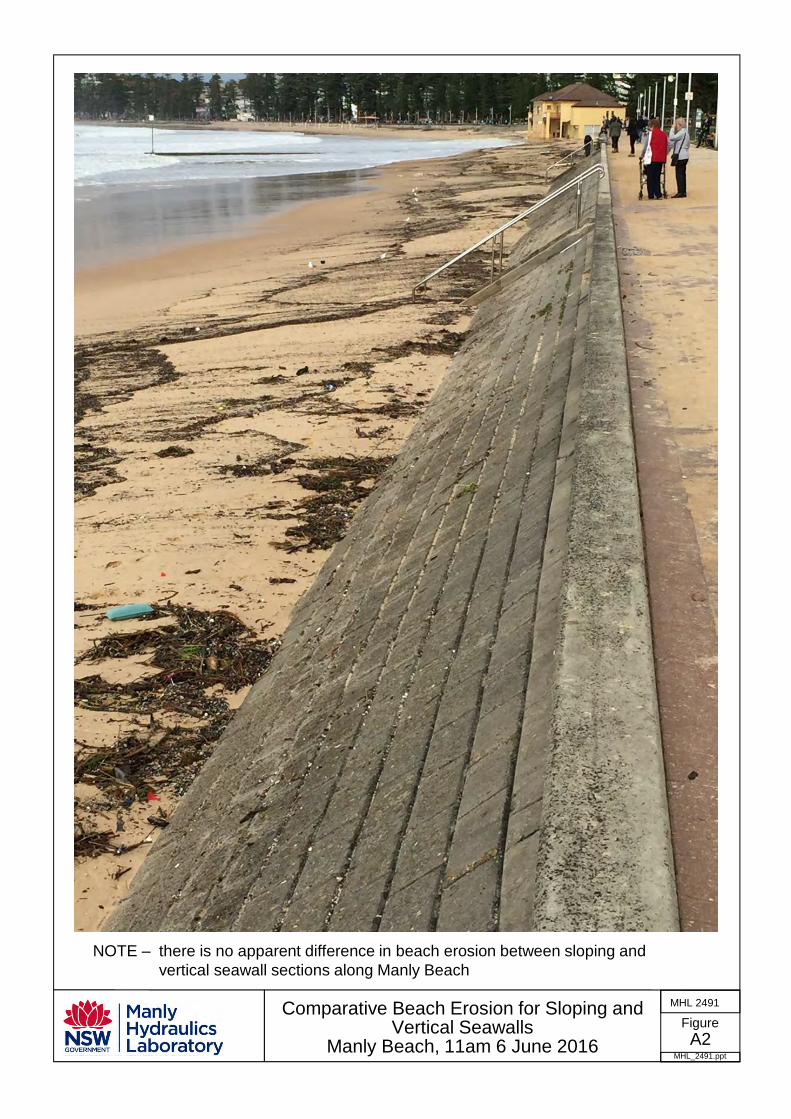
Figure 12
MHL_2491.ppt
MHL 2491Comparative Beach Erosion for Sloping and Vertical Seawalls
Manly Beach, 11am 6 June 2016 A2
NOTE – there is no apparent difference in beach erosion between sloping and vertical seawall sections along Manly Beach
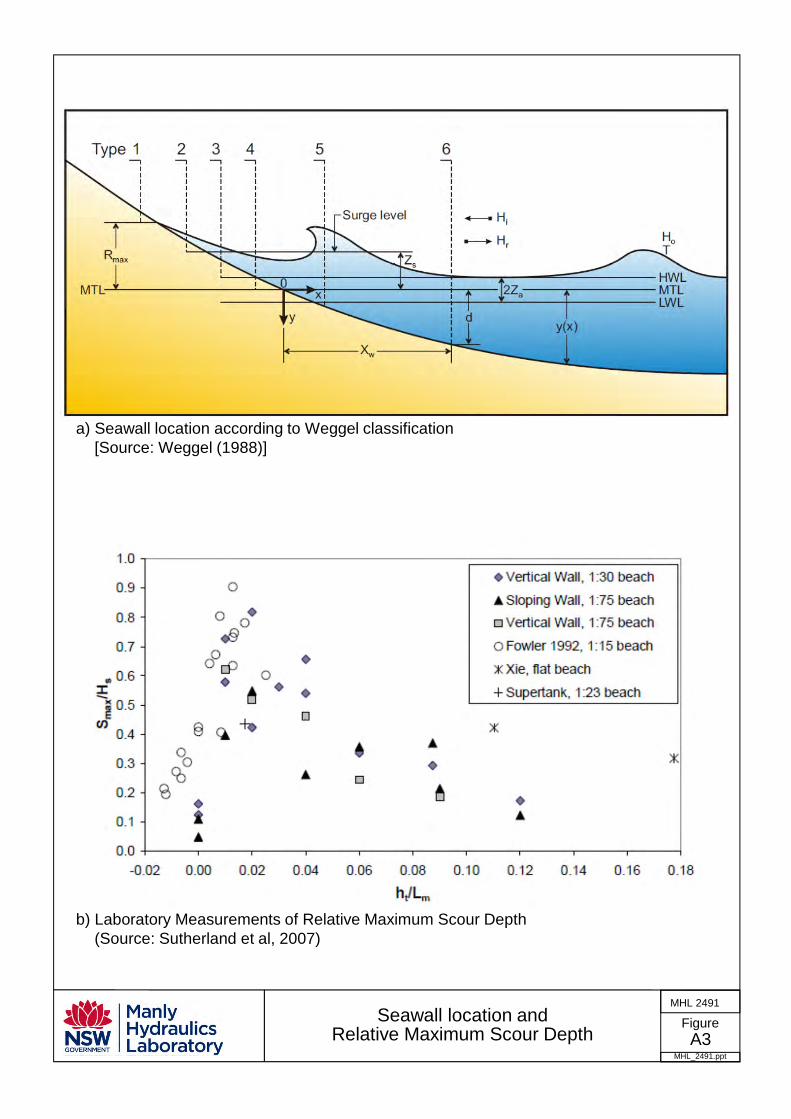
Figure 13
MHL_2491.ppt
MHL 2491Seawall location and
Relative Maximum Scour Depth A3
a) Seawall location according to Weggel classification[Source: Weggel (1988)]
b) Laboratory Measurements of Relative Maximum Scour Depth (Source: Sutherland et al, 2007)
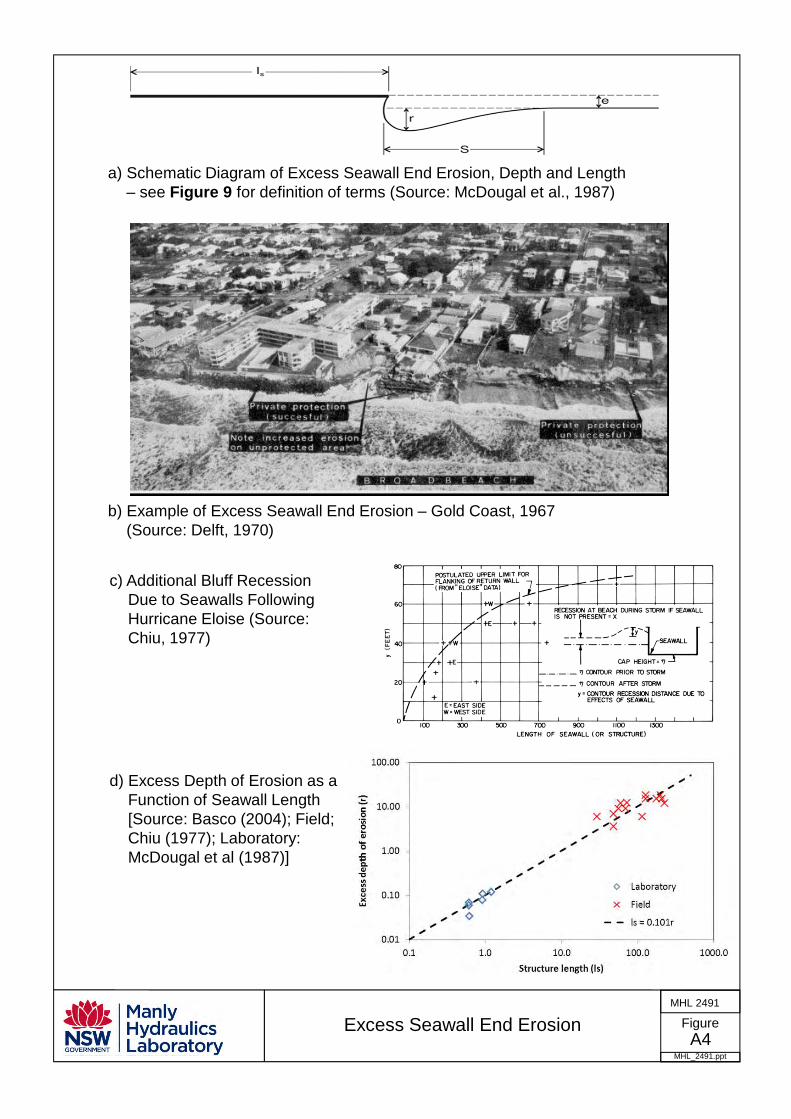
Figure 14
MHL_2491.ppt
MHL 2491
Excess Seawall End ErosionA4
a) Schematic Diagram of Excess Seawall End Erosion, Depth and Length – see Figure 9 for definition of terms (Source: McDougal et al., 1987)
b) Example of Excess Seawall End Erosion – Gold Coast, 1967 (Source: Delft, 1970)
c) Additional Bluff Recession Due to Seawalls Following Hurricane Eloise (Source: Chiu, 1977)
d) Excess Depth of Erosion as a Function of Seawall Length [Source: Basco (2004); Field; Chiu (1977); Laboratory: McDougal et al (1987)]

Figure 15
MHL_2491.ppt
MHL 2491Offshore Bathymetry Collaroy-Narrabeen A5
Source: 2015 OEH Offshore Hydrographic Survey
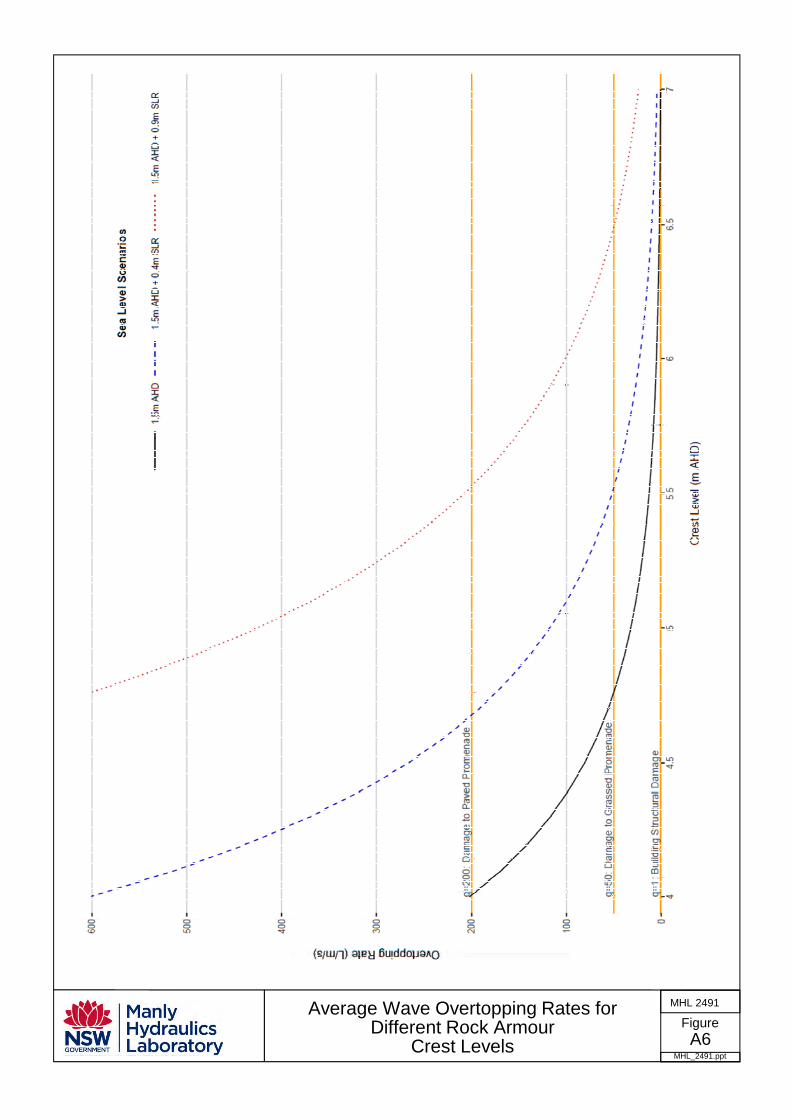
Figure 16
MHL_2491.ppt
MHL 2491Average Wave Overtopping Rates for Different Rock Armour
Crest Levels A6
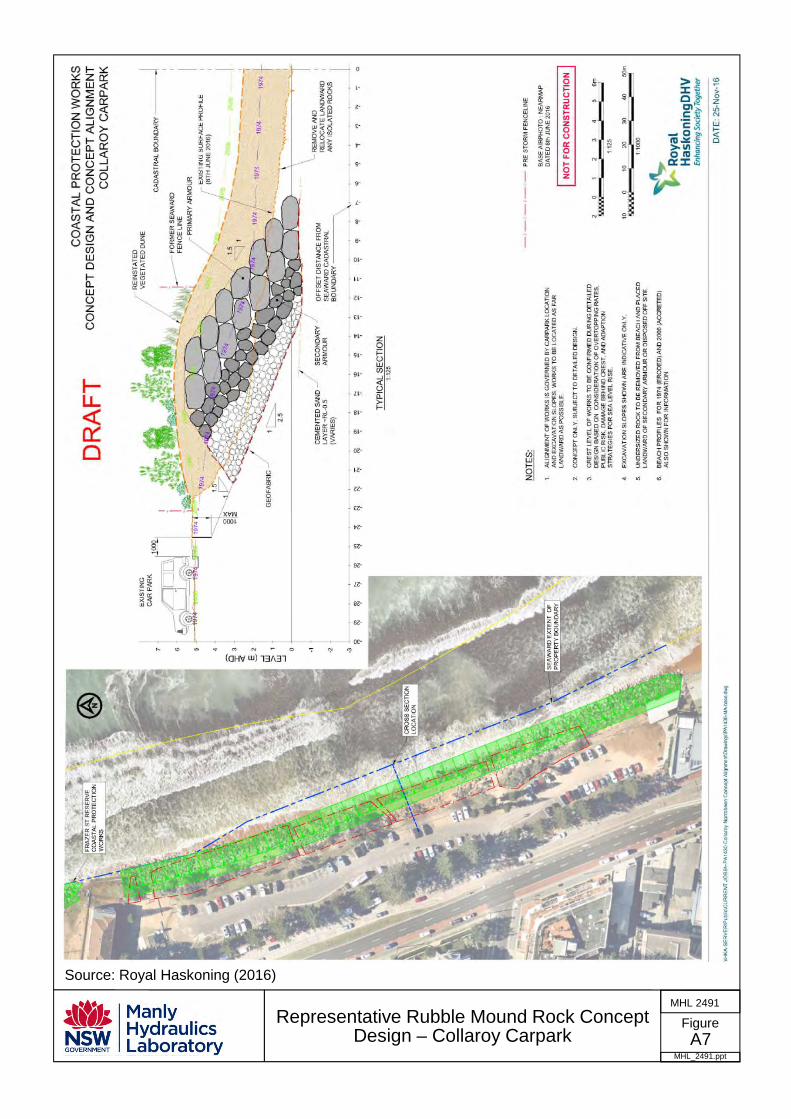
Figure 17
MHL_2491.ppt
MHL 2491
Representative Rubble Mound Rock Concept Design – Collaroy Carpark A7
Source: Royal Haskoning (2016)
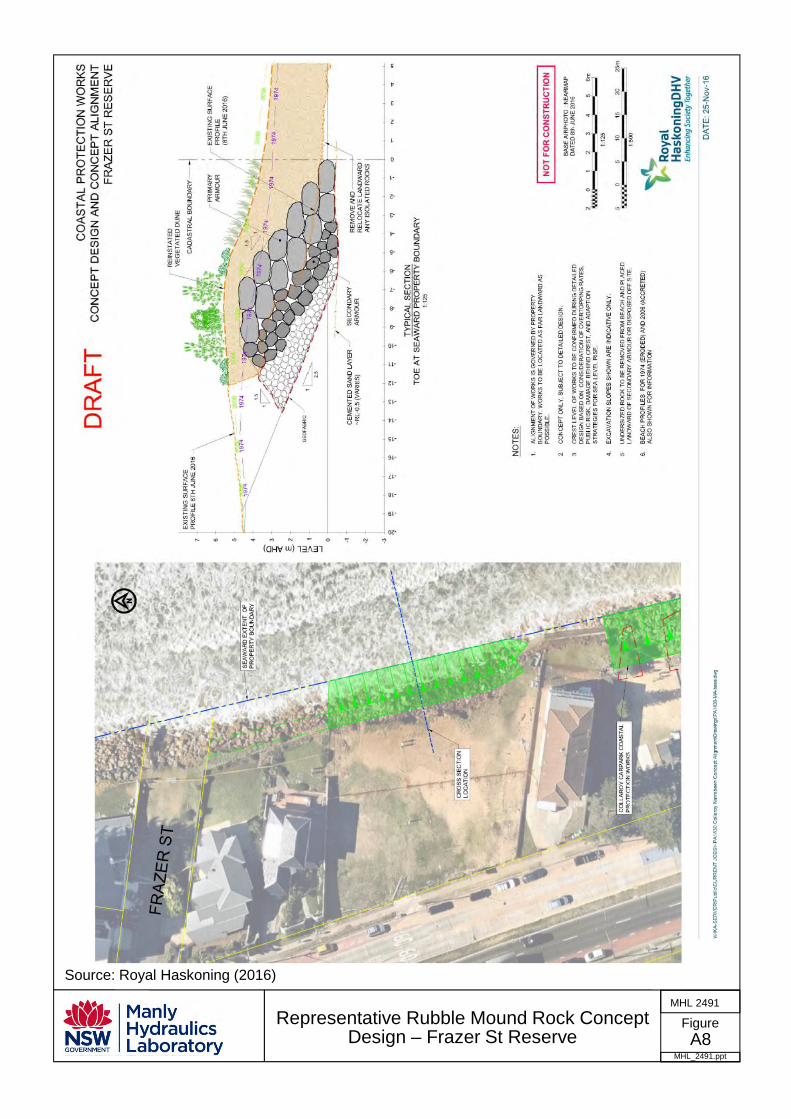
Figure 18
MHL_2491.ppt
MHL 2491
Representative Rubble Mound Rock Concept Design – Frazer St Reserve A8
Source: Royal Haskoning (2016)
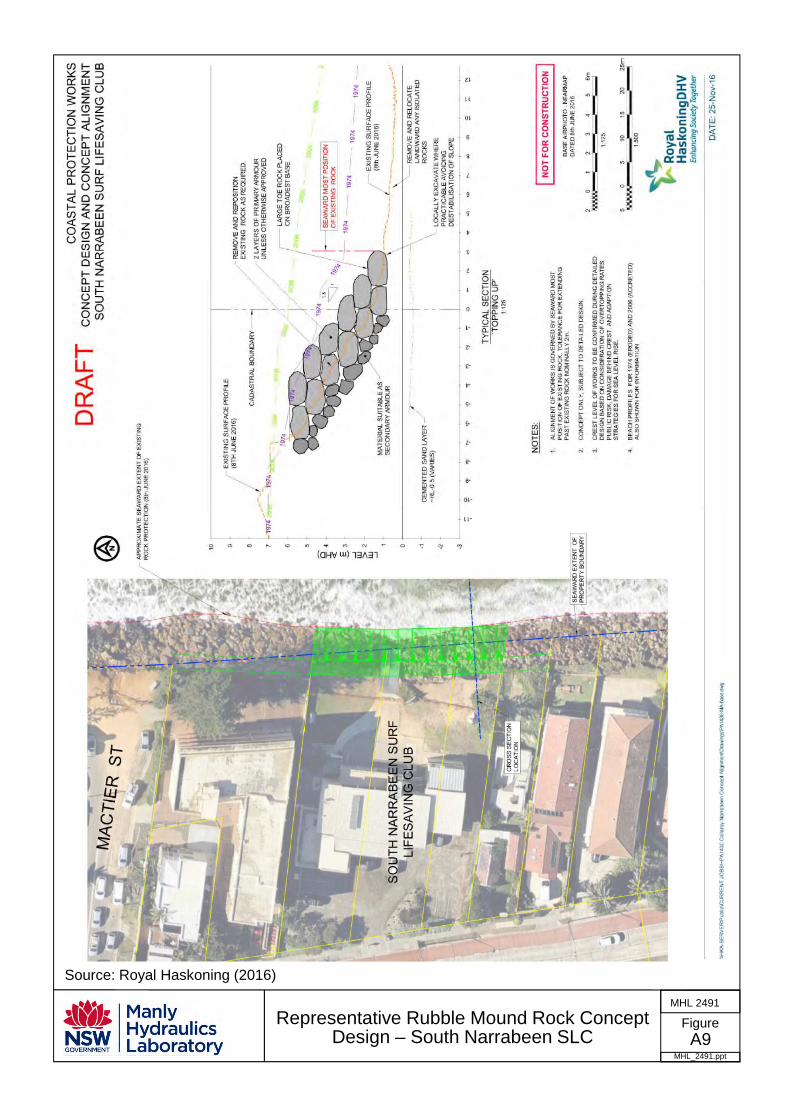
Figure 19
MHL_2491.ppt
MHL 2491
Representative Rubble Mound Rock Concept Design – South Narrabeen SLC A9
Source: Royal Haskoning (2016)
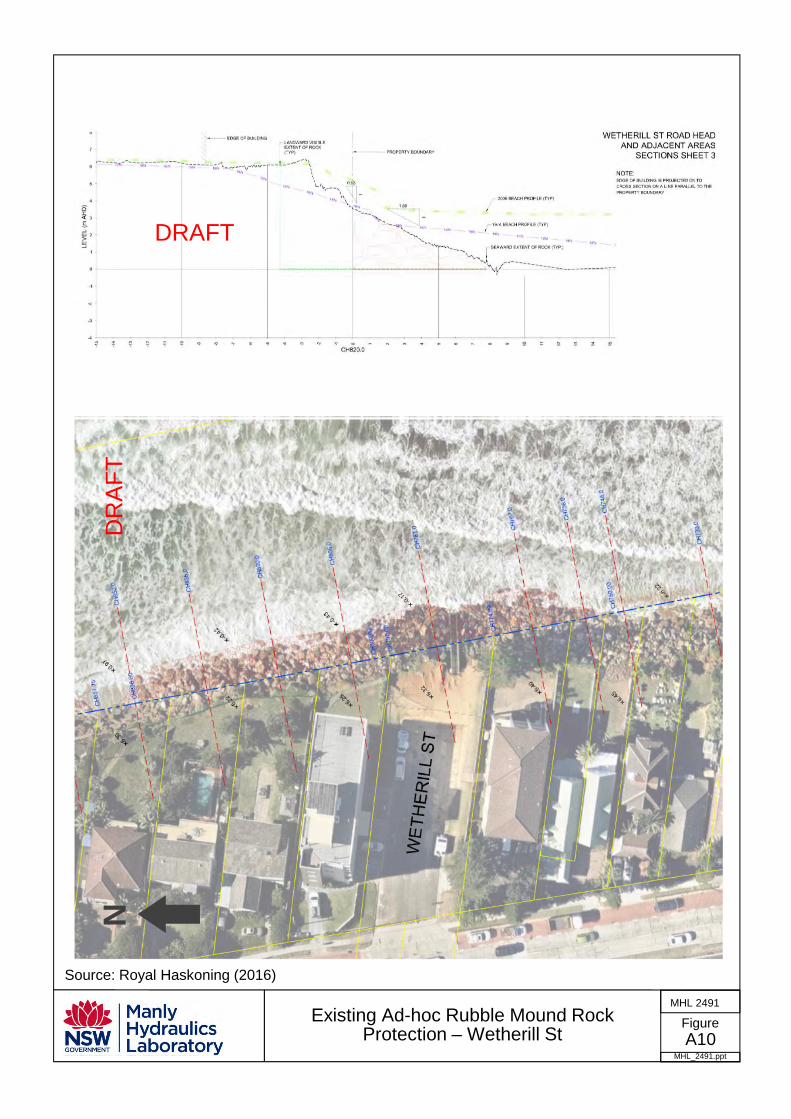
Figure 20
MHL_2491.ppt
MHL 2491Existing Ad-hoc Rubble Mound Rock
Protection – Wetherill St A10
Source: Royal Haskoning (2016)
DR
AF
T
DRAFT
N
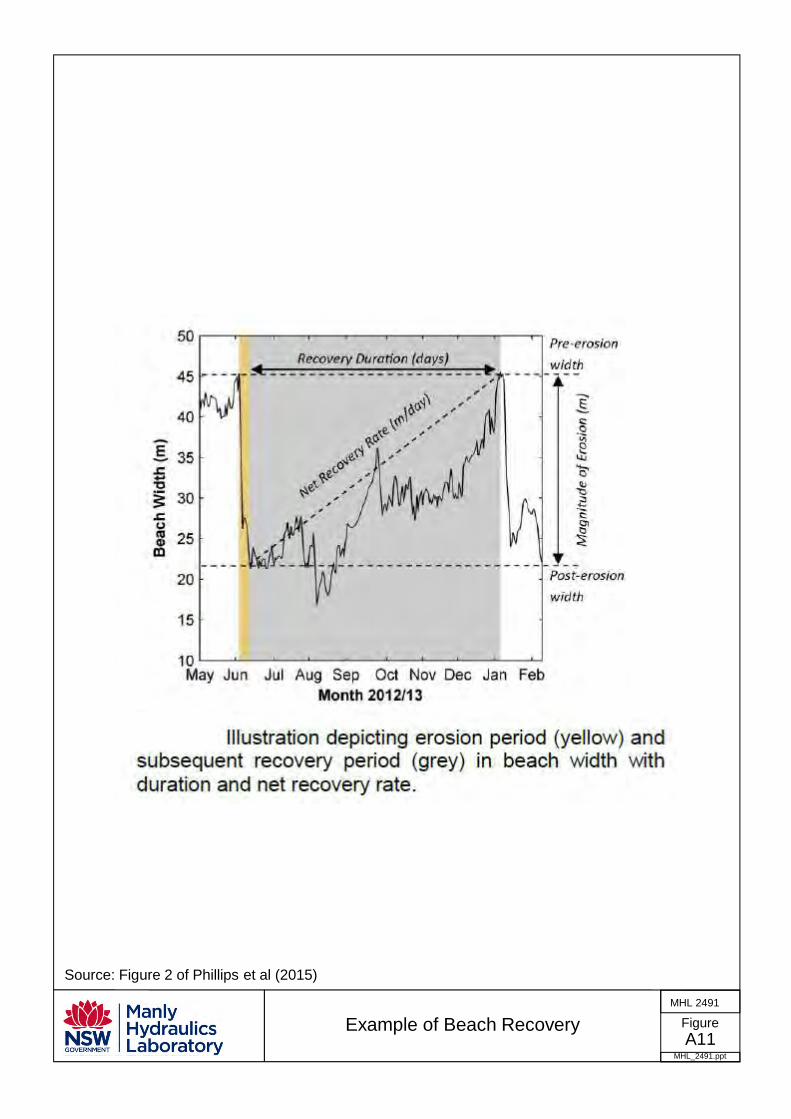
Figure 21
MHL_2491.ppt
MHL 2491
Example of Beach Recovery
Source: Figure 2 of Phillips et al (2015)
A11

© Crown 2016 MHL 2491
B1
Appendix B – Seawall Design Criteria for Collaroy-Narrabeen Beach (Haskoning, 2016)
25 November 2016 PA1293-106_L002F02-seawall design criteria-Nov16 1/4
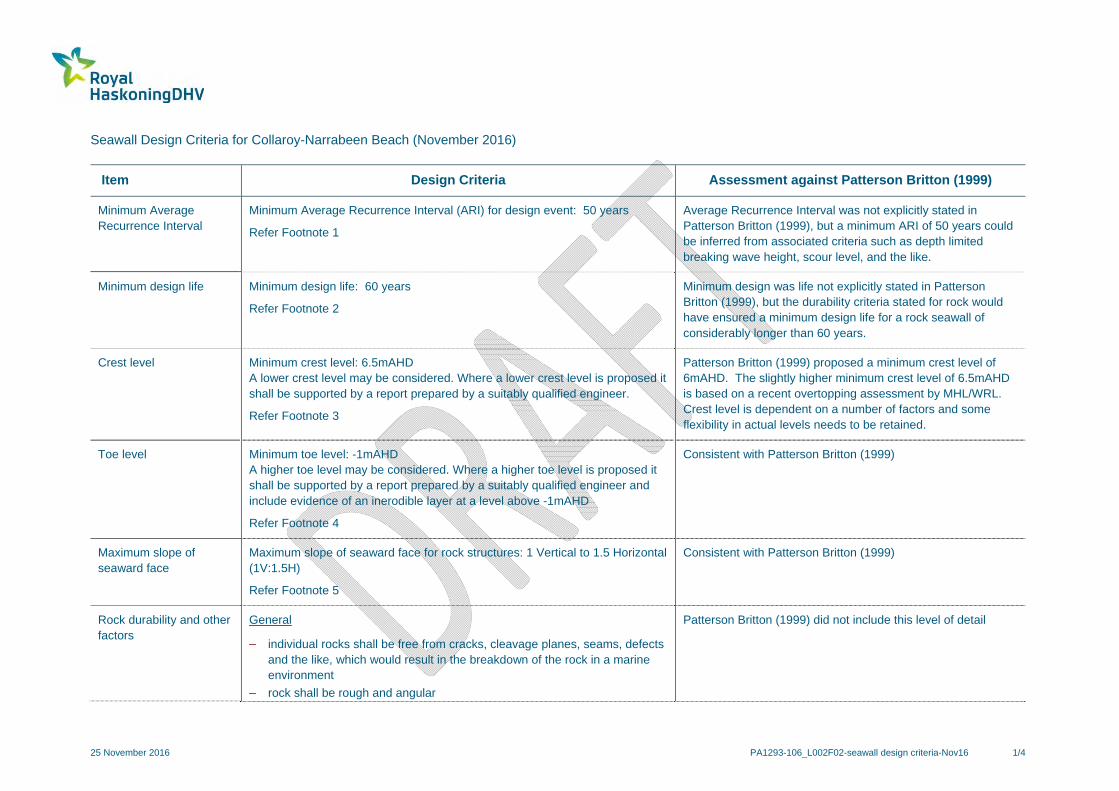
Seawall Design Criteria for Collaroy-Narrabeen Beach (November 2016)
Item Design Criteria Assessment against Patterson Britton (1999)
Minimum Average Recurrence Interval
Minimum Average Recurrence Interval (ARI) for design event: 50 years
Refer Footnote 1
Average Recurrence Interval was not explicitly stated in Patterson Britton (1999), but a minimum ARI of 50 years could be inferred from associated criteria such as depth limited breaking wave height, scour level, and the like.
Minimum design life Minimum design life: 60 years
Refer Footnote 2
Minimum design was life not explicitly stated in Patterson Britton (1999), but the durability criteria stated for rock would have ensured a minimum design life for a rock seawall of considerably longer than 60 years.
Crest level Minimum crest level: 6.5mAHD A lower crest level may be considered. Where a lower crest level is proposed it shall be supported by a report prepared by a suitably qualified engineer.
Refer Footnote 3
Patterson Britton (1999) proposed a minimum crest level of 6mAHD. The slightly higher minimum crest level of 6.5mAHD is based on a recent overtopping assessment by MHL/WRL. Crest level is dependent on a number of factors and some flexibility in actual levels needs to be retained.
Toe level Minimum toe level: -1mAHD A higher toe level may be considered. Where a higher toe level is proposed it shall be supported by a report prepared by a suitably qualified engineer and include evidence of an inerodible layer at a level above -1mAHD
Refer Footnote 4
Consistent with Patterson Britton (1999)
Maximum slope of seaward face
Maximum slope of seaward face for rock structures: 1 Vertical to 1.5 Horizontal (1V:1.5H)
Refer Footnote 5
Consistent with Patterson Britton (1999)
Rock durability and other factors
General
individual rocks shall be free from cracks, cleavage planes, seams, defects and the like, which would result in the breakdown of the rock in a marine environment
rock shall be rough and angular
Patterson Britton (1999) did not include this level of detail

25 November 2016 PA1293-106_L002F02-seawall design criteria-Nov16 2/4
Item Design Criteria Assessment against Patterson Britton (1999)
the ratio of the maximum dimension of any rock to the minimum dimension, measured at right angles to the maximum dimension, shall not exceed 2.5
armour rock shall be individually placed, not rolled or dropped into position
placed rocks shall be wedged and locked together such that they are not free to move
Sandstone
minimum dry density 2.300kg/m³
water absorption less than 1.5%
saturated point load strength index (Is50) greater than 1.5MPa sodium soundness weight loss less than 9%
wet/dry strength variation less than 30%
Igneous
minimum dry density 2,650kg/m³
saturated point load strength index (Is50) greater than 5.0MPa
sodium soundness weight loss less than 12%
no more than 15% (by volume) olivine and no zones of secondary alteration such as chloritisation
- no signs of stress relief
Rock size grading and filtration design
Notes: 1. Minimum median rock mass: W=5.0t (sandstone), W= 3.8t (igneous) 2. Each layer shall have a minimum thickness of two rocks
Layer
Median Rock Size
Rock Size Gradation (%)
Primary Armour Layer
W (see Note 1)
125 to 75
First Underlayer W/10 130 to 70
Second Underlayer W/200 150 to 50
Generally consistent with Patterson Britton (1999) where values were included, slight increase in median rock mass for igneous rock from 3.5t to 3.8t
25 November 2016 PA1293-106_L002F02-seawall design criteria-Nov16 3/4
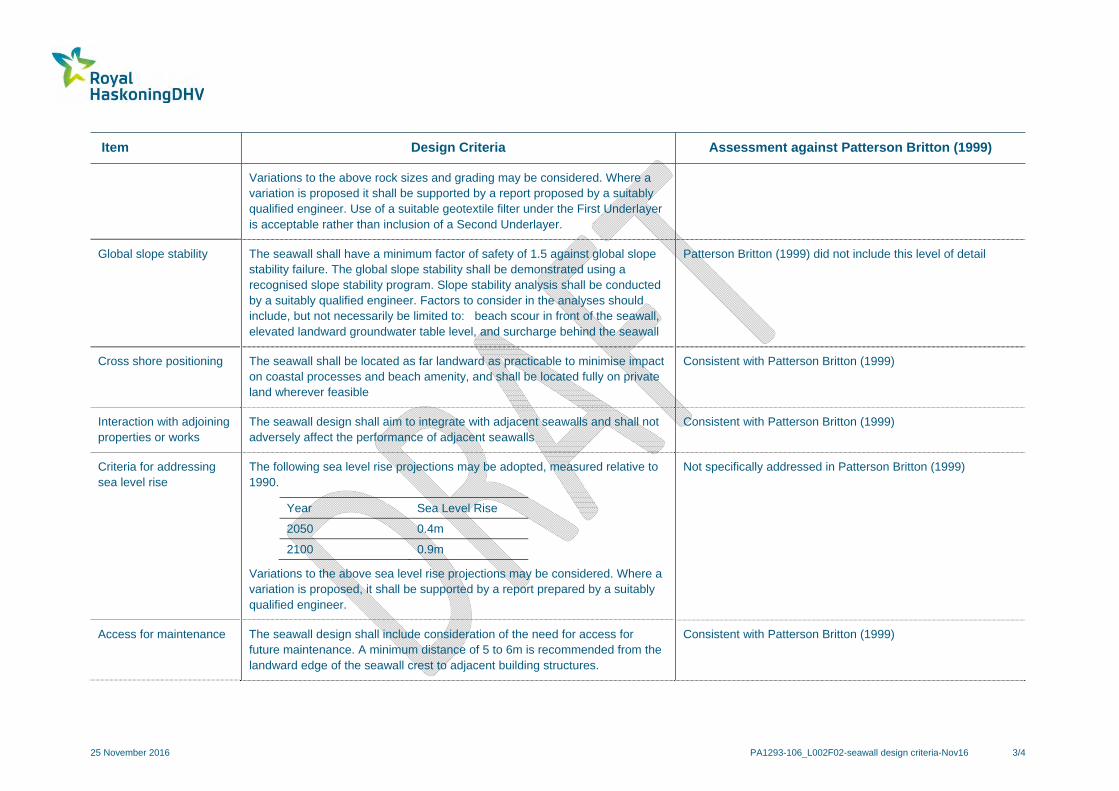
Item Design Criteria Assessment against Patterson Britton (1999)
Variations to the above rock sizes and grading may be considered. Where a variation is proposed it shall be supported by a report proposed by a suitably qualified engineer. Use of a suitable geotextile filter under the First Underlayer is acceptable rather than inclusion of a Second Underlayer.
Global slope stability The seawall shall have a minimum factor of safety of 1.5 against global slope stability failure. The global slope stability shall be demonstrated using a recognised slope stability program. Slope stability analysis shall be conducted by a suitably qualified engineer. Factors to consider in the analyses should include, but not necessarily be limited to: beach scour in front of the seawall, elevated landward groundwater table level, and surcharge behind the seawall
Patterson Britton (1999) did not include this level of detail
Cross shore positioning The seawall shall be located as far landward as practicable to minimise impact on coastal processes and beach amenity, and shall be located fully on private land wherever feasible
Consistent with Patterson Britton (1999)
Interaction with adjoining properties or works
The seawall design shall aim to integrate with adjacent seawalls and shall not adversely affect the performance of adjacent seawalls
Consistent with Patterson Britton (1999)
Criteria for addressing sea level rise
The following sea level rise projections may be adopted, measured relative to 1990.
Year Sea Level Rise
2050 0.4m
2100 0.9m
Variations to the above sea level rise projections may be considered. Where a variation is proposed, it shall be supported by a report prepared by a suitably qualified engineer.
Not specifically addressed in Patterson Britton (1999)
Access for maintenance The seawall design shall include consideration of the need for access for future maintenance. A minimum distance of 5 to 6m is recommended from the landward edge of the seawall crest to adjacent building structures.
Consistent with Patterson Britton (1999)
25 November 2016 PA1293-106_L002F02-seawall design criteria-Nov16 4/4
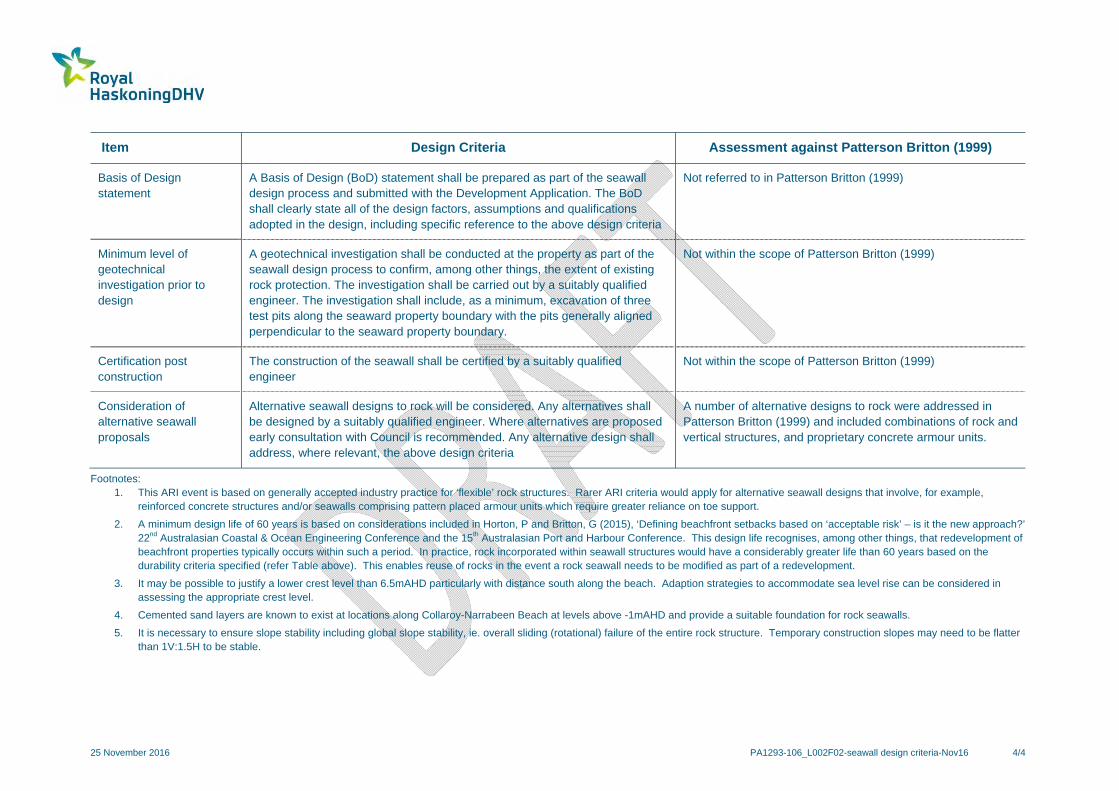
Item Design Criteria Assessment against Patterson Britton (1999)
Basis of Design statement
A Basis of Design (BoD) statement shall be prepared as part of the seawall design process and submitted with the Development Application. The BoD shall clearly state all of the design factors, assumptions and qualifications adopted in the design, including specific reference to the above design criteria
Not referred to in Patterson Britton (1999)
Minimum level of geotechnical investigation prior to design
A geotechnical investigation shall be conducted at the property as part of the seawall design process to confirm, among other things, the extent of existing rock protection. The investigation shall be carried out by a suitably qualified engineer. The investigation shall include, as a minimum, excavation of three test pits along the seaward property boundary with the pits generally aligned perpendicular to the seaward property boundary.
Not within the scope of Patterson Britton (1999)
Certification post construction
The construction of the seawall shall be certified by a suitably qualified engineer
Not within the scope of Patterson Britton (1999)
Consideration of alternative seawall proposals
Alternative seawall designs to rock will be considered. Any alternatives shall be designed by a suitably qualified engineer. Where alternatives are proposed early consultation with Council is recommended. Any alternative design shall address, where relevant, the above design criteria
A number of alternative designs to rock were addressed in Patterson Britton (1999) and included combinations of rock and vertical structures, and proprietary concrete armour units.
Footnotes: 1. This ARI event is based on generally accepted industry practice for ‘flexible’ rock structures. Rarer ARI criteria would apply for alternative seawall designs that involve, for example,
reinforced concrete structures and/or seawalls comprising pattern placed armour units which require greater reliance on toe support.
2. A minimum design life of 60 years is based on considerations included in Horton, P and Britton, G (2015), ‘Defining beachfront setbacks based on ‘acceptable risk’ – is it the new approach?’ 22nd Australasian Coastal & Ocean Engineering Conference and the 15th Australasian Port and Harbour Conference. This design life recognises, among other things, that redevelopment of beachfront properties typically occurs within such a period. In practice, rock incorporated within seawall structures would have a considerably greater life than 60 years based on the durability criteria specified (refer Table above). This enables reuse of rocks in the event a rock seawall needs to be modified as part of a redevelopment.
3. It may be possible to justify a lower crest level than 6.5mAHD particularly with distance south along the beach. Adaption strategies to accommodate sea level rise can be considered in assessing the appropriate crest level.
4. Cemented sand layers are known to exist at locations along Collaroy-Narrabeen Beach at levels above -1mAHD and provide a suitable foundation for rock seawalls.
5. It is necessary to ensure slope stability including global slope stability, ie. overall sliding (rotational) failure of the entire rock structure. Temporary construction slopes may need to be flatter than 1V:1.5H to be stable.

© Crown 2016 MHL 2491
C1
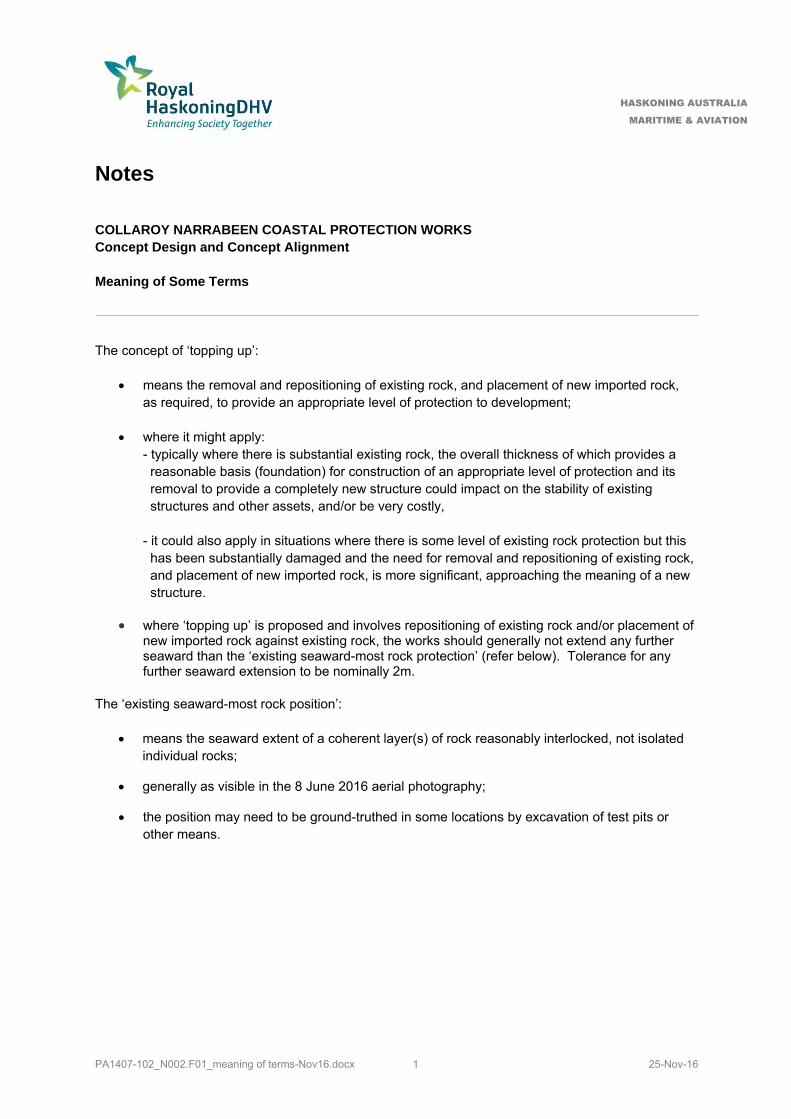
Appendix C – NOTES: COLLAROY NARRABEEN COASTAL PROTECTION WORKS Concept Design and Concept Alignment (Haskoning, 2016)
PA1407-102_N002.F01_meaning of terms-Nov16.docx 1 25-Nov-16
HASKONING AUSTRALIA
MARITIME & AVIATION
1
Notes COLLAROY NARRABEEN COASTAL PROTECTION WORKS
Concept Design and Concept Alignment
Meaning of Some Terms
The concept of ‘topping up’:
means the removal and repositioning of existing rock, and placement of new imported rock, as required, to provide an appropriate level of protection to development;
where it might apply:
- typically where there is substantial existing rock, the overall thickness of which provides a reasonable basis (foundation) for construction of an appropriate level of protection and its removal to provide a completely new structure could impact on the stability of existing structures and other assets, and/or be very costly, - it could also apply in situations where there is some level of existing rock protection but this has been substantially damaged and the need for removal and repositioning of existing rock, and placement of new imported rock, is more significant, approaching the meaning of a new structure.
where ‘topping up’ is proposed and involves repositioning of existing rock and/or placement of
new imported rock against existing rock, the works should generally not extend any further seaward than the ‘existing seaward-most rock protection’ (refer below). Tolerance for any further seaward extension to be nominally 2m.
The ‘existing seaward-most rock position’:
means the seaward extent of a coherent layer(s) of rock reasonably interlocked, not isolated individual rocks;
generally as visible in the 8 June 2016 aerial photography;
the position may need to be ground-truthed in some locations by excavation of test pits or other means.

DRAFT Collaroy-Narrabeen Beach: Coastal Protection Works Concept Design and Concept Alignment Notes on existing situation and potential alignment1
1 Includes consideration of discussions at meeting with Council officers and MHL/WRL on 26 August 2016. Reference to location of existing rock protection is based on examination of aerial photography captured on 8 June 2016. PA1407-102_N001.F01-existing&potential alignment notes-Nov16.docx 1 25-Nov-2016
Segment / Location Chainage (m) (approx.)
Comments
Collaroy Carpark 0-250 (250m)
chainage starts at north-east corner of Beach Club
chainage terminates at The Breakers
existing rock protection is contained within the property boundary except near northern end adjacent to The Breakers
north-east corner of Beach Club and south-east corner of vertical wall at The Breakers control seawall alignment at ends (these two structures unlikely to be modified)
cemented sand layer -0.5m AHD at northern end of the carpark
sufficient space generally exists between carpark and property boundary to construct a rock seawall
alignment of any rock seawall dependent on Council desired cross section eastward of carpark – Council advice is that maintaining the pre June 2016 storm width of grassed area seaward of the carpark is required
reinstate pre-storm pedestrian access points to the beach; no additional pedestrian access points required
provide clear vehicular access points for end tipping sand onto beach at northern and southern ends of the beach
the seawall alignment along this segment will be governed by the crest position of a seawall, as determined after re-establishment of pre-storm width of grassed area
sloping rock revetment can be accommodated without encroachment beyond property boundary and is considered appropriate for this segment
1096 Pittwater Road, ‘The Breakers’ c. 250-260
(10m)
vertical concrete seawall and rock toe constructed c.1967 (Patterson Britton, 2001)
vertical seawall is contained within property boundary by some distance (may be a concession to the rock toe protection)
cemented sand layer -0.5 to -0.7m AHD
little evidence of significant rock toe to vertical seawall
longer return of concrete seawall exists on northern side of property – probably encroaches onto Council land
vertical seawall unlikely to be modified as it has been shown to be robust in several storms, thus controls alignment
the seawall alignment at The Breakers should switch to the toe position of a structure, namely that the toe be no further seaward than the property boundary, as opposed to alignment being governed by the crest position as is the case to the south
DRAFT Collaroy-Narrabeen Beach: Coastal Protection Works Concept Design and Concept Alignment Notes on existing situation and potential alignment1
1 Includes consideration of discussions at meeting with Council officers and MHL/WRL on 26 August 2016. Reference to location of existing rock protection is based on examination of aerial photography captured on 8 June 2016. PA1407-102_N001.F01-existing&potential alignment notes-Nov16.docx 2 25-Nov-2016
Segment / Location Chainage (m) (approx.)
Comments
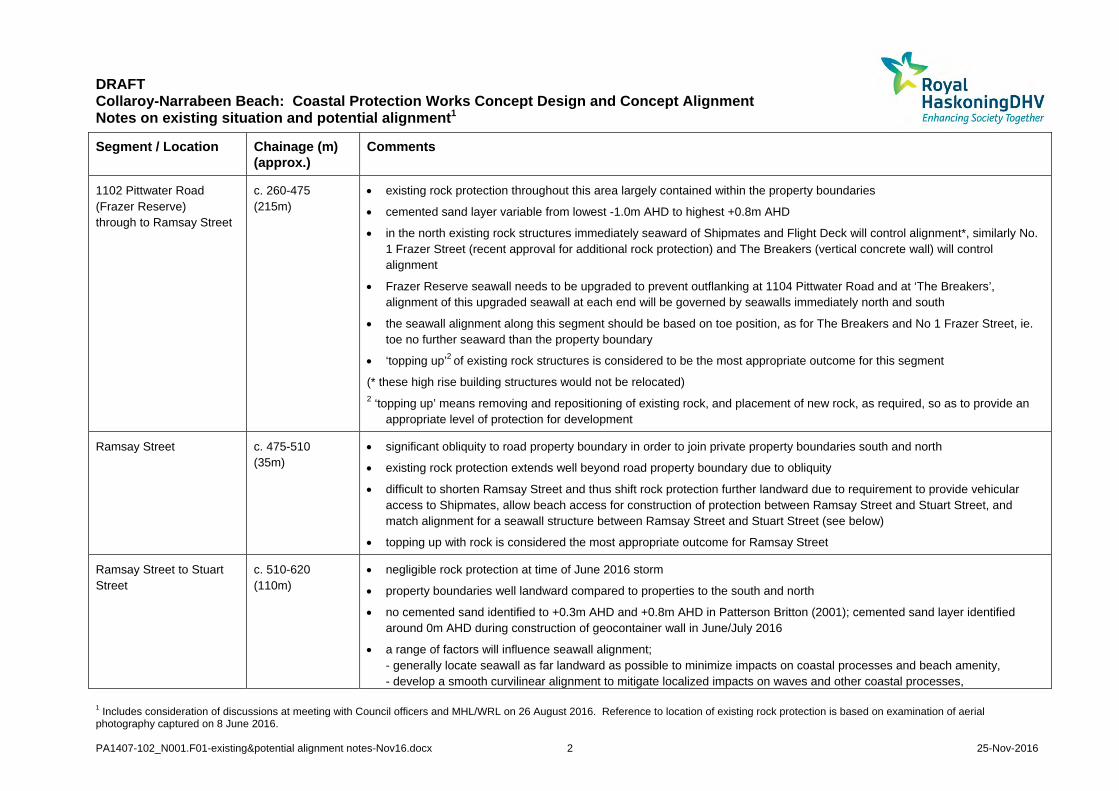
1102 Pittwater Road (Frazer Reserve) through to Ramsay Street
c. 260-475 (215m)
existing rock protection throughout this area largely contained within the property boundaries
cemented sand layer variable from lowest -1.0m AHD to highest +0.8m AHD
in the north existing rock structures immediately seaward of Shipmates and Flight Deck will control alignment*, similarly No. 1 Frazer Street (recent approval for additional rock protection) and The Breakers (vertical concrete wall) will control alignment
Frazer Reserve seawall needs to be upgraded to prevent outflanking at 1104 Pittwater Road and at ‘The Breakers’, alignment of this upgraded seawall at each end will be governed by seawalls immediately north and south
the seawall alignment along this segment should be based on toe position, as for The Breakers and No 1 Frazer Street, ie. toe no further seaward than the property boundary
‘topping up’2 of existing rock structures is considered to be the most appropriate outcome for this segment
(* these high rise building structures would not be relocated) 2 ‘topping up’ means removing and repositioning of existing rock, and placement of new rock, as required, so as to provide an
appropriate level of protection for development
Ramsay Street c. 475-510 (35m)
significant obliquity to road property boundary in order to join private property boundaries south and north
existing rock protection extends well beyond road property boundary due to obliquity
difficult to shorten Ramsay Street and thus shift rock protection further landward due to requirement to provide vehicular access to Shipmates, allow beach access for construction of protection between Ramsay Street and Stuart Street, and match alignment for a seawall structure between Ramsay Street and Stuart Street (see below)
topping up with rock is considered the most appropriate outcome for Ramsay Street
Ramsay Street to Stuart Street
c. 510-620 (110m)
negligible rock protection at time of June 2016 storm
property boundaries well landward compared to properties to the south and north
no cemented sand identified to +0.3m AHD and +0.8m AHD in Patterson Britton (2001); cemented sand layer identified around 0m AHD during construction of geocontainer wall in June/July 2016
a range of factors will influence seawall alignment; - generally locate seawall as far landward as possible to minimize impacts on coastal processes and beach amenity, - develop a smooth curvilinear alignment to mitigate localized impacts on waves and other coastal processes,
DRAFT Collaroy-Narrabeen Beach: Coastal Protection Works Concept Design and Concept Alignment Notes on existing situation and potential alignment1
1 Includes consideration of discussions at meeting with Council officers and MHL/WRL on 26 August 2016. Reference to location of existing rock protection is based on examination of aerial photography captured on 8 June 2016. PA1407-102_N001.F01-existing&potential alignment notes-Nov16.docx 3 25-Nov-2016
Segment / Location Chainage (m) (approx.)
Comments
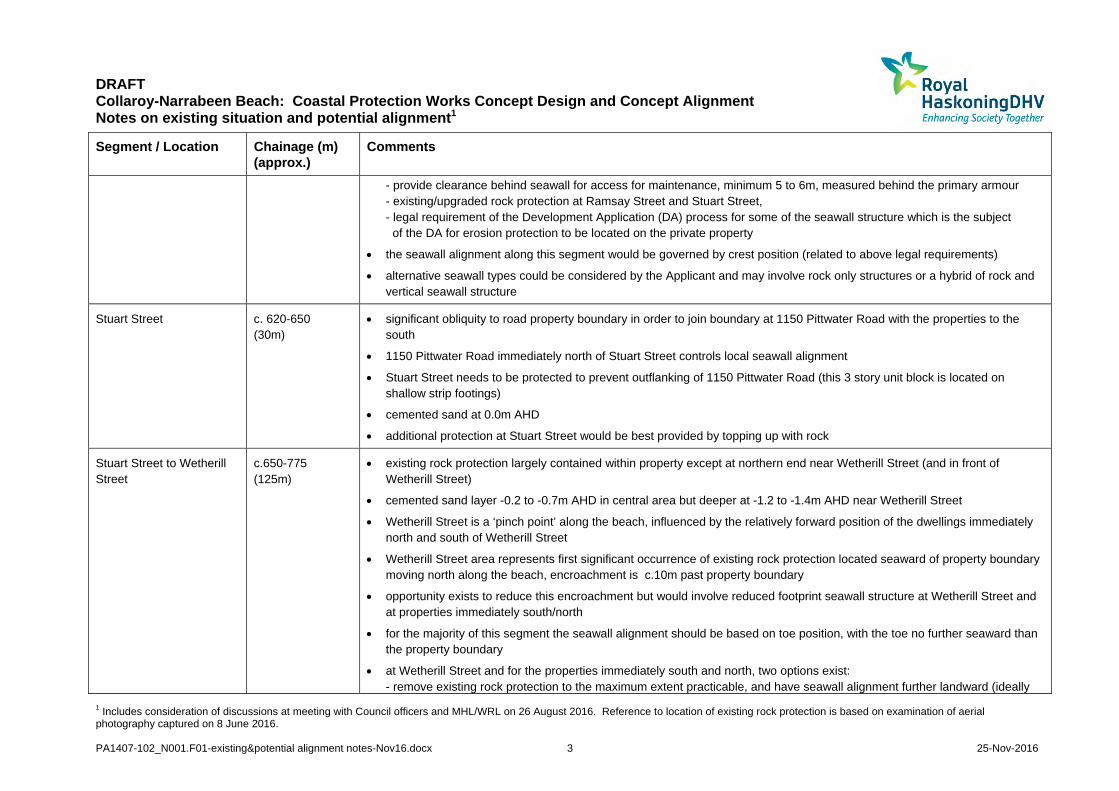
- provide clearance behind seawall for access for maintenance, minimum 5 to 6m, measured behind the primary armour - existing/upgraded rock protection at Ramsay Street and Stuart Street, - legal requirement of the Development Application (DA) process for some of the seawall structure which is the subject of the DA for erosion protection to be located on the private property
the seawall alignment along this segment would be governed by crest position (related to above legal requirements)
alternative seawall types could be considered by the Applicant and may involve rock only structures or a hybrid of rock and vertical seawall structure
Stuart Street c. 620-650 (30m)
significant obliquity to road property boundary in order to join boundary at 1150 Pittwater Road with the properties to the south
1150 Pittwater Road immediately north of Stuart Street controls local seawall alignment
Stuart Street needs to be protected to prevent outflanking of 1150 Pittwater Road (this 3 story unit block is located on shallow strip footings)
cemented sand at 0.0m AHD
additional protection at Stuart Street would be best provided by topping up with rock
Stuart Street to Wetherill Street
c.650-775 (125m)
existing rock protection largely contained within property except at northern end near Wetherill Street (and in front of Wetherill Street)
cemented sand layer -0.2 to -0.7m AHD in central area but deeper at -1.2 to -1.4m AHD near Wetherill Street
Wetherill Street is a ‘pinch point’ along the beach, influenced by the relatively forward position of the dwellings immediately north and south of Wetherill Street
Wetherill Street area represents first significant occurrence of existing rock protection located seaward of property boundary moving north along the beach, encroachment is c.10m past property boundary
opportunity exists to reduce this encroachment but would involve reduced footprint seawall structure at Wetherill Street and at properties immediately south/north
for the majority of this segment the seawall alignment should be based on toe position, with the toe no further seaward than the property boundary
at Wetherill Street and for the properties immediately south and north, two options exist: - remove existing rock protection to the maximum extent practicable, and have seawall alignment further landward (ideally
DRAFT Collaroy-Narrabeen Beach: Coastal Protection Works Concept Design and Concept Alignment Notes on existing situation and potential alignment1
1 Includes consideration of discussions at meeting with Council officers and MHL/WRL on 26 August 2016. Reference to location of existing rock protection is based on examination of aerial photography captured on 8 June 2016. PA1407-102_N001.F01-existing&potential alignment notes-Nov16.docx 4 25-Nov-2016
Segment / Location Chainage (m) (approx.)
Comments
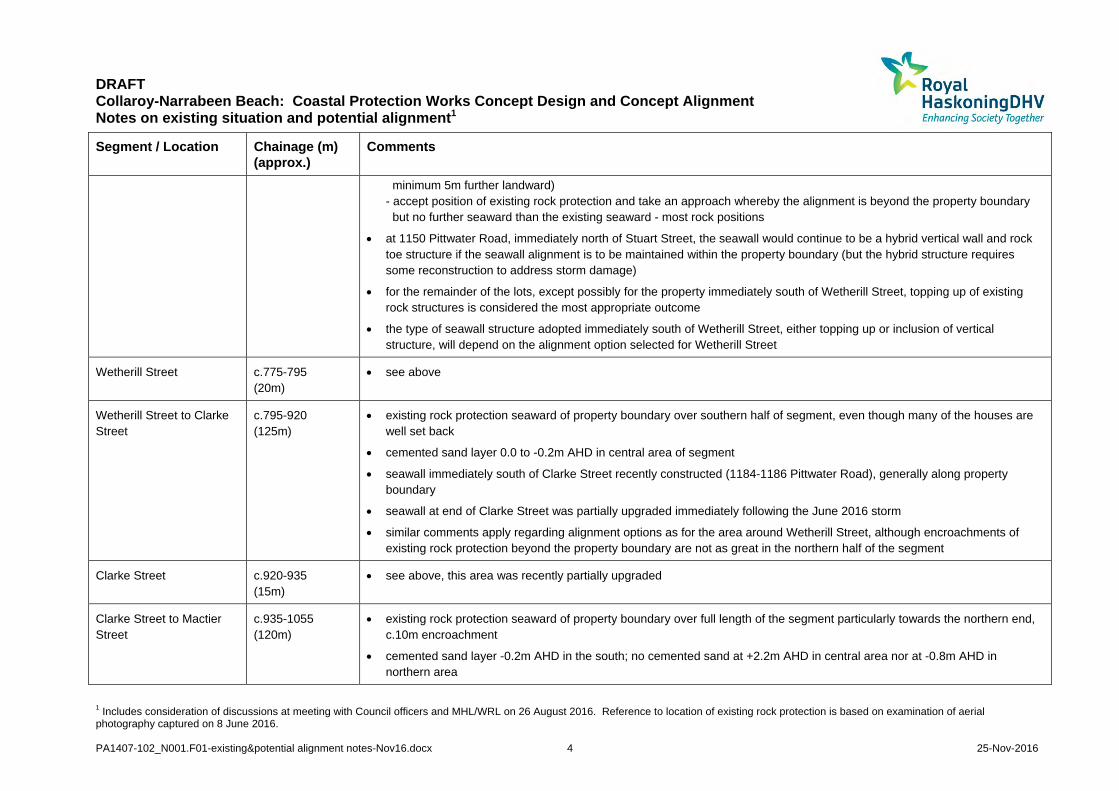
minimum 5m further landward) - accept position of existing rock protection and take an approach whereby the alignment is beyond the property boundary but no further seaward than the existing seaward - most rock positions
at 1150 Pittwater Road, immediately north of Stuart Street, the seawall would continue to be a hybrid vertical wall and rock toe structure if the seawall alignment is to be maintained within the property boundary (but the hybrid structure requires some reconstruction to address storm damage)
for the remainder of the lots, except possibly for the property immediately south of Wetherill Street, topping up of existing rock structures is considered the most appropriate outcome
the type of seawall structure adopted immediately south of Wetherill Street, either topping up or inclusion of vertical structure, will depend on the alignment option selected for Wetherill Street
Wetherill Street c.775-795 (20m)
see above
Wetherill Street to Clarke Street
c.795-920 (125m)
existing rock protection seaward of property boundary over southern half of segment, even though many of the houses are well set back
cemented sand layer 0.0 to -0.2m AHD in central area of segment
seawall immediately south of Clarke Street recently constructed (1184-1186 Pittwater Road), generally along property boundary
seawall at end of Clarke Street was partially upgraded immediately following the June 2016 storm
similar comments apply regarding alignment options as for the area around Wetherill Street, although encroachments of existing rock protection beyond the property boundary are not as great in the northern half of the segment
Clarke Street c.920-935 (15m)
see above, this area was recently partially upgraded
Clarke Street to Mactier Street
c.935-1055 (120m)
existing rock protection seaward of property boundary over full length of the segment particularly towards the northern end, c.10m encroachment
cemented sand layer -0.2m AHD in the south; no cemented sand at +2.2m AHD in central area nor at -0.8m AHD in northern area

DRAFT Collaroy-Narrabeen Beach: Coastal Protection Works Concept Design and Concept Alignment Notes on existing situation and potential alignment1
1 Includes consideration of discussions at meeting with Council officers and MHL/WRL on 26 August 2016. Reference to location of existing rock protection is based on examination of aerial photography captured on 8 June 2016. PA1407-102_N001.F01-existing&potential alignment notes-Nov16.docx 5 25-Nov-2016
Segment / Location Chainage (m) (approx.)
Comments
this segment contains South Narrabeen SLSC
similar comments apply regarding alignment options and seawall types as for the area around Wetherill Street, noting that encroachments are universal for this segment, however access and parking requirements for the unit block immediately south of Mactier Street will prohibit a rock seawall alignment towards the property boundary
Mactier Street c.1055-1075 (20m)
existing rock protection extends well seaward of road property boundary, c.10m
cemented sand layer 0.0m AHD immediately north of Mactier Street
Mactier Street to Goodwin Street
c.1075-1190 (115m)
existing rock protection seaward of property boundary over full length of segment, particularly extensive near northern end, c.15m, but this influenced by failure of the previous rock protection (2A/2B Goodwin Street)
cemented sand layer 0.0m AHD in southern area, -0.2 to -0.5m AHD towards northern end, no cemented sand layer to -0.2m AHD in central area
similar comments apply regarding alignment options and seawall types as for the area around Wetherill Street, noting that encroachments are significant and universal for this segment, however limited space seaward of houses in central area of the segment will prohibit a rock seawall alignment towards the property boundary
Goodwin Street c.1190-1205 (15m)
existing rock protection seaward of property boundary
seawall at end of road partially upgraded immediately following the June 2016 storm (after air photo taken on 8 June)
Goodwin Street to Devitt Street
c.1205-1337 (132m)
existing rock protection seaward of property boundary along full segment with minor exception at northern end, c.10m length
maximum encroachment, c.12m
foundations for pool and the basement area in central section of segment at Marquesas will influence any piled seawall solution (interference with ground anchors)
cemented sand layer -0.6 to -0.7m AHD at southern boundary of Marquesas
10m unprotected section at northern end of segment fronts Council land
similar comments apply regarding alignment options and seawall types as for the area around Wetherill Street, noting that encroachments are significant and generally universal for this segment (exception is 10m unprotected section at northern end of segment); existing pool and basement at Marquesas will restrict options as noted above
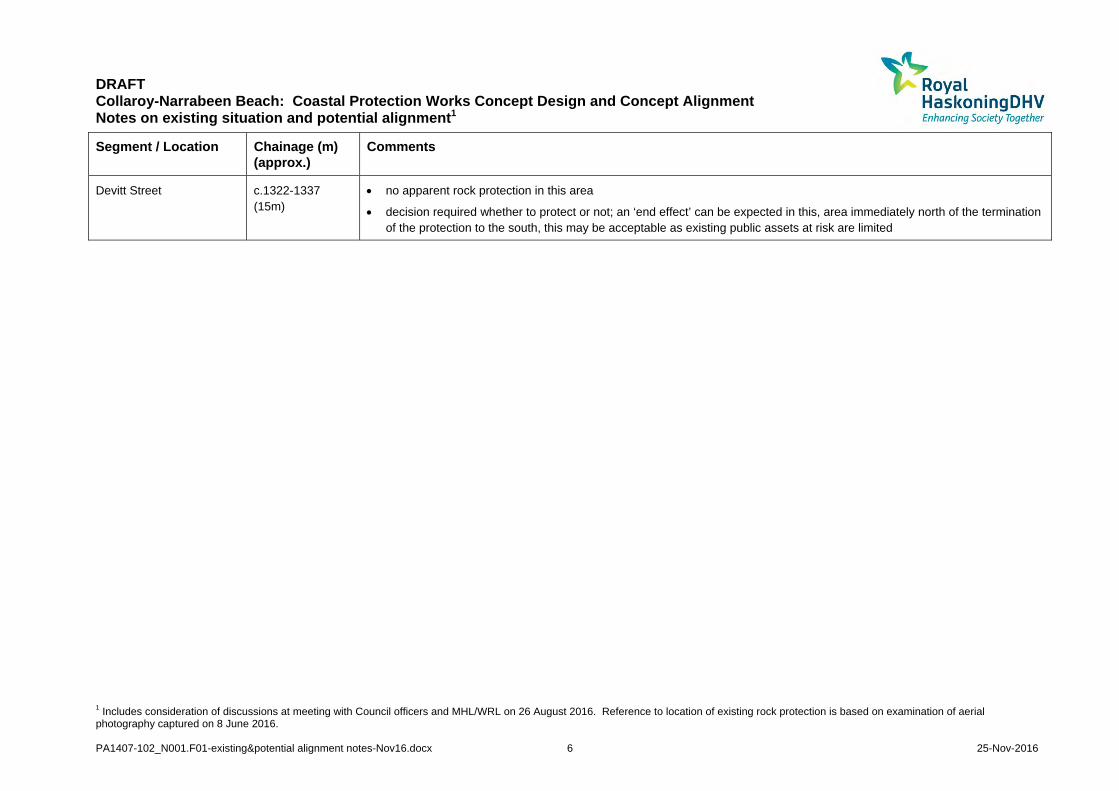
DRAFT Collaroy-Narrabeen Beach: Coastal Protection Works Concept Design and Concept Alignment Notes on existing situation and potential alignment1
1 Includes consideration of discussions at meeting with Council officers and MHL/WRL on 26 August 2016. Reference to location of existing rock protection is based on examination of aerial photography captured on 8 June 2016. PA1407-102_N001.F01-existing&potential alignment notes-Nov16.docx 6 25-Nov-2016
Segment / Location Chainage (m) (approx.)
Comments
Devitt Street c.1322-1337 (15m)
no apparent rock protection in this area
decision required whether to protect or not; an ‘end effect’ can be expected in this, area immediately north of the termination of the protection to the south, this may be acceptable as existing public assets at risk are limited
© Crown 2016 MHL 2491
D1
Appendix D – Draft Conceptual Alignment, Visual Representation, Selected Site Information and Concept Design for Coastal Protection Works (Haskoning, 2016)