Embed Size (px)
Citation preview
Bank of Japan
Population Ageing, Macroeconomic Crisis and Policy Challengesand Policy Challenges
~ Prepared for the Panel “The General Theory and the Policy Reponses to Macroeconomic Crisis” at the 75th Anniversary Conference of Keynes’
General Theory, University of Cambridge, June 19-21 ~
Kiyohiko G. NishimuraD t G f th B k f JDeputy Governor of the Bank of Japan
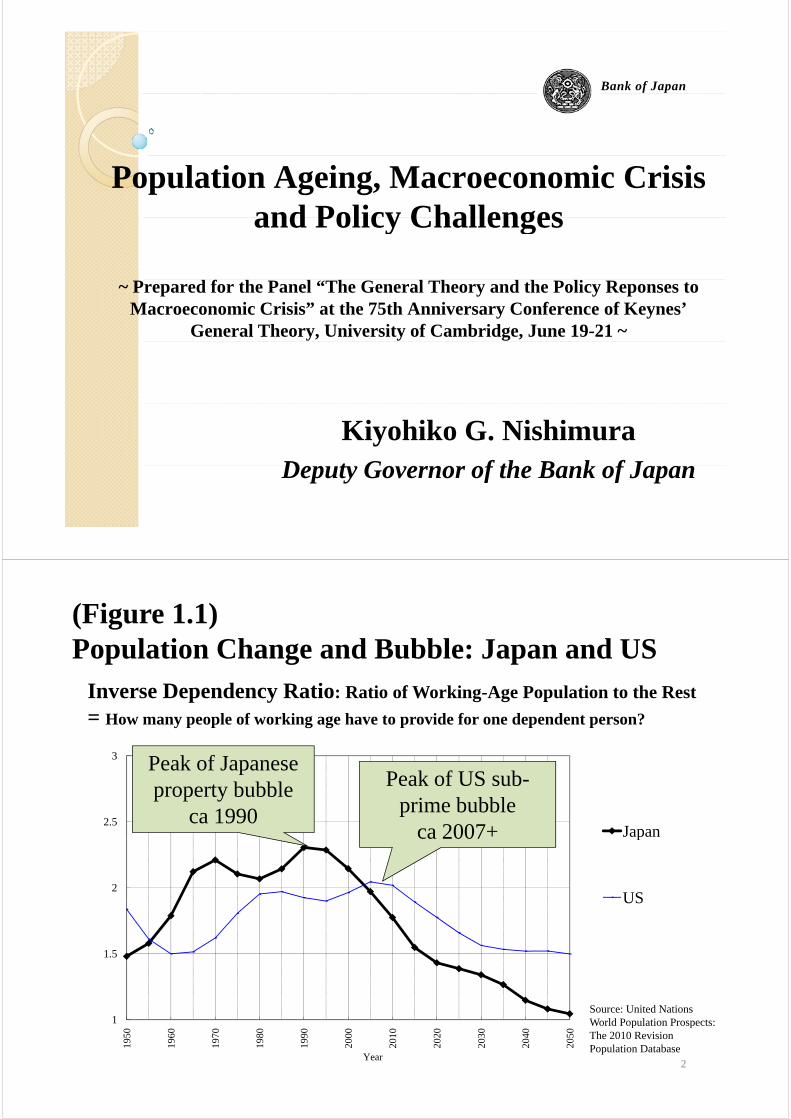
(Figure 1.1) Population Change and Bubble: Japan and USPopulation Change and Bubble: Japan and US
Inverse Dependency Ratio: Ratio of Working-Age Population to the Rest
= H l f ki h t id f d d t ?
3
= How many people of working age have to provide for one dependent person?
Peak of Japanese Peak of US sub
2.5Japan
property bubbleca 1990
Peak of US sub-prime bubble
ca 2007+
2
p
US
ca 2007
1.5
US
1Source: United Nations World Population Prospects:
1950
1960
1970
1980
1990
2000
2010
2020
2030
2040
2050
Year2
World Population Prospects: The 2010 Revision Population Database
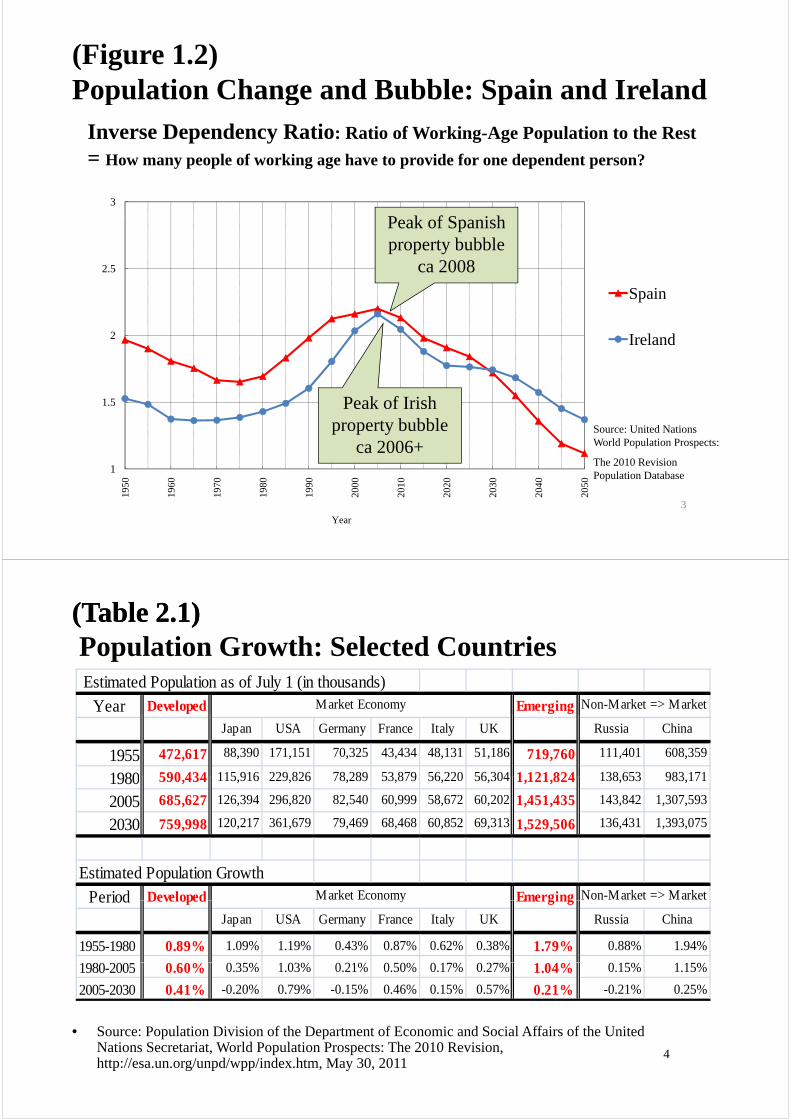
(Figure 1.2) Population Change and Bubble: Spain and IrelandPopulation Change and Bubble: Spain and Ireland
Inverse Dependency Ratio: Ratio of Working-Age Population to the Rest
= H l f ki h t id f d d t ?
3
P k f S i h
= How many people of working age have to provide for one dependent person?
2.5
Peak of Spanish property bubble
ca 2008
2
Spain
Ireland
1 5
Ireland
Peak of Irish
1
1.5
Source: United Nations World Population Prospects:
The 2010 Revision
Peak of Irish property bubble
ca 2006+1
1950
1960
1970
1980
1990
2000
2010
2020
2030
2040
2050
Year
3
The 2010 Revision Population Database
(Table 2.1) (Table 2.1) Population Growth: Selected Countries Estimated Population as of July 1 (in thousands)
Year Developed Emerging Non-Market => MarketMarket Economy
Population Growth: Selected Countries
Japan USA Germany France Italy UK Russia China
1955 472,617 88,390 171,151 70,325 43,434 48,131 51,186 719,760 111,401 608,359
1980 590 434 115 916 229 826 78 289 53 879 56 220 56 304 1 121 824 138 653 983 1711980 590,434 115,916 229,826 78,289 53,879 56,220 56,304 1,121,824 138,653 983,171
2005 685,627 126,394 296,820 82,540 60,999 58,672 60,202 1,451,435 143,842 1,307,593
2030 759,998 120,217 361,679 79,469 68,468 60,852 69,313 1,529,506 136,431 1,393,075
Estimated Population Growth
Period Developed EmergingMarket Economy Non-Market => MarketPeriod Developed Emerging
Japan USA Germany France Italy UK Russia China
1955-1980 0.89% 1.09% 1.19% 0.43% 0.87% 0.62% 0.38% 1.79% 0.88% 1.94%
y
1980-2005 0.60% 0.35% 1.03% 0.21% 0.50% 0.17% 0.27% 1.04% 0.15% 1.15%
2005-2030 0.41% -0.20% 0.79% -0.15% 0.46% 0.15% 0.57% 0.21% -0.21% 0.25%
4
• Source: Population Division of the Department of Economic and Social Affairs of the United Nations Secretariat, World Population Prospects: The 2010 Revision, http://esa.un.org/unpd/wpp/index.htm, May 30, 2011

(Table 2.2) (Table 2.2) Life Expectancy: Selected CountriesEstimated Life Expectancy at birth (years)
Life Expectancy: Selected Countries
Year
Japan USA Germany France Italy UK Russia China
Market Economy Non-Market => Market
p y y
1950-195562 69 68 67 66 69 65 45
1975-198075 73 73 74 73 73 68 66
2000-200582 77 79 80 80 78 65 72
2025 203085 81 83 84 84 82 72 76
2025-2030
5
• Source: Population Division of the Department of Economic and Social Affairs of the United Nations Secretariat, World Population Prospects: The 2010 Revision, http://esa.un.org/unpd/wpp/index.htm, Jun 8, 2011
(Figure 2.1) (Figure 2.1) Ageing Population and Property Prices: JapanAgeing Population and Property Prices: Japan
Relative abundance of young i id d i h hi h i
Ageing Population and Property Prices: Japan Ageing Population and Property Prices: Japan
1002.5(Inverse Dependency Ratio) (Real Land Price, Peak<Mar.1991>=100)
coincided with higher property prices
75
Relative abundance of old leads to lower property price
50
2.0
25
1.5Declining property prices
aggravated B/S adjustment
01.0
Inverse Dependency Ratio (Japan)Real Land Price (PEAK=100)
1955
1960
1965
1970
1975
1980
1985
1990
1995
2000
2005
2010
2015
2020
2025
2030
Year 6
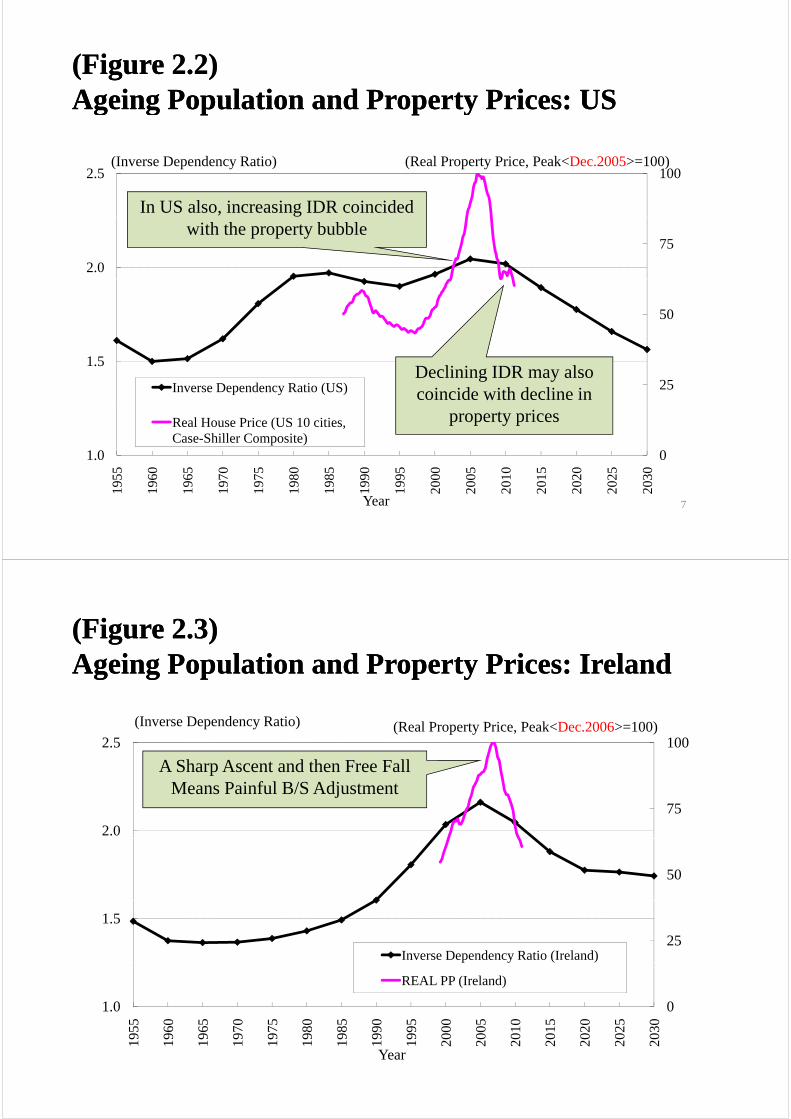
(Figure 2.2) (Figure 2.2) A i P l ti d P t P i USA i P l ti d P t P i USAgeing Population and Property Prices: US Ageing Population and Property Prices: US
1002.5(Inverse Dependency Ratio) (Real Property Price, Peak<Dec.2005>=100)
In US also, increasing IDR coincided
75
2.0
with the property bubble
50
25
1.5
Inverse Dependency Ratio (US)Declining IDR may also coincide with decline in
01.0
Real House Price (US 10 cities, Case-Shiller Composite)
property prices
1955
1960
1965
1970
1975
1980
1985
1990
1995
2000
2005
2010
2015
2020
2025
2030
Year 7
(Figure 2.3) (Figure 2.3) Ageing Population and Property Prices: IrelandAgeing Population and Property Prices: Ireland
1002.5
(Inverse Dependency Ratio) (Real Property Price, Peak<Dec.2006>=100)
A Sharp Ascent and then Free Fall
75
2.0
Means Painful B/S Adjustment
50
25
1.5
Inverse Dependency Ratio (Ireland)
01.0
5 0 5 0 5 0 5 0 5 0 5 0 5 0 5 0
p y ( )
REAL PP (Ireland)
1955
1960
1965
1970
1975
1980
1985
1990
1995
2000
2005
2010
2015
2020
2025
2030
Year
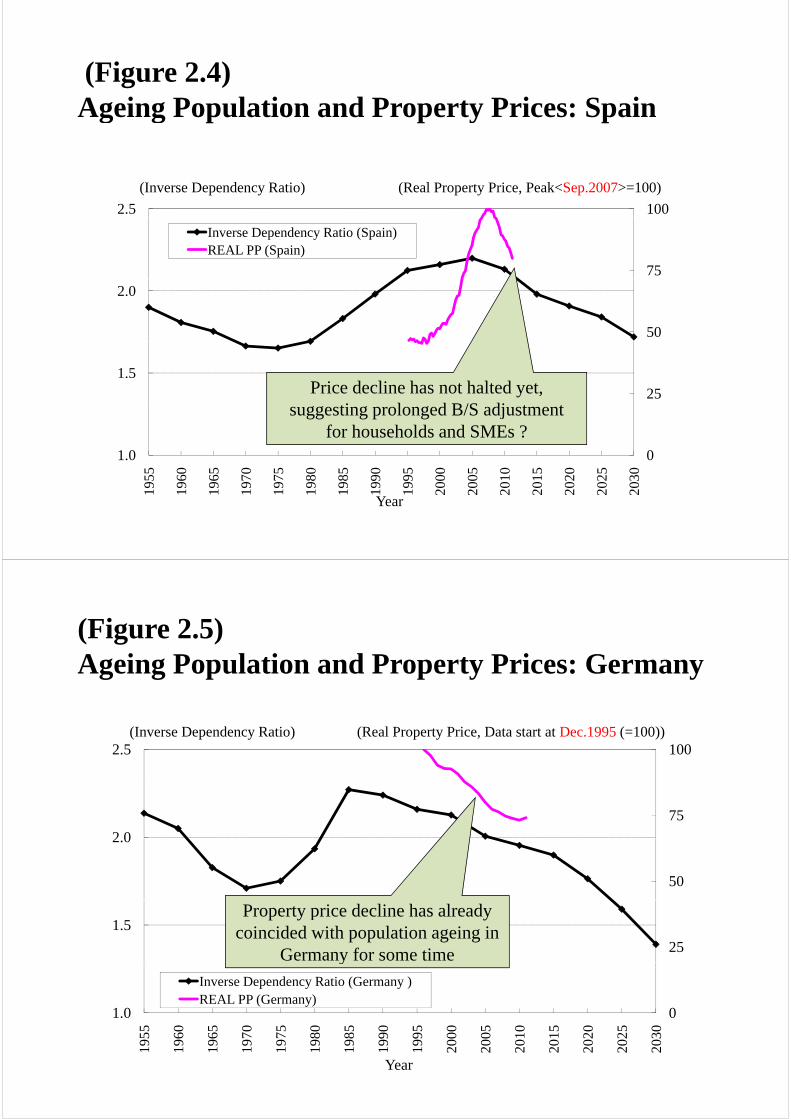
(Figure 2.4) Ageing Population and Property Prices: Spain
1002.5
(Inverse Dependency Ratio) (Real Property Price, Peak<Sep.2007>=100)
75
Inverse Dependency Ratio (Spain)REAL PP (Spain)
50
2.0
251.5
Price decline has not halted yet,i l d B/S dj
01.0
suggesting prolonged B/S adjustmentfor households and SMEs ?
1955
1960
1965
1970
1975
1980
1985
1990
1995
2000
2005
2010
2015
2020
2025
2030
Year
(Figure 2.5) Ageing Population and Property Prices: Germany
1002.5(Inverse Dependency Ratio) (Real Property Price, Data start at Dec.1995 (=100))
75
2 0
50
2.0
25
1.5Property price decline has already
coincided with population ageing in Germany for some time
01.0
Inverse Dependency Ratio (Germany )REAL PP (Germany)
y
1955
1960
1965
1970
1975
1980
1985
1990
1995
2000
2005
2010
2015
2020
2025
2030
Year

(Table 2.3) Impact of GlobalizationImpact of GlobalizationNumerical Example Based on UN Population Estimates
Y P l ti A P i
Period Developed EmergingMarketW ld
Young Population Asset PriceInflation
Rate
1:
p g gWorld Rate
unit = thousands per annum
1:Cold War
(1955)472,617 472,617
2 P2: Pre-
Globalization
(1980)590,434 590,434 0.89%
(1980)3:
Globalization 685,627 1,451,435 2,137,062 5.28%
11
(2005)
<Note: Fixed Exchange Rate Between Regions in Period 3>
(Table 2.4)Aftermath of GlobalizationAftermath of Globalization
Young Population Asset PriceInflation
RatePeriod Developed EmergingMarketWorld
1: Cold War472 617 472 617
unit = thousands per annum
(1955)472,617 472,617
2: Pre-Globalization590 434 590 434 0 89%
(1980)590,434 590,434
3: Globalization685 627 1 451 435 2 137 062
0.89%
5 28%(2005)
685,627 1,451,435 2,137,062
4: Post-Globalization
5.28%
0 28%12
4: Post Globalization(2030) 759,998 1,529,506 2,289,504 0.28%
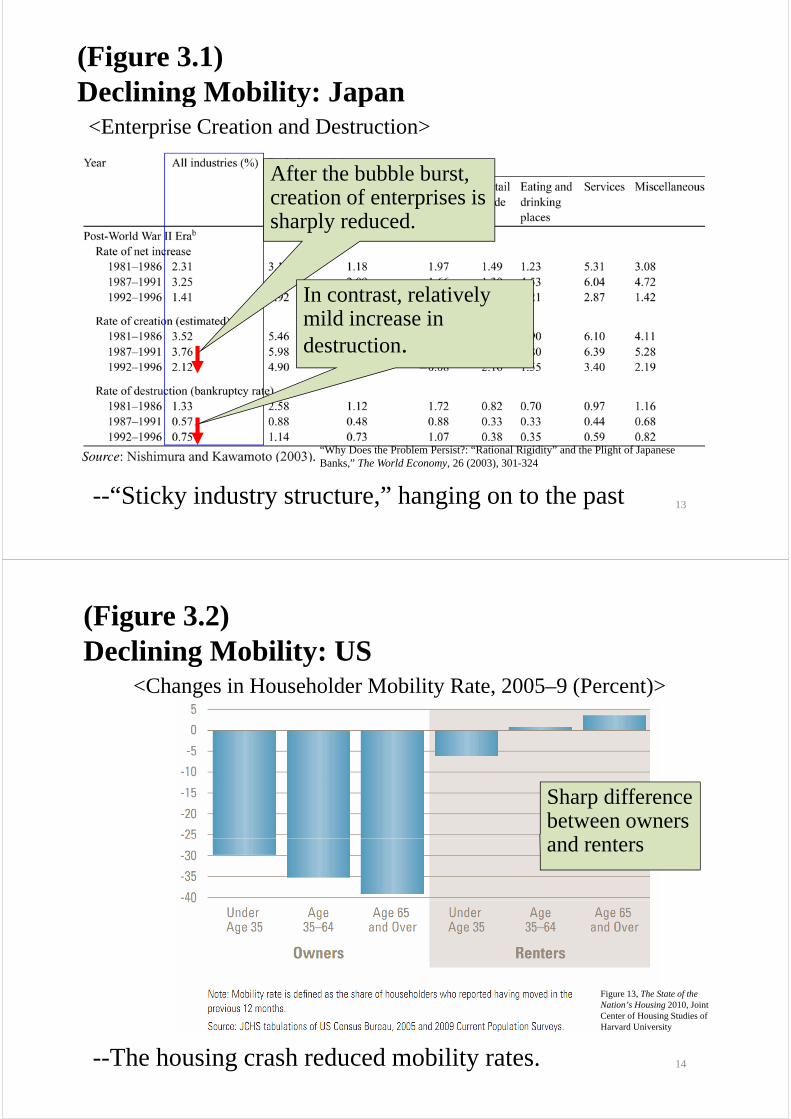
(Figure 3.1) Declining Mobility: JapanDeclining Mobility: Japan
<Enterprise Creation and Destruction>
After the bubble burst, creation of enterprises is h l d dsharply reduced.
In contrast, relatively mild increase in d t tidestruction.
“Why Does the Problem Persist?: “Rational Rigidity” and the Plight of Japanese Banks ” The World Economy 26 (2003) 301-324
--“Sticky industry structure,” hanging on to the past 13
Banks, The World Economy, 26 (2003), 301 324
(Figure 3.2) Declining Mobility: USDeclining Mobility: US
<Changes in Householder Mobility Rate, 2005–9 (Percent)>
Sharp difference between owners
d tand renters
Figure 13, The State of the Nation’s Housing 2010, Joint Center of Housing Studies of H d U i it
--The housing crash reduced mobility rates. 14
Harvard University

(Figure 3.3)Breakdown
TFP of survivingand exiting firms
Breakdown of Natural SelectionSelection Mechanism 1997: many industries saw more
productive firms exiting.in Japanese Financial
p gBreakdown of natural selection
Crisis of 1997
Shaded: exiting firms are more productiveare more productive than surviving firms
Nishimura, Nakajima, Kiyota (2005) “Does
15
Nishimura, Nakajima, Kiyota (2005) Does Natural Selection Mechanism Still Work in Severe Recessions? –Examination of the Japanese Economy in the 1990s- “ Journal of Economic Behavior and Organization, 58:1 (2005), 53-78
End of PresentationEnd of Presentation
View of the BOJ courtyard around sunset
16
Appendix: Financial Crisis and Inverse Dependency Ratio: An Update
In a speech in January 2011,1 I presented some telling figures on the correlation of financial crisis, or so-called bubbles, and the inverse dependency ratio in Japan, United States, Greece, Portugal, Spain, Ireland and China. The figures were based on the 2008 revision of the United Nations World Population Prospects. Since then, the United Nations has published its 2010 revision. This appendix updates these figures and expands on them by including more European and Asian countries. The Japanese inverse dependency ratio peaked around 1990, and it was in the very next year, 1991, that the Japanese Bubble peaked. The peak of the US ratio was between 2005 and 2010, and the peak of the US Subprime Bubble was 2007 (Figure A.1 [same as Figure 1.1]). The economically troubled countries of the eurozone present a similar pattern to Japan and the United States. The ratios for Greece, Portugal and Spain have almost the same time profile, and all of them peaked around 2000-2005. The peak of the Spanish property boom was just after the ratio’s peak, and the financial problems of Greece also started at the same time. A particularly interesting case is Ireland, which showed a sharp rise in the ratio until around 2005. The bursting of the country’s property market bubble was just a few years around the corner (Figure. A.2). How about other European countries? The so-called Core Europe, Germany, France and Italy, passed the peak 10+ years ago, and seemingly, did not have any particularly alarming property bubbles around 2010 (Figure A.3). However, new and potential members of the eurozone show similar patterns to Greece, Spain, Portugal, and Ireland (Figure A.4). Their ratios peaked around 2005-2010, and some have their own problems. In contrast to advanced countries, emerging Asia has shown remarkable resilience against the financial crisis of 2008. In fact, their inverse dependency ratio is still rising, as exemplified by China’s ratio (Figure A.5). The inverse dependency ratios of many other Asian countries have a quite similar time profile to that of China (Figure A.6). However, their ascent will be checked in a relatively short period, and the peak will be around 2010-15 in many of these countries. After that, the ratio will fall as rapidly as it is now rising.
1 See footnote 2.
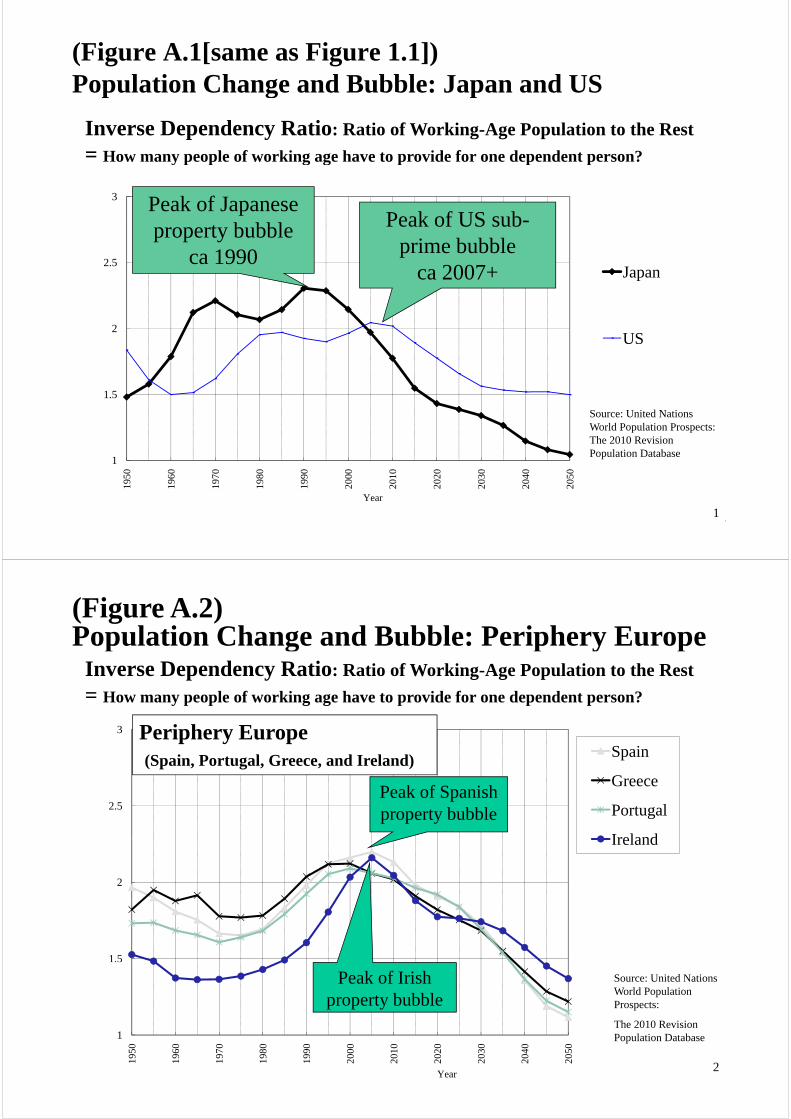
(Figure A.1[same as Figure 1.1]) Population Change and Bubble: Japan and USp g p
Inverse Dependency Ratio: Ratio of Working-Age Population to the Rest
= How many people of working age have to provide for one dependent person?
3 Peak of Japanese Peak of US sub
= How many people of working age have to provide for one dependent person?
2.5Japan
property bubbleca 1990
Peak of US sub-prime bubble
ca 2007+
2
p
US
ca 2007
1.5
US
1
Source: United Nations World Population Prospects: The 2010 Revision Population Database
1950
1960
1970
1980
1990
2000
2010
2020
2030
2040
2050
Year
11
(Figure A.2) Population Change and Bubble: Periphery Europe
Inverse Dependency Ratio: Ratio of Working-Age Population to the Rest
= How many people of working age have to provide for one dependent person?
3
Spain
G
Periphery Europe(Spain, Portugal, Greece, and Ireland)
2.5
Greece
Portugal
Ireland
Peak of Spanish property bubble
2
Ireland
1.5
Source: United Nations World Population Prospects:
The 2010 Revision
Peak of Irish property bubble
1
1950
1960
1970
1980
1990
2000
2010
2020
2030
2040
2050
Year2
The 2010 Revision Population Database

(Figure A.3) Core Europe compared with Periphery Europe Inverse Dependency Ratio: Ratio of Working-Age Population to the Rest
= How many people of working age have to provide for one dependent person?
3 Core Europe (Germany, France, Italy) compared with Spain
2.5Core Europe already passed
the peak 10+ years ago
2
Germany
France
1 5
Italy
Spain1.5
Source: United Nations World Population Prospects:
1
1950
1960
1970
1980
1990
2000
2010
2020
2030
2040
2050
Year
Prospects:
The 2010 Revision Population Database
3
(Figure A.4) New and Potential Members of EU
Inverse Dependency Ratio: Ratio of Working-Age Population to the Rest
= How many people of working age have to provide for one dependent person?
3Hungary
Almost all peak around 2010!
2.5
Poland
Chech Republic
Bulgaria
around 2010!
2
Bulgaria
Slovania
Slovakia
1 5
Lithuania
Estonia
1.5 Latvia
Romania
1
1950
1960
1970
1980
1990
2000
2010
2020
2030
2040
2050
Year
Source: United Nations World Population Prospects: The 2010 Revision Population Database 4

(Figure A.5) China compared with Japan and US
Inverse Dependency Ratio: Ratio of Working-Age Population to the Rest
= How many people of working age have to provide for one dependent person?
3
Japan
Chinese peak?
2.5
Japanca 1990
US
2
ca 2007+
China
1.5
ca 2010-2015
1
Source: United Nations World Population Prospects:
The 2010 Revision
1950
1960
1970
1980
1990
2000
2010
2020
2030
2040
2050
Year
The 2010 Revision Population Database
5
(Figure A.6) Asia: Some Will See a Sharper Turn
Inverse Dependency Ratio: Ratio of Working-Age Population to the Rest
= How many people of working age have to provide for one dependent person?
3 2010-2015:Sh i i
y p p g g p p p
2.5
Sharp turning pointfor Korea, Hong Kong,
Singapore, Thailand
2China
1 5
Korea
Hong Kong
Singapore1.5 Singapore
Thailand
Indonesia
1
1950
1960
1970
1980
1990
2000
2010
2020
2030
2040
2050
Year
Malaysia
6