Embed Size (px)
Citation preview

FIJI
MINISTRY OF FISHERIES AND FORESTS and
FOOD AND AGRICULTURE ORGANIZATION OF THE UNITED NATIONS
A REVIEW OF THE FOREST REVENUE SYSTEM
AND TAXATION OF THE FORESTRY SECTOR IN FIJI
by
Adrian Whiteman, FAO, Rome,
Final version: October 2005

This report is the output of a two-week assignment (during October 2003) on loan to the Government of Fiji, funded out of the FAO Regular Programme Budget. The author wishes to acknowledge the help and co-operation given by staff of the Forestry Department, the Ministry of Fisheries and Forests and others in the forestry sector in Fiji with the completion of this work. In particular, Mr Osea Tuinivanua and Mr Manoj Charan have provided very valuable support to this work. The conclusions and recommendations presented here are those of the author and do not represent the official policy of the Food and Agriculture Organization of the United Nations or the Government of Fiji.
The designations employed and the presentation of the material in this document do not imply the expression of any opinion whatsoever on the part of the Food and Agriculture Organization of the United Nations concerning the legal status of any country, territory, city or area or of its authorities, or concerning the delimitation of its frontiers or boundaries.

Table of Contents
EXECUTIVE SUMMARY ......................................................................................................I
1 INTRODUCTION .............................................................................................................1
2 ECONOMIC RENT AND FOREST CHARGES ...............................................................2 2.1 What is economic rent? .........................................................................................................2
2.1.1 Economic rent and charges in the forestry sector................................................................. 3 2.2 How is economic rent estimated? .........................................................................................4 2.3 The main challenges when calculating economic rent .........................................................5
2.3.1 Data quality............................................................................................................................ 5 2.3.2 Variability ............................................................................................................................... 6 2.3.3 Normal profit .......................................................................................................................... 6
2.4 The importance of setting the correct level of forest charges...............................................7 2.4.1 Landowners income .............................................................................................................. 7 2.4.2 Efficiency ............................................................................................................................... 7
3 TRENDS AND CURRENT STATUS OF THE FORESTRY SECTOR .............................9 3.1 General description................................................................................................................9 3.2 Description of forest resources............................................................................................10
3.2.1 Closed Forests .................................................................................................................... 10 3.2.2 Open forests ........................................................................................................................ 12 3.2.3 Other wooded land .............................................................................................................. 12 3.2.4 Forest plantations................................................................................................................ 12
3.3 Trends and current status of forest area.............................................................................12 3.3.1 FAO Global Forest Resource Assessment 2000 (FRA 2000) ............................................ 12 3.3.2 National estimate of forest area in 1995 ............................................................................. 13 3.3.3 Forest area statistics reported by the Forestry Department................................................ 13 3.3.4 Summary of forest area statistics ........................................................................................ 14
3.4 Trends and current status of forest management...............................................................15 3.4.1 History of forest management and silviculture .................................................................... 15 3.4.2 Trends in forest management ............................................................................................. 15 3.4.3 Current forest management objectives ............................................................................... 15 3.4.4 Forest management plans................................................................................................... 15 3.4.5 Silviculture and forest management practices .................................................................... 16 3.4.6 Forest conservation measures............................................................................................ 16 3.4.7 Forest protection measures................................................................................................. 16 3.4.8 Forest harvesting practices ................................................................................................. 17 3.4.9 Public participation in forest management .......................................................................... 17 3.4.10 Special programmes and incentives to promote sustainable forest management ............. 17
3.5 Forestry policy and institutions ............................................................................................18 3.5.1 Legal framework for forest management ............................................................................ 18 3.5.2 Forest institutions and forest managers .............................................................................. 18 3.5.3 Current forestry policy ......................................................................................................... 19
3.6 Trends and current status of production and trade of forest products ...............................20 3.6.1 Roundwood ......................................................................................................................... 20 3.6.2 Sawnwood........................................................................................................................... 22 3.6.3 Wood based panels............................................................................................................. 24 3.6.4 Paper and paperboard ........................................................................................................ 25 3.6.5 Forest processing industry structure ................................................................................... 25 3.6.6 Summary of forest products production and trade.............................................................. 27

4 TRENDS AND CURRENT STATUS OF FOREST CHARGES......................................28 4.1 Current levels of forest charges ..........................................................................................28
4.1.1 Charges for harvesting roundwood in the indigenous forest............................................... 28 4.1.2 Charges for harvesting roundwood in forest plantations..................................................... 30 4.1.3 Other forest charges............................................................................................................ 30
4.2 Trends in forest charges......................................................................................................30 4.3 Revenue collection and administration ...............................................................................33
4.3.1 Process of setting forest charges........................................................................................ 33 4.3.2 Collection and distribution of forest charges ....................................................................... 34
4.4 Trends in total revenue collection........................................................................................35 4.4.1 Structure and composition of forest revenue ...................................................................... 35 4.4.2 Administrative efficiency...................................................................................................... 37 4.4.3 Contribution to government expenditure on the sector ....................................................... 37
5 ECONOMIC RENT ANALYSIS......................................................................................39 5.1 Data collection .....................................................................................................................39
5.1.1 Roundwood production and processing costs .................................................................... 39 5.1.2 Roundwood and product prices........................................................................................... 40
5.2 Calculation methodology .....................................................................................................42 5.3 Delivered roundwood production cost.................................................................................43
5.3.1 The total roundwood production cost for a "typical" forest operation.................................. 43 5.3.2 The impact of transport distance and harvesting intensity on the total roundwood
production cost .................................................................................................................... 45 5.4 Processing costs and profitability ........................................................................................46
5.4.1 Description of an “average” sawmill .................................................................................... 47 5.4.2 Operating costs ................................................................................................................... 47 5.4.3 Capital costs ........................................................................................................................ 49 5.4.4 Product mix and selling price .............................................................................................. 50
5.5 Estimated economic rent .....................................................................................................51 5.5.1 Comparison with the FSA submission ................................................................................ 52 5.5.2 Species variation ................................................................................................................. 53
6 TAXATION OF THE FORESTRY SECTOR ..................................................................56 6.1 General tax incentives .........................................................................................................56 6.2 Industry specific tax incentives............................................................................................56 6.3 Subsidies to the forestry sector ...........................................................................................57
6.3.1 Seed Capital Revolving Fund.............................................................................................. 57 6.4 Other incentives to the domestic forest processing industry ..............................................59 6.5 Overall assessment .............................................................................................................59
6.5.1 Costs to the Government (fiscal costs) ............................................................................... 59 6.5.2 Economic costs ................................................................................................................... 60 6.5.3 Benefits................................................................................................................................ 60
7 COSTS AND BENEFITS OF THE FORESTRY SECTOR IN FIJI .................................61 7.1 Cost-benefit framework .......................................................................................................61 7.2 Assessment of some of the costs and benefits of the forestry sector in Fiji.......................63
7.2.1 Industrial forest products ..................................................................................................... 63 7.2.2 Other forest products........................................................................................................... 63 7.2.3 Forest resource and carbon stock....................................................................................... 64 7.2.4 Water services..................................................................................................................... 64 7.2.5 Biodiversity .......................................................................................................................... 65 7.2.6 Recreation and amenity ...................................................................................................... 65 7.2.7 Other social and cultural functions ...................................................................................... 66

7.3 Economic linkages...............................................................................................................66 7.4 Summary of the costs and benefits .....................................................................................67
8 CONCLUSIONS AND RECOMMENDATIONS..............................................................68 8.1 Forest charges - some general principles...........................................................................68 8.2 Appraisal of the current forest revenue system in Fiji.........................................................68
8.2.1 Administrative efficiency...................................................................................................... 68 8.2.2 Total forest revenue collection ............................................................................................ 69 8.2.3 Economic efficiency............................................................................................................. 70 8.2.4 Equity................................................................................................................................... 71
8.3 Recommendations for changes to the forest revenue system ...........................................72
REFERENCES ..................................................................................................................74
GLOSSARY.......................................................................................................................77
List of Appendices
APPENDIX 1: STATISTICAL TABLES....................................................................................................... 78
APPENDIX 2: FOREST HARVESTING COST MODEL ............................................................................ 93
APPENDIX 3: FOREST INDUSTRY MODEL............................................................................................. 96
List of Tables
Table 1 Summary of forest charges in Fiji in 2003 ....................................................................................... iii
Table 2 Fixed and variable operating costs for an “average” sawmill in Fiji..................................................v
Table 3 Product sales by market and grade of production for an “average” sawmill in Fiji..........................vi
Table 4 Forest plantation area in Fiji in 2000, as reported in FRA 2000.................................................... 13
Table 5 Total forest area in Fiji in 1995, as reported in Hasni (1997) ........................................................ 13
Table 6 Number of new entrants to the sector and exits from the sector 1986 - 1998 .............................. 27
Table 7 Summary of forest charges in Fiji in 2003 ..................................................................................... 28
Table 8 Species distribution by royalty class.............................................................................................. 29
Table 9 Levels and changes in royalty rates in Fiji compared with changes in prices 1982 - 2001 .......... 31
Table 10 Current (2003) prices for delivered (mill-gate) roundwood in Fiji .................................................. 40
Table 11 Current (2003) sawnwood prices in Fiji ......................................................................................... 41
Table 12 Average sawnwood export prices 1999 - 2002 (at 2003 prices) ................................................... 41
Table 13 Estimated cost of harvesting, extraction, loading and transport for a “typical” forest operation in Fiji .................................................................................................................................................. 44
Table 14 Total log input cost for an “average” sawmill in Fiji ....................................................................... 48
Table 15 Fixed and variable operating costs for an “average” sawmill in Fiji............................................... 49
Table 16 Capital cost of the investment in an “average” sawmill in Fiji........................................................ 50
Table 17 Product sales by market and grade of production for an “average” sawmill in Fiji........................ 50
Table 18 Calculation of the average level of economic rent by species class ............................................. 54
Table 19 Estimated cost of harvesting, extraction, loading and transport for a “typical” forest operation in Fiji with a subsidised loan from the SCARF .................................................................................. 58
Table 20 The main costs and benefits associated with the forestry sector and methodologies often used to value different costs and benefits .................................................................................................. 62
Table 21 Value-added in the forestry sector in Fiji since 1990 (in million FJD) ........................................... 63
Table 22 Summary of the main costs and benefits of the forestry sector in Fiji........................................... 67
Table 23 Distribution of forest land in Fiji by forest type and land ownership 1986 - 1998, as reported by the Forestry Department...................................................................................................................... 78
Table 24 Amount of forest land in timber concessions and long term licences in Fiji and royalties collected from such areas 1986 - 1998......................................................................................................... 78
Table 25 Timber production in Fiji by forest type and product type 1986 - 1998, as reported by the Forestry Department .................................................................................................................................... 79
Table 26 Number and size of forest processing facilities in Fiji 1986 - 1998 ............................................... 82
Table 27 Distribution of log consumption in Fiji by mill size 1986 - 1998..................................................... 85
Table 28 Number of mills in Fiji by mill size 1986 - 1998 ............................................................................. 85
Table 29 Average mill size in Fiji (excluding FFI and TFI) 1986 - 1998 ....................................................... 85
Table 30 Revenue collection and government expenditure on forestry 1977 - 2002................................... 85
Table 31 Log production volumes by province and species class 1999 and 2000 ...................................... 86
Table 32 Sawnwood export prices 1999 - 2002 ........................................................................................... 86
Table 33 Industrial roundwood production and trade in Fiji 1961 - 2002, from FAO ................................... 88
Table 34 Sawnwood production and trade in Fiji 1961 - 2002, from FAO ................................................... 90
Table 35 Wood based panel production and trade in Fiji 1961 - 2002, from FAO....................................... 91
Table 36 Paper and paperboard trade in Fiji 1961 - 2002, from FAO.......................................................... 92
Table 37 Depreciation calculation in the forest industry model .................................................................. 101
Table 38 Projected sales volume in the forest industry model (in cubic metres) ....................................... 101
Table 39 Projected sales price in the forest industry model (in FJD per cubic metre) ............................... 102
Table 40 Projected sales revenue in the forest industry model (in FJD ‘000)............................................ 102
Table 41 Projected income in the forest industry model ............................................................................ 103
Table 42 Projected cash-flow in the forest industry model......................................................................... 103
Table 43 Adjusted cash-flow in the forest industry model .......................................................................... 104
Table 44 Measures of financial performance in the forest industry model................................................. 104
Table 45 Calculation of the benefit distribution in the forest industry model .............................................. 105

Table 46 Summary of results produced by the forest industry model ........................................................ 105
List of Figures
Figure 1 Total delivered roundwood production cost in Fiji (by activity and type of cost) ............................. iv
Figure 2 Distribution of the economic rent from production in Fiji between landowners, government and industry per cubic metre of roundwood (CUM)............................................................................... vii
Figure 3 The relationship between production costs, profits, economic rent and forest charges ................. 5
Figure 4 Map of the Fiji Islands.................................................................................................................... 10
Figure 5 Distribution of forest land in Fiji by forest type and land ownership 1986 - 1998, as reported by the Forestry Department...................................................................................................................... 14
Figure 6 Roundwood production in Fiji by forest type and species group 1986 - 1998, as reported by the Forestry Department...................................................................................................................... 20
Figure 7 Industrial roundwood production in Fiji by product type and species group 1986 - 1998, as reported by the Forestry Department ............................................................................................ 21
Figure 8 Industrial roundwood production, consumption and trade in Fiji 1961 - 2002, from FAO ............. 21
Figure 9 Sawnwood production in Fiji 1961 - 2002 by species group, from FAO ....................................... 23
Figure 10 Sawnwood production, consumption and trade in Fiji 1961 - 2002, from FAO............................. 23
Figure 11 Wood based panel production, consumption and trade in Fiji 1961 - 2002, from FAO ................ 24
Figure 12 Paper and paperboard imports into Fiji 1961 - 2002, from FAO ................................................... 25
Figure 13 Consumption of sawlogs and veneer logs by mill size (excluding Fiji Forest Industries and Tropik Wood Industries) 1986 - 1998 ....................................................................................................... 26
Figure 14 Royalty rates in Fiji (Zone 1) after adjustment for inflation 1982 - 2002........................................ 31
Figure 15 Cumulative increases in royalty rates and prices in Fiji (Zone 1) 1982 - 2002 ............................. 32
Figure 16 Trends in the structure and composition of forest revenue collected by the government in Fiji 1982 - 2002.................................................................................................................................... 35
Figure 17 Trends in the average royalty payment in Fiji 1977 - 2002 (at 2003 prices) ................................. 36
Figure 18 Distribution of production volumes and total royalty payments by species class in Fiji in 1999 and 2000............................................................................................................................................... 36
Figure 19 Trends in the Scaling Fee charged by the Forestry Department in Fiji 1977 - 1998..................... 37
Figure 20 Trends in net and total government expenditure on forestry in Fiji 1981- 1998 (at 2003 prices).. 38
Figure 21 A simplified picture of the process used to collect cost data and produce unit costs of production for various forestry and forest processing activities in Fiji ............................................................. 39
Figure 22 Total delivered roundwood production cost in Fiji (by activity and type of cost) ........................... 44
Figure 23 Impact of transport distance and harvesting intensity on the total delivered roundwood production cost in Fiji ....................................................................................................................................... 45

Figure 24 Distribution of the economic rent from production in Fiji between landowners, government and industry per cubic metre of roundwood (CUM).............................................................................. 52
Figure 25 The relationship between the selling price of sawnwood and the economic rent from roundwood production in Fiji............................................................................................................................. 53
Figure 26 Prices and consumption of consumable items used in the forest harvesting cost model ............. 93
Figure 27 Machine productivity and utilisation rates used in the forest harvesting cost model..................... 93
Figure 28 Labour inputs and costs used in the forest harvesting cost model ............................................... 94
Figure 29 Machinery costs used in the forest harvesting cost model............................................................ 94
Figure 30 Miscellaneous variables used in the forest harvesting cost model ............................................... 95
Figure 31 Delivered roundwood cost estimate produced by the forest harvesting cost model ..................... 95
Figure 32 Miscellaneous details and roundwood costs used in the forest industry model............................ 96
Figure 33 Capital and manufacturing costs used in the forest industry model.............................................. 97
Figure 34 Replacement capital requirements and sales details used in the forest industry model............... 98
Figure 35 Production start-up and capital drawdown schedule used in the forest industry model ............... 99
Figure 36 Debt repayment calculation used in the forest industry model.................................................... 100
List of Boxes
Box 1 Composition of sawnwood production costs for an “average” sawmill in Fiji ..................................vi
Box 2 Normal profit in the calculation of production costs and economic rent.......................................... 4
Box 3 Composition of sawnwood production costs for an “average” sawmill in Fiji ................................ 51

i
A REVIEW OF THE FOREST REVENUE SYSTEM
AND TAXATION OF THE FORESTRY SECTOR IN FIJI
EXECUTIVE SUMMARY
Introduction
This report presents an analysis of the economics of forest harvesting and processing in Fiji. The analysis has been used to examine the level of economic rent from roundwood production and to comment on the forest revenue system in the country. The results and analysis presented here are based on information collected during a two-week mission to Fiji (from 14-24 October 2003), along with additional information collected from FAO databases and other international sources.
The paper was prepared in response to a request from the Government of Fiji to FAO, for assistance with reviewing the forest revenue system in the country. The requirement for this work arose out of the recommendations of a 1989 study of the forestry sector in Fiji. The analysis here addresses three issues raised in that study, namely: the forest revenue system in Fiji; taxation of the forest industry; and the costs and benefits of the forest industry to the national economy.
Analytical framework
The analysis of the forest revenue system has been based on the theory of “economic rent”. In the forestry context, economic rent is the value of forest productivity, which can be determined by subtracting all of the costs of production and processing from the final value of outputs sold in the market place. This is often referred to as the “residual stumpage value” methodology and is a standard methodology used in many countries around the World to estimate the value of standing trees.
Production and processing costs have been calculated from the costs of labour, raw materials and capital used in forest industry operations, using standard economic and accounting methodologies. In addition, economic rent calculations recognise the necessity for forest operators to earn a reasonable rate of return on the capital employed in their operations (i.e. a return on capital or ROC). This rate of return, sometimes referred to as “normal profit”, has been set at a level of 20 percent, which seems reasonable in view of the other investment opportunities available in Fiji, the risk associated with forest operations and the expectations of those involved in the industry.1
In theory, the economic rent from forest operations should accrue to the owners of the forest resource. Therefore, in the case of Fiji, the majority of this should accrue to landowners. However, as the Government is responsible for revenue collection and disbursement, a small share should also accrue to the Government to cover their administration costs.
If the sum of all forest charges is less than the economic rent, then the remaining amount accrues to forest operators and is usually referred to as “excess profit” or “windfall profit” (i.e. an amount over and above the “normal profit” required to remain in business). The aim of the forest revenue system should be to ensure that landowners receive the maximum benefit possible from the use of their resource and to minimise any “excess profit” earned by the industry.
1 Note: a 20 percent ROC s not the same as a 20 percent profit margin (see Section 5.2 on page 42 for further
explanation of the calculation methodology employed here).

ii
Data collection and analysis
The economics of forest harvesting and processing was analysed using two models:
• The forest harvesting cost model calculates the cost of forest harvesting, extraction and delivery to the mill, from the costs of labour, consumables and capital (including ROC) employed in forest operations. The model is based on standard cost accounting methodologies as described in FAO (1977). The model was originally constructed to analyse the costs of forest operations in Suriname, but it has been modified to reflect harvesting costs, productivity and site conditions prevalent in Fiji.
• The forest industry model calculates the profitability of forest processing operations in a similar way to above, with the exception that it uses projected cash-flows from the operation to calculate profitability (i.e. net present value or NPV). This model was originally constructed to analyse the profitability of forest processing operations in Indonesia, but it has also been adjusted to reflect the scale of operations, productivity levels and costs in the industry in Fiji. For the purposes of this analysis, the model examines the situation of a medium-sized sawmill in the country.
The cost information produced from the forest harvesting cost model is used as an input to the forest industry model. These costs, plus other operational costs (including forest charges), are then used in the forest industry model to estimate net income, by subtracting the total of these costs from the value of output (i.e. forest product prices multiplied by production volumes). Annual net income from processing operations is included in the projected cash-flow, along with the cost of capital investments (i.e. plant and machinery).
The cash-flow from operations is discounted (at the required ROC) to produce the NPV of the sawmill investment, which is equal to the “excess profit” from operations. The forest industry model estimates the share of the economic rent that is currently captured by the Government and landowners in the form of forest charges. It also estimates the amounts that should be paid as corporate taxes by forest operators.
Data for all of these models has been collected from three main sources:
• Baseline estimates of unit costs, prices, consumption of materials and productivity rates has been taken from information published by the Forestry Department and other international data sources.
• Where necessary, these costs have then been adjusted to reflect local conditions, based on discussions with representatives of the industry and government in Fiji.
• Further adjustments were also made as a result of site visits to and discussions with a number of forest operators on Viti Levu and Vanua Levu.
It should be noted that there will always be some uncertainty with the results of any economic rent analysis. Firstly, it is often difficult to obtain reliable and accurate cost and price information. Forest operators have an incentive to exaggerate costs and understate the value of production. Secondly, in some cases, forest operators may not themselves have a reliable view of their costs. Thirdly, there are often problems regarding the level of efficiency in the industry. It is quite common for economic rent to be dissipated through inefficient operations, so it is not always the case that surplus economic rent (i.e. the share of economic rent that is not captured by government and landowners) accrues to the forest operator as excess profit. Finally, it should be noted that economic rent calculations are often based on industry averages. Some operators will be more or less efficient than others, some will be better or worse at marketing their product and some will benefit (or suffer from higher production costs) due to factors such as the scale of operations, site conditions and location. Thus, the results of this analysis should only be used as a general guide to the level of charges that might be collected.

iii
Trends and current status of forest charges in Fiji2
In most tropical countries, the charges for harvesting roundwood are determined in one of two ways:
• In some counties, tropical forest resources are owned by the state and the state sets royalty rates and collects charges, which then become part of the government’s revenue collection.
• In other countries, landowners own forest resources and are free to set their own charges in negotiation with forest operators, which they then keep themselves.
In both of the above situations, the two main issues of concern in any analysis of forest charges are the levels of charges that are set (i.e. how much of the economic rent is captured by the resource owners' forest charges) and the distribution of charges (i.e. how much of the charges collected should go to the Government and how much should be retained by people living in and around forest areas)
The system of forest charges that has developed in Fiji is somewhat unusual in that the government sets and collects royalties (that are then distributed to landowners) but, on top of this, landowners have also started to collect their own additional charges (“commissions” and payments for “goodwill”). In other words, the total level of charges that is eventually set is determined largely by negotiation between landowners and forest operators (i.e. they negotiate the surplus in addition to the royalty payments). A summary of all of the forest charges currently collected in Fiji is given in Table 1.
Table 1 Summary of forest charges in Fiji in 2003 Amount by species class (in FJD per m3) Type of charge Class 1 Class 2 Class 3 Class 4
Royalty Zone 1 (Viti Levu) 40.00 30.00 10.00 6.50 Zone 2 (Vanua Levu) 40.00 30.00 9.30 6.00 Zone 3 (elsewhere) 32.00 32.00 8.00 6.00 Premium Zone 1 (Viti Levu) 4.00 - 6.00 Zone 2 (Vanua Levu) nil Zone 3 (elsewhere) nil Commission Zone 1 (Viti Levu) 20.00 - 45.00 10.00 - 20.00 10.00 - 15.00 10.00 - 12.00 Zone 2 (Vanua Levu) 15.00 - 25.00 10.00 - 15.00 10.00 - 15.00 10.00 - 12.00 Zone 3 (elsewhere) data not available Goodwill 0.50-12.00 Land Rent varies Scaling Fee 3.50 Map Fee varies (charged on the basis of cost recovery) Application Fee varies (charged on the basis of cost recovery) Renewal Fee varies (charged on the basis of cost recovery) Processing Fee varies (charged on the basis of cost recovery)
Source: various documents, interviews and field visits.
Although nearly all of the charges collected are distributed to the landowners, the government retains a small proportion of the total charges collected, to cover their administrative costs (i.e. the “fees” at the bottom of the table). It should also be noted that the distribution (amongst landowners) of the charges collected may differ between the official charges collected as royalties and the additional charges collected directly by landowners.
Comparing the historical trends in forest charges (over the last two decades) with inflation and changes in sawnwood prices, Royalties have increased broadly in line with inflation in the three lowest species classes.
2 The term “forest charges” is used here to cover all payments made to government and landowners by forest
operators, including royalties, fees and other payments made to landowners.

iv
Royalties for Class 1 species have increased by 25 percent in real terms, which roughly matches the increase in average sawnwood export prices. It should also be noted that payment of the informal charges directly to landowners is a fairly recent innovation, which was started by forest processors. These developments suggest that there is a lot of competition for access to the resource and that forest charges have responded to changes in product prices and resource availability.
Results of the economic rent analysis
Economic rent has been calculated for a “typical” forest operation in Fiji. In the forest harvesting operation, it has been assumed that the operator is harvesting 200 ha per year, at an average harvesting intensity of 30 m3/ha, to give an average level of production of 3,000 m3/year. It has been assumed that the forest operator has to construct 20 metres of road per ha (including an access road) and has a haulage distance of 50 km (each way). At this level of production and working for 8 months per year (with an 8-hour day), the operator could harvest, extract, load and unload and transport the total volume of roundwood production with one chainsaw crew, one D6 bulldozer (for road building and skidding), one loader and one truck (with a 25 m3 capacity). It has also been assumed that the average age of the truck is 7 years old, while the average age of the other equipment is 18 years old. The depreciated value of these items has been calculated and used in the economic rent calculations.
Under the above assumptions, the total delivered cost of roundwood production would be around FJD 64/m3. This is quite reasonable in comparison with production costs in other tropical countries. Figure 22 shows the composition of this cost by production activity and type of cost. Changes in transport distance would change production costs slightly, at a rate of roughly FJD 0.17/m3 per kilometre. Lower harvesting intensities could increase production costs significantly, but this would depend upon how much road building would be required in forests with lower stocking.
Figure 1 Total delivered roundwood production cost in Fiji (by activity and type of cost)
Production cost by activity
Planning and surveying: FJD 2.00 (3%)Road building: FJD 9.49 (15%)Felling: FJD 6.22 (10%)Skidding: FJD 13.22 (21%)Loading: FJD 5.22 (8%)Road transport: FJD 17.63 (27%)Unloading and reloading: FJD 10.45 (16%)
Production cost by type of cost
Labour: FJD 16.26 (25%)
Consumables: FJD 21.19 (33%)
Capital: FJD 14.59 (23%)
Normal profit (20% ROC): FJD 12.19 (19%)

v
For the analysis of forest processing costs, the following assumptions have been made about the status and condition of an “average” sawmill in Fiji:
• output capacity of 5,000 m3/year, with a current level of capacity utilisation of 60 percent, giving a current output level of about 3,000 m3/year;
• average product recovery rate of 50 percent across all product types, giving a required log input of 6,000 m3/year;
• sawnwood production of a range of grades, with 50 percent for export and 50 percent for the domestic market, with most of the Class 1 and 2 species going into the export market; and
• a debt-equity ratio of 20:80, with debt financed at a real interest rate of 12 percent.
Total fixed and variable operating costs used in the model are presented in Table 2 below. The log cost in this table includes the delivered roundwood production cost and the payment of all forest charges (as shown in Table 1 above) across the range of species used in the sawmill (see Table 3 for details of the assumed species composition of production).
Table 2 Fixed and variable operating costs for an “average” sawmill in Fiji
Variable costs (FJD per m3 of production) Sawnwood for export market
Sawnwood for domestic market
Log cost 275.94 225.54 Labour 78.96 78.96 Resins/chemicals/treatment 15.00 15.00 Fuel, energy and consumables 60.00 45.00 Packaging 32.00 6.00 Delivery 15.00 15.00 Total 476.90 385.50 Fixed costs (FJD per m3 of capacity) Personnel: administration 12.00 12.00 Personnel: support staff 7.00 7.00 Personnel: maintenance staff 9.73 9.73 Sales cost 15.00 15.00 General overhead 30.00 30.00 Total 73.73 73.73 Total cost (FJD per m3 of production) Total calculated at final level of utilisation 599.79 508.39
For the capital cost of the sawmill, it has been assumed that the depreciated value of all plant and machinery is about FJD 1.4 million, with a further FJD 573,000 invested in working capital, giving a total investment of around FJD 2.0 million. The depreciation period used is five years and various assumptions were also made about the replacement or overhauling of some capital items after three to five years.
The composition of sawnwood production (by species class and grade) assumed in the model and the selling prices of each of the different products are shown in Table 3. The average selling price is FJD 763/m3, which is in the region of the average product prices revealed in discussions with sawmillers.

vi
Table 3 Product sales by market and grade of production for an “average” sawmill in Fiji
Product Grade Export tax (percent)
Output (percent)
Mill net price (FJD per m3)
Real price change (percent/year)
Sawnwood for export market Class 1 FF Select 0 50.0 1,200 0.0 Class 1 FF Standard 0 7.5 900 0.0 Class 1 Ungraded 0 2.5 900 0.0 Class 2 FF Select 0 30.0 800 0.0 Class 2 FF Standard 0 7.5 800 0.0 Class 2 Ungraded 0 2.5 750 0.0 Total/average 100 1,009 0.0 Sawnwood for domestic market Class 1 FF Select 0 15.0 750 0.0 Class 1 FF Standard 0 5.0 550 0.0 Class 2 FF Select 0 5.0 580 0.0 Class 2 FF Standard 0 5.0 480 0.0 Class 3 FF Select 0 35.0 480 0.0 Class 3 FF Standard 0 12.0 480 0.0 Class 4 FF Select 0 15.0 480 0.0 Class 4 FF Standard 0 3.0 480 0.0 Class 3 and 4 Ungraded 0 5.0 250 0.0 Total/average 100 518 0.0
Given the above costs and prices, the composition of sawnwood production costs for the “average” sawmill in Fiji was calculated and is shown in Box 1 below. The delivered roundwood cost includes an allowance for “normal profit” in the harvesting operation, but excludes the payment of forest charges. Forest charges include the payment of all official and unofficial charges (i.e. “goodwill” and “commissions”). Capital costs represents the consumption of existing and replacement capital throughout the life of the sawmill investment (assuming zero residual value), while “normal profit” represents the amount required for the sawmill operator to earn a 20 percent ROC (after tax) on their equity investment in the sawmill. Corporation tax is the estimated average annual tax liability divided by annual sawnwood production.
Box 1 Composition of sawnwood production costs for an “average” sawmill in Fiji
Delivered roundwood cost (excl. charges, incl. ROC of 20% on harvesting operation) 128.47 17%
Forest charges 122.27 16%
Other fixed and variable operating costs 303.35 40%
Total: operational costs 554.09 73%
Capital costs 85.17 11%
“Normal profit” (i.e. ROC of 20% on sawmill investment) 82.35 11%
Corporation tax 35.25 5%
“Excess profit” 6.27 1%
Total: capital costs, taxes and profit 209.04 27%
Average product value (FJD per cubic metre of sawnwood produced) 763.13 100%
The economic rent from production is equal to forest charges plus “excess profit” and amounts to FJD 128.54 per cubic metre of sawnwood produced, or about 17 percent of the average product value. With

vii
the assumed product recovery rate of 50 percent, this implies that the economic rent is equal to FJD 64.27 per cubic metre of roundwood consumed by the sawmill. As these figures show, under the above assumptions, the majority of the economic rent from production is captured by the existing forest charges. Given the variability in costs and prices that probably exists across the sector and the fact that these are calculations based on averages, these figures suggest that there is little room to increase forest charges.
Figure 2 Distribution of the economic rent from production in Fiji between landowners, government and industry per cubic metre of roundwood (CUM)
Landowners commission and goodwill: FJD 24.75/CUM (39%)
Landowners share of royalties: FJD 29.39/CUM (46%)
NLTB fees and royalty share: FJD 3.47/CUM (5%)
Forestry Department fees: FJD 3.53/CUM (5%)
Producer's excess profit: FJD 3.13/CUM (5%)
Figure 2 shows the distribution of economic rent from production (per cubic metre of roundwood) between landowners, the Government and industry. The figure shows that total forest charges currently capture 95 percent or almost all of the economic rent from production. Fees paid to the Forestry Department and NLTB each account for a further 5 percent of the economic rent. Landowners receive the remaining 85 percent of the economic rent. Of this, slightly more than half of this comes through the official system of royalty payments as opposed to the unofficial system of “commissions” and payments for “goodwill”.
It should also be noted that, in addition to the payments of charges to the Government, the “average” sawmill should be paying corporation taxes to the Government of around FJD 35.25 per cubic metre of sawnwood produced (equal to about FJD 17.63 per cubic metre of roundwood).
The results above have been compared with the figures quoted in the submission on forest charges from the Fiji Sawmillers Association (FSA, 2003). Although there are some differences between these results and the figures from the FSA, the overall results are broadly comparable. For example, they quote figures for total sawnwood production costs (excluding a profit margin) in the range of FJD 570/m3 to FJD 720/m3. The figure calculated here for total operational costs plus capital costs amounts to FJD 640/m3 (see Box 1), which is roughly in the middle of this range.
It should be noted that the above results are not simply a reiteration of the FSA figures, having been based on data collected from a number of sources in Fiji and elsewhere and having been calculated in an entirely different way. Indeed, the purpose of this analysis was to bring some international experience and a rigorous

viii
analytical approach to the forest charging issue, in order to provide the Forestry Department with an independent estimate of the economic rent from production. As the figures calculated here are not markedly different from those provided by the FSA, it is suggested that this might be taken as an indicator of their reliability.
Further analysis has examined the variation in economic rent between the different species classes. Based on the price data shown in Table 3, this has shown that there could be much wider variation in the economic rent from different species than is currently reflected in the forest charges. However, it is felt that the reliability of the price data is currently insufficient to support a radical revision to the relative levels of the forest charges for different species classes. A relatively simple methodology has been presented to allow this to be explored further.
Conclusions and recommendations
On the whole, the procedures currently in place for monitoring production and collecting forest charges are excellent. However, it is debatable whether the Government recovers all of their administrative costs of implementing the system. There is also some uncertainty about whether the current licensing arrangements provide landowners and producers with a secure and binding agreement to supply roundwood and pay all unofficial charges.
• Recommendation 1: Administrative costs. The Forestry Department should review their expenditure on forest monitoring, control and charge collection to assess whether their fees cover their costs. If not, they should consider increasing their fees. There is very little room for an increase in charges, but a modest increase in the Scaling Fee would probably do no harm. NLTB may wish to consider this issue as well.
• Recommendation 2: Licences and security of wood supply. In consultation with interested stakeholders, the Forestry Department and NLTB should examine whether the problem of landowners and/or producers reneging on production agreements is a major problem and what, if anything, they should do about it. The aim should be to use licences to reinforce the agreement to supply roundwood in a harvesting area, to minimise the likelihood of broken contracts and the consequential costs to both landowners and producers.
Currently, the sum of official and unofficial forest charges appears to account for the majority of the economic rent from production, suggesting that there is little scope to increase charges overall. However, the amounts collected in the form of unofficial charges are not recorded anywhere and can not be accurately judged. It would be in everyone’s interest if this information was recorded properly and published.
• Recommendation 3: Total charge collection. The Forestry Department should record the total amount of revenue collected from unofficial charges and publish this information along with the statistics on official revenue collection. The level of unofficial payments (lump-sums and per cubic metre) should be recorded in licence agreements.
The current system whereby forest charges are set by a mixture of administrative decree (official charges) and negotiation (unofficial charges) has distinct advantages in terms of promoting economic efficiency. This is because there appears to be a high level of competition for the resource. Therefore, there is little economic justification to increase the overall level of forest Royalties. However, the relative levels of the Royalties for different species classes is worthy of further examination, as well as the composition of the species classes. A modest increase in the level of Royalties for the higher valued species could be partly offset by reductions in Royalties for the lower valued species classes. Improvements in the availability of information about the levels of (unofficial and official) charges currently being paid would also assist landowners and producers in their negotiations.

ix
• Recommendation 4: Analyse the relative values of different species. The Forestry Department should collect some better information about product prices (in domestic and export markets) and the mixture of products typically produced from each species (by grade and market destination). This should be analysed to identify the relative levels of economic rent from different species and revise the composition of the species classes.
• Recommendation 5: Revision of the Royalties. Royalties should not be increased by very much (if at all). For example, Royalties in the top two species classes could be increased in line with inflation and Royalties in the lower two species classes could be kept the same or even reduced. The relative levels of the different species classes (and movement of individual species between the classes) should be determined from the outcome of Recommendation 3,
• Recommendation 6: Average levels of unofficial charges. The Forestry Department should publish annually the average level of unofficial charges paid by producers (per cubic metre) by species class and zone.
Competition requires a “level playing field” and the Forestry Department should not restrict the awarding of licences to specific groups or individuals. However, they should also ensure that all operators are competent and able to follow the same requirements for good harvesting practice. The frequent use of short-term Annual Licences and the fragmented nature of forest ownership are a barrier to the long-term development of the sector, which will require security of supplies and economies of scale. The Forestry Department might examine how they can encourage improved performance in the processing sector through the types of licences available to producers and by increasing the scale and security of wood supply.
• Recommendation 7: Awarding licenses. Licences should continue to be awarded in an open and transparent manner without fear or favour, subject to the condition that all producers have to meet the same minimum standards of competence and comply with all forest regulations.
• Recommendation 8: Long-term strategy. The Forestry Department should consult with all interested stakeholders about the feasibility of developing a long-term strategy for the sector. In particular, this should focus on improving the security of wood supply from the highly fragmented forest ownership, while maintaining the overall objective that landowners should continue to receive the maximum possible benefit from the use of their forest resources.
The question of how much of the forest charges should go through official channels and how much should go through unofficial channels is a sensitive issue. Ultimately, the decision about this should be a political decision, which is beyond the scope of this report. An impartial economic appraisal of the situation could conclude that, if landowners are capable of looking after their own interests, then there is no need for the NLTB to collect forest charges at all. However, the current system whereby NLTB are involved has two advantages:
• it provides a more formal and accountable system to ensure that everyone that is entitled to a share of the benefits from production is given a share; and
• it provides a safety-net to ensure that landowners receive the maximum possible amount of benefits from the utilisation of their resource.
Evidence from other countries that have given landowners more control over forest charges has shown that that they sometimes lose out in the long run. Therefore, this would support the argument that NLTB should continue to be involved in the administration of the forest revenue system.
• Recommendation 9: Revenue collection and disbursement. NLTB should continue to play a role in revenue collection and disbursement in order to provide a safety-net for landowners.

x

1
1 INTRODUCTION In many countries, forest resources represent a significant natural asset that can be used to produce a wide range of economic, environmental and social goods and services. Revenues from harvesting forest resources generate income for resource owners and encourage the conservation and sustainable management of those resources. Taxes paid by the forest industry also generate revenues that the government can use to support economic development and other government policies and programmes.
In 1988, a report by the Food and Agriculture Organization of the United Nations (FAO) identified a number of economic issues in the forestry sector in Fiji that should be considered further (Rizer, 1988). These included the following:
• Royalty rates: a study should examine the royalty payments made to landowners to examine the appropriate level of payments and determine a workable royalty system for Fiji;
• Taxation of the industry: a study should examine the taxes paid and subsidies received by the industry to determine whether these are in the long-term interests of the Fijian economy;
• Cost-benefit analysis of the industry: a study should examine the full social, economic and environmental costs of the forestry sector in Fiji to guide future forestry policymaking;
• Input-output study: an input-output model should be constructed to examine the linkages between the forestry sector and other parts of the Fijian economy to guide future forestry policymaking;
• Stabilisation study: a study should examine the need for a revenue stabilisation fund to ensure a stable flow of income in the industry and tax receipts from the industry to government; and
• Industry restructuring: a study should examine the economic and financial implications of different administrative and institutional arrangements for government involvement in forest management and processing.
A further request for FAO assistance in the above areas was made by the Permanent Secretary of the Ministry of Fisheries and Forests (MoFF) in 2003 (Mathias, 2003). This report addresses the first two of the above issues and will also comment on the remaining issues, in particular the cost-benefit analysis of the sector.
The remainder of this report is in seven main sections. Section two briefly describes the concept of economic rent: what it means; how it is calculated; and why it is so important. The third and fourth sections of the report describe the trends and current status of the forestry sector and the forest revenue system in Fiji. Section five describes the data and calculations used in the analysis of economic rent in the sector and presents the results of this analysis. Section six discusses the taxation of the industry and section seven presents some information about the costs and benefits of the forestry sector to Fiji. Conclusions and recommendations are presented in the final section of the report.

2
2 ECONOMIC RENT AND FOREST CHARGES Economic efficiency is an underlying objective of government policy in most countries and should be reflected in forestry policies. Economic theory shows that economies tend to function most efficiently when the levels of output and prices of goods and services are established through competitive markets. Therefore, in situations where the government influences the production of a good or service, such as in the case of forest charges,3 it is important to ensure that these policies do not introduce unnecessary distortions into the economy.4
Forest charges can be structured in a variety of ways, such as: flat-rate charges per cubic metre of roundwood cut or taken from the forest; annual charges on the area of forest in a concession; percentage tariffs on the value of forest products produced or exported; or as a combination of such charges (see: Gray (1983), for a comprehensive discussion of the different types of forest charges commonly in use around the World). Such charges are often set with reference to the economic rent from roundwood production. However, there has been a long-running debate about whether forest charges in many countries have been set at sufficiently high levels to capture a significant share of the economic rent from roundwood production (see, for example: Repetto and Gillis (1988) for an early review of the level of forest charges in place around the world).
This section of the report describes what economic rent is and shows how it can be calculated and used as a guide for setting forest charges. It then describes some of the challenges to calculating economic rent, before finishing by re-emphasising why it is so important to establish the correct level of charges for the use of forest resources.
2.1 What is economic rent?
Economic rent can be defined as the surplus value created during the production of a good or service, due to the ownership of a factor of production that is in fixed or limited supply. In many economic activities, it is not possible to create economic rents. Thus, for example, if a sawmiller could sell sawnwood for far more than the cost of production (and thus, earn an economic rent from that activity), other producers would soon enter the market and drive product prices down, such that the surplus would disappear. However, if that activity was dependant upon a factor of production in fixed supply (e.g. a prime location in a city or an exclusive property right such as a patented production process or copyright on a product design), then other producers could not enter that particular part of the market and drive prices down and the economic rent would persist.
The classic example of an economic rent is a land rent. Land supply is generally fixed and land (usually) costs nothing to produce yet, with the addition of other inputs, land can be made to produce outputs that are higher in value than the total cost of these other inputs. On very productive land or land in favourable locations, the economic rent is high; while in more remote or less productive areas, economic rent is much lower. In a competitive market, potential users of the land would compete to use the land, resulting in a rental payment to the owner(s) of the land that would be equal to the economic rent from the best use of that land.
It should also be noted that other factors of production can earn economic rents if there are artificial barriers or other rigidities that restrict the supply of these factors to the market. An important point for governments to
3 The term “forest charges” is used here as a generic term to include all fees, royalties and other payments made
by users of the forest resource. The latter terms all have specific meanings in Fiji, which are described in Section 4 of this report. In many countries, forest charges are set by the government and equate to the standing or “stumpage” price of roundwood. However, in the case of Fiji, it should be noted that landowners also set their own charges for the use of the resource.
4 In some cases, distortions in the economy can be justified on social, environmental or economic grounds. It is beyond the scope of this study to examine if and when such distortions could be justified in Fiji, although Section 7 will offer some preliminary comments on this.

3
note is that they can have a major impact on the creation of rents in many parts of the economy if the policies they pursue affect the flow of capital or place other constraints on the way that markets function.
2.1.1 Economic rent and charges in the forestry sector
Economic rent in the forestry sector differs between plantation forests and natural forests. In plantation forests, inputs are required to plant and manage the trees, so it is the land that is in fixed supply and the economic rent is basically a land rent. In the case of natural forests, the situation is slightly different because the trees are produced for free (i.e. the resource occurs naturally). In this case, it is the forest that is in fixed supply (i.e. natural forest can not be created, except over a very long time-period) so the economic rent is the standing (or “stumpage”) value of the roundwood that can be produced from these free trees.
As already noted, in competitive markets, buyers and sellers would compete to establish land rents and prices for roundwood from the natural forest, such that all of the economic rent would accrue to the owners of the resource. Thus, for example, in the case of forest plantations, forest managers would compete for land with other potential land users, resulting in market-based rental payments for the land. Similarly, in the case of natural forests, purchasers of roundwood would compete with each other to determine market-based stumpage prices, such that forest owners would receive the full value of the economic rent from the trees that are produced by nature. In some countries, roundwood is sold standing by competitive means such as auctions or tenders but, for a number of reasons, this is not common in tropical forests managed under selective cutting systems.
In cases where competition is imperfect, it is possible for the forest industry to capture some of the economic rent from forest production, resulting in lower payments to the owners of the resource and a distortion of the benefits from forest production away from the owners of the resource and towards the industry. Such imperfect competition in the market for harvesting rights is quite common for a number of reasons. Firstly, there is often an information failure. The forest industry operates in competitive local and international markets and usually has a good understanding of the costs and value of production while resource owners often have much less information about what their resource might be worth. Secondly, the structure of the market may also limit competition. Small numbers of producers in the forest processing sector may reduce competition for the resource, particularly when the effect of location is taken into account. For example, because of the relatively high costs of transporting roundwood, competition to harvest roundwood from a forest at any particular location is often limited to only a handful of local companies. This is certainly the case in Fiji, where the number of forest processing companies is quite small. Thus, in the absence of perfect competition, the rationale for using economic rent analysis is that it provides a methodology for estimating what stumpage prices would be under more competitive conditions and it can be used to as a guide to setting forest charges that result in the full recovery of economic rent for the resource owners.
The rationale behind government involvement in the setting of forest charges depends on the type of forest ownership. In many countries, natural forests are owned by the state, so the forest charges set by the government are equivalent to the stumpage price of roundwood. In such cases, it is important for the government to set the correct level of charges so that government revenues from forest harvesting are optimised and so that the resource is priced correctly.
In the case of Fiji, the majority of the natural forest is owned by traditional landowners and the royalties collected by government are distributed amongst them. In addition, landowners also set their own charges for harvesting rights on top of the government royalties (“commissions” and payments for “goodwill”). Therefore, the role of government in setting forest charges is somewhat less important than in many other countries. However, at the national level, it is still in the interest of economic efficiency to ensure that the resource is priced correctly. Furthermore, it could be argued that the government should influence stumpage prices or forest charges to protect resource owners and ensure that they gain the maximum benefit from the use of their resource.

4
An additional point that should be considered is that there are also a few relatively small forest charges that are collected and retained by the Government (i.e. the Forestry Department) and other statutory bodies such as the Native Land Trust Board (NLTB). In such cases, these charges should be included in the economic rent analysis and the level of these charges should be set at a rate that allows these institutions to recover all reasonable costs incurred for the services rendered.
2.2 How is economic rent estimated?
It can usually be assumed that the markets for most of the factors of production in the forestry sector are competitive markets. Therefore, the economic rent from forest harvesting can be simply estimated by subtracting the costs of production from the value of production, where the value of production is measured at a point where the product is sold in a competitive market. This “residual value” approach is the methodology used in many countries around the World to estimate economic rent and stumpage prices or forest charges.
However, this calculation is often more complicated than it seems. Firstly, it is usually necessary to build-up the total cost of production from the cost of individual activities (e.g. forest management and planning, felling, extraction and transport to the point of sale). Secondly, the cost of each activity also usually has to be constructed from its individual components (e.g. labour costs; the costs of consumable items used in the activity such as raw materials, fuel and minor tools and spare parts, and the cost of capital such as equipment, machinery and buildings). In addition to these cost components, the calculation of total production cost should also include an allowance for normal profit (see Box 2).
Box 2 Normal profit in the calculation of production costs and economic rent
Thirdly, the calculation can involve estimating the costs of numerous activities, depending upon the point at which the product is sold in a competitive market. For example, if there are many buyers and sellers of delivered roundwood (e.g. where there are independent loggers) it may be possible to obtain market prices for delivered roundwood and calculate the economic rent by subtracting harvesting, extraction and delivery costs from these prices. If, however, most roundwood is used in integrated forest operations (i.e. harvesting and processing by the same company), then it may be necessary to work back from forest product prices. This will involve taking into account the costs of forest processing (in addition to the costs mentioned above) in the calculation of economic rent. In the case of forest plantations, the economic rent calculation is complicated further by the need to include in the calculation the costs of planting and managing the resource (including an allowance for normal profit on the forest plantation investment).
The two cost components that are generally the most difficult to estimate are capital costs and the level of profit that a forest operator should be allowed to retain (i.e. the normal profit). The cost of capital is usually based on the economic depreciation of capital used in the production process (see Whiteman (1999a) for a discussion of depreciation). The level of normal profit is usually expressed as a required rate of return on the total amount of capital invested in the production process.
In any economic activity it is necessary for producers to earn a certain amount of profit to justify their continued investment in that activity. This level of profit is usually referred to as normal profit, which, in the forestry context, can be defined as:
"the level of profit that provides a return on the forestry company’s investment in capital and infrastructure, which is just sufficient to keep the forestry company operating in the sector."
The level of normal profit is usually determined with reference to the returns that can be made from investing in other sectors of the economy or in financial instruments (such as stocks, bonds or savings accounts), with an adjustment to take into the account the relative risk associated with investing in the forestry sector compared with the risk from these other types of investments.
5
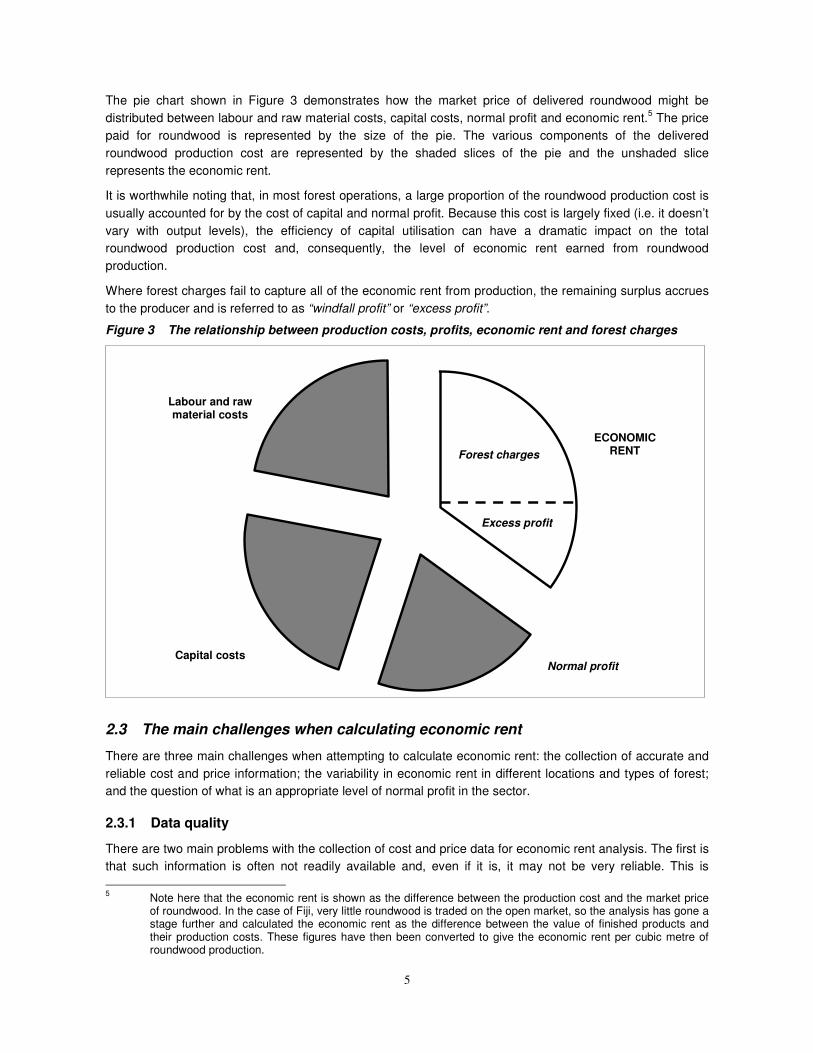
The pie chart shown in Figure 3 demonstrates how the market price of delivered roundwood might be distributed between labour and raw material costs, capital costs, normal profit and economic rent.5 The price paid for roundwood is represented by the size of the pie. The various components of the delivered roundwood production cost are represented by the shaded slices of the pie and the unshaded slice represents the economic rent.
It is worthwhile noting that, in most forest operations, a large proportion of the roundwood production cost is usually accounted for by the cost of capital and normal profit. Because this cost is largely fixed (i.e. it doesn’t vary with output levels), the efficiency of capital utilisation can have a dramatic impact on the total roundwood production cost and, consequently, the level of economic rent earned from roundwood production.
Where forest charges fail to capture all of the economic rent from production, the remaining surplus accrues to the producer and is referred to as “windfall profit” or “excess profit”.
Figure 3 The relationship between production costs, profits, economic rent and forest charges
2.3 The main challenges when calculating economic rent
There are three main challenges when attempting to calculate economic rent: the collection of accurate and reliable cost and price information; the variability in economic rent in different locations and types of forest; and the question of what is an appropriate level of normal profit in the sector.
2.3.1 Data quality
There are two main problems with the collection of cost and price data for economic rent analysis. The first is that such information is often not readily available and, even if it is, it may not be very reliable. This is 5 Note here that the economic rent is shown as the difference between the production cost and the market price
of roundwood. In the case of Fiji, very little roundwood is traded on the open market, so the analysis has gone a stage further and calculated the economic rent as the difference between the value of finished products and their production costs. These figures have then been converted to give the economic rent per cubic metre of roundwood production.
Labour and raw material costs
ECONOMIC RENT
Capital costs
Forest charges
Excess profit
Normal profit

6
particularly the case with some of the components of the production cost (e.g. the cost of repairs and maintenance) where forest operators often do not keep accurate records. This can partly be overcome by referring to machine operator’s handbooks and collecting information about the cost of typical repair and maintenance activities in order to calculate an estimate of the cost. Another way in which the situation may be addressed is by asking forest operators about how often they perform various activities such as maintenance in order to get a general idea of the cost of such activities.
The second problem that occurs is that it is often in the interest of the respondents to any enquiry to understate prices and overstate costs in order to give the impression that profitability is low (and, consequently, that forest charges should be low). Some take this a step further and deliberately record low prices in their records in order to alter their tax position (this is particularly a problem in integrated forest operations where this practice, known as artificial transfer pricing, can be used to considerable advantage). This problem can only be overcome by judging how reliable the data collected is, by comparing the responses given by individuals with each other and with any competitive market information that may be available.
2.3.2 Variability
The second challenge is that, like any rent, the level of economic rent from roundwood production can vary greatly due to a number of factors such as the productivity of a site, the volume of commercial species present, transport distances and other site conditions.
Where the total roundwood production cost varies due to factors over which the forest operator has little control, this variability should be taken into account in the design of the forest charging policy. In other words if, for example, the total roundwood production cost from a particular area is high because it is a long way from the market, this should be accommodated in the forest charging system by setting a lower forest charge for outputs produced from this area. Examples of factors that should be accommodated in this way include: the level of stocking of commercial species in the forest; terrain and other working conditions; and the distance from the forest to the market. The most important of these factors is likely to be transport distance and this is the main variable that is examined in this analysis.
There is also a second group of factors that can affect the economic rent from production, over which forest operators do have some control. These mostly concern the efficiency of operations and include variables such as: the length of skid-trails used to extract timber; harvesting machine availability and utilisation rates; and the utilisation of appropriate technology. In these cases, the charging policy and the way in which forest licences are awarded and supervised should aim to encourage greater efficiency and the reduction of the total roundwood production cost, in order that the economic rent from production can be maximised. In other words, inefficiency and low productivity is not a reasonable excuse for setting low forest charges.
2.3.3 Normal profit
The last major challenge in the calculation of economic rent is determining what the normal level of profit should be. As noted above, the forest charging system should aim to set charges at a level that results in resource owners capturing most or all of the economic rent from forest production. However, if forest charges are set at a level that is too high, this will reduce the level of profits in the sector and will reduce investment in the sector. The consequences of this could be just as damaging for the sector as setting a level of forest charges that is too low. Therefore, a careful balance must be achieved between the rights of forest owners to receive the full value of production from their resource and the need of forest operators to earn a normal level of profit.
In discussions with a number of forest operators, it was claimed that they are currently not making any profit and that they are just recovering their operating costs (i.e. they were implying that they were not making enough income to cover capital costs, let alone an allowance for normal profit or a return on capital).

7
However, some visits to sawmills and discussions with the Forestry Department showed that they are making new capital investments, so it seems unlikely that they are not making any profit.
In view of the fact that the charging policy should, in the long-run, allow forest operators to make new investments, normal profit has been included in the calculation of economic rent as an amount that allows the forest operator to earn a rate of return of 20 percent on their capital investment. The figure of 20 percent return on capital (ROC) has been based on discussions with various stakeholders in the sector and is comparable with the current rate of interest in Fiji, after allowing for the risk of investment in the forestry sector.6
2.4 The importance of setting the correct level of forest charges
The above discussion has explained the concept of economic rent and shown how it can be calculated and used to guide forest charging policies. This section briefly discusses the two main reasons why it is so important to try to achieve the correct level of forest charges.
2.4.1 Landowners income
The most obvious reason for setting the correct level of forest charges is that this will have a direct impact on the income that landowners will obtain from the utilisation of their forest resource. If charges are too low (which is often the case) landowners income will not be maximised and this will reduce the potential for forest revenues to lift landowners out of poverty. If, on the other hand, forest charges are set too high, this may also result in reduced production from the sector and could lead to landowners obtaining sub-optimal levels of revenues from the sector.
Related to this, if forest resources appear to be producing relatively low levels of income, there will be little incentive to preserve and manage them for wood production and more of an incentive to convert them to other land-uses. While this is probably not a major concern in Fiji at the moment, it could be important in the long-run if competing activities such as agriculture increase in importance.
A third more subtle reason for attempting to get the forest charging policy right is that governments tend to base the priority that they give to different parts of their administration on the relative importance of each sector to the national economy. If the revenues generated from forest charges are low, this will generally limit the attention that the government gives to the forestry sector and reduce the scope for the forestry administration to finance and implement other policies for the sector that they wish to pursue.
2.4.2 Efficiency
Although revenue collection is often an important consideration, a potentially far more important concern about forest charging policies is that, if the policies are not well designed, they can allow low levels of efficiency in roundwood production and forest processing to persist. This leads to waste and the misallocation of resources (not only in terms of forest resources, but also labour and capital) and can have negative social and environmental consequences as well.
Some examples of the detrimental effects of poorly designed forest charging policies include:
• low charges reduce the incentive for forest operators to reduce production costs to a minimum;
6 The commercial bank lending rate in Fiji is currently about 8 percent to 12 percent in real (i.e. inflation adjusted)
terms, but banks are reluctant to invest in forest operations. Finance companies that offer loans for purchasing mobile equipment (e.g. bulldozers, skidders and trucks, etc.) charge 15 percent to 18 percent and are making loans to the sector. Considering that these institutions have a more balanced portfolio of investment risks, the required rate of return for investors in the forestry sector should be somewhat high than this, so a rate of return of 20 percent (in real terms) seems reasonable.

8
• incorrect charges for different locations and species can discourage producers from maximising production from each area of forest and can give an unfair advantage to certain locations and certain types of forest; and
• low charges reduce the incentive to improve the marketing of roundwood and forest products.
Not only are these effects wasteful, but they can encourage the development of a processing sector that is too large (i.e. if roundwood is cheap – more companies want to use it) and discourage efficiency in roundwood utilisation in the processing sector.7 They can also lead to vast amounts of capital being tied-up in a poorly performing forest processing sector, when some of this capital would be more profitably employed in other sectors of the economy.
There may be circumstances where the government deliberately decides to influence charging policies in order to give a subsidy to roundwood production or to the domestic forest processing industry. However, experience has shown that forest charging policies are often a crude tool for implementing broader forestry or economic development policies and can often result in unintended effects. For example, economic rent that is not captured by resource owners might be kept by forest operators, but it could be passed on to consumers, contractors or others involved in the production process.8
In summary, these issues are critical because they have the potential to distort the whole of the economy and trap economic development into a cycle of poorly performing industries dependent upon the wasteful use of the forest resource.
7 For example, there is no incentive to invest thousands of dollars in machinery with high product recovery rates
to save a few hundred dollars on wood raw material costs. 8 This can also include government officials involved in the awarding and monitoring of forest licences. In many
countries, low rent capture finances corruption in the forestry sector.

9
3 TRENDS AND CURRENT STATUS OF THE FORESTRY SECTOR In order to assess the potential revenue collection from forest royalties and taxes and to examine the contribution of the sector to the Fijian economy, it is essential to obtain information about the trends and current status of the sector. This section of the report briefly presents some recent information about forest resources, forest management, institutions and policies in Fiji, along with statistics about forest area, production, consumption and trade. More detailed statistics can also be found in Appendix 1 of this report.
3.1 General description
The Republic of the Fiji Islands, in the southern Pacific Ocean, is located approximately 3,100 km north-east of Sydney, Australia, and approximately 5,000 km south-west of Honolulu, Hawaii. The islands lie between 178° E and 179° W longitude and between 16° and 23° S latitude, just inside the tropical belt. Fiji is made up of about 330 islands and about 500 more tiny atolls, islets, and reefs, which cover a total land area of about 18,390 km2. The island of Viti Levu (Big Fiji) covers about half of Fiji's area (10 429 km2) and Vanua Levu (Big Land) about a third (5 556 km2), followed by Taveuni (434 km2). The smaller islands are largely encompassed in two recognized groups, the Yasawa Group and the Lau Group. Rotuma, an isolated island about 450 km north of Vanua Levu, is also a part of Fiji (see Figure 4). About 100 of the islands are inhabited and support a population of 806,212 (end 1999), with a population growth well below 2 percent (Bureau of Statistics, 2003). The two largest islands (Viti Levu and Vanua Levu) together contain over 90 percent of the population.
The climate in Fiji is tropical, but cooling winds make the climate relatively comfortable. Temperatures range from about 16° C to 32° C. December to April, which are also the rainy season, are the hottest months, with daily highs reaching 32° C. The windward (south-eastern) sides of the islands receive as much as 3,330 mm of rain a year, while the leeward northern sides receive about 2,540 mm. Heavy rains and cyclones often occur between November and April.
The large islands are of volcanic origin, of varying geological age and of moderately fertile soil, with fairly steep dissected topography in the forest areas. Mount Tomaniivi, on Viti Levu, is the highest point at 1,324 m. A number of the smaller islands are coral formations, rising only a few meters above sea level. Nearly all the islands are surrounded by coral reefs. The major rivers on Viti Levu include the Rewa, Sigatoka, Nadi and Ba. The Dreketi is the largest river on Vanua Levu.
Three major landforms occur in Fiji: flatlands, hilly lands and steep lands. Elevations range up to around 1,300 m and the mountainous topography produces pronounced windward/leeward rainfall effects. Rain forests dominate the windward and summit steep lands. Dry forests on the leeward sides have been largely usurped by grazing and fire, and persist only as remnants. Instead, extensive lowland areas support talasiqa vegetation, extensive degraded areas dominated by grasses and ferns.

10
Figure 4 Map of the Fiji Islands
3.2 Description of forest resources
The following description of forest resources is derived from Mueller-Dombois and Fosberg (1998).
3.2.1 Closed Forests
Broadleaved lowland rain forest: on Viti Levu and Vanua Levu, this forest is mostly a mixed assemblage of 20 to 30 m tall trees, largely dominated by primary Fijian species on the steep lands, but largely displaced on flatter lands, with a lower limit of annual rainfall of 2,500 mm. The canopy matrix includes 40 to 50 angiosperm species featuring Calophyllum vitiense and Endospermum macrophyllum, along with Canarium vitiense, Cleistocalyx spp., Garcinia vitiense, Heritiera ornithocephala, Myristica castaneifolia, Palaquium hornei, Parinari insularum and Syzygium spp. Kauri (Agathis vitiense) and two other gymnosperms, Dacrydium elatum and Nageia vitiensis, are also common and become more frequent in a drier forest subtype with rainfall as low as 2,250 mm per year.
A mature lowland rain forest type on Vanua Balavu of the Lau Group features Dysoxylum mollissimum ssp. molle, Ficus prolixa, Kleinhovia hospita, Maniltoa floribunda and Veitchia joannis on shallow soils over limestone or basalt. Kabara Island, also in the Lau Group, has a little-disturbed rain forest that occupies a plateau of limestone rock with little soil development. The main trees here are Ficus spp., Intsia bijuga, Koelreuteria elegans, Pittosporum brackenridgei and Milletia pinnata.
The terrain of Rotuma is mostly rolling-hills and most of it is has been cleared for coconut plantations and mixed agriculture. The remaining patches of forest on steep slopes, cinder cones and little-weathered lava are dominated by a forest of Dendrocnide vitiensis, Elattostachys falcata, Planchonella samoensis and Pometia pinnata.
Cloud forest: this unique, stunted ecosystem is restricted to mountaintops and ridges above 600 m elevation near the coast and above 900 m inland. Stunting is related to cooler temperatures, higher winds and lower light levels that reduce photosynthesis, along with excess moisture levels that accelerate nutrient

11
leaching and decrease soil aeration. Except at the lower elevational limits of cloud forest, common lowland species in Fiji do not generally penetrate into this zone. At 1,200 m elevation, unique trees include Ardisia brackenridgei, Dysoxylum lenticellare, Fagraea vitiensis and Weinmannia sp., and among the shrubs are Pipturus argenteus, Randia vitiensis and Scaevola floribunda. At 800 m, several common lowland species are seen, including Alstonia vitiensis, Bischofia javanica, Calophyllum neo-ebudicum, Heritiera ornithocephala, Palaquium hornei and Parinari insularum. Taxa occurring in all cloud forest elevational variants include Cyathea alata, Dysoxylum gillespianum, Macaranga seemannii and Syzygium sp.
Broadleaved dry forest: the leeward lowland primary dry forests in Fiji have largely been destroyed by grazing and fire. These "dry" forests are only seasonally dry and during the warm season they receive as much rain as the wet uplands. On Viti Levu, no primary dry forest remains. Instead, stands of Casuarina equisetifolia have taken their place. Those forests in advanced stages of recovery are associated with the trees Acacia richii, Alphitonia zizyphoides, Gymnostoma vitiense and Trichospermum richii and the palm Pritchardia pacifica.
A dry forest of sandalwood (Santalum yasi), along with Casuarina equisetifolia and Gymnostoma vitiense, occurs on Vanua Levu. Associated species include Fagraea gracilipes and Myristica castaneifolia. The sandalwood trade in Fiji, during the early nineteenth century, heavily depleted these forests and the species survives only as small relict populations.
Mangrove forest: the richest mangroves in Fiji occur at the mouths of major river deltas around mud-covered stream banks in the tidal zone. Seven mangrove species are represented. Rhizophora stylosa and R. x selala form a scrubby seaward fringe, replaced further inland by a mixed forest of Bruguiera gymnorrhiza, Excoecaria agallocha, Lumnitzera littorea and Xylocarpus granatum. Rhizophora samoensis is scattered throughout.
Coastal forest: a zone dominated by pure stands of Casuarina equisetifolia or Pandanus tectorius is supplanted inland by a mixed littoral forest that includes Barringtonia asiatica, Calophyllum inophyllum, Cocos nucifera, Cordia subcordata, Hibiscus tiliaceus, Hernandia nymphaeifolia, Terminalia catappa, Thespesia populnea and Tournefortia argentea.
A unique coastal forest exists at Sigatoka, on the south-west coast of Viti Levu. Here the dune forest is dominated by native species that normally grow inland, such as Calophyllum inophyllum, Dysoxylum mollissimum ssp. molle and Syzygium richii. These dunes are composed of magnetite sands rich in iron, which may explain the occurrence of this unique forest.
Mixed upland rain forest: found above 400 m near the coast and above 600 m inland on Viti Levu, Vanua Levu and Taveuni, the physiognomy of upland rain forests differs from that of lowland forests in being lower-statured, with crowns lower on their trunks. Temperatures are cooler and rainfall is generally higher, except that some upper elevation areas experience seasonal droughts, such as the high mountain ranges on the lee side of Viti Levu. Thus, a wet-zone forest with more than 3,750 mm annual rainfall can be distinguished from an intermediate-zone forest with 2,000 to 3,750 mm rainfall.
The wet-zone forest features two gymnosperms, Agathis vitiensis and Nageia vitiensis, along with a mix of many species also found in lowland rain forest, such as Calophyllum vitiense, Dysoxylum molllisimum spp. molle, Endospermum macrophyllum, Garcinia myrtifolia, Metrosideros collina, Myristica castaneifolia, Podocarpus affinis and Syzygium effusum.
The intermediate-zone forest features Agathis vitiensis, with Dacrydium elatum replacing the two Podocarpus species. The associated tree species are mostly the same as those found in lowland rain forest. Also appearing are the tree fern Cyathea lunulata and the smaller subcanopy trees Alstonia vitiensis, Discocalyx divaricata and Plerandra vitiensis. Invasions of the fern Dicranopteris linearis and the grass Miscanthus floridulus follow recurring fires.
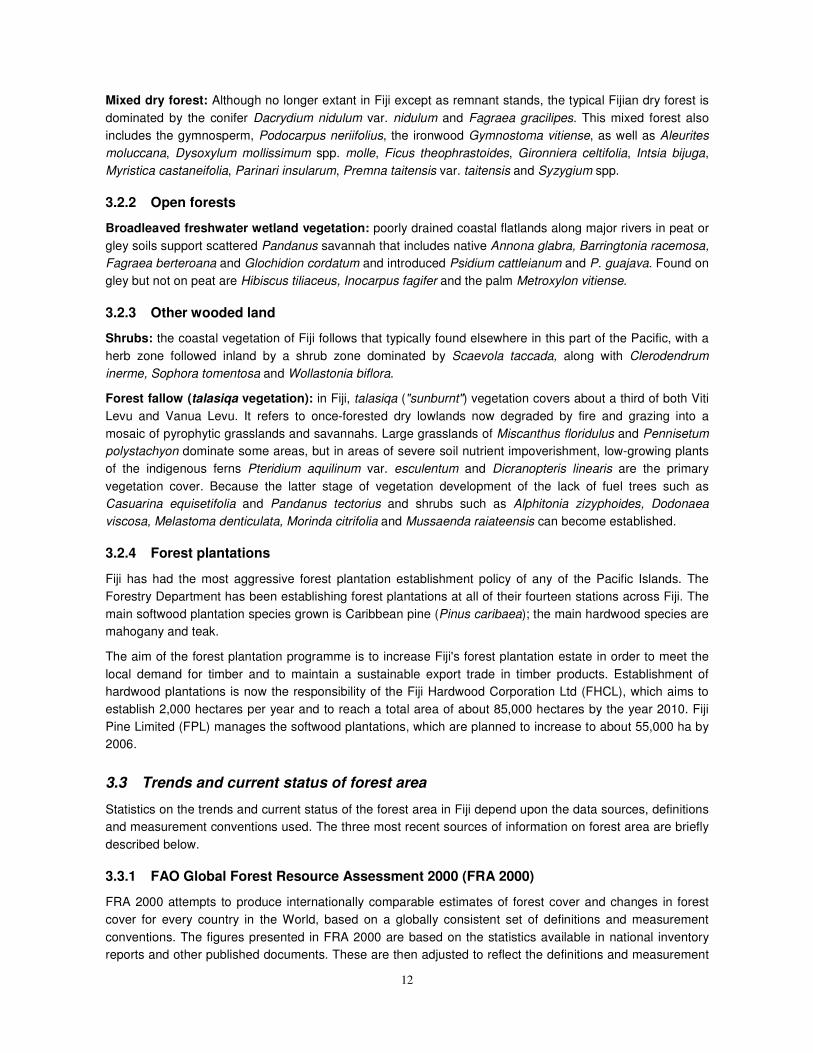
12
Mixed dry forest: Although no longer extant in Fiji except as remnant stands, the typical Fijian dry forest is dominated by the conifer Dacrydium nidulum var. nidulum and Fagraea gracilipes. This mixed forest also includes the gymnosperm, Podocarpus neriifolius, the ironwood Gymnostoma vitiense, as well as Aleurites moluccana, Dysoxylum mollissimum spp. molle, Ficus theophrastoides, Gironniera celtifolia, Intsia bijuga, Myristica castaneifolia, Parinari insularum, Premna taitensis var. taitensis and Syzygium spp.
3.2.2 Open forests
Broadleaved freshwater wetland vegetation: poorly drained coastal flatlands along major rivers in peat or gley soils support scattered Pandanus savannah that includes native Annona glabra, Barringtonia racemosa, Fagraea berteroana and Glochidion cordatum and introduced Psidium cattleianum and P. guajava. Found on gley but not on peat are Hibiscus tiliaceus, Inocarpus fagifer and the palm Metroxylon vitiense.
3.2.3 Other wooded land
Shrubs: the coastal vegetation of Fiji follows that typically found elsewhere in this part of the Pacific, with a herb zone followed inland by a shrub zone dominated by Scaevola taccada, along with Clerodendrum inerme, Sophora tomentosa and Wollastonia biflora.
Forest fallow (talasiqa vegetation): in Fiji, talasiqa ("sunburnt") vegetation covers about a third of both Viti Levu and Vanua Levu. It refers to once-forested dry lowlands now degraded by fire and grazing into a mosaic of pyrophytic grasslands and savannahs. Large grasslands of Miscanthus floridulus and Pennisetum polystachyon dominate some areas, but in areas of severe soil nutrient impoverishment, low-growing plants of the indigenous ferns Pteridium aquilinum var. esculentum and Dicranopteris linearis are the primary vegetation cover. Because the latter stage of vegetation development of the lack of fuel trees such as Casuarina equisetifolia and Pandanus tectorius and shrubs such as Alphitonia zizyphoides, Dodonaea viscosa, Melastoma denticulata, Morinda citrifolia and Mussaenda raiateensis can become established.
3.2.4 Forest plantations
Fiji has had the most aggressive forest plantation establishment policy of any of the Pacific Islands. The Forestry Department has been establishing forest plantations at all of their fourteen stations across Fiji. The main softwood plantation species grown is Caribbean pine (Pinus caribaea); the main hardwood species are mahogany and teak.
The aim of the forest plantation programme is to increase Fiji's forest plantation estate in order to meet the local demand for timber and to maintain a sustainable export trade in timber products. Establishment of hardwood plantations is now the responsibility of the Fiji Hardwood Corporation Ltd (FHCL), which aims to establish 2,000 hectares per year and to reach a total area of about 85,000 hectares by the year 2010. Fiji Pine Limited (FPL) manages the softwood plantations, which are planned to increase to about 55,000 ha by 2006.
3.3 Trends and current status of forest area
Statistics on the trends and current status of the forest area in Fiji depend upon the data sources, definitions and measurement conventions used. The three most recent sources of information on forest area are briefly described below.
3.3.1 FAO Global Forest Resource Assessment 2000 (FRA 2000)
FRA 2000 attempts to produce internationally comparable estimates of forest cover and changes in forest cover for every country in the World, based on a globally consistent set of definitions and measurement conventions. The figures presented in FRA 2000 are based on the statistics available in national inventory reports and other published documents. These are then adjusted to reflect the definitions and measurement

13
conventions used in FRA 2000 to produce internationally comparable statistics. Thus, the figures presented in FRA 2000 may differ from those presented in national statistics.
The FRA 2000 estimate of the total forest area in Fiji in 2000 is 814,732 ha or about 46 percent of the total land area (FAO, 2001). The annual change in forest area between 1990 and 2000 has been estimated as about -1,747 ha per year (or a loss of about 0.2 percent of the forest area each year), implying a total forest area in 1990 of about 832,202 ha (based on: Tang et al, 1993).
According to FRA 2000, the area of forest plantations in Fiji is about 97,200 ha (or 12 percent of the total forest area), implying that the area of indigenous forests is about 717,500 ha. It is also estimated that the area of forest plantations is currently increasing by about 9,200 ha per year. A detailed breakdown of the species, purpose and ownership of forest plantations is also given in FRA 2000 and is shown in Table 4.
Table 4 Forest plantation area in Fiji in 2000, as reported in FRA 2000 Area by main purpose or use Area by ownership/management Total area
Industrial use Non-industrial use Public Private Species group
(in ha) (in %) (in ha) (in %) (in ha) (in %) (in ha) (in %) (in ha) (in %) Mahogany 42,000 43.2 42,000 100.0 0 0.0 34,440 82.0 7,560 18.0 Other Broadleaves 4,900 5.0 4,900 100.0 0 0.0 4,018 82.0 882 18.0 Pine 43,300 44.5 43,300 100.0 0 0.0 43,300 100.0 0 0.0 Unspecified 7,000 7.2 7,000 100.0 0 0.0 5,740 82.0 1,260 18.0 Total/average 97,200 100.0 97,200 100.0 0 0.0 87,498 90.0 9,702 10.0
Source: FAO (2001).
3.3.2 National estimate of forest area in 1995
The previous estimate of forest area published by FAO (FAO, 1997) was based on a national estimate of forest area for the year 1995 (Hasni, 1997). This reported a total forest area of 840,512 ha, of which 747,266 ha was natural forest and 93,246 ha was forest plantations (see Table 5). In addition, it was estimated that there was a further 152,775 ha of other wooded land (land with trees, but insufficient crown cover or in individual plots that are too small to be considered as proper “forest” according to FAO’s terms and definitions).
The figure for total forest plantation area is roughly comparable with that presented in FRA 2000, but the figure for the area of natural forest is slightly higher than the figure presented in FRA 2000, probably because of differences in definitions and measurement conventions between the statistics collected by national authorities and the those used in the FRA.
Table 5 Total forest area in Fiji in 1995, as reported in Hasni (1997) Forest type Area (in ha) Dense natural forest 284,328 Medium dense natural forest 420,474 Mangrove forest 42,464 Total: natural forest 747,266 Hardwood plantation 48,268 Pine Plantation 44,978 Total: forest plantations 93,246 Total: forest 840,512 Scattered natural forest 152,775 Total: other wooded land 152,775 Total: forest and other wooded land 993,287
Source: Hasni (1997).
3.3.3 Forest area statistics reported by the Forestry Department
The Forestry Department in Fiji also report statistics on the area of forest land in their annual reports (Forestry Department, 1998 and earlier). These show a total forest land area of around 890,000 ha, which has changed very little over the last 15 years (see Figure 5 and Table 23 in Appendix 1).

14
Figure 5 Distribution of forest land in Fiji by forest type and land ownership 1986 - 1998, as reported by the Forestry Department
0
100
200
300
400
500
600
700
800
900
1986 1987 1988 1989 1990 1991 1992 1993 1994 1995 1996 1997 1998
Year
Are
a (in
thou
sand
ha)
Forest plantation
Indigenous forest:production
Indigenous forest:non-commercial
Indigenous forest:protection
Source: Forestry Department (1998 and earlier).
According to these statistics, the forest plantation area has increased from around 85,000 ha in 1986 to around 115,000 ha in 1998. This is a much lower rate of increase (2,500 ha per year) than the figure presented in FRA 2000 (9,200 ha per year). The total area of forest plantations is also about 20,000 ha higher than the figures presented earlier, perhaps because this includes land destined for forest plantation establishment that has not been planted yet.
The reported area of indigenous forest is around 775,000 ha, which is also somewhat higher than the figures presented earlier. This may be because some scattered forest areas are included in these figures as ”forest”, whereas they would be counted as “other wooded land” according to FAO’s definitions and measurement conventions.
These statistics (see Table 23) also show that landowning communities (“Native land”) own the majority of forests in Fiji (around 84 percent).
3.3.4 Summary of forest area statistics
Although the statistics used to identify the trends and current status of forest area in Fiji are somewhat conflicting, it appears that the total area of forest in Fiji is somewhere between 815,000 ha and 890,000 ha, depending on the definitions and measurement conventions used. Changes in the total forest area indicate that deforestation is very low, although some deforestation in indigenous forest areas is partly offset by increases in the area of forest plantations. The area of forest plantations may be between 100,000 ha and 115,000 ha, implying that the area of indigenous forests could be between 720,000 ha and 775,000 ha.

15
3.4 Trends and current status of forest management
3.4.1 History of forest management and silviculture
Fiji is a Melanesian island group, but with strong Polynesian influences. Traditional forest management was largely restricted to family home-gardens, which utilised agroforestry techniques, while the broader extent of accessible mataqali (village or clan) forest lands were used as a communal source of fuel, building materials and for hunting and gathering activities. Timber and particularly sandalwood attracted the first European traders to Fiji, with most of the sandalwood being logged before 1820. Throughout the 19th Century, planters arrived and cleared lowland forests for cotton, sugar and coconuts. Industrial timber harvesting grew slowly. In 1928, nine sawmills were producing around 6,000 cubic metres of timber. By the late-1940s, timber supplies in the vicinity of main centres of population were being depleted and serious erosion was occurring in the “dry zone” as a result of uncontrolled grazing, burning and timber cutting. The Forestry Department was established in 1938 with the objective of monitoring and controlling the exploitation of the native forest. A programme for resource development through large-scale plantations was implemented during the 1960s. The principal species planted were Pinus caribaea and Swietenia macrophylla. Since the 1980s, Fiji has been a modest exporter of forestry products, following the start of significant harvesting in the forest plantations in 1987.
3.4.2 Trends in forest management
The principal trend in forest management in Fiji during the past 30 years has been the effort to establish a significant plantation estate as a substitute and complement to natural forest wood supplies. Fiji now has a significant plantation estate, much of which is presently approaching maturity. The plantations are expected to provide an important alternative to natural forest harvesting, and should enable significant areas of natural forest to be retired into some form of conservation status (Brown, 1997; Oliver, 1999).
3.4.3 Current forest management objectives
The principal elements of Fijian forest policy have remained largely unchanged during the past half-century. A Forest Policy was approved in 1950, with the following key forest management objectives:
• to protect and develop natural vegetation where its retention is necessary for climatic reasons and for the conservation of soil and water necessary for good agriculture and continuous supplies of forest produce;
• to develop the production of such timbers as can be produced economically and to provide a surplus for export;
• to maintain and improve soil fertility by preserving or extending forest cover; and
• to check soil erosion and to recover areas already eroded.
A National Forests Action Plan (NFAP) was finalised in 1990, leading to the identification of 29 projects, in the fields of forest management and industrial development, forestry in land-use, conservation and institutional strengthening. A subsequent Forestry Sector Review has resulted in the incorporation of additional recommendations into the NFAP to help promote sustainable forest management (FAO, 1995 and 1998a).
3.4.4 Forest management plans
Natural forests in Fiji are largely under the control of customary landowners and management responsibilities, outside of periods of logging, lie with these landowners. Management of large tracts of forests is generally passive, with little or no management input. All logging licenses issued in Fiji must comply with the requirements of the Fiji National Logging Code of Practice, which was produced in 1990.

16
The Code of Practice requires the preparation of detailed logging and management plans. Planning infrastructure has been strengthened by the implementation of a Forest Resources Tactical Planning Project, which assisted in the provision of mapping data and training to help establish a practical and effective process for the preparation of environmentally sound coupe-level logging plans, hardwood plantation plans, and management plans. Management responsibility for Fiji’s plantation resource is vested in FHCL and FPL. Both corporations have detailed management plans in place.
3.4.5 Silviculture and forest management practices
At present, there is little or no management of indigenous forests except during the period when an area is being logged. Logging is generally carried out under a selection system, after which management responsibility reverts to the mataqali landowners. Experience shows that if logged-over forest is left undisturbed for 20 years it can be cut again. Sometimes, however, logged forest has been converted to agricultural use. Currently, plantation reforestation activities are carried out by FHCL, while FPL is involved in afforestation activities. More than 50,000 ha of hardwood plantations, mainly Swietenia macrophylla, have been planted, mainly by direct planting of seedlings at wide (9 x 4 metres) spacing. No pruning or thinning is carried out and rotations are 30 - 35 years. Around 40,000 ha of Pinus caribaea has been planted. Seedlings are planted at densities of 1000 - 1500 stems per hectare. On high quality sites, pruning to 6 metres is carried out for sawlog production. Thinning regimes are still being developed. Pinus caribaea is presently grown on rotations of around 17 years.
3.4.6 Forest conservation measures
The total area of protection forest in Fiji is around 280,000 ha (see Table 23). Of this, the formal protected areas network comprises a range of forest and nature reserves covering more than 37,000 ha. Nature reserves provide full protection to flora, fauna, soil and water resources. Conversely, Forest Reserves provide only a limited degree of protection status. Activities in these forests are restricted by a requirement to obtain a written consent from the Conservator of Forests. Several other communally-operated parks have also been established.
Environmental management is being integrated into planning and development processes to safeguard the environment and its regeneration capacity. A National Environment Working Group has been established to formulate a national environmental strategy, covering environmental protection and natural resources management. The Department of Environment is presently developing multi-sectoral legislation to support sustainable development and a Fiji Biodiversity Strategy Action Plan.
3.4.7 Forest protection measures
Cyclones are a frequent occurrence in Fiji, with the country being struck by 21 cyclones between 1980 and 1997. Detailed records of plantation damage were kept for several cyclones, but others were equally destructive. For example, Cyclone Kina in 1992 damaged almost 12,000 ha of plantations, of which 3,000 ha were written off. More than 7,000 ha were rehabilitated by firming or propping and the remainder was partially rehabilitated. Thus, wind-firmness is an important property in plantation species selection. Natural forests also sustain periodic heavy damage during cyclones (Strelke, 1997).
Wildfires cause significant losses as well. Escapes from burning of sugar cane are a major source of forest fires. In 1989, almost 1,000 ha of plantation were burned in a wildfire. FPL has introduced a programme of prescribed burning, particularly in stands adjacent to sugar cane fields, to reduce wildfire damage. Two insects, Ambrosia beetles (Crossotarsus externedentatus) and subterranean termites (Neotermes samoanus) have caused considerable concern in Swietenia macrophylla plantations. Attacks by Ambrosia beetles caused planting to be suspended in the late 1970s, but better management of debris appears to be effectively managing the problem. Biological control of subterranean termites through the application of

17
entomophilic nematodes shows significant promise. The major fungal problem in Fiji is Brown root rot (Phellinus noxius).
3.4.8 Forest harvesting practices
It is estimated that around 150,000 ha of natural forest has been systematically harvested on Fiji. Logging has been based on a selection system, but generally without any post-logging silvicultural treatment. The selection system utilised in Fiji generally operates on a 20-year cutting cycle. Sometimes, however, logged-over forest has been converted to other uses. Natural forest management based on reduced impact logging is presently being implemented in a 5,000 ha pilot project (Natural Forest Management pilot project). To harvest timber on native land, a Forestry Right License is required under law. These are negotiated through the NLTB. There are four categories of tenure for timber cutting rights in the natural forests:
• Timber concessions (15-30 year period);
• Long term licenses (10 years);
• Annual licenses; and
• Other licences and prepayment licenses (usually for land clearing).
The area of timber concessions and long term licenses was around 263,000 ha in 1998, of which 132,000 ha was production forest (see Table 24). However, the majority of forest processing companies harvest roundwood under annual licences.
The Fiji National Code of Logging Practice was implemented in 1990. The code prescribes desirable practices aimed at protecting the forest environment, its assets and its users, while allowing the execution of economically viable harvesting within acceptable safety standards. The main elements of the code include requirements for planning, operational standards, environmental requirements, equipment and safety standards and requirements for training and supervision. The code covers all commercial logging operations (Jiko, 2000).
3.4.9 Public participation in forest management
The large area of Fijian forests under customary ownership ensures a high degree of, at least de facto, people’s participation in forest management. The government has, however, accorded priority to ensuring greater landowner participation in all aspects of forestry sector development. An objective is to have landholders participate more as shareholders or owner-operators in forestry activities. As part of extension and community forestry programmes, the Forestry Department has collaborated with a number of other agencies to run forest awareness activities. These are aimed at improving awareness and educating communities in the importance of mangrove ecosystems and forest protection, the importance of sustainable forest management and relationships between forest, land and marine ecosystems.
3.4.10 Special programmes and incentives to promote sustainable forest management
A variety of projects and programmes in support of sustainable forest management has been implemented in Fiji, many of which derive from the National Forestry Action Plan of 1990. A key initiative has been the development of the National Code of Logging Practice, introduced in 1990 and subsequently supported by the Forest Resource Tactical Planning Project. Both of these initiatives, and the Forestry Decree of 1992, have contributed significantly to reaching a goal of sustainable forest management. The Natural Forest Management pilot project is utilising reduced impact logging techniques across 5,000 ha of natural forest. Permanent sample plots have been established in anticipation of implementing a full sustainable forest management regime. Two eco-forestry initiatives are incorporating this pilot work into their current projects, which aim to involve landowners in management decisions and practices.
18
Fiji has imposed a ban on log exports, with the primary objective of stimulating local processing. A ban on circular sawmills was imposed in 1997, to help boost recovery rates and strengthen incentives for good management (FAO, 1996; FAO, 1998b; Swarup, 2000). Fiji has also expressed strong interest in the development of an internationally accepted certification system for Pacific Islands forest products (EFI, 2000).
3.5 Forestry policy and institutions
3.5.1 Legal framework for forest management
The principal piece of forestry legislation in Fiji is the Forest Decree 1992, which replaced the Forest Act 1953 (amended in 1990). The Forest Decree 1992 largely legislates to support the objectives specified in the Fijian Forestry Sector Review 1988, namely:
“to maximise the sustainable contribution of the sector to the development and diversification of the economy whilst bringing the Fijian people into fuller and more active participation in sectoral development of all levels and stages and, at the same time, protecting and enhancing the effectiveness of the country’s forest in environmental conservation”.
Amended Forest Regulations 1990 (associated with the Forests Act 1953) also remain in force. A number of other forestry specific regulations also guide forestry development, including the following:
• Forest Sawmill Regulations 1968;
• Forest Guard Regulations 1955; and
• Forest (Fire Prevention) Regulations 1972.
Legislation and regulations creating specific forestry institutions also have relevance, in particular the following:
• Fiji Pine Commission Act 1976;
• Commission Forests (Maintenance and Protection) Regulations 1987; and
• Fiji Pine Decree 1990.
A variety of legislation relating to land, environment and conservation has been enacted, with implications for forests. Relevant pieces of legislation include the following:
• Native Land Trust Act 1940;
• Land Conservation and Improvement Act 1953;
• Nature Reserves Act 1956; and
• Native Land (Leases and Licences) Regulations 1984; and
• Native Land (Forest) Regulations 1984.
3.5.2 Forest institutions and forest managers
The Fijian government’s principal forestry agency is the Forestry Department, which is a part of MoFF. The Forestry Department has a primary role in enforcement of logging regulations. It also has a significant role in management in natural forests, particularly to support management decision-making by assembling a database for the natural forest resources, including: maps; inventories; and GIS. Most of Fiji’s plantation forests are managed by FHCL and FPL. Hardwood plantation forests established by the Forestry Department were transferred to the newly formed FHCL in 1998. FPL was corporatised in 1991 and is,

19
eventually, expected to be privatised. It manages most of the country’s softwood plantations. Forestry research is primarily under the auspices of the Silvicultural Research Division of the Forestry Department.
Eighty-three percent of land in Fiji is under customary (mataqali) ownership, with 10 percent alienated freehold land and the remaining 7 percent of land under government ownership. Almost 90 percent of the unexploited production forests and 84 percent of all Fijian forests are in mataqali ownership. Fijian mataqali do not have any corporate authority to deal in land and all negotiations for the use of timber grown on mataqali lands must be conducted through the NLTB.
3.5.3 Current forestry policy
The Government of Fiji recognizes the potential of the forestry sector to provide rural employment, income and economic development, to promote rural stability, to improve rural living standards and to act as a major source of foreign exchange.
MoFF has responsibility for most aspects of the forestry sector in Fiji, although NLTB is also an important stakeholder within Government, in view of their responsibilities related to the administration of native land. The mandate of the Ministry is to ensure that forest resources are managed sustainably and developed for the optimal benefit of all stakeholders. To achieve this, the core roles and responsibilities of MoFF are: research and development; provision of extension services and training; forest law enforcement, monitoring and surveillance; and the provision of supporting infrastructure (where economically viable).
The overall aim of government intervention is to create and provide wherever possible the social and economic environment in which the private sector can flourish and develop forest resources. The intervention policy and strategy of the Ministry is selective and relates only to areas where the private sector should not or cannot invest. More active and direct intervention (e.g. in commercial activities) is only carried out in order to stimulate investment by the private sector and to provide a sound foundation on which the private sector can build. This includes affirmative action programs that are necessary to encourage the direct participation of indigenous Fijians and Rotumans in the development of the sector.
Government policy and strategy for the forestry sector over the period 2002-04 is as follows (MoFF, 2003):
• to maximise the sector’s contribution to the economy and develop the sector to its fullest potential through the encouragement of value-adding and the provision of necessary infrastructure;
• to promote environmental conservation and management as the basis for the sustainable development of the sector, through the enforcement of the National Code of Logging Practice and certification and branding;
• to promote the utilisation of the forest resource in a way that benefits the resource owners and the community at large;
• to develop and maximise the mahogany resource, including the development of a major downstream processing industry that will benefit the Fijian economy;
• to continue the management and establishment of hardwood plantations through FHCL;
• to develop the marketing and competitive pricing of mahogany relative to international market prices (which are to be ascertained before harvesting); and
• to assess the correct share for landowners of the benefits from the harvesting of the mahogany resource.

20
3.6 Trends and current status of production and trade of forest products
Statistics on the trends in production and trade of forest products have been collected from the Forestry Department’s Annual Reports (Forestry Department, 1998 and earlier) and FAO (FAOSTAT, FAO’s on-line statistical database, available at: http://apps.fao.org/page/collections?subset=forestry). A brief description of the main trends is given below and more details of the statistics available are given in Appendix 1.
3.6.1 Roundwood
Trends in total roundwood production since 1986 are given in Figure 6 (and Table 25 in Appendix 1). The figure shows that annual non-coniferous roundwood production from the indigenous forest has declined from around 200 thousand cubic metres in 1986 to around 130 thousand cubic metres in 1998. Production of non-coniferous roundwood from forest plantations has not amounted to much so far, although it is expected that production will increase significantly, as these plantations reach an appropriate age for felling over the next few years.
The figure also shows the tremendous increase in the annual production of coniferous roundwood from forest plantations over the last decade. This has increased from under 20 thousand cubic metres in 1986 to over 400 thousand cubic metres in 1998. The majority of this production comes from the plantations managed by FPL, which have started to reach maturity. It is expected that this production will also continue to increase in the future.
Total annual production has increased from around 120 thousand cubic metres in 1986 to over 550 thousand cubic metres in 1998, with the majority of production shifting from the indigenous forest to forest plantations. This trend can be expected to continue as more of the pine plantations reach maturity and harvesting starts in the mahogany plantations.
Figure 6 Roundwood production in Fiji by forest type and species group 1986 - 1998, as reported by the Forestry Department
0
100
200
300
400
500
600
1986 1987 1988 1989 1990 1991 1992 1993 1994 1995 1996 1997 1998
Year
Pro
duct
ion
(in th
ousa
nd c
ubic
met
res) Coniferous
roundwood fromforest plantations
Non-coniferousroundwood fromforest plantations
Non-coniferousroundwood fromindigenous forest
Source: Forestry Department (1998 and earlier).

21
Figure 7 Industrial roundwood production in Fiji by product type and species group 1986 - 1998, as reported by the Forestry Department
0
100
200
300
400
500
600
1986 1987 1988 1989 1990 1991 1992 1993 1994 1995 1996 1997 1998
Year
Pro
duct
ion
(in th
ousa
nd c
ubic
met
res)
Coniferouspulpwood
Coniferoussawlog andveneer log
Non-coniferoussawlog andveneer log
Source: Forestry Department (1998 and earlier).
Figure 8 Industrial roundwood production, consumption and trade in Fiji 1961 - 2002, from FAO
-600
-500
-400
-300
-200
-100
0
100
200
300
400
1961 1966 1971 1976 1981 1986 1991 1996 2001
Year
Am
ount
(in
thou
sand
cub
ic m
etre
s)
Source: FAO (FAOSTAT). Note: the size of the shaded bar equals production and the height equals consumption.

22
Figure 7 shows the trends in annual industrial roundwood production since 1986, divided into sawlog and veneer log production (coniferous and non-coniferous) and pulpwood production.9 The figure shows that non-coniferous sawlog and veneer log production has declined from around 190 thousand cubic metres in 1986 to around 130 thousand cubic metres in 1998. This trend mirrors that of the production from indigenous forests. In contrast, production of coniferous sawlog and veneer logs has increased from around 10 thousand cubic metres to around 130 thousand cubic metres over the same period. Thus, the production of coniferous sawlog and veneer logs (all from the forest plantations) has increased to about half of the total annual sawlog and veneer log production over the last decade. The annual production of coniferous pulpwood has also increased from nothing in 1986 to around 290 thousand cubic metres in 1998.
The long-term trend in annual industrial roundwood production and trade since 1961 (as reported to FAO)10 is shown in Figure 8 (and Table 33). In this figure, the total length of the shaded bar represents total production. The amount below the zero-line represents exports and the height of the bar (i.e. the amount of the bar above the zero-line) represents domestic consumption. Imports of industrial roundwood into Fiji have always been negligible and are not shown in the figure.
This figure shows that the domestic market for industrial roundwood has increased only modestly over the last two decades (if at all), implying that the domestic forest processing sector has not grown significantly. Rather, the huge increase in production since the mid-1980s has been accommodated by an increase in exports. Almost all of these exports are coniferous wood chips produced from the forest plantations, which are exported to Japan.
3.6.2 Sawnwood
Trends in the annual production of sawnwood since 1961 are shown in Figure 9 (and Table 34 in Appendix 1). This figure shows that production increased until the mid-1970s. Since then, production has remained at around 80 thousand cubic metres to 100 thousand cubic metres in most years and has not grown significantly. In terms of species mix, the figure shows that annual production of coniferous sawnwood has increased since the mid-1980s, following the start of significant harvesting in the pine plantations. Over the last decade, coniferous sawnwood production has remained roughly constant at around 40 thousand cubic metres and now accounts for about half of all production. Conversely, the annual production of non-coniferous sawnwood has fallen from about 60 thousand cubic metres to 40 thousand cubic metres over the same period.
The figure also shows the tremendous variability in production from year to year. This can be possibly be attributed to the cyclical nature of the tourism sector (resort development is one of the main markets for local sawnwood) and, in recent years, political instability.
Figure 10 shows the trend in annual sawnwood production, trade and consumption since 1961. Over the period until the mid-1970s, consumption increased to around 80 thousand cubic metres. Exports of sawnwood were negligible and some of this consumption was satisfied by imports of sawnwood. Since the mid-1970s, imports of sawnwood have almost vanished and exports have increased to around 20 thousand cubic metres per year. Both production and exports are split roughly equally between coniferous and non-coniferous sawnwood. The most striking feature of this figure is that domestic consumption appears to have fallen over the last two decades, from around 80 thousand cubic metres per year in the early-1980s to around 60 thousand cubic metres in recent years.
9 Industrial roundwood production excludes the production of woodfuel (fuelwood and charcoal). It includes the
production of other industrial roundwood (i.e. roundwood used without further processing for uses such as posts and poles), but recorded production of these other products in Fiji is negligible and is excluded here.
10 Due to differences in definitions and measurement conventions, the statistics reported by FAO differ slightly from those presented by the Forestry Department, but these differences are usually small.

23
Figure 9 Sawnwood production in Fiji 1961 - 2002 by species group, from FAO
0
20
40
60
80
100
120
140
160
1961 1966 1971 1976 1981 1986 1991 1996 2001
Year
Pro
duct
ion
(in th
ousa
nd c
ubic
met
res)
Coniferous sawnwood
Non-coniferous sawnwood
Source: FAO (FAOSTAT).
Figure 10 Sawnwood production, consumption and trade in Fiji 1961 - 2002, from FAO
-40
-20
0
20
40
60
80
100
120
1961 1966 1971 1976 1981 1986 1991 1996 2001
Year
Am
ount
(in
thou
sand
cub
ic m
etre
s)
Imports
Production
Source: FAO (FAOSTAT). Note: the size of the shaded bar equals production and the height of both bars equals consumption.

24
3.6.3 Wood based panels
Trends in the annual production, trade and consumption of wood based panels since 1961 are shown in Figure 11 (and Table 35 in the appendix). Until the early-1970s, consumption of wood based panels in Fiji was entirely satisfied by imports. Wood based panel production started in the early-1970s with the production of plywood and veneer sheets (the only two wood based panels that are manufactured in Fiji). Production increased to around 15 thousand cubic metres in the mid-1980s and has remained at around this level ever since. The majority of this production is manufactured from logs from the indigenous forest and each of these two products accounts for approximately half of the total.
Figure 11 Wood based panel production, consumption and trade in Fiji 1961 - 2002, from FAO
-20
-15
-10
-5
0
5
10
15
20
1961 1966 1971 1976 1981 1986 1991 1996 2001
Year
Am
ount
(in
thou
sand
cub
ic m
etre
s)
Imports
Production
Source: FAO (FAOSTAT). Note: the size of the shaded bar equals production and the height of both bars equals consumption.
Total consumption of wood based panels has varied greatly from year to year, but has remained roughly constant at around 10 thousand cubic metres per year since the mid-1980s. To some extent, this consumption could account for the fall in sawnwood consumption noted earlier (i.e. product substitution). A small amount of wood based panel consumption is satisfied by particleboard and fibreboard imports into the country, but the majority is satisfied by domestic veneer sheet and plywood production. In addition, exports of veneer sheets and plywood have amounted to slightly over 5 thousand cubic metres per year over the last two decades.

25
3.6.4 Paper and paperboard
Fiji does not produce any paper or paperboard, so domestic consumption is entirely satisfied by imports. The trend in imports of paper and paperboard since 1961 is shown in Figure 12 (and Table 36), along with the division of imports into the three main paper product categories.
Figure 12 Paper and paperboard imports into Fiji 1961 - 2002, from FAO
0
2
4
6
8
10
12
14
16
18
20
22
1961 1966 1971 1976 1981 1986 1991 1996 2001
Year
Impo
rts
(in th
ousa
nd m
etri
c to
nnes
)
Other paper and paperboard
Printing and writing paper
Newsprint
Source: FAO (FAOSTAT).
The figure shows that imports increased steadily up until the early-1990s, since when they increased more rapidly to reach a level of around 18 thousand metric tonnes (MT) per year. Newsprint imports and consumption have remained constant for the last two decades at around 2 thousand MT per year and all of the growth in consumption has occurred in the other two product categories. Paper consumption increases rapidly when countries reach a certain level of development and the trends shown here are very similar to those found in other countries at the same level of development as Fiji.
3.6.5 Forest processing industry structure
The structure of the forest processing industry (size and number of mills) is important for the calculation of economic rent, as the average size of processing facilities affects the profitability of the sector and the amount that forest processors can afford to pay for the raw material.
The forest processing industry in Fiji is dominated by two large companies: Fiji Forest Industries (FFI) and Tropik Wood Industries (TWI). Together, these two companies consume about 150 thousand cubic metres of sawlogs and veneer logs each year (or roughly 40% of total production). TWI mostly processes pine sawlogs and consumes almost all pine sawlog production. The production of pine woodchips is also a major activity of TWI. FFI includes sawnwood and plywood production and is supplied by one of the few long-term forest concessions operating in Fiji (and by far the largest). FFI consumes about 50 thousand cubic metres of non-coniferous sawlogs and veneer logs or about one-third of production from the indigenous forest.

26
Other than these two companies, the remainder of the forest processing sector in Fiji is quite small. One other company produces both sawnwood and plywood - Valebasoga Tropikboard - but this company was in receivership at the end of 2003. All other mills only produce sawnwood and obtain nearly all of their supplies from the indigenous forest.
Figure 13 Consumption of sawlogs and veneer logs by mill size (excluding Fiji Forest Industries and Tropik Wood Industries) 1986 - 1998
0
20
40
60
80
100
120
140
160
180
1986 1987 1988 1989 1990 1991 1992 1993 1994 1995 1996 1997 1998
Year
Log
inpu
t (in
thou
sand
cub
ic m
etre
s)
Up to 1,000 and others
1,001-5,000
5,001-10,000
0ver 10,000
Source: Forestry Department (1998 and earlier).
Trends in the structure of the forest processing industry are shown in Figure 13 and Table 26 to Table 29 in Appendix 1. Despite the decline in sawlog and veneer log production from the indigenous forest, the forest processing industry has not consolidated very much. Excluding FFI and TWI, around half of all production was processed in mills with an annual log intake of less than 5,000 cubic metres in 1986 and the same was true in 1998. However, the overall number of mills declined from 53 to 29 over the same period and the estimated number of mills operating at the end of 2003 was 21. In addition, the average mill size increased slightly from an annual log intake of 2,500 cubic metres in 1986 to 3,500 cubic metres in 1998.
The imposition of a ban on the use of circular saws in 1997 has led to some new investments in sawmilling technology. Site visits revealed that many sawmills are using new technology (e.g. modern bandsaws, some with computerised controls) and the overall condition of processing technology is relatively good compared with other tropical wood producing countries of a similar size and level of development. In addition, there have been a number of investments in kiln drying technology and machinery to produce higher value products (e.g. profiled boards and mouldings).

27
Table 6 Number of new entrants to the sector and exits from the sector 1986 - 1998 Total 1986-98 Annual average Size of mill (by annual log
intake in cubic metres) Entry Exit Total Entry Exit Total 0ver 10,000 3 5 8 0.2 0.4 0.6 5,001-10,000 9 7 16 0.7 0.5 1.2 1,001-5,000 20 20 40 1.5 1.5 3.1 0-1,000 49 73 122 3.8 5.6 9.4 All sizes 81 105 186 6.2 8.1 14.3
Source: Forestry Department (1998 and earlier).
The sector also suffers from a high level of turnover, in terms of the number of mills starting up or closing down each year. Table 6 shows the number of new entrants and exits from the sector over the period 1986 to 1998. In a few cases, these entries/exits represent temporary shutdowns, but in the majority of cases they represent permanent closures of mills or changes in investors and/or management. Given that the average number of mils operating during this period was 38, the average annual level of turnover - 14 - is somewhat high, representing over one-third of the total number of mills. Turnover in the smaller mill size category is particularly high, suggesting that the long-term viability of these operations is quite low. It is also worth noting that, in 1998, only 12 of the 29 mills operating at that time had been operating for five years or more and almost all of these were in the larger size categories.
3.6.6 Summary of forest products production and trade
Recent trends in the production of industrial roundwood in Fiji have shown a decline in production from the indigenous forest as production from the pine plantations has increased. Apart from the production and export of woodchips from the pine plantations, most industrial roundwood is converted into sawnwood and a small amount is converted into plywood. Total production of these two products increased greatly during the 1970s, but has not increased by much since then.
The domestic market for sawnwood and plywood is almost entirely satisfied by domestic production, but there are small amounts of imports of other types of wood based panel. In addition, Fiji imports all of its paper and paperboard requirements. The domestic market for sawnwood and wood based panels has not grown at all in recent years. About one-third of sawnwood production is exported along with one-quarter of plywood and veneer sheet production. These export markets have also not expanded in recent years.
The forest processing industry comprises a small number of large to medium sized mills and a number of very small mills. Given the limitations of the domestic market, sluggish growth and fierce competition in export markets and the foreseen increases in industrial roundwood production from the forest plantations, the challenge for the sector will be to develop export markets to utilise this potential production.

28
4 TRENDS AND CURRENT STATUS OF FOREST CHARGES As in most forest revenue systems, the charges paid to the Government in Fiji can be grouped into three main types:
• charges for the use of the forest resource;
• charges to cover the cost of services provided by the Government; and
• general taxes paid by all companies and individuals.
In addition, a number of informal or unofficial charges have also been introduced in recent years.
These charges vary according to the type of forest, ownership and location. In addition, different parts of the government administration have responsibilities for fixing, assessing and collecting these different charges. This section of the report describes the trends and current status of the first two types of charges outlined above. The payment of taxes is noted here (for completeness), but will be discussed in more detail in Section 6 of this report.
4.1 Current levels of forest charges
4.1.1 Charges for harvesting roundwood in the indigenous forest
A summary of all of the different forest charges currently paid for harvesting roundwood in the indigenous forest in Fiji is given in Table 7 and a brief description of each of them is given below. The first five charges (royalty, premium, commission, goodwill and land rent) represent charges for the use of the resource. With the exception of the land rent (which is relatively small) they account for the majority of total charges paid. The other charges are charges paid for services provided by the Forestry Department and NLTB.
Table 7 Summary of forest charges in Fiji in 2003
Amount by species class (in FJD per m3) Type of charge
Class 1 Class 2 Class 3 Class 4 Royalty Zone 1 (Viti Levu) 40.00 30.00 10.00 6.50 Zone 2 (Vanua Levu) 40.00 30.00 9.30 6.00 Zone 3 (elsewhere) 32.00 32.00 8.00 6.00 Premium Zone 1 (Viti Levu) 4.00 - 6.00 Zone 2 (Vanua Levu) nil Zone 3 (elsewhere) nil Commission Zone 1 (Viti Levu) 20.00 - 45.00 10.00 - 20.00 10.00 - 15.00 10.00 - 12.00 Zone 2 (Vanua Levu) 15.00 - 25.00 10.00 - 15.00 10.00 - 15.00 10.00 - 12.00 Zone 3 (elsewhere) data not available Goodwill 0.50-12.00 Land Rent varies Scaling Fee 3.50 Map Fee varies (charged on the basis of cost recovery) Application Fee varies (charged on the basis of cost recovery) Renewal Fee varies (charged on the basis of cost recovery) Processing Fee varies (charged on the basis of cost recovery)
Source: various documents, interviews and field visits.

29
Royalty: royalties are official charges that are fixed by Ministerial Decree and charged per cubic metre. For the purpose of fixing the royalties, Fiji is currently divided into three zones to reflect the differences in operating costs between the different islands. Royalties are also divided into four species classes to reflect the different qualities and values of products that can be manufactured from each species. A list of the species currently included in each royalty class is given in Table 8.
Table 8 Species distribution by royalty class Royalty class
Class 1 Class 2 Class 3 Class 4
Species
Amunu Buabua Dakua Makadre Dakua Salusalu Kuasi Rosawa Vesi Yaka
Bauvudi Dabi Damanu Dilo Kauceuti Kaudamu Kaunicina Kauvula Mavota Nawanawa Sagali Raintree
Doi Dogo Laubu Qumu Rosarosa Sacau Sausauira Tivi Vaivai-ni-veikau Yasiyasi
All native species not included in Classes 1-3, with the exception of Yasidina (Sandalwood - Santalum yasi) to which special conditions apply.
Source: Forestry Department.
Premium: premiums have been recently introduced by NLTB and are charged per cubic metre. Currently, premiums are only charged in Zone 1 (Viti Levu). The standard premium rate is FJD 6.00/m3, although one sawmiller said that they paid FJD 6.00/m3 for harvesting in primary forest and only FJD 4.00/m3 in secondary forest. Premiums are paid in advance on the volume that will be harvested and are distributed amongst landowners immediately. NLTB stated that the original intention of these charges was to give landowners some immediate revenue once a harvesting licence has been approved.
Commission: commissions are payments (usually per cubic metre) that are negotiated directly between the producer and landowners. A range of figures was quoted in documents and during interviews with sawmillers and landowners. Table 7 gives the range of figures quoted, although the consensus was somewhere nearer the lower end of the ranges given above. Commissions vary by species class. In particular, much higher commissions are usually paid for species in Class 1. Commissions in the lower valued species classes may not vary by very much. Commissions may also be higher in Zone 1 than Zone 2, although this could be as a result of the particular individuals that were interviewed rather than a reliable statistical estimate. Commissions have no formal legal status, but are often codified in the contracts that are made directly between producers and landowners.
Goodwill: goodwill is another benefit to landowners that is paid for by producers. Goodwill payments can be in cash or in kind and can include activities such as building or improving roads in the community, providing free forest products or other goods and building other types of infrastructure for the local community. Once the cost of goodwill is spread across the volume harvested, a wide range of payments (per cubic metre) was quoted in documents and interviews. Goodwill payments have the same legal status as commissions. Commissions and goodwill payments are both recent innovations, which apparently started when producers wanted to encourage more landowners to allow harvesting in their forests.
Land Rent: land rent is paid each year by those producers that hold long term forest concessions. Land rent varies and it was not possible to collect information about the level of land rents. However, the most that can be charged as land rent is six percent of the unimproved capital value of the land (USDC, 2000), so forest land rent is likely to be quite low. Land rent assessed every five years by NLTB, who have the legal power to do this.

30
Scaling Fee: the Forestry Department collects a scaling fee on every cubic metre of roundwood that is harvested. This fee does not vary by species or location and is supposed to cover the Forestry Department’s costs of production monitoring and control.
Map Fee: the Forestry Department also charges for the production of a harvesting map and plan, which is a necessary part of any licence. The charge reflects the cost of production and is generally quite small. Amounts of FJD 100 to FJD 200 (in total) were quoted during interviews.
Application, renewal and processing fees: these fees are charged by NLTB to cover their administrative costs of processing and approving licences. Figures quoted were in the range of FJD 1,000 to FJD 1,500 in total (for a first application) and less for a renewal.
4.1.2 Charges for harvesting roundwood in forest plantations
The majority of forest plantations in Fiji are the pine plantations managed by FPL and the mahogany plantations managed by FHCL. However, there are also some small areas of forest plantations owned and managed by private individuals (extension plantations). Most of the above charges do not apply to harvesting in the extension plantations (although a proportion of the total land rent of an agricultural landholding would be attributable to any forest plantations therein, if the landholding was on native land). In addition, the Forestry Department was somewhat uncertain about whether production monitoring and control would be required in such areas and, therefore, whether the Scaling Fee would be charged.
For the other forest plantation areas, the Government has devised a different system for assessing and collecting forest charges. For example, in the mahogany plantations, charges will be assessed as follows:
• landowners will receive land rent for the lease of the land covered by the forest plantations;
• landowners will receive 10 percent of the stumpage value of all harvested roundwood; and
• landowners will hold a share in the equity of FHCL through the Fiji Mahogany Trust (FMT).
The first two benefits above are similar to the land rents and royalty payments that landowners currently receive from harvesting in the indigenous forest. The equity share in FHCL has yet to be decided (Government of Fiji, 2002) and the dividends from this will be used to acquire further shares in FHCL or to pay for other services for the benefit of landowners.
4.1.3 Other forest charges
There are some small charges for the production of other forest products (e.g. posts, poles and fuelwood), but the volumes harvested and amounts collected are relatively small. In addition, the Forestry Department charges user fees for entry to some forest parks and to recover the cost of some other services provided. A small amount of money is also collected from fines for forest offences. Further details of the amounts collected from these charges are given in Table 30 in Appendix 1.
There are no specific forest charges on the processing of forest products or the trade and sale of forest products, other than general taxes (e.g. income tax, value-added tax (VAT), import and export duties).
4.2 Trends in forest charges
Premiums, commissions and goodwill are relatively recent charges that have been introduced by the NLTB and landowners. Apart from these developments, forest royalties have been raised on three occasions in the last two decades. Table 9 shows the forest royalties charged since 1982 and compares them to changes in general prices (GDP inflation) and sawnwood export prices over the same period.
As the table shows, since 1982, forest royalties in Fiji have been simplified, with the reduction in the number of royalty classes from five to four. In addition, the number of different zones has been reduced from four to

31
three. Originally, the two main islands were split into two different zones for the purpose of setting forest royalties. These zones have been merged on both of the islands and a third zone has been created to accommodate harvesting on the other islands. It should also be noted that although the two main islands are in different zones, the royalties in these two zones have been the same in the top two species classes since 1990 and differ only slightly in the other two classes.
Table 9 Levels and changes in royalty rates in Fiji compared with changes in prices 1982 - 2001 Amount by location (in FJD per m3) Increases with revisions
Year Royalty class Viti Levu Vanua Levu Elsewhere Viti Levu Vanua Levu Elsewhere
GDP inflation over the same
period
Change in sawnwood export
prices over the same period
Class 1 15.70 13.00 12.90 10.60 n.a. n.a. n.a. n.a. Class 2 14.70 12.00 11.90 9.60 n.a. n.a. n.a. n.a. Class 3 5.80 4.40 4.30 3.00 n.a. n.a. n.a. n.a. Class 4 3.00 2.30 2.20 1.60 n.a. n.a. n.a. n.a.
1982
Class 5 1.60 1.50 1.30 1.00 n.a. n.a. n.a. n.a.
n.a. n.a.
Class 1 25.00 25.00 18.00 74% 113% n.a. Class 2 23.00 23.00 16.00 72% 114% n.a. Class 3 6.80 6.10 5.00 33% 67% n.a.
1990
Class 4 3.50 3.15 3.00 32% 66% n.a.
56% 51%
Class 1 35.00 35.00 28.00 40% 40% 56% Class 2 26.00 26.00 19.00 13% 13% 19% Class 3 8.80 8.10 7.00 29% 33% 40%
1995
Class 4 5.50 5.15 5.00 57% 63% 67%
19% 10%
Class 1 40.00 40.00 32.00 14% 14% 14% Class 2 30.00 30.00 22.00 15% 15% 16% Class 3 10.00 9.30 8.00 14% 15% 14% 2001
Class 4 6.50 6.00 6.00 18% 17% 20%
21% 84%
Source: Forestry Department.
Figure 14 Royalty rates in Fiji (Zone 1) after adjustment for inflation 1982 - 2002
0
5
10
15
20
25
30
35
40
45
1982 1984 1986 1988 1990 1992 1994 1996 1998 2000 2002
Year
Fore
st r
oyal
ty (i
n FJ
D p
er C
UM
at 2
003
pric
es) Class 1 Class 2
Class 3 Class 4
Source: Forestry Department.
Figure 14 shows the trends in royalty rates in Zone 1 (Viti Levu) for each of the four species classes since 1982 after adjustment for inflation (i.e. the figures are all converted to 2003 prices using the GDP deflator for Fiji). This shows that increases in royalty rates have fallen slightly behind inflation for Class 3 species.

32
Increases in royalty rates for Class 2 species have matched inflation and increases for Class 4 species have been slightly higher than inflation. Increases in royalty rates for Class 1 species have been well above inflation, although the last increase (in 2001) did not return the real level of the royalty to the level achieved with the previous increase (in 1995). The real increase in royalty rates for Class 1 species amounts to about 25 - 30 percent on average over the period. This high increase is presumably justified by increases in the selling prices of sawnwood manufactured from these species.
Figure 15 Cumulative increases in royalty rates and prices in Fiji (Zone 1) 1982 - 2002
0%
20%
40%
60%
80%
100%
120%
140%
160%
180%
200%
220%
1982 1984 1986 1988 1990 1992 1994 1996 1998 2000 2002
Year
Cum
ulat
ive
incr
ease
in fo
rest
roy
altie
s an
d pr
ices Class 1
Class 2
Class 3
Class 4
GDP inflation
Sawnwood export prices
Source: Forestry Department.
Figure 15 presents this information in a slightly different way and shows how the cumulative increases in royalty rates (not adjusted for inflation) compare with increases in general prices (GDP inflation) and sawnwood export prices. This confirms that increases in royalty rates for Class 1 species have been broadly in line with increases in sawnwood export prices.

33
4.3 Revenue collection and administration11
4.3.1 Process of setting forest charges
The harvesting and extraction of forest products in Fiji is controlled by a number of licensing requirements that fall under the control of the Forestry Department and NLTB. Specifically, the following legislation refers to licensing and the payment of fees:
Sec. 33 - 1984 Native Land (Leases and Licences) Regulations, Cap 134:
Reg. 10 “The Board may, by licence, grant such rights in, on, under or over native land, for such purposes and subject to such terms, conditions and covenants as the Board shall determine.”
Sec. 33 - Native Land (Forest) Regulations, Cap 134:
Reg. 8(1) “All forest produce cut, sawn, converted, collected or removed under a licence in Forms 1 or 2 shall be liable to royalty at the rate laid down in the royalty rate list in the Second Schedule:”
Forest Decree, 1992:
Sec. 16(1) “A licence shall be subject to the payment of such fees as may be prescribed.”
Sec. 38(2) “prescribe -
(i) in the royalties due on produce cut or collected under licence on State land or on native land in forest reserves;
(ii) the fees and any other charges due to the State on produce cut or collected under a licence on any land.”
The above legislation states that both the Forestry Department and the NLTB have the power to award licences and set forest charges.
Current practice is for the Forestry Department and NLTB to consult with the forestry industry and to agree between themselves what the level of forest royalties should be. There is no formal system of formulae and/or calculations for the revision of forest charges, although it appears that past revisions have been broadly in line with inflation and changes in sawnwood prices. Revisions in the past have taken place infrequently, but the aim now is to revise the forest royalty rates every 2.5 years.
For the informal charges (commissions and goodwill payments), the level of charges are negotiated directly between forest operators and landowners. In addition to the official licences from NLTB and the Forestry Department, most harvesting operations are also governed by a legal contract between the operator and landowners, which specifies the payments that should be made.
11 The discussion here is restricted to charges on harvesting of natural forest on native land. NLTB are not
involved in harvesting on private land or crown/state land. (In the latter, royalties are charged but are retained by the Government). Although the Forestry Department are responsible for the supervision of harvesting on private land, very little production comes from private land and it is unclear what charges, if any, would be levied. The charges collected from operations in private forest plantations on native land are restricted to the land rents levied by NLTB on agricultural land and are arranged accordingly. Arrangements for setting, collecting and distributing charges from operations in the mahogany and pine plantations are also organised differently (see Section 4.1.2).

34
4.3.2 Collection and distribution of forest charges
The collection and distribution of forest charges is closely tied to the awarding of licences and the monitoring of forest operations by the Forestry Department.
In order to harvest forest products, landowners must first apply for a licence from NLTB. This is relatively easy for native land outside reserves, but is quite difficult for native reserve land (where the applicant(s) must get the majority agreement of all of the relevant landowners). The licence from NLTB is awarded in the name of the applicant(s) (i.e. landowners), but the producer or “contractor” is usually specified on the licence. At the time that the licence is issued, NLTB collects the application or renewal fee and processing fee, plus an advance payment for royalties and premium (where applicable). These fees are normally paid by the producer.
In addition to this, the producer must also obtain a Forestry Right License. This is awarded by the Forestry Department and is subject to the producer submitting a forest management or harvesting plan and abiding to all forestry regulations. The licence is free, but requires a map and the Forestry Department collects a small charge for this. The Forestry Department also usually collects an advance payment for some of the Scaling Fees that will be due.
When production starts, the producer must obtain a permit to cut and remove the harvested forest products. Forestry Department staff visit production areas to record and mark production, usually in the presence of both the producer and a landowners representative. Permits are time-bound, so the frequency of inspections is dependent on the level of production and the times at which producers wish to take their products to the mill. This information is then entered into the Forestry Department’s management information system, which is used to record production and calculate the royalties and scaling fees due. The Forestry Department invoices producers for the Scaling Fees and sends the royalty information to NLTB. NLTB is now (since October 1996) responsible for the invoicing and collection of royalties and premiums.
NLTB distribute 90 percent of the royalties collected in each mataqali to the landowners registered in that mataqali, according to a formula. NLTB are encouraging landowners to accept payments directly into bank accounts, otherwise NLTB have to visit landowners to pay them in cash. There was some debate about the length of time it took for NLTB to distribute this money, with some stakeholders complaining that it could take up to six months (or more) for money to be distributed.
The other ten percent of the royalties collected is retained by NLTB to cover their administration costs. This proportion has fallen from 25 percent (and then 15 percent) in recent years. NLTB believe that the current figure is too low to cover all of their costs, which is why they have introduced higher application and processing fees. In contrast, discussions with the Forestry Department suggested that they believe that the Scaling Fees and Map Fees that they collect are sufficient to cover their costs of monitoring and administration.
Commissions and goodwill payments are paid directly by producers to landowners (or their representatives) according to whatever they have agreed. Interviews with stakeholders suggested that these payments are preferred by landowners because this money is distributed far more quickly than the royalties are. For example, one landowner said that they got their commissions within one week of the logs leaving the forest. It should be noted that there are no rules governing the distribution of this money and it is unclear whether these payments benefit all landowners. However, one producer did say that they pay commission and goodwill into a community fund, which is controlled and used by the community for social projects.
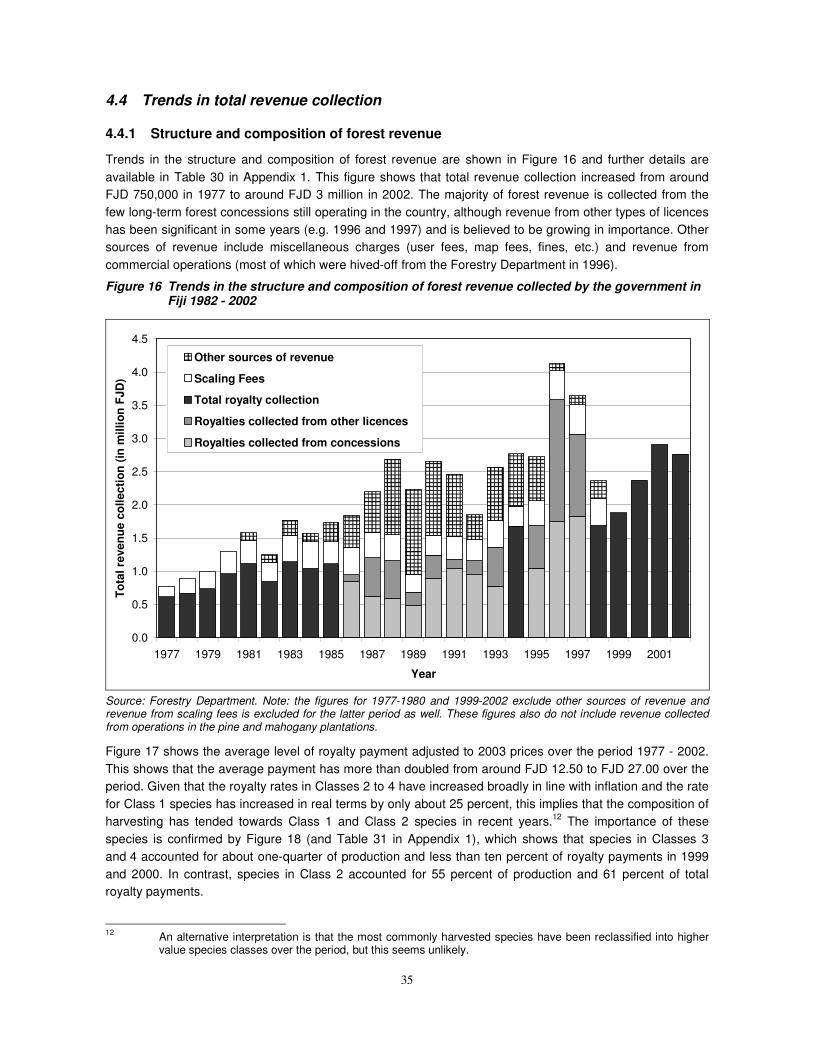
35
4.4 Trends in total revenue collection
4.4.1 Structure and composition of forest revenue
Trends in the structure and composition of forest revenue are shown in Figure 16 and further details are available in Table 30 in Appendix 1. This figure shows that total revenue collection increased from around FJD 750,000 in 1977 to around FJD 3 million in 2002. The majority of forest revenue is collected from the few long-term forest concessions still operating in the country, although revenue from other types of licences has been significant in some years (e.g. 1996 and 1997) and is believed to be growing in importance. Other sources of revenue include miscellaneous charges (user fees, map fees, fines, etc.) and revenue from commercial operations (most of which were hived-off from the Forestry Department in 1996).
Figure 16 Trends in the structure and composition of forest revenue collected by the government in Fiji 1982 - 2002
0.0
0.5
1.0
1.5
2.0
2.5
3.0
3.5
4.0
4.5
1977 1979 1981 1983 1985 1987 1989 1991 1993 1995 1997 1999 2001
Year
Tota
l rev
enue
col
lect
ion
(in m
illio
n FJ
D)
Other sources of revenue
Scaling Fees
Total royalty collection
Royalties collected from other licences
Royalties collected from concessions
Source: Forestry Department. Note: the figures for 1977-1980 and 1999-2002 exclude other sources of revenue and revenue from scaling fees is excluded for the latter period as well. These figures also do not include revenue collected from operations in the pine and mahogany plantations.
Figure 17 shows the average level of royalty payment adjusted to 2003 prices over the period 1977 - 2002. This shows that the average payment has more than doubled from around FJD 12.50 to FJD 27.00 over the period. Given that the royalty rates in Classes 2 to 4 have increased broadly in line with inflation and the rate for Class 1 species has increased in real terms by only about 25 percent, this implies that the composition of harvesting has tended towards Class 1 and Class 2 species in recent years.12 The importance of these species is confirmed by Figure 18 (and Table 31 in Appendix 1), which shows that species in Classes 3 and 4 accounted for about one-quarter of production and less than ten percent of royalty payments in 1999 and 2000. In contrast, species in Class 2 accounted for 55 percent of production and 61 percent of total royalty payments.
12 An alternative interpretation is that the most commonly harvested species have been reclassified into higher
value species classes over the period, but this seems unlikely.

36
Figure 17 Trends in the average royalty payment in Fiji 1977 - 2002 (at 2003 prices)
0
5
10
15
20
25
30
1977 1979 1981 1983 1985 1987 1989 1991 1993 1995 1997 1999 2001
Year
Ave
rage
roy
alty
pay
men
t (in
FJD
per
CU
M a
t 200
3 pr
ices
)
Source: Forestry Department.
Figure 18 Distribution of production volumes and total royalty payments by species class in Fiji in 1999 and 2000
Share of total production
Class 1 Class 2 Class 3 Class 4
Share of total royalties
Source: Forestry Department (2001).

37
4.4.2 Administrative efficiency
An important feature of any forest revenue system is the administrative efficiency of the system or the costs of revenue collection compared to the total amounts collected. The trend in the real level of the Scaling Fee is shown by the black line (measured against the right axis) in Figure 19. This shows that, after adjusting for inflation, the level of the Scaling Fee has remained constant at about FJD 3.50 (at 2003 prices) over the last two decades. As the average level of royalty payments has increased in real terms, the level of the Scaling Fee relative to the average royalty payment has fallen over the same period. The grey line (measured against the left axis) in Figure 19 shows that Scaling Fees have fallen from an additional 30 percent on top of royalties throughout much of the 1980s to around 15 percent in more recent years. Assuming that the Scaling Fee does cover the Forestry Department’s costs of monitoring and administration (as they seem to think it does), this figure is remarkably low compared with many other countries, suggesting that the forest revenue system is efficient.
Figure 19 Trends in the Scaling Fee charged by the Forestry Department in Fiji 1977 - 1998
0%
5%
10%
15%
20%
25%
30%
35%
40%
45%
1977 1979 1981 1983 1985 1987 1989 1991 1993 1995 1997
Year
Sca
ling
Fee
as a
pro
port
ion
of th
e av
erag
e ro
yalty
pay
men
t
0
1
2
3
4
5
6
Ave
rage
leve
l of t
he S
calin
g Fe
e (in
FJD
pe
r C
UM
at 2
003
pric
es)
Scaling Fee as a percentage of the average royalty payment
Real level of the Scaling Fee
Source: Forestry Department.
4.4.3 Contribution to government expenditure on the sector
Figure 20 shows the trend in total government expenditure on forestry from 1981 to 1998 (adjusted for inflation to 2003 prices), along with the contribution to expenditure from revenue collected and retained by the government (i.e. excluding royalties). As the figure shows, the total level of government expenditure on forestry in Fiji has remained roughly constant over the period at between FJD 7 million and FJD 9 million per year (at 2003 prices). Thus, there is very little correlation between expenditure and production from the natural forest, suggesting that production monitoring, control and revenue collection activities do not account for a significant proportion of government expenditure on the sector.
The amount collected from Scaling Fees has declined from just under FJD 1 million (at 2003 prices) in the early 1980s (around 10 to 15 percent of expenditure), to about FJD 500,000 (around five percent of expenditure) in recent years. Net government expenditure on the forestry sector has been about

38
FJD 7 million (around 80 percent of the total), showing that the implementation of forestry policy has been largely financed by the state.
Figure 20 Trends in net and total government expenditure on forestry in Fiji 1981- 1998 (at 2003 prices)
0
1
2
3
4
5
6
7
8
9
10
1981 1983 1985 1987 1989 1991 1993 1995 1997
Year
Am
ount
(in
mill
ion
FJD
at 2
003
pric
es) Net government
expenditure onforestry
Other sources ofrevenue
Revenue fromScaling Fees
Source: Forestry Department (1998 and earlier). Note: the total height of the bars represents total government expenditure on the sector.

39
5 ECONOMIC RENT ANALYSIS This section describes the data collected about production costs and product prices in Fiji and the methodology used to calculate economic rent. It finishes by presenting the results of the economic rent analysis and describing the implications of these results for the level of forest charges.
5.1 Data collection
In order to calculate the level of economic rent from roundwood production in Fiji, it was necessary to collect detailed information about the costs of forest operations. In addition, because there is no log export market and it is difficult to obtain reliable information about domestic log prices, the costs of forest processing were also estimated in order to subtract all of these costs from forest product prices to arrive at the economic rent.
5.1.1 Roundwood production and processing costs
Production costs were calculated “from the bottom up”. In other words, information about the costs of individual factors of production (e.g. labour, fuel, tools and machines) was collected and used, along with information collected about the consumption of materials and productivity rates, in order to calculate the unit costs of production for each activity (e.g. felling, road transport, kiln drying). A simplified picture of the process used to estimate the unit costs of production is given in Figure 21.
Figure 21 A simplified picture of the process used to collect cost data and produce unit costs of production for various forestry and forest processing activities in Fiji
Prices in local and international markets
Cost of variousfactors of production
Operators handbooks and discussions
Consumption of various factors of production
Field observationsand discussions
Productivity rates for different activities
Unit cost of production for each forestry or forest processing activity
The above information was collected from a variety of sources from both within Fiji and abroad.13 The local information was collected as part of the two-week visit in October 2003, during interviews with Forestry Department staff and local producers. In total, interviews were held with 11 individuals from the forest industry, three Forestry Department staff, three landowners’ representatives and a representative of the Fiji 13 For example, see Whiteman (1999b) for details of internationally available sources of information about
machinery and equipment costs

40
Sawmillers Association. In addition, eight forest processing facilities were visited and one forest harvesting site.
Information on wage rates and import tariffs was obtained from official statistics from the Bureau of Statistics (2000), Fiji Trade and Investment Bureau (FTIB, 2003) and US Department of Commerce (USDC, 2000). Other documents consulted included a submission on forest charges from the Fiji Sawmillers Association (FSA, 2003) and calculations by the NLTB (2003). Discrepancies between these documents, the interviews with individuals from the forest industry and the economic rent calculations were discussed with Forestry Department and, where appropriate, the calculations presented here were modified accordingly.
It should be noted that, throughout this process, figures were constantly checked, re-checked and updated after discussions with different stakeholders and taking into account experiences from other countries. Although this is never a precise process, it is believed that the figures presented here present a reasonable and unbiased picture of the cost and price structure of forest operations in Fiji.
Other types of information from international data sources were also used to check and validate the statements given during interviews. For example, information about materials consumption and productivity rates was collected from reference sources such as machine operator’s handbooks and compared to statements from the industry. For a variety of reasons, the level of productivity and capital utilisation in Fiji is less than the maximum that could possibly be achieved, but it is probably higher than most other countries at a similar level of development. The analysis presented here is based on current harvesting methods and levels of productivity, although there may be some room for improvement.
5.1.2 Roundwood and product prices
Price information was collected from the main sources listed above. In addition, the Forestry Department supplied sawnwood export price data by species and grade for the period 1999 to 2002.
Most forest processors in Fiji harvest roundwood from their own licence areas, so it was not possible to gather much information about market prices for delivered roundwood. Table 10 presents the range of figures obtained from the data sources, along with estimates of product recovery rates. The individual number of observations is very small, so these figures should be treated with a great deal of caution. However, although the range for Class 1 species is quite wide, there was a remarkable convergence between the different data sources about the prices paid for roundwood in the other classes.
Table 10 Current (2003) prices for delivered (mill-gate) roundwood in Fiji
Mill-gate price (in FJD per m3) Product recovery rate (in percent) Royalty class
Low High Low High Class 1 species 210 280 50 55 Class 2 species 130 150 48 51 Class 3 species 110 120 48 Class 4 species 90 46
Source: Field survey.
It is also interesting to note that the quoted mill-gate prices are much higher than the delivered roundwood production cost (including royalties and all other charges) calculated below. Where the majority of a commodity is processed in an integrated operation, is not unusual for “spot” prices to be much higher than production costs. However, these figures demonstrate the importance to forest processors of having a stable and secure source of supply. If all roundwood was harvested by independent loggers, the mill-gate price would probably be much lower, as it is unlikely that the industry could pay these prices for all of their raw materials. This divergence between mill-gate prices and delivered roundwood costs has profound implications for the Government’s policy towards awarding harvesting licences.

41
Table 11 presents information about sawnwood prices by royalty class and grade and the average grade distribution. This information was obtained from the Fiji Sawmillers Association (FSA, 2003) and NLTB (2003). These figures are quite surprising, in that the FSA are quoting higher product prices than NLTB. The figures from the FSA also seem to contradict some of the other statements in their submission (e.g. where they highlight the fact that export prices for some Class 1 species have fallen dramatically in 2003 due to competition from other countries in major export markets).
Table 11 Current (2003) sawnwood prices in Fiji
Price by royalty class (in FJD per cubic metre) Data source and grade Grade
distribution Class 1 Class 2 Class 3 Class 4
FSA: FF Select and better 70% 1,200
[export] 900
[export] 480
[wholesale] 480
[wholesale]
FSA: FF Standard 25% 550
[wholesale] 480
[wholesale] 480
[wholesale] 480
[wholesale]
FSA: Commons 5% 250
[wholesale] 250
[wholesale] 250
[wholesale] 250
[wholesale] FSA: Average of above 100% 990 763 469 469 NLTB: Average of all grades n.a. 700 500 400 320
Source: FSA (2003) and NLTB (2003).
Table 12 Average sawnwood export prices 1999 - 2002 (at 2003 prices)
Average price by grade (FJD per cubic metre at 2003 prices, FOB) Species
Select and better Standard Ungraded All grades Buabua 1,047 948 704 954 Dakua Makadre 1,053 n.a. 1,019 1,043 Dakua Salusalu 1,020 n.a. 1,220 1,105 Rosawa 874 727 773 825 Vesi 872 n.a. 849 862 Yaka 1,188 975 1,092 1,103 Average for Class 1 species 1,009 883 943 1,007 Bauvudi 803 n.a. 771 790 Damanu 792 865 673 771 Kaudamu 837 934 686 861 Kauvula 756 798 796 785 Average for Class 2 species 797 866 732 805 Rosarosa 1,407 509 570 749 Sacau 1,143 704 917 965 Yasiyasi 1,206 704 628 791 Average for Class 3 species 1,252 639 705 845
Source: Forestry Department.
Table 12 presents information about average sawnwood export prices by species and grade over the period 1999 to 2002 (more detailed statistics are available in Table 32 in Appendix 1). These figures have all been updated to 2003 prices using the GDP deflator. Unfortunately, the overall amount of exports from Fiji is so small that individual export consignments of unusually high or low value confound any attempt to draw conclusions from these figures about trends in prices or the relative value of different species and sawnwood product grades. It is, therefore, extremely difficult to identify any clear patterns in these figures or to comment on whether individual species should be moved from one royalty class to another. However, the general levels of prices recorded in these statistics would seem to confirm that the export prices given in the FSA submission seem a little on the high side.

42
5.2 Calculation methodology
The economic rent from forest harvesting was calculated using two simple spreadsheet models. Copies of these models, along with their associated manuals, were left with the Forestry Department and can also be found at: www.fao.org/forestry/finance.
First, the total delivered roundwood production cost was calculated using a model developed for an FAO Project in Suriname (see Whiteman, 1999a for further details of the roundwood production cost model used in this analysis). The model uses standard forestry costing techniques, such as those described in FAO (1977). The scale of harvesting operations in Fiji is similar to Suriname, so it was very easy to input the data collected in Fiji into the existing modelling framework. An example of the data used in the model and the outputs from the model is given in Appendix 2.
The results from this model were then entered into a forest industry cost model. This model was first developed for a DFID Project in Indonesia, but has been subsequently used in a number of other countries. Again, the model follows internationally accepted investment appraisal and accounting procedures used to measure profit and loss, deprecation and tax (see Scotland and Whiteman (1997), for details of how to use the model). Although the scale of operations in Fiji is relatively small compared with Indonesia, it was quite easy to input the data from Fiji into the model and to use it to examine the profitability of forest processing operations. An example of the data used in this model and the outputs produced by the model is given in Appendix 3.
It should be noted that this analysis uses a discounted cash-flow methodology to calculate the profitability of investments in the forestry sector (i.e. the ROC), or the level of “normal profit” required by processors and the residual economic rent from production. The submissions from the FSA and NLTB used the simpler approach of a required profit margin (or mark-up on non-capital operational expenditure) as a measure of the “normal profit” required by processors. While this is much simpler, it is not a very accurate or reliable indicator of the level of profits required to retain investment (or encourage new investment) in the sector. For harvesting operations, the two approaches give quite similar results.14 However, for the analysis of investments in the processing industry, the amount of profit required for a 20 percent ROC will be very different (i.e. much higher) than a 20 percent profit margin, because of the capital intensive nature of production. This explains why a rate of 20 percent ROC may seem a little low in comparison with what forest processors might expect as an acceptable profit margin.
14 Indeed, the harvesting cost model also calculates delivered roundwood cost including a profit margin or return
on expenditure as an alternative calculation methodology - see Figure 31.

43
5.3 Delivered roundwood production cost
As already noted, roundwood production costs can vary due to a range of factors outside and within the forest managers' control. Therefore, as a starting point for this analysis, the production cost for a "typical" or "representative" forest operation was constructed. A sensitivity analysis then examined variations in the total roundwood production cost, due to variations in the two factors that are likely to have the greatest impact on costs: transport distance and harvesting intensity.
5.3.1 The total roundwood production cost for a "typical" forest operation
The four main factors that influence roundwood production costs are: the area being cut each year (i.e. scale of operations); harvesting intensity (and, thus, annual production from the area); harvesting, extraction and transport methods currently used to get timber from the forest to the mill; and the average transport distance. Information about each of these variables was collected during the field visits and discussions with forest managers.
Cutting area. The majority of forest operations in Fiji are small-scale logging operations managed by small to medium-sized sawmills under Annual Licences. Discussions with the industry and the Forestry Department revealed that the average licence area includes about 500 acres (or 200 ha) of forest. Therefore, an annual cutting area of 200 ha was used in the analysis as representative of a "typical" forest operation currently working in Fiji.
Harvesting intensity. Very little information is available about the sustainable yield from the natural forest in Fiji. According to the Forestry Department, first harvests may produce as much as 30 m3/ha or more. Following this, it is believed that a cutting cycle of 20 years gives sufficient time for regeneration. However, the Forestry Department did express some concern that, after a second harvest, it may take a much longer time for the forest to reach a commercially acceptable stocking level. Assuming an annual harvest area of one-twentieth of the total productive area, the figures presented for Fiji’s long-established forest concessions in Table 24 suggest an average harvesting intensity in secondary forest of 10 m3/ha to 15 m3/ha. The transition from harvesting in primary forest to secondary forest is only gradually starting to take place in Fiji, so the higher figure of 30 m3/ha was used in this analysis. However, it must be recognised that this figure will fall in the future. By multiplying this figure by 200 ha, this would suggest that the current level of production in a "typical" forest operation in Fiji might be around 3,000 m3/year. This figure would also be in line with the log input of most of the medium-sized sawmills in the country.
Production techniques. Harvesting in Fiji is quite expensive due to the terrain and the fact that logging only takes place for part of the year in most operations. In terms of their impact on production costs, the three most important aspects of current harvesting practices are the amount of road building required, skidding distances in the forest and the quality and age of equipment used. Most forest harvesting areas in Fiji require some road building in the forest and usually require the construction of access roads as well. Based on discussions with the Forestry Department and interviews with producers, it was assumed that an average of 2 km of access road would be built in a typical harvesting area, plus another 2 km of road in the forest, giving a roading density of 10 m/ha in the forest. From the roading density, it is possible to calculate the average skidding distance, assuming an indirectness factor (in this case, this was assumed to be 20 percent). This resulted in an average skidding distance of 300 m, which was confirmed during the field visit and interviews. This is probably close to the optimal roading density in forests with a stocking level of 30 m3/ha. In terms of the equipment used in forest operations, most operators use bulldozers for road construction and skidding and medium-sized logging trucks. Most machinery is quite old, so the depreciated value of equipment is quite low but repair costs are relatively high.
Transport distances. Fiji is small, so most harvesting operations are quite close to mills. Discussions with sawmillers revealed that most of them can make one to two round trips from the forest to the mill in a day, suggesting a haulage distance of 50 km each way.

44
Table 13 shows the estimated cost of harvesting, extraction, loading and transport for a “typical” forest operation in Fiji, calculated by the model. Added to this was another small cost of FJD 2.00/m3 to cover the cost of planning and surveying, to give a total delivered roundwood production cost (excluding forest charges) of FJD 64.24/m3 (USD 32.12/m3). This cost is broadly comparable with the total delivered roundwood production cost in many other countries with moist tropical forests, but is relatively high in view of the quite short transport distance. In part, this is due to the small scale of operations, quite low harvesting intensity and low level of machinery utilisation.
Table 13 Estimated cost of harvesting, extraction, loading and transport for a “typical” forest operation in Fiji
Cost by activity (in FJD per cubic metre) Type of cost Felling
Skidding
with dozer Skidding
with skidder Loading
Road
transport Unloading
& reloading Water
transport Road
building Total
Labour 3.57 2.50 NA 1.19 3.57 2.38 NA 1.07 14.26 Consumables 2.47 3.93 NA 1.04 6.96 2.07 NA 4.73 21.19 Capital 0.12 4.30 NA 1.14 4.11 2.29 NA 2.62 14.59 Total (excluding profit) 6.15 10.72 NA 3.37 14.64 6.74 NA 8.42 50.04 Return on capital 0.07 2.50 NA 1.86 2.99 3.71 NA 1.07 12.19 Total (including ROC) 6.22 13.22 NA 5.22 17.63 10.45 NA 9.49 62.24
Figure 22 Total delivered roundwood production cost in Fiji (by activity and type of cost)
Production cost by activity
Planning and surveying: FJD 2.00 (3%)Road building: FJD 9.49 (15%)Felling: FJD 6.22 (10%)Skidding: FJD 13.22 (21%)Loading: FJD 5.22 (8%)Road transport: FJD 17.63 (27%)Unloading and reloading: FJD 10.45 (16%)
Production cost by type of cost
Labour: FJD 16.26 (25%)
Consumables: FJD 21.19 (33%)
Capital: FJD 14.59 (23%)
Normal profit (20% ROC): FJD 12.19 (19%)
Figure 22 shows the composition of total delivered roundwood cost by production activity and type of cost. The figure shows that felling and extraction to the roadside accounts for about half of the total cost and loading, transport and unloading accounts for the other half. The largest individual component of production cost is road transport, which accounts for 27 percent of the total cost (FJD 17.63/m3). Skidding is the next largest component, accounting for 21 percent of the total (FJD 13.22/m3).
Labour costs account for about 25 percent of the total cost (FJD 16.26/m3). This is relatively high compared with many other tropical developing countries and reflects the comparatively high labour costs in Fiji. Consumables (fuel, tools and spare parts) account for the largest share of production costs at 33 percent (FJD 21.19/m3). This is quite high, but reflects the age of machinery (which requires a lot of expenditure on

45
maintenance and repairs). Conversely, the cost of capital is quite low (FJD 14.59/m3 or 23 percent of the total). The cost of capital is the cost of depreciation of the machinery used in forest operations. As much of the machinery used in Fiji is quite old, it is already heavily depreciated and further depreciation costs are therefore quite low. The allowance for normal profit is the amount required to earn a 20 percent ROC on the money invested in machinery. This is also relatively low due to the age (and value) of machinery used in operations, accounting for about 19 percent of the total cost (FJD 12.19/m3).
5.3.2 The impact of transport distance and harvesting intensity on the total roundwood production cost
The impact of transport distance and harvesting intensity on the total delivered roundwood production cost in Fiji is shown in Figure 23. The figures presented here have been calculated by varying the transport distance and harvesting intensity in the roundwood production cost model, while keeping the other variables the same except the cutting area, which has been increased to maintain a production level of 6,000 m3 per year.
Figure 23 Impact of transport distance and harvesting intensity on the total delivered roundwood production cost in Fiji
60
65
70
75
80
85
90
95
100
105
110
40 45 50 55 60 65 70 75 80
Transport distance (one-way journey in km)
Rou
ndw
ood
prod
uctio
n co
st (i
n FJ
D p
er C
UM
) Harvestingintensity =10 m3/ha
Harvestingintensity =15 m3/ha
Harvestingintensity =20 m3/ha
Harvestingintensity =25 m3/ha
Harvestingintensity =30 m3/ha
The slope of the lines in Figure 23 shows that, as transport distances increase, the total delivered roundwood production cost becomes greater at a rate of roughly FJD 0.17/m3 (or USD 0.08/m3) per kilometre. Transport costs increase with distance not only because more fuel is consumed transporting roundwood over longer distances but also because, as distances extend, more trucks have to be used to keep-up with production. Only one truck would be required to deliver the volume of timber produced by the "typical" forest operation up to a distance of around 60 km. Beyond this point, overtime or contractors would have to be used to supplement the forest managers equipment up until a transport distance of around 100 km, at which point purchasing a second truck could probably be justified. Another option would be to stockpile logs in the forest and transport them all year round. The model assumes that harvesting only takes place for eight months of the year. However, it is likely that loading and transporting logs could take place for longer and a number of operators said that they stockpiled logs in the forest in order to maintain an even flow

46
of production. For this reason, the cost of a secondary loading and unloading is also incorporated into the calculations.
The difference between the curves in Figure 23 shows the impact of harvesting intensity on production cost. As harvesting intensity falls, production cost increases exponentially. Thus, with a 50 km transport distance, a fall in the harvesting intensity from 30 m3/ha to 25 m3/ha increases the production cost by FJD 4.20/m3. A fall from 25 m3/ha to 20 m3/ha would increase the production cost by FJD 6.60/m3 and a fall from 15 m3/ha to 10 m3/ha would increase the production cost by FJD 15.40/m3
A lower harvesting intensity increases the production cost because the costs of road and skid trail construction are spread over lower production volumes as harvesting intensity falls. One bulldozer would be almost fully employed on road construction and skidding in the “typical” forest operation. If harvesting intensity falls and the cutting area is increased to compensate for this, more bulldozer time would be required to construct roads and skid trails in the larger area (i.e. with a harvesting intensity of only 15 m3/ha, the cutting area would have to be twice as large to maintain the same level of total production and two bulldozers would be required).
This analysis has assumed that the cutting area each year can be increased in order to maintain production levels. If the cutting area was kept constant, the different curves would be even further apart (i.e. production cost would increase more for each reduction in harvesting intensity). This is because, in addition to the reason already noted above, the utilisation of the bulldozer would fall (i.e. the bulldozer would be used gradually less and less for skidding operations and would be idle for more of the time).
The above analysis suggests that production costs might increase significantly as harvesting moves from well-stocked primary forest to secondary forest areas. However, this will depend upon how much road building would be required on re-entry to a previously harvested area. For example, if harvesting in secondary forest did not require any new road building, a harvesting intensity of only 15 m3/ha would result in a total production cost that is roughly the same as harvesting at an intensity of 30 m3/ha in primary forest where road building is required.
5.4 Processing costs and profitability
In the forest industry model, the delivered roundwood cost is added to the cost of all forest charges, plus other fixed and variable operating costs, to arrive at a total operating cost at the current rate of capacity utilisation. This is subtracted from the value of product sales in the model to give net income. These figures are then projected forwards over the expected life of the investment (in this case, assumed to be 20 years) to form part of the projected cash-flow from the investment.
Capital costs include the cost of all plant and machinery, replacement capital and working capital (e.g. stocks of products, raw materials and accounts due or receivable) and these are also entered into the cash-flow. Adjustments are made to the cash-flow to take into account allowances for depreciation and the calculation of interest payments and loan repayments (if applicable) and corporation tax payments.
The model calculates the net present value (or NPV) of the investment at three different discount rates (i.e. three different levels of ROC). As in the forest harvesting cost model, a central discount rate of 20 percent was chosen as the required ROC or level of “normal profit” expected from the investment. If the NPV from the investment is positive at the 20 percent discount rate, this would indicate that the rate of return on the investment is more than 20 percent (i.e. the required ROC) and that “excess profit” is being earned in the processing operation.
The model presents the NPV of the investment in three different ways:
• before financing and tax (i.e. this is a measure of the overall profitability of the investment);

47
• after financing but before tax (i.e. this is a measure of the return on the investors equity in the investment); and
• after financing and tax (i.e. this is the investors return after taxes have been paid).
For the purpose of this analysis, it is the last of these measures that is most important, as this takes into account the effect of borrowing and taxation on the investor’s profits.
Using all of these calculations, the model also expresses the results in terms of the shares of product value that can be attributed to production costs (including capital costs and “normal profit”), fees and charges, taxes and “excess profit” (i.e. the NPV of the investment divided by the amount of production). Income and expenditure varies throughout the life of the investment due to requirements to replace machinery, so these figures represent the average shares of the product value over the life of the investment rather than the shares in any particular year.
5.4.1 Description of an “average” sawmill
The forest industry model is flexible and can be used to analyse the profitability of any type of investment in new or existing processing facilities in a country. However, as most indigenous roundwood in Fiji is converted into sawnwood, the calculations were restricted to analysing the costs of sawmilling. In addition, the analysis only examined the profitability of an existing sawmill rather than a new investment in the sector.
As in the case of forest harvesting, there is variation in the management, location and scale of operations in the processing sector in Fiji. However, for the purpose of this analysis, it was assumed that an “average” sawmill has the capacity to produce about 5,000 m3/year, but is currently only operating at about 60 percent capacity (i.e. with an output of about 3,000 m3/year). Most sawmills claim to be running at well-below full capacity and field visits confirmed that they have the capacity to produce more than they are, so this level of capacity utilisation seems appropriate. This level of production is representative of the medium-sized sawmills operating in the sector, which seems to be the most durable part of the forest processing industry.
The model used a product recovery rate of 50 percent across all product types, which is a reasonable working assumption. This gives a required log input of 6,000 m3/year, which matches the output level assumed in the forest harvesting model. It was also assumed that all log inputs are obtained from the sawmiller’s own licence area.
The model was constructed for a sawmilling operation on Viti Levu, but there is little reason to expect sawmilling costs to differ significantly between the two main islands. The only difference incorporated into the model due to this was the payment of premiums to NLTB.
The model assumes that the sawmill produces a range of products by grade and species group, with half of production for the export market and half for the domestic market (see below). It also assumes that 20 percent of the capital invested in the sawmill is financed by borrowing (at a real interest rate of 12 percent), with the remaining 80 percent financed by the sawmiller’s own equity. If investment in a sawmill can earn an ROC of 20 percent or more, it is generally in the sawmiller’s financial interest to borrow as much as possible if the interest rate is lower than this. However, interviews revealed that commercial lenders are wary of over-exposing themselves to the forest processing sector. Therefore, an assumption of a debt-equity ratio of 20:80 seems reasonable.
5.4.2 Operating costs
The total operating cost of a sawmill comprises the log input cost plus the fixed and variable processing costs such as fuel, labour, and consumables. The total log input cost calculated in the forest industry model is shown in Table 14. The first set of costs is the delivered roundwood production costs and these are taken directly from the results of the forest harvesting model (described above).

48
The second set of costs in the model is the forest charges paid to landowners and government. Payments made directly to landowners are the first component of these charges and have been calculated on the basis of average “commission” and “goodwill” payments to landowners, determined in interviews with the industry and landowners. The “commissions” paid vary according to the species group and the input mix shown here (by species class) is based on the submission on forest charges from the FSA (FSA, 2003) and discussions with sawmillers. The majority of Class 1 and Class 2 species are used for export while production for the domestic market tends to be more heavily weighted towards the lower value species classes. The second component of forest charges are the royalties and fees paid to NLTB and the last component of these charges are the fees paid to the Forestry Department for scaling and maps. Lump sum payments, such as the map fee and NLTB licence application fee, have been converted to charges per cubic metre, based on the assumed level of roundwood production of 6,000 m3/year.
The total level of all of these forest charges amounts to around FJD 50/m3 for roundwood used to produce sawnwood for the domestic market and FJD 75/m3 for roundwood used to produce export grade sawnwood. These differences are due to the different mixture of species used to produce sawnwood for these two different markets and the different levels of charges paid for the different species.
Table 14 Total log input cost for an “average” sawmill in Fiji Log production costs (FJD per m3 of roundwood)
Sawnwood for export market
Sawnwood for domestic market
Planning and surveying 2.00 2.00 Felling 6.22 6.22 Skidding 13.22 13.22 Loading, unloading and reloading 15.67 15.67 Transport 17.63 17.63 Road building 9.49 9.49 Total 64.24 64.24
Sawnwood for export market
Sawnwood for domestic market Royalties, fees and other charges
(FJD per m3 of roundwood) Proportion (%) Charge Proportion (%) Charge
Class 1 Landowners commission 60 25.00 20 25.00 Class 2 Landowners commission 40 20.00 10 20.00 Class 3 Landowners commission 0 15.00 50 15.00 Class 4 Landowners commission 0 10.00 20 10.00 Landowners goodwill 5.00 5.00 NLTB Licence application fees 0.20 0.20 Class 1 Royalty 60 40.00 20 40.00 Class 2 Royalty 40 30.00 10 30.00 Class 3 Royalty 0 10.00 50 10.00 Class 4 Royalty 0 6.50 20 6.50 Premium 6.00 6.00 FD Scaling fee 3.50 3.50 FD Map 0.03 0.03 Total 73.73 48.53 Other roundwood variables Total log cost from licence area (FJD per m3) 137.97 112.77 Proportion of logs from licence area (%) 100 100 Cost of logs from elsewhere (FJD per m3) 150.00 130.00 Conversion factor (m3 logs per m3 of product) 2.00 2.00 First year of production 1 1 Last year of production 20 20 Total log cost (FJD per m3 of product) 275.94 225.54
The last set of figures in Table 14 is used to account for purchases of logs from elsewhere (not used in this case) and the product recovery rate or conversion factor. With an average conversion factor of two to one, the total log input cost is simply the delivered roundwood cost plus total forest charges, all multiplied by two. This amounts to about FJD 225/m3 for sawnwood sold in the domestic market and FJD 275/m3 for exported sawnwood.

49
The other fixed and variable operating costs used in the model are shown in Table 15. Estimates of these costs were obtained from discussions with sawmillers, site visits and from the FSA submission. For example, labour costs were based on discussions about the numbers of employees in the mills visited, average wage rates and social costs and the cost of specialised labour such as sawdoctors. Differences in these costs can be attributed to differences in treatment, drying and packaging used when producing sawnwood for the domestic and export markets. However, the log cost accounts for over half of all variable costs and most of the difference in production costs between sawnwood destined for the two different markets.
Table 15 Fixed and variable operating costs for an “average” sawmill in Fiji
Variable costs (FJD per m3 of production) Sawnwood for export market
Sawnwood for domestic market
Log cost 275.94 225.54 Labour 78.96 78.96 Resins/chemicals/treatment 15.00 15.00 Fuel, energy and consumables 60.00 45.00 Packaging 32.00 6.00 Delivery 15.00 15.00 Total 476.90 385.50 Fixed costs (FJD per m3 of capacity) Personnel: administration 12.00 12.00 Personnel: support staff 7.00 7.00 Personnel: maintenance staff 9.73 9.73 Sales cost 15.00 15.00 General overhead 30.00 30.00 Total 73.73 73.73 Total cost (FJD per m3 of production) Total calculated at final level of utilisation 599.79 508.39
The last line in the table shows the total operating cost per cubic metre of sawnwood produced, which is estimated at around FJD 600/m3 for export grade sawnwood and FJD 510/m3 for domestic sawnwood. It should be noted that this figure could be reduced by up to 20 percent with higher levels of capacity utilisation (i.e. the fixed operating costs could be spread across a greater volume of production).
5.4.3 Capital costs
It is difficult to determine the value of the capital utilised in an “average” sawmill. As a starting point, the likely cost of plant and machinery seen during sawmill visits was estimated from international data sources, adjusted to cost and price levels in Fiji (e.g. allowing for import tariffs and shipping costs). Most forest processing machinery is imported, so this provides a useful starting point for the analysis. These estimates were then adjusted for depreciation, to take into account the age of machinery seen during sawmill visits (see Whiteman (1999b) for a description of how to do this). The results obtained were then compared with the results of discussions with sawmillers about machinery that they had just purchased or installed in their mills. Generally, the figures obtained by these two routes were broadly comparable and resulted in the estimates used in the forest industry model shown in Table 16 below.
The total capital investment in an “average” sawmill was estimated at about FJD 1.4 million, with a further FJD 573,000 invested in working capital. The figures for investment in stationary equipment (e.g. bandsaws and kiln drying units) and mobile equipment (e.g. loaders, trucks, etc.) are close to the figures quoted by sawmillers (adjusted for the different capacity levels of the different mills visited). The estimate of total investment in production plant capital is also close to what would be expected for a mill of this size in other similar countries. It is slightly below some of the figures quoted by some sawmillers, but is believed to be a more realistic estimate of the true capital value of the typical mill of this size currently operating in Fiji.
The figure for investment in working capital would be considered very high by international standards. This is due to the generally high levels of stock seen during sawmill visits (particularly stocks of unsold products) and the payment terms that seem to be common within the industry in Fiji.

50
All industry in Fiji benefits from generous allowances for depreciation (“accelerated depreciation”), such that most items of capital expenditure can be depreciated over five years. Although accelerated depreciation is more of a tax benefit than a measure of the true consumption of capital, it is only used in the model to calculate corporate tax liability, so a depreciation period of five years was used throughout the analysis for all depreciable assets. Various assumptions were also made about the replacement or overhauling of some capital items after three to five years (see Figure 34 in Appendix 3 for further details), based on typical replacement and renewal schedules for the types of sawmilling equipment used in Fiji.
Table 16 Capital cost of the investment in an “average” sawmill in Fiji Depreciation period Production plant capital (FJD '000) Amount Total Remaining
Site and services 120 5 2 Structures 300 5 2 Stationary equipment 650 5 5 Mobile equipment 300 5 5 Mill stores and miscellaneous supplies 30 5 5 Owner's construction overhead 0 5 5 Engineering 0 5 5 Total 1,400 Other capital (FJD '000) Pre-operating expense 0 Working capital 573 Capitalised interest 0 Total 573 Total capital (FJD '000) Sum of plant and other capital requirements 1,973
Table 17 Product sales by market and grade of production for an “average” sawmill in Fiji
Product Grade Export tax (percent)
Output (percent)
Mill net price (FJD per m3)
Real price change (percent/year)
Sawnwood for export market Class 1 FF Select 0 50.0 1,200 0.0 Class 1 FF Standard 0 7.5 900 0.0 Class 1 Ungraded 0 2.5 900 0.0 Class 2 FF Select 0 30.0 800 0.0 Class 2 FF Standard 0 7.5 800 0.0 Class 2 Ungraded 0 2.5 750 0.0 Total/average 100 1,009 0.0 Sawnwood for domestic market Class 1 FF Select 0 15.0 750 0.0 Class 1 FF Standard 0 5.0 550 0.0 Class 2 FF Select 0 5.0 580 0.0 Class 2 FF Standard 0 5.0 480 0.0 Class 3 FF Select 0 35.0 480 0.0 Class 3 FF Standard 0 12.0 480 0.0 Class 4 FF Select 0 15.0 480 0.0 Class 4 FF Standard 0 3.0 480 0.0 Class 3 and 4 Ungraded 0 5.0 250 0.0 Total/average 100 518 0.0
5.4.4 Product mix and selling price
The composition of sawnwood produced by an “average” sawmill (by species class and grade) and the selling prices of each of the different products are shown in Table 17. The output mix was based on the FSA submission, discussions with sawmillers and discussions with the Forestry Department. The prices were based on the same sources, but were reduced slightly in some cases in light of the export statistics produced by the Forestry Department (see Table 12).
The above figures resulted in an average selling price of FJD 763/m3, which is in the region of the average product prices revealed in discussions with sawmillers.

51
5.5 Estimated economic rent
Based on the cost and price information presented above, the complete cost structure and the level of economic rent generated from forest processing in Fiji was calculated and is presented below.
Box 3 Composition of sawnwood production costs for an “average” sawmill in Fiji
Delivered roundwood cost (excl. charges, incl. ROC of 20% on harvesting operation) 128.47 17%
Forest charges 122.27 16%
Other fixed and variable operating costs 303.35 40%
Total: operational costs 554.09 73%
Capital costs 85.17 11%
“Normal profit” (i.e. ROC of 20% on sawmill investment) 82.35 11%
Corporation tax 35.25 5%
“Excess profit” 6.27 1%
Total: capital costs, taxes and profit 209.04 27%
Average product value (FJD per cubic metre of sawnwood produced) 763.13 100%
Box 3 shows how the average (sawnwood) product value is distributed between operational costs, capital costs, taxes and profit. The delivered roundwood cost includes an allowance for “normal profit” in the harvesting operation, but excludes the payment of forest charges. Forest charges include the payment of all official and unofficial charges (i.e. “goodwill” and “commissions”). Capital costs represents the consumption of existing and replacement capital throughout the life of the sawmill investment (assuming zero residual value), while “normal profit” represents the amount required for the sawmill operator to earn a 20 percent ROC (after tax) on their equity investment in the sawmill. Corporation tax is the estimated average annual tax liability divided by annual sawnwood production.
The economic rent from production is equal to forest charges plus “excess profit” and amounts to FJD 128.54 per cubic metre of sawnwood produced, or about 17 percent of the average product value. With the assumed product recovery rate of 50 percent, this implies that the economic rent is equal to FJD 64.27 per cubic metre of roundwood consumed by the sawmill.
Figure 24 shows the distribution of economic rent from production (per cubic metre of roundwood) between landowners, the Government and industry. The figure shows that total forest charges currently capture 95 percent or almost all of the economic rent from production. Fees paid to the Forestry Department and NLTB each account for a further 5 percent of the economic rent. Landowners receive the remaining 85 percent of the economic rent. Of this, slightly more than half of this comes through the official system of royalty payments as opposed to the unofficial system of “commissions” and payments for “goodwill”.
It should also be noted that, in addition to the payments of charges to the Government, the “average” sawmill should be paying corporation taxes to the Government of around FJD 35.25 per cubic metre of sawnwood produced (equal to about FJD 17.63 per cubic metre of roundwood).

52
Figure 24 Distribution of the economic rent from production in Fiji between landowners, government and industry per cubic metre of roundwood (CUM)
Landowners commission and goodwill: FJD 24.75/CUM (39%)
Landowners share of royalties: FJD 29.39/CUM (46%)
NLTB fees and royalty share: FJD 3.47/CUM (5%)
Forestry Department fees: FJD 3.53/CUM (5%)
Producer's excess profit: FJD 3.13/CUM (5%)
5.5.1 Comparison with the FSA submission
Although this analysis has used some of the information from the submission on forest charges by the FSA (FSA, 2003), it has also incorporated a lot of other data and information from experiences in other countries, information from international data sources and statistics held by the Forestry Department in Fiji. In addition, the calculation methodology used differs significantly from the approach taken by the FSA.
The estimate of delivered roundwood costs produced by the FSA is somewhat higher than the figures presented here. Their figure of FJD 94/m3 (excluding forest charges) is higher than the estimate presented here of FJD 64/m3. This could be due to the amount for “cartage” in their calculations (which is not explained in their submission). Another difference between the two approaches is that their figures include an amount for overheads in the harvesting operation, while the calculations here have assumed that all overheads would be covered in the forest processing operation.
On the processing side, the estimate of processing costs calculated here is somewhat higher than the FSA estimate. The differences in the calculation methodologies are so large that it is not possible to identify what might be the cause of these differences.
Although there are some differences between these figures and those from the FSA, when both parts of the production operation are combined, the figures calculated here are remarkably close to the figures from the FSA. For example, they quote figures for total sawnwood production costs (excluding a profit margin) in the range of FJD 570/m3 to FJD 720/m3. The figure calculated here for total operational costs plus capital costs amounts to FJD 640/m3 (see Box 3), which is roughly in the middle of this range.
As noted earlier, it is always difficult to estimate production costs and economic rent with any degree of accuracy, because of the difficulty of collecting reliable information about costs and prices in the industry. This is particularly difficult when the time available for interviews, field visits and data collection is very limited. This analysis has tried to bring some international experiences and a rigorous analytical approach to

53
the forest charging issue, in order to provide the Forestry Department with an independent estimate of the economic rent from production. As the figures calculated here are not markedly different from those provided by the FSA, it is suggested that this might be taken as an indicator of their reliability.
5.5.2 Species variation
The level of economic rent from production undoubtedly varies by species, as higher valued species can be sold for more profit in the market place. However, when considering the adjustment of forest charges by species group it is important to take into consideration the different grades of product quality that can be manufactured and the acceptability of each species in local and export markets. For example, Class 1 species produce a mixture of high, medium and lower quality sawnwood grades, which are sold in both the local and export markets. Furthermore, forest operators are required to take the lower valued species (and to pay for them) in their licence areas. Added to this, there is the problem already noted of collecting information about the selling prices of different species and product grades in different markets. This makes it very difficult to come to any conclusion about what changes, if any, should be made to the relative levels of forest charges between different species groups.
It is not proposed here to present any firm recommendations about revising the relative levels of the different royalty classes or changes in the species included in each of the classes. Rather, the analysis below presents a simple methodology that could be used to explore this issue further (if desired).
Figure 25 The relationship between the selling price of sawnwood and the economic rent from roundwood production in Fiji
0
50
100
150
200
250
300
650 700 750 800 850 900 950 1,000 1,050 1,100 1,150 1,200
Selling price of sawnwood (FJD per CUM of sawnwood)
Eco
nom
ic r
ent (
FJD
per
CU
M o
f ro
undw
ood)
Sawnwood produced for the domestic market: Economic Rent = -269 + (0.451 x Selling Price)
Sawnwood produced for the export market: Economic Rent = -289 + (0.451 x Selling Price)
Figure 25 presents the relationship between the selling price of sawnwood and the economic rent from roundwood production, based on the cost data collected and used in the forest harvesting and forest industry models. The relationship for exported sawnwood was derived by assuming that all sawnwood production would be sold in this market and assuming that only one species would be used for production. For any given sawnwood price, the royalty payment for this species was then adjusted until the NPV of the sawmill equalled zero. The economic rent from roundwood production was then taken from the summary table

54
presented in the forest industry model. This process was repeated for different levels of sawnwood prices and under an alternative assumption that all production would be sold in the domestic market, to arrive at the two curves and equations shown in the figure.
The curve for sawnwood sold in the domestic market is higher than the curve for exported sawnwood, because the operational costs are lower for the former (e.g. due to lower packaging, drying and treatment costs). If costs are lower then, for a given sawnwood price, the economic rent will be higher. The difference between these two curves is FJD 20/m3, which is equal to the differences in these costs (see the figures in Table 15 and divide the differences by two to convert from sawnwood to roundwood). It must also be remembered that, although the relationship is higher for sawnwood sold in the domestic market, the selling price for sawnwood of a given species and grade will generally be lower in the domestic market than in the export market, leading usually to a lower level of economic rent.
Table 18 Calculation of the average level of economic rent by species class
Royalty class Market Grade
Proportion of total
production
Selling price
(FJD per m3)
Economic rent
(FJD per m3)
Contribution to total economic rent (FJD per m3)
Average level of economic rent by market and royalty class
(FJD per m3) Class 1 Export FF Select 25.00% 1,200 252.80 63.20 Class 1 Export FF Standard 3.75% 900 117.39 4.40 Class 1 Export Ungraded 1.25% 900 117.39 1.47
230.23
Class 1 Domestic FF Select 15.00% 750 69.02 10.35 Class 1 Domestic FF Standard 3.75% 550 -21.24 -0.80
50.97
161.28
Contribution to the economic rent from the whole operation 78.63 Class 2 Export FF Select 1.25% 800 72.25 0.90 Class 2 Export FF Standard 7.50% 800 72.25 5.42 Class 2 Export Ungraded 2.50% 750 49.69 1.24
67.24
Class 2 Domestic FF Select 2.50% 580 -7.70 -0.19 Class 2 Domestic FF Standard 2.50% 480 -52.84 -1.32
-30.27
37.24
Contribution to the economic rent from the whole operation 6.05 Class 3 Domestic FF Select 17.50% 480 -52.84 -9.25 Class 3 Domestic FF Standard 6.00% 480 -52.84 -3.17
-52.84 -52.84
Contribution to the economic rent from the whole operation -12.42 Class 4 Domestic FF Select 7.50% 480 -52.84 -3.96 Class 4 Domestic FF Standard 1.50% 480 -52.84 -0.79 Class 3 and 4 Domestic Ungraded 2.50% 250 -156.64 -3.92
-75.40 -75.40
Contribution to the economic rent from the whole operation -8.67 Average level of economic rent from the whole operation 63.59
Note: the sawnwood selling price is per cubic metre of sawnwood, all of the economic rent figures are expressed in terms of the economic rent per cubic metre of roundwood.
Table 18 shows how these relationships might be used to examine the relative levels of economic rent produced from harvesting different species. The figures in the first five columns in the table are the same as those presented in Table 17, re-ordered by species (Royalty class).15 The economic rent shown in the sixth column is calculated from the equations given in Figure 25. The contribution to total economic rent (column seven) is the economic rent for each individual product (i.e. row) multiplied by its contribution to total production (i.e. the figures in columns six multiplied by the percentages in column four).
As the subtotals for each species class show, at the given selling prices, Class 1 species account for the majority of economic rent, with a modest contribution from Class 2 species. Class 3 and Class 4 species have a negative economic rent and are unprofitable (i.e. production costs exceed the sawnwood prices used here, even before forest charges are taken into account). The sum of the four subtotals - FJD 63.59/m3 - is very close to the average level of economic rent presented above (FJD 64.27/m3), indicating that these two equations are quite accurate.
15 Note: the percentage contributions to total output are half of the amounts shown in Table 17, because they take
into account that half of production is sold in the export market and half is sold in the domestic market.

55
The figures in the last two columns of the table are the most interesting, as they show the average level of economic rent by market and species class. These are calculated as weighted averages for each market and species class, using the percentages and estimates of economic rent (columns four and six) for the respective sub-sets of species class and market. For example, the weighted average level of economic rent for Class 1 species sold in the export market is calculated as follows:
(25 x 252.80) + (3.75 x 117.39) + (1.25 x 117.39) = 230.23 (25 + 3.75 + 1.25)
These figures show that, under the given assumptions about selling prices and distribution of sales by market and grade, the economic rent for Class 1 species is about FJD 160/m3 and about FJD 40/m3 for Class 2 species. Again, Class 3 and Class 4 species have a negative level of economic rent. This would suggest that the relative levels of the royalties should be much higher for the top two species classes with, possibly, a zero royalty for the bottom two classes.
The above analysis has only served to demonstrate how this issue might be investigated further. A table such as the one above could be completed with more reliable data about prices and the composition of outputs by species (market and grade) in order to examine the relative differences in economic rent between the different species.
In the interest of maximising the potential production from the forest, it is desirable to have producers remove all commercial species from the forest. To encourage this, there will probably always be a certain amount of cross-subsidisation in forest operations, where processors are allowed to take high valued species at sub-optimal prices in return for also having to take the lower valued species. However, this simple analysis suggests that there may be scope to widen the difference in royalty payments between the lowest and highest royalty classes in order to encourage the harvesting of the lower valued species and the development of markets for them.

56
6 TAXATION OF THE FORESTRY SECTOR The previous report by Rizer (1988) referred to a number of subsidies and tax incentives that were then in place to encourage investment in the forestry sector and recommended that these should be examined to see if they were in the best interests of the Fijian economy. Discussions with the Fiji Islands Revenue and Customs Authority revealed that all of the schemes referred to earlier had been closed and they suggested that the forestry sector is now generally taxed in the same way as other sectors in the economy.
However, there remain a number of incentives to encourage foreign and domestic investment (and some quite significant incentives specifically for the forestry sector). These fall into the following three categories: general tax incentives; industry specific tax incentives; and subsidies to the forestry sector. In addition, there is some evidence that the administration of foreign trade might be providing another implicit incentive to the domestic forest processing industry (see below).
6.1 General tax incentives
The Fiji Government introduced a new Investment Incentives Package in January 2001. The main thrust of this new package is to make incentives transparent, easily available, automatic and non-discretionary. It encompasses eight principles aimed at stimulating economic growth through increased investments (FTIB, 2003). The Investment Incentives Package includes the following:
� an attractive rate of income tax: Corporate Tax of 31 percent (or lower for some types of business) and Income Tax in bands up to 31 percent (down from 32 percent in 2003 and with the intention of eventually reducing this to 30 percent);
� no Withholding Tax on dividends (provided these are distributed to the shareholders after a company’s profits are fully taxed at corporate level);
� exemption from income tax on income from exports (with a declining percentage of exempted export income from 2001 to 2009);
� a generous depreciation allowance;
� a carry-forward of losses (allowing losses in one year to be offset against taxable income in up to the next eight years, subject to continuity of ownership or carrying on of the same business); and
� relatively low import duties (and duty free imports for goods that will be processed and re-exported under the new Duty Suspension Scheme).
As these incentives are available to all sectors of the economy, there is no specific advantage to companies and individuals working in the forestry sector and they do not distort the overall pattern of activities in the economy.
One or two of the companies interviewed mentioned that the administration of the Duty Suspension Scheme was so complicated that it was difficult to take advantage of this incentive (e.g. to import cloth, fixtures and fittings to manufacture value-added wood products for re-export). This is likely to be only a minor problem affecting a few companies in the sector, but it could be investigated further if the Government wishes to strengthen the promotion of an export-orientated wood processing sector.
6.2 Industry specific tax incentives
Companies in the forestry sector (along with some others) are also eligible for the following two specific incentives:
� Investment allowances: a business entity or taxpayer may claim as a deduction an investment allowance of 40 percent of the purchase of capital assets of not less than FJD 50,000 per annum.

57
Such capital assets can not include land, buildings, passenger motor vehicles or trading stock. This investment allowance can be claimed between 2001 and 2005 (both years inclusive) for expenditures incurred during this period. Businesses in the forestry sector are eligible for this incentive if they undertake substantial transformation of the natural resource (meaning unprocessed or raw natural produce, including timber, wholly derived in or from Fiji). Substantial transformation means that the process applied to the natural resource results in a product having a different classification under the Harmonised System (HS) codes from that of the raw materials and excludes the logging of timber.
� Further reductions in import duties: companies involved in logging and sawmilling operations qualify for 5 percent fiscal duty plus VAT on the importation on all sawmilling and logging equipment including skidders, dozers and logging trucks (provided that the automobiles are equipped with boosters and perforated trays).
Considering the likely levels of profit and capital expenditure in the forestry sector in Fiji, the investment allowance described above could be quite significant and result in reductions in the Corporate Taxes paid by sawmills.
For example, the calculations for an “average” sawmill (described in Section 5.4 above) suggest that such a sawmill should pay Corporate Tax of around FJD 130,000 per year (on average). However, the sawmill would also be spending an average of around FJD 150,000 per year on equipment that is eligible for the investment allowance tax exemption. By offsetting 40 percent of the cost of this investment - FJD 60,000 - against their Corporate Taxes (which is quite feasible), their Corporate Tax bill could be reduced by 15 percent (i.e. an allowance of FJD 60,000 would result in a reduction of Corporate tax of FJD 19,200 (FJD 60,000.x 32 percent), which is equal to about 15 percent of their original tax bill). Smaller and less profitable sawmills could probably also claim a similar amount in investment allowances, resulting in a greater reduction in their Corporate Tax bill. This could partly explain the relatively low levels of Corporate Tax payment admitted by some sawmillers that were interviewed.
6.3 Subsidies to the forestry sector
There are no specific subsidies for forest management and forest operations in Fiji (e.g. to support tree planting, harvesting and processing). However, certain companies and individuals operating in the forestry sector are eligible to apply for subsidised loans from the Seed Capital Revolving Fund (SCARF).
6.3.1 Seed Capital Revolving Fund
As part of the affirmative action for indigenous Fijians and Rotumans, the Fijian Government has provided FJD 4.5 million for the SCARF program to assist the tourism, fisheries and forestry industries. The fund began in 2002 and is administered by the Fiji Development Bank (Fiji Development Bank, 2005).
Loans under this scheme cover investments in logging, sawmilling, further processing of wood products and the acquisition of working capital (for operation or establishment of eligible enterprises and limited to 30 percent of the total loan amount). Eligible investments include the purchase of fixed assets such as: land; buildings; machinery; and equipment, for existing or established business.
Eligibility criteria for loans are as follows:
� applicants are at least 21-years old and are a Fiji-Citizen registered in the Vola ni Kawa Bula or the Rotuman’s Birth Register;
� applicants are either an individual, part of a partnership, co-operative or corporate entity;
� the project is situated within 1 km of a government feeder road (if on Viti Levu or Vanua Levu) or situated within 3 km of the nearest inter-island port of call if on an outer island; and

58
� if applying as part of a joint venture or partnership, the business at least 51 percent owned by a Fijian/Rotuman.
The maximum loan amount is 65 percent of the total project cost and is not to exceed FJD 162,500, while the equity contribution of the borrower must be at least 35 percent of the total project cost (with the possibility of 25 percent provided by the Government and the balance provided by the applicant in cash or kind) and should not be more than FJD 87,500 per applicant. The (nominal) interest rate for the loan is eight percent per year, with repayment periods depending on the type of asset purchased.
The provision of subsidised loans from SCARF is not likely to have much of an impact in the processing sector, except for very small-scale operators. For example, the “average” sawmill described and analysed in Section 5.4 above would involve an investment of around FJD 2 million, so the maximum total project cost that can be submitted for SCARF funding (FJD 250,000) would only cover about 12.5 percent of the total investment. With the modest difference between commercial interest rates (around 15 percent in nominal terms) and the SCARF interest rate of eight percent, the subsidised loan available from SCARF would have only a marginal impact on productions costs and the sawmill owner’s rate of return.
Where SCARF could have a major impact is on companies and individuals engaged in logging operations. The delivered roundwood production cost for a “typical” forest operation (described in Section 5.3 above) assumed that an operator would not be able to obtain a commercial loan for such activities (which is often the case) and would have to finance the operation entirely from their own funds. It also assumed that they would require a 20 percent (real) ROC on their investment, so any loan at a real interest rate of less than 20 percent would reduce their total delivered roundwood production cost or could enable them to earn a higher ROC on their equity investment in the operation. Furthermore, the total investment required for such an operation would only be around FJD 215,000, so the entire project could be submitted for SCARF funding.
To examine the impact of SCARF funding on forest operations, the calculations described in Section 5.3.1 above were repeated assuming that 65 percent of the capital investment would be funded at the subsidised (nominal) interest rate of eight percent (equal to a five percent real rate of interest - i.e. after adjusting for inflation at three percent per annum) and with the repayment periods allowed under the SCARF scheme. The results of this recalculation are shown in Table 19 below.
Table 19 Estimated cost of harvesting, extraction, loading and transport for a “typical” forest operation in Fiji with a subsidised loan from the SCARF
Cost by activity (in FJD per cubic metre) Type of cost Felling
Skidding
with dozer Skidding
with skidder Loading
Road
transport Unloading
& reloading Water
transport Road
building Total
Labour 3.57 2.50 NA 1.19 3.57 2.38 NA 1.07 14.26 Consumables 2.47 3.93 NA 1.04 6.96 2.07 NA 4.73 21.19 Capital 0.13 4.47 NA 1.27 4.21 2.53 NA 2.70 15.31 Total (excluding profit) 6.16 10.90 NA 3.49 14.74 6.98 NA 8.50 50.77 Return on capital 0.04 1.55 NA 1.19 2.36 2.39 NA 0.66 8.19 Total (including ROC) 6.20 12.45 NA 4.68 17.10 9.37 NA 9.16 58.96
Comparing this with the original calculations (shown in Table 13 on page 44), this shows that that the total delivered roundwood cost with a (subsidised) SCARF loan would be about FJD 3.28/m3 (or 5.3 percent) lower than without the loan. The total cost (excluding the allowance for profit) would increase because of the additional cost of interest repayments, but the additional amount required to provide a 20 percent ROC would be reduced by much more than this increase (because of the much lower level of equity invested in the project by the operator). Alternatively, if the roundwood was sold at the same price as the delivered roundwood cost from operators not eligible for a SCARF loan (the original FJD 62.24/m3), the operator’s ROC would be raised from 20 percent to 29 percent.
The above analysis shows that the subsidised loans available from SCARF would have only a very marginal impact on the total delivered roundwood production cost and, thus, the potential for SCARF to distort the

59
market for roundwood is quite limited. As this is likely to have little or no impact on average roundwood prices in the market as a whole, it provides a major inducement to investment by indigenous Fijians (by significantly raising their ROC) without introducing a major distortion into the market.
6.4 Other incentives to the domestic forest processing industry
One final incentive to the domestic forest processing industry concerns the way that foreign trade (specifically imports of wood products) is administered in Fiji.
Table 34 and Table 35 (on pages 90 and 91) show that, in recent years, there have been almost no imports of sawnwood into Fiji and very few imports of wood based panels. Strictly speaking, companies and individuals are free to import wood products into Fiji, subject to the payment of (quite modest) import duties. However, several people interviewed suggested that non-tariff barriers (e.g. requirements for phytosanitary certificates, etc.) were used to restrict the importation of wood products into the country.
A number of sawmillers commented that it would be much more profitable for them to sell imported sawnwood than to manufacture (and then sell) the same product locally. This is also confirmed by the domestic price statistics for sawnwood, where price levels in Fiji are somewhat higher than international market prices. Thus, it seems likely that the domestic sawmilling industry is protected from international competition, allowing it to charge relatively high prices for their products. Although this is not an explicit tax incentive or subsidy, such import protection is a significant incentive to the domestic industry.
There are two main economic problems with import protection. The first is that protection acts as a disincentive to increasing efficiency in domestic harvesting and processing operations, because the costs of any inefficiency can simply be passed onto consumers. The second is the effect of protection on the distribution of income in the economy, as the process of passing on costs to consumers protects the income levels of operators while increasing the costs of consumption to consumers.
Despite these two problems (economic efficiency and equity), the negative economic effects of import protection in Fiji may not be that great. In the first case, there appears to be significant competition for raw materials, which suggests that processors will be pressured into increasing efficiency due to limitations on the supply-side (i.e. availability of raw materials) even though they do not face the forces of international competition. In terms of equity, the effect of import protection may actually be beneficial, as many purchasers of wood in the country are relatively wealthy (e.g. hotel operators - often supported by foreign investors) and part of the benefits from the high domestic prices for wood products in the country are passed onto the poorer landowners in the form of official and unofficial forest charges. Thus, from a broad perspective, while these problems are worth noting, they may not be that great.
6.5 Overall assessment
The costs and benefits of the above incentives are as follows:
6.5.1 Costs to the Government (fiscal costs)
Investment allowance: The reduction in Corporate Tax estimated above (FJD 19,200) was based on an “average” sawmill, producing 5,000 m3 of sawnwood per year. This implies an average Corporate Tax loss of FJD 3,840 per one-thousand cubic metres of production. At an average level of production of about 80,000 m3 per year in recent years, this suggests that the total cost of this allowance (in terms of avoided Corporate Taxes) could be in the order of FJD 300,000 per year.
SCARF funding: The “cost” of SCARF funding is the difference between the interest that the Government would obtain if they lent this money at a commercial rate of interest (15 percent) and the interest that they will earn at the subsidised rate of interest (eight percent). For every FJD one-million lent, this amounts to

60
FJD 70,000 per year. The total subsidy to the forestry sector will depend upon how much of the FJD 4.5 million assigned to tourism, fisheries and forestry is used for forestry projects. Assuming that forestry projects account for about one-third of the SCARF funding, the total subsidy for forestry would amount to about FJD 100,000 per year.
6.5.2 Economic costs
Non-tariff barriers: The “cost” of the restricted level of forest product imports into Fiji depends on how much of the domestic production would be substituted by imports (if importing were easier) and the prices of those products (compared to the price of domestically produced wood products). Furthermore, the latter depends on how much product substitution would take place, as substituting domestic sawn hardwood with imported sawn softwood would result in significant savings to consumers (e.g. the regional trade price for sawn hardwood is quite similar to the domestic market price in Fiji, but regional trade price for sawn softwood is about FJD 100/m3 lower). It is impossible to know how much would be substituted if importing wood products were to be made easier, but the benefits to consumers (in the form of lower wood product prices) could amount to about FJD 500,000 for every 5,000 m3 of sawn softwood imports that might occur.
Other market distortions: As noted above, apart from the trade issue, the market distortions (in prices and investment) from the subsidies and incentives on offer in Fiji are quite modest and probably do not have a major impact on the overall economic efficiency of the sector.
6.5.3 Benefits
The main benefit of the incentives available to the forestry sector in Fiji is that these incentives probably help to create income and employment, contribute to poverty alleviation and play a small part in redistributing income towards the poor (i.e. native landowners) in the country.
A comprehensive cost-benefit analysis of these incentives would require considerable work to examine the number of jobs (and other benefits) created by these incentives and to compare these against the impact of government incentives for other parts of the economy. This would require a significant effort and is beyond the scope of this report. However, it appears that the costs of these incentives (to the government) are quite modest and probably worthwhile. The economic distortions are also quite small - with the exception of the implicit restrictions on trade - and the latter possibly have quite a significant impact on income distribution (by passing on some of the benefits of higher wood product process to landowners). Thus, in their totality, it seems likely that these incentives are worthwhile and justified.

61
7 COSTS AND BENEFITS OF THE FORESTRY SECTOR IN FIJI The report by Rizer (1988) also referred to the need for a cost-benefit analysis of the forestry sector in Fiji and the development of an input-output model to explore the linkages between the sector and other parts of the economy. It should be noted that either of these exercises (especially the latter) would involve a considerable amount of work and expense, which may not be justified. However, based on the information contained in this report and discussions with stakeholders in Fiji it has been possible to make some comments on these subjects and suggest activities that may be considered as a priority for further follow-up activities.
This section starts by outlining (and, where possible, quantifying) some of the main costs and benefits of the forestry sector in Fiji. It then briefly discusses the linkages that are likely to be most important and their effects. Finally, it presents an overall assessment of the situation and recommendations for follow-up activities.
7.1 Cost-benefit framework
Cost-benefit analysis involves the assessment and calculation of all costs and benefits (both financial and non-financial) associated with any project, policy or sector. At the level of individual projects, policies or programmes, the flows of costs and benefits can be assessed and valued for the life of the intervention (or some other suitable timeframe) and the difference between total benefits and total costs (i.e. total benefits minus total costs - which can be negative) is the value of the intervention.
However, for the assessment of a sector as a whole, it is necessary to examine both the flows of costs and benefits associated with activities in the sector and changes in the stock or value of all assets used in the sector (including natural assets - such as soil, water and biological resources - which may not have a financial value). As in normal accounting, asset values are usually measured at the beginning and end of the year and changes in asset values are added to the value of cost and benefit flows within the year. Such an approach (usually called “environmental income accounting”) is, therefore, somewhat more complicated than standard cost-benefit analysis, as it requires the quantification (and valuation) of asset stocks as well as valuation of the flows of costs and benefits through the sector.
A further complication in cost-benefit analysis of the forestry sector is the presence of a wide range of social and environmental costs and benefits associated with the sector. In order to include these in the analysis, it is necessary to quantify and, if at all possible, value these costs and benefits. Typically, the most important non-financial costs and benefits associated with the forestry sector are the value of flows and changes in the value of stocks of the following: soil, carbon and water; biodiversity; recreation and amenity; and the social and cultural benefits associated with forests. These are largely non-financial costs and benefits, which can be valued using a variety of economic techniques (see Table 20) although in some cases (e.g. recreation values) it is possible to convert some of these non-financial benefits into monetary income for the forest owner. In addition, the production of forest products for subsistence purposes (usually woodfuel and non-wood forest products) can have a high value that does not appear in the marketplace.
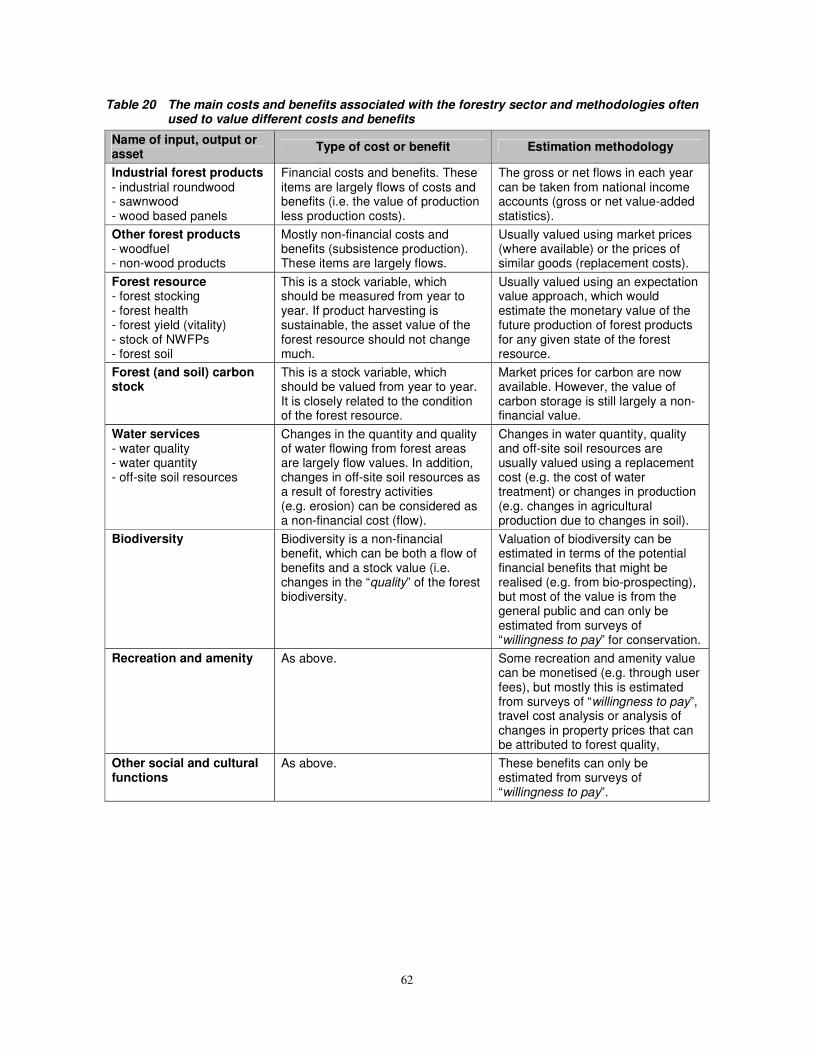
62
Table 20 The main costs and benefits associated with the forestry sector and methodologies often used to value different costs and benefits
Name of input, output or asset Type of cost or benefit Estimation methodology
Industrial forest products - industrial roundwood - sawnwood - wood based panels
Financial costs and benefits. These items are largely flows of costs and benefits (i.e. the value of production less production costs).
The gross or net flows in each year can be taken from national income accounts (gross or net value-added statistics).
Other forest products - woodfuel - non-wood products
Mostly non-financial costs and benefits (subsistence production). These items are largely flows.
Usually valued using market prices (where available) or the prices of similar goods (replacement costs).
Forest resource - forest stocking - forest health - forest yield (vitality) - stock of NWFPs - forest soil
This is a stock variable, which should be measured from year to year. If product harvesting is sustainable, the asset value of the forest resource should not change much.
Usually valued using an expectation value approach, which would estimate the monetary value of the future production of forest products for any given state of the forest resource.
Forest (and soil) carbon stock
This is a stock variable, which should be valued from year to year. It is closely related to the condition of the forest resource.
Market prices for carbon are now available. However, the value of carbon storage is still largely a non-financial value.
Water services - water quality - water quantity - off-site soil resources
Changes in the quantity and quality of water flowing from forest areas are largely flow values. In addition, changes in off-site soil resources as a result of forestry activities (e.g. erosion) can be considered as a non-financial cost (flow).
Changes in water quantity, quality and off-site soil resources are usually valued using a replacement cost (e.g. the cost of water treatment) or changes in production (e.g. changes in agricultural production due to changes in soil).
Biodiversity Biodiversity is a non-financial benefit, which can be both a flow of benefits and a stock value (i.e. changes in the “quality” of the forest biodiversity.
Valuation of biodiversity can be estimated in terms of the potential financial benefits that might be realised (e.g. from bio-prospecting), but most of the value is from the general public and can only be estimated from surveys of “willingness to pay” for conservation.
Recreation and amenity As above. Some recreation and amenity value can be monetised (e.g. through user fees), but mostly this is estimated from surveys of “willingness to pay”, travel cost analysis or analysis of changes in property prices that can be attributed to forest quality,
Other social and cultural functions
As above. These benefits can only be estimated from surveys of “willingness to pay”.

63
7.2 Assessment of some of the costs and benefits of the forestry sector in Fiji
7.2.1 Industrial forest products
The annual net flow of benefits from formal activities in the forestry sector in Fiji are already calculated by the Bureau of Statistics and reported to international organisations such as the United Nations Industrial Development Organization (UNIDO).16 Table 21 shows the statistics produced by these sources since 1990. UNIDO only collects information about value-added in the processing sector and these figures are currently only available for Fiji up until 1994. The Bureau of Statistics produced estimates of value-added for forestry and processing activities in 1995 and has produced statistics for value-added in forestry activities (i.e. roundwood production) alone since then.
Table 21 Value-added in the forestry sector in Fiji since 1990 (in million FJD) 1990 1991 1992 1993 1994 1995 1996 1997 1998 1999 2000 2001 Forestry, logging and related service activities n.a. n.a. n.a. n.a. n.a. 24.9 26.9 23.0 28.4 24.1 25.5 25.4 Woodworking 16.1 17.9 16.7 24.1 22.9 11.9 n.a. n.a. n.a. n.a. n.a. n.a. Paper production and processing 7.0 7.0 9.0 9.0 9.0 8.2 n.a. n.a. n.a. n.a. n.a. n.a. Wooden furniture industry 4.6 5.7 6.6 5.2 4.5 14.6 n.a. n.a. n.a. n.a. n.a. n.a. Sources: from 1990 to 1994 - UNIDO (2002); from 1995 - Bureau of Statistics (2002 and 2003).
As the table shows, the value-added in forestry (i.e. roundwood production) amounts to roughly FJD 25 million each year. Based on the economic rent calculations described earlier and recent production statistics, it is estimated that about half of this is value-added in indigenous roundwood production (i.e. production from the natural forest), with the remainder coming from the forest plantation sector. Furthermore, the value-added from indigenous roundwood production is probably shared roughly equally between: official forest charges; unofficial charges; operators’ ROC; and payment of wages and salaries.
On the processing side, there is some value-added from the production of value-added paper products (i.e. packaging materials) but, as this is not based on the domestic forest resource, it can not really be considered as a benefit of the forestry sector in Fiji. Excluding this, the other two main industrial sectors (woodworking - sawnwood and wood based panel production - and the wooden furniture industry) account for a further FJD 25 million in value-added each year.17
Thus, the total net benefit from the production of industrial forest products in Fiji is probably around FJD 50 million per year. The total Gross Domestic Product of Fiji in 2000 was FJD 3.2 billion, implying that the formal forestry sector accounts for about 1.5 percent of national income.
7.2.2 Other forest products
Other forest products include woodfuel and a wide range of non-wood forest products that may be used by people (e.g. for food, medicine, plaiting materials and local building materials). Information about the level and value of production of these other products is not readily available in Fiji and it would probably be difficult to collect such information.
Given the remoteness of much of the forest, the level of urbanisation and the general level of economic development in Fiji, it seems unlikely that the collection of other forest products for subsistence purposes is of significant economic value. However, one area of informal forestry production (which may not be captured
16 Value-added is defined as the total value of sales from a sector less the value of purchases from other sectors.
Thus, it is the same as the net benefit from activities in the sector. Value-added is distributed as incomes to the owners of the factors of production as rents or forest charges (to landowners and government), ROC (to investors) and wages and salaries (to labour).
17 It should be noted that UNIDO and the Bureau of Statistics show very different figures for these two components of the forest processing sector, but this is probably due to differences in the classification of enterprises into the two different sub-sectors. What is encouraging is that there is no great difference in the totals for the forest processing sector given by these two different sources.

64
in official value-added statistics for the sector) is the production of handicrafts, such as wood carvings, souvenirs, mats and baskets. Considering the significant tourism sector in the country and the interests of tourists in purchasing such products, it is possible that these activities result in a modest amount of value-added in addition to that recorded in official statistics.
7.2.3 Forest resource and carbon stock
With respect to the value of the forest resource and the value of the stock of carbon held in the forest and forest soils, the situation in Fiji is likely to be markedly different in the natural forest and forest plantation sub-sectors.
In the natural forest, the Forestry Department’s statistics suggest that the natural forest area may have declined by about 25,000 ha or 3.1 percent in total since 1986 (equal to an annual loss of around 1,500 ha or 0.2 percent per year). In addition, some Forestry Department staff suggested that, although current harvesting is sustainable in terms of retaining the regenerative capacity of the forest, they did not expect that current harvesting levels in the natural forest could be continued indefinitely (as it is becoming gradually more difficult to find trees that can be commercially harvested) and that a significant period of regeneration might be required in many areas at some time in the future. Thus, it seems likely that there is a modest and gradual depletion in the commercial value of the natural forest resource each year.
The commercial value of the natural forest resource in Fiji may currently be around FJD 250 million (assuming an annual level of value-added from forestry activities of FJD 25 million per year (in perpetuity) and a discount rate of 10 percent). Thus, the current annual loss of natural forest (0.2 percent) would be equal to a decline in the value of the commercial growing stock of around FJD 0.5 million per year. However, this is an absolute minimum. Considering that the current level of production probably can not be maintained in perpetuity, the gradual decline in the quality of the forest (in addition to changes in area) would suggest that the annual change in the value of the resource is probably several times (and possibly an order of magnitude) higher than this.
Based on data from various studies in other tropical countries, the non-market value of carbon held in forests is often roughly equivalent to the value of the stock of commercial timber.18 Thus, the value of annual changes in the carbon held in Fiji’s natural forests (due to changes in forest area and average growing stock) might be of a similar magnitude to those described above.
In Fiji’s forest plantations, the opposite of the above is likely to be the case. The forest plantations have increased in area in recent years and they have matured. This has led to an increase in the stock volume and, more importantly, a considerable increase in the value of this stock (in terms of it being much closer to the age when trees can be harvested).
The current assignment did not involve a detailed investigation of the forest plantation sub-sector in Fiji, but it seems likely that the positive changes in the value of the forest plantation growing stock (in terms of both commercial timber value and the value of carbon stocks) would be larger than the losses in stock value in the natural forest. However, an analysis of the net effect of these changes would also have to take into consideration the current timber income and the costs of planting and managing this resource. Thus, it can not be determined whether the net change in this value is positive or negative (nor the magnitude of this change). This would require a more thorough investigation of the forest plantation sub-sector.
7.2.4 Water services
Forests can have a major direct impact on the quality and quantity of water from forested areas and, indirectly, on soil resources in neighbouring areas (e.g. as a result of their effects on soil erosion). The
18 The value of carbon stored per cubic metre is much lower than the value of timber (per cubic metre), but this
value can be applied to the entire growing stock volume and not just the commercial volume.
65
linkages between forests and water are varied and poorly understood. Furthermore, these linkages are believed to be limited to very small catchment areas and the effects of forests on large catchment areas are extremely difficult to assess.
For example, forests are believed to improve water quality, but this is only true under certain circumstances and there are many examples of how forestry activities can lead to a decline in water quality (e.g. through soil disturbance due to harvesting and afforestation). Forests may regulate the flow of water, resulting in a reduction in the negative effects of high rainfall (e.g. floods and soil erosion) but, again, this is not always the case. Furthermore, with respect to water quantity, a scientific consensus is gradually forming that forests reduce water quantity (due to high transpiration rates), which can be a significant cost in areas where water is scarce.
In small islands, water supply is often a crucial issue and Fiji is no exception. However, discussion with Forestry Department staff suggested that they believed that forest-water linkages may not be particularly important in Fiji, due to the location of the main forest areas in relation to the areas where water supply and demand are most critical. A complete evaluation of the costs and benefits of the forestry sector with respect to water resources would require a comprehensive and detailed analysis of where forest and water resources overlap, the explicit linkages between the two (in terms of water quality and quantity) and a study on the value of water. It seems unlikely that this would be a priority for resource managers in either the forestry or water sectors.
Based on the above, at first glance, it seems likely that the costs and benefits of the impact of forests on water resources in Fiji may be negligible.
7.2.5 Biodiversity
The value of forest biodiversity can be both a flow of value and a stock of value. The flow of value is the perceived benefit that people obtain each year from the conservation of biological diversity, which is poorly understood and very difficult to estimate. This is what economists refer to as a “non-use” value. In addition, there may be a use value if biodiversity from the forest is (or could be) used commercially (e.g. bio-prospecting for new chemical compounds that might be used as medicines or food additives). Currently, there are no known commercial bio-prospecting activities in Fiji, so the value of forest biodiversity is likely to be mostly a non-use value.
As with the value of the forest resource, the stock of biodiversity value is the sum of the future value of these flows that may be obtained from any given state of the forest resource. This can increase (if the amount of forest biodiversity or people’s valuation of this increases) or it can decrease (if the opposite occurs).
In total, about one-third of Fiji’s forests are protected (280,000 ha - see Table 23), but this includes areas protected for a range of different uses (biodiversity, soil and water protection). Of this, the formal protected areas network covers only 37,000 ha (or about five percent of the forest area). In addition to protected areas, there will also be biodiversity of some value in other forest areas, but the value of this biodiversity may be quite low.
Given Fiji’s current level of economic development, it seems likely that the non-use value of forest biodiversity amongst the local population will be low. In terms of the global population’s valuation of forest biodiversity, Fiji is internationally recognised as part of the Polynesia-Micronesia biodiversity hotspot, so there may be some value placed on the nation’s biodiversity resources. This value is currently unknown, but might be quite significant.
7.2.6 Recreation and amenity
The use of forests for recreation can be a significant value in densely populated countries. The value of forest recreation can be estimated using a variety of economic techniques and it is sometimes possible to

66
capture some of this value through user fees (e.g. entry fees, car parking charges, fees for commercial tour permits and licence fees for other commercial recreation activities). In addition, studies have shown that an attractive natural environment (including trees and forests) can result in increases in property prices compared to similar properties in unattractive areas.
There are currently only a small number of formal forest recreation sites in Fiji and visitor numbers are unknown. However, in addition to the local population, Fiji is a major regional tourism destination, attracting around 326 thousand holiday visitors in 1999 (Bureau of Statistics, 2001). The average length of visit is just over one week and this part of the economy is growing strongly (e.g. holiday visitor numbers were only 256 thousand in 1995).
The majority of holiday visitors to Fiji probably do not visit the forest, so the current value of this use of the forest is probably quite modest. However, given the wealth of most visitors, their average length of stay and the availability of suitable sites, there may be potential for some development of forest recreation in the future.
7.2.7 Other social and cultural functions
Other social and cultural functions of forests include historical/traditional uses and the use of forests for educational purposes. These uses are very difficult to value and there is currently no readily available information about the quantity or value of these forest uses in Fiji. However, given the relatively small number of people living in or near the forest in Fiji, it seems likely that the value of these functions would be negligible.
7.3 Economic linkages
Analysis of economic linkages is used to show the total effect of activities in a sector on the national economy (usually in terms of the income and employment generated by activities). In addition to the direct effect of activities (e.g. value-added, as shown in Table 21), there are also usually indirect effects in terms of income and employment generated in industries that provide goods and services to the sector (e.g. transport, machinery suppliers, fuel retailers) as well as in industries that purchase goods and materials from the sector (e.g. retailing, construction, etc.). Furthermore, some of the income paid to workers in a sector is then spent locally, resulting in additional induced income and employment effects within the local economy.
Studies of economic linkages require the construction of an input-output table for the whole economy, with considerable detail of the purchases and sales of those companies operating in the forestry sector. This is a significant exercise, which usually builds upon existing general input-output tables for the economy as a whole (which may or may not be available for Fiji). Surveys of companies’ expenditures and sales are used to construct the level of detail required for the analysis and the input-output tables can then be used to show how marginal changes in output in the sector lead to changes in direct, indirect and induced income and employment.
The few countries that have produced income and employment multipliers for the forestry sector (e.g. Canada and the United Kingdom) have reported multipliers in the range of two to three. In other words, for every one job created in the forestry sector, an additional one to two jobs are created in related industries and the local economy. Similarly, the total value-added that is linked to activities in the forestry sector is two to three times higher than the direct value-added reported for the sector.
In the case of Fiji, it seems likely that the income and employment multipliers for the sector may be somewhat lower than reported elsewhere. This is due to the nature of island economies and the capital intensity of forestry activities. For example, Canada reports a high forestry sector multiplier because there is a significant industry involved in producing chemicals, tools, equipment and machinery for the forestry

67
sector. In the case of Fiji, it is likely that the majority of equipment is imported. Furthermore, a significant proportion of the forestry sector’s output in Fiji is exported (which would tend to limit downstream multiplier effects). On the other hand, the induced multiplier effects of forestry activities in Fiji could be quite high in areas where the local sawmill is the main employer.
In general, it seems likely that the income and employment multipliers related to forestry sector activities in Fiji would be low, possibly in the range of 1.5 to 2.0. Given the amount of effort required to produce such a study properly and the “disappointing” result that may be obtained, it is recommended that investing in such a study would not be a valuable use of resources.
7.4 Summary of the costs and benefits
A summary of the main costs and benefits of the forestry sector in Fiji is given in Table 22. Despite not being able to value many of the different functions of the forestry sector, this shows that the non-financial effects of the sector as a whole are probably slightly positive and that the annual change in the stock value is probably positive (due to the increase in the value of the forest plantation resources outweighing any decline in other values). In other words, annual activities in the sector have a positive net benefit and the value of the asset stock is increasing.
Table 22 Summary of the main costs and benefits of the forestry sector in Fiji
Name of input, output or asset Annual net flow Annual change in stock value
Industrial forest products
Gross value-added of about FJD 50 million.
Unknown, but probably slightly positive
Other forest products
Probably a very small amount of value-added in woodfuel production. Possibly a significant amount of value-added in handicraft production.
Negligible.
Forest resource
Not applicable. In the natural forest, annual decrease of at least FJD 0.5 million, possibly several times this amount. Probably significant increase in the forest plantations.
Forest (and soil) carbon stock
Not applicable. As above.
Water services Probably negligible. Not applicable. Biodiversity Possibly quite significant to the
global conservation community. Unknown, but likely to be negligible (and probably a small decrease).
Recreation and amenity Probably negligible. Unknown, but likely to be negligible. Other social and cultural functions
As above. As above.
A significant amount of further work to quantify and estimate all of these values could probably not be justified. However, if desired, it would seem most beneficial to examine the amount of value-added in handicraft production and the potential to increase the value of forest recreation through development of informal and commercial recreation activities.

68
8 CONCLUSIONS AND RECOMMENDATIONS
8.1 Forest charges - some general principles
Most forest revenue systems have strengths and weaknesses. However, there are some broad principles that can be followed when analysing the forest revenue system in a country. For example, Gray (1983) lists the following five main principles that should be considered when designing a system of forest charges:
• Forestry policy. Forest charges should reflect the overall objectives of forestry policy (i.e. they should encourage forest concessionaires to carry-out activities that meet the objectives of forestry policy and discourage activities that work against the policy).
• Administrative efficiency. The charging system should aim to minimise the costs of implementation (to both the government and forest concessionaires) and reduce the scope for evasion.
• Government revenues. The charging system should aim to capture a significant proportion of the economic rent, unless there is a specific objective to allow forest concessionaires to obtain cheap wood for some reason (e.g. in order to promote a domestic forest processing industry).
• Economic efficiency. Forest charges should promote efficiency in the use of the forest resource and in the use of all other resources involved in the forestry sector.
• Equity. The charging system should take into account the impact of charges on different groups within the sector.
To a large extent, satisfying the last four principles outlined above would also meet the objectives of forestry policy in Fiji, which stresses the need for efficiency and the maximisation of benefits for landowners from the utilisation of their forest resources. Therefore, the appraisal below will focus on how well the current forest revenue system performs against these four principles. As the forest revenue system is closely related to the current licensing procedures, it will also comment on this as well where appropriate.
8.2 Appraisal of the current forest revenue system in Fiji
8.2.1 Administrative efficiency
There are three main costs of administering any forest revenue system:
• the cost of calculating the charges that are due;
• the cost of collecting these amounts; and
• the cost of policing the system (i.e. detecting and pursuing any individuals that have not paid their charges).
In addition to this, in the case of Fiji, there is also the cost of distributing to landowners the revenues collected by the Government on their behalf.
The Forestry Department calculates the official forest charges that should be paid and polices production, while the NLTB collects the charges and disburses revenue to landowners. The Forestry Department collects a Scaling Fee of FJD 3.50/m3 for this from producers (plus a negligible Map Fee) and the NLTB collects a similar amount, partly from producers and partly by retaining a 10 percent share of all of the official charges collected by them. The above fees amount to about 10 percent of the total charges paid (including unofficial charges).
The Forestry Department believe that their fees are sufficient to cover their costs, but the NLTB expressed some reservations about this. Comparing these fees with other countries, this is a remarkably low

69
administrative cost. If this is a reflection of the efficiency of these two institutions, it is a remarkable achievement. However, it could reflect the fact that the true costs of administration are uncertain. In particular, for the Forestry Department, the amounts collected and retained by them seem very low considering the amount of work that must be involved in monitoring forest operations. For example, the revenue collected from fees covers only five percent of the expenditure of the department. This raises the question: is it true that production monitoring only accounts for five percent of the activities of the Forestry Department?
Another aspect of the administrative efficiency of the system concerns the procedures in place for recording production and calculating charges. In the field, roundwood leaving the forest is usually checked by the Forestry Department in the presence of representatives of producers and landowners. This approach, involving all three major stakeholders, is commendable and should reduce the scope for collusion, corruption and theft. Indeed, the Forestry Department’s statistics for fines and penalties show that very little illegal production is recorded. In local offices, the Forestry Department has a computer system that records production and calculates the charges that should be paid. This was demonstrated during the field-visits. This also appears to be working well and is comparable with product recording systems in many developed countries. The quality of production statistics in Fiji is excellent and this system could have other long-term benefits should producers decide to try to obtain certification for their products.
One final consideration should be the costs of administration borne by the private-sector. In general, it appears that the requirements for monitoring and paperwork are not particularly onerous and are certainly not any worse than the requirements in many other countries. However, there is one potential problem and that concerns the nature of the licences issued by the Government. At the moment, the main licence establishing a harvesting area is issued in the name of landowners. A number of forest operators complained that they sometimes entered into agreements with landowners, paid for licences and started to pay some of the unofficial fees, only to have the landowners try to renege on the agreement at a later date. This usually occurs when a competitor comes along and offers the landowners a better deal. This is a very real cost to producers.
Many producers also have a separate legal contract with landowners to reinforce their agreements, but this is quite weak in comparison to the powers available to the Forestry Department and NLTB. In particular, the latter can revoke or refuse to reissue licences to landowners. Markets work most efficiently when they are governed by a secure legal framework and binding contracts and the cost of such problems might be reduced if the licences could be improved in this respect.
8.2.2 Total forest revenue collection
The above analysis has indicated that the current levels of official and unofficial charges collected from producers in Fiji accounts for about 95 percent of the economic rent from production. Given the level of precision in these calculations, it is probably reasonable to say that landowners are earning the maximum possible benefit from the use of their forest resources and there is little scope to increase charges.
This conclusion is not only confirmed by the calculations set-out above, but by other indications such as the fact that the availability of indigenous roundwood is probably declining, or at least becoming more difficult to access. Further evidence of increasing competition to access a diminishing resource is provided by the development of unofficial payments, which was recently initiated by producers as they competed to acquire harvesting rights. With so much competition for the resource and the widespread use of short-term licences, it is very unlikely that producers could earn any “excess profit” for very long.
Apart from the above, there is the issue of how much of the charges should be paid through the official system of Royalties and Premiums and how much should be paid through unofficial channels. The determining factor should be the equitability or “fairness” of the two alternative systems, although a mixed approach does have other advantages as well (see below). It should also be noted that landowners have

70
become used to the unofficial system of payments and seem to prefer it to the official system. The Government could simply try to redirect all of the unofficial charges through the official system by increasing Royalties by the amounts that are currently paid as unofficial charges. However, it seems likely that this would be unpopular with both landowners and producers. It could also lead to a situation where landowners continue to try to extract additional payments from producers. If such a situation occurred, it could reduce the availability of the resource even further and drive some producers out of business. This would not be in the interests of landowners, as it could lead to less production and a lower total amount of revenues collected for landowners overall (i.e. it is possible for forest charges to be set too high!).
One final point to consider is that the unofficial payments are not currently recorded anywhere. The Forestry Department and NLTB are both charged with the responsibility of making sure that landowners receive the maximum benefit from the use of their forest resources. They can not measure their performance in this respect as long as a major component of the charges collected are not recorded anywhere.
8.2.3 Economic efficiency
The above analysis of economic rent demonstrated how production costs can vary depending on a number of factors such as: location; terrain; forest stocking; technical, managerial and marketing skills; and scale of operations. Some of these factors are within the control of producers (e.g. managerial skills) and the forest revenue system should not allow poorly managed operations to survive at the expense of the better operators. However, some of the variation is due to factors beyond their control and they should not be penalised for this.
The problem with all analyses of economic rent is that they are often based on averages, which are then translated into recommendations about levels of charges that reflect these averages. There is no such thing as an average forest operation or average sawmill! Therefore, one of two outcomes usually occurs. In some cases, forest charges are set too low, so that no producer is penalised (but many benefit a lot from under-priced wood). Alternatively, the charges are set at a level close to the average level of economic rent, so that some unfortunate producers are penalised, while the lucky ones do rather well out of the arrangement. Either way, administratively fixed forest charges are never detailed enough to reflect the circumstances faced by each individual operator in the industry (whether within or beyond their control). Market forces can do a much better job of this, if competition for the resource can be guaranteed.
In terms of economic efficiency, the system that has developed in Fiji has several advantages in this respect. The official system of Royalties sets a baseline for the value of roundwood that landowners should expect to obtain. It also sends them market signals about the relative value of different species. On top of this, they are free to negotiate additional payments that, in effect, determine the market price of the standing roundwood. Unlike in many counties where the Government retains all forest revenue, Fiji’s landowners seem able to negotiate very attractive prices, probably due the high level of competition for the resource.
Although there seems to be a lot of competition for the resource, one aspect that might be considered is the availability of market information. Landowners are at a disadvantage in this respect, as producers know a lot more about the forestry business than they do. Improved information should improve the functioning of the market and lead to greater economic efficiency. As noted in the analysis above, this might extend to a revaluation of the relative levels of the Royalties.
Another consideration concerns the awarding of licences. The FSA submission suggested that licences should only be awarded to processors. Such a move would be anti-competitive and should be resisted. Many countries have a vibrant and dynamic independent logging sector and if an independent logger can produce roundwood more efficiently than a sawmiller can, they should be allowed to do so. Indeed, it is in the sawmiller’s interest to buy their roundwood from the cheapest source available, even if that means buying it from someone else rather than producing it themselves. In addition, processing is beyond the capacity of
71
most landowners, but some of them may be able to start businesses as independent loggers. Therefore, restrictions on the awarding of licences should be avoided as it might exclude landowners from the industry.
However, this argument applies in both directions. Competition requires a “level playing field” and the Forestry Department should ensure that independent loggers are competent and able to follow the same requirements for good harvesting practice that sawmillers have to comply with.19
A final consideration concerns the scale and duration of licences. Forest areas owned by different landowning communities are generally small and highly fragmented. Annual-licences are good for encouraging competition, but they discourage investment in the processing industry, which tends to be of a long-term nature and requires security of supply. The forest processing industry in Fiji could probably be more efficient with higher levels of capacity utilisation (and, maybe, some new investment in improved technology), but this is unlikely to occur under current circumstances. The combination of these factors tends to push up costs, lower profitability and reduce the amounts that processors can afford to pay landowners as forest charges.
It is not suggested here that the Government should try to encourage the industry to restructure into just a few small large mills. Indeed, the medium-sized sawmills in the sector appear to be quite well managed and have proved resilient to fluctuations in market conditions in the past. Furthermore, a small number of very large mills would probably reduce competition for the resource (leading to a completely new set of problems). Rather, it is suggested here that the Forestry Department might examine how they can encourage improved performance in the processing sector through the types of licences available to producers and by increasing the scale and security of wood supply.
Many countries struggle with the sorts of problems described above. They try to solve them by measures such as: organising landowners into co-operatives; offering landowners shares in processing operations; or guaranteeing a certain amount of supply from state owned forests. Crucial to the success of such initiatives is a meaningful dialogue between stakeholders about the strategic direction for the future of the sector. The forestry sector in Fiji has considerable potential and the Forestry Department may wish to consider this further.
8.2.4 Equity
An assessment of the level of equity or “fairness” inherent in the forest revenue system is a matter of whether some individuals are given an unreasonable advantage over others. Measures to improve the functioning of the market and competition for the resource (as described above) should ensure that producers and landowners are each given their fair share of the benefits from production. Furthermore, competition should ensure that all producers are treated equally. The question that remains is whether the landowners’ benefits are distributed fairly amongst themselves.
Currently, the distribution of forest charges through official channels is arranged by NLTB according to a formula. This was not reviewed and it would, anyway, be beyond the scope of this exercise to comment on this. The procedures for distributing the unofficial charges is not clear, although almost everyone interviewed said that they felt that the unofficial system was working better than the official system, giving landowners more control over the benefits that they receive from the forest and usually more rapid payments.
19 This requirement for a “level playing field” should also apply to other areas of public policy. For example, during
discussions with one sawmiller, it was claimed that a native landowner had won a public procurement contract that was tilted in their favour, but did not have the capacity to produce the volume required. The sawmiller (who did not win the contract) was supplying the native landowner at the slightly lower price he had bid, while the landowner was then selling this on to meet the contract at a higher price. It is questionable whether this arrangement satisfies the intention behind the policy to support business development by native landowners, but it serves as an example of how such policies have to be implemented with great care.

72
Ultimately, the decision about how much of the forest charges should go through official channels and how much should go through unofficial channels is a political decision. An impartial economic appraisal of the situation could conclude that, if landowners are capable of looking after their own interests, then there is no need for the NLTB to collect forest charges at all. However, the current system whereby NLTB are involved has two advantages:
• it provides a more formal and accountable system to ensure that everyone that is entitled to a share of the benefits from production is given a share; and
• it provides a safety-net to ensure that landowners receive the maximum possible amount of benefits from the utilisation of their resource.
NLTB have the responsibility to achieve the two objectives above on behalf of landowners. They could possibly achieve the latter without being involved in charge collection and disbursement, but it is unlikely that they could achieve the former. Furthermore, evidence from other countries that have given landowners more control over forest charges has shown that that they sometimes lose out in the long run. Therefore, this would support the argument that NLTB should continue to be involved in the administration of the forest revenue system.
As noted above, the economic arguments for increasing the share of payments that go through the official system are quite weak. If the issue is simply a problem that NLTB find it difficult to cover their administrative costs from their share of royalties, they should increase the share that they retain rather than increase the level of Royalties.
8.3 Recommendations for changes to the forest revenue system
Based on the above discussion and conclusions, the following recommendations are presented for further consideration by the Forestry Department:
Recommendation 1: Administrative costs. The Forestry Department should review their expenditure on forest monitoring, control and charge collection to assess whether their fees cover their costs. If not, they should consider increasing their fees. There is very little room for an increase in charges, but a modest increase in the Scaling Fee would probably do no harm. NLTB may wish to consider this issue as well.
Recommendation 2: Licences and security of wood supply. In consultation with interested stakeholders, the Forestry Department and NLTB should examine whether the problem of landowners and/or producers reneging on production agreements is a major problem and what, if anything, they should do about it. The aim should be to use licences to reinforce the agreement to supply roundwood in a harvesting area, to minimise the likelihood of broken contracts and the consequential costs to both landowners and producers.
Recommendation 3: Total charge collection. The Forestry Department should record the total amount of revenue collected from unofficial charges and publish this information along with the statistics on official revenue collection. The level of unofficial payments (lump-sums and per cubic metre) should be recorded in licence agreements.
Recommendation 4: Analyse the relative values of different species. The Forestry Department should collect some better information about product prices (in domestic and export markets) and the mixture of products typically produced from each species (by grade and market destination). This should be analysed to identify the relative levels of economic rent from different species and revise the composition of the species classes.
Recommendation 5: Revision of the Royalties. Royalties should not be increased by very much (if at all). For example, Royalties in the top two species classes could be increased in line with inflation and Royalties in the lower two species classes could be kept the same or even reduced. The relative levels of the different

73
species classes (and movement of individual species between the classes) should be determined from the outcome of Recommendation 3,
Recommendation 6: Average levels of unofficial charges. The Forestry Department should publish annually the average level of unofficial charges paid by producers (per cubic metre) by species class and zone.
Recommendation 7: Awarding licenses. Licences should continue to be awarded in an open and transparent manner without fear or favour, subject to the condition that all producers have to meet the same minimum standards of competence and comply with all forest regulations.
Recommendation 8: Long-term strategy. The Forestry Department should consult with all interested stakeholders about the feasibility of developing a long-term strategy for the sector. In particular, this should focus on improving the security of wood supply from the highly fragmented forest ownership, while maintaining the overall objective that landowners should continue to receive the maximum possible benefit from the use of their forest resources.
Recommendation 9: Revenue collection and disbursement. NLTB should continue to play a role in revenue collection and disbursement in order to provide a safety-net for landowners.

74
REFERENCES Brown, C, 1997, Regional study - the South Pacific, Asia Pacific Forestry Sector Outlook Study, Working
Paper No. 1, Food and Agriculture Organization of the United Nations, Rome, Italy.
Bureau of Statistics, 2000, 1997-1998 Annual employment survey report, Government of Fiji, Bureau of Statistics, Suva, Fiji.
Bureau of Statistics, 2001, Fiji tourism and migration report 1998-1999, Government of Fiji, Bureau of Statistics, Suva, Fiji.
Bureau of Statistics, 2002, Census of Mining and Quarrying, Manufacturing and Electricity and Water 1995, Bureau of Statistics, Suva, Fiji.
Bureau of Statistics, 2003, Key statistics - March 2003, Government of Fiji, Bureau of Statistics, Suva, Fiji.
Caterpillar, 1996, Caterpillar performance handbook: edition 27, Caterpillar Inc., Peoria, USA.
EFI, 2000, Country profile – Fiji, European Forest Institute Certification Information Service website, available at: http://www.efi.fi/cis/english/creports/fiji.html.
FAO, 1977, Planning forest roads and harvesting systems, Forestry Paper 2, Food and Agriculture Organization of the United Nations, Rome.
FAO, 1995, National Forestry Action Programmes, NFAP Update 32, Food and Agriculture Organization of the United Nations, Rome, Italy.
FAO, 1996, Proceedings of Heads of Forestry Meeting 18 - 22 July 1994, Food and Agriculture Organization of the United Nations, Apia, Samoa.
FAO, 1998a, Asia and the Pacific National Forest Programmes Update 33, Food and Agriculture Organization of the United Nations, Bangkok, Thailand.
FAO, 1998b; Proceedings of Heads of Forestry Meeting 23 - 28 September 1996, Food and Agriculture Organization of the United Nations, Apia, Samoa.
FAO, 1997, State of the World’s forests 1997, Food and Agriculture Organization of the United Nations, Rome.
FAO, 2001, Global forest resources assessment 2000: Main report, Forestry Paper 140, Food and Agriculture Organization of the United Nations, Rome.
Fiji Development Bank, 2005, description of the SCARF Scheme, Fiji Development Bank, Suva, Fiji, available at: http://www.fijidevelopmentbank.com.
Forestry Department, 1998, Forestry Department annual report, Ministry of Agriculture, Fisheries, Forests and ALTA, Suva, Fiji.
Forestry Department, 2001, Timber revenue system annual report 2000, Ministry of Agriculture, Fisheries and Forests, Suva, Fiji.
FSA, 2003, Fiji sawmillers submission regarding royalty proposition by NLTB, Fiji Sawmillers Association, Ba, Fiji.
FTIB, 2003, Incentives available for investing in the Fiji Islands, Fiji Trade and Investment Bureau, Suva, Fiji, available at: http://www.ftib.org.fj/show/contents/invest_incentives/new_incentives.htm.
Gray, J, 1983, Forest revenue systems in developing countries, Forestry Paper 43, Food and Agriculture Organization of the United Nations, Rome, Italy.

75
Government of Fiji, 2002, Qarase outlines landowners benefit from mahogany, Press release: August 5th 2002, Government of Fiji Press Office, Suva, Fiji, available at: www.fiji.gov.fj.
Hasni, S, 1997, Country profile - Fiji, Tropical Forest Update, Vol. 7, No. 2, Food and Agriculture Organization of the United Nations, Rome, Italy.
Jiko, L R, 2000, Fiji country report, in: “Proceedings of regional consultation on implementation of Codes of Logging Practice and directions for the future, 12-16 July 1999, Port Vila, Vanuatu”, FAO Project RAS/97/330 Field Document No. 3, Food and Agriculture Organization of the United Nations, Apia, Samoa.
Mathias, A, 2003, Back to office report from the Fifth Meeting of the FAO Southwest Pacific Ministers for Agriculture, Food and Agriculture Organization of the United Nations, Apia, Samoa.
MoFF, 2003, Forestry sector policy and strategy 2002-2004, Government of Fiji, Ministry of Fisheries and Forestry, Suva, Fiji, available at: http://www.fiji.gov.fj/ministries/fisheries_forest.shtml.
Mueller-Dombois, D, and Fosberg, F R, 1998, Vegetation of the tropical Pacific islands, Springer-Verlag, New York, USA.
NLTB, 2003, Maximising forest resource benefits on native land, Native Land Trust Board, Suva, Fiji.
Oliver, W, 1999, An update of plantation forestry in the South Pacific, FAO Project RAS/97/330 Working Paper No. 7, Food and Agriculture Organization of the United Nations, Apia, Samoa.
Repetto, R, and Gillis, M, 1988, Public policies and the misuse of forest resources, Cambridge University Press, Cambridge, UK.
Rizer, J P, 1988, Data requirements of Fiji’s current and future timber industry, Project report from FAO Project: FO:DP/FIJ/88/006, Food and Agriculture Organization of the United Nations, Rome, Italy.
Scotland, N, and Whiteman, A, 1997, The ITFMP forest industry model: operator's manual, Report No: SMAT/EC/97/1, Indonesia-UK Tropical Forest Management Project, Jakarta, Indonesia, available at: http://www.fao.org/forestry/finance.
Strelke, B, 1997, Proceedings of a regional workshop on the management of cyclone damage to forests and trees in South Pacific island countries, FAO Project RAS/97/330, Field Document No. 2, Food and Agriculture Organization of the United Nations, Apia, Samoa.
Swarup, R, 2000, Country report – Fiji, Report to: “Regional Heads of Forestry Meeting, 8-12 May 2000, Nadi, Fiji”, Food and Agriculture Organization of the United Nations, Apia, Samoa.
Tang H T, Finiasi L S, and Gjerum, L F, 1993, Proceedings of heads of forestry meeting 21-25 September 1992, Apia, Western Samoa, Field Document 1, FAO/UNDP South Pacific Forestry Development Programme, Food and Agriculture Organization of the United Nations, Apia, Samoa.
UNIDO, 2002, Industrial Statistics Database 3-digit ISIC Revision 2 (CD-ROM), 1963-2000, United Nations Industrial Development Organization, Vienna, Austria.
USDC, 2000, Country commercial guide: Fiji FY2000, US Department of Commerce - Commercial Service, available at: http://www.export.gov/comm_svc/.
Whiteman, A, (1999a), A roundwood production cost model for Suriname, Project report from FAO Project: GCP/SUR/001/NET, Food and Agriculture Organization of the United Nations, Rome, Italy, available at: http://www.fao.org/forestry/finance.
Whiteman, A, (1999b), Economic data and information about the forest sector in Suriname, Project report from FAO Project: GCP/SUR/001/NET, Food and Agriculture Organization of the United Nations, Rome, Italy, available at: http://www.fao.org/forestry/finance.

76

77
GLOSSARY
CUM Cubic metres.
FAO Food and Agriculture Organization of the United Nations.
FFI Fiji Forest Industries Ltd.
FHCL Fiji Hardwood Corporation Ltd.
FJD Fiji dollar.
FMT Fiji Mahogany Trust.
FPL Fiji Pine Ltd.
FRA 2000 FAO Global Forest Resource Assessment 2000.
FSA Fiji Sawmillers Association.
FTIB Fiji Trade and Investment Bureau.
GDP Gross Domestic Product (note: the GDP deflator is a measure of price inflation that is based on the prices of all goods and services produced in the economy).
MoFF Ministry of Fisheries and Forests.
MT Metric tonnes.
NFAP National Forests Action Plan.
NLTB Native Land Trust Board.
NPV Net Present Value: the surplus of total discounted benefits less total discounted costs of an investment, calculated at a specified discount rate.
ROC Return on Capital: the expected rate of return on investments made in the sector, measured as the amount of profit earned expressed as a percentage of the total capital invested.
SCARF Seed Capital Revolving Fund
TWI Tropik Wood Industries Ltd.
UNIDO United Nations Industrial Development Organization
USD United States dollar.
VAT Value-added tax.

78
APPENDIX 1: STATISTICAL TABLES Table 23 Distribution of forest land in Fiji by forest type and land ownership 1986 - 1998, as
reported by the Forestry Department Production forest
Indigenous forest Forest plantation Year Crown or state land
Forest reserve
Crown or state lease
Native land
Private land Total Crown or
state land Forest reserve
Crown or state lease
FPC lease
Private land Total
Protection forest
Non-commercial
forest Total
1986 5.60 0.96 0.56 216.14 14.01 237.27 0.66 6.08 22.22 45.15 11.35 85.46 269.10 298.50 890.33
1987 n.a. n.a. n.a. n.a. n.a. n.a. n.a. n.a. n.a. n.a. n.a. n.a. n.a. n.a. n.a.
1988 5.60 0.96 12.04 194.35 14.01 226.96 0.66 6.08 29.04 47.06 12.79 95.63 269.10 300.86 892.55
1989 5.60 0.96 12.92 190.74 14.01 224.23 3.43 6.08 32.26 43.04 13.33 98.14 269.10 304.47 895.94
1990 5.60 0.96 0.85 187.84 13.96 209.21 5.03 6.08 35.39 43.63 13.77 103.90 268.13 309.24 890.48
1991 5.24 0.94 0.84 181.60 13.58 202.20 5.03 6.08 38.38 35.63 13.99 99.11 266.58 307.65 875.54
1992 5.24 0.94 0.84 178.52 13.54 199.08 5.18 6.08 40.80 37.57 13.99 103.62 265.46 310.45 878.61
1993 n.a. n.a. n.a. n.a. n.a. n.a. n.a. n.a. n.a. n.a. n.a. n.a. n.a. n.a. n.a.
1994 n.a. n.a. n.a. n.a. n.a. n.a. n.a. n.a. n.a. n.a. n.a. n.a. n.a. n.a. n.a.
1995 n.a. n.a. n.a. n.a. n.a. n.a. n.a. n.a. n.a. n.a. n.a. n.a. n.a. n.a. n.a.
1996 5.24 0.94 0.84 170.89 13.34 191.25 5.18 6.08 49.39 43.68 7.70 112.03 260.34 306.39 870.01
1997 5.24 0.94 0.84 167.34 13.34 187.70 5.18 6.08 49.85 43.68 7.70 112.49 260.33 309.94 870.46 1998 5.24 0.94 0.84 156.83 13.08 176.93 5.18 6.08 50.56 43.68 9.20 114.70 277.02 320.70 889.35
Source: Forestry Department (1998 and earlier).
Table 24 Amount of forest land in timber concessions and long term licences in Fiji and royalties collected from such areas 1986 - 1998
Annual allowable cut (in m3) Year
Number of concessions and licences
Total area
(in ha)
Productive area
(in ha)
Estimated total standing volume
(in m3) Maximum Minimum
Production (in m3)
Royalties paid
(in F$)
Average royalty
payment (in F$/m3)
1986 11 278,042 143,128 9,195,074 51,450 41,500 108,729 844,971 7.77 1987 11 279,977 144,737 8,541,959 51,450 41,500 103,611 626,971 6.05 1988 11 279,977 144,737 8,541,959 51,450 41,500 95,268 590,241 6.20 1989 10 278,042 143,128 9,195,074 51,450 41,500 68,788 485,449 7.06 1990 8 278,042 143,128 9,195,074 51,450 41,500 77,956 889,351 11.41 1991 8 279,002 144,722 9,411,845 n.a. n.a. 45,823 1,034,639 22.58 1992 8 279,002 144,722 9,411,845 n.a. n.a. 40,858 946,176 23.16 1993 9 282,177 144,722 9,411,845 n.a. n.a. 37,493 776,758 20.72 1994 9 282,177 144,722 9,411,845 n.a. n.a. 46,774 1,759,302 37.61 1995 7 262,948 132,209 8,628,445 n.a. n.a. 46,892 1,046,033 22.31 1996 7 262,948 132,209 8,628,445 n.a. n.a. 75,313 1,749,844 23.23 1997 9 262,948 132,209 8,628,445 n.a. n.a. 79,729 1,829,573 22.95 1998 9 262,948 132,209 8,628,445 n.a. n.a. 69,369 1,898,942 27.37 Source: Forestry Department (1998 and earlier).

79
Table 25 Timber production in Fiji by forest type and product type 1986 - 1998, as reported by the Forestry Department
Type of forest product (and conversion factor to roundwood equivalent or RWE)
Logs (in m3)
Sawnwood (in m3)
Poles & posts (in m3 or linear m)
Pulpwood (in m3)
Fuelwood (in m3 or
stacked m3)
Fuelwood licences (in m3 or
stacked m3)
Charcoal (in kg) Year Forest type Wood type
1.00 2.00 1.00 or 0.011 1.00 1.00 or 0.75 1.00 or 0.75 0.006
Total (in m3 RWE)
Indigenous Inland Non-coniferous 185,475 33 529 7,227 4,888 195,156 Mangroves Non-coniferous 36 3,700 included above 3,280 2,831 All indigenous forest 185,475 33 565 0 10,927 4,888 3,280 197,987 Plantation FPL Coniferous 8,086 2,033 5,952 16,071 Forestry Department Coniferous 6 1,723 1,729 Hardwood Non-coniferous 1,411 237 39 1,687 All forest plantations 9,503 0 3,756 0 6,189 39 0 19,487 Total Production: coniferous 8,092 0 3,756 0 5,952 0 0 17,800 Total Production: non-coniferous 186,886 33 565 0 11,164 4,927 3,280 199,674
1986
Total Production: all species 194,978 33 4,321 0 17,116 4,927 3,280 217,474 Indigenous Inland Non-coniferous 221,757 26 293 15,355 3,095 235,940 Mangroves Non-coniferous 312 2,378 included above 3,600 2,117 All indigenous forest 221,757 26 605 0 17,733 3,095 3,600 238,057 Plantation FPL Coniferous 21,688 55,757 1,383 78,828 Forestry Department Coniferous 1,278 962 2,240 Hardwood Non-coniferous 3,815 561 4,376 All forest plantations 26,781 0 962 55,757 1,944 0 0 85,444 Total Production: coniferous 22,966 0 962 55,757 1,383 0 0 81,068 Total Production: non-coniferous 225,572 26 605 0 18,294 3,095 3,600 242,433
1987
Total Production: all species 248,538 26 1,567 55,757 19,677 3,095 3,600 323,501 Indigenous Inland Non-coniferous 203,578 307 12,052 24,983 231,661 Mangroves Non-coniferous 17 4,470 8,310 3,419 All indigenous forest 203,578 0 324 0 16,522 24,983 8,310 235,081 Plantation FPL Coniferous 79,379 118,992 2,403 200,774 Forestry Department Coniferous 4,495 1,530 1,195 59 7,279 Hardwood Non-coniferous 6,170 1,396 7,566 All forest plantations 90,044 0 1,530 120,187 3,858 0 0 215,619 Total Production: coniferous 83,874 0 1,530 120,187 2,462 0 0 208,053 Total Production: non-coniferous 209,748 0 324 0 17,918 24,983 8,310 242,647
1988
Total Production: all species 293,622 0 1,854 120,187 20,380 24,983 8,310 450,700 Indigenous Inland Non-coniferous 162,163 482 7,933 10,542 178,485 Mangroves Non-coniferous 16 2,502 13,767 2,601 All indigenous forest 162,163 0 498 0 10,435 10,542 13,767 181,085 Plantation FPL Coniferous 78,136 1,774 144,768 4,171 228,849 Forestry Department Coniferous 19,197 2,656 6,652 28,505 Hardwood Non-coniferous 6,964 1,312 8,276 All forest plantations 104,297 0 4,430 151,420 5,483 0 0 265,630 Total Production: coniferous 97,333 0 4,430 151,420 4,171 0 0 257,354 Total Production: non-coniferous 169,127 0 498 0 11,747 10,542 13,767 189,361
1989
Total Production: all species 266,460 0 4,928 151,420 15,918 10,542 13,767 446,715 Indigenous Inland Non-coniferous 153,820 276 416 7,476 9,874 9,900 169,729 Mangroves Non-coniferous 52 1,438 1,490 All indigenous forest 153,820 276 468 0 8,914 9,874 9,900 171,219 Plantation FPL Coniferous 77,367 170,458 5,289 253,114 Forestry Department Coniferous 23,132 8,820 13,652 156 45,760 Extension Coniferous 304 360 534 1,198 Hardwood Non-coniferous 2,331 745 3,076 All forest plantations 103,134 0 9,180 184,644 6,190 0 0 303,148 Total Production: coniferous 100,803 0 9,180 184,644 5,445 0 0 300,072 Total Production: non-coniferous 156,151 276 468 0 9,659 9,874 9,900 174,295
1990
Total Production: all species 256,954 276 9,648 184,644 15,104 9,874 9,900 474,367

80
Table 25 Timber production in Fiji by forest type and product type 1986 - 1998, as reported by the Forestry Department (continued)
Type of forest product (and conversion factor to roundwood equivalent or RWE)
Logs (in m3)
Sawnwood (in m3)
Poles & posts (in m3 or linear m)
Pulpwood (in m3)
Fuelwood (in m3 or
stacked m3)
Fuelwood licences (in m3 or
stacked m3)
Charcoal (in kg) Year Forest type Wood type
1.00 2.00 1.00 or 0.011 1.00 1.00 or 0.75 1.00 or 0.75 0.006
Total (in m3 RWE)
Indigenous Inland Non-coniferous 120,077 326 2,837 662 123,902 Mangroves Non-coniferous 69 1,027 1,800 1,107 All indigenous forest 120,077 0 395 0 3,864 662 1,800 125,009 Plantation FPL Coniferous 119,055 2,755 224,828 8,082 354,720 Forestry Department Coniferous 7,020 674 3,474 11,168 Hardwood Non-coniferous 2,742 2,764 5,506 All forest plantations 128,817 0 3,429 228,302 10,846 0 0 371,394 Total Production: coniferous 126,075 0 3,429 228,302 8,082 0 0 365,888 Total Production: non-coniferous 122,819 0 395 0 6,628 662 1,800 130,515
1991
Total Production: all species 248,894 0 3,824 228,302 14,710 662 1,800 496,403 Indigenous Inland Non-coniferous 108,991 396 3,812 39 5 113,238 Mangroves Non-coniferous 83 971 1,054 All indigenous forest 108,991 0 479 0 4,783 39 5 114,292 Plantation FPL Coniferous 100,164 927 201,248 302,339 Others Coniferous 1,965 1,965 Forestry Department Non-coniferous 1,110 572 1,682 Others Non-coniferous 185 185 All forest plantations 103,424 0 927 201,248 572 0 0 306,171 Total Production: coniferous 102,129 0 927 201,248 0 0 0 304,304 Total Production: non-coniferous 110,286 0 479 0 5,355 39 5 116,159
1992
Total Production: all species 212,415 0 1,406 201,248 5,355 39 5 420,463 Indigenous Inland Non-coniferous 129,674 145 513 1,851 132,183 Mangroves Non-coniferous 43 512 85 640 All indigenous forest 129,674 145 556 0 512 1,936 0 132,823 Plantation FPL Coniferous 114,393 247,793 362,186 FD Mahogany Non-coniferous 3,267 1 1,872 5,140 FD others Non-coniferous 386 386 All forest plantations 118,046 0 1 247,793 0 1,872 0 367,712 Total Production: coniferous 114,393 0 0 247,793 0 0 0 362,186 Total Production: non-coniferous 133,327 145 557 0 512 3,808 0 138,349
1993
Total Production: all species 247,720 145 557 247,793 512 3,808 0 500,535 Indigenous Inland Non-coniferous 135,954 403 2,839 139,196 Mangroves Non-coniferous 1,262 707 1,969 All indigenous forest 135,954 0 1,665 0 3,546 0 0 141,165 Plantation FPL Coniferous 130,202 252,115 382,317 FD Mahogany Non-coniferous 2,762 1,367 4,129 FD others Non-coniferous 0 All forest plantations 132,964 0 0 253,482 0 0 0 386,446 Total Production: coniferous 130,202 0 0 252,115 0 0 0 382,317 Total Production: non-coniferous 138,716 0 1,665 1,367 3,546 0 0 145,294
1994
Total Production: all species 268,918 0 1,665 253,482 3,546 0 0 527,611 Indigenous Inland Non-coniferous 129,506 201 373 130,080 Mangroves Non-coniferous 24 450 474 All indigenous forest 129,506 0 225 0 823 0 0 130,554 Plantation FPL Coniferous 123,783 305,592 429,375 FD Mahogany Non-coniferous 1,603 539 2,142 FD others Non-coniferous 34 34 All forest plantations 125,420 0 0 305,592 539 0 0 431,551 Total Production: coniferous 123,783 0 0 305,592 0 0 0 429,375 Total Production: non-coniferous 131,143 0 225 0 1,362 0 0 132,730
1995
Total Production: all species 254,926 0 225 305,592 1,362 0 0 562,105
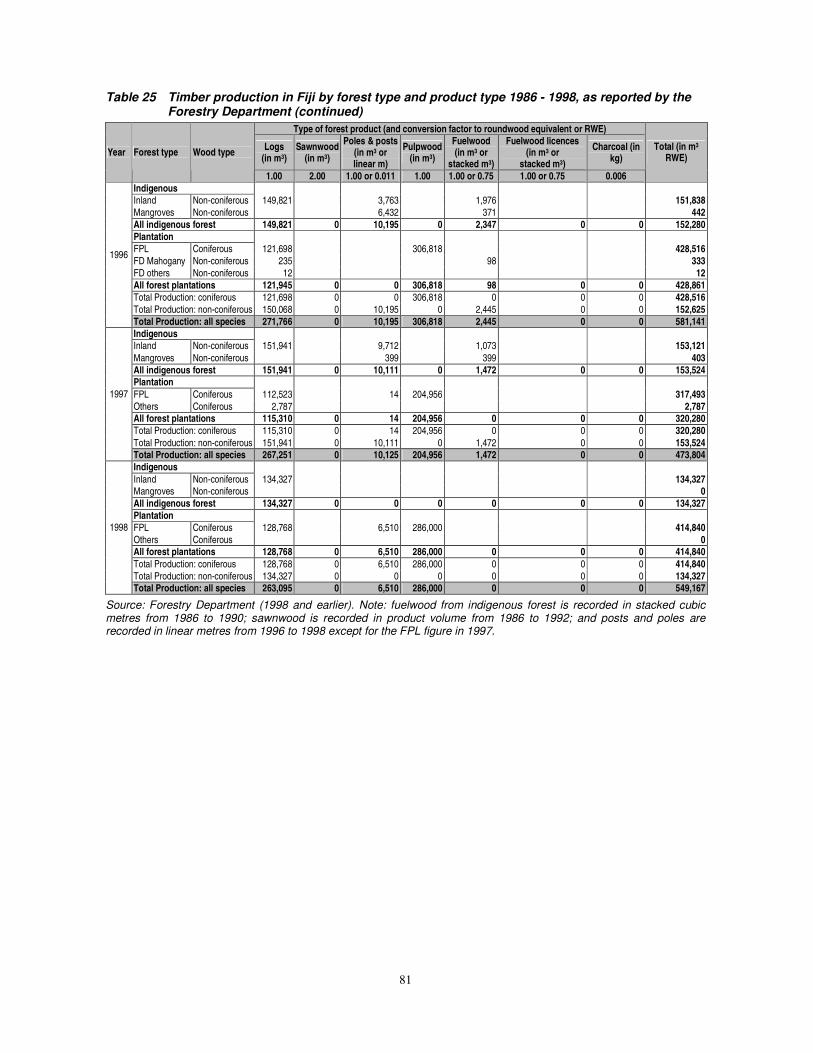
81
Table 25 Timber production in Fiji by forest type and product type 1986 - 1998, as reported by the Forestry Department (continued)
Type of forest product (and conversion factor to roundwood equivalent or RWE)
Logs (in m3)
Sawnwood (in m3)
Poles & posts (in m3 or linear m)
Pulpwood (in m3)
Fuelwood (in m3 or
stacked m3)
Fuelwood licences (in m3 or
stacked m3)
Charcoal (in kg) Year Forest type Wood type
1.00 2.00 1.00 or 0.011 1.00 1.00 or 0.75 1.00 or 0.75 0.006
Total (in m3 RWE)
Indigenous Inland Non-coniferous 149,821 3,763 1,976 151,838 Mangroves Non-coniferous 6,432 371 442 All indigenous forest 149,821 0 10,195 0 2,347 0 0 152,280 Plantation FPL Coniferous 121,698 306,818 428,516 FD Mahogany Non-coniferous 235 98 333 FD others Non-coniferous 12 12 All forest plantations 121,945 0 0 306,818 98 0 0 428,861 Total Production: coniferous 121,698 0 0 306,818 0 0 0 428,516 Total Production: non-coniferous 150,068 0 10,195 0 2,445 0 0 152,625
1996
Total Production: all species 271,766 0 10,195 306,818 2,445 0 0 581,141 Indigenous Inland Non-coniferous 151,941 9,712 1,073 153,121 Mangroves Non-coniferous 399 399 403 All indigenous forest 151,941 0 10,111 0 1,472 0 0 153,524 Plantation FPL Coniferous 112,523 14 204,956 317,493 Others Coniferous 2,787 2,787 All forest plantations 115,310 0 14 204,956 0 0 0 320,280 Total Production: coniferous 115,310 0 14 204,956 0 0 0 320,280 Total Production: non-coniferous 151,941 0 10,111 0 1,472 0 0 153,524
1997
Total Production: all species 267,251 0 10,125 204,956 1,472 0 0 473,804 Indigenous Inland Non-coniferous 134,327 134,327 Mangroves Non-coniferous 0 All indigenous forest 134,327 0 0 0 0 0 0 134,327 Plantation FPL Coniferous 128,768 6,510 286,000 414,840 Others Coniferous 0 All forest plantations 128,768 0 6,510 286,000 0 0 0 414,840 Total Production: coniferous 128,768 0 6,510 286,000 0 0 0 414,840 Total Production: non-coniferous 134,327 0 0 0 0 0 0 134,327
1998
Total Production: all species 263,095 0 6,510 286,000 0 0 0 549,167
Source: Forestry Department (1998 and earlier). Note: fuelwood from indigenous forest is recorded in stacked cubic metres from 1986 to 1990; sawnwood is recorded in product volume from 1986 to 1992; and posts and poles are recorded in linear metres from 1996 to 1998 except for the FPL figure in 1997.

82
Table 26 Number and size of forest processing facilities in Fiji 1986 - 1998 Log input by year (in cubic metres) Company 1986 1987 1988 1989 1990 1991 1992 1993 1994 1995 1996 1997 1998 Average
Fiji Forest Industries 55,971 56,901 46,515 43,834 50,900 44,285 39,230 35,076 46,501 47,588 55,735 53,116 49,330 48,076 Valebasoga 520 3,441 10,251 17,019 8,380 20,776 10,065 Waiqele Sawmill 6,151 5,524 5,388 5,016 5,092 4,420 6,582 5,346 8,536 8,659 8,880 9,265 10,591 6,881 Lumber Processors 1,208 4,830 3,019 CBM Timbers 5,278 5,346 436 813 2,968 Taiwan Timbers 1,936 2,212 2,074 Taveuni Woo IL 4,496 37 904 4,576 182 2,039 Vunimoli 5,053 5,664 1,181 2,220 1,599 1,584 1,408 1,857 2,387 828 176 1,088 119 1,936 Pacific Produce 2,963 444 1,704 Dongwoo/Sae Han Timbers 3,653 1,477 1,316 1,797 923 369 352 1,412 Santa Singh Sawmill 109 442 532 1,756 1,077 1,689 1,633 2,434 306 1,680 1,510 1,197 Savusavu 2,424 629 130 1,061 Rattan Singh 1,612 472 1,042 Jai Narayan 89 833 986 636 Joe Sam 294 654 901 616 Labasa Sawmill 276 769 792 246 521 Raviravi Sawmill 509 509 Hanif Industries 402 249 326 Northern Lumber 313 313 Mikaele Naqila Sawmill 302 302 Seaqaqa Sawmills 281 281 Wailevu 10 72 223 872 162 268 Bua Sawmills 241 241 Bua 27 136 254 393 203 Tuvamila 192 273 31 165 Seaqaqa Timber Industries 92 32 223 369 69 157 Naua 132 132 Seaqaqa Sawmill 22 32 71 12 496 127 Vermon 112 64 88 Luvuluvu 23 187 15 44 139 73 113 85 Soqulu 73 73 P Hazelman 21 114 68 Hermant Sawmill 78 29 54 Matasawalevu 29 31 30 Daku Sawmill 18 12 15 Others 3,054 25,071 51,382 7,337 440 191 224 204 204 81 979 138 7,442 Total: Northern Division 76,333 99,835 106,282 62,666 63,627 58,215 51,367 51,240 69,329 71,148 85,928 80,401 90,407 74,368

83
Table 26 Number and size of forest processing facilities in Fiji 1986 - 1998 (continued) Log input by year (in cubic metres) Company
1986 1987 1988 1989 1990 1991 1992 1993 1994 1995 1996 1997 1998 Average Tropik Wood Industries 22,966 83,874 102,315 100,803 126,075 100,164 114,393 130,202 123,783 121,854 112,523 117,507 104,705 Pacific Lumber Company 16,498 12,405 8,315 15,657 8,553 12,286 Fiji Pine Commission 8,086 8,086 Cabe Sawmill 9,690 7,044 2,344 3,753 3,695 5,305 Dayal Sawmill 4,834 5,866 4,562 4,946 4,906 5,023 K K Komove Logging 3,323 3,323 Arula Investment 758 5,643 7,331 5,432 3,284 1,299 1,448 71 3,158 Singh Enterprises 2,166 5,815 6,571 1,749 1,045 1,477 1,225 2,864 Best Industries 2,764 4,865 2,929 3,467 5,265 1,417 1,449 733 1,077 2,106 2,607 G P Reddy 3,442 2,909 2,705 3,316 262 1,393 2,054 2,297 Valley Timber 750 1,033 689 1,535 707 3,365 3,799 3,793 2,584 1,733 3,502 2,135 Jamac Timbers 1,902 3,072 4,285 765 326 2,070 Vitilevu Sawmill 540 1,931 4,594 1,071 49 1,637 Nasaucoka 2,465 1,949 959 2,000 1,680 685 1,623 Yarawa Sawmill 1,458 1,264 1,540 1,316 2,018 1,519 Olosara 1,857 1,630 1,272 637 1,349 Rewarani 907 898 903 Vueti & Ketewai 855 855 Navosa Sawmills 781 914 823 839 Wood Ranges 1,202 2,232 263 112 85 779 Waikataka Lumber 630 630 Gonesau Sawmill 568 568 Pacific Green 550 550 Ba Timber Industries 97 133 105 179 1,761 1,009 547 Wasal Khan 317 687 502 Prem Lotan 542 388 336 1,053 99 484 Vusena Forest Products Ltd. 379 379 Azmad Ali 368 368 Rup Industries 361 361 Fijana Timbers 319 319 Khan's Lumber 226 226 Waitamata 150 150 P A Nand 147 147 Local Timbers 99 99 TBS 75 75 Pacific Timbers 13 13 Others 457 535 343 4,083 10,541 7,339 618 332 93 463 86 4 2,075 Total: Western Division 42,364 53,465 103,200 134,035 133,650 144,492 123,878 145,025 163,275 145,634 135,957 121,937 130,803 121,363

84
Table 26 Number and size of forest processing facilities in Fiji 1986 - 1998 (continued) Log input by year (in cubic metres) Company
1986 1987 1988 1989 1990 1991 1992 1993 1994 1995 1996 1997 1998 Average Mohammed Ali Woodcraft 14,337 26,540 21,994 20,957 Pacific Lumber Company (Debua) 18,528 18,232 20,880 22,904 11,173 18,343 Fenning 7,535 19,579 24,622 17,245 TBS 12,470 16,056 12,775 13,767 Timbers (Fiji) Ltd 8,787 8,787 Mana Forest 1,666 5,128 18,516 4,494 7,451 Namosi Timber Co. 11,976 2,760 7,368 Dhannu Prasad 3,968 6,769 8,948 10,341 5,743 3,066 6,473 Timber and Building Supplies 8,904 7,835 6,820 3,692 3,621 6,174 Nur Ahmed & Sons/Yarawa Sawmill 6,041 7,703 3,572 599 6,037 6,894 9,055 6,097 6,932 3,918 4,986 6,636 9,603 6,006 South Pacific Sawmilling Co./Southern Forest 211 606 3,325 6,613 2,347 3,499 4,893 6,214 8,642 6,929 11,150 13,869 5,692 Pacific Timber Development 2,438 9,422 10,354 2,188 7,310 6,202 4,170 5,912 2,251 5,583 Sharma Sawmill 634 4,904 9,810 5,116 PUO Mill 2,762 1,732 1,641 2,045 Wood Rangers 935 2,112 2,791 2,981 1,649 1,714 2,030 Jamac 2,810 2,635 2,087 2,250 2,263 1,987 141 2,025 Veisari 3,459 1,348 106 1,638 Watabu 1,845 963 1,404 Waimanu 1,532 291 234 958 1,825 2,170 2,076 2,370 2,007 179 1,364 Ami Chand 2,370 1,839 712 599 440 1,192 Tropik Wood Industries 1,011 1,011 Nabukavesi 100 213 181 3,862 586 988 Vuniniudrovu 1,637 1,109 725 1,092 928 934 376 132 867 Nakoba Timber Milling 1,033 1,359 102 831 Wainivesi 449 1,580 434 821 Singh's Timber Milling/ B Singh and Sons 1,135 1,124 1,071 938 685 370 46 767 Kadavu Development Co. 727 727 Local Timber 914 748 638 342 695 667 Sam's Sawmill 677 621 649 Drotini 398 336 1,426 281 610 Pulled Logging 470 470 Rup Farms 835 652 46 435 106 29 351 Waitamata 945 213 39 159 215 669 300 192 104 588 351 343 Ram's 4 652 328 Shiu Govind 470 322 13 20 540 273 Namosi Sawmill 694 17 83 265 Waila 603 236 308 288 30 137 336 149 261 Baljit Singh 239 239 R P Chand 21 437 229 Green Timber 388 245 24 219 Fiji Sawmill 512 52 87 217 Match Factory 27 224 119 290 165 Fiji Sawmills 175 140 158 Douglas 77 189 133 Express Lumber 154 98 126 Nakaulevu (R Prasad) 163 97 7 89 TTR Sawmill 55 39 166 87 Nakaulevu (K Raj) 63 63 Achaibar Singh 60 60 Valley Timber 50 50 Balram 15 30 23 Suva Timber Supplies 15 15 Dominion Sawmills 25 5 15 Hira Lal/Mataitini 14 14 Others 125 7,495 6,869 5,331 2,743 6,018 4,675 256 127 165 17 77 2,825 Total: Southern Division 72,897 95,387 80,328 66,776 57,357 46,187 36,738 37,819 35,406 38,148 49,634 64,913 41,313 55,608 TOTAL: ALL DIVISIONS 191,594 248,687 289,810 263,477 254,634 248,894 211,983 234,084 268,010 254,930 271,519 267,251 262,523 251,338
Source: Forestry Department (1998 and earlier). Note: the “others” category includes some log exports in 1987 - 1988.

85
Table 27 Distribution of log consumption in Fiji by mill size 1986 - 1998 Year Size of mill (by
annual log intake in cubic metres) 1986 1987 1988 1989 1990 1991 1992 1993 1994 1995 1996 1997 1998 Average 0ver 10,000 117,804 153,100 186,038 207,027 162,876 180,714 139,394 149,469 176,703 181,622 214,187 219,927 212,073 176,995 FFI and TWI 55,971 79,867 130,389 146,149 151,703 170,360 139,394 149,469 176,703 171,371 177,589 165,639 166,837 144,726 Other 61,833 73,233 55,649 60,878 11,173 10,354 0 0 0 10,251 36,598 54,288 45,236 32,269 5,001-10,000 40,299 43,865 29,222 5,016 41,460 16,704 30,184 39,184 40,136 30,702 26,849 24,281 18,390 29,715 1,001-5,000 21,440 11,272 9,184 28,744 32,262 33,140 30,329 36,677 42,755 35,668 23,147 20,965 27,187 27,136 0-1,000 8,415 7,349 6,772 5,939 4,312 4,788 6,559 7,962 7,992 6,229 6,254 2,078 4,654 6,100 Others 3,636 33,101 58,594 16,751 13,724 13,548 5,517 792 424 709 1,082 0 219 11,392 Total 191,594 248,687 289,810 263,477 254,634 248,894 211,983 234,084 268,010 254,930 271,519 267,251 262,523 251,338
Source: Forestry Department (1998 and earlier). Note: the “others” category includes some log exports in 1987 - 1988.
Table 28 Number of mills in Fiji by mill size 1986 - 1998 Year Size of mill (by
annual log intake in cubic metres) 1986 1987 1988 1989 1990 1991 1992 1993 1994 1995 1996 1997 1998 Average
0ver 10,000 5 6 5 6 3 3 2 2 2 3 4 5 5 4 FFI and TWI 1 2 2 2 2 2 2 2 2 2 2 2 2 2 Other 4 4 3 4 1 1 0 0 0 1 2 3 3 2 5,001-10,000 6 7 4 1 6 2 4 6 6 4 4 3 2 4 1,001-5,000 9 7 4 12 13 14 14 15 15 16 8 11 9 11 Up to 1,000 33 30 25 14 11 8 20 18 21 16 24 3 13 18 Total 53 50 38 33 33 27 40 41 44 39 40 22 29 38
Source: Forestry Department (1998 and earlier).
Table 29 Average mill size in Fiji (excluding FFI and TFI) 1986 - 1998 Year Mill statistics 1986 1987 1988 1989 1990 1991 1992 1993 1994 1995 1996 1997 1998 Average
Total log input (in m3) 131,987 135,719 100,827 100,577 89,207 64,986 67,072 83,823 90,883 82,850 92,848 101,612 95,467 95,220 Total number of mills 52 48 36 31 31 25 38 39 42 37 38 20 27 36 Average log input (in m3) 2,538 2,827 2,801 3,244 2,878 2,599 1,765 2,149 2,164 2,239 2,443 5,081 3,536 2,790
Source: Forestry Department (1998 and earlier).
Table 30 Revenue collection and government expenditure on forestry 1977 - 2002 Revenue (in FJD) Expenditure (in FJD)
Year Collected for landowners
Fees for government
Commercial undertakings Miscellaneous Total for
government Annual
recurrent Capital Total Net government
expenditure Natural forest log production
1977 614,700 164,802 n.a. n.a. n.a. n.a. n.a. n.a. n.a. 166,900 1978 671,000 219,785 n.a. n.a. n.a. n.a. n.a. n.a. n.a. 179,300 1979 734,700 267,024 n.a. n.a. n.a. n.a. n.a. n.a. n.a. 193,100 1980 962,200 332,347 n.a. n.a. n.a. n.a. n.a. n.a. n.a. 206,200 1981 1,115,237 342,816 100,231 23,253 466,300 2,290,978 221,995 2,512,973 2,046,673 216,200 1982 845,632 293,669 73,763 33,967 401,399 2,653,072 167,382 2,820,454 2,419,055 154,000 1983 1,140,068 404,177 180,399 42,652 627,228 2,918,435 585,899 3,504,334 2,877,106 161,300 1984 1,041,802 401,737 100,072 28,830 530,639 3,004,277 799,762 3,804,039 3,273,400 175,400 1985 1,111,105 338,629 267,299 25,755 631,683 3,233,351 1,722,122 4,955,473 4,323,790 203,300 1986 947,044 405,401 460,884 31,235 897,520 3,275,800 1,982,300 5,258,100 4,360,580 185,475 1987 1,200,982 380,907 597,393 20,590 998,890 3,185,300 1,846,000 5,031,300 4,032,410 215,780 1988 1,158,187 391,368 1,088,761 48,800 1,528,929 2,535,010 2,215,841 4,750,851 3,221,922 203,578 1989 687,555 262,622 1,266,807 19,007 1,548,436 2,934,862 2,734,318 5,669,180 4,120,744 162,163 1990 1,244,898 297,194 1,061,846 50,489 1,409,529 3,186,921 2,039,676 5,226,597 3,817,068 153,820 1991 118,106 348,341 885,406 48,712 1,282,459 3,535,733 2,646,739 6,182,472 4,900,013 120,077 1992 1,157,782 313,616 354,183 29,584 697,383 4,866,144 2,616,984 7,483,128 6,785,745 108,991 1993 1,362,472 395,518 762,685 45,002 1,203,205 5,008,662 2,129,320 7,137,982 5,934,777 116,929 1994 1,681,129 300,711 739,584 49,515 1,089,810 5,268,754 2,126,844 7,395,598 6,305,788 135,954 1995 1,688,244 371,846 629,566 35,371 1,036,783 4,979,976 2,010,669 6,990,645 5,953,862 129,506 1996 3,582,851 436,804 83,615 29,595 550,014 5,379,924 2,132,909 7,512,833 6,962,819 149,821 1997 3,064,943 444,300 93,987 44,000 582,287 5,454,846 2,038,998 7,493,844 6,911,557 151,941 1998 1,689,458 413,092 36,761 224,921 674,774 5,589,586 778,586 6,368,172 5,693,398 134,327 1999 1,879,753 n.a. n.a. n.a. n.a. n.a. n.a. n.a. n.a. 80,320 2000 2,372,869 n.a. n.a. n.a. n.a. n.a. n.a. n.a. n.a. 106,672 2001 2,908,963 n.a. n.a. n.a. n.a. n.a. n.a. n.a. n.a. 110,318 2002 2,766,800 n.a. n.a. n.a. n.a. n.a. n.a. n.a. n.a. 101,971
Source: Forestry Department (1998 and earlier). Note: NLTB have collected royalties since 1996 and the Forestry Department also hived-off some commercial undertakings in this year.

86
Table 31 Log production volumes by province and species class 1999 and 2000 Volume by province (in cubic metres)
Year Royalty class Ba Bua Cakaudro
ve Macuata Nadroga/ Navosa Naitasiri Namosi Ra Rewa Senua Tailevu Total
Class 1 2,173 1,373 3,661 7,482 2,024 5 149 0 417 2,411 319 20,014 Class 2 1,321 3,006 5,871 16,026 3,793 707 463 666 2,406 9,851 2,116 46,225 Class 3 554 550 2,337 5,102 278 31 83 1 570 1,894 222 11,622 Class 4 383 458 975 2,380 121 11 11 10 139 328 355 5,171 Mahogany 88 0 0 0 0 0 0 0 0 0 0 88 Pine n.a. n.a. n.a. n.a. n.a. n.a. n.a. n.a. n.a. n.a. n.a. n.a.
1999
All classes 4,518 5,388 12,843 30,991 6,216 754 706 677 3,532 14,484 3,012 83,121 Class 1 638 907 2,775 8,861 2,451 0 126 118 231 3,707 81 19,894 Class 2 701 5,474 6,109 25,059 3,876 28 132 1,313 1,234 14,018 674 58,619 Class 3 364 952 1,924 6,819 312 1 58 93 454 2,946 53 13,974 Class 4 336 1,411 2,163 11,156 124 2 17 102 55 617 45 16,028 Mahogany 184 0 0 56 0 22 0 103 0 0 14 379 Pine 35 0 0 0 0 113 0 0 0 0 0 148
2000
All classes 2,258 8,743 12,971 51,952 6,764 164 334 1,728 1,974 21,288 867 109,043
Source: Forestry Department (2001).
Table 32 Sawnwood export prices 1999 - 2002 Price by year (FJD per cubic metre, FOB)
1999 2000 2001 2002 Species Royalty class Grade Moisture
content Treatment low high low high low high low high
Average (converted to 2003 prices)
FF Sel+ KD Untreated 1,080 1,163 FF Sel Wet Untreated 760 968 930 FF Stand Wet Untreated 760 1,000 948 Shorts Wet Untreated 900 1,000 1,023
Buabua 1
Ungraded AD Untreated 400 1,000 704 FF Sel+ KD Treated 980 1,300 780 1,265 1,090 FF Sel+ KD Untreated 1,111 830 1,349 1,104 FF Sel+ Wet Treated 700 1,400 950 1,150 1,093 FF Sel+ Wet Untreated 860 1,050 965 FF Sel KD Treated 1,130 750 1,000 1,027 FF Sel KD Untreated 1,000 830 1,106 800 1,448 1,081 FF Sel Wet Untreated 830 1,063 1,012 Ungraded KD Untreated 800 995 900 1,222 1,016 Ungraded AD Untreated 825 900 750 1,450 1,017
Dakua Makadre 1
Ungraded Wet Untreated 900 1,000 1,023 FF Sel+ KD Treated 974 1,147 900 1,300 1,088 FF Sel+ Wet Untreated 720 950 860 886 750 1,100 904 FF Sel KD Untreated 800 1,320 813 1,200 1,067 FF Sel Wet Untreated 770 1,124 1,020 Ungraded KD Untreated 684 1,840 1,268 Ungraded AD Untreated 1,164 1,170
Dakua Salusalu 1
Ungraded Wet Untreated 541 1,889 1,221 FF Sel (decking) KD Untreated 1,480 1,495 FF Sel+ Wet Untreated 514 900 671 786 700 1,100 801 FF Sel KD Untreated 1,045 1,050 FF Sel Wet Untreated 491 838 800 850 772 FF Stand AD Untreated 620 820 727
Rosawa 1
Ungraded Wet Untreated 594 944 773 FF Sel+ KD Untreated 650 930 794 FF Sel KD Untreated 844 889 871 FF Sel AD Untreated 800 950 879 FF Sel Wet Untreated 985 1,028 714 1,020 944 Ungraded KD Untreated 621 624 Ungraded AD Untreated 750 1,060 910
Vesi 1
Ungraded Wet Untreated 550 1,464 1,012 FF Sel+ KD Untreated 800 1,300 980 1,300 900 1,550 1,171 FF Sel Wet Untreated 1,068 1,100 1,350 1,204 FF Stand KD Untreated 680 1,260 975 Ungraded KD Untreated 1,070 1,261 1,171 Ungraded AD Untreated 680 1,260 975 Ungraded Wet Untreated 850 1,000 960
Yaka 1
Ungraded Wet Untreated 729 1,782 1,262
Source: Forestry Department.

87
Table 32 Sawnwood export prices 1999 - 2002 (continued) Price by year (FJD per cubic metre, FOB)
1999 2000 2001 2002 Species Royalty class Grade Moisture
content Treatment low high low high low high low high
Average (converted to 2003 prices)
FF Sel+ KD Treated 600 1,062 660 963 857 FF Sel KD Treated 574 733 740 1,324 849 FF Sel KD Untreated 613 618 780 703 Ungraded Wet Treated 653 810 759
Bauvudi 2
Ungraded Wet Untreated 779 783 F Prime KD Untreated 995 1,006 1,077 FF Sel+ KD Untreated 596 896 753 FF Sel KD Treated 590 625 FF Sel KD Untreated 830 619 889 611 906 619 1,023 812 FF Sel Wet Untreated 500 690 727 650 800 690 FF Stand KD Untreated 800 804 FF Stand Wet Untreated 720 1,000 926 Ungraded KD Untreated 497 557 530 Ungraded KD Untreated 757 994 880
Damanu 2
Ungraded Wet Treated 505 710 611 FF Sel+ KD Treated 728 990 900 1,000 911 FF Sel+ KD Untreated 719 898 817 FF Sel KD Treated 760 910 780 1,180 935 FF Sel KD Untreated 890 540 739 773 FF Sel AD Untreated 743 747 FF Stand+ Wet Treated 949 1,022 FF Stand KD Treated 740 910 829 FF Stand KD Treated 700 910 809 FF Stand Wet Untreated 1,000 1,077
Kaudamu 2
Ungraded KD Treated 450 915 686 FF Sel+ KD Treated 698 660 883 500 848 733 FF Sel KD Treated 665 790 480 980 777 779 FF Stand+ Wet Untreated 820 883 FF Stand KD Treated 500 740 850 712 Ungraded KD Treated 650 966 680 937 841 Ungraded KD Untreated 932 937
Kauvula 2
Ungraded Wet Treated 520 600 560 673 611 FF Sel KD Untreated 1,393 1,407 FF Stand+ KD Untreated 700 707 FF Stand Wet Untreated 300 300 310
Rosarosa 3
Ungraded Wet Untreated 650 460 550 570 FF Sel+ KD Untreated 1,180 1,192 FF Sel KD Untreated 1,089 1,094 FF Stand+ KD Untreated 700 704 Ungraded KD Untreated 825 829
Sacau 3
Ungraded Wet Untreated 1,000 1,005 FF Sel+ KD Untreated 1,200 1,206 FF Stand KD Untreated 700 704 Ungraded AD Untreated 700 704
Yasiyasi 3
Ungraded AD Untreated 550 553
Source: Forestry Department.

88
Table 33 Industrial roundwood production and trade in Fiji 1961 - 2002, from FAO Production (in cubic metres) Imports (in cubic metres) Imports (in USD '000)
Year Coniferous sawlogs and veneer logs
Non-coniferous sawlogs and veneer logs
Coniferous pulpwood
Chips and particles
Other industrial roundwood Total Other industrial
roundwood Total Other industrial roundwood Total
1961 0 56,000 56,000 1962 0 62,000 2,000 64,000 1963 3,700 72,000 2,000 77,700 1964 2,500 74,000 3,000 79,500 1965 2,900 89,000 4,000 95,900 1966 34,000 62,000 3,000 99,000 1967 29,000 59,000 1,000 89,000 1968 32,000 70,000 2,000 104,000 1969 28,000 75,000 2,000 105,000 1970 30,000 77,000 2,000 109,000 1971 28,000 68,000 F 3,000 99,000 1972 31,000 79,000 F 3,000 113,000 1973 21,000 116,000 4,000 141,000 1,100 1,100 78 78 1974 24,000 135,000 2,000 F 161,000 1,000 1,000 72 72 1975 23,000 F 126,000 F 2,000 F 151,000 100 100 24 24 1976 23,000 F 132,000 F 2,000 F 157,000 100 100 19 19 1977 23,000 F 132,000 F 2,000 F 157,000 100 F 100 F 19 F 19 F 1978 23,000 F 132,000 F 3,000 158,000 100 F 100 F 19 F 19 F 1979 28,000 F 164,000 F 3,000 195,000 1980 34,000 F 200,000 F 2,200 236,200 1981 30,000 F 193,000 3,000 226,000 1982 25,000 F 193,000 F 2,200 220,200 1983 27,000 F 150,000 4,300 181,300 1984 24,000 158,000 4,400 186,400 1985 30,000 175,000 7,300 212,300 1986 38,000 157,000 4,000 199,000 1987 23,000 D 200,000 56,000 D 1,000 280,000 1988 84,000 D 171,000 120,000 D 1,500 376,500 1989 97,000 169,000 151,000 D 4,400 D 421,400 1990 101,000 D 169,000 F 185,000 D 9,200 D 464,200 1991 126,000 D 169,000 F 228,000 D 3,400 D 526,400 1992 102,000 D 169,000 F 201,000 D 900 D 472,900 1993 114,000 130,000 247,000 600 491,600 1994 130,000 139,000 252,000 1,200 522,200 1995 124,000 131,000 306,000 200 561,200 1996 122,000 D 131,000 F 307,000 D 100 D 560,100 1997 113,000 40,000 F 205,000 D 100 D 358,100 1998 129,000 50,000 F 286,000 D 269,000 0 479,000 1999 118,000 60,000 250,000 266,000 0 428,000 2000 92,000 107,000 250,000 F 259,000 0 F 449,000 2001 89,000 111,000 273,000 273,000 0 F 473,000 2002 89,000 F 111,000 F 273,000 F 273,000 F 0 F 473,000
Source: FAO (FAOSTAT), updated with Forestry Department statistics. Note: F = FAO Estimate; D = Forestry Department Statistic; and * = unofficial estimate.

89
Table 33 Industrial roundwood production and trade in Fiji 1961 - 2002, from FAO (continued) Exports (in cubic metres) Exports (in USD '000)
Year Coniferous sawlogs and veneer logs
Non-coniferous sawlogs and veneer logs
Coniferous industrial
roundwood
Tropical non-con. industrial
roundwood
Total industrial
roundwood
Chips and particles Total
Coniferous sawlogs and veneer logs
Non-coniferous sawlogs and veneer logs
Coniferous industrial
roundwood
Tropical non-con. industrial
roundwood
Total industrial
roundwood
Chips and particles Total
1961 1962 1963 3,700 3,500 7,200 7,200 57 89 0 0 146 146 1964 2,500 2,200 4,700 4,700 60 63 0 0 123 123 1965 2,900 1,500 4,400 4,400 62 46 0 0 108 108 1966 7,300 1,500 8,800 8,800 140 37 0 0 177 177 1967 900 4,300 5,200 5,200 16 84 0 0 100 100 1968 500 4,300 4,800 4,800 10 100 0 0 110 110 1969 3,200 2,000 5,200 5,200 73 36 0 0 109 109 1970 800 1,100 1,900 1,900 19 19 0 0 38 38 1971 100 0 100 100 4 0 0 0 4 4 1972 1973 1974 1975 1976 1977 1978 1979 1980 13,100 0 13,100 13,100 1,534 0 0 0 1,534 1,534 1981 2,300 0 2,300 2,300 184 0 0 0 184 184 1982 2,300 F 0 2,300 2,300 184 F 0 0 0 184 184 1983 1,600 0 1,600 1,600 91 0 0 0 91 91 1984 15,500 0 15,500 15,500 972 0 0 0 972 972 1985 4,100 0 4,100 4,100 211 0 0 0 211 211 1986 4,100 F 0 4,100 4,100 211 F 0 0 0 211 211 1987 9,800 * 0 F 9,800 41,000 * 50,800 693 * 0 F 0 0 693 2,600 F 3,293 1988 9,800 F 0 9,800 184,000 * 193,800 693 F 0 0 0 693 12,500 F 13,193 1989 9,800 0 9,800 138,600 * 148,400 554 0 0 0 554 9,900 F 10,454 1990 0 8,228 8,228 143,700 * 151,928 0 1,281 1,281 14,319 * 15,600 1991 2,587 570 3,157 223,600 * 226,757 301 70 371 22,400 F 22,771 1992 6,665 62 6,727 302,232 308,959 571 16 587 15,221 15,808 1993 0 25 25 349,000 349,025 0 19 19 13,987 14,006 1994 700 1,200 1,900 308,700 310,600 483 443 926 10,810 11,736 1995 2,100 100 2,200 519,400 521,600 1,179 39 1,218 22,919 24,137 1996 200 400 600 355,800 356,400 16 208 224 15,700 F 15,924 1997 15 D 50 D 65 D 241,000 241,065 3 D 29 D 31 D 17,355 17,386 1998 0 D 0 D 0 D 303,000 303,000 0 D 0 D 0 D 17,326 17,326 1999 0 D 0 D 0 D 214,000 214,000 0 D 0 D 0 D 9,600 9,600 2000 0 D 0 D 0 D 259,000 259,000 0 D 0 D 0 D 12,202 12,202 2001 0 D 0 D 0 D 206,000 206,000 0 D 0 D 0 D 10,856 10,856 2002 0 D 0 D 0 D 206,000 F 206,000 0 D 0 D 0 D 10,856 F 10,856
Source: FAO (FAOSTAT), updated with Forestry Department statistics. Note: F = FAO Estimate; D = Forestry Department Statistic; and * = unofficial estimate.

90
Table 34 Sawnwood production and trade in Fiji 1961 - 2002, from FAO Production (in cubic metres) Imports (in cubic metres) Imports (in USD '000) Exports (in cubic metres) Exports (in USD '000)
Year Coniferous sawnwood
Non-coniferous sawnwood Total Coniferous
sawnwood Non-coniferous
sawnwood Total Coniferous sawnwood
Non-coniferous sawnwood Total Coniferous
sawnwood Non-coniferous
sawnwood Total Coniferous sawnwood
Non-coniferous sawnwood Total
1961 0 25,000 25,000 10,000 800 10,800 550 75 625 0 1,700 1,700 0 110 110 1962 0 28,000 28,000 11,300 700 12,000 602 56 658 0 3,100 3,100 0 199 199 1963 0 30,000 30,000 5,900 1,000 6,900 314 97 411 1,800 800 2,600 118 54 172 1964 9,000 26,000 35,000 18,100 900 19,000 1,033 96 1,129 2,100 1,000 3,100 141 72 213 1965 13,000 29,000 42,000 24,200 700 24,900 1,368 82 1,450 2,700 1,100 3,800 235 79 314 1966 16,000 29,000 45,000 8,000 100 8,100 500 16 516 4,600 2,000 6,600 338 144 482 1967 14,000 28,000 42,000 7,400 200 7,600 484 19 503 700 3,200 3,900 50 235 285 1968 16,000 34,000 50,000 8,900 400 9,300 679 47 726 300 3,500 3,800 29 263 292 1969 14,000 36,000 50,000 3,200 300 3,500 230 38 268 1,300 0 1,300 94 0 94 1970 15,000 37,000 52,000 8,900 4,700 13,600 595 337 932 1,700 1,600 3,300 144 121 265 1971 16,000 F 39,000 F 55,000 F 9,500 F 300 F 9,800 F 725 F 40 F 765 F 2,300 F 1,200 F 3,500 F 239 F 115 F 354 F 1972 15,000 F 40,000 F 55,000 F 14,600 F 400 F 15,000 F 1,406 F 66 F 1,472 F 1,800 F 900 F 2,700 F 177 F 78 F 255 F 1973 9,000 F 52,000 F 61,000 F 8,800 F 8,600 17,400 F 1,048 F 1,032 F 2,080 F 1,600 F 1,300 F 2,900 F 157 F 169 F 326 F 1974 11,000 F 64,000 F 75,000 F 4,600 F 9,200 13,800 F 685 F 1,356 F 2,041 F 1,600 F 1,600 F 3,200 F 157 F 240 F 397 F 1975 17,000 F 73,000 F 90,000 F 5,700 9,200 F 14,900 F 827 1,356 F 2,183 F 2,700 1,900 F 4,600 F 483 320 F 803 1976 13,000 F 61,000 F 74,000 F 100 9,200 F 9,300 F 14 1,356 F 1,370 F 6,300 2,100 F 8,400 F 1,057 399 F 1,456 1977 16,000 F 75,000 F 91,000 F 100 F 9,200 F 9,300 F 14 F 1,356 F 1,370 F 6,300 F 2,400 F 8,700 F 1,057 F 480 F 1,537 F 1978 16,000 F 75,000 F 91,000 F 100 F 0 100 F 14 F 0 14 F 6,300 F 2,700 F 9,000 F 1,057 F 600 F 1,657 F 1979 16,000 F 74,000 F 90,000 F 0 400 400 0 169 169 4,300 3,100 7,400 1,114 839 1,953 1980 20,000 F 97,000 F 117,000 F 0 300 300 0 52 52 6,500 6,200 12,700 1,782 1,672 3,454 1981 17,000 F 83,000 100,000 F 300 300 600 55 F 52 F 107 F 3,400 500 3,900 997 130 1,127 1982 13,000 F 63,000 F 76,000 F 300 F 300 F 600 F 55 F 52 F 107 F 4,300 2,000 6,300 1,270 493 1,763 1983 16,000 66,000 82,000 300 F 300 F 600 F 55 F 52 F 107 F 5,400 1,200 6,600 1,382 278 1,660 1984 13,000 F 67,000 F 80,000 F 0 100 100 0 34 34 11,100 0 11,100 3,063 0 3,063 1985 14,000 F 77,000 F 91,000 F 2,300 * 0 2,300 * 400 F 0 400 F 8,600 0 8,600 2,180 0 2,180 1986 17,600 60,000 77,600 2,300 F 0 2,300 F 400 F 0 400 F 6,400 * 0 6,400 * 1,947 * 0 1,947 * 1987 26,400 62,000 88,400 2,300 F 0 F 2,300 F 400 F 0 F 400 F 2,900 * 0 F 2,900 F 1,176 * 0 F 1,176 F 1988 50,000 53,000 103,000 0 0 0 0 0 0 12,100 * 0 12,100 * 2,705 * 0 2,705 * 1989 41,000 52,600 93,600 0 0 0 0 0 0 31,800 0 31,800 7,959 0 7,959 1990 41,000 F 52,600 F 93,600 F 0 0 0 0 0 0 35,110 D 0 35,110 D 9,756 D 0 9,756 D 1991 90,000 F 51,000 F 141,000 F 0 0 0 0 0 0 20,959 D 0 20,959 D 5,226 D 0 5,226 D 1992 40,000 F 51,000 F 91,000 F 77 34 111 13 6 19 856 24,359 25,215 300 4,049 4,349 1993 57,000 54,000 111,000 64 9 73 26 4 30 9,300 3,802 13,102 3,427 1,830 5,257 1994 47,000 65,000 112,000 0 9 F 9 F 0 4 F 4 F 2,000 27,900 29,900 953 7,855 8,808 1995 43,000 59,000 102,000 0 500 500 0 47 47 15,000 11,500 26,500 4,421 3,744 8,165 1996 43,000 F 59,000 F 102,000 F 200 27 227 26 14 40 7,400 8,800 16,200 1,966 2,893 4,859 1997 56,000 77,000 133,000 0 0 0 0 0 0 8,000 9,000 17,000 3,259 3,958 7,217 1998 64,000 67,000 131,000 0 F 0 F 0 F 0 F 0 F 0 F 12,000 18,000 30,000 5,221 2,278 7,499 1999 34,000 30,000 64,000 0 F 0 F 0 F 0 F 0 F 0 F 13,000 4,000 17,000 4,441 1,584 6,025 2000 32,000 40,000 72,000 0 0 F 0 F 0 0 F 0 F 13,000 F 14,000 27,000 F 4,441 F 4,873 F 9,314 F 2001 39,000 40,000 79,000 0 0 F 0 F 0 0 F 0 F 6,000 5,000 11,000 2,000 1,950 3,950 2002 39,000 F 40,000 F 79,000 F 0 F 0 F 0 F 0 F 0 F 0 F 6,000 F 5,000 F 11,000 F 2,000 F 1,950 F 3,950 F
Source: FAO (FAOSTAT). Note: F = FAO Estimate; and * = unofficial estimate.

91
Table 35 Wood based panel production and trade in Fiji 1961 - 2002, from FAO Production (in cubic metres) Imports (in cubic metres) Imports (in USD '000) Exports (in cubic metres) Exports (in USD '000)
Year Veneer sheets Plywood Total Veneer
Sheets Plywood Particleboard Fibreboard Total Veneer Sheets Plywood Particleboard Fibreboard Total Veneer
Sheets Plywood Total Veneer Sheets Plywood Total
1961 1,000 1,000 170 170 1962 190 1,800 1,990 33 133 166 1963 700 2,000 2,700 107 137 244 1964 500 3,200 3,700 85 188 273 1965 200 3,200 3,400 75 228 303 1966 300 3,100 3,400 116 203 319 1967 500 3,200 3,700 148 247 395 1968 1,000 3,200 4,200 224 294 518 1969 1,000 140 1,053 2,193 228 13 166 407 1970 400 0 400 0 1,600 100 1,053 2,753 0 348 33 204 585 400 0 400 58 0 58 1971 1,300 0 1,300 0 1,700 F 100 F 1,264 F 3,064 F 0 438 F 36 F 278 F 752 F 1,300 F 100 1,400 258 F 18 276 1972 1,000 0 1,000 0 1,600 F 300 F 1,158 F 3,058 F 0 483 F 95 F 294 F 872 F 1,000 100 1,100 263 24 287 1973 2,700 100 2,800 0 1,600 F 300 F 1,558 F 3,458 F 0 829 F 98 F 354 F 1,281 F 1,000 100 1,100 269 F 25 F 294 1974 2,600 100 2,700 0 1,000 F 300 F 1,242 F 2,542 F 0 704 F 119 F 557 F 1,380 F 1,000 F 100 1,100 269 F 25 F 294 1975 8,000 F 1,000 9,000 F 0 200 200 3,074 3,474 0 185 93 765 1,043 7,900 100 8,000 725 40 765 1976 7,000 F 1,200 8,200 F 0 200 300 2,401 2,901 0 124 228 732 1,084 7,000 100 7,100 706 22 728 1977 7,000 1,500 8,500 0 200 F 300 F 2,401 F 2,901 F 0 124 F 228 F 732 F 1,084 F 7,000 F 100 F 7,100 F 706 F 22 F 728 F 1978 7,000 2,600 9,600 0 200 F 300 F 2,401 F 2,901 F 0 124 F 228 F 732 F 1,084 F 7,000 F 100 F 7,100 F 706 F 22 F 728 F 1979 8,000 3,300 11,300 0 400 F 700 F 1,600 F 2,700 F 0 245 545 489 1,279 8,000 F 0 8,000 1,039 0 1,039 1980 7,000 3,400 10,400 0 300 1,300 700 F 2,300 F 0 137 930 264 1,331 7,000 0 7,000 980 0 980 1981 11,000 F 3,600 14,600 F 0 200 1,500 400 F 2,100 F 0 98 1,056 140 F 1,294 F 10,800 400 11,200 1,939 316 2,255 1982 10,000 F 4,000 14,000 F 0 100 1,400 3,169 1,600 0 71 1,015 1,103 1,144 9,500 1,000 10,500 1,891 684 2,575 1983 13,000 F 3,900 16,900 F 0 100 F 1,400 F 304 1,700 F 0 71 F 1,015 F 132 1,195 F 12,800 400 13,200 2,145 334 2,479 1984 14,000 F 3,900 17,900 F 0 200 1,200 250 1,500 0 95 685 89 832 13,800 700 14,500 2,658 477 3,135 1985 15,000 F 5,200 20,200 F 0 0 900 300 1,000 0 0 542 102 601 14,300 1,900 16,200 2,417 1,108 3,525 1986 10,400 5,900 16,300 0 0 900 F 300 F 1,000 F 0 0 542 F 89 F 601 F 2,400 * 1,900 F 4,300 F 2,060 * 1,108 F 3,168 F 1987 10,300 5,300 15,600 0 0 F 900 F 300 F 1,000 F 0 0 F 542 F 89 F 601 F 2,800 * 1,900 F 4,700 F 2,420 * 1,108 F 3,528 F 1988 10,600 5,200 F 15,800 F 0 0 900 F 300 F 1,000 F 0 0 542 F 89 F 601 F 900 * 1,900 F 2,800 F 514 * 1,108 F 1,622 F 1989 10,600 5,500 16,100 0 0 300 700 F 800 F 0 0 203 259 F 432 F 5,200 2,200 7,400 2,916 1,446 4,362 1990 10,600 F 5,500 F 16,100 F 0 0 300 F 400 F 500 F 0 0 203 F 259 F 432 F 3,800 600 4,400 2,128 F 1,446 F 3,574 F 1991 10,100 5,500 F 15,600 F 0 0 300 500 800 0 0 203 F 229 F 432 F 3,000 2,500 5,500 1,600 F 1,446 F 3,046 F 1992 10,100 F 10,000 F 20,100 F 1,370 161 200 2,437 7,237 5 72 118 706 1,946 4,274 8,271 12,548 2,278 3,668 5,947 1993 10,100 F 5,500 F 15,600 F 0 32 100 1,786 2,022 0 14 38 520 595 3,800 1,200 5,000 2,350 887 3,237 1994 10,100 F 5,500 F 15,600 F 0 2,300 2,700 5,000 0 362 835 1,197 4,600 2,200 6,800 2,955 1,539 4,494 1995 10,100 F 5,500 F 15,600 F 0 1,200 4,000 5,200 0 160 1,433 1,593 4,800 2,400 13,100 3,162 1,921 5,288 1996 10,100 F 5,500 F 15,600 F 0 1,200 F 600 F 2,800 4,750 F 0 160 F 165 942 1,304 F 6,000 F 2,900 8,900 F 3,945 2,111 6,056 1997 10,100 F 5,500 F 15,600 F 0 F 0 300 F 1,400 F 1,900 F 0 F 0 78 435 F 556 F 9,700 1,900 11,600 3,308 1,378 4,686 1998 6,000 5,000 11,000 0 F 0 F 400 F 2,200 2,800 F 0 F 0 F 83 615 728 F 5,000 5,000 10,000 3,414 2,903 6,317 1999 4,000 7,000 11,000 0 F 0 F 400 F 2,200 F 2,800 F 0 F 0 F 83 615 F 728 F 3,000 4,000 7,000 1,621 2,170 3,791 2000 3,000 9,000 12,000 0 F 0 F 400 F 2,200 F 2,800 F 0 F 0 F 83 615 F 728 F 2,000 4,000 6,000 1,400 2,146 3,546 2001 6,000 14,000 20,000 0 F 0 F 400 F 2,200 F 2,800 F 0 F 0 F 83 615 F 728 F 2,000 4,000 6,000 1,431 2,427 3,858 2002 6,000 F 14,000 F 20,000 F 0 F 0 F 400 F 2,200 F 2,800 F 0 F 0 F 83 615 F 728 F 2,000 F 4,000 F 6,000 F 1,431 F 2,427 F 3,858 F Source: FAO (FAOSTAT). Note: F = FAO Estimate; and * = unofficial estimate.

92
Table 36 Paper and paperboard trade in Fiji 1961 - 2002, from FAO Imports (in metric tonnes) Imports (in USD '000) Exports (in metric tonnes) Exports (in USD '000)
Year Newsprint Printing and writing paper
Other paper and paperboard Total Newsprint Printing and
writing paper Other paper and
paperboard Total Other paper and paperboard Total Other paper and
paperboard Total
1961 100 200 100 400 25 72 81 178 100 100 15 15 1962 100 200 100 400 30 72 81 183 100 100 20 20 1963 100 200 100 400 34 88 77 199 100 100 23 23 1964 100 400 100 600 39 122 67 228 100 100 22 22 1965 100 300 400 800 21 135 139 295 100 100 29 29 1966 300 300 1,400 2,000 50 132 528 710 100 100 24 24 1967 300 300 1,200 1,800 64 150 437 651 200 200 51 51 1968 200 400 1,400 2,000 59 183 282 524 200 200 58 58 1969 400 700 2,000 3,100 83 155 854 1,092 1970 800 500 1,600 2,900 121 199 720 1,040 1971 700 400 1,300 2,400 148 210 595 953 1972 800 400 1,400 2,600 198 269 647 1,114 1973 1,300 600 2,300 4,200 340 443 678 1,461 1974 1,100 900 3,500 5,500 459 685 1,162 2,306 1975 900 2,600 2,100 5,600 349 598 978 1,925 1976 1,000 2,000 900 3,900 337 428 454 1,219 1977 1,400 2,000 900 4,300 611 428 454 1,493 1978 1,500 2,000 900 4,400 730 428 454 1,612 1979 1,700 2,000 4,000 7,700 857 1,990 2,759 5,606 1980 1,700 2,400 4,600 8,700 990 2,564 3,887 7,441 1981 2,100 2,100 4,300 8,500 1,310 2,795 3,713 7,818 1982 2,000 2,400 3,200 7,600 1,166 2,675 2,778 6,619 1983 2,000 2,200 3,600 7,800 1,183 2,236 3,092 6,511 1984 1,700 2,800 3,300 7,800 1,005 2,747 2,928 6,680 1985 2,000 3,000 4,000 9,000 1,177 2,925 3,347 7,449 1986 2,000 3,000 4,000 9,000 1,150 2,925 3,347 7,422 1987 1,700 3,000 4,000 8,700 960 2,925 3,347 7,232 1988 1,400 3,000 4,000 8,400 800 2,925 3,347 7,072 1989 1,900 3,000 4,000 8,900 1,100 2,925 3,347 7,372 1990 1,400 4,900 8,000 14,300 935 1,293 6,462 8,690 1991 1,800 6,800 11,000 19,600 1,325 5,650 8,619 15,594 1992 1,800 1,557 900 4,257 1,300 1,555 721 3,576 1993 2,475 1,257 7,100 10,832 1,235 1,461 5,542 8,238 1994 2,700 6,000 11,000 19,700 1,927 6,079 9,355 17,361 1995 2,500 6,000 12,000 20,500 1,920 7,493 10,921 20,334 1996 2,200 6,000 5,500 13,700 1,591 7,493 4,933 14,017 1997 2,200 1,300 2,600 6,100 1,591 1,989 1,959 5,539 1998 2,300 2,000 4,800 9,100 1,419 2,187 3,855 7,461 1999 2,100 4,700 11,000 17,800 1,300 4,121 6,522 11,943 2000 2,100 4,700 11,000 17,800 1,300 4,121 6,522 11,943 2001 2,100 4,700 11,000 17,800 1,300 4,121 6,522 11,943 2002 2,100 4,700 11,000 17,800 1,300 4,121 6,522 11,943
Source: FAO (FAOSTAT).

93
APPENDIX 2: FOREST HARVESTING COST MODEL
The following figures show the spreadsheets containing the data used in the calculation of delivered roundwood cost for a “typical” forest harvesting operation. These follow standard production cost methodologies as set out in FAO (1977) and the “Caterpillar Handbook” (Caterpillar, 1996). Further details about how the model works can be found in Whiteman (1999a).
Figure 26 Prices and consumption of consumable items used in the forest harvesting cost model
Fuel and lubricants Felling Skidding Skidding Loading Road Unloading Water Road Unitswith dozer with skidder transport & reloading transport building
Petrol 1.00 F$/litre 3.00 litre/hourDiesel 0.90 F$/litre 25.00 20.00 20.00 30.00 20.00 50.00 35.00 litre/hourOils 5.40 F$/litre 2.50 0.25 0.13 0.11 0.30 0.11 0.50 0.27 litre/hourGrease 5.40 F$/litre 0.25 0.02 0.02 0.01 0.02 0.01 0.05 0.02 litre/hourOther lubricants 5.40 F$/litre 0.25 0.04 0.08 0.05 0.02 0.05 0.02 0.05 litre/hour
Other consumable items Felling Skidding Skidding Loading Road Unloading Water Road Unitswith dozer with skidder transport transport building
Air filter 0.03 0.03 0.04 0.04 0.04 0.04 0.04 0.04 F$ per hourFuel filter 0.03 0.05 0.05 0.05 0.04 0.05 0.04 0.05 F$ per hourOil filter 0.03 0.08 0.08 0.08 0.05 0.08 0.05 0.08 F$ per hourOther filters 0.00 0.03 0.03 0.03 0.00 0.03 0.00 0.03 F$ per hourTracks or tyres 0.00 8.00 5.75 6.25 18.25 6.25 0.00 13.50 F$ per hourOther minor parts 0.40 2.50 2.50 0.25 0.10 0.25 0.22 2.50 F$ per hourTools 45 90 90 90 90 90 75 90 F$ per yearClothing 0 0 0 0 0 0 0 0 F$ per yearOther consumable items 0 110 110 110 75 110 180 110 F$ per year
Felling Skidding Skidding Loading Road Unloading Water Road Unitswith dozer with skidder transport & reloading transport building
Total consumable cost 2.47 3.93 NA 1.04 6.96 2.07 NA 4.73 F$/m3Total consumable cost 1.23 1.96 NA 0.52 3.48 1.04 NA 2.36 US$ per m3
Consumable cost
Unit costFuel consumption (per machine)
Cost of other minor parts and equipment (per machine)
Total consumable cost by activity
Figure 27 Machine productivity and utilisation rates used in the forest harvesting cost model
Productivity information Felling Skidding Skidding Loading Road Unloading Water Road Unitswith dozer with skidder transport & reloading transport building
Number of working days 200 250 200 200 200 200 200 250 days/yearNumber of working hours 8 8 8 8 8 8 8 8 hours/dayAverage machine availability 80 80 80 80 80 80 80 80 %Available working hours 1,280 1,600 1,280 1,280 1,280 1,280 1,280 1,600 hours/year/unitUnproductive time 10 10 60 300 minutes/tripUnproductive time 15 10 NA 10 15 10 NA 10 minutes/hourEffective working hours 960 1,345 NA 1,067 954 1,067 NA 1,867 hours/year/unitOutput rate 6.0 5.0 20 200 NA m3/tripOutput rate 8.0 6.8 NA 25 7 25 NA NA m3/hourNumber of machines/crews 1.00 0.70 1.00 0.33 1.00 0.67 1.00 0.30 unitsAnnual production per unit 6,000 8,571 NA 18,000 6,000 18,000 NA NA m3/unitActual working hours 750 1,257 NA 720 879 720 NA 1,905 hours/year/unitAverage machine utilisation 78 93 NA 68 92 68 NA 102 %
Machine productivity and utilisation

94
Figure 28 Labour inputs and costs used in the forest harvesting cost model
Labour information Felling Skidding Skidding Loading Road Unloading Water Road Unitswith dozer with skidder transport & reloading transport building
No. of operators 1 1 1 1 1 1 1 1 person(s)Operators wage 675 675 675 675 675 675 675 675 F$ per monthOperators wage F$ per m3
No. of assistants 1 1 1 1 1 1 3 1 person(s)Assistants wage 468 468 468 468 468 468 468 468 F$ per monthAssistants wage F$ per m3
Social cost 30 30 30 30 30 30 30 30 %Overhead 20 20 20 20 20 20 20 20 %
Labour cost Felling Skidding Skidding Loading Road Unloading Water Road Unitswith dozer with skidder transport & reloading transport building
Total labour cost 3.57 2.50 NA 1.19 3.57 2.38 NA 1.07 F$/m3
Total labour cost 1.78 1.25 NA 0.59 1.78 1.19 NA 0.53 US$/m3
Labour inputs and cost (per machine)
Total labour cost by activity
Figure 29 Machinery costs used in the forest harvesting cost model
Machine information Felling Skidding Skidding Loading Road Unloading Water Road Unitswith dozer with skidder transport & reloading transport building
Machine type Stihl 80 Cat D6 Cat 518 Cat 950 20t truck Cat 950 Barge Cat D6Purchase price (new) 1,200 230,000 175,000 190,000 165,000 190,000 135,000 230,000 US$Depreciation rate 25.0 6.9 8.2 3.9 13.7 3.9 3.0 6.9 %/yearCurrent age 0 18 18 18 7 18 10 18 yearsCurrent value 1,200 63,507 37,515 92,848 58,825 92,848 99,552 63,507 US$Investment period 3 10 10 10 10 10 20 10 yearsResidual value 506 31,068 15,945 62,375 13,479 62,375 54,136 31,068 US$Loan financing 0 0 0 0 0 0 0 0 %Repayment period 3 5 5 5 5 5 5 5 yearsRepair cost - parts 0.12 10.75 9.84 8.95 8.52 8.95 3.65 10.75 US$/hourRepair cost - labour 0.10 2.64 2.99 2.22 0.72 2.22 0.45 2.64 F$/hourAnnual insurance cost 0.0 0.0 0.0 0.0 0.0 0.0 0.0 0.0 %/year
Capital cost Felling Skidding Skidding Loading Road Unloading Water Road Unitswith dozer with skidder transport & reloading transport building
Financing payments 0.00 0.00 NA 0.00 0.00 0.00 NA 0.00 US$/m3
Investor's capital 0.07 0.74 NA 0.52 0.98 1.03 NA 0.32 US$/m3
Residual value -0.03 -0.36 NA -0.35 -0.22 -0.69 NA -0.16 US$/m3
Repairs and insurance 0.02 1.77 NA 0.40 1.30 0.81 NA 1.15 US$/m3
Total capital cost 0.12 4.30 NA 1.14 4.11 2.29 NA 2.62 F$/m3Total capital cost 0.06 2.15 NA 0.57 2.06 1.14 NA 1.31 US$/m3
Capital cost Felling Skidding Skidding Loading Road Unloading Water Road Unitswith dozer with skidder transport & reloading transport building
After financing 0.07 2.50 NA 1.86 2.99 3.71 NA 1.07 F$/m3After financing 0.03 1.25 NA 0.93 1.50 1.86 NA 0.54 US$/m3
Consumption of capital, major repairs and insurance (per machine)
Total capital cost by activity (without allowance for return to capital)
Allowance for return to capital

95
Figure 30 Miscellaneous variables used in the forest harvesting cost model
Annual cutting area 200 ha/year Market exchange rate 2.00 F$/US$ Unloading 1 time(s)Harvesting intensity 30.0 m3/ha Expected level of profit 20 %/year Reloading 1 time(s)Expected annual production 6,000 m3 Interest rate 18 %/year Total 2 time(s)
Hauling details Water UnitsPublic In forest transport
Haul distance 43 5 0 kmSpeed when loaded 35 15 4 km/hourSpeed when unloaded 45 25 5 km/hourDuration of each trip 176 NA minutes
Roading and skid trail construction UnitsAccess Access In forest by dozer
Roading and skid trail density 0 10.0 10.0 360 m/haConstruction rate 7 7 100 m/hour
Skid trail details Skidding details Skidding Unitswith dozer
Skid trail indirectness factor 20 % Winching speed 35 m/minuteAverage distance using winch 0 metres Speed when loaded 3 km/hourAverage skidding distance 300 metres Speed when unloaded 5 km/hourTotal skidding + winching distance 300 metres Proportion of winching 100 %
Proportion of skidding 100 %Total harvesting cost (inc ROC) 62.24 F$/m3 Duration of each trip 53 minutesTotal harvesting cost (inc ROC) 31.12 US$/m3
Total harvesting cost (inc ROE) 59.32 F$/m3Total harvesting cost (inc ROE) 29.66 US$/m3
Secondary loading
0
120
Miscellaneous variables
Road transportAccess
21525
Forest details
Existing roads
Skiddingwith skidder
Road constructionIn forest
0 0by skidder
Skid trail construction
35
00
106
Figure 31 Delivered roundwood cost estimate produced by the forest harvesting cost model
Felling Skidding Skidding Loading Road Unloading Water Road TOTAL Unitswith dozer with skidder transport & reloading transport building
3.57 2.50 NA 1.19 3.57 2.38 NA 1.07 14.26 F$/m32.47 3.93 NA 1.04 6.96 2.07 NA 4.73 21.19 F$/m30.12 4.30 NA 1.14 4.11 2.29 NA 2.62 14.59 F$/m36.15 10.72 NA 3.37 14.64 6.74 NA 8.42 50.04 F$/m30.07 2.50 NA 1.86 2.99 3.71 NA 1.07 12.19 F$/m36.22 13.22 NA 5.22 17.63 10.45 NA 9.49 62.24 F$/m31.22 1.99 NA 0.61 2.63 1.21 NA 1.62 9.27 F$/m37.37 12.72 NA 3.97 17.27 7.95 NA 10.04 59.32 F$/m3
Felling Skidding Skidding Loading Road Unloading Water Road TOTAL Unitswith dozer with skidder transport & reloading transport building
1.78 1.25 NA 0.59 1.78 1.19 NA 0.53 7.13 US$/m3
1.23 1.96 NA 0.52 3.48 1.04 NA 2.36 10.60 US$/m3
0.06 2.15 NA 0.57 2.06 1.14 NA 1.31 7.29 US$/m3
3.08 5.36 NA 1.68 7.32 3.37 NA 4.21 25.02 US$/m3
0.03 1.25 NA 0.93 1.50 1.86 NA 0.54 6.10 US$/m3
3.11 6.61 NA 2.61 8.82 5.22 NA 4.75 31.12 US$/m3
0.61 1.00 NA 0.30 1.31 0.61 NA 0.81 4.64 US$/m3
3.68 6.36 NA 1.99 8.63 3.97 NA 5.02 29.66 US$/m3
Labour
Harvesting cost calculation workbookFAO Temporary Assistance
to the Ministry of Fisheries and Forests in Fiji
Type of cost
Type of cost
Labour
ConsumablesCapital
TOTAL (including ROE)
Return on capitalTOTAL (including ROC)Return on other expenditure
TOTAL (excluding profit)
ConsumablesCapital
TOTAL (including ROE)
TOTAL (excluding profit)Return on capitalTOTAL (including ROC)Return on other expenditure

96
APPENDIX 3: FOREST INDUSTRY MODEL
The following figures and tables show the spreadsheets containing the data used in the calculation of profitability and economic rent for an “average” sawmill. This follows the discounted cash-flow approach, which is a standard accounting and investment appraisal methodology used in industry worldwide. The cash-flows produced by the model are given in the tables at the end of this appendix. Further details about how the model works can be found in Scotland and Whiteman (1997).
Figure 32 Miscellaneous details and roundwood costs used in the forest industry model
Mill and model details Page 1
20032060
20032.00
Annual production capacity ('000 m3/MT)
2.52.5
Roundwood costs Page 2
Log production costs (F$ per m3 of roundwood)
2.00 2.006.22 6.22
13.22 13.2215.67 15.6717.63 17.639.49 9.49
Total 64.24 64.24
Royalties, fees and other charges (F$ per m3 of roundwood)Proportion (%) Charge Proportion (%) Charge
60 25.00 20 25.0040 20.00 10 20.000 15.00 50 15.000 10.00 20 10.00
5.00 5.000.20 0.20
60 40.00 20 40.0040 30.00 10 30.000 10.00 50 10.000 6.50 20 6.50
6.00 6.003.50 3.500.03 0.03
Total 73.73 48.53
Other roundwood variables
137.97 112.77100 100
150.00 130.002.00 2.00
1 120 20
Total log cost (F$ per m3/MT product) 275.94 225.54
New or existing millModel's AuthorDate of last revision
Name of mill
Product 1Product 2
Average-sized sawmillViti LevuExistingAdrian Whiteman, FAO24th October 2003Sawnwood for export marketSawnwood for domestic market
Location
Exchange rate used - F$/US$
Sawnwood for export marketSawnwood for domestic market
Reference yearPeriod of investment (years)Utilisation coefficient (%)Price base
Sawnwood for export market Sawnwood for domestic market
Felling
Total log cost from licence area (F$ per m3)
Sawnwood for export market Sawnwood for domestic market
Class 4 RoyaltyPremium
SkiddingLoading, unloading and reloadingTransportRoad building
NLTB Licence application feesLandowners goodwill
Planning and surveying
FD Map
Class 1 Landowners commissionClass 2 Landowners commissionClass 3 Landowners commissionClass 4 Landowners commission
FD Scaling fee
Class 1 RoyaltyClass 2 RoyaltyClass 3 Royalty
Proportion of logs from licence area (%)Cost of logs from elsewhere (F$ per m3)Conversion factor (m3 logs per m3/MT product)First year of productionLast year of production

97
Figure 33 Capital and manufacturing costs used in the forest industry model
Manufacturing costs Page 3
Variable costs (F$ per m3/MT production)
275.94 225.5478.96 78.9615.00 15.0060.00 45.0032.00 6.0015.00 15.00
Total 476.90 385.50Fixed costs (F$ per m3/MT capacity)
12.00 12.007.00 7.009.73 9.73
15.00 15.0030.00 30.00
Total 73.73 73.73Total cost (F$ per m3/MT production)
Total calculated at final level of utilisation 599.79 508.39
Initial capital requirements Page 4
Production plant capital ('000 F$)Total Remaining
120 5 2300 5 2650 5 5300 5 530 5 50 5 50 5 5
Total 1,400Other capital ('000 F$)
0573
0Total 573
Total capital ('000 F$)
1,973
Working capital requirements Page 5
Inventories
8.0 42.45 34.704.0 46.14 39.11
Inventories: misc supplies 4.0 8.23 5.08Total 96.82 78.88
Short-term liabilities
Accounts payable: salaries 2.0 4.88 4.88Accounts payable: others 8.0 30.31 24.00
Total 35.19 28.88Short-term assets
8.0 92.28 78.21
150
Value (F$ per m3/MT production)Number of weeks supplies held
Accounts receivable
Cash reserve
Total value (in '000 F$)
Sawnwood for export market Sawnwood for domestic marketInventories: logsInventories: product
Mill stores and miscellaneous suppliesOwner's construction overheadEngineering
Sum of plant and other capital requirements
Pre-operating expenseWorking capitalCapitalised interest
Site and servicesStructuresStationary equipmentMobile equipment
Sales costGeneral overhead
Amount Depreciation period
Delivery
Personnel: administrationPersonnel: support staffPersonnel: maintenance staff
LabourResins/chemicals/treatmentFuel, energy and consumablesPackaging
Sawnwood for export market Sawnwood for domestic market
Log cost

98
Figure 34 Replacement capital requirements and sales details used in the forest industry model
Replacement capital requirements Page 6
Year6 200 5
11 200 516 200 53 300 56 400 59 400 5
12 400 515 400 518 400 5
Sales and other financial details Page 7
Product sales by market and grade of production
Export tax Output(percent) (percent)
Class 1 FF Select 0 50.0 1,200 0.0Class 1 FF Standard 0 7.5 900 0.0Class 1 Ungraded 0 2.5 900 0.0Class 2 FF Select 0 30.0 800 0.0Class 2 FF Standard 0 7.5 800 0.0Class 2 Ungraded 0 2.5 750 0.0
100 1,009 0.0
Class 1 FF Select 0 15.0 750 0.0Class 1 FF Standard 0 5.0 550 0.0Class 2 FF Select 0 5.0 580 0.0Class 2 FF Standard 0 5.0 480 0.0Class 3 FF Select 0 35.0 480 0.0Class 3 FF Standard 0 12.0 480 0.0Class 4 FF Select 0 15.0 480 0.0Class 4 FF Standard 0 3.0 480 0.0Class 3 and 4 Ungraded 0 5.0 250 0.0
100 518 0.0
Amount Amount20 1280 32
Mobile equipmentAmount ('000 F$)
Mobile equipmentMobile equipmentStationary equipmentStationary equipmentStationary equipmentStationary equipment
Item
Stationary equipmentStationary equipment
(percent/year)Mill net price
(F$ per m3/MT)
Depreciation period
Product Grade
Total/average
Debt
Total/average
Sawnwood for export market
Sawnwood for domestic market
Debt/equity ratio (%)Interest rate
Real price change
Corporate tax rate
Other costs (%)
Equity

99
Figure 35 Production start-up and capital drawdown schedule used in the forest industry model
Production start-up schedule Page 8
Capacity installation
100 1,500 1,500100 1,500 1,500100 1,500 1,500100 1,500 1,500100 1,500 1,500100 1,500 1,500
Manufacturing costs
100 369 1,294100 369 1,294100 369 1,294100 369 1,294100 369 1,294100 369 1,294
Capital drawdown schedule Page 9
Drawdown (%)
0 0 0 0 0 00 0 0 0 0 00 0 0 0 0 00 0 0 0 0 0
Drawdown ('000 F$)
0 0 0 0 0 00 0 0 0 0 00 0 0 0 0 00 0 0 0 0 00 0 0 0 0 0
Year 1
Annual production:Sawnwood for domestic market
Proportion of annualcapacity available(%)
Annual production:Sawnwood for export market
Year 2Year 3Year 4Year 5
costs (percent)Year 1Year 2
Year 6
Capitalised interest
Annual fixedcosts ('000 F$)
Annual variablecosts ('000 F$)
Year 3Year 4Year 5Year 6
Payment of fixed
Year 3 Year 4
Total
Total plant capitalPre-operating expenseWorking capitalCapitalised interest
Total plant capitalPre-operating expenseWorking capital
Year 5 Year 6
Year 1 Year 2 Year 3 Year 4 Year 5 Year 6
Year 1 Year 2

100
Figure 36 Debt repayment calculation used in the forest industry model
Debt repayment calculation ('000 F$) Page 10
Existing debt and equity
Total:years 1 to 5
Debt 395 0 0 0 0 0 0Equity 1,579 0 0 0 0 0 0Total 1,973 0 0 0 0 0 0
Other loan details
10
391
Debt repayment by year ('000 F$) Page 11
Loan Interest TotalEquity Debt Equity Debt payment payment payment
1 1,579 395 0 355 39 45 842 0 355 0 316 39 40 803 0 316 0 276 39 36 754 0 276 0 237 39 31 705 0 237 0 197 39 26 666 0 197 0 158 39 21 617 0 158 0 118 39 17 568 0 118 0 79 39 12 519 0 79 0 39 39 7 47
10 0 39 0 (0) 39 2 4211 0 (0) 0 (0) 0 (0) (0)12 0 (0) 0 (0) 0 (0) (0)13 0 (0) 0 (0) 0 (0) (0)14 0 (0) 0 (0) 0 (0) (0)15 0 (0) 0 (0) 0 (0) (0)16 0 (0) 0 (0) 0 (0) (0)17 0 (0) 0 (0) 0 (0) (0)18 0 (0) 0 (0) 0 (0) (0)19 0 (0) 0 (0) 0 (0) (0)
Year 4 Year 5
Number of annual paymentsProportion of capacity required before
Existing Year 1 Year 2 Year 3
repayments can be made (percent) 100Annual principle repayment ('000 F$)First year of repayment
Opening balance Closing balanceYear

101
Table 37 Depreciation calculation in the forest industry model Initial capital (FJD '000) 2003 2004 2005 2006 2007 2008 2009 2010 2011 2012 2013 2014 2015 2016 2017 2018 2019 2020 2021 2022 Site and services 60 60 0 0 0 0 0 0 0 0 0 0 0 0 0 0 0 0 0 0 Structures 150 150 0 0 0 0 0 0 0 0 0 0 0 0 0 0 0 0 0 0 Stationary equipment 130 130 130 130 130 0 0 0 0 0 0 0 0 0 0 0 0 0 0 0 Mobile equipment 60 60 60 60 60 0 0 0 0 0 0 0 0 0 0 0 0 0 0 0 Mill stores and miscellaneous supplies 6 6 6 6 6 0 0 0 0 0 0 0 0 0 0 0 0 0 0 0 Owner's construction overhead 0 0 0 0 0 0 0 0 0 0 0 0 0 0 0 0 0 0 0 0 Engineering 0 0 0 0 0 0 0 0 0 0 0 0 0 0 0 0 0 0 0 0 Total initial capital 406 406 196 196 196 0 0 0 0 0 0 0 0 0 0 0 0 0 0 0 Replacement capital (FJD '000) Mobile equipment 0 0 0 0 0 40 40 40 40 40 0 0 0 0 0 0 0 0 0 0 Mobile equipment 0 0 0 0 0 0 0 0 0 0 40 40 40 40 40 0 0 0 0 0 Mobile equipment 0 0 0 0 0 0 0 0 0 0 0 0 0 0 0 40 40 40 40 40 Stationary equipment 0 0 60 60 60 60 60 0 0 0 0 0 0 0 0 0 0 0 0 0 Stationary equipment 0 0 0 0 0 80 80 80 80 80 0 0 0 0 0 0 0 0 0 0 Stationary equipment 0 0 0 0 0 0 0 0 80 80 80 80 80 0 0 0 0 0 0 0 Stationary equipment 0 0 0 0 0 0 0 0 0 0 0 80 80 80 80 80 0 0 0 0 Stationary equipment 0 0 0 0 0 0 0 0 0 0 0 0 0 0 80 80 80 80 80 0 Stationary equipment 0 0 0 0 0 0 0 0 0 0 0 0 0 0 0 0 0 80 80 80 Total replacement capital 0 0 60 60 60 180 180 120 200 200 120 200 200 120 200 200 120 200 200 120 Total initial and replacement capital 406 406 256 256 256 180 180 120 200 200 120 200 200 120 200 200 120 200 200 120
Table 38 Projected sales volume in the forest industry model (in cubic metres) Product Species Grade 2003 2004 2005 2006 2007 2008 2009 2010 2011 2012 2013 2014 2015 2016 2017 2018 2019 2020 2021 2022 Sawnwood for export market Class 1 FF Sel. 750 750 750 750 750 750 750 750 750 750 750 750 750 750 750 750 750 750 750 750 Sawnwood for export market Class 1 FF Stand. 113 113 113 113 113 113 113 113 113 113 113 113 113 113 113 113 113 113 113 113 Sawnwood for export market Class 1 Ungraded 38 38 38 38 38 38 38 38 38 38 38 38 38 38 38 38 38 38 38 38 Sawnwood for export market Class 2 FF Sel. 450 450 450 450 450 450 450 450 450 450 450 450 450 450 450 450 450 450 450 450 Sawnwood for export market Class 2 FF Stand. 113 113 113 113 113 113 113 113 113 113 113 113 113 113 113 113 113 113 113 113 Sawnwood for export market Class 2 Ungraded 38 38 38 38 38 38 38 38 38 38 38 38 38 38 38 38 38 38 38 38 Sawnwood for domestic market Class 1 FF Sel. 225 225 225 225 225 225 225 225 225 225 225 225 225 225 225 225 225 225 225 225 Sawnwood for domestic market Class 1 FF Stand. 75 75 75 75 75 75 75 75 75 75 75 75 75 75 75 75 75 75 75 75 Sawnwood for domestic market Class 2 FF Sel. 75 75 75 75 75 75 75 75 75 75 75 75 75 75 75 75 75 75 75 75 Sawnwood for domestic market Class 2 FF Stand. 75 75 75 75 75 75 75 75 75 75 75 75 75 75 75 75 75 75 75 75 Sawnwood for domestic market Class 3 FF Sel. 525 525 525 525 525 525 525 525 525 525 525 525 525 525 525 525 525 525 525 525 Sawnwood for domestic market Class 3 FF Stand. 180 180 180 180 180 180 180 180 180 180 180 180 180 180 180 180 180 180 180 180 Sawnwood for domestic market Class 4 FF Sel. 225 225 225 225 225 225 225 225 225 225 225 225 225 225 225 225 225 225 225 225 Sawnwood for domestic market Class 4 FF Stand. 45 45 45 45 45 45 45 45 45 45 45 45 45 45 45 45 45 45 45 45 Sawnwood for domestic market Class 3 and 4 Ungraded 75 75 75 75 75 75 75 75 75 75 75 75 75 75 75 75 75 75 75 75 Total sales volume 3,000 3,000 3,000 3,000 3,000 3,000 3,000 3,000 3,000 3,000 3,000 3,000 3,000 3,000 3,000 3,000 3,000 3,000 3,000 3,000

102
Table 39 Projected sales price in the forest industry model (in FJD per cubic metre) Product Market Grade 2003 2004 2005 2006 2007 2008 2009 2010 2011 2012 2013 2014 2015 2016 2017 2018 2019 2020 2021 2022 Sawnwood for export market Class 1 FF Select 1,200 1,200 1,200 1,200 1,200 1,200 1,200 1,200 1,200 1,200 1,200 1,200 1,200 1,200 1,200 1,200 1,200 1,200 1,200 1,200 Sawnwood for export market Class 1 FF Standard 900 900 900 900 900 900 900 900 900 900 900 900 900 900 900 900 900 900 900 900 Sawnwood for export market Class 1 Ungraded 900 900 900 900 900 900 900 900 900 900 900 900 900 900 900 900 900 900 900 900 Sawnwood for export market Class 2 FF Select 800 800 800 800 800 800 800 800 800 800 800 800 800 800 800 800 800 800 800 800 Sawnwood for export market Class 2 FF Standard 800 800 800 800 800 800 800 800 800 800 800 800 800 800 800 800 800 800 800 800 Sawnwood for export market Class 2 Ungraded 750 750 750 750 750 750 750 750 750 750 750 750 750 750 750 750 750 750 750 750 Sawnwood for domestic market Class 1 FF Select 750 750 750 750 750 750 750 750 750 750 750 750 750 750 750 750 750 750 750 750 Sawnwood for domestic market Class 1 FF Standard 550 550 550 550 550 550 550 550 550 550 550 550 550 550 550 550 550 550 550 550 Sawnwood for domestic market Class 2 FF Select 580 580 580 580 580 580 580 580 580 580 580 580 580 580 580 580 580 580 580 580 Sawnwood for domestic market Class 2 FF Standard 480 480 480 480 480 480 480 480 480 480 480 480 480 480 480 480 480 480 480 480 Sawnwood for domestic market Class 3 FF Select 480 480 480 480 480 480 480 480 480 480 480 480 480 480 480 480 480 480 480 480 Sawnwood for domestic market Class 3 FF Standard 480 480 480 480 480 480 480 480 480 480 480 480 480 480 480 480 480 480 480 480 Sawnwood for domestic market Class 4 FF Select 480 480 480 480 480 480 480 480 480 480 480 480 480 480 480 480 480 480 480 480 Sawnwood for domestic market Class 4 FF Standard 480 480 480 480 480 480 480 480 480 480 480 480 480 480 480 480 480 480 480 480 Sawnwood for domestic market Class 3 and 4 Ungraded 250 250 250 250 250 250 250 250 250 250 250 250 250 250 250 250 250 250 250 250 Average product price 763 763 763 763 763 763 763 763 763 763 763 763 763 763 763 763 763 763 763 763
Table 40 Projected sales revenue in the forest industry model (in FJD ‘000) Product Market Grade 2003 2004 2005 2006 2007 2008 2009 2010 2011 2012 2013 2014 2015 2016 2017 2018 2019 2020 2021 2022 Sawnwood for export market Class 1 FF Select 900 900 900 900 900 900 900 900 900 900 900 900 900 900 900 900 900 900 900 900 Sawnwood for export market Class 1 FF Standard 101 101 101 101 101 101 101 101 101 101 101 101 101 101 101 101 101 101 101 101 Sawnwood for export market Class 1 Ungraded 34 34 34 34 34 34 34 34 34 34 34 34 34 34 34 34 34 34 34 34 Sawnwood for export market Class 2 FF Select 360 360 360 360 360 360 360 360 360 360 360 360 360 360 360 360 360 360 360 360 Sawnwood for export market Class 2 FF Standard 90 90 90 90 90 90 90 90 90 90 90 90 90 90 90 90 90 90 90 90 Sawnwood for export market Class 2 Ungraded 28 28 28 28 28 28 28 28 28 28 28 28 28 28 28 28 28 28 28 28 Sawnwood for domestic market Class 1 FF Select 169 169 169 169 169 169 169 169 169 169 169 169 169 169 169 169 169 169 169 169 Sawnwood for domestic market Class 1 FF Standard 41 41 41 41 41 41 41 41 41 41 41 41 41 41 41 41 41 41 41 41 Sawnwood for domestic market Class 2 FF Select 44 44 44 44 44 44 44 44 44 44 44 44 44 44 44 44 44 44 44 44 Sawnwood for domestic market Class 2 FF Standard 36 36 36 36 36 36 36 36 36 36 36 36 36 36 36 36 36 36 36 36 Sawnwood for domestic market Class 3 FF Select 252 252 252 252 252 252 252 252 252 252 252 252 252 252 252 252 252 252 252 252 Sawnwood for domestic market Class 3 FF Standard 86 86 86 86 86 86 86 86 86 86 86 86 86 86 86 86 86 86 86 86 Sawnwood for domestic market Class 4 FF Select 108 108 108 108 108 108 108 108 108 108 108 108 108 108 108 108 108 108 108 108 Sawnwood for domestic market Class 4 FF Standard 22 22 22 22 22 22 22 22 22 22 22 22 22 22 22 22 22 22 22 22 Sawnwood for domestic market Class 3 and 4 Ungraded 19 19 19 19 19 19 19 19 19 19 19 19 19 19 19 19 19 19 19 19 Total sales revenue 2,289 2,289 2,289 2,289 2,289 2,289 2,289 2,289 2,289 2,289 2,289 2,289 2,289 2,289 2,289 2,289 2,289 2,289 2,289 2,289 Other revenue Total revenue 2,289 2,289 2,289 2,289 2,289 2,289 2,289 2,289 2,289 2,289 2,289 2,289 2,289 2,289 2,289 2,289 2,289 2,289 2,289 2,289

103
Table 41 Projected income in the forest industry model Income (FJD '000) 2003 2004 2005 2006 2007 2008 2009 2010 2011 2012 2013 2014 2015 2016 2017 2018 2019 2020 2021 2022 Total revenue 2,289 2,289 2,289 2,289 2,289 2,289 2,289 2,289 2,289 2,289 2,289 2,289 2,289 2,289 2,289 2,289 2,289 2,289 2,289 2,289 Product manufacturing costs Fixed 369 369 369 369 369 369 369 369 369 369 369 369 369 369 369 369 369 369 369 369 Variable 1,294 1,294 1,294 1,294 1,294 1,294 1,294 1,294 1,294 1,294 1,294 1,294 1,294 1,294 1,294 1,294 1,294 1,294 1,294 1,294 Subtotal 1,662 1,662 1,662 1,662 1,662 1,662 1,662 1,662 1,662 1,662 1,662 1,662 1,662 1,662 1,662 1,662 1,662 1,662 1,662 1,662 Other manufacturing costs Total manufacturing costs 1,662 1,662 1,662 1,662 1,662 1,662 1,662 1,662 1,662 1,662 1,662 1,662 1,662 1,662 1,662 1,662 1,662 1,662 1,662 1,662 Other tax deductible costs Depreciation 406 406 256 256 256 180 180 120 200 200 120 200 200 120 200 200 120 200 200 120 Interest expense 45 40 36 31 26 21 17 12 7 2 (0) (0) (0) (0) (0) (0) (0) (0) (0) 0 Export taxes 0 0 0 0 0 0 0 0 0 0 0 0 0 0 0 0 0 0 0 0 Net Income before tax 176 181 336 340 345 426 431 495 420 425 507 427 427 507 427 427 507 427 427 507 Corporate tax 56 58 107 109 110 136 138 158 134 136 162 137 137 162 137 137 162 137 137 162 Net income after tax 120 123 228 231 235 290 293 337 286 289 345 290 290 345 290 290 345 290 290 345 Cumulative net income 120 243 471 702 937 1,227 1,519 1,856 2,142 2,431 2,775 3,066 3,356 3,701 3,992 4,282 4,627 4,917 5,208 5,552
Table 42 Projected cash-flow in the forest industry model Cash flow (FJD '000) Existing 2003 2004 2005 2006 2007 2008 2009 2010 2011 2012 2013 2014 2015 2016 2017 2018 2019 2020 2021 2022 Cash receipts Net income n.a. 120 123 228 231 235 290 293 337 286 289 345 290 290 345 290 290 345 290 290 345 Depreciation n.a. 406 406 256 256 256 180 180 120 200 200 120 200 200 120 200 200 120 200 200 120 Total from operations n.a. 526 529 484 487 491 470 473 457 486 489 465 490 490 465 490 490 465 490 490 465 Capital funds Long term debt 395 0 0 0 0 0 0 0 0 0 0 0 0 0 0 0 0 0 0 0 0 Equity 1,579 0 0 0 0 0 0 0 0 0 0 0 0 0 0 0 0 0 0 0 0 Total from capital sources 1,973 0 0 0 0 0 0 0 0 0 0 0 0 0 0 0 0 0 0 0 0 Total receipts 1,973 526 529 484 487 491 470 473 457 486 489 465 490 490 465 490 490 465 490 490 465 Cash expenditures Plant capital 1,400 0 0 0 0 0 0 0 0 0 0 0 0 0 0 0 0 0 0 0 0 Preoperating expenses n.a. 0 0 0 0 0 0 0 0 0 0 0 0 0 0 0 0 0 0 0 0 Working capital 573 0 0 0 0 0 0 0 0 0 0 0 0 0 0 0 0 0 0 0 0 Capitalised interest n.a. 0 0 0 0 0 0 0 0 0 0 0 0 0 0 0 0 0 0 0 0 Replacement Capital n.a. 0 0 300 0 0 600 0 0 400 0 200 400 0 0 400 200 0 400 0 0 Debt Repayment n.a. 39 39 39 39 39 39 39 39 39 39 0 0 0 0 0 0 0 0 0 0 Total expenditures 1,973 39 39 339 39 39 639 39 39 439 39 200 400 0 0 400 200 0 400 0 0 Net cash flow 0 486 490 145 448 451 (170) 433 417 46 449 265 90 490 465 90 290 465 90 490 465 Cumulative net cash flow 0 486 976 1,121 1,569 2,020 1,850 2,283 2,700 2,747 3,196 3,461 3,551 4,042 4,506 4,597 4,887 5,352 5,443 5,933 6,398

104
Table 43 Adjusted cash-flow in the forest industry model Adjusted cash flow (FJD '000) Existing 2003 2004 2005 2006 2007 2008 2009 2010 2011 2012 2013 2014 2015 2016 2017 2018 2019 2020 2021 2022 Inflow Product Revenue n.a. 2,289 2,289 2,289 2,289 2,289 2,289 2,289 2,289 2,289 2,289 2,289 2,289 2,289 2,289 2,289 2,289 2,289 2,289 2,289 2,289 Other Revenue n.a. 0 0 0 0 0 0 0 0 0 0 0 0 0 0 0 0 0 0 0 0 Total inflow n.a. 2,289 2,289 2,289 2,289 2,289 2,289 2,289 2,289 2,289 2,289 2,289 2,289 2,289 2,289 2,289 2,289 2,289 2,289 2,289 2,289 Outflow Manufacturing Costs n.a. 1,662 1,662 1,662 1,662 1,662 1,662 1,662 1,662 1,662 1,662 1,662 1,662 1,662 1,662 1,662 1,662 1,662 1,662 1,662 1,662 Payment of export tax n.a. 0 0 0 0 0 0 0 0 0 0 0 0 0 0 0 0 0 0 0 0 Change in gross fixed assets 1,400 0 0 300 0 0 600 0 0 400 0 200 400 0 0 400 200 0 400 0 0 Change in net working capital 573 0 0 0 0 0 0 0 0 0 0 0 0 0 0 0 0 0 0 0 0 Preoperating expenses n.a. 0 0 0 0 0 0 0 0 0 0 0 0 0 0 0 0 0 0 0 0 Capitalised interest n.a. 0 0 0 0 0 0 0 0 0 0 0 0 0 0 0 0 0 0 0 0 Total outflow 1,973 1,662 1,662 1,962 1,662 1,662 2,262 1,662 1,662 2,062 1,662 1,862 2,062 1,662 1,662 2,062 1,862 1,662 2,062 1,662 1,662 Net benefit before financing and tax (1,973) 627 627 327 627 627 27 627 627 227 627 427 227 627 627 227 427 627 227 627 627 Financing (FJD '000) Long term loans received 395 0 0 0 0 0 0 0 0 0 0 0 0 0 0 0 0 0 0 0 0 Repayment of long term loans 0 39 39 39 39 39 39 39 39 39 39 0 0 0 0 0 0 0 0 0 0 Interest payments 0 45 40 36 31 26 21 17 12 7 2 (0) (0) (0) (0) (0) (0) (0) (0) (0) 0 Net financing 395 (84) (80) (75) (70) (66) (61) (56) (51) (47) (42) 0 0 0 0 0 0 0 0 0 0 Net benefit after financing & before tax (1,579) 543 547 252 557 562 (34) 571 576 181 585 427 227 627 627 227 427 627 227 627 627 Tax payment (FJD '000) Corporate tax n.a. 56 58 107 109 110 136 138 158 134 136 162 137 137 162 137 137 162 137 137 162 Net benefit after financing and tax (1,579) 486 490 145 448 451 (170) 433 417 46 449 265 90 490 465 90 290 465 90 490 465 Royalties, fees and other charges (FJD '000) Landowners commission and goodwill n.a. 149 149 149 149 149 149 149 149 149 149 149 149 149 149 149 149 149 149 149 149 NLTB Licence application fees n.a. 1 1 1 1 1 1 1 1 1 1 1 1 1 1 1 1 1 1 1 1 Royalties and premium n.a. 196 196 196 196 196 196 196 196 196 196 196 196 196 196 196 196 196 196 196 196 FD scaling and map fees n.a. 21 21 21 21 21 21 21 21 21 21 21 21 21 21 21 21 21 21 21 21 Export taxes n.a. 0 0 0 0 0 0 0 0 0 0 0 0 0 0 0 0 0 0 0 0 Corporate tax n.a. 56 58 107 109 110 136 138 158 134 136 162 137 137 162 137 137 162 137 137 162 Net benefit to landowners and government n.a. 423 425 474 476 477 503 505 525 501 503 529 503 503 529 503 503 529 503 503 529
Table 44 Measures of financial performance in the forest industry model Total NPV (FJD '000) Annualised NPV (FJD '000)
Discount rate Discount rate Point of measurement 15.0% 20.0% 25.0% 15.0% 20.0% 25.0%
IRR
Before financing and tax 1,161 505 70 186 104 18 26.0% After financing but before tax 1,212 607 211 194 125 53 28.7% After financing and tax 515 92 (188) 82 19 (47) 21.4%
Note: NPV = net present value; IRR = internal rate of return.

105
Table 45 Calculation of the benefit distribution in the forest industry model Share of average product value (in FJD/m3) at a discount rate of: 15.0% Economic rent
Producer Landowners Government Royalty share
Point of measurement Cost
(inc. ROC) Excess profit
Commission and goodwill 90%
NLTB fees & royalty share FD fees Taxes
Producers excess profit
Forest charges
Before financing and tax 579 62 50 59 7 7 0 62 122 After financing but before tax 576 65 50 59 7 7 0 65 122 After financing and tax 576 27 50 59 7 7 37 27 122 Distribution of benefits 76% 4% 6% 8% 1% 1% 5% 18% 82%
Share of average product value (in FJD/m3) at a discount rate of: 20.0% Economic rent Producer Landowners Government Point of measurement
Cost (inc. ROC)
Excess profit
Commission and goodwill Royalty share
NLTB fees & royalty share FD fees Taxes
Producers excess profit
Forest charges
Before financing and tax 606 35 50 59 7 7 0 35 122 After financing but before tax 599 42 50 59 7 7 0 42 122 After financing and tax 599 6 50 59 7 7 35 6 122 Distribution of benefits 79% 1% 6% 8% 1% 1% 5% 5% 95%
Share of average product value (in FJD/m3) at a discount rate of: 25.0% Economic rent Producer Landowners Government Point of measurement
Cost (inc. ROC)
Excess profit
Commission and goodwill Royalty share
NLTB fees & royalty share FD fees Taxes
Producers excess profit
Forest charges
Before financing and tax 635 6 50 59 7 7 0 6 122 After financing but before tax 623 18 50 59 7 7 0 18 122 After financing and tax 623 (16) 50 59 7 7 34 -16 122 Distribution of benefits 82% -2% 6% 8% 1% 1% 4% -15% 115%
Table 46 Summary of results produced by the forest industry model Measures of economic performance Share of average product value (in FJD/m3 at central discount rate)
Producer Landowners Government Total NPV (FJD '000) at different discount rates Point of measurement IRR
15.0% 20.0% 25.0% Cost
(inc. ROC) Excess profit
Commission and goodwill
Royalty share
NLTB fees & royalty share FD fees Taxes
Overall 26.0% 1,161 505 70 606 35 50 59 7 7 0 After finance 28.7% 1,212 607 211 599 42 50 59 7 7 0 After tax 21.4% 515 92 (188) 599 6 50 59 7 7 35 Share of the average product value after tax (in percent) 79% 1% 6% 8% 1% 1% 5% Share of the economic rent from production after tax (in percent) n.a. 5% 39% 46% 5% 5% n.a.