Embed Size (px)
Citation preview

Background Statement for SEMI Draft Document 5432NEW STANDARD: TEST METHOD FOR IN-LINE CHARACTERIZATION OF PV SILICON WAFERS BY USING PHOTOLUMINESCENCE
Notice: This background statement is not part of the balloted item. It is provided solely to assist the recipient in reaching an informed decision based on the rationale of the activity that preceded the creation of this Document.
Notice: Recipients of this Document are invited to submit, with their comments, notification of any relevant patented technology or copyrighted items of which they are aware and to provide supporting documentation. In this context, “patented technology” is defined as technology for which a patent has issued or has been applied for. In the latter case, only publicly available information on the contents of the patent application is to be provided.
Photoluminescence (PL) characterization of Si wafers and bricks regarding material defects has been developed during the past few years and the technique is now at the brink of being introduced in Si wafer manufacturing lines. Therefore it is necessary to develop a standardized test method for PL measurements to help to introduce this important method in the PV industry.
The corresponding SNARF was approved by the PV Materials Committee in its meeting in Munich on June 13, 2012. The draft document was developed since July 2012 and was approved for yellow ballot by the PV Materials Committee in its meeting in Munich on June 20, 2013. It will be adjudicated in Dresden in October 2013.
The ballot results will be reviewed and adjudicated at the meetings indicated in the table below. Check www.semi.org/standards under Calendar of Events for the latest update.
Review and Adjudication InformationTask Force Review Committee Adjudication
Group: PV Si Materials Task Force Europe PV Materials CommitteeDate: October 7, 2013 October 7, 2013Time & Timezone: 1:00-3:00 PM CEST 3:00-4:30 PM CESTLocation: Messe Dresden Messe DresdenCity, State/Country:
Dresden, Germany Dresden, Germany
Leader(s): P. Wagner H. Aulich, P. WagnerStandards Staff: Y. Guillou < [email protected] > Y. Guillou < [email protected] >
This meeting’s details are subject to change, and additional review sessions may be scheduled if necessary. Contact Standards staff for confirmation. Telephone and web information will be distributed to interested parties as the meeting date approaches. If you will not be able to attend these meetings in person but would like to participate by telephone/web, please contact Standards staff.
DRAFTDocument Number:
Date: 5/8/23
SEMI Draft Document 5432NEW STANDARD: TEST METHOD FOR IN-LINE CHARACTERIZATION OF PV SILICON WAFERS BY USING PHOTOLUMINESCENCE1 Purpose1.1 Multicrystalline silicon (mc-Si) wafers produced by casting and controlled solidification usually contain regions containing high grown-in defect density in addition to the grain boundaries.
1.2 These defects may consist of impurity elements as well as structural defects within grains such as dislocations and dislocation networks, which may impact the solar cell efficiency negatively.
1.3 The defective areas are frequently close to the sidewalls and bottom of the ingot from which the wafers are cut.
1.4 Wafers containing highly defective areas impact the yield of a manufacturing line and should be excluded from solar cell manufacturing.
1.5 Therefore methods are required that allow a fast in-line characterization and sorting of wafers.
1.6 This method uses photoluminescence for detecting defective areas in wafers.
2 Scope2.1 This test method identifies defective areas in crystalline silicon (Si) wafers.
2.2 It employs an in-line, non-contacting and non-destructive method for characterizing clean, dry, as-cut Si wafers supported by a mechanism that moves the test specimen through the measurement equipment.
2.3 The method covers square and pseudo-square Si wafers for photovoltaic (PV) applications, with a nominal edge length ≥ 125 mm and a nominal thickness ≥ 100 µm. It applies to both single-crystalline as well as multi-crystalline Si wafers.
2.4 The method is intended for in-line high throughput measurements. Therefore it is mandatory to operate the measurement system under statistical process control (SPC, e.g. ISO 11462) in order to obtain reliable, repeatable and reproducible measurement data.
2.5 The method is based on recording and evaluating near-infrared photoluminescence (PL) radiation emitted from the wafer after excitation with monochromatic light.
2.6 Other measurement techniques may also provide similar information about the defective areas of a wafer as compared to this test method, but they are not the subject of this test method.
2.7 The test may also be used for off-line, stationary characterization of Si wafers provided the requirements of the test method are met.
NOTICE: SEMI Standards and Safety Guidelines do not purport to address all safety issues associated with their use. It is the responsibility of the users of the documents to establish appropriate safety and health practices, and determine the applicability of regulatory or other limitations prior to use.
3 Limitations3.1 Substantial variations of doping concentration across a wafer or between successive wafers may impact the measurement result.
3.2 Substantial variations of surface texture across a wafer or between successive wafers may also impact the measurement result.
3.3 The temperature of the wafers must be 23 ± 5 °C when measured.
3.4 Large surface defects, such as pits or chips, or contamination, such as slurry residue or particles on the wafer surface, also may impact the measurement result.
4 Referenced Standards and Documents4.1 SEMI Standards and Safety Guidelines
This is a Draft Document of the SEMI International Standards program. No material on this page is to be construed as an official or adopted Standard or Safety Guideline. Permission is granted to reproduce and/or distribute this document, in whole or in part, only within the scope of SEMI International Standards committee (document development) activity. All other reproduction and/or distribution without the prior written consent of SEMI is prohibited.
Page 1 Doc. jn l SEMI
Semiconductor Equipment and Materials International3081 Zanker RoadSan Jose, CA 95134-2127Phone: 408.943.6900, Fax: 408.943.7943

DRAFTDocument Number:
Date: 5/8/23
SEMI E89 — Guide for Measurement System Analysis (MSA)
SEMI M59 — Terminology for Silicon Technology
SEMI MF1569 –– Guide for Generation of Consensus Reference Materials for Semiconductor Technology
4.2 ISO Standards1
ISO 11462-1 — Guidelines for implementation of statistical process control (SPC) – Part 1: Elements of SPC
ISO 11462-2 –– Guidelines for implementation of statistical process control (SPC) – Part 2: Catalogue of tools and techniques
NOTICE: Unless otherwise indicated, all documents cited shall be the latest published versions.
5 Terminology(Refer to the SEMI Standards Compilation of Terms (COTs) for a list of the current Abbreviations, Acronyms, Definitions, and Symbols.)
5.1 Terms and acronyms relating to silicon and other semiconductor technology are defined in SEMI M59.
5.2 Other Abbreviations and Acronyms used in this document
5.2.1 AOI –– angle of incidence
5.2.2 MSA –– measurement system analysis
5.2.3 PL — photoluminescence
5.3 Definitions
5.3.1 bright grain boundaries, on a Si wafer –– grain boundaries that appear as bright lines on a dark background in a PL image. They usually occur close to the wafer edges in edge impurity areas or in wafers from the bottom or the top of an ingot.
5.3.2 dark line defect, on a Si wafer — an area on a Si wafer with a high density of defects, mainly grain boundaries, appearing as dark lines in a PL image.
5.3.3 defect cluster, on a Si wafer — an area on a Si wafer with a high density of dislocations and other defects.
5.3.4 edge impurity area, of a Si wafer — an area along the edge(s) of a Si wafer with a high concentration of impurities, characterized by a high recombination of excess charge carriers resulting in dark PL images. It occurs most frequently along the edge(s) of wafers or in wafers from the bottom or the top of an ingot.
6 Summary of Test Method6.1 The wafer resting on a transport mechanism is moved past an infrared laser light source and a digital line camera.6.2 A narrow strip of infrared light with wavelength e is projected on the wafer parallel to the leading edge of the wafer moving along the transport direction (see Figure 1).6.3 The light projected on the wafer generates electron-hole pairs in the bulk of the wafer that emit light with a wavelength pl > e when they recombine, creating the photoluminescence (PL) light or radiation.6.4 The PL light emitted from the illuminated strip is imaged by a line array of sensors (digital line camera) through a filter that blocks light with wavelength e and transmits light with wavelength pl.6.5 Successive images of the illuminated strip on the wafer are recorded by the digital line camera as the wafer is advanced, creating a full-wafer scan.6.6 The full-wafer image is processed and evaluated by appropriate algorithms and size and location of defective areas are reported.6.7 At regular time intervals, a reference material is measured and used for normalizing the PL picture of the sample under test. 1 International Organization for Standardization, ISO Central Secretariat, 1 rue de Varembé, Case postale 56, CH-1211 Geneva 20, Switzerland; Telephone: 41.22.749.01.11, Fax: 41.22.733.34.30, http://www.iso.ch
This is a Draft Document of the SEMI International Standards program. No material on this page is to be construed as an official or adopted Standard or Safety Guideline. Permission is granted to reproduce and/or distribute this document, in whole or in part, only within the scope of SEMI International Standards committee (document development) activity. All other reproduction and/or distribution without the prior written consent of SEMI is prohibited.
Page 2 Doc. jn l SEMI
Semiconductor Equipment and Materials International3081 Zanker RoadSan Jose, CA 95134-2127Phone: 408.943.6900, Fax: 408.943.7943

DRAFTDocument Number:
Date: 5/8/23
7 Apparatus (see Figure 1)7.1 Projector — one or more light sources that project sections of a narrow strip of FWHM width w of continuous infrared light under an AOI on the wafer surface, so that an uninterrupted light strip is generated across the entire wafer. The distance of the projector to the wafer surface is ≥ wafer diagonal. The infrared light wavelength e is selected so that it is ≤ 1 µm and its penetration depth in Si is ≥ 10 µm. The projector may consist of more than one light source.
7.2 Camera — digital camera with a line array of sensors (≥ 1024 pixels) and set up with its line of sight perpendicular to the wafer surface, recording the PL radiation emitted by the wafer. The distance of the sensor to the wafer surface is the same as for the projector. The noise level (3 ) of the camera shall be ≤ 1 % of the peak signal and the dynamic range shall be ≥ 255 gray levels. The sensor array is selected for the light wavelength pl.
7.3 Camera filter — an optical filter that transmits only light with a wavelength ≥ pl.
7.4 Computer — for controlling the measurement system and equipped with software for recording and processing the camera images according to § 14.
7.5 Wafer Transport — consisting of a mechanism that transports the wafer continuously through the measurement apparatus without obstructing the line of sight of the camera and the illumination. The mechanism shall not leave traces or residue on the wafer surface.
8 Safety Precautions8.1 The entire equipment must be placed in a closed housing and secured with a safety lock that stops the belts and switches off the tool when the housing is opened.8.2 The infrared light used is invisible to humans. Special provisions shall be taken to protect the eyes of operators during maintenance activities.
8.3 Protecting goggles shall be used by operators and maintenance personnel if required by local, national or international safety requirements.
8.4 Avoid illuminating the wafer when it is not moving through the equipment. This might result in heating the wafer locally and deforming/breaking it.
9 Test Specimens9.1 Clean, dry Si wafers with as-cut surfaces.
10 Preparation of Apparatus10.1 The suitability of the equipment is determined by performing statistically based instrument repeatability and reproducibility study to ascertain whether the equipment is operating within the manufacture’s stated specification, e.g. according to SEMI E89.10.2 Align the projector and the camera according to the supplier’s instructions.10.3 Adjust the sensitivity of the camera and the light intensity of projected line segment so that the intensity profile of the image of the light line segment in the camera extends over at least three digital intensity levels above the noise level of the camera.10.4 Define the control limits for SPC for the measurement equipment with a set of selected wafers.NOTE 1: As this test method is intended for a high throughput, high volume measurement the equipment cannot be calibrated for measuring each individual wafer. Therefore careful SPC has to be performed.
11 Calibration and Standardization11.1 Record a PL image of a single crystalline wafer – the calibration wafer – with the same size and surface condition as the samples under test and with known homogeneous excess charge carrier lifetime and doping concentration.
11.2 Average the gray values of this PL image along the x-direction, so that an intensity profile Ical(y) is obtained.
11.3 Store this profile for future use.
11.4 Calculate the average gray value Ical,m of the calibration wafer and store it, too.
This is a Draft Document of the SEMI International Standards program. No material on this page is to be construed as an official or adopted Standard or Safety Guideline. Permission is granted to reproduce and/or distribute this document, in whole or in part, only within the scope of SEMI International Standards committee (document development) activity. All other reproduction and/or distribution without the prior written consent of SEMI is prohibited.
Page 3 Doc. jn l SEMI
Semiconductor Equipment and Materials International3081 Zanker RoadSan Jose, CA 95134-2127Phone: 408.943.6900, Fax: 408.943.7943

DRAFTDocument Number:
Date: 5/8/23
11.5 Immediately afterwards generate and store an intensity profile Iref,cal(y) of the reference material strip.
11.6 Repeat and store the calibration in regular time intervals, after any maintenance activity involving the light source and if the light source is changed.
12 Procedure12.1 Adjust the equipment and calibrate it according to the supplier's instructions.12.2 Verify the equipment is within SPC limits.12.3 Measure the wafer.12.3.1 Place a wafer on the transport belts.12.3.2 Align the wafer so that its leading edge is parallel to the projected light strip.12.3.3 Move the wafer through the measurement station. 12.3.4 Scan the entire length of the wafer.12.3.5 Record the successive digital PL images of the projected light strip during the scan.12.3.6 Combine the successive strip images to a digital gray scale raw image RI of the entire wafer.12.3.7 Process RI according to § 13 12.3.8 Report all required parameters according to § 15
12.3.9 Repeat with the next wafer.
12.4 Use a strip of monocrystalline Si as long as the sample under test as reference material and measure it in regular time intervals:
12.4.1 Orient the Si strip so that its long axis is perpendicular to the belt travel direction.
12.4.2 Record its PL image.
12.4.3 Average its intensity along the x-direction to obtain an average intensity profile Iref(y) and use it for temporal and spatial flat-field correction for subsequent test samples according to ¶ 14.7
13 Image Processing Operations13.1 Several standard operations are used for processing the digital image RI. They are shortly outlined here. For more detailed information the reader is referred to literature.
13.2 Threshold operation2: all pixels with a gray value below a threshold value are marked 1, all other pixels with 0, or vice versa.
13.3 Dynamic threshold operation: each pixel is compared to a threshold calculated by a function based on the values of the pixels in an area surrounding the pixel under evaluation.
13.4 Erosion and dilation operations3: the image is convoluted with a structure element or kernel of size e × e, with the uneven integer e ≥ 3. An example for e = 3 is displayed in Figure 2.
13.5 Thinning operation4: the image is successively convoluted with the structure elements E1 through E8 as displayed in Figure 3 until no changes occur anymore.
13.6 Opening operation: an erosion operation is applied to the image followed by a dilation operation.
13.7 Closing operation: a dilation operation is applied to an image followed by an erosion operation.
13.8 Bottom-hat filter or transform5: a closing operation is applied to an image 1 resulting in image 2 and image 1 is then subtracted from image 2.
2 See http://en.wikipedia.org/wiki/Thresholding_(image_processing)3 See http://en.wikipedia.org/wiki/Mathematical_morphology4 See http://en.wikipedia.org/wiki/Thinning_(morphology)5 Also called black top-hat transform, see http://en.wikipedia.org/wiki/Top-hat_transform
This is a Draft Document of the SEMI International Standards program. No material on this page is to be construed as an official or adopted Standard or Safety Guideline. Permission is granted to reproduce and/or distribute this document, in whole or in part, only within the scope of SEMI International Standards committee (document development) activity. All other reproduction and/or distribution without the prior written consent of SEMI is prohibited.
Page 4 Doc. jn l SEMI
Semiconductor Equipment and Materials International3081 Zanker RoadSan Jose, CA 95134-2127Phone: 408.943.6900, Fax: 408.943.7943

DRAFTDocument Number:
Date: 5/8/23
13.9 Top-hat filter or transform6: an opening operation is applied to image 1 resulting in image 2. Image 2 is then subtracted from image 1.
13.10 Blur filter: each pixel of an image is replaced by the mean of its surrounding pixels.
13.11 Logical OR operation: binary images are compared pixel by pixel and the resulting image pixel is set to 1 if anyone or all of the corresponding pixels of the original images equals 1. Otherwise the pixel of the resulting image is set to 0.
13.12 Logical AND operation: binary images are compared pixel by pixel and the resulting image pixel is set to 1 if all of the corresponding pixels of the original images equal 1. Otherwise the pixel of the resulting image is set to 0.
14 Calculations and Image Processing14.1 Process the raw wafer image RI in seven main steps:
14.1.1 Step 1: Flat-field correction.
NOTE 2: The laser light illumination intensity may vary across the wafer surface perpendicular to the transport direction of the wafer as well as in time. These variations in intensity are corrected by the so called flat-field correction.
14.1.2 Step 2: detection of wafer edge.
14.1.3 Step 3: determination of impurity area.
14.1.4 Step 4: determination of dark line defects.
14.1.5 Step 5: determination of dislocation clusters.
14.1.6 Step 6: determination of “bright” grain boundaries.
NOTE 3: In a PL image grain boundaries occur usually as lines darker than the adjacent interior of the grains. However, in highly defective areas grain boundaries may occur as lighter lines on a darker background.
14.1.7 Step 7: estimation of normalized solar cell efficiency.
14.2 The following calculations are performed automatically within the instrument. An outline of the calculation structure is provided here to indicate the nature of the procedure.
14.3 Assign a rectangular coordinate system to the image so that the x-axis is parallel to the wafer transport direction and the y-direction perpendicular to it. The origin of the coordinate system is at the lower left corner of the camera image.
14.4 Identify each pixel by a pair (x, y) of integer index numbers, e.g. (215, 30), corresponding to the indices of the pixel in line 30 of column 215 of the pixel array of the image.
14.5 Identify the gray-scale image brightness of the pixel at (x, y) by I(x, y).
NOTE 4: For thinning, the structure elements are applied iteratively to the binary image in the order they are displayed in Fig. 3 until no changes in the image occur.
14.6 Other structure elements as the ones displayed in Figs. 2 and 3 may be used, but then their size and pattern shall be reported.
14.7 Step 1, flat-field correction:
14.7.1 Perform a flat-field correction of RI by using Iref(y), Ical(y), Ical,m and Iref,cal(y) to obtain a corrected image QI.
14.8 Step 2, wafer edge detection:
14.8.1 Apply an appropriate filter to QI for detecting the wafer edges and define the x-y-coordinates representing the wafer edges by a sub-pixeling7 procedure. Report the type of filter and settings used.
Discard data outside of the wafer edges and denote the remaining image as A.
14.9 Step 3, determination of edge impurity area:
6 Also called white top-hat transform, see http//:en.wikipedia.org/wiki/Top-hat_transform7 See http://en.wikipedia.org/wiki/Sub-pixel_resolution
This is a Draft Document of the SEMI International Standards program. No material on this page is to be construed as an official or adopted Standard or Safety Guideline. Permission is granted to reproduce and/or distribute this document, in whole or in part, only within the scope of SEMI International Standards committee (document development) activity. All other reproduction and/or distribution without the prior written consent of SEMI is prohibited.
Page 5 Doc. jn l SEMI
Semiconductor Equipment and Materials International3081 Zanker RoadSan Jose, CA 95134-2127Phone: 408.943.6900, Fax: 408.943.7943

DRAFTDocument Number:
Date: 5/8/23
14.9.1 Define a threshold th1 based on the average gray level in the central part of the wafer.
14.9.2 Generate a binary image BA1 by applying th1 to A. Report the threshold th1.
14.9.3 Mark all pixels below threshold to obtain image BA2.
14.9.4 Apply closing operation with an n × n structure element to BA2 with n ≥ 3. Report n.
14.9.5 Identify all topologically connected regions of BA2.
14.9.6 Discard all connected regions with the number of pixels below a specified pixels count cp1. Report cp1.
14.9.7 The remaining connected marked pixels constitute the defective area DA (see Figure 4).
14.9.8 Optional: Smooth boundaries between DA and other regions. Report Blur filter characteristics used for smoothing.
14.9.9 Mark DA for further analysis. Report the pixel count cpDA of DA in percent of the total wafer pixel count.
14.10 Step 4, determination of dark line defects:
14.10.1 Perform bottom hat filtering on A with m × m kernel resulting in BL1 with m ≥ 3. Report m.
14.10.2 Perform a threshold operation on BL1 with threshold th2. Report threshold th2.
14.10.3 Mark all pixels above threshold to obtain image BL2.
14.10.4 Perform a thinning operation on BL2 resulting in BL3.
14.10.5 Identify all topologically connected regions
14.10.6 Discard all connected regions in BL3 with pixel count < cp2 from further analysis. Report cp2.
14.10.7 Proceed with step 5, ¶ 14.12
14.10.8 Discard all pixels of the defective area DA and defect clusters DC.
14.10.9 The remaining marked pixels constitute the dark line defects DL (see Figure 5).
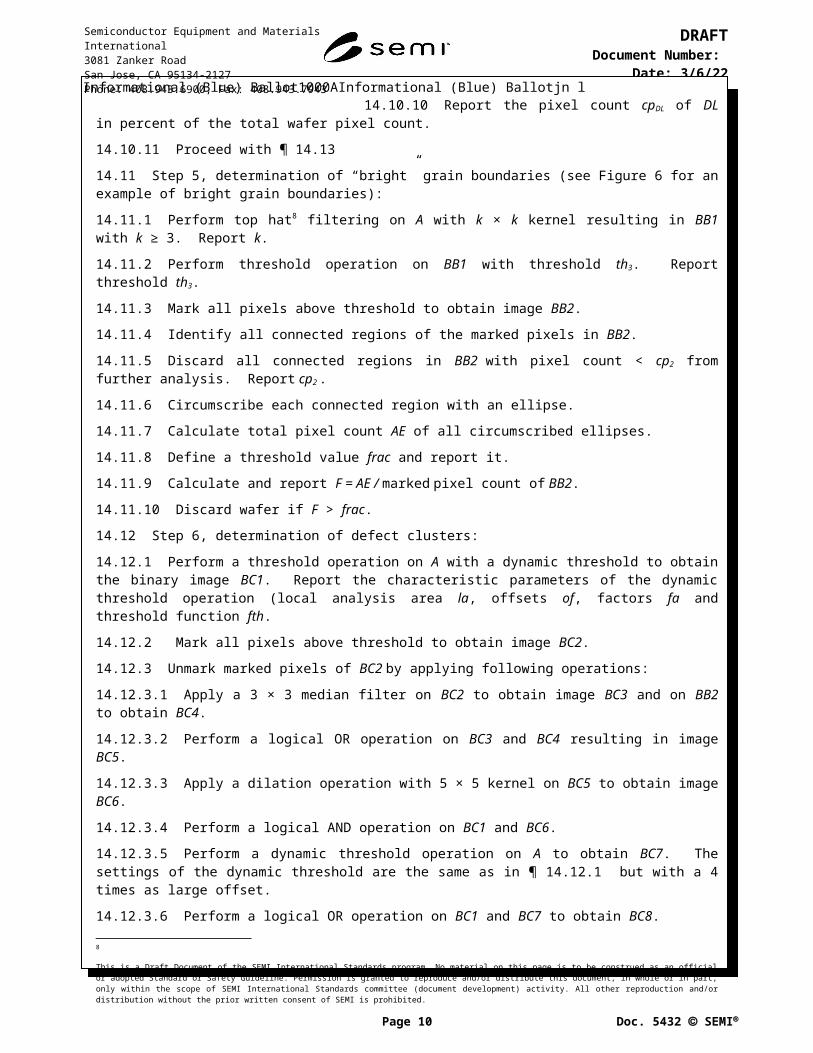
14.10.10 Report the pixel count cpDL of DL in percent of the total wafer pixel count.
14.10.11 Proceed with ¶ 14.13
14.11 Step 5, determination of “bright” grain boundaries (see Figure 6 for an example of bright grain boundaries):
14.11.1 Perform top hat8 filtering on A with k × k kernel resulting in BB1 with k ≥ 3. Report k.
14.11.2 Perform threshold operation on BB1 with threshold th3. Report threshold th3.
14.11.3 Mark all pixels above threshold to obtain image BB2.
14.11.4 Identify all connected regions of the marked pixels in BB2.
14.11.5 Discard all connected regions in BB2 with pixel count < cp2 from further analysis. Report cp2 .
14.11.6 Circumscribe each connected region with an ellipse.
14.11.7 Calculate total pixel count AE of all circumscribed ellipses.
14.11.8 Define a threshold value frac and report it.
14.11.9 Calculate and report F = AE / marked pixel count of BB2.
14.11.10 Discard wafer if F > frac.
14.12 Step 6, determination of defect clusters:
14.12.1 Perform a threshold operation on A with a dynamic threshold to obtain the binary image BC1. Report the characteristic parameters of the dynamic threshold operation (local analysis area la, offsets of, factors fa and threshold function fth.
8
This is a Draft Document of the SEMI International Standards program. No material on this page is to be construed as an official or adopted Standard or Safety Guideline. Permission is granted to reproduce and/or distribute this document, in whole or in part, only within the scope of SEMI International Standards committee (document development) activity. All other reproduction and/or distribution without the prior written consent of SEMI is prohibited.
Page 6 Doc. jn l SEMI
Semiconductor Equipment and Materials International3081 Zanker RoadSan Jose, CA 95134-2127Phone: 408.943.6900, Fax: 408.943.7943

DRAFTDocument Number:
Date: 5/8/23
14.12.2 Mark all pixels above threshold to obtain image BC2.
14.12.3 Unmark marked pixels of BC2 by applying following operations:
14.12.3.1 Apply a 3 × 3 median filter on BC2 to obtain image BC3 and on BB2 to obtain BC4.
14.12.3.2 Perform a logical OR operation on BC3 and BC4 resulting in image BC5.
14.12.3.3 Apply a dilation operation with 5 × 5 kernel on BC5 to obtain image BC6.
14.12.3.4 Perform a logical AND operation on BC1 and BC6.
14.12.3.5 Perform a dynamic threshold operation on A to obtain BC7. The settings of the dynamic threshold are the same as in ¶ 14.12.1 but with a 4 times as large offset.
14.12.3.6 Perform a logical OR operation on BC1 and BC7 to obtain BC8.
14.12.4 Apply open/close operations to BC8 with a p × p kernel to obtain image BC9. Report p.
14.12.5 Identify all connected regions in BC9.
14.12.6 Discard all connected regions in BC9 with pixel count < cp3 from further analysis. Report cp3.
14.12.7 Discard all pixels of the defective area DA.
14.12.8 The remaining marked pixels constitute the defect cluster area DC (see Figure 5).
14.12.9 Report the pixel count cpDC of the defect cluster area in percent of the total wafer pixel count.
14.12.10 Continue with ¶ 14.10.8
14.13 Step 7, estimation of normalized solar cell efficiency:
14.13.1 Estimate the normalized efficiency norm of a solar cell produced with this wafer by the following equation (1):
ηnorm=ηmax %−cpDA⋅k1−cpDL⋅k2−cpDC⋅k 3 (1)
with weighing factors k1, k2 and k3, which have to be determined experimentally for each solar cell process by comparing the efficiency of the resulting solar cell with max of a solar cell where cpDA = cpDL = cpDC = 0.
14.14 Report if any of the steps 1 to 7 have been skipped.
15 Report15.1 The report shall contain the following elements.
15.2 General Information
15.2.1 Date and time of test.
15.2.2 Identification of operator.
15.2.3 Identification number of measurement equipment.
15.2.4 Software revision.
15.2.5 Calibration and SPC status of measurement equipment.
15.2.6 Ambient temperature.
15.2.7 Lot identification, including each wafer ID.
15.2.8 Date of calibration.
15.2.9 ID number of calibration wafer.
15.3 Image recording parameters
15.3.1 Width w of illuminated strip.
This is a Draft Document of the SEMI International Standards program. No material on this page is to be construed as an official or adopted Standard or Safety Guideline. Permission is granted to reproduce and/or distribute this document, in whole or in part, only within the scope of SEMI International Standards committee (document development) activity. All other reproduction and/or distribution without the prior written consent of SEMI is prohibited.
Page 7 Doc. jn l SEMI
Semiconductor Equipment and Materials International3081 Zanker RoadSan Jose, CA 95134-2127Phone: 408.943.6900, Fax: 408.943.7943

DRAFTDocument Number:
Date: 5/8/23
15.3.2 Angle of incidence AOI.
15.3.3 Wavelength e of illumination.
15.3.4 Wavelength pl of PL radiation.
15.4 Image processing parameters
15.4.1 Report the image processing parameters according to Table 1.
15.4.2 Report size and pattern of structure elements if other ones than displayed in Figs. 2 and 3 are used.
15.5 Wafer characteristics
15.5.1 Relative defective area cpDA.
15.5.2 Relative area of dark line defects cpDC.
15.5.3 Relative area of defect clusters cpDN.
15.5.4 Weighing parameters k1, k2, k3.
15.5.5 norm
This is a Draft Document of the SEMI International Standards program. No material on this page is to be construed as an official or adopted Standard or Safety Guideline. Permission is granted to reproduce and/or distribute this document, in whole or in part, only within the scope of SEMI International Standards committee (document development) activity. All other reproduction and/or distribution without the prior written consent of SEMI is prohibited.
Page 8 Doc. jn l SEMI
Semiconductor Equipment and Materials International3081 Zanker RoadSan Jose, CA 95134-2127Phone: 408.943.6900, Fax: 408.943.7943

DRAFTDocument Number:
Date: 5/8/23
Table 1 Image Processing Parameters
Processing Step Parameter Value or Text Unit
2 Filter type
2 Filter settings
2 Kernel size n px
3 Threshold th1 bit
3 Kernel size n px
3 Pixel count cp1 px
3 Blur filter kernel size, if applicable px
4 Threshold th2 bit
4 Kernel size m px
4 Size and pattern of structure elements for thinning, if applicable
4 Pixel count cp2 px
6 Threshold function
6 Pixel count cp3 px
16 Precision and Bias16.1 No certified reference materials currently exist for establishing the accuracy of measurement equipment that can be used with equipment as described in this test method. Therefore, bias of equipment performing these measurements has not been developed.
16.2 Provisional reference materials may be qualified by using appropriate equipment that is capable measuring certified reference materials as well as silicon wafers (SEMI MF1569).
16.3 In the absence of inter-laboratory test data to establish its reproducibility this test method should be used for materials specification and acceptance only after the parties to the test have established reproducibility and correlation.
17 Related Documents17.1 B. Birkmann, A. Huesler, A. Seidl, K. Ramspeck, H. Nagel, Analysis of Multicrystalline Wafers Originating from Corner and Edge Bricks and Forecast of Cell Properties, Proc. of 26th European Photovoltaic Solar Energy Conference, Hamburg 2011, WIP, Munich 2011, H. Ossenbrink, A. Jaeger-Waldau, P. Helm, eds., p. 937 – 940.
This is a Draft Document of the SEMI International Standards program. No material on this page is to be construed as an official or adopted Standard or Safety Guideline. Permission is granted to reproduce and/or distribute this document, in whole or in part, only within the scope of SEMI International Standards committee (document development) activity. All other reproduction and/or distribution without the prior written consent of SEMI is prohibited.
Page 9 Doc. jn l SEMI
Semiconductor Equipment and Materials International3081 Zanker RoadSan Jose, CA 95134-2127Phone: 408.943.6900, Fax: 408.943.7943
DRAFTDocument Number:
Date: 5/8/23
NOTE: The belts represent generically the transport mechanism.Figure 1
Schematic Drawing of the Set-up for Obtaining a Photoluminescence Image.
NOTE: The origin of the structure element is at its center.Figure 2
A 3 × 3 Structure Element/Kernel as an Example of the Structure Elements to Be Used for the Erosion and Dilation Processes.
This is a Draft Document of the SEMI International Standards program. No material on this page is to be construed as an official or adopted Standard or Safety Guideline. Permission is granted to reproduce and/or distribute this document, in whole or in part, only within the scope of SEMI International Standards committee (document development) activity. All other reproduction and/or distribution without the prior written consent of SEMI is prohibited.
Page 10 Doc. jn l SEMI
1 1
1 1
1 1
1
1
1
digital line camera
wafer transport direction, x-direction
wafer
laser light projector
projected laser light strip
surface normal and line of sight of camera
transport belts
filter
AOI
Semiconductor Equipment and Materials International3081 Zanker RoadSan Jose, CA 95134-2127Phone: 408.943.6900, Fax: 408.943.7943

DRAFTDocument Number:
Date: 5/8/23
NOTE: The origin of the structure elements E1 to E8 is at their centers.Figure 3
The Structure Elements to Be Used for the Thinning Operation.
Figure 4Example of a Wafer with Marked Defective Area.9
9 Source and copyright: meyerburger.picturepark.com
This is a Draft Document of the SEMI International Standards program. No material on this page is to be construed as an official or adopted Standard or Safety Guideline. Permission is granted to reproduce and/or distribute this document, in whole or in part, only within the scope of SEMI International Standards committee (document development) activity. All other reproduction and/or distribution without the prior written consent of SEMI is prohibited.
Page 11 Doc. jn l SEMI
0 0
1 1
1
0
1
0
1
1 0
0
1
1
1 0
1 0
1 01
1 1
0 0
1
1
0
1
0
1 1
1
0
0
1
0
1 0
1
1
0
0 1
0 1
1 10
0
1
1 1
0
0
1
E1 E2 E3 E4
E5 E6 E7 E8
Semiconductor Equipment and Materials International3081 Zanker RoadSan Jose, CA 95134-2127Phone: 408.943.6900, Fax: 408.943.7943
DRAFTDocument Number:
Date: 5/8/23
NOTE: Pink lines mark the dark line defects, red lines border the defect clustersFigure 5
Example of Wafer with Marked Dark Line Defects and Defect Clusters.
Figure 6Example of a Wafer with a High Density of Bright Grain Boundaries.
This is a Draft Document of the SEMI International Standards program. No material on this page is to be construed as an official or adopted Standard or Safety Guideline. Permission is granted to reproduce and/or distribute this document, in whole or in part, only within the scope of SEMI International Standards committee (document development) activity. All other reproduction and/or distribution without the prior written consent of SEMI is prohibited.
Page 12 Doc. jn l SEMI
Semiconductor Equipment and Materials International3081 Zanker RoadSan Jose, CA 95134-2127Phone: 408.943.6900, Fax: 408.943.7943

DRAFTDocument Number:
Date: 5/8/23
NOTICE: Semiconductor Equipment and Materials International (SEMI) makes no warranties or representations as to the suitability of the Standards and Safety Guidelines set forth herein for any particular application. The determination of the suitability of the Standard or Safety Guideline is solely the responsibility of the user. Users are cautioned to refer to manufacturer’s instructions, product labels, product data sheets, and other relevant literature, respecting any materials or equipment mentioned herein. Standards and Safety Guidelines are subject to change without notice.
By publication of this Standard or Safety Guideline, SEMI takes no position respecting the validity of any patent rights or copyrights asserted in connection with any items mentioned in this Standard or Safety Guideline. Users of this Standard or Safety Guideline are expressly advised that determination of any such patent rights or copyrights, and the risk of infringement of such rights are entirely their own responsibility.
This is a Draft Document of the SEMI International Standards program. No material on this page is to be construed as an official or adopted Standard or Safety Guideline. Permission is granted to reproduce and/or distribute this document, in whole or in part, only within the scope of SEMI International Standards committee (document development) activity. All other reproduction and/or distribution without the prior written consent of SEMI is prohibited.
Page 13 Doc. jn l SEMI
Semiconductor Equipment and Materials International3081 Zanker RoadSan Jose, CA 95134-2127Phone: 408.943.6900, Fax: 408.943.7943