Embed Size (px)
Citation preview
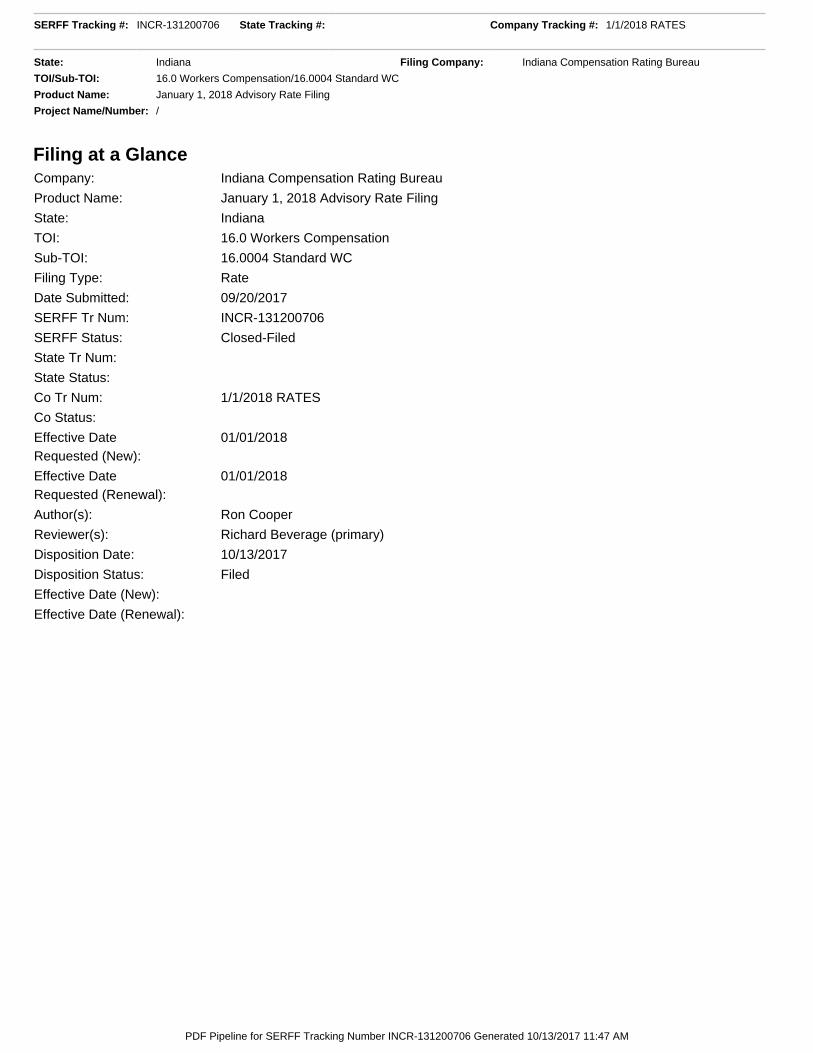
Filing at a Glance Company: Indiana Compensation Rating Bureau
Product Name: January 1, 2018 Advisory Rate Filing
State: Indiana
TOI: 16.0 Workers Compensation
Sub-TOI: 16.0004 Standard WC
Filing Type: Rate
Date Submitted: 09/20/2017
SERFF Tr Num: INCR-131200706
SERFF Status: Closed-Filed
State Tr Num:
State Status:
Co Tr Num: 1/1/2018 RATES
Co Status:
Effective DateRequested (New):
01/01/2018
Effective DateRequested (Renewal):
01/01/2018
Author(s): Ron Cooper
Reviewer(s): Richard Beverage (primary)
Disposition Date: 10/13/2017
Disposition Status: Filed
Effective Date (New):
Effective Date (Renewal):
SERFF Tracking #: INCR-131200706 State Tracking #: Company Tracking #: 1/1/2018 RATES
State: Indiana Filing Company: Indiana Compensation Rating Bureau
TOI/Sub-TOI: 16.0 Workers Compensation/16.0004 Standard WC
Product Name: January 1, 2018 Advisory Rate Filing
Project Name/Number: /
PDF Pipeline for SERFF Tracking Number INCR-131200706 Generated 10/13/2017 11:47 AM

General Information
Company and Contact
Filing Fees
Project Name: Status of Filing in Domicile: Pending
Project Number: Domicile Status Comments:
Reference Organization: Reference Number:
Reference Title: Advisory Org. Circular: ICRB Circular 2017-06
Filing Status Changed: 10/13/2017 Company Status Changed:
State Status Changed: Deemer Date:
Created By: Ron Cooper Submitted By: Ron Cooper
Corresponding Filing Tracking Number:
Filing Description:
Full filing of advisory loss costs, advisory rates and rating values for both voluntary and assigned risk business effectiveJanuary 1, 2018 for new and renewal policies. This filing proposes a 12.1% decrease to the overall voluntary loss cost leveland a 12.8% decrease to the overall voluntary and assigned risk rate level.
Filing Contact InformationRon Cooper, President [email protected]
5920 Castleway W Dr
Indianapolis, IN 46250
317-842-2800 [Phone] 301 [Ext]
Filing Company InformationIndiana Compensation RatingBureau
5920 Castleway W Dr
Indianapolis, IN 46250
(317) 842-2800 ext. 301[Phone]
CoCode:
Group Code:
Group Name: ICRB
FEIN Number: 35-0837318
State of Domicile: Indiana
Company Type: RatingOrganization
State ID Number:
Fee Required? Yes
Fee Amount: $35.00
Retaliatory? No
Fee Explanation:
Per Company: Yes
Company Amount Date Processed Transaction #Indiana Compensation Rating Bureau $35.00 09/20/2017 128865038
SERFF Tracking #: INCR-131200706 State Tracking #: Company Tracking #: 1/1/2018 RATES
State: Indiana Filing Company: Indiana Compensation Rating Bureau
TOI/Sub-TOI: 16.0 Workers Compensation/16.0004 Standard WC
Product Name: January 1, 2018 Advisory Rate Filing
Project Name/Number: /
PDF Pipeline for SERFF Tracking Number INCR-131200706 Generated 10/13/2017 11:47 AM
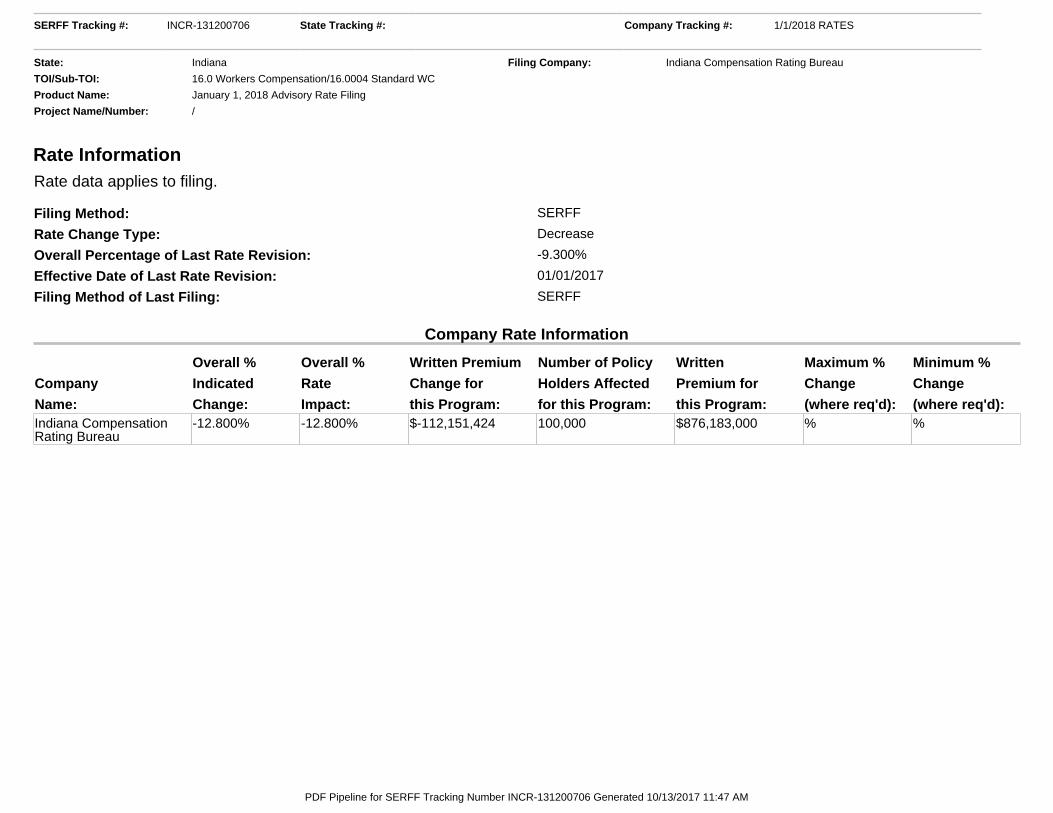
Rate Information Rate data applies to filing.
Filing Method: SERFF
Rate Change Type: Decrease
Overall Percentage of Last Rate Revision: -9.300%
Effective Date of Last Rate Revision: 01/01/2017
Filing Method of Last Filing: SERFF
Company Rate Information
Company
Name:
Overall %
Indicated
Change:
Overall %
Rate
Impact:
Written Premium
Change for
this Program:
Number of Policy
Holders Affected
for this Program:
Written
Premium for
this Program:
Maximum %
Change
(where req'd):
Minimum %
Change
(where req'd):Indiana CompensationRating Bureau
-12.800% -12.800% $-112,151,424 100,000 $876,183,000 % %
SERFF Tracking #: INCR-131200706 State Tracking #: Company Tracking #: 1/1/2018 RATES
State: Indiana Filing Company: Indiana Compensation Rating Bureau
TOI/Sub-TOI: 16.0 Workers Compensation/16.0004 Standard WC
Product Name: January 1, 2018 Advisory Rate Filing
Project Name/Number: /
PDF Pipeline for SERFF Tracking Number INCR-131200706 Generated 10/13/2017 11:47 AM
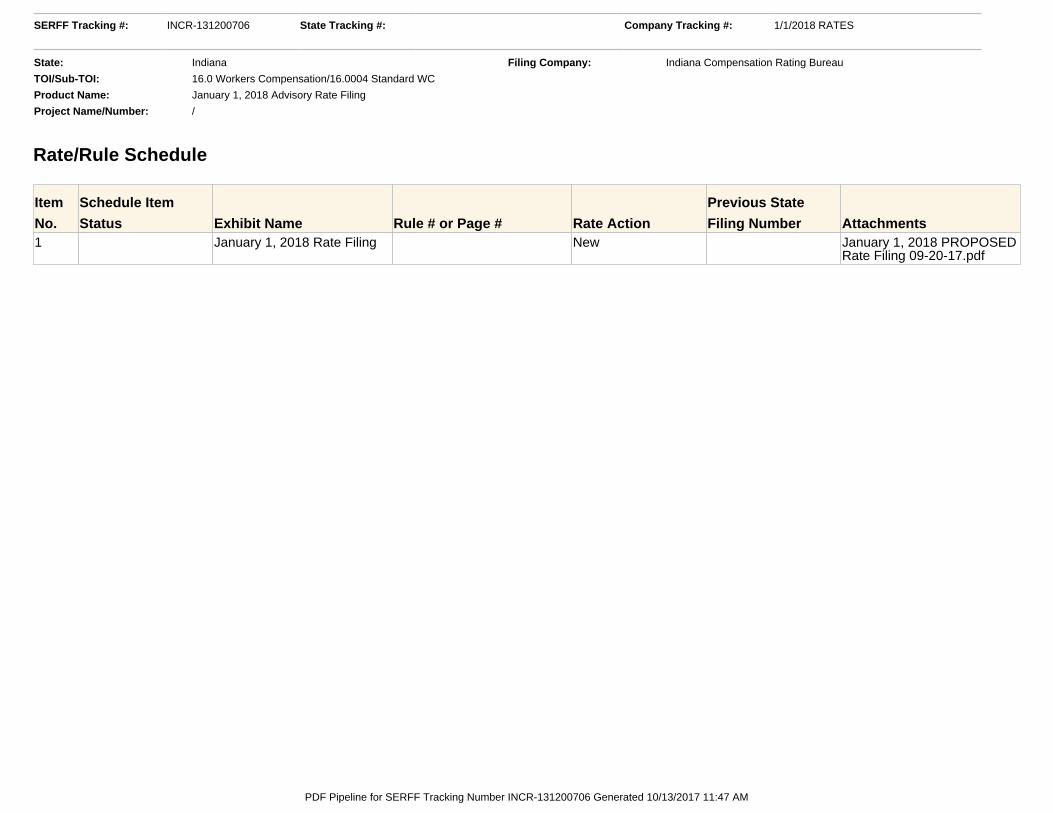
Rate/Rule Schedule
Item
No.
Schedule Item
Status Exhibit Name Rule # or Page # Rate Action
Previous State
Filing Number Attachments1 January 1, 2018 Rate Filing New January 1, 2018 PROPOSED
Rate Filing 09-20-17.pdf
SERFF Tracking #: INCR-131200706 State Tracking #: Company Tracking #: 1/1/2018 RATES
State: Indiana Filing Company: Indiana Compensation Rating Bureau
TOI/Sub-TOI: 16.0 Workers Compensation/16.0004 Standard WC
Product Name: January 1, 2018 Advisory Rate Filing
Project Name/Number: /
PDF Pipeline for SERFF Tracking Number INCR-131200706 Generated 10/13/2017 11:47 AM
© Copyright 2017 National Council on Compensation Insurance, Inc. All Rights Reserved.
Indiana
Advisory Loss Costs, Advisory Rates, Assigned Risk Rates, andRating Values Filing
Proposed Effective January 1, 2018

September 20, 2017
Steve Robertson Commissioner of Insurance Indiana Department of Insurance 311 W. Washington St., Suite 300 Indianapolis, IN 46204-2787
RE: Workers Compensation Advisory Loss Costs, Rates, and Rating Values: Indiana Voluntary and Assigned Risk Markets
Dear Commissioner Robertson:
In accordance with the applicable statutes and regulations in the state of Indiana, I am filing for your consideration and approval the workers compensation advisory loss costs, advisory rates, and rating values for the Indiana voluntary market and assigned risk rates and rating values for the Indiana assigned risk market.
This filing proposes a 12.1% decrease to the overall voluntary loss cost level and a 12.8% decrease to the overall voluntary and assigned risk rate level to become effective on January 1, 2018 for new and renewal business.
Please note the following in connection with this filing:
1. As a result of Item B-1397, effective July 1, 2007, a single combined rate is still calculatedfor Class Codes 7710 and 7711 via a payroll-weighted average of the separately indicatedrates for these two Class Codes.
2. As a result of Item B-1435, effective January 1, 2018:a. Class Code 1655 is discontinued and the rate for Class Code 1642 is payroll
weighted to reflect the combined experience of Class Codes 1642 and 1655.b. Class Codes 1741 and 1853 are discontinued and the rate for Class Code 1701 is
payroll weighted to reflect the combined experience of Class Codes 1701, 1741, and1853.
c. Class Codes 1860, 4282 and 4279 are combined to reflect the first year of a two-year transition program. In the second year of the transition, Class Codes 1860 and 4282 will be discontinued.
d. Class Codes 2534 and 2501 are combined to reflect the first year of a two-yeartransition program. In the second year of the transition, Class Code 2534 will be discontinued.
e. Class Code 3175 is discontinued and the rate for Class Code 3169 is payrollweighted to reflect the combined experience of Class Codes 3175 and 3169.
f. Class Code 3223 is discontinued and the rate for Class Code 3180 is payrollweighted to reflect the combined experience of Class Codes 3223 and 3180.
g. Class Codes 4113 and 4111 are combined to reflect the first year of a two-yeartransition program. In the second year of the transition, Class Code 4113 will be discontinued.
h. Class Codes 4053, 4061 and 4062 are combined to reflect the first year of a three-year transition program. In the third year of the transition, Class Codes 4053 and 4061 will be discontinued.
i. Class Code 4439 is discontinued and the rate for Class Code 4558 is payroll weighted to reflect the combined experience of Class Codes 4439 and 4558.
j. Class Codes 4716 and 4683 are combined to reflect the first year of a three-year transition program. In the third year of the transition, Class Code 4716 will be discontinued.
k. Class Code 5069 is discontinued and the rate for Class Code 5059 is payroll weighted to reflect the combined experience of Class Codes 5059 and 5069.
l. Class Code 6017 is discontinued and the rate for Class Code 5213 is payroll weighted to reflect the combined experience of Class Codes 5213 and 6017.
m. Class Codes 7228 and 7229 are discontinued and the rate for Class Code 7219 is established and payroll weighted to reflect the combined experience of Class Codes 7228 and 7229.
n. Class Code 7225 is established. 3. As a result of Item R-1413, the retrospective rating plan parameters were updated.
Our desire is to make this filing as clear as possible. For additional information, we would be glad to meet with you at your convenience.
We make this filing on behalf of the members and subscribers of the Indiana Compensation Rating Bureau. All persons on the “Interested Persons List” have been notified of the captioned filing.
We respectfully request that the filing be “Filed” electronically via the NAIC SERFF system within thirty days.
Sincerely, Actuarial content prepared by:
Ronald W. Cooper, CWCP Robert Moss, ACAS, MAAA President Assistant Actuary, NCCI Enclosure
Copyright 2017 National Council on Compensation Insurance, Inc. All Rights Reserved. These materials are comprised of NCCI actuarial judgment and proprietary and confidential information which are valuable assets of NCCI and are protected by copyright and other intellectual property laws. Any persons in the legal possession of these materials are required to maintain them in the strictest confidence and shall implement sufficient safeguards to protect the confidentiality of such materials in the same respect as it protects its own intellectual property. NCCI will seek appropriate legal remedies for any unauthorized use, sale, reproduction, distribution, preparation of derivative works, or transfer of this material, or any part thereof in any media. Authorized uses of these materials are governed by one or more agreements between NCCI and an end user. Unless expressly authorized by NCCI, you may not copy, create derivative works (by way of example, create or supplement your own works, or other materials), display, perform, or use the materials, in whole or in part, in any media and in any manner including posting to a web site. NCCI MAKES NO REPRESENTATIONS OR WARRANTIES RELATING TO THESE MATERIALS, INCLUDING ANY EXPRESS, STATUTORY OR IMPLIED WARRANTIES INCLUDING THE IMPLIED WARRANTY OF MERCHANTABILITY AND FITNESS FOR A PARTICULAR PURPOSE. ADDITIONALLY, AUTHORIZED END USERS ASSUME RESPONSIBILITY FOR THE USE OF, AND FOR ANY AND ALL RESULTS DERIVED OR OBTAINED THROUGH THE USE OF SUCH MATERIALS.
Indiana
Advisory Loss Costs, Advisory Rates, and Assigned Risk Rates Filing – January 1, 2018
Actuarial Certification
I, Rob Moss, am an Assistant Actuary for the National Council on Compensation Insurance, Inc. I am an Associate of the Casualty Actuarial Society and a member of the American Academy of Actuaries, and I meet the Qualification Standards of the American Academy of Actuaries to provide the actuarial report contained herein.
The information contained in this report has been prepared under my direction in accordance with applicable Actuarial Standards of Practice as promulgated by the Actuarial Standards Board. The Actuarial Standards Board is vested by the U.S.-based actuarial organizations with the responsibility for promulgating Actuarial Standards of Practice for actuaries providing professional services in the United States. Each of these organizations requires its members, through its Code of Professional Conduct, to observe the Actuarial Standards of Practice when practicing in the United States.
Robert Moss, ACAS, MAAA Assistant Actuary Actuarial & Economic Services
© Copyright 2017 National Council on Compensation Insurance, Inc. All Rights Reserved.
Indiana
Advisory Loss Costs, Advisory Rates, and Assigned Risk Rates Filing – January 1, 2018
Disclosures
Purpose of the Report
The purpose of this report is to provide the proposed advisory rates and loss costs, assigned risk rates, and rating values for workers compensation policies in Indiana, proposed to be effective January 1, 2018. The intended users of this report are:
The Indiana Department of Insurance Affiliated carriers, for their reference in determining workers compensation rates
Scope
The prospective advisory rates are intended to cover the indemnity and medical benefits provided under the system, the expenses associated with providing these benefits (loss adjustment expenses) and any other costs associated with providing workers compensation insurance (such as commissions, taxes, etc.). The filing also contains advisory loss costs. The prospective loss costs are intended to cover the indemnity and medical benefits provided under the system, as well as some of the expenses associated with providing these benefits (loss adjustment expenses). They do not, however, contemplate any other costs associated with providing workers compensation insurance (such as commissions, taxes, etc.).
Carriers offering workers compensation insurance in Indiana may desire to a) adopt the advisory rates which are based on NCCI’s compilations of expense data, b) deviate from the advisory rates, or c) adopt the advisory loss costs to which they would apply their own expense provisions. The latter option can be accomplished through a loss cost multiplier that is applied to the approved advisory prospective loss costs in order to compute the final workers compensation rates that a carrier intends to charge. This multiplier is intended to cover the other costs associated with providing workers compensation insurance that are not already part of the advisory prospective loss costs. Employers unable to secure coverage in the voluntary market can apply for such coverage in the assigned risk market. The proposed rates for the voluntary market are also applicable to the assigned risk policies, with a proposed effective date of January 1, 2018. Currently, assigned risk policies with premium greater than $2,500 are assessed a 25% surcharge, with the surcharge being applied to the premium amount above $2,500. This filing proposes no change to the assigned risk surcharge.
© Copyright 2017 National Council on Compensation Insurance, Inc. All Rights Reserved.
Indiana
Advisory Loss Costs, Advisory Rates, and Assigned Risk Rates Filing – January 1, 2018
Disclosures
Data Sources and Dates
The overall average loss cost level change is based on a review of Financial Call Data, which is an aggregation of workers compensation data annually reported to NCCI. In this filing, Financial Call Data submissions received after July 25, 2017 were not considered for inclusion in the analysis. Advisory rate and loss cost level changes at the classification code level are based on Unit Statistical Data, which is the audited exposure, premium and loss information reported to NCCI on a policy level. In this filing, Unit Statistical Data submissions received after July 14, 2017 were not considered for inclusion in the analysis. In some areas, NCCI’s analysis also relies on other data sources, which are reviewed for reasonableness and are referenced in the filing where applicable. This filing was prepared as of August 23, 2017. Therefore, events that occurred after this date that may have a material impact on workers compensation costs in this jurisdiction have not been considered in the analysis. NCCI maintains several data reporting initiatives and programs to assist carriers to report data and to ensure that the data that is reported to NCCI is complete, accurate, and reported in a timely fashion. Occasionally, a carrier’s data submission is not available for use in an NCCI filing either because the data was not reported prior to the filing, had quality issues, or NCCI determined that the data that was reported should not be included in the filing based on NCCI's actuarial judgment. Data for all carriers writing at least one-tenth of one percent of the Indiana workers compensation written premium volume have been included in the experience period on which this filing is based. Other exclusions are made for the purposes of analysis, but do not have a material impact on the proposed changes in this filing. Methodology Changes
Two changes were made to the General and Production Expense Provision Calculations shown in Exhibit II:
1. The calculation of “Effect of Carrier Deviations” was updated to adjust the Company Standard Premium to remove an average Profit and Contingency provision of 2.5% and
© Copyright 2017 National Council on Compensation Insurance, Inc. All Rights Reserved.
Indiana
Advisory Loss Costs, Advisory Rates, and Assigned Risk Rates Filing – January 1, 2018
Disclosures
an Expense Constant of $160 for those states where NCCI files loss costs. This change was made to better capture deviations in Company Standard Premium relative to NCCI level premium not including Profit and Contingency or Expense Constant. This change impacts the calculation of “Gross Adjusted Premium” for the General Expense Provision and the calculation of “Gross Direct Written Premium” for the Production Expense Provision.
2. The calculation of “Adjusted Direct Written Premium” was changed to no longer adjust forthe effect of schedule rating and carrier deviations. This change was made to better align the commissions paid with the premium dollars upon which they were based. This change impacts the calculation of “Direct Commission & Brokerage Provision” for the Production Expense Provision.
The impact of these changes was negligible to the overall General and Production Expense Provisions.
Risks and Uncertainty
This filing includes assumptions and projections concerning the future. As with any prospective analysis, there exists estimation uncertainty in these assumptions and projections. Areas of this analysis subject to estimation uncertainty that could have a material impact on the final results include the following:
Projection of future loss development Selection of loss ratio trends Potential impact of changes to laws and/or regulations
In addition, any future changes to workers compensation law or regulations that apply retroactively to policies or benefit claims on policies in the proposed effective period may have a significant impact on the adequacy of the advisory rates and loss costs proposed in this filing.
© Copyright 2017 National Council on Compensation Insurance, Inc. All Rights Reserved.

Indiana
Advisory Loss Costs, Advisory Rates, and Assigned Risk Rates Filing – January 1, 2018
Table of Contents
Part 1 Filing Overview
- Executive Summary - Overview of Methodology - Summary of Selections - Selections Underlying the Proposed Changes - Additional Proposed Changes
Part 2 Proposed Values
- Proposed Advisory Rates, Loss Costs, and Rating Values - Proposed Assigned Risk Rates and Rating Values - Proposed Values for Inclusion in the Experience Rating Plan Manual - Proposed Values for Inclusion in the Retrospective Rating Plan Manual
Part 3 Supporting Exhibits
- Exhibit I: Determination of the Indicated Rate Level Change - Exhibit II: Workers Compensation Expense Program - Appendix A: Factors Underlying the Proposed Advisory Rate Level Change - Appendix B: Calculations Underlying the Rate Change by Classification - Appendix C: Memoranda for Laws and Assessments
Part 4 Additional Information
- Definitions - Key Contacts
© Copyright 2017 National Council on Compensation Insurance, Inc. All Rights Reserved.
Page 1 of 138
Indiana
Advisory Loss Costs, Advisory Rates, and Assigned Risk Rates Filing – January 1, 2018
Part 1 Filing Overview
- Executive Summary
- Overview of Methodology
- Summary of Selections
- Selections Underlying the Proposed Changes
- Additional Proposed Changes
© Copyright 2017 National Council on Compensation Insurance, Inc. All Rights Reserved.
Page 2 of 138
Indiana
Advisory Loss Costs, Advisory Rates, and Assigned Risk Rates Filing – January 1, 2018
Executive Summary
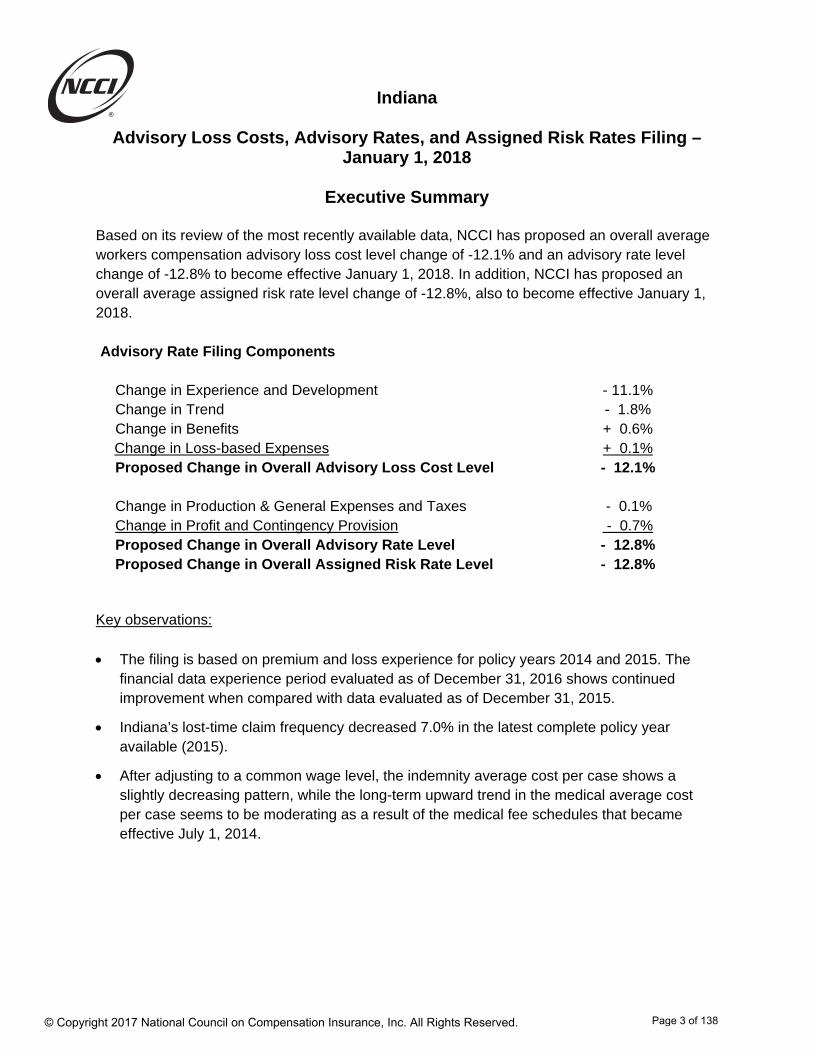
Based on its review of the most recently available data, NCCI has proposed an overall average workers compensation advisory loss cost level change of -12.1% and an advisory rate level change of -12.8% to become effective January 1, 2018. In addition, NCCI has proposed an overall average assigned risk rate level change of -12.8%, also to become effective January 1, 2018. Advisory Rate Filing Components
Change in Experience and Development - 11.1% Change in Trend - 1.8% Change in Benefits + 0.6% Change in Loss-based Expenses + 0.1% Proposed Change in Overall Advisory Loss Cost Level - 12.1% Change in Production & General Expenses and Taxes - 0.1% Change in Profit and Contingency Provision - 0.7% Proposed Change in Overall Advisory Rate Level - 12.8% Proposed Change in Overall Assigned Risk Rate Level - 12.8%
Key observations: The filing is based on premium and loss experience for policy years 2014 and 2015. The
financial data experience period evaluated as of December 31, 2016 shows continued improvement when compared with data evaluated as of December 31, 2015.
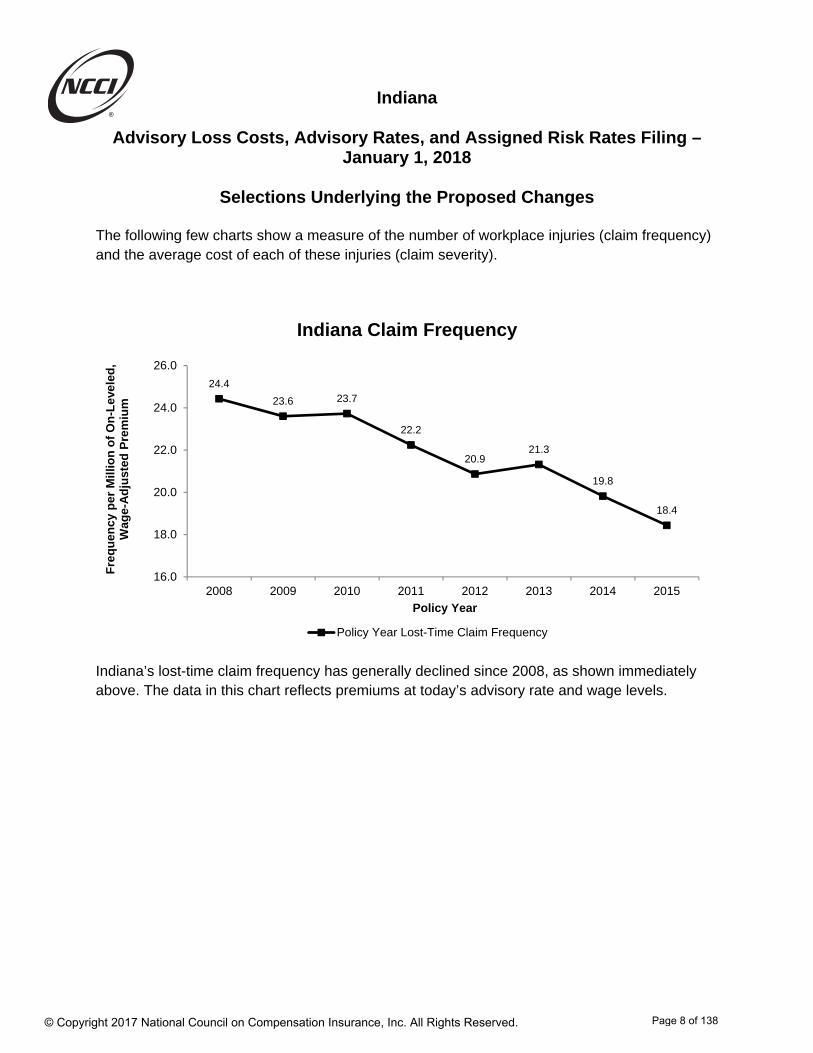
Indiana’s lost-time claim frequency decreased 7.0% in the latest complete policy year available (2015).
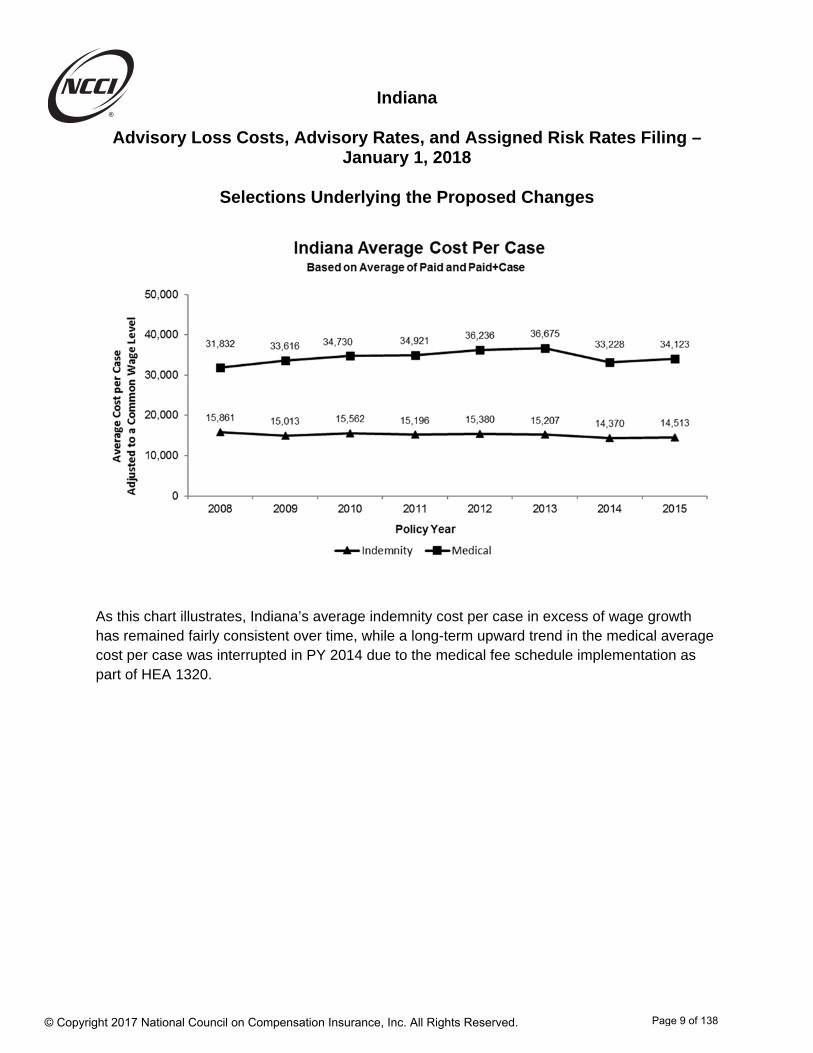
After adjusting to a common wage level, the indemnity average cost per case shows a slightly decreasing pattern, while the long-term upward trend in the medical average cost per case seems to be moderating as a result of the medical fee schedules that became effective July 1, 2014.
© Copyright 2017 National Council on Compensation Insurance, Inc. All Rights Reserved.
Page 3 of 138
Indiana
Advisory Loss Costs, Advisory Rates, and Assigned Risk Rates Filing – January 1, 2018
Executive Summary
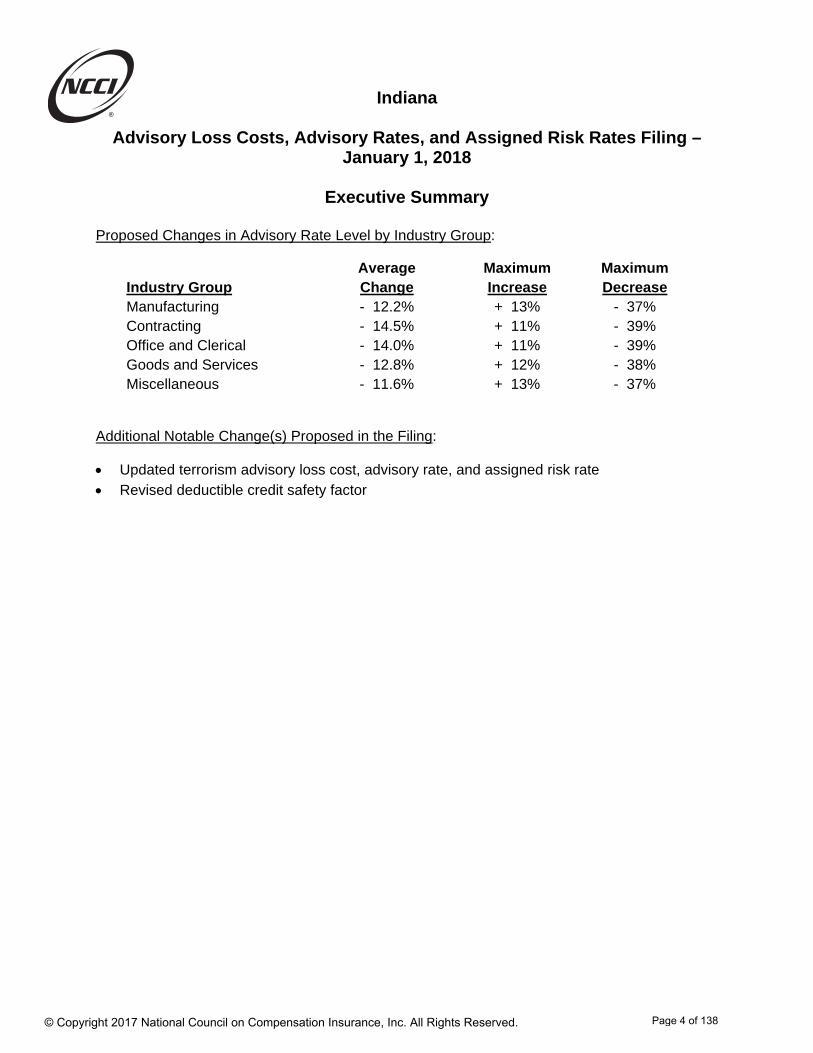
Proposed Changes in Advisory Rate Level by Industry Group:
Industry Group Average Change
Maximum Increase
Maximum Decrease
Manufacturing - 12.2% + 13% - 37% Contracting - 14.5% + 11% - 39% Office and Clerical - 14.0% + 11% - 39% Goods and Services - 12.8% + 12% - 38% Miscellaneous - 11.6% + 13% - 37%
Additional Notable Change(s) Proposed in the Filing:
Updated terrorism advisory loss cost, advisory rate, and assigned risk rate Revised deductible credit safety factor
© Copyright 2017 National Council on Compensation Insurance, Inc. All Rights Reserved.
Page 4 of 138
Indiana
Advisory Loss Costs, Advisory Rates, and Assigned Risk Rates Filing – January 1, 2018
Overview of Methodology
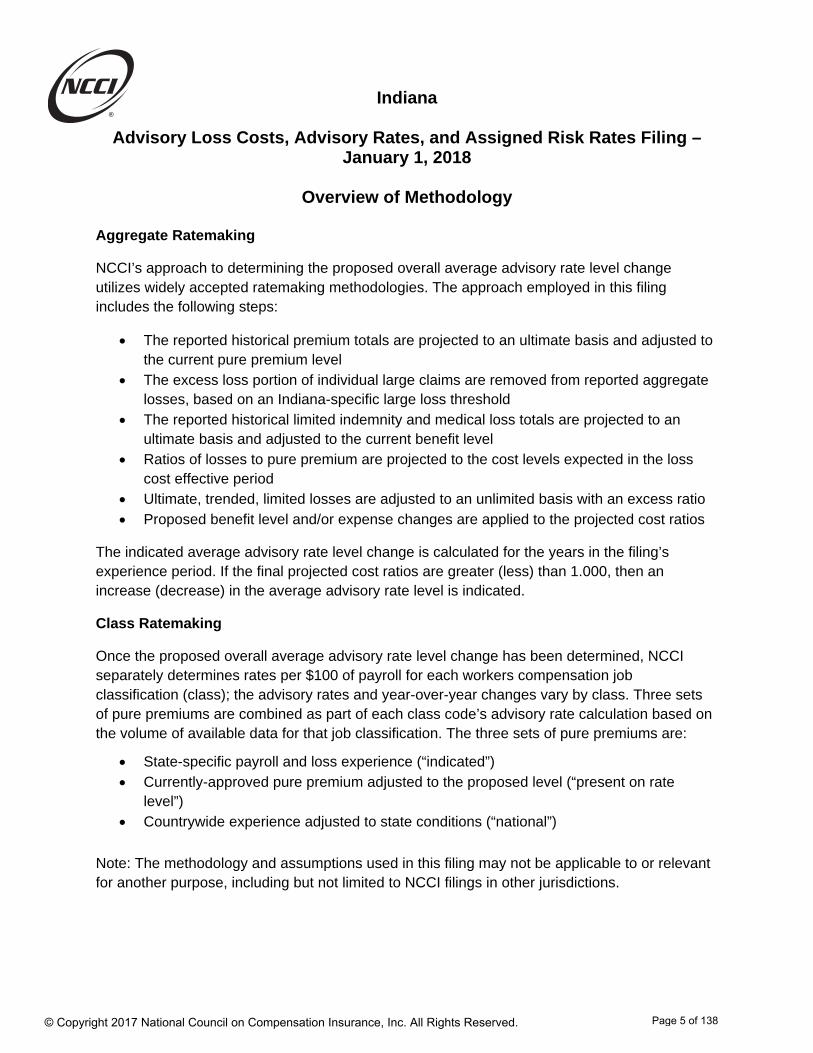
Aggregate Ratemaking
NCCI’s approach to determining the proposed overall average advisory rate level change utilizes widely accepted ratemaking methodologies. The approach employed in this filing includes the following steps:
The reported historical premium totals are projected to an ultimate basis and adjusted to the current pure premium level
The excess loss portion of individual large claims are removed from reported aggregate losses, based on an Indiana-specific large loss threshold
The reported historical limited indemnity and medical loss totals are projected to an ultimate basis and adjusted to the current benefit level
Ratios of losses to pure premium are projected to the cost levels expected in the loss cost effective period
Ultimate, trended, limited losses are adjusted to an unlimited basis with an excess ratio Proposed benefit level and/or expense changes are applied to the projected cost ratios
The indicated average advisory rate level change is calculated for the years in the filing’s experience period. If the final projected cost ratios are greater (less) than 1.000, then an increase (decrease) in the average advisory rate level is indicated.
Class Ratemaking
Once the proposed overall average advisory rate level change has been determined, NCCI separately determines rates per $100 of payroll for each workers compensation job classification (class); the advisory rates and year-over-year changes vary by class. Three sets of pure premiums are combined as part of each class code’s advisory rate calculation based on the volume of available data for that job classification. The three sets of pure premiums are:
State-specific payroll and loss experience (“indicated”) Currently-approved pure premium adjusted to the proposed level (“present on rate
level”) Countrywide experience adjusted to state conditions (“national”)
Note: The methodology and assumptions used in this filing may not be applicable to or relevant for another purpose, including but not limited to NCCI filings in other jurisdictions.
© Copyright 2017 National Council on Compensation Insurance, Inc. All Rights Reserved.
Page 5 of 138
Indiana
Advisory Loss Costs, Advisory Rates, and Assigned Risk Rates Filing – January 1, 2018
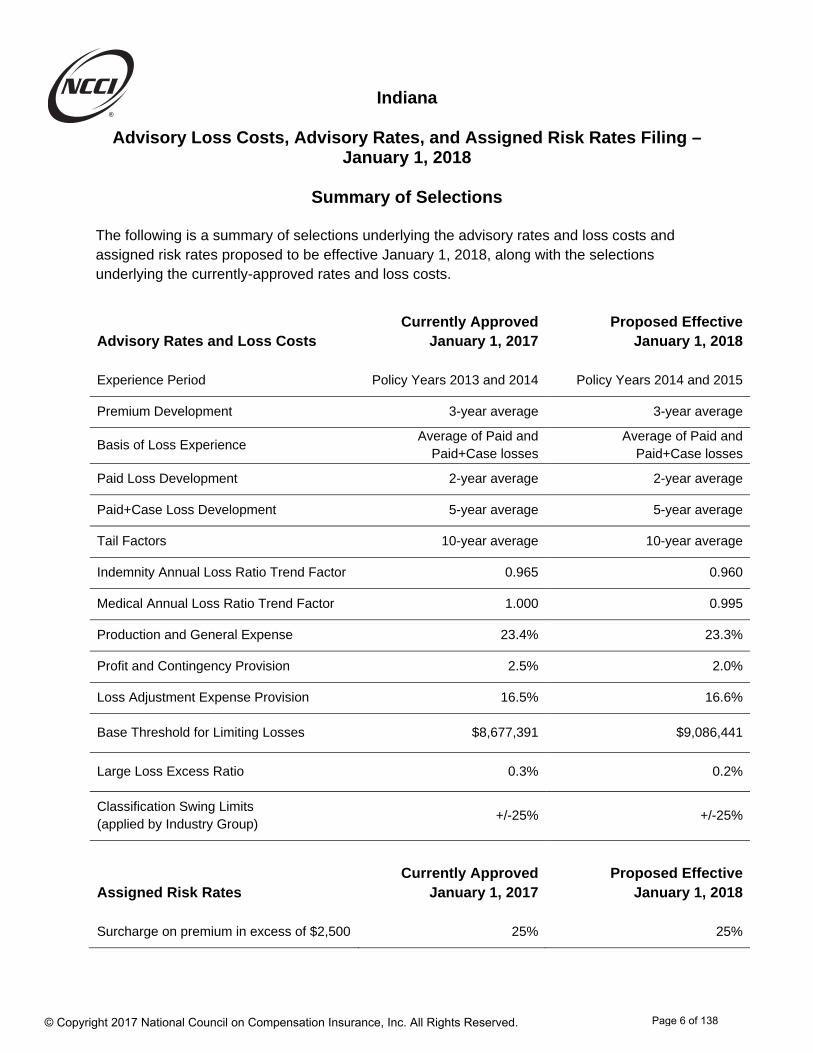
Summary of Selections
The following is a summary of selections underlying the advisory rates and loss costs and assigned risk rates proposed to be effective January 1, 2018, along with the selections underlying the currently-approved rates and loss costs.
Advisory Rates and Loss Costs
Currently ApprovedJanuary 1, 2017
Proposed EffectiveJanuary 1, 2018
Experience Period Policy Years 2013 and 2014 Policy Years 2014 and 2015
Premium Development 3-year average 3-year average
Basis of Loss Experience Average of Paid and
Paid+Case losses Average of Paid and
Paid+Case losses
Paid Loss Development 2-year average 2-year average
Paid+Case Loss Development 5-year average 5-year average
Tail Factors 10-year average 10-year average
Indemnity Annual Loss Ratio Trend Factor 0.965 0.960
Medical Annual Loss Ratio Trend Factor 1.000 0.995
Production and General Expense 23.4% 23.3%
Profit and Contingency Provision 2.5% 2.0%
Loss Adjustment Expense Provision 16.5% 16.6%
Base Threshold for Limiting Losses $8,677,391 $9,086,441
Large Loss Excess Ratio 0.3% 0.2%
Classification Swing Limits (applied by Industry Group)
+/-25% +/-25%
Assigned Risk Rates
Currently ApprovedJanuary 1, 2017
Proposed EffectiveJanuary 1, 2018
Surcharge on premium in excess of $2,500 25% 25%
© Copyright 2017 National Council on Compensation Insurance, Inc. All Rights Reserved.
Page 6 of 138
Indiana
Advisory Loss Costs, Advisory Rates, and Assigned Risk Rates Filing – January 1, 2018
Selections Underlying the Proposed Changes
Experience and Development
NCCI analyzed the emerging experience of Indiana workers compensation policies in recent years. The primary focus of our analysis was on premiums and losses from policy years 2014 and 2015 evaluated as of December 31, 2016. The most recently available full policy year is 2015 since the last policy had an effective date of December 31, 2015 and did not expire until December 31, 2016. During this year’s analysis, after reviewing various possible experience periods, the use of the two most recently available full policy years of data was selected as most appropriate in terms of providing balance between stability and responsiveness.
Different aggregations of loss experience were analyzed in preparation of this filing. These were (i) paid losses (benefit amounts already paid by insurers on reported claims) and (ii) the sum of paid losses plus case reserves (paid losses and the amounts set aside to cover future payments on those claims). In this filing, NCCI utilized loss development factors based on each of these two loss aggregations. This is consistent with NCCI filings made in the past several years in Indiana. Loss development factors are needed since paid losses and case reserve estimates on a given claim change over time until the claim is finally closed. The loss development factors are based on how paid losses and case reserve estimates changed over time for claims from older years. In this filing, NCCI selected development factors appropriate for the experience base.
Trend
This filing relies primarily on the experience from policy years 2014 and 2015. However, the proposed advisory loss cost, advisory rate, and assigned risk rates are intended for use with policies with effective dates starting on January 1, 2018. It is necessary to use trend factors that forecast how much the future Indiana workers compensation experience will differ from the past. These trend factors measure anticipated changes in the amount of indemnity and medical benefits as compared with anticipated changes in the amount of workers’ wages. For example, if benefit costs are expected to grow faster than wages, then a trend factor greater than zero is indicated. Conversely, if wages are expected to grow faster than benefit costs, then a trend factor less than zero is indicated.
While historical changes in claim frequency and average cost per case were also reviewed, NCCI applies loss ratio trend factors in the determination of the proposed overall average advisory rate level change.
© Copyright 2017 National Council on Compensation Insurance, Inc. All Rights Reserved.
Page 7 of 138
Indiana
Advisory Loss Costs, Advisory Rates, and Assigned Risk Rates Filing – January 1, 2018
Selections Underlying the Proposed Changes
The following few charts show a measure of the number of workplace injuries (claim frequency) and the average cost of each of these injuries (claim severity).
Indiana’s lost-time claim frequency has generally declined since 2008, as shown immediately above. The data in this chart reflects premiums at today’s advisory rate and wage levels.
24.4
23.6 23.7
22.2
20.921.3
19.8
18.4
16.0
18.0
20.0
22.0
24.0
26.0
2008 2009 2010 2011 2012 2013 2014 2015
Fre
qu
ency
per
Mill
ion
of
On
-Lev
eled
, W
age-
Ad
just
ed P
rem
ium
Policy Year
Indiana Claim Frequency
Policy Year Lost-Time Claim Frequency
© Copyright 2017 National Council on Compensation Insurance, Inc. All Rights Reserved.
Page 8 of 138
Indiana
Advisory Loss Costs, Advisory Rates, and Assigned Risk Rates Filing – January 1, 2018
Selections Underlying the Proposed Changes
As this chart illustrates, Indiana’s average indemnity cost per case in excess of wage growth has remained fairly consistent over time, while a long-term upward trend in the medical average cost per case was interrupted in PY 2014 due to the medical fee schedule implementation as part of HEA 1320.
© Copyright 2017 National Council on Compensation Insurance, Inc. All Rights Reserved.
Page 9 of 138

Indiana
Advisory Loss Costs, Advisory Rates, and Assigned Risk Rates Filing – January 1, 2018
Selections Underlying the Proposed Changes
Loss ratios result after combining observed changes in Indiana’s average claim frequency with corresponding changes in Indiana’s average cost per case.
Based on our analysis this year, we are proposing to decrease the annual indemnity loss ratio trend from –3.5% to –4.0% and the annual medical loss ratio trend from +0.0% to –0.5%.
© Copyright 2017 National Council on Compensation Insurance, Inc. All Rights Reserved.
Page 10 of 138
Indiana
Advisory Loss Costs, Advisory Rates, and Assigned Risk Rates Filing – January 1, 2018
Selections Underlying the Proposed Changes
Benefit Changes
Indemnity Benefit Changes: Workers injured in Indiana receive wage replacement (indemnity) benefits at a rate of two-thirds of their pre-injury weekly wage. These benefits are subject to a weekly minimum and maximum. In Indiana, legislation must be enacted to change benefit levels. Since no legislation was enacted with respect to a change in indemnity benefits for the prospective policy period, there are no indemnity benefit changes included in the 1/1/2018 filing.
Medical Fee Schedule Changes: NCCI has included the impact of the two most recent Medical Fee Schedule updates effective October 1, 2016 and January 1, 2017. The combined change is estimated to increase overall workers compensation system costs by 0.6%. Please see Appendix C-I for additional details.
Expense-Related Provisions
This filing proposes changes to several expense-related provisions as described below. Please see Exhibit II for additional detail.
Production and General Expense: The proposed advisory rates include a provision for production and general expenses. The latest data from the Insurance Expense Exhibit (which is reported annually by insurers to state insurance departments) is used to derive the Indiana expense provision. The current provision in the advisory rates for production expense is 18.2% of premium. This filing proposes an increase in this provision to 18.3%. The current provision in the advisory rates for general expenses is 5.2% of premium. This filing proposes a decrease in this provision to 5.0% of premium. The overall advisory rate change due to the proposed production and general expense provisions is a decrease of 0.1%.
In this year’s filing, the denominator of the “direct commission and brokerage provision” was adjusted to better align the commissions paid with the premium dollars upon which they were based. Secondly, this review also resulted in an improved matching between the company and NCCI-level premium utilized in the “effect of carrier deviations” component of the production and general expense provisions. The impact of these two changes was negligible with respect to the overall proposed production and general
© Copyright 2017 National Council on Compensation Insurance, Inc. All Rights Reserved.
Page 11 of 138
Indiana
Advisory Loss Costs, Advisory Rates, and Assigned Risk Rates Filing – January 1, 2018
Selections Underlying the Proposed Changes
expense provisions.
Premium Taxes and Assessments: This filing proposes no change to the currently approved provision for taxes and assessments of 1.6%.
Profit and Contingency Provision: By law, Indiana rates must be determined such that workers compensation insurers in Indiana can be expected to earn a reasonable rate of return. Analysis and determination of a profit and contingency (P&C) provision is necessary to ensure this premise is maintained. In this filing, NCCI is proposing to lower the current P&C provision from 2.5% to 2.0%—resulting in a rate level impact of –0.7%. Loss-Based Expenses: The proposed advisory rates and loss costs include a provision for loss adjustment expenses (LAE). These are expenses associated with the handling of workers compensation claims. LAE is included in the advisory rates and loss costs by using a ratio of loss adjustment expense dollars to loss dollars (called the LAE provision). In this filing, NCCI is proposing to increase the current LAE provision from 16.5% to 16.6% of losses—resulting in a rate level impact of +0.1%.
© Copyright 2017 National Council on Compensation Insurance, Inc. All Rights Reserved.
Page 12 of 138
Indiana
Advisory Loss Costs, Advisory Rates, and Assigned Risk Rates Filing – January 1, 2018
Additional Proposed Changes
Updated Terrorism Advisory Loss Cost, Advisory Rate, and Assigned Risk Rate
As a result of NCCI’s most recent analysis, the proposed terrorism advisory rate and loss cost per $100 of payroll in Indiana decreased from $0.02 and $0.01 to $0.01 and $0.005, respectively.
The proposed assigned risk terrorism rate per $100 of payroll in Indiana decreased from $0.02 to $0.01.
Background: The Terrorism Risk Insurance Act of 2002 (“TRIA” or the “Act”) was implemented since Congress recognized that terrorism is a catastrophe exposure that is real and significant for insurers of workers compensation and other lines of insurance.
TRIA 2002 was renewed and amended as TRIE in 2005 and as TRIPRA in 2007.
The U.S. Congress passed the Terrorism Risk Insurance Plan Reauthorization Act (TRIPRA 2015), which changed various coverage parameters for certified terrorism losses and generally increased carriers’ financial responsibility (and thus decreased the U.S Government’s financial support). TRIPRA of 2015 is set to expire on 12/31/2020.
Each jurisdiction’s terrorism miscellaneous value was initially based on the result of one of six modeled states. Over the years, NCCI has submitted Item filings that proposed changes to the miscellaneous values, rules, and policy forms. In addition to changes in the law itself, NCCI anticipated that the risk and cost of terrorism losses may have changed over time.
NCCI Analysis: NCCI worked with expert catastrophe loss modeling firms to assess the impact of terrorism risk on workers compensation insurance losses. NCCI selected results which included an estimated average terrorism workers compensation loss dollar amount per worker for each NCCI jurisdiction under TRIPRA 2015 parameters and provisions.
NCCI converted those estimates from the modeling firms to a rate per $100 payroll using average weekly wage information and currently approved loss-based expense provisions, by jurisdiction. NCCI relied on average weekly wage information from the Bureau of Labor Statistics Quarterly Census of Employment and Wages—which is consistent with what NCCI uses in other areas of its filings. The starting point for the proposed terrorism miscellaneous value rate is the indicated terrorism rate for Indiana and is loaded for all currently approved expenses and rounded to the nearest penny.
© Copyright 2017 National Council on Compensation Insurance, Inc. All Rights Reserved.
Page 13 of 138
Indiana
Advisory Loss Costs, Advisory Rates, and Assigned Risk Rates Filing – January 1, 2018
Additional Proposed Changes
Revised Deductible Credit Safety Factor
This filing proposes to increase the Deductible Credit Safety Factor (“safety factor”) currently in effect in this jurisdiction’s voluntary/assigned risk market from the currently approved value of 0.70 to 0.95. This change will result in larger premium credits for employers that select a deductible under the small deductible program. The overall impact to statewide premium is estimated to be negligible (less than 0.1%). The safety factor is applied to the Loss Elimination Ratio (LER) in the deductible credit formula so that the credit is appropriate for the insured population that selects a small deductible. The factor reflects components for adverse selection, credit default, loss of investment income, and increased variance. Below are the proposed provisions and the currently approved provisions:
Component Current Provision Proposed ProvisionA. Adverse Selection 25.0% 0.0%
B. Credit Default 2.7% 0.8% C. Loss of Investment Income 1.3% 0.8%
D. Increased Variance 4.0% 3.8% Indicated Safety Factor
[=(1-A) x (1-B) x (1-D) / (1+C)] 0.69 0.95
Selected Safety Factor 0.70 0.95 NCCI’s recent safety factor analysis examined each of the four components:
Adverse Selection – this component accounts for the possibility that an insured may choose a deductible because the premium credit is greater than losses expected in the deductible layer. The analysis of the component compared experience for deductible selectors to experience for all risks at the state and hazard group level utilizing total expected losses. Results indicated an adverse selection component of 0.0%.
Credit Default – this component accounts for the possibility that the insured will default on the obligation to reimburse the insurer for losses in the deductible layer. It is based on the U.S. bankruptcy rates for years 2009 to 2013. The average rate over this period was 0.8%1.
Loss of Investment Income – this component is intended to provide a reasonable return on the lent premium for the time between insurer payment of deductible layer losses and insured reimbursement of same. It is based on the interest rate forecasted for the 3-
1 U.S. District Courts: Administrative offices - Bankruptcies; Moody's Analytics Aggregated; U.S. Census Bureau, Statistics of U.S. Businesses (SUSB).
© Copyright 2017 National Council on Compensation Insurance, Inc. All Rights Reserved.
Page 14 of 138
Indiana
Advisory Loss Costs, Advisory Rates, and Assigned Risk Rates Filing – January 1, 2018
Additional Proposed Changes
month Treasury bill for years 2018 through 2022. The average rate over this period was 3.3%2. The payback period was assumed to be 3 months, so the loss of investment income component over this period is 0.8% (= 1.0333/12 – 1).
Increased Variance – small deductibles (less than $10,000) have a greater impact on the variability of the average claim size than on the average claim size itself. The increased variance component accounts for the increased risk resulting from the removal of the stabilizing impact of small losses. It is calculated based on the procedure developed by Rollins and Washburn3, which incorporates the variance principle for risk as suggested by Miccolis4. The variance principle states that the risk provision is proportional to the variance of the pure premium dollars. This analysis indicated an increased variance component of 3.8%.
2 U.S. Board of Governors of the Federal Reserve System (FRB); Moody's Analytics Forecast, last updated 2/8/2016. 3 J. Rollins and M.J. Washburn, “A Quantification of Snader’s Deductible Safety Factor”, CAS Forum Winter 1994, pp. 383-411. 4 R. Miccolis, “On Theory of Increased Limits and Excess Loss Pricing”, PCAS LXIV, 1977, pp. 27–59.
© Copyright 2017 National Council on Compensation Insurance, Inc. All Rights Reserved.
Page 15 of 138

Indiana
Advisory Loss Costs, Advisory Rates, and Assigned Risk Rates Filing – January 1, 2018
Part 2 Proposed Values
- Proposed Advisory Rates, Loss Costs and Rating Values - Proposed Assigned Risk Rates and Rating Values - Proposed Values for Inclusion in the Experience Rating Plan Manual - Proposed Values for Inclusion in the Retrospective Rating Plan Manual
© Copyright 2017 National Council on Compensation Insurance, Inc. All Rights Reserved.
Page 16 of 138
Indiana
Advisory Loss Costs, Advisory Rates, and Assigned Risk Rates Filing – January 1, 2018
Proposed Advisory Rates, Loss Costs, and Rating Values
The following pages include proposed advisory rates, loss costs, and rating values:
Advisory rates, loss costs, minimum premiums, expected loss rates, and d-ratios by class code, along with associated footnotes
Advisory miscellaneous values, such as:
o Premium discount percentages o Premium Reduction Percentages by Deductible Amount o Maximum and minimum weekly payroll applicable for select class codes o Premium determination for Partners and Sole Proprietors o Terrorism advisory rate and loss cost o United States Longshore and Harbor Workers’ Compensation Coverage
Percentage
© Copyright 2017 National Council on Compensation Insurance, Inc. All Rights Reserved.
Page 17 of 138
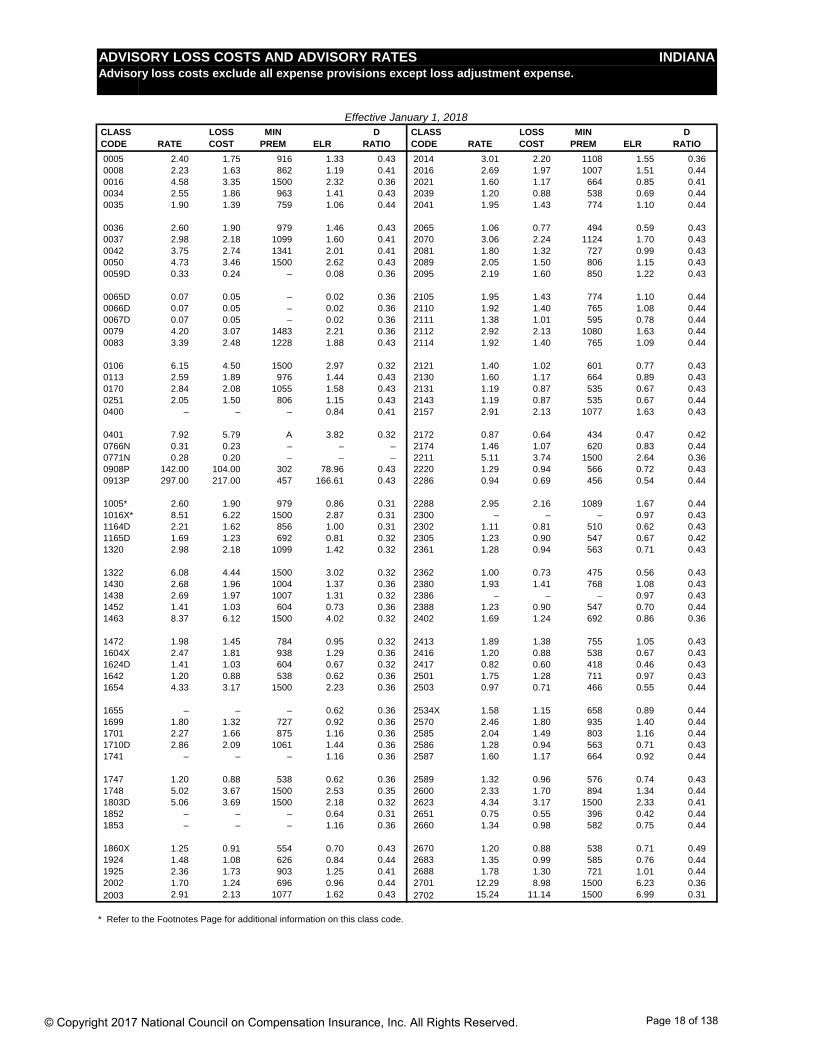
ADVISORY LOSS COSTS AND ADVISORY RATES INDIANAAdvisory loss costs exclude all expense provisions except loss adjustment expense.
Effective January 1, 2018
CLASS LOSS MIN D CLASS LOSS MIN D CODE RATE COST PREM ELR RATIO CODE RATE COST PREM ELR RATIO
0005 2.40 1.75 916 1.33 0.43 2014 3.01 2.20 1108 1.55 0.36 0008 2.23 1.63 862 1.19 0.41 2016 2.69 1.97 1007 1.51 0.44 0016 4.58 3.35 1500 2.32 0.36 2021 1.60 1.17 664 0.85 0.41 0034 2.55 1.86 963 1.41 0.43 2039 1.20 0.88 538 0.69 0.44 0035 1.90 1.39 759 1.06 0.44 2041 1.95 1.43 774 1.10 0.44
0036 2.60 1.90 979 1.46 0.43 2065 1.06 0.77 494 0.59 0.43 0037 2.98 2.18 1099 1.60 0.41 2070 3.06 2.24 1124 1.70 0.43 0042 3.75 2.74 1341 2.01 0.41 2081 1.80 1.32 727 0.99 0.43 0050 4.73 3.46 1500 2.62 0.43 2089 2.05 1.50 806 1.15 0.43 0059D 0.33 0.24 – 0.08 0.36 2095 2.19 1.60 850 1.22 0.43
0065D 0.07 0.05 – 0.02 0.36 2105 1.95 1.43 774 1.10 0.44 0066D 0.07 0.05 – 0.02 0.36 2110 1.92 1.40 765 1.08 0.44 0067D 0.07 0.05 – 0.02 0.36 2111 1.38 1.01 595 0.78 0.44 0079 4.20 3.07 1483 2.21 0.36 2112 2.92 2.13 1080 1.63 0.44 0083 3.39 2.48 1228 1.88 0.43 2114 1.92 1.40 765 1.09 0.44
0106 6.15 4.50 1500 2.97 0.32 2121 1.40 1.02 601 0.77 0.43 0113 2.59 1.89 976 1.44 0.43 2130 1.60 1.17 664 0.89 0.43 0170 2.84 2.08 1055 1.58 0.43 2131 1.19 0.87 535 0.67 0.43 0251 2.05 1.50 806 1.15 0.43 2143 1.19 0.87 535 0.67 0.44 0400 – – – 0.84 0.41 2157 2.91 2.13 1077 1.63 0.43
0401 7.92 5.79 A 3.82 0.32 2172 0.87 0.64 434 0.47 0.42 0766N 0.31 0.23 – – – 2174 1.46 1.07 620 0.83 0.44 0771N 0.28 0.20 – – – 2211 5.11 3.74 1500 2.64 0.36 0908P 142.00 104.00 302 78.96 0.43 2220 1.29 0.94 566 0.72 0.43 0913P 297.00 217.00 457 166.61 0.43 2286 0.94 0.69 456 0.54 0.44
1005* 2.60 1.90 979 0.86 0.31 2288 2.95 2.16 1089 1.67 0.44 1016X* 8.51 6.22 1500 2.87 0.31 2300 – – – 0.97 0.43 1164D 2.21 1.62 856 1.00 0.31 2302 1.11 0.81 510 0.62 0.43 1165D 1.69 1.23 692 0.81 0.32 2305 1.23 0.90 547 0.67 0.42 1320 2.98 2.18 1099 1.42 0.32 2361 1.28 0.94 563 0.71 0.43
1322 6.08 4.44 1500 3.02 0.32 2362 1.00 0.73 475 0.56 0.43 1430 2.68 1.96 1004 1.37 0.36 2380 1.93 1.41 768 1.08 0.43 1438 2.69 1.97 1007 1.31 0.32 2386 – – – 0.97 0.43 1452 1.41 1.03 604 0.73 0.36 2388 1.23 0.90 547 0.70 0.44 1463 8.37 6.12 1500 4.02 0.32 2402 1.69 1.24 692 0.86 0.36
1472 1.98 1.45 784 0.95 0.32 2413 1.89 1.38 755 1.05 0.43 1604X 2.47 1.81 938 1.29 0.36 2416 1.20 0.88 538 0.67 0.43 1624D 1.41 1.03 604 0.67 0.32 2417 0.82 0.60 418 0.46 0.43 1642 1.20 0.88 538 0.62 0.36 2501 1.75 1.28 711 0.97 0.43 1654 4.33 3.17 1500 2.23 0.36 2503 0.97 0.71 466 0.55 0.44
1655 – – – 0.62 0.36 2534X 1.58 1.15 658 0.89 0.44 1699 1.80 1.32 727 0.92 0.36 2570 2.46 1.80 935 1.40 0.44 1701 2.27 1.66 875 1.16 0.36 2585 2.04 1.49 803 1.16 0.44 1710D 2.86 2.09 1061 1.44 0.36 2586 1.28 0.94 563 0.71 0.43 1741 – – – 1.16 0.36 2587 1.60 1.17 664 0.92 0.44
1747 1.20 0.88 538 0.62 0.36 2589 1.32 0.96 576 0.74 0.43 1748 5.02 3.67 1500 2.53 0.35 2600 2.33 1.70 894 1.34 0.44 1803D 5.06 3.69 1500 2.18 0.32 2623 4.34 3.17 1500 2.33 0.41 1852 – – – 0.64 0.31 2651 0.75 0.55 396 0.42 0.44 1853 – – – 1.16 0.36 2660 1.34 0.98 582 0.75 0.44
1860X 1.25 0.91 554 0.70 0.43 2670 1.20 0.88 538 0.71 0.49 1924 1.48 1.08 626 0.84 0.44 2683 1.35 0.99 585 0.76 0.44 1925 2.36 1.73 903 1.25 0.41 2688 1.78 1.30 721 1.01 0.44 2002 1.70 1.24 696 0.96 0.44 2701 12.29 8.98 1500 6.23 0.36 2003 2.91 2.13 1077 1.62 0.43 2702 15.24 11.14 1500 6.99 0.31
* Refer to the Footnotes Page for additional information on this class code.
© Copyright 2017 National Council on Compensation Insurance, Inc. All Rights Reserved. Page 18 of 138

ADVISORY LOSS COSTS AND ADVISORY RATES INDIANAAdvisory loss costs exclude all expense provisions except loss adjustment expense.
Effective January 1, 2018
CLASS LOSS MIN D CLASS LOSS MIN D CODE RATE COST PREM ELR RATIO CODE RATE COST PREM ELR RATIO
2709 8.23 6.02 1500 4.24 0.36 3224 1.96 1.43 777 1.13 0.44 2710 6.54 4.78 1500 3.14 0.32 3227 2.10 1.54 822 1.19 0.44 2714 3.27 2.39 1190 1.85 0.44 3240 2.04 1.49 803 1.16 0.44 2731 3.24 2.37 1181 1.65 0.36 3241 1.61 1.18 667 0.90 0.43 2735 3.57 2.61 1285 2.00 0.44 3255 1.51 1.10 636 0.88 0.49
2759 5.28 3.86 1500 3.00 0.44 3257 1.66 1.21 683 0.92 0.43 2790 1.17 0.86 529 0.66 0.44 3270 1.37 1.00 592 0.76 0.43 2797 1.81 1.32 730 1.01 0.43 3300 4.65 3.40 1500 2.54 0.43 2799 3.78 2.76 1351 2.02 0.41 3303 2.63 1.92 988 1.48 0.44 2802 3.79 2.77 1354 2.04 0.41 3307 2.42 1.77 922 1.34 0.43
2835 1.67 1.22 686 0.99 0.49 3315 2.34 1.71 897 1.33 0.44 2836 1.45 1.06 617 0.85 0.49 3334 1.35 0.99 585 0.77 0.43 2841 2.45 1.79 932 1.38 0.44 3336 1.55 1.13 648 0.79 0.36 2881 1.95 1.43 774 1.14 0.49 3365 3.75 2.74 1341 1.92 0.36 2883 1.76 1.29 714 0.98 0.43 3372 2.16 1.58 840 1.15 0.41
2913 – – – 0.98 0.43 3373 3.57 2.61 1285 2.04 0.43 2915 1.95 1.43 774 1.05 0.41 3383 0.82 0.60 418 0.46 0.44 2916 2.40 1.75 916 1.16 0.32 3385 0.47 0.34 308 0.27 0.44 2923 1.81 1.32 730 1.02 0.44 3400 2.74 2.00 1023 1.45 0.41 2942 – – – 0.54 0.49 3507 1.93 1.41 768 1.08 0.43
2960 3.16 2.31 1155 1.76 0.43 3515 1.60 1.17 664 0.88 0.43 3004 0.85 0.62 428 0.44 0.36 3548 0.97 0.71 466 0.54 0.43 3018 1.66 1.21 683 0.85 0.36 3559 1.73 1.26 705 0.96 0.43 3022 1.99 1.45 787 1.13 0.44 3574 0.91 0.67 447 0.51 0.44 3027 1.89 1.38 755 0.96 0.36 3581 0.82 0.60 418 0.46 0.44
3028 1.81 1.32 730 1.01 0.43 3612 1.55 1.13 648 0.83 0.41 3030 4.08 2.98 1445 2.08 0.36 3620 2.60 1.90 979 1.32 0.36 3040 3.85 2.81 1373 1.97 0.36 3629 1.28 0.94 563 0.73 0.44 3041 3.29 2.40 1196 1.81 0.43 3632 1.67 1.22 686 0.90 0.41 3042 2.16 1.58 840 1.16 0.41 3634 1.19 0.87 535 0.67 0.44
3064 3.13 2.29 1146 1.76 0.43 3635 1.70 1.24 696 0.94 0.43 3069 – – – 1.16 0.43 3638 0.93 0.68 453 0.52 0.44 3076 2.08 1.52 815 1.16 0.43 3642 1.43 1.05 610 0.79 0.43 3081D 2.91 2.13 1077 1.46 0.36 3643 1.45 1.06 617 0.80 0.43 3082D 2.93 2.14 1083 1.45 0.36 3647 1.35 0.99 585 0.73 0.41
3085D 2.52 1.84 954 1.26 0.36 3648 1.06 0.77 494 0.60 0.44 3110 2.16 1.58 840 1.21 0.43 3681 0.76 0.56 399 0.43 0.44 3111 1.87 1.37 749 1.04 0.43 3685 0.55 0.40 333 0.31 0.44 3113 1.16 0.85 525 0.64 0.43 3719 0.50 0.37 318 0.23 0.31 3114 1.80 1.32 727 1.01 0.43 3724 2.50 1.83 948 1.21 0.32
3118 1.11 0.81 510 0.64 0.44 3726 2.19 1.60 850 1.02 0.31 3119 0.58 0.42 343 0.34 0.49 3803 1.78 1.30 721 1.00 0.43 3122 1.19 0.87 535 0.67 0.44 3807 1.40 1.02 601 0.79 0.44 3126 1.11 0.81 510 0.61 0.43 3808 2.68 1.96 1004 1.44 0.41 3131 1.06 0.77 494 0.59 0.43 3821X 4.94 3.61 1500 2.63 0.41
3132 2.02 1.48 796 1.12 0.43 3822X 2.84 2.08 1055 1.50 0.41 3145 1.81 1.32 730 1.00 0.43 3824X 2.02 1.48 796 1.09 0.41 3146 1.45 1.06 617 0.80 0.43 3826 0.38 0.28 280 0.21 0.43 3169 1.48 1.08 626 0.82 0.43 3827 1.81 1.32 730 0.97 0.41 3175 – – – 0.82 0.43 3830 1.17 0.86 529 0.62 0.41
3179 1.16 0.85 525 0.65 0.44 3851 2.01 1.47 793 1.14 0.44 3180 1.69 1.24 692 0.96 0.44 3865 1.13 0.83 516 0.66 0.49 3188 1.06 0.77 494 0.60 0.44 3881 3.65 2.67 1310 2.03 0.43 3220 1.11 0.81 510 0.62 0.43 4000 4.22 3.08 1489 2.05 0.32 3223 – – – 0.96 0.44 4021 2.72 1.99 1017 1.38 0.36
* Refer to the Footnotes Page for additional information on this class code.
© Copyright 2017 National Council on Compensation Insurance, Inc. All Rights Reserved. Page 19 of 138
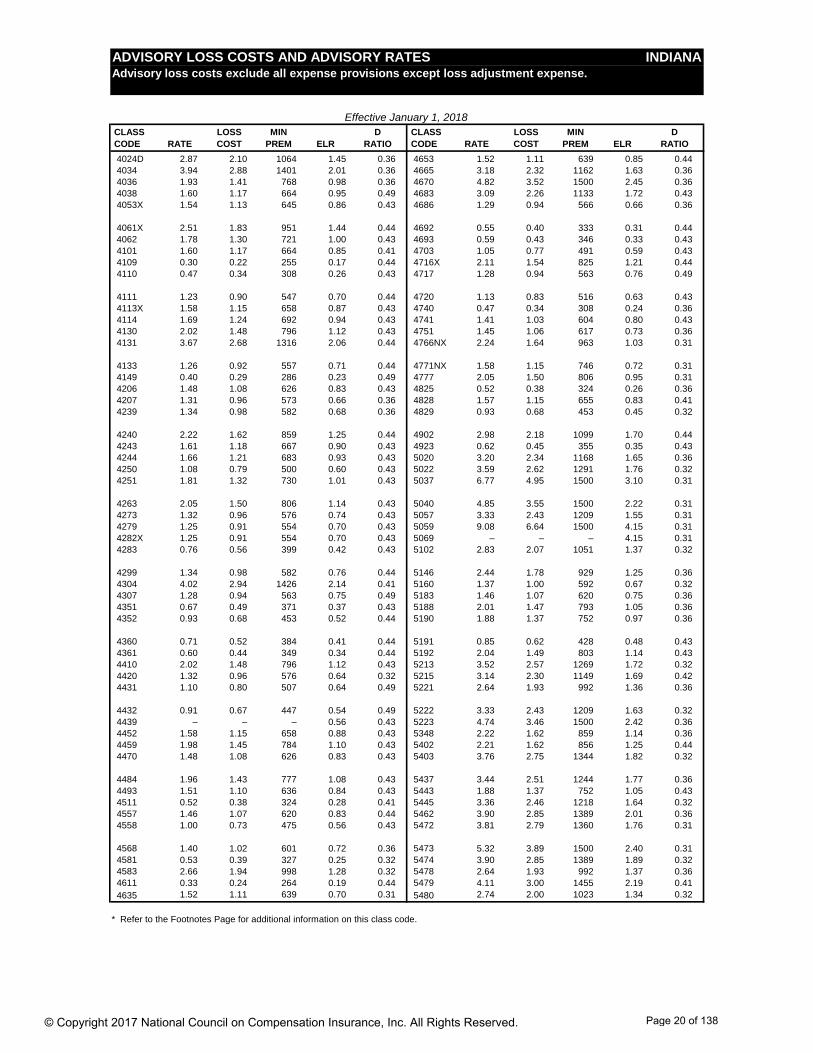
ADVISORY LOSS COSTS AND ADVISORY RATES INDIANAAdvisory loss costs exclude all expense provisions except loss adjustment expense.
Effective January 1, 2018
CLASS LOSS MIN D CLASS LOSS MIN D CODE RATE COST PREM ELR RATIO CODE RATE COST PREM ELR RATIO
4024D 2.87 2.10 1064 1.45 0.36 4653 1.52 1.11 639 0.85 0.44 4034 3.94 2.88 1401 2.01 0.36 4665 3.18 2.32 1162 1.63 0.36 4036 1.93 1.41 768 0.98 0.36 4670 4.82 3.52 1500 2.45 0.36 4038 1.60 1.17 664 0.95 0.49 4683 3.09 2.26 1133 1.72 0.43 4053X 1.54 1.13 645 0.86 0.43 4686 1.29 0.94 566 0.66 0.36
4061X 2.51 1.83 951 1.44 0.44 4692 0.55 0.40 333 0.31 0.44 4062 1.78 1.30 721 1.00 0.43 4693 0.59 0.43 346 0.33 0.43 4101 1.60 1.17 664 0.85 0.41 4703 1.05 0.77 491 0.59 0.43 4109 0.30 0.22 255 0.17 0.44 4716X 2.11 1.54 825 1.21 0.44 4110 0.47 0.34 308 0.26 0.43 4717 1.28 0.94 563 0.76 0.49
4111 1.23 0.90 547 0.70 0.44 4720 1.13 0.83 516 0.63 0.43 4113X 1.58 1.15 658 0.87 0.43 4740 0.47 0.34 308 0.24 0.36 4114 1.69 1.24 692 0.94 0.43 4741 1.41 1.03 604 0.80 0.43 4130 2.02 1.48 796 1.12 0.43 4751 1.45 1.06 617 0.73 0.36 4131 3.67 2.68 1316 2.06 0.44 4766NX 2.24 1.64 963 1.03 0.31
4133 1.26 0.92 557 0.71 0.44 4771NX 1.58 1.15 746 0.72 0.31 4149 0.40 0.29 286 0.23 0.49 4777 2.05 1.50 806 0.95 0.31 4206 1.48 1.08 626 0.83 0.43 4825 0.52 0.38 324 0.26 0.36 4207 1.31 0.96 573 0.66 0.36 4828 1.57 1.15 655 0.83 0.41 4239 1.34 0.98 582 0.68 0.36 4829 0.93 0.68 453 0.45 0.32
4240 2.22 1.62 859 1.25 0.44 4902 2.98 2.18 1099 1.70 0.44 4243 1.61 1.18 667 0.90 0.43 4923 0.62 0.45 355 0.35 0.43 4244 1.66 1.21 683 0.93 0.43 5020 3.20 2.34 1168 1.65 0.36 4250 1.08 0.79 500 0.60 0.43 5022 3.59 2.62 1291 1.76 0.32 4251 1.81 1.32 730 1.01 0.43 5037 6.77 4.95 1500 3.10 0.31
4263 2.05 1.50 806 1.14 0.43 5040 4.85 3.55 1500 2.22 0.31 4273 1.32 0.96 576 0.74 0.43 5057 3.33 2.43 1209 1.55 0.31 4279 1.25 0.91 554 0.70 0.43 5059 9.08 6.64 1500 4.15 0.31 4282X 1.25 0.91 554 0.70 0.43 5069 – – – 4.15 0.31 4283 0.76 0.56 399 0.42 0.43 5102 2.83 2.07 1051 1.37 0.32
4299 1.34 0.98 582 0.76 0.44 5146 2.44 1.78 929 1.25 0.36 4304 4.02 2.94 1426 2.14 0.41 5160 1.37 1.00 592 0.67 0.32 4307 1.28 0.94 563 0.75 0.49 5183 1.46 1.07 620 0.75 0.36 4351 0.67 0.49 371 0.37 0.43 5188 2.01 1.47 793 1.05 0.36 4352 0.93 0.68 453 0.52 0.44 5190 1.88 1.37 752 0.97 0.36
4360 0.71 0.52 384 0.41 0.44 5191 0.85 0.62 428 0.48 0.43 4361 0.60 0.44 349 0.34 0.44 5192 2.04 1.49 803 1.14 0.43 4410 2.02 1.48 796 1.12 0.43 5213 3.52 2.57 1269 1.72 0.32 4420 1.32 0.96 576 0.64 0.32 5215 3.14 2.30 1149 1.69 0.42 4431 1.10 0.80 507 0.64 0.49 5221 2.64 1.93 992 1.36 0.36
4432 0.91 0.67 447 0.54 0.49 5222 3.33 2.43 1209 1.63 0.32 4439 – – – 0.56 0.43 5223 4.74 3.46 1500 2.42 0.36 4452 1.58 1.15 658 0.88 0.43 5348 2.22 1.62 859 1.14 0.36 4459 1.98 1.45 784 1.10 0.43 5402 2.21 1.62 856 1.25 0.44 4470 1.48 1.08 626 0.83 0.43 5403 3.76 2.75 1344 1.82 0.32
4484 1.96 1.43 777 1.08 0.43 5437 3.44 2.51 1244 1.77 0.36 4493 1.51 1.10 636 0.84 0.43 5443 1.88 1.37 752 1.05 0.43 4511 0.52 0.38 324 0.28 0.41 5445 3.36 2.46 1218 1.64 0.32 4557 1.46 1.07 620 0.83 0.44 5462 3.90 2.85 1389 2.01 0.36 4558 1.00 0.73 475 0.56 0.43 5472 3.81 2.79 1360 1.76 0.31
4568 1.40 1.02 601 0.72 0.36 5473 5.32 3.89 1500 2.40 0.31 4581 0.53 0.39 327 0.25 0.32 5474 3.90 2.85 1389 1.89 0.32 4583 2.66 1.94 998 1.28 0.32 5478 2.64 1.93 992 1.37 0.36 4611 0.33 0.24 264 0.19 0.44 5479 4.11 3.00 1455 2.19 0.41 4635 1.52 1.11 639 0.70 0.31 5480 2.74 2.00 1023 1.34 0.32
* Refer to the Footnotes Page for additional information on this class code.
© Copyright 2017 National Council on Compensation Insurance, Inc. All Rights Reserved. Page 20 of 138
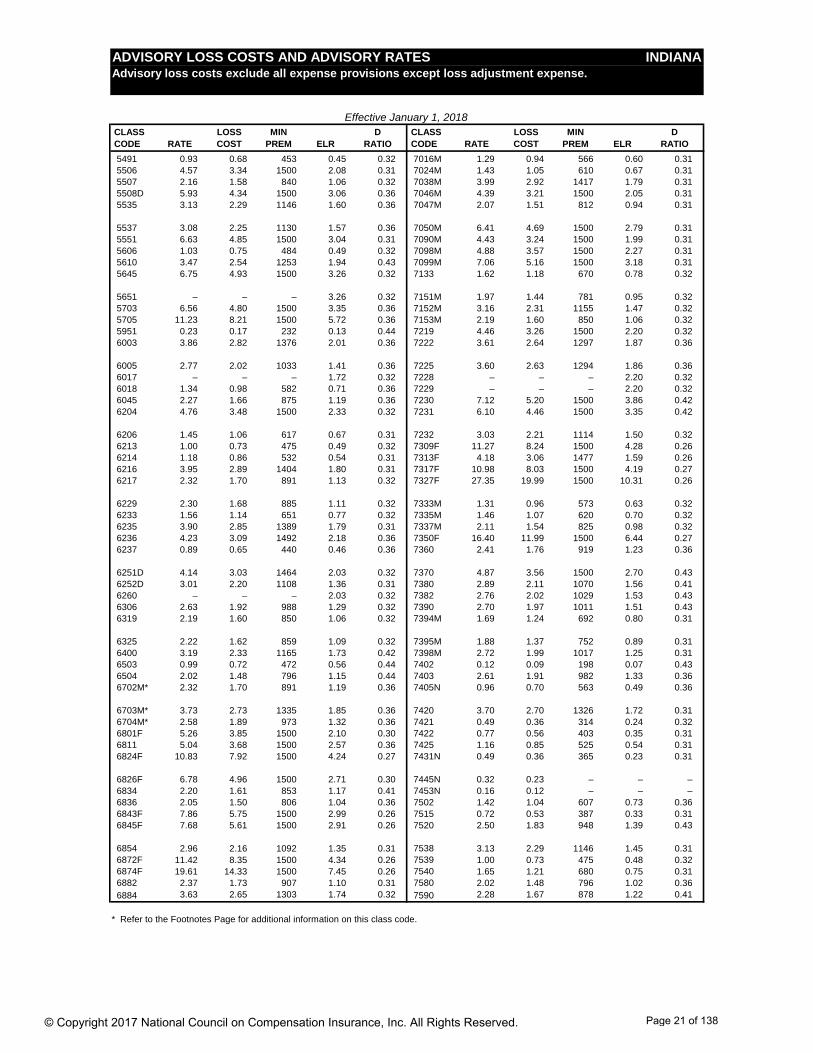
ADVISORY LOSS COSTS AND ADVISORY RATES INDIANAAdvisory loss costs exclude all expense provisions except loss adjustment expense.
Effective January 1, 2018
CLASS LOSS MIN D CLASS LOSS MIN D CODE RATE COST PREM ELR RATIO CODE RATE COST PREM ELR RATIO
5491 0.93 0.68 453 0.45 0.32 7016M 1.29 0.94 566 0.60 0.31 5506 4.57 3.34 1500 2.08 0.31 7024M 1.43 1.05 610 0.67 0.31 5507 2.16 1.58 840 1.06 0.32 7038M 3.99 2.92 1417 1.79 0.31 5508D 5.93 4.34 1500 3.06 0.36 7046M 4.39 3.21 1500 2.05 0.31 5535 3.13 2.29 1146 1.60 0.36 7047M 2.07 1.51 812 0.94 0.31
5537 3.08 2.25 1130 1.57 0.36 7050M 6.41 4.69 1500 2.79 0.31 5551 6.63 4.85 1500 3.04 0.31 7090M 4.43 3.24 1500 1.99 0.31 5606 1.03 0.75 484 0.49 0.32 7098M 4.88 3.57 1500 2.27 0.31 5610 3.47 2.54 1253 1.94 0.43 7099M 7.06 5.16 1500 3.18 0.31 5645 6.75 4.93 1500 3.26 0.32 7133 1.62 1.18 670 0.78 0.32
5651 – – – 3.26 0.32 7151M 1.97 1.44 781 0.95 0.32 5703 6.56 4.80 1500 3.35 0.36 7152M 3.16 2.31 1155 1.47 0.32 5705 11.23 8.21 1500 5.72 0.36 7153M 2.19 1.60 850 1.06 0.32 5951 0.23 0.17 232 0.13 0.44 7219 4.46 3.26 1500 2.20 0.32 6003 3.86 2.82 1376 2.01 0.36 7222 3.61 2.64 1297 1.87 0.36
6005 2.77 2.02 1033 1.41 0.36 7225 3.60 2.63 1294 1.86 0.36 6017 – – – 1.72 0.32 7228 – – – 2.20 0.32 6018 1.34 0.98 582 0.71 0.36 7229 – – – 2.20 0.32 6045 2.27 1.66 875 1.19 0.36 7230 7.12 5.20 1500 3.86 0.42 6204 4.76 3.48 1500 2.33 0.32 7231 6.10 4.46 1500 3.35 0.42
6206 1.45 1.06 617 0.67 0.31 7232 3.03 2.21 1114 1.50 0.32 6213 1.00 0.73 475 0.49 0.32 7309F 11.27 8.24 1500 4.28 0.26 6214 1.18 0.86 532 0.54 0.31 7313F 4.18 3.06 1477 1.59 0.26 6216 3.95 2.89 1404 1.80 0.31 7317F 10.98 8.03 1500 4.19 0.27 6217 2.32 1.70 891 1.13 0.32 7327F 27.35 19.99 1500 10.31 0.26
6229 2.30 1.68 885 1.11 0.32 7333M 1.31 0.96 573 0.63 0.32 6233 1.56 1.14 651 0.77 0.32 7335M 1.46 1.07 620 0.70 0.32 6235 3.90 2.85 1389 1.79 0.31 7337M 2.11 1.54 825 0.98 0.32 6236 4.23 3.09 1492 2.18 0.36 7350F 16.40 11.99 1500 6.44 0.27 6237 0.89 0.65 440 0.46 0.36 7360 2.41 1.76 919 1.23 0.36
6251D 4.14 3.03 1464 2.03 0.32 7370 4.87 3.56 1500 2.70 0.43 6252D 3.01 2.20 1108 1.36 0.31 7380 2.89 2.11 1070 1.56 0.41 6260 – – – 2.03 0.32 7382 2.76 2.02 1029 1.53 0.43 6306 2.63 1.92 988 1.29 0.32 7390 2.70 1.97 1011 1.51 0.43 6319 2.19 1.60 850 1.06 0.32 7394M 1.69 1.24 692 0.80 0.31
6325 2.22 1.62 859 1.09 0.32 7395M 1.88 1.37 752 0.89 0.31 6400 3.19 2.33 1165 1.73 0.42 7398M 2.72 1.99 1017 1.25 0.31 6503 0.99 0.72 472 0.56 0.44 7402 0.12 0.09 198 0.07 0.43 6504 2.02 1.48 796 1.15 0.44 7403 2.61 1.91 982 1.33 0.36 6702M* 2.32 1.70 891 1.19 0.36 7405N 0.96 0.70 563 0.49 0.36
6703M* 3.73 2.73 1335 1.85 0.36 7420 3.70 2.70 1326 1.72 0.31 6704M* 2.58 1.89 973 1.32 0.36 7421 0.49 0.36 314 0.24 0.32 6801F 5.26 3.85 1500 2.10 0.30 7422 0.77 0.56 403 0.35 0.31 6811 5.04 3.68 1500 2.57 0.36 7425 1.16 0.85 525 0.54 0.31 6824F 10.83 7.92 1500 4.24 0.27 7431N 0.49 0.36 365 0.23 0.31
6826F 6.78 4.96 1500 2.71 0.30 7445N 0.32 0.23 – – – 6834 2.20 1.61 853 1.17 0.41 7453N 0.16 0.12 – – – 6836 2.05 1.50 806 1.04 0.36 7502 1.42 1.04 607 0.73 0.36 6843F 7.86 5.75 1500 2.99 0.26 7515 0.72 0.53 387 0.33 0.31 6845F 7.68 5.61 1500 2.91 0.26 7520 2.50 1.83 948 1.39 0.43
6854 2.96 2.16 1092 1.35 0.31 7538 3.13 2.29 1146 1.45 0.31 6872F 11.42 8.35 1500 4.34 0.26 7539 1.00 0.73 475 0.48 0.32 6874F 19.61 14.33 1500 7.45 0.26 7540 1.65 1.21 680 0.75 0.31 6882 2.37 1.73 907 1.10 0.31 7580 2.02 1.48 796 1.02 0.36 6884 3.63 2.65 1303 1.74 0.32 7590 2.28 1.67 878 1.22 0.41
* Refer to the Footnotes Page for additional information on this class code.
© Copyright 2017 National Council on Compensation Insurance, Inc. All Rights Reserved. Page 21 of 138

ADVISORY LOSS COSTS AND ADVISORY RATES INDIANAAdvisory loss costs exclude all expense provisions except loss adjustment expense.
Effective January 1, 2018
CLASS LOSS MIN D CLASS LOSS MIN D CODE RATE COST PREM ELR RATIO CODE RATE COST PREM ELR RATIO
7600 2.66 1.94 998 1.38 0.36 8288 6.27 4.58 1500 3.16 0.35 7601 – – – 1.38 0.36 8291 3.00 2.19 1105 1.62 0.41 7605 2.01 1.47 793 1.03 0.36 8292 2.38 1.74 910 1.33 0.43 7610 0.35 0.26 270 0.19 0.41 8293 6.66 4.87 1500 3.47 0.36 7611 – – – 1.38 0.36 8304 4.02 2.94 1426 2.05 0.36
7612 – – – 1.38 0.36 8350 2.66 1.94 998 1.30 0.32 7613 – – – 1.38 0.36 8380 1.77 1.29 718 0.95 0.41 7698X 4.09 2.99 1448 1.78 0.31 8381 1.56 1.14 651 0.83 0.41 7699X 1.62 1.18 670 0.79 0.35 8385 2.02 1.48 796 1.03 0.36 7705 3.51 2.57 1266 1.88 0.41 8392 1.87 1.37 749 1.03 0.43
7710X 2.60 1.90 979 1.24 0.32 8393X 1.46 1.07 620 0.82 0.43 7711X 2.60 1.90 979 1.24 0.32 8500 4.87 3.56 1500 2.48 0.36 7720 1.89 1.38 755 0.96 0.36 8601 0.27 0.20 245 0.15 0.42 7725X 1.72 1.26 702 0.79 0.32 8602 0.77 0.56 403 0.41 0.41 7855 1.91 1.40 762 0.98 0.36 8603 0.05 0.04 176 0.02 0.43
8001 1.53 1.12 642 0.86 0.44 8606 1.63 1.19 673 0.79 0.32 8002 1.49 1.09 629 0.82 0.43 8709F 5.42 3.96 1500 2.06 0.26 8006 1.54 1.13 645 0.86 0.43 8719 1.95 1.43 774 0.89 0.31 8008 1.03 0.75 484 0.58 0.44 8720 0.92 0.67 450 0.47 0.36 8010 1.24 0.91 551 0.70 0.44 8721 0.26 0.19 242 0.13 0.36
8013 0.30 0.22 255 0.17 0.43 8723 0.14 0.10 204 0.08 0.43 8015 0.52 0.38 324 0.29 0.43 8725 1.68 1.23 689 0.86 0.36 8017 1.10 0.80 507 0.62 0.44 8726F 3.07 2.24 1127 1.23 0.30 8018 2.02 1.48 796 1.14 0.44 8734M 0.31 0.23 258 0.15 0.36 8021 2.18 1.59 847 1.20 0.43 8737M 0.28 0.20 248 0.14 0.36
8031 1.80 1.32 727 1.00 0.43 8738M 0.45 0.33 302 0.23 0.36 8032 1.57 1.15 655 0.89 0.44 8742 0.23 0.17 232 0.12 0.36 8033 2.02 1.48 796 1.11 0.43 8745 2.70 1.97 1011 1.45 0.41 8037 2.32 1.70 891 1.31 0.44 8748 0.44 0.32 299 0.23 0.41 8039 1.39 1.02 598 0.78 0.44 8755 0.18 0.13 217 0.09 0.36
8044 1.99 1.45 787 1.07 0.41 8799 0.81 0.59 415 0.44 0.43 8045 0.51 0.37 321 0.29 0.44 8800 1.25 0.91 554 0.73 0.49 8046 1.80 1.32 727 1.00 0.43 8803 0.06 0.04 179 0.03 0.36 8047 0.74 0.54 393 0.42 0.44 8805M 0.19 0.14 220 0.10 0.43 8058 1.87 1.37 749 1.02 0.43 8810 0.14 0.10 204 0.08 0.43
8072 0.52 0.38 324 0.29 0.44 8814M 0.17 0.12 214 0.10 0.43 8102 1.29 0.94 566 0.73 0.44 8815M 0.27 0.20 245 0.15 0.43 8103 1.58 1.15 658 0.84 0.41 8820 0.11 0.08 195 0.06 0.41 8105 – – – 1.14 0.44 8824 2.02 1.48 796 1.14 0.44 8106 2.67 1.95 1001 1.37 0.36 8825 1.22 0.89 544 0.71 0.49
8107 1.92 1.40 765 0.98 0.36 8826 1.41 1.03 604 0.78 0.43 8111 1.98 1.45 784 1.11 0.43 8829 1.54 1.13 645 0.85 0.43 8116 2.08 1.52 815 1.16 0.43 8831 1.09 0.80 503 0.60 0.43 8203 3.88 2.84 1382 2.17 0.43 8832 0.20 0.15 223 0.11 0.43 8204 3.88 2.84 1382 1.96 0.36 8833 0.65 0.48 365 0.36 0.43
8209 2.63 1.92 988 1.46 0.43 8835 1.80 1.32 727 1.00 0.43 8215 1.95 1.43 774 1.01 0.36 8842 2.63 1.92 988 1.45 0.43 8227 2.43 1.78 925 1.11 0.31 8855 0.14 0.10 204 0.07 0.43 8232 2.73 2.00 1020 1.40 0.36 8856 0.26 0.19 242 0.14 0.43 8233 1.85 1.35 743 0.97 0.36 8864 1.19 0.87 535 0.66 0.43
8235 2.66 1.94 998 1.49 0.43 8868 0.29 0.21 251 0.16 0.44 8263 3.89 2.84 1385 2.06 0.41 8869 0.96 0.70 462 0.54 0.44 8264 2.91 2.13 1077 1.50 0.36 8871 0.08 0.06 185 0.04 0.44 8265 4.23 3.09 1492 2.03 0.32 8901 0.14 0.10 204 0.07 0.42 8279 5.83 4.26 1500 2.79 0.32 9012 0.95 0.69 459 0.51 0.41
* Refer to the Footnotes Page for additional information on this class code.
© Copyright 2017 National Council on Compensation Insurance, Inc. All Rights Reserved. Page 22 of 138

ADVISORY LOSS COSTS AND ADVISORY RATES INDIANAAdvisory loss costs exclude all expense provisions except loss adjustment expense.
Effective January 1, 2018
CLASS LOSS MIN D CLASS LOSS MIN D CODE RATE COST PREM ELR RATIO CODE RATE COST PREM ELR RATIO
9014X 2.05 1.50 806 1.14 0.43 9015 2.72 1.99 1017 1.51 0.43 9016 2.48 1.81 941 1.37 0.43 9019 1.18 0.86 532 0.60 0.36 9033 2.25 1.64 869 1.25 0.43
9040 2.07 1.51 812 1.17 0.44 9044 1.19 0.87 535 0.67 0.44 9052 1.50 1.10 633 0.85 0.44 9058 1.37 1.00 592 0.80 0.49 9060 1.10 0.80 507 0.62 0.44
9061 1.05 0.77 491 0.61 0.49 9062 1.17 0.86 529 0.69 0.49 9063 0.81 0.59 415 0.45 0.44 9077F 4.93 3.60 1500 2.03 0.40 9082 1.09 0.80 503 0.64 0.49
9083 0.98 0.72 469 0.57 0.49 9084 1.15 0.84 522 0.63 0.43 9088a a a a a a 9089 0.81 0.59 415 0.45 0.44 9093 1.49 1.09 629 0.83 0.44
9101 2.90 2.12 1074 1.63 0.44 9102 2.21 1.62 856 1.23 0.43 9154 1.37 1.00 592 0.75 0.43 9156 1.40 1.02 601 0.74 0.41 9170 5.04 3.68 1500 2.29 0.31
9178 5.62 4.11 1500 3.24 0.49 9179 9.59 7.01 1500 5.38 0.44 9180 5.42 3.96 1500 2.70 0.35 9182 1.55 1.13 648 0.85 0.43 9186 7.96 5.82 1500 3.78 0.32
9220 3.27 2.39 1190 1.74 0.41 9402 2.59 1.89 976 1.33 0.36 9403 3.96 2.89 1407 1.93 0.32 9410 1.61 1.18 667 0.89 0.43 9501 2.37 1.73 907 1.27 0.41
9505 2.51 1.83 951 1.35 0.41 9516 3.31 2.42 1203 1.71 0.36 9519 3.49 2.55 1259 1.80 0.36 9521 1.83 1.34 736 0.93 0.36 9522 1.89 1.38 755 1.04 0.43
9534 1.87 1.37 749 0.92 0.32 9554 5.54 4.05 1500 2.70 0.32 9586 0.40 0.29 286 0.23 0.49 9600 1.37 1.00 592 0.79 0.44 9620 0.68 0.50 374 0.36 0.41
* Refer to the Footnotes Page for additional information on this class code.
© Copyright 2017 National Council on Compensation Insurance, Inc. All Rights Reserved. Page 23 of 138
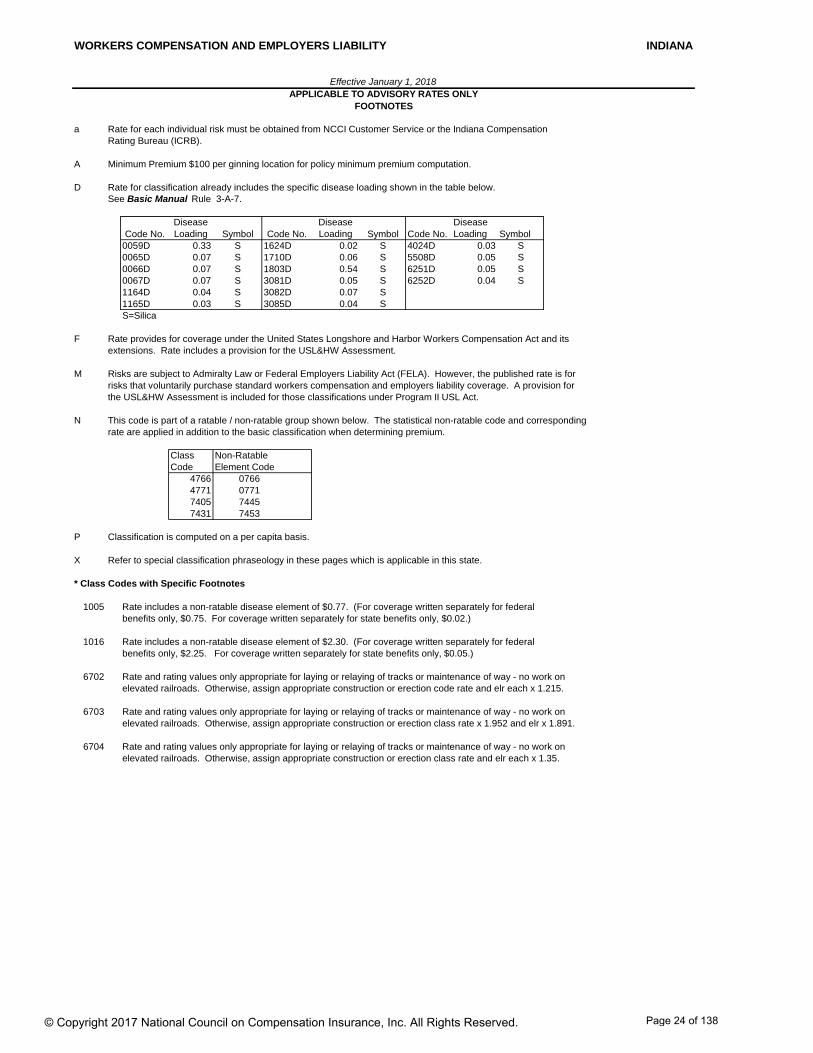
WORKERS COMPENSATION AND EMPLOYERS LIABILITY INDIANA
Effective January 1, 2018
FOOTNOTES
a Rate for each individual risk must be obtained from NCCI Customer Service or the Indiana CompensationRating Bureau (ICRB).
A Minimum Premium $100 per ginning location for policy minimum premium computation.
D Rate for classification already includes the specific disease loading shown in the table below. See Basic Manual Rule 3-A-7.
Code No.Disease Loading Symbol Code No.
Disease Loading Symbol Code No.
Disease Loading Symbol
0059D 0.33 S 1624D 0.02 S 4024D 0.03 S0065D 0.07 S 1710D 0.06 S 5508D 0.05 S0066D 0.07 S 1803D 0.54 S 6251D 0.05 S0067D 0.07 S 3081D 0.05 S 6252D 0.04 S1164D 0.04 S 3082D 0.07 S1165D 0.03 S 3085D 0.04 SS=Silica
F Rate provides for coverage under the United States Longshore and Harbor Workers Compensation Act and itsextensions. Rate includes a provision for the USL&HW Assessment.
M Risks are subject to Admiralty Law or Federal Employers Liability Act (FELA). However, the published rate is for risks that voluntarily purchase standard workers compensation and employers liability coverage. A provision for the USL&HW Assessment is included for those classifications under Program II USL Act.
N This code is part of a ratable / non-ratable group shown below. The statistical non-ratable code and correspondingrate are applied in addition to the basic classification when determining premium.
Class Non-RatableCode Element Code
4766 07664771 07717405 74457431 7453
P Classification is computed on a per capita basis.
X Refer to special classification phraseology in these pages which is applicable in this state.
* Class Codes with Specific Footnotes
1005 Rate includes a non-ratable disease element of $0.77. (For coverage written separately for federalbenefits only, $0.75. For coverage written separately for state benefits only, $0.02.)
1016 Rate includes a non-ratable disease element of $2.30. (For coverage written separately for federal benefits only, $2.25. For coverage written separately for state benefits only, $0.05.)
6702 Rate and rating values only appropriate for laying or relaying of tracks or maintenance of way - no work on elevated railroads. Otherwise, assign appropriate construction or erection code rate and elr each x 1.215.
6703 Rate and rating values only appropriate for laying or relaying of tracks or maintenance of way - no work on elevated railroads. Otherwise, assign appropriate construction or erection class rate x 1.952 and elr x 1.891.
6704 Rate and rating values only appropriate for laying or relaying of tracks or maintenance of way - no work onelevated railroads. Otherwise, assign appropriate construction or erection class rate and elr each x 1.35.
APPLICABLE TO ADVISORY RATES ONLY
© Copyright 2017 National Council on Compensation Insurance, Inc. All Rights Reserved. Page 24 of 138
WORKERS COMPENSATION AND EMPLOYERS LIABILITY INDIANA
Effective January 1, 2018
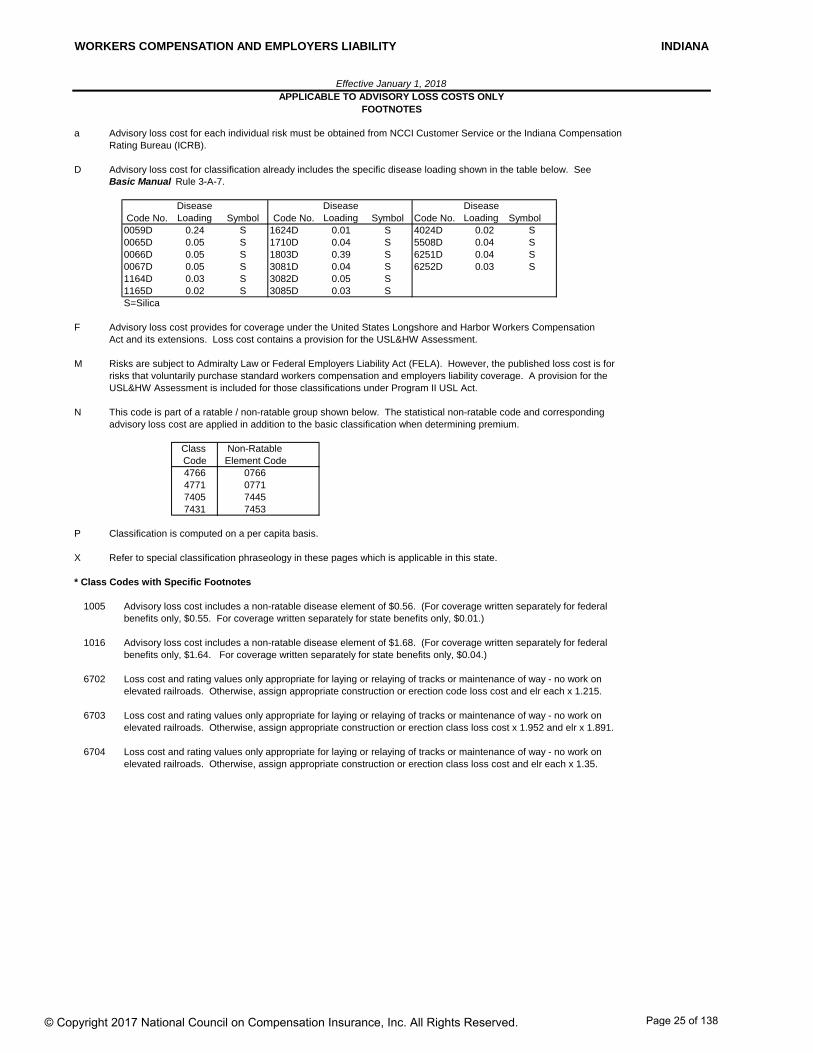
FOOTNOTES
a Advisory loss cost for each individual risk must be obtained from NCCI Customer Service or the Indiana CompensationRating Bureau (ICRB).
D Advisory loss cost for classification already includes the specific disease loading shown in the table below. See Basic Manual Rule 3-A-7.
Code No.Disease Loading Symbol Code No.
Disease Loading Symbol Code No.
Disease Loading Symbol
0059D 0.24 S 1624D 0.01 S 4024D 0.02 S0065D 0.05 S 1710D 0.04 S 5508D 0.04 S0066D 0.05 S 1803D 0.39 S 6251D 0.04 S0067D 0.05 S 3081D 0.04 S 6252D 0.03 S1164D 0.03 S 3082D 0.05 S1165D 0.02 S 3085D 0.03 SS=Silica
F Advisory loss cost provides for coverage under the United States Longshore and Harbor Workers CompensationAct and its extensions. Loss cost contains a provision for the USL&HW Assessment.
M Risks are subject to Admiralty Law or Federal Employers Liability Act (FELA). However, the published loss cost is for risks that voluntarily purchase standard workers compensation and employers liability coverage. A provision for the USL&HW Assessment is included for those classifications under Program II USL Act.
N This code is part of a ratable / non-ratable group shown below. The statistical non-ratable code and correspondingadvisory loss cost are applied in addition to the basic classification when determining premium.
Class Non-RatableCode Element Code4766 07664771 07717405 74457431 7453
P Classification is computed on a per capita basis.
X Refer to special classification phraseology in these pages which is applicable in this state.
* Class Codes with Specific Footnotes
1005 Advisory loss cost includes a non-ratable disease element of $0.56. (For coverage written separately for federalbenefits only, $0.55. For coverage written separately for state benefits only, $0.01.)
1016 Advisory loss cost includes a non-ratable disease element of $1.68. (For coverage written separately for federalbenefits only, $1.64. For coverage written separately for state benefits only, $0.04.)
6702 Loss cost and rating values only appropriate for laying or relaying of tracks or maintenance of way - no work on elevated railroads. Otherwise, assign appropriate construction or erection code loss cost and elr each x 1.215.
6703 Loss cost and rating values only appropriate for laying or relaying of tracks or maintenance of way - no work on elevated railroads. Otherwise, assign appropriate construction or erection class loss cost x 1.952 and elr x 1.891.
6704 Loss cost and rating values only appropriate for laying or relaying of tracks or maintenance of way - no work onelevated railroads. Otherwise, assign appropriate construction or erection class loss cost and elr each x 1.35.
APPLICABLE TO ADVISORY LOSS COSTS ONLY
© Copyright 2017 National Council on Compensation Insurance, Inc. All Rights Reserved. Page 25 of 138
WORKERS COMPENSATION AND EMPLOYERS LIABILITY INDIANA
Effective January 1, 2018
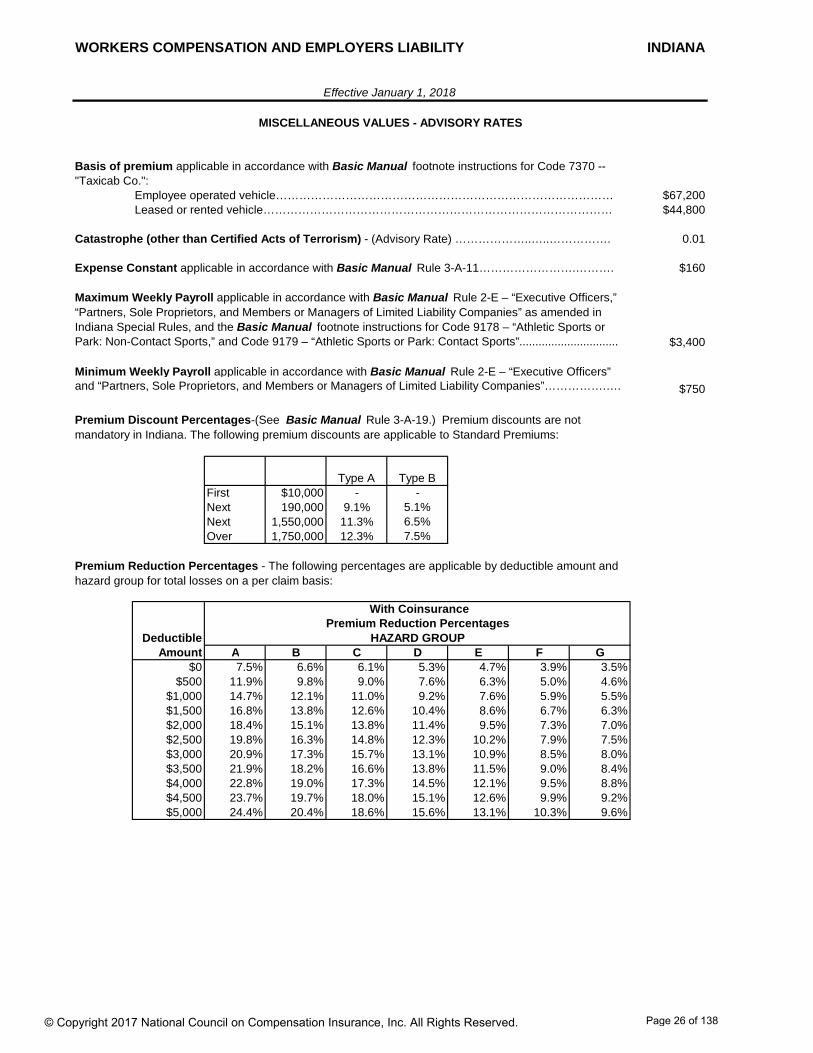
MISCELLANEOUS VALUES - ADVISORY RATES
Basis of premium applicable in accordance with Basic Manual footnote instructions for Code 7370 --"Taxicab Co.":
Employee operated vehicle…………………………………………………………………………… $67,200Leased or rented vehicle……………………………………………………………………………… $44,800
Catastrophe (other than Certified Acts of Terrorism) - (Advisory Rate) ………………..…..……………. 0.01
Expense Constant applicable in accordance with Basic Manual Rule 3-A-11…………………….………. $160
$3,400
Minimum Weekly Payroll applicable in accordance with Basic Manual Rule 2-E – “Executive Officers” and “Partners, Sole Proprietors, and Members or Managers of Limited Liability Companies”…………….…. $750
Type A Type BFirst $10,000 - -Next 190,000 9.1% 5.1%Next 1,550,000 11.3% 6.5%Over 1,750,000 12.3% 7.5%
With Coinsurance
Deductible HAZARD GROUPAmount A B C D E F G
$0 7.5% 6.6% 6.1% 5.3% 4.7% 3.9% 3.5%$500 11.9% 9.8% 9.0% 7.6% 6.3% 5.0% 4.6%
$1,000 14.7% 12.1% 11.0% 9.2% 7.6% 5.9% 5.5%$1,500 16.8% 13.8% 12.6% 10.4% 8.6% 6.7% 6.3%$2,000 18.4% 15.1% 13.8% 11.4% 9.5% 7.3% 7.0%$2,500 19.8% 16.3% 14.8% 12.3% 10.2% 7.9% 7.5%$3,000 20.9% 17.3% 15.7% 13.1% 10.9% 8.5% 8.0%$3,500 21.9% 18.2% 16.6% 13.8% 11.5% 9.0% 8.4%$4,000 22.8% 19.0% 17.3% 14.5% 12.1% 9.5% 8.8%$4,500 23.7% 19.7% 18.0% 15.1% 12.6% 9.9% 9.2%$5,000 24.4% 20.4% 18.6% 15.6% 13.1% 10.3% 9.6%
Maximum Weekly Payroll applicable in accordance with Basic Manual Rule 2-E – “Executive Officers,” “Partners, Sole Proprietors, and Members or Managers of Limited Liability Companies” as amended in Indiana Special Rules, and the Basic Manual footnote instructions for Code 9178 – “Athletic Sports or Park: Non-Contact Sports,” and Code 9179 – “Athletic Sports or Park: Contact Sports”...............................
Premium Discount Percentages-(See Basic Manual Rule 3-A-19.) Premium discounts are not mandatory in Indiana. The following premium discounts are applicable to Standard Premiums:
Premium Reduction Percentages - The following percentages are applicable by deductible amount and hazard group for total losses on a per claim basis:
Premium Reduction Percentages
© Copyright 2017 National Council on Compensation Insurance, Inc. All Rights Reserved. Page 26 of 138
WORKERS COMPENSATION AND EMPLOYERS LIABILITY INDIANA
Effective January 1, 2018
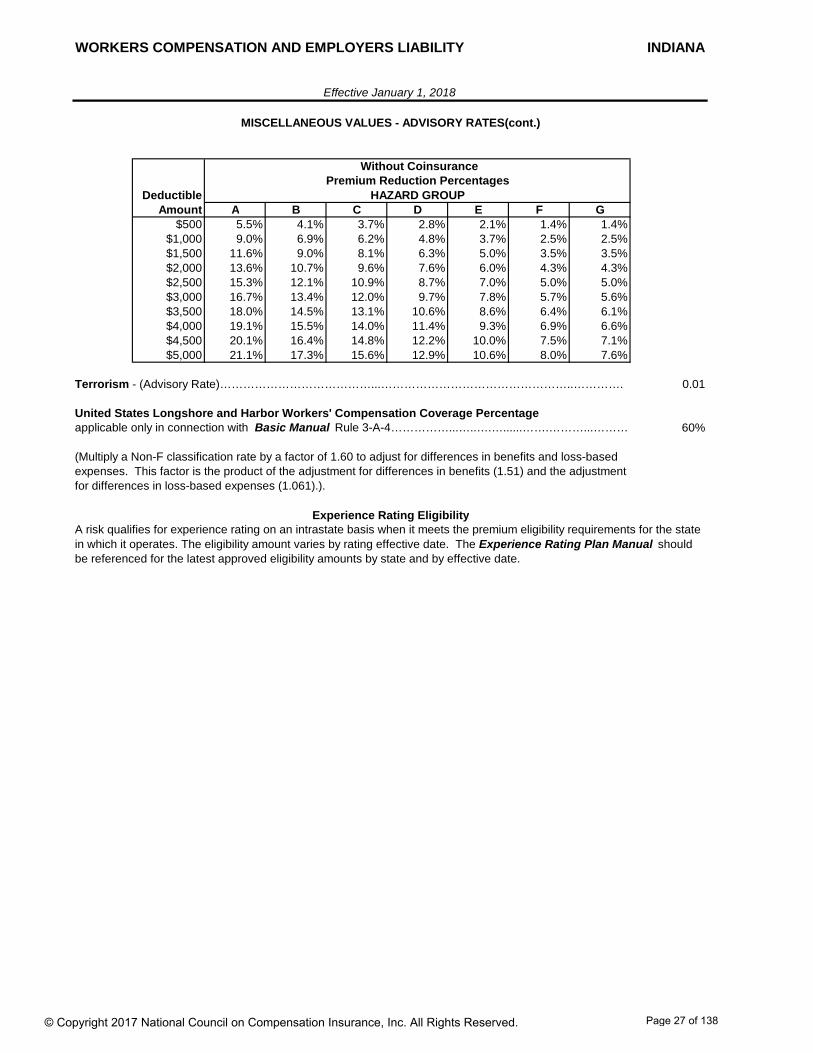
MISCELLANEOUS VALUES - ADVISORY RATES(cont.)
Without Coinsurance
Deductible HAZARD GROUPAmount A B C D E F G
$500 5.5% 4.1% 3.7% 2.8% 2.1% 1.4% 1.4%$1,000 9.0% 6.9% 6.2% 4.8% 3.7% 2.5% 2.5%$1,500 11.6% 9.0% 8.1% 6.3% 5.0% 3.5% 3.5%$2,000 13.6% 10.7% 9.6% 7.6% 6.0% 4.3% 4.3%$2,500 15.3% 12.1% 10.9% 8.7% 7.0% 5.0% 5.0%$3,000 16.7% 13.4% 12.0% 9.7% 7.8% 5.7% 5.6%$3,500 18.0% 14.5% 13.1% 10.6% 8.6% 6.4% 6.1%$4,000 19.1% 15.5% 14.0% 11.4% 9.3% 6.9% 6.6%$4,500 20.1% 16.4% 14.8% 12.2% 10.0% 7.5% 7.1%$5,000 21.1% 17.3% 15.6% 12.9% 10.6% 8.0% 7.6%
Terrorism - (Advisory Rate)…………………………………...…………………………………………..…………. 0.01
United States Longshore and Harbor Workers' Compensation Coverage Percentageapplicable only in connection with Basic Manual Rule 3-A-4……………...…..….…......…….………...……….
A risk qualifies for experience rating on an intrastate basis when it meets the premium eligibility requirements for the state in which it operates. The eligibility amount varies by rating effective date. The Experience Rating Plan Manual should be referenced for the latest approved eligibility amounts by state and by effective date.
(Multiply a Non-F classification rate by a factor of 1.60 to adjust for differences in benefits and loss-based expenses. This factor is the product of the adjustment for differences in benefits (1.51) and the adjustment for differences in loss-based expenses (1.061).).
60%
Experience Rating Eligibility
Premium Reduction Percentages
© Copyright 2017 National Council on Compensation Insurance, Inc. All Rights Reserved. Page 27 of 138
WORKERS COMPENSATION AND EMPLOYERS LIABILITY INDIANA
Effective January 1, 2018
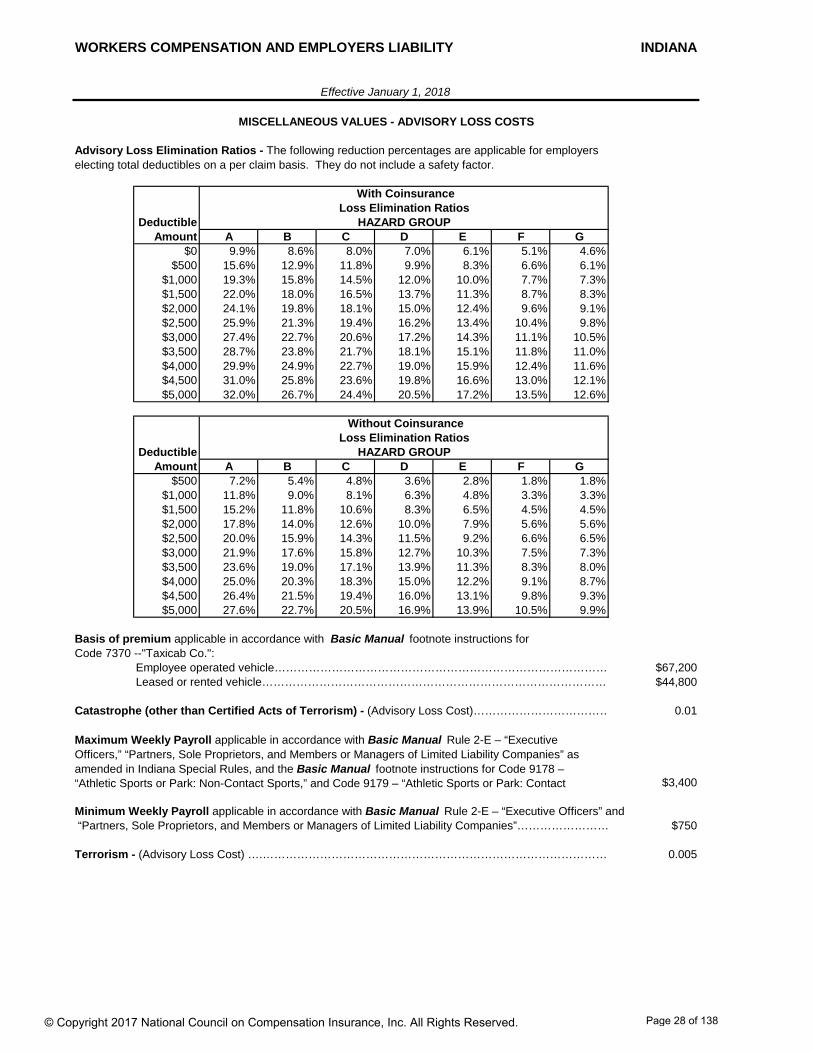
MISCELLANEOUS VALUES - ADVISORY LOSS COSTS
With Coinsurance
Deductible HAZARD GROUPAmount A B C D E F G
$0 9.9% 8.6% 8.0% 7.0% 6.1% 5.1% 4.6%$500 15.6% 12.9% 11.8% 9.9% 8.3% 6.6% 6.1%
$1,000 19.3% 15.8% 14.5% 12.0% 10.0% 7.7% 7.3%$1,500 22.0% 18.0% 16.5% 13.7% 11.3% 8.7% 8.3%$2,000 24.1% 19.8% 18.1% 15.0% 12.4% 9.6% 9.1%$2,500 25.9% 21.3% 19.4% 16.2% 13.4% 10.4% 9.8%$3,000 27.4% 22.7% 20.6% 17.2% 14.3% 11.1% 10.5%$3,500 28.7% 23.8% 21.7% 18.1% 15.1% 11.8% 11.0%$4,000 29.9% 24.9% 22.7% 19.0% 15.9% 12.4% 11.6%$4,500 31.0% 25.8% 23.6% 19.8% 16.6% 13.0% 12.1%$5,000 32.0% 26.7% 24.4% 20.5% 17.2% 13.5% 12.6%
Without Coinsurance
Deductible HAZARD GROUPAmount A B C D E F G
$500 7.2% 5.4% 4.8% 3.6% 2.8% 1.8% 1.8%$1,000 11.8% 9.0% 8.1% 6.3% 4.8% 3.3% 3.3%$1,500 15.2% 11.8% 10.6% 8.3% 6.5% 4.5% 4.5%$2,000 17.8% 14.0% 12.6% 10.0% 7.9% 5.6% 5.6%$2,500 20.0% 15.9% 14.3% 11.5% 9.2% 6.6% 6.5%$3,000 21.9% 17.6% 15.8% 12.7% 10.3% 7.5% 7.3%$3,500 23.6% 19.0% 17.1% 13.9% 11.3% 8.3% 8.0%$4,000 25.0% 20.3% 18.3% 15.0% 12.2% 9.1% 8.7%$4,500 26.4% 21.5% 19.4% 16.0% 13.1% 9.8% 9.3%$5,000 27.6% 22.7% 20.5% 16.9% 13.9% 10.5% 9.9%
Basis of premium applicable in accordance with Basic Manual footnote instructions for Code 7370 --"Taxicab Co.":
Employee operated vehicle…………………………………………………………………………… $67,200Leased or rented vehicle……………………………………………………………………………… $44,800
Catastrophe (other than Certified Acts of Terrorism) - (Advisory Loss Cost)……………………………… 0.01
$3,400
Minimum Weekly Payroll applicable in accordance with Basic Manual Rule 2-E – “Executive Officers” and “Partners, Sole Proprietors, and Members or Managers of Limited Liability Companies”…………………… $750
Terrorism - (Advisory Loss Cost) ….……………………………………………………………………………… 0.005
Maximum Weekly Payroll applicable in accordance with Basic Manual Rule 2-E – “Executive Officers,” “Partners, Sole Proprietors, and Members or Managers of Limited Liability Companies” as amended in Indiana Special Rules, and the Basic Manual footnote instructions for Code 9178 – “Athletic Sports or Park: Non-Contact Sports,” and Code 9179 – “Athletic Sports or Park: Contact
Advisory Loss Elimination Ratios - The following reduction percentages are applicable for employers electing total deductibles on a per claim basis. They do not include a safety factor.
Loss Elimination Ratios
Loss Elimination Ratios
© Copyright 2017 National Council on Compensation Insurance, Inc. All Rights Reserved. Page 28 of 138
WORKERS COMPENSATION AND EMPLOYERS LIABILITY INDIANA
Effective January 1, 2018
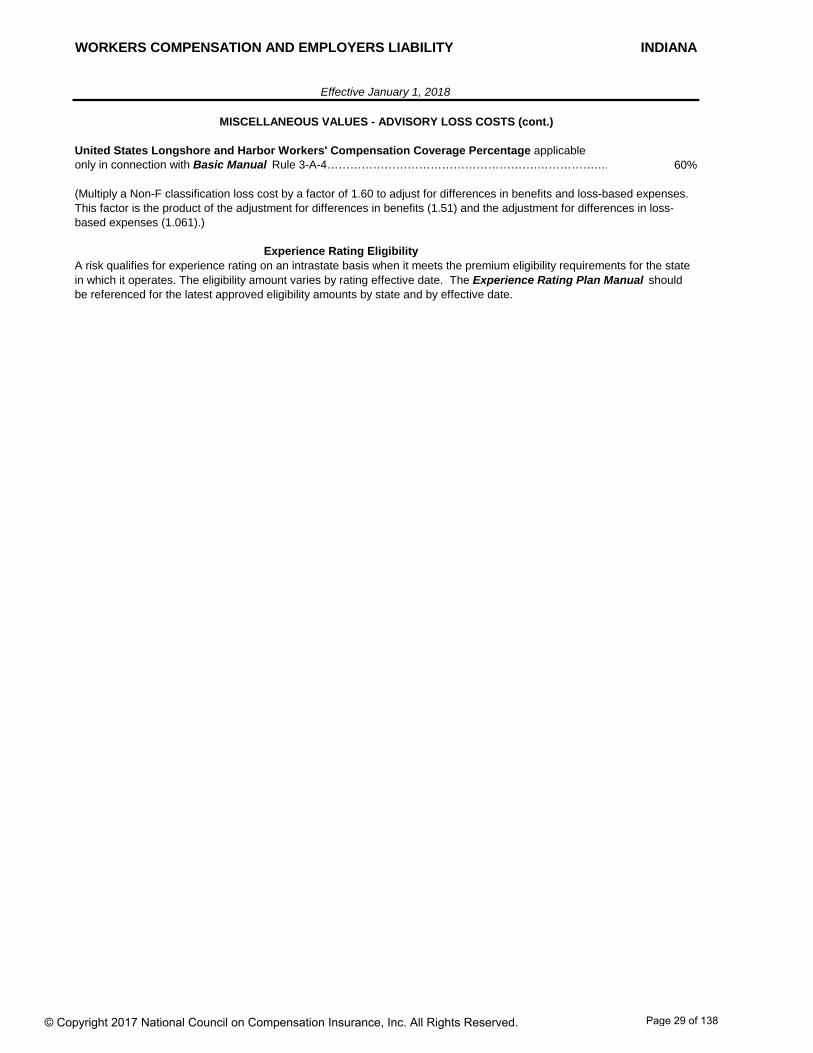
MISCELLANEOUS VALUES - ADVISORY LOSS COSTS (cont.)
United States Longshore and Harbor Workers' Compensation Coverage Percentage applicableonly in connection with Basic Manual Rule 3-A-4……………………………………………….…………….… 60%
Experience Rating Eligibility
(Multiply a Non-F classification loss cost by a factor of 1.60 to adjust for differences in benefits and loss-based expenses. This factor is the product of the adjustment for differences in benefits (1.51) and the adjustment for differences in loss-based expenses (1.061).)
A risk qualifies for experience rating on an intrastate basis when it meets the premium eligibility requirements for the state in which it operates. The eligibility amount varies by rating effective date. The Experience Rating Plan Manual should be referenced for the latest approved eligibility amounts by state and by effective date.
© Copyright 2017 National Council on Compensation Insurance, Inc. All Rights Reserved. Page 29 of 138

Indiana
Advisory Loss Costs, Advisory Rates, and Assigned Risk Rates Filing – January 1, 2018
Proposed Assigned Risk Rates and Rating Values
The following pages include proposed assigned risk rates and rating values:
Assigned risk rates, minimum premium, expected loss rates, and d-ratios by class code, along with associated footnotes
Miscellaneous values, such as:
o Maximum and minimum weekly payroll applicable for select class codes o Premium determination for Partners and Sole Proprietors o Terrorism rate o United States Longshore and Harbor Workers’ Compensation Coverage
Percentage
© Copyright 2017 National Council on Compensation Insurance, Inc. All Rights Reserved.
Page 30 of 138
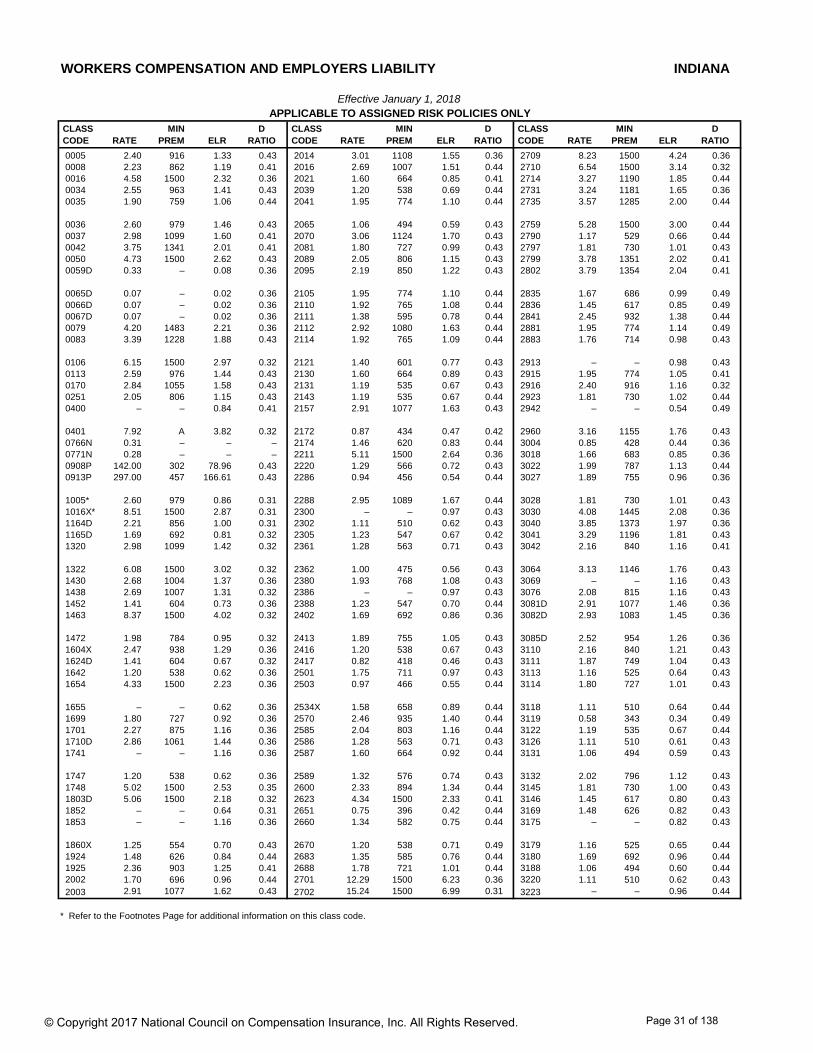
WORKERS COMPENSATION AND EMPLOYERS LIABILITY INDIANA
Effective January 1, 2018APPLICABLE TO ASSIGNED RISK POLICIES ONLY
CLASS MIN D CLASS MIN D CLASS MIN D CODE RATE PREM ELR RATIO CODE RATE PREM ELR RATIO CODE RATE PREM ELR RATIO
0005 2.40 916 1.33 0.43 2014 3.01 1108 1.55 0.36 2709 8.23 1500 4.24 0.36 0008 2.23 862 1.19 0.41 2016 2.69 1007 1.51 0.44 2710 6.54 1500 3.14 0.32 0016 4.58 1500 2.32 0.36 2021 1.60 664 0.85 0.41 2714 3.27 1190 1.85 0.44 0034 2.55 963 1.41 0.43 2039 1.20 538 0.69 0.44 2731 3.24 1181 1.65 0.36 0035 1.90 759 1.06 0.44 2041 1.95 774 1.10 0.44 2735 3.57 1285 2.00 0.44
0036 2.60 979 1.46 0.43 2065 1.06 494 0.59 0.43 2759 5.28 1500 3.00 0.44 0037 2.98 1099 1.60 0.41 2070 3.06 1124 1.70 0.43 2790 1.17 529 0.66 0.44 0042 3.75 1341 2.01 0.41 2081 1.80 727 0.99 0.43 2797 1.81 730 1.01 0.43 0050 4.73 1500 2.62 0.43 2089 2.05 806 1.15 0.43 2799 3.78 1351 2.02 0.41 0059D 0.33 – 0.08 0.36 2095 2.19 850 1.22 0.43 2802 3.79 1354 2.04 0.41
0065D 0.07 – 0.02 0.36 2105 1.95 774 1.10 0.44 2835 1.67 686 0.99 0.49 0066D 0.07 – 0.02 0.36 2110 1.92 765 1.08 0.44 2836 1.45 617 0.85 0.49 0067D 0.07 – 0.02 0.36 2111 1.38 595 0.78 0.44 2841 2.45 932 1.38 0.44 0079 4.20 1483 2.21 0.36 2112 2.92 1080 1.63 0.44 2881 1.95 774 1.14 0.49 0083 3.39 1228 1.88 0.43 2114 1.92 765 1.09 0.44 2883 1.76 714 0.98 0.43
0106 6.15 1500 2.97 0.32 2121 1.40 601 0.77 0.43 2913 – – 0.98 0.43 0113 2.59 976 1.44 0.43 2130 1.60 664 0.89 0.43 2915 1.95 774 1.05 0.41 0170 2.84 1055 1.58 0.43 2131 1.19 535 0.67 0.43 2916 2.40 916 1.16 0.32 0251 2.05 806 1.15 0.43 2143 1.19 535 0.67 0.44 2923 1.81 730 1.02 0.44 0400 – – 0.84 0.41 2157 2.91 1077 1.63 0.43 2942 – – 0.54 0.49
0401 7.92 A 3.82 0.32 2172 0.87 434 0.47 0.42 2960 3.16 1155 1.76 0.43 0766N 0.31 – – – 2174 1.46 620 0.83 0.44 3004 0.85 428 0.44 0.36 0771N 0.28 – – – 2211 5.11 1500 2.64 0.36 3018 1.66 683 0.85 0.36 0908P 142.00 302 78.96 0.43 2220 1.29 566 0.72 0.43 3022 1.99 787 1.13 0.44 0913P 297.00 457 166.61 0.43 2286 0.94 456 0.54 0.44 3027 1.89 755 0.96 0.36
1005* 2.60 979 0.86 0.31 2288 2.95 1089 1.67 0.44 3028 1.81 730 1.01 0.43 1016X* 8.51 1500 2.87 0.31 2300 – – 0.97 0.43 3030 4.08 1445 2.08 0.36 1164D 2.21 856 1.00 0.31 2302 1.11 510 0.62 0.43 3040 3.85 1373 1.97 0.36 1165D 1.69 692 0.81 0.32 2305 1.23 547 0.67 0.42 3041 3.29 1196 1.81 0.43 1320 2.98 1099 1.42 0.32 2361 1.28 563 0.71 0.43 3042 2.16 840 1.16 0.41
1322 6.08 1500 3.02 0.32 2362 1.00 475 0.56 0.43 3064 3.13 1146 1.76 0.43 1430 2.68 1004 1.37 0.36 2380 1.93 768 1.08 0.43 3069 – – 1.16 0.43 1438 2.69 1007 1.31 0.32 2386 – – 0.97 0.43 3076 2.08 815 1.16 0.43 1452 1.41 604 0.73 0.36 2388 1.23 547 0.70 0.44 3081D 2.91 1077 1.46 0.36 1463 8.37 1500 4.02 0.32 2402 1.69 692 0.86 0.36 3082D 2.93 1083 1.45 0.36
1472 1.98 784 0.95 0.32 2413 1.89 755 1.05 0.43 3085D 2.52 954 1.26 0.36 1604X 2.47 938 1.29 0.36 2416 1.20 538 0.67 0.43 3110 2.16 840 1.21 0.43 1624D 1.41 604 0.67 0.32 2417 0.82 418 0.46 0.43 3111 1.87 749 1.04 0.43 1642 1.20 538 0.62 0.36 2501 1.75 711 0.97 0.43 3113 1.16 525 0.64 0.43 1654 4.33 1500 2.23 0.36 2503 0.97 466 0.55 0.44 3114 1.80 727 1.01 0.43
1655 – – 0.62 0.36 2534X 1.58 658 0.89 0.44 3118 1.11 510 0.64 0.44 1699 1.80 727 0.92 0.36 2570 2.46 935 1.40 0.44 3119 0.58 343 0.34 0.49 1701 2.27 875 1.16 0.36 2585 2.04 803 1.16 0.44 3122 1.19 535 0.67 0.44 1710D 2.86 1061 1.44 0.36 2586 1.28 563 0.71 0.43 3126 1.11 510 0.61 0.43 1741 – – 1.16 0.36 2587 1.60 664 0.92 0.44 3131 1.06 494 0.59 0.43
1747 1.20 538 0.62 0.36 2589 1.32 576 0.74 0.43 3132 2.02 796 1.12 0.43 1748 5.02 1500 2.53 0.35 2600 2.33 894 1.34 0.44 3145 1.81 730 1.00 0.43 1803D 5.06 1500 2.18 0.32 2623 4.34 1500 2.33 0.41 3146 1.45 617 0.80 0.43 1852 – – 0.64 0.31 2651 0.75 396 0.42 0.44 3169 1.48 626 0.82 0.43 1853 – – 1.16 0.36 2660 1.34 582 0.75 0.44 3175 – – 0.82 0.43
1860X 1.25 554 0.70 0.43 2670 1.20 538 0.71 0.49 3179 1.16 525 0.65 0.44 1924 1.48 626 0.84 0.44 2683 1.35 585 0.76 0.44 3180 1.69 692 0.96 0.44 1925 2.36 903 1.25 0.41 2688 1.78 721 1.01 0.44 3188 1.06 494 0.60 0.44 2002 1.70 696 0.96 0.44 2701 12.29 1500 6.23 0.36 3220 1.11 510 0.62 0.43 2003 2.91 1077 1.62 0.43 2702 15.24 1500 6.99 0.31 3223 – – 0.96 0.44
* Refer to the Footnotes Page for additional information on this class code.
© Copyright 2017 National Council on Compensation Insurance, Inc. All Rights Reserved. Page 31 of 138

WORKERS COMPENSATION AND EMPLOYERS LIABILITY INDIANA
Effective January 1, 2018APPLICABLE TO ASSIGNED RISK POLICIES ONLY
CLASS MIN D CLASS MIN D CLASS MIN D CODE RATE PREM ELR RATIO CODE RATE PREM ELR RATIO CODE RATE PREM ELR RATIO
3224 1.96 777 1.13 0.44 4024D 2.87 1064 1.45 0.36 4653 1.52 639 0.85 0.44 3227 2.10 822 1.19 0.44 4034 3.94 1401 2.01 0.36 4665 3.18 1162 1.63 0.36 3240 2.04 803 1.16 0.44 4036 1.93 768 0.98 0.36 4670 4.82 1500 2.45 0.36 3241 1.61 667 0.90 0.43 4038 1.60 664 0.95 0.49 4683 3.09 1133 1.72 0.43 3255 1.51 636 0.88 0.49 4053X 1.54 645 0.86 0.43 4686 1.29 566 0.66 0.36
3257 1.66 683 0.92 0.43 4061X 2.51 951 1.44 0.44 4692 0.55 333 0.31 0.44 3270 1.37 592 0.76 0.43 4062 1.78 721 1.00 0.43 4693 0.59 346 0.33 0.43 3300 4.65 1500 2.54 0.43 4101 1.60 664 0.85 0.41 4703 1.05 491 0.59 0.43 3303 2.63 988 1.48 0.44 4109 0.30 255 0.17 0.44 4716X 2.11 825 1.21 0.44 3307 2.42 922 1.34 0.43 4110 0.47 308 0.26 0.43 4717 1.28 563 0.76 0.49
3315 2.34 897 1.33 0.44 4111 1.23 547 0.70 0.44 4720 1.13 516 0.63 0.43 3334 1.35 585 0.77 0.43 4113X 1.58 658 0.87 0.43 4740 0.47 308 0.24 0.36 3336 1.55 648 0.79 0.36 4114 1.69 692 0.94 0.43 4741 1.41 604 0.80 0.43 3365 3.75 1341 1.92 0.36 4130 2.02 796 1.12 0.43 4751 1.45 617 0.73 0.36 3372 2.16 840 1.15 0.41 4131 3.67 1316 2.06 0.44 4766NX 2.24 963 1.03 0.31
3373 3.57 1285 2.04 0.43 4133 1.26 557 0.71 0.44 4771NX 1.58 746 0.72 0.31 3383 0.82 418 0.46 0.44 4149 0.40 286 0.23 0.49 4777 2.05 806 0.95 0.31 3385 0.47 308 0.27 0.44 4206 1.48 626 0.83 0.43 4825 0.52 324 0.26 0.36 3400 2.74 1023 1.45 0.41 4207 1.31 573 0.66 0.36 4828 1.57 655 0.83 0.41 3507 1.93 768 1.08 0.43 4239 1.34 582 0.68 0.36 4829 0.93 453 0.45 0.32
3515 1.60 664 0.88 0.43 4240 2.22 859 1.25 0.44 4902 2.98 1099 1.70 0.44 3548 0.97 466 0.54 0.43 4243 1.61 667 0.90 0.43 4923 0.62 355 0.35 0.43 3559 1.73 705 0.96 0.43 4244 1.66 683 0.93 0.43 5020 3.20 1168 1.65 0.36 3574 0.91 447 0.51 0.44 4250 1.08 500 0.60 0.43 5022 3.59 1291 1.76 0.32 3581 0.82 418 0.46 0.44 4251 1.81 730 1.01 0.43 5037 6.77 1500 3.10 0.31
3612 1.55 648 0.83 0.41 4263 2.05 806 1.14 0.43 5040 4.85 1500 2.22 0.31 3620 2.60 979 1.32 0.36 4273 1.32 576 0.74 0.43 5057 3.33 1209 1.55 0.31 3629 1.28 563 0.73 0.44 4279 1.25 554 0.70 0.43 5059 9.08 1500 4.15 0.31 3632 1.67 686 0.90 0.41 4282X 1.25 554 0.70 0.43 5069 – – 4.15 0.31 3634 1.19 535 0.67 0.44 4283 0.76 399 0.42 0.43 5102 2.83 1051 1.37 0.32
3635 1.70 696 0.94 0.43 4299 1.34 582 0.76 0.44 5146 2.44 929 1.25 0.36 3638 0.93 453 0.52 0.44 4304 4.02 1426 2.14 0.41 5160 1.37 592 0.67 0.32 3642 1.43 610 0.79 0.43 4307 1.28 563 0.75 0.49 5183 1.46 620 0.75 0.36 3643 1.45 617 0.80 0.43 4351 0.67 371 0.37 0.43 5188 2.01 793 1.05 0.36 3647 1.35 585 0.73 0.41 4352 0.93 453 0.52 0.44 5190 1.88 752 0.97 0.36
3648 1.06 494 0.60 0.44 4360 0.71 384 0.41 0.44 5191 0.85 428 0.48 0.43 3681 0.76 399 0.43 0.44 4361 0.60 349 0.34 0.44 5192 2.04 803 1.14 0.43 3685 0.55 333 0.31 0.44 4410 2.02 796 1.12 0.43 5213 3.52 1269 1.72 0.32 3719 0.50 318 0.23 0.31 4420 1.32 576 0.64 0.32 5215 3.14 1149 1.69 0.42 3724 2.50 948 1.21 0.32 4431 1.10 507 0.64 0.49 5221 2.64 992 1.36 0.36
3726 2.19 850 1.02 0.31 4432 0.91 447 0.54 0.49 5222 3.33 1209 1.63 0.32 3803 1.78 721 1.00 0.43 4439 – – 0.56 0.43 5223 4.74 1500 2.42 0.36 3807 1.40 601 0.79 0.44 4452 1.58 658 0.88 0.43 5348 2.22 859 1.14 0.36 3808 2.68 1004 1.44 0.41 4459 1.98 784 1.10 0.43 5402 2.21 856 1.25 0.44 3821X 4.94 1500 2.63 0.41 4470 1.48 626 0.83 0.43 5403 3.76 1344 1.82 0.32
3822X 2.84 1055 1.50 0.41 4484 1.96 777 1.08 0.43 5437 3.44 1244 1.77 0.36 3824X 2.02 796 1.09 0.41 4493 1.51 636 0.84 0.43 5443 1.88 752 1.05 0.43 3826 0.38 280 0.21 0.43 4511 0.52 324 0.28 0.41 5445 3.36 1218 1.64 0.32 3827 1.81 730 0.97 0.41 4557 1.46 620 0.83 0.44 5462 3.90 1389 2.01 0.36 3830 1.17 529 0.62 0.41 4558 1.00 475 0.56 0.43 5472 3.81 1360 1.76 0.31
3851 2.01 793 1.14 0.44 4568 1.40 601 0.72 0.36 5473 5.32 1500 2.40 0.31 3865 1.13 516 0.66 0.49 4581 0.53 327 0.25 0.32 5474 3.90 1389 1.89 0.32 3881 3.65 1310 2.03 0.43 4583 2.66 998 1.28 0.32 5478 2.64 992 1.37 0.36 4000 4.22 1489 2.05 0.32 4611 0.33 264 0.19 0.44 5479 4.11 1455 2.19 0.41 4021 2.72 1017 1.38 0.36 4635 1.52 639 0.70 0.31 5480 2.74 1023 1.34 0.32
* Refer to the Footnotes Page for additional information on this class code.
© Copyright 2017 National Council on Compensation Insurance, Inc. All Rights Reserved. Page 32 of 138
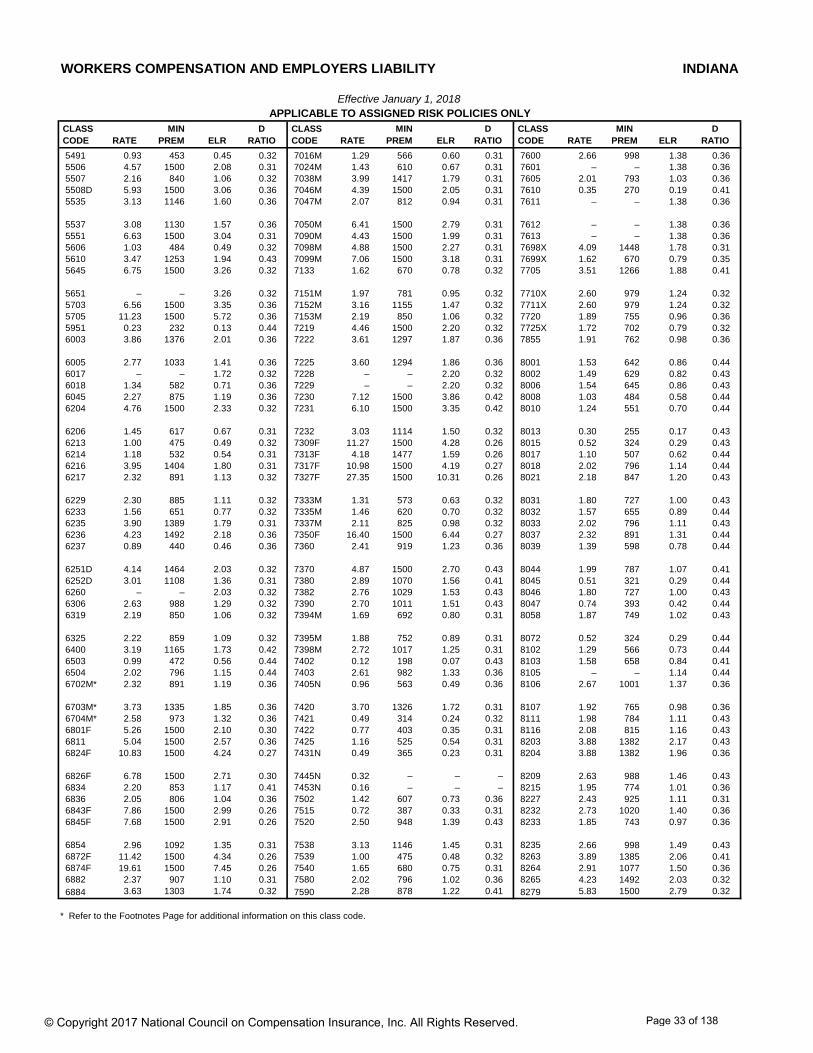
WORKERS COMPENSATION AND EMPLOYERS LIABILITY INDIANA
Effective January 1, 2018APPLICABLE TO ASSIGNED RISK POLICIES ONLY
CLASS MIN D CLASS MIN D CLASS MIN D CODE RATE PREM ELR RATIO CODE RATE PREM ELR RATIO CODE RATE PREM ELR RATIO
5491 0.93 453 0.45 0.32 7016M 1.29 566 0.60 0.31 7600 2.66 998 1.38 0.36 5506 4.57 1500 2.08 0.31 7024M 1.43 610 0.67 0.31 7601 – – 1.38 0.36 5507 2.16 840 1.06 0.32 7038M 3.99 1417 1.79 0.31 7605 2.01 793 1.03 0.36 5508D 5.93 1500 3.06 0.36 7046M 4.39 1500 2.05 0.31 7610 0.35 270 0.19 0.41 5535 3.13 1146 1.60 0.36 7047M 2.07 812 0.94 0.31 7611 – – 1.38 0.36
5537 3.08 1130 1.57 0.36 7050M 6.41 1500 2.79 0.31 7612 – – 1.38 0.36 5551 6.63 1500 3.04 0.31 7090M 4.43 1500 1.99 0.31 7613 – – 1.38 0.36 5606 1.03 484 0.49 0.32 7098M 4.88 1500 2.27 0.31 7698X 4.09 1448 1.78 0.31 5610 3.47 1253 1.94 0.43 7099M 7.06 1500 3.18 0.31 7699X 1.62 670 0.79 0.35 5645 6.75 1500 3.26 0.32 7133 1.62 670 0.78 0.32 7705 3.51 1266 1.88 0.41
5651 – – 3.26 0.32 7151M 1.97 781 0.95 0.32 7710X 2.60 979 1.24 0.32 5703 6.56 1500 3.35 0.36 7152M 3.16 1155 1.47 0.32 7711X 2.60 979 1.24 0.32 5705 11.23 1500 5.72 0.36 7153M 2.19 850 1.06 0.32 7720 1.89 755 0.96 0.36 5951 0.23 232 0.13 0.44 7219 4.46 1500 2.20 0.32 7725X 1.72 702 0.79 0.32 6003 3.86 1376 2.01 0.36 7222 3.61 1297 1.87 0.36 7855 1.91 762 0.98 0.36
6005 2.77 1033 1.41 0.36 7225 3.60 1294 1.86 0.36 8001 1.53 642 0.86 0.44 6017 – – 1.72 0.32 7228 – – 2.20 0.32 8002 1.49 629 0.82 0.43 6018 1.34 582 0.71 0.36 7229 – – 2.20 0.32 8006 1.54 645 0.86 0.43 6045 2.27 875 1.19 0.36 7230 7.12 1500 3.86 0.42 8008 1.03 484 0.58 0.44 6204 4.76 1500 2.33 0.32 7231 6.10 1500 3.35 0.42 8010 1.24 551 0.70 0.44
6206 1.45 617 0.67 0.31 7232 3.03 1114 1.50 0.32 8013 0.30 255 0.17 0.43 6213 1.00 475 0.49 0.32 7309F 11.27 1500 4.28 0.26 8015 0.52 324 0.29 0.43 6214 1.18 532 0.54 0.31 7313F 4.18 1477 1.59 0.26 8017 1.10 507 0.62 0.44 6216 3.95 1404 1.80 0.31 7317F 10.98 1500 4.19 0.27 8018 2.02 796 1.14 0.44 6217 2.32 891 1.13 0.32 7327F 27.35 1500 10.31 0.26 8021 2.18 847 1.20 0.43
6229 2.30 885 1.11 0.32 7333M 1.31 573 0.63 0.32 8031 1.80 727 1.00 0.43 6233 1.56 651 0.77 0.32 7335M 1.46 620 0.70 0.32 8032 1.57 655 0.89 0.44 6235 3.90 1389 1.79 0.31 7337M 2.11 825 0.98 0.32 8033 2.02 796 1.11 0.43 6236 4.23 1492 2.18 0.36 7350F 16.40 1500 6.44 0.27 8037 2.32 891 1.31 0.44 6237 0.89 440 0.46 0.36 7360 2.41 919 1.23 0.36 8039 1.39 598 0.78 0.44
6251D 4.14 1464 2.03 0.32 7370 4.87 1500 2.70 0.43 8044 1.99 787 1.07 0.41 6252D 3.01 1108 1.36 0.31 7380 2.89 1070 1.56 0.41 8045 0.51 321 0.29 0.44 6260 – – 2.03 0.32 7382 2.76 1029 1.53 0.43 8046 1.80 727 1.00 0.43 6306 2.63 988 1.29 0.32 7390 2.70 1011 1.51 0.43 8047 0.74 393 0.42 0.44 6319 2.19 850 1.06 0.32 7394M 1.69 692 0.80 0.31 8058 1.87 749 1.02 0.43
6325 2.22 859 1.09 0.32 7395M 1.88 752 0.89 0.31 8072 0.52 324 0.29 0.44 6400 3.19 1165 1.73 0.42 7398M 2.72 1017 1.25 0.31 8102 1.29 566 0.73 0.44 6503 0.99 472 0.56 0.44 7402 0.12 198 0.07 0.43 8103 1.58 658 0.84 0.41 6504 2.02 796 1.15 0.44 7403 2.61 982 1.33 0.36 8105 – – 1.14 0.44 6702M* 2.32 891 1.19 0.36 7405N 0.96 563 0.49 0.36 8106 2.67 1001 1.37 0.36
6703M* 3.73 1335 1.85 0.36 7420 3.70 1326 1.72 0.31 8107 1.92 765 0.98 0.36 6704M* 2.58 973 1.32 0.36 7421 0.49 314 0.24 0.32 8111 1.98 784 1.11 0.43 6801F 5.26 1500 2.10 0.30 7422 0.77 403 0.35 0.31 8116 2.08 815 1.16 0.43 6811 5.04 1500 2.57 0.36 7425 1.16 525 0.54 0.31 8203 3.88 1382 2.17 0.43 6824F 10.83 1500 4.24 0.27 7431N 0.49 365 0.23 0.31 8204 3.88 1382 1.96 0.36
6826F 6.78 1500 2.71 0.30 7445N 0.32 – – – 8209 2.63 988 1.46 0.43 6834 2.20 853 1.17 0.41 7453N 0.16 – – – 8215 1.95 774 1.01 0.36 6836 2.05 806 1.04 0.36 7502 1.42 607 0.73 0.36 8227 2.43 925 1.11 0.31 6843F 7.86 1500 2.99 0.26 7515 0.72 387 0.33 0.31 8232 2.73 1020 1.40 0.36 6845F 7.68 1500 2.91 0.26 7520 2.50 948 1.39 0.43 8233 1.85 743 0.97 0.36
6854 2.96 1092 1.35 0.31 7538 3.13 1146 1.45 0.31 8235 2.66 998 1.49 0.43 6872F 11.42 1500 4.34 0.26 7539 1.00 475 0.48 0.32 8263 3.89 1385 2.06 0.41 6874F 19.61 1500 7.45 0.26 7540 1.65 680 0.75 0.31 8264 2.91 1077 1.50 0.36 6882 2.37 907 1.10 0.31 7580 2.02 796 1.02 0.36 8265 4.23 1492 2.03 0.32 6884 3.63 1303 1.74 0.32 7590 2.28 878 1.22 0.41 8279 5.83 1500 2.79 0.32
* Refer to the Footnotes Page for additional information on this class code.
© Copyright 2017 National Council on Compensation Insurance, Inc. All Rights Reserved. Page 33 of 138
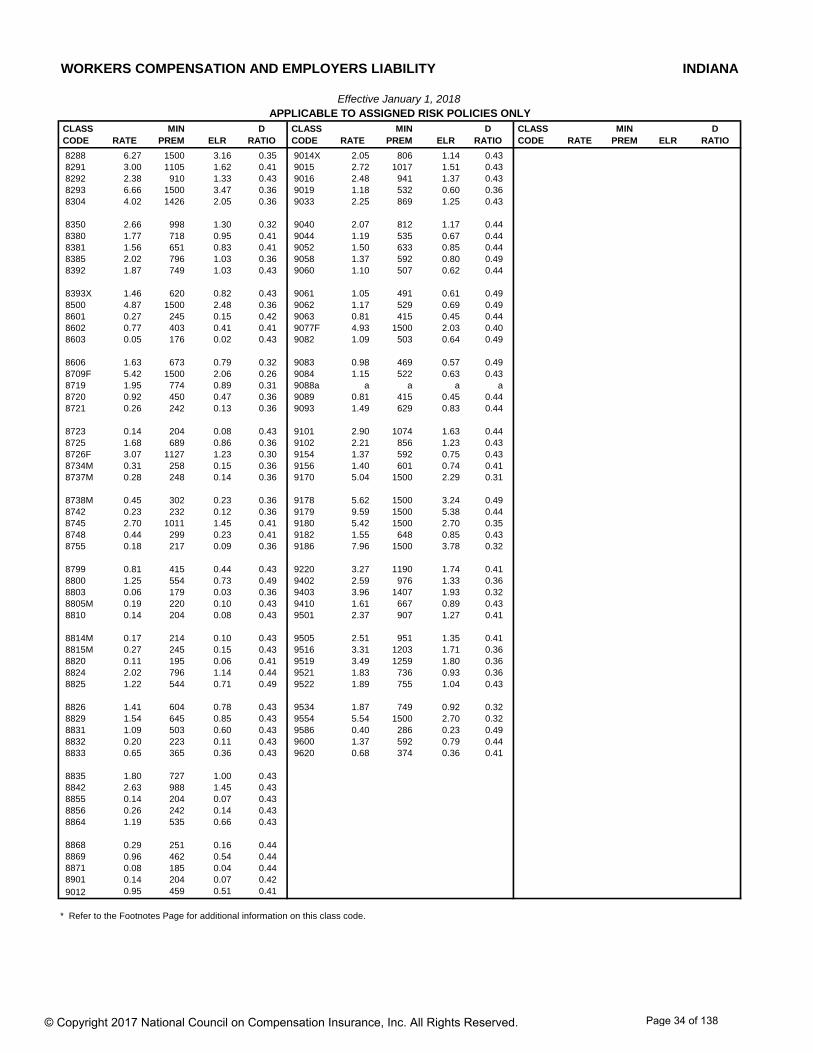
WORKERS COMPENSATION AND EMPLOYERS LIABILITY INDIANA
Effective January 1, 2018APPLICABLE TO ASSIGNED RISK POLICIES ONLY
CLASS MIN D CLASS MIN D CLASS MIN D CODE RATE PREM ELR RATIO CODE RATE PREM ELR RATIO CODE RATE PREM ELR RATIO
8288 6.27 1500 3.16 0.35 9014X 2.05 806 1.14 0.43 8291 3.00 1105 1.62 0.41 9015 2.72 1017 1.51 0.43 8292 2.38 910 1.33 0.43 9016 2.48 941 1.37 0.43 8293 6.66 1500 3.47 0.36 9019 1.18 532 0.60 0.36 8304 4.02 1426 2.05 0.36 9033 2.25 869 1.25 0.43
8350 2.66 998 1.30 0.32 9040 2.07 812 1.17 0.44 8380 1.77 718 0.95 0.41 9044 1.19 535 0.67 0.44 8381 1.56 651 0.83 0.41 9052 1.50 633 0.85 0.44 8385 2.02 796 1.03 0.36 9058 1.37 592 0.80 0.49 8392 1.87 749 1.03 0.43 9060 1.10 507 0.62 0.44
8393X 1.46 620 0.82 0.43 9061 1.05 491 0.61 0.49 8500 4.87 1500 2.48 0.36 9062 1.17 529 0.69 0.49 8601 0.27 245 0.15 0.42 9063 0.81 415 0.45 0.44 8602 0.77 403 0.41 0.41 9077F 4.93 1500 2.03 0.40 8603 0.05 176 0.02 0.43 9082 1.09 503 0.64 0.49
8606 1.63 673 0.79 0.32 9083 0.98 469 0.57 0.49 8709F 5.42 1500 2.06 0.26 9084 1.15 522 0.63 0.43 8719 1.95 774 0.89 0.31 9088a a a a a 8720 0.92 450 0.47 0.36 9089 0.81 415 0.45 0.44 8721 0.26 242 0.13 0.36 9093 1.49 629 0.83 0.44
8723 0.14 204 0.08 0.43 9101 2.90 1074 1.63 0.44 8725 1.68 689 0.86 0.36 9102 2.21 856 1.23 0.43 8726F 3.07 1127 1.23 0.30 9154 1.37 592 0.75 0.43 8734M 0.31 258 0.15 0.36 9156 1.40 601 0.74 0.41 8737M 0.28 248 0.14 0.36 9170 5.04 1500 2.29 0.31
8738M 0.45 302 0.23 0.36 9178 5.62 1500 3.24 0.49 8742 0.23 232 0.12 0.36 9179 9.59 1500 5.38 0.44 8745 2.70 1011 1.45 0.41 9180 5.42 1500 2.70 0.35 8748 0.44 299 0.23 0.41 9182 1.55 648 0.85 0.43 8755 0.18 217 0.09 0.36 9186 7.96 1500 3.78 0.32
8799 0.81 415 0.44 0.43 9220 3.27 1190 1.74 0.41 8800 1.25 554 0.73 0.49 9402 2.59 976 1.33 0.36 8803 0.06 179 0.03 0.36 9403 3.96 1407 1.93 0.32 8805M 0.19 220 0.10 0.43 9410 1.61 667 0.89 0.43 8810 0.14 204 0.08 0.43 9501 2.37 907 1.27 0.41
8814M 0.17 214 0.10 0.43 9505 2.51 951 1.35 0.41 8815M 0.27 245 0.15 0.43 9516 3.31 1203 1.71 0.36 8820 0.11 195 0.06 0.41 9519 3.49 1259 1.80 0.36 8824 2.02 796 1.14 0.44 9521 1.83 736 0.93 0.36 8825 1.22 544 0.71 0.49 9522 1.89 755 1.04 0.43
8826 1.41 604 0.78 0.43 9534 1.87 749 0.92 0.32 8829 1.54 645 0.85 0.43 9554 5.54 1500 2.70 0.32 8831 1.09 503 0.60 0.43 9586 0.40 286 0.23 0.49 8832 0.20 223 0.11 0.43 9600 1.37 592 0.79 0.44 8833 0.65 365 0.36 0.43 9620 0.68 374 0.36 0.41
8835 1.80 727 1.00 0.43 8842 2.63 988 1.45 0.43 8855 0.14 204 0.07 0.43 8856 0.26 242 0.14 0.43 8864 1.19 535 0.66 0.43
8868 0.29 251 0.16 0.44 8869 0.96 462 0.54 0.44 8871 0.08 185 0.04 0.44 8901 0.14 204 0.07 0.42 9012 0.95 459 0.51 0.41
* Refer to the Footnotes Page for additional information on this class code.
© Copyright 2017 National Council on Compensation Insurance, Inc. All Rights Reserved. Page 34 of 138
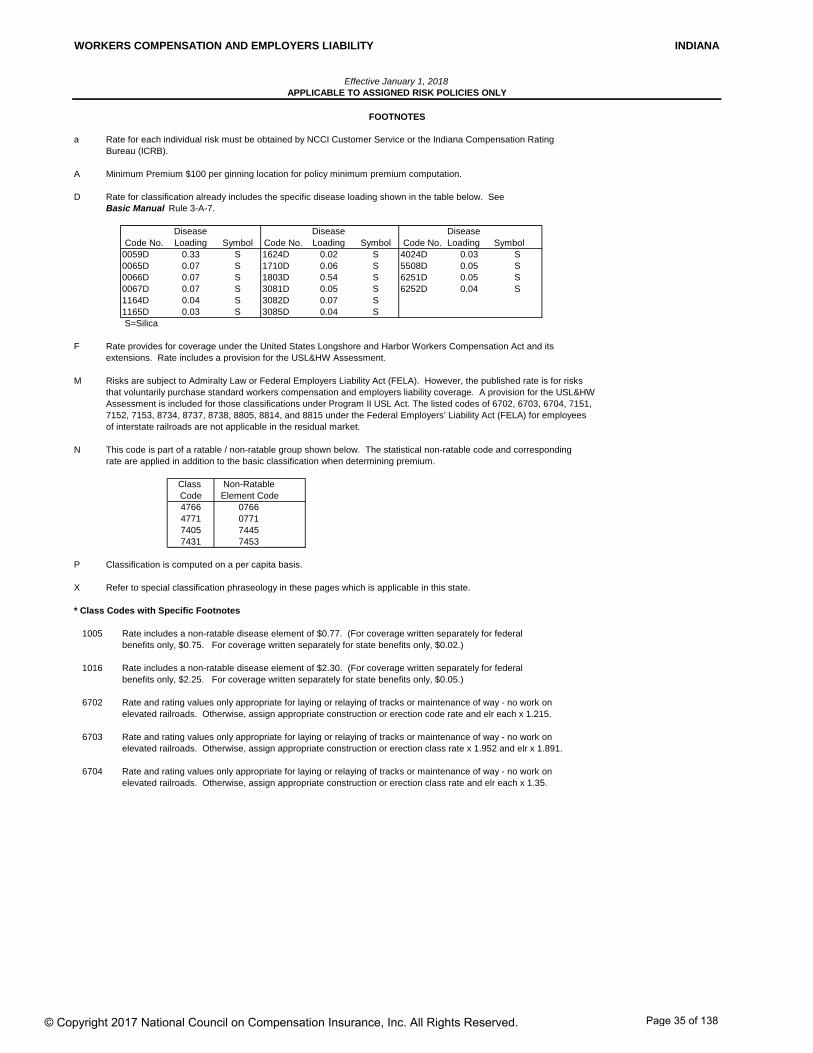
WORKERS COMPENSATION AND EMPLOYERS LIABILITY INDIANA
Effective January 1, 2018APPLICABLE TO ASSIGNED RISK POLICIES ONLY
FOOTNOTES
a Rate for each individual risk must be obtained by NCCI Customer Service or the Indiana Compensation Rating Bureau (ICRB).
A Minimum Premium $100 per ginning location for policy minimum premium computation.
D Rate for classification already includes the specific disease loading shown in the table below. See Basic Manual Rule 3-A-7.
Code No.Disease Loading Symbol Code No.
Disease Loading Symbol Code No.
Disease Loading Symbol
0059D 0.33 S 1624D 0.02 S 4024D 0.03 S0065D 0.07 S 1710D 0.06 S 5508D 0.05 S0066D 0.07 S 1803D 0.54 S 6251D 0.05 S0067D 0.07 S 3081D 0.05 S 6252D 0.04 S1164D 0.04 S 3082D 0.07 S1165D 0.03 S 3085D 0.04 S S=Silica
F Rate provides for coverage under the United States Longshore and Harbor Workers Compensation Act and itsextensions. Rate includes a provision for the USL&HW Assessment.
M Risks are subject to Admiralty Law or Federal Employers Liability Act (FELA). However, the published rate is for risks that voluntarily purchase standard workers compensation and employers liability coverage. A provision for the USL&HW Assessment is included for those classifications under Program II USL Act. The listed codes of 6702, 6703, 6704, 7151, 7152, 7153, 8734, 8737, 8738, 8805, 8814, and 8815 under the Federal Employers’ Liability Act (FELA) for employees of interstate railroads are not applicable in the residual market.
N This code is part of a ratable / non-ratable group shown below. The statistical non-ratable code and correspondingrate are applied in addition to the basic classification when determining premium.
Class Non-RatableCode Element Code4766 07664771 07717405 74457431 7453
P Classification is computed on a per capita basis.
X Refer to special classification phraseology in these pages which is applicable in this state.
* Class Codes with Specific Footnotes
1005 Rate includes a non-ratable disease element of $0.77. (For coverage written separately for federalbenefits only, $0.75. For coverage written separately for state benefits only, $0.02.)
1016 Rate includes a non-ratable disease element of $2.30. (For coverage written separately for federal benefits only, $2.25. For coverage written separately for state benefits only, $0.05.)
6702 Rate and rating values only appropriate for laying or relaying of tracks or maintenance of way - no work on elevated railroads. Otherwise, assign appropriate construction or erection code rate and elr each x 1.215.
6703 Rate and rating values only appropriate for laying or relaying of tracks or maintenance of way - no work on elevated railroads. Otherwise, assign appropriate construction or erection class rate x 1.952 and elr x 1.891.
6704 Rate and rating values only appropriate for laying or relaying of tracks or maintenance of way - no work onelevated railroads. Otherwise, assign appropriate construction or erection class rate and elr each x 1.35.
© Copyright 2017 National Council on Compensation Insurance, Inc. All Rights Reserved. Page 35 of 138
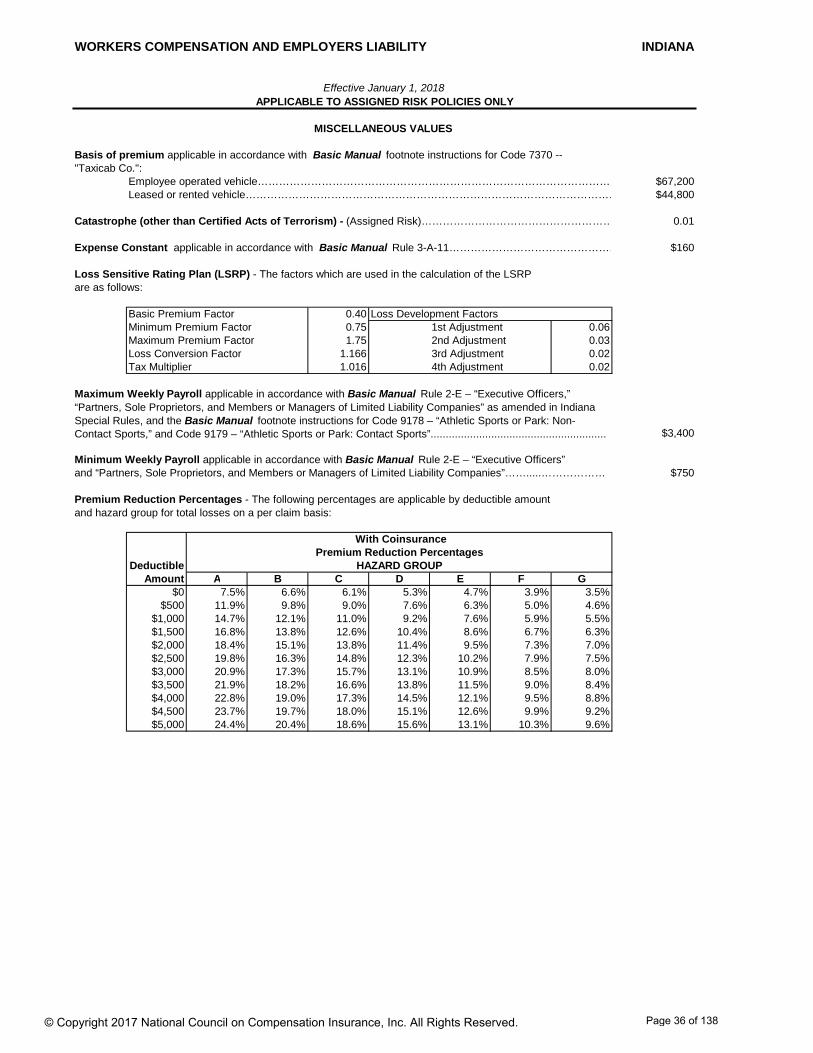
WORKERS COMPENSATION AND EMPLOYERS LIABILITY INDIANA
Effective January 1, 2018APPLICABLE TO ASSIGNED RISK POLICIES ONLY
MISCELLANEOUS VALUES
Basis of premium applicable in accordance with Basic Manual footnote instructions for Code 7370 --"Taxicab Co.":
Employee operated vehicle………………………………………………………………………………………… $67,200Leased or rented vehicle…………………………………………………………………………………………… $44,800
Catastrophe (other than Certified Acts of Terrorism) - (Assigned Risk)……………………………………………… 0.01
Expense Constant applicable in accordance with Basic Manual Rule 3-A-11………………………………………… $160
Loss Sensitive Rating Plan (LSRP) - The factors which are used in the calculation of the LSRPare as follows:
Basic Premium Factor 0.40 Loss Development FactorsMinimum Premium Factor 0.75 1st Adjustment 0.06Maximum Premium Factor 1.75 2nd Adjustment 0.03Loss Conversion Factor 1.166 3rd Adjustment 0.02Tax Multiplier 1.016 4th Adjustment 0.02
$3,400
Minimum Weekly Payroll applicable in accordance with Basic Manual Rule 2-E – “Executive Officers” and “Partners, Sole Proprietors, and Members or Managers of Limited Liability Companies”…….....……………… $750
With Coinsurance
Deductible HAZARD GROUPAmount A B C D E F G
$0 7.5% 6.6% 6.1% 5.3% 4.7% 3.9% 3.5%$500 11.9% 9.8% 9.0% 7.6% 6.3% 5.0% 4.6%
$1,000 14.7% 12.1% 11.0% 9.2% 7.6% 5.9% 5.5%$1,500 16.8% 13.8% 12.6% 10.4% 8.6% 6.7% 6.3%$2,000 18.4% 15.1% 13.8% 11.4% 9.5% 7.3% 7.0%$2,500 19.8% 16.3% 14.8% 12.3% 10.2% 7.9% 7.5%$3,000 20.9% 17.3% 15.7% 13.1% 10.9% 8.5% 8.0%$3,500 21.9% 18.2% 16.6% 13.8% 11.5% 9.0% 8.4%$4,000 22.8% 19.0% 17.3% 14.5% 12.1% 9.5% 8.8%$4,500 23.7% 19.7% 18.0% 15.1% 12.6% 9.9% 9.2%$5,000 24.4% 20.4% 18.6% 15.6% 13.1% 10.3% 9.6%
Maximum Weekly Payroll applicable in accordance with Basic Manual Rule 2-E – “Executive Officers,” “Partners, Sole Proprietors, and Members or Managers of Limited Liability Companies” as amended in Indiana Special Rules, and the Basic Manual footnote instructions for Code 9178 – “Athletic Sports or Park: Non-Contact Sports,” and Code 9179 – “Athletic Sports or Park: Contact Sports”..........................................................
and hazard group for total losses on a per claim basis:Premium Reduction Percentages - The following percentages are applicable by deductible amount
Premium Reduction Percentages
© Copyright 2017 National Council on Compensation Insurance, Inc. All Rights Reserved. Page 36 of 138

WORKERS COMPENSATION AND EMPLOYERS LIABILITY INDIANA
Effective January 1, 2018APPLICABLE TO ASSIGNED RISK POLICIES ONLY
MISCELLANEOUS VALUES (cont.)
Without Coinsurance
Deductible HAZARD GROUPAmount A B C D E F G
$500 5.5% 4.1% 3.7% 2.8% 2.1% 1.4% 1.4%$1,000 9.0% 6.9% 6.2% 4.8% 3.7% 2.5% 2.5%$1,500 11.6% 9.0% 8.1% 6.3% 5.0% 3.5% 3.5%$2,000 13.6% 10.7% 9.6% 7.6% 6.0% 4.3% 4.3%$2,500 15.3% 12.1% 10.9% 8.7% 7.0% 5.0% 5.0%$3,000 16.7% 13.4% 12.0% 9.7% 7.8% 5.7% 5.6%$3,500 18.0% 14.5% 13.1% 10.6% 8.6% 6.4% 6.1%$4,000 19.1% 15.5% 14.0% 11.4% 9.3% 6.9% 6.6%$4,500 20.1% 16.4% 14.8% 12.2% 10.0% 7.5% 7.1%$5,000 21.1% 17.3% 15.6% 12.9% 10.6% 8.0% 7.6%
Terrorism - (Assigned Risk)………………………………..……………….…………..……………………………………… 0.01
United States Longshore and Harbor Workers' Compensation Coverage Percentage applicable only in connection with Basic Manual Rule 3-A-4….…..….…............................................................... 60%
Experience Rating Eligibility
A 25% residual market surcharge is applicable to the premium in excess of $2,500 of the standard premium, subject to audit.
Premium Reduction Percentages
A risk qualifies for experience rating on an intrastate basis when it meets the premium eligibility requirements for the state in which it operates. The eligibility amount varies by rating effective date. The Experience Rating Plan Manual should be referenced for the latest approved eligibility amounts by state and by effective date.
(Multiply a Non-F classification rate by a factor of 1.60 to adjust for differences in benefits and loss-based expenses. This factor is the product of the adjustment for differences in benefits (1.51) and the adjustment for differences in loss-based expenses (1.061).)
© Copyright 2017 National Council on Compensation Insurance, Inc. All Rights Reserved. Page 37 of 138
Indiana
Advisory Loss Costs, Advisory Rates, and Assigned Risk Rates Filing – January 1, 2018
Proposed Values for Inclusion in the Experience Rating Plan Manual
The following pages include proposed values for the Experience Rating Plan Manual:
Table of Weighting Values Table of Ballast Values Experience rating premium eligibility amounts
© Copyright 2017 National Council on Compensation Insurance, Inc. All Rights Reserved.
Page 38 of 138

EXPERIENCE RATING PLAN MANUAL INDIANA
Effective January 1, 2018 TABLE OF WEIGHTING VALUESAPPLICABLE TO ALL POLICIESExperience Rating Program - ERA
Expected Weighting Expected WeightingLosses Values Losses Values
0 -- 1,581 0.04 891,572 -- 940,750 0.441,582 -- 6,391 0.05 940,751 -- 992,776 0.456,392 -- 11,304 0.06 992,777 -- 1,047,905 0.46
11,305 -- 16,324 0.07 1,047,906 -- 1,106,423 0.4716,325 -- 21,453 0.08 1,106,424 -- 1,168,652 0.48
21,454 -- 35,882 0.09 1,168,653 -- 1,234,960 0.4935,883 -- 53,412 0.10 1,234,961 -- 1,305,759 0.5053,413 -- 69,005 0.11 1,305,760 -- 1,381,524 0.5169,006 -- 84,188 0.12 1,381,525 -- 1,462,796 0.5284,189 -- 99,372 0.13 1,462,797 -- 1,550,199 0.53
99,373 -- 114,743 0.14 1,550,200 -- 1,644,455 0.54114,744 -- 130,406 0.15 1,644,456 -- 1,746,402 0.55130,407 -- 146,430 0.16 1,746,403 -- 1,857,023 0.56146,431 -- 162,870 0.17 1,857,024 -- 1,977,474 0.57162,871 -- 179,768 0.18 1,977,475 -- 2,109,127 0.58
179,769 -- 197,167 0.19 2,109,128 -- 2,253,622 0.59197,168 -- 215,102 0.20 2,253,623 -- 2,412,935 0.60215,103 -- 233,611 0.21 2,412,936 -- 2,589,468 0.61233,612 -- 252,730 0.22 2,589,469 -- 2,786,173 0.62252,731 -- 272,499 0.23 2,786,174 -- 3,006,719 0.63
272,500 -- 292,957 0.24 3,006,720 -- 3,255,720 0.64292,958 -- 314,145 0.25 3,255,721 -- 3,539,063 0.65314,146 -- 336,107 0.26 3,539,064 -- 3,864,381 0.66336,108 -- 358,890 0.27 3,864,382 -- 4,241,746 0.67358,891 -- 382,544 0.28 4,241,747 -- 4,684,738 0.68
382,545 -- 407,122 0.29 4,684,739 -- 5,212,105 0.69407,123 -- 432,682 0.30 5,212,106 -- 5,850,495 0.70432,683 -- 459,286 0.31 5,850,496 -- 6,639,090 0.71459,287 -- 487,000 0.32 6,639,091 -- 7,637,974 0.72487,001 -- 515,899 0.33 7,637,975 -- 8,944,202 0.73
515,900 -- 546,060 0.34 8,944,203 -- 10,725,418 0.74546,061 -- 577,569 0.35 10,725,419 -- 13,298,281 0.75577,570 -- 610,521 0.36 13,298,282 -- 17,341,343 0.76610,522 -- 645,017 0.37 17,341,344 -- 24,618,848 0.77645,018 -- 681,170 0.38 24,618,849 -- 41,599,677 0.78
681,171 -- 719,103 0.39 41,599,678 -- 126,503,784 0.79719,104 -- 758,952 0.40 126,503,785 AND OVER 0.80758,953 -- 800,866 0.41800,867 -- 845,011 0.42845,012 -- 891,571 0.43
(a) G . . . . . . . . . . . . . . . . . . . . . . . . . . . . . . . . . . . . . . . . . . . . . . . . . . . . . . . . . . . . . . . . . . . 7.55 (b) State Per Claim Accident Limitation . . . . . . . . . . . . . . . . . . . . . . . . . . . . . . . . . . . . . . . . $188,500(c) State Multiple Claim Accident Limitation . . . . . . . . . . . . . . . . . . . . . . . . . . . . . . . . . . . . . . . . $377,000(d) USL&HW Per Claim Accident Limitation . . . . . . . . . . . . . . . . . . . . . . . . . . . . . . . . . . . . . . . . $831,500(e) USL&HW Multiple Claim Accident Limitation . . . . . . . . . . . . . . . . . . . . . . . . . . . . . . . . . . . . . $1,663,000(f) Employers Liability Accident Limitation . . . . . . . . . . . . . . . . . . . . . . . . . . . . . . . . . . . . . . . . $55,000(g) Primary/Excess Loss Split Point . . . . . . . . . . . . . . . . . . . . . . . . . . . . . . . . . . . . . . . . . . . . . . $16,500(h) USL&HW Act -- Expected Loss Factor -- Non-F Classes . . . . . . . . . . . . . . . . . . . . . . . . . . . . 1.54(Multiply a Non-F classification ELR by the USL&HW Act - Expected Loss Factor of 1.54.)
9/17
© Copyright 2017 National Council on Compensation Insurance, Inc. All Rights Reserved. Page 39 of 138
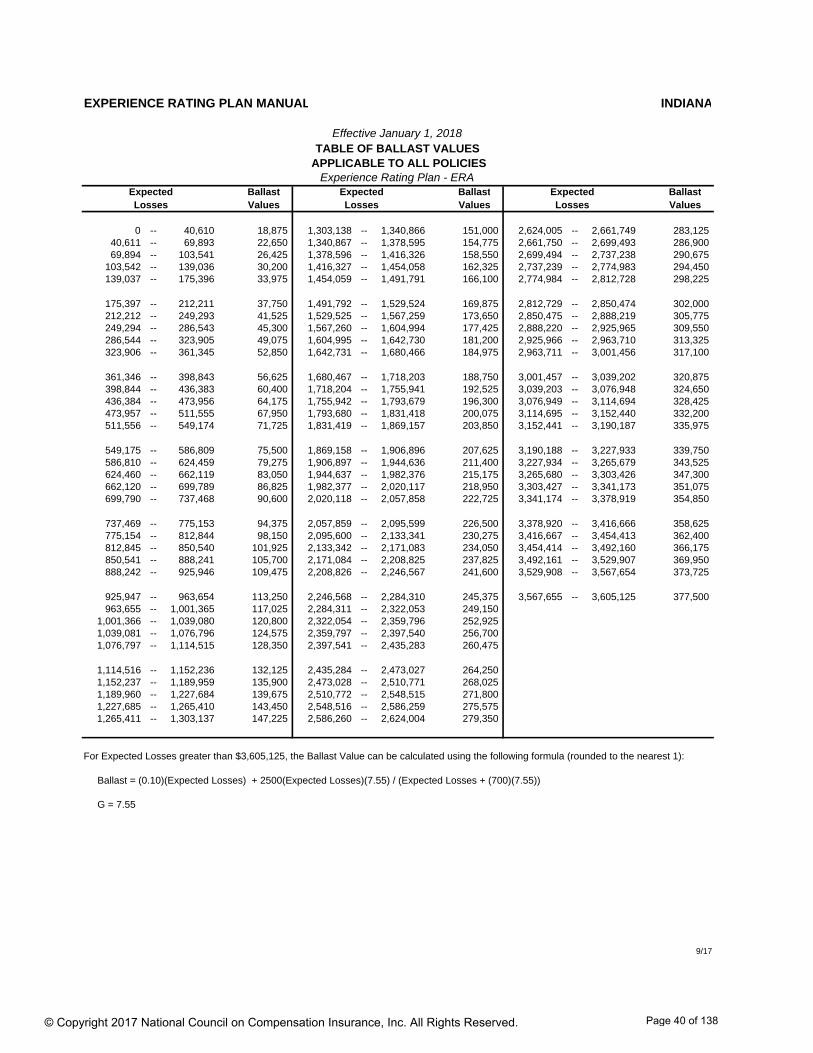
EXPERIENCE RATING PLAN MANUAL INDIANA
Effective January 1, 2018 TABLE OF BALLAST VALUES
APPLICABLE TO ALL POLICIESExperience Rating Plan - ERA
Expected Ballast Expected Ballast Expected BallastLosses Values Losses Values Losses Values
0 -- 40,610 18,875 1,303,138 -- 1,340,866 151,000 2,624,005 -- 2,661,749 283,12540,611 -- 69,893 22,650 1,340,867 -- 1,378,595 154,775 2,661,750 -- 2,699,493 286,90069,894 -- 103,541 26,425 1,378,596 -- 1,416,326 158,550 2,699,494 -- 2,737,238 290,675
103,542 -- 139,036 30,200 1,416,327 -- 1,454,058 162,325 2,737,239 -- 2,774,983 294,450139,037 -- 175,396 33,975 1,454,059 -- 1,491,791 166,100 2,774,984 -- 2,812,728 298,225
175,397 -- 212,211 37,750 1,491,792 -- 1,529,524 169,875 2,812,729 -- 2,850,474 302,000212,212 -- 249,293 41,525 1,529,525 -- 1,567,259 173,650 2,850,475 -- 2,888,219 305,775249,294 -- 286,543 45,300 1,567,260 -- 1,604,994 177,425 2,888,220 -- 2,925,965 309,550286,544 -- 323,905 49,075 1,604,995 -- 1,642,730 181,200 2,925,966 -- 2,963,710 313,325323,906 -- 361,345 52,850 1,642,731 -- 1,680,466 184,975 2,963,711 -- 3,001,456 317,100
361,346 -- 398,843 56,625 1,680,467 -- 1,718,203 188,750 3,001,457 -- 3,039,202 320,875398,844 -- 436,383 60,400 1,718,204 -- 1,755,941 192,525 3,039,203 -- 3,076,948 324,650436,384 -- 473,956 64,175 1,755,942 -- 1,793,679 196,300 3,076,949 -- 3,114,694 328,425473,957 -- 511,555 67,950 1,793,680 -- 1,831,418 200,075 3,114,695 -- 3,152,440 332,200511,556 -- 549,174 71,725 1,831,419 -- 1,869,157 203,850 3,152,441 -- 3,190,187 335,975
549,175 -- 586,809 75,500 1,869,158 -- 1,906,896 207,625 3,190,188 -- 3,227,933 339,750586,810 -- 624,459 79,275 1,906,897 -- 1,944,636 211,400 3,227,934 -- 3,265,679 343,525624,460 -- 662,119 83,050 1,944,637 -- 1,982,376 215,175 3,265,680 -- 3,303,426 347,300662,120 -- 699,789 86,825 1,982,377 -- 2,020,117 218,950 3,303,427 -- 3,341,173 351,075699,790 -- 737,468 90,600 2,020,118 -- 2,057,858 222,725 3,341,174 -- 3,378,919 354,850
737,469 -- 775,153 94,375 2,057,859 -- 2,095,599 226,500 3,378,920 -- 3,416,666 358,625775,154 -- 812,844 98,150 2,095,600 -- 2,133,341 230,275 3,416,667 -- 3,454,413 362,400812,845 -- 850,540 101,925 2,133,342 -- 2,171,083 234,050 3,454,414 -- 3,492,160 366,175850,541 -- 888,241 105,700 2,171,084 -- 2,208,825 237,825 3,492,161 -- 3,529,907 369,950888,242 -- 925,946 109,475 2,208,826 -- 2,246,567 241,600 3,529,908 -- 3,567,654 373,725
925,947 -- 963,654 113,250 2,246,568 -- 2,284,310 245,375 3,567,655 -- 3,605,125 377,500963,655 -- 1,001,365 117,025 2,284,311 -- 2,322,053 249,150
1,001,366 -- 1,039,080 120,800 2,322,054 -- 2,359,796 252,9251,039,081 -- 1,076,796 124,575 2,359,797 -- 2,397,540 256,7001,076,797 -- 1,114,515 128,350 2,397,541 -- 2,435,283 260,475
1,114,516 -- 1,152,236 132,125 2,435,284 -- 2,473,027 264,2501,152,237 -- 1,189,959 135,900 2,473,028 -- 2,510,771 268,0251,189,960 -- 1,227,684 139,675 2,510,772 -- 2,548,515 271,8001,227,685 -- 1,265,410 143,450 2,548,516 -- 2,586,259 275,5751,265,411 -- 1,303,137 147,225 2,586,260 -- 2,624,004 279,350
For Expected Losses greater than $3,605,125, the Ballast Value can be calculated using the following formula (rounded to the nearest 1):
Ballast = (0.10)(Expected Losses) + 2500(Expected Losses)(7.55) / (Expected Losses + (700)(7.55))
G = 7.55
9/17
© Copyright 2017 National Council on Compensation Insurance, Inc. All Rights Reserved. Page 40 of 138
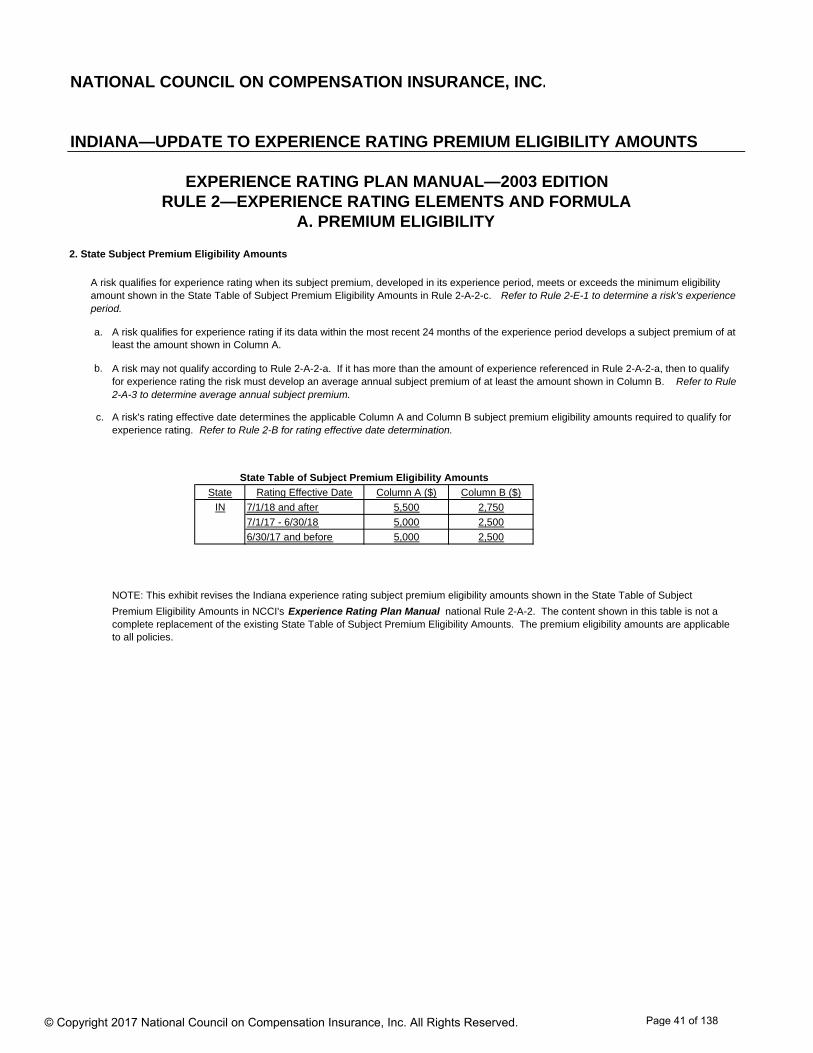
NATIONAL COUNCIL ON COMPENSATION INSURANCE, INC.
2. State Subject Premium Eligibility Amounts
a.
b.
c.
State Rating Effective Date Column A ($) Column B ($)
IN 7/1/18 and after 5,500 2,750
7/1/17 - 6/30/18 5,000 2,500
6/30/17 and before 5,000 2,500
A risk qualifies for experience rating if its data within the most recent 24 months of the experience period develops a subject premium of at least the amount shown in Column A.
INDIANA—UPDATE TO EXPERIENCE RATING PREMIUM ELIGIBILITY AMOUNTS
EXPERIENCE RATING PLAN MANUAL—2003 EDITIONRULE 2—EXPERIENCE RATING ELEMENTS AND FORMULA
A. PREMIUM ELIGIBILITY
A risk qualifies for experience rating when its subject premium, developed in its experience period, meets or exceeds the minimum eligibility amount shown in the State Table of Subject Premium Eligibility Amounts in Rule 2-A-2-c. Refer to Rule 2-E-1 to determine a risk's experience period.
A risk may not qualify according to Rule 2-A-2-a. If it has more than the amount of experience referenced in Rule 2-A-2-a, then to qualify for experience rating the risk must develop an average annual subject premium of at least the amount shown in Column B. Refer to Rule 2-A-3 to determine average annual subject premium.
A risk's rating effective date determines the applicable Column A and Column B subject premium eligibility amounts required to qualify for experience rating. Refer to Rule 2-B for rating effective date determination.
State Table of Subject Premium Eligibility Amounts
NOTE: This exhibit revises the Indiana experience rating subject premium eligibility amounts shown in the State Table of Subject
Premium Eligibility Amounts in NCCI's Experience Rating Plan Manual national Rule 2-A-2. The content shown in this table is not a complete replacement of the existing State Table of Subject Premium Eligibility Amounts. The premium eligibility amounts are applicable to all policies.
© Copyright 2017 National Council on Compensation Insurance, Inc. All Rights Reserved. Page 41 of 138

Indiana
Advisory Loss Costs, Advisory Rates, and Assigned Risk Rates Filing – January 1, 2018
Proposed Values for Inclusion in the Retrospective Rating Plan Manual
The following pages include values for inclusion in the Retrospective Rating Plan Manual:
Hazard group differentials Table of expected loss ranges Excess loss factors Excess loss and allocated expense factors Excess loss pure premium factors Retrospective pure premium development factors
© Copyright 2017 National Council on Compensation Insurance, Inc. All Rights Reserved.
Page 42 of 138
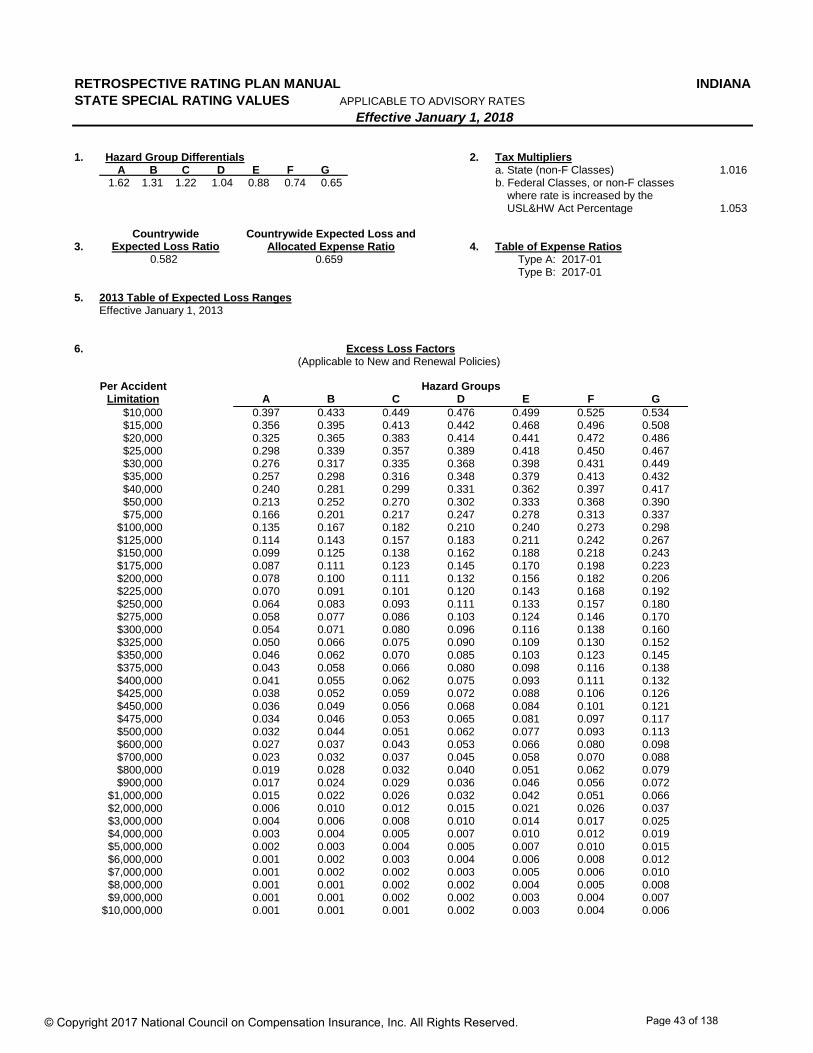
RETROSPECTIVE RATING PLAN MANUAL INDIANASTATE SPECIAL RATING VALUES APPLICABLE TO ADVISORY RATES
Effective January 1, 2018
1. Hazard Group Differentials 2. Tax Multipliers A B C D E F G a. State (non-F Classes) 1.016 1.62 1.31 1.22 1.04 0.88 0.74 0.65 b. Federal Classes, or non-F classes
where rate is increased by theUSL&HW Act Percentage 1.053
Countrywide Expected Loss and3. Allocated Expense Ratio 4. Table of Expense Ratios
0.659
5. 2013 Table of Expected Loss RangesEffective January 1, 2013
6. Excess Loss Factors (Applicable to New and Renewal Policies)
Per Accident Hazard GroupsLimitation A B C D E F G
$10,000 0.397 0.433 0.449 0.476 0.499 0.525 0.534$15,000 0.356 0.395 0.413 0.442 0.468 0.496 0.508$20,000 0.325 0.365 0.383 0.414 0.441 0.472 0.486$25,000 0.298 0.339 0.357 0.389 0.418 0.450 0.467$30,000 0.276 0.317 0.335 0.368 0.398 0.431 0.449$35,000 0.257 0.298 0.316 0.348 0.379 0.413 0.432$40,000 0.240 0.281 0.299 0.331 0.362 0.397 0.417$50,000 0.213 0.252 0.270 0.302 0.333 0.368 0.390$75,000 0.166 0.201 0.217 0.247 0.278 0.313 0.337
$100,000 0.135 0.167 0.182 0.210 0.240 0.273 0.298$125,000 0.114 0.143 0.157 0.183 0.211 0.242 0.267$150,000 0.099 0.125 0.138 0.162 0.188 0.218 0.243$175,000 0.087 0.111 0.123 0.145 0.170 0.198 0.223$200,000 0.078 0.100 0.111 0.132 0.156 0.182 0.206$225,000 0.070 0.091 0.101 0.120 0.143 0.168 0.192$250,000 0.064 0.083 0.093 0.111 0.133 0.157 0.180$275,000 0.058 0.077 0.086 0.103 0.124 0.146 0.170$300,000 0.054 0.071 0.080 0.096 0.116 0.138 0.160$325,000 0.050 0.066 0.075 0.090 0.109 0.130 0.152$350,000 0.046 0.062 0.070 0.085 0.103 0.123 0.145$375,000 0.043 0.058 0.066 0.080 0.098 0.116 0.138$400,000 0.041 0.055 0.062 0.075 0.093 0.111 0.132$425,000 0.038 0.052 0.059 0.072 0.088 0.106 0.126$450,000 0.036 0.049 0.056 0.068 0.084 0.101 0.121$475,000 0.034 0.046 0.053 0.065 0.081 0.097 0.117$500,000 0.032 0.044 0.051 0.062 0.077 0.093 0.113$600,000 0.027 0.037 0.043 0.053 0.066 0.080 0.098$700,000 0.023 0.032 0.037 0.045 0.058 0.070 0.088$800,000 0.019 0.028 0.032 0.040 0.051 0.062 0.079$900,000 0.017 0.024 0.029 0.036 0.046 0.056 0.072
$1,000,000 0.015 0.022 0.026 0.032 0.042 0.051 0.066$2,000,000 0.006 0.010 0.012 0.015 0.021 0.026 0.037$3,000,000 0.004 0.006 0.008 0.010 0.014 0.017 0.025$4,000,000 0.003 0.004 0.005 0.007 0.010 0.012 0.019$5,000,000 0.002 0.003 0.004 0.005 0.007 0.010 0.015$6,000,000 0.001 0.002 0.003 0.004 0.006 0.008 0.012$7,000,000 0.001 0.002 0.002 0.003 0.005 0.006 0.010$8,000,000 0.001 0.001 0.002 0.002 0.004 0.005 0.008$9,000,000 0.001 0.001 0.002 0.002 0.003 0.004 0.007
$10,000,000 0.001 0.001 0.001 0.002 0.003 0.004 0.006
0.582Expected Loss Ratio
Countrywide
Type A: 2017-01 Type B: 2017-01
© Copyright 2017 National Council on Compensation Insurance, Inc. All Rights Reserved. Page 43 of 138
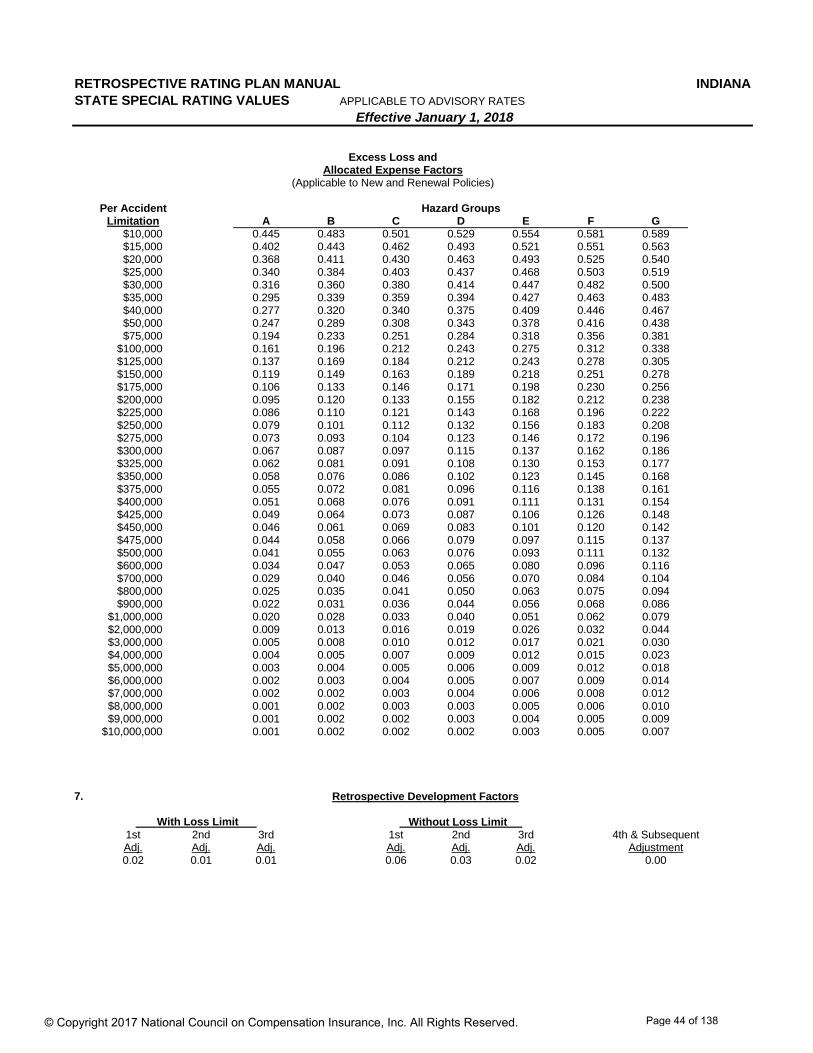
RETROSPECTIVE RATING PLAN MANUAL INDIANASTATE SPECIAL RATING VALUES APPLICABLE TO ADVISORY RATES
Effective January 1, 2018
Excess Loss andAllocated Expense Factors
(Applicable to New and Renewal Policies)
Per Accident Hazard GroupsLimitation A B C D E F G
$10,000 0.445 0.483 0.501 0.529 0.554 0.581 0.589$15,000 0.402 0.443 0.462 0.493 0.521 0.551 0.563$20,000 0.368 0.411 0.430 0.463 0.493 0.525 0.540$25,000 0.340 0.384 0.403 0.437 0.468 0.503 0.519$30,000 0.316 0.360 0.380 0.414 0.447 0.482 0.500$35,000 0.295 0.339 0.359 0.394 0.427 0.463 0.483$40,000 0.277 0.320 0.340 0.375 0.409 0.446 0.467$50,000 0.247 0.289 0.308 0.343 0.378 0.416 0.438$75,000 0.194 0.233 0.251 0.284 0.318 0.356 0.381
$100,000 0.161 0.196 0.212 0.243 0.275 0.312 0.338$125,000 0.137 0.169 0.184 0.212 0.243 0.278 0.305$150,000 0.119 0.149 0.163 0.189 0.218 0.251 0.278$175,000 0.106 0.133 0.146 0.171 0.198 0.230 0.256$200,000 0.095 0.120 0.133 0.155 0.182 0.212 0.238$225,000 0.086 0.110 0.121 0.143 0.168 0.196 0.222$250,000 0.079 0.101 0.112 0.132 0.156 0.183 0.208$275,000 0.073 0.093 0.104 0.123 0.146 0.172 0.196$300,000 0.067 0.087 0.097 0.115 0.137 0.162 0.186$325,000 0.062 0.081 0.091 0.108 0.130 0.153 0.177$350,000 0.058 0.076 0.086 0.102 0.123 0.145 0.168$375,000 0.055 0.072 0.081 0.096 0.116 0.138 0.161$400,000 0.051 0.068 0.076 0.091 0.111 0.131 0.154$425,000 0.049 0.064 0.073 0.087 0.106 0.126 0.148$450,000 0.046 0.061 0.069 0.083 0.101 0.120 0.142$475,000 0.044 0.058 0.066 0.079 0.097 0.115 0.137$500,000 0.041 0.055 0.063 0.076 0.093 0.111 0.132$600,000 0.034 0.047 0.053 0.065 0.080 0.096 0.116$700,000 0.029 0.040 0.046 0.056 0.070 0.084 0.104$800,000 0.025 0.035 0.041 0.050 0.063 0.075 0.094$900,000 0.022 0.031 0.036 0.044 0.056 0.068 0.086
$1,000,000 0.020 0.028 0.033 0.040 0.051 0.062 0.079$2,000,000 0.009 0.013 0.016 0.019 0.026 0.032 0.044$3,000,000 0.005 0.008 0.010 0.012 0.017 0.021 0.030$4,000,000 0.004 0.005 0.007 0.009 0.012 0.015 0.023$5,000,000 0.003 0.004 0.005 0.006 0.009 0.012 0.018$6,000,000 0.002 0.003 0.004 0.005 0.007 0.009 0.014$7,000,000 0.002 0.002 0.003 0.004 0.006 0.008 0.012$8,000,000 0.001 0.002 0.003 0.003 0.005 0.006 0.010$9,000,000 0.001 0.002 0.002 0.003 0.004 0.005 0.009
$10,000,000 0.001 0.002 0.002 0.002 0.003 0.005 0.007
7.
With Loss Limit Without Loss Limit 1st 2nd 3rd 1st 2nd 3rd 4th & SubsequentAdj. Adj. Adj. Adj. Adj. Adj. Adjustment0.02 0.01 0.01 0.06 0.03 0.02 0.00
Retrospective Development Factors
© Copyright 2017 National Council on Compensation Insurance, Inc. All Rights Reserved. Page 44 of 138
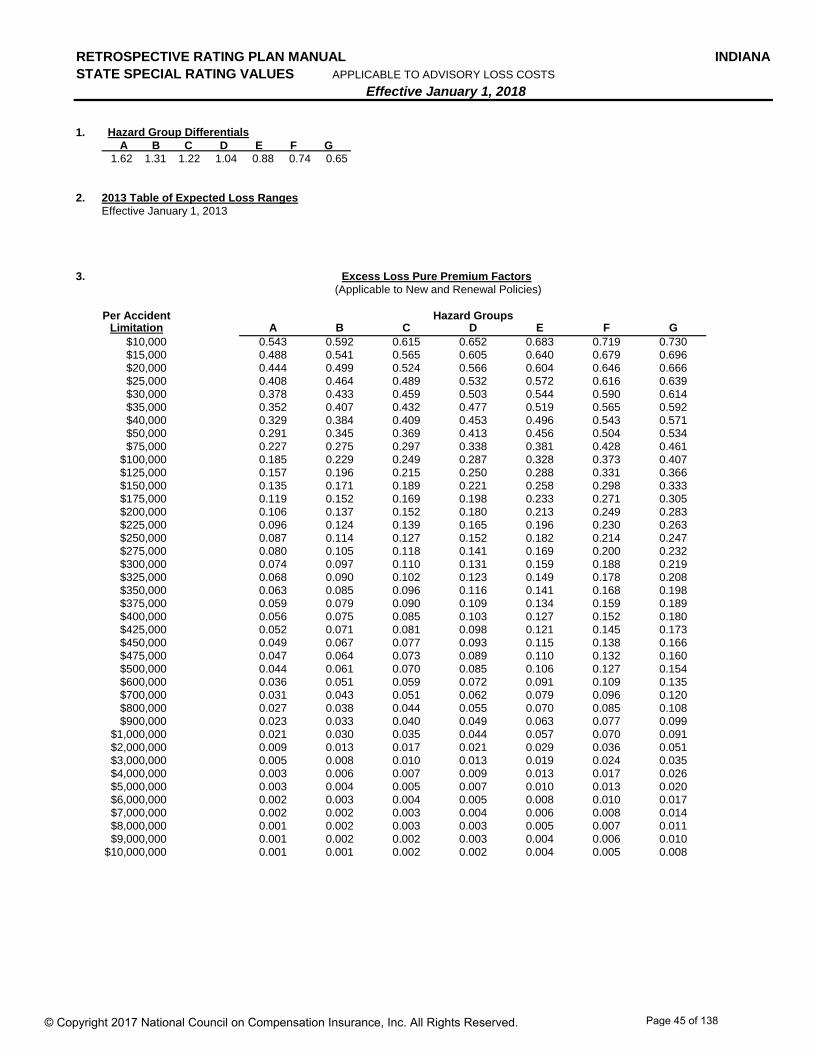
RETROSPECTIVE RATING PLAN MANUAL INDIANASTATE SPECIAL RATING VALUES APPLICABLE TO ADVISORY LOSS COSTS
Effective January 1, 2018
1. Hazard Group Differentials A B C D E F G 1.62 1.31 1.22 1.04 0.88 0.74 0.65
2. 2013 Table of Expected Loss RangesEffective January 1, 2013
3. Excess Loss Pure Premium Factors(Applicable to New and Renewal Policies)
Per Accident Hazard GroupsLimitation A B C D E F G
$10,000 0.543 0.592 0.615 0.652 0.683 0.719 0.730$15,000 0.488 0.541 0.565 0.605 0.640 0.679 0.696$20,000 0.444 0.499 0.524 0.566 0.604 0.646 0.666$25,000 0.408 0.464 0.489 0.532 0.572 0.616 0.639$30,000 0.378 0.433 0.459 0.503 0.544 0.590 0.614$35,000 0.352 0.407 0.432 0.477 0.519 0.565 0.592$40,000 0.329 0.384 0.409 0.453 0.496 0.543 0.571$50,000 0.291 0.345 0.369 0.413 0.456 0.504 0.534$75,000 0.227 0.275 0.297 0.338 0.381 0.428 0.461
$100,000 0.185 0.229 0.249 0.287 0.328 0.373 0.407$125,000 0.157 0.196 0.215 0.250 0.288 0.331 0.366$150,000 0.135 0.171 0.189 0.221 0.258 0.298 0.333$175,000 0.119 0.152 0.169 0.198 0.233 0.271 0.305$200,000 0.106 0.137 0.152 0.180 0.213 0.249 0.283$225,000 0.096 0.124 0.139 0.165 0.196 0.230 0.263$250,000 0.087 0.114 0.127 0.152 0.182 0.214 0.247$275,000 0.080 0.105 0.118 0.141 0.169 0.200 0.232$300,000 0.074 0.097 0.110 0.131 0.159 0.188 0.219$325,000 0.068 0.090 0.102 0.123 0.149 0.178 0.208$350,000 0.063 0.085 0.096 0.116 0.141 0.168 0.198$375,000 0.059 0.079 0.090 0.109 0.134 0.159 0.189$400,000 0.056 0.075 0.085 0.103 0.127 0.152 0.180$425,000 0.052 0.071 0.081 0.098 0.121 0.145 0.173$450,000 0.049 0.067 0.077 0.093 0.115 0.138 0.166$475,000 0.047 0.064 0.073 0.089 0.110 0.132 0.160$500,000 0.044 0.061 0.070 0.085 0.106 0.127 0.154$600,000 0.036 0.051 0.059 0.072 0.091 0.109 0.135$700,000 0.031 0.043 0.051 0.062 0.079 0.096 0.120$800,000 0.027 0.038 0.044 0.055 0.070 0.085 0.108$900,000 0.023 0.033 0.040 0.049 0.063 0.077 0.099
$1,000,000 0.021 0.030 0.035 0.044 0.057 0.070 0.091$2,000,000 0.009 0.013 0.017 0.021 0.029 0.036 0.051$3,000,000 0.005 0.008 0.010 0.013 0.019 0.024 0.035$4,000,000 0.003 0.006 0.007 0.009 0.013 0.017 0.026$5,000,000 0.003 0.004 0.005 0.007 0.010 0.013 0.020$6,000,000 0.002 0.003 0.004 0.005 0.008 0.010 0.017$7,000,000 0.002 0.002 0.003 0.004 0.006 0.008 0.014$8,000,000 0.001 0.002 0.003 0.003 0.005 0.007 0.011$9,000,000 0.001 0.002 0.002 0.003 0.004 0.006 0.010
$10,000,000 0.001 0.001 0.002 0.002 0.004 0.005 0.008
© Copyright 2017 National Council on Compensation Insurance, Inc. All Rights Reserved. Page 45 of 138
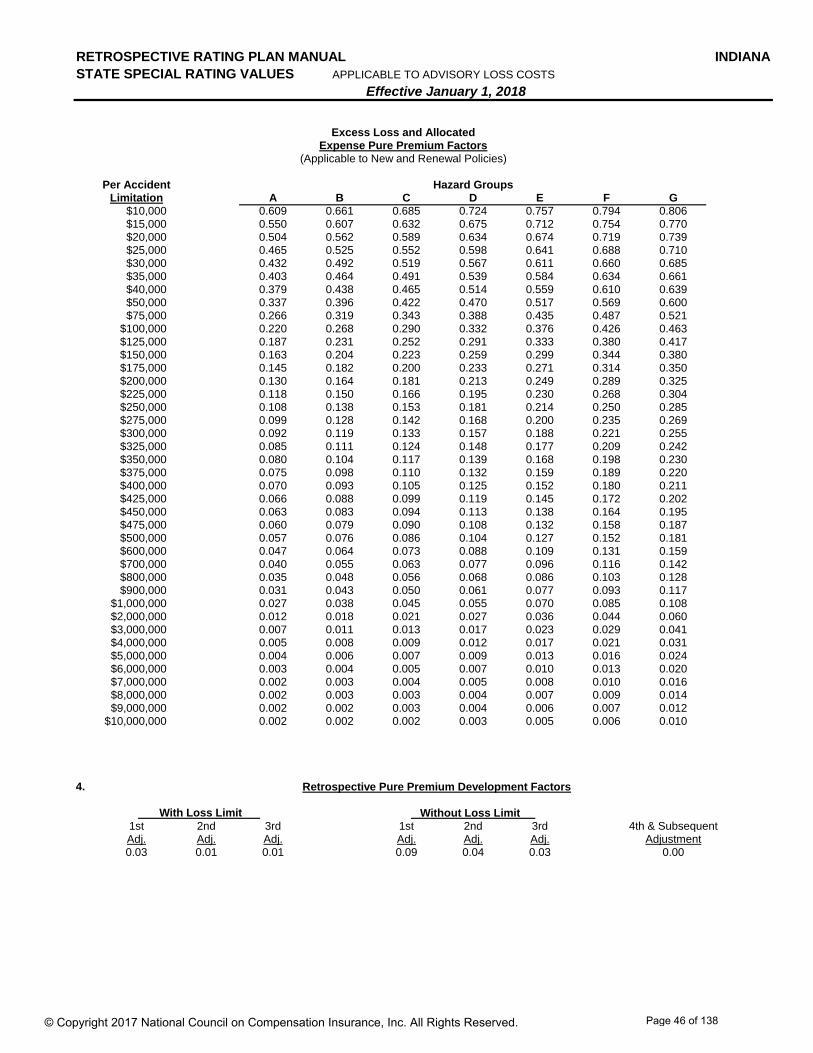
RETROSPECTIVE RATING PLAN MANUAL INDIANASTATE SPECIAL RATING VALUES APPLICABLE TO ADVISORY LOSS COSTS
Effective January 1, 2018
Excess Loss and AllocatedExpense Pure Premium Factors
(Applicable to New and Renewal Policies)
Per Accident Hazard GroupsLimitation A B C D E F G
$10,000 0.609 0.661 0.685 0.724 0.757 0.794 0.806$15,000 0.550 0.607 0.632 0.675 0.712 0.754 0.770$20,000 0.504 0.562 0.589 0.634 0.674 0.719 0.739$25,000 0.465 0.525 0.552 0.598 0.641 0.688 0.710$30,000 0.432 0.492 0.519 0.567 0.611 0.660 0.685$35,000 0.403 0.464 0.491 0.539 0.584 0.634 0.661$40,000 0.379 0.438 0.465 0.514 0.559 0.610 0.639$50,000 0.337 0.396 0.422 0.470 0.517 0.569 0.600$75,000 0.266 0.319 0.343 0.388 0.435 0.487 0.521
$100,000 0.220 0.268 0.290 0.332 0.376 0.426 0.463$125,000 0.187 0.231 0.252 0.291 0.333 0.380 0.417$150,000 0.163 0.204 0.223 0.259 0.299 0.344 0.380$175,000 0.145 0.182 0.200 0.233 0.271 0.314 0.350$200,000 0.130 0.164 0.181 0.213 0.249 0.289 0.325$225,000 0.118 0.150 0.166 0.195 0.230 0.268 0.304$250,000 0.108 0.138 0.153 0.181 0.214 0.250 0.285$275,000 0.099 0.128 0.142 0.168 0.200 0.235 0.269$300,000 0.092 0.119 0.133 0.157 0.188 0.221 0.255$325,000 0.085 0.111 0.124 0.148 0.177 0.209 0.242$350,000 0.080 0.104 0.117 0.139 0.168 0.198 0.230$375,000 0.075 0.098 0.110 0.132 0.159 0.189 0.220$400,000 0.070 0.093 0.105 0.125 0.152 0.180 0.211$425,000 0.066 0.088 0.099 0.119 0.145 0.172 0.202$450,000 0.063 0.083 0.094 0.113 0.138 0.164 0.195$475,000 0.060 0.079 0.090 0.108 0.132 0.158 0.187$500,000 0.057 0.076 0.086 0.104 0.127 0.152 0.181$600,000 0.047 0.064 0.073 0.088 0.109 0.131 0.159$700,000 0.040 0.055 0.063 0.077 0.096 0.116 0.142$800,000 0.035 0.048 0.056 0.068 0.086 0.103 0.128$900,000 0.031 0.043 0.050 0.061 0.077 0.093 0.117
$1,000,000 0.027 0.038 0.045 0.055 0.070 0.085 0.108$2,000,000 0.012 0.018 0.021 0.027 0.036 0.044 0.060$3,000,000 0.007 0.011 0.013 0.017 0.023 0.029 0.041$4,000,000 0.005 0.008 0.009 0.012 0.017 0.021 0.031$5,000,000 0.004 0.006 0.007 0.009 0.013 0.016 0.024$6,000,000 0.003 0.004 0.005 0.007 0.010 0.013 0.020$7,000,000 0.002 0.003 0.004 0.005 0.008 0.010 0.016$8,000,000 0.002 0.003 0.003 0.004 0.007 0.009 0.014$9,000,000 0.002 0.002 0.003 0.004 0.006 0.007 0.012
$10,000,000 0.002 0.002 0.002 0.003 0.005 0.006 0.010
4.
With Loss Limit Without Loss Limit 1st 2nd 3rd 1st 2nd 3rd 4th & SubsequentAdj. Adj. Adj. Adj. Adj. Adj. Adjustment0.03 0.01 0.01 0.09 0.04 0.03 0.00
Retrospective Pure Premium Development Factors
© Copyright 2017 National Council on Compensation Insurance, Inc. All Rights Reserved. Page 46 of 138
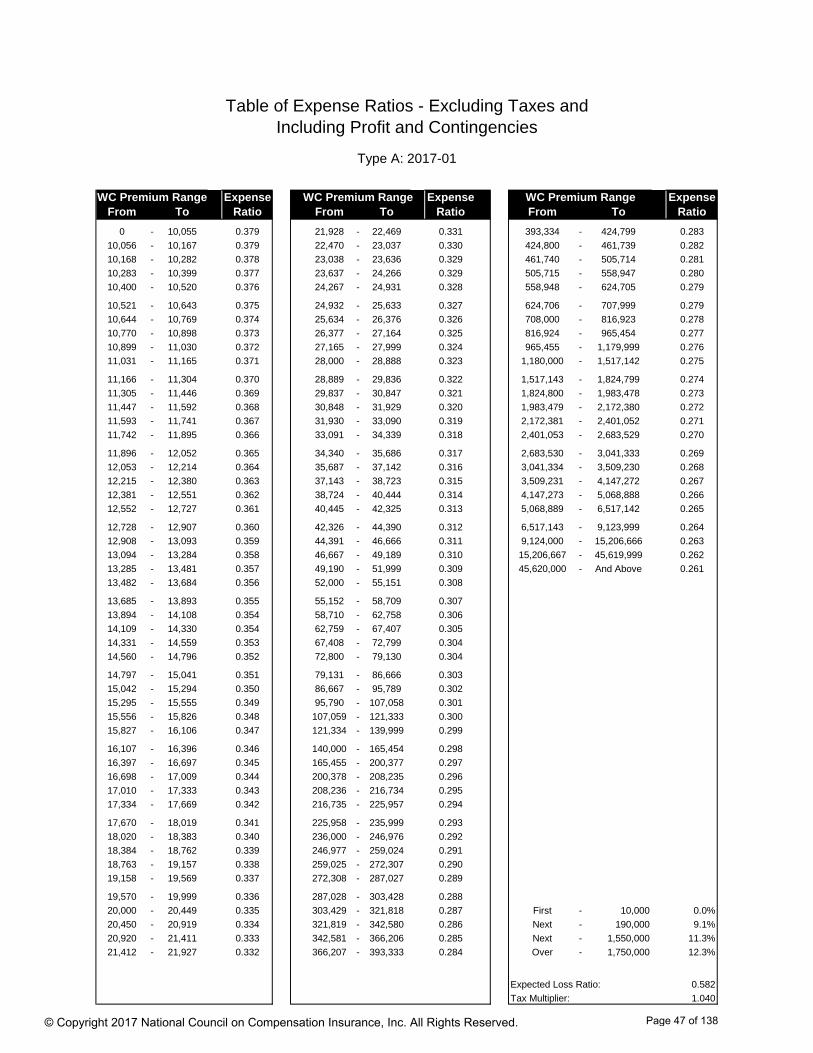
Table of Expense Ratios - Excluding Taxes andIncluding Profit and Contingencies
Type A: 2017-01
WC Premium Range Expense WC Premium Range Expense WC Premium Range ExpenseFrom To Ratio From To Ratio From To Ratio
0 - 10,055 0.379 21,928 - 22,469 0.331 393,334 - 424,799 0.283
10,056 - 10,167 0.379 22,470 - 23,037 0.330 424,800 - 461,739 0.282
10,168 - 10,282 0.378 23,038 - 23,636 0.329 461,740 - 505,714 0.281
10,283 - 10,399 0.377 23,637 - 24,266 0.329 505,715 - 558,947 0.280
10,400 - 10,520 0.376 24,267 - 24,931 0.328 558,948 - 624,705 0.279
10,521 - 10,643 0.375 24,932 - 25,633 0.327 624,706 - 707,999 0.279
10,644 - 10,769 0.374 25,634 - 26,376 0.326 708,000 - 816,923 0.278
10,770 - 10,898 0.373 26,377 - 27,164 0.325 816,924 - 965,454 0.277
10,899 - 11,030 0.372 27,165 - 27,999 0.324 965,455 - 1,179,999 0.276
11,031 - 11,165 0.371 28,000 - 28,888 0.323 1,180,000 - 1,517,142 0.275
11,166 - 11,304 0.370 28,889 - 29,836 0.322 1,517,143 - 1,824,799 0.274
11,305 - 11,446 0.369 29,837 - 30,847 0.321 1,824,800 - 1,983,478 0.273
11,447 - 11,592 0.368 30,848 - 31,929 0.320 1,983,479 - 2,172,380 0.272
11,593 - 11,741 0.367 31,930 - 33,090 0.319 2,172,381 - 2,401,052 0.271
11,742 - 11,895 0.366 33,091 - 34,339 0.318 2,401,053 - 2,683,529 0.270
11,896 - 12,052 0.365 34,340 - 35,686 0.317 2,683,530 - 3,041,333 0.269
12,053 - 12,214 0.364 35,687 - 37,142 0.316 3,041,334 - 3,509,230 0.268
12,215 - 12,380 0.363 37,143 - 38,723 0.315 3,509,231 - 4,147,272 0.267
12,381 - 12,551 0.362 38,724 - 40,444 0.314 4,147,273 - 5,068,888 0.266
12,552 - 12,727 0.361 40,445 - 42,325 0.313 5,068,889 - 6,517,142 0.265
12,728 - 12,907 0.360 42,326 - 44,390 0.312 6,517,143 - 9,123,999 0.264
12,908 - 13,093 0.359 44,391 - 46,666 0.311 9,124,000 - 15,206,666 0.263
13,094 - 13,284 0.358 46,667 - 49,189 0.310 15,206,667 - 45,619,999 0.262
13,285 - 13,481 0.357 49,190 - 51,999 0.309 45,620,000 - And Above 0.261
13,482 - 13,684 0.356 52,000 - 55,151 0.308
13,685 - 13,893 0.355 55,152 - 58,709 0.307
13,894 - 14,108 0.354 58,710 - 62,758 0.306
14,109 - 14,330 0.354 62,759 - 67,407 0.305
14,331 - 14,559 0.353 67,408 - 72,799 0.304
14,560 - 14,796 0.352 72,800 - 79,130 0.304
14,797 - 15,041 0.351 79,131 - 86,666 0.303
15,042 - 15,294 0.350 86,667 - 95,789 0.302
15,295 - 15,555 0.349 95,790 - 107,058 0.301
15,556 - 15,826 0.348 107,059 - 121,333 0.300
15,827 - 16,106 0.347 121,334 - 139,999 0.299
16,107 - 16,396 0.346 140,000 - 165,454 0.298
16,397 - 16,697 0.345 165,455 - 200,377 0.297
16,698 - 17,009 0.344 200,378 - 208,235 0.296
17,010 - 17,333 0.343 208,236 - 216,734 0.295
17,334 - 17,669 0.342 216,735 - 225,957 0.294
17,670 - 18,019 0.341 225,958 - 235,999 0.293
18,020 - 18,383 0.340 236,000 - 246,976 0.292
18,384 - 18,762 0.339 246,977 - 259,024 0.291
18,763 - 19,157 0.338 259,025 - 272,307 0.290
19,158 - 19,569 0.337 272,308 - 287,027 0.289
19,570 - 19,999 0.336 287,028 - 303,428 0.288
20,000 - 20,449 0.335 303,429 - 321,818 0.287 First - 10,000 0.0%
20,450 - 20,919 0.334 321,819 - 342,580 0.286 Next - 190,000 9.1%
20,920 - 21,411 0.333 342,581 - 366,206 0.285 Next - 1,550,000 11.3%
21,412 - 21,927 0.332 366,207 - 393,333 0.284 Over - 1,750,000 12.3%
Expected Loss Ratio: 0.582
Tax Multiplier: 1.040
© Copyright 2017 National Council on Compensation Insurance, Inc. All Rights Reserved. Page 47 of 138

Table of Expense Ratios - Excluding Taxes and Including Profit and Contingencies
Type B: 2017-01
WC Premium Range Expense WC Premium Range Expense WC Premium Range ExpenseFrom To Ratio From To Ratio From To Ratio
0 - 10,099 0.379 19,246 - 19,999 0.355 213,549 - 228,275 0.331
10,100 - 10,303 0.379 20,000 - 20,816 0.354 228,276 - 245,185 0.330
10,304 - 10,515 0.378 20,817 - 21,702 0.354 245,186 - 264,799 0.329
10,516 - 10,736 0.377 21,703 - 22,666 0.353 264,800 - 287,826 0.329
10,737 - 10,967 0.376 22,667 - 23,720 0.352 287,827 - 315,238 0.328
10,968 - 11,208 0.375 23,721 - 24,878 0.351 315,239 - 348,421 0.327
11,209 - 11,460 0.374 24,879 - 26,153 0.350 348,422 - 389,411 0.326
11,461 - 11,724 0.373 26,154 - 27,567 0.349 389,412 - 441,333 0.325
11,725 - 11,999 0.372 27,568 - 29,142 0.348 441,334 - 509,230 0.324
12,000 - 12,289 0.371 29,143 - 30,909 0.347 509,231 - 601,818 0.323
12,290 - 12,592 0.370 30,910 - 32,903 0.346 601,819 - 735,555 0.322
12,593 - 12,911 0.369 32,904 - 35,172 0.345 735,556 - 945,714 0.321
12,912 - 13,246 0.368 35,173 - 37,777 0.344 945,715 - 1,323,999 0.320
13,247 - 13,599 0.367 37,778 - 40,799 0.343 1,324,000 - 1,809,565 0.319
13,600 - 13,972 0.366 40,800 - 44,347 0.342 1,809,566 - 1,981,904 0.318
13,973 - 14,366 0.365 44,348 - 48,571 0.341 1,981,905 - 2,190,526 0.317
14,367 - 14,782 0.364 48,572 - 53,684 0.340 2,190,527 - 2,448,235 0.316
14,783 - 15,223 0.363 53,685 - 59,999 0.339 2,448,236 - 2,774,666 0.315
15,224 - 15,692 0.362 60,000 - 67,999 0.338 2,774,667 - 3,201,538 0.314
15,693 - 16,190 0.361 68,000 - 78,461 0.337 3,201,539 - 3,783,636 0.313
16,191 - 16,721 0.360 78,462 - 92,727 0.336 3,783,637 - 4,624,444 0.312
16,722 - 17,288 0.359 92,728 - 113,333 0.335 4,624,445 - 5,945,714 0.311
17,289 - 17,894 0.358 113,334 - 145,714 0.334 5,945,715 - 8,323,999 0.310
17,895 - 18,545 0.357 145,715 - 200,606 0.333 8,324,000 - 13,873,333 0.309
18,546 - 19,245 0.356 200,607 - 213,548 0.332 13,873,334 - 41,619,999 0.308
41,620,000 - And Above 0.307
First - 10,000 0.0%
Next - 190,000 5.1%
Next - 1,550,000 6.5%
Over - 1,750,000 7.5%
Expected Loss Ratio: 0.582
Tax Multiplier: 1.040
© Copyright 2017 National Council on Compensation Insurance, Inc. All Rights Reserved. Page 48 of 138
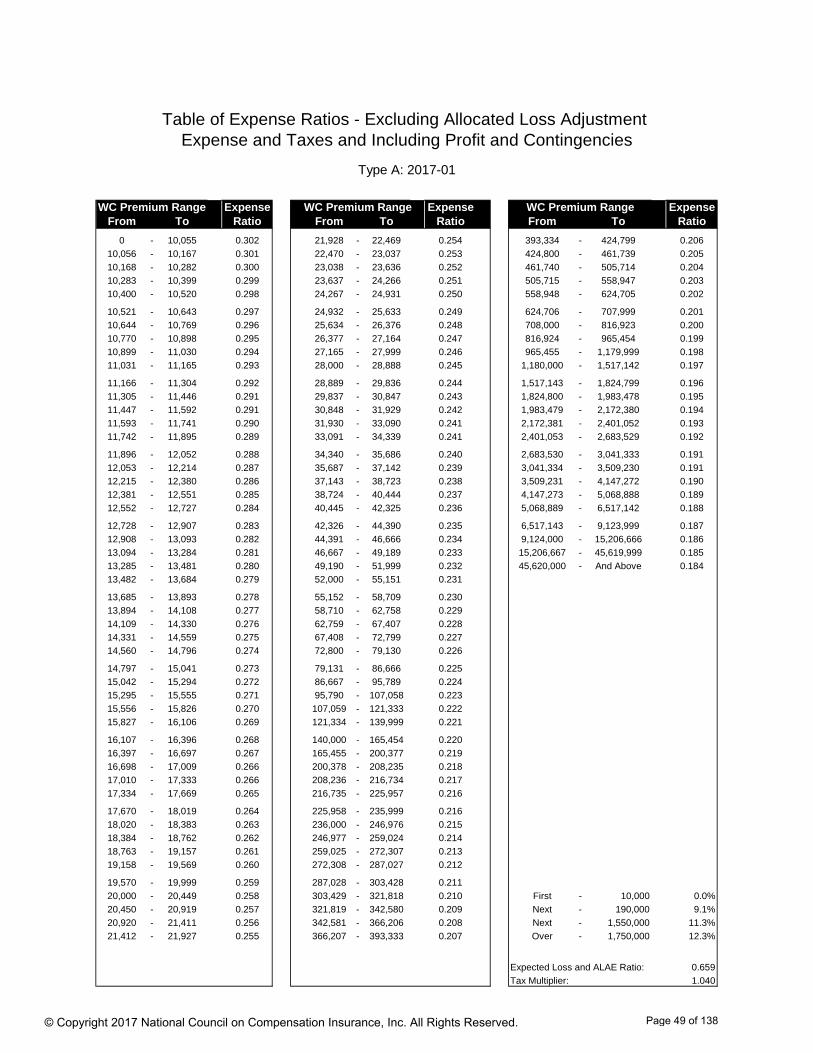
Table of Expense Ratios - Excluding Allocated Loss Adjustment Expense and Taxes and Including Profit and Contingencies
Type A: 2017-01
WC Premium Range Expense WC Premium Range Expense WC Premium Range ExpenseFrom To Ratio From To Ratio From To Ratio
0 - 10,055 0.302 21,928 - 22,469 0.254 393,334 - 424,799 0.206
10,056 - 10,167 0.301 22,470 - 23,037 0.253 424,800 - 461,739 0.205
10,168 - 10,282 0.300 23,038 - 23,636 0.252 461,740 - 505,714 0.204
10,283 - 10,399 0.299 23,637 - 24,266 0.251 505,715 - 558,947 0.203
10,400 - 10,520 0.298 24,267 - 24,931 0.250 558,948 - 624,705 0.202
10,521 - 10,643 0.297 24,932 - 25,633 0.249 624,706 - 707,999 0.201
10,644 - 10,769 0.296 25,634 - 26,376 0.248 708,000 - 816,923 0.200
10,770 - 10,898 0.295 26,377 - 27,164 0.247 816,924 - 965,454 0.199
10,899 - 11,030 0.294 27,165 - 27,999 0.246 965,455 - 1,179,999 0.198
11,031 - 11,165 0.293 28,000 - 28,888 0.245 1,180,000 - 1,517,142 0.197
11,166 - 11,304 0.292 28,889 - 29,836 0.244 1,517,143 - 1,824,799 0.196
11,305 - 11,446 0.291 29,837 - 30,847 0.243 1,824,800 - 1,983,478 0.195
11,447 - 11,592 0.291 30,848 - 31,929 0.242 1,983,479 - 2,172,380 0.194
11,593 - 11,741 0.290 31,930 - 33,090 0.241 2,172,381 - 2,401,052 0.193
11,742 - 11,895 0.289 33,091 - 34,339 0.241 2,401,053 - 2,683,529 0.192
11,896 - 12,052 0.288 34,340 - 35,686 0.240 2,683,530 - 3,041,333 0.191
12,053 - 12,214 0.287 35,687 - 37,142 0.239 3,041,334 - 3,509,230 0.191
12,215 - 12,380 0.286 37,143 - 38,723 0.238 3,509,231 - 4,147,272 0.190
12,381 - 12,551 0.285 38,724 - 40,444 0.237 4,147,273 - 5,068,888 0.189
12,552 - 12,727 0.284 40,445 - 42,325 0.236 5,068,889 - 6,517,142 0.188
12,728 - 12,907 0.283 42,326 - 44,390 0.235 6,517,143 - 9,123,999 0.187
12,908 - 13,093 0.282 44,391 - 46,666 0.234 9,124,000 - 15,206,666 0.186
13,094 - 13,284 0.281 46,667 - 49,189 0.233 15,206,667 - 45,619,999 0.185
13,285 - 13,481 0.280 49,190 - 51,999 0.232 45,620,000 - And Above 0.184
13,482 - 13,684 0.279 52,000 - 55,151 0.231
13,685 - 13,893 0.278 55,152 - 58,709 0.230
13,894 - 14,108 0.277 58,710 - 62,758 0.229
14,109 - 14,330 0.276 62,759 - 67,407 0.228
14,331 - 14,559 0.275 67,408 - 72,799 0.227
14,560 - 14,796 0.274 72,800 - 79,130 0.226
14,797 - 15,041 0.273 79,131 - 86,666 0.225
15,042 - 15,294 0.272 86,667 - 95,789 0.224
15,295 - 15,555 0.271 95,790 - 107,058 0.223
15,556 - 15,826 0.270 107,059 - 121,333 0.222
15,827 - 16,106 0.269 121,334 - 139,999 0.221
16,107 - 16,396 0.268 140,000 - 165,454 0.220
16,397 - 16,697 0.267 165,455 - 200,377 0.219
16,698 - 17,009 0.266 200,378 - 208,235 0.218
17,010 - 17,333 0.266 208,236 - 216,734 0.217
17,334 - 17,669 0.265 216,735 - 225,957 0.216
17,670 - 18,019 0.264 225,958 - 235,999 0.216
18,020 - 18,383 0.263 236,000 - 246,976 0.215
18,384 - 18,762 0.262 246,977 - 259,024 0.214
18,763 - 19,157 0.261 259,025 - 272,307 0.213
19,158 - 19,569 0.260 272,308 - 287,027 0.212
19,570 - 19,999 0.259 287,028 - 303,428 0.211
20,000 - 20,449 0.258 303,429 - 321,818 0.210 First - 10,000 0.0%
20,450 - 20,919 0.257 321,819 - 342,580 0.209 Next - 190,000 9.1%
20,920 - 21,411 0.256 342,581 - 366,206 0.208 Next - 1,550,000 11.3%
21,412 - 21,927 0.255 366,207 - 393,333 0.207 Over - 1,750,000 12.3%
Expected Loss and ALAE Ratio: 0.659
Tax Multiplier: 1.040
© Copyright 2017 National Council on Compensation Insurance, Inc. All Rights Reserved. Page 49 of 138

Table of Expense Ratios - Excluding Allocated Loss Adjustment Expense and Taxes and Including Profit and Contingencies
Type B: 2017-01
WC Premium Range Expense WC Premium Range Expense WC Premium Range ExpenseFrom To Ratio From To Ratio From To Ratio
0 - 10,099 0.302 19,246 - 19,999 0.278 213,549 - 228,275 0.254
10,100 - 10,303 0.301 20,000 - 20,816 0.277 228,276 - 245,185 0.253
10,304 - 10,515 0.300 20,817 - 21,702 0.276 245,186 - 264,799 0.252
10,516 - 10,736 0.299 21,703 - 22,666 0.275 264,800 - 287,826 0.251
10,737 - 10,967 0.298 22,667 - 23,720 0.274 287,827 - 315,238 0.250
10,968 - 11,208 0.297 23,721 - 24,878 0.273 315,239 - 348,421 0.249
11,209 - 11,460 0.296 24,879 - 26,153 0.272 348,422 - 389,411 0.248
11,461 - 11,724 0.295 26,154 - 27,567 0.271 389,412 - 441,333 0.247
11,725 - 11,999 0.294 27,568 - 29,142 0.270 441,334 - 509,230 0.246
12,000 - 12,289 0.293 29,143 - 30,909 0.269 509,231 - 601,818 0.245
12,290 - 12,592 0.292 30,910 - 32,903 0.268 601,819 - 735,555 0.244
12,593 - 12,911 0.291 32,904 - 35,172 0.267 735,556 - 945,714 0.243
12,912 - 13,246 0.291 35,173 - 37,777 0.266 945,715 - 1,323,999 0.242
13,247 - 13,599 0.290 37,778 - 40,799 0.266 1,324,000 - 1,809,565 0.241
13,600 - 13,972 0.289 40,800 - 44,347 0.265 1,809,566 - 1,981,904 0.241
13,973 - 14,366 0.288 44,348 - 48,571 0.264 1,981,905 - 2,190,526 0.240
14,367 - 14,782 0.287 48,572 - 53,684 0.263 2,190,527 - 2,448,235 0.239
14,783 - 15,223 0.286 53,685 - 59,999 0.262 2,448,236 - 2,774,666 0.238
15,224 - 15,692 0.285 60,000 - 67,999 0.261 2,774,667 - 3,201,538 0.237
15,693 - 16,190 0.284 68,000 - 78,461 0.260 3,201,539 - 3,783,636 0.236
16,191 - 16,721 0.283 78,462 - 92,727 0.259 3,783,637 - 4,624,444 0.235
16,722 - 17,288 0.282 92,728 - 113,333 0.258 4,624,445 - 5,945,714 0.234
17,289 - 17,894 0.281 113,334 - 145,714 0.257 5,945,715 - 8,323,999 0.233
17,895 - 18,545 0.280 145,715 - 200,606 0.256 8,324,000 - 13,873,333 0.232
18,546 - 19,245 0.279 200,607 - 213,548 0.255 13,873,334 - 41,619,999 0.231
41,620,000 - And Above 0.230
First 10,000 0.0%
Next 190,000 5.1%
Next 1,550,000 6.5%
Over 1,750,000 7.5%
Expected Loss and ALAE Ratio: 0.659
Tax Multiplier: 1.040
© Copyright 2017 National Council on Compensation Insurance, Inc. All Rights Reserved. Page 50 of 138
Indiana
Advisory Loss Costs, Advisory Rates, and Assigned Risk Rates Filing – January 1, 2018
Part 3 Supporting Exhibits
- Exhibit I: Determination of the Indicated Rate Level Change
- Exhibit II: Workers Compensation Expense Program - Appendix A: Factors Underlying the Proposed Rate Level Change - Appendix B: Calculations Underlying the Rate Change by Classification - Appendix C: Memoranda for Laws and Assessments
© Copyright 2017 National Council on Compensation Insurance, Inc. All Rights Reserved.
Page 51 of 138
Indiana
Advisory Loss Costs, Advisory Rates, and Assigned Risk Rates Filing – January 1, 2018
Exhibit I – Determination of Indicated Rate Level Change
NCCI uses the following general methodology to determine the indicated change based on experience, trend, and benefits for each of the policy years in the experience period:
1. Standard earned premium at Designated Statistical Reporting (DSR) level is developed to ultimate and on-leveled to the current approved advisory rate level
2. Reported indemnity and medical losses are limited by a large loss threshold, developed to ultimate using limited development factors, and on-leveled to a common benefit level to yield adjusted limited losses
3. Limited indemnity and medical cost ratios excluding trend and benefits are calculated as adjusted losses (step 2) divided by premium available for benefit costs (step 1)
4. Trend factors are applied to the indemnity and medical cost ratios to reflect expected differences between the historical experience years and the effective period of the proposed filing
5. An excess provision is applied to adjust the limited cost ratios to an unlimited basis 6. A factor is applied to reflect the impact of proposed indemnity and medical benefit
changes 7. The projected unlimited indemnity and medical cost ratios including benefit changes are
added to yield the indicated change based on experience, trend, and benefits
The indicated change based on experience, trend, and benefits for this filing is calculated as the average of the indicated changes for each of the individual policy years in the experience period. Lastly, the impact of the change in expense-related provisions is applied to determine the indicated overall average advisory rate level change. The detailed calculations can be found on the following pages.
© Copyright 2017 National Council on Compensation Insurance, Inc. All Rights Reserved.
Page 52 of 138

Section A - Policy Year 2015 Experience
Premium:
(1) Standard Earned Premium Developed to Ultimate (Appendix A-II) $780,232,151(2) Premium On-level Factor (Appendix A-I) 0.561(3) Premium Adjusted to Current Level = (1) x (2) $437,710,237
Indemnity Benefit Cost:
(4) Limited Indemnity Losses Developed to Ultimate (Appendix A-II) $112,196,036(5) Indemnity Loss On-level Factor (Appendix A-I) 1.044(6) Adjusted Limited Indemnity Losses = (4) x (5) $117,132,662(7) Adjusted Limited Indemnity Cost Ratio excluding Trend and Benefits = (6) / (3) 0.268(8) Factor to Reflect Indemnity Trend (Appendix A-III) 0.885(9) Projected Limited Indemnity Cost Ratio = (7) x (8) 0.237
(10) Factor to Adjust Indemnity Cost Ratio to an Unlimited Basis (Appendix A-II) 1.002(11) Projected Indemnity Cost Ratio = (9) x (10) 0.237(12) Factor to Reflect Proposed Changes in Indemnity Benefits 1.000(13) Projected Indemnity Cost Ratio including Benefit Changes = (11) x (12) 0.237
Medical Benefit Cost:
(14) Limited Medical Losses Developed to Ultimate (Appendix A-II) $275,128,983(15) Medical Loss On-level Factor (Appendix A-I) 1.001(16) Adjusted Limited Medical Losses = (14) x (15) $275,404,112(17) Adjusted Limited Medical Cost Ratio excluding Trend and Benefits = (16) / (3) 0.629(18) Factor to Reflect Medical Trend (Appendix A-III) 0.985(19) Projected Limited Medical Cost Ratio = (17) x (18) 0.620(20) Factor to Adjust Medical Cost Ratio to an Unlimited Basis (Appendix A-II) 1.002(21) Projected Medical Cost Ratio = (19) x (20) 0.621(22) Factor to Reflect Proposed Changes in Medical Benefits (Appendix C) 1.008(23) Projected Medical Cost Ratio including Benefit Changes = (21) x (22) 0.626
Total Benefit Cost:
(24) Indicated Change Based on Experience, Trend and Benefits = (13) + (23) 0.863
EXHIBIT I
INDIANA
Determination of Indicated Rate Level Change
© Copyright 2017 National Council on Compensation Insurance, Inc. All Rights Reserved.
Page 53 of 138
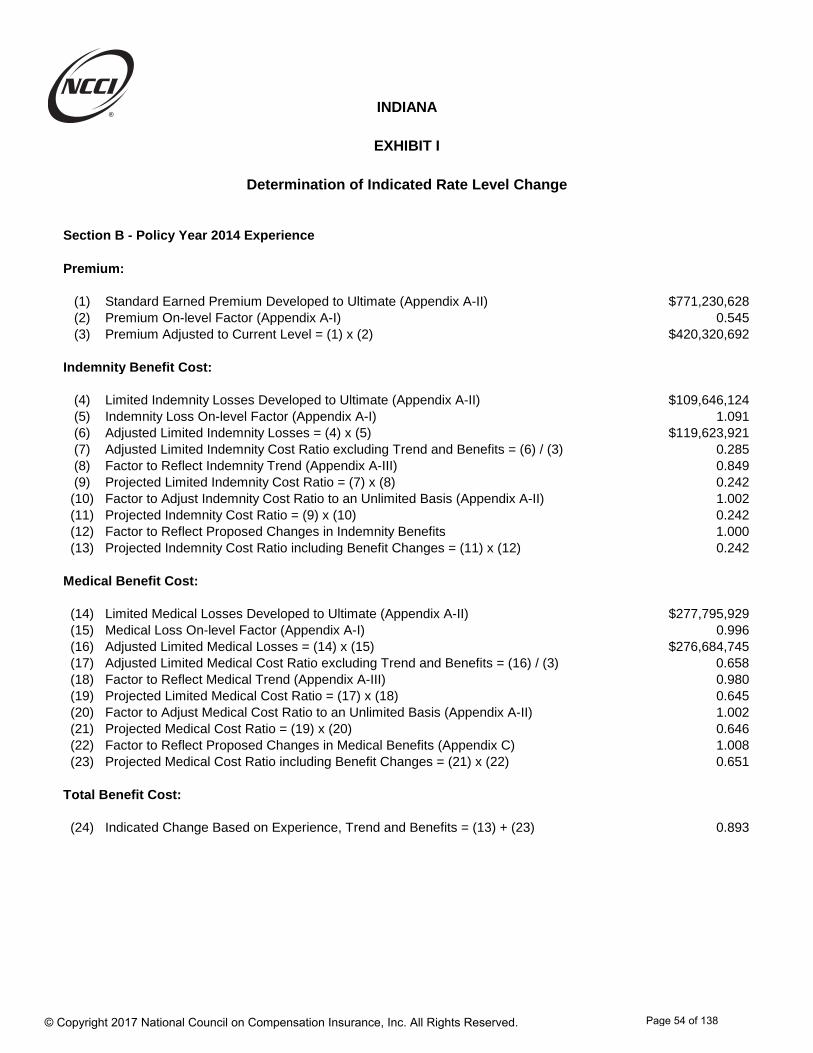
EXHIBIT I
INDIANA
Determination of Indicated Rate Level Change
Section B - Policy Year 2014 Experience
Premium:
(1) Standard Earned Premium Developed to Ultimate (Appendix A-II) $771,230,628(2) Premium On-level Factor (Appendix A-I) 0.545(3) Premium Adjusted to Current Level = (1) x (2) $420,320,692
Indemnity Benefit Cost:
(4) Limited Indemnity Losses Developed to Ultimate (Appendix A-II) $109,646,124(5) Indemnity Loss On-level Factor (Appendix A-I) 1.091(6) Adjusted Limited Indemnity Losses = (4) x (5) $119,623,921(7) Adjusted Limited Indemnity Cost Ratio excluding Trend and Benefits = (6) / (3) 0.285(8) Factor to Reflect Indemnity Trend (Appendix A-III) 0.849(9) Projected Limited Indemnity Cost Ratio = (7) x (8) 0.242
(10) Factor to Adjust Indemnity Cost Ratio to an Unlimited Basis (Appendix A-II) 1.002(11) Projected Indemnity Cost Ratio = (9) x (10) 0.242(12) Factor to Reflect Proposed Changes in Indemnity Benefits 1.000(13) Projected Indemnity Cost Ratio including Benefit Changes = (11) x (12) 0.242
Medical Benefit Cost:
(14) Limited Medical Losses Developed to Ultimate (Appendix A-II) $277,795,929(15) Medical Loss On-level Factor (Appendix A-I) 0.996(16) Adjusted Limited Medical Losses = (14) x (15) $276,684,745(17) Adjusted Limited Medical Cost Ratio excluding Trend and Benefits = (16) / (3) 0.658(18) Factor to Reflect Medical Trend (Appendix A-III) 0.980(19) Projected Limited Medical Cost Ratio = (17) x (18) 0.645(20) Factor to Adjust Medical Cost Ratio to an Unlimited Basis (Appendix A-II) 1.002(21) Projected Medical Cost Ratio = (19) x (20) 0.646(22) Factor to Reflect Proposed Changes in Medical Benefits (Appendix C) 1.008(23) Projected Medical Cost Ratio including Benefit Changes = (21) x (22) 0.651
Total Benefit Cost:
(24) Indicated Change Based on Experience, Trend and Benefits = (13) + (23) 0.893
© Copyright 2017 National Council on Compensation Insurance, Inc. All Rights Reserved. Page 54 of 138
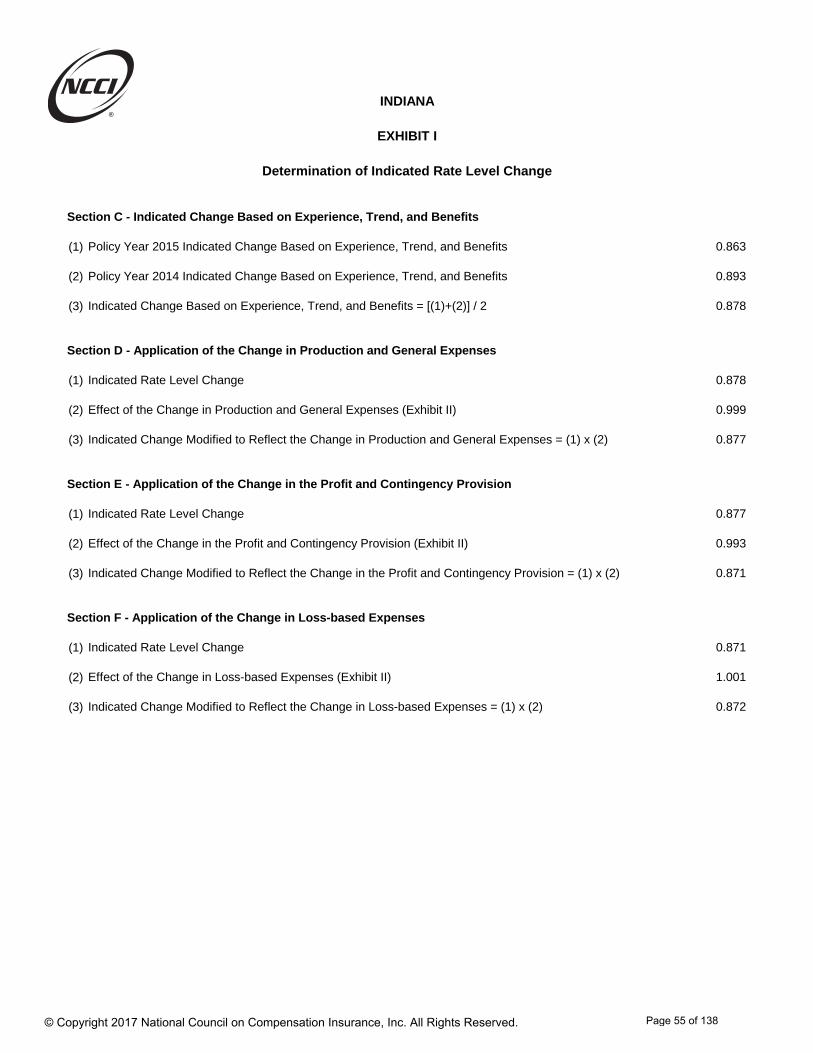
Section C - Indicated Change Based on Experience, Trend, and Benefits
(1) Policy Year 2015 Indicated Change Based on Experience, Trend, and Benefits 0.863
(2) Policy Year 2014 Indicated Change Based on Experience, Trend, and Benefits 0.893
(3) Indicated Change Based on Experience, Trend, and Benefits = [(1)+(2)] / 2 0.878
Section D - Application of the Change in Production and General Expenses
(1) Indicated Rate Level Change 0.878
(2) Effect of the Change in Production and General Expenses (Exhibit II) 0.999
(3) Indicated Change Modified to Reflect the Change in Production and General Expenses = (1) x (2) 0.877
Section E - Application of the Change in the Profit and Contingency Provision
(1) Indicated Rate Level Change 0.877
(2) Effect of the Change in the Profit and Contingency Provision (Exhibit II) 0.993
(3) Indicated Change Modified to Reflect the Change in the Profit and Contingency Provision = (1) x (2) 0.871
Section F - Application of the Change in Loss-based Expenses
(1) Indicated Rate Level Change 0.871
(2) Effect of the Change in Loss-based Expenses (Exhibit II) 1.001
(3) Indicated Change Modified to Reflect the Change in Loss-based Expenses = (1) x (2) 0.872
INDIANA
EXHIBIT I
Determination of Indicated Rate Level Change
© Copyright 2017 National Council on Compensation Insurance, Inc. All Rights Reserved. Page 55 of 138
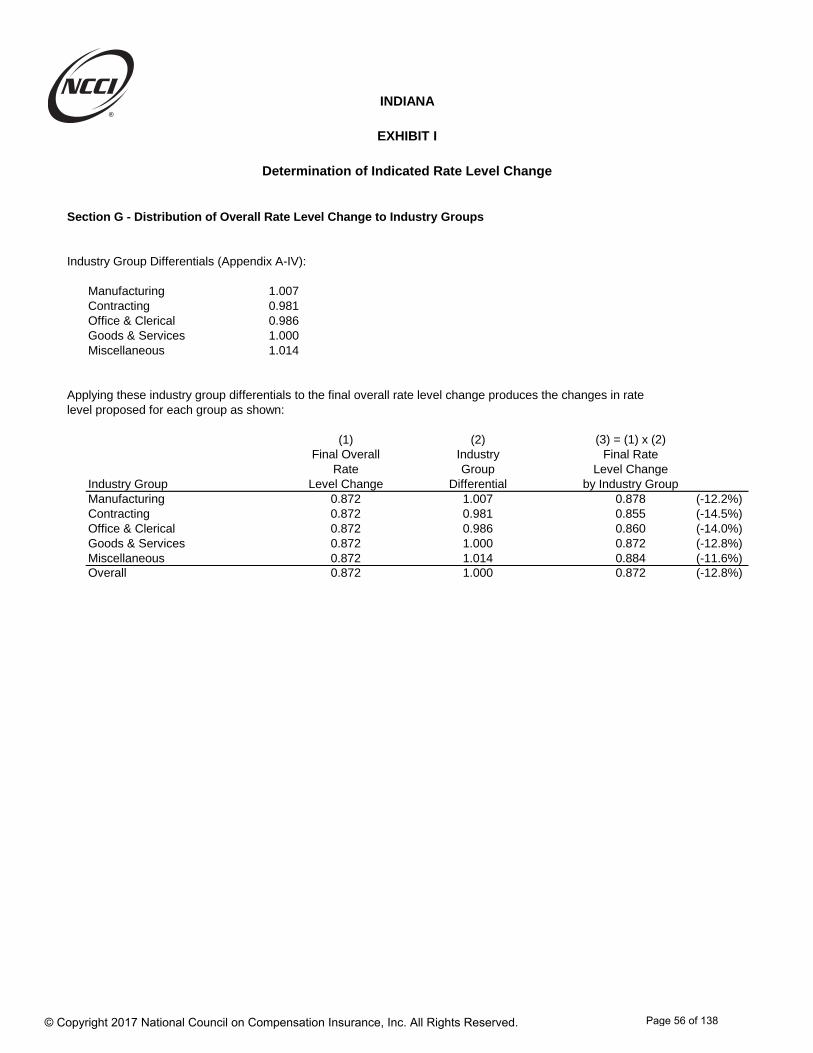
INDIANA
EXHIBIT I
Determination of Indicated Rate Level Change
Section G - Distribution of Overall Rate Level Change to Industry Groups
Industry Group Differentials (Appendix A-IV):
Manufacturing 1.007Contracting 0.981Office & Clerical 0.986Goods & Services 1.000Miscellaneous 1.014
(1) (2) (3) = (1) x (2)Final Overall Industry Final Rate
Rate Group Level ChangeIndustry Group Level Change Differential by Industry GroupManufacturing 0.872 1.007 0.878 (-12.2%)Contracting 0.872 0.981 0.855 (-14.5%)Office & Clerical 0.872 0.986 0.860 (-14.0%)Goods & Services 0.872 1.000 0.872 (-12.8%)Miscellaneous 0.872 1.014 0.884 (-11.6%)Overall 0.872 1.000 0.872 (-12.8%)
Applying these industry group differentials to the final overall rate level change produces the changes in rate level proposed for each group as shown:
© Copyright 2017 National Council on Compensation Insurance, Inc. All Rights Reserved. Page 56 of 138

Indiana
Advisory Loss Costs, Advisory Rates, and Assigned Risk Rates Filing – January 1, 2018
Exhibit II – Workers Compensation Expense Program
The proposed advisory rates include several expense-related provisions as described below.
Production and General Expenses: Production costs include commissions, costs of preparing the policy, verifying the correct application of rates and rating plans, billing and collecting premium and the costs of maintaining company branch offices. General expenses are commonly classified into four categories: general administration, audit, boards and bureaus, and inspection expenses.
Premium Taxes and Assessments: The proposed advisory rates have a provision for taxes, licenses, and fees (excluding Federal Income Tax) of 1.6%. This includes 1.3% for the Premium Tax and a 0.3% miscellaneous tax provision.
Profit and Contingency Provision: By law, Indiana workers compensation rates must be determined so that insurers can be expected to earn a reasonable rate of return. Analysis and determination of a profit and contingency provision is necessary to ensure this premise is maintained.
Loss-based Expense Provisions: The proposed advisory rates include a provision for loss adjustment expenses (LAE). LAE is included in the advisory rates by using a ratio of loss adjustment expense dollars to loss dollars (called the LAE provision). These expenses are directly associated with the handling of workers compensation claims. The LAE provision is comprised of two components: Defense and Cost Containment Expenses (DCCE) and Adjusting and Other Expenses (AOE). NCCI uses the following general methodology to determine the proposed LAE provision based on data for private carriers.
1. Using data obtained from the NCCI Call for Loss Adjustment Expense, accidentyear developed LAE ratios are calculated on a countrywide basis, includingseparate DCCE and AOE ratio components, in addition to policy year andaccident year developed DCCE ratios on a state-specific basis.
2. An Indiana-to-countrywide DCCE relativity is selected based on NAIC AnnualStatement data.
3. The Indiana proposed DCCE ratio is calculated as an average of:a. The countrywide-selected DCCE ratio multiplied by the state-to-
countrywide DCCE relativity.b. The state-specific DCCE ratios developed using multiplicative and
additive methods on both a policy year and accident year basis.4. Given the nature of AOE, it cannot be allocated to a specific claim, and hence
cannot be accurately attributed to specific states. In this filing, the state-specific
© Copyright 2017 National Council on Compensation Insurance, Inc. All Rights Reserved. Page 57 of 138

Indiana
Advisory Loss Costs, Advisory Rates, and Assigned Risk Rates Filing – January 1, 2018
Exhibit II – Workers Compensation Expense Program
AOE ratio reflects the latest selected countrywide provision. A separate AOE provision that had been used in previous filings in Indiana, which was based on NCCI Statistical Plan data and averaged together with the countrywide provision to determine the final AOE provision, is not being considered when determining the final AOE provision for this filing.
Expense Constant: Insurer expenses as a proportion of premium vary by size of risk. As risk size increases, marginal expenses tend to diminish. An expense constant helps address these expense differences by size of risk. The expense constant together with the expense provision included in the manual rate provide the necessary funding for insurer expenses
The proposed expenses are reviewed each year and incorporates the most recently available data from the Insurance Expense Exhibit, which is reported annually by insurers to state insurance departments.
© Copyright 2017 National Council on Compensation Insurance, Inc. All Rights Reserved. Page 58 of 138
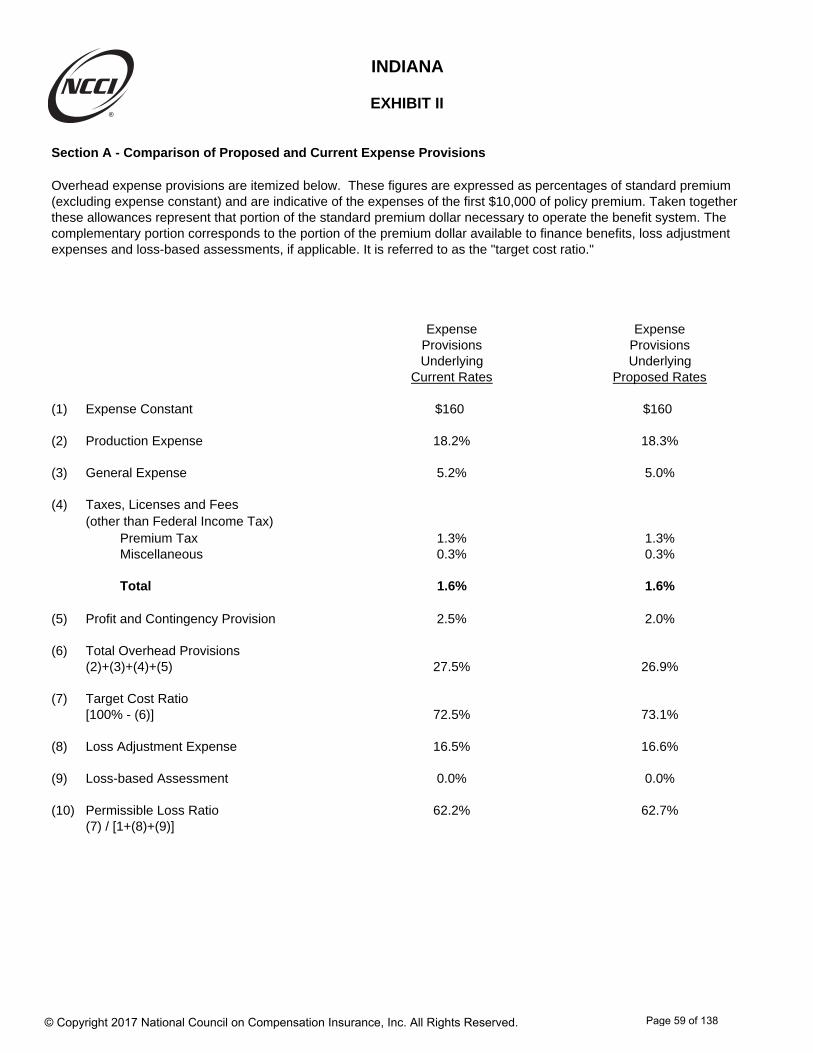
Section A - Comparison of Proposed and Current Expense Provisions
Overhead expense provisions are itemized below. These figures are expressed as percentages of standard premium(excluding expense constant) and are indicative of the expenses of the first $10,000 of policy premium. Taken togetherthese allowances represent that portion of the standard premium dollar necessary to operate the benefit system. The complementary portion corresponds to the portion of the premium dollar available to finance benefits, loss adjustmentexpenses and loss-based assessments, if applicable. It is referred to as the "target cost ratio."
Expense ExpenseProvisions ProvisionsUnderlying Underlying
Current Rates Proposed Rates
(1) Expense Constant $160 $160
(2) Production Expense 18.2% 18.3%
(3) General Expense 5.2% 5.0%
(4) Taxes, Licenses and Fees(other than Federal Income Tax)
Premium Tax 1.3% 1.3%Miscellaneous 0.3% 0.3%
Total 1.6% 1.6%
(5) Profit and Contingency Provision 2.5% 2.0%
(6) Total Overhead Provisions(2)+(3)+(4)+(5) 27.5% 26.9%
(7) Target Cost Ratio[100% - (6)] 72.5% 73.1%
(8) Loss Adjustment Expense 16.5% 16.6%
(9) Loss-based Assessment 0.0% 0.0%
(10) Permissible Loss Ratio 62.2% 62.7%(7) / [1+(8)+(9)]
INDIANA
EXHIBIT II
© Copyright 2017 National Council on Compensation Insurance, Inc. All Rights Reserved. Page 59 of 138

Section B - Calculation of Change in Expense Provisions
A B C DCol. A with Col. C with
Current Proposed Prod Col. B with Proposed ProfitExpenses & Gen Exp Proposed Taxes and Contingency
(1) Production Expense 18.2% 18.3% 18.3% 18.3%
(2) General Expense 5.2% 5.0% 5.0% 5.0%
(3) Taxes 1.6% 1.6% 1.6% 1.6%
(4) Profit and Contingency Provision 2.5% 2.5% 2.5% 2.0%
(5) Total Provisions 27.5% 27.4% 27.4% 26.9%(1)+(2)+(3)+(4)
(6) TCR 72.5% 72.6% 72.6% 73.1%(100%-(5))
(7) Loss Based Expenses 16.5% 16.6% 16.6% 16.6%
(8) Change in Production and General Expense 0.999 -0.1%(6A) / (6B)
(9) Change in Taxes and Assessments 1.000 0.0%(6B) / (6C)
(10) Change in Profit and Contingency Provision 0.993 -0.7%(6C) / (6D)
(11) Change in Loss Based Expenses 1.001 +0.1%[1.0 + (7B)]/[1.0 + (7A)]
INDIANA
EXHIBIT II
© Copyright 2017 National Council on Compensation Insurance, Inc. All Rights Reserved. Page 60 of 138

Section C - Countrywide Expense Program
NCCI annually reviews expense provisions underlying workers compensation rates.
This review procedure is based on countrywide expense data. Since a significant portion of
workers compensation insurance is interstate business, it is not practical to allocate expenses
(especially general, other acquisition, and adjusting and other loss adjustment expenses) to particular
states.
The NCCI expense program is designed to ensure equity among employers through a
percentage provision in manual rates, a schedule of premium discounts for risks with standard
premium in excess of $10,000, and the application of an expense constant.
The majority of expenses incurred in workers compensation vary directly by layer of
premium and are accordingly termed variable expenses. An equitable apportionment of variable
expense is achieved through the application of premium discounts. As the premium for a policy
increases, some expenses incurred in handling the insurance coverage become proportionately
less in terms of premium. A fair expense program must, therefore, provide that the larger premium
policies be charged a lower percentage of premium for these expenses than the smaller policies.
Other expenses such as issuing, recording and auditing are common to all policies regardless
of size. These common expenses are called fixed expenses and are addressed by incorporating
an expense constant in the program.
INDIANA
EXHIBIT II
© Copyright 2017 National Council on Compensation Insurance, Inc. All Rights Reserved. Page 61 of 138

Section D - Derivation of General Expense Provisions
The data below (amounts in thousands) illustrates that the combination of a 5.0% general expense provisionin the manual rates, a $160 expense constant, and the premium discount schedule generates general expensepremium dollars that are consistent with historical actual general expenses as reported in the Insurance Expense Exhibit. All figures below obtained from the Insurance Expense Exhibit (IEE) include data for participatingstock, non-participating stock, and mutual companies.
2014 2015 2016
(1) Direct Earned Premium 45,490,584 47,962,596 49,589,244 (NAIC Insurance Expense Exhibit Data)(1a) Effect of Premium Discounts 0.9287 0.9284 0.9283(1b) Effect of Schedule Rating 0.9613 0.9605 0.9548(1c) Effect of Carrier Deviations 1.0341 1.0387 1.0312(1d) Effect of Deductibles 0.7331 0.7375 0.7398(1e) Expense Constant Offset 0.9918 0.9918 0.9918
(2) Gross Adjusted Premium 66,663,095 69,637,333 72,736,701(STD Premium @ NCCI Level Excl. Expense Constant){(1) / [(1a) x (1b) x (1c) x (1d)]} x (1e)
(3) Direct General Expenses Incurred 2,763,969 2,819,889 2,813,993 (NAIC Insurance Expense Exhibit Data)(3a) Proportion of Expense Constant
Attributable to General Expenses 0.4063 0.4063 0.4063
(4) General Expenses Incurred 2,540,034 2,585,963 2,569,655(Excluding Expense Constant Revenue)(3) - (2) x [1-(1e)]/(1e) x (3a)
(5) Ratio of General Expense to Premium 3.81% 3.71% 3.53%(Excluding Expense Constant Revenue)(4)/(2)
(6) General Expense Gradations 1.26% 1.27% 1.28%(General Expenses in Average Premium Discount)
(7) General Expense Provision 5.07% 4.98% 4.81%(5)+(6)
(8) Selected General Expense Provision 5.0%( Three-Year Average)
INDIANA
EXHIBIT II
© Copyright 2017 National Council on Compensation Insurance, Inc. All Rights Reserved. Page 62 of 138
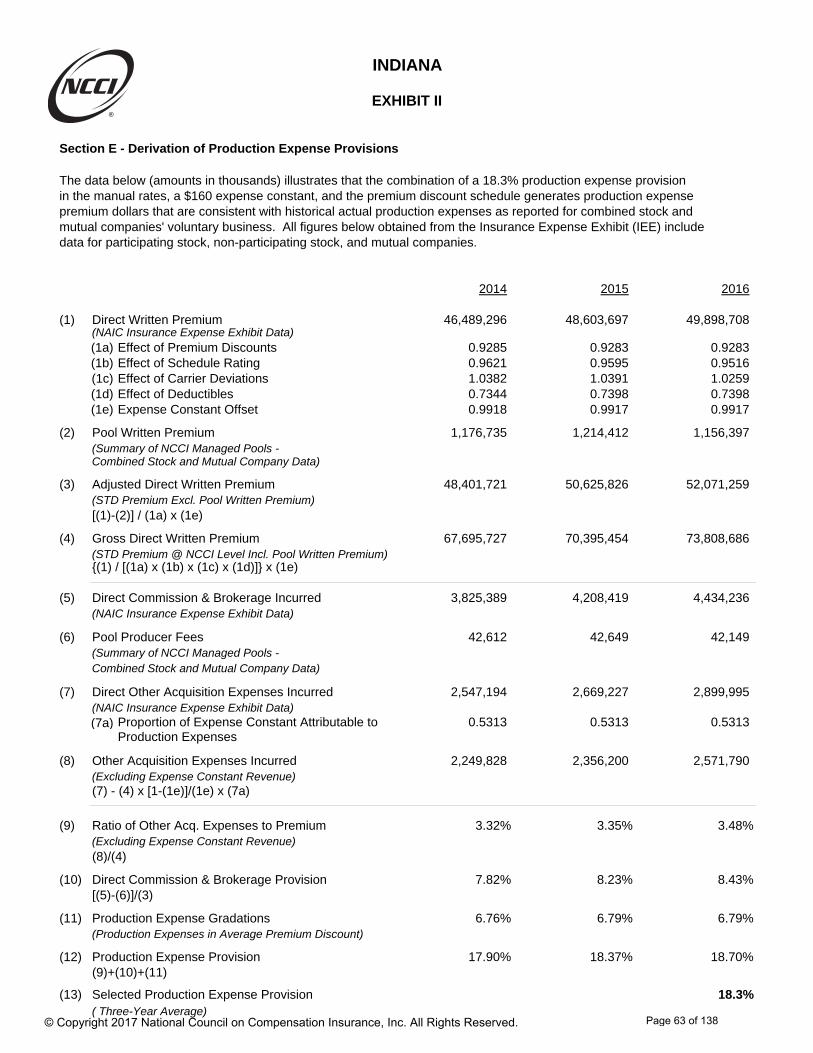
Section E - Derivation of Production Expense Provisions
The data below (amounts in thousands) illustrates that the combination of a 18.3% production expense provisionin the manual rates, a $160 expense constant, and the premium discount schedule generates production expensepremium dollars that are consistent with historical actual production expenses as reported for combined stock andmutual companies' voluntary business. All figures below obtained from the Insurance Expense Exhibit (IEE) includedata for participating stock, non-participating stock, and mutual companies.
2014 2015 2016
(1) Direct Written Premium 46,489,296 48,603,697 49,898,708 (NAIC Insurance Expense Exhibit Data)(1a) Effect of Premium Discounts 0.9285 0.9283 0.9283(1b) Effect of Schedule Rating 0.9621 0.9595 0.9516(1c) Effect of Carrier Deviations 1.0382 1.0391 1.0259(1d) Effect of Deductibles 0.7344 0.7398 0.7398 (1e) Expense Constant Offset 0.9918 0.9917 0.9917
(2) Pool Written Premium 1,176,735 1,214,412 1,156,397 (Summary of NCCI Managed Pools -Combined Stock and Mutual Company Data)
(3) Adjusted Direct Written Premium 48,401,721 50,625,826 52,071,259(STD Premium Excl. Pool Written Premium)[(1)-(2)] / (1a) x (1e)
(4) Gross Direct Written Premium 67,695,727 70,395,454 73,808,686(STD Premium @ NCCI Level Incl. Pool Written Premium){(1) / [(1a) x (1b) x (1c) x (1d)]} x (1e)
(5) Direct Commission & Brokerage Incurred 3,825,389 4,208,419 4,434,236 (NAIC Insurance Expense Exhibit Data)
(6) Pool Producer Fees 42,612 42,649 42,149 (Summary of NCCI Managed Pools -Combined Stock and Mutual Company Data)
(7) Direct Other Acquisition Expenses Incurred 2,547,194 2,669,227 2,899,995 (NAIC Insurance Expense Exhibit Data)(7a) Proportion of Expense Constant Attributable to 0.5313 0.5313 0.5313
Production Expenses
(8) Other Acquisition Expenses Incurred 2,249,828 2,356,200 2,571,790 (Excluding Expense Constant Revenue)(7) - (4) x [1-(1e)]/(1e) x (7a)
(9) Ratio of Other Acq. Expenses to Premium 3.32% 3.35% 3.48%(Excluding Expense Constant Revenue)(8)/(4)
(10) Direct Commission & Brokerage Provision 7.82% 8.23% 8.43%[(5)-(6)]/(3)
(11) Production Expense Gradations 6.76% 6.79% 6.79%(Production Expenses in Average Premium Discount)
(12) Production Expense Provision 17.90% 18.37% 18.70%(9)+(10)+(11)
(13) Selected Production Expense Provision 18.3%( Three-Year Average)
INDIANA
EXHIBIT II
© Copyright 2017 National Council on Compensation Insurance, Inc. All Rights Reserved. Page 63 of 138
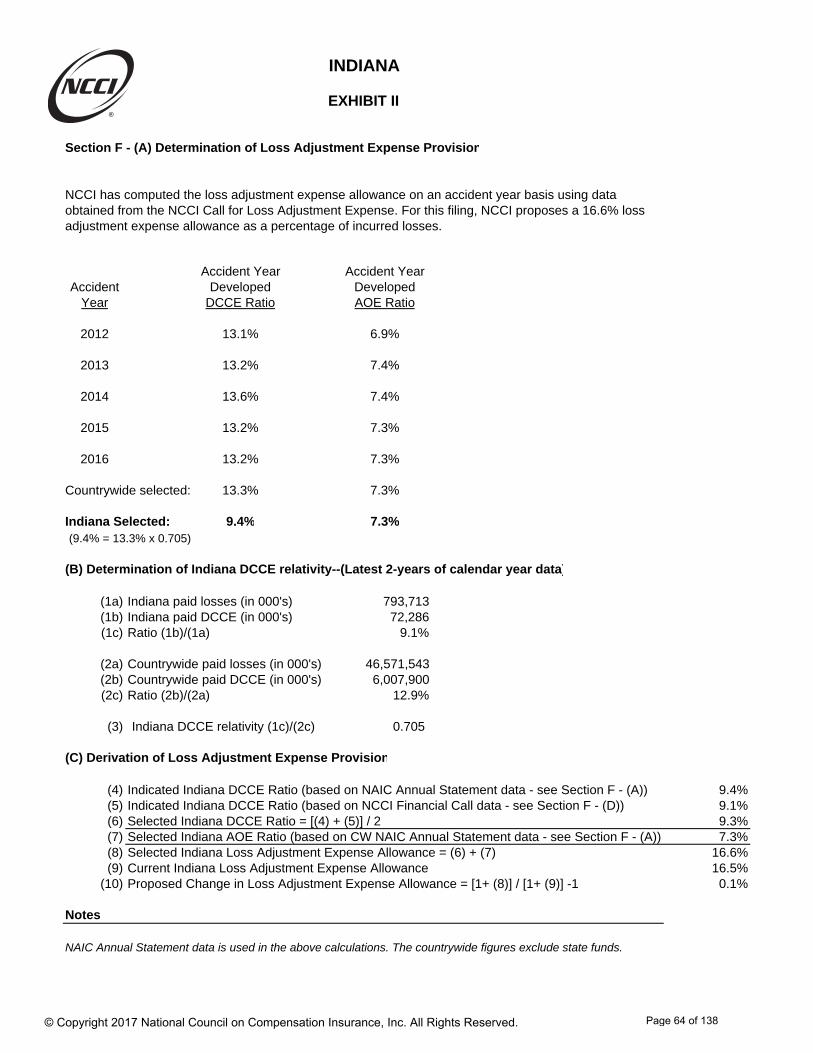
Section F - (A) Determination of Loss Adjustment Expense Provision
NCCI has computed the loss adjustment expense allowance on an accident year basis using data obtained from the NCCI Call for Loss Adjustment Expense. For this filing, NCCI proposes a 16.6% lossadjustment expense allowance as a percentage of incurred losses.
Accident Year Accident YearAccident Developed Developed
Year DCCE Ratio AOE Ratio
2012 13.1% 6.9%
2013 13.2% 7.4%
2014 13.6% 7.4%
2015 13.2% 7.3%
2016 13.2% 7.3%
Countrywide selected: 13.3% 7.3%
Indiana Selected: 9.4% 7.3%(9.4% = 13.3% x 0.705)
(B) Determination of Indiana DCCE relativity--(Latest 2-years of calendar year data)
(1a) Indiana paid losses (in 000's) 793,713(1b) Indiana paid DCCE (in 000's) 72,286(1c) Ratio (1b)/(1a) 9.1%
(2a) Countrywide paid losses (in 000's) 46,571,543(2b) Countrywide paid DCCE (in 000's) 6,007,900(2c) Ratio (2b)/(2a) 12.9%
(3) Indiana DCCE relativity (1c)/(2c) 0.705
(C) Derivation of Loss Adjustment Expense Provision
(4) Indicated Indiana DCCE Ratio (based on NAIC Annual Statement data - see Section F - (A)) 9.4%(5) Indicated Indiana DCCE Ratio (based on NCCI Financial Call data - see Section F - (D)) 9.1%(6) Selected Indiana DCCE Ratio = [(4) + (5)] / 2 9.3%(7) Selected Indiana AOE Ratio (based on CW NAIC Annual Statement data - see Section F - (A)) 7.3%(8) Selected Indiana Loss Adjustment Expense Allowance = (6) + (7) 16.6%(9) Current Indiana Loss Adjustment Expense Allowance 16.5%
(10) Proposed Change in Loss Adjustment Expense Allowance = [1+ (8)] / [1+ (9)] -1 0.1%
Notes
NAIC Annual Statement data is used in the above calculations. The countrywide figures exclude state funds.
INDIANA
EXHIBIT II
© Copyright 2017 National Council on Compensation Insurance, Inc. All Rights Reserved. Page 64 of 138

(D) Derivation of Expense Provisions - Defense & Cost Containment Expense (Financial data)
Paid DCCE to Paid LossesRatio 2 yr avg 3 yr avg 4 yr avg 5 yr avg 5 x hilo Selected
PY @16 Factor to Ult. Factor to Ult. Factor to Ult. Factor to Ult. Factor to Ult. Factor to Ult.
2013 0.078 0.008 0.005 0.007 0.005 0.005 0.0052014 0.081 0.014 0.011 0.012 0.010 0.010 0.0112015 0.069 0.022 0.019 0.019 0.017 0.016 0.019
2 yr avg 3 yr avg 4 yr avg 5 yr avg 5 x hilo SelectedRatio Ultimate Ultimate Ultimate Ultimate Ultimate Ultimate
PY @16 Ratio Ratio Ratio Ratio Ratio Ratio
2013 0.078 0.086 0.083 0.085 0.083 0.083 0.0832014 0.081 0.095 0.092 0.093 0.091 0.091 0.0922015 0.069 0.091 0.088 0.088 0.086 0.085 0.088
2 year average 0.090
Paid DCCE to Paid LossesRatio 2 yr avg 3 yr avg 4 yr avg 5 yr avg 5 x hilo Selected
AY @16 Factor to Ult. Factor to Ult. Factor to Ult. Factor to Ult. Factor to Ult. Factor to Ult.
2014 0.081 0.009 0.008 0.010 0.008 0.008 0.0082015 0.076 0.016 0.015 0.017 0.140 0.014 0.0152016 0.062 0.025 0.024 0.025 0.022 0.021 0.024
2 yr avg 3 yr avg 4 yr avg 5 yr avg 5 x hilo SelectedRatio Ultimate Ultimate Ultimate Ultimate Ultimate Ultimate
AY @16 Ratio Ratio Ratio Ratio Ratio Ratio
2014 0.081 0.090 0.089 0.091 0.089 0.089 0.0892015 0.076 0.092 0.091 0.093 0.090 0.090 0.0912016 0.062 0.087 0.086 0.087 0.084 0.083 0.086
2 year average 0.089
INDIANA
EXHIBIT II
Additive Method
Accident Year Evaluation
Policy Year Evaluation
© Copyright 2017 National Council on Compensation Insurance, Inc. All Rights Reserved. Page 65 of 138
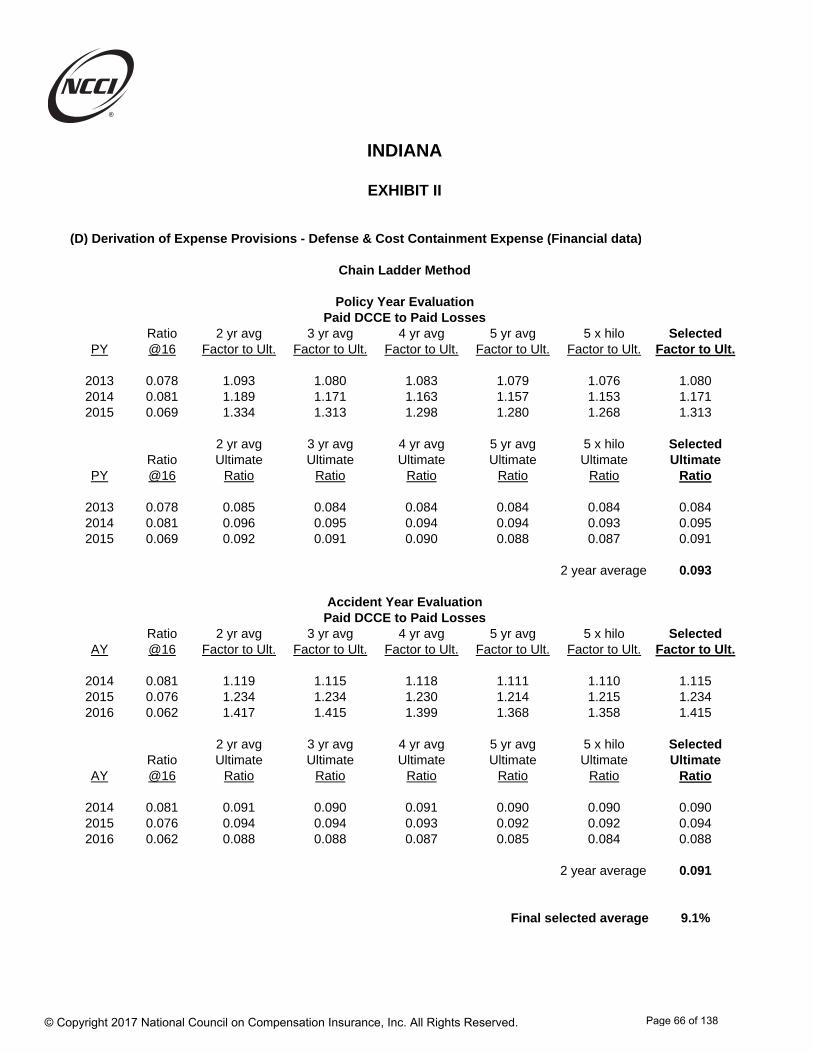
(D) Derivation of Expense Provisions - Defense & Cost Containment Expense (Financial data)
Paid DCCE to Paid LossesRatio 2 yr avg 3 yr avg 4 yr avg 5 yr avg 5 x hilo Selected
PY @16 Factor to Ult. Factor to Ult. Factor to Ult. Factor to Ult. Factor to Ult. Factor to Ult.
2013 0.078 1.093 1.080 1.083 1.079 1.076 1.0802014 0.081 1.189 1.171 1.163 1.157 1.153 1.1712015 0.069 1.334 1.313 1.298 1.280 1.268 1.313
2 yr avg 3 yr avg 4 yr avg 5 yr avg 5 x hilo SelectedRatio Ultimate Ultimate Ultimate Ultimate Ultimate Ultimate
PY @16 Ratio Ratio Ratio Ratio Ratio Ratio
2013 0.078 0.085 0.084 0.084 0.084 0.084 0.0842014 0.081 0.096 0.095 0.094 0.094 0.093 0.0952015 0.069 0.092 0.091 0.090 0.088 0.087 0.091
2 year average 0.093
Paid DCCE to Paid LossesRatio 2 yr avg 3 yr avg 4 yr avg 5 yr avg 5 x hilo Selected
AY @16 Factor to Ult. Factor to Ult. Factor to Ult. Factor to Ult. Factor to Ult. Factor to Ult.
2014 0.081 1.119 1.115 1.118 1.111 1.110 1.1152015 0.076 1.234 1.234 1.230 1.214 1.215 1.2342016 0.062 1.417 1.415 1.399 1.368 1.358 1.415
2 yr avg 3 yr avg 4 yr avg 5 yr avg 5 x hilo SelectedRatio Ultimate Ultimate Ultimate Ultimate Ultimate Ultimate
AY @16 Ratio Ratio Ratio Ratio Ratio Ratio
2014 0.081 0.091 0.090 0.091 0.090 0.090 0.0902015 0.076 0.094 0.094 0.093 0.092 0.092 0.0942016 0.062 0.088 0.088 0.087 0.085 0.084 0.088
0.0912 year average
9.1%Final selected average
INDIANA
EXHIBIT II
Chain Ladder Method
Accident Year Evaluation
Policy Year Evaluation
© Copyright 2017 National Council on Compensation Insurance, Inc. All Rights Reserved. Page 66 of 138
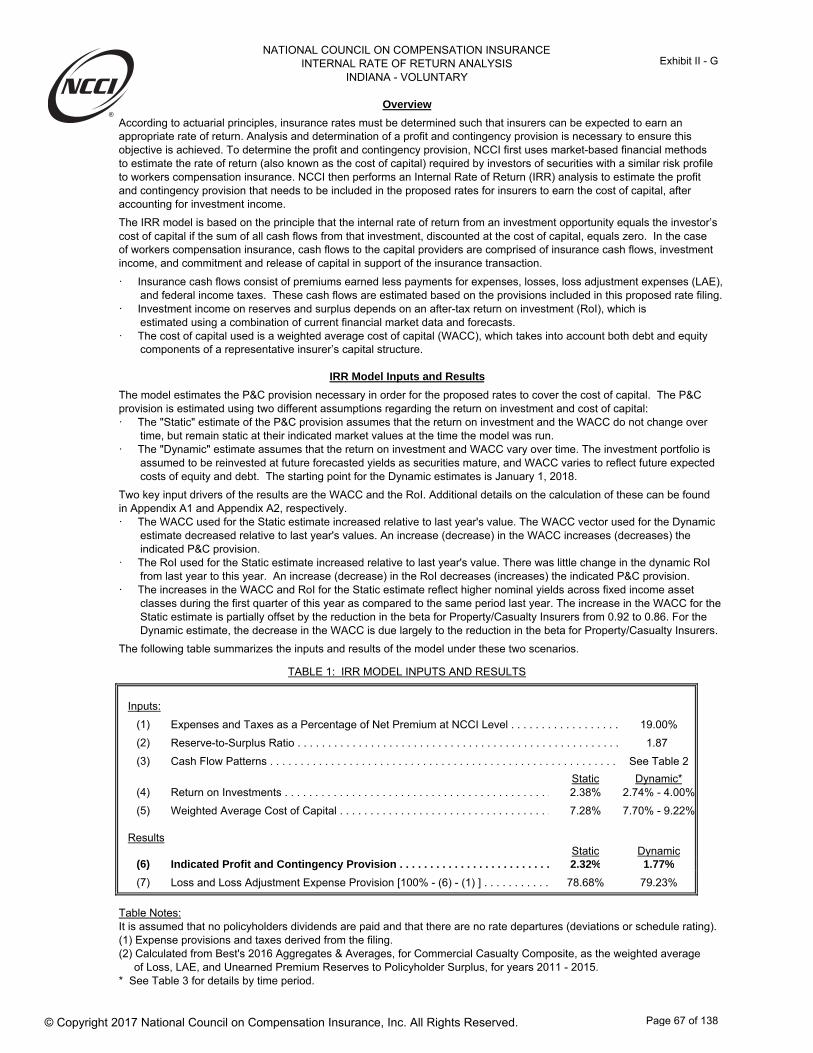
According to actuarial principles, insurance rates must be determined such that insurers can be expected to earn an appropriate rate of return. Analysis and determination of a profit and contingency provision is necessary to ensure this objective is achieved. To determine the profit and contingency provision, NCCI first uses market-based financial methods to estimate the rate of return (also known as the cost of capital) required by investors of securities with a similar risk profile to workers compensation insurance. NCCI then performs an Internal Rate of Return (IRR) analysis to estimate the profit and contingency provision that needs to be included in the proposed rates for insurers to earn the cost of capital, after accounting for investment income.
The IRR model is based on the principle that the internal rate of return from an investment opportunity equals the investor’s cost of capital if the sum of all cash flows from that investment, discounted at the cost of capital, equals zero. In the case of workers compensation insurance, cash flows to the capital providers are comprised of insurance cash flows, investment income, and commitment and release of capital in support of the insurance transaction.
· Insurance cash flows consist of premiums earned less payments for expenses, losses, loss adjustment expenses (LAE), and federal income taxes. These cash flows are estimated based on the provisions included in this proposed rate filing.· Investment income on reserves and surplus depends on an after-tax return on investment (RoI), which is estimated using a combination of current financial market data and forecasts.· The cost of capital used is a weighted average cost of capital (WACC), which takes into account both debt and equity components of a representative insurer’s capital structure.
The model estimates the P&C provision necessary in order for the proposed rates to cover the cost of capital. The P&C provision is estimated using two different assumptions regarding the return on investment and cost of capital:· The "Static" estimate of the P&C provision assumes that the return on investment and the WACC do not change over time, but remain static at their indicated market values at the time the model was run. · The "Dynamic" estimate assumes that the return on investment and WACC vary over time. The investment portfolio is assumed to be reinvested at future forecasted yields as securities mature, and WACC varies to reflect future expected costs of equity and debt. The starting point for the Dynamic estimates is January 1, 2018.
Two key input drivers of the results are the WACC and the RoI. Additional details on the calculation of these can be found in Appendix A1 and Appendix A2, respectively.· The WACC used for the Static estimate increased relative to last year's value. The WACC vector used for the Dynamic estimate decreased relative to last year's values. An increase (decrease) in the WACC increases (decreases) the indicated P&C provision.· The RoI used for the Static estimate increased relative to last year's value. There was little change in the dynamic RoI from last year to this year. An increase (decrease) in the RoI decreases (increases) the indicated P&C provision.· The increases in the WACC and RoI for the Static estimate reflect higher nominal yields across fixed income asset classes during the first quarter of this year as compared to the same period last year. The increase in the WACC for the Static estimate is partially offset by the reduction in the beta for Property/Casualty Insurers from 0.92 to 0.86. For the Dynamic estimate, the decrease in the WACC is due largely to the reduction in the beta for Property/Casualty Insurers.
The following table summarizes the inputs and results of the model under these two scenarios.
Inputs:
(1) Expenses and Taxes as a Percentage of Net Premium at NCCI Level . . . . . . . . . . . . . . . . . . 19.00%
(2) Reserve-to-Surplus Ratio . . . . . . . . . . . . . . . . . . . . . . . . . . . . . . . . . . . . . . . . . . . . . . . . . . . . . 1.87
(3) Cash Flow Patterns . . . . . . . . . . . . . . . . . . . . . . . . . . . . . . . . . . . . . . . . . . . . . . . . . . . . . . . . . See Table 2
Static Dynamic*(4) Return on Investments . . . . . . . . . . . . . . . . . . . . . . . . . . . . . . . . . . . . . . . . . . . . 2.38% 2.74% - 4.00%
(5) Weighted Average Cost of Capital . . . . . . . . . . . . . . . . . . . . . . . . . . . . . . . . . . . 7.28% 7.70% - 9.22%
ResultsStatic Dynamic
(6) Indicated Profit and Contingency Provision . . . . . . . . . . . . . . . . . . . . . . . . . 2.32% 1.77%
(7) Loss and Loss Adjustment Expense Provision [100% - (6) - (1) ] . . . . . . . . . . . 78.68% 79.23%
Table Notes:It is assumed that no policyholders dividends are paid and that there are no rate departures (deviations or schedule rating).(1) Expense provisions and taxes derived from the filing.(2) Calculated from Best's 2016 Aggregates & Averages, for Commercial Casualty Composite, as the weighted average of Loss, LAE, and Unearned Premium Reserves to Policyholder Surplus, for years 2011 - 2015.* See Table 3 for details by time period.
TABLE 1: IRR MODEL INPUTS AND RESULTS
NATIONAL COUNCIL ON COMPENSATION INSURANCEINTERNAL RATE OF RETURN ANALYSIS
INDIANA - VOLUNTARY
IRR Model Inputs and Results
Overview
© Copyright 2017 National Council on Compensation Insurance, Inc. All Rights Reserved.
Page 67 of 138
Exhibit II - G

(1) (2) (3) (4) (5) (1) (2)Policy-Year Paid WeightedCollected Earned Written Expenses Losses Return on Average Cost
Time Premium Premium Premium and Taxes and LAE Time Investments of Capital0.00 - - - - - 0.00 - - 0.25 14.52% 3.86% 30.90% 14.52% 1.28% 0.25 2.74% 7.70%0.50 31.32% 14.54% 54.50% 31.32% 4.83% 0.50 2.78% 8.03%0.75 53.34% 31.09% 77.90% 53.34% 10.32% 0.75 2.87% 8.21%1.00 76.69% 53.33% 100.00% 76.69% 17.70% 1.00 2.91% 8.47%1.25 89.23% 74.46% 100.00% 89.23% 29.15% 1.25 3.03% 8.76%1.50 96.99% 88.79% 100.00% 96.99% 40.60% 1.50 3.06% 8.99%1.75 100.00% 97.24% 100.00% 100.00% 52.05% 1.75 3.16% 9.15%2.00 100.00% 100.00% 100.00% 100.00% 63.50% 2.00 3.18% 9.27%2.25 100.00% 100.00% 100.00% 100.00% 67.98% 2.25 3.22% 9.30%2.50 100.00% 100.00% 100.00% 100.00% 72.45% 2.50 3.22% 9.29%2.75 100.00% 100.00% 100.00% 100.00% 76.93% 2.75 3.65% 9.23%3.00 100.00% 100.00% 100.00% 100.00% 81.40% 3.00 3.64% 9.14%3.25 100.00% 100.00% 100.00% 100.00% 83.10% 3.25 3.61% 9.04%3.50 100.00% 100.00% 100.00% 100.00% 84.80% 3.50 3.61% 9.01%3.75 100.00% 100.00% 100.00% 100.00% 86.50% 3.75 3.60% 9.06%4.00 100.00% 100.00% 100.00% 100.00% 88.20% 4.00 3.59% 9.05%4.25 100.00% 100.00% 100.00% 100.00% 89.10% 4.25 3.55% 8.99%4.50 100.00% 100.00% 100.00% 100.00% 90.00% 4.50 3.54% 8.93%4.75 100.00% 100.00% 100.00% 100.00% 90.90% 4.75 3.50% 8.82%5.00 100.00% 100.00% 100.00% 100.00% 91.80% 5.00 3.49% 8.74%6.00 100.00% 100.00% 100.00% 100.00% 93.60% 6.00 3.30% 8.73%7.00 100.00% 100.00% 100.00% 100.00% 95.00% 7.00 3.33% 8.78%8.00 100.00% 100.00% 100.00% 100.00% 95.60% 8.00 3.53% 8.93%9.00 100.00% 100.00% 100.00% 100.00% 95.90% 9.00 3.72% 9.12%
10.00 100.00% 100.00% 100.00% 100.00% 96.60% 10.00 3.72% 9.09%11.00 100.00% 100.00% 100.00% 100.00% 97.20% 11.00 3.72% 9.08%12.00 100.00% 100.00% 100.00% 100.00% 97.40% 12.00 3.71% 9.08%13.00 100.00% 100.00% 100.00% 100.00% 97.60% 13.00 3.70% 9.09%14.00 100.00% 100.00% 100.00% 100.00% 97.70% 14.00 3.69% 9.09%15.00 100.00% 100.00% 100.00% 100.00% 97.80% 15.00 3.70% 9.10%16.00 100.00% 100.00% 100.00% 100.00% 98.00% 16.00 3.85% 9.11%17.00 100.00% 100.00% 100.00% 100.00% 98.10% 17.00 3.86% 9.13%18.00 100.00% 100.00% 100.00% 100.00% 98.30% 18.00 3.88% 9.15%19.00 100.00% 100.00% 100.00% 100.00% 98.60% 19.00 3.89% 9.17%20.00 100.00% 100.00% 100.00% 100.00% 98.80% 20.00 3.90% 9.18%21.00 100.00% 100.00% 100.00% 100.00% 99.00% 21.00 3.98% 9.20%22.00 100.00% 100.00% 100.00% 100.00% 99.10% 22.00 3.98% 9.21%23.00 100.00% 100.00% 100.00% 100.00% 99.10% 23.00 3.99% 9.22%24.00 100.00% 100.00% 100.00% 100.00% 99.20% 24.00 4.00% 9.22%25.00 100.00% 100.00% 100.00% 100.00% 99.30% 25.00 4.00% 9.22%26.00 100.00% 100.00% 100.00% 100.00% 99.40% 26.00 4.00% 9.22%27.00 100.00% 100.00% 100.00% 100.00% 99.50% 27.00 4.00% 9.22%28.00 100.00% 100.00% 100.00% 100.00% 99.50% 28.00 4.00% 9.22%29.00 100.00% 100.00% 100.00% 100.00% 99.70% 29.00 4.00% 9.22%30.00 100.00% 100.00% 100.00% 100.00% 99.80% 30.00 4.00% 9.22%31.00 100.00% 100.00% 100.00% 100.00% 99.86% 31.00 4.00% 9.22%32.00 100.00% 100.00% 100.00% 100.00% 99.91% 32.00 4.00% 9.22%33.00 100.00% 100.00% 100.00% 100.00% 99.95% 33.00 4.00% 9.22%34.00 100.00% 100.00% 100.00% 100.00% 99.98% 34.00 4.00% 9.22%35.00 100.00% 100.00% 100.00% 100.00% 100.00% 35.00 4.00% 9.22%
Table 2 Notes:Table 2 shows cumulative cash flows. For ease of reading no additional numbers are shown after a column reaches 100% cumulative cash flow.(1) Derived from estimates of premium distribution and payment terms by size of policy.(2) Based on written premium pattern assuming uniform writings within quarters and standard quarterly earning pattern.(3) Based on this jurisdiction’s premium writings by quarter.(4) Expenses assumed paid as premium is collected; timing of taxes based on NCCI's Tax and Assessment Directory.(5) Derived from loss development data underlying this rate filing. Payouts for the first 30 years are based upon the ratio of paid losses to incurred losses from the most recent 30 policy years for which data is available. For the following years, loss payouts are assumed to trail off geometrically, with an adjustment so that the payout will be complete at 35 years.
NATIONAL COUNCIL ON COMPENSATION INSURANCEINTERNAL RATE OF RETURN ANALYSIS
INDIANA - VOLUNTARY
TABLE 3: DYNAMIC ESTIMATE INPUTS
TABLE 2: CASH FLOW PATTERNS (CUMULATIVE)
© Copyright 2017 National Council on Compensation Insurance, Inc. All Rights Reserved.
Page 68 of 138
Exhibit II - G
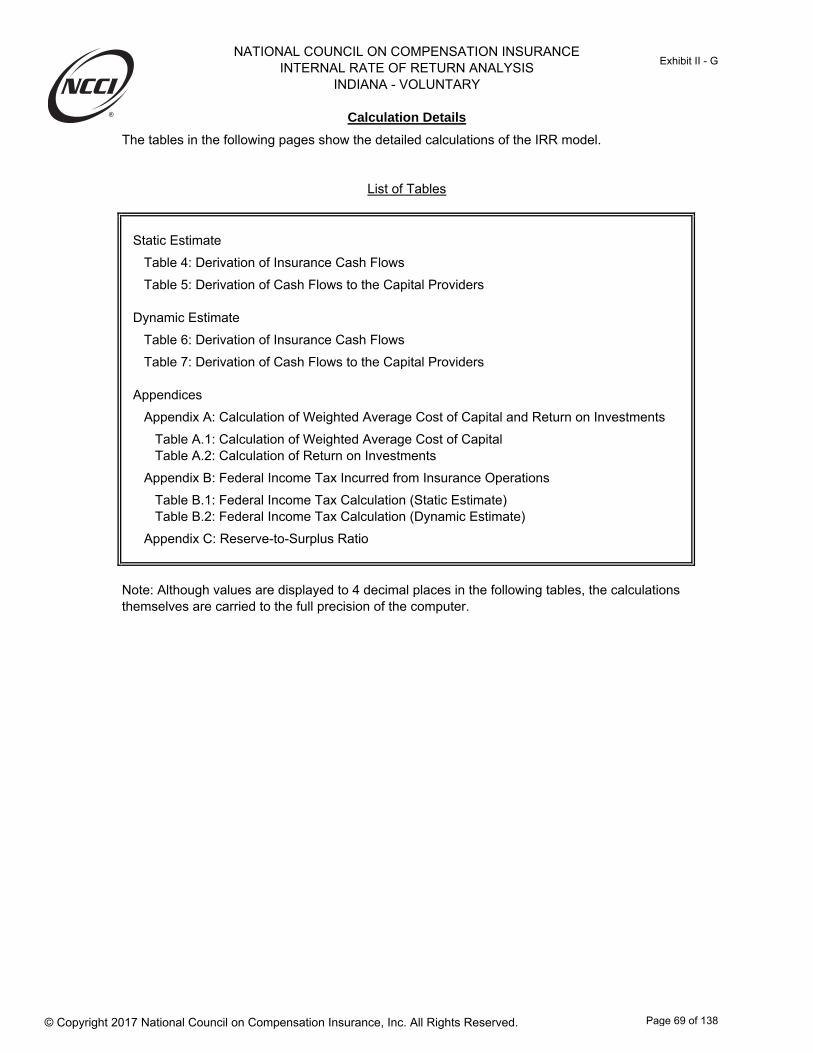
NATIONAL COUNCIL ON COMPENSATION INSURANCEINTERNAL RATE OF RETURN ANALYSIS
INDIANA - VOLUNTARY
Calculation Details
The tables in the following pages show the detailed calculations of the IRR model.
List of Tables
Static Estimate
Table 4: Derivation of Insurance Cash Flows
Table 5: Derivation of Cash Flows to the Capital Providers
Dynamic Estimate
Table 6: Derivation of Insurance Cash Flows
Table 7: Derivation of Cash Flows to the Capital Providers
Appendices
Appendix A: Calculation of Weighted Average Cost of Capital and Return on Investments
Table A.1: Calculation of Weighted Average Cost of CapitalTable A.2: Calculation of Return on Investments
Appendix B: Federal Income Tax Incurred from Insurance Operations
Table B.1: Federal Income Tax Calculation (Static Estimate)Table B.2: Federal Income Tax Calculation (Dynamic Estimate)
Appendix C: Reserve-to-Surplus Ratio
Note: Although values are displayed to 4 decimal places in the following tables, the calculations themselves are carried to the full precision of the computer.
© Copyright 2017 National Council on Compensation Insurance, Inc. All Rights Reserved.
Page 69 of 138
Exhibit II - G

(1) (2) (3) (4) (5)Collected Expense Paid Losses Federal InsurancePremium and Taxes and LAE Income Tax Cash flow
Time Factor Factor Factor Factor Factor0.00 - - - - - 0.25 0.1452 0.0276 0.0101 0.0093 0.0983 0.50 0.3132 0.0595 0.0380 0.0185 0.1972 0.75 0.5334 0.1014 0.0812 0.0278 0.3231 1.00 0.7669 0.1457 0.1393 0.0370 0.4449 1.25 0.8923 0.1695 0.2293 0.0317 0.4617 1.50 0.9699 0.1843 0.3194 0.0264 0.4398 1.75 1.0000 0.1900 0.4095 0.0210 0.3795 2.00 1.0000 0.1900 0.4996 0.0157 0.2947 2.25 1.0000 0.1900 0.5348 0.0149 0.2603 2.50 1.0000 0.1900 0.5700 0.0141 0.2259 2.75 1.0000 0.1900 0.6052 0.0133 0.1915 3.00 1.0000 0.1900 0.6404 0.0125 0.1571 3.25 1.0000 0.1900 0.6538 0.0122 0.1440 3.50 1.0000 0.1900 0.6672 0.0118 0.1310 3.75 1.0000 0.1900 0.6805 0.0115 0.1180 4.00 1.0000 0.1900 0.6939 0.0111 0.1050 4.25 1.0000 0.1900 0.7010 0.0109 0.0981 4.50 1.0000 0.1900 0.7081 0.0107 0.0913 4.75 1.0000 0.1900 0.7152 0.0105 0.0844 5.00 1.0000 0.1900 0.7222 0.0102 0.0775 6.00 1.0000 0.1900 0.7364 0.0098 0.0638 7.00 1.0000 0.1900 0.7474 0.0094 0.0532 8.00 1.0000 0.1900 0.7521 0.0092 0.0487 9.00 1.0000 0.1900 0.7545 0.0090 0.0465
10.00 1.0000 0.1900 0.7600 0.0088 0.0412 11.00 1.0000 0.1900 0.7647 0.0086 0.0367 12.00 1.0000 0.1900 0.7663 0.0085 0.0352 13.00 1.0000 0.1900 0.7679 0.0084 0.0337 14.00 1.0000 0.1900 0.7687 0.0083 0.0330 15.00 1.0000 0.1900 0.7694 0.0082 0.0323 16.00 1.0000 0.1900 0.7710 0.0082 0.0308 17.00 1.0000 0.1900 0.7718 0.0082 0.0300 18.00 1.0000 0.1900 0.7734 0.0082 0.0284 19.00 1.0000 0.1900 0.7757 0.0082 0.0261 20.00 1.0000 0.1900 0.7773 0.0082 0.0245 21.00 1.0000 0.1900 0.7789 0.0082 0.0230 22.00 1.0000 0.1900 0.7797 0.0082 0.0222 23.00 1.0000 0.1900 0.7797 0.0082 0.0222 24.00 1.0000 0.1900 0.7805 0.0082 0.0214 25.00 1.0000 0.1900 0.7812 0.0082 0.0206 26.00 1.0000 0.1900 0.7820 0.0081 0.0198 27.00 1.0000 0.1900 0.7828 0.0081 0.0190 28.00 1.0000 0.1900 0.7828 0.0081 0.0190 29.00 1.0000 0.1900 0.7844 0.0081 0.0175 30.00 1.0000 0.1900 0.7852 0.0081 0.0167 31.00 1.0000 0.1900 0.7857 0.0081 0.0162 32.00 1.0000 0.1900 0.7861 0.0081 0.0158 33.00 1.0000 0.1900 0.7864 0.0081 0.0155 34.00 1.0000 0.1900 0.7866 0.0081 0.0153 35.00 1.0000 0.1900 0.7868 0.0081 0.0151
Column Notes:(1) is Collected Premium by time period, expressed as a factor, = Table 2 col (1)(2) is Expenses and Taxes by time period, expressed as a factor, = Table 1 row (1) x Table (2) col (4)(3) is Paid Losses and LAE by time period, expressed as a factor, = Table 1 row (7, Static) x Table (2) col (5)(4) per the Tax Reform Act of 1986, federal income taxes are computed as the tax rate (35%) times the adjusted underwriting income calculated per IRS rules. See Appendix B for details.(5) is the Total Insurance Cash Flow by time period, expressed as a factor, = (1) - [(2) + (3) + (4)]
NATIONAL COUNCIL ON COMPENSATION INSURANCEINTERNAL RATE OF RETURN ANALYSIS
INDIANA - VOLUNTARY
TABLE 4: DERIVATION OF INSURANCE CASH FLOW (STATIC ESTIMATE)
Calculation Details - Static Estimate
© Copyright 2017 National Council on Compensation Insurance, Inc. All Rights Reserved.
Page 70 of 138
Exhibit II - G

(1) (2) (3) (4) (5) (6) (7)Unearned Premium, Factor for Total Invested Income from Capital Capital Discounted
Unpaid Loss Surplus Funds Invested Funds Provider Provider Capital and Unpaid LAE Allocated to Factor Factor Equity Cash Flow Provider Cash
Time Reserve Factor Reserves Factor Factor Flow Factor0.00 - - - - - - - 0.25 0.2907 0.1554 0.2823 0.0008 (0.1832) (0.1832) (0.1816) 0.50 0.4760 0.2546 0.4988 0.0031 (0.2985) (0.1152) (0.1122) 0.75 0.6315 0.3377 0.7237 0.0067 (0.3938) (0.0954) (0.0913) 1.00 0.7470 0.3995 0.9134 0.0115 (0.4570) (0.0631) (0.0594) 1.25 0.6119 0.3272 0.8314 0.0167 (0.3530) 0.1040 0.0961 1.50 0.4912 0.2627 0.7238 0.0213 (0.2627) 0.0902 0.0819 1.75 0.3831 0.2049 0.5880 0.0251 (0.1834) 0.0793 0.0707 2.00 0.2872 0.1536 0.4407 0.0281 (0.1179) 0.0656 0.0575 2.25 0.2520 0.1347 0.3867 0.0306 (0.0958) 0.0221 0.0190 2.50 0.2168 0.1159 0.3327 0.0327 (0.0741) 0.0217 0.0184 2.75 0.1815 0.0971 0.2786 0.0345 (0.0527) 0.0214 0.0178 3.00 0.1463 0.0783 0.2246 0.0360 (0.0316) 0.0211 0.0172 3.25 0.1330 0.0711 0.2041 0.0372 (0.0228) 0.0088 0.0070 3.50 0.1196 0.0640 0.1835 0.0384 (0.0141) 0.0087 0.0068 3.75 0.1062 0.0568 0.1630 0.0394 (0.0056) 0.0085 0.0066 4.00 0.0928 0.0496 0.1425 0.0403 0.0028 0.0084 0.0064 4.25 0.0858 0.0459 0.1316 0.0411 0.0076 0.0048 0.0036 4.50 0.0787 0.0421 0.1207 0.0419 0.0124 0.0047 0.0035 4.75 0.0716 0.0383 0.1099 0.0425 0.0170 0.0047 0.0034 5.00 0.0645 0.0345 0.0990 0.0431 0.0217 0.0046 0.0033 6.00 0.0504 0.0269 0.0773 0.0452 0.0318 0.0101 0.0069 7.00 0.0393 0.0210 0.0604 0.0469 0.0397 0.0079 0.0050 8.00 0.0346 0.0185 0.0531 0.0482 0.0438 0.0041 0.0024 9.00 0.0323 0.0172 0.0495 0.0494 0.0464 0.0026 0.0014
10.00 0.0267 0.0143 0.0411 0.0505 0.0506 0.0042 0.0022 11.00 0.0220 0.0118 0.0338 0.0514 0.0543 0.0036 0.0017 12.00 0.0205 0.0109 0.0314 0.0522 0.0560 0.0017 0.0008 13.00 0.0189 0.0101 0.0290 0.0529 0.0576 0.0017 0.0007 14.00 0.0181 0.0097 0.0278 0.0536 0.0588 0.0012 0.0005 15.00 0.0173 0.0093 0.0266 0.0542 0.0600 0.0012 0.0004 16.00 0.0157 0.0084 0.0241 0.0548 0.0615 0.0015 0.0005 17.00 0.0149 0.0080 0.0229 0.0554 0.0625 0.0010 0.0003 18.00 0.0134 0.0072 0.0205 0.0559 0.0638 0.0014 0.0004 19.00 0.0110 0.0059 0.0169 0.0563 0.0655 0.0017 0.0005 20.00 0.0094 0.0050 0.0145 0.0567 0.0668 0.0012 0.0003 21.00 0.0079 0.0042 0.0121 0.0570 0.0679 0.0012 0.0003 22.00 0.0071 0.0038 0.0109 0.0573 0.0686 0.0007 0.0002 23.00 0.0071 0.0038 0.0109 0.0576 0.0689 0.0003 0.0001 24.00 0.0063 0.0034 0.0097 0.0578 0.0695 0.0007 0.0001 25.00 0.0055 0.0029 0.0085 0.0580 0.0702 0.0006 0.0001 26.00 0.0047 0.0025 0.0072 0.0582 0.0708 0.0006 0.0001 27.00 0.0039 0.0021 0.0060 0.0584 0.0714 0.0006 0.0001 28.00 0.0039 0.0021 0.0060 0.0585 0.0715 0.0001 0.0000 29.00 0.0024 0.0013 0.0036 0.0586 0.0725 0.0010 0.0001 30.00 0.0016 0.0008 0.0024 0.0587 0.0730 0.0005 0.0001 31.00 0.0011 0.0006 0.0016 0.0587 0.0733 0.0003 0.0000 32.00 0.0007 0.0004 0.0010 0.0588 0.0735 0.0002 0.0000 33.00 0.0004 0.0002 0.0006 0.0588 0.0737 0.0002 0.0000 34.00 0.0002 0.0001 0.0003 0.0588 0.0738 0.0001 0.0000 35.00 - - - 0.0588 0.0739 0.0001 0.0000
Column Notes:(1) is Unearned Premium Reserve (equal to Written Premium minus Earned Premium, per the cashflow pattern) plus Unpaid Loss and LAE Reserve (equal to Incurred minus Paid Losses and LAE) by time period, expressed as a factor, = [Table 2 col (3) - Table 2 col (2)] + Table 1 row (7, Static) x [Table 2 col (2) - Table 2 col (5)](2) is the Surplus derived from Reserves per the Reserve-to-Surplus Ratio by time period, expressed as a factor, = (1) / Table 1 row (2)(3) is Reserves plus Surplus minus Agent Balances by time period, expressed as a factor, = (1) + (2) - Agent Balances. Agent Balances exist when Written Premium exceeds Collected Premium, = [Table 2 col (3) - Table 2 col (1)].(4) is derived by applying the Return on Investments [Table 1 row (4, Static)] to the average Invested Funds (4) from the previous and current time periods, plus previous Income from Invested Funds, by time period expressed as a factor.(5) is Insurance Cash Flow plus Income from Invested Funds minus Total Invested Funds by time period, expressed as a factor, = Table 4 col (5) + (4) - (3)(6) is the difference between Capital Provider Equity (5) at the current and previous time periods, expressed as a factor(7) is the Capital Provider Cash Flow (6) discounted by the Weighted Average Cost of Capital [Table 1 row (5, Static)], expressed as a factor
NATIONAL COUNCIL ON COMPENSATION INSURANCEINTERNAL RATE OF RETURN ANALYSIS
INDIANA - VOLUNTARY
TABLE 5: DERIVATION OF CASH FLOWS TO THE CAPITAL PROVIDERS (STATIC ESTIMATE)
Calculation Details - Static Estimate (continued)
© Copyright 2017 National Council on Compensation Insurance, Inc. All Rights Reserved.
Page 71 of 138
Exhibit II - G

(1) (2) (3) (4) (5)Collected Expense Paid Losses Federal InsurancePremium and Taxes and LAE Income Tax Cash flow
Time Factor Factor Factor Factor Factor0.00 - - - - - 0.25 0.1452 0.0276 0.0102 0.0090 0.0984 0.50 0.3132 0.0595 0.0382 0.0181 0.1974 0.75 0.5334 0.1014 0.0818 0.0271 0.3232 1.00 0.7669 0.1457 0.1402 0.0361 0.4448 1.25 0.8923 0.1695 0.2309 0.0305 0.4613 1.50 0.9699 0.1843 0.3217 0.0250 0.4390 1.75 1.0000 0.1900 0.4124 0.0194 0.3782 2.00 1.0000 0.1900 0.5031 0.0138 0.2931 2.25 1.0000 0.1900 0.5385 0.0130 0.2584 2.50 1.0000 0.1900 0.5740 0.0122 0.2238 2.75 1.0000 0.1900 0.6095 0.0114 0.1891 3.00 1.0000 0.1900 0.6449 0.0106 0.1545 3.25 1.0000 0.1900 0.6584 0.0103 0.1414 3.50 1.0000 0.1900 0.6718 0.0099 0.1283 3.75 1.0000 0.1900 0.6853 0.0095 0.1151 4.00 1.0000 0.1900 0.6988 0.0092 0.1020 4.25 1.0000 0.1900 0.7059 0.0090 0.0951 4.50 1.0000 0.1900 0.7130 0.0088 0.0882 4.75 1.0000 0.1900 0.7202 0.0085 0.0813 5.00 1.0000 0.1900 0.7273 0.0083 0.0744 6.00 1.0000 0.1900 0.7416 0.0079 0.0605 7.00 1.0000 0.1900 0.7527 0.0075 0.0498 8.00 1.0000 0.1900 0.7574 0.0073 0.0453 9.00 1.0000 0.1900 0.7598 0.0071 0.0431
10.00 1.0000 0.1900 0.7653 0.0069 0.0378 11.00 1.0000 0.1900 0.7701 0.0067 0.0332 12.00 1.0000 0.1900 0.7717 0.0066 0.0318 13.00 1.0000 0.1900 0.7733 0.0065 0.0303 14.00 1.0000 0.1900 0.7740 0.0064 0.0296 15.00 1.0000 0.1900 0.7748 0.0063 0.0289 16.00 1.0000 0.1900 0.7764 0.0062 0.0273 17.00 1.0000 0.1900 0.7772 0.0062 0.0265 18.00 1.0000 0.1900 0.7788 0.0062 0.0250 19.00 1.0000 0.1900 0.7812 0.0062 0.0226 20.00 1.0000 0.1900 0.7828 0.0062 0.0210 21.00 1.0000 0.1900 0.7843 0.0062 0.0194 22.00 1.0000 0.1900 0.7851 0.0062 0.0186 23.00 1.0000 0.1900 0.7851 0.0062 0.0186 24.00 1.0000 0.1900 0.7859 0.0062 0.0178 25.00 1.0000 0.1900 0.7867 0.0062 0.0171 26.00 1.0000 0.1900 0.7875 0.0062 0.0163 27.00 1.0000 0.1900 0.7883 0.0062 0.0155 28.00 1.0000 0.1900 0.7883 0.0062 0.0155 29.00 1.0000 0.1900 0.7899 0.0062 0.0139 30.00 1.0000 0.1900 0.7907 0.0062 0.0131 31.00 1.0000 0.1900 0.7912 0.0062 0.0126 32.00 1.0000 0.1900 0.7916 0.0062 0.0122 33.00 1.0000 0.1900 0.7919 0.0062 0.0119 34.00 1.0000 0.1900 0.7921 0.0062 0.0117 35.00 1.0000 0.1900 0.7923 0.0062 0.0115
Column Notes:(1) is Collected Premium by time period, expressed as a factor, = Table 2 col (1)(2) is Expenses and Taxes by time period, expressed as a factor, = Table 1 row (1) x Table (2) col (4)(3) is Paid Losses and LAE by time period, expressed as a factor, = Table 1 row (7, Dynamic) x Table (2) col (5)(4) per the Tax Reform Act of 1986, federal income taxes are computed as the tax rate (35%) times the adjusted underwriting income calculated per IRS rules. See Appendix B for details.(5) is the Total Insurance Cash Flow by time period, expressed as a factor, = (1) - [(2) + (3) + (4)]
NATIONAL COUNCIL ON COMPENSATION INSURANCEINTERNAL RATE OF RETURN ANALYSIS
INDIANA - VOLUNTARY
TABLE 6: DERIVATION OF INSURANCE CASH FLOW (DYNAMIC ESTIMATE)
Calculation Details - Dynamic Estimate
© Copyright 2017 National Council on Compensation Insurance, Inc. All Rights Reserved.
Page 72 of 138
Exhibit II - G

(1) (2) (3) (4) (5) (6) (7) (8)Unearned Premium, Factor for Total Income from Capital Capital Cumulative Discounted
Unpaid Loss Surplus Invested Invested Provider Provider Discount Capital and Unpaid LAE Allocated to Funds Funds Equity Cash Flow Factor Provider Cash
Time Reserve Factor Reserves Factor Factor Factor Factor Flow Factor0.00 - - - - - - - - 0.25 0.2908 0.1555 0.2825 0.0010 (0.1832) (0.1832) 0.9908 (0.1815) 0.50 0.4766 0.2549 0.4996 0.0037 (0.2986) (0.1154) 0.9718 (0.1122) 0.75 0.6327 0.3383 0.7254 0.0080 (0.3942) (0.0956) 0.9529 (0.0911) 1.00 0.7490 0.4005 0.9164 0.0139 (0.4577) (0.0635) 0.9337 (0.0593) 1.25 0.6144 0.3285 0.8352 0.0204 (0.3535) 0.1042 0.9143 0.0953 1.50 0.4939 0.2641 0.7279 0.0264 (0.2626) 0.0909 0.8948 0.0814 1.75 0.3856 0.2062 0.5919 0.0315 (0.1821) 0.0804 0.8754 0.0704 2.00 0.2892 0.1546 0.4438 0.0356 (0.1151) 0.0670 0.8563 0.0573 2.25 0.2537 0.1357 0.3894 0.0389 (0.0921) 0.0231 0.8374 0.0193 2.50 0.2183 0.1167 0.3350 0.0418 (0.0694) 0.0226 0.8191 0.0185 2.75 0.1828 0.0978 0.2806 0.0445 (0.0469) 0.0225 0.8012 0.0180 3.00 0.1474 0.0788 0.2262 0.0468 (0.0249) 0.0220 0.7838 0.0173 3.25 0.1339 0.0716 0.2055 0.0487 (0.0154) 0.0095 0.7671 0.0073 3.50 0.1204 0.0644 0.1848 0.0505 (0.0061) 0.0093 0.7507 0.0070 3.75 0.1070 0.0572 0.1642 0.0520 0.0030 0.0091 0.7346 0.0067 4.00 0.0935 0.0500 0.1435 0.0534 0.0119 0.0089 0.7189 0.0064 4.25 0.0864 0.0462 0.1325 0.0546 0.0172 0.0052 0.7035 0.0037 4.50 0.0792 0.0424 0.1216 0.0557 0.0223 0.0051 0.6887 0.0035 4.75 0.0721 0.0386 0.1107 0.0567 0.0273 0.0050 0.6743 0.0034 5.00 0.0650 0.0347 0.0997 0.0576 0.0323 0.0049 0.6603 0.0033 6.00 0.0507 0.0271 0.0778 0.0605 0.0433 0.0110 0.6266 0.0069 7.00 0.0396 0.0212 0.0608 0.0629 0.0519 0.0086 0.5760 0.0050 8.00 0.0349 0.0186 0.0535 0.0649 0.0567 0.0048 0.5288 0.0025 9.00 0.0325 0.0174 0.0499 0.0668 0.0600 0.0033 0.4846 0.0016
10.00 0.0269 0.0144 0.0413 0.0685 0.0649 0.0049 0.4442 0.0022 11.00 0.0222 0.0119 0.0340 0.0699 0.0691 0.0041 0.4072 0.0017 12.00 0.0206 0.0110 0.0316 0.0711 0.0712 0.0022 0.3734 0.0008 13.00 0.0190 0.0102 0.0292 0.0722 0.0733 0.0021 0.3423 0.0007 14.00 0.0182 0.0097 0.0280 0.0733 0.0749 0.0016 0.3137 0.0005 15.00 0.0174 0.0093 0.0268 0.0743 0.0764 0.0015 0.2876 0.0004 16.00 0.0158 0.0085 0.0243 0.0753 0.0783 0.0019 0.2636 0.0005 17.00 0.0151 0.0080 0.0231 0.0762 0.0796 0.0013 0.2415 0.0003 18.00 0.0135 0.0072 0.0207 0.0770 0.0813 0.0017 0.2213 0.0004 19.00 0.0111 0.0059 0.0170 0.0778 0.0833 0.0020 0.2027 0.0004 20.00 0.0095 0.0051 0.0146 0.0784 0.0848 0.0015 0.1856 0.0003 21.00 0.0079 0.0042 0.0122 0.0789 0.0862 0.0014 0.1700 0.0002 22.00 0.0071 0.0038 0.0109 0.0794 0.0871 0.0009 0.1557 0.0001 23.00 0.0071 0.0038 0.0109 0.0798 0.0875 0.0004 0.1425 0.0001 24.00 0.0063 0.0034 0.0097 0.0802 0.0884 0.0008 0.1305 0.0001 25.00 0.0055 0.0030 0.0085 0.0806 0.0892 0.0008 0.1195 0.0001 26.00 0.0048 0.0025 0.0073 0.0809 0.0899 0.0007 0.1094 0.0001 27.00 0.0040 0.0021 0.0061 0.0812 0.0906 0.0007 0.1002 0.0001 28.00 0.0040 0.0021 0.0061 0.0814 0.0908 0.0002 0.0917 0.0000 29.00 0.0024 0.0013 0.0036 0.0816 0.0919 0.0010 0.0840 0.0001 30.00 0.0016 0.0008 0.0024 0.0818 0.0924 0.0005 0.0769 0.0000 31.00 0.0011 0.0006 0.0016 0.0818 0.0928 0.0004 0.0704 0.0000 32.00 0.0007 0.0004 0.0010 0.0819 0.0930 0.0003 0.0645 0.0000 33.00 0.0004 0.0002 0.0006 0.0819 0.0932 0.0002 0.0590 0.0000 34.00 0.0002 0.0001 0.0003 0.0819 0.0934 0.0001 0.0540 0.0000 35.00 - - - 0.0819 0.0935 0.0001 0.0495 0.0000
Column Notes:(1) is Unearned Premium Reserve (equal to Written Premium minus Earned Premium, per the cashflow pattern) plus Unpaid Loss and LAE Reserve (equal to Incurred minus Paid Losses and LAE) by time period, expressed as a factor, = [Table 2 col (3) - Table 2 col (2)] + Table 1 row (7, Dynamic) x [Table 2 col (2) - Table 2 col (5)](2) is the Surplus derived from Reserves per the Reserve-to-Surplus Ratio by time period, expressed as a factor, = (1) / Table 1 row (2)(3) is Reserves plus Surplus minus Agent Balances by time period, expressed as a factor, = (1) + (2) - Agent Balances. Agent Balances exist when Written Premium exceeds Collected Premium, = [Table 2 col (3) - Table 2 col (1)].(4) is derived by applying the Return on Investments [Table 3 col (1)] to the average Invested Funds (4) from the previous and current time periods, plus previous Income from Invested Funds, by time period expressed as a factor.(5) is Insurance Cash Flow plus Income from Invested Funds minus Total Invested Funds by time period, expressed as a factor, = Table 6 col (5) + (4) - (3)(6) is the difference between Capital Provider Equity (5) at the current and previous time periods, expressed as a factor(7) is derived from the respective Weighted Average Cost of Capital [Table 3 col (2)] for each time period, expressed as a factor(8) is the Capital Provider Cash Flow (6) discounted by the Cumulative Discount Factor (7), expressed as a factor
NATIONAL COUNCIL ON COMPENSATION INSURANCEINTERNAL RATE OF RETURN ANALYSIS
INDIANA - VOLUNTARY
TABLE 7: DERIVATION OF CASH FLOWS TO THE CAPITAL PROVIDERS (DYNAMIC ESTIMATE)
Calculation Details - Dynamic Estimate (continued)
© Copyright 2017 National Council on Compensation Insurance, Inc. All Rights Reserved.
Page 73 of 138
Exhibit II - G
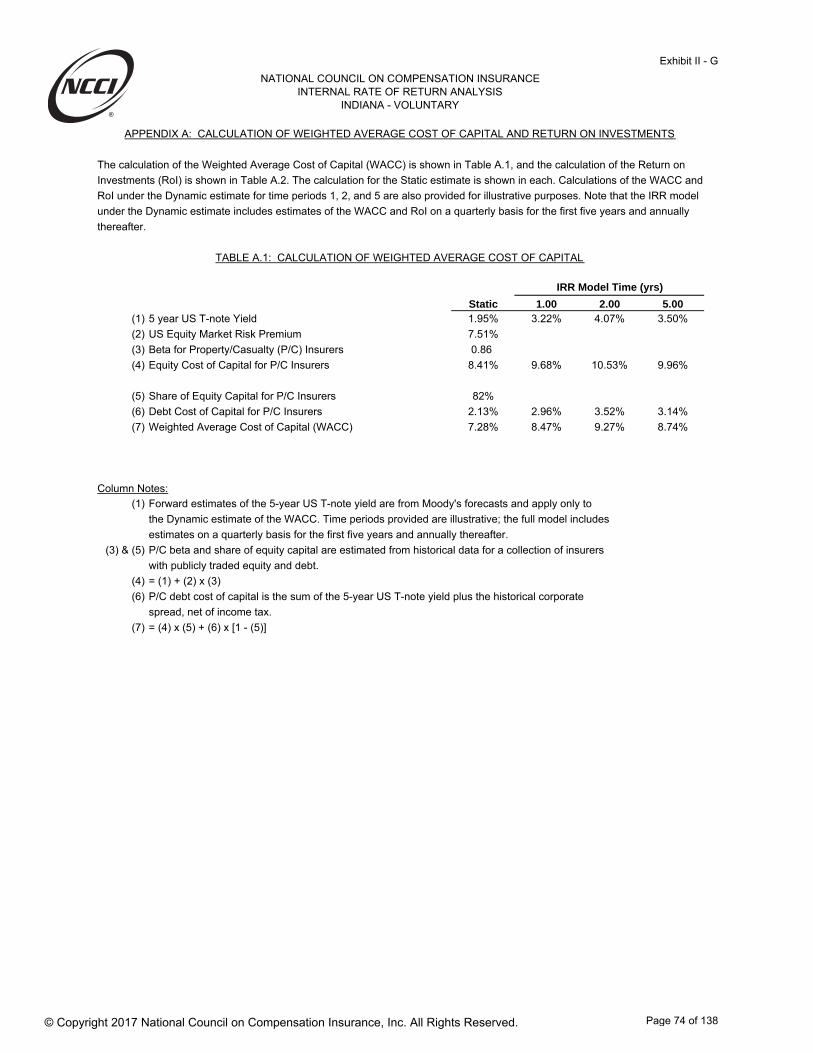
The calculation of the Weighted Average Cost of Capital (WACC) is shown in Table A.1, and the calculation of the Return on
Investments (RoI) is shown in Table A.2. The calculation for the Static estimate is shown in each. Calculations of the WACC and
RoI under the Dynamic estimate for time periods 1, 2, and 5 are also provided for illustrative purposes. Note that the IRR model
under the Dynamic estimate includes estimates of the WACC and RoI on a quarterly basis for the first five years and annually
thereafter.
Static 1.00 2.00 5.00(1) 5 year US T-note Yield 1.95% 3.22% 4.07% 3.50%
(2) US Equity Market Risk Premium 7.51%
(3) Beta for Property/Casualty (P/C) Insurers 0.86
(4) Equity Cost of Capital for P/C Insurers 8.41% 9.68% 10.53% 9.96%
(5) Share of Equity Capital for P/C Insurers 82%
(6) Debt Cost of Capital for P/C Insurers 2.13% 2.96% 3.52% 3.14%
(7) Weighted Average Cost of Capital (WACC) 7.28% 8.47% 9.27% 8.74%
Column Notes:
(1) Forward estimates of the 5-year US T-note yield are from Moody's forecasts and apply only to
the Dynamic estimate of the WACC. Time periods provided are illustrative; the full model includes
estimates on a quarterly basis for the first five years and annually thereafter.
(3) & (5) P/C beta and share of equity capital are estimated from historical data for a collection of insurers
with publicly traded equity and debt.
(4) = (1) + (2) x (3)
(6) P/C debt cost of capital is the sum of the 5-year US T-note yield plus the historical corporate
spread, net of income tax.
(7) = (4) x (5) + (6) x [1 - (5)]
IRR Model Time (yrs)
NATIONAL COUNCIL ON COMPENSATION INSURANCEINTERNAL RATE OF RETURN ANALYSIS
INDIANA - VOLUNTARY
APPENDIX A: CALCULATION OF WEIGHTED AVERAGE COST OF CAPITAL AND RETURN ON INVESTMENTS
TABLE A.1: CALCULATION OF WEIGHTED AVERAGE COST OF CAPITAL
© Copyright 2017 National Council on Compensation Insurance, Inc. All Rights Reserved.
Page 74 of 138
Exhibit II - G
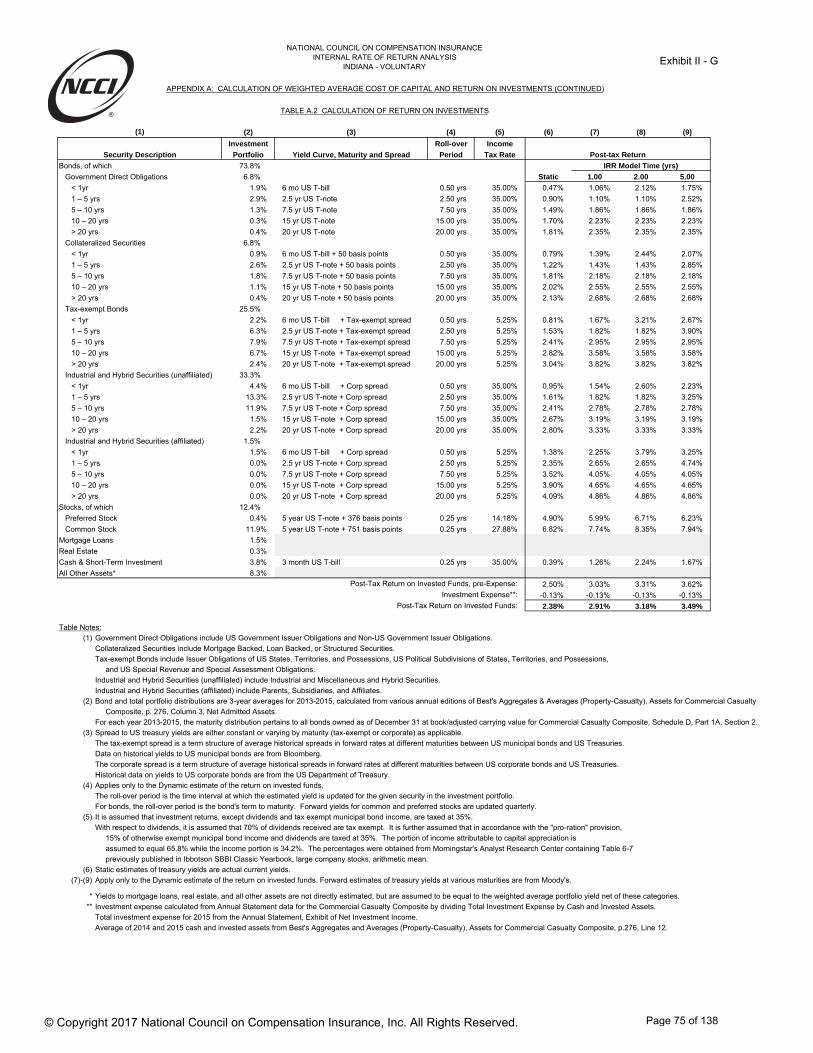
(2) (3) (4) (5) (6) (7) (8) (9)
Investment Roll-over Income
Portfolio Yield Curve, Maturity and Spread Period Tax Rate
Bonds, of which 73.8%
Government Direct Obligations 6.8% Static 1.00 2.00 5.00
< 1yr 1.9% 6 mo US T-bill 0.50 yrs 35.00% 0.47% 1.06% 2.12% 1.75%
1 ‒ 5 yrs 2.9% 2.5 yr US T-note 2.50 yrs 35.00% 0.90% 1.10% 1.10% 2.52%
5 ‒ 10 yrs 1.3% 7.5 yr US T-note 7.50 yrs 35.00% 1.49% 1.86% 1.86% 1.86%
10 ‒ 20 yrs 0.3% 15 yr US T-note 15.00 yrs 35.00% 1.70% 2.23% 2.23% 2.23%
> 20 yrs 0.4% 20 yr US T-note 20.00 yrs 35.00% 1.81% 2.35% 2.35% 2.35%
Collateralized Securities 6.8%
< 1yr 0.9% 6 mo US T-bill + 50 basis points 0.50 yrs 35.00% 0.79% 1.39% 2.44% 2.07%
1 ‒ 5 yrs 2.6% 2.5 yr US T-note + 50 basis points 2.50 yrs 35.00% 1.22% 1.43% 1.43% 2.85%
5 ‒ 10 yrs 1.8% 7.5 yr US T-note + 50 basis points 7.50 yrs 35.00% 1.81% 2.18% 2.18% 2.18%
10 ‒ 20 yrs 1.1% 15 yr US T-note + 50 basis points 15.00 yrs 35.00% 2.02% 2.55% 2.55% 2.55%
> 20 yrs 0.4% 20 yr US T-note + 50 basis points 20.00 yrs 35.00% 2.13% 2.68% 2.68% 2.68%
Tax-exempt Bonds 25.5%
< 1yr 2.2% 6 mo US T-bill + Tax-exempt spread 0.50 yrs 5.25% 0.81% 1.67% 3.21% 2.67%
1 ‒ 5 yrs 6.3% 2.5 yr US T-note + Tax-exempt spread 2.50 yrs 5.25% 1.53% 1.82% 1.82% 3.90%
5 ‒ 10 yrs 7.9% 7.5 yr US T-note + Tax-exempt spread 7.50 yrs 5.25% 2.41% 2.95% 2.95% 2.95%
10 ‒ 20 yrs 6.7% 15 yr US T-note + Tax-exempt spread 15.00 yrs 5.25% 2.82% 3.58% 3.58% 3.58%
> 20 yrs 2.4% 20 yr US T-note + Tax-exempt spread 20.00 yrs 5.25% 3.04% 3.82% 3.82% 3.82%
Industrial and Hybrid Securities (unaffiliated) 33.3%
< 1yr 4.4% 6 mo US T-bill + Corp spread 0.50 yrs 35.00% 0.95% 1.54% 2.60% 2.23%
1 ‒ 5 yrs 13.3% 2.5 yr US T-note + Corp spread 2.50 yrs 35.00% 1.61% 1.82% 1.82% 3.25%
5 ‒ 10 yrs 11.9% 7.5 yr US T-note + Corp spread 7.50 yrs 35.00% 2.41% 2.78% 2.78% 2.78%
10 ‒ 20 yrs 1.5% 15 yr US T-note + Corp spread 15.00 yrs 35.00% 2.67% 3.19% 3.19% 3.19%
> 20 yrs 2.2% 20 yr US T-note + Corp spread 20.00 yrs 35.00% 2.80% 3.33% 3.33% 3.33%
Industrial and Hybrid Securities (affiliated) 1.5%
< 1yr 1.5% 6 mo US T-bill + Corp spread 0.50 yrs 5.25% 1.38% 2.25% 3.79% 3.25%
1 ‒ 5 yrs 0.0% 2.5 yr US T-note + Corp spread 2.50 yrs 5.25% 2.35% 2.65% 2.65% 4.74%
5 ‒ 10 yrs 0.0% 7.5 yr US T-note + Corp spread 7.50 yrs 5.25% 3.52% 4.05% 4.05% 4.05%
10 ‒ 20 yrs 0.0% 15 yr US T-note + Corp spread 15.00 yrs 5.25% 3.90% 4.65% 4.65% 4.65%
> 20 yrs 0.0% 20 yr US T-note + Corp spread 20.00 yrs 5.25% 4.09% 4.86% 4.86% 4.86%
Stocks, of which 12.4%
Preferred Stock 0.4% 5 year US T-note + 376 basis points 0.25 yrs 14.18% 4.90% 5.99% 6.71% 6.23%
Common Stock 11.9% 5 year US T-note + 751 basis points 0.25 yrs 27.88% 6.82% 7.74% 8.35% 7.94%
Mortgage Loans 1.5%
Real Estate 0.3%
Cash & Short-Term Investment 3.8% 3 month US T-bill 0.25 yrs 35.00% 0.39% 1.26% 2.24% 1.67%
All Other Assets* 8.3%Post-Tax Return on Invested Funds, pre-Expense: 2.50% 3.03% 3.31% 3.62%
Investment Expense**: -0.13% -0.13% -0.13% -0.13%Post-Tax Return on Invested Funds: 2.38% 2.91% 3.18% 3.49%
Table Notes:
(1) Government Direct Obligations include US Government Issuer Obligations and Non-US Government Issuer Obligations.
Collateralized Securities include Mortgage Backed, Loan Backed, or Structured Securities.
Tax-exempt Bonds include Issuer Obligations of US States, Territories, and Possessions, US Political Subdivisions of States, Territories, and Possessions,
and US Special Revenue and Special Assessment Obligations.
Industrial and Hybrid Securities (unaffiliated) include Industrial and Miscellaneous and Hybrid Securities.
Industrial and Hybrid Securities (affiliated) include Parents, Subsidiaries, and Affiliates.
(2) Bond and total portfolio distributions are 3-year averages for 2013-2015, calculated from various annual editions of Best's Aggregates & Averages (Property-Casualty), Assets for Commercial Casualty
Composite, p. 276, Column 3, Net Admitted Assets.
For each year 2013-2015, the maturity distribution pertains to all bonds owned as of December 31 at book/adjusted carrying value for Commercial Casualty Composite, Schedule D, Part 1A, Section 2.
(3) Spread to US treasury yields are either constant or varying by maturity (tax-exempt or corporate) as applicable.
The tax-exempt spread is a term structure of average historical spreads in forward rates at different maturities between US municipal bonds and US Treasuries.
Data on historical yields to US municipal bonds are from Bloomberg.
The corporate spread is a term structure of average historical spreads in forward rates at different maturities between US corporate bonds and US Treasuries.
Historical data on yields to US corporate bonds are from the US Department of Treasury.
(4) Applies only to the Dynamic estimate of the return on invested funds.
The roll-over period is the time interval at which the estimated yield is updated for the given security in the investment portfolio.
For bonds, the roll-over period is the bond's term to maturity. Forward yields for common and preferred stocks are updated quarterly.
(5) It is assumed that investment returns, except dividends and tax exempt municipal bond income, are taxed at 35%.
With respect to dividends, it is assumed that 70% of dividends received are tax exempt. It is further assumed that in accordance with the "pro-ration" provision,
15% of otherwise exempt municipal bond income and dividends are taxed at 35%. The portion of income attributable to capital appreciation is
assumed to equal 65.8% while the income portion is 34.2%. The percentages were obtained from Morningstar's Analyst Research Center containing Table 6-7
previously published in Ibbotson SBBI Classic Yearbook, large company stocks, arithmetic mean.
(6) Static estimates of treasury yields are actual current yields.
(7)-(9) Apply only to the Dynamic estimate of the return on invested funds. Forward estimates of treasury yields at various maturities are from Moody's.
* Yields to mortgage loans, real estate, and all other assets are not directly estimated, but are assumed to be equal to the weighted average portfolio yield net of these categories.
** Investment expense calculated from Annual Statement data for the Commercial Casualty Composite by dividing Total Investment Expense by Cash and Invested Assets.
Total investment expense for 2015 from the Annual Statement, Exhibit of Net Investment Income.
Average of 2014 and 2015 cash and invested assets from Best's Aggregates and Averages (Property-Casualty), Assets for Commercial Casualty Composite, p.276, Line 12.
(1)
Post-tax Return
IRR Model Time (yrs)
Security Description
APPENDIX A: CALCULATION OF WEIGHTED AVERAGE COST OF CAPITAL AND RETURN ON INVESTMENTS (CONTINUED)
NATIONAL COUNCIL ON COMPENSATION INSURANCEINTERNAL RATE OF RETURN ANALYSIS
INDIANA - VOLUNTARY
TABLE A.2 CALCULATION OF RETURN ON INVESTMENTS
© Copyright 2017 National Council on Compensation Insurance, Inc. All Rights Reserved.
Page 75 of 138
Exhibit II - G
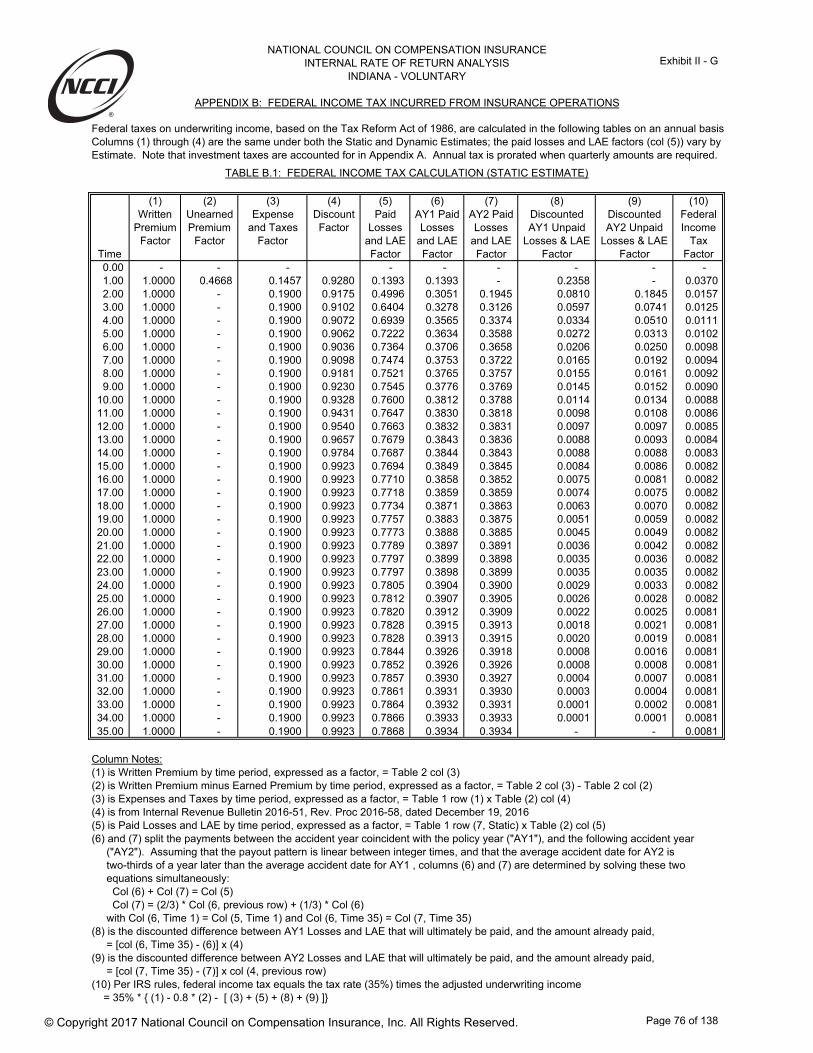
NATIONAL COUNCIL ON COMPENSATION INSURANCEINTERNAL RATE OF RETURN ANALYSIS
INDIANA - VOLUNTARY
APPENDIX B: FEDERAL INCOME TAX INCURRED FROM INSURANCE OPERATIONS
Federal taxes on underwriting income, based on the Tax Reform Act of 1986, are calculated in the following tables on an annual basisColumns (1) through (4) are the same under both the Static and Dynamic Estimates; the paid losses and LAE factors (col (5)) vary byEstimate. Note that investment taxes are accounted for in Appendix A. Annual tax is prorated when quarterly amounts are required.
(1) (2) (3) (4) (5) (6) (7) (8) (9) (10)Written Unearned Expense Discount Paid AY1 Paid AY2 Paid Discounted Discounted Federal
Premium Premium and Taxes Factor Losses Losses Losses AY1 Unpaid AY2 Unpaid IncomeFactor Factor Factor and LAE and LAE and LAE Losses & LAE Losses & LAE Tax
Time Factor Factor Factor Factor Factor Factor0.00 - - - - - - - - - 1.00 1.0000 0.4668 0.1457 0.9280 0.1393 0.1393 - 0.2358 - 0.0370 2.00 1.0000 - 0.1900 0.9175 0.4996 0.3051 0.1945 0.0810 0.1845 0.0157 3.00 1.0000 - 0.1900 0.9102 0.6404 0.3278 0.3126 0.0597 0.0741 0.0125 4.00 1.0000 - 0.1900 0.9072 0.6939 0.3565 0.3374 0.0334 0.0510 0.0111 5.00 1.0000 - 0.1900 0.9062 0.7222 0.3634 0.3588 0.0272 0.0313 0.0102 6.00 1.0000 - 0.1900 0.9036 0.7364 0.3706 0.3658 0.0206 0.0250 0.0098 7.00 1.0000 - 0.1900 0.9098 0.7474 0.3753 0.3722 0.0165 0.0192 0.0094 8.00 1.0000 - 0.1900 0.9181 0.7521 0.3765 0.3757 0.0155 0.0161 0.0092 9.00 1.0000 - 0.1900 0.9230 0.7545 0.3776 0.3769 0.0145 0.0152 0.0090
10.00 1.0000 - 0.1900 0.9328 0.7600 0.3812 0.3788 0.0114 0.0134 0.0088 11.00 1.0000 - 0.1900 0.9431 0.7647 0.3830 0.3818 0.0098 0.0108 0.0086 12.00 1.0000 - 0.1900 0.9540 0.7663 0.3832 0.3831 0.0097 0.0097 0.0085 13.00 1.0000 - 0.1900 0.9657 0.7679 0.3843 0.3836 0.0088 0.0093 0.0084 14.00 1.0000 - 0.1900 0.9784 0.7687 0.3844 0.3843 0.0088 0.0088 0.0083 15.00 1.0000 - 0.1900 0.9923 0.7694 0.3849 0.3845 0.0084 0.0086 0.0082 16.00 1.0000 - 0.1900 0.9923 0.7710 0.3858 0.3852 0.0075 0.0081 0.0082 17.00 1.0000 - 0.1900 0.9923 0.7718 0.3859 0.3859 0.0074 0.0075 0.0082 18.00 1.0000 - 0.1900 0.9923 0.7734 0.3871 0.3863 0.0063 0.0070 0.0082 19.00 1.0000 - 0.1900 0.9923 0.7757 0.3883 0.3875 0.0051 0.0059 0.0082 20.00 1.0000 - 0.1900 0.9923 0.7773 0.3888 0.3885 0.0045 0.0049 0.0082 21.00 1.0000 - 0.1900 0.9923 0.7789 0.3897 0.3891 0.0036 0.0042 0.0082 22.00 1.0000 - 0.1900 0.9923 0.7797 0.3899 0.3898 0.0035 0.0036 0.0082 23.00 1.0000 - 0.1900 0.9923 0.7797 0.3898 0.3899 0.0035 0.0035 0.0082 24.00 1.0000 - 0.1900 0.9923 0.7805 0.3904 0.3900 0.0029 0.0033 0.0082 25.00 1.0000 - 0.1900 0.9923 0.7812 0.3907 0.3905 0.0026 0.0028 0.0082 26.00 1.0000 - 0.1900 0.9923 0.7820 0.3912 0.3909 0.0022 0.0025 0.0081 27.00 1.0000 - 0.1900 0.9923 0.7828 0.3915 0.3913 0.0018 0.0021 0.0081 28.00 1.0000 - 0.1900 0.9923 0.7828 0.3913 0.3915 0.0020 0.0019 0.0081 29.00 1.0000 - 0.1900 0.9923 0.7844 0.3926 0.3918 0.0008 0.0016 0.0081 30.00 1.0000 - 0.1900 0.9923 0.7852 0.3926 0.3926 0.0008 0.0008 0.0081 31.00 1.0000 - 0.1900 0.9923 0.7857 0.3930 0.3927 0.0004 0.0007 0.0081 32.00 1.0000 - 0.1900 0.9923 0.7861 0.3931 0.3930 0.0003 0.0004 0.0081 33.00 1.0000 - 0.1900 0.9923 0.7864 0.3932 0.3931 0.0001 0.0002 0.0081 34.00 1.0000 - 0.1900 0.9923 0.7866 0.3933 0.3933 0.0001 0.0001 0.0081 35.00 1.0000 - 0.1900 0.9923 0.7868 0.3934 0.3934 - - 0.0081
Column Notes:(1) is Written Premium by time period, expressed as a factor, = Table 2 col (3)(2) is Written Premium minus Earned Premium by time period, expressed as a factor, = Table 2 col (3) - Table 2 col (2)(3) is Expenses and Taxes by time period, expressed as a factor, = Table 1 row (1) x Table (2) col (4)(4) is from Internal Revenue Bulletin 2016-51, Rev. Proc 2016-58, dated December 19, 2016(5) is Paid Losses and LAE by time period, expressed as a factor, = Table 1 row (7, Static) x Table (2) col (5)(6) and (7) split the payments between the accident year coincident with the policy year ("AY1"), and the following accident year ("AY2"). Assuming that the payout pattern is linear between integer times, and that the average accident date for AY2 is two-thirds of a year later than the average accident date for AY1 , columns (6) and (7) are determined by solving these two equations simultaneously: Col (6) + Col (7) = Col (5) Col (7) = (2/3) * Col (6, previous row) + (1/3) * Col (6) with Col (6, Time 1) = Col (5, Time 1) and Col (6, Time 35) = Col (7, Time 35)(8) is the discounted difference between AY1 Losses and LAE that will ultimately be paid, and the amount already paid, = [col (6, Time 35) - (6)] x (4)(9) is the discounted difference between AY2 Losses and LAE that will ultimately be paid, and the amount already paid, = [col (7, Time 35) - (7)] x col (4, previous row)(10) Per IRS rules, federal income tax equals the tax rate (35%) times the adjusted underwriting income = 35% * { (1) - 0.8 * (2) - [ (3) + (5) + (8) + (9) ]}
TABLE B.1: FEDERAL INCOME TAX CALCULATION (STATIC ESTIMATE)
© Copyright 2017 National Council on Compensation Insurance, Inc. All Rights Reserved.
Page 76 of 138
Exhibit II - G

NATIONAL COUNCIL ON COMPENSATION INSURANCEINTERNAL RATE OF RETURN ANALYSIS
INDIANA - VOLUNTARY
APPENDIX B: FEDERAL INCOME TAX INCURRED FROM INSURANCE OPERATIONS (CONTINUED)
(1) (2) (3) (4) (5) (6) (7) (8) (9) (10)Written Unearned Expense Discount Paid AY1 Paid AY2 Paid Discounted Discounted Federal
Premium Premium and Taxes Factor Losses Losses Losses AY1 Unpaid AY2 Unpaid IncomeFactor Factor Factor and LAE and LAE and LAE Losses & LAE Losses & LAE Tax
Time Factor Factor Factor Factor Factor Factor0.00 - - - - - - - - - 1.00 1.0000 0.4668 0.1457 0.9280 0.1402 0.1402 - 0.2375 - 0.0361 2.00 1.0000 - 0.1900 0.9175 0.5031 0.3072 0.1959 0.0816 0.1858 0.0138 3.00 1.0000 - 0.1900 0.9102 0.6449 0.3301 0.3148 0.0601 0.0746 0.0106 4.00 1.0000 - 0.1900 0.9072 0.6988 0.3590 0.3397 0.0336 0.0513 0.0092 5.00 1.0000 - 0.1900 0.9062 0.7273 0.3660 0.3613 0.0273 0.0316 0.0083 6.00 1.0000 - 0.1900 0.9036 0.7416 0.3732 0.3684 0.0207 0.0252 0.0079 7.00 1.0000 - 0.1900 0.9098 0.7527 0.3779 0.3748 0.0166 0.0193 0.0075 8.00 1.0000 - 0.1900 0.9181 0.7574 0.3791 0.3783 0.0156 0.0162 0.0073 9.00 1.0000 - 0.1900 0.9230 0.7598 0.3803 0.3795 0.0146 0.0153 0.0071
10.00 1.0000 - 0.1900 0.9328 0.7653 0.3839 0.3815 0.0115 0.0135 0.0069 11.00 1.0000 - 0.1900 0.9431 0.7701 0.3856 0.3844 0.0099 0.0109 0.0067 12.00 1.0000 - 0.1900 0.9540 0.7717 0.3859 0.3857 0.0097 0.0098 0.0066 13.00 1.0000 - 0.1900 0.9657 0.7733 0.3870 0.3863 0.0088 0.0094 0.0065 14.00 1.0000 - 0.1900 0.9784 0.7740 0.3870 0.3870 0.0089 0.0088 0.0064 15.00 1.0000 - 0.1900 0.9923 0.7748 0.3876 0.3872 0.0085 0.0087 0.0063 16.00 1.0000 - 0.1900 0.9923 0.7764 0.3885 0.3879 0.0076 0.0082 0.0062 17.00 1.0000 - 0.1900 0.9923 0.7772 0.3887 0.3886 0.0074 0.0075 0.0062 18.00 1.0000 - 0.1900 0.9923 0.7788 0.3898 0.3890 0.0063 0.0071 0.0062 19.00 1.0000 - 0.1900 0.9923 0.7812 0.3910 0.3902 0.0051 0.0059 0.0062 20.00 1.0000 - 0.1900 0.9923 0.7828 0.3916 0.3912 0.0045 0.0049 0.0062 21.00 1.0000 - 0.1900 0.9923 0.7843 0.3925 0.3919 0.0036 0.0042 0.0062 22.00 1.0000 - 0.1900 0.9923 0.7851 0.3926 0.3925 0.0035 0.0036 0.0062 23.00 1.0000 - 0.1900 0.9923 0.7851 0.3925 0.3926 0.0036 0.0035 0.0062 24.00 1.0000 - 0.1900 0.9923 0.7859 0.3932 0.3928 0.0029 0.0034 0.0062 25.00 1.0000 - 0.1900 0.9923 0.7867 0.3935 0.3933 0.0027 0.0028 0.0062 26.00 1.0000 - 0.1900 0.9923 0.7875 0.3939 0.3936 0.0022 0.0025 0.0062 27.00 1.0000 - 0.1900 0.9923 0.7883 0.3943 0.3940 0.0018 0.0021 0.0062 28.00 1.0000 - 0.1900 0.9923 0.7883 0.3941 0.3942 0.0020 0.0019 0.0062 29.00 1.0000 - 0.1900 0.9923 0.7899 0.3954 0.3945 0.0008 0.0016 0.0062 30.00 1.0000 - 0.1900 0.9923 0.7907 0.3953 0.3954 0.0008 0.0008 0.0062 31.00 1.0000 - 0.1900 0.9923 0.7912 0.3957 0.3955 0.0004 0.0007 0.0062 32.00 1.0000 - 0.1900 0.9923 0.7916 0.3958 0.3958 0.0003 0.0004 0.0062 33.00 1.0000 - 0.1900 0.9923 0.7919 0.3960 0.3959 0.0001 0.0003 0.0062 34.00 1.0000 - 0.1900 0.9923 0.7921 0.3961 0.3960 0.0001 0.0001 0.0062 35.00 1.0000 - 0.1900 0.9923 0.7923 0.3961 0.3961 - - 0.0062
Column Notes:(1) is Written Premium by time period, expressed as a factor, = Table 2 col (3)(2) is Written Premium minus Earned Premium by time period, expressed as a factor, = Table 2 col (3) - Table 2 col (2)(3) is Expenses and Taxes by time period, expressed as a factor, = Table 1 row (1) x Table (2) col (4)(4) is from Internal Revenue Bulletin 2016-51, Rev. Proc 2016-58, dated December 19, 2016(5) is Paid Losses and LAE by time period, expressed as a factor, = Table 1 row (7, Dynamic) x Table (2) col (5)(6) and (7) split the payments between the accident year coincident with the policy year ("AY1"), and the following accident year ("AY2"). Assuming that the payout pattern is linear between integer times, and that the average accident date for AY2 is two-thirds of a year later than the average accident date for AY1 , columns (6) and (7) are determined by solving these two equations simultaneously: Col (6) + Col (7) = Col (5) Col (7) = (2/3) * Col (6, previous row) + (1/3) * Col (6) with Col (6, Time 1) = Col (5, Time 1) and Col (6, Time 35) = Col (7, Time 35)(8) is the discounted difference between AY1 Losses and LAE that will ultimately be paid, and the amount already paid, = [col (6, Time 35) - (6)] x (4)(9) is the discounted difference between AY2 Losses and LAE that will ultimately be paid, and the amount already paid, = [col (7, Time 35) - (7)] x col (4, previous row)(10) Per IRS rules, federal income tax equals the tax rate (35%) times the adjusted underwriting income = 35% * { (1) - 0.8 * (2) - [ (3) + (5) + (8) + (9) ]}
TABLE B.2: FEDERAL INCOME TAX CALCULATION (DYNAMIC ESTIMATE)
© Copyright 2017 National Council on Compensation Insurance, Inc. All Rights Reserved.
Page 77 of 138
Exhibit II - G
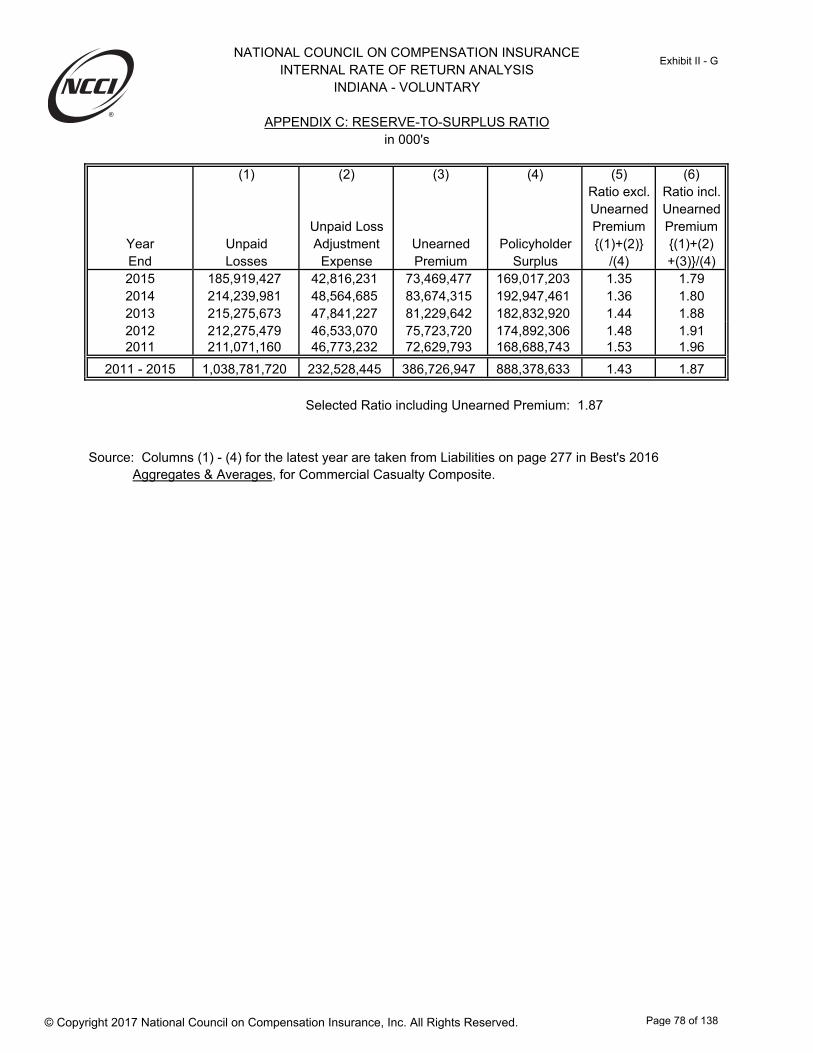
NATIONAL COUNCIL ON COMPENSATION INSURANCEINTERNAL RATE OF RETURN ANALYSIS
INDIANA - VOLUNTARY
APPENDIX C: RESERVE-TO-SURPLUS RATIO
(1) (2) (3) (4) (5) (6)Ratio excl. Ratio incl.Unearned Unearned
Unpaid Loss Premium PremiumYear Unpaid Adjustment Unearned Policyholder {(1)+(2)} {(1)+(2)End Losses Expense Premium Surplus /(4) +(3)}/(4)2015 185,919,427 42,816,231 73,469,477 169,017,203 1.35 1.792014 214,239,981 48,564,685 83,674,315 192,947,461 1.36 1.802013 215,275,673 47,841,227 81,229,642 182,832,920 1.44 1.882012 212,275,479 46,533,070 75,723,720 174,892,306 1.48 1.912011 211,071,160 46,773,232 72,629,793 168,688,743 1.53 1.96
2011 - 2015 1,038,781,720 232,528,445 386,726,947 888,378,633 1.43 1.87
Source: Columns (1) - (4) for the latest year are taken from Liabilities on page 277 in Best's 2016Aggregates & Averages, for Commercial Casualty Composite.
in 000's
Selected Ratio including Unearned Premium: 1.87
© Copyright 2017 National Council on Compensation Insurance, Inc. All Rights Reserved.
Page 78 of 138
Exhibit II - G
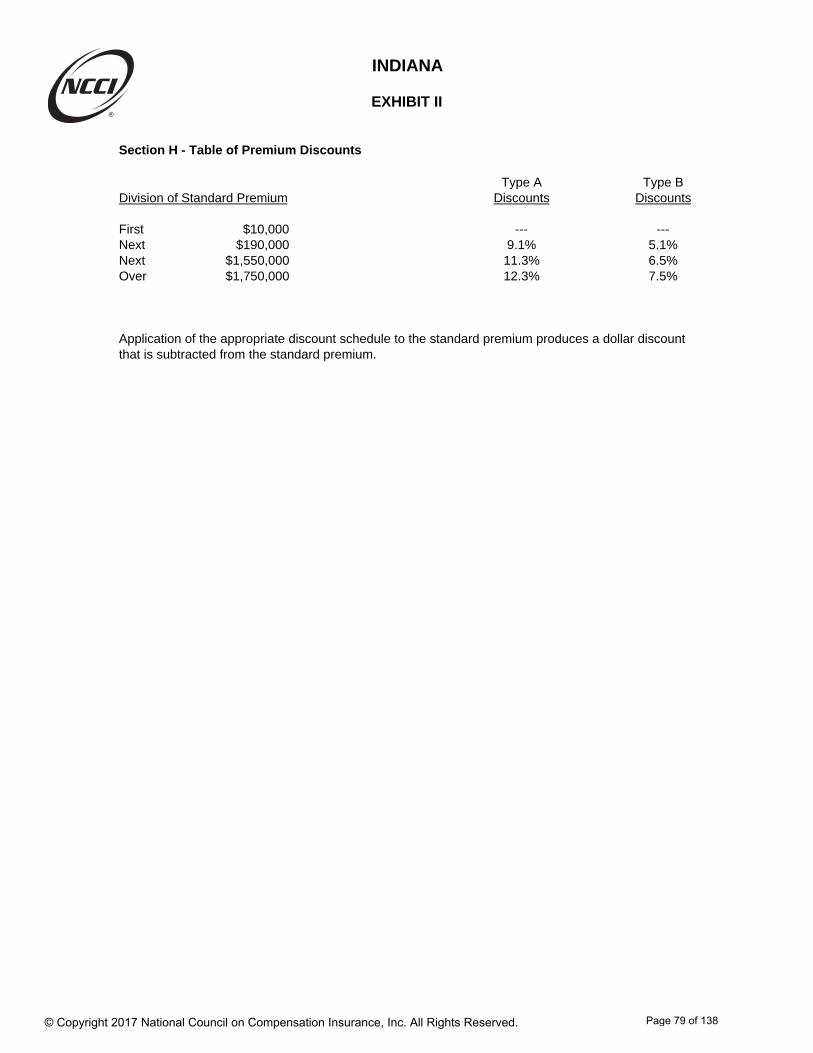
Section H - Table of Premium Discounts
Type A Type BDivision of Standard Premium Discounts Discounts
First $10,000 --- ---Next1 $190,000 9.1% 5.1%Next2 $1,550,000 11.3% 6.5%Over $1,750,000 12.3% 7.5%
Application of the appropriate discount schedule to the standard premium produces a dollar discountthat is subtracted from the standard premium.
INDIANA
EXHIBIT II
© Copyright 2017 National Council on Compensation Insurance, Inc. All Rights Reserved.
Page 79 of 138
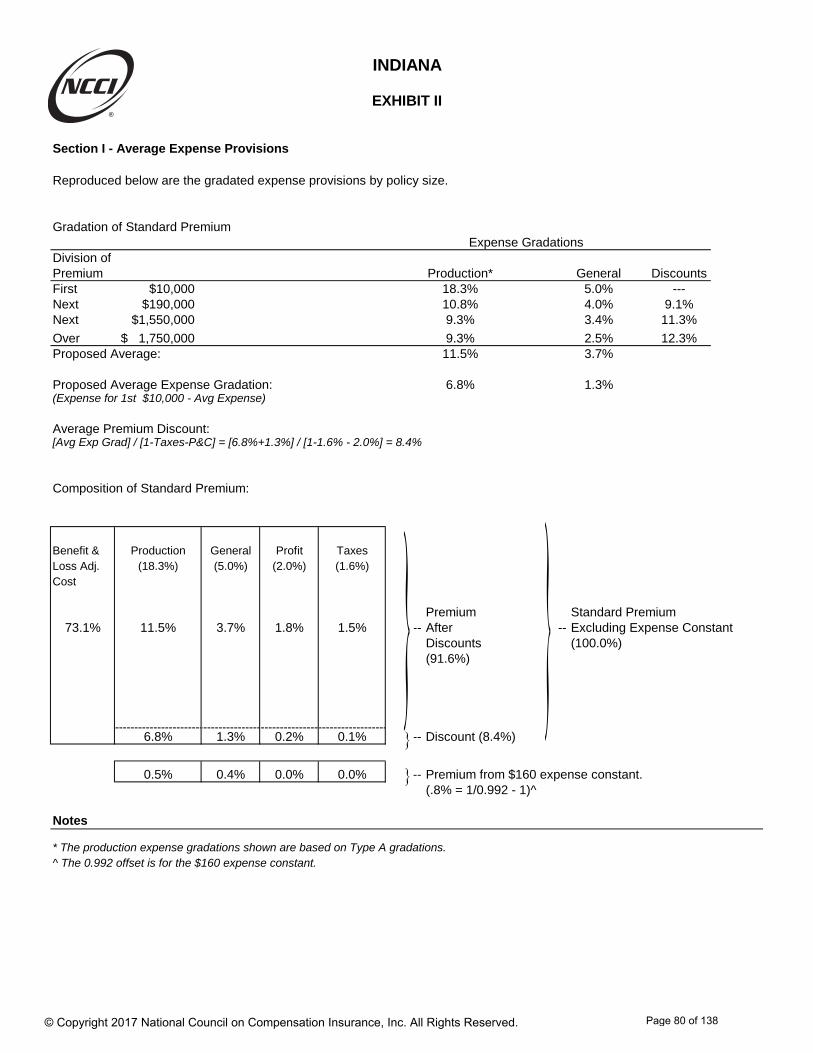
Section I - Average Expense Provisions
Reproduced below are the gradated expense provisions by policy size.
Gradation of Standard PremiumExpense Gradations
Division of Type A *Premium Production* General DiscountsFirst $10,000 18.3% 5.0% ---Next1 $190,000 10.8% 4.0% 9.1%Next2 $1,550,000 9.3% 3.4% 11.3%
Over 1,750,000$ 9.3% 2.5% 12.3%Proposed Average: 11.5% 3.7%
Proposed Average Expense Gradation: 6.8% 1.3%(Expense for 1st $10,000 - Avg Expense)
Average Premium Discount:[Avg Exp Grad] / [1-Taxes-P&C] = [6.8%+1.3%] / [1-1.6% - 2.0%] = 8.4%
Composition of Standard Premium:
Benefit & Production General Profit TaxesLoss Adj. (18.3%) (5.0%) (2.0%) (1.6%)Cost
Premium Standard Premium73.1% 11.5% 3.7% 1.8% 1.5% -- After -- Excluding Expense Constant
Discounts (100.0%)(91.6%)
6.8% 1.3% 0.2% 0.1% -- Discount (8.4%)
0.5% 0.4% 0.0% 0.0% -- Premium from $160 expense constant.(.8% = 1/0.992 - 1)^
Notes
* The production expense gradations shown are based on Type A gradations.^ The 0.992 offset is for the $160 expense constant.
INDIANA
EXHIBIT II
© Copyright 2017 National Council on Compensation Insurance, Inc. All Rights Reserved.
Page 80 of 138

Section J -Indiana Expense Provisions as a Percentage of Net Premium at NCCI Level
The exhibit below illustrates the allocation of the final premium dollar after the application of premiumdiscounts and expense constants based on Indiana expense provisions.
Notes
Benefit & Loss Adjustment Costs 79.0% = (73.1%) / 92.5%Production Expense 13.0% = (11.5% + 0.5%) / 92.5%General Expense 4.4% = (3.7% + 0.4%) / 92.5%Profit 2.0% = (1.8% + 0.0%) / 92.5%Taxes 1.6% = (1.5% + 0.0%) / 92.5%
Total 100.0%
INDIANA
EXHIBIT II
Benefit & Loss Adjustment Costs, 79.0%
Production Expense, 13.0%
General Expense, 4.4%Profit, 2.0% Taxes, 1.6%
Components of Premium
© Copyright 2017 National Council on Compensation Insurance, Inc. All Rights Reserved.
Page 81 of 138
Indiana
Advisory Loss Costs, Advisory Rates, and Assigned Risk Rates Filing – January 1, 2018
Appendix A – Factors Underlying the Proposed Rate Level Change
Appendix A-I Determination of Policy Year On-level Factors
NCCI uses premium and loss on-level factors to adjust historical policy year experience to current advisory rate and benefit levels, respectively.
Premium on-level factors are adjustment factors that reflect the cumulative impact of all premium level changes that have occurred during and after the individual year being on-leveled. To calculate a weighted average, NCCI utilizes a monthly premium distribution for Indiana based on an analysis of policies reported in the Unit Statistical Data, which was updated for this filing. Additional adjustments applied as part of the premium on-level factor calculation include:
Adjustment for Expense Constant Removal: This factor removes premium collected via the charged expense constant.
Adjustment for Expense Removal: This factor is applied to remove expenses from the reported assigned risk and voluntary DSR level premium totals—serving to make the separate market premiums more comparable.
Experience Rating Off-Balance Adjustment Factor: This factor reflects the relative difference between the average experience rating modification for the historical year being on-leveled and the average experience rating modification targeted in the filing.
Loss on-level factors are adjustment factors that reflect the cumulative impact of all benefit level changes that have occurred during and after the individual year of data being on-leveled.
Note: For NCCI ratemaking purposes, proposed benefit level changes that (i) do not impact the experience period of the filing and (ii) have not yet been approved are included in Exhibit I, rather than in the loss on-level calculation.
© Copyright 2017 National Council on Compensation Insurance, Inc. All Rights Reserved.
Page 82 of 138
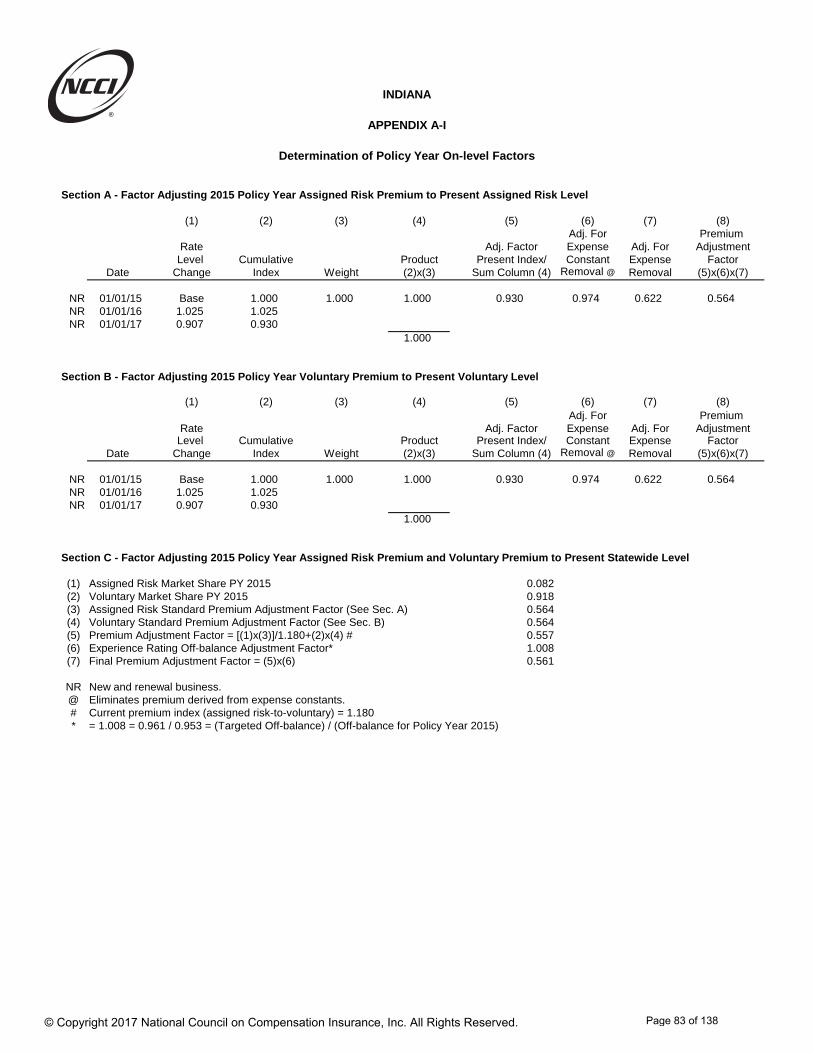
INDIANA
APPENDIX A-I
Determination of Policy Year On-level Factors
Section A - Factor Adjusting 2015 Policy Year Assigned Risk Premium to Present Assigned Risk Level
(1) (2) (3) (4) (5) (6) (7) (8) Adj. For Premium
Rate Adj. Factor Expense Adj. For AdjustmentLevel Cumulative Product Present Index/ Constant Expense Factor
Date Change Index Weight (2)x(3) Sum Column (4) Removal @ Removal (5)x(6)x(7)
NR 01/01/15 Base 1.000 1.000 1.000 0.930 0.974 0.622 0.564NR 01/01/16 1.025 1.025NR 01/01/17 0.907 0.930
1.000
Section B - Factor Adjusting 2015 Policy Year Voluntary Premium to Present Voluntary Level
(1) (2) (3) (4) (5) (6) (7) (8)Adj. For Premium
Rate Adj. Factor Expense Adj. For AdjustmentLevel Cumulative Product Present Index/ Constant Expense Factor
Date Change Index Weight (2)x(3) Sum Column (4) Removal @ Removal (5)x(6)x(7)
NR 01/01/15 Base 1.000 1.000 1.000 0.930 0.974 0.622 0.564NR 01/01/16 1.025 1.025NR 01/01/17 0.907 0.930
1.000
Section C - Factor Adjusting 2015 Policy Year Assigned Risk Premium and Voluntary Premium to Present Statewide Level
(1) Assigned Risk Market Share PY 2015 0.082(2) Voluntary Market Share PY 2015 0.918(3) Assigned Risk Standard Premium Adjustment Factor (See Sec. A) 0.564(4) Voluntary Standard Premium Adjustment Factor (See Sec. B) 0.564(5) Premium Adjustment Factor = [(1)x(3)]/1.180+(2)x(4) # 0.557(6) Experience Rating Off-balance Adjustment Factor* 1.008(7) Final Premium Adjustment Factor = (5)x(6) 0.561
NR New and renewal business.@ Eliminates premium derived from expense constants.# Current premium index (assigned risk-to-voluntary) = 1.180* = 1.008 = 0.961 / 0.953 = (Targeted Off-balance) / (Off-balance for Policy Year 2015)
© Copyright 2017 National Council on Compensation Insurance, Inc. All Rights Reserved.
Page 83 of 138
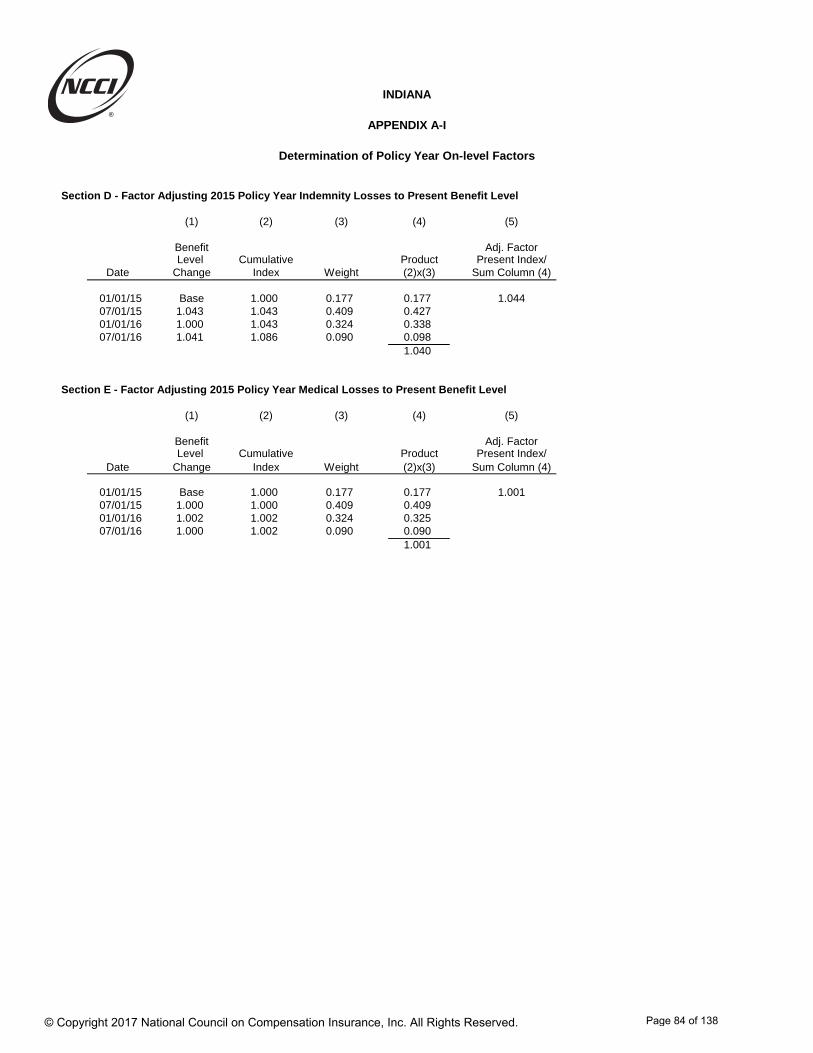
INDIANA
APPENDIX A-I
Determination of Policy Year On-level Factors
Section D - Factor Adjusting 2015 Policy Year Indemnity Losses to Present Benefit Level
(1) (2) (3) (4) (5)
Benefit Adj. FactorLevel Cumulative Product Present Index/
Date Change Index Weight (2)x(3) Sum Column (4)
01/01/15 Base 1.000 0.177 0.177 1.04407/01/15 1.043 1.043 0.409 0.42701/01/16 1.000 1.043 0.324 0.33807/01/16 1.041 1.086 0.090 0.098
1.040
Section E - Factor Adjusting 2015 Policy Year Medical Losses to Present Benefit Level
(1) (2) (3) (4) (5)
Benefit Adj. FactorLevel Cumulative Product Present Index/
Date Change Index Weight (2)x(3) Sum Column (4)
01/01/15 Base 1.000 0.177 0.177 1.00107/01/15 1.000 1.000 0.409 0.40901/01/16 1.002 1.002 0.324 0.32507/01/16 1.000 1.002 0.090 0.090
1.001
© Copyright 2017 National Council on Compensation Insurance, Inc. All Rights Reserved.
Page 84 of 138
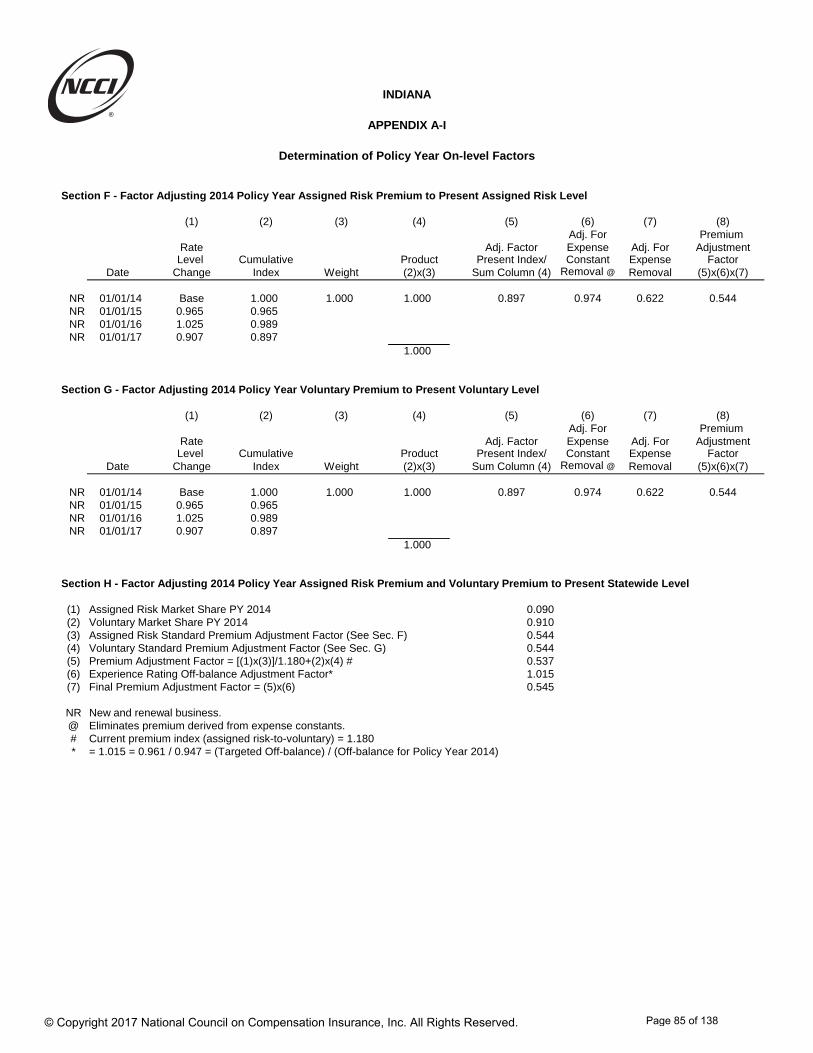
INDIANA
APPENDIX A-I
Determination of Policy Year On-level Factors
Section F - Factor Adjusting 2014 Policy Year Assigned Risk Premium to Present Assigned Risk Level
(1) (2) (3) (4) (5) (6) (7) (8) Adj. For Premium
Rate Adj. Factor Expense Adj. For AdjustmentLevel Cumulative Product Present Index/ Constant Expense Factor
Date Change Index Weight (2)x(3) Sum Column (4) Removal @ Removal (5)x(6)x(7)
NR 01/01/14 Base 1.000 1.000 1.000 0.897 0.974 0.622 0.544NR 01/01/15 0.965 0.965NR 01/01/16 1.025 0.989NR 01/01/17 0.907 0.897
1.000
Section G - Factor Adjusting 2014 Policy Year Voluntary Premium to Present Voluntary Level
(1) (2) (3) (4) (5) (6) (7) (8)Adj. For Premium
Rate Adj. Factor Expense Adj. For AdjustmentLevel Cumulative Product Present Index/ Constant Expense Factor
Date Change Index Weight (2)x(3) Sum Column (4) Removal @ Removal (5)x(6)x(7)
NR 01/01/14 Base 1.000 1.000 1.000 0.897 0.974 0.622 0.544NR 01/01/15 0.965 0.965NR 01/01/16 1.025 0.989NR 01/01/17 0.907 0.897
1.000
Section H - Factor Adjusting 2014 Policy Year Assigned Risk Premium and Voluntary Premium to Present Statewide Level
(1) Assigned Risk Market Share PY 2014 0.090(2) Voluntary Market Share PY 2014 0.910(3) Assigned Risk Standard Premium Adjustment Factor (See Sec. F) 0.544(4) Voluntary Standard Premium Adjustment Factor (See Sec. G) 0.544(5) Premium Adjustment Factor = [(1)x(3)]/1.180+(2)x(4) # 0.537(6) Experience Rating Off-balance Adjustment Factor* 1.015(7) Final Premium Adjustment Factor = (5)x(6) 0.545
NR New and renewal business.@ Eliminates premium derived from expense constants.# Current premium index (assigned risk-to-voluntary) = 1.180* = 1.015 = 0.961 / 0.947 = (Targeted Off-balance) / (Off-balance for Policy Year 2014)
© Copyright 2017 National Council on Compensation Insurance, Inc. All Rights Reserved.
Page 85 of 138
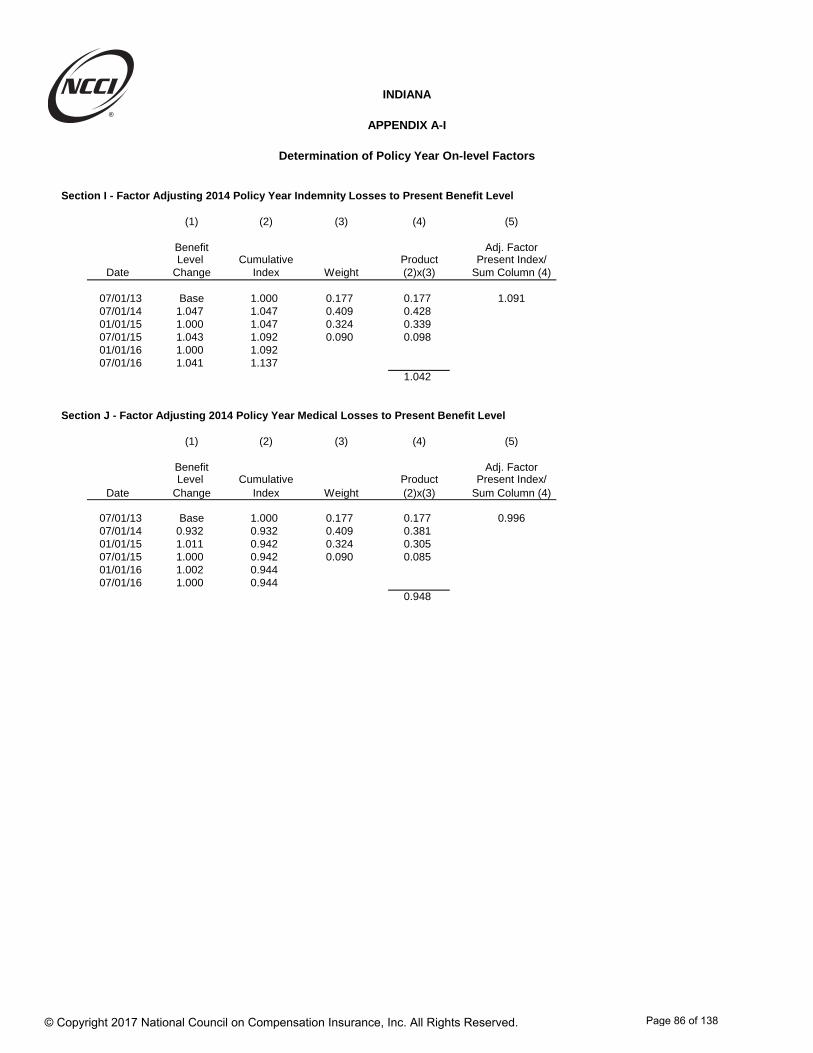
INDIANA
APPENDIX A-I
Determination of Policy Year On-level Factors
Section I - Factor Adjusting 2014 Policy Year Indemnity Losses to Present Benefit Level
(1) (2) (3) (4) (5)
Benefit Adj. FactorLevel Cumulative Product Present Index/
Date Change Index Weight (2)x(3) Sum Column (4)
07/01/13 Base 1.000 0.177 0.177 1.09107/01/14 1.047 1.047 0.409 0.42801/01/15 1.000 1.047 0.324 0.33907/01/15 1.043 1.092 0.090 0.09801/01/16 1.000 1.09207/01/16 1.041 1.137
1.042
Section J - Factor Adjusting 2014 Policy Year Medical Losses to Present Benefit Level
(1) (2) (3) (4) (5)
Benefit Adj. FactorLevel Cumulative Product Present Index/
Date Change Index Weight (2)x(3) Sum Column (4)
07/01/13 Base 1.000 0.177 0.177 0.99607/01/14 0.932 0.932 0.409 0.38101/01/15 1.011 0.942 0.324 0.30507/01/15 1.000 0.942 0.090 0.08501/01/16 1.002 0.94407/01/16 1.000 0.944
0.948
© Copyright 2017 National Council on Compensation Insurance, Inc. All Rights Reserved.
Page 86 of 138
Indiana
Advisory Loss Costs, Advisory Rates, and Assigned Risk Rates Filing – January 1, 2018
Appendix A – Factors Underlying the Proposed Rate Level Change
Appendix A-II Determination of Premium and Losses Developed to an Ultimate Report
Development factors are used to project premium and limited losses to an ultimate report. In general, the ultimate development factors are based on a chain-ladder approach that utilizes average link ratios for several maturities and the application of a tail factor.
Limited Large Loss Methodology
In order to limit volatility on the advisory rate indications due to the impact of extraordinary large losses, a limited large loss methodology is used in Indiana. A base threshold for the large loss limitation is determined by the volume of premium in the state as well as the number of years used in the experience period. The base threshold proposed in this filing is $9,086,441, based on the volume of premium in policy years 2013 and 2014 underlying the currently approved filing that utilizes data valued as of 12/31/2015. The base threshold is detrended by policy year to reflect the inflationary impact on claim costs due to wage inflation. The wage index used as a basis for these calculations is the Indiana average weekly wages from the Quarterly Census of Employment and Wages (QCEW). Detrended thresholds are used in the experience period, trend period, and loss development period. Indemnity and medical losses are limited at the detrended large loss threshold corresponding to their Policy Year, as shown in Appendix A-II Section L.
Limited indemnity and medical losses used to calculate the ultimate losses are shown in Appendix A-II Section A.
After developing limited indemnity and medical losses to an ultimate report, a statewide excess ratio at the base threshold is used to adjust the limited losses to an unlimited basis. The proposed excess ratio in this filing is 0.2%, as shown in Appendix A-II Section K.
Development Factors
For premium development, link ratios are used from 1st report through 5th report. It is assumed that no further development occurs after the 5th report.
For indemnity and medical loss development, link ratios calculated from limited losses are used from 1st report through the 19th report.
For indemnity and medical loss development past the 19th report, a “tail” factor is used to reflect all future expected emergence. The calculation of indemnity and medical paid + case 19th-to-ultimate tail factors utilize all available experience for the years prior to the tail attachment point. Tail factors are calculated for the most recent ten available policy years, each relying on losses
© Copyright 2017 National Council on Compensation Insurance, Inc. All Rights Reserved.
Page 87 of 138
Indiana
Advisory Loss Costs, Advisory Rates, and Assigned Risk Rates Filing – January 1, 2018
Appendix A – Factors Underlying the Proposed Rate Level Change
in older policy years as well as a factor to adjust for the differences in the volume of losses between the policy years. Tail factors are calculated separately for indemnity and medical losses by comparing the changes in the volume of policy year losses that occur on policy years reported after a nineteenth report to the volume of policy year losses at the nineteenth report, along with the application of a growth adjustment factor.
Since unlimited losses are used for the tail factor, they are adjusted to a limited basis as shown in Appendix A-II Section H.
© Copyright 2017 National Council on Compensation Insurance, Inc. All Rights Reserved.
Page 88 of 138
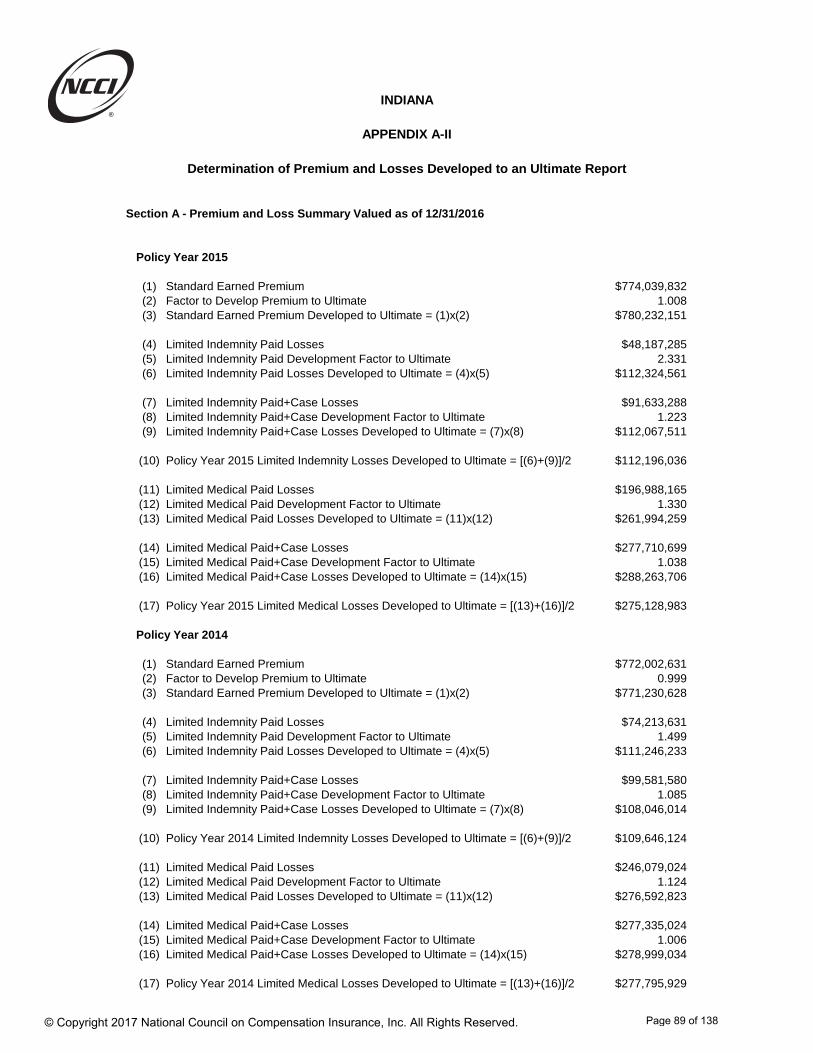
Section A - Premium and Loss Summary Valued as of 12/31/2016
Policy Year 2015
(1) Standard Earned Premium $774,039,832(2) Factor to Develop Premium to Ultimate 1.008(3) Standard Earned Premium Developed to Ultimate = (1)x(2) $780,232,151
(4) Limited Indemnity Paid Losses $48,187,285(5) Limited Indemnity Paid Development Factor to Ultimate 2.331(6) Limited Indemnity Paid Losses Developed to Ultimate = (4)x(5) $112,324,561
(7) Limited Indemnity Paid+Case Losses $91,633,288(8) Limited Indemnity Paid+Case Development Factor to Ultimate 1.223(9) Limited Indemnity Paid+Case Losses Developed to Ultimate = (7)x(8) $112,067,511
(10) Policy Year 2015 Limited Indemnity Losses Developed to Ultimate = [(6)+(9)]/2 $112,196,036
(11) Limited Medical Paid Losses $196,988,165(12) Limited Medical Paid Development Factor to Ultimate 1.330(13) Limited Medical Paid Losses Developed to Ultimate = (11)x(12) $261,994,259
(14) Limited Medical Paid+Case Losses $277,710,699(15) Limited Medical Paid+Case Development Factor to Ultimate 1.038(16) Limited Medical Paid+Case Losses Developed to Ultimate = (14)x(15) $288,263,706
(17) Policy Year 2015 Limited Medical Losses Developed to Ultimate = [(13)+(16)]/2 $275,128,983
Policy Year 2014
(1) Standard Earned Premium $772,002,631(2) Factor to Develop Premium to Ultimate 0.999(3) Standard Earned Premium Developed to Ultimate = (1)x(2) $771,230,628
(4) Limited Indemnity Paid Losses $74,213,631(5) Limited Indemnity Paid Development Factor to Ultimate 1.499(6) Limited Indemnity Paid Losses Developed to Ultimate = (4)x(5) $111,246,233
(7) Limited Indemnity Paid+Case Losses $99,581,580(8) Limited Indemnity Paid+Case Development Factor to Ultimate 1.085(9) Limited Indemnity Paid+Case Losses Developed to Ultimate = (7)x(8) $108,046,014
(10) Policy Year 2014 Limited Indemnity Losses Developed to Ultimate = [(6)+(9)]/2 $109,646,124
(11) Limited Medical Paid Losses $246,079,024(12) Limited Medical Paid Development Factor to Ultimate 1.124(13) Limited Medical Paid Losses Developed to Ultimate = (11)x(12) $276,592,823
(14) Limited Medical Paid+Case Losses $277,335,024(15) Limited Medical Paid+Case Development Factor to Ultimate 1.006(16) Limited Medical Paid+Case Losses Developed to Ultimate = (14)x(15) $278,999,034
(17) Policy Year 2014 Limited Medical Losses Developed to Ultimate = [(13)+(16)]/2 $277,795,929
APPENDIX A-II
INDIANA
Determination of Premium and Losses Developed to an Ultimate Report
© Copyright 2017 National Council on Compensation Insurance, Inc. All Rights Reserved.
Page 89 of 138
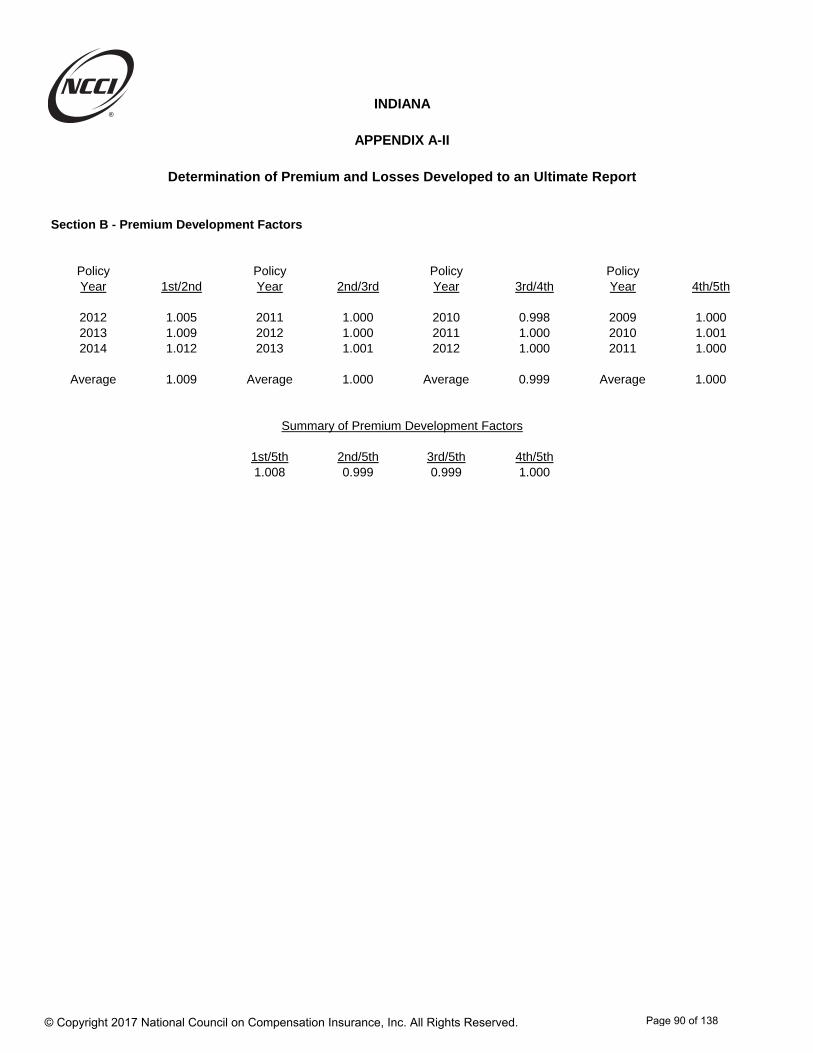
Section B - Premium Development Factors
Policy Policy Policy PolicyYear 1st/2nd Year 2nd/3rd Year 3rd/4th Year 4th/5th
2012 1.005 2011 1.000 2010 0.998 2009 1.0002013 1.009 2012 1.000 2011 1.000 2010 1.0012014 1.012 2013 1.001 2012 1.000 2011 1.000
Average 1.009 Average 1.000 Average 0.999 Average 1.000
1st/5th 2nd/5th 3rd/5th 4th/5th1.008 0.999 0.999 1.000
INDIANA
APPENDIX A-II
Summary of Premium Development Factors
Determination of Premium and Losses Developed to an Ultimate Report
© Copyright 2017 National Council on Compensation Insurance, Inc. All Rights Reserved.
Page 90 of 138
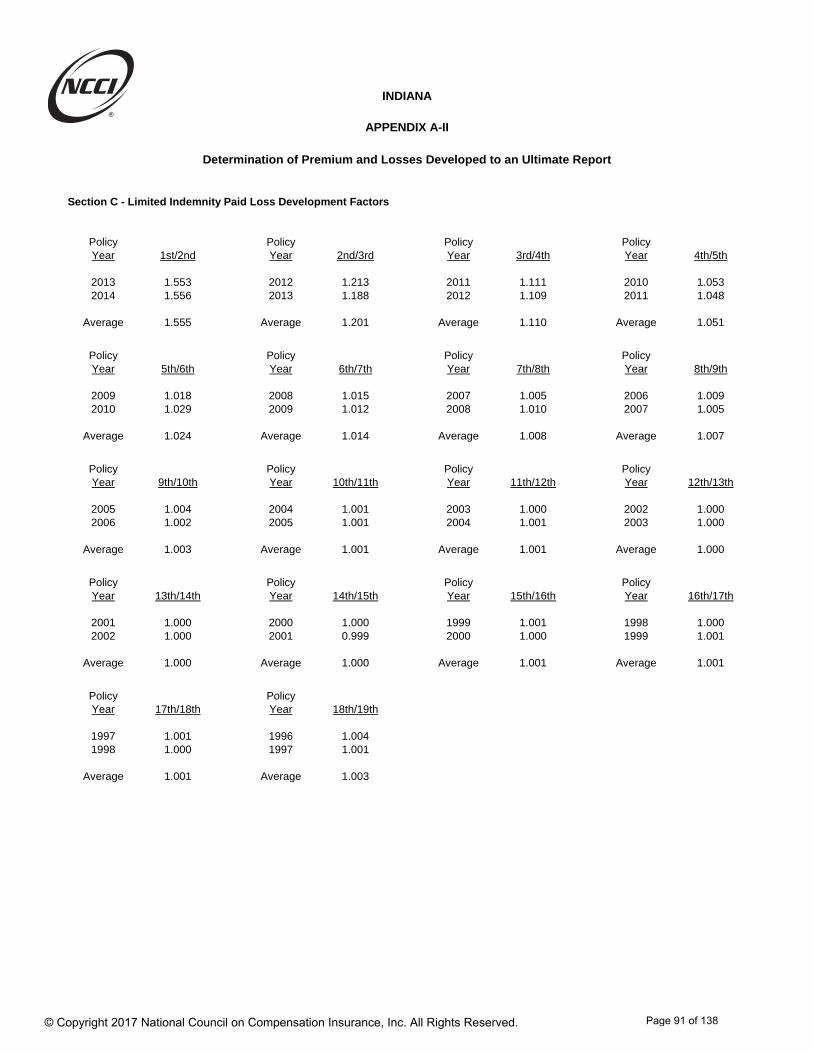
Section C - Limited Indemnity Paid Loss Development Factors
Policy Policy Policy PolicyYear 1st/2nd Year 2nd/3rd Year 3rd/4th Year 4th/5th
2013 1.553 2012 1.213 2011 1.111 2010 1.0532014 1.556 2013 1.188 2012 1.109 2011 1.048
Average 1.555 Average 1.201 Average 1.110 Average 1.051
Policy Policy Policy PolicyYear 5th/6th Year 6th/7th Year 7th/8th Year 8th/9th
2009 1.018 2008 1.015 2007 1.005 2006 1.0092010 1.029 2009 1.012 2008 1.010 2007 1.005
Average 1.024 Average 1.014 Average 1.008 Average 1.007
Policy Policy Policy PolicyYear 9th/10th Year 10th/11th Year 11th/12th Year 12th/13th
2005 1.004 2004 1.001 2003 1.000 2002 1.0002006 1.002 2005 1.001 2004 1.001 2003 1.000
Average 1.003 Average 1.001 Average 1.001 Average 1.000
Policy Policy Policy PolicyYear 13th/14th Year 14th/15th Year 15th/16th Year 16th/17th
2001 1.000 2000 1.000 1999 1.001 1998 1.0002002 1.000 2001 0.999 2000 1.000 1999 1.001
Average 1.000 Average 1.000 Average 1.001 Average 1.001
Policy PolicyYear 17th/18th Year 18th/19th
1997 1.001 1996 1.0041998 1.000 1997 1.001
Average 1.001 Average 1.003
Determination of Premium and Losses Developed to an Ultimate Report
INDIANA
APPENDIX A-II
© Copyright 2017 National Council on Compensation Insurance, Inc. All Rights Reserved.
Page 91 of 138

Determination of Premium and Losses Developed to an Ultimate Report
INDIANA
APPENDIX A-II
Section D - Limited Medical Paid Loss Development Factors
Policy Policy Policy PolicyYear 1st/2nd Year 2nd/3rd Year 3rd/4th Year 4th/5th
2013 1.174 2012 1.043 2011 1.015 2010 1.0092014 1.192 2013 1.040 2012 1.015 2011 1.008
Average 1.183 Average 1.042 Average 1.015 Average 1.009
Policy Policy Policy PolicyYear 5th/6th Year 6th/7th Year 7th/8th Year 8th/9th
2009 1.007 2008 1.004 2007 1.003 2006 1.0062010 1.009 2009 1.004 2008 1.002 2007 1.003
Average 1.008 Average 1.004 Average 1.003 Average 1.005
Policy Policy Policy PolicyYear 9th/10th Year 10th/11th Year 11th/12th Year 12th/13th
2005 1.001 2004 1.002 2003 1.001 2002 1.0002006 1.007 2005 1.004 2004 1.003 2003 1.002
Average 1.004 Average 1.003 Average 1.002 Average 1.001
Policy Policy Policy PolicyYear 13th/14th Year 14th/15th Year 15th/16th Year 16th/17th
2001 1.003 2000 1.001 1999 1.000 1998 1.0032002 1.000 2001 1.003 2000 1.000 1999 1.000
Average 1.002 Average 1.002 Average 1.000 Average 1.002
Policy PolicyYear 17th/18th Year 18th/19th
1997 1.002 1996 1.0001998 1.003 1997 1.002
Average 1.003 Average 1.001
© Copyright 2017 National Council on Compensation Insurance, Inc. All Rights Reserved.
Page 92 of 138
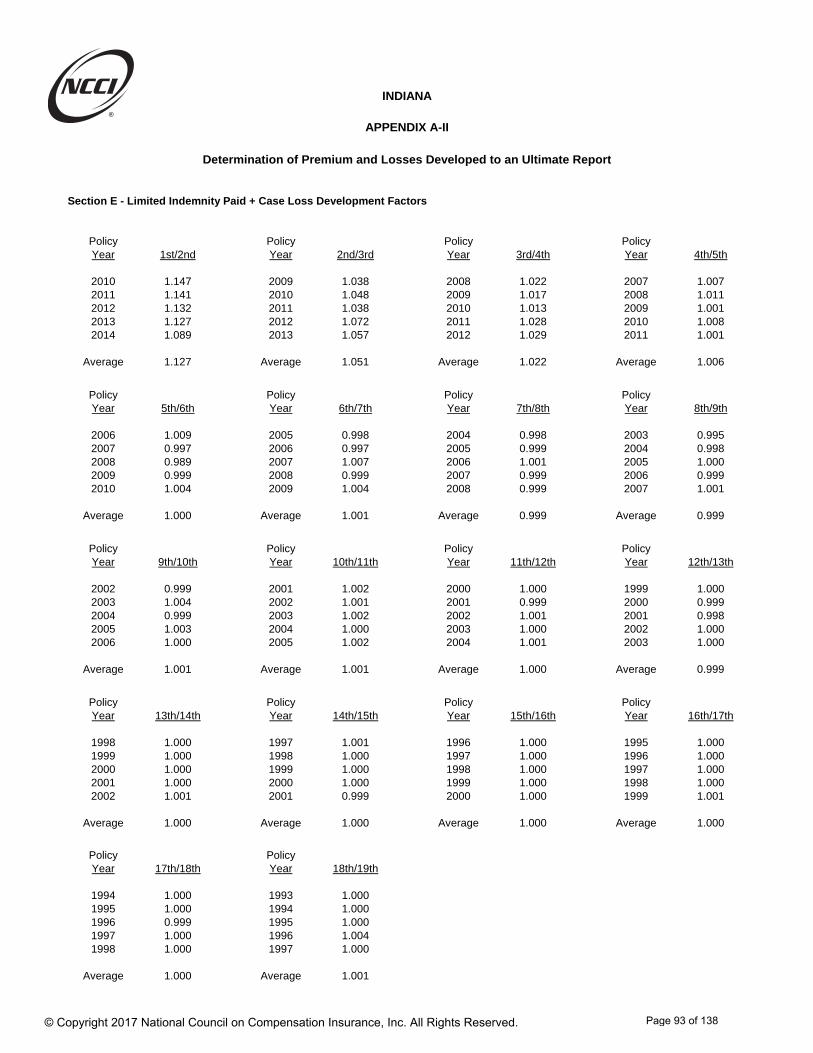
Section E - Limited Indemnity Paid + Case Loss Development Factors
Policy Policy Policy PolicyYear 1st/2nd Year 2nd/3rd Year 3rd/4th Year 4th/5th
2010 1.147 2009 1.038 2008 1.022 2007 1.0072011 1.141 2010 1.048 2009 1.017 2008 1.0112012 1.132 2011 1.038 2010 1.013 2009 1.0012013 1.127 2012 1.072 2011 1.028 2010 1.0082014 1.089 2013 1.057 2012 1.029 2011 1.001
Average 1.127 Average 1.051 Average 1.022 Average 1.006
Policy Policy Policy PolicyYear 5th/6th Year 6th/7th Year 7th/8th Year 8th/9th
2006 1.009 2005 0.998 2004 0.998 2003 0.9952007 0.997 2006 0.997 2005 0.999 2004 0.9982008 0.989 2007 1.007 2006 1.001 2005 1.0002009 0.999 2008 0.999 2007 0.999 2006 0.9992010 1.004 2009 1.004 2008 0.999 2007 1.001
Average 1.000 Average 1.001 Average 0.999 Average 0.999
Policy Policy Policy PolicyYear 9th/10th Year 10th/11th Year 11th/12th Year 12th/13th
2002 0.999 2001 1.002 2000 1.000 1999 1.0002003 1.004 2002 1.001 2001 0.999 2000 0.9992004 0.999 2003 1.002 2002 1.001 2001 0.9982005 1.003 2004 1.000 2003 1.000 2002 1.0002006 1.000 2005 1.002 2004 1.001 2003 1.000
Average 1.001 Average 1.001 Average 1.000 Average 0.999
Policy Policy Policy PolicyYear 13th/14th Year 14th/15th Year 15th/16th Year 16th/17th
1998 1.000 1997 1.001 1996 1.000 1995 1.0001999 1.000 1998 1.000 1997 1.000 1996 1.0002000 1.000 1999 1.000 1998 1.000 1997 1.0002001 1.000 2000 1.000 1999 1.000 1998 1.0002002 1.001 2001 0.999 2000 1.000 1999 1.001
Average 1.000 Average 1.000 Average 1.000 Average 1.000
Policy PolicyYear 17th/18th Year 18th/19th
1994 1.000 1993 1.0001995 1.000 1994 1.0001996 0.999 1995 1.0001997 1.000 1996 1.0041998 1.000 1997 1.000
Average 1.000 Average 1.001
Determination of Premium and Losses Developed to an Ultimate Report
INDIANA
APPENDIX A-II
© Copyright 2017 National Council on Compensation Insurance, Inc. All Rights Reserved.
Page 93 of 138
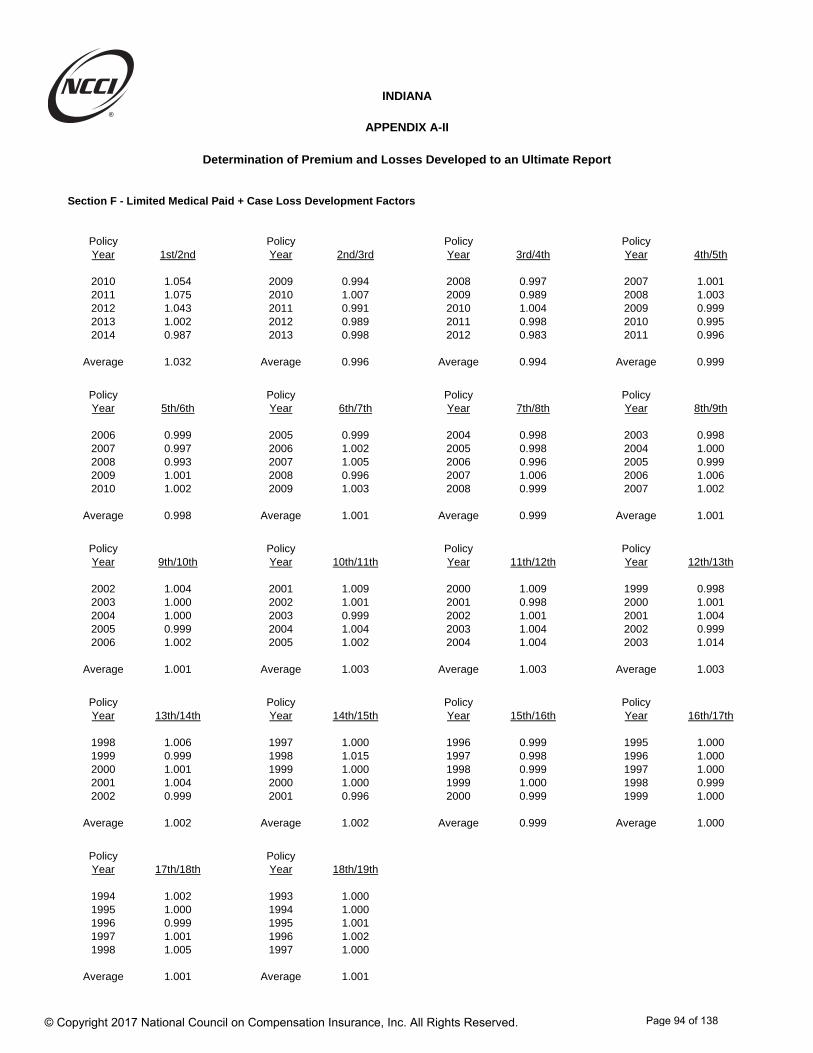
Determination of Premium and Losses Developed to an Ultimate Report
INDIANA
APPENDIX A-II
Section F - Limited Medical Paid + Case Loss Development Factors
Policy Policy Policy PolicyYear 1st/2nd Year 2nd/3rd Year 3rd/4th Year 4th/5th
2010 1.054 2009 0.994 2008 0.997 2007 1.0012011 1.075 2010 1.007 2009 0.989 2008 1.0032012 1.043 2011 0.991 2010 1.004 2009 0.9992013 1.002 2012 0.989 2011 0.998 2010 0.9952014 0.987 2013 0.998 2012 0.983 2011 0.996
Average 1.032 Average 0.996 Average 0.994 Average 0.999
Policy Policy Policy PolicyYear 5th/6th Year 6th/7th Year 7th/8th Year 8th/9th
2006 0.999 2005 0.999 2004 0.998 2003 0.9982007 0.997 2006 1.002 2005 0.998 2004 1.0002008 0.993 2007 1.005 2006 0.996 2005 0.9992009 1.001 2008 0.996 2007 1.006 2006 1.0062010 1.002 2009 1.003 2008 0.999 2007 1.002
Average 0.998 Average 1.001 Average 0.999 Average 1.001
Policy Policy Policy PolicyYear 9th/10th Year 10th/11th Year 11th/12th Year 12th/13th
2002 1.004 2001 1.009 2000 1.009 1999 0.9982003 1.000 2002 1.001 2001 0.998 2000 1.0012004 1.000 2003 0.999 2002 1.001 2001 1.0042005 0.999 2004 1.004 2003 1.004 2002 0.9992006 1.002 2005 1.002 2004 1.004 2003 1.014
Average 1.001 Average 1.003 Average 1.003 Average 1.003
Policy Policy Policy PolicyYear 13th/14th Year 14th/15th Year 15th/16th Year 16th/17th
1998 1.006 1997 1.000 1996 0.999 1995 1.0001999 0.999 1998 1.015 1997 0.998 1996 1.0002000 1.001 1999 1.000 1998 0.999 1997 1.0002001 1.004 2000 1.000 1999 1.000 1998 0.9992002 0.999 2001 0.996 2000 0.999 1999 1.000
Average 1.002 Average 1.002 Average 0.999 Average 1.000
Policy PolicyYear 17th/18th Year 18th/19th
1994 1.002 1993 1.0001995 1.000 1994 1.0001996 0.999 1995 1.0011997 1.001 1996 1.0021998 1.005 1997 1.000
Average 1.001 Average 1.001
© Copyright 2017 National Council on Compensation Insurance, Inc. All Rights Reserved.
Page 94 of 138
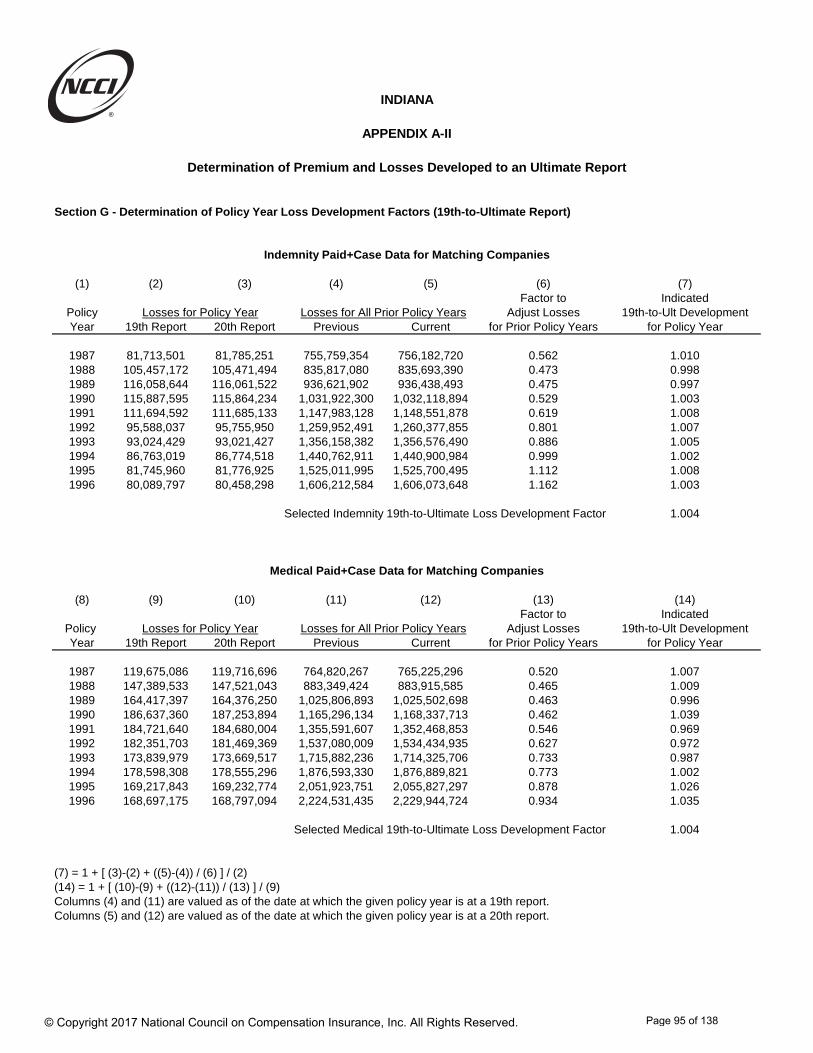
Section G - Determination of Policy Year Loss Development Factors (19th-to-Ultimate Report)
(1) (2) (3) (4) (5) (6) (7)Factor to Indicated
Policy Adjust Losses 19th-to-Ult DevelopmentYear 19th Report 20th Report Previous Current for Prior Policy Years for Policy Year
1987 81,713,501 81,785,251 755,759,354 756,182,720 0.562 1.0101988 105,457,172 105,471,494 835,817,080 835,693,390 0.473 0.9981989 116,058,644 116,061,522 936,621,902 936,438,493 0.475 0.9971990 115,887,595 115,864,234 1,031,922,300 1,032,118,894 0.529 1.0031991 111,694,592 111,685,133 1,147,983,128 1,148,551,878 0.619 1.0081992 95,588,037 95,755,950 1,259,952,491 1,260,377,855 0.801 1.0071993 93,024,429 93,021,427 1,356,158,382 1,356,576,490 0.886 1.0051994 86,763,019 86,774,518 1,440,762,911 1,440,900,984 0.999 1.0021995 81,745,960 81,776,925 1,525,011,995 1,525,700,495 1.112 1.0081996 80,089,797 80,458,298 1,606,212,584 1,606,073,648 1.162 1.003
Selected Indemnity 19th-to-Ultimate Loss Development Factor 1.004
(8) (9) (10) (11) (12) (13) (14)Factor to Indicated
Policy Adjust Losses 19th-to-Ult DevelopmentYear 19th Report 20th Report Previous Current for Prior Policy Years for Policy Year
1987 119,675,086 119,716,696 764,820,267 765,225,296 0.520 1.0071988 147,389,533 147,521,043 883,349,424 883,915,585 0.465 1.0091989 164,417,397 164,376,250 1,025,806,893 1,025,502,698 0.463 0.9961990 186,637,360 187,253,894 1,165,296,134 1,168,337,713 0.462 1.0391991 184,721,640 184,680,004 1,355,591,607 1,352,468,853 0.546 0.9691992 182,351,703 181,469,369 1,537,080,009 1,534,434,935 0.627 0.9721993 173,839,979 173,669,517 1,715,882,236 1,714,325,706 0.733 0.9871994 178,598,308 178,555,296 1,876,593,330 1,876,889,821 0.773 1.0021995 169,217,843 169,232,774 2,051,923,751 2,055,827,297 0.878 1.0261996 168,697,175 168,797,094 2,224,531,435 2,229,944,724 0.934 1.035
Selected Medical 19th-to-Ultimate Loss Development Factor 1.004
(7) = 1 + [ (3)-(2) + ((5)-(4)) / (6) ] / (2)(14) = 1 + [ (10)-(9) + ((12)-(11)) / (13) ] / (9)Columns (4) and (11) are valued as of the date at which the given policy year is at a 19th report.Columns (5) and (12) are valued as of the date at which the given policy year is at a 20th report.
Losses for Policy Year Losses for All Prior Policy Years
Determination of Premium and Losses Developed to an Ultimate Report
APPENDIX A-II
INDIANA
Medical Paid+Case Data for Matching Companies
Indemnity Paid+Case Data for Matching Companies
Losses for Policy Year Losses for All Prior Policy Years
© Copyright 2017 National Council on Compensation Insurance, Inc. All Rights Reserved.
Page 95 of 138
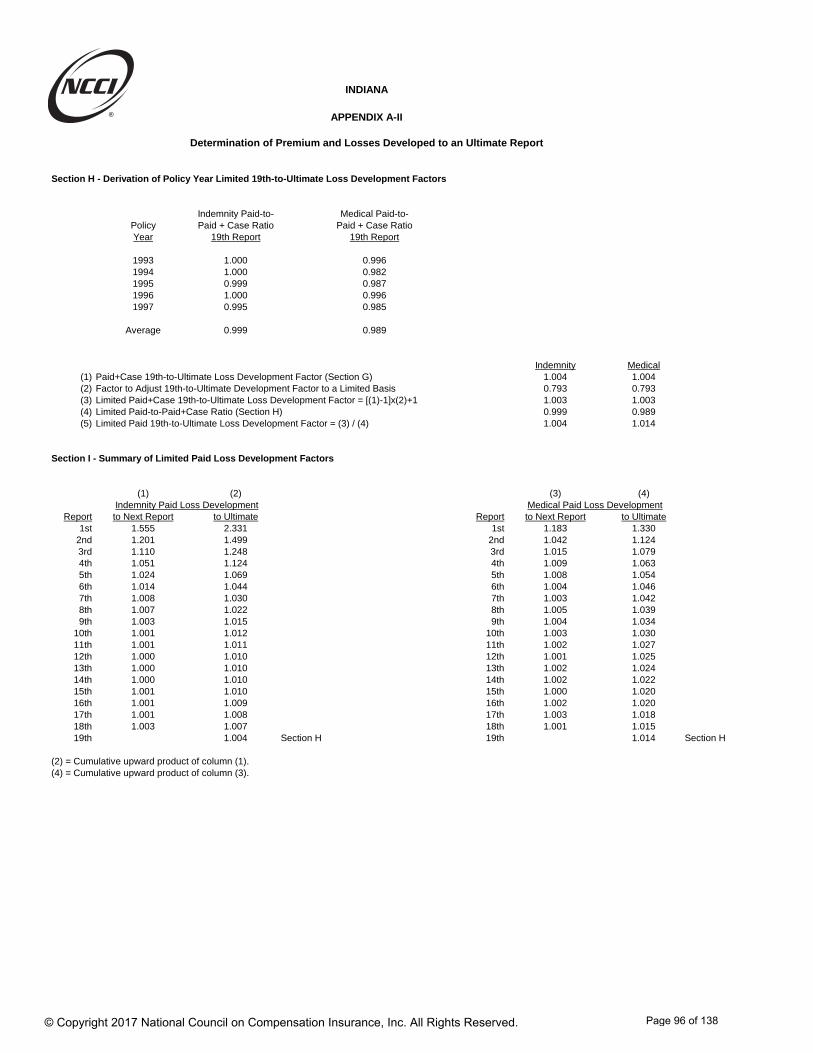
Section H - Derivation of Policy Year Limited 19th-to-Ultimate Loss Development Factors
Indemnity Paid-to- Medical Paid-to-Policy Paid + Case Ratio Paid + Case RatioYear 19th Report 19th Report
1993 1.000 0.9961994 1.000 0.9821995 0.999 0.9871996 1.000 0.9961997 0.995 0.985
Average 0.999 0.989
Indemnity Medical(1) Paid+Case 19th-to-Ultimate Loss Development Factor (Section G) 1.004 1.004(2) Factor to Adjust 19th-to-Ultimate Development Factor to a Limited Basis 0.793 0.793(3) Limited Paid+Case 19th-to-Ultimate Loss Development Factor = [(1)-1]x(2)+1 1.003 1.003(4) Limited Paid-to-Paid+Case Ratio (Section H) 0.999 0.989(5) Limited Paid 19th-to-Ultimate Loss Development Factor = (3) / (4) 1.004 1.014
Section I - Summary of Limited Paid Loss Development Factors
(1) (2) (3) (4)Indemnity Paid Loss Development Medical Paid Loss Development
Report to Next Report to Ultimate Report to Next Report to Ultimate1st 1.555 2.331 1st 1.183 1.330
2nd 1.201 1.499 2nd 1.042 1.1243rd 1.110 1.248 3rd 1.015 1.0794th 1.051 1.124 4th 1.009 1.0635th 1.024 1.069 5th 1.008 1.0546th 1.014 1.044 6th 1.004 1.0467th 1.008 1.030 7th 1.003 1.0428th 1.007 1.022 8th 1.005 1.0399th 1.003 1.015 9th 1.004 1.034
10th 1.001 1.012 10th 1.003 1.03011th 1.001 1.011 11th 1.002 1.02712th 1.000 1.010 12th 1.001 1.02513th 1.000 1.010 13th 1.002 1.02414th 1.000 1.010 14th 1.002 1.02215th 1.001 1.010 15th 1.000 1.02016th 1.001 1.009 16th 1.002 1.02017th 1.001 1.008 17th 1.003 1.01818th 1.003 1.007 18th 1.001 1.01519th 1.004 Section H 19th 1.014 Section H
(2) = Cumulative upward product of column (1).(4) = Cumulative upward product of column (3).
INDIANA
APPENDIX A-II
Determination of Premium and Losses Developed to an Ultimate Report
© Copyright 2017 National Council on Compensation Insurance, Inc. All Rights Reserved.
Page 96 of 138
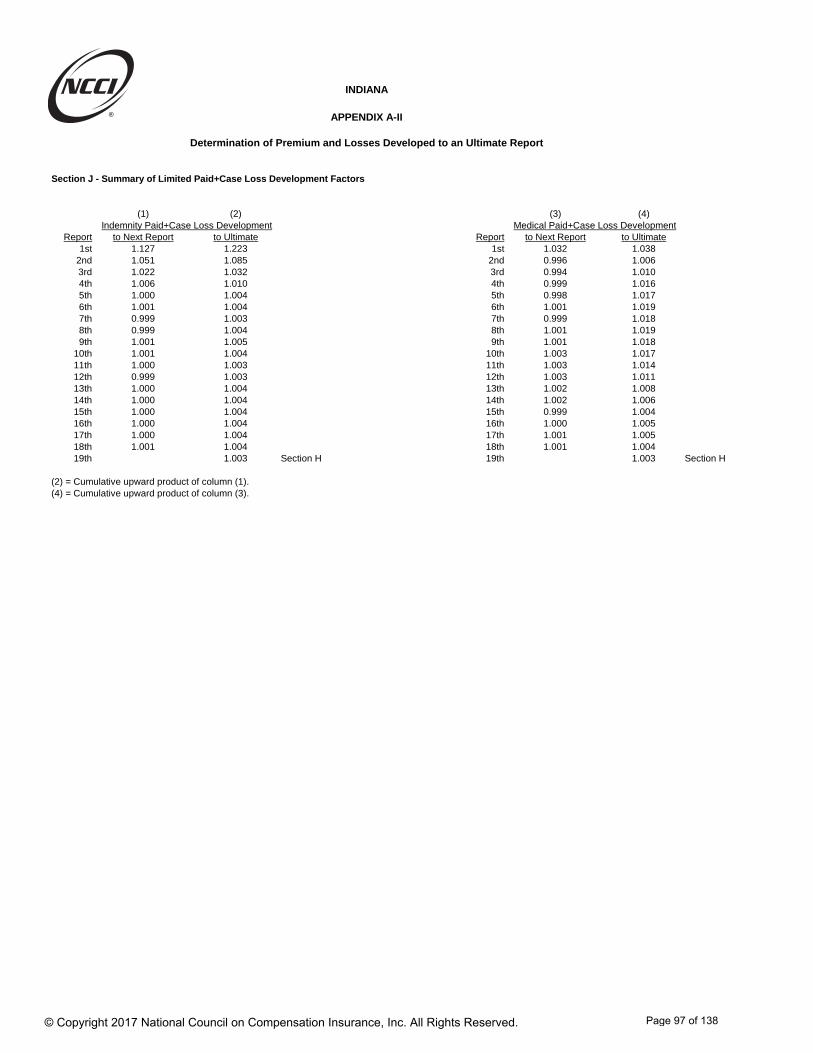
INDIANA
APPENDIX A-II
Determination of Premium and Losses Developed to an Ultimate Report
Section J - Summary of Limited Paid+Case Loss Development Factors
(1) (2) (3) (4)Indemnity Paid+Case Loss Development Medical Paid+Case Loss Development
Report to Next Report to Ultimate Report to Next Report to Ultimate1st 1.127 1.223 1st 1.032 1.038
2nd 1.051 1.085 2nd 0.996 1.0063rd 1.022 1.032 3rd 0.994 1.0104th 1.006 1.010 4th 0.999 1.0165th 1.000 1.004 5th 0.998 1.0176th 1.001 1.004 6th 1.001 1.0197th 0.999 1.003 7th 0.999 1.0188th 0.999 1.004 8th 1.001 1.0199th 1.001 1.005 9th 1.001 1.018
10th 1.001 1.004 10th 1.003 1.01711th 1.000 1.003 11th 1.003 1.01412th 0.999 1.003 12th 1.003 1.01113th 1.000 1.004 13th 1.002 1.00814th 1.000 1.004 14th 1.002 1.00615th 1.000 1.004 15th 0.999 1.00416th 1.000 1.004 16th 1.000 1.00517th 1.000 1.004 17th 1.001 1.00518th 1.001 1.004 18th 1.001 1.00419th 1.003 Section H 19th 1.003 Section H
(2) = Cumulative upward product of column (1).(4) = Cumulative upward product of column (3).
© Copyright 2017 National Council on Compensation Insurance, Inc. All Rights Reserved.
Page 97 of 138

Section K - Factor to Adjust Limited Losses to an Unlimited Basis
(1) Threshold at the Midpoint of the Loss Cost Effective Period* 9,086,441(2) Statewide Excess Ratio for (1) 0.002(3) Market Share for Carriers Missing from Large Loss and Catastrophe Call 0.000(4) Factor to Adjust Limited Losses to an Unlimited Basis = 1.0 / {1.0 - [(2) x (1.0 - (3))]} 1.002
Section L - Policy Year Large Loss Limits
Policy YearExperience Detrended
Year Limit2015 8,027,1562014 7,803,7602013 7,604,5742012 7,487,8892011 7,339,1092010 7,146,1632009 6,950,4512008 6,904,5452007 6,835,1832006 6,663,6702005 6,470,2632004 6,308,7002003 6,113,3622002 5,924,4702001 5,777,6032000 5,643,0781999 5,485,2081998 5,312,9531997 5,077,789
* November 29, 2018 is the midpoint of the effective period for which the revised loss costs are being proposed.
APPENDIX A-II
INDIANA
Determination of Premium and Losses Developed to an Ultimate Report
© Copyright 2017 National Council on Compensation Insurance, Inc. All Rights Reserved.
Page 98 of 138

Indiana
Advisory Loss Costs, Advisory Rates, and Assigned Risk Rates Filing – January 1, 2018
Appendix A – Factors Underlying the Proposed Rate Level Change
Appendix A-III Trend Factors
NCCI separately analyzes a measure of the number of workplace injuries (claim frequency) and the average indemnity and medical costs of each of these injuries (claim severity). Premium, lost-time claim counts, and limited losses used in these frequency and severity calculations are developed to ultimate and adjusted for changes in the level of workers’ wages over time using the United States Bureau of Labor Statistics Quarterly Census of Employment and Wages for Indiana. Note that medical-only claim counts are excluded from the claim frequency and severity calculations, but the losses associated with medical-only claims are included.
While claim frequency and average costs per case are reviewed separately, NCCI selects annual indemnity and medical loss ratio trend factors based on an analysis of historical indemnity and medical loss ratios, along with other pertinent considerations, including, but not limited to, changes in system benefits and administration, economic environment, credibility of state data, and prior trend approach and selection.
The lost-time claim frequency, average costs per case, and loss ratios for Policy Years 2008 through 2015 are shown in Appendix A-III, along with the impact of the trend selection for each policy year in the experience period. The trend lengths displayed in Section B(3) are calculated by comparing the average accident date for the effective period of the proposed rates to each of the policy years in the experience period. The average accident dates are based on an Indiana distribution of policy writings by month and assume a uniform probability of loss over the coverage period.
© Copyright 2017 National Council on Compensation Insurance, Inc. All Rights Reserved.
Page 99 of 138

Section A - Summary of Policy Year Data
(1) (2) (3) (4) (5) (6)
Lost-TimePolicy Claim Avg Cost Loss Avg Cost LossYear Frequency* Per Case*^ Ratio^ Per Case*^ Ratio^
2008 24.427 15,861 0.387 31,832 0.7772009 23.604 15,013 0.354 33,616 0.7932010 23.728 15,562 0.369 34,730 0.8252011 22.240 15,196 0.338 34,921 0.7772012 20.865 15,380 0.321 36,236 0.7572013 21.319 15,207 0.324 36,675 0.7822014 19.822 14,370 0.285 33,228 0.6582015 18.439 14,513 0.268 34,123 0.629
* Figures have been adjusted to the common wage level.^ Based on an average of paid and paid+case losses.
Section B - Summary of Annual Trend FactorsIndemnity Medical
(1) Current Approved Annual Loss Ratio Trend Factor 0.965 1.000
(2) Selected Annual Loss Ratio Trend Factor 0.960 0.995
(3) Length of Trend Period from Midpoint of Policy Year to Midpoint of Effective Period:
YearsPolicy Year 2014 3.998Policy Year 2015 2.998
(4) Trend Factor Applied to Experience Year = (2) ^ (3) Indemnity Medical
Policy Year 2014 0.849 0.980Policy Year 2015 0.885 0.985
Indemnity Medical
INDIANA
APPENDIX A-III
Policy Year Trend Factors
© Copyright 2017 National Council on Compensation Insurance, Inc. All Rights Reserved.
Page 100 of 138

INDIANA
APPENDIX A-IV
Derivation of Industry Group Differentials
Industry group differentials are used to more equitably distribute the overall rate level change based on the individual experience of each industry group. The payroll, losses and claim counts used in the calculations below are from NCCI’s Workers Compensation Statistical Plan (WCSP) data.
I. Expected Losses
The current expected losses (columns (1) and (2)) are the payroll extended by the pure premiums underlying the latest approved rates. The proposed expected losses (3) are the current expected losses adjusted to the proposed level. These adjustments include the proposed experience, trend, benefit and, if applicable, loss-based expense changes as well as any miscellaneous premium adjustments.
Industry Group
(1) Latest Year
Current Expected Losses Prior to Adjustment for
Change in Off-Balance
(2) Five Year
Current Expected Losses Prior to Adjustment for
Change in Off-Balance
(3) Five Year
Proposed Expected Losses Prior to Adjustment for
Change in Off-Balance
(4)
Current Ratio of
Manual to Standard Premium
(5)
Proposed Ratio of
Manual to Standard Premium
Manufacturing 216,587,660 978,781,066 862,403,338 1.100 1.112
Contracting 124,428,976 585,359,292 515,547,899 1.136 1.137
Office & Clerical 79,550,026 368,399,188 324,650,858 1.082 1.098
Goods & Services 251,491,972 1,155,539,110 1,018,245,188 1.016 1.034
Miscellaneous 139,610,548 651,659,339 573,835,230 1.047 1.056
Statewide 811,669,180 3,739,737,995 3,294,682,513
Industry Group
(6) Latest Year
Current Expected Losses Adjusted
for Change in Off-Balance (1)x(4)/(5)
(7) Five Year
Current Expected Losses Adjusted
for Change in Off-Balance (2)x(4)/(5)
(8) Five Year
Proposed Expected Losses Adjusted
for Change in Off-Balance (3)x(4)/(5)
(9)
Current/ Proposed
(7)/(8)
(10)
Adjustment to Proposed for
Current Relativity
(9)IG/(9)SW
Manufacturing 214,250,383 968,218,680 853,096,827 1.135 1.000
Contracting 124,319,540 584,844,464 515,094,471 1.135 1.000
Office & Clerical 78,390,827 363,030,894 319,920,062 1.135 1.000
Goods & Services 247,113,968 1,135,423,342 1,000,519,450 1.135 1.000
Miscellaneous 138,420,685 646,105,425 568,944,588 1.136 1.001
Statewide 802,495,403 3,697,622,805 3,257,575,398 1.135
© Copyright 2017 National Council on Compensation Insurance, Inc. All Rights Reserved.
Page 101 of 138
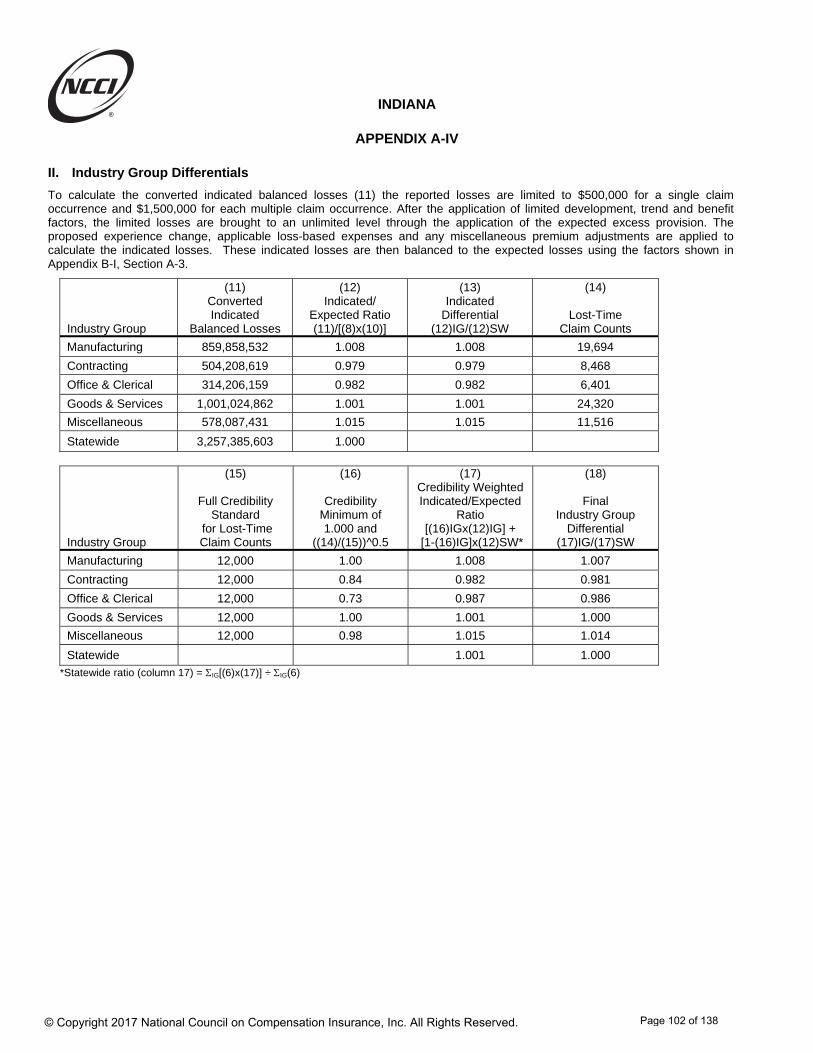
INDIANA
APPENDIX A-IV
II. Industry Group Differentials
To calculate the converted indicated balanced losses (11) the reported losses are limited to $500,000 for a single claim occurrence and $1,500,000 for each multiple claim occurrence. After the application of limited development, trend and benefit factors, the limited losses are brought to an unlimited level through the application of the expected excess provision. The proposed experience change, applicable loss-based expenses and any miscellaneous premium adjustments are applied to calculate the indicated losses. These indicated losses are then balanced to the expected losses using the factors shown in Appendix B-I, Section A-3.
Industry Group
(11) Converted Indicated
Balanced Losses
(12) Indicated/
Expected Ratio (11)/[(8)x(10)]
(13) Indicated
Differential (12)IG/(12)SW
(14)
Lost-Time Claim Counts
Manufacturing 859,858,532 1.008 1.008 19,694
Contracting 504,208,619 0.979 0.979 8,468
Office & Clerical 314,206,159 0.982 0.982 6,401
Goods & Services 1,001,024,862 1.001 1.001 24,320
Miscellaneous 578,087,431 1.015 1.015 11,516
Statewide 3,257,385,603 1.000
Industry Group
(15)
Full Credibility Standard
for Lost-Time Claim Counts
(16)
Credibility Minimum of 1.000 and
((14)/(15))^0.5
(17) Credibility Weighted Indicated/Expected
Ratio [(16)IGx(12)IG] +
[1-(16)IG]x(12)SW*
(18)
Final Industry Group
Differential (17)IG/(17)SW
Manufacturing 12,000 1.00 1.008 1.007
Contracting 12,000 0.84 0.982 0.981
Office & Clerical 12,000 0.73 0.987 0.986
Goods & Services 12,000 1.00 1.001 1.000
Miscellaneous 12,000 0.98 1.015 1.014
Statewide 1.001 1.000
*Statewide ratio (column 17) = IG[(6)x(17)] ÷ IG(6)
© Copyright 2017 National Council on Compensation Insurance, Inc. All Rights Reserved.
Page 102 of 138

Indiana
Advisory Loss Costs, Advisory Rates, and Assigned Risk Rates Filing – January 1, 2018
Appendix B – Calculations Underlying the
Rate Change by Classification
NCCI separately determines advisory rates for each workers compensation classification. The proposed change from the current advisory rate will vary depending on the classification. The following are the general steps utilized to determine the individual classification rates:
1. Calculate industry group differentials, which are used to more equitably distribute the proposed overall average advisory rate level change based on the individual experience of each industry group
2. For each classification, determine the indicated pure premiums based on the most recently-available five policy periods of Indiana payroll and loss experience
3. Indicated pure premiums are credibility-weighted with present on rate level pure premiums and national pure premiums to generate derived by formula pure premiums
4. Final adjustments include the application of a test correction factor, the ratio of manual-to-standard premium, and swing limits.
© Copyright 2017 National Council on Compensation Insurance, Inc. All Rights Reserved.
Page 103 of 138
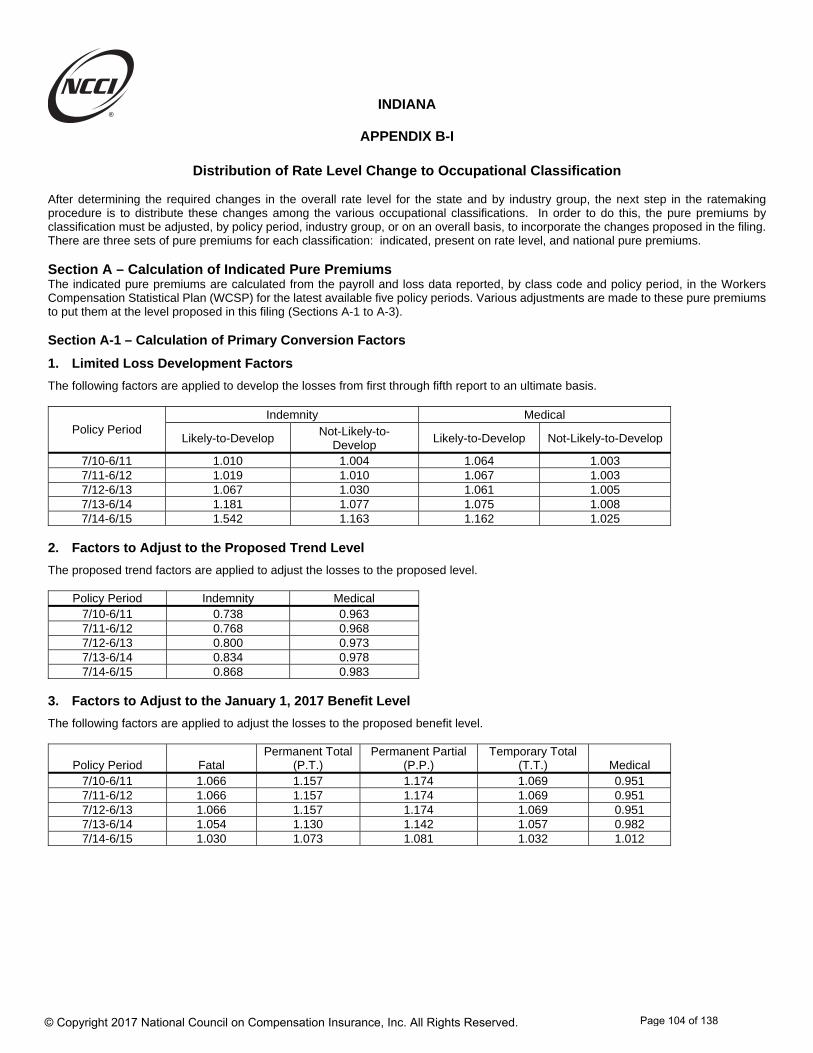
INDIANA
APPENDIX B-I
Distribution of Rate Level Change to Occupational Classification After determining the required changes in the overall rate level for the state and by industry group, the next step in the ratemaking procedure is to distribute these changes among the various occupational classifications. In order to do this, the pure premiums by classification must be adjusted, by policy period, industry group, or on an overall basis, to incorporate the changes proposed in the filing. There are three sets of pure premiums for each classification: indicated, present on rate level, and national pure premiums. Section A – Calculation of Indicated Pure Premiums The indicated pure premiums are calculated from the payroll and loss data reported, by class code and policy period, in the Workers Compensation Statistical Plan (WCSP) for the latest available five policy periods. Various adjustments are made to these pure premiums to put them at the level proposed in this filing (Sections A-1 to A-3). Section A-1 – Calculation of Primary Conversion Factors
1. Limited Loss Development Factors
The following factors are applied to develop the losses from first through fifth report to an ultimate basis.
Policy Period Indemnity Medical
Likely-to-Develop Not-Likely-to-
DevelopLikely-to-Develop Not-Likely-to-Develop
7/10-6/11 1.010 1.004 1.064 1.003 7/11-6/12 1.019 1.010 1.067 1.003 7/12-6/13 1.067 1.030 1.061 1.005 7/13-6/14 1.181 1.077 1.075 1.008 7/14-6/15 1.542 1.163 1.162 1.025
2. Factors to Adjust to the Proposed Trend Level
The proposed trend factors are applied to adjust the losses to the proposed level.
Policy Period Indemnity Medical7/10-6/11 0.738 0.963 7/11-6/12 0.768 0.968 7/12-6/13 0.800 0.973 7/13-6/14 0.834 0.9787/14-6/15 0.868 0.983
3. Factors to Adjust to the January 1, 2017 Benefit Level
The following factors are applied to adjust the losses to the proposed benefit level.
Policy Period Fatal Permanent Total
(P.T.) Permanent Partial
(P.P.) Temporary Total
(T.T.) Medical 7/10-6/11 1.066 1.157 1.174 1.069 0.951 7/11-6/12 1.066 1.157 1.174 1.069 0.951 7/12-6/13 1.066 1.157 1.174 1.069 0.951 7/13-6/14 1.054 1.130 1.142 1.057 0.982 7/14-6/15 1.030 1.073 1.081 1.032 1.012
© Copyright 2017 National Council on Compensation Insurance, Inc. All Rights Reserved.
Page 104 of 138

INDIANA
APPENDIX B-I
4. Primary Conversion Factors: Indicated Pure Premiums
The factors above, contained within Section A-1, are combined multiplicatively, resulting in the following factors for the Likely-to-Develop (L) and Not-Likely-to-Develop (NL) groupings.
Policy Period Fatal (L) Fatal (NL)
P.T.* P.P. (L) P.P. (NL) T.T. (L) T.T. (NL) Medical (L) Medical
(NL) 7/10-6/11 0.795 0.790 0.862 0.875 0.870 0.797 0.792 0.974 0.9197/11-6/12 0.834 0.827 0.905 0.919 0.911 0.837 0.829 0.982 0.9237/12-6/13 0.910 0.878 0.988 1.002 0.967 0.912 0.881 0.982 0.930 7/13-6/14 1.038 0.947 1.113 1.125 1.026 1.041 0.949 1.032 0.968 7/14-6/15 1.379 1.040 1.436 1.447 1.091 1.381 1.042 1.156 1.020
* Permanent total losses are always assigned to the Likely-to-Develop grouping. Section A-2 – Expected Excess Provision and Redistribution
After the application of the primary conversion factors, the limited losses are brought to an expected unlimited level through the application of excess loss factors by hazard group. These factors are shown below.
Hazard Group
A B C D E F G
(1) Excess Ratios
0.046 0.065 0.075 0.092 0.116 0.141 0.173
(2) Excess Factors 1/(1-(1))
1.048 1.070 1.081 1.101 1.131 1.164 1.209
As the excess loss factors are on a combined (indemnity and medical) basis, a portion (40%) of the indemnity expected excess losses are redistributed to medical in order to more accurately allocate expected excess losses. Since a portion of the expected excess losses are redistributed in an additive manner, the expected excess factors shown above cannot be combined multiplicatively with either the primary or secondary loss conversion factors.
© Copyright 2017 National Council on Compensation Insurance, Inc. All Rights Reserved.
Page 105 of 138

INDIANA
APPENDIX B-I
Section A-3 – Calculation of Secondary Conversion Factors
1. Factors to Adjust for Proposed Industry Group Differentials
The following factors are applied to adjust the indicated industry group differentials for the effects of credibility weighting the industry group differentials and weighting the differentials by the latest year expected losses.
Manufacturing Contracting
Office and Clerical
Goods and Services Miscellaneous
(1) Indicated Differentials* 1.008 0.979 0.982 1.001 1.015
(2) Final Differentials** 1.007 0.981 0.986 1.000 1.014
(3) Adjustment (2)/(1) 0.999 1.002 1.004 0.999 0.999 *See Appendix A-IV, column (13). **See Appendix A-IV, column (18). 2. Factors to Balance Indicated to Expected Losses
The expected losses are calculated as the pure premium underlying the current rates, adjusted to the proposed level and adjusted for the Experience Rating Plan off-balance. The indicated losses are balanced to the expected losses by applying the following factors.
Policy Period
(1) Adjustment of
Indicated Losses to Pure Premium
at Proposed Level
(2) Current Ratio of
Manual to Standard Premium
(3) Proposed Ratio of
Manual to Standard Premium
(4)
Off-balance Adjustment
(2)/(3)
(5) Balancing
Indicated to Expected Losses
(1)x(4) 7/10-6/11 0.970 1.069 1.056 1.012 0.982 7/11-6/12 0.972 1.069 1.062 1.007 0.979 7/12-6/13 0.948 1.068 1.080 0.989 0.938 7/13-6/14 0.979 1.069 1.097 0.974 0.954 7/14-6/15 1.086 1.069 1.108 0.965 1.048
3. Adjustment for Experience Change
A factor of 0.890 is applied to adjust for the experience change in the proposed rate level. 4. Factor to Reflect the Proposed Loss-Based Expense Provisions
A factor of 1.166 is applied to include the proposed loss-based expense provisions. 5. Secondary Conversion Factors: Indicated Pure Premiums
The factors above, contained within section A-3, are combined multiplicatively, resulting in the following factors:
Policy Period Manufacturing Contracting Office and Clerical Goods and Services Miscellaneous
7/10-6/11 1.018 1.021 1.023 1.018 1.018 7/11-6/12 1.015 1.018 1.020 1.015 1.015 7/12-6/13 0.972 0.975 0.977 0.972 0.972 7/13-6/14 0.989 0.992 0.994 0.989 0.9897/14-6/15 1.086 1.090 1.092 1.086 1.086
© Copyright 2017 National Council on Compensation Insurance, Inc. All Rights Reserved.
Page 106 of 138
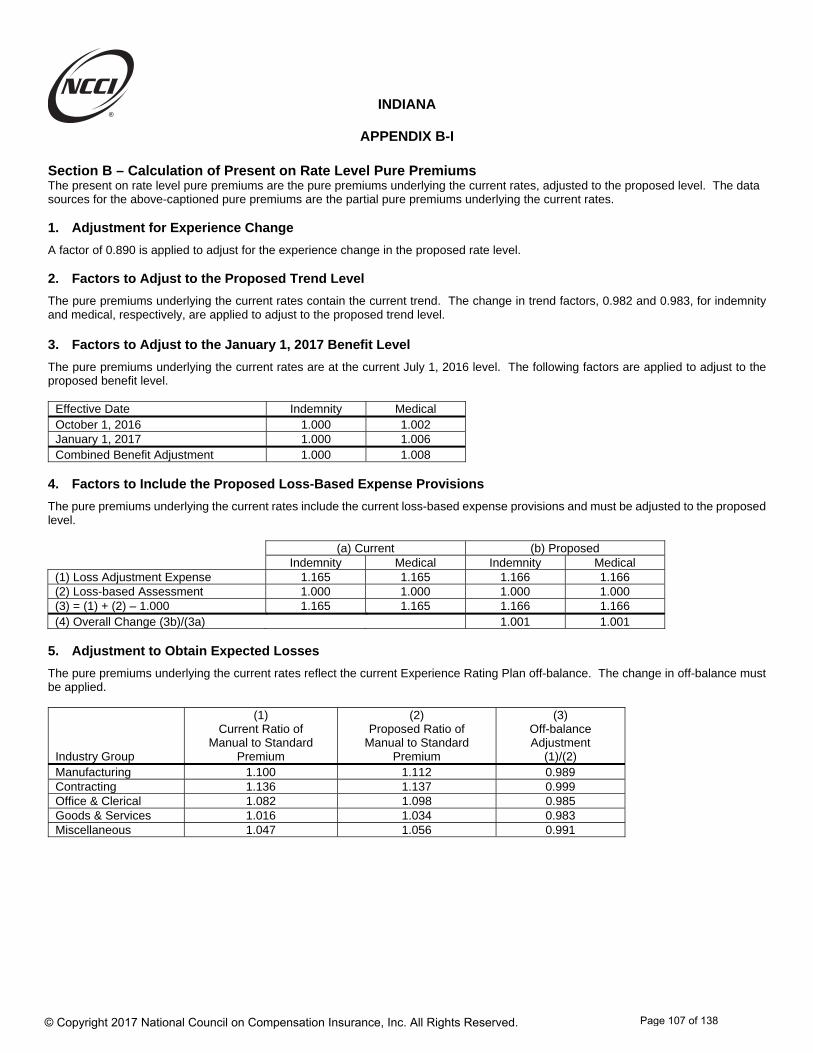
INDIANA
APPENDIX B-I
Section B – Calculation of Present on Rate Level Pure Premiums The present on rate level pure premiums are the pure premiums underlying the current rates, adjusted to the proposed level. The data sources for the above-captioned pure premiums are the partial pure premiums underlying the current rates. 1. Adjustment for Experience Change
A factor of 0.890 is applied to adjust for the experience change in the proposed rate level. 2. Factors to Adjust to the Proposed Trend Level
The pure premiums underlying the current rates contain the current trend. The change in trend factors, 0.982 and 0.983, for indemnity and medical, respectively, are applied to adjust to the proposed trend level. 3. Factors to Adjust to the January 1, 2017 Benefit Level
The pure premiums underlying the current rates are at the current July 1, 2016 level. The following factors are applied to adjust to the proposed benefit level.
Effective Date Indemnity Medical October 1, 2016 1.000 1.002January 1, 2017 1.000 1.006Combined Benefit Adjustment 1.000 1.008
4. Factors to Include the Proposed Loss-Based Expense Provisions
The pure premiums underlying the current rates include the current loss-based expense provisions and must be adjusted to the proposed level.
(a) Current (b) Proposed Indemnity Medical Indemnity Medical
(1) Loss Adjustment Expense 1.165 1.165 1.166 1.166 (2) Loss-based Assessment 1.000 1.000 1.000 1.000 (3) = (1) + (2) – 1.000 1.165 1.165 1.166 1.166 (4) Overall Change (3b)/(3a) 1.001 1.001
5. Adjustment to Obtain Expected Losses
The pure premiums underlying the current rates reflect the current Experience Rating Plan off-balance. The change in off-balance must be applied.
Industry Group
(1) Current Ratio of
Manual to Standard Premium
(2) Proposed Ratio of
Manual to Standard Premium
(3) Off-balance Adjustment
(1)/(2) Manufacturing 1.100 1.112 0.989 Contracting 1.136 1.137 0.999 Office & Clerical 1.082 1.098 0.985 Goods & Services 1.016 1.034 0.983 Miscellaneous 1.047 1.056 0.991
© Copyright 2017 National Council on Compensation Insurance, Inc. All Rights Reserved.
Page 107 of 138
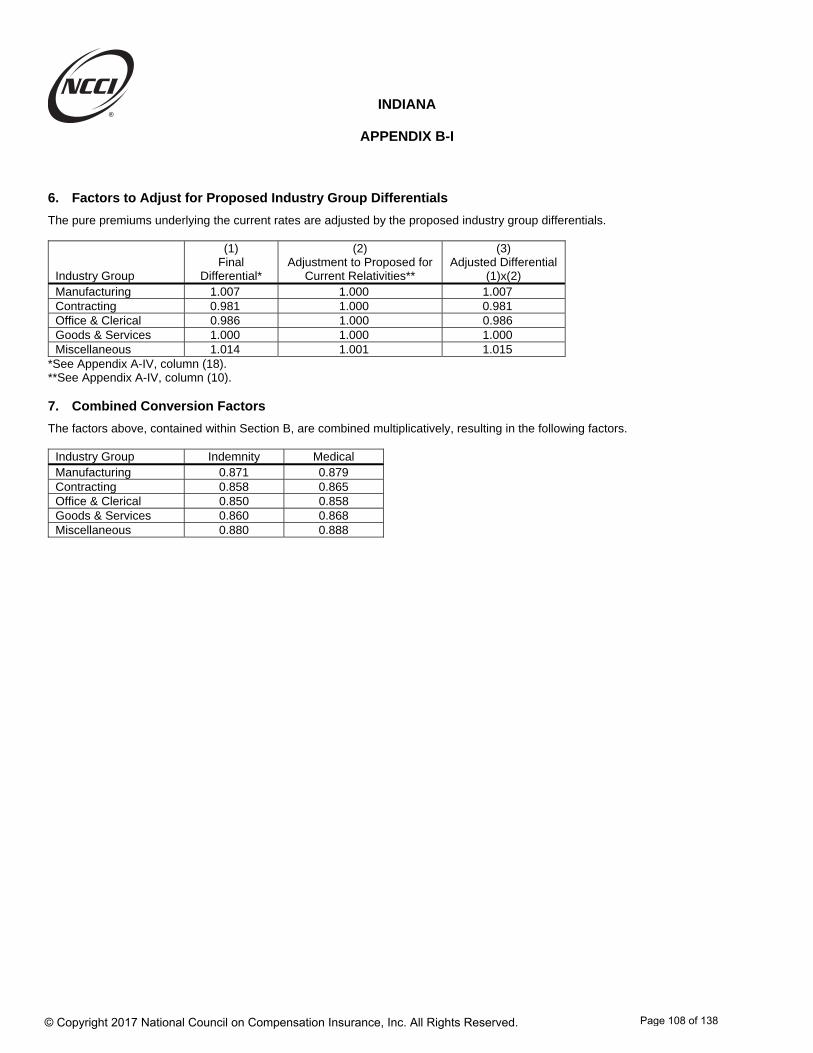
INDIANA
APPENDIX B-I
6. Factors to Adjust for Proposed Industry Group Differentials
The pure premiums underlying the current rates are adjusted by the proposed industry group differentials.
Industry Group
(1) Final
Differential*
(2) Adjustment to Proposed for
Current Relativities**
(3) Adjusted Differential
(1)x(2) Manufacturing 1.007 1.000 1.007Contracting 0.981 1.000 0.981Office & Clerical 0.986 1.000 0.986 Goods & Services 1.000 1.000 1.000 Miscellaneous 1.014 1.001 1.015
*See Appendix A-IV, column (18). **See Appendix A-IV, column (10). 7. Combined Conversion Factors
The factors above, contained within Section B, are combined multiplicatively, resulting in the following factors.
Industry Group Indemnity Medical Manufacturing 0.871 0.879Contracting 0.858 0.865Office & Clerical 0.850 0.858 Goods & Services 0.860 0.868 Miscellaneous 0.880 0.888
© Copyright 2017 National Council on Compensation Insurance, Inc. All Rights Reserved.
Page 108 of 138
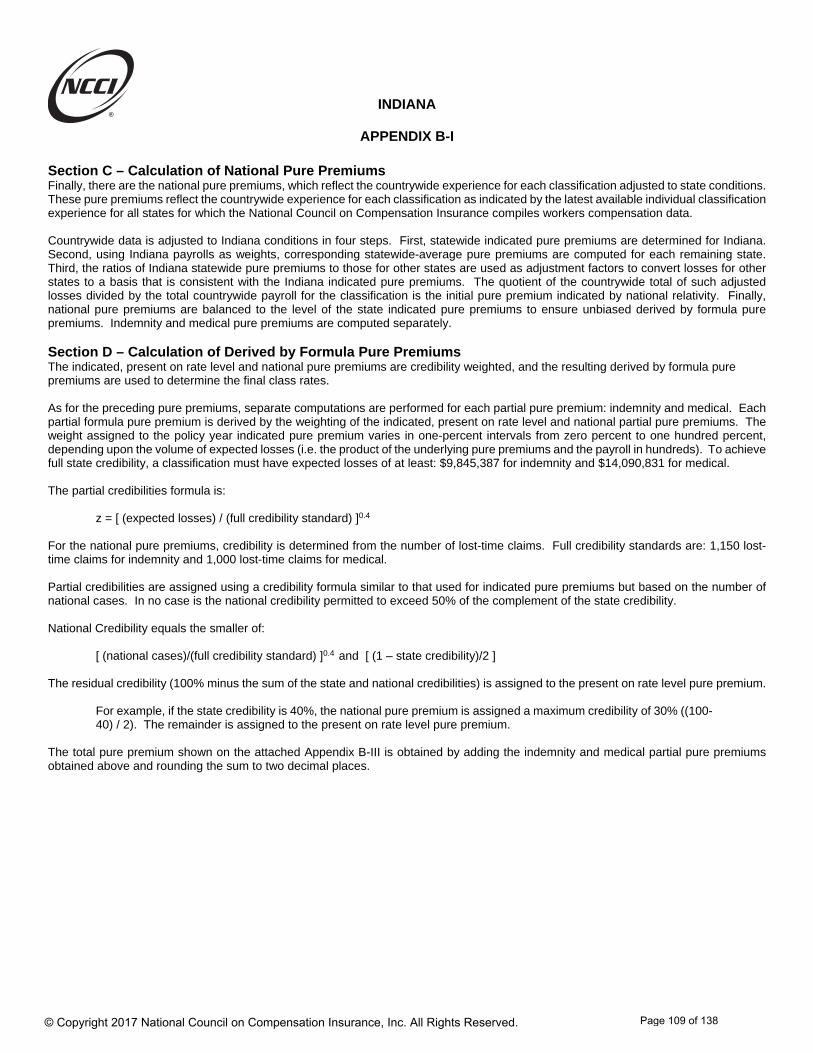
INDIANA
APPENDIX B-I
Section C – Calculation of National Pure Premiums Finally, there are the national pure premiums, which reflect the countrywide experience for each classification adjusted to state conditions. These pure premiums reflect the countrywide experience for each classification as indicated by the latest available individual classification experience for all states for which the National Council on Compensation Insurance compiles workers compensation data. Countrywide data is adjusted to Indiana conditions in four steps. First, statewide indicated pure premiums are determined for Indiana. Second, using Indiana payrolls as weights, corresponding statewide-average pure premiums are computed for each remaining state. Third, the ratios of Indiana statewide pure premiums to those for other states are used as adjustment factors to convert losses for other states to a basis that is consistent with the Indiana indicated pure premiums. The quotient of the countrywide total of such adjusted losses divided by the total countrywide payroll for the classification is the initial pure premium indicated by national relativity. Finally, national pure premiums are balanced to the level of the state indicated pure premiums to ensure unbiased derived by formula pure premiums. Indemnity and medical pure premiums are computed separately. Section D – Calculation of Derived by Formula Pure Premiums The indicated, present on rate level and national pure premiums are credibility weighted, and the resulting derived by formula pure premiums are used to determine the final class rates. As for the preceding pure premiums, separate computations are performed for each partial pure premium: indemnity and medical. Each partial formula pure premium is derived by the weighting of the indicated, present on rate level and national partial pure premiums. The weight assigned to the policy year indicated pure premium varies in one-percent intervals from zero percent to one hundred percent, depending upon the volume of expected losses (i.e. the product of the underlying pure premiums and the payroll in hundreds). To achieve full state credibility, a classification must have expected losses of at least: $9,845,387 for indemnity and $14,090,831 for medical. The partial credibilities formula is: z = [ (expected losses) / (full credibility standard) ]0.4 For the national pure premiums, credibility is determined from the number of lost-time claims. Full credibility standards are: 1,150 lost-time claims for indemnity and 1,000 lost-time claims for medical. Partial credibilities are assigned using a credibility formula similar to that used for indicated pure premiums but based on the number of national cases. In no case is the national credibility permitted to exceed 50% of the complement of the state credibility. National Credibility equals the smaller of:
[ (national cases)/(full credibility standard) ]0.4 and [ (1 – state credibility)/2 ] The residual credibility (100% minus the sum of the state and national credibilities) is assigned to the present on rate level pure premium.
For example, if the state credibility is 40%, the national pure premium is assigned a maximum credibility of 30% ((100-40) / 2). The remainder is assigned to the present on rate level pure premium.
The total pure premium shown on the attached Appendix B-III is obtained by adding the indemnity and medical partial pure premiums obtained above and rounding the sum to two decimal places.
© Copyright 2017 National Council on Compensation Insurance, Inc. All Rights Reserved.
Page 109 of 138
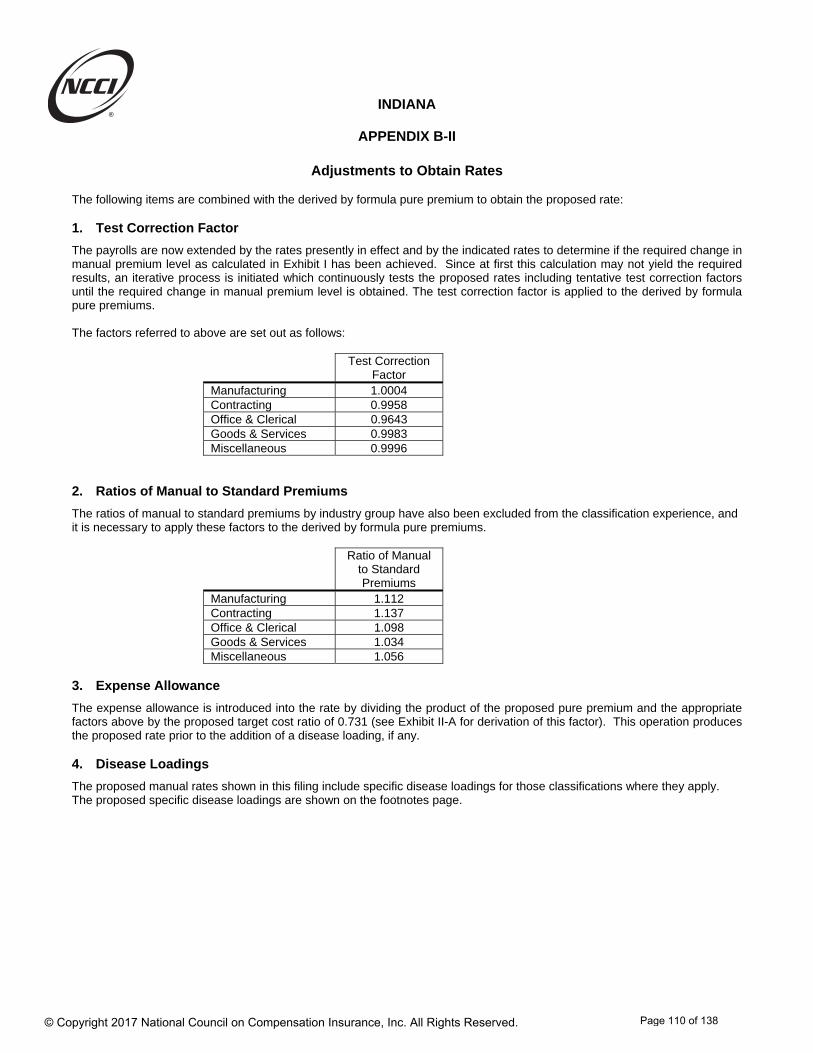
INDIANA
APPENDIX B-II
Adjustments to Obtain Rates
The following items are combined with the derived by formula pure premium to obtain the proposed rate:
1. Test Correction Factor
The payrolls are now extended by the rates presently in effect and by the indicated rates to determine if the required change in manual premium level as calculated in Exhibit I has been achieved. Since at first this calculation may not yield the required results, an iterative process is initiated which continuously tests the proposed rates including tentative test correction factors until the required change in manual premium level is obtained. The test correction factor is applied to the derived by formula pure premiums.
The factors referred to above are set out as follows:
Test Correction Factor
Manufacturing 1.0004 Contracting 0.9958 Office & Clerical 0.9643 Goods & Services 0.9983Miscellaneous 0.9996
2. Ratios of Manual to Standard Premiums
The ratios of manual to standard premiums by industry group have also been excluded from the classification experience, and it is necessary to apply these factors to the derived by formula pure premiums.
Ratio of Manual
to Standard Premiums
Manufacturing 1.112 Contracting 1.137 Office & Clerical 1.098 Goods & Services 1.034Miscellaneous 1.056
3. Expense Allowance
The expense allowance is introduced into the rate by dividing the product of the proposed pure premium and the appropriate factors above by the proposed target cost ratio of 0.731 (see Exhibit II-A for derivation of this factor). This operation produces the proposed rate prior to the addition of a disease loading, if any.
4. Disease Loadings
The proposed manual rates shown in this filing include specific disease loadings for those classifications where they apply. The proposed specific disease loadings are shown on the footnotes page.
© Copyright 2017 National Council on Compensation Insurance, Inc. All Rights Reserved.
Page 110 of 138
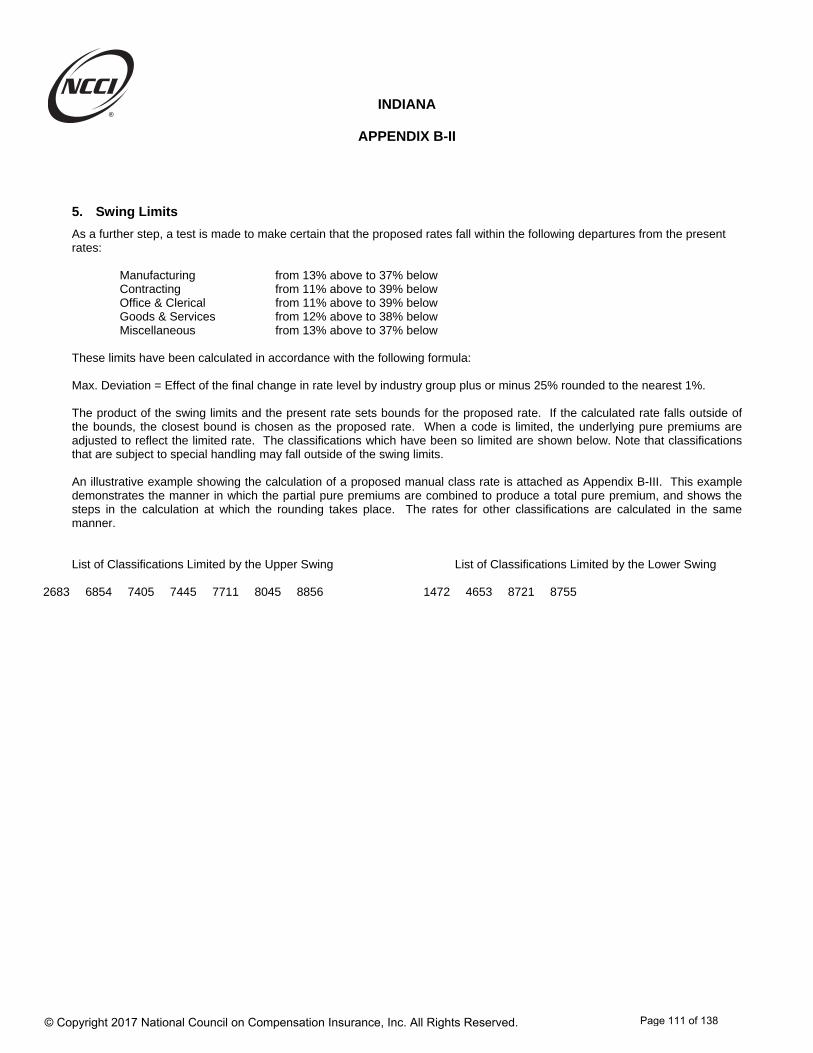
INDIANA
APPENDIX B-II
5. Swing Limits
As a further step, a test is made to make certain that the proposed rates fall within the following departures from the present rates:
Manufacturing from 13% above to 37% belowContracting from 11% above to 39% below Office & Clerical from 11% above to 39% belowGoods & Services from 12% above to 38% below Miscellaneous from 13% above to 37% below
These limits have been calculated in accordance with the following formula: Max. Deviation = Effect of the final change in rate level by industry group plus or minus 25% rounded to the nearest 1%. The product of the swing limits and the present rate sets bounds for the proposed rate. If the calculated rate falls outside of the bounds, the closest bound is chosen as the proposed rate. When a code is limited, the underlying pure premiums are adjusted to reflect the limited rate. The classifications which have been so limited are shown below. Note that classifications that are subject to special handling may fall outside of the swing limits. An illustrative example showing the calculation of a proposed manual class rate is attached as Appendix B-III. This example demonstrates the manner in which the partial pure premiums are combined to produce a total pure premium, and shows the steps in the calculation at which the rounding takes place. The rates for other classifications are calculated in the same manner. List of Classifications Limited by the Upper Swing List of Classifications Limited by the Lower Swing
2683 6854 7405 7445 7711 8045 8856 1472 4653 8721 8755
© Copyright 2017 National Council on Compensation Insurance, Inc. All Rights Reserved.
Page 111 of 138
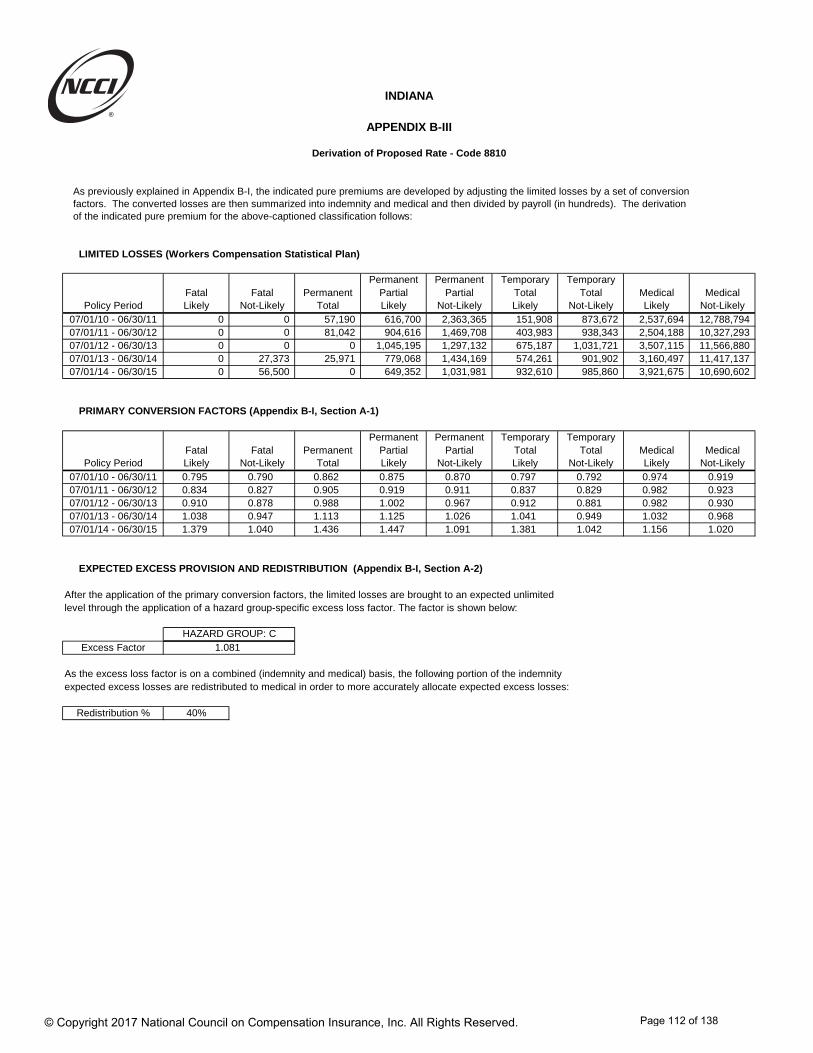
INDIANA
APPENDIX B-III
Derivation of Proposed Rate - Code 8810
As previously explained in Appendix B-I, the indicated pure premiums are developed by adjusting the limited losses by a set of conversionfactors. The converted losses are then summarized into indemnity and medical and then divided by payroll (in hundreds). The derivationof the indicated pure premium for the above-captioned classification follows:
LIMITED LOSSES (Workers Compensation Statistical Plan)
Permanent Permanent Temporary TemporaryFatal Fatal Permanent Partial Partial Total Total Medical Medical
Policy Period Likely Not-Likely Total Likely Not-Likely Likely Not-Likely Likely Not-Likely07/01/10 - 06/30/11 0 0 57,190 616,700 2,363,365 151,908 873,672 2,537,694 12,788,79407/01/11 - 06/30/12 0 0 81,042 904,616 1,469,708 403,983 938,343 2,504,188 10,327,29307/01/12 - 06/30/13 0 0 0 1,045,195 1,297,132 675,187 1,031,721 3,507,115 11,566,88007/01/13 - 06/30/14 0 27,373 25,971 779,068 1,434,169 574,261 901,902 3,160,497 11,417,13707/01/14 - 06/30/15 0 56,500 0 649,352 1,031,981 932,610 985,860 3,921,675 10,690,602
PRIMARY CONVERSION FACTORS (Appendix B-I, Section A-1)
Permanent Permanent Temporary TemporaryFatal Fatal Permanent Partial Partial Total Total Medical Medical
Policy Period Likely Not-Likely Total Likely Not-Likely Likely Not-Likely Likely Not-Likely07/01/10 - 06/30/11 0.795 0.790 0.862 0.875 0.870 0.797 0.792 0.974 0.91907/01/11 - 06/30/12 0.834 0.827 0.905 0.919 0.911 0.837 0.829 0.982 0.92307/01/12 - 06/30/13 0.910 0.878 0.988 1.002 0.967 0.912 0.881 0.982 0.93007/01/13 - 06/30/14 1.038 0.947 1.113 1.125 1.026 1.041 0.949 1.032 0.96807/01/14 - 06/30/15 1.379 1.040 1.436 1.447 1.091 1.381 1.042 1.156 1.020
EXPECTED EXCESS PROVISION AND REDISTRIBUTION (Appendix B-I, Section A-2)
After the application of the primary conversion factors, the limited losses are brought to an expected unlimited level through the application of a hazard group-specific excess loss factor. The factor is shown below:
HAZARD GROUP: CExcess Factor 1.081
As the excess loss factor is on a combined (indemnity and medical) basis, the following portion of the indemnity expected excess losses are redistributed to medical in order to more accurately allocate expected excess losses:
Redistribution % 40%
© Copyright 2017 National Council on Compensation Insurance, Inc. All Rights Reserved.
Page 112 of 138

INDIANA
APPENDIX B-III
Derivation of Proposed Rate - Code 8810
EXPECTED UNLIMITED LOSSES (Limited Losses x Primary Conversion Factors, then adjusted for the Excess Provision and Redistribution)
Permanent Permanent Temporary TemporaryFatal Fatal Permanent Partial Partial Total Total Medical Medical
Policy Period Likely Not-Likely Total Likely Not-Likely Likely Not-Likely Likely Not-Likely07/01/10 - 06/30/11 0 0 51,696 565,864 2,156,156 126,961 725,610 2,695,149 12,794,96707/01/11 - 06/30/12 0 0 76,911 871,786 1,404,040 354,584 815,729 2,698,809 10,373,61607/01/12 - 06/30/13 0 0 0 1,098,234 1,315,348 645,727 953,165 3,777,166 11,699,56307/01/13 - 06/30/14 0 27,183 30,312 919,090 1,543,041 626,889 897,544 3,574,842 12,024,20307/01/14 - 06/30/15 0 61,618 0 985,323 1,180,664 1,350,590 1,077,241 4,973,279 11,860,294
SECONDARY CONVERSION FACTORS (Appendix B-I, Section A-3)
INDUSTRY GROUP:Policy Period Office and Clerical
07/01/10 - 06/30/11 1.02307/01/11 - 06/30/12 1.02007/01/12 - 06/30/13 0.97707/01/13 - 06/30/14 0.99407/01/14 - 06/30/15 1.092
PAYROLL, FINAL CONVERTED LOSSES (Expected Unlimited Losses x Secondary Conversion Factors)
Indemnity Indemnity Medical Medical Total TotalPolicy Period Payroll Likely Not-Likely Likely Not-Likely Indemnity Medical Total
07/01/10 - 06/30/11 22,695,205,795 761,645 2,948,047 2,757,137 13,089,251 3,709,692 15,846,388 19,556,08007/01/11 - 06/30/12 22,607,692,687 1,329,347 2,264,164 2,752,785 10,581,088 3,593,511 13,333,873 16,927,38407/01/12 - 06/30/13 21,491,638,143 1,703,850 2,216,337 3,690,291 11,430,473 3,920,187 15,120,764 19,040,95107/01/13 - 06/30/14 21,996,115,686 1,566,833 2,452,961 3,553,393 11,952,058 4,019,794 15,505,451 19,525,24507/01/14 - 06/30/15 23,062,774,024 2,550,817 2,532,919 5,430,821 12,951,441 5,083,736 18,382,262 23,465,998
Total 111,853,426,335 7,912,492 12,414,428 18,184,427 60,004,311 20,326,920 78,188,738 98,515,658INDICATED PURE PREMIUM 0.018 0.070 0.09
The present on rate level pure premiums are developed by adjusting the pure premiums underlying the current rateby the conversion factors calculated in Appendix B-I. The derivation of the present on rate level pure premiums for theabove-captioned classification follows:
Indemnity Medical TotalPure Premiums Underlying Current Rate 0.022 0.078 0.10Conversion Factors (App. B-I, Section B) 0.850 0.858 xxxPURE PREMIUMS PRESENT ON RATE LEVEL(Underlying Pure Premiums) x (Conversion Factor) 0.019 0.067 0.09
© Copyright 2017 National Council on Compensation Insurance, Inc. All Rights Reserved.
Page 113 of 138
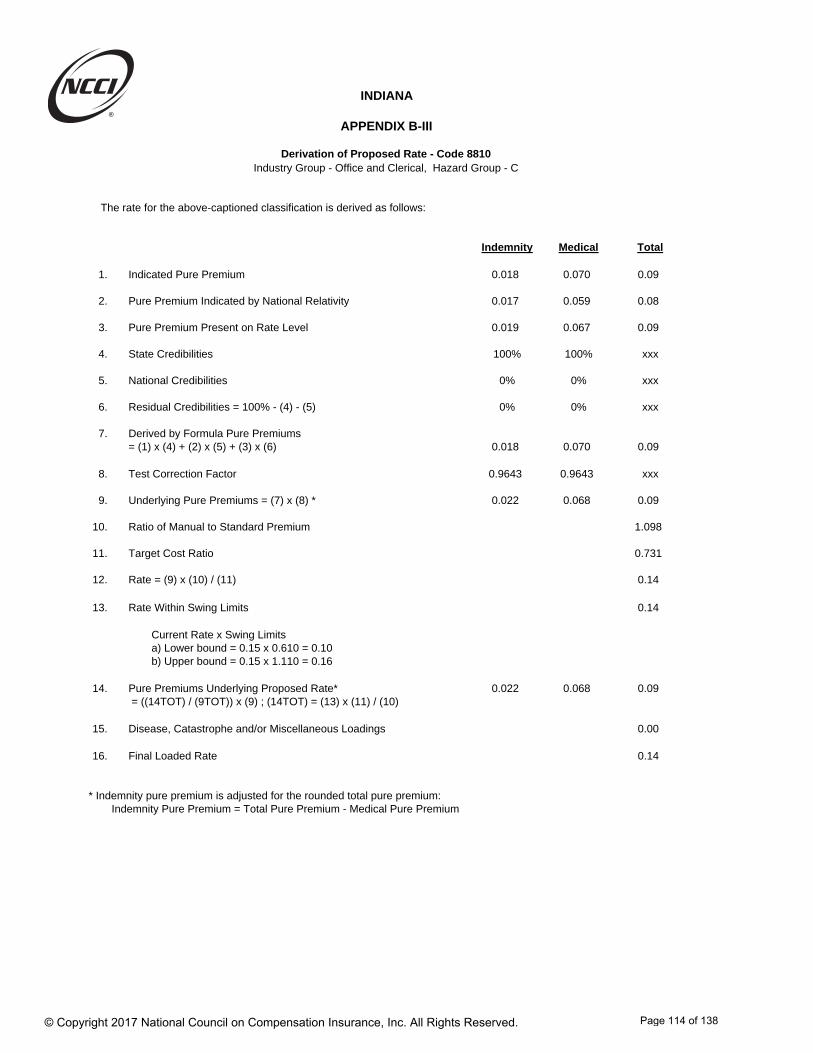
INDIANA
APPENDIX B-III
Derivation of Proposed Rate - Code 8810Industry Group - Office and Clerical, Hazard Group - C
The rate for the above-captioned classification is derived as follows:
Indemnity Medical Total
1. Indicated Pure Premium 0.018 0.070 0.09
2. Pure Premium Indicated by National Relativity 0.017 0.059 0.08
3. Pure Premium Present on Rate Level 0.019 0.067 0.09
4. State Credibilities 100% 100% xxx
5. National Credibilities 0% 0% xxx
6. Residual Credibilities = 100% - (4) - (5) 0% 0% xxx
7. Derived by Formula Pure Premiums= (1) x (4) + (2) x (5) + (3) x (6) 0.018 0.070 0.09
8. Test Correction Factor 0.9643 0.9643 xxx
9. Underlying Pure Premiums = (7) x (8) * 0.022 0.068 0.09
10. Ratio of Manual to Standard Premium 1.098
11. Target Cost Ratio 0.731
12. Rate = (9) x (10) / (11) 0.14
13. Rate Within Swing Limits 0.14
Current Rate x Swing Limitsa) Lower bound = 0.15 x 0.610 = 0.10b) Upper bound = 0.15 x 1.110 = 0.16
14. Pure Premiums Underlying Proposed Rate* 0.022 0.068 0.09 = ((14TOT) / (9TOT)) x (9) ; (14TOT) = (13) x (11) / (10)
15. Disease, Catastrophe and/or Miscellaneous Loadings 0.00
16. Final Loaded Rate 0.14
* Indemnity pure premium is adjusted for the rounded total pure premium:Indemnity Pure Premium = Total Pure Premium - Medical Pure Premium
© Copyright 2017 National Council on Compensation Insurance, Inc. All Rights Reserved.
Page 114 of 138
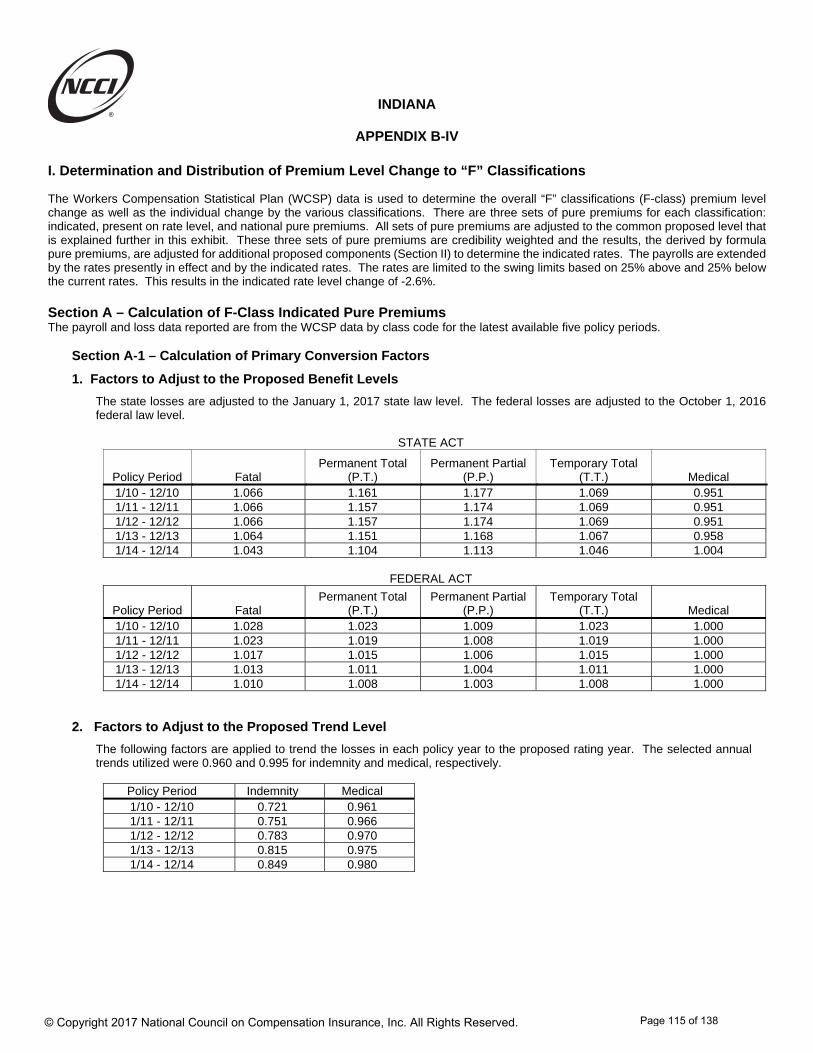
INDIANA
APPENDIX B-IV
I. Determination and Distribution of Premium Level Change to “F” Classifications
The Workers Compensation Statistical Plan (WCSP) data is used to determine the overall “F” classifications (F-class) premium level change as well as the individual change by the various classifications. There are three sets of pure premiums for each classification: indicated, present on rate level, and national pure premiums. All sets of pure premiums are adjusted to the common proposed level that is explained further in this exhibit. These three sets of pure premiums are credibility weighted and the results, the derived by formula pure premiums, are adjusted for additional proposed components (Section II) to determine the indicated rates. The payrolls are extended by the rates presently in effect and by the indicated rates. The rates are limited to the swing limits based on 25% above and 25% below the current rates. This results in the indicated rate level change of -2.6%. Section A – Calculation of F-Class Indicated Pure Premiums The payroll and loss data reported are from the WCSP data by class code for the latest available five policy periods.
Section A-1 – Calculation of Primary Conversion Factors
1. Factors to Adjust to the Proposed Benefit Levels
The state losses are adjusted to the January 1, 2017 state law level. The federal losses are adjusted to the October 1, 2016 federal law level.
STATE ACT
Policy Period Fatal Permanent Total
(P.T.)Permanent Partial
(P.P.)Temporary Total
(T.T.) Medical1/10 - 12/10 1.066 1.161 1.177 1.069 0.951 1/11 - 12/11 1.066 1.157 1.174 1.069 0.9511/12 - 12/12 1.066 1.157 1.174 1.069 0.9511/13 - 12/13 1.064 1.151 1.168 1.067 0.9581/14 - 12/14 1.043 1.104 1.113 1.046 1.004
FEDERAL ACT
Policy Period Fatal Permanent Total
(P.T.) Permanent Partial
(P.P.) Temporary Total
(T.T.) Medical 1/10 - 12/10 1.028 1.023 1.009 1.023 1.0001/11 - 12/11 1.023 1.019 1.008 1.019 1.0001/12 - 12/12 1.017 1.015 1.006 1.015 1.000 1/13 - 12/13 1.013 1.011 1.004 1.011 1.000 1/14 - 12/14 1.010 1.008 1.003 1.008 1.000
2. Factors to Adjust to the Proposed Trend Level
The following factors are applied to trend the losses in each policy year to the proposed rating year. The selected annual trends utilized were 0.960 and 0.995 for indemnity and medical, respectively.
Policy Period Indemnity Medical 1/10 - 12/10 0.721 0.9611/11 - 12/11 0.751 0.9661/12 - 12/12 0.783 0.970 1/13 - 12/13 0.815 0.975 1/14 - 12/14 0.849 0.980
© Copyright 2017 National Council on Compensation Insurance, Inc. All Rights Reserved.
Page 115 of 138
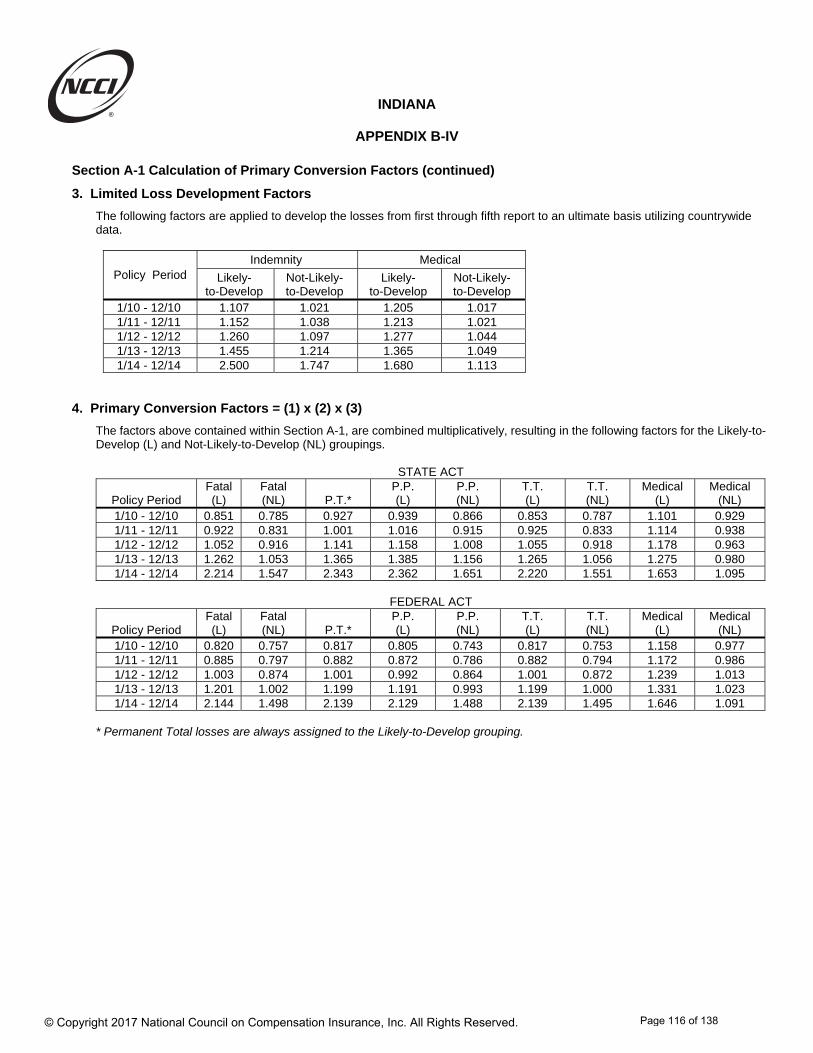
INDIANA
APPENDIX B-IV
Section A-1 Calculation of Primary Conversion Factors (continued)
3. Limited Loss Development Factors
The following factors are applied to develop the losses from first through fifth report to an ultimate basis utilizing countrywide data.
Policy Period Indemnity Medical
Likely- to-Develop
Not-Likely-to-Develop
Likely- to-Develop
Not-Likely-to-Develop
1/10 - 12/10 1.107 1.021 1.205 1.0171/11 - 12/11 1.152 1.038 1.213 1.0211/12 - 12/12 1.260 1.097 1.277 1.044 1/13 - 12/13 1.455 1.214 1.365 1.049 1/14 - 12/14 2.500 1.747 1.680 1.113
4. Primary Conversion Factors = (1) x (2) x (3)
The factors above contained within Section A-1, are combined multiplicatively, resulting in the following factors for the Likely-to-Develop (L) and Not-Likely-to-Develop (NL) groupings.
STATE ACT
Policy Period Fatal (L)
Fatal (NL) P.T.*
P.P. (L)
P.P. (NL)
T.T. (L)
T.T. (NL)
Medical (L)
Medical (NL)
1/10 - 12/10 0.851 0.785 0.927 0.939 0.866 0.853 0.787 1.101 0.9291/11 - 12/11 0.922 0.831 1.001 1.016 0.915 0.925 0.833 1.114 0.9381/12 - 12/12 1.052 0.916 1.141 1.158 1.008 1.055 0.918 1.178 0.963 1/13 - 12/13 1.262 1.053 1.365 1.385 1.156 1.265 1.056 1.275 0.980 1/14 - 12/14 2.214 1.547 2.343 2.362 1.651 2.220 1.551 1.653 1.095
FEDERAL ACT
Policy Period Fatal (L)
Fatal (NL) P.T.*
P.P. (L)
P.P. (NL)
T.T. (L)
T.T. (NL)
Medical (L)
Medical (NL)
1/10 - 12/10 0.820 0.757 0.817 0.805 0.743 0.817 0.753 1.158 0.977 1/11 - 12/11 0.885 0.797 0.882 0.872 0.786 0.882 0.794 1.172 0.9861/12 - 12/12 1.003 0.874 1.001 0.992 0.864 1.001 0.872 1.239 1.0131/13 - 12/13 1.201 1.002 1.199 1.191 0.993 1.199 1.000 1.331 1.0231/14 - 12/14 2.144 1.498 2.139 2.129 1.488 2.139 1.495 1.646 1.091
* Permanent Total losses are always assigned to the Likely-to-Develop grouping.
© Copyright 2017 National Council on Compensation Insurance, Inc. All Rights Reserved.
Page 116 of 138
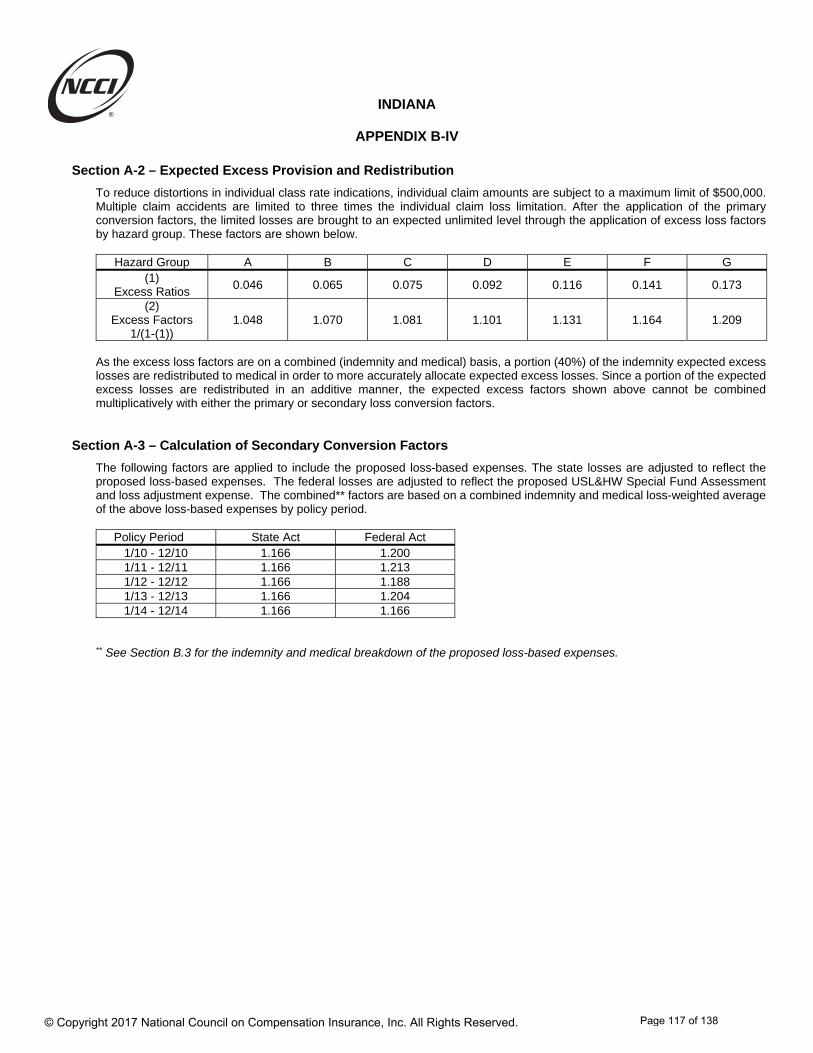
INDIANA
APPENDIX B-IV
Section A-2 – Expected Excess Provision and Redistribution
To reduce distortions in individual class rate indications, individual claim amounts are subject to a maximum limit of $500,000. Multiple claim accidents are limited to three times the individual claim loss limitation. After the application of the primary conversion factors, the limited losses are brought to an expected unlimited level through the application of excess loss factors by hazard group. These factors are shown below.
Hazard Group A B C D E F G(1)
Excess Ratios 0.046 0.065 0.075 0.092 0.116 0.141 0.173
(2) Excess Factors
1/(1-(1)) 1.048 1.070 1.081 1.101 1.131 1.164 1.209
As the excess loss factors are on a combined (indemnity and medical) basis, a portion (40%) of the indemnity expected excess losses are redistributed to medical in order to more accurately allocate expected excess losses. Since a portion of the expected excess losses are redistributed in an additive manner, the expected excess factors shown above cannot be combined multiplicatively with either the primary or secondary loss conversion factors.
Section A-3 – Calculation of Secondary Conversion Factors
The following factors are applied to include the proposed loss-based expenses. The state losses are adjusted to reflect the proposed loss-based expenses. The federal losses are adjusted to reflect the proposed USL&HW Special Fund Assessment and loss adjustment expense. The combined** factors are based on a combined indemnity and medical loss-weighted average of the above loss-based expenses by policy period.
Policy Period State Act Federal Act 1/10 - 12/10 1.166 1.2001/11 - 12/11 1.166 1.213 1/12 - 12/12 1.166 1.188 1/13 - 12/13 1.166 1.204 1/14 - 12/14 1.166 1.166
** See Section B.3 for the indemnity and medical breakdown of the proposed loss-based expenses.
© Copyright 2017 National Council on Compensation Insurance, Inc. All Rights Reserved.
Page 117 of 138
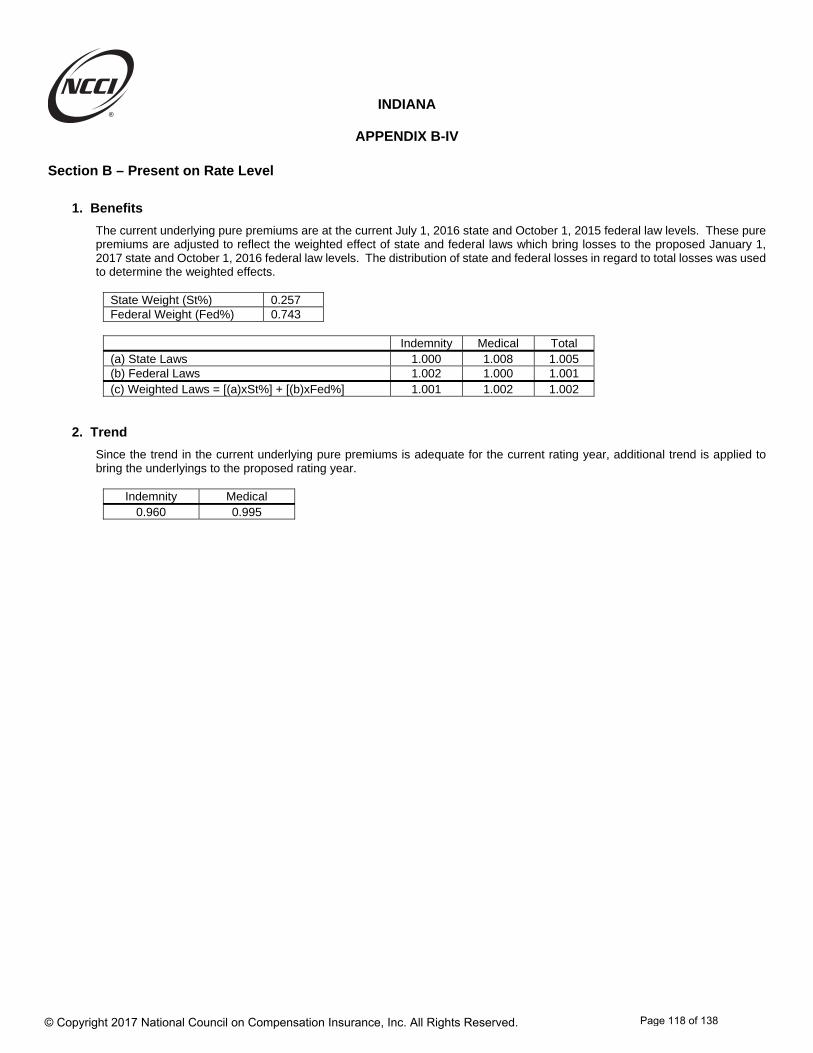
INDIANA
APPENDIX B-IV
Section B – Present on Rate Level
1. Benefits
The current underlying pure premiums are at the current July 1, 2016 state and October 1, 2015 federal law levels. These pure premiums are adjusted to reflect the weighted effect of state and federal laws which bring losses to the proposed January 1, 2017 state and October 1, 2016 federal law levels. The distribution of state and federal losses in regard to total losses was used to determine the weighted effects.
State Weight (St%) 0.257 Federal Weight (Fed%) 0.743
Indemnity Medical Total (a) State Laws 1.000 1.008 1.005 (b) Federal Laws 1.002 1.000 1.001 (c) Weighted Laws = [(a)xSt%] + [(b)xFed%] 1.001 1.002 1.002
2. Trend
Since the trend in the current underlying pure premiums is adequate for the current rating year, additional trend is applied to bring the underlyings to the proposed rating year.
Indemnity Medical
0.960 0.995
© Copyright 2017 National Council on Compensation Insurance, Inc. All Rights Reserved.
Page 118 of 138

INDIANA
APPENDIX B-IV
Section B – Present on Rate Level (continued)
3. Loss-Based Expenses
The current underlying pure premiums are adjusted to reflect the change in the weighted effect of the loss-based expense provisions.
Proposed:
STATE ACT Indemnity Medical Total (a) Loss Adjustment Expense 1.166 1.166 1.166 (b) Loss-Based Assessment 1.000 1.000 1.000 (c) Total = (a) + (b) - 1 1.166 1.166 1.166
FEDERAL ACT
Indemnity Medical Total (d) Loss Adjustment Expense 1.166 1.166 1.166 (e) Loss-Based Assessment 1.119 1.000 1.071 (f) Total = (d) + (e) - 1 1.285 1.166 1.237
Indemnity Medical Total (g) Weighted Proposed Expenses = [(c) x St%] + [(f) x Fed%]
1.254 1.166 1.219
Current:
STATE ACT Indemnity Medical Total (h) Loss Adjustment Expense 1.165 1.165 1.165 (i) Loss-Based Assessment 1.000 1.000 1.000 (j) Total = (h) + (i) - 1 1.165 1.165 1.165
FEDERAL ACT
Indemnity Medical Total (k) Loss Adjustment Expense 1.165 1.165 1.165 (l) Loss-Based Assessment 1.116 1.000 1.064 (m) Total = (k) + (l) - 1 1.281 1.165 1.229
Indemnity Medical Total (n) Weighted Current Expenses =
[(j) x St%] + [(m) x Fed%] 1.251 1.165 1.213
Change:
Indemnity Medical Total Weighted Expense Change in Loss-Based Expenses = [(g) / (n)]
1.002 1.001 1.005
4. Conversion Factors = (1) x (2) x (3)
The factors have been applied multiplicatively resulting in the following factors.
Indemnity Medical 0.963 0.998
© Copyright 2017 National Council on Compensation Insurance, Inc. All Rights Reserved.
Page 119 of 138
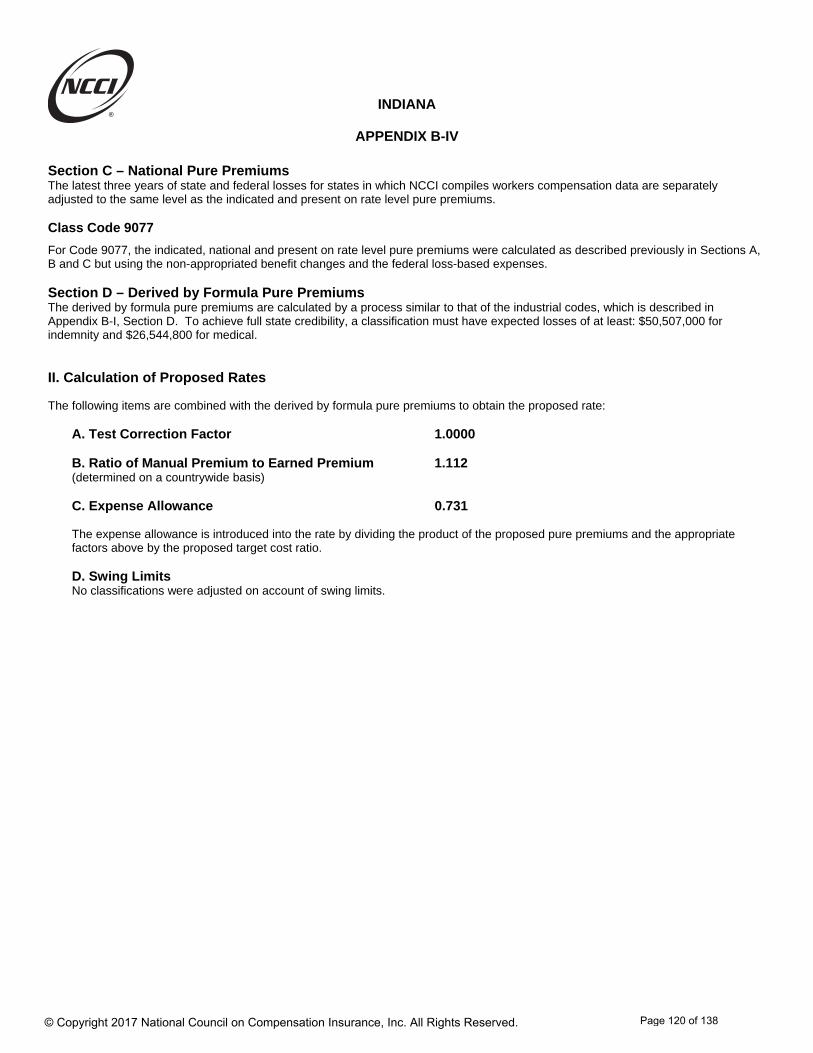
INDIANA
APPENDIX B-IV
Section C – National Pure Premiums The latest three years of state and federal losses for states in which NCCI compiles workers compensation data are separately adjusted to the same level as the indicated and present on rate level pure premiums. Class Code 9077
For Code 9077, the indicated, national and present on rate level pure premiums were calculated as described previously in Sections A, B and C but using the non-appropriated benefit changes and the federal loss-based expenses. Section D – Derived by Formula Pure Premiums The derived by formula pure premiums are calculated by a process similar to that of the industrial codes, which is described in Appendix B-I, Section D. To achieve full state credibility, a classification must have expected losses of at least: $50,507,000 for indemnity and $26,544,800 for medical. II. Calculation of Proposed Rates
The following items are combined with the derived by formula pure premiums to obtain the proposed rate:
A. Test Correction Factor 1.0000
B. Ratio of Manual Premium to Earned Premium 1.112 (determined on a countrywide basis) C. Expense Allowance 0.731 The expense allowance is introduced into the rate by dividing the product of the proposed pure premiums and the appropriate factors above by the proposed target cost ratio. D. Swing Limits No classifications were adjusted on account of swing limits.
© Copyright 2017 National Council on Compensation Insurance, Inc. All Rights Reserved.
Page 120 of 138

INDIANA
APPENDIX B-IV
Derivation of Proposed Rate - Code 7313
The indicated pure premiums are developed by adjusting the limited losses by a set of conversion factors. The converted losses are thensummarized into indemnity and medical and then divided by payroll (in hundreds). The derivation of the indicated pure premium for theabove-captioned classification follows:
STATE ACT - LIMITED LOSSES (Workers Compensation Statistical Plan)
Permanent Permanent Temporary TemporaryFatal Fatal Permanent Partial Partial Total Total Medical Medical
Policy Period Likely Not-Likely Total Likely Not-Likely Likely Not-Likely Likely Not-Likely01/01/10 - 12/31/10 0 0 0 0 0 0 0 0 001/01/11 - 12/31/11 0 0 0 0 0 0 0 0 3,72901/01/12 - 12/31/12 0 0 0 0 0 0 0 0 25701/01/13 - 12/31/13 0 0 0 0 0 0 0 0 13301/01/14 - 12/31/14 0 0 0 0 0 0 0 0 0
FEDERAL ACT - LIMITED LOSSES (Workers Compensation Statistical Plan)
Permanent Permanent Temporary TemporaryFatal Fatal Permanent Partial Partial Total Total Medical Medical
Policy Period Likely Not-Likely Total Likely Not-Likely Likely Not-Likely Likely Not-Likely01/01/10 - 12/31/10 0 0 0 0 0 0 0 0 18,24801/01/11 - 12/31/11 0 0 0 0 0 0 0 0 4,87001/01/12 - 12/31/12 0 0 0 0 0 0 0 0 001/01/13 - 12/31/13 0 0 0 0 0 0 0 0 001/01/14 - 12/31/14 0 0 0 0 0 0 0 0 0
STATE ACT - PRIMARY PARTIAL CONVERSION FACTORS (Appendix B-IV, Section A-1)
Permanent Permanent Temporary TemporaryFatal Fatal Permanent Partial Partial Total Total Medical Medical
Policy Period Likely Not-Likely Total Likely Not-Likely Likely Not-Likely Likely Not-Likely01/01/10 - 12/31/10 0.851 0.785 0.927 0.939 0.866 0.853 0.787 1.101 0.92901/01/11 - 12/31/11 0.922 0.831 1.001 1.016 0.915 0.925 0.833 1.114 0.93801/01/12 - 12/31/12 1.052 0.916 1.141 1.158 1.008 1.055 0.918 1.178 0.96301/01/13 - 12/31/13 1.262 1.053 1.365 1.385 1.156 1.265 1.056 1.275 0.98001/01/14 - 12/31/14 2.214 1.547 2.343 2.362 1.651 2.220 1.551 1.653 1.095
FEDERAL ACT - PRIMARY PARTIAL CONVERSION FACTORS (Appendix B-IV, Section A-1)
Permanent Permanent Temporary TemporaryFatal Fatal Permanent Partial Partial Total Total Medical Medical
Policy Period Likely Not-Likely Total Likely Not-Likely Likely Not-Likely Likely Not-Likely01/01/10 - 12/31/10 0.820 0.757 0.817 0.805 0.743 0.817 0.753 1.158 0.97701/01/11 - 12/31/11 0.885 0.797 0.882 0.872 0.786 0.882 0.794 1.172 0.98601/01/12 - 12/31/12 1.003 0.874 1.001 0.992 0.864 1.001 0.872 1.239 1.01301/01/13 - 12/31/13 1.201 1.002 1.199 1.191 0.993 1.199 1.000 1.331 1.02301/01/14 - 12/31/14 2.144 1.498 2.139 2.129 1.488 2.139 1.495 1.646 1.091
© Copyright 2017 National Council on Compensation Insurance, Inc. All Rights Reserved.
Page 121 of 138
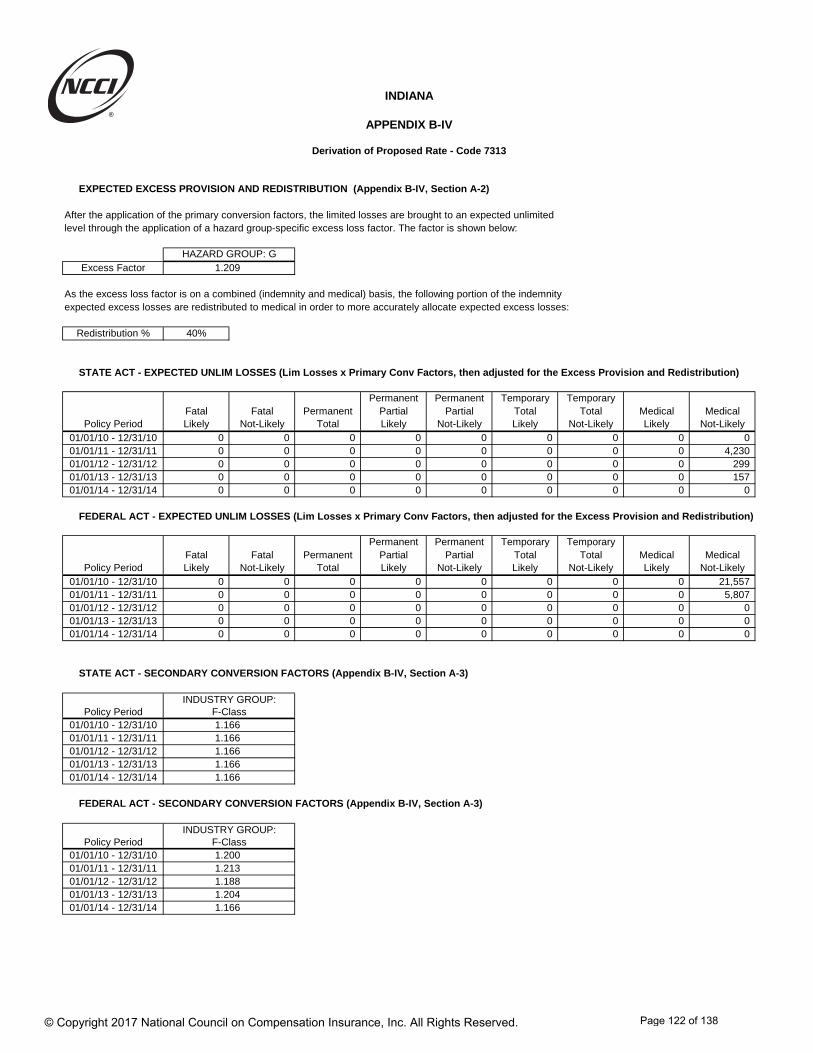
INDIANA
APPENDIX B-IV
Derivation of Proposed Rate - Code 7313
EXPECTED EXCESS PROVISION AND REDISTRIBUTION (Appendix B-IV, Section A-2)
After the application of the primary conversion factors, the limited losses are brought to an expected unlimited level through the application of a hazard group-specific excess loss factor. The factor is shown below:
HAZARD GROUP: GExcess Factor 1.209
As the excess loss factor is on a combined (indemnity and medical) basis, the following portion of the indemnity expected excess losses are redistributed to medical in order to more accurately allocate expected excess losses:
Redistribution % 40%
STATE ACT - EXPECTED UNLIM LOSSES (Lim Losses x Primary Conv Factors, then adjusted for the Excess Provision and Redistribution)
Permanent Permanent Temporary TemporaryFatal Fatal Permanent Partial Partial Total Total Medical Medical
Policy Period Likely Not-Likely Total Likely Not-Likely Likely Not-Likely Likely Not-Likely01/01/10 - 12/31/10 0 0 0 0 0 0 0 0 001/01/11 - 12/31/11 0 0 0 0 0 0 0 0 4,23001/01/12 - 12/31/12 0 0 0 0 0 0 0 0 29901/01/13 - 12/31/13 0 0 0 0 0 0 0 0 15701/01/14 - 12/31/14 0 0 0 0 0 0 0 0 0
FEDERAL ACT - EXPECTED UNLIM LOSSES (Lim Losses x Primary Conv Factors, then adjusted for the Excess Provision and Redistribution)
Permanent Permanent Temporary TemporaryFatal Fatal Permanent Partial Partial Total Total Medical Medical
Policy Period Likely Not-Likely Total Likely Not-Likely Likely Not-Likely Likely Not-Likely01/01/10 - 12/31/10 0 0 0 0 0 0 0 0 21,55701/01/11 - 12/31/11 0 0 0 0 0 0 0 0 5,80701/01/12 - 12/31/12 0 0 0 0 0 0 0 0 001/01/13 - 12/31/13 0 0 0 0 0 0 0 0 001/01/14 - 12/31/14 0 0 0 0 0 0 0 0 0
STATE ACT - SECONDARY CONVERSION FACTORS (Appendix B-IV, Section A-3)
INDUSTRY GROUP:Policy Period F-Class
01/01/10 - 12/31/10 1.16601/01/11 - 12/31/11 1.16601/01/12 - 12/31/12 1.16601/01/13 - 12/31/13 1.16601/01/14 - 12/31/14 1.166
FEDERAL ACT - SECONDARY CONVERSION FACTORS (Appendix B-IV, Section A-3)
INDUSTRY GROUP:Policy Period F-Class
01/01/10 - 12/31/10 1.20001/01/11 - 12/31/11 1.21301/01/12 - 12/31/12 1.18801/01/13 - 12/31/13 1.20401/01/14 - 12/31/14 1.166
© Copyright 2017 National Council on Compensation Insurance, Inc. All Rights Reserved.
Page 122 of 138

INDIANA
APPENDIX B-IV
Derivation of Proposed Rate - Code 7313
TOTAL - PAYROLL, FINAL CONVERTED LOSSES
Indemnity Indemnity Medical Medical Total TotalPolicy Period Payroll Likely Not-Likely Likely Not-Likely Indemnity Medical Total
01/01/10 - 12/31/10 1,299,658 0 0 0 25,868 0 25,868 25,86801/01/11 - 12/31/11 1,402,914 0 0 0 11,976 0 11,976 11,97601/01/12 - 12/31/12 1,622,349 0 0 0 349 0 349 34901/01/13 - 12/31/13 1,920,536 0 0 0 183 0 183 18301/01/14 - 12/31/14 2,399,311 0 0 0 0 0 0 0
Total 8,644,768 0 0 0 38,376 0 38,376 38,376INDICATED PURE PREMIUM 0.000 0.444 0.44
The present on rate level pure premiums are developed by adjusting the pure premiums underlying the current rateby the conversion factors. The derivation of the present on rate level pure premiums for the above-captionedclassification follows:
Indemnity Medical TotalPure Premiums Underlying Current Rate 1.062 1.498 2.56Conversion Factors (Section B) 0.963 0.998 xxxPURE PREMIUMS PRESENT ON RATE LEVEL(Underlying Pure Premiums) x (Conversion Factor) 1.023 1.495 2.52
© Copyright 2017 National Council on Compensation Insurance, Inc. All Rights Reserved.
Page 123 of 138
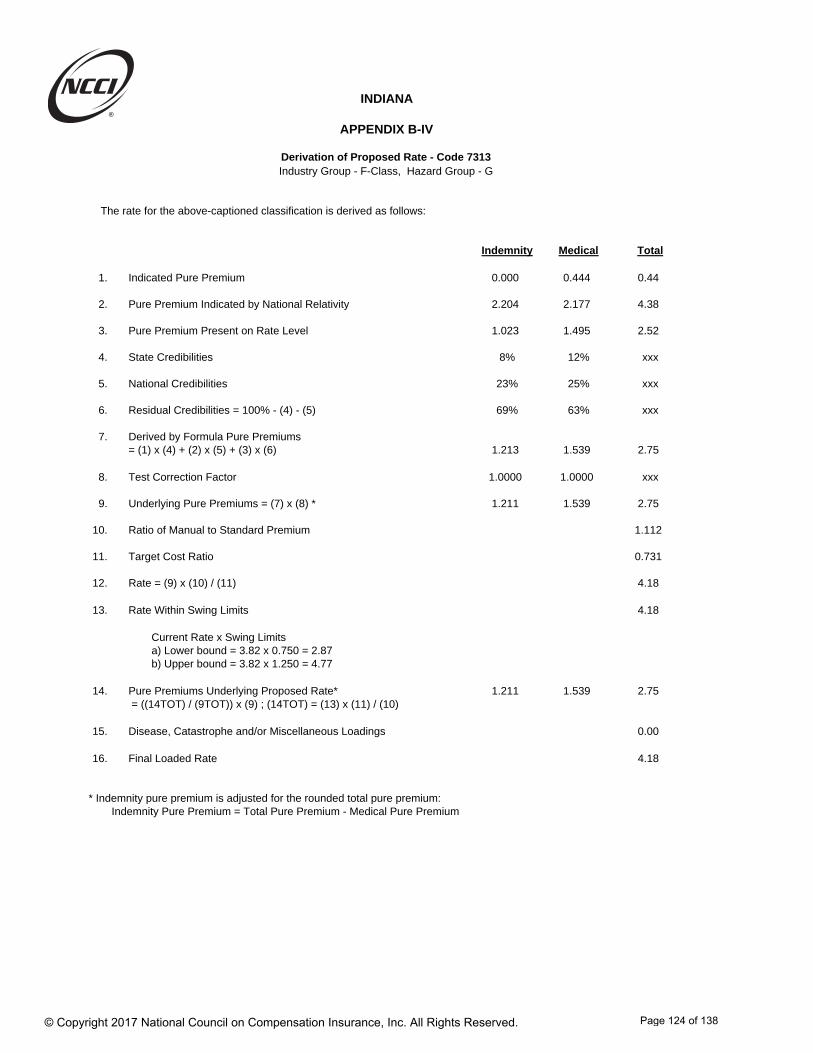
INDIANA
APPENDIX B-IV
Derivation of Proposed Rate - Code 7313Industry Group - F-Class, Hazard Group - G
The rate for the above-captioned classification is derived as follows:
Indemnity Medical Total
1. Indicated Pure Premium 0.000 0.444 0.44
2. Pure Premium Indicated by National Relativity 2.204 2.177 4.38
3. Pure Premium Present on Rate Level 1.023 1.495 2.52
4. State Credibilities 8% 12% xxx
5. National Credibilities 23% 25% xxx
6. Residual Credibilities = 100% - (4) - (5) 69% 63% xxx
7. Derived by Formula Pure Premiums= (1) x (4) + (2) x (5) + (3) x (6) 1.213 1.539 2.75
8. Test Correction Factor 1.0000 1.0000 xxx
9. Underlying Pure Premiums = (7) x (8) * 1.211 1.539 2.75
10. Ratio of Manual to Standard Premium 1.112
11. Target Cost Ratio 0.731
12. Rate = (9) x (10) / (11) 4.18
13. Rate Within Swing Limits 4.18
Current Rate x Swing Limitsa) Lower bound = 3.82 x 0.750 = 2.87b) Upper bound = 3.82 x 1.250 = 4.77
14. Pure Premiums Underlying Proposed Rate* 1.211 1.539 2.75 = ((14TOT) / (9TOT)) x (9) ; (14TOT) = (13) x (11) / (10)
15. Disease, Catastrophe and/or Miscellaneous Loadings 0.00
16. Final Loaded Rate 4.18
* Indemnity pure premium is adjusted for the rounded total pure premium:Indemnity Pure Premium = Total Pure Premium - Medical Pure Premium
© Copyright 2017 National Council on Compensation Insurance, Inc. All Rights Reserved.
Page 124 of 138
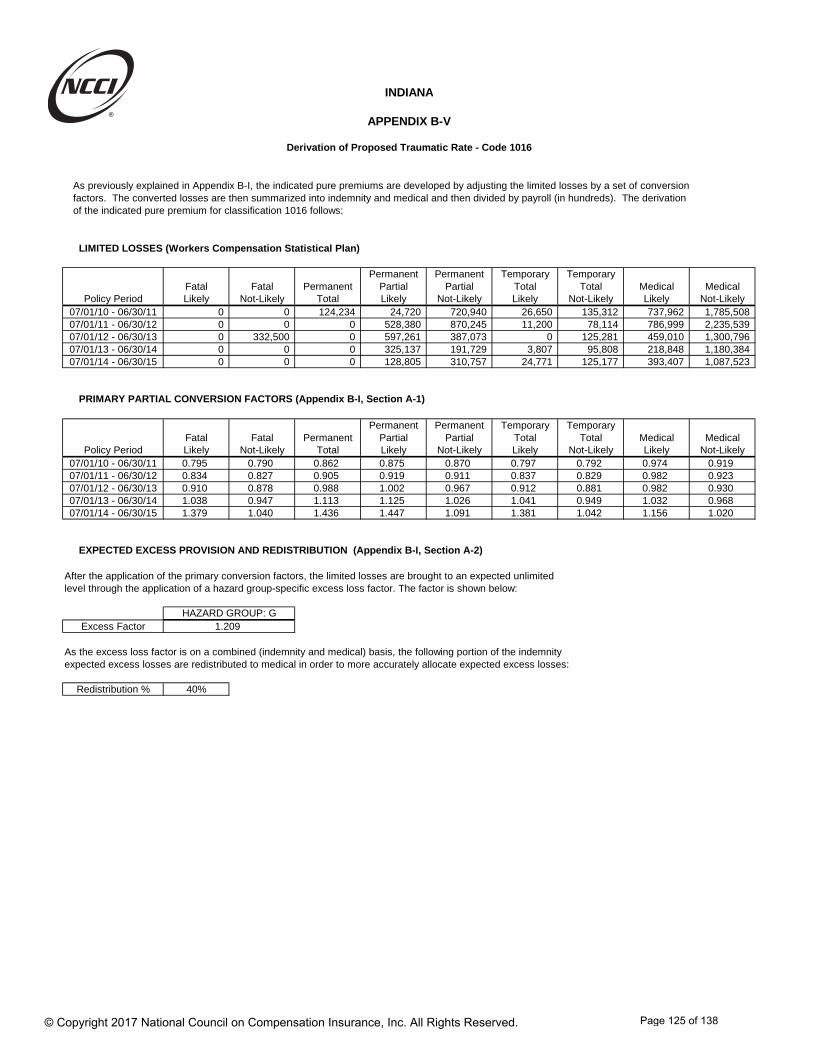
INDIANA
APPENDIX B-V
Derivation of Proposed Traumatic Rate - Code 1016
As previously explained in Appendix B-I, the indicated pure premiums are developed by adjusting the limited losses by a set of conversionfactors. The converted losses are then summarized into indemnity and medical and then divided by payroll (in hundreds). The derivationof the indicated pure premium for classification 1016 follows:
LIMITED LOSSES (Workers Compensation Statistical Plan)
Permanent Permanent Temporary TemporaryFatal Fatal Permanent Partial Partial Total Total Medical Medical
Policy Period Likely Not-Likely Total Likely Not-Likely Likely Not-Likely Likely Not-Likely07/01/10 - 06/30/11 0 0 124,234 24,720 720,940 26,650 135,312 737,962 1,785,50807/01/11 - 06/30/12 0 0 0 528,380 870,245 11,200 78,114 786,999 2,235,53907/01/12 - 06/30/13 0 332,500 0 597,261 387,073 0 125,281 459,010 1,300,79607/01/13 - 06/30/14 0 0 0 325,137 191,729 3,807 95,808 218,848 1,180,38407/01/14 - 06/30/15 0 0 0 128,805 310,757 24,771 125,177 393,407 1,087,523
PRIMARY PARTIAL CONVERSION FACTORS (Appendix B-I, Section A-1)
Permanent Permanent Temporary TemporaryFatal Fatal Permanent Partial Partial Total Total Medical Medical
Policy Period Likely Not-Likely Total Likely Not-Likely Likely Not-Likely Likely Not-Likely07/01/10 - 06/30/11 0.795 0.790 0.862 0.875 0.870 0.797 0.792 0.974 0.91907/01/11 - 06/30/12 0.834 0.827 0.905 0.919 0.911 0.837 0.829 0.982 0.92307/01/12 - 06/30/13 0.910 0.878 0.988 1.002 0.967 0.912 0.881 0.982 0.93007/01/13 - 06/30/14 1.038 0.947 1.113 1.125 1.026 1.041 0.949 1.032 0.96807/01/14 - 06/30/15 1.379 1.040 1.436 1.447 1.091 1.381 1.042 1.156 1.020
EXPECTED EXCESS PROVISION AND REDISTRIBUTION (Appendix B-I, Section A-2)
After the application of the primary conversion factors, the limited losses are brought to an expected unlimited level through the application of a hazard group-specific excess loss factor. The factor is shown below:
HAZARD GROUP: GExcess Factor 1.209
As the excess loss factor is on a combined (indemnity and medical) basis, the following portion of the indemnity expected excess losses are redistributed to medical in order to more accurately allocate expected excess losses:
Redistribution % 40%
© Copyright 2017 National Council on Compensation Insurance, Inc. All Rights Reserved.
Page 125 of 138
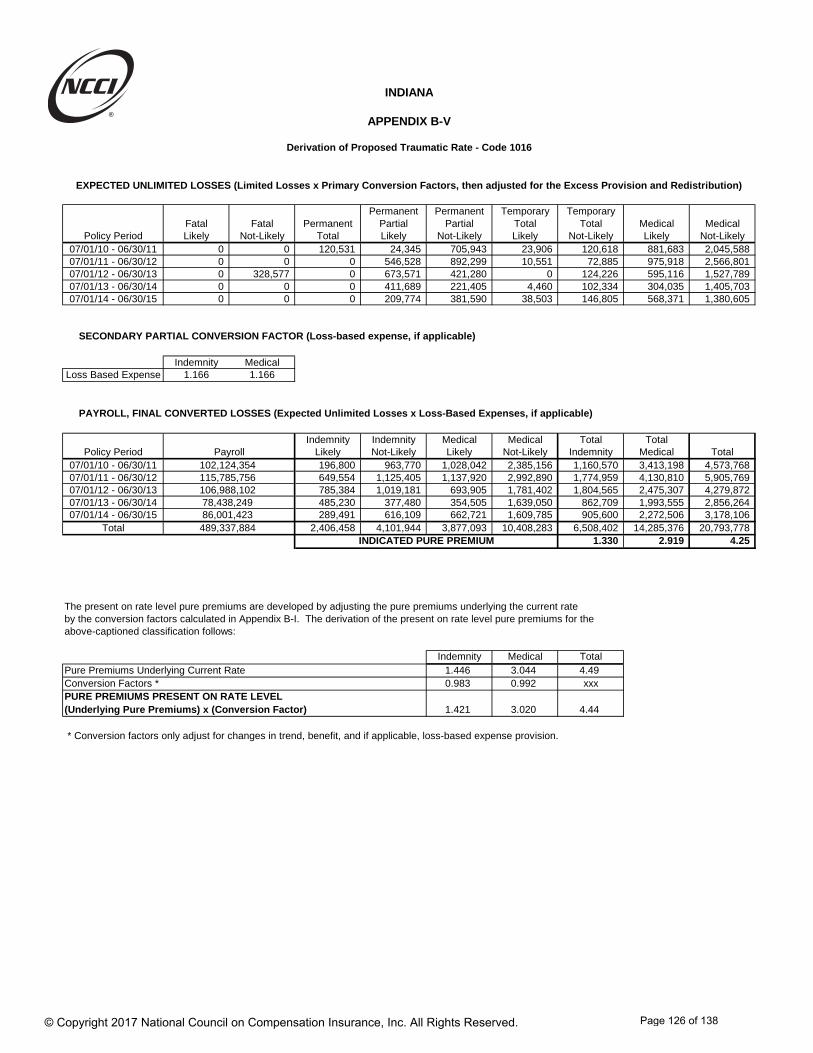
INDIANA
APPENDIX B-V
Derivation of Proposed Traumatic Rate - Code 1016
EXPECTED UNLIMITED LOSSES (Limited Losses x Primary Conversion Factors, then adjusted for the Excess Provision and Redistribution)
Permanent Permanent Temporary TemporaryFatal Fatal Permanent Partial Partial Total Total Medical Medical
Policy Period Likely Not-Likely Total Likely Not-Likely Likely Not-Likely Likely Not-Likely07/01/10 - 06/30/11 0 0 120,531 24,345 705,943 23,906 120,618 881,683 2,045,58807/01/11 - 06/30/12 0 0 0 546,528 892,299 10,551 72,885 975,918 2,566,80107/01/12 - 06/30/13 0 328,577 0 673,571 421,280 0 124,226 595,116 1,527,78907/01/13 - 06/30/14 0 0 0 411,689 221,405 4,460 102,334 304,035 1,405,70307/01/14 - 06/30/15 0 0 0 209,774 381,590 38,503 146,805 568,371 1,380,605
SECONDARY PARTIAL CONVERSION FACTOR (Loss-based expense, if applicable)
Indemnity MedicalLoss Based Expense 1.166 1.166
PAYROLL, FINAL CONVERTED LOSSES (Expected Unlimited Losses x Loss-Based Expenses, if applicable)
Indemnity Indemnity Medical Medical Total TotalPolicy Period Payroll Likely Not-Likely Likely Not-Likely Indemnity Medical Total
07/01/10 - 06/30/11 102,124,354 196,800 963,770 1,028,042 2,385,156 1,160,570 3,413,198 4,573,76807/01/11 - 06/30/12 115,785,756 649,554 1,125,405 1,137,920 2,992,890 1,774,959 4,130,810 5,905,76907/01/12 - 06/30/13 106,988,102 785,384 1,019,181 693,905 1,781,402 1,804,565 2,475,307 4,279,87207/01/13 - 06/30/14 78,438,249 485,230 377,480 354,505 1,639,050 862,709 1,993,555 2,856,26407/01/14 - 06/30/15 86,001,423 289,491 616,109 662,721 1,609,785 905,600 2,272,506 3,178,106
Total 489,337,884 2,406,458 4,101,944 3,877,093 10,408,283 6,508,402 14,285,376 20,793,778INDICATED PURE PREMIUM 1.330 2.919 4.25
The present on rate level pure premiums are developed by adjusting the pure premiums underlying the current rateby the conversion factors calculated in Appendix B-I. The derivation of the present on rate level pure premiums for theabove-captioned classification follows:
Indemnity Medical TotalPure Premiums Underlying Current Rate 1.446 3.044 4.49Conversion Factors * 0.983 0.992 xxxPURE PREMIUMS PRESENT ON RATE LEVEL(Underlying Pure Premiums) x (Conversion Factor) 1.421 3.020 4.44
* Conversion factors only adjust for changes in trend, benefit, and if applicable, loss-based expense provision.
© Copyright 2017 National Council on Compensation Insurance, Inc. All Rights Reserved.
Page 126 of 138

INDIANA
APPENDIX B-V
Derivation of Proposed Traumatic Rate - Code 1016COAL MINING—NOC, Hazard Group - G
The traumatic rate for classification 1016 is derived as follows:
Indemnity Medical Total
1. Indicated Pure Premium 1.330 2.919 4.25
2. Pure Premium Indicated by National Relativity 1.561 2.771 4.33
3. Pure Premium Present on Rate Level 1.421 3.020 4.44
4. State Credibilities† 67% 97% xxx
5. National Credibilities 16% 1% xxx
6. Residual Credibilities = 100% - (4) - (5) 17% 2% xxx
7. Derived by Formula Pure Premiums= (1) x (4) + (2) x (5) + (3) x (6) 1.382 2.920 4.30
8. Voluntary Offset 1.000 1.000 xxx
9. Underlying Pure Premiums = (7) x (8) * 1.380 2.920 4.30
10. Ratio of Manual to Standard Premium 1.056
11. Target Cost Ratio 0.731
12. Rate = (9) x (10) / (11) 6.21
13. Rate Within Swing Limits 6.21
Current Rate x Swing Limitsa) Lower bound = 6.48 x 0.75 = 4.86b) Upper bound = 6.48 x 1.25 = 8.10
14. Pure Premiums Underlying Proposed Rate* 1.380 2.920 4.30= ((14TOT) / (9TOT)) x (9) ; (14TOT) = (13) x (11) / (10)
15. Proposed Traumatic Rate 6.21
16. Proposed Traumatic Loss Cost = (15) x 0.731 # 4.54
† To achieve full state credibility, the classification must have expected losses of at least: $18,845,552 for indemnity, and $15,823,108 for medical.
* Indemnity pure premium is adjusted for the rounded total pure premium:
Indemnity Pure Premium = Total Pure Premium - Medical Pure Premium
# 0.731 = Factor to convert from Traumatic Rate to Traumatic Loss Costs
© Copyright 2017 National Council on Compensation Insurance, Inc. All Rights Reserved.
Page 127 of 138
Indiana
Advisory Loss Costs, Advisory Rates, and Assigned Risk Rates Filing – January 1, 2018
Appendix C – Memoranda for Laws and Assessments
Appendix C provides details on changes affecting workers compensation benefit costs that are not yet reflected in the on-level factors shown in Appendix A-I. Such changes may result from legislative changes to the maximum weekly wage used for calculating benefits along with changes to the awards per degree of permanent partial impairment, changes to medical reimbursement levels, or other recurring changes that directly affect worker compensation benefit levels. In addition, changes to the administration of the workers compensation system, including benefit levels, may result from specific regulatory, legislative, or judicial action.
The following changes affecting State benefit levels are detailed in this section of the filing:
Annual Update to the Medical Fee Schedule
Longshore and Harbor Workers’ Compensation Act
o Change in the Minimum and Maximum Weekly Benefits, Effective October 1, 2016
o Annual Assessment
© Copyright 2017 National Council on Compensation Insurance, Inc. All Rights Reserved.
Page 128 of 138
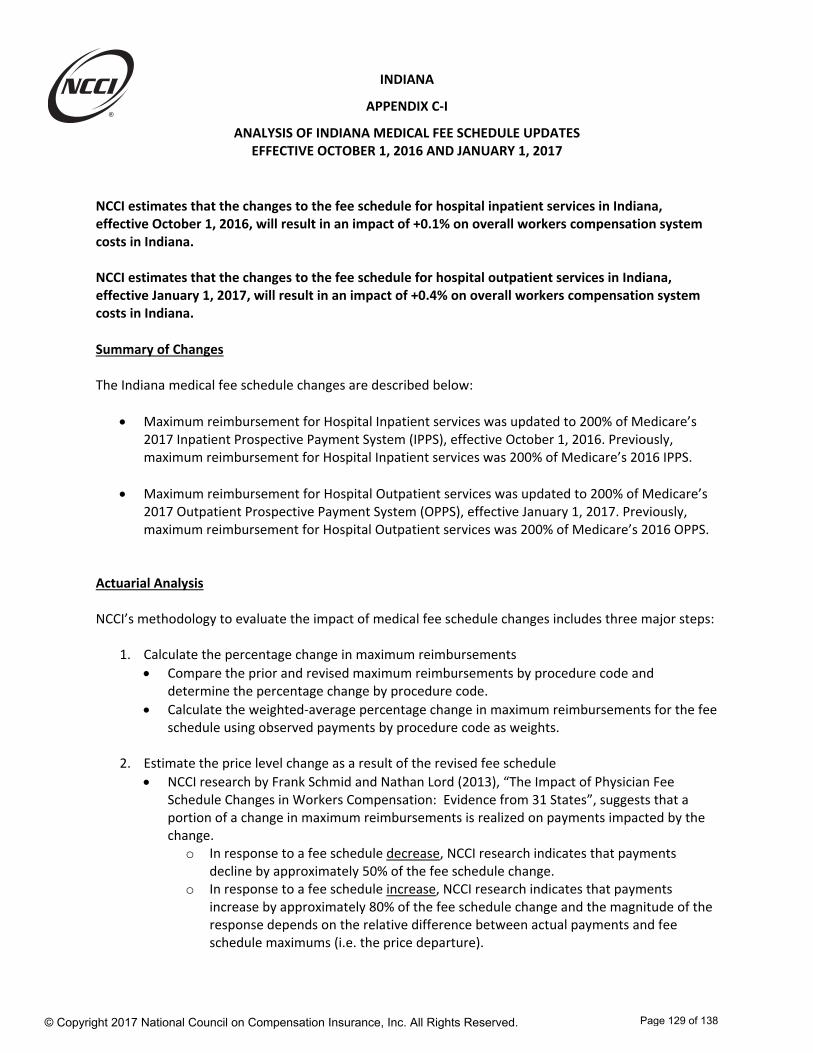
INDIANA
APPENDIX C‐I
ANALYSIS OF INDIANA MEDICAL FEE SCHEDULE UPDATES EFFECTIVE OCTOBER 1, 2016 AND JANUARY 1, 2017
NCCI estimates that the changes to the fee schedule for hospital inpatient services in Indiana, effective October 1, 2016, will result in an impact of +0.1% on overall workers compensation system costs in Indiana. NCCI estimates that the changes to the fee schedule for hospital outpatient services in Indiana, effective January 1, 2017, will result in an impact of +0.4% on overall workers compensation system costs in Indiana.
Summary of Changes The Indiana medical fee schedule changes are described below:
Maximum reimbursement for Hospital Inpatient services was updated to 200% of Medicare’s 2017 Inpatient Prospective Payment System (IPPS), effective October 1, 2016. Previously, maximum reimbursement for Hospital Inpatient services was 200% of Medicare’s 2016 IPPS.
Maximum reimbursement for Hospital Outpatient services was updated to 200% of Medicare’s 2017 Outpatient Prospective Payment System (OPPS), effective January 1, 2017. Previously, maximum reimbursement for Hospital Outpatient services was 200% of Medicare’s 2016 OPPS.
Actuarial Analysis NCCI’s methodology to evaluate the impact of medical fee schedule changes includes three major steps:
1. Calculate the percentage change in maximum reimbursements
Compare the prior and revised maximum reimbursements by procedure code and determine the percentage change by procedure code.
Calculate the weighted‐average percentage change in maximum reimbursements for the fee schedule using observed payments by procedure code as weights.
2. Estimate the price level change as a result of the revised fee schedule
NCCI research by Frank Schmid and Nathan Lord (2013), “The Impact of Physician Fee Schedule Changes in Workers Compensation: Evidence from 31 States”, suggests that a portion of a change in maximum reimbursements is realized on payments impacted by the change.
o In response to a fee schedule decrease, NCCI research indicates that payments decline by approximately 50% of the fee schedule change.
o In response to a fee schedule increase, NCCI research indicates that payments increase by approximately 80% of the fee schedule change and the magnitude of the response depends on the relative difference between actual payments and fee schedule maximums (i.e. the price departure).
© Copyright 2017 National Council on Compensation Insurance, Inc. All Rights Reserved.
Page 129 of 138
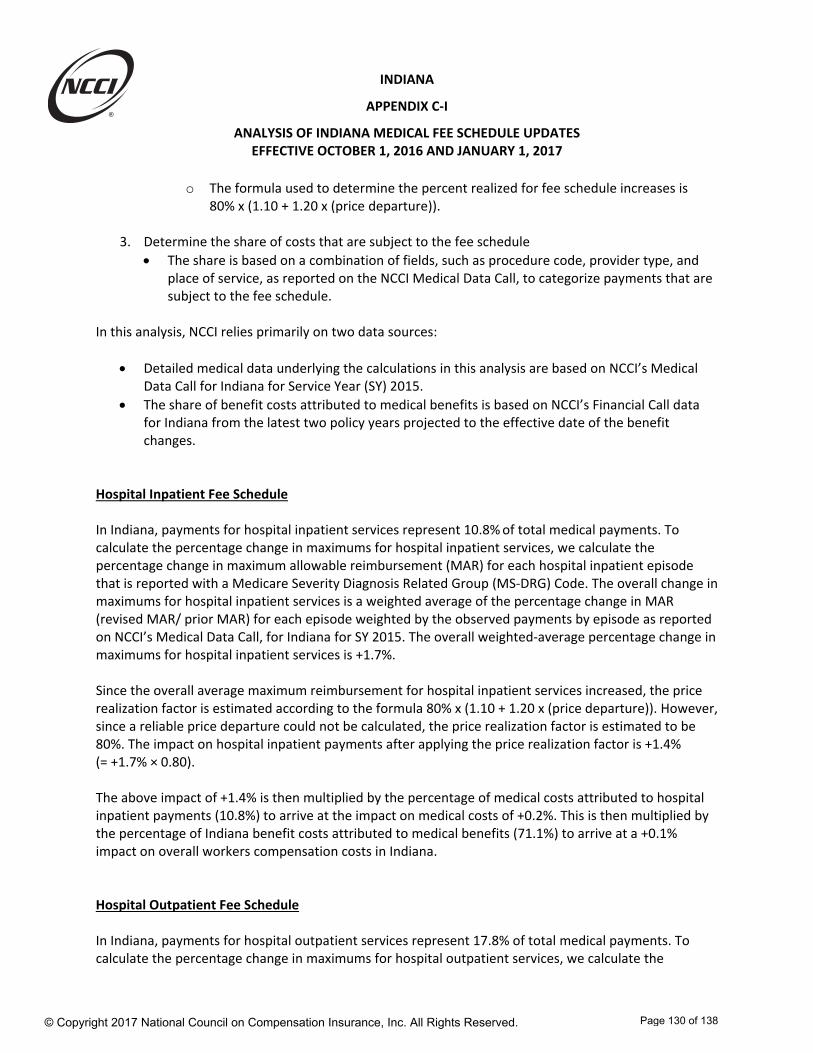
INDIANA
APPENDIX C‐I
ANALYSIS OF INDIANA MEDICAL FEE SCHEDULE UPDATES EFFECTIVE OCTOBER 1, 2016 AND JANUARY 1, 2017
o The formula used to determine the percent realized for fee schedule increases is 80% x (1.10 + 1.20 x (price departure)).
3. Determine the share of costs that are subject to the fee schedule
The share is based on a combination of fields, such as procedure code, provider type, and place of service, as reported on the NCCI Medical Data Call, to categorize payments that are subject to the fee schedule.
In this analysis, NCCI relies primarily on two data sources:
Detailed medical data underlying the calculations in this analysis are based on NCCI’s Medical Data Call for Indiana for Service Year (SY) 2015.
The share of benefit costs attributed to medical benefits is based on NCCI’s Financial Call data for Indiana from the latest two policy years projected to the effective date of the benefit changes.
Hospital Inpatient Fee Schedule In Indiana, payments for hospital inpatient services represent 10.8% of total medical payments. To calculate the percentage change in maximums for hospital inpatient services, we calculate the percentage change in maximum allowable reimbursement (MAR) for each hospital inpatient episode that is reported with a Medicare Severity Diagnosis Related Group (MS‐DRG) Code. The overall change in maximums for hospital inpatient services is a weighted average of the percentage change in MAR (revised MAR/ prior MAR) for each episode weighted by the observed payments by episode as reported on NCCI’s Medical Data Call, for Indiana for SY 2015. The overall weighted‐average percentage change in maximums for hospital inpatient services is +1.7%. Since the overall average maximum reimbursement for hospital inpatient services increased, the price realization factor is estimated according to the formula 80% x (1.10 + 1.20 x (price departure)). However, since a reliable price departure could not be calculated, the price realization factor is estimated to be 80%. The impact on hospital inpatient payments after applying the price realization factor is +1.4% (= +1.7% × 0.80). The above impact of +1.4% is then multiplied by the percentage of medical costs attributed to hospital inpatient payments (10.8%) to arrive at the impact on medical costs of +0.2%. This is then multiplied by the percentage of Indiana benefit costs attributed to medical benefits (71.1%) to arrive at a +0.1% impact on overall workers compensation costs in Indiana. Hospital Outpatient Fee Schedule In Indiana, payments for hospital outpatient services represent 17.8% of total medical payments. To calculate the percentage change in maximums for hospital outpatient services, we calculate the
© Copyright 2017 National Council on Compensation Insurance, Inc. All Rights Reserved.
Page 130 of 138
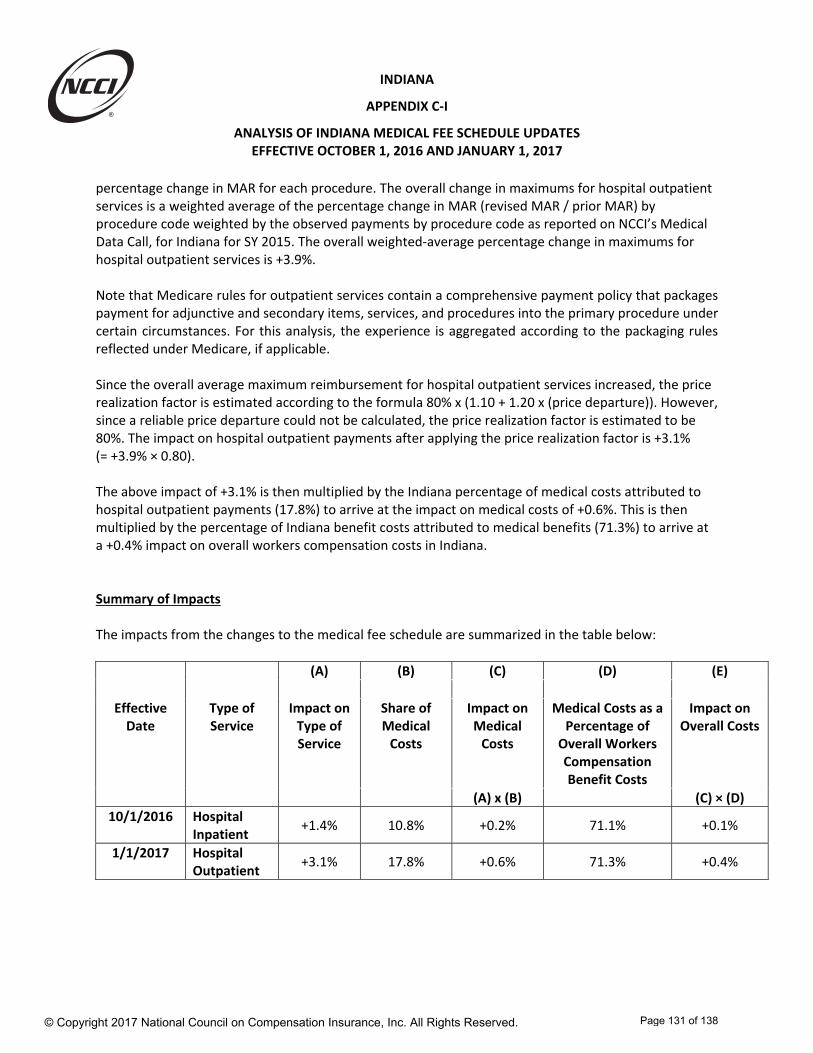
INDIANA
APPENDIX C‐I
ANALYSIS OF INDIANA MEDICAL FEE SCHEDULE UPDATES EFFECTIVE OCTOBER 1, 2016 AND JANUARY 1, 2017
percentage change in MAR for each procedure. The overall change in maximums for hospital outpatient services is a weighted average of the percentage change in MAR (revised MAR / prior MAR) by procedure code weighted by the observed payments by procedure code as reported on NCCI’s Medical Data Call, for Indiana for SY 2015. The overall weighted‐average percentage change in maximums for hospital outpatient services is +3.9%. Note that Medicare rules for outpatient services contain a comprehensive payment policy that packages payment for adjunctive and secondary items, services, and procedures into the primary procedure under certain circumstances. For this analysis, the experience is aggregated according to the packaging rules reflected under Medicare, if applicable. Since the overall average maximum reimbursement for hospital outpatient services increased, the price realization factor is estimated according to the formula 80% x (1.10 + 1.20 x (price departure)). However, since a reliable price departure could not be calculated, the price realization factor is estimated to be 80%. The impact on hospital outpatient payments after applying the price realization factor is +3.1% (= +3.9% × 0.80). The above impact of +3.1% is then multiplied by the Indiana percentage of medical costs attributed to hospital outpatient payments (17.8%) to arrive at the impact on medical costs of +0.6%. This is then multiplied by the percentage of Indiana benefit costs attributed to medical benefits (71.3%) to arrive at a +0.4% impact on overall workers compensation costs in Indiana. Summary of Impacts The impacts from the changes to the medical fee schedule are summarized in the table below:
(A) (B) (C) (D) (E)
Effective Date
Type of Service
Impact on Type of Service
Share of Medical Costs
Impact on Medical Costs
Medical Costs as a Percentage of Overall Workers Compensation Benefit Costs
Impact on Overall Costs
(A) x (B) (C) × (D)
10/1/2016 Hospital Inpatient
+1.4% 10.8% +0.2% 71.1% +0.1%
1/1/2017 Hospital Outpatient
+3.1% 17.8% +0.6% 71.3% +0.4%
© Copyright 2017 National Council on Compensation Insurance, Inc. All Rights Reserved.
Page 131 of 138

1.
2.
3.
4.
5.6.
7.
Type of Injury
Fatal 3.8% + 0.4
Permanent Total 2.2% + 0.3
Permanent Partial 45.7% + 0.1
Temporary Total 8.1% + 0.3
Total Indemnity 59.8% + 0.2
Medical 40.2% 0.0
Total 100.0% + 0.1
1
2
3
4
5
INDIANA
APPENDIX C-II
Change in the Minimum and Maximum Weekly Benefits, Effective October 1, 2016
In the Longshore And Harbor Workers' Compensation Act , maximum and, for certain benefit types, minimum workers compensation indemnity benefit provisions are dependent upon the national average weekly wage (NAWW). The impacts summarized in the table below result from anticipated changes in workers compensation costs due to the change in the NAWW from $703.00 ("current") to $718.24 ("revised"), and apply to injuries occurring on or after October 1, 2016.
The approach used in calculating the effects of a change in the NAWW is as follows:
Longshore and Harbor Workers' Compensation Act
Various distributions based on internal and external data are employed in determining the impact by type of injury. For example, for Fatal injuries, a countrywide distribution of average ages and dependents by type (e.g., spouse, spouse with one child, parent, etc.) is used in calculating mortality-adjusted annuity values under both the current and revised weekly maximum benefits, with the likelihood of remarriage incorporated as applicable.
NCCI Unit Statistical Plan data for the 36-month policy period ending 12/31/2013 on the 10/01/2015 law level and developed to an ultimate basis by type of injury.
Percentage of Losses Effect (%)
Based on NCCI Detailed Claim Information data.
Bureau of Labor Statistics Quarterly Census of Employment and Wages, for all private sector employment, and adjusted to reflect injured workers.
For states where the rate of compensation is based on spendable wages, state and federal tax withholding tables are used in conjunction with pertinent assumptions (e.g., number of dependents).
Multiply the impact on total indemnity benefit costs (Step 6) by the percentage of losses attributed to indemnity benefits to determine the impact of the change in the NAWW on overall benefit costs.
Obtain the latest available NAWW from the United States Department of Labor, Division of Longshore and Harbor Workers' Compensation (DLHWC).
Calculate the minimum and maximum benefits by benefit payment type that are dependent upon and expressed as a percentage of the current and revised NAWW.
Using a countrywide distribution of workers and their wages¹, indexed to the Longshore And Harbor Workers' Compensation Act average weekly wage², determine expected current and revised average weekly benefits by benefit payment type (and dependency type, as appropriate)³.
Use the above-calculated average weekly benefits to determine the indemnity benefit costs for each injury type (Fatal, Permanent Total, Permanent Partial, and Temporary Total)4 prior to and subsequent to the change in the NAWW. Calculate the ratio of the revised indemnity benefit costs to current indemnity benefit costs for each injury type to determine the impact by injury type from the change in the NAWW.
Determine the indemnity cost distribution by injury type5.Using the indemnity cost distribution (Step 5) and the effects by injury type (Step 4), calculate the effect of the change in NAWW on total indemnity benefit costs.
© Copyright 2017 National Council on Compensation Insurance, Inc. All Rights Reserved.
Page 132 of 138
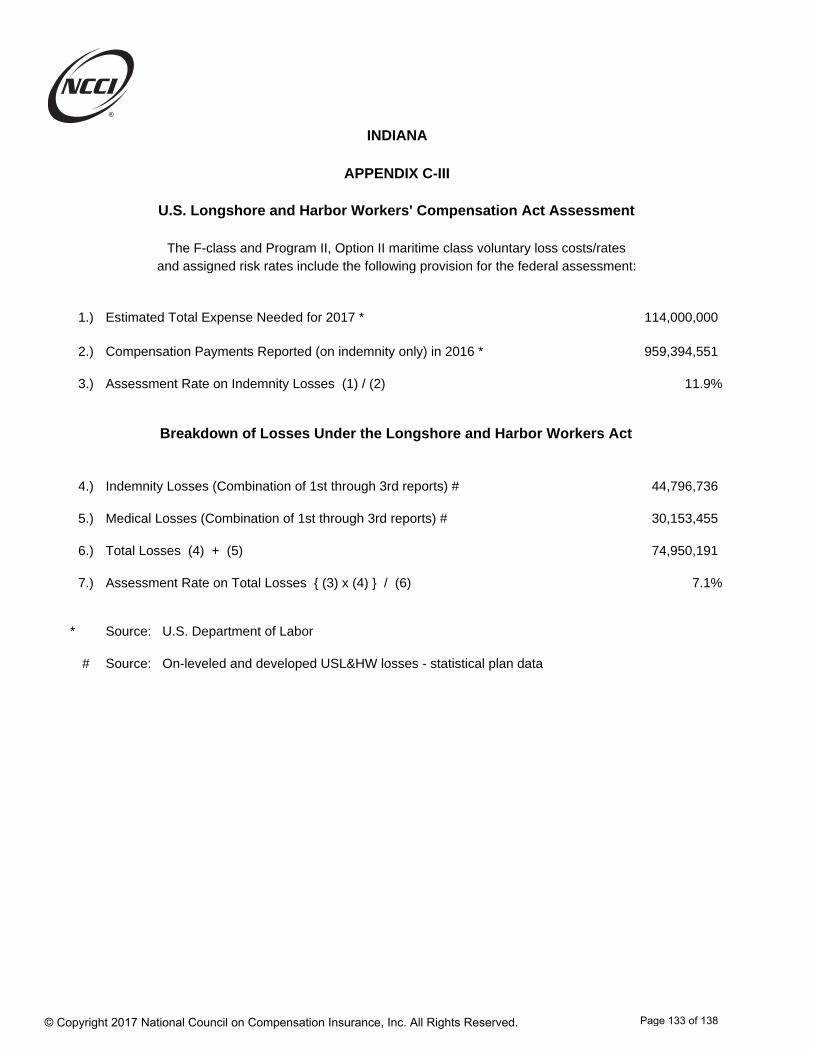
1.) Estimated Total Expense Needed for 2017 * 114,000,000
2.) Compensation Payments Reported (on indemnity only) in 2016 * 959,394,551
3.) Assessment Rate on Indemnity Losses (1) / (2) 11.9%
4.) Indemnity Losses (Combination of 1st through 3rd reports) # 44,796,736
5.) Medical Losses (Combination of 1st through 3rd reports) # 30,153,455
6.) Total Losses (4) + (5) 74,950,191
7.) Assessment Rate on Total Losses { (3) x (4) } / (6) 7.1%
* Source: U.S. Department of Labor
# Source: On-leveled and developed USL&HW losses - statistical plan data
Breakdown of Losses Under the Longshore and Harbor Workers Act
INDIANA
APPENDIX C-III
U.S. Longshore and Harbor Workers' Compensation Act Assessment
The F-class and Program II, Option II maritime class voluntary loss costs/ratesand assigned risk rates include the following provision for the federal assessment:
© Copyright 2017 National Council on Compensation Insurance, Inc. All Rights Reserved.
Page 133 of 138

INDIANA
APPENDIX D
I. Factor to Convert Advisory Rates to Assigned Risk Rates
A factor of 1.000 is applied to the advisory rates in order to convert to assigned risk rates.
II. Factor to Convert Advisory Rates to Advisory Loss Costs
A factor of 0.731 is applied to the advisory rates in order to convert to advisory loss costs. Thisfactor is the proposed target cost ratio for advisory rates.
© Copyright 2017 National Council on Compensation Insurance, Inc. All Rights Reserved. Page 134 of 138

Indiana
Advisory Loss Costs, Advisory Rates, and Assigned Risk Rates Filing – January 1, 2018
Part 4 Additional Information
- Definitions
- Key Contacts
© Copyright 2017 National Council on Compensation Insurance, Inc. All Rights Reserved.
Page 135 of 138

Indiana
Advisory Loss Costs, Advisory Rates, and Assigned Risk Rates Filing – January 1, 2018
Definitions
Accident Year (AY): A loss accounting definition in which experience is summarized by the calendar year in which an accident occurred. Calendar Year (CY):
1. The 12-month period beginning January 1 and ending December 31. 2. Method of accounting for all financial transactions occurring during a specific year.
Case Reserves: Reserves that an insurance company establishes for specific (known) claims. DSR Level Premium: The standard earned premium that would result if business were written at NCCI state-approved loss costs or rates instead of at the company rates. It is the common benchmark level at which carriers report premium on the Financial Calls. Frequency: The number of lost-time claims per million dollars of on-leveled, wage-adjusted premium. Incurred Claim Count: The total of all claims reported, whether open or closed, as of a given valuation date. An indemnity claim is associated with a payment or case reserve for an indemnity loss (i.e., lost work time-related benefits) and excludes claims closed without an indemnity payment. Lost-time Claims: Claims where an injured employee has received wage replacement benefits due to a compensable workplace injury. Limited Losses: Losses that result after the application of NCCI's large loss procedure—in which individual large claims are limited to jurisdiction and year-specific large loss thresholds. On-Level Factor: Applied to historical premiums and losses to adjust the historical experience to reflect approved loss cost/rate level changes as well as statutory benefit level changes implemented since that time. Paid+Case Losses: The sum of paid losses and case reserves. Also known as “case incurred losses.” Paid Losses: Losses that an insurance company has paid as a result of claim activity.
© Copyright 2017 National Council on Compensation Insurance, Inc. All Rights Reserved.
Page 136 of 138
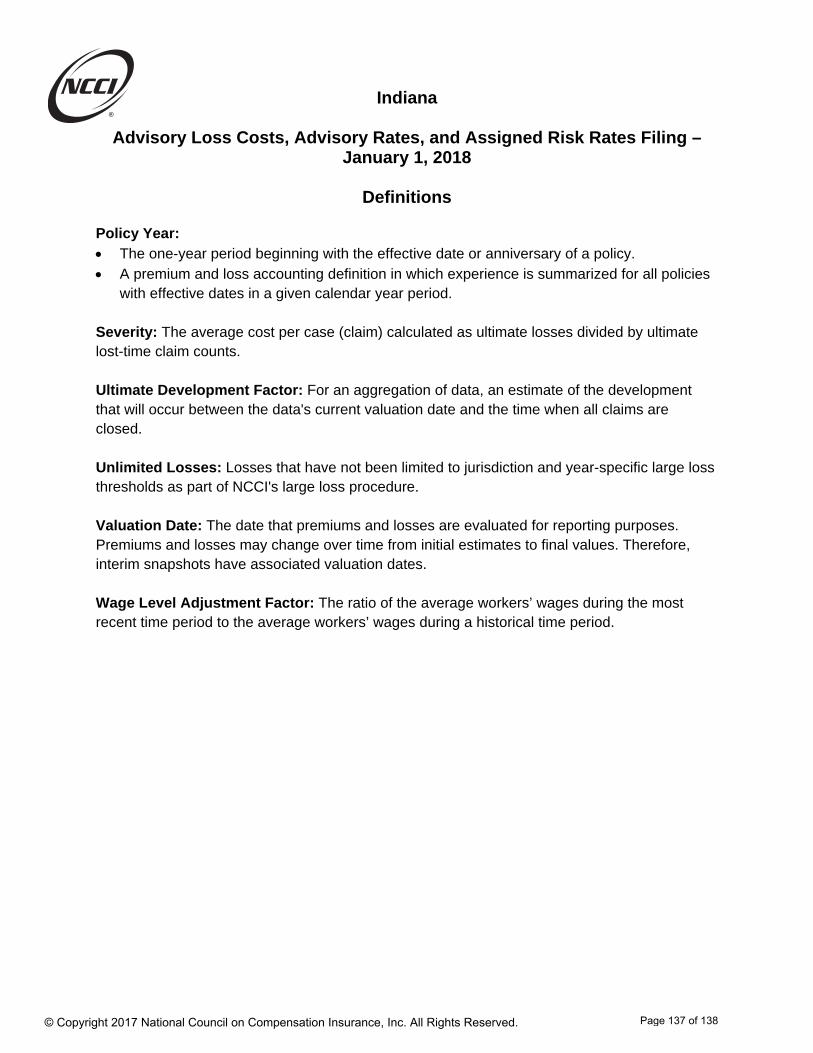
Indiana
Advisory Loss Costs, Advisory Rates, and Assigned Risk Rates Filing – January 1, 2018
Definitions
Policy Year: The one-year period beginning with the effective date or anniversary of a policy. A premium and loss accounting definition in which experience is summarized for all policies
with effective dates in a given calendar year period. Severity: The average cost per case (claim) calculated as ultimate losses divided by ultimate lost-time claim counts. Ultimate Development Factor: For an aggregation of data, an estimate of the development that will occur between the data's current valuation date and the time when all claims are closed. Unlimited Losses: Losses that have not been limited to jurisdiction and year-specific large loss thresholds as part of NCCI's large loss procedure. Valuation Date: The date that premiums and losses are evaluated for reporting purposes. Premiums and losses may change over time from initial estimates to final values. Therefore, interim snapshots have associated valuation dates. Wage Level Adjustment Factor: The ratio of the average workers’ wages during the most recent time period to the average workers’ wages during a historical time period.
© Copyright 2017 National Council on Compensation Insurance, Inc. All Rights Reserved.
Page 137 of 138

Indiana
Advisory Loss Costs, Advisory Rates, and Assigned Risk Rates Filing – January 1, 2018
Key Contacts
ICRB KEY CONTACTS
Ronald W. Cooper, CWCP, President ([email protected]) Duane Schroeder, CPCU, Vice President ([email protected])
ICRB
5920 Castleway West Drive Indianapolis, IN 46250
Phone (317) 842-2800 Fax (317) 842-3717
NCCI KEY CONTACTS
Amy Quinn, State Relations Executive Regulatory Division
National Council on Compensation Insurance, Inc. (NCCI) 204 Caughman Farm Lane, Suite 303
Lexington, SC 29072 Phone (803) 356-0851 Fax (561) 893-5825
Robert Moss, ACAS, MAAA, Assistant Actuary Actuarial and Economic Services Division
National Council on Compensation Insurance, Inc. (NCCI) 901 Peninsula Corporate Circle Boca Raton, Florida 33487-1362
Phone (561) 893-3794 Fax (561) 893-5430
All NCCI employees can be contacted via e-mail using the following format:
First Name_Last [email protected]
© Copyright 2017 National Council on Compensation Insurance, Inc. All Rights Reserved.
Page 138 of 138
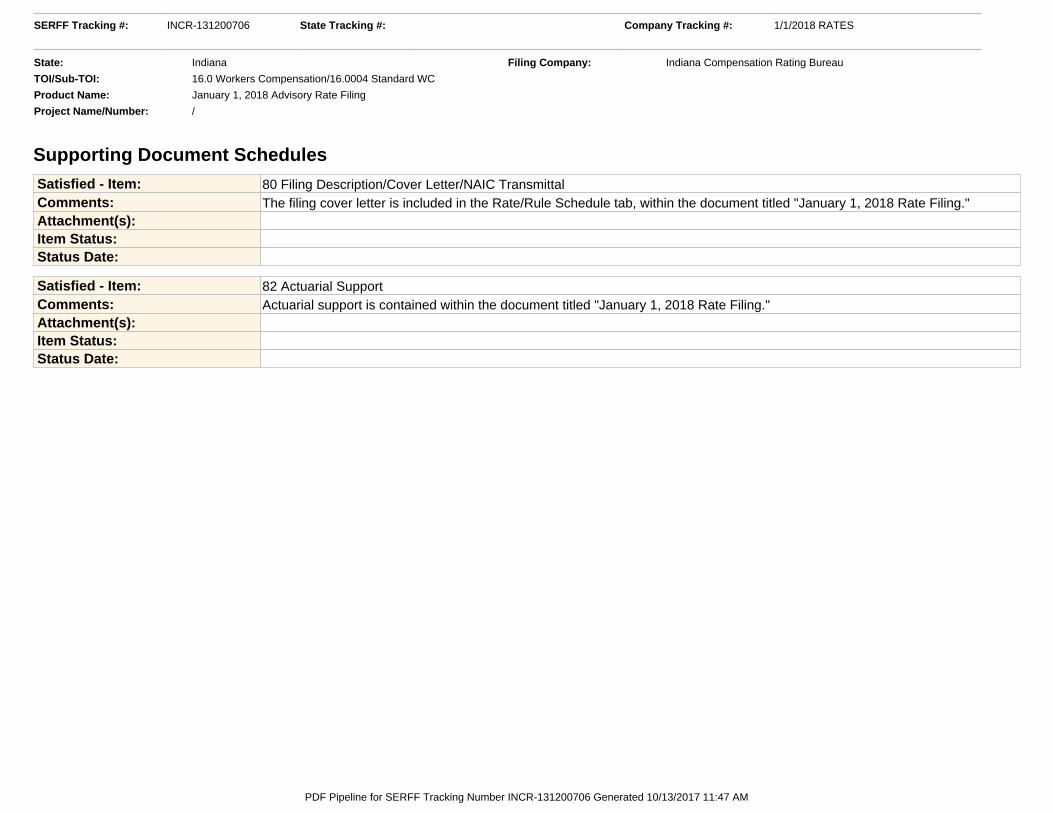
Supporting Document Schedules Satisfied - Item: 80 Filing Description/Cover Letter/NAIC TransmittalComments: The filing cover letter is included in the Rate/Rule Schedule tab, within the document titled "January 1, 2018 Rate Filing."Attachment(s):Item Status:Status Date:
Satisfied - Item: 82 Actuarial SupportComments: Actuarial support is contained within the document titled "January 1, 2018 Rate Filing."Attachment(s):Item Status:Status Date:
SERFF Tracking #: INCR-131200706 State Tracking #: Company Tracking #: 1/1/2018 RATES
State: Indiana Filing Company: Indiana Compensation Rating Bureau
TOI/Sub-TOI: 16.0 Workers Compensation/16.0004 Standard WC
Product Name: January 1, 2018 Advisory Rate Filing
Project Name/Number: /
PDF Pipeline for SERFF Tracking Number INCR-131200706 Generated 10/13/2017 11:47 AM