Embed Size (px)
Citation preview

Filling the Missing Cone in Protein Electron CrystallographyDOUGLAS L. DORSET*Electron Diffraction Department, Hauptman-Woodward Medical Research Institute, Inc., Buffalo, New York 14203-1196
KEY WORDS protein electron crystallography; missing cone; tilt values
ABSTRACT The hyper-resolution property of the Sayre equation is explored for extrapolatingamplitudes and phases into the missing cone of data left after tilting a representative protein(rubredoxin) to restricted limits in the electron microscope. At 0.6 nm resolution, a reasonableprediction of crystallographic phases can be made to reconstruct the lost information. Best resultsare obtained if the goniometer tilt value is greater than approximately 660°, but some missinginformation can be restored if the tilt is restricted to 645°. Microsc. Res. Tech. 46:98–103, 1999.r 1999 Wiley-Liss, Inc.
INTRODUCTIONAlthough electron crystallography has become an
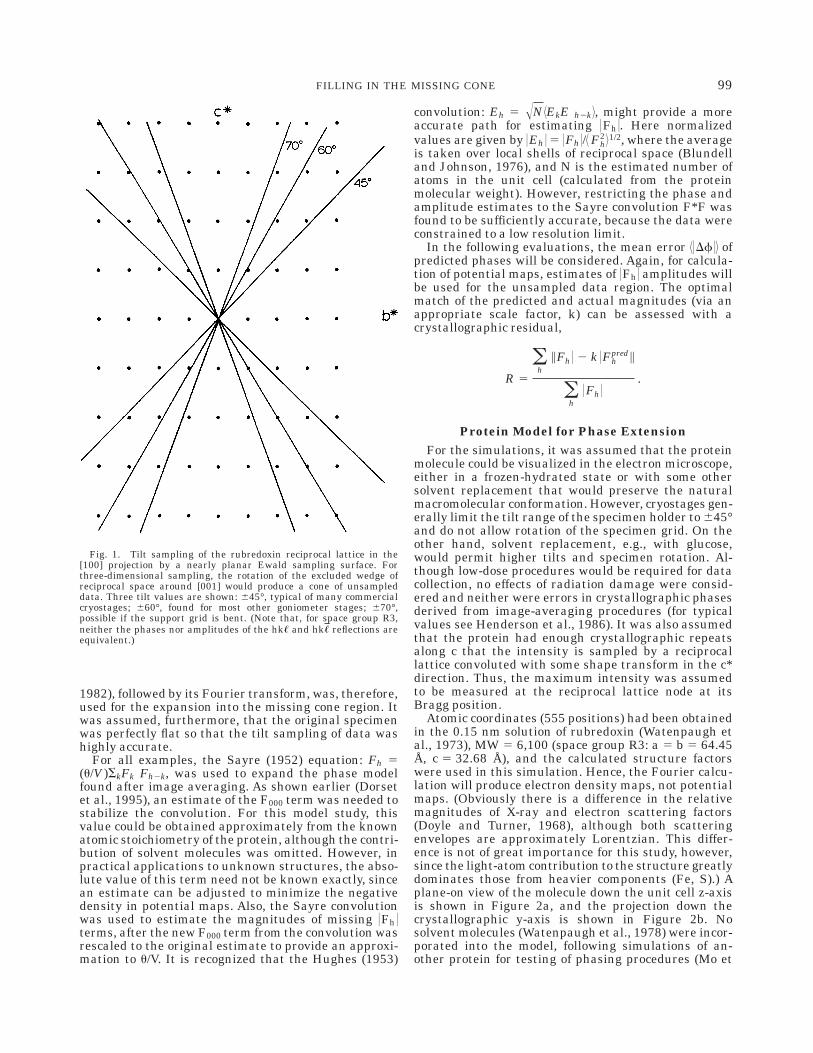
important technique for the quantitative characteriza-tion of materials that are otherwise difficult to crystal-lize (Dorset, 1995), there is at least one barrier tostructure analysis in addition to the usual ones im-posed by diffraction physics. Goniometric data sam-pling in the electron microscope is tomographic (Vainsh-tein, 1978). That is to say, there are physical limitationsimposed by the thickness and width of the sampleholder blade within the gap of the electron microscopeobjective lens pole piece that typically restrict tilting ofan essentially flat Ewald sampling surface (Fig. 1) to660° (Amos, et al., 1982). If rotation of the specimen inthe grid plane is unrestricted, the unsampled volume ofreciprocal space is a cone. This limitation is well knownas the ‘‘dead zone’’ or ‘‘missing cone’’ problem in electroncrystallography (Vainshtein, 1964).
In the most optimal conditions for data collection,e.g., for some small molecules and linear polymers, it ispossible to overcome the limited tilt range of thegoniometer stage by employing two crystallization pro-cedures. If crystallization by self-seeding and epitaxialorientation gives two orthogonal views of the chainpacking, then it is possible, in principle, to collect datafrom a complete reciprocal lattice, provided also thatthe separate crystallizations produce the same crystal-line polymorph of the sample (Dorset, 1995). Structureanalyses from such data have permitted individualatomic sites to be visualized.
The outlook is far less favorable when there is onlyone crystalline orientation available for data collection.Electron crystallography has become a very importanttechnique for the characterization of integral proteinsof biomembranes, since these most readily form two-dimensional crystalline layers (by reconstitution in aphospholipid bilayer). Obviously, it is not so easy tomanipulate the sample preparation, in a way analogousto small-molecule or polymer crystallization, to obtaintwo orthogonal views of the molecular packing. Themissing cone will, therefore, cause a blurring of detailsalong the normal to the layer surface, a problem thatcan be solved partially by improving the resolution ofthe data collection. It can be imagined that, if a certaindetail of the protein structure strongly depends on
scattering information along the unsampled cone axisdirection, there will always be some uncertainty aboutit when these important data are absent (Henderson etal., 1990). The importance of this missing set of data,even at high resolution, was very well demonstratedwhen the recent X-ray structure of bacteriorhodopsinwas compared to the best 3-D electron crystallographicresult (Pebay-Peyroula, et al., 1997). While details ofthe transmembrane helices were well determined byelectron crystallography, the surface polypeptide foldsconnecting these helices were not accurately located,until more recent experiments at higher tilt values(Kimura et al., 1997).
Most frequently in protein electron crystallography,crystallographic phases have been determined from theFourier transform of averaged electron micrographs, atask that becomes more and more demanding as theresolution of the determination is increased (Hender-son et al., 1986). Recently, the prospect of phase exten-sion from available low-resolution phases has shownsome promise as a technique for predicting missinghigher-resolution information (Dorset, 1996; Dorset etal., 1995; Gilmore et al., 1993). In this paper, we shallexplore a similar case where phase extension is used toprovide information within the missing cone un-sampled by goniometry. It will be shown that, if enoughinformation is obtained from the observed part of theunit-cell transform, the unmeasured part can also bepredicted, to recover details of the molecular envelope,even though the amplitudes must be predicted inaddition to the missing phase terms.
ANALYSISOriginal Phase Determinations
and Their ExpansionA model protein was considered for phase extension
into reciprocal space regions unsampled by goniometrictilts. A ‘‘basis set,’’ formed by the usual image averagingfor the observable part of reciprocal space (Amos et al.,
Contract grant sponsor: National Institute of General Medical Sciences;Contract grant number: GM-46733.
*Correspondence to: Douglas L. Dorset, Electron Diffraction Department,Hauptman-Woodward Medical Research Institute, Inc., 73 High Street, BuffaloNY 14203-1196. E-mail: [email protected]
Received 10 October 1997; accepted in revised form 7 January 1999.
MICROSCOPY RESEARCH AND TECHNIQUE 46:98–103 (1999)
r 1999 WILEY-LISS, INC.
1982), followed by its Fourier transform, was, therefore,used for the expansion into the missing cone region. Itwas assumed, furthermore, that the original specimenwas perfectly flat so that the tilt sampling of data washighly accurate.
For all examples, the Sayre (1952) equation: Fh 5(u/V )SkFk Fh2k, was used to expand the phase modelfound after image averaging. As shown earlier (Dorsetet al., 1995), an estimate of the F000 term was needed tostabilize the convolution. For this model study, thisvalue could be obtained approximately from the knownatomic stoichiometry of the protein, although the contri-bution of solvent molecules was omitted. However, inpractical applications to unknown structures, the abso-lute value of this term need not be known exactly, sincean estimate can be adjusted to minimize the negativedensity in potential maps. Also, the Sayre convolutionwas used to estimate the magnitudes of missing 0Fh 0terms, after the new F000 term from the convolution wasrescaled to the original estimate to provide an approxi-mation to u/V. It is recognized that the Hughes (1953)
convolution: Eh 5 ÎN7EkE h2k8, might provide a moreaccurate path for estimating 0Fh 0. Here normalizedvalues are given by 0Eh 0 5 0Fh 0/7 Fh
2 81/2, where the averageis taken over local shells of reciprocal space (Blundelland Johnson, 1976), and N is the estimated number ofatoms in the unit cell (calculated from the proteinmolecular weight). However, restricting the phase andamplitude estimates to the Sayre convolution F*F wasfound to be sufficiently accurate, because the data wereconstrained to a low resolution limit.
In the following evaluations, the mean error 70Df 08 ofpredicted phases will be considered. Again, for calcula-tion of potential maps, estimates of 0Fh 0 amplitudes willbe used for the unsampled data region. The optimalmatch of the predicted and actual magnitudes (via anappropriate scale factor, k) can be assessed with acrystallographic residual,
R 5
oh
\Fh 0 2 k 0Fhpred \
oh
0Fh 0.
Protein Model for Phase ExtensionFor the simulations, it was assumed that the protein
molecule could be visualized in the electron microscope,either in a frozen-hydrated state or with some othersolvent replacement that would preserve the naturalmacromolecular conformation. However, cryostages gen-erally limit the tilt range of the specimen holder to 645°and do not allow rotation of the specimen grid. On theother hand, solvent replacement, e.g., with glucose,would permit higher tilts and specimen rotation. Al-though low-dose procedures would be required for datacollection, no effects of radiation damage were consid-ered and neither were errors in crystallographic phasesderived from image-averaging procedures (for typicalvalues see Henderson et al., 1986). It was also assumedthat the protein had enough crystallographic repeatsalong c that the intensity is sampled by a reciprocallattice convoluted with some shape transform in the c*direction. Thus, the maximum intensity was assumedto be measured at the reciprocal lattice node at itsBragg position.
Atomic coordinates (555 positions) had been obtainedin the 0.15 nm solution of rubredoxin (Watenpaugh etal., 1973), MW 5 6,100 (space group R3: a 5 b 5 64.45Å, c 5 32.68 Å), and the calculated structure factorswere used in this simulation. Hence, the Fourier calcu-lation will produce electron density maps, not potentialmaps. (Obviously there is a difference in the relativemagnitudes of X-ray and electron scattering factors(Doyle and Turner, 1968), although both scatteringenvelopes are approximately Lorentzian. This differ-ence is not of great importance for this study, however,since the light-atom contribution to the structure greatlydominates those from heavier components (Fe, S).) Aplane-on view of the molecule down the unit cell z-axisis shown in Figure 2a, and the projection down thecrystallographic y-axis is shown in Figure 2b. Nosolvent molecules (Watenpaugh et al., 1978) were incor-porated into the model, following simulations of an-other protein for testing of phasing procedures (Mo et
Fig. 1. Tilt sampling of the rubredoxin reciprocal lattice in the[100] projection by a nearly planar Ewald sampling surface. Forthree-dimensional sampling, the rotation of the excluded wedge ofreciprocal space around [001] would produce a cone of unsampleddata. Three tilt values are shown: 645°, typical of many commercialcryostages; 660°, found for most other goniometer stages; 670°,possible if the support grid is bent. (Note that, for space group R3,neither the phases nor amplitudes of the hk< and hk< reflections areequivalent.)
99FILLING IN THE MISSING CONE
al., 1996). In any case, solvent peaks would be expectedto appear at 0.25 nm resolution (Watenpaugh et al.,1973). (In other words, the solvent region was assumedto be flat, and the presence of (NH4)2SO4, used forsalting out the protein, was ignored. No ordered sulfurpositions had been found anyway, even at 0.12 nmresolution (Watenpaugh et al., 1978).) At 0.6 nm (theresolution considered in this model determination),there were 383 unique hk< data obeying the Millerindex rules for space group R3 in the hexagonalsetting: 2 h 1 k 1 < 5 3n. (In this space group 0F(hk<) 0and 0F(hk<) 0 are not equivalent.) Again, for this analy-sis, it was assumed that all crystallographic phasescould be found by image averaging to the tilt limits ofthe goniometer stage.
RESULTSTilt Limit: 660°
It was first assumed that the goniometer could betilted a full 660°. At 0.6 nm resolution, there were 16unique reflections in the unmeasured missing-coneregion. If the remaining 111 reflections were used as abasis set for phase extension by the Sayre convolution,then the mean phase error for all predicted missingreflections was 73.9°, but only 35.3° for the four mostintense reflections. The predicted amplitude values,0Fh
pred 0, within the missing cone were greatly underesti-mated by the Sayre equation. If a scale factor is soughtso that sh 0Fh 0 5 kSh 0 Fh
pred 0, then there is a moderatelygood correlation between actual and predicted values(R 5 0.36). However, the value of k would not beobvious in an actual experiment (see below).
Tilt Limit: 645°For the more restricted tilt range at 0.6 nm resolu-
tion, there were 36 unique reflections in the missing-cone region. A basis set of 91 phased structure factorspredicted unsampled phase values to an accuracy of68.9° or 55.0° for the 10 most intense reflections. Theconsequence of a missing cone of reflections is clearlydemonstrated in Figure 3a, where there are regions ofthe map where the electron density does not overlap theprotein chain backbone. Although the overall phaseprediction is just as reliable as for the less restrictivetilt experiment above, the amplitude prediction is notas satisfactory (R 5 0.58), even assuming that a valuecan be found for the scale factor, k. Nevertheless, if theestimated amplitude values for the missing cone aremultiplied by 100 and coupled with the predictedphases, there is a marked improvement in the electrondensity map (Fig. 3b).
DISCUSSIONThe restrictions to structure interpretation imposed
by tilt limitations of the goniometer stage in an electronmicroscope can be overcome more or less by higher-resolution sampling of the reciprocal lattice. This isdemonstrated effectively by existing high-resolution(about 0.3 nm) studies of bacteriorhodopsin (Grigorieffet al., 1996), Pho E porin (Jap et al., 1991), and a plantlight-harvesting complex (Kuhlbrandt et al., 1994).Polypeptide chains can be fit to the density profiles ofthe three-dimensional potential maps, even though
there might be some residual blurring of features indirections near the incident electron beam direction foruntilted samples (e.g., the comparison of X-ray andelectron diffraction results for bacteriorhodopsin citedabove). More recently, very accurate experiments athigh tilt (Kimura et al., 1997) have recovered the helixloop details of bacteriorhodopsin not seen in the initialthree-dimensional electron crystallographic study andrefinement (Grigorieff et al., 1996).
The object of this study was to investigate a mediumresolution range, a practical limit often found directlyin Fourier transforms of experimental low-dose elec-tron micrographs, before lattices need to be ‘‘unbent’’ bycorrelational averaging techniques (Henderson et al.,1986). Predicted phase accuracies given above werealso similar to those found, on another resolution scale,for linear polymer samples for which only one crystalorientation was available for data collection (Dorsetand McCourt, 1997). That is, if the data resolution ishigh enough and the tilt value large enough, there ishope for a useful reconstruction of unsampled regionsusing the hyper-resolution property of the Sayre equa-tion. The effectiveness of the phase prediction alsodepends on the intensity of measured off-zonal reflec-tions. As found in many phase extension trials inprotein electron crystallography, the most accuratephase predictions are found for the most intense reflec-tions (Dorset, et al., 1995; Dorset, 1996).
While the phase accuracy of even the best determina-tions may not appear to be all that good, the values arecomparable to early attempts to use direct phasingmethods to predict the values of measured low-angleX-ray diffraction data (Podjarny et al., 1981); e.g., thosewhere the incomplete set of phase predictions frommultiple isomorphous replacement were inconclusive.In optimal cases, the predictions are significantly betterthan the random value, i.e., 90° mean error. As shownin Figure 3, if the major goal of a determination is toimprove the features of a density envelope at lowresolution, the accuracy this extension will be useful,just as it has been useful for improving the model fittingto the potential map from the polysaccharide mannan I(Dorset and McCourt, 1997). As noted in previous testson small molecules (Ramachandran and Srinivasan,1970), it is again seen that the phase accuracy is muchmore important for reconstruction of maps than is theamplitude accuracy.
The ultimate remedy for difficulties caused by themissing-cone problems would be to sample data atlarger tilt values. Recently, a manufacturer has pro-posed a cryostage capable of tilting the specimen 680°.Even though rotation is not an option with this stage,certainly enough of the reciprocal lattice could besampled from a large number of specimens to improvethe resolution along the third dimension parallel to thecone axis. Even increasing the tilt range to 670°(effectively done in early studies by bending the supportgrid; Unwin and Zamphigi, 1980), or, better, insertion ofa wedge into the sample holder, would increase theaccuracy of the determination, as demonstrated experi-mentally by Kimura et al. (1997) for bacteriorhodopsin.
100 D.L. DORSET

ACKNOWLEDGMENTSResearch was supported by a grant from the National
Institute of General Medical Sciences (GM-46733),
which is gratefully acknowledged. Thanks are also dueto Dr. Mary P. McCourt for assistance in preparingsome of the figures.
Fig. 2. Projections of the rubredoxin structure at 0.6nm resolution based on a complete reciprocal lattice;protein monomer unit shown (linked Ca positions for thepolypeptide chain) and compared to electron densityprofile: a: Projected down the unit cell z-axis. b: Pro-jected down the y-axis, perpendicular to the missingcone axis.
101FILLING IN THE MISSING CONE

Fig. 3. Effect of the missing cone at 645° tilt, projec-tion down the unit cell y-axis: a: Electron density map(from X-ray amplitudes and phases) calculated exclud-ing the data from the missing cone. Some chain regionscan be found that do not coincide with calculatedelectron density. b: Electron density map with datawithin the missing cone restored by the Sayre convolu-tion. In many cases, deficient density in a is restored.(The estimated missing-cone amplitudes from the Sayreequation were multiplied by 100 for the calculation ofthis map.)
102 D.L. DORSET

REFERENCESAmos LA, Henderson R, Unwin PNT. 1982. Three-dimensional struc-
ture determination by electron microscopy of two-dimensional crys-tals. Prog Biophys Mol Biol 39:183–231.
Blundell TL, Johnson LN. 1976. Protein crystallography. London:Academic Press. p 142.
Dorset DL. 1995. Structural electron crystallography. New York:Plenum Press.
Dorset DL. 1996. Direct phasing in protein electron crystallography:phase extension and the prospect for ab initio determinations. ActaCrystallogr A52:480–489.
Dorset DL, McCourt MP. 1997. Direct methods of structure analysis inpolymer crystallography. Adv. X-Ray Analysis 41 (in press).
Doyle PA, Turner PS. 1968. Relativistic Hartree-Fock x-ray andelectron scattering factors. Acta Crystallogr A24:390–397.
Dorset DL, Kopp S, Fryer JR, Tivol WF. 1995. The Sayre equation inelectron crystallography. Ultramicroscopy 57:59–89.
Gilmore CJ, Shankland K, Fryer JR. 1993. Phase extension in electroncrystallography using the maximum entropy method and its applica-tion to two-dimensional purple membrane data from Halobacteriumhalobium. Ultramicroscopy 49:132–146.
Gilmore CJ, Nicholson WV, Dorset DL. 1996. Direct methods inprotein electron crystallography: the ab initio structure determina-tion of two membrane proteins in projection using maximumentropy and likelihood. Acta Crystallogr A52:937–946.
Grigorieff N, Ceska TA, Downing KH, Baldwin JM, Henderson R.1996. Electron-crystallographic refinement of the structure of bacte-riorhodopsin. J Mol Biol 259:393–421.
Henderson R, Baldwin JM, Downing KH, Lepault J, Zemlin F. 1986.Structure of purple membrane from Halobacterium halobium: record-ing, measurement, and evaluation of electron micrographs at 3.5 Åresolution. Ultramicroscopy 19:147–178.
Henderson R, Baldwin JM, Ceska TA, Zemlin F, Beckmann E,Downing KH. 1990. Model for the structure of bacteriorhodopsinbased on high-resolution electron microscopy. J Mol Biol 213:899–929.
Hughes EW. 1953. The signs of products of structure factors. ActaCrystallogr 6:871.
Jap BK, Walian PJ, Gehring K. 1991. Structural architecture of anouter membrane channel determined by electron crystallography.Nature 350:167–170.
Kimura Y, Vassylyev DG, Miyazawa A, Matsushima M, Mitsuoka K,Murata K, Hirai T, Fujiyoshi Y. 1997. Surface of bacteriorhodopsinrevealed by high-resolution electron crystallography. Nature 389:206–211.
Kuhlbrandt W, Wang DN, Fujiyoshi Y. 1994. Atomic model of plantlight-harvesting complex by electron crystallography. Nature 367:614–621.
Mo F, Mathiesen RH, Hauback BC, Adman ET. 1996. Application ofknown x-ray phases in the crystallographic study of a small protein.Acta Crystallogr D52:893–900.
Pebay-Peyroula E, Rummel G, Rosenbusch JP, Landau EM. 1997.X-ray structure of bacteriorhodopsin at 2.5 angstroms from micro-crystals grown in lipidic cubic phases. Science 277:1676–1681.
Podjarny AD, Schevitz RW, Sigler PB. 1981. Phasing low-resolutionmacromolecular structure factors by matricial direct methods. ActaCrystallogr A37:662–668.
Ramachandran GN, Srinivasan R. 1970. Fourier methods in crystallog-raphy. New York: John Wiley & Sons. p 62–67.
Sayre D. 1952. The squaring method: a new method for phasedetermination. Acta Crystallogr 5:60–65.
Unwin PNT, Zamphigi G. 1980. Structure of the junction betweencommunicating cells. Nature 283:545–549.
Vainshtein BK. 1964. Structure analysis by electron diffraction.Oxford: Pergamon Press. p 51.
Vainshtein BK. 1978. Electron microscopical analysis of the three-dimensional structure of biological macromolecules. Adv OpticalElectron Microsc 7:281–377.
Watenpaugh KD, Sieker LC, Herriott JR, Jensen LH. 1973. Refine-ment of the model of a protein: rubredoxin at 1.5 Å resolution. ActaCrystallogr B29:943–956.
Watenpaugh KD, Margulis TH, Sieker LC, Jensen LH. 1978. Waterstructure in a protein crystal: rubredoxin at 1.2 Å resolution. J MolBiol 122:175–190.
103FILLING IN THE MISSING CONE