Embed Size (px)
Citation preview

2007 HEAVY VEHICLE CHARGES DETERMINATION
REGULATORY IMPACT STATEMENT VOLUME I
December 2007
Prepared by
National Transport Commission

National Transport Commission 2007 Heavy Vehicle Charges Determination: Regulatory Impact Statement
Report Prepared by: National Transport Commission ISBN: 1 921168 72 2
REPORT OUTLINE
Date: December 2007
ISBN: 1 921168 72 2
Title: 2007 Heavy Vehicle Charges Determination: Regulatory Impact Statement
Address: National Transport Commission Level 15/628 Bourke Street MELBOURNE VIC 3000
E-mail: [email protected] Website: www.ntc.gov.au
Type of report: Regulatory Impact Statement
Objectives: To improve transport efficiency, productivity and equity, reduce administration costs, improve road safety, and promote nationally consistent regulatory reform.
NTC Programs: Pricing
Key words: charges, heavy vehicles, road cost recovery, allocated costs, pricing.


FOREWORD
The Productivity Commission’s Road and Rail Infrastructure Pricing Inquiry, and the direction outlined by heads of government on 13 April 2007, clearly set out an agenda for pricing reform to unlock more productivity from the road network. As part of the first phase of this reform, the Australian Transport Council (ATC) and Council of Australian Governments (COAG) asked the National Transport Commission (NTC) to prepare a heavy vehicle charges determination for implementation in 2008. ATC and COAG specified that the determination should ensure that heavy vehicles continue to pay their share of increasing road expenditure by all levels of government. Thus the 2007 Heavy Vehicle Charges Determination (“the Determination”) will be the ‘building block’ for pricing reform. It will sustain the revenue base needed for governments to invest in better and safer roads, including the infrastructure upgrades needed for improved heavy vehicle access. In the past, updating heavy vehicle road use charges has been an emotive and often divisive issue. The NTC is encouraged by the cooperative approach of the freight industry in the development of this proposal. Indeed, the constructive views provided by industry have helped the NTC to better understand and respond proactively to the operating challenges it faces, and enabled the NTC to develop charges that are more flexible than they have been to date. In preparing this Final Regulatory Impact Statement (RIS), the NTC has reported differences between its recommended option and the industry’s views transparently and honestly. It has also made independent assessments of the impacts of its recommended option, and endeavoured to manage these impacts – for example, by recommending the phasing-in of charge increases to allow operators to better plan and re-negotiate freight contracts. Australia must maintain a world-class road and rail transport network to service the growing freight task, to reduce road trauma, and to ensure Australian businesses can compete cost-effectively in the global marketplace. The trucking industry has long supported the principle of paying its way. The NTC’s recommendations will ensure that this happens, and continues to do so between determinations. It is now time for governments to similarly respond by ensuring that productivity gains from the road asset – which are required by the industry to support a competitive economy – are released. The NTC acknowledges the work of Meena Naidu, Chris Egger, Matthew Clarke and Pauline Sullivan as the major contributors to this RIS. The statement has been presented in two volumes: Volume 1 describes the issues, options and recommendations; Volume II contains the technical appendices that underpin the analysis.
Michael Deegan
Chairman


SUMMARY
The road leading to the Determination
In 2006, the Productivity Commission conducted an inquiry into Road and Rail Freight Infrastructure Pricing (PC Inquiry), which included a review of the NTC’s methodology for developing recommendations on heavy vehicle charges. After the Productivity Commission broadly endorsed this methodology, the Australian Transport Council (ATC) directed the NTC to begin work on a new heavy vehicle charges determination, to replace the current Second Determination.
In April 2007, the Council of Australian Governments (COAG) outlined a road pricing reform plan, and endorsed the ATC directive for a 2007 Heavy Vehicle Charges Determination (“the Determination”) as part of the first phase of this plan. This reflected findings from the PC Inquiry that:
• heavy vehicle charges were set to under-recover costs: this Determination shows that in 2007/08 heavy vehicles will under-recover expenditure by $168m
• vehicles are subsidised if they do not recover their attributable costs: the Determination finds B-doubles under-recover their attributable costs by just over $11,000 per vehicle per year.
Addressing issues of cost recovery through the Determination is the first step in a broader COAG reform program which seeks to improve the efficiency and productivity of the road network through heavy vehicle price reform.
In line with specific directions from the ATC and COAG, the primary objectives of the 2007 Determination are to ensure that:
• road expenditure allocated to heavy vehicles in aggregate is fully recovered
• each vehicle class at least recovers its attributable expenditure, so that there are no cross-subsidies between vehicle classes
• charges accommodate high-productivity vehicles
• charges are consistent with the ATC approved pricing principles
• charges are updated in a way that enables them to continue to recover both allocated and attributable expenditure between determinations.
Following extensive consultation on the Draft Regulatory Impact Statement, NTC sought to achieve a further objective to maintain vehicle configuration flexibility, so that operators can change their vehicle configuration to meet the specific needs of each trip without facing adverse financial implications. This objective, which responds to trucking industry concerns, is consistent with COAG’s productivity reform agenda.
Process the NTC used to develop its recommendations
In July 2007, the NTC released a Draft Regulatory Impact Statement (RIS) that outlined a range of options (including its preferred options) for heavy vehicle charges. In developing these options, the NTC was informed by the Third Determination consultation process, the PC Inquiry, discussions and a technical workshop with industry representatives and government, and analyses of potential impacts of changes in the level of charges.

The NTC then completed comprehensive public consultation on the draft RIS. It invited industry and government stakeholders and other interested parties to make written submissions, receive industry briefings and/or participate in public focus group sessions held around the country. It received 22 written submissions and held focus groups in Melbourne, Sydney, Brisbane, Adelaide, Perth, Canberra and Darwin1. It also undertook further discussions with industry representative groups (including the Australian Trucking Association and its member associations and the National Farmers Federation) and governments.
Stakeholders raised a variety of concerns in relation to the draft RIS and the NTC’s preferred options. Key concerns included that:
• Competitive constraints make it difficult for industry to absorb increased costs
• Incentives for local government to provide access to the local road network are weak
• Enforcement costs should not be included in the cost base without a better enforcement and compliance framework
• The phasing in of charges needs to occur more evenly over the phase in period, to give industry time to better respond to changes
• The use of the proposed high productivity formula to set charges for higher productivity vehicles could impose significant administrative and enforcement burdens
• The proposed charges schedule constrained vehicle configuration flexibility.
After listening carefully to all stakeholders’ comments and views, the NTC responded by making significant changes to its preferred options in developing this Final RIS.
NTC’s recommendations
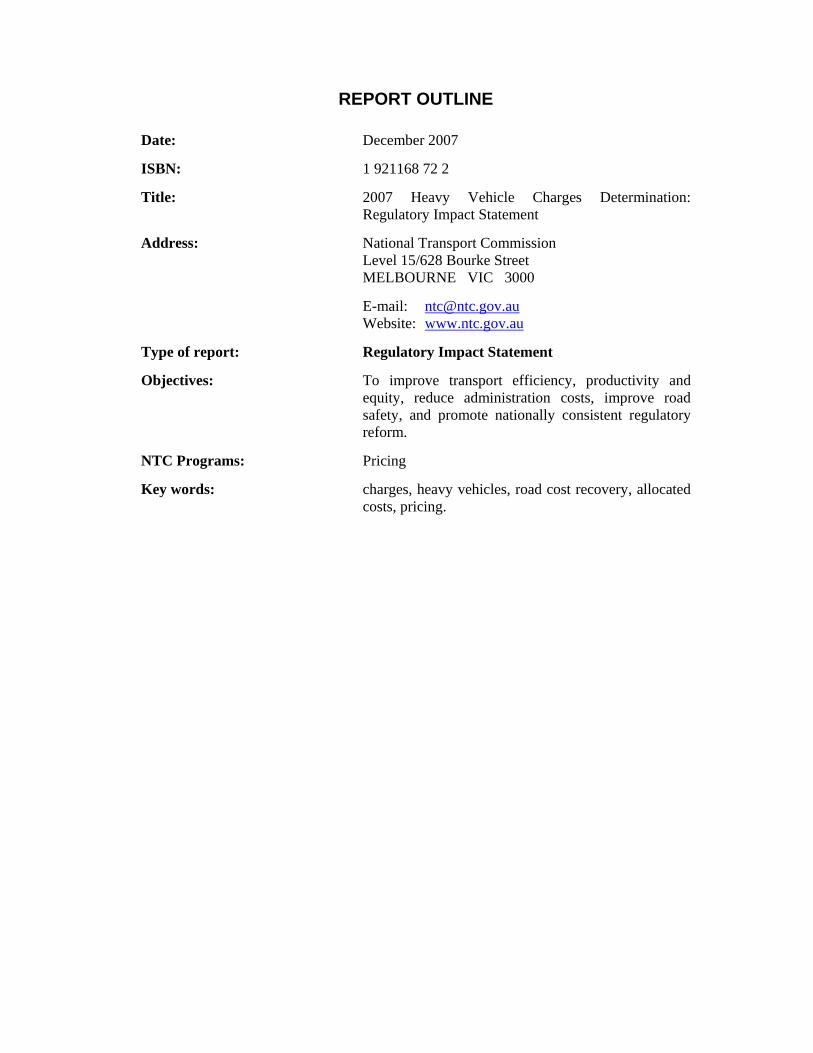
The NTC recommends the heavy vehicle charges schedule contained in Appendix I Vol. II of the Final RIS and shown for selected vehicles in Table ES1 below. These recommended charges are based on the preferred charging option described in the draft RIS, but the registration charges are more modular through the application of differentiated trailer axle charges rather than a uniform trailer axle charge.
The recommended charges meet all the objectives listed above, with two minor exceptions:
• The charges have been set to ensure that heavy vehicles fully recover their allocated expenditure in aggregate and each vehicle class at least recovers its attributable expenditure. However, the charges schedule includes a phase-in period of up to three years for some registration charges to establish a manageable implementation path for heavy vehicle operators and registration authorities. As a result of this phase-in period, the charges will not fully recover allocated and attributable expenditure until the final year of implementation (2010/11).
• The recommendations in relation to the annual adjustment process will enable charges to be updated so that they continue to fully recover allocated costs between determinations, and minimise the extent to which cross-subsidies across vehicle classes occur between determinations. The most precise way to ensure that no cross-subsidies
1 Focus group presentations and transcripts are available on the NTC website.
occur between determinations is to recalculate charges every year. However, the NTC did not favour this option because it may lead to charges volatility and will impose a significant regulatory burden.
Table ES1. The NTC’s recommended heavy vehicle charges for selected vehicles (nominal)
3 year phase in Current
07/08 Prime mover
Year 1 total Year 2 total Year 3 total
Fuel charge (cents) 19.633 21.0 21.0 21.0Registration charges ($ per vehicle)
2 axle rigid truck, 4.5 - 7 tonnes 355 380 380 380 3803 axle rigid truck over 18.5 tonnes, no trailer 946
859 859 859 859
4 axle rigid truck over 25t no trailer 859 859 859 859Heavy truck/trailer over 42.5 tonnes 2 5,737 5,161 6,491 7,158 7,158 6 axle articulated truck 5,084 3,930 5,070 5,145 5,220 B-double 9 axle 8,041 7,050 9,330 11,835 14,340 Double road train 8,751 7,050 10,090 10,240 10,390 Triple road train 10,526 7,050 11,990 12,215 12,440 2 axle bus over 10 tonnes 592 380 380 380 380Annual under-recovery ($m) 168 83 39 0Trailer charge per axle Year 1 Year 2 Year 3Standard trailer axle charge 355 380 380 380Semi trailer tr-axle 355 380 405 430B-double lead trailer – tandem axle 355 380 1,140 1,900B-double lead trailer – tri axle 355 380 1,190 2,000Road train dolly trailer 355 380 380 380
In calculating the recommended charges, the NTC:
• included 2007/08 budget expenditure in the seven-year average expenditure figure used in establishing the cost base
• partially included enforcement costs in the cost base
• allocated costs in line with the methodology developed as part of the Third Determination workings, except for a modification to address trucking industry concerns about the costs allocated to double and triple road trains
• adopted a modular charges structure that maintains vehicle configuration flexibility and accommodates higher productivity vehicles within the charges schedule
2 Note the prime mover registration charge for this class of vehicle has been phased in over 2 years. This figure represents the year 1 prime mover charge. The prime mover charge in years 2 and 3 is $5,828

• adopted a phase-in period of up to three years for the recommended registration charges
• modified the annual adjustment process by updating some of the formula components and removing the cap and floor on the adjustment amount, and recommended introducing an annual review to determine whether key variables have changed sufficiently to warrant a new determination, and undertaking a charges determination at least every five years.
Inclusion of 2007/08 budget expenditure in the cost base
In calculating the expenditure figure included in the Final RIS cost base, the NTC used an average of seven years’ expenditure data, including 2007/08 budget expenditure and actual expenditure for 2001/02 to 2006/07. This resulted in a cost base of $1,978m, which is $125m more than the Draft RIS cost base.
The NTC considered using 2006/07 budget expenditure and actual expenditure for 2000/01 to 2005/06. However, it preferred the inclusion of 2007/08 budget expenditure because:
• This approach ensures that the expenditure figure used to calculate the cost base is as up-to-date as possible, reducing the lag in the recovery of the current year of expenditure.
• Although it leads to a higher cost base than the alternative option, the resulting higher charges can be phased in over up three years and so will create less of a price shock for vehicle operators.
• It is administratively simpler, because it avoids the need for an annual adjustment to occur on the same date as new charges under the 2007 Determination begin to be implemented.
• It is consistent with the current methodology.
Partial inclusion of enforcement costs in the cost base
In calculating the cost base, the NTC took the view that it is appropriate for heavy vehicle charges to recover the costs associated with enforcing axle mass limits, as the primary objective of these constraints is to manage road wear (and thus avoid expenditure on road maintenance). In addition, because of the difficulties in separating mass-related and safety-related costs, the NTC took the view that the enforcement costs reported by road agencies, discounted to account for the fact that the NSW road agency appears to spend significantly more on safety-related enforcement than road agencies in other jurisdictions, is a reasonable proxy for mass-related costs.
In reaching this view, the NTC considered two alternative options: full inclusion of enforcement costs (i.e., both mass- and safety-related costs) and full exclusion of enforcement costs. It also considered the PC Inquiry’s finding that “the costs of enforcing heavy vehicle mass and speed restrictions are appropriately recovered through road user charges”, and the ATC pricing principle that heavy vehicle charges should enable “full recovery of allocated infrastructure costs”. The NTC concluded that only the recovery of mass-related enforcement is appropriate. This is because safety-related enforcement costs

cannot be considered to be infrastructure costs. Therefore their recovery through heavy vehicle charges would be inconsistent with the ATC’s current pricing principles.
The NTC noted the strong view expressed by the trucking industry that the recovery of enforcement costs is not justified without a framework for enforcement that resulted in better, more targeted and efficient enforcement. The NTC considers that work currently being done, including the development of a National Heavy Vehicle Enforcement Strategy, will improve the consistency and quality of enforcement, and improve the national accreditation program. The recovery of enforcement costs through heavy vehicle charges provides an opportunity for the cost of these various initiatives to be recovered, and could also provide incentives for operators to participate in accreditation leading to safer roads.
Allocation of costs
The methodology the NTC used to allocate the cost base to the different vehicle classes is based on the best available research, and was updated and consulted on as part of the Third Determination process. The Productivity Commission found that this methodology is reasonable although conservative in nature. In general, the methodology also has the support of the trucking industry.
The methodology relies on road usage data from the Australian Bureau of Statistics’ Survey of Motor Vehicle Usage (SMVU) to allocate costs. In responses to the draft RIS, the trucking industry expressed concerns about the quality of this data. The NTC reviewed the data, and undertook further analysis on the reliability of the road train data. It found the standard error associated with road train vehicle kilometres travelled (VKT) is sufficiently large that the VKT for double and triple roads trains fell within a similar range applying a 95 per cent confidence interval.
Given the significant impact VKT has on cost allocation, the NTC applied an average road train VKT figure of 133,750 to both double and triple road trains. This increased the cost allocated to double road trains from $35,611 to $38,055 and decreased the cost allocated to triple road trains from $68,342 to $47,323 (before unsealed travel adjustments are made) compared to the draft RIS.
Adoption of a modular charges structure that maintains vehicle configuration flexibility and accommodates higher productivity vehicles
In the draft RIS, the NTC presented two options for charges:
• Option C1: Fuel-based charge of 21.3 cents per litre plus annual registration charges with differentiated prime mover charges, which ensured that heavy vehicles fully recover their allocated costs in aggregate, and all vehicle classes recover at least their attributable costs (marginal road use costs).
• Option C2: Fuel-based charge of 19.7 cents per litre plus annual registration charges with differentiated prime mover charges, which ensured that heavy vehicles fully recover their allocated costs in aggregate, and all vehicle classes recover their fully allocated costs (including common costs).
Consultations indicated that while there was broad support for the principle of attributable cost recovery, there were also concerns about the implications of the proposed options for vehicle configuration flexibility and the enforcement burden.
The trucking industry strongly put the view that operators should be able to change their vehicle configuration to meet their needs for specific trips without facing adverse financial implications. To enable a standard trailer axle charge, the draft RIS options proposed that

B-double, double road train and triple road train prime movers would all have different registration charges. The trucking industry expressed concern that the flexibility of the current charges arrangement would be lost by having a differentiated charge for a prime mover that is the same, except for the trailer configuration.
Some governments expressed concern that a change to the charges structure would result in a greater enforcement burden. This is because operators would be given an incentive to register their prime mover in the most inexpensive class (a double road train) but run it as part of a B-double or triple road train configuration.
In light of these concerns, and in consultation with the trucking industry, the NTC developed a third option:
• Option C3. Fuel-based charge of 21.0 cents per litre plus annual registration charges that, like Option C1, ensured that heavy vehicles fully recover their allocated costs in aggregate, and all vehicle classes recover at least their attributable costs.
However, unlike Option C1, this option maintains the flexibility of a prime mover by providing a multi-combinational prime mover charge. Cost recovery is achieved by differentiating the trailer axle charge by the type of trailer, not by the vehicle configuration. This modular approach is similar to the charging structure the ATA proposed in its submission in response to the draft RIS, and enables virtually any configuration of prime mover and trailers to be accommodated through the charges schedule.
This modular charge structure means that higher productivity vehicles can also be accommodated within the charges schedule. The NTC considers this is preferable to the use of higher productivity formula as proposed in the draft RIS, on the grounds that it is simpler and NTC analysis indicates that it results in very similar charges to the formula.
The NTC is conscious that although registration charges constitute a relatively small proportion of vehicle operating costs, its recommended registration charges for some vehicles represent a considerable cost increase. This is particularly the case for vehicles in classes that are currently under-recovering their attributable costs. Nevertheless, the NTC prefers its recommended charges option for the following reasons:
• as indicated above, this option meets all the primary objectives for the 2007 Heavy Vehicle Charges Determination
• unlike Options C1 and C2, it maintains vehicle configuration flexibility and accommodate higher productivity vehicles
• the charges under Option C3 better share the recovery of costs between the prime mover and the trailer. The charges under Option C2 do not adequately adhere to the pricing principle of having “regard to other pricing applications, such as light vehicle charges…” because they include a registration charge for two axle rigid vehicles that is below the mid point of the range of maximum charges for light vehicles.
Figure ES1 shows how total registration charges are derived under the recommended Option C3.

Figure ES1 Application of registration charges to vehicles
Adoption of a phase-in period of up to three years for registration charges
The recommended registration charges will result in cost increases for prime movers and trucks in some heavy vehicle classes, and the introduction of differential trailer axle charges will result in large cost increases for some trailer types. In recognition of this, the recommended charges schedule includes a phase-in period of up to three years. Under this schedule:
• The increased fuel-based charge is fully implemented in Year 1.
• For truck and prime mover registration charges, all increases and decreases are fully implemented in Year 1, except those for heavy truck trailers. In this case, the increase in the vehicle component of the registration charge is phased in evenly over three years. This exception is due to the large size of the increase, which has partly resulted from reclassification of SMVU data, and feedback from stakeholders on the impacts of this increase.
• For trailer registration charges, the increase in the standard trailer per axle rate is fully implemented in Year 1. Where a differential trailer axle charge is proposed, the charge is phased in over three years with the Year 1 charge being equivalent to the standard trailer axle rate and the balance being implemented evenly in the remaining years.
As noted above, this phasing in will result in a continued under-recovery of expenditure in Years 1 and 2. However, both the governments and heavy vehicle operators have indicated that it is necessary, to provide them with sufficient time to make the operational and system changes required to accommodate the new charges schedule.

Modification to the annual adjustment process
The NTC recommends modifying the current annual adjustment process by:
• Updating the formula components to align with the new 2007 Determination cost allocation model
• Removing the CPI cap and 0 per cent floor on registration charge increases
• Indexing the fuel-based charge by the Annual Adjustment Formula used to index registration charges.
In addition, the NTC recommends that it undertakes an annual review to evaluate whether key variables have moved sufficiently to warrant a new determination and that a charges determination occurs at least every five years (if not already undertaken as a result of the annual review).
The NTC considers that this approach to the annual adjustment (Option A2) is preferable to the alternative approaches it considered. It will ensure that charges continue to recover heavy vehicle allocated expenditure in aggregate in a way that is formula-driven, relatively simple, and will not require a new determination each year. In addition, when combined with an annual review process and more frequent determinations, it will minimise “ongoing cross-subsidisation across different heavy vehicle classes”.
In comparison:
• Options A1 (update formula components and include fuel indexation) does not achieve full recovery of allocated expenditure in aggregate or reduce cross-subsidisation across vehicle classes between determinations.
• Option A3 (index both registration charges and fuel-based charge by CPI or RCMP1) does not ensure that the adjusted charges match the estimated cost of road use over time, and therefore may result in the need for major corrections in subsequent determinations. In addition, it does not have much stakeholder support.
• Option A4 (annual recalculation of charges) is the most accurate way to ensure ongoing cost recovery and removal of cross-subsidisation, but it would introduce unnecessary charges volatility and require a significant amount of maintenance and consultation. Many stakeholders who commented on Option A4 expressed similar views.
The impact of new charges
NTC has considered the impacts of its recommended charges schedule. In general, it believes this schedule (which, as discussed above, includes a phase-in period) provides heavy vehicle operators with sufficient time to re-negotiate contracts and pass costs on to their customers, and to consider how they can achieve operational efficiencies, particularly in the use of their trailer fleet. It also provides registration agencies enough time to make the system changes required to facilitate the modified charges structure.
Impact on heavy vehicle operators
Under the recommended charges schedule, the fuel-based charge will increase by 1.367 cents per litre, or about 1.3 per cent. The increase will be implemented through a reduction in the fuel rebate from 18.51 cents per litre to 17.143 cents per litre.
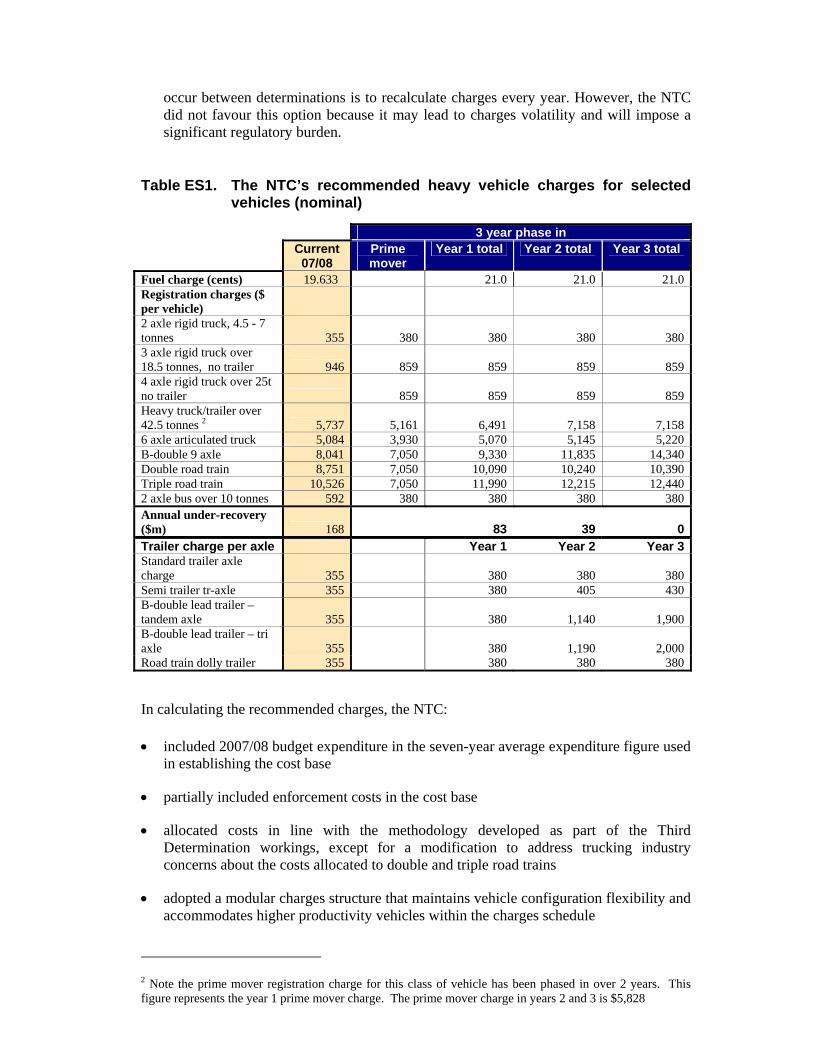
In addition, the registration charge for all vehicles and vehicle-trailer combinations will change. Around 25 per cent of vehicles will experience a decrease in their registration charge. The remaining 75 per cent of vehicles and 100 per cent of trailers will experience an increase in their registration charge.
These increases will have a direct impact on vehicle operating costs, but the impact will vary depending on a range of factors including heavy vehicle class and VKT. To illustrate the likely impact, the NTC modelled the average vehicle impacts within each heavy vehicle class. The results of this modelling for some key heavy vehicle types are shown in Table ES2.
Table ES2. Change in average vehicle operating costs for key vehicle types
Vehicle type 2007 average vehicle operating
costs $
Percentage change in
Year 1
Percentage change in
Year 2
Percentage change in
Year 3 2 axle rigid truck 4.5 to 7 tonnes (no trailer)
22,100 0.4 0.4 0.4
3 axle rigid truck over 18 tonnes (no trailer)
37,400 0.2 0.2 0.2
Heavy truck trailer over 42.5 tonnes
116,200 1.1 1.7 1.7
6 axle articulated truck 124,800 0.5 0.5 0.6 9 axle B-double 278,200 1.0 1.9 2.8 Double road train 252,200 1.0 1.1 1.1 Triple road train 301,300 1.0 1.0 1.1 Note: annual percentage changes are not cumulative
The table shows that a B-double with average vehicle class characteristics in terms of load and distance travelled per annum (179,000km) faces a rise of 2.8 per cent after charges are fully phased-in. However, a shorthaul B-double that travels around 120,000 kilometres per annum is likely to face a rise of 3.9 per cent, while a longhaul B-double that travels 240,000 kilometres per year will face a rise 2.3 per cent.
NTC has also recognised that different operators will be affected differently by this Determination. It has therefore undertaken a variety of case studies to understand the impacts on real operations. The impact of the Determination on the operations considered in the case studies did not exceed 2 per cent.
In line with the ATC’s request, the NTC also considered the substitution effects for vehicles with similar vehicle characteristics and carrying capacity that face different charges. It found that these effects are unlikely to be significant, because the recommended registration charges are more closely related to trailer type and capacity, and so there is closer alignment between vehicles of similar carrying capacity that are likely to be substitutes for each other. The NTC does not support locally based concessions aimed at discouraging substitution, as this would create incentives for vehicles in other jurisdictions to register their vehicles in the states/territories where the concessions exist.

Impacts on end users
The flow-through impact of the NTC’s recommended charges to consumer prices is difficult to assess, due to the lack of available information. However, the NTC estimated this impact on a trolley containing $100 worth of grocery items. If found that:
• For retail outlets dependent on B-doubles, the maximum additional cost per $100 trolley of goods would be 17 cents. This level of impact would occur in remote areas, and the impact in other areas would be less.
• For retail outlets dependent on road trains, the maximum impact would be an extra 7 cents per $100 trolley of goods in remote areas.3
The recommended charges may also have an impact on vehicles owned by primary producers. However, this impact is not expected to be significant, given that each government is able to, and generally does, provide concessions for primary producers of 40–50 per cent of heavy vehicle charges. NTC notes that primary producers using hire and reward operators will be more adversely affected.
The recommended charges will have impacts on small businesses, but on average they are not expected to be significant, particularly due to the low share of registration charges in annual vehicle operating costs.
Impact on government revenue
The recommended registration charges will lead to increases in the total revenue generated by these charges for each jurisdiction (see Table ES3), and mostly lead to increases in the revenue generated by registration charges for specific vehicle classes.
Table ES3 Registration revenue by jurisdiction $’000s (nominal)
State/Territory
Current revenue (2007/08)
Proposed revenue 2008/09
Proposed revenue 2009/10
Proposed revenue 2009/10
Percentage change in
revenue from current to 2009/10
NSW 150,313 150,144 159,228 166,778 11.0
Vic 171,433 172,147 185,841 197,894 15.4
Qld 146,881 149,445 160,107 169,816 15.6
SA 57,859 58,750 64,478 69,982 21.0
WA 86,169 87,452 90,940 94,113 9.2
Tas 14,940 14,864 15,726 16,503 10.5
NT 7,972 8,421 8,651 8,858 11.1
ACT 2,860 2,806 2,961 3,084 7.8
Total 638,428 644,030 687,933 727,028 13.9
The recommended fuel-based charge will increase the revenue generated by this charge from $1.146 billion to $1.226 billion – an increase of 6.9 per cent.
3 These estimates are based on averages, and consumer price impacts will vary depending on individual transport operator’s circumstances and the decisions made by individual retail outlets on cost mark-ups.

The NTC also considered the impact of the investment resulting from increased charges. In particular, it notes that the Monash University Accident Research Centre estimates that improved road investment (including shoulder sealing, audible edge lines, passing lanes and rest areas) will contribute at least 38 per cent of the total future reduction in heavy vehicle related road deaths and casualties under the current National Heavy Vehicle Safety Strategy, compared to 30 per cent from the effective use of speed limiters, 18 per cent from better fatigue management, 9 per cent from increased seatbelt use by heavy vehicle drivers and 5 per cent from safer heavy vehicles.
The next steps
ATC has stated this Determination will be implemented on 1 July 2008.

CONTENTS
1. INTRODUCTION ....................................................................................................1 1.1 The governmental directions leading to a new determination.....................................1 1.2 NTC’s role in developing heavy vehicle charges ........................................................2 1.3 Previous determinations .............................................................................................3 1.4 Developing the 2007 Heavy Vehicle Charges Determination .....................................4
2. WHAT IS THE PROBLEM .....................................................................................5 2.1 Heavy vehicle charges don’t recover heavy vehicle allocated
expenditure .................................................................................................................6 2.1.1 Increase in expenditure on roads..................................................................................6 2.1.2 Changes in the fleet numbers and usage ...................................................................10 2.1.3 The annual adjustment ...............................................................................................11 2.1.4 Impact on the level of cost recovery ...........................................................................11
2.2 Is it appropriate to recover enforcement costs through charges?.............................12 2.2.1 The principle for including enforcement costs.............................................................12 2.2.2 Getting a better outcome out of enforcement..............................................................13 2.2.3 Revenues association with enforcement.....................................................................14
2.3 Smoothing the variability in road expenditures .........................................................15 2.4 Developing charges for high-productivity vehicles....................................................16
3. THE OBJECTIVE .................................................................................................18 3.1.1 ATC approved pricing principles .................................................................................19 3.1.2 COAG requirements ...................................................................................................19 3.1.3 The considerations .....................................................................................................20
4. THE OPTIONS......................................................................................................22 4.1 Which years of expenditure should be averaged in determining the cost
base? ........................................................................................................................22 4.1.1 Option CB1: Include 2007/08 budget expenditure in the cost base ............................24 4.1.2 Option CB2: Include 2006/07 budget expenditure in the cost base ............................24
4.2 To what extent should enforcement costs be included in the cost base?.................25 4.2.1 Option a: Full inclusion of road agency enforcement costs .........................................26 4.2.2 Option b: Partial inclusion of road agency enforcement costs.....................................27 4.2.3 Option c: Full exclusion of enforcement costs.............................................................28 4.2.4 Comparing the impact of the options for enforcement costs .......................................29 4.2.5 A framework for enforcement .....................................................................................30
4.3 How should costs be allocated between vehicle classes? .......................................30 4.3.1 The importance of VKT in allocating costs..................................................................30 4.3.2 The reliability of road usage data................................................................................31
4.4 How should prices be set to fully recover heavy vehicle costs in aggregate and ensure all vehicle classes at least recover their attributable costs?.....................................................................................................31 4.4.1 Implications for B-doubles and road trains..................................................................32 4.4.2 Implications for vehicle flexibility and enforcement burden .........................................33 4.4.3 Option C1 ...................................................................................................................33 4.4.4 Option C2 ...................................................................................................................34 4.4.5 Option C3 ...................................................................................................................35
4.5 What charges should apply to high-productivity vehicles? .......................................38 4.5.1 Higher productivity vehicle charge formula .................................................................38 4.5.2 Modular approach to charges .....................................................................................41
4.6 Should charges under the 2007 Determination be phased in?.................................44 4.7 How should charges be adjusted annually? .............................................................47
4.7.1 Option A1: Maintain the current adjustment process with modifications and inclusion of fuel indexation...................................................................................48
4.7.2 Option A2: Option A1 with removal of the cap and floor ............................................48 4.7.3 Option A3: Indexation of both registration and fuel charges.......................................49 4.7.4 Option A4: Annual re-calculation of charges..............................................................50 4.7.5 Stakeholder comments on the options........................................................................50

5. ASSESSMENT OF POTENTIAL IMPACTS ....................................................... 54 5.1 Impact on fuel-based charge....................................................................................54 5.2 Impact on registration charge...................................................................................54
5.2.1 Impact on heavy vehicles ...........................................................................................54 5.2.2 Impact on jurisdictions’ registration revenue ...............................................................55
5.3 Impact on vehicle operating costs ............................................................................55 5.3.1 Impact on road user charges per net tonne kilometre.................................................57 5.3.2 Impact on the vehicle fleet ..........................................................................................58 5.3.3 Case studies of impact on operational costs...............................................................58
5.4 Impacts on industry production costs .......................................................................64 5.5 End user impacts......................................................................................................65
5.5.1 Impacts on the price of consumer goods ....................................................................65 5.5.2 Ability to pass on cost increases.................................................................................66 5.5.3 Impacts on primary producers ....................................................................................66 5.5.4 Impacts on small businesses......................................................................................67
5.6 Impacts on competition ............................................................................................67 5.7 Implications for government financing......................................................................68
5.7.1 The need for road investment .....................................................................................68 5.7.2 Charges contribution to road investment ....................................................................68
5.8 Impact of road investment on heavy vehicle productivity and safety........................69 5.8.1 Case studies of improved productivity ........................................................................69 5.8.2 Case studies of improved safety.................................................................................69
5.9 Potential productivity improvements.........................................................................70 5.9.1 COAG-endorsed NTC work program..........................................................................70 5.9.2 Targeted infrastructure improvements ........................................................................71 5.9.3 Other regulatory reforms.............................................................................................72
6. CONSULTATION................................................................................................. 73 6.1 The consultation process .........................................................................................73 6.2 Major issues raised and the NTC’s response...........................................................74
6.2.1 The treatment of enforcement costs ...........................................................................74 6.2.2 The methodology for estimating heavy vehicle charges revenue................................75 6.2.3 Estimation of the allocated cost base .........................................................................76 6.2.4 Impacts of differential multi-combination prime mover charges ..................................76 6.2.5 The inability of industry to pass on large increases in charges ...................................77 6.2.6 Concern over the adoption of the high-productivity vehicle formula ............................77 6.2.7 Need for productivity offsets by opening up the network more....................................78
7. RECOMMENDATION .......................................................................................... 79 7.1 Recommended heavy vehicle charges ....................................................................80
7.1.1 Inclusion of 2007/08 budget expenditure in the cost base ..........................................82 7.1.2 Partial inclusion of enforcement costs in the cost base...............................................82 7.1.3 Allocation of costs.......................................................................................................82 7.1.4 Adoption of a revised charges structure......................................................................83 7.1.5 Adoption of a phase-in period of up to three years for registration charges ................83 7.1.6 Modification to the annual adjustment process ...........................................................84
7.2 Compliance issues ...................................................................................................85 7.3 Implementation issues..............................................................................................85 7.4 Legislative issues .....................................................................................................85
8. REFERENCES..................................................................................................... 87
9. GLOSSARY OF TERMS ..................................................................................... 89
LIST OF TABLES
Table 1. Total road construction and maintenance expenditure estimates ($2007/08m real terms)....................................................................................6
Table 2. Changes in fleet numbers since the Second Determination.....................10 Table 3. Heavy vehicle enforcement expenditure by state ......................................27 Table 4. Adjusted heavy vehicle enforcement expenditure by state ......................28 Table 5. Allocation of enforcement costs for each option ($/vehicle) ....................29 Table 6. Charges under Option C1 for select vehicles under different
enforcement scenarios .................................................................................34 Table 7. Charges under Option C2 for select vehicles under different
enforcement scenarios .................................................................................35 Table 8. Charges under Option C3 for select vehicles under different
enforcement scenarios .................................................................................36 Table 9. Modular charge components of higher productivity vehicles ..................42 Table 10. Registration charges for B-Triples and B-Doubles derived using the
different approaches .....................................................................................43 Table 11. Option C1 with a two or three year phase in of registration increases
(nominal) ........................................................................................................45 Table 12. Option C3 with a two year phase in of registration increases (nominal) .46 Table 13. Option C3 with a three year phase in of registration increases
(nominal) ........................................................................................................47 Table 14. Summary of stakeholder submission comments on options for annual
adjustment process.......................................................................................51 Table 15. Registration revenue by jurisdiction ($ ‘000s)............................................55 Table 16. All jurisdiction registration revenue by vehicle class ($ ‘000s) ................55 Table 17. Change in average vehicle operating costs for key vehicle types ...........56 Table 18. Changes in registration costs as a share of average vehicle operating
costs ...............................................................................................................57 Table 19. Changes in total heavy vehicle charges as a share of average vehicle
operating costs..............................................................................................57 Table 20. Impact on $100 worth of groceries (cents) .................................................66 Table 21. Recommended schedule of charges after phasing in ...............................79 Table 22. The NTC’s recommended heavy vehicle charges for selected vehicles
with phasing (nominal) .................................................................................81
LIST OF FIGURES
Figure 1. COAG road pricing reform plan.....................................................................2 Figure 2. Allocated arterial expenditure ($2007/08 real terms) ...................................7 Figure 3. Arterial, reported local and allocable local road expenditure
movements over the past seven years ($2007/08).......................................8 Figure 4. Forecast impact of the freight task on truck numbers ................................9 Figure 5. Growth in the total heavy fleet number since the Second
Determination ................................................................................................10 Figure 6. B-double under-recovery of fully allocated costs per vehicle (nominal).12 Figure 7. Process for developing, implementing and adjusting charges................22 Figure 8. Heavy vehicle allocated cost base ($nominal) ...........................................23 Figure 9. Application of charges under Option 3Cb to vehicles ..............................37 Figure 10. Comparison of changes in road expenditure to changes in RCMPI and
CPI (2000/01 = 100.0).....................................................................................50 Figure 11. Road user charges per net tonne kilometre (once fully implemented)....58 Figure 12. Case study 1: impact on vehicle operating cost shares ..........................59 Figure 13. Case study 2: impact on vehicle operating cost shares ..........................60 Figure 14. Case study 3: impact on vehicle operating cost shares ..........................61 Figure 15. Case study 4: impact on vehicle operating cost shares ..........................62 Figure 16. Case study 5: impact on vehicle operating cost shares ..........................63 Figure 17. Case study 6: impact on vehicle operating cost shares ..........................64

2007 Heavy Vehicle Charges Determination Regulatory Impact Statement Vol I Page 1
1. INTRODUCTION
1.1 The governmental directions leading to a new determination
In 2006 the Productivity Commission conducted an inquiry into Road and Rail Freight Infrastructure Pricing (PC Inquiry). As part of this inquiry, the Productivity Commission reviewed the methodology the National Transport Commission (NTC) uses to develop its recommendations on heavy vehicle charges. While the Productivity Commission identified some shortcomings and conservative assumptions in this methodology, it broadly endorsed the NTC’s approach.
Following this endorsement, the Australian Transport Council (ATC) directed the NTC to begin work on a new heavy vehicle charges determination, to replace the current Second Determination. The full direction is as follows:
(ATC) DIRECTED the NTC, having regard to the final report of the Productivity Commission and the deliberations of COAG on future pricing issues, to develop a Heavy Vehicle Pricing Determination that:
(i) considers the inclusion of heavy vehicle enforcement costs in the cost base; and
(ii) allows for incremental charging for higher productivity vehicles;
AGREED that its preferred timeframe for the delivery of a Heavy Vehicle Road Pricing Determination is mid 2007; and
DIRECTED the NTC to report to the next ATC meeting on a Heavy Vehicle Pricing Determination.4
On 13 April 2007, the Council of Australian Governments (COAG) outlined a road reform agenda, and endorsed the ATC directive for a new heavy vehicle charges determination as part of Phase 1 of this plan (see Figure 1).
4 Recorded in the draft minutes of the 13 October 2006 ATC meeting.

Page 2 2007 Heavy Vehicle Charges Determination Regulatory Impact Statement Vol I
Figure 1. COAG road pricing reform plan
At its May 2007 meeting, ATC reinforced its earlier direction and requested the NTC to begin preparing a Regulatory Impact Statement (RIS) so that a new determination could be implemented on 1 July 2008, in line with COAG’s timetable. The ATC clearly indicated that in preparing the RIS, the NTC should follow the pricing principles approved in 2004, and meet COAG’s requirement that the Determination “ensure ongoing delivery of aggregate cost-recovery and removal of cross-subsidisation across heavy vehicle classes” (COAG 2007).
1.2 NTC’s role in developing heavy vehicle charges
The NTC is responsible for recommending heavy vehicle charges to the ATC. This function is set out in the Inter-Governmental Agreement for Regulatory and Operational Reform in Road, Rail and Intermodal Transport (IGA), and is intended to ensure that nationally uniform charges are applied to heavy vehicles.
Clause 5.1 of the IGA sets out that one of the responsibilities and functions of the NTC is to:
(c) develop
(i) road use charging principles for Heavy Vehicles (until such time as the Council decides that another organisation should undertake this function);
(ii) Proposed Reforms in relation to Heavy Vehicle Road Use Charges based on charging principles agreed by the Council from time to time;
The IGA specifies that a:
End 2011
End 2014
Delivery of heavy vehicles Determination ⎪PBS and other agreed reforms
End 2009
Independent review of PAYGO and externalities
Feasibility study (incl. trials) on Incremental Pricing Scheme ⎪CSO Research
Evaluation of incremental pricing
Alternative institutional arrangements ⎪ Review of Road Freight Infra Regulation
Implementation of the result of Phase 1 and 2 work programs
Feasibility study of mass-distance location based charges
Implementation of the results of Phase 3 work programs
Phas
e 2
Phas
e 3
2007
Tim
elin
e fo
r ref
orm
National Guidelines for Transport System Management
Phas
e 1
2007 Heavy Vehicle Charges Determination Regulatory Impact Statement Vol I Page 3
Road Use Charge means a fee for payment for use of the road system, which in the case of a Heavy Vehicle, does not include: - a nominal or other administration charge associated with registration of a
vehicle; - stamp duties; - compulsory third party insurance premiums; - injury protection charges; and - administrative components of permit, licence or other fees.
In addition, the IGA makes it clear that heavy vehicle charges must apply uniformly in all jurisdictions. This is intended to stop heavy vehicle operators ‘shopping around’ for the jurisdiction with the lowest registration charges (which would distort price signals within the market) and to ensure that all heavy vehicles pay their allocated share of road expenditure.
In developing its recommended heavy vehicle charges, the NTC assesses the level and types of expenditure on roads, assesses the usage of roads by different vehicle classes, and consults with stakeholders. The ATC considers the NTC’s recommended heavy vehicle charges, and determines whether or not to approve them. If a majority of its members approves the recommendations, governments in all jurisdictions are obliged to implement them.
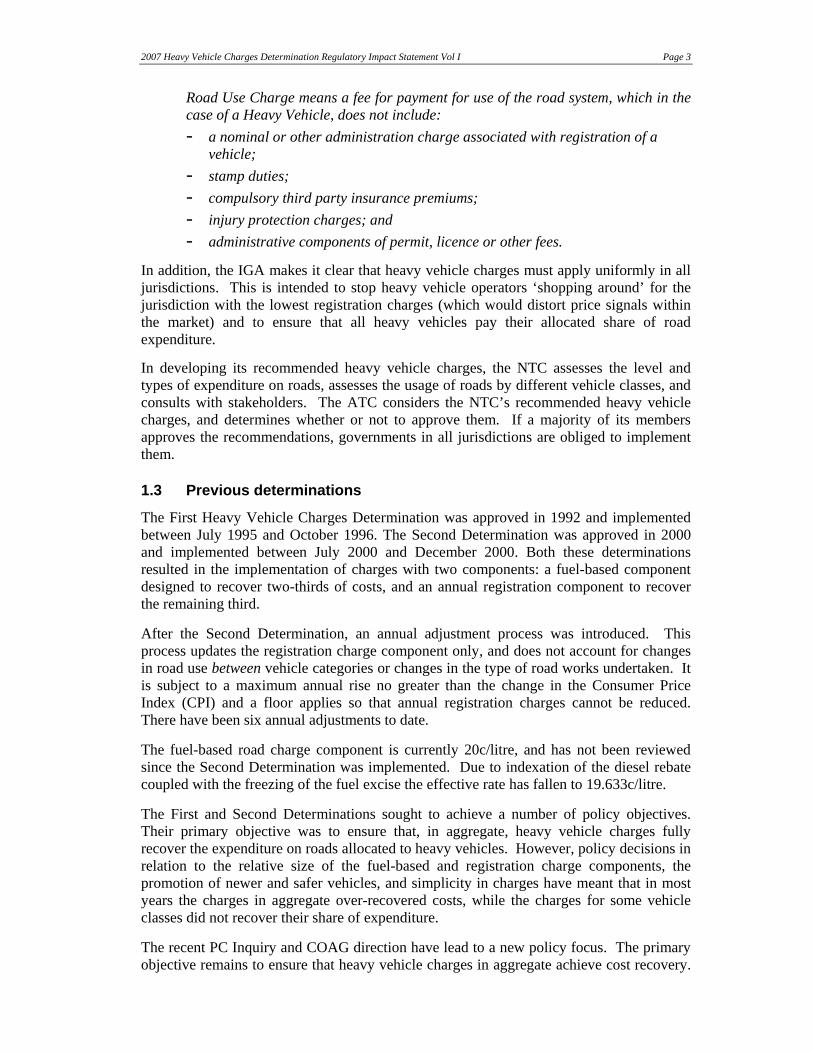
1.3 Previous determinations
The First Heavy Vehicle Charges Determination was approved in 1992 and implemented between July 1995 and October 1996. The Second Determination was approved in 2000 and implemented between July 2000 and December 2000. Both these determinations resulted in the implementation of charges with two components: a fuel-based component designed to recover two-thirds of costs, and an annual registration component to recover the remaining third.
After the Second Determination, an annual adjustment process was introduced. This process updates the registration charge component only, and does not account for changes in road use between vehicle categories or changes in the type of road works undertaken. It is subject to a maximum annual rise no greater than the change in the Consumer Price Index (CPI) and a floor applies so that annual registration charges cannot be reduced. There have been six annual adjustments to date.
The fuel-based road charge component is currently 20c/litre, and has not been reviewed since the Second Determination was implemented. Due to indexation of the diesel rebate coupled with the freezing of the fuel excise the effective rate has fallen to 19.633c/litre.
The First and Second Determinations sought to achieve a number of policy objectives. Their primary objective was to ensure that, in aggregate, heavy vehicle charges fully recover the expenditure on roads allocated to heavy vehicles. However, policy decisions in relation to the relative size of the fuel-based and registration charge components, the promotion of newer and safer vehicles, and simplicity in charges have meant that in most years the charges in aggregate over-recovered costs, while the charges for some vehicle classes did not recover their share of expenditure.
The recent PC Inquiry and COAG direction have lead to a new policy focus. The primary objective remains to ensure that heavy vehicle charges in aggregate achieve cost recovery.

Page 4 2007 Heavy Vehicle Charges Determination Regulatory Impact Statement Vol I
In addition, all vehicle classes should recover their attributable (or marginal) costs so that there is no cross-subsidisation between vehicles classes.
1.4 Developing the 2007 Heavy Vehicle Charges Determination
In 2006, the NTC put forward recommendations for a Third Determination. In reaching these recommendations, it undertook extensive consultation and released several reports that documented the technical underpinning of the Determination models and the changes made to these models since the Second Determination.
The ATC did not approve the Third Determination, but requested the NTC to begin work on a 2007 Determination in response to the PC Inquiry and COAG direction. In doing so, the NTC has built on some of the workings for the Third Determination, rather than duplicating this work. For example, it largely used the same methodology for assessing the cost base and allocating costs as it used in developing its recommendations for the Third Determination.5
In July 2007, the NTC released a draft RIS that outlined its preferred option for heavy vehicle charges. This option met the minimum COAG and ATC requirements that each vehicle class at least recover its attributable costs and that heavy vehicles in aggregate fully recover their allocated costs. It then completed comprehensive public consultation on the draft RIS, and considered the comments and issues raised by stakeholders.
As a result of this process, the NTC revised its preferred option. It then undertook further consultation with industry, interested parties and government before finalising its recommendations and preparing this final RIS.
5 Throughout this RIS, the NTC will refer to documents prepared for the Third Determination where appropriate, and identify any continuing concerns raised by stakeholders and detail any further changes since those reports were released.

2007 Heavy Vehicle Charges Determination Regulatory Impact Statement Vol I Page 5
2. WHAT IS THE PROBLEM
In recent years government spending on road infrastructure has increased. Whilst road usage of the heavy vehicle fleet has also increased, the increase in the overall fleet size has been relatively small. As a result of these changes, heavy vehicle charges in aggregate no longer recover heavy vehicle allocated expenditure, and the charges for some heavy vehicle classes do not recover these vehicles’ attributable expenditure. This is the primary problem that the 2007 Heavy Vehicle Charges Determination needs to address.
There are also several secondary problems that need to be addressed:
• The NTC has been asked to consider whether it would be appropriate to recover costs associated with enforcing laws relevant to heavy vehicles through heavy vehicle charges.
• The NTC has identified that the current practice of calculating the cost base to be recovered through heavy vehicle charges by averaging three years of road expenditure may not sufficiently smooth out the year-to-year variability in this expenditure. In addition, it has been asked to consider the feasibility of including budget expenditure for 2007/08 in calculating the cost base.
• The NTC has been asked to develop charges for the new generation of high-productivity vehicles.
• The NTC has been asked to consider whether the new charges should be phased in, in recognition of the fact that moving to charges that ensure all vehicle classes at least recover their attributable expenditure may result in significant increases in charges for some vehicle classes.
The sections below discuss these problems in more detail. Box 1 defines some of the key terms used in these sections.
Box 1: Definition of key terms
It is important to understand some of the terminology used to describe how the charges are calculated. The key terms are:
Total expenditure: This includes all road expenditure by all levels of government including local government, state/territories and Auslink.
Allocable expenditure: This is the total pool of expenditure after a certain percentage of local road expenditure, which is already recovered through rates, has been deducted.
Allocated expenditure: This is the allocable expenditure distributed across the various classes or groups. This report will generally refer to heavy vehicle allocated expenditure, which is the share of allocable expenditure recovered by all vehicles over 4.5 tonnes. Total allocated expenditure equals allocable expenditure.
Attributable expenditure: This is the expenditure related to the provision and maintenance of roads and which varies depending on the use of the road system by different types of vehicles. It is equivalent to the long run marginal cost and therefore includes capital as well as operational costs. These costs are directly attributable to vehicle types.
Common costs: These are costs that are not attributed to particular use and include such things as signage and expenditure related to the impact of weathering on the roads. These costs are also often referred to as non-attributable expenditure.
Page 6 2007 Heavy Vehicle Charges Determination Regulatory Impact Statement Vol I
2.1 Heavy vehicle charges don’t recover heavy vehicle allocated expenditure
The charges under the Second Determination were calibrated to ensure that at minimum, they recovered historic heavy vehicle allocated expenditure. In 2000, these charges over-recovered this historic expenditure by $140m in nominal terms. However, this situation has reversed, and the charges now under-recover this expenditure. The primary reasons are that expenditure has increased at a greater rate than fleet growth, and the annual adjustment has not been able to keep pace with the increase in expenditure because it is subject to a CPI cap.
2.1.1 Increase in expenditure on roads
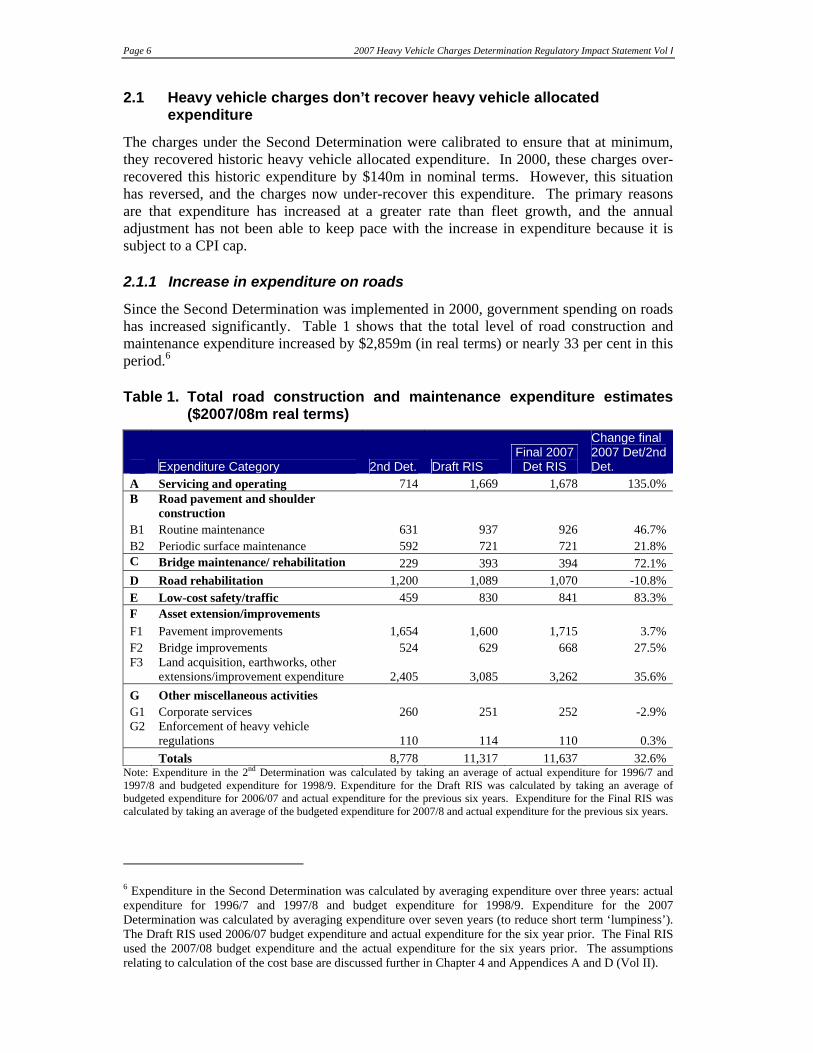
Since the Second Determination was implemented in 2000, government spending on roads has increased significantly. Table 1 shows that the total level of road construction and maintenance expenditure increased by $2,859m (in real terms) or nearly 33 per cent in this period.6
Table 1. Total road construction and maintenance expenditure estimates ($2007/08m real terms)
Expenditure Category 2nd Det. Draft RIS Final 2007
Det RIS
Change final 2007 Det/2nd Det.
A Servicing and operating 714 1,669 1,678 135.0% B Road pavement and shoulder
construction B1 Routine maintenance 631 937 926 46.7% B2 Periodic surface maintenance 592 721 721 21.8% C Bridge maintenance/ rehabilitation 229 393 394 72.1% D Road rehabilitation 1,200 1,089 1,070 -10.8% E Low-cost safety/traffic 459 830 841 83.3% F Asset extension/improvements F1 Pavement improvements 1,654 1,600 1,715 3.7% F2 Bridge improvements 524 629 668 27.5% F3 Land acquisition, earthworks, other
extensions/improvement expenditure 2,405 3,085 3,262 35.6% G Other miscellaneous activities G1 Corporate services 260 251 252 -2.9% G2 Enforcement of heavy vehicle
regulations 110 114 110 0.3% Totals 8,778 11,317 11,637 32.6%
Note: Expenditure in the 2nd Determination was calculated by taking an average of actual expenditure for 1996/7 and 1997/8 and budgeted expenditure for 1998/9. Expenditure for the Draft RIS was calculated by taking an average of budgeted expenditure for 2006/07 and actual expenditure for the previous six years. Expenditure for the Final RIS was calculated by taking an average of the budgeted expenditure for 2007/8 and actual expenditure for the previous six years.
6 Expenditure in the Second Determination was calculated by averaging expenditure over three years: actual expenditure for 1996/7 and 1997/8 and budget expenditure for 1998/9. Expenditure for the 2007 Determination was calculated by averaging expenditure over seven years (to reduce short term ‘lumpiness’). The Draft RIS used 2006/07 budget expenditure and actual expenditure for the six year prior. The Final RIS used the 2007/08 budget expenditure and the actual expenditure for the six years prior. The assumptions relating to calculation of the cost base are discussed further in Chapter 4 and Appendices A and D (Vol II).
2007 Heavy Vehicle Charges Determination Regulatory Impact Statement Vol I Page 7
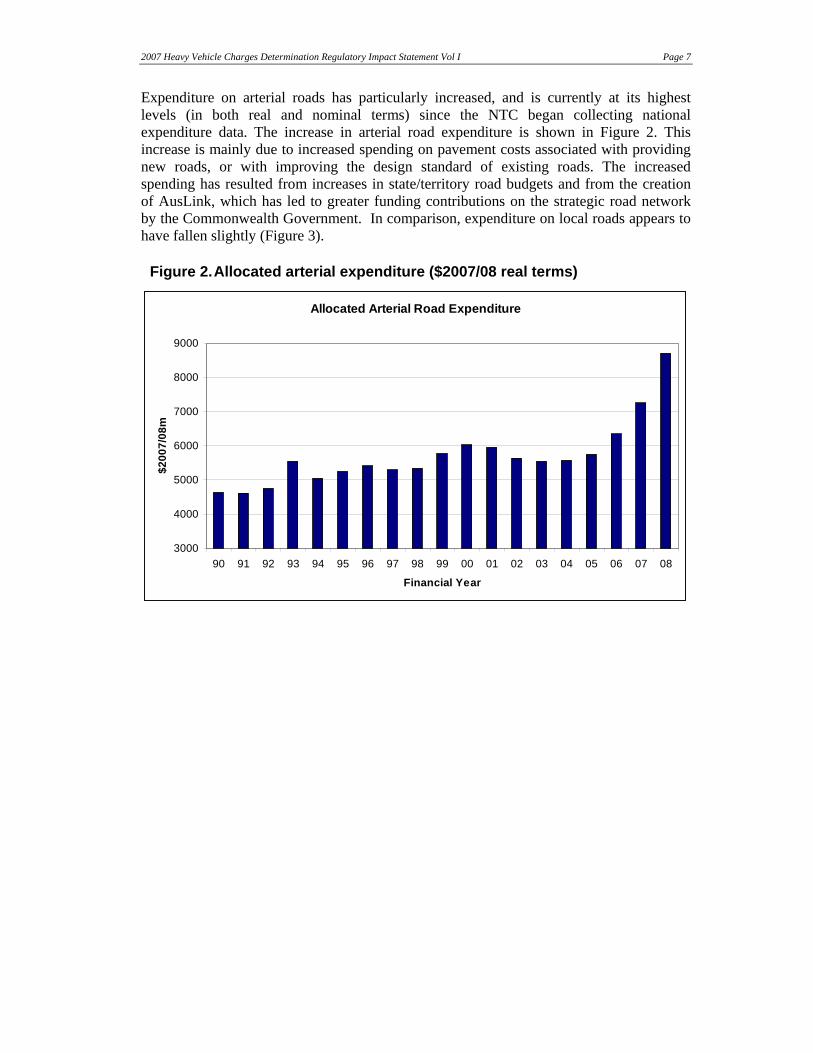
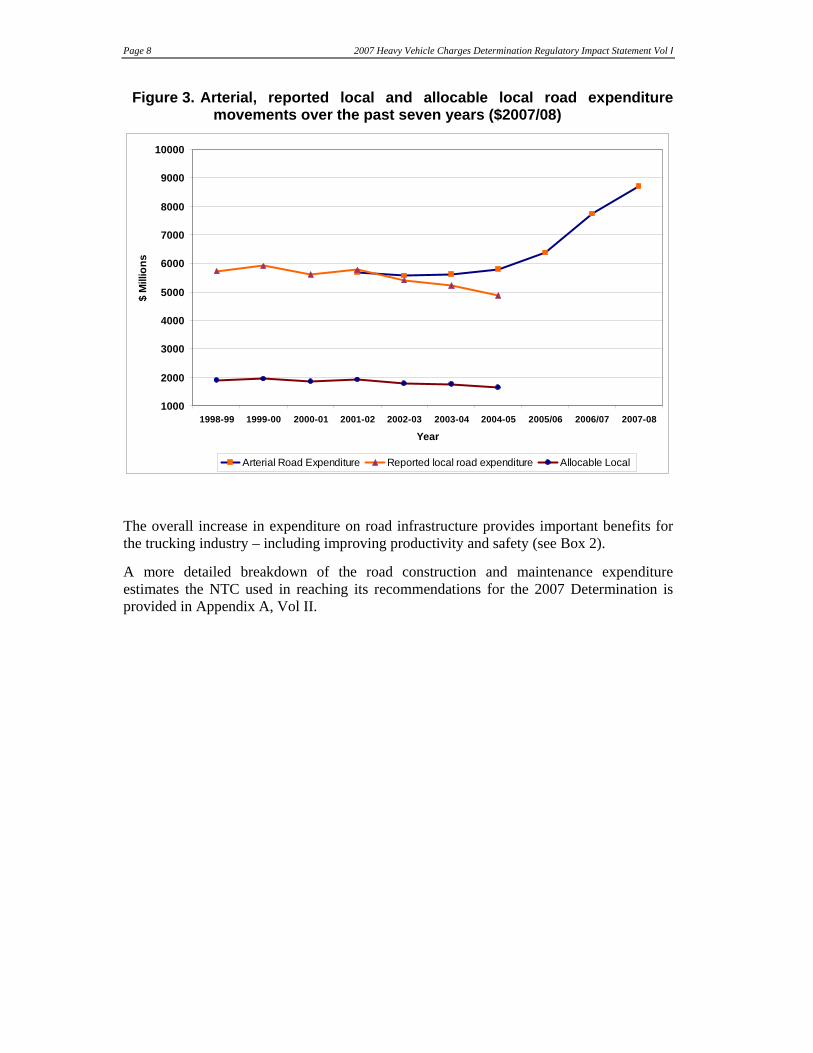
Expenditure on arterial roads has particularly increased, and is currently at its highest levels (in both real and nominal terms) since the NTC began collecting national expenditure data. The increase in arterial road expenditure is shown in Figure 2. This increase is mainly due to increased spending on pavement costs associated with providing new roads, or with improving the design standard of existing roads. The increased spending has resulted from increases in state/territory road budgets and from the creation of AusLink, which has led to greater funding contributions on the strategic road network by the Commonwealth Government. In comparison, expenditure on local roads appears to have fallen slightly (Figure 3).
Figure 2. Allocated arterial expenditure ($2007/08 real terms)
Allocated Arterial Road Expenditure
3000
4000
5000
6000
7000
8000
9000
90 91 92 93 94 95 96 97 98 99 00 01 02 03 04 05 06 07 08
Financial Year
$200
7/08
m
Page 8 2007 Heavy Vehicle Charges Determination Regulatory Impact Statement Vol I
Figure 3. Arterial, reported local and allocable local road expenditure movements over the past seven years ($2007/08)
1000
2000
3000
4000
5000
6000
7000
8000
9000
10000
1998-99 1999-00 2000-01 2001-02 2002-03 2003-04 2004-05 2005/06 2006/07 2007-08
Year
$ M
illio
ns
Arterial Road Expenditure Reported local road expenditure Allocable Local
The overall increase in expenditure on road infrastructure provides important benefits for the trucking industry – including improving productivity and safety (see Box 2).
A more detailed breakdown of the road construction and maintenance expenditure estimates the NTC used in reaching its recommendations for the 2007 Determination is provided in Appendix A, Vol II.

2007 Heavy Vehicle Charges Determination Regulatory Impact Statement Vol I Page 9
Box 2. Link between road investments and productivity and safety There is a strong link between increased investment in the road network and improving the productivity and safety of heavy vehicles – and pricing reform plays a key role in enabling this investment.
The NTC’s Twice The Task report (February 2006) highlighted the importance of pricing reform for enabling continuing productivity and safety improvements to address the growing freight task (Figure 4).
Figure 4. Forecast impact of the freight task on truck numbers
The transport reform option (2020) is based on improved access for more productive heavy vehicles through more flexible regulations, pricing reform and infrastructure investment.
Source: Twice The Task (NTC/BTRE 2006)
COAG’s National Reform Agenda (10 February 2006) for quad axle groups, B-triples and Performance Based Standards involves significant infrastructure investment to improve access for this ‘new generation’ of high-productivity heavy vehicles. An Australian Industry Group survey (Transport & Logistics Operations in Australian Manufacturing 2006) also found that better infrastructure plays an important role in reducing general transport costs. Heavy vehicle charges can contribute to freight link upgrades, removing bottlenecks and reducing logistics costs for exports.
An international heavy vehicle road safety benchmarking study commissioned by the NTC in 2002 highlighted the important role of better roads on truck safety. It concluded that:
… if Australian roads were upgraded to having similar proportions of divided and limited access roads, as in the United States or Great Britain, the Australian truck fatality rate could be expected to be similar to that in these countries … upgrading of the Australian road system to these standards … require(s) significant investment.
The National Road Safety Strategy also concludes that improving the safety of roads is the single most significant achievable factor in reducing road trauma. The research shows improving the safety of the roads could save 332 lives a year – almost half of the national target.
Page 10 2007 Heavy Vehicle Charges Determination Regulatory Impact Statement Vol I
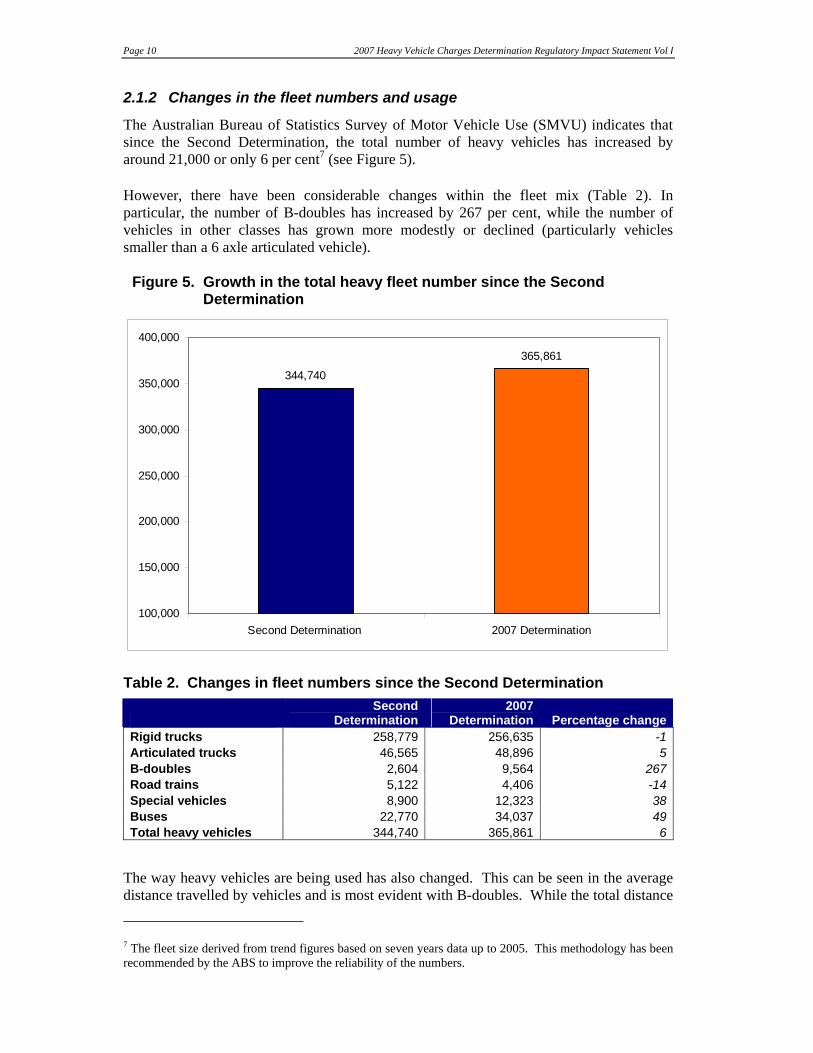
2.1.2 Changes in the fleet numbers and usage
The Australian Bureau of Statistics Survey of Motor Vehicle Use (SMVU) indicates that since the Second Determination, the total number of heavy vehicles has increased by around 21,000 or only 6 per cent7 (see Figure 5).
However, there have been considerable changes within the fleet mix (Table 2). In particular, the number of B-doubles has increased by 267 per cent, while the number of vehicles in other classes has grown more modestly or declined (particularly vehicles smaller than a 6 axle articulated vehicle).
Figure 5. Growth in the total heavy fleet number since the Second Determination
344,740
365,861
100,000
150,000
200,000
250,000
300,000
350,000
400,000
Second Determination 2007 Determination
Table 2. Changes in fleet numbers since the Second Determination
Second
Determination 2007
Determination Percentage change Rigid trucks 258,779 256,635 -1 Articulated trucks 46,565 48,896 5 B-doubles 2,604 9,564 267 Road trains 5,122 4,406 -14 Special vehicles 8,900 12,323 38 Buses 22,770 34,037 49 Total heavy vehicles 344,740 365,861 6
The way heavy vehicles are being used has also changed. This can be seen in the average distance travelled by vehicles and is most evident with B-doubles. While the total distance
7 The fleet size derived from trend figures based on seven years data up to 2005. This methodology has been recommended by the ABS to improve the reliability of the numbers.

2007 Heavy Vehicle Charges Determination Regulatory Impact Statement Vol I Page 11
travelled by vehicles in this class has increased from 562 million kilometres per annum to 1,687 million kilometres, the average distance travelled per trip has fallen by 18 per cent. This suggests that these larger, safer and more productive vehicles are being used more widely than for long haul trips. This may reflect the fact that these vehicles have broader network access and that heavy vehicle operators are changing their asset utilisation, to improve productivity and safety in urban areas with safer vehicles.
2.1.3 The annual adjustment
Since the Second Determination, an automatic annual adjustment has applied to heavy vehicle charges. The adjustment enables these charges to increase between determinations to reflect nominal changes in heavy vehicle allocated expenditure while taking into account changes in the overall fleet size. However, the adjustment applies only to the annual registration component of heavy vehicle charges, and is subject to a floor of current charges and a CPI cap. In addition, it does not take into account changes in road use between vehicle categories.
These shortcomings mean that the annual adjustment does not enable ongoing full cost recovery of road expenditure between determinations. For example, the CPI cap means that annual adjustment does not adequately accommodate increases in expenditure greater than the cost of general inflation (due to increased construction activity or higher than CPI increases in construction costs). In addition, because the adjustment does not apply to the fuel-based component, it only partly indexes heavy vehicle charges to expenditures.
In recognition of these shortcomings, COAG has asked ATC to instruct the NTC to amend the adjustment approach to enable continued full cost recovery in aggregate and for each vehicle class between determinations.
2.1.4 Impact on the level of cost recovery
The NTC has calculated that in 2007/08 heavy vehicles in aggregate under-recover heavy vehicle allocated expenditure by $168m. This figure was calculated using trend 2005 fleet numbers based on seven years of trend data over the 1999 to 2005 period, compared to road expenditure data based on the latest available seven year averages.8 This methodology eliminates any lumpiness in the data and provides a consistent basis for comparison.9
The under-recovery has arisen because of the increase in expenditure, and the change in fleet mix and the fact that not all vehicle classes are recovering their fully allocated and attributable costs. In particular, B-doubles significantly under-recover both their fully allocated and attributable costs. Therefore, a disproportionate growth in these vehicles since the Second Determination means that as a class, they under-recover to a greater extent than they did in 2000 (see Figure 6).
8 The period for arterial expenditure is 2001/02 – 2007/08 and the period for local government expenditure is 1998/99 – 2004/05 9 The methodology for calculating the level of charges recovery is detailed in Appendix C

Page 12 2007 Heavy Vehicle Charges Determination Regulatory Impact Statement Vol I
Figure 6. B-double under-recovery of fully allocated costs per vehicle (nominal)
$0
$2,000
$4,000
$6,000
$8,000
$10,000
$12,000
$14,000
$16,000
$18,000
Second Determination Current
Common costAttributable
The PC Inquiry considered this issue. It found that vehicles that recovered their attributable (long run marginal) costs, but not their fully allocated costs (including common costs), were still paying their way. The implication of this finding is that all heavy vehicle classes should at least recover their attributable costs.
2.2 Is it appropriate to recover enforcement costs through charges?
The ATC has directed the NTC to consider including enforcement costs in the cost base to be recovered through heavy vehicle charges. When looking to include a new cost category to a charging framework it is important to understand how that cost compares with other costs, to determine the appropriateness of including the cost at all.
2.2.1 The principle for including enforcement costs
The ATC direction requires that NTC consider whether, and to what extent, it is appropriate to recover enforcement costs. To answer this, it is important to consider the role of enforcement and the associated outcomes.
Enforcement costs means the costs involved in ensuring that heavy vehicles comply with laws associated with their access to the road network. The most relevant laws relate to safety (e.g., prevention of driver fatigue and speeding) and mass (e.g. constraints on loading):
• The objective of safety-related laws is to ensure that granting heavy vehicles access to the network does not impose additional, unwarranted safety-related costs on the community. They recognise that there may be short-term commercial incentives on heavy vehicle operators to operate in an unsafe way in order to reduce costs. They also
$8,400
$16,032

2007 Heavy Vehicle Charges Determination Regulatory Impact Statement Vol I Page 13
recognise that incidents involving heavy vehicles are likely to result in higher safety-related costs than those involving only light vehicles.
• Laws related to mass recognise the relationship between heavy vehicle road use and infrastructure cost by providing a mass limit on vehicles. Enforcement helps to ensure those mass limits are not breached. Therefore, it prevents additional costs associated with infrastructure provision which may be inefficient in terms of the amount of the cost and who bears it.
In the NTC’s view, heavy vehicles are required to recover costs associated with heavy vehicle access to the road network, to ensure efficient outcomes in the transportation of freight. Enforcement is similarly associated with heavy vehicle access and seeks to ensure efficient outcomes. Therefore, in principle, it is an appropriate cost to be recovered through charges.
This view is supported by the findings of the Productivity Commission, which also looked into this issue as part of its Inquiry. The Productivity Commission found that:
“The costs of enforcing heavy vehicle mass and speed restrictions are appropriately recovered through road user charges. However the inclusion of these costs is not likely to have a significant effect on heavy vehicle charges.” (PC 2007)
It noted that other countries recover heavy vehicle policing costs in road charges.
The NTC sought constitutional advice on the legality of recovering enforcement costs. This advice confirmed that there is no legal constraint to recovering enforcement costs, and referred to an analogous case of Airservices Australia v Canadian Airlines International Ltd (1999) 202 CLR 133 which was heard in the High Court. In this case McHugh J stated:
“[I]n my opinion, in characterising a charge as a fee for services …, it is legitimate to take account of the changing circumstances of government which are exemplified by the devolving of functions from government departments to statutory authorities or other corporate bodies which, under the terms of their enabling statutes, have a monopoly on the provision of a certain service and are directed by the legislature to provide those services on a ‘user pays’ basis. Charges by such authorities and bodies should be seen as essentially cost driven, imposed on users for the purpose of reimbursing the cost of services provided. They should not be approached as if they were imposed simply to raise revenue for the general government of the country.”
The extent to which enforcement costs should be recovered through heavy vehicle charges is discussed in Chapter 4.
2.2.2 Getting a better outcome out of enforcement
As the growing freight task places more pressure on the trucking industry, enforcement has become an increasingly important issue, for both government and the industry. During the consultation process, stakeholders put the view that a holistic approach to enforcement should be taken: that a broad framework is needed to strengthen enforcement and to ensure it is targeted and more consistent.
Focus group discussions raised potential mechanisms to link charges to broader enforcement and compliance arrangements. The Community and Public Sector Union cited a number of anecdotal examples of the need to strengthen enforcement, and argued “that any heavy vehicle charge must include the costs of enforcement and this ‘income’

Page 14 2007 Heavy Vehicle Charges Determination Regulatory Impact Statement Vol I
must be returned to the road agencies for use in properly funding enforcement activities.”(CPSU, 2007)
However, the relationship between enforcement and compliance was also acknowledged. For example, focus group discussions noted that increasing the level of compliance through mechanisms such as accreditation is likely to lessen the enforcement burden. The trucking industry highlighted that offering additional financial concessions for accredited operators will result in a higher level of overall compliance (by increasing the number of accredited operators) and thus reduce the enforcement burden. The NTC is in the process of reviewing the National Heavy Vehicle Accreditation Scheme with the objective of improving road safety through creating an audited based compliance model for accreditation. The model encourages the participation in accreditation through a system of incentives and provides for more targeted enforcement activities. The Determination provides a funding mechanism to support this scheme.
The NTC has long been of the view that a stronger compliance and enforcement framework would ensure safer heavy vehicle operations. With COAG’s endorsement, it has been working with jurisdictions on the delivery of the COAG-required national heavy vehicle enforcement strategy. This strategy seeks to promote national consistency in enforcement leading to more targeted and effective enforcement. It is also developing a compliance strategy that seeks to identify inconsistencies in the application (both operationally and legislatively) of agreed compliance and enforcement programs, which limit the effectiveness of those programs.
However, while enforcement is an essential condition for compliance, it is not sufficient on its own to ensure compliance.10 Therefore, the NTC is developing a strategic compliance framework in conjunction with stakeholders that both:
• continuously and rationally matches the institutional capacity of the regulatory system to the demands placed on it by the reform process, and
• implements a range of complementary strategic interventions designed to encourage and assist voluntary compliance and encourage workplaces to go beyond compliance to best practice.
The recovery of enforcement costs through heavy vehicle charges provides an opportunity for the cost of these various initiatives to be recovered, and could also provide incentives for operators to participate in accreditation leading to safer roads.
2.2.3 Revenues association with enforcement
The trucking industry has argued that if it is appropriate to include enforcement costs in the cost base to be recovered through heavy vehicle charges, then it is also appropriate to deduct fine revenues from the cost base. During the consultation process, the NTC committed to obtaining more information on fine revenues and considering this issue further.
10 ‘Compliance,’ is a behavioural outcome - being the degree of conformity on the part of the regulated population with a legislated standard. ‘Enforcement’ is a particular compliance assurance process (through the use of administrative or judicial sanctions) directed towards catching and penalising those who break the law. It is a means to securing the end of acceptable levels of compliance by deterring those who would otherwise break the law if they could get away with it.

2007 Heavy Vehicle Charges Determination Regulatory Impact Statement Vol I Page 15
Fine revenue from heavy vehicle enforcement takes two forms: revenue from Traffic Infringement Notices (TINS) that do not result in court action, and revenue from court-awarded fines arising from court convictions. Information on fine revenue is difficult to obtain as the administration of TINS is often handled by independent authorities rather than the road authorities, and in almost all jurisdictions, the revenue goes directly into state/territory consolidated revenue. The exception is NSW, where mass-related TINS revenue, which is of the order of $5 million per annum, goes to the Roads and Traffic Authority (RTA).
To date, only Queensland and WA have provided estimates for their 2006/07 revenue from all TINS and court-awarded fines. For Queensland, total fine revenues amounted to $3.3 million ($2.5 million in TINS and $0.8 million in court-awarded fines). These estimates include fines for all heavy vehicle offences not just mass-related offences. For WA, total fine revenues were $467,000 ($395,000 from TINS and $72,000 from court-awarded fines), again including fines for all heavy vehicle offences.
These estimates indicate that fine revenues are considerably less than total enforcement expenditure. For example, for Queensland the fine revenues are equivalent to 24 per cent of enforcement expenditure, and for WA they are equivalent to 8 per cent of enforcement expenditure.
In considering the appropriateness of deducting fine revenues from the cost base, the NTC considered the purpose of fines. A fine is a sum of money that is required to be paid as a penalty for an offence. While it is a punishment for committing an offence, more importantly it is intended to deter people from committing the offence in the first place. As such, the efficient level of a fine is the point at which it acts as an effective deterrent.
In the NTC’s view, a fine is not a cost recovery mechanism. Indeed, considering fine revenues in establishing the cost base may not promote setting fines at an efficient deterrent level. Instead it might encourage the setting of fines at levels to maximise revenues to the jurisdictions.
The rail industry supports this view. For example, in its submission, Asciano noted:
“any nexus between enforcement expenditure and revenue from enforcement activities has the unfortunate side-effect of encouraging the linking of funding to such revenue. This in turn encourages enforcement agencies to “over-enforce” in order to secure funding rather than enforcement to secure obedience to the law. This is contrary to the intent of enforcement and would be a most unfortunate behaviour to encourage.” (Asciano, 2007)
For the above reasons, the NTC does not consider that it is appropriate to deduct fine revenues from the cost base to be recovered through heavy vehicle charges.
2.3 Smoothing the variability in road expenditures
Expenditure on roads tends to be variable – in some years it can be particularly high and others it can be relatively low. Under the NTC’s current methodology, the cost base to be recovered through heavy vehicle charges is calculated by averaging three years of heavy vehicle allocated expenditure (two historic years and the current budget year). This approach is intended to smooth out variations in road expenditure, to reduce the impact of unusually high or low years of expenditure on charges.
However, during the PC Inquiry, the NTC identified that the smoothing effect of a three-year average may not be sufficient, particularly as determinations tend to occur only every seven years. Figure 2 demonstrates this point well: it shows that expenditure on arterial

Page 16 2007 Heavy Vehicle Charges Determination Regulatory Impact Statement Vol I
roads in 2007 and 2008 is considerably higher than in previous years. Calculating the cost base for the 2007 Determination based on three-year average that includes these two years would result in charges that may over-recover expenditure, if the level of expenditure in future years falls again. To overcome this problem, the NTC proposed using an average of the expenditure over seven years in establishing the cost base.
At the beginning of the Determination process, ATC advised NTC that its preferred implementation date for the Determination was 1 July 2007. Therefore, adopting the seven-year averaging approach, NTC applied the normal practice which included 2006/07 budget expenditure figures and actual expenditure figures for the previous six years. However, the ATC has since requested the NTC to consider the feasibility of including the 2007/08 budget expenditure figures and the actual expenditure for the six previous years in calculating the cost base for the 2007 Determination. This is in recognition that the Determination will not be implemented until 1 July 2008, and will therefore be a year out of date if the 2006/07 budget figures are included.
2.4 Developing charges for high-productivity vehicles
The ATC has directed the NTC to develop incremental charges for high-productivity vehicles. This direction reflects the need for a pricing solution that accommodates the introduction of more productive vehicles onto the road network. Currently, these vehicles sit outside the vehicle classifications used for heavy vehicle charges.
The NTC’s report Twice the Task also identified the need to provide access for high- productivity vehicles. The report described the need to find solutions to better optimise the current road network to address the forecast doubling of the freight task from year 2000 levels by 2020. If more productive vehicles are not given access to the road network, the total number of vehicles required to accomplish the increased freight task will need to increase. As the South Australian Freight Council stated in its submission “We need to carry more freight with a smaller number of trucks.”(SAFC, 2007)
High-productivity vehicles are not necessarily new vehicles. Nor are they necessarily significantly innovative. In many cases, they are modular versions of the existing fleet: a prime mover may carry an additional third trailer or a trailer may be longer or heavier than the current arrangements allow.
To date, access to the road network for these high-productivity vehicles has been limited. Because they are considered to create more road wear than vehicles in the existing fleet, road managers have been reluctant to grant them access on the grounds that this will make the sustainability of the network more difficult. A pricing solution would overcome this problem.
In some cases, high-productivity vehicles are designed to order. Therefore, it will be important that any pricing solution is flexible enough to accommodate a variety of different vehicle characteristics and operations, while being consistent with current pricing principles and the existing charges framework. As the Australian Trucking Association noted in its submission to the Draft RIS:
“The commercial realities of industry utilisation and the current charging administration system are based upon interchangeable prime mover and trailer units forming combinations. The movement toward whole of combination permit fees for cost recovery purposes will impart price rigidities upon combination selection and thereby present the industry with significant utilisation problems.” (ATA 2007)

2007 Heavy Vehicle Charges Determination Regulatory Impact Statement Vol I Page 17
It will also be important that the charging arrangements for high-productivity vehicles are sufficiently transparent and predictable to enable operators to negotiate contracts with confidence. A consultation workshop with key stakeholders and technical experts in May 2007 indicated that any pricing solution for these vehicles:
• must be transparent
• must be based on best available data
• must consider the treatment of common costs
• should not lead to perverse outcomes (financial/operational decisions), and
• should be consistent with ATC and COAG pricing principles.
In line with good regulatory practice, the pricing solution also needs to provide consistency, certainty and administrative simplicity.
The options and proposed approaches for dealing with all of the problems identified above are discussed in Chapter 4.

Page 18 2007 Heavy Vehicle Charges Determination Regulatory Impact Statement Vol I
3. THE OBJECTIVE
The primary objectives of the 2007 Heavy Vehicle Charges Determination are to ensure that:
• road expenditure allocated to heavy vehicles in aggregate is fully recovered
• each vehicle class at least recovers its attributable expenditure, so that there are no cross-subsidies between vehicle classes
• charges accommodate high-productivity vehicles
• charges are consistent with the ATC’s approved pricing principles
• charges are updated in a way that enables them to continue to recover both allocated and attributable expenditure between determinations.
These objectives have been clearly stated by both the ATC and COAG. Specifically, at its 4 May 2007 Meeting, the ATC:
NOTED that COAG has:
• requested that ATC direct the NTC to prepare a new heavy vehicle charging determination to apply from 2008, based on an updated PAYGO process, which fully recovers, and continues to recover, from heavy vehicle users the allocated share of infrastructure costs in aggregate and removes cross subsidies among heavy vehicle classes;
DIRECTED that the NTC prepare a draft Regulation Impact Statement (RIS) for a new heavy vehicle charging determination to be implemented from 1 July 2008 that:
• includes discussion of charging options to achieve full cost recovery, without over-recovery, with vehicle classes at least recovering their attributable costs;
• considers phasing in options over 2 and 3 years where necessary;
• is based on the ATC approved pricing principles for the third determination and adopts a 7 year averaging period for road expenditure;
• discusses the case for and against possible inclusion of enforcement costs in the cost base to be recovered, to inform public consultation on this issue;
• adopts the national approach of calculating charges for new high productivity vehicle classes on the basis of full recovery of allocated costs, with B-triple charges based on road train costs (although B-triples operating outside road train networks could be subject to incremental charges during proposed trials); and
• in addition, ATC requested the NTC to consider issues relating to differential treatment of vehicle classes of equivalent load capacity and that NTC also consider the capacity to include 2007/08 budgeted financial commitments in the heavy vehicle charge calculations
DIRECTED the NTC prepare advice for Ministers consideration at the November 2007 ATC meeting on the outcomes of the public consultation process and on the process for implementing a new determination on 1 July 2008.

2007 Heavy Vehicle Charges Determination Regulatory Impact Statement Vol I Page 19
DIRECTED the NTC to develop appropriate indexation adjustment arrangements to ensure the ongoing delivery of full expenditure recovery, as requested by COAG.11
The trucking industry raised a further objective: that heavy vehicle charges should maintain vehicle configuration flexibility. That is, that operators should be able to change their vehicle configuration to meet the specific needs the trip without facing adverse financial implications.
3.1.1 ATC approved pricing principles
In recommending national heavy vehicle charges, the NTC is bound by a set of Road Use Pricing Principles, which were approved by ATC in August 2004 and reaffirmed in May 2007. These pricing principles are:
“National heavy vehicle road use prices should promote optimal use of infrastructure, vehicles and transport modes.
This is subject to the following:
• full recovery of allocated infrastructure costs while minimising both the over and under recovery from any class of vehicle
• cost effectiveness of pricing instruments
• transparency
• the need to balance administrative simplicity, efficiency and equity (eg impact on regional and remote communities/access)
• the need to have regard to other pricing applications such as light vehicle charges, tolling and congestion.
3.1.2 COAG requirements
In addition to these principles, COAG (at its 13 April 2007 meeting) required that there is no cross-subsidisation between vehicle classes, and that heavy vehicle charges be adjusted each year to ensure they continue to fully recover costs between determinations. Specifically, the COAG Communiqué supplementary information from this meeting specifies that:
“ATC direct the NTC, in developing its Determination, to apply principles and methods that ensure the delivery of full cost recovery in aggregate, further develop indexation adjustment arrangements to ensure the ongoing delivery of full expenditure recovery in aggregate and remove cross-subsidisation across different heavy vehicle classes, recognising that transition to any new arrangement may require a phased approach” (COAG 2007).
In effect this means that revenues from both the registration charge component and the fuel-based charge component for a given vehicle class must recover, at a minimum, the attributable cost associated with that class. The attributable cost is the infrastructure-related cost which is associated with the use of a vehicle. This interpretation of cross-subsidy is consistent with the PC Inquiry Final Report, which informed the COAG
11 Draft Minutes of the ATA meeting 4 May 2007 (Broome)

Page 20 2007 Heavy Vehicle Charges Determination Regulatory Impact Statement Vol I
requirements. The report stated “A price is generally considered to be subsidy free if it is equal to, or exceeds, its directly attributable or incremental costs of productions.”(PC, 2006)
It also means that both the registration charge component and the fuel-based charge component need to be adjusted annually, to ensure that charges continue to fully recover costs between determinations.
3.1.3 The considerations
The NTC’s recommended heavy vehicle charges under the Third Determination were informed by a number of ‘considerations’ (NTC, 2006). These considerations were effectively the NTC’s interpretation of the ATC’s pricing principles and provided a policy framework that guided the development of heavy vehicle charges. They were informed by both formal and informal consultation. However, these considerations were not formal directions.
Some of these considerations conflict with the ATC’s and COAG’s directions to the NTC in developing recommendations for the 2007 Determination. Where this is the case, the NTC has given precedence to the directions. The discussion below lists the considerations and identifies where changes were required.
A. The results of the charges should support both the pricing principles and the objectives set out for the NTC in the Inter-Governmental Agreement.
B. The charges should ensure that heavy vehicles as a whole ‘pay their way’, and each major category of heavy vehicles also pays its way.
In effect, this consideration is the same as the direction that charges should ensure that the heavy vehicle fleet as a whole recovers both its attributable and common costs, and that each individual vehicle class at a minimum recovers its attributable costs.
C. The revised charges should promote freight efficiency.
D. Cross-subsidies between vehicle classes should be kept to a minimum.
COAG has required that there are no cross-subsidies between vehicle classes therefore this consideration has been strengthened accordingly.
E. A cautious approach should be taken where assumptions are needed and independent verification of assumptions will be sought.
F. Imposts from changes should be minimised for any category of vehicle.
G. The Determination should not anticipate significant policy issues that will be dealt with in a subsequent determination, and no attempt should be made to move charges in any particular direction ahead of this.
The 2007 Determination has been requested as part of a broader reform program. Therefore, while it does not attempt to predetermine outcomes of COAG’s road reform agenda, it does seek to improve on the current charges methodology to both achieve the ATC requirements and move towards greater productivity of the heavy vehicle fleet. This consideration has been amended to require the Determination to be in keeping with the broader reform program as outlined in COAG’s road reform agenda.
H. The Determination should not be used to promote modal outcomes.
2007 Heavy Vehicle Charges Determination Regulatory Impact Statement Vol I Page 21
The NTC notes that recommendation 12.1 of the PC Inquiry stated “The focus of the policy reform agenda for road and rail freight infrastructure should be on enhancing efficiency and productivity within each mode.” (PC, 2006)
I. Decreases in charges should only occur in exceptional circumstances.
Currently a number of vehicle classes significantly over-recover their costs. This is for a number of reasons including:
• the method used to set the original fuel-based charge component led to an over-recovery of costs by the lighter end of the heavy vehicle fleet
• the uniform increase in the registration charge component resulting from the annual adjustment exacerbated the original over-recovery
• the requirement to meet a certain balance of revenues between the Commonwealth and States/Territories (see consideration J), and
• changes in usage data and fleet mix.
Therefore, in order to ensure that heavy vehicles in aggregate recover their costs, but not over-recover, and that all vehicle classes recover their attributable costs, some registration charges will need to fall.
J. Changes that would significantly alter the balance of Commonwealth/state and territory revenues should be avoided.
The options discussed do result in some change in the balance of revenues between Commonwealth and states/territories to ensure there is no over-recovery.

Page 22 2007 Heavy Vehicle Charges Determination Regulatory Impact Statement Vol I
4. THE OPTIONS
The NTC has considered and consulted on a range of options for addressing the problems identified in Chapter 2 and meeting the objectives outlined in Chapter 3. These problems arise in different steps in the process for developing, implementing and adjusting heavy vehicle charges (see Figure 7). Therefore they can be addressed by making choices within the relevant step. The sections below discuss the each of the choices to be made, and the options for each choice.
Figure 7. Process for developing, implementing and adjusting charges
4.1 Which years of expenditure should be averaged in determining the cost base?
As section 2.3 discussed, road expenditure can vary considerable from year to year. To date, the NTC’s charges methodology has used an average of three years of heavy vehicle allocated expenditure (two historic years and the current budget year) to calculate the cost base to be recovered through heavy vehicle charges. This approach is intended to mitigate the impact of an unusually high or low year of expenditure thus resulting in a more representative expenditure figure.
However, if more than one of the three years used in calculating the expenditure figure is higher or lower than the average expenditure over the period a determination covers, charges will over- or under-recover. To address this problem, the NTC proposed to ATC that the charges methodology be amended so that an average of seven years expenditure is used to calculate the cost base (one year budget expenditure and six years actual
Determine cost base Allocate costs Set prices
Step 1 Step 2 Step 3
Step 4Step 5
Years included in the costs base?
• Option CB1: Include 2007/08 budget expenditure
• Option CB2: Include 2006/07 budget expenditure
Road Agency Enforcement costs?
• Option a: Full inclusion• Option b: Partial inclusion• Option c: No inclusion
How are costs allocated?• Third determination
methodology• The importance of VKT• Reliability of road use data
How are prices set to recover attributable costs?
• Option C1: Differentiated prime mover charge, attributable cost recovery by class
• Option C2: Differentiated prime mover charge, allocated cost recovery by class
• Option C3: Differentiated trailer charge, attributable cost recovery by class
High Productivity Vehicles• High Productivity Charge formula• Modular approach to charges
ImplementHow should charges be phased in?
• Over two years• Over three years
Adjust annuallyHow should charges be adjusted annually?
• Option A1: maintain current adjustment process with modifications and inclusion of fuel index
• Option A2: Option A1 with removal of cap and floor
• Option A3: Indexation of both registration and fuel charges
• Option A4 Annual re-calculation of charges

2007 Heavy Vehicle Charges Determination Regulatory Impact Statement Vol I Page 23
expenditure). This would further smooth out unusual variations in expenditure from year to year, making charges less sensitive to these variations.
The Productivity Commission considered the NTC’s proposal as part of the PC Inquiry. It acknowledged the benefits of the approach, but also noted “that it exacerbates the reliance on historic expenditure data and therefore the lag in under- or over-recovery.” (p 87, PC 2006) The ATC considered the proposal and the Productivity Commission’s comments. On balance, the ATC supported the change to a seven-year averaging period. However, the ATC asked the NTC to look at the feasibility of including budget expenditure for 2007/08 in calculating the expenditure figure for the cost base, to minimise the lag identified by the Productivity Commission.
The 2007/08 budget figures for all states were not available in time to be included in the draft RIS. Therefore, the NTC calculated the cost base using 2006/07 budget expenditure and actual expenditure for the six years prior to 2006/07. For the final RIS, all states’ 2007/08 budget expenditure and 2006/07 actual expenditure figures were available, so the NTC used an average of the 2007/08 budget expenditure and the six previous years’ actual expenditure in calculating the cost base. This resulted in an increase in the cost base to be recovered by heavy vehicles of $125m compared to the draft RIS, and $670m compared to the Second Determination (see Figure 8).
Figure 8. Heavy vehicle allocated cost base ($nominal)
$1,283
$1,828
$1,953
$1,000
$1,200
$1,400
$1,600
$1,800
$2,000
2nd Det. 3 year Draft RIS Final RIS
$m
The alternative to including the 2007/08 budget expenditure in calculating the cost base is to include the 2006/07 budget expenditure and, in line with the current methodology, reflect 2007/08 expenditure through the annual adjustment process when the actual expenditure for this year is known. Each of these options is explored below.
Page 24 2007 Heavy Vehicle Charges Determination Regulatory Impact Statement Vol I
4.1.1 Option CB1: Include 2007/08 budget expenditure in the cost base
The first option is to include the 2007/08 budget expenditure in the cost base for this Determination, along with actual expenditure data for 2001/02 to 2006/07. This would result in a cost base of $1,953m to be recovered through charges.
This option has several benefits:
• It would make the expenditure figure used to calculate the cost base as up-to-date as possible, reducing the lag in the recovery of the current year of expenditure.
• Although it would result in a higher cost base, the resulting higher charges could be phased in over the implementation period of two or three years (see section 4.6.).
• It would prevent the need for an annual adjustment to occur on the same date as new charges under the 2007 Determination begin to be implemented, as would happen under Option CB2, (see below). As a consequence, it would ensure that all vehicle classes can recover their attributable costs, at least in the first year of the Determination (also see below).
This option is the NTC’s preferred option. Because of the benefits outlined above, it best meets the objective of achieving full cost recovery in aggregate while ensuring no cross-subsidies between vehicle classes. It is also administratively simpler, as jurisdictions will only need to advise heavy vehicle operators of one increase in charges (resulting from the Determination) rather than two increases (one from the Determination and one from the annual adjustment, both of which would be effective on 1 July 2008). In addition, if the new charges are phased in over the implementation period, it will result in less of a price shock for operators than Option CB2.
4.1.2 Option CB2: Include 2006/07 budget expenditure in the cost base
The second option is to include the 2006/07 budget expenditure in calculating the cost base along with actual expenditure for 2000/2001 to 2005/06. This would result in a cost base of $1,828m12 to be recovered through charges that will be phased in over the implementation period. In line with the current methodology, this option would mean that 2007/08 expenditure levels would not be reflected in charges until after the 2009 annual adjustment.
The annual adjustment process adjusts charges to reflect the most recent year’s actual expenditure published in the NTC’s annual report. Therefore, the charges resulting from the 2007 Determination would reflect the 2006/07 budget expenditure figures, and would be adjusted to reflect the 2006/07 actual expenditure figures published in the 2007 annual report through the 2008 adjustment process. This would occur on the same date as the new charges under the Determination are implemented – 1 July 2008. The NTC calculates that this annual adjustment would increase charges by an additional 2.5 per cent. This additional increase would be recovered in full in 2008/09. Actual 2007/08 expenditure would then be reflected in the 2009 annual adjustment, and would be recovered in full in 2009/10.
The advantage of this approach is that it provides greater accuracy in charges, in that the unusually high road expenditure budgeted for 2007/08 will not be reflected in charges until that expenditure becomes ‘actual’. However, the disadvantages are that: 12 Note this cost base is in $2006/07 as the annual adjustment effectively acts as an index to $2007/08.
2007 Heavy Vehicle Charges Determination Regulatory Impact Statement Vol I Page 25
• It involves a further lag in the recovery of expenditure for governments of Australia: expenditure incurred in 2007/08 is not fully recovered until the end of 2009/10. The PC Inquiry noted that such lags mean governments are not compensated for the cost of financing investments over that period (pg 78, PC 2006).
• It would result in B-doubles and triple road trains failing to recover their attributable costs upon implementation of the Determination. This is because the annual adjustment is a uniform increase in charges and does not recognise the different costs associated with different vehicles.
• It may involve greater volatility in charges and price shocks for operators, due to the fact that increases resulting from annual adjustments are recovered in full in one year, not phased in.
4.2 To what extent should enforcement costs be included in the cost base?
As section 2.2 discussed, the NTC considers that in principle, it is appropriate that enforcement costs be recovered through charges. However, to what extent should these costs be recovered?
The ATC pricing principles provide some guidance on this question. One of these principles is that heavy vehicle charges should enable “full recovery of allocated infrastructure costs”. In the NTC’s interpretation, this principle means that enforcement costs related to mass constraints should be recovered. Breaches of mass constraints lead to greater wear on the infrastructure and thus more maintenance expenditure. Ultimately, this leads to increased charges that must be borne by all heavy vehicle operators. Thus, in effect, operators whose heavy vehicles breach mass constraints are being subsidised by those who comply with these constraints operators. Such a subsidy is inefficient, and therefore costs related to enforcing mass constraints should be recovered through charges.
In general, stakeholders did not agree with the NTC’s interpretation for a variety of reasons. Some stakeholders supported the inclusion of all enforcement costs in the cost base (i.e. mass-related and safety-related enforcement). For example:
• The NSW Roads and Traffic Authority (RTA) argued that safety-related enforcement cannot be easily divorced from mass-related enforcement: that the two go hand-in-hand. Further, it argued that heavy vehicle operators benefit in a commercial sense from safety-related enforcement because it helps to create a level playing field.
• Several rail industry stakeholders expressed a similar view:
− Asciano Limited commented that “mass is not just a road damage related issue: it presumably has some link back to safety…you can[not] just simply say mass is an economic issue and other things are safety issues.”13 It also argued that all enforcement costs should be included on the basis of consistency. It noted the rail industry is required to recover both safety and mass-related enforcement costs despite having a significant safety regulatory burden (Asciano, 2007).
13 Paul Bugler (Asciano) NSW Charges Focus Group, 2 August 2007

Page 26 2007 Heavy Vehicle Charges Determination Regulatory Impact Statement Vol I
− The Australasian Railway Association expressed similar views, and noted that the difficulty in separating out the different enforcement costs is a further reason for the full inclusion of these costs (ARA, 2007).
− The Australian Rail Track Corporation Ltd (ARTC) argued that safety-related enforcement costs are a reasonable cost associated with use of the road infrastructure and therefore are infrastructure-related costs (ARTC 2007).
In contrast, stakeholders from the trucking industry and the National Farmers Federation opposed the inclusion of any enforcement costs, particularly without a supporting framework aimed at reducing breaches. The National Farmers Federation stated that “the incorporation of enforcement costs…merely encourages the establishment of a permanent bureaucracy that has little intention of reducing breaches” (NFF 2007).
Although the NTC accepts that mass-related enforcement can lead to multiple benefits, it notes the primary objective of mass constraints is to manage road wear. This is supported by the fact that incremental pricing trials being undertaken as part of the COAG road reform agenda allow additional mass above prescribed limits14 on the network at a cost to the operator equivalent to the wear caused by the additional mass. Therefore, the NTC concludes that given the current pricing principles, it is only appropriate to include mass-related enforcement costs in the cost base.
However, it is difficult to estimate the mass-related enforcement costs. Previously, the NTC has been reluctant to consider the issue of enforcement costs because of the incomplete nature of the data it captures for this cost category. The data provided by governments on heavy vehicle enforcement costs reflects the differing enforcement systems in place, specifically:
• the way infringements are classified – heavy vehicle infringements are not always distinguishable from light vehicles
• the differing responsibilities of police and road agencies for enforcement – the NTC only collects road agency enforcement costs.
In addition, the data provided does not distinguish between different types of enforcement (i.e., between mass-related and safety-related enforcement).
Given these difficulties, the NTC considers there are three options in relation to enforcement costs – to fully include road agency enforcement costs in the cost base, to partially include road agency enforcement costs in the cost base, and to exclude all enforcement costs from the cost base. Each of these options is discussed below.
4.2.1 Option a: Full inclusion of road agency enforcement costs
A large portion of heavy vehicle enforcement is undertaken by agencies other than road agencies (such as the police). Therefore, because the data provided to the NTC only includes road agency costs, it understates the true value of enforcement costs. In recognition of this, option a assumes that road agencies are tasked primarily with mass-related enforcement duties and therefore that these agencies’ full enforcement costs should be recovered through heavy vehicle charges.
14 Subject to meeting safety standards

2007 Heavy Vehicle Charges Determination Regulatory Impact Statement Vol I Page 27
If this is the case, then there are two approaches for allocating these enforcement cost between the vehicle classes. The first (Option a(i)), is to allocate expenditure to individual vehicle classes based on nationally aggregated heavy vehicle vehicle-kilometres-travelled (VKT). This is consistent with the approach of cost allocation for other expenditure categories.
As shown in Table 3, NSW’s share of total enforcement expenditure is disproportionately large when compared with its proportion of heavy vehicle VKT (the basis on which expenditure is allocated between the vehicle classes). This means that under Option a(i), trucks in other jurisdictions recover some of the cost of enforcement in NSW.
Table 3. Heavy vehicle enforcement expenditure by state NSW Vic Qld SA WA Tas NT ACT
Enforcement expenditure ($2007/08m) 66.4 10.7 14.7 8.5 6.5 0.7 2.3 0.4Percentage expenditure
60.2 9.7 13.4 7.7 5.9 0.6 2.1 0.4
Heavy vehicle VKT (%)
32.9 23.3 20.9 7.5 11.2 2.3 1.2 0.6
The second approach (Option a(ii)) involves allocating the full enforcement costs recorded for each state/territory and then allocating by heavy vehicle VKT within each jurisdiction. Under this option, NSW’s enforcement costs of $66.4m is allocated across each of the heavy vehicle classes in that state, based on the relative level of VKT within that state. The same process is used to allocate the enforcement costs for each state and territory, to derive a total dollar figure for each heavy vehicle class in each jurisdiction. These dollar figures are then summed across the eight jurisdictions for each heavy vehicle class, then those national total dollar figures for each heavy vehicle class are divided by the total number of heavy vehicles nationally to come up with a full enforcement allocated cost per vehicle in each class.
The principal difference between Options a(i) and a(ii) is the distributional impact on vehicle classes (see Table 5). Compared to Option a(i), Option a(ii) results in higher allocated enforcement costs per vehicle for most rigid trucks and 2 axle buses, and lower enforcement costs for articulated trucks, B-doubles and road trains. For B-doubles and road trains, it provides allocated costs that fall between those provided by Option a(i) and Option b (partial inclusion of road agency enforcement costs). Nevertheless, Option a(ii) still involves the inclusion of a higher amount of enforcement costs to be recovered in aggregate than Option b. In general, this means it would lead to a higher fuel charge, all else being equal, than Option b.
4.2.2 Option b: Partial inclusion of road agency enforcement costs
Option b assumes that some road agencies are engaged in safety-related enforcement activities as well as mass-related enforcement. This is particularly true in NSW, where the RTA has a more comprehensive enforcement role than other road agencies. Therefore the total enforcement cost reported by road agencies is discounted to estimate mass-related enforcement costs.
To determine an appropriate discount, the NTC identified that in most jurisdictions, enforcement costs are related to the share of heavy vehicle VKT in the jurisdiction. The

Page 28 2007 Heavy Vehicle Charges Determination Regulatory Impact Statement Vol I
only state where this doesn’t hold true is NSW (see Table 5). Therefore, the NTC proposes that the percentage share of heavy vehicle VKT in each jurisdiction represents a good approximation of its share of mass-related enforcement costs (the primary enforcement activity of most road agencies, except the NSW RTA).
Under this proposal, NSW’s enforcement expenditure is discounted so that it represents the same share of national enforcement expenditure as the NSW share of national heavy vehicle VKT (see Table 4). This reduces the level of NSW enforcement expenditure to be included in the cost base from $66.4m to $21.5m, and the total enforcement expenditure to be included from $110 million to $65 million (or 59 per cent of total road agency enforcement costs).
This approach assumes that road agencies in all jurisdictions except NSW focus their heavy vehicle enforcement activities on mass-related enforcement. This assumption appears to be supported by a Victorian report, which found that mass-related penalties in Victoria constitute around 41 per cent of all road-related infringements (by both heavy and light vehicles) (VicRoads, 2004).
Table 4. Adjusted heavy vehicle enforcement expenditure by state NSW Vic Qld SA WA Tas NT ACT Adjusted Expenditure ($07/08m) 21.5 10.7 14.7 8.5 6.5 0.7 2.3 0.4 Adjusted Percentage expenditure
32.9 16.4 22.5 13.1 9.9 1.1 3.5 0.7
HV-VKT15 % 32.9 23.3 20.9 7.5 11.2 2.3 1.2 0.6
Both the South Australian Department of Transport, Energy & Infrastructure and Queensland Transport supported the adoption of this approach for this Determination. The focus group consultation process found that trucking operators also generally supported the inclusion of partial enforcement if combined with an appropriate enforcement framework (see section 4.2.5 below).
However, Queensland Transport suggested that enforcement should not be treated in the same manner as other expenditure items in terms of recovery. It recommended that enforcement-related costs be recovered solely through registration charges, on the basis that the Commonwealth Government is not involved in enforcement activities and therefore should not recover revenues associated with enforcement. However, the NTC notes that the current charges methodology is only intended to recover expenditure in aggregate. In doing so, it ensures consistency in charges across states and territories and provides a balance between the variable fuel-based charge and the fixed registration charge. Therefore it would be inconsistent with the current charges methodology to treat one expenditure category separately from others.
4.2.3 Option c: Full exclusion of enforcement costs
The third option is to exclude enforcement costs completely from the cost base. In the absence of an enforcement framework, the trucking industry argued enforcement costs should be excluded from the cost base. In particular, the Australian Livestock Transporters 15 Heavy vehicle - vehicle kilometres travelled

2007 Heavy Vehicle Charges Determination Regulatory Impact Statement Vol I Page 29
Association noted that “[t]here is no guarantee that any proposed enforcement cost figure would not move upwards in the future at the behest of State Governments and there remains at the present time no requirement on State Governments to be efficient in how these funds are expended.” (ALTA, 2007).
The ATA argued that the recovery of enforcement costs “would impose an indiscriminate and inefficient cost upon heavy vehicle road users” and that compliant operators (particularly those who are accredited) would face in effect a “double take”. Therefore, it opposed the inclusion of enforcement costs on any basis. The cement and forestry industries echoed the concerns of the ATA.
While the NTC recognises the relationship between enforcement and compliance, it notes that there are still benefits for compliant operators in ensuring that the whole industry is compliant.
4.2.4 Comparing the impact of the options for enforcement costs
Table 5 shows the contribution to allocated costs under each option for the treatment of enforcement costs.
Table 5. Allocation of enforcement costs for each option ($/vehicle)
Allocation per
vehicle – Option
a(i) $/vehicle
Allocation per
vehicle – Option
a(ii) $/vehicle
Allocation per
vehicle – Option b $/vehicle
Allocation per
vehicle – Option c $/vehicle
Rigid trucks: 2 axle: no trailer: GVM 4.5 to 7.0 tonne 109 125 65 0 Rigid trucks: 2 axle: no trailer: GVM 7.0 to 12.0 tonne 161 186 96 0 Rigid trucks: 2 axle: no trailer: GVM over 12.0 tonne 153 148 92 0 Rigid trucks: 2 axle: with trailer 168 192 101 0 Rigid trucks: 3 axle: no trailer: GVM 4.5 to 18.0 tonne 133 104 80 0 Rigid trucks: 3 axle: no trailer: GVM over 18.0 tonne 196 222 117 0 Rigid trucks: 3 axle: with trailer: less than 42.5 tonne 341 333 204 0 Rigid trucks: 4 axle: no trailer: GVM 4.5 to 25.0 tonne 81 61 48 0 Rigid trucks: 4 axle: no trailer: GVM over 25.0 tonne 234 250 140 0 Rigid trucks: 4 axle: with trailer: less than 42.5 tonne 545 686 326 0 Rigid trucks: Heavy Truck/Trailer Combination 526 570 315 0 Articulated trucks: single trailer: 3 axle rig 156 122 93 0 Articulated trucks: single trailer: 4 axle rig 396 320 237 0 Articulated trucks: single 3 axle trailer: 5 axle rig 410 346 245 0 Articulated trucks: single 2 axle trailer: 5 axle rig 581 478 347 0 Articulated trucks: single trailer: 6 axle rig 813 753 486 0 Articulated trucks: B-double: < 9 axle rig 1,502 1,353 898 0 Articulated trucks: B-double: 9+ axle rig 1,636 1,543 979 0 Articulated trucks: Road train: 2 trailers 1,224 874 758 0 Articulated trucks: Road train: 3 trailers 1,778 940 702 0 Articulated trucks: > 6 axle rig (NEC) 814 625 487 0 Other trucks 60 80 36 0 Buses: 2 axle: GVM 4.5 to 10.0 tonne 179 223 107 0 Buses: 2 axle: GVM over 10.0 tonne 296 340 177 0 Buses: 3 axle 516 474 308 0 Buses: articulated 362 253 216 0

Page 30 2007 Heavy Vehicle Charges Determination Regulatory Impact Statement Vol I
4.2.5 A framework for enforcement
During the consultation process, the trucking industry stated a strong view that the inclusion of enforcement costs could only be justified if there was a framework that linked charges with enforcement activity and recognised both compliance and revenue from enforcement. The industry was concerned that without such a framework, the recovery of enforcement costs would not result in better, more targeted and efficient levels of enforcement. It was also concerned about the quality of the data available on enforcement. However, if a framework was in place, the industry considered it appropriate to recover mass-related enforcement costs.
The NTC has considered the frameworks being developed to improve the consistency and quality of enforcement. It notes that a national heavy vehicle enforcement strategy is currently being developed, and a chain of responsibility laws are being implemented around the country. This work will also improve the quality of enforcement data. More importantly, NTC notes that it is currently undertaking a review of accreditation with the intent of introducing an audited compliance based model to accreditation. This holistic model acknowledges the considerable safety and productivity benefits associated with accreditation and seeks to encourage greater participation in accreditation through the regulatory and financial incentives. The model also incorporates features intended to lead to more targeted enforcement activities.
The recovery of enforcement costs through charges better facilitates the provision of financial incentives.
4.3 How should costs be allocated between vehicle classes?
The methodology the NTC used to allocate the cost base to be recovered through charges to the different vehicle classes is based on the best available research, and was updated and consulted on as part of the Third Determination process. This methodology is detailed in Appendix B.
The Productivity Commission reviewed the methodology in detail as part of the PC Inquiry. It found that the methodology was reasonable but conservative in nature (i.e. that overall it favoured the trucking industry). The NTC also notes that in general, the trucking industry supports the methodology. Although it disagrees with some of the cost allocations in the NTC model (see section 6.2.2), the industry commented to the PC Inquiry that there is transparency as well as a “high degree of accuracy in the current model”16. In addition, industry representatives attending a technical workshop in May 2007 acknowledged that the current models are an improvement to those used in the Second Determination.
4.3.1 The importance of VKT in allocating costs
The NTC would like to emphasise the importance of road use data, particularly vehicle kilometres travelled (VKT) in the allocation of costs and derivation of charges. That is, the heavy vehicle charges that apply to each vehicle class reflect that class’ consumption of the network.
Although the carrying capacity is also taken into account, it is the extent to which a vehicle is used that determines the level of road wear attributable to that vehicle. For example, a triple road train that travels only 30,000km a year consumes considerably less of the road
16 Neil Gow, ATA (PC Public Hearing, 6/11/06 Canberra)

2007 Heavy Vehicle Charges Determination Regulatory Impact Statement Vol I Page 31
infrastructure (and therefore has a lower road access cost) than a B-double that does 300,000km a year. Therefore, vehicle classes that on average do high kilometres will be allocated a higher proportion of costs than vehicle classes that do low kilometres, even though the latter might have a greater carrying capacity.
4.3.2 The reliability of road usage data
The road usage data the NTC uses in allocating the cost base between vehicle classes is provided by the Australian Bureau of Statistics through its Survey of Motor Vehicle Usage (SMVU). During consultation, the trucking industry expressed some concerns about the quality of this data. The industry noted that the SMVU road usage numbers did not seem to always accurately reflect actual road usage, particularly the data for road trains. However, it conceded that the SMVU data set was the best nationally consistent data set available on heavy vehicle road use.
The NTC considered the industry’s views, particularly in relation to the data for road trains’ road usage. The NTC agreed that there seems to be considerable differences in VKT between double (type 1) and triple (type 2) road trains of 120,691km and 180,919km respectively. The NTC noted the SMVU sample size for this part of the heavy vehicle fleet is particularly small. While this reflects the small proportion of the total fleet, it does mean that the resulting data is less reliable.
Given this, the NTC undertook further analysis on the reliability of the SMVU road train data. It found the standard error associated with road train VKT was sufficiently large that the VKT for double and triple roads trains fell within a similar range applying a 95 per cent confidence interval. On this basis, and given the significant impact VKT has on cost allocation, the NTC has adopted a conservative approach and applied an average road train VKT figure of 133,750 to both double and triple road trains. This has the impact of increasing the cost allocated to double road trains from $35,611 to $38,055 and decreasing the costs allocated to triple road trains from $68,342 to $47,323 (before unsealed travel adjustments are made).
4.4 How should prices be set to fully recover heavy vehicle costs in aggregate and ensure all vehicle classes at least recover their attributable costs?
As Chapter 3 identified, the primary objectives for heavy vehicle charges under the 2007 Determination include ensuring that heavy vehicles in aggregate fully recover heavy vehicle allocated expenditure, and that each vehicle class at least recovers its attributable expenditure. The NTC considered the implications of these objectives, particularly the objective related to the recovery of attributable expenditure, for B-doubles, road trains, vehicle flexibility and the enforcement burden. It found that:
• setting charges for B-doubles to recover their attributable cost is not likely to create an incentive for operators to substitute them with less safe vehicles
• setting charges for road train trailers to reflect the attributable cost of these trailers will address the current under-recovery by triple road trains and over-recovery by double road-trains
• the many road agencies already offer flexibility for heavy vehicles to switch between registration classes at short notice
Page 32 2007 Heavy Vehicle Charges Determination Regulatory Impact Statement Vol I
• the net impact on rural and regional areas is negligible as the costs are simply redistributed between road train types already servicing these areas
• the enforcement burden should be no greater, as governments must still ensure that operators are correctly charged for their number of trailers; and
• a move to full recovery of attributable costs will result in registration charges for most classes of vehicle increasing by a moderate amount or falling.
Given the above, the NTC believes that attributable cost recovery is appropriate and consistent with other ATC principles and COAG requirements for heavy vehicle charges. Therefore, it has treated this as a minimum requirement in developing the options for setting charges.
The NTC’s considerations and the options for setting charges are outlined below. Please note that all the options result in full recovery of heavy vehicle allocated expenditure in aggregate and full recovery of attributable costs, and none of the options result in over-recovery. In addition, all options assume the inclusion of 2007/08 budget expenditure in establishing the cost base as discussed in section 4.1, and reflect the changes in the allocation of costs to double and triple road trains discussed in section 4.3.
4.4.1 Implications for B-doubles and road trains
The PC Inquiry found that based on Third Determination data, B-doubles and road trains fail to recover both their attributed and allocated costs (p119 PC 2007). Therefore, the objective that each vehicle class at least recovers its attributable expenditure has considerable implications for these vehicle classes.
Impact on B-doubles
In 2000, the Second Determination capped charges for B-doubles – then a relatively new class of heavy vehicle – at the level of road train charges to ensure there was no incentive for operators to substitute B-doubles with less safe road trains. However, this cap prevented B-doubles from recovering their attributable costs. This is because road trains’ attributable costs are lower than B-doubles reflecting the fact that they mainly travel on unsealed roads in remote and regional areas (see Appendix B Vol II, for more detail).
The most recent SMVU data shows that, in most cases, B-doubles and road trains operate on distinct networks. B-doubles increasingly operate in urban and port areas where road trains do not have access. Therefore, the NTC’s best assessment is that substitution is unlikely to be a significant risk.
During consultations, the trucking industry suggested that it is more likely that B-doubles would be substituted with 6 axle articulated semi trailer vehicles. The NTC considered the relative efficiency of these two vehicle classes on the basis of net tonne kilometres and found on average a B-double is still more efficient than a 6 axle articulated vehicle, even with higher charges. The trucking industry was unable to provide the NTC with any further compelling evidence of their substitution concerns.
The ATC asked the NTC to consider the implications for B-doubles and road trains which do operate on the same network. This is a particular concern in WA where road trains have the same access as B-doubles. The concern is that operators may substitute safer B-doubles with compact road trains which face lower registration charges but have the

2007 Heavy Vehicle Charges Determination Regulatory Impact Statement Vol I Page 33
same carrying capacity. The NTC notes that this is a very local issue specific to WA which will be more completely addressed through the broader reform program.
Impact on road trains
Under the Second Determination, double and triple road train prime movers are charged the same weighted average charge (the difference in charges being the number of trailers) to ensure double and triple trailer sets can be easily substituted.
As a result of this, triple road trains significantly under-recover their attributable costs, while double road trains over-recover their fully allocated costs. The reason for this is that the trailer charge currently does not reflect the actual infrastructure cost of a trailer. Adopting the principle of attributable cost recovery by vehicle class and applying the same charging methodology would differentiate the prime mover charges for double and triple road trains.
4.4.2 Implications for vehicle flexibility and enforcement burden
The NTC’s consultations indicated that while there is broad support for the principle of attributable cost recovery, there are also concerns about the implications this may have for vehicle configuration flexibility and the enforcement burden.
The trucking industry strongly put the view that operators should be able to change their vehicle configuration to meet their needs for specific trips without facing adverse financial implications. In order to enable a standard trailer axle charge, the draft RIS options proposed that B-double, double road train and triple road train prime movers would all have different registration charges. The trucking industry expressed concern that the flexibility of the current charges arrangement would be lost by having a differentiated charge for a prime mover that is the same, except for the trailer configuration.
Some jurisdictions expressed concern that a change to the charges structure would result in a greater enforcement burden. This is because operators would be given an incentive to register their prime mover in the most inexpensive class (a double road train) but run it as part of a B-double or triple road train configuration.
In light of these concerns, and in consultation with the trucking industry, the NTC has developed an additional charges option since the release of the draft RIS (Option C3). Like Options C1 and C2, this option ensures that the objectives for cost recovery are met. However, it better maximises the flexibility of a prime mover by providing a multi-combinational prime mover charge. Cost recovery is achieved by differentiating the trailer axle charge by the type of trailer, not by the vehicle configuration. This approach is consistent with the modular approach to charging that the ATA proposed in its submission to the draft RIS, and enables virtually any configuration of prime mover and trailers to be accommodated through the charges schedule.
4.4.3 Option C1
Option C1 achieves full cost recovery of heavy vehicle allocated expenditure in aggregate, and ensures that all vehicle classes recover their attributable costs. However, it allows for vehicle classes to over- or under-recover their common costs. The option also ensures that the minimum registration charge for heavy vehicles does not fall below the maximum registration charge for light vehicles. This in line with the ATC pricing principle that charges “should have regard to other pricing principles such as light vehicle charges” and protects against perverse vehicle investment signals.

Page 34 2007 Heavy Vehicle Charges Determination Regulatory Impact Statement Vol I
Table 6 shows the charges that would result from this option when combined with the Option b (partial inclusion of road agency enforcement costs, which is the NTC’s preferred option) and with option c (exclusion of all enforcement costs), and based on a cost base that includes 2007/08 budget expenditure. Consistent with the current charges regime, Option C1 has a standard trailer axle charge that necessitates a differentiated prime mover charge for the heavier end of the fleet.
Table 6. Charges under Option C1 for select vehicles under different enforcement scenarios
Current charges
(2007/08)
Charges under Option C1 +
partial enforcement
Charges under Option C1 + no
enforcement
Fuel charge (cents/litre) 19.633 21.3 19.8
Registration charges ($ per vehicle) Prime mover Total Prime
Mover Total Prime mover Total
Trailer charge per axle 355 365 365 2 axle rigid truck, 4.5 - 7t 355 355 365 365 365 365 3 axle rigid truck > 18.5t, no trailer 946 946 827 827 876 876 4 axle rigid truck over 25t no trailer 2,365 2,365 827 827 876 876 Heavy truck/trailer over 42.5 t 5,794 7,071 6,042 7,320 6 axle articulated truck 4,019 5,084 4,060 5,155 4,454 5,349 B-double 9 axle 5,911 8,041 13,796 15,986 14,402 16,592 Double road train 5,911 8,751 7,531 10,451 8,175 11,095 Triple road train 5,911 10,526 8,292 13,037 9,245 13,990 2 axle bus over 10 t 592 592 365 365 365 365 Registration share of charge revenue 35.5% 36% 39%
The NTC notes that it may appear counter-intuitive that as the enforcement cost component of the cost base falls, registration charges increase. This occurs because the fuel charge falls. As a result, fuel charge revenues decrease by a greater amount than the increase in registration charge revenues. So while registration charges increase slightly, overall charges (i.e. fuel and registration) decrease as less enforcement cost is taken into account.
4.4.4 Option C2
Option C2 achieves full cost recovery of heavy vehicle allocated expenditure in aggregate and ensures that each vehicle class recovering its fully allocated expenditure. That is, each vehicle class recovers its attributable expenditure and its share of common costs: there is no over or under-recovery of costs by vehicle classes. The impact of this is that the fuel charge does not increase to the same extent as under Option C1. However, registration charges increase significantly for those vehicle classes that currently under-recover their fully allocated costs by a considerable amount.
As with Option C1, the registration charges of vehicle classes that do not currently under-recover their allocated expenditure increase moderately or even decrease under this option. However, unlike Option C1, the minimum registration charge falls below the average maximum registration charge faced by light vehicles. This is primarily because the lighter

2007 Heavy Vehicle Charges Determination Regulatory Impact Statement Vol I Page 35
end of the heavy vehicle fleet over-recovers its share of common costs under Option C1 to accommodate the failure of B-doubles to do so. This result is inconsistent with the ATC pricing principles (which require charges to have regard to other road pricing mechanisms) and may lead to perverse outcomes at the boundary between light and heavy vehicles (i.e. it creates an incentive for operators to purchase a vehicle over rather than under 4.5 tonnes so that they face a lower registration charge).
Table 7 shows the charges under Option C2, again combined with Options a and b for the inclusion of enforcement costs and based on a cost base that includes 2007/08 budget expenditure. As under Option C1, the charges include a standard trailer axle charge and differentiated prime mover charge for the heavier end of the fleet.
Table 7. Charges under Option C2 for select vehicles under different enforcement scenarios
Current charges
(2007/08)
Charges under Option C2 +
partial enforcement
Charges under Option C2 + no
enforcement
Fuel charge (cents/litre) 19.633 19.7 17.9
Registration charges ($ per vehicle) Prime mover Total Prime
Mover Total Prime mover Total
Trailer charge per axle 355 365 365 2 axle rigid truck, 4.5 - 7t 355 355 235 235 234 234 3 axle rigid truck > 18.5t, no trailer 946 946 977 977 1,075 1,075 4 axle rigid truck over 25t no trailer 2,365 2,365 977 977 1,075 1,075 Heavy truck/trailer over 42.5 t 5,737 5,737 6,383 7,661 6,725 8,003 6 axle articulated truck 4,019 5,084 4,754 5,849 5059 6,154 B-double 9 axle 5,911 8,041 2,040 22,230 20,906 23,096 Double road train 5,911 8,751 8,957 11,877 9,827 12,747 Triple road train 5,911 10,526 9,986 14,731 11,207 15,952 2 axle bus over 10 t 592 592 298 298 403 403 Registration share of charge revenue 35.5% 41% 44%
4.4.5 Option C3
Option C3 is the NTC’s preferred option. It based on Option C1 but, as discussed above, it seeks to ensure maximum vehicle flexibility through the modification of the charges structure to allow a multi-combinational prime mover charge for B-doubles and road trains. The objective that vehicle classes at least recover their attributable costs is achieved by applying differentiated trailer axle charges instead of a uniform charge. Trailer flexibility is maintained, as the cost of a particular trailer remains the same regardless of the vehicle configuration it is used in. With this modification, charges become modular and cost recovery is spread more evenly between the trailer and prime mover charges.
Table 8 shows the charges the result under Option C3, again combined with Options b and c for the inclusion of enforcement costs and based on a cost base that includes 2007/08 budget expenditure.

Page 36 2007 Heavy Vehicle Charges Determination Regulatory Impact Statement Vol I
Table 8. Charges under Option C3 for select vehicles under different enforcement scenarios
Current charges
(2007/08)
Charges under Option C3 +
partial enforcement
Charges under Option C3 + no
enforcement
Fuel charge (cents/litre) 19.633 21.0 20.9
Registration charges ($ per vehicle) Prime mover Total Prime
Mover Total Prime mover Total
2 axle rigid truck, 4.5 - 7t 355 355 380 380 350 350 3 axle rigid truck > 18.5t, no trailer 946 946 859 859 761 761 4 axle rigid truck over 25t no trailer 2,365 2,365 859 859 761 761 Heavy truck/trailer over 42.5 t 5,737 5,737 5,828 7,158 5,672 5,672 6 axle articulated truck 4,019 5,084 3,930 5,220 3,799 4,864 B-double 9 axle 5,911 8,041 7,050 14,340 5,050 13,090 Double road train 5,911 8,751 7,050 10,390 5,050 7,890 Triple road train 5,911 10,526 7,050 12,440 5,050 9,665 2 axle bus over 10 t 592 592 380 380 350 350 Trailer charges ($ per axle) Standard trailer axle charge 355 380 355 Semi trailer tri-axle 355 430 355 B-double lead trailer – tandem axle 355 1,900 2,275 B-double lead trailer – tri axle 355 2,000 2,325 Road train dolly trailer 355 380 355 Registration share of charge revenue 35.5% 37.2% 35.3%
Figure 9 below better illustrates how the charges under Option C3 apply to different vehicles.

2007 Heavy Vehicle Charges Determination Regulatory Impact Statement Vol I Page 37
Figure 9. Application of charges under Option 3Cb to vehicles
Vehicle Component cost Prime mover + ( Trailer charge x number of axles )
Total registration
Articulated truck: 2 axle semi trailer: 5 axle rig
$3930 + ($380 x 2)
$4,690
Articulated truck: tri axle semi trailer: 6 axle rig
$3930 + ($430 x 3)
$5,220
B-double: 9 axle rig (tri axle lead trailer and tri axle semi trailer)
$7050 + (2,000 x 3) + ($430 x 3)
$14,340
Road Train: 2 tri axle semi trailers (1 dolly)
$7050 + (430 x 3) + ($380 x 2) + ($430 x 3)
$10,390
Road Train: 3 tri axle semi trailers (2 dollies)
$7050+(430 x 3)+(380 x 2)+(430 x 3)+(380x2)+(430 x 3)
$12,440

Page 38 2007 Heavy Vehicle Charges Determination Regulatory Impact Statement Vol I
4.5 What charges should apply to high-productivity vehicles?
The heavy vehicle industry is currently going through a period of considerable change, with the COAG-supported implementation of a Performance Based Standards approach to allow new heavy vehicle types to operate. These new vehicle types are likely to impose additional costs on the road infrastructure, but have considerable productivity benefits. However, because they do not fit with the current vehicle classifications, there are constraints on the use of these vehicles.
To remove these constraints, the ATC directed the NTC to develop charges for these high-productivity vehicles. It also indicated that these vehicles should recover their fully allocated costs.
In the draft RIS, the NTC proposed an approach that involved a high-productivity vehicle charge formula. Feedback on this approach was mixed, so the NTC developed an alternative modular approach to charges – Option C3 discussed above – that accommodates higher productivity vehicles. Each of these options is discussed below.
4.5.1 Higher productivity vehicle charge formula
In the draft RIS, the NTC proposed that a higher productivity vehicle charge formula to be used to calculate charges unless the vehicle type can be accommodated within the registration charge range for the nearest prescriptive vehicle type. It also proposed that:
• the formula be transparent and consistent with the current determination methodology to enable to costing of new high-productivity charges
• vehicles that cause no additional damage to the network be mapped to existing registration categories
• commonsense guidelines for the application of the formula to new vehicle types be produced to minimise any perverse outcomes.
The NTC also proposed a formula that states that the annual registration charge equals the allocated cost less the fuel charge revenue expected to be paid by the vehicle per annum, and outlined the steps involved in this calculation (see Box 3). In addition, it outlined a process for estimating the key input values for this formula, based on the expected values for annual VKT, AGM and fuel usage; a first principles approach to determining the ESA value; and estimating the PCU value given the relative length of the new vehicle compared to a medium size passenger car.

2007 Heavy Vehicle Charges Determination Regulatory Impact Statement Vol I Page 39
Box 3: Steps involved in applying the higher productivity vehicle charges formula
Step 1: To consider whether it is appropriate to apply the formula to the new vehicle or to map to an existing vehicle class.
Step 2: To derive the allocated cost which is based on the sum of attributable and non-attributable (common) costs.
Allocated cost = [(AGM unit cost*AGM value)+(ESA unit cost* ESA value)+(PCU unit cost*PCU value)+ (VKT unit cost)+(non attributable unit cost)]* annual VKT
Where:
AGM unit cost = 0.14 cents per tonne kilometre
ESA unit cost = 3.44 cents per ESA kilometre
PCU unit cost = 0.33 cents per PCU kilometre
VKT unit cost = 1.18 cents per kilometre
Non-attributable unit cost = 2.26 cents per kilometre.
These unit costs are set at the average unit costs across the entire network that the NTC has derived from its cost allocation and road use modelling.
Noting the following:
AGM is average gross mass
ESA is equivalent standard axles
PCU is passenger car unit
VKT is vehicle kilometres travelled
Step 3: To derive annual fuel charge revenue based on projected fuel economy and annual travel.
Annual fuel charge revenue = NTC derived fuel charge * fuel usage per kilometre* annual VKT.
The NTC fuel charge that applies at the time will be used to set the “NTC derived fuel charge”.
Step 4: To derive the registration charge by deducting the annual fuel charge revenue from the allocated cost.
In submissions in response to the draft RIS, stakeholders expressed mixed views on the higher productivity formula and estimation of the data inputs for this formula. For example:
• Australian Livestock Transporters Association (ALTA) commented that it would be simpler and more effective to develop a charging system for higher productivity vehicles based on the current “class-by-class” registration calculations, such as via a “multi-combination registration fee” that “could be stepped to reflect the higher/newer combinations”.
• Australian Rail Track Corporation (ARTC) expressed general support for the higher productivity formula, provided that the incremental pricing for higher productivity vehicles was fully cost/risk reflective.
• Australian Trucking Association (ATA) opposed a formula which estimates a charge for higher productivity vehicles based on individualised fuel consumption, kilometres travelled and average gross mass projections, stating that this will result in an
Page 40 2007 Heavy Vehicle Charges Determination Regulatory Impact Statement Vol I
“individualised mass-distance charge administered under the auspices of individual road agency permit systems”. It argued that this returns the administration of nationally consistent heavy vehicle charges to the individual road agency permit fee system prevalent in the 1980s. ATA also put the view that:
− The current charges schedule can be adequately accommodate “modular” vehicles commonly referred to as higher productivity vehicles such as B-triples, quad-axle semis etc. This can be achieved through either the existing fixed charge per axle or based on the application of “PCU, ESA, GVM, VKT and fuel consumption relationships” which should enable a revised “charging structure for trailers” applying a “well reasoned building block approach” so that there is an established charge for the additional axle or trailer.
− The allocated cost for higher productivity vehicles that have more than one trailer (e.g. B-double, B-triple) should not include the non-attributable cost since these type of vehicles do not recover their full common costs under the registration charges as per Option C1 (assuming partial recovery of enforcement costs).
• Cement Industry Federation (CIF) expressed similar views to the ATA (see above).
• The Department of Transport, Energy & Infrastructure (SA) stated that the proposed approach higher productivity charges will generate a number of administrative issues, including additional resource requirements, as it includes operating the new vehicle types under a permit system. It also commented with reference to B-triples, that a simple system will become a complex system and recommends that B-triples are classed and charged as double road trains. In addition asked how infrastructure expenditure and road use statistics specific to higher productivity vehicles will be isolated from future PAYGO determinations.
• National Farmers Federation (NFF) noted that the higher productivity formula does not provide clarity on how the higher productivity vehicles will be charged and expressed concern that this would not provide certainty for operators looking to invest in new technology, with the “potential to deter them from choosing the higher productivity option”.
• Queensland Rail (QR) stated that pricing for higher productivity vehicles should be based on full cost recovery and also reflect the direct costs of infrastructure changes required for their operation.
• Queensland Transport (QT) supported mapping higher productivity vehicles that are not expected to cause additional road damage to existing vehicle registration categories. However, it noted that data needed for the higher productivity formula may not be readily available. As a result of this, it suggested that there may be a need for jurisdictions to share empirical data, and for the development of standardised estimated techniques (e.g. fuel consumption rates) and commissioning of additional studies of particular freight tasks.
In direct consultation with the ATA, the NTC developed an example calculation for a hypothetical B-triple configuration. During this consultation, ATA suggested that the formula inputs (such as annual VKT, ESA rate, AGM in tonnes, PCU value and fuel usage per kilometre) should be estimated so that they are appropriately relative to an existing vehicle class that is comparatively the same as the higher productivity vehicle given the characteristics of the new higher productivity vehicle. They also expressed the view that

2007 Heavy Vehicle Charges Determination Regulatory Impact Statement Vol I Page 41
the B-triple is just a B-double with an extra trailer and the charging system should evolve to a modular concept in which there is a simple charge for any additional trailers.
During the public hearings, the NTC presented the higher productivity formula and the example B-triple calculation. Similar comments were received to that expressed by ATA including:
• There has to be some appropriate relativity between new vehicle types and existing vehicle types. There was significant discussion around maintaining appropriate relativities at the public hearings in WA and NSW.
• Most of the higher productivity vehicles can be accommodated under the existing charging schedule. This was highlighted at the public hearings in Melbourne and Canberra.
• In addition, at the Canberra public hearing, a number of participants (including the ALTA and the ATA) suggested that a revised charging approach could involve charging trailers at different rates depending on the type of trailer and the number of trailers in the overall vehicle configuration – a “modular vehicle concept”. The ATA further recommended that one prime mover charge could be applied to all vehicles that have more than one trailer (a multi-combinational prime move charge), thereby reducing the possibility of inappropriate substitution between vehicle classes at the higher mass end range.
4.5.2 Modular approach to charges
Based on the stakeholder comments in submissions and at the public hearings, the NTC developed a modular approach to charges that accommodates higher productivity vehicles. This approach – Option C3 discussed above – consists of a revised registration charging schedule that allows for modularisation of the trailer component of the registration charge for vehicles that have trailers into different components based on:
• the type of axle groupings that make up the trailer axles (that is, excluding the prime mover axle groupings)
• the number of axle groupings
• the number of axles within each axle grouping.
The NTC prefers this modular approach. It notes that several stakeholders suggested a modular approach during the consultative process. The NTC considers that it is a simple method for charging vehicles regarded as higher productivity vehicles. Importantly, it is consistent with the Determination objective that each vehicle class should recover at least its attributable costs.
Whilst these vehicles may not fully recover their allocated costs, their charges are set at a level comparable to substitute vehicles and are therefore more appropriate. It is expected that full allocated cost recovery will result from the broader price reform process.
Under the modular approach, a registration charge for higher productivity vehicle types that have an additional axle (such as a Quad-axle semi compared to a 6-axle articulated truck) or an additional trailer (such as a B-Triple compared to a B-Double) can easily be generated from the charges schedule. Table 9 shows how the registration charge for three

Page 42 2007 Heavy Vehicle Charges Determination Regulatory Impact Statement Vol I
vehicle types, which could be categorised as higher productivity vehicles, can be constructed through the recommended schedule of charges.
Table 9. Modular charge components of higher productivity vehicles
Vehicle Modular Components Resulting charge
Quad-Axle Semi
• 1 x short-combination prime mover
• 1 x 4 axle semi trailer
$5,650
Quad-Tri B-Double
• 1 x multi-combination prime mover
• 1 x 4 axle lead trailer
• 1 x 3 axle semi trailer
$16,340
B-Triple • 1 x multi-combination prime mover
• 2 x 3 axle lead trailer
• 1 x 3 axle semi trailer
$20,340
If the modular approach under Option C3 is adopted, the NTC considers that there is no need for the higher productivity formula to be used as the basis for establishing a registration charge for new vehicle types. The reasons for this are as follows:
• Many of the higher productivity vehicles are simply existing vehicle types with more trailers or axles than are currently allowed. For example, a B-Triple is the same as a B-Double except it has one additional 3 axle lead trailer, and a quad-tri B-Double is the same as a B-double except it has one more axle on the lead trailer. The modular approach allows for the setting of a registration charge for these vehicles.
• Other more innovative higher productivity vehicles may have a different length and average mass compared to similar vehicle types (based on axle groupings), which may result in a slightly different registration charge under the higher productivity formula approach compared to an approach based on modularised trailer charging. However, the degree of accuracy generated via the higher productivity formula is not necessary for the following reasons:
− The charges for existing vehicle types are based on a range of vehicles classified under each class which will each have a length and average gross mass that is most likely higher or lower than the average length and average gross mass used for each vehicle class in the costing model (sourced from the survey of motor vehicle data from ABS). Therefore, applying the modularised approach to trailer charging for new innovative vehicles is similar to the current approach to setting a registration charge for existing vehicles, which do not necessarily confirm to the average for the vehicle class.
− New innovative vehicles would have to be a good deal shorter or longer in length than current vehicles classes to have an impact on the allocated cost under the higher productivity formula, since the PCU unit cost is relatively small compared to the other unit costs.

2007 Heavy Vehicle Charges Determination Regulatory Impact Statement Vol I Page 43
In addition, the NTC’s analysis indicates the modular approach and the formula result in similar registration charges for higher productivity vehicles that have an additional trailer or axles compared to existing vehicle types.17 For example, Table 10 shows that the registration charges derived using the different approaches for a B-Triple are very similar. This further supports the justification for the modular approach, and suggests that the higher productivity formula can be used to validate the modular approach to setting the trailer component of the registration charge.
Table 10. Registration charges for B-Triples and B-Doubles derived using the different approaches
B-double B-triple Difference
Charge using modular approach $14,340 $20,340 $6,000
Charge using high productivity formula $14,913 $20,418 $5,505 Note: the higher productivity formula charges exclude non-attributable costs are per the revised higher productivity formula in Appendix H.
In the NTC’s view, the difference of around $5,500 between the charges for B-Doubles and B-Triples under the higher productivity formula provides a strong justification for the charge of $2,000 per axle for lead trailer axles (or $6,000 in total for a B-Triple) under the modular approach. A detailed calculation of the registration charge for the B-Triple vehicle under the higher productivity formula is provided in Appendix H. This appendix also includes a similar comparison of vehicle configurations that have quad-axles on the semi-trailer, which provides justification for the magnitude of the fourth axle trailer charge under the modular approach.
The modular approach to developing the trailer charge component of the registration charge will involve defining the type of trailer axle groupings that make up a vehicle’s configuration. This differential (modular) trailer charging approach can be used to determine the trailer component of the registration cost for any vehicle, including PBS vehicles, based on the trailer axle group types. It is not anticipated that there will be any vehicles that cannot fit into this modular approach.
In the case of Performance Based Standards (PBS) vehicles, the NTC considers that a potentially effective approach is for the PBS Review Panel (PRP) to decide how to modularise the new vehicle into its components (the PRP could also set up guidelines that would assist it in this process). However, if there is a new innovative vehicle that is unlikely to be a PBS vehicle, the jurisdictions can modularise this vehicle into its components in a manner that they deem consistent with the trailer types (this is expected this to be an extremely small amount of vehicles).
If the practical application of these guidelines does not suitably enable an appropriate classification of the trailer axles of a new innovative vehicle, the Performance Based Standards Review Panel can assess the vehicle configuration and modularise the vehicle’s trailer axles into its component parts.
17 The higher productivity formula used in this analysis has taken into account the feedback received from public consultations. This feedback has led NTC to revise the formula such that input values (such as annual VKT, ESA value, PCU value and fuel usage) and other aspects of the formula are estimated in a way that is relative to existing vehicle classes and is also simple to calculate. The revised higher productivity formula is outlined in Appendix H.

Page 44 2007 Heavy Vehicle Charges Determination Regulatory Impact Statement Vol I
Incremental prices are not considered in this Determination. Under the Road Reform Plan, COAG has required a detailed review, including trials, to assess the feasibility of incremental pricing by December 2008.
4.6 Should charges under the 2007 Determination be phased in?
The charges that result from the NTC preferred options include both increases for prime movers and trucks in some heavy vehicle classes and decreases for others. The introduction of differential trailer charges will also result in large increases for some trailer types. To mitigate the impact of charge increases, the draft RIS included two options for phasing in charges over a period of either two or three years.
The NTC notes that in principle, COAG supports the phasing in of charges under the 2007 Determination. However, it also notes that this will mean that charges do not fully recover expenditure until the final year of implementation.
Consultation on the draft RIS revealed that although some operators preferred to implement the Determination fully in year one, there was a strong preference for a phase in period of at least three years. The trucking industry indicated that such a phase in period would better enable it to either absorb or pass on the increased cost.
In the draft RIS, the NTC proposed a phasing in schedule that sought to recover a greater proportion of costs in year one, to take into account that in subsequent years operators would also face annual adjustment increases. However, the Brisbane focus group indicated a strong preference for greater weight being placed on the later years:
“It is definitely going to take a year for us to figure out what our fleet should really look like, because of all of the issues around rates and getting new rates out of customers and the types of vehicles you run…a more balanced introduction would be better”18
Therefore, the NTC has changed its phase in methodology to better address these concerns. The tables below present the options for a two or three year phasing in period. For simplicity of comparison, the phasing in options have been demonstrated only for the charges under Option C1 and C3, both assuming partial recovery of enforcement costs, and a cost base that includes 2007/08 budget expenditure. Please note that charges being phased in are still subject to an annual adjustment, so the charges in the tables below are in nominal terms (i.e dollars of the day) and do not include any future annual adjustment. However, as discussed earlier, when 2007/08 budget expenditure is included in calculating in the cost base an annual adjustment is not required in 2008 and is unlikely to be required in 2009.
Table 11 shows charges Option C1 phased in over two and three years. The following principles were applied to the phasing in of charges under this option:
• The fuel charge is implemented in full in year 1.
• If prime mover registration charges have increased only marginally or have fallen, the charge is passed through in full in year one.
18 T Knowles, Brisbane Focus Group, 3 August 2007
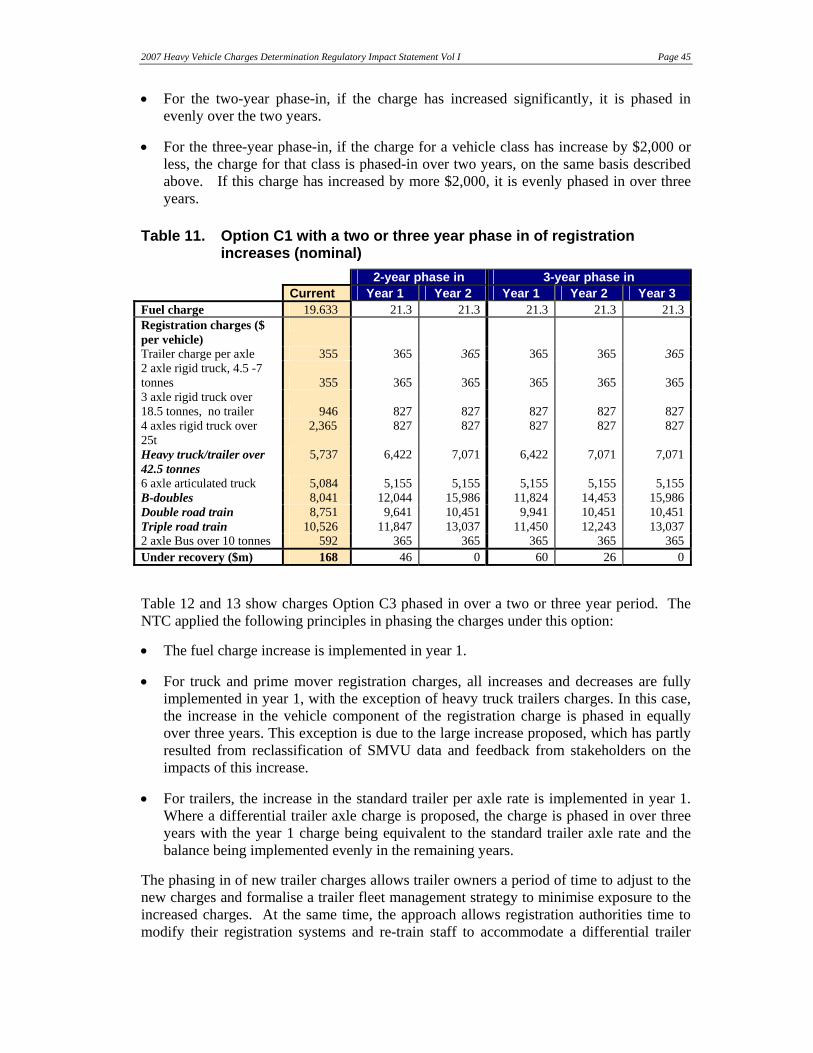
2007 Heavy Vehicle Charges Determination Regulatory Impact Statement Vol I Page 45
• For the two-year phase-in, if the charge has increased significantly, it is phased in evenly over the two years.
• For the three-year phase-in, if the charge for a vehicle class has increase by $2,000 or less, the charge for that class is phased-in over two years, on the same basis described above. If this charge has increased by more $2,000, it is evenly phased in over three years.
Table 11. Option C1 with a two or three year phase in of registration increases (nominal)
2-year phase in 3-year phase in Current Year 1 Year 2 Year 1 Year 2 Year 3 Fuel charge 19.633 21.3 21.3 21.3 21.3 21.3Registration charges ($ per vehicle)
Trailer charge per axle 355 365 365 365 365 3652 axle rigid truck, 4.5 -7 tonnes 355 365 365 365 365 3653 axle rigid truck over 18.5 tonnes, no trailer 946 827 827 827 827 8274 axles rigid truck over 25t
2,365 827 827 827 827 827
Heavy truck/trailer over 42.5 tonnes
5,737 6,422 7,071 6,422 7,071 7,071
6 axle articulated truck 5,084 5,155 5,155 5,155 5,155 5,155B-doubles 8,041 12,044 15,986 11,824 14,453 15,986Double road train 8,751 9,641 10,451 9,941 10,451 10,451Triple road train 10,526 11,847 13,037 11,450 12,243 13,0372 axle Bus over 10 tonnes 592 365 365 365 365 365Under recovery ($m) 168 46 0 60 26 0
Table 12 and 13 show charges Option C3 phased in over a two or three year period. The NTC applied the following principles in phasing the charges under this option:
• The fuel charge increase is implemented in year 1.
• For truck and prime mover registration charges, all increases and decreases are fully implemented in year 1, with the exception of heavy truck trailers charges. In this case, the increase in the vehicle component of the registration charge is phased in equally over three years. This exception is due to the large increase proposed, which has partly resulted from reclassification of SMVU data and feedback from stakeholders on the impacts of this increase.
• For trailers, the increase in the standard trailer per axle rate is implemented in year 1. Where a differential trailer axle charge is proposed, the charge is phased in over three years with the year 1 charge being equivalent to the standard trailer axle rate and the balance being implemented evenly in the remaining years.
The phasing in of new trailer charges allows trailer owners a period of time to adjust to the new charges and formalise a trailer fleet management strategy to minimise exposure to the increased charges. At the same time, the approach allows registration authorities time to modify their registration systems and re-train staff to accommodate a differential trailer

Page 46 2007 Heavy Vehicle Charges Determination Regulatory Impact Statement Vol I
axle charge system. The NTC’s preferred option is for the three-year phase in period (shown in Table 13).
Table 12. Option C3 with a two year phase in of registration increases (nominal)
2 year phase in Current
07/08 Prime mover Year 1 total Year 2 total
Fuel Charge 19.633 21.0 21.0Registration Charges ($ per vehicle)
2 axle rigid truck, 4.5 - 7 tonnes 355 380 380 3803 axle rigid truck over 18.5 tonnes, no trailer 946
859 859 859
4 axle rigid truck over 25t no trailer 859 859 859Heavy truck/trailer over 42.5 tonnes 19 5,737 5161 6,491 7,158 6 axle articulated truck 5,084 3930 5,070 5,220 B-double 9 axle 8,041 7050 9,330 14,340 Double road train 8,751 7050 10,090 10,390 Triple road train 10,526 7050 11,990 12,440 2 axle bus over 10 tonnes 592 380 380 380Annual under-recovery ($m) 168 83 0Trailer charge per axle Year 1 Year 2Standard trailer axle charge 355 380 380Semi trailer tr-axle 355 380 430B-double lead trailer – tandem axle 355 380 1,900B-double lead trailer – tri axle 355 380 2,000Road train dolly trailer 355 380 380
19 Note the prime mover registration charge for this class of vehicle has been phased in over 2 years. This figure represents the year 1 prime mover charge. The prime mover charge in years 2 and 3 is $5,828
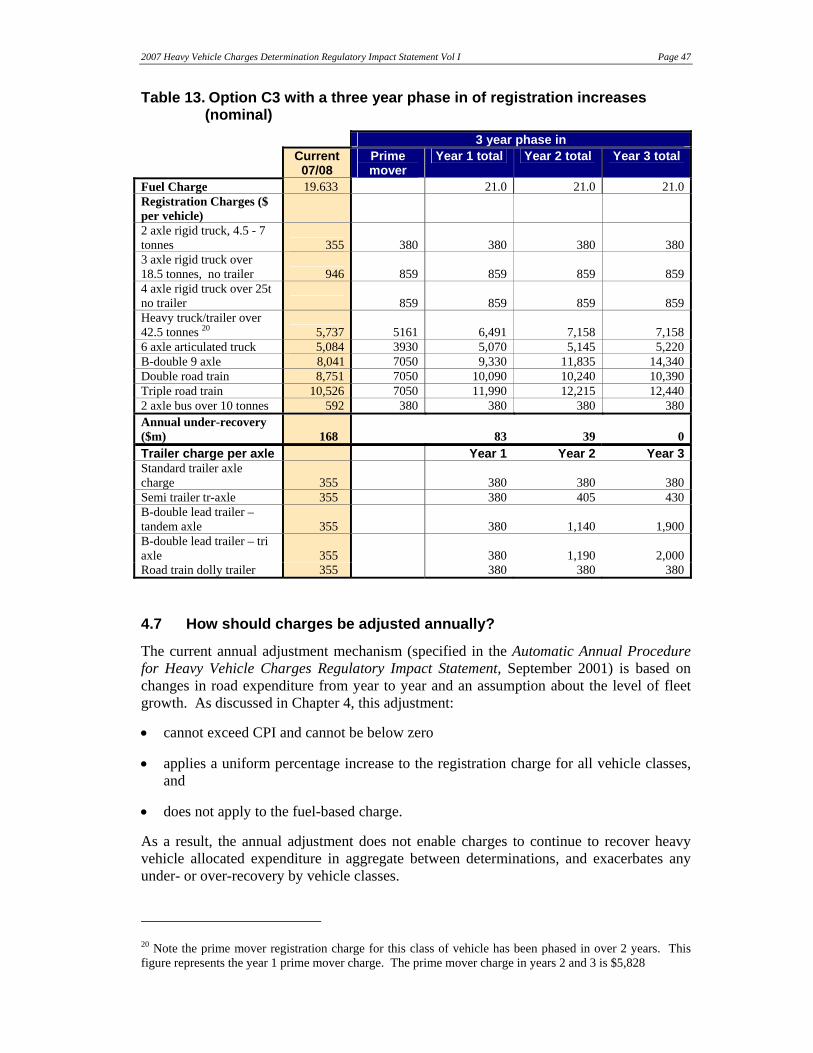
2007 Heavy Vehicle Charges Determination Regulatory Impact Statement Vol I Page 47
Table 13. Option C3 with a three year phase in of registration increases (nominal)
3 year phase in Current
07/08 Prime mover
Year 1 total Year 2 total Year 3 total
Fuel Charge 19.633 21.0 21.0 21.0Registration Charges ($ per vehicle)
2 axle rigid truck, 4.5 - 7 tonnes 355 380 380 380 3803 axle rigid truck over 18.5 tonnes, no trailer 946 859 859 859 8594 axle rigid truck over 25t no trailer 859 859 859 859Heavy truck/trailer over 42.5 tonnes 20 5,737 5161 6,491 7,158 7,158 6 axle articulated truck 5,084 3930 5,070 5,145 5,220 B-double 9 axle 8,041 7050 9,330 11,835 14,340 Double road train 8,751 7050 10,090 10,240 10,390 Triple road train 10,526 7050 11,990 12,215 12,440 2 axle bus over 10 tonnes 592 380 380 380 380Annual under-recovery ($m) 168 83 39 0Trailer charge per axle Year 1 Year 2 Year 3Standard trailer axle charge 355 380 380 380Semi trailer tr-axle 355 380 405 430B-double lead trailer – tandem axle 355 380 1,140 1,900B-double lead trailer – tri axle 355 380 1,190 2,000Road train dolly trailer 355 380 380 380
4.7 How should charges be adjusted annually?
The current annual adjustment mechanism (specified in the Automatic Annual Procedure for Heavy Vehicle Charges Regulatory Impact Statement, September 2001) is based on changes in road expenditure from year to year and an assumption about the level of fleet growth. As discussed in Chapter 4, this adjustment:
• cannot exceed CPI and cannot be below zero
• applies a uniform percentage increase to the registration charge for all vehicle classes, and
• does not apply to the fuel-based charge.
As a result, the annual adjustment does not enable charges to continue to recover heavy vehicle allocated expenditure in aggregate between determinations, and exacerbates any under- or over-recovery by vehicle classes.
20 Note the prime mover registration charge for this class of vehicle has been phased in over 2 years. This figure represents the year 1 prime mover charge. The prime mover charge in years 2 and 3 is $5,828

Page 48 2007 Heavy Vehicle Charges Determination Regulatory Impact Statement Vol I
COAG has asked the ATC to direct the NTC to further develop the annual adjustment arrangements to address these shortcomings, noting that any new arrangements may need to be phased in.
The draft RIS set out four options for further developing the annual adjustment arrangements to ensure that charges continue to recovery heavy vehicle allocated expenditure in aggregate between determinations, and to remove cross-subsidisation across vehicle classes. The NTC notes that to ensure charges continue to recover costs in aggregate, the fuel component will need to be adjusted in the same way as the registration component. It further notes that this is consistent with the Energy White Paper titled “Securing Australia’s Energy Future” (2004), which stated that the future objective of fuel taxation for heavy vehicles is to link the road user charge component of the federal fuel excise to the NTC’s annual adjustment mechanism.
The four options and stakeholder comments on these options are outlined below.
4.7.1 Option A1: Maintain the current adjustment process with modifications and inclusion of fuel indexation
This option consists of the current adjustment process for registration charges (as specified in the Automatic Annual Procedure for Heavy Vehicle Charges Regulatory Impact Statement, NRTC September 2001) with the following modifications:
• Updated formula components so as to align with the new 2007 Determination cost allocation model including:
− new A,B and C Factors and Road Use Factor (see Appendix E, Vol II). These factors allow for changes in road expenditure, vehicle kilometres travelled by both light and heavy vehicles and number of vehicles.
− replacing the three-year moving average (to determine changes in road expenditure) with a seven-year moving average. This seven-year moving average is based on a seven-year average of real expenditure instead of the previous approach of using nominal expenditure (see Appendix F, Vol II).
• The indexation of the fuel-based charge by the Annual Adjustment Formula used to index registration charges. This may require changes to the Fuel Tax Act 2006.
4.7.2 Option A2: Option A1 with removal of the cap and floor
This option is the same as Option A1 (outlined above) but also includes the removal of the CPI cap and 0 per cent floor. This removal means that this option better enables charges to continue to recover allocated expenditure in aggregate over time than Option A1. For example, the annual adjustment could not increase charges sufficiently to recover the large increase in road expenditure over 2007 and 2008 (see Figure 2) if increases are capped by the CPI.
However, like Option A1, this option does not ensure that any increase in charges resulting from the annual adjustment is allocated between vehicle class according to their road usage. As a result, it will inevitably result in over and under-recovery between vehicle classes over time. For example, if one vehicle class’ contribution to the overall road task changes significantly over time, this could result in changes to the relative cost allocation per vehicle between vehicle types.

2007 Heavy Vehicle Charges Determination Regulatory Impact Statement Vol I Page 49
In the draft RIS, the NTC proposed two potential approaches to address this issue, including undertaking more frequent determinations and monitoring changes in key variables to determine when a recalculation of charges is warranted. After considering stakeholder feedback (see below) the NTC now considers the preferred approach is to:
• Undertake an annual review to determine whether key variables have moved sufficiently to warrant a new determination. (Appendix G outlines the variables that should be monitored as part of this process.)
• Undertake a new determination at least every five years (i.e., if not already undertaken as a result of the annual review).
When combined with the above approach, Option A2 is the NTC’s preferred option.
4.7.3 Option A3: Indexation of both registration and fuel charges
Under this option both fuel and registration charges would be indexed by either the CPI or the Road Construction and Maintenance Price Index (RCMPI). RCMPI is calculated by BTRE, and is the index the NTC uses to generate a real series of road expenditure in the cost allocation model. The application of the CPI in the annual adjustment methodology therefore represents an inconsistency with the Determination methodology. However, it was adopted due to its simplicity.
One of the key benefits of Option A3 is its simplicity. However, it does not ensure that the resulting charges match the estimated cost of road use over time, and therefore may result in the need for major corrections in subsequent determinations. This is because changes in road expenditure are driven by changes in the price of inputs (e.g. construction materials) and changes in real output or activity. The use of a price index such as CPI or RCMPI would only capture the change in the price of inputs, and not the change in the real output or amount of construction work that has been undertaken. In addition, CPI and RCMPI are only proxies for the price of inputs.
Figure 10 compares the estimated movement in arterial road expenditure to the CPI and RMCPI over the period 1999/00 to 2007/08 (with the final year of this series, 2007/08, based on forecast data). This comparison shows that arterial road expenditure has increased at a rate that is considerably more than the increase in both the RCMPI and CPI over this period. The implication of this is that changes in RCMPI and CPI have historically not been representative of changes in road expenditure.

Page 50 2007 Heavy Vehicle Charges Determination Regulatory Impact Statement Vol I
Figure 10. Comparison of changes in road expenditure to changes in RCMPI and CPI (2000/01 = 100.0)
90
110
130
150
170
190
210
1999/002000/01
2001/022002/03
2003/042004/05
2005/062006/07
2007/08 F
Arterial Road Expenditure RCMPI CPI (All Groups)
4.7.4 Option A4: Annual re-calculation of charges
This option requires updating expenditure and road usage data each year, assuming that the cost allocation rules and methods of charge calculation do not change. The benefit of this option is that, as well as ensuring cost recovery in aggregate over time, it ensures that each vehicle class is allocated the correct amount of cost according to its usage. However, the complexity behind heavy vehicle charges means that this process is unlikely to be undertaken as an automatic adjustment and would be more akin to a normal determination.
There are also other problems with this approach:
• The process may lead to annual charges volatility, because the fuel and registration charges could go up or down depending on changes to the fleet. This is inconsistent with general regulatory pricing principles of consistency, predictability and certainty. As a result, it may be difficult for operators to manage forward contracts.
• The process may require a consultation process as it would lead to differentiated changes in charges. This may make it more difficult to meet an annual timetable.
• The process is resource-intensive and may involve significant legislative and administrative difficulties for governments.
4.7.5 Stakeholder comments on the options
In submissions, stakeholders expressed differing views on the options. No stakeholders supported Option A1, and some rail industry and road agency stakeholders supported Options A2 and A3 and A4. Trucking industry stakeholders did not support any of the options, but argued for the retention of the current annual adjustment arrangements (see Table 14 for a summary of stakeholder views).

2007 Heavy Vehicle Charges Determination Regulatory Impact Statement Vol I Page 51
Table 14. Summary of stakeholder submission comments on options for annual adjustment process
Option Stakeholder Comments
A1 Maintain current process with modifications and inclusion of fuel indexation
None
A2 Option 1 with removal of the cap and floor
Australasian Railway Association
Supports a charging option that fully recovers road and related expenditure, and notes that the CPI cap “is… one of the reasons for charges falling short of expenditure”. Supports Option 2 assuming that Option 4 is too difficult to implement.
South Australian Department of Transport, Energy & Infrastructure
Considers that the CPI cap has contributed to aggregate cost under-recovery, particularly in times of escalating road maintenance prices and expenditure. Also notes that because the annual adjustment does not currently apply to fuel this is a major contributor to aggregate under-recovery.
QR Supports Option 2 on the basis that Option 4 may be problematic for a number of reasons including “price volatility, complexity and data availability”.
Queensland Transport
Believes Option 2 retains a degree of “simplicity whilst maintaining aggregate cost recovery”.
A3 Indexation of registration and fuel charges by CPI or RCMPI
Asciano Considers Option 3 is likely to have less harmful effects on parties that are “least able to manage the cost impacts”. Also does not approve of the 7 year average used in Options 1 and 2.
Engineers Australia
Prefers Option 3 with RCMPI as it is simple, is a less time consuming process, meets “the full costs of road use” and avoids further deterioration of competitive neutrality.
A4 Annual recalculation of charges
Australian Rail Track Corporation
Considers that only an annual recalculation of charges will achieve “full cost recovery by each vehicle class”. Acknowledges issues with this approach including price volatility, complexity and data availability and states that it would have no objection to Option 2 being applied.
None of the above
National Farmers Federation
Considers removing CPI cap on registration fees or expanding the adjustment process to include fuel would remove the “incentive for Governments to ensure the maximum utilisation of road spend”. This reflects its concern that there is poor accountability of funds allocated to road projects.
Australian Trucking Association
Supports retention of current methodology. Considers current charges already result in significant over-recovery and over-recovery will increase if the CPI cap is removed and annual adjustments extended to fuel.
Australian Cement Industry Fed’n
Supports the ATA’s view on basis that the “current arrangements are already over-recovering from heavy vehicles”.

Page 52 2007 Heavy Vehicle Charges Determination Regulatory Impact Statement Vol I
Stakeholders at the public hearings also expressed a mixed range of views. At the Canberra hearing, some argued that if the annual adjustment had been applied to the fuel charge historically then we would be in an over-recovery situation now, while others argued that the current adjustment process has resulted in significant under-recovery thereby providing the case for change to a structure that delivers cost recover.
At the Canberra and Sydney hearings, trucking industry representatives commented that their industry would not be as concerned with annual adjustments if it was confident that government spending on roads was efficient and delivered productivity improvements for the industry.
Some stakeholders made specific comments on the options proposed in the draft RIS:
• In relation to Option A1, some argued that the zero per cent floor should be removed: if governments cut spending on roads then charges should fall (Brisbane).
• In relation to Option A3, some put the view that the CPI is not an appropriate index since the costs measured in the CPI are largely unrelated to the transport industry (Adelaide and Sydney).
• In relation to Option A4, some commented that if there is a new determination each year, charges will be volatile, which is a problem for operators that are locked into contracts (Sydney). Others opposed this option because it would require going through the current determination process on an annual basis (Brisbane).
Several parties expressed views on how to deal with over- and under-recovery between vehicle classes as part of the annual adjustment process:
• QR recommended that an annual review be conducted as a “check and balancing mechanism” to ensure that each vehicle class is recovering its fully allocated costs throughout the life of the Determination.
• Queensland Transport suggested that Option 2 will result in over or under-recovery for different vehicle classes and that new determinations will be necessary to correct any distortions.
• SA DTEI stated that the preferred solution is to monitor changes in parameters to gauge whether they are experiencing changes of a substantial nature that would re-warrant a re-calculation of charges using updated road expenditure and road usage data.
• Some Queensland-based stakeholders considered that the annual adjustment needs to take into account that the fleet mix changes over time through, for example, a mechanism that triggers a determination once certain variables get beyond a range – say “10 per cent” of their original value.
After considering all stakeholders’ comments, the NTC considers that Option A2, combined with an annual review to determine whether key variables have moved sufficiently to warrant a new determination is warranted and a charges determination at least every five years is the most appropriate approach for ensuring that the annual adjustment process enables charges to continue to recover heavy vehicle allocated expenditure in aggregate and ensure there is no cross-subsidisation across vehicle classes. Its reasons are as follows:
2007 Heavy Vehicle Charges Determination Regulatory Impact Statement Vol I Page 53
• Option A2 will achieve COAG’s requirement that annual adjustment arrangements ensure “the ongoing delivery of full expenditure recovery in aggregate” in a way that is formula-driven, relatively simple, and will not require a new determination each year. This option also has a reasonable amount stakeholder support. In addition, when this option is combined with an annual review process and more frequent determinations, it will minimise “ongoing cross-subsidisation across different heavy vehicle classes’.
• The NTC does not favour Option A1 because it would not achieve COAG’s requirements about ongoing cost recovery and removal of cross-subsidisation, and there is not stakeholder support for this option.
• The NTC does not favour Option A3 (which involves indexation via a CPI or RCMPI measure) because the historical correlation between CPI and road expenditure is weak. There is also little stakeholders support for this option.
• Although Option A4 is the most accurate way to achieve COAG’s requirements about ongoing cost recovery and removal of cross-subsidisation, the NTC does not favour this option because it would introduce unnecessary charges volatility and require a significant amount of maintenance and consultation. Many stakeholders who commented on Option A4 expressed similar views.
• The NTC does not accept some stakeholders’ view that there is no need to change from the current annual adjustment process (which includes a CPI cap and excludes fuel adjustments) as it believes the premise used to support this view (that current charges are already resulting in significant over-recovery) is invalid.
The NTC notes that a small number of parties opposed the change to a seven-year average in the annual adjustment formula. However, it considers that this change is important as it is required to ensure consistency with any new determination.
The NTC also notes that one stakeholder suggested that all of the increase that would result from an annual adjustment should apply only to the registration charge component (and not the fuel-based component). The NTC does not favour this approach since it would lead to major adjustments to registration and fuel charges at the time of the next determination since the fuel charges would have incurred no change from one determination to the next.
Page 54 2007 Heavy Vehicle Charges Determination Regulatory Impact Statement Vol I
5. ASSESSMENT OF POTENTIAL IMPACTS
The charges that will result from the NTC’s recommendations for the 2007 Heavy Vehicle Charges Determination – that is, charges under Option C3, with partial inclusion of enforcement costs and inclusion of 2007/08 budget expenditure in the cost base, and a phase-in period of up to three years for registration charges – will have an impact on the heavy vehicle industry. One of the primary drivers of these impacts is the increase in the cost base due to increased expenditure on roads. Another is the fact that the charges ensure that all vehicle classes at least recover their attributable costs, which means that charges will increase for those vehicle classes that currently under-recovery these costs. However, the impact is not uniform across vehicle classes and is relatively small compared to other costs operators face.
Further, the expected impact on the heavy vehicle industry is somewhat moderated by the fact that only one in four of the 260,000 heavy vehicles in Australia provide commercial ‘hire and reward’ services (although this sector accounts for over half of the road freight task). For most of the 200,000 companies that operate heavy vehicles, transport is ancillary to their main business, particularly in the construction and farming industries.
The sections below discuss the impacts of the NTC’s recommendations on the fuel-based charge component, the registration charge component, vehicle operating costs, industry production costs, end users, competition, government financing, and productivity and safety.
5.1 Impact on fuel-based charge
Option C3 will increase the fuel charge by 1.367 cents per litre. This increase is less than the increase proposed in the Third Determination recommendations (2.467 cents per litre). It will be implemented through a reduction in the fuel rebate from 18.51 cents per litre to 17.143 cents per litre. The effect will vary considerably in dollar terms on owner-drivers and fleet owners, depending on the distances their vehicles travel.
The increase in the fuel-based charge will add about 1.3 per cent to the effective fuel costs per litre paid by heavy vehicle operators after the fuel rebate is taken into account, based on current diesel prices. In comparison the overall rise in diesel fuel prices since mid 2004 is 30 per cent, despite a fall off from the price peaks experienced in 2006.
5.2 Impact on registration charge
The changes to the registration charge component under Option C3 will affect the registration costs of heavy vehicles, and the revenue from this charge collected by the jurisdictions.
5.2.1 Impact on heavy vehicles
Under Option C3, all vehicles and vehicle-trailer combinations experience a change in registration charges. Around 25 per cent of vehicles experience a decrease in their registration charge. The remaining 75 per cent of vehicles and 100 per cent of trailers will experience an increase in their registration charge.
The impact of increases in registration charges on vehicles such as B-doubles and road trains will require adjustment by the industry to incorporate its effect into freight rates and contractual arrangements. For this reason, the NTC’s preference is for a three-year phase-

2007 Heavy Vehicle Charges Determination Regulatory Impact Statement Vol I Page 55
in for vehicle types where large registration increases will apply, to assist transport operators in planning and negotiating future contracts.
5.2.2 Impact on jurisdictions’ registration revenue
The charges under Option C3 will lead to increases in the total revenue generated by registration charges (see Table 15), and mostly lead to increases in the revenue generated by registration of specific vehicle classes (see Table 16). Both these tables exclude post 2007/08 annual adjustment impacts and assume constant usage figures.
Table 15. Registration revenue by jurisdiction ($ ‘000s)
State/territory
Current 2007/08 revenue
Proposed revenue 2008/09
Proposed revenue 2009/10
Proposed revenue 2009/10
Percentage change in revenue 2009/10
compared to 2007/08
NSW 150,313 150,144 159,228 166,778 11.0 Victoria 171,433 172,147 185,841 197,894 15.4 Queensland 146,881 149,445 160,107 169,816 15.6 SA 57,859 58,750 64,478 69,982 21.0 WA 86,169 87,452 90,940 94,113 9.2 Tasmania 14,940 14,864 15,726 16,503 10.5 NT 7,972 8,421 8,651 8,858 11.1 ACT 2,860 2,806 2,961 3,084 7.8 Total 638,428 644,030 687,933 727,028 13.9
Table 16. All jurisdiction registration revenue by vehicle class ($ ‘000s)
Vehicle class Current 2007/08
revenue
Proposed revenue after full implementation
2009/10 Percentage change
in revenue Rigid trucks 219,384 216,664 -1.2 Articulated trucks 252,589 257,538 2.0 B-Doubles 85,489 164,540 92.5 Road trains 50,336 59,709 18.6 Special purpose trucks 11,325 11,862 4.7 Buses 19,305 16,715 -13.4 Total 638,428 727,028 13.9
5.3 Impact on vehicle operating costs
The impact of the charges under Option C3 will have a direct influence on transport operator vehicle operating costs. The NTC used the recently updated ARRB HDM IV model (ARRB 2006a) to assess this impact on the vehicle operating costs (as at mid 2007) for each heavy vehicle class. This model looks at average vehicle impacts within each heavy vehicle class and the results are subject to the assumptions made. Although it

Page 56 2007 Heavy Vehicle Charges Determination Regulatory Impact Statement Vol I
cannot provide exact impacts that apply to all transport operators of a vehicle type, it does provide illustrative examples of the magnitude of the impact that might be experienced.
Table 17 shows the likely impact on total vehicle operating costs of Option C3 during the phase-in period for some key heavy vehicle types. For example, the table shows that a B-double that has average vehicle class characteristics in terms of load and distance travelled per annum faces a rise of 2.8 per cent after charges are fully phased-in.
Table 17. Change in average vehicle operating costs for key vehicle types
Vehicle type 2007 average vehicle operating
costs $
Percentage change in
Year 1
Percentage change in
Year 2
Percentage change in
Year 3 2 axle rigid truck 4.5 to 7 tonnes (no trailer)
22,100 0.4 0.4 0.4
3 axle rigid truck over 18 tonnes (no trailer)
37,400 0.2 0.2 0.2
Heavy truck trailer over 42.5 tonnes
116,200 1.1 1.7 1.7
6 axle articulated truck 124,800 0.5 0.5 0.6 9 axle B-double 278,200 1.0 1.9 2.8 Double road train 252,200 1.0 1.1 1.1 Triple road train 301,300 1.0 1.0 1.1 Note: annual percentage changes are not cumulative
The example for a B-double is based on an ‘average’ vehicle that travels 179,000 km per annum. However, for a shorthaul B-double operator that travels around 120,000 kilometres per annum, vehicle operating costs will increase by 3.9 per cent as a result of the increases in both the fuel and registration charges under Option C3. In contrast, a longhaul B-double operator that travels 240,000 kilometres per year will face a 2.3 per cent increase in its vehicle operating costs due to the higher operating costs associated with operating greater distances.
The NTC has also undertaken impact analysis using alternative models as the ATN-PKF model (2007) and the TransEco cost model. These alternative models showed the impact to be similar as the impacts described above.
The overall impact on vehicle operating cost is not significant. This is because registration costs represent only a relatively small share of a heavy vehicle operators’ annual costs (see Table 18).

2007 Heavy Vehicle Charges Determination Regulatory Impact Statement Vol I Page 57
Table 18. Changes in registration costs as a share of average vehicle operating costs
Vehicle type Current registration
share
Percentage share in Year 1
Percentage share in Year 2
Percentage share in Year 3
2 axle rigid truck 4.5 to 7 tonnes (no trailer)
1.6 1.7 1.7 1.7
3 axle rigid truck over 18 tonnes (no trailer)
2.5 2.3 2.3 2.3
Heavy truck trailer over 42.5 tonnes
4.9 5.5 6.1 6.1
6 axle articulated truck 4.1 4.0 4.1 4.2 9 axle B-double 2.9 3.3 4.2 5.0 Double road train 3.5 4.0 4.0 4.1 Triple road train 3.5 3.9 4.0 4.1
The total impact of the registration charges and fuel-based charge under Option C3 is shown in Table 19 relative to total vehicle operating costs. In the case of B-doubles, the total heavy vehicle charges rise from around 10.4 per cent currently to 12.9 per cent.
Table 19. Changes in total heavy vehicle charges as a share of average vehicle operating costs
Vehicle type Current charge share
Percentage share in Year 1
Percentage share in Year 2
Percentage share in Year 3
2 axle rigid truck 4.5 to 7 tonnes (no trailer)
6.4 6.9 6.9 6.9
3 axle rigid truck over 18 tonnes (no trailer)
8.6 8.8 8.8 8.8
Heavy truck trailer over 42.5 tonnes
11.2 12.2 12.7 12.7
6 axle articulated truck 11.2 11.7 11.8 11.8 9 axle B-double 10.4 11.3 12.1 12.9 Double road train 10.5 11.5 11.5 11.6 Triple road train 10.5 11.4 11.5 11.5
5.3.1 Impact on road user charges per net tonne kilometre
Once fully implemented, Option C3 ensures charges per net tonne kilometre for B-doubles and road trains remain lower than for articulated and rigid trucks (see Figure 11).

Page 58 2007 Heavy Vehicle Charges Determination Regulatory Impact Statement Vol I
Figure 11. Road user charges per net tonne kilometre (once fully implemented)
0.0
0.5
1.0
1.5
2.0
2.5
3.0
3.5
4.0
4.5
3 axle rigidtruck over
18.5 tonnes
Heavy trucktrailer over42.5 tonnes
6 axlearticulated
truck
9 axle B-double
Doubleroad train
Triple roadtrain
Cen
ts p
er n
et to
nne
kilo
met
re
5.3.2 Impact on the vehicle fleet
An NTC-commissioned survey of B-double operators in 2005 (NTC 2005c) found that operating costs would need to increase by 15–25 per cent before they would consider moving back to semi-trailers. As Table 17 indicates, the increase in charges for B-doubles under Option C3 are only around 2.8 per cent.
5.3.3 Case studies of impact on operational costs
Because the impacts of its recommended charges will vary across operators, the NTC commissioned CRA International (2007) to assess these impacts on specific types of operations. These case studies were undertaken with the assistance of the trucking industry, which provided data on the specific operations.
Case study 1: Inbound livestock transport for an abattoir in regional NSW
Description
The case study evaluated the inbound transport cost associated with a typical one-year kill at the abattoir. Over 80 per cent of the livestock processed was sourced from five regions in NSW, with 11 per cent of the livestock sourced from Queensland and the remainder came from Victoria and SA. B-doubles and double road trains serviced over 85 per cent of the inbound livestock transport task by value.

2007 Heavy Vehicle Charges Determination Regulatory Impact Statement Vol I Page 59
Impacts
For this operation, the total truck running costs would increase by:
• 0.4 per cent for a 6-axle articulated truck
• 1.8 per cent for a 9-axle B-double
• 0.7 per cent for double road trains.
As a share of total vehicle operating costs, registration costs would rise from 1.8 per cent to 2.6 per cent, while fuel costs would remain steady at 26.8 per cent (Figure 12).
For the entire operation, overall vehicle operating costs would rise by $91,000 per annum which would represent a rise of 1.2 per cent from its total cost base of $7.6 million. It is expected that the three year phase-in will assist operators to pass on those increases.
Figure 12. Case study 1: impact on vehicle operating cost shares
37.1% 36.7%
21.4% 21.1%
26.8% 26.8%
12.9% 12.8%2.6%1.8%
0%
10%
20%
30%
40%
50%
60%
70%
80%
90%
100%
Existing share Share if NTC chargesimplemented
% S
hare
RegistrationMaintenanceFuel CrewCapital & Insurances
Case study 2: Linehaul operation based in South East Australia
Description
This operation employs over 200 vehicles, of which more than 65 per cent are 9 axle B-doubles. It is involved in the transport of bulk materials, general freight, liquids, livestock and the local distribution of freight. The kilometres travelled by its B-doubles are significantly higher than the kilometres travelled by its 6 axle articulated trucks.
There are also significant differences in the kilometres of travel involved in the different linehaul activities. In particular, B-doubles involved in general freight and livestock

Page 60 2007 Heavy Vehicle Charges Determination Regulatory Impact Statement Vol I
transport undertake fewer kilometres of travel per vehicle than B-doubles involved in other linehaul activities.
Impacts
For this operation, linehaul costs would increase by between 1.7 per cent (for local distribution) and almost 3 per cent (for general freight). As a share of total vehicle operating costs, registration costs would rise from 2 per cent to 3.2 per cent, while fuel costs would fall slightly from 31.1 per cent to 31.0 per cent (Figure 13).
In overall dollar terms, annual vehicle operating costs would rise by $590,000 per annum. This represents an increase of 1.6 per cent on its total annual cost base of $36.5 million. It is expected that the three year phase-in will assist operators to pass on those increases.
Figure 13. Case study 2: impact on vehicle operating cost shares
66.9% 65.8%
31.1% 31.0%
3.2%2.0%
0%
10%
20%
30%
40%
50%
60%
70%
80%
90%
100%
Existing share Share if NTC chargesimplemented
% S
hare Registration
Fuel
Other inputs
Case study 3: Bulk haul operation in regional Victoria
Description
This operation uses seven 9 axle B-doubles and three 6 axle articulated trucks to transport grains and other bulk materials. The operator provided data on a truck-by-truck basis, which reflects the fact that the trucks can be involved in the haul of grain on one occasion and another bulk material on the next occasion. The revenue from its bulk haul operations is predominately obtained from operations undertaken by B-doubles.
Impact
As a share of total vehicle operating costs, registration costs will increase from 1.7 per cent to 2.8 per cent, and fuel costs will remain steady at 26.6 per cent for this operation (Figure 14). Its annual vehicle operating costs will rise by $59,000 or 1.4 per cent, from a total cost base of $4.13 million per annum. It is expected that the three year phase-in will assist operators to pass on those increases.

2007 Heavy Vehicle Charges Determination Regulatory Impact Statement Vol I Page 61
Figure 14. Case study 3: impact on vehicle operating cost shares
71.7% 70.7%
26.6% 26.6%
1.7% 2.8%
0%
10%
20%
30%
40%
50%
60%
70%
80%
90%
100%
Existing share Share if NTC chargesimplemented
% S
hare Registration
FuelOther inputs
Case study 4: mine haul operation in Northern Territory
Description
This operation employs quad axle prime movers to haul ore from several locations to a central point for processing. It employs multi-combination vehicles consisting of 9 quad axle prime movers pulling B-doubles with two following trailers. There is also one spare vehicle, which is a quad axle prime mover that pulls a B-double and one trailer. During the period assessed over 95 per cent of its revenue was obtained from operations of the quad road trains. The operator’s contract with the mine involves a payment per tonne of ore carried from the mine site to the central processing point, and the mine supplies the fuel.
Impact
For this operation, registration and fuel costs represent about 21 per cent of its total calculated vehicle operating costs. This is much smaller than the share that these costs account for in three case studies above. This is partly because the mine supplies its fuel, but it is mainly due to the fact that the mine haul operation costs more to run per unit of output than the other case studies.
Because of these higher unit costs, the NTC’s recommendations will have a smaller percentage impact on the vehicle operation costs of this operation. As a share of total vehicle operating costs, its registration costs will increase from 0.8 per cent to 1.2 per cent, and its fuel costs will increase from 20.7 per cent to 20.9 per cent (Figure 15). Its annual vehicle operating costs will rise by around $112,000 or 0.7 per cent, from a total cost base of $15.2 million per annum. It is expected that the three year phase-in will assist operators to pass on those increases.

Page 62 2007 Heavy Vehicle Charges Determination Regulatory Impact Statement Vol I
Figure 15. Case study 4: impact on vehicle operating cost shares
78.5% 77.9%
20.7% 20.9%1.2%0.8%
0%
10%
20%
30%
40%
50%
60%
70%
80%
90%
100%
Existing share Share if NTC chargesimplemented
% S
hare Registration
FuelOther inputs
Case study 5: prime mover owner-operator
Description
This operator provides a prime mover registered as a B-double prime mover to a freight forwarder and does not own any trailers himself.
Impact
The owner-driver will be affected by increases in the registration charge for the B-double prime mover and the fuel-based charge. The cost of registering his B-double prime mover will rise by 19 per cent or $1,139, taking the annual registration cost from $5,911 to $7,050. However, his overall increase in vehicle operating costs will be just 0.8 per cent in Year 1, because of the phase-in period.
As a share of total vehicle operating costs, his registration costs will increase from 1.7 per cent to 2.0 per cent, while his fuel costs will rise slightly from 34.5 per cent to 34.7 per cent (Figure 16).

2007 Heavy Vehicle Charges Determination Regulatory Impact Statement Vol I Page 63
Figure 16. Case study 5: impact on vehicle operating cost shares
63.8% 63.3%
34.5% 34.7%
1.7% 2.0%
0%
10%
20%
30%
40%
50%
60%
70%
80%
90%
100%
Existing share Share if NTC chargesimplemented
% S
hare Registration
FuelOther inputs
Case study 6: freight forwarder
Description
This operator is a large freight forwarder that makes extensive use of owner-driver prime movers and operates a fleet of 300 B-double trailers.
Impact
Freight forwarders with B-double lead trailers and tri-axle semi-trailers are expected to experience the largest impact as a result of the NTC’s recommendations, although the phase-in period will mean that the increases in trailer costs wont be felt immediately. For this operator, the overall impact on its annual vehicle operating costs will be an increase of $2.5 million or 1.9 per cent, from its cost base of $137 million per annum. It is expected that the three year phase-in will assist the operator in passing on those increases.
As a share of total vehicle operating costs, registration costs will increase from 1.2 per cent to 2.8 per cent, while fuel costs will fall slightly from 13.7 to 13.6 per cent (Figure 17). The very low fuel cost share compared to the other case studies is due to the fact the owner-drivers it utilises pay for much of the fuel costs.

Page 64 2007 Heavy Vehicle Charges Determination Regulatory Impact Statement Vol I
Figure 17. Case study 6: impact on vehicle operating cost shares
85.1% 83.6%
13.7% 13.6%2.8%1.2%
0%
10%
20%
30%
40%
50%
60%
70%
80%
90%
100%
Existing share Share if NTC chargesimplemented
% S
hare Registration
FuelOther inputs
5.4 Impacts on industry production costs
The extent to which the changes in heavy vehicle operating costs discussed above will flow through to industry and the economy can be determined using the latest Input Output tables produced by the Australian Bureau of Statistics for 2001/02 (ABS 2006b). Overall, the effects of the proposed charges on industry production costs are estimated to be small. This is because road transport costs represent just 1.8 per cent of the overall intermediate input costs for Australian industry (including both domestic and export-related production). For export-related production only, road transport costs represent 3.2 per cent.
The NTC expects that the industries with the highest share of road transport costs relative to total intermediate input costs will most affected by the recommendations. These are the:
• cement, lime and concrete slurry industry (13 per cent)
• sawmill products industry (11 per cent)
• non-metallic minerals and plaster products industry (8 per cent), and
• meat and meat products industry (7 per cent).21
In translating the impact of the proposed new heavy vehicle charges onto industry inputs, it is important to realise that it is only the net change in road transport vehicle operating costs that flows through to industry, and ultimately to domestic consumer prices and export prices. Therefore, given that heavy vehicle charges make up less than 5 per cent of overall 21 These shares are based on total production whether for domestic or export end use. Data by industry on an export-only basis is not available.

2007 Heavy Vehicle Charges Determination Regulatory Impact Statement Vol I Page 65
heavy vehicle operating costs, the impact of even large changes in heavy vehicle registration costs is significantly reduced by the time it flows through into industry input costs.
For example, under charges Option 3C, B-double registration charges will rise by 78 per cent once fully phased-in from their 2007/08 level. Put in context, this increase will make the share of registration charges in B-double operating costs increase from 2.9 per cent to 5.0 per cent, with overall B-double operating costs based on an average vehicle increasing by 2.8 per cent. If we look at the cement industry (which is the most sensitive to road transport cost changes), and assume it is only serviced by 9 axle B-doubles for its input requirements, then the effect on the cement industry can be calculated by multiplying the increase in B-double operating costs by the share of road transport in its overall input costs. In this case, a 2.8 per cent increase in B-double operating costs multiplied by 13 per cent equals a 0.36 per cent impact on the cement industry’s overall input costs.
For the export sector, road transport contributes 3.2 per cent of overall input costs. Taking the expected increase in B-double operating costs under Option C3, which is largest increase across all vehicle classes, the impact on the export sector would be a rise in input costs of 0.1 per cent. However, again these effects are based on averages. There will be individual businesses that will incur greater or lesser impacts on their production costs depending upon where they are positioned relative to the average.
5.5 End user impacts
5.5.1 Impacts on the price of consumer goods
The flow-through impact of the NTC’s recommended charges to consumer prices is difficult to assess, due to the lack of available information. However, research by the BTRE (2000) has found that transport costs contribute to just under 5 per cent of grocery retail prices in the major cities, between 5.5 per cent and 6 per cent in rural and remote areas. The impact of the recommended charges on a trolley containing $100 worth of grocery items is shown in Table 20. This shows that:
• For retail outlets dependent on B-doubles, the maximum additional cost per $100 trolley of goods would be 17 cents. This level of impact would occur in remote areas, and the in other areas would be less.
• For retail outlets dependent on road trains, the maximum impact would be an extra 7 cents per $100 trolley of goods in remote areas.
These estimates are based on averages, and consumer price impacts will vary depending on individual transport operator’s circumstances and the decisions made by individual retail outlets on cost mark-ups.

Page 66 2007 Heavy Vehicle Charges Determination Regulatory Impact Statement Vol I
Table 20. Impact on $100 worth of groceries (cents)
Area Vehicle Type Year 1 Year 2 Year 3 Urban 2 axle rigid truck 4.5 to 7
tonnes (no trailer) 2 2 2
3 axle rigid truck over 18 tonnes (no trailer)
1 1 1
Heavy truck trailer over 42.5 tonnes
5 8 8
6 axle articulated truck 2 3 3 9 axle B-double 5 9 13 Rural/Remote 2 axle rigid truck 4.5 to 7
tonnes (no trailer) 3 3 3
3 axle rigid truck over 18 tonnes (no trailer)
1 1 1
Heavy truck trailer over 42.5 tonnes
7 10 10
6 axle articulated truck 3 3 4 9 axle B-double 6 11 17 Double road train 6 6 7 Triple road train 6 6 7 Note: annual cost changes are not cumulative
5.5.2 Ability to pass on cost increases
The overall impact of cost increases will be less significant for larger hire and reward operators who already have contractual arrangements in place, particularly for fuel cost increases. Generally, smaller transport operators, with less negotiating power and administrative resources, are less able to pass on cost increases.
The NTC expects the extra cost for both fuel and registration will be passed on to end users. However, it understands that, due to the highly competitive and diverse nature of the trucking industry, there is no set process for this to occur. The industry’s management of the significant increases in the price of fuel since 2004 – when the TransEco Linehaul fuel cost index rose by 33 per cent between the June quarter of 2004 and the March quarter of 2007 without major disruptions to the supply chain – suggests that it has had recent experience in negotiating with its customers to pass on cost increases. However, in general, it is expected that the larger the fleet size of a transport owner/operator, the stronger the bargaining power and more successful they will be being able to pass on cost increases from heavy vehicle charges.
5.5.3 Impacts on primary producers
There may be considerable concern about the impact of recommended charges on Australia’s primary producers, particularly in light of the current drought and its impact on economic activity.
While the NTC recognises that this is an important issue, it is outside its mandate to resolve. However, it should be pointed out that each jurisdiction is able to, and generally does, provide concessions for primary producers. These concessions, which are in the
2007 Heavy Vehicle Charges Determination Regulatory Impact Statement Vol I Page 67
order of 40–50 per cent, recognise that primary producers generally operate vehicles well below average usage. The current concessions available for primary producers are listed Appendix K of Volume 2 of the RIS.
To maintain uniformity of charges, the NTC supports a uniform approach being taken in the application of primary producer concession schemes.
5.5.4 Impacts on small businesses
The NTC’s recommended charges will have impacts on small businesses, but on average they are not expected to be significant, particularly due to the low share of registration charges in annual vehicle operating costs. The largest impacts will be on those businesses that have vehicles that travel a lot less than the national average for that vehicle class. Compliance costs and the administrative burden are likely to be unchanged.
The NTC recognises that owner-operators and small businesses with multi-combination vehicles will not be as well placed as large fleet operators to renegotiate contracts to take account of heavy vehicle charge increases. However, the NTC does not expect the impacts of its recommended charges on their own will result in significant disruption to economic activity either on a national or regional basis.
5.6 Impacts on competition
National heavy vehicle charges do not provide any restrictions on competition. The charges are set to recover road expenditure, and therefore simply reflect the costs of road use associated with different types of vehicles.
Differences in charges for different types of vehicles reflect differences in the costs to government of providing and maintaining roads for different vehicles, while ensuring that appropriate price signals are delivered vis-à-vis light vehicle charges, environmental concerns regarding emissions and relative safety of different vehicle configurations. Neither the existing nor the recommended heavy vehicle charges:
• impose methods of work on operators
• directly restrict the number of operators in the industry
• advantage one operator compared to another, regardless of size, or
• erect barriers to entry to the industry.
The levels of charges and the way in which they are administered has little, if any, impact on methods of work employed by different operators. Heavy vehicle charges have no bearing on the number of operators in the industry, as there is no restriction on the number of vehicles that can be registered or the number of operators that can register heavy vehicles. As all operators with the same vehicle type pay the same charges, which are commensurate with their share of road expenditure, and the charges do not vary with the number of vehicles registered by any one operator, they do not advantage large versus small operators.
As is currently the case, a large component of the recommended charge (two thirds) is levied as a variable charge through diesel excise payments. Consequently, fixed annual charges are a relatively small component of the charges. They are small in comparison to the capital costs of heavy vehicles and therefore do not constitute barriers to entry to the

Page 68 2007 Heavy Vehicle Charges Determination Regulatory Impact Statement Vol I
road transport industry. Typically, the fixed annual charge on registration of a heavy vehicle represents between 2 per cent and 5 per cent of the total costs of operating the vehicle.
The impacts of the recommended charges on road/rail competition are likely to be small. Registration charges for the vehicle classes that compete most directly with rail (i.e., B-doubles and triple road trains) are subject to the largest increases, to ensure that they at least recover their attributable expenditure. However, as registration charges are a small proportion of total vehicle operating costs, it is likely that the impact of these increases on the relative competitive position of road freight will be marginal.
5.7 Implications for government financing
5.7.1 The need for road investment
There is considerable evidence that governments’ increasing investments in building and upgrading road infrastructure are necessary to improve the productivity and safety of the trucking industry, and that heavy vehicle charges need to keep pace with these investments to make the improvements possible. For example:
• The NTC’s Twice The Task report (February 2006) highlighted the importance of continuing productivity, safety and pricing reform to address the growing freight task.
• COAG’s National Reform Agenda (10 February 2006) for quad axle groups, B-triples and Performance Based Standards recognises that significant infrastructure investment is required to improve access for this ‘new generation’ of heavy vehicles.
• Multi-combination vehicles, such as B-doubles and road trains, currently under-recover their costs. The Productivity Commission and COAG recently endorsed the principle of individual vehicle classes ‘paying their way’. This recognises the investment needed on major freight corridors, which are generally used by these heavier vehicles.
• An Australian Industry Group survey (Transport & Logistics Operations in Australian Manufacturing 2006) found that better infrastructure plays an important role in reducing general transport costs. Heavy vehicle charges can contribute to freight link upgrades, removing bottlenecks and reducing logistics costs for exports, particularly as the freight task grows.
Although heavy vehicle charges are not directly hypothecated into heavy-vehicle-specific end uses, the funds raised under the PAYGO system are a proxy for future heavy vehicle road expenditure requirements that are necessary to maintain the network. Given that road expenditure benefits both light as well as heavy vehicles, the general level of road expenditure both current and future planned investment has important implications for the heavy vehicle industry in improving access and catering for the growth in land freight requirements.
5.7.2 Charges contribution to road investment
Even though two thirds of heavy vehicle charge revenue is collected through fuel charges (which goes to Federal Treasury as consolidate revenue), a fair proportion of registration revenue is either directly or indirectly hypothecated by the states into road-related expenditure.

2007 Heavy Vehicle Charges Determination Regulatory Impact Statement Vol I Page 69
Two jurisdictions – NSW and SA – direct vehicle registration revenue both for light and heavy vehicles to a fund that is specifically required to be used on road expenditure by the road authority. Queensland’s vehicle registration revenue initially goes to its Treasury’s consolidated revenue, but is then 100 per cent reallocated to the road authority for expenditure on roads. Also, revenue from the Federal Interstate Registration scheme is forwarded directly to the Federal Department of Transport and Regional Services for redistribution to jurisdictions based on a tonne-km travel formula for most jurisdictions. In effect, up to 60 per cent of registration revenue is either directly or indirectly hypothecated to road-related expenditure. In addition, the level of heavy vehicle charges has an important influence on the level of available state-sourced funds for road expenditure in NSW, SA and Queensland.
5.8 Impact of road investment on heavy vehicle productivity and safety
5.8.1 Case studies of improved productivity
There is very little information available on the quantitative benefits of road investment for heavy vehicle productivity. However, it is clear that some projects have very important influences on the operating costs of heavy vehicle operators that use the new or upgraded roads in question, through savings in travel time and fuel costs, which result in higher productivity and lower operating costs. For example, road projects such as the Albury/Wodonga Bypass and Craigieburn Bypass have undoubtedly had an impact on operating costs for heavy vehicle users using the Hume Highway. These projects have reduced both travel time and fuel costs.
The Deer Park Bypass in Victoria, which is a $331 million project to construct 9.3km of four-lane freeway between the Western Highway and Western Ring Road in Melbourne, will also provide substantial benefits to the heavy vehicle industry. The current road carries 70,000 vehicles per day of which 10 per cent are heavy vehicles. This project will result in reduced and more reliable travel times and more direct access to the Western Ring Road and Melbourne ports. Its estimated benefit to the heavy vehicle industry – based on a 30-year timeframe and a discount rate of 7 per cent – is of the order of $98 million in 2007 dollar terms. Of this, 90 per cent is due to travel time savings, 9 per cent to vehicle operating cost savings and 1 per cent to accident savings.
5.8.2 Case studies of improved safety
National Heavy Vehicle Safety Strategy
Approximately 330 people are killed each year in Australia in crashes involving heavy vehicles (which represents 20 per cent of road fatalities) and three times as many are injured, costing around $2 billion annually.
The Monash University Accident Research Centre (Austroads 2005b) estimates that improved road investment – including shoulder sealing, audible edge lines, passing lanes and rest areas – will contribute at least a 38 per cent of the total future reduction in heavy-vehicle-related road deaths and casualties under the current National Heavy Vehicle Safety Strategy. Other contributing factors will be effective use of speed delimiters 30 per cent, better fatigue management 18 per cent, increased seatbelt use by heavy vehicle drivers 9 per cent and safer heavy vehicles 5 per cent.
Page 70 2007 Heavy Vehicle Charges Determination Regulatory Impact Statement Vol I
Black spot and general road improvement programs
The Monash University Accident Research Centre also estimates that for each $100 million spent on black spot programs, at least 20 lives will be saved (including four related to heavy vehicle crashes) (Austroads 2005a). For each $100 million spent on general road improvements, at least 1.5 lives will be saved (including 0.3 lives related to heavy vehicle crashes). By 2010, the number of fatalities prevented per year in Australia as a result of road improvements will total 453, of which 144 lives will be saved from black spot expenditure and 309 from general road improvement expenditure. Of the 453 lives saved, 91 will relate to reduced heavy vehicle crashes.
5.9 Potential productivity improvements
Over the last two years, COAG has agreed to a wide-ranging reform program, including pricing reform and regulatory harmonisation. However, it is critical that these initiatives are not seen in isolation. The economic benefits from any single initiative will be influenced by the extent to which other reforms are implemented. If the full benefits of reform are to be realised, a range of policy levers must be used, and supported where required by targeted infrastructure investment.
In a highly competitive global market, the road transport industry must continue to pursue productivity improvements and lower prices. This is particularly important given the changing nature of manufacturing and distribution, with these activities becoming more transport intensive. In addition, in export markets that are highly price sensitive, improvements in productivity directly impact on national competitiveness.
As noted in this RIS, industry has acknowledged its responsibility for and indicated preparedness to continue ‘paying its way’ with respect to road infrastructure. It has also indicated that it is looking to work with governments to unlock productivity opportunities made available through 2007 Heavy Vehicle Charges Determination.
The NTC’s consultations, as well as other discussions occurring as part of the NTC’s broader work program, identified priority areas where industry and government could direct their efforts. These priorities can be categorised into three broad areas:
• initiatives currently being progressed through the COAG endorsed NTC work program
• targeted infrastructure improvements.
• other regulatory reforms – not currently included in the program
5.9.1 COAG-endorsed NTC work program
In February 2006 COAG committed to the implementation of performance-based standards (PBS). The potential productivity benefits arising from full implementation of PBS is well documented. While the NTC is working closely with jurisdictions to meet COAG’s timelines, industry is concerned that governments continue to pursue these initiatives as a matter of priority.
The broader issue of access to the network for high-productivity vehicles continues to be a critical imperative. While development of the B-triple network is a priority for some

2007 Heavy Vehicle Charges Determination Regulatory Impact Statement Vol I Page 71
operators, increasing access for vehicle configurations such as the Super B-doubles22 is a priority for those operators transporting containerised freight. Super B-doubles can move two 40 ft containers in one trip. Thus enabling increased access for these vehicles will lead to benefits in terms of reducing the time taken to clear containers from the wharves, improving landside efficiency, and limiting the total number of trucks required to undertake the containerised transport task. The NTC’s recommended charges provides a pricing solution that should facilitate increased access, by ensuring they pay the appropriate cost for access to the road network.
A challenge for governments is responding to the differing needs of the transport industry, in markedly differing locations. It is evident that the requirements of rural transport operators are significantly different to those transporting port traffic in urban areas. Some industry representatives have indicated that governments need to consider these issues from a sectoral perspective, rather than as a homogenous transport task.
5.9.2 Targeted infrastructure improvements
Targeted infrastructure improvements are also critical to allow increased access to higher productivity vehicles. While truck technology has improved, road infrastructure has not kept pace. In consultations, stakeholders provided several examples where limited additional road investment would achieve considerable productivity benefits:
• The Australian Livestock Transporters Association (ALTA) prepared a comprehensive case study examining non-price barriers to productivity improvements in livestock transport operations. This case study cites examples of where lack of suitable right and left turn lanes limited the use of higher productivity vehicle combinations.
• South Australian wine industry stakeholders commented that they have requested construction of a roundabout in the Barossa Valley to enable B-double access to a winery. They have been advised that they must contribute 25 – 30 per cent of construction costs, despite only being responsible for 0.8 per cent of total traffic. Further, there is effectively a funding demarcation between local councils, as those surrounding the Barossa region see little value in upgrading roads that will largely benefit the Barossa Valley.
These examples exemplify industry’s concerns regarding the perceived lack of coordination across governments with respect to road funding and provision. Road responsibilities are dispersed across all three tiers of government. There may be little incentive for a local council or state/territory to invest in road improvements if they do not capture a significant proportion of benefits.
It is also worth noting that the question of targeted investment goes beyond governments to the customers of transport operators. A number of examples were provided of where primary producers, across a range of industries, had not upgraded entry to their farms to enable entry of higher productivity vehicles. This is an area where governments can play a leadership role by bringing together producers, operators and transport agencies to look at opportunities for productivity improvements from origin to destination.
22 Also known as High Efficiency Container Transport (HECT) vehicles

Page 72 2007 Heavy Vehicle Charges Determination Regulatory Impact Statement Vol I
5.9.3 Other regulatory reforms
Industry continues to raise the broader concerns about regulatory fragmentation. Key issues include:
• inconsistent implementation of previous NRTC/NTC reforms
• differing permit requirements
• livestock loading regulations in NSW.
The extent of impact varies by jurisdictions, and some of these issues are being addressed through current projects such as National Accreditation, compliance strategy, the national heavy vehicle enforcement strategy and the COAG reform program (current NTC projects).
2007 Heavy Vehicle Charges Determination Regulatory Impact Statement Vol I Page 73
6. CONSULTATION
6.1 The consultation process
Following the formal direction from the ATC to commence work on a new determination, the NTC prepared a draft RIS which it published on 6 July 2007. The draft RIS was informed by the previous Third Determination consultation process in 2005, the PC Inquiry in 2006, discussions (including a technical workshop in May 2007) with industry representatives and government, and analyses of potential impacts of changes in the level of charges.
The publication of the draft RIS commenced a formal public consultation process. The NTC interested parties to make written submissions, receive industry briefings and/or participate in public hearings that involved focus group discussions. It received 22 written submissions and held focus groups in Melbourne, Sydney, Brisbane, Adelaide, Perth, Canberra and Darwin23 between the 1st and 16th of August 2007. It also undertook further discussions with trucking industry representative groups (including the Australian Trucking Association and its member associations and the National Farmers Federation) and with government.
This extensive consultation led to significant changes to the NTC’s recommendations, particularly to address industry views about maintaining flexibility in the heavy vehicle fleet and ensuring that pricing structures support high-productivity vehicles without creating an administrative burden.
Submissions in response to the draft RIS were received from:
Number Stakeholder Abbreviation 1 Australian Rail Track Corporation ARTC
2 National Farmers Federation NFF
3 National Association of Forest Industries NAFI
4 Cement Industry Federation CIF
5 Asciano (formerly Pacific National and Patrick) Asciano
6 Australasian Railway Association ARA
7 Peter Crisp MP (Member for Mildura) Crisp
8 NSW Farmers Federation NSWFF
9 Warwick Moppett (Mayor, Gilgandra Shire Council) WM
10 Australian Trucking Association ATA
11 Quinn Transport Quinn
12 Department of Transport, Energy and Infrastructure (SA) DTEI
13 QR (Queensland Rail) QR
14 South Australian Freight Council SAFC
15 Community and Public Sector Union – State Public Services Federation Group CPSU
23 Focus group presentations and transcripts are available on the NTC website.

Page 74 2007 Heavy Vehicle Charges Determination Regulatory Impact Statement Vol I
16 Australian Automobile Association AAA
17 Queensland Transport QT
18 Australian Livestock Transporters Association ALTA
19 Engineers Australia EA
20 Bus Industry Confederation BIC
21 Roads & Traffic Authority (NSW) RTA
22 Betts Transport Betts
6.2 Major issues raised and the NTC’s response
Many of the issues raised by stakeholders during the consultation process have been discussed earlier in this report. However, this section summarised the main points raised and the NTC’s response.
6.2.1 The treatment of enforcement costs
Description of the issue
Submissions from the trucking industry stakeholders – including the Australian Trucking Association, National Farmers Federation, Cement Industry Federation, the National Association of Forest Industries, Australian Livestock Transporters Association, South Australian Freight Council and the Bus Industry Confederation – did not support inclusion of any enforcement costs in the cost base to be recovered through charges. The main reason given was that it would impose an indiscriminate and inefficient cost on heavy vehicle road users and that compliant operators (particularly those who are accredited) would face in effect a “double take”.
In contrast, other stakeholders – including the Australasian Railway Association, Asciano, Australian Rail Track Corporation, QR and the NSW Roads & Traffic Authority – supported the full inclusion of enforcement costs. Their main reasons were the fact that full recovery of enforcement costs occurs in other transport industries and the Productivity Commission’s comment that costs of enforcing heavy vehicle mass and speed restrictions are appropriately covered through road user charges.
Engineers Australia, Queensland Transport and the Department of Transport, Energy and Infrastructure (SA) supported the inclusion of only mass-related enforcement costs. Their reasons were that heavy vehicle charges focus on the recovery of road-related expenditure and enforcement related to reducing overloading results in an extension in the life of pavements. Therefore, mass-related enforcement is a substitute for increased road maintenance and is a legitimate cost related to infrastructure.
NTC’s response
The NTC found that there is an in-principle argument for the inclusion of enforcement costs, but that the ATC pricing principles limit the inclusion of enforcement costs to infrastructure-related enforcement (i.e. mass-related enforcement). Further, it found that the partial recovery of the road agency enforcement costs reported to the NTC sufficiently approximates mass-related enforcement costs.

2007 Heavy Vehicle Charges Determination Regulatory Impact Statement Vol I Page 75
It is important that a holistic approach to enforcement is taken. Therefore, the NTC supports future charging adjustments and determinations recovering the administrative costs of the National Heavy Vehicle Enforcement Strategy and provide a funding pool for financial incentives for industry participation in accreditation (thereby reducing the enforcement burden on jurisdictions).
6.2.2 The methodology for estimating heavy vehicle charges revenue
Description of the issue
The Australian Trucking Association (ATA) indicated concern over the NTC’s methodology for calculating charges revenues that determine the level of over or under-recovery of heavy vehicle allocated expenditure. The NTC’s methodology calculated that currently heavy vehicle charges under-recover this expenditure by $168m per year.
The ATA claimed that the NTC’s methodology was fundamentally flawed, and that according to its own approach to the calculation, heavy vehicles currently over-recover their allocated expenditure by $130m per year.
A number of other trucking industry stakeholders, including the Cement Industry Federation, the National Farmers Federation, National Association of Forest Industries and the Australian Livestock Transporters Association, supported the ATA’s approach to the calculation.
The NTC’s response
The NTC responded to the ATA’s concern by engaging Meyrick and Associates to conduct a thorough critique of both the ATA and NTC approaches to calculating heavy vehicle charges revenue (see Appendix C). It notes that the ATA’s approach differs from its own in that it:
• includes revenues associated with a sulphur excise charge
• includes revenues associated with petrol excise cost recovery
• includes revenues associated with metropolitan boundary excise differentials, and
• Uses a different the method for indexation: the ATA calculates fuel and registration revenues as at the year of representative usage, and indexes the resulting revenue by the change in the CPI to bring it into current dollar terms.
Meyrick concluded that it is inappropriate to include revenues associated with the sulphur, petrol and metropolitan boundary excises as these excises are no longer collected. In addition, they are not related to infrastructure provision (and therefore are outside of the Determination scope as stated in the ATC pricing principles). Meyrick also concluded that the ATA method of indexation is inappropriate and that even if it were appropriate to index the registration charge, it is inappropriate to index the fuel charge which has remained constant at 19.633 cents per litre.
While the case for the exclusion of non-infrastructure-related revenues that are no longer collected by governments is fairly clear, the NTC considers it is important to explain why the ATA’s method of indexation is flawed.
The NTC’s methodology works on the basis of averages that provide representative expenditure and usage. Instead of taking one year of actual expenditure, an average of

Page 76 2007 Heavy Vehicle Charges Determination Regulatory Impact Statement Vol I
seven years historic expenditure is deemed to represent a typical annual expenditure figure. This is matched by an average usage figure over the same seven-year period – the usage figures in the median year of the expenditure period is deemed to represent average usage. Current charges are then applied to the usage figures of that representative year, to give a representative level of recovered charges revenue in real terms, calculated in a consistent manner to the cost base that charges are to recover. No further indexation is required as current charges are used to calculate revenues.
The draft RIS used a representative usage year of 2004, as this is the midpoint of the seven-year period used to calculate average expenditure (2000/01 – 2006/07). The final RIS adopts more recent expenditure data (2001/02 – 2007/08), and therefore uses 2005 usage data.
The need to derive the registration and fuel charge revenue estimates is due to the fact that registration revenue actual data is not available from all states and territories, and the fuel-based charge revenue (which is collected by Federal Treasury and accounts for two thirds of overall heavy vehicle charge revenue) is not available.
6.2.3 Estimation of the allocated cost base
Description of the issue
Leaving aside the issue of heavy vehicle enforcement costs, the appropriateness of the allocated cost base and the methodologies used to derive that cost base is an ongoing topic of debate. The ATA and other trucking industry stakeholders tend to support the view that the NTC overestimates the cost base for heavy vehicles particularly in areas such as the estimation of Equivalent Standard Axle (ESA) values for heavy vehicles and the way in which weathering impacts are treated.
In contrast, the rail industry considers that the NTC underestimates the true heavy vehicle cost base. The Australasian Railway Association, Australian Road Track Corporation, QR and the Department of Transport Energy and Infrastructure (SA) all submitted that the NTC underestimates the ESA impacts.
The NTC’s response
As part of its Third Determination workings, the NTC commissioned research to evaluate the way in which the cost base is derived, in order to improve confidence in the NTC’s cost allocation methodology. This work and the methodologies use by the NTC to estimate heavy vehicle allocated costs were supported in the final report of the Productivity Commission’s review of Road and Rail Freight Infrastructure Pricing. The NTC has not been provided with any reason to modify its cost allocation methodology from that used in the Third Determination.
6.2.4 Impacts of differential multi-combination prime mover charges
Description of the issue
A number of stakeholders – including the Australian Trucking Association, Australian Livestock Transporters Association, Quin Transport, National Farmers Federation, National Association of Forest Industries and the South Australian Freight Council – submitted that the NTC’s draft RIS preferred option would have adverse impacts on the
2007 Heavy Vehicle Charges Determination Regulatory Impact Statement Vol I Page 77
trucking industry’s productivity, due to the impact of large differentials in prime mover charges between multi-combination prime mover types.
These stakeholders argued that moving away from having the same prime mover charge for different types of B-doubles and road trains would upset the flexibility of the trucking industry, due to differing network accessibility issues, which would have negative impacts on productivity and would force transport operators to always have to register a prime mover at the highest multi-combination registration level even if only a small part of annual trips required that type of use.
The NTC’s response
The NTC responded to these views by revising the recommended charges option in this Final RIS. The recommended option now includes a single multi-combination prime mover charge.
6.2.5 The inability of industry to pass on large increases in charges
Description of the issue
Trucking industry stakeholders, such as from the Australian Trucking Association, Australian Livestock Transporters Association, Cement Industry Federation, National Association of Forest Industries and the South Australian Freight Council, submitted that their industry will have a lot of difficulty passing on increases in heavy vehicle charges, particularly increases in the registration charge component. Smaller transport operators, such as Quinn Transport and Betts Transport, and the National Farmers Federation and NSW Farmers Federation submitted that their members are very much price takers and would be unable to pass on cost increases.
The NTC’s response
The NTC considers that its preferred for phasing in its recommended charges over three years should help address this issue by allowing businesses time to plan and renegotiate their contracts. In addition, the impacts will be reduced for those who receive either primary producer or non-primary producer concessions (see Appendix K and L).
6.2.6 Concern over the adoption of the high-productivity vehicle formula
Description of the issue
In the draft RIS, the NTC proposed the use of a high-productivity vehicle formula to derive charges for vehicles that fall into this category. These sorts of vehicles are essentially those going through the Performance Based Standards system and include B-triple and quad axle vehicles that have been approved through the PBS system.
Stakeholders such as the Australian Trucking Association and the Cement Industry Federation did not see a need for this formula and were of the view that the current charging schedule could be used to effectively charge these vehicles.
The Department for Transport Energy and Infrastructure (SA) also expressed concern over the administrative arrangements required to support such a formula.

Page 78 2007 Heavy Vehicle Charges Determination Regulatory Impact Statement Vol I
The NTC’s response
The NTC responded to these concerns by assessing the extent to which high-productivity vehicles could be effectively mapped to the charges schedule. The net result of this work, particularly the adaptation of the charges schedule to incorporate differential trailer axle charging, has enabled almost all high productivity vehicles to now be mapped onto the proposed new charges schedule, including PBS approved B-triples and quad axle vehicles.
6.2.7 Need for productivity offsets by opening up the network more
Description of the issue
Stakeholders such as the Member for Mildura, Peter Crisp MP, and the National Farmers Federation advocated the need for government-agreed productivity offsets to accompany any increase in heavy vehicle charges. Participants in the focus groups discussions that the NTC conducted in most capital cities also echoed these views.
The trucking industry’s view was that because the industry and its users were often price takers that could not readily pass on charge increases, the industry’s usual way of coping with cost increases (such as those from international oil price movements, wage rises etc) was to look for productivity gains to offset the cost increases.
The NTC’s response
This issue as well as the NTC’s response is discussed in detail in section 5.9 of this report. The NTC has no mandate to recommend productivity offsets tied to the heavy vehicle charging. However, currently there are a number of initiatives being driven in particular by COAG which will result in productivity offsets over the medium to longer term. Some of these initiatives are already incorporated into the NTC work program.
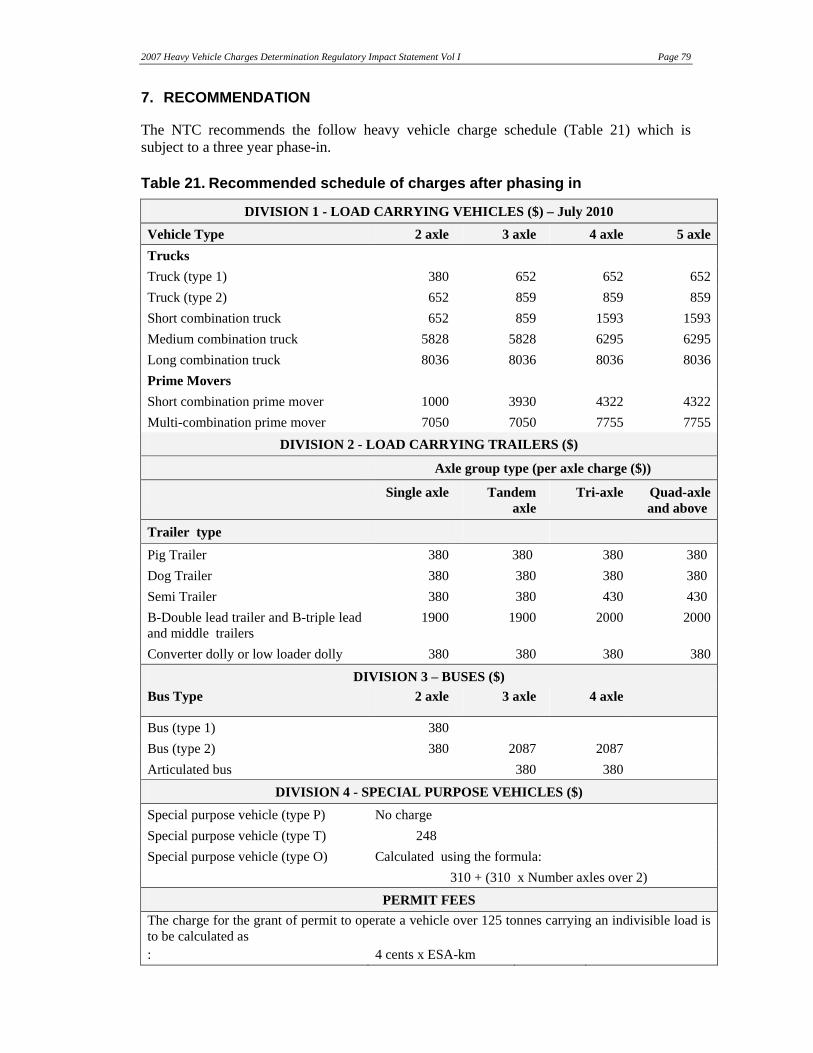
2007 Heavy Vehicle Charges Determination Regulatory Impact Statement Vol I Page 79
7. RECOMMENDATION
The NTC recommends the follow heavy vehicle charge schedule (Table 21) which is subject to a three year phase-in.
Table 21. Recommended schedule of charges after phasing in
DIVISION 1 - LOAD CARRYING VEHICLES ($) – July 2010
Vehicle Type 2 axle 3 axle 4 axle 5 axleTrucks Truck (type 1) 380 652 652 652Truck (type 2) 652 859 859 859Short combination truck 652 859 1593 1593Medium combination truck 5828 5828 6295 6295Long combination truck 8036 8036 8036 8036Prime Movers Short combination prime mover 1000 3930 4322 4322Multi-combination prime mover 7050 7050 7755 7755
DIVISION 2 - LOAD CARRYING TRAILERS ($)
Axle group type (per axle charge ($))
Single axle Tandem axle
Tri-axle Quad-axle and above
Trailer type
Pig Trailer 380 380 380 380 Dog Trailer 380 380 380 380 Semi Trailer 380 380 430 430 B-Double lead trailer and B-triple lead and middle trailers
1900 1900 2000 2000
Converter dolly or low loader dolly 380 380 380 380
DIVISION 3 – BUSES ($) Bus Type 2 axle 3 axle 4 axle
Bus (type 1) 380 Bus (type 2) 380 2087 2087 Articulated bus 380 380
DIVISION 4 - SPECIAL PURPOSE VEHICLES ($)
Special purpose vehicle (type P) No charge Special purpose vehicle (type T) 248 Special purpose vehicle (type O) Calculated using the formula:
310 + (310 x Number axles over 2)
PERMIT FEES The charge for the grant of permit to operate a vehicle over 125 tonnes carrying an indivisible load is to be calculated as : 4 cents x ESA-km

Page 80 2007 Heavy Vehicle Charges Determination Regulatory Impact Statement Vol I
These charges, which are consistent with Option C3, meet the primary objectives for the 2007 Heavy Vehicle Charges Determination listed in Chapter 3, which include that:
• road expenditure allocated to heavy vehicles in aggregate is fully recovered
• each vehicle class at least recovers its attributed expenditure, so that there are no cross-subsidies between vehicle classes
• charges accommodate high-productivity vehicles
• charges are consistent with the ATC approved pricing principles
• charges are updated so that they continue to fully recover costs between determinations.
In addition, the recommended charges allow maximum vehicle configuration flexibility and are administratively simple, which meets the needs of trucking industry and state and territory government stakeholders. Further, they include a phase-in period of up to three years for registration charges, which establishes a manageable implementation path for vehicle operators.
The NTC notes that the implementation of a 2007 Heavy Vehicle Charges Determination is only the first step in the reform process outlined by COAG in its meeting of 13 April 2007. But crucially, the Determination will enable investment in a safer and more productive road network while the reform process continues.
The NTC’s recommended charges for selected vehicles are shown on Table 22. The sections below summarise the recommended charges and the basis for their recommendation, and discuss their implications for compliance costs, implementation, and legislative change.
7.1 Recommended heavy vehicle charges
As indicated above, the NTC recommends the heavy vehicle charges contained in Table 21. In calculating these charges, the NTC:
• included 2007/08 budget expenditure in the seven-year average expenditure figure used in establishing the cost base (Option CB1)
• partly included enforcement costs in the cost base (Option b)
• allocated costs in line with the methodology developed as part of the Third Determination workings, except for a modification to address trucking industry concerns about the costs allocated to double and triple road trains
• adopted a revised charges structure that allows maximum vehicle flexibility and accommodates higher productivity vehicles within the charges schedule (Option C3)
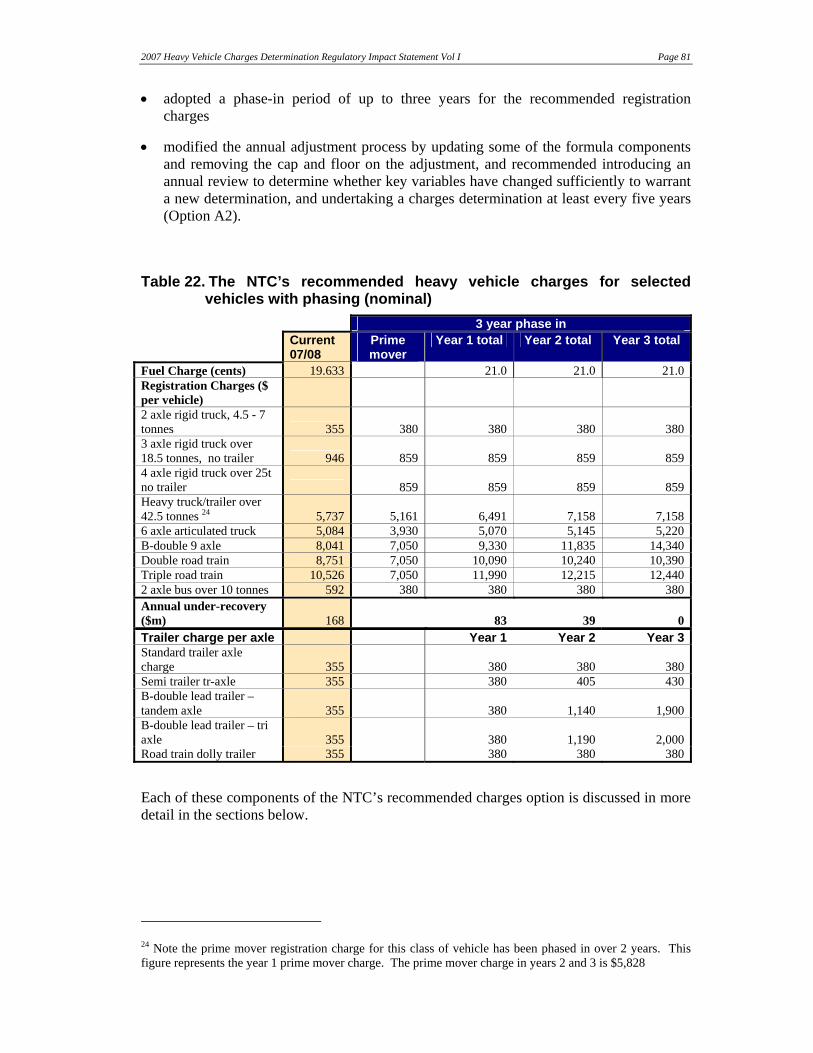
2007 Heavy Vehicle Charges Determination Regulatory Impact Statement Vol I Page 81
• adopted a phase-in period of up to three years for the recommended registration charges
• modified the annual adjustment process by updating some of the formula components and removing the cap and floor on the adjustment, and recommended introducing an annual review to determine whether key variables have changed sufficiently to warrant a new determination, and undertaking a charges determination at least every five years (Option A2).
Table 22. The NTC’s recommended heavy vehicle charges for selected vehicles with phasing (nominal)
3 year phase in Current
07/08 Prime mover
Year 1 total Year 2 total Year 3 total
Fuel Charge (cents) 19.633 21.0 21.0 21.0Registration Charges ($ per vehicle)
2 axle rigid truck, 4.5 - 7 tonnes 355 380 380 380 3803 axle rigid truck over 18.5 tonnes, no trailer 946 859 859 859 8594 axle rigid truck over 25t no trailer 859 859 859 859Heavy truck/trailer over 42.5 tonnes 24 5,737 5,161 6,491 7,158 7,158 6 axle articulated truck 5,084 3,930 5,070 5,145 5,220 B-double 9 axle 8,041 7,050 9,330 11,835 14,340 Double road train 8,751 7,050 10,090 10,240 10,390 Triple road train 10,526 7,050 11,990 12,215 12,440 2 axle bus over 10 tonnes 592 380 380 380 380Annual under-recovery ($m) 168 83 39 0Trailer charge per axle Year 1 Year 2 Year 3Standard trailer axle charge 355 380 380 380Semi trailer tr-axle 355 380 405 430B-double lead trailer – tandem axle 355 380 1,140 1,900B-double lead trailer – tri axle 355 380 1,190 2,000Road train dolly trailer 355 380 380 380
Each of these components of the NTC’s recommended charges option is discussed in more detail in the sections below.
24 Note the prime mover registration charge for this class of vehicle has been phased in over 2 years. This figure represents the year 1 prime mover charge. The prime mover charge in years 2 and 3 is $5,828

Page 82 2007 Heavy Vehicle Charges Determination Regulatory Impact Statement Vol I
7.1.1 Inclusion of 2007/08 budget expenditure in the cost base
In calculating the expenditure figure to be included in the cost base, the NTC used an average of seven years’ expenditure data, including 2007/08 budget expenditure and actual expenditure for 2001/02 to 2006/07. This resulted in a cost base of $1,953m.
The NTC preferred this option to the alternative (which included 2006/07 budget expenditure) because:
• It ensures that the expenditure figure used to calculate the cost base is as up-to-date as possible, reducing the lag in the recovery of the current year of expenditure.
• Although it leads a higher cost base than the alternative option, the resulting higher charges can be phased in over up three years and so will create less of a price shock for vehicle operators.
• It is administratively simpler, because it avoids the need for an annual adjustment to occur on the same date as new charges under the 2007 Determination begin to be implemented.
• It is consistent with the current methodology.
7.1.2 Partial inclusion of enforcement costs in the cost base
In calculating the cost base, the NTC took the view that it is appropriate for heavy vehicle charges to recover the costs associated with enforcing mass constraints, as the primary objective of these constraints is to manage road wear (and thus avoid expenditure on road maintenance). In addition, because of the difficulties in separating mass-related and safety-related costs, the NTC took the view that the enforcement costs reported by road agencies, discounted to account for the fact that the NSW road agency undertakes significantly more safety-related enforcement than road agencies in other jurisdictions, is a reasonable proxy for mass-related costs.
In reaching this view, the NTC considered the PC Inquiry’s finding that “the costs of enforcing heavy vehicle mass and speed restrictions through road user charges”. It also considered the ATC pricing principle that states that heavy vehicle charges should enable “full recovery of allocated infrastructure costs”. The NTC concluded that only the recovery of mass-related enforcement is appropriate, as safety-related enforcement costs cannot be considered to be infrastructure costs and therefore their recovery through heavy vehicle charges would be inconsistent with the ATC’s current pricing principles.
7.1.3 Allocation of costs
The methodology the NTC used to allocate the cost base to the different vehicle classes is based on the best available research, and was updated and consulted on as part of the Third Determination process. The Productivity Commission has found that this methodology is reasonable although conservative in nature. In general, the methodology also has the support of the trucking industry.
The methodology relies on road usage data from the Australian Bureau of Statistics’ Survey of Motor Vehicle Usage (SMVU) to allocate costs. In response to trucking industry concerns about the quality of this data, the NTC reviewed the data and undertook further analysis on the reliability of the road train data. It found the standard error associated with road train VKT was sufficiently large that the VKT for double and triple
2007 Heavy Vehicle Charges Determination Regulatory Impact Statement Vol I Page 83
roads trains fell within a similar range applying a 95 per cent confidence interval. Given the significant impact VKT has on cost allocation, the NTC applied an average road train VKT figure of 133,750 to both double and triple road trains. This had the impact of increasing the cost allocated to double road trains from $35,611 to $38,055 and decreasing the costs allocated to triple road trains from $68,342 to $47,323 (before unsealed travel adjustments are made) compared the draft RIS.
7.1.4 Adoption of a revised charges structure
The NTC adopted a revised registration charges structure that is based on Option C1 (the preferred option in the draft RIS), but which allows greater vehicle configuration flexibility by establishing a multi-combinational prime mover charge for B-doubles and road trains. The objective that vehicle classes at least recover their attributable costs is achieved by applying differentiated trailer axle charges instead of a uniform charge. Trailer flexibility is maintained, as the cost of a particular trailer remains the same regardless of the vehicle configuration it is used in. These modifications mean that charges are modular and cost recovery is spread more evenly between the trailer and prime mover charges.
In addition, the modular charge structure means that higher productivity vehicles are accommodated within the charges schedule. The NTC considers this is preferable to the use of higher productivity formula as proposed in the draft RIS, on the grounds that it is simpler and NTC analysis indicates that results in very similar charges to the formula.
The NTC is conscious that although registration charges constitute a relatively small proportion of vehicle operating costs, its recommended registration charges for some vehicles represent a considerable cost increase. This is particularly the case for vehicles in classes that are currently under-recovering their attributable costs. Nevertheless, the NTC prefers its recommended charges for the following reasons:
• As indicated above, they meet all the primary objectives for the 2007 Heavy Vehicle Charges Determination
• Unlike Options C1 and C2, they maintain maximum vehicle configuration flexibility and accommodate higher productivity vehicles
• The charges under Option C1 provide for a greater increase in registration charges for vehicle classes that are current under-recovering their attributable costs,
• The charges under Option C2 do not adequately adhere to the pricing principle of having “regard to other pricing applications, such as light vehicle charges…” because they include a registration charge for two axle rigid vehicles that is below the mid point of the range of maximum charges for light vehicles.
7.1.5 Adoption of a phase-in period of up to three years for registration charges
As in previous determinations, the NTC’s recommended charges comprise a fuel-based charge and registration charges. The recommended charges are to be implemented from 1 July 2008.
However, the recommended registration charges will result in cost increases for prime movers and trucks in some heavy vehicle classes, and the introduction of differential trailer axle charges will result in large cost increases for some trailer types. In recognition of this,

Page 84 2007 Heavy Vehicle Charges Determination Regulatory Impact Statement Vol I
the recommended charges schedule includes a phase-in period of up to three years. Under this schedule:
• The increased fuel-based charge is fully implemented in Year 1.
• For truck and prime mover registration charges, all increases and decreases are fully implemented in Year 1, except those for heavy truck trailers. In this case, the increase in the vehicle component of the registration charge is phased in equally over three years. This exception is due to the large size of the increase, which has partly resulted from reclassification of SMVU data, and feedback from stakeholders on the impacts of this increase.
• For trailer registration charges, the increase in the standard trailer per axle rate is fully implemented in Year 1. Where a differential trailer axle charge is proposed, the charge is phased in over three years with the Year 1 charge being equivalent to the standard trailer axle rate and the balance being implemented evenly in the remaining years.
The NTC notes that this phasing-in will result in a continued under-recovery of expenditure in Years 1 and 2. However, both the jurisdictions and heavy vehicle operators have indicated that it is necessary, to provide them with sufficient time to make the operational and system changes required to accommodate the new charges schedule.
7.1.6 Modification to the annual adjustment process
The NTC has modified the current annual adjustment process by:
• Updating the formula components to align with the new 2007 Determination cost allocation model
• Removing the CPI cap and 0 per cent floor on registration charge increases
• Indexing the fuel-based charge by the Annual Adjustment Formula used to index registration charges.
In addition, the NTC recommends that it undertakes an annual review to evaluate whether key variables have moved sufficiently to warrant a new determination and that a charges determination occurs at least every five years (if not already undertaken as a result of the annual review).
The NTC considers that this approach to the annual adjustment (Option A2) is preferable to the alternative approaches it considered. It will ensure that charges continue to recover heavy vehicle allocated expenditure in aggregate in a way that is formula-driven, relatively simple, and will not require a new determination each year. In addition, when combined with an annual review process and more frequent determinations, it will minimise “ongoing cross-subsidisation across different heavy vehicle classes”.
The NTC notes that implementing its recommended modifications to the annual adjustment process will require changes to the Fuel Tax Act 2006, to allow for the automatic indexation of road user charges.

2007 Heavy Vehicle Charges Determination Regulatory Impact Statement Vol I Page 85
7.2 Compliance issues
The NTC considers that its recommended heavy vehicle charges will not create any compliance issues, because the compliance costs associated with heavy vehicle charges are negligible.
7.3 Implementation issues
The key issues associated with the NTC’s recommended charges schedule stem from the move away from just one standard trailer axle registration charge that applies to all trailer types, regardless of the trailer axle configuration. The recommended charges schedule introduces a differential trailer axle registration charges system based on breaking down trailers into five main categories and having differential trailer axle charges applying in some cases.
The feedback that the NTC has received from registration authorities to date indicates that although each trailer type is separately registered and categorised in their registration systems, the proposed five key trailer categories are generally not categorised readily under the five main groups. Therefore, system changes and associated staff training will be required.
These changes will take some time to implement, and it is unlikely that necessary changes will be implemented fully before 1 July 2008, when the 2007 Determination is due to come into effect. However, as discussed in section 7.1.5 above, the recommended charges schedule phases in differential trailer axle charges over three years, and charges higher than the standard trailer axle charges do not take effect until 1 July 2009. This should provide registration authorities with sufficient time make the necessary system changes and undertake staff training.
The registration authorities have indicated that these system changes could be reasonably costly. For example, NSW RTA estimates that IT, paper and staff training costs associated with the system changes could equal $3 million. However, this would be a one-off expense, which the NTC believes is justified to enable a more efficient heavy vehicle charging system to be implemented.
The NTC has been advised that the recommended charges schedule (including the introduction of differential trailer axle registration charges) will have no impact on the National Exchange of Vehicle and Driver Information System (NEVDIS).
7.4 Legislative issues
If approved by the ATC, the recommended annual registration charges will be set out in the form of a model Act made under the National Transport Commission Act 2003. This approach is consistent with the requirements of the Inter-Governmental Agreement for Regulatory and Operational Reform in Road, Rail and Intermodal Transport (the IGA). The model Act will not be ‘operative’, in that it will not create any legally enforceable rights or obligations for any party. It will instead provide an authoritative depository for the content of the agreed reform. The model Act will appear as a schedule to Regulations made under the National Transport Commission Act 2003 on the Federal Register of Legislative Instruments in accordance with the provisions of the Legislative Instruments Act 2003. This approach will facilitate the continued referencing of the national charges by jurisdictions.

Page 86 2007 Heavy Vehicle Charges Determination Regulatory Impact Statement Vol I
The charges set out in the model Act will supersede those currently contained in the Road Transport Charges (Australian Capital Territory) Act 1993. The location of the charges in that Act was a product of the template legislative reform mechanism adopted by the National Road Transport Commission.25 This approach has been replaced by the model legislation system set out in the IGA. The template legislation is to be repealed once all jurisdictions have removed any remaining references to it.
The model Act will continue to reflect the key concepts (such as determined charges and the annual adjustment process) and definitions contained in the Road Transport Charges (Australian Capital Territory) Act 1993. It will depart from them as necessary, to reflect any matters agreed by the ATC that are not currently provided for (such as the phasing in of certain registration charges).
The recommended fuel-based charge will, as is currently the case, be determined by the responsible Commonwealth Minister under the Fuel Tax Act 200626 in the form of a disallowable legislative instrument. The Commonwealth Department of Transport and Regional Services will liaise with the Attorney-General’s Department to ensure the appropriate fuel tax instruments are drafted. These instruments will be registered and tabled in Parliament in accordance with the relevant legislative requirements.
The processes outlined above will, subject to the passage of the necessary legislation in each State and Territory, provide the basis for updated heavy vehicle charges to become effective from 1 July 2008.
25 Under the template approach, the legislation prepared by the National Road Transport Commission was approved by the Australian Transport Council. This legislation was then enacted by Commonwealth Parliament, and applied in the Australian Capital Territory and the Jervis Bay Territory. It was intended that each State and the Northern Territory would then enact legislation, adopting the Commonwealth legislation by reference. 26 The Fuel Tax Act 2006 allows the Commonwealth Minister for Transport to set the effective level of duty payable on fuel for heavy vehicles.

2007 Heavy Vehicle Charges Determination Regulatory Impact Statement Vol I Page 87
8. REFERENCES
ARRB Transport Research (2006a) HDM IV Heavy Vehicle Cost Model
ARRB Transport Research (2006b) Analysis of ABS Input/Output Tables for 2001/02
Asciano (2007) Asciano Submission to the National Transport Commission Re: 2007 Heavy Vehicle Charge Determination, July
Australian Bureau of Statistics (2006) Survey of Motor Vehicle Use, Cat No. 9208.0 various issues
Australian Industry Group (2006) Transport & Logistics Operations in Australia
Australasian Transport News-PKF Pty Ltd (2007), Truck Operating Cost Model
Austroads Road Safety Handbook (2005a) Volume 2, Report on Road Improvement as a Road Safety Countermeasure by Monash University Accident Research Centre
Austroads Road Safety Handbook (2005b) Volume 3, Improving Heavy Vehicle Safety by Monash University Accident Research Centre
Bureau of Transport and Regional Economics (2000) Transport Costs in Regional City-Country Price Differentials, Canberra, unpublished
The Council of Australian Governments (2007) COAG National Reform Agenda – Competition Reform, April
CRA International (2007) Case Studies of the Effect on Operator Costs of the NTC’s 2007 Heavy Vehicle Charges
The Inter-Governmental Agreement (2003) (IGA) for Regulatory and Operational Reform in Road, Rail and Intermodal Transport
Meyrick and Associates (2007) Assessment of Heavy Vehicle Charge Recovery Estimates, August
National Road Transport Commission (1998) Updating Heavy Vehicle Charges: Technical Report, NRTC, Melbourne
National Road Transport Commission (2000) Updating Heavy Vehicle Charges: Regulatory Impact Statement, NTC, Melbourne
National Road Transport Commission, (2001) Annual Adjustment Procedure for Heavy Vehicle Charges – Initial Adjustment: Regulatory Impact Statement, NRTC, Melbourne
National Transport Commission, (2005a), Review of Heavy Vehicle Axle Load Data, NTC, Melbourne
National Transport Commission, (2005b), Review Local Road Use, NTC, Melbourne
National Transport Commission, (2005c), A Survey and Analysis of Heavy Vehicle Fleet Costs and Sensitivities in Vehicle Choice, September 2005 (unpublished)
National Transport Commission, (2005d), Third Heavy Vehicle Pricing Determination Technical Report, NTC, Melbourne
National Transport Commission (2006), Third Heavy Vehicle Charges Determination Regulatory Impact Statement, NTC, Melbourne
Productivity Commission (2006) Road and Rail Freight Infrastructure Pricing, Report no.

Page 88 2007 Heavy Vehicle Charges Determination Regulatory Impact Statement Vol I
41, Canberra, December
VicRoads (2004), Annual Report 2003/04, Appendices on Compliance and Enforcement

2007 Heavy Vehicle Charges Determination Regulatory Impact Statement Vol I Page 89
9. GLOSSARY OF TERMS
Term Definition
AGM Average Gross Mass (an average of the total mass of a vehicle and its load per kilometre travelled).
Attributable costs Costs of providing and maintaining roads that vary depending on the use of the road system by different types of vehicles. These costs are directly attributable to vehicles.
CPI Consumer Price Index.
Equivalent Standard Axles (ESA)
A measure of the relative road wear of different axles carrying different loads, calculated as:
4
load referenceloadESA ⎟
⎠⎞
⎜⎝⎛=
where the reference load varies depending on the number of axles in the axle group and the types of tyres it is fitted with.
Externalities Externalities can be of a detrimental or beneficial nature. Detrimental externalities are the result of an activity that causes damage to others with no corresponding compensation paid by those who generate the externality such as noise, air pollution and greenhouse gas emissions. Beneficial externalities are the result of activity which causes incidental benefits to others with no corresponding compensation provided to those who generate the externality.
Gross Vehicle Mass (GVM)
The maximum mass the manufacturer or road authority has rated the vehicle as safe to carry.
Heavy vehicle Vehicle 4.5 tonnes and above GVM.
Higher Mass Limits (HML)
A scheme which allows for increases to general access mass limits provided the vehicle is operated in accordance with conditions stipulated for HML.
High productivity vehicle This is a heavy vehicle that does not meet current prescriptive specifications based on mass, volume, height, vehicle/trailer length and/or axle configuration due to productivity related improvements to the vehicle.
For these vehicles it is proposed that a high productivity vehicle charge formula apply unless the vehicle type can be accommodated within the registration charge range for the nearest prescriptive vehicle type.
IGA Inter-Governmental Agreement.
Incremental pricing Heavy vehicle pricing that would operate in addition to the existing heavy vehicle charges. The aim of incremental pricing
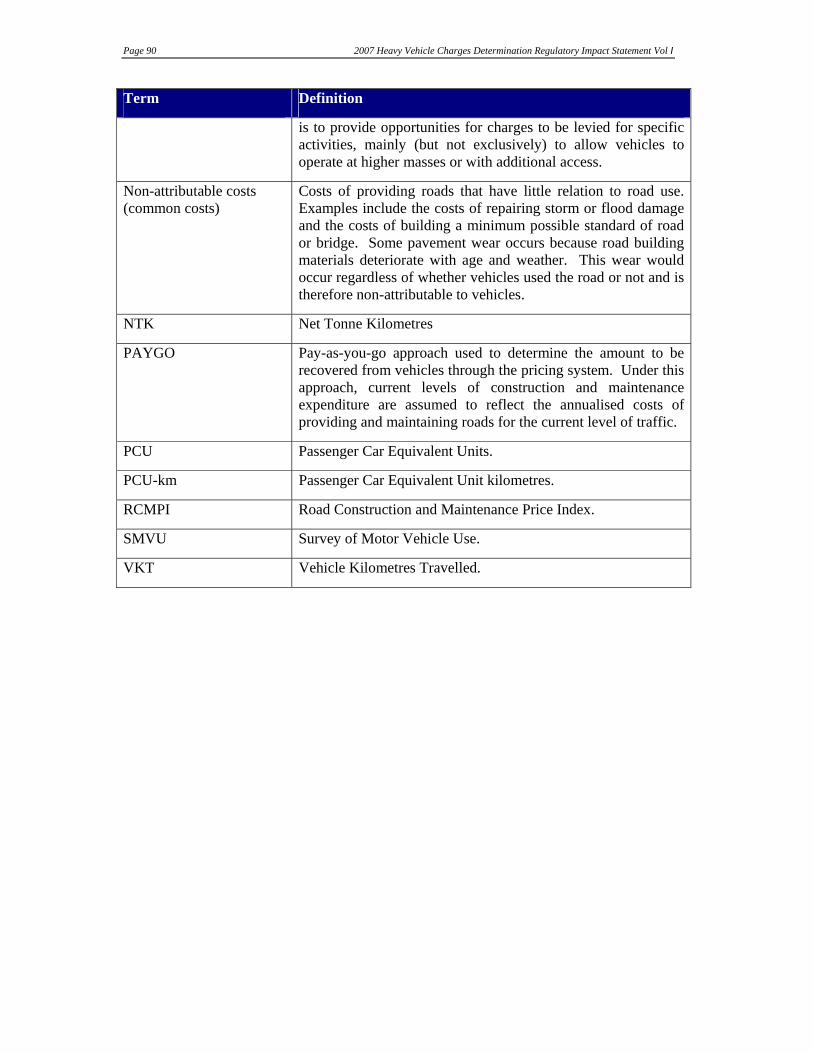
Page 90 2007 Heavy Vehicle Charges Determination Regulatory Impact Statement Vol I
Term Definition
is to provide opportunities for charges to be levied for specific activities, mainly (but not exclusively) to allow vehicles to operate at higher masses or with additional access.
Non-attributable costs (common costs)
Costs of providing roads that have little relation to road use. Examples include the costs of repairing storm or flood damage and the costs of building a minimum possible standard of road or bridge. Some pavement wear occurs because road building materials deteriorate with age and weather. This wear would occur regardless of whether vehicles used the road or not and is therefore non-attributable to vehicles.
NTK Net Tonne Kilometres
PAYGO Pay-as-you-go approach used to determine the amount to be recovered from vehicles through the pricing system. Under this approach, current levels of construction and maintenance expenditure are assumed to reflect the annualised costs of providing and maintaining roads for the current level of traffic.
PCU Passenger Car Equivalent Units.
PCU-km Passenger Car Equivalent Unit kilometres.
RCMPI Road Construction and Maintenance Price Index.
SMVU Survey of Motor Vehicle Use.
VKT Vehicle Kilometres Travelled.