Embed Size (px)
Citation preview
WaterstoneEnvironmental Hydrology and Engineering Inc.
Groundwater AvailabilityModeling (GAM) for the
Central Gulf Coast Aquifer -Preliminary Conceptual Model
A Presentation to: Stakeholder Advisory ForumHarry Hafernick CenterEdna, TexasAugust 6, 2001
Presentation Topics
ÜReview of GAM Objectives
ÜConceptual Model of Groundwater Flowfor Central Gulf Coast GAM
ÜGAM Schedule
GAM Objectives
•• Include substantial Stakeholder inputInclude substantial Stakeholder input•• Create standardized, publicly availableCreate standardized, publicly available
numerical groundwater flow models withnumerical groundwater flow models withsupporting datasupporting data
•• Provide information on groundwaterProvide information on groundwateravailability through 2050 for normal andavailability through 2050 for normal anddrought-of-record conditionsdrought-of-record conditions
•• Provide strategic water-managementProvide strategic water-managementtools for regional water planningtools for regional water planning
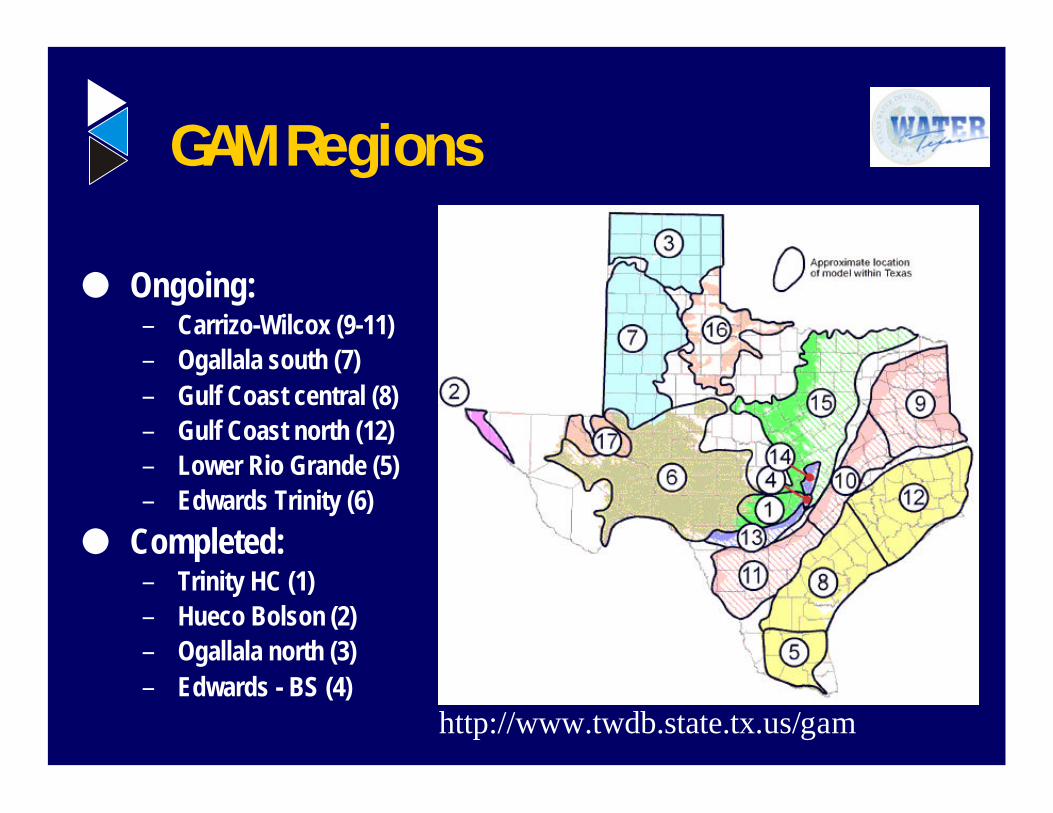
GAM Regions
l Ongoing:– Carrizo-Wilcox (9-11)– Ogallala south (7)– Gulf Coast central (8)– Gulf Coast north (12)– Lower Rio Grande (5)– Edwards Trinity (6)
l Completed:– Trinity HC (1)– Hueco Bolson (2)– Ogallala north (3)– Edwards - BS (4)
http://www.twdb.state.tx.us/gam
Conceptual Model TopicsConceptual Model Topics
ÜSchematic Diagram of Aquifer SystemÜModel Region and BoundariesÜGeology/HydrostratigraphyÜStructureÜWater Levels & Regional Groundwater FlowÜHydraulic PropertiesÜRechargeÜDischargeÜWater QualityÜSubsidence
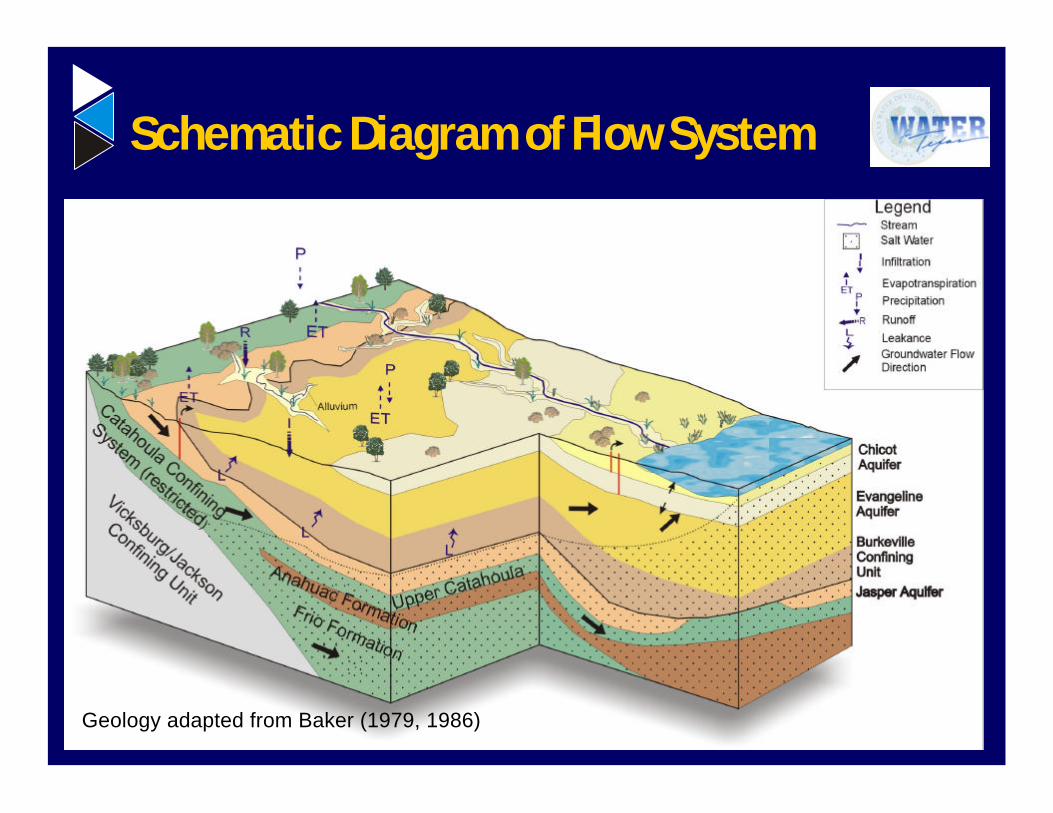
Schematic Diagram of Flow System
Adapted from Baker, 1979 and 1985.
Geology adapted from Baker (1979, 1986)
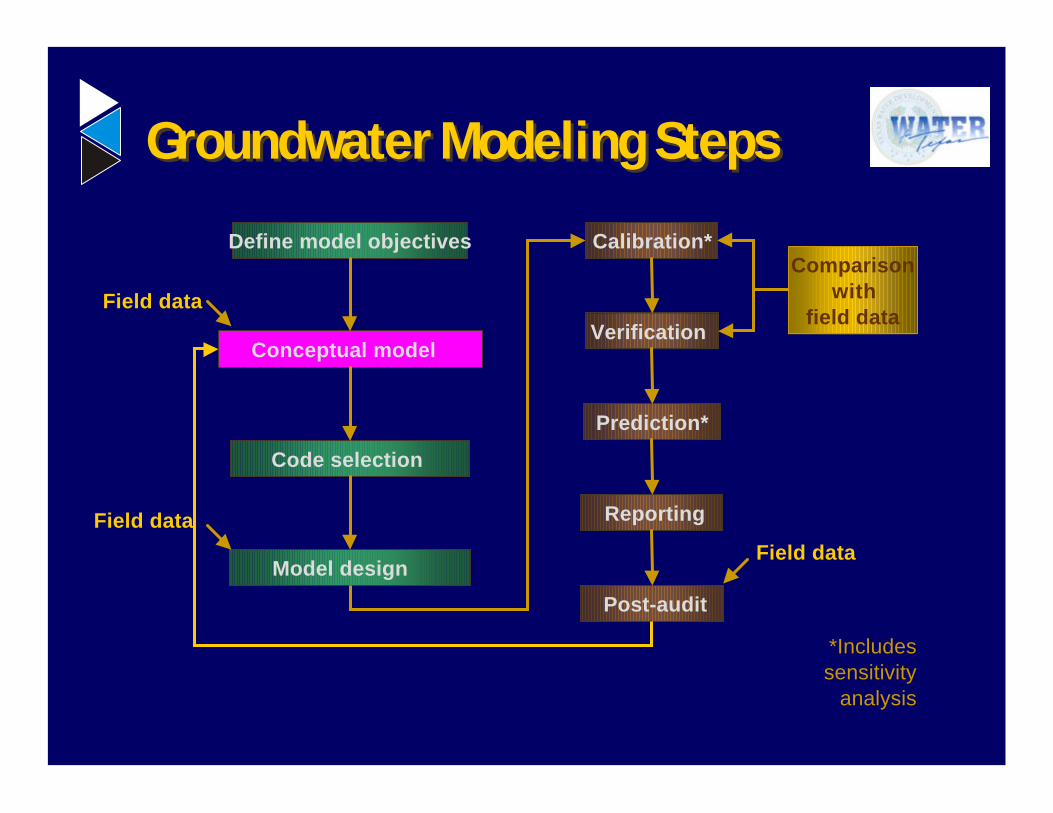
Groundwater Modeling StepsGroundwater Modeling Steps
Define model objectives
Conceptual model
Code selection
Field data
Calibration*
Reporting
Verification
Post-audit
Prediction*
Comparisonwith
field data
Model design
Field data
Field data
*Includessensitivity
analysis
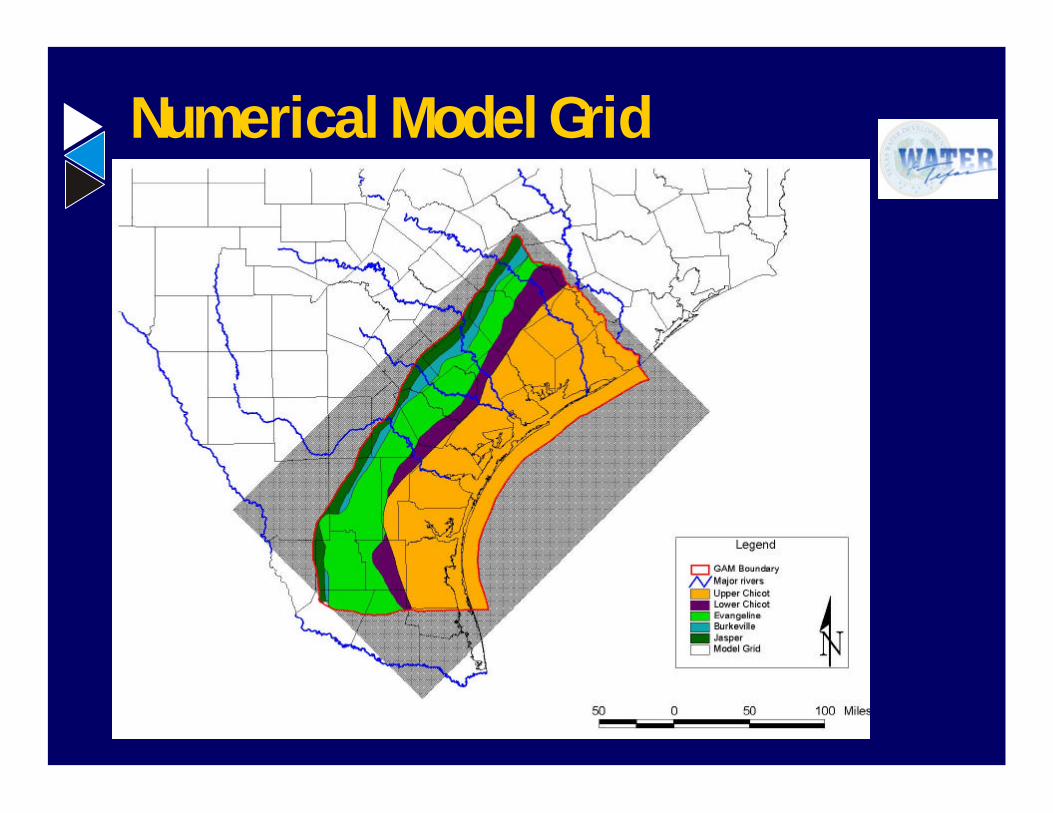
Numerical Model Grid
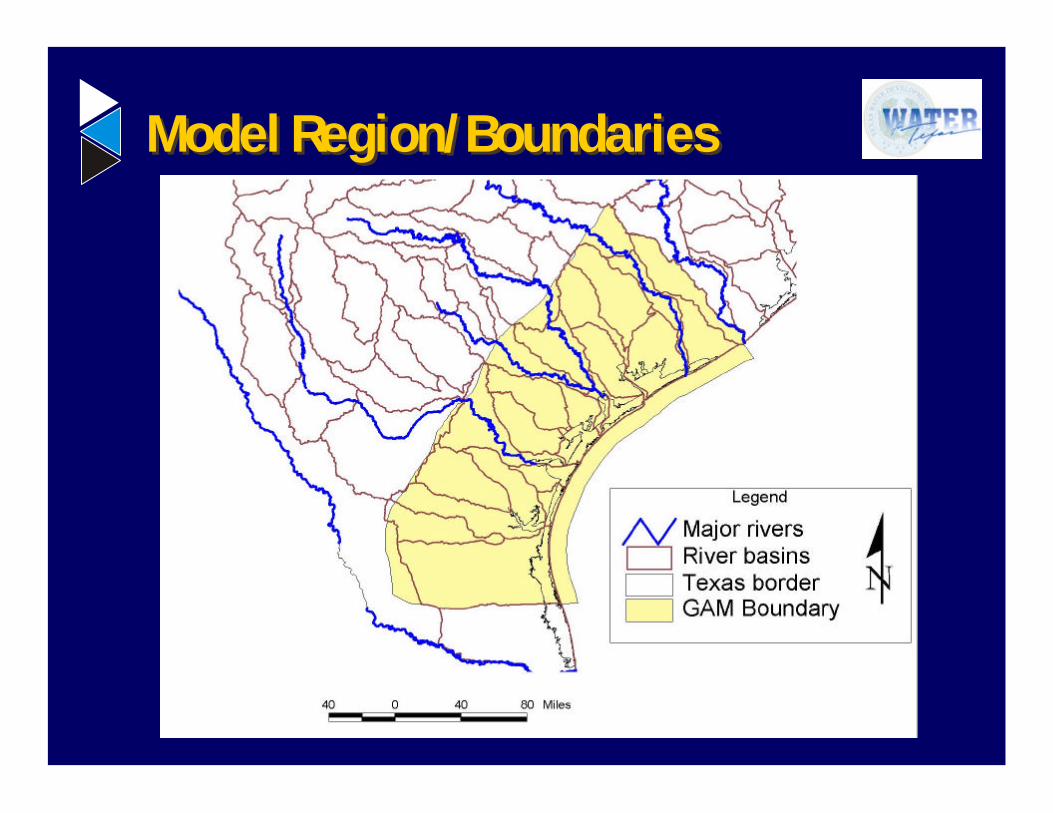
Model Region/BoundariesModel Region/Boundaries

Geologic FormationsGeologic Formations
Adapted from TAMU-CC (2000)
Stratigraphic UnitsBaker (1979) Carr, et al. (1985)
Holocene Alluvium
Beaumont Clay
Bentley Fm.
Willis Sand
Burkeville Confining Unit
Jasper Aquifer
Anahuac Fm.Lower Miocene-Upper Oligocene Confining
Unit
Frio Fm.
Jasper Aquifer
Ryder (1988)
Lower Pleistocene-Upper Pliocene Permeable Zone
Burkeville Confining Unit
Evangeline Aquifer
Catahoula Confining
System
Baker (1979) TAMU-CC(2000)
Lower Pilocene-Upper Miocene Permeable
Zone
Lagarto Confining
Unit
Ter
tiar
y
Upper Chicot Aquifer
Chicot Aquifer
Lower Miocene-Upper Oligocene Permeable Unit
Oligocene
Mio
cen
e
Oakville Sandstone
Middle Miocene Confining Unit
System Series
Qu
ater
nar
y
Pliocene
Hydrogeologic UnitsP
leis
toce
ne
Goliad Sand
Montgomery Fm.
Lower Chicot Aquifer
Holocene-Upper Pleistocene Permeable
Zone
Upper Chicot Aquifer
Evangeline Aquifer
Lower Chicot Aquifer
Evangeline Aquifer
Middle Miocene PermeableCatahoula Tuff
Fleming Fm.
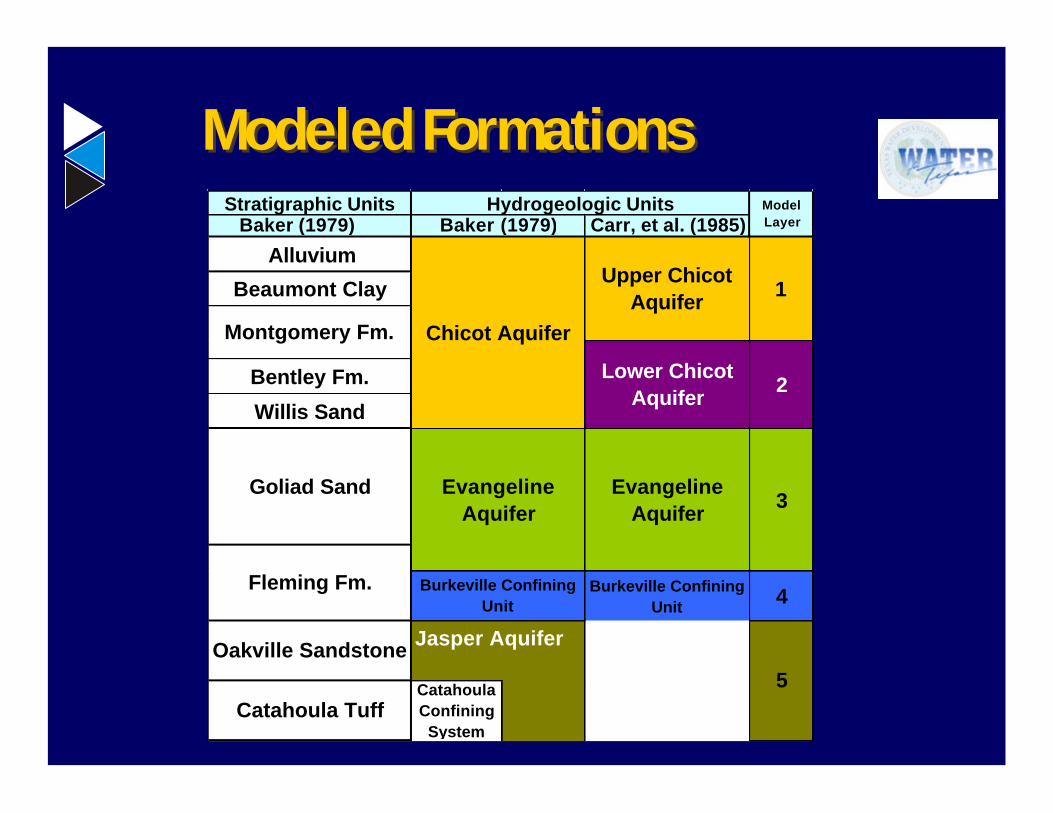
Modeled FormationsModeled FormationsStratigraphic Units
Baker (1979) Carr, et al. (1985)
Alluvium
Beaumont Clay
Bentley Fm.
Willis Sand
Burkeville Confining Unit 4
Jasper AquiferOakville Sandstone
Hydrogeologic Units
Evangeline Aquifer
Burkeville Confining Unit
Baker (1979)Model Layer
1
2
Catahoula Tuff
Evangeline Aquifer
Fleming Fm.
Goliad Sand
Montgomery Fm.
Lower Chicot Aquifer
5
3
Upper Chicot Aquifer
Chicot Aquifer
Catahoula Confining
System
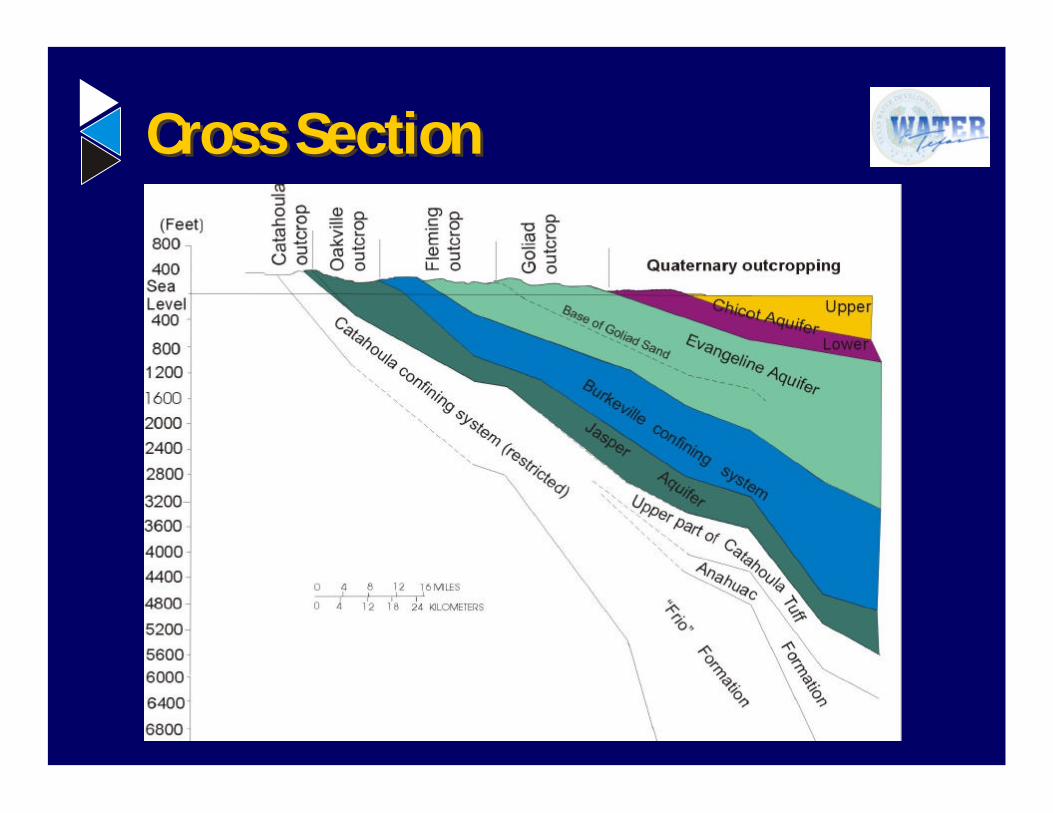
Cross SectionCross Section
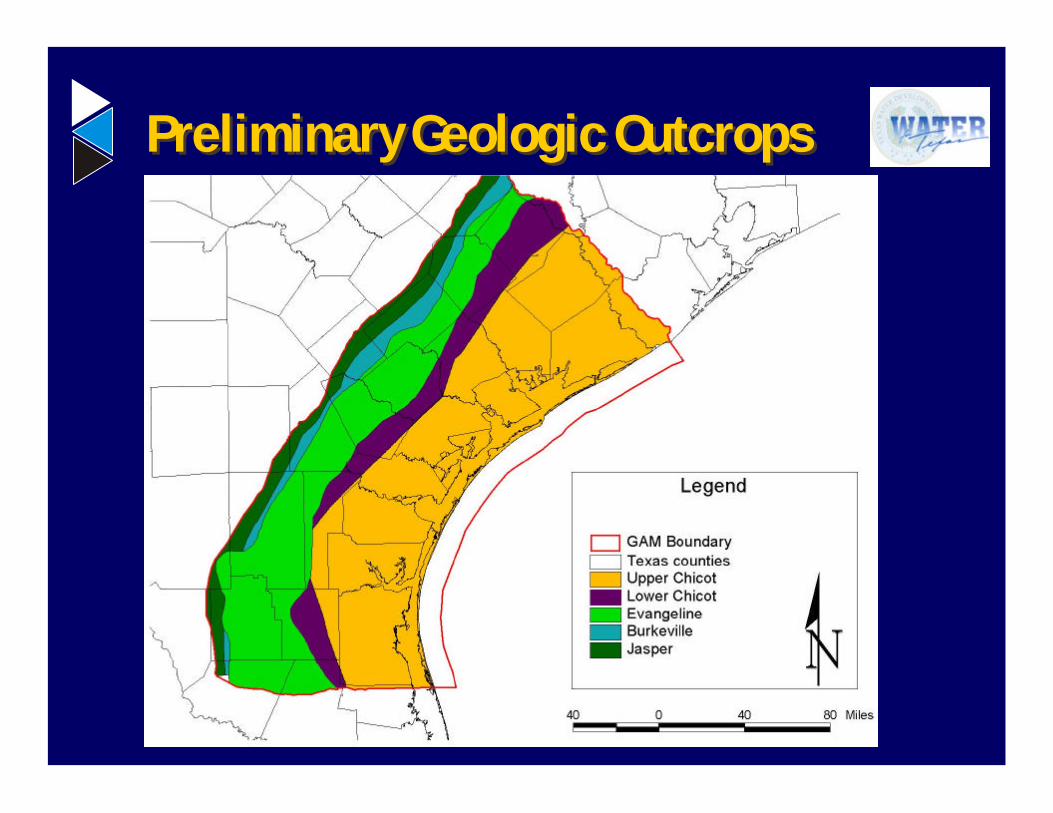
Preliminary Geologic OutcropsPreliminary Geologic Outcrops
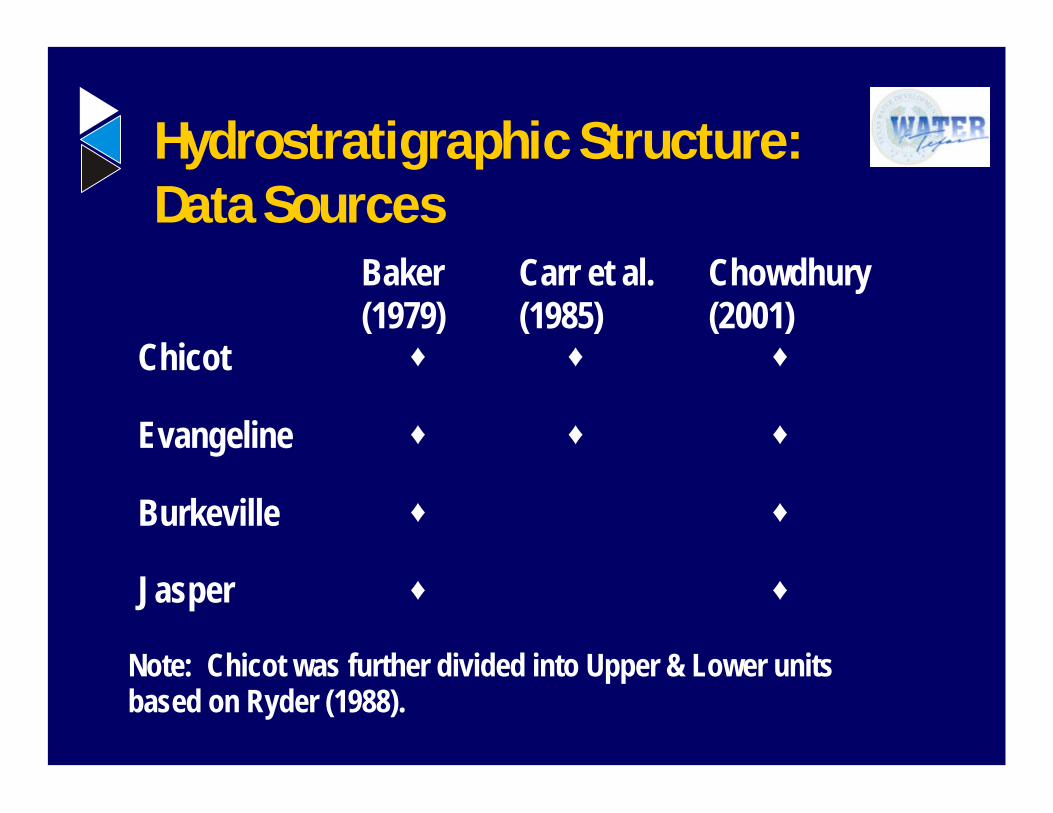
Hydrostratigraphic Structure:Data Sources
Baker (1979)
Carr et al. (1985)
Chowdhury (2001)
Chicot ♦ ♦ ♦
Evangeline ♦ ♦ ♦
Burkeville ♦ ♦
Jasper ♦ ♦
Note: Chicot was further divided into Upper & Lower units based on Ryder (1988).

Hydrostratigraphic StructureHydrostratigraphic Structure
ÜBaker (1979)—TWDB Report 236– 7 cross sections defining all 5 hydrostratigraphic layers
ÜCarr et al. (1985)—TWDB Report 289– Detailed contour maps define base of Chicot and Evangeline– About 400 electric logs used to define contours
ÜChowdhury (in progress)—Southern Gulf Coast GAM– Model overlap with SGC GAM– Used Baker (1979), Carr et al. (1985) and about 50 additional
borehole electric logsÜTAMU—CC
– Used their subdivision of Upper Chicot

HSU Structure – Evangeline
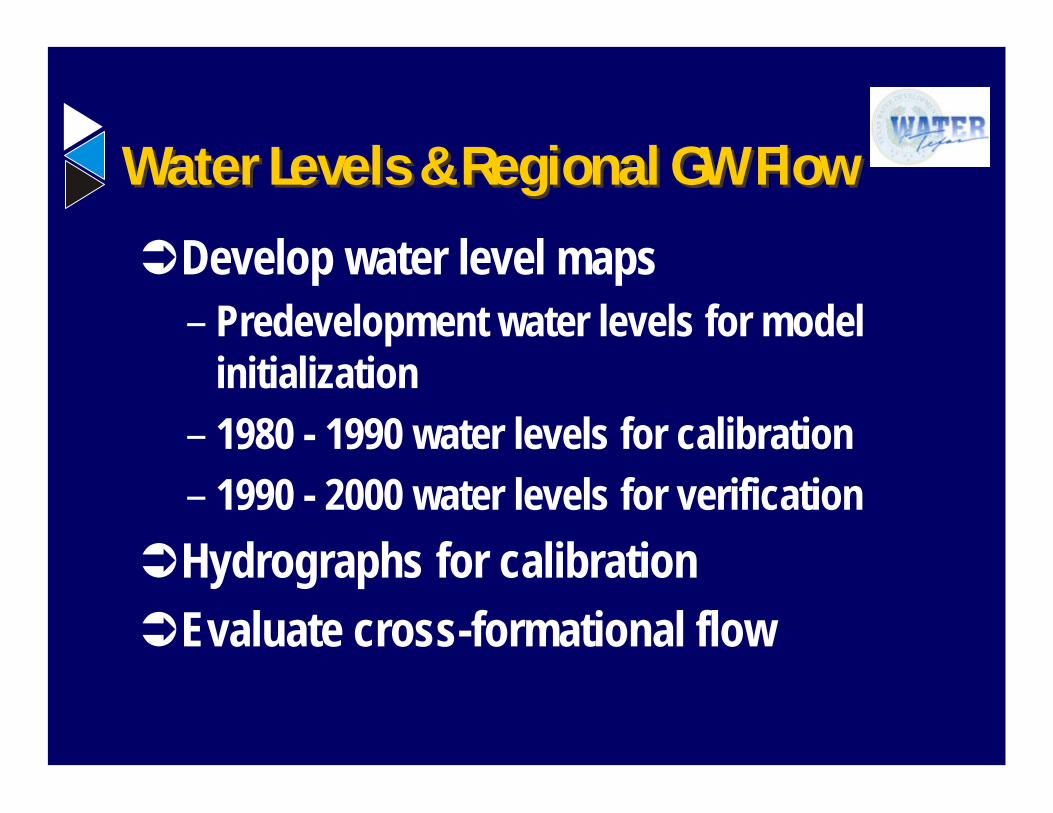
Water Levels & Regional GW FlowWater Levels & Regional GW Flow
ÜDevelop water level maps– Predevelopment water levels for model
initialization– 1980 - 1990 water levels for calibration– 1990 - 2000 water levels for verification
ÜHydrographs for calibrationÜEvaluate cross-formational flow
Water-Level Data Sources
ÜTWDB Groundwater DatabaseÜUSGS ReportsÜTWDB and predecessor reports
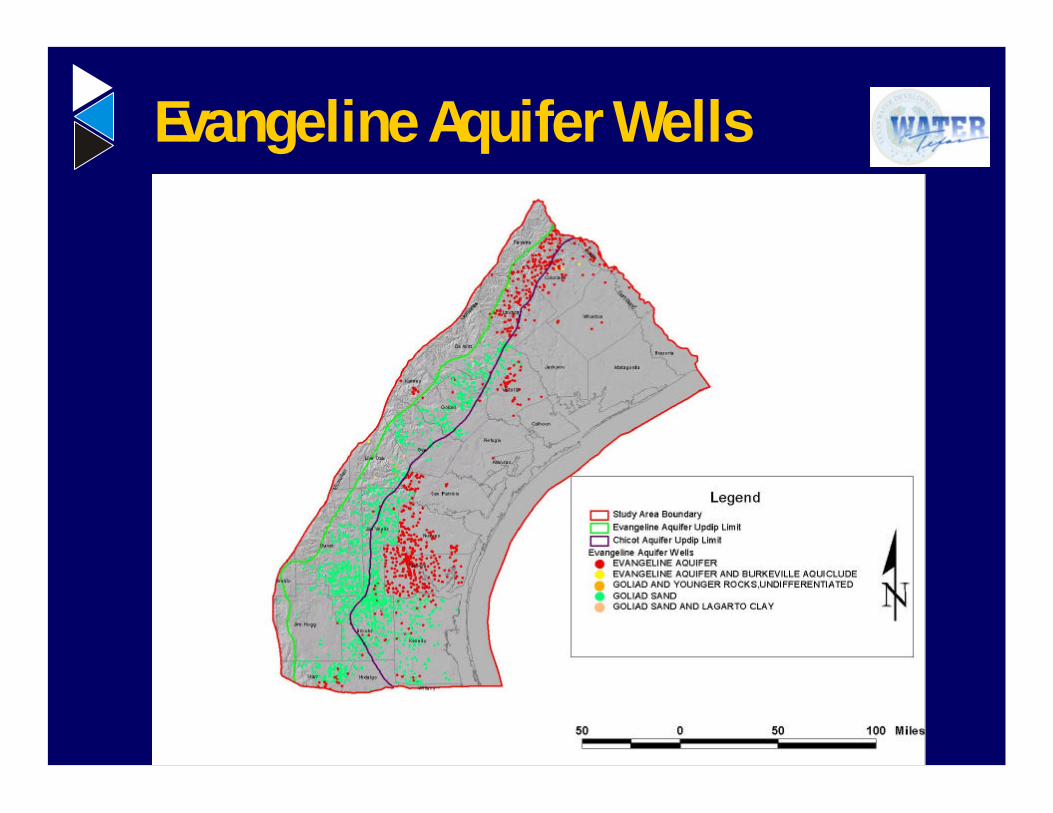
Evangeline Aquifer Wells

Anomalous Data:Gulf Coast Aquifer Wells?
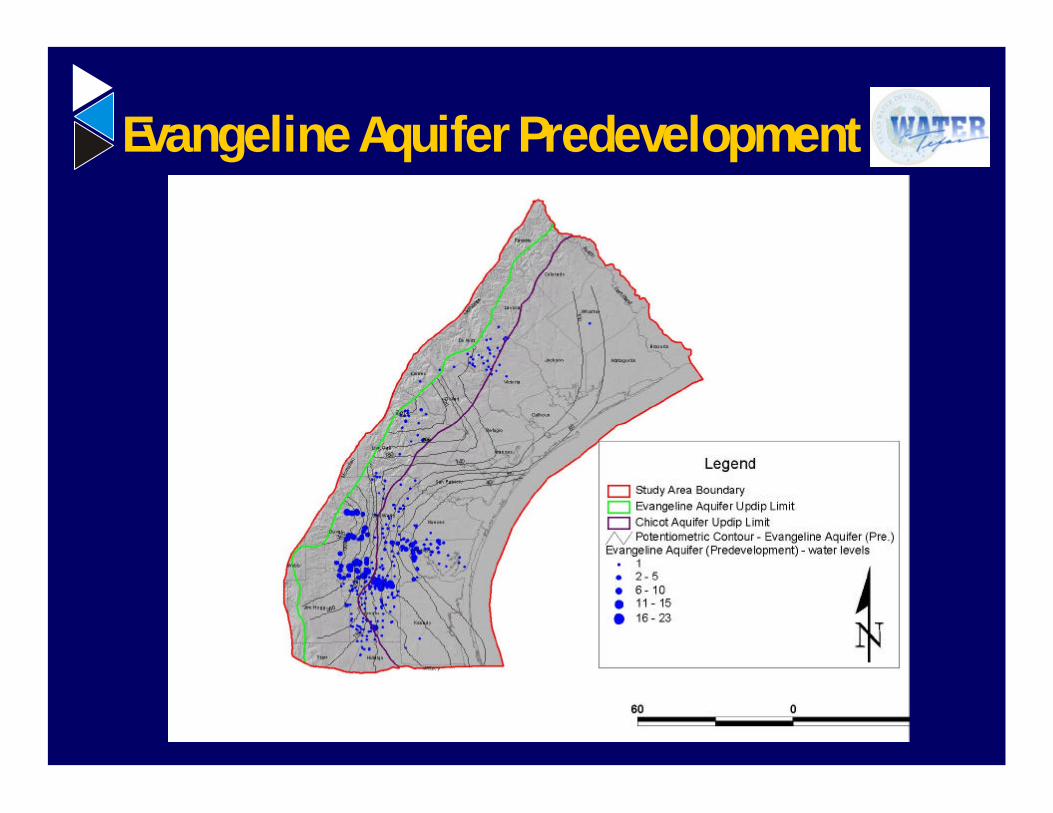
Evangeline Aquifer Predevelopment
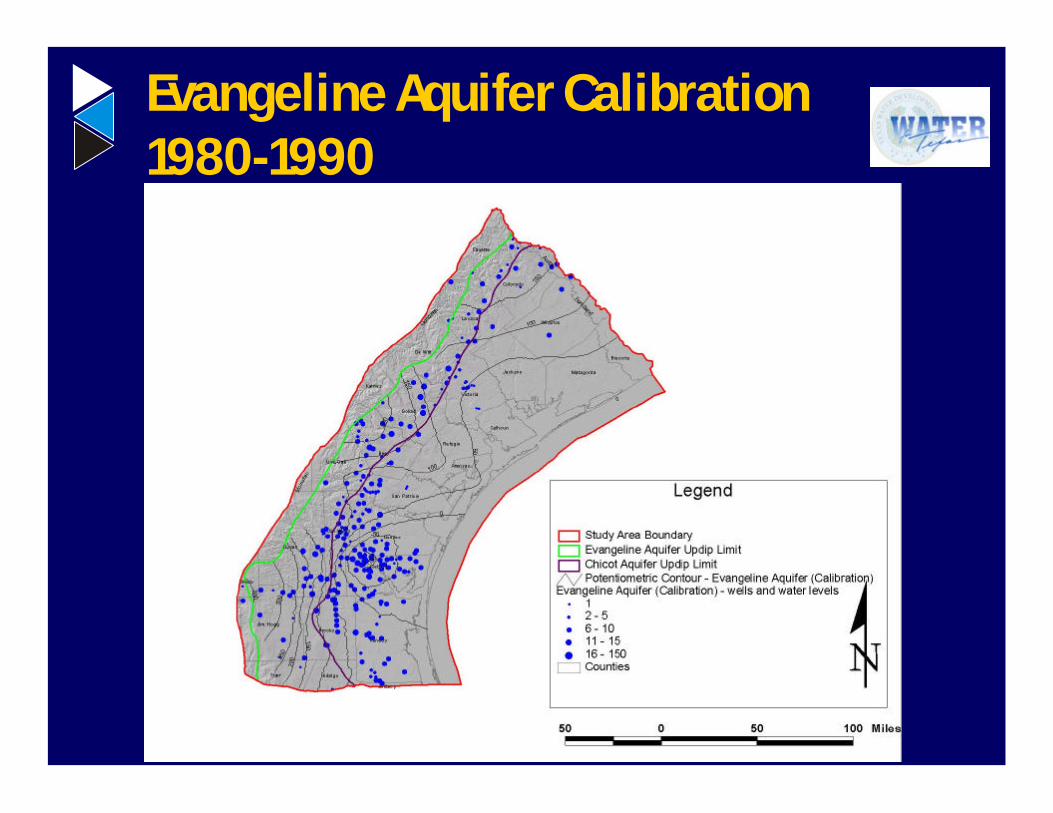
Evangeline Aquifer Calibration1980-1990
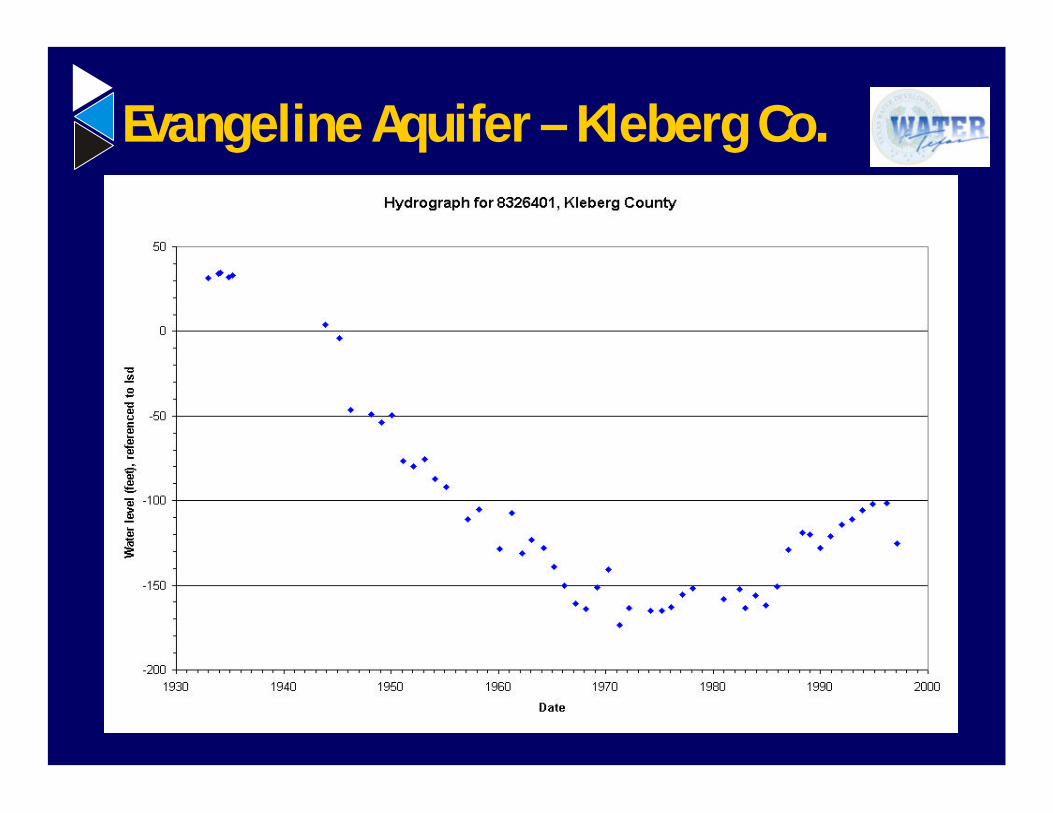
Evangeline Aquifer – Kleberg Co.
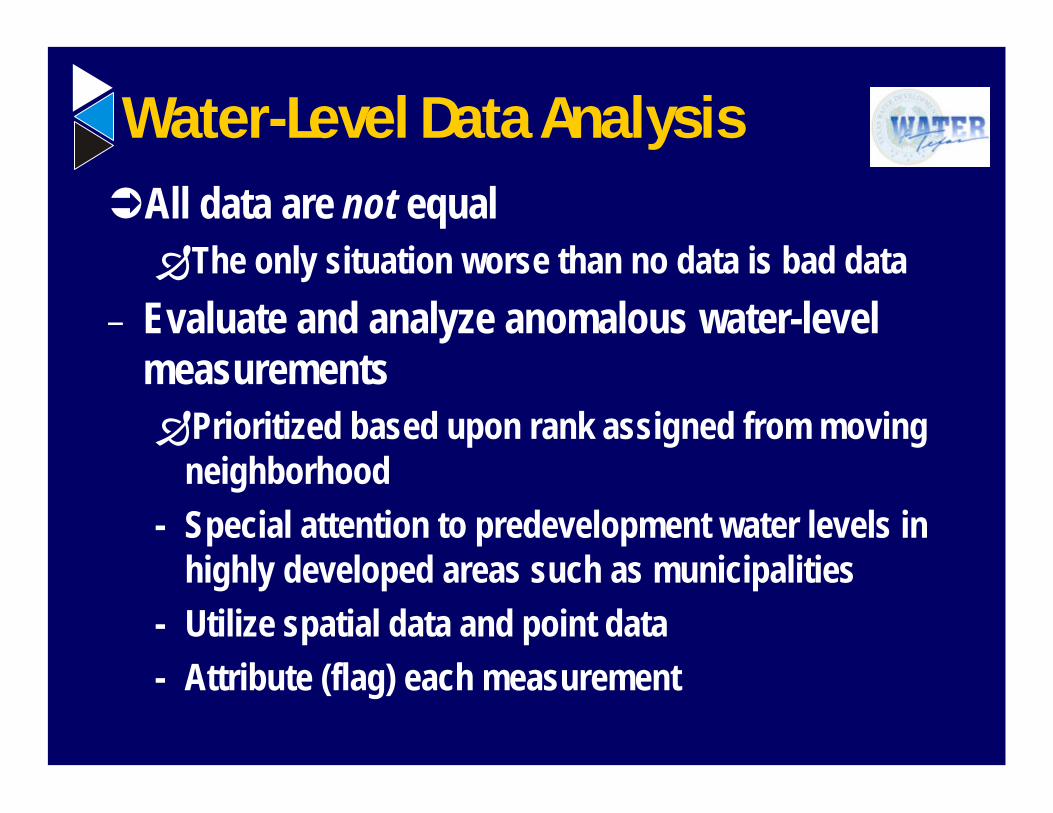
Water-Level Data AnalysisÜAll data are not equalÐThe only situation worse than no data is bad data
– Evaluate and analyze anomalous water-levelmeasurementsÐPrioritized based upon rank assigned from moving
neighborhood- Special attention to predevelopment water levels in
highly developed areas such as municipalities- Utilize spatial data and point data- Attribute (flag) each measurement

Aquifer Hydraulic Properties
ÜProperties related to aquifer’s abilityto transmit and store groundwater– Hydraulic conductivity (K)– Storativity (S)– Specific Yield (Sy)
Data Sources and ApproachÜData sources:
– Myers 1969 – TWDB aquifer test summary report– County groundwater reports– TWDB online database of specific capacity results
ÜCoordinates used where provided,otherwise reconciled with TWDB welldatabaseÜContoured information not used since
underlying data is unknownÜGrouped by aquifer and analyzed

Areal Distribution of AquiferProperty DataAreal Distribution of AquiferProperty Data
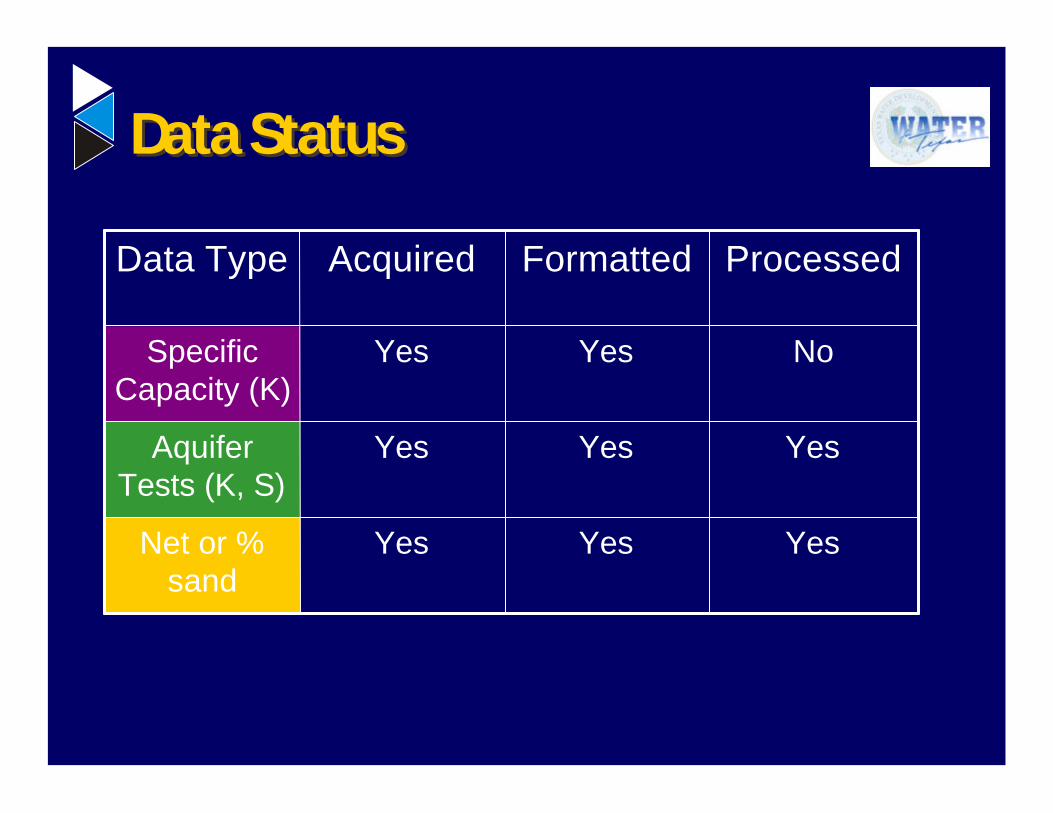
Data StatusData Status
YesYesYesNet or %sand
YesYesYesAquiferTests (K, S)
NoYesYesSpecificCapacity (K)
ProcessedFormattedAcquiredData Type

Preliminary Summary of Resultsfrom Aquifer TestsPreliminary Summary of Resultsfrom Aquifer Tests
K(ft/d)
S
0.8 - 361112Jasper
2 - 1203516Burkeville(outcrop)
0.4 - 1311977Evangeline
2.3 - 62351116Chicot
7.0E-05- 1.8E-023.7E-036Jasper
1.3E-04 - 1.0E-026.0E-034Burkeville
1.8E-05 - 1.0E-033.3E-0430Evangeline
4.6E-5 - 4.0E-039.1E-0421Chicot
RangeAverage# DataLayer

Hydraulic Conductivity DataReviewHydraulic Conductivity DataReview
ÜPotential errors in assignment to proper modellayersÜTo be evaluated during calibrationÜQC screened interval against layering geometry in GIS
ÜData represent horizontal hydraulic conductivity,no vertical hydraulic conductivity reported
ÜBurkeville data scarce since not usually a watersource
ÜDerived K data is a starting point—calibrate tofinal K

Storativity Data ReviewStorativity Data Review
ÜPotential error in assignment to propermodel layersÜ To be evaluated during calibrationÜ QC screened interval against layering geometry in GIS
ÜSpecific storage will be estimated frompumping test dataÜSpecific yield data
– Can be reasonably estimated for these types ofmaterials
Sand Percent
ÜAquifer deposits are derived from streams anddeltasÜSandier parts represent channels
ÜSandier parts have higher ability to transmitgroundwater (hydraulic conductivity)Ü In other Texas aquifer systems it is possible to
relate hydraulic conductivity to amount of sand toprovide extra information about the aquiferÜObtained Wilson and Hosman (1988) analysis of
geophysical well logs for sand percent

Evangeline Sand Percentage

Jasper Sand Percentage

Data Use in Calibration
ÜUse sand percentage to establish areas ofsimilar properties
ÜUse test data to establish initial K, S, and SyÜCalibrate vertical hydraulic conductivity (no
test data)
Recharge
ÜInfiltration– Precipitation– Temperature– Evaporation and ET– Irrigation/Crop UseÜSW/GW interaction

Data Coverage for Recharge EstimationData Coverage for Recharge Estimation
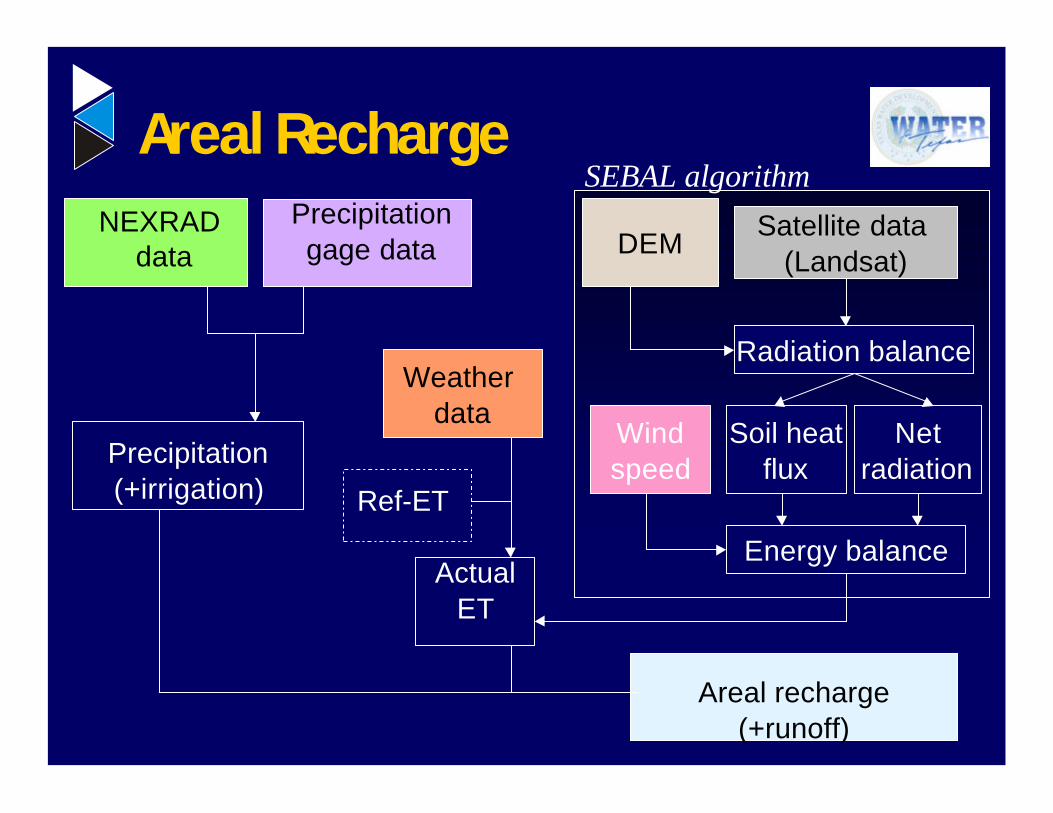
Areal RechargeNEXRAD
dataPrecipitationgage data
Precipitation(+irrigation)
Areal recharge(+runoff)
ActualET
Weather data
Ref-ET
Satellite data (Landsat)
Radiation balance
DEM
Soil heatflux
Netradiation
Energy balance
Windspeed
SEBAL algorithm
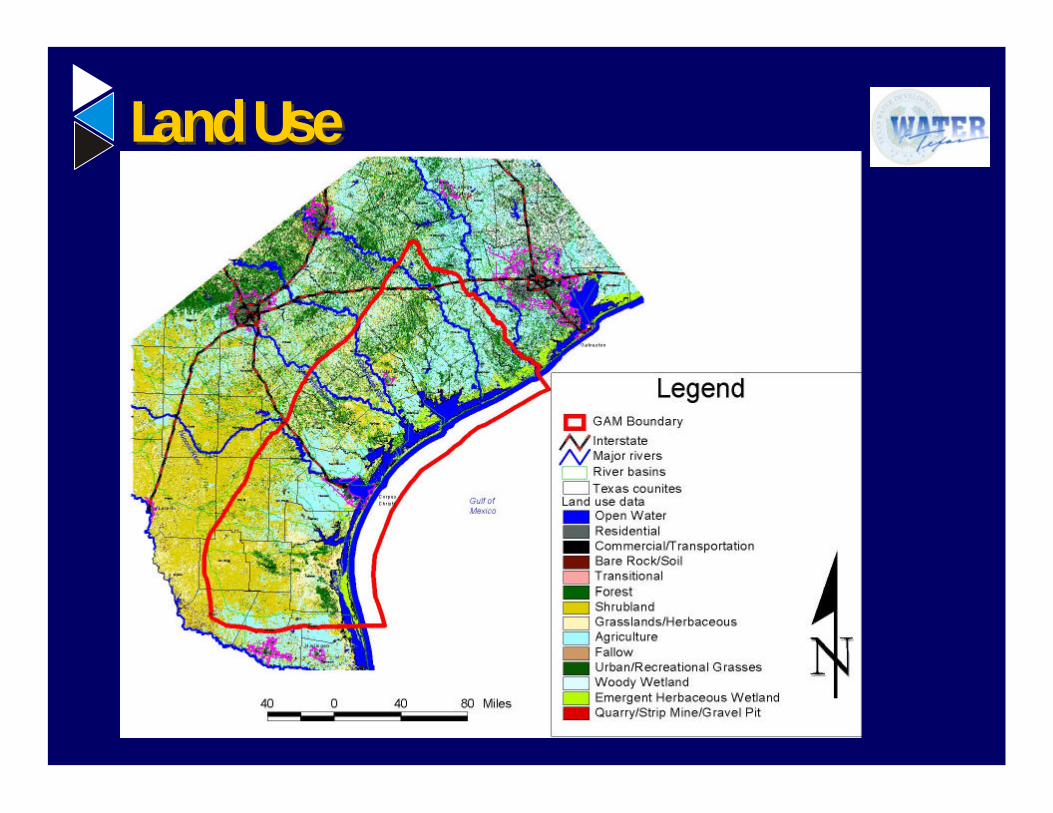
Land UseLand Use

Target values forstream/aquifer interaction
Stream/Aquifer Interaction
Daily streamflows(uncontrolled)
Base flow
Hydrograph Separation(HYSEP, Furey…)
Stream gain andloss data

Presentation of FindingsPresentation of Findings
PartialYesYesStreamflow
YesYesYesWeather
NoNoNoNEXRAD
NoYesYesPrecip.
ProcessedFormattedAcquiredData Type
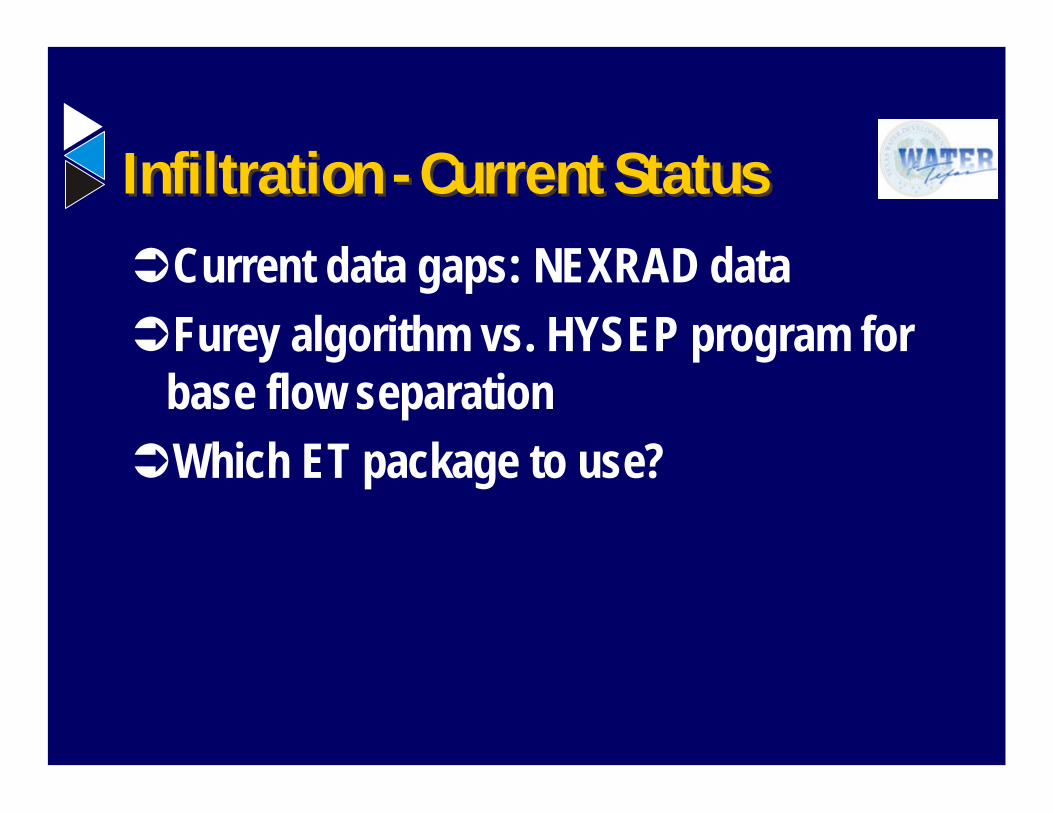
Infiltration - Current StatusInfiltration - Current StatusÜCurrent data gaps: NEXRAD dataÜFurey algorithm vs. HYSEP program for
base flow separationÜWhich ET package to use?
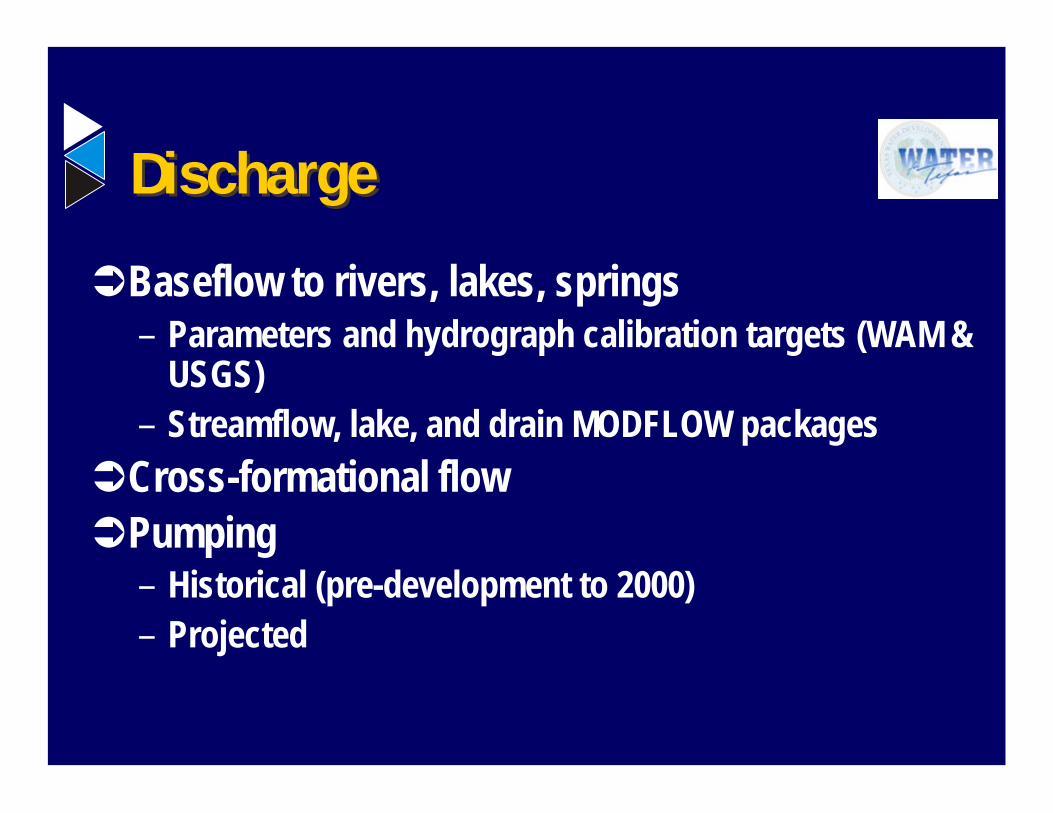
DischargeDischarge
ÜBaseflow to rivers, lakes, springs– Parameters and hydrograph calibration targets (WAM &
USGS)– Streamflow, lake, and drain MODFLOW packages
ÜCross-formational flowÜPumping
– Historical (pre-development to 2000)– Projected
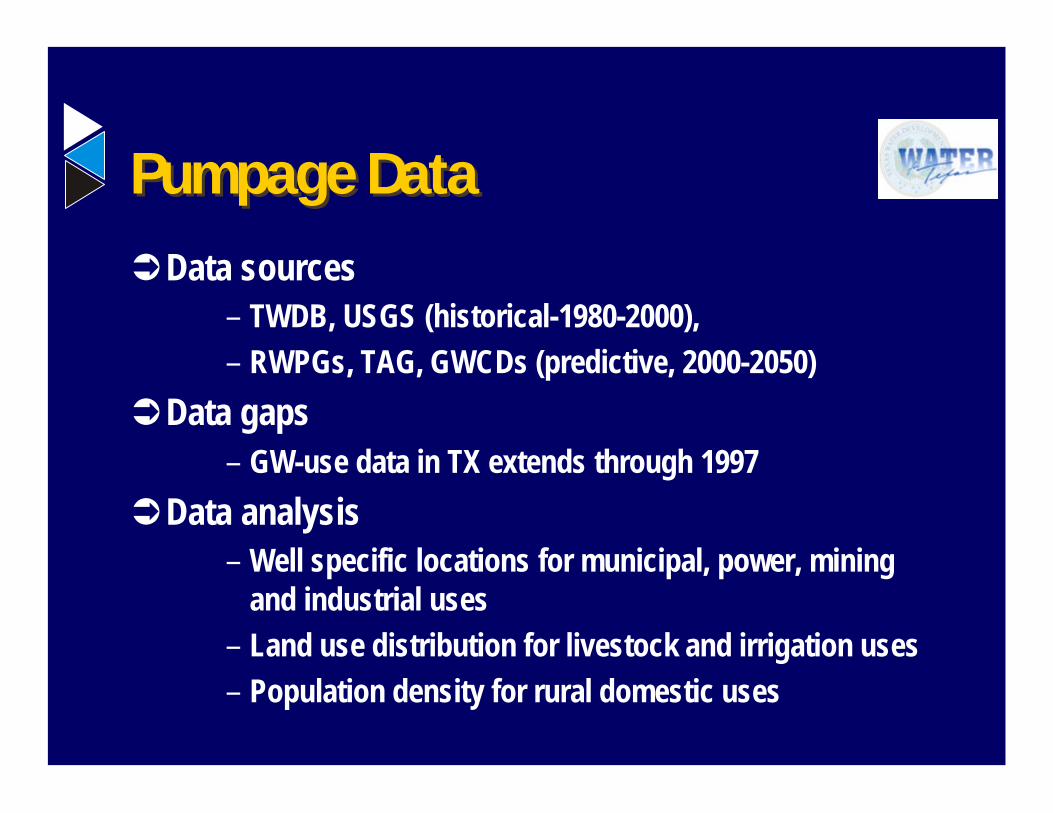
Pumpage DataPumpage DataÜData sources
– TWDB, USGS (historical-1980-2000),– RWPGs, TAG, GWCDs (predictive, 2000-2050)
ÜData gaps– GW-use data in TX extends through 1997
ÜData analysis– Well specific locations for municipal, power, mining
and industrial uses– Land use distribution for livestock and irrigation uses– Population density for rural domestic uses

Pumpage by County (1980) – All UsesPumpage by County (1980) – All Uses

Pumpage by County (1990) – All Uses
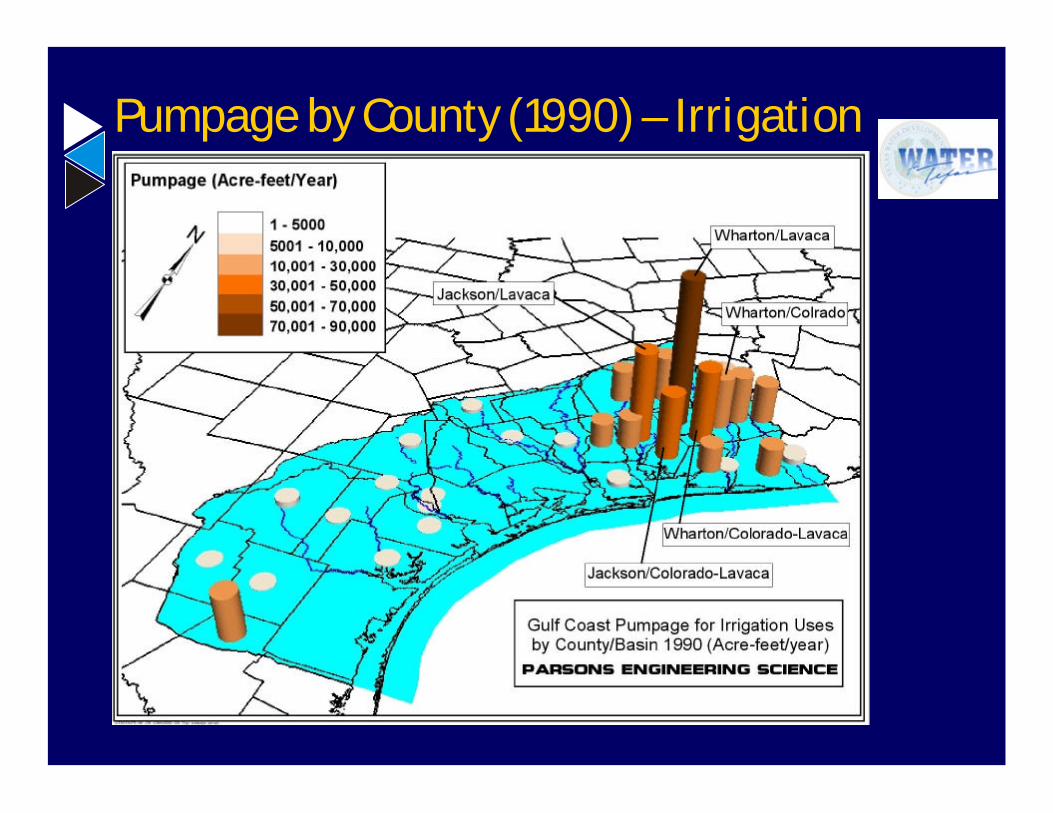
Pumpage by County (1990) – Irrigation
Water Quality DataÜApproach
–Develop water quality distributions forTDS and another constituent of interest
ÜData sources–TWDB, TNRCC (1944-2000)–Reports from Bureau of Economic
Geology

Evangeline TDSEvangeline TDS

Evangeline TDS Data LocationsEvangeline TDS Data Locations

Jasper TDSJasper TDS
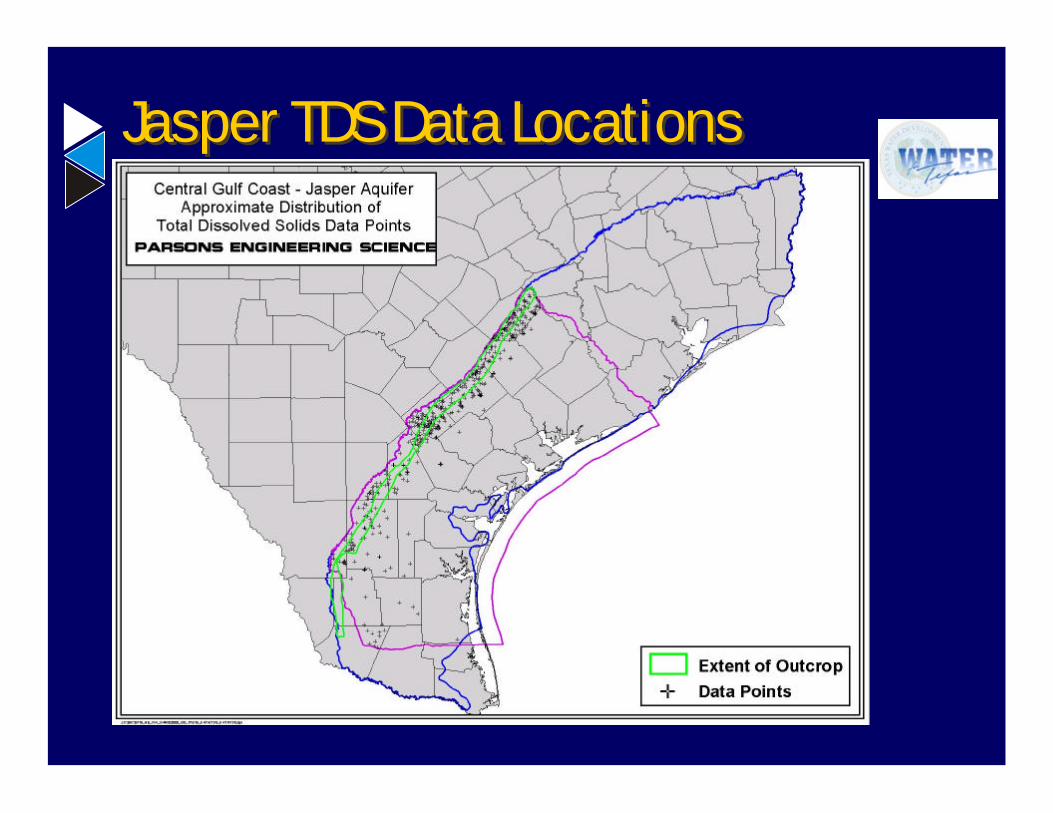
Jasper TDS Data LocationsJasper TDS Data Locations
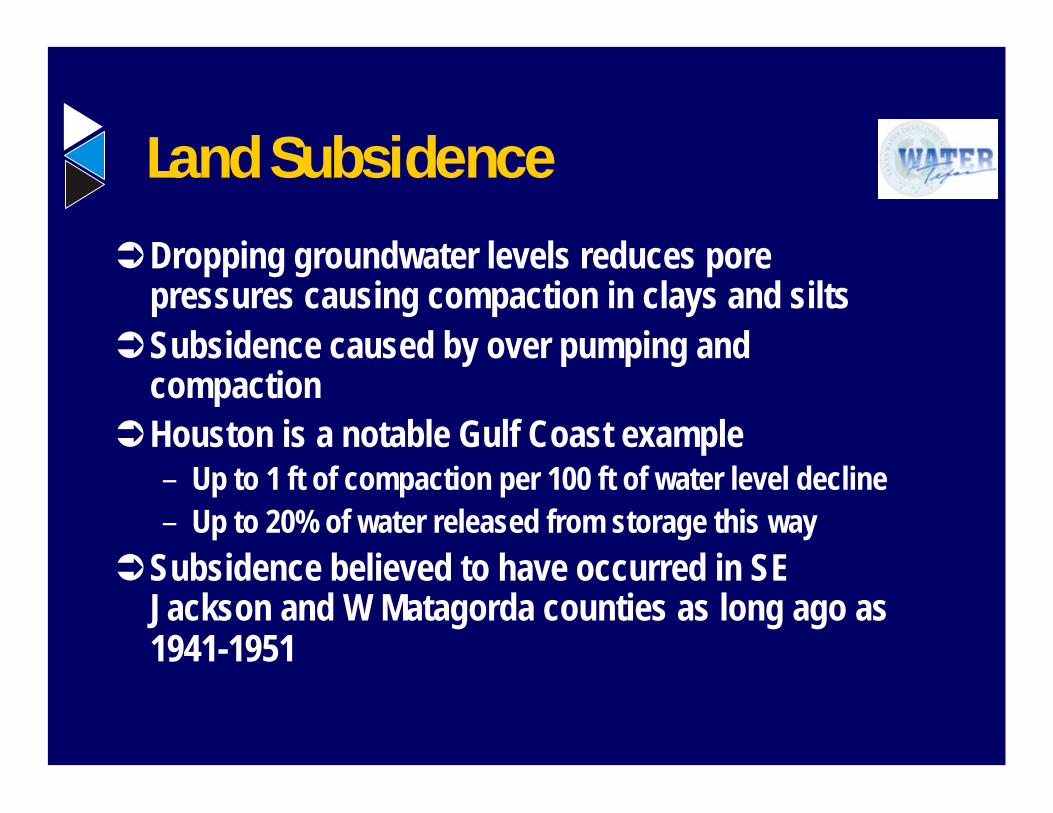
Land Subsidence
ÜDropping groundwater levels reduces porepressures causing compaction in clays and siltsÜSubsidence caused by over pumping and
compactionÜHouston is a notable Gulf Coast example
– Up to 1 ft of compaction per 100 ft of water level decline– Up to 20% of water released from storage this way
ÜSubsidence believed to have occurred in SEJackson and W Matagorda counties as long ago as1941-1951
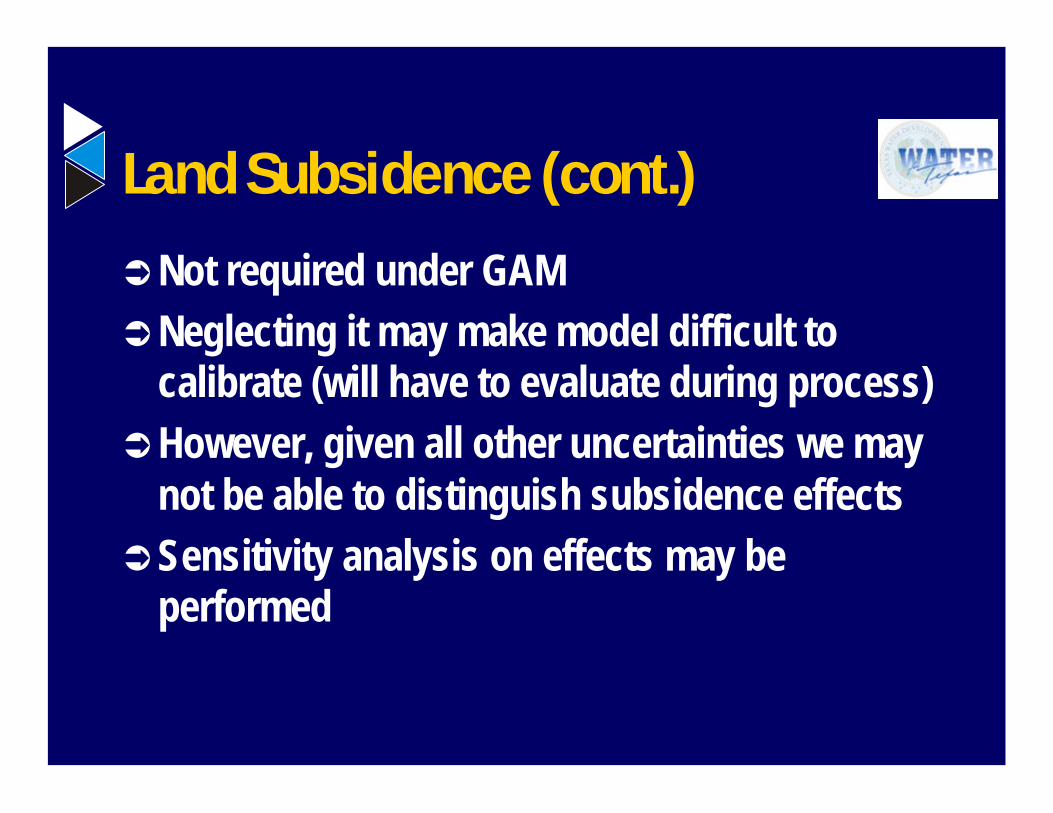
Land Subsidence (cont.)
ÜNot required under GAMÜNeglecting it may make model difficult to
calibrate (will have to evaluate during process)ÜHowever, given all other uncertainties we may
not be able to distinguish subsidence effectsÜSensitivity analysis on effects may be
performed
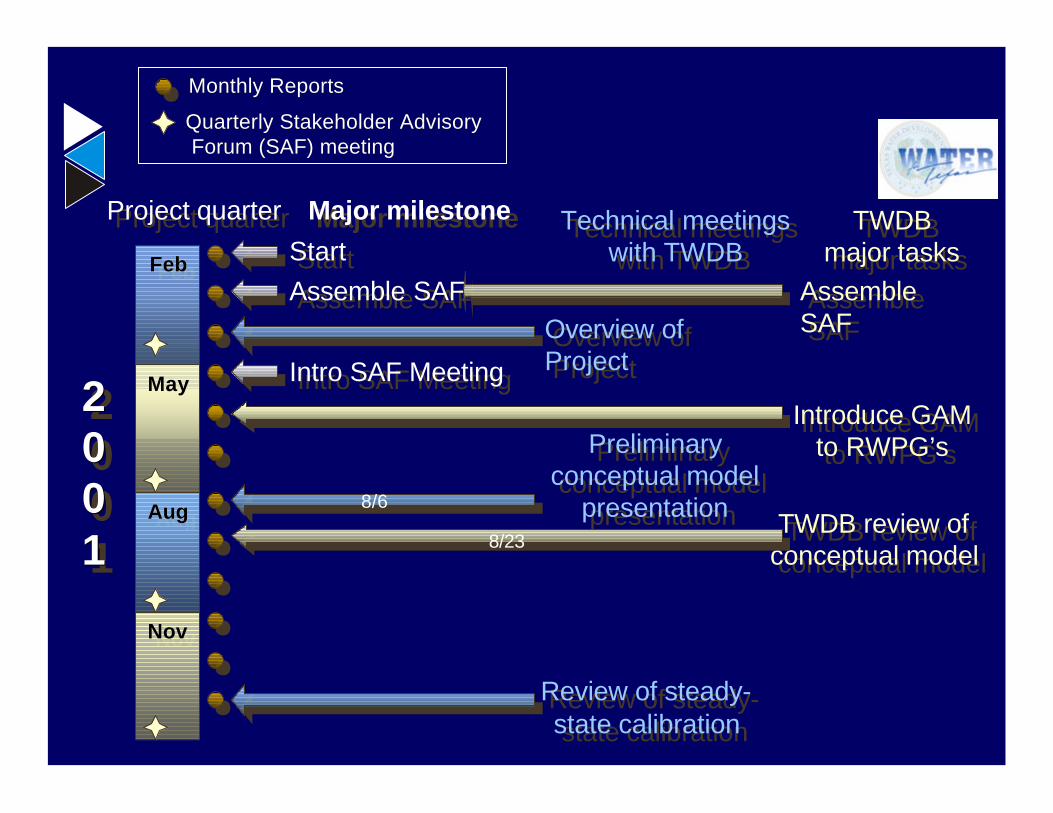
FebFebFeb
Project quarterProject quarter Major milestoneMajor milestoneTechnical meetings
with TWDBTechnical meetings
with TWDBTWDB
major tasksTWDB
major tasks
MayMayMay
AugAugAug
NovNovNov
StartStart
Assemble SAFAssemble SAF
Intro SAF MeetingIntro SAF MeetingOverview ofProject
Overview ofProject
AssembleSAF
AssembleSAF
Introduce GAMto RWPG’s
Introduce GAMto RWPG’sPreliminary
conceptual modelpresentation
Preliminaryconceptual model
presentation
2001
22000011
Review of steady-state calibration
Review of steady-state calibration
Monthly ReportsMonthly Reports
Quarterly Stakeholder AdvisoryQuarterly Stakeholder Advisory Forum (SAF) meeting Forum (SAF) meeting
TWDB review ofconceptual modelTWDB review of
conceptual model
8/6
8/23
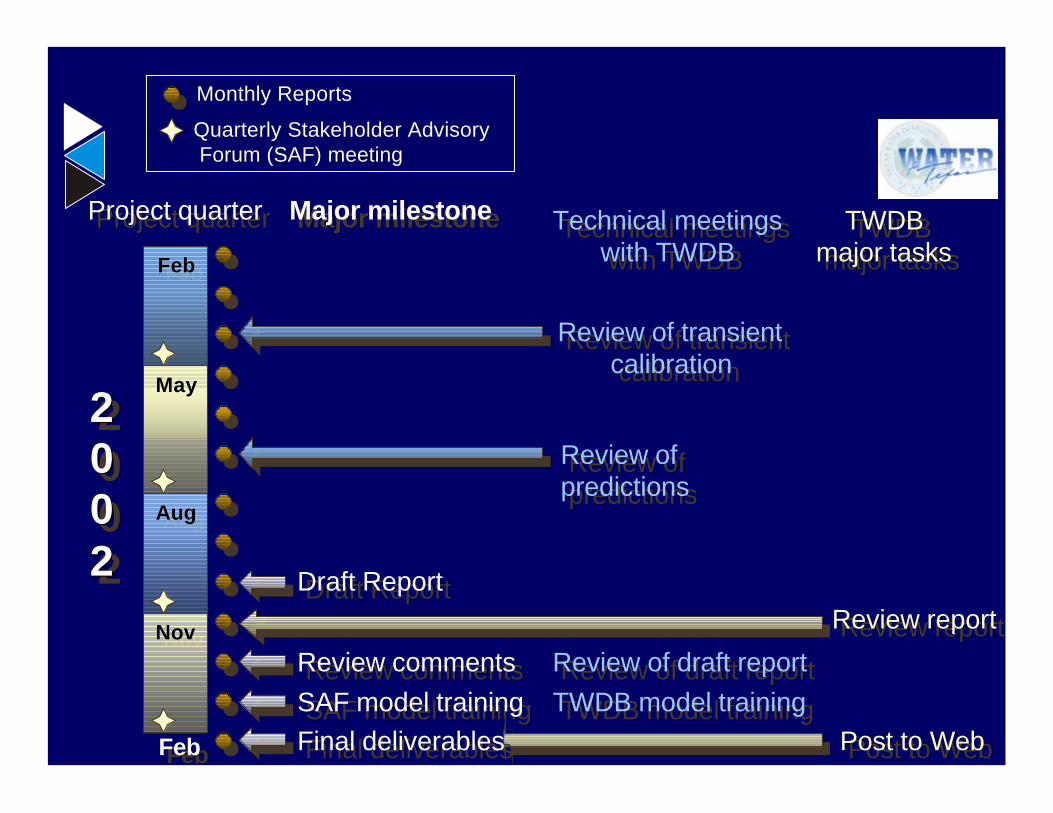
FebFebFeb
Project quarterProject quarter Major milestoneMajor milestoneTechnical meetings
with TWDBTechnical meetings
with TWDBTWDB
major tasksTWDB
major tasks
MayMayMay
AugAugAug
NovNovNov
Draft ReportDraft Report
Review commentsReview comments
Review ofpredictions
Review ofpredictions
Post to WebPost to Web
Review of transientcalibration
Review of transientcalibration
2002
22000022
Review of draft reportReview of draft report
SAF model trainingSAF model training TWDB model trainingTWDB model training
Final deliverablesFinal deliverablesFebFeb
Review reportReview report
Monthly ReportsMonthly Reports
Quarterly Stakeholder AdvisoryQuarterly Stakeholder Advisory Forum (SAF) meeting Forum (SAF) meeting
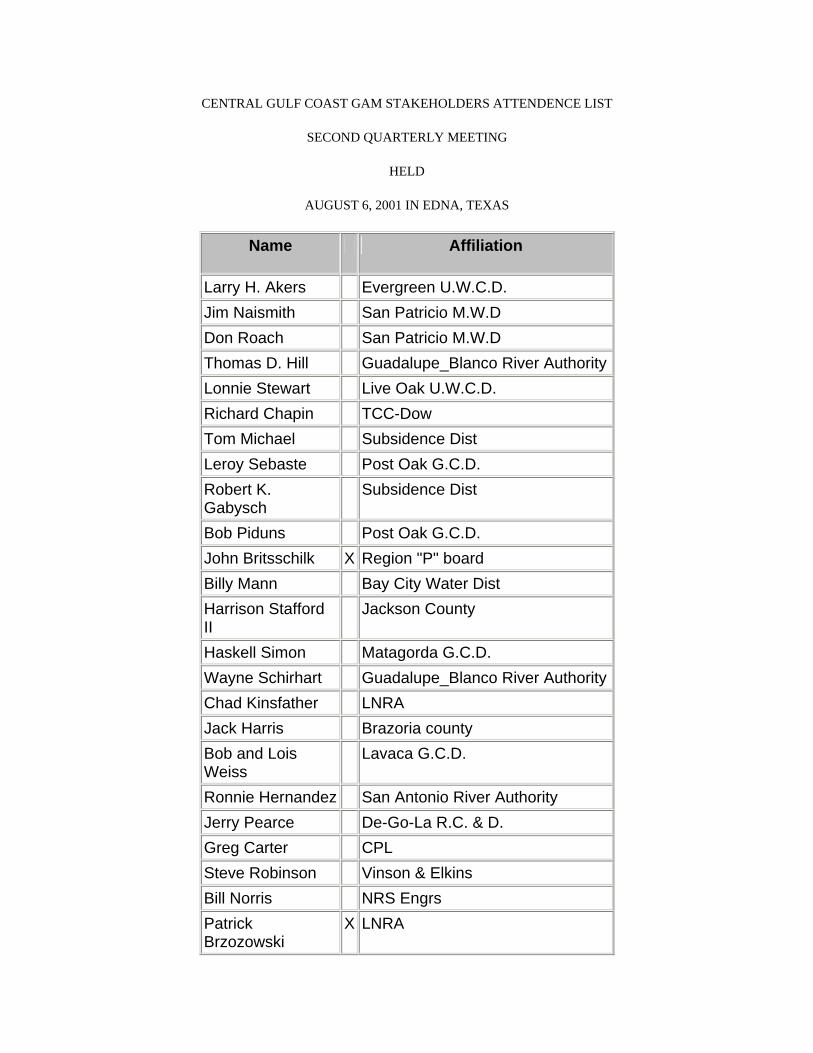
CENTRAL GULF COAST GAM STAKEHOLDERS ATTENDENCE LIST
SECOND QUARTERLY MEETING
HELD
AUGUST 6, 2001 IN EDNA, TEXAS
Name Affiliation
Larry H. Akers Evergreen U.W.C.D. Jim Naismith San Patricio M.W.D Don Roach San Patricio M.W.D Thomas D. Hill Guadalupe_Blanco River Authority Lonnie Stewart Live Oak U.W.C.D. Richard Chapin TCC-Dow Tom Michael Subsidence Dist Leroy Sebaste Post Oak G.C.D. Robert K. Gabysch
Subsidence Dist
Bob Piduns Post Oak G.C.D. John Britsschilk X Region "P" board Billy Mann Bay City Water Dist Harrison Stafford II
Jackson County
Haskell Simon Matagorda G.C.D. Wayne Schirhart Guadalupe_Blanco River Authority Chad Kinsfather LNRA Jack Harris Brazoria county Bob and Lois Weiss
Lavaca G.C.D.
Ronnie Hernandez San Antonio River Authority Jerry Pearce De-Go-La R.C. & D. Greg Carter CPL Steve Robinson Vinson & Elkins Bill Norris NRS Engrs Patrick Brzozowski
X LNRA

James Dodson NRA -Coastal Bend Div Steve Musich TNRCC Jack C Nelson LNRA Frank Samuel Jr X Wharton County X = Unable to confidently decipher
name
Questions & Responses fromSecond Stakeholder Advisory Forum
Central Gulf Coast GAMheld
August 6, 2001Harry Hafernick Center, Lake Texana
Introduction
The second Stakeholder Advisory Forum (SAF) for the Central Gulf Coast GroundwaterAvailability Model (GAM) was held on August 6th at the Harry Hafernick Center onLake Texana near Edna. The presentation included a review of the GAM Project Teamand GAM Objectives and Expectations, and a presentation of the Conceptual Model ofGroundwater Flow in the Central Gulf Coast Aquifer. The presentation material is postedat the TWDB GAM website at: http://www.twdb.state.tx.us/gam/glfc_c/SAF2_GC-c.pdf
Meeting Questions & Responses: (not necessarily listed in the order in which they wereasked or discussed)
1. Because the area where the meeting is being held is near the edge of the modelregion, will it be addressed? What is northernmost county included?
Response: Because of the model overlap that is defined as a requirement by the TWDB,the Edna region will be included in both the Central Gulf Coast GAM and the NorthernGulf Coast GAM (USGS). The Central Gulf Coast GAM extends east to the western partof Austin, Fort Bend, and Brazoria County. The Northern Gulf Coast GAM extends westto include most of Lavaca and Jackson Counties and a small part of Calhoun County.While the local area (Edna) is located near the western boundary of the Northern GulfCoast GAM, it is a large distance from the eastern model boundary of the Central GulfCoast GAM.
2. What are examples of field data that are used at the conceptual model stage of theproject?
Response: Examples of field data that are evaluated in developing the conceptual modelinclude: geologic logs, water levels, aquifer tests, stream gage levels, precipitation,temperature, evaporation, historical pumpage, water-quality parameters, etc.
3. What version of MODFLOW will be used?
Response: The TWDB has prescribed that MODFLOW-96 (Harbaugh and McDonald,1996, USGS Open-File Report 96-485) must be used for all GAMs.

2
4. The geology in the model region is a complex alluvial system that is not consistentthroughout the study area. The problem is that it does not represent well as layers.
Response: Yes we are aware of this fact and realize that there is uncertainty insubdividing it into model layers. The complex depositional environment (different riverstages, fluvial deltas, etc.) contributes to this complexity and the difficulty in representingit in model layers.
5. Are the Baker (1979) and Carr et al. (1985) reports available?
Response: A listing of all TWDB reports is located at the TWDB website at:http://www.twdb.state.tx.us/publications/publications.htm.Baker (1979, TWDB Report 236) is available at the TWDB website at:http://www.twdb.state.tx.us/publications/reports/GroundWaterReports/GWReports/GWreports.htm#236. Note that Figure 1 is not included in this online version. Copies of thesereports are available for a fee through TWDB’s TNRIS office athttp://www.tnris.state.tx.us/ordering.htm or 512-463-8337.
6. How many cross sections are included in Baker?
Response: There are 12 cross sections for the entire Gulf Coast in Baker (1979). Withinour model region there are five cross sections perpendicular to the Gulf coast and onecross section parallel to the coast.
7. At any location, the Evangeline may consist of 5 or 6 sand units interbedded with claylenses. How will this be modeled?
Response: A regional scale model is being developed with properties input on a 1-mile by1-mile grid scale areally and one layer vertically for the Evangeline. This modelingscale does not allow simulation of these individual sand and clay units within theEvangeline. Because the sand and clay units are not considered continuous over verylarge distances, they are lumped together to represent one aquifer unit consistent with thehydrostratigraphic interpretations of Baker (1979) and Carr et al. (1985). This is amodel limitation. Modeling regionally at a smaller scale vertically is impracticalbecause the necessary data are not available.
8. What does the Evangeline predevelopment water-level map show?
Response: This map is intended to show the distribution of hydraulic head or water-levelelevation in the Evangeline Aquifer prior to development by pumping. The water-levelelevation is calculated as the elevation of the top of the well minus the depth to watermeasured from the top of the well. Flow directions in the aquifer can be determinedbased on differences in water-level elevation in different wells. Water-level data from theearly 1900s were used where possible in developing this map.
9. Did we look at Taylor for predevelopment data?
3
Response: Yes. (Full reference is: Taylor, T.U., 1907. Underground Waters of CoastalPlain of Texas. USGS Water-Supply and Irrigation Paper No. 190.)
10. What is the source of data and why are they sparse in areas? Are you using TWDBwell information? General discussion of TWDB database.
Response: The principal source of well data is the TWDB website. We need additionalinformation in areas of data gaps. [Please contact either Waterstone or TWDB if you areaware of measurements not currently listed in the TNRCC or TWDB database, especiallyearly measurements.] Some wells may be plugged and no longer visible from surface.Some wells do not have proper locations. Advances in technology (GPS units) andmethodologies of historically locating wells spatially (using topographic maps) werediscussed. Also screen intervals, well depths and how they may change depending ondriller and the driller’s report were discussed.
11. Will some data be ignored or eliminated?
Response: We may if the data are so uncertain that they cannot be properly assigned.
12. Have you done a frequency analysis on hydraulic property data? This should beincluded in final report.
Response: Various types of statistical analyses will be performed when the aquiferproperty database is completed and documented. These analyses will be documented inthe final report.
13. What are K and QC?
Response: K refers to hydraulic conductivity, which is a measure of the ability of thegeologic unit to transmit water. QC is quality control.
14. Have you looked at oil field logs?
Response: Open discussion. The cost to acquire data from oil companies is not availablein the project budget. A quote of $600/mile was received from a seismic broker. Ifstakeholders can assist in this process, it would be appreciated. It is believed thathydrostratigraphic interpretations included in Baker (1979), Carr et al. (1985), andvarious reports from the USGS Regional Aquifer Systems (RASA) investigations haveutilized some oil field logs in their research.
15. Have you looked at uranium mines? A stakeholder thought they were required toconduct geophysical surveys for TNRCC.
Response: [Steve Musick – TNRCC] stated they have some electric logs and pump testinformation in their files [not digital and does not cover a large area, mostly locatedaround Evangeline outcrop in western portion of study area].
4
16. How are we going to use physical properties (e.g., sand percentages)?
Response: We will attempt to correlate K and sand percentage to assist in mapping thedistribution of K during model calibration. We will try to look at directional K propertiesrelative to depositional environment.
17. Open discussion of model scale. GWCDs appear to want a “micro” answer andmodel is more “macro” in scale. The model may not be able to answer all questions orconcerns.
Response: The model can answer some questions but one needs to be aware of themodel’s limitations. This model will include averaging of properties at a 1-mile by 1-mile scale. We need to be aware of the spatial limitations. The model will not be able toanswer if a neighbor’s well will impact someone. The model may be on a larger scalethan required to address some questions. An option is to “telescope” the model and putin finer detail at a later date (beyond scope of current GAM project).
18. Open discussion of problems with well completions. Some wells are screened inwrong intervals or are poorly developed. Specific capacity may increase substantiallyafter well-development activities.
19. Will the interbed storage package in MODFLOW be used? Is the scope for NorthernGulf Coast GAM and Central Gulf Coast GAMs the same except for use of the interbedstorage package? Why are model areas not using same options and how it will impact theoverlapping area?
Open discussion of using interbed storage package: We discussed that the subsidencepackage was not completed when the scope for the Central Gulf Coast GAM was defined.According to a Harris-Galveston Subsidence District representative, the packageappears to have correctly forecasted subsidence in the Houston area. It is important tohave data to correlate/calibrate the results against. Subsidence has been studied in theHouston area and a useful database collected over a long time period has beendeveloped. Very limited subsidence data is available within the Central Gulf Coast GAMregion as compared with the Houston region. We do not know the importance ofsubsidence on the Central Gulf Coast model region. We will include scoping orapproximate calculations on the magnitude of the impact of subsidence on water budgets.All models are required to calibrate within a particular range. Both models are using thesame geologic structure in the overlap area and are using publicly available data fordeveloping model inputs. Therefore both models should provide somewhat similarresults, with the exception of the use of the interbed storage package. The Northern GulfCoast model should include most of the key areas experiencing subsidence (it extendswest to include most of Lavaca and Jackson Counties and a small part of CalhounCounty).
20. What is the TWDB’s commitment to the groundwater districts?
5
Response: The TWDB is tasked with completing models of the major aquifers in the nextcouple of years. The TWDB has been tasked to model the minor aquifers but has notreceived the funds to do so. Waterstone will provide a training session to thestakeholders at the end of the Central Gulf Coast modeling project so that stakeholderscan use the model themselves. The TWDB will assist the GWCDs as time, staff, andfunds permit. In the meantime, it is important for the districts to get familiar with theirresources and where additional research and/or data are needed. Modeling efforts [andgroundwater management] can only be improved with better data.
21. Can we identify type of data and where needed, and contact names for persons whohave data available?
Response: The types of data that are being compiled and evaluated for the model havebeen outlined in the presentation including key data sources. (Note: the presentation isprovided on the TWDB website). If anyone has data that they feel would supplement thepresented data, they are welcomed to provide it. Data for model areas that currentlyshow sparse data would be useful. Examples of data that are needed includepredevelopment water levels. Contact persons include Cindy Ridgeway at the TWDB(512-936-2386) and Patrick Williamson at Waterstone (303-444-1000).