Embed Size (px)
Citation preview
George Laue
PLAN 301
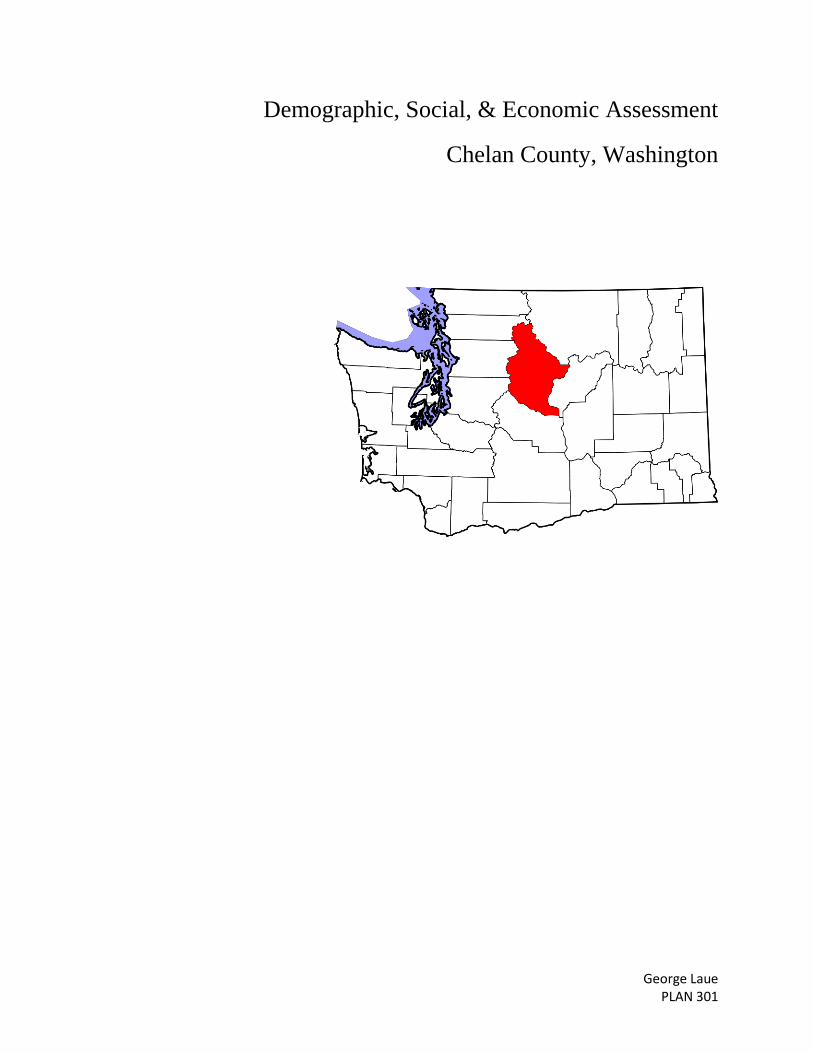
Demographic, Social, & Economic Assessment
Chelan County, Washington
i
Table of Contents
1.0 Introduction
1.1 Background & Purpose
1.2 Chelan County Overview
2.0 Demographic Assessment
2.1 Total County Population
2.2 Population by Race and Ethnicity
2.3 Population Pyramid
2.4 Population Projection: Regression Techniques
3.0 Social Assessment
3.1 Housing Tenure by Race and Ethnicity
3.2 Family and Non-Family Housing Units
3.3 Educational Attainment
3.4 Vehicles Available per Occupied Housing Unit
3.5 Method of Commute to Work
4.0 Economic Assessment
4.1 Employment by industry
4.2 County Income
4.3 NAICS Codes
4.4 Location Quotients
5.0 County Economic Analysis write-up

ii
Table of Tables
Table 1 ………………………………………………………………………..………..2
Table 2 ………………………………………………………………………………….2
Table 3 …………………………………………………………………………….……6
Table 4 ………………………………………………………………………..………..8
Table 5 ………………………………………………………………………..………11
Table 6 ………………………………………………………………………….…….13
Table 7 ……………………………………………………………………….……….15
Table 8 …………………………………………………………………………..……17
Table 9 ………………………………………………………………………………..18
Table 10 ……………………………………………………………………….……..20
Table 11 ……………………………………………………………………..……….21
Table 12 …………………………………………………………………..………….23
Table 13 ………………………………………………………………………….…..23
Table 14 ………………………………………………………………………………25
Table 15 ………………………………………………………………………..…….27
Table 16 ………………………………………………………………………..…….28
iii
Table of Figures
Figure 1 …………………………………………………………………………………3
Figure 2 ………………………………………………………………………..…….…4
Figure 3 …………………………………………………………………………………5
Figure 4 …………………………………………………………………………………7
Figure 5 ..……………………………………………………………………………….9
Figure 6 ………………………………………………………………………..……….12
Figure 7 ………………………………………………………………………..………12
Figure 8 ………………………………………………………………………………..14
Figure 9 ………………………………………………………………………….……14
Figure 10 ……………………………………………………………………………..15
Figure 11 ………………………………………………………………………….….16
Figure 12 ……………………………………………………………………………..17
Figure 13 ……………………………………………………………………………..19
Figure 14 ……………………………………………………………………………..21
Figure 15 ……………………………………………………………………………..22
Figure 16 ………………………………………………………………….…..……..26
1
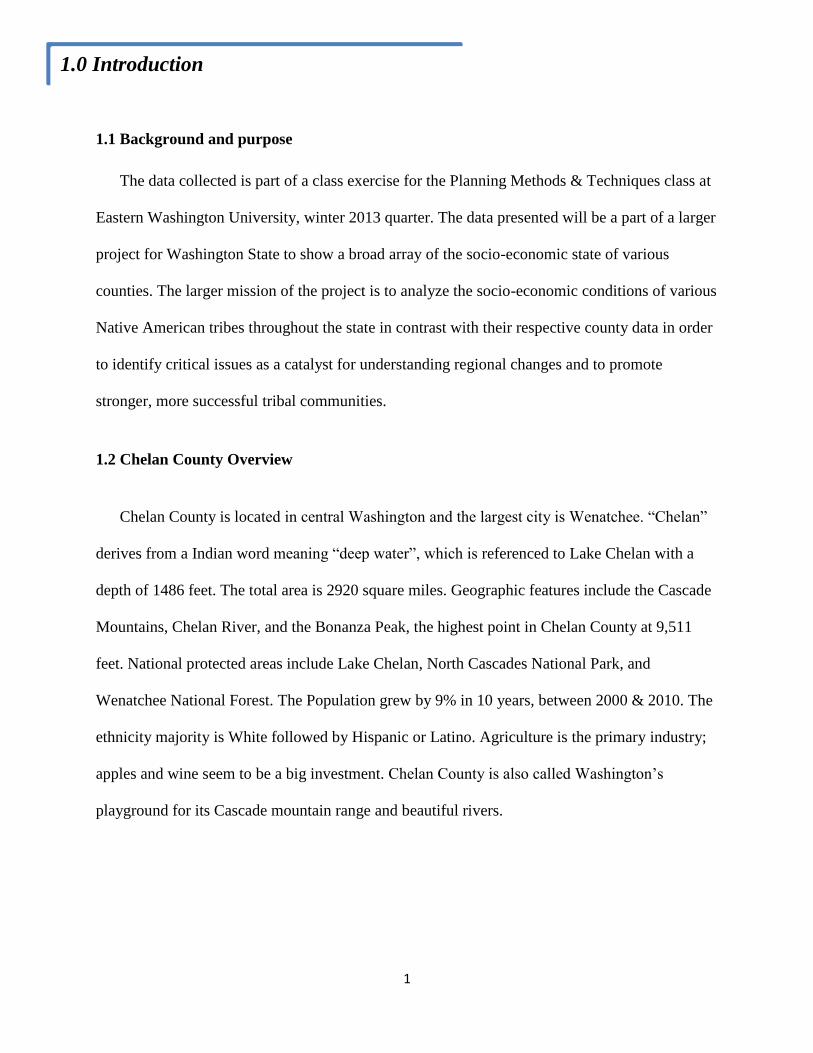
1.1 Background and purpose
The data collected is part of a class exercise for the Planning Methods & Techniques class at
Eastern Washington University, winter 2013 quarter. The data presented will be a part of a larger
project for Washington State to show a broad array of the socio-economic state of various
counties. The larger mission of the project is to analyze the socio-economic conditions of various
Native American tribes throughout the state in contrast with their respective county data in order
to identify critical issues as a catalyst for understanding regional changes and to promote
stronger, more successful tribal communities.
1.2 Chelan County Overview
Chelan County is located in central Washington and the largest city is Wenatchee. “Chelan”
derives from a Indian word meaning “deep water”, which is referenced to Lake Chelan with a
depth of 1486 feet. The total area is 2920 square miles. Geographic features include the Cascade
Mountains, Chelan River, and the Bonanza Peak, the highest point in Chelan County at 9,511
feet. National protected areas include Lake Chelan, North Cascades National Park, and
Wenatchee National Forest. The Population grew by 9% in 10 years, between 2000 & 2010. The
ethnicity majority is White followed by Hispanic or Latino. Agriculture is the primary industry;
apples and wine seem to be a big investment. Chelan County is also called Washington’s
playground for its Cascade mountain range and beautiful rivers.
1.0 Introduction
2
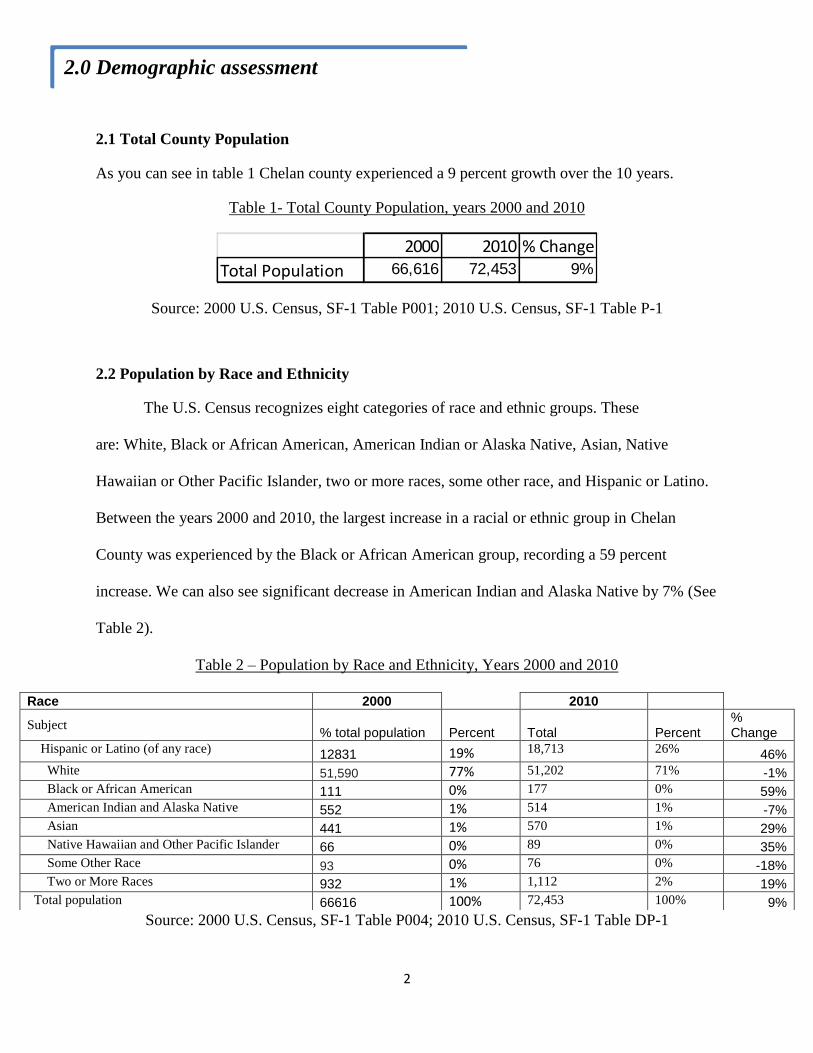
2.1 Total County Population
As you can see in table 1 Chelan county experienced a 9 percent growth over the 10 years.
Table 1- Total County Population, years 2000 and 2010
2000 2010 % Change
Total Population 66,616 72,453 9%
Source: 2000 U.S. Census, SF-1 Table P001; 2010 U.S. Census, SF-1 Table P-1
2.2 Population by Race and Ethnicity
The U.S. Census recognizes eight categories of race and ethnic groups. These
are: White, Black or African American, American Indian or Alaska Native, Asian, Native
Hawaiian or Other Pacific Islander, two or more races, some other race, and Hispanic or Latino.
Between the years 2000 and 2010, the largest increase in a racial or ethnic group in Chelan
County was experienced by the Black or African American group, recording a 59 percent
increase. We can also see significant decrease in American Indian and Alaska Native by 7% (See
Table 2).
Table 2 – Population by Race and Ethnicity, Years 2000 and 2010
Source: 2000 U.S. Census, SF-1 Table P004; 2010 U.S. Census, SF-1 Table DP-1
Race 2000
2010
Subject % total population Percent Total Percent
% Change
Hispanic or Latino (of any race) 12831 19% 18,713 26% 46%
White 51,590 77% 51,202 71% -1%
Black or African American 111 0% 177 0% 59%
American Indian and Alaska Native 552 1% 514 1% -7%
Asian 441 1% 570 1% 29%
Native Hawaiian and Other Pacific Islander 66 0% 89 0% 35%
Some Other Race 93 0% 76 0% -18%
Two or More Races 932 1% 1,112 2% 19%
Total population 66616 100% 72,453 100% 9%
2.0 Demographic assessment

3
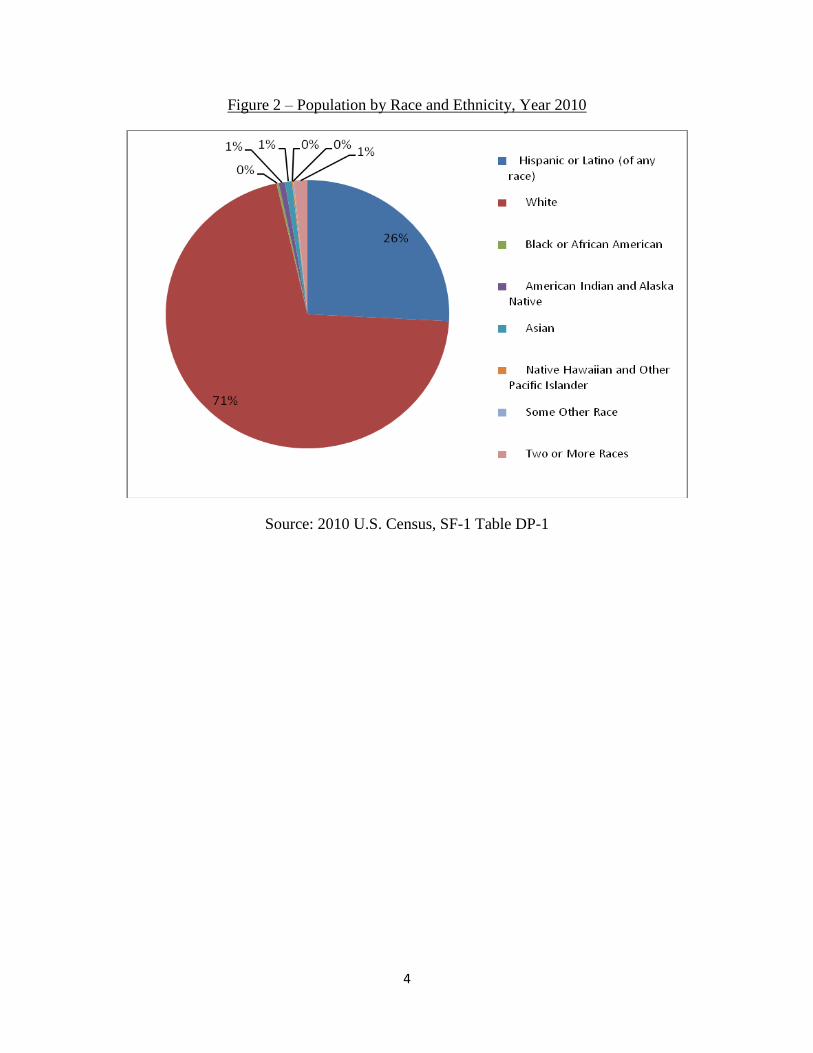
The majority of Chelan County’s population is comprised of two groups, Whites and
Hispanics or Latinos. In (Figure 1) the population race distribution as you can see in the pie chart
below is a majority of white and Hispanic or Latino then Native Americans next. This may be
because Chelan County is in the north central area of Washington where there are no big cities
for an intermixture of races rather a more agriculture based area. However, because there is a
small group of other race than white it is vital to hear their voices during public meetings. Then
As you can see in (Figure 2) the Hispanic or Latino population has increased by almost 10%. But
we see a decrease in the American Indian and Alaska Native population.
Figure 1 – Population by Race and Ethnicity, Year 2000
Source: 2000 U.S. Census, SF-1 Table P004
4
Figure 2 – Population by Race and Ethnicity, Year 2010
Source: 2010 U.S. Census, SF-1 Table DP-1
5
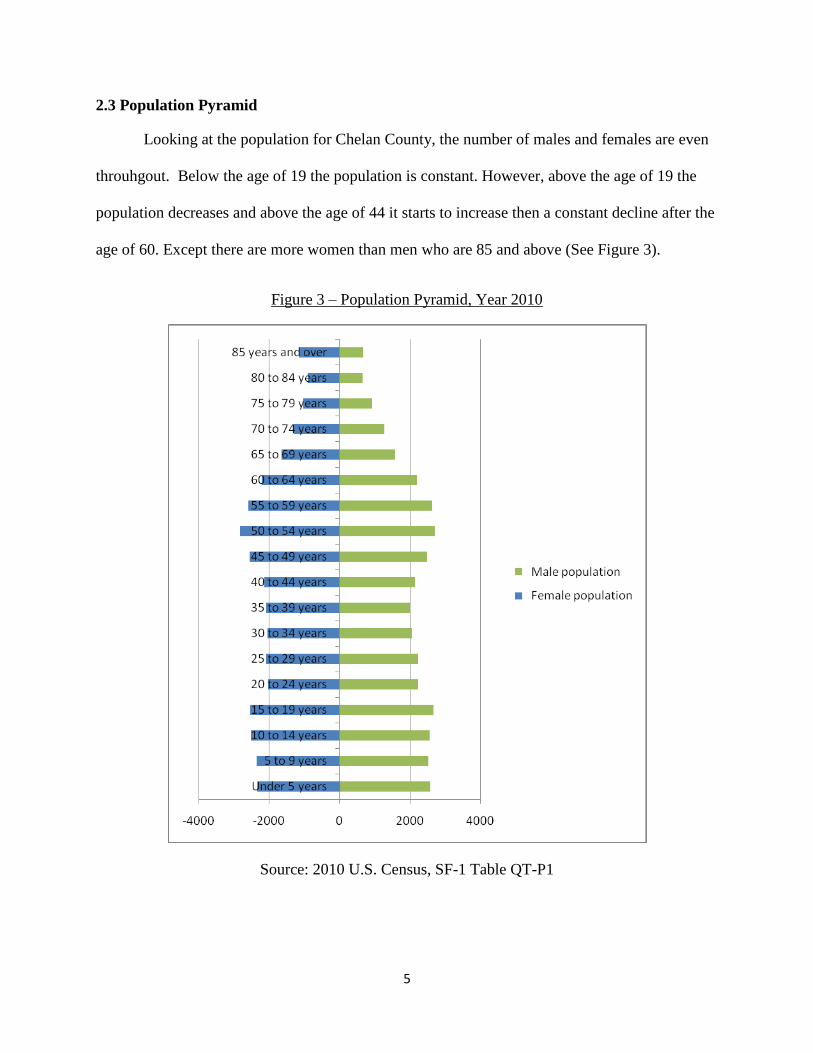
2.3 Population Pyramid
Looking at the population for Chelan County, the number of males and females are even
throuhgout. Below the age of 19 the population is constant. However, above the age of 19 the
population decreases and above the age of 44 it starts to increase then a constant decline after the
age of 60. Except there are more women than men who are 85 and above (See Figure 3).
Figure 3 – Population Pyramid, Year 2010
Source: 2010 U.S. Census, SF-1 Table QT-P1
6
2.4 Population Projection: Regression Techniques
In this section I will talk about the methods of population forecasting. The regression
technique uses the past population data to find the real change and rate of change between two
given decades and is then added to the existing population total to project the future population
10 years out. For the purpose of this report, population data from the years 1990, 2000 and 2010
were used to project the population of Chelan County for the years 2020 and 2030.
There are four regression projection techniques. The first is real difference between the
years 2000-2010. The second is the rate of change between 2000-2010; this is the 10 year rate of
change. The third is the average real change between 1990-2000 and 2000-2010. Then finally the
fourth technique is the average rate of change between 1990-2000 and 2000-2010 (See Table 3).
The use of these four techniques provides a range of possible population totals that
can be used to speculate how much the population will increase based on its historical growth.
Table 3 – Population Projections for 2020 and 2030, Regression Techniques
2010 2020 2030
10 year Real Change 72453 78,290 84,127
10 year rate of
Change 72453
78,974 86081
20 year Real Change 72453 82555 92657
20 year Rate of
Change 72453 85495 100884
Source: U.S. Census, 1990 SF-1 Table P001, 2000 SF-1 Table P001, 2010 SF-1 Table P-01
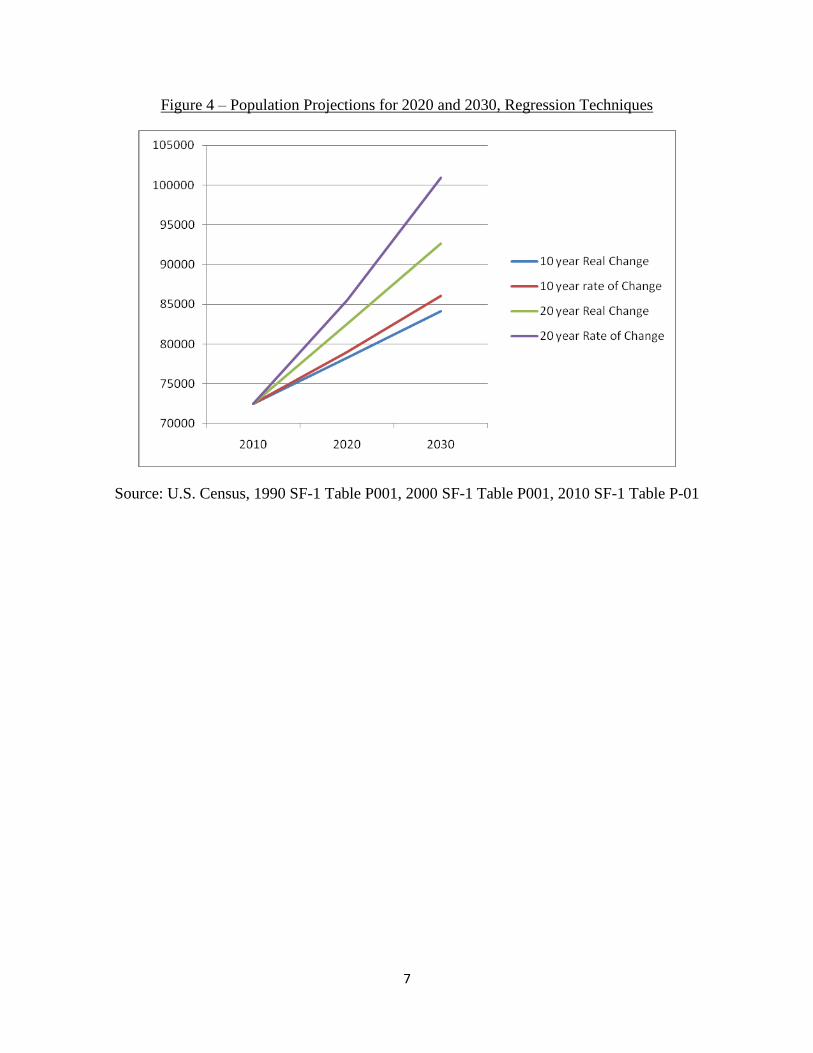
The rate of change projection tended to be higher than the real change projections (See Figure 4).
7
Figure 4 – Population Projections for 2020 and 2030, Regression Techniques
Source: U.S. Census, 1990 SF-1 Table P001, 2000 SF-1 Table P001, 2010 SF-1 Table P-01
8
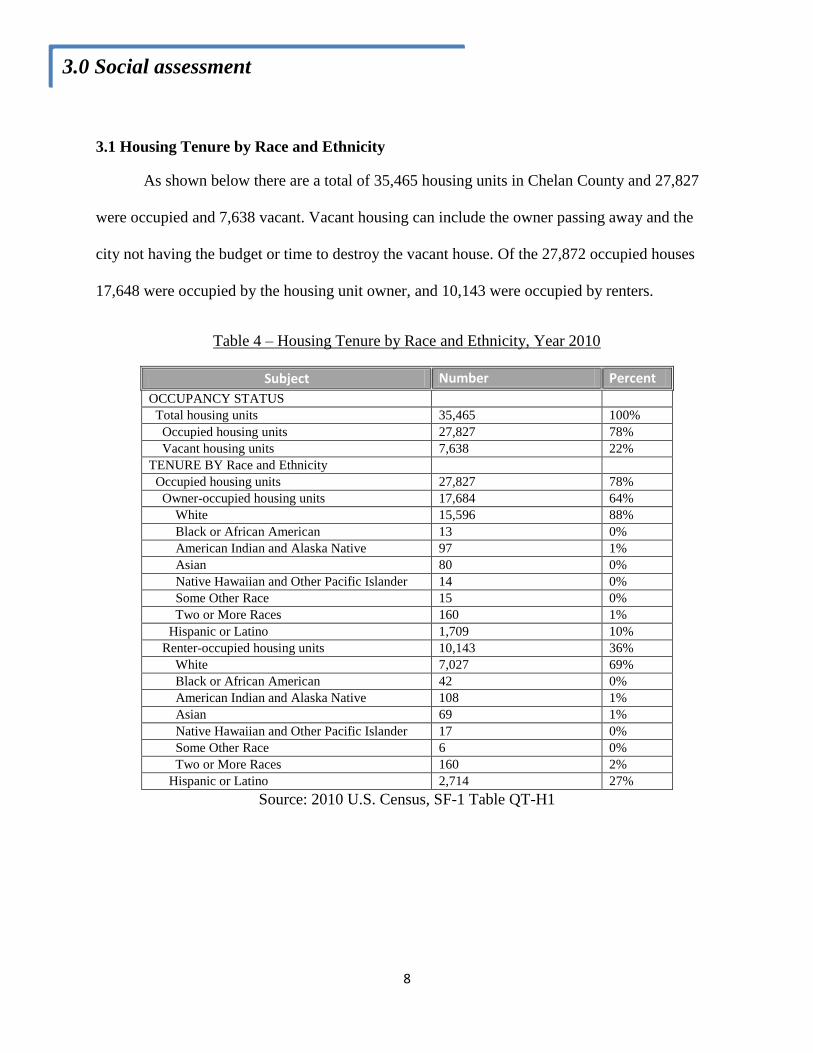
3.1 Housing Tenure by Race and Ethnicity
As shown below there are a total of 35,465 housing units in Chelan County and 27,827
were occupied and 7,638 vacant. Vacant housing can include the owner passing away and the
city not having the budget or time to destroy the vacant house. Of the 27,872 occupied houses
17,648 were occupied by the housing unit owner, and 10,143 were occupied by renters.
Table 4 – Housing Tenure by Race and Ethnicity, Year 2010
Subject Number Percent
OCCUPANCY STATUS
Total housing units 35,465 100%
Occupied housing units 27,827 78%
Vacant housing units 7,638 22%
TENURE BY Race and Ethnicity
Occupied housing units 27,827 78%
Owner-occupied housing units 17,684 64%
White 15,596 88%
Black or African American 13 0%
American Indian and Alaska Native 97 1%
Asian 80 0%
Native Hawaiian and Other Pacific Islander 14 0%
Some Other Race 15 0%
Two or More Races 160 1%
Hispanic or Latino 1,709 10%
Renter-occupied housing units 10,143 36%
White 7,027 69%
Black or African American 42 0%
American Indian and Alaska Native 108 1%
Asian 69 1%
Native Hawaiian and Other Pacific Islander 17 0%
Some Other Race 6 0%
Two or More Races 160 2%
Hispanic or Latino 2,714 27%
Source: 2010 U.S. Census, SF-1 Table QT-H1
3.0 Social assessment
9
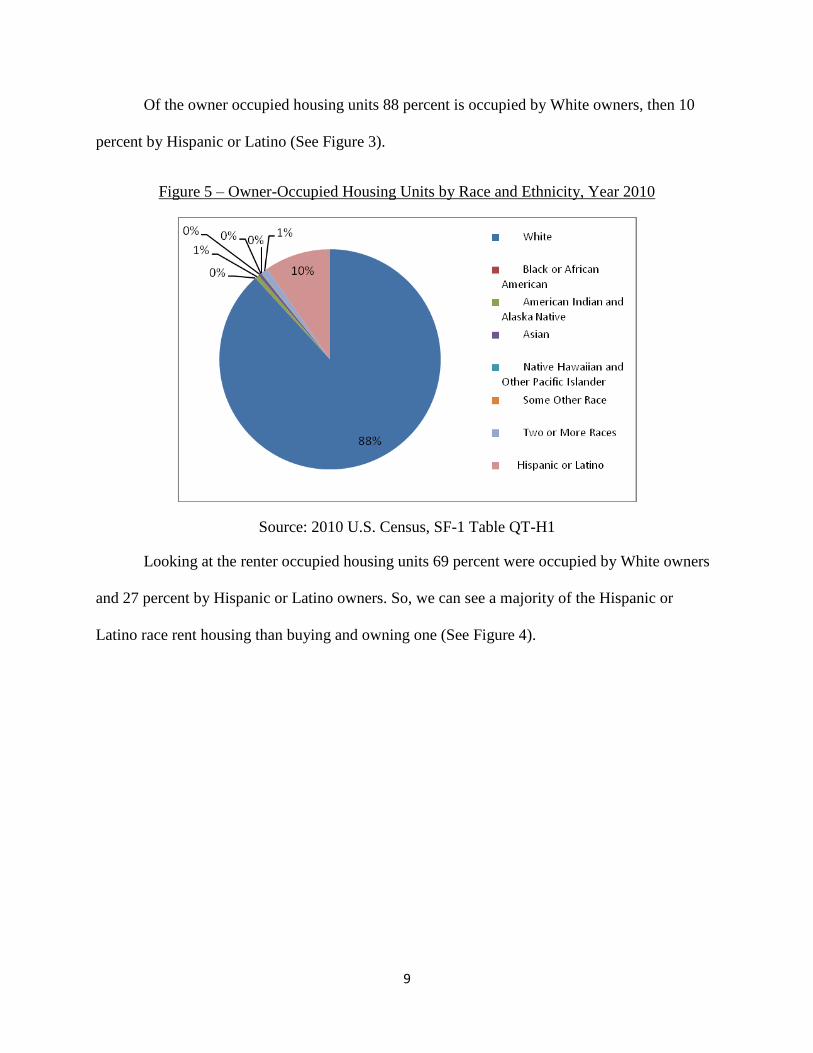
Of the owner occupied housing units 88 percent is occupied by White owners, then 10
percent by Hispanic or Latino (See Figure 3).
Figure 5 – Owner-Occupied Housing Units by Race and Ethnicity, Year 2010
Source: 2010 U.S. Census, SF-1 Table QT-H1
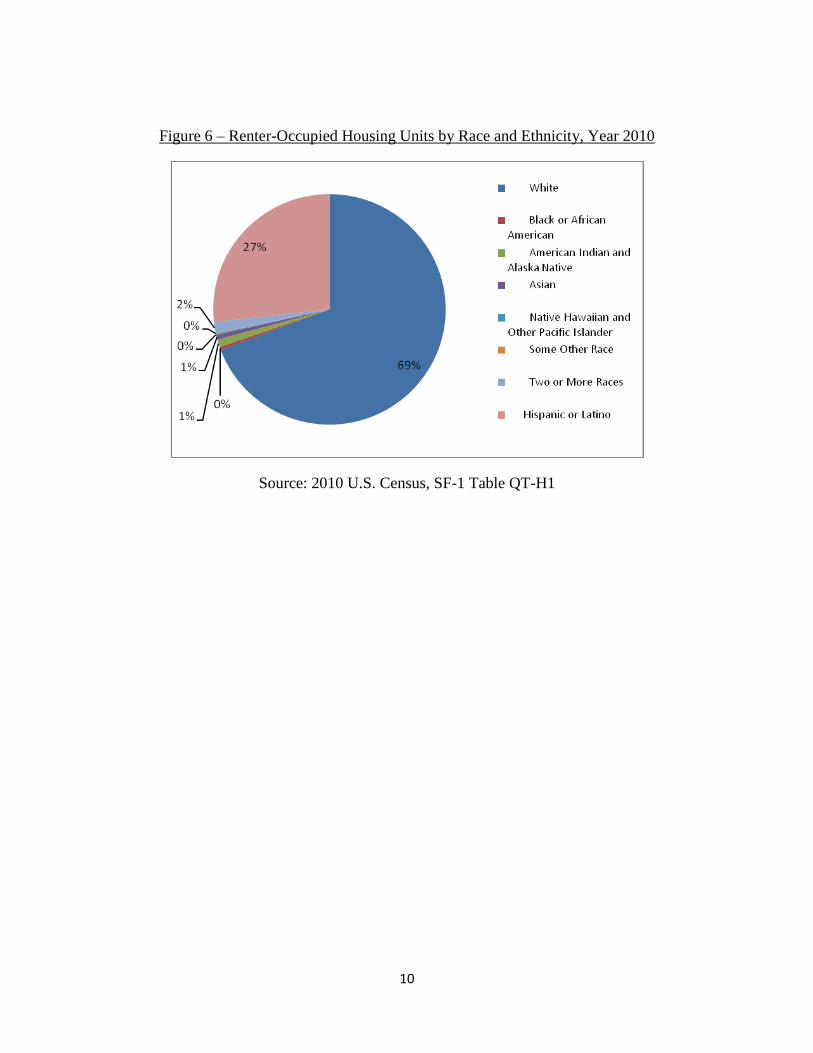
Looking at the renter occupied housing units 69 percent were occupied by White owners
and 27 percent by Hispanic or Latino owners. So, we can see a majority of the Hispanic or
Latino race rent housing than buying and owning one (See Figure 4).
10
Figure 6 – Renter-Occupied Housing Units by Race and Ethnicity, Year 2010
Source: 2010 U.S. Census, SF-1 Table QT-H1
11
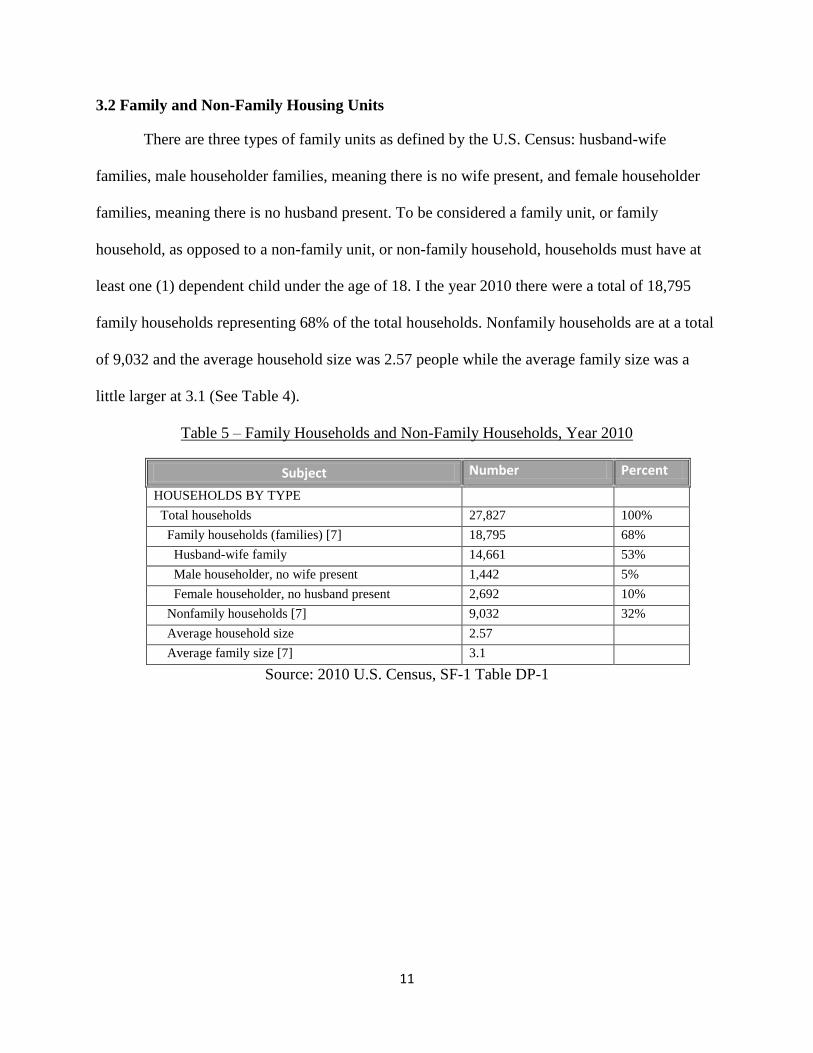
3.2 Family and Non-Family Housing Units
There are three types of family units as defined by the U.S. Census: husband-wife
families, male householder families, meaning there is no wife present, and female householder
families, meaning there is no husband present. To be considered a family unit, or family
household, as opposed to a non-family unit, or non-family household, households must have at
least one (1) dependent child under the age of 18. I the year 2010 there were a total of 18,795
family households representing 68% of the total households. Nonfamily households are at a total
of 9,032 and the average household size was 2.57 people while the average family size was a
little larger at 3.1 (See Table 4).
Table 5 – Family Households and Non-Family Households, Year 2010
Subject Number Percent
HOUSEHOLDS BY TYPE
Total households 27,827 100%
Family households (families) [7] 18,795 68%
Husband-wife family 14,661 53%
Male householder, no wife present 1,442 5%
Female householder, no husband present 2,692 10%
Nonfamily households [7] 9,032 32%
Average household size 2.57
Average family size [7] 3.1
Source: 2010 U.S. Census, SF-1 Table DP-1
12
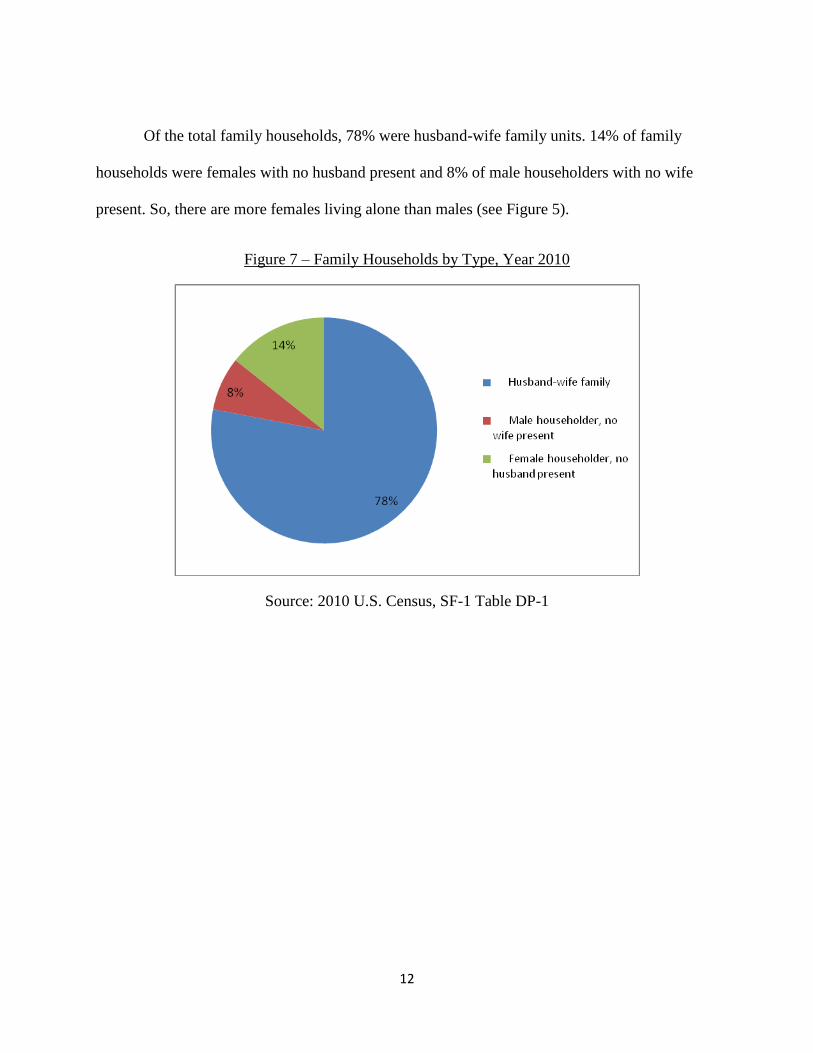
Of the total family households, 78% were husband-wife family units. 14% of family
households were females with no husband present and 8% of male householders with no wife
present. So, there are more females living alone than males (see Figure 5).
Figure 7 – Family Households by Type, Year 2010
Source: 2010 U.S. Census, SF-1 Table DP-1
13
3.3 Educational Attainment
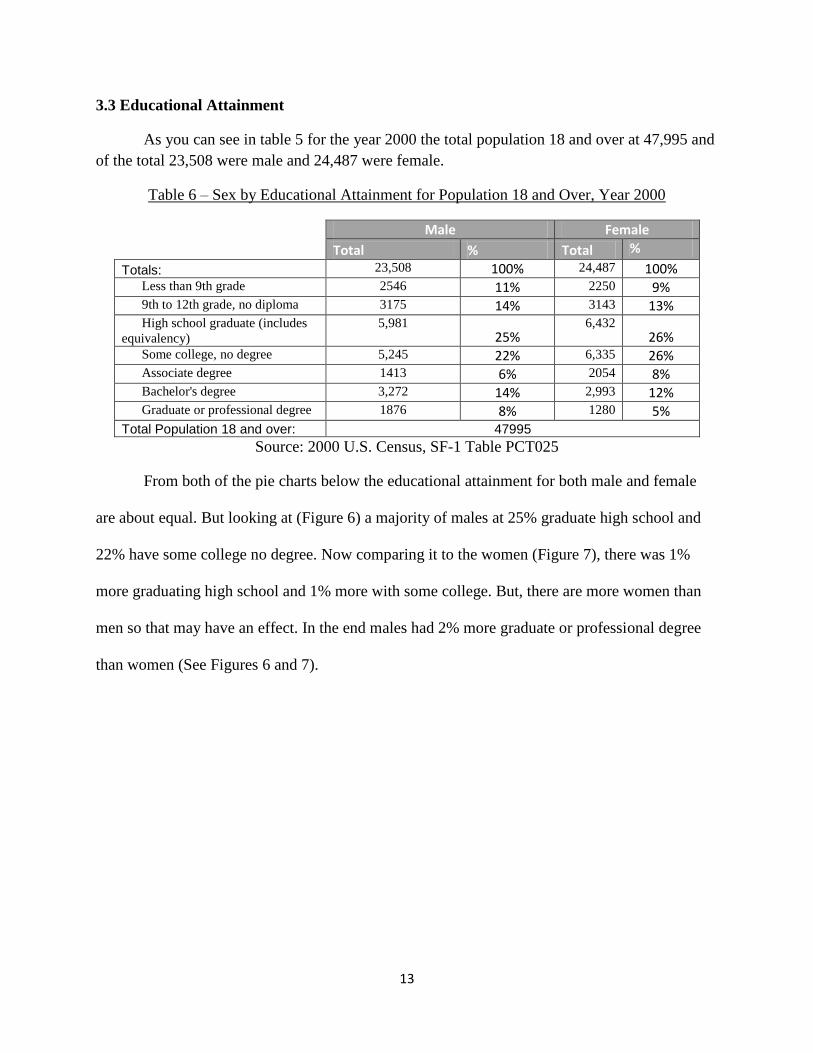
As you can see in table 5 for the year 2000 the total population 18 and over at 47,995 and
of the total 23,508 were male and 24,487 were female.
Table 6 – Sex by Educational Attainment for Population 18 and Over, Year 2000
Male Female
Total % Total %
Totals: 23,508 100% 24,487 100% Less than 9th grade 2546 11% 2250 9% 9th to 12th grade, no diploma 3175 14% 3143 13% High school graduate (includes
equivalency)
5,981 25%
6,432 26%
Some college, no degree 5,245 22% 6,335 26% Associate degree 1413 6% 2054 8% Bachelor's degree 3,272 14% 2,993 12% Graduate or professional degree 1876 8% 1280 5% Total Population 18 and over: 47995
Source: 2000 U.S. Census, SF-1 Table PCT025
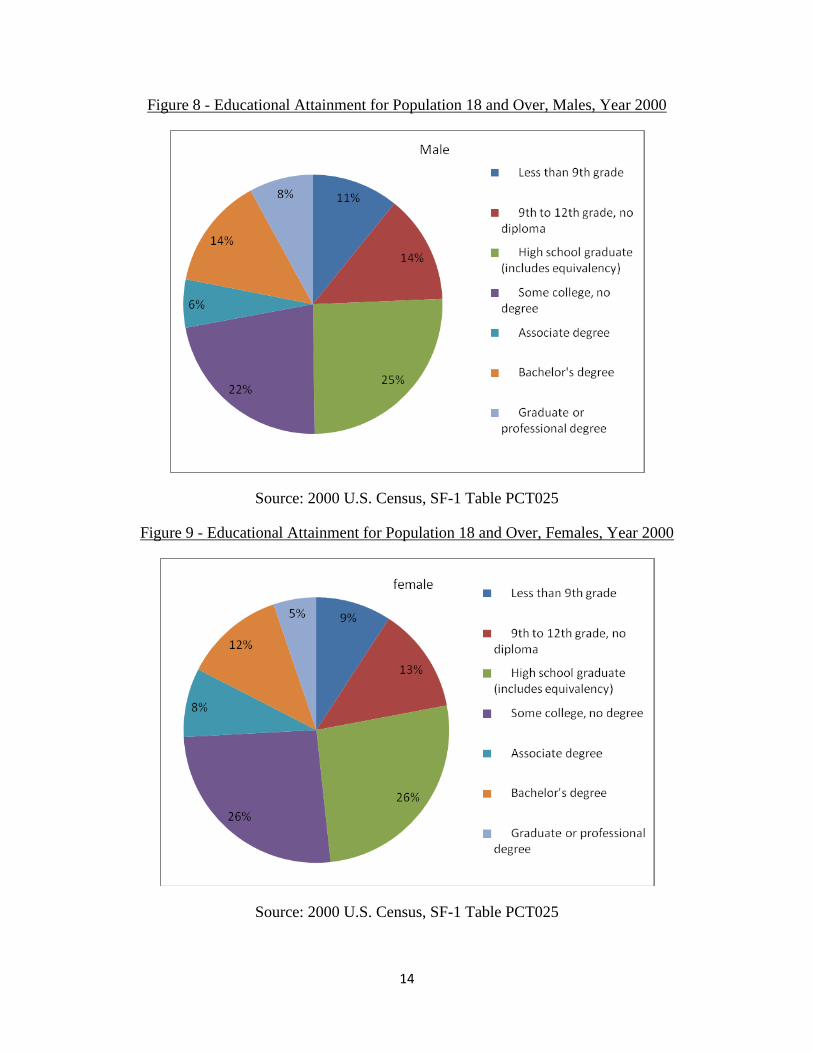
From both of the pie charts below the educational attainment for both male and female
are about equal. But looking at (Figure 6) a majority of males at 25% graduate high school and
22% have some college no degree. Now comparing it to the women (Figure 7), there was 1%
more graduating high school and 1% more with some college. But, there are more women than
men so that may have an effect. In the end males had 2% more graduate or professional degree
than women (See Figures 6 and 7).
14
Figure 8 - Educational Attainment for Population 18 and Over, Males, Year 2000
Source: 2000 U.S. Census, SF-1 Table PCT025
Figure 9 - Educational Attainment for Population 18 and Over, Females, Year 2000
Source: 2000 U.S. Census, SF-1 Table PCT025
15
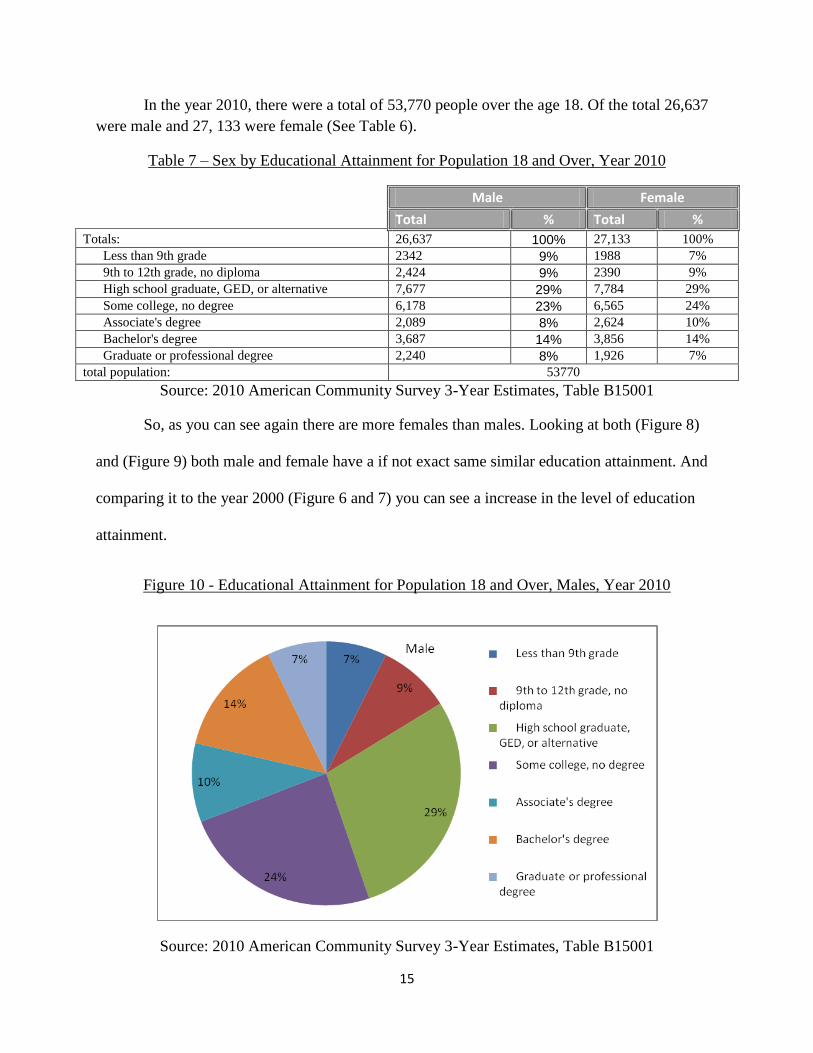
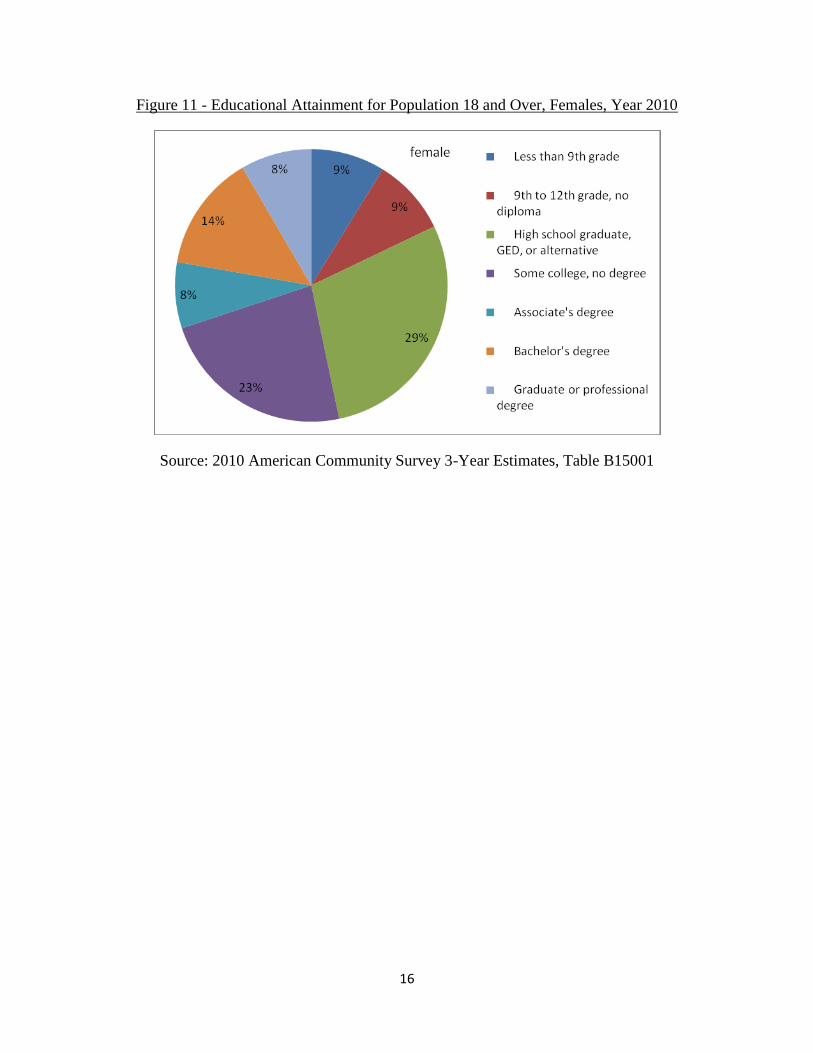
In the year 2010, there were a total of 53,770 people over the age 18. Of the total 26,637
were male and 27, 133 were female (See Table 6).
Table 7 – Sex by Educational Attainment for Population 18 and Over, Year 2010
Male Female
Total % Total %
Totals: 26,637 100% 27,133 100%
Less than 9th grade 2342 9% 1988 7%
9th to 12th grade, no diploma 2,424 9% 2390 9%
High school graduate, GED, or alternative 7,677 29% 7,784 29%
Some college, no degree 6,178 23% 6,565 24%
Associate's degree 2,089 8% 2,624 10%
Bachelor's degree 3,687 14% 3,856 14%
Graduate or professional degree 2,240 8% 1,926 7%
total population: 53770
Source: 2010 American Community Survey 3-Year Estimates, Table B15001
So, as you can see again there are more females than males. Looking at both (Figure 8)
and (Figure 9) both male and female have a if not exact same similar education attainment. And
comparing it to the year 2000 (Figure 6 and 7) you can see a increase in the level of education
attainment.
Figure 10 - Educational Attainment for Population 18 and Over, Males, Year 2010
Source: 2010 American Community Survey 3-Year Estimates, Table B15001
16
Figure 11 - Educational Attainment for Population 18 and Over, Females, Year 2010
Source: 2010 American Community Survey 3-Year Estimates, Table B15001
17
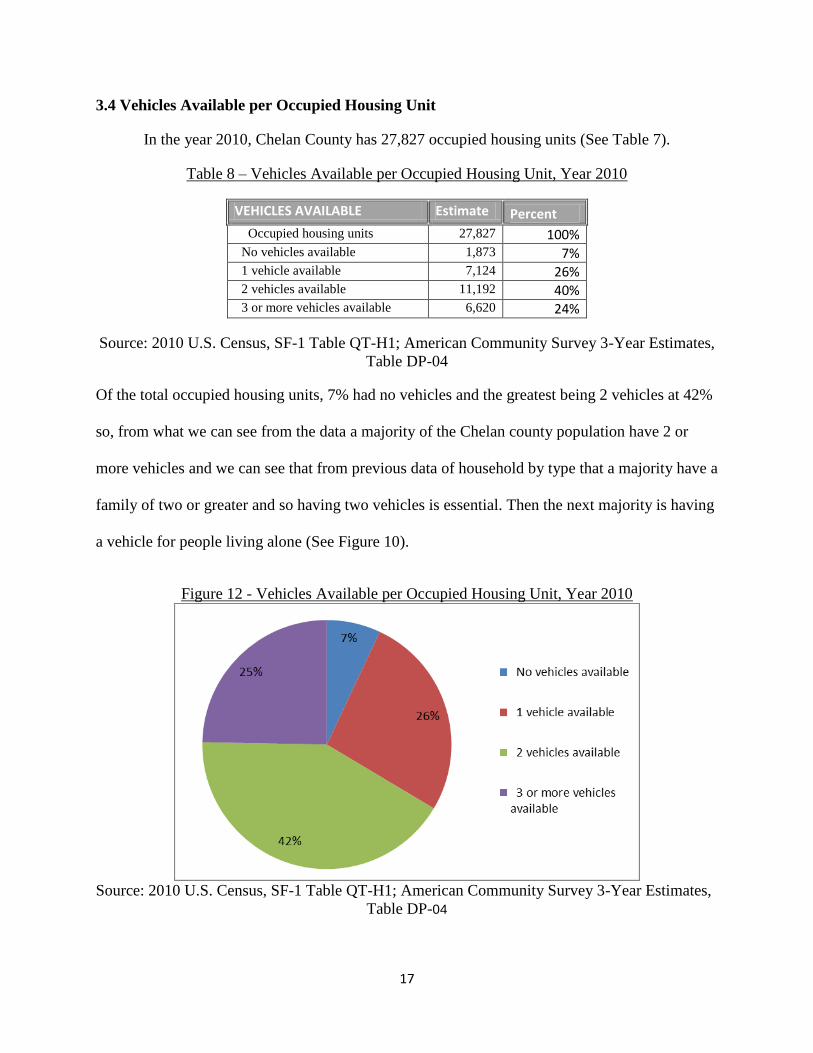
3.4 Vehicles Available per Occupied Housing Unit
In the year 2010, Chelan County has 27,827 occupied housing units (See Table 7).
Table 8 – Vehicles Available per Occupied Housing Unit, Year 2010
VEHICLES AVAILABLE Estimate Percent
Occupied housing units 27,827 100% No vehicles available 1,873 7% 1 vehicle available 7,124 26% 2 vehicles available 11,192 40% 3 or more vehicles available 6,620 24%
Source: 2010 U.S. Census, SF-1 Table QT-H1; American Community Survey 3-Year Estimates,
Table DP-04
Of the total occupied housing units, 7% had no vehicles and the greatest being 2 vehicles at 42%
so, from what we can see from the data a majority of the Chelan county population have 2 or
more vehicles and we can see that from previous data of household by type that a majority have a
family of two or greater and so having two vehicles is essential. Then the next majority is having
a vehicle for people living alone (See Figure 10).
Figure 12 - Vehicles Available per Occupied Housing Unit, Year 2010
Source: 2010 U.S. Census, SF-1 Table QT-H1; American Community Survey 3-Year Estimates,
Table DP-04
18
3.5 Method of Commute to Work
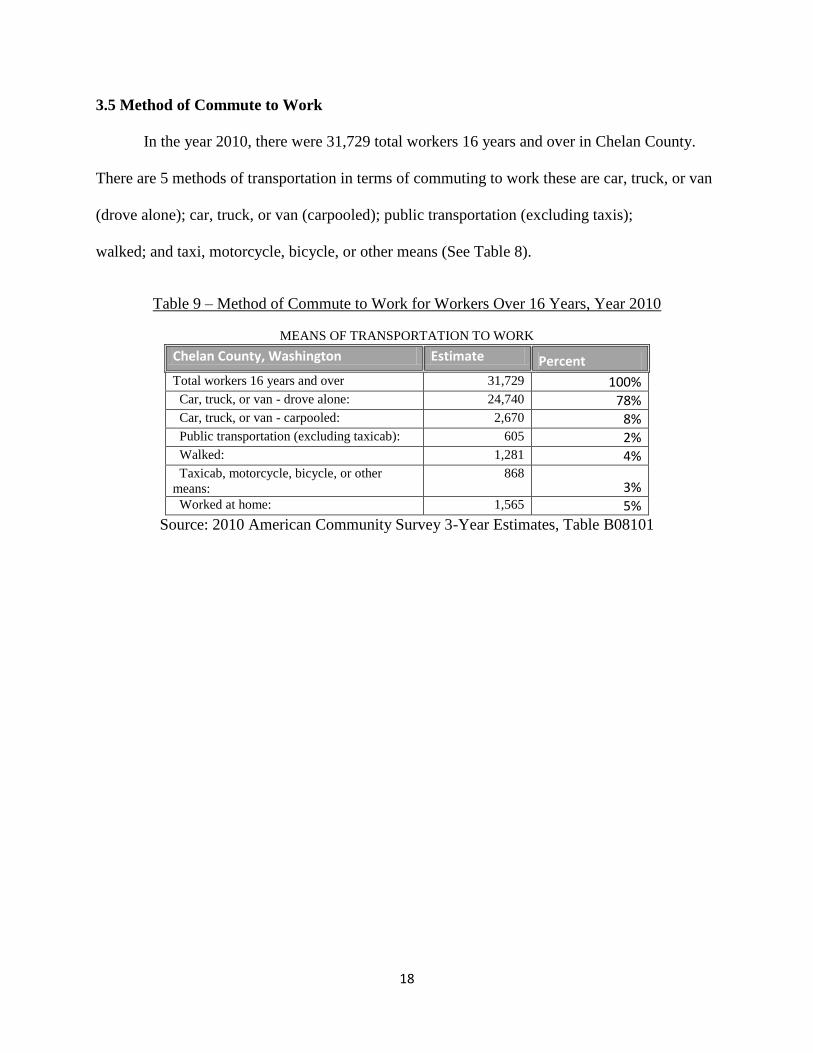
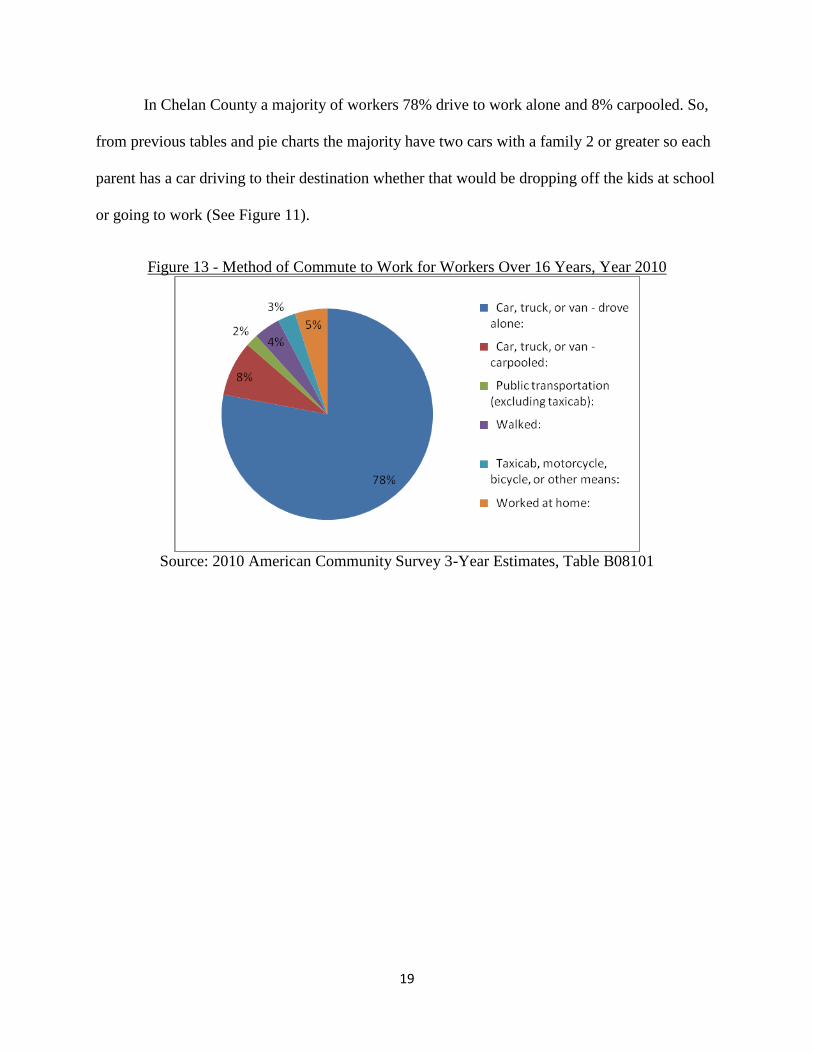
In the year 2010, there were 31,729 total workers 16 years and over in Chelan County.
There are 5 methods of transportation in terms of commuting to work these are car, truck, or van
(drove alone); car, truck, or van (carpooled); public transportation (excluding taxis);
walked; and taxi, motorcycle, bicycle, or other means (See Table 8).
Table 9 – Method of Commute to Work for Workers Over 16 Years, Year 2010
MEANS OF TRANSPORTATION TO WORK
Chelan County, Washington Estimate Percent
Total workers 16 years and over 31,729 100% Car, truck, or van - drove alone: 24,740 78% Car, truck, or van - carpooled: 2,670 8% Public transportation (excluding taxicab): 605 2% Walked: 1,281 4% Taxicab, motorcycle, bicycle, or other
means:
868 3%
Worked at home: 1,565 5%
Source: 2010 American Community Survey 3-Year Estimates, Table B08101
19
In Chelan County a majority of workers 78% drive to work alone and 8% carpooled. So,
from previous tables and pie charts the majority have two cars with a family 2 or greater so each
parent has a car driving to their destination whether that would be dropping off the kids at school
or going to work (See Figure 11).
Figure 13 - Method of Commute to Work for Workers Over 16 Years, Year 2010
Source: 2010 American Community Survey 3-Year Estimates, Table B08101
20
4.1 Employment by industry In Chelan County there were 28,507 people over the age of 16 employed in 2000 (See
Table 10).
Table 10 – Employment by Industry for Workers Over 16 Years, Year 2000
INDUSTRY Number Percent
Employed 28,507 100%
Agriculture, forestry, fishing and hunting, and mining 2,527 9%
Construction 1,963 7%
Manufacturing 1,879 7%
Wholesale trade 2,138 7%
Retail trade 3,046 11%
Transportation and warehousing, and utilities 1,786 6%
Information 520 2%
Finance, insurance, real estate, and rental and leasing 1,317 5%
Professional, scientific, management, administrative, and waste management
services
1,771
6%
Educational, health and social services 6,123 21%
Arts, entertainment, recreation, accommodation and food services 3,129 11%
Other services (except public administration) 1,313 5%
Public administration 995 3%
Source: 2000 U.S. Census, SF-3 Table DP-3
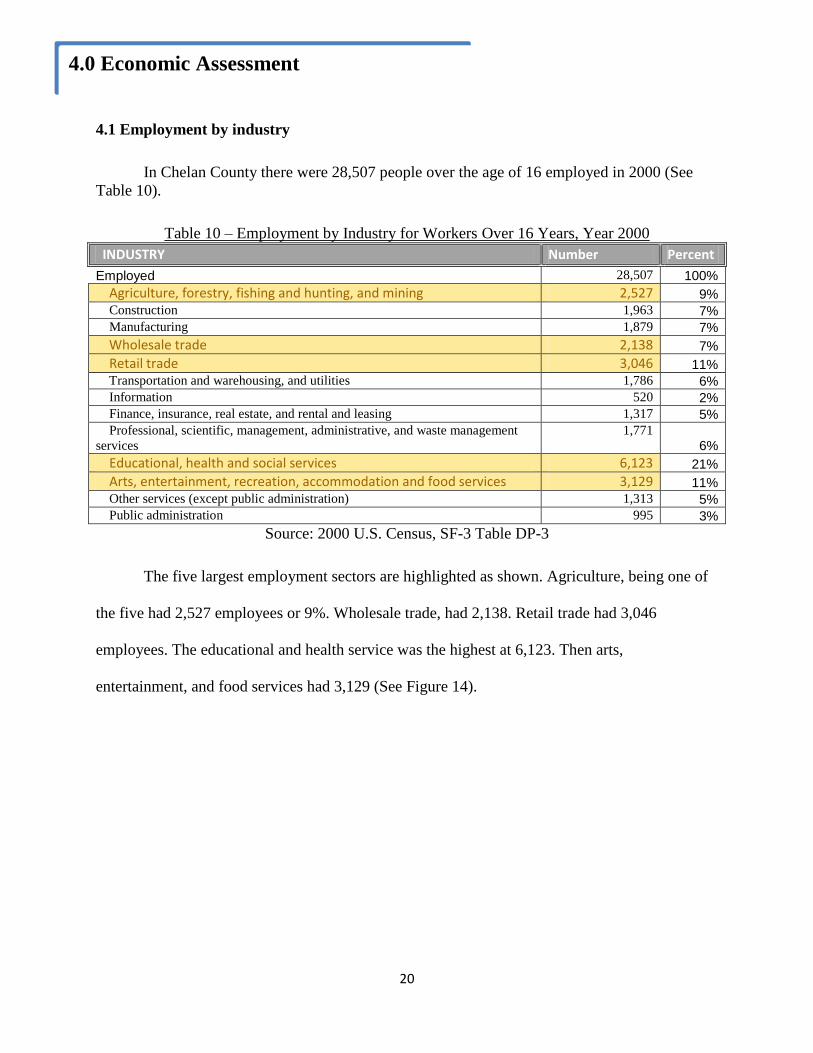
The five largest employment sectors are highlighted as shown. Agriculture, being one of
the five had 2,527 employees or 9%. Wholesale trade, had 2,138. Retail trade had 3,046
employees. The educational and health service was the highest at 6,123. Then arts,
entertainment, and food services had 3,129 (See Figure 14).
4.0 Economic Assessment
21
Figure 14 – Five Largest Employment Industries, Year 2000
Source: 2000 U.S. Census, SF-3 Table DP-3
In comparison, there were 32,096 people 16 and above who were employed in 2010 (See Table
11).
Table 11 – Employment by Industry for Workers Over 16 Years, Year 2010
INDUSTRY Estimate Percent
Civilian employed population 16 years and over 32,096 100%
Agriculture, forestry, fishing and hunting, and mining 3,118 10%
Construction 2,523 8%
Manufacturing 2,120 7%
Wholesale trade 1,536 5%
Retail trade 3,986 12%
Transportation and warehousing, and utilities 1,879 6%
Information 499 2%
Finance and insurance, and real estate and rental and leasing 1,354 4%
Professional, scientific, and management, and administrative and waste management
services
2,244 7%
Educational services, and health care and social assistance 7,045 22%
Arts, entertainment, and recreation, and accommodation and food services 3,196 10%
Other services, except public administration 1,219 4%
Public administration 1,377 4%
Source: 2010 American Community Survey 3-Year Estimates, Table DP-03
22
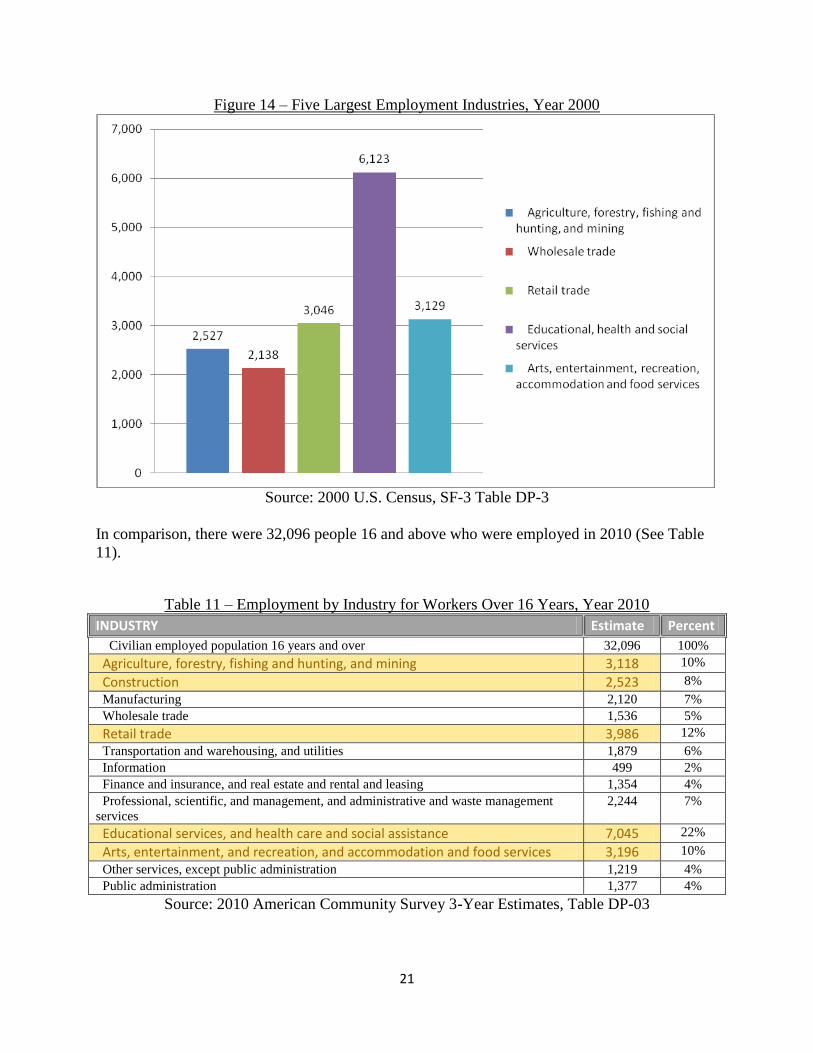
The top five industries in 2010 have one different emerging industry from the year 2000 and
that’s construction. Construction had 2,523 employees. Educational services it still the top
industry in Chelan County (See Figure 15).
Figure 15 – Five Largest Employment Industries, Year 2010
Source: 2010 American Community Survey 3-Year Estimates, Table DP-03
23
4.2 County Income
In the year 2000, the majority of employees over the age of 16, 4,730 people or 19
percent, were making between $50,000 and $74,999. Only 520 people or 2 percent make
$200,000 or more. The median household income was $37,316 (See Table 12).
Table 12 – County Income, Year 2000
Income Number Percent
Households 24,962 100%
Less than $10,000 2,234 9%
$10,000 to $14,999 1,885 8%
$15,000 to $24,999 4,038 16%
$25,000 to $34,999 3,580 14%
$35,000 to $49,999 4,120 17%
$50,000 to $74,999 4,730 19%
$75,000 to $99,999 2,027 8%
$100,000 to $149,999 1,486 6%
$150,000 to $199,999 342 1%
$200,000 or more 520 2%
Median household income (dollars) 37,316
Source: 2000 U.S. Census, SF-3 Table DP-3
In Comparison, the majority of employees over the age of 16, 5,481 people or 21 percent, were
making between $50,000 and $74,999 annually. Only 643 people which is 100 more people from
10 years ago are making $200,000 or more. The per capita county income in the year 2010 was
$24,378 (See Table 13).
Table 13 – County Income, Year 2010
Income Number Percent
Total households 26,676 100%
Less than $10,000 1,806 7%
$10,000 to $14,999 1,414 5%
$15,000 to $24,999 2,820 11%
$25,000 to $34,999 3,068 12%
$35,000 to $49,999 4,616 17%
$50,000 to $74,999 5,481 21%
$75,000 to $99,999 3,081 12%
$100,000 to $149,999 2,838 11%
$150,000 to $199,999 909 3%
$200,000 or more 643 2%
Median household income (dollars) 48,674
Mean household income (dollars) 62,691
Per capita income (dollars) 24,378
24
Source: 2010 American Community Survey 3-Year Estimates, Table DP-03
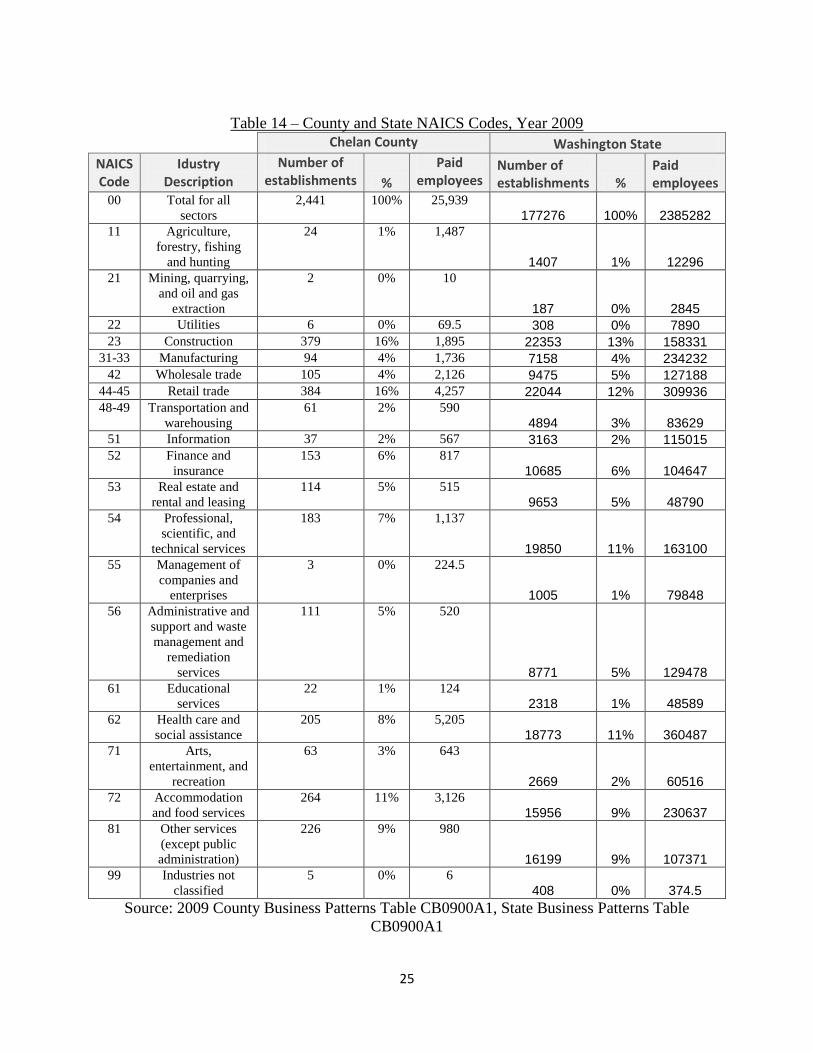
4.3 NAICS Code
The North American Industry Classification System (NAICS) is the standard used by U.S.
statistical agencies in classifying business establishments for the purpose of collecting,
analyzing, and publishing statistical data related to the national business economy. There are a
number of classification categories used in NAICS, Chelan County documented eighteen in the
year 2009 (See Table 14).
25
Table 14 – County and State NAICS Codes, Year 2009
Chelan County Washington State
NAICS Code
Idustry Description
Number of establishments %
Paid employees
Number of establishments %
Paid employees
00 Total for all
sectors
2,441 100% 25,939
177276 100% 2385282
11 Agriculture,
forestry, fishing
and hunting
24 1% 1,487
1407 1% 12296
21 Mining, quarrying,
and oil and gas
extraction
2 0% 10
187 0% 2845
22 Utilities 6 0% 69.5 308 0% 7890
23 Construction 379 16% 1,895 22353 13% 158331
31-33 Manufacturing 94 4% 1,736 7158 4% 234232
42 Wholesale trade 105 4% 2,126 9475 5% 127188
44-45 Retail trade 384 16% 4,257 22044 12% 309936
48-49 Transportation and
warehousing
61 2% 590
4894 3% 83629
51 Information 37 2% 567 3163 2% 115015
52 Finance and
insurance
153 6% 817
10685 6% 104647
53 Real estate and
rental and leasing
114 5% 515
9653 5% 48790
54 Professional,
scientific, and
technical services
183 7% 1,137
19850 11% 163100
55 Management of
companies and
enterprises
3 0% 224.5
1005 1% 79848
56 Administrative and
support and waste
management and
remediation
services
111 5% 520
8771 5% 129478
61 Educational
services
22 1% 124
2318 1% 48589
62 Health care and
social assistance
205 8% 5,205
18773 11% 360487
71 Arts,
entertainment, and
recreation
63 3% 643
2669 2% 60516
72 Accommodation
and food services
264 11% 3,126
15956 9% 230637
81 Other services
(except public
administration)
226 9% 980
16199 9% 107371
99 Industries not
classified
5 0% 6
408 0% 374.5
Source: 2009 County Business Patterns Table CB0900A1, State Business Patterns Table
CB0900A1
26
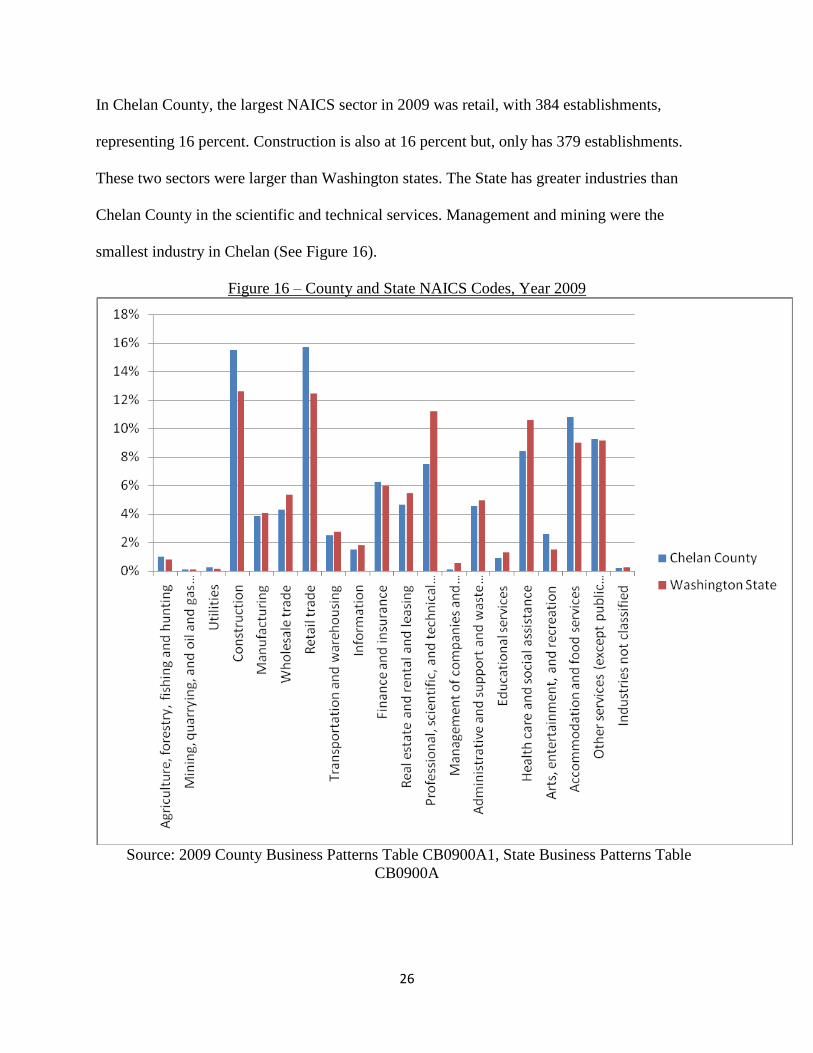
In Chelan County, the largest NAICS sector in 2009 was retail, with 384 establishments,
representing 16 percent. Construction is also at 16 percent but, only has 379 establishments.
These two sectors were larger than Washington states. The State has greater industries than
Chelan County in the scientific and technical services. Management and mining were the
smallest industry in Chelan (See Figure 16).
Figure 16 – County and State NAICS Codes, Year 2009
Source: 2009 County Business Patterns Table CB0900A1, State Business Patterns Table
CB0900A
27
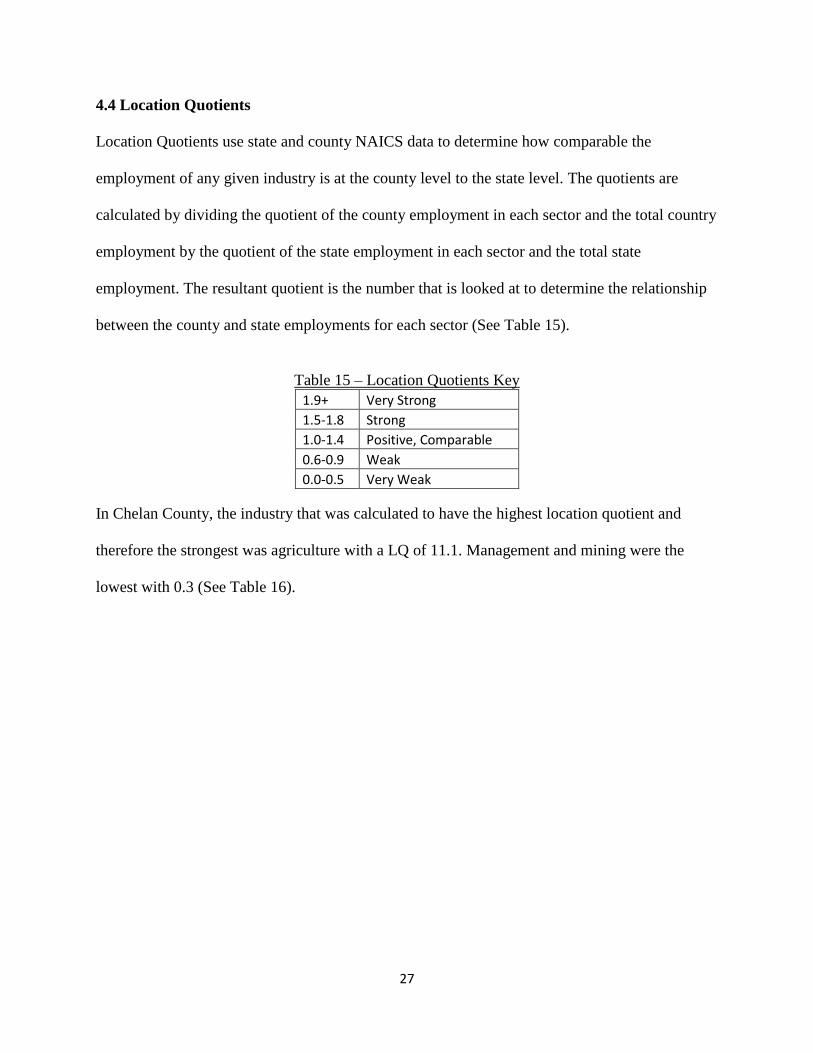
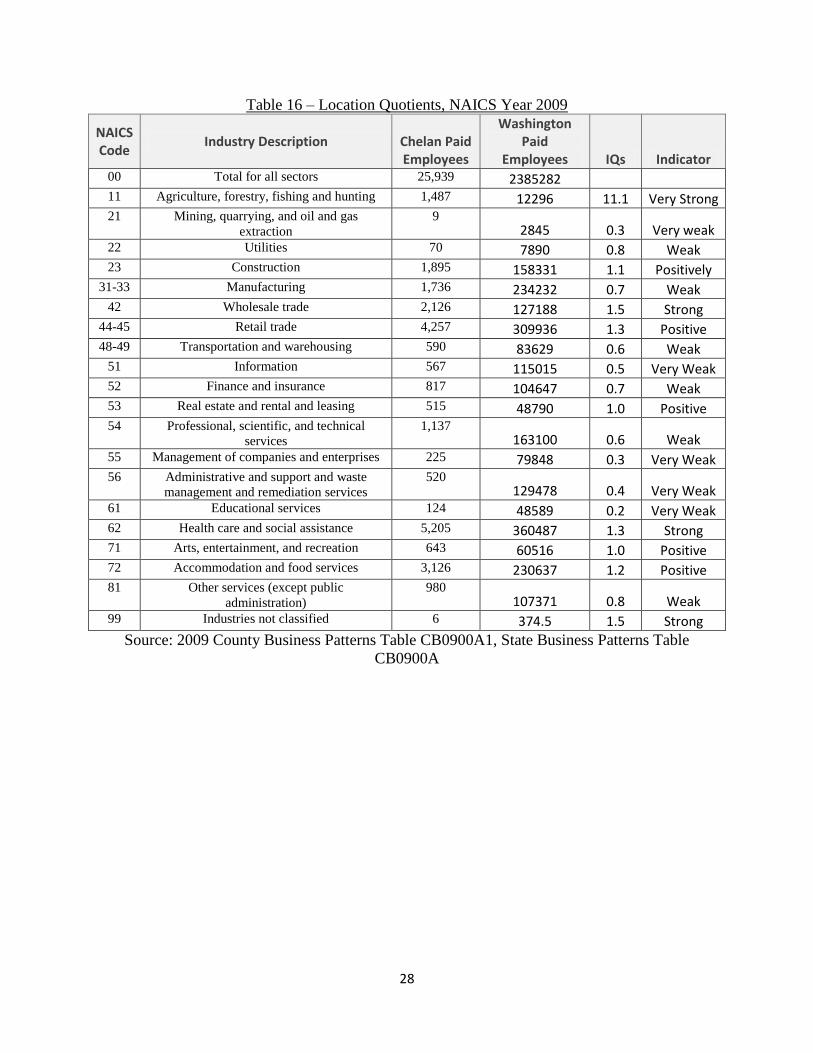
4.4 Location Quotients
Location Quotients use state and county NAICS data to determine how comparable the
employment of any given industry is at the county level to the state level. The quotients are
calculated by dividing the quotient of the county employment in each sector and the total country
employment by the quotient of the state employment in each sector and the total state
employment. The resultant quotient is the number that is looked at to determine the relationship
between the county and state employments for each sector (See Table 15).
Table 15 – Location Quotients Key
1.9+ Very Strong
1.5-1.8 Strong
1.0-1.4 Positive, Comparable
0.6-0.9 Weak
0.0-0.5 Very Weak
In Chelan County, the industry that was calculated to have the highest location quotient and
therefore the strongest was agriculture with a LQ of 11.1. Management and mining were the
lowest with 0.3 (See Table 16).
28
Table 16 – Location Quotients, NAICS Year 2009
NAICS Code
Industry Description Chelan Paid Employees
Washington Paid
Employees IQs Indicator 00 Total for all sectors 25,939 2385282 11 Agriculture, forestry, fishing and hunting 1,487 12296 11.1 Very Strong 21 Mining, quarrying, and oil and gas
extraction
9 2845 0.3 Very weak
22 Utilities 70 7890 0.8 Weak 23 Construction 1,895 158331 1.1 Positively
31-33 Manufacturing 1,736 234232 0.7 Weak 42 Wholesale trade 2,126 127188 1.5 Strong
44-45 Retail trade 4,257 309936 1.3 Positive 48-49 Transportation and warehousing 590 83629 0.6 Weak
51 Information 567 115015 0.5 Very Weak 52 Finance and insurance 817 104647 0.7 Weak 53 Real estate and rental and leasing 515 48790 1.0 Positive 54 Professional, scientific, and technical
services
1,137 163100 0.6 Weak
55 Management of companies and enterprises 225 79848 0.3 Very Weak 56 Administrative and support and waste
management and remediation services
520 129478 0.4 Very Weak
61 Educational services 124 48589 0.2 Very Weak 62 Health care and social assistance 5,205 360487 1.3 Strong 71 Arts, entertainment, and recreation 643 60516 1.0 Positive 72 Accommodation and food services 3,126 230637 1.2 Positive 81 Other services (except public
administration)
980 107371 0.8 Weak
99 Industries not classified 6 374.5 1.5 Strong
Source: 2009 County Business Patterns Table CB0900A1, State Business Patterns Table
CB0900A
29
Executive Summary:
Chelan County also called Washington’s Playground, offers a variety of outdoor
recreation and accommodations. The top industry in Chelan is Retail. Yes, they sell food, hotel
services to the tourists who come to ski and go to Lake Chelan. Throughout this analysis I will
be recommending ways that Chelan County can increase its total annual industry payroll, reduce
its unemployment rate, and increase median household income. I will also focus on growing
industries like professional scientific and technical services and the retail industry between 2004
and 2010. The purpose of the report is to provide Chelan County with a decision making tool to
determine which industry it should support.
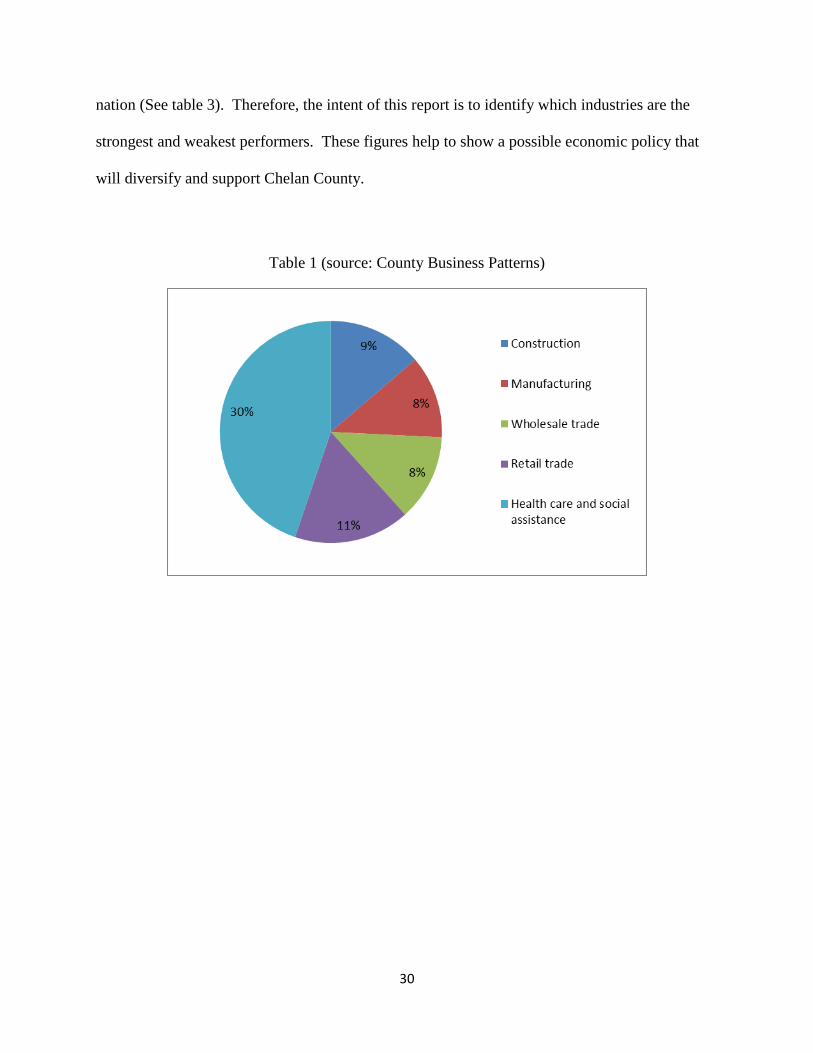
Economic Overview:
Chelan County has 20 base industries while it has some number under 1-6 digit level.
Altogether the industries in the County had an annual payroll of $901,516,000 in 2010 with retail
and healthcare providing the largest portion (See table 1). Agriculture used to employ the
greatest number of people in 2004 but, now we can see a significant decline. The top employed
industries as of 2010 include: Education and health care services 22%, Agriculture 10%, and
Retail trade 12%. So just by looking at that we know to keep supporting these industries while
improving the growing industries. Looking back at the location quotient, construction and retail
trade are strong industries compared to the state. Despite the increase in annual payroll and
growing industries Chelan’s unemployment rate has been higher than both the state and nation
but, since 2008 it has been gradually decreasing and it’s even lower than the state and nation
(See table 2). In addition, the County’s median household income is lower than the state and
5.0 Economic Analysis
30
nation (See table 3). Therefore, the intent of this report is to identify which industries are the
strongest and weakest performers. These figures help to show a possible economic policy that
will diversify and support Chelan County.
Table 1 (source: County Business Patterns)
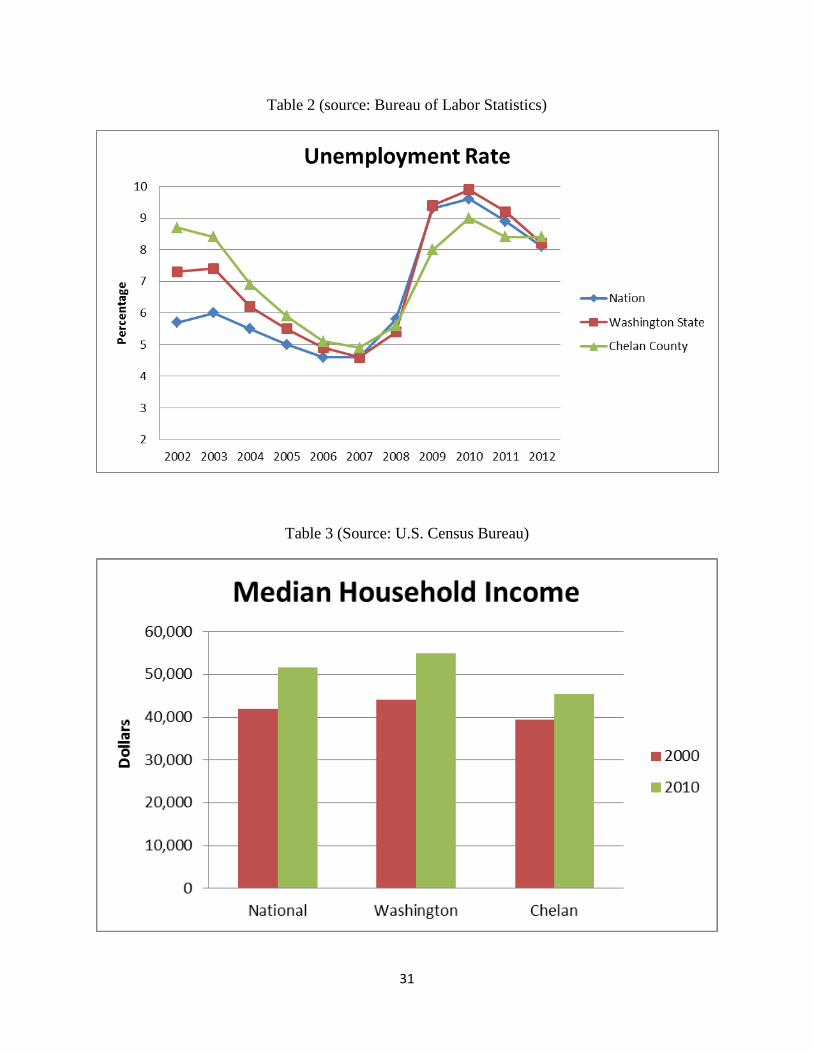
31
Table 2 (source: Bureau of Labor Statistics)
Table 3 (Source: U.S. Census Bureau)
32
Methodology:
The economic analysis methods used in this report consists of the business patterns and
the location quotient. I began my analysis by gathering the 20 base industry data from the
economic census. I looked at the 2010 business pattern and analyzed the annual pay and total
establishments to determine the top industries. Then I choose the two growing or important
industries Chelan should support. I will use the year’s 2004 and 2010 to compare and see which
industries have grown and which have declined. We can probably see a decline in a lot of the
industries because of the 2008 recession. So, this will be merely to compare and show the
difference. This will also help me discus how this will help achieve Chelan County’s economic
goal.
Then I looked at the Location Quotient. I compared Chelan County and Washington
State’s using the below equation.
LQ = (e(i)/e) / (E(i)/E)
e(i) = Local employment in industry (i)
e = Total local employment
E(i) = National employment industry (i)
E = Total national employment
The Location Quotient shows which industries had the biggest and smallest presence
within the local economy. Any LQ values equal to 1.0 indicates that the industry is performing
exactly the same as the state. So, the number derived is greater than 1.0 then, the industry is
performing better than the same industry is statewide and in contrast if it’s less than 1.0 indicates
the industry is performing below the state level.
33
Results & Data:
I found that Chelan County’s traditional economic foundation has revolved around
agriculture and tourism businesses to support its County. As the agriculture sector remains a base
industry it has been declining in both employment and market share. Agriculture at 1,801
employees, 52,289 annual payroll, 37 total establishments in 2004 and 1,109, 33,179, 22 in
2010.The results of the economic analysis also showed a number of growing industries like,
Manufacturing and scientific and technical services. Because the agriculture industry has been
declining it was said that the manufacturing industry would also decline but actually did not and
had 1,778 employees, 64,065 annual payroll, and 85 industries in 2004 and 1,826, 73,688, 93 in
2010. I thought the increase in manufacturing was interesting because there was a overall
decrease in agriculture. I also wanted to focus on Accommodation and Food Services since the
high profile tourism industry, one could assume that the Food Service & Drinking Places and
Accommodations sectors are interrelated and benefited by the flow of visitors into the County.
And we can see that tourists affect this industry because they employed 3,156 with a annual
payroll of 43,872 and 260 industry’s in 2004 and in 2010 employed 3,198 paid 55,125 277
industries. These emerging industries could become the base industries of tomorrow, such as
scientific and technical services which grew from 853 to 1,080 employees between 2004 and
2010.
From the Location Quotient I found that agriculture while having a low annual
pay and declining employees it was very strong compared to the state. Also, the accommodation
industry compared to the state is strong as too at a LQ of 1.2. From the results of the Location
Quotient Industries Chelan should support their retail trade, accommodation, and real estate.
34
Conclusion:
The analysis of Chelan County’s industries has helped determine which industries it
should support and focus on. Chelan county should support it’s growing industries but also
keeping the strongest industries strong.
As I explained in the introduction that the goal was to increase annual payroll, reduce the
unemployment rate, and improve the household income. I think as the economy gets better more
people are willing to spend and that means vacations. As Chelan is Washington’s playground
people will come from all corners of the state. But we can see a decrease in many industries
compared to 2004 because of the 2008 recession. So, I suggest that for Chelan to achieve those
goals by supporting and encouraging tourism and recreation and the accommodation and food
service base industry since they correlate together. Chelan should always keep its agriculture
and manufacturing. I think it would be conservative for Chelan to manufacture their own goods
and not from outside sources. Chelan can sell accommodations to tourists and transporting
agriculture goods around the state and nation.
Agriculture plays and important role in Chelan even though it has declined over the years
it is still a competing industry. While having a low annual pay and declining employees it was
still a very stronger industry compared to the state. The County has a strong manufacturing
industry which correlates to agriculture but, if agriculture keeps declining we can probably see
manufacturing decline too. The County’s apple and winery are its key agriculture and a
significant part of Chelan County history so, it needs to be kept that way and advertised and sold
at it’s local hotels and restaurants which will support the accommodations industry. The
35
manufacturing industry should be supported to keep employment that is declining in the
agriculture sector.
Another strategy is to support the Scientific and technical professionals and Health care
services. The scientific and technical industry has been gradually growing and can promote
people to go to college and invest in the County. Same with the strong health care service. This
can encourage research, law and consulting businesses through incentives such as providing
facilities and tax breaks. Targeting retail trade industry research will further other goals for the
region. Chelan can encourage the health care industry by providing training of the labor force
that provides technical skill needed by the healthcare industry such as phlebotomist. This would
help foster the private sector job base of health care and provide above average wage jobs, as
well as, encourage the retention and expansion of the health care industry.
Retail and accommodations should be kept strong and improved because of it’s tourism.
They should keep maintaining and improving these services by advertising. Support tourism
promotional activities such as development of brochures, local and self-contained events, and
recreational opportunities and media spots. Marketing of recreational and tourist amenities is a
component to attract year-round tourism and the relocation of businesses to Chelan. This will
help the county’s overall annual payroll. The growth of retail and accommodations will also
increase employment in these industries. I also, understand that some people in the county don’t
want more people moving into Chelan, but to help the economy the county is going to need to
develop inside of its urban growth boundary with as much possible growth to not only support
but increase its economy. Chelan County can support and focus on expanding its growing
industries like scientific and technical support it will have a positive effect on other struggling
industries.