Embed Size (px)
Citation preview
PARK & RIDE
STUDY
FINAL Adopted June 19, 2014
2014 SBCAG BOARD MEMBERSHIP ROSTER
SUPERVISORS Member Supervisorial District
SALUD CARBAJAL FIRST DISTRICT
JANET WOLF SECOND DISTRICT
DOREEN FARR THIRD DISTRICT
PETER ADAM FOURTH DISTRICT
STEVE LAVAGNINO (Chair) FIFTH DISTRICT
CITIES Member Alternate
BUELLTON HOLLY SIERRA JUDITH DALE Councilmember Councilmember
CARPINTERIA AL CLARK WADE NOMURA Councilmember Councilmember GOLETA MICHAEL BENNETT ROGER ACEVES
Mayor Councilmember GUADALUPE FRANCES ROMERO JERRY TUCKER
Mayor Councilmember LOMPOC JOHN LINN BOB LINGL
Mayor Councilmember SANTA BARBARA HELENE SCHNEIDER (Vice Chair) BENDY WHITE
Mayor Councilmember SANTA MARIA ALICE PATINO JACK BOYSEN
Mayor Councilmember SOLVANG JIM RICHARDSON ED SKYTT
Mayor Councilmember
EX-OFFICIO (NON-VOTING) MEMBERS
CALTRANS DISTRICT 5 TIM GUBBINS
19th SENATE DISTRICT HANNAH BETH JACKSON
35th ASSEMBLY DISTRICT KATCHO ACHADJIAN
37th ASSEMBLY DISTRICT DAS WILLIAMS
SBCAG PROJECT STAFF
Jim Kemp Executive Director
Peter Imhof Deputy Director, Planning
Julio Perucho Transportation Planner/Project Manager
SBCAG INTERNAL WORKING GROUP
Kent Epperson TDM Program Administrator
Sarkes Khachek Transportation Planner
Fred Luna Transportation Engineer
Scott Spaulding Transportation Planner
Thank you to Alan Holmes of the Ventura County Transportation Commission, Tim Gillham and Morgen
Marshall of the San Luis Obispo Council of Governments, Laura Williams of the Chumash Casino, and
SBCAG intern Elizabeth Theocharides for their assistance with this project.
Thanks to retirees Michael Powers, SBCAG, and Pat Mickelson, Caltrans.
Financial support for the preparation of this report was provided in part by the Federal Highway
Administration, Federal Transit Administration, U.S. Department of Transportation, and the State of
California. The contents of this report do not necessarily reflect the official views or policy of the U.S.
Department of Transportation.
i
TABLE OF CONTENTS
Table of Contents .......................................................................................................................................... i
List of Tables ................................................................................................................................................. v
List of Figures .............................................................................................................................................. ix
Executive Summary ...................................................................................................................................... 1
Chapter 1: Introduction ................................................................................................................................ 9
A. What is a Park & Ride facility? .......................................................................................................... 9
B. What is the value of a P&R facility? .................................................................................................. 9
C. Why develop a P&R Plan? ................................................................................................................ 9
D. What does this P&R Study accomplish? .......................................................................................... 9
E. What is the local history of P&R planning? .................................................................................... 10
Chapter 2: Methodology ............................................................................................................................ 11
Chapter 3: Research & Literature Review .................................................................................................. 13
A. What is the definition of a P&R facility? ......................................................................................... 13
B. What are the goals of a P&R facility? ............................................................................................. 13
C. Are there different types of P&R facilities? .................................................................................... 14
D. How is a centralized inventory of existing P&R facilities created? ................................................ 16
E. Where is the optimal P&R facility location? ................................................................................... 16
1. Providing for integration with community ................................................................................ 17
2. Reducing the financial impact and risk to the implementing agency ....................................... 17
F. How do you determine P&R facility demand? ............................................................................... 18
G. How do you determine P&R facility conditions? ........................................................................... 19
Chapter 4: Inventory & Site Visits .............................................................................................................. 21
A. Existing Park & Ride Facilities ........................................................................................................ 21
1. Santa Barbara County Existing P&R Facilities ........................................................................... 28
ii
a. Santa Barbara County Amtrak Train Stations ....................................................................... 52
b. Santa Barbara County Amtrak Thruway Bus Stations ........................................................... 55
c. Santa Barbara County Chumash Casino Shuttle Lots ........................................................... 57
2. Western Ventura County Existing P&R Facilities ....................................................................... 59
3. Southern San Luis Obispo County Existing P&R Facilities ........................................................ 63
Chapter 5: Surveys ...................................................................................................................................... 65
Chapter 6: Facility Improvements .............................................................................................................. 67
A. P&R Facility Improvement Evaluation Criteria .............................................................................. 67
B. P&R Facility Improvement Recommendations ............................................................................. 69
Chapter 7: New Facilities ............................................................................................................................ 77
A. Analytical Methodology & Results ................................................................................................. 77
B. County-to-County And City-To-City Commute Patterns - 2006-2010 CTPP ................................ 83
C. City-Level Overall Mode Share Data - 2006-2010 ACS ................................................................. 87
D. City-Level Directional Worker Flow & Mode Share Data - 2006-2010 ACS CTPP and 2011 LEHD
93
E. 2006-2010 ACS CTPP and 2011 LEHD Zonal Overlaps ................................................................ 110
F. Multi-Modal Connectivity of Zonal Overlaps ............................................................................... 110
G. Prior Park & Ride Facility Construction Recommendations ........................................................ 124
1. South Coast Highway 101 Deficiency Plan............................................................................... 124
2. 101 In Motion ............................................................................................................................ 125
3. 2040 Regional Transportation Plan and Sustainable Communities Strategy ......................... 125
a. Planned P&R Facilities .......................................................................................................... 126
H. P&R Facility Construction Recommendation .............................................................................. 127
Chapter 8: Facility Design Standards ....................................................................................................... 129
A. Design Standards ......................................................................................................................... 129
1. Signage & Focal Points ............................................................................................................. 129
2. Parking & Storage .................................................................................................................... 131
iii
3. Circulation & Access ................................................................................................................. 131
4. Multi-Modal Connectivity ......................................................................................................... 131
5. Lighting & Drainage ................................................................................................................. 132
6. Safety ........................................................................................................................................ 132
7. Functional Zones ...................................................................................................................... 132
8. Lot Design Examples ................................................................................................................ 132
9. Facility Design and Relationship to Usage ............................................................................... 135
10. Site Selection ........................................................................................................................ 136
B. Operational Standards ................................................................................................................. 137
1. Formal Carpooling .................................................................................................................... 137
2. Flexible Carpooling ................................................................................................................... 138
a. Mobile Carpooling Solutions ................................................................................................ 140
b. US 101 High Occupancy Vehicle (HOV) Project and Flexible Carpooling ........................... 141
Chapter 9: Future Park & Ride Study Updates......................................................................................... 142
Appendix A: Surveys ................................................................................................................................. 143
Appendix B: Survey Results ...................................................................................................................... 149
A. Windshield-Distributed Paper Survey .......................................................................................... 149
1. Selected Results ....................................................................................................................... 150
B. Coastal Express Paper Survey ...................................................................................................... 153
1. Selected Results ....................................................................................................................... 153
C. Clean Air Express - Lompoc Survey .............................................................................................. 156
D. Clean Air Express - Santa Maria Survey ....................................................................................... 158
E. Facility-Specific Comments.......................................................................................................... 160
F. 2008 Park & Ride Lot Survey Report - SLOCOG and rideshare.org ............................................ 168
Appendix C: Survey Extra Comments ...................................................................................................... 171
Appendix D: 2006-2010 ACS CTPP & LEHD Complete Data ................................................................... 183
iv
A. 2006-2010 ACS CTPP Data .......................................................................................................... 183
B. 2011 LEHD Data ............................................................................................................................ 188
Appendix E: City of Buellton North Park & Ride Project Plans ................................................................ 194
Appendix F: References ............................................................................................................................ 206
v
LIST OF TABLES
Table 1: P&R Facility Classification by Function ........................................................................................ 14
Table 2: P&R Facility Classification by Distance from Destination ........................................................... 14
Table 3: Existing P&R Facilities—Santa Barbara County ........................................................................... 21
Table 4: Commuter Parking Lots—City of Santa Barbara ......................................................................... 22
Table 5: Clean Air Express & Joint Use P&R Facilities ................................................................................ 22
Table 6: Amtrak Lots .................................................................................................................................. 22
Table 7: Chumash Casino P&R Lots ........................................................................................................... 23
Table 8: Existing P&R Facilities—Ventura County (Western) .................................................................... 23
Table 9: Existing P&R Facilities—San Luis Obispo County (Southern) ..................................................... 23
Table 10: Santa Barbara County P&R Facility Usage Rates (All Spaces) ................................................... 24
Table 11: Santa Barbara County P&R Facility Usages Rates (Non-ADA Spaces Only) ............................. 24
Table 12: Buellton: Avenue of Flags (South) .............................................................................................. 29
Table 13: Lompoc: Ocean Lanes Bowling Alley* ....................................................................................... 31
Table 14: Lompoc: Clean Air Express P&R Lot........................................................................................... 33
Table 15: Orcutt: Clark Avenue/SR 135 NE ................................................................................................. 35
Table 16: Orcutt: Clark Avenue/SR 135 NW ............................................................................................... 37
Table 17: Orcutt: Clark Avenue/US 101 ...................................................................................................... 39
Table 18: Santa Barbara: Carrillo Commuter Parking Lot ......................................................................... 41
Table 19: Santa Barbara: Cota Commuter Parking Lot ............................................................................. 43
Table 20: Santa Maria: Clean Air Express P&R Lot (Old)* ......................................................................... 45
Table 21: Santa Maria: Clean Air Express P&R Lot (New) ......................................................................... 47
Table 22: Santa Ynez: SR 246/SR 154 ........................................................................................................ 49
Table 23: Solvang: Park Way/SR 246 ......................................................................................................... 51
Table 24: Amtrak Train Station: Carpinteria .............................................................................................. 52
vi
Table 25: Amtrak Train Station: Goleta ..................................................................................................... 52
Table 26: Amtrak Train Station: Guadalupe .............................................................................................. 53
Table 27: Amtrak Train Station: Santa Barbara ......................................................................................... 53
Table 28: Amtrak Train Station: Surf (Lompoc) ........................................................................................ 54
Table 29: Amtrak Thruway Bus Station: Buellton ..................................................................................... 55
Table 30: Amtrak Thruway Bus Station: Lompoc ...................................................................................... 55
Table 31: Amtrak Thruway Bus Station: Santa Maria ................................................................................ 56
Table 32: Amtrak Thruway Bus Station: Solvang ...................................................................................... 56
Table 33: Chumash Casino Shuttle Lot—Goleta ........................................................................................ 57
Table 34: Chumash Casino Shuttle Lot—Santa Maria ............................................................................... 57
Table 35: Chumash Casino Shuttle Lot—Lompoc ..................................................................................... 58
Table 36: Paper Survey Response Rate by County .................................................................................... 65
Table 37: ADA Accessibility Guidelines for Parking Spaces ....................................................................... 69
Table 38: Worker Trips For North County Areas ........................................................................................ 86
Table 39: Worker Trips For South Coast Areas .......................................................................................... 87
Table 40: Means of Transportation to Work by Selected Characteristics ................................................. 88
Table 41: CTPP TAZ Data – Total Trips & Carpooler Percentage – Santa Maria Area ............................ 100
Table 42: CTPP TAZ Data – Selected ZONE Trips Vs Total Trips – Santa Maria Area ............................ 100
Table 43: CTPP TAZ Data – Total Trips & Carpooler Percentage – Lompoc Area .................................. 100
Table 44: CTPP TAZ Data – Selected Zone Trips Vs Total Trips – Lompoc Area .................................... 100
Table 45: CTPP TAZ Data – Total Trips & Carpooler Percentage – Santa Ynez Area ............................. 101
Table 46: CTPP TAZ Data – Selected Zone Trips Vs Total Trips – Santa Ynez Area............................... 101
Table 47: CTPP TAZ Data – Total Trips & Carpooler Percentage – Goleta Area ..................................... 101
Table 48: CTPP TAZ Data – Selected Zone Trips Vs Total Trips – Goleta Area ...................................... 101
Table 49: CTPP TAZ Data – Total Trips & Carpooler Percentage – Santa Barbara Area ........................ 102
vii
Table 50: CTPP TAZ Data – Selected Zone Trips Vs Total Trips – Santa Barbara Area .......................... 102
Table 51: CTPP TAZ Data – Total Trips & Carpooler Percentage – Carpinteria Area ............................. 102
Table 52: CTPP TAZ Data – Selected Zone Trips Vs Total Trips – Carpinteria Area ............................... 102
Table 53: LEHD Census Block Group Data – Santa Maria Area ............................................................... 103
Table 54: LEHD Census Block Group Data – Lompoc Area ..................................................................... 104
Table 55: LEHD Census Block Group Data – Santa Ynez Area ................................................................ 104
Table 56: LEHD Census Block Group Data – South Coast Area .............................................................. 104
Table 57: Zonal Overlap Multi-Modal Connectivity ................................................................................. 111
Table 58: 2040 Regional Transportation Plan Project List ...................................................................... 126
Table 59: Paper Survey Response Rates by Santa Barbara County Facility ............................................ 149
Table 60: Paper Survey Response Rates by Ventura County Facility ...................................................... 149
Table 61: CTPP TAZ Data – Total Trips & Carpooler Percentage – Santa Maria Area ............................ 183
Table 62: CTPP TAZ Data – Selected TAZ Trips Vs Total Trips – Santa Maria Area ............................... 183
Table 63: CTPP TAZ Data – Total Trips & Carpooler Percentage – Lompoc Area .................................. 184
Table 64: CTPP TAZ Data – Selected TAZ Trips Vs Total Trips – Lompoc Area ..................................... 184
Table 65: CTPP TAZ Data – Total Trips & Carpooler Percentage – Santa Ynez Area ............................. 184
Table 66: CTPP TAZ Data – Selected TAZ Trips Vs Total Trips – Santa Ynez Area ................................ 185
Table 67: CTPP TAZ Data – Total Trips & Carpooler Percentage – Goleta Area ..................................... 185
Table 68: CTPP TAZ Data – Selected TAZ Trips Vs Total Trips – Goleta Area ........................................ 186
Table 69: CTPP TAZ Data – Total Trips & Carpooler Percentage – Santa Barbara Area ........................ 186
Table 70: CTPP TAZ Data – Selected TAZ Trips Vs Total Trips – Santa Barbara Area ............................ 187
Table 71: CTPP TAZ Data – Total Trips & Carpooler Percentage – Carpinteria Area .............................. 187
Table 72: CTPP TAZ Data – Selected TAZ Trips Vs Total Trips – Carpinteria Area ................................. 188
Table 73: LEHD Census Tract Data – Santa Maria Area ........................................................................... 188
Table 74: LEHD Census Tract Data – Lompoc Area ................................................................................. 188

viii
Table 75: LEHD Census Tract Data – South Coast Area .......................................................................... 188
ix
LIST OF FIGURES
Figure 1: High Priority Area 1 & Expansion Area 1 & 2 – Santa Maria Area ................................................. 3
Figure 2: High Priority Area 2 & Expansion Area 3 – Lompoc Area ............................................................. 4
Figure 3: Secondary Priority Area 1 – Carpinteria Area ............................................................................... 5
Figure 4: Secondary Priority Area 2 – Goleta Area ...................................................................................... 6
Figure 5: City of Buellton: Avenue of Flags (North) – [B-PL-400] ................................................................ 7
Figure 6: Existing P&R Facilities—Santa Barbara County ......................................................................... 26
Figure 7: Existing P&R Facilities – Tri-County ............................................................................................ 27
Figure 8: Existing P&R Facilities—Ventura County (Western) ................................................................... 59
Figure 9: Existing P&R Facilities—San Luis Obispo County (Southern) .................................................... 63
Figure 10: Expansion Area 1 & 2 – Santa Maria Area ................................................................................. 74
Figure 11: High Priority Area 2 & Expansion Area 3 – Lompoc Area ......................................................... 75
Figure 12: High Priority Area 1 – Santa Maria Area.................................................................................... 79
Figure 13: High Priority Area 2 – Lompoc Area .......................................................................................... 80
Figure 14: Secondary Priority Area 1 – Carpinteria Area ........................................................................... 81
Figure 15: Secondary Priority Area 2 – Goleta Area................................................................................... 82
Figure 16: City of Buellton: Avenue of Flags (North) – [B-PL-400] ............................................................ 83
Figure 17: Interregional Commute Patterns .............................................................................................. 84
Figure 18: Sub regional Commute Patterns ............................................................................................... 84
Figure 19: Santa Maria Area Commute Patterns ....................................................................................... 85
Figure 20: Lompoc Area Commute Patterns ............................................................................................. 85
Figure 21: South Coast Commute Patterns ............................................................................................... 86
Figure 22: 2006-2010 ACS Carpooler Data – Santa Maria Area ................................................................ 89
Figure 23: 2006-2010 ACS Carpooler Data – Lompoc Area ....................................................................... 90
Figure 24: 2006-2010 ACS Carpooler Data – Goleta Area ......................................................................... 91
x
Figure 25: 2006-2010 ACS Carpooler Data – Santa Barbara and Carpinteria Area ................................... 92
Figure 26: 2006-2010 ACS CTPP Census TAZ Data – Santa Maria Area ................................................... 94
Figure 27: 2006-2010 ACS CTPP Census TAZ Data – Lompoc Area .......................................................... 95
Figure 28: 2006-2010 ACS CTPP Census TAZ Data – Santa Ynez Area .................................................... 96
Figure 29: 2006-2010 ACS CTPP Census TAZ Data – Goleta Area ............................................................ 97
Figure 30: 2006-2010 ACS CTPP Census TAZ Data – Santa Barbara Area................................................ 98
Figure 31: 2006-2010 ACS CTPP Census TAZ Data – Carpinteria Area ..................................................... 99
Figure 32: LEHD Census Block Group Data – Santa Maria Area .............................................................. 105
Figure 33: LEHD Census Block Group Data – Lompoc Area .................................................................... 106
Figure 34: LEHD Census Block Group Data – Santa Ynez Area ............................................................... 107
Figure 35: LEHD Census Block Group Data – Goleta Area ....................................................................... 108
Figure 36: LEHD Census Block Group Data – Santa Barbara and Carpinteria Area ................................ 109
Figure 37: 2006-2010 ACS CTPP Census TAZ and LEHD Census Block Group Data – Santa Maria Area
.................................................................................................................................................................. 112
Figure 38: 2006-2010 ACS CTPP Census TAZ and LEHD Census Block Group Data – Lompoc Area ..... 113
Figure 39: 2006-2010 ACS CTPP Census TAZ and LEHD Census Block Group Data – Santa Ynez Area 114
Figure 40: 2006-2010 ACS CTPP Census TAZ and LEHD Census Block Group Data – Goleta Area ....... 115
Figure 41: 2006-2010 ACS CTPP Census TAZ and LEHD Census Block Group Data – Santa Barbara Area
.................................................................................................................................................................. 116
Figure 42: 2006-2010 ACS CTPP Census TAZ and LEHD Census Block Group Data – Carpinteria Area 117
Figure 43: Zonal Overlap Connectivity - Santa Maria Area ..................................................................... 118
Figure 44: Zonal Overlap Connectivity – Lompoc Area ........................................................................... 119
Figure 45: Zonal Overlap Connectivity – Santa Ynez Area ...................................................................... 120
Figure 46: Zonal Overlap Connectivity – Goleta Area ............................................................................. 121
Figure 47: Zonal Overlap Connectivity – Santa Barbara Area ................................................................. 122
Figure 48: Zonal Overlap Connectivity – Carpinteria Area ...................................................................... 123
xi
Figure 49: State of California – Department of Transportation – Park & Ride Plaque ........................... 129
Figure 50: State of California – Department of Transportation – Park & Ride Plaque ........................... 130
Figure 51: State of California – Department of Transportation – Park & Ride Info Plaque .................... 130
Figure 52: State of California – Department of Transportation – Park & Ride Next Right (Left) Plaque 130
Figure 53: Functional Zones of a Transit Facility...................................................................................... 132
Figure 54: Example Park & Ride Layout – Small-Sized Lot ..................................................................... 133
Figure 55: Example Park & Ride Layout – Medium-Sized Lot ................................................................. 134
Figure 56: Example Park & Ride Layout – Large-Sized Lot ..................................................................... 135
Figure 57: Example Park & Ride Facility Map - Color Coded Direction of Travel .................................... 139
Figure 58: LEHD Census Tract Data – Santa Maria Area ......................................................................... 190
Figure 59: LEHD Census Tract Data – Lompoc Area ............................................................................... 191
Figure 60: LEHD Census Tract Data – Goleta Area .................................................................................. 192
Figure 61: LEHD Census Tract Data – Santa Barbara and Carpinteria Area ........................................... 193
1
EXECUTIVE SUMMARY
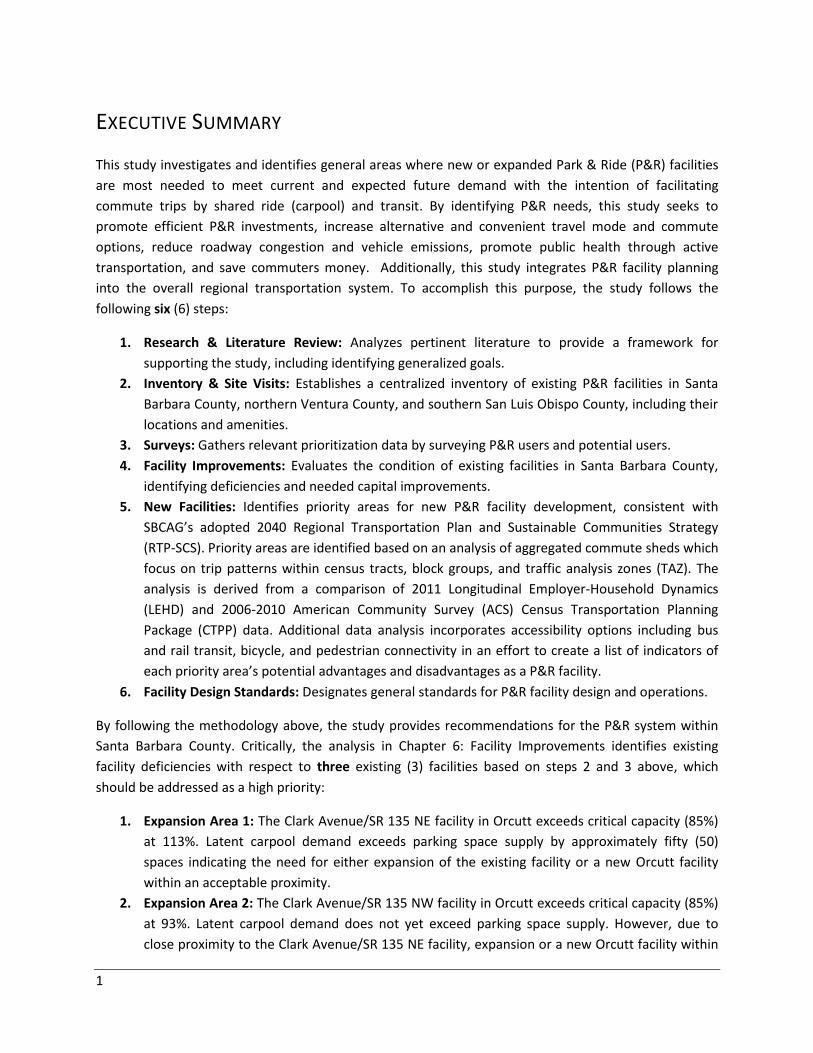
This study investigates and identifies general areas where new or expanded Park & Ride (P&R) facilities
are most needed to meet current and expected future demand with the intention of facilitating
commute trips by shared ride (carpool) and transit. By identifying P&R needs, this study seeks to
promote efficient P&R investments, increase alternative and convenient travel mode and commute
options, reduce roadway congestion and vehicle emissions, promote public health through active
transportation, and save commuters money. Additionally, this study integrates P&R facility planning
into the overall regional transportation system. To accomplish this purpose, the study follows the
following six (6) steps:
1. Research & Literature Review: Analyzes pertinent literature to provide a framework for
supporting the study, including identifying generalized goals.
2. Inventory & Site Visits: Establishes a centralized inventory of existing P&R facilities in Santa
Barbara County, northern Ventura County, and southern San Luis Obispo County, including their
locations and amenities.
3. Surveys: Gathers relevant prioritization data by surveying P&R users and potential users.
4. Facility Improvements: Evaluates the condition of existing facilities in Santa Barbara County,
identifying deficiencies and needed capital improvements.
5. New Facilities: Identifies priority areas for new P&R facility development, consistent with
SBCAG’s adopted 2040 Regional Transportation Plan and Sustainable Communities Strategy
(RTP-SCS). Priority areas are identified based on an analysis of aggregated commute sheds which
focus on trip patterns within census tracts, block groups, and traffic analysis zones (TAZ). The
analysis is derived from a comparison of 2011 Longitudinal Employer-Household Dynamics
(LEHD) and 2006-2010 American Community Survey (ACS) Census Transportation Planning
Package (CTPP) data. Additional data analysis incorporates accessibility options including bus
and rail transit, bicycle, and pedestrian connectivity in an effort to create a list of indicators of
each priority area’s potential advantages and disadvantages as a P&R facility.
6. Facility Design Standards: Designates general standards for P&R facility design and operations.
By following the methodology above, the study provides recommendations for the P&R system within
Santa Barbara County. Critically, the analysis in Chapter 6: Facility Improvements identifies existing
facility deficiencies with respect to three existing (3) facilities based on steps 2 and 3 above, which
should be addressed as a high priority:
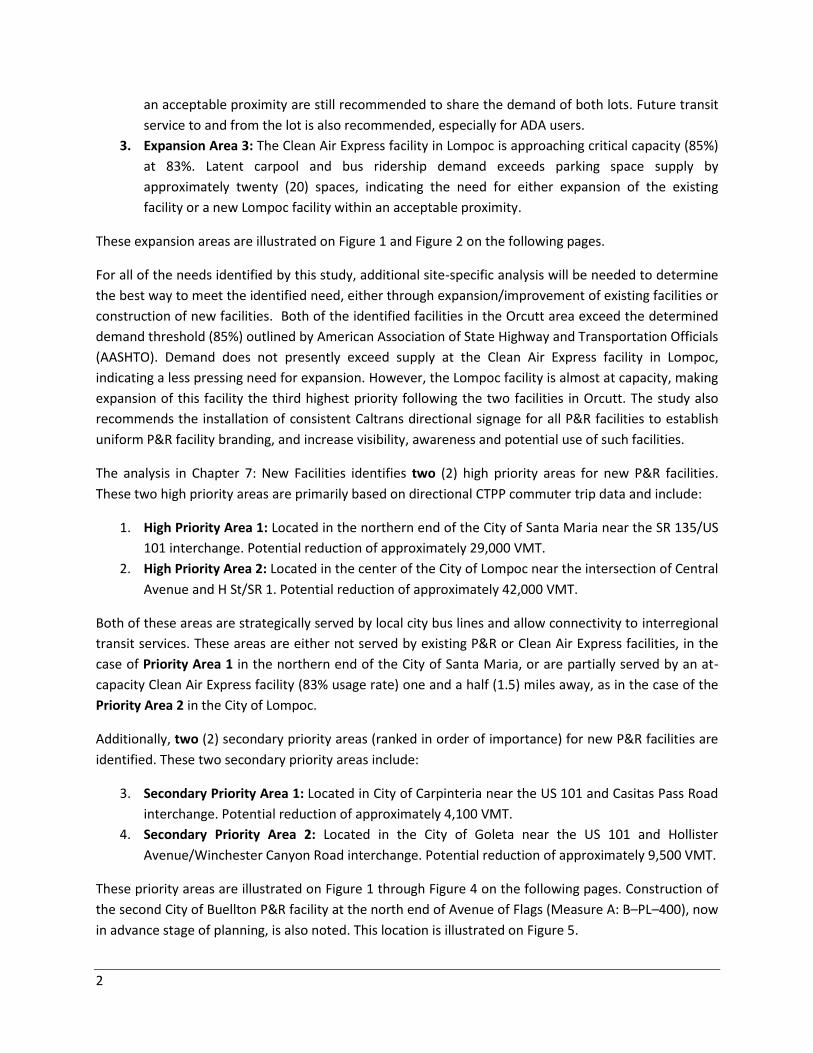
1. Expansion Area 1: The Clark Avenue/SR 135 NE facility in Orcutt exceeds critical capacity (85%)
at 113%. Latent carpool demand exceeds parking space supply by approximately fifty (50)
spaces indicating the need for either expansion of the existing facility or a new Orcutt facility
within an acceptable proximity.
2. Expansion Area 2: The Clark Avenue/SR 135 NW facility in Orcutt exceeds critical capacity (85%)
at 93%. Latent carpool demand does not yet exceed parking space supply. However, due to
close proximity to the Clark Avenue/SR 135 NE facility, expansion or a new Orcutt facility within
2
an acceptable proximity are still recommended to share the demand of both lots. Future transit
service to and from the lot is also recommended, especially for ADA users.
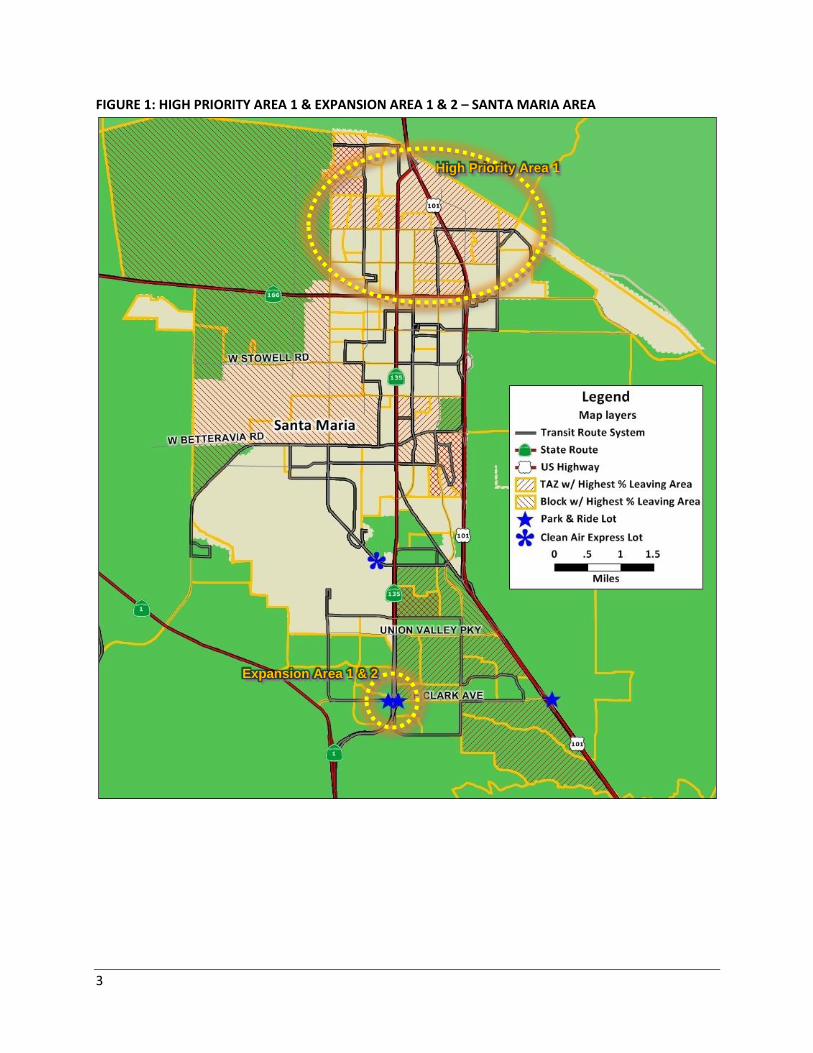
3. Expansion Area 3: The Clean Air Express facility in Lompoc is approaching critical capacity (85%)
at 83%. Latent carpool and bus ridership demand exceeds parking space supply by
approximately twenty (20) spaces, indicating the need for either expansion of the existing
facility or a new Lompoc facility within an acceptable proximity.
These expansion areas are illustrated on Figure 1 and Figure 2 on the following pages.
For all of the needs identified by this study, additional site-specific analysis will be needed to determine
the best way to meet the identified need, either through expansion/improvement of existing facilities or
construction of new facilities. Both of the identified facilities in the Orcutt area exceed the determined
demand threshold (85%) outlined by American Association of State Highway and Transportation Officials
(AASHTO). Demand does not presently exceed supply at the Clean Air Express facility in Lompoc,
indicating a less pressing need for expansion. However, the Lompoc facility is almost at capacity, making
expansion of this facility the third highest priority following the two facilities in Orcutt. The study also
recommends the installation of consistent Caltrans directional signage for all P&R facilities to establish
uniform P&R facility branding, and increase visibility, awareness and potential use of such facilities.
The analysis in Chapter 7: New Facilities identifies two (2) high priority areas for new P&R facilities.
These two high priority areas are primarily based on directional CTPP commuter trip data and include:
1. High Priority Area 1: Located in the northern end of the City of Santa Maria near the SR 135/US
101 interchange. Potential reduction of approximately 29,000 VMT.
2. High Priority Area 2: Located in the center of the City of Lompoc near the intersection of Central
Avenue and H St/SR 1. Potential reduction of approximately 42,000 VMT.
Both of these areas are strategically served by local city bus lines and allow connectivity to interregional
transit services. These areas are either not served by existing P&R or Clean Air Express facilities, in the
case of Priority Area 1 in the northern end of the City of Santa Maria, or are partially served by an at-
capacity Clean Air Express facility (83% usage rate) one and a half (1.5) miles away, as in the case of the
Priority Area 2 in the City of Lompoc.
Additionally, two (2) secondary priority areas (ranked in order of importance) for new P&R facilities are
identified. These two secondary priority areas include:
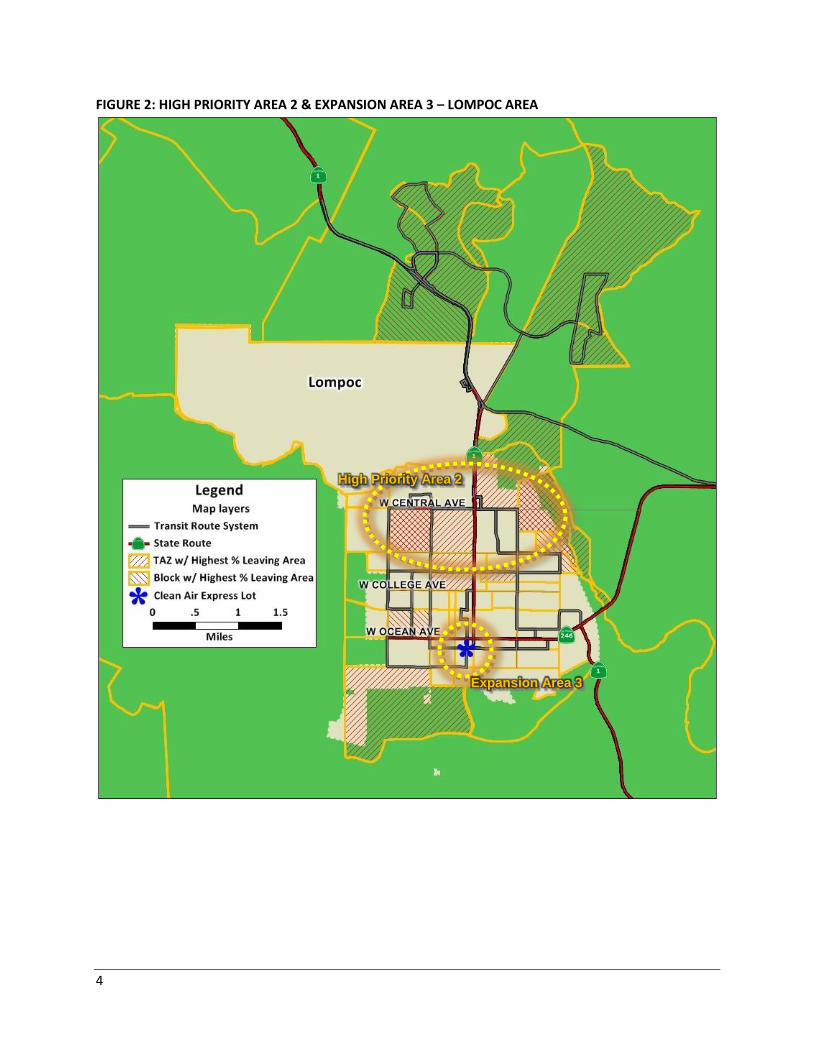
3. Secondary Priority Area 1: Located in City of Carpinteria near the US 101 and Casitas Pass Road
interchange. Potential reduction of approximately 4,100 VMT.
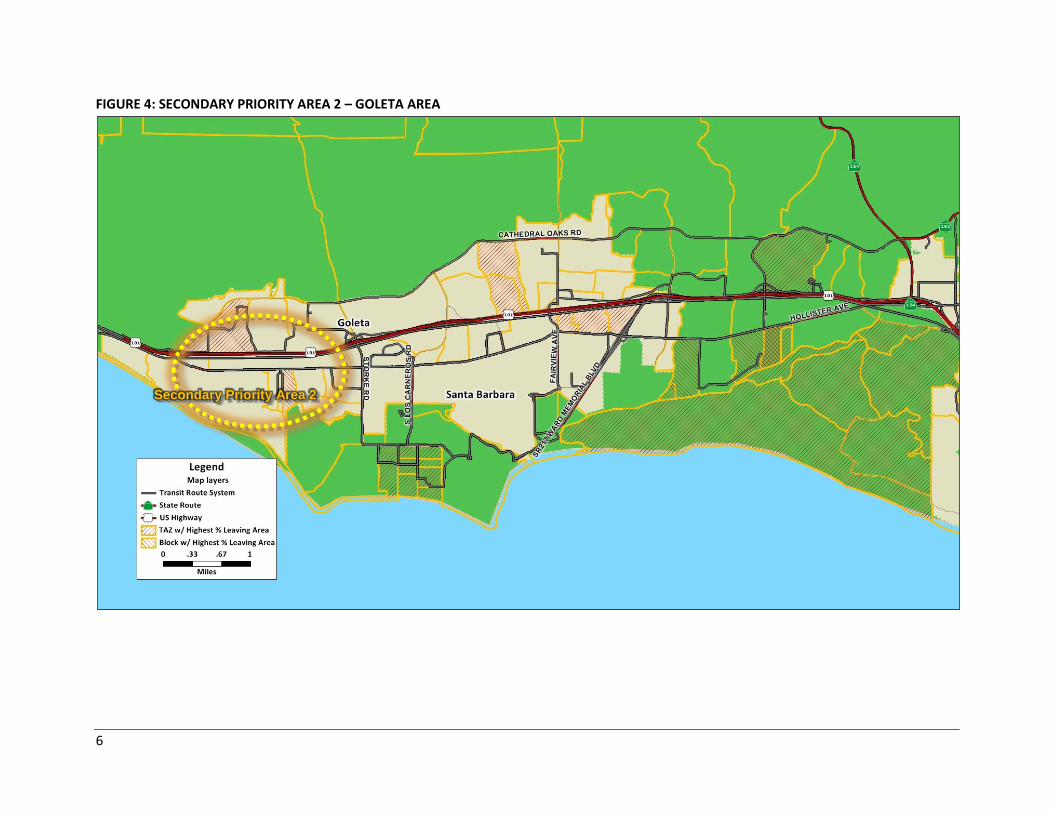
4. Secondary Priority Area 2: Located in the City of Goleta near the US 101 and Hollister
Avenue/Winchester Canyon Road interchange. Potential reduction of approximately 9,500 VMT.
These priority areas are illustrated on Figure 1 through Figure 4 on the following pages. Construction of
the second City of Buellton P&R facility at the north end of Avenue of Flags (Measure A: B–PL–400), now
in advance stage of planning, is also noted. This location is illustrated on Figure 5.
3
FIGURE 1: HIGH PRIORITY AREA 1 & EXPANSION AREA 1 & 2 – SANTA MARIA AREA
Expansion Area 1 & 2
High Priority Area 1
4
FIGURE 2: HIGH PRIORITY AREA 2 & EXPANSION AREA 3 – LOMPOC AREA
Expansion Area 3
High Priority Area 2
5
FIGURE 3: SECONDARY PRIORITY AREA 1 – CARPINTERIA AREA
Secondary Priority Area 1
6
FIGURE 4: SECONDARY PRIORITY AREA 2 – GOLETA AREA
Secondary Priority Area 2
7
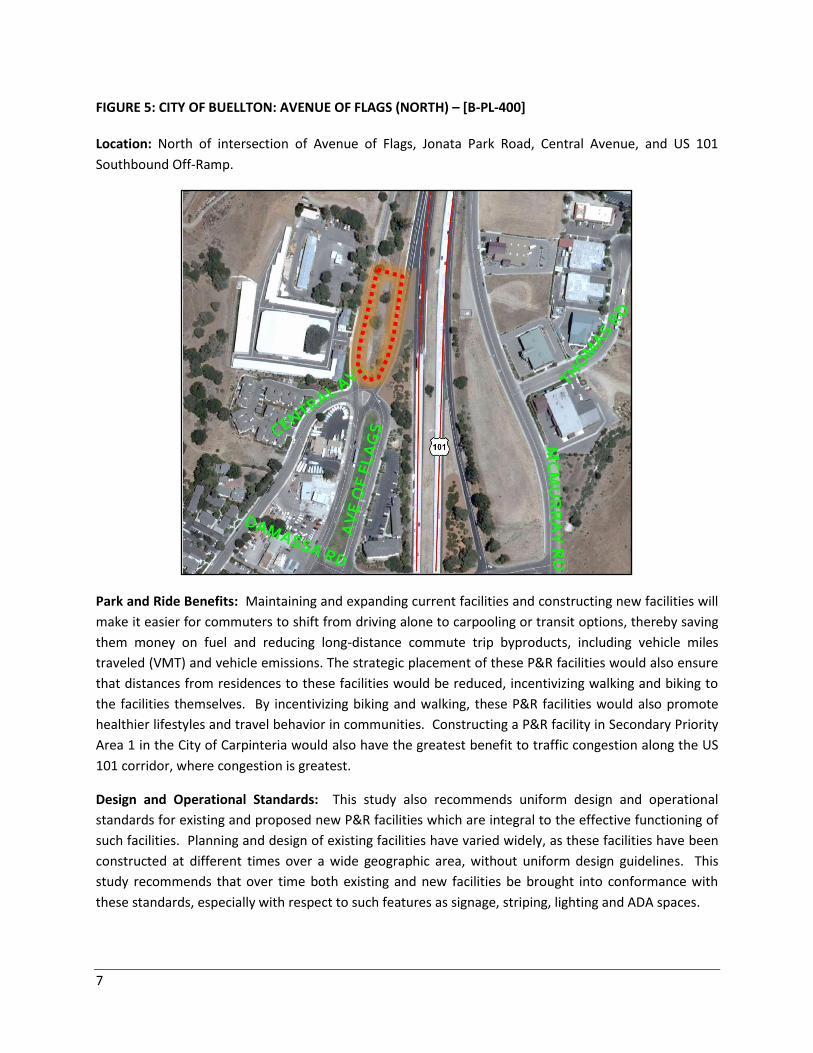
FIGURE 5: CITY OF BUELLTON: AVENUE OF FLAGS (NORTH) – [B-PL-400]
Location: North of intersection of Avenue of Flags, Jonata Park Road, Central Avenue, and US 101
Southbound Off-Ramp.
Park and Ride Benefits: Maintaining and expanding current facilities and constructing new facilities will
make it easier for commuters to shift from driving alone to carpooling or transit options, thereby saving
them money on fuel and reducing long-distance commute trip byproducts, including vehicle miles
traveled (VMT) and vehicle emissions. The strategic placement of these P&R facilities would also ensure
that distances from residences to these facilities would be reduced, incentivizing walking and biking to
the facilities themselves. By incentivizing biking and walking, these P&R facilities would also promote
healthier lifestyles and travel behavior in communities. Constructing a P&R facility in Secondary Priority
Area 1 in the City of Carpinteria would also have the greatest benefit to traffic congestion along the US
101 corridor, where congestion is greatest.
Design and Operational Standards: This study also recommends uniform design and operational
standards for existing and proposed new P&R facilities which are integral to the effective functioning of
such facilities. Planning and design of existing facilities have varied widely, as these facilities have been
constructed at different times over a wide geographic area, without uniform design guidelines. This
study recommends that over time both existing and new facilities be brought into conformance with
these standards, especially with respect to such features as signage, striping, lighting and ADA spaces.
8
Multi-modal Connectivity: This Study prioritizes transit, bicycle and pedestrian connectivity to park and
ride facilities. According to the Federal Highway Administration’s Linking Bicycle/Pedestrian Facilities
with Transit study, bicycle and pedestrian connectivity is critical “from an energy use and pollution
emissions standpoint… automobile P&R trips involve cold start vehicle operation, with associated
pollution emission and fuel use rates several times higher than the average for all automobile travel.” (p.
4) Additionally, the FHWA study indicates that “switching short auto access trips to bicycles can free up
P&R spaces for travelers living more than 2 miles from the lot, improving the cost-effectiveness of the
overall transit access system” and that surveys in California revealed “30 percent to 68 percent of
bicycle locker users at park-and ride lots formerly drove alone to their destination before switching to
bike-and-ride.” (p. 6)
Chapter 7 accordingly evaluates transit, bike and pedestrian connectivity in detail for all zonal overlap
areas. This Study also recommends installation of bike lockers or racks at both existing P&R lots and
future P&R facilities. Multi-modal connectivity design standards to encourage bicycle and pedestrian
access are outlined in Chapter 8: Facility Design Standards.
Site Selection Criteria: In addition to design and operational standards, Chapter 8 also articulates
criteria for selection of new park and ride sites. These criteria include:
Site Access: A direct, adequately controlled access point improves access to the facility and the
efficiency of transit service.
Proximity to Major Roads and Highways: Bus service is concentrated along these routes and
given the structure of the typical street network in the region, leaving these routes imposes a
significant time penalty.
Transit Service Potential: If the area around the lot can contribute passengers to the transit
service, the density and efficiency of the service is improved.1
User Demand: Potential demand for each potential site.
Size and Expansion Potential: Lot size is adequate to meet projected demand with space to
accommodate additional demand, if needed in the future.
Land and Lease Acquisition: Cost management.
Land Use and Zoning: May determine the feasibility of lighting or feasibility of developing the
site.
Safety and Security: A lot perceived as dangerous will be avoided despite other favorable
attributes; hazards may include crime, vehicle collisions, or flooding.
Community Impacts: Locations in areas with compatible land uses are preferred.
1 Potential sites could have linkage with Clean Air Express and other forms of bus transit.
9
CHAPTER 1: INTRODUCTION
A. WHAT IS A PARK & RIDE FACILITY?
A Park & Ride (P&R) facility is a place where travelers can park their automobiles or bicycles and transfer
to ride in carpools, vanpools, buses, or trains. It is a change-of-mode facility.
B. WHAT IS THE VALUE OF A P&R FACILITY?
P&R facilities provide for intermodal connectivity. This connectivity facilitates transfers from low-
occupancy to high-occupancy modes of transportation, reducing single-occupant vehicle (SOV) trips and
consequently reducing roadway congestion and greenhouse gas (GHG) emissions, as well as worksite
parking demand. P&R facilities increase availability and access to transit use among commuters who do
not live within walking distance of a convenient transit stop or station, and expand carpooling and
vanpooling opportunities.
C. WHY DEVELOP A P&R PLAN?
Robert J. Spillar, a leading transportation engineer and noted authority on park-and-ride planning,
whose work has been the foundation of many P&R plans, explains in Park-and-Ride Planning and Design
Guidelines (1997) that the purpose of a P&R plan is to identify a common regional approach to the
provision of P&R facilities. Broad policy issues including the goals and objectives of the system plan,
system level measures of effectiveness, operational goals and responsibilities, and generalized location
decisions, should be evaluated at the system plan level. Additionally, the plan should be a dynamic
guideline to reflect inevitable evolving conditions as well as new opportunities for P&R developments
over its lifetime and that it must provide a common platform from which participating agencies can
program further site-specific studies, investments, and construction projects.
The American Association of State Highway and Transportation Officials (AASHTO) (2004) adds that a
sound planning process is fundamental because “it is typically more effective to plan park and ride
facilities as part of a coordinated and multi-modal transportation and land use system, than to plan
individual facilities and try to tie these facilities together after the fact (and) success of the individual
park and ride facility lies in its ability to connect with the regional transportation network and the
selection of a site location within that network” (p. 11).
D. WHAT DOES THIS P&R STUDY ACCOMPLISH?
Fundamentally, this P&R Study identifies areas of Santa Barbara County where demand is highest for
new or enhanced P&R facilities. Additionally, the P&R Study identifies improvements needed to existing
P&R facilities to increase their effectiveness.
More broadly, the P&R Study:
10
1. Establishes a centralized inventory of existing P&R facilities in Santa Barbara County, northern
Ventura County, and southern San Luis Obispo County, including their locations and amenities.
2. Evaluates the condition of existing facilities in Santa Barbara County, identifying deficiencies and
prioritizing capital improvements.
3. Identifies and evaluates priority areas for new P&R facilities by assessing demand.
E. WHAT IS THE LOCAL HISTORY OF P&R PLANNING?
Beginning in 1970 with the enactment of Section 134 of the Federal Aid Highway Act, Caltrans designed
and operated a statewide system of P&R facilities (Caltrans, 1996). In May 1993, the Caltrans District 5
Public Transportation Planning Office produced its first Park and Ride Program Report. At that time,
there were four formal P&R facilities in Santa Barbara County (Caltrans, 1993):
1. Orcutt—NE Clark Avenue/SR 135
2. Orcutt—NW Clark Avenue/SR 135
3. Orcutt—Clark Avenue/US 101
4. Santa Ynez—SR 246/SR 154
Caltrans District 5 produced an updated report —Park & Ride Lot Final Program Report—in April 1996,
which included the same four P&R facilities in Santa Barbara County. The State eliminated funding and
staffing for the statewide P&R program in the FY 1995-96 budget. Responsibility for P&R facility
planning and development was, for the most part, shifted from Caltrans to local agencies.
In 2010, Caltrans produced the Park and Ride Program Resource Guide (PRPRG). In it Caltrans devised
the requirements for developing a P&R project, which included a summary of legal and legislative
support for P&R facilities, funding sources for P&R facility improvements, and descriptions of P&R
project analysis methods.
In addition, the Santa Barbara County Association of Government’s (SBCAG’s) northern neighbor, the
San Luis Obispo Council of Governments (SLOCOG), produced an Inventory and Analysis of Park and Ride
Lots in San Luis Obispo in May 1991. SLOCOG completed the most recent update of the report—Park &
Ride Lot Development Study—in 2013.
SBCAG has not previously had a Park & Ride Study.
11
CHAPTER 2: METHODOLOGY
SBCAG staff followed a basic methodology in preparing the P&R Study. This six (6) step methodology is
outlined below:
1. Research & Literature Review: Extensive research and literature review provides a framework
for supporting this Park & Ride Study. This literature review defines P&R facilities, identifies
generalized goals for these facilities, and identifies different types of facility categories. The
literature review further identifies how to determine the optimal location for the creation of
new facilities, including how to provide for the integration of that facility into the community
and assisting in the reduction of financial impacts and risks to the implementing agency. Perhaps
most importantly, this framework helps identify and evaluate proposed and potential priority
areas by properly assessing demand. A description of the attributes affecting usage and a way to
properly determine existing P&R facility conditions and deficiencies rounds out the research and
literature review.
2. Inventory & Site Visits: The preceding literature review helps craft a framework for generating a
centralized inventory of existing facilities. This centralized inventory includes existing P&R
facilities in Santa Barbara County, northern Ventura County, and southern San Luis Obispo
County, including their locations and amenities.
3. Surveys: Gathers relevant prioritization data by surveying P&R facility users and potential users.
4. Facility Improvements: Evaluates the condition of existing facilities in Santa Barbara County,
identifying deficiencies and needed capital improvements. SBCAG formed an internal working
group which included SBCAG transportation planners, an SBCAG transportation engineer, and
SBCAG’s Transportation Demand Management (TDM) program administrator. Further
consultation with local agencies affected by the P&R Study included communication with
Ventura County Transportation Commission (VCTC) Transportation Demand Management (TDM)
program manager, San Luis Obispo Council of Governments (SLOCOG) transportation planner
and regional rideshare manager, and the Chumash Casino Resort transportation department
administrative assistant.
5. New Facilities: Identifies priority areas for new P&R facility development, consistent with
SBCAG’s adopted 2040 Regional Transportation Plan and Sustainable Communities Strategy
(RTP-SCS). Priority areas are identified based on an analysis of aggregated commute sheds which
focus on trip patterns within census tracts, block groups, and traffic analysis zones (TAZ). The
analysis is derived from a comparison of 2011 Longitudinal Employer-Household Dynamics
(LEHD) and 2006-2010 American Community Survey (ACS) Census Transportation Planning
Package (CTPP) data. Further data analysis focuses on overlaid transit access points and
accessibility of lots in an effort to create a list of indicators of each priority area’s potential
advantages and disadvantages as a P&R facility.
6. Facility Design Standards: Designates general standards for P&R facility design and operations.

12
The following chapter highlights the findings of the research and literature review. Further chapters and
appendices highlight the formation and findings of the internal working group as well as the details
highlighting the data gathering and survey effort undertaken to determine a final P&R policy
recommendation. Ultimately, this Park & Ride Study serves as a guide to the development of new
facilities and as a rubric to identify potential future locations and key components of successful facilities.
13
CHAPTER 3: RESEARCH & LITERATURE REVIEW
A. WHAT IS THE DEFINITION OF A P&R FACILITY?
Existing plans and studies offer a range of definitions for what constitutes a P&R facility. For example,
SLOCOG’s Park & Ride Lot Development Study (2013) defines P&R facilities simply as “vacant lots where
commuters pre-determine to meet, or large intermodal facilities that link individuals to many other
modes of transportation, including bus and rail.” By comparison, P&R facilities are defined by the
University of Aberdeen’s Review of Park & Ride in Aberdeenshire (2006) as “passenger mode transfer
from private car to public transport” (which) “varies in formality, from highly informal on-street parking
in the suburbs with lift-sharing into the town or city centre, to formal dedicated terminals and services
with car parking facilities provided” (p. iii). This same study also offers a simplified definition of P&R
facilities as “car parks, or interchanges, or some combination of the two” (p. 3).
Spillar (p. 10) expands the definition of P&R facilities by classifying them “as intermodal transfer facilities
(which) provide a staging location for travelers to transfer between the auto mode and transit or
between the single occupant vehicle (SOV) and other higher occupancy vehicle (HOV or carpools)
modes.” Spillar (p. 10) identifies that “a hierarchy of park-and-ride facilities can be developed based on
the functional characteristics of the individual park-and-ride lot.” This hierarchy includes “six facility
types… ranging from the informal park-and-ride lot to the design intensive suburban park-and-ride lot.”
These six facility types are defined in the following section; however, all six facility types fundamentally
serve as “a transit stop to which motorists regularly drive their cars and leave them parked on-street or
in an adjacent property.”
Caltrans’ Park and Ride Program Resource Guide (2010) mirrors the above P&R definitions by stating
that P&R lots “support transit usage and carpooling, which leads to improved performance of the entire
transportation system. They provide a location for individuals to park their vehicles to join carpools and
to access bus and rail services, thereby taking vehicles off local streets and roads and the State Highway
System (SHS).” (p. 1)
For purposes of this P&R study, a P&R facility is defined as a facility where travelers can park their
automobiles or bicycles and transfer to ride in carpools, vanpools, buses, or trains. P&R facilities assist
in the transfer from low-occupancy to high-occupancy modes of transportation, reducing single-
occupant vehicle (SOV) trips and consequently reducing roadway congestion and greenhouse gas (GHG)
emissions as well as worksite parking demand.
B. WHAT ARE THE GOALS OF A P&R FACILITY?
Caltrans’ Park and Ride Program Resource Guide (2010) identifies “the goals of a network of park and
ride lots (which) include, but are not limited to, increasing the mobility options of travelers, increasing
person throughput on the system, decreasing the number of vehicle trips, decreasing the greenhouse
gas and air pollution associated with transportation, and decreasing congestion on transportation
facilities.” (p. 1). SLOCOG’s Park & Ride Lot Development Study (2013) identifies the main goals of a P&R
14
facility as “to reduce single occupant vehicles by creating a place for commuters to meet in a safe,
convenient accessible location” (p. 3). This study also identifies the goal “from the user’s standpoint (as)
opportunities to share the fuel costs or burden of driving, along with the use of carpool lanes and
reduced travel times” (p. 3).
C. ARE THERE DIFFERENT TYPES OF P&R FACILITIES?
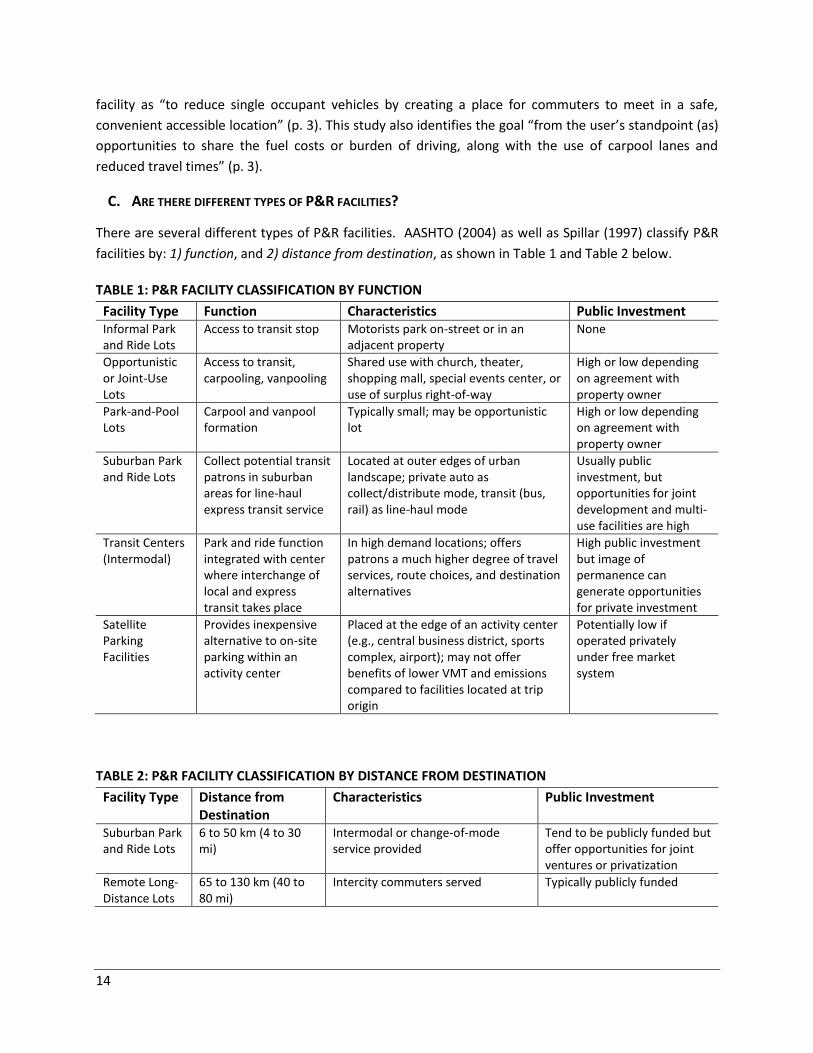
There are several different types of P&R facilities. AASHTO (2004) as well as Spillar (1997) classify P&R
facilities by: 1) function, and 2) distance from destination, as shown in Table 1 and Table 2 below.
TABLE 1: P&R FACILITY CLASSIFICATION BY FUNCTION
Facility Type Function Characteristics Public Investment Informal Park and Ride Lots
Access to transit stop Motorists park on-street or in an adjacent property
None
Opportunistic or Joint-Use Lots
Access to transit, carpooling, vanpooling
Shared use with church, theater, shopping mall, special events center, or use of surplus right-of-way
High or low depending on agreement with property owner
Park-and-Pool Lots
Carpool and vanpool formation
Typically small; may be opportunistic lot
High or low depending on agreement with property owner
Suburban Park and Ride Lots
Collect potential transit patrons in suburban areas for line-haul express transit service
Located at outer edges of urban landscape; private auto as collect/distribute mode, transit (bus, rail) as line-haul mode
Usually public investment, but opportunities for joint development and multi-use facilities are high
Transit Centers (Intermodal)
Park and ride function integrated with center where interchange of local and express transit takes place
In high demand locations; offers patrons a much higher degree of travel services, route choices, and destination alternatives
High public investment but image of permanence can generate opportunities for private investment
Satellite Parking Facilities
Provides inexpensive alternative to on-site parking within an activity center
Placed at the edge of an activity center (e.g., central business district, sports complex, airport); may not offer benefits of lower VMT and emissions compared to facilities located at trip origin
Potentially low if operated privately under free market system
TABLE 2: P&R FACILITY CLASSIFICATION BY DISTANCE FROM DESTINATION
Facility Type Distance from Destination
Characteristics Public Investment
Suburban Park and Ride Lots
6 to 50 km (4 to 30 mi)
Intermodal or change-of-mode service provided
Tend to be publicly funded but offer opportunities for joint ventures or privatization
Remote Long-Distance Lots
65 to 130 km (40 to 80 mi)
Intercity commuters served Typically publicly funded
15
Facility Type Distance from Destination
Characteristics Public Investment
Local Urban Park and Ride Lots
2 to 7 km (1 to 4 mi) Fills gap between suburban market and central business district; informal, shared use, or opportunistic
Often publicly funded, but provide opportunities for private operation
Peripheral Park and Ride Lots
Located at edge or periphery of primary destination
Intercept travelers prior to activity center; satellite park and ride lot
Opportunities for private investment; public investment should be carefully evaluated
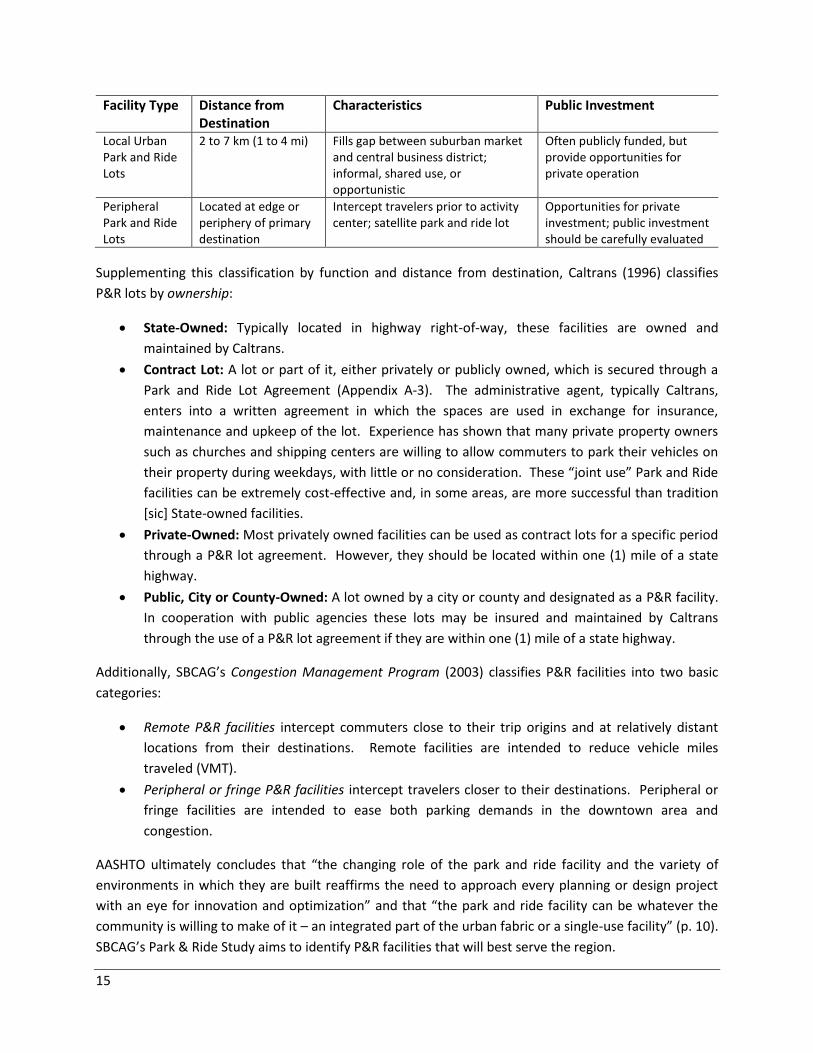
Supplementing this classification by function and distance from destination, Caltrans (1996) classifies
P&R lots by ownership:
State-Owned: Typically located in highway right-of-way, these facilities are owned and
maintained by Caltrans.
Contract Lot: A lot or part of it, either privately or publicly owned, which is secured through a
Park and Ride Lot Agreement (Appendix A-3). The administrative agent, typically Caltrans,
enters into a written agreement in which the spaces are used in exchange for insurance,
maintenance and upkeep of the lot. Experience has shown that many private property owners
such as churches and shipping centers are willing to allow commuters to park their vehicles on
their property during weekdays, with little or no consideration. These “joint use” Park and Ride
facilities can be extremely cost-effective and, in some areas, are more successful than tradition
[sic] State-owned facilities.
Private-Owned: Most privately owned facilities can be used as contract lots for a specific period
through a P&R lot agreement. However, they should be located within one (1) mile of a state
highway.
Public, City or County-Owned: A lot owned by a city or county and designated as a P&R facility.
In cooperation with public agencies these lots may be insured and maintained by Caltrans
through the use of a P&R lot agreement if they are within one (1) mile of a state highway.
Additionally, SBCAG’s Congestion Management Program (2003) classifies P&R facilities into two basic
categories:
Remote P&R facilities intercept commuters close to their trip origins and at relatively distant
locations from their destinations. Remote facilities are intended to reduce vehicle miles
traveled (VMT).
Peripheral or fringe P&R facilities intercept travelers closer to their destinations. Peripheral or
fringe facilities are intended to ease both parking demands in the downtown area and
congestion.
AASHTO ultimately concludes that “the changing role of the park and ride facility and the variety of
environments in which they are built reaffirms the need to approach every planning or design project
with an eye for innovation and optimization” and that “the park and ride facility can be whatever the
community is willing to make of it – an integrated part of the urban fabric or a single-use facility” (p. 10).
SBCAG’s Park & Ride Study aims to identify P&R facilities that will best serve the region.
16
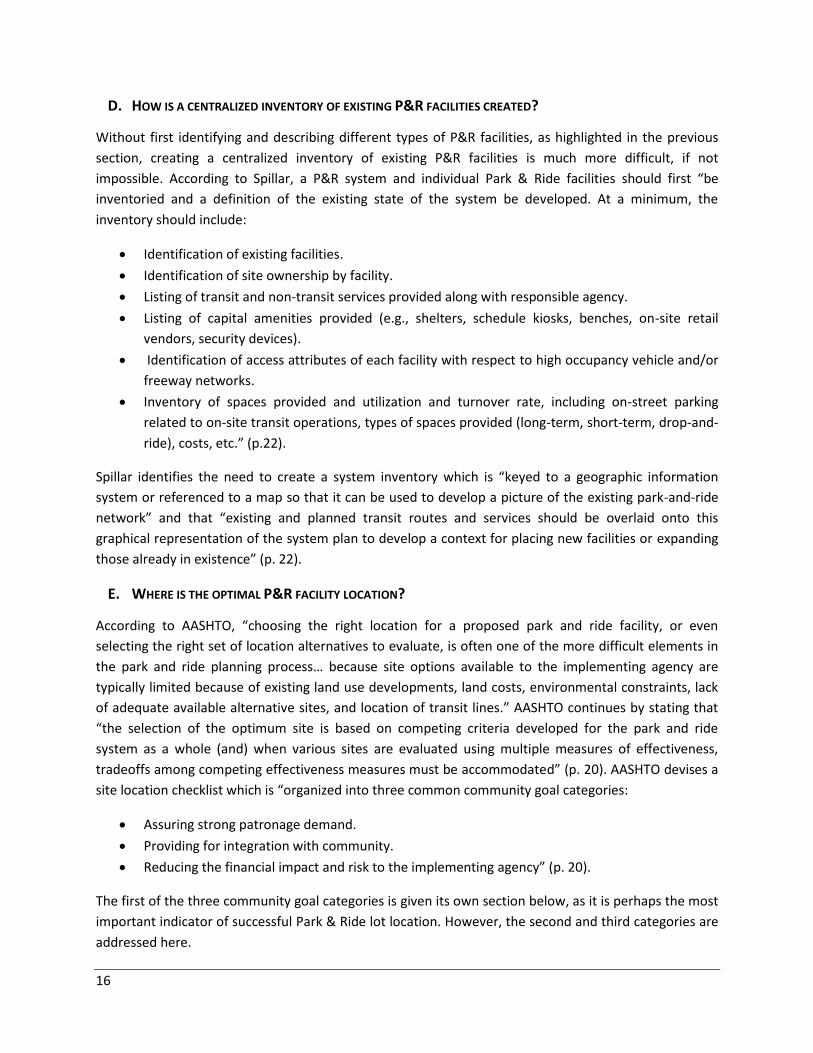
D. HOW IS A CENTRALIZED INVENTORY OF EXISTING P&R FACILITIES CREATED?
Without first identifying and describing different types of P&R facilities, as highlighted in the previous
section, creating a centralized inventory of existing P&R facilities is much more difficult, if not
impossible. According to Spillar, a P&R system and individual Park & Ride facilities should first “be
inventoried and a definition of the existing state of the system be developed. At a minimum, the
inventory should include:
Identification of existing facilities.
Identification of site ownership by facility.
Listing of transit and non-transit services provided along with responsible agency.
Listing of capital amenities provided (e.g., shelters, schedule kiosks, benches, on-site retail
vendors, security devices).
Identification of access attributes of each facility with respect to high occupancy vehicle and/or
freeway networks.
Inventory of spaces provided and utilization and turnover rate, including on-street parking
related to on-site transit operations, types of spaces provided (long-term, short-term, drop-and-
ride), costs, etc.” (p.22).
Spillar identifies the need to create a system inventory which is “keyed to a geographic information
system or referenced to a map so that it can be used to develop a picture of the existing park-and-ride
network” and that “existing and planned transit routes and services should be overlaid onto this
graphical representation of the system plan to develop a context for placing new facilities or expanding
those already in existence” (p. 22).
E. WHERE IS THE OPTIMAL P&R FACILITY LOCATION?
According to AASHTO, “choosing the right location for a proposed park and ride facility, or even
selecting the right set of location alternatives to evaluate, is often one of the more difficult elements in
the park and ride planning process… because site options available to the implementing agency are
typically limited because of existing land use developments, land costs, environmental constraints, lack
of adequate available alternative sites, and location of transit lines.” AASHTO continues by stating that
“the selection of the optimum site is based on competing criteria developed for the park and ride
system as a whole (and) when various sites are evaluated using multiple measures of effectiveness,
tradeoffs among competing effectiveness measures must be accommodated” (p. 20). AASHTO devises a
site location checklist which is “organized into three common community goal categories:
Assuring strong patronage demand.
Providing for integration with community.
Reducing the financial impact and risk to the implementing agency” (p. 20).
The first of the three community goal categories is given its own section below, as it is perhaps the most
important indicator of successful Park & Ride lot location. However, the second and third categories are
addressed here.
17
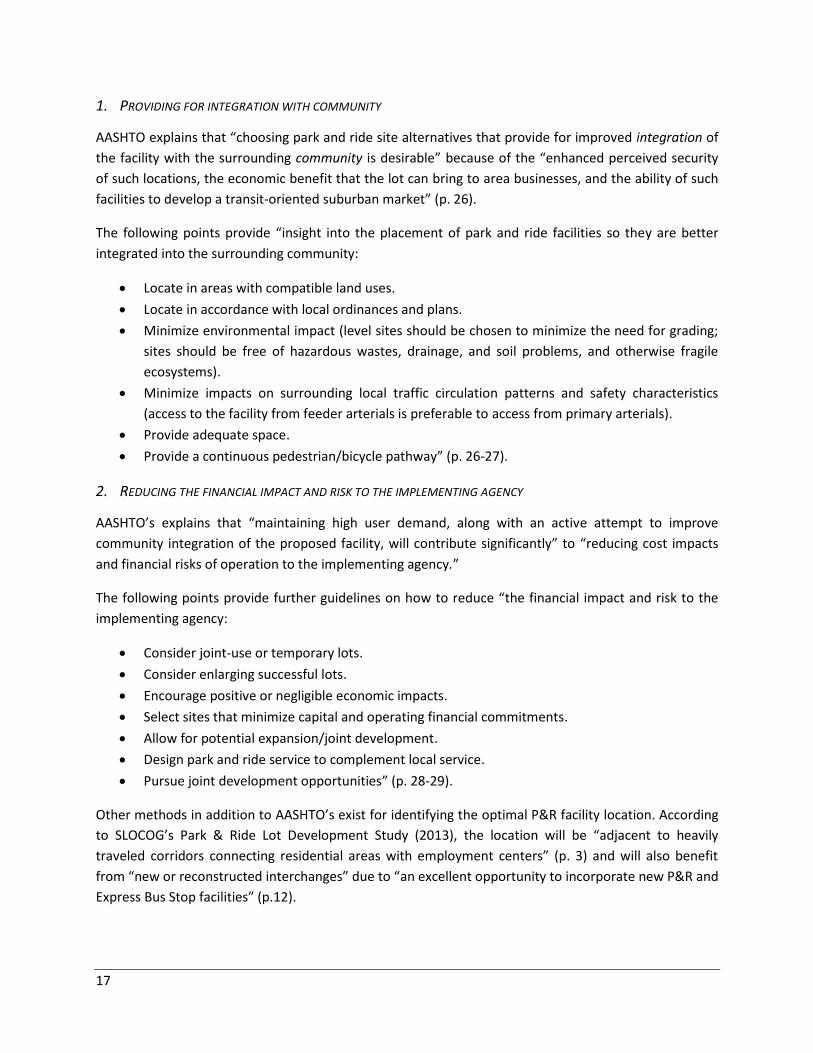
1. PROVIDING FOR INTEGRATION WITH COMMUNITY
AASHTO explains that “choosing park and ride site alternatives that provide for improved integration of
the facility with the surrounding community is desirable” because of the “enhanced perceived security
of such locations, the economic benefit that the lot can bring to area businesses, and the ability of such
facilities to develop a transit-oriented suburban market” (p. 26).
The following points provide “insight into the placement of park and ride facilities so they are better
integrated into the surrounding community:
Locate in areas with compatible land uses.
Locate in accordance with local ordinances and plans.
Minimize environmental impact (level sites should be chosen to minimize the need for grading;
sites should be free of hazardous wastes, drainage, and soil problems, and otherwise fragile
ecosystems).
Minimize impacts on surrounding local traffic circulation patterns and safety characteristics
(access to the facility from feeder arterials is preferable to access from primary arterials).
Provide adequate space.
Provide a continuous pedestrian/bicycle pathway” (p. 26-27).
2. REDUCING THE FINANCIAL IMPACT AND RISK TO THE IMPLEMENTING AGENCY
AASHTO’s explains that “maintaining high user demand, along with an active attempt to improve
community integration of the proposed facility, will contribute significantly” to “reducing cost impacts
and financial risks of operation to the implementing agency.”
The following points provide further guidelines on how to reduce “the financial impact and risk to the
implementing agency:
Consider joint-use or temporary lots.
Consider enlarging successful lots.
Encourage positive or negligible economic impacts.
Select sites that minimize capital and operating financial commitments.
Allow for potential expansion/joint development.
Design park and ride service to complement local service.
Pursue joint development opportunities” (p. 28-29).
Other methods in addition to AASHTO’s exist for identifying the optimal P&R facility location. According
to SLOCOG’s Park & Ride Lot Development Study (2013), the location will be “adjacent to heavily
traveled corridors connecting residential areas with employment centers” (p. 3) and will also benefit
from “new or reconstructed interchanges” due to “an excellent opportunity to incorporate new P&R and
Express Bus Stop facilities” (p.12).
18
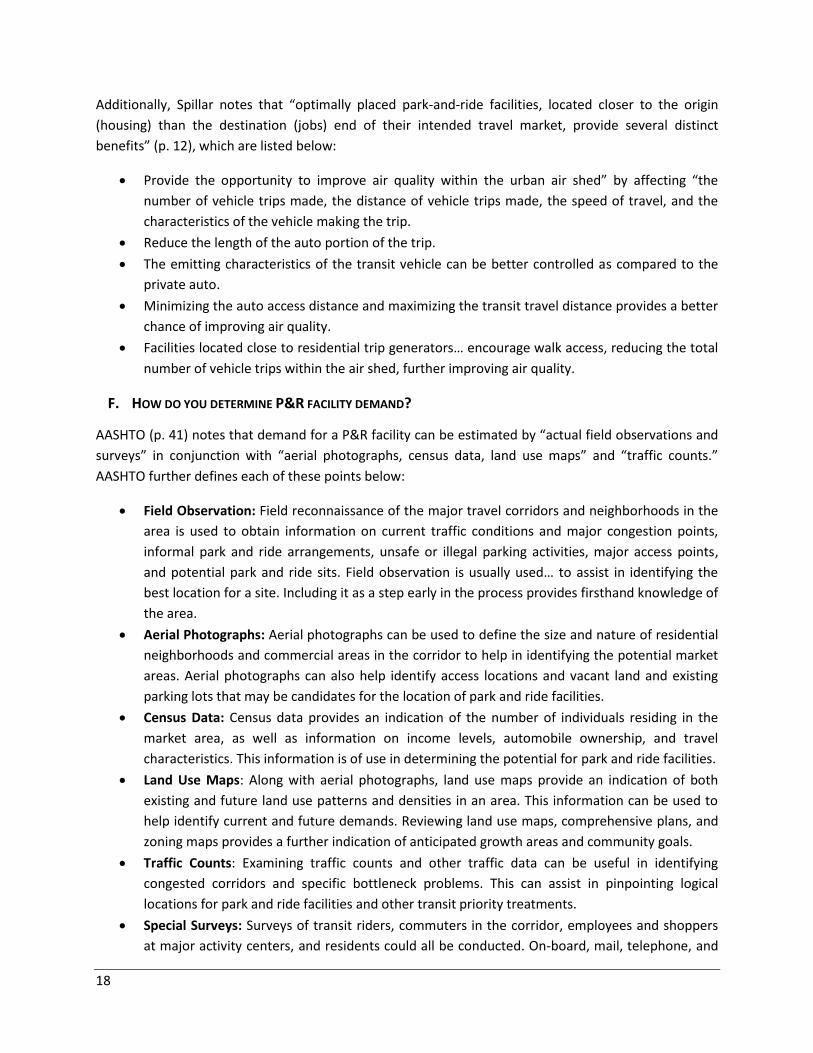
Additionally, Spillar notes that “optimally placed park-and-ride facilities, located closer to the origin
(housing) than the destination (jobs) end of their intended travel market, provide several distinct
benefits” (p. 12), which are listed below:
Provide the opportunity to improve air quality within the urban air shed” by affecting “the
number of vehicle trips made, the distance of vehicle trips made, the speed of travel, and the
characteristics of the vehicle making the trip.
Reduce the length of the auto portion of the trip.
The emitting characteristics of the transit vehicle can be better controlled as compared to the
private auto.
Minimizing the auto access distance and maximizing the transit travel distance provides a better
chance of improving air quality.
Facilities located close to residential trip generators… encourage walk access, reducing the total
number of vehicle trips within the air shed, further improving air quality.
F. HOW DO YOU DETERMINE P&R FACILITY DEMAND?
AASHTO (p. 41) notes that demand for a P&R facility can be estimated by “actual field observations and
surveys” in conjunction with “aerial photographs, census data, land use maps” and “traffic counts.”
AASHTO further defines each of these points below:
Field Observation: Field reconnaissance of the major travel corridors and neighborhoods in the
area is used to obtain information on current traffic conditions and major congestion points,
informal park and ride arrangements, unsafe or illegal parking activities, major access points,
and potential park and ride sits. Field observation is usually used… to assist in identifying the
best location for a site. Including it as a step early in the process provides firsthand knowledge of
the area.
Aerial Photographs: Aerial photographs can be used to define the size and nature of residential
neighborhoods and commercial areas in the corridor to help in identifying the potential market
areas. Aerial photographs can also help identify access locations and vacant land and existing
parking lots that may be candidates for the location of park and ride facilities.
Census Data: Census data provides an indication of the number of individuals residing in the
market area, as well as information on income levels, automobile ownership, and travel
characteristics. This information is of use in determining the potential for park and ride facilities.
Land Use Maps: Along with aerial photographs, land use maps provide an indication of both
existing and future land use patterns and densities in an area. This information can be used to
help identify current and future demands. Reviewing land use maps, comprehensive plans, and
zoning maps provides a further indication of anticipated growth areas and community goals.
Traffic Counts: Examining traffic counts and other traffic data can be useful in identifying
congested corridors and specific bottleneck problems. This can assist in pinpointing logical
locations for park and ride facilities and other transit priority treatments.
Special Surveys: Surveys of transit riders, commuters in the corridor, employees and shoppers
at major activity centers, and residents could all be conducted. On-board, mail, telephone, and
19
direct interview techniques may all be used to conduct these surveys, which may be done for
the specific purpose of obtaining information on the potential for a park and ride facility or
which may be part of a larger study.
Following AASHTO’s Special Survey guidelines, the Martin Metropolitan Planning Organization Park and
Ride Study created “travel surveys (which) were utilized in this study as a tool to evaluate travel
patterns, park and ride demand, and potential park and ride locations” (p. 3).
G. HOW DO YOU DETERMINE P&R FACILITY CONDITIONS?
A large part of SBCAG’s Park & Ride Study involves inventorying and determining the condition of the
current Santa Barbara County lots. In order to properly analyze these conditions, a framework is
necessary. Fortunately, there are many ways to evaluate P&R facility conditions. Several characteristics,
according to SLOCOG’s Park & Ride Lot Development Study of September 2005, should be given
consideration, including the “amount of space available for parking, existing use, and any special
circumstances (which) relate to limited size, difficult shapes, or difficult terrain” (p. 14). Further
examples of these evaluation categories include signage, pavement conditions, striping and wheel stops,
and landscaping.
Signage: Improving signage and boundary definition where signage is clearly deficient is an
inexpensive and highly successful means of attracting more riders. Signs are one of the most
effective marketing tools to promote P&R to drivers. It is important to inform motorists of the
existing lot by use of directional roadway signs. They should be strategically placed to draw the
most attention to existing lots, contract lots, and future lots.
Boundary Identification: Signs or markers are placed within a site to establish the boundaries of
a Park & Ride facility. This is most helpful when a Park & Ride lot is situated within a larger lot,
such as a super market parking lot. By identifying which spaces are designated for Park & Ride
users and which are for patrons of the facility, conflicts and complaints can be avoided.
Pavement Conditions: The condition of the pavement at a P&R facility is important to maximize
the potential of the lot. Pavement with cracks or other deterioration should be treated in order
to return the pavement to good or excellent condition. The pavement conditions of the
screened lots should be ranked from poor to excellent: a poor ranking indicates that the lot is
gravel, dirt, or pavement with excessive cracking. A fair ranking indicates that the pavement (is)
observed to have signs of alligator cracking. A good ranking reflects that the lot (is) in good
condition, but could use a future slurry coat. An excellent ranking indicates the lot (is) observed
not to need any treatments.
Striping and wheel stops: Striping and wheel stops help to distinguish the boundaries of
individual parking stalls and can maximize the number of usable spaces.
Landscaping: The surrounding vegetation, more importantly tree cover, can significantly
enhance the aesthetics and comfort of a P&R lot. Planting vegetation and shade trees, using
native species where possible, is recommended at lots where no current landscaping exists.
Landscaping at P&R lots should meet or exceed the required standards imposed by the
jurisdictional authority for similar, private developments.

20
Additional P&R facility condition evaluation categories include available spaces, lighting, telephones,
bike lockers, transit stops, handicapped spaces, benches, and shelter. All of these categories helped
SBCAG devise a P&R condition checklist that was utilized to evaluate existing and potential future
facilities.
21
CHAPTER 4: INVENTORY & SITE VISITS
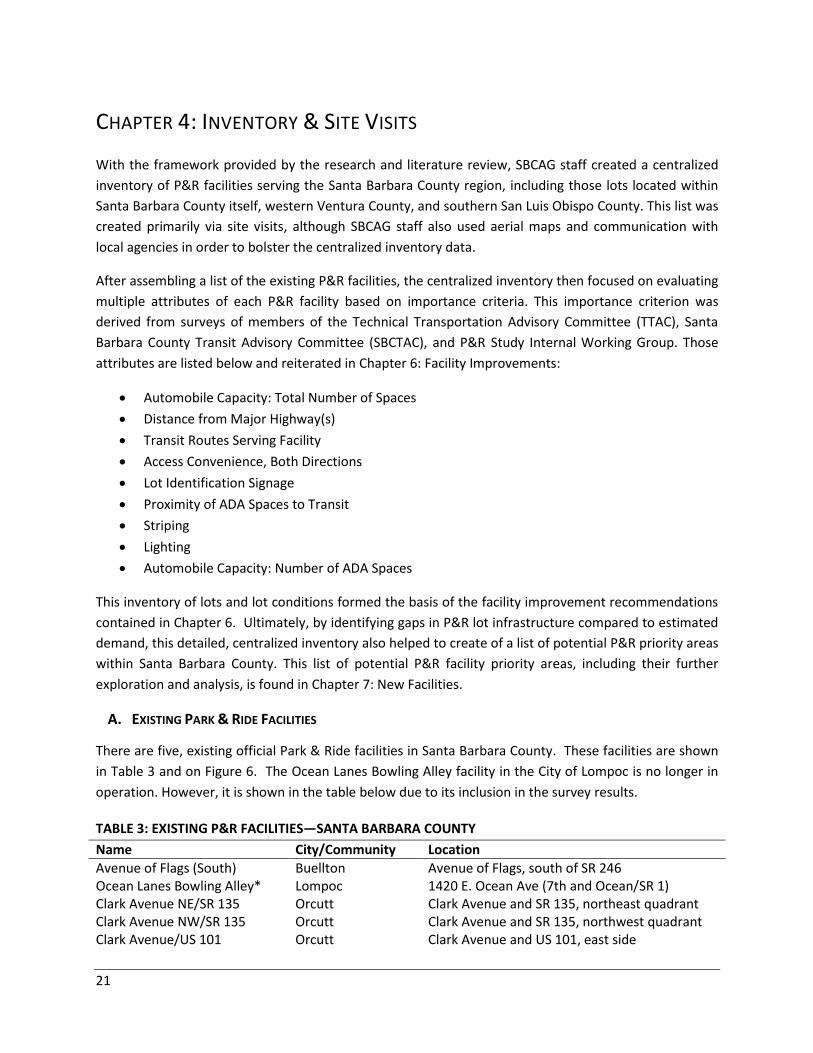
With the framework provided by the research and literature review, SBCAG staff created a centralized
inventory of P&R facilities serving the Santa Barbara County region, including those lots located within
Santa Barbara County itself, western Ventura County, and southern San Luis Obispo County. This list was
created primarily via site visits, although SBCAG staff also used aerial maps and communication with
local agencies in order to bolster the centralized inventory data.
After assembling a list of the existing P&R facilities, the centralized inventory then focused on evaluating
multiple attributes of each P&R facility based on importance criteria. This importance criterion was
derived from surveys of members of the Technical Transportation Advisory Committee (TTAC), Santa
Barbara County Transit Advisory Committee (SBCTAC), and P&R Study Internal Working Group. Those
attributes are listed below and reiterated in Chapter 6: Facility Improvements:
Automobile Capacity: Total Number of Spaces
Distance from Major Highway(s)
Transit Routes Serving Facility
Access Convenience, Both Directions
Lot Identification Signage
Proximity of ADA Spaces to Transit
Striping
Lighting
Automobile Capacity: Number of ADA Spaces
This inventory of lots and lot conditions formed the basis of the facility improvement recommendations
contained in Chapter 6. Ultimately, by identifying gaps in P&R lot infrastructure compared to estimated
demand, this detailed, centralized inventory also helped to create of a list of potential P&R priority areas
within Santa Barbara County. This list of potential P&R facility priority areas, including their further
exploration and analysis, is found in Chapter 7: New Facilities.
A. EXISTING PARK & RIDE FACILITIES
There are five, existing official Park & Ride facilities in Santa Barbara County. These facilities are shown
in Table 3 and on Figure 6. The Ocean Lanes Bowling Alley facility in the City of Lompoc is no longer in
operation. However, it is shown in the table below due to its inclusion in the survey results.
TABLE 3: EXISTING P&R FACILITIES—SANTA BARBARA COUNTY
Name City/Community Location
Avenue of Flags (South) Buellton Avenue of Flags, south of SR 246 Ocean Lanes Bowling Alley* Lompoc 1420 E. Ocean Ave (7th and Ocean/SR 1) Clark Avenue NE/SR 135 Orcutt Clark Avenue and SR 135, northeast quadrant Clark Avenue NW/SR 135 Orcutt Clark Avenue and SR 135, northwest quadrant Clark Avenue/US 101 Orcutt Clark Avenue and US 101, east side
22
Name City/Community Location
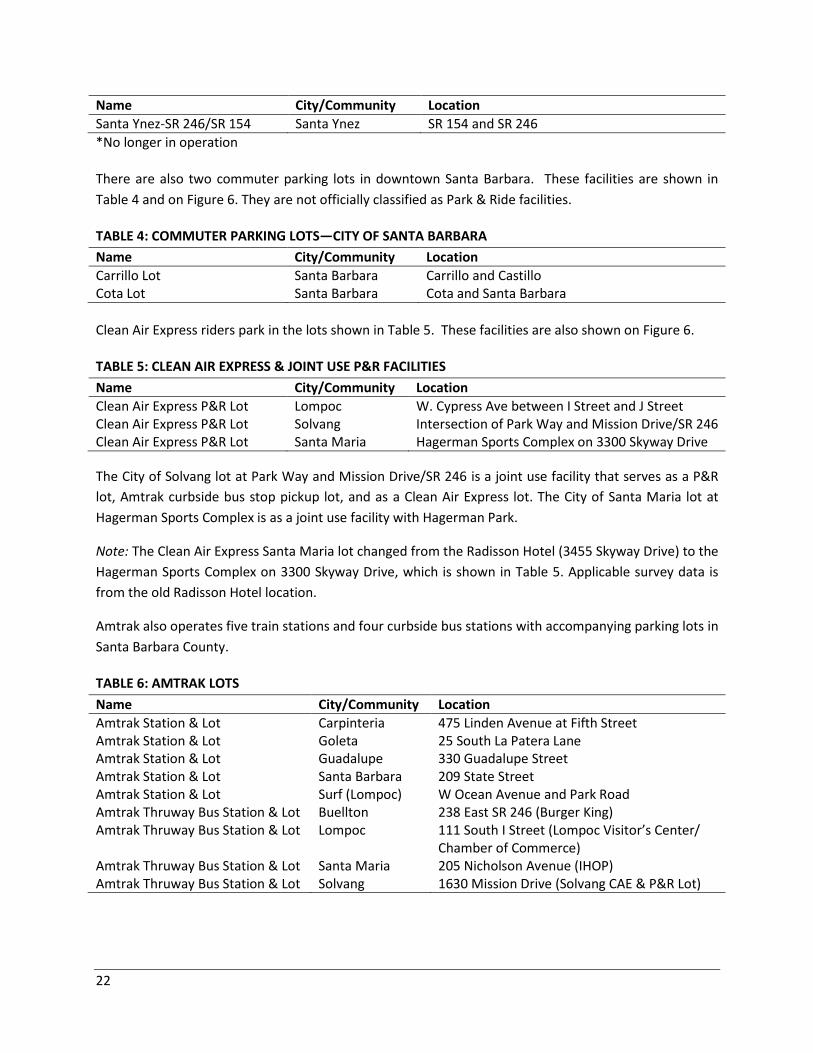
Santa Ynez-SR 246/SR 154 Santa Ynez SR 154 and SR 246
*No longer in operation
There are also two commuter parking lots in downtown Santa Barbara. These facilities are shown in
Table 4 and on Figure 6. They are not officially classified as Park & Ride facilities.
TABLE 4: COMMUTER PARKING LOTS—CITY OF SANTA BARBARA
Name City/Community Location
Carrillo Lot Santa Barbara Carrillo and Castillo Cota Lot Santa Barbara Cota and Santa Barbara
Clean Air Express riders park in the lots shown in Table 5. These facilities are also shown on Figure 6.
TABLE 5: CLEAN AIR EXPRESS & JOINT USE P&R FACILITIES
Name City/Community Location
Clean Air Express P&R Lot Lompoc W. Cypress Ave between I Street and J Street Clean Air Express P&R Lot Solvang Intersection of Park Way and Mission Drive/SR 246 Clean Air Express P&R Lot Santa Maria Hagerman Sports Complex on 3300 Skyway Drive
The City of Solvang lot at Park Way and Mission Drive/SR 246 is a joint use facility that serves as a P&R
lot, Amtrak curbside bus stop pickup lot, and as a Clean Air Express lot. The City of Santa Maria lot at
Hagerman Sports Complex is as a joint use facility with Hagerman Park.
Note: The Clean Air Express Santa Maria lot changed from the Radisson Hotel (3455 Skyway Drive) to the
Hagerman Sports Complex on 3300 Skyway Drive, which is shown in Table 5. Applicable survey data is
from the old Radisson Hotel location.
Amtrak also operates five train stations and four curbside bus stations with accompanying parking lots in
Santa Barbara County.
TABLE 6: AMTRAK LOTS
Name City/Community Location
Amtrak Station & Lot Carpinteria 475 Linden Avenue at Fifth Street Amtrak Station & Lot Goleta 25 South La Patera Lane Amtrak Station & Lot Guadalupe 330 Guadalupe Street Amtrak Station & Lot Santa Barbara 209 State Street Amtrak Station & Lot Surf (Lompoc) W Ocean Avenue and Park Road Amtrak Thruway Bus Station & Lot Buellton 238 East SR 246 (Burger King) Amtrak Thruway Bus Station & Lot Lompoc 111 South I Street (Lompoc Visitor’s Center/
Chamber of Commerce) Amtrak Thruway Bus Station & Lot Santa Maria 205 Nicholson Avenue (IHOP) Amtrak Thruway Bus Station & Lot Solvang 1630 Mission Drive (Solvang CAE & P&R Lot)
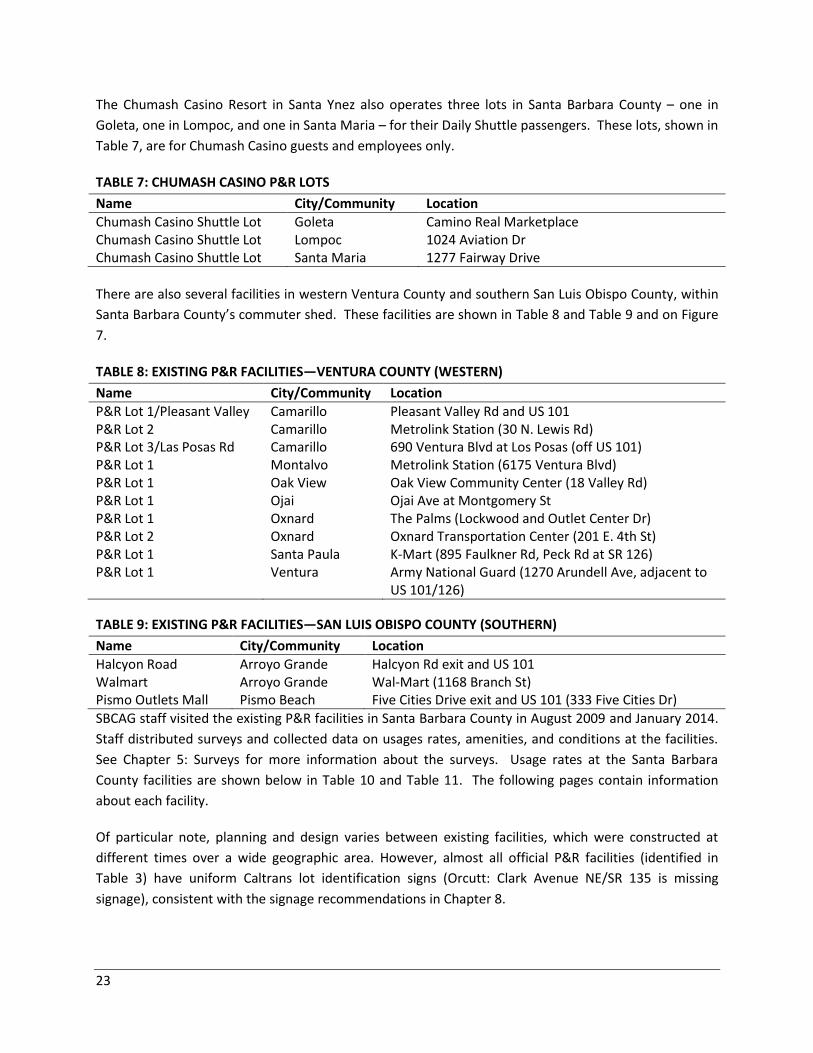
23
The Chumash Casino Resort in Santa Ynez also operates three lots in Santa Barbara County – one in
Goleta, one in Lompoc, and one in Santa Maria – for their Daily Shuttle passengers. These lots, shown in
Table 7, are for Chumash Casino guests and employees only.
TABLE 7: CHUMASH CASINO P&R LOTS
Name City/Community Location
Chumash Casino Shuttle Lot Goleta Camino Real Marketplace Chumash Casino Shuttle Lot Lompoc 1024 Aviation Dr Chumash Casino Shuttle Lot Santa Maria 1277 Fairway Drive
There are also several facilities in western Ventura County and southern San Luis Obispo County, within
Santa Barbara County’s commuter shed. These facilities are shown in Table 8 and Table 9 and on Figure
7.
TABLE 8: EXISTING P&R FACILITIES—VENTURA COUNTY (WESTERN)
Name City/Community Location
P&R Lot 1/Pleasant Valley Camarillo Pleasant Valley Rd and US 101 P&R Lot 2 Camarillo Metrolink Station (30 N. Lewis Rd) P&R Lot 3/Las Posas Rd Camarillo 690 Ventura Blvd at Los Posas (off US 101) P&R Lot 1 Montalvo Metrolink Station (6175 Ventura Blvd) P&R Lot 1 Oak View Oak View Community Center (18 Valley Rd) P&R Lot 1 Ojai Ojai Ave at Montgomery St P&R Lot 1 Oxnard The Palms (Lockwood and Outlet Center Dr) P&R Lot 2 Oxnard Oxnard Transportation Center (201 E. 4th St) P&R Lot 1 Santa Paula K-Mart (895 Faulkner Rd, Peck Rd at SR 126) P&R Lot 1 Ventura Army National Guard (1270 Arundell Ave, adjacent to
US 101/126)
TABLE 9: EXISTING P&R FACILITIES—SAN LUIS OBISPO COUNTY (SOUTHERN)
Name City/Community Location
Halcyon Road Arroyo Grande Halcyon Rd exit and US 101 Walmart Arroyo Grande Wal-Mart (1168 Branch St) Pismo Outlets Mall Pismo Beach Five Cities Drive exit and US 101 (333 Five Cities Dr)
SBCAG staff visited the existing P&R facilities in Santa Barbara County in August 2009 and January 2014.
Staff distributed surveys and collected data on usages rates, amenities, and conditions at the facilities.
See Chapter 5: Surveys for more information about the surveys. Usage rates at the Santa Barbara
County facilities are shown below in Table 10 and Table 11. The following pages contain information
about each facility.
Of particular note, planning and design varies between existing facilities, which were constructed at
different times over a wide geographic area. However, almost all official P&R facilities (identified in
Table 3) have uniform Caltrans lot identification signs (Orcutt: Clark Avenue NE/SR 135 is missing
signage), consistent with the signage recommendations in Chapter 8.
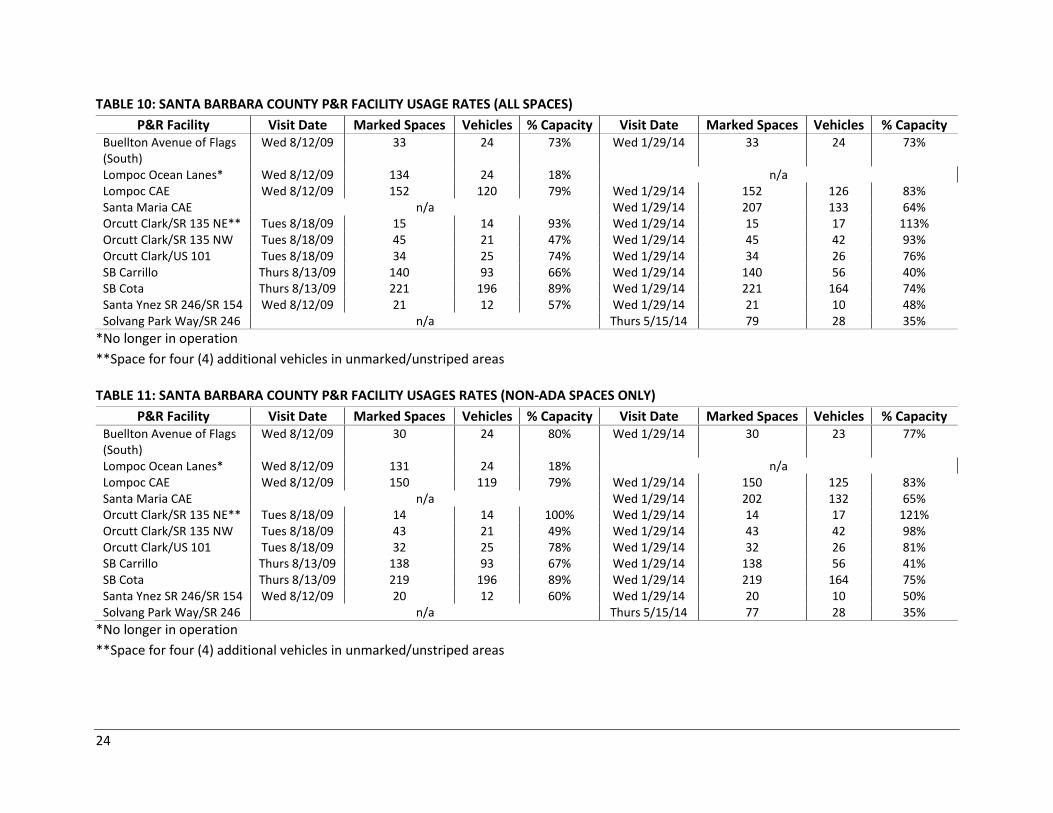
24
TABLE 10: SANTA BARBARA COUNTY P&R FACILITY USAGE RATES (ALL SPACES)
P&R Facility Visit Date Marked Spaces Vehicles % Capacity Visit Date Marked Spaces Vehicles % Capacity Buellton Avenue of Flags (South)
Wed 8/12/09 33 24 73% Wed 1/29/14 33 24 73%
Lompoc Ocean Lanes* Wed 8/12/09 134 24 18% n/a Lompoc CAE Wed 8/12/09 152 120 79% Wed 1/29/14 152 126 83% Santa Maria CAE n/a Wed 1/29/14 207 133 64% Orcutt Clark/SR 135 NE** Tues 8/18/09 15 14 93% Wed 1/29/14 15 17 113% Orcutt Clark/SR 135 NW Tues 8/18/09 45 21 47% Wed 1/29/14 45 42 93% Orcutt Clark/US 101 Tues 8/18/09 34 25 74% Wed 1/29/14 34 26 76% SB Carrillo Thurs 8/13/09 140 93 66% Wed 1/29/14 140 56 40% SB Cota Thurs 8/13/09 221 196 89% Wed 1/29/14 221 164 74% Santa Ynez SR 246/SR 154 Wed 8/12/09 21 12 57% Wed 1/29/14 21 10 48% Solvang Park Way/SR 246 n/a Thurs 5/15/14 79 28 35%
*No longer in operation
**Space for four (4) additional vehicles in unmarked/unstriped areas
TABLE 11: SANTA BARBARA COUNTY P&R FACILITY USAGES RATES (NON-ADA SPACES ONLY)
P&R Facility Visit Date Marked Spaces Vehicles % Capacity Visit Date Marked Spaces Vehicles % Capacity Buellton Avenue of Flags (South)
Wed 8/12/09 30 24 80% Wed 1/29/14 30 23 77%
Lompoc Ocean Lanes* Wed 8/12/09 131 24 18% n/a Lompoc CAE Wed 8/12/09 150 119 79% Wed 1/29/14 150 125 83% Santa Maria CAE n/a Wed 1/29/14 202 132 65% Orcutt Clark/SR 135 NE** Tues 8/18/09 14 14 100% Wed 1/29/14 14 17 121% Orcutt Clark/SR 135 NW Tues 8/18/09 43 21 49% Wed 1/29/14 43 42 98% Orcutt Clark/US 101 Tues 8/18/09 32 25 78% Wed 1/29/14 32 26 81% SB Carrillo Thurs 8/13/09 138 93 67% Wed 1/29/14 138 56 41% SB Cota Thurs 8/13/09 219 196 89% Wed 1/29/14 219 164 75% Santa Ynez SR 246/SR 154 Wed 8/12/09 20 12 60% Wed 1/29/14 20 10 50% Solvang Park Way/SR 246 n/a Thurs 5/15/14 77 28 35%
*No longer in operation
**Space for four (4) additional vehicles in unmarked/unstriped areas
25
These Caltrans lot identification signs are illustrated in Figure 49 and Figure 50 in Chapter 8: Facility
Design Standards in Signage & Focal Points subsection. However, almost all P&R facilities lack Caltrans
standard directional signage shown in Figure 52 (the Santa Ynez: 246 & 154 lot has directional signage).
As the tables below will show, the existence of uniform signage varies.
A more detailed description of the existing P&R facilities by jurisdiction follows. In the tables that
follow, where information is not available (e.g., because a facility is longer in operation), this
information is labeled “n/a” (not available/applicable).
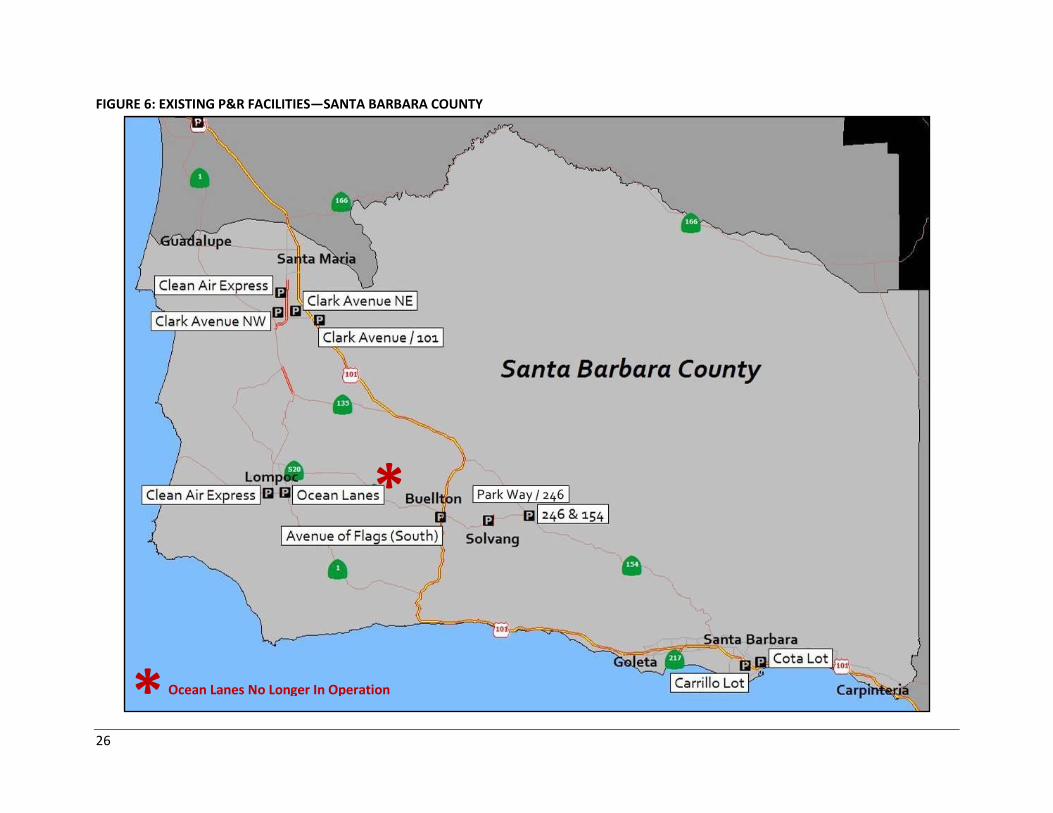
26
FIGURE 6: EXISTING P&R FACILITIES—SANTA BARBARA COUNTY
*
* Ocean Lanes No Longer In Operation
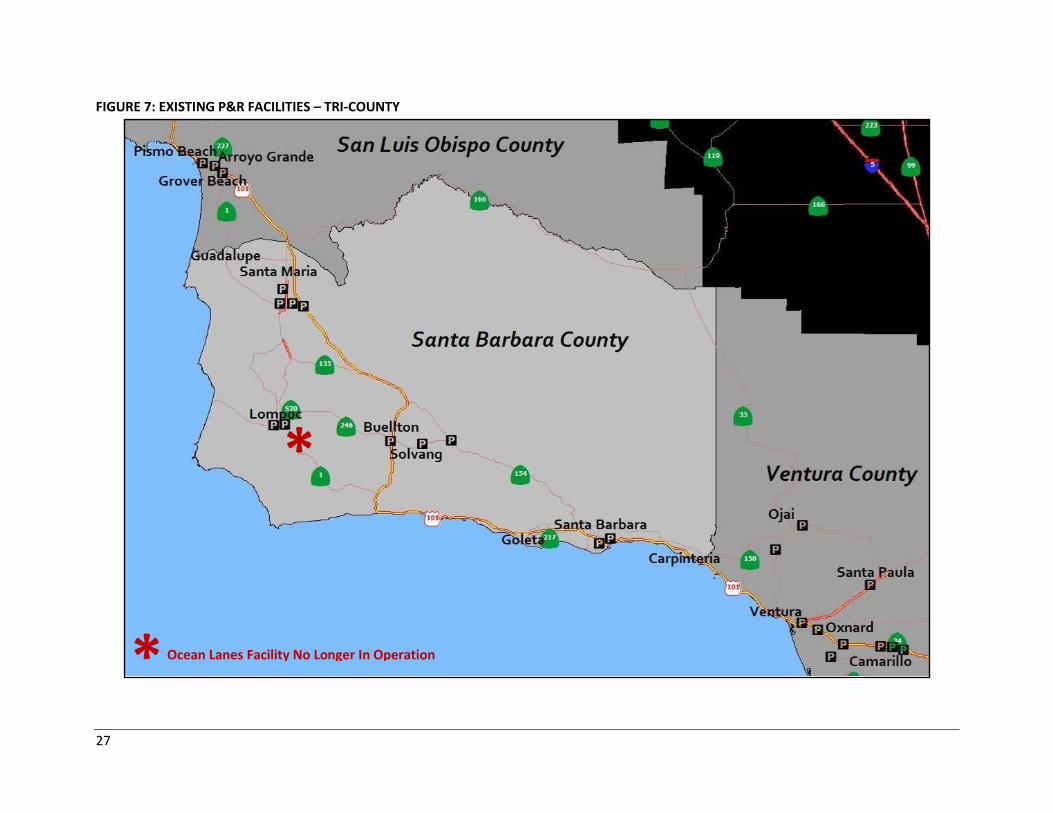
27
FIGURE 7: EXISTING P&R FACILITIES – TRI-COUNTY
*
* Ocean Lanes Facility No Longer In Operation
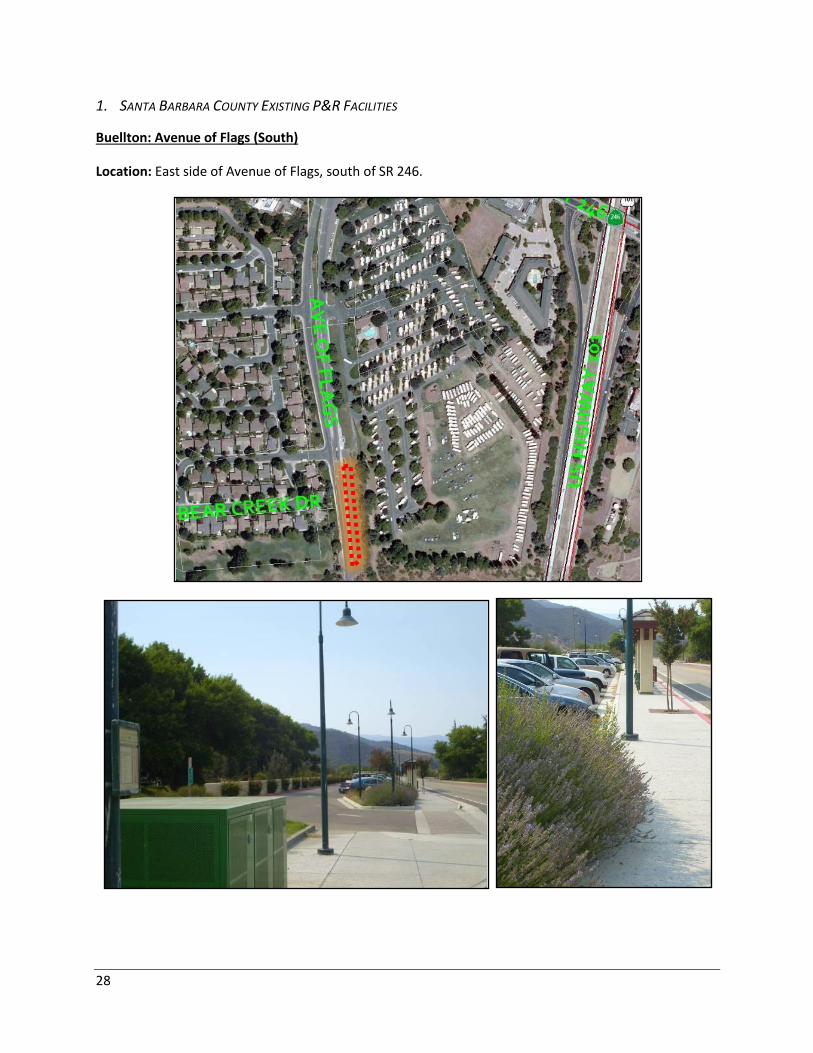
28
1. SANTA BARBARA COUNTY EXISTING P&R FACILITIES
Buellton: Avenue of Flags (South)
Location: East side of Avenue of Flags, south of SR 246.
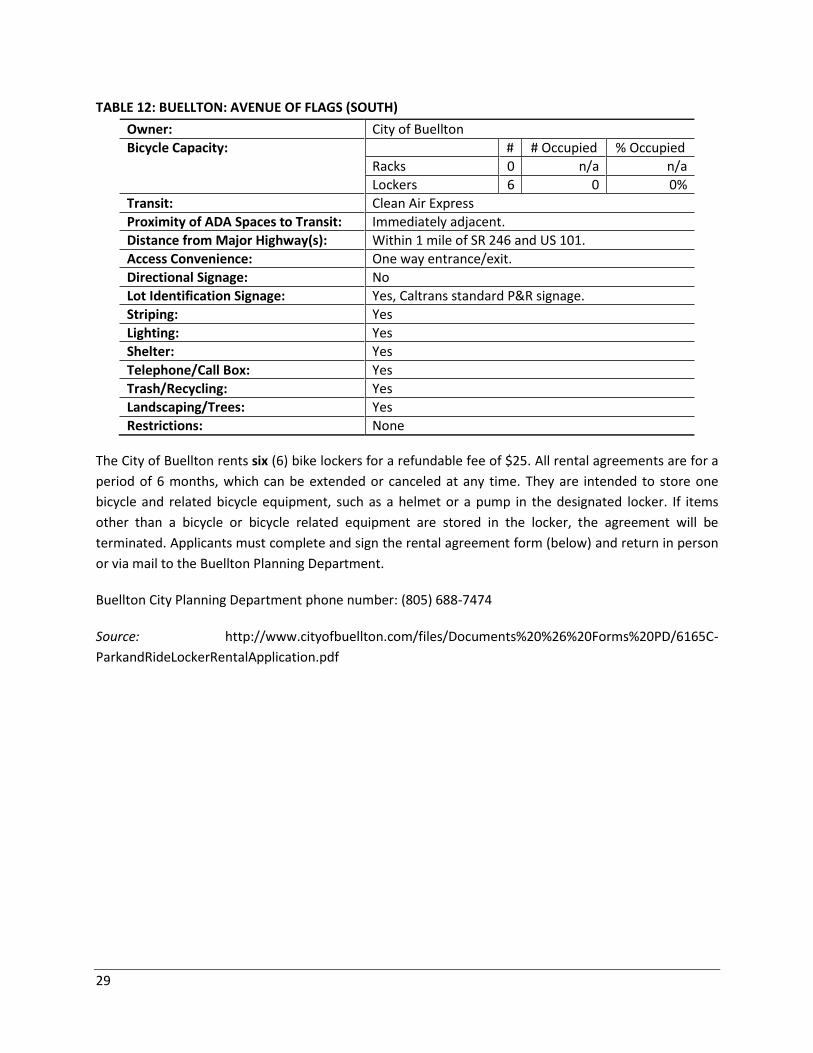
29
TABLE 12: BUELLTON: AVENUE OF FLAGS (SOUTH)
Owner: City of Buellton
Bicycle Capacity: # # Occupied % Occupied
Racks 0 n/a n/a
Lockers 6 0 0%
Transit: Clean Air Express
Proximity of ADA Spaces to Transit: Immediately adjacent.
Distance from Major Highway(s): Within 1 mile of SR 246 and US 101.
Access Convenience: One way entrance/exit.
Directional Signage: No
Lot Identification Signage: Yes, Caltrans standard P&R signage.
Striping: Yes
Lighting: Yes
Shelter: Yes
Telephone/Call Box: Yes
Trash/Recycling: Yes
Landscaping/Trees: Yes
Restrictions: None
The City of Buellton rents six (6) bike lockers for a refundable fee of $25. All rental agreements are for a
period of 6 months, which can be extended or canceled at any time. They are intended to store one
bicycle and related bicycle equipment, such as a helmet or a pump in the designated locker. If items
other than a bicycle or bicycle related equipment are stored in the locker, the agreement will be
terminated. Applicants must complete and sign the rental agreement form (below) and return in person
or via mail to the Buellton Planning Department.
Buellton City Planning Department phone number: (805) 688-7474
Source: http://www.cityofbuellton.com/files/Documents%20%26%20Forms%20PD/6165C-
ParkandRideLockerRentalApplication.pdf
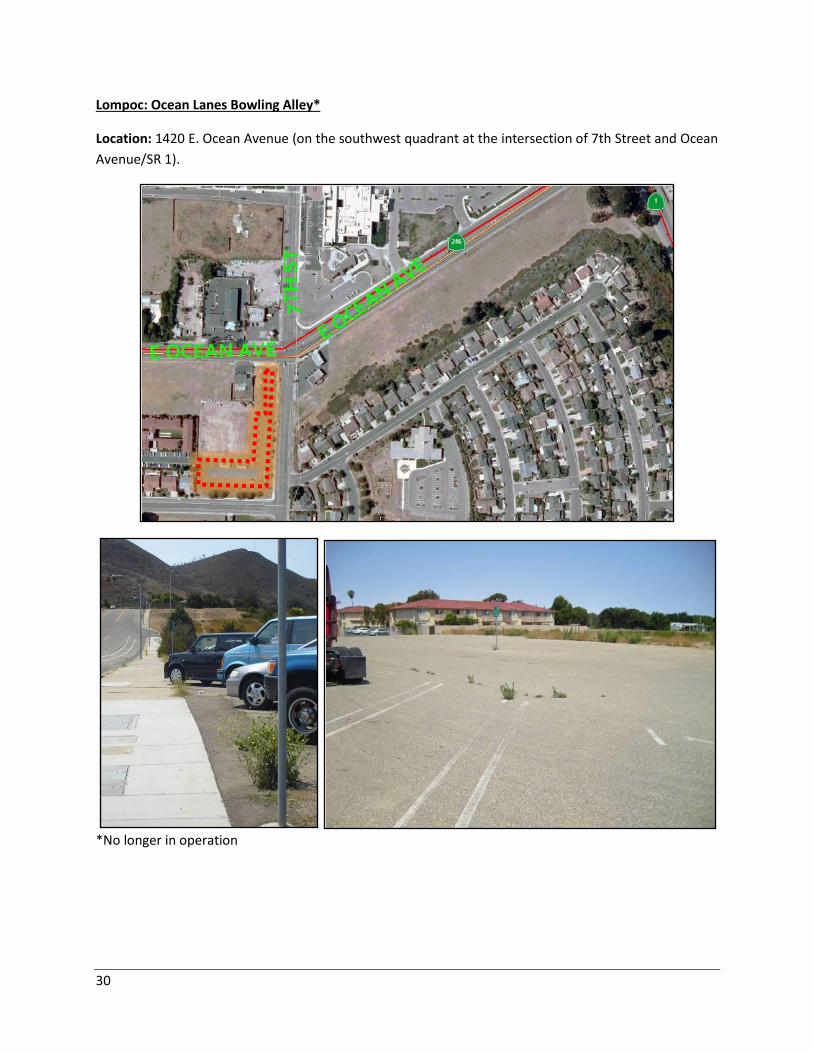
30
Lompoc: Ocean Lanes Bowling Alley*
Location: 1420 E. Ocean Avenue (on the southwest quadrant at the intersection of 7th Street and Ocean
Avenue/SR 1).
*No longer in operation
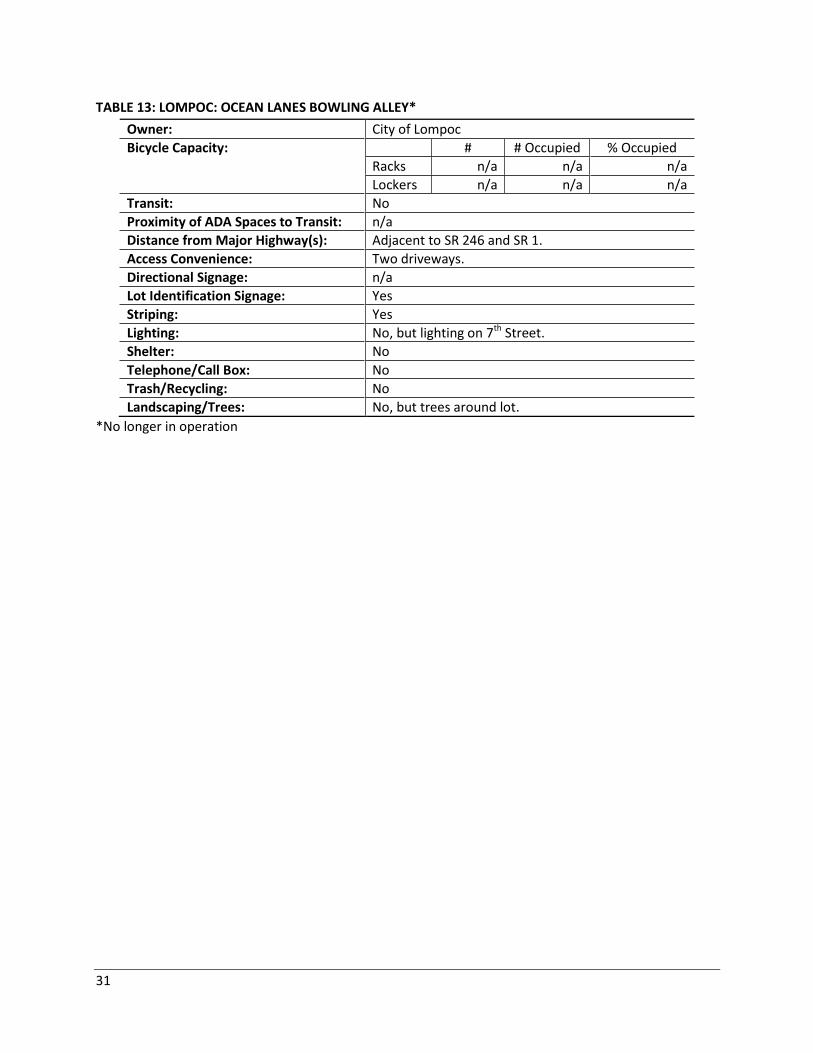
31
TABLE 13: LOMPOC: OCEAN LANES BOWLING ALLEY*
Owner: City of Lompoc
Bicycle Capacity: # # Occupied % Occupied
Racks n/a n/a n/a
Lockers n/a n/a n/a
Transit: No
Proximity of ADA Spaces to Transit: n/a
Distance from Major Highway(s): Adjacent to SR 246 and SR 1.
Access Convenience: Two driveways.
Directional Signage: n/a
Lot Identification Signage: Yes
Striping: Yes
Lighting: No, but lighting on 7th Street.
Shelter: No
Telephone/Call Box: No
Trash/Recycling: No
Landscaping/Trees: No, but trees around lot.
*No longer in operation
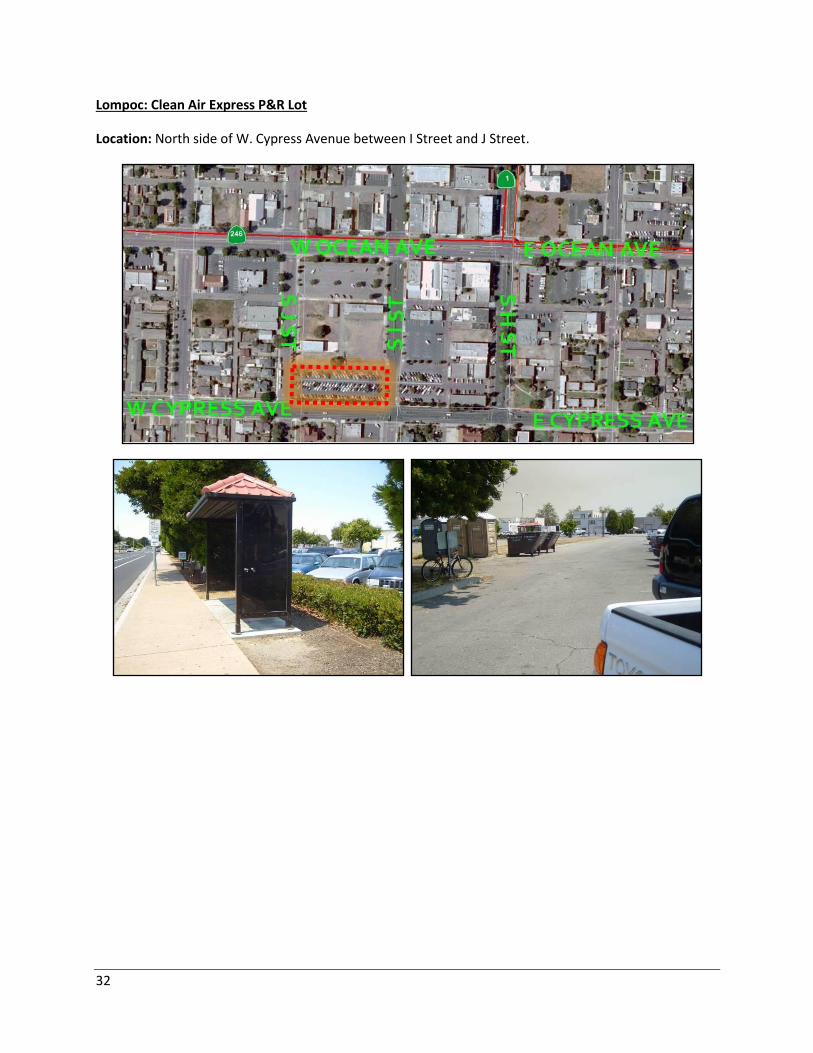
32
Lompoc: Clean Air Express P&R Lot
Location: North side of W. Cypress Avenue between I Street and J Street.
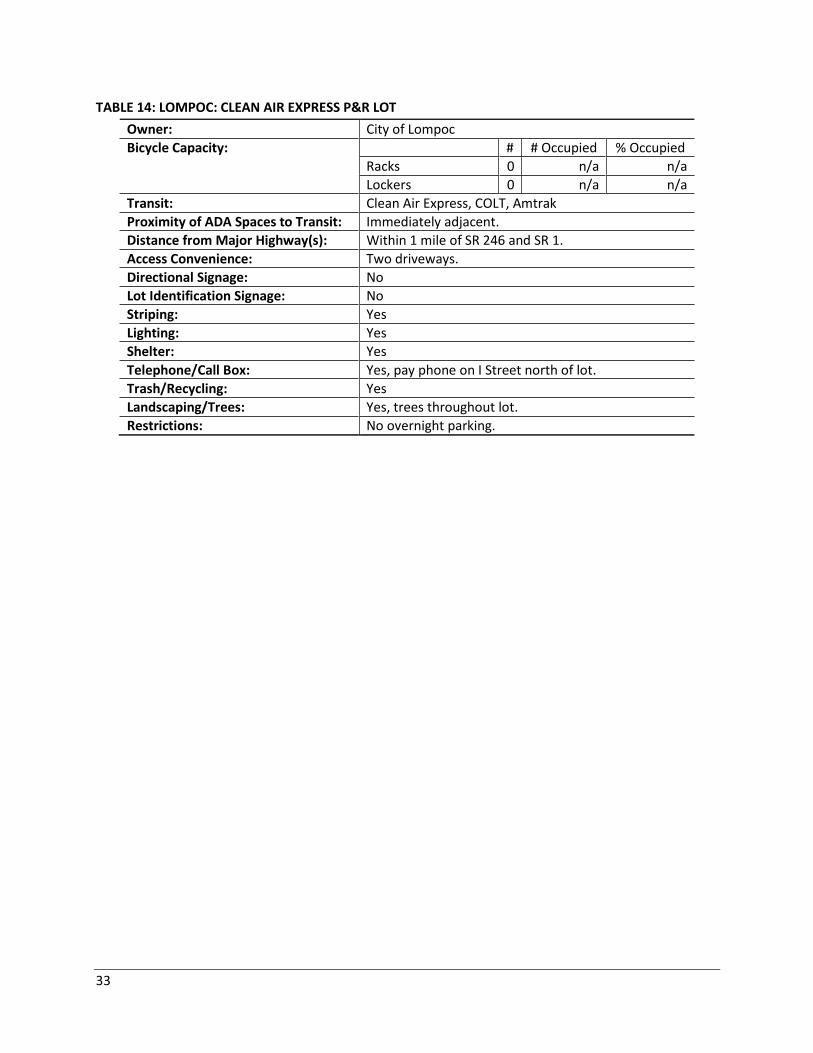
33
TABLE 14: LOMPOC: CLEAN AIR EXPRESS P&R LOT
Owner: City of Lompoc
Bicycle Capacity: # # Occupied % Occupied
Racks 0 n/a n/a
Lockers 0 n/a n/a
Transit: Clean Air Express, COLT, Amtrak
Proximity of ADA Spaces to Transit: Immediately adjacent.
Distance from Major Highway(s): Within 1 mile of SR 246 and SR 1.
Access Convenience: Two driveways.
Directional Signage: No
Lot Identification Signage: No
Striping: Yes
Lighting: Yes
Shelter: Yes
Telephone/Call Box: Yes, pay phone on I Street north of lot.
Trash/Recycling: Yes
Landscaping/Trees: Yes, trees throughout lot.
Restrictions: No overnight parking.
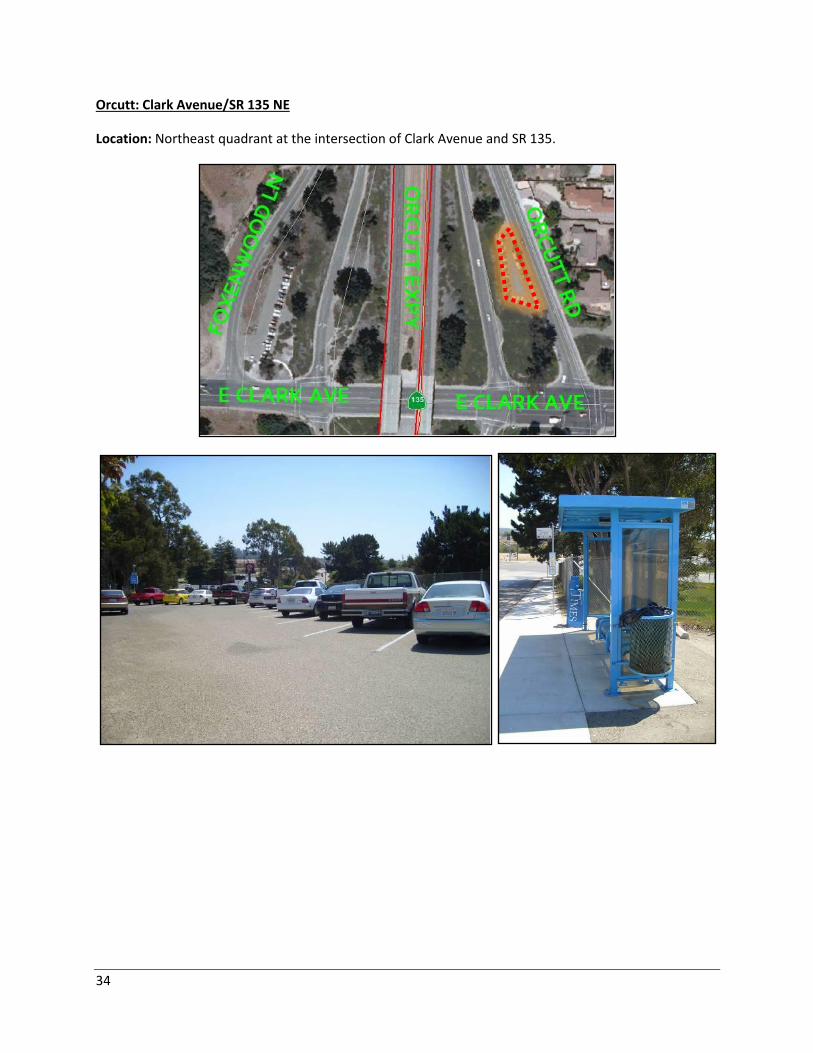
34
Orcutt: Clark Avenue/SR 135 NE
Location: Northeast quadrant at the intersection of Clark Avenue and SR 135.
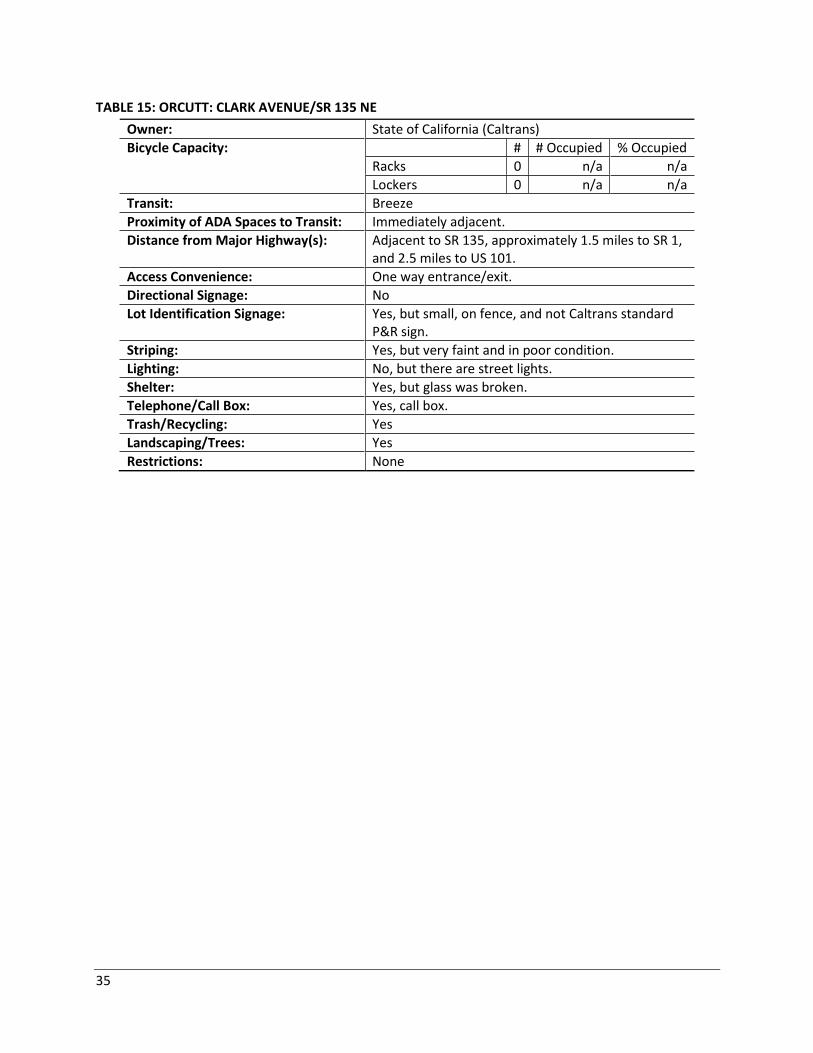
35
TABLE 15: ORCUTT: CLARK AVENUE/SR 135 NE
Owner: State of California (Caltrans)
Bicycle Capacity: # # Occupied % Occupied
Racks 0 n/a n/a
Lockers 0 n/a n/a
Transit: Breeze
Proximity of ADA Spaces to Transit: Immediately adjacent.
Distance from Major Highway(s): Adjacent to SR 135, approximately 1.5 miles to SR 1, and 2.5 miles to US 101.
Access Convenience: One way entrance/exit.
Directional Signage: No
Lot Identification Signage: Yes, but small, on fence, and not Caltrans standard P&R sign.
Striping: Yes, but very faint and in poor condition.
Lighting: No, but there are street lights.
Shelter: Yes, but glass was broken.
Telephone/Call Box: Yes, call box.
Trash/Recycling: Yes
Landscaping/Trees: Yes
Restrictions: None
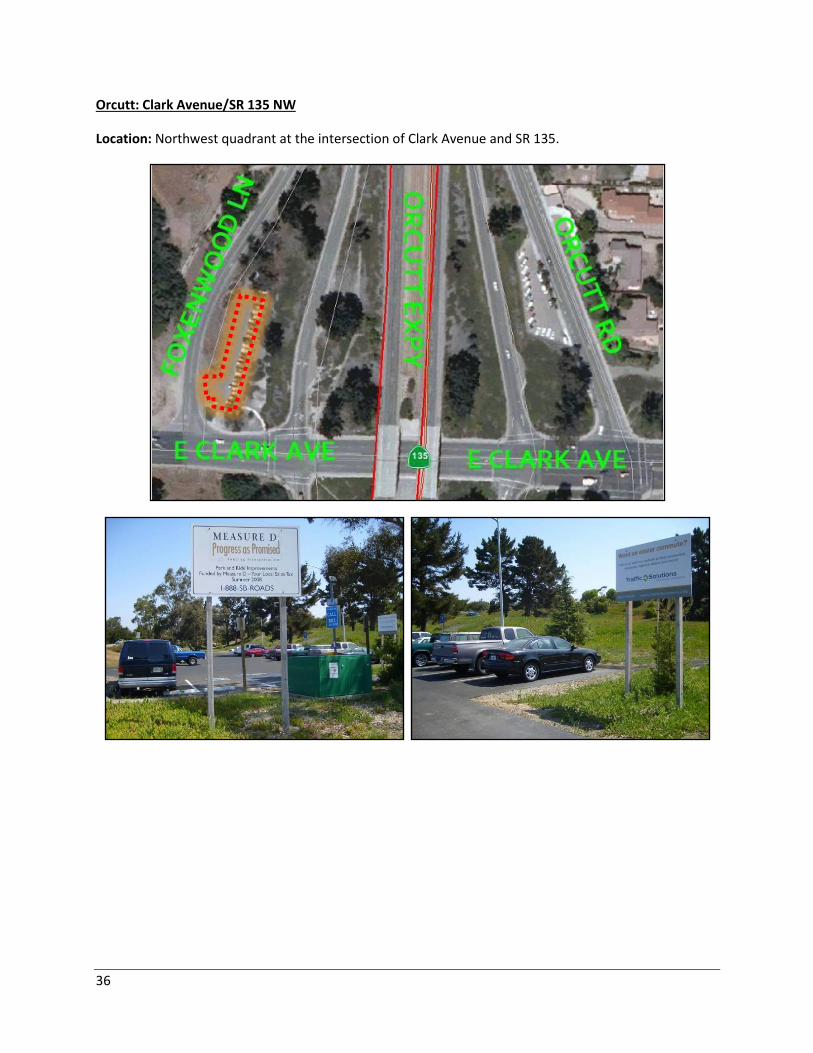
36
Orcutt: Clark Avenue/SR 135 NW
Location: Northwest quadrant at the intersection of Clark Avenue and SR 135.
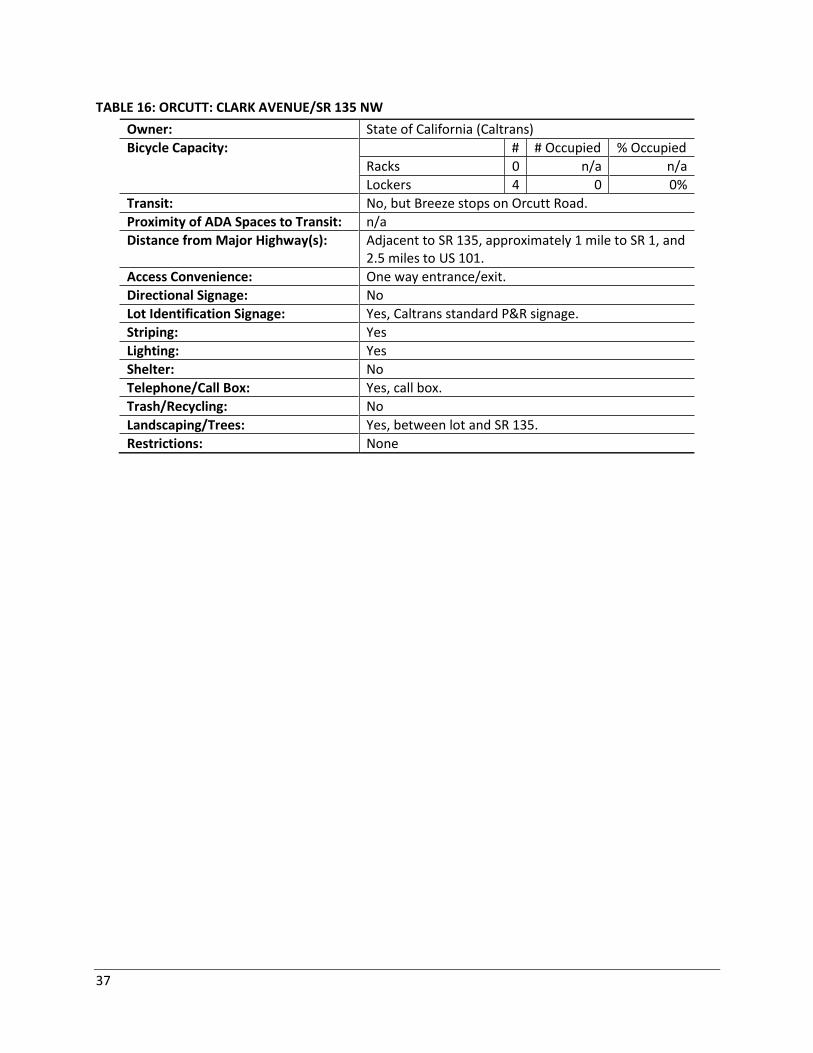
37
TABLE 16: ORCUTT: CLARK AVENUE/SR 135 NW
Owner: State of California (Caltrans)
Bicycle Capacity: # # Occupied % Occupied
Racks 0 n/a n/a
Lockers 4 0 0%
Transit: No, but Breeze stops on Orcutt Road.
Proximity of ADA Spaces to Transit: n/a
Distance from Major Highway(s): Adjacent to SR 135, approximately 1 mile to SR 1, and 2.5 miles to US 101.
Access Convenience: One way entrance/exit.
Directional Signage: No
Lot Identification Signage: Yes, Caltrans standard P&R signage.
Striping: Yes
Lighting: Yes
Shelter: No
Telephone/Call Box: Yes, call box.
Trash/Recycling: No
Landscaping/Trees: Yes, between lot and SR 135.
Restrictions: None
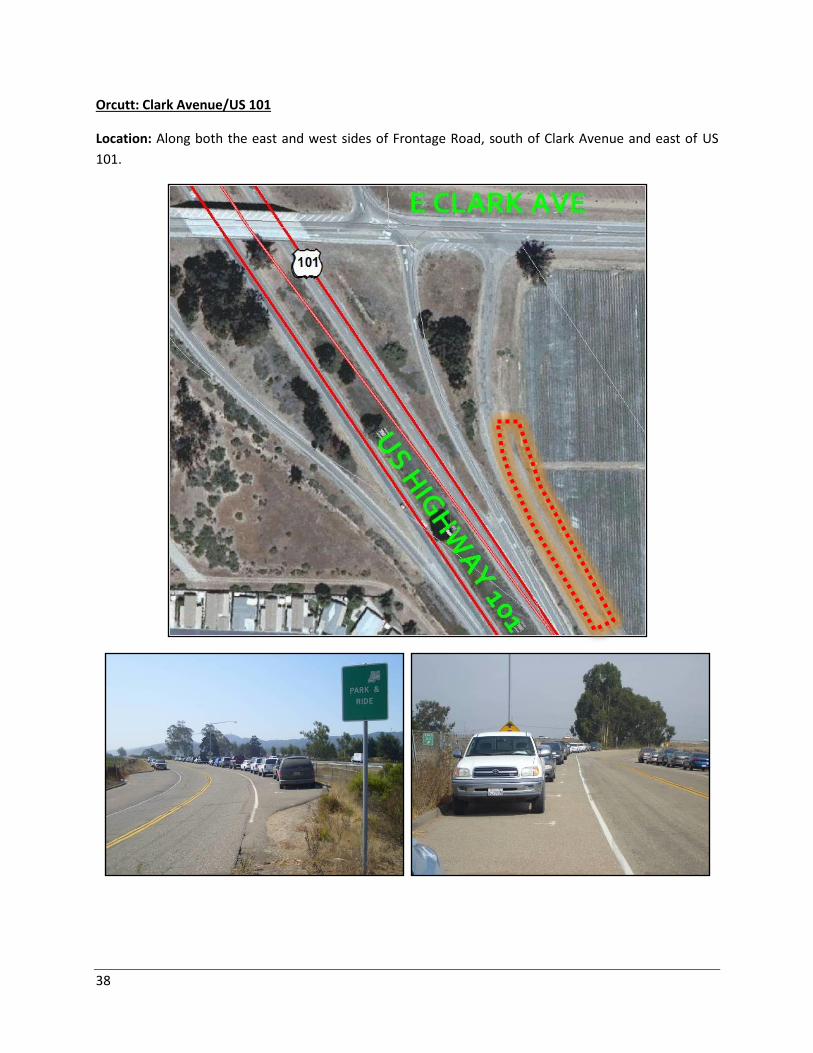
38
Orcutt: Clark Avenue/US 101
Location: Along both the east and west sides of Frontage Road, south of Clark Avenue and east of US
101.
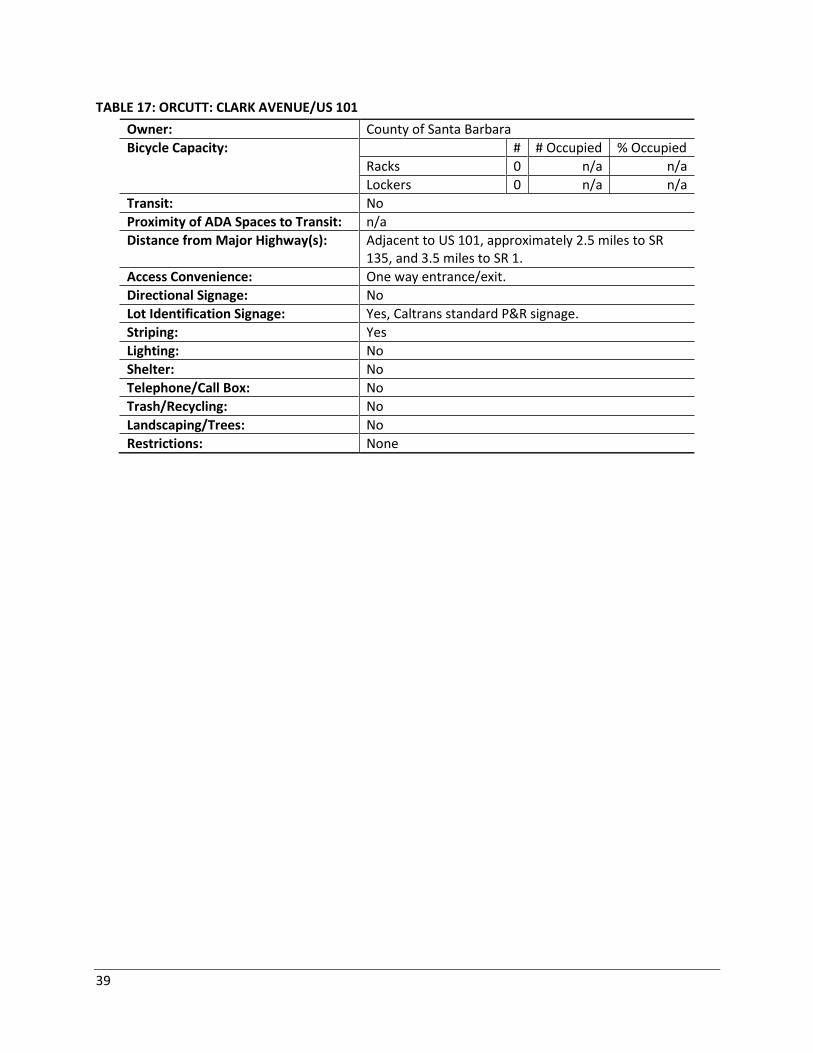
39
TABLE 17: ORCUTT: CLARK AVENUE/US 101
Owner: County of Santa Barbara
Bicycle Capacity: # # Occupied % Occupied
Racks 0 n/a n/a
Lockers 0 n/a n/a
Transit: No
Proximity of ADA Spaces to Transit: n/a
Distance from Major Highway(s): Adjacent to US 101, approximately 2.5 miles to SR 135, and 3.5 miles to SR 1.
Access Convenience: One way entrance/exit.
Directional Signage: No
Lot Identification Signage: Yes, Caltrans standard P&R signage.
Striping: Yes
Lighting: No
Shelter: No
Telephone/Call Box: No
Trash/Recycling: No
Landscaping/Trees: No
Restrictions: None
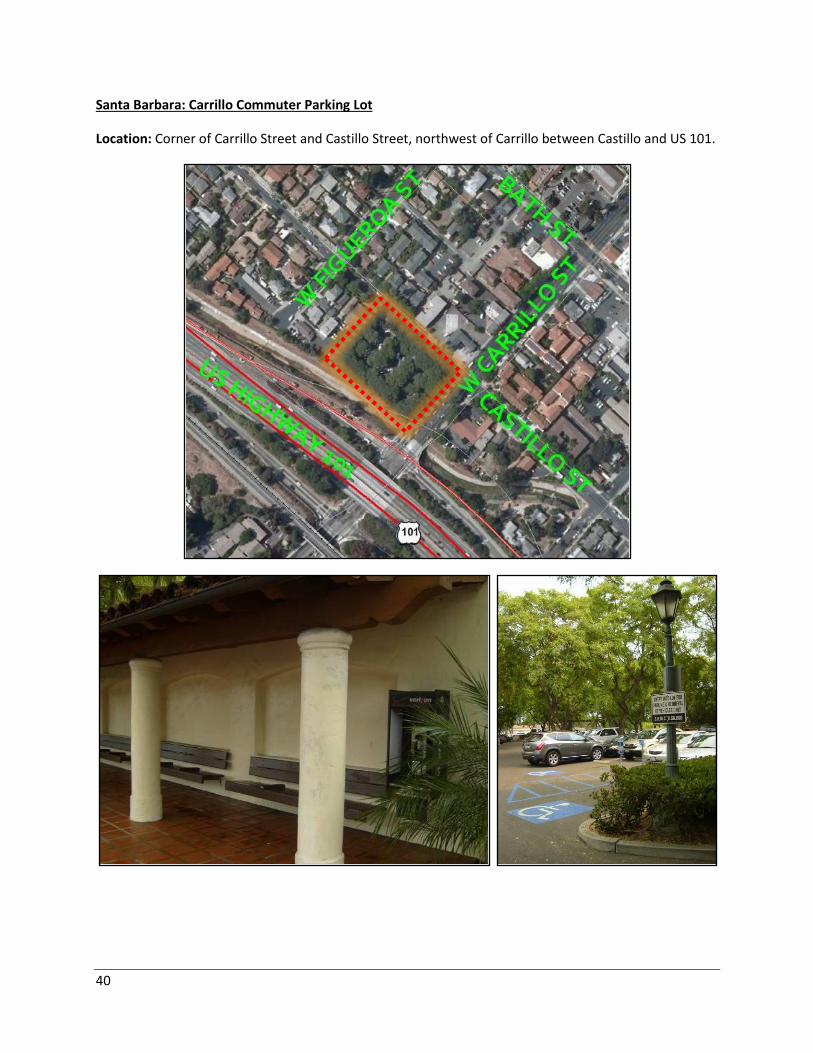
40
Santa Barbara: Carrillo Commuter Parking Lot
Location: Corner of Carrillo Street and Castillo Street, northwest of Carrillo between Castillo and US 101.

41
TABLE 18: SANTA BARBARA: CARRILLO COMMUTER PARKING LOT
Owner: City of Santa Barbara
Bicycle Capacity: # # Occupied % Occupied
Racks 0 n/a n/a
Lockers 0 n/a n/a
Transit: SBMTD Commuter Lot Shuttle
Proximity of ADA Spaces to Transit: Immediately adjacent.
Distance from Major Highway(s): Within 1 mile of US 101/SR 1.
Access Convenience: Two driveways.
Directional Signage: No
Lot Identification Signage: Yes
Striping: Yes
Lighting: Yes
Shelter: Yes
Telephone/Call Box: Yes, pay phone.
Trash/Recycling: Yes
Landscaping/Trees: Yes, trees throughout lot.
Restrictions: Maximum stay is 72 hours.
The City of Santa Barbara sells $40 monthly permits for this commuter lot
(http://www.santabarbaraca.gov/gov/depts/pw/dtp/permits.asp, accessed December 11, 2013).
SBMTD provides service to and from the lot on the Commuter Lot Shuttle and a free boarding pass for
the Downtown-Waterfront Shuttle.
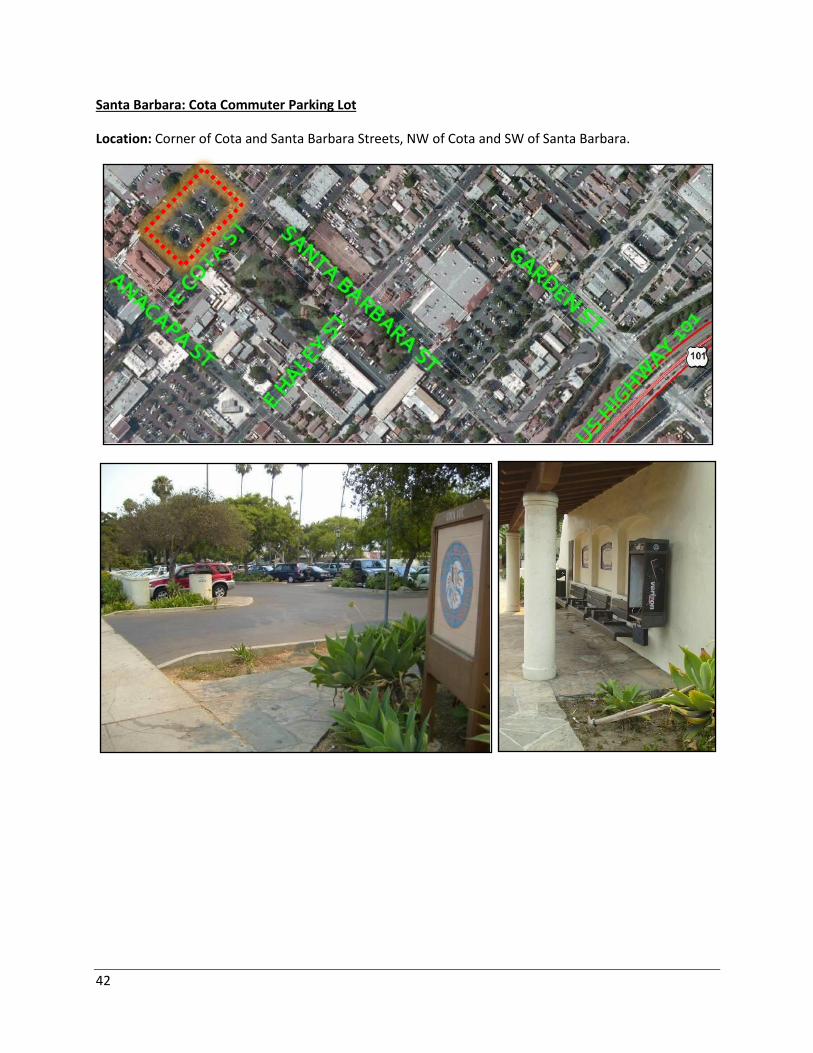
42
Santa Barbara: Cota Commuter Parking Lot
Location: Corner of Cota and Santa Barbara Streets, NW of Cota and SW of Santa Barbara.
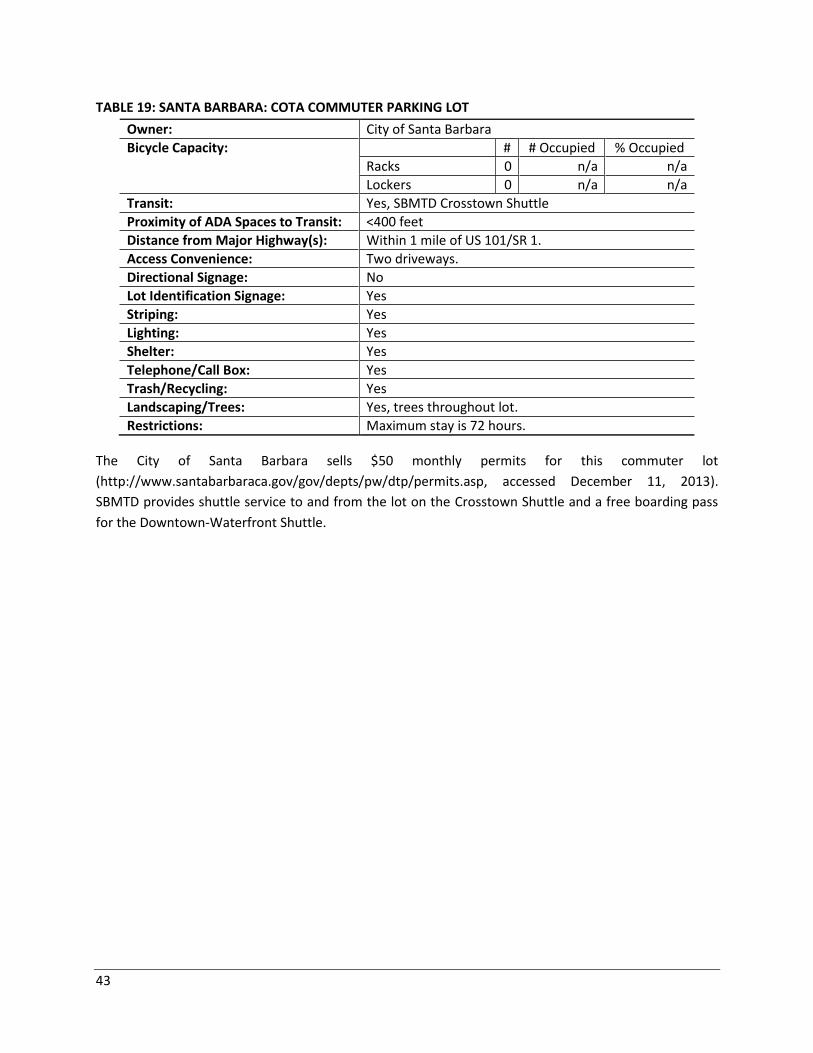
43
TABLE 19: SANTA BARBARA: COTA COMMUTER PARKING LOT
Owner: City of Santa Barbara
Bicycle Capacity: # # Occupied % Occupied
Racks 0 n/a n/a
Lockers 0 n/a n/a
Transit: Yes, SBMTD Crosstown Shuttle
Proximity of ADA Spaces to Transit: <400 feet
Distance from Major Highway(s): Within 1 mile of US 101/SR 1.
Access Convenience: Two driveways.
Directional Signage: No
Lot Identification Signage: Yes
Striping: Yes
Lighting: Yes
Shelter: Yes
Telephone/Call Box: Yes
Trash/Recycling: Yes
Landscaping/Trees: Yes, trees throughout lot.
Restrictions: Maximum stay is 72 hours.
The City of Santa Barbara sells $50 monthly permits for this commuter lot
(http://www.santabarbaraca.gov/gov/depts/pw/dtp/permits.asp, accessed December 11, 2013).
SBMTD provides shuttle service to and from the lot on the Crosstown Shuttle and a free boarding pass
for the Downtown-Waterfront Shuttle.
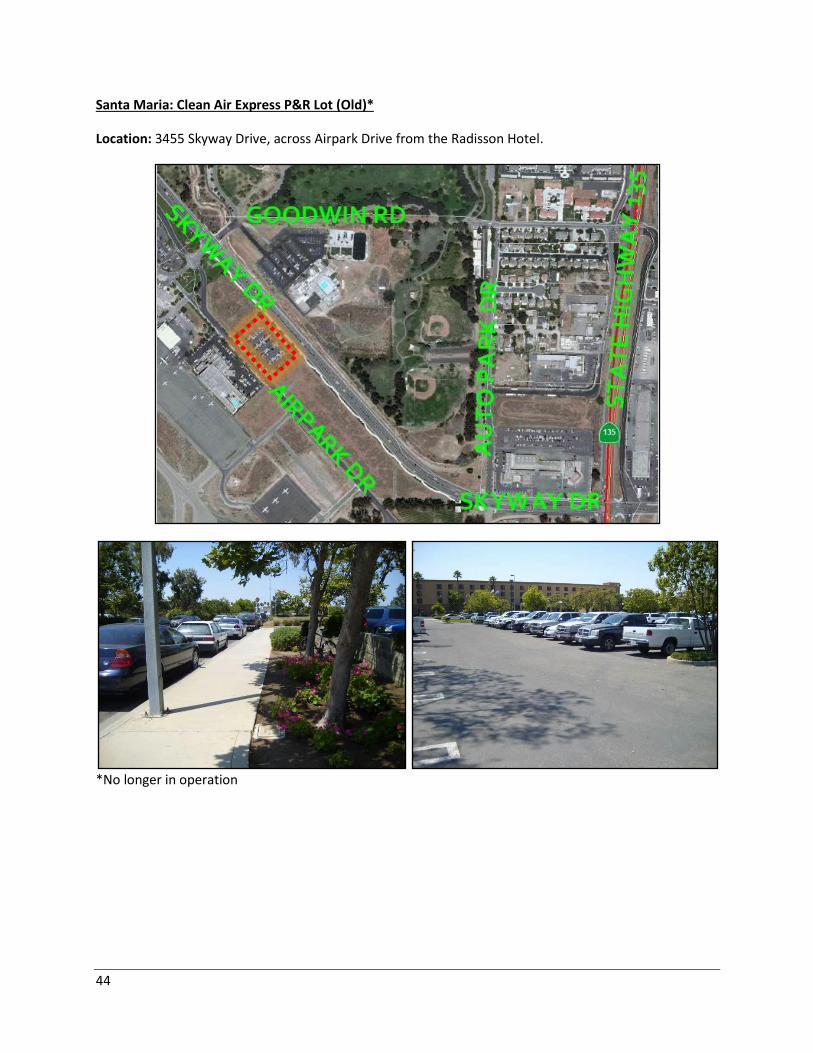
44
Santa Maria: Clean Air Express P&R Lot (Old)*
Location: 3455 Skyway Drive, across Airpark Drive from the Radisson Hotel.
*No longer in operation
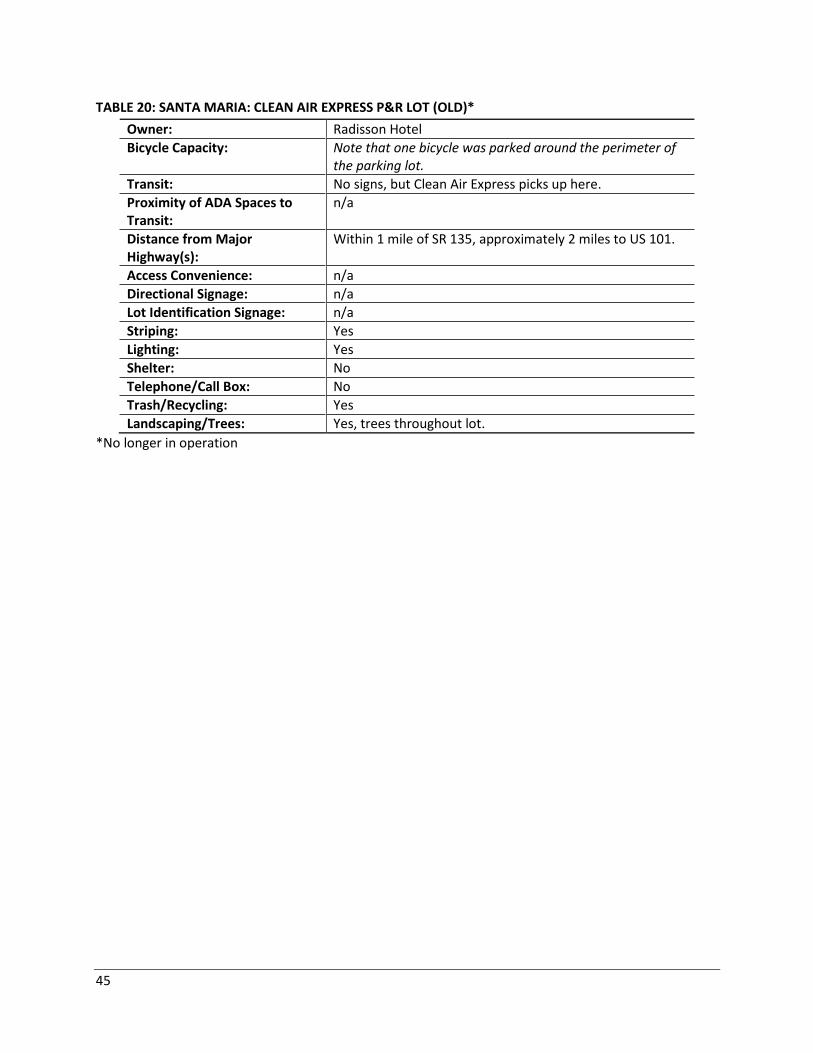
45
TABLE 20: SANTA MARIA: CLEAN AIR EXPRESS P&R LOT (OLD)*
Owner: Radisson Hotel
Bicycle Capacity: Note that one bicycle was parked around the perimeter of the parking lot.
Transit: No signs, but Clean Air Express picks up here.
Proximity of ADA Spaces to Transit:
n/a
Distance from Major Highway(s):
Within 1 mile of SR 135, approximately 2 miles to US 101.
Access Convenience: n/a
Directional Signage: n/a
Lot Identification Signage: n/a
Striping: Yes
Lighting: Yes
Shelter: No
Telephone/Call Box: No
Trash/Recycling: Yes
Landscaping/Trees: Yes, trees throughout lot.
*No longer in operation
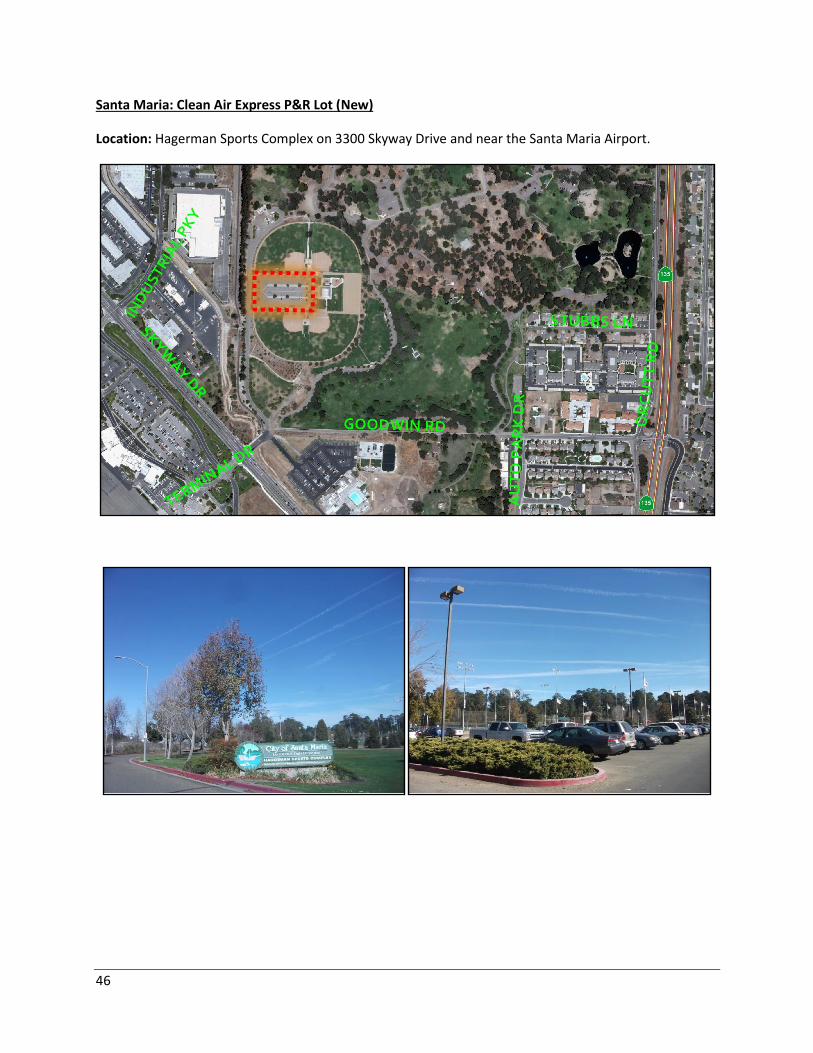
46
Santa Maria: Clean Air Express P&R Lot (New)
Location: Hagerman Sports Complex on 3300 Skyway Drive and near the Santa Maria Airport.
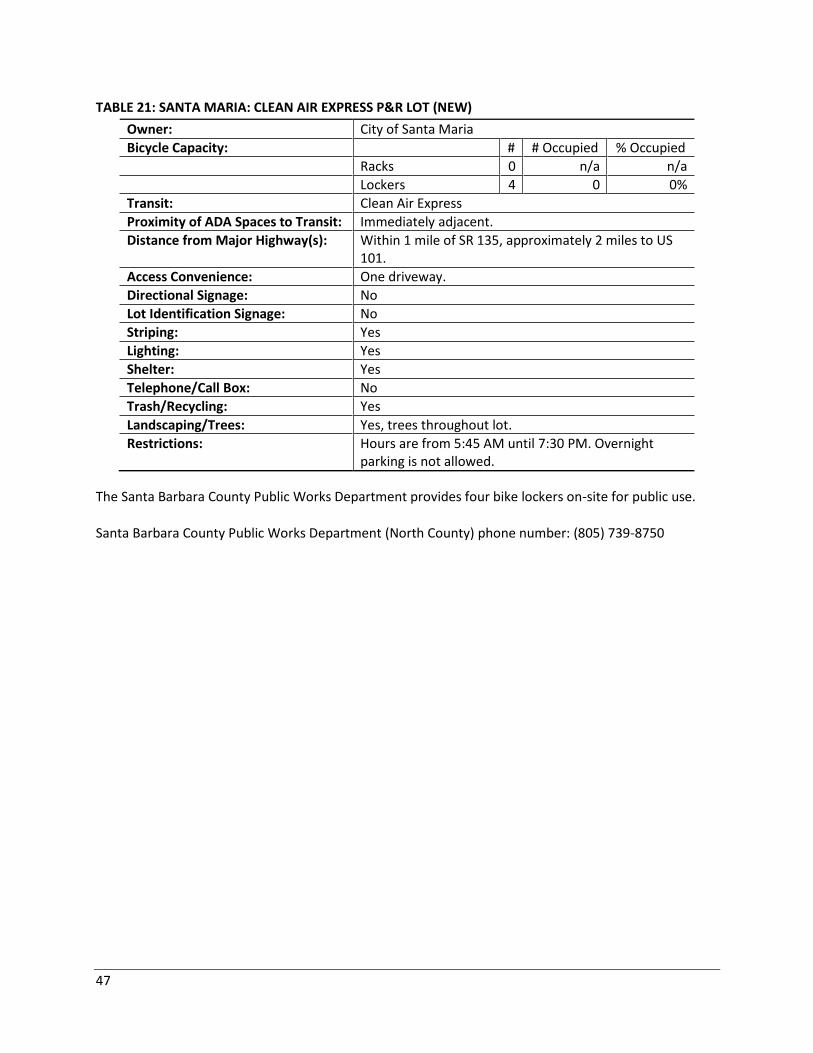
47
TABLE 21: SANTA MARIA: CLEAN AIR EXPRESS P&R LOT (NEW)
Owner: City of Santa Maria
Bicycle Capacity: # # Occupied % Occupied
Racks 0 n/a n/a
Lockers 4 0 0%
Transit: Clean Air Express
Proximity of ADA Spaces to Transit: Immediately adjacent.
Distance from Major Highway(s): Within 1 mile of SR 135, approximately 2 miles to US 101.
Access Convenience: One driveway.
Directional Signage: No
Lot Identification Signage: No
Striping: Yes
Lighting: Yes
Shelter: Yes
Telephone/Call Box: No
Trash/Recycling: Yes
Landscaping/Trees: Yes, trees throughout lot.
Restrictions: Hours are from 5:45 AM until 7:30 PM. Overnight parking is not allowed.
The Santa Barbara County Public Works Department provides four bike lockers on-site for public use.
Santa Barbara County Public Works Department (North County) phone number: (805) 739-8750
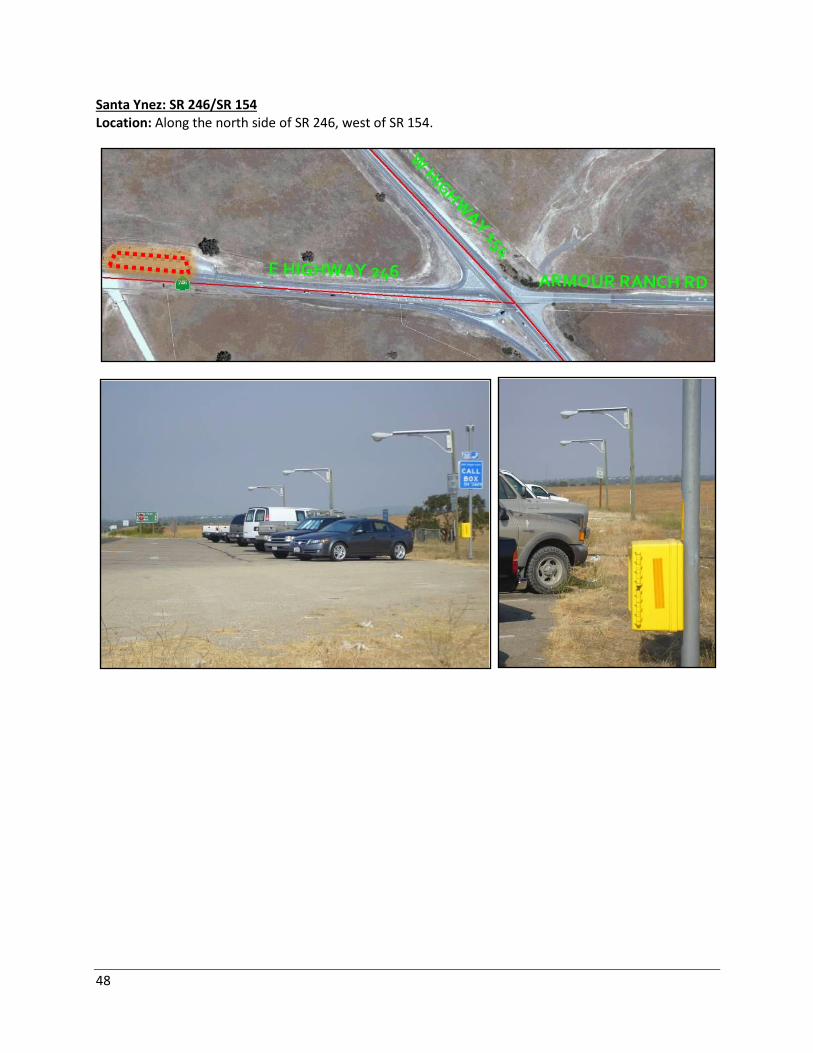
48
Santa Ynez: SR 246/SR 154 Location: Along the north side of SR 246, west of SR 154.
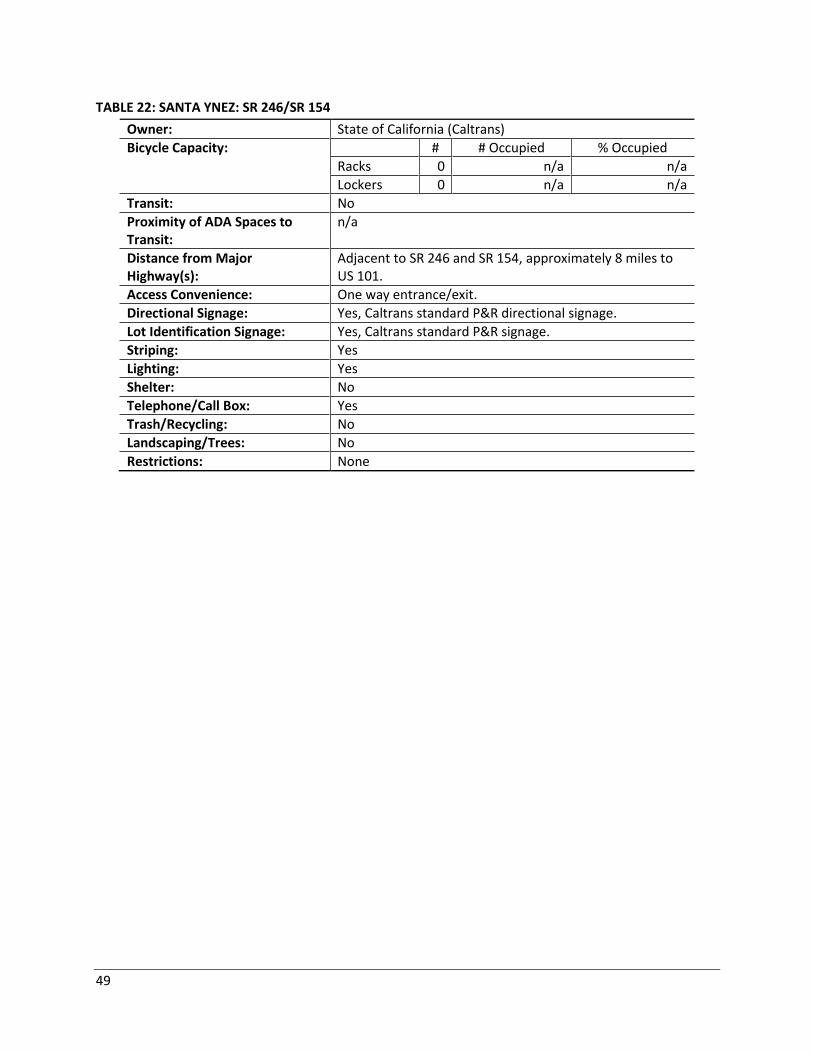
49
TABLE 22: SANTA YNEZ: SR 246/SR 154
Owner: State of California (Caltrans)
Bicycle Capacity: # # Occupied % Occupied
Racks 0 n/a n/a
Lockers 0 n/a n/a
Transit: No
Proximity of ADA Spaces to Transit:
n/a
Distance from Major Highway(s):
Adjacent to SR 246 and SR 154, approximately 8 miles to US 101.
Access Convenience: One way entrance/exit.
Directional Signage: Yes, Caltrans standard P&R directional signage.
Lot Identification Signage: Yes, Caltrans standard P&R signage.
Striping: Yes
Lighting: Yes
Shelter: No
Telephone/Call Box: Yes
Trash/Recycling: No
Landscaping/Trees: No
Restrictions: None
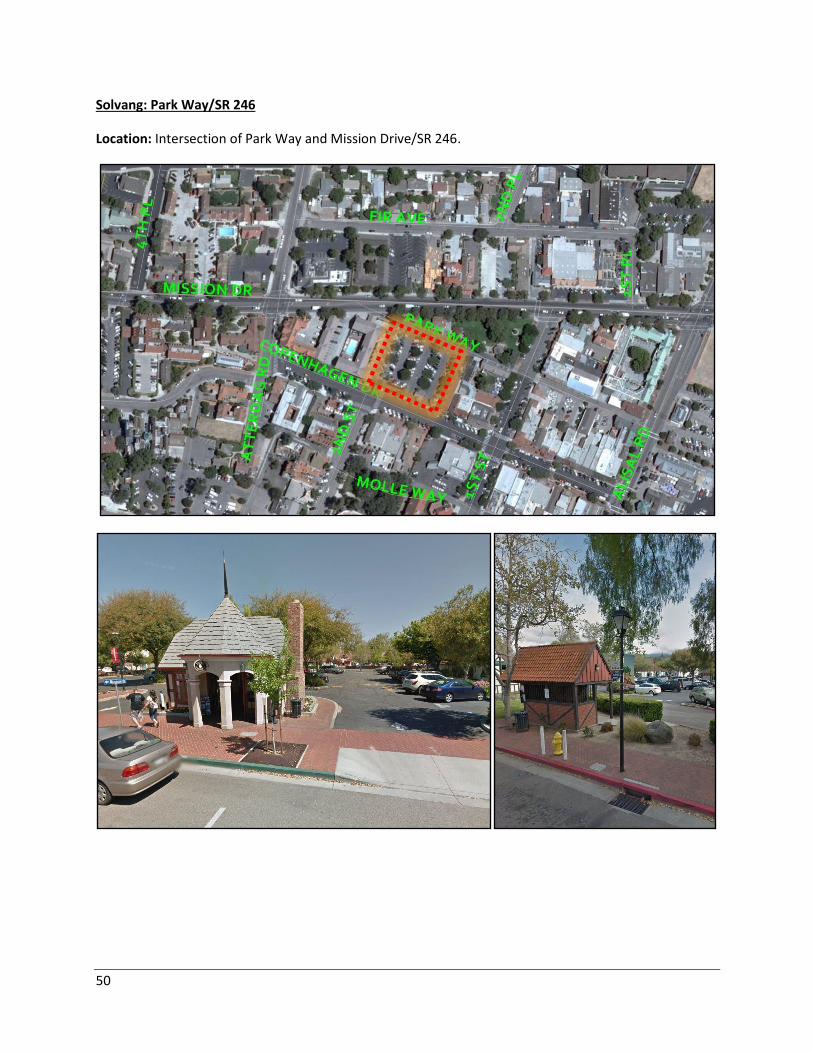
50
Solvang: Park Way/SR 246
Location: Intersection of Park Way and Mission Drive/SR 246.
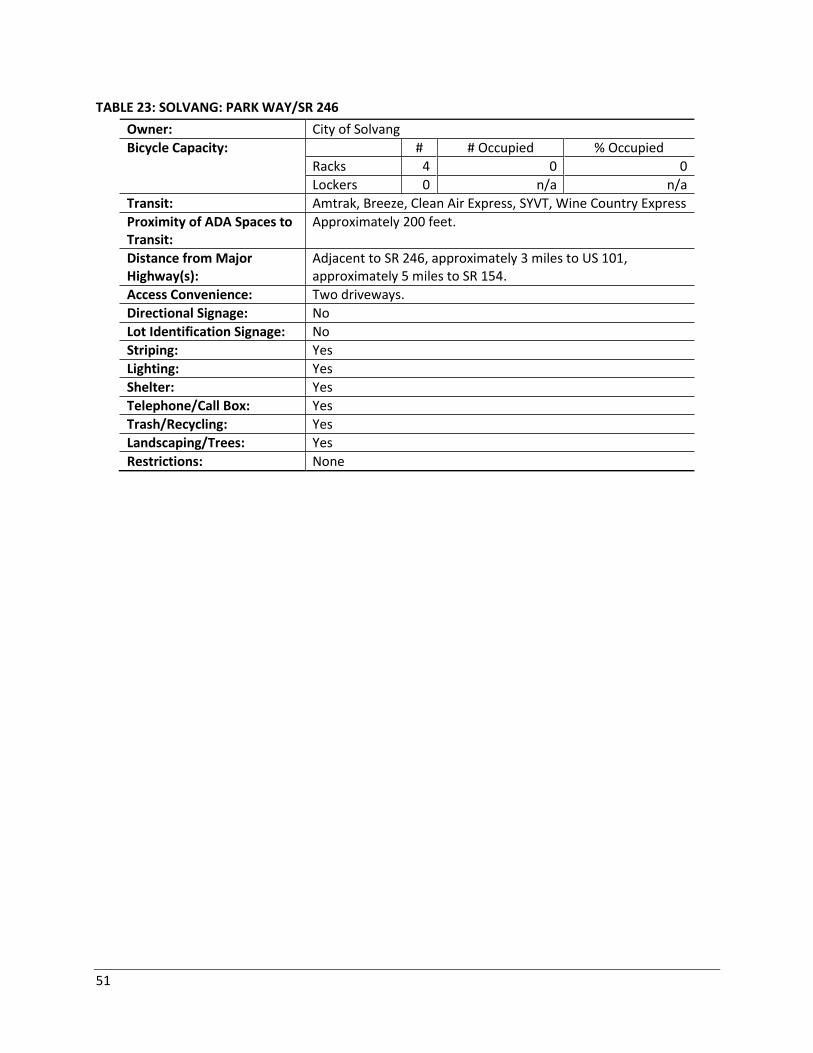
51
TABLE 23: SOLVANG: PARK WAY/SR 246
Owner: City of Solvang
Bicycle Capacity: # # Occupied % Occupied
Racks 4 0 0
Lockers 0 n/a n/a
Transit: Amtrak, Breeze, Clean Air Express, SYVT, Wine Country Express
Proximity of ADA Spaces to Transit:
Approximately 200 feet.
Distance from Major Highway(s):
Adjacent to SR 246, approximately 3 miles to US 101, approximately 5 miles to SR 154.
Access Convenience: Two driveways.
Directional Signage: No
Lot Identification Signage: No
Striping: Yes
Lighting: Yes
Shelter: Yes
Telephone/Call Box: Yes
Trash/Recycling: Yes
Landscaping/Trees: Yes
Restrictions: None
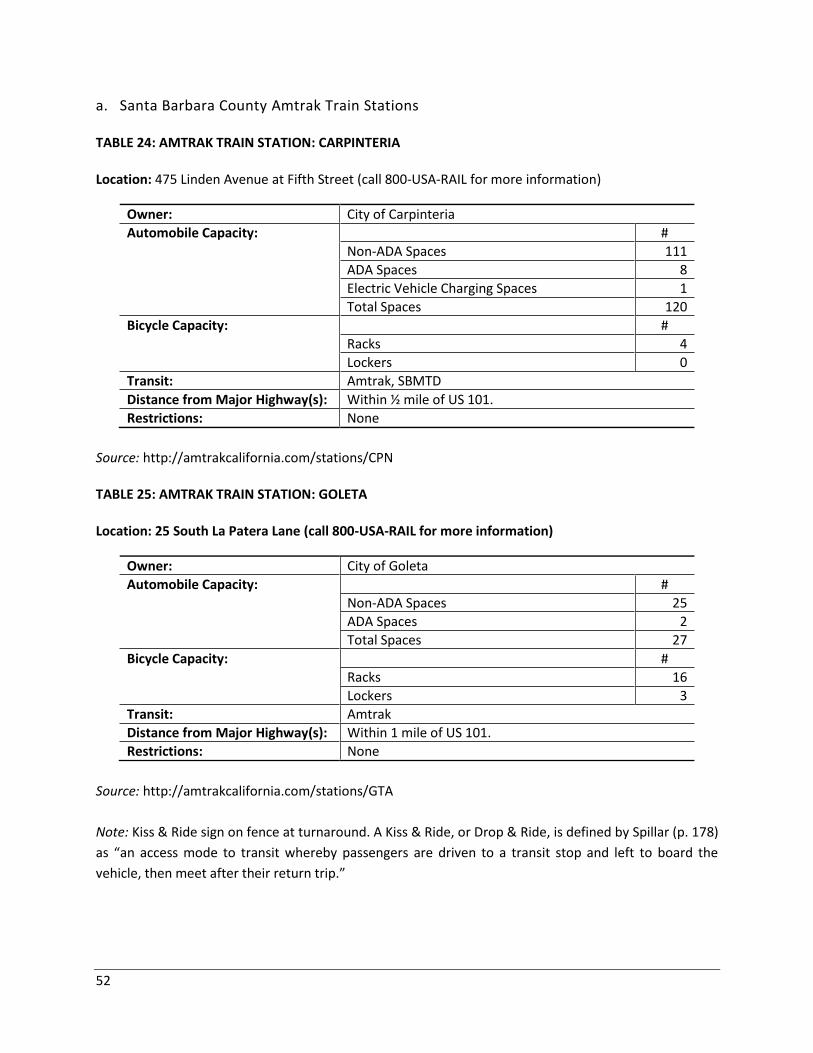
52
a. Santa Barbara County Amtrak Train Stations
TABLE 24: AMTRAK TRAIN STATION: CARPINTERIA
Location: 475 Linden Avenue at Fifth Street (call 800-USA-RAIL for more information)
Owner: City of Carpinteria
Automobile Capacity: #
Non-ADA Spaces 111
ADA Spaces 8
Electric Vehicle Charging Spaces 1
Total Spaces 120
Bicycle Capacity: #
Racks 4
Lockers 0
Transit: Amtrak, SBMTD
Distance from Major Highway(s): Within ½ mile of US 101.
Restrictions: None
Source: http://amtrakcalifornia.com/stations/CPN
TABLE 25: AMTRAK TRAIN STATION: GOLETA
Location: 25 South La Patera Lane (call 800-USA-RAIL for more information)
Owner: City of Goleta
Automobile Capacity: #
Non-ADA Spaces 25
ADA Spaces 2
Total Spaces 27
Bicycle Capacity: #
Racks 16
Lockers 3
Transit: Amtrak
Distance from Major Highway(s): Within 1 mile of US 101.
Restrictions: None
Source: http://amtrakcalifornia.com/stations/GTA
Note: Kiss & Ride sign on fence at turnaround. A Kiss & Ride, or Drop & Ride, is defined by Spillar (p. 178)
as “an access mode to transit whereby passengers are driven to a transit stop and left to board the
vehicle, then meet after their return trip.”
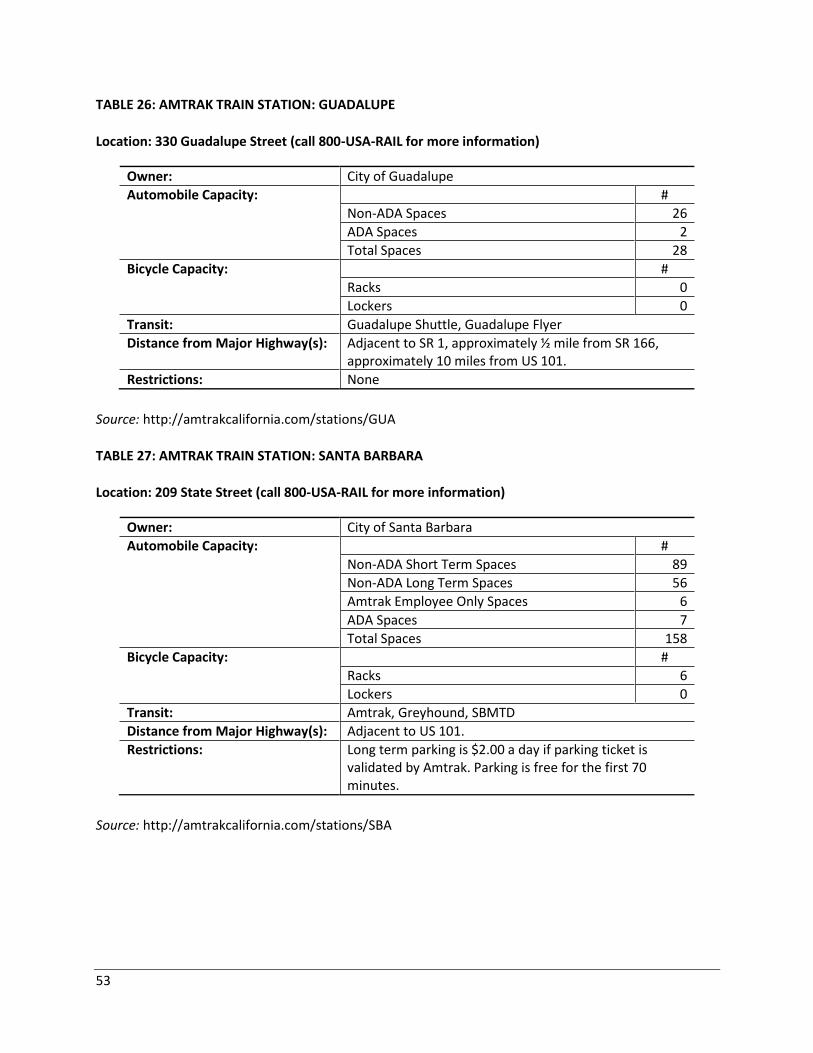
53
TABLE 26: AMTRAK TRAIN STATION: GUADALUPE
Location: 330 Guadalupe Street (call 800-USA-RAIL for more information)
Owner: City of Guadalupe
Automobile Capacity: #
Non-ADA Spaces 26
ADA Spaces 2
Total Spaces 28
Bicycle Capacity: #
Racks 0
Lockers 0
Transit: Guadalupe Shuttle, Guadalupe Flyer
Distance from Major Highway(s): Adjacent to SR 1, approximately ½ mile from SR 166, approximately 10 miles from US 101.
Restrictions: None
Source: http://amtrakcalifornia.com/stations/GUA
TABLE 27: AMTRAK TRAIN STATION: SANTA BARBARA
Location: 209 State Street (call 800-USA-RAIL for more information)
Owner: City of Santa Barbara
Automobile Capacity: #
Non-ADA Short Term Spaces 89
Non-ADA Long Term Spaces 56
Amtrak Employee Only Spaces 6
ADA Spaces 7
Total Spaces 158
Bicycle Capacity: #
Racks 6
Lockers 0
Transit: Amtrak, Greyhound, SBMTD
Distance from Major Highway(s): Adjacent to US 101.
Restrictions: Long term parking is $2.00 a day if parking ticket is validated by Amtrak. Parking is free for the first 70 minutes.
Source: http://amtrakcalifornia.com/stations/SBA
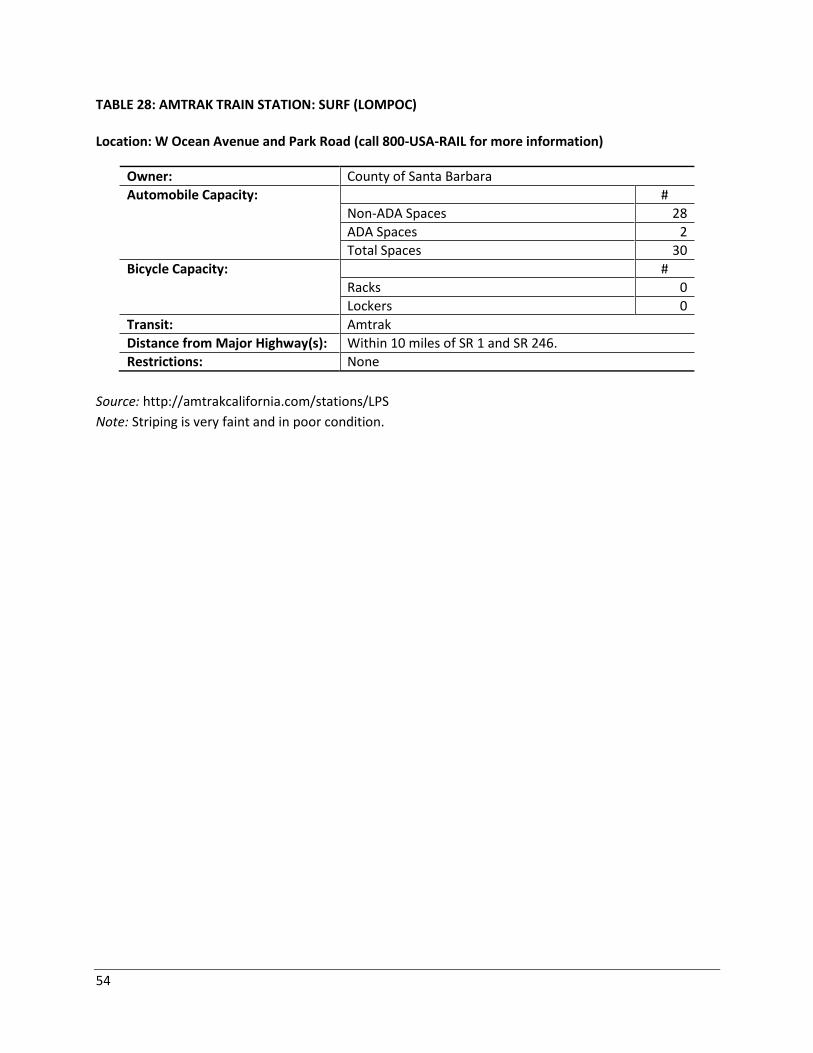
54
TABLE 28: AMTRAK TRAIN STATION: SURF (LOMPOC)
Location: W Ocean Avenue and Park Road (call 800-USA-RAIL for more information)
Owner: County of Santa Barbara
Automobile Capacity: #
Non-ADA Spaces 28
ADA Spaces 2
Total Spaces 30
Bicycle Capacity: #
Racks 0
Lockers 0
Transit: Amtrak
Distance from Major Highway(s): Within 10 miles of SR 1 and SR 246.
Restrictions: None
Source: http://amtrakcalifornia.com/stations/LPS
Note: Striping is very faint and in poor condition.
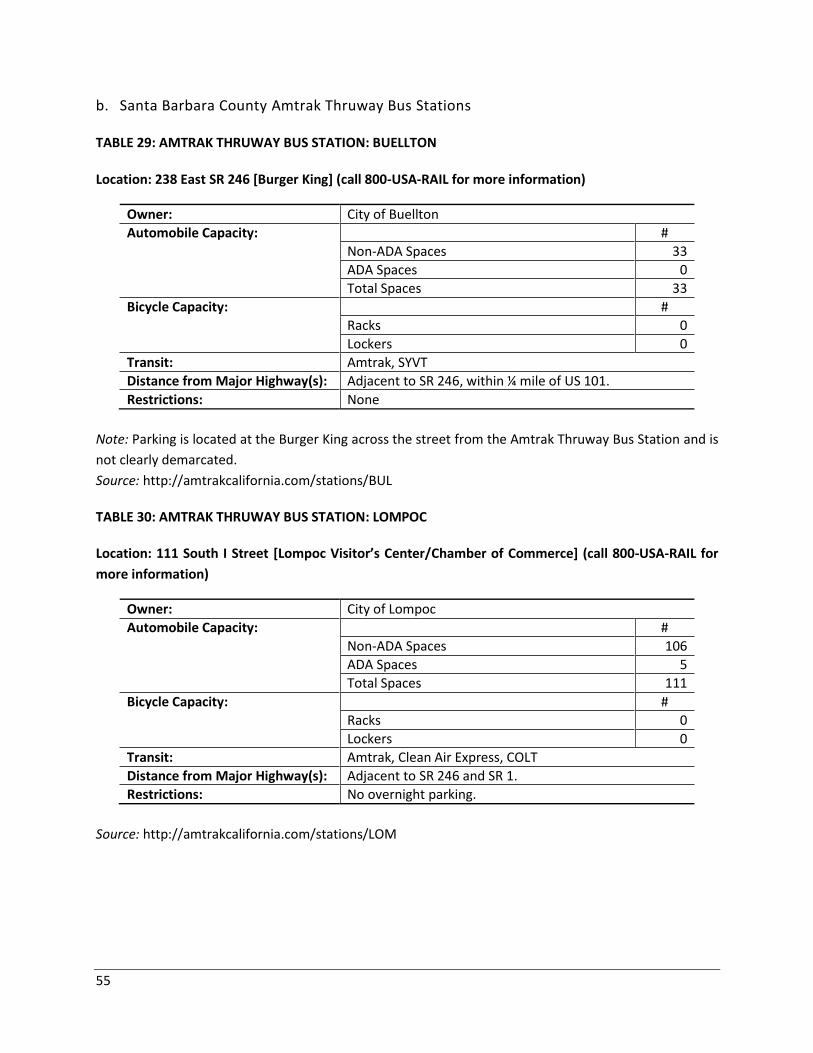
55
b. Santa Barbara County Amtrak Thruway Bus Stations
TABLE 29: AMTRAK THRUWAY BUS STATION: BUELLTON
Location: 238 East SR 246 [Burger King] (call 800-USA-RAIL for more information)
Owner: City of Buellton
Automobile Capacity: #
Non-ADA Spaces 33
ADA Spaces 0
Total Spaces 33
Bicycle Capacity: #
Racks 0
Lockers 0
Transit: Amtrak, SYVT
Distance from Major Highway(s): Adjacent to SR 246, within ¼ mile of US 101.
Restrictions: None
Note: Parking is located at the Burger King across the street from the Amtrak Thruway Bus Station and is
not clearly demarcated.
Source: http://amtrakcalifornia.com/stations/BUL
TABLE 30: AMTRAK THRUWAY BUS STATION: LOMPOC
Location: 111 South I Street [Lompoc Visitor’s Center/Chamber of Commerce] (call 800-USA-RAIL for
more information)
Owner: City of Lompoc
Automobile Capacity: #
Non-ADA Spaces 106
ADA Spaces 5
Total Spaces 111
Bicycle Capacity: #
Racks 0
Lockers 0
Transit: Amtrak, Clean Air Express, COLT
Distance from Major Highway(s): Adjacent to SR 246 and SR 1.
Restrictions: No overnight parking.
Source: http://amtrakcalifornia.com/stations/LOM
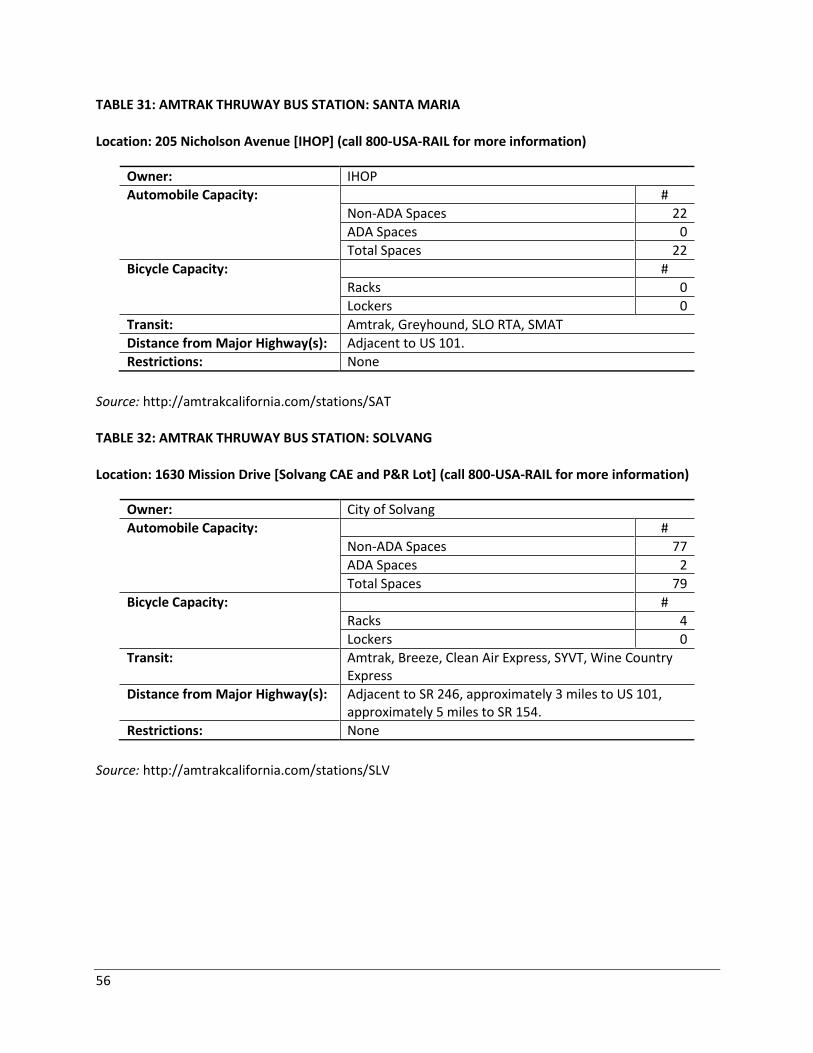
56
TABLE 31: AMTRAK THRUWAY BUS STATION: SANTA MARIA
Location: 205 Nicholson Avenue [IHOP] (call 800-USA-RAIL for more information)
Owner: IHOP
Automobile Capacity: #
Non-ADA Spaces 22
ADA Spaces 0
Total Spaces 22
Bicycle Capacity: #
Racks 0
Lockers 0
Transit: Amtrak, Greyhound, SLO RTA, SMAT
Distance from Major Highway(s): Adjacent to US 101.
Restrictions: None
Source: http://amtrakcalifornia.com/stations/SAT
TABLE 32: AMTRAK THRUWAY BUS STATION: SOLVANG
Location: 1630 Mission Drive [Solvang CAE and P&R Lot] (call 800-USA-RAIL for more information)
Owner: City of Solvang
Automobile Capacity: #
Non-ADA Spaces 77
ADA Spaces 2
Total Spaces 79
Bicycle Capacity: #
Racks 4
Lockers 0
Transit: Amtrak, Breeze, Clean Air Express, SYVT, Wine Country Express
Distance from Major Highway(s): Adjacent to SR 246, approximately 3 miles to US 101, approximately 5 miles to SR 154.
Restrictions: None
Source: http://amtrakcalifornia.com/stations/SLV
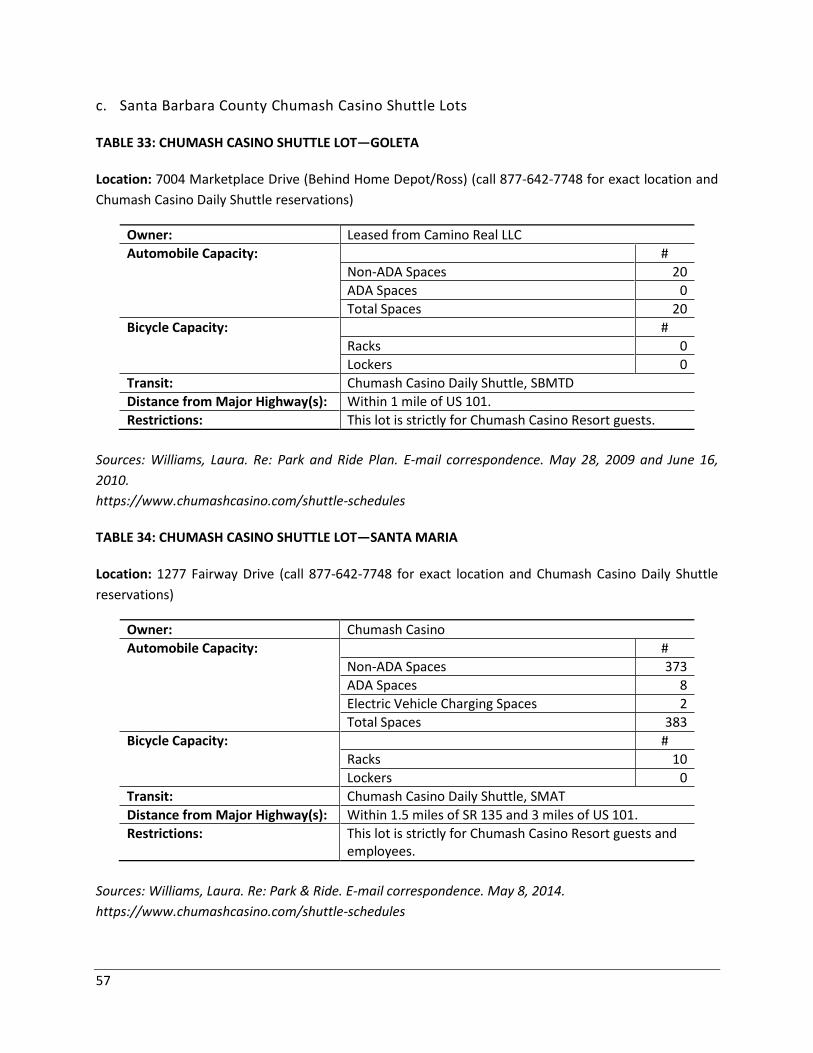
57
c. Santa Barbara County Chumash Casino Shuttle Lots
TABLE 33: CHUMASH CASINO SHUTTLE LOT—GOLETA
Location: 7004 Marketplace Drive (Behind Home Depot/Ross) (call 877-642-7748 for exact location and
Chumash Casino Daily Shuttle reservations)
Owner: Leased from Camino Real LLC
Automobile Capacity: #
Non-ADA Spaces 20
ADA Spaces 0
Total Spaces 20
Bicycle Capacity: #
Racks 0
Lockers 0
Transit: Chumash Casino Daily Shuttle, SBMTD
Distance from Major Highway(s): Within 1 mile of US 101.
Restrictions: This lot is strictly for Chumash Casino Resort guests.
Sources: Williams, Laura. Re: Park and Ride Plan. E-mail correspondence. May 28, 2009 and June 16,
2010.
https://www.chumashcasino.com/shuttle-schedules
TABLE 34: CHUMASH CASINO SHUTTLE LOT—SANTA MARIA
Location: 1277 Fairway Drive (call 877-642-7748 for exact location and Chumash Casino Daily Shuttle
reservations)
Owner: Chumash Casino
Automobile Capacity: #
Non-ADA Spaces 373
ADA Spaces 8
Electric Vehicle Charging Spaces 2
Total Spaces 383
Bicycle Capacity: #
Racks 10
Lockers 0
Transit: Chumash Casino Daily Shuttle, SMAT
Distance from Major Highway(s): Within 1.5 miles of SR 135 and 3 miles of US 101.
Restrictions: This lot is strictly for Chumash Casino Resort guests and employees.
Sources: Williams, Laura. Re: Park & Ride. E-mail correspondence. May 8, 2014.
https://www.chumashcasino.com/shuttle-schedules
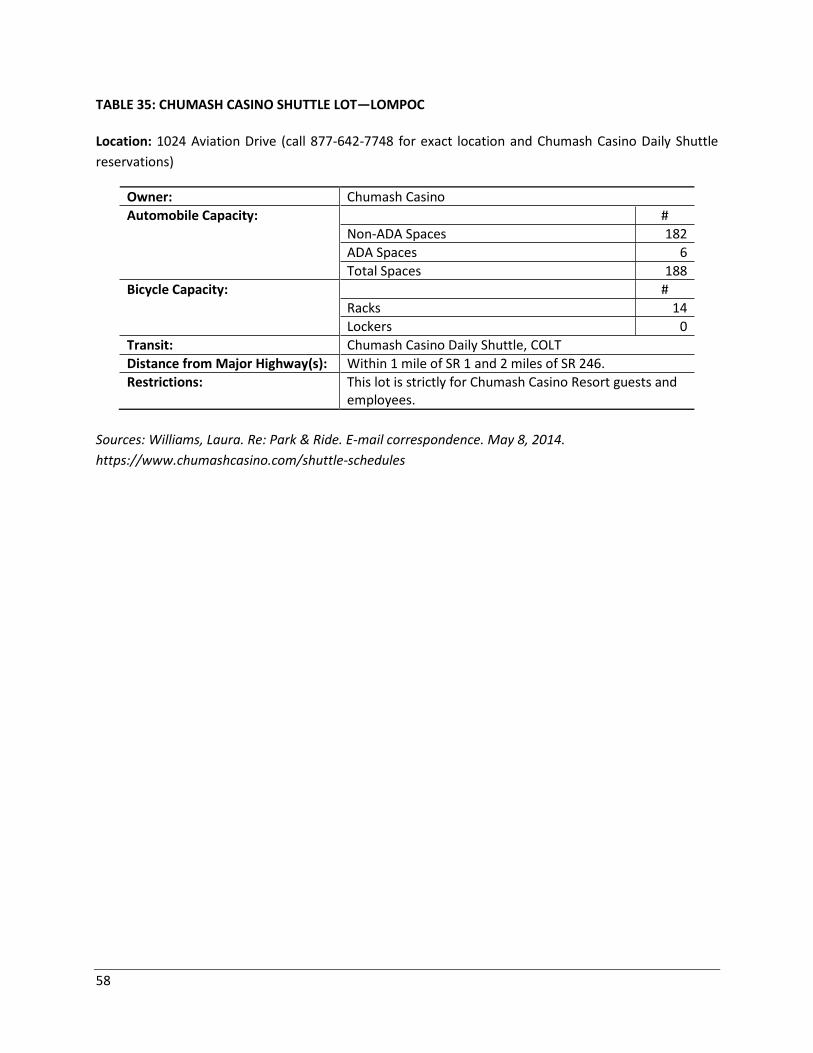
58
TABLE 35: CHUMASH CASINO SHUTTLE LOT—LOMPOC
Location: 1024 Aviation Drive (call 877-642-7748 for exact location and Chumash Casino Daily Shuttle
reservations)
Owner: Chumash Casino
Automobile Capacity: #
Non-ADA Spaces 182
ADA Spaces 6
Total Spaces 188
Bicycle Capacity: #
Racks 14
Lockers 0
Transit: Chumash Casino Daily Shuttle, COLT
Distance from Major Highway(s): Within 1 mile of SR 1 and 2 miles of SR 246.
Restrictions: This lot is strictly for Chumash Casino Resort guests and employees.
Sources: Williams, Laura. Re: Park & Ride. E-mail correspondence. May 8, 2014.
https://www.chumashcasino.com/shuttle-schedules
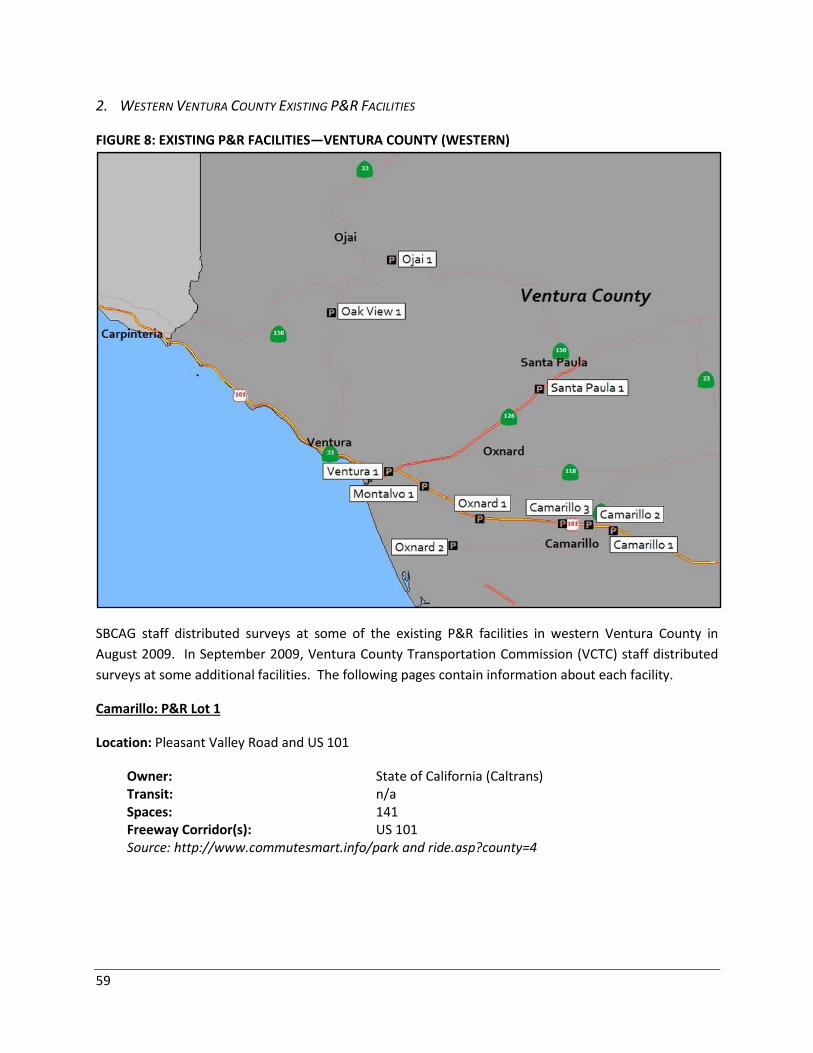
59
2. WESTERN VENTURA COUNTY EXISTING P&R FACILITIES
FIGURE 8: EXISTING P&R FACILITIES—VENTURA COUNTY (WESTERN)
SBCAG staff distributed surveys at some of the existing P&R facilities in western Ventura County in
August 2009. In September 2009, Ventura County Transportation Commission (VCTC) staff distributed
surveys at some additional facilities. The following pages contain information about each facility.
Camarillo: P&R Lot 1
Location: Pleasant Valley Road and US 101
Owner: State of California (Caltrans) Transit: n/a Spaces: 141 Freeway Corridor(s): US 101 Source: http://www.commutesmart.info/park and ride.asp?county=4
60
Camarillo: P&R Lot 2
Location: Metrolink Station (30 N. Lewis Rd)
Owner: City of Camarillo Transit: Metrolink, VISTA, Amtrak Spaces: 220 Freeway Corridor(s): US 101 Source: http://www.commutesmart.info/park and ride.asp?county=4
Camarillo: P&R Lot 3
Location: 690 Ventura Blvd at Los Posas (off US 101)
Owner: State of California (Caltrans) Transit: VISTA Spaces: 122 Freeway Corridor(s): US 101 Source: http://www.commutesmart.info/park and ride.asp?county=4
Montalvo/East Ventura: P&R Lot 1
Location: Metrolink Station (6175 Ventura Blvd)
Owner: Ventura County Transportation Commission (VCTC) Transit: Metrolink
Spaces: 55 Freeway Corridor(s): US 101 Source: http://www.commutesmart.info/park and ride.asp?county=4
Oak View: P&R Lot 1
Location: Oak View Community Center (18 Valley Road)
Owner: County of Ventura Transit: Gold Coast Transit Spaces: 20 Freeway Corridor(s): 33 Source: http://www.commutesmart.info/park and ride.asp?county=4
61
Ojai: P&R Lot 1
Location: on the north side of Ojai Avenue/SR 150, east of Fox Street
Owner: City of Ojai Transit: Gold Coast Transit Spaces: 68 Freeway Corridor(s): SR 33/SR 150 Source: http://www.commutesmart.info/park and ride.asp?county=4
Oxnard: P&R Lot 1
Location: The Palms (Lockwood and Outlet Center Dr)
Owner: Property Manager Transit: Gold Coast Transit Spaces: 72 Freeway Corridor(s): US 101 Source: http://www.commutesmart.info/park and ride.asp?county=4
Oxnard: P&R Lot 2
Location: Oxnard Transportation Center (201 E. 4th St)
Owner: City of Oxnard Transit: Metrolink, VISTA, Amtrak, Gold Coast Transit Spaces: 75 Freeway Corridor(s): US 101 Source: http://www.commutesmart.info/park and ride.asp?county=4
Santa Paula: P&R Lot 1
Location: K-Mart (895 Faulkner Rd, Peck Rd at SR 126)
Owner: K-Mart Transit: VISTA Spaces: 50 Freeway Corridor(s): SR 126 Source: http://www.commutesmart.info/park and ride.asp?county=4
62
Ventura: P&R Lot 1
Location: at the Army National Guard (1270 Arundell Avenue) on the southeast side of Arundell Avenue,
between E. Main Street and Market Street
Owner: National Guard Transit: Gold Coast Transit Spaces: 20 Freeway Corridor(s): US 101 Source: http://www.commutesmart.info/park and ride.asp?county=4
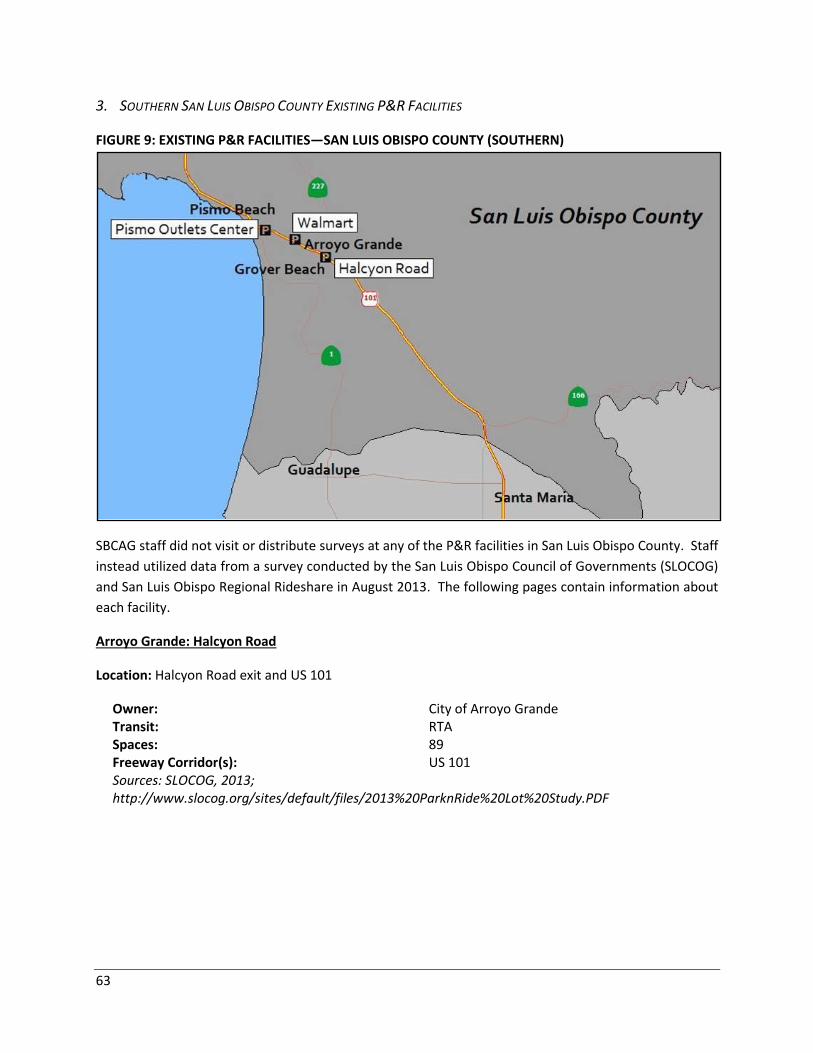
63
3. SOUTHERN SAN LUIS OBISPO COUNTY EXISTING P&R FACILITIES
FIGURE 9: EXISTING P&R FACILITIES—SAN LUIS OBISPO COUNTY (SOUTHERN)
SBCAG staff did not visit or distribute surveys at any of the P&R facilities in San Luis Obispo County. Staff
instead utilized data from a survey conducted by the San Luis Obispo Council of Governments (SLOCOG)
and San Luis Obispo Regional Rideshare in August 2013. The following pages contain information about
each facility.
Arroyo Grande: Halcyon Road
Location: Halcyon Road exit and US 101
Owner: City of Arroyo Grande Transit: RTA Spaces: 89 Freeway Corridor(s): US 101 Sources: SLOCOG, 2013; http://www.slocog.org/sites/default/files/2013%20ParknRide%20Lot%20Study.PDF
64
Arroyo Grande: Walmart
Location: Walmart (1168 Branch St)
Owner: Walmart Transit: RTA Spaces: 26 Freeway Corridor(s): US 101 Sources: SLOCOG, 2013; http://www.slocog.org/sites/default/files/2013%20ParknRide%20Lot%20Study.PDF
Ramona Garden: Grover Beach
Location: Five Cities Drive exit and US 101 (333 Five Cities Drive)
Owner: City of Grover Beach Transit: n/a Spaces: 20 Freeway Corridor(s): n/a Sources: SLOCOG, 2013; http://www.slocog.org/sites/default/files/2013%20ParknRide%20Lot%20Study.PDF
Pismo Beach: Prime Outlets Mall
Location: Five Cities Drive exit and US 101 (333 Five Cities Drive)
Owner: Pismo Outlets Mall Transit: RTA Spaces: 20 Freeway Corridor(s): US 101 Sources: SLOCOG, 2013; http://www.slocog.org/sites/default/files/2013%20ParknRide%20Lot%20Study.PDF
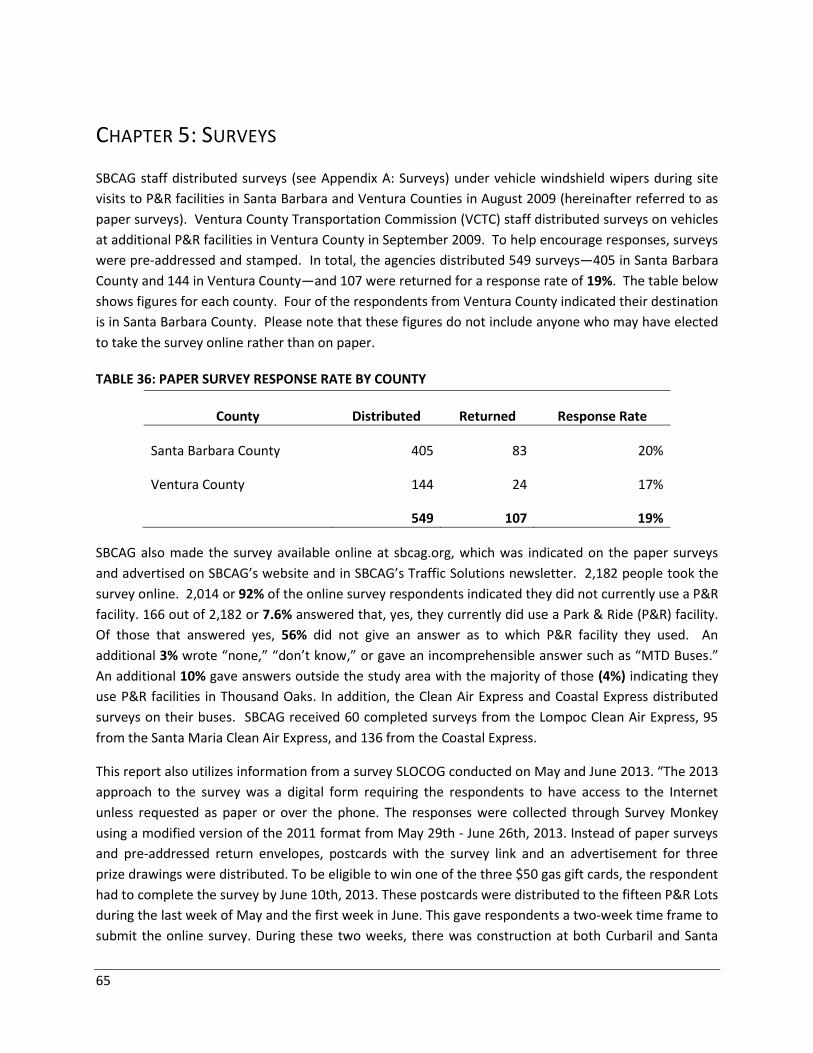
65
CHAPTER 5: SURVEYS
SBCAG staff distributed surveys (see Appendix A: Surveys) under vehicle windshield wipers during site
visits to P&R facilities in Santa Barbara and Ventura Counties in August 2009 (hereinafter referred to as
paper surveys). Ventura County Transportation Commission (VCTC) staff distributed surveys on vehicles
at additional P&R facilities in Ventura County in September 2009. To help encourage responses, surveys
were pre-addressed and stamped. In total, the agencies distributed 549 surveys—405 in Santa Barbara
County and 144 in Ventura County—and 107 were returned for a response rate of 19%. The table below
shows figures for each county. Four of the respondents from Ventura County indicated their destination
is in Santa Barbara County. Please note that these figures do not include anyone who may have elected
to take the survey online rather than on paper.
TABLE 36: PAPER SURVEY RESPONSE RATE BY COUNTY
County Distributed Returned Response Rate
Santa Barbara County 405 83 20%
Ventura County 144 24 17%
549 107 19%
SBCAG also made the survey available online at sbcag.org, which was indicated on the paper surveys
and advertised on SBCAG’s website and in SBCAG’s Traffic Solutions newsletter. 2,182 people took the
survey online. 2,014 or 92% of the online survey respondents indicated they did not currently use a P&R
facility. 166 out of 2,182 or 7.6% answered that, yes, they currently did use a Park & Ride (P&R) facility.
Of those that answered yes, 56% did not give an answer as to which P&R facility they used. An
additional 3% wrote “none,” “don’t know,” or gave an incomprehensible answer such as “MTD Buses.”
An additional 10% gave answers outside the study area with the majority of those (4%) indicating they
use P&R facilities in Thousand Oaks. In addition, the Clean Air Express and Coastal Express distributed
surveys on their buses. SBCAG received 60 completed surveys from the Lompoc Clean Air Express, 95
from the Santa Maria Clean Air Express, and 136 from the Coastal Express.
This report also utilizes information from a survey SLOCOG conducted on May and June 2013. “The 2013
approach to the survey was a digital form requiring the respondents to have access to the Internet
unless requested as paper or over the phone. The responses were collected through Survey Monkey
using a modified version of the 2011 format from May 29th ‐ June 26th, 2013. Instead of paper surveys
and pre‐addressed return envelopes, postcards with the survey link and an advertisement for three
prize drawings were distributed. To be eligible to win one of the three $50 gas gift cards, the respondent
had to complete the survey by June 10th, 2013. These postcards were distributed to the fifteen P&R Lots
during the last week of May and the first week in June. This gave respondents a two‐week time frame to
submit the online survey. During these two weeks, there was construction at both Curbaril and Santa
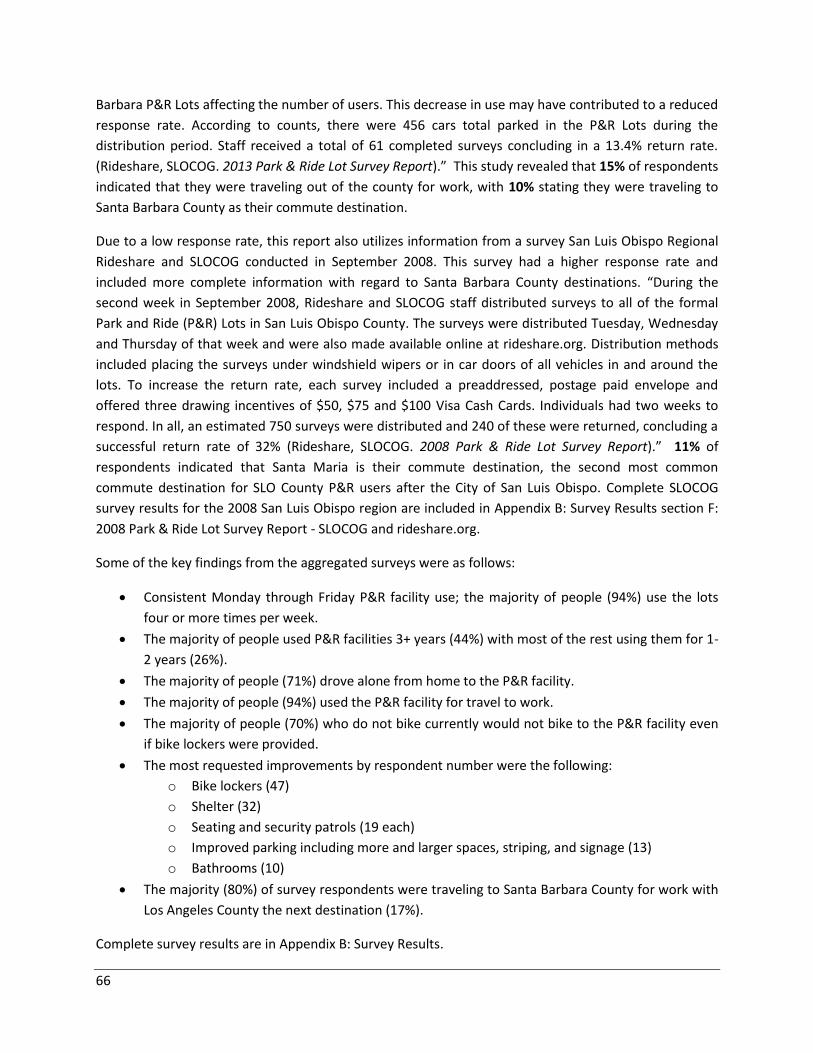
66
Barbara P&R Lots affecting the number of users. This decrease in use may have contributed to a reduced
response rate. According to counts, there were 456 cars total parked in the P&R Lots during the
distribution period. Staff received a total of 61 completed surveys concluding in a 13.4% return rate.
(Rideshare, SLOCOG. 2013 Park & Ride Lot Survey Report).” This study revealed that 15% of respondents
indicated that they were traveling out of the county for work, with 10% stating they were traveling to
Santa Barbara County as their commute destination.
Due to a low response rate, this report also utilizes information from a survey San Luis Obispo Regional
Rideshare and SLOCOG conducted in September 2008. This survey had a higher response rate and
included more complete information with regard to Santa Barbara County destinations. “During the
second week in September 2008, Rideshare and SLOCOG staff distributed surveys to all of the formal
Park and Ride (P&R) Lots in San Luis Obispo County. The surveys were distributed Tuesday, Wednesday
and Thursday of that week and were also made available online at rideshare.org. Distribution methods
included placing the surveys under windshield wipers or in car doors of all vehicles in and around the
lots. To increase the return rate, each survey included a preaddressed, postage paid envelope and
offered three drawing incentives of $50, $75 and $100 Visa Cash Cards. Individuals had two weeks to
respond. In all, an estimated 750 surveys were distributed and 240 of these were returned, concluding a
successful return rate of 32% (Rideshare, SLOCOG. 2008 Park & Ride Lot Survey Report).” 11% of
respondents indicated that Santa Maria is their commute destination, the second most common
commute destination for SLO County P&R users after the City of San Luis Obispo. Complete SLOCOG
survey results for the 2008 San Luis Obispo region are included in Appendix B: Survey Results section F:
2008 Park & Ride Lot Survey Report - SLOCOG and rideshare.org.
Some of the key findings from the aggregated surveys were as follows:
Consistent Monday through Friday P&R facility use; the majority of people (94%) use the lots
four or more times per week.
The majority of people used P&R facilities 3+ years (44%) with most of the rest using them for 1-
2 years (26%).
The majority of people (71%) drove alone from home to the P&R facility.
The majority of people (94%) used the P&R facility for travel to work.
The majority of people (70%) who do not bike currently would not bike to the P&R facility even
if bike lockers were provided.
The most requested improvements by respondent number were the following:
o Bike lockers (47)
o Shelter (32)
o Seating and security patrols (19 each)
o Improved parking including more and larger spaces, striping, and signage (13)
o Bathrooms (10)
The majority (80%) of survey respondents were traveling to Santa Barbara County for work with
Los Angeles County the next destination (17%).
Complete survey results are in Appendix B: Survey Results.
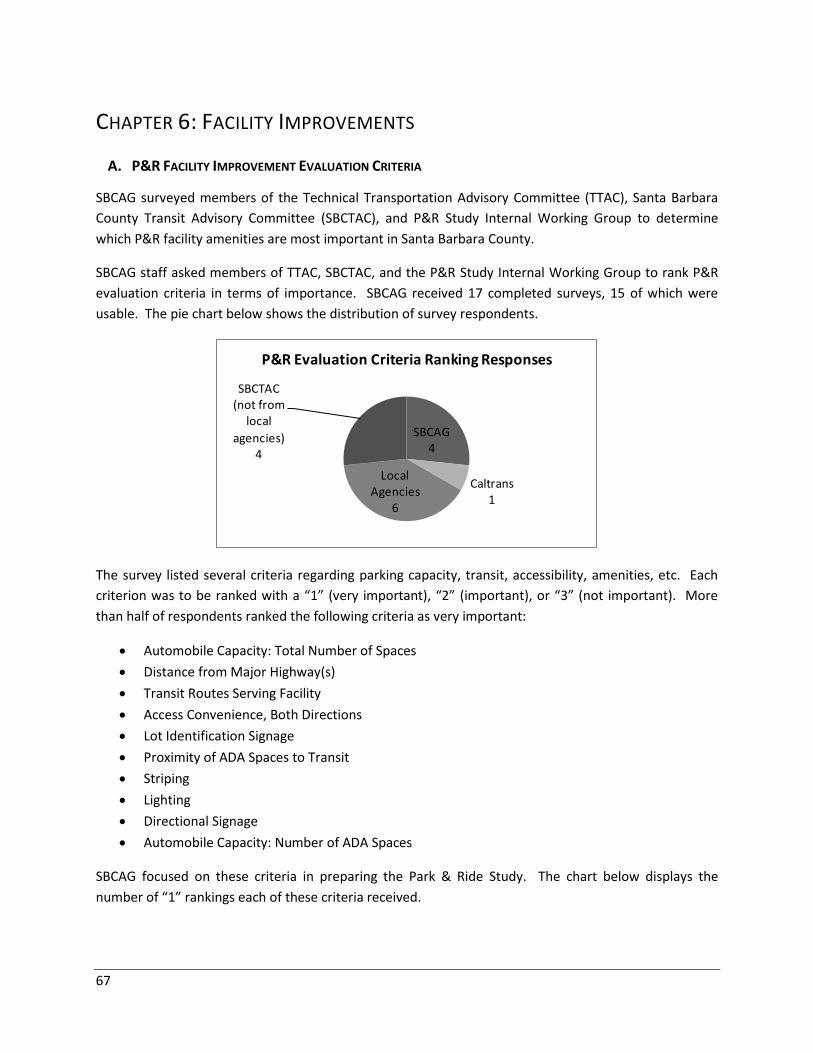
67
CHAPTER 6: FACILITY IMPROVEMENTS
A. P&R FACILITY IMPROVEMENT EVALUATION CRITERIA
SBCAG surveyed members of the Technical Transportation Advisory Committee (TTAC), Santa Barbara
County Transit Advisory Committee (SBCTAC), and P&R Study Internal Working Group to determine
which P&R facility amenities are most important in Santa Barbara County.
SBCAG staff asked members of TTAC, SBCTAC, and the P&R Study Internal Working Group to rank P&R
evaluation criteria in terms of importance. SBCAG received 17 completed surveys, 15 of which were
usable. The pie chart below shows the distribution of survey respondents.
The survey listed several criteria regarding parking capacity, transit, accessibility, amenities, etc. Each
criterion was to be ranked with a “1” (very important), “2” (important), or “3” (not important). More
than half of respondents ranked the following criteria as very important:
Automobile Capacity: Total Number of Spaces
Distance from Major Highway(s)
Transit Routes Serving Facility
Access Convenience, Both Directions
Lot Identification Signage
Proximity of ADA Spaces to Transit
Striping
Lighting
Directional Signage
Automobile Capacity: Number of ADA Spaces
SBCAG focused on these criteria in preparing the Park & Ride Study. The chart below displays the
number of “1” rankings each of these criteria received.
SBCAG4
Caltrans1
Local Agencies
6
SBCTAC (not from
local
agencies)4
P&R Evaluation Criteria Ranking Responses
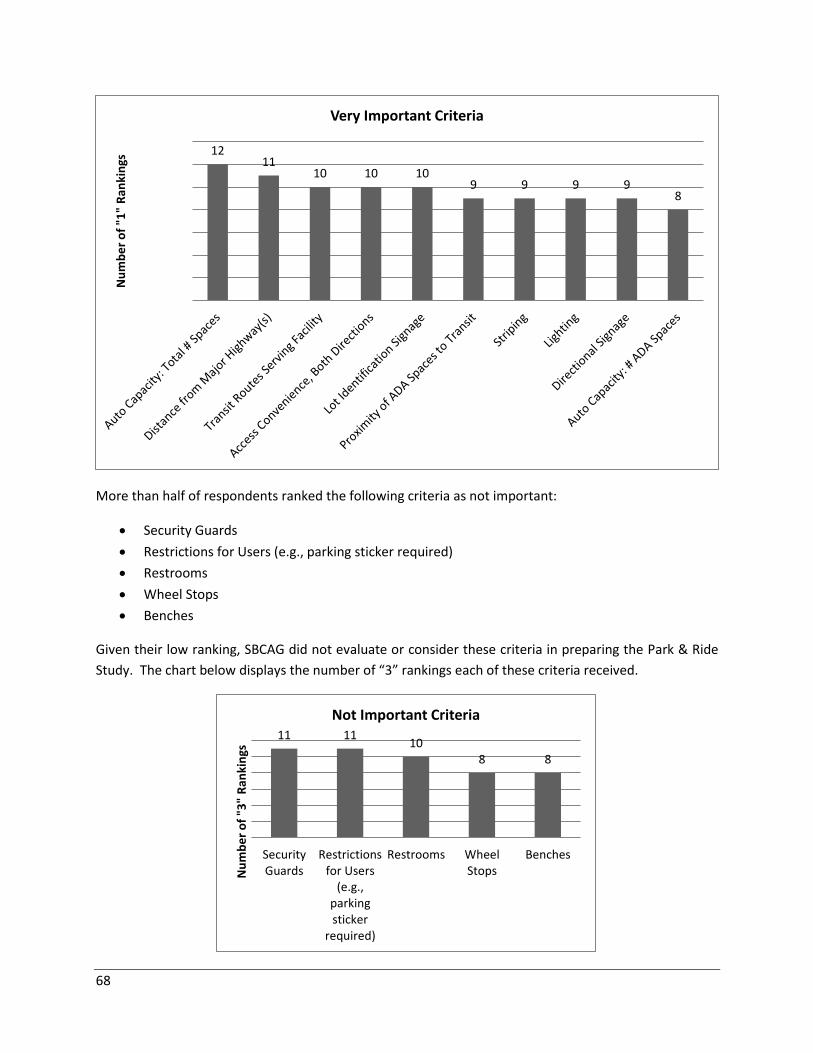
68
More than half of respondents ranked the following criteria as not important:
Security Guards
Restrictions for Users (e.g., parking sticker required)
Restrooms
Wheel Stops
Benches
Given their low ranking, SBCAG did not evaluate or consider these criteria in preparing the Park & Ride
Study. The chart below displays the number of “3” rankings each of these criteria received.
12 11
10 10 10 9 9 9 9
8
Nu
mb
er
of
"1"
Ran
kin
gs
Very Important Criteria
11 11 10
8 8
SecurityGuards
Restrictionsfor Users
(e.g.,parkingsticker
required)
Restrooms WheelStops
Benches
Nu
mb
er
of
"3"
Ran
kin
gs
Not Important Criteria
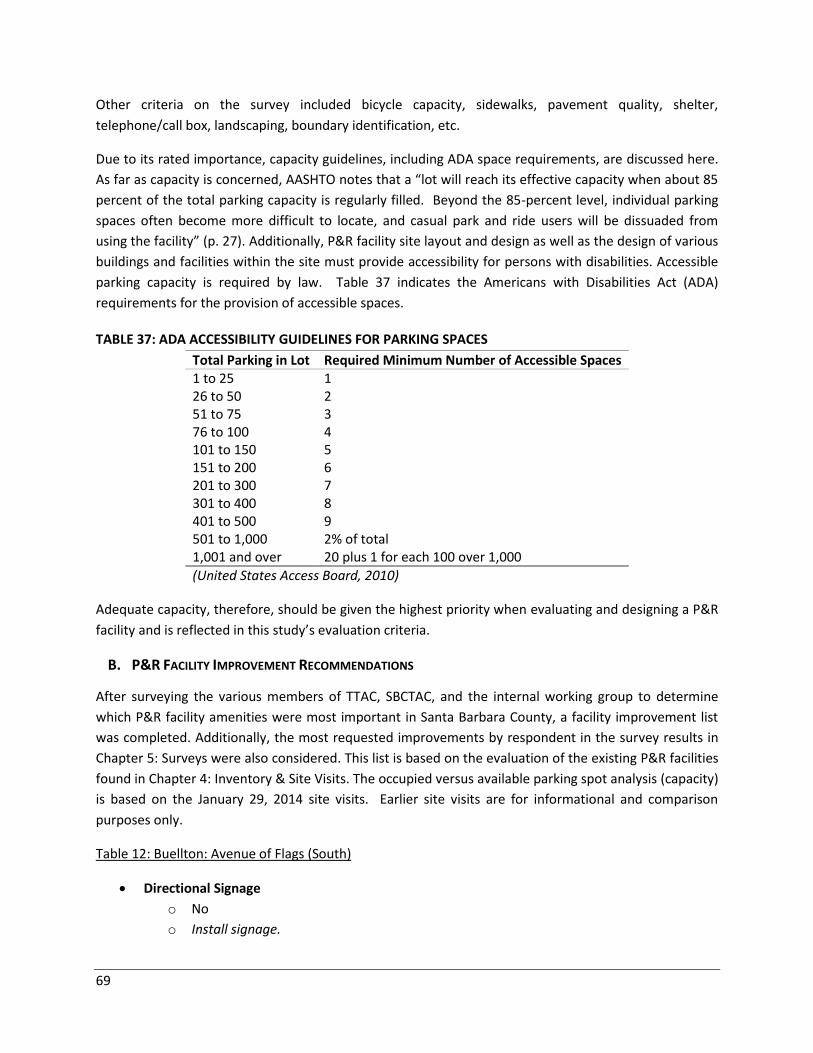
69
Other criteria on the survey included bicycle capacity, sidewalks, pavement quality, shelter,
telephone/call box, landscaping, boundary identification, etc.
Due to its rated importance, capacity guidelines, including ADA space requirements, are discussed here.
As far as capacity is concerned, AASHTO notes that a “lot will reach its effective capacity when about 85
percent of the total parking capacity is regularly filled. Beyond the 85-percent level, individual parking
spaces often become more difficult to locate, and casual park and ride users will be dissuaded from
using the facility” (p. 27). Additionally, P&R facility site layout and design as well as the design of various
buildings and facilities within the site must provide accessibility for persons with disabilities. Accessible
parking capacity is required by law. Table 37 indicates the Americans with Disabilities Act (ADA)
requirements for the provision of accessible spaces.
TABLE 37: ADA ACCESSIBILITY GUIDELINES FOR PARKING SPACES
Total Parking in Lot Required Minimum Number of Accessible Spaces 1 to 25 1 26 to 50 2 51 to 75 3 76 to 100 4 101 to 150 5 151 to 200 6 201 to 300 7 301 to 400 8 401 to 500 9 501 to 1,000 2% of total 1,001 and over 20 plus 1 for each 100 over 1,000
(United States Access Board, 2010)
Adequate capacity, therefore, should be given the highest priority when evaluating and designing a P&R
facility and is reflected in this study’s evaluation criteria.
B. P&R FACILITY IMPROVEMENT RECOMMENDATIONS
After surveying the various members of TTAC, SBCTAC, and the internal working group to determine
which P&R facility amenities were most important in Santa Barbara County, a facility improvement list
was completed. Additionally, the most requested improvements by respondent in the survey results in
Chapter 5: Surveys were also considered. This list is based on the evaluation of the existing P&R facilities
found in Chapter 4: Inventory & Site Visits. The occupied versus available parking spot analysis (capacity)
is based on the January 29, 2014 site visits. Earlier site visits are for informational and comparison
purposes only.
Table 12: Buellton: Avenue of Flags (South)
Directional Signage
o No
o Install signage.
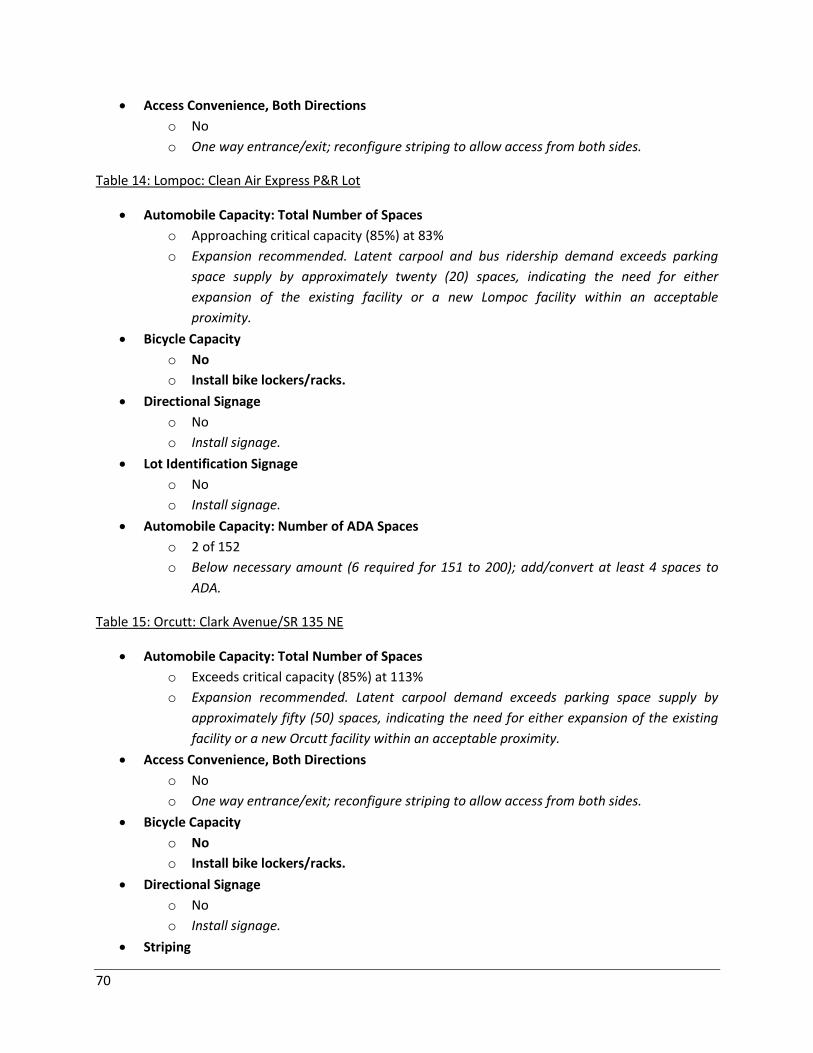
70
Access Convenience, Both Directions
o No
o One way entrance/exit; reconfigure striping to allow access from both sides.
Table 14: Lompoc: Clean Air Express P&R Lot
Automobile Capacity: Total Number of Spaces
o Approaching critical capacity (85%) at 83%
o Expansion recommended. Latent carpool and bus ridership demand exceeds parking
space supply by approximately twenty (20) spaces, indicating the need for either
expansion of the existing facility or a new Lompoc facility within an acceptable
proximity.
Bicycle Capacity
o No
o Install bike lockers/racks.
Directional Signage
o No
o Install signage.
Lot Identification Signage
o No
o Install signage.
Automobile Capacity: Number of ADA Spaces
o 2 of 152
o Below necessary amount (6 required for 151 to 200); add/convert at least 4 spaces to
ADA.
Table 15: Orcutt: Clark Avenue/SR 135 NE
Automobile Capacity: Total Number of Spaces
o Exceeds critical capacity (85%) at 113%
o Expansion recommended. Latent carpool demand exceeds parking space supply by
approximately fifty (50) spaces, indicating the need for either expansion of the existing
facility or a new Orcutt facility within an acceptable proximity.
Access Convenience, Both Directions
o No
o One way entrance/exit; reconfigure striping to allow access from both sides.
Bicycle Capacity
o No
o Install bike lockers/racks.
Directional Signage
o No
o Install signage.
Striping
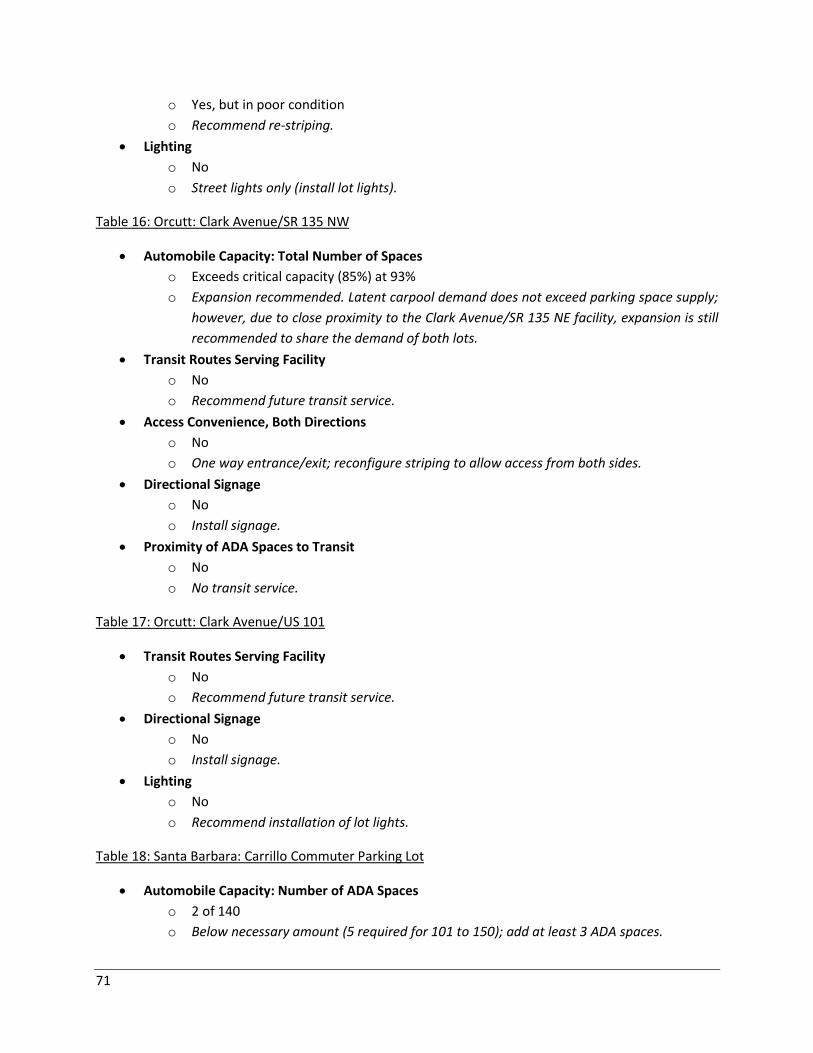
71
o Yes, but in poor condition
o Recommend re-striping.
Lighting
o No
o Street lights only (install lot lights).
Table 16: Orcutt: Clark Avenue/SR 135 NW
Automobile Capacity: Total Number of Spaces
o Exceeds critical capacity (85%) at 93%
o Expansion recommended. Latent carpool demand does not exceed parking space supply;
however, due to close proximity to the Clark Avenue/SR 135 NE facility, expansion is still
recommended to share the demand of both lots.
Transit Routes Serving Facility
o No
o Recommend future transit service.
Access Convenience, Both Directions
o No
o One way entrance/exit; reconfigure striping to allow access from both sides.
Directional Signage
o No
o Install signage.
Proximity of ADA Spaces to Transit
o No
o No transit service.
Table 17: Orcutt: Clark Avenue/US 101
Transit Routes Serving Facility
o No
o Recommend future transit service.
Directional Signage
o No
o Install signage.
Lighting
o No
o Recommend installation of lot lights.
Table 18: Santa Barbara: Carrillo Commuter Parking Lot
Automobile Capacity: Number of ADA Spaces
o 2 of 140
o Below necessary amount (5 required for 101 to 150); add at least 3 ADA spaces.
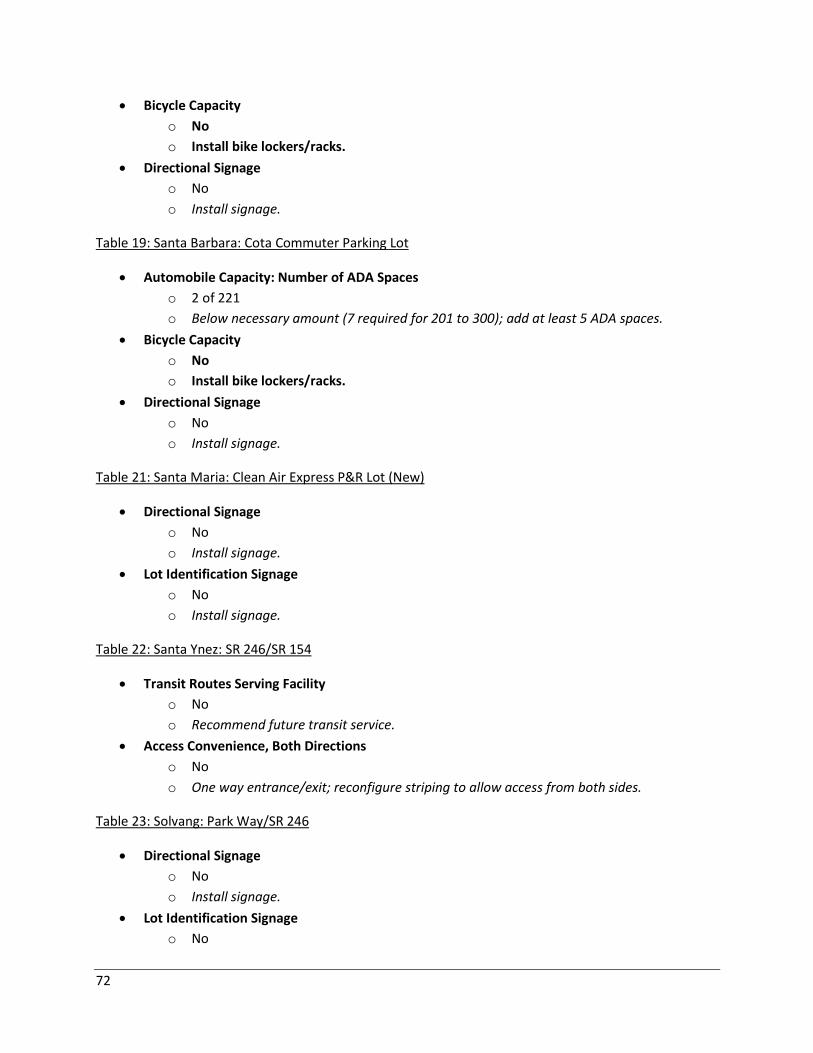
72
Bicycle Capacity
o No
o Install bike lockers/racks.
Directional Signage
o No
o Install signage.
Table 19: Santa Barbara: Cota Commuter Parking Lot
Automobile Capacity: Number of ADA Spaces
o 2 of 221
o Below necessary amount (7 required for 201 to 300); add at least 5 ADA spaces.
Bicycle Capacity
o No
o Install bike lockers/racks.
Directional Signage
o No
o Install signage.
Table 21: Santa Maria: Clean Air Express P&R Lot (New)
Directional Signage
o No
o Install signage.
Lot Identification Signage
o No
o Install signage.
Table 22: Santa Ynez: SR 246/SR 154
Transit Routes Serving Facility
o No
o Recommend future transit service.
Access Convenience, Both Directions
o No
o One way entrance/exit; reconfigure striping to allow access from both sides.
Table 23: Solvang: Park Way/SR 246
Directional Signage
o No
o Install signage.
Lot Identification Signage
o No
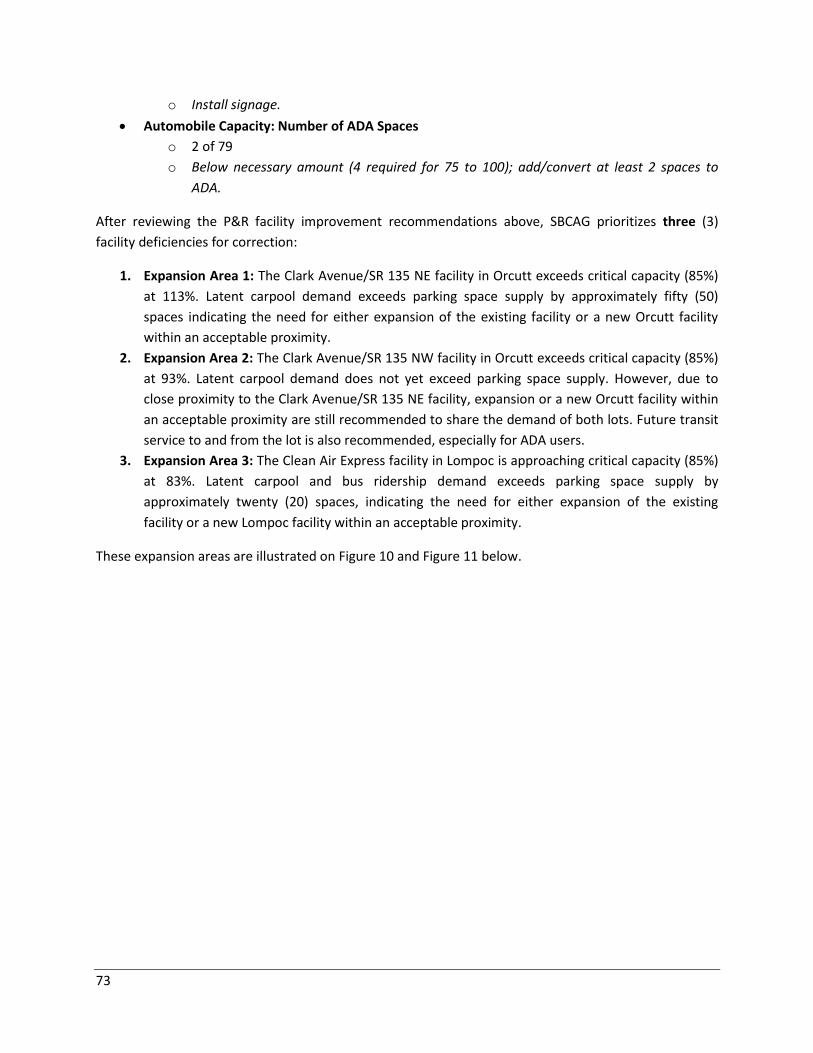
73
o Install signage.
Automobile Capacity: Number of ADA Spaces
o 2 of 79
o Below necessary amount (4 required for 75 to 100); add/convert at least 2 spaces to
ADA.
After reviewing the P&R facility improvement recommendations above, SBCAG prioritizes three (3)
facility deficiencies for correction:
1. Expansion Area 1: The Clark Avenue/SR 135 NE facility in Orcutt exceeds critical capacity (85%)
at 113%. Latent carpool demand exceeds parking space supply by approximately fifty (50)
spaces indicating the need for either expansion of the existing facility or a new Orcutt facility
within an acceptable proximity.
2. Expansion Area 2: The Clark Avenue/SR 135 NW facility in Orcutt exceeds critical capacity (85%)
at 93%. Latent carpool demand does not yet exceed parking space supply. However, due to
close proximity to the Clark Avenue/SR 135 NE facility, expansion or a new Orcutt facility within
an acceptable proximity are still recommended to share the demand of both lots. Future transit
service to and from the lot is also recommended, especially for ADA users.
3. Expansion Area 3: The Clean Air Express facility in Lompoc is approaching critical capacity (85%)
at 83%. Latent carpool and bus ridership demand exceeds parking space supply by
approximately twenty (20) spaces, indicating the need for either expansion of the existing
facility or a new Lompoc facility within an acceptable proximity.
These expansion areas are illustrated on Figure 10 and Figure 11 below.
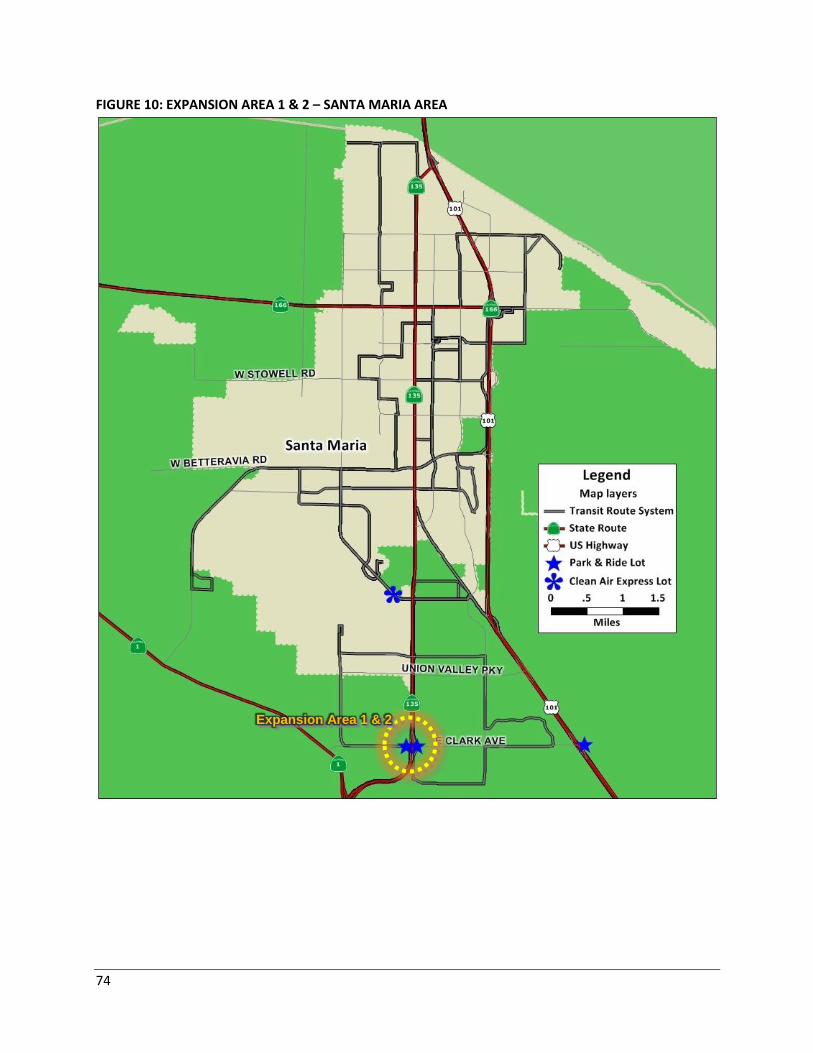
74
FIGURE 10: EXPANSION AREA 1 & 2 – SANTA MARIA AREA
Expansion Area 1 & 2
75
FIGURE 11: HIGH PRIORITY AREA 2 & EXPANSION AREA 3 – LOMPOC AREA
Expansion Area 3
76
Both of the identified facilities in the Orcutt area exceed the determined demand threshold (85%)
outlined by AASHTO in Chapter 6: Facility Improvements subsection A. Demand does not exceed supply
at the Clean Air Express facility in Lompoc, indicating a less pressing need for expansion. Thus, priority is
highest for the two facilities in Orcutt. It is also recommended to install directional signage that meets
California Department of Transportation standards for all official P&R facilities to increase awareness
and potential use of these facilities.
The following chapter explores the creation of new P&R facilities.
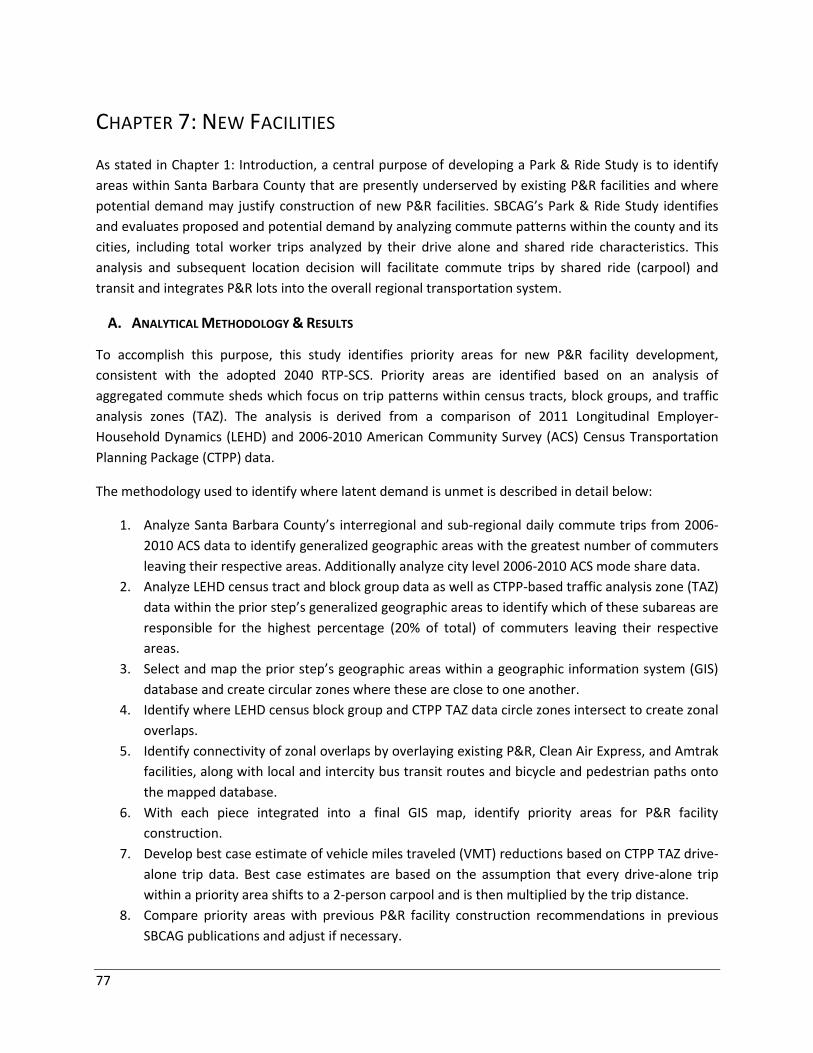
77
CHAPTER 7: NEW FACILITIES
As stated in Chapter 1: Introduction, a central purpose of developing a Park & Ride Study is to identify
areas within Santa Barbara County that are presently underserved by existing P&R facilities and where
potential demand may justify construction of new P&R facilities. SBCAG’s Park & Ride Study identifies
and evaluates proposed and potential demand by analyzing commute patterns within the county and its
cities, including total worker trips analyzed by their drive alone and shared ride characteristics. This
analysis and subsequent location decision will facilitate commute trips by shared ride (carpool) and
transit and integrates P&R lots into the overall regional transportation system.
A. ANALYTICAL METHODOLOGY & RESULTS
To accomplish this purpose, this study identifies priority areas for new P&R facility development,
consistent with the adopted 2040 RTP-SCS. Priority areas are identified based on an analysis of
aggregated commute sheds which focus on trip patterns within census tracts, block groups, and traffic
analysis zones (TAZ). The analysis is derived from a comparison of 2011 Longitudinal Employer-
Household Dynamics (LEHD) and 2006-2010 American Community Survey (ACS) Census Transportation
Planning Package (CTPP) data.
The methodology used to identify where latent demand is unmet is described in detail below:
1. Analyze Santa Barbara County’s interregional and sub-regional daily commute trips from 2006-
2010 ACS data to identify generalized geographic areas with the greatest number of commuters
leaving their respective areas. Additionally analyze city level 2006-2010 ACS mode share data.
2. Analyze LEHD census tract and block group data as well as CTPP-based traffic analysis zone (TAZ)
data within the prior step’s generalized geographic areas to identify which of these subareas are
responsible for the highest percentage (20% of total) of commuters leaving their respective
areas.
3. Select and map the prior step’s geographic areas within a geographic information system (GIS)
database and create circular zones where these are close to one another.
4. Identify where LEHD census block group and CTPP TAZ data circle zones intersect to create zonal
overlaps.
5. Identify connectivity of zonal overlaps by overlaying existing P&R, Clean Air Express, and Amtrak
facilities, along with local and intercity bus transit routes and bicycle and pedestrian paths onto
the mapped database.
6. With each piece integrated into a final GIS map, identify priority areas for P&R facility
construction.
7. Develop best case estimate of vehicle miles traveled (VMT) reductions based on CTPP TAZ drive-
alone trip data. Best case estimates are based on the assumption that every drive-alone trip
within a priority area shifts to a 2-person carpool and is then multiplied by the trip distance.
8. Compare priority areas with previous P&R facility construction recommendations in previous
SBCAG publications and adjust if necessary.
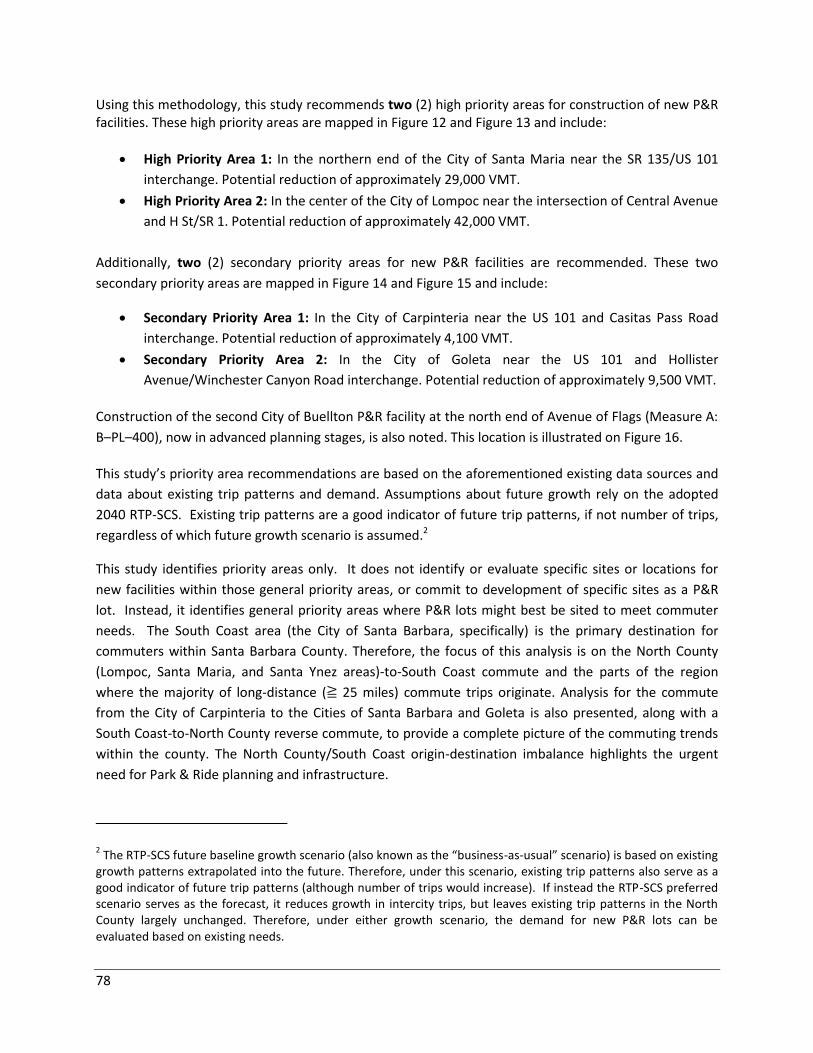
78
Using this methodology, this study recommends two (2) high priority areas for construction of new P&R facilities. These high priority areas are mapped in Figure 12 and Figure 13 and include:
High Priority Area 1: In the northern end of the City of Santa Maria near the SR 135/US 101
interchange. Potential reduction of approximately 29,000 VMT.
High Priority Area 2: In the center of the City of Lompoc near the intersection of Central Avenue
and H St/SR 1. Potential reduction of approximately 42,000 VMT.
Additionally, two (2) secondary priority areas for new P&R facilities are recommended. These two
secondary priority areas are mapped in Figure 14 and Figure 15 and include:
Secondary Priority Area 1: In the City of Carpinteria near the US 101 and Casitas Pass Road
interchange. Potential reduction of approximately 4,100 VMT.
Secondary Priority Area 2: In the City of Goleta near the US 101 and Hollister
Avenue/Winchester Canyon Road interchange. Potential reduction of approximately 9,500 VMT.
Construction of the second City of Buellton P&R facility at the north end of Avenue of Flags (Measure A:
B–PL–400), now in advanced planning stages, is also noted. This location is illustrated on Figure 16.
This study’s priority area recommendations are based on the aforementioned existing data sources and
data about existing trip patterns and demand. Assumptions about future growth rely on the adopted
2040 RTP-SCS. Existing trip patterns are a good indicator of future trip patterns, if not number of trips,
regardless of which future growth scenario is assumed.2
This study identifies priority areas only. It does not identify or evaluate specific sites or locations for
new facilities within those general priority areas, or commit to development of specific sites as a P&R
lot. Instead, it identifies general priority areas where P&R lots might best be sited to meet commuter
needs. The South Coast area (the City of Santa Barbara, specifically) is the primary destination for
commuters within Santa Barbara County. Therefore, the focus of this analysis is on the North County
(Lompoc, Santa Maria, and Santa Ynez areas)-to-South Coast commute and the parts of the region
where the majority of long-distance (≧ 25 miles) commute trips originate. Analysis for the commute
from the City of Carpinteria to the Cities of Santa Barbara and Goleta is also presented, along with a
South Coast-to-North County reverse commute, to provide a complete picture of the commuting trends
within the county. The North County/South Coast origin-destination imbalance highlights the urgent
need for Park & Ride planning and infrastructure.
2 The RTP-SCS future baseline growth scenario (also known as the “business-as-usual” scenario) is based on existing
growth patterns extrapolated into the future. Therefore, under this scenario, existing trip patterns also serve as a good indicator of future trip patterns (although number of trips would increase). If instead the RTP-SCS preferred scenario serves as the forecast, it reduces growth in intercity trips, but leaves existing trip patterns in the North County largely unchanged. Therefore, under either growth scenario, the demand for new P&R lots can be evaluated based on existing needs.

79
FIGURE 12: HIGH PRIORITY AREA 1 – SANTA MARIA AREA
High Priority Area 1
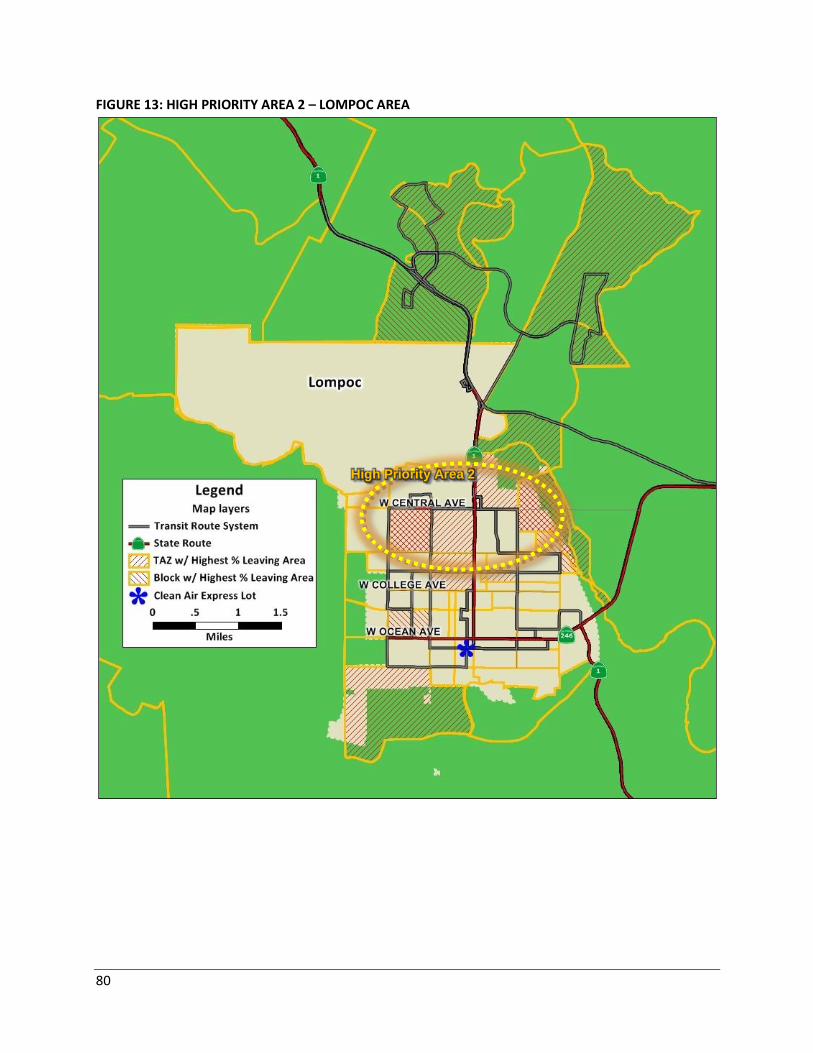
80
FIGURE 13: HIGH PRIORITY AREA 2 – LOMPOC AREA
High Priority Area 2

81
FIGURE 14: SECONDARY PRIORITY AREA 1 – CARPINTERIA AREA
Secondary Priority Area 1

82
FIGURE 15: SECONDARY PRIORITY AREA 2 – GOLETA AREA
Secondary Priority Area 2
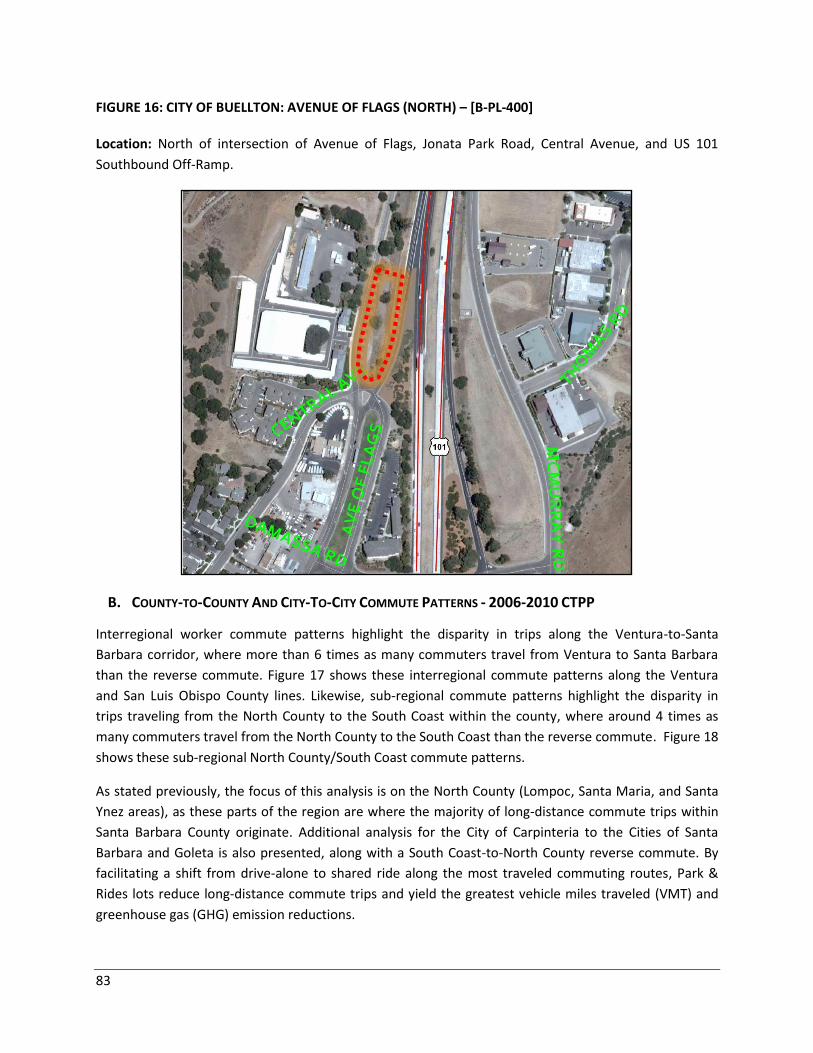
83
FIGURE 16: CITY OF BUELLTON: AVENUE OF FLAGS (NORTH) – [B-PL-400]
Location: North of intersection of Avenue of Flags, Jonata Park Road, Central Avenue, and US 101
Southbound Off-Ramp.
B. COUNTY-TO-COUNTY AND CITY-TO-CITY COMMUTE PATTERNS - 2006-2010 CTPP
Interregional worker commute patterns highlight the disparity in trips along the Ventura-to-Santa
Barbara corridor, where more than 6 times as many commuters travel from Ventura to Santa Barbara
than the reverse commute. Figure 17 shows these interregional commute patterns along the Ventura
and San Luis Obispo County lines. Likewise, sub-regional commute patterns highlight the disparity in
trips traveling from the North County to the South Coast within the county, where around 4 times as
many commuters travel from the North County to the South Coast than the reverse commute. Figure 18
shows these sub-regional North County/South Coast commute patterns.
As stated previously, the focus of this analysis is on the North County (Lompoc, Santa Maria, and Santa
Ynez areas), as these parts of the region are where the majority of long-distance commute trips within
Santa Barbara County originate. Additional analysis for the City of Carpinteria to the Cities of Santa
Barbara and Goleta is also presented, along with a South Coast-to-North County reverse commute. By
facilitating a shift from drive-alone to shared ride along the most traveled commuting routes, Park &
Rides lots reduce long-distance commute trips and yield the greatest vehicle miles traveled (VMT) and
greenhouse gas (GHG) emission reductions.
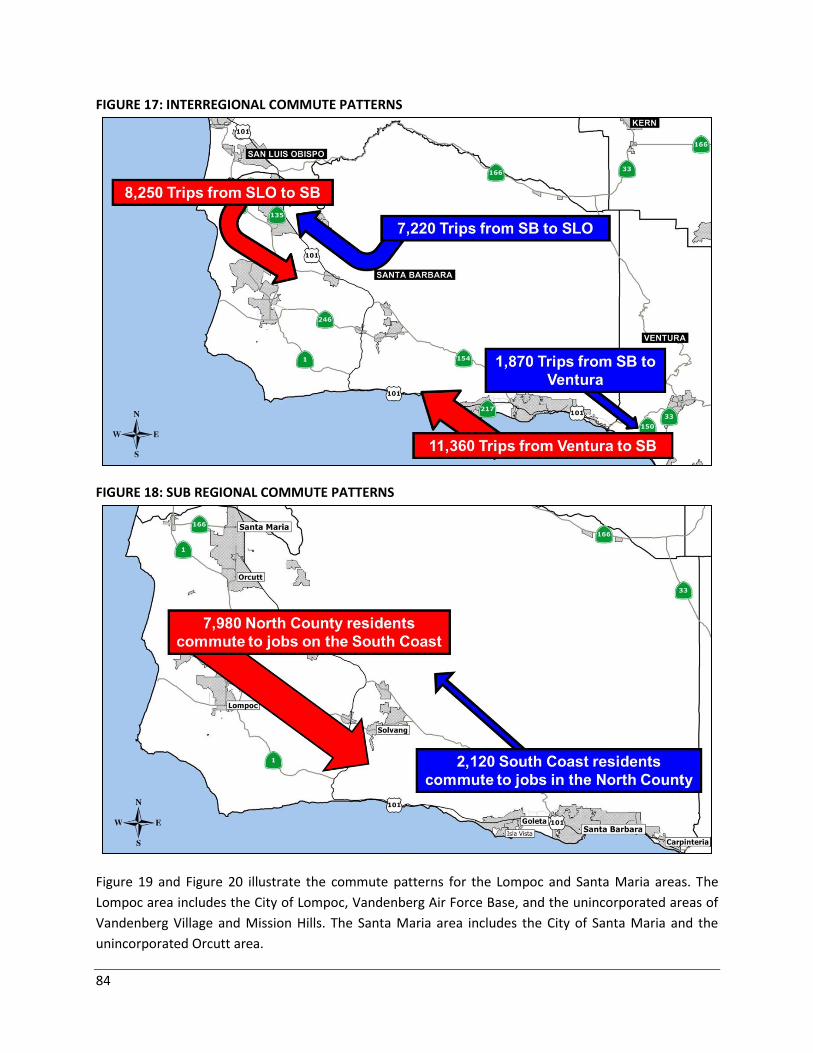
84
FIGURE 17: INTERREGIONAL COMMUTE PATTERNS
FIGURE 18: SUB REGIONAL COMMUTE PATTERNS
Figure 19 and Figure 20 illustrate the commute patterns for the Lompoc and Santa Maria areas. The
Lompoc area includes the City of Lompoc, Vandenberg Air Force Base, and the unincorporated areas of
Vandenberg Village and Mission Hills. The Santa Maria area includes the City of Santa Maria and the
unincorporated Orcutt area.
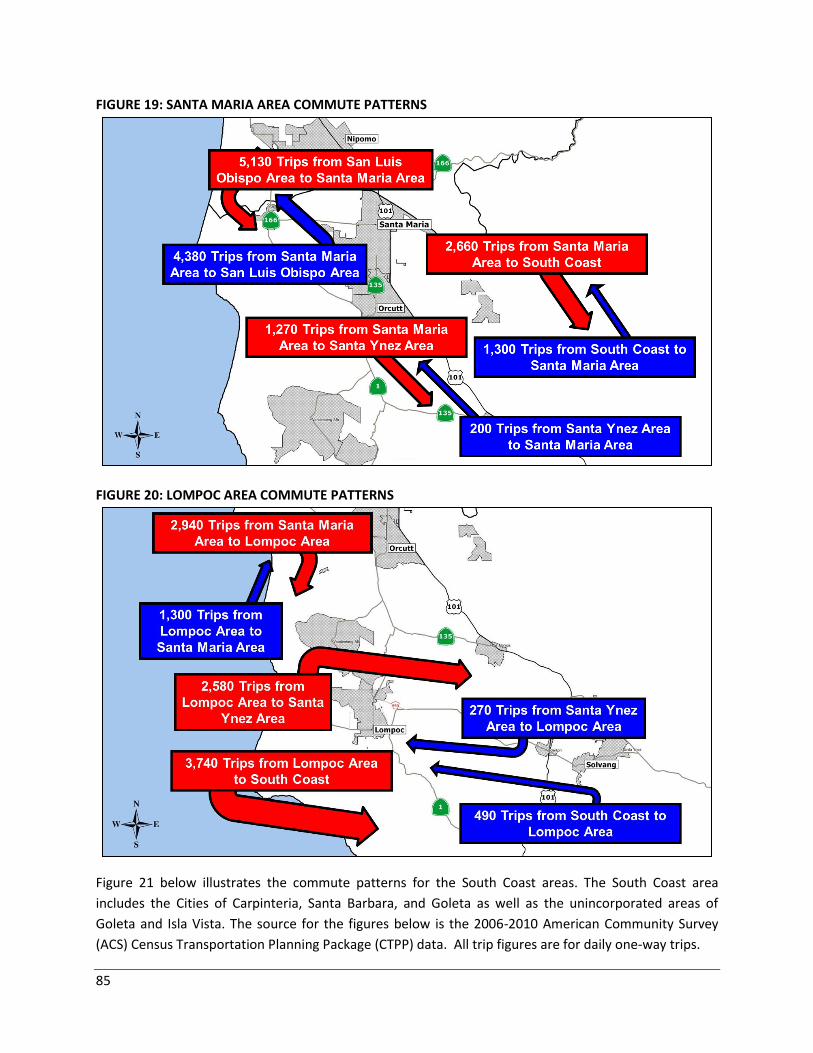
85
FIGURE 19: SANTA MARIA AREA COMMUTE PATTERNS
FIGURE 20: LOMPOC AREA COMMUTE PATTERNS
Figure 21 below illustrates the commute patterns for the South Coast areas. The South Coast area
includes the Cities of Carpinteria, Santa Barbara, and Goleta as well as the unincorporated areas of
Goleta and Isla Vista. The source for the figures below is the 2006-2010 American Community Survey
(ACS) Census Transportation Planning Package (CTPP) data. All trip figures are for daily one-way trips.
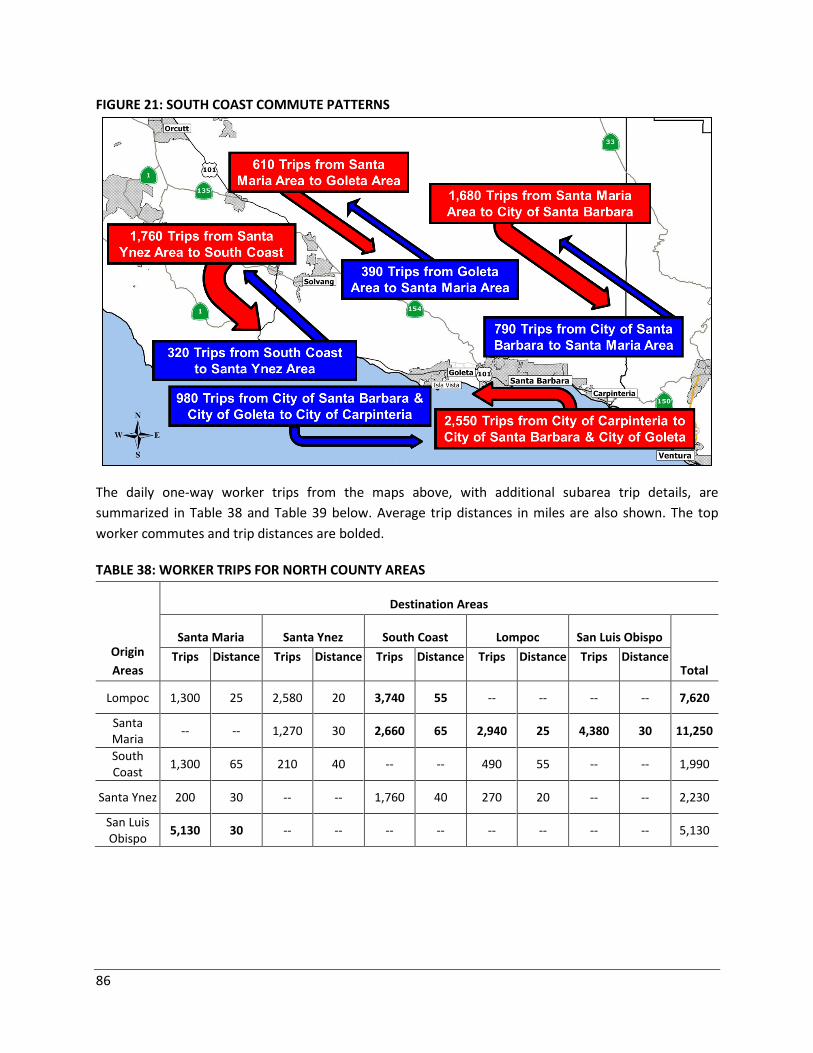
86
FIGURE 21: SOUTH COAST COMMUTE PATTERNS
The daily one-way worker trips from the maps above, with additional subarea trip details, are
summarized in Table 38 and Table 39 below. Average trip distances in miles are also shown. The top
worker commutes and trip distances are bolded.
TABLE 38: WORKER TRIPS FOR NORTH COUNTY AREAS
Origin
Areas
Destination Areas
Santa Maria Santa Ynez South Coast Lompoc San Luis Obispo
Total Trips Distance Trips Distance Trips Distance Trips Distance Trips Distance
Lompoc 1,300 25 2,580 20 3,740 55 -- -- -- -- 7,620
Santa Maria
-- -- 1,270 30 2,660 65 2,940 25 4,380 30 11,250
South Coast
1,300 65 210 40 -- -- 490 55 -- -- 1,990
Santa Ynez 200 30 -- -- 1,760 40 270 20 -- -- 2,230
San Luis Obispo
5,130 30 -- -- -- -- -- -- -- -- 5,130
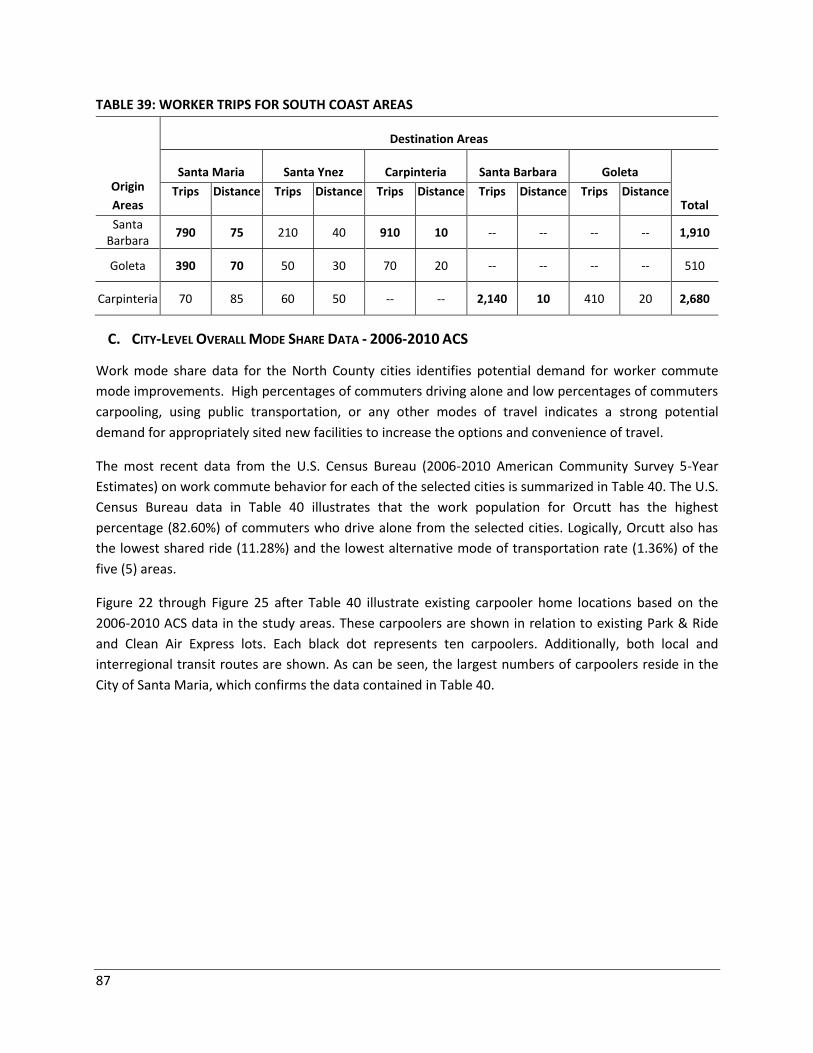
87
TABLE 39: WORKER TRIPS FOR SOUTH COAST AREAS
Origin
Areas
Destination Areas
Santa Maria Santa Ynez Carpinteria Santa Barbara Goleta
Total Trips Distance Trips Distance Trips Distance Trips Distance Trips Distance
Santa Barbara
790 75 210 40 910 10 -- -- -- -- 1,910
Goleta 390 70 50 30 70 20 -- -- -- -- 510
Carpinteria 70 85 60 50 -- -- 2,140 10 410 20 2,680
C. CITY-LEVEL OVERALL MODE SHARE DATA - 2006-2010 ACS
Work mode share data for the North County cities identifies potential demand for worker commute
mode improvements. High percentages of commuters driving alone and low percentages of commuters
carpooling, using public transportation, or any other modes of travel indicates a strong potential
demand for appropriately sited new facilities to increase the options and convenience of travel.
The most recent data from the U.S. Census Bureau (2006-2010 American Community Survey 5-Year
Estimates) on work commute behavior for each of the selected cities is summarized in Table 40. The U.S.
Census Bureau data in Table 40 illustrates that the work population for Orcutt has the highest
percentage (82.60%) of commuters who drive alone from the selected cities. Logically, Orcutt also has
the lowest shared ride (11.28%) and the lowest alternative mode of transportation rate (1.36%) of the
five (5) areas.
Figure 22 through Figure 25 after Table 40 illustrate existing carpooler home locations based on the
2006-2010 ACS data in the study areas. These carpoolers are shown in relation to existing Park & Ride
and Clean Air Express lots. Each black dot represents ten carpoolers. Additionally, both local and
interregional transit routes are shown. As can be seen, the largest numbers of carpoolers reside in the
City of Santa Maria, which confirms the data contained in Table 40.
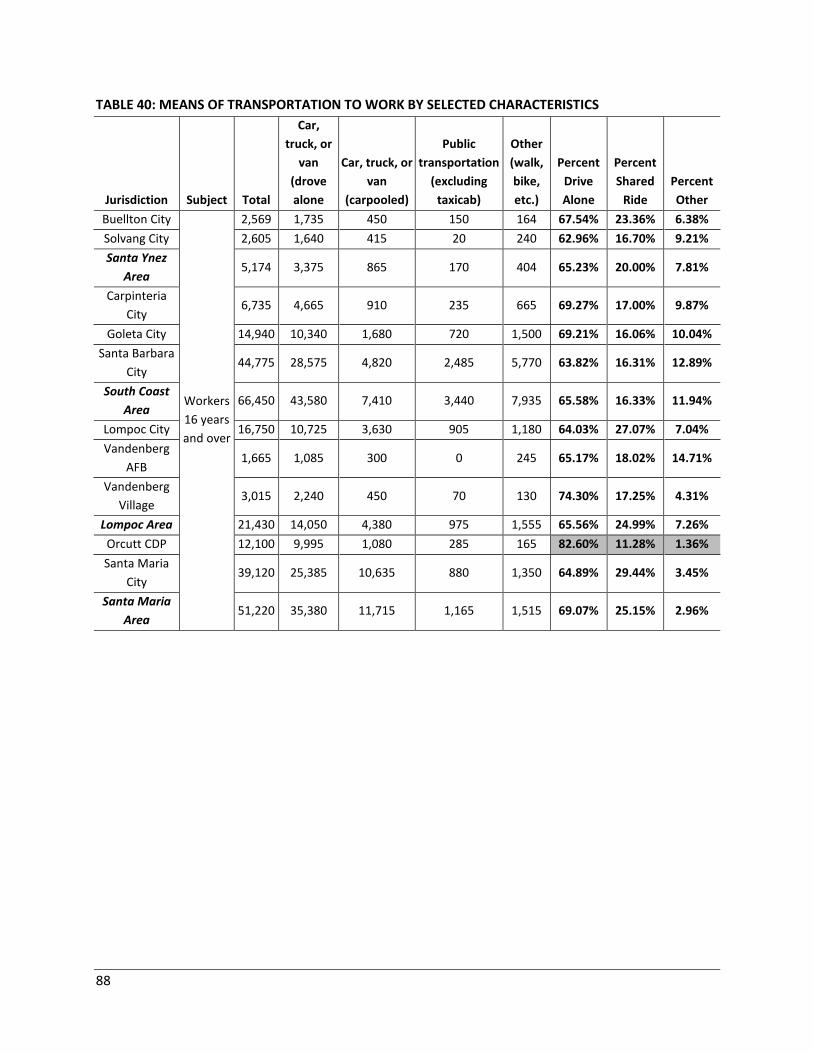
88
TABLE 40: MEANS OF TRANSPORTATION TO WORK BY SELECTED CHARACTERISTICS
Jurisdiction Subject Total
Car,
truck, or
van
(drove
alone
Car, truck, or
van
(carpooled)
Public
transportation
(excluding
taxicab)
Other
(walk,
bike,
etc.)
Percent
Drive
Alone
Percent
Shared
Ride
Percent
Other
Buellton City
Workers
16 years
and over
2,569 1,735 450 150 164 67.54% 23.36% 6.38%
Solvang City 2,605 1,640 415 20 240 62.96% 16.70% 9.21%
Santa Ynez
Area 5,174 3,375 865 170 404 65.23% 20.00% 7.81%
Carpinteria
City 6,735 4,665 910 235 665 69.27% 17.00% 9.87%
Goleta City 14,940 10,340 1,680 720 1,500 69.21% 16.06% 10.04%
Santa Barbara
City 44,775 28,575 4,820 2,485 5,770 63.82% 16.31% 12.89%
South Coast
Area 66,450 43,580 7,410 3,440 7,935 65.58% 16.33% 11.94%
Lompoc City 16,750 10,725 3,630 905 1,180 64.03% 27.07% 7.04%
Vandenberg
AFB 1,665 1,085 300 0 245 65.17% 18.02% 14.71%
Vandenberg
Village 3,015 2,240 450 70 130 74.30% 17.25% 4.31%
Lompoc Area 21,430 14,050 4,380 975 1,555 65.56% 24.99% 7.26%
Orcutt CDP 12,100 9,995 1,080 285 165 82.60% 11.28% 1.36%
Santa Maria
City 39,120 25,385 10,635 880 1,350 64.89% 29.44% 3.45%
Santa Maria
Area 51,220 35,380 11,715 1,165 1,515 69.07% 25.15% 2.96%
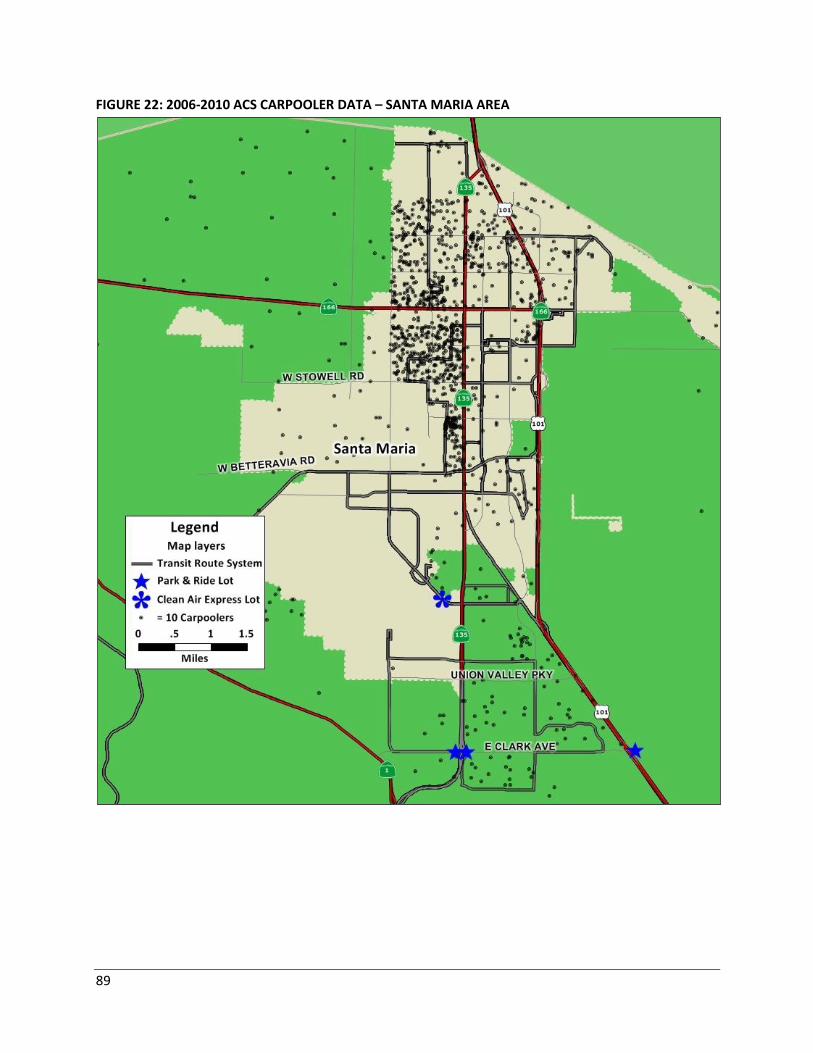
89
FIGURE 22: 2006-2010 ACS CARPOOLER DATA – SANTA MARIA AREA
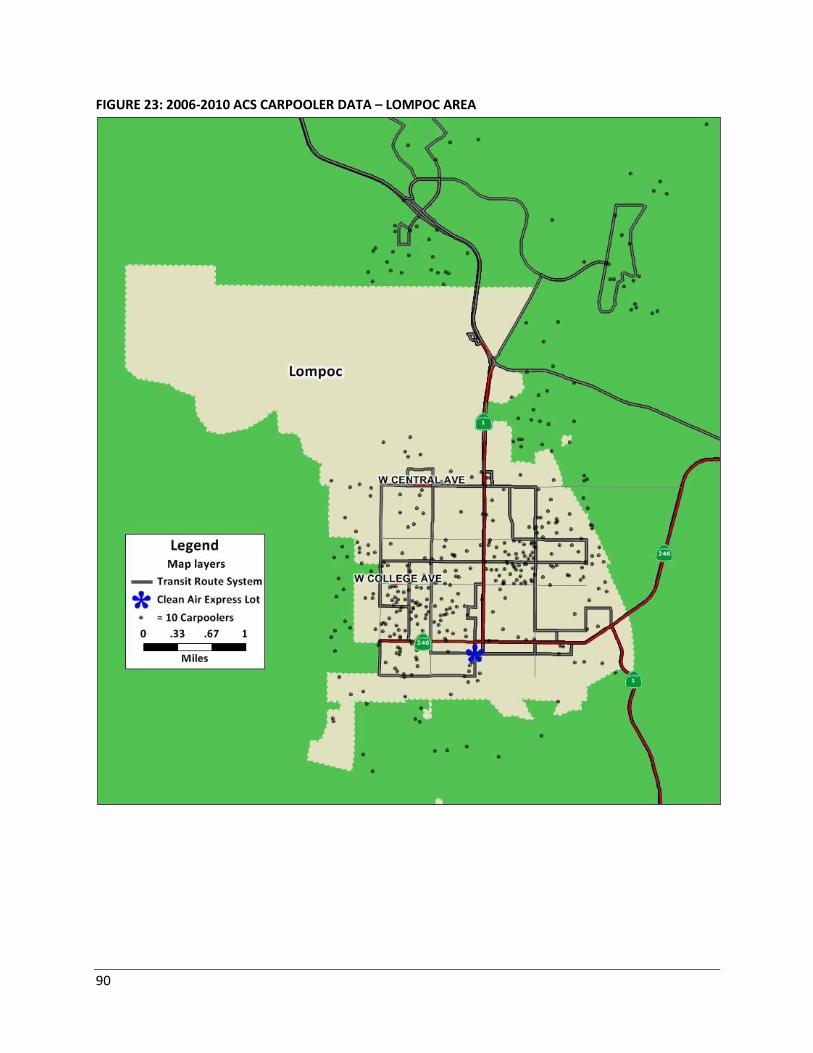
90
FIGURE 23: 2006-2010 ACS CARPOOLER DATA – LOMPOC AREA
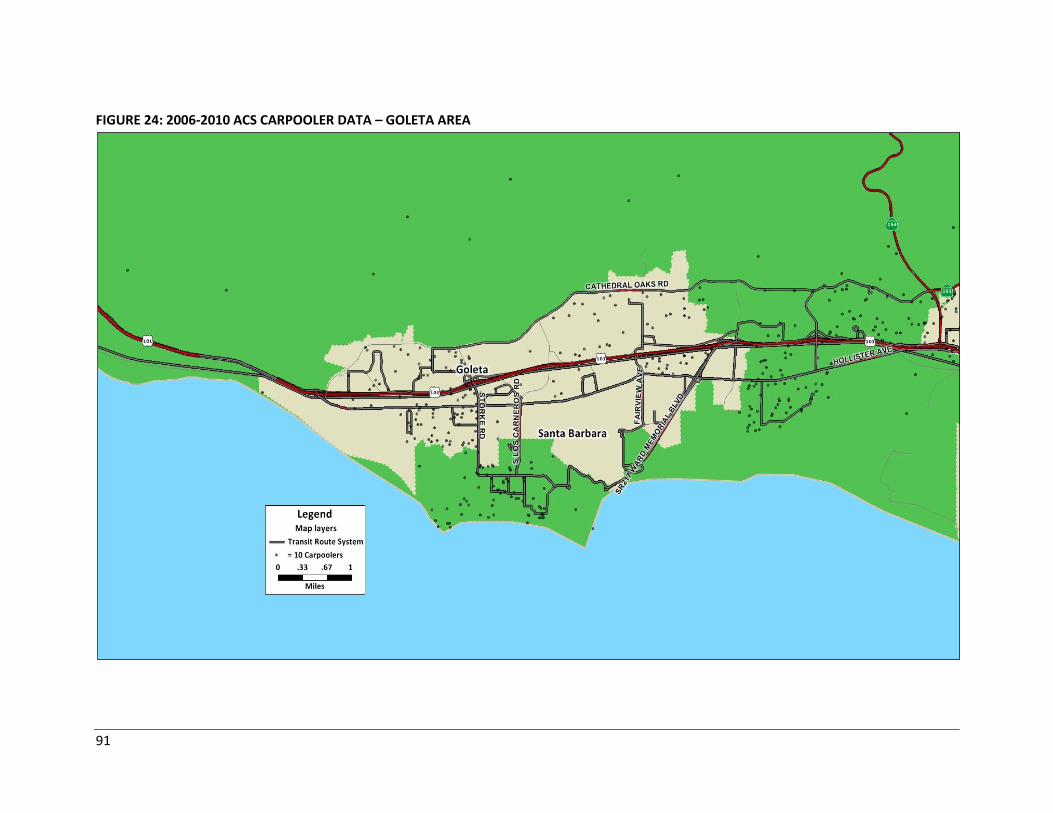
91
FIGURE 24: 2006-2010 ACS CARPOOLER DATA – GOLETA AREA
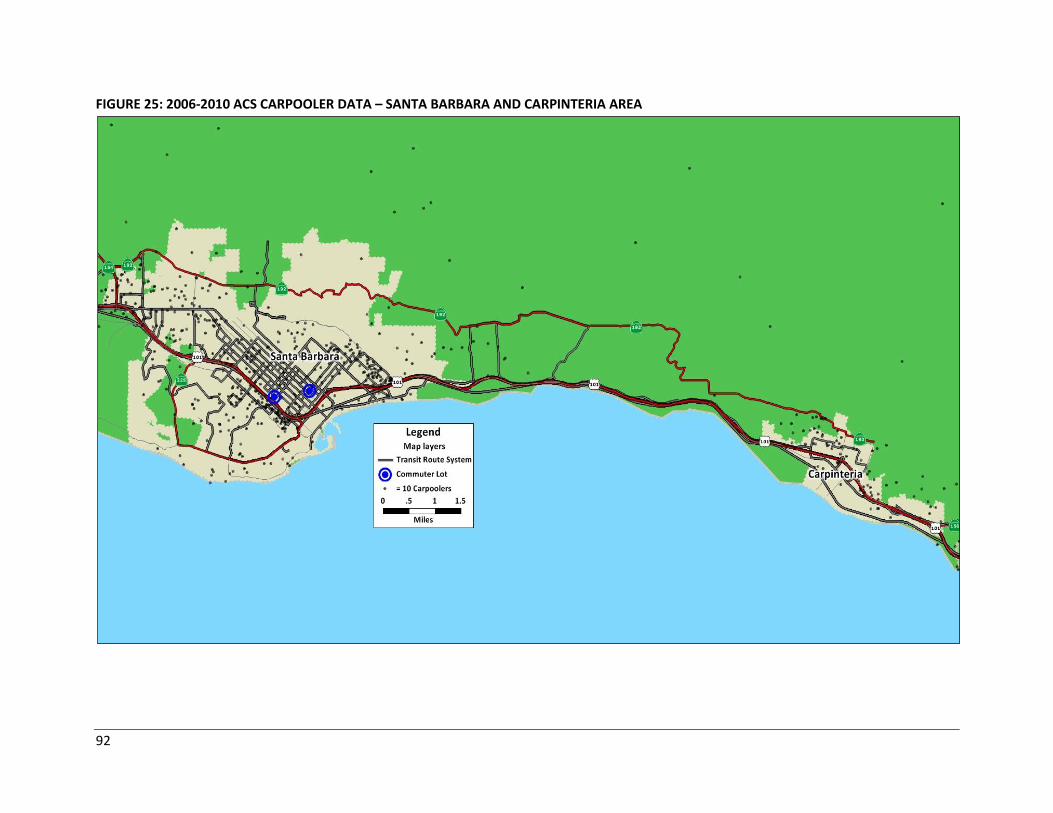
92
FIGURE 25: 2006-2010 ACS CARPOOLER DATA – SANTA BARBARA AND CARPINTERIA AREA
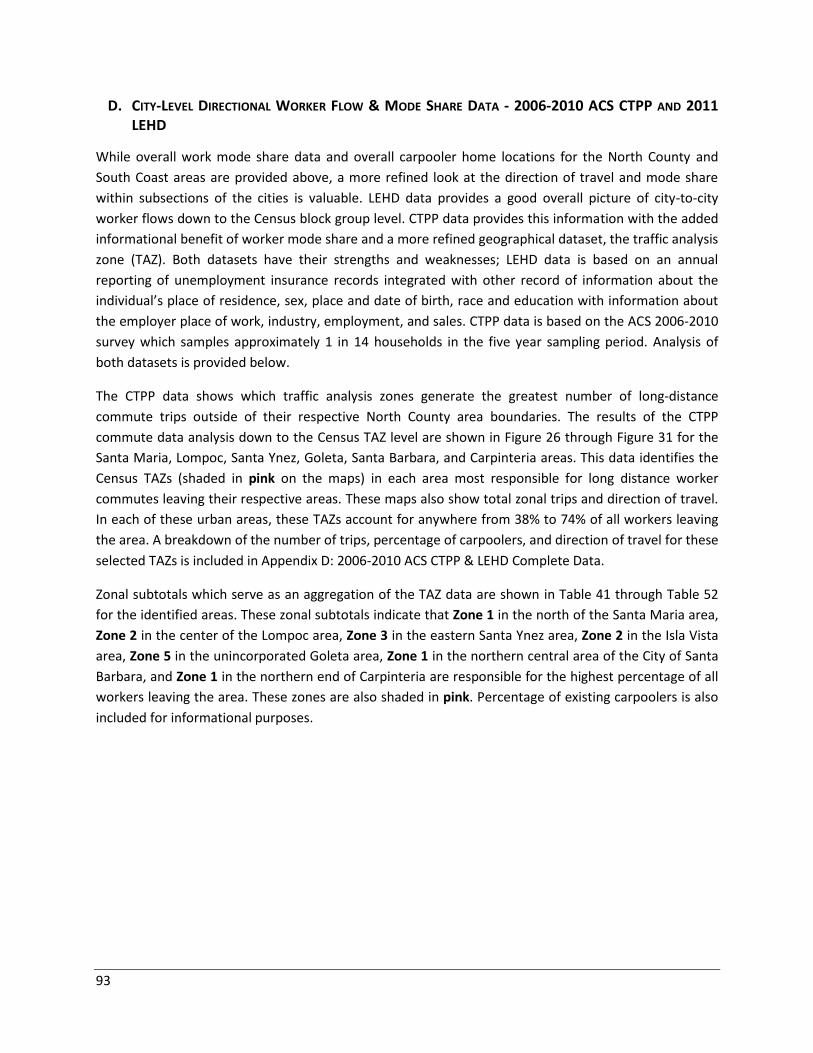
93
D. CITY-LEVEL DIRECTIONAL WORKER FLOW & MODE SHARE DATA - 2006-2010 ACS CTPP AND 2011
LEHD
While overall work mode share data and overall carpooler home locations for the North County and
South Coast areas are provided above, a more refined look at the direction of travel and mode share
within subsections of the cities is valuable. LEHD data provides a good overall picture of city-to-city
worker flows down to the Census block group level. CTPP data provides this information with the added
informational benefit of worker mode share and a more refined geographical dataset, the traffic analysis
zone (TAZ). Both datasets have their strengths and weaknesses; LEHD data is based on an annual
reporting of unemployment insurance records integrated with other record of information about the
individual’s place of residence, sex, place and date of birth, race and education with information about
the employer place of work, industry, employment, and sales. CTPP data is based on the ACS 2006-2010
survey which samples approximately 1 in 14 households in the five year sampling period. Analysis of
both datasets is provided below.
The CTPP data shows which traffic analysis zones generate the greatest number of long-distance
commute trips outside of their respective North County area boundaries. The results of the CTPP
commute data analysis down to the Census TAZ level are shown in Figure 26 through Figure 31 for the
Santa Maria, Lompoc, Santa Ynez, Goleta, Santa Barbara, and Carpinteria areas. This data identifies the
Census TAZs (shaded in pink on the maps) in each area most responsible for long distance worker
commutes leaving their respective areas. These maps also show total zonal trips and direction of travel.
In each of these urban areas, these TAZs account for anywhere from 38% to 74% of all workers leaving
the area. A breakdown of the number of trips, percentage of carpoolers, and direction of travel for these
selected TAZs is included in Appendix D: 2006-2010 ACS CTPP & LEHD Complete Data.
Zonal subtotals which serve as an aggregation of the TAZ data are shown in Table 41 through Table 52
for the identified areas. These zonal subtotals indicate that Zone 1 in the north of the Santa Maria area,
Zone 2 in the center of the Lompoc area, Zone 3 in the eastern Santa Ynez area, Zone 2 in the Isla Vista
area, Zone 5 in the unincorporated Goleta area, Zone 1 in the northern central area of the City of Santa
Barbara, and Zone 1 in the northern end of Carpinteria are responsible for the highest percentage of all
workers leaving the area. These zones are also shaded in pink. Percentage of existing carpoolers is also
included for informational purposes.
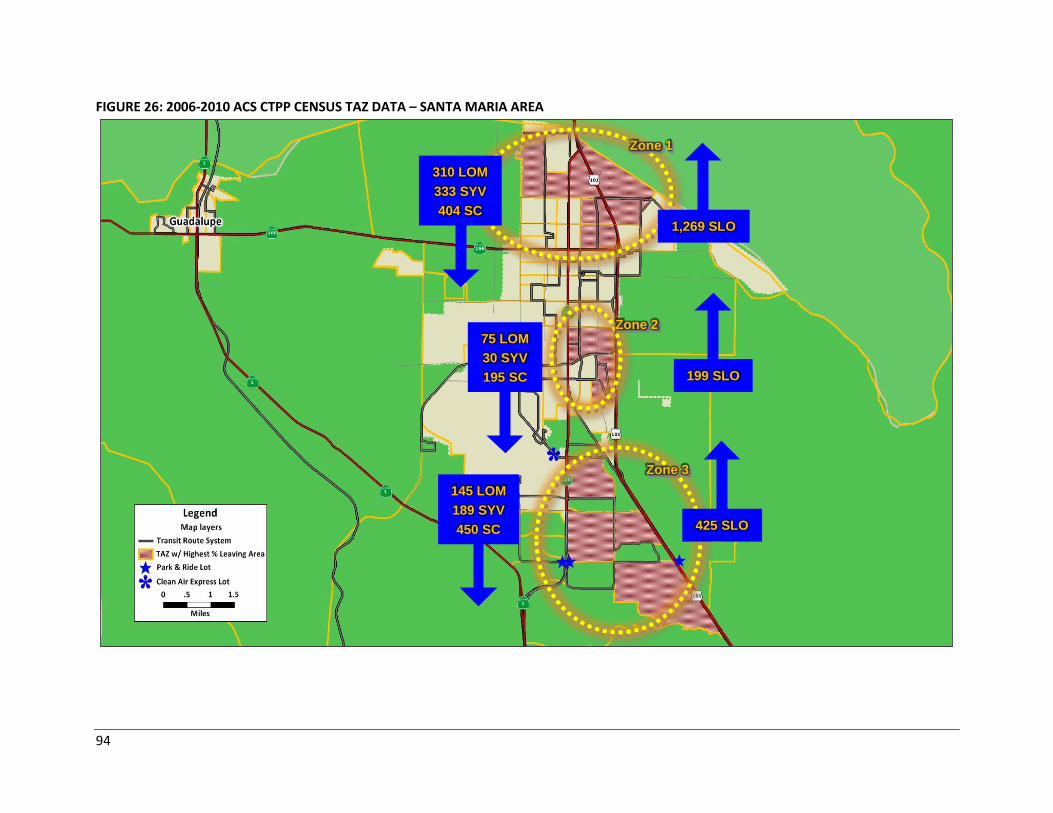
94
FIGURE 26: 2006-2010 ACS CTPP CENSUS TAZ DATA – SANTA MARIA AREA
Zone 1
Zone 2
Zone 3
1,269 SLO
310 LOM
333 SYV
404 SC
199 SLO
75 LOM
30 SYV
195 SC
145 LOM
189 SYV
450 SC 425 SLO
95
FIGURE 27: 2006-2010 ACS CTPP CENSUS TAZ DATA – LOMPOC AREA
Zone 1
Zone 2
Zone 3
160 SM
255 SC
225 SYV
219 SM 540 SYV
1,045 SC
60 SM
40 SYV
330 SC
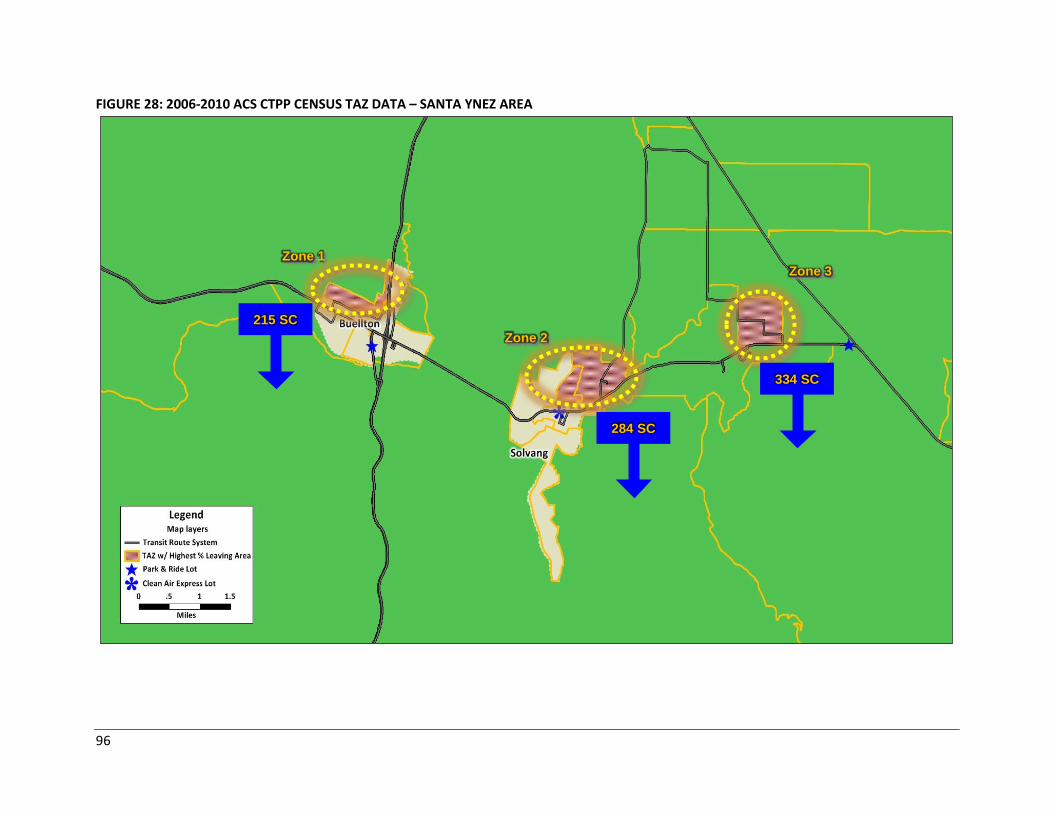
96
FIGURE 28: 2006-2010 ACS CTPP CENSUS TAZ DATA – SANTA YNEZ AREA
Zone 1
Zone 2
Zone 3
215 SC
284 SC
334 SC
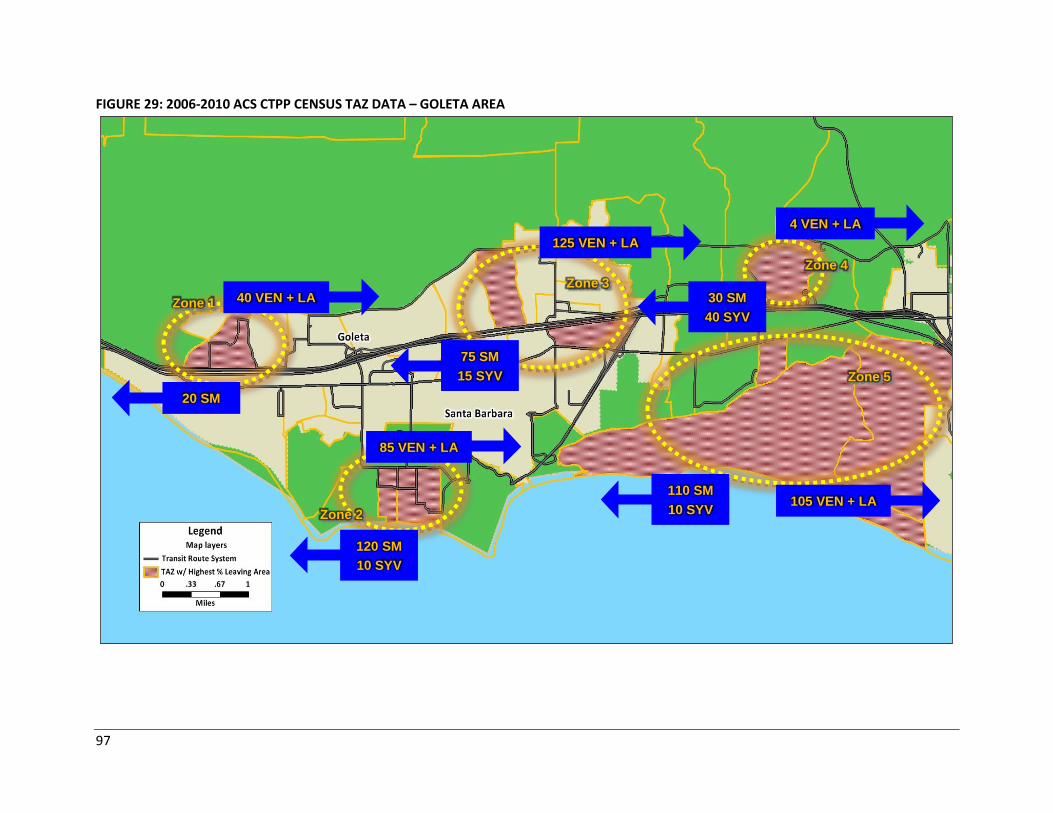
97
FIGURE 29: 2006-2010 ACS CTPP CENSUS TAZ DATA – GOLETA AREA
Zone 5
Zone 2
Zone 3
Zone 4
Zone 1
20 SM
40 VEN + LA
120 SM
10 SYV
85 VEN + LA
75 SM
15 SYV
125 VEN + LA
30 SM
40 SYV
4 VEN + LA
110 SM
10 SYV 105 VEN + LA
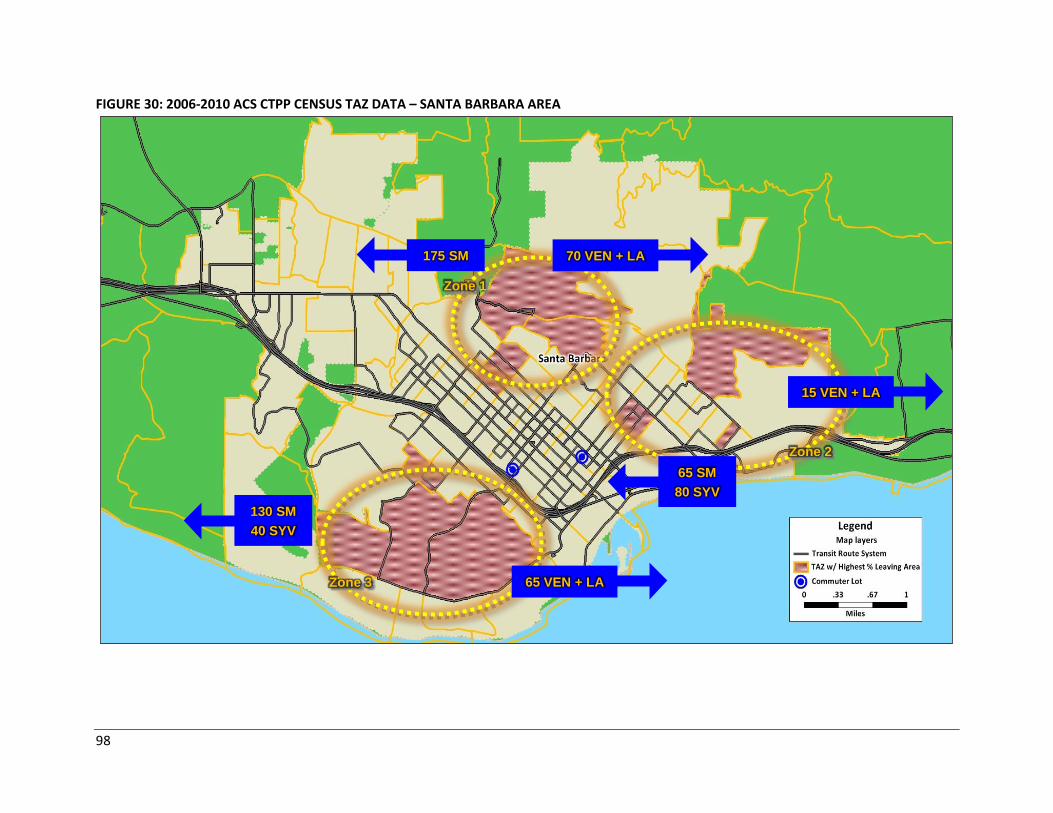
98
FIGURE 30: 2006-2010 ACS CTPP CENSUS TAZ DATA – SANTA BARBARA AREA
Zone 1
Zone 2
Zone 3
175 SM 70 VEN + LA
15 VEN + LA
65 VEN + LA
130 SM
40 SYV
65 SM
80 SYV
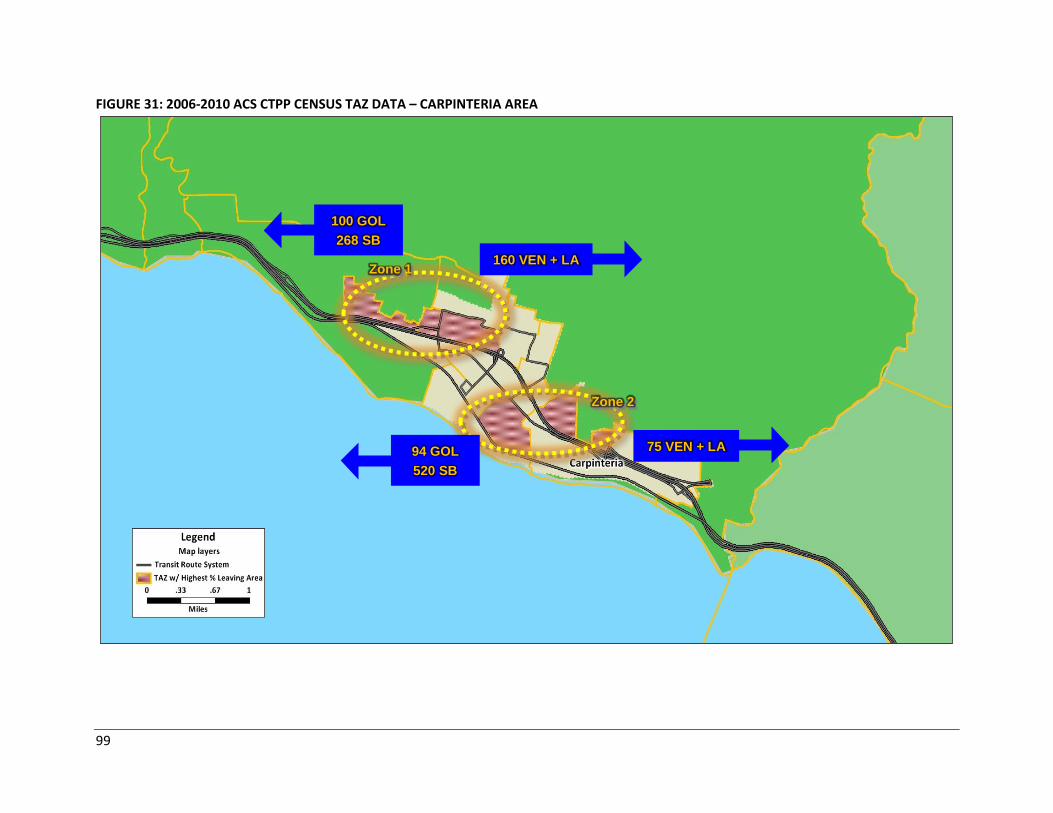
99
FIGURE 31: 2006-2010 ACS CTPP CENSUS TAZ DATA – CARPINTERIA AREA
Zone 1
Zone 2
100 GOL
268 SB
160 VEN + LA
75 VEN + LA 94 GOL
520 SB
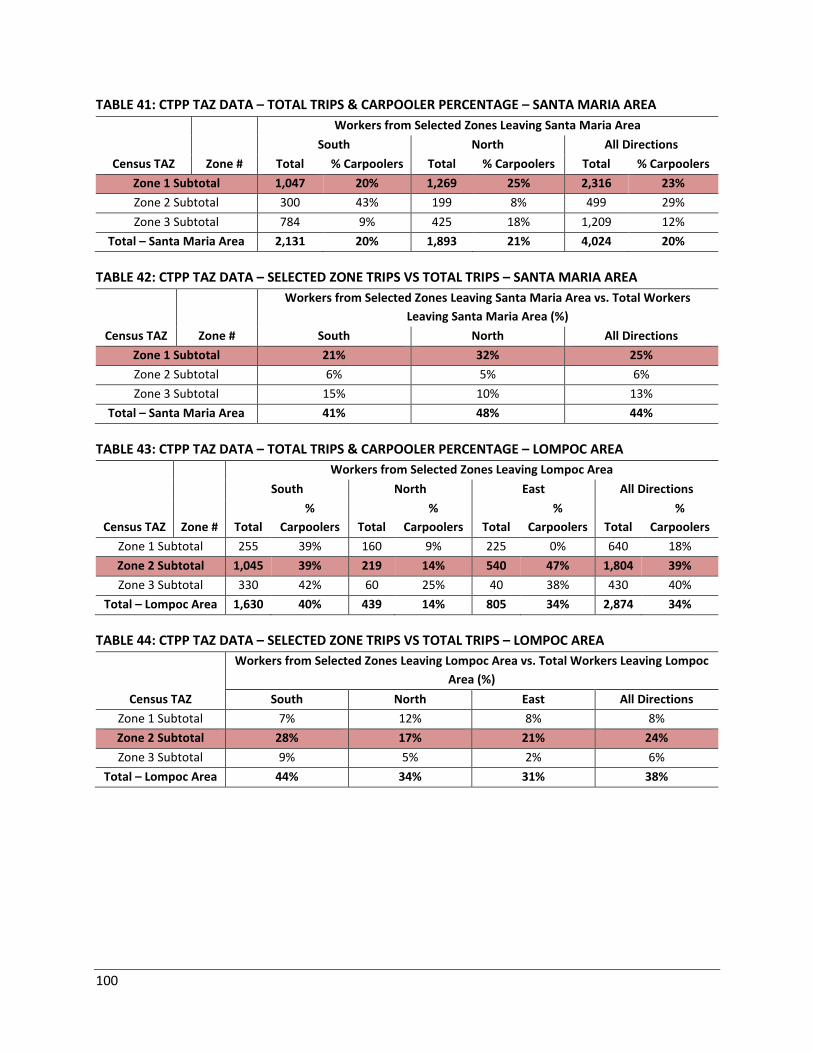
100
TABLE 41: CTPP TAZ DATA – TOTAL TRIPS & CARPOOLER PERCENTAGE – SANTA MARIA AREA
Census TAZ Zone #
Workers from Selected Zones Leaving Santa Maria Area
South North All Directions
Total % Carpoolers Total % Carpoolers Total % Carpoolers
Zone 1 Subtotal 1,047 20% 1,269 25% 2,316 23%
Zone 2 Subtotal 300 43% 199 8% 499 29%
Zone 3 Subtotal 784 9% 425 18% 1,209 12%
Total – Santa Maria Area 2,131 20% 1,893 21% 4,024 20%
TABLE 42: CTPP TAZ DATA – SELECTED ZONE TRIPS VS TOTAL TRIPS – SANTA MARIA AREA
Census TAZ Zone #
Workers from Selected Zones Leaving Santa Maria Area vs. Total Workers
Leaving Santa Maria Area (%)
South North All Directions
Zone 1 Subtotal 21% 32% 25%
Zone 2 Subtotal 6% 5% 6%
Zone 3 Subtotal 15% 10% 13%
Total – Santa Maria Area 41% 48% 44%
TABLE 43: CTPP TAZ DATA – TOTAL TRIPS & CARPOOLER PERCENTAGE – LOMPOC AREA
Census TAZ Zone #
Workers from Selected Zones Leaving Lompoc Area
South North East All Directions
Total
%
Carpoolers Total
%
Carpoolers Total
%
Carpoolers Total
%
Carpoolers
Zone 1 Subtotal 255 39% 160 9% 225 0% 640 18%
Zone 2 Subtotal 1,045 39% 219 14% 540 47% 1,804 39%
Zone 3 Subtotal 330 42% 60 25% 40 38% 430 40%
Total – Lompoc Area 1,630 40% 439 14% 805 34% 2,874 34%
TABLE 44: CTPP TAZ DATA – SELECTED ZONE TRIPS VS TOTAL TRIPS – LOMPOC AREA
Census TAZ
Workers from Selected Zones Leaving Lompoc Area vs. Total Workers Leaving Lompoc
Area (%)
South North East All Directions
Zone 1 Subtotal 7% 12% 8% 8%
Zone 2 Subtotal 28% 17% 21% 24%
Zone 3 Subtotal 9% 5% 2% 6%
Total – Lompoc Area 44% 34% 31% 38%
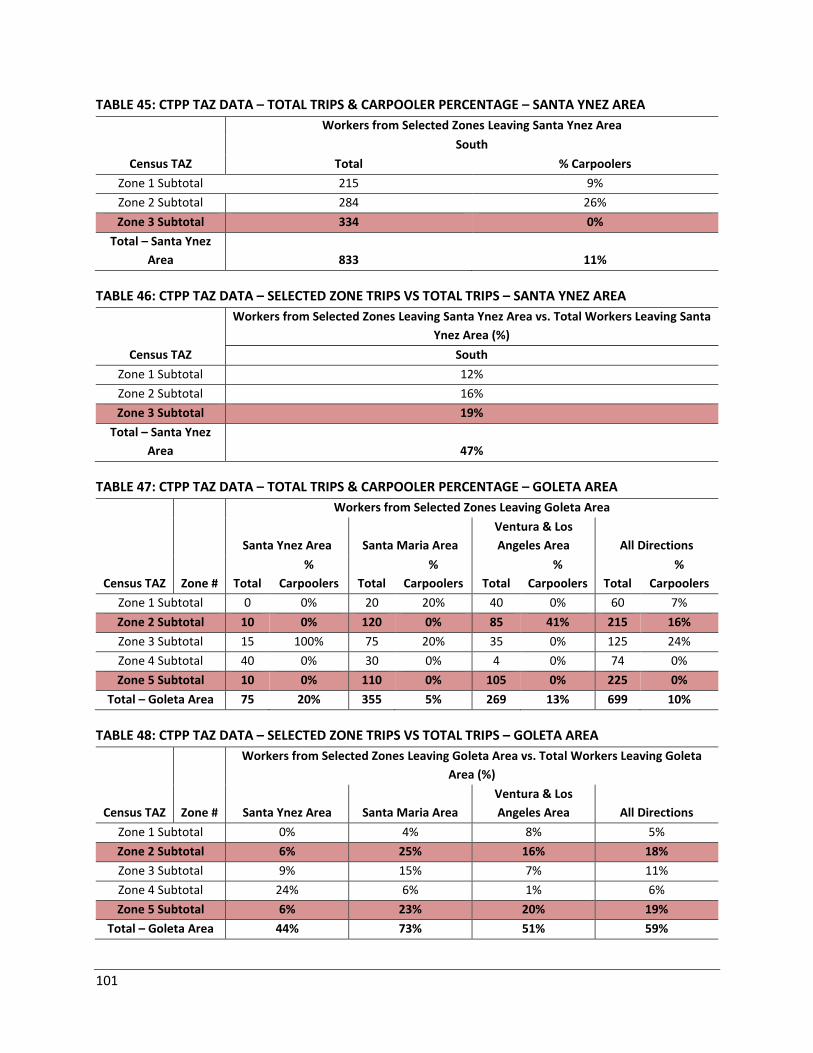
101
TABLE 45: CTPP TAZ DATA – TOTAL TRIPS & CARPOOLER PERCENTAGE – SANTA YNEZ AREA
Census TAZ
Workers from Selected Zones Leaving Santa Ynez Area
South
Total % Carpoolers
Zone 1 Subtotal 215 9%
Zone 2 Subtotal 284 26%
Zone 3 Subtotal 334 0%
Total – Santa Ynez
Area 833 11%
TABLE 46: CTPP TAZ DATA – SELECTED ZONE TRIPS VS TOTAL TRIPS – SANTA YNEZ AREA
Census TAZ
Workers from Selected Zones Leaving Santa Ynez Area vs. Total Workers Leaving Santa
Ynez Area (%)
South
Zone 1 Subtotal 12%
Zone 2 Subtotal 16%
Zone 3 Subtotal 19%
Total – Santa Ynez
Area 47%
TABLE 47: CTPP TAZ DATA – TOTAL TRIPS & CARPOOLER PERCENTAGE – GOLETA AREA
Census TAZ Zone #
Workers from Selected Zones Leaving Goleta Area
Santa Ynez Area Santa Maria Area
Ventura & Los
Angeles Area All Directions
Total
%
Carpoolers Total
%
Carpoolers Total
%
Carpoolers Total
%
Carpoolers
Zone 1 Subtotal 0 0% 20 20% 40 0% 60 7%
Zone 2 Subtotal 10 0% 120 0% 85 41% 215 16%
Zone 3 Subtotal 15 100% 75 20% 35 0% 125 24%
Zone 4 Subtotal 40 0% 30 0% 4 0% 74 0%
Zone 5 Subtotal 10 0% 110 0% 105 0% 225 0%
Total – Goleta Area 75 20% 355 5% 269 13% 699 10%
TABLE 48: CTPP TAZ DATA – SELECTED ZONE TRIPS VS TOTAL TRIPS – GOLETA AREA
Census TAZ Zone #
Workers from Selected Zones Leaving Goleta Area vs. Total Workers Leaving Goleta
Area (%)
Santa Ynez Area Santa Maria Area
Ventura & Los
Angeles Area All Directions
Zone 1 Subtotal 0% 4% 8% 5%
Zone 2 Subtotal 6% 25% 16% 18%
Zone 3 Subtotal 9% 15% 7% 11%
Zone 4 Subtotal 24% 6% 1% 6%
Zone 5 Subtotal 6% 23% 20% 19%
Total – Goleta Area 44% 73% 51% 59%
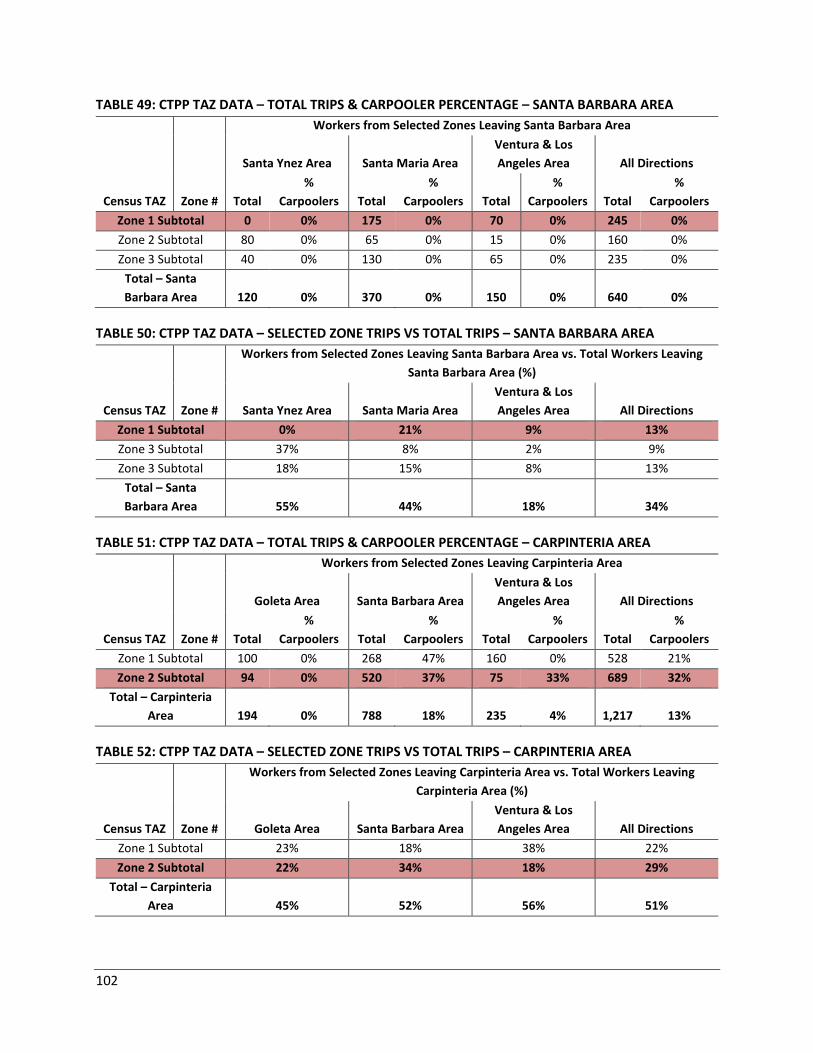
102
TABLE 49: CTPP TAZ DATA – TOTAL TRIPS & CARPOOLER PERCENTAGE – SANTA BARBARA AREA
Census TAZ Zone #
Workers from Selected Zones Leaving Santa Barbara Area
Santa Ynez Area Santa Maria Area
Ventura & Los
Angeles Area All Directions
Total
%
Carpoolers Total
%
Carpoolers Total
%
Carpoolers Total
%
Carpoolers
Zone 1 Subtotal 0 0% 175 0% 70 0% 245 0%
Zone 2 Subtotal 80 0% 65 0% 15 0% 160 0%
Zone 3 Subtotal 40 0% 130 0% 65 0% 235 0%
Total – Santa
Barbara Area 120 0% 370 0% 150 0% 640 0%
TABLE 50: CTPP TAZ DATA – SELECTED ZONE TRIPS VS TOTAL TRIPS – SANTA BARBARA AREA
Census TAZ Zone #
Workers from Selected Zones Leaving Santa Barbara Area vs. Total Workers Leaving
Santa Barbara Area (%)
Santa Ynez Area Santa Maria Area
Ventura & Los
Angeles Area All Directions
Zone 1 Subtotal 0% 21% 9% 13%
Zone 3 Subtotal 37% 8% 2% 9%
Zone 3 Subtotal 18% 15% 8% 13%
Total – Santa
Barbara Area 55% 44% 18% 34%
TABLE 51: CTPP TAZ DATA – TOTAL TRIPS & CARPOOLER PERCENTAGE – CARPINTERIA AREA
Census TAZ Zone #
Workers from Selected Zones Leaving Carpinteria Area
Goleta Area Santa Barbara Area
Ventura & Los
Angeles Area All Directions
Total
%
Carpoolers Total
%
Carpoolers Total
%
Carpoolers Total
%
Carpoolers
Zone 1 Subtotal 100 0% 268 47% 160 0% 528 21%
Zone 2 Subtotal 94 0% 520 37% 75 33% 689 32%
Total – Carpinteria
Area 194 0% 788 18% 235 4% 1,217 13%
TABLE 52: CTPP TAZ DATA – SELECTED ZONE TRIPS VS TOTAL TRIPS – CARPINTERIA AREA
Census TAZ Zone #
Workers from Selected Zones Leaving Carpinteria Area vs. Total Workers Leaving
Carpinteria Area (%)
Goleta Area Santa Barbara Area
Ventura & Los
Angeles Area All Directions
Zone 1 Subtotal 23% 18% 38% 22%
Zone 2 Subtotal 22% 34% 18% 29%
Total – Carpinteria
Area 45% 52% 56% 51%
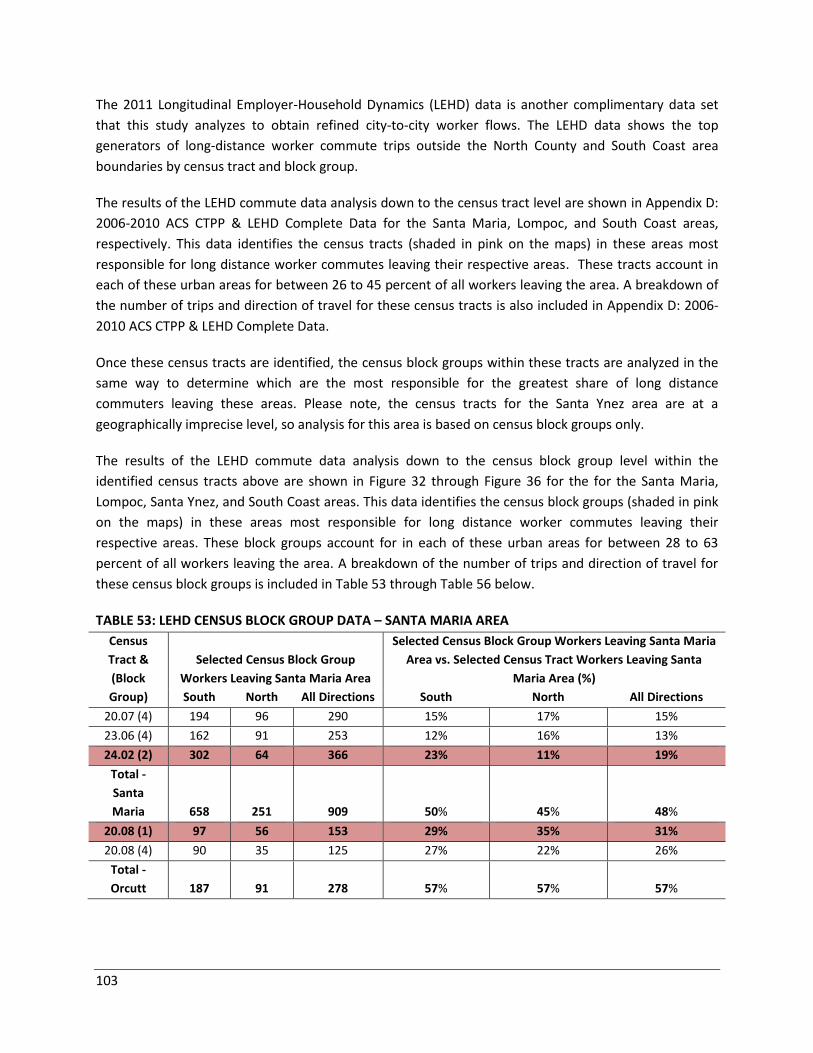
103
The 2011 Longitudinal Employer-Household Dynamics (LEHD) data is another complimentary data set
that this study analyzes to obtain refined city-to-city worker flows. The LEHD data shows the top
generators of long-distance worker commute trips outside the North County and South Coast area
boundaries by census tract and block group.
The results of the LEHD commute data analysis down to the census tract level are shown in Appendix D:
2006-2010 ACS CTPP & LEHD Complete Data for the Santa Maria, Lompoc, and South Coast areas,
respectively. This data identifies the census tracts (shaded in pink on the maps) in these areas most
responsible for long distance worker commutes leaving their respective areas. These tracts account in
each of these urban areas for between 26 to 45 percent of all workers leaving the area. A breakdown of
the number of trips and direction of travel for these census tracts is also included in Appendix D: 2006-
2010 ACS CTPP & LEHD Complete Data.
Once these census tracts are identified, the census block groups within these tracts are analyzed in the
same way to determine which are the most responsible for the greatest share of long distance
commuters leaving these areas. Please note, the census tracts for the Santa Ynez area are at a
geographically imprecise level, so analysis for this area is based on census block groups only.
The results of the LEHD commute data analysis down to the census block group level within the
identified census tracts above are shown in Figure 32 through Figure 36 for the for the Santa Maria,
Lompoc, Santa Ynez, and South Coast areas. This data identifies the census block groups (shaded in pink
on the maps) in these areas most responsible for long distance worker commutes leaving their
respective areas. These block groups account for in each of these urban areas for between 28 to 63
percent of all workers leaving the area. A breakdown of the number of trips and direction of travel for
these census block groups is included in Table 53 through Table 56 below.
TABLE 53: LEHD CENSUS BLOCK GROUP DATA – SANTA MARIA AREA
Census
Tract &
(Block
Group)
Selected Census Block Group
Workers Leaving Santa Maria Area
Selected Census Block Group Workers Leaving Santa Maria
Area vs. Selected Census Tract Workers Leaving Santa
Maria Area (%)
South North All Directions South North All Directions
20.07 (4) 194 96 290 15% 17% 15%
23.06 (4) 162 91 253 12% 16% 13%
24.02 (2) 302 64 366 23% 11% 19%
Total -
Santa
Maria 658 251 909 50% 45% 48%
20.08 (1) 97 56 153 29% 35% 31%
20.08 (4) 90 35 125 27% 22% 26%
Total -
Orcutt 187 91 278 57% 57% 57%
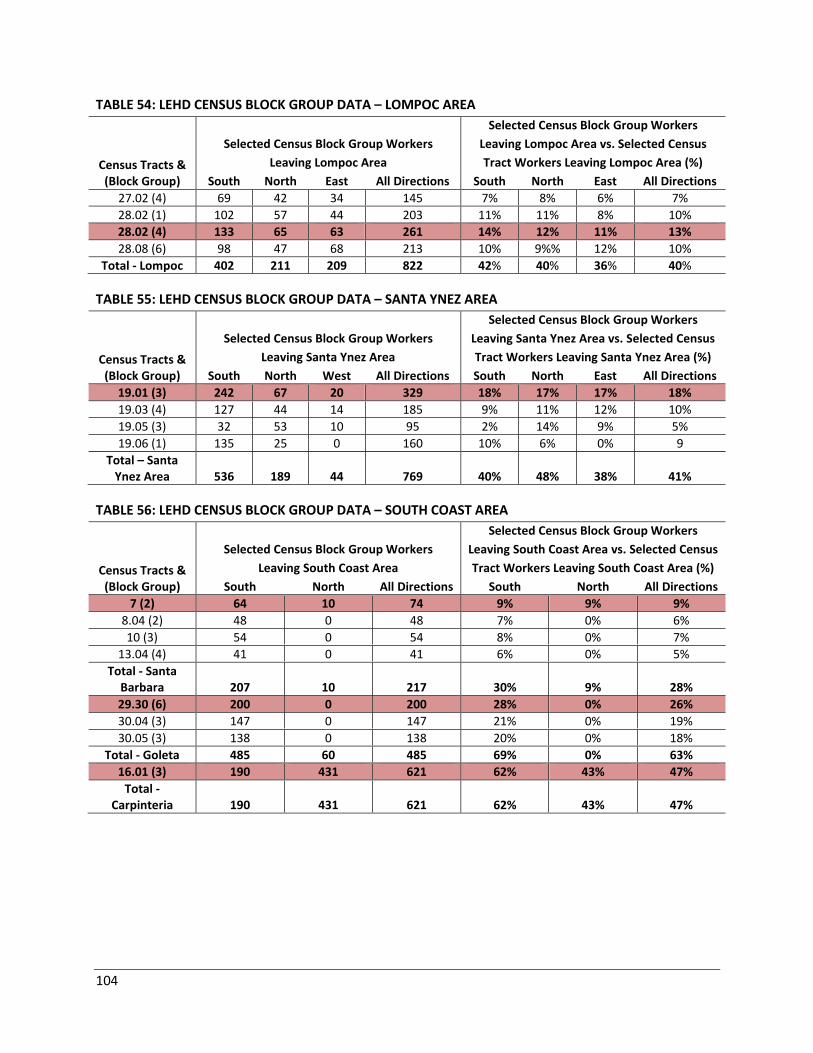
104
TABLE 54: LEHD CENSUS BLOCK GROUP DATA – LOMPOC AREA
Census Tracts & (Block Group)
Selected Census Block Group Workers
Leaving Lompoc Area
Selected Census Block Group Workers
Leaving Lompoc Area vs. Selected Census
Tract Workers Leaving Lompoc Area (%)
South North East All Directions South North East All Directions
27.02 (4) 69 42 34 145 7% 8% 6% 7%
28.02 (1) 102 57 44 203 11% 11% 8% 10%
28.02 (4) 133 65 63 261 14% 12% 11% 13%
28.08 (6) 98 47 68 213 10% 9%% 12% 10%
Total - Lompoc 402 211 209 822 42% 40% 36% 40%
TABLE 55: LEHD CENSUS BLOCK GROUP DATA – SANTA YNEZ AREA
Census Tracts & (Block Group)
Selected Census Block Group Workers
Leaving Santa Ynez Area
Selected Census Block Group Workers
Leaving Santa Ynez Area vs. Selected Census
Tract Workers Leaving Santa Ynez Area (%)
South North West All Directions South North East All Directions
19.01 (3) 242 67 20 329 18% 17% 17% 18%
19.03 (4) 127 44 14 185 9% 11% 12% 10%
19.05 (3) 32 53 10 95 2% 14% 9% 5%
19.06 (1) 135 25 0 160 10% 6% 0% 9
Total – Santa Ynez Area 536 189 44 769 40% 48% 38% 41%
TABLE 56: LEHD CENSUS BLOCK GROUP DATA – SOUTH COAST AREA
Census Tracts & (Block Group)
Selected Census Block Group Workers
Leaving South Coast Area
Selected Census Block Group Workers
Leaving South Coast Area vs. Selected Census
Tract Workers Leaving South Coast Area (%)
South North All Directions South North All Directions
7 (2) 64 10 74 9% 9% 9%
8.04 (2) 48 0 48 7% 0% 6%
10 (3) 54 0 54 8% 0% 7%
13.04 (4) 41 0 41 6% 0% 5%
Total - Santa Barbara 207 10 217 30% 9% 28%
29.30 (6) 200 0 200 28% 0% 26%
30.04 (3) 147 0 147 21% 0% 19%
30.05 (3) 138 0 138 20% 0% 18%
Total - Goleta 485 60 485 69% 0% 63%
16.01 (3) 190 431 621 62% 43% 47%
Total - Carpinteria 190 431 621 62% 43% 47%
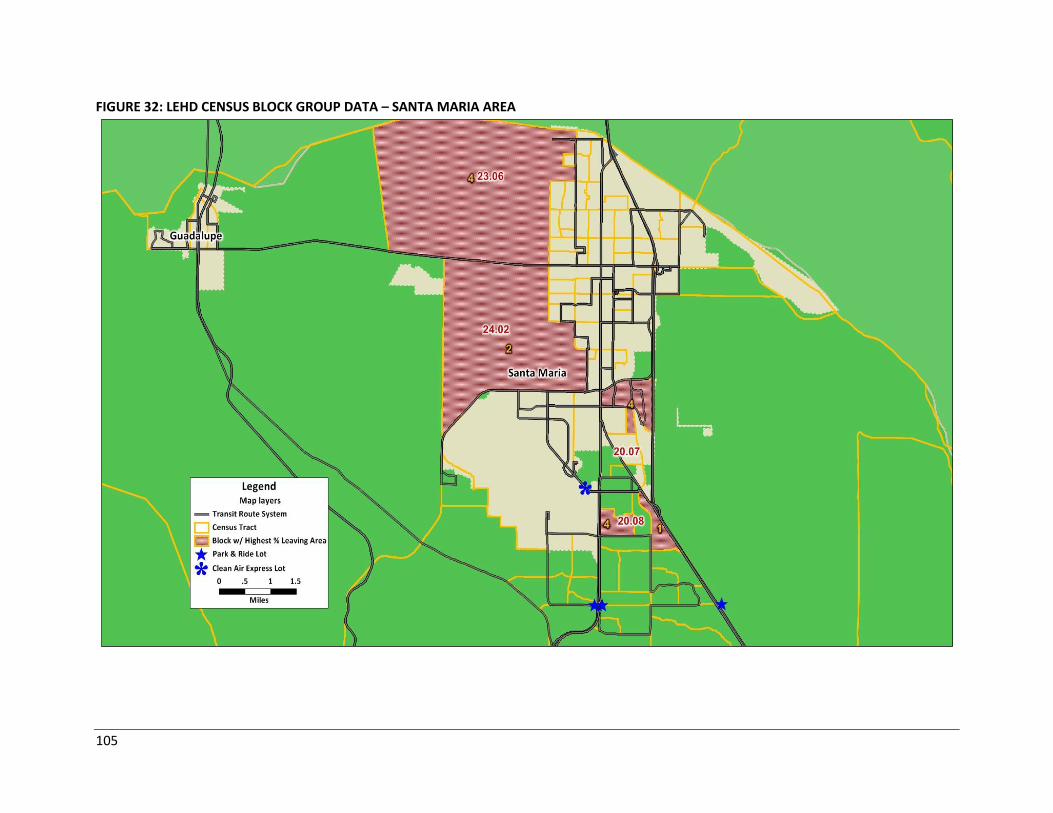
105
FIGURE 32: LEHD CENSUS BLOCK GROUP DATA – SANTA MARIA AREA
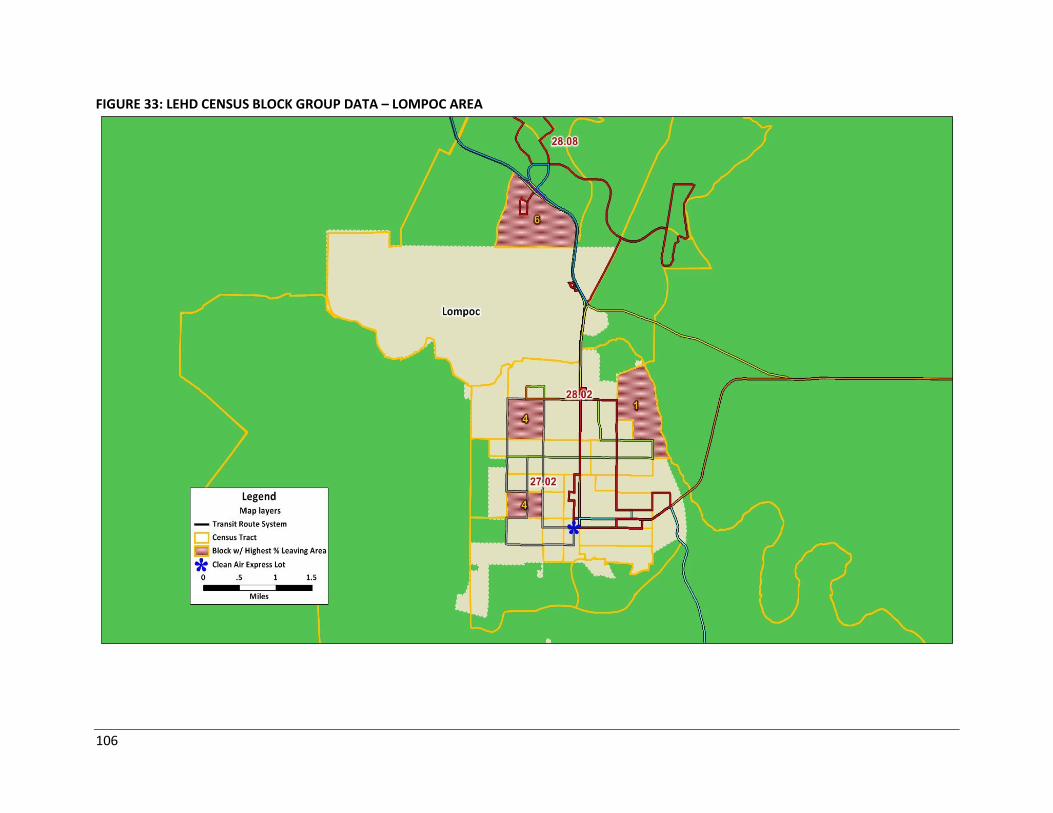
106
FIGURE 33: LEHD CENSUS BLOCK GROUP DATA – LOMPOC AREA
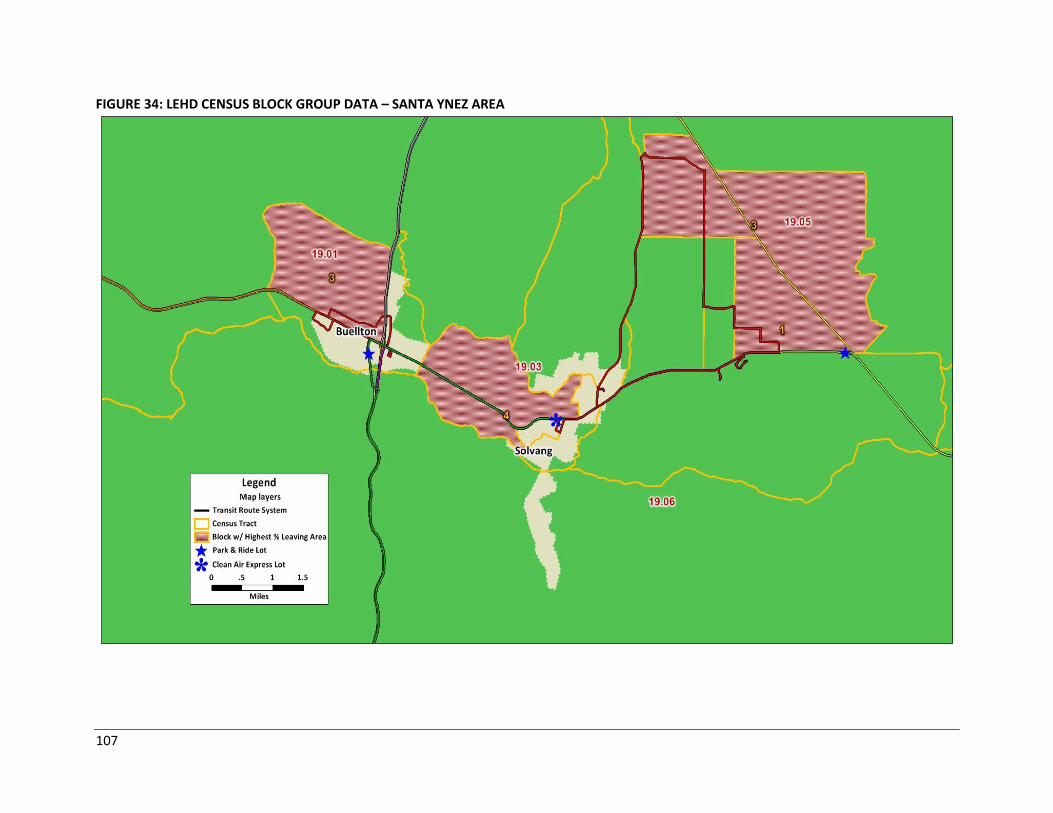
107
FIGURE 34: LEHD CENSUS BLOCK GROUP DATA – SANTA YNEZ AREA
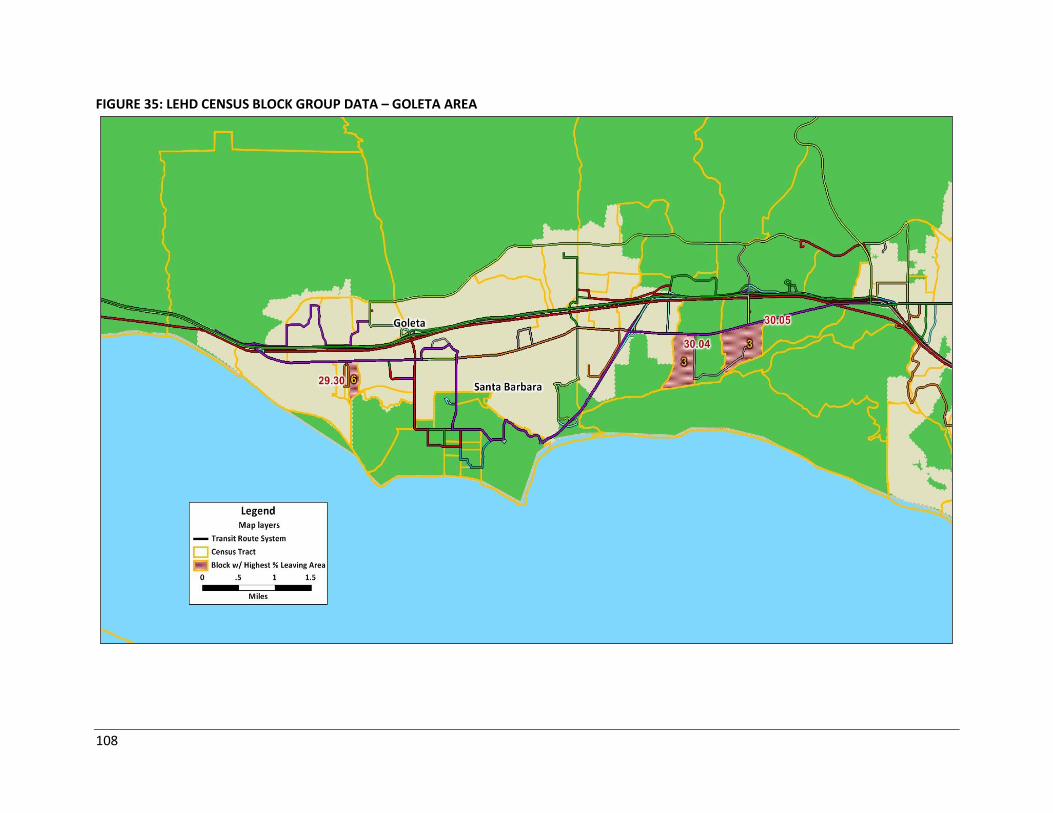
108
FIGURE 35: LEHD CENSUS BLOCK GROUP DATA – GOLETA AREA
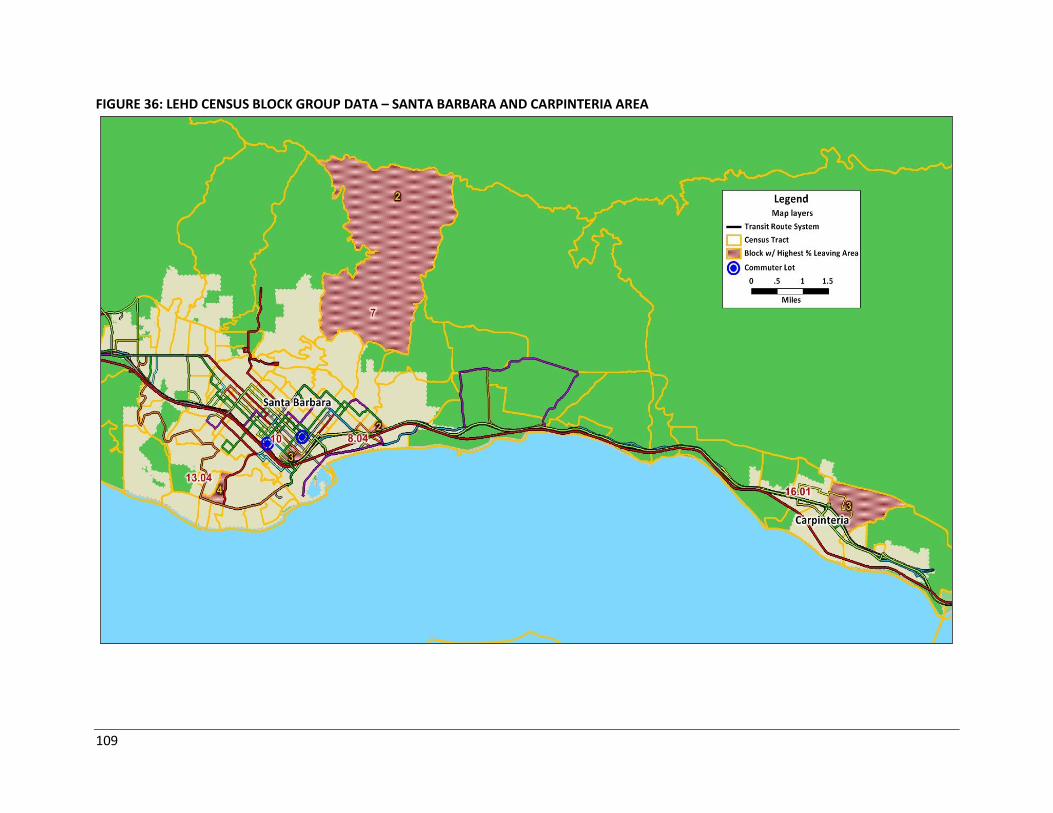
109
FIGURE 36: LEHD CENSUS BLOCK GROUP DATA – SANTA BARBARA AND CARPINTERIA AREA
110
E. 2006-2010 ACS CTPP AND 2011 LEHD ZONAL OVERLAPS
CTPP data presented in Chapter 7: New Facilities Section D identifies zonal subtotals and indicates that
Zone 1 in the north of the Santa Maria area, Zone 2 in the center of the Lompoc area, Zone 3 in the
eastern Santa Ynez area, Zone 2 in the Isla Vista area, Zone 5 in the unincorporated Goleta area, Zone 1
in the northern central area of the City of Santa Barbara, and Zone 1 in the northern end of Carpinteria
are responsible for the highest percentage of all workers leaving the area. LEHD data, also presented in
Chapter 7: New Facilities Section D, identifies census block group 2 in census tract 24.02 in the center of
the Santa Maria area, census block group 1 in census tract 20.08 in the Orcutt area, census block group 4
in census tract 28.02 in the center of the Lompoc area, census block group 3 in census tract 19.01 in the
City of Buellton, census block group 6 in census tract 29.30 in Goleta, census block group 2 in census
tract 7 in Santa Barbara, and census block group 3 in census tract 16.01 in Carpinteria as responsible for
the highest percentage of all workers leaving the area.
Maps of the Santa Maria, Lompoc, and South Coast areas are presented in Figure 37 through Figure 42
with the two dataset selections overlapping one another, referred to as Zonal Overlaps3. The Zonal
Overlaps represent where LEHD census block group and CTPP TAZ data circle zones intersect and
suggest confidence in both datasets. Additionally, these figures illustrate local and intercity bus transit
routes as well as existing P&R and Clean Air Express facilities.
F. MULTI-MODAL CONNECTIVITY OF ZONAL OVERLAPS
The identified Zonal Overlaps are also analyzed by their ease of access for bicycles and pedestrians as
well as connectivity to rail (Amtrak). Multi-modal connectivity of the Zonal Overlaps is tabulated in Table
57 on the following page. Class 1 bicycle paths are separate from automobile traffic. Class 2 bicycle
paths are on-street, painted bike lanes. Class 3 bicycle paths are on-street bike routes designated by
signs. Alternate bicycle paths are suggested alternate routes. These bicycle paths also serve as
pedestrian connections.
Figure 43 through Figure 48 illustrate multi-modal connectivity of the Zonal Overlaps by identifying
bicycle facilities and pedestrian routes as well as existing Amtrak stations and Amtrak bus pickup
locations. For the Zonal Overlaps that have connectivity to Amtrak, the Pacific Surfliner4 and Coast
Starlight5 operate six combined round trips a day to and from Santa Barbara, three of which offer service
to and from San Luis Obispo. Most of these trains offer bike racks. However, their viability as commuter
trains is questionable due to existing schedules, late arrivals and departures.
3 A “zonal overlap” indicates where two main sources of Census data, LEHD & CTPP data, overlap. Priority areas
identify which zonal overlaps should be given the highest priority.
4 http://www.amtrak.com/ccurl/287/706/Pacific-Surfliner-Schedule-040714,0.pdf
5 http://www.amtrak.com/ccurl/76/405/Coast-Starlight-Schedule-060914.pdf
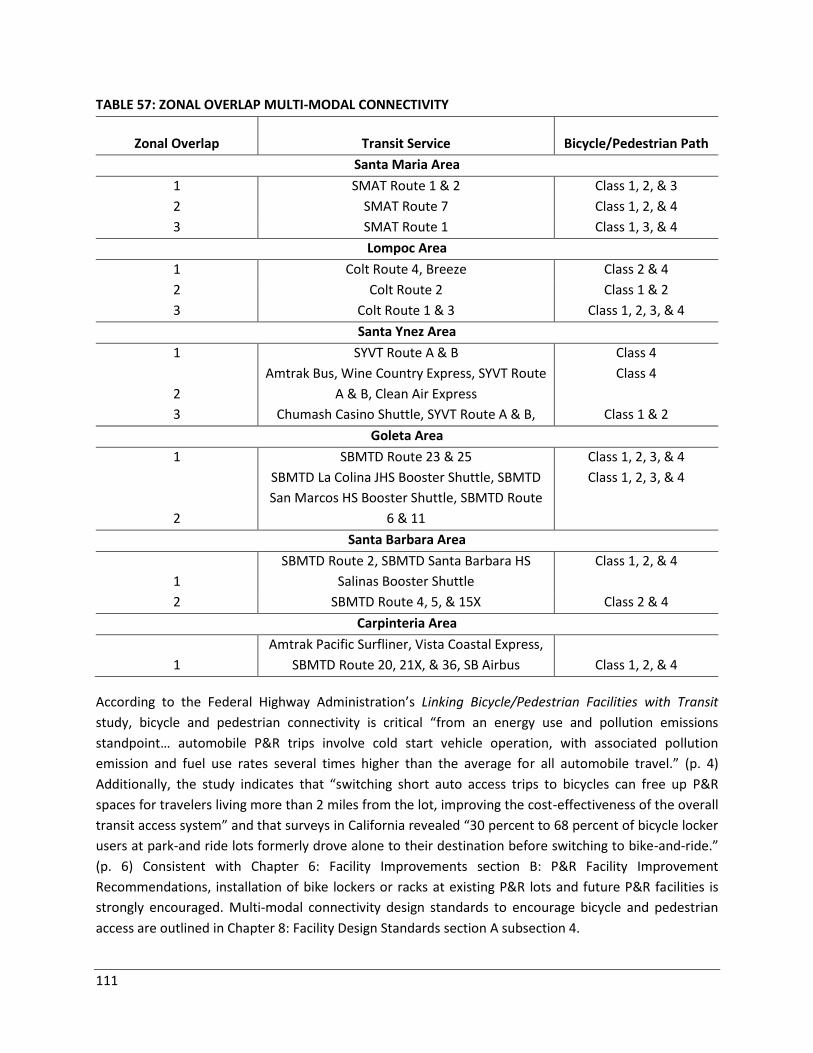
111
TABLE 57: ZONAL OVERLAP MULTI-MODAL CONNECTIVITY
Zonal Overlap Transit Service Bicycle/Pedestrian Path
Santa Maria Area
1 SMAT Route 1 & 2 Class 1, 2, & 3
2 SMAT Route 7 Class 1, 2, & 4
3 SMAT Route 1 Class 1, 3, & 4
Lompoc Area
1 Colt Route 4, Breeze Class 2 & 4
2 Colt Route 2 Class 1 & 2
3 Colt Route 1 & 3 Class 1, 2, 3, & 4
Santa Ynez Area
1 SYVT Route A & B Class 4
2
Amtrak Bus, Wine Country Express, SYVT Route
A & B, Clean Air Express
Class 4
3 Chumash Casino Shuttle, SYVT Route A & B, Class 1 & 2
Goleta Area
1 SBMTD Route 23 & 25 Class 1, 2, 3, & 4
2
SBMTD La Colina JHS Booster Shuttle, SBMTD
San Marcos HS Booster Shuttle, SBMTD Route
6 & 11
Class 1, 2, 3, & 4
Santa Barbara Area
1
SBMTD Route 2, SBMTD Santa Barbara HS
Salinas Booster Shuttle
Class 1, 2, & 4
2 SBMTD Route 4, 5, & 15X Class 2 & 4
Carpinteria Area
1
Amtrak Pacific Surfliner, Vista Coastal Express,
SBMTD Route 20, 21X, & 36, SB Airbus Class 1, 2, & 4
According to the Federal Highway Administration’s Linking Bicycle/Pedestrian Facilities with Transit
study, bicycle and pedestrian connectivity is critical “from an energy use and pollution emissions
standpoint… automobile P&R trips involve cold start vehicle operation, with associated pollution
emission and fuel use rates several times higher than the average for all automobile travel.” (p. 4)
Additionally, the study indicates that “switching short auto access trips to bicycles can free up P&R
spaces for travelers living more than 2 miles from the lot, improving the cost-effectiveness of the overall
transit access system” and that surveys in California revealed “30 percent to 68 percent of bicycle locker
users at park-and ride lots formerly drove alone to their destination before switching to bike-and-ride.”
(p. 6) Consistent with Chapter 6: Facility Improvements section B: P&R Facility Improvement
Recommendations, installation of bike lockers or racks at existing P&R lots and future P&R facilities is
strongly encouraged. Multi-modal connectivity design standards to encourage bicycle and pedestrian
access are outlined in Chapter 8: Facility Design Standards section A subsection 4.
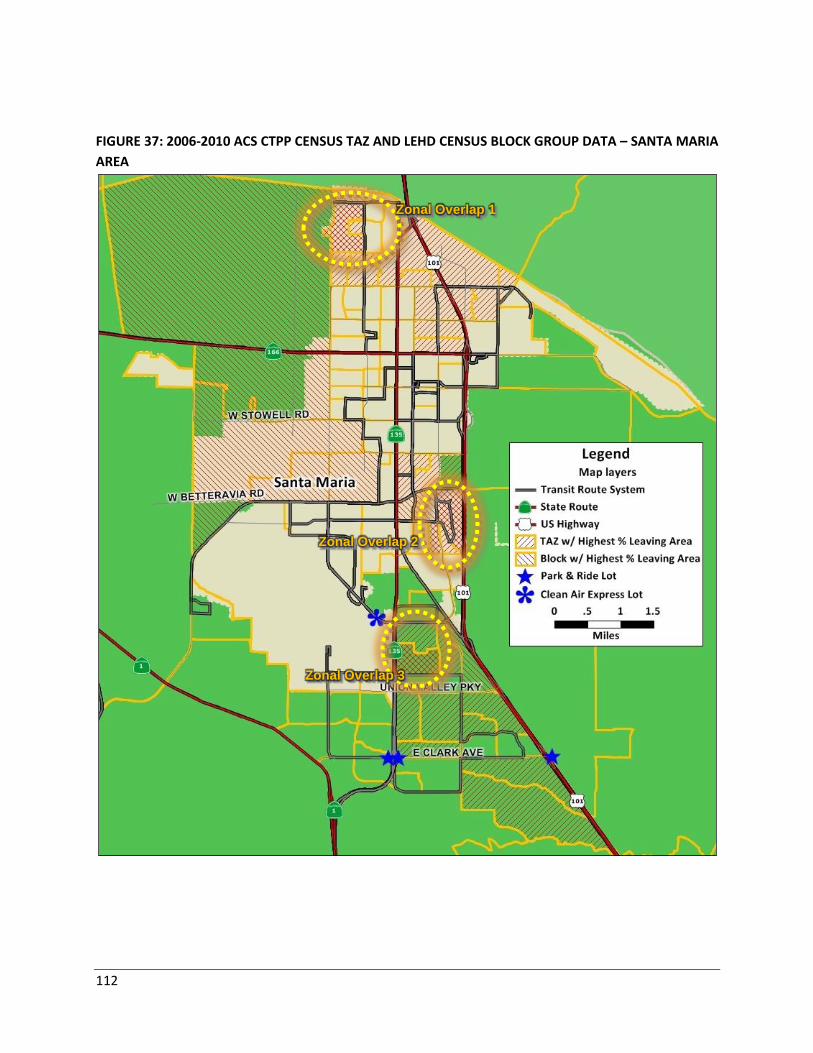
112
FIGURE 37: 2006-2010 ACS CTPP CENSUS TAZ AND LEHD CENSUS BLOCK GROUP DATA – SANTA MARIA
AREA
Zonal Overlap 1
Zonal Overlap 2
Zonal Overlap 3
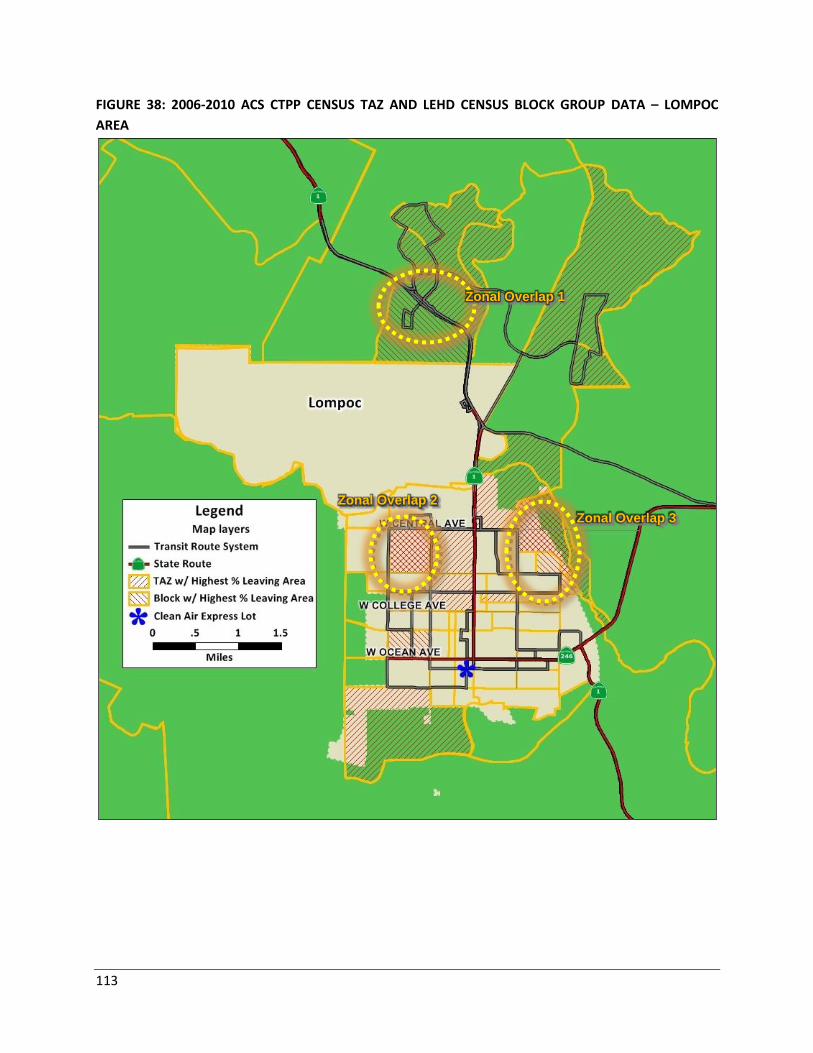
113
FIGURE 38: 2006-2010 ACS CTPP CENSUS TAZ AND LEHD CENSUS BLOCK GROUP DATA – LOMPOC
AREA
Zonal Overlap 1
Zonal Overlap 3
Zonal Overlap 2
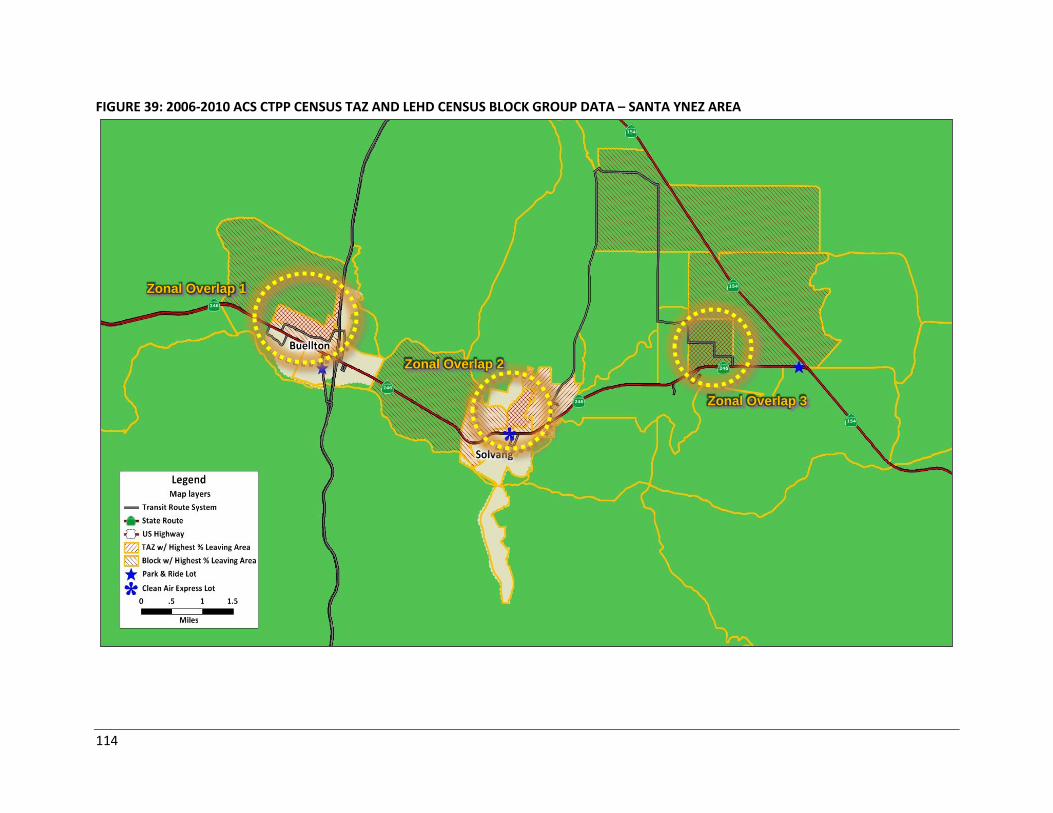
114
FIGURE 39: 2006-2010 ACS CTPP CENSUS TAZ AND LEHD CENSUS BLOCK GROUP DATA – SANTA YNEZ AREA
Zonal Overlap 1
Zonal Overlap 3
Zonal Overlap 2

115
FIGURE 40: 2006-2010 ACS CTPP CENSUS TAZ AND LEHD CENSUS BLOCK GROUP DATA – GOLETA AREA
Zonal Overlap 1
Zonal Overlap 2
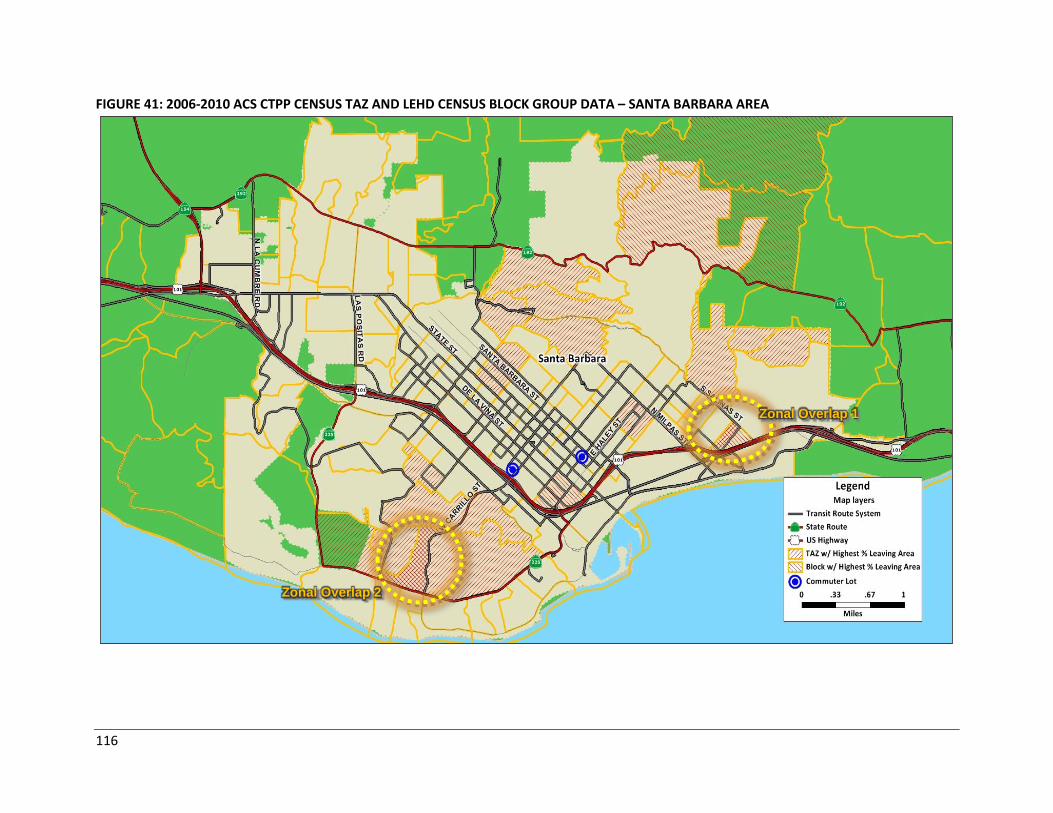
116
FIGURE 41: 2006-2010 ACS CTPP CENSUS TAZ AND LEHD CENSUS BLOCK GROUP DATA – SANTA BARBARA AREA
Zonal Overlap 1
Zonal Overlap 2
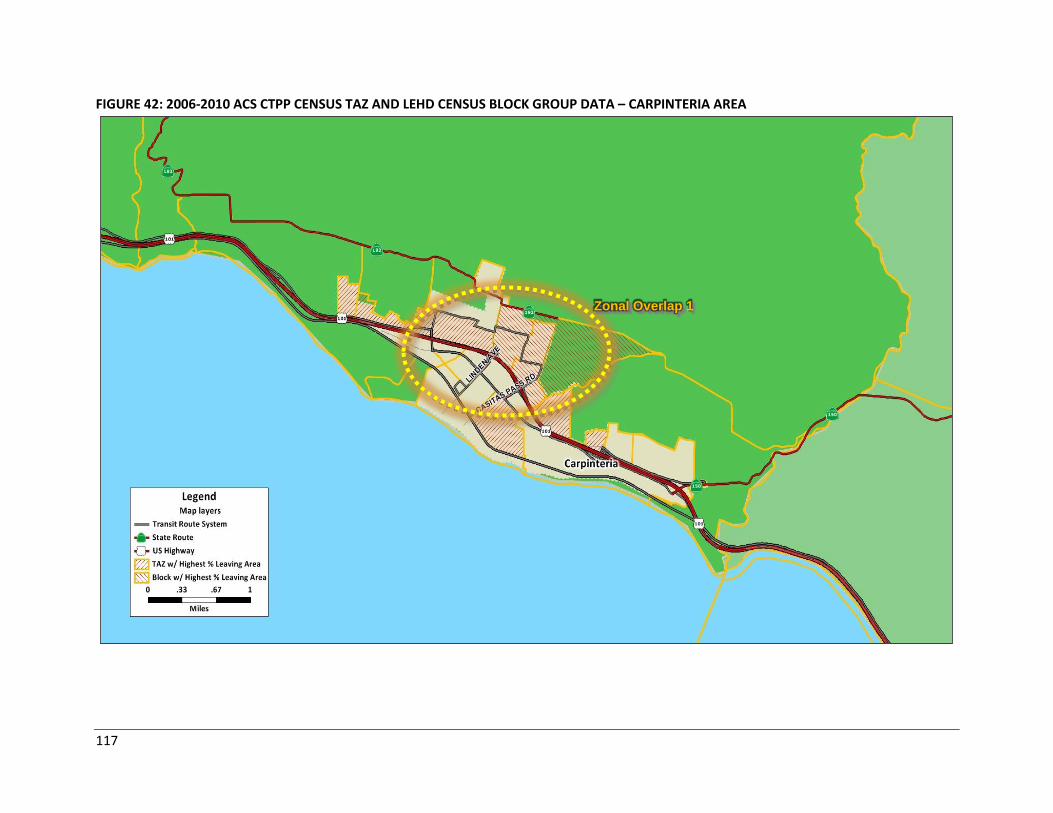
117
FIGURE 42: 2006-2010 ACS CTPP CENSUS TAZ AND LEHD CENSUS BLOCK GROUP DATA – CARPINTERIA AREA
Zonal Overlap 1
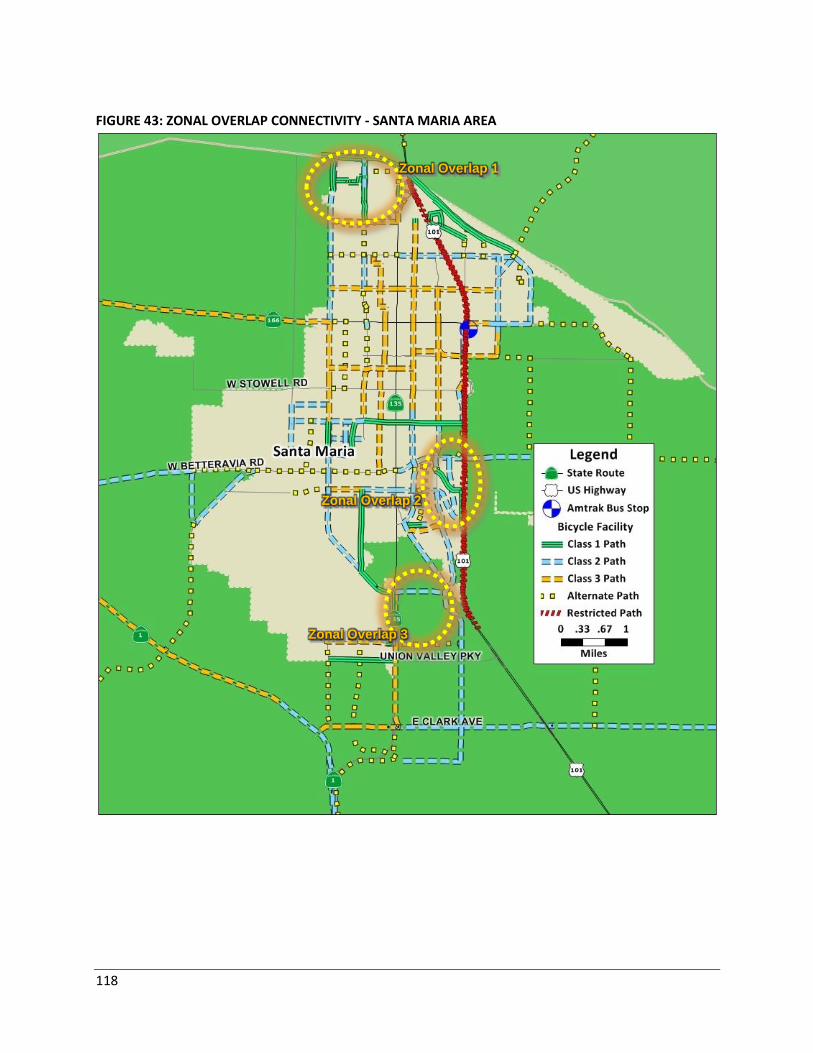
118
FIGURE 43: ZONAL OVERLAP CONNECTIVITY - SANTA MARIA AREA
Zonal Overlap 1
Zonal Overlap 2
Zonal Overlap 3
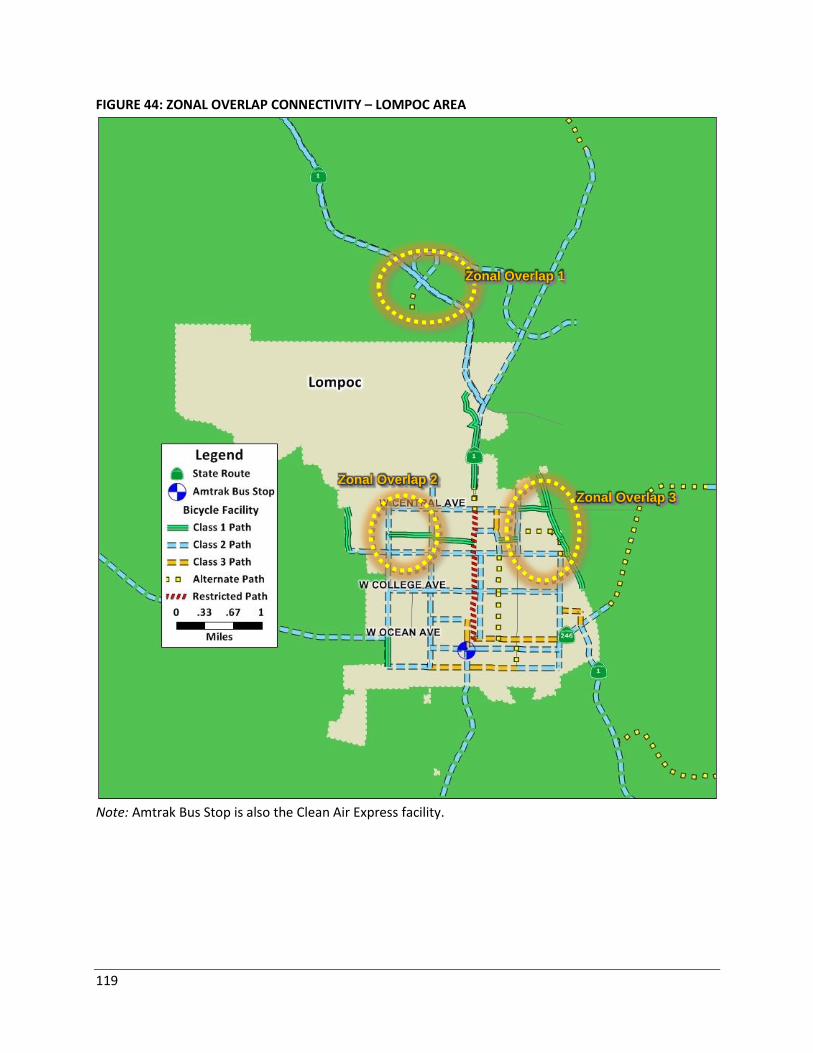
119
FIGURE 44: ZONAL OVERLAP CONNECTIVITY – LOMPOC AREA
Note: Amtrak Bus Stop is also the Clean Air Express facility.
Zonal Overlap 1
Zonal Overlap 3
Zonal Overlap 2

120
FIGURE 45: ZONAL OVERLAP CONNECTIVITY – SANTA YNEZ AREA
Note: Amtrak Bus Stop is also the Clean Air Express and P&R facility (joint-use).
Zonal Overlap 1
Zonal Overlap 3
Zonal Overlap 2
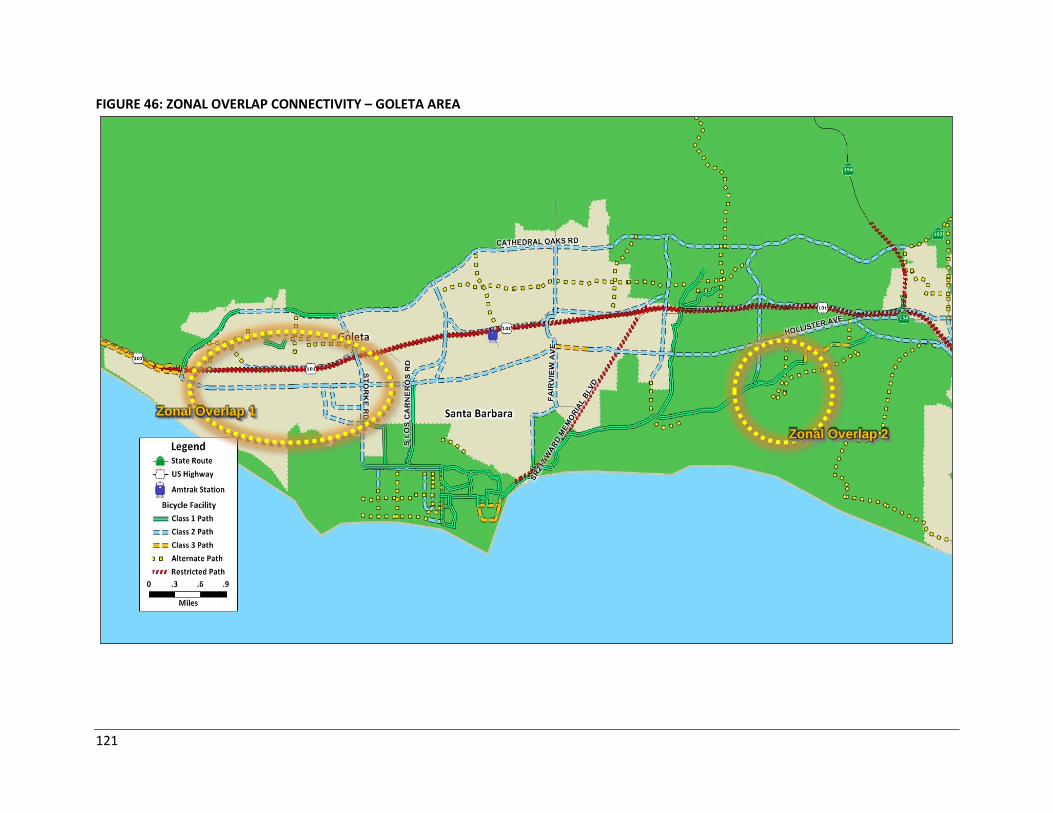
121
FIGURE 46: ZONAL OVERLAP CONNECTIVITY – GOLETA AREA
Zonal Overlap 1
Zonal Overlap 2
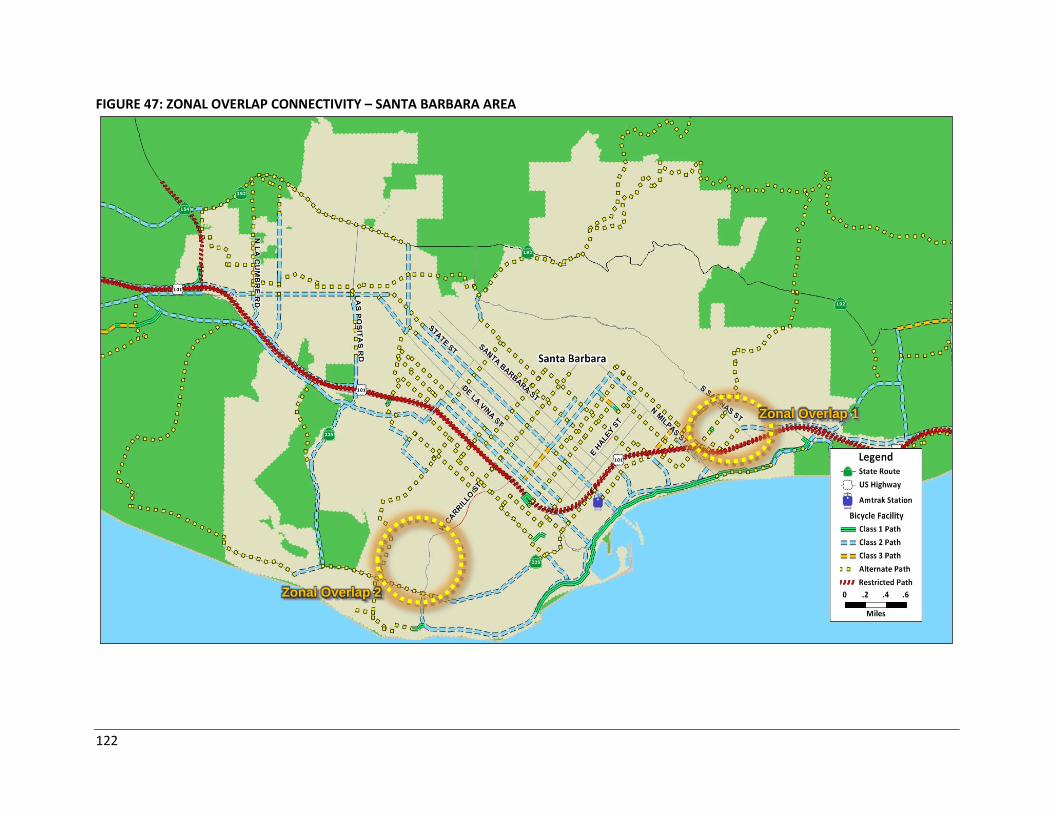
122
FIGURE 47: ZONAL OVERLAP CONNECTIVITY – SANTA BARBARA AREA
Zonal Overlap 1
Zonal Overlap 2
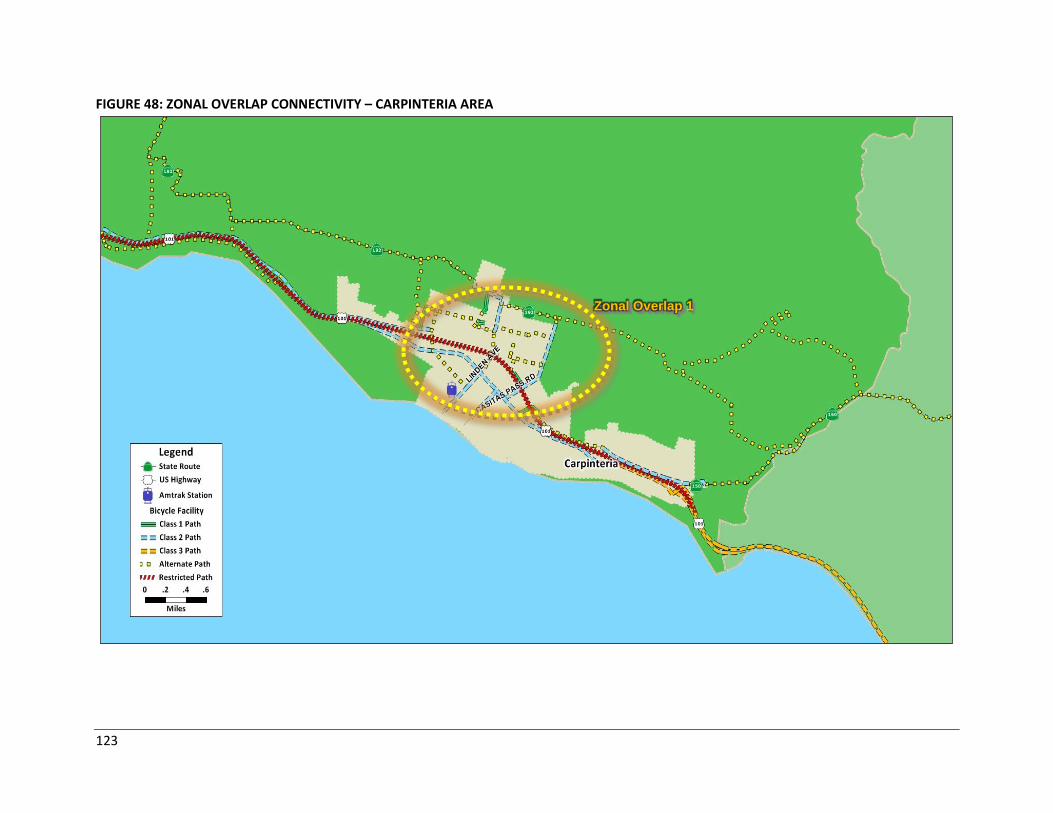
123
FIGURE 48: ZONAL OVERLAP CONNECTIVITY – CARPINTERIA AREA
Zonal Overlap 1
124
G. PRIOR PARK & RIDE FACILITY CONSTRUCTION RECOMMENDATIONS
This study also evaluates and incorporates facility construction recommendations identified in prior
SBCAG publications. This study’s recommendations are compared against previously identified priority
areas to see if they are consistent with them.
1. SOUTH COAST HIGHWAY 101 DEFICIENCY PLAN
The South Coast Highway 101 Deficiency Plan was published by SBCAG in June 20026 as a response to
traffic trends on Highway 101, indicating an increase in traffic growth overall as well as during the peak
hours. These trends led to a continuing decline in freeway peak hour level of service which was verified
by speed surveys. Part of the deficiency plan utilizes transportation demand management (TDM)
strategies which includes the construction of P&R facilities, as identified below:
1. Construct Park-and-Ride Lot at the juncture of Highway 101 and Route 33: This park
and ride lot would be located within Ventura County. It will provide 30+ parking spaces
serving commuters from the relatively isolated community of Ojai who desire to carpool
to either the South Coast or Ventura. This potential lot can also be served by express
transit service between Ventura and Santa Barbara County. Since this project is in
Ventura County, coordination with the Ventura County Transportation Commission
(VCTC) and Caltrans would be required. Assuming 100% utilization, this lot has the
potential to reduce VMT on an annual basis by 156,000. This project will provide
congestion relief on Highway 101 during the AM and PM peak hours.7
2. Construct Park-and-Ride Lots near Bailard/Casitas/Linden interchanges: These park
and ride facilities will provide 30+ parking space locations each that will serve
commuters traveling from areas south of Santa Barbara County to the South Coast.
These potential lots can also be served by express transit service between Ventura and
Santa Barbara County and/or between Carpinteria and Santa Barbara/Goleta. Assuming
one location being constructed operating at 100% utilization, this lot has the potential to
reduce VMT on an annual basis by 130,000 VMT. This project will provide AM and PM
peak hour congestion relief on Highway 101.8
The first location is outside of the purview of SBCAG as it is located in Ventura County. However, there is
a P&R facility location relatively nearby (~7 miles) at the East Ventura Metrolink Station near the US 101
and Victoria Avenue interchange. The second location is within the City of Carpinteria and is also
identified as a priority area within this plan.
6 http://www.sbcag.org/PDFs/publications/Hwy101DeficiencyPlan.pdf
7 The South Coast Highway 101Deficiency Plan, Page 122, Section 3.
8 The South Coast Highway 101Deficiency Plan, Page 122, Section 4.
125
2. 101 IN MOTION
The 101 In Motion plan was published by SBCAG in July 20069 based on a policy directive to find long
term solutions to the growing congestion problem along 27 miles of the Highway 101 corridor in
Southern Santa Barbara County. The 101 in Motion team, in conjunction with an extensive stakeholder’s
advisory committee, worked for over two years to develop a package of solutions that had broad-based
community support. The 101 In Motion plan consensus package principally relied on capital
improvements, highlighted by the addition of carpool lanes on the US 101 freeway from Milpas Street in
the City of Santa Barbara to the Santa Barbara/Ventura County line, improvements to US 101
interchanges and ramps, and the addition of commuter rail from Camarillo to Goleta with stops in
Oxnard, Ventura, Carpinteria, and Santa Barbara, for a total of 47.8 miles (20 miles within Santa Barbara
County).
Additional components of the adopted consensus package included a plan to “Facilitate Transit and
Carpool Use” by designating new lanes south of Milpas Street as HOV/Carpool, increasing express bus
services to North Santa Barbara County, connecting local bus and shuttles with rail and regional services,
prioritizing buses on selected streets through signal priority, queue jumps, bulb-outs at bus stops, etc.
Additionally, the adopted package included a plan to “manage demand,” which included providing
vanpool/carpooling/trip reduction incentives, encouraging telecommuting and flexwork/flextime,
varying parking rates as feasible by jurisdictions, and individualized marketing. Part of these two
components included a reiteration of the South Coast Highway 101 Deficiency Plan to:
1. Construct a P&R facility at the Junction of US 101 and Route 33
As identified before, this location is outside of the purview of SBCAG as it is located in Ventura County.
3. 2040 REGIONAL TRANSPORTATION PLAN AND SUSTAINABLE COMMUNITIES STRATEGY
The 2040 RTP-SCS was adopted by the SBCAG Board in August 201310 and plans how the Santa Barbara
County region should meet its transportation needs for the 30-year period from 2010 to 2040,
considering existing and projected future land use patterns as well as forecast population and job
growth. It identifies and prioritizes expenditure of the $7.4 billion in anticipated funding for
transportation projects of all transportation modes: highways, streets and roads, transit, rail, bicycle and
pedestrian, as well as transportation demand management measures and intelligent transportation
system. Part of the plan includes the construction of P&R facilities, as identified in Table 58.
The second City of Buellton P&R facility at the north end of Avenue of Flags (Measure A: B–PL–400) has
preliminary plans, current as of June 2013, for thirty-five (35) Non-ADA parking spaces and one (1) ADA
parking space for a total of thirty-six (36) spaces. One (1) non-ADA space is planned for van accessibility.
Additional planned amenities are bike lockers and shelter.
9 http://www.sbcag.org/PDFs/publications/101%20Final%20Report%20in%20Color.pdf
10 http://www.sbcag.org/planning/2040RTP/images_docs/Final2040RTP&SCS-Chapters.pdf
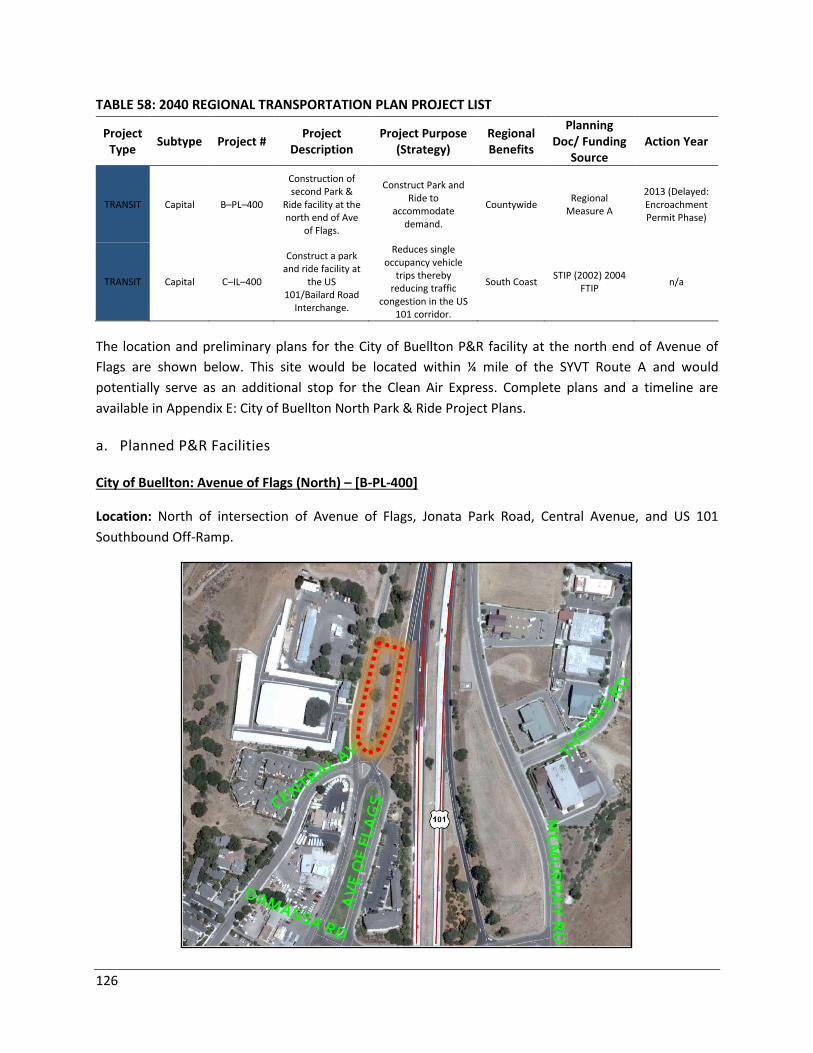
126
TABLE 58: 2040 REGIONAL TRANSPORTATION PLAN PROJECT LIST
Project Type
Subtype Project # Project
Description Project Purpose
(Strategy) Regional Benefits
Planning Doc/ Funding
Source Action Year
TRANSIT Capital B–PL–400
Construction of second Park &
Ride facility at the north end of Ave
of Flags.
Construct Park and Ride to
accommodate demand.
Countywide Regional
Measure A
2013 (Delayed: Encroachment Permit Phase)
TRANSIT Capital C–IL–400
Construct a park and ride facility at
the US 101/Bailard Road
Interchange.
Reduces single occupancy vehicle
trips thereby reducing traffic
congestion in the US 101 corridor.
South Coast STIP (2002) 2004
FTIP n/a
The location and preliminary plans for the City of Buellton P&R facility at the north end of Avenue of
Flags are shown below. This site would be located within ¼ mile of the SYVT Route A and would
potentially serve as an additional stop for the Clean Air Express. Complete plans and a timeline are
available in Appendix E: City of Buellton North Park & Ride Project Plans.
a. Planned P&R Facilities
City of Buellton: Avenue of Flags (North) – [B-PL-400]
Location: North of intersection of Avenue of Flags, Jonata Park Road, Central Avenue, and US 101
Southbound Off-Ramp.
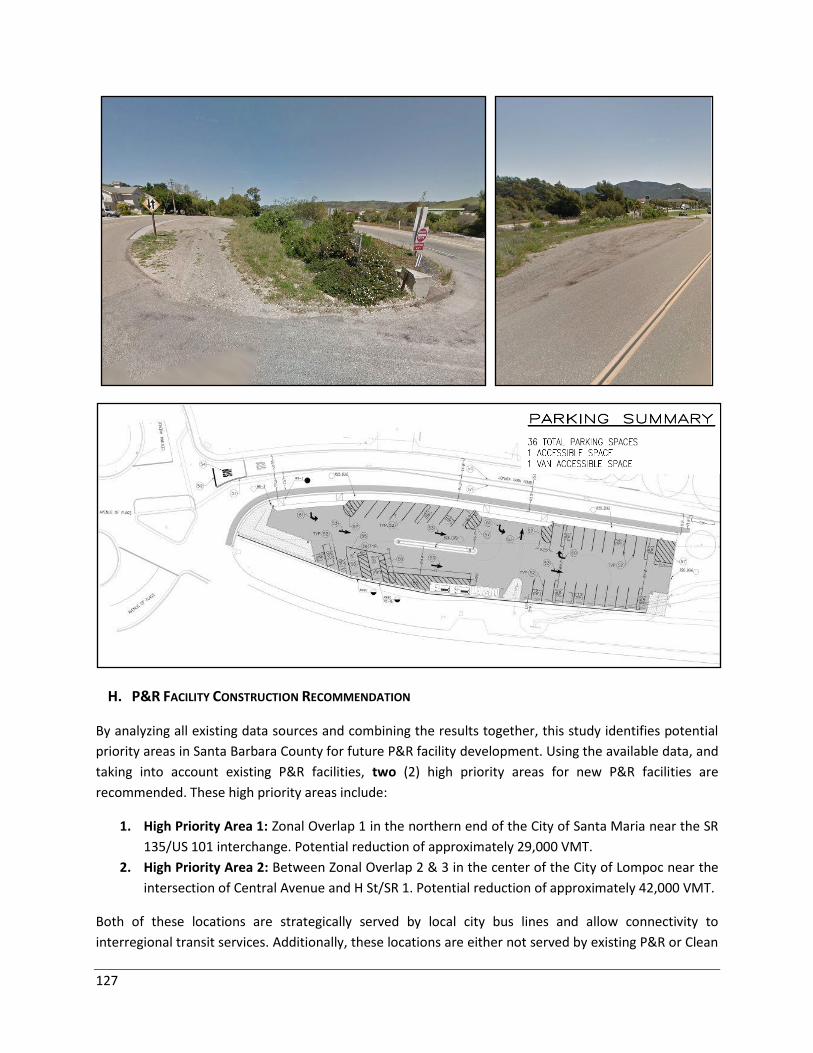
127
H. P&R FACILITY CONSTRUCTION RECOMMENDATION
By analyzing all existing data sources and combining the results together, this study identifies potential
priority areas in Santa Barbara County for future P&R facility development. Using the available data, and
taking into account existing P&R facilities, two (2) high priority areas for new P&R facilities are
recommended. These high priority areas include:
1. High Priority Area 1: Zonal Overlap 1 in the northern end of the City of Santa Maria near the SR
135/US 101 interchange. Potential reduction of approximately 29,000 VMT.
2. High Priority Area 2: Between Zonal Overlap 2 & 3 in the center of the City of Lompoc near the
intersection of Central Avenue and H St/SR 1. Potential reduction of approximately 42,000 VMT.
Both of these locations are strategically served by local city bus lines and allow connectivity to
interregional transit services. Additionally, these locations are either not served by existing P&R or Clean
128
Air Express facilities, in the case of High Priority Area 1 in the northern end of the City of Santa Maria, or
are partially served by an at-capacity Clean Air Express facility (83% usage rate identified in Table 10 and
Table 11 in Chapter 4: Inventory & Site Visits Section A) one and a half (1.5) miles away, as in the case of
High Priority Area 2 in the City of Lompoc.
Additionally, two (2) secondary priority areas (ranked in order of importance) for new P&R facilities are
recommended. These two secondary priority areas include:
3. Secondary Priority Area 1: Zonal Overlap 1 in the City of Carpinteria near the US 101 and Casitas
Pass Road interchange. Potential reduction of approximately 4,100 VMT.
4. Secondary Priority Area 2: Zonal Overlap 1 in the City of Goleta near the US 101 and Hollister
Avenue/Winchester Canyon Road interchange. Potential reduction of approximately 9,500 VMT.
Construction of the second City of Buellton P&R facility at the north end of Avenue of Flags (Measure A:
B–PL–400), now in advance stage of planning, is also noted.
By constructing new P&R facilities, commuters would find it easier to shift from driving alone to
carpooling or transit options, thereby saving money on fuel and reducing long-distance commute trip
byproducts, including vehicle miles traveled (VMT) and greenhouse gas (GHG) emission. The strategic
placement of these P&R facilities would also ensure distances to these facilities would be reduced,
incentivizing walking and biking to the facilities themselves. Constructing a P&R facility in Secondary
Priority Area 1 in the City of Carpinteria would have the greatest benefit to traffic congestion along the
US 101 corridor where congestion is greatest. These P&R facilities would additionally promote healthier
travel behavior in communities by incentivizing biking and walking. The data provided by the U.S.
Census Bureau helps this study encourage alternative and convenient travel mode options.
129
CHAPTER 8: FACILITY DESIGN STANDARDS
Certain design standards, including siting, physical characteristics, amenities, and other features, can aid
in the implementation and ultimate success of a P&R facility. These design standards are loosely
developed from different source materials, including The American Association of State Highway and
Transportation Officials (AASHTO), the Virginia Department of Transportation (VDOT), and SLOCOG’s
Park & Ride Lot Development Study. The following design standards are general recommendations, as
ultimate design will be site-specific and depend on external variables ranging from lot size to financial
considerations.
A. DESIGN STANDARDS
The Virginia Department of Transportation (VDOT) establishes a set of design standards for commuter
and P&R lot design in their 2006 Traffic Engineering Design Manual. A list of design standards for any
new P&R facility has been developed based on this manual and is presented below:
1. SIGNAGE & FOCAL POINTS
Lot identification signs should meet California Department of Transportation (Caltrans)
standards (see Figure 49 through Figure 52 below).
Lot identification signs should be sized and located to be highly visible to motorists.
Guide or directional signs should be adequately spaced in advance of the facility.
Signs should provide good sight distance for entrance and exit.
Signs should be provided for multi-modal and handicapped parking areas.
Signs should be lighted.
Install elevated visual focal point (e.g. clock tower) for recognition.
FIGURE 49: STATE OF CALIFORNIA – DEPARTMENT OF TRANSPORTATION – PARK & RIDE PLAQUE
Source: http://www.dot.ca.gov/hq/traffops/engineering/control-devices/specs/G95A.pdf
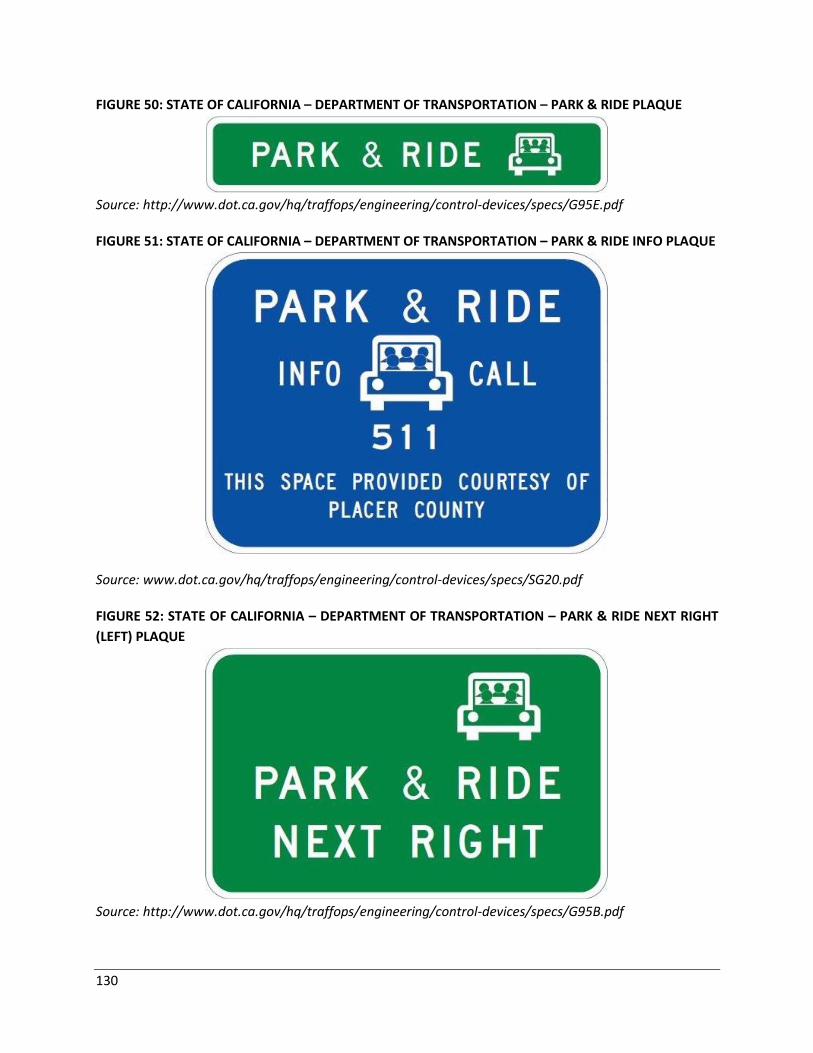
130
FIGURE 50: STATE OF CALIFORNIA – DEPARTMENT OF TRANSPORTATION – PARK & RIDE PLAQUE
Source: http://www.dot.ca.gov/hq/traffops/engineering/control-devices/specs/G95E.pdf
FIGURE 51: STATE OF CALIFORNIA – DEPARTMENT OF TRANSPORTATION – PARK & RIDE INFO PLAQUE
Source: www.dot.ca.gov/hq/traffops/engineering/control-devices/specs/SG20.pdf
FIGURE 52: STATE OF CALIFORNIA – DEPARTMENT OF TRANSPORTATION – PARK & RIDE NEXT RIGHT
(LEFT) PLAQUE
Source: http://www.dot.ca.gov/hq/traffops/engineering/control-devices/specs/G95B.pdf
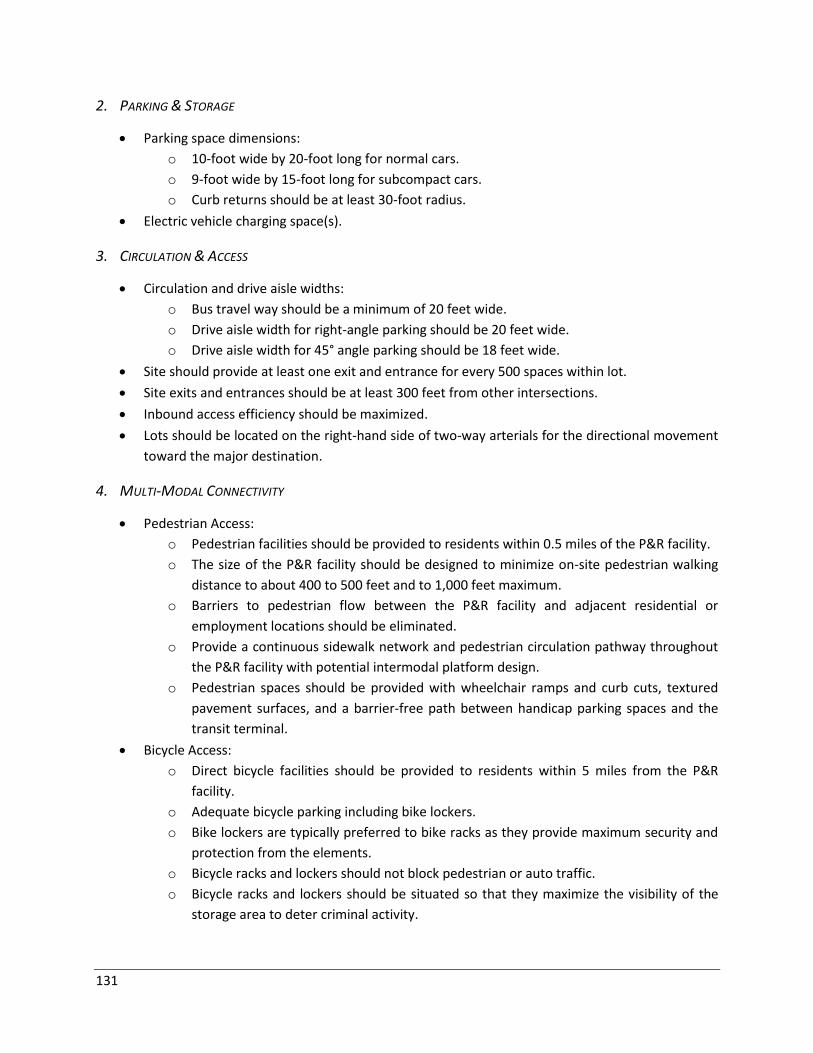
131
2. PARKING & STORAGE
Parking space dimensions:
o 10-foot wide by 20-foot long for normal cars.
o 9-foot wide by 15-foot long for subcompact cars.
o Curb returns should be at least 30-foot radius.
Electric vehicle charging space(s).
3. CIRCULATION & ACCESS
Circulation and drive aisle widths:
o Bus travel way should be a minimum of 20 feet wide.
o Drive aisle width for right-angle parking should be 20 feet wide.
o Drive aisle width for 45° angle parking should be 18 feet wide.
Site should provide at least one exit and entrance for every 500 spaces within lot.
Site exits and entrances should be at least 300 feet from other intersections.
Inbound access efficiency should be maximized.
Lots should be located on the right-hand side of two-way arterials for the directional movement
toward the major destination.
4. MULTI-MODAL CONNECTIVITY
Pedestrian Access:
o Pedestrian facilities should be provided to residents within 0.5 miles of the P&R facility.
o The size of the P&R facility should be designed to minimize on-site pedestrian walking
distance to about 400 to 500 feet and to 1,000 feet maximum.
o Barriers to pedestrian flow between the P&R facility and adjacent residential or
employment locations should be eliminated.
o Provide a continuous sidewalk network and pedestrian circulation pathway throughout
the P&R facility with potential intermodal platform design.
o Pedestrian spaces should be provided with wheelchair ramps and curb cuts, textured
pavement surfaces, and a barrier-free path between handicap parking spaces and the
transit terminal.
Bicycle Access:
o Direct bicycle facilities should be provided to residents within 5 miles from the P&R
facility.
o Adequate bicycle parking including bike lockers.
o Bike lockers are typically preferred to bike racks as they provide maximum security and
protection from the elements.
o Bicycle racks and lockers should not block pedestrian or auto traffic.
o Bicycle racks and lockers should be situated so that they maximize the visibility of the
storage area to deter criminal activity.
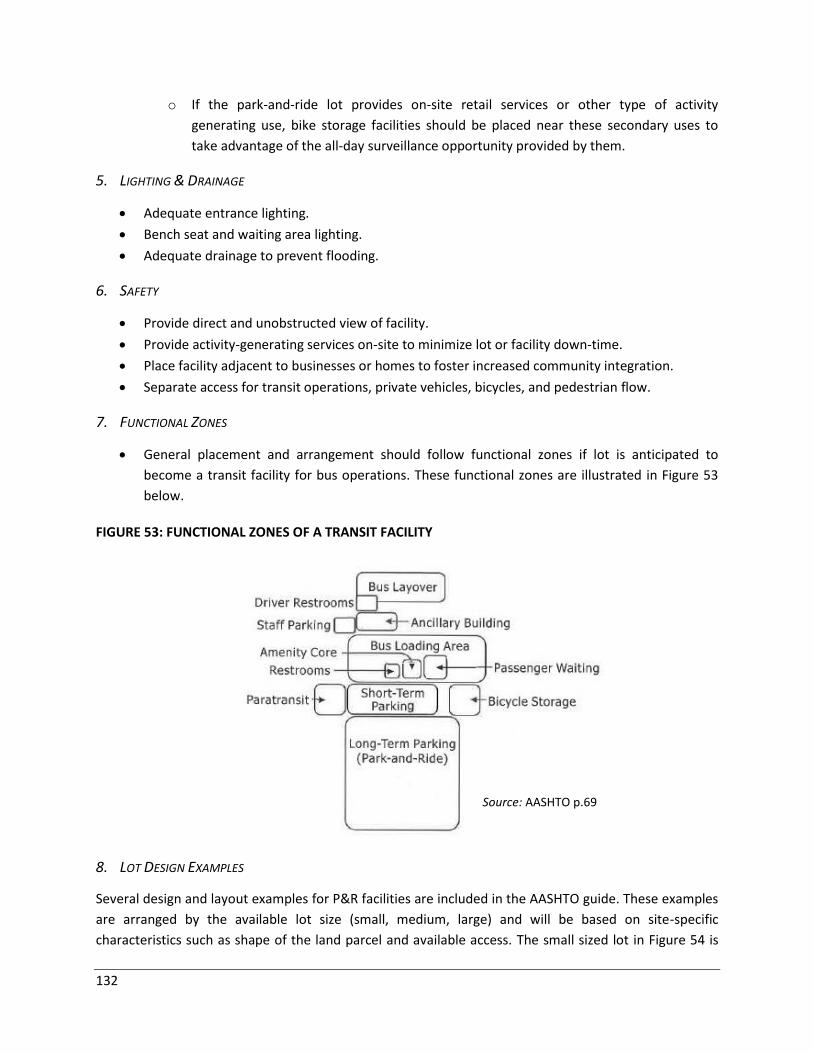
132
o If the park-and-ride lot provides on-site retail services or other type of activity
generating use, bike storage facilities should be placed near these secondary uses to
take advantage of the all-day surveillance opportunity provided by them.
5. LIGHTING & DRAINAGE
Adequate entrance lighting.
Bench seat and waiting area lighting.
Adequate drainage to prevent flooding.
6. SAFETY
Provide direct and unobstructed view of facility.
Provide activity-generating services on-site to minimize lot or facility down-time.
Place facility adjacent to businesses or homes to foster increased community integration.
Separate access for transit operations, private vehicles, bicycles, and pedestrian flow.
7. FUNCTIONAL ZONES
General placement and arrangement should follow functional zones if lot is anticipated to
become a transit facility for bus operations. These functional zones are illustrated in Figure 53
below.
FIGURE 53: FUNCTIONAL ZONES OF A TRANSIT FACILITY
8. LOT DESIGN EXAMPLES
Several design and layout examples for P&R facilities are included in the AASHTO guide. These examples
are arranged by the available lot size (small, medium, large) and will be based on site-specific
characteristics such as shape of the land parcel and available access. The small sized lot in Figure 54 is
Source: AASHTO p.69
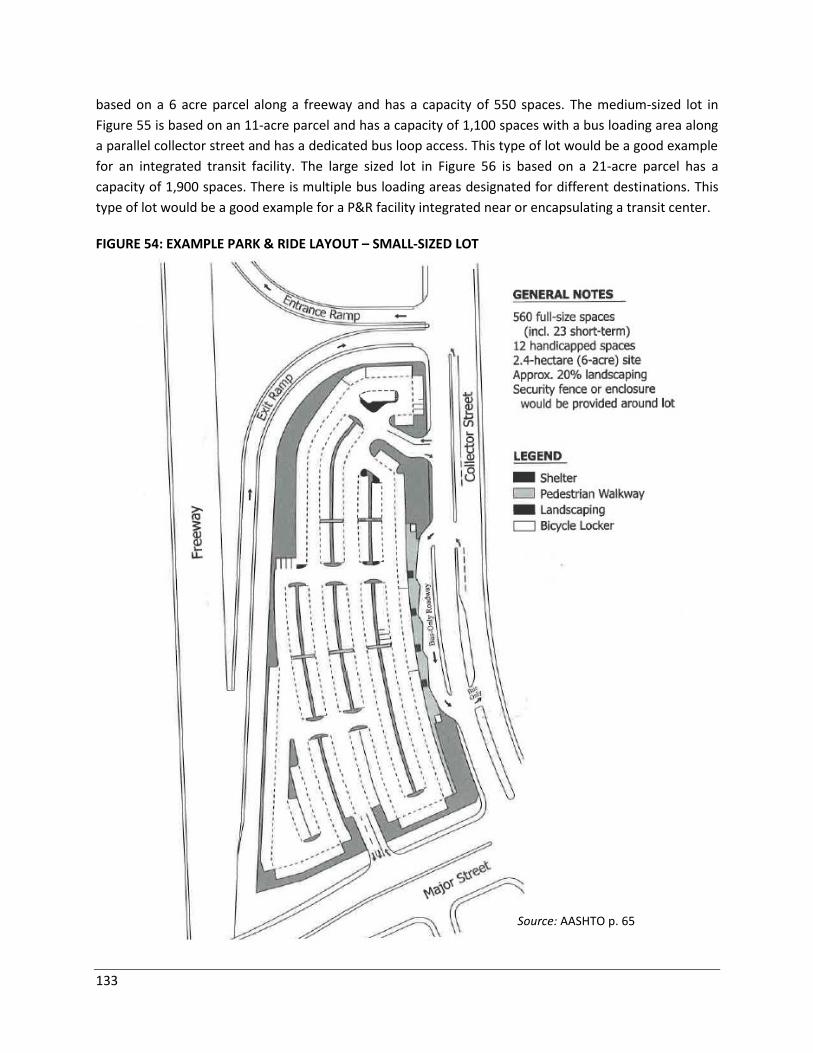
133
based on a 6 acre parcel along a freeway and has a capacity of 550 spaces. The medium-sized lot in
Figure 55 is based on an 11-acre parcel and has a capacity of 1,100 spaces with a bus loading area along
a parallel collector street and has a dedicated bus loop access. This type of lot would be a good example
for an integrated transit facility. The large sized lot in Figure 56 is based on a 21-acre parcel has a
capacity of 1,900 spaces. There is multiple bus loading areas designated for different destinations. This
type of lot would be a good example for a P&R facility integrated near or encapsulating a transit center.
FIGURE 54: EXAMPLE PARK & RIDE LAYOUT – SMALL-SIZED LOT
Source: AASHTO p. 65
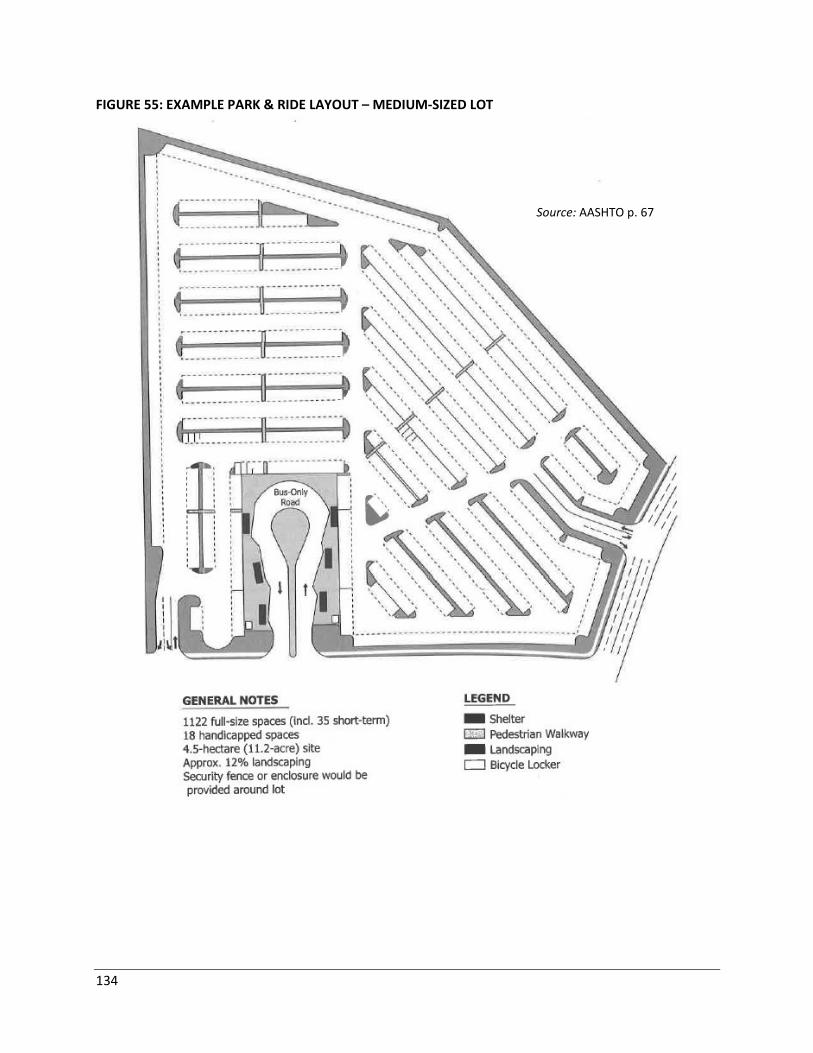
134
FIGURE 55: EXAMPLE PARK & RIDE LAYOUT – MEDIUM-SIZED LOT
Source: AASHTO p. 67
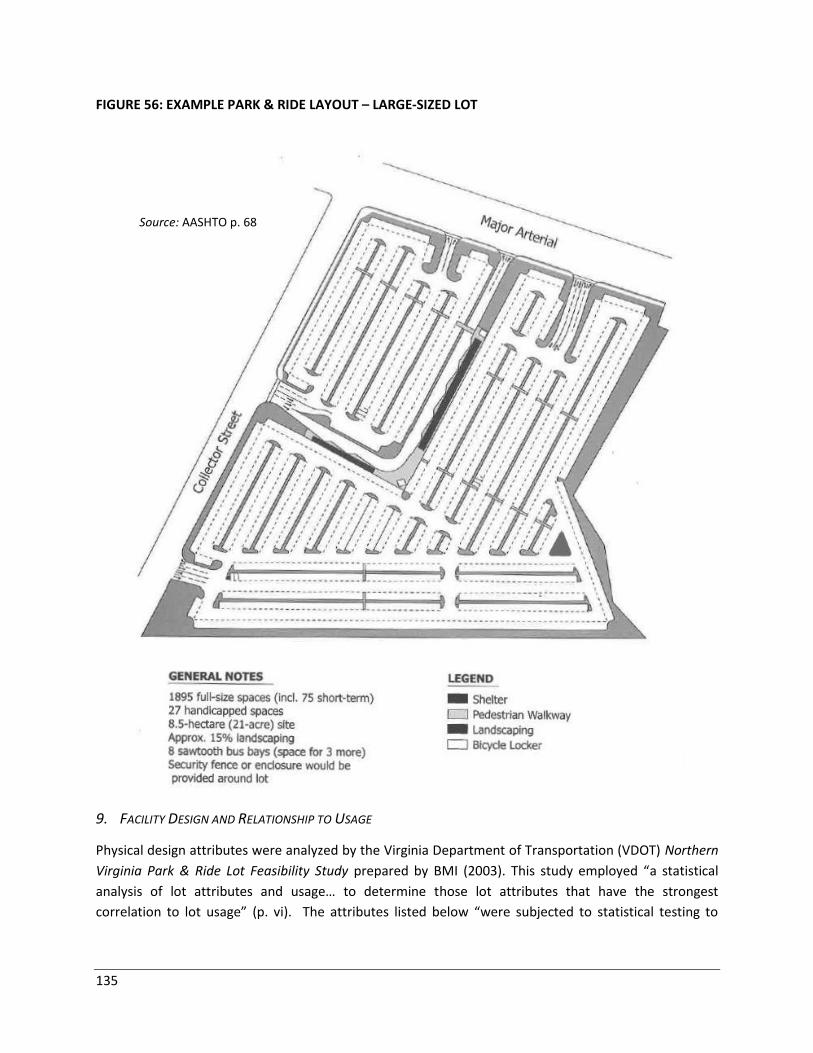
135
FIGURE 56: EXAMPLE PARK & RIDE LAYOUT – LARGE-SIZED LOT
9. FACILITY DESIGN AND RELATIONSHIP TO USAGE
Physical design attributes were analyzed by the Virginia Department of Transportation (VDOT) Northern
Virginia Park & Ride Lot Feasibility Study prepared by BMI (2003). This study employed “a statistical
analysis of lot attributes and usage… to determine those lot attributes that have the strongest
correlation to lot usage” (p. vi). The attributes listed below “were subjected to statistical testing to
Source: AASHTO p. 68
136
determine if there was a correlation between the attribute and the volume-capacity ratio (i.e.,
utilization) for the lot” (p. 29).
Lighting
Public phone
Bus transit service
Bus shelters
Connection to a bike route
Bike racks, bike lockers, or other amenities
Connecting sidewalks, and
Direct HOV access (i.e. within one-quarter [¼] mile).
The results of the statistical tests showed that only three lot attributes met the criteria for finding a
correlation:
Lighting
Bus service
Direct HOV access (i.e. within one-quarter [¼] mile).
Caltrans, in Appendix A-5 of its 1996 report, identifies the following design elements that have been
proven to aid in the success of P&R facilities:
Multi-Modal Potential: Transit pullouts and user shelters within close proximity, bike lockers
and bike access to the lot.
Visibility: Visible from access roads and surrounding uses, increase awareness (advertisement)
and decreases vandalism.
Security and Safety: Visible from access roads and surrounding uses; amenities such as lighting,
proper landscaping and a telephone/call box.
Adequate Space: Enough to accommodate demand, potential for expansion.
Landscaping: Aesthetically pleasing, easily maintained, doesn’t compromise safety and security
by creating dark areas, and should expect later lot expansion.
10. SITE SELECTION
The Virginia Department of Transportation (VDOT) Northern Virginia Park & Ride Lot Feasibility Study
prepared by BMI (2003) also provides guidelines for ensuring optimal site selection. It ties optimal P&R
site selection to the use of the following criteria:
Site Access: A direct, adequately controlled access point improves access to the facility and the
efficiency of transit service.
Proximity to Major Roads and Highways: Bus service is concentrated along these routes and
given the structure of the typical street network in the region, leaving these routes imposes a
significant time penalty.
137
Transit Service Potential: If the area around the lot can contribute passengers to the transit
service, the density and efficiency of the service is improved.11
User Demand: Potential demand for each potential site.
Size and Expansion Potential: Lot size is adequate to meet projected demand with space to
accommodate additional demand, if needed in the future.
Land and Lease Acquisition: Cost management.
Land Use and Zoning: May determine the feasibility of lighting or feasibility of developing the
site.
Safety and Security: A lot perceived as dangerous will be avoided despite other favorable
attributes; hazards may include crime, vehicle collisions, or flooding.
Community Impacts: Locations in areas with compatible land uses are preferred” (p. 35).
The above physical design standards, including site selection criteria, will promote the use of any new
P&R facility.
B. OPERATIONAL STANDARDS
In addition to the physical design of a proposed P&R facility is consideration of how it will functionally
operate to serve carpoolers. The formality of the lot will largely determine how it will operate. AASHTO
describes “two types of joint-use park and ride [facilities]: opportunistic and planned. Opportunistic can
be developed within existing public or private parking lots that demonstrate peak parking demands at
times not typically associated with peak transit demand (e.g., movie theaters, churches, large shopping
centers). The planned lot involves seeking out potential partners to develop prospective transit facilities
(p.72).”
Ease of arrangement in finding other carpoolers with a similar destination is essential to operational
usage of a P&R facility. P&R carpooling can be flexible (at time of arrival to lot) or formally arranged.
Flexible carpooling is common in areas with high volumes of drivers and where users aim to distribute a
toll cost or utilize an HOV lane. Intercity commutes in Santa Barbara County with home-to-work travel
done on a recurring basis may be best arranged using a formal system.
1. FORMAL CARPOOLING
Formal P&R operations can be achieved by visiting SBCAG’s Traffic Solutions Division website, which
provides carpool matching (www.trafficsolutions.info). The website allows potential carpoolers to create
an account and find others with similar travel patterns. The website tools helps make the most of
available commute resources beyond commuter matching including:
Emergency ride home
Cash incentives for employees
11 Potential sites could have linkage with Clean Air Express and other forms of bus transit.
138
Commute cost calculator
Usage of a carpool matching system creates a way for P&R users to establish ride share plans to be
implemented at a lot. Information concerning the matching system should be incorporated into the
physical design characteristics of a lot. Signage at the various lots referring users to the Traffic Solutions
Division’s website is the best way to notify users of the matching system.
The Traffic Solutions Division also has a Commuter Hotline number (805 963-SAVE) that provides:
Local and regional transit schedules
Carpool/vanpool information
Bicycle commuting tips
Vanpool assistance
The Traffic Solutions Division provides a useful platform for carpool matching in Santa Barbara County
and also provides a website specifically dealing with P&R facilities
(www.trafficsolutions.info/parknride.htm). VDOT indicates that “Park & Ride programs require a
program website that provides users with a map of all Park & Ride lots around the state. The map should
also include relevant information about each lot including directions to the lot, capacity of the lot,
surface type, multimodal access (i.e., bike trails), and lighting conditions… It is also helpful to provide
Park & Ride site diagrams, identify whether or not an entrance sign is posted, etc.” (p.8). Updates to
Santa Barbara County’s Park & Ride webpage may benefit from such additions in order to increase the
ease of accessing county lots with potential to increase usage.
As important as making rideshare at P&R facilities easy is increasing general public awareness of those
facilities. In addition to clear and visible signage, a Park & Ride webpage available through connection to
the Traffic Solutions website adds public visibility for potential users. According to VDOT, “The key
element of the branding effort is the Park & Ride signage system – consistent graphics and iconology
and a critical mass of Park & Ride signs along commuter corridors.” They mention additional effective
P&R advertising strategies as “press releases, local radio interviews, advertising, leaflets, posters,
exhibitions, promotional videos, internet promotions, direct contact (meetings with major employers),
special offers, and inclusion in general travel information.”
2. FLEXIBLE CARPOOLING
To aid flexible carpooling, benches at a lot color-coded by direction of travel would link carpoolers with
similar destinations. Color-coded benches require minimal cost if already planned in a lot to
accommodate users. Another option is designation of parking areas within the lot based on direction of
travel, something especially useful for the Santa Maria area where commuters are traveling both
northward to the San Luis Obispo County area as well as southward to the South Coast of Santa Barbara
County. This designation of parking areas based on direction of travel would be in the form of a
simplified lot map with color-coded and labeled zones. See Figure 57 on the following page for a
directionally color-coded map example.
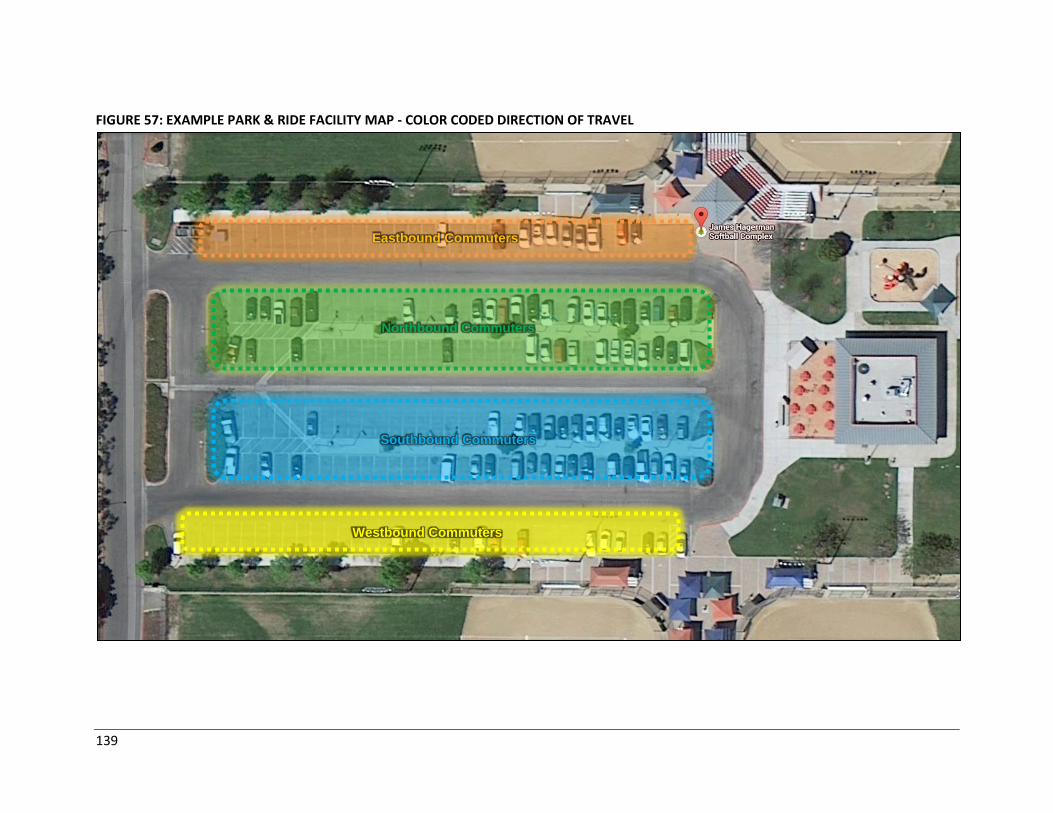
139
FIGURE 57: EXAMPLE PARK & RIDE FACILITY MAP - COLOR CODED DIRECTION OF TRAVEL
Eastbound Commuters
Northbound Commuters
Westbound Commuters
Southbound Commuters
140
These two ideas for flexible carpooling would also benefit from simplified peak-period timetables
attached to benches or below existing P&R signs. These timetables would operate in the same way
bus/transit timetables do and would help establish meeting times for flexible carpoolers.
Another proposed system has been implemented by Marin County, California from 1979 to 1980. This
system was a rudimentary program which designated major intersections near bus stops as meeting
places. These major intersections acted as informal meeting places that eventually transformed into a
more formalized carpool program.
a. Mobile Carpooling Solutions
Flexible carpooling can also be effective by using mobile solutions such as smart phone applications.
These applications should be available to provide much of the same information provided on the Park &
Ride program website. SBCAG’s Traffic Solutions Division has developed a mobile app to aid in carpool
matching. Integration of Park & Ride facility information into this application may be an efficient way to
simultaneously distribute P&R lot knowledge with carpool matching that will aid in its operations.
A number of smart phone applications are available on the market. These include:
1. Carma
o Carma is a free, real-time mobile app which enables private cars to become part of the
public transport network by providing a marketplace for drivers to offer their unused
seats to other people in real time. A driver running the app is matched in real time with
anyone searching for a ride along the same route.
o Source: www.carmacarpool.com
2. Ridejoy
o Ridejoy is a community-driven ridesharing system. Ridejoy allows shared rides by
allowing drivers to list extra seat spaces in a car and allows passengers to find rides
using the site. Ridejoy also offers a free mobile app.
o Source: www.ridejoy.com
3. ZimRide
o Zimride connects inter-city drivers and passengers through social networking and a
mobile app and is the largest rideshare program in the United States. ZimRide offers the
ability to find and book rides, view profiles, communicate with other drivers and
passengers, and post rides, either from their website or from a mobile device.
o Source: www.zimride.com
4. Lyft
o Lyft is a service of ZimRide and is a real-time app that operates like a social media
service. When a ride is requested via Lyft, a background-checked local driver will pick up
and deliver the rider to a desired location. Operates as a pseudo-taxi service.
o Source: www.lyft.com
141
5. Sidecar
o Sidecar provides ride-sharing to help people catch a ride from amateur drivers. Using
the SideCar mobile app, people can see other drivers who are nearby, how long it will
take for a car to arrive and request a ride. Also operates as a pseudo-taxi service.
o Source: www.side.cr
b. US 101 High Occupancy Vehicle (HOV) Project and Flexible Carpooling
Flexible carpooling will see an increase in ridership when the US 101 High Occupancy Vehicle (HOV)
project is implemented. This project constructs one HOV lane in each direction on US 101 from Mussel
Shoals in Ventura County to the City of Santa Barbara. Upon completion of the project, this sixteen (16)-
mile corridor will be expanded from four to six lanes and be a part of a continuous forty (40)-mile, six-
lane highway, extending from the City of Ventura in Ventura County to the City of Goleta in Santa
Barbara County. The carpool lanes will be the first ever opened on the Central Coast of California.
Flexible carpooling ridership is correlated to very congested freeways with HOV lanes, a phenomenon
that will exist along this stretch of highway. Therefore, flexible carpooling should be planned for, both
by ensuring that there are safe and logical pickup points and also by counting flexible carpool trips in the
mobility benefits of the lane.

142
CHAPTER 9: FUTURE PARK & RIDE STUDY UPDATES
This Park & Ride Study for Santa Barbara County is based on the current location of P&R facilities as well
as travel data and characteristics most current to its publication. This travel data is utilized in Chapter 7:
New Facilities as a means of analyzing travel patterns within the county to determine the most
appropriate location for new P&R facilities. Additionally, analysis of all currently existing lots provides
information existing infrastructure and available capacity which influences recommendations towards
the construction of new P&R facilities. Because these two factors are the most important in influencing
the recommendations provided in this study, the Santa Barbara County Park & Ride Study should be
updated as new lots are constructed and new relevant data is released.
Longitudinal Employer-Household Dynamics (LEHD) data provided by the US Census provides
information on employee’s residential and work locations to the “New Facilities” analysis. LEHD data is
extracted mainly from annual unemployment insurance records and is therefore updated annually. To
supplement LEHD data, new lot analysis methodology examines its overlap in major commute trip areas
with Census Transportation Planning Package (CTPP) data. CTPP data is based on a sample survey that is
conducted over five-year periods and is therefore released in five-year increments.
Although these two data sources sometimes report data in a shorter time frame, this study is not
recommended to be updated with each release. Instead, the study should be reviewed and updated as
necessary on a five-year basis, which allows for smoother data patterns to emerge and protects this
same data from temporary spikes. While commute origin-destinations change minimally every day,
overall commute patterns should be observed over longer periods of time. The analytical methodology
uses a detailed level of geography to generate its results, numbers which should be updated with each
future study. However, these updates may or may not result in changes to the LEHD/CTPP zonal
overlaps used to recommend lot locations.
Also included in the updates to the Park & Ride Study should be any new addition to the county’s P&R
inventory. A complete lot inventory is the only way to determine accurately where new lots are needed.
Furthermore, an updated assessment of the capacity and condition of both new and previously existing
lots in the county is needed with each update. Upon update, field observation of each lot’s current
capacity during peak hours should be measured. Because effective lot capacity occurs at 85 percent of
the total parking capacity, lots exceeding this capacity signal need for expansion and/or additional lots in
the area.
An assessment of the condition of lots in the P&R network will allow an updated ranking of
improvements needed. Coupled with capacity measurements, this study will help to prioritize lot
improvements based on available funding. Many of the condition factors used in Chapter 4: Inventory &
Site Visits of this study, such as “striping” and “lighting,” will only need to be maintained on an as
needed basis. Accordingly, lot capacity should be given priority.
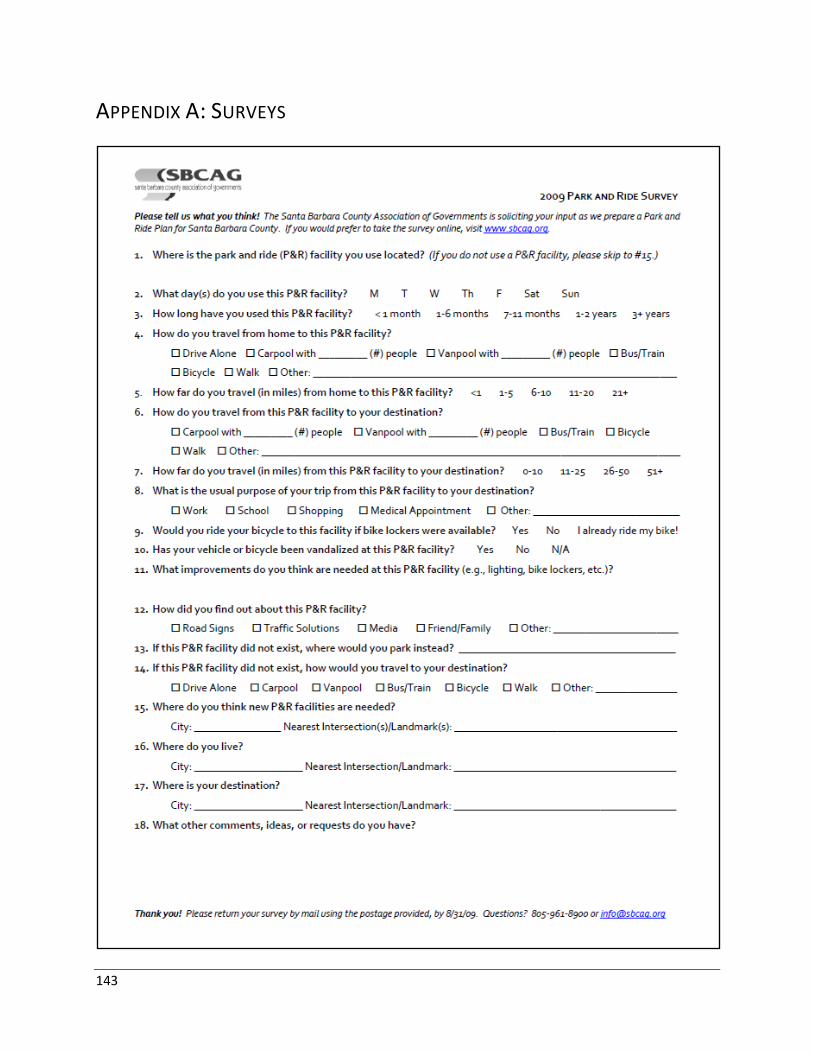
143
APPENDIX A: SURVEYS
144
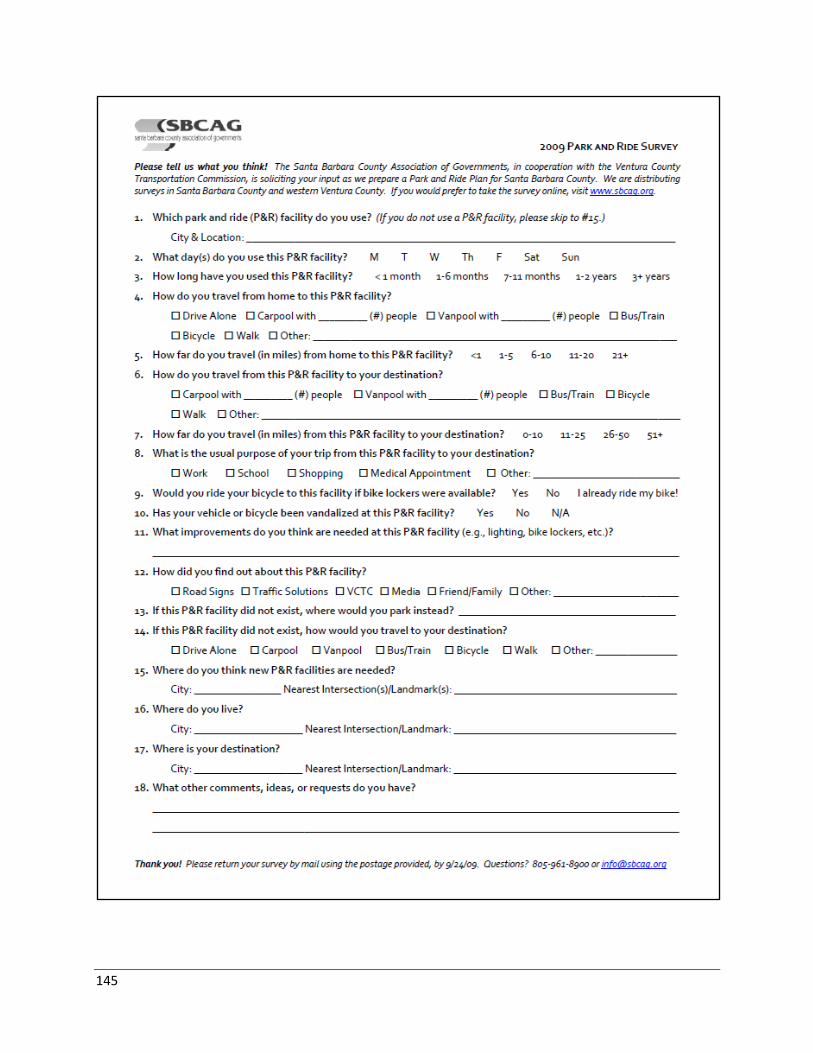
145
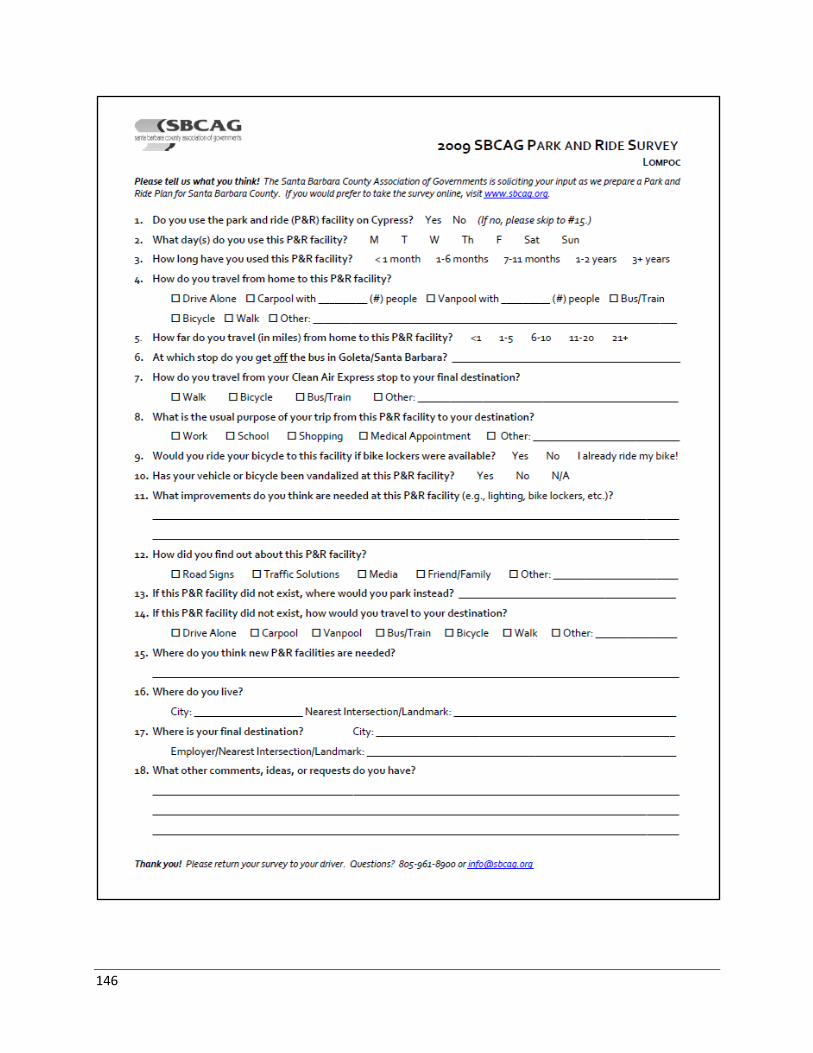
146
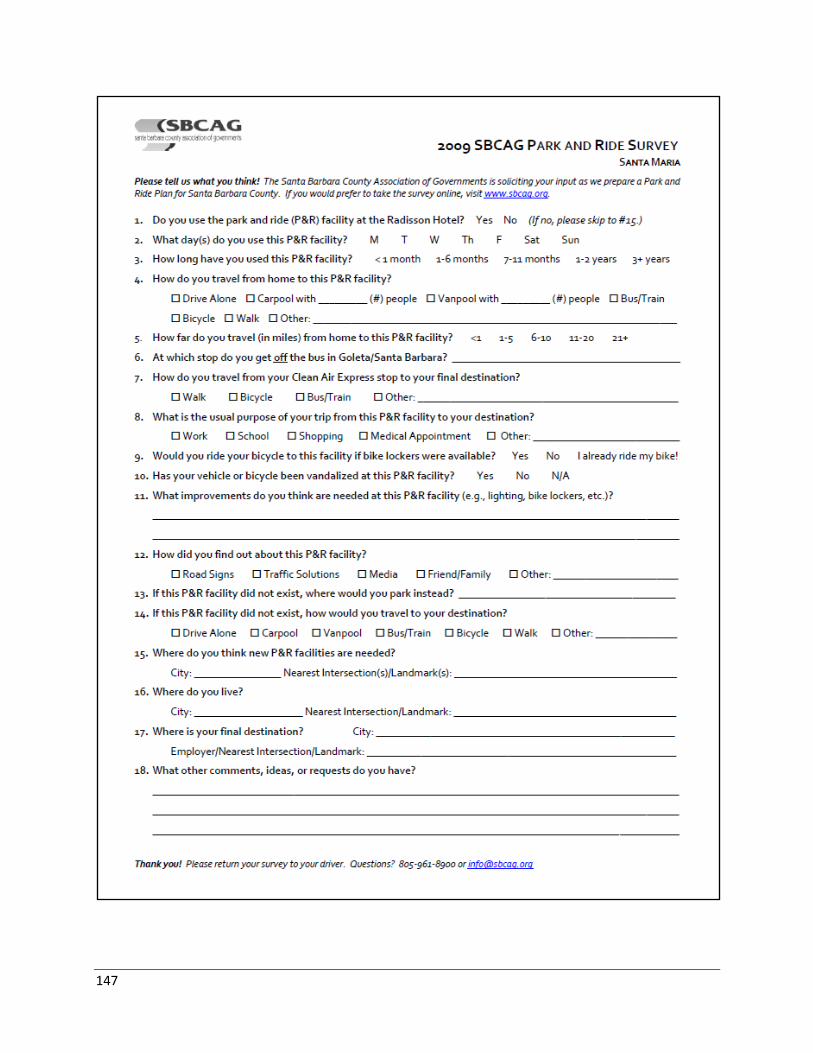
147
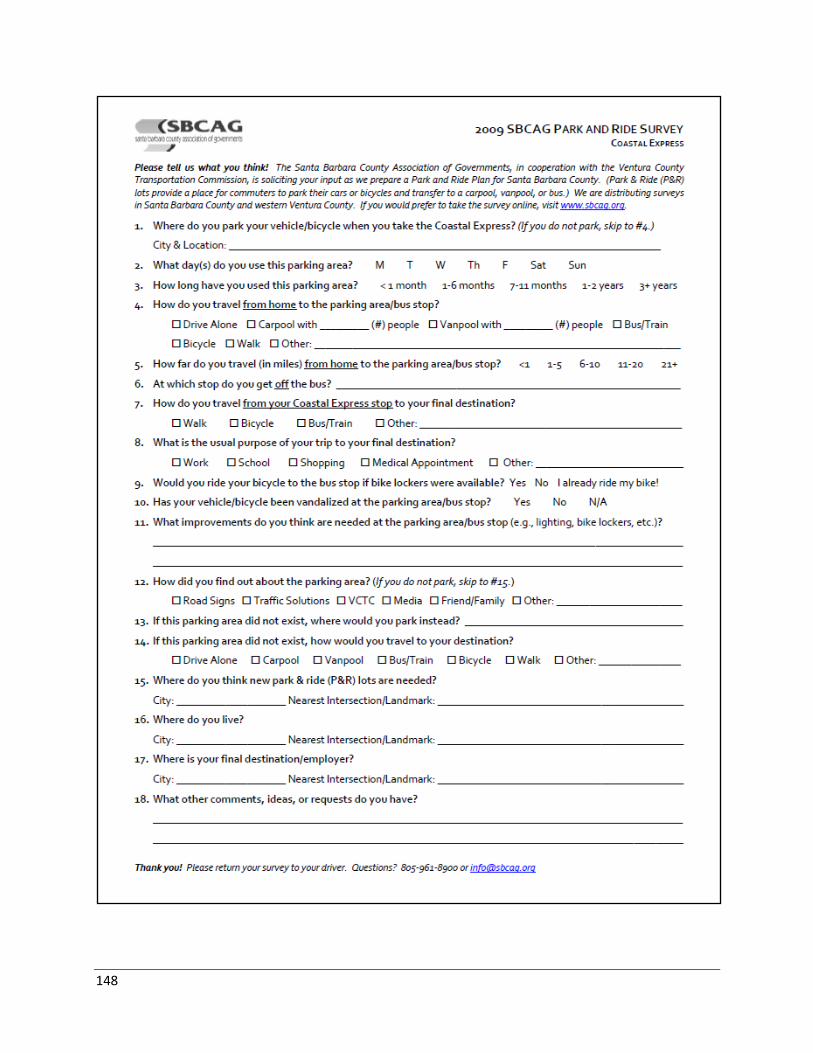
148
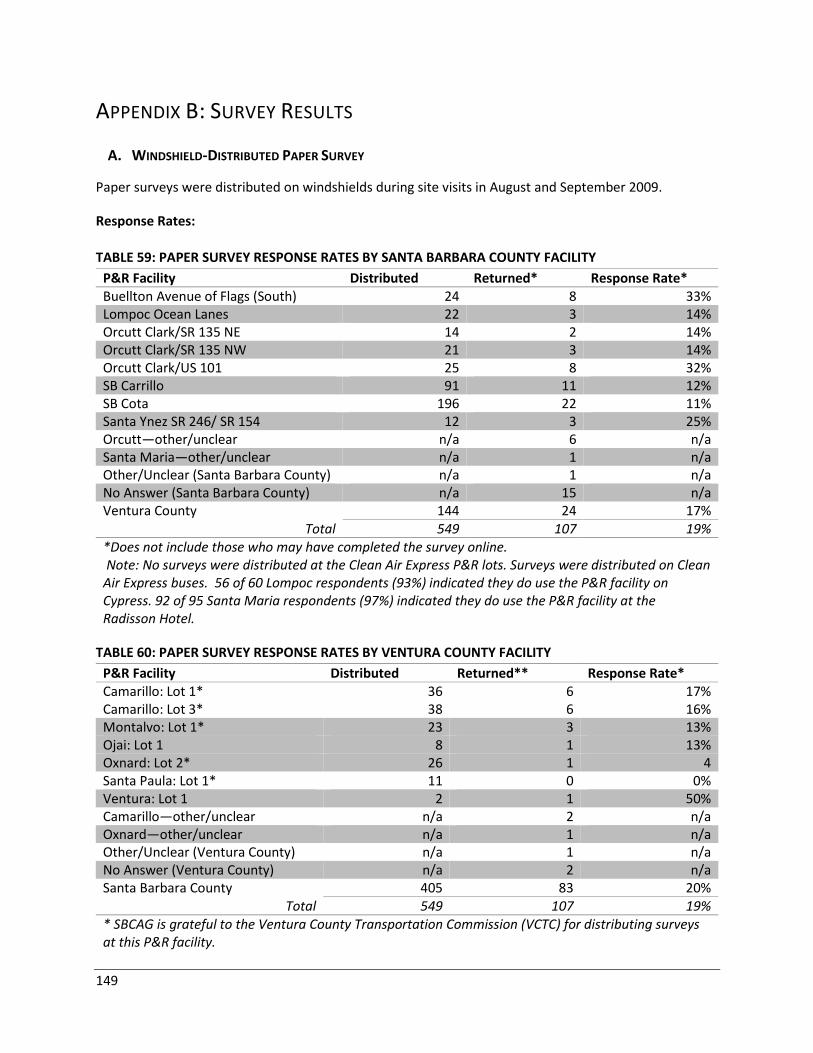
149
APPENDIX B: SURVEY RESULTS
A. WINDSHIELD-DISTRIBUTED PAPER SURVEY
Paper surveys were distributed on windshields during site visits in August and September 2009.
Response Rates:
TABLE 59: PAPER SURVEY RESPONSE RATES BY SANTA BARBARA COUNTY FACILITY
P&R Facility Distributed Returned* Response Rate* Buellton Avenue of Flags (South) 24 8 33% Lompoc Ocean Lanes 22 3 14% Orcutt Clark/SR 135 NE 14 2 14% Orcutt Clark/SR 135 NW 21 3 14% Orcutt Clark/US 101 25 8 32% SB Carrillo 91 11 12% SB Cota 196 22 11% Santa Ynez SR 246/ SR 154 12 3 25% Orcutt—other/unclear n/a 6 n/a Santa Maria—other/unclear n/a 1 n/a Other/Unclear (Santa Barbara County) n/a 1 n/a No Answer (Santa Barbara County) n/a 15 n/a Ventura County 144 24 17%
Total 549 107 19% *Does not include those who may have completed the survey online. Note: No surveys were distributed at the Clean Air Express P&R lots. Surveys were distributed on Clean Air Express buses. 56 of 60 Lompoc respondents (93%) indicated they do use the P&R facility on Cypress. 92 of 95 Santa Maria respondents (97%) indicated they do use the P&R facility at the Radisson Hotel.
TABLE 60: PAPER SURVEY RESPONSE RATES BY VENTURA COUNTY FACILITY
P&R Facility Distributed Returned** Response Rate* Camarillo: Lot 1* 36 6 17% Camarillo: Lot 3* 38 6 16% Montalvo: Lot 1* 23 3 13% Ojai: Lot 1 8 1 13% Oxnard: Lot 2* 26 1 4 Santa Paula: Lot 1* 11 0 0% Ventura: Lot 1 2 1 50% Camarillo—other/unclear n/a 2 n/a Oxnard—other/unclear n/a 1 n/a Other/Unclear (Ventura County) n/a 1 n/a No Answer (Ventura County) n/a 2 n/a Santa Barbara County 405 83 20%
Total 549 107 19% * SBCAG is grateful to the Ventura County Transportation Commission (VCTC) for distributing surveys at this P&R facility.
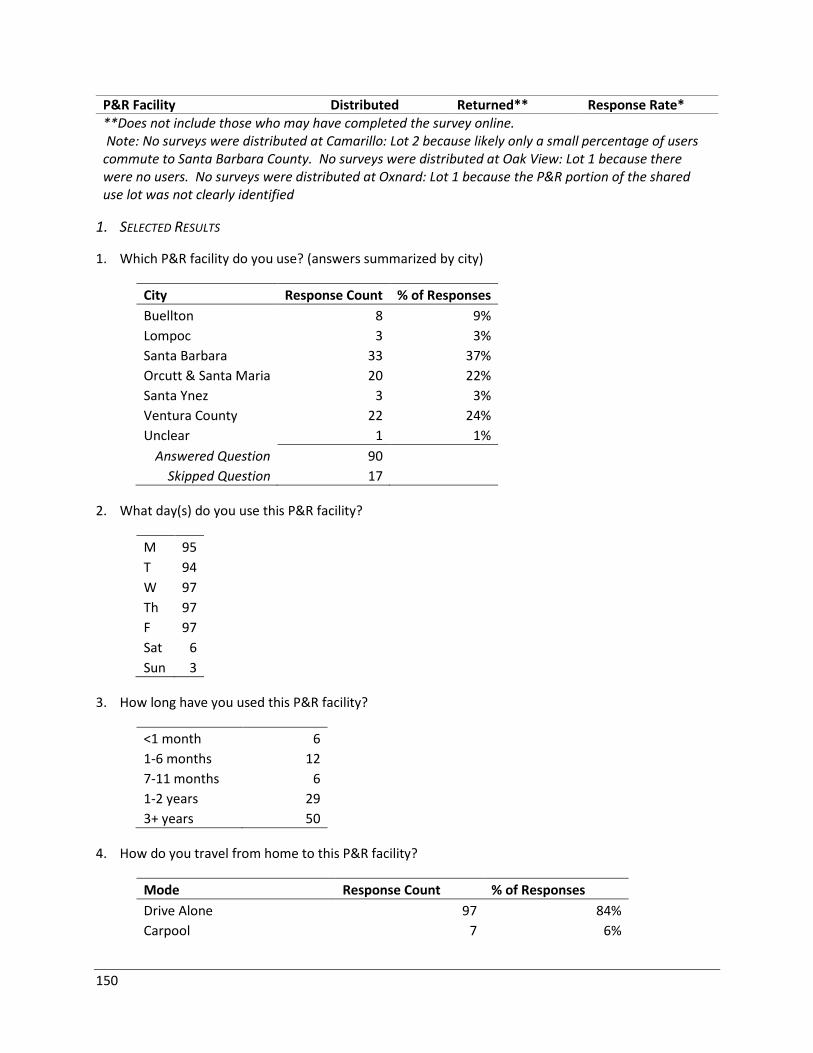
150
P&R Facility Distributed Returned** Response Rate* **Does not include those who may have completed the survey online. Note: No surveys were distributed at Camarillo: Lot 2 because likely only a small percentage of users commute to Santa Barbara County. No surveys were distributed at Oak View: Lot 1 because there were no users. No surveys were distributed at Oxnard: Lot 1 because the P&R portion of the shared use lot was not clearly identified
1. SELECTED RESULTS
1. Which P&R facility do you use? (answers summarized by city)
City Response Count % of Responses
Buellton 8 9%
Lompoc 3 3%
Santa Barbara 33 37%
Orcutt & Santa Maria 20 22%
Santa Ynez 3 3%
Ventura County 22 24%
Unclear 1 1%
Answered Question 90
Skipped Question 17
2. What day(s) do you use this P&R facility?
M 95
T 94
W 97
Th 97
F 97
Sat 6
Sun 3
3. How long have you used this P&R facility?
<1 month 6
1-6 months 12
7-11 months 6
1-2 years 29
3+ years 50
4. How do you travel from home to this P&R facility?
Mode Response Count % of Responses
Drive Alone 97 84%
Carpool 7 6%
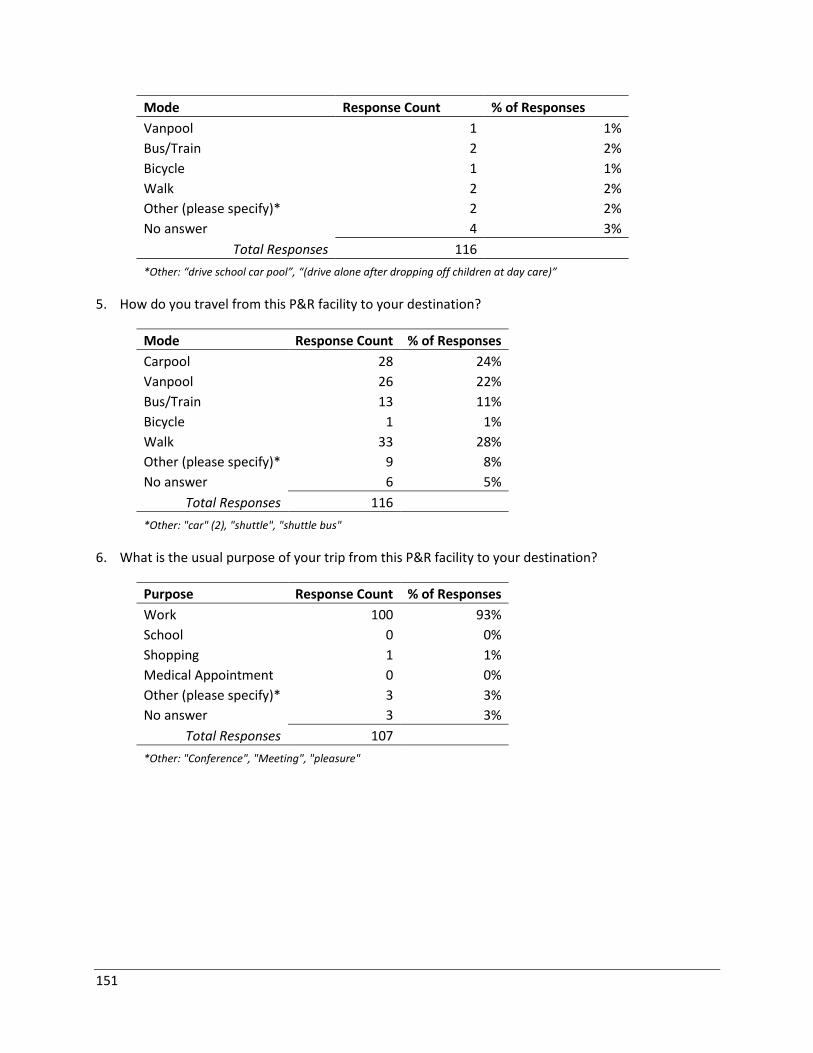
151
Mode Response Count % of Responses
Vanpool 1 1%
Bus/Train 2 2%
Bicycle 1 1%
Walk 2 2%
Other (please specify)* 2 2%
No answer 4 3%
Total Responses 116 *Other: “drive school car pool”, “(drive alone after dropping off children at day care)”
5. How do you travel from this P&R facility to your destination?
Mode Response Count % of Responses
Carpool 28 24%
Vanpool 26 22%
Bus/Train 13 11%
Bicycle 1 1%
Walk 33 28%
Other (please specify)* 9 8%
No answer 6 5%
Total Responses 116
*Other: "car" (2), "shuttle", "shuttle bus"
6. What is the usual purpose of your trip from this P&R facility to your destination?
Purpose Response Count % of Responses
Work 100 93%
School 0 0%
Shopping 1 1%
Medical Appointment 0 0%
Other (please specify)* 3 3%
No answer 3 3%
Total Responses 107 *Other: "Conference", "Meeting", "pleasure"
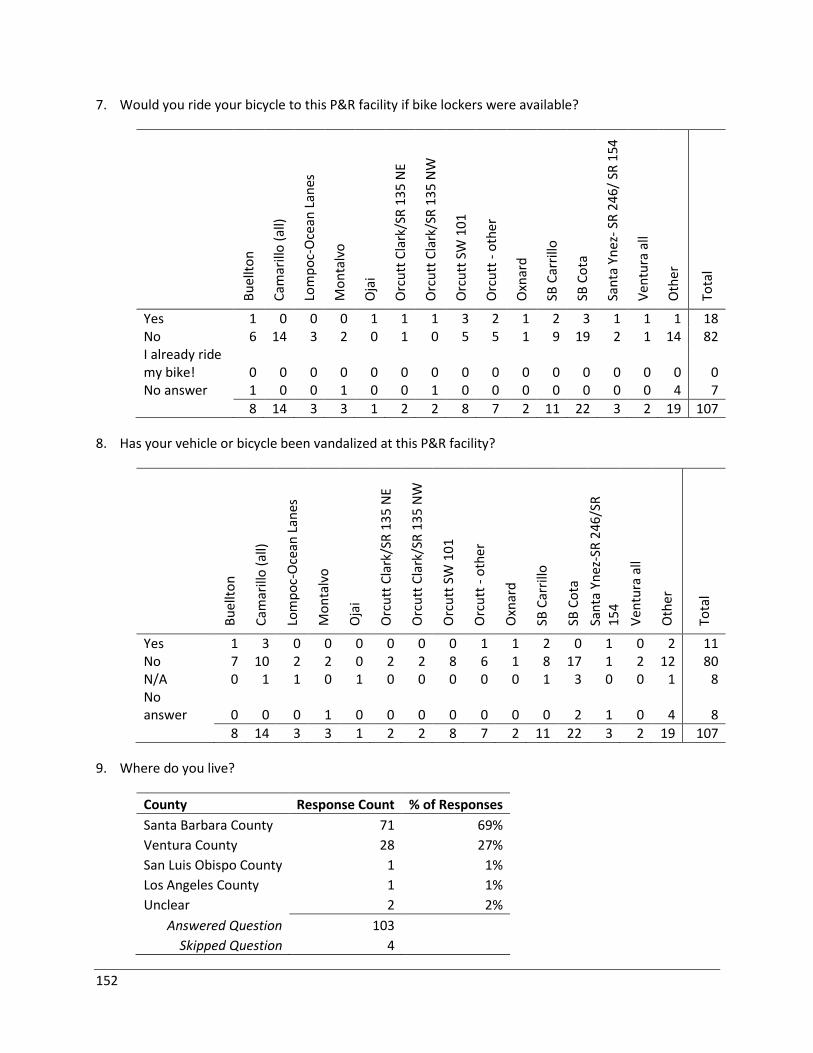
152
7. Would you ride your bicycle to this P&R facility if bike lockers were available?
Bu
ellt
on
Cam
arill
o (
all)
Lom
po
c-O
cean
Lan
es
Mo
nta
lvo
Oja
i
Orc
utt
Cla
rk/S
R 1
35
NE
Orc
utt
Cla
rk/S
R 1
35
NW
Orc
utt
SW
10
1
Orc
utt
- o
ther
Oxn
ard
SB C
arri
llo
SB C
ota
San
ta Y
nez
- SR
24
6/
SR 1
54
Ven
tura
all
Oth
er
Tota
l
Yes 1 0 0 0 1 1 1 3 2 1 2 3 1 1 1 18 No 6 14 3 2 0 1 0 5 5 1 9 19 2 1 14 82 I already ride my bike! 0 0 0 0 0 0 0 0 0 0 0 0 0 0 0 0 No answer 1 0 0 1 0 0 1 0 0 0 0 0 0 0 4 7
8 14 3 3 1 2 2 8 7 2 11 22 3 2 19 107
8. Has your vehicle or bicycle been vandalized at this P&R facility?
Bu
ellt
on
Cam
arill
o (
all)
Lom
po
c-O
cean
Lan
es
Mo
nta
lvo
Oja
i
Orc
utt
Cla
rk/S
R 1
35
NE
Orc
utt
Cla
rk/S
R 1
35
NW
Orc
utt
SW
10
1
Orc
utt
- o
ther
Oxn
ard
SB C
arri
llo
SB C
ota
San
ta Y
nez
-SR
24
6/S
R
15
4
Ven
tura
all
Oth
er
Tota
l
Yes 1 3 0 0 0 0 0 0 1 1 2 0 1 0 2 11 No 7 10 2 2 0 2 2 8 6 1 8 17 1 2 12 80 N/A 0 1 1 0 1 0 0 0 0 0 1 3 0 0 1 8 No answer 0 0 0 1 0 0 0 0 0 0 0 2 1 0 4 8
8 14 3 3 1 2 2 8 7 2 11 22 3 2 19 107
9. Where do you live?
County Response Count % of Responses
Santa Barbara County 71 69%
Ventura County 28 27%
San Luis Obispo County 1 1%
Los Angeles County 1 1%
Unclear 2 2%
Answered Question 103 Skipped Question 4
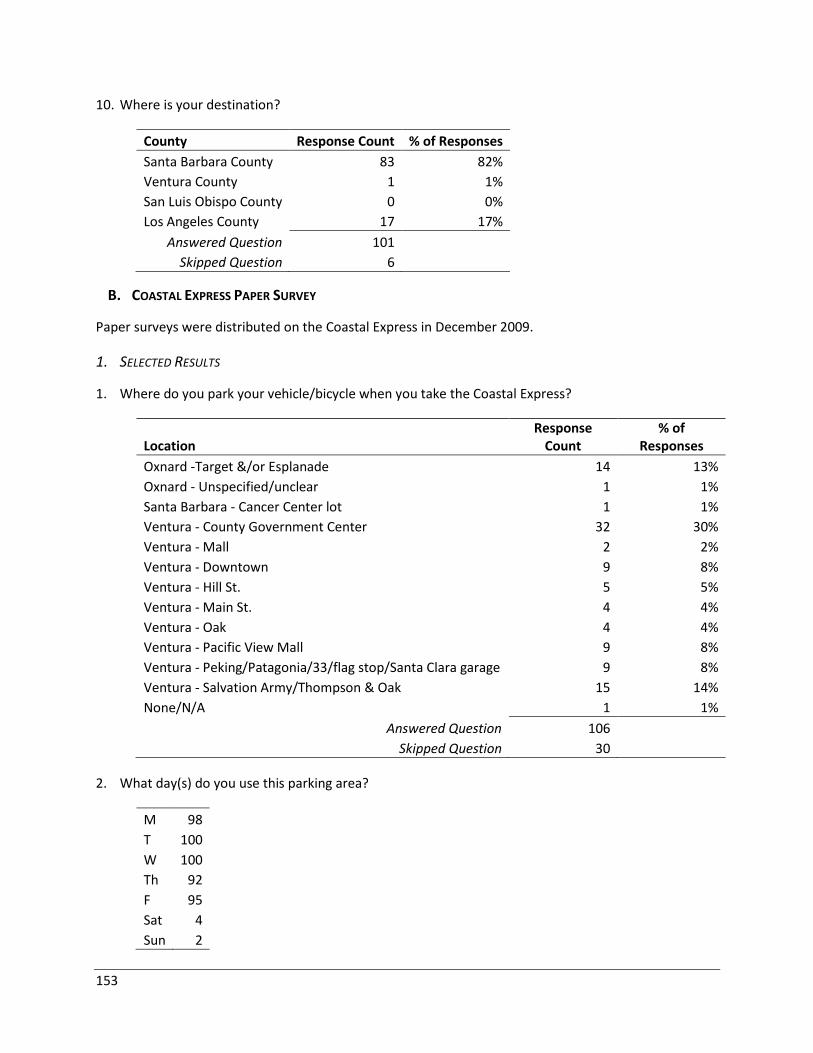
153
10. Where is your destination?
County Response Count % of Responses
Santa Barbara County 83 82%
Ventura County 1 1%
San Luis Obispo County 0 0%
Los Angeles County 17 17%
Answered Question 101 Skipped Question 6
B. COASTAL EXPRESS PAPER SURVEY
Paper surveys were distributed on the Coastal Express in December 2009.
1. SELECTED RESULTS
1. Where do you park your vehicle/bicycle when you take the Coastal Express?
Location Response
Count % of
Responses
Oxnard -Target &/or Esplanade 14 13%
Oxnard - Unspecified/unclear 1 1%
Santa Barbara - Cancer Center lot 1 1%
Ventura - County Government Center 32 30%
Ventura - Mall 2 2%
Ventura - Downtown 9 8%
Ventura - Hill St. 5 5%
Ventura - Main St. 4 4%
Ventura - Oak 4 4%
Ventura - Pacific View Mall 9 8%
Ventura - Peking/Patagonia/33/flag stop/Santa Clara garage 9 8%
Ventura - Salvation Army/Thompson & Oak 15 14%
None/N/A 1 1%
Answered Question 106
Skipped Question 30
2. What day(s) do you use this parking area?
M 98
T 100
W 100
Th 92
F 95
Sat 4
Sun 2
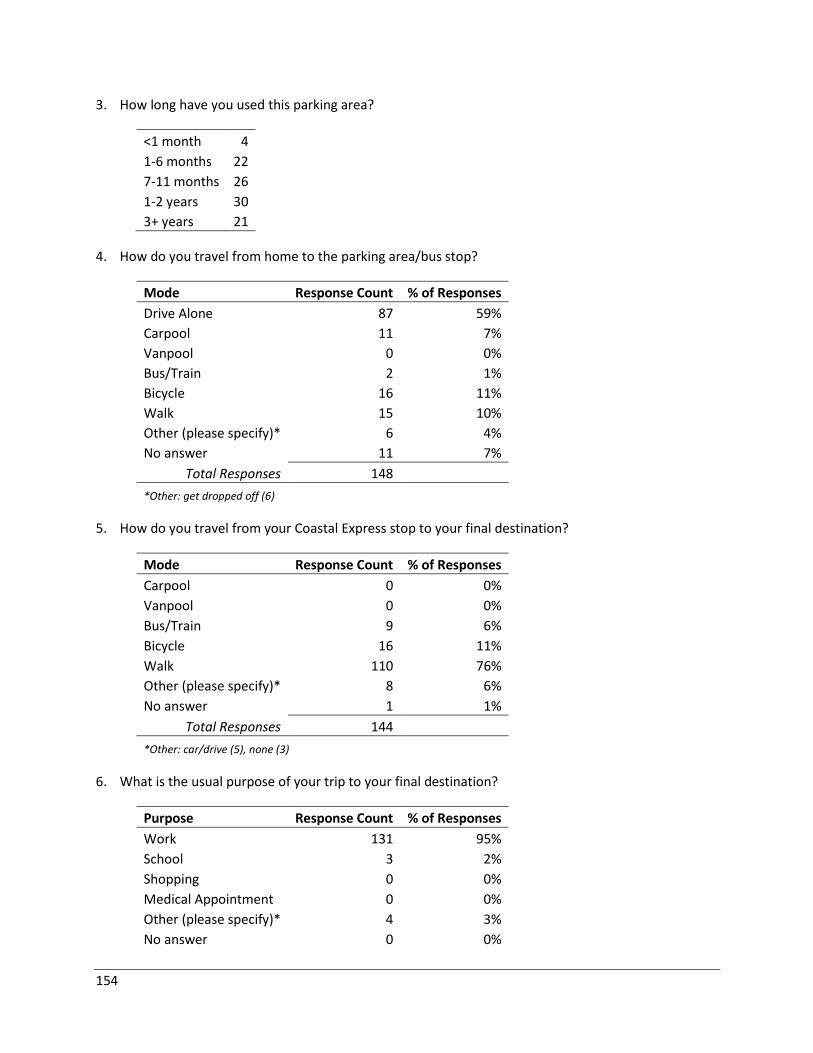
154
3. How long have you used this parking area?
<1 month 4
1-6 months 22
7-11 months 26
1-2 years 30
3+ years 21
4. How do you travel from home to the parking area/bus stop?
Mode Response Count % of Responses
Drive Alone 87 59%
Carpool 11 7%
Vanpool 0 0%
Bus/Train 2 1%
Bicycle 16 11%
Walk 15 10%
Other (please specify)* 6 4%
No answer 11 7%
Total Responses 148 *Other: get dropped off (6)
5. How do you travel from your Coastal Express stop to your final destination?
Mode Response Count % of Responses
Carpool 0 0%
Vanpool 0 0%
Bus/Train 9 6%
Bicycle 16 11%
Walk 110 76%
Other (please specify)* 8 6%
No answer 1 1%
Total Responses 144
*Other: car/drive (5), none (3)
6. What is the usual purpose of your trip to your final destination?
Purpose Response Count % of Responses
Work 131 95%
School 3 2%
Shopping 0 0%
Medical Appointment 0 0%
Other (please specify)* 4 3%
No answer 0 0%
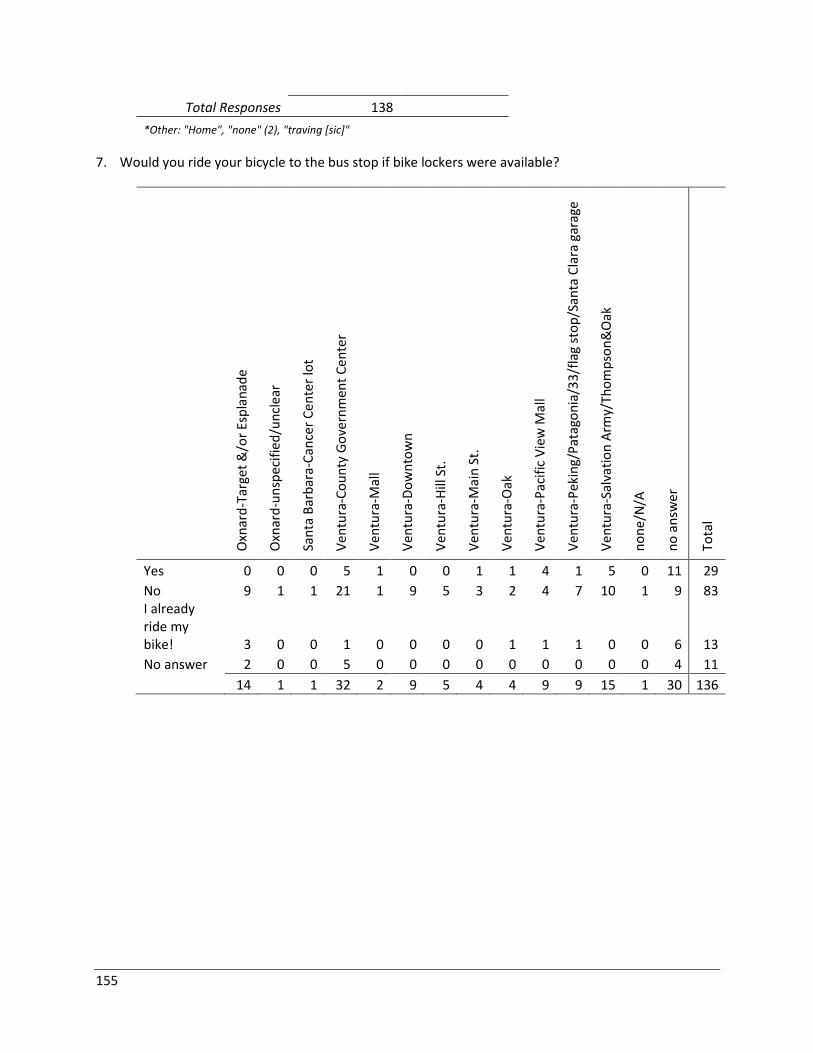
155
Total Responses 138
*Other: "Home", "none" (2), "traving [sic]"
7. Would you ride your bicycle to the bus stop if bike lockers were available?
Oxn
ard
-Tar
get
&/o
r Es
pla
nad
e
Oxn
ard
-un
spec
ifie
d/u
ncl
ear
San
ta B
arb
ara-
Can
cer
Ce
nte
r lo
t
Ven
tura
-Co
un
ty G
ove
rnm
ent
Cen
ter
Ven
tura
-Mal
l
Ven
tura
-Do
wn
tow
n
Ven
tura
-Hill
St.
Ven
tura
-Mai
n S
t.
Ven
tura
-Oak
Ven
tura
-Pac
ific
Vie
w M
all
Ven
tura
-Pek
ing/
Pat
ago
nia
/33
/fla
g st
op
/San
ta C
lara
gar
age
Ven
tura
-Sal
vati
on
Arm
y/Th
om
pso
n&
Oak
no
ne
/N/A
no
an
swer
Tota
l
Yes 0 0 0 5 1 0 0 1 1 4 1 5 0 11 29
No 9 1 1 21 1 9 5 3 2 4 7 10 1 9 83 I already ride my bike! 3 0 0 1 0 0 0 0 1 1 1 0 0 6 13
No answer 2 0 0 5 0 0 0 0 0 0 0 0 0 4 11
14 1 1 32 2 9 5 4 4 9 9 15 1 30 136
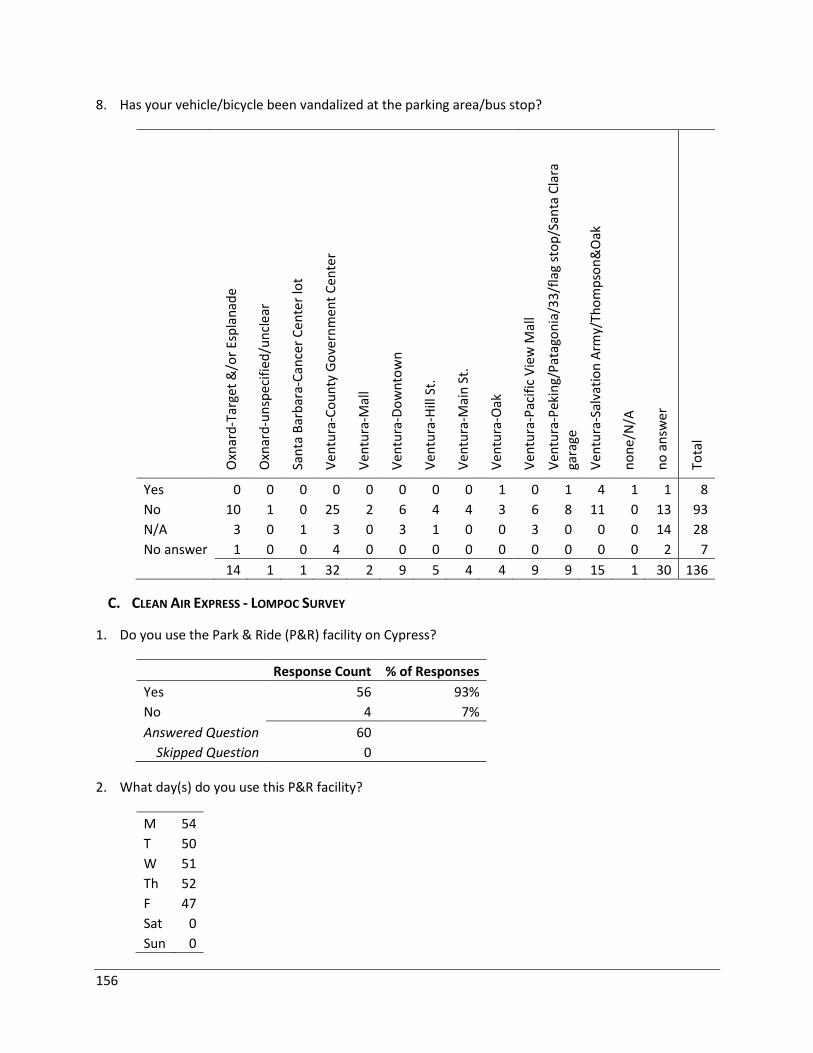
156
8. Has your vehicle/bicycle been vandalized at the parking area/bus stop?
Oxn
ard
-Tar
get
&/o
r Es
pla
nad
e
Oxn
ard
-un
spec
ifie
d/u
ncl
ear
San
ta B
arb
ara-
Can
cer
Ce
nte
r lo
t
Ven
tura
-Co
un
ty G
ove
rnm
ent
Cen
ter
Ven
tura
-Mal
l
Ven
tura
-Do
wn
tow
n
Ven
tura
-Hill
St.
Ven
tura
-Mai
n S
t.
Ven
tura
-Oak
Ven
tura
-Pac
ific
Vie
w M
all
Ven
tura
-Pek
ing/
Pat
ago
nia
/33
/fla
g st
op
/San
ta C
lara
ga
rage
Ven
tura
-Sal
vati
on
Arm
y/Th
om
pso
n&
Oak
no
ne
/N/A
no
an
swer
Tota
l
Yes 0 0 0 0 0 0 0 0 1 0 1 4 1 1 8
No 10 1 0 25 2 6 4 4 3 6 8 11 0 13 93
N/A 3 0 1 3 0 3 1 0 0 3 0 0 0 14 28
No answer 1 0 0 4 0 0 0 0 0 0 0 0 0 2 7
14 1 1 32 2 9 5 4 4 9 9 15 1 30 136
C. CLEAN AIR EXPRESS - LOMPOC SURVEY
1. Do you use the Park & Ride (P&R) facility on Cypress?
Response Count % of Responses
Yes 56 93%
No 4 7%
Answered Question 60 Skipped Question 0
2. What day(s) do you use this P&R facility?
M 54
T 50
W 51
Th 52
F 47
Sat 0
Sun 0
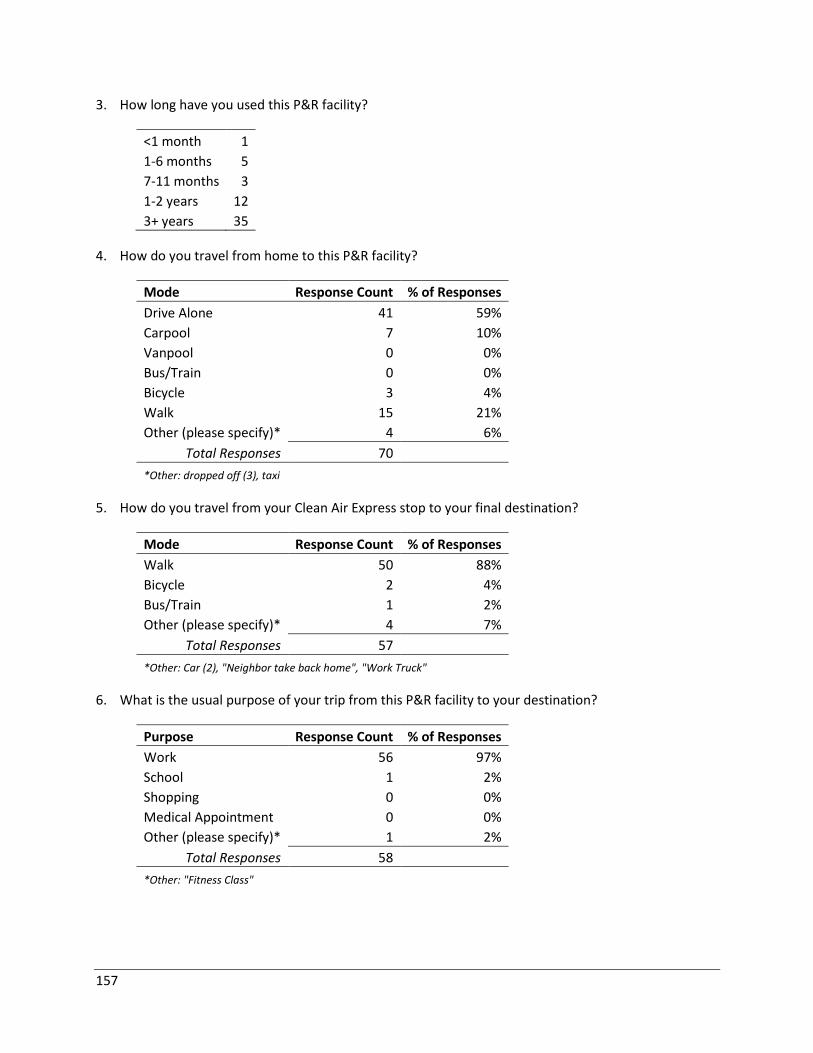
157
3. How long have you used this P&R facility?
<1 month 1
1-6 months 5
7-11 months 3
1-2 years 12
3+ years 35
4. How do you travel from home to this P&R facility?
Mode Response Count % of Responses
Drive Alone 41 59%
Carpool 7 10%
Vanpool 0 0%
Bus/Train 0 0%
Bicycle 3 4%
Walk 15 21%
Other (please specify)* 4 6%
Total Responses 70 *Other: dropped off (3), taxi
5. How do you travel from your Clean Air Express stop to your final destination?
Mode Response Count % of Responses
Walk 50 88%
Bicycle 2 4%
Bus/Train 1 2%
Other (please specify)* 4 7%
Total Responses 57 *Other: Car (2), "Neighbor take back home", "Work Truck"
6. What is the usual purpose of your trip from this P&R facility to your destination?
Purpose Response Count % of Responses
Work 56 97%
School 1 2%
Shopping 0 0%
Medical Appointment 0 0%
Other (please specify)* 1 2%
Total Responses 58 *Other: "Fitness Class"
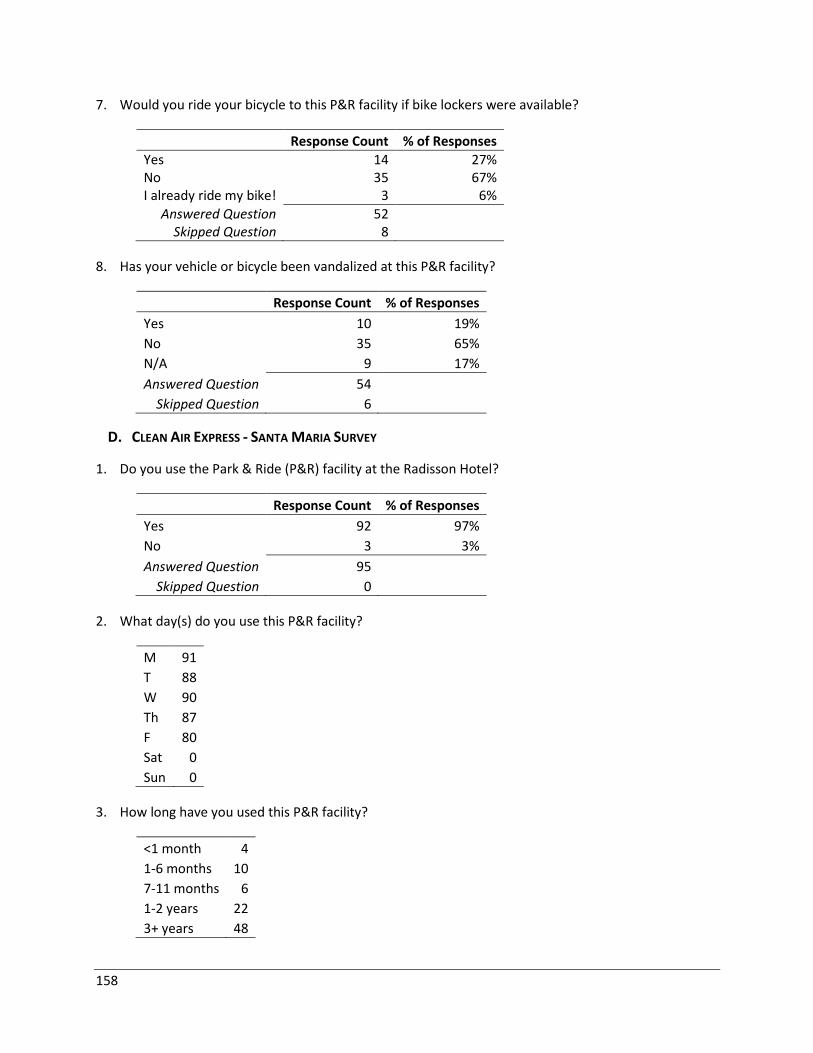
158
7. Would you ride your bicycle to this P&R facility if bike lockers were available?
Response Count % of Responses
Yes 14 27% No 35 67% I already ride my bike! 3 6%
Answered Question 52 Skipped Question 8
8. Has your vehicle or bicycle been vandalized at this P&R facility?
Response Count % of Responses
Yes 10 19%
No 35 65%
N/A 9 17%
Answered Question 54 Skipped Question 6
D. CLEAN AIR EXPRESS - SANTA MARIA SURVEY
1. Do you use the Park & Ride (P&R) facility at the Radisson Hotel?
Response Count % of Responses
Yes 92 97%
No 3 3%
Answered Question 95 Skipped Question 0
2. What day(s) do you use this P&R facility?
M 91
T 88
W 90
Th 87
F 80
Sat 0
Sun 0
3. How long have you used this P&R facility?
<1 month 4
1-6 months 10
7-11 months 6
1-2 years 22
3+ years 48
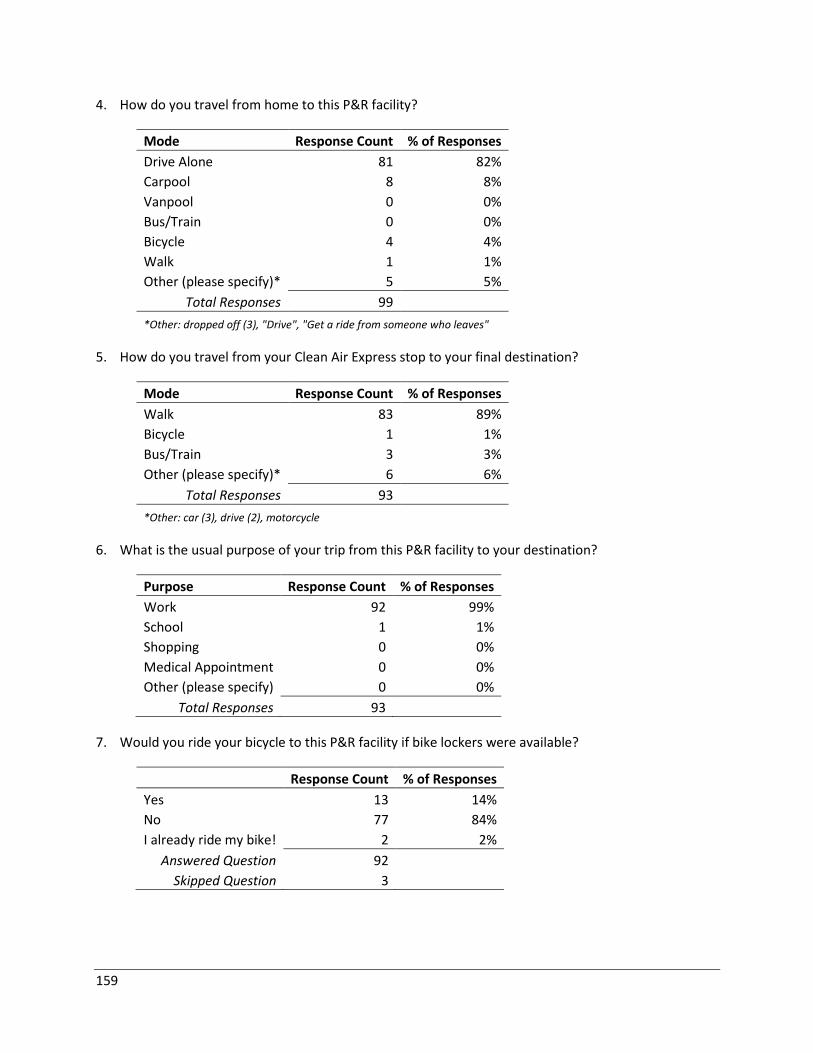
159
4. How do you travel from home to this P&R facility?
Mode Response Count % of Responses
Drive Alone 81 82%
Carpool 8 8%
Vanpool 0 0%
Bus/Train 0 0%
Bicycle 4 4%
Walk 1 1%
Other (please specify)* 5 5%
Total Responses 99 *Other: dropped off (3), "Drive", "Get a ride from someone who leaves"
5. How do you travel from your Clean Air Express stop to your final destination?
Mode Response Count % of Responses
Walk 83 89%
Bicycle 1 1%
Bus/Train 3 3%
Other (please specify)* 6 6%
Total Responses 93 *Other: car (3), drive (2), motorcycle
6. What is the usual purpose of your trip from this P&R facility to your destination?
Purpose Response Count % of Responses
Work 92 99%
School 1 1%
Shopping 0 0%
Medical Appointment 0 0%
Other (please specify) 0 0%
Total Responses 93
7. Would you ride your bicycle to this P&R facility if bike lockers were available?
Response Count % of Responses
Yes 13 14%
No 77 84%
I already ride my bike! 2 2%
Answered Question 92 Skipped Question 3
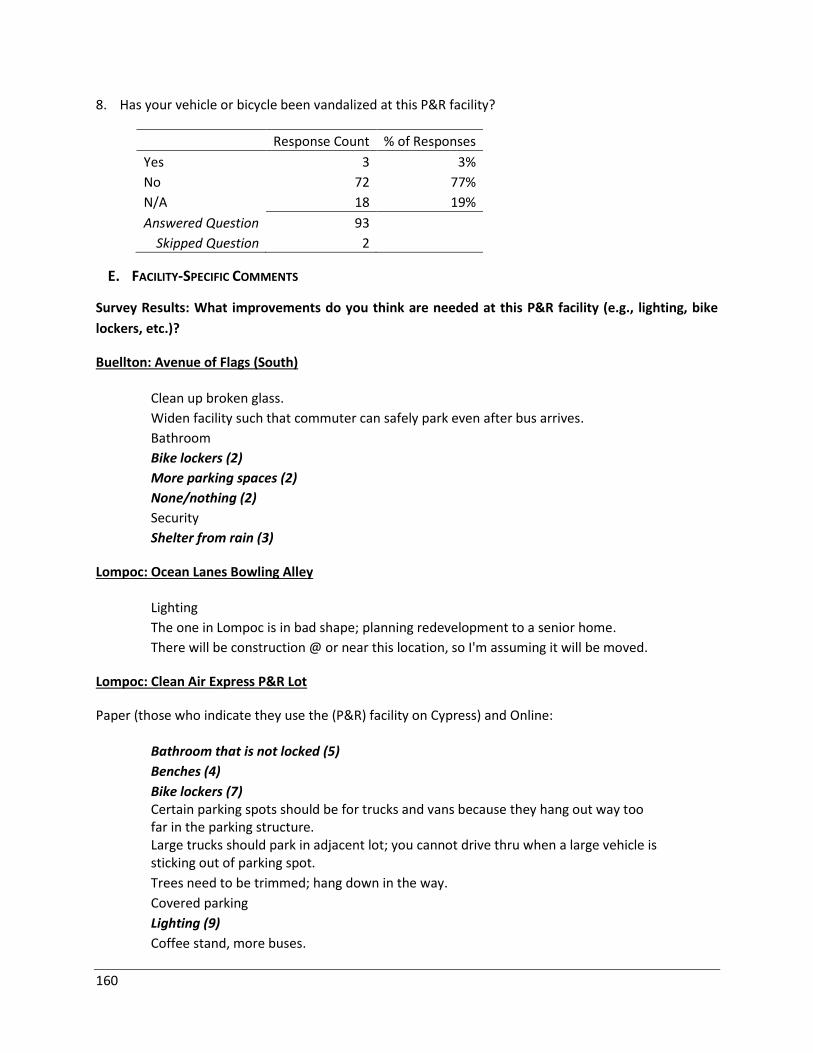
160
8. Has your vehicle or bicycle been vandalized at this P&R facility?
Response Count % of Responses
Yes 3 3%
No 72 77%
N/A 18 19%
Answered Question 93 Skipped Question 2
E. FACILITY-SPECIFIC COMMENTS
Survey Results: What improvements do you think are needed at this P&R facility (e.g., lighting, bike
lockers, etc.)?
Buellton: Avenue of Flags (South)
Clean up broken glass.
Widen facility such that commuter can safely park even after bus arrives.
Bathroom
Bike lockers (2)
More parking spaces (2)
None/nothing (2)
Security
Shelter from rain (3)
Lompoc: Ocean Lanes Bowling Alley
Lighting
The one in Lompoc is in bad shape; planning redevelopment to a senior home.
There will be construction @ or near this location, so I'm assuming it will be moved.
Lompoc: Clean Air Express P&R Lot
Paper (those who indicate they use the (P&R) facility on Cypress) and Online:
Bathroom that is not locked (5)
Benches (4)
Bike lockers (7) Certain parking spots should be for trucks and vans because they hang out way too far in the parking structure. Large trucks should park in adjacent lot; you cannot drive thru when a large vehicle is sticking out of parking spot.
Trees need to be trimmed; hang down in the way.
Covered parking
Lighting (9)
Coffee stand, more buses.
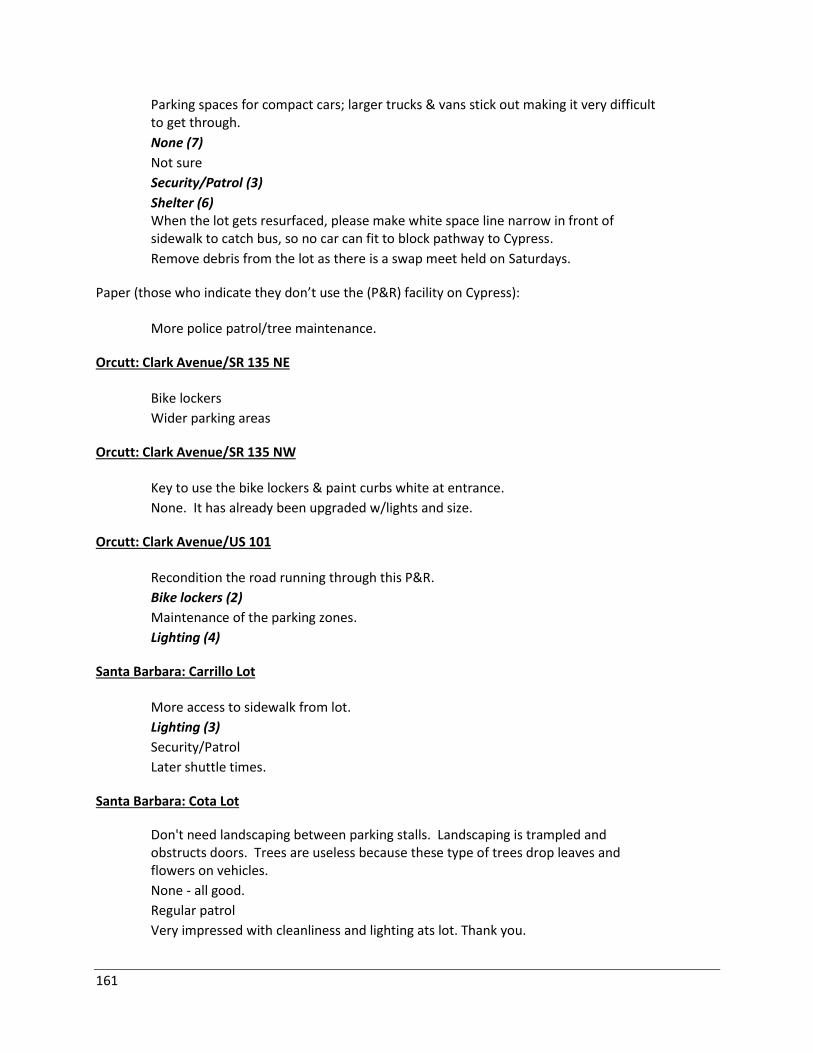
161
Parking spaces for compact cars; larger trucks & vans stick out making it very difficult to get through.
None (7)
Not sure
Security/Patrol (3)
Shelter (6) When the lot gets resurfaced, please make white space line narrow in front of sidewalk to catch bus, so no car can fit to block pathway to Cypress.
Remove debris from the lot as there is a swap meet held on Saturdays.
Paper (those who indicate they don’t use the (P&R) facility on Cypress):
More police patrol/tree maintenance.
Orcutt: Clark Avenue/SR 135 NE
Bike lockers
Wider parking areas
Orcutt: Clark Avenue/SR 135 NW
Key to use the bike lockers & paint curbs white at entrance.
None. It has already been upgraded w/lights and size.
Orcutt: Clark Avenue/US 101
Recondition the road running through this P&R.
Bike lockers (2)
Maintenance of the parking zones.
Lighting (4)
Santa Barbara: Carrillo Lot
More access to sidewalk from lot.
Lighting (3)
Security/Patrol
Later shuttle times.
Santa Barbara: Cota Lot
Don't need landscaping between parking stalls. Landscaping is trampled and obstructs doors. Trees are useless because these type of trees drop leaves and flowers on vehicles.
None - all good.
Regular patrol
Very impressed with cleanliness and lighting ats lot. Thank you.
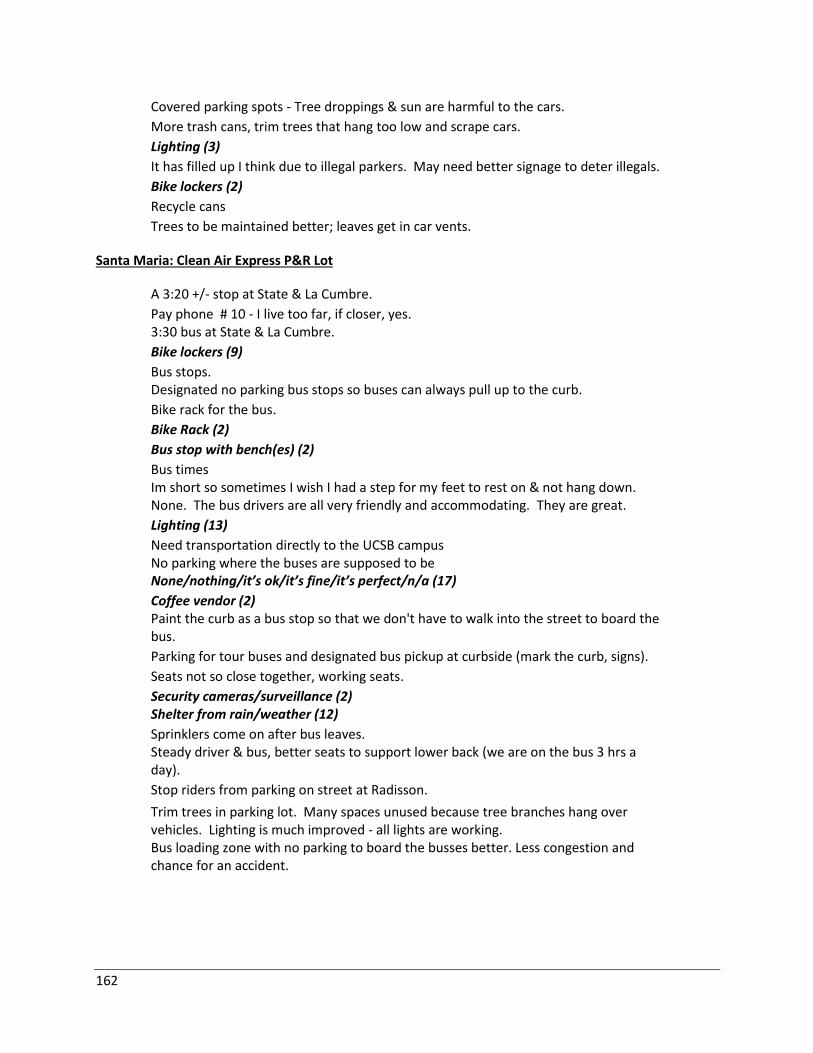
162
Covered parking spots - Tree droppings & sun are harmful to the cars.
More trash cans, trim trees that hang too low and scrape cars.
Lighting (3)
It has filled up I think due to illegal parkers. May need better signage to deter illegals.
Bike lockers (2)
Recycle cans
Trees to be maintained better; leaves get in car vents.
Santa Maria: Clean Air Express P&R Lot
A 3:20 +/- stop at State & La Cumbre.
Pay phone # 10 - I live too far, if closer, yes. 3:30 bus at State & La Cumbre.
Bike lockers (9)
Bus stops. Designated no parking bus stops so buses can always pull up to the curb.
Bike rack for the bus.
Bike Rack (2)
Bus stop with bench(es) (2)
Bus times Im short so sometimes I wish I had a step for my feet to rest on & not hang down. None. The bus drivers are all very friendly and accommodating. They are great.
Lighting (13)
Need transportation directly to the UCSB campus No parking where the buses are supposed to be None/nothing/it’s ok/it’s fine/it’s perfect/n/a (17)
Coffee vendor (2) Paint the curb as a bus stop so that we don't have to walk into the street to board the bus.
Parking for tour buses and designated bus pickup at curbside (mark the curb, signs).
Seats not so close together, working seats.
Security cameras/surveillance (2) Shelter from rain/weather (12)
Sprinklers come on after bus leaves. Steady driver & bus, better seats to support lower back (we are on the bus 3 hrs a day).
Stop riders from parking on street at Radisson.
Trim trees in parking lot. Many spaces unused because tree branches hang over vehicles. Lighting is much improved - all lights are working. Bus loading zone with no parking to board the busses better. Less congestion and chance for an accident.
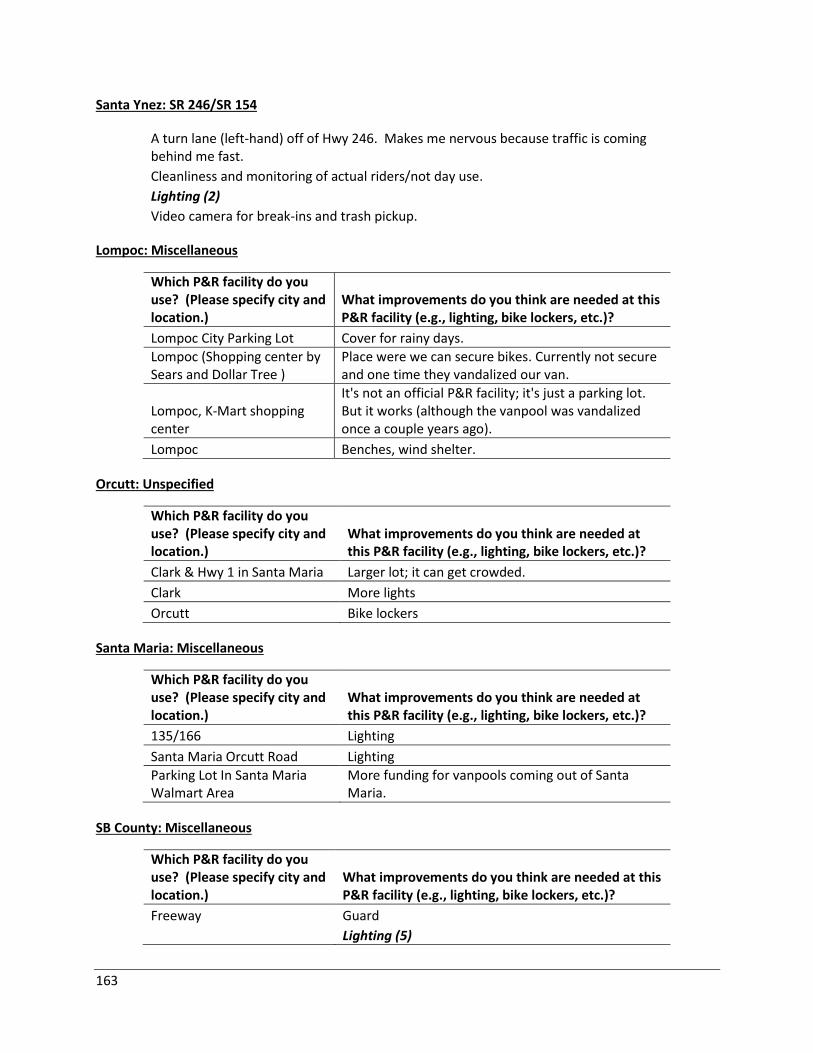
163
Santa Ynez: SR 246/SR 154
A turn lane (left-hand) off of Hwy 246. Makes me nervous because traffic is coming behind me fast.
Cleanliness and monitoring of actual riders/not day use.
Lighting (2)
Video camera for break-ins and trash pickup.
Lompoc: Miscellaneous
Which P&R facility do you use? (Please specify city and location.)
What improvements do you think are needed at this P&R facility (e.g., lighting, bike lockers, etc.)?
Lompoc City Parking Lot Cover for rainy days.
Lompoc (Shopping center by Sears and Dollar Tree )
Place were we can secure bikes. Currently not secure and one time they vandalized our van.
Lompoc, K-Mart shopping center
It's not an official P&R facility; it's just a parking lot. But it works (although the vanpool was vandalized once a couple years ago).
Lompoc Benches, wind shelter.
Orcutt: Unspecified
Which P&R facility do you use? (Please specify city and location.)
What improvements do you think are needed at this P&R facility (e.g., lighting, bike lockers, etc.)?
Clark & Hwy 1 in Santa Maria Larger lot; it can get crowded.
Clark More lights
Orcutt Bike lockers
Santa Maria: Miscellaneous
Which P&R facility do you use? (Please specify city and location.)
What improvements do you think are needed at this P&R facility (e.g., lighting, bike lockers, etc.)?
135/166 Lighting
Santa Maria Orcutt Road Lighting
Parking Lot In Santa Maria Walmart Area
More funding for vanpools coming out of Santa Maria.
SB County: Miscellaneous
Which P&R facility do you use? (Please specify city and location.)
What improvements do you think are needed at this P&R facility (e.g., lighting, bike lockers, etc.)?
Freeway Guard
Lighting (5)
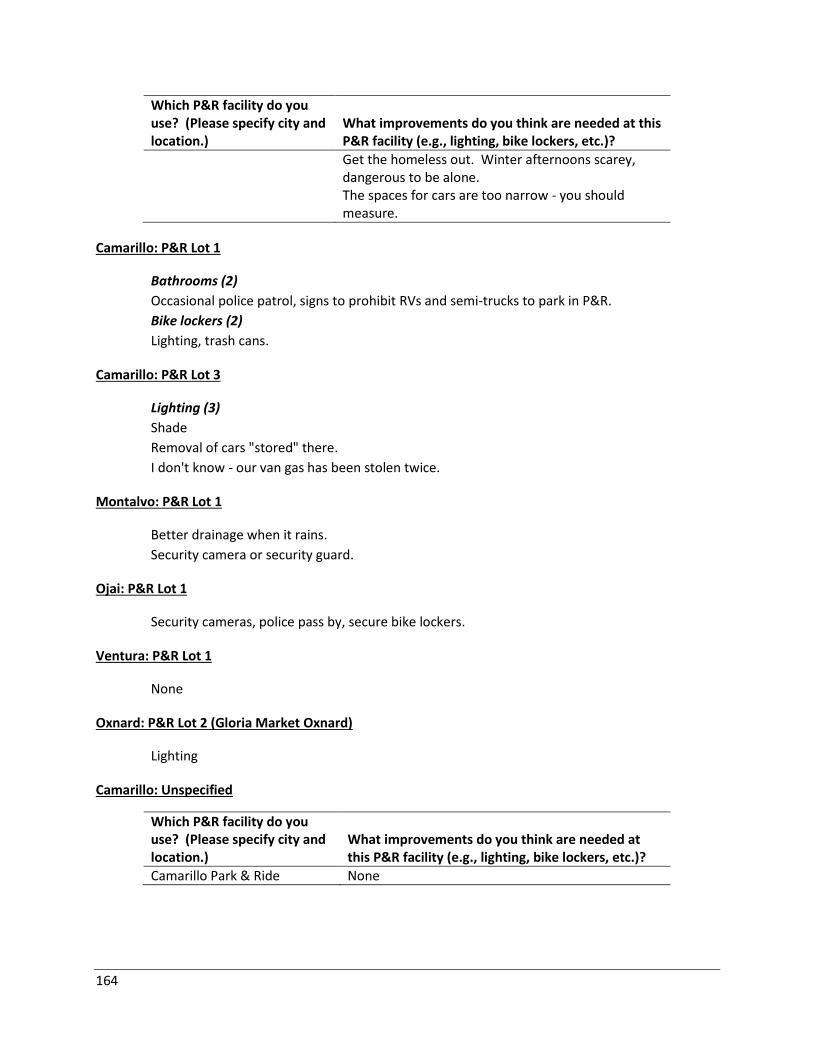
164
Which P&R facility do you use? (Please specify city and location.)
What improvements do you think are needed at this P&R facility (e.g., lighting, bike lockers, etc.)?
Get the homeless out. Winter afternoons scarey, dangerous to be alone.
The spaces for cars are too narrow - you should measure.
Camarillo: P&R Lot 1
Bathrooms (2)
Occasional police patrol, signs to prohibit RVs and semi-trucks to park in P&R.
Bike lockers (2)
Lighting, trash cans.
Camarillo: P&R Lot 3
Lighting (3)
Shade
Removal of cars "stored" there.
I don't know - our van gas has been stolen twice.
Montalvo: P&R Lot 1
Better drainage when it rains.
Security camera or security guard.
Ojai: P&R Lot 1
Security cameras, police pass by, secure bike lockers.
Ventura: P&R Lot 1
None
Oxnard: P&R Lot 2 (Gloria Market Oxnard)
Lighting
Camarillo: Unspecified
Which P&R facility do you use? (Please specify city and location.)
What improvements do you think are needed at this P&R facility (e.g., lighting, bike lockers, etc.)?
Camarillo Park & Ride None
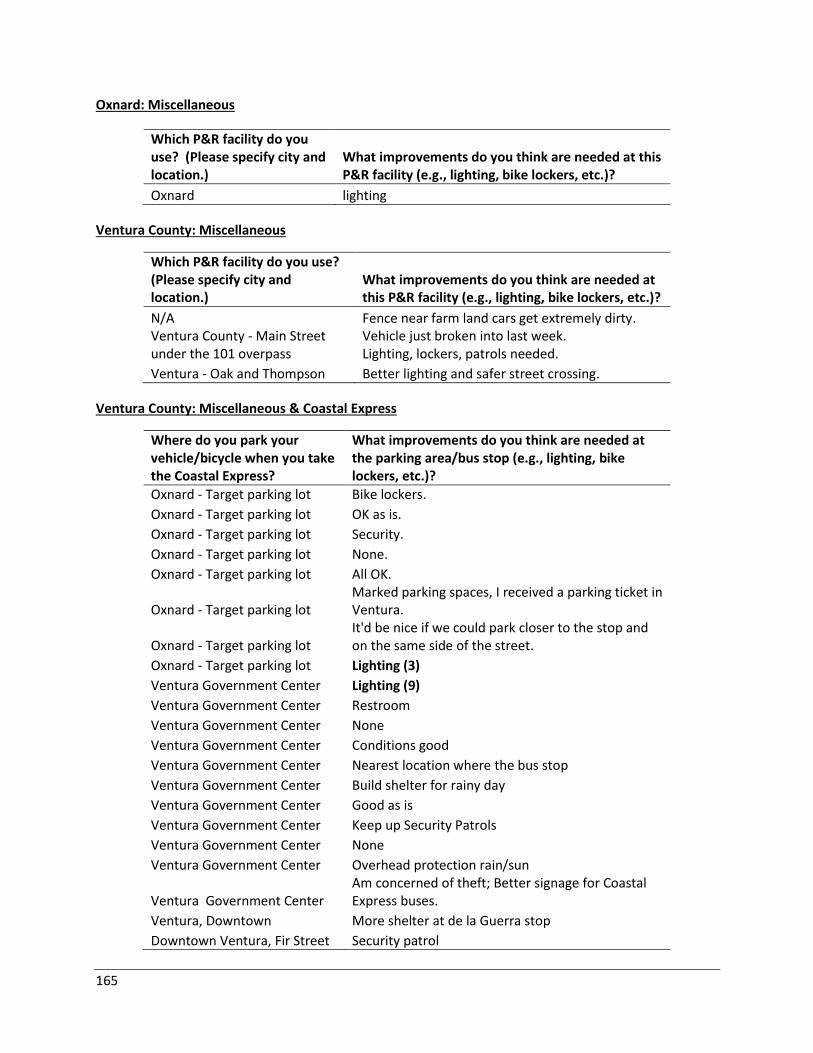
165
Oxnard: Miscellaneous
Which P&R facility do you use? (Please specify city and location.)
What improvements do you think are needed at this P&R facility (e.g., lighting, bike lockers, etc.)?
Oxnard lighting
Ventura County: Miscellaneous
Which P&R facility do you use? (Please specify city and location.)
What improvements do you think are needed at this P&R facility (e.g., lighting, bike lockers, etc.)?
N/A Fence near farm land cars get extremely dirty. Ventura County - Main Street under the 101 overpass
Vehicle just broken into last week. Lighting, lockers, patrols needed.
Ventura - Oak and Thompson Better lighting and safer street crossing.
Ventura County: Miscellaneous & Coastal Express
Where do you park your vehicle/bicycle when you take the Coastal Express?
What improvements do you think are needed at the parking area/bus stop (e.g., lighting, bike lockers, etc.)?
Oxnard - Target parking lot Bike lockers.
Oxnard - Target parking lot OK as is.
Oxnard - Target parking lot Security.
Oxnard - Target parking lot None.
Oxnard - Target parking lot All OK.
Oxnard - Target parking lot Marked parking spaces, I received a parking ticket in Ventura.
Oxnard - Target parking lot It'd be nice if we could park closer to the stop and on the same side of the street.
Oxnard - Target parking lot Lighting (3)
Ventura Government Center Lighting (9)
Ventura Government Center Restroom
Ventura Government Center None
Ventura Government Center Conditions good
Ventura Government Center Nearest location where the bus stop
Ventura Government Center Build shelter for rainy day
Ventura Government Center Good as is
Ventura Government Center Keep up Security Patrols
Ventura Government Center None
Ventura Government Center Overhead protection rain/sun
Ventura Government Center Am concerned of theft; Better signage for Coastal Express buses.
Ventura, Downtown More shelter at de la Guerra stop
Downtown Ventura, Fir Street Security patrol
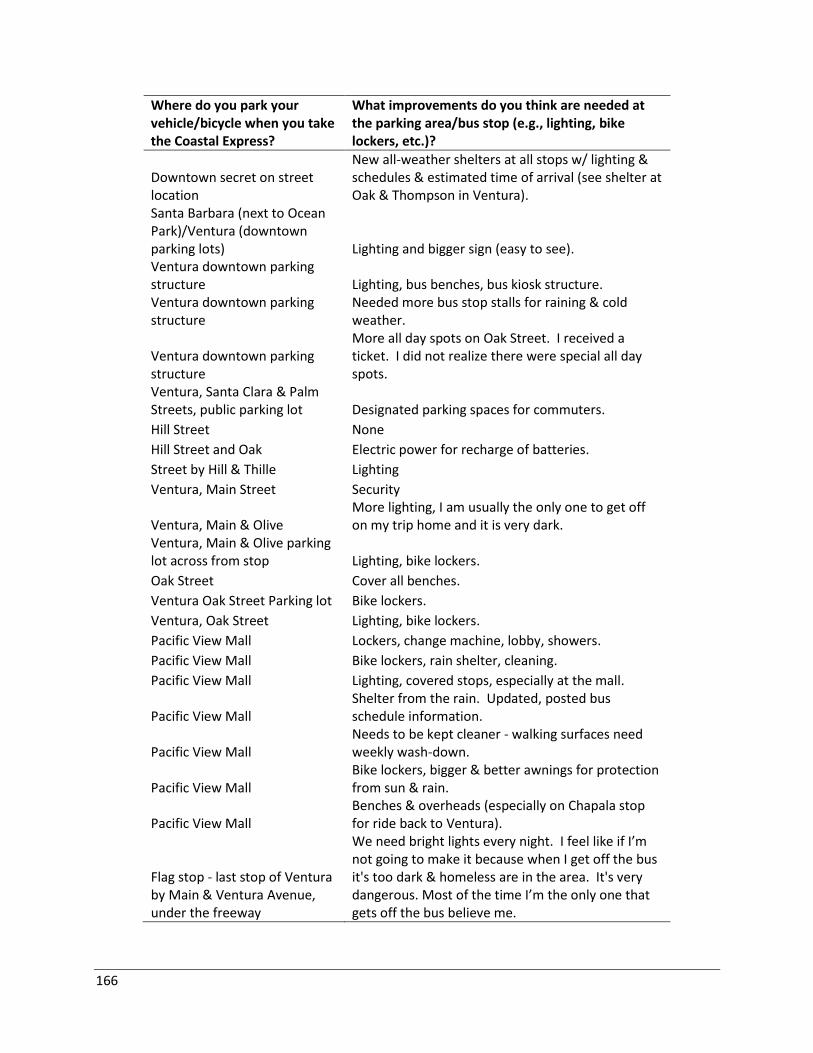
166
Where do you park your vehicle/bicycle when you take the Coastal Express?
What improvements do you think are needed at the parking area/bus stop (e.g., lighting, bike lockers, etc.)?
Downtown secret on street location
New all-weather shelters at all stops w/ lighting & schedules & estimated time of arrival (see shelter at Oak & Thompson in Ventura).
Santa Barbara (next to Ocean Park)/Ventura (downtown parking lots) Lighting and bigger sign (easy to see). Ventura downtown parking structure Lighting, bus benches, bus kiosk structure. Ventura downtown parking structure
Needed more bus stop stalls for raining & cold weather.
Ventura downtown parking structure
More all day spots on Oak Street. I received a ticket. I did not realize there were special all day spots.
Ventura, Santa Clara & Palm Streets, public parking lot Designated parking spaces for commuters.
Hill Street None
Hill Street and Oak Electric power for recharge of batteries.
Street by Hill & Thille Lighting
Ventura, Main Street Security
Ventura, Main & Olive More lighting, I am usually the only one to get off on my trip home and it is very dark.
Ventura, Main & Olive parking lot across from stop Lighting, bike lockers.
Oak Street Cover all benches.
Ventura Oak Street Parking lot Bike lockers.
Ventura, Oak Street Lighting, bike lockers.
Pacific View Mall Lockers, change machine, lobby, showers.
Pacific View Mall Bike lockers, rain shelter, cleaning.
Pacific View Mall Lighting, covered stops, especially at the mall.
Pacific View Mall Shelter from the rain. Updated, posted bus schedule information.
Pacific View Mall Needs to be kept cleaner - walking surfaces need weekly wash-down.
Pacific View Mall Bike lockers, bigger & better awnings for protection from sun & rain.
Pacific View Mall Benches & overheads (especially on Chapala stop for ride back to Ventura).
Flag stop - last stop of Ventura by Main & Ventura Avenue, under the freeway
We need bright lights every night. I feel like if I’m not going to make it because when I get off the bus it's too dark & homeless are in the area. It's very dangerous. Most of the time I’m the only one that gets off the bus believe me.
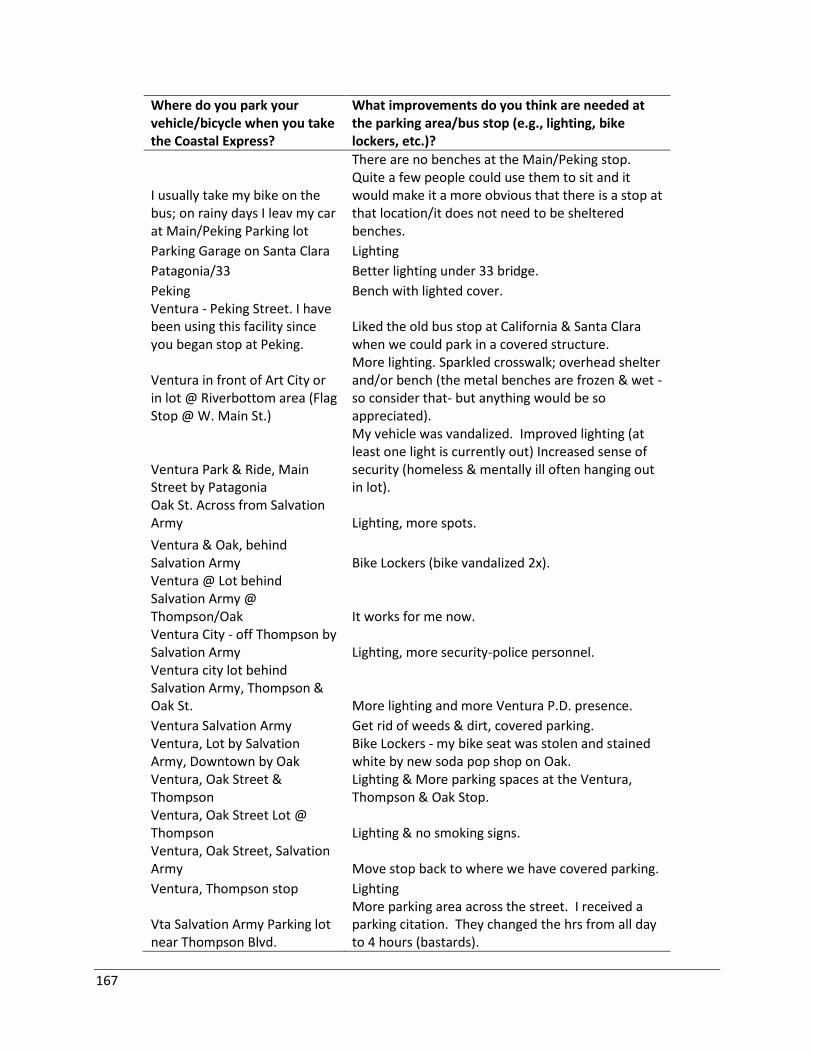
167
Where do you park your vehicle/bicycle when you take the Coastal Express?
What improvements do you think are needed at the parking area/bus stop (e.g., lighting, bike lockers, etc.)?
I usually take my bike on the bus; on rainy days I leav my car at Main/Peking Parking lot
There are no benches at the Main/Peking stop. Quite a few people could use them to sit and it would make it a more obvious that there is a stop at that location/it does not need to be sheltered benches.
Parking Garage on Santa Clara Lighting
Patagonia/33 Better lighting under 33 bridge.
Peking Bench with lighted cover. Ventura - Peking Street. I have been using this facility since you began stop at Peking.
Liked the old bus stop at California & Santa Clara when we could park in a covered structure.
Ventura in front of Art City or in lot @ Riverbottom area (Flag Stop @ W. Main St.)
More lighting. Sparkled crosswalk; overhead shelter and/or bench (the metal benches are frozen & wet - so consider that- but anything would be so appreciated).
Ventura Park & Ride, Main Street by Patagonia
My vehicle was vandalized. Improved lighting (at least one light is currently out) Increased sense of security (homeless & mentally ill often hanging out in lot).
Oak St. Across from Salvation Army Lighting, more spots.
Ventura & Oak, behind Salvation Army Bike Lockers (bike vandalized 2x). Ventura @ Lot behind Salvation Army @ Thompson/Oak It works for me now. Ventura City - off Thompson by Salvation Army Lighting, more security-police personnel. Ventura city lot behind Salvation Army, Thompson & Oak St. More lighting and more Ventura P.D. presence.
Ventura Salvation Army Get rid of weeds & dirt, covered parking. Ventura, Lot by Salvation Army, Downtown by Oak
Bike Lockers - my bike seat was stolen and stained white by new soda pop shop on Oak.
Ventura, Oak Street & Thompson
Lighting & More parking spaces at the Ventura, Thompson & Oak Stop.
Ventura, Oak Street Lot @ Thompson Lighting & no smoking signs. Ventura, Oak Street, Salvation Army Move stop back to where we have covered parking.
Ventura, Thompson stop Lighting
Vta Salvation Army Parking lot near Thompson Blvd.
More parking area across the street. I received a parking citation. They changed the hrs from all day to 4 hours (bastards).
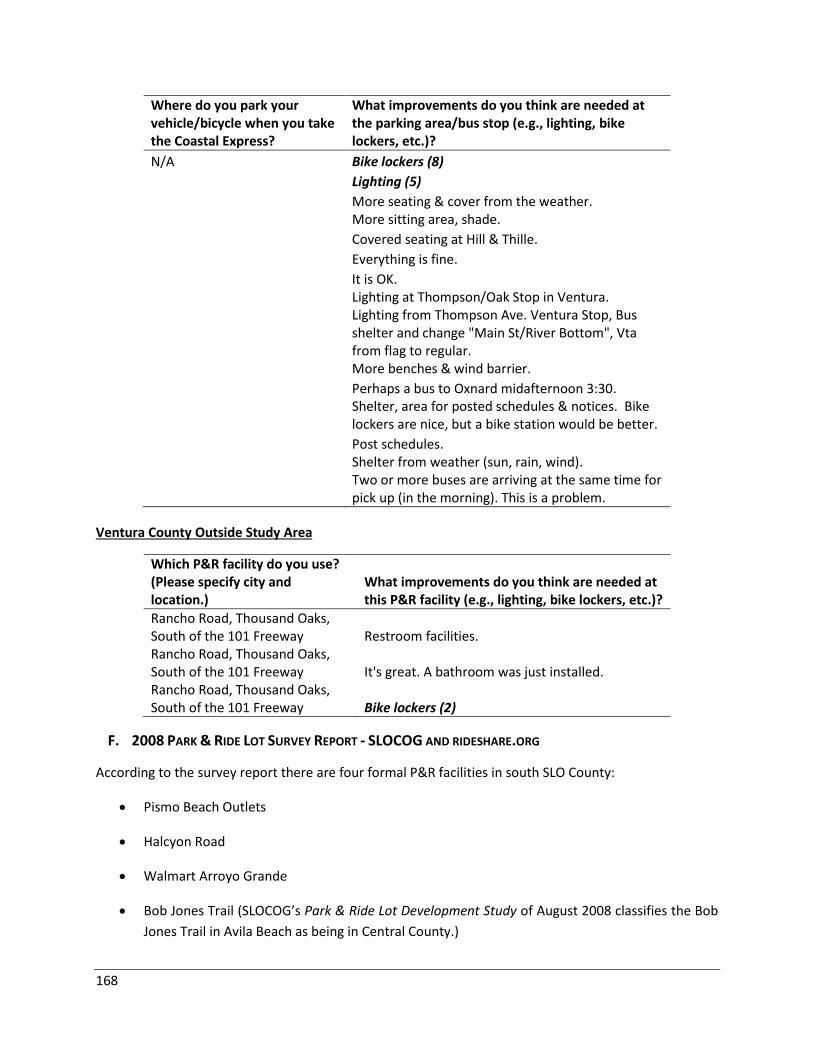
168
Where do you park your vehicle/bicycle when you take the Coastal Express?
What improvements do you think are needed at the parking area/bus stop (e.g., lighting, bike lockers, etc.)?
N/A Bike lockers (8)
Lighting (5)
More seating & cover from the weather. More sitting area, shade.
Covered seating at Hill & Thille.
Everything is fine.
It is OK. Lighting at Thompson/Oak Stop in Ventura.
Lighting from Thompson Ave. Ventura Stop, Bus shelter and change "Main St/River Bottom", Vta from flag to regular.
More benches & wind barrier.
Perhaps a bus to Oxnard midafternoon 3:30.
Shelter, area for posted schedules & notices. Bike lockers are nice, but a bike station would be better.
Post schedules. Shelter from weather (sun, rain, wind).
Two or more buses are arriving at the same time for pick up (in the morning). This is a problem.
Ventura County Outside Study Area
Which P&R facility do you use? (Please specify city and location.)
What improvements do you think are needed at this P&R facility (e.g., lighting, bike lockers, etc.)?
Rancho Road, Thousand Oaks, South of the 101 Freeway Restroom facilities. Rancho Road, Thousand Oaks, South of the 101 Freeway It's great. A bathroom was just installed. Rancho Road, Thousand Oaks, South of the 101 Freeway Bike lockers (2)
F. 2008 PARK & RIDE LOT SURVEY REPORT - SLOCOG AND RIDESHARE.ORG
According to the survey report there are four formal P&R facilities in south SLO County:
Pismo Beach Outlets
Halcyon Road
Walmart Arroyo Grande
Bob Jones Trail (SLOCOG’s Park & Ride Lot Development Study of August 2008 classifies the Bob
Jones Trail in Avila Beach as being in Central County.)
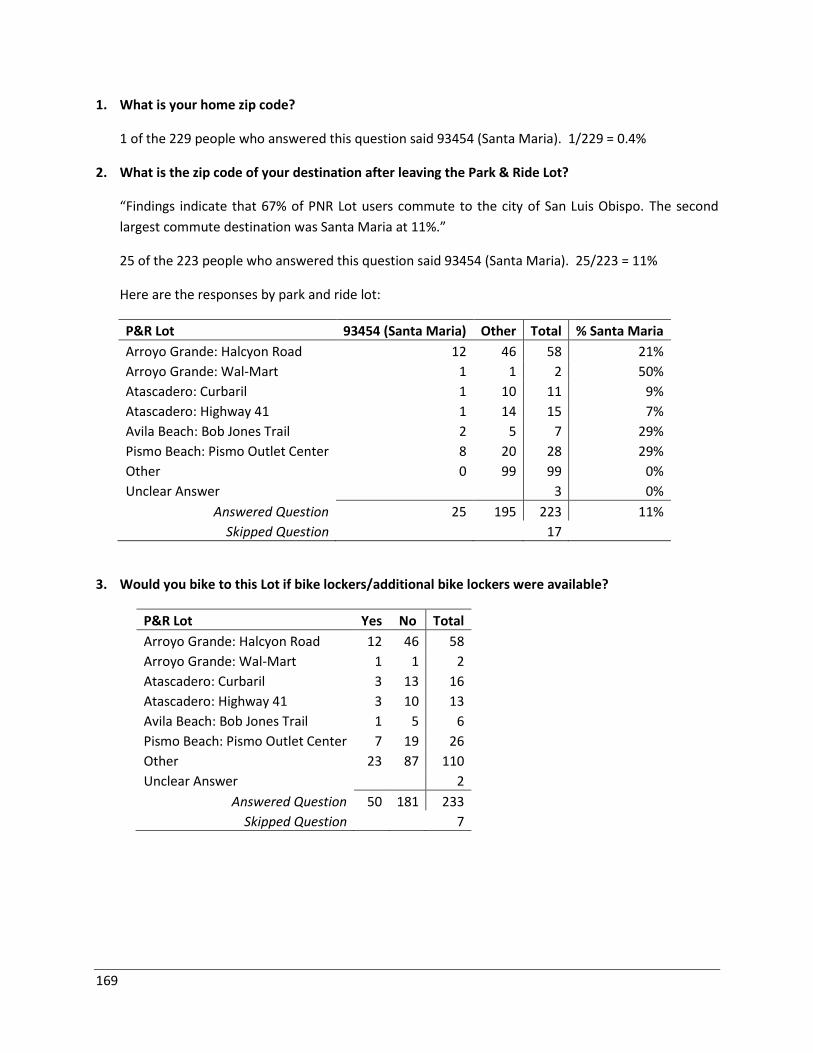
169
1. What is your home zip code?
1 of the 229 people who answered this question said 93454 (Santa Maria). 1/229 = 0.4%
2. What is the zip code of your destination after leaving the Park & Ride Lot?
“Findings indicate that 67% of PNR Lot users commute to the city of San Luis Obispo. The second
largest commute destination was Santa Maria at 11%.”
25 of the 223 people who answered this question said 93454 (Santa Maria). 25/223 = 11%
Here are the responses by park and ride lot:
P&R Lot 93454 (Santa Maria) Other Total % Santa Maria
Arroyo Grande: Halcyon Road 12 46 58 21%
Arroyo Grande: Wal-Mart 1 1 2 50%
Atascadero: Curbaril 1 10 11 9%
Atascadero: Highway 41 1 14 15 7%
Avila Beach: Bob Jones Trail 2 5 7 29%
Pismo Beach: Pismo Outlet Center 8 20 28 29%
Other 0 99 99 0%
Unclear Answer
3 0%
Answered Question 25 195 223 11%
Skipped Question
17
3. Would you bike to this Lot if bike lockers/additional bike lockers were available?
P&R Lot Yes No Total
Arroyo Grande: Halcyon Road 12 46 58
Arroyo Grande: Wal-Mart 1 1 2
Atascadero: Curbaril 3 13 16
Atascadero: Highway 41 3 10 13
Avila Beach: Bob Jones Trail 1 5 6
Pismo Beach: Pismo Outlet Center 7 19 26
Other 23 87 110
Unclear Answer
2
Answered Question 50 181 233
Skipped Question
7
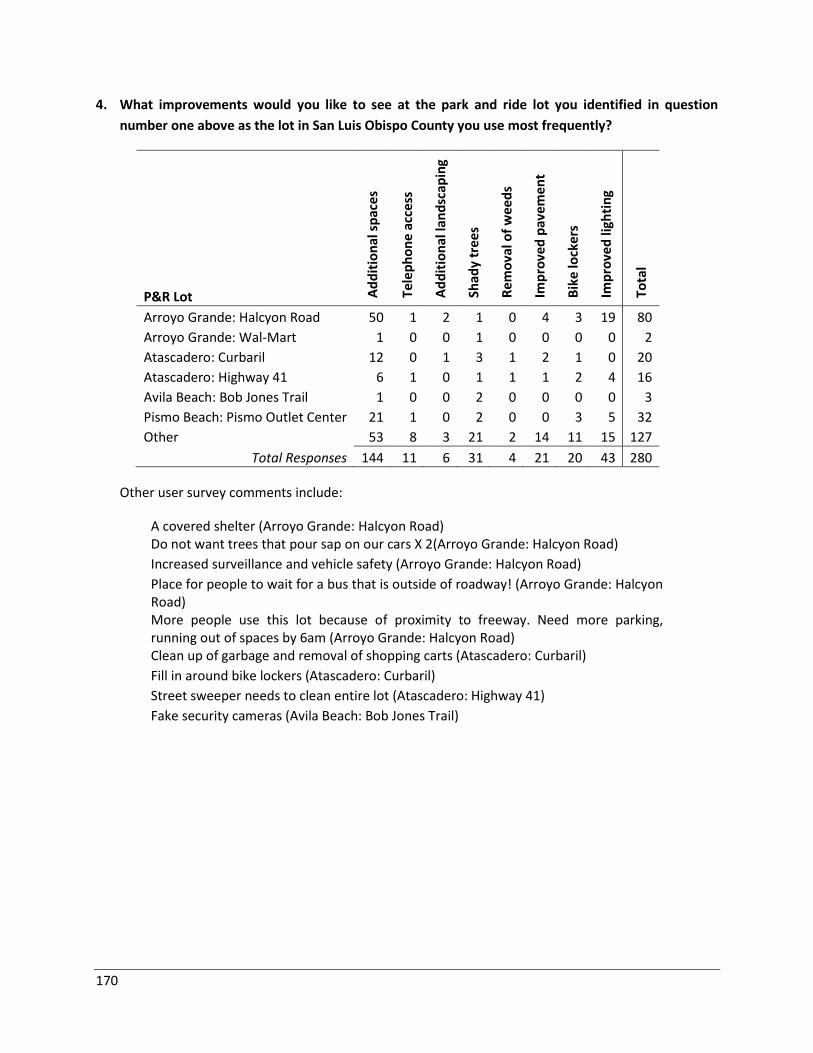
170
4. What improvements would you like to see at the park and ride lot you identified in question
number one above as the lot in San Luis Obispo County you use most frequently?
P&R Lot Ad
dit
ion
al s
pac
es
Tele
ph
on
e ac
cess
Ad
dit
ion
al la
nd
scap
ing
Shad
y tr
ees
Re
mo
val o
f w
eed
s
Imp
rove
d p
avem
en
t
Bik
e lo
cker
s
Imp
rove
d li
ghti
ng
Tota
l
Arroyo Grande: Halcyon Road 50 1 2 1 0 4 3 19 80
Arroyo Grande: Wal-Mart 1 0 0 1 0 0 0 0 2
Atascadero: Curbaril 12 0 1 3 1 2 1 0 20
Atascadero: Highway 41 6 1 0 1 1 1 2 4 16
Avila Beach: Bob Jones Trail 1 0 0 2 0 0 0 0 3
Pismo Beach: Pismo Outlet Center 21 1 0 2 0 0 3 5 32
Other 53 8 3 21 2 14 11 15 127
Total Responses 144 11 6 31 4 21 20 43 280
Other user survey comments include:
A covered shelter (Arroyo Grande: Halcyon Road) Do not want trees that pour sap on our cars X 2(Arroyo Grande: Halcyon Road)
Increased surveillance and vehicle safety (Arroyo Grande: Halcyon Road)
Place for people to wait for a bus that is outside of roadway! (Arroyo Grande: Halcyon Road) More people use this lot because of proximity to freeway. Need more parking, running out of spaces by 6am (Arroyo Grande: Halcyon Road) Clean up of garbage and removal of shopping carts (Atascadero: Curbaril)
Fill in around bike lockers (Atascadero: Curbaril)
Street sweeper needs to clean entire lot (Atascadero: Highway 41)
Fake security cameras (Avila Beach: Bob Jones Trail)
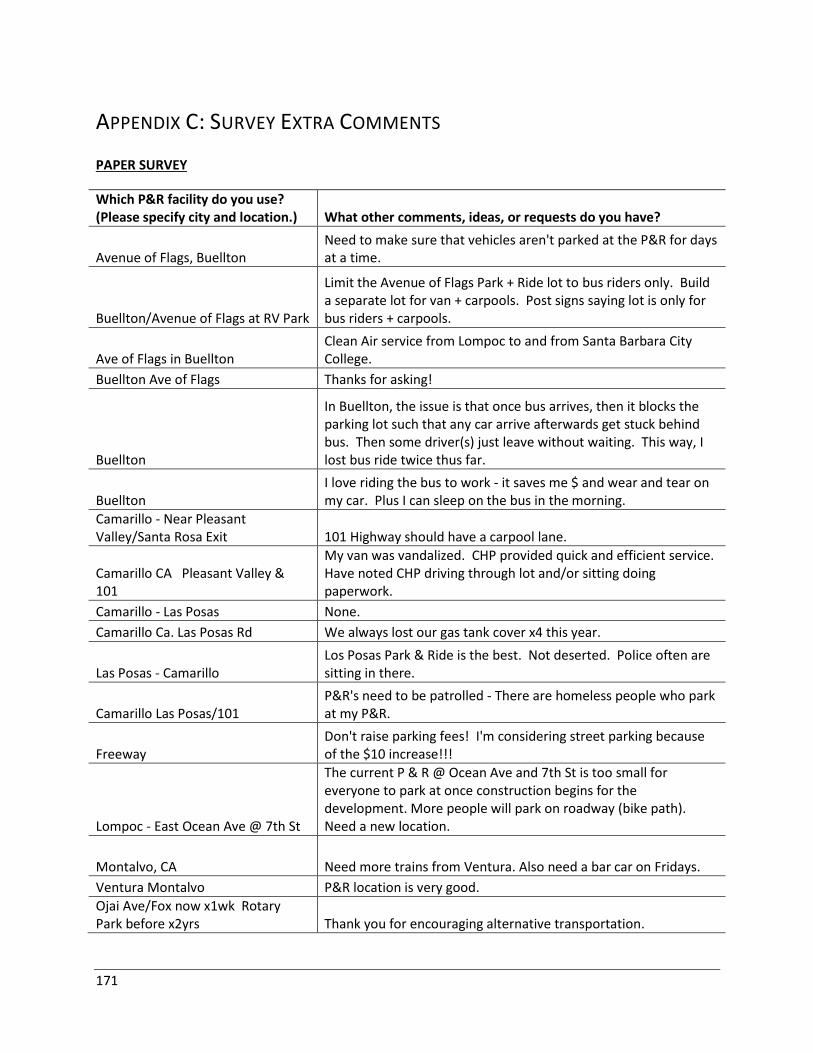
171
APPENDIX C: SURVEY EXTRA COMMENTS
PAPER SURVEY
Which P&R facility do you use? (Please specify city and location.) What other comments, ideas, or requests do you have?
Avenue of Flags, Buellton Need to make sure that vehicles aren't parked at the P&R for days at a time.
Buellton/Avenue of Flags at RV Park
Limit the Avenue of Flags Park + Ride lot to bus riders only. Build a separate lot for van + carpools. Post signs saying lot is only for bus riders + carpools.
Ave of Flags in Buellton Clean Air service from Lompoc to and from Santa Barbara City College.
Buellton Ave of Flags Thanks for asking!
Buellton
In Buellton, the issue is that once bus arrives, then it blocks the parking lot such that any car arrive afterwards get stuck behind bus. Then some driver(s) just leave without waiting. This way, I lost bus ride twice thus far.
Buellton I love riding the bus to work - it saves me $ and wear and tear on my car. Plus I can sleep on the bus in the morning.
Camarillo - Near Pleasant Valley/Santa Rosa Exit 101 Highway should have a carpool lane.
Camarillo CA Pleasant Valley & 101
My van was vandalized. CHP provided quick and efficient service. Have noted CHP driving through lot and/or sitting doing paperwork.
Camarillo - Las Posas None.
Camarillo Ca. Las Posas Rd We always lost our gas tank cover x4 this year.
Las Posas - Camarillo Los Posas Park & Ride is the best. Not deserted. Police often are sitting in there.
Camarillo Las Posas/101 P&R's need to be patrolled - There are homeless people who park at my P&R.
Freeway Don't raise parking fees! I'm considering street parking because of the $10 increase!!!
Lompoc - East Ocean Ave @ 7th St
The current P & R @ Ocean Ave and 7th St is too small for everyone to park at once construction begins for the development. More people will park on roadway (bike path). Need a new location.
Montalvo, CA Need more trains from Ventura. Also need a bar car on Fridays.
Ventura Montalvo P&R location is very good.
Ojai Ave/Fox now x1wk Rotary Park before x2yrs Thank you for encouraging alternative transportation.
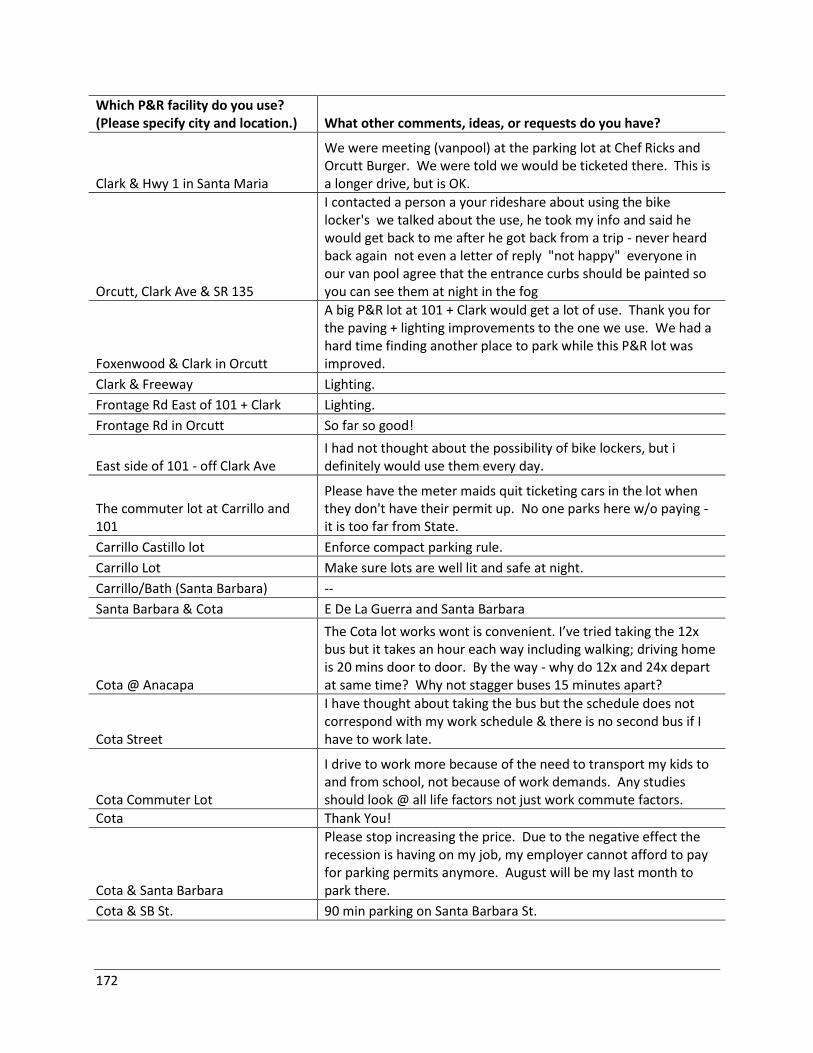
172
Which P&R facility do you use? (Please specify city and location.) What other comments, ideas, or requests do you have?
Clark & Hwy 1 in Santa Maria
We were meeting (vanpool) at the parking lot at Chef Ricks and Orcutt Burger. We were told we would be ticketed there. This is a longer drive, but is OK.
Orcutt, Clark Ave & SR 135
I contacted a person a your rideshare about using the bike locker's we talked about the use, he took my info and said he would get back to me after he got back from a trip - never heard back again not even a letter of reply "not happy" everyone in our van pool agree that the entrance curbs should be painted so you can see them at night in the fog
Foxenwood & Clark in Orcutt
A big P&R lot at 101 + Clark would get a lot of use. Thank you for the paving + lighting improvements to the one we use. We had a hard time finding another place to park while this P&R lot was improved.
Clark & Freeway Lighting.
Frontage Rd East of 101 + Clark Lighting.
Frontage Rd in Orcutt So far so good!
East side of 101 - off Clark Ave I had not thought about the possibility of bike lockers, but i definitely would use them every day.
The commuter lot at Carrillo and 101
Please have the meter maids quit ticketing cars in the lot when they don't have their permit up. No one parks here w/o paying - it is too far from State.
Carrillo Castillo lot Enforce compact parking rule.
Carrillo Lot Make sure lots are well lit and safe at night.
Carrillo/Bath (Santa Barbara) --
Santa Barbara & Cota E De La Guerra and Santa Barbara
Cota @ Anacapa
The Cota lot works wont is convenient. I’ve tried taking the 12x bus but it takes an hour each way including walking; driving home is 20 mins door to door. By the way - why do 12x and 24x depart at same time? Why not stagger buses 15 minutes apart?
Cota Street
I have thought about taking the bus but the schedule does not correspond with my work schedule & there is no second bus if I have to work late.
Cota Commuter Lot
I drive to work more because of the need to transport my kids to and from school, not because of work demands. Any studies should look @ all life factors not just work commute factors.
Cota Thank You!
Cota & Santa Barbara
Please stop increasing the price. Due to the negative effect the recession is having on my job, my employer cannot afford to pay for parking permits anymore. August will be my last month to park there.
Cota & SB St. 90 min parking on Santa Barbara St.
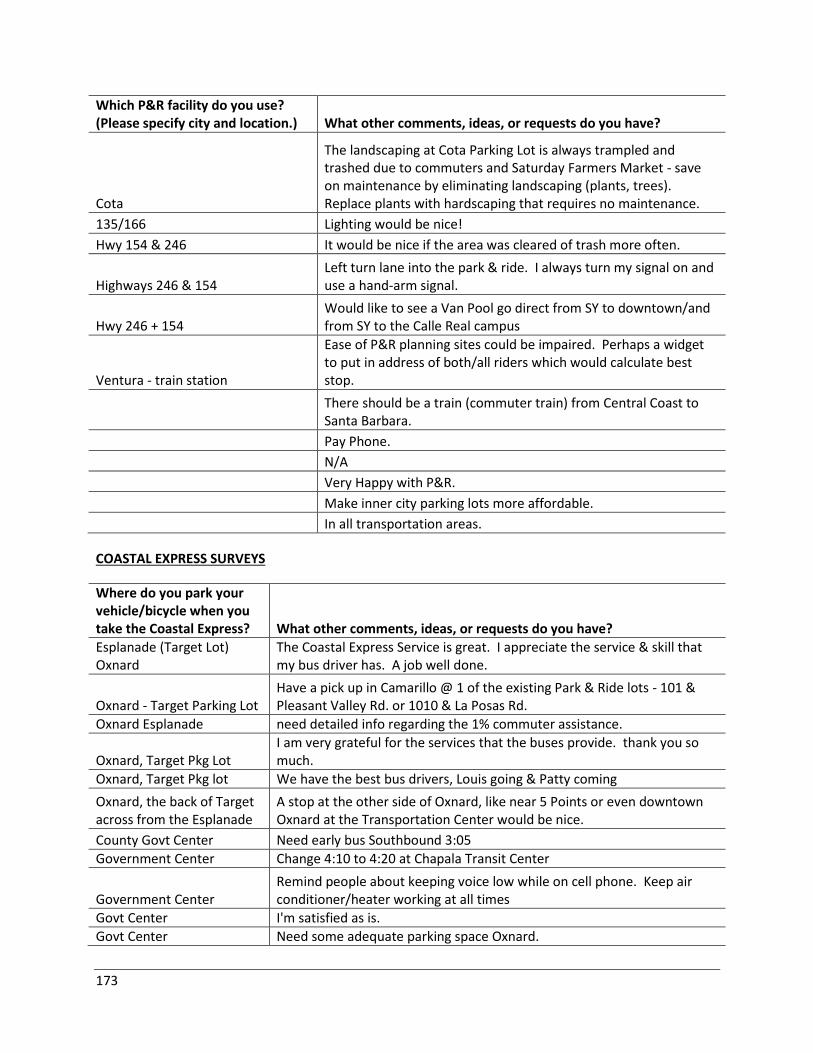
173
Which P&R facility do you use? (Please specify city and location.) What other comments, ideas, or requests do you have?
Cota
The landscaping at Cota Parking Lot is always trampled and trashed due to commuters and Saturday Farmers Market - save on maintenance by eliminating landscaping (plants, trees). Replace plants with hardscaping that requires no maintenance.
135/166 Lighting would be nice!
Hwy 154 & 246 It would be nice if the area was cleared of trash more often.
Highways 246 & 154 Left turn lane into the park & ride. I always turn my signal on and use a hand-arm signal.
Hwy 246 + 154 Would like to see a Van Pool go direct from SY to downtown/and from SY to the Calle Real campus
Ventura - train station
Ease of P&R planning sites could be impaired. Perhaps a widget to put in address of both/all riders which would calculate best stop.
There should be a train (commuter train) from Central Coast to Santa Barbara.
Pay Phone.
N/A
Very Happy with P&R.
Make inner city parking lots more affordable.
In all transportation areas.
COASTAL EXPRESS SURVEYS
Where do you park your vehicle/bicycle when you take the Coastal Express? What other comments, ideas, or requests do you have?
Esplanade (Target Lot) Oxnard
The Coastal Express Service is great. I appreciate the service & skill that my bus driver has. A job well done.
Oxnard - Target Parking Lot Have a pick up in Camarillo @ 1 of the existing Park & Ride lots - 101 & Pleasant Valley Rd. or 1010 & La Posas Rd.
Oxnard Esplanade need detailed info regarding the 1% commuter assistance.
Oxnard, Target Pkg Lot I am very grateful for the services that the buses provide. thank you so much.
Oxnard, Target Pkg lot We have the best bus drivers, Louis going & Patty coming
Oxnard, the back of Target across from the Esplanade
A stop at the other side of Oxnard, like near 5 Points or even downtown Oxnard at the Transportation Center would be nice.
County Govt Center Need early bus Southbound 3:05
Government Center Change 4:10 to 4:20 at Chapala Transit Center
Government Center Remind people about keeping voice low while on cell phone. Keep air conditioner/heater working at all times
Govt Center I'm satisfied as is.
Govt Center Need some adequate parking space Oxnard.
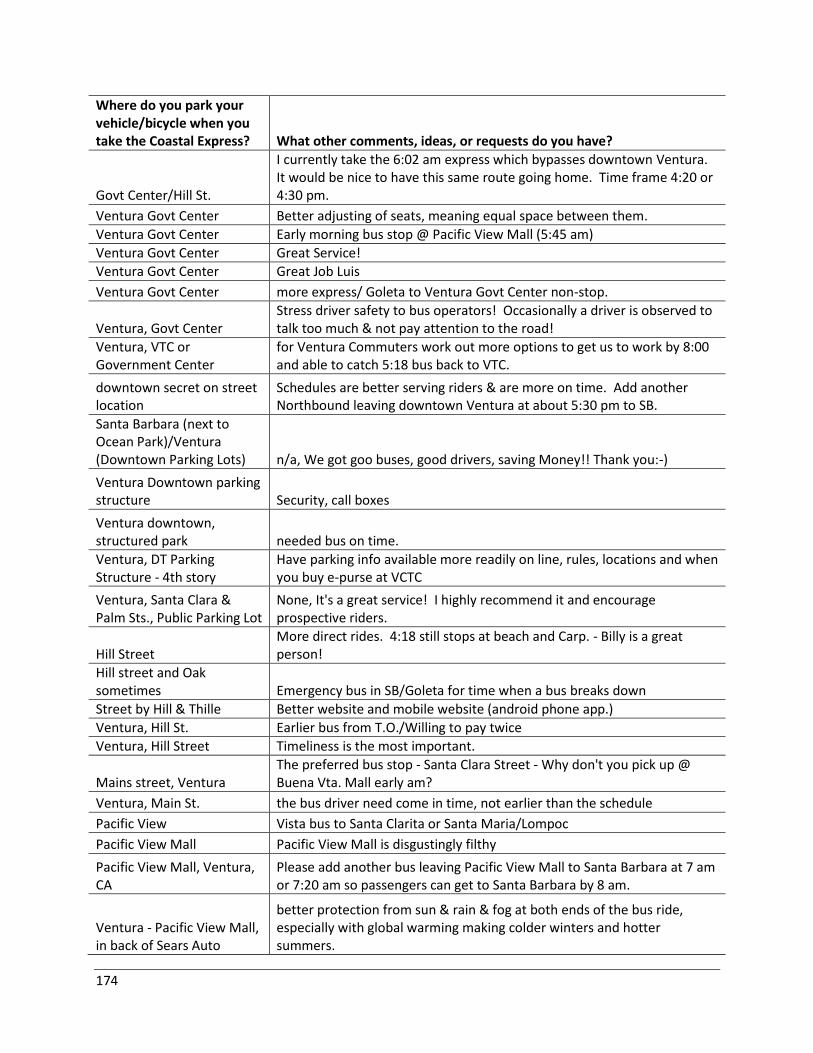
174
Where do you park your vehicle/bicycle when you take the Coastal Express? What other comments, ideas, or requests do you have?
Govt Center/Hill St.
I currently take the 6:02 am express which bypasses downtown Ventura. It would be nice to have this same route going home. Time frame 4:20 or 4:30 pm.
Ventura Govt Center Better adjusting of seats, meaning equal space between them.
Ventura Govt Center Early morning bus stop @ Pacific View Mall (5:45 am)
Ventura Govt Center Great Service!
Ventura Govt Center Great Job Luis
Ventura Govt Center more express/ Goleta to Ventura Govt Center non-stop.
Ventura, Govt Center Stress driver safety to bus operators! Occasionally a driver is observed to talk too much & not pay attention to the road!
Ventura, VTC or Government Center
for Ventura Commuters work out more options to get us to work by 8:00 and able to catch 5:18 bus back to VTC.
downtown secret on street location
Schedules are better serving riders & are more on time. Add another Northbound leaving downtown Ventura at about 5:30 pm to SB.
Santa Barbara (next to Ocean Park)/Ventura (Downtown Parking Lots) n/a, We got goo buses, good drivers, saving Money!! Thank you:-)
Ventura Downtown parking structure Security, call boxes
Ventura downtown, structured park needed bus on time.
Ventura, DT Parking Structure - 4th story
Have parking info available more readily on line, rules, locations and when you buy e-purse at VCTC
Ventura, Santa Clara & Palm Sts., Public Parking Lot
None, It's a great service! I highly recommend it and encourage prospective riders.
Hill Street More direct rides. 4:18 still stops at beach and Carp. - Billy is a great person!
Hill street and Oak sometimes Emergency bus in SB/Goleta for time when a bus breaks down
Street by Hill & Thille Better website and mobile website (android phone app.)
Ventura, Hill St. Earlier bus from T.O./Willing to pay twice
Ventura, Hill Street Timeliness is the most important.
Mains street, Ventura The preferred bus stop - Santa Clara Street - Why don't you pick up @ Buena Vta. Mall early am?
Ventura, Main St. the bus driver need come in time, not earlier than the schedule
Pacific View Vista bus to Santa Clarita or Santa Maria/Lompoc
Pacific View Mall Pacific View Mall is disgustingly filthy
Pacific View Mall, Ventura, CA
Please add another bus leaving Pacific View Mall to Santa Barbara at 7 am or 7:20 am so passengers can get to Santa Barbara by 8 am.
Ventura - Pacific View Mall, in back of Sears Auto
better protection from sun & rain & fog at both ends of the bus ride, especially with global warming making colder winters and hotter summers.
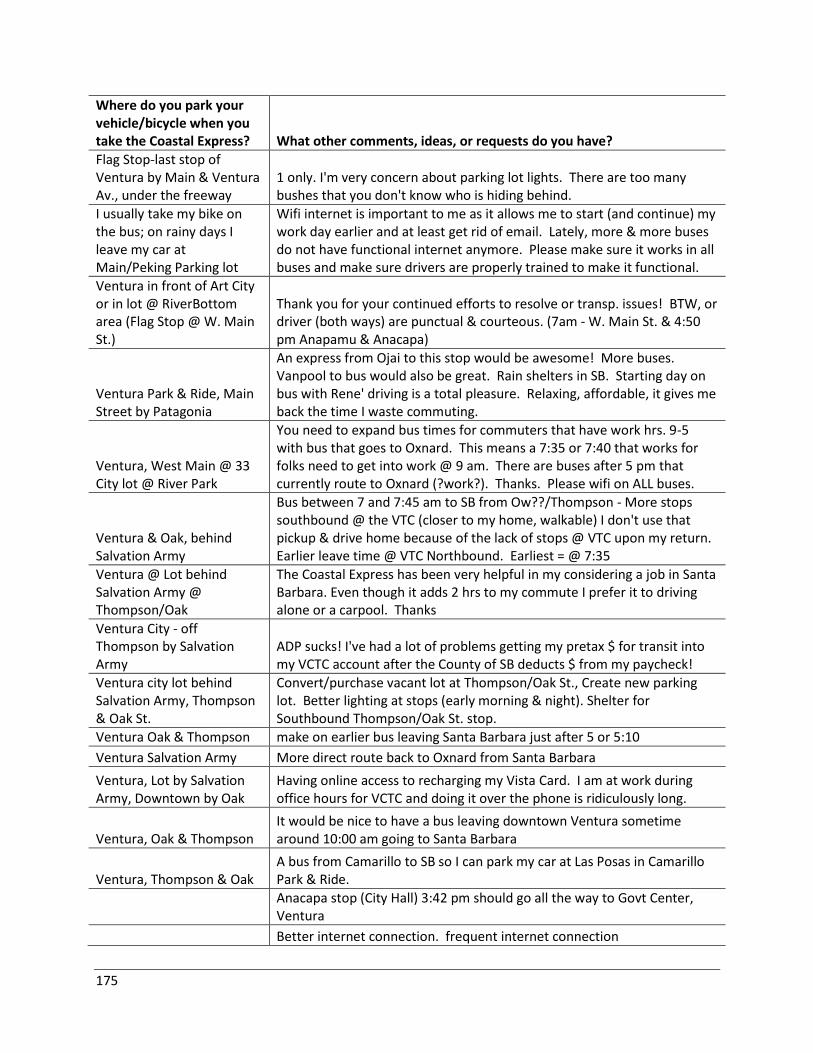
175
Where do you park your vehicle/bicycle when you take the Coastal Express? What other comments, ideas, or requests do you have?
Flag Stop-last stop of Ventura by Main & Ventura Av., under the freeway
1 only. I'm very concern about parking lot lights. There are too many bushes that you don't know who is hiding behind.
I usually take my bike on the bus; on rainy days I leave my car at Main/Peking Parking lot
Wifi internet is important to me as it allows me to start (and continue) my work day earlier and at least get rid of email. Lately, more & more buses do not have functional internet anymore. Please make sure it works in all buses and make sure drivers are properly trained to make it functional.
Ventura in front of Art City or in lot @ RiverBottom area (Flag Stop @ W. Main St.)
Thank you for your continued efforts to resolve or transp. issues! BTW, or driver (both ways) are punctual & courteous. (7am - W. Main St. & 4:50 pm Anapamu & Anacapa)
Ventura Park & Ride, Main Street by Patagonia
An express from Ojai to this stop would be awesome! More buses. Vanpool to bus would also be great. Rain shelters in SB. Starting day on bus with Rene' driving is a total pleasure. Relaxing, affordable, it gives me back the time I waste commuting.
Ventura, West Main @ 33 City lot @ River Park
You need to expand bus times for commuters that have work hrs. 9-5 with bus that goes to Oxnard. This means a 7:35 or 7:40 that works for folks need to get into work @ 9 am. There are buses after 5 pm that currently route to Oxnard (?work?). Thanks. Please wifi on ALL buses.
Ventura & Oak, behind Salvation Army
Bus between 7 and 7:45 am to SB from Ow??/Thompson - More stops southbound @ the VTC (closer to my home, walkable) I don't use that pickup & drive home because of the lack of stops @ VTC upon my return. Earlier leave time @ VTC Northbound. Earliest = @ 7:35
Ventura @ Lot behind Salvation Army @ Thompson/Oak
The Coastal Express has been very helpful in my considering a job in Santa Barbara. Even though it adds 2 hrs to my commute I prefer it to driving alone or a carpool. Thanks
Ventura City - off Thompson by Salvation Army
ADP sucks! I've had a lot of problems getting my pretax $ for transit into my VCTC account after the County of SB deducts $ from my paycheck!
Ventura city lot behind Salvation Army, Thompson & Oak St.
Convert/purchase vacant lot at Thompson/Oak St., Create new parking lot. Better lighting at stops (early morning & night). Shelter for Southbound Thompson/Oak St. stop.
Ventura Oak & Thompson make on earlier bus leaving Santa Barbara just after 5 or 5:10
Ventura Salvation Army More direct route back to Oxnard from Santa Barbara
Ventura, Lot by Salvation Army, Downtown by Oak
Having online access to recharging my Vista Card. I am at work during office hours for VCTC and doing it over the phone is ridiculously long.
Ventura, Oak & Thompson It would be nice to have a bus leaving downtown Ventura sometime around 10:00 am going to Santa Barbara
Ventura, Thompson & Oak A bus from Camarillo to SB so I can park my car at Las Posas in Camarillo Park & Ride.
Anacapa stop (City Hall) 3:42 pm should go all the way to Govt Center, Ventura
Better internet connection. frequent internet connection
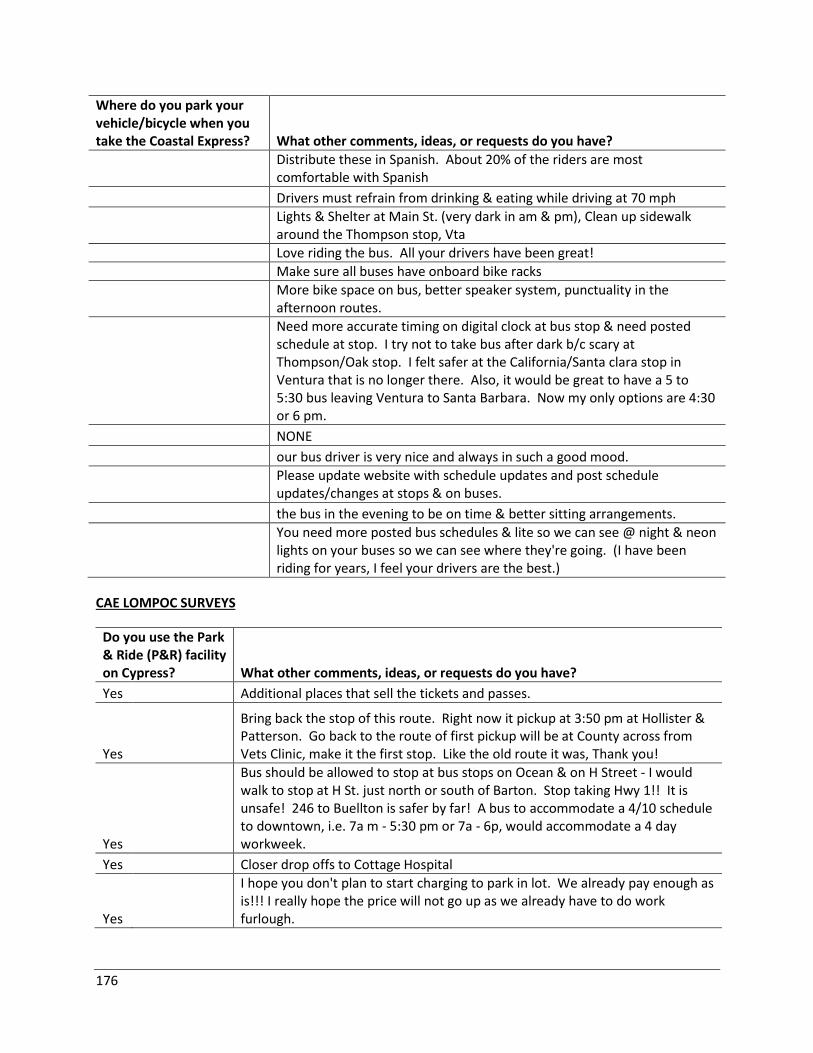
176
Where do you park your vehicle/bicycle when you take the Coastal Express? What other comments, ideas, or requests do you have?
Distribute these in Spanish. About 20% of the riders are most comfortable with Spanish
Drivers must refrain from drinking & eating while driving at 70 mph
Lights & Shelter at Main St. (very dark in am & pm), Clean up sidewalk around the Thompson stop, Vta
Love riding the bus. All your drivers have been great!
Make sure all buses have onboard bike racks
More bike space on bus, better speaker system, punctuality in the afternoon routes.
Need more accurate timing on digital clock at bus stop & need posted schedule at stop. I try not to take bus after dark b/c scary at Thompson/Oak stop. I felt safer at the California/Santa clara stop in Ventura that is no longer there. Also, it would be great to have a 5 to 5:30 bus leaving Ventura to Santa Barbara. Now my only options are 4:30 or 6 pm.
NONE
our bus driver is very nice and always in such a good mood.
Please update website with schedule updates and post schedule updates/changes at stops & on buses.
the bus in the evening to be on time & better sitting arrangements.
You need more posted bus schedules & lite so we can see @ night & neon lights on your buses so we can see where they're going. (I have been riding for years, I feel your drivers are the best.)
CAE LOMPOC SURVEYS
Do you use the Park & Ride (P&R) facility on Cypress? What other comments, ideas, or requests do you have?
Yes Additional places that sell the tickets and passes.
Yes
Bring back the stop of this route. Right now it pickup at 3:50 pm at Hollister & Patterson. Go back to the route of first pickup will be at County across from Vets Clinic, make it the first stop. Like the old route it was, Thank you!
Yes
Bus should be allowed to stop at bus stops on Ocean & on H Street - I would walk to stop at H St. just north or south of Barton. Stop taking Hwy 1!! It is unsafe! 246 to Buellton is safer by far! A bus to accommodate a 4/10 schedule to downtown, i.e. 7a m - 5:30 pm or 7a - 6p, would accommodate a 4 day workweek.
Yes Closer drop offs to Cottage Hospital
Yes
I hope you don't plan to start charging to park in lot. We already pay enough as is!!! I really hope the price will not go up as we already have to do work furlough.
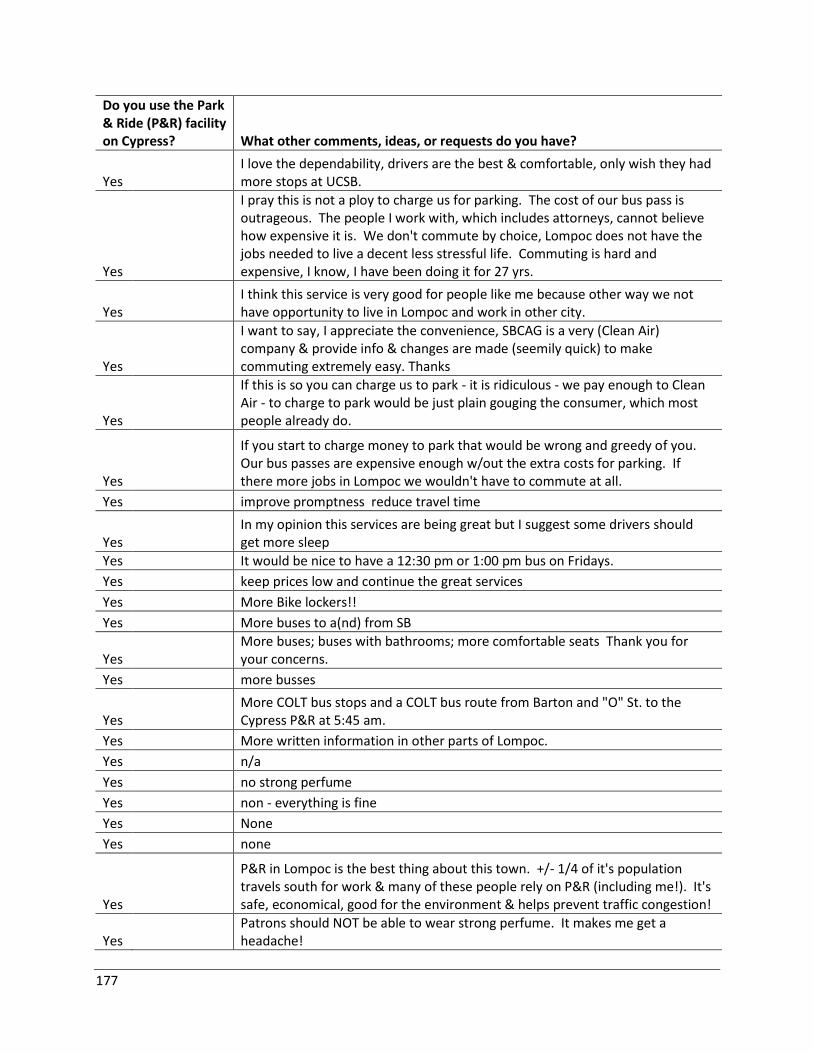
177
Do you use the Park & Ride (P&R) facility on Cypress? What other comments, ideas, or requests do you have?
Yes I love the dependability, drivers are the best & comfortable, only wish they had more stops at UCSB.
Yes
I pray this is not a ploy to charge us for parking. The cost of our bus pass is outrageous. The people I work with, which includes attorneys, cannot believe how expensive it is. We don't commute by choice, Lompoc does not have the jobs needed to live a decent less stressful life. Commuting is hard and expensive, I know, I have been doing it for 27 yrs.
Yes I think this service is very good for people like me because other way we not have opportunity to live in Lompoc and work in other city.
Yes
I want to say, I appreciate the convenience, SBCAG is a very (Clean Air) company & provide info & changes are made (seemily quick) to make commuting extremely easy. Thanks
Yes
If this is so you can charge us to park - it is ridiculous - we pay enough to Clean Air - to charge to park would be just plain gouging the consumer, which most people already do.
Yes
If you start to charge money to park that would be wrong and greedy of you. Our bus passes are expensive enough w/out the extra costs for parking. If there more jobs in Lompoc we wouldn't have to commute at all.
Yes improve promptness reduce travel time
Yes In my opinion this services are being great but I suggest some drivers should get more sleep
Yes It would be nice to have a 12:30 pm or 1:00 pm bus on Fridays.
Yes keep prices low and continue the great services
Yes More Bike lockers!!
Yes More buses to a(nd) from SB
Yes More buses; buses with bathrooms; more comfortable seats Thank you for your concerns.
Yes more busses
Yes More COLT bus stops and a COLT bus route from Barton and "O" St. to the Cypress P&R at 5:45 am.
Yes More written information in other parts of Lompoc.
Yes n/a
Yes no strong perfume
Yes non - everything is fine
Yes None
Yes none
Yes
P&R in Lompoc is the best thing about this town. +/- 1/4 of it's population travels south for work & many of these people rely on P&R (including me!). It's safe, economical, good for the environment & helps prevent traffic congestion!
Yes Patrons should NOT be able to wear strong perfume. It makes me get a headache!
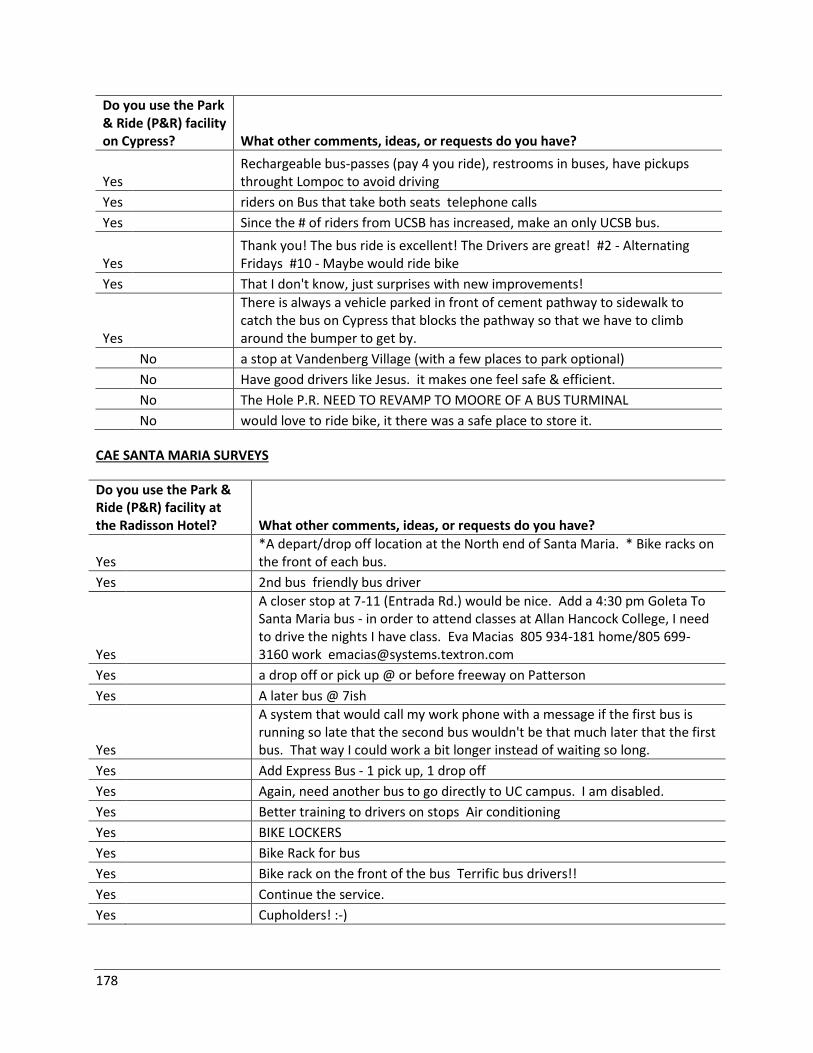
178
Do you use the Park & Ride (P&R) facility on Cypress? What other comments, ideas, or requests do you have?
Yes Rechargeable bus-passes (pay 4 you ride), restrooms in buses, have pickups throught Lompoc to avoid driving
Yes riders on Bus that take both seats telephone calls
Yes Since the # of riders from UCSB has increased, make an only UCSB bus.
Yes Thank you! The bus ride is excellent! The Drivers are great! #2 - Alternating Fridays #10 - Maybe would ride bike
Yes That I don't know, just surprises with new improvements!
Yes
There is always a vehicle parked in front of cement pathway to sidewalk to catch the bus on Cypress that blocks the pathway so that we have to climb around the bumper to get by.
No a stop at Vandenberg Village (with a few places to park optional)
No Have good drivers like Jesus. it makes one feel safe & efficient.
No The Hole P.R. NEED TO REVAMP TO MOORE OF A BUS TURMINAL
No would love to ride bike, it there was a safe place to store it.
CAE SANTA MARIA SURVEYS
Do you use the Park & Ride (P&R) facility at the Radisson Hotel? What other comments, ideas, or requests do you have?
Yes *A depart/drop off location at the North end of Santa Maria. * Bike racks on the front of each bus.
Yes 2nd bus friendly bus driver
Yes
A closer stop at 7-11 (Entrada Rd.) would be nice. Add a 4:30 pm Goleta To Santa Maria bus - in order to attend classes at Allan Hancock College, I need to drive the nights I have class. Eva Macias 805 934-181 home/805 699-3160 work [email protected]
Yes a drop off or pick up @ or before freeway on Patterson
Yes A later bus @ 7ish
Yes
A system that would call my work phone with a message if the first bus is running so late that the second bus wouldn't be that much later that the first bus. That way I could work a bit longer instead of waiting so long.
Yes Add Express Bus - 1 pick up, 1 drop off
Yes Again, need another bus to go directly to UC campus. I am disabled.
Yes Better training to drivers on stops Air conditioning
Yes BIKE LOCKERS
Yes Bike Rack for bus
Yes Bike rack on the front of the bus Terrific bus drivers!!
Yes Continue the service.
Yes Cupholders! :-)
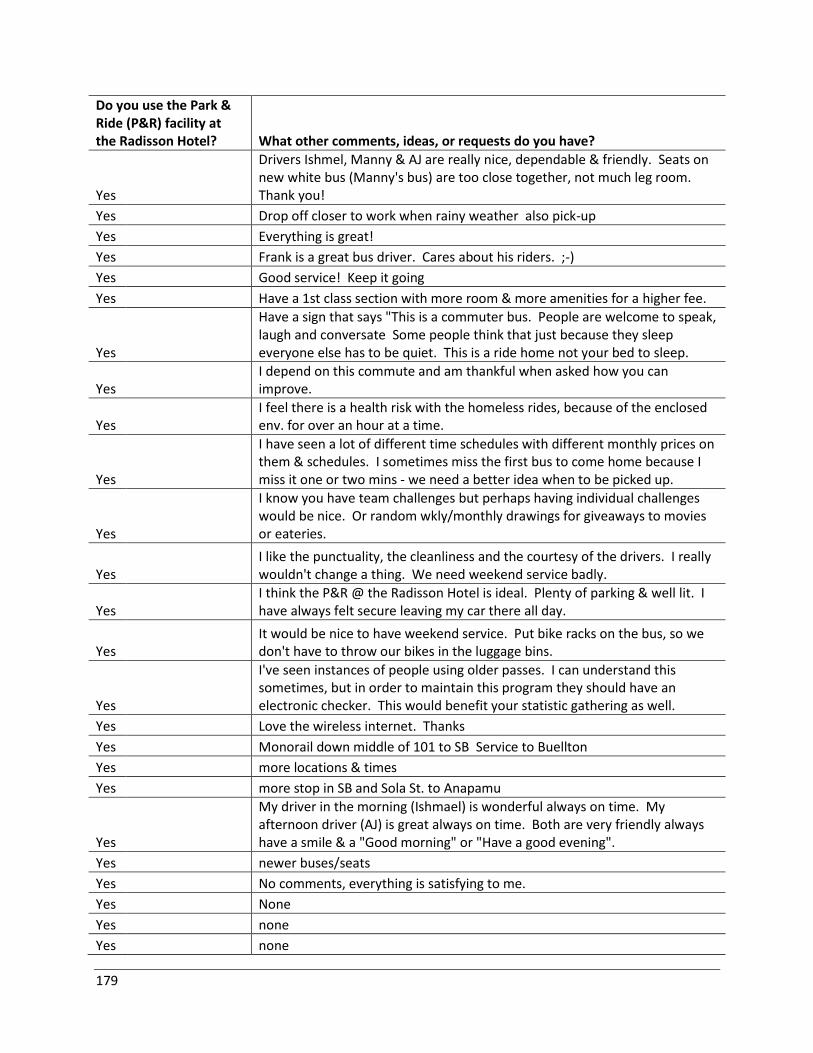
179
Do you use the Park & Ride (P&R) facility at the Radisson Hotel? What other comments, ideas, or requests do you have?
Yes
Drivers Ishmel, Manny & AJ are really nice, dependable & friendly. Seats on new white bus (Manny's bus) are too close together, not much leg room. Thank you!
Yes Drop off closer to work when rainy weather also pick-up
Yes Everything is great!
Yes Frank is a great bus driver. Cares about his riders. ;-)
Yes Good service! Keep it going
Yes Have a 1st class section with more room & more amenities for a higher fee.
Yes
Have a sign that says "This is a commuter bus. People are welcome to speak, laugh and conversate Some people think that just because they sleep everyone else has to be quiet. This is a ride home not your bed to sleep.
Yes I depend on this commute and am thankful when asked how you can improve.
Yes I feel there is a health risk with the homeless rides, because of the enclosed env. for over an hour at a time.
Yes
I have seen a lot of different time schedules with different monthly prices on them & schedules. I sometimes miss the first bus to come home because I miss it one or two mins - we need a better idea when to be picked up.
Yes
I know you have team challenges but perhaps having individual challenges would be nice. Or random wkly/monthly drawings for giveaways to movies or eateries.
Yes I like the punctuality, the cleanliness and the courtesy of the drivers. I really wouldn't change a thing. We need weekend service badly.
Yes I think the P&R @ the Radisson Hotel is ideal. Plenty of parking & well lit. I have always felt secure leaving my car there all day.
Yes It would be nice to have weekend service. Put bike racks on the bus, so we don't have to throw our bikes in the luggage bins.
Yes
I've seen instances of people using older passes. I can understand this sometimes, but in order to maintain this program they should have an electronic checker. This would benefit your statistic gathering as well.
Yes Love the wireless internet. Thanks
Yes Monorail down middle of 101 to SB Service to Buellton
Yes more locations & times
Yes more stop in SB and Sola St. to Anapamu
Yes
My driver in the morning (Ishmael) is wonderful always on time. My afternoon driver (AJ) is great always on time. Both are very friendly always have a smile & a "Good morning" or "Have a good evening".
Yes newer buses/seats
Yes No comments, everything is satisfying to me.
Yes None
Yes none
Yes none
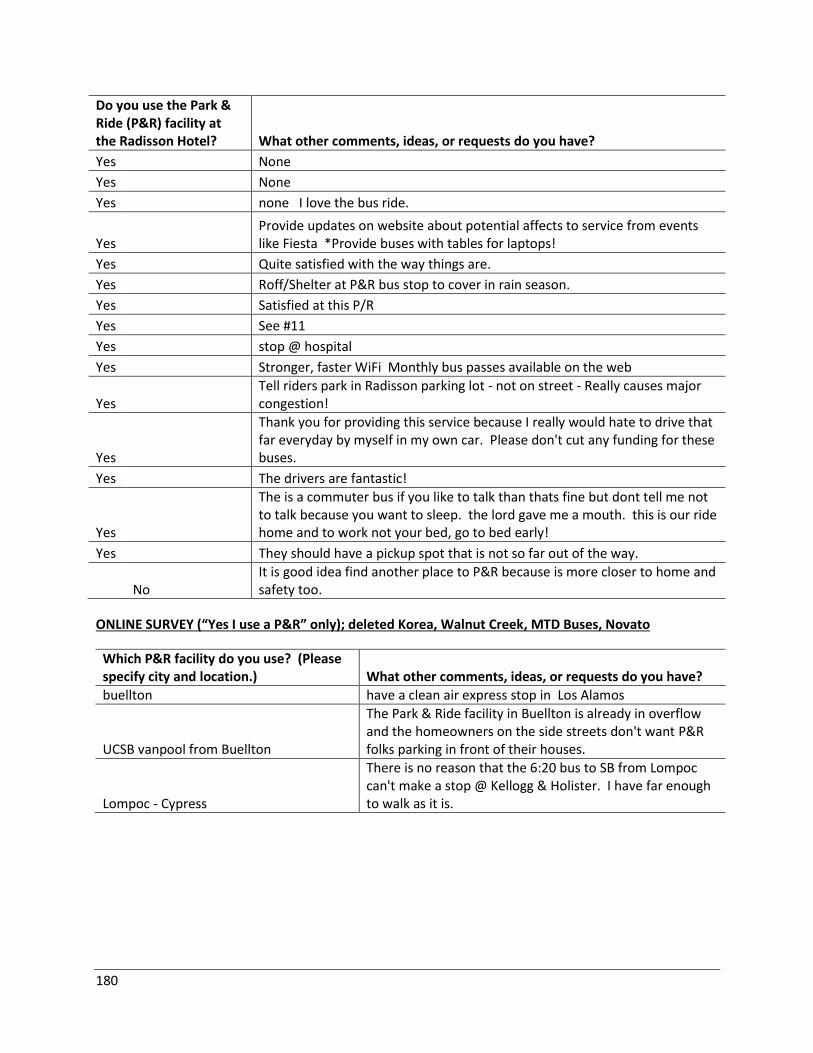
180
Do you use the Park & Ride (P&R) facility at the Radisson Hotel? What other comments, ideas, or requests do you have?
Yes None
Yes None
Yes none I love the bus ride.
Yes Provide updates on website about potential affects to service from events like Fiesta *Provide buses with tables for laptops!
Yes Quite satisfied with the way things are.
Yes Roff/Shelter at P&R bus stop to cover in rain season.
Yes Satisfied at this P/R
Yes See #11
Yes stop @ hospital
Yes Stronger, faster WiFi Monthly bus passes available on the web
Yes Tell riders park in Radisson parking lot - not on street - Really causes major congestion!
Yes
Thank you for providing this service because I really would hate to drive that far everyday by myself in my own car. Please don't cut any funding for these buses.
Yes The drivers are fantastic!
Yes
The is a commuter bus if you like to talk than thats fine but dont tell me not to talk because you want to sleep. the lord gave me a mouth. this is our ride home and to work not your bed, go to bed early!
Yes They should have a pickup spot that is not so far out of the way.
No
It is good idea find another place to P&R because is more closer to home and safety too.
ONLINE SURVEY (“Yes I use a P&R” only); deleted Korea, Walnut Creek, MTD Buses, Novato
Which P&R facility do you use? (Please specify city and location.) What other comments, ideas, or requests do you have?
buellton have a clean air express stop in Los Alamos
UCSB vanpool from Buellton
The Park & Ride facility in Buellton is already in overflow and the homeowners on the side streets don't want P&R folks parking in front of their houses.
Lompoc - Cypress
There is no reason that the 6:20 bus to SB from Lompoc can't make a stop @ Kellogg & Holister. I have far enough to walk as it is.
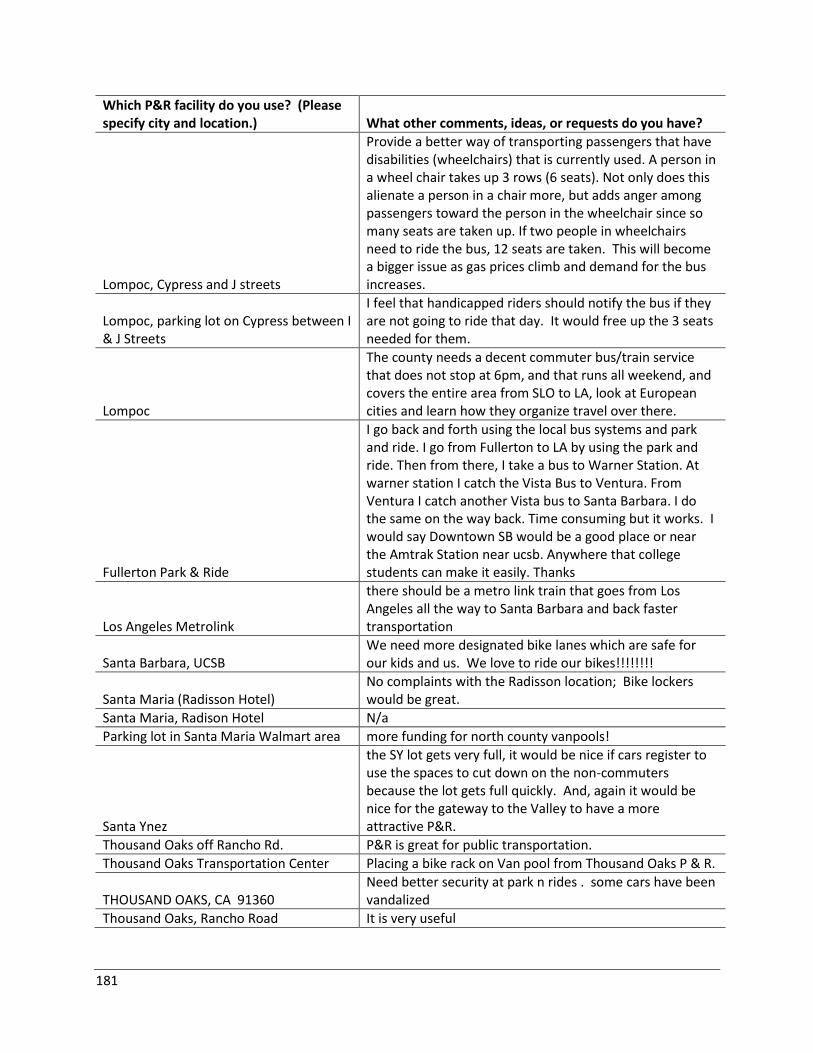
181
Which P&R facility do you use? (Please specify city and location.) What other comments, ideas, or requests do you have?
Lompoc, Cypress and J streets
Provide a better way of transporting passengers that have disabilities (wheelchairs) that is currently used. A person in a wheel chair takes up 3 rows (6 seats). Not only does this alienate a person in a chair more, but adds anger among passengers toward the person in the wheelchair since so many seats are taken up. If two people in wheelchairs need to ride the bus, 12 seats are taken. This will become a bigger issue as gas prices climb and demand for the bus increases.
Lompoc, parking lot on Cypress between I & J Streets
I feel that handicapped riders should notify the bus if they are not going to ride that day. It would free up the 3 seats needed for them.
Lompoc
The county needs a decent commuter bus/train service that does not stop at 6pm, and that runs all weekend, and covers the entire area from SLO to LA, look at European cities and learn how they organize travel over there.
Fullerton Park & Ride
I go back and forth using the local bus systems and park and ride. I go from Fullerton to LA by using the park and ride. Then from there, I take a bus to Warner Station. At warner station I catch the Vista Bus to Ventura. From Ventura I catch another Vista bus to Santa Barbara. I do the same on the way back. Time consuming but it works. I would say Downtown SB would be a good place or near the Amtrak Station near ucsb. Anywhere that college students can make it easily. Thanks
Los Angeles Metrolink
there should be a metro link train that goes from Los Angeles all the way to Santa Barbara and back faster transportation
Santa Barbara, UCSB We need more designated bike lanes which are safe for our kids and us. We love to ride our bikes!!!!!!!!
Santa Maria (Radisson Hotel) No complaints with the Radisson location; Bike lockers would be great.
Santa Maria, Radison Hotel N/a
Parking lot in Santa Maria Walmart area more funding for north county vanpools!
Santa Ynez
the SY lot gets very full, it would be nice if cars register to use the spaces to cut down on the non-commuters because the lot gets full quickly. And, again it would be nice for the gateway to the Valley to have a more attractive P&R.
Thousand Oaks off Rancho Rd. P&R is great for public transportation.
Thousand Oaks Transportation Center Placing a bike rack on Van pool from Thousand Oaks P & R.
THOUSAND OAKS, CA 91360 Need better security at park n rides . some cars have been vandalized
Thousand Oaks, Rancho Road It is very useful
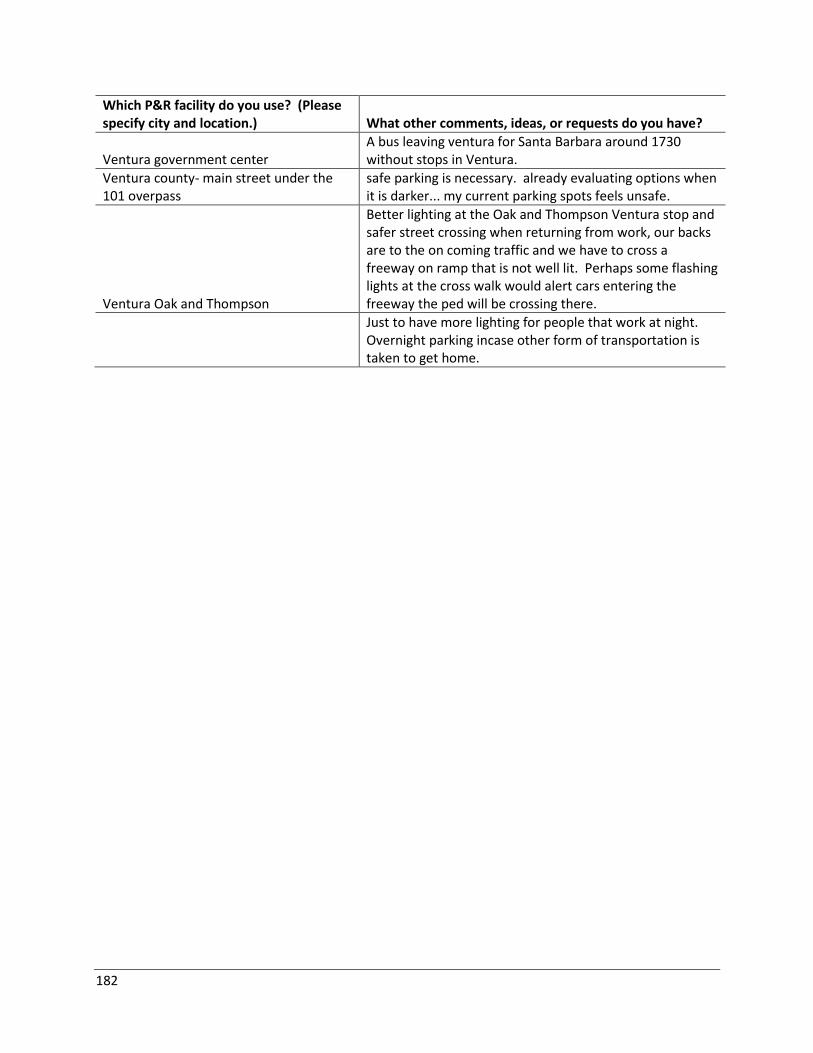
182
Which P&R facility do you use? (Please specify city and location.) What other comments, ideas, or requests do you have?
Ventura government center A bus leaving ventura for Santa Barbara around 1730 without stops in Ventura.
Ventura county- main street under the 101 overpass
safe parking is necessary. already evaluating options when it is darker... my current parking spots feels unsafe.
Ventura Oak and Thompson
Better lighting at the Oak and Thompson Ventura stop and safer street crossing when returning from work, our backs are to the on coming traffic and we have to cross a freeway on ramp that is not well lit. Perhaps some flashing lights at the cross walk would alert cars entering the freeway the ped will be crossing there.
Just to have more lighting for people that work at night. Overnight parking incase other form of transportation is taken to get home.
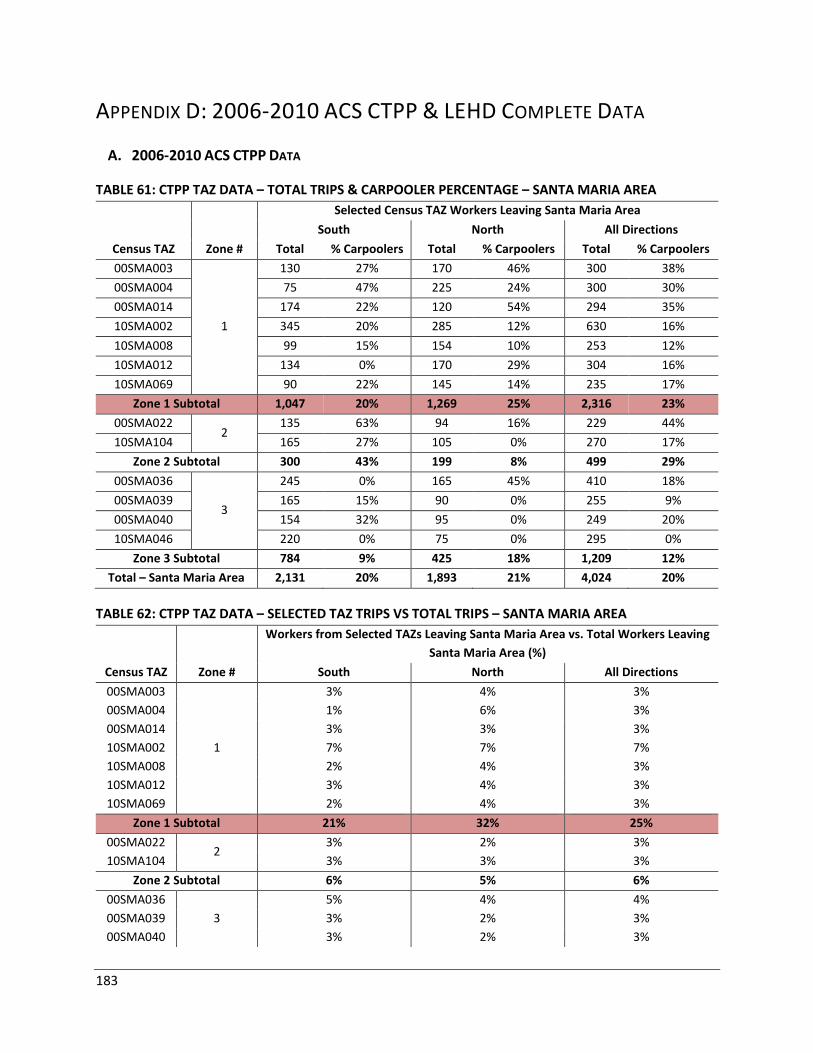
183
APPENDIX D: 2006-2010 ACS CTPP & LEHD COMPLETE DATA
A. 2006-2010 ACS CTPP DATA
TABLE 61: CTPP TAZ DATA – TOTAL TRIPS & CARPOOLER PERCENTAGE – SANTA MARIA AREA
Census TAZ Zone #
Selected Census TAZ Workers Leaving Santa Maria Area
South North All Directions
Total % Carpoolers Total % Carpoolers Total % Carpoolers
00SMA003
1
130 27% 170 46% 300 38%
00SMA004 75 47% 225 24% 300 30%
00SMA014 174 22% 120 54% 294 35%
10SMA002 345 20% 285 12% 630 16%
10SMA008 99 15% 154 10% 253 12%
10SMA012 134 0% 170 29% 304 16%
10SMA069 90 22% 145 14% 235 17%
Zone 1 Subtotal 1,047 20% 1,269 25% 2,316 23%
00SMA022 2
135 63% 94 16% 229 44%
10SMA104 165 27% 105 0% 270 17%
Zone 2 Subtotal 300 43% 199 8% 499 29%
00SMA036
3
245 0% 165 45% 410 18%
00SMA039 165 15% 90 0% 255 9%
00SMA040 154 32% 95 0% 249 20%
10SMA046 220 0% 75 0% 295 0%
Zone 3 Subtotal 784 9% 425 18% 1,209 12%
Total – Santa Maria Area 2,131 20% 1,893 21% 4,024 20%
TABLE 62: CTPP TAZ DATA – SELECTED TAZ TRIPS VS TOTAL TRIPS – SANTA MARIA AREA
Census TAZ Zone #
Workers from Selected TAZs Leaving Santa Maria Area vs. Total Workers Leaving
Santa Maria Area (%)
South North All Directions
00SMA003
1
3% 4% 3%
00SMA004 1% 6% 3%
00SMA014 3% 3% 3%
10SMA002 7% 7% 7%
10SMA008 2% 4% 3%
10SMA012 3% 4% 3%
10SMA069 2% 4% 3%
Zone 1 Subtotal 21% 32% 25%
00SMA022 2
3% 2% 3%
10SMA104 3% 3% 3%
Zone 2 Subtotal 6% 5% 6%
00SMA036
3
5% 4% 4%
00SMA039 3% 2% 3%
00SMA040 3% 2% 3%
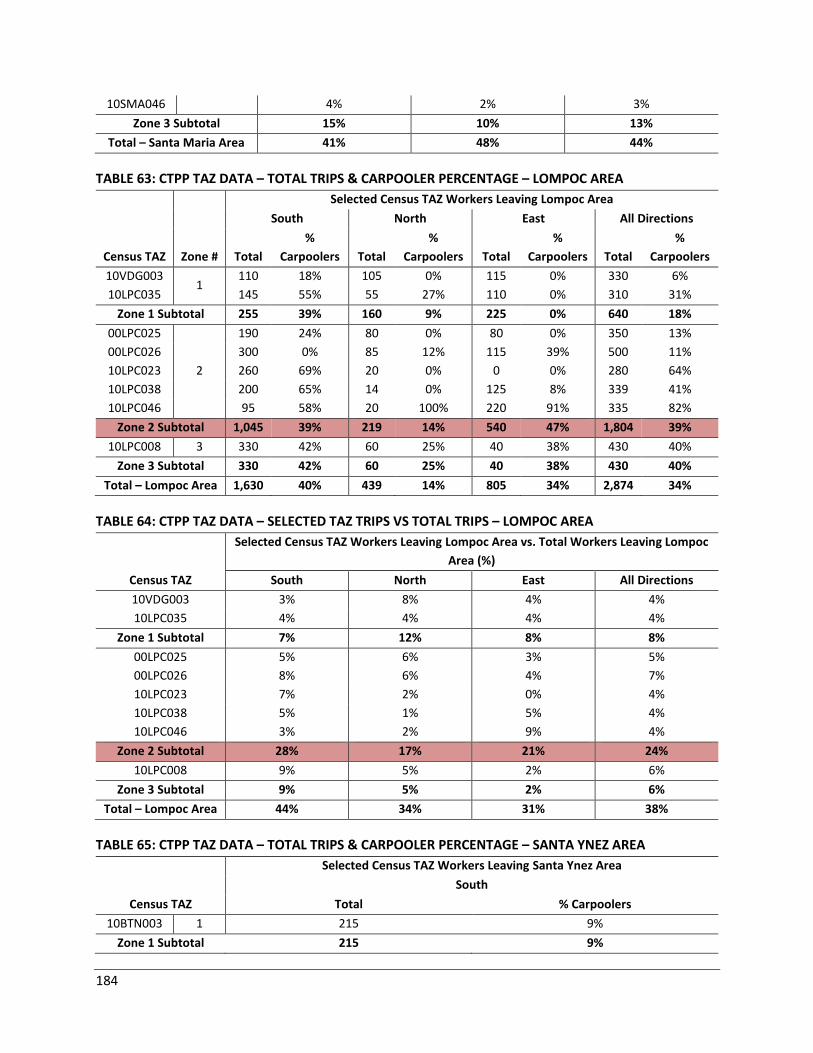
184
10SMA046 4% 2% 3%
Zone 3 Subtotal 15% 10% 13%
Total – Santa Maria Area 41% 48% 44%
TABLE 63: CTPP TAZ DATA – TOTAL TRIPS & CARPOOLER PERCENTAGE – LOMPOC AREA
Census TAZ Zone #
Selected Census TAZ Workers Leaving Lompoc Area
South North East All Directions
Total
%
Carpoolers Total
%
Carpoolers Total
%
Carpoolers Total
%
Carpoolers
10VDG003 1
110 18% 105 0% 115 0% 330 6%
10LPC035 145 55% 55 27% 110 0% 310 31%
Zone 1 Subtotal 255 39% 160 9% 225 0% 640 18%
00LPC025
2
190 24% 80 0% 80 0% 350 13%
00LPC026 300 0% 85 12% 115 39% 500 11%
10LPC023 260 69% 20 0% 0 0% 280 64%
10LPC038 200 65% 14 0% 125 8% 339 41%
10LPC046 95 58% 20 100% 220 91% 335 82%
Zone 2 Subtotal 1,045 39% 219 14% 540 47% 1,804 39%
10LPC008 3 330 42% 60 25% 40 38% 430 40%
Zone 3 Subtotal 330 42% 60 25% 40 38% 430 40%
Total – Lompoc Area 1,630 40% 439 14% 805 34% 2,874 34%
TABLE 64: CTPP TAZ DATA – SELECTED TAZ TRIPS VS TOTAL TRIPS – LOMPOC AREA
Census TAZ
Selected Census TAZ Workers Leaving Lompoc Area vs. Total Workers Leaving Lompoc
Area (%)
South North East All Directions
10VDG003 3% 8% 4% 4%
10LPC035 4% 4% 4% 4%
Zone 1 Subtotal 7% 12% 8% 8%
00LPC025 5% 6% 3% 5%
00LPC026 8% 6% 4% 7%
10LPC023 7% 2% 0% 4%
10LPC038 5% 1% 5% 4%
10LPC046 3% 2% 9% 4%
Zone 2 Subtotal 28% 17% 21% 24%
10LPC008 9% 5% 2% 6%
Zone 3 Subtotal 9% 5% 2% 6%
Total – Lompoc Area 44% 34% 31% 38%
TABLE 65: CTPP TAZ DATA – TOTAL TRIPS & CARPOOLER PERCENTAGE – SANTA YNEZ AREA
Census TAZ
Selected Census TAZ Workers Leaving Santa Ynez Area
South
Total % Carpoolers
10BTN003 1 215 9%
Zone 1 Subtotal 215 9%
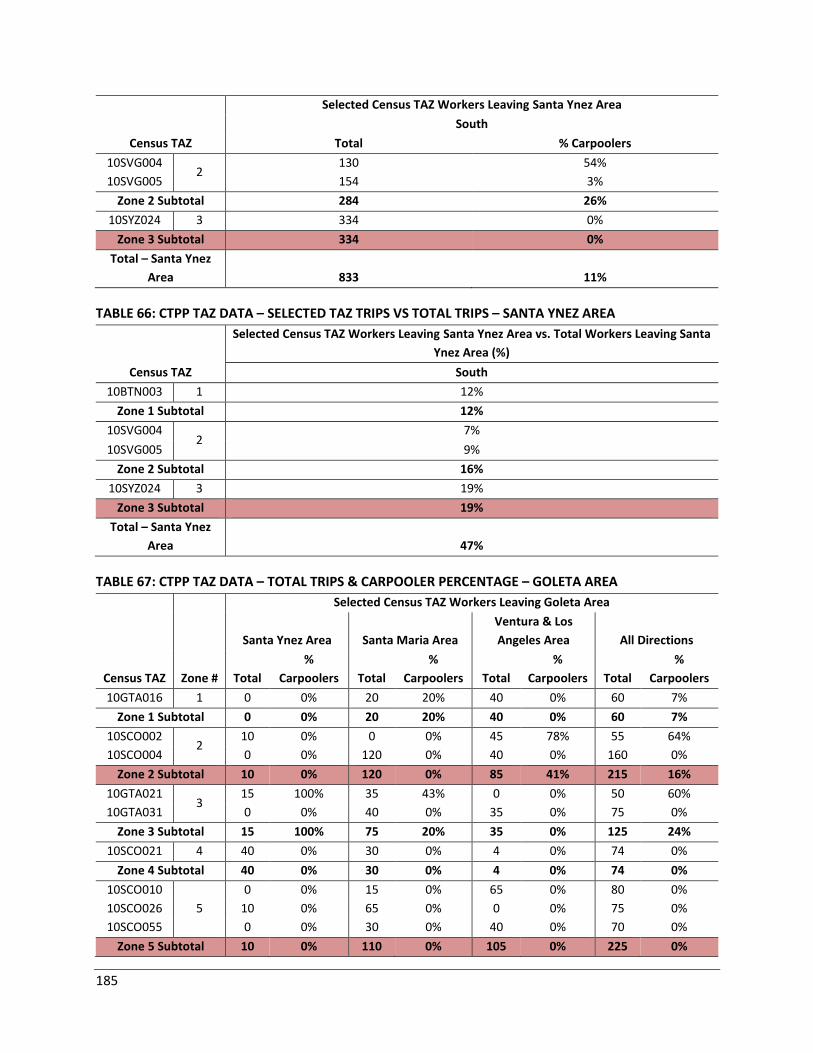
185
Census TAZ
Selected Census TAZ Workers Leaving Santa Ynez Area
South
Total % Carpoolers
10SVG004 2
130 54%
10SVG005 154 3%
Zone 2 Subtotal 284 26%
10SYZ024 3 334 0%
Zone 3 Subtotal 334 0%
Total – Santa Ynez
Area 833 11%
TABLE 66: CTPP TAZ DATA – SELECTED TAZ TRIPS VS TOTAL TRIPS – SANTA YNEZ AREA
Census TAZ
Selected Census TAZ Workers Leaving Santa Ynez Area vs. Total Workers Leaving Santa
Ynez Area (%)
South
10BTN003 1 12%
Zone 1 Subtotal 12%
10SVG004 2
7%
10SVG005 9%
Zone 2 Subtotal 16%
10SYZ024 3 19%
Zone 3 Subtotal 19%
Total – Santa Ynez
Area 47%
TABLE 67: CTPP TAZ DATA – TOTAL TRIPS & CARPOOLER PERCENTAGE – GOLETA AREA
Census TAZ Zone #
Selected Census TAZ Workers Leaving Goleta Area
Santa Ynez Area Santa Maria Area
Ventura & Los
Angeles Area All Directions
Total
%
Carpoolers Total
%
Carpoolers Total
%
Carpoolers Total
%
Carpoolers
10GTA016 1 0 0% 20 20% 40 0% 60 7%
Zone 1 Subtotal 0 0% 20 20% 40 0% 60 7%
10SCO002 2
10 0% 0 0% 45 78% 55 64%
10SCO004 0 0% 120 0% 40 0% 160 0%
Zone 2 Subtotal 10 0% 120 0% 85 41% 215 16%
10GTA021 3
15 100% 35 43% 0 0% 50 60%
10GTA031 0 0% 40 0% 35 0% 75 0%
Zone 3 Subtotal 15 100% 75 20% 35 0% 125 24%
10SCO021 4 40 0% 30 0% 4 0% 74 0%
Zone 4 Subtotal 40 0% 30 0% 4 0% 74 0%
10SCO010
5
0 0% 15 0% 65 0% 80 0%
10SCO026 10 0% 65 0% 0 0% 75 0%
10SCO055 0 0% 30 0% 40 0% 70 0%
Zone 5 Subtotal 10 0% 110 0% 105 0% 225 0%
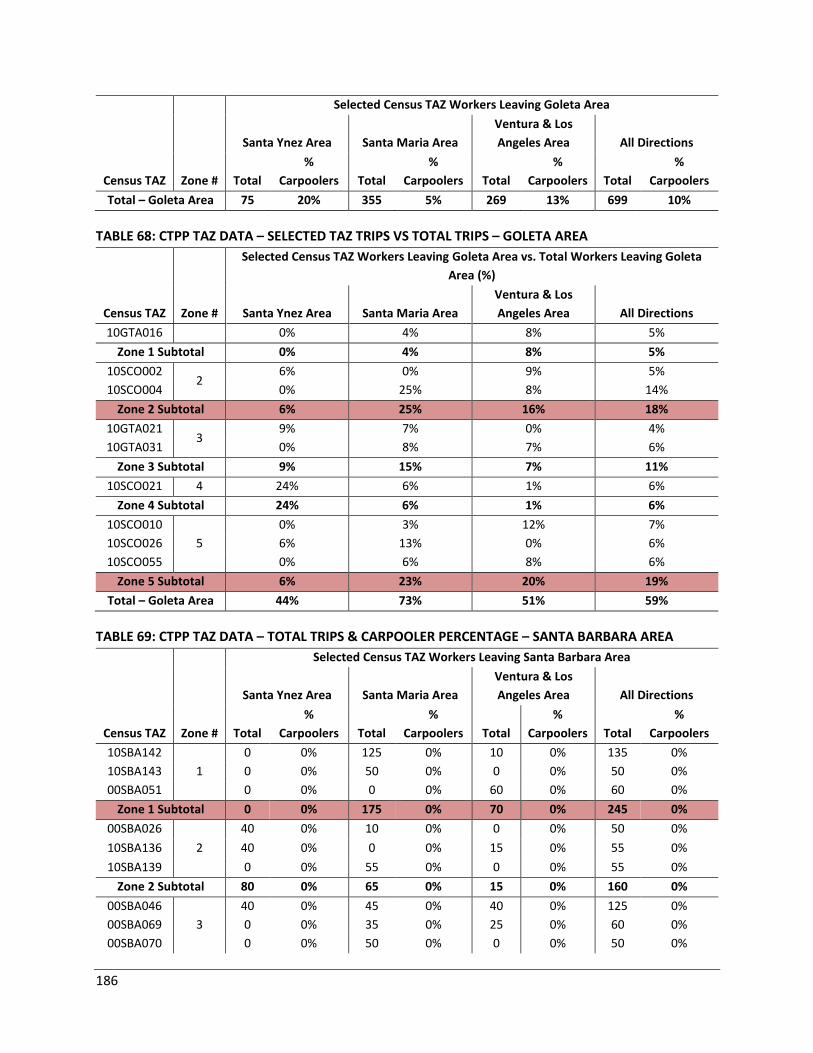
186
Census TAZ Zone #
Selected Census TAZ Workers Leaving Goleta Area
Santa Ynez Area Santa Maria Area
Ventura & Los
Angeles Area All Directions
Total
%
Carpoolers Total
%
Carpoolers Total
%
Carpoolers Total
%
Carpoolers
Total – Goleta Area 75 20% 355 5% 269 13% 699 10%
TABLE 68: CTPP TAZ DATA – SELECTED TAZ TRIPS VS TOTAL TRIPS – GOLETA AREA
Census TAZ Zone #
Selected Census TAZ Workers Leaving Goleta Area vs. Total Workers Leaving Goleta
Area (%)
Santa Ynez Area Santa Maria Area
Ventura & Los
Angeles Area All Directions
10GTA016 0% 4% 8% 5%
Zone 1 Subtotal 0% 4% 8% 5%
10SCO002 2
6% 0% 9% 5%
10SCO004 0% 25% 8% 14%
Zone 2 Subtotal 6% 25% 16% 18%
10GTA021 3
9% 7% 0% 4%
10GTA031 0% 8% 7% 6%
Zone 3 Subtotal 9% 15% 7% 11%
10SCO021 4 24% 6% 1% 6%
Zone 4 Subtotal 24% 6% 1% 6%
10SCO010
5
0% 3% 12% 7%
10SCO026 6% 13% 0% 6%
10SCO055 0% 6% 8% 6%
Zone 5 Subtotal 6% 23% 20% 19%
Total – Goleta Area 44% 73% 51% 59%
TABLE 69: CTPP TAZ DATA – TOTAL TRIPS & CARPOOLER PERCENTAGE – SANTA BARBARA AREA
Census TAZ Zone #
Selected Census TAZ Workers Leaving Santa Barbara Area
Santa Ynez Area Santa Maria Area
Ventura & Los
Angeles Area All Directions
Total
%
Carpoolers Total
%
Carpoolers Total
%
Carpoolers Total
%
Carpoolers
10SBA142
1
0 0% 125 0% 10 0% 135 0%
10SBA143 0 0% 50 0% 0 0% 50 0%
00SBA051 0 0% 0 0% 60 0% 60 0%
Zone 1 Subtotal 0 0% 175 0% 70 0% 245 0%
00SBA026
2
40 0% 10 0% 0 0% 50 0%
10SBA136 40 0% 0 0% 15 0% 55 0%
10SBA139 0 0% 55 0% 0 0% 55 0%
Zone 2 Subtotal 80 0% 65 0% 15 0% 160 0%
00SBA046
3
40 0% 45 0% 40 0% 125 0%
00SBA069 0 0% 35 0% 25 0% 60 0%
00SBA070 0 0% 50 0% 0 0% 50 0%
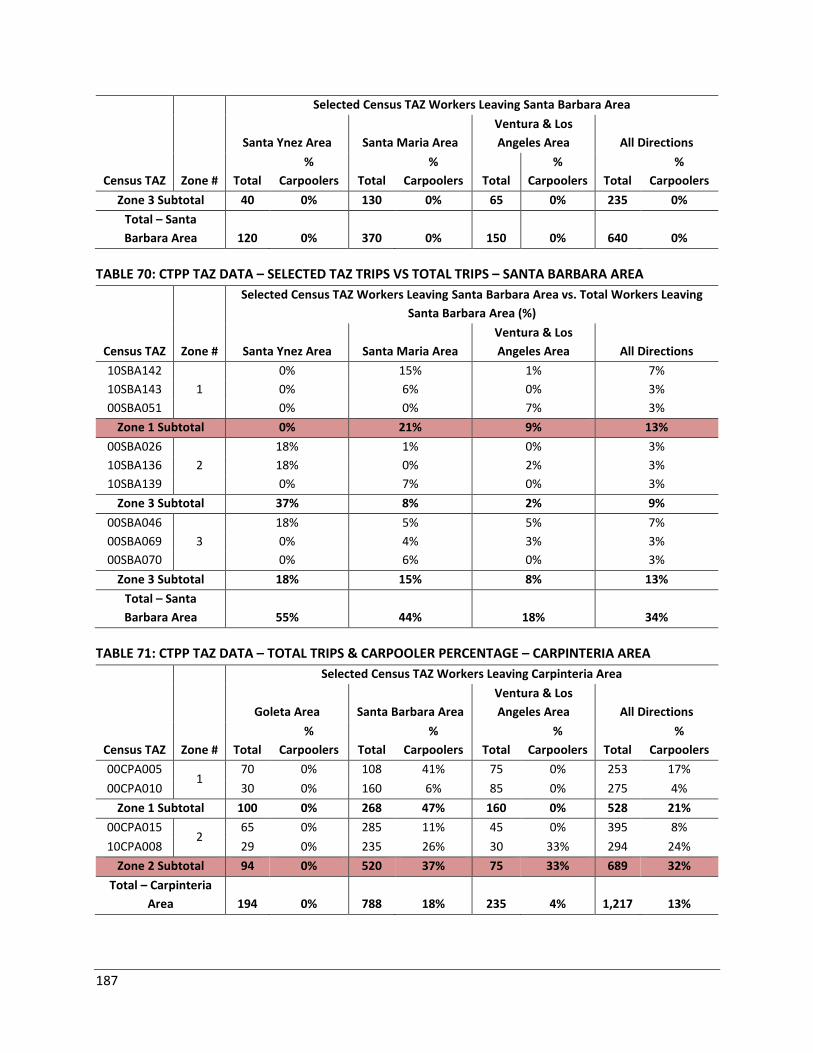
187
Census TAZ Zone #
Selected Census TAZ Workers Leaving Santa Barbara Area
Santa Ynez Area Santa Maria Area
Ventura & Los
Angeles Area All Directions
Total
%
Carpoolers Total
%
Carpoolers Total
%
Carpoolers Total
%
Carpoolers
Zone 3 Subtotal 40 0% 130 0% 65 0% 235 0%
Total – Santa
Barbara Area 120 0% 370 0% 150 0% 640 0%
TABLE 70: CTPP TAZ DATA – SELECTED TAZ TRIPS VS TOTAL TRIPS – SANTA BARBARA AREA
Census TAZ Zone #
Selected Census TAZ Workers Leaving Santa Barbara Area vs. Total Workers Leaving
Santa Barbara Area (%)
Santa Ynez Area Santa Maria Area
Ventura & Los
Angeles Area All Directions
10SBA142
1
0% 15% 1% 7%
10SBA143 0% 6% 0% 3%
00SBA051 0% 0% 7% 3%
Zone 1 Subtotal 0% 21% 9% 13%
00SBA026
2
18% 1% 0% 3%
10SBA136 18% 0% 2% 3%
10SBA139 0% 7% 0% 3%
Zone 3 Subtotal 37% 8% 2% 9%
00SBA046
3
18% 5% 5% 7%
00SBA069 0% 4% 3% 3%
00SBA070 0% 6% 0% 3%
Zone 3 Subtotal 18% 15% 8% 13%
Total – Santa
Barbara Area 55% 44% 18% 34%
TABLE 71: CTPP TAZ DATA – TOTAL TRIPS & CARPOOLER PERCENTAGE – CARPINTERIA AREA
Census TAZ Zone #
Selected Census TAZ Workers Leaving Carpinteria Area
Goleta Area Santa Barbara Area
Ventura & Los
Angeles Area All Directions
Total
%
Carpoolers Total
%
Carpoolers Total
%
Carpoolers Total
%
Carpoolers
00CPA005 1
70 0% 108 41% 75 0% 253 17%
00CPA010 30 0% 160 6% 85 0% 275 4%
Zone 1 Subtotal 100 0% 268 47% 160 0% 528 21%
00CPA015 2
65 0% 285 11% 45 0% 395 8%
10CPA008 29 0% 235 26% 30 33% 294 24%
Zone 2 Subtotal 94 0% 520 37% 75 33% 689 32%
Total – Carpinteria
Area 194 0% 788 18% 235 4% 1,217 13%
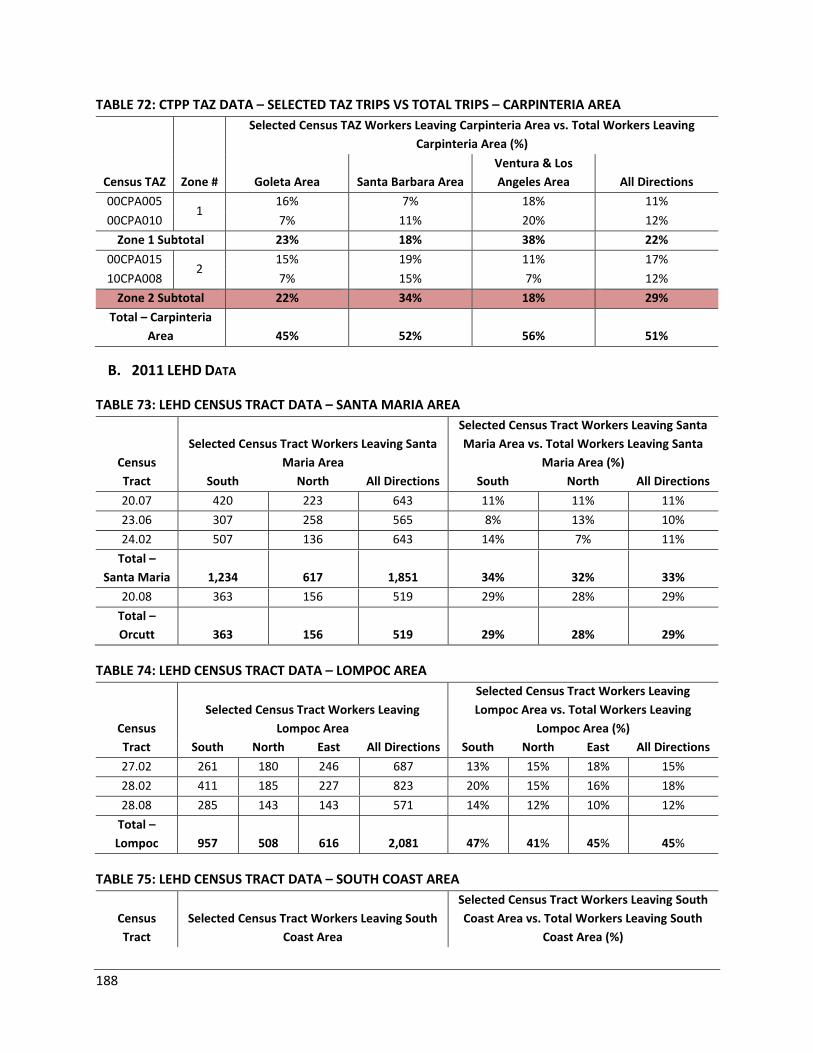
188
TABLE 72: CTPP TAZ DATA – SELECTED TAZ TRIPS VS TOTAL TRIPS – CARPINTERIA AREA
Census TAZ Zone #
Selected Census TAZ Workers Leaving Carpinteria Area vs. Total Workers Leaving
Carpinteria Area (%)
Goleta Area Santa Barbara Area
Ventura & Los
Angeles Area All Directions
00CPA005 1
16% 7% 18% 11%
00CPA010 7% 11% 20% 12%
Zone 1 Subtotal 23% 18% 38% 22%
00CPA015 2
15% 19% 11% 17%
10CPA008 7% 15% 7% 12%
Zone 2 Subtotal 22% 34% 18% 29%
Total – Carpinteria
Area 45% 52% 56% 51%
B. 2011 LEHD DATA
TABLE 73: LEHD CENSUS TRACT DATA – SANTA MARIA AREA
Census
Tract
Selected Census Tract Workers Leaving Santa
Maria Area
Selected Census Tract Workers Leaving Santa
Maria Area vs. Total Workers Leaving Santa
Maria Area (%)
South North All Directions South North All Directions
20.07 420 223 643 11% 11% 11%
23.06 307 258 565 8% 13% 10%
24.02 507 136 643 14% 7% 11%
Total –
Santa Maria 1,234 617 1,851 34% 32% 33%
20.08 363 156 519 29% 28% 29%
Total –
Orcutt 363 156 519 29% 28% 29%
TABLE 74: LEHD CENSUS TRACT DATA – LOMPOC AREA
Census
Tract
Selected Census Tract Workers Leaving
Lompoc Area
Selected Census Tract Workers Leaving
Lompoc Area vs. Total Workers Leaving
Lompoc Area (%)
South North East All Directions South North East All Directions
27.02 261 180 246 687 13% 15% 18% 15%
28.02 411 185 227 823 20% 15% 16% 18%
28.08 285 143 143 571 14% 12% 10% 12%
Total –
Lompoc 957 508 616 2,081 47% 41% 45% 45%
TABLE 75: LEHD CENSUS TRACT DATA – SOUTH COAST AREA
Census
Tract
Selected Census Tract Workers Leaving South
Coast Area
Selected Census Tract Workers Leaving South
Coast Area vs. Total Workers Leaving South
Coast Area (%)
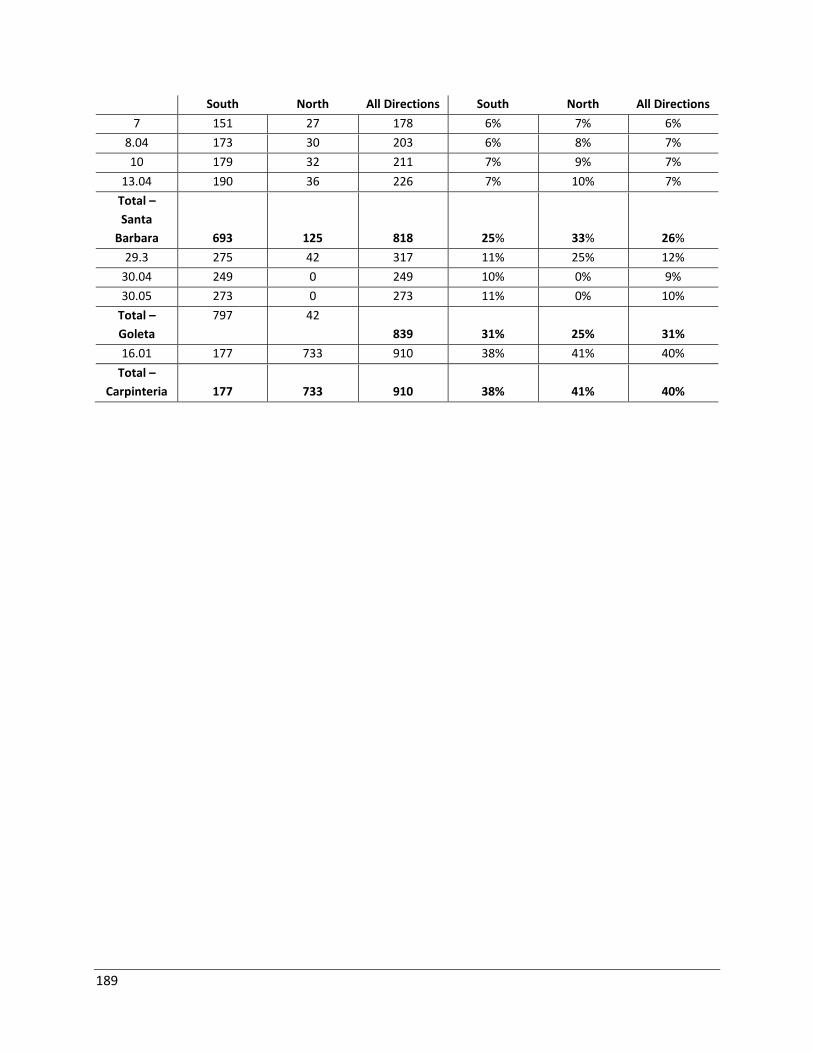
189
South North All Directions South North All Directions
7 151 27 178 6% 7% 6%
8.04 173 30 203 6% 8% 7%
10 179 32 211 7% 9% 7%
13.04 190 36 226 7% 10% 7%
Total –
Santa
Barbara 693 125 818 25% 33% 26%
29.3 275 42 317 11% 25% 12%
30.04 249 0 249 10% 0% 9%
30.05 273 0 273 11% 0% 10%
Total –
Goleta
797 42
839 31% 25% 31%
16.01 177 733 910 38% 41% 40%
Total –
Carpinteria 177 733 910 38% 41% 40%
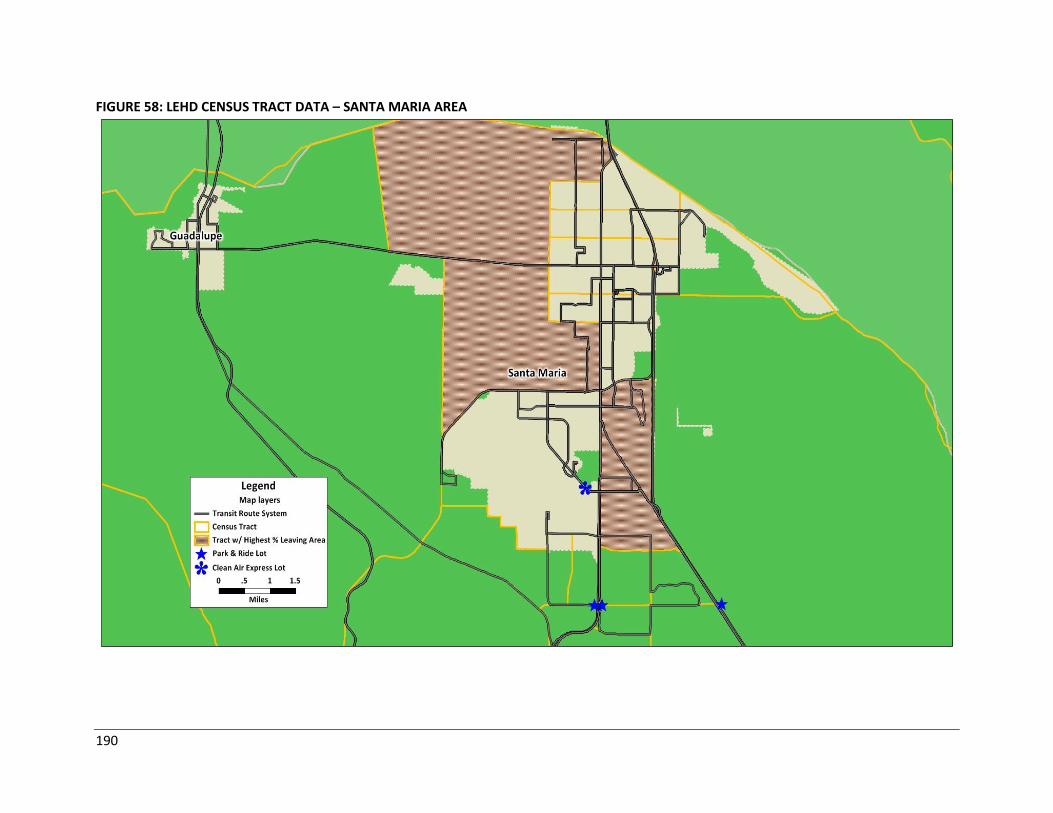
190
FIGURE 58: LEHD CENSUS TRACT DATA – SANTA MARIA AREA
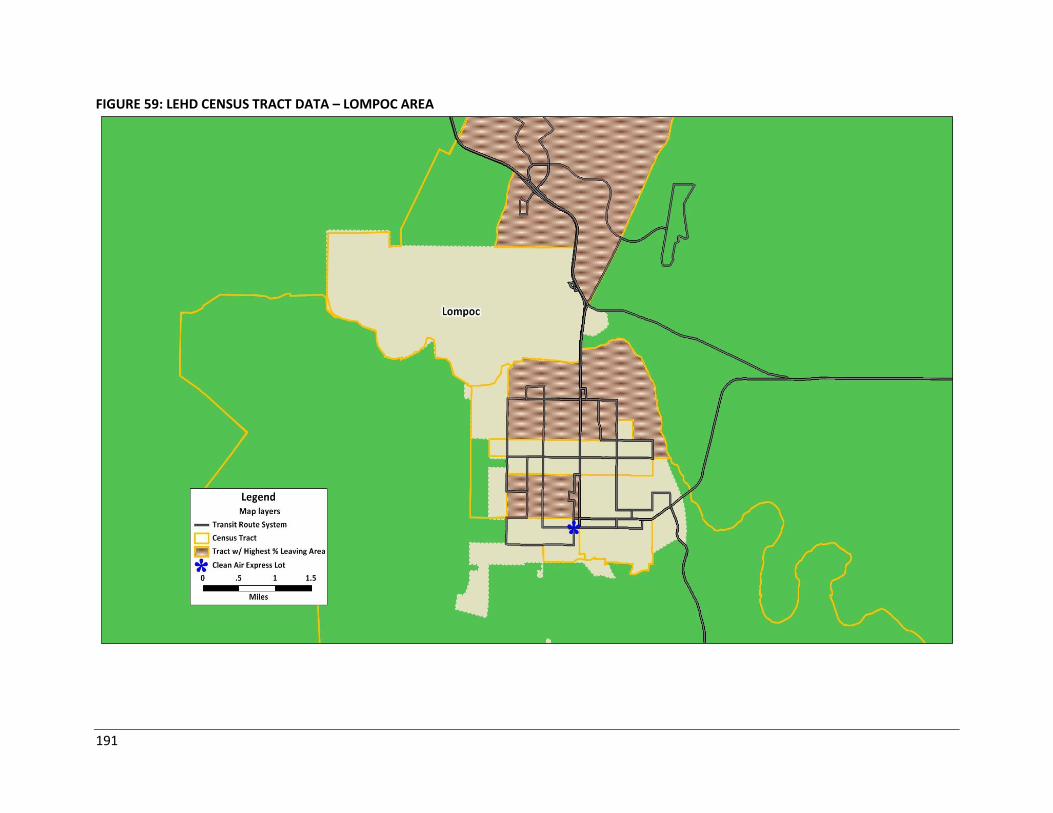
191
FIGURE 59: LEHD CENSUS TRACT DATA – LOMPOC AREA
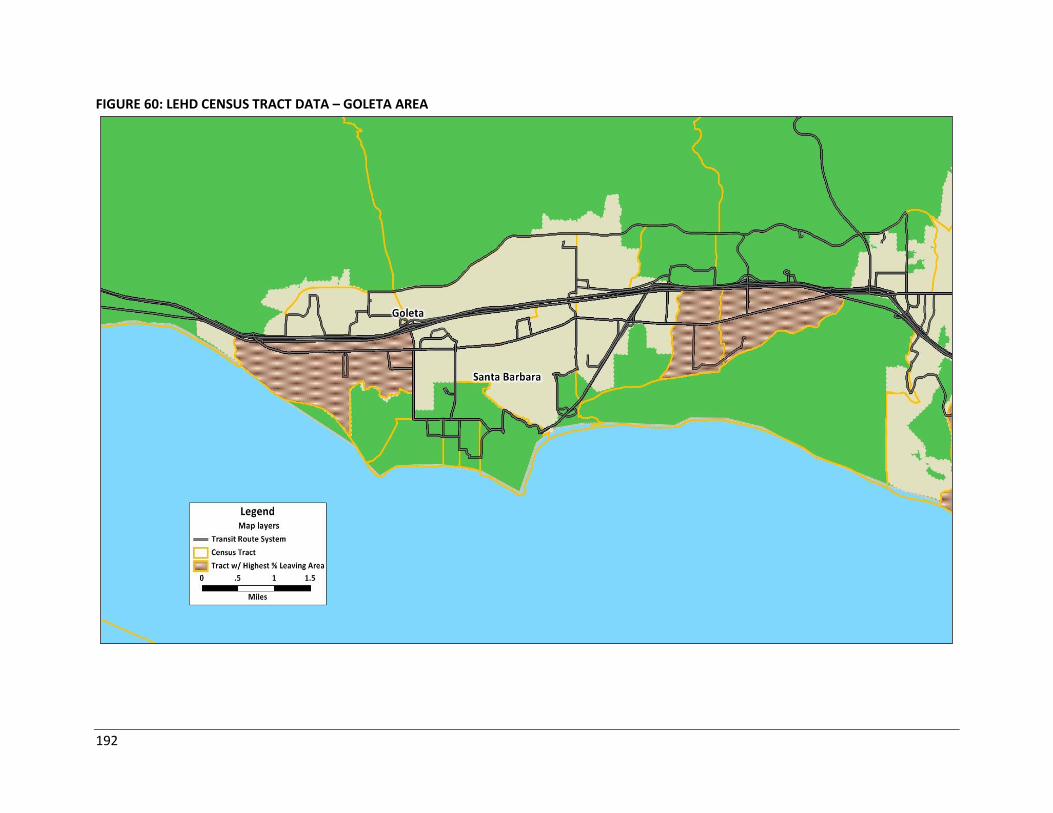
192
FIGURE 60: LEHD CENSUS TRACT DATA – GOLETA AREA
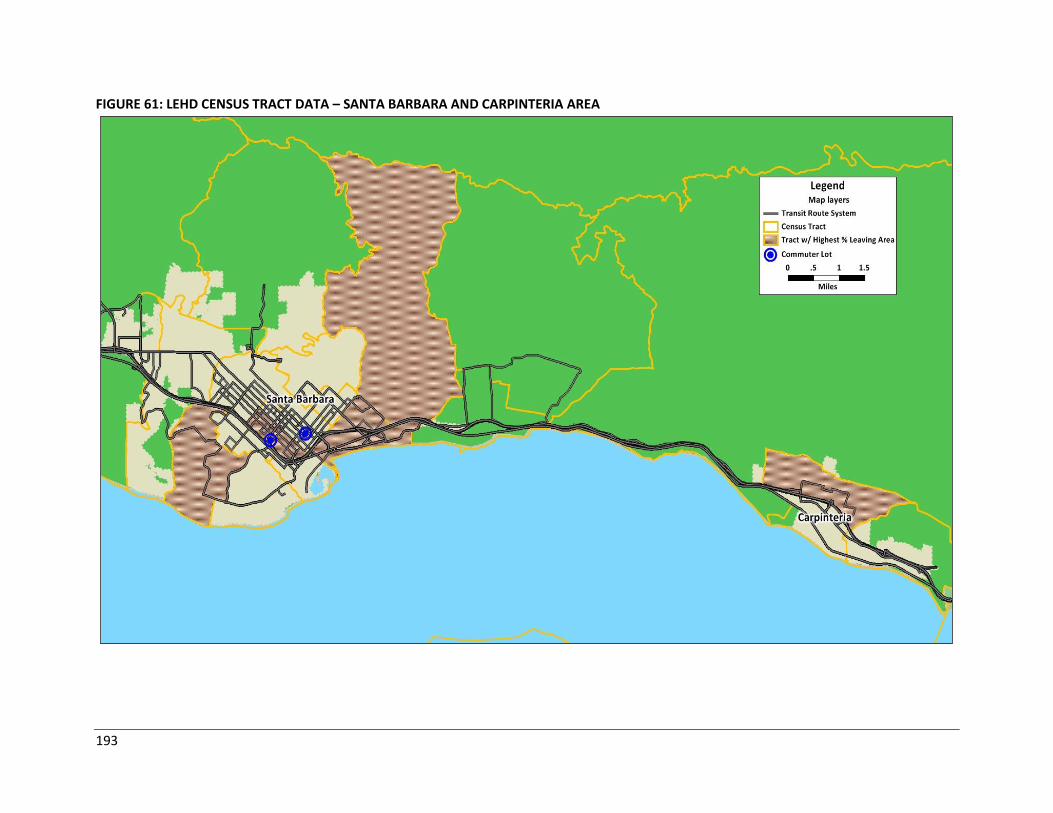
193
FIGURE 61: LEHD CENSUS TRACT DATA – SANTA BARBARA AND CARPINTERIA AREA
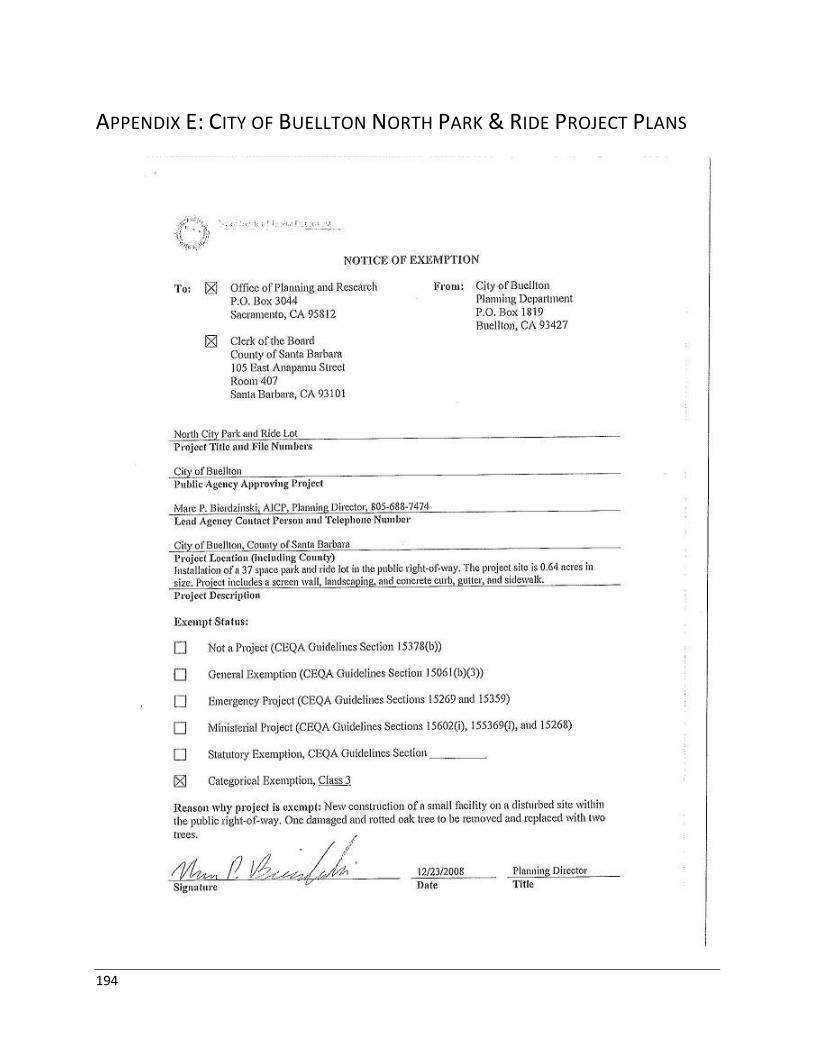
194
APPENDIX E: CITY OF BUELLTON NORTH PARK & RIDE PROJECT PLANS
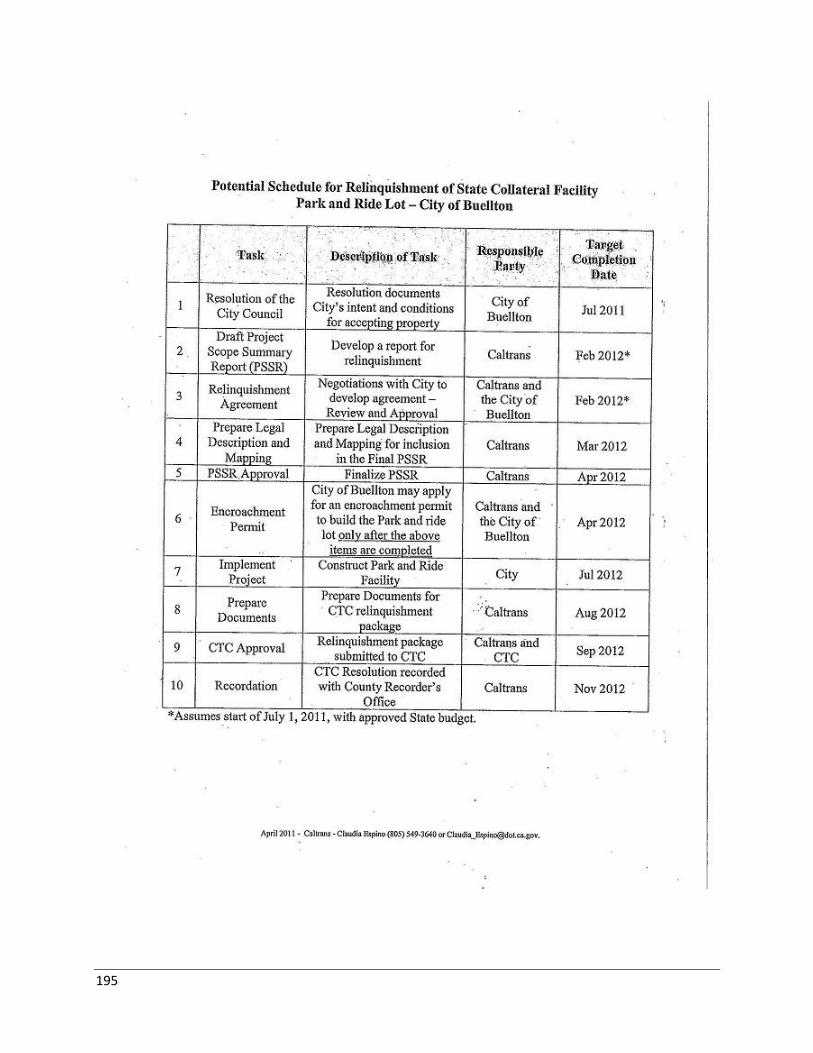
195
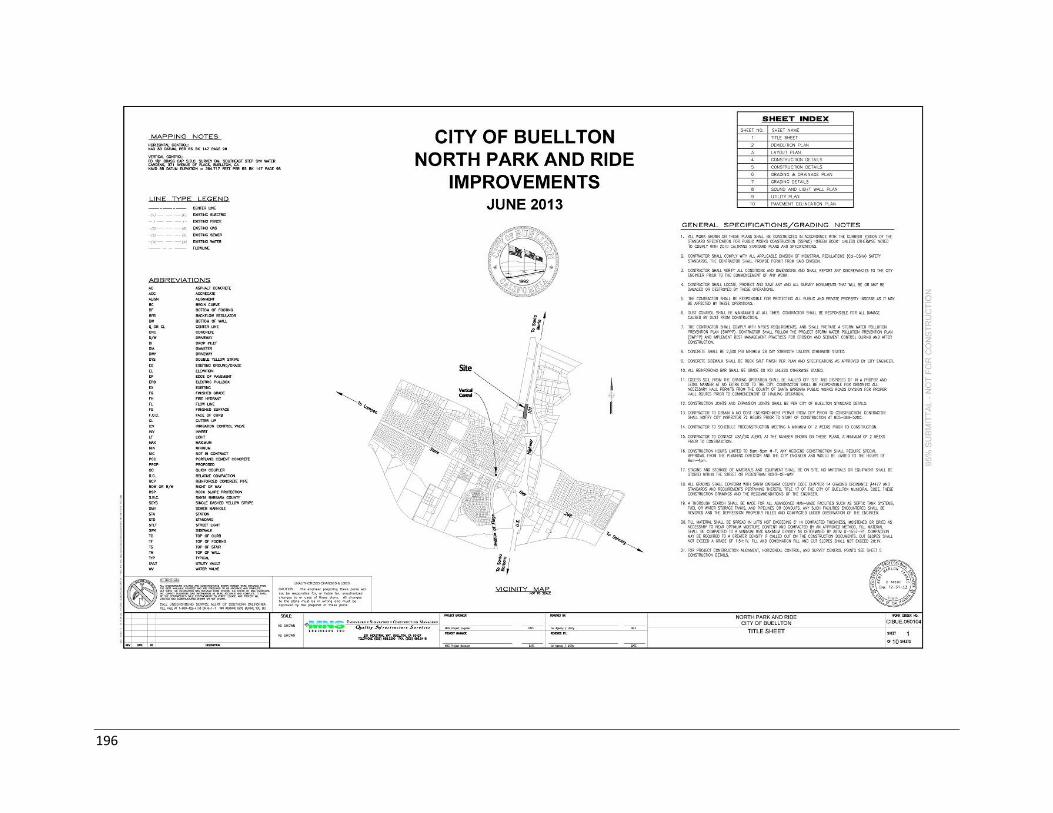
196
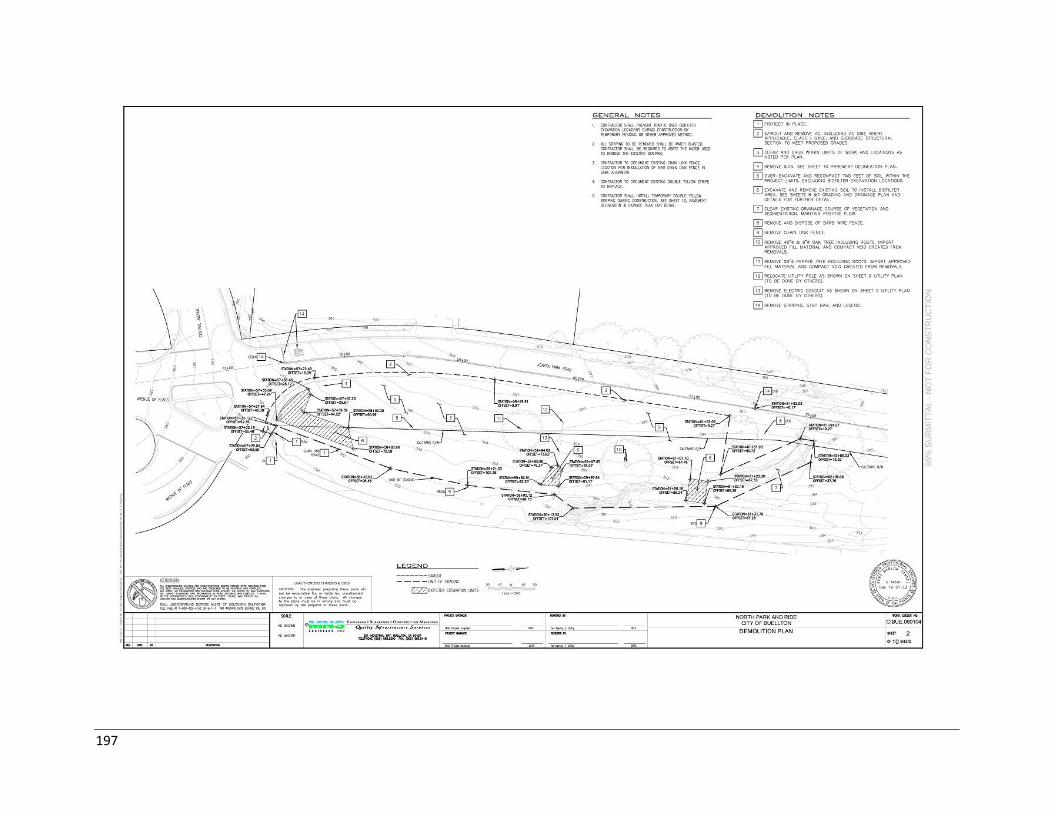
197
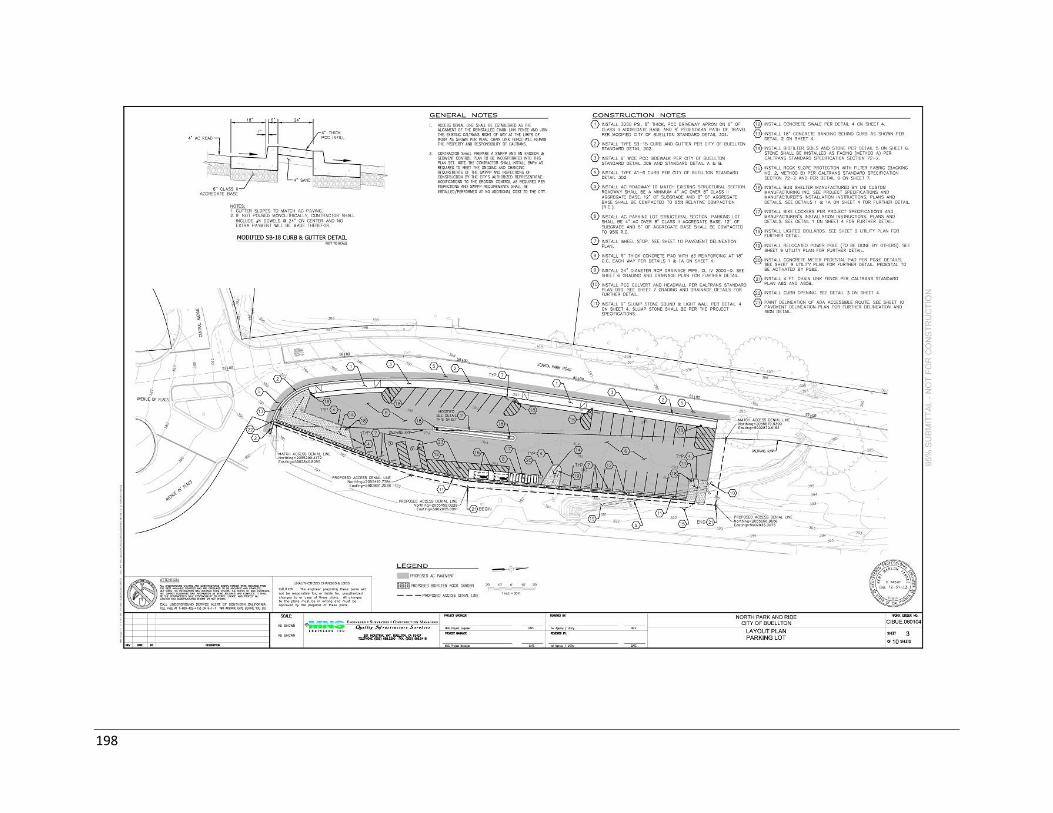
198
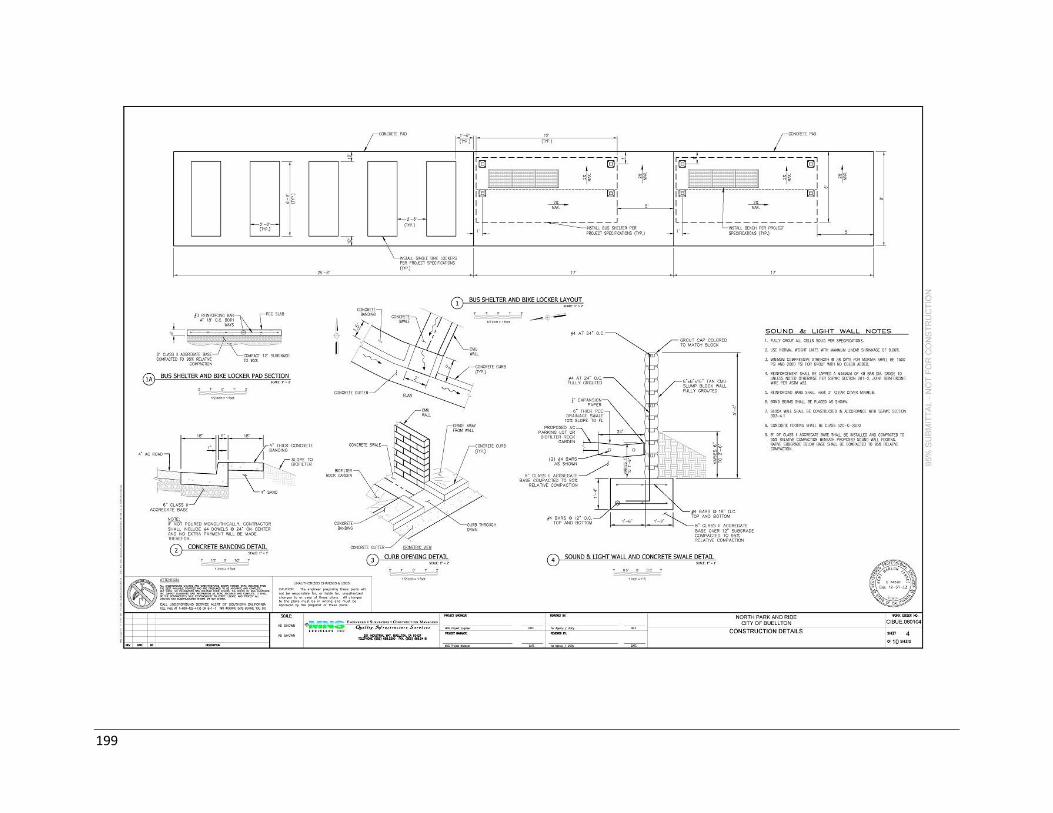
199
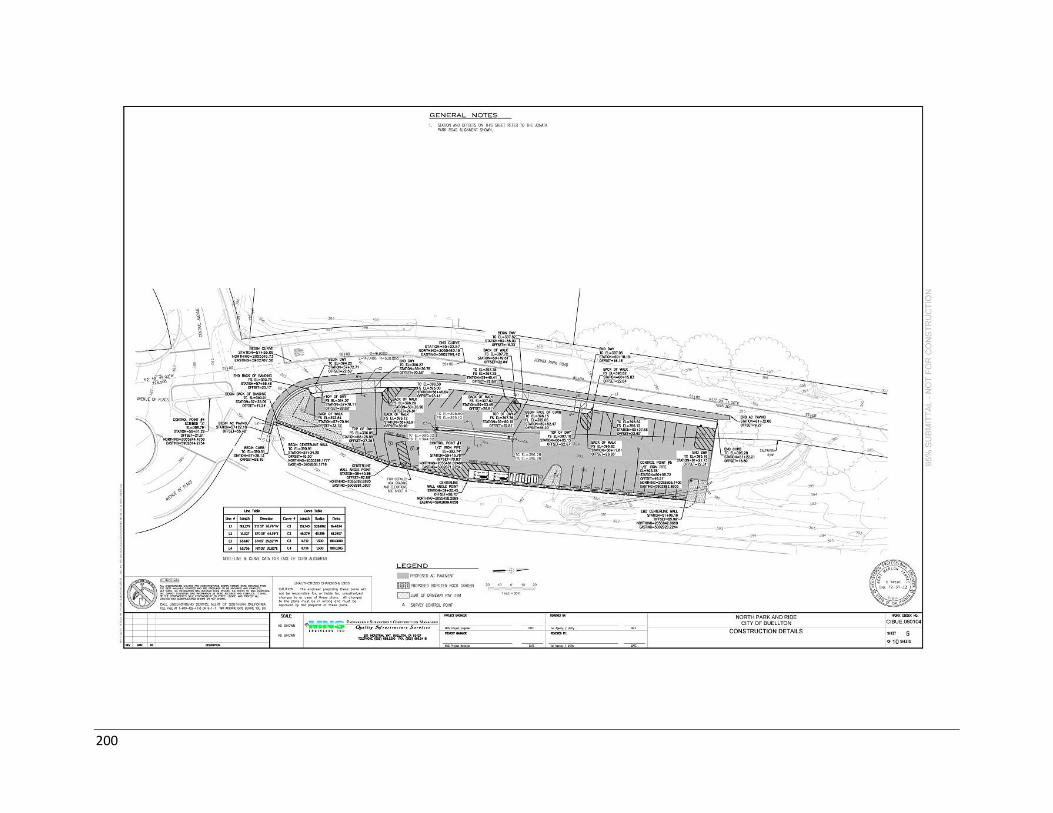
200
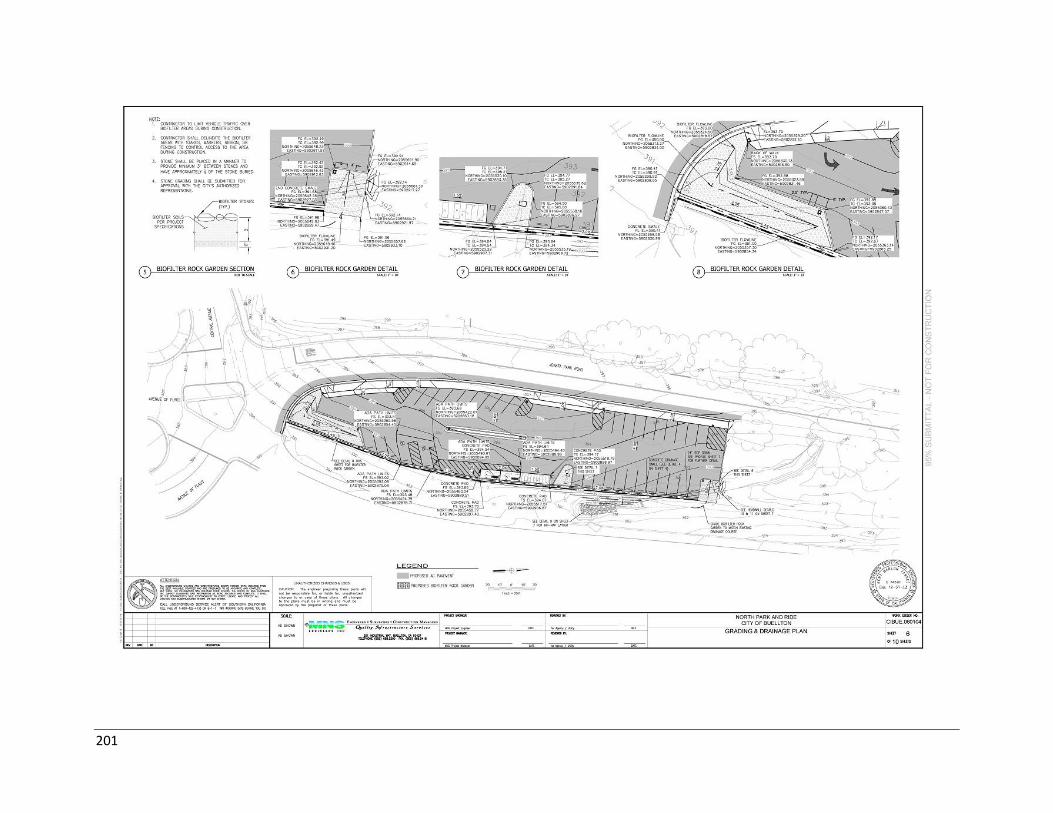
201
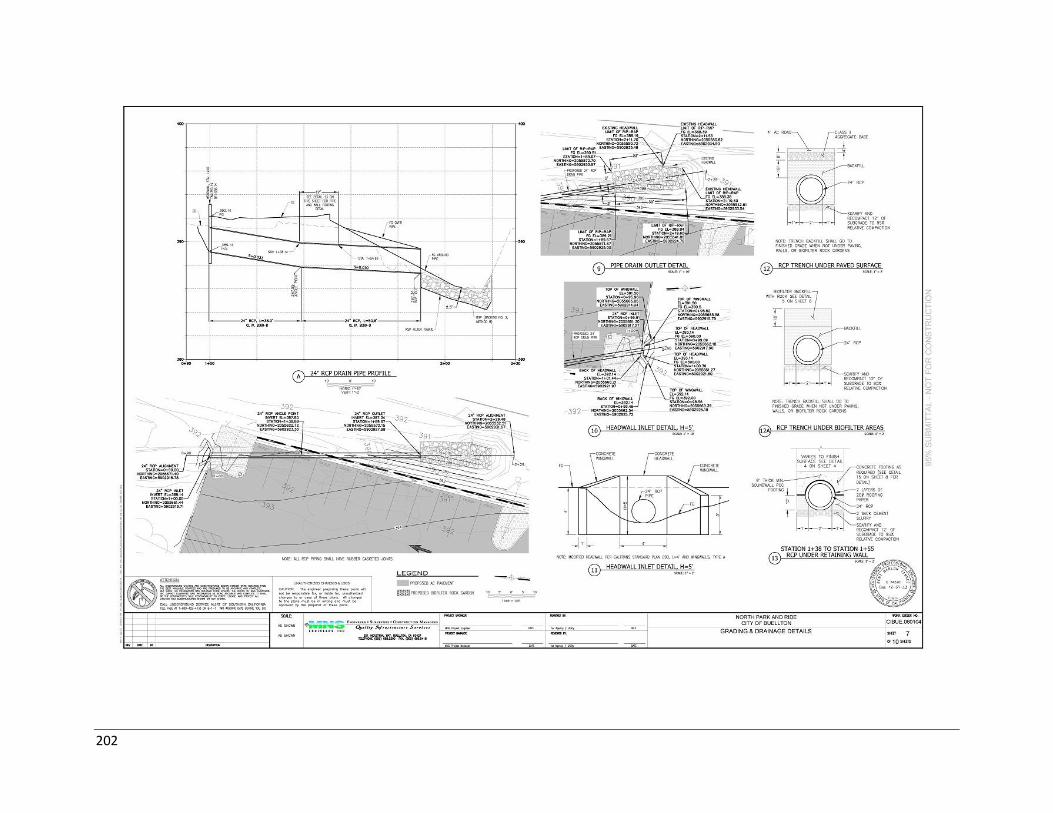
202
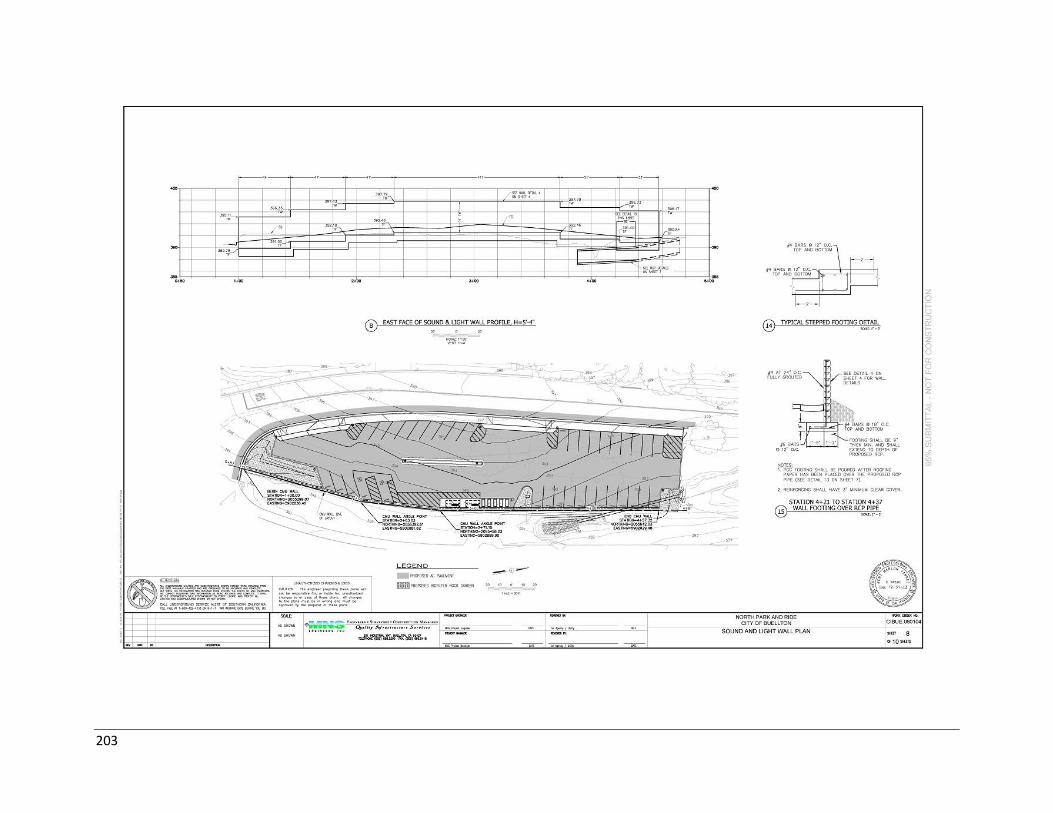
203
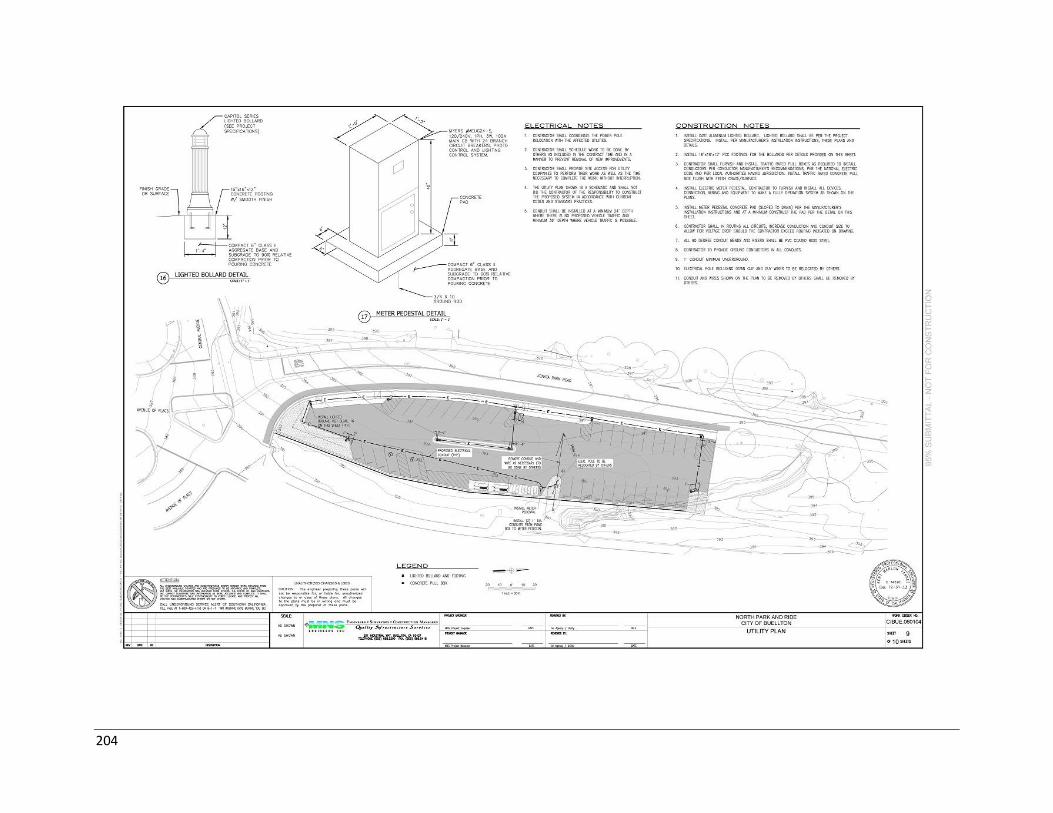
204
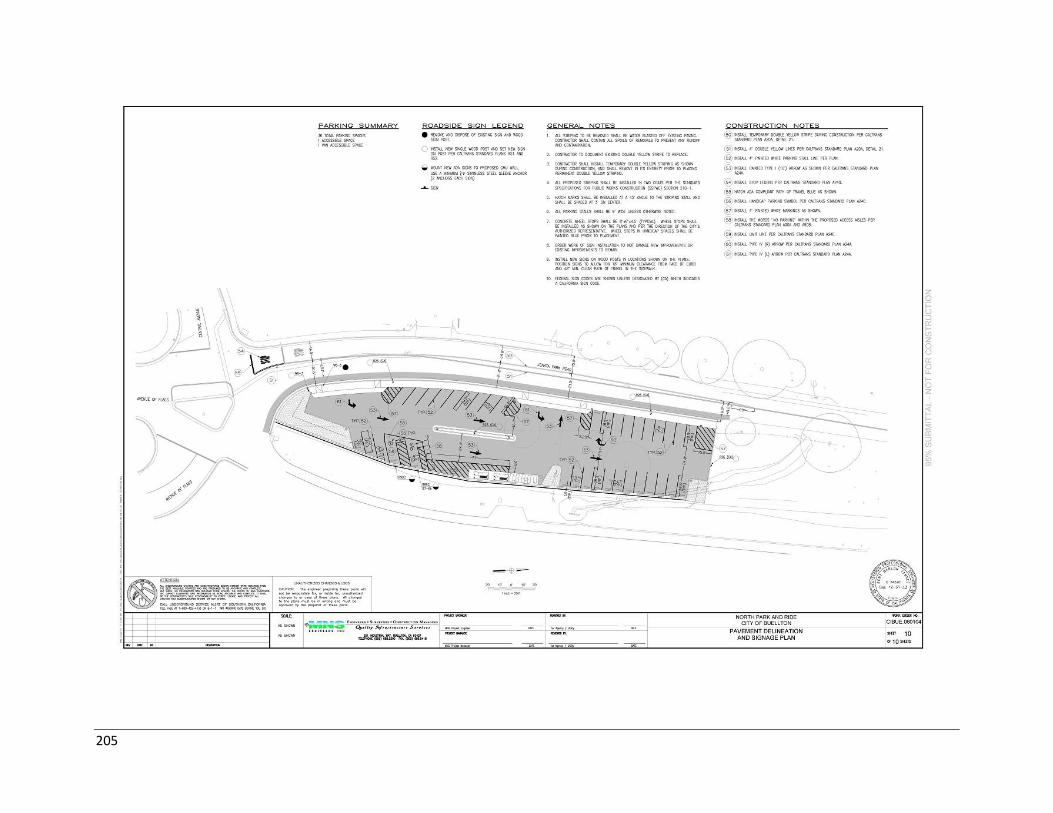
205
206
APPENDIX F: REFERENCES
American Association of State Highway and Transportation Officials (AASHTO). Guide for Park and ride
Facilities. November 2004.12
Chumash Casino Resort. Info Desk: Shuttle. Accessed June 30, 2010.
http://www.chumashcasino.com/InfoDesk/Shuttle/Shuttle.aspx
City of Santa Barbara. Monthly/Commuter Permits. Accessed May 24, 2010.
www.santabarbaraca.gov/Resident/Transportation_and_Parking/Parking/PERMITS.htm.
Franklin Regional Council of Governments. Franklin County Park and Ride Study. September 2008.
www.frcog.org/pubs/transportation/park%20and%20ride/fc_parkandride_study.pdf.
Gillham, Tim. Re: SLOCOG 2013 Park & Ride Study. E-mail correspondence. March 24, 2014.
Martin Metropolitan Planning Organization. Park and ride Study Final Report. May 2007.
http://www.martinmpo.com/wp-content/uploads/2011/12/13.-MARTINPNRFINAL1.pdf.
Metropolitan Council. Park and ride Facility Site Location Plan. May 2005.
www.metrocouncil.org/parkridefacilitysitelocation/AdoptedFinalPlanReportMay25_2005.pdf.
San Luis Obispo Council of Governments (SLOCOG). 2013 Park & Ride Lot Study. August 2013.
San Luis Obispo Council of Governments (SLOCOG). 2013 Park & Ride Lot Survey Report. May/June 2013.
Santa Barbara County Association of Governments (SBCAG). 101 In Motion Final Report. July 2006.
http://www.sbcag.org/PDFs/publications/101%20Final%20Report%20in%20Color.pdf.
Santa Barbara County Association of Governments (SBCAG). 2040 Regional Transportation Plan and
Sustainable Communities Strategy. August 2013.
http://www.sbcag.org/planning/2040RTP/images_docs/Final2040RTP&SCS-Chapters.pdf.
Santa Barbara County Association of Governments (SBCAG). Congestion Management Program.
November 2003. www.sbcag.org/PDFs/publications/2003CMP.pdf.
Santa Barbara County Association of Governments (SBCAG). South Coast Highway 101 Deficiency Plan.
June 2002. http://sbcag.org/PDFs/publications/Hwy101DeficiencyPlan.pdf.
Spillar, Robert J. Park and ride Planning and Design Guidelines, Monograph 11. October 1997.
www.pbworld.com/library/fellowship/spillar/.
12 “The foundational basis of [this] guide was the Park and Ride Planning and Design Guidelines, Monograph 11
(October, 1997), developed by Robert J. Spillar, Parsons Brinkerhoff Quade and Douglas, Inc.”
207
State of California Department of Transportation (Caltrans). Park and Ride Program Resource Guide
2010.
http://www.dot.ca.gov/hq/traffops/systemops/hov/Park_and_Ride/Park_and_Ride_Program_Reso
urce_Guide.pdf
State of California Department of Transportation (Caltrans). Division of Mass Transportation and Division
of Traffic Operations. Caltrans Park & Ride and HOV Transit Enhancement. July 2005.
http://www.dot.ca.gov/hq/MassTrans/Docs-Pdfs/BRT/BRT-Buspool-Final-Rpt.pdf
State of California Department of Transportation (Caltrans) District 5. Planning and Public Transportation
Branch. Park & Ride Program Report. May 1993.
State of California Department of Transportation (Caltrans) District 5. Planning and Public Transportation
Branch. Park & Ride Lot Final Program Report. April 1996.
United States Access Board. ADA Accessibility Guidelines for Buildings and Facilities (ADAAG). Accessed
May 24, 2010. www.access-board.gov/adaag/html/adaag.htm.
Federal Highway Administration. Publication No. FHWA-PD-93-012; Case Study No. 9: Linking
Bicycle/Pedestrian Facilities with Transit - National Bicycling and Walking Study. October 1992.
www.safety.fhwa.dot.gov/ped_bike/docs/case9.pdf
University of Aberdeen. Review of Park and Ride in Aberdeenshire. March 2006.
http://www.sustaccess.org/files/pdf/33_Final_Report_-_issue_3.pdf
Virginia Department of Transportation (VDOT). Northern Virginia Park & Ride Lot Feasibility Study. April
2003. http://virginiadot.org/projects/resources/NorthernVirginia/NoVA-pknride-study.pdf.
Virginia Department of Transportation (VDOT). Traffic Engineering Design Manual. 2006.
http://www.virginiadot.org/business/resources/vdot_tedm_toc.pdf
Williams, Laura. Re: Park and Ride Plan. E-mail correspondence. May 28, 2009.
Williams, Laura. Re: Park and Ride Plan. E-mail correspondence. June 16, 2010.
Williams, Laura. Re: Park & Ride. E-mail correspondence. May 8, 2014.