Embed Size (px)
Citation preview

Evesham Utilities Authority, NJFinal Audit Report December 2010

i
Contents Executive Summary Section 1 Introduction
1.1 General ....................................................................................................................... 1-1 1.2 Background ............................................................................................................... 1-2 1.3 Purpose and Scope ................................................................................................... 1-2
Section 2 Facility Description 2.1 Elmwood Wastewater Treatment Facility ............................................................. 2-1
2.1.1 Screening System ....................................................................................... 2-1 2.1.2 Grit Removal System ................................................................................ 2-1 2.1.3 Influent Pump Station ............................................................................... 2-1 2.1.4 Orbal Aeration System ............................................................................. 2-2 2.1.5 Clariflocculators ......................................................................................... 2-2 2.1.6 Rapid Sand Filtration ................................................................................ 2-3 2.1.7 Disinfection ................................................................................................ 2-3 2.1.8 Solids Handling ......................................................................................... 2-3
2.1.8.1 Sludge Thickening Tank .............................................................. 2-3 2.1.8.2 Belt Filter Presses .......................................................................... 2-4 2.2 Woodstream Wastewater Treatment Plant Facility ............................................. 2-4
2.2.1 Influent Pump Station ............................................................................... 2-4 2.2.2 Screening, Grease, and Grit Removal System ....................................... 2-4 2.2.3 Equalization Tank ..................................................................................... 2-5 2.2.4 Pre-Packaged Contact Stabilization Plants ............................................ 2-5 2.2.5 Biofor Filtration System ............................................................................ 2-6 2.2.6 Ultraviolet Disinfection System ............................................................... 2-6
2.3 Elmwood Administration Building with Attached Garage ............................... 2-6 2.3.1 Description of Building Envelope ........................................................... 2-6 2.3.2 Description of Building HVAC ............................................................... 2-7 2.3.3 Description of Building Lighting ............................................................ 2-7 2.4 Elmwood Sludge Recirculation/Alum Storage Building ................................... 2-8 2.4.1 Description of Building Envelope ........................................................... 2-8 2.4.2 Description of Building HVAC ............................................................... 2-8 2.4.3 Description of Building Lighting ............................................................ 2-8 2.5 Elmwood – Chemical Feed Operators Lab Building ........................................... 2-8 2.5.1 Description of Building Envelope ........................................................... 2-8 2.5.2 Description of Building HVAC ............................................................... 2-9 2.5.3 Description of Building Lighting ............................................................ 2-9 2.6 Elmwood Sludge Dewatering Building ................................................................ 2-9 2.6.1 Description of Building Envelope ........................................................... 2-9 2.6.2 Description of Building HVAC ............................................................. 2-10

Table of Contents Bordentown Sewerage Authority
ii
2.6.3 Description of Building Lighting .......................................................... 2-10 2.7 Elmwood Generator Building ............................................................................... 2-10 2.7.1 Description of Building Envelope ......................................................... 2-10 2.7.2 Description of Building HVAC ............................................................. 2-10 2.7.3 Description of Building Lighting .......................................................... 2-10 2.8 Elmwood Site Lighting .......................................................................................... 2-11 2.9 Woodstream Control/BioFor Building ............................................................... 2-11 2.9.1 Description of Building Envelope ......................................................... 2-11 2.9.2 Description of Building HVAC ............................................................. 2-11 2.9.3 Description of Building Lighting .......................................................... 2-11 2.10 Woodstream – Blower Building ........................................................................... 2-12 2.10.1. Description of Building Envelope ......................................................... 2-12 2.10.2 Description of Building HVAC ............................................................. 2-12 2.10.3 Description of Building Lighting .......................................................... 2-12 2.11 Woodstream Site Lighting ..................................................................................... 2-12
Section 3 Baseline Energy Use 3.1 Utility Data Analysis ................................................................................................ 3-1
3.1.1 Electric Charges ......................................................................................... 3-1 3.1.2 Natural Gas Charges ................................................................................. 3-2
3.2 Facility Results .......................................................................................................... 3-2 3.2.1 Elmwood Wastewater Treatment Plant Facility ................................... 3-2 3.2.2 Woodstream Wastewater Treatment Plant Facility .............................. 3-4 3.3 Aggregate Costs ........................................................................................................ 3-7 3.4 Portfolio Manager ..................................................................................................... 3-7 3.4.1 Portfolio Manager Overview ................................................................... 3-7 3.4.2 Energy Performance Rating ..................................................................... 3-7 3.4.3 Portfolio Manager Account Information................................................ 3-8
Section 4 Energy Conservation and Retrofit Measures (ECRM)
4.1 Elmwood Wastewater Treatment Facility ............................................................. 4-2 4.1.1 Orbal Aeration System ............................................................................. 4-2 4.1.2 Sludge Holding Tank-Mixing System…………………………………4-5
4.2 Woodstream Wastewater Treatment Facility ....................................................... 4-6 4.2.1 Equalization Tank Mixing System .......................................................... 4-6 4.2.2 Extended Aeration System ....................................................................... 4-8 4.2.3 Ultraviolet Disinfection System ............................................................. 4-15 4.3 Building Lighting Systems .................................................................................... 4-18 4.3.1 Elmwood Administration Building with Attached Garage .............. 4-18 4.3.2 Elmwood Sludge Recirculation/Alum Storage Building .................. 4-20 4.3.3 Elmwood Chemical Feed, Operations Lab Building .......................... 4-22 4.3.4 Elmwood Sludge Dewatering Building ............................................... 4-23 4.3.5 Elmwood Generator Building ............................................................... 4-25

Table of Contents Bordentown Sewerage Authority
iii
4.3.6 Elmwood Site Lighting ........................................................................... 4-26 4.3.7 Woodstream Control/Biofor Building ................................................. 4-28 4.3.8 Woodstream Blower Building ............................................................... 4-29 4.3.9 Woodstream Site Lighting ..................................................................... 4-31 4.4 Building HVAC Systems .................... …………………………………………...4-33 4.4.1 Elmwood Wastewater Treatment Plant…………………………… ... 4-33 4.4.2 Elmwood Administration Building with Attached Garage……… .. 4-34 4.4.3 Elmwood Sludge Recirculation/Alum Storage Building………… .. 4-41 4.4.4 Elmwood – Chemical Feed Operators Lab Building……………… .. 4-42 4.4.5 Elmwood Sludge Dewatering Building………………………………4-43 4.4.6 Elmwood Generator Building…………………………………………4-47 4.4.7 Woodstream Control/Biofor Building……………………………… . 4-47 4.4.8 Woodstream – Blower Building………………………………………4-52 4.5 Motor Upgrades and VFD Additions .................................................................. 4-53
4.5.1 Elmwood – Sludge Recirculation/Alum Storage Building & Chemical Feed Building ................................................................... 4-54
4.5.2 Elmwood – Outdoor Process Equipment ............................................ 4-55 4.5.3 Woodstream – Biofor Building .............................................................. 4-56 4.5.4 Woodstream – Blower Building ...................................... ……………..4-58
4.5.5 Woodstream – Influent Pump Station .................................................. 4-59 4.5.6 Woodstream – Junk Pump Room.......................................................... 4-60 4.5.7 Woodstream – Backwash Building ....................................................... 4-61 4.5.8 Woodstream – Outdoor Process Equipment ....................................... 4-62 4.5.9 All Combined Motors ............................................................................. 4-63
4.6 Alternative Energy Sources ................................................................................... 4-64 4.6.1 Photovoltaic Solar Energy System Overview ...................................... 4-64
4.6.1.1 Elmwood Wastewater Treatment Plant ................................. 4-66 4.6.1.2 Woodstream Wastewater Treatment Plant ............................ 4-66 4.6.1.3 Basis for Design and Calculations ........................................... 4-67
4.6.2 Ground Source Heat Pump Systems .................................................... 4-69 4.6.3 Wind Power Generation ......................................................................... 4-70 4.6.4 Combined Heat and Power Cogeneration Technology ..................... 4-72
Section 5 Evaluation of Energy Purchasing and Procurement Strategies
5.1 Energy Deregulation ................................................................................................ 5-1 5.1.1 Alternate Third Party Electrical Energy Supplier………………………5-2 5.2 Demand Response Program.................................................................................... 5-3
Section 6 Ranking of Energy Conservation and Retrofit Measures (ECRM)
6.1 ECRMs ........................................................................................................................ 6-1 6.1.1 WWTP Process Upgrades ........................................................................ 6-1 6.1.2 Lighting Systems ....................................................................................... 6-2
Table of Contents Bordentown Sewerage Authority
iv
6.1.3 HVAC Systems .......................................................................................... 6-3 6.1.4 Motor Upgrades and VFD Additions ..................................................... 6-3 6.1.5 Solar Energy………………………………………………………………6-4 6.1.6 Wind Energy .............................................................................................. 6-5
Section 7 Grants, Incentives and Funding Sources 7.1 Renewable Energy .................................................................................................... 7-1
7.1.1 Renewable Energy Certificates (NJ BPU) ............................................... 7-1 7.1.2 Clean Energy Solutions Capital Investment Loan/Grant (NJ EDA) ................................................................................................. 7-1 7.1.3 Renewable Energy Incentive Program (NJ BPU) .................................. 7-1 7.1.4 Grid Connected Renewables Program (NJ BPU) .................................. 7-2 7.1.5 Utility Financing Programs ...................................................................... 7-2 7.1.6 Renewable Energy Manufacturing Incentive (NJ BPU) ....................... 7-2 7.1.7 PSE&G Solar Loan Program .................................................................... 7-2 7.1.8 Environmental Infrastructure Financing Program (NJ DEP) .............. 7-2 7.1.9 Clean Renewable Energy Bonds (IRS) .................................................... 7-3 7.1.10 Qualified Energy Conservation Bonds (IRS) ......................................... 7-3 7.1.11 Global Climate Change Mitigation Incentive Fund (US EDA) ........... 7-3 7.1.12 Private Tax-Exempt Financing ................................................................ 7-3 7.1.13 Performance Based Contracts (ESCOs) .................................................. 7-4 7.1.14 Power Purchase Agreement (SPCs) ........................................................ 7-4
7.2 Energy Efficiency ...................................................................................................... 7-5 7.2.1 Introduction................................................................................................ 7-5 7.2.2 New Jersey Smart Start Buildings Program (NJ BPU) ......................... 7-5 7.2.3 Pay for Performance Program (NJ BPU) ................................................ 7-5 7.2.4 Local Government Energy Audits (NJ BPU) ......................................... 7-6 7.2.5 Free Energy Benchmarking ...................................................................... 7-6 7.2.6 Clean Energy Solutions Capital Investment Loan/Grant (NJ EDA) . 7-7 7.2.7 Direct Install (NJ BPU) .............................................................................. 7-7 7.2.8 Environmental Infrastructure Financing Program (NJ DEP) .............. 7-7 7.2.9 Global Climate Change Mitigation Incentive Fund (US EDA) ........... 7-7 7.2.10 Private Tax-Exempt Financing ................................................................ 7-8 7.2.11 Performance Based Contracts (ESCOs) .................................................. 7-8
Appendices Appendix A Utility Bill Information Appendix B Statement of Energy Performance - Portfolio Manager Reference Sheet Appendix C eQUEST Model Run - Summaries Appendix D Lighting Spreadsheets Appendix E Solar Energy Financing Worksheet Appendix F UV System Analysis Appendix G New Jersey Smart Incentive Worksheets

Table of Contents Bordentown Sewerage Authority
v
Appendix H Engineer’s Opinion of Probable Construction Costs Appendix I ECRM Financial Analysis Appendix J WindCAD Models Appendix K Wind Financial Worksheets Appendix L Motor and VFD Upgrades Analysis Appendix M Wind Turbine Energy System – Vendor Pricing and Information Appendix N First Energy Solutions – Alternative Energy Supplier Proposal

ES-1
Executive Summary As part of an initiative to reduce energy cost and consumption, the Evesham MUA secured the services of Camp Dresser and McKee (CDM) to perform an energy audit at their two wastewater treatment plants in an effort to develop comprehensive Energy Conservation and Retrofit Measures (ECRMs).
CDM’s energy audit team visited the facilities on July 13th 2010. As a result of the site visits and evaluation of the historical energy usage of the facilities, CDM was successful in identifying opportunities for energy savings measures.
CDM has also evaluated the potential for renewable energy technologies to be implemented at the Authority’s wastewater treatment plant facilities to offset the electrical energy usage. Specifically, the use of solar electric photovoltaic panels, ground source heat pumps and wind turbines were investigated.
In addition to identifying ECRMs and the potential for on-site energy generation, an alternate third party supplier was contacted in an effort to identify further energy cost savings available for Authority. This is discussed further in Section 5. Additionally, there is potential for the Authority to make money by participation in a Demand Response Program, as discussed in Section 5.2.
Not all ECRMs identified as a result of the energy audit are recommended. ECRMs must be economically feasible to be recommended for implementation. The feasibility of each ECRM was measured through a simple payback analysis. The simple payback period was determined after establishing Engineer’s Opinion of Probable Construction Cost estimates, O&M estimates, projected annual energy savings estimates, and the potential value of New Jersey Clean Energy rebates, or Renewable Energy Credits, if applicable. Generally, ECRMs with a payback period of 20 years or less are recommended, unless other factors such as wastewater system operational issues need to be factored into the decision process.
Historical Energy Usage The following table, Table ES-1, summarizes the historical energy usage at each of facility, for the average from January 2009 through January 2010, as presented in Section 3. These values can serve as a benchmarking tool, along with the building profile that has been established through the EPA’s Portfolio Manager Program for the wastewater treatment plant facility, to quantify the reduction in electrical energy and natural gas usage following the implementation of the recommended ECRMs.

Executive Summary
ES-2
Table ES-1: Summary of Annual Energy Usage & Cost
Electrical Energy
Use (kWH)
Peak Summer Demand
(kW)
Peak Winter
Demand (kW)
Fuel Use for Entire Building (therms)
Cost for Electric Service
Cost for Fuel
Elmwood WWTP 2,301,075 391 402.4 9,769 $323,758 $11,158
Woodstream WWTP 2,793,110 436.9 458.7 9,929 $385,548 $11,329
Wastewater Process Improvements ECRMs The following table, Table ES-2, presents the recommended ECRM identified
Table ES-2 Ranking of Energy Savings Measures for Wastewater Process Improvements
Overall Ranking
(Based on Simple
Payback) Site Total Cost
Anticipated Annual Energy Savings (kWh)
Annual Fiscal
Savings1
Simple Payback (Years)
1
Woodstream WPCF – New VFDs and Control
System for Contact Stabilization Plants
$264,888 293,862 $109,165 2.4
2 Elmwood WPCF – Orbal
System Controls Upgrade
$581,100 939,207 $142,890 4.1
3 Woodstream WPCF –
Flow Pacing Integration for UV System
$177,840 171,288 $23,980 7.4
4 Woodstream WPCF – Equalization Tank $213,000 209,300 $29,400 7.5
1. Annual Fiscal Savings accounts for maintenance costs.
Building Lighting and HVAC System ECRMs The following table, Table ES-3, presents the ranking of recommended ECRMs identified for the building lighting and HVAC systems based on the simple payback analysis.
Additional ECRMs associated were identified and evaluated, as discussed in Sections 2 and 4; but, were not recommended due to longer payback periods. This table includes the Engineer’s Opinion of Probable Construction Cost, projected annual energy cost savings, projected annual energy usage savings, and total simple payback period for each recommended ECRM. The ECRMs are ranked based on payback period.

Executive Summary
ES-3
Table ES-31 Ranking of Energy Savings Measures for Building Lighting and HVAC Systems
Overall Ranking
(Based on Simple
Payback) Site Total Cost
Anticipated Annual Energy Savings
Annual Fiscal
Savings3
Simple Payback (Years)
1 Elmwood Site Lighting - Lighting Upgrades $11,688.8 14851.2 kWh $2,079.2 5.3
2 Woodstream Site Lighting - Lighting Upgrades $6,875.6 8,736 kWh $1,223 5.3
3 Elmwood Sludge
Recirculation/Alum Storage Building - Lighting Upgrades
$5,721.1 4,741 kWh $663.7 7.9
4 Woodstream Control/Biofor Building - Lighting Upgrades $10,714.7 9,026 kWh $1,263.7 8.0
5 Elmwood Chemical Feed, Operators Lab Building -
Lighting Upgrades $2,819.5 2,317 kWh $324.4 8.0
6 Elmwood Administration
Building with Attached Garage - Lighting Upgrades
$20,060 12,848.1 kWh $1,799 8.8
7 Elmwood Sludge Dewatering Building - Lighting Upgrades $6,039.3 4,098 kWh $573.7 9.9
8 Elmwood Administration
Building with Attached Garage- Furnace Upgrades
$9,846 751 Therms $902 10.9
9 Woodstream Blower Building - Lighting Upgrades $2,706 1,151 kWh $161.2 11.1
10 Elmwood Generator Building - Lighting Upgrades $2,076.3 1,124 kWh $157.3 11.3
11 Elmwood Administration
Building with Attached Garage - Condenser Upgrades
$11,236 6,450 kWh $903 12.4
12 Elmwood Sludge Dewatering Building – Boiler Upgrade $14,847 354 Therms $1,175 12.6
13 Woodstream Control/Biofor Building – Condenser Upgrade $11,666 3,510 kWh $491 23.8
1. ‘Total Cost’ takes into account any applicable rebates. 2. Savings assume all building heat provided by natural gas, at current natural gas
aggregate rate per therm 3. ‘Annual Fiscal Savings’ takes into account maintenance costs.
Motor Upgrades and VFD Addition ECRMs Section 4.4 of the report provides for an economic evaluation of upgrading all motors over 20 HP to premium efficiency, and adding VFDs to pumps that are currently utilizing other forms of starters.
Table ES-4 includes a simple payback analysis for the upgrade of motors, and addition of VFDs.

Executive Summary
ES-4
Table ES-4 Ranking of Energy Savings Measures for Motor Upgrades and VFDs
Overall Ranking
(Based on Simple
Payback) Site Total Cost1
Anticipated Annual Energy
Savings
Annual Fiscal
Savings2
Simple Payback (Years)
1 Woodstream - Outdoor Process Motor Upgrades $8,486.4 53,214.7 kWh $7,450.1 1.1
2 Elmwood Outdoor Process Motor Upgrades $44,697 226,336 kWh $31,687 1.4
3
Elmwood Sludge Recirculation/Alum
Storage Building Motor Upgrades
$66,231 204,939 kWh $28,691 2.3
4 Woodstream - Biofor Building Motor Upgrades $24,872.8 57,876.8 kWh $8,103 3.1
6 Woodstream - Influent Pump Station Motor
Upgrades $6,268.5 9,764.2 kWh $1,367 4.6
7 Woodstream - Junk Pump Room Motor Upgrades $29,211.4 40,730.8 kWh $5,702 5.1
8 Woodstream - Backwash Building Motor Upgrades $20,700 21,496.6 kWh $3,010 6.9
9 Woodstream - Blower Building Motor Upgrades $34,250 27,487.2 kWh $3,848.2 8.9
1. ‘Total Cost’ takes into account any applicable rebates.
Renewable Energy ECRMs Solar Energy Section 4.5 of the report provides for an economic evaluation of a PV solar system that was evaluated to be installed at Evesham MUA facilities. The evaluation covered the economic feasibility of the MUA installing a solar energy system under a typical construction contract and to assume full responsibility of the operation of such a system.
Based on a simple payback model, summarized in Table ES-5, it would benefit the Evesham MUA to further investigate the installation of a solar energy system at the Elmwood Treatment Plant, but not at the Woodstream Treatment Plant. This is primarily based on the initial upfront capital investment required for a solar energy system installation and the 13.3 year payback period for the Elmwood Treatment Plant, and a negative net present value (NPV) for the Woodstream Treatment Plant. This payback period may justify installing the solar energy system. Other options such as Power Purchase Agreements are potentially available as well to help finance

Executive Summary
ES-5
the project. Solar technology is constantly changing and will most likely continue to lower in price. Two major factors influencing the project financial evaluation is the variance of the prevailing energy market conditions and Solar Renewable Energy Credit (SREC) rates, with the largest impact to the payback model being the SREC credit pricing.
Table ES-5 includes a simple payback analysis for the installation of a solar energy system at the Elmwood WWTP. Refer to Appendix E for a more detailed solar financing spreadsheet.
Table ES-5: Simple Payback Analysis for Solar Energy System
Parameter Solar
Engineer's Opinion of Probable Cost $2,806,213
1st Year Production 373,830 kWh
Annual Electric Savings $52,336.2
Annual Estimated SREC Revenue $158,130
Project Simple Payback 13.3 Years
Wind Power Generation Section 4.3.2 of the report provides for an economic evaluation of a wind turbine energy system that is not recommended to be installed at any of the Evesham MUA Facilities, due to a payback period of greater than 20 years. The evaluation covered the economic feasibility of furnishing and installing a wind turbine energy system under a typical construction contract and to assume full responsibility of the operation of such a system.
Wind power as a renewable energy source also qualifies for Renewable Energy Certificates (REC’s). The prevailing energy market, Renewable Energy Incentive Program (REIP) and REC’s comprise the major factors influencing a wind turbine energy system installation. Other options, such as government bonds or a Power Purchase Agreement are potentially available and can assist with the financing of this project.
Table ES-6 includes a typical simple payback analysis for the installation of a wind turbine energy system located in the Borough. Refer to Appendix K for a more detailed wind energy financing spreadsheet.
Table ES-6: Ranking of Energy Savings Measures Summary – Wind Turbine Energy System
Parameter
Wind Turbine (Minimum Site
Wind Speed – 3.6 m/s)
Wind Turbine (Maximum Site
Wind Speed – 5.2 m/s)
Wind Turbine (Average Site
Wind Speed – 4.4 m/s)
Engineer’s Opinion of Probable Cost
$71,995 $71,995 $71,995

Executive Summary
ES-6
Table ES-6: Ranking of Energy Savings Measures Summary – Wind Turbine Energy System
Parameter
Wind Turbine (Minimum Site
Wind Speed – 3.6 m/s)
Wind Turbine (Maximum Site
Wind Speed – 5.2 m/s)
Wind Turbine (Average Site
Wind Speed – 4.4 m/s)
Renewable Energy Incentive Program**
($10,058) ($31,968) ($20,035)
Total Cost $61,937 $40,027 $51,960
1st Year Production 3,143 kWh 9,990 kWh 6,261 kWh
Annual Estimated Electric Savings $440.0 $1,398.6 $876.5
Annual Estimated REC Revenue $79 $250 $157
Project Simple Payback 119 Years 24 Years 50 Years
** REIP incentive is calculated for only the first year and is applied as a deduction.
Recommended ECRMs Table ES-7 summarizes the Total Engineer’s Opinion of Probable Construction Cost, annual energy savings, projected annual energy and O&M cost savings and the payback period based on the implementation of all of the above recommended ECRMs.
Table ES-7: Recommended ECRM’s1
Total Engineer’s Opinion of Probable Construction Cost
Projected Annual Energy Savings (kWH or therms)
Projected Annual Fiscal Savings
Simple Payback Period (years)
$1,587,841 2,324,355 kWh 1105 Therms $407,009 3.9
1. Does not include energy savings associated with Solar Energy System or Wind Power Generation.

1-1
C:\cdmxm\cranerp\d0453649\Section 1.doc
Figure 1-1: Energy Audit Phases
Section 1 Introduction 1.1 General As part of an initiative to reduce energy cost and consumption, the Evesham Municipal Utilities Authority (EMUA) has secured the services of Camp Dresser and McKee (CDM) to perform an energy audit for their Elmwood and Woodstream wastewater treatment plants in an effort to develop comprehensive energy conservation initiatives.
The performance of an Energy Audit requires a coordinated phased approach to identify, evaluate and recommend energy conservation and retrofit measures (ECRM). The various phases conducted under this Energy Audit included the following:
Gather preliminary data on all facilities;
Facility inspection;
Identify and evaluate potential ECRMs and evaluate renewable/distributed energy measures;
Develop the energy audit report.
Figure 1-1 is a schematic representation of the phases utilized by CDM to prepare the Energy Audit Report.

Section 1 Introduction
1-2
C:\cdmxm\cranerp\d0453649\Section 1.doc
1.2 Background The EMUA owns and operates two wastewater treatment plants; the Elmwood and Woodstream wastewater treatment plants having a design average flow rating of 2.5 and 1.5 million gallons per day, respectively. Both treatment plants are located in Evesham, New Jersey. The collection system consists of 131 miles of sewer pipes and twenty three (23) remote pump stations. Seven of the pump stations serve the Woodstream collection system with the remaining pump stations serving the Elmwood collection system.
The Elmwood wastewater treatment plant utilizes the Activated Sludge Process to provide primary and secondary treatment for the removal of BOD5, ammonia, and suspended solids in the wastewater flow. Primary treatment consists of influent screening, grit removal, and influent pumping. Secondary treatment consists of aeration utilizing two Orbal aeration units, final sedimentation through two clariflocculators, rapid sand filtration, and chlorination and dechlorination using sodium hypochlorite and sodium bisulfate, respectively. Treated wastewater is ultimately discharged into the Southwest Branch of the Rancocas Creek.
Waste activated sludge removed from the clariflocculators is conveyed to the sludge thickening tank where it is aerated prior to being conveyed to the belt filter presses located in the Sludge Handling Facility where sludge cake is produced at a concentration of 18% minimum.
The Woodstream wastewater treatment plant also employs the Activated Sludge Process to provide primary and secondary treatment for the removal of BOD5 and suspended solids in the wastewater flow. Primary treatment consists of conveying the wastewater into a grit, grease and screenings removal unit where heavy inorganic solids, fats and grease are removed. Effluent from the grit, grease and screenings removal unit is conveyed to an equalization tank where the wastewater flow is mixed via aeration. Secondary treatment consists of utilizing two pre-packaged treatment units employing the contact stabilization process, a Biofor filtration system which provides both the physical removal of remaining solid matter and the biological removal of ammonia, and ultraviolet disinfection. Treated wastewater is ultimately discharged into the Pennsauken Creek.
Both pre-packaged treatment plants are equipped with aerobic digesters where the sludge is hauled to the Elmwood wastewater treatment plant for processing.
1.3 Purpose and Scope The objective of the energy audit is to identify energy conservation and retrofit measures to reduce energy usage and to develop an economic basis to financially validate the planning and implementation of identified energy conservation and retrofit measures.

Section 1 Introduction
1-3
C:\cdmxm\cranerp\d0453649\Section 1.doc
Significant energy savings may be available with retrofits to the buildings’ envelopes, heating and cooling systems and lighting systems. It should be noted that the magnitude of energy savings available is not only dependent on the type of treatment process and delivery systems in use, but also on the age and condition of the equipment and the capital available to implement major changes. Therefore, with the growing demands for electricity and the increased cost for this electricity, feasible alternatives for reducing energy consumption and operating costs must be evaluated for each wastewater treatment plant on a case-by-case basis.
The purpose of this energy audit is to identify the various critical processes within the Elmwood and Woodstream wastewater treatment plant facilities that are major consumers of electrical energy and are clear candidates for energy savings measures. In addition, potential energy producing systems such as combined heat and power co-generation, solar electric, ground source heat pumps, and wind energy systems to be located at the wastewater treatment plants were also evaluated. A discussion on these technologies is included in Section 4 Energy Conservation and Retrofit Measures (ECRM).
The existing process systems that have been identified for possible energy savings retrofits include the following:
Internal Screw Lift Pumps;
Elmwood Wastewater Treatment Plant
Orbal Surface Aeration System;
Utility Plant Water System;
Waste Activated Sludge Holding Tank Mixing System;
Building HVAC Systems;
Building Lighting Systems; and
Motor Upgrades.
Equalization Tank Mixing System;
Woodstream Wastewater Treatment Plant
Contact Stabilization Package Plants Aeration System;
Ultraviolet Disinfection System;
Building HVAC Systems;

Section 1 Introduction
1-4
C:\cdmxm\cranerp\d0453649\Section 1.doc
Building Lighting Systems; and
Motor Upgrades.
In addition to identifying ECRMs and the potential for on-site energy generation, alternative third party suppliers were contacted in an effort to identify further cost savings available for the Authority, by switching service providers. This is discussed further in Section 5.
2-1
Section 2 Facility Description
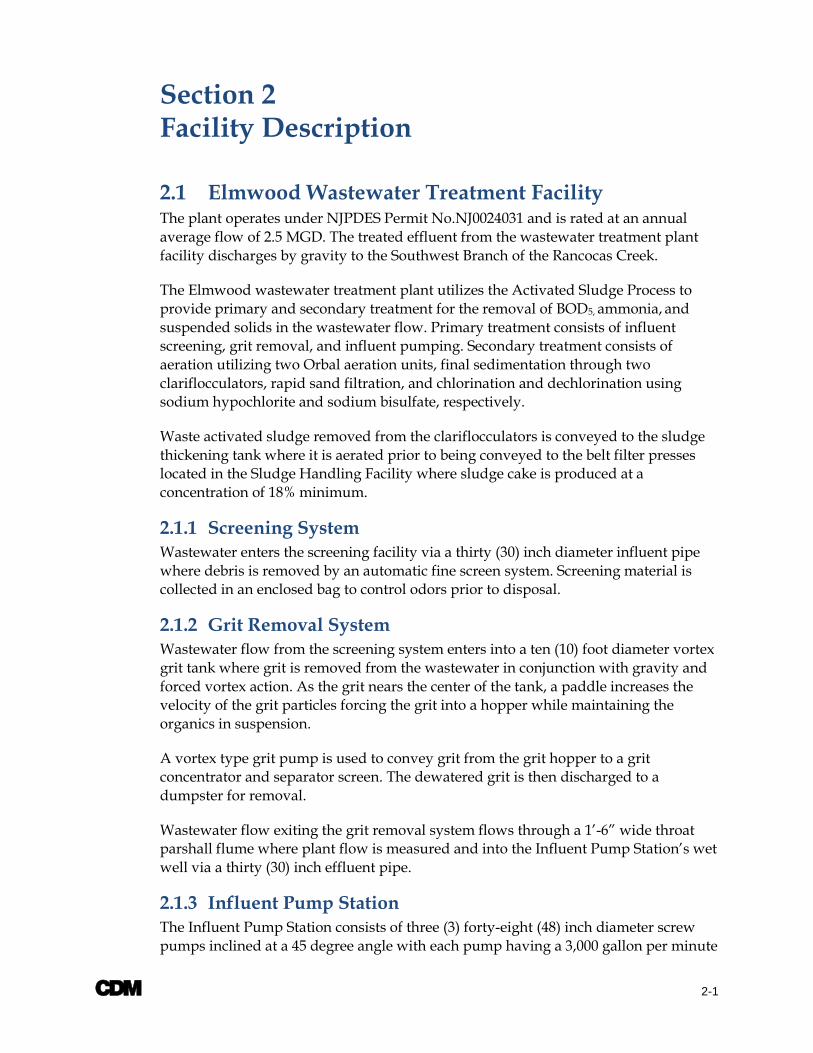
2.1 Elmwood Wastewater Treatment Facility The plant operates under NJPDES Permit No.NJ0024031 and is rated at an annual average flow of 2.5 MGD. The treated effluent from the wastewater treatment plant facility discharges by gravity to the Southwest Branch of the Rancocas Creek.
The Elmwood wastewater treatment plant utilizes the Activated Sludge Process to provide primary and secondary treatment for the removal of BOD5, ammonia, and suspended solids in the wastewater flow. Primary treatment consists of influent screening, grit removal, and influent pumping. Secondary treatment consists of aeration utilizing two Orbal aeration units, final sedimentation through two clariflocculators, rapid sand filtration, and chlorination and dechlorination using sodium hypochlorite and sodium bisulfate, respectively.
Waste activated sludge removed from the clariflocculators is conveyed to the sludge thickening tank where it is aerated prior to being conveyed to the belt filter presses located in the Sludge Handling Facility where sludge cake is produced at a concentration of 18% minimum.
2.1.1 Screening System Wastewater enters the screening facility via a thirty (30) inch diameter influent pipe where debris is removed by an automatic fine screen system. Screening material is collected in an enclosed bag to control odors prior to disposal.
2.1.2 Grit Removal System Wastewater flow from the screening system enters into a ten (10) foot diameter vortex grit tank where grit is removed from the wastewater in conjunction with gravity and forced vortex action. As the grit nears the center of the tank, a paddle increases the velocity of the grit particles forcing the grit into a hopper while maintaining the organics in suspension.
A vortex type grit pump is used to convey grit from the grit hopper to a grit concentrator and separator screen. The dewatered grit is then discharged to a dumpster for removal.
Wastewater flow exiting the grit removal system flows through a 1’-6” wide throat parshall flume where plant flow is measured and into the Influent Pump Station’s wet well via a thirty (30) inch effluent pipe.
2.1.3 Influent Pump Station The Influent Pump Station consists of three (3) forty-eight (48) inch diameter screw pumps inclined at a 45 degree angle with each pump having a 3,000 gallon per minute

Section 2 Facility Description
2-2
flow capacity. Each pump is equipped with a 40 Hp constant speed motor. Typically, one internal screw pump is operation to convey average daily flow and a second pump is placed into operation, if required, to convey wet weather flows. Pump operation is controlled via a bubbler control system.
The wastewater flow from the grit removal system as well as wash water flow from the belt filter press system, drain lines from the Orbal aeration units, seal water flow from various pump systems, backwash flow from the sand filter system, and sanitary flow from various buildings within the treatment plant discharge into the pump station’s wet well. Wastewater flow from the screw pumps discharges into a distribution box which distributes the flow to the two Orbal aeration units.
2.1.4 Orbal Aeration System Wastewater flow from the screw pump distribution box is conveyed to a distribution box associated with each Orbal Aeration System whereby the flow can be distributed to Cell 1 and/or Cell 2 via the use of sluice gates. As the flow is discharged to Cell 1 or 2 of each Orbal Aeration System, it passes through one (1) or four (4) Palmer Bowlus flumes which measures and records the “relative” flow distribution to the various cells.
Each Orbal Aeration System is a multi-cell structure consisting of three (3) aeration cells and an outlet cell located at the center of each unit. Four (4) two speed forty (40) horsepower rotary aerator assemblies are provided for mixing and aeration within each aeration system. Molded thermoplastic discs are provided to provide the necessary mixing and oxygen transfer to the wastewater.
Three (3) variable speed screw-centrifugal type pumping units having 40 Hp motors are provided to return sludge from the clariflocculators to the Orbal Aeration System. The variable speed pumping system can vary the return activated sludge flow from 50% to 150% of the design average flow as required to balance the solids loading in the Orbal Aeration System.
Three (3) constant speed screw-centrifugal type pumping units having 3 Hp motors are provided to waste sludge from the activated sludge process.
2.1.5 Clariflocculators Wastewater flow from each Orbal Aeration System is conveyed by gravity to a sixty-five (65) foot diameter clariflocculator via a twenty-four (24) inch pipeline. The wastewater flow enters each clariflocculator through a thirty (30) foot diameter center influent well.
Scum and grease which enter the clariflocculator from the Orbal Aeration System are skimmed from the water surface by a full surface skimmer and discharged into a scum box where the grease and scum are combined with the settled sludge within the
Section 2 Facility Description
2-3
clariflocculator. The quantity of settled sludge removed from the clariflocculator is controlled by a telescopic valve.
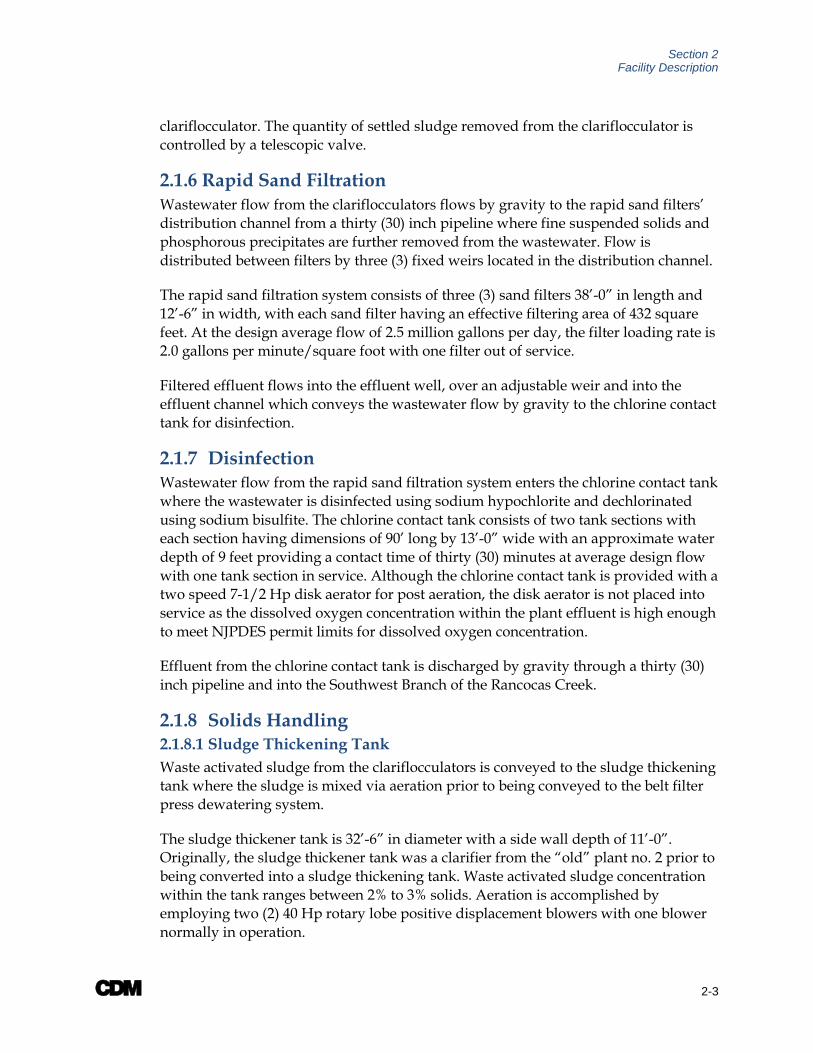
2.1.6 Rapid Sand Filtration Wastewater flow from the clariflocculators flows by gravity to the rapid sand filters’ distribution channel from a thirty (30) inch pipeline where fine suspended solids and phosphorous precipitates are further removed from the wastewater. Flow is distributed between filters by three (3) fixed weirs located in the distribution channel.
The rapid sand filtration system consists of three (3) sand filters 38’-0” in length and 12’-6” in width, with each sand filter having an effective filtering area of 432 square feet. At the design average flow of 2.5 million gallons per day, the filter loading rate is 2.0 gallons per minute/square foot with one filter out of service.
Filtered effluent flows into the effluent well, over an adjustable weir and into the effluent channel which conveys the wastewater flow by gravity to the chlorine contact tank for disinfection.
2.1.7 Disinfection Wastewater flow from the rapid sand filtration system enters the chlorine contact tank where the wastewater is disinfected using sodium hypochlorite and dechlorinated using sodium bisulfite. The chlorine contact tank consists of two tank sections with each section having dimensions of 90’ long by 13’-0” wide with an approximate water depth of 9 feet providing a contact time of thirty (30) minutes at average design flow with one tank section in service. Although the chlorine contact tank is provided with a two speed 7-1/2 Hp disk aerator for post aeration, the disk aerator is not placed into service as the dissolved oxygen concentration within the plant effluent is high enough to meet NJPDES permit limits for dissolved oxygen concentration.
Effluent from the chlorine contact tank is discharged by gravity through a thirty (30) inch pipeline and into the Southwest Branch of the Rancocas Creek.
2.1.8 Solids Handling 2.1.8.1 Sludge Thickening Tank Waste activated sludge from the clariflocculators is conveyed to the sludge thickening tank where the sludge is mixed via aeration prior to being conveyed to the belt filter press dewatering system.
The sludge thickener tank is 32’-6” in diameter with a side wall depth of 11’-0”. Originally, the sludge thickener tank was a clarifier from the “old” plant no. 2 prior to being converted into a sludge thickening tank. Waste activated sludge concentration within the tank ranges between 2% to 3% solids. Aeration is accomplished by employing two (2) 40 Hp rotary lobe positive displacement blowers with one blower normally in operation.
Section 2 Facility Description
2-4
Thickened sludge is conveyed to the belt filter press dewatering system via the sludge transfer pumps.
2.1.8.2 Belt Filter Presses All sludge produced from the Elmwood and Woodstream Wastewater Treatment Plant facilities are dewatered at the Elmwood Wastewater Treatment Plant prior to ultimate disposal.
There are two (2) belt filter presses each with a design capacity of 160 gallons per minute and a belt filter width of 2.2 meters. The belt filter presses have been designed to achieve a minimum solids capture of 95% with a minimum cake solid concentration of 18%.
2.2 Woodstream Wastewater Treatment Plant Facility The plant operates under NJPDES Permit No.NJ0024040 and is rated at an annual average flow of 1.5 MGD. The treated effluent from the wastewater treatment plant facility discharges by gravity to the Pennsauken Creek.
The Woodstream wastewater treatment plant also employs the Activated Sludge Process to provide primary and secondary treatment for the removal of BOD5 and suspended solids in the wastewater flow. Primary treatment consists of conveying the wastewater into a grit, grease and screenings removal unit where heavy inorganic solids, fats and grease are removed. Effluent from the grit, grease and screenings removal unit is conveyed to an equalization tank where the wastewater flow is mixed via aeration. Secondary treatment consists of utilizing two pre-packaged treatment units employing the contact stabilization process, a Biofor filtration system which provides both the physical removal of remaining solid matter and the biological removal of ammonia, and ultraviolet disinfection.
Both pre-packaged treatment plants are equipped with aerobic digesters where the sludge is hauled to the Elmwood wastewater treatment plant for processing.
2.2.1 Influent Pump Station Wastewater collected from the Woodstream Sewer Service Area enters a pump station (Pump Station Number 1), where the wastewater is collected and pumped into a Lakeside complete plant for the removal of screenings, grease, and grit material. The pump station consists of three (3) submersible variable speed 25 Hp pumps. Typically, two (2) pumps are in operation.
2.2.2 Screening, Grease, and Grit Removal System From Pump Station Number 1, wastewater is conveyed to a Lakeside complete plant which provides for the removal of screenings, grease, and grit. The screening removal portion of the complete plant incorporates a rotating screening basket having ¼ inch spacing with a peak flow capacity of 4.79 million gallons per day. The screening

Section 2 Facility Description
2-5
system is also equipped with a wash water spray system which removes organic material and a screw press conveyer which removes excess water while reducing the screening material volume to at least 40% of its volume prior to discharge. Wastewater from the complete plant flows by gravity into the equalization tank.
2.2.3 Equalization Tank Wastewater flow from the Lakeside complete plant as well as filter backwash water from the Biofor system enters the equalization tank which is 48’-0”in diameter with a sidewall depth of 20’-0” and consisting of ninety-six (96) coarse bubble diffusers. Two (2) constant speed 60 Hp positive displacement blowers (normally one blower is in operation) provides the necessary aeration to keep the contents within the equalization tank well mixed before being conveyed to the two (2) pre-packaged contact stabilization plants by two (2) constant speed 7-1/2 Hp pumping units.
2.2.4 Pre-Packaged Contact Stabilization Plants Wastewater flow from the equalization tank is pumped into a flow distribution box which distributes the wastewater flow into two (2) pre-packaged contact stabilization plants numbered 1 and 2. Flow distribution is approximately 35% for plant number 1 and 65% for plant number 2.
Contact Stabilization Plant Number 1 has an outer diameter of 70’-0” with a clarifier diameter of 32’-6”. The plant is equipped with a reaeration zone having a 132,000 gallon capacity with a side water depth of 15’-0”, a contact zone having a 79,000 gallon capacity with a side water depth of 15’-0”, a clarifier having a 81,318 gallon capacity with a surface area of 829 square feet, and a digester zone having a 116,000 gallon capacity with a side water depth of 15’-0”.,
Contact Stabilization Plant Number 2 has an outer diameter of 84’-0” with a clarifier diameter of 41’-6”. The plant is equipped with a reaeration zone having a 208,000 gallon capacity with a side water depth of 15’-0”, a contact zone having a 95,000 gallon capacity with a side water depth of 15’-0”, a clarifier having a 124,609 gallon capacity with a surface area of 1,320 square feet, and a digester zone having a 171,000 gallon capacity with a side water depth of 15’-0”.,
Aeration is provided to the contact stabilization plants by three (3) constant speed centrifugal blowers. Two (2) blowers (numbers 1 and 2) are equipped with 150 Hp motors and the third blower (number 3) is equipped with a 100 Hp motor. Typically, blower number 1 or 2 provides air to contact stabilization plant number 2 and blower number 3 provides air to contact stabilization plant number 1.
Sludge produced from the two contact stabilization plants is hauled to the Evesham wastewater treatment plant for further processing.
Effluent from the contact stabilization plants is screened prior to being pumped to the Biofor filtration system via Pump Station Number 2.

Section 2 Facility Description
2-6
2.2.5 Biofor Filtration System The Biofor system consists of three (3) up flow filter cells where ammonia is removed biologically and additional removal of suspended solid material occurs. Filtered effluent is collected in the filter system’s Clearwell Tank where the effluent flows by gravity to the ultraviolet disinfection system. Filter backwash water is collected in the filter system’s Mudwell Tank and conveyed back to the equalization tank.
2.2.6 Ultraviolet Disinfection System The Infilco DeDegremont, Inc. Aquaray 40 Ultraviolet (UV) Disinfection System consists of two channels having a total of 320 low pressure, low output lamps orientated in a vertical arrangement. Flow through the channel is perpendicular to the lamps. The two (2) channels consist of 2 banks (2 modules per bank), each rated to treat 2 MGD of wastewater flow at a design UV Transmittance of 65%. At the time of the energy audit, both channels were in use.
The banks are controlled and monitored by a PLC located in the Power Distribution System; however, the PLC control system is currently not in operation. As a result, all lamps are activated under full intensity during the course of the day independent of plant flow.
Effluent from the ultraviolet disinfection system discharges by gravity to the Pennsauken Creek.
2.3 Elmwood Administration Building with Attached Garage
2.3.1 Description of Building Envelope The energy audit included an evaluation of the building’s envelope (exterior shell) to determine the components’ effective R-values to be utilized in the building model and to locate and fix any thermal weaknesses that may be present. The components of a building envelope include the exterior walls, foundation and roof. The construction and material, age and general condition of these components, including exterior windows and doors, impact the building’s energy use.
The Elmwood Administration Building along with its Attached Garage’s walls consists of 4” brick and motar façade with 8” CMU back up blocks. The existing roofing system consists of metal roofing over a pitched roof deck with 3” rigid insulation above the 5/8” drywall attic ceiling. We were not able to access the roof at the time of the audit, but CDM did note small signs of interior leakage. This could indicate infiltration of water from the roof deck or condensation from piping.
The windows throughout the building are insulating double pane windows with weatherstripping. The majority of the doors are of steel and glass construction. It was observed that the double pane glass on the outside door have started to fail. The failure of the thermal insulating value of the double pane glass becomes apparent as

Section 2 Facility Description
2-7
any moisture condenses between the two panes, which is identifiable by any clouding. Frosting or cloudiness occurring in double pane glass are signs that the seal between the two panes of glass containing the layer of air or gas is broken and allowing for moist air to enter, thus diminishing the thermal insulation value.
Our inspection has revealed that the building envelope is in good condition and is currently providing a high level of insulation. As such, any modifications to the insulation system would not prove to be cost effective, from an energy savings stand-point.
2.3.2 Description of Building HVAC The Elmwood Administration Building is heated by four (4) Trane electronic ignition 90MBH output-gas fired furnace units. There are some electric baseboard heaters in the building that are rarely used for heating. Conditioned air is distributed throughout the building by ductwork. All rooms that are heated by the furnaces are individually controlled by programmable thermostats. While on site, CDM noted the setpoint of these thermostats ranges from 69-74 degrees F. From midnight to 5 AM the building is unoccupied and the thermostats are setback to 78 degrees F in the summer. Cooling is provided to the building by a split direct-expansion air conditioning system. Four (4) Trane air cooled condensers located outside the building provide cooling to the coils in the air handling unit. They each have a cooling capacity of approximately 5 tons. The control room is cooled by a General Electric wall A/C unit. The garage is heated by four (4) gas fired radiant heaters and ventilated by roof mounted exhaust fans. There are two (2) Brasch electric unit heaters located in the storage room of the garage.
2.3.3 Description of Building Lighting The Elmwood Administration Building with Attached Garage‘s existing lighting system consists of 1X4 (1, 2 lamp), 2X2 (2 lamp), 2X4 (2 lamp) T8 fixtures with electronic ballasts, 2x4 (2, 3 lamp) T12 standard efficiency linear fluorescent fixtures with magnetic ballasts, and incandescent fixtures. Existing exterior lighting consists of incandescent fixtures. Refer to Section 4 for a more detailed description.

Section 2 Facility Description
2-8
2.4 Elmwood Sludge Recirculation/Alum Storage Building
2.4.1 Description of Building Envelope The Elmwood Sludge Recirculation/Alum Storage Building’s ground floor walls consist of brick and mortar façade with concrete masonry (CMU) back up blocks. The basement floor wall façade consists of poured concrete. The existing roofing system of the building consists of EPDM roofing with rigid insulation over flat roof decks. CDM did not have roof access at the time of the audit, but observed no signs of interior leakage from the roof.
The windows throughout the building are insulating double pane windows with weatherstripping. The exterior doors are hollow metal doors. FRP doors are recommended on an energy efficiency level, as the doors are made out of a high strength, light weight material with energy saving insulation and good sealing ability, as the doors will not expand or contract with changing climate. It is recommended that any hollow metal doors are replaced with FRP doors. The windows and exterior doors were sealed well with no signs of infiltration.
Our inspection has revealed that the building envelope is in good condition and is currently providing a moderate level of insulation. As such, any modifications to the insulation system would not prove to be cost effective, from an energy savings stand-point.
2.4.2 Description of Building HVAC The Elmwood Sludge Recirculation/Alum Storage Building consists of the Upper Pump Room and the Chemical Feed Room. These areas are heated by four (4) Modine ceiling mounted gas forced air unit heaters. The Upper Pump Room contains two (2) unit heaters having an output of 36 MBH each. The Chemical Feed Room contains two (2) unit heaters having a rated output of 60 MBH each. The Honeywell room thermostat is set at 60 degrees F. Exhaust fans provide ventilation to each of the spaces.
2.4.3 Description of Building Lighting The Elmwood Sludge Recirculation/Alum Storage Building’s existing lighting system consists of 1X4 (3 lamp), and 2X4 (2 lamp) T12 standard efficiency linear fluorescent fixtures with magnetic ballasts. Existing exterior lighting consists of high pressure sodium fixtures. Refer to Section 4 for a more detailed description.
2.5 Elmwood – Chemical Feed Operators Lab Building 2.5.1 Description of Building Envelope The Elmwood Chemical Feed Operators Lab Building’s walls are composite cavity walls consisting of a brick and mortar facade and CMU back-up blocks. CDM did not

Section 2 Facility Description
2-9
have access to the roof at the time of the audit and therefore is unable to report on the roof’s condition.
The windows throughout the building are insulating double pane windows with weatherstripping. The exterior doors are 1 ¾” thick hollow metal and are recommended to be replaced with FRP doors for reasons as indicated in Section 2.4.1. The equipment garage overhead door is made of steel. The windows and exterior doors were sealed well with no signs of infiltration.
Our inspection has revealed that the building envelope is in good condition and is currently providing a moderate level of insulation.
2.5.2 Description of Building HVAC The Elmwood Chemical Feed Operators Lab Building’s is heated by electric unit heaters. Two (2) 10 kW electric unit heaters provide heat to the Chemical Room. One (1) 10 kW Dayton electric unit heater provides heat to the garage. It was reported that the 10 kW Brasch electric unit heater in the Equipment Room is rarely used. The Equipment Room is heated and cooled by a wall mounted heat pump unit. Two wall mounted exhaust fans and motor operated wall intake louvers provide ventilation to the Chemical Room. The manual thermostats in the building are set at 40-45 degrees F.
2.5.3 Description of Building Lighting The Elmwood Chemical Feed Operators Lab Building’s existing lighting system consists of 1X4 (3 lamp) T12 standard efficiency linear fluorescent fixtures with magnetic ballasts, and high pressure sodium fixtures. Existing exterior lighting consists of high pressure sodium fixtures. Refer to Section 4 for a more detailed description.
2.6 Elmwood Sludge Dewatering Building 2.6.1 Description of Building Envelope The Elmwood Sludge Dewatering Building walls are composite cavity walls consisting of brick and mortar facade, and CMU back-up blocks. The existing roofing system of the building consists of EPDM roofing with rigid insulation over a flat roof deck of corrugated steel. CDM did not have access to the roof, but there were no signs of interior leakage from the roof.
The windows throughout the building are insulating double pane windows. The exterior doors are hollow metal and are recommended to be replaced with FRP doors for reasons as indicated in Section 2.4.1. The windows and exterior doors were sealed well with no signs of infiltration.
Our inspection has revealed that the building envelope is in overall good condition and is currently providing a moderate level of insulation.

Section 2 Facility Description
2-10
2.6.2 Description of Building HVAC The Elmwood Sludge Dewatering Building is heated by a 455 MBH input Weil McLain cast-iron gas fired boiler. The boiler has a gross output capacity of 359 MBH which gives it an efficiency of 79%. The hot water is pumped to the four (4) Trane hot water unit heaters in the building. One (1) electric baseboard heater serves the Lavatory. Two 18”x 18” motorized dampers are used to provide ventilation air to the Boiler Room. Two (2) roof-mounted exhaust fans remove air from the Equipment Room, one (1) fan exhausts air from the Lavatory, and one (1) wall mounted fan exhausts air from the Motor Control Room. The Office has a wall mounted heat pump unit that runs during an operator’s day.
2.6.3 Description of Building Lighting The Elmwood Solids Processing Building’s existing lighting system consists of 1x4 (2, 3 lamp) T12 standard efficiency linear fluorescent fixtures with magnetic ballasts, compact fluorescent, and high pressure sodium fixtures. Existing exterior lighting consists of high pressure sodium wall pack fixtures. Refer to Section 4 for a more detailed description.
2.7 Elmwood Generator Building 2.7.1 Description of Building Envelope The Elmwood Generator Building walls are composite cavity walls consisting of a brick and mortar façade and CMU back-up blocks. The roof is composed of EPDM, rigid insulation over steel roof decks. CDM did not have access to the roof, but there were no signs of interior leakage from the roof.
The Elmwood Generator Building’s entrance door is a hollow metal door and is recommended to be replaced with a FRP door as indicated in Section 2.4.1.
Our inspection has revealed that the building envelope is in good condition and is currently providing a moderate level of insulation.
2.7.2 Description of Building HVAC The Elmwood Generator Building is heated by a 10 kW Dayton electric unit heater. An exhaust fan and motor operated wall inlet dampers provide ventilation for the room.
2.7.3 Description of Building Lighting The Elmwood Generator Building’s existing lighting system consists of 1X4 (3 lamp) T12 standard efficiency linear fluorescent fixtures with magnetic ballasts. Existing exterior fixtures consist of high pressure sodium fixtures. Refer to Section 4 for a more detailed description.

Section 2 Facility Description
2-11
2.8 Elmwood Site Lighting The Elmwood existing site lighting system consists of pole mounted high pressure sodium site lighting fixtures, and tank mounted high pressure sodium fixtures. Refer to Section 4 for a more detailed description.
2.9 Woodstream Control/BioFor Building 2.9.1 Description of Building Envelope The Control/BioFor Building’s walls are composite walls consisting of thick lightweight aggregate CMU blocks. At the time of inspection, CDM was unable to access to the roof; however, there were no signs of interior leakage from the roof.
The windows are double pane windows with weatherstripping. The exterior doors are of steel and glass construction. The windows and exterior doors were sealed well with no signs of infiltration.
Our inspection has revealed that the building envelope is in good condition and is currently providing a high level of insulation.
2.9.2 Description of Building HVAC The Control/BioFor Building is heated by gas fired and hot water unit heaters, a 525 MBH input gas fired hot water boiler and an air handler unit with an internal heating and cooling coil. There is a 10 ton Rheem condensing unit located outside that provides cold refrigerant to the air handling unit’s coils. The HB Smith boiler has a 394 MBH output which gives it an efficiency of 75%. The gas boiler serves Trane 60 MBH hot water unit heaters in the Electrical, Generator, and Maintenance Rooms of the Administration Building. The air handling unit delivers cooling and heating to the remainder of the Administration Building. Two (2) roof-mounted exhaust fans exhaust air from the Maintenance Room. A Zonex System controller monitors and determines the heating and cooling conditions in the Administration Building. There are five Sterling gas fired unit heaters with various heating capacities in the Biofor Room. Exhaust fans and motorized inlet dampers provide ventilation for the room. Refer to Section 4.3.7 to see equipment data.
2.9.3 Description of Building Lighting The Control/Biofor Building’s existing lighting system consists of 1X4 (2 lamp), 2X4 (3 lamp) T8 fixtures with electronic ballasts, 2X4 (2 lamp) T12 linear fluorescent fixtures with magnetic ballasts, 2X2 Octron fixtures, metal halide fixtures, and compact fluorescent fixtures. Existing exterior fixtures consist of high pressure sodium fixtures. Refer to Section 4 for a more detailed description.
Section 2 Facility Description
2-12
2.10 Woodstream – Blower Building 2.10.1 Description of Building Envelope The Blower Building walls are composite walls consisting of vinyl siding and CMU back up blocks. At the time of inspection, CDM was unable to access to the roof; however, there were no signs of interior leakage from the roof.
The windows are single pane windows. The exterior doors are steel doors. CDM suggests FRP doors as indicated in Section 2.4.1, which are recommended on an energy efficiency level. The windows and exterior doors were not sealed well which allows infiltration.
Our inspection has revealed that the building envelope is in good condition and is currently providing a moderate level of insulation.
2.10.2 Description of Building HVAC The Blower Building is heated by six (6) electric unit heaters in the following rooms: two (2) heaters in the Blower Room, two (2) in the Aluminum Sulfate Room, one (1) in the Electrical Room, and one (1) at the basement entry. A Frigidaire wall mounted air conditioning unit provides cooling to the Electrical Room. Exhaust fans and motor operated wall dampers provide ventilation for the building.
2.10.3 Description of Building Lighting The Elmwood Generator Building’s existing lighting system consists of 1X4 (2 lamp) T8 fixtures with electronic ballasts, 1X8 (2 lamp) T12 linear fluorescent fixtures with magnetic ballasts, and incandescent fixtures. Existing exterior fixtures consist of high pressure sodium fixtures. Refer to Section 4 for a more detailed description.
2.11 Woodstream Site Lighting The Woodstream existing site lighting system consists of pole mounted high pressure sodium site lighting fixtures, and tank mounted high pressure sodium fixtures. Refer to Section 4 for a more detailed description.

3-1
Section 3 Baseline Energy Use
3.1 Utility Data Analysis The first step in the energy audit process is the compilation and quantification of the facility’s current and historical energy usage and associated utility costs. It is important to establish the existing patterns of electric and gas usage in order to be able to identify areas in which energy consumption can be reduced.
For this study, the monthly gas and electric bills per facility were analyzed and unit costs of energy were obtained. The unit cost of energy, as determined from the information provided by the Authority, was utilized in determining the feasibility of switching from one energy source to another or reducing the demand on that particular source of energy to create annual cost savings for the Evesham Municipal Utilities Authority.
3.1.1 Electric Charges It is important to understand how the utility companies charge for the service. The majority of the energy consumed is electric, as a result of both indoor and outdoor lighting systems, pumping systems, and wastewater treatment processes and equipment. Electricity is charged by three basic components: electrical consumption (kWH), electrical demand (kW) and power factor (kVAR) (reactive power). The cost for electrical consumption is similar to the cost for fuel oil, the monthly consumption appears on the utility bill as kWH consumed per month with a cost figure associated with it. The service connections are either billed on a flat rate or time of day rates per kWH.
Electrical demand can be as much as 50 percent or more of the electric bill. The maximum demand (kW value) during the billing period is multiplied by the demand cost factor and the result is added to the electric bill. It is often possible to decrease the electric bill by 15 – 25 percent by reducing the demand, while still using the same amount of energy.
The power factor (reactive power) is the power required to energize electric and magnetic fields that result in the production of real power. Power factor is important because transmission and distribution systems must be designed and built to manage the need for real power as well as the reactive power component (the total power). If the power factor is low, then the total power required can be greater than 50 percent or more than the real power alone. The power factor charge is a penalty for having a low power factor.
The other parts of the electric bill are the supply charges, delivery charges, system benefits, transmission revenue adjustments, state and municipality tariff surcharges and sales taxes, which cannot be avoided.

Section 3 Baseline Energy Use
3-2
PSE&G is the distributor and supplier of electric energy for the Evesham MUA Authority’s wastewater treatment facilities. .
3.1.2 Natural Gas Charges South Jersey Gas is the current distributor and BGSS is the current supplier of natural gas for the Elmwood Wastewater Treatment Plant. The Authority is charged for the cost of the natural gas, a delivery charge and a customer charge, which covers gas administration charges. PSE&G is the current distributor and supplier of natural gas for the Woodstream Wastewater Treatment Plant.
3.2 Facility Results 3.2.1 Elmwood Wastewater Treatment Plant Facility Electric power for the Wastewater Treatment Plant Facility is fed from one General Secondary Service three phase line from PSE&G. Figure 3.2-1 illustrates the average monthly total energy consumption from March 2009 through June 2010. For example, for the month of April, the bar graph represents average energy consumption for April 2009 and 2010. This same graphical representation approach has been carried through for all months and is typical for all graphs presented in this Section. Electrical usage has been averaged by month for the above referenced time period to portray a more encompassing monthly usage trend.
From the graph in Figure 3.2-1, it can be determined that the average annual baseline electrical consumption for the Elmwood Wastewater Treatment Plant is approximately 1,920,780 kWH / month.
Figure 3.2-1: Elmwood Treatment Plant Electrical Usage

Section 3 Baseline Energy Use
3-3
The most recent tariff rates available at the time of this audit for the wastewater treatment plant facility’s electrical service can be found on the electrical bills provided by PSE&G and are as follows:
Acct #: 42-011-084-06 Service Charge: $372.11
Distribution Charges:
Annual Demand $3.225412797/kW
On-Peak kWh $0.004549043/kWh Off-Peak kWh $0.004549002/kWh
Societal Benefits Charge: $0.007507999/kWh
Securitization Transition Charge: $0.010353979/kWh
BGS Capacity Generation $4.664197460/kWh
Transmission $1.658288043/kWh
BGS Energy On-peak $0.107938022/kWh Off-peak $0.072191016/kWh
Figure 3.2-2 illustrates the average monthly demand load for the wastewater treatment plant facility from January 2009 through January 2010.

Section 3 Baseline Energy Use
3-4
Figure 3.2-2: Elmwood Treatment Plant Maximum Monthly Demand
Refer to Table 3.3-1, in Section 3.3 for the average electrical aggregate cost. These tariffs are subject to change quite frequently. Refer to Appendix A for a complete Historical Data Analysis.
The gas usage for the Wastewater Treatment Plant is metered at one location. The monthly total gas consumption from July 2009 through May 2010 at the plant is illustrated in Figure 3.2-3.
Figure 3.2-3: Elmwood Treatment Plant Total Gas Usage
For more on the Elmwood Wastewater Treatment Plant facility’s gas usage, refer to Section 4.3.
3.2.2 Woodstream Wastewater Treatment Plant Facility Electric power for the Woodstream Wastewater Treatment Plant Facility is fed from one General Secondary Service three phase line from PSE&G. Figure 3.2-4 illustrates the average monthly total energy consumption from March 2009 through June 2010.
From the graph in Figure 3.2-4, it can be determined that the average annual baseline electrical consumption for the Woodstream wastewater treatment plant is approximately 232,450 kWh / month.

Section 3 Baseline Energy Use
3-5
Figure 3.2-4: Woodstream Treatment Plant Electrical Usage
The most recent tariff rates available at the time of this audit for the wastewater treatment plant facility’s electrical service can be found on the electrical bills provided by PSE&G and are as follows:
Acct #: 42-005-830-03 Service Charge: $372.11
Distribution Charges:
Annual Demand $3.225404157/kW
On-Peak kWh $0.004549007/kWh
Off-Peak kWh $0.004548995/kWh
Societal Benefits Charge: $0.007508015/kWh
Securitization Transition Charge: $0.0110353991/kWh
BGS Capacity Generation $4.664195342/kW Transmission $1.658298958/kW
BGS Energy On-peak $0.107938022/kWh Off-peak $0.072191016/kWh
Figure 3.2-5 illustrates the monthly demand load for the Woodstream wastewater treatment facility from March 2009 through June 2010.

Section 3 Baseline Energy Use
3-6
Figure 3.2-5: Woodstream Facility Maximum Monthly Demand
Refer to Table 3.3-1, in Section 3.3, for average electrical aggregate cost. These tariffs are subject to change quite frequently. Refer to Appendix A for a complete Historical Data Analysis.
The gas usage for the Woodstream Wastewater Treatment Plant is metered at one location. The monthly total gas consumption from January 2008 through June 2010 at the plant is illustrated in Figure 3.2-6.
Figure 3.2-6: Woodstream Facility Total Gas Usage
For more on the Woodstream Wastewater Treatment Plant Facility’s gas usage, refer to Section 4.3

Section 3 Baseline Energy Use
3-7
3.3 Aggregate Costs For the purposes of computing energy savings for all identified energy conservation and retrofit measures, aggregate unit costs for electrical energy and fuel, in terms of cost/kWH and cost/therm, were determined for each service location and utilized in the simple payback analyses discussed in subsequent sections. The aggregate unit cost accounts for all distribution and supply charges for each location. Table 3.3-1 and Table 3.3-2 summarize the aggregate costs for electrical energy consumption and therms utilized, respectively.
Table 3.3-1: Electrical Aggregate Unit Costs
Service Location Aggregate $ / kW-hr
Elmwood Wastewater Treatment Facility
$0.14
Woodstream Wastewater Treatment Facility
$0.14
Table 3.3-2: Natural Gas Aggregate Unit Costs
Service Location Aggregate $ / therm
Elmwood Wastewater Treatment Facility
$1.20
Woodstream Wastewater Treatment Facility
$1.27
3.4 Portfolio Manager 3.4.1 Portfolio Manager Overview Portfolio Manager is an interactive energy management tool that allows the Evesham MUA Authority to track and assess energy consumption at the WWTP in a secure online environment. Portfolio Manager can help the Evesham MUA Authority set investment priorities, verify efficiency improvements, and receive EPA recognition for superior energy performance.
3.4.2 Energy Performance Rating For many facilities, you can rate their energy performance on a scale of 1–100 relative to similar facilities nationwide. Your facility is not compared to the other facilities entered into Portfolio Manager to determine your ENERGY STAR rating. Instead, statistically representative models are used to compare your facility against similar facilities from a national survey conducted by the Department of Energy’s Energy

Section 3 Baseline Energy Use
3-8
Information Administration. This national survey, known as the Commercial Building Energy Consumption Survey (CBECS), is conducted every four years, and gathers data on building characteristics and energy use from thousands of facilities across the United States. Your facility’s peer group of comparison is those facilities in the CBECS survey that have similar facility and operating characteristics. A rating of 50 indicates that the facility, from an energy consumption standpoint, performs better than 50% of all similar facilities nationwide, while a rating of 75 indicates that the facility performs better than 75% of all similar facilities nationwide.
The wastewater treatment plant facility is eligible to receive a rating, yet is not eligible for an Energy Star label.
3.4.3 Portfolio Manager Account Information A Portfolio Manager account has been established for the Evesham MUA Authority, which includes a profile for the Elmwood Wastewater Treatment Plant Facility and Woodstream Wastewater Treatment Plant Facility. Information entered into this Portfolio Manager Facility profile, including electrical energy consumption and natural gas consumption has been used to establish a performance baseline.
It is recommended that the information be updated to track the buildings’ energy usage. At the time of the audit the Elmwood Wastewater Treatment Plant received a rating of 41. The Woodstream Wastewater Treatment Plant received a rating of 2.
Appendix B contains a Portfolio Manager Reference sheet.
The following website link, username and password shall be used to access the Portfolio Manager account and building profiles that has been established for the Authority:
https://www.energystar.gov/istar/pmpam/ USERNAME: EveshamWWTP PASSWORD: energystar
4-1
C:\cdmxm\cranerp\d0453649\Section 4.docx
Section 4 Energy Conservation and Retrofit Measures (ECRM) The following is a summary of how Annual Return on Investment (AROI), Internal Rate of Return (IRR), and Net Present Value (NPV) will be broken down in the cost analysis for all ECRMs recommended in this report.
Included in the simplified payback analysis summary table is the ‘Annual Return on Investment’ (AROI) values. This value is a performance measure used to evaluate the efficiency of an investment and is calculated using the following equation:
Where OCS = Operating Cost Savings, and AECS = Annual Energy Cost Savings. Also included in the table are net present values for each option. The NPV calculates the present value of an investment’s future cash flows based on the time value of money, which is accounted for by a discount rate (DR) (assume bond rate of 3%). NPV is calculated using the following equation:
Where Cn=Annual cash flow, and N = number of years.
The Internal Rate of Return (IRR) expresses an annual rate that results in a break-even point for the investment. If the Authority is currently experiencing a lower return on their capital than the IRR, the project is financially advantageous. This measure also allows the Authority to compare ECRM’s against each other to determine the most appealing choices.
Where Cn=Annual cash flow, and N = number of years.
The lifetime energy savings represents the cumulative energy savings over the assumed life of the ECRM.

Section 4 Energy Conservation and Retrofit Measures (ECRM)
4-2
4.1 Elmwood Wastewater Treatment Facility CDM has evaluated the current operation of the Elmwood Wastewater Treatment Facility and has identified potential ECRMs to enhance the current process.
4.1.1 Orbal Aeration System The activated sludge process utilized at the Elmwood WWTP is the Orbal® three (3) channel complete mix, looped reactor system from Envirex which is now, Siemens Water Technologies. There are two (2) Orbal systems each with three (3) concentric channels, with the outer channel containing approximately 50% of the total volume. Wastewater flow from the screw pump distribution box enters a distribution box associated with the Orbal System whereby the flow can be discharged to the outer channel of each system which is operated under an oxygen deficit condition to promote simultaneous nitrification-denitrification. Although the actual oxygen demand of the first channel is approximately 75% of the total demand across the system, the aeration discs allotted to this channel only supply 30-60% of the systems overall oxygen requirements. This is done to ensure a constant DO deficit, an operating DO concentration of 0 mg/L, throughout this aerated anoxic reactor (channel). The simultaneous nitrification-denitrification results in an overall denitrification rate of 80%, without internal recycle.
The second aeration channel operates in a ‘swing’ mode, designed for 1 mg/L DO, which varies diurnally with the daily load conditions. The third channel is an anoxic zone that further removes nitrates.
The aerated channels of the Orbal systems contain unique (proprietary) aeration disks that provide high oxygen transfer and mixing efficiencies, with four (2) two-speed (1760 rpm, 1185 rpm) forty horsepower aerators supplying the air. At high speed an aerator motor draws 46.3 amps and at low speed, 34.3 amps.
The aeration system does not currently have an automated
Orbal System – Aerator Drives

Section 4 Energy Conservation and Retrofit Measures (ECRM)
4-3
DO control system. Discussions with plant staff indicated that dissolved oxygen levels and aerator speed adjustments are manual.
Table 4.1-1 summarizes baseline energy usage and annual energy cost for the Orbal Aeration System.
Table 4.1-1: Existing Annual Energy Consumption and Cost # of Aerators in Operation per System: 4 (24 hours, 7 days/week, 2 at half
speed, 2 at full speed)
# of Orbal Systems in Operation: 2
Amperage Draw per System: 161.2 amps
Total Amperage Draw for both Systems: 332.4 amps
Total Delivered Power1: 214.3 kW
Total Annual kWh: 1,878,413
Total Annual Energy Cost: $262,980
1. Power (W) = 3 (1/2) *Voltage*Current*Power Factor. An 80% power factor was assumed.
Oxygen requirements change continuously based on daily fluctuations in plant flow and loadings. Providing the correct monitoring and control systems for the aeration process is critical, since energy demand increases as the DO demand increases. The installation of a DO control system would automatically control aerator output and optimize energy usage.
Siemens provides a proprietary control system, SmartBNRTM, which addresses the precise control required to accomplish simultaneous nutrient removal in the aerated-anoxic reactor, through an integrated control strategy that utilizes both oxidation-reduction potential (ORP) and DO. The main function of the control system remains the optimization of delivered oxygen, by matching the oxygen delivery rate to the oxygen demand resulting in power cost savings.
The control system maintains precise reactor conditions to remove nitrogen and phosphorous as well as provide selection of microorganisms to minimize the chance of bulking or other interruptions in process efficiency.
The facility influent data was analyzed to determine a total estimated oxygen demand under average and monthly max conditions of 4,960 and 6,330 lbs O2/day, respectively. Based upon process operational data provided by the manufacturer, the published aeration disk oxygen transfer characteristic is 3.5 lbs O2/hour/bhp. Therefore, the current oxygen transfer rate supplied for both Orbal plants is 16,867 lbs O2/day calculated as follows:

Section 4 Energy Conservation and Retrofit Measures (ECRM)
4-4
However, accounting for age and wear on the equipment, and to account for a reduced oxygen transfer efficiency while the aerators are operating at low speed, a conservative transfer efficiency of 2.5 lbs O2/hr*bhp can be expected resulting in a daily oxygen delivery rate of 12,048 lbs O2/day, which is about twice the oxygen demand calculated under maximum month loading conditions.
The implementation of the SmartBNR control system and the installation of VFDs on the aerators would work to optimize the operation and turn down of the aerators to meet the required oxygen demand, resulting in the potential for a 50% annual energy savings of 939,207 kWh ($131,490). The following table, Table 4.1-2, summarizes the simple payback and financial analysis for the implementation of the SmartBNR control system.
Table 4.1-2 Elmwood Orbal System ECRM Financial Analysis
Integration of SmartBNR Controls
Engineer’s Opinion of Probable Cost $581,100
Annual Energy Savings $131,490
Annual Maintenance Cost Savings (AMCS) $11,400
Simple Payback (years) 4.1
Annual Return on Investment (AROI) 20%
Lifetime Energy Savings (15 years) $2,445,571
Internal Rate of Return (IRR) 26%
Net Present Value (NPV) $1,637,569
1. Maintenance cost savings associated with monitoring and controlling DO, assumed savings of 4 hours/week at $55/hour.
Based upon the simple payback periods, internal rates of return and net present values, it is recommended that a control system, such as SmartBNR by Siemens, be implemented to achieve the greatest energy savings.
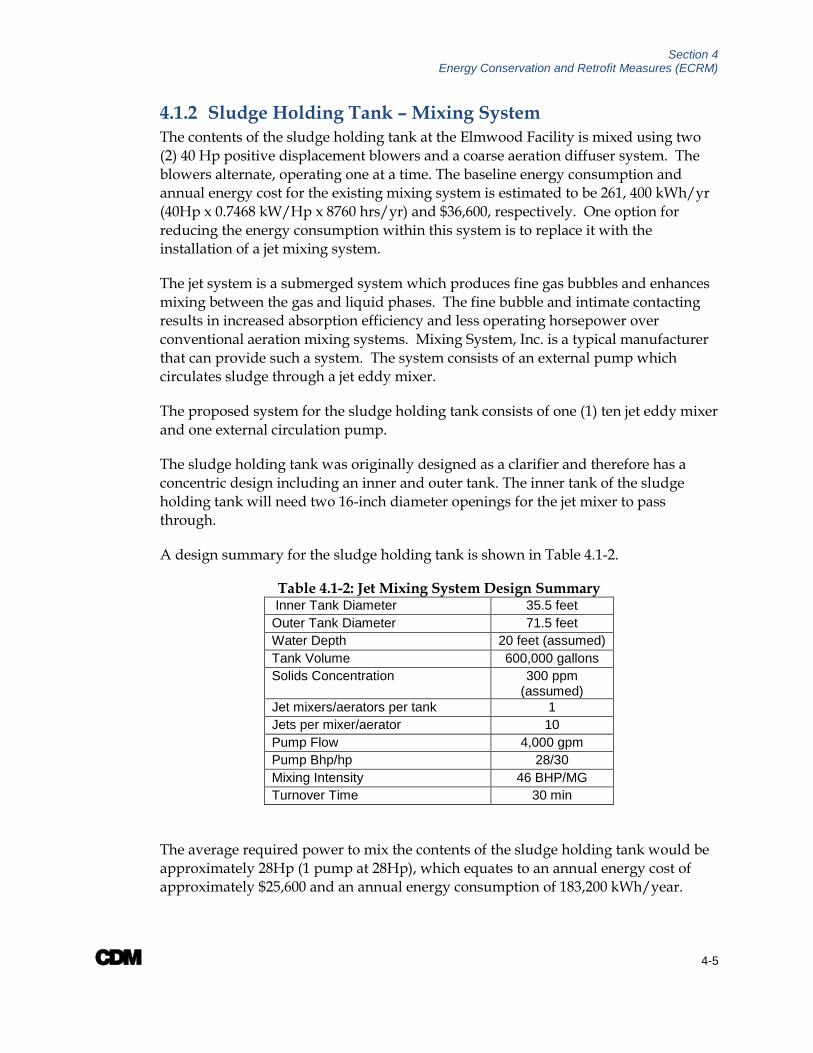
Section 4 Energy Conservation and Retrofit Measures (ECRM)
4-5
4.1.2 Sludge Holding Tank – Mixing System The contents of the sludge holding tank at the Elmwood Facility is mixed using two (2) 40 Hp positive displacement blowers and a coarse aeration diffuser system. The blowers alternate, operating one at a time. The baseline energy consumption and annual energy cost for the existing mixing system is estimated to be 261, 400 kWh/yr (40Hp x 0.7468 kW/Hp x 8760 hrs/yr) and $36,600, respectively. One option for reducing the energy consumption within this system is to replace it with the installation of a jet mixing system.
The jet system is a submerged system which produces fine gas bubbles and enhances mixing between the gas and liquid phases. The fine bubble and intimate contacting results in increased absorption efficiency and less operating horsepower over conventional aeration mixing systems. Mixing System, Inc. is a typical manufacturer that can provide such a system. The system consists of an external pump which circulates sludge through a jet eddy mixer.
The proposed system for the sludge holding tank consists of one (1) ten jet eddy mixer and one external circulation pump.
The sludge holding tank was originally designed as a clarifier and therefore has a concentric design including an inner and outer tank. The inner tank of the sludge holding tank will need two 16-inch diameter openings for the jet mixer to pass through.
A design summary for the sludge holding tank is shown in Table 4.1-2.
Table 4.1-2: Jet Mixing System Design Summary Inner Tank Diameter 35.5 feet Outer Tank Diameter 71.5 feet Water Depth 20 feet (assumed) Tank Volume 600,000 gallons Solids Concentration 300 ppm
(assumed) Jet mixers/aerators per tank 1 Jets per mixer/aerator 10 Pump Flow 4,000 gpm Pump Bhp/hp 28/30 Mixing Intensity 46 BHP/MG Turnover Time 30 min
The average required power to mix the contents of the sludge holding tank would be approximately 28Hp (1 pump at 28Hp), which equates to an annual energy cost of approximately $25,600 and an annual energy consumption of 183,200 kWh/year.

Section 4 Energy Conservation and Retrofit Measures (ECRM)
4-6
Based upon the annual estimated baseline energy usage and cost of 261,400 kWh/yr and $36,600, respectively, the installation of a jet mixing system will result in an annual energy cost savings of $11,000 and energy consumption savings of 78,500kWh/year.
Refer to Appendix H for costs pertaining to the jet mixing system.
Table 4.1-3: Jet Mixing System Probable Cost Summary New System Installation Cost $ 198,000.00
Annual Energy Savings $11,000
Annual O&M Cost $1,000
Simple Payback Period, years 19.8
Lifetime, years 20
Internal Rate of Return (IRR) 1.0%
Net Present Value (NPV) (-$34,000)
The above cost summary provides for the simple payback and financial analysis for retrofitting the sludge holding tank and reflects the normal operational mode of the sludge holding tank system.
Based upon the simple payback periods, internal rates of return and net present values presented in Table 4-6, it is not recommended that a jet mixer system be installed. However, it is recommended to replace the existing blower motors with high efficiency motors as discussed in Section 4.5.2.
4.2 Woodstream Wastewater Treatment Facility CDM has evaluated the current operation of the Woodstream Wastewater Treatment Facility and has identified potential ECRMs to enhance the current process.
4.2.1 Equalization Tank Mixing System The contents of the equalization tank at the Woodstream Facility is mixed using two (2) 60 Hp positive displacement blowers and a coarse air diffuser system. Typically, only one blower is in operation. The baseline energy consumption and annual energy cost for the existing mixing system is estimated to be 392,500 kWh/yr (60Hp x 0.7468 kW/Hp x 8760 hrs/yr) and $55,000, respectively. One option for reducing the energy

Section 4 Energy Conservation and Retrofit Measures (ECRM)
4-7
consumption within this system is to replace it with the installation of a jet mixing system as similarly described in Section 4.1.2.
The proposed system for the equalization tank consists of one (1) ten jet eddy mixer and one external circulation pump.
A design summary for the equalization tank is shown in Table 4.2-1.
Table 4.2-1: Jet Mixing System Design Summary Tank Diameter 48 feet Water Depth 20 feet Tank Volume 270,000 gallons Solids Concentration 1% Jet mixers/aerators per tank 1 Jets per mixer/aerator 10 Pump Flow 4,000 gpm Pump Bhp/hp 28/30 Mixing Intensity 103 BHP/MG Turnover Time 14 min
The average required power to operate one tank would be approximately 28Hp (1 pump at 28Hp), which equates to an annual energy cost of approximately $25,600 and an annual energy consumption of 183,200 kWh/year. Based upon the estimated baseline energy usage and cost presented of 392,500 kWh/yr and $55,000, respectively, the installation of a jet mixing system will result in an annual energy cost savings of $29, 400 and energy consumption savings of 209,300kWh/year.
Refer to Appendix H for costs pertaining to the jet mixing system.
Table 4.2-2: Jet Mixing System Probable Cost Summary New System Installation Cost $213,000
Annual Energy Savings $29,400
Annual O&M Cost $1,000
Simple Payback Period, years 7.5
Lifetime, years 20
Internal Rate of Return (IRR) 12.5%
Net Present Value (NPV) $224,000

Section 4 Energy Conservation and Retrofit Measures (ECRM)
4-8
The above cost summary provides for the simple payback and financial analysis for retrofitting the equalization tank and reflects the normal operational mode of the equalization tank system.
Based upon the simple payback periods, internal rates of return and net present values presented in Table 4.2-2, it is recommended that a jet mixer system, such as one manufactured by Mixing Systems Inc., be installed in order to achieve energy savings associated with the equalization tank aeration system.
However, should the Authority decide not to pursue this energy savings measure, then it is recommended to replace the existing blower motors with high efficiency motors as discussed in Section 4.5.2.
4.2.2 Extended Aeration System The activated sludge process utilized at the Woodstream WWTP is contact stabilization. There are two (2) contact stabilization packaged plants within circular concrete tanks that include four zones. The bulk of the finely suspended and dissolved organics are rapidly removed through adsorption within the first zone, the contact zone. This zone provides approximately 1/3 of the total detention time at average flow. The high uptake rate in this zone allows for the use of a short detention time overall. This is the main reason why contact stabilization, as with the case at Woodstream, has been historically applied as a means of secondary treatment within a minimum bioreactor volume.
Once the bulk of the organic material is removed within the contact zone, the mixed liquor flows to the settling zone were solid-liquid separation occurs. The settled sludge is then returned to the reaeration zone where the organic matter is oxidized and stabilized by microorganisms within the digester zone.
This activated sludge process utilizes an aeration system to provide oxygen for the biological oxidation of carbonaceous and nitrogenous matter and to ensure that the biological solids are maintained mixed within the wastewater. Aeration devices for wastewater treatment can be classified into two basic types:
(1) Agitating wastewater mechanically to dissolve oxygen from atmospheric air into the wastewater (mechanical aeration); or
(2) Introducing air or pure oxygen into the wastewater with submerged diffusers (diffused air).
The contact zone, reaeration zone and aerobic digester zones of the two (2) packaged contact stabilization plants are aerated with three (3) centrifugal blowers supplying

Section 4 Energy Conservation and Retrofit Measures (ECRM)
4-9
the air. The contact zone and reaeration zones are equipped with fine bubble diffusers and the digestion zone is equipped with coarse bubble diffusers. The following table, Table 4.2-3, provides a general description of the Contact Stabilization Plants.
Table 4.2-3: Existing Contact Stabilization Plants Contact Zone Clarifier Zone Reaeration Zone Digester Zone
PLANT 1 (15 feet SWD)
Volume (gallons) 79,000 81,318 132,000 116,000
Volume (ft3) 10,560 10,870 17,645 15,506 PLANT 2 (15 feet SWD)
Volume (gallons) 95,000 124,609 208,000 171,000
Volume (ft3) 12,699 16,657 27,804 22,858
Aeration air is provided to the contact stabilization plants by three (3) constant speed centrifugal blowers. Two (2) blowers (numbers 1 and 2) are equipped with 150 Hp motors and the third blower (number 3) is equipped with a 100 Hp motor. Typically, blower number 1 or 2 provides air to contact stabilization plant number 2 and blower number 3 provides air to contact stabilization plant number 1. The blowers have been in operation for 30 years.
The aeration basins do not currently have a DO control system. Discussions with plant staff indicated that dissolved oxygen levels are typically maintained between 6 and 9 mg/L. In most wastewater treatment plants, a minimum dissolved oxygen (DO) level of 2.0 mg/l is commonly maintained in the aeration basins.
Currently, there is no recorded air flow data, so with the assistance of plant staff the power delivered to the aerated zones of the contact stabilization plants was determined from blower amperage readings taken on July 20, 2010 and are summarized in Table 4.2-4.
Table 4.2-4 summarizes the operating conditions utilized to estimate the annual cost of operation.

Section 4 Energy Conservation and Retrofit Measures (ECRM)
4-10
Table 4.2-4: Existing Annual Energy Consumption and Cost PLANT 1
Blower 3 (100 hp): 24 hour, 7 day operation
Average Amps: 90
Delivered Power1: 60 kW (80hp)
Annual kWh: 525,600
Annual Energy Cost: $73,584
PLANT 2
Blower 1 (150 hp): 24 hour, 7 day operation
Average Amps: 103
Delivered Power1: 68.5 kW (92hp)
Annual kWh: 600,113
Annual Energy Cost: $84,016
TOTAL ANNUAL ENERGY COST (BOTH PLANTS): $157,600
2. Power = 3 (1/2) *Voltage*Current*Power Factor. An 80% power factor was assumed.
CDM analyzed the existing conditions to determine if energy savings can be realized with blower modifications or replacements. In addition to potential equipment modifications or replacements, one of the more critical elements to any energy conservation project for aeration systems is a dissolved oxygen control system.
Oxygen requirements change continuously based on daily fluctuations in plant flow and loadings. Providing the correct monitoring and control systems for the aeration process is critical, since energy demand increases as the DO demand increases. The installation of a DO control system would automatically control blower output and optimize energy usage.
A typical automated DO control system is known as a DO loop. A DO loop control system consists of DO probes in each aeration bay to continuously monitor the DO levels, which are then fed back to the main control panel (MCP). The DO readings from the DO transmitters would be wired to a new PLC which could be connected to a SCADA system for monitoring and DO set point input. A software program in the PLC interprets the readings and sends a signal to the blower VFDs to maintain, increase, or decrease speed, depending on the DO reading when compared to a set DO point or range. The individual DO readings from each bay and measured air flow rates into each diffuser grid will be used to control the inlet air valves of each diffuser grid to maintain the desired DO concentration in each pass automatically. Each diffuser grid drop leg will be provided with one modulating control valve, one thermal dispersion flow meter and one isolation valve.

Section 4 Energy Conservation and Retrofit Measures (ECRM)
4-11
Since a course or fine bubble diffused air system distributes air at the bottom of the tank and the probe is at the water surface, the mixed liquor dissolved oxygen is fairly constant throughout the tank. Therefore, this type of control system works well for a course or fine bubble diffused aeration system providing instantaneous change in blower output under varying flows and loads to the plant. The control system would also allow for sequencing between the available blowers, depending upon the air demand.
Current Conditions The facility influent data was analyzed to determine the actual required blower demands for both Contact Stabilization Plants. This was based on a reported plant flow distribution of 35% to Plant 1 and 65% to Plant 2. Tables 4.2-5 and 4.2-6 present a summary of the relevant design parameters used to calculate the amount of air needed based on the actual current operating conditions.
This aeration analysis to determine the oxygen demand in lbs/day was completed on volumes of the contact zone, the reaeration zone and the digestion zone. The conversion to air flow (scfm) was based on the oxygen transfer efficiency (OTE) of fine bubble diffusers and coarse bubble in the digester zone.
Table 4.2-5: Contact Stabilization Plant #1 Aeration Summary Current Flow and Load Conditions
Average Max
Month Max Day Aeration Tank Influent Flow mgd 0.24 0.35 0.42 Wastewater Temperature1 deg C 17.4 17.4 17.4 Beta 0.95 0.95 0.95 Alpha 0.65 0.65 0.65 Oxygen Saturation (Cd, based on WW temp) mg/L 9.58 9.58 9.58 Dissolved Oxygen Concentration mg/L 2 2 2 Oxygen Saturation (Cs, based on Standard Conditions) mg/L 9.09 9.09 9.09 Oxygen Demand/BOD removed lb/lb 1.19 1.19 1.19 Oxygen Demand/TKN removed lb/lb 4.25 4.25 4.25 Aerated Digester Oxygen Demand/BOD lb/lb 1.8 1.8 1.8 Influent BOD Concentration mg/L 261 378 309 Influent BOD Load lb/day 532 1096 1090 Influent Nitrogen Concentration mg/L 31.7 27.3 24.3 Influent Nitrogen Load lb/day 64 79 86 Oxygen Demand lb/day 670 895 1,014 Density of Air 0.075 0.075 0.075 Diffuser Efficiency % 12 12 12 Oxygen in Air % 23.20% 23.20% 23.20% Standard Oxygen Rate (SOR) lb/day 1390 1857 2104
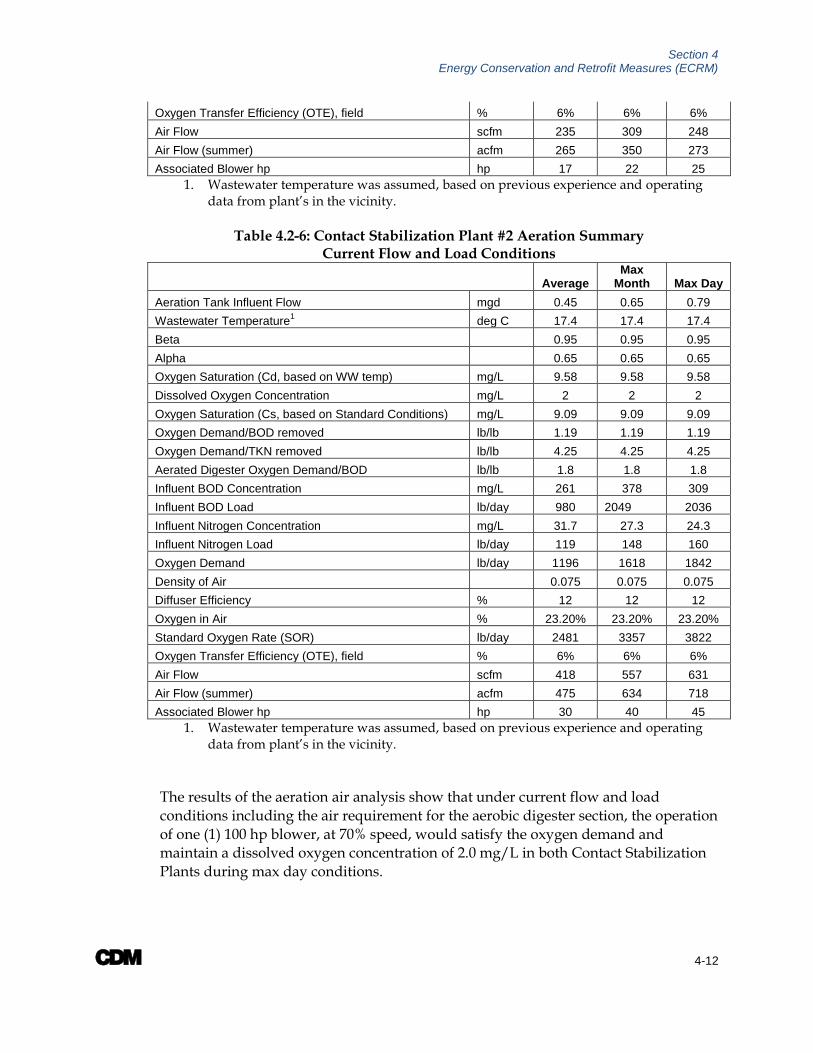
Section 4 Energy Conservation and Retrofit Measures (ECRM)
4-12
Oxygen Transfer Efficiency (OTE), field % 6% 6% 6% Air Flow scfm 235 309 248 Air Flow (summer) acfm 265 350 273 Associated Blower hp hp 17 22 25
1. Wastewater temperature was assumed, based on previous experience and operating data from plant’s in the vicinity.
Table 4.2-6: Contact Stabilization Plant #2 Aeration Summary
Current Flow and Load Conditions
Average Max
Month Max Day Aeration Tank Influent Flow mgd 0.45 0.65 0.79 Wastewater Temperature1 deg C 17.4 17.4 17.4 Beta 0.95 0.95 0.95 Alpha 0.65 0.65 0.65 Oxygen Saturation (Cd, based on WW temp) mg/L 9.58 9.58 9.58 Dissolved Oxygen Concentration mg/L 2 2 2 Oxygen Saturation (Cs, based on Standard Conditions) mg/L 9.09 9.09 9.09 Oxygen Demand/BOD removed lb/lb 1.19 1.19 1.19 Oxygen Demand/TKN removed lb/lb 4.25 4.25 4.25 Aerated Digester Oxygen Demand/BOD lb/lb 1.8 1.8 1.8 Influent BOD Concentration mg/L 261 378 309 Influent BOD Load lb/day 980 2049 2036 Influent Nitrogen Concentration mg/L 31.7 27.3 24.3 Influent Nitrogen Load lb/day 119 148 160 Oxygen Demand lb/day 1196 1618 1842 Density of Air 0.075 0.075 0.075 Diffuser Efficiency % 12 12 12 Oxygen in Air % 23.20% 23.20% 23.20% Standard Oxygen Rate (SOR) lb/day 2481 3357 3822 Oxygen Transfer Efficiency (OTE), field % 6% 6% 6% Air Flow scfm 418 557 631 Air Flow (summer) acfm 475 634 718 Associated Blower hp hp 30 40 45
1. Wastewater temperature was assumed, based on previous experience and operating data from plant’s in the vicinity.
The results of the aeration air analysis show that under current flow and load conditions including the air requirement for the aerobic digester section, the operation of one (1) 100 hp blower, at 70% speed, would satisfy the oxygen demand and maintain a dissolved oxygen concentration of 2.0 mg/L in both Contact Stabilization Plants during max day conditions.

Section 4 Energy Conservation and Retrofit Measures (ECRM)
4-13
A similar air analysis was conducted for the plant design flow of 1.5 MGD, assuming typical medium strength influent wastewater concentrations of 220 mg/l BOD and 220 mg/l TSS. The result of this analysis indicates that the total required design blower capacity is 85 hp for both plants. Therefore, under plant design conditions, one (1) 100 hp blower would satisfy the design oxygen demand.
Aeration System Improvement Alternatives To estimate potential energy savings for the aeration system, actual facility wastewater influent data were used to estimate the amount of air and power required for the aeration system for both Contact Stabilization Plants. The range as shown in Tables 4.2-5 and 4.2-6 is from 653 to 880 scfm and 47 hp to 70 hp.
To achieve energy savings for the aeration system, four (4) alternatives were evaluated: retrofitting the existing blowers with premium efficiency motors and VFDs, installing new centrifugal blowers with VFDs, installing new positive displacement blowers with VFDs and installing new turbo high-efficiency blowers with VFDs. Each alternative includes the installation of a DO control system to fully realize the potential energy savings by automatically controlling the blowers speed and associated output based upon measured DO concentrations.
A dissolved oxygen sensor and controller and flow control valves would be provided for each aerated zone. The dissolved oxygen feedback would be utilized to turn-down the blowers or to throttle the flow control valves, optimizing the delivery of the aeration air and the associated energy use.
Alternative 1: VFDs on Existing Centrifugal Blowers Review of the current operation of the aeration system has lead to the determination that there is adequate aeration air available through the operation of the existing blowers to maintain the process with a minimum DO set point of 2 mg/L throughout the aeration system volume.
The first alternative is to retrofit the existing blowers with variable frequency drives (VFDs) and new premium efficiency motors. Under average flow and load conditions, one 100 (hp) blower could operate at 50% speed assuming that this does not place the blowers in a surge operational condition. This results in an expected annual energy consumption (assuming 90.7% motors) of 360,251 kWh ($50,435) which is calculated as follows:
(100 hp/0.907*50%*0.746kW/hp*24 hr/day*365 days/year)= 360,251 kWh/year
Based upon this expected energy consumption, the potential annual energy cost savings is calculated to be $107,165.

Section 4 Energy Conservation and Retrofit Measures (ECRM)
4-14
Should the Authority elect not to install variable frequency drives for the existing blowers, then it is recommended that new premium efficiency motors, as a minimum, be installed in order to realize energy efficiency. Energy savings associated with new premium efficiency motors is detailed in Appendix L and Section 4.5.4.
Alternative 2: Installing New Centrifugal Blowers with VFDs Due to the age of the existing blowers, the installation of two (2) new 100 hp centrifugal blowers (one duty, one standby), with VFDs, has been evaluated. Based on the average annual air requirements and discussion presented under Alternative 1, this retrofit would also result in an estimated annual energy cost savings of $107,165.
Alternative 3: Installing New Positive Displacement Blowers with VFDs The third alternative is to replace the existing blowers with two (2) new positive displacement blowers (one duty, one standby). Manufacturers such as Aerzen or Dresser Roots can provide positive displacement blowers to meet the conditions of the facility. With a preliminary selection from Roots of a 75 hp blower (brakehorsepower of 60 Hp), the estimated annual energy consumption and cost is 392,097 kWh/yr and $54,894, respectively, resulting in an annual energy cost savings of $102,706.
Alternative 4: Installing New Turbo Blowers with VFDs
A final alternative is the installation of new turbo blowers (one duty, one standby). Based on the average annual air requirements, this retrofit would result in a preliminary 100 hp blower (brakehorsepower of 84 Hp)having an estimated annual energy consumption and cost of 548,940 kWh/yr and $76,850, respectively resulting in an annual energy cost savings of $80,750.
The following table, Table 4.2-7, summarizes the simple payback and financial analysis for these four alternatives.

Section 4 Energy Conservation and Retrofit Measures (ECRM)
4-15
Table 4.2-7Woodstream Contact Stabilization System ECRMS
New VFDs New Centrifugals
w/VFDs
New Positive Displacement
Blowers w/VFDs
New Turbo Blowers w/VFDs
Engineer’s Opinion of Probable Cost $264,888 $813,665 $550,025 $753,605
Annual Energy Savings $107,165 $107,165 $102,706 $80,750
Annual Maintenance Cost Savings (AMCS)
$2,000 $8,000 $10,000 $10,000
Simple Payback (years) 2.4 7.1 4.9 8.3
Annual Return on Investment (AROI) 36% 9% 15% 7%
Lifetime Energy Savings (15 years) $1,993,153 $1,993,153 $1,910,220 $1,501,862
Internal Rate of Return (IRR) 44% 14% 22% 11%
Net Present Value (NPV) $1,449,653 $977,972 $1,197,040 $647,449
Based upon the simple payback periods, internal rates of return and net present values of the energy savings alternatives evaluated, it is recommended that the existing blowers be retrofitted with VFDs and a DO control system be implemented to achieve the greatest energy savings.
However, based upon the age of the existing blowers, they have exceeded their useful life and replacement should be considered by the Authority. Should the Authority consider replacing the existing blowers, then Alternatives 2 through 4 should be considered as viable replacement options. This report, however, based solely upon the simple payback analysis, will recommend the installation of variable frequency drives and new premium efficient motors for the existing blowers.
4.2.3 Ultraviolet Disinfection System The UV disinfection system consists of two (2) channels; each channel includes two (2) banks of UV lamp modules. The banks span the width of the channel. A bank of lamps consists of 2 modules, each module consisting of 40 low pressure, low output (LPLO) lamps suspended from racks.

Section 4 Energy Conservation and Retrofit Measures (ECRM)
4-16
The UV disinfection system is operated year round. The system is currently not operating in automatic and consequently all banks are operated continuously to ensure compliance with the plant’s discharge permit. The UV system is sized such that a flow between 0 and 2 MGD will require that two banks be energized. One bank is adequate to treat 1 MGD each; however, operating with only one bank in service is not recommended as the bank does not span the entire channel. The electrical energy demand for each UV module is 3 kW (2 module/bank, 6 kW per bank).
Analysis of the plant’s current operating procedure is presented in Appendix F. The current operation with 4 banks on continuously equates to an annual energy usage of 228,384 kWh/year and at $0.14/kWh an annual operating cost of $31,974. This does not account for maintenance time required for cleaning of the lamp modules and / or replacement of lamps or ballasts. The current cleaning system requires removal of a UV bank from the channel, to be soaked in a chemical cleaning tank.
Two potential energy savings measures have been considered: the upgrade to the UV system controls to allow for flow pacing of the banks and due to the age of the existing system, the replacement of the existing LPLO system with a low pressure, high output (LPHO) system.
Configuration of Automatic Flow Pacing
As discussed previously, the UV Disinfection system no longer operates automatically based on flow conditions. Upgrading to incorporate automatic flow pacing, controlling the operation of the UV banks, would at a minimum involve the installation of a new plc based control panel with operator touch screen that would be interfaced with the influent flow or water level over the influent and effluent weirs to calculate the required UV dose and associate that to the operation of the UV banks.
As presented in Appendix F, it is projected that with the ability to energize only the necessary banks that an annual energy savings of 171,288 kWh may be possible, an annual energy cost savings of $23,980.
New Low Pressure, High Output (LPHO) System
An attractive feature of low pressure, high output lamps is the ability to ramp the power up and down to each bank in the disinfection channel. Additionally the higher output of the lamps will allow for greater treatment capacity through the same volume (existing channels). For Woodstream, the implementation of a LPHO system would result in the ability for one module of lamps (1/2 a bank) to treat 2 – 2.5 MGD of flow.

Section 4 Energy Conservation and Retrofit Measures (ECRM)
4-17
This increase in treatment capacity is not currently necessary, but upgrading the existing system to an LPHO system result in greater operational flexibility and energy efficiency of the UV Disinfection system.
An annual energy cost savings of $23,980 has been conservatively estimated, although there may be potential for further energy savings as a result of the ability to ramp the power up and down to each bank in an LPHO system.
The following table, Table 4.2-8, summarizes the simple payback and financial analysis for these two alternatives.
Table 4.2-8: Woodstream UV Disinfection System ECRMS
Flow Pacing Integration
New LPHO System
Engineer’s Opinion of Probable Cost $177,840 $436,800
Rebate NA NA
Total Cost $177,840 $436,800
Annual Energy Savings $23,980 $23,980
Annual Maintenance Cost Savings (AMCS) NA NA
Simple Payback 7.4 30.7
Annual Return on Investment (AROI) 8.5% 0.5%
Lifetime Energy Savings (15 years) $446,000 $446,000
Internal Rate of Return (IRR) 13% 0.2%
Net Present Value (NPV) $200,067 ($58,893)
Based upon the simple payback periods, internal rates of return and net present values of the two energy savings alternatives evaluated, it is recommended that the existing UV systems controls be upgraded to establish flow pacing abilities.

Section 4 Energy Conservation and Retrofit Measures (ECRM)
4-18
4.3 Building Lighting Systems The goal of this section is to present any lighting energy conservation measures that may also be cost beneficial. It should be noted that replacing current bulbs with more energy-efficient equivalents will have a small effect on the building heating and cooling loads. The building cooling load will see a small decrease from an upgrade to more efficient bulbs and the heating load will see a small increase, as the more energy efficient bulbs give off less heat.
Two options are offered for all buildings. The first option will be for upgrading existing interior lighting, if applicable. The second option will be for upgrading existing exterior lighting that is fed from the building. A total cost for upgrading both options at the same time will be presented. The overall site lighting for each plant, such as street and area lighting, has been broken out separately for simplified analysis. For the building interior options, retrofitting of existing fluorescent fixtures includes upgrading both ballasts and lamps for the fixture. Refer to Appendix D for more information.
For all of the buildings, it was noted there were no existing interior occupancy sensors installed. Installing occupancy sensors in rooms where there are none will typically increase energy savings; however, if the space is not occupied often in the first place, there will be little savings by installing occupancy sensors. Therefore, occupancy sensor installation has been recommended in this report. Refer to Appendix D for occupancy sensor locations and quantities.
Please note that the Engineer’s Estimate of Probable Construction Costs presented herein are estimates based on historic data compiled from similar installations and engineering opinions. Additional engineering will be required for each measure identified in this report and final scope of work and budget cost estimates will need to be confirmed prior to the coordination of project financing or the issuance of a Request for Proposal.
4.3.1 Elmwood Administration Building with Attached Garage It is recommended that the existing lighting system at Elmwood Administration Building with Attached Garage be upgraded to high efficiency standards to create lighting uniformity throughout the building. In general, the recommended lighting upgrade, as presented in Appendix D, involves replacing existing inefficient bulbs, and installing new energy-efficient luminaires to the existing lighting systems. Options for improving the interior and exterior lighting for Elmwood Administration Building with Attached Garage are listed in Table 4.3-1.
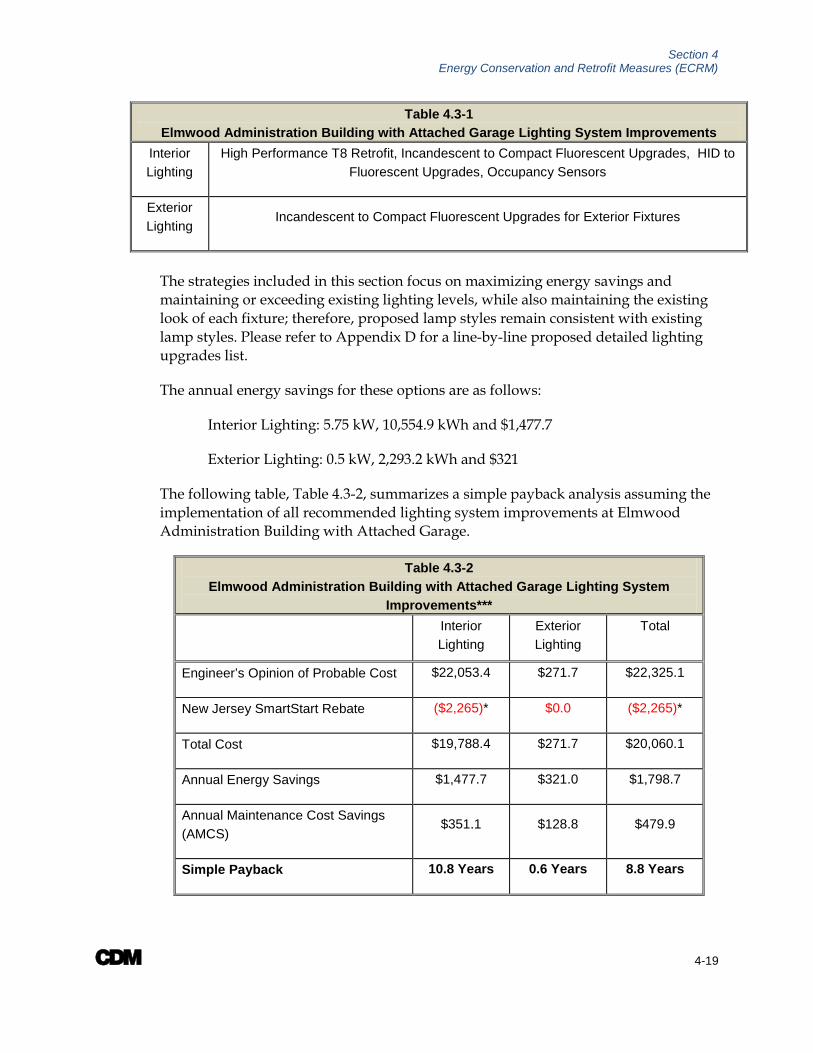
Section 4 Energy Conservation and Retrofit Measures (ECRM)
4-19
Table 4.3-1 Elmwood Administration Building with Attached Garage Lighting System Improvements
Interior Lighting
High Performance T8 Retrofit, Incandescent to Compact Fluorescent Upgrades, HID to Fluorescent Upgrades, Occupancy Sensors
Exterior Lighting
Incandescent to Compact Fluorescent Upgrades for Exterior Fixtures
The strategies included in this section focus on maximizing energy savings and maintaining or exceeding existing lighting levels, while also maintaining the existing look of each fixture; therefore, proposed lamp styles remain consistent with existing lamp styles. Please refer to Appendix D for a line-by-line proposed detailed lighting upgrades list.
The annual energy savings for these options are as follows:
Interior Lighting: 5.75 kW, 10,554.9 kWh and $1,477.7
Exterior Lighting: 0.5 kW, 2,293.2 kWh and $321
The following table, Table 4.3-2, summarizes a simple payback analysis assuming the implementation of all recommended lighting system improvements at Elmwood Administration Building with Attached Garage.
Table 4.3-2 Elmwood Administration Building with Attached Garage Lighting System
Improvements*** Interior
Lighting Exterior Lighting
Total
Engineer’s Opinion of Probable Cost $22,053.4 $271.7 $22,325.1
New Jersey SmartStart Rebate ($2,265)* $0.0 ($2,265)*
Total Cost $19,788.4 $271.7 $20,060.1
Annual Energy Savings $1,477.7 $321.0 $1,798.7
Annual Maintenance Cost Savings (AMCS)
$351.1 $128.8 $479.9
Simple Payback 10.8 Years 0.6 Years 8.8 Years
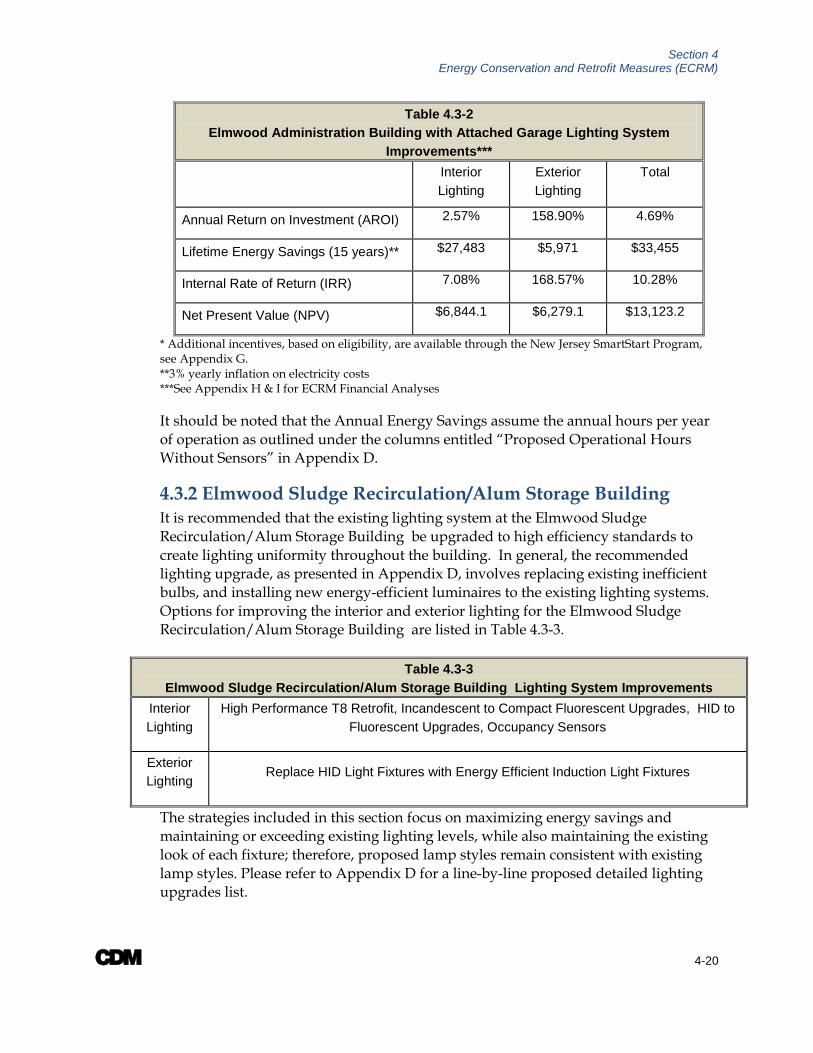
Section 4 Energy Conservation and Retrofit Measures (ECRM)
4-20
Table 4.3-2 Elmwood Administration Building with Attached Garage Lighting System
Improvements*** Interior
Lighting Exterior Lighting
Total
Annual Return on Investment (AROI) 2.57% 158.90% 4.69%
Lifetime Energy Savings (15 years)** $27,483 $5,971 $33,455
Internal Rate of Return (IRR) 7.08% 168.57% 10.28%
Net Present Value (NPV) $6,844.1 $6,279.1 $13,123.2
* Additional incentives, based on eligibility, are available through the New Jersey SmartStart Program, see Appendix G. **3% yearly inflation on electricity costs ***See Appendix H & I for ECRM Financial Analyses It should be noted that the Annual Energy Savings assume the annual hours per year of operation as outlined under the columns entitled “Proposed Operational Hours Without Sensors” in Appendix D.
4.3.2 Elmwood Sludge Recirculation/Alum Storage Building It is recommended that the existing lighting system at the Elmwood Sludge Recirculation/Alum Storage Building be upgraded to high efficiency standards to create lighting uniformity throughout the building. In general, the recommended lighting upgrade, as presented in Appendix D, involves replacing existing inefficient bulbs, and installing new energy-efficient luminaires to the existing lighting systems. Options for improving the interior and exterior lighting for the Elmwood Sludge Recirculation/Alum Storage Building are listed in Table 4.3-3.
Table 4.3-3 Elmwood Sludge Recirculation/Alum Storage Building Lighting System Improvements
Interior Lighting
High Performance T8 Retrofit, Incandescent to Compact Fluorescent Upgrades, HID to Fluorescent Upgrades, Occupancy Sensors
Exterior Lighting
Replace HID Light Fixtures with Energy Efficient Induction Light Fixtures
The strategies included in this section focus on maximizing energy savings and maintaining or exceeding existing lighting levels, while also maintaining the existing look of each fixture; therefore, proposed lamp styles remain consistent with existing lamp styles. Please refer to Appendix D for a line-by-line proposed detailed lighting upgrades list.
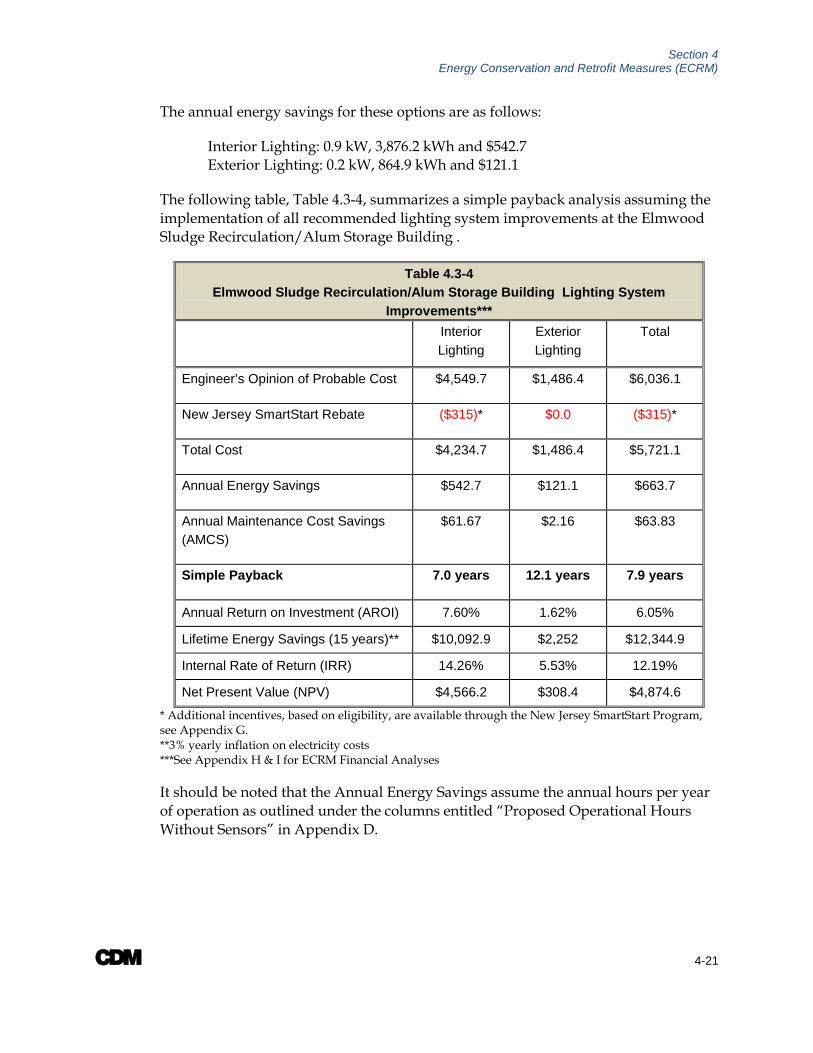
Section 4 Energy Conservation and Retrofit Measures (ECRM)
4-21
The annual energy savings for these options are as follows:
Interior Lighting: 0.9 kW, 3,876.2 kWh and $542.7 Exterior Lighting: 0.2 kW, 864.9 kWh and $121.1
The following table, Table 4.3-4, summarizes a simple payback analysis assuming the implementation of all recommended lighting system improvements at the Elmwood Sludge Recirculation/Alum Storage Building .
Table 4.3-4 Elmwood Sludge Recirculation/Alum Storage Building Lighting System
Improvements*** Interior
Lighting Exterior Lighting
Total
Engineer’s Opinion of Probable Cost $4,549.7 $1,486.4 $6,036.1
New Jersey SmartStart Rebate ($315)* $0.0 ($315)*
Total Cost $4,234.7 $1,486.4 $5,721.1
Annual Energy Savings $542.7 $121.1 $663.7
Annual Maintenance Cost Savings (AMCS)
$61.67 $2.16 $63.83
Simple Payback 7.0 years 12.1 years 7.9 years
Annual Return on Investment (AROI) 7.60% 1.62% 6.05%
Lifetime Energy Savings (15 years)** $10,092.9 $2,252 $12,344.9
Internal Rate of Return (IRR) 14.26% 5.53% 12.19%
Net Present Value (NPV) $4,566.2 $308.4 $4,874.6
* Additional incentives, based on eligibility, are available through the New Jersey SmartStart Program, see Appendix G. **3% yearly inflation on electricity costs ***See Appendix H & I for ECRM Financial Analyses It should be noted that the Annual Energy Savings assume the annual hours per year of operation as outlined under the columns entitled “Proposed Operational Hours Without Sensors” in Appendix D.

Section 4 Energy Conservation and Retrofit Measures (ECRM)
4-22
4.3.3 Elmwood Chemical Feed, Operators Lab Building It is recommended that the existing lighting system at the Elmwood Chemical Feed, Operators Lab Building be upgraded to high efficiency standards to create lighting uniformity throughout the building. In general, the recommended lighting upgrade, as presented in Appendix D, involves replacing existing inefficient bulbs, and installing new energy-efficient luminaires to the existing lighting systems. Options for improving the interior and exterior lighting for the Elmwood Chemical Feed, Operators Lab Building are listed in Table 4.3-5.
Table 4.3-5 Elmwood Chemical Feed, Operators Lab Building Lighting System Improvements
Interior Lighting
High Performance T8 Retrofit
Exterior Lighting
Replace HID Light Fixtures with Energy Efficient Induction Light Fixtures
The strategies included in this section focus on maximizing energy savings and maintaining or exceeding existing lighting levels, while also maintaining the existing look of each fixture; therefore, proposed lamp styles remain consistent with existing lamp styles. Please refer to Appendix D for a line-by-line proposed detailed lighting upgrades list.
The annual energy savings for these options are as follows:
Interior Lighting: 0.3 kW, 1,451.9 kWh and $203.3 Exterior Lighting: 0.2 kW, 864.9 kWh and $121.1
The following table, Table 4.3-6, summarizes a simple payback analysis assuming the implementation of all recommended lighting system improvements at the Elmwood Chemical Feed, Operators Lab Building.
Table 4.3-6 Elmwood Chemical Feed, Operators Lab Building Lighting System
Improvements*** Interior
Lighting Exterior Lighting
Total
Engineer’s Opinion of Probable Cost $1,423.1 $1,486.4 $2,909.5
New Jersey SmartStart Rebate ($90)* $0.0 ($90)*

Section 4 Energy Conservation and Retrofit Measures (ECRM)
4-23
Table 4.3-6 Elmwood Chemical Feed, Operators Lab Building Lighting System
Improvements*** Interior
Lighting Exterior Lighting
Total
Total Cost $1,333.1 $1,486.4 $2,819.5
Annual Energy Savings $203.3 $121.1 $324.4
Annual Maintenance Cost Savings (AMCS)
$24.93 $2.16 $27.09
Simple Payback 5.8 years 12.1 years 8.0 years
Annual Return on Investment (AROI) 10.45% 1.62% 5.53%
Lifetime Energy Savings (15 years)** $3,780.6 $2,252 $6,033
Internal Rate of Return (IRR) 17.85% 5.53% 11.84%
Net Present Value (NPV) $1,990.1 $308.4 $2,298.5
* Additional incentives, based on eligibility, are available through the New Jersey SmartStart Program, see Appendix G. **3% yearly inflation on electricity costs ***See Appendix H & I for ECRM Financial Analyses
It should be noted that the Annual Energy Savings assume the annual hours per year of operation as outlined under the columns entitled “Proposed Operational Hours Without Sensors” in Appendix D.
4.3.4 Elmwood Sludge Dewatering Building It is recommended that the existing lighting system at the Elmwood Sludge Dewatering Building be upgraded to high efficiency standards to create lighting uniformity throughout the building. In general, the recommended lighting upgrade, as presented in Appendix D, involves replacing existing inefficient bulbs, and installing new energy-efficient luminaires to the existing lighting systems. Options for improving the interior and exterior lighting for the Elmwood Sludge Dewatering Building are listed in Table 4.3-7.

Section 4 Energy Conservation and Retrofit Measures (ECRM)
4-24
Table 4.3-7 Elmwood Sludge Dewatering Building Lighting System Improvements
Interior Lighting
High Performance T8 Retrofit, Occupancy Sensors
Exterior Lighting
Replace HID Light Fixtures with Energy Efficient Induction Light Fixtures
The strategies included in this section focus on maximizing energy savings and maintaining or exceeding existing lighting levels, while also maintaining the existing look of each fixture; therefore, proposed lamp styles remain consistent with existing lamp styles. Please refer to Appendix D for a line-by-line proposed detailed lighting upgrades list.
The annual energy savings for these options are as follows:
Interior Lighting: 0.4 kW, 1,935.9 kWh and $271.0 Exterior Lighting: 0.5 kW, 2,162.2 kWh and $302.7
The following table, Table 4.3-8, summarizes a simple payback analysis assuming the implementation of all recommended lighting system improvements at the Elmwood Sludge Dewatering Building.
Table 4.3-8 Elmwood Sludge Dewatering Building Lighting System Improvements***
Interior Lighting
Exterior Lighting
Total
Engineer’s Opinion of Probable Cost $2,498.4 $3,715.9 $6,214.3
New Jersey SmartStart Rebate ($175)* $0.0 ($175)*
Total Cost $2,323.4 $3,715.9 $6,039.3
Annual Energy Savings $271.0 $302.7 $573.7
Annual Maintenance Cost Savings (AMCS)
$31.9 $5.4 $37.3
Simple Payback 7.7 years 12.1 years 9.9 years
Annual Return on Investment (AROI) 6.37% 1.62% 3.45%

Section 4 Energy Conservation and Retrofit Measures (ECRM)
4-25
Table 4.3-8 Elmwood Sludge Dewatering Building Lighting System Improvements***
Interior Lighting
Exterior Lighting
Total
Lifetime Energy Savings (15 years)** $5,041 $5,630 $10,671
Internal Rate of Return (IRR) 12.63% 5.53% 8.45%
Net Present Value (NPV) $2,088.5 $771.0 $2,859.6
* Additional incentives, based on eligibility, are available through the New Jersey SmartStart Program, see Appendix G. **3% yearly inflation on electricity costs ***See Appendix H & I for ECRM Financial Analyses It should be noted that the Annual Energy Savings assume the annual hours per year of operation as outlined under the columns entitled “Proposed Operational Hours Without Sensors” in Appendix D.
4.3.5 Elmwood Generator Building It is recommended that the existing lighting system at the Elmwood Generator Building be upgraded to high efficiency standards to create lighting uniformity throughout the building. In general, the recommended lighting upgrade, as presented in Appendix D, involves replacing existing inefficient bulbs, and installing new energy-efficient luminaires to the existing lighting systems. Options for improving the interior and exterior lighting for the Elmwood Generator Building are listed in Table 4.3-9.
Table 4.3-9 Elmwood Generator Building Lighting System Improvements
Interior Lighting
High Performance T8 Retrofit
Exterior Lighting
Replace HID Light Fixtures with Energy Efficient Induction Light Fixtures
The strategies included in this section focus on maximizing energy savings and maintaining or exceeding existing lighting levels, while also maintaining the existing look of each fixture; therefore, proposed lamp styles remain consistent with existing lamp styles. Please refer to Appendix D for a line-by-line proposed detailed lighting upgrades list.
The annual energy savings for these options are as follows:

Section 4 Energy Conservation and Retrofit Measures (ECRM)
4-26
Interior Lighting: 0.3 kW, 691.4 kWh and $96.8 Exterior Lighting: 0.1 kW, 432.4 kWh and $60.5
The following table, Table 4.3-10, summarizes a simple payback analysis assuming the implementation of all recommended lighting system improvements at the Elmwood Generator Building.
Table 4.3-10 Elmwood Generator Building Lighting System Improvements***
Interior Lighting
Exterior Lighting
Total
Engineer’s Opinion of Probable Cost $1,423.1 $743.2 $2,166.3
New Jersey SmartStart Rebate ($90)* $0.0 ($90)*
Total Cost $1,333.1 $743.2 $2,076.3
Annual Energy Savings $96.8 $60.5 $157.3
Annual Maintenance Cost Savings (AMCS)
$24.93 $1.08 $26.01
Simple Payback 11.0 years 12.1 years 11.3 years
Annual Return on Investment (AROI) 2.46% 1.62% 2.16%
Lifetime Energy Savings (15 years)** $1,800 $1,126 $2,926
Internal Rate of Return (IRR) 6.91% 5.53% 6.42%
Net Present Value (NPV) $439.5 $154.2 $593.7
* Additional incentives, based on eligibility, are available through the New Jersey SmartStart Program, see Appendix G. **3% yearly inflation on electricity costs ***See Appendix H & I for ECRM Financial Analyses
It should be noted that the Annual Energy Savings assume the annual hours per year of operation as outlined under the columns entitled “Proposed Operational Hours Without Sensors” in Appendix D.
4.3.6 Elmwood Site Lighting It is recommended that the existing site lighting system at the Elmwood Plant be upgraded to high efficiency standards to create lighting uniformity throughout the site. In general, the recommended lighting upgrade, as presented in Appendix D,

Section 4 Energy Conservation and Retrofit Measures (ECRM)
4-27
involves replacing existing inefficient light fixtures with energy efficient alternatives. Improvements for the site lighting for Elmwood Plant are listed in Table 4.3-15.
Table 4.3-11 Elmwood Site Lighting System Improvements
Exterior Lighting
Replace HID Light Fixtures with Energy Efficient Induction Light Fixtures
The strategies included in this section focus on maximizing energy savings and maintaining or exceeding existing lighting levels, while also maintaining the existing look of each fixture; therefore, proposed lamp styles remain consistent with existing lamp styles. Please refer to Appendix D for a line-by-line proposed detailed lighting upgrades list.
The annual energy savings for these options are as follows:
Exterior Lighting: 3.4 kW, 14,851.2 kWh and $2,079.2
The following table, Table 4.3-16, summarizes a simple payback analysis assuming the implementation of all recommended site lighting system improvements at Elmwood Plant.
Table 4.3-12 Elmwood Site Lighting System Improvements***
Total
Engineer’s Opinion of Probable Cost $12,878.6
New Jersey SmartStart Rebate ($1,190)*
Total Cost $11,688.6
Annual Energy Savings $2,079.2
Annual Maintenance Cost Savings (AMCS)
$113.3
Simple Payback 5.3 years
Annual Return on Investment (AROI) 12.09%
Lifetime Energy Savings (15 years)** $38,670

Section 4 Energy Conservation and Retrofit Measures (ECRM)
4-28
Table 4.3-12 Elmwood Site Lighting System Improvements***
Total
Internal Rate of Return (IRR) 19.82%
Net Present Value (NPV) $20,241.1
* Additional incentives, based on eligibility, are available through the New Jersey SmartStart Program, see Appendix G. **3% yearly inflation on electricity costs ***See Appendix H & I for ECRM Financial Analyses It should be noted that the Annual Energy Savings assume the annual hours per year of operation as outlined under the columns entitled “Proposed Operational Hours Without Sensors” in Appendix D.
4.3.7 Woodstream Control/Biofor Building It is recommended that the existing lighting system at the Woodstream Control/Biofor Building be upgraded to high efficiency standards to create lighting uniformity throughout the building. In general, the recommended lighting upgrade, as presented in Appendix D, involves replacing existing inefficient bulbs, and installing new energy-efficient luminaires to the existing lighting systems. Options for improving the interior and exterior lighting for the Woodstream Control/Biofor Building are listed in Table 4.3-13.
Table 4.3-13 Woodstream Control/Biofor Building Lighting System Improvements
Interior Lighting
High Performance T8 Retrofit, Incandescent to Compact Fluorescent Upgrades, Occupancy Sensors
Exterior Lighting
Incandescent to Compact Fluorescent Upgrades for Exterior Fixtures
The strategies included in this section focus on maximizing energy savings and maintaining or exceeding existing lighting levels, while also maintaining the existing look of each fixture; therefore, proposed lamp styles remain consistent with existing lamp styles. Please refer to Appendix D for a line-by-line proposed detailed lighting upgrades list.
The annual energy savings for these options are as follows:

Section 4 Energy Conservation and Retrofit Measures (ECRM)
4-29
Interior Lighting: 3.6 kW, 7,728.8 kWh and $1,802 Exterior Lighting: 0.3 kW, 1,297.3 kWh and $181.6
The following table, Table 4.3-14, summarizes a simple payback analysis assuming the implementation of all recommended lighting system improvements at the Woodstream Control/Biofor Building.
Table 4.3-14 Woodstream Control/Biofor Building Lighting System Improvements***
Interior Lighting
Exterior Lighting
Total
Engineer’s Opinion of Probable Cost $10,145.2 $2,229.6 $12,374.7
New Jersey SmartStart Rebate ($1,560)* ($100)* ($1,660)*
Total Cost $8,585.2 $2,129.6 $10,714.7
Annual Energy Savings $1,082 $181.6 $1,263.7
Annual Maintenance Cost Savings (AMCS)
$68.75 $2.16 $70.91
Simple Payback 7.5 years 11.6 years 8.0 years
Annual Return on Investment (AROI) 6.74% 1.96% 5.79%
Lifetime Energy Savings (15 years)** $20,124.6 $3,378 $23,503
Internal Rate of Return (IRR) 13.12% 6.09% 11.83%
Net Present Value (NPV) $8,173.8 $546.9 $8,720.7
* Additional incentives, based on eligibility, are available through the New Jersey SmartStart Program, see Appendix G. **3% yearly inflation on electricity costs ***See Appendix H & I for ECRM Financial Analyses It should be noted that the Annual Energy Savings assume the annual hours per year of operation as outlined under the columns entitled “Proposed Operational Hours Without Sensors” in Appendix D.
4.3.8 Woodstream Blower Building It is recommended that the existing lighting system at the Woodstream Blower Building be upgraded to high efficiency standards to create lighting uniformity

Section 4 Energy Conservation and Retrofit Measures (ECRM)
4-30
throughout the building. In general, the recommended lighting upgrade, as presented in Appendix D, involves replacing existing inefficient bulbs, and installing new energy-efficient luminaires to the existing lighting systems. Options for improving the interior and exterior lighting for the Woodstream Blower Building are listed in Table 4.3-15.
Table 4.3-15 Woodstream Blower Building Lighting System Improvements
Interior Lighting
High Performance T8 Retrofit, Incandescent to Compact Fluorescent Upgrades, Occupancy Sensors
Exterior Lighting
Incandescent to Compact Fluorescent Upgrades for Exterior Fixtures
The strategies included in this section focus on maximizing energy savings and maintaining or exceeding existing lighting levels, while also maintaining the existing look of each fixture; therefore, proposed lamp styles remain consistent with existing lamp styles. Please refer to Appendix D for a line-by-line proposed detailed lighting upgrades list.
The annual energy savings for these options are as follows:
Interior Lighting: 0.5 kW, 286.5 kWh and $40.1 Exterior Lighting: 0.2 kW, 864.9 kWh and $121.1
The following table, Table 4.3-16, summarizes a simple payback analysis assuming the implementation of all recommended lighting system improvements at the Woodstream Blower Building.
Table 4.3-16 Woodstream Blower Building Lighting System Improvements***
Interior Lighting
Exterior Lighting
Total
Engineer’s Opinion of Probable Cost $1,294.6 $1,486.4 $2,781.0
New Jersey SmartStart Rebate ($15)* ($60)* ($75)*
Total Cost $1,279.6 $1,426.4 $2,706.0
Annual Energy Savings $40.1 $121.1 $161.2

Section 4 Energy Conservation and Retrofit Measures (ECRM)
4-31
Table 4.3-16 Woodstream Blower Building Lighting System Improvements***
Interior Lighting
Exterior Lighting
Total
Annual Maintenance Cost Savings (AMCS)
$79.7 $2.2 $81.9
Simple Payback 10.7 years 11.6 years 11.1 years
Annual Return on Investment (AROI)
2.70% 1.97% 2.32%
Lifetime Energy Savings (15 years)**
$746 $2,252 $2,998
Internal Rate of Return (IRR) 7.28% 6.11% 6.67%
Net Present Value (NPV) $465.3 $368.4 $833.7
* Additional incentives, based on eligibility, are available through the New Jersey SmartStart Program, see Appendix G. **3% yearly inflation on electricity costs ***See Appendix H & I for ECRM Financial Analyses It should be noted that the Annual Energy Savings assume the annual hours per year of operation as outlined under the columns entitled “Proposed Operational Hours Without Sensors” in Appendix D.
4.3.9 Woodstream Site Lighting It is recommended that the existing site lighting system at the Woodstream Plant be upgraded to high efficiency standards to create lighting uniformity throughout the site. In general, the recommended lighting upgrade, as presented in Appendix D, involves replacing existing inefficient light fixtures with energy efficient alternatives. Improvements for the site lighting for Woodstream Plant are listed in Table 4.2-17.
Table 4.3-17 Woodstream Site Lighting System Improvements
Exterior Lighting
Replace HID Light Fixtures with Energy Efficient Induction Light Fixtures.
The strategies included in this section focus on maximizing energy savings and maintaining or exceeding existing lighting levels, while also maintaining the existing look of each fixture; therefore, proposed lamp styles remain consistent with existing

Section 4 Energy Conservation and Retrofit Measures (ECRM)
4-32
lamp styles. Please refer to Appendix D for a line-by-line proposed detailed lighting upgrades list.
The annual energy savings for these options are as follows:
Exterior Lighting: 2.0 kW, 8,736 kWh and $1,223
The following table, Table 4.3-18, summarizes a simple payback analysis assuming the implementation of all recommended site lighting system improvements at Woodstream Plant.
Table 4.3-18 Woodstream Site Lighting System Improvements***
Total
Engineer’s Opinion of Probable Cost $7,575.6
New Jersey SmartStart Rebate ($700)*
Total Cost $6,875.6
Annual Energy Savings $1,223.0
Annual Maintenance Cost Savings (AMCS)
$66.67
Simple Payback 5.3 years
Annual Return on Investment (AROI) 12.09%
Lifetime Energy Savings (15 years)** $22,747
Internal Rate of Return (IRR) 19.82%
Net Present Value (NPV) $11,906.5
* Additional incentives, based on eligibility, are available through the New Jersey SmartStart Program, see Appendix G. **3% yearly inflation on electricity costs ***See Appendix H & I for ECRM Financial Analyses It should be noted that the Annual Energy Savings assume the annual hours per year of operation as outlined under the columns entitled “Proposed Operational Hours Without Sensors” in Appendix D.

Section 4 Energy Conservation and Retrofit Measures (ECRM)
4-33
4.4 Building HVAC Systems The goal of this section is to present any heating and cooling energy reduction and cost saving measures that may also be cost beneficial. Where possible, measures will be presented with a life-cycle cost analysis. This analysis displays a payback period based on weighing the capital cost of the measure against predicted annual fiscal savings.
Some buildings, with more complex HVAC systems, were modeled to more accurately predict energy usage savings from certain recommendations. Buildings modeled were done so using software called eQUEST, a Department of Energy-sponsored energy modeling program, to establish a baseline space heating and cooling energy usage. Climate data from Glassboro, NJ was used for analyses. From this, the model may be calibrated, using historical utility bills, to predict the impact of theoretical energy savings measures. However, because each site has one electric bill, CDM was not able to accurately track electric heating requirements for each individual building at the wastewater plants. The electric usage for heating is extremely small when compared to the electric use that is process related. For this reason, modeling all of the buildings and calibrating to the entire plant’s electric bill would not be beneficial for estimated electrical heating or energy savings.
There is one gas meter at each of the two plants. At the Elmwood site, three buildings are on one gas meter. These buildings are the Administration Building with attached Garage, the Sludge Recirculation/Alum Storage Building, and the Sludge Dewatering Building. All three buildings were modeled and their predicted gas usages were combined and calibrated to the actual usage. The Control/BioFor Building is the only building that uses gas at the Woodstream site.
Once annual energy savings from a particular measure have been predicted and the initial capital cost has been estimated, payback periods may be approximated. Equipment cost estimate calculations are provided in Appendix G. Building eQUEST model run summaries for ECRMs may be found in Appendix C.
4.4.1 Elmwood Wastewater Treatment Plant As stated above, the entire Elmwood Wastewater Treatment Facility is on one electric bill. Modeling all of the buildings and calibrating to the entire plant’s electric bill would not be beneficial for estimated electrical usage or energy savings. However, there are three buildings that have gas heating. The three buildings that have gas heating are all billed on one account. The Administration Building with Attached Garage, the Sludge Recirculation/Alum Storage Building, and the Sludge Dewatering Building were modeled and calibrated to match the actual gas usage for the plant. To calibrate the models, CDM used natural gas bills from July 2009 through May 2010. Figure 4.4.1-1 below compares actual monthly gas usages, with those predicted by the
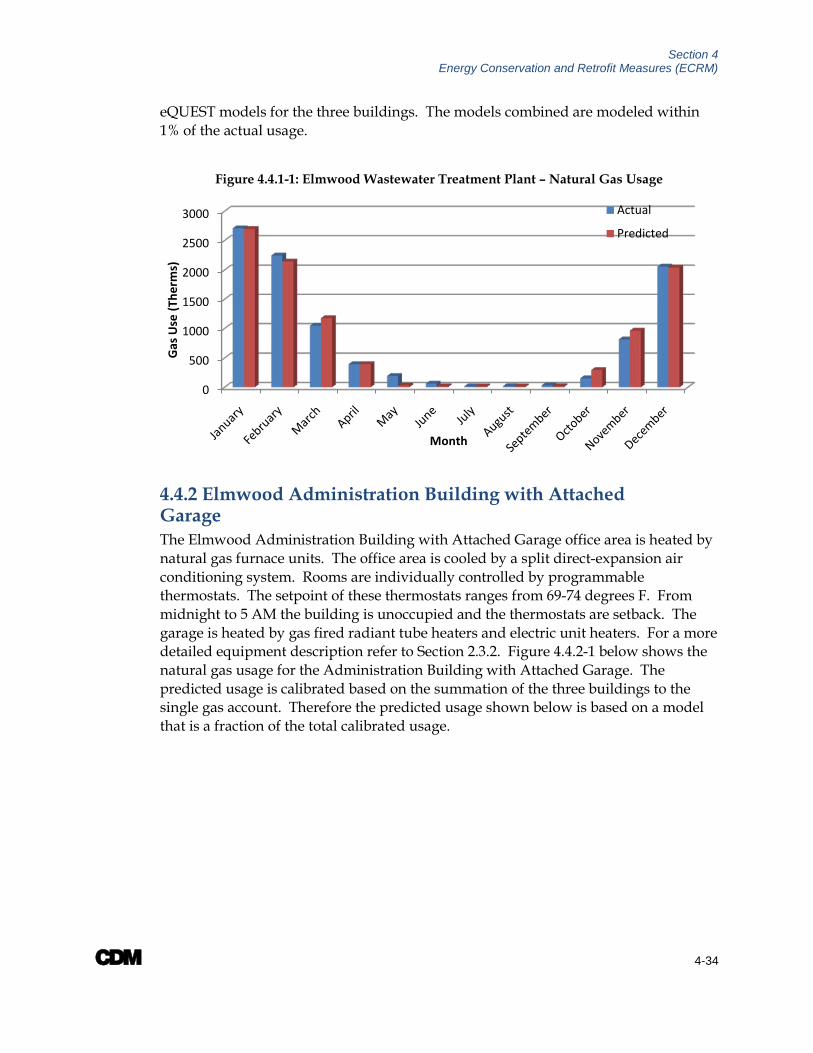
Section 4 Energy Conservation and Retrofit Measures (ECRM)
4-34
eQUEST models for the three buildings. The models combined are modeled within 1% of the actual usage.
Figure 4.4.1-1: Elmwood Wastewater Treatment Plant – Natural Gas Usage
4.4.2 Elmwood Administration Building with Attached Garage The Elmwood Administration Building with Attached Garage office area is heated by natural gas furnace units. The office area is cooled by a split direct-expansion air conditioning system. Rooms are individually controlled by programmable thermostats. The setpoint of these thermostats ranges from 69-74 degrees F. From midnight to 5 AM the building is unoccupied and the thermostats are setback. The garage is heated by gas fired radiant tube heaters and electric unit heaters. For a more detailed equipment description refer to Section 2.3.2. Figure 4.4.2-1 below shows the natural gas usage for the Administration Building with Attached Garage. The predicted usage is calibrated based on the summation of the three buildings to the single gas account. Therefore the predicted usage shown below is based on a model that is a fraction of the total calibrated usage.
0
500
1000
1500
2000
2500
3000
Gas
Use
(The
rms)
Month
Actual
Predicted
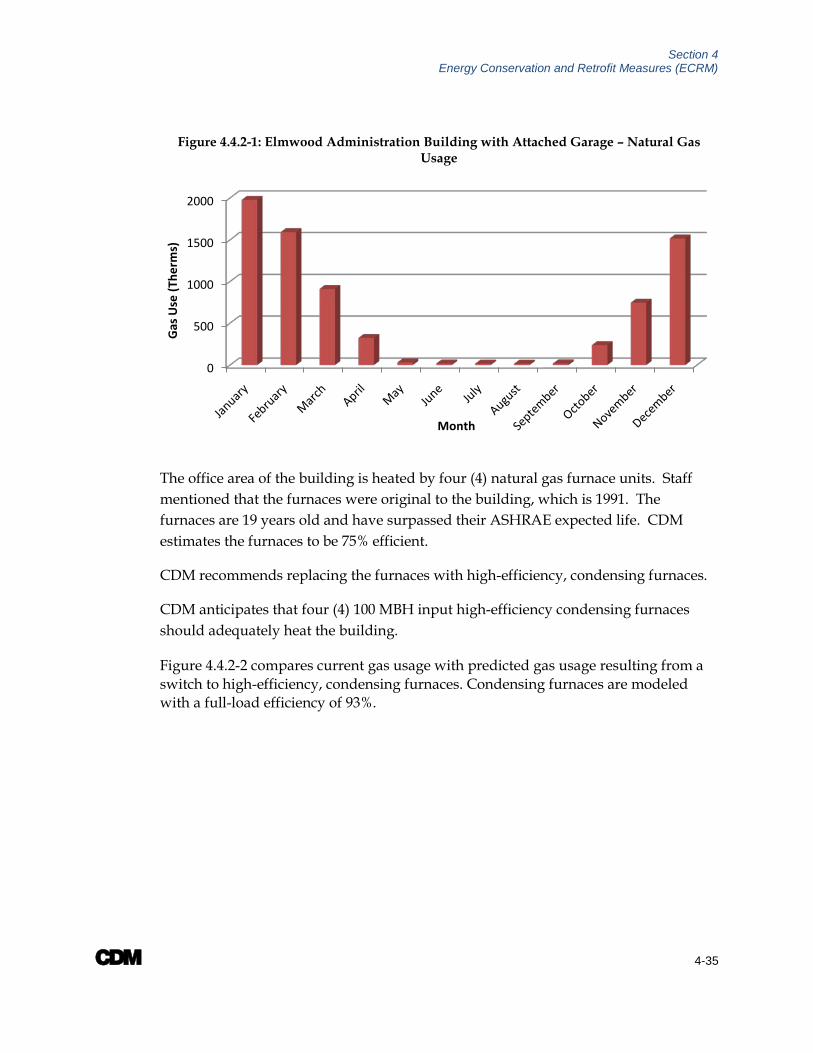
Section 4 Energy Conservation and Retrofit Measures (ECRM)
4-35
Figure 4.4.2-1: Elmwood Administration Building with Attached Garage – Natural Gas Usage
The office area of the building is heated by four (4) natural gas furnace units. Staff mentioned that the furnaces were original to the building, which is 1991. The furnaces are 19 years old and have surpassed their ASHRAE expected life. CDM estimates the furnaces to be 75% efficient.
CDM recommends replacing the furnaces with high-efficiency, condensing furnaces.
CDM anticipates that four (4) 100 MBH input high-efficiency condensing furnaces should adequately heat the building.
Figure 4.4.2-2 compares current gas usage with predicted gas usage resulting from a switch to high-efficiency, condensing furnaces. Condensing furnaces are modeled with a full-load efficiency of 93%.
0
500
1000
1500
2000
Gas
Use
(The
rms)
Month

Section 4 Energy Conservation and Retrofit Measures (ECRM)
4-36
Figure 4.4.2-2: Elmwood Administration Building with Attached Garage – Furnace Upgrade - Natural Gas Usage
Fiscal savings from such an upgrade are then identified in Table 4.4.2-1 below. Lifetime savings calculations for all ECRM’s may be found in Appendix I. It’s important to note that these are estimates based on building models, and further investigation is warranted before pursuing furnace replacements.
Table 4.4.2-1: Elmwood Administration Building with Attached Garage Furnace Upgrade Payback
Predicted Annual Savings (Therms) 751
Total Annual Savings $902
Initial Capital Cost of Upgrade $11,046
Incentives** $1,200
Cost of Upgrade $9,846
Simple Payback 10.9
Lifetime Energy Savings (18 years)* $19,314
Annual Maintenance Cost Savings (AMCS)
$0
Annual Return on Investment (AROI) 3.61%
Internal Rate of Return (IRR) 8.67%
0200400600800
100012001400160018002000
Gas
Use
(The
rms)
Month
Predicted
Condensing Furnace

Section 4 Energy Conservation and Retrofit Measures (ECRM)
4-37
Table 4.4.2-1: Elmwood Administration Building with Attached Garage Furnace Upgrade Payback
Net Present Value (NPV) $5,917 *Assumes 2% yearly inflation on natural gas costs
**Incentives, per New Jersey Clean Energy Program are granted on a case by case basis ($300-$400 per unit)
There are four 6 ton Trane air-cooled condensing units located outside of the building. The condensing units are tied to direct-expansion coils located in the four air handling units in the mechanical room. This provides cooling throughout most of the Administration Building. Two of them have either exceeded or are approaching their AHRAE expected lives. One of them is 17 years old, and the other is 20 years old. It should be noted, that over time, efficiency declines and equipment degrades. Due to age of service and improvements in equipment efficiency, these units should be replaced. The two older condensers are modeled with an efficiency of 8 EER. The largest cooling capacity that can be realized with a current residential condensing furnace is 5 tons. The following analysis was completed with the replacement condensing units sized at 5 tons and an efficiency of 12.3 EER. Figure 4.4.2-3 below shows the existing, and replacement cooling electrical usage next to each other for comparison.
Figure 4.4.2-3: Elmwood Administration Building with Attached Garage – Condenser Upgrade -Cooling Electrical Usage
0
1000
2000
3000
4000
5000
6000
7000
8000
Cool
ing
Elec
tric
al U
se (k
Wh)
Month
Actual
Predicted

Section 4 Energy Conservation and Retrofit Measures (ECRM)
4-38
Predicted fiscal savings from such an upgrade are identified in Table 4.4.2-2 below. A 5 ton condensing unit must have an SEER rating of at least 14 to receive an incentive from New Jersey Clean Energy SmartStart program. The costs associated with each of the new units can be seen in Appendix H. Due to the entire plant being on a single electric bill, the Elmwood Administration Building with Attached Garage electrical usage is not calibrated to actual usage. The savings and payback displayed below are based off a model of the Elmwood Administration Building with Attached Garage, and further investigation is warranted before proceeding.
Table 4.4.2-2: Elmwood Administration Building with Attached Garage Condenser Replacement
Predicted Annual Savings (kWh) 6,450
Total Annual Savings $903
Initial Capital Cost of Upgrade $12,156
Incentives** $920
Cost of Upgrade $11,236
Simple Payback 12.4
Lifetime Energy Savings (20 years)* $24,264
Annual Maintenance Cost Savings (AMCS) $0
Annual Return on Investment (AROI) 3.04%
Internal Rate of Return (IRR) 7.81%
Net Present Value (NPV) $6,298
*Assumes 3% yearly inflation on electricity costs **Incentives per New Jersey Clean Energy Program, are $92 per ton
Over several decades, ASHRAE has compiled data pertaining to service lives of most HVAC related equipment. From this, ASHRAE indicates a median service life (life until replacement) for HVAC related equipment that may be used as an estimate for the useful life of HVAC equipment currently in service. For example, ASHRAE indicates a window air conditioning unit has a median service life of 10 years. Therefore, if a window unit has been in service for more than 10 years, the owner may want to consider replacement. Not only will a replacement ensure minimal downtime between units (the unit is replaced before it ceases to function), but it will also maintain rated system efficiency, as efficiency tends to decrease with age.
All major equipment associated with the Elmwood Administration Building with Attached Garage noted during CDM’s on site audit is listed in Table 4.4.2-3, along

Section 4 Energy Conservation and Retrofit Measures (ECRM)
4-39
with ASHRAE-expected service lives. It should be noted that equipment that was not seen while on site and was observed on the provided drawings are included. Where equipment ages were not found on the equipment tags, they have been estimated based on the unit appearance, approximate renovation dates, or last manufacture date of the particular model. Additionally, in cases where a unit’s manufacturer and/or model could not be determined due to an unreadable, faded, destroyed, or lost tag, manufacturer and model number information has been represented as “unknown”.
Table 4.4.2-3: Elmwood Administration Building with Attached Garage HVAC Equipment Service Lives
Description Unit
Location Service Location Manufacturer Model
Estimated Efficiency
Estimated Age
(Years)
ASHRAE Expected
Life (Years)
Gas Fired Furnace Unit (x4)
Mechanical/ Electrical
Room Office Area Trane 120 MBH input unit 75% 19 18
Air-Cooled Condensing
Unit Outside Office Area Trane TTA072C300A0 Unknown 20 20
Air-Cooled Condensing
Unit Outside Office Area Trane TTA072C300A0 Unknown 17 20
Air-Cooled Condensing
Unit Outside Office Area Trane 2TTA0072A3000AA 10 SEER 7 20
Air-Cooled Condensing
Unit Outside Office Area Trane 2TTA0072A3000AA 10 SEER 4 20
Gas Fired Radiant
Heater (x4) Garage Garage Unknown Unknown Unknown Unknown 18
Electric Unit Heater (x2)
Garage Storage Garage Storage Brasch Unknown 100% Unknown 13

Section 4 Energy Conservation and Retrofit Measures (ECRM)
4-40
CDM also created an inventory of observed domestic water heaters. This will identify any water heaters that are in need of replacement. Domestic water heaters observed to be in poor or aging condition would warrant replacement, as they are likely not operating at peak efficiency. This domestic water heater inventory may be seen as Table 4.4.2-4 below.
Table 4.4.2-4: Elmwood Administration Building with Attached Garage Domestic Water Heaters
Location Make
Storage Capacity (Gallons) Type
Heating Capacity
Estimated Age (Years)
Mechanical/ Electrical
Room
State Industries
Inc. 50 Gas 48 MBH Unknown
Mechanical/ Electrical
Room
State Industries
Inc. 50 Gas 48 MBH Unknown
Garage Ariston 4 Electric 1500 Watts Unknown
An inventory of observed compressors may be seen as Table 4.4.2-5 below.
Table 4.4.2-5: Elmwood Administration Building with Attached Garage Compressors
Location Make Receiver Capacity
(Gallons) Motor (HP) Observed Condition
Mechanical/ Electrical
Room
Marathon Electric ~50 3/4 Old
Mechanical/ Electrical
Room
Ingersoll-Rand Unknown Unknown Old

Section 4 Energy Conservation and Retrofit Measures (ECRM)
4-41
4.4.3 Elmwood Sludge Recirculation/Alum Storage Building The Elmwood Sludge Recirculation/Alum Storage Building’s HVAC equipment consists of gas fired unit heaters, exhaust fans and intake louvers. For a more detailed equipment description refer to Section 2.4.2. Figure 4.4.3-1 below shows the natural gas usage for the Elmwood Sludge Recirculation/Alum Storage Building. The predicted usage is calibrated based on the summation of the three buildings to the single gas account. Therefore the predicted usage shown below is based on a model that is a fraction of the total calibrated usage.
Figure 4.4.3-1: Elmwood Sludge Recirculation/Alum Storage Building – Natural Gas Usage
The HVAC equipment at the Elmwood Sludge Recirculation/Alum Storage Building’s appeared to be operating efficiently and based upon our site inspection appears to be in good operating order. Due to the equipment condition, CDM did not identify any HVAC-related energy savings recommendations for this building.
All major equipment noted during CDM’s on site audit is listed in Table 4.4.3-1 below, along with estimated current ages and ASHRAE-expected service lives. It should be noted that equipment capacities that were not seen while on site and was observed on the provided drawings are included.
0
100
200
300
400
500
Gas
Use
(The
rms)
Month
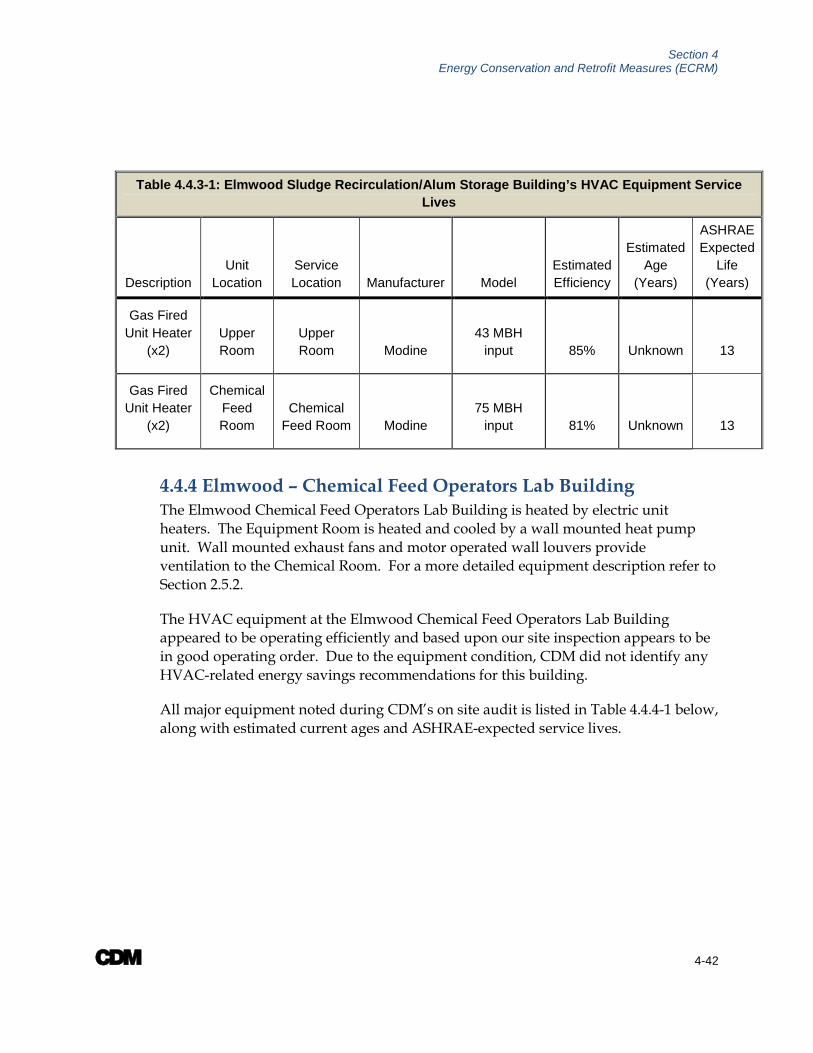
Section 4 Energy Conservation and Retrofit Measures (ECRM)
4-42
Table 4.4.3-1: Elmwood Sludge Recirculation/Alum Storage Building’s HVAC Equipment Service Lives
Description Unit
Location Service Location Manufacturer Model
Estimated Efficiency
Estimated Age
(Years)
ASHRAE Expected
Life (Years)
Gas Fired Unit Heater
(x2) Upper Room
Upper Room Modine
43 MBH input 85% Unknown 13
Gas Fired Unit Heater
(x2)
Chemical Feed Room
Chemical Feed Room Modine
75 MBH input 81% Unknown 13
4.4.4 Elmwood – Chemical Feed Operators Lab Building The Elmwood Chemical Feed Operators Lab Building is heated by electric unit heaters. The Equipment Room is heated and cooled by a wall mounted heat pump unit. Wall mounted exhaust fans and motor operated wall louvers provide ventilation to the Chemical Room. For a more detailed equipment description refer to Section 2.5.2.
The HVAC equipment at the Elmwood Chemical Feed Operators Lab Building appeared to be operating efficiently and based upon our site inspection appears to be in good operating order. Due to the equipment condition, CDM did not identify any HVAC-related energy savings recommendations for this building.
All major equipment noted during CDM’s on site audit is listed in Table 4.4.4-1 below, along with estimated current ages and ASHRAE-expected service lives.
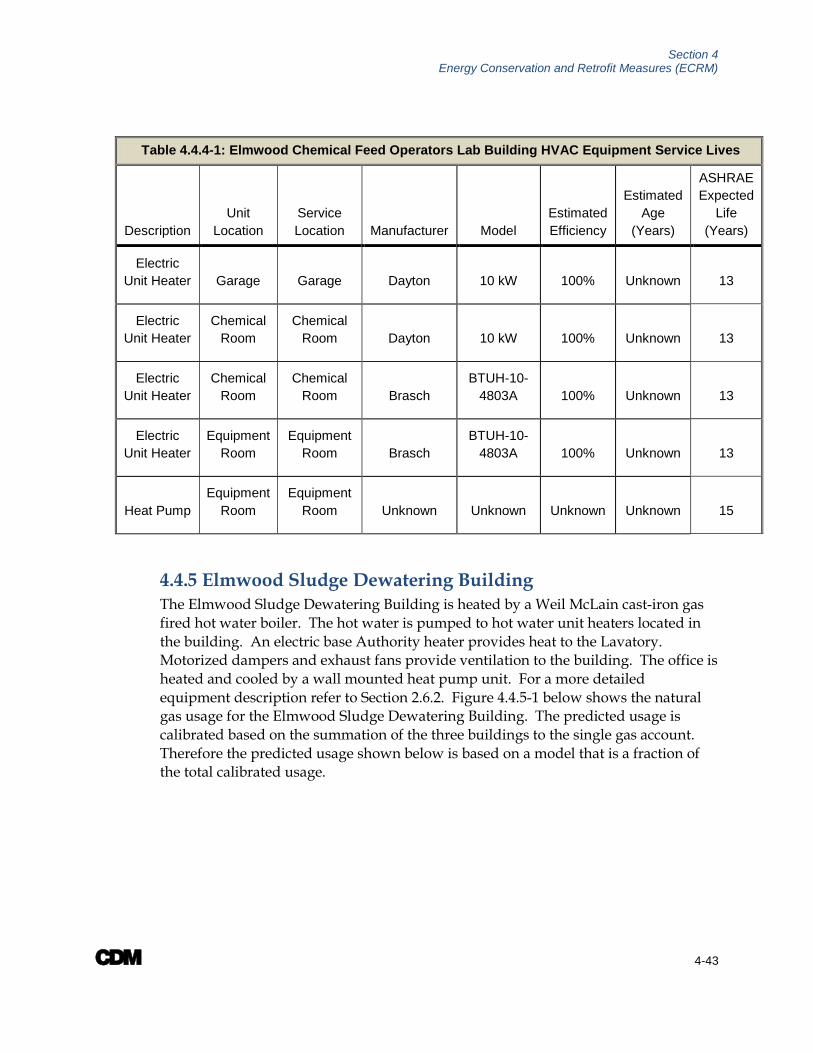
Section 4 Energy Conservation and Retrofit Measures (ECRM)
4-43
Table 4.4.4-1: Elmwood Chemical Feed Operators Lab Building HVAC Equipment Service Lives
Description Unit
Location Service Location Manufacturer Model
Estimated Efficiency
Estimated Age
(Years)
ASHRAE Expected
Life (Years)
Electric Unit Heater Garage Garage Dayton 10 kW 100% Unknown 13
Electric Unit Heater
Chemical Room
Chemical Room Dayton 10 kW 100% Unknown 13
Electric Unit Heater
Chemical Room
Chemical Room Brasch
BTUH-10-4803A 100% Unknown 13
Electric Unit Heater
Equipment Room
Equipment Room Brasch
BTUH-10-4803A 100% Unknown 13
Heat Pump Equipment
Room Equipment
Room Unknown Unknown Unknown Unknown 15
4.4.5 Elmwood Sludge Dewatering Building The Elmwood Sludge Dewatering Building is heated by a Weil McLain cast-iron gas fired hot water boiler. The hot water is pumped to hot water unit heaters located in the building. An electric base Authority heater provides heat to the Lavatory. Motorized dampers and exhaust fans provide ventilation to the building. The office is heated and cooled by a wall mounted heat pump unit. For a more detailed equipment description refer to Section 2.6.2. Figure 4.4.5-1 below shows the natural gas usage for the Elmwood Sludge Dewatering Building. The predicted usage is calibrated based on the summation of the three buildings to the single gas account. Therefore the predicted usage shown below is based on a model that is a fraction of the total calibrated usage.

Section 4 Energy Conservation and Retrofit Measures (ECRM)
4-44
Figure 4.4.5-1: Elmwood Sludge Dewatering Building – Natural Gas Usage
Currently, the heating system utilizes one (1) gas-fired Weil McLain cast iron boiler, with an input rating of 455 MBH. A hot water gross I=B=R rating of 359 MBH gives this boiler an overall efficiency of 79%.
CDM recommends replacing this boiler with a high-efficiency, condensing boiler.
CDM anticipates that one (1) 399 MBH input high-efficiency condensing boiler should adequately heat the building.
Figure 4.4.5-2 compares current gas usage with predicted gas usage resulting from a switch to a high-efficiency, condensing boiler. Condensing boilers are modeled with a full-load efficiency of 92% and return water temperature as low as 100°F in mild weather.
0
100
200
300
400
500G
as U
se (T
herm
s)
Month
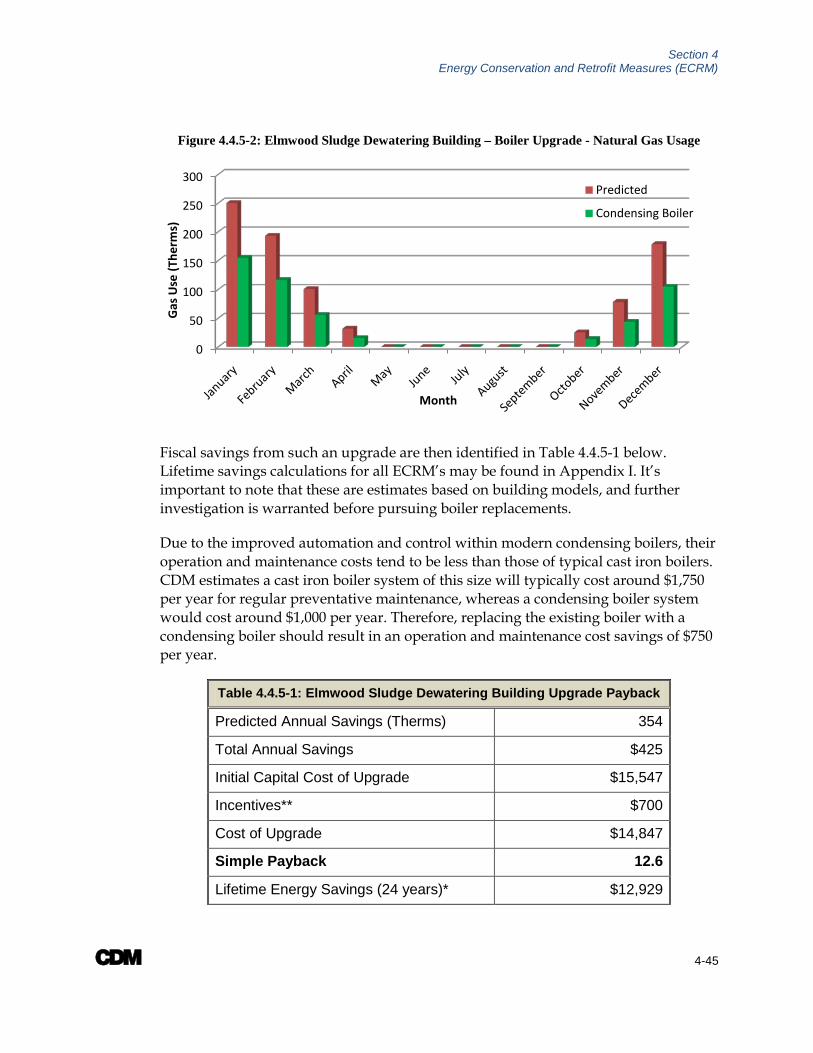
Section 4 Energy Conservation and Retrofit Measures (ECRM)
4-45
Figure 4.4.5-2: Elmwood Sludge Dewatering Building – Boiler Upgrade - Natural Gas Usage
Fiscal savings from such an upgrade are then identified in Table 4.4.5-1 below. Lifetime savings calculations for all ECRM’s may be found in Appendix I. It’s important to note that these are estimates based on building models, and further investigation is warranted before pursuing boiler replacements.
Due to the improved automation and control within modern condensing boilers, their operation and maintenance costs tend to be less than those of typical cast iron boilers. CDM estimates a cast iron boiler system of this size will typically cost around $1,750 per year for regular preventative maintenance, whereas a condensing boiler system would cost around $1,000 per year. Therefore, replacing the existing boiler with a condensing boiler should result in an operation and maintenance cost savings of $750 per year.
Table 4.4.5-1: Elmwood Sludge Dewatering Building Upgrade Payback
Predicted Annual Savings (Therms) 354
Total Annual Savings $425
Initial Capital Cost of Upgrade $15,547
Incentives** $700
Cost of Upgrade $14,847
Simple Payback 12.6
Lifetime Energy Savings (24 years)* $12,929
0
50
100
150
200
250
300G
as U
se (T
herm
s)
Month
Predicted
Condensing Boiler

Section 4 Energy Conservation and Retrofit Measures (ECRM)
4-46
Table 4.4.5-1: Elmwood Sludge Dewatering Building Upgrade Payback
Annual Maintenance Cost Savings (AMCS)
$750
Annual Return on Investment (AROI) 3.75%
Internal Rate of Return (IRR) 8.78%
Net Present Value (NPV) $12,532 *Assumes 2% yearly inflation on natural gas costs
**Incentives, per New Jersey Clean Energy Program, are $1.75 per MBH
The boiler currently operating at the Elmwood Sludge Dewatering Building is only 20 years old. It may not be financially feasible to replace this boiler immediately. When the current boilers begin approaching their useful life the Authority should investigate a boiler upgrade. CDM completed a boiler upgrade analysis above to allow the Authority to examine the approximate savings.
All major equipment noted during CDM’s on site audit is listed in Table 4.4.5-2 below, along with estimated current ages and ASHRAE-expected service lives. It should be noted that equipment capacities that were not seen while on site and was observed on the provided drawings are included.
Table 4.4.5-2: Elmwood Sludge Dewatering Building HVAC Equipment Service Lives
Description Unit
Location Service Location Manufacturer Model
Estimated Efficiency
Estimated Age
(Years)
ASHRAE Expected
Life (Years)
Gas Fired Cast Iron
Boiler Boiler Room Hot Water
Unit Heater Weil McLane PFG-8-PI 79% 20 35
Hot Water Unit Heater
(x4)
Boiler Room, Dewatering
Room, Motor Control Room
Boiler Room, Dewatering
Room, Motor Control Room Modine
75 MBH Output Unknown Unknown 20
Heat Pump Office Office Unknown Unknown Unknown Unknown 15
CDM also created an inventory of observed domestic water heaters. This will identify any water heaters that are in need of replacement. Domestic water heaters observed to be in poor or aging condition would warrant replacement, as they are likely not

Section 4 Energy Conservation and Retrofit Measures (ECRM)
4-47
operating at peak efficiency. This domestic water heater inventory may be seen as Table 4.4.5-3 below.
Table 4.4.5-3 Elmwood Sludge Dewatering Building Domestic Water Heaters
Location Make
Storage Capacity (Gallons) Type
Heating Capacity
Estimated Age
(Years)
Lavatory In-Sink-Erator 2.5 Electric 1500 Watts Unknown
4.4.6 Elmwood Generator Building The Elmwood Generator Building’s HVAC system consists of an electric unit heater, exhaust fan, and motor operated wall dampers. For a more detailed equipment description refer to Section 2.7.2. The HVAC equipment at the Elmwood Generator Building appeared to be operating efficiently and based upon our site inspection appears to be in good operating order. Due to the equipment condition, CDM did not identify any HVAC-related energy savings recommendations for this building.
All major equipment noted during CDM’s on site audit is listed in Table 4.4.6-1 below, along with estimated current ages and ASHRAE-expected service lives.
Table 4.4.6-1 Elmwood Generator Building HVAC Equipment Service Lives
Description Unit
Location Service Location Manufacturer Model
Estimated Efficiency
Estimated Age
(Years)
ASHRAE Expected
Life (Years)
Electric Unit Heater
Generator Building
Generator Building Dayton 3UF87 100% Unknown 13
4.4.7 Woodstream Control/BioFor Building As stated above, the entire Woodstream Wastewater Treatment Facility is on one electric bill. CDM is only evaluating the Control/BioFor Building and Blower Building. The electrical usage was not calibrated due to the majority of electrical usage comes from process loads, and CDM is not evaluating all the buildings at the Woodstream site. However, the Control/BioFor Building is the only building that uses gas. The Control/BioFor Building was modeled and calibrated to match the actual gas usage. To calibrate the model, CDM used natural gas bills from January
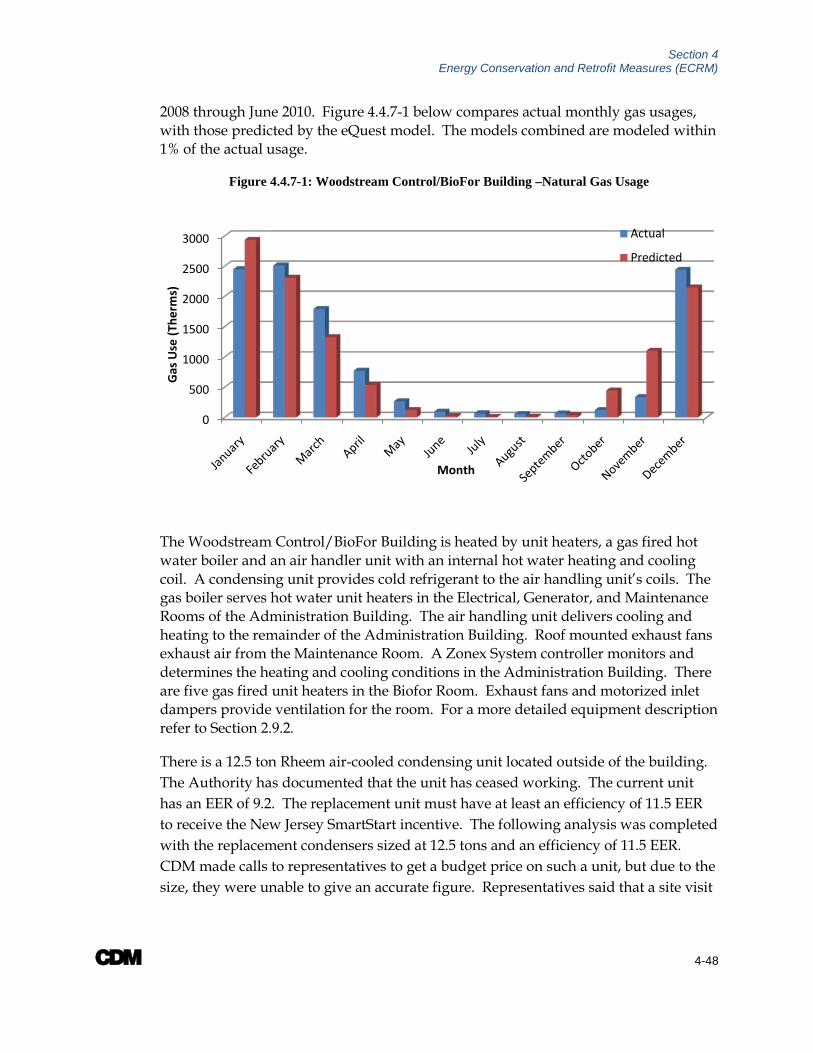
Section 4 Energy Conservation and Retrofit Measures (ECRM)
4-48
2008 through June 2010. Figure 4.4.7-1 below compares actual monthly gas usages, with those predicted by the eQuest model. The models combined are modeled within 1% of the actual usage.
Figure 4.4.7-1: Woodstream Control/BioFor Building –Natural Gas Usage
The Woodstream Control/BioFor Building is heated by unit heaters, a gas fired hot water boiler and an air handler unit with an internal hot water heating and cooling coil. A condensing unit provides cold refrigerant to the air handling unit’s coils. The gas boiler serves hot water unit heaters in the Electrical, Generator, and Maintenance Rooms of the Administration Building. The air handling unit delivers cooling and heating to the remainder of the Administration Building. Roof mounted exhaust fans exhaust air from the Maintenance Room. A Zonex System controller monitors and determines the heating and cooling conditions in the Administration Building. There are five gas fired unit heaters in the Biofor Room. Exhaust fans and motorized inlet dampers provide ventilation for the room. For a more detailed equipment description refer to Section 2.9.2.
There is a 12.5 ton Rheem air-cooled condensing unit located outside of the building. The Authority has documented that the unit has ceased working. The current unit has an EER of 9.2. The replacement unit must have at least an efficiency of 11.5 EER to receive the New Jersey SmartStart incentive. The following analysis was completed with the replacement condensers sized at 12.5 tons and an efficiency of 11.5 EER. CDM made calls to representatives to get a budget price on such a unit, but due to the size, they were unable to give an accurate figure. Representatives said that a site visit
0
500
1000
1500
2000
2500
3000
Gas
Use
(The
rms)
Month
Actual
Predicted

Section 4 Energy Conservation and Retrofit Measures (ECRM)
4-49
must be completed in order to grant a budget price for the condensing unit. Therefore, the budget price was taken from CostWorks 2010. Figure 4.4.7-2 below shows the existing, and replacement cooling electrical usage next to each other for comparison.
Figure 4.4.7-2: Woodstream Control/BioFor Building – Condenser Upgrade - Cooling Electrical Usage
Predicted fiscal savings from such an upgrade are identified in Table 4.4.7-1 below. The costs associated with the new unit can be seen in Appendix H. A 12.5 ton condensing unit must have an EER rating of at least 11.5 to receive an incentive from New Jersey Clean Energy SmartStart program. Due to the entire plant being on a single electric bill, the Woodstream Control/BioFor Building electrical usage is not calibrated to actual usage. The savings and payback displayed below are based off a model of the Woodstream Control/BioFor Building, and further investigation is warranted before proceeding.
Table 4.4.7-1: Woodstream Control/BioFor Building Condenser Replacement
Predicted Annual Savings (kWh) 3,510
Total Annual Savings $491
Initial Capital Cost of Upgrade $12,614
Incentives** $948
0
500
1000
1500
2000
2500
3000
3500
4000
4500
Cool
ing
Elec
tric
ity
Use
(kW
h)
Month
Predicted
Condenser Replacement
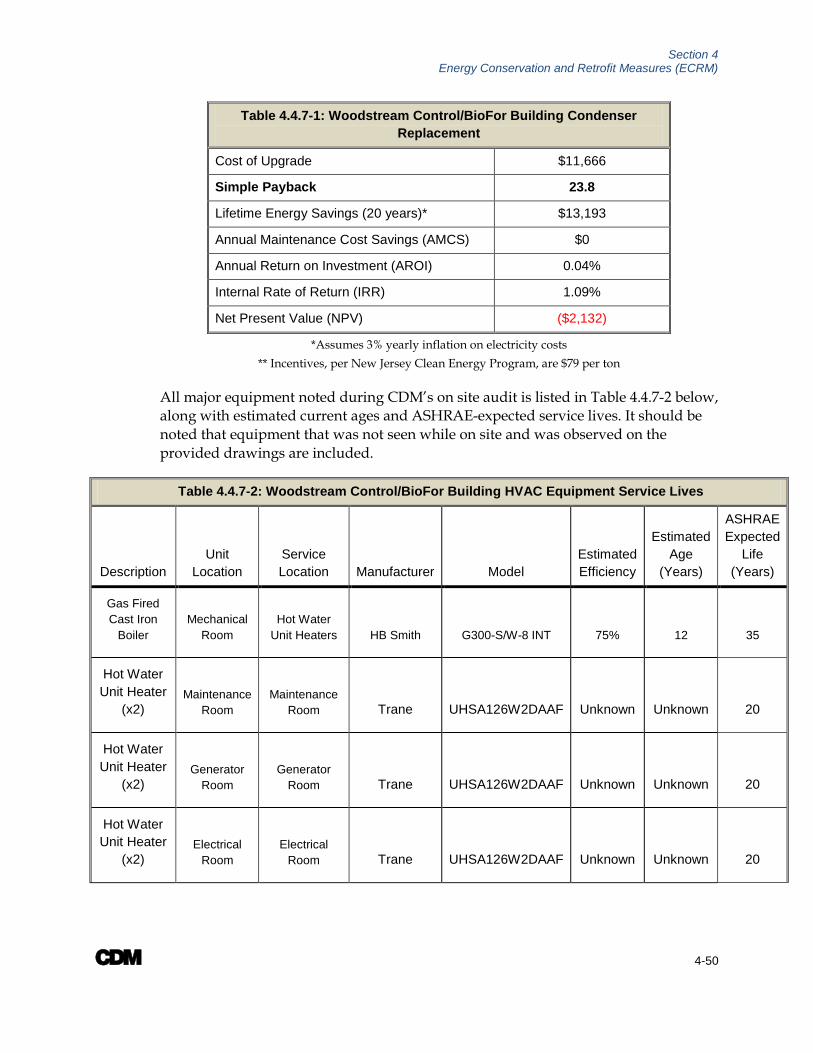
Section 4 Energy Conservation and Retrofit Measures (ECRM)
4-50
Table 4.4.7-1: Woodstream Control/BioFor Building Condenser Replacement
Cost of Upgrade $11,666
Simple Payback 23.8
Lifetime Energy Savings (20 years)* $13,193
Annual Maintenance Cost Savings (AMCS) $0
Annual Return on Investment (AROI) 0.04%
Internal Rate of Return (IRR) 1.09%
Net Present Value (NPV) ($2,132)
*Assumes 3% yearly inflation on electricity costs ** Incentives, per New Jersey Clean Energy Program, are $79 per ton
All major equipment noted during CDM’s on site audit is listed in Table 4.4.7-2 below, along with estimated current ages and ASHRAE-expected service lives. It should be noted that equipment that was not seen while on site and was observed on the provided drawings are included.
Table 4.4.7-2: Woodstream Control/BioFor Building HVAC Equipment Service Lives
Description Unit
Location Service Location Manufacturer Model
Estimated Efficiency
Estimated Age
(Years)
ASHRAE Expected
Life (Years)
Gas Fired Cast Iron
Boiler Mechanical
Room Hot Water
Unit Heaters HB Smith G300-S/W-8 INT 75% 12 35
Hot Water Unit Heater
(x2) Maintenance
Room Maintenance
Room Trane UHSA126W2DAAF Unknown Unknown 20
Hot Water Unit Heater
(x2) Generator
Room Generator
Room Trane UHSA126W2DAAF Unknown Unknown 20
Hot Water Unit Heater
(x2) Electrical
Room Electrical
Room Trane UHSA126W2DAAF Unknown Unknown 20

Section 4 Energy Conservation and Retrofit Measures (ECRM)
4-51
Table 4.4.7-2: Woodstream Control/BioFor Building HVAC Equipment Service Lives
Air Handling
Unit Mechanical
Room Administration
Building Rheem RHGE 1502L Unknown Unknown 20
Condensing Unit Outside
Air Handling Unit Rheem RAWD-1250AD 9.2 EER 14 20
Gas Fired Unit Heater
(X2) BioFor
Building BioFor
Building Sterling 300 MBH input 80% Unknown 13
Gas Fired Unit Heater
(X2) BioFor
Building BioFor
Building Sterling 130 MBH input 80% Unknown 13
Gas Fired Unit Heater
BioFor Building
BioFor Building Sterling 200 MBH input 80% Unknown 13
CDM also created an inventory of observed domestic water heaters. This will identify any water heaters that are in need of replacement. Domestic water heaters observed to be in poor or aging condition would warrant replacement, as they are likely not operating at peak efficiency. This domestic water heater inventory may be seen as Table 4.4.7-3 below.
Table 4.4.7-3: Woodstream Control/BioFor Building Domestic Water Heaters
Location Make
Storage Capacity (Gallons) Type
Heating Capacity
Estimated Age
(Years)
Mechanical Room Bradford
White Corp. 75 Gas 80 MBH Good
An inventory of observed compressors may be seen as Table 4.4.7-4 below.
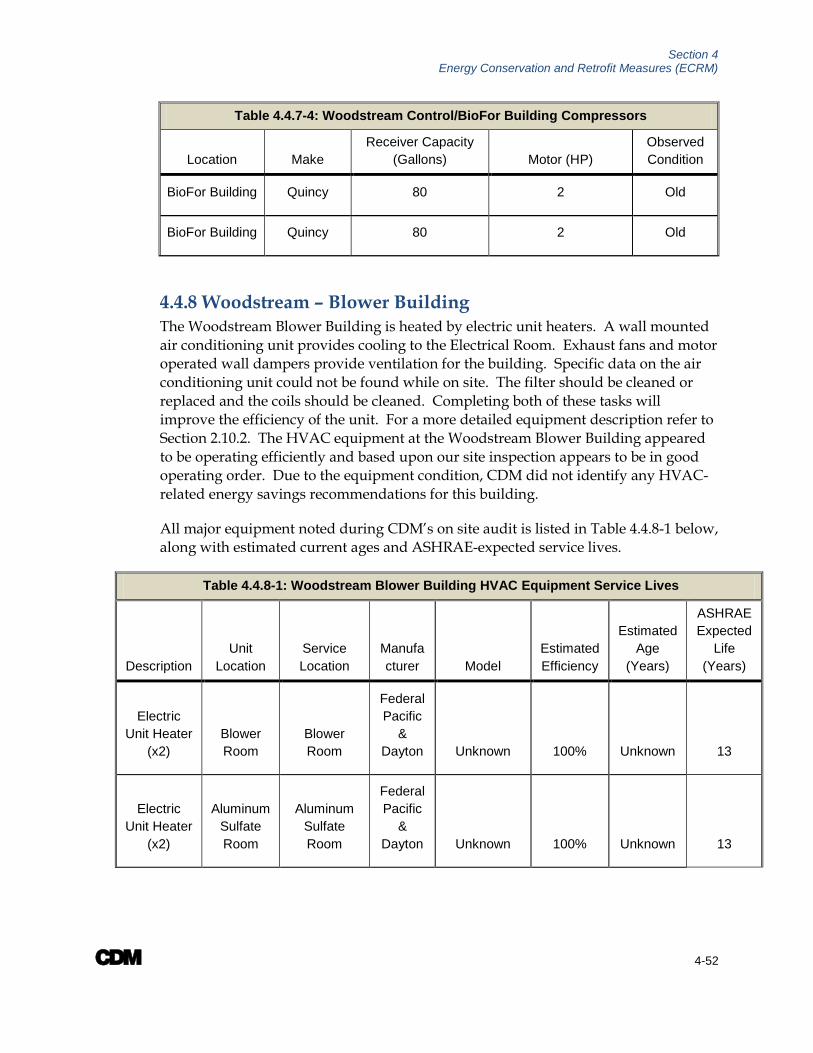
Section 4 Energy Conservation and Retrofit Measures (ECRM)
4-52
Table 4.4.7-4: Woodstream Control/BioFor Building Compressors
Location Make Receiver Capacity
(Gallons) Motor (HP) Observed Condition
BioFor Building Quincy 80 2 Old
BioFor Building Quincy 80 2 Old
4.4.8 Woodstream – Blower Building The Woodstream Blower Building is heated by electric unit heaters. A wall mounted air conditioning unit provides cooling to the Electrical Room. Exhaust fans and motor operated wall dampers provide ventilation for the building. Specific data on the air conditioning unit could not be found while on site. The filter should be cleaned or replaced and the coils should be cleaned. Completing both of these tasks will improve the efficiency of the unit. For a more detailed equipment description refer to Section 2.10.2. The HVAC equipment at the Woodstream Blower Building appeared to be operating efficiently and based upon our site inspection appears to be in good operating order. Due to the equipment condition, CDM did not identify any HVAC-related energy savings recommendations for this building.
All major equipment noted during CDM’s on site audit is listed in Table 4.4.8-1 below, along with estimated current ages and ASHRAE-expected service lives.
Table 4.4.8-1: Woodstream Blower Building HVAC Equipment Service Lives
Description Unit
Location Service Location
Manufacturer Model
Estimated Efficiency
Estimated Age
(Years)
ASHRAE Expected
Life (Years)
Electric Unit Heater
(x2) Blower Room
Blower Room
Federal Pacific
& Dayton Unknown 100% Unknown 13
Electric Unit Heater
(x2)
Aluminum Sulfate Room
Aluminum Sulfate Room
Federal Pacific
& Dayton Unknown 100% Unknown 13

Section 4 Energy Conservation and Retrofit Measures (ECRM)
4-53
Table 4.4.8-1: Woodstream Blower Building HVAC Equipment Service Lives
Electric Unit Heater
Electrical Room
Electrical Room
Unknown Unknown 100% Unknown 13
Electric Air Heater
Basement Entry
Basement Entry Indeeco
253-F031-01871-6011 100% Unknown 13
Window Air Conditionin
g Unit Electrical
Room Electrical
Room Frigidair
e Unknown Unknown Unknown 10
4.5 Motor Upgrades and VFD Additions The goal of this section is to present any energy conservation measures related to upgrading motors to premium efficiency models, and adding variable frequency drives (VFD) that may also be cost beneficial.
To model the expected energy savings from upgrading motors to premium efficiency models, and the addition of VFDs, MotorMaster+ 4.0 software was utilized. Additional installation and labor costs were modeled using CostWorks software.
Additional benefits when adding VFDs include removal of traditional motor starters, lower stress levels on the motor bearings and windings, and a decrease in stress and wear on the motor/pump.
Application of a VFD to a pump results in a cubic power reduction with speed, where a 1% reduction in pump speed, will result in a 4% reduction in energy usage required to drive the pump. For the pumps which we added VFDs at the Elmwood and Woodstream treatment plants, we assumed a 25% decrease in energy usage, which results in a 6.25% reduction in pump horsepower.
Please note that the Engineer’s Estimate of Probable Construction Costs presented herein are estimates based on historic data compiled from similar installations and engineering opinions. Additional engineering will be required for each measure identified in this report and final scope of work and budget cost estimates will need to be confirmed prior to the coordination of project financing.
In addition, several of the motors surveyed had unreadable nameplate data. Therefore, CDM has assumed standard NEMA efficiencies for these motors for analysis. Refer to Appendix L for individual motor and VFD information.

Section 4 Energy Conservation and Retrofit Measures (ECRM)
4-54
4.5.1 Elmwood - Sludge Recirculation/Alum Storage Building & Chemical Feed Building It is recommended that the following existing motors at the Elmwood Sludge Recirculation/Alum Storage Building and Chemical Feed Building be upgraded to high efficiency standards to create energy savings potential for the Authority. The following pieces of equipment are included in the analysis:
- Sludge Recirculation Building - RAS #1 Motor (Runs 3,680 hours per year) - Sludge Recirculation Building - RAS #2 Motor (Runs 7,686 hours per year) - Sludge Recirculation Building - RAS #3 Motor (Runs 4,300 hours per year) - Dewatering Building - Sludge Pump #1 Motor (Runs 2,860 hours per year) - Dewatering Building - Sludge Pump #2 Motor (Runs 2,860 hours per year) - Dewatering Building - Swing Pump Motor (Runs 1,000 hours per year) - Dewatering Building - Internal Recirculation Pump Motor (Runs 1,000 hours per year) - Chemical Feed Building - Utility Water Pump #1 Motor (Runs 4,947.9 hours per year) - Chemical Feed Building - Utility Water Pump #2 Motor (Runs 1,705.7 hours per year) - Chemical Feed Building - Utility Water Pump #3 Motor (Runs 1,714.2 hours per year)
The combined annual energy savings for this option is as follows:
Motor Upgrades: 55.9 kW, 204,939 kWh and $28,691.3
Refer to Appendix L for more information regarding motor annual energy savings.
The following Table, Table 4.5-1, summarizes a simple payback analysis assuming the implementation of all recommended motor upgrades for the Elmwood Sludge Recirculation/Alum Storage Building and Chemical Feed Building. For more information about the upgrades and a complete breakdown of simple payback and savings per motor, refer to Appendix L.
Table 4.5-1 Elmwood Sludge Recirculation/Alum Storage
Building Motor Upgrades***
Engineer’s Opinion of Probable Cost $70,121.3
New Jersey SmartStart Rebate -$2,276.6*
Total Cost $66,231
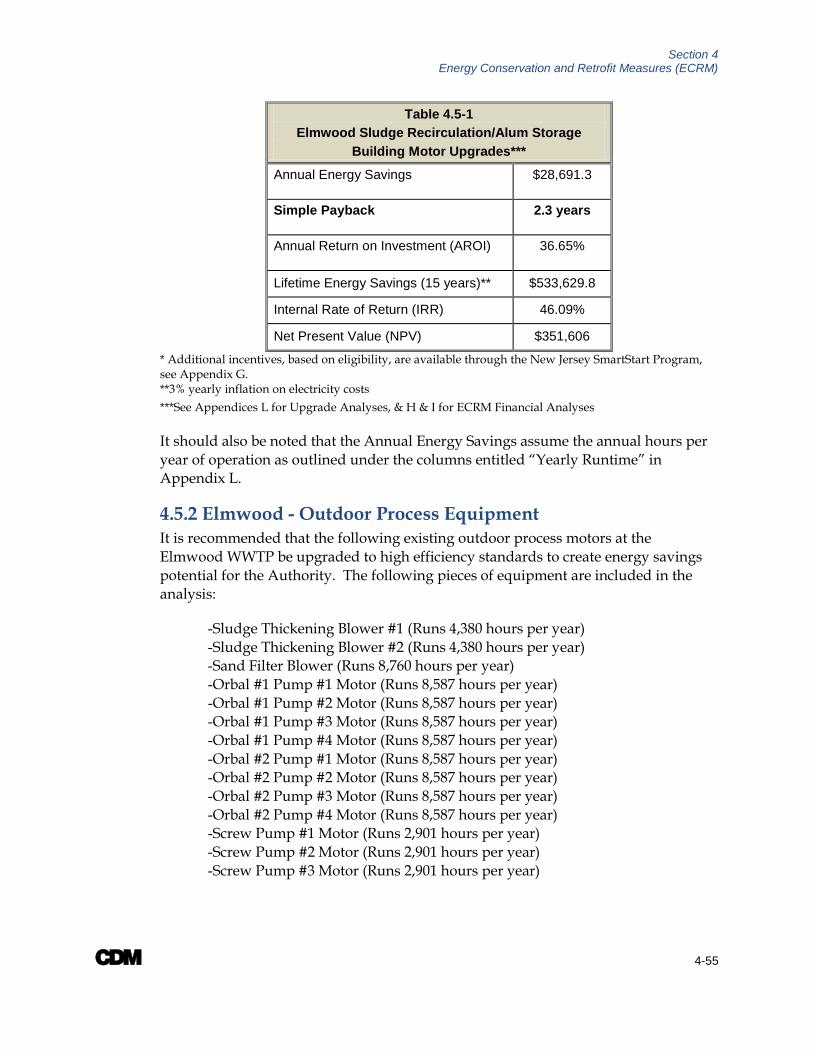
Section 4 Energy Conservation and Retrofit Measures (ECRM)
4-55
Table 4.5-1 Elmwood Sludge Recirculation/Alum Storage
Building Motor Upgrades***
Annual Energy Savings $28,691.3
Simple Payback 2.3 years
Annual Return on Investment (AROI) 36.65%
Lifetime Energy Savings (15 years)** $533,629.8
Internal Rate of Return (IRR) 46.09%
Net Present Value (NPV) $351,606
* Additional incentives, based on eligibility, are available through the New Jersey SmartStart Program, see Appendix G. **3% yearly inflation on electricity costs ***See Appendices L for Upgrade Analyses, & H & I for ECRM Financial Analyses
It should also be noted that the Annual Energy Savings assume the annual hours per year of operation as outlined under the columns entitled “Yearly Runtime” in Appendix L.
4.5.2 Elmwood - Outdoor Process Equipment It is recommended that the following existing outdoor process motors at the Elmwood WWTP be upgraded to high efficiency standards to create energy savings potential for the Authority. The following pieces of equipment are included in the analysis:
-Sludge Thickening Blower #1 (Runs 4,380 hours per year)
-Sludge Thickening Blower #2 (Runs 4,380 hours per year)
-Sand Filter Blower (Runs 8,760 hours per year)
-Orbal #1 Pump #1 Motor (Runs 8,587 hours per year)
-Orbal #1 Pump #2 Motor (Runs 8,587 hours per year)
-Orbal #1 Pump #3 Motor (Runs 8,587 hours per year) -Orbal #1 Pump #4 Motor (Runs 8,587 hours per year) -Orbal #2 Pump #1 Motor (Runs 8,587 hours per year)
-Orbal #2 Pump #2 Motor (Runs 8,587 hours per year)
-Orbal #2 Pump #3 Motor (Runs 8,587 hours per year) -Orbal #2 Pump #4 Motor (Runs 8,587 hours per year) -Screw Pump #1 Motor (Runs 2,901 hours per year) -Screw Pump #2 Motor (Runs 2,901 hours per year) -Screw Pump #3 Motor (Runs 2,901 hours per year)

Section 4 Energy Conservation and Retrofit Measures (ECRM)
4-56
The annual energy savings for this option is as follows:
Motor Upgrades: 43.3 kW, 226,335.7 kWh and $44,696.6
The following Table, Table 4.5-2, summarizes a simple payback analysis assuming the implementation of all recommended outdoor process motors. For more information about the upgrade and a complete breakdown of simple payback and savings per motor, refer to Appendix L.
Table 4.5-2 Elmwood Outdoor Process Motor Upgrades***
Engineer’s Opinion of Probable Cost $47,296.6
New Jersey SmartStart Rebate -$2,600*
Total Cost $44,696.6
Annual Energy Savings $31,687
Simple Payback 1.4 years
Annual Return on Investment (AROI) 64.23%
Lifetime Energy Savings (15 years)** $589,343.8
Internal Rate of Return (IRR) 73.87%
Net Present Value (NPV) $416,764.5
* Additional incentives, based on eligibility, are available through the New Jersey SmartStart Program, see Appendix G. **3% yearly inflation on electricity costs ***See Appendices L for Upgrade Analyses, & H & I for ECRM Financial Analyses
It should be noted that the Annual Energy Savings assume the annual hours per year of operation as outlined under the columns entitled “Yearly Runtime” in Appendix L.
4.5.3 Woodstream - Biofor Building It is recommended that the following existing motors at the Woodstream Biofor Building be upgraded to high efficiency standards to create energy savings potential for the Authority. The following pieces of equipment are included in the analysis:

Section 4 Energy Conservation and Retrofit Measures (ECRM)
4-57
-Air Scour Blower #1 Motor (Runs 1,092 hours per year) -Air Scour Blower #2 Motor (Runs 1,092 hours per year) -Process Blower #3 Motor (Runs 8,760 hours per year) -Process Blower #4 Motor (Runs 8,760 hours per year) -Process Blower #5 Motor (Runs 8,760 hours per year)
The combined annual energy savings for this option is as follows:
Motor Upgrades: 8.14 kW, 57,876.8 kWh and $8,102.8
The following Table, Table 4.5-3, summarizes a simple payback analysis assuming the implementation of all recommended motor upgrades for Woodstream - Biofor Building. For more information about the upgrade and a complete breakdown of simple payback and savings per motor, refer to Appendix L.
Table 4.5-3 Woodstream - Biofor Building Motor Upgrades***
Engineer’s Opinion of Probable Cost $26,442.8
New Jersey SmartStart Rebate -$1,570*
Total Cost $24,872.8
Annual Energy Savings $8,102.8
Simple Payback 3 years
Annual Return on Investment (AROI) 25.91%
Lifetime Energy Savings (15 years)** $150,702.4
Internal Rate of Return (IRR) 35.01%
Net Present Value (NPV) $93,128.4
* Additional incentives, based on eligibility, are available through the New Jersey SmartStart Program, see Appendix G. **3% yearly inflation on electricity costs ***See Appendices L for Upgrade Analyses, & H & I for ECRM Financial Analyses
It should be noted that the Annual Energy Savings assume the annual hours per year of operation as outlined under the columns entitled “Yearly Runtime” in Appendix L.

Section 4 Energy Conservation and Retrofit Measures (ECRM)
4-58
4.5.4 Woodstream - Blower Building It is recommended that the following existing motors at the Woodstream Blower Building be upgraded to high efficiency standards to create energy savings potential for the Authority. The following pieces of equipment are included in the analysis:
-Air Scour Blower #3 Motor (Runs 8,760 hours per year) -Air Scour Blower #4 Motor (Runs 8,760 hours per year) -Process Blower #1 Motor (Runs 8,760 hours per year) -Process Blower #2 Motor (Runs 8,760 hours per year) -Standby Blower Motor (Runs 0 hours per year)
The combined annual energy savings for this option is as follows:
Motor Upgrades: 4.12 kW, 27,487.2 kWh and $3,848.2
The following Table, Table 4.5-4, summarizes a simple payback analysis assuming the implementation of all recommended motor upgrade for the Blower Building. For more information about the upgrade and a complete breakdown of simple payback and savings per motor, refer to Appendix L.
Table 4.5-4 Woodstream - Blower Building Motor Upgrades***
Engineer’s Opinion of Probable Cost $36,570
New Jersey SmartStart Rebate -$2,320*
Total Cost $34,250
Annual Energy Savings $3,848.2
Simple Payback 8.9 years
Annual Return on Investment (AROI) 0.11%
Lifetime Energy Savings (15 years)** $43,149.5
Internal Rate of Return (IRR) 2.83%
Net Present Value (NPV) ($463.6)
* Additional incentives, based on eligibility, are available through the New Jersey SmartStart Program, see Appendix G. **3% yearly inflation on electricity costs ***See Appendices L for Upgrade Analyses, & H & I for ECRM Financial Analyses

Section 4 Energy Conservation and Retrofit Measures (ECRM)
4-59
It should be noted that the Annual Energy Savings assume the annual hours per year of operation as outlined under the columns entitled “Yearly Runtime” in Appendix L.
4.5.5 Woodstream - Influent Pump Station
It is recommended that the following existing motors at the Woodstream Influent Pump Station be upgraded to high efficiency standards to create energy savings potential for the Authority. The following pieces of equipment are included in the analysis:
-Influent Pump #1 Motor (Runs 4,380 hours per year) -Influent Pump #2 Motor (Runs 4,380 hours per year) -Influent Pump #3 Motor (Runs 0 hours per year)
The combined annual energy savings for this option is as follows:
Motor Upgrades: 3.34 kW, 9,764.2 kWh and $1,367
The following Table, Table 4.5-5, summarizes a simple payback analysis assuming the implementation of all recommended motor upgrade for the Woodstream Influent Pump Station. For more information about the upgrade and a complete breakdown of simple payback and savings per motor, refer to Appendix L.
Table 4.5-5
Woodstream - Influent Pump Station Motor Upgrades***
Engineer’s Opinion of Probable Cost $6,658.5
New Jersey SmartStart Rebate -$390*
Total Cost $6,268.5
Annual Energy Savings $1,367
Simple Payback 4.6 years
Annual Return on Investment (AROI) 13.86%
Lifetime Energy Savings (15 years)** $25,424.3
Internal Rate of Return (IRR) 21.89%
Net Present Value (NPV) $13,249

Section 4 Energy Conservation and Retrofit Measures (ECRM)
4-60
* Additional incentives, based on eligibility, are available through the New Jersey SmartStart Program, see Appendix G. **3% yearly inflation on electricity costs ***See Appendices L for Upgrade Analyses, & H & I for ECRM Financial Analyses
It should be noted that the Annual Energy Savings assume the annual hours per year of operation as outlined under the columns entitled “Yearly Runtime” in Appendix L.
4.5.6 Woodstream - Junk Pump Room It is recommended that the following existing motors at the Woodstream - Junk Pump Room be upgraded to high efficiency standards to create energy savings potential for the Authority. The following pieces of equipment are included in the analysis:
-Junk Pump #1 Motor (Runs 5,110 hours per year) -Junk Pump #2 Motor (Runs 1,095 hours per year) -Junk Pump #3 Motor (Runs 0 hours per year)
The combined annual energy savings for this option is as follows:
Motor Upgrades: 19.7 kW, 40,731 kWh and $5,702
The following Table, Table 4.5-6, summarizes a simple payback analysis assuming the implementation of all recommended motor upgrade for the Woodstream - Junk Pump Room. For more information about the upgrade and a complete breakdown of simple payback and savings per motor, refer to Appendix L.

Section 4 Energy Conservation and Retrofit Measures (ECRM)
4-61
Table 4.5-6 Woodstream - Junk Pump Room Motor Upgrades***
Engineer’s Opinion of Probable Cost $29,661.4
New Jersey SmartStart Rebate -$450*
Total Cost $29,211.4
Annual Energy Savings $5,702
Simple Payback 5.1 years
Annual Return on Investment (AROI) 12.6%
Lifetime Energy Savings (15 years)** $106,057
Internal Rate of Return (IRR) 20.41%
Net Present Value (NPV) $53,432
* Additional incentives, based on eligibility, are available through the New Jersey SmartStart Program, see Appendix G. **3% yearly inflation on electricity costs ***See Appendices L for Upgrade Analyses, & H & I for ECRM Financial Analyses
It should be noted that the Annual Energy Savings assume the annual hours per year of operation as outlined under the columns entitled “Yearly Runtime” in Appendix L.
4.5.7 Woodstream - Backwash Building It is recommended that the following existing motors at the Woodstream - Backwash Building be upgraded to high efficiency standards to create energy savings potential for the Authority. The following pieces of equipment are included in the analysis:
-Backwash Pump #1 Motor (Runs 1,095 hours per year) -Backwash Pump #2 Motor (Runs 1,095 hours per year)
The combined annual energy savings for this option is as follows:
Motor Upgrades: 19.6 kW, 21,497 kWh and $3,010
The following Table, Table 4.5-7, summarizes a simple payback analysis assuming the implementation of all recommended motor upgrade for the Woodstream - Backwash Building. For more information about the upgrade and a complete breakdown of simple payback and savings per motor, refer to Appendix L.

Section 4 Energy Conservation and Retrofit Measures (ECRM)
4-62
Table 4.5-7 Woodstream - Backwash Building Motor
Upgrades***
Engineer’s Opinion of Probable Cost $20,700
New Jersey SmartStart Rebate -$0*
Total Cost $20,700
Annual Energy Savings $3,010
Simple Payback 6.9 years
Annual Return on Investment (AROI) 7.87%
Lifetime Energy Savings (15 years)** $55,974
Internal Rate of Return (IRR) 14.61%
Net Present Value (NPV) $23,128
* Additional incentives, based on eligibility, are available through the New Jersey SmartStart Program, see Appendix G. **3% yearly inflation on electricity costs ***See Appendices L for Upgrade Analyses, & H & I for ECRM Financial Analyses
It should be noted that the Annual Energy Savings assume the annual hours per year of operation as outlined under the columns entitled “Yearly Runtime” in Appendix M.
4.5.8 Woodstream - Outdoor Process Equipment It is recommended that the following existing outdoor process motors at the Woodstream WWTP be upgraded to high efficiency standards to create energy savings potential for the Authority. The following pieces of equipment are included in the analysis:
-High Pressure Air Scrubber (Runs 8,760 hours per year)
The annual energy savings for this option is as follows:
Motor Upgrades: 6.1 kW, 53,214.7 kWh and $7,450
The following Table, Table 4.5-8, summarizes a simple payback analysis assuming the implementation of all recommended outdoor process motors. For more information

Section 4 Energy Conservation and Retrofit Measures (ECRM)
4-63
about the upgrade and a complete breakdown of simple payback and savings per motor, refer to Appendix L.
Table 4.5-8 Woodstream - Outdoor Process Motor Upgrades***
Engineer’s Opinion of Probable Cost $8,616
New Jersey SmartStart Rebate -$130*
Total Cost $8,486.4
Annual Energy Savings $7,450.1
Simple Payback 1.1 years
Annual Return on Investment (AROI) 81.12%
Lifetime Energy Savings (15 years)** $138,563
Internal Rate of Return (IRR) 90.79%
Net Present Value (NPV) $100,010
* Additional incentives, based on eligibility, are available through the New Jersey SmartStart Program, see Appendix G. **3% yearly inflation on electricity costs ***See Appendices L for Upgrade Analyses, & H & I for ECRM Financial Analyses
It should be noted that the Annual Energy Savings assume the annual hours per year of operation as outlined under the columns entitled “Yearly Runtime” in Appendix L.
4.5.9 All Combined Motors CDM has completed a full motor replacement analysis; in which replacing almost all motors described in this analysis is considered. Based on this analysis, it is recommended that most of the existing motors at the Evesham MUA could be upgraded to high efficiency standards to create energy savings potential for the Authority.
The annual energy savings for this option is as follows:
All Motor Upgrades: 160.2kW, 641,845kWh and $89,858.3
Refer to Appendix M for more information regarding motor annual energy savings.

Section 4 Energy Conservation and Retrofit Measures (ECRM)
4-64
The following Table, Table 4.5-9, summarizes a simple payback analysis assuming the implementation of all recommended motor upgrades and VFD additions for the Authority. For more information about the upgrades and VFD additions and a complete breakdown of simple payback per motor, refer to Appendix L.
Table 4.5-9 All Combined Motor Upgrades and VFD
Additions***
Engineer’s Opinion of Probable Cost $246,066.9
New Jersey SmartStart Rebate -$11,350*
Total Cost $234,717
Annual Energy Savings $89,858.3
Simple Payback 2.6 years
Annual Return on Investment (AROI) 31.62%
Lifetime Energy Savings (15 years)** $1,671,266
Internal Rate of Return (IRR) 40.94%
Net Present Value (NPV) $1,073,898
* Additional incentives, based on eligibility, are available through the New Jersey SmartStart Program, see Appendix G. **3% yearly inflation on electricity costs ***See Appendix L for ECRM Financial Analyses It should be noted that the Annual Energy Savings assume the annual hours per year of operation as outlined under the columns entitled “Yearly Runtime” in Appendix L.
4.6 Alternative Energy Sources 4.6.1 Photovoltaic Solar Energy System Overview Photovoltaic (PV) cells convert energy in sunlight directly into electrical energy through the use of silicon semi conductors, diodes and collection grids. Several PV cells are then linked together in a single frame of module to become a solar panel. PV cells are able to convert the energy from the sun into electricity. The angle of inclination of the PV cells, the amount of sunlight available, the orientation of the panels, the amount of physical space available and the efficiency of the individual panels are all factors that affect the amount of electricity that is generated.

Section 4 Energy Conservation and Retrofit Measures (ECRM)
4-65
Based on the estimated cumulative total available land area, calculations determine that the installation of a photovoltaic (PV) solar energy ground system will be appropriate for the Elmwood Treatment Plant, and Woodstream Treatment Plant.
As part of this energy audit, a preliminary engineering feasibility study of the wastewater treatment plants was completed, and consisted of the following tasks:
a. Site Visit by our engineers;
b. Satellite Image Analysis and Conceptual design and layout of the photovoltaic system;
c. Design and construction cost estimates;
d. Determine a preliminary design for the size and energy production of the solar system.
The total unobstructed available area of land with southern exposure was evaluated. It is important to note the following:
1. The PV system sizing and kWh production was calculated assuming the installation of a crystalline module facing south direction (220 Degree Azimuth) and tilted approximately 20 degrees to allow better rain water shedding and snow melting. Please note that the kWh production as well as system size may differ significantly based on final panel tilt selected during the design phase.
2. Blended electric rates were used based on actual utility bills and were applied for the facility.
The following is a preliminary study on the feasibility of installing a PV solar system at the Elmwood and Woodstream treatment plants to generate a portion of the facilities electricity requirements. The system is designed to offset the electric purchased from the local utility and not as a backup or emergency source of power.
In order to determine the best location for the installation of the PV solar system, a satellite image analysis and site walk through of the facilities was performed on July 13-14th, 2010. Also, as part of our assessment, we investigated possible locations for electrical equipment that need to be installed such as combiner boxes, disconnect switches and DC to AC inverters. Consideration was also given to locations of interconnection between the solar system and the facilities electrical grid.

Section 4 Energy Conservation and Retrofit Measures (ECRM)
4-66
4.6.1.1 Elmwood Wastewater Treatment Plant There is no amount of shading on the land that may have an impact to the design and layout of a solar PV array. The quality of land was not confirmed, and prior to installation of a solar array, site analysis should determine if the land is feasible for a PV solar system.
The Project Team conducted both a facility walk through and a satellite image analysis and based on the estimated available area calculations predict that a system rated at approximately 238.3 kW (dc) is feasible.
Electrical Service The electrical service size of the Elmwood Wastewater Treatment Plant is 1600 A, at 277/480V, 3-phase. The interconnection point for the PV system will require a modification or replacement of the existing service entrance equipment wherein the PV system feeder connections will have to be made after the main circuit breaker, and protective relaying will also have to be implemented. Preferably, the AC inverter should be installed in close proximity to the service entrance equipment, but in the case of the Elmwood Wastewater Treatment Plant, the main circuit breaker is the standby generator building and there is little to no available space. The inverter should be installed outside on a concrete pad in a weather proof enclosure. AC wiring would run from the inverters into the connection point(s) at the service entrance equipment. Any connection points would have to meet NEC and local utility requirements. Further investigation and verification of the clearances required for the standby generator, and the existing electrical equipment would be required prior to implementation of a PV system.
4.6.1.2 Woodstream Wastewater Treatment Plant There is a minimal amount of shading on the land that may have an impact to the design and layout of a solar PV array. A shading analysis would need to be performed during the design phase of the project. The quality of land was not confirmed, and prior to installation of a solar array, site analysis should determine if the land is feasible for a PV solar system.
The Project Team conducted both a facility walk through and a satellite image analysis and based on the estimated available area calculations predict that a system rated at approximately 67.8 kW (dc) is feasible.
Electrical Service The electrical service size of the Woodstream Wastewater Treatment Plant is 2000 A, at 480V, 3-phase. The interconnection point for the PV system will require a modification or replacement of the existing service entrance equipment wherein the PV system feeder connections will have to be made after the main circuit breaker, and

Section 4 Energy Conservation and Retrofit Measures (ECRM)
4-67
protective relaying will also have to be implemented. Any connection points would have to meet NEC and local utility requirements. Further investigation and verification of existing electrical equipment would be required prior to implementation of a PV system.
4.6.1.3 Basis for Design and Calculations The most common solar PV system is referred to as a (“fixed tilt”) system typically mounted to a metal rack that can be fixed at a specific angle. There are also (“tracking systems”) or movable along one or two axes to follow the position of the sun during the day. For a roof-mounted PV system, tracking systems are very rarely installed and are usually used for ground-mounted systems only, as they require more complex racks and higher maintenance costs. For the “fixed” system, the tilt is determined based on the following factors: geographical location, total targeted kWh production, seasonal electricity requirements and weather conditions such as wind. Ideally, the module tilt for Southern New Jersey should be 25-35 degrees with an azimuth as close as possible to 180 (south); however, our experience has shown that PV systems are typically installed at a tilt of 20 degrees or lower in order to avoid any issues with wind and to maximize total system size.
The type of PV panels and equipment used to mount the system shall be determined based on the wind conditions determined during the design phase of the project. In general, penetration/tie-down systems, non-penetrating ballasted type systems, or a combination of the two should be considered.
Calculation of PV System Yield An industry accepted software package, PV Watts, was used to calculate projected annual electrical production of the crystalline silicon PV system in its first year, as summarized in Table 4.5-1. The system was design to provide maximum kWh production based on available land space. The assumptions we used in the calculations were as follows: average monthly electrical usage per month of each facility, average aggregate electrical rate of each facility, square feet of available land space, and a solar rating of 3.89 kWh/m^2 per day.
Fixed Tilt System

Section 4 Energy Conservation and Retrofit Measures (ECRM)
4-68
Table 4.6-1 PV Solar System Summary
Site Est. Area (ft2)
kWh Annual Energy Savings
Est. Annual SREC
Lifetime Energy Savings
(25 Years)*
Annual Return On Investment
(AROI)
Net Present Value (NPV)
Simple Payback
Internal Rate of Return (IRR)
Elmwood Wastewater Treatment
Plant
23,833 373,830 $52,336.2 $158,130 $1,938,782 3.50% $265,289 13.3 3.99%
Woodstream Wastewater Treatment
Plant
6,777 68,806 $9,632.8 $29,105 $351,206.3 0.37% ($322,081.3) 22.9 N/A
*3% yearly inflation on electricity costs
Total Costs It should be noted that construction costs are only estimates based on historic data compiled from similar installations, and engineering opinion. Additional engineering and analysis is required to confirm the condition of the land, the system type, sizing, costs and savings. For illustration purposes, a draft financial analysis pro forma is attached outlining all project costs and revenues, Refer to Appendix E.
Table 4.6-2 Solar PV Array Engineer’s Opinion of Probable Cost
Engineer’s Opinion of Probable Cost $3,693,625
As stated above the engineer’s opinion of probable costs are based on experience with the pricing of solar installations in New Jersey, and are intended to provide the Authority with a reasonable budget cost. A typical solar installation can vary in cost from $7.00 - $10.00 per watt depending on size, complexity of the system, labor rates, etc. Approximately 60-70% of that number is material costs while the balance is labor, engineering, etc. Like any installation, certain conditions can affect a price upward or downward. We have included a budget of $9/watt for the solar system installation with an additional estimated budget of $100,000 for potential electric service work.
Based on a simple payback model, summarized in Table 4.6-1, it would benefit the Evesham MUA to further investigate the installation of a solar energy system at the Elmwood Treatment Plant, but not at the Woodstream Treatment Plant. This is

Section 4 Energy Conservation and Retrofit Measures (ECRM)
4-69
primarily based on the initial upfront capital investment required for a solar energy system installation and the 13.3 year payback period for the Elmwood Treatment Plant, and a negative net present value (NPV) for the Woodstream Treatment Plant. This payback period may justify installing the solar energy system. Other options such as Power Purchase Agreements are potentially available as well to help finance the project. Solar technology is constantly changing and will most likely continue to lower in price. Two major factors influencing the project financial evaluation is the variance of the prevailing energy market conditions and Solar Renewable Energy Credit (SREC) rates, with the largest impact to the payback model being the SREC credit pricing.
Table 4.6-1 includes the total simple payback analysis for the installation of a solar energy system at the Evesham and Woodstream MUA facilities. Refer to Appendix E for a more detailed solar financing spreadsheet.
Refer to Section 7 for discussion on Solar Renewable Energy Certificates and other financing options for solar projects. The financial model in Appendix E provides an annual forecast illustration of project revenues and costs for 25 years.
4.6.2 Ground Source Heat Pump Systems Ground source heat pumps utilize the relatively constant temperature of underground water sources to reject or supply heat to the interior space. Water is pumped through a loop that runs from the underground source to heat pumps at the building level. Depending on the time of year and building demand, these heat pumps use the ground source loop as a heat source or a heat sink.
Typically, ground source heat pump systems are most efficient when used in spaces that have similar heating and cooling loads, as the same loop and heat pumps are used for both cooling and heating. For wastewater treatment plant facilities, the heating and cooling loads are essentially unequal with most of the cooling in plant process areas achieved by ventilation of outdoor air to meet code requirements. Furthermore, as a water conservation measure, the cooling medium for a proposed ground source geothermal system will likely consist of treated plant effluent, which, although treated, will tend to foul heat transfer components as a result of inherent microbiological organisms present in the cooling media. Potential fouling of heat transfer components will result in increased maintenance efforts and system outage.
Ground source heat pump systems are often very costly to install due to the high cost of test boring and drilling wells. Due to this, the largely unbalanced heating and cooling demands at wastewater treatment plants, and the potential fouling of heat transfer components, CDM anticipates that installation of a ground source heat pump system would not prove cost-beneficial.

Section 4 Energy Conservation and Retrofit Measures (ECRM)
4-70
4.6.3 Wind Power Generation On-site wind power generation typically utilizes a form of turbine, which is rotated with the flow of wind across it, this rotational force powers a generator, producing DC electricity. The DC electricity is then converted into AC electricity, which can be used for commercial power, or can be fed back into the power grid, reducing the overall electric demand. The size of the turbine is proportional to the amount of wind and concurrently the amount of energy it can produce.
CDM has determined that it is not feasible for the Evesham MUA to install wind turbine energy systems at its facilities. This is primarily due to 50 year payback for averaged wind speeds. There are many other incentives that could possibly provide additional funding which would reduce the payback period further.
Because the Authority does not have a large area for installation of a larger wind turbine at any of the two locations surveyed for the audit, a small 5kW wind turbine was chosen. A turbine of this size could be installed in most locations. Depending on area available, and funding, the A may choose to install more than one wind turbine on the premises.
Utilizing NASA’s Atmospheric Science Data Center online wind mapping tool, it was determined that the local average wind speeds for the Evesham MUA ranged from 3.6 m/s to 5.2 m/s at 30 meters above the ground. In general, around 7mph of average wind speed, as determined over the course of a year, is necessary to “fuel” the turbine. These values fall within the range of feasibility for installation of a new wind turbine system.
For the purposes of this feasibility analysis, CDM chose a 5kW Endurance S-343 wind turbine. Please refer to Appendix M for vendor information. This turbine size is used most often for small commercial applications. Power Curve data was determined through the use of the product specification sheets on vendor websites. Actual turbine size, height, location, and manufacturer should be determined upon design of a wind turbine system.
The estimated wind speed data, associated wind probability distribution function (weibull value), turbulence losses, and other relevant data were then incorporated into Wind Cad to estimate the annual output for the wind turbine. Refer to Appendix J for Wind Cad Modeling.

Section 4 Energy Conservation and Retrofit Measures (ECRM)
4-71
This simple payback calculation takes into account the incentive provided for wind turbines through the REIP program. For the first 16,000 kWh of production, the incentive is $3.20/kWh. For production between 16,000 kWh – 750,000 kWh the REIP program incentive is $0.50/kWh. CDM used this incentive as an upfront deduction from the Engineer's Opinion of Probable Cost. In addition, in order to benefit from the REIP incentive, the Authority must purchase a wind turbine on the approved NJ Clean Energy list. CDM chose the Endurance S-343 wind turbine for this analysis as it is approved by the NJ Clean Energy program and is the appropriate size for smaller commercial installations and the limited area available on the site. Refer to the NJ Clean Energy website for more information.
Table 4.6-3 includes a simple payback analysis for the installation of one wind turbine energy system. Refer to Appendix K for a more detailed wind turbine financing spreadsheet, including utility cost avoidance and REC’s.
Table 4.6-3: Simple Payback Analysis for Wind Turbine Energy System
Parameter
Wind Turbine (Minimum Site Wind Speed –
3.6 m/s)
Wind Turbine (Maximum Site
Wind Speed – 5.2 m/s)
Wind Turbine (Average Site
Wind Speed –4.4 m/s)
Engineer’s Opinion of Probable Cost
$71,995 $71,995 $71,995
Renewable Energy Incentive Program**
($10,058) ($31,968) ($20,035)
Total Cost $61,937 $40,027 $51,960
1st Year Production 3,143 kWh 9,990 kWh 6,261 kWh
Annual Estimated Electric Savings $440.0 $1,398.6 $876.5
Annual Estimated REC Revenue $79 $250 $157
Project Simple Payback 119 Years 24 Years 50 Years
Annual Return On Investment (AROI)
(3.2%) 0.1% (2.0%)
Lifetime Energy Savings (25 years) $8,184 $26,012 $16,302
Internal Rate of Return (IRR) NA 2.2% (2.9%)
Net Present Value (NPV) ($50,575) ($3,912) ($29,326)
*Refer to Appendix J for Wind Cad Modeling **REIP incentive is calculated for only the first year and is applied as a deduction. Based on the simple payback model, summarized in Table 4.3-5, it would not benefit

Section 4 Energy Conservation and Retrofit Measures (ECRM)
4-72
the Authority to further investigate the installation of a wind energy system at its facilities. This is primarily based on the initial upfront capital investment required for a wind turbine energy system installation and the 50 year average wind speed payback period.
It should be noted that CDM used only REC values, utility cost avoidance factors, and the REIP incentive in determining simple payback periods. As stated above, other incentives and financial programs such as Power Purchase Agreements are available to help finance this installation. For example, if a Power Purchase Agreement is completed, the private company financing the project would benefit from the 30% tax credit. Other incentives such as CREB's and first year usage incentives could be available to the Authority in lowering the payback period. Refer to www.dsireusa.org for an extensive listing of possible incentives for the New Jersey area.
The NJBPU has compiled a list of “Trade Allies” that include certain renewable energy system installers, vendors, and manufacturers. This list is not an endorsement or a requirement for qualifying for benefits under the REIP. To be listed in the Trade Ally database, the installers must have completed three successful installations with three completed and approved projects within NJCEP per category. Therefore, the Authority may choose a different company than is listed in the Trade Ally database to install a renewable energy system should the project be implemented.
It should also be noted that the wind turbine represented above is for feasibility purposes only. If the Authority decides to install a wind turbine, different mounting heights, turbine sizes, and manufacturers should be considered. In addition, permits may be required for installation according to local zoning laws. The FAA must also be notified in order to give clearance for the tower, and for installation of aviation safety lights if necessary.
4.6.4 Combined Heat and Power Cogeneration Technology The feasibility study to implement combined heat and power cogeneration systems at the Authority’s wastewater treatment plants was not conducted as the plants do not employ the anaerobic digestion process and therefore digester gas is not available as potential fuel. Furthermore, the natural gas service main serving the wastewater treatment plants cannot convey the required gas flow to support a reasonable sized cogeneration system in terms of electrical energy production without making extensive changes to the gas main and service requirements.
5-1
Section 5 Evaluation of Energy Purchasing and Procurement Strategies 5.1 Energy Deregulation In 1999, New Jersey State Legislature passed the Electric Discount & Energy Competition Act (EDECA) to restructure the electric power industry in New Jersey. This law, the deregulation of the market, allowed all consumers to shop for their electric supplier. The intent was to create a competitive market for electrical energy supply. As a result, utilities were allowed to charge Cost of Service and customers were given the ability to choose a third party supplier. Energy deregulation in New Jersey increased the energy buyers’ options by separating the function of electricity distribution from that of electricity supply.
Public Service Enterprise Group (PSE&G) is currently the supplier of electrical energy for the Evesham Elmwood and Woodstream Wastewater Treatment Plant Facilities.. Energy deregulation creates the opportunity to choose your electric generation supplier. The benefit of this is the ability to choose a supplier based on what is important to you, for example, lowest rate or how the electric generation supply is produced.
To sell electric generation service in New Jersey, electric power suppliers must be licensed by the New Jersey Board of Public Utilities (NJ BPU). They must also be registered with the local public utility (PSE&G) to sell electric service in that utility’s service areas. The following suppliers are licensed with the NJ BPU and are registered to sell electric service in the PSE&G service territory:
Amerada Hess Corp BOC Energy Services Con Edison Solutions, Inc. Constellation New Energy, Inc. Direct Energy, LLC. First Energy Solutions Corp. Glacial Energy Integrys Energy Service Liberty Power Pepco Energy Services, Inc. PP&L Energy Plus, LLC. Reliant Energy Solutions East, LLC. Sempra Energy Solutions South Jersey Energy Strategic Energy LLC Suez Energy Resources NA, Inc UGI Energy Services
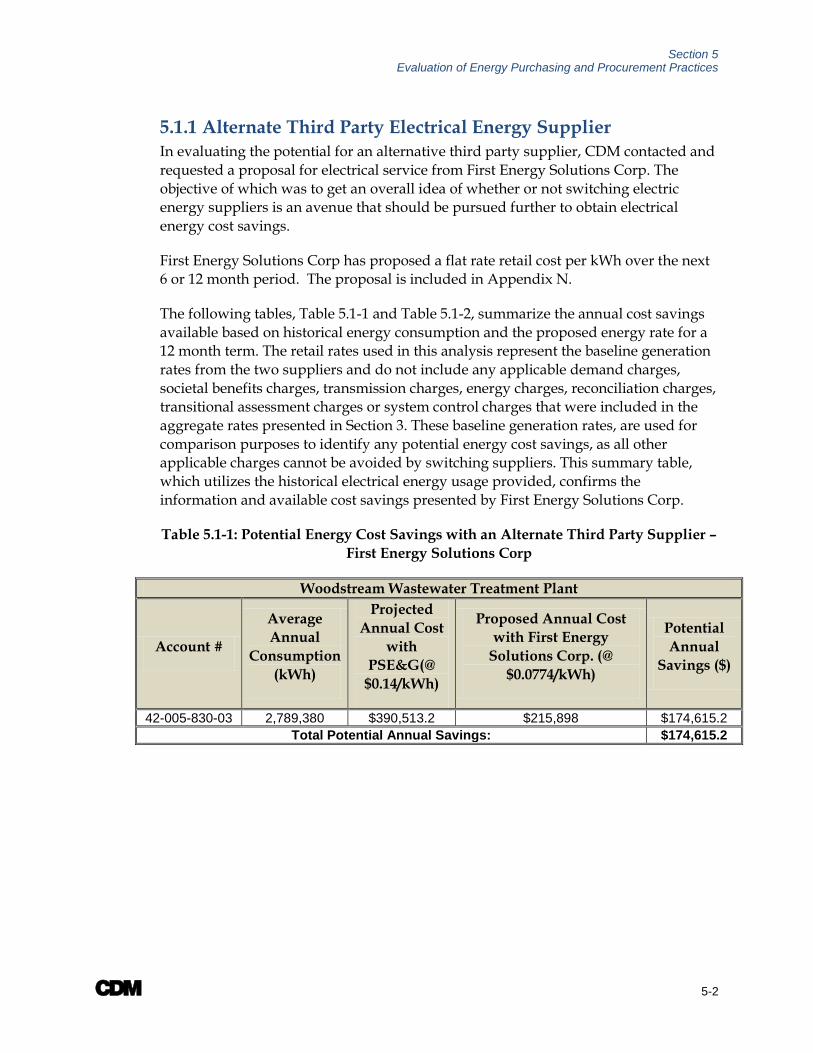
Section 5 Evaluation of Energy Purchasing and Procurement Practices
5-2
5.1.1 Alternate Third Party Electrical Energy Supplier In evaluating the potential for an alternative third party supplier, CDM contacted and requested a proposal for electrical service from First Energy Solutions Corp. The objective of which was to get an overall idea of whether or not switching electric energy suppliers is an avenue that should be pursued further to obtain electrical energy cost savings.
First Energy Solutions Corp has proposed a flat rate retail cost per kWh over the next 6 or 12 month period. The proposal is included in Appendix N.
The following tables, Table 5.1-1 and Table 5.1-2, summarize the annual cost savings available based on historical energy consumption and the proposed energy rate for a 12 month term. The retail rates used in this analysis represent the baseline generation rates from the two suppliers and do not include any applicable demand charges, societal benefits charges, transmission charges, energy charges, reconciliation charges, transitional assessment charges or system control charges that were included in the aggregate rates presented in Section 3. These baseline generation rates, are used for comparison purposes to identify any potential energy cost savings, as all other applicable charges cannot be avoided by switching suppliers. This summary table, which utilizes the historical electrical energy usage provided, confirms the information and available cost savings presented by First Energy Solutions Corp.
Table 5.1-1: Potential Energy Cost Savings with an Alternate Third Party Supplier – First Energy Solutions Corp
Woodstream Wastewater Treatment Plant
Account #
Average Annual
Consumption (kWh)
Projected Annual Cost
with PSE&G(@
$0.14/kWh)
Proposed Annual Cost with First Energy
Solutions Corp. (@ $0.0774/kWh)
Potential Annual
Savings ($)
42-005-830-03 2,789,380 $390,513.2 $215,898 $174,615.2 Total Potential Annual Savings: $174,615.2
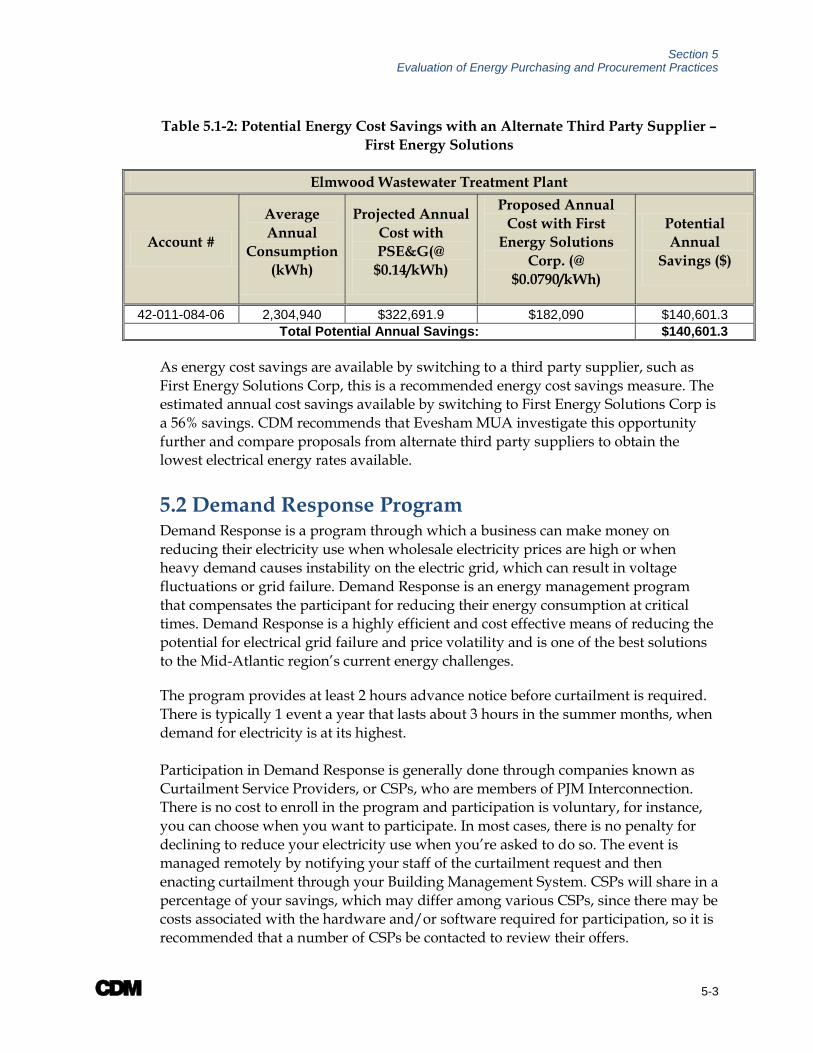
Section 5 Evaluation of Energy Purchasing and Procurement Practices
5-3
Table 5.1-2: Potential Energy Cost Savings with an Alternate Third Party Supplier – First Energy Solutions
Elmwood Wastewater Treatment Plant
Account #
Average Annual
Consumption (kWh)
Projected Annual Cost with PSE&G(@
$0.14/kWh)
Proposed Annual Cost with First
Energy Solutions Corp. (@
$0.0790/kWh)
Potential Annual
Savings ($)
42-011-084-06 2,304,940 $322,691.9 $182,090 $140,601.3 Total Potential Annual Savings: $140,601.3
As energy cost savings are available by switching to a third party supplier, such as First Energy Solutions Corp, this is a recommended energy cost savings measure. The estimated annual cost savings available by switching to First Energy Solutions Corp is a 56% savings. CDM recommends that Evesham MUA investigate this opportunity further and compare proposals from alternate third party suppliers to obtain the lowest electrical energy rates available.
5.2 Demand Response Program Demand Response is a program through which a business can make money on reducing their electricity use when wholesale electricity prices are high or when heavy demand causes instability on the electric grid, which can result in voltage fluctuations or grid failure. Demand Response is an energy management program that compensates the participant for reducing their energy consumption at critical times. Demand Response is a highly efficient and cost effective means of reducing the potential for electrical grid failure and price volatility and is one of the best solutions to the Mid-Atlantic region’s current energy challenges.
The program provides at least 2 hours advance notice before curtailment is required. There is typically 1 event a year that lasts about 3 hours in the summer months, when demand for electricity is at its highest. Participation in Demand Response is generally done through companies known as Curtailment Service Providers, or CSPs, who are members of PJM Interconnection. There is no cost to enroll in the program and participation is voluntary, for instance, you can choose when you want to participate. In most cases, there is no penalty for declining to reduce your electricity use when you’re asked to do so. The event is managed remotely by notifying your staff of the curtailment request and then enacting curtailment through your Building Management System. CSPs will share in a percentage of your savings, which may differ among various CSPs, since there may be costs associated with the hardware and/or software required for participation, so it is recommended that a number of CSPs be contacted to review their offers.

6-1
Section 6 Ranking of Energy Conservation and Retrofit Measures (ECRM) 6.1 ECRMs The main objective of this energy audit is to identify potential Energy Conservation and Retrofit Measures and to determine whether or not the identified ECRM’s are economically feasible to warrant the cost for planning and implementation of each measure. Economic feasibility of each identified measure was evaluated through a simple payback analysis. The simple payback analysis consists of establishing the Engineer’s Opinion of Probable Construction Cost estimates; O&M cost savings estimates, projected annual energy savings estimates and the potential value of New Jersey Clean Energy Rebates or Renewable Energy Credits, if applicable. The simple payback period is then determined as the amount of time (years) until the energy savings associated with each measure amounts to the capital investment cost.
As discussed in Section 3, aggregate unit costs for electrical energy delivery and usage and natural gas delivery and usage, which accounts for all demand and tariff charges at each complex, was determined and utilized in the simple payback analyses.
In general, ECRMs having a payback period of 20 years or less have been recommended and only those recommended ECRMs within Section 4 of the report have been ranked for possible implementation. The most attractive rankings are those with the lowest simple payback period.
Ranking of ECRMs has been broken down into the following categories:
WWTP Process Upgrades
Lighting Systems
HVAC Systems
Motor Upgrades & VFD Additions
Solar
6.1.1 WWTP Process Upgrades Several options to identify energy conservation measures at the Elmwood and Woodstream WPCFs were evaluated. Detailed discussions on these options are presented in Section 4.1. Table 6.1-1 includes a ranking of the recommended ECRMs for the wastewater treatment processes, with payback periods less than 20 years.

Section 6 Ranking of Energy Conservation and Retrofit Measures (ECRM)
6-2
Table 6.1-1 Sludge Holding Tank Mixing System
Location & Measure Engineer’s Opinion of Probable
Cost
Incentives Total Cost1 Annual Fiscal
Savings2
Simple Payback (Years)
Woodstream WPCF – New VFDs and Control System for Contact
Stabilization Plants $264,888 $0 $264,888 $109,165 2.4 Elmwood WPCF – Orbal System
Controls Upgrade $581,100 $0 $581,100 $142,890 4.1 Woodstream WPCF – Flow
Pacing Integration for UV System $177,840 $0 $177,840 $23,980 7.4 Woodstream WPCF –
Equalization Tank $213,000 $0 $213,000 $29,400 7.5 1. ‘Total Cost’ takes into account any applicable rebates. 2. ‘Annual Fiscal Savings’ takes into account maintenance costs savings.
6.1.2 Lighting Systems Table 6.1-2 includes the recommended ECRMs to provide energy savings for all building lighting systems, which include the installation of energy-efficient luminaires and occupancy sensors. A detailed discussion on building lighting systems is presented in Section 4.2.
Table 6.1-2 Ranking of Energy Savings Measures Summary – Lighting System Retrofits
Location/Measure Engineer’s Opinion of Probable
Cost
Incentives Total Cost1 Annual Fiscal
Savings2
Simple Payback (Years)
Elmwood Site Lighting - Lighting Upgrades $12,878.6 ($1,190) $11,688.8 $2,079.2 5.3
Woodstream Site Lighting - Lighting Upgrades $7,575.6 ($700) $6,875.6 $1,223 5.3
Elmwood Sludge Recirculation/Alum Storage
Building - Lighting Upgrades $6,036.1 ($315) $5,721.1 $663.7 7.9
Woodstream Control/Biofor Building - Lighting Upgrades $12,374.7 ($1,660) $10,714.7 $1,263.7 8.0
Elmwood Chemical Feed, Operators Lab Building - Lighting
Upgrades $2,909.5 ($90) $2,819.5 $324.4 8.0
Elmwood Administration Building with Attached Garage -
Lighting Upgrades $22,325.1 ($2,265) $20,060.1 $1,798.7 8.8
Elmwood Sludge Dewatering Building - Lighting Upgrades $6,214.3 ($175) $6,039.3 $573.7 9.9
Woodstream Blower Building - Lighting Upgrades $2,781.0 ($75) $2,706 $161.2 11.1

Section 6 Ranking of Energy Conservation and Retrofit Measures (ECRM)
6-3
Table 6.1-2 Ranking of Energy Savings Measures Summary – Lighting System Retrofits
Location/Measure Engineer’s Opinion of Probable
Cost
Incentives Total Cost1 Annual Fiscal
Savings2
Simple Payback (Years)
Elmwood Generator Building - Lighting Upgrades $2,166.3 ($90) $2,076.3 $157.3 11.3
3. ‘Total Cost’ takes into account any applicable rebates. 4. ‘Annual Fiscal Savings’ takes into account maintenance costs savings.
6.1.3 HVAC Systems Table 6.1-3 includes the recommended ECRM to provide energy savings for building HVAC systems, which provide a simple payback of less than 20 years. The condensing unit upgrade at the Control/BioFor Building is included because the current unit has ceased working. A detailed discussion on building HVAC systems is presented in Section 4.4.
Table 6.1-3 Ranking of Energy Savings Measures Summary – HVAC System Upgrade
Building & Measure Retrofit
Cost Incentives Total Cost1
Annual Fiscal
Savings2
Simple Payback (Years)
Elmwood Administration Building with Attached Garage- Furnace
Upgrades $11,046 $1,200 $9,846 $902 10.9 Elmwood Administration Building with Attached Garage - Condenser
Upgrades $12,156 $920 $11,236 $903 12.4 Elmwood Sludge Dewatering
Building – Boiler Upgrade $15,547 $700 $14,847 $1,175 12.6 Woodstream Control/Biofor
Building – Condenser Upgrade $12,614 $948 $11,666 $491 23.8 1. ‘Total Cost’ takes into account any applicable rebates. 2. ‘Annual Fiscal Savings’ takes into account maintenance costs savings.
6.1.4 Motor Upgrades and VFD Additions Table 6.1-3 includes the recommended ECRM to provide energy savings by upgrading motors to premium efficiency models, and adding VFDs. A detailed discussion on motor upgrades and VFD additions is presented in Section 4.4.

Section 6 Ranking of Energy Conservation and Retrofit Measures (ECRM)
6-4
Table 6.1-3 Ranking of Energy Savings Measures Summary – Motor Upgrades and VFD Additions
Building & Measure Engineer’s Opinion of Probable
Cost
Incentives Total Cost Annual Fiscal
Savings
Simple Payback (Years)
Woodstream - Outdoor Process Motor Upgrades $8,616 ($130) $8,486.4 $7,450.1 1.1
Elmwood Outdoor Process Motor Upgrades $47,297 ($2,600) $44,697 $31,687 1.4
Elmwood Sludge Recirculation/Alum Storage
Building Motor Upgrades $70,121.3 ($2,276.6) $66,231 $28,691 2.3
Woodstream - Biofor Building Motor Upgrades $26,442.8 ($1,570) $24,872.8 $8,103 3.1
Woodstream - Influent Pump Station Motor Upgrades $6,658.5 ($390) $6,268.5 $1,367 4.6
Woodstream - Junk Pump Room Motor Upgrades $29,661.4 ($450) $29,211.4 $5.702 5.1
Woodstream - Backwash Building Motor Upgrades $20,700 ($0) $20,700 $3,010 6.9
Woodstream - Blower Building Motor Upgrades $36,570 ($2,320) $34,250 $3,848.2 8.9
6.1.5 Solar Energy Implementation of a new solar energy system has been evaluated to determine the economic feasibility for furnishing and installing such systems for the Evesham MUA. Based on the simple payback modeling performed, it would benefit the Authority to further investigate installing the solar energy system at the Elmwood Treatment Plant, and not the Woodstream Treatment Plant. This is primarily based on the initial upfront capital investment required for a solar energy system installation and the 13.3 year payback period for the Elmwood Treatment Plant, and a negative net present value (NPV) for the Woodstream Treatment Plant.
Two major factors influencing the project financial evaluation is the variance of the prevailing energy market conditions and Solar Renewable Energy Credit (SREC) rates, with the largest impact to the payback model being the SREC credit pricing. For the payback model, conservative estimates of the SREC’s market value over a 15 year period were assumed, as discussed in Section 4.6.
Table 6.1-4 includes a simple payback analysis for the installation of solar energy systems at the Elmwood and Woodstream Treatment Plants. Refer to Appendix E for a more detailed solar financing spreadsheet.

Section 6 Ranking of Energy Conservation and Retrofit Measures (ECRM)
6-5
Table 6.1-4 Ranking of Energy Savings Measures Summary – Solar Energy Systems
Parameter Solar
Engineer's Opinion of Probable Cost $3,693,625
1st Year Production 442,636 kWh
Annual Electric Savings $61,969
Annual Estimated SREC Revenue $187,235
Project Simple Payback 14.8 Years
6.1.6 Wind Energy Implementation of new wind energy systems has been evaluated to determine the economic feasibility for furnishing and installing such systems. Based on the simple payback modeling performed, it would not benefit the Authority to further investigate installing the wind energy systems. This is primarily based on the initial upfront capital investment required for a wind energy system installation and an unacceptable payback period of greater than 20 years. Table 6.1-5, includes a ranking of the wind energy ECRMs evaluated for the Authority.
Table 6.1-5: Ranking of Energy Savings Measures Summary – Wind Turbine Energy System
Parameter
Wind Turbine (Minimum Site Wind Speed –
3.6 m/s)
Wind Turbine (Maximum Site
Wind Speed – 5.2 m/s)
Wind Turbine (Average Site
Wind Speed – 4.4 m/s)
Engineer’s Opinion of Probable Cost
$71,995 $71,995 $71,995
Renewable Energy Incentive Program**
($10,058) ($31,968) ($20,035)
Total Cost $61,937 $40,027 $51,960
1st Year Production 3,143 kWh 9,990 kWh 6,261 kWh
Annual Estimated Electric Savings $440.0 $1,398.6 $876.5
Annual Estimated REC Revenue $79 $250 $157
Project Simple Payback 119 Years 24 Years 50 Years

7-1
Section 7 Grants, Incentives and Funding Sources 7.1 Renewable Energy 7.1.1 Renewable Energy Certificates (NJ BPU) As part of New Jersey’s Renewable Portfolio Standards (RPS), electric suppliers are required to have an annually-increasing percentage of their retail sales generated by renewable energy. Electric suppliers fulfill this obligation by purchasing renewable energy certificates (RECs) from the owners of solar generating systems. One REC is created for every 1,000 kWh (1 MWh) of renewable electricity generated. Although solar systems generate electricity and SRECs in tandem, the two are independent commodities and sold separately. The RPS, and creation of RECs, is intended to provide additional revenue flow and financial support for renewable energy projects in New Jersey. Class I RECs, which include electricity generation from wind, wave, tidal, geothermal and sustainable biomass typically trade at around $25/MWh. RECs generated from solar electricity, or SRECs, trade at $550/MWh due to supplemental funding from NJ PBU. The supplemental funding will decrease over time to $350/MWh.
7.1.2 Clean Energy Solutions Capital Investment Loan/Grant (NJ EDA) NJ EDA in cooperation with NJ DEP is offering interest-free loans and grants for energy efficiency, combined heat and power (CHP) and renewable energy projects with total project capital equipment costs of at least $1 million. The interest-free loans are available for up to $5 million, a portion of which may be issued as a grant. The most recent round was closed as of October 2009, but new CESCI program updates will be posted at www.njeda.com. For additional information, [email protected] or call 866-534-7789.
7.1.3 Renewable Energy Incentive Program (NJ BPU) The Renewable Energy Incentive Program (REIP) provides rebates for installing solar, wind, and sustainable biomass systems in Smart Growth regions. Rebates of $1.00 per watt are available for solar electricity projects up to 50 kW in capacity. Wind systems can receive rebates up to $3.20 per expected kWh produced. Sustainable biomass rebates start at $4.00 per watt installed with a maximum incentive amount of 30 percent of project costs. REIP will give out $53.25 million in rebates from 2009 - 2012. Project owners must complete the Pay for Performance Program, Direct Install or Local Municipal audit, or the rebate will be reduced by $0.10 per watt.
The REIP Funding Cycle 2, opened May 3, 2010, for solar installation incentives was recently closed. The budget is currently being reviewed and there is still expectation for Funding Cycle 3 to open in September. For further information on the status of this program, please visit: http://www.njcleanenergy.com/renewable-energy/home/home

Section 7 Available Grants, Incentives and Funding Sources
7-2
7.1.4 Grid Connected Renewables Program (NJ BPU) The New Jersey Grid Connected Renewables Program offers competitive incentives for wind and sustainable biomass electricity generation projects larger than 1 Megawatt (MW). Applications for the most recent round of funding, which totaled $6 million, were due January 8, 2010. Requests for Proposals (RFPs) for the next round will be posted at www.njcleanenergy.com and www.state.nj.us/bpu. A total of roughly $16 million is available for incentives under this program during 2010. Most of the incentives offered under this program will take the form of a payment for energy production ($/MWh) once the project is operating. Incentives range up to $58.49/MWh for publicly-owned wastewater biogas projects. Up to 10% of the incentive may be requested in the form of a lump grant to cover up-front costs such as financing fees, interconnection fees, project design, permitting, and construction costs.
7.1.5 Utility Financing Programs All four Electric Distribution Companies (EDCs) in New Jersey have developed long term contracting or financing programs for the development of solar energy systems. In all of the programs, Solar Renewable Energy Credits (SRECs) generated by the solar energy systems will be sold at auction to energy suppliers who are required to purchase a certain quantity of SRECs to meet their Renewable Portfolio Standard requirements.
7.1.6 Renewable Energy Manufacturing Incentive (NJ BPU) New Jersey’s Renewable Energy Manufacturing Incentive (REMI) program provides rebates to purchase and install solar panels, inverters, and racking systems manufactured in New Jersey. Rebates for panels start at $0.25 per watt and rebates for racking systems and inverters start at $0.15 per watt for solar projects up to 500 kW in capacity. To be eligible for REMI, applicants must apply to either the Renewable Energy Incentive Program (REIP) or the SREC Registration Program (SRP).
7.1.7 PSE&G Solar Loan Program Public Service Electric and Gas (PSE&G) of New Jersey will offer $143 million in loans to their customers for solar electric systems in 2009-2010. Their Solar Loan program will provide 15-year loans at an interest rate of 11.3092% to cover 40-60% of the cost of solar systems 500 kW in capacity or less. PSE&G customers may repay the loan through cash payments or by signing over their Solar Renewable Energy Certificates (SRECs) to PSE&G. Loan applications are scheduled to be accepted on a quarterly basis. For more information, call 973-430-8460.
7.1.8 Environmental Infrastructure Financing Program (NJ DEP) The Environmental Infrastructure Financing Program (EIFP) provides low-interest loans for the planning, design and construction of a variety of water, wastewater and stormwater infrastructure projects. NJ DEP traditionally provides loans at 0% interest for approximately 20 years for up to one-half the allowable project costs. The remaining project costs are funded through 20-year loans at about the market rate or

Section 7 Available Grants, Incentives and Funding Sources
7-3
less. Approximately $100 million-$200 million is available per year. In 2009, 20 percent of the projects funded were required to be “green infrastructure” projects, including energy efficiency and renewable energy projects. Applicants must submit a commitment letter in the beginning of October and an application in March annually. For more information, contact Stanley V. Cach, Jr. Assistant Director NJDEP-Municipal Finance and Construction Element at 609-292-8961 or [email protected].
7.1.9 Clean Renewable Energy Bonds (IRS) CREBs are 0% interest bonds typically issued for up to approximately $3.0 million administered by the Internal Revenue Service (IRS). Last year, $2.2 billion in CREBs was allocated to municipal entities to fund 610 renewable energy projects, including anaerobic digestion. IRS has been allocating funding for CREBs annually since 2005. Last year, IRS solicited applications starting in April, which were due in August. The IRS is expected to receive additional funding for CREBs and release another round of solicitations in 2010.
7.1.10 Qualified Energy Conservation Bonds (IRS) These IRS 0% interest bonds are very similar to CREBs except they are allocated based on state and county population. New Jersey was allocated $90 million as part of the ARRA stimulus fund. QECBs are typically distributed through municipal bond banks or state economic development agencies.
7.1.11 Global Climate Change Mitigation Incentive Fund (US EDA) The Economic Development Agency (part of the U.S. Department of Commerce) administers the GCCMIF to public works projects that reduce greenhouse gas emissions and creates new jobs. In FY 2009, $15 million was allocated to the fund, and additional funding is expected to be allocated in FY 2010. Applications are due on a rolling basis. The program does not have a maximum grant amount but does limit the grant to 50 percent of the project cost.
7.1.12 Private Tax-Exempt Financing Similar to traditional municipal bond financing, there are many private financial service companies that offer a myriad of options for tax-exempt financing of municipal projects. The providers of these services suggest that this capital can be offered at competitive rates in an expedited timeframe and with fewer complications when compared to traditional municipal financing methods. Though these factors would need to be compared on a case-by-case basis, the one distinct advantage to private financing on the current project would likely be the flexibility to structure payments to meet budget needs with consideration given to the terms and conditions of existing loan and/or bond agreements. For example, this mechanism could be used to limit the digestion project dept payments in the initial years when the current bond debt is the greatest and the operations savings of the project has yet to be fully realized. It should also be noted that, in many cases, the construction and long term

Section 7 Available Grants, Incentives and Funding Sources
7-4
financing can be rolled into a single private financing agreement. Also, in some instances, equipment manufacturers have the ability to offer competitive financing terms (e.g. Siemens Financial Services Corporation), though financing from these sources is generally contingent upon a substantial portion of the project cost (~20% to 30%) being for their respective equipment.
7.1.13 Performance Based Contracts (ESCOs) A second financing alternative for a project of this nature would be to enter into a Performance Based Contract with an Energy Services Company (ESCO). The premise of this type of contract is that it requires no initial municipal capital contributions in order to implement the project - instead relying on future operations cost savings and/or energy production, to fund the annual payments. Prior to entering into an agreement for the funding of the project, an ECSO would perform an energy audit and/or conceptual studies to confirm future energy cost savings or energy production inherent with the projects implementation and operation. The contract would then be formulated based on some measurable parameter(s) (sludge reduction, energy production, etc) which would be verified by measurement throughout the contract duration. The savings in energy costs or energy production would then be used to pay back the capital investment of the project over the contract time period (typically on the order of 10-years or less). The ESCO would guarantee the agreed upon energy savings or energy production. If the project does not meet energy savings or production commitments, the ESCO pays the owner the equivalent difference.
With this funding alternative, the ownership and operation of the facility would be maintained by the original owner. A performance contract may also include ESCO operation and maintenance of the energy-related facilities if that were deemed appropriate. Significant ESCO’s with experience in this area include Siemens Building Technologies, Chevron and Johnson Controls. CDM has functioned in several roles on performance based contracts including being the owner’s representative and, on different contracts, providing design-build services (as a subcontractor to the ECSO). We can provide additional experience-based information upon request.
7.1.14 Power Purchase Agreements (SPCs) More commonly referred to as a Build-Own-Transfer (BOT) agreement in the Water/Wastewater industry, a Power Purchase Agreement (PPA) also delivers a project with no initial capital contribution by the original owner. In this model, a Special Purpose Company (SPC) created by a developer, would own the energy production facilities. Within the framework of a PPA, a SPC will typically lease property from the owners for construction and operation of the new facilities. The funding and construction of the new facilities would be performed by the SPC who would then own and operate the facilities for the duration of the contract (typically 20 to 30 years). Throughout that period of time, the original owner would purchase power from the SPC at a pre-negotiated rate which would take into account the initial capital cost, operation and maintenance of the constructed facility, ancillary benefits of the project and investor returns on investment. For renewable energy, financial

Section 7 Available Grants, Incentives and Funding Sources
7-5
incentives may enable this financing approach to compete favorably with utility power tariffs. Incentives include state and local tax credits, renewable energy credits, and Federal energy production tax credits or energy investment tax credits. It is expected that a number of experienced companies and developers may be interested in a PPA for New Jersey municipal renewable energy projects.
7.2 Energy Efficiency 7.2.1 Introduction New Jersey's Clean Energy Program (NJ CEP) promotes increased energy efficiency and the use of clean, renewable sources of energy including solar, wind, geothermal, and sustainable biomass. The results for New Jersey are a stronger economy, less pollution, lower costs, and reduced demand for electricity. NJCEP offers financial incentives, programs, and services for residential, commercial, and municipal customers.
NJCEP reduces the need to generate electricity and burn natural gas which eliminates the pollution that would have been caused by such electric generation or natural gas usage. The benefits of these programs continue for the life of the measures installed, which on average is about 15 years. Thus, the public receives substantial environmental and public health benefits from programs that also lower energy bills and benefit the economy.
7.2.2 New Jersey Smart Start Buildings Program (NJ BPU) The New Jersey Smart Start Buildings Program offers rebate incentives for several qualifying equipment such as high efficient premium motors and lighting, and lighting controls.
Incentive information and incentive calculation worksheets are provided for the various new equipment installation identified in this report and are included in Appendix F.
7.2.3 Pay for Performance Program (NJ BPU) Another program offered through the New Jersey Smart Start Program, is the Pay for Performance Program. Commercial, industrial and institutional buildings with an average annual peak demand over 200 kW are eligible for participation. In addition, local government agencies, which do not meet the 200 kW demand requirement and are not receiving Energy Efficiency and Conservation Block Grants are eligible.
Incentives are available for buildings that are able to present an Energy Reduction Plans that reduce the building’s current energy consumption by 15% or more, in addition to incentives for installing the recommended measures and incentives for presenting the energy savings in a post-construction benchmarking report. No more than 50% of the total energy savings may be derived from lighting retrofits. In addition, the total energy savings of 15% may not come from the implementation of one energy savings measure.

Section 7 Available Grants, Incentives and Funding Sources
7-6
7.2.4 Local Government Energy Audits (NJ BPU) New Jersey’s Clean Energy Program offers an incentives program that will subsidize the cost of an energy audit for local government entities. This audit identifies cost-justified energy efficiency measures for sites in the service territory of one of New Jersey’s regulated electric and/or gas utilities.
The program provides guidance to eligible entities as they select buildings to be audited. Participants in the program then select one of the pre-qualified energy auditing firms that will produce a report to satisfy program requirements. The program will then subsidize 75% of the cost of the audit. The remaining 25% of the cost will be subsidized if the participant expends that sum of money implementing energy efficiency upgrades. All recommended measures are eligible for additional incentives available through the NJ SmartStart Buildings Program. However, these incentives will be subtracted from the cost of the installed measures.
Applications for this program are submitted for each individual building and will be considered on a building-by-building basis. Funds are awarded on a first-come, first-serve basis and case-by-case basis.
7.2.5 Free Energy Benchmarking Industrial facilities are eligible for a free energy benchmarking assessment conducted by the NJ Board of Public Utilities. This benchmarking provides energy managers with a building energy performance assessment and valuable information on how to get an energy efficiency project started. The benchmarking process may involve comparing a facility’s energy use to that of its peers (dependent upon availability of sufficient comparative data), or simply its own energy use year-to-year. If the building type fits either the EPA’s ENERGY STAR® Portfolio Manager or EPA Energy Performance Indicator models, then its energy performance is compared to national data for similar buildings. The five major benchmarks used to analyze building performance include: electricity use, heating fuel use, weather-normalized heating fuel use, total cost, and total cost per resident, all of which are normalized for comparison by square footage and weather. If an ENERGY STAR benchmark is conducted, a detailed description of the building’s specific score is included in the report.
The analysis included in each report is based on the information provided on a Building Data Request Form submitted by the owner/manager, which includes building, energy supplier, and other information. The building’s utility bills are also used to assess its electricity and heating fuel consumption for the year(s) provided. The benchmarking report includes: a summary table of each building’s energy use and cost information, assessment of the building’s carbon footprint, recommended next steps, and information on other offerings available through New Jersey’s Clean Energy Program. Please contact Joe Carlamere of New Jersey’s Clean Energy Program at 732-855-2895 for additional information.

Section 7 Available Grants, Incentives and Funding Sources
7-7
7.2.6 Clean Energy Solutions Capital Investment Loan/Grant (NJ EDA) NJ EDA in cooperation with NJ DEP is offering interest-free loans and grants for energy efficiency, combined heat and power (CHP) and renewable energy projects with total project capital equipment costs of at least $1 million. The interest-free loans are available for up to $5 million, a portion of which may be issued as a grant. The most recent round was closed as of October 2009, but new CESCI program updates will be posted at www.njeda.com. For additional information, [email protected] or call 866-534-7789.
7.2.7 Direct Install (NJ BPU) Owners of existing small to mid-size commercial and industrial facilities with a peak electric demand that did not exceed 200 kW in any of the preceding 12 months are eligible to participate in Direct Install. Buildings must be located in New Jersey and served by one of the state’s public, regulated electric or natural gas utility companies.
This program will cover up to 80% of the retro-fitting costs associated with the use of new energy efficient equipment. Lighting, HVAC, refrigeration, motors, natural gas systems, and variable frequency drives are covered under the Direct Install program.
7.2.8 Environmental Infrastructure Financing Program (NJ DEP) The Environmental Infrastructure Financing Program (EIFP) provides low-interest loans for the planning, design and construction of a variety of water, wastewater and stormwater infrastructure projects. NJ DEP traditionally provides loans at 0% interest for approximately 20 years for up to one-half the allowable project costs. The remaining project costs are funded through 20-year loans at about the market rate or less. Approximately $100 million-$200 million is available per year. In 2009, 20 percent of the projects funded were required to be “green infrastructure” projects, including energy efficiency and renewable energy projects. Applicants must submit a commitment letter in the beginning of October and an application in March annually. For more information, contact Stanley V. Cach, Jr. Assistant Director NJDEP-Municipal Finance and Construction Element at 609-292-8961 or [email protected].
7.2.9 Global Climate Change Mitigation Incentive Fund (US EDA) The Economic Development Agency (part of the U.S. Department of Commerce) administers the GCCMIF to public works projects that reduce greenhouse gas emissions and creates new jobs. In FY 2009, $15 million was allocated to the fund, and additional funding is expected to be allocated in FY 2010. Applications are due on a rolling basis. The program does not have a maximum grant amount but does limit the grant to 50 percent of the project cost.
Section 7 Available Grants, Incentives and Funding Sources
7-8
7.2.10 Private Tax-Exempt Financing Similar to traditional municipal bond financing, there are many private financial service companies that offer a myriad of options for tax-exempt financing of municipal projects. The providers of these services suggest that this capital can be offered at competitive rates in an expedited timeframe and with fewer complications when compared to traditional municipal financing methods. Though these factors would need to be compared on a case-by-case basis, the one distinct advantage to private financing on the current project would likely be the flexibility to structure payments to meet budget needs with consideration given to the terms and conditions of existing loan and/or bond agreements. It should also be noted that, in many cases, the construction and long term financing can be rolled into a single private financing agreement. Also, in some instances, equipment manufacturers have the ability to offer competitive financing terms (e.g. Siemens Financial Services Corporation), though financing from these sources is generally contingent upon a substantial portion of the project cost (~20% to 30%) being for their respective equipment.
7.2.11 Performance Based Contracts (ESCOs) Another financing option would be to enter into a Performance Based Contract with an Energy Services Company (ESCO). The premise of this type of contract is that it requires no initial municipal capital contributions in order to implement the project - instead relying on future operations cost savings and/or energy production, to fund the annual payments. Prior to entering into an agreement for the funding of the project, an ECSO would perform an energy audit and/or conceptual studies to confirm future energy cost savings inherent with the projects implementation and operation. The contract would then be formulated based on some measurable parameter(s) (sludge reduction, energy production, etc) which would be verified by measurement throughout the contract duration. The savings in energy costs would then be used to pay back the capital investment of the project over the contract time period (typically on the order of 10-years or less). The ESCO would guarantee the agreed upon energy savings. If the project does not meet energy savings or production commitments, the ESCO pays the owner the equivalent difference.
With this funding alternative, the ownership and operation of the facility would be maintained by the original owner. A performance contract may also include ESCO operation and maintenance of the energy-related facilities if that were deemed appropriate. Significant ESCO’s with experience in this area include Siemens Building Technologies, Chevron and Johnson Controls. CDM has functioned in several roles on performance based contracts including being the owner’s representative and, on different contracts, providing design-build services (as a subcontractor to the ECSO). We can provide additional experience-based information upon request.

APPENDIX A
UTILITY BILL INFORMATION

Electric Bills for Plots ‐ Elmwood Wastewater Treatment PlantPSE&G BGS
Delivery Charges Ac # Supply Charges Ac #42 011 084 06
Meter #778019999
January 2007 -$ -$ -$ 0 0.0 #DIV/0! February 2007 -$ -$ -$ 0 0.0 #DIV/0! March 2007 -$ -$ -$ 0 0.0 #DIV/0! April 2007 -$ -$ -$ 0 0.0 #DIV/0! May 2007 -$ -$ -$ 0 0.0 #DIV/0! June 2007 -$ -$ -$ 0 0.0 #DIV/0! July 2007 -$ -$ -$ 0 0.0 #DIV/0! August 2007 -$ -$ -$ 0 0.0 #DIV/0! September 2007 -$ -$ -$ 0 0.0 #DIV/0! October 2007 -$ -$ -$ 0 0.0 #DIV/0! November 2007 -$ -$ -$ 0 0.0 #DIV/0! December 2007 -$ -$ -$ 0 0.0 #DIV/0!
January 2008 -$ -$ -$ 0 0.0 #DIV/0!February 2008 -$ -$ -$ 0 0.0 #DIV/0!
March 2008 -$ -$ -$ 0 0.0 #DIV/0!April 2008 -$ -$ -$ 0 0.0 #DIV/0!May 2008 -$ -$ -$ 0 0.0 #DIV/0!J 2008 $ $ $ 0 0 0 #DIV/0!
Comments Month Cost Per kWhMeasured DemandTotal KWHTotal Electric ChargesYear
June 2008 -$ -$ -$ 0 0.0 #DIV/0!July 2008 -$ -$ -$ 0 0.0 #DIV/0!
August 2008 -$ -$ -$ 0 0.0 #DIV/0!September 2008 -$ -$ -$ 0 0.0 #DIV/0!
October 2008 -$ -$ -$ 0 0.0 #DIV/0!November 2008 -$ -$ -$ 0 0.0 #DIV/0!December 2008 -$ -$ -$ 0 0.0 #DIV/0!January 2009 -$ -$ -$ 0 0.0 #DIV/0!February 2009 -$ -$ -$ 0 0.0 #DIV/0!
March 2009 5,738.72$ 18,526.06$ 24,264.78$ 186015 387.6 0.13$ April 2009 5,725.34$ 18,566.01$ 24,291.35$ 187696 355.0 0.13$ May 2009 5,813.44$ 18,319.04$ 24,132.48$ 189398 364.9 0.13$ June 2009 8,516.01$ 21,319.41$ 29,835.41$ 183801 374.8 0.16$ July 2009 8,940.38$ 23,006.84$ 31,947.22$ 190356 391.1 0.17$
August 2009 8,679.98$ 22,738.93$ 31,418.91$ 195447 343.7 0.16$ September 2009 8,960.69$ 22,114.27$ 31,074.96$ 190419 382.4 0.16$
October 2009 6,063.63$ 19,232.38$ 25,296.02$ 192238 357.0 0.13$ November 2009 5,813.09$ 18,398.46$ 24,211.55$ 185809 358.7 0.13$ December 2009 6,479.46$ 20,644.95$ 27,124.42$ 208543 402.4 0.13$ January 2010 6,717.05$ 20,042.77$ 26,759.82$ 206042 372.3 0.13$ February 2010 6,436.45$ 19,041.54$ 25,478.00$ 193043 383.7 0.13$ March 2010 6,729.70$ 20,078.62$ 26,808.31$ 203426 391.0 0.13$ April 2010 6,409.13$ 19,207.61$ 25,616.74$ 194555 361.8 0.13$ May 2010 5,841.47$ 16,951.53$ 22,793.00$ 175089 335.1 0.13$ June 2010 7,844.70$ 17,384.77$ 25,229.47$ 166111 299.7 0.15$ July 2010 264.04$ 580.73$ 844.76$ 5534 0.0 0.15$

Month Combined (KWH) Demand (KW)January 206042 372February 193043 384
March 194720 389April 191125 358May 182243 350June 174956 337July 190356 391
August 195447 344September 190419 382
October 192238 357November 185809 359December 208543 402
Total 2304940

Gas Bills for Plots ‐ Elmwood Wastewater Treatment PlantSouth Jersey Energy BGSSDelivery Charges Ac. # Supply Charges Ac. #
20602399808
Meter #778019999
January 2007 -$ -$ -$ - #VALUE! February 2007 -$ -$ -$ - #VALUE! March 2007 -$ -$ -$ - #VALUE! April 2007 -$ -$ -$ - #VALUE! May 2007 -$ -$ -$ - #VALUE! June 2007 -$ -$ -$ - #VALUE! July 2007 -$ -$ -$ - #VALUE! August 2007 -$ -$ -$ - #VALUE! September 2007 -$ -$ -$ - #VALUE! October 2007 -$ -$ -$ - #VALUE! November 2007 -$ -$ -$ - #VALUE! December 2007 -$ -$ -$ - #VALUE!
January 2008 -$ -$ -$ - #VALUE!February 2008 -$ -$ -$ - #VALUE!
March 2008 -$ -$ -$ - #VALUE!April 2008 -$ -$ -$ - #VALUE!M 2008 $ $ $ #VALUE!
Comments Month Year Total Gas Charges Total Therms Cost Per Therm
May 2008 -$ -$ -$ - #VALUE!June 2008 21.52$ 18.44$ 39.96$ 13 3.06$ July 2008 26.84$ 26.81$ 53.66$ 19 2.89$
August 2008 27.10$ 21.49$ 48.59$ 19 2.54$ September 2008 36.78$ 44.91$ 81.69$ 46 1.77$
October 2008 77.83$ 126.07$ 203.90$ 149 1.36$ November 2008 402.12$ 728.62$ 1,130.74$ 940 1.20$ December 2008 791.91$ 1,671.15$ 2,463.07$ 1,888 1.30$ January 2009 1,234.47$ 2,708.76$ 3,943.23$ 2,846 1.39$ February 2009 833.65$ 1,475.35$ 2,309.00$ 1,902 1.21$
March 2009 504.31$ 708.05$ 1,212.36$ 1,130 1.07$ April 2009 196.91$ 215.45$ 412.36$ 413 1.00$ May 2009 160.38$ 162.94$ 323.32$ 323 1.00$ June 2009 46.35$ 43.41$ 89.76$ 63 1.43$ July 2009 23.31$ 23.11$ 46.42$ 16 2.90$
August 2009 26.45$ 13.78$ 40.23$ 19 2.11$ September 2009 29.05$ 9.49$ 38.54$ 19 1.98$
October 2009 89.12$ 79.61$ 168.72$ 157 1.07$ November 2009 319.58$ 398.67$ 718.25$ 688 1.04$ December 2009 1,011.80$ 1,383.99$ 2,395.79$ 2,230 1.07$
January 2010 1,189.65$ 1,916.01$ 3,105.66$ 2,572 1.21$ February 2010 403.57$ 1,793.30$ 2,996.66$ 2,596 1.15$ March 2010 215.82$ 604.36$ 1,065.15$ 966 1.10$ April 2010 168.78$ 217.94$ 408.66$ 377 1.09$ May 2010 28.84$ 35.46$ 84.30$ 66 1.28$ June 2010 7.00$ 3.42$ 10.42$ 6 1.70$

Month Combined (Therms)January 2709February 2249
March 1048April 395May 194June 63July 17
August 19September 33
October 153November 814December 2059
Total 9754

Electric Bills for Plots ‐ Woodstream Wastewater Treatment PlantPSEG BGS
Delivery Charges Ac # Supply Charges Ac #42 005 830 03
Meter #778013147
January 2007 -$ -$ -$ 0 0.0 #DIV/0! February 2007 -$ -$ -$ 0 0.0 #DIV/0! March 2007 -$ -$ -$ 0 0.0 #DIV/0! April 2007 -$ -$ -$ 0 0.0 #DIV/0! May 2007 -$ -$ -$ 0 0.0 #DIV/0! June 2007 -$ -$ -$ 0 0.0 #DIV/0! July 2007 -$ -$ -$ 0 0.0 #DIV/0! August 2007 -$ -$ -$ 0 0.0 #DIV/0! September 2007 -$ -$ -$ 0 0.0 #DIV/0! October 2007 -$ -$ -$ 0 0.0 #DIV/0! November 2007 -$ -$ -$ 0 0.0 #DIV/0! December 2007 -$ -$ -$ 0 0.0 #DIV/0!
January 2008 -$ -$ -$ 0 0.0 #DIV/0!February 2008 -$ -$ -$ 0 0.0 #DIV/0!
March 2008 -$ -$ -$ 0 0.0 #DIV/0!April 2008 -$ -$ -$ 0 0.0 #DIV/0!May 2008 -$ -$ -$ 0 0.0 #DIV/0!J 2008 $ $ $ 0 0 0 #DIV/0!
Comments Month Cost Per kWhMeasured DemandTotal KWHTotal Electric ChargesYear
June 2008 -$ -$ -$ 0 0.0 #DIV/0!July 2008 -$ -$ -$ 0 0.0 #DIV/0!
August 2008 -$ -$ -$ 0 0.0 #DIV/0!September 2008 -$ -$ -$ 0 0.0 #DIV/0!
October 2008 -$ -$ -$ 0 0.0 #DIV/0!November 2008 -$ -$ -$ 0 0.0 #DIV/0!December 2008 -$ -$ -$ 0 0.0 #DIV/0!January 2009 -$ -$ -$ 0 0.0 #DIV/0!February 2009 -$ -$ -$ 0 0.0 #DIV/0!
March 2009 7,177.92$ 23,553.59$ 30,731.51$ 243910 433.0 0.13$ April 2009 7,264.77$ 23,425.86$ 30,690.64$ 243920 443.1 0.13$ May 2009 7,180.03$ 22,624.19$ 29,804.22$ 240114 434.3 0.12$ June 2009 9,660.21$ 25,854.64$ 35,514.86$ 226297 398.9 0.16$ July 2009 9,924.99$ 27,065.09$ 36,990.08$ 226443 406.9 0.16$
August 2009 9,513.89$ 25,256.88$ 34,770.77$ 217983 372.7 0.16$ September 2009 9,345.36$ 24,161.74$ 33,507.10$ 208237 378.8 0.16$
October 2009 7,064.21$ 22,822.67$ 29,886.88$ 229674 401.6 0.13$ November 2009 6,840.43$ 22,053.44$ 28,893.87$ 224744 399.1 0.13$ December 2009 7,633.31$ 24,835.09$ 32,468.39$ 253011 442.4 0.13$ January 2010 7,864.58$ 23,281.88$ 31,146.46$ 241062 458.7 0.13$ February 2010 7,558.49$ 22,469.47$ 30,027.96$ 230256 443.3 0.13$ March 2010 7,678.02$ 23,264.15$ 30,942.18$ 236829 426.5 0.13$ April 2010 7,666.27$ 22,932.23$ 30,598.49$ 235265 438.0 0.13$ May 2010 8,160.62$ 23,830.40$ 31,991.02$ 255180 436.9 0.13$ June 2010 10,754.65$ 23,570.03$ 34,324.68$ 234427 409.1 0.15$ July 2010 361.76$ 786.25$ 1,148.01$ 7799 0.0 0.15$

Month Combined (KWH) Demand (KW)January 241062 459February 230256 443
March 240369 430April 239592 441May 247647 436June 230362 404July 226443 407
August 217983 373September 208237 379
October 229674 402November 224744 399December 253011 442
Total 2789380

Gas Bills for Plots ‐ Woodstream Wastewater Treatment PlantPSE&G 0
Delivery Charges Ac. # Supply Charges Ac. #0
Meter #778013147
January 2007 -$ -$ -$ - #VALUE! February 2007 -$ -$ -$ - #VALUE! March 2007 -$ -$ -$ - #VALUE! April 2007 -$ -$ -$ - #VALUE! May 2007 -$ -$ -$ - #VALUE! June 2007 -$ -$ -$ - #VALUE! July 2007 -$ -$ -$ - #VALUE! August 2007 -$ -$ -$ - #VALUE! September 2007 -$ -$ -$ - #VALUE! October 2007 -$ -$ -$ - #VALUE! November 2007 -$ -$ -$ - #VALUE! December 2007 -$ -$ -$ - #VALUE!
January 2008 -$ -$ 3,596.37$ 2,593 1.39$ February 2008 -$ -$ 4,309.71$ 3,020 1.43$
March 2008 -$ -$ 3,168.88$ 2,079 1.52$ April 2008 -$ -$ 1,307.16$ 854 1.53$ M 2008 $ $ 307 59$ 183 1 68$
Comments Month Year Total Gas Charges Total Therms Cost Per Therm
May 2008 -$ -$ 307.59$ 183 1.68$ June 2008 -$ -$ 180.48$ 97 1.86$ July 2008 -$ -$ 129.49$ 64 2.02$
August 2008 -$ -$ 114.44$ 60 1.91$ September 2008 -$ -$ 108.73$ 67 1.62$
October 2008 -$ -$ 185.04$ 127 1.45$ November 2008 -$ -$ 412.18$ 296 1.39$ December 2008 -$ -$ 3,031.25$ 2,262 1.34$ January 2009 -$ -$ 2,964.57$ 2,201 1.35$ February 2009 -$ -$ 3,039.97$ 2,397 1.27$
March 2009 -$ -$ 2,235.29$ 1,996 1.12$ April 2009 -$ -$ 1,000.32$ 1,021 0.98$ May 2009 -$ -$ 432.51$ 468 0.92$ June 2009 -$ -$ 111.80$ 115 0.97$ July 2009 -$ -$ 73.11$ 69 1.05$
August 2009 -$ -$ 58.24$ 53 1.11$ September 2009 -$ -$ 62.81$ 61 1.02$
October 2009 -$ -$ 107.84$ 114 0.95$ November 2009 -$ -$ 395.27$ 377 1.05$ December 2009 -$ -$ 2,869.78$ 2,619 1.10$
January 2010 -$ -$ 2,918.63$ 2,550 1.14$ February 2010 -$ -$ 2,612.66$ 2,119 1.23$ March 2010 -$ -$ 1,530.87$ 1,298 1.18$ April 2010 -$ -$ 462.33$ 446 1.04$ May 2010 -$ -$ 155.17$ 150 1.04$ June 2010 -$ -$ 82.26$ 73 1.13$
July 2010 -$ -$ 2.67$ 2 1.13$

Month Combined (Therms)January 2448February 2512
March 1791April 773May 267June 95July 67
August 56September 64
October 121November 337December 2441
Total 10972

APPENDIX B
STATEMENT OF ENERGY PERFORMANCE
PORTFOLIO MANAGER REFERENCE SHEET

���������� ��
���������������� ��������������������������������������������
��������� !"� ���������#$%����&��������������"����� �����!��������'�(������������'��"����� !�����������������"���������������
�(����)������ �!�"��������#������$��%��$��������� �&�� ������$���'��( �
�(����)���������
������)������(��*����&����(����)����
���������"��))������)����*�����(���������*���+����
����������)�+���������),
������,�,�����-�, �%.��/�"�*0��.+� ��))�)�(�����.����-�"�*0��.+�� )���)���#������$��1��*0��.+ ������) ���
�����)� �������)- �2,���*0��.�13 + (��2�.����*0��.�13 + ���������������*��"� ��$�",����$��1��."�+ �-���$/�."��-�"���,"",�$"�*��4�������+ ��(�������(���(�!�����'������+�����)� �%.��,��2��5,��������6�-�"�4� ������������.���������/������ ����,�$����5���1��2,����78 (�����,�$����5���1��2�.�����78 �(��9�:,;;���$���;�������,�$����5���1��2�.�����78 )9���.,� ,$1�#�3� !�"���������
�����������
2���3��;�4���,;�,$1�%��;�"",�$��
��"� ��$��/����$ ,�,�$"���"��5� �����/��,����;����5,",������/,"��.,� ,$1��8�����,;���/��
�/��,$;�����,�$���$��,$� ��,�/,$��/,""������$��,"����.�����
�������� ������)����������0�*��� ��������.��������������������"<�$�,���,�$�;�������3������8$ �����,��=.��,�� �1������3������#/�������$5,��$��$����4�$ ,�,�$" �1��� �>.����8��.�,$��,�$ �1��
�����*)�������*������������
����"?�����33�,���,�$�;����/�����&-@�2#�&��."�����".��,��� �����%���,�/,$�����$�/"��;��/��%��,� ��$ ,$1� ��������� ��;��/�����&-@�2#�&�,"�$���;,$���.$�,���33��5���,"�����,5� �;�����%����#/���%���$��1��%��;����$���&��,$1�,"���"� ��$�������"�.�����$��1��������,$1��;��(�,"��/���,$,�.����������,1,����;����/�����&-@�2#�&� ��<��.�"���3��"�$���$��1����$".�3�,�$���$$.��,A� ����������$�/�3��,� �������.����-�"�5��.�"�,$�.$,�"��;�5��.���*��1���.�,��;���+�������$5���� ����0��.��,�/�� B."���$�"��� ��;������5��,�$���"� ��$�C��,�,���A,3��� ��(��<��.�"���3��"�$���$��1��,$��$",�����$$.��,A� ����������$�/�3��,� ������"� ��$�����,$1��2D&���2��$ �� ���;���5�$�,���,�$�;�������3������,$ �����,��>.��,�����2D&���2��$ �� �((�;����/���������;������$ �8�2���E,1/�,$1�D�$ ���0�;����,1/�,$1�>.��,���
#/��1�5��$��$���"�,����"��/���5���1���,���$�� � ����;,����.���/,"�;����,"���/�.�"�*,$��. �"��/���,���;����$���,$1��$��1�� �����E,��$"� �%��;�"",�$���;��,�,���,$"3���,�$���$ �$����,A,$1��/��2�%+��$ �������"�".11�"�,�$"�;����� .�,$1��/,"���5����;��;;�����2�$ ������$�"�*��;���$�,$1�������$�����$.����+�����/��:,��������4������,�$�2�����1,�"�:,5,",�$��7�2����%��*�#+����%�$$"��5�$,���5����!��!�"/,$1��$��:�4������
�%��C����()���

������������ � ���������������������� �����������
8$��� ���;������.,� ,$1����>.��,;��;����/�����&-@�2#�&����%��;�"",�$����$1,$����*%�+������&�1,"���� ����/,�����*&�+��."��5��, �����/�����.������;��/�� ����.$ ����,$1�/���.,� ,$1F"��$��1��3��;����$������,$1��#/,"��/��0�,"��,"� �",1$� ����3��5, ���$������1��$���".�������;���3��3����F"�3/�",�����$ ��3����,$1��/�������,"�,�"���"�������",�"��������$��1����$".�3�,�$������"","���/��%�����&��,$� �.�����/��0,$1��/��,$;�����,�$��/����/���.,� ,$1���$�������3�������/�"��$���� �,$���%���;��,����$�1���
�������(��/���������������&���(&�(2�����������(�����������&��&������/��3�������������������*������)����*�����(�4��#�?�@�.��."���/��0����/���G����,$ ,������/������/�5��.��,"�����������&�,$��. ����$�����
�� ��� � 5�6+�����������!� ����6 �������� 5�� ��� ��7+��� �� ����
�������������������� �!�"�������
#������$��%��$��8"��/,"��/���;;,�,����.,� ,$1�$���������� ,"3���� �,$�/�����&-@�2#�&�&�1,"�����;�E����� �.,� ,$1"H�
�)/�� !�"�������� 8"��/,"��$����.����� �"��,3�,�$��;��/��"3����,$>.�"�,�$H�
6�(�������������� �&�� �������$���'��( �
8"��/,"�� ��""����.������$ ����3����H�4����������/���$�����,A��,�$���>.,��"��$����.�����A,3�� ���
�����������(�����!�����7�,�,���!�"�������
%��$��
:��"��/,"�2�%���3��"�$����",$1���"��.��.��H�2�%"��$$������".��,��� �;����.��,3����.,� ,$1���3."�"�*�,�/��/���G��3�,�$��;���.�����������/,� ��$F"�/�"3,���"+�$�����$��/������".��,��� ��"��3��"�$�,$1��$�����3���,�$��;����.,� ,$1�
������ �*�.$,�,3���!�"��������#������$��%��$�+
�� ��� � 5�6+�����������!� ����6 �������� 5�� ��� ��7+��� �� ����
�.������ �*������������(���!�����
8�!-9���(����������
���1���*�,��,1���"�3���,���+�
8"��/,"��/���5���1���,���1,���� ���$ ��$��$����,�$��;��/����"��������;���,$1�,$����/�;��,�,��H�#/,"�"/�.� �����/���5���1����$��$����,�$�"�,���� ��5���������$�/�3��,� ����:(�"/�.� �����3���� �,$��1������:(�,"�$����/��"�����"4��:(���/�������$����."��,���1,�����G�1�$ ���$ ����:(�,"���>.,�� �;����/���$��1�3��;����$������,$1��
��
�.�������**������������(���!�����
8�!-9���(����������
��1���*�,��,1���"�3����,���+�
8"��/,"��/���5���1���,���1,���� ���$ ��$��$����,�$��;��/����"���������;����,��,"������� �$ �,"����5,$1��/��;��,�,��H�#/,"�"/�.� �����/��5���1����$��$����,�$��"�,���� ��5���������$�/3��,� ����:(�"/�.� ������3���� �,$��1������:(�,"$����/��"�����"�4��:(���/�������$����."�,���1,�����G�1�$� ���$ ����:(�,"���>.,�� �;���/���$��1��3��;����$������,$1��
��
������!��������������
��-:�*�,��,�$�1����$"�3�� ��+�
8"��/,"��/��3��$�� �",1$�;�������������".�� �,$�,��,�$�1����$"�3��� ���*�-:+H�#/,"�,"��/�����.$��;�;�����/��3��$��,"� �",1$� ����3����""��
��
�:����������(2���������������(���� ���
:��"��/,"�;��,�,���/�5���$��$",���;,G� �;,�����,�0��;,�����,�$�3����""H�#�,�0���;,�����,�$�,"���3����""."� ������ .�����:��3��/�1�$"���$ �$,���1�$��5��"��
��
�������������.��� @�"�
:��"��/,"�;��,�,�����$ .���$.��,�$������5����"�3����;��/���������$��3����""H��.��,�$������5���,"��$", ��� ��$��3����""�,$��. � �;����/��3.�3�"��;�����5,$1�$.��,�$�"�*,�����$,���1�$��3/�"3/���."+�#/,"�����,$��. ���,���1,����$,��,;,���,�$���,���1,��� �$,��,;,���,�$��3/�"3/��."�����5���������,��.���,$1�"�$ �;,����"��
��
���!����"

������������ � ���������������������� �����������
���������� ��������������������������������������������������%.��,��2��5,��������6�-�"�4��
�������)/�"����(���(��)
�����"�;;<=#>>>>�82�&�8�&�����������%&����99�/�(�8�9"����$�,���C��,�,��
��������������&��"�-�, �%.��/�"��
������!��� ����!��� �����)�+���82�&�8�&�����������%&����99
(���� (� ��� ������
����� �� �� �)������
���� � ��� �� �
���� ���� �) � �
����� �� ��� (�)��
����) �� ��) )�)��
�����) ��� �) ��(����
����) �� ��) �)����
)���) )� �) �)��(��
����) �� ��) �)(�����
����) �� ��) �)� �)�
����) �� �) �� ����
;;<=#>>>>�������/�����82�&�8�&�����������%&����99 $3,#<3$<#4==
;;<=#>>>>�������/�����82����8�&����������99 ;3>=>3>;?4;;
���������(���(��)�8��������(&���9�������/�����82����8�&����������99 ;3>=>3>;?4;;
���&����&�����������(���(��)�8��������(&���9�(�����/���������&���'����������(�������������(���(��)�������@�
�����)/�"������������
�����"�$=0=$,>><=<�8�&����9�/�(�8�9"����$�,���C��,�,��
������!��� ����!��� �����)�+���8�&����9
���(�� (����� ����
�(�� ������ �)��
���� ���� ���
����� � �� ��)�
��(�) ��(�� �(�
���(�) ����) ����
��(�) �����) ����
)����) ����) �(�
�����) )���) ��
����) ����) ���
���#����"

����) ����) ���
$=0=$,>><=<�������/�����8�&����9 >3;=$4==
$=0=$,>><=<�������/�����82����8�&����������99 >;=3$==4==
������������������������/�����82����8�&����������99 >;=3$==4==
���&����&��������������������(�����/���������&���'����������(�����������������������������@
���������������:���/��;.�����$".�3�,�$������"�"/��$����5����3��"�$���/���������$��1��."���;��/,"��.,� ,$1H%���"����$;,����/��������$��� ,�,�$���;.��"�* ,"��,����$��1���1�$�������;.����,�+�."� �,$��/,"�;��,�,���
�%�������������������������):���/��;.�����$".�3�,�$������"�"/��$����5��,$��. �������$�",���"������$ �����,$ �3����������� �����.��;��,�,��H�%���"����$;,����/���$���$�",���"���������,$ �,$"������,�$"�/�5�����$���,��� �;�����/,"�,"��������$�",���"�"���"��."�������3���� �
�����)/�"��.������ �*���������������
����������"��.������ �*���������������
������!��� ����!��� �.������ �*����������8��!�8����������������/�����)99
(���� (� ��� ����
����� �� �� ���
���� � ��� ����
���� ���� ���
����� �� ��� ���
����) �� ��) ����
�����) ��� �) ���(
����) �� ��) ���
)���) )� �) ���
����) �� ��) ��(�
����) �� ��) ���)
(� ��) �� �) ����
����������8��!9 $=4$,
����������� ����� ���*!/�$��33��,$1�;����/�����&-@�2#�&���/��4���,;�,$1�%��;�"",�$����."������/��"����%�����&���/���",1$� ��$ �"���3� ��/��2�%�+
����?�IIIIIIIIIIIIIIIIIIIIIIIIIIIIIIIIIIIIIIIIIIIII�:���?�IIIIIIIIIIIII�
2,1$��.��?�IIIIIIIIIIIIIIIIIIIIIIIIIIIIIIIIIIIIII�2,1$��.���,"���>.,�� ��/�$��33��,$1�;����/�����&-@�2#�&�
���"����"

�� +������!���6 4�!�����+�� �������4�%���"��0��3��/,"�C��,�,���2.������;�����.����$������ "J� ��$���".��,��,������%����$����/��2������$���;��$��1��%��;����$���*2�%+�$ �E�������;��1�����$��$�� �������".��,��� �����%���/�$��33��,$1�;����/�����&-@�2#�&�
-�$�����8$;�����,�$?������� �!�"��������#������$��%��$�@�����.,�� �))�C�������$�/��5��.��,�$�%��,� ��$ ,$1�:���? ���� ����
�(����)��/�(��+���������)������
23����#�3�
�.$,�,3��!�"�������#������$�
%��$��
�5���1��8$;�.�$���,���1,����:���$ *��:(+�4�$��$����,�$� ��
�5���1���;;�.�$���,���1,����:���$ *��:(+�4�$��$����,�$� �
%��$��:�",1$�C����&���� �
C,G� �C,���#�,�0���C,�����,�$�%����""� ���
�.��,�$��&���5��� @�"�
�����)����*�����(�����/�������5��.��,�$�%��,� " 4��3��,"�$"
���*�����(�������(� �������*�$ ,$1�:���?�(� ���+
��������*�$ ,$1�:���?��� ��+ ��������*�;- ������ ����������.�����
�$��1��%��;����$���&��,$1 ?#� ,-� �(� ���� (�
�$��1��8$��$",���
������������� �� (� �� ���� ���� (�
�������������� �� ��� ��� ���� ���� �(�
�$��1��4�"�
��������� K� )����� K� �����(� ���� ���� K� �������
������� ������ K�������� K�)��) ���� ���� ���� K��(�)����
-���$/�."��-�"���,"",�$"�
��4������� ��(�� ����� ���� ���� ���(��
014���;������ ���� ���� ���� ���� ����
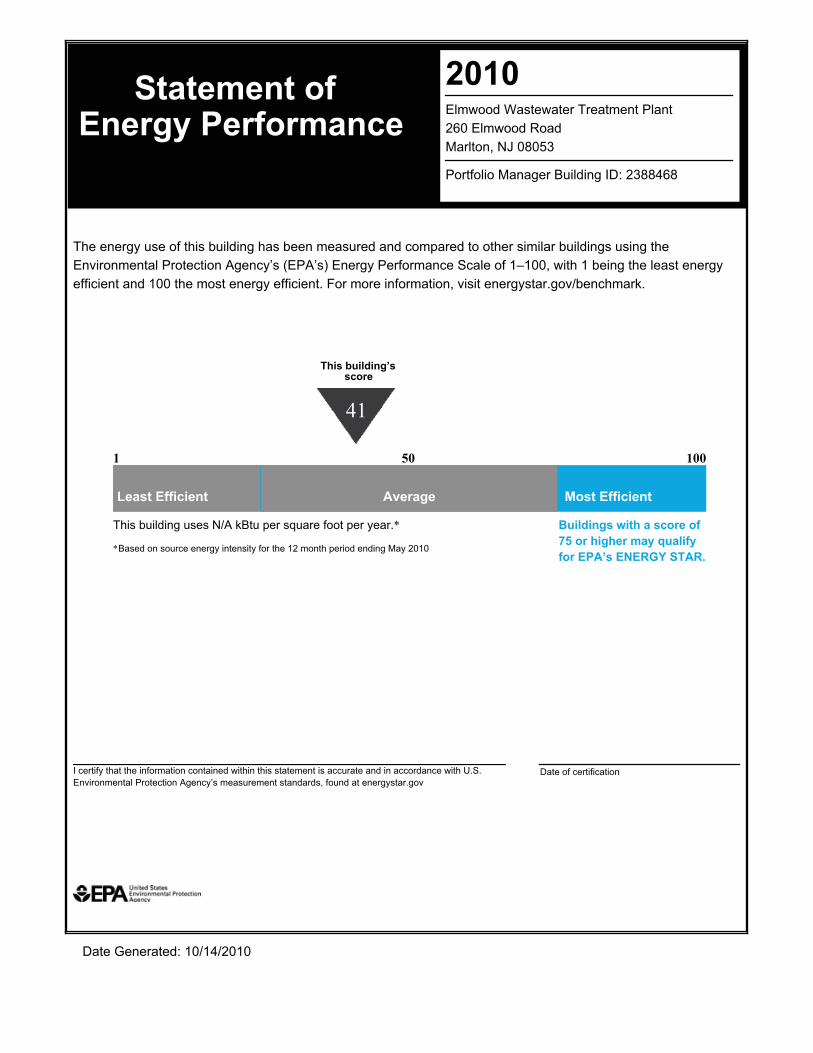
$=#=������ �!�"��������#������$��%��$��������� �&�� ������$���'��( �
%���;��,����$�1����.,� ,$1�8:?� �����
#/���$��1��."���;��/,"��.,� ,$1�/�"����$����".�� ��$ ����3��� ������/���",�,�����.,� ,$1"�.",$1��/��$5,��$��$����%������,�$��1�$��L"�*�%�L"+��$��1��%��;����$���2������;��M����,�/�����,$1��/�����"���$��1��;;,�,�$���$ ����/����"���$��1���;;,�,�$���C��������,$;�����,�$��5,",���$��1�"����1�5���$�/���0�
�&���'�������A��(����
$!
���
��������**�(����
#/,"��.,� ,$1�."�"�����0��.�3���">.����;����3��������%
%��"� ��$�"�.�����$��1��,$��$",���;����/������$�/�3��,� ��$ ,$1�������
:�����;�����,;,���,�$
:����-�$����� ?��������
�����������*�����)����*�����(�
�
6������**�(����
��
�.�����
�������������&����(�����*;-����&��&�����)�B����*)*������A������� �����4
8�����,;���/����/��,$;�����,�$���$��,$� ��,�/,$��/,"�"������$��,"����.������$ �,$������ �$����,�/�7�2��$5,��$��$����%������,�$��1�$��L"����".����$��"��$ �� "��;�.$ �����$��1�"����1�5
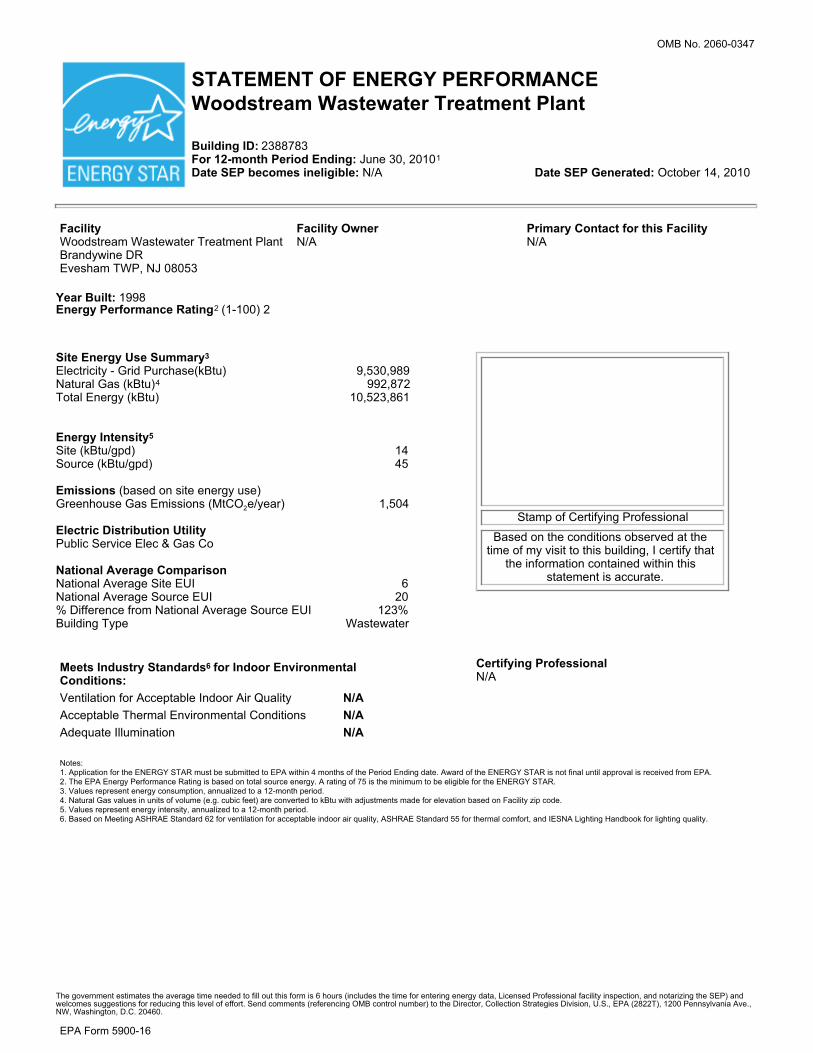
���������� ��
���������������� �����������������������������������������������
��������� !"� ���� ����#$%����&��������������"������ ����
!��������'�(������������'��"����� !�����������������"���������������
�(����)�������� !�� ���" ����#�� �!����$% ���� ��&"'���()*+��, !�#�$������- �
�(����)���������
������)������(��*����&����(����)����
���������"��..������)����*�����(���������/���0��
����������)�+���������),
*%����'�'�&���1�'��$���, ��/2���0� .�- �.�.��� ��� %�1 ��/2���0�� ..�����#�� %�*���3&�/2���0 ��- ������
�����)� �������)- �4'���/2����35�0 ����4������/2����35�0 �-�������������/� ��������'�������3&����0 �1����,�����1 ��*!'��'����/��6���&� �0 ��-�������(���(�!�����'������+�����)� �$��%'��4��+'���*%���7�1 ��6� ������������.���������/������ �� �'�� %��+�� 3��4'���*89 ���� �'�� %��+�� 3��4������*89 ��:�(';;�������;��!�� �'�� %��+�� 3��4������*89 � :����'%�'�3�#&5� � ���" �����
�����������
4� !5��;�6���';&'�3�$��;���'�� %
� ��������,������'�'���������+��� ���,��'!���;�!&�+'�'������,'����'%�'�3��9�����';&��, �
�,��'�;��! �'������� '����"'�,'���,'��� ��!����'�� ���� ���
�������� ������)����������0�*��� ��������.��������������������"<���'% �'���;�������5� �%��9�������'��=� %'�& �1������5� �%��#,��! %�*�+'���!��� %�6���'�'��� �1�����>� ���9%%�!'� �'�� �1��
�����*)�������*������������
�����?�����55%'� �'���;����,��*�*)1@�4#�)�!����������!'��������*$��"'�,'����!���,���;��,��$��'���*��'�3�� �����" ����;��,��*�*)1@�4#�)�'������;'� %����'%� 55��+ %�'������'+���;��!�*$����#,��*$��*���3&�$��;��! ����) �'�3�'��� ���������� %������������3&����� �'�3��;��-�'���,��!'�'!�!��������%'3'�%��;����,��*�*)1@�4#�)� ��< %������5�����������3&������!5�'���� ��� %'A������ ���!���,�5��'������� ��� %�1 ��+ %����'����'����;�+�%�!��/��3�����'��;���0� ������+���������2����"'�,� �B���!�����! ���;����%�+ �'���� �������C �'%'�&�A'5������-��< %������5�����������3&�'�����'�&�� ��� %'A������ ���!���,�5��'������� �����������'�3��4D)�*�4� �� �����;���+���'% �'���;��� ���5� �%��'������ '��>� %'�&���4D)�*�4� �� ���--�;����,��! %���!;����� ���9*4���E'3,�'�3�D �����2�;���%'3,�'�3�>� %'�&�
#,��3�+���!�������'! �����,�� +�� 3���'!������������;'%%������,'��;��!�'����,�����/'��%������,���'!��;��������'�3�����3&�� � ��E'�������$��;���'�� %�; �'%'�&�'��5���'���� ������ �'A'�3��,��4*$0� ��"�%��!�����33���'����;��������'�3��,'��%�+�%��;��;;�����4������!!�����/��;�����'�3�����������%���!���0�����,��('��������6�%%���'���4�� ��3'���('+'�'����8�4���*$��/�#0����$����&%+ �' ��+�������� �,'�3�����(�6������
*$��C��!�-.���

������������ � ���������������������� �����������
9��������;��� ���'%�'�3����>� %';&�;����,��*�*)1@�4#�)�� �$��;���'�� %�*�3'�����/$*0���� �)�3'����������,'�����/)�0�!����+ %'� ����,�� ���� �&��;��,��� � ������%&'�3�,����'%�'�3F������3&�5��;��! ����� �'�3��#,'���,��2%'���'�����'3�������5��+'��� �� �� �3% ������!! �&��;� �5��5���&F��5,&�'� %� ����5�� �'�3��, � ����'��'���� ��"�%%� �'������ %�����3&������!5�'������� ��'����,��$*����)��'������%���,��2'�3��,��'�;��! �'����, ���,����'%�'�3��"��������5�� ����, ����������'����$���;�%'��� � 3���
�������(��/���������������&���(&�(2�����������(�����������&��&������/��3�������������������*������)����*�����(�4��#*?�@���!�����,��2�� �,���G����'��'� ����, ��� �,�+ %���'������������)�'��%���� �������
�� ��� � 5�6+�����������!� ����6 �������� 5�� ��� ��7+��� �� ����
���������������������� !�� ���" ���
#�� �!����$% ���9���,'���,���;;'�' %���'%�'�3�� !���������'�5% &���'��,��*�*)1@�4#�)�)�3'���&��;�E ��%����'%�'�3�H�
�)/�� � ���" ���� 9���,'�� �� ���� ��������'5�'����;��,���5 ���'�>����'��H�
6�(�������� ��&"'���()��*+��, !
#�$������- �9���,'�� ������� ���� ��� �����!5%���H�6������"� �,������! %'A �'�����>�'���� �� ���� ���A'5������
�����������(������ ����8�'%'�&�� ���" ���
$% ���
(�����,'��4*$���5������� ��'�3%�����������H�4*$�� �����������!'�����;���!�%�'5%����'%�'�3� !5�����/"'�,��,���G��5�'����;� ������ ������,'%����F��,��5'� %�0������ ���,�&�������!'����� ���5������'�3���%&� �5���'����;� ���'%�'�3�
�������� !�/���'�'5 %�� ���" ����#�� �!����$% ��0
�� ��� � 5�6+�����������!� ����6 �������� 5�� ��� ��7+��� �� ����
�.������ �*������������(���!�����
8�!-9���(����������
-�!3�%�/!'%%'3� !��5��%'���0�
9���,'���,�� +�� 3���'�%�3'� %���! ���������� �'����;��,��" ���" ����;%�"'�3�'�����,�; �'%'�&H�#,'���,��%������,�� +�� 3���������� �'�����'! �����+��� ���!���,�5��'������(-��,��%������5������'��!3�%����(-�'�������,��� !�� �6��(-���,��� ���� �������'�%�3'� %��G&3����! ������(-�'����>�'����;����,������3&5��;��! ����� �'�3��
��
�.�������**������������(���!�����
8�!-9���(����������
��!3�%�/!'%%'3� !��5���%'���0�
9���,'���,�� +�� 3���'�%�3'� %���! ���������� �'����;��,��" ���" ���� ;����'��'����� ��� ���'��%� +'�3��,��; �'%'�&H�#,'���,��%������,� +�� 3���������� �'������'! �����+��� ���!���,5��'������(-��,��%�������5������'��!3�%����(-�'������,��� !�� ��6��(-���,��� ���� ������'�%�3'� %��G&3�����! ������(-�'����>�'����;���,������3&�5��;��! ����� �'�3��
��
������!��������������
��1(�/!'%%'���3 %%����5��� &0�
9���,'���,��5% ������'3��;%�"�� ����!� ������'�!'%%'���3 %%����5���� &�/�1(0H�#,'��'���,�� !�����;�;%�"��,��5% ���'�����'3�������5��������
��
�:����������(2���������������(���� ���
(�����,'��; �'%'�&�, +�� �����'���;'G���;'%!���'�2%�;'%�� �'���5������H�#�'�2%��;'%�� �'���'�� �5�����������������������(��5 �,�3����� ����'���3��%�+�%���
��
�������������.��� @���
(�����,'��; �'%'�&�������������'������!�+ %� ��5 ���;��,����� �!����5������H�����'������!�+ %�'�����'������ �&�5�������'��%�����;����,��5��5����;���!�+'�3�����'�����/'������'���3����5,��5,�����0�#,'��! &�'��%�����'�%�3'� %��'��';'� �'�����'�%�3'� %���'��';'� �'����5,��5,�������!�+ %�������'���% �'�3�� ���;'%������
��
���!����"

������������ � ���������������������� �����������
���������� ��������������������������������������������������$��%'��4��+'���*%���7�1 ��6��
�������)/�"����(���(��)
�����"�;;<=#,#>;�82�&�8�&�����������%&����99�/�(�8�9"���*��'���C �'%'�&
��������������&��"�1�'��$���, ���
������!��� ����!��� �����)�+���82�&�8�&�����������%&����99
����� �� �� �.��
-���� -� ��� --�-���
����� �� �� -��.-�
���� � ��� ����
���� ���� �� ��
����� �� ��� ������
����. �� ��. - ����
�����. ��� �. ���� �
����. �� ��. ����
.���. .� �. ���- �
����. �� ��. ����.�
����. �� ��. �� �
;;<=#,#>;�������/�����82�&�8�&�����������%&����99 $3;?,3,;,4==
;;<=#,#>;�������/�����82����8�&����������99 ?3-,=3?<<40<
���������(���(��)�8��������(&���9�������/�����82����8�&����������99 ?3-,=3?<<40<
���&����&�����������(���(��)�8��������(&���9�(�����/���������&���'����������(�������������(���(��)�������@�
�����)/�"������������
�����"����������������8�&����9�/�(�8�9"���*��'���C �'%'�&
������!��� ����!��� �����)�+���8�&����9
-��� ����� �����
���� -���� ������
��� ����� ��� �-�
��� ���� �����
���� ���� �-�-�-
���. ����� ��. � �
����. ����. �-���
���. �����. ��-�
.��. ����. ����
���. .���. -���
���#����"

���. ����. �����
���������������������/�����8�&����9 ?3<-04<=
���������������������/�����82����8�&����������99 ?<-30<=4==
������������������������/�����82����8�&����������99 ?<-30<=4==
���&����&��������������������(�����/���������&���'����������(�����������������������������@
���������������(���,��;��%������!5�'������ %���,�"�� ��+����5��������,����� %�����3&������;��,'����'%�'�3H$%� ������;'�!��,���� ������ ��'�'�� %�;��%��/�'���'�������3&��3���� ����;��%��'%0������'���,'��; �'%'�&�
�%�������������������������)(���,��;��%������!5�'������ %���,�"�� ��+��'��%���� %%�����'�����% �� ������"'���5�"���%�� ���� �&����; �'%'�&H�$%� ������;'�!��, ���������'�����% �����"'���'��� %% �'����, +��������!'�����;��!��,'�%'�����%%�����'����&���!��!���������5������
�����)/�"��.������ �*���������������
����������"��.������ �*���������������
������!��� ����!��� �.������ �*����������8��!�8����������������/�����)99
����� �� �� ���
-���� -� ��� ���
����� �� �� �.�
���� � ��� ���
���� ���� �.�
����� �� ��� �.�
����. �� ��. ��-
�����. ��� �. ���
����. �� ��. ��.
.���. .� �. ��.
����. �� ��. �-�
����. �� ��. �-�
����������8��!9 <4<$
����������� ����� ���/�,��� 55%&'�3�;����,��*�*)1@�4#�)���,��6���';&'�3�$��;���'�� %�!��������,��� !��$*����)���, ���'3���� ����� !5����,��4*$�0
� !�?�IIIIIIIIIIIIIIIIIIIIIIIIIIIIIIIIIIIIIIIIIIIII�( ��?�IIIIIIIIIIIII�
4'3� ����?�IIIIIIIIIIIIIIIIIIIIIIIIIIIIIIIIIIIIII�4'3� �����'����>�'����",��� 55%&'�3�;����,��*�*)1@�4#�)�
���"����"

�� +������!���6 4�!�����+�� �������4�$%� ���2��5��,'��C �'%'�&�4�!! �&�;���&�����"���������J�����������!'��'�����*$�����%&��,��4� ��!�����;�*���3&�$��;��! ����/4*$0 ���E�������;��3���!������������������!'��������*$��",��� 55%&'�3�;����,��*�*)1@�4#�)�
1���� %�9�;��! �'��?��������� !�� ���" ����#�� �!����$% ��@� ����'%� �..�C�����!���,�*+ %� �'���$��'���*��'�3�( ��? ����� ���
�(����)��/�(��+���������)�������� !
45 ���#&5�
���'�'5 %� ���" ���#�� �!���
$% ���
�+�� 3��9�;%������'�%�3'� %�(�! ��/��(-0�6������� �'��� -�
�+�� 3��*;;%������'�%�3'� %�(�! ��/��(-0�6������� �'��� ��
$% ���(��'3��C%�"�) ��� �
C'G���C'%!�#�'�2%��C'%�� �'���$������� ���
����'����)�!�+ %� @���
�����)����*�����(�����/������*+ %� �'���$��'��� 6�!5 �'����
���*�����(�������(� �������/*��'�3�( ��?��� ��0
��������/*��'�3�( ��?��� ��0 ��������*�;- ������ ����������.�����
*���3&�$��;��! ����) �'�3 $� $� �-� ���� -�
*���3&�9�����'�&�
������������� �� ��� ��� ���� ���� ��
�������������� �� �-� �-� ���� ���� �
*���3&�6���
��������� K� .��� � K� .��� � ���� ���� K���������
������� ������ K-��- ���� K-��- ���� ���� ���� K��������
1����,�����1 ��*!'��'����
��6���&� � ��-�� ��-�� ���� ���� ����
236���;��&� � ���� ���� ���� ���� ����

$=#=�������� !�� ���" ����#�� �!����$% ���� ��&"'���()*+��, !�#�$������- �
$���;�%'��� � 3�����'%�'�3�9(?� ����
#,������3&������;��,'����'%�'�3�, �������!� ������ �����!5 ���������,����'!'% ����'%�'�3����'�3��,�*�+'���!��� %�$������'����3���&L��/*$�L�0�*���3&�$��;��! ����4� %���;��M���"'�,�����'�3��,��%� �������3&�;;'�'���� ������,��!��������3&��;;'�'�����C���!����'�;��! �'����+'�'������3&�� ��3�+�����,! �2�
�&���'�������A��(����
#
���
��������**�(����
#,'����'%�'�3����������2����5����>� ���;����5���&� ��$
$� ������������������3&�'�����'�&�;����,����!���,�5��'������'�3��������
( ����;�����';'� �'��
( ���1���� ���?��������
�����������*�����)����*�����(�
�
6������**�(����
��
�.�����
�������������&����(�����*;-����&��&�����)�B����*)*������A������� �����4
9�����';&��, ���,��'�;��! �'������� '����"'�,'���,'���� ��!����'�� ���� ��� ���'�� ����� ����"'�,�8�4�*�+'���!��� %�$������'����3���&L��!� ����!������ �� �����;����� ������3&�� ��3�+

1
Portfolio Manager is an interactive energy management tool that allows you to track and assess energy and water consumption across your entire portfolio of buildings in a secure online environment. Use this Quick Reference Guide to identify opportunities for energy efficiency improvements, track your progress over time, and verify results.
PoRtfolio ManaGeR QUick RefeRence GUide
IdentIfy energy effIcIency projectsUse Portfolio Manager to identify under-performing buildings to target for energy efficiency improvements and establish baselines for setting and measuring progress for energy efficiency improvement projects over time.
step ActIvIty ActIon
access Portfolio Manager. (step not shown)
Visit www.energystar.gov/benchmark.Scroll down to the Login section on the right-hand side in the middle of the page.
access your account: (step not shown)
• Create a new account.• Login to an existing account.
• Click regIster, and follow instructions.• Enter user name and password, and click LogIn.
Review system updates and enter account.(step not shown) click Access My portfoLIo, located below Welcome to portfolio Manager.
add a new facility. (step not shown) click Add a Property, located in the upper right portion of the screen.
Select property type and entergeneral facility information.(step not shown)
Select the option that most closely resembles your facility and click contInUe. enter general data and click sAve. for more information on facility space types, see: www.energystar.gov/index.cfm?c=eligibility.bus_portfoliomanager_space_types.
enter space use data.
from the facility summary page, shown above, go to the space Use section, located half way down the page, and click Add spAce.• Enter a facility name. In the select a space type menu, select the appropriate space type(s) for your building. if your space is not listed, select other. click contInUe.• Enter building characteristics. Click sAve. information required for each space type is listed here: www.energystar.gov/index.cfm?c=eligibility.bus_ portfoliomanager_space_types.• Repeat steps above to add all major spaces in your facility.
Use bulk import service to minimize manual data entry of large sets of facility data (10 or more facilities or campuses are required). • Go back to My portfolio by clicking on the link in the upper left portion of the page.• Click IMport facility data Using templates, located below Add a property.
enter energy use data.
from the facility summary page, go to the energy Meters section, located below the space Use section, and click Add Meter. • Enter meter name, type, and units. Click sAve. • Enter number of months and start date. Click contInUe. • Enter energy use and cost for each month. Click sAve. • Repeat for all energy meters and fuel types.
1
2
3
4
5
ww
w.e
nerg
ysta
r.gov
/ben
chm
ark
6
7
7
6

2
step ActIvIty ActIon
create custom groups.
organize facilities into groups (e.g., fire Stations, northwest Region). Groups are completely customizable, and each facility may belong to multiple groups.• From the My portfolio page, click creAte groUp, located directly to the right of the group drop-down menu.• Follow instructions to select buildings and name your group. • Once they have been saved, custom groups will be available in the group drop- down menu.
View and interpret results.
option 1: Go to My portfolio and view all buildings to compare performance metrics.
Option 2: Export data to Microsoft® Excel.
• On the My portfolio page, select the view, from the view drop-down menu that will display the data you wish to export. The My portfolio page will update to display the selected view. (9a)• Select the doWnLoAd In exceL link. a file download dialog window will open. Follow the steps provided by Excel. (9b)• Use Excel functionality to view building energy performance graphically . The example below shows a comparison of Energy Use Intensity for a portfolio of fire stations, identifying under-performing buildings to target for energy eficiency improvements.
9
Fire Stations - EUI Comparison
0
50
100
150
200
250
300
350
Fire Statio
n 1
Fire Statio
n 2
Fire Statio
n 3
Fire Statio
n 4
Fire Statio
n 5
Fire Statio
n 6
Fire Statio
n 7
Fire Statio
n 8
Fire Statio
n 9
Fire Statio
n 10
Fire Stations
Curr
ent W
eath
er
Nor
mal
ized
Sou
rce
Ener
gy
Use
Inte
nsity
(k
BTU
/SF)
8
8
ww
w.e
nerg
ysta
r.gov
/ben
chm
ark
9b
9a

3
trAck progress over tIMe Portfolio Manager comes pre-populated with nine standard summary views of facility data, which are displayed on the My Portfolio summary page. these standard views include: • Summary: Energy Use • Performance: Green House Gas emissions • Performance: Financial • Performance: Water Use
additionally, users can create and save custom downloadable views by choosing from more than 70 different metrics. the default view set by the user will display automatically after logging into Portfolio Manager, and data from all views can be exported to Microsoft® Excel.
ww
w.e
nerg
ysta
r.gov
/ben
chm
ark
creAte A cUstoM vIeW
step ActIon
from the My portfolio page or the facility summary page, select the create view link, located directly to the right of the view drop-down menu.
Enter a name for the view. To set as the default view, select the box labeled set this view as My portfolio default, located directly to the right of view name. You may include up to 7 (seven) columns in each view.
choose each metric to be included in the view by selecting an order number from the preferred column order drop-down menu to the left of the facility data column.
click sAve at the bottom of the page. You will be returned to the My portfolio page, and your custom view will be available in the view drop-down menu. (step not shown)
4
3
1
2
2
3
1
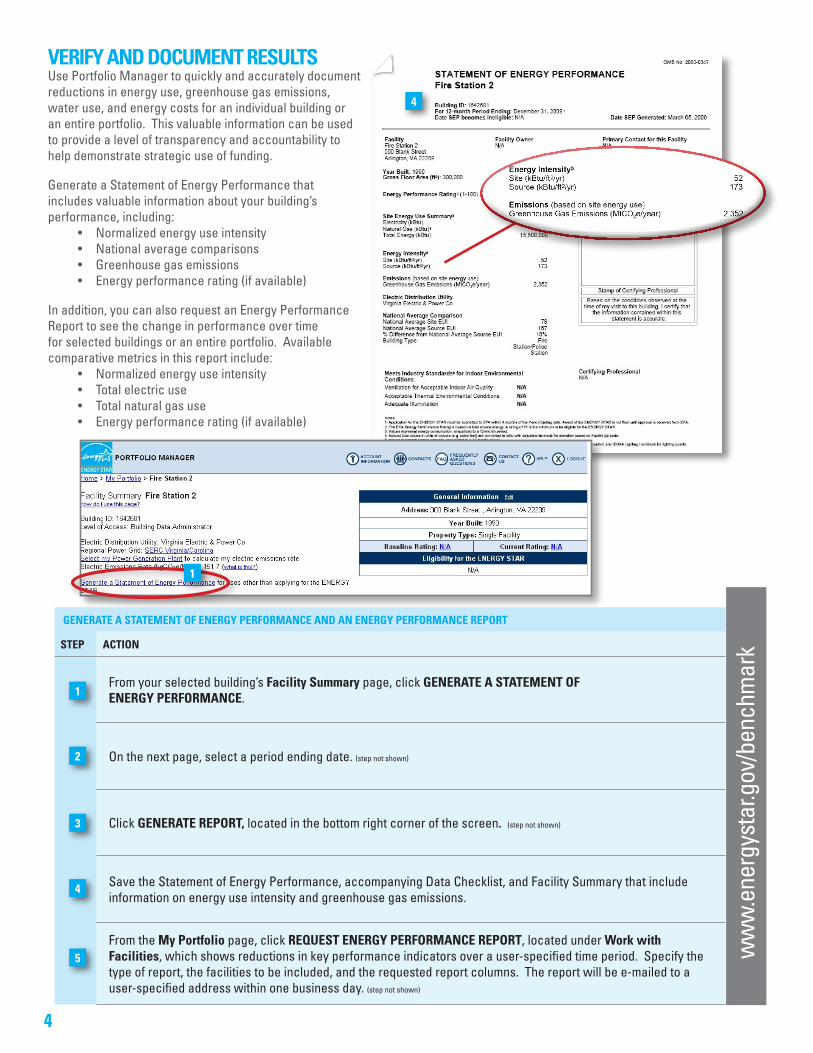
4
verIfy And docUMent resULtsUse Portfolio Manager to quickly and accurately document reductions in energy use, greenhouse gas emissions, water use, and energy costs for an individual building or an entire portfolio. this valuable information can be used to provide a level of transparency and accountability to help demonstrate strategic use of funding.
Generate a Statement of energy Performance that includes valuable information about your building’s performance, including:
• Normalized energy use intensity • National average comparisons • Greenhouse gas emissions • Energy performance rating (if available)
in addition, you can also request an energy Performance Report to see the change in performance over time for selected buildings or an entire portfolio. available comparative metrics in this report include:
• Normalized energy use intensity • Total electric use • Total natural gas use • Energy performance rating (if available)
ww
w.e
nerg
ysta
r.gov
/ben
chm
ark
generAte A stAteMent of energy perforMAnce And An energy perforMAnce report
step ActIon
from your selected building’s facility summary page, click generAte A stAteMent of energy perforMAnce.
On the next page, select a period ending date. (step not shown)
click generAte report, located in the bottom right corner of the screen. (step not shown)
Save the Statement of energy Performance, accompanying data checklist, and facility Summary that include information on energy use intensity and greenhouse gas emissions.
from the My portfolio page, click reQUest energy perforMAnce report, located under Work with facilities, which shows reductions in key performance indicators over a user-specified time period. Specify the type of report, the facilities to be included, and the requested report columns. the report will be e-mailed to a user-specified address within one business day. (step not shown)
4
5
3
1
2
1
4

APPENDIX C eQUEST MODEL RUN
SUMMARIES
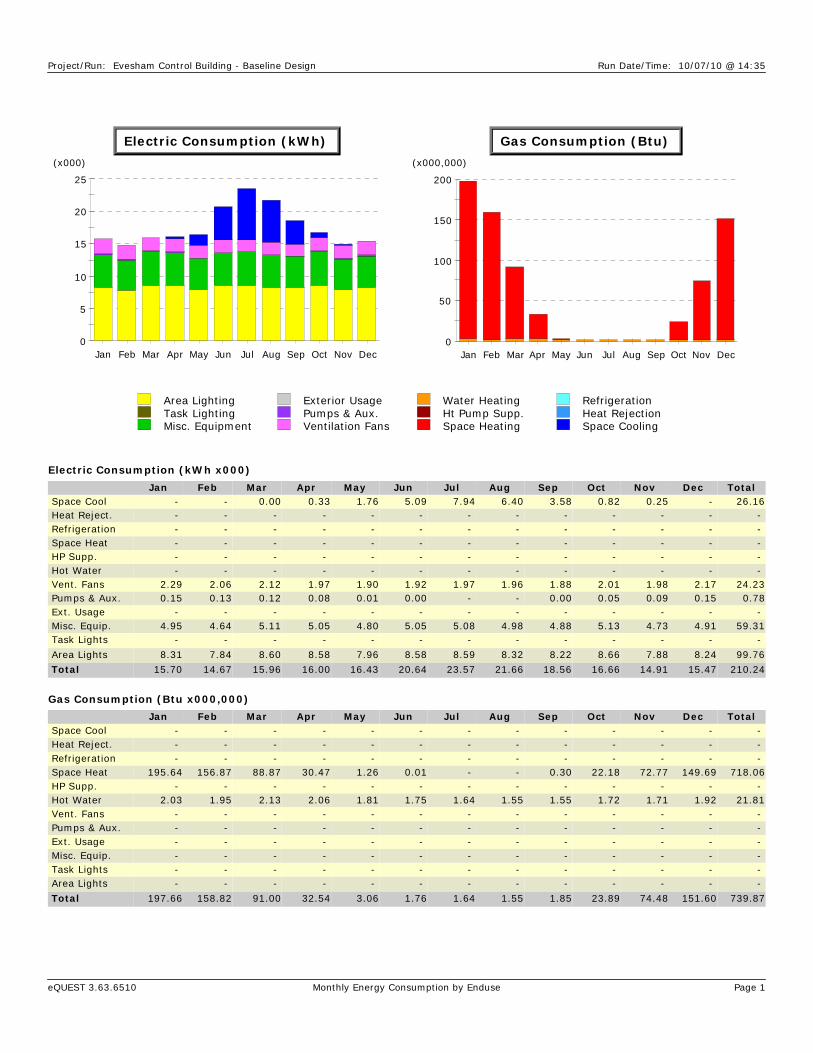
Project/Run: Evesham Control Building - Baseline Design Run Date/Time: 10/07/10 @ 14:35
eQUEST 3.63.6510 Monthly Energy Consumption by Enduse Page 1
0
5
10
15
20
25
Jan Feb Mar Apr May Jun Jul Aug Sep Oct Nov Dec
Electric Consumption (kWh)
(x000)
0
50
100
150
200
Jan Feb Mar Apr May Jun Jul Aug Sep Oct Nov Dec
Gas Consumption (Btu)
(x000,000)
Area LightingTask LightingMisc. Equipment
Exterior UsagePumps & Aux.Ventilation Fans
Water HeatingHt Pump Supp.Space Heating
RefrigerationHeat RejectionSpace Cooling
Electric Consumption (kWh x000)
Jan Feb Mar Apr May Jun Jul Aug Sep Oct Nov Dec Total Space Cool - - 0.00 0.33 1.76 5.09 7.94 6.40 3.58 0.82 0.25 - 26.16 Heat Reject. - - - - - - - - - - - - - Refrigeration - - - - - - - - - - - - - Space Heat - - - - - - - - - - - - - HP Supp. - - - - - - - - - - - - - Hot Water - - - - - - - - - - - - - Vent. Fans 2.29 2.06 2.12 1.97 1.90 1.92 1.97 1.96 1.88 2.01 1.98 2.17 24.23 Pumps & Aux. 0.15 0.13 0.12 0.08 0.01 0.00 - - 0.00 0.05 0.09 0.15 0.78 Ext. Usage - - - - - - - - - - - - - Misc. Equip. 4.95 4.64 5.11 5.05 4.80 5.05 5.08 4.98 4.88 5.13 4.73 4.91 59.31 Task Lights - - - - - - - - - - - - -
Area Lights 8.31 7.84 8.60 8.58 7.96 8.58 8.59 8.32 8.22 8.66 7.88 8.24 99.76
Total 15.70 14.67 15.96 16.00 16.43 20.64 23.57 21.66 18.56 16.66 14.91 15.47 210.24
Gas Consumption (Btu x000,000)
Jan Feb Mar Apr May Jun Jul Aug Sep Oct Nov Dec Total Space Cool - - - - - - - - - - - - - Heat Reject. - - - - - - - - - - - - - Refrigeration - - - - - - - - - - - - - Space Heat 195.64 156.87 88.87 30.47 1.26 0.01 - - 0.30 22.18 72.77 149.69 718.06 HP Supp. - - - - - - - - - - - - - Hot Water 2.03 1.95 2.13 2.06 1.81 1.75 1.64 1.55 1.55 1.72 1.71 1.92 21.81 Vent. Fans - - - - - - - - - - - - - Pumps & Aux. - - - - - - - - - - - - - Ext. Usage - - - - - - - - - - - - - Misc. Equip. - - - - - - - - - - - - - Task Lights - - - - - - - - - - - - - Area Lights - - - - - - - - - - - - -
Total 197.66 158.82 91.00 32.54 3.06 1.76 1.64 1.55 1.85 23.89 74.48 151.60 739.87

Project/Run: Evesham Control Building Furnace - Baseline Design Run Date/Time: 10/07/10 @ 15:31
eQUEST 3.63.6510 Monthly Energy Consumption by Enduse Page 1
0
5
10
15
20
25
Jan Feb Mar Apr May Jun Jul Aug Sep Oct Nov Dec
Electric Consumption (kWh)
(x000)
0
50
100
150
200
Jan Feb Mar Apr May Jun Jul Aug Sep Oct Nov Dec
Gas Consumption (Btu)
(x000,000)
Area LightingTask LightingMisc. Equipment
Exterior UsagePumps & Aux.Ventilation Fans
Water HeatingHt Pump Supp.Space Heating
RefrigerationHeat RejectionSpace Cooling
Electric Consumption (kWh x000)
Jan Feb Mar Apr May Jun Jul Aug Sep Oct Nov Dec Total Space Cool - - 0.00 0.33 1.76 5.09 7.94 6.40 3.58 0.82 0.25 - 26.16 Heat Reject. - - - - - - - - - - - - - Refrigeration - - - - - - - - - - - - - Space Heat - - - - - - - - - - - - - HP Supp. - - - - - - - - - - - - - Hot Water - - - - - - - - - - - - - Vent. Fans 2.29 2.06 2.12 1.97 1.90 1.92 1.97 1.96 1.88 2.01 1.98 2.17 24.23 Pumps & Aux. 0.15 0.13 0.12 0.08 0.01 0.00 - - 0.00 0.05 0.09 0.15 0.78 Ext. Usage - - - - - - - - - - - - - Misc. Equip. 4.95 4.64 5.11 5.05 4.80 5.05 5.08 4.98 4.88 5.13 4.73 4.91 59.31 Task Lights - - - - - - - - - - - - -
Area Lights 8.31 7.84 8.60 8.58 7.96 8.58 8.59 8.32 8.22 8.66 7.88 8.24 99.76
Total 15.70 14.67 15.96 16.00 16.43 20.64 23.57 21.66 18.56 16.66 14.91 15.47 210.24
Gas Consumption (Btu x000,000)
Jan Feb Mar Apr May Jun Jul Aug Sep Oct Nov Dec Total Space Cool - - - - - - - - - - - - - Heat Reject. - - - - - - - - - - - - - Refrigeration - - - - - - - - - - - - - Space Heat 176.05 141.16 79.13 26.64 1.03 0.01 - - 0.24 19.35 64.68 134.66 642.94 HP Supp. - - - - - - - - - - - - - Hot Water 2.03 1.95 2.13 2.06 1.81 1.75 1.64 1.55 1.55 1.72 1.71 1.92 21.81 Vent. Fans - - - - - - - - - - - - - Pumps & Aux. - - - - - - - - - - - - - Ext. Usage - - - - - - - - - - - - - Misc. Equip. - - - - - - - - - - - - - Task Lights - - - - - - - - - - - - - Area Lights - - - - - - - - - - - - -
Total 178.08 143.10 81.26 28.70 2.83 1.76 1.64 1.55 1.79 21.06 66.40 136.57 664.75

Project/Run: Evesham Control Building Condensers - Baseline Design Run Date/Time: 10/12/10 @ 09:18
eQUEST 3.63.6510 Monthly Energy Consumption by Enduse Page 1
0
5
10
15
20
25
Jan Feb Mar Apr May Jun Jul Aug Sep Oct Nov Dec
Electric Consumption (kWh)
(x000)
0
50
100
150
200
Jan Feb Mar Apr May Jun Jul Aug Sep Oct Nov Dec
Gas Consumption (Btu)
(x000,000)
Area LightingTask LightingMisc. Equipment
Exterior UsagePumps & Aux.Ventilation Fans
Water HeatingHt Pump Supp.Space Heating
RefrigerationHeat RejectionSpace Cooling
Electric Consumption (kWh x000)
Jan Feb Mar Apr May Jun Jul Aug Sep Oct Nov Dec Total Space Cool - - 0.00 0.23 1.28 3.82 6.07 4.86 2.70 0.58 0.17 - 19.71 Heat Reject. - - - - - - - - - - - - - Refrigeration - - - - - - - - - - - - - Space Heat - - - - - - - - - - - - - HP Supp. - - - - - - - - - - - - - Hot Water - - - - - - - - - - - - - Vent. Fans 2.29 2.06 2.12 1.97 1.90 1.92 1.97 1.96 1.88 2.01 1.98 2.17 24.23 Pumps & Aux. 0.15 0.13 0.12 0.08 0.01 0.00 - - 0.00 0.05 0.09 0.15 0.78 Ext. Usage - - - - - - - - - - - - - Misc. Equip. 4.95 4.64 5.11 5.05 4.80 5.05 5.08 4.98 4.88 5.13 4.73 4.91 59.31 Task Lights - - - - - - - - - - - - -
Area Lights 8.31 7.84 8.60 8.58 7.96 8.58 8.59 8.32 8.22 8.66 7.88 8.24 99.76
Total 15.70 14.67 15.96 15.90 15.96 19.37 21.71 20.11 17.68 16.42 14.84 15.47 203.79
Gas Consumption (Btu x000,000)
Jan Feb Mar Apr May Jun Jul Aug Sep Oct Nov Dec Total Space Cool - - - - - - - - - - - - - Heat Reject. - - - - - - - - - - - - - Refrigeration - - - - - - - - - - - - - Space Heat 195.64 156.87 88.86 30.47 1.26 0.01 - - 0.30 22.17 72.77 149.69 718.05 HP Supp. - - - - - - - - - - - - - Hot Water 2.03 1.95 2.13 2.06 1.81 1.75 1.64 1.55 1.55 1.72 1.71 1.92 21.81 Vent. Fans - - - - - - - - - - - - - Pumps & Aux. - - - - - - - - - - - - - Ext. Usage - - - - - - - - - - - - - Misc. Equip. - - - - - - - - - - - - - Task Lights - - - - - - - - - - - - - Area Lights - - - - - - - - - - - - -
Total 197.66 158.82 91.00 32.53 3.06 1.76 1.64 1.55 1.85 23.89 74.48 151.60 739.86

Project/Run: Recirculation building_Rev1 - Baseline Design Run Date/Time: 10/07/10 @ 09:45
eQUEST 3.63.6510 Monthly Energy Consumption by Enduse Page 1
0
1
2
3
4
Jan Feb Mar Apr May Jun Jul Aug Sep Oct Nov Dec
Electric Consumption (kWh)
(x000)
0
10
20
30
40
50
Jan Feb Mar Apr May Jun Jul Aug Sep Oct Nov Dec
Gas Consumption (Btu)
(x000,000)
Area LightingTask LightingMisc. Equipment
Exterior UsagePumps & Aux.Ventilation Fans
Water HeatingHt Pump Supp.Space Heating
RefrigerationHeat RejectionSpace Cooling
Electric Consumption (kWh x000)
Jan Feb Mar Apr May Jun Jul Aug Sep Oct Nov Dec Total Space Cool - - - - - - - - - - - - - Heat Reject. - - - - - - - - - - - - - Refrigeration - - - - - - - - - - - - - Space Heat - - - - - - - - - - - - - HP Supp. - - - - - - - - - - - - - Hot Water - - - - - - - - - - - - - Vent. Fans 0.18 0.14 0.06 0.01 - - - - - 0.01 0.05 0.13 0.57 Pumps & Aux. - - - - - - - - - - - - - Ext. Usage - - - - - - - - - - - - - Misc. Equip. 0.77 0.69 0.76 0.75 0.74 0.75 0.78 0.74 0.75 0.77 0.73 0.78 9.02 Task Lights - - - - - - - - - - - - -
Area Lights 2.14 1.93 2.12 2.11 2.05 2.11 2.20 2.05 2.11 2.14 2.03 2.20 25.18
Total 3.08 2.76 2.94 2.87 2.80 2.86 2.98 2.80 2.86 2.91 2.81 3.11 34.78
Gas Consumption (Btu x000,000)
Jan Feb Mar Apr May Jun Jul Aug Sep Oct Nov Dec Total Space Cool - - - - - - - - - - - - - Heat Reject. - - - - - - - - - - - - - Refrigeration - - - - - - - - - - - - - Space Heat 47.14 36.44 16.65 3.76 - - - - - 3.10 14.05 34.77 155.91 HP Supp. - - - - - - - - - - - - - Hot Water - - - - - - - - - - - - - Vent. Fans - - - - - - - - - - - - - Pumps & Aux. - - - - - - - - - - - - - Ext. Usage - - - - - - - - - - - - - Misc. Equip. - - - - - - - - - - - - - Task Lights - - - - - - - - - - - - - Area Lights - - - - - - - - - - - - -
Total 47.14 36.44 16.65 3.76 - - - - - 3.10 14.05 34.77 155.91

Project/Run: Sludge Dewatering Building - Baseline Design Run Date/Time: 10/14/10 @ 10:19
eQUEST 3.63.6510 Monthly Energy Consumption by Enduse Page 1
0
10
20
30
40
Jan Feb Mar Apr May Jun Jul Aug Sep Oct Nov Dec
Electric Consumption (kWh)
(x000)
0
10
20
30
Jan Feb Mar Apr May Jun Jul Aug Sep Oct Nov Dec
Gas Consumption (Btu)
(x000,000)
Area LightingTask LightingMisc. Equipment
Exterior UsagePumps & Aux.Ventilation Fans
Water HeatingHt Pump Supp.Space Heating
RefrigerationHeat RejectionSpace Cooling
Electric Consumption (kWh x000)
Jan Feb Mar Apr May Jun Jul Aug Sep Oct Nov Dec Total Space Cool - - - 0.00 0.01 0.04 0.07 0.05 0.03 0.00 0.00 - 0.20 Heat Reject. - - - - - - - - - - - - - Refrigeration - - - - - - - - - - - - - Space Heat 0.02 0.02 0.06 0.06 0.02 - - - 0.00 0.04 0.05 0.04 0.31 HP Supp. 0.15 0.14 0.05 0.00 - - - - - 0.00 0.03 0.12 0.48 Hot Water 0.05 0.05 0.06 0.05 0.05 0.05 0.04 0.04 0.04 0.04 0.04 0.05 0.56 Vent. Fans 30.28 27.35 30.28 29.30 30.27 29.30 30.27 30.27 29.30 30.27 29.30 30.28 356.47 Pumps & Aux. 0.11 0.10 0.11 0.11 0.11 0.11 0.11 0.11 0.11 0.11 0.11 0.11 1.35 Ext. Usage - - - - - - - - - - - - - Misc. Equip. 1.29 1.22 1.34 1.33 1.30 1.33 1.38 1.30 1.33 1.34 1.29 1.33 15.78 Task Lights - - - - - - - - - - - - -
Area Lights 3.12 2.96 3.26 3.25 3.12 3.25 3.39 3.12 3.25 3.25 3.11 3.25 38.32
Total 35.02 31.84 35.16 34.10 34.88 34.07 35.28 34.90 34.05 35.07 33.93 35.18 413.47
Gas Consumption (Btu x000,000)
Jan Feb Mar Apr May Jun Jul Aug Sep Oct Nov Dec Total Space Cool - - - - - - - - - - - - - Heat Reject. - - - - - - - - - - - - - Refrigeration - - - - - - - - - - - - - Space Heat 25.02 19.31 10.09 3.17 - - - - - 2.53 7.85 17.85 85.82 HP Supp. - - - - - - - - - - - - - Hot Water - - - - - - - - - - - - - Vent. Fans - - - - - - - - - - - - - Pumps & Aux. - - - - - - - - - - - - - Ext. Usage - - - - - - - - - - - - - Misc. Equip. - - - - - - - - - - - - - Task Lights - - - - - - - - - - - - - Area Lights - - - - - - - - - - - - -
Total 25.02 19.31 10.09 3.17 - - - - - 2.53 7.85 17.85 85.82
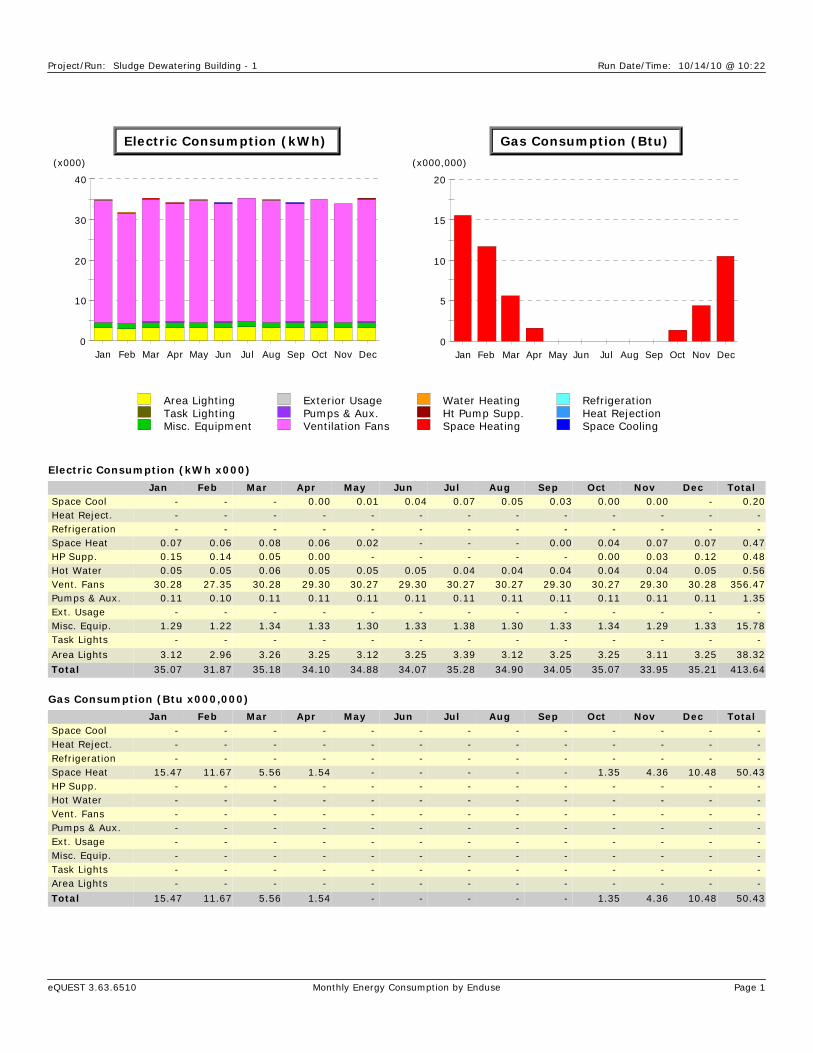
Project/Run: Sludge Dewatering Building - 1 Run Date/Time: 10/14/10 @ 10:22
eQUEST 3.63.6510 Monthly Energy Consumption by Enduse Page 1
0
10
20
30
40
Jan Feb Mar Apr May Jun Jul Aug Sep Oct Nov Dec
Electric Consumption (kWh)
(x000)
0
5
10
15
20
Jan Feb Mar Apr May Jun Jul Aug Sep Oct Nov Dec
Gas Consumption (Btu)
(x000,000)
Area LightingTask LightingMisc. Equipment
Exterior UsagePumps & Aux.Ventilation Fans
Water HeatingHt Pump Supp.Space Heating
RefrigerationHeat RejectionSpace Cooling
Electric Consumption (kWh x000)
Jan Feb Mar Apr May Jun Jul Aug Sep Oct Nov Dec Total Space Cool - - - 0.00 0.01 0.04 0.07 0.05 0.03 0.00 0.00 - 0.20 Heat Reject. - - - - - - - - - - - - - Refrigeration - - - - - - - - - - - - - Space Heat 0.07 0.06 0.08 0.06 0.02 - - - 0.00 0.04 0.07 0.07 0.47 HP Supp. 0.15 0.14 0.05 0.00 - - - - - 0.00 0.03 0.12 0.48 Hot Water 0.05 0.05 0.06 0.05 0.05 0.05 0.04 0.04 0.04 0.04 0.04 0.05 0.56 Vent. Fans 30.28 27.35 30.28 29.30 30.27 29.30 30.27 30.27 29.30 30.27 29.30 30.28 356.47 Pumps & Aux. 0.11 0.10 0.11 0.11 0.11 0.11 0.11 0.11 0.11 0.11 0.11 0.11 1.35 Ext. Usage - - - - - - - - - - - - - Misc. Equip. 1.29 1.22 1.34 1.33 1.30 1.33 1.38 1.30 1.33 1.34 1.29 1.33 15.78 Task Lights - - - - - - - - - - - - -
Area Lights 3.12 2.96 3.26 3.25 3.12 3.25 3.39 3.12 3.25 3.25 3.11 3.25 38.32
Total 35.07 31.87 35.18 34.10 34.88 34.07 35.28 34.90 34.05 35.07 33.95 35.21 413.64
Gas Consumption (Btu x000,000)
Jan Feb Mar Apr May Jun Jul Aug Sep Oct Nov Dec Total Space Cool - - - - - - - - - - - - - Heat Reject. - - - - - - - - - - - - - Refrigeration - - - - - - - - - - - - - Space Heat 15.47 11.67 5.56 1.54 - - - - - 1.35 4.36 10.48 50.43 HP Supp. - - - - - - - - - - - - - Hot Water - - - - - - - - - - - - - Vent. Fans - - - - - - - - - - - - - Pumps & Aux. - - - - - - - - - - - - - Ext. Usage - - - - - - - - - - - - - Misc. Equip. - - - - - - - - - - - - - Task Lights - - - - - - - - - - - - - Area Lights - - - - - - - - - - - - -
Total 15.47 11.67 5.56 1.54 - - - - - 1.35 4.36 10.48 50.43

Project/Run: Control Building including BioFor_Rev2 - Baseline Design Run Date/Time: 10/08/10 @ 10:20
eQUEST 3.63.6510 Monthly Energy Consumption by Enduse Page 1
0
10
20
30
40
50
Jan Feb Mar Apr May Jun Jul Aug Sep Oct Nov Dec
Electric Consumption (kWh)
(x000)
0
100
200
300
Jan Feb Mar Apr May Jun Jul Aug Sep Oct Nov Dec
Gas Consumption (Btu)
(x000,000)
Area LightingTask LightingMisc. Equipment
Exterior UsagePumps & Aux.Ventilation Fans
Water HeatingHt Pump Supp.Space Heating
RefrigerationHeat RejectionSpace Cooling
Electric Consumption (kWh x000)
Jan Feb Mar Apr May Jun Jul Aug Sep Oct Nov Dec Total Space Cool 0.06 0.05 0.07 0.28 1.30 2.80 4.25 3.54 2.23 0.70 0.26 0.05 15.60 Heat Reject. - - - - - - - - - - - - - Refrigeration - - - - - - - - - - - - - Space Heat - - - - - - - - - - - - - HP Supp. - - - - - - - - - - - - - Hot Water - - - - - - - - - - - - - Vent. Fans 5.42 4.90 5.42 5.24 5.42 5.27 5.48 5.44 5.25 5.42 5.24 5.42 63.93 Pumps & Aux. 0.20 0.18 0.19 0.18 0.17 0.16 0.16 0.16 0.16 0.18 0.18 0.20 2.13 Ext. Usage - - - - - - - - - - - - - Misc. Equip. 32.43 30.36 33.37 33.12 31.26 33.12 33.31 32.45 31.96 33.56 30.79 33.34 389.06 Task Lights - - - - - - - - - - - - -
Area Lights 5.72 5.39 5.92 5.91 5.48 5.91 5.91 5.72 5.66 5.96 5.42 5.92 68.92
Total 43.83 40.88 44.98 44.72 43.63 47.26 49.11 47.32 45.27 45.81 41.90 44.92 539.64
Gas Consumption (Btu x000,000)
Jan Feb Mar Apr May Jun Jul Aug Sep Oct Nov Dec Total Space Cool - - - - - - - - - - - - - Heat Reject. - - - - - - - - - - - - - Refrigeration - - - - - - - - - - - - - Space Heat 292.8 230.0 132.2 53.2 11.4 1.8 0.1 0.5 3.5 43.9 109.9 214.2 1,093.5 HP Supp. - - - - - - - - - - - - - Hot Water 0.8 0.7 0.8 0.7 0.6 0.6 0.6 0.5 0.5 0.6 0.6 0.7 7.8 Vent. Fans - - - - - - - - - - - - - Pumps & Aux. - - - - - - - - - - - - - Ext. Usage - - - - - - - - - - - - - Misc. Equip. - - - - - - - - - - - - - Task Lights - - - - - - - - - - - - - Area Lights - - - - - - - - - - - - -
Total 293.6 230.8 133.0 53.9 12.0 2.4 0.7 1.0 4.0 44.5 110.5 214.9 1,101.3

Project/Run: Control Building including BioFor Condenser - Baseline Design Run Date/Time: 10/12/10 @ 09:46
eQUEST 3.63.6510 Monthly Energy Consumption by Enduse Page 1
0
10
20
30
40
50
Jan Feb Mar Apr May Jun Jul Aug Sep Oct Nov Dec
Electric Consumption (kWh)
(x000)
0
100
200
300
Jan Feb Mar Apr May Jun Jul Aug Sep Oct Nov Dec
Gas Consumption (Btu)
(x000,000)
Area LightingTask LightingMisc. Equipment
Exterior UsagePumps & Aux.Ventilation Fans
Water HeatingHt Pump Supp.Space Heating
RefrigerationHeat RejectionSpace Cooling
Electric Consumption (kWh x000)
Jan Feb Mar Apr May Jun Jul Aug Sep Oct Nov Dec Total Space Cool 0.05 0.04 0.06 0.21 1.01 2.17 3.29 2.74 1.73 0.54 0.20 0.04 12.09 Heat Reject. - - - - - - - - - - - - - Refrigeration - - - - - - - - - - - - - Space Heat - - - - - - - - - - - - - HP Supp. - - - - - - - - - - - - - Hot Water - - - - - - - - - - - - - Vent. Fans 5.42 4.90 5.42 5.24 5.42 5.27 5.48 5.44 5.25 5.42 5.24 5.42 63.93 Pumps & Aux. 0.20 0.18 0.19 0.18 0.17 0.16 0.16 0.16 0.16 0.18 0.18 0.20 2.13 Ext. Usage - - - - - - - - - - - - - Misc. Equip. 32.43 30.36 33.37 33.12 31.26 33.12 33.31 32.45 31.96 33.56 30.79 33.34 389.06 Task Lights - - - - - - - - - - - - -
Area Lights 5.72 5.39 5.92 5.91 5.48 5.91 5.91 5.72 5.66 5.96 5.42 5.92 68.92
Total 43.81 40.87 44.97 44.66 43.34 46.63 48.16 46.53 44.76 45.65 41.84 44.91 536.12
Gas Consumption (Btu x000,000)
Jan Feb Mar Apr May Jun Jul Aug Sep Oct Nov Dec Total Space Cool - - - - - - - - - - - - - Heat Reject. - - - - - - - - - - - - - Refrigeration - - - - - - - - - - - - - Space Heat 292.8 230.0 132.2 53.2 11.4 1.8 0.1 0.5 3.5 43.9 109.9 214.2 1,093.5 HP Supp. - - - - - - - - - - - - - Hot Water 0.8 0.7 0.8 0.7 0.6 0.6 0.6 0.5 0.5 0.6 0.6 0.7 7.8 Vent. Fans - - - - - - - - - - - - - Pumps & Aux. - - - - - - - - - - - - - Ext. Usage - - - - - - - - - - - - - Misc. Equip. - - - - - - - - - - - - - Task Lights - - - - - - - - - - - - - Area Lights - - - - - - - - - - - - -
Total 293.6 230.8 133.0 53.9 12.0 2.4 0.7 1.0 4.0 44.5 110.5 214.9 1,101.3

APPENDIX D
LIGHTING SPREADSHEETS
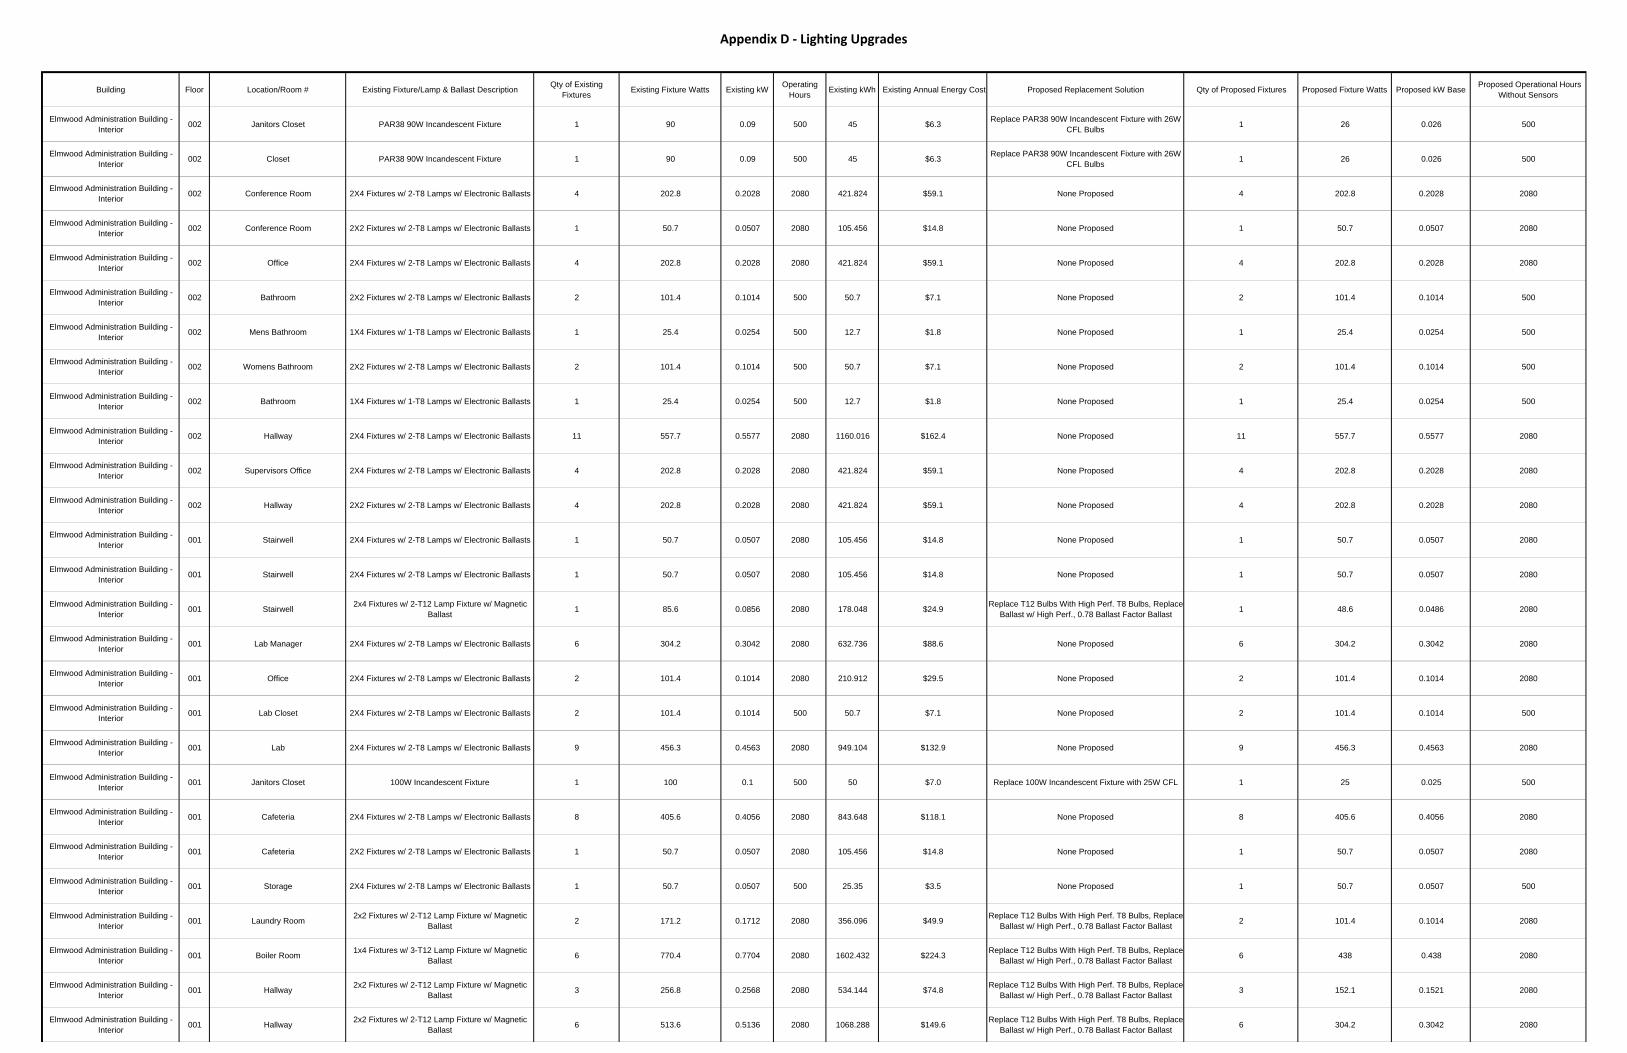
Appendix D ‐ Lighting Upgrades
Building Floor Location/Room # Existing Fixture/Lamp & Ballast Description Qty of Existing Fixtures Existing Fixture Watts Existing kW Operating
Hours Existing kWh Existing Annual Energy Cost Proposed Replacement Solution Qty of Proposed Fixtures Proposed Fixture Watts Proposed kW Base Proposed Operational Hours Without Sensors
Elmwood Administration Building - Interior 002 Janitors Closet PAR38 90W Incandescent Fixture 1 90 0.09 500 45 $6.3 Replace PAR38 90W Incandescent Fixture with 26W
CFL Bulbs 1 26 0.026 500
Elmwood Administration Building - Interior 002 Closet PAR38 90W Incandescent Fixture 1 90 0.09 500 45 $6.3 Replace PAR38 90W Incandescent Fixture with 26W
CFL Bulbs 1 26 0.026 500
Elmwood Administration Building - Interior 002 Conference Room 2X4 Fixtures w/ 2-T8 Lamps w/ Electronic Ballasts 4 202.8 0.2028 2080 421.824 $59.1 None Proposed 4 202.8 0.2028 2080
Elmwood Administration Building - Interior 002 Conference Room 2X2 Fixtures w/ 2-T8 Lamps w/ Electronic Ballasts 1 50.7 0.0507 2080 105.456 $14.8 None Proposed 1 50.7 0.0507 2080
Elmwood Administration Building - Interior 002 Office 2X4 Fixtures w/ 2-T8 Lamps w/ Electronic Ballasts 4 202.8 0.2028 2080 421.824 $59.1 None Proposed 4 202.8 0.2028 2080
Elmwood Administration Building - Interior 002 Bathroom 2X2 Fixtures w/ 2-T8 Lamps w/ Electronic Ballasts 2 101.4 0.1014 500 50.7 $7.1 None Proposed 2 101.4 0.1014 500
Elmwood Administration Building - Interior 002 Mens Bathroom 1X4 Fixtures w/ 1-T8 Lamps w/ Electronic Ballasts 1 25.4 0.0254 500 12.7 $1.8 None Proposed 1 25.4 0.0254 500
Elmwood Administration Building - Interior 002 Womens Bathroom 2X2 Fixtures w/ 2-T8 Lamps w/ Electronic Ballasts 2 101.4 0.1014 500 50.7 $7.1 None Proposed 2 101.4 0.1014 500
Elmwood Administration Building - Interior 002 Bathroom 1X4 Fixtures w/ 1-T8 Lamps w/ Electronic Ballasts 1 25.4 0.0254 500 12.7 $1.8 None Proposed 1 25.4 0.0254 500
Elmwood Administration Building - Interior 002 Hallway 2X4 Fixtures w/ 2-T8 Lamps w/ Electronic Ballasts 11 557.7 0.5577 2080 1160.016 $162.4 None Proposed 11 557.7 0.5577 2080
Elmwood Administration Building - Interior 002 Supervisors Office 2X4 Fixtures w/ 2-T8 Lamps w/ Electronic Ballasts 4 202.8 0.2028 2080 421.824 $59.1 None Proposed 4 202.8 0.2028 2080
Elmwood Administration Building - Interior 002 Hallway 2X2 Fixtures w/ 2-T8 Lamps w/ Electronic Ballasts 4 202.8 0.2028 2080 421.824 $59.1 None Proposed 4 202.8 0.2028 2080
Elmwood Administration Building - Interior 001 Stairwell 2X4 Fixtures w/ 2-T8 Lamps w/ Electronic Ballasts 1 50.7 0.0507 2080 105.456 $14.8 None Proposed 1 50.7 0.0507 2080
Elmwood Administration Building - Interior 001 Stairwell 2X4 Fixtures w/ 2-T8 Lamps w/ Electronic Ballasts 1 50.7 0.0507 2080 105.456 $14.8 None Proposed 1 50.7 0.0507 2080
Elmwood Administration Building - Interior 001 Stairwell 2x4 Fixtures w/ 2-T12 Lamp Fixture w/ Magnetic
Ballast 1 85.6 0.0856 2080 178.048 $24.9 Replace T12 Bulbs With High Perf. T8 Bulbs, Replace Ballast w/ High Perf., 0.78 Ballast Factor Ballast 1 48.6 0.0486 2080
Elmwood Administration Building - Interior 001 Lab Manager 2X4 Fixtures w/ 2-T8 Lamps w/ Electronic Ballasts 6 304.2 0.3042 2080 632.736 $88.6 None Proposed 6 304.2 0.3042 2080
Elmwood Administration Building - Interior 001 Office 2X4 Fixtures w/ 2-T8 Lamps w/ Electronic Ballasts 2 101.4 0.1014 2080 210.912 $29.5 None Proposed 2 101.4 0.1014 2080
Elmwood Administration Building - Interior 001 Lab Closet 2X4 Fixtures w/ 2-T8 Lamps w/ Electronic Ballasts 2 101.4 0.1014 500 50.7 $7.1 None Proposed 2 101.4 0.1014 500
Elmwood Administration Building - Interior 001 Lab 2X4 Fixtures w/ 2-T8 Lamps w/ Electronic Ballasts 9 456.3 0.4563 2080 949.104 $132.9 None Proposed 9 456.3 0.4563 2080
Elmwood Administration Building - Interior 001 Janitors Closet 100W Incandescent Fixture 1 100 0.1 500 50 $7.0 Replace 100W Incandescent Fixture with 25W CFL 1 25 0.025 500
Elmwood Administration Building - Interior 001 Cafeteria 2X4 Fixtures w/ 2-T8 Lamps w/ Electronic Ballasts 8 405.6 0.4056 2080 843.648 $118.1 None Proposed 8 405.6 0.4056 2080
Elmwood Administration Building - Interior 001 Cafeteria 2X2 Fixtures w/ 2-T8 Lamps w/ Electronic Ballasts 1 50.7 0.0507 2080 105.456 $14.8 None Proposed 1 50.7 0.0507 2080
Elmwood Administration Building - Interior 001 Storage 2X4 Fixtures w/ 2-T8 Lamps w/ Electronic Ballasts 1 50.7 0.0507 500 25.35 $3.5 None Proposed 1 50.7 0.0507 500
Elmwood Administration Building - Interior 001 Laundry Room 2x2 Fixtures w/ 2-T12 Lamp Fixture w/ Magnetic
Ballast 2 171.2 0.1712 2080 356.096 $49.9 Replace T12 Bulbs With High Perf. T8 Bulbs, Replace Ballast w/ High Perf., 0.78 Ballast Factor Ballast 2 101.4 0.1014 2080
Elmwood Administration Building - Interior 001 Boiler Room 1x4 Fixtures w/ 3-T12 Lamp Fixture w/ Magnetic
Ballast 6 770.4 0.7704 2080 1602.432 $224.3 Replace T12 Bulbs With High Perf. T8 Bulbs, Replace Ballast w/ High Perf., 0.78 Ballast Factor Ballast 6 438 0.438 2080
Elmwood Administration Building - Interior 001 Hallway 2x2 Fixtures w/ 2-T12 Lamp Fixture w/ Magnetic
Ballast 3 256.8 0.2568 2080 534.144 $74.8 Replace T12 Bulbs With High Perf. T8 Bulbs, Replace Ballast w/ High Perf., 0.78 Ballast Factor Ballast 3 152.1 0.1521 2080
Elmwood Administration Building - Interior 001 Hallway 2x2 Fixtures w/ 2-T12 Lamp Fixture w/ Magnetic
Ballast 6 513.6 0.5136 2080 1068.288 $149.6 Replace T12 Bulbs With High Perf. T8 Bulbs, Replace Ballast w/ High Perf., 0.78 Ballast Factor Ballast 6 304.2 0.3042 2080

Appendix D ‐ Lighting Upgrades
Building Floor Location/Room # Existing Fixture/Lamp & Ballast Description Qty of Existing Fixtures Existing Fixture Watts Existing kW Operating
Hours Existing kWh Existing Annual Energy Cost Proposed Replacement Solution Qty of Proposed Fixtures Proposed Fixture Watts Proposed kW Base Proposed Operational Hours Without Sensors
Elmwood Administration Building - Interior 001 Womens Locker Room 2x2 Fixtures w/ 2-T12 Lamp Fixture w/ Magnetic
Ballast 3 256.8 0.2568 500 128.4 $18.0 Replace T12 Bulbs With High Perf. T8 Bulbs, Replace Ballast w/ High Perf., 0.78 Ballast Factor Ballast 3 152.1 0.1521 500
Elmwood Administration Building - Interior 001 Womens Locker Room 150W Incandescent Fixture 1 150 0.15 500 75 $10.5 Replace 150W Incandescent Fixture with 25W CFL 1 25 0.025 500
Elmwood Administration Building - Interior 001 Hallway 2x2 Fixtures w/ 2-T12 Lamp Fixture w/ Magnetic
Ballast 4 342.4 0.3424 2080 712.192 $99.7 Replace T12 Bulbs With High Perf. T8 Bulbs, Replace Ballast w/ High Perf., 0.78 Ballast Factor Ballast 4 202.8 0.2028 2080
Elmwood Administration Building - Interior 001 Mens Locker Room 2x4 Fixtures w/ 2-T12 Lamp Fixture w/ Magnetic
Ballast 6 513.6 0.5136 500 256.8 $36.0 Replace T12 Bulbs With High Perf. T8 Bulbs, Replace Ballast w/ High Perf., 0.78 Ballast Factor Ballast 6 291.6 0.2916 500
Elmwood Administration Building - Interior 001 Shower 150W Incandescent Fixture 1 150 0.15 500 75 $10.5 Replace 150W Incandescent Fixture with 25W CFL 1 25 0.025 500
Elmwood Administration Building - Interior 001 Mens Bathroom 2x2 Fixtures w/ 2-T12 Lamp Fixture w/ Magnetic
Ballast 4 342.4 0.3424 500 171.2 $24.0 Replace T12 Bulbs With High Perf. T8 Bulbs, Replace Ballast w/ High Perf., 0.78 Ballast Factor Ballast 4 202.8 0.2028 500
Elmwood Administration Building - Interior 001 Mens Bathroom 2x2 Fixtures w/ 2-T12 Lamp Fixture w/ Magnetic
Ballast 1 85.6 0.0856 500 42.8 $6.0 Replace T12 Bulbs With High Perf. T8 Bulbs, Replace Ballast w/ High Perf., 0.78 Ballast Factor Ballast 1 50.7 0.0507 500
Elmwood Administration Building - Interior 001 Mens Bathroom 150W Incandescent Fixture 1 150 0.15 500 75 $10.5 Replace 150W Incandescent Fixture with 25W CFL 1 25 0.025 500
Elmwood Administration Building - Interior 001 Garage 400W Metal Halide Fixtures 12 5496 5.496 2080 11431.68 $1,600.4 Replace Metal Halide Fixtures with 6-Lamp
Fluorescent Highbay Fixtures 12 2712 2.712 2080
Elmwood Administration Building - Interior 001 Library 2x2 Fixtures w/ 2-T12 Lamp Fixture w/ Magnetic
Ballast 2 171.2 0.1712 2080 356.096 $49.9 Replace T12 Bulbs With High Perf. T8 Bulbs, Replace Ballast w/ High Perf., 0.78 Ballast Factor Ballast 2 101.4 0.1014 2080
Elmwood Administration Building - Interior 001 Garage Storage 1x4 Fixtures w/ 3-T12 Lamp Fixture w/ Magnetic
Ballast 1 128.4 0.1284 500 64.2 $9.0 Replace T12 Bulbs With High Perf. T8 Bulbs, Replace Ballast w/ High Perf., 0.78 Ballast Factor Ballast 1 73 0.073 500
Elmwood Administration Building - Interior 001 Garage Storage 1x4 Fixtures w/ 3-T12 Lamp Fixture w/ Magnetic
Ballast 1 128.4 0.1284 500 64.2 $9.0 Replace T12 Bulbs With High Perf. T8 Bulbs, Replace Ballast w/ High Perf., 0.78 Ballast Factor Ballast 1 73 0.073 500
Elmwood Administration Building - Interior 001 Control Room 2x4 Fixtures w/ 4-T12 Lamp Fixture w/ Magnetic
Ballast 9 1540.8 1.5408 2080 3204.864 $448.7 Replace T12 Bulbs With High Perf. T8 Bulbs, Replace Ballast w/ High Perf., 0.78 Ballast Factor Ballast 9 875.7 0.8757 2080
Elmwood Administration Building - Interior 001 Control Room 2x2 Fixtures w/4-T12 Lamp Fixture w/ Magnetic
Ballast 2 342.4 0.3424 2080 712.192 $99.7 Replace T12 Bulbs With High Perf. T8 Bulbs, Replace Ballast w/ High Perf., 0.78 Ballast Factor Ballast 2 194.6 0.1946 2080
Elmwood Sludge Recirculation/Alum Storage Building - Interior 001 Overall 2x4 Fixtures w/ 2-T12 Lamp Fixture w/ Magnetic
Ballast 7 599.2 0.5992 4368 2617.3056 $366.4 Replace T12 Bulbs With High Perf. T8 Bulbs, Replace Ballast w/ High Perf., 0.78 Ballast Factor Ballast 7 340.2 0.3402 4368
Elmwood Sludge Recirculation/Alum Storage Building - Interior 001 Overall 1x4 Fixtures w/ 3-T12 Lamp Fixture w/ Magnetic
Ballast 6 770.4 0.7704 4368 3365.1072 $471.1 Replace T12 Bulbs With High Perf. T8 Bulbs, Replace Ballast w/ High Perf., 0.78 Ballast Factor Ballast 6 438 0.438 4368
Elmwood Sludge Recirculation/Alum Storage Building - Interior 001 Overall 2x4 Fixtures w/ 2-T12 Lamp Fixture w/ Magnetic
Ballast 8 684.8 0.6848 4368 2991.2064 $418.8 Replace T12 Bulbs With High Perf. T8 Bulbs, Replace Ballast w/ High Perf., 0.78 Ballast Factor Ballast 8 388.8 0.3888 4368
Elmwood Generator Building - Interior 001 Overall 1x4 Fixtures w/ 3-T12 Lamp Fixture w/ Magnetic
Ballast 6 770.4 0.7704 2080 1602.432 $224.3 Replace T12 Bulbs With High Perf. T8 Bulbs, Replace Ballast w/ High Perf., 0.78 Ballast Factor Ballast 6 438 0.438 2080
Elmwood Chemical Feed Building - Interior 001 Overall 1x4 Fixtures w/ 3-T12 Lamp Fixture w/ Magnetic
Ballast 3 385.2 0.3852 4368 1682.5536 $235.6 Replace T12 Bulbs With High Perf. T8 Bulbs, Replace Ballast w/ High Perf., 0.78 Ballast Factor Ballast 3 219 0.219 4368
Elmwood Chemical Feed Building - Interior 001 Overall 175W Fixture 6 1326 1.326 4368 5791.968 $810.9 None Proposed 6 1326 1.326 4368
Elmwood Chemical Feed Building - Interior 001 Overall 1x4 Fixtures w/ 3-T12 Lamp Fixture w/ Magnetic
Ballast 3 385.2 0.3852 4368 1682.5536 $235.6 Replace T12 Bulbs With High Perf. T8 Bulbs, Replace Ballast w/ High Perf., 0.78 Ballast Factor Ballast 3 219 0.219 4368
Elmwood Sludge Dewatering Building - Interior 001 Press Room 175W Fixture 12 2652 2.652 4368 11583.936 $1,621.8 None Proposed 12 2652 2.652 4368
Elmwood Sludge Dewatering Building - Interior 001 Press Room 1x4 Fixtures w/ 3-T12 Lamp Fixture w/ Magnetic
Ballast 1 128.4 0.1284 4368 560.8512 $78.5 Replace T12 Bulbs With High Perf. T8 Bulbs, Replace Ballast w/ High Perf., 0.78 Ballast Factor Ballast 1 73 0.073 4368
Elmwood Sludge Dewatering Building - Interior 001 Press Room 1x4 Fixtures w/ 2-T12 Lamp Fixture w/ Magnetic
Ballast 4 342.4 0.3424 4368 1495.6032 $209.4 Replace T12 Bulbs With High Perf. T8 Bulbs, Replace Ballast w/ High Perf., 0.78 Ballast Factor Ballast 4 194.4 0.1944 4368
Elmwood Sludge Dewatering Building - Interior 001 Office 1x4 Fixtures w/ 2-T12 Lamp Fixture w/ Magnetic
Ballast 1 85.6 0.0856 4368 373.9008 $52.3 Replace T12 Bulbs With High Perf. T8 Bulbs, Replace Ballast w/ High Perf., 0.78 Ballast Factor Ballast 1 48.6 0.0486 4368
Elmwood Sludge Dewatering Building - Interior 001 Boiler Room 1x4 Fixtures w/ 3-T12 Lamp Fixture w/ Magnetic
Ballast 1 128.4 0.1284 4368 560.8512 $78.5 Replace T12 Bulbs With High Perf. T8 Bulbs, Replace Ballast w/ High Perf., 0.78 Ballast Factor Ballast 1 73 0.073 4368
Elmwood Sludge Dewatering Building - Interior 001 MCC Room 1x4 Fixtures w/ 3-T12 Lamp Fixture w/ Magnetic
Ballast 2 256.8 0.2568 4368 1121.7024 $157.0 Replace T12 Bulbs With High Perf. T8 Bulbs, Replace Ballast w/ High Perf., 0.78 Ballast Factor Ballast 2 146 0.146 4368

Appendix D ‐ Lighting Upgrades
Building Floor Location/Room # Existing Fixture/Lamp & Ballast Description Qty of Existing Fixtures Existing Fixture Watts Existing kW Operating
Hours Existing kWh Existing Annual Energy Cost Proposed Replacement Solution Qty of Proposed Fixtures Proposed Fixture Watts Proposed kW Base Proposed Operational Hours Without Sensors
Elmwood Sludge Dewatering Building - Interior 001 Bathroom 42W CFL Fixture 1 49 0.049 4368 214.032 $30.0 None Proposed 1 49 0.049 4368
Woodstream Control/BioFor Building -Interior 001 Garage 1X4 Fixtures w/ 2-T8 Lamps w/ Electronic Ballasts 9 456.3 0.4563 2080 949.104 $132.9 None Proposed 9 456.3 0.4563 2080
Woodstream Control/BioFor Building -Interior 001 Boiler Room 1X4 Fixtures w/ 2-T8 Lamps w/ Electronic Ballasts 4 202.8 0.2028 2080 421.824 $59.1 None Proposed 4 202.8 0.2028 2080
Woodstream Control/BioFor Building -Interior 001 Electrical Room 1X4 Fixtures w/ 2-T8 Lamps w/ Electronic Ballasts 5 253.5 0.2535 2080 527.28 $73.8 None Proposed 5 253.5 0.2535 2080
Woodstream Control/BioFor Building -Interior 001 Generator Room 1X4 Fixtures w/ 2-T8 Lamps w/ Electronic Ballasts 7 354.9 0.3549 2080 738.192 $103.3 None Proposed 7 354.9 0.3549 2080
Woodstream Control/BioFor Building -Interior 001 Meter Shop 1X4 Fixtures w/ 2-T8 Lamps w/ Electronic Ballasts 5 253.5 0.2535 2080 527.28 $73.8 None Proposed 5 253.5 0.2535 2080
Woodstream Control/BioFor Building -Interior 001 Hallway 2x2 Fixtures w/ 31W Octron Lamp 12 372 0.372 2080 773.76 $108.3 None Proposed 12 372 0.372 2080
Woodstream Control/BioFor Building -Interior 001 Break Room 2X4 Fixtures w/ 3-T8 Lamps w/ Electronic Ballasts 6 528 0.528 2080 1098.24 $153.8 None Proposed 6 528 0.528 2080
Woodstream Control/BioFor Building -Interior 001 Conference Room 2x2 Fixtures w/ 31W Octron Lamp 12 372 0.372 2080 773.76 $108.3 None Proposed 12 372 0.372 2080
Woodstream Control/BioFor Building -Interior 001 Conference Room 42W CFL Fixture 20 980 0.98 2080 2038.4 $285.4 None Proposed 20 980 0.98 2080
Woodstream Control/BioFor Building -Interior 001 Mens Bathroom 2x4 Fixtures w/ 2-T12 Lamp Fixture w/ Magnetic
Ballast 2 171.2 0.1712 500 85.6 $12.0 Replace T12 Bulbs With High Perf. T8 Bulbs, Replace Ballast w/ High Perf., 0.78 Ballast Factor Ballast 2 97.2 0.0972 500
Woodstream Control/BioFor Building -Interior 001 Womens Bathroom 2x4 Fixtures w/ 2-T12 Lamp Fixture w/ Magnetic
Ballast 2 171.2 0.1712 500 85.6 $12.0 Replace T12 Bulbs With High Perf. T8 Bulbs, Replace Ballast w/ High Perf., 0.78 Ballast Factor Ballast 2 97.2 0.0972 500
Woodstream Control/BioFor Building -Interior 001 Lab 2X4 Fixtures w/ 2-T8 Lamps w/ Electronic Ballasts 4 202.8 0.2028 2080 421.824 $59.1 None Proposed 4 202.8 0.2028 2080
Woodstream Control/BioFor Building -Interior 001 Biofor Building 400W Metal Halide Fixtures 15 6870 6.87 2080 14289.6 $2,000.5 Replace Metal Halide Fixtures with 6-Lamp
Fluorescent Highbay Fixtures 15 3390 3.39 2080
Woodstream Control/BioFor Building -Interior 001 Biofor Building 2X4 Fixtures w/ 2-T8 Lamps w/ Electronic Ballasts 10 507 0.507 2080 1054.56 $147.6 None Proposed 10 507 0.507 2080
Woodstream Control/BioFor Building -Interior 001 Closet 1X4 Fixtures w/ 2-T8 Lamps w/ Electronic Ballasts 1 50.7 0.0507 500 25.35 $3.5 None Proposed 1 50.7 0.0507 500
Woodstream Blower Building - Interior 001 Blower Room 1X4 Fixtures w/ 2-T8 Lamps w/ Electronic Ballasts 15 760.5 0.7605 2080 1581.84 $221.5 None Proposed 15 760.5 0.7605 2080
Woodstream Blower Building - Interior 001 Blower Room 1X4 Fixtures w/ 2-T8 Lamps w/ Electronic Ballasts 4 202.8 0.2028 2080 421.824 $59.1 None Proposed 4 202.8 0.2028 2080
Woodstream Blower Building - Interior 001 Chlorine Storage 150W Incandescent Fixture 2 300 0.3 500 150 $21.0 Replace 150W Incandescent Fixture with 25W CFL 2 50 0.05 500
Woodstream Blower Building - Interior 001 Storage 8' T12 Fixture w/ 2-T12 Lamps 1 227 0.227 500 113.5 $15.9 Replace 8' T12 Fixture with 1 Tandem Double-Length
2-T8 Lamp Fixture 1 120 0.12 500
Woodstream Blower Building - Interior 001 Storage 100W Incandescent Fixture 2 200 0.2 500 100 $14.0 Replace 100W Incandescent Fixture with 25W CFL 2 50 0.05 500
Elmwood Generator Building - Exterior 000 Exterior 150W High Pressure Sodium Wall Pack 1 189 0.189 4368 825.552 $115.6 Replace 150W Fixture with Induction Light Fixture 1 90 0.09 4368
Elmwood Sludge Dewatering Building - Exterior 000 Exterior 150W High Pressure Sodium Wall Pack 5 945 0.945 4368 4127.76 $577.9 Replace 150W Fixture with Induction Light Fixture 5 450 0.45 4368
Elmwood Sludge Recirculation/Alum Storage Building - Exterior 000 Exterior 150W High Pressure Sodium Wall Pack 2 378 0.378 4368 1651.104 $231.2 Replace 150W Fixture with Induction Light Fixture 2 180 0.18 4368
Elmwood Site Lighting 000 Site Lighting Pole Mounted Luminare - 1 Head (250W MH) 15 4650 4.65 4368 20311.2 $2,843.6 Replace 250W Fixture with Induction Light Fixture 15 1650 1.65 4368
Elmwood Site Lighting 000 Site Lighting Pole Mounted Luminare - 2 Head (250W MH) 1 620 0.62 4368 2708.16 $379.1 Replace 250W Fixture with Induction Light Fixture 1 220 0.22 4368
Elmwood Administration Building - Exterior 000 Exterior 100W Incandescent Fixture 7 700 0.7 4368 3057.6 $428.1 Replace 100W Incandescent Fixture with 25W CFL 7 175 0.175 4368

Appendix D ‐ Lighting Upgrades
Building Floor Location/Room # Existing Fixture/Lamp & Ballast Description Qty of Existing Fixtures Existing Fixture Watts Existing kW Operating
Hours Existing kWh Existing Annual Energy Cost Proposed Replacement Solution Qty of Proposed Fixtures Proposed Fixture Watts Proposed kW Base Proposed Operational Hours Without Sensors
Elmwood Chemical Feed Building - Exterior 000 Exterior 150W High Pressure Sodium Wall Pack 2 378 0.378 4368 1651.104 $231.2 Replace 150W Fixture with Induction Light Fixture 2 180 0.18 4368
Elmwood Site Lighting 000 Tank Lighting 100W High Pressure Sodium Tank Light 28 3780 3.78 500 1890 $264.6 None Proposed 28 3780 3.78 500
Woodstream Site Lighting 000 Site Lighting Pole Mounted Luminare - 1 Head (250W MH) 10 3100 3.1 4368 13540.8 $1,895.7 Replace 250W Fixture with Induction Light Fixture 10 1100 1.1 4368
Woodstream Control/BioFor Building -Exterior 000 Exterior 150W High Pressure Sodium Wall Pack 3 567 0.567 4368 2476.656 $346.7 Replace 150W Fixture with Induction Light Fixture 3 270 0.27 4368
Woodstream Blower Building - Exterior 000 Exterior 150W High Pressure Sodium Wall Pack 2 378 0.378 4368 1651.104 $231.2 Replace 150W Fixture with Induction Light Fixture 2 180 0.18 4368
Woodstream Site Lighting 000 Tank Lighting 100W High Pressure Sodium Tank Light 10 1350 1.35 500 675 $94.5 None Proposed 10 1350 1.35 500
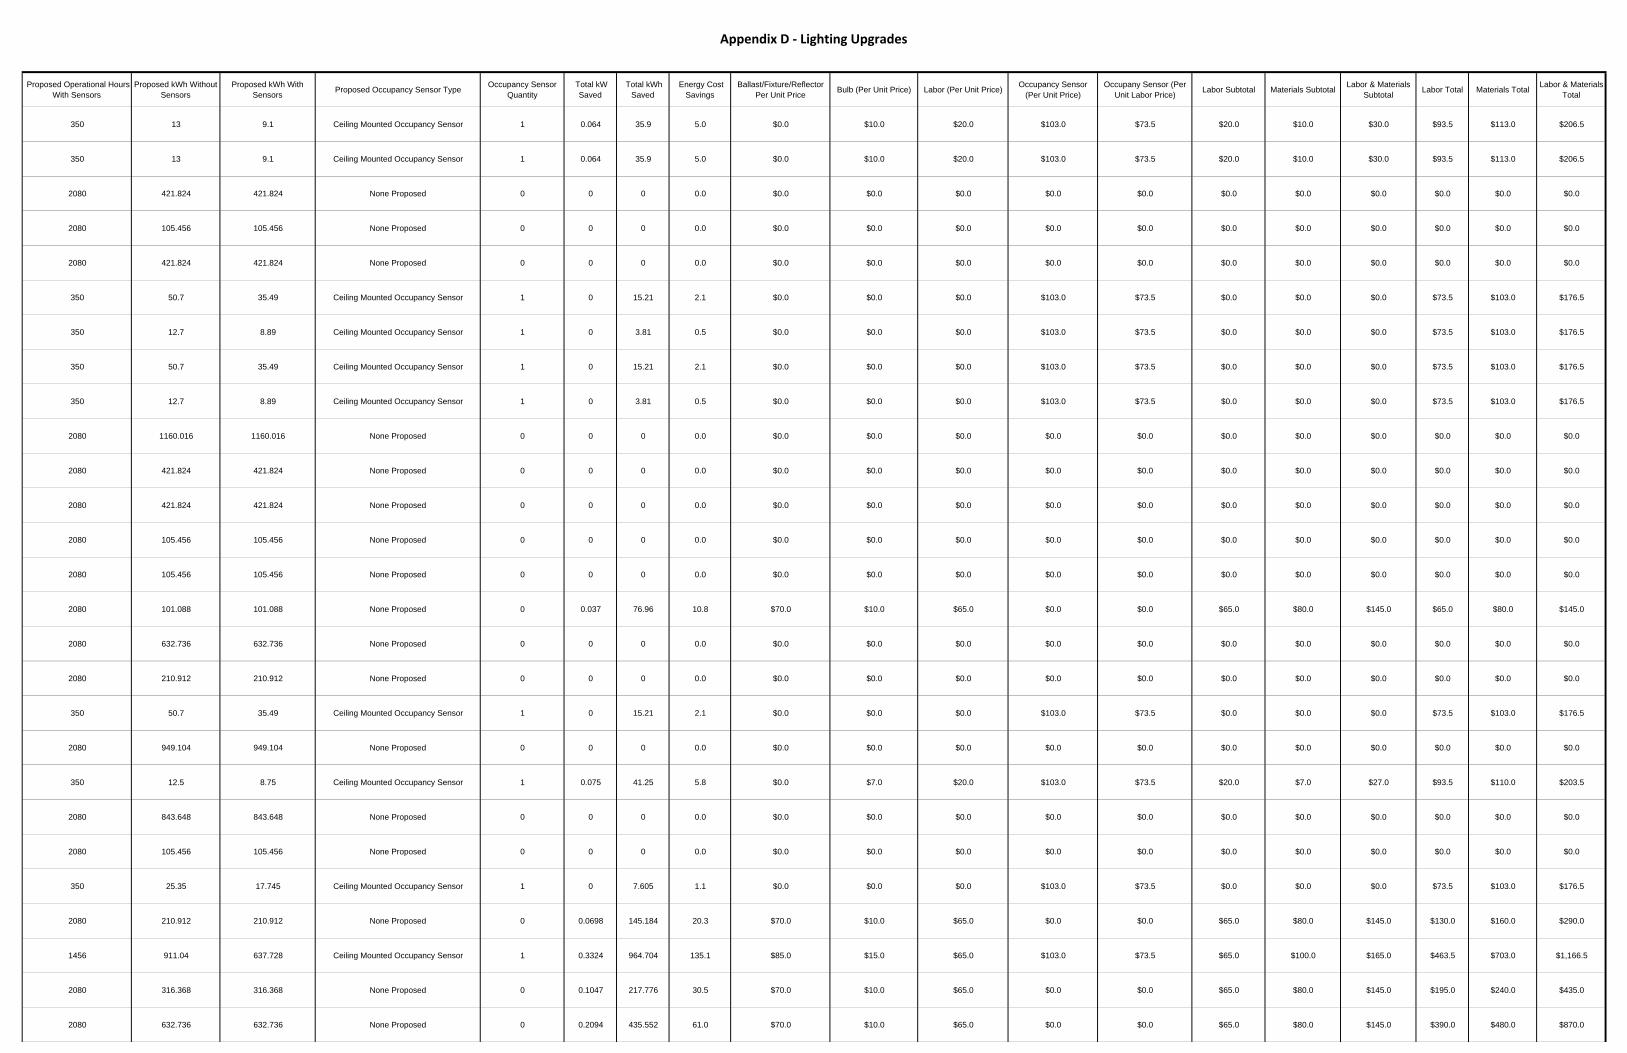
Appendix D ‐ Lighting Upgrades
Proposed Operational Hours With Sensors
Proposed kWh Without Sensors
Proposed kWh With Sensors Proposed Occupancy Sensor Type Occupancy Sensor
Quantity Total kW
Saved Total kWh
Saved Energy Cost
Savings Ballast/Fixture/Reflector
Per Unit Price Bulb (Per Unit Price) Labor (Per Unit Price) Occupancy Sensor (Per Unit Price)
Occupany Sensor (Per Unit Labor Price) Labor Subtotal Materials Subtotal Labor & Materials
Subtotal Labor Total Materials Total Labor & Materials Total
350 13 9.1 Ceiling Mounted Occupancy Sensor 1 0.064 35.9 5.0 $0.0 $10.0 $20.0 $103.0 $73.5 $20.0 $10.0 $30.0 $93.5 $113.0 $206.5
350 13 9.1 Ceiling Mounted Occupancy Sensor 1 0.064 35.9 5.0 $0.0 $10.0 $20.0 $103.0 $73.5 $20.0 $10.0 $30.0 $93.5 $113.0 $206.5
2080 421.824 421.824 None Proposed 0 0 0 0.0 $0.0 $0.0 $0.0 $0.0 $0.0 $0.0 $0.0 $0.0 $0.0 $0.0 $0.0
2080 105.456 105.456 None Proposed 0 0 0 0.0 $0.0 $0.0 $0.0 $0.0 $0.0 $0.0 $0.0 $0.0 $0.0 $0.0 $0.0
2080 421.824 421.824 None Proposed 0 0 0 0.0 $0.0 $0.0 $0.0 $0.0 $0.0 $0.0 $0.0 $0.0 $0.0 $0.0 $0.0
350 50.7 35.49 Ceiling Mounted Occupancy Sensor 1 0 15.21 2.1 $0.0 $0.0 $0.0 $103.0 $73.5 $0.0 $0.0 $0.0 $73.5 $103.0 $176.5
350 12.7 8.89 Ceiling Mounted Occupancy Sensor 1 0 3.81 0.5 $0.0 $0.0 $0.0 $103.0 $73.5 $0.0 $0.0 $0.0 $73.5 $103.0 $176.5
350 50.7 35.49 Ceiling Mounted Occupancy Sensor 1 0 15.21 2.1 $0.0 $0.0 $0.0 $103.0 $73.5 $0.0 $0.0 $0.0 $73.5 $103.0 $176.5
350 12.7 8.89 Ceiling Mounted Occupancy Sensor 1 0 3.81 0.5 $0.0 $0.0 $0.0 $103.0 $73.5 $0.0 $0.0 $0.0 $73.5 $103.0 $176.5
2080 1160.016 1160.016 None Proposed 0 0 0 0.0 $0.0 $0.0 $0.0 $0.0 $0.0 $0.0 $0.0 $0.0 $0.0 $0.0 $0.0
2080 421.824 421.824 None Proposed 0 0 0 0.0 $0.0 $0.0 $0.0 $0.0 $0.0 $0.0 $0.0 $0.0 $0.0 $0.0 $0.0
2080 421.824 421.824 None Proposed 0 0 0 0.0 $0.0 $0.0 $0.0 $0.0 $0.0 $0.0 $0.0 $0.0 $0.0 $0.0 $0.0
2080 105.456 105.456 None Proposed 0 0 0 0.0 $0.0 $0.0 $0.0 $0.0 $0.0 $0.0 $0.0 $0.0 $0.0 $0.0 $0.0
2080 105.456 105.456 None Proposed 0 0 0 0.0 $0.0 $0.0 $0.0 $0.0 $0.0 $0.0 $0.0 $0.0 $0.0 $0.0 $0.0
2080 101.088 101.088 None Proposed 0 0.037 76.96 10.8 $70.0 $10.0 $65.0 $0.0 $0.0 $65.0 $80.0 $145.0 $65.0 $80.0 $145.0
2080 632.736 632.736 None Proposed 0 0 0 0.0 $0.0 $0.0 $0.0 $0.0 $0.0 $0.0 $0.0 $0.0 $0.0 $0.0 $0.0
2080 210.912 210.912 None Proposed 0 0 0 0.0 $0.0 $0.0 $0.0 $0.0 $0.0 $0.0 $0.0 $0.0 $0.0 $0.0 $0.0
350 50.7 35.49 Ceiling Mounted Occupancy Sensor 1 0 15.21 2.1 $0.0 $0.0 $0.0 $103.0 $73.5 $0.0 $0.0 $0.0 $73.5 $103.0 $176.5
2080 949.104 949.104 None Proposed 0 0 0 0.0 $0.0 $0.0 $0.0 $0.0 $0.0 $0.0 $0.0 $0.0 $0.0 $0.0 $0.0
350 12.5 8.75 Ceiling Mounted Occupancy Sensor 1 0.075 41.25 5.8 $0.0 $7.0 $20.0 $103.0 $73.5 $20.0 $7.0 $27.0 $93.5 $110.0 $203.5
2080 843.648 843.648 None Proposed 0 0 0 0.0 $0.0 $0.0 $0.0 $0.0 $0.0 $0.0 $0.0 $0.0 $0.0 $0.0 $0.0
2080 105.456 105.456 None Proposed 0 0 0 0.0 $0.0 $0.0 $0.0 $0.0 $0.0 $0.0 $0.0 $0.0 $0.0 $0.0 $0.0
350 25.35 17.745 Ceiling Mounted Occupancy Sensor 1 0 7.605 1.1 $0.0 $0.0 $0.0 $103.0 $73.5 $0.0 $0.0 $0.0 $73.5 $103.0 $176.5
2080 210.912 210.912 None Proposed 0 0.0698 145.184 20.3 $70.0 $10.0 $65.0 $0.0 $0.0 $65.0 $80.0 $145.0 $130.0 $160.0 $290.0
1456 911.04 637.728 Ceiling Mounted Occupancy Sensor 1 0.3324 964.704 135.1 $85.0 $15.0 $65.0 $103.0 $73.5 $65.0 $100.0 $165.0 $463.5 $703.0 $1,166.5
2080 316.368 316.368 None Proposed 0 0.1047 217.776 30.5 $70.0 $10.0 $65.0 $0.0 $0.0 $65.0 $80.0 $145.0 $195.0 $240.0 $435.0
2080 632.736 632.736 None Proposed 0 0.2094 435.552 61.0 $70.0 $10.0 $65.0 $0.0 $0.0 $65.0 $80.0 $145.0 $390.0 $480.0 $870.0

Appendix D ‐ Lighting Upgrades
Proposed Operational Hours With Sensors
Proposed kWh Without Sensors
Proposed kWh With Sensors Proposed Occupancy Sensor Type Occupancy Sensor
Quantity Total kW
Saved Total kWh
Saved Energy Cost
Savings Ballast/Fixture/Reflector
Per Unit Price Bulb (Per Unit Price) Labor (Per Unit Price) Occupancy Sensor (Per Unit Price)
Occupany Sensor (Per Unit Labor Price) Labor Subtotal Materials Subtotal Labor & Materials
Subtotal Labor Total Materials Total Labor & Materials Total
350 76.05 53.235 Ceiling Mounted Occupancy Sensor 1 0.1047 75.165 10.5 $70.0 $10.0 $65.0 $103.0 $73.5 $65.0 $80.0 $145.0 $268.5 $343.0 $611.5
500 12.5 12.5 None Proposed 0 0.125 62.5 8.8 $0.0 $7.0 $20.0 $0.0 $0.0 $20.0 $7.0 $27.0 $20.0 $7.0 $27.0
2080 421.824 421.824 None Proposed 0 0.1396 290.368 40.7 $70.0 $10.0 $65.0 $0.0 $0.0 $65.0 $80.0 $145.0 $260.0 $320.0 $580.0
350 145.8 102.06 Ceiling Mounted Occupancy Sensor 1 0.222 154.74 21.7 $70.0 $10.0 $65.0 $103.0 $73.5 $65.0 $80.0 $145.0 $463.5 $583.0 $1,046.5
500 12.5 12.5 None Proposed 0 0.125 62.5 8.8 $0.0 $7.0 $20.0 $0.0 $0.0 $20.0 $7.0 $27.0 $20.0 $7.0 $27.0
350 101.4 70.98 Ceiling Mounted Occupancy Sensor 1 0.1396 100.22 14.0 $70.0 $10.0 $65.0 $103.0 $73.5 $65.0 $80.0 $145.0 $333.5 $423.0 $756.5
350 25.35 17.745 None Proposed 0 0.0349 25.055 3.5 $70.0 $10.0 $65.0 $0.0 $0.0 $65.0 $80.0 $145.0 $65.0 $80.0 $145.0
350 12.5 8.75 None Proposed 0 0.125 66.25 9.3 $0.0 $7.0 $20.0 $0.0 $0.0 $20.0 $7.0 $27.0 $20.0 $7.0 $27.0
2080 5640.96 5640.96 None Proposed 0 2.784 5790.72 810.7 $168.0 $105.0 $100.0 $0.0 $0.0 $100.0 $273.0 $373.0 $1,200.0 $3,276.0 $4,476.0
2080 210.912 210.912 None Proposed 0 0.0698 145.184 20.3 $70.0 $10.0 $65.0 $0.0 $0.0 $65.0 $80.0 $145.0 $130.0 $160.0 $290.0
350 36.5 25.55 Ceiling Mounted Occupancy Sensor 1 0.0554 38.65 5.4 $85.0 $15.0 $65.0 $103.0 $73.5 $65.0 $100.0 $165.0 $138.5 $203.0 $341.5
350 36.5 25.55 Ceiling Mounted Occupancy Sensor 1 0.0554 38.65 5.4 $85.0 $15.0 $65.0 $103.0 $73.5 $65.0 $100.0 $165.0 $138.5 $203.0 $341.5
2080 1821.456 1821.456 None Proposed 0 0.6651 1383.408 193.7 $105.0 $20.0 $65.0 $0.0 $0.0 $65.0 $125.0 $190.0 $585.0 $1,125.0 $1,710.0
2080 404.768 404.768 None Proposed 0 0.1478 307.424 43.0 $105.0 $20.0 $65.0 $0.0 $0.0 $65.0 $125.0 $190.0 $130.0 $250.0 $380.0
4368 1485.9936 1485.9936 None Proposed 0 0.259 1131.312 158.4 $70.0 $10.0 $65.0 $0.0 $0.0 $65.0 $80.0 $145.0 $455.0 $560.0 $1,015.0
4368 1913.184 1913.184 None Proposed 0 0.3324 1451.9232 203.3 $85.0 $15.0 $65.0 $0.0 $0.0 $65.0 $100.0 $165.0 $390.0 $600.0 $990.0
4368 1698.2784 1698.2784 None Proposed 0 0.296 1292.928 181.0 $70.0 $10.0 $65.0 $0.0 $0.0 $65.0 $80.0 $145.0 $520.0 $640.0 $1,160.0
2080 911.04 911.04 None Proposed 0 0.3324 691.392 96.8 $85.0 $15.0 $65.0 $0.0 $0.0 $65.0 $100.0 $165.0 $390.0 $600.0 $990.0
4368 956.592 956.592 None Proposed 0 0.1662 725.9616 101.6 $85.0 $15.0 $65.0 $0.0 $0.0 $65.0 $100.0 $165.0 $195.0 $300.0 $495.0
4368 5791.968 5791.968 None Proposed 0 0 0 0.0 $0.0 $0.0 $0.0 $0.0 $0.0 $0.0 $0.0 $0.0 $0.0 $0.0 $0.0
4368 956.592 956.592 None Proposed 0 0.1662 725.9616 101.6 $85.0 $15.0 $65.0 $0.0 $0.0 $65.0 $100.0 $165.0 $195.0 $300.0 $495.0
4368 11583.936 11583.936 None Proposed 0 0 0 0.0 $0.0 $0.0 $0.0 $0.0 $0.0 $0.0 $0.0 $0.0 $0.0 $0.0 $0.0
4368 318.864 318.864 None Proposed 0 0.0554 241.9872 33.9 $85.0 $15.0 $65.0 $0.0 $0.0 $65.0 $100.0 $165.0 $65.0 $100.0 $165.0
4368 849.1392 849.1392 None Proposed 0 0.148 646.464 90.5 $70.0 $10.0 $65.0 $0.0 $0.0 $65.0 $80.0 $145.0 $260.0 $320.0 $580.0
4368 212.2848 212.2848 None Proposed 0 0.037 161.616 22.6 $70.0 $10.0 $65.0 $0.0 $0.0 $65.0 $80.0 $145.0 $65.0 $80.0 $145.0
3057.6 318.864 223.2048 Ceiling Mounted Occupancy Sensor 1 0.0554 337.6464 47.3 $85.0 $15.0 $65.0 $103.0 $73.5 $65.0 $100.0 $165.0 $138.5 $203.0 $341.5
4368 637.728 637.728 None Proposed 0 0.1108 483.9744 67.8 $85.0 $15.0 $65.0 $0.0 $0.0 $65.0 $100.0 $165.0 $130.0 $200.0 $330.0

Appendix D ‐ Lighting Upgrades
Proposed Operational Hours With Sensors
Proposed kWh Without Sensors
Proposed kWh With Sensors Proposed Occupancy Sensor Type Occupancy Sensor
Quantity Total kW
Saved Total kWh
Saved Energy Cost
Savings Ballast/Fixture/Reflector
Per Unit Price Bulb (Per Unit Price) Labor (Per Unit Price) Occupancy Sensor (Per Unit Price)
Occupany Sensor (Per Unit Labor Price) Labor Subtotal Materials Subtotal Labor & Materials
Subtotal Labor Total Materials Total Labor & Materials Total
3057.6 214.032 149.8224 Ceiling Mounted Occupancy Sensor 1 0 64.2096 9.0 $0.0 $0.0 $0.0 $103.0 $73.5 $0.0 $0.0 $0.0 $73.5 $103.0 $176.5
2080 949.104 949.104 None Proposed 0 0 0 0.0 $0.0 $0.0 $0.0 $0.0 $0.0 $0.0 $0.0 $0.0 $0.0 $0.0 $0.0
2080 421.824 421.824 None Proposed 0 0 0 0.0 $0.0 $0.0 $0.0 $0.0 $0.0 $0.0 $0.0 $0.0 $0.0 $0.0 $0.0
1456 527.28 369.096 Ceiling Mounted Occupancy Sensor 1 0 158.184 22.1 $0.0 $0.0 $0.0 $103.0 $73.5 $0.0 $0.0 $0.0 $73.5 $103.0 $176.5
1456 738.192 516.7344 Ceiling Mounted Occupancy Sensor 1 0 221.4576 31.0 $0.0 $0.0 $0.0 $103.0 $73.5 $0.0 $0.0 $0.0 $73.5 $103.0 $176.5
2080 527.28 527.28 None Proposed 0 0 0 0.0 $0.0 $0.0 $0.0 $0.0 $0.0 $0.0 $0.0 $0.0 $0.0 $0.0 $0.0
2080 773.76 773.76 None Proposed 0 0 0 0.0 $0.0 $0.0 $0.0 $0.0 $0.0 $0.0 $0.0 $0.0 $0.0 $0.0 $0.0
2080 1098.24 1098.24 None Proposed 0 0 0 0.0 $0.0 $0.0 $0.0 $0.0 $0.0 $0.0 $0.0 $0.0 $0.0 $0.0 $0.0
2080 773.76 773.76 None Proposed 0 0 0 0.0 $0.0 $0.0 $0.0 $0.0 $0.0 $0.0 $0.0 $0.0 $0.0 $0.0 $0.0
2080 2038.4 2038.4 None Proposed 0 0 0 0.0 $0.0 $0.0 $0.0 $0.0 $0.0 $0.0 $0.0 $0.0 $0.0 $0.0 $0.0
350 48.6 34.02 Ceiling Mounted Occupancy Sensor 1 0.074 51.58 7.2 $70.0 $10.0 $65.0 $103.0 $73.5 $65.0 $80.0 $145.0 $203.5 $263.0 $466.5
350 48.6 34.02 Ceiling Mounted Occupancy Sensor 1 0.074 51.58 7.2 $70.0 $10.0 $65.0 $103.0 $73.5 $65.0 $80.0 $145.0 $203.5 $263.0 $466.5
2080 421.824 421.824 None Proposed 0 0 0 0.0 $0.0 $0.0 $0.0 $0.0 $0.0 $0.0 $0.0 $0.0 $0.0 $0.0 $0.0
2080 7051.2 7051.2 None Proposed 0 3.48 7238.4 1,013.4 $168.0 $105.0 $100.0 $0.0 $0.0 $100.0 $273.0 $373.0 $1,500.0 $4,095.0 $5,595.0
2080 1054.56 1054.56 None Proposed 0 0 0 0.0 $0.0 $0.0 $0.0 $0.0 $0.0 $0.0 $0.0 $0.0 $0.0 $0.0 $0.0
350 25.35 17.745 Ceiling Mounted Occupancy Sensor 1 0 7.605 1.1 $0.0 $0.0 $0.0 $103.0 $73.5 $0.0 $0.0 $0.0 $73.5 $103.0 $176.5
2080 1581.84 1581.84 None Proposed 0 0 0 0.0 $0.0 $0.0 $0.0 $0.0 $0.0 $0.0 $0.0 $0.0 $0.0 $0.0 $0.0
2080 421.824 421.824 None Proposed 0 0 0 0.0 $0.0 $0.0 $0.0 $0.0 $0.0 $0.0 $0.0 $0.0 $0.0 $0.0 $0.0
350 25 17.5 Ceiling Mounted Occupancy Sensor 1 0.25 132.5 18.6 $0.0 $7.0 $20.0 $103.0 $73.5 $20.0 $7.0 $27.0 $113.5 $117.0 $230.5
350 60 42 Ceiling Mounted Occupancy Sensor 1 0.107 71.5 10.0 $65.1 $105.0 $93.0 $103.0 $73.5 $93.0 $170.1 $263.1 $166.5 $273.1 $439.6
350 25 17.5 Ceiling Mounted Occupancy Sensor 1 0.15 82.5 11.6 $0.0 $7.0 $20.0 $103.0 $73.5 $20.0 $7.0 $27.0 $113.5 $117.0 $230.5
4368 393.12 393.12 None Proposed 0 0.099 432.432 60.5 $0.0 $380.0 $137.0 $0.0 $0.0 $137.0 $380.0 $517.0 $137.0 $380.0 $517.0
4368 1965.6 1965.6 None Proposed 0 0.495 2162.16 302.7 $0.0 $380.0 $137.0 $0.0 $0.0 $137.0 $380.0 $517.0 $685.0 $1,900.0 $2,585.0
4368 786.24 786.24 None Proposed 0 0.198 864.864 121.1 $0.0 $380.0 $137.0 $0.0 $0.0 $137.0 $380.0 $517.0 $274.0 $760.0 $1,034.0
4368 7207.2 7207.2 None Proposed 0 3 13104 1,834.6 $0.0 $390.0 $137.0 $0.0 $0.0 $137.0 $390.0 $527.0 $2,055.0 $5,850.0 $7,905.0
4368 960.96 960.96 None Proposed 0 0.4 1747.2 244.6 $0.0 $780.0 $274.0 $0.0 $0.0 $274.0 $780.0 $1,054.0 $274.0 $780.0 $1,054.0
4368 764.4 764.4 None Proposed 0 0.525 2293.2 321.0 $0.0 $7.0 $20.0 $0.0 $0.0 $20.0 $7.0 $27.0 $140.0 $49.0 $189.0

Appendix D ‐ Lighting Upgrades
Proposed Operational Hours With Sensors
Proposed kWh Without Sensors
Proposed kWh With Sensors Proposed Occupancy Sensor Type Occupancy Sensor
Quantity Total kW
Saved Total kWh
Saved Energy Cost
Savings Ballast/Fixture/Reflector
Per Unit Price Bulb (Per Unit Price) Labor (Per Unit Price) Occupancy Sensor (Per Unit Price)
Occupany Sensor (Per Unit Labor Price) Labor Subtotal Materials Subtotal Labor & Materials
Subtotal Labor Total Materials Total Labor & Materials Total
4368 786.24 786.24 None Proposed 0 0.198 864.864 121.1 $0.0 $380.0 $137.0 $0.0 $0.0 $137.0 $380.0 $517.0 $274.0 $760.0 $1,034.0
500 1890 1890 None Proposed 0 0 0 0.0 $0.0 $0.0 $0.0 $0.0 $0.0 $0.0 $0.0 $0.0 $0.0 $0.0 $0.0
4368 4804.8 4804.8 None Proposed 0 2 8736 1,223.0 $0.0 $390.0 $137.0 $0.0 $0.0 $137.0 $390.0 $527.0 $1,370.0 $3,900.0 $5,270.0
4368 1179.36 1179.36 None Proposed 0 0.297 1297.296 181.6 $0.0 $380.0 $137.0 $0.0 $0.0 $137.0 $380.0 $517.0 $411.0 $1,140.0 $1,551.0
4368 786.24 786.24 None Proposed 0 0.198 864.864 121.1 $0.0 $380.0 $137.0 $0.0 $0.0 $137.0 $380.0 $517.0 $274.0 $760.0 $1,034.0
500 675 675 None Proposed 0 0 0 0.0 $0.0 $0.0 $0.0 $0.0 $0.0 $0.0 $0.0 $0.0 $0.0 $0.0 $0.0

APPENDIX E
SOLAR ENERGY FINANCING WORKSHEET

Elmwood SolarDesign Goal: Provide 15% of average annual electricity
Existing ConditonsAverage Annual Electrical Usage (kWh) 2,484,876Current Utility Price ($/kWh) 0.14Actual SREC Market Values (January 2010-Present) $110/MWh - $700/MWh
CalculationsSolar Rating (Zip Code: 08053) 3.89 kWh/sq-m/daySolar Capacity Required (kW) 238.33Roof Space Needed (sq-ft) 23,833.00Annual Solar kWh (PV Watts) 373,830Net System installation Cost ($9/kWh) $2,144,970Electrical Service Modification Cost $100,000Total System Installation Cost $2,244,970
Materials $1,571,479Labor $673,491
Engineers Opinion of Probable Cost $2,806,213
AssumptionsAnnual System Degredation 0.50%Annual Utility Inflation 3.00%Annual Maintenance Costs 2%
Year Utility Price Solar kWh Utility Savings SRECS Maintenance Costs Annual Cash Flow Cummulative Cash Flow SREC Factor ($/kWh)* REC Factor ($/kWh)Install
1 0.1400 373,830.0 $52,336.2 $158,130 ($7,477) $202,989.7 $202,989.7 $0.4232 0.1442 371,960.9 $53,636.8 $157,339 ($7,439) $203,537.0 $406,526.7 $0.4233 0.1485 370,101.0 $54,969.6 $156,553 ($7,402) $204,120.3 $610,647.0 $0.4234 0.1530 368,250.5 $56,335.6 $155,770 ($7,365) $204,740.6 $815,387.6 $0.4235 0.1576 366,409.3 $57,735.6 $154,991 ($7,328) $205,398.5 $1,020,786.1 $0.4236 0.1623 364,577.2 $59,170.3 $154,216 ($7,292) $206,094.9 $1,226,881.0 $0.4237 0.1672 362,754.4 $60,640.7 $153,445 ($7,255) $206,830.7 $1,433,711.7 $0.4238 0.1722 360,940.6 $62,147.6 $152,678 ($7,219) $207,606.6 $1,641,318.4 $0.4239 0.1773 359,135.9 $63,692.0 $151,914 ($7,183) $208,423.7 $1,849,742.1 $0.423
10 0.1827 357,340.2 $65,274.7 $151,155 ($7,147) $209,282.8 $2,059,024.9 $0.42311 0.1881 355,553.5 $66,896.8 $150,399 ($7,111) $210,184.8 $2,269,209.7 $0.42312 0.1938 353,775.7 $68,559.2 $149,647 ($7,076) $211,130.8 $2,480,340.5 $0.42313 0.1996 352,006.9 $70,262.9 $148,899 ($7,040) $212,121.6 $2,692,462.2 $0.42314 0.2056 350,246.8 $72,008.9 $148,154 ($7,005) $213,158.4 $2,905,620.5 $0.42315 0.2118 348,495.6 $73,798.3 $147,414 ($6,970) $214,242.0 $3,119,862.6 $0.42316 0.2181 346,753.1 $75,632.2 $8,669 ($6,935) $77,366.0 $3,197,228.5 $0.02517 0.2247 345,019.3 $77,511.7 $8,625 ($6,900) $79,236.8 $3,276,465.3 $0.02518 0.2314 343,294.2 $79,437.8 $8,582 ($6,866) $81,154.3 $3,357,619.6 $0.02519 0.2383 341,577.8 $81,411.9 $8,539 ($6,832) $83,119.8 $3,440,739.3 $0.02520 0.2455 339,869.9 $83,434.9 $8,497 ($6,797) $85,134.3 $3,525,873.6 $0.02521 0.2529 338,170.5 $85,508.3 $8,454 ($6,763) $87,199.2 $3,613,072.8 $0.02522 0.2604 336,479.7 $87,633.2 $8,412 ($6,730) $89,315.6 $3,702,388.4 $0.02523 0.2683 334,797.3 $89,810.9 $8,370 ($6,696) $91,484.9 $3,793,873.2 $0.02524 0.2763 333,123.3 $92,042.7 $8,328 ($6,662) $93,708.3 $3,887,581.5 $0.02525 0.2846 331,457.7 $94,329.9 $8,286 ($6,629) $95,987.2 $3,983,568.7 $0.025
* SREC factor is referenced from the NJBPU Solar Alternative Compliance Payment (SACP) schedule.

Woodstream SolarDesign Goal: Provide 2% of average annual electricity
Existing ConditonsAverage Annual Electrical Usage (kWh) 3,019,407Current Utility Price ($/kWh) 0.14Actual SREC Market Values (January 2010-Present) $110/MWh - $700/MWh
CalculationsSolar Rating (Zip Code: 08053) 3.89 kWh/sq-m/daySolar Capacity Required (kW) 67.77Roof Space Needed (sq-ft) 6,777.00Annual Solar kWh (PV Watts) 68,806Net System installation Cost ($9/kWh) $609,930Electrical Service Modification Cost $100,000Total System Installation Cost $709,930
Materials $496,951Labor $212,979
Engineers Opinion of Probable Cost $887,413
AssumptionsAnnual System Degredation 0.50%Annual Utility Inflation 3.00%Annual Maintenance Costs 2%
Year Utility Price Solar kWh Utility Savings SRECS Maintenance Costs Annual Cash Flow Cummulative Cash Flow SREC Factor ($/kWh)* REC Factor ($/kWh)Install
1 0.1400 68,806.0 $9,632.8 $29,105 ($1,376) $37,361.7 $37,361.7 $0.4232 0.1442 68,462.0 $9,872.2 $28,959 ($1,369) $37,462.4 $74,824.0 $0.4233 0.1485 68,119.7 $10,117.5 $28,815 ($1,362) $37,569.8 $112,393.8 $0.4234 0.1530 67,779.1 $10,369.0 $28,671 ($1,356) $37,683.9 $150,077.7 $0.4235 0.1576 67,440.2 $10,626.6 $28,527 ($1,349) $37,805.0 $187,882.8 $0.4236 0.1623 67,103.0 $10,890.7 $28,385 ($1,342) $37,933.2 $225,815.9 $0.4237 0.1672 66,767.5 $11,161.3 $28,243 ($1,335) $38,068.6 $263,884.6 $0.4238 0.1722 66,433.6 $11,438.7 $28,101 ($1,329) $38,211.4 $302,096.0 $0.4239 0.1773 66,101.4 $11,722.9 $27,961 ($1,322) $38,361.8 $340,457.8 $0.423
10 0.1827 65,770.9 $12,014.3 $27,821 ($1,315) $38,520.0 $378,977.8 $0.42311 0.1881 65,442.1 $12,312.8 $27,682 ($1,309) $38,686.0 $417,663.8 $0.42312 0.1938 65,114.9 $12,618.8 $27,544 ($1,302) $38,860.1 $456,523.8 $0.42313 0.1996 64,789.3 $12,932.4 $27,406 ($1,296) $39,042.5 $495,566.3 $0.42314 0.2056 64,465.4 $13,253.7 $27,269 ($1,289) $39,233.3 $534,799.6 $0.42315 0.2118 64,143.0 $13,583.1 $27,132 ($1,283) $39,432.7 $574,232.3 $0.42316 0.2181 63,822.3 $13,920.6 $1,596 ($1,276) $14,239.7 $588,472.0 $0.02517 0.2247 63,503.2 $14,266.6 $1,588 ($1,270) $14,584.1 $603,056.1 $0.02518 0.2314 63,185.7 $14,621.1 $1,580 ($1,264) $14,937.0 $617,993.1 $0.02519 0.2383 62,869.8 $14,984.4 $1,572 ($1,257) $15,298.8 $633,291.9 $0.02520 0.2455 62,555.4 $15,356.8 $1,564 ($1,251) $15,669.6 $648,961.5 $0.02521 0.2529 62,242.6 $15,738.4 $1,556 ($1,245) $16,049.6 $665,011.1 $0.02522 0.2604 61,931.4 $16,129.5 $1,548 ($1,239) $16,439.2 $681,450.2 $0.02523 0.2683 61,621.8 $16,530.3 $1,541 ($1,232) $16,838.4 $698,288.6 $0.02524 0.2763 61,313.6 $16,941.1 $1,533 ($1,226) $17,247.7 $715,536.3 $0.02525 0.2846 61,007.1 $17,362.1 $1,525 ($1,220) $17,667.1 $733,203.4 $0.025
* SREC factor is referenced from the NJBPU Solar Alternative Compliance Payment (SACP) schedule.

APPENDIX F UV SYSTEM ANALYSIS
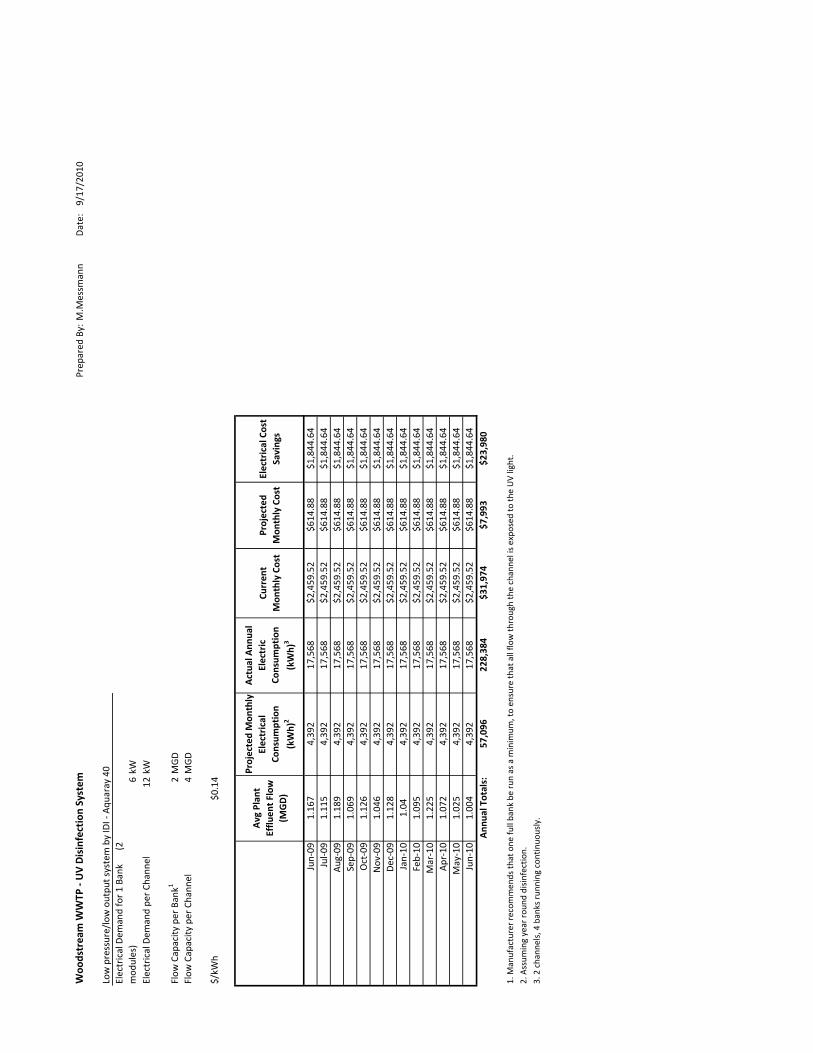
Woo
dstream W
WTP
‐ UV Disinfection System
Prep
ared
By:
M.M
essm
ann
Date: 9/17
/201
0
Low pressure/low outpu
t system by IDI ‐ Aqu
aray 40
Electrical Dem
and for 1 Ba
nk (2
mod
ules)
6kW
Electrical Dem
and pe
r Ch
anne
l12
kW
Flow
Capacity
per Bank1
2MGD
Flow
Capacity
per Chann
el4MGD
$/kW
h$0
.14
Avg Plant
Efflu
ent Flow
(M
GD)
Projected Mon
thly
Electrical
Consum
ption
(kWh)
2
Actua
l Ann
ual
Electric
Consum
ption
(kWh)
3
Curren
t Mon
thly Cost
Projected
Mon
thly Cost
Electrical Cost
Savings
Jun‐09
1.16
74,39
217
,568
$2,459
.52
$614
.88
$1,844
.64
Jul‐0
91.11
54,39
217
,568
$2,459
.52
$614
.88
$1,844
.64
Aug
‐09
1.18
94,39
217
,568
$2,459
.52
$614
.88
$1,844
.64
Sep‐09
1.06
94,39
217
,568
$2,459
.52
$614
.88
$1,844
.64
Oct‐09
1.12
64,39
217
,568
$2,459
.52
$614
.88
$1,844
.64
Nov
‐09
1.04
64,39
217
,568
$2,459
.52
$614
.88
$1,844
.64
Dec‐09
1.12
84,39
217
,568
$2,459
.52
$614
.88
$1,844
.64
Jan‐10
1.04
4,39
217
,568
$2,459
.52
$614
.88
$1,844
.64
Feb‐10
1.09
54,39
217
,568
$2,459
.52
$614
.88
$1,844
.64
Mar‐10
1.22
54,39
217
,568
$2,459
.52
$614
.88
$1,844
.64
Apr‐10
1.07
24,39
217
,568
$2,459
.52
$614
.88
$1,844
.64
May‐10
1.02
54,39
217
,568
$2,459
.52
$614
.88
$1,844
.64
Jun‐10
1.00
44,39
217
,568
$2,459
.52
$614
.88
$1,844
.64
Ann
ual Totals:
57,096
228,384
$31,974
$7,993
$23,980
1. M
anufacturer recommen
ds th
at one
full bank
be run as a m
inim
um, to en
sure th
at all flo
w th
rough the channe
l is expo
sed to th
e UV light.
2. Assum
ing year rou
nd disinfection.
3. 2 chann
els, 4 banks run
ning
con
tinuo
usly.

APPENDIX G
NEW JERSEY SMART START INCENTIVE WORKSHEETS

2010 Prescriptive Lighting Application
Prescriptive Lighting Incentive
$__________ Total Incentive (per attached worksheet calculations)
Note: Prescriptive Lighting Worksheet must accompany this application.
Customer InformationCompany ElectricUtilityServingApplicant ElectricAccountNo. InstallationDate
FacilityAddress City State Zip
TypeofProject SizeofBuilding
❑ NewConstruction ❑ Renovation ❑ EquipmentReplacement
CompanyMailingAddress City State Zip
ContactPerson(Name/Title) TelephoneNo. FaxNo. () ()
Incorporated?❑ Yes❑ No❑ Exempt FederalTaxID#orSSN EmailAddress
IncentivePaymentto Pleaseassignpaymenttocontractor/vendor/otherindicatedbelow
❑ Customer❑ Contractor❑ Other CustomerSignature
002-01/10
Payee Information (must submit W-9 form with application)
Contractor/Vendor Information (if different from Payee)
Company ContactName Incorporated? FederalTaxID# YesNoStreetAddress City StateZipTelephoneNo. FaxNo. () ()
Company ContactName Incorporated? FederalTaxID# ❑ Yes❑ NoStreetAddress City StateZipTelephoneNo. FaxNo. () ()
EmailAddress
EmailAddress
Building Type (circle one)Education-PrimarySchool;Education-CommunityCollege;Education-University;Grocery;Medical-Hospital;Medical-Clinic;LodgingHotel(GuestRooms);LodgingMotel;Manufacturing-LightIndustrial;Office-Large;Office-Small;Restaurant-SitDown;Restaurant-FastFood;Retail-3StoryLarge;Retail-SingleStoryLarge;Retail-Small;StorageConditioned;StorageUnconditioned;Warehouse;Other

Specific Program Requirements* (These requirements are in addition to the Program Terms and Conditions.)
1.PleaserefertotheProgramGuideforadditionalapplicabletechnicalrequirements.2.Includethemanufacturer’sspecificationsheetwiththeapplicationpackageandmailor
faxdirectlytotheCommercial/IndustrialMarketManager.3.IncentivesforT-5andT-8lampswithelectronicballastsareavailableonly
forfixtureswithaTotalHarmonicDistortionof≤20%.4.AlleligiblelightingdevicesmustbeULlisted.5.RequirementsforCFLfixtures(mustmeetallrequirements): ■FixturesmustbenewandENERGYSTARqualified ■Fixturesmusthavereplaceableelectronicballasts ■TotalHarmonicDistortion(THD)mustnotexceed33% ■Powerfactoroftheballastmustbenolessthan90% ■ Themanufacturermustwarrantallfixturesforaminimumof3years.Warranty
doesnotpertaintolampsorphotocellsnotphysicallypartofthefixture. ■Theinstallermustwarrantfixtureinstallation–minimumof1yr.5.1Screw-inPAR38or30CompactFluorescentLamps(CFL)with
AluminumReflectorsreplacingexistingincandescentfixtures. ■Thelampmustbewarrantedbythemanufacturerfor8,000hours ■TotalHarmonicDistortionmustnotexceed33% ■Powerfactoroftheballastmustbe≥90%6.PulseStartMetalHalide(includingpole-mountedparkinglotlighting)
musthavea12%minimumwattagereduction.
7.T-5orT-8FixturesreplacingincandescentorT-12fluorescentfixturesgreaterthan250wattorHighIntensityDischargeshallcomplyasfollows:
7.1T-5fixturesreplacingT-12fluorescentorincandescentfixtures250wattsorgreater,orHIDfixturesshallhaveaballastfactorgreaterthanorequalto1.0;havereflectivitygreaterthanorequalto91%;haveaminimum2lamps;andbedesignatedasF54T5HO.
7.2T-8fixturesreplacingT-12fluorescentorincandescentfixtures250wattsorgreater,orHIDfixturesshallhaveaballastfactorgreaterthanorequalto1.14;havereflectivitygreaterthanorequalto91%;haveaminimumof4lamps;andbedesignatedasF32T8,minimum32watts.
7.3IncentivesfordelampedT-8lampswithnewreflectorsareavailableonlyforfixtureswithaTotalHarmonicDistortionof≤20%.Electronicballastreplacementrequiredforalleligibledelampedfixtures.Eligibledelampingcanincludereductioninlinearlampfeetfromexistingconditions.Forexample,1-8'linearfluorescentlampcanbeconsideredas2-4'linearlamps.U-bendlamps4'intotallengthcanbeconsideredas2-F17/T8lamps.
7.4Electronicballastreplacementisnecessaryforalleligibledelampedfixtures.7.5ReducedwattageT8(28W/25W4')(1-4lamps)retrofitrequireslampandballast replacement.8.LEDRefridgerated/FreezerCaseLightingmustmeetNEEPDesignLights
ConsortiumStandardsorbeonanENERGYSTARoraSSLQualifiedProductlist.Fornewdoorinstallationsonexistingopencases,indicatethenumberofLEDfixturestobeinstalled.Alsoindicate"NewDoor"intheFixtureTypecolumnonthe PrescriptiveLightingWorksheet(ie.NewDoor5'LED).
Acknowledgement
cUStomeR’S SignAtURe_______________________________________________________________________
Bysigning,IcertifythatIhaveread,understandandagreetotheSpecificProgramRequirements/TermsandConditionslistedonthisapplicationform,Iwillalsosubmitforapprovalaproperlycompletedapplicationpackage,whichincludesthissignedapplication,worksheet(ifapplicable),manufacturer’sspecificationsheetsandcompleteutilitybill(nameandaddressonutilitybillmustmatchnameandaddressonapplication).
Visit our web site: NJCleanEnergy.com/ssbNewJerseySmartStartBuildings®isaregisteredtrademark.UseofthemarkwithoutthepermissionoftheNewJerseyBoardofPublicUtilities,OfficeofCleanEnergyisprohibited.
*Incentives/Requirementssubjecttochange.
Mail or fax your application package dIRECTLy to the Commercial/Industrial Market Manager.NewJersey'sCleanEnergyProgram
c/oTRCEnergyServices900Route9North,Suite104•Woodbridge,NJ07095
Phone:866-657-6278•Fax:732-855-0422
❑ PayeeInformationisfilledoutandaW-9formofthepayeeisincluded❑ Manufacturer'sspecificationsheetsforproposedtechnologyareincluded❑ Acopy(allpages)ofarecentmonth'sutilitybillisincluded
Application Checklist (Before submitting your application, please make sure you have signed in the space below and completed the following items.)
Prescriptive Lighting Measures and Incentives*
Recessed and Surface-mounted compact Fluorescents(new Fixtures Replacing incandescent Fixtures only): Onlyavailableforhard-wired,electronicallyballastednewfixtureswithrareearthphosphorlampsand4-pin basedtubes(including:twintube,quadtube,tripletube,2Dorcirclinelamps),THD<33%andBF>0.9
Screw-in PAR 38 or PAR 30 (cFl) as per 5.1 aboveHigh-efficiency Fluorescent Fixtures:For retrofit of t-12 fixtures to t-5 or t-8 with electronic ballasts
For replacement of fixtures with new t-5 or t-8 fixtures
Type of Fixture Incentive
$25per1-lampfixture$30per2-lampormorefixture
$7perlampreplaced
$15perfixture(1-4lampsretrofits)
HID,T-12,IncandescentHID,T-12,IncandescentHID,T-12,Incandescent
HIDonlyHIDonlyHIDonlyT-12onlyT-12only
≥1000Watts400-999Watt250-399Watt175-249Watt100-174Watt75-99Watt<250Watt<250Watt
T-5,T-8T-5,T-8T-5,T-8T-5,T-8T-5,T-8T-5,T-8
T-5,T-8(1&2lamp)T-5,T-8(3&4lamp)
$284$100$50$43$30$16$25$30
type of old Fixture wattage of old Fixture type of new Fixture incentive Per Fixture Removed
For retrofit of t-8 fixtures by permanent delamping & new reflectors are available only for fixtures with a total $20 per fixture Harmonic distortion of ≤20%. electronic ballast replacement required for all eligible delamped fixtures.
new construction & complete Renovation Performance based onlyled exit Signs (new fixtures only): For existing facilities with connected load <75 kw $20 per fixture
For existing facilities with connected load ≥ 75 kw $10 per fixture
Pulse Start metal Halide (for fixtures ≥ 150 watts) $25 per fixture (includes parking lot lighting)
Parking lot low bay - led $43 per fixture
t-12 to t-8 fixtures by permanent delamping & new reflectors. electronic ballast replacement is necessary for all eligible delamped fixtures. $30 per fixture
Retrofit of existing 32 watt t-8 system to Reduced wattage (28w/25w 4') $10 per fixture (1-4 lamps)
led Refrigerated/Freezer case lighting: incentive for replacement of fluorescent lighting systems $42 per 5' led fixturein medium or low temperature display cases $65 per 6' led fixture
induction lighting Fixtures
Retrofit of Hid $50 per Hid (≥100w) fixture retrofitted with induction lamp, power coupler and generator. Replacement unit must use 30% less wattage per fixture than existing Hid system .Replacement of Hid $70 per Hid (≥100w) fixture with a new induction fixture

Program Terms and Conditions
definitions:
design incentives – IncentivesthatmaybeofferedtodesignprofessionalsbytheProgram.
design Services–ServicesthatmaybeofferedtodesignprofessionalsundertheProgram.
energy-efficient measures–AnydeviceeligibletoreceiveaProgramIncentivepaymentthroughtheNJCleanEnergyCommercialandIndustrialProgram(NewJerseySmartStartBuildings).
new Jersey Utilities–Theregulatedelectricand/orgasutilitiesintheStateofNewJersey.Theyare:AtlanticCityElectric,JerseyCentralPower&Light,RocklandElectricCompany,NewJerseyNaturalGas,ElizabethtownGas,PSE&G,andSouthJerseyGas.
Administrator–NewJerseyBoardofPublicUtilities,OfficeofCleanEnergy
Participating customers–Thosenon-residentialelectricand/orgasservicecustomersoftheNewJerseyUtilitieswhoparticipateinthisProgram.
Product installation or equipment installation–InstallationoftheEnergy-EfficientMeasures.
market manager–TRCEnergyServices.
Program–TheCommercialandIndustrialEnergy-EfficientConstructionProgram(NewJerseySmartStartBuildings)offeredhereinbytheNewJerseyBoardofPublicUtilities,OfficeofCleanEnergypursuanttostateregulatoryapprovalundertheNewJerseyElectricDiscountandEnergyCompetitionAct,NJSA48:3-49,etseq.
Program incentives–ReferstotheamountorlevelofincentivethattheProgramprovidestoParticipatingCustomerspursuanttotheProgramofferedherein(seedescriptionunder“IncentiveAmount”heading).
Program offer–ProgramIncentivesareavailabletonon-residentialretailelectricand/orgasservicecustomersoftheNewJerseyUtilitiesidentifiedabove.ProgramIncentivesfornewconstructionareavailableonlyforprojectsinareasdesignatedforgrowthintheStatePlan.Publicschool(K-12)newconstructionprojectsareexemptedfromthisrestrictionandareeligiblefornewProgramincentivesthroughouttheState.Customers,ortheirtradeallies,candetermineifalocationisinadesignatedgrowthareabyreferringtotheSmartGrowthLocatoravailablefromtheHMFAwebsiteorcontacttheMarketManagerifyouareuncertainaboutprojecteligibility.
Application and eligibility Process–TheProgrampaysincentivesaftertheinstallationofqualifiedenergyefficientmeasuresthatwerepre-approved(forexceptionstothiscondition,pleasereferto“ExceptionsforApproval”.)InordertobeeligibleforProgramIncentives,aCustomer,oranagent(contractor/vendor)authorizedbyaCustomer,mustsubmitaproperlycompletedapplicationpackage.Thepackagemustincludeanapplicationsignedbythecustomer;acomplete(current)utilitybill;andtechnologyworksheetandmanufacturer’scutsheets(whereappropriate).ThisinformationmustbesubmittedtotheMarketManagerbeforeequipmentisinstalled.Applicationsformeasuresthatareselfinstalledbycustomersmustbesubmittedbythecustomerandnotthesalesvendorofthemeasure,however,thecustomermayelecttoassignpaymentoftheincentivetothesalesvendor.ThisapplicationpackagemustbereceivedbytheMarketManageronorbeforeDecember31,2010inordertobeeligiblefor2010incentives.TheMarketManagerwillreviewtheapplicationpackagetodetermineiftheprojectiseligibleforaProgramIncentive.Ifeligible,theCustomerwillreceiveanapprovalletterwiththeestimatedauthorizedincentiveamountandthedatebywhichtheequipmentmustbeinstalledinorderfortheapprovaltoremainineffect.Uponreceiptofanapprovalletter,theCustomermaythenproceedtoinstalltheequipmentlistedontheapprovedapplication.EquipmentinstalledpriortothedateoftheMarketManager’sapprovalletterisnoteligibleforanincentive.TheMarketManagerreservestherighttoconductapre-inspectionofthefacilitypriortotheinstallationofequipment.Thiswillbedonepriortotheissuanceoftheapprovalletter.Allequipmentmustbepurchasedwithin12monthsofdateofapplication.Any customer and/or agent who purchases equipment prior to the receipt of an incentive approval letter does so at his/her own risk.
exceptions for Approval–TheApplicationandEligibilityProcesspertainstoallprojectsexceptforthoseinvolvingeitherUnitaryHVACorMotorshavinganincentiveamountlessthan$5,000.Thesemeasures,atthisincentivelevel,maybeinstalledwithoutpriorapproval.Inaddition,butatthesolediscretionoftheMarketManager,emergencyreplacementofequipmentmaynotrequireapriorapprovaldeterminationandletter.in such cases, please notify the market manager of such emergencies as early as possible, that an application will soon be sent in that was not pre-approved.
Post installation Approval–Afterinstallationiscompleted,theCustomer,oranagentauthorizedbytheCustomer,mustfinalizeandsubmitaninvoiceforthepurchaseoftheequipment(materialcostmustbebrokenoutfromlaborcosts),andanyotherrequireddocumentationasspecifiedontheequipmentapplicationorintheMarketManager’sinitialapprovalletter.
NJ SmartStart Buildings®

PleaserefertotheProgramGuideontheNJCleanEnergy.com/ssbwebsiteforthecompleteApplicationandEligibilityProcess.
TheMarketManagerreservestherighttoverifysalestransactionsandtohavereasonableaccesstoParticipatingCustomer’sfacilitytoinspectbothpre-existingproductorequipment(ifapplicable)andtheEnergy-EfficientMeasuresinstalledunderthisProgram,eitherpriortoissuingincentivesoratalatertime.
Energy-EfficientMeasuresmustbeinstalledinbuildingslocatedwithinaNewJerseyUtilities’serviceterritoryanddesignatedontheParticipatingCustomer’sincentiveapplication.ProgramIncentivesareavailableforqualifiedEnergy-EfficientMeasuresaslistedanddescribedintheProgrammaterialsandincentiveapplications.TheParticipatingCustomermustultimatelyowntheequipment,eitherthroughanup-frontpurchaseorattheendofashort-termlease.DesignIncentivesareavailabletodesignprofessionalsasdescribedintheProgrammaterialsandapplications.Adifferentandseparateagreementmustbeexecutedbyparticipatingdesignprofessionalstobeeligibleforthistypeofincentive.ThedesignprofessionaldoesnotneedtobebasedinNewJersey.
Equipment procured by Participating Customers through another program offered by New Jersey's Clean Energy Program or the New Jersey Utilities, as applicable, is not eligible for incentives through this program. Customers who have not contributed to the Societal Benefits Charge of the applicable New Jersey Utility are not be eligible for incentives offered through this program.
incentive Amount–ProgramIncentiveswillequaleither:a)theapprovedProgramIncentiveamount,orb)theactualequipmentcostoftheEnergy-EfficientMeasure,whicheverisless,asdeterminedbytheMarketManager.Productsofferedatnodirectcosttothecustomerareineligible.Incompleteapplicationsubmissions,applicationsrequiringinspectionsandunanticipatedhighvolumeofactivitiesmaycauseprocessingdelays.ProgramIncentivesarelimitedto$500,000perutilityaccountinacalendaryear.ContacttheMarketManagerregardinganyquestions.
tax liability–TheMarketManagerwillnotberesponsibleforanytaxliabilitythatmaybeimposedonanyParticipatingCustomerasaresultofthepaymentofProgramIncentives.AllParticipatingCustomersmustsupplytheirFederalTaxIdentificationnumberorsocialsecuritynumbertotheMarketManagerontheapplicationforminordertoreceiveaProgramIncentive.Inaddition,ParticipatingCustomersmustalsoprovideaTaxClearanceForm(BusinessAssistanceorIncentiveClearanceCertificate)thatisdatedwithin90daysofequipmentinstallation.
endorsement–TheMarketManagerandAdministratordonotendorse,supportorrecommendanyparticularmanufacturer,productorsystemdesigninpromotingthisProgram.
warranties–THEMARKETMANAGERANDADMINISTRATORDONOTWARRANTTHEPERFORMANCEOFINSTALLEDEQUIPMENT,AND/ORSERVICESRENDEREDASPARTOFTHISPROGRAM,EITHEREXPRESSLYORIMPLICITLY.NOWARRANTIESORREPRESENTATIONSOFANYKIND,WHETHERSTATUTORY,EXPRESSED,ORIMPLIED,INCLUDING,WITHOUTLIMITATIONS,WARRANTIESOFMERCHANTABILITYORFITNESSFORAPARTICULARPURPOSEREGARDINGEQUIPMENTORSERVICESPROVIDEDBYAMANUFACTURERORVENDOR.CONTACTYOURVENDOR/SERVICESPROVIDERFORDETAILSREGARDINGPERFORMANCEANDWARRANTIES.
limitation of liability–ByvirtueofparticipatinginthisProgram,ParticipatingCustomersagreetowaiveanyandallclaimsordamagesagainsttheMarketManagerortheAdministrator,exceptthereceiptoftheProgramIncentive.ParticipatingCustomersagreethattheMarketManager’sandAdministrator’sliability,inconnectionwiththisProgram,islimitedtopayingtheProgramIncentivespecified.UndernocircumstancesshalltheMarketManager,itsrepresentatives,orsubcontractors,ortheAdministrator,beliableforanylostprofits,special,punitive,consequentialorincidentaldamagesorforanyotherdamagesorclaimsconnectedwithorresultingfromparticipationinthisProgram.Further,anyliabilityattributedtotheMarketManagerunderthisProgramshallbeindividual,andnotjointand/orseveral.
Assignment–TheParticipatingCustomermayassignProgramIncentivepaymentstoaspecifiedvendor.
Participating customer’s certification–ParticipatingCustomercertifiesthathe/shepurchasedandinstalledtheequipmentlistedintheirapplicationattheirdefinedNewJerseylocation.ParticipatingCustomeragreesthatallinformationistrueandthathe/shehasconformedtoalloftheProgramandequipmentrequirementslistedintheapplication.
termination–TheNewJerseyBoardofPublicUtilitiesreservestherighttoextend,modify(thisincludesmodificationofProgramIncentivelevels)orterminatethisProgramwithoutpriororfurthernotice.
Acknowledgement –Ihaveread,understoodandamincompliancewithallrulesandregulationsconcerningthisincentiveprogram.Icertifythatallinformationprovidediscorrecttothebestofmyknowledge,andIgivetheMarketManagerpermissiontosharemyrecordswiththeNewJerseyBoardofPublicUtilities,andcontractorsitselectstomanage,coordinateorevaluatetheNJSmartStartBuildingsProgram.Additionally,IallowreasonableaccesstomypropertytoinspecttheinstallationandperformanceofthetechnologiesandinstallationsthatareeligibleforincentivesundertheguidelinesofNewJersey’sCleanEnergyProgram.

2010 Prescriptive Lighting Incentive Worksheet
Prescriptive Lighting Information
Total (including additional sheets)
For additional fixtures, attach additional sheets and check here
002–01/10
Customer InformationCompany
Check here if multiple worksheets are being submitted for one project/building.
Facility Address
Date Submitted
Reason Fixture Type Fixture Type Permanent Location Size of A B Total Incentives N–New Installed Removed Delamp w/ (Bldg/Rm) Replaced Incentive # of (AxB) R–Replaced New Lamps Per Fixture Units Reflector (Y/N) in Watts (Table) (Examples) R 2x4 3L T-5 2x4 3L T-12 N Office 40 $15 8 $15 x 8 = $120
R 2x2 2L T-8 2x2 2L T-12 N Office 34 $15 10 $15 x 10 = $150
R 28w CFL 100w Incan N Supply Room 100 $25 3 $25 x 3 = $75
R 250w Pulse Start Metal Halide 400w Mercury Vapor N Warehouse 450 $25 3 $25 x 3 = $75
N New Doors 5' LED 1L T-8 5' N Dairy Case #5 38 $42 25 $42 x 25=$1,050

Specific Program Requirements* (These requirements are in addition to the Program Terms and Conditions.)
1. Please refer to the Program Guide for additional applicable technical requirements.2. Include the manufacturer’s specification sheet with the application package and mail or
fax directly to the Commercial/Industrial Market Manager.3. Incentives for T-5 and T-8 lamps with electronic ballasts are available only
for fixtures with a Total Harmonic Distortion of ≤20%.4. All eligible lighting devices must be UL listed. 5. R equirements for CFL fixtures (must meet all requirements): ■ Fixtures must be new and Energy Star qualified ■ Fixtures must have replaceable electronic ballasts ■ Total Harmonic Distortion (THD) must not exceed 33% ■ Power factor of the ballast must be no less than 90% ■ The manufacturer must warrant all fixtures for a minimum of 3 years. Warranty
does not pertain to lamps or photocells not physically part of the fixture. ■ The installer must warrant fixture installation – minimum of 1 yr.5.1 Screw-in PAR 38 or 30 Compact Fluorescent Lamps (CFL) with
Aluminum Reflectors replacing existing incandescent fixtures. ■ The lamp must be warranted by the manufacturer for 8,000 hours ■ Total Harmonic Distortion must not exceed 33% ■ Power factor of the ballast must be ≥90%6. Pulse Start Metal Halide (including pole-mounted parking lot lighting)
must have a 12% minimum wattage reduction.
7. T-5 or T-8 Fixtures replacing incandescent or T-12 fluorescent fixtures greater than 250 watt or High Intensity Discharge shall comply as follows:
7.1 T-5 fixtures replacing T-12 fluorescent or incandescent fixtures 250 watts or greater, or HID fixtures shall have a ballast factor greater than or equal to 1.0; have reflectivity greater than or equal to 91%; have a minimum 2 lamps; and be designated as F54T5 HO.
7.2 T-8 fixtures replacing T-12 fluorescent or incandescent fixtures 250 watts or greater, or HID fixtures shall have a ballast factor greater than or equal to 1.14; have reflectivity greater than or equal to 91%; have a minimum of 4 lamps; and be designated as F32T8, minimum 32 watts.
7.3 Incentives for delamped T-8 lamps with new reflectors are available only for fixtures with a total Harmonic Distortion of ≤20%. Electronic ballast replacement required for all eligible delamped fixtures. Eligible delamping can include reduction in linear lamp feet from existing conditions. For example, 1-8' linear fluorescent lamp can be considered as 2-4' linear lamps. U-bend lamps 4' in total length can be considered as 2-F17/T8 lamps.
7.4 Electronic ballast replacement is necessary for all eligible delamped fixtures.7.5 Reduced wattage T8 (28W/25W 4') (1-4 lamps) retrofit requires lamp and ballast replacement.8. LED Refridgerated/Freezer Case Lighting must meet NEEP Design Lights
Consortium Standards or be on an ENERGY STAR or a SSL Qualified Product list. For new door installations on existing open cases, indicate the number of LED fixtures to be installed. Also indicate "New Door" in the Fixture Type column on the Prescriptive Lighting Worksheet (ie. New Door 5' LED).
Acknowledgement
cUStomeR’S SignAtURe _______________________________________________________________________
By signing, I certify that I have read, understand and agree to the Specific Program Requirements/Terms and Conditions listed on this application form, I will also submit for approval a properly completed application package, which includes this signed application, worksheet (if applicable), manufacturer’s specification sheets and complete utility bill (name and address on utility bill must match name and address on application).
Visit our web site: NJCleanEnergy.com/ssbNew Jersey SmartStart Buildings® is a registered trademark. Use of the mark without the permission of the New Jersey Board of Public Utilities, Office of Clean Energy is prohibited.
*Incentives/Requirements subject to change.
Mail or fax your application package DIRECTLy to the Commercial/Industrial Market Manager.
New Jersey's Clean Energy Programc/o TRC Energy Services
900 Route 9 North, Suite 104 • Woodbridge, NJ 07095Phone: 866-657-6278 • Fax: 732-855-0422
Prescriptive Lighting Measures and Incentives*
Recessed and Surface-mounted compact Fluorescents(new Fixtures Replacing incandescent Fixtures only): Only available for hard-wired, electronically ballasted new fixtures with rare earth phosphor lamps and 4-pin based tubes (including: twin tube, quad tube, triple tube, 2D or circline lamps), THD<33% and BF>0.9
Screw-in PAR 38 or PAR 30 (cFl) as per 5.1 aboveHigh-efficiency Fluorescent Fixtures:For retrofit of t-12 fixtures to t-5 or t-8 with electronic ballasts
For replacement of fixtures with new t-5 or t-8 fixtures
Type of Fixture Incentive
$25 per 1-lamp fixture$30 per 2-lamp or more fixture
$7 per lamp replaced
$15 per fixture (1-4 lamps retrofits)
HID, T-12, IncandescentHID, T-12, IncandescentHID, T-12, Incandescent
HID onlyHID onlyHID onlyT-12 only T-12 only
≥ 1000 Watts400-999 Watt250-399 Watt175-249 Watt100-174 Watt
75-99 Watt <250 Watt<250 Watt
T-5, T-8T-5, T-8T-5, T-8T-5, T-8T-5, T-8T-5, T-8
T-5, T-8 (1 & 2 lamp)T-5, T-8 (3 & 4 lamp)
$284$100$50$43$30$16$25$30
type of old Fixture wattage of old Fixture type of new Fixture incentive Per Fixture Removed
For retrofit of t-8 fixtures by permanent delamping & new reflectors are available only for fixtures with a total $20 per fixture Harmonic distortion of ≤20%. electronic ballast replacement required for all eligible delamped fixtures.
new construction & complete Renovation Performance based onlyled exit Signs (new fixtures only): For existing facilities with connected load <75 kw $20 per fixture
For existing facilities with connected load ≥ 75 kw $10 per fixture
Pulse Start metal Halide (for fixtures ≥ 150 watts) $25 per fixture (includes parking lot lighting)
Parking lot low bay - led $43 per fixture
t-12 to t-8 fixtures by permanent delamping & new reflectors. electronic ballast replacement is necessary for all eligible delamped fixtures. $30 per fixture
Retrofit of existing 32 watt t-8 system to Reduced wattage (28w/25w 4') $10 per fixture (1-4 lamps)
led Refrigerated/Freezer case lighting: incentive for replacement of fluorescent lighting systems $42 per 5' led Fixturein medium or low temperature display cases $65 per 6' led Fixture
induction lighting Fixtures
Retrofit of Hid $50 per Hid (≥100w) fixture retrofitted with induction lamp, power coupler and generator. Replacement unit must use 30% less wattage per fixture than existing Hid system .Replacement of Hid $70 per Hid (≥100w) fixture with a new induction fixture

Program Terms and Conditions
definitions:
design incentives – Incentives that may be offered to design professionals by the Program.
design Services – Services that may be offered to design professionals under the Program.
energy-efficient measures – Any device eligible to receive a Program Incentive payment through the NJ Clean Energy Commercial and Industrial Program (New Jersey SmartStart Buildings).
new Jersey Utilities – The regulated electric and/or gas utilities in the State of New Jersey. They are: Atlantic City Electric, Jersey Central Power & Light, Rockland Electric Company, New Jersey Natural Gas, Elizabethtown Gas, PSE&G, and South Jersey Gas.
Administrator – New Jersey Board of Public Utilities, Office of Clean Energy
Participating customers – Those non-residential electric and/or gas service customers of the New Jersey Utilities who participate in this Program.
Product installation or equipment installation – Installation of the Energy-Efficient Measures.
market manager – TRC Energy Services.
Program – The Commercial and Industrial Energy-Efficient Construction Program (New Jersey SmartStart Buildings) offered herein by the New Jersey Board of Public Utilities, Office of Clean Energy pursuant to state regulatory approval under the New Jersey Electric Discount and Energy Competition Act, NJSA 48:3-49, et seq.
Program incentives – Refers to the amount or level of incentive that the Program provides to Participating Customers pursuant to the Program offered herein (see description under “Incentive Amount” heading).
Program offer – Program Incentives are available to non-residential retail electric and/or gas service customers of the New Jersey Utilities identified above. Program Incentives for new construction are available only for projects in areas designated for growth in the State Plan. Public school (K-12) new construction projects are exempted from this restriction and are eligible for new Program incentives throughout the State. Customers, or their trade allies, can determine if a location is in a designated growth area by referring to the Smart Growth Locator available from the HMFA website or contact the Market Manager if you are uncertain about project eligibility.
Application and eligibility Process – The Program pays incentives after the installation of qualified energy efficient measures that were pre-approved (for exceptions to this condition, please refer to “Exceptions for Approval”.) In order to be eligible for Program Incentives, a Customer, or an agent (contractor/vendor) authorized by a Customer, must submit a properly completed application package. The package must include an application signed by the customer; a complete (current) utility bill; and technology worksheet and manufacturer’s cut sheets (where appropriate). This information must be submitted to the Market Manager before equipment is installed. Applications for measures that are self installed by customers must be submitted by the customer and not the sales vendor of the measure, however, the customer may elect to assign payment of the incentive to the sales vendor. This application package must be received by the Market Manager on or before December 31, 2010 in order to be eligible for 2010 incentives. The Market Manager will review the application package to determine if the project is eligible for a Program Incentive. If eligible, the Customer will receive an approval letter with the estimated authorized incentive amount and the date by which the equipment must be installed in order for the approval to remain in effect. Upon receipt of an approval letter, the Customer may then proceed to install the equipment listed on the approved application. Equipment installed prior to the date of the Market Manager’s approval letter is not eligible for an incentive. The Market Manager reserves the right to conduct a pre-inspection of the facility prior to the installation of equipment. This will be done prior to the issuance of the approval letter. All equipment must be purchased within 12 months of date of application. Any customer and/or agent who purchases equipment prior to the receipt of an incentive approval letter does so at his/her own risk.
exceptions for Approval – The Application and Eligibility Process pertains to all projects except for those involving either Unitary HVAC or Motors having an incentive amount less than $5,000. These measures, at this incentive level, may be installed without prior approval. In addition, but at the sole discretion of the Market Manager, emergency replacement of equipment may not require a prior approval determination and letter. in such cases, please notify the market manager of such emergencies as early as possible, that an application will soon be sent in that was not pre-approved.
Post installation Approval – After installation is completed, the Customer, or an agent authorized by the Customer, must finalize and submit an invoice for the purchase of the equipment (material cost must be broken out from labor costs), and any other required documentation as specified on the equipment application or in the Market Manager’s initial approval letter.
NJ SmartStart Buildings®

Please refer to the Program Guide on the NJCleanEnergy.com/ssb website for the complete Application and Eligibility Process.
The Market Manager reserves the right to verify sales transactions and to have reasonable access to Participating Customer’s facility to inspect both pre-existing product or equipment (if applicable) and the Energy-Efficient Measures installed under this Program, either prior to issuing incentives or at a later time.
Energy-Efficient Measures must be installed in buildings located within a New Jersey Utilities’ service territory and designated on the Participating Customer’s incentive application. Program Incentives are available for qualified Energy-Efficient Measures as listed and described in the Program materials and incentive applications. The Participating Customer must ultimately own the equipment, either through an up-front purchase or at the end of a short-term lease. Design Incentives are available to design professionals as described in the Program materials and applications. A different and separate agreement must be executed by participating design professionals to be eligible for this type of incentive. The design professional does not need to be based in New Jersey.
Equipment procured by Participating Customers through another program offered by New Jersey's Clean Energy Program or the New Jersey Utilities, as applicable, is not eligible for incentives through this program. Customers who have not contributed to the Societal Benefits Charge of the applicable New Jersey Utility are not be eligible for incentives offered through this program.
incentive Amount – Program Incentives will equal either: a) the approved Program Incentive amount, or b) the actual equipment cost of the Energy-Efficient Measure, whichever is less, as determined by the Market Manager. Products offered at no direct cost to the customer are ineligible. Incomplete application submissions, applications requiring inspections and unanticipated high volume of activities may cause processing delays. Program Incentives are limited to $500,000 per utility account in a calendar year. Contact the Market Manager regarding any questions.
tax liability – The Market Manager will not be responsible for any tax liability that may be imposed on any Participating Customer as a result of the payment of Program Incentives. All Participating Customers must supply their Federal Tax Identification number or social security number to the Market Manager on the application form in order to receive a Program Incentive. In addition, Participating Customers must also provide a Tax Clearance Form (Business Assistance or Incentive Clearance Certificate) that is dated within 90 days of equipment installation.
endorsement – The Market Manager and Administrator do not endorse, support or recommend any particular manufacturer, product or system design in promoting this Program.
warranties – THE MARKET MANAGER AND ADMINISTRATOR DO NOT WARRANT THE PERFORMANCE OF INSTALLED EQUIPMENT, AND/OR SERVICES RENDERED AS PART OF THIS PROGRAM, EITHER EXPRESSLY OR IMPLICITLY. NO WARRANTIES OR REPRESENTATIONS OF ANY KIND, WHETHER STATUTORY, EXPRESSED, OR IMPLIED, INCLUDING, WITHOUT LIMITATIONS, WARRANTIES OF MERCHANTABILITY OR FITNESS FOR A PARTICULAR PURPOSE REGARDING EQUIPMENT OR SERVICES PROVIDED BY A MANUFACTURER OR VENDOR. CONTACT YOUR VENDOR/SERVICES PROVIDER FOR DETAILS REGARDING PERFORMANCE AND WARRANTIES.
limitation of liability – By virtue of participating in this Program, Participating Customers agree to waive any and all claims or damages against the Market Manager or the Administrator, except the receipt of the Program Incentive. Participating Customers agree that the Market Manager’s and Administrator’s liability, in connection with this Program, is limited to paying the Program Incentive specified. Under no circumstances shall the Market Manager, its representatives, or subcontractors, or the Administrator, be liable for any lost profits, special, punitive, consequential or incidental damages or for any other damages or claims connected with or resulting from participation in this Program. Further, any liability attributed to the Market Manager under this Program shall be individual, and not joint and/or several.
Assignment – The Participating Customer may assign Program Incentive payments to a specified vendor.
Participating customer’s certification – Participating Customer certifies that he/she purchased and installed the equipment listed in their application at their defined New Jersey location. Participating Customer agrees that all information is true and that he/she has conformed to all of the Program and equipment requirements listed in the application.
termination – The New Jersey Board of Public Utilities reserves the right to extend, modify (this includes modification of Program Incentive levels) or terminate this Program without prior or further notice.
Acknowledgement – I have read, understood and am in compliance with all rules and regulations concerning this incentive program. I certify that all information provided is correct to the best of my knowledge, and I give the Market Manager permission to share my records with the New Jersey Board of Public Utilities, and contractors it selects to manage, coordinate or evaluate the NJ SmartStart Buildings Program. Additionally, I allow reasonable access to my property to inspect the installation and performance of the technologies and installations that are eligible for incentives under the guidelines of New Jersey’s Clean Energy Program.

2010 Lighting Controls Application
Lighting Control Incentive
$__________ Total Incentive (per attached worksheet calculations)
Note: Lighting Controls Incentive Worksheet must accompany this application.
001-01/10
Customer InformationCompany ElectricUtilityServingApplicant ElectricAccountNo. InstallationDate
FacilityAddress City State Zip
TypeofProject SizeofBuilding
❑ NewConstruction ❑ Renovation ❑ EquipmentReplacement
CompanyMailingAddress City State Zip
ContactPerson(Name/Title) TelephoneNo. FaxNo. () ()
Incorporated?❑ Yes❑ No❑ Exempt FederalTaxID#orSSN EmailAddress
IncentivePaymentto Pleaseassignpaymenttocontractor/vendor/otherindicatedbelow
❑ Customer❑ Contractor❑ Other CustomerSignature
Payee Information (must submit W-9 form with application)
Contractor/Vendor Information (if different from Payee)
Company ContactName Incorporated? FederalTaxID# YesNoStreetAddress City StateZipTelephoneNo. FaxNo. () ()
Company ContactName Incorporated? FederalTaxID# ❑ Yes❑ NoStreetAddress City StateZipTelephoneNo. FaxNo. () ()
EmailAddress
EmailAddress
Building Type (circle one)Education-PrimarySchool;Education-CommunityCollege;Education-University;Grocery;Medical-Hospital;Medical-Clinic;LodgingHotel(GuestRooms);LodgingMotel;Manufacturing-LightIndustrial;Office-Large;Office-Small;Restaurant-SitDown;Restaurant-FastFood;Retail-3StoryLarge;Retail-SingleStoryLarge;Retail-Small;StorageConditioned;StorageUnconditioned;Warehouse;Other

Specific Program Requirements* (These requirements are in addition to the Program Terms and Conditions.)
Visit our web site: www.NJCleanEnergy.com
1.PleaserefertotheProgramGuideforadditionalapplicabletechnicalrequirements,includingspecialrequirementsforlightingcontrols.
2.Includethemanufacturer’sspecificationsheetwiththeapplicationpackageandmailorfaxdirectlytotheCommercial/IndustrialMarketManager.
3.AlllightingcontrolseligibleforincentivesmustbeULlisted.4.Lightingcontrolincentivesareonlyavailableforcontrolofeligible
energyefficientlightingfixtures.5.Ifmorethanoneeligiblelightingcontroldeviceisassociatedwith
thesameeligiblefixture,theincentivepaidwillbeforthelightingcontroldevicethatyieldsthelargestincentiveonly.
6.OccupancySensorControls(existingfacilitiesonly): ■Thereisnoincentiveavailableforoccupancysensorsinstalledina
spacewheretheyareprohibitedbystateorlocalbuildingorsafetycode.Additionally,noincentiveiseligibleforoccupancysensorsinthefollowingspecificspacesinallcases:stairways,restrooms(remotemountedonlyallowed),elevators,corridors/hallways,lobbies,andclosets/storageareas.
■Incentiveswillonlybepaidforeligibleoccupancysensors(OSW&OSR)controllingatleast2eligiblelightingfixturesand,forOSRinstallations,aminimumtotalconnectedloadof180watts.
■IncentiveswillonlybepaidforeligibleOSRHoccupancysensorscontrollingeligiblefixtureswhenthecontrolledwattageisgreaterthan180watts.
■Occupancysensorswithmanualoverridetothe“ON”positionareineligibleforincentive.
7.High-LowControls(OHLFandOHLH): ■Incentiveswillnotbepaidforhigh-lowcontrolsoneligible
fluorescentfixtureswheredaylightdimmingcontrolscanbeeffectivelyemployed.
■Incentiveswillnotbepaidforspacessmallerthan250squarefeet. ■Incentivesavailableonlywhen“lowlevel”isnomorethan60%of
“highlevel.” ■Incentivesarenotavailableforthefollowingspaces:stairways,
elevators,corridors/hallways,orlobbies. ■OHLFwillcontrolfixturesthathaveaballastfactorlessthan1.0forT-5sand1.14forT-8s. ■OHLHwillcontrolfixturesthathaveaballastfactorgreaterthan orequalto1.0forT-5sand1.14forT-8s.8.DaylightDimmingControlsforeligiblefixtures: ■Incentiveswillonlybepaidforeligibledaylightdimmingcontrols
operatingatleast4eligibleballastswithaminimumtotalconnectedloadof240watts.
■ Dimmingshallbecontinuousorsteppedat4ormorelevels. ■Incentiveswillbepaidonlyforeligibledaylightdimmingcontrol
systemsdesignedinaccordancewithIESNApracticeasdelineatedin“RP-5-99,IESNARecommendedPracticeofDaylighting.”
■ DLDwillcontrolfixturesthathaveaballastfactorlessthan1.0forT-5sand1.14forT-8s.
■ DDHwillcontrolfixturesthathaveaballastfactorgreaterthanorequalto1.0forT-5sand1.14forT-8s.
NewJerseySmartStartBuildings®isaregisteredtrademark.UseofthemarkwithoutthepermissionoftheNewJerseyBoardofPublicUtilities,OfficeofCleanEnergyisprohibited.*Incentives/Requirementssubjecttochange.
Acknowledgement
cUStomeR'S SignAtURe___________________________________________________________________________
Bysigning,IcertifythatIhaveread,understandandagreetotheSpecificProgramRequirements/TermsandConditionslistedonthisapplicationform,Iwillalsosubmitforapprovalaproperlycompletedapplicationpackage,whichincludesthissignedapplication,worksheet(ifapplicable),manufacturer’sspecificationsheetsandcompleteutilitybill(nameandaddressonutilitybillmustmatchnameandaddressonapplication).
Lighting Control Prescriptive Incentives*
Control Device Type Incentive per Unit
OSW–OccupancySensorWallMounted(Existingfacilitiesonly) $20percontrol
OSR–OccupancySensorRemoteMounted(Existingfacilitiesonly) $35percontrol
DLD–FluorescentDaylightDimming $25perfixturecontrolled
DLD–FluorescentDaylightDimming(OfficeApplications) $50perfixturecontrolled
OHLF–OccupancyControlledHigh-LowwithStepBallast $25perfixturecontrolled
OSRH–OccupancySensorRemoteMounted $35percontrol
OHLH–OccupancyControlledHigh-LowwithStepBallast $75perfixturecontrolled
DDH–DaylightDimming $75perfixturecontrolled
Mail or fax your application package DIRECTLy to the Commercial/Industrial Market Manager.
NewJersey'sCleanEnergyProgramc/oTRCEnergyServices
900Route9North,Suite104•Woodbridge,NJ07095Phone:866-657-6278•Fax:732-855-0422
❑ PayeeInformationisfilledoutandaW-9formofthepayeeisincluded❑ Manufacturer'sspecificationsheetsforproposedtechnologyareincluded❑ Acopy(allpages)ofarecentmonth'sutilitybillisincluded
Application Checklist (Before submitting your application, please make sure you have signed in the space below and completed the following items.)

Program Terms and Conditions
definitions:
design incentives – IncentivesthatmaybeofferedtodesignprofessionalsbytheProgram.
design Services–ServicesthatmaybeofferedtodesignprofessionalsundertheProgram.
energy-efficient measures–AnydeviceeligibletoreceiveaProgramIncentivepaymentthroughtheNJCleanEnergyCommercialandIndustrialProgram(NewJerseySmartStartBuildings).
new Jersey Utilities–Theregulatedelectricand/orgasutilitiesintheStateofNewJersey.Theyare:AtlanticCityElectric,JerseyCentralPower&Light,RocklandElectricCompany,NewJerseyNaturalGas,ElizabethtownGas,PSE&G,andSouthJerseyGas.
Administrator–NewJerseyBoardofPublicUtilities,OfficeofCleanEnergy
Participating customers–Thosenon-residentialelectricand/orgasservicecustomersoftheNewJerseyUtilitieswhoparticipateinthisProgram.
Product installation or equipment installation–InstallationoftheEnergy-EfficientMeasures.
market manager–TRCEnergyServices.
Program–TheCommercialandIndustrialEnergy-EfficientConstructionProgram(NewJerseySmartStartBuildings)offeredhereinbytheNewJerseyBoardofPublicUtilities,OfficeofCleanEnergypursuanttostateregulatoryapprovalundertheNewJerseyElectricDiscountandEnergyCompetitionAct,NJSA48:3-49,etseq.
Program incentives–ReferstotheamountorlevelofincentivethattheProgramprovidestoParticipatingCustomerspursuanttotheProgramofferedherein(seedescriptionunder“IncentiveAmount”heading).
Program offer–ProgramIncentivesareavailabletonon-residentialretailelectricand/orgasservicecustomersoftheNewJerseyUtilitiesidentifiedabove.ProgramIncentivesfornewconstructionareavailableonlyforprojectsinareasdesignatedforgrowthintheStatePlan.Publicschool(K-12)newconstructionprojectsareexemptedfromthisrestrictionandareeligiblefornewProgramincentivesthroughouttheState.Customers,ortheirtradeallies,candetermineifalocationisinadesignatedgrowthareabyreferringtotheSmartGrowthLocatoravailablefromtheHMFAwebsiteorcontacttheMarketManagerifyouareuncertainaboutprojecteligibility.
Application and eligibility Process–TheProgrampaysincentivesaftertheinstallationofqualifiedenergyefficientmeasuresthatwerepre-approved(forexceptionstothiscondition,pleasereferto“ExceptionsforApproval”.)InordertobeeligibleforProgramIncentives,aCustomer,oranagent(contractor/vendor)authorizedbyaCustomer,mustsubmitaproperlycompletedapplicationpackage.Thepackagemustincludeanapplicationsignedbythecustomer;acomplete(current)utilitybill;andtechnologyworksheetandmanufacturer’scutsheets(whereappropriate).ThisinformationmustbesubmittedtotheMarketManagerbeforeequipmentisinstalled.Applicationsformeasuresthatareselfinstalledbycustomersmustbesubmittedbythecustomerandnotthesalesvendorofthemeasure,however,thecustomermayelecttoassignpaymentoftheincentivetothesalesvendor.ThisapplicationpackagemustbereceivedbytheMarketManageronorbeforeDecember31,2010inordertobeeligiblefor2010incentives.TheMarketManagerwillreviewtheapplicationpackagetodetermineiftheprojectiseligibleforaProgramIncentive.Ifeligible,theCustomerwillreceiveanapprovalletterwiththeestimatedauthorizedincentiveamountandthedatebywhichtheequipmentmustbeinstalledinorderfortheapprovaltoremainineffect.Uponreceiptofanapprovalletter,theCustomermaythenproceedtoinstalltheequipmentlistedontheapprovedapplication.EquipmentinstalledpriortothedateoftheMarketManager’sapprovalletterisnoteligibleforanincentive.TheMarketManagerreservestherighttoconductapre-inspectionofthefacilitypriortotheinstallationofequipment.Thiswillbedonepriortotheissuanceoftheapprovalletter.Allequipmentmustbepurchasedwithin12monthsofdateofapplication.Any customer and/or agent who purchases equipment prior to the receipt of an incentive approval letter does so at his/her own risk.
exceptions for Approval–TheApplicationandEligibilityProcesspertainstoallprojectsexceptforthoseinvolvingeitherUnitaryHVACorMotorshavinganincentiveamountlessthan$5,000.Thesemeasures,atthisincentivelevel,maybeinstalledwithoutpriorapproval.Inaddition,butatthesolediscretionoftheMarketManager,emergencyreplacementofequipmentmaynotrequireapriorapprovaldeterminationandletter.in such cases, please notify the market manager of such emergencies as early as possible, that an application will soon be sent in that was not pre-approved.
Post installation Approval–Afterinstallationiscompleted,theCustomer,oranagentauthorizedbytheCustomer,mustfinalizeandsubmitaninvoiceforthepurchaseoftheequipment(materialcostmustbebrokenoutfromlaborcosts),andanyotherrequireddocumentationasspecifiedontheequipmentapplicationorintheMarketManager’sinitialapprovalletter.
NJ SmartStart Buildings®

PleaserefertotheProgramGuideontheNJCleanEnergy.com/ssbwebsiteforthecompleteApplicationandEligibilityProcess.
TheMarketManagerreservestherighttoverifysalestransactionsandtohavereasonableaccesstoParticipatingCustomer’sfacilitytoinspectbothpre-existingproductorequipment(ifapplicable)andtheEnergy-EfficientMeasuresinstalledunderthisProgram,eitherpriortoissuingincentivesoratalatertime.
Energy-EfficientMeasuresmustbeinstalledinbuildingslocatedwithinaNewJerseyUtilities’serviceterritoryanddesignatedontheParticipatingCustomer’sincentiveapplication.ProgramIncentivesareavailableforqualifiedEnergy-EfficientMeasuresaslistedanddescribedintheProgrammaterialsandincentiveapplications.TheParticipatingCustomermustultimatelyowntheequipment,eitherthroughanup-frontpurchaseorattheendofashort-termlease.DesignIncentivesareavailabletodesignprofessionalsasdescribedintheProgrammaterialsandapplications.Adifferentandseparateagreementmustbeexecutedbyparticipatingdesignprofessionalstobeeligibleforthistypeofincentive.ThedesignprofessionaldoesnotneedtobebasedinNewJersey.
Equipment procured by Participating Customers through another program offered by New Jersey's Clean Energy Program or the New Jersey Utilities, as applicable, is not eligible for incentives through this program. Customers who have not contributed to the Societal Benefits Charge of the applicable New Jersey Utility are not be eligible for incentives offered through this program.
incentive Amount–ProgramIncentiveswillequaleither:a)theapprovedProgramIncentiveamount,orb)theactualequipmentcostoftheEnergy-EfficientMeasure,whicheverisless,asdeterminedbytheMarketManager.Productsofferedatnodirectcosttothecustomerareineligible.Incompleteapplicationsubmissions,applicationsrequiringinspectionsandunanticipatedhighvolumeofactivitiesmaycauseprocessingdelays.ProgramIncentivesarelimitedto$500,000perutilityaccountinacalendaryear.ContacttheMarketManagerregardinganyquestions.
tax liability–TheMarketManagerwillnotberesponsibleforanytaxliabilitythatmaybeimposedonanyParticipatingCustomerasaresultofthepaymentofProgramIncentives.AllParticipatingCustomersmustsupplytheirFederalTaxIdentificationnumberorsocialsecuritynumbertotheMarketManagerontheapplicationforminordertoreceiveaProgramIncentive.Inaddition,ParticipatingCustomersmustalsoprovideaTaxClearanceForm(BusinessAssistanceorIncentiveClearanceCertificate)thatisdatedwithin90daysofequipmentinstallation.
endorsement–TheMarketManagerandAdministratordonotendorse,supportorrecommendanyparticularmanufacturer,productorsystemdesigninpromotingthisProgram.
warranties–THEMARKETMANAGERANDADMINISTRATORDONOTWARRANTTHEPERFORMANCEOFINSTALLEDEQUIPMENT,AND/ORSERVICESRENDEREDASPARTOFTHISPROGRAM,EITHEREXPRESSLYORIMPLICITLY.NOWARRANTIESORREPRESENTATIONSOFANYKIND,WHETHERSTATUTORY,EXPRESSED,ORIMPLIED,INCLUDING,WITHOUTLIMITATIONS,WARRANTIESOFMERCHANTABILITYORFITNESSFORAPARTICULARPURPOSEREGARDINGEQUIPMENTORSERVICESPROVIDEDBYAMANUFACTURERORVENDOR.CONTACTYOURVENDOR/SERVICESPROVIDERFORDETAILSREGARDINGPERFORMANCEANDWARRANTIES.
limitation of liability–ByvirtueofparticipatinginthisProgram,ParticipatingCustomersagreetowaiveanyandallclaimsordamagesagainsttheMarketManagerortheAdministrator,exceptthereceiptoftheProgramIncentive.ParticipatingCustomersagreethattheMarketManager’sandAdministrator’sliability,inconnectionwiththisProgram,islimitedtopayingtheProgramIncentivespecified.UndernocircumstancesshalltheMarketManager,itsrepresentatives,orsubcontractors,ortheAdministrator,beliableforanylostprofits,special,punitive,consequentialorincidentaldamagesorforanyotherdamagesorclaimsconnectedwithorresultingfromparticipationinthisProgram.Further,anyliabilityattributedtotheMarketManagerunderthisProgramshallbeindividual,andnotjointand/orseveral.
Assignment–TheParticipatingCustomermayassignProgramIncentivepaymentstoaspecifiedvendor.
Participating customer’s certification–ParticipatingCustomercertifiesthathe/shepurchasedandinstalledtheequipmentlistedintheirapplicationattheirdefinedNewJerseylocation.ParticipatingCustomeragreesthatallinformationistrueandthathe/shehasconformedtoalloftheProgramandequipmentrequirementslistedintheapplication.
termination–TheNewJerseyBoardofPublicUtilitiesreservestherighttoextend,modify(thisincludesmodificationofProgramIncentivelevels)orterminatethisProgramwithoutpriororfurthernotice.
Acknowledgement –Ihaveread,understoodandamincompliancewithallrulesandregulationsconcerningthisincentiveprogram.Icertifythatallinformationprovidediscorrecttothebestofmyknowledge,andIgivetheMarketManagerpermissiontosharemyrecordswiththeNewJerseyBoardofPublicUtilities,andcontractorsitselectstomanage,coordinateorevaluatetheNJSmartStartBuildingsProgram.Additionally,IallowreasonableaccesstomypropertytoinspecttheinstallationandperformanceofthetechnologiesandinstallationsthatareeligibleforincentivesundertheguidelinesofNewJersey’sCleanEnergyProgram.

2010 Lighting Controls Incentive Worksheet
Lighting Controls Information
Total(including additional sheets)
For additional fixtures, attach additional sheets and check here
*For OSW and OSR, insert number of control devices; for DLD and OHLF, insert total number of ballasts controlled; for OHLH and DDH, insert total number of fixtures controlled.
Location Reason Control Fixture Type Watts A B C Total N–New Device Controlled Controlled # of Fixtures # of Units* Incentive Incentive R–Replaced Type per Device Controlled per Unit (B x C) per Device
(Examples)
N OSW 4-lamp, T8 220 2 4 $20 4 x $20 = $80
N OSR 2-lamp, T8 330 6 2 $35 2 x $35 = $70
N DLD 2-lamp, T8 275 N/A 6 $50 6 x $50 = $300
N OHLF 4-lamp, T8 140 N/A 12 $25 12 x $25 = $300
N OSRH 4-lamp, T5 234 1 5 $35 5 x $35 = $175
001-01/10
Customer InformationCompany
Check here if multiple worksheets are being submitted for one project/building.
Facility Address
Date Submitted
Office 101
Conference Room A
Large Office 400
Warehouse A
Warehouse B

Specific Program Requirements* (These requirements are in addition to the Program Terms and Conditions.)
Visit our web site: www.NJCleanEnergy.com
Lighting Control Prescriptive Incentives*
Control Device Type Incentive per Unit
OSW – Occupancy Sensor Wall Mounted (Existing facilities only) $20 per control
OSR – Occupancy Sensor Remote Mounted (Existing facilities only) $35 per control
DLD – Fluorescent Daylight Dimming $25 per fixture controlled
DLD – Fluorescent Daylight Dimming (Office Applications) $50 per fixture controlled
OHLF – Occupancy Controlled High-Low with Step Ballast $25 per fixture controlled
OSRH – Occupancy Sensor Remote Mounted $35 per control
OHLH – Occupancy Controlled High-Low with Step Ballast $75 per fixture controlled
DDH – Daylight Dimming $75 per fixture controlled
1. Please refer to the Program Guide for additional applicable technical requirements, including special requirements for lighting controls.
2. Include the manufacturer’s specification sheet with the application package and mail or fax directly to the Commercial/Industrial Market Manager.
3. All lighting controls eligible for incentives must be UL listed.4. Lighting control incentives are only available for control of eligible
energy efficient lighting fixtures.5. If more than one eligible lighting control device is associated with
the same eligible fixture, the incentive paid will be for the lighting control device that yields the largest incentive only.
6. Occupancy Sensor Controls (existing facilities only): ■ There is no incentive available for occupancy sensors installed in a
space where they are prohibited by state or local building or safety code. Additionally, no incentive is eligible for occupancy sensors in the following specific spaces in all cases: stairways, restrooms (remote mounted only allowed), elevators, corridors/hallways, lobbies, and closets/storage areas.
■ Incentives will only be paid for eligible occupancy sensors (OSW & OSR) controlling at least 2 eligible lighting fixtures and, for OSR installations, a minimum total connected load of 180 watts.
■ Incentives will only be paid for eligible OSRH occupancy sensors controlling eligible fixtures when the controlled wattage is greater than 180 watts.
■ Occupancy sensors with manual override to the “ON” position are ineligible for incentive.
7. High-Low Controls (OHLF and OHLH): ■ Incentives will not be paid for high-low controls on eligible
fluorescent fixtures where daylight dimming controls can be effectively employed.
■ Incentives will not be paid for spaces smaller than 250 square feet. ■ Incentives available only when “low level” is no more than 60% of
“high level.” ■ Incentives are not available for the following spaces: stairways,
elevators, corridors/hallways, or lobbies. ■ OHLF will control fixtures that have a ballast factor less than 1.0
for T-5s and 1.14 for T-8s. ■ OHLH will control fixtures that have a ballast factor greater than
or equal to 1.0 for T-5s and 1.14 for T-8s.8. Daylight Dimming Controls for Eligible Fixtures: ■ Incentives will only be paid for eligible daylight dimming controls
operating at least 4 eligible ballasts with a minimum total connected load of 240 watts.
■ Dimming shall be continuous or stepped at 4 or more levels. ■ Incentives will be paid only for eligible daylight dimming control
systems designed in accordance with IESNA practice as delineated in “RP-5-99, IESNA Recommended Practice of Daylighting.”
■ DLD will control fixtures that have a ballast factor less than 1.0 for T-5s and 1.14 for T-8s.
■ DDH will control fixtures that have a ballast factor greater than or equal to 1.0 for T-5s and 1.14 for T-8s.
New Jersey SmartStart Buildings® is a registered trademark. Use of the mark without the permission of the New Jersey Board of Public Utilities, Office of Clean Energy is prohibited. *Incentives/Requirements subject to change.
Mail or fax your application package DIRECTLy to the Commercial/Industrial Market Manager.
New Jersey's Clean Energy Programc/o TRC Energy Services
900 Route 9 North, Suite 104 • Woodbridge, NJ 07095Phone: 866-657-6278 • Fax: 732-855-0422

Program Terms and Conditions
Definitions:
Design Incentives – Incentives that may be offered to design professionals by the Program.
Design Services – Services that may be offered to design professionals under the Program.
Energy-Efficient Measures – Any device eligible to receive a Program Incentive payment through the NJ Clean Energy Commercial and Industrial Program (New Jersey SmartStart Buildings).
New Jersey Utilities – The regulated electric and/or gas utilities in the State of New Jersey. They are: Atlantic City Electric, Jersey Central Power & Light, Rockland Electric Company, New Jersey Natural Gas, Elizabethtown Gas, PSE&G, and South Jersey Gas.
Administrator – New Jersey Board of Public Utilities, Office of Clean Energy
Participating Customers – Those non-residential electric and/or gas service customers of the New Jersey Utilities who participate in this Program.
Product Installation or Equipment Installation – Installation of the Energy-Efficient Measures.
Market Manager – TRC Energy Services.
Program – The Commercial and Industrial Energy-Efficient Construction Program (New Jersey SmartStart Buildings) offered herein by the New Jersey Board of Public Utilities, Office of Clean Energy pursuant to state regulatory approval under the New Jersey Electric Discount and Energy Competition Act, NJSA 48:3-49, et seq.
Program Incentives – Refers to the amount or level of incentive that the Program provides to Participating Customers pursuant to the Program offered herein (see description under “Incentive Amount” heading).
Program Offer – Program Incentives are available to non-residential retail electric and/or gas service customers of the New Jersey Utilities identified above. Program Incentives for new construction are available only for projects in areas designated for growth in the State Plan. Public school (K-12) new construction projects are exempted from this restriction and are eligible for new Program incentives throughout the State. Customers, or their trade allies, can determine if a location is in a designated growth area by referring to the Smart Growth Locator available from the HMFA website or contact the Market Manager if you are uncertain about project eligibility.
Application and Eligibility Process – The Program pays incentives after the installation of qualified energy efficient measures that were pre-approved (for exceptions to this condition, please refer to “Exceptions for Approval”.) In order to be eligible for Program Incentives, a Customer, or an agent (contractor/vendor) authorized by a Customer, must submit a properly completed application package. The package must include an application signed by the customer; a complete (current) utility bill; and technology worksheet and manufacturer’s cut sheets (where appropriate). This information must be submitted to the Market Manager before equipment is installed. Applications for measures that are self installed by customers must be submitted by the customer and not the sales vendor of the measure, however, the customer may elect to assign payment of the incentive to the sales vendor. This application package must be received by the Market Manager on or before December 31, 2010 in order to be eligible for 2010 incentives. The Market Manager will review the application package to determine if the project is eligible for a Program Incentive. If eligible, the Customer will receive an approval letter with the estimated authorized incentive amount and the date by which the equipment must be installed in order for the approval to remain in effect. Upon receipt of an approval letter, the Customer may then proceed to install the equipment listed on the approved application. Equipment installed prior to the date of the Market Manager’s approval letter is not eligible for an incentive. The Market Manager reserves the right to conduct a pre-inspection of the facility prior to the installation of equipment. This will be done prior to the issuance of the approval letter. All equipment must be purchased within 12 months of date of application. Any Customer and/or agent who purchases equipment prior to the receipt of an incentive approval letter does so at his/her own risk.
Exceptions for Approval – The Application and Eligibility Process pertains to all projects except for those involving either Unitary HVAC or Motors having an incentive amount less than $5,000. These measures, at this incentive level, may be installed without prior approval. In addition, but at the sole discretion of the Market Manager, emergency replacement of equipment may not require a prior approval determination and letter. In such cases, please notify the Market Manager of such emergencies as early as possible, that an application will soon be sent in that was not pre-approved.
Post Installation Approval – After installation is completed, the Customer, or an agent authorized by the Customer, must finalize and submit an invoice for the purchase of the equipment (material cost must be broken out from labor costs), and any other required documentation as specified on the equipment application or in the Market Manager’s initial approval letter.
NJ SmartStart Buildings®

Please refer to the Program Guide on the NJCleanEnergy.com/ssb website for the complete Application and Eligibility Process.
The Market Manager reserves the right to verify sales transactions and to have reasonable access to Participating Customer’s facility to inspect both pre-existing product or equipment (if applicable) and the Energy-Efficient Measures installed under this Program, either prior to issuing incentives or at a later time.
Energy-Efficient Measures must be installed in buildings located within a New Jersey Utilities’ service territory and designated on the Participating Customer’s incentive application. Program Incentives are available for qualified Energy-Efficient Measures as listed and described in the Program materials and incentive applications. The Participating Customer must ultimately own the equipment, either through an up-front purchase or at the end of a short-term lease. Design Incentives are available to design professionals as described in the Program materials and applications. A different and separate agreement must be executed by participating design professionals to be eligible for this type of incentive. The design professional does not need to be based in New Jersey.
Equipment procured by Participating Customers through another program offered by New Jersey's Clean Energy Program or the New Jersey Utilities, as applicable, is not eligible for incentives through this program. Customers who have not contributed to the Societal Benefits Charge of the applicable New Jersey Utility are not be eligible for incentives offered through this program.
Incentive Amount – Program Incentives will equal either: a) the approved Program Incentive amount, or b) the actual equipment cost of the Energy-Efficient Measure, whichever is less, as determined by the Market Manager. Products offered at no direct cost to the customer are ineligible. Incomplete application submissions, applications requiring inspections and unanticipated high volume of activities may cause processing delays. Program Incentives are limited to $500,000 per utility account in a calendar year. Contact the Market Manager regarding any questions.
Tax Liability – The Market Manager will not be responsible for any tax liability that may be imposed on any Participating Customer as a result of the payment of Program Incentives. All Participating Customers must supply their Federal Tax Identification number or social security number to the Market Manager on the application form in order to receive a Program Incentive. In addition, Participating Customers must also provide a Tax Clearance Form (Business Assistance or Incentive Clearance Certificate) that is dated within 90 days of equipment installation.
Endorsement – The Market Manager and Administrator do not endorse, support or recommend any particular manufacturer, product or system design in promoting this Program.
Warranties – THE MARKET MANAGER AND ADMINISTRATOR DO NOT WARRANT THE PERFORMANCE OF INSTALLED EQUIPMENT, AND/OR SERVICES RENDERED AS PART OF THIS PROGRAM, EITHER EXPRESSLY OR IMPLICITLY. NO WARRANTIES OR REPRESENTATIONS OF ANY KIND, WHETHER STATUTORY, EXPRESSED, OR IMPLIED, INCLUDING, WITHOUT LIMITATIONS, WARRANTIES OF MERCHANTABILITY OR FITNESS FOR A PARTICULAR PURPOSE REGARDING EQUIPMENT OR SERVICES PROVIDED BY A MANUFACTURER OR VENDOR. CONTACT YOUR VENDOR/SERVICES PROVIDER FOR DETAILS REGARDING PERFORMANCE AND WARRANTIES.
Limitation of Liability – By virtue of participating in this Program, Participating Customers agree to waive any and all claims or damages against the Market Manager or the Administrator, except the receipt of the Program Incentive. Participating Customers agree that the Market Manager’s and Administrator’s liability, in connection with this Program, is limited to paying the Program Incentive specified. Under no circumstances shall the Market Manager, its representatives, or subcontractors, or the Administrator, be liable for any lost profits, special, punitive, consequential or incidental damages or for any other damages or claims connected with or resulting from participation in this Program. Further, any liability attributed to the Market Manager under this Program shall be individual, and not joint and/or several.
Assignment – The Participating Customer may assign Program Incentive payments to a specified vendor.
Participating Customer’s Certification – Participating Customer certifies that he/she purchased and installed the equipment listed in their application at their defined New Jersey location. Participating Customer agrees that all information is true and that he/she has conformed to all of the Program and equipment requirements listed in the application.
Termination – The New Jersey Board of Public Utilities reserves the right to extend, modify (this includes modification of Program Incentive levels) or terminate this Program without prior or further notice.
Acknowledgement – I have read, understood and am in compliance with all rules and regulations concerning this incentive program. I certify that all information provided is correct to the best of my knowledge, and I give the Market Manager permission to share my records with the New Jersey Board of Public Utilities, and contractors it selects to manage, coordinate or evaluate the NJ SmartStart Buildings Program. Additionally, I allow reasonable access to my property to inspect the installation and performance of the technologies and installations that are eligible for incentives under the guidelines of New Jersey’s Clean Energy Program.

New Jersey Clean Energy Program Technical Worksheet – Solar Electric Equipment Information
Please carefully read all of the following information. With the help of your Installation Contractor, fully complete Sections A through D, as applicable, of the attached Technical Worksheet for Solar Electric Equipment, as well as the New Jersey Clean Energy Program Rebate Application Form.
Rebates will be processed based on the date the New Jersey Clean Energy Program (NJCEP) approves the Final Application Form, not on the purchase date of the equipment. Program procedures and rebates are subject to change or cancellation without notice. To qualify for a rebate, Applicant must comply with all Program Eligibility Requirements, Terms and Conditions, and Installation Requirements, and submit a completed Pre-Installation Application Form. For more information about the New Jersey Clean Energy Program, or for assistance in completing applications or forms, please see www.njcleanenergy.com or call 866-NJSMART
Equipment installation must meet the following minimum requirements in order to qualify for payment under the provisions of the New Jersey Clean Energy Program; proposed changes to the requirements will be considered, but they must be documented by the Applicant or Installation Contractor and approved by the NJCEP. These requirements are not all-encompassing and are intended only to address certain minimum safety and efficiency standards.
1. The installation must comply with the provisions of the National Electrical Code and all other applicable local, state and federal codes or practices. 2. All required permits must be properly obtained and posted. 3. The NJCEP Inspection must be performed before the local Building Code Enforcement Office. If not, this may delay the processing of the rebate 4. All required inspections must be performed (i.e., Electrical/NEC, Local Building Codes Enforcement Office, etc.). Note: In order to ensure compliance with provisions of the NEC, an inspection by a state-licensed electrical inspector is mandatory.
1. Modules must be UL Listed and must be properly installed according to manufacturer’s instructions. 2. The maximum amount of sunlight available year-round on a daily basis should not be obstructed. All applications must include documentation of the impact from any obstruction on the annual performance of the solar electric array. This analysis can be performed by using the New Jersey Clean Power Estimator on the program website www.njcep.com. 3. In order to qualify for program incentives, the solar electric system must adhere to a minimum design threshold, relative to the estimated system production using PVWATTS:
• Solar electric array orientations require that the calculated system output must be at least 80% of the default output calculated by PVWatts. Additionally, all individual series strings of modules output must be at least 70% of the default output calculated by PVWatts. • For building integrated solar electric systems (i.e., part of the building envelope materials are comprised of solar electric components), the estimated system output must be 40% of the default output estimated by PVWATTS.
4. System wiring must be installed in accordance with the provisions of the NEC. 5. All modules installed in a series string must be installed in the same plane.
1. The inverter and controls must be properly installed according to manufacturer’s instructions. 2. The inverter must be certified as compliant with the requirements of IEEE 929 for small photovoltaic systems and with UL 1741. 3. The system should be equipped with the following visual indicators and/or controls:
• On/off switch • Operating mode setting indicator • AC/DC over current protection • Operating status indicator 4. Warning labels must be posted on the control panels and junction boxes indicating that the circuits are energized by an alternate power source independent of utility-provided power. 5. Operating instructions must be posted on or near the system, or on file with facilities operation and maintenance documents. 6. Systems must have monitoring capability that is readily accessible to the owner. This monitor (meter or display) must at minimum display instantaneous and cumulative production. All projects greater than 10kW must have an output meter that meets ANSI C.12 standards
1. Areas where wiring passes through ceilings, walls or other areas of the building must be properly restored, booted and sealed. 2. All interconnecting wires must be copper. (Some provisions may be made for aluminum wiring; approval must be received from utility engineering departments prior to acceptance.) 3. Thermal insulation in areas where wiring is installed must be replaced to “as found or better condition.” Access doors to these areas must be properly sealed and gasketed. 4. Wiring connections must be properly made, insulated and weather-protected. 5. All wiring must be attached to the system components by the use of strain relief’s or cable clamps, unless enclosed in conduit. 6. All outside wiring must be rated for wet conditions and/or encased in liquid-tight conduit. 7. Insulation on any wiring located in areas with potential high ambient temperature must be rated at 90° C or higher. 8. All wiring splices must be contained in UL-approved workboxes.
1. The batteries must be installed according to the manufacturer’s instructions. 2. Battery terminals must be adequately protected from accidental contact. 3. DC-rated over current protection must be provided in accordance with the provisions of the NEC.
Revised January 2009
GENERAL TERMS AND CONDITIONS
INSTALLATION REQUIREMENTS
A: Code Requirements
B: Solar Electric Module Array
C: Inverter and Controls
D: Control Panel to Solar Electric Array Wire Runs
E: Batteries (If Applicable)

New Jersey Clean Energy Program Technical Worksheet – Solar Electric Equipment Information
Original Application Date: _________________ Revised Application Date: ______________________ Customer Name: _______________________________ Application Number: _________________ (Corresponding to Rebate Application Form) (Assigned by the NJBPU) A: EQUIPMENT INFORMATION 1. Solar Electric Module Manufacturer: ________________________ Module Model Number: _____________________________ 2. Power Rating per Module: ________ DC Watts (Refer to STC conditions) Number of Modules: _____________________________ 3. Total Array Output: _______ _ DC Watts (No. of Modules x Power Rating) 4. Inverter Manufacturer: __________________________________ Inverter Model Number: _____________________ 5. Inverter’s Continuous AC Rating: _________________________ AC Watts Number of Inverters: _____________________ 6. Total Inverter Output: ________ AC Watts (Inverter Continuous AC Rating x Number of Inverters) 7. Inverter’s Peak Efficiency: ______ _ _ (Refer to manufacturer’s peak efficiency rating)
1. Solar Electric Array Location: _ Rooftop _ Pole Mount or Ground Mount Location: 2. Solar Electric Module Orientation: __________ degrees (e.g., 180 degrees magnetic south)
Note: in Central New Jersey, magnetic south compass reading is 10 degrees east of true south. 3. Solar Electric Module Tilt: ___________ degrees (e.g., flat mount = 0 degrees; vertical mount = 90 degrees) 4. Solar Electric Module Tracking: _Fixed _Single-axis _Double-axis 5. Inverter Location: _ Indoor _ Outdoor Location: _________________________________________________________________ 6. Utility-Accessible AC Disconnect Switch Location: ________________________________________________________________ 7. System Type and Mode of Operation:
_ Utility interactive (parallel/capable of back feeding the meter) (_ with battery backup) _ Dedicated circuit, utility power as backup (transfer switch) (_ with battery charging) _ Stand-alone (system confined to an independent circuit, no utility backup) (_ with battery charging)
1. System rated output (Section A, line 3 above): ____________ DC Watts 2. Incentive Calculation (Calculate appropriate incentive based on System Rated Output):
Residential Applicants that perform Energy Efficiency Audit a. 0 to 10,000 Watts x $1.75/Watt = $___________________+
Commercial, Farm, Public and Non-Profit 0 to 50,000 Watts x $1.00/Watt = $_____________________+
Residential Applicants that do not perform Energy Efficiency Audit b. 0 to 10,000 Watts x $1.55/Watt = $___________________+
Large PV Project Applications > 50,000 Watts = $____Not eligible for rebates____________
d. Total Rebate Calculation: $__________________________
Total Rebate Calculation: $____________________________
3. School Applicants: Maximum Annual School Rebate: $________________ (For Public School applicants, enter the lesser value from no. 6 on the School Application form or $50,000) 4. Total Installed System Cost: $_____________________________
(Eligible installed system cost includes all equipment, installation, and applicable interconnection costs before the New Jersey Clean Energy Program incentive.)
5. Requested Incentive (Enter the appropriate value from C2. b or c): $___________________________________
1. Module: _____ Years at _____ Percent of Rated Power Output 2. Inverter:_____ Years 3. Installation: _____ Years Revised January 2009
B: PROPOSED INSTALLATION/INTERCONNECTION INFORMATION
C: INCENTIVE REQUEST CALCULATION
D: WARRANTY INFORMATION
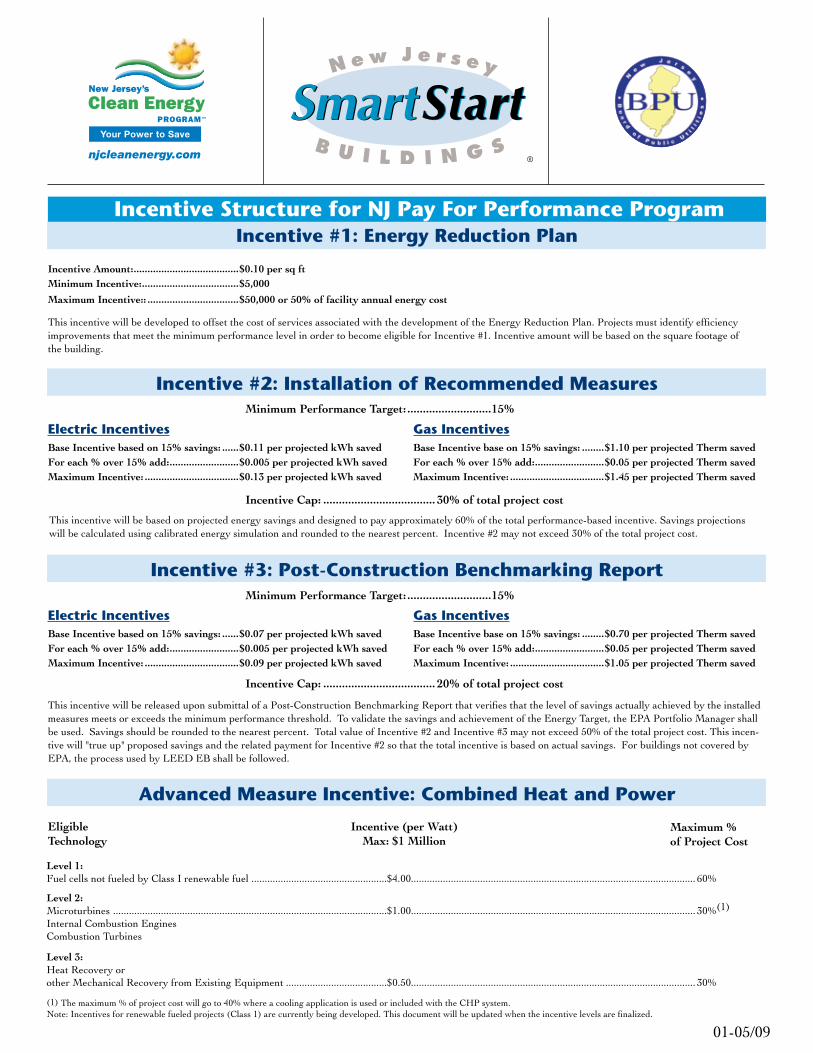
01-05/09
Incentive #1: Energy Reduction Plan
Incentive #2: Installation of Recommended Measures
Incentive #3: Post-Construction Benchmarking Report
Advanced Measure Incentive: Combined Heat and Power
Incentive Amount: ......................................$0.10 per sq ftMinimum Incentive: ...................................$5,000
Maximum Incentive:: .................................$50,000 or 50% of facility annual energy cost
This incentive will be developed to offset the cost of services associated with the development of the Energy Reduction Plan. Projects must identify efficiency improvements that meet the minimum performance level in order to become eligible for Incentive #1. Incentive amount will be based on the square footage ofthe building.
Electric IncentivesBase Incentive based on 15% savings: ......$0.11 per projected kWh savedFor each % over 15% add: .........................$0.005 per projected kWh savedMaximum Incentive: ..................................$0.13 per projected kWh saved
Gas IncentivesBase Incentive base on 15% savings: ........$1.10 per projected Therm savedFor each % over 15% add: .........................$0.05 per projected Therm savedMaximum Incentive: ..................................$1.45 per projected Therm saved
This incentive will be based on projected energy savings and designed to pay approximately 60% of the total performance-based incentive. Savings projections will be calculated using calibrated energy simulation and rounded to the nearest percent. Incentive #2 may not exceed 30% of the total project cost.
Level 1:Fuel cells not fueled by Class I renewable fuel ...................................................$4.00........................................................................................................... 60%
Level 2:Microturbines .......................................................................................................$1.00........................................................................................................... 30%(1)
Internal Combustion EnginesCombustion Turbines
Level 3:Heat Recovery or other Mechanical Recovery from Existing Equipment ......................................$0.50........................................................................................................... 30%
(1) The maximum % of project cost will go to 40% where a cooling application is used or included with the CHP system.Note: Incentives for renewable fueled projects (Class 1) are currently being developed. This document will be updated when the incentive levels are finalized.
Electric IncentivesBase Incentive based on 15% savings: ......$0.07 per projected kWh savedFor each % over 15% add: .........................$0.005 per projected kWh savedMaximum Incentive: ..................................$0.09 per projected kWh saved
Gas IncentivesBase Incentive base on 15% savings: ........$0.70 per projected Therm savedFor each % over 15% add: .........................$0.05 per projected Therm savedMaximum Incentive: ..................................$1.05 per projected Therm saved
This incentive will be released upon submittal of a Post-Construction Benchmarking Report that verifies that the level of savings actually achieved by the installed measures meets or exceeds the minimum performance threshold. To validate the savings and achievement of the Energy Target, the EPA Portfolio Manager shall be used. Savings should be rounded to the nearest percent. Total value of Incentive #2 and Incentive #3 may not exceed 50% of the total project cost. This incen-tive will "true up" proposed savings and the related payment for Incentive #2 so that the total incentive is based on actual savings. For buildings not covered by EPA, the process used by LEED EB shall be followed.
EligibleTechnology
Incentive (per Watt)Max: $1 Million
Maximum %of Project Cost
Incentive Cap: .................................... 30% of total project cost
Minimum Performance Target: ...........................15%
Minimum Performance Target: ...........................15%
Incentive Cap: .................................... 20% of total project cost
Incentive Structure for NJ Pay For Performance Program

Designed for small to medium-sized facilities, Direct Install, by New Jersey’s Clean Energy Program, cuts energy costs by replacing eligible lighting, HVAC, motors, natural gas, refrigeration and other equipment with higher effi ciency alternatives. The program pays up to 80% of retrofi t costs, dramatically lowering your upfront costs and improving your payback on the project. Services are provided by a network of Participating Contractors who perform
Energy Assessments to identify eligible alternatives and then install the qualifying measures.
NJCleanEnergy.com/ssb
The program is completely turnkey!Participating Contractors are approved to perform Energy Assessmentsand install the energy efficient equipment in your building.
Costs to you are minimal!Your share of the project’s cost will be approximately 20%, New Jersey’s Clean Energy Program pays the remaining 80%. With incentives sodramatic, your payback can be less than 2 years.
Turnaround time is quick!Direct Install is designed to fast-track project implementation so yourbusiness can begin saving on energy costs sooner rather than later. Participating Contractors will perform the Energy Assessments and implement the recommended effi ciency measures quickly.
Owners of existing small buildings to mid-size commercial andindustrial facilities with a peak electric demand that did not exceed200 kW in any of the preceding 12 months are eligible to participate in Direct Install. Buildings must be located in New Jersey and served by one of the state’s public, regulated electric or natural gas utility companies.
WHAT IS DIRECT INSTALL?
WHO’S ELIGIBLE?
WHAT TO EXPECT?
Contact us today at 866-NJSMART and get started on a path to savings.

APPENDIX H
ENGINEER’S OPINION OF PROBABLE CONSTRUCTION COSTS
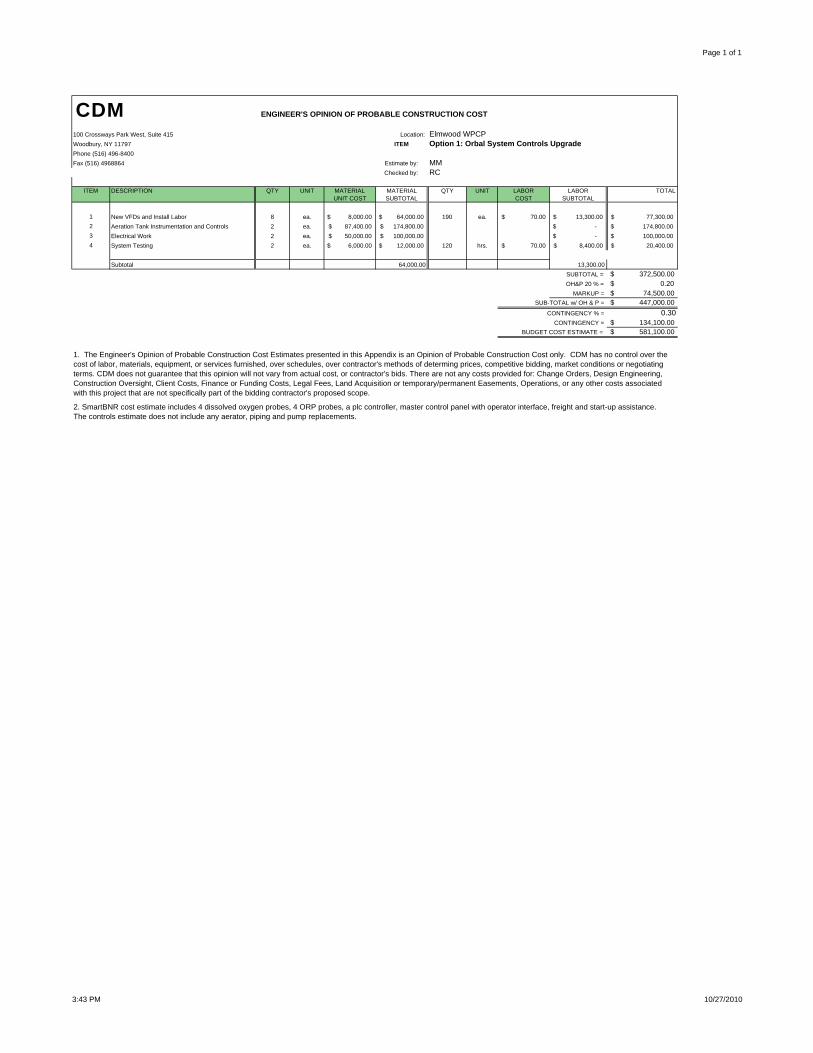
Page 1 of 1
CDM ENGINEER'S OPINION OF PROBABLE CONSTRUCTION COST
100 Crossways Park West, Suite 415 Location: Elmwood WPCPWoodbury, NY 11797 ITEM Option 1: Orbal System Controls UpgradePhone (516) 496-8400Fax (516) 4968864 Estimate by: MM
Checked by: RC
ITEM DESCRIPTION QTY UNIT MATERIAL MATERIAL QTY UNIT LABOR LABOR TOTALUNIT COST SUBTOTAL COST SUBTOTAL
1 New VFDs and Install Labor 8 ea. 8,000.00$ 64,000.00$ 190 ea. 70.00$ 13,300.00$ 77,300.00$ 2 Aeration Tank Instrumentation and Controls 2 ea. 87,400.00$ 174,800.00$ -$ 174,800.00$ 3 Electrical Work 2 ea. 50,000.00$ 100,000.00$ -$ 100,000.00$ 4 System Testing 2 ea. 6,000.00$ 12,000.00$ 120 hrs. 70.00$ 8,400.00$ 20,400.00$
Subtotal 64,000.00 13,300.00SUBTOTAL = 372,500.00$ OH&P 20 % = 0.20$
MARKUP = 74,500.00$ SUB-TOTAL w/ OH & P = 447,000.00$
CONTINGENCY % = 0.30CONTINGENCY = 134,100.00$
BUDGET COST ESTIMATE = 581,100.00$
1. The Engineer's Opinion of Probable Construction Cost Estimates presented in this Appendix is an Opinion of Probable Construction Cost only. CDM has no control over the cost of labor, materials, equipment, or services furnished, over schedules, over contractor's methods of determing prices, competitive bidding, market conditions or negotiating terms. CDM does not guarantee that this opinion will not vary from actual cost, or contractor's bids. There are not any costs provided for: Change Orders, Design Engineering, Construction Oversight, Client Costs, Finance or Funding Costs, Legal Fees, Land Acquisition or temporary/permanent Easements, Operations, or any other costs associated with this project that are not specifically part of the bidding contractor's proposed scope.
2. SmartBNR cost estimate includes 4 dissolved oxygen probes, 4 ORP probes, a plc controller, master control panel with operator interface, freight and start-up assistance. The controls estimate does not include any aerator, piping and pump replacements.
3:43 PM 10/27/2010

Page 1 of 4
CDM ENGINEER'S OPINION OF PROBABLE CONSTRUCTION COST
100 Crossways Park West, Suite 415 Location: Woodstream WPCPWoodbury, NY 11797 ITEM Option 1: VFDs on existing blowersPhone (516) 496-8400Fax (516) 4968864 Estimate by: MM
Checked by: RC
ITEM DESCRIPTION QTY UNIT MATERIAL MATERIAL QTY UNIT LABOR LABOR TOTALUNIT COST SUBTOTAL COST SUBTOTAL
1 New 150 hp VFDs and Install Labor 2 ea. 18,000.00$ 36,000.00$ 80 hrs. 70.00$ 5,600.00$ 41,600.00$ 2 New 100 hp VFDs and Install Labor 1 ea. 15,000.00$ 15,000.00$ 40 hrs. 70.00$ 2,800.00$ 17,800.00$ 3 Aeration Tank Instrumentation and Controls 2 ea. 30,000.00$ 60,000.00$ -$ 60,000.00$ 4 Electrical Work 3 ea. 10,000.00$ 30,000.00$ -$ 30,000.00$ 5 System Testing 2 ea. 6,000.00$ 12,000.00$ 120 hrs. 70.00$ 8,400.00$ 20,400.00$
Subtotal 36,000.00 5,600.00SUBTOTAL = 169,800.00$ OH&P 20 % = 0.20$
MARKUP = 33,960.00$ SUB-TOTAL w/ OH & P = 203,760.00$
CONTINGENCY % = 0.30CONTINGENCY = 61,128.00$
BUDGET COST ESTIMATE = 264,888.00$
1. The Engineer's Opinion of Probable Construction Cost Estimates presented in this Appendix is an Opinion of Probable Construction Cost only. CDM has no control over the cost of labor, materials, equipment, or services furnished, over schedules, over contractor's methods of determing prices, competitive bidding, market conditions or negotiating terms. CDM does not guarantee that this opinion will not vary from actual cost, or contractor's bids. There are not any costs provided for: Change Orders, Design Engineering, Construction Oversight, Client Costs, Finance or Funding Costs, Legal Fees, Land Acquisition or temporary/permanent Easements, Operations, or any other costs associated with this project that are not specifically part of the bidding contractor's proposed scope.
4:17 PM 10/27/2010

Page 2 of 4
CDM ENGINEER'S OPINION OF PROBABLE CONSTRUCTION COST
100 Crossways Park West, Suite 415 Location: Woodstream WPCPWoodbury, NY 11797 ITEM Option 2: New Centrifugal Blowers with VFDsPhone (516) 496-8400Fax (516) 4968864 Estimate by: MM
Checked by: RC
ITEM DESCRIPTION QTY UNIT MATERIAL MATERIAL QTY UNIT LABOR LABOR TOTALUNIT COST SUBTOTAL COST SUBTOTAL
1 Blowers 2 ea. 125,000.00$ 250,000.00$ 64 hrs. 70.00$ 4,480.00$ 254,480.00$ 2 New VFDs and Install Labor 2 ea. 15,000.00$ 30,000.00$ 150 hrs. 70.00$ 10,500.00$ 40,500.00$ 3 Remove existing blowers 3 ea. -$ 160 hrs. 70.00$ 11,200.00$ 11,200.00$ 4 Rigging 2 ea. 5,000.00$ 10,000.00$ 3 ea 5,000.00$ 15,000.00$ 25,000.00$ 5 New Piping 2 ea. 15,000.00$ 30,000.00$ -$ 30,000.00$ 6 Blower Instrumentation and Controls 2 ea. 30,000.00$ 60,000.00$ -$ 60,000.00$ 7 Aeration Tank Instrumentation and Controls 2 ea. 30,000.00$ 60,000.00$ -$ 60,000.00$ 8 Electrical Work 2 ea. 10,000.00$ 20,000.00$ -$ 20,000.00$ 9 System Testing 2 ea. 6,000.00$ 12,000.00$ 120 hrs. 70.00$ 8,400.00$ 20,400.00$
Subtotal 250,000.00 4,480.00SUBTOTAL = 521,580.00$ OH&P 20 % = 0.20$
MARKUP = 104,316.00$ SUB-TOTAL w/ OH & P = 625,896.00$
CONTINGENCY % = 0.30CONTINGENCY = 187,768.80$
BUDGET COST ESTIMATE = 813,664.80$
1. The Engineer's Opinion of Probable Construction Cost Estimates presented in this Appendix is an Opinion of Probable Construction Cost only. CDM has no control over the cost of labor, materials, equipment, or services furnished, over schedules, over contractor's methods of determing prices, competitive bidding, market conditions or negotiating terms. CDM does not guarantee that this opinion will not vary from actual cost, or contractor's bids. There are not any costs provided for: Change Orders, Design Engineering, Construction Oversight, Client Costs, Finance or Funding Costs, Legal Fees, Land Acquisition or temporary/permanent Easements, Operations, or any other costs associated with this project that are not specifically part of the bidding contractor's proposed scope.
4:17 PM 10/27/2010

Page 3 of 4
CDM ENGINEER'S OPINION OF PROBABLE CONSTRUCTION COST
100 Crossways Park West, Suite 415 Location: Woodstream WPCPWoodbury, NY 11797 ITEM Option 3: New Positive Displacement Blowers W/VFDsPhone (516) 496-8400Fax (516) 4968864 Estimate by: MM
Checked by: RC
ITEM DESCRIPTION QTY UNIT MATERIAL MATERIAL QTY UNIT LABOR LABOR TOTALUNIT COST SUBTOTAL COST SUBTOTAL
1 Positive Displacement Blowers 2 ea. 42,000.00$ 84,000.00$ 64 hrs. 70.00$ 4,480.00$ 88,480.00$ 2 New VFDs and Install Labor 2 ea. 13,500.00$ 27,000.00$ 150 hrs. 70.00$ 10,500.00$ 37,500.00$ 3 Remove existing blowers 3 ea. -$ 160 hrs. 70.00$ 11,200.00$ 11,200.00$ 4 Rigging 2 ea. 5,000.00$ 10,000.00$ 3 ea 5,000.00$ 15,000.00$ 25,000.00$ 5 New Piping 2 ea. 15,000.00$ 30,000.00$ -$ 30,000.00$ 6 Blower Instrumentation and Controls 2 ea. 30,000.00$ 60,000.00$ -$ 60,000.00$ 7 Aeration Tank Instrumentation and Controls 2 ea. 30,000.00$ 60,000.00$ -$ 60,000.00$ 8 Electrical Work 2 ea. 10,000.00$ 20,000.00$ -$ 20,000.00$ 9 System Testing 2 ea. 6,000.00$ 12,000.00$ 120 hrs. 70.00$ 8,400.00$ 20,400.00$
Subtotal 84,000.00 4,480.00SUBTOTAL = 352,580.00$ OH&P 20 % = 0.20$
MARKUP = 70,516.00$ SUB-TOTAL w/ OH & P = 423,096.00$
CONTINGENCY % = 0.30CONTINGENCY = 126,928.80$
BUDGET COST ESTIMATE = 550,024.80$
1. The Engineer's Opinion of Probable Construction Cost Estimates presented in this Appendix is an Opinion of Probable Construction Cost only. CDM has no control over the cost of labor, materials, equipment, or services furnished, over schedules, over contractor's methods of determing prices, competitive bidding, market conditions or negotiating terms. CDM does not guarantee that this opinion will not vary from actual cost, or contractor's bids. There are not any costs provided for: Change Orders, Design Engineering, Construction Oversight, Client Costs, Finance or Funding Costs, Legal Fees, Land Acquisition or temporary/permanent Easements, Operations, or any other costs associated with this project that are not specifically part of the bidding contractor's proposed scope.
4:17 PM 10/27/2010

Page 4 of 4
CDM ENGINEER'S OPINION OF PROBABLE CONSTRUCTION COST
100 Crossways Park West, Suite 415 Location: Woodstream WPCPWoodbury, NY 11797 ITEM Option 4: New Turbo Blowers w/VFDsPhone (516) 496-8400Fax (516) 4968864 Estimate by: MM
Checked by: RC
ITEM DESCRIPTION QTY UNIT MATERIAL MATERIAL QTY UNIT LABOR LABOR TOTALUNIT COST SUBTOTAL COST SUBTOTAL
1 Turbo Blowers (includes VFDs) 2 ea. 126,000.00$ 252,000.00$ 64 hrs. 70.00$ 4,480.00$ 256,480.00$ 2 Remove existing blowers 3 ea. -$ 160 hrs. 70.00$ 11,200.00$ 11,200.00$ 3 Rigging 2 ea. 5,000.00$ 10,000.00$ 3 ea 5,000.00$ 15,000.00$ 25,000.00$ 4 New Piping 2 ea. 15,000.00$ 30,000.00$ -$ 30,000.00$ 5 Blower Instrumentation and Controls 2 ea. 30,000.00$ 60,000.00$ -$ 60,000.00$ 6 Aeration Tank Instrumentation and Controls 2 ea. 30,000.00$ 60,000.00$ -$ 60,000.00$ 7 Electrical Work 2 ea. 10,000.00$ 20,000.00$ -$ 20,000.00$ 8 System Testing 2 ea. 6,000.00$ 12,000.00$ 120 hrs. 70.00$ 8,400.00$ 20,400.00$
-$ -$ -$ Subtotal 252,000.00 4,480.00
SUBTOTAL = 483,080.00$ OH&P 20 % = 0.20$
MARKUP = 96,616.00$ SUB-TOTAL w/ OH & P = 579,696.00$
CONTINGENCY % = 0.30CONTINGENCY = 173,908.80$
BUDGET COST ESTIMATE = 753,604.80$
1. The Engineer's Opinion of Probable Construction Cost Estimates presented in this Appendix is an Opinion of Probable Construction Cost only. CDM has no control over the cost of labor, materials, equipment, or services furnished, over schedules, over contractor's methods of determing prices, competitive bidding, market conditions or negotiating terms. CDM does not guarantee that this opinion will not vary from actual cost, or contractor's bids. There are not any costs provided for: Change Orders, Design Engineering, Construction Oversight, Client Costs, Finance or Funding Costs, Legal Fees, Land Acquisition or temporary/permanent Easements, Operations, or any other costs associated with this project that are not specifically part of the bidding contractor's proposed scope.
4:17 PM 10/27/2010

Page 1 of 2
CDM ENGINEER'S OPINION OF PROBABLE CONSTRUCTION COST
100 Crossways Park West, Suite 415 Location: Woodstream WPCPWoodbury, NY 11797 ITEM Option 1: Controls Upgrade on UV System Phone (516) 496-8400Fax (516) 4968864 Estimate by: MM
Checked by: RC
ITEM DESCRIPTION QTY UNIT MATERIAL MATERIAL QTY UNIT LABOR LABOR TOTALUNIT COST SUBTOTAL COST SUBTOTAL
1 Controls Upgrade1 1 ea. 74,000.00$ 74,000.00$ ea. 1,312.00$ -$ 74,000.00$ 2 Electrical Work 2 ls. 20,000.00$ 40,000.00$ 40,000.00$
Subtotal 74,000.00 0.00SUBTOTAL = 114,000.00$ OH&P 20 % = 0.20$
MARKUP = 22,800.00$ SUB-TOTAL w/ OH & P = 136,800.00$
CONTINGENCY % = 0.30CONTINGENCY = 41,040.00$
BUDGET COST ESTIMATE = 177,840.00$
1. Lump sum cost estimate was provided from the manufacturer. Cost includes all hardware, programming, start-up and freight charges. An evaulation of the equipment and all communication cards would be necessary to ensure they are in working order and that flow pacing could be reimplemented.
2. The Engineer's Opinion of Probable Construction Cost Estimates presented in this Appendix is an Opinion of Probable Construction Cost only. CDM has no control over the cost of labor, materials, equipment, or services furnished, over schedules, over contractor's methods of determing prices, competitive bidding, market conditions or negotiating terms. CDM does not guarantee that this opinion will not vary from actual cost, or contractor's bids. There are not any costs provided for: Change Orders, Design Engineering, Construction Oversight, Client Costs, Finance or Funding Costs, Legal Fees, Land Acquisition or temporary/permanent Easements, Operations, or any other costs associated with this project that are not specifically part of the bidding contractor's proposed scope.
4:27 PM 10/27/2010

Page 2 of 2
CDM ENGINEER'S OPINION OF PROBABLE CONSTRUCTION COST
100 Crossways Park West, Suite 415 Location: Woodstream WPCPWoodbury, NY 11797 ITEM Option 2: Replacement of existing UV System Phone (516) 496-8400Fax (516) 4968864 Estimate by: MM
Checked by: RC
ITEM DESCRIPTION QTY UNIT MATERIAL MATERIAL QTY UNIT LABOR LABOR TOTALUNIT COST SUBTOTAL COST SUBTOTAL
1 UV System Replacement1 1 ea. 210,000.00$ 210,000.00$ ea. -$ 210,000.00$ 2 Demolition/Install 1 ls. 50,000.00$ 50,000.00$ 50,000.00$ 3 Electrical work 1 ls. 20,000.00$ 20,000.00$ 20,000.00$
Subtotal 210,000.00 0.00SUBTOTAL = 280,000.00$ OH&P 20 % = 0.20$
MARKUP = 56,000.00$ SUB-TOTAL w/ OH & P = 336,000.00$
CONTINGENCY % = 0.30CONTINGENCY = 100,800.00$
BUDGET COST ESTIMATE = 436,800.00$
1. The lump sum cost estimate was provided by the manufacturer. Cost covers the new UV system, with automatic wipers and flow pacing controls covered under Option 1.
2. The Engineer's Opinion of Probable Construction Cost Estimates presented in this Appendix is an Opinion of Probable Construction Cost only. CDM has no control over the cost of labor, materials, equipment, or services furnished, over schedules, over contractor's methods of determing prices, competitive bidding, market conditions or negotiating terms. CDM does not guarantee that this opinion will not vary from actual cost, or contractor's bids. There are not any costs provided for: Change Orders, Design Engineering, Construction Oversight, Client Costs, Finance or Funding Costs, Legal Fees, Land Acquisition or temporary/permanent Easements, Operations, or any other costs associated with this project that are not specifically part of the bidding contractor's proposed scope.
4:27 PM 10/27/2010

Page 1 of 1
CDM ENGINEER'S OPINION OF PROBABLE CONSTRUCTION COST
11 British American Blvd Location: Evesham Municipal Utilities AuthorityLatham, NY 12110 Estimate by: MJRPhone (518) 782-4500 Checked by: MGFax (518) 786-3810
ITEM DESCRIPTION QTY UNIT *MATERIAL MATERIAL QTY UNIT **LABOR LABOR TOTALUNIT COST SUBTOTAL COST SUBTOTAL
Elmwood Administration and Attached Garage
1Furnace, Gas-Fired, Condensing High Efficiency100 MBH 4 ea. 1,700.00$ 6,800.00$ 4 ea. 221.00$ 884.00$ 7,684.00$ Subtotal 6,800.00 884.00
*Pricing per quote 10/7/2010 SUBTOTAL = 7,684.00$ MARKUP % = 0.15$
**Includes installation of new furnaces MARKUP = 1,152.60$ Does not include disposal of current furnaces, modification of gas piping, electrical, or modifying ductwork SUB-TOTAL w/ OH & P = 8,836.60$
CONTINGENCY % = 0.25Notes: CONTINGENCY = 2,209.15$
1. BUDGET COST ESTIMATE = 11,045.75$
2.
3.
This is a Conceptual Level Opinion of Probable Cost only. CDM has no control over the cost of labor, materials, equipment, or services furnished, over schedules, over contractor's methods of determining prices, competitive bidding (at least 3 each - both prime bidders and major subcontractors), market conditions or negotiating terms. CDM does not guarantee that this opinion will not vary from actual cost, or contractor's bids. There are not any costs provided for: Change Orders, Client Costs, Finance or Funding Costs, Legal Fees, Land Acquisition or temporary/permanent Easements, Operations, or any other costs associated with this project that are not specifically part of the bidding contractor's proposed scope.
Since some of the work will occur in older buildings, there is the potential to encounter asbestos or other materials requiring special removal and handling. Currently available information is not adequate to determine if such conditions exist, consequently these costs are not included in this estimate.
This estimate does not consider escalation of costs over time
10:01 AM 10/14/2010

Page 1 of 1
CDM ENGINEER'S OPINION OF PROBABLE CONSTRUCTION COST
11 British American Blvd Location: Evesham Municipal Utilities AuthorityLatham, NY 12110 Estimate by: MJRPhone (518) 782-4500 Checked by: MGFax (518) 786-3810
ITEM DESCRIPTION QTY UNIT *MATERIAL MATERIAL QTY UNIT **LABOR LABOR TOTALUNIT COST SUBTOTAL COST SUBTOTAL
Elmwod Administration and Attached Garage1 Condensing Unit, 14 SEER, 5 Ton 2 ea. 3,853.00$ 7,706.00$ 2 ea. 375.00$ 750.00$ 8,456.00$
Subtotal 7,706.00 750.00*Pricing per acdirect.com SUBTOTAL = 8,456.00$
MARKUP % = 0.15$ **Includes installation of new condensers MARKUP = 1,268.40$
Does not include disposal of current condensers, or modification of piping SUB-TOTAL w/ OH & P = 9,724.40$ CONTINGENCY % = 0.25
Notes: CONTINGENCY = 2,431.10$ 1. BUDGET COST ESTIMATE = 12,155.50$
2.
3.
This is a Conceptual Level Opinion of Probable Cost only. CDM has no control over the cost of labor, materials, equipment, or services furnished, over schedules, over contractor's methods of determining prices, competitive bidding (at least 3 each - both prime bidders and major subcontractors), market conditions or negotiating terms. CDM does not guarantee that this opinion will not vary from actual cost, or contractor's bids. There are not any costs provided for: Change Orders, Client Costs, Finance or Funding Costs, Legal Fees, Land Acquisition or temporary/permanent Easements, Operations, or any other costs associated with this project that are not specifically part of the bidding contractor's proposed scope.
Since some of the work will occur in older buildings, there is the potential to encounter asbestos or other materials requiring special removal and handling. Currently available information is not adequate to determine if such conditions exist, consequently these costs are not included in this estimate.
This estimate does not consider escalation of costs over time.
10:01 AM 10/14/2010
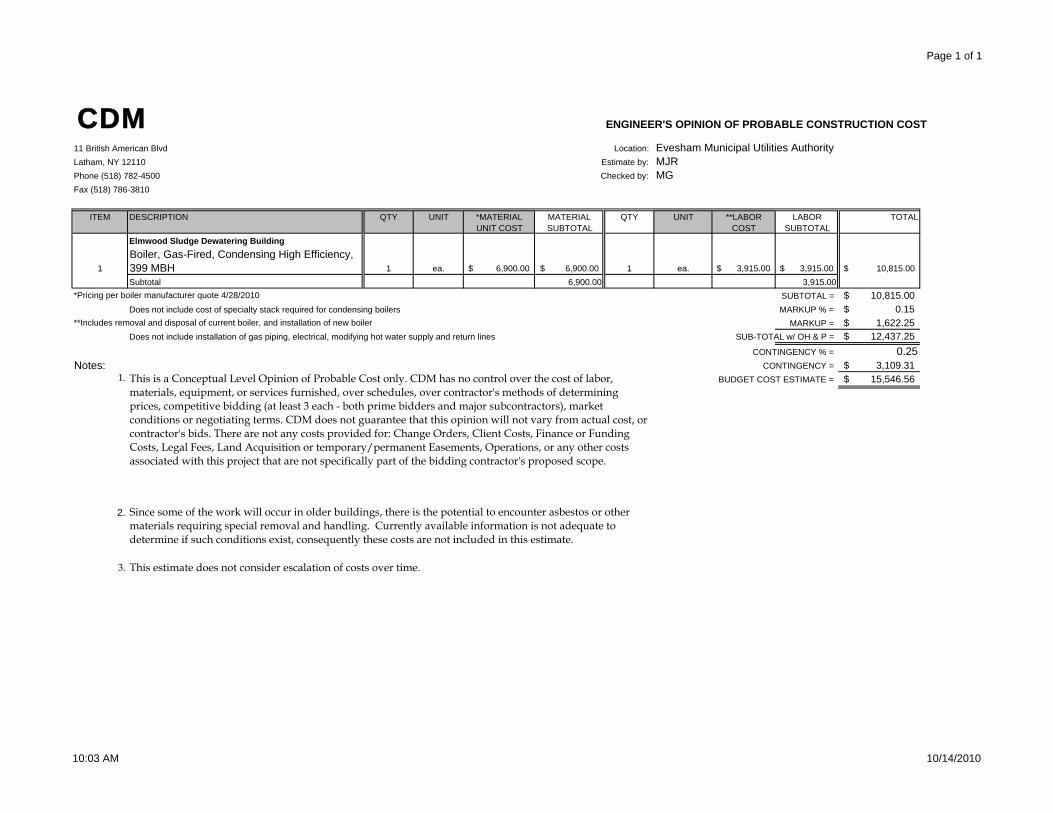
Page 1 of 1
CDM ENGINEER'S OPINION OF PROBABLE CONSTRUCTION COST
11 British American Blvd Location: Evesham Municipal Utilities AuthorityLatham, NY 12110 Estimate by: MJRPhone (518) 782-4500 Checked by: MGFax (518) 786-3810
ITEM DESCRIPTION QTY UNIT *MATERIAL MATERIAL QTY UNIT **LABOR LABOR TOTALUNIT COST SUBTOTAL COST SUBTOTAL
Elmwood Sludge Dewatering Building
1Boiler, Gas-Fired, Condensing High Efficiency, 399 MBH 1 ea. 6,900.00$ 6,900.00$ 1 ea. 3,915.00$ 3,915.00$ 10,815.00$ Subtotal 6,900.00 3,915.00
*Pricing per boiler manufacturer quote 4/28/2010 SUBTOTAL = 10,815.00$ Does not include cost of specialty stack required for condensing boilers MARKUP % = 0.15$
**Includes removal and disposal of current boiler, and installation of new boiler MARKUP = 1,622.25$ Does not include installation of gas piping, electrical, modifying hot water supply and return lines SUB-TOTAL w/ OH & P = 12,437.25$
CONTINGENCY % = 0.25Notes: CONTINGENCY = 3,109.31$
1. BUDGET COST ESTIMATE = 15,546.56$
2.
3.
This is a Conceptual Level Opinion of Probable Cost only. CDM has no control over the cost of labor, materials, equipment, or services furnished, over schedules, over contractor's methods of determining prices, competitive bidding (at least 3 each - both prime bidders and major subcontractors), market conditions or negotiating terms. CDM does not guarantee that this opinion will not vary from actual cost, or contractor's bids. There are not any costs provided for: Change Orders, Client Costs, Finance or Funding Costs, Legal Fees, Land Acquisition or temporary/permanent Easements, Operations, or any other costs associated with this project that are not specifically part of the bidding contractor's proposed scope.
Since some of the work will occur in older buildings, there is the potential to encounter asbestos or other materials requiring special removal and handling. Currently available information is not adequate to determine if such conditions exist, consequently these costs are not included in this estimate.
This estimate does not consider escalation of costs over time.
10:03 AM 10/14/2010
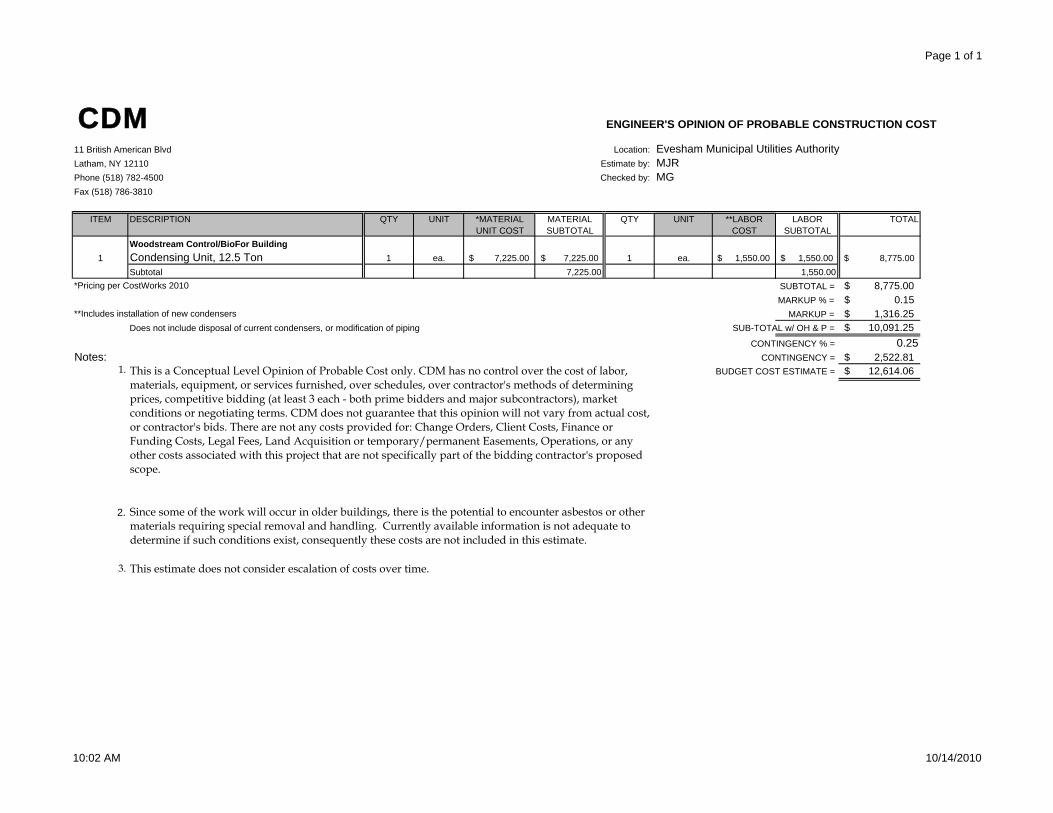
Page 1 of 1
CDM ENGINEER'S OPINION OF PROBABLE CONSTRUCTION COST
11 British American Blvd Location: Evesham Municipal Utilities AuthorityLatham, NY 12110 Estimate by: MJRPhone (518) 782-4500 Checked by: MGFax (518) 786-3810
ITEM DESCRIPTION QTY UNIT *MATERIAL MATERIAL QTY UNIT **LABOR LABOR TOTALUNIT COST SUBTOTAL COST SUBTOTAL
Woodstream Control/BioFor Building1 Condensing Unit, 12.5 Ton 1 ea. 7,225.00$ 7,225.00$ 1 ea. 1,550.00$ 1,550.00$ 8,775.00$
Subtotal 7,225.00 1,550.00*Pricing per CostWorks 2010 SUBTOTAL = 8,775.00$
MARKUP % = 0.15$ **Includes installation of new condensers MARKUP = 1,316.25$
Does not include disposal of current condensers, or modification of piping SUB-TOTAL w/ OH & P = 10,091.25$ CONTINGENCY % = 0.25
Notes: CONTINGENCY = 2,522.81$ 1. BUDGET COST ESTIMATE = 12,614.06$
2.
3.
This is a Conceptual Level Opinion of Probable Cost only. CDM has no control over the cost of labor, materials, equipment, or services furnished, over schedules, over contractor's methods of determining prices, competitive bidding (at least 3 each - both prime bidders and major subcontractors), market conditions or negotiating terms. CDM does not guarantee that this opinion will not vary from actual cost, or contractor's bids. There are not any costs provided for: Change Orders, Client Costs, Finance or Funding Costs, Legal Fees, Land Acquisition or temporary/permanent Easements, Operations, or any other costs associated with this project that are not specifically part of the bidding contractor's proposed scope.
Since some of the work will occur in older buildings, there is the potential to encounter asbestos or other materials requiring special removal and handling. Currently available information is not adequate to determine if such conditions exist, consequently these costs are not included in this estimate.
This estimate does not consider escalation of costs over time.
10:02 AM 10/14/2010

Page 1 of 1
3:35 PM 10/20/2010
CDM ENGINEER'S OPINION OF PROBABLE CONSTRUCTION COST
110 Fieldcrest Avenue, 6th Floor Location: Evesham - Elmwood FacilityEdison, New Jersey 08837 ITEM Jet Mixing SystemPhone (732) 225-7000 Estimate by: Liz YanoseyFax (732) 225-7851 Checked by:
ITEM DESCRIPTION QTY UNIT MATERIAL MATERIAL QTY UNIT LABOR LABOR TOTALUNIT COST SUBTOTAL COST SUBTOTAL
1 Jet Mixing System, pump, piping, and supports 1 ea 52,000.00$ 52,000.00$ 90 hrs 70.00$ 6,300.00$ 58,300.00$ 2 Instrumentation and Controls 1 l.s. 2,000.00$ 2,000.00$ 0 hrs 70.00$ -$ 2,000.00$ 3 Electrical Work 1 l.s. 20,000.00$ 20,000.00$ 0 hrs 70.00$ -$ 20,000.00$ 4 Pipe demolition inside tank 1 ls -$ -$ 32 hrs 70.00$ 2,240.00$ 2,240.00$ 5 Cleaning Sludge From Tank 1 ls 5,000.00$ 5,000.00$ 24 hrs 70.00$ 1,680.00$ 6,680.00$ 6 External Piping Installation 1 ea 3,500.00$ 3,500.00$ 32 hrs 70.00$ 2,240.00$ 5,740.00$ 7 Structural Equipment Pads 1 ls 2,000.00$ 2,000.00$ 0 hrs 70.00$ -$ 2,000.00$
8Inner Tank - Core Drill Existing Tank Wall w/ Linkseal 1 ls 2,500.00$ 2,500.00$ 0 hrs 70.00$ -$ 2,500.00$
9Outer Tank - Core Drill Existing Tank Wall w/ Linkseal 1 ls 2,500.00$ 2,500.00$ 0 hrs 70.00$ -$ 2,500.00$
10 Demolition of Existing Blower 1 ls 5,000.00$ 5,000.00$ 0 hrs 70.00$ -$ 5,000.00$ 11 Temporary Sludge Holding Tank 1 ls 20,000.00$ 20,000.00$ hrs 70.00$ -$ 20,000.00$
Subtotal 114,500.00 12,460.00SUBTOTAL = 126,960.00$ MARKUP % = 0.20$
MARKUP = 25,392.00$ SUB-TOTAL w/ OH & P = 152,352.00$
CONTINGENCY % = 0.30CONTINGENCY = 45,705.60$
Notes: BUDGET COST ESTIMATE = 198,057.60$ 1. The Engineer's Opinion of Probable Construction Cost Estimates presented in thisAppendix is an Opinion of Probable Construction Cost only. CDM has no control over the cost of labor, materials, equipment, or services furnished, over schedules, over contractor'smethods of determing prices, competitive bidding, market conditions or negotiating terms.CDM does not guarantee that this opinion will not vary from actual cost, or contractor's bids.There are not any costs provided for: Change Orders, Design Engineering, Construction Oversight, Client Costs, Finance or Funding Costs, Legal Fees, Land Acquisition ortemporary/permanent Easements, Operations, or any other costs associated with this projectthat are not specifically part of the bidding contractor's proposed scope.

Page 1 of 1
3:36 PM 10/20/2010
CDM ENGINEER'S OPINION OF PROBABLE CONSTRUCTION COST
110 Fieldcrest Avenue, 6th Floor Location: Evesham - Woodstream FacilityEdison, New Jersey 08837 ITEM Jet Mixing SystemPhone (732) 225-7000 Estimate by: Liz YanoseyFax (732) 225-7851 Checked by:
ITEM DESCRIPTION QTY UNIT MATERIAL MATERIAL QTY UNIT LABOR LABOR TOTALUNIT COST SUBTOTAL COST SUBTOTAL
1 Jet Mixing System, pump, piping, and supports 1 ea 45,000.00$ 45,000.00$ 120 hrs 70.00$ 8,400.00$ 53,400.00$ 2 Instrumentation and Controls 1 l.s. 2,000.00$ 2,000.00$ 0 hrs 70.00$ -$ 2,000.00$ 3 Electrical Work 1 l.s. 10,000.00$ 10,000.00$ 0 hrs 70.00$ -$ 10,000.00$ 4 Pipe demolition inside tank 1 ls -$ -$ 80 hrs 70.00$ 5,600.00$ 5,600.00$ 5 Cleaning Sludge From Tank 1 ls 2,500.00$ 2,500.00$ 60 hrs 70.00$ 4,200.00$ 6,700.00$ 6 External Piping Installation 1 ea 3,500.00$ 3,500.00$ 80 hrs 70.00$ 5,600.00$ 9,100.00$ 7 Structural Equipment Pads 1 ls 2,000.00$ 2,000.00$ 0 hrs 70.00$ -$ 2,000.00$ 8 Core Drill Existing Tank Wall w/ Linkseal 1 ls 2,500.00$ 2,500.00$ 0 hrs 70.00$ -$ 2,500.00$ 9 Demolition of Existing Blower 1 ls 5,000.00$ 5,000.00$ 0 hrs 70.00$ -$ 5,000.00$
10 Temporary Sludge Holding Facility 1 ls 40,000.00$ 40,000.00$ 0 hrs 70.00$ -$ 40,000.00$ Subtotal 112,500.00 23,800.00
SUBTOTAL = 136,300.00$ MARKUP % = 0.20$
MARKUP = 27,260.00$ SUB-TOTAL w/ OH & P = 163,560.00$
CONTINGENCY % = 0.30CONTINGENCY = 49,068.00$
Notes: BUDGET COST ESTIMATE = 212,628.00$ 1. The Engineer's Opinion of Probable Construction Cost Estimates presented in thisAppendix is an Opinion of Probable Construction Cost only. CDM has no control over the cost of labor, materials, equipment, or services furnished, over schedules, over contractor'smethods of determing prices, competitive bidding, market conditions or negotiating terms.CDM does not guarantee that this opinion will not vary from actual cost, or contractor's bids.There are not any costs provided for: Change Orders, Design Engineering, Construction Oversight, Client Costs, Finance or Funding Costs, Legal Fees, Land Acquisition ortemporary/permanent Easements, Operations, or any other costs associated with this projectthat are not specifically part of the bidding contractor's proposed scope.


CDM ENGINEER'S OPINION OF PROBABLE CONSTRUCTION COST
11 British American Blvd Location: Evesham MUALatham, NY 12110 Estimate by: RGPhone (518) 782-4500 Checked by: JMFax (518) 786-3810
ITEM DESCRIPTION QTY UNIT MATERIAL MATERIAL QTY UNIT LABOR LABOR TOTALUNIT COST SUBTOTAL COST SUBTOTAL
Elmwood Administration Building1 Lighting Upgrades 1 ea. 9,653.00$ 9,653.00$ 1 ea. 5,877.50$ 5,877.50$ 15,530.50$
Subtotal 9,653.00$ 5,877.50$ SUBTOTAL = 15,530.50$ MARKUP % = 0.15$
MARKUP = 2,329.58$ SUB-TOTAL w/ OH & P = 17,860.08$
Notes: CONTINGENCY % = 0.251. Bonds not included in estimate CONTINGENCY = 4,465.02$ 2. Escalation not included in estimate. BUDGET COST ESTIMATE = 22,325.09$
ITEM DESCRIPTION QTY UNIT MATERIAL MATERIAL QTY UNIT LABOR LABOR TOTALUNIT COST SUBTOTAL COST SUBTOTAL
Elmwood Sludge Recirculation/Alum Storage Building1 Lighting Upgrades 1 ea. 2,560.00$ 2,560.00$ 1 ea. 1,639.00$ 1,639.00$ 4,199.00$
Subtotal 2,560.00$ 1,639.00$ SUBTOTAL = 4,199.00$ MARKUP % = 0.15$
MARKUP = 629.85$ SUB-TOTAL w/ OH & P = 4,828.85$
Notes: CONTINGENCY % = 0.251. Bonds not included in estimate CONTINGENCY = 1,207.21$ 2. Escalation not included in estimate. BUDGET COST ESTIMATE = 6,036.06$

CDM ENGINEER'S OPINION OF PROBABLE CONSTRUCTION COST
11 British American Blvd Location: Evesham MUALatham, NY 12110 Estimate by: RGPhone (518) 782-4500 Checked by: JMFax (518) 786-3810
ITEM DESCRIPTION QTY UNIT MATERIAL MATERIAL QTY UNIT LABOR LABOR TOTALUNIT COST SUBTOTAL COST SUBTOTAL
Elmwood Chemical Feed Building1 Lighting Upgrades 1 ea. 1,360.00$ 1,360.00$ 1 ea. 664.00$ 664.00$ 2,024.00$
Subtotal 1,360.00$ 664.00$ SUBTOTAL = 2,024.00$ MARKUP % = 0.15$
MARKUP = 303.60$ SUB-TOTAL w/ OH & P = 2,327.60$
Notes: CONTINGENCY % = 0.251. Bonds not included in estimate CONTINGENCY = 581.90$ 2. Escalation not included in estimate. BUDGET COST ESTIMATE = 2,909.50$
ITEM DESCRIPTION QTY UNIT MATERIAL MATERIAL QTY UNIT LABOR LABOR TOTALUNIT COST SUBTOTAL COST SUBTOTAL
Elmwood Sludge Dewatering Building1 Lighting Upgrades 1 ea. 2,906.00$ 2,906.00$ 1 ea. 1,417.00$ 1,417.00$ 4,323.00$
Subtotal 2,906.00$ 1,417.00$ SUBTOTAL = 4,323.00$ MARKUP % = 0.15$
MARKUP = 648.45$ SUB-TOTAL w/ OH & P = 4,971.45$
Notes: CONTINGENCY % = 0.251. Bonds not included in estimate CONTINGENCY = 1,242.86$ 2. Escalation not included in estimate. BUDGET COST ESTIMATE = 6,214.31$

CDM ENGINEER'S OPINION OF PROBABLE CONSTRUCTION COST
11 British American Blvd Location: Evesham MUALatham, NY 12110 Estimate by: RGPhone (518) 782-4500 Checked by: JMFax (518) 786-3810
ITEM DESCRIPTION QTY UNIT MATERIAL MATERIAL QTY UNIT LABOR LABOR TOTALUNIT COST SUBTOTAL COST SUBTOTAL
Elmwood Generator Building1 Lighting Upgrades 1 ea. 980.00$ 980.00$ 1 ea. 527.00$ 527.00$ 1,507.00$
Subtotal 980.00$ 527.00$ SUBTOTAL = 1,507.00$ MARKUP % = 0.15$
MARKUP = 226.05$ SUB-TOTAL w/ OH & P = 1,733.05$
Notes: CONTINGENCY % = 0.251. Bonds not included in estimate CONTINGENCY = 433.26$ 2. Escalation not included in estimate. BUDGET COST ESTIMATE = 2,166.31$
ITEM DESCRIPTION QTY UNIT MATERIAL MATERIAL QTY UNIT LABOR LABOR TOTALUNIT COST SUBTOTAL COST SUBTOTAL
Woodstream Control/BioFor Building1 Lighting Upgrades 1 ea. 6,070.00$ 6,070.00$ 1 ea. 2,538.50$ 2,538.50$ 8,608.50$
Subtotal 6,070.00$ 2,538.50$ SUBTOTAL = 8,608.50$ MARKUP % = 0.15$
MARKUP = 1,291.28$ SUB-TOTAL w/ OH & P = 9,899.78$
Notes: CONTINGENCY % = 0.251. Bonds not included in estimate CONTINGENCY = 2,474.94$ 2. Escalation not included in estimate. BUDGET COST ESTIMATE = 12,374.72$

CDM ENGINEER'S OPINION OF PROBABLE CONSTRUCTION COST
11 British American Blvd Location: Evesham MUALatham, NY 12110 Estimate by: RGPhone (518) 782-4500 Checked by: JMFax (518) 786-3810
ITEM DESCRIPTION QTY UNIT MATERIAL MATERIAL QTY UNIT LABOR LABOR TOTALUNIT COST SUBTOTAL COST SUBTOTAL
Woodstream Blower Building 1 Lighting Upgrades 1 ea. 1,267.10$ 1,267.10$ 1 ea. 667.50$ 667.50$ 1,934.60$
Subtotal 1,267.10$ 667.50$ SUBTOTAL = 1,934.60$ MARKUP % = 0.15$
MARKUP = 290.19$ SUB-TOTAL w/ OH & P = 2,224.79$
Notes: CONTINGENCY % = 0.251. Bonds not included in estimate CONTINGENCY = 556.20$ 2. Escalation not included in estimate. BUDGET COST ESTIMATE = 2,780.99$
ITEM DESCRIPTION QTY UNIT MATERIAL MATERIAL QTY UNIT LABOR LABOR TOTALUNIT COST SUBTOTAL COST SUBTOTAL
Elmwood Site Lighting1 Lighting Upgrades 1 ea. 6,630.00$ 6,630.00$ 1 ea. 2,329.00$ 2,329.00$ 8,959.00$
Subtotal 6,630.00$ 2,329.00$ SUBTOTAL = 8,959.00$ MARKUP % = 0.15$
MARKUP = 1,343.85$ SUB-TOTAL w/ OH & P = 10,302.85$
Notes: CONTINGENCY % = 0.251. Bonds not included in estimate CONTINGENCY = 2,575.71$ 2. Escalation not included in estimate. BUDGET COST ESTIMATE = 12,878.56$

CDM ENGINEER'S OPINION OF PROBABLE CONSTRUCTION COST
11 British American Blvd Location: Evesham MUALatham, NY 12110 Estimate by: RGPhone (518) 782-4500 Checked by: JMFax (518) 786-3810
ITEM DESCRIPTION QTY UNIT MATERIAL MATERIAL QTY UNIT LABOR LABOR TOTALUNIT COST SUBTOTAL COST SUBTOTAL
Woodstream Site Lighting1 Lighting Upgrades 1 ea. 3,900.00$ 3,900.00$ 1 ea. 1,370.00$ 1,370.00$ 5,270.00$
Subtotal 3,900.00$ 1,370.00$ SUBTOTAL = 5,270.00$ MARKUP % = 0.15$
MARKUP = 790.50$ SUB-TOTAL w/ OH & P = 6,060.50$
Notes: CONTINGENCY % = 0.251. Bonds not included in estimate CONTINGENCY = 1,515.13$ 2. Escalation not included in estimate. BUDGET COST ESTIMATE = 7,575.63$
ITEM DESCRIPTION QTY UNIT MATERIAL MATERIAL QTY UNIT LABOR LABOR TOTALUNIT COST SUBTOTAL COST SUBTOTAL
Elmwood - Sludge Recirculation/Alum Storage Building & Chemical Feed Building1 Motor Upgrades 1 ea. 35,975.00$ 35,975.00$ 1 ea. 12,805.00$ 12,805.00$ 48,780.00$
Subtotal 35,975.00$ 12,805.00$ SUBTOTAL = 48,780.00$ MARKUP % = 0.15$
MARKUP = 7,317.00$ SUB-TOTAL w/ OH & P = 56,097.00$
Notes: CONTINGENCY % = 0.251. Bonds not included in estimate CONTINGENCY = 14,024.25$ 2. Escalation not included in estimate. BUDGET COST ESTIMATE = 70,121.25$

CDM ENGINEER'S OPINION OF PROBABLE CONSTRUCTION COST
11 British American Blvd Location: Evesham MUALatham, NY 12110 Estimate by: RGPhone (518) 782-4500 Checked by: JMFax (518) 786-3810
ITEM DESCRIPTION QTY UNIT MATERIAL MATERIAL QTY UNIT LABOR LABOR TOTALUNIT COST SUBTOTAL COST SUBTOTAL
Elmwood - Outdoor Process Equipment1 Motor Upgrades 1 ea. 28,950.00$ 28,950.00$ 1 ea. 3,952.00$ 3,952.00$ 32,902.00$
Subtotal 28,950.00$ 3,952.00$ SUBTOTAL = 32,902.00$ MARKUP % = 0.15$
MARKUP = 4,935.30$ SUB-TOTAL w/ OH & P = 37,837.30$
Notes: CONTINGENCY % = 0.251. Bonds not included in estimate CONTINGENCY = 9,459.33$ 2. Escalation not included in estimate. BUDGET COST ESTIMATE = 47,296.63$
ITEM DESCRIPTION QTY UNIT MATERIAL MATERIAL QTY UNIT LABOR LABOR TOTALUNIT COST SUBTOTAL COST SUBTOTAL
Woodstream - Biofor Building1 Motor Upgrades 1 ea. 15,925.00$ 15,925.00$ 1 ea. 2,470.00$ 2,470.00$ 18,395.00$
Subtotal 15,925.00$ 2,470.00$ SUBTOTAL = 18,395.00$ MARKUP % = 0.15$
MARKUP = 2,759.25$ SUB-TOTAL w/ OH & P = 21,154.25$
Notes: CONTINGENCY % = 0.251. Bonds not included in estimate CONTINGENCY = 5,288.56$ 2. Escalation not included in estimate. BUDGET COST ESTIMATE = 26,442.81$

CDM ENGINEER'S OPINION OF PROBABLE CONSTRUCTION COST
11 British American Blvd Location: Evesham MUALatham, NY 12110 Estimate by: RGPhone (518) 782-4500 Checked by: JMFax (518) 786-3810
ITEM DESCRIPTION QTY UNIT MATERIAL MATERIAL QTY UNIT LABOR LABOR TOTALUNIT COST SUBTOTAL COST SUBTOTAL
Woodstream - Blower Building1 Motor Upgrades 1 ea. 22,225.00$ 22,225.00$ 1 ea. 3,215.00$ 3,215.00$ 25,440.00$
Subtotal 22,225.00$ 3,215.00$ SUBTOTAL = 25,440.00$ MARKUP % = 0.15$
MARKUP = 3,816.00$ SUB-TOTAL w/ OH & P = 29,256.00$
Notes: CONTINGENCY % = 0.251. Bonds not included in estimate CONTINGENCY = 7,314.00$ 2. Escalation not included in estimate. BUDGET COST ESTIMATE = 36,570.00$
ITEM DESCRIPTION QTY UNIT MATERIAL MATERIAL QTY UNIT LABOR LABOR TOTALUNIT COST SUBTOTAL COST SUBTOTAL
Woodstream - Influent Pump Station1 Motor Upgrades 1 ea. 3,975.00$ 3,975.00$ 1 ea. 657.00$ 657.00$ 4,632.00$
Subtotal 3,975.00$ 657.00$ SUBTOTAL = 4,632.00$ MARKUP % = 0.15$
MARKUP = 694.80$ SUB-TOTAL w/ OH & P = 5,326.80$
Notes: CONTINGENCY % = 0.251. Bonds not included in estimate CONTINGENCY = 1,331.70$ 2. Escalation not included in estimate. BUDGET COST ESTIMATE = 6,658.50$
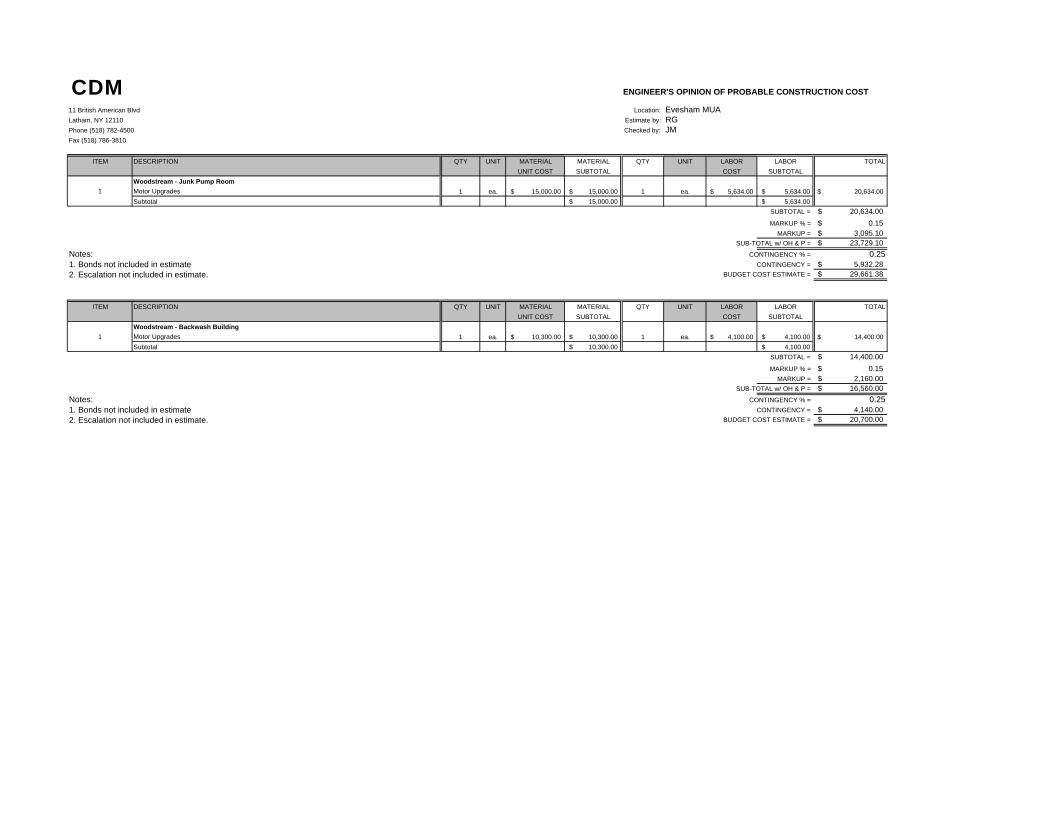
CDM ENGINEER'S OPINION OF PROBABLE CONSTRUCTION COST
11 British American Blvd Location: Evesham MUALatham, NY 12110 Estimate by: RGPhone (518) 782-4500 Checked by: JMFax (518) 786-3810
ITEM DESCRIPTION QTY UNIT MATERIAL MATERIAL QTY UNIT LABOR LABOR TOTALUNIT COST SUBTOTAL COST SUBTOTAL
Woodstream - Junk Pump Room1 Motor Upgrades 1 ea. 15,000.00$ 15,000.00$ 1 ea. 5,634.00$ 5,634.00$ 20,634.00$
Subtotal 15,000.00$ 5,634.00$ SUBTOTAL = 20,634.00$ MARKUP % = 0.15$
MARKUP = 3,095.10$ SUB-TOTAL w/ OH & P = 23,729.10$
Notes: CONTINGENCY % = 0.251. Bonds not included in estimate CONTINGENCY = 5,932.28$ 2. Escalation not included in estimate. BUDGET COST ESTIMATE = 29,661.38$
ITEM DESCRIPTION QTY UNIT MATERIAL MATERIAL QTY UNIT LABOR LABOR TOTALUNIT COST SUBTOTAL COST SUBTOTAL
Woodstream - Backwash Building1 Motor Upgrades 1 ea. 10,300.00$ 10,300.00$ 1 ea. 4,100.00$ 4,100.00$ 14,400.00$
Subtotal 10,300.00$ 4,100.00$ SUBTOTAL = 14,400.00$ MARKUP % = 0.15$
MARKUP = 2,160.00$ SUB-TOTAL w/ OH & P = 16,560.00$
Notes: CONTINGENCY % = 0.251. Bonds not included in estimate CONTINGENCY = 4,140.00$ 2. Escalation not included in estimate. BUDGET COST ESTIMATE = 20,700.00$
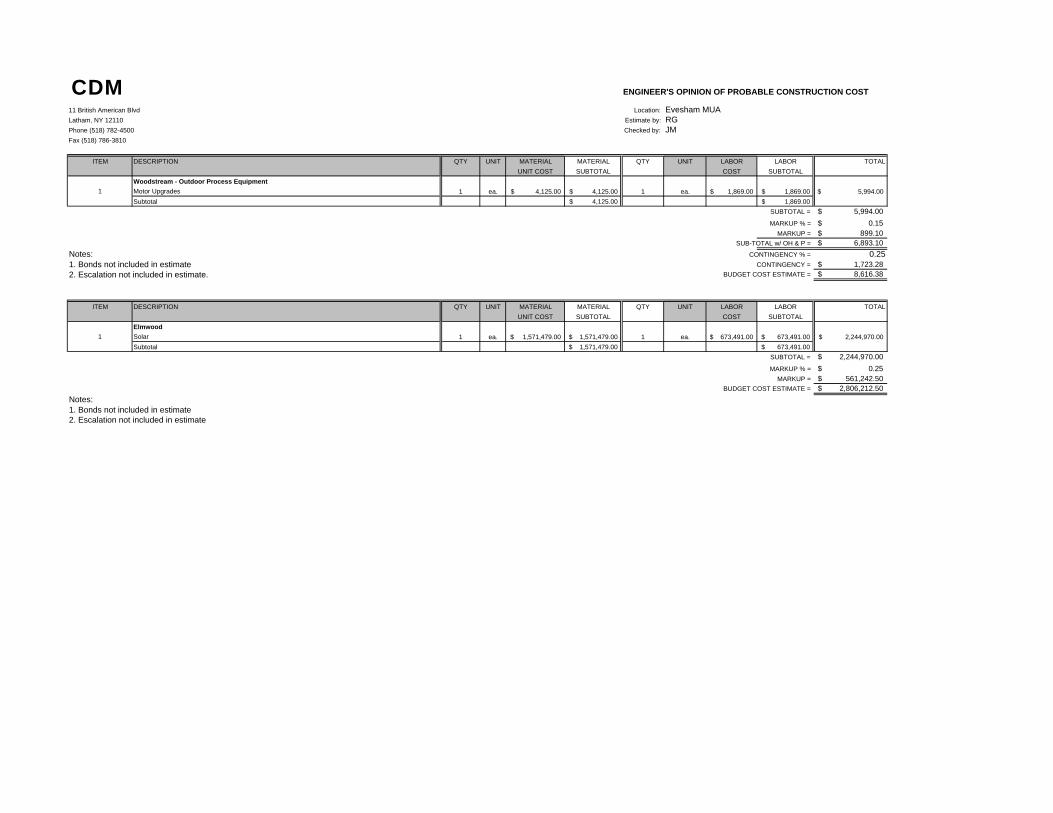
CDM ENGINEER'S OPINION OF PROBABLE CONSTRUCTION COST
11 British American Blvd Location: Evesham MUALatham, NY 12110 Estimate by: RGPhone (518) 782-4500 Checked by: JMFax (518) 786-3810
ITEM DESCRIPTION QTY UNIT MATERIAL MATERIAL QTY UNIT LABOR LABOR TOTALUNIT COST SUBTOTAL COST SUBTOTAL
Woodstream - Outdoor Process Equipment1 Motor Upgrades 1 ea. 4,125.00$ 4,125.00$ 1 ea. 1,869.00$ 1,869.00$ 5,994.00$
Subtotal 4,125.00$ 1,869.00$ SUBTOTAL = 5,994.00$ MARKUP % = 0.15$
MARKUP = 899.10$ SUB-TOTAL w/ OH & P = 6,893.10$
Notes: CONTINGENCY % = 0.251. Bonds not included in estimate CONTINGENCY = 1,723.28$ 2. Escalation not included in estimate. BUDGET COST ESTIMATE = 8,616.38$
ITEM DESCRIPTION QTY UNIT MATERIAL MATERIAL QTY UNIT LABOR LABOR TOTALUNIT COST SUBTOTAL COST SUBTOTAL
Elmwood1 Solar 1 ea. 1,571,479.00$ 1,571,479.00$ 1 ea. 673,491.00$ 673,491.00$ 2,244,970.00$
Subtotal 1,571,479.00$ 673,491.00$ SUBTOTAL = 2,244,970.00$ MARKUP % = 0.25$
MARKUP = 561,242.50$ BUDGET COST ESTIMATE = 2,806,212.50$
Notes:1. Bonds not included in estimate2. Escalation not included in estimate
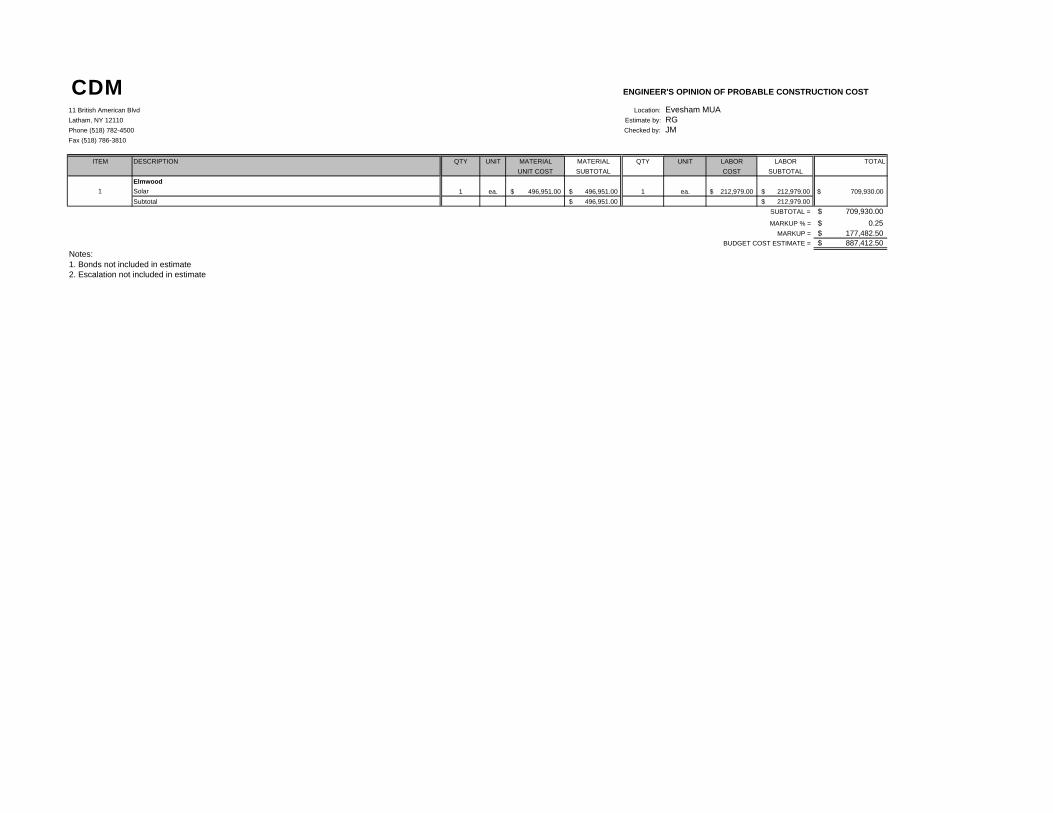
CDM ENGINEER'S OPINION OF PROBABLE CONSTRUCTION COST
11 British American Blvd Location: Evesham MUALatham, NY 12110 Estimate by: RGPhone (518) 782-4500 Checked by: JMFax (518) 786-3810
ITEM DESCRIPTION QTY UNIT MATERIAL MATERIAL QTY UNIT LABOR LABOR TOTALUNIT COST SUBTOTAL COST SUBTOTAL
Elmwood1 Solar 1 ea. 496,951.00$ 496,951.00$ 1 ea. 212,979.00$ 212,979.00$ 709,930.00$
Subtotal 496,951.00$ 212,979.00$ SUBTOTAL = 709,930.00$ MARKUP % = 0.25$
MARKUP = 177,482.50$ BUDGET COST ESTIMATE = 887,412.50$
Notes:1. Bonds not included in estimate2. Escalation not included in estimate

APPENDIX I
ECRM FINANCIAL ANALYSES

IRR, NPV, AROI - Elmwood WWTP: Orbal Systems Control Upgrade
Financial CalculationsBased on inflation of: 3%Option 1
Year Energy Savings Cash Flow0 ($581,100)1 $131,490 $142,8902 $135,435 $146,8353 $139,498 $150,8984 $143,683 $155,0835 $147,993 $159,3936 $152,433 $163,8337 $157,006 $168,4068 $161,716 $173,1169 $166,568 $177,968
10 $171,565 $182,96511 $176,712 $188,11212 $182,013 $193,41313 $187,473 $198,87314 $193,097 $204,49715 $198,890 $210,290
IRR 26.24%NPV $1,637,569AROI 19.59%
New Motors and VFDs

Elmwood WPCP ‐ Orbal System Controls Upgrade Lifetime Savings Analysis
ECRMOption 1 - New Control
System
Assumed Inflation (Gas) 2%Initial Yearly Savings (Gas)Assumed Inflation (Electricity) 3%Initial Yearly Savings (Electricity) $131,490.00Assumed Average Useful Life (Years) 15
Lifetime Savings $2,445,571.19
Year Annual Savings1 $131,490.002 $135,434.703 $139,497.744 $143,682.675 $147,993.156 $152,432.957 $157,005.948 $161,716.119 $166,567.6010 $171,564.6311 $176,711.5612 $182,012.9113 $187,473.3014 $193,097.5015 $198,890.42

IRR, NPV, AROI - Contact Stabilization System ECRMs
Financial CalculationsBased on inflation of: 3%Option 1 Option 2 Option 3 Option 4
New Centrifugal Blowers New Positive Displacement Blowers New Turbo Blowers
Year Energy Savings Cash Flow Year Energy Savings Cash Flow Year Energy Savings Cash Flow Year Energy Savings Cash Flow0 ($264,888) 0 ($813,665) 0 ($550,025) 0 ($753,605)1 $107,165 $109,165 1 $107,165 $115,165 1 $102,706 $112,706 1 $80,750 $90,7502 $110,380 $112,380 2 $110,380 $118,380 2 $105,787 $115,787 2 $83,173 $93,1733 $113,691 $115,691 3 $113,691 $121,691 3 $108,961 $118,961 3 $85,668 $95,6684 $117,102 $119,102 4 $117,102 $125,102 4 $112,230 $122,230 4 $88,238 $98,2385 $120,615 $122,615 5 $120,615 $128,615 5 $115,597 $125,597 5 $90,885 $100,8856 $124,234 $126,234 6 $124,234 $132,234 6 $119,064 $129,064 6 $93,611 $103,6117 $127,961 $129,961 7 $127,961 $135,961 7 $122,636 $132,636 7 $96,420 $106,4208 $131,799 $133,799 8 $131,799 $139,799 8 $126,315 $136,315 8 $99,312 $109,3129 $135,753 $137,753 9 $135,753 $143,753 9 $130,105 $140,105 9 $102,292 $112,292
10 $139,826 $141,826 10 $139,826 $147,826 10 $134,008 $144,008 10 $105,360 $115,36011 $144,021 $146,021 11 $144,021 $152,021 11 $138,028 $148,028 11 $108,521 $118,52112 $148,341 $150,341 12 $148,341 $156,341 12 $142,169 $152,169 12 $111,777 $121,77713 $152,792 $154,792 13 $152,792 $160,792 13 $146,434 $156,434 13 $115,130 $125,13014 $157,375 $159,375 14 $157,375 $165,375 14 $150,827 $160,827 14 $118,584 $128,58415 $162,097 $164,097 15 $162,097 $170,097 15 $155,352 $165,352 15 $122,142 $132,142
IRR 43.89% IRR 13.93% IRR 21.61% IRR 10.98%NPV $1,449,653 NPV $977,972 NPV $1,197,040 NPV $647,449AROI 36.21% AROI 9.15% AROI 15.49% AROI 7.04%
New VFDs

Woodstream WPCP ‐ Contact Stabilization System ECRMs Lifetime Savings Analysis
ECRM Option 1 - New VFDsOption 2 - New Centrifugal
BlowersOption 3- New Positive Displacement Blowers
Option 4 - New Turbo Blowers
Assumed Inflation (Gas) 2% 2% 2% 2%Initial Yearly Savings (Gas)Assumed Inflation (Electricity) 3% 3% 3% 3%Initial Yearly Savings (Electricity) $107,165.00 $107,165.00 $102,706.00 $80,750.00Assumed Average Useful Life (Years) 15 15 15 15
Lifetime Savings $1,993,152.61 $1,993,152.61 $1,910,220.05 $1,501,862.30
Year Annual Savings Annual Savings Annual Savings Annual Savings1 $107,165.00 $107,165.00 $102,706.00 $80,750.002 $110,379.95 $110,379.95 $105,787.18 $83,172.503 $113,691.35 $113,691.35 $108,960.80 $85,667.684 $117,102.09 $117,102.09 $112,229.62 $88,237.715 $120,615.15 $120,615.15 $115,596.51 $90,884.846 $124,233.61 $124,233.61 $119,064.40 $93,611.387 $127,960.61 $127,960.61 $122,636.34 $96,419.728 $131,799.43 $131,799.43 $126,315.43 $99,312.319 $135,753.42 $135,753.42 $130,104.89 $102,291.68
10 $139,826.02 $139,826.02 $134,008.03 $105,360.4311 $144,020.80 $144,020.80 $138,028.28 $108,521.2512 $148,341.42 $148,341.42 $142,169.12 $111,776.8913 $152,791.67 $152,791.67 $146,434.20 $115,130.1914 $157,375.42 $157,375.42 $150,827.22 $118,584.1015 $162,096.68 $162,096.68 $155,352.04 $122,141.62

IRR, NPV, AROI - UV System ECRMs
Financial CalculationsBased on inflation of: 3%Option 1 Option 2
Overall System Replacement
Year Energy Savings Cash Flow Year Energy Savings Cash Flow0 ($177,840) 0 ($436,800)1 $23,980 $23,980 1 $23,980 $23,9802 $24,699 $24,699 2 $24,699 $24,6993 $25,440 $25,440 3 $25,440 $25,4404 $26,204 $26,204 4 $26,204 $26,2045 $26,990 $26,990 5 $26,990 $26,9906 $27,799 $27,799 6 $27,799 $27,7997 $28,633 $28,633 7 $28,633 $28,6338 $29,492 $29,492 8 $29,492 $29,4929 $30,377 $30,377 9 $30,377 $30,37710 $31,288 $31,288 10 $31,288 $31,28811 $32,227 $32,227 11 $32,227 $32,22712 $33,194 $33,194 12 $33,194 $33,19413 $34,190 $34,190 13 $34,190 $34,19014 $35,215 $35,215 14 $35,215 $35,21515 $36,272 $36,272 15 $36,272 $36,272
IRR 13.22% IRR 0.24%NPV $200,067 NPV ($58,893)AROI 8.48% AROI 0.49%
Control Upgrade
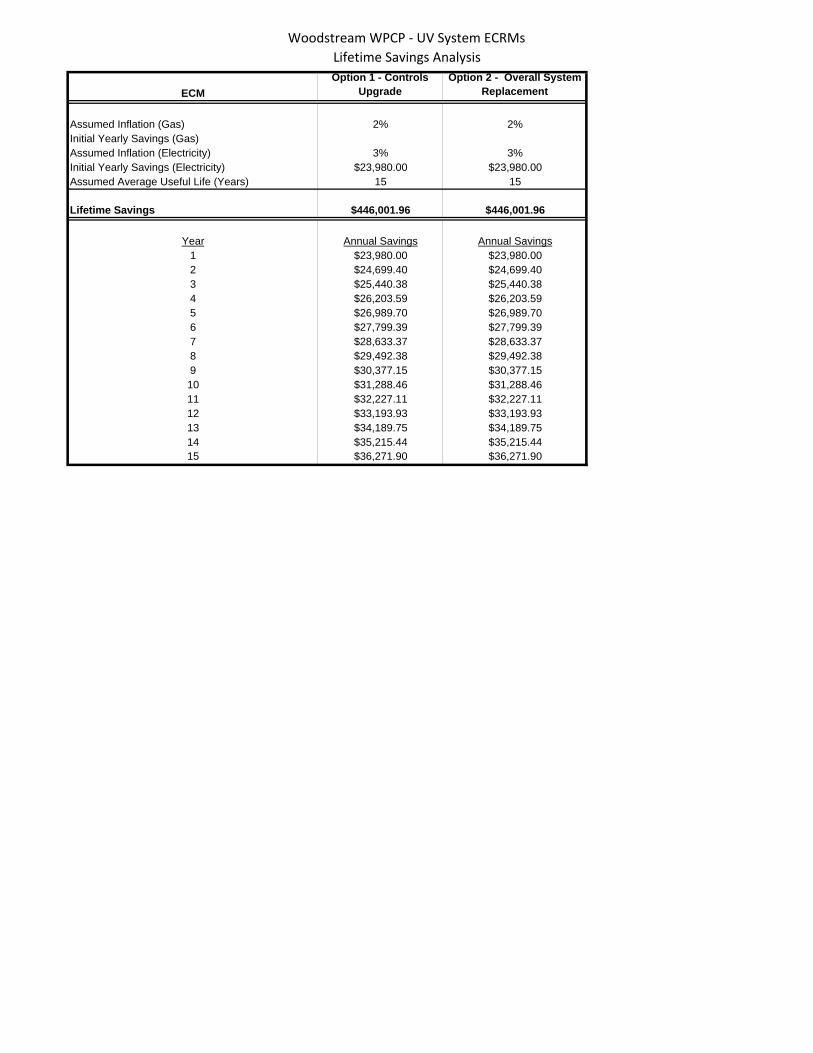
Woodstream WPCP ‐ UV System ECRMs Lifetime Savings Analysis
ECMOption 1 - Controls
UpgradeOption 2 - Overall System
Replacement
Assumed Inflation (Gas) 2% 2%Initial Yearly Savings (Gas)Assumed Inflation (Electricity) 3% 3%Initial Yearly Savings (Electricity) $23,980.00 $23,980.00Assumed Average Useful Life (Years) 15 15
Lifetime Savings $446,001.96 $446,001.96
Year Annual Savings Annual Savings1 $23,980.00 $23,980.002 $24,699.40 $24,699.403 $25,440.38 $25,440.384 $26,203.59 $26,203.595 $26,989.70 $26,989.706 $27,799.39 $27,799.397 $28,633.37 $28,633.378 $29,492.38 $29,492.389 $30,377.15 $30,377.1510 $31,288.46 $31,288.4611 $32,227.11 $32,227.1112 $33,193.93 $33,193.9313 $34,189.75 $34,189.7514 $35,215.44 $35,215.4415 $36,271.90 $36,271.90

IRR, NPV, AROI - HVAC ECRMS
Furnace Upgrade Condensing Unit Upgrade Boiler Upgrade Condensing Unit UpgradeElmwoodAdministration with Attached Garage Elmwood Administration with Attached Garage Elmwood Sludge Dewatering Building Woodstream Control/BioFor Building
Year Cash Flow Year Cash Flow Year Cash Flow Year Cash Flow0 ($9,846.00) 0 ($11,236.00) 0 ($14,847.00) 0 ($11,666.00)1 $902.00 1 $903.00 1 $1,175.00 1 $491.002 $929.06 2 $930.09 2 $1,210.25 2 $505.733 $956.93 3 $957.99 3 $1,246.56 3 $520.904 $985.64 4 $986.73 4 $1,283.95 4 $536.535 $1,015.21 5 $1,016.33 5 $1,322.47 5 $552.626 $1,045.67 6 $1,046.82 6 $1,362.15 6 $569.207 $1,077.04 7 $1,078.23 7 $1,403.01 7 $586.288 $1,109.35 8 $1,110.58 8 $1,445.10 8 $603.879 $1,142.63 9 $1,143.89 9 $1,488.45 9 $621.9810 $1,176.91 10 $1,178.21 10 $1,533.11 10 $640.6411 $1,212.21 11 $1,213.56 11 $1,579.10 11 $659.8612 $1,248.58 12 $1,249.96 12 $1,626.47 12 $679.6613 $1,286.04 13 $1,287.46 13 $1,675.27 13 $700.0514 $1,324.62 14 $1,326.09 14 $1,725.53 14 $721.0515 $1,364.36 15 $1,365.87 15 $1,777.29 15 $742.6816 $1,405.29 16 $1,406.84 16 $1,830.61 16 $764.9617 $1,447.45 17 $1,449.05 17 $1,885.53 17 $787.9118 $1,490.87 18 $1,492.52 18 $1,942.10 18 $811.55
19 $1,537.30 19 $2,000.36 19 $835.8920 $1,583.42 20 $2,060.37 20 $860.97
21 $2,122.1822 $2,185.8523 $2,251.4224 $2,318.96
IRR 8.67% IRR 7.81% IRR 8.78% IRR 1.09%NPV $5,917.11 NPV $6,297.98 NPV $12,531.64 NPV ($2,132.02)AROI 3.61% AROI 3.04% AROI 3.75% AROI 0.04%

ECM
Elmwood Administration with Attached Garage -
Furnace Upgrade
Elmwood Administration with Attached Garage -
Condensing Unit Upgrade
Elmwood Sludge Dewatering Building -
Boiler Upgrade
Woodstream Control/BioFor Building - Condensing Unit
Upgrade
Assumed Inflation (Gas) 2% 2% 2% 2%Initial Yearly Savings (Gas) $902.00 $425.00Assumed Inflation (Electricity) 3% 3% 3% 3%Initial Yearly Savings (Electricity) $903.00 $491.00Assumed Average Useful Life (Years) 18 20 24 20
Lifetime Savings $19,313.91 $24,263.95 $12,929.29 $13,193.35
Year Annual Savings Annual Savings Annual Savings Annual Savings1 $902.00 $903.00 $425.00 $491.002 $920.04 $930.09 $433.50 $505.733 $938.44 $957.99 $442.17 $520.904 $957.21 $986.73 $451.01 $536.535 $976.35 $1,016.33 $460.03 $552.626 $995.88 $1,046.82 $469.23 $569.207 $1,015.80 $1,078.23 $478.62 $586.288 $1,036.11 $1,110.58 $488.19 $603.879 $1,056.84 $1,143.89 $497.96 $621.98
10 $1,077.97 $1,178.21 $507.91 $640.6411 $1,099.53 $1,213.56 $518.07 $659.8612 $1,121.52 $1,249.96 $528.43 $679.6613 $1,143.95 $1,287.46 $539.00 $700.0514 $1,166.83 $1,326.09 $549.78 $721.0515 $1,190.17 $1,365.87 $560.78 $742.6816 $1,213.97 $1,406.84 $571.99 $764.9617 $1,238.25 $1,449.05 $583.43 $787.9118 $1,263.02 $1,492.52 $595.10 $811.5519 $1,537.30 $607.00 $835.8920 $1,583.42 $619.14 $860.9721 $631.5322 $644.1623 $657.0424 $670.18

IRR, NPV, AROI - Wind Energy Systems
Financial CalculationsBased on inflation of: 3%O&M inflation: 3%
Wind Turbine - Minimum Wind Speed Wind Turbine - Maximum Wind Speed Wind Turbine - Average Wind SpeedREIP Incentive: $10,058 REIP Incentive: $31,968 REIP Incentive: $20,035
Year Energy Savings REC Sales Cash Flow Year Energy Savings REC Sales Cash Flow Year Energy Savings REC Sales Cash Flow0 ($61,937) 0 ($40,027) 0 ($51,960)1 $440.0 $79 $519 1 $1,398.6 $250 $1,648 1 $876.5 $157 $1,0332 $451.0 $78 $529 2 $1,433.4 $249 $1,682 2 $898.3 $156 $1,0543 $462.2 $78 $540 3 $1,469.0 $247 $1,716 3 $920.6 $155 $1,0764 $473.6 $77 $551 4 $1,505.5 $246 $1,752 4 $943.5 $154 $1,0985 $485.4 $77 $562 5 $1,542.9 $245 $1,788 5 $967.0 $153 $1,1206 $497.5 $77 $574 6 $1,581.2 $244 $1,825 6 $991.0 $153 $1,1447 $509.8 $76 $586 7 $1,620.5 $242 $1,863 7 $1,015.6 $152 $1,1688 $522.5 $76 $598 8 $1,660.8 $241 $1,902 8 $1,040.9 $151 $1,1929 $535.5 $75 $611 9 $1,702.1 $240 $1,942 9 $1,066.7 $150 $1,21710 $548.8 $75 $624 10 $1,744.4 $239 $1,983 10 $1,093.2 $150 $1,24311 $562.4 $75 $637 11 $1,787.7 $238 $2,025 11 $1,120.4 $149 $1,26912 $576.4 $74 $651 12 $1,832.1 $236 $2,068 12 $1,148.2 $148 $1,29613 $590.7 $74 $665 13 $1,877.7 $235 $2,113 13 $1,176.8 $147 $1,32414 $605.4 $74 $679 14 $1,924.3 $234 $2,158 14 $1,206.0 $147 $1,35315 $620.5 $73 $694 15 $1,972.1 $233 $2,205 15 $1,236.0 $146 $1,38216 $635.9 $73 $709 16 $2,021.1 $232 $2,253 16 $1,266.7 $145 $1,41217 $651.7 $73 $724 17 $2,071.4 $231 $2,302 17 $1,298.2 $144 $1,44318 $667.9 $72 $740 18 $2,122.8 $229 $2,352 18 $1,330.4 $144 $1,47419 $684.5 $72 $756 19 $2,175.6 $228 $2,404 19 $1,363.5 $143 $1,50720 $701.5 $71 $773 20 $2,229.7 $227 $2,457 20 $1,397.4 $142 $1,54021 $718.9 $71 $790 21 $2,285.1 $226 $2,511 21 $1,432.1 $142 $1,57422 $736.8 $71 $808 22 $2,341.9 $225 $2,567 22 $1,467.7 $141 $1,60923 $755.1 $70 $825 23 $2,400.0 $224 $2,624 23 $1,504.2 $140 $1,64424 $773.9 $70 $844 24 $2,459.7 $223 $2,682 24 $1,541.6 $139 $1,68125 $793.1 $70 $863 25 $2,520.8 $221 $2,742 25 $1,579.9 $139 $1,719
IRR #NUM! IRR 2.2% IRR -2.9%NPV -$50,575 NPV -$3,912 NPV -$29,326AROI -3.2% AROI 0.1% AROI -2.0%

ECM Elmwood Solar Woodstream Solar
Assumed Inflation (Gas)Initial Yearly Savings (Gas)Assumed Inflation (Electricity) 3% 3%Initial Yearly Savings (Electricity) $52,336.20 $9,632.84Assumed Average Useful Life (Years) 25 25
Lifetime Savings $1,908,139.35 $351,206.26
Year Annual Savings Annual Savings1 $52,336.20 $9,632.842 $53,906.29 $9,921.833 $55,523.47 $10,219.484 $57,189.18 $10,526.065 $58,904.85 $10,841.856 $60,672.00 $11,167.107 $62,492.16 $11,502.118 $64,366.92 $11,847.189 $66,297.93 $12,202.5910 $68,286.87 $12,568.6711 $70,335.48 $12,945.7312 $72,445.54 $13,334.1013 $74,618.91 $13,734.1314 $76,857.47 $14,146.1515 $79,163.20 $14,570.5316 $81,538.09 $15,007.6517 $83,984.24 $15,457.8818 $86,503.76 $15,921.6219 $89,098.88 $16,399.2720 $91,771.84 $16,891.2421 $94,525.00 $17,397.9822 $97,360.75 $17,919.9223 $100,281.57 $18,457.5224 $103,290.02 $19,011.2425 $106,388.72 $19,581.58
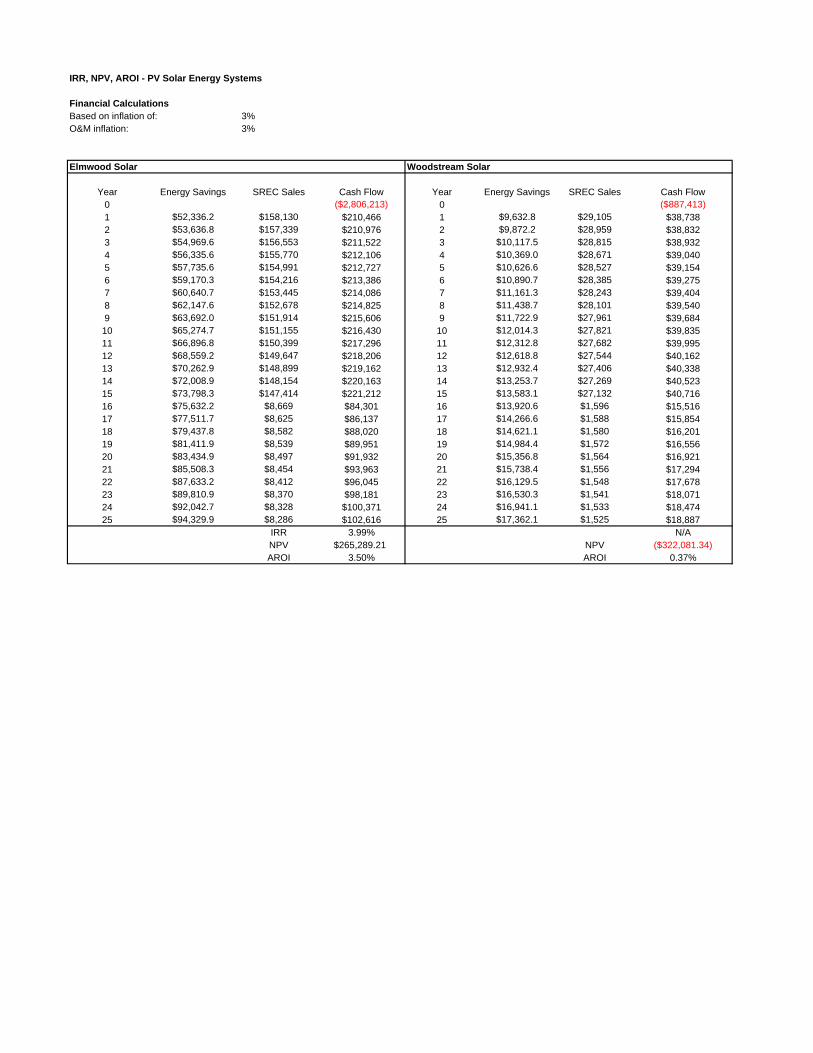
IRR, NPV, AROI - PV Solar Energy Systems
Financial CalculationsBased on inflation of: 3%O&M inflation: 3%
Elmwood Solar Woodstream Solar
Year Energy Savings SREC Sales Cash Flow Year Energy Savings SREC Sales Cash Flow0 ($2,806,213) 0 ($887,413)1 $52,336.2 $158,130 $210,466 1 $9,632.8 $29,105 $38,7382 $53,636.8 $157,339 $210,976 2 $9,872.2 $28,959 $38,8323 $54,969.6 $156,553 $211,522 3 $10,117.5 $28,815 $38,9324 $56,335.6 $155,770 $212,106 4 $10,369.0 $28,671 $39,0405 $57,735.6 $154,991 $212,727 5 $10,626.6 $28,527 $39,1546 $59,170.3 $154,216 $213,386 6 $10,890.7 $28,385 $39,2757 $60,640.7 $153,445 $214,086 7 $11,161.3 $28,243 $39,4048 $62,147.6 $152,678 $214,825 8 $11,438.7 $28,101 $39,5409 $63,692.0 $151,914 $215,606 9 $11,722.9 $27,961 $39,68410 $65,274.7 $151,155 $216,430 10 $12,014.3 $27,821 $39,83511 $66,896.8 $150,399 $217,296 11 $12,312.8 $27,682 $39,99512 $68,559.2 $149,647 $218,206 12 $12,618.8 $27,544 $40,16213 $70,262.9 $148,899 $219,162 13 $12,932.4 $27,406 $40,33814 $72,008.9 $148,154 $220,163 14 $13,253.7 $27,269 $40,52315 $73,798.3 $147,414 $221,212 15 $13,583.1 $27,132 $40,71616 $75,632.2 $8,669 $84,301 16 $13,920.6 $1,596 $15,51617 $77,511.7 $8,625 $86,137 17 $14,266.6 $1,588 $15,85418 $79,437.8 $8,582 $88,020 18 $14,621.1 $1,580 $16,20119 $81,411.9 $8,539 $89,951 19 $14,984.4 $1,572 $16,55620 $83,434.9 $8,497 $91,932 20 $15,356.8 $1,564 $16,92121 $85,508.3 $8,454 $93,963 21 $15,738.4 $1,556 $17,29422 $87,633.2 $8,412 $96,045 22 $16,129.5 $1,548 $17,67823 $89,810.9 $8,370 $98,181 23 $16,530.3 $1,541 $18,07124 $92,042.7 $8,328 $100,371 24 $16,941.1 $1,533 $18,47425 $94,329.9 $8,286 $102,616 25 $17,362.1 $1,525 $18,887
IRR 3.99% N/ANPV $265,289.21 NPV ($322,081.34)AROI 3.50% AROI 0.37%

ECM Evesham MUA - Minimum Wind Speed Evesham MUA - Maximum Wind Speed
Evesham MUA - Average Wind Speed
Assumed Inflation (Gas) 2% 2% 2%Initial Yearly Savings (Gas) $0.00 $0.00 $0.00Assumed Inflation (Electricity) 3% 3% 3%Initial Yearly Savings (Electricity) $440.00 $1,398.60 $876.50Assumed Average Useful Life (Years) 25 25 25
Lifetime Savings $8,183.52 $26,012.44 $16,301.95
Year Annual Savings Annual Savings Annual Savings1 $440.00 $1,398.60 $876.502 $453.20 $1,440.56 $902.803 $466.80 $1,483.77 $929.884 $480.80 $1,528.29 $957.785 $495.22 $1,574.14 $986.516 $510.08 $1,621.36 $1,016.107 $525.38 $1,670.00 $1,046.598 $541.14 $1,720.10 $1,077.989 $557.38 $1,771.70 $1,110.32
10 $574.10 $1,824.86 $1,143.6311 $591.32 $1,879.60 $1,177.9412 $609.06 $1,935.99 $1,213.2813 $627.33 $1,994.07 $1,249.6814 $646.15 $2,053.89 $1,287.1715 $665.54 $2,115.51 $1,325.7816 $685.51 $2,178.97 $1,365.5617 $706.07 $2,244.34 $1,406.5318 $727.25 $2,311.67 $1,448.7219 $749.07 $2,381.02 $1,492.1820 $771.54 $2,452.45 $1,536.9521 $794.69 $2,526.03 $1,583.0622 $818.53 $2,601.81 $1,630.5523 $843.09 $2,679.86 $1,679.4624 $868.38 $2,760.26 $1,729.8525 $894.43 $2,843.07 $1,781.74
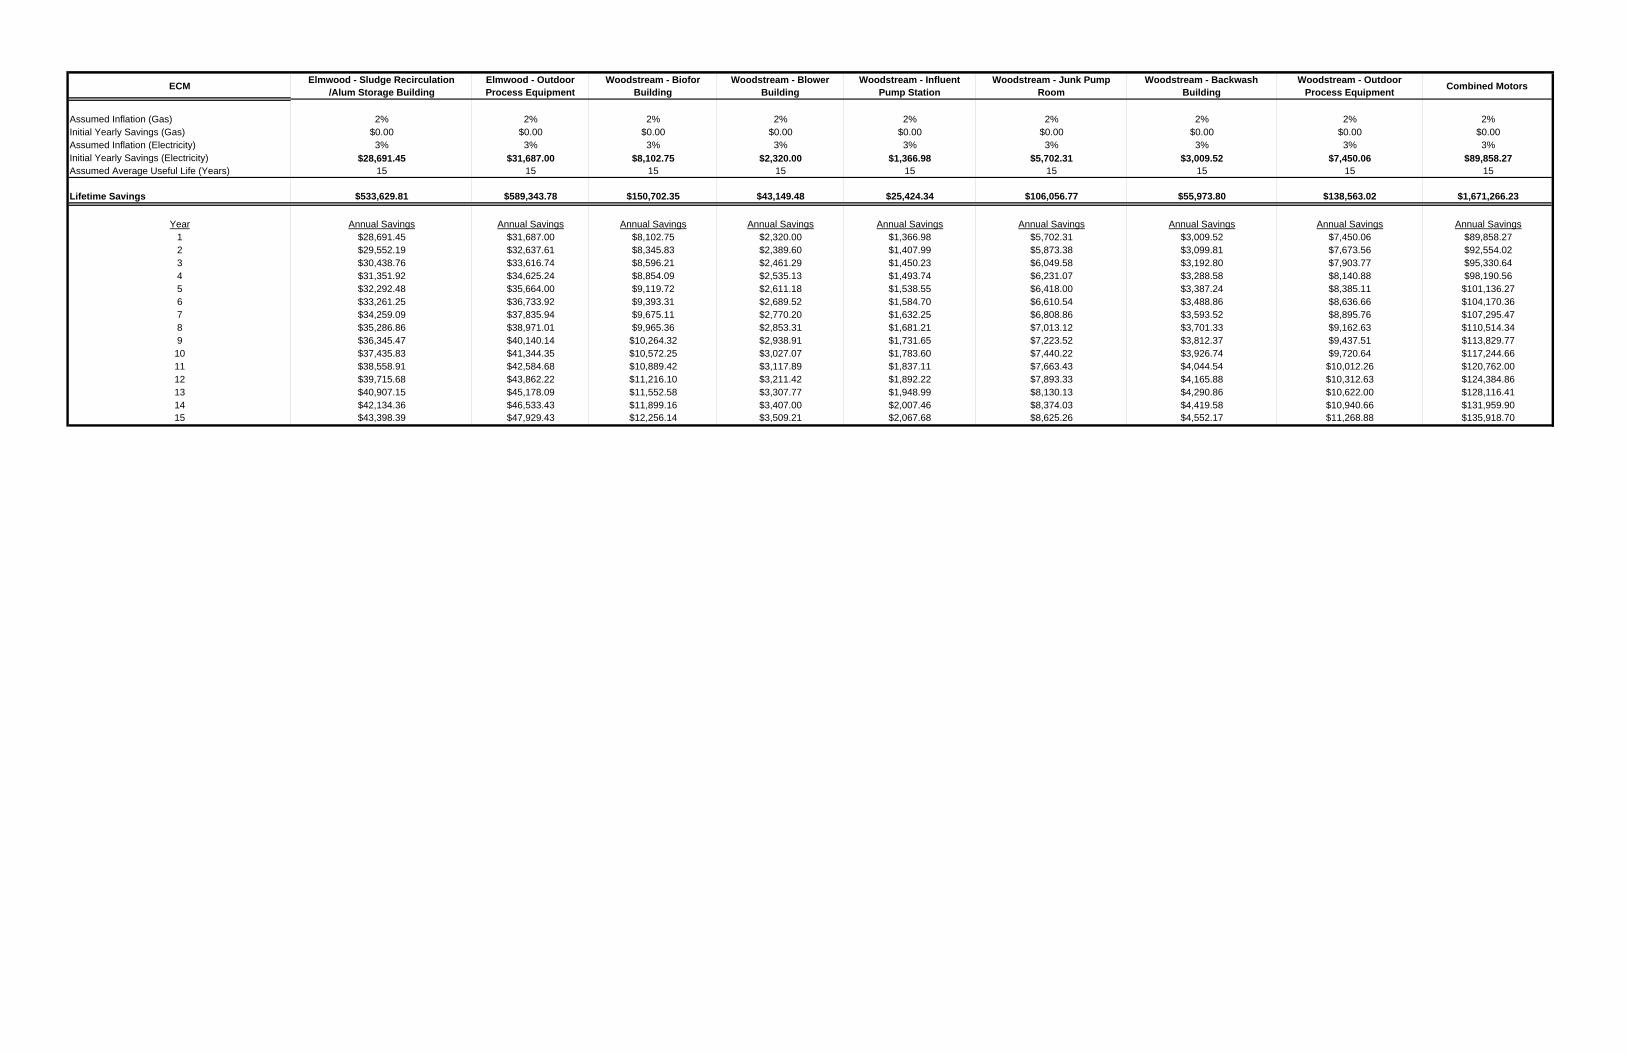
ECM Elmwood - Sludge Recirculation/Alum Storage Building
Elmwood - Outdoor Process Equipment
Woodstream - Biofor Building
Woodstream - Blower Building
Woodstream - Influent Pump Station
Woodstream - Junk Pump Room
Woodstream - Backwash Building
Woodstream - Outdoor Process Equipment Combined Motors
Assumed Inflation (Gas) 2% 2% 2% 2% 2% 2% 2% 2% 2%Initial Yearly Savings (Gas) $0.00 $0.00 $0.00 $0.00 $0.00 $0.00 $0.00 $0.00 $0.00Assumed Inflation (Electricity) 3% 3% 3% 3% 3% 3% 3% 3% 3%Initial Yearly Savings (Electricity) $28,691.45 $31,687.00 $8,102.75 $2,320.00 $1,366.98 $5,702.31 $3,009.52 $7,450.06 $89,858.27Assumed Average Useful Life (Years) 15 15 15 15 15 15 15 15 15
Lifetime Savings $533,629.81 $589,343.78 $150,702.35 $43,149.48 $25,424.34 $106,056.77 $55,973.80 $138,563.02 $1,671,266.23
Year Annual Savings Annual Savings Annual Savings Annual Savings Annual Savings Annual Savings Annual Savings Annual Savings Annual Savings1 $28,691.45 $31,687.00 $8,102.75 $2,320.00 $1,366.98 $5,702.31 $3,009.52 $7,450.06 $89,858.272 $29,552.19 $32,637.61 $8,345.83 $2,389.60 $1,407.99 $5,873.38 $3,099.81 $7,673.56 $92,554.023 $30,438.76 $33,616.74 $8,596.21 $2,461.29 $1,450.23 $6,049.58 $3,192.80 $7,903.77 $95,330.644 $31,351.92 $34,625.24 $8,854.09 $2,535.13 $1,493.74 $6,231.07 $3,288.58 $8,140.88 $98,190.565 $32,292.48 $35,664.00 $9,119.72 $2,611.18 $1,538.55 $6,418.00 $3,387.24 $8,385.11 $101,136.276 $33,261.25 $36,733.92 $9,393.31 $2,689.52 $1,584.70 $6,610.54 $3,488.86 $8,636.66 $104,170.367 $34,259.09 $37,835.94 $9,675.11 $2,770.20 $1,632.25 $6,808.86 $3,593.52 $8,895.76 $107,295.478 $35,286.86 $38,971.01 $9,965.36 $2,853.31 $1,681.21 $7,013.12 $3,701.33 $9,162.63 $110,514.349 $36,345.47 $40,140.14 $10,264.32 $2,938.91 $1,731.65 $7,223.52 $3,812.37 $9,437.51 $113,829.7710 $37,435.83 $41,344.35 $10,572.25 $3,027.07 $1,783.60 $7,440.22 $3,926.74 $9,720.64 $117,244.6611 $38,558.91 $42,584.68 $10,889.42 $3,117.89 $1,837.11 $7,663.43 $4,044.54 $10,012.26 $120,762.0012 $39,715.68 $43,862.22 $11,216.10 $3,211.42 $1,892.22 $7,893.33 $4,165.88 $10,312.63 $124,384.8613 $40,907.15 $45,178.09 $11,552.58 $3,307.77 $1,948.99 $8,130.13 $4,290.86 $10,622.00 $128,116.4114 $42,134.36 $46,533.43 $11,899.16 $3,407.00 $2,007.46 $8,374.03 $4,419.58 $10,940.66 $131,959.9015 $43,398.39 $47,929.43 $12,256.14 $3,509.21 $2,067.68 $8,625.26 $4,552.17 $11,268.88 $135,918.70
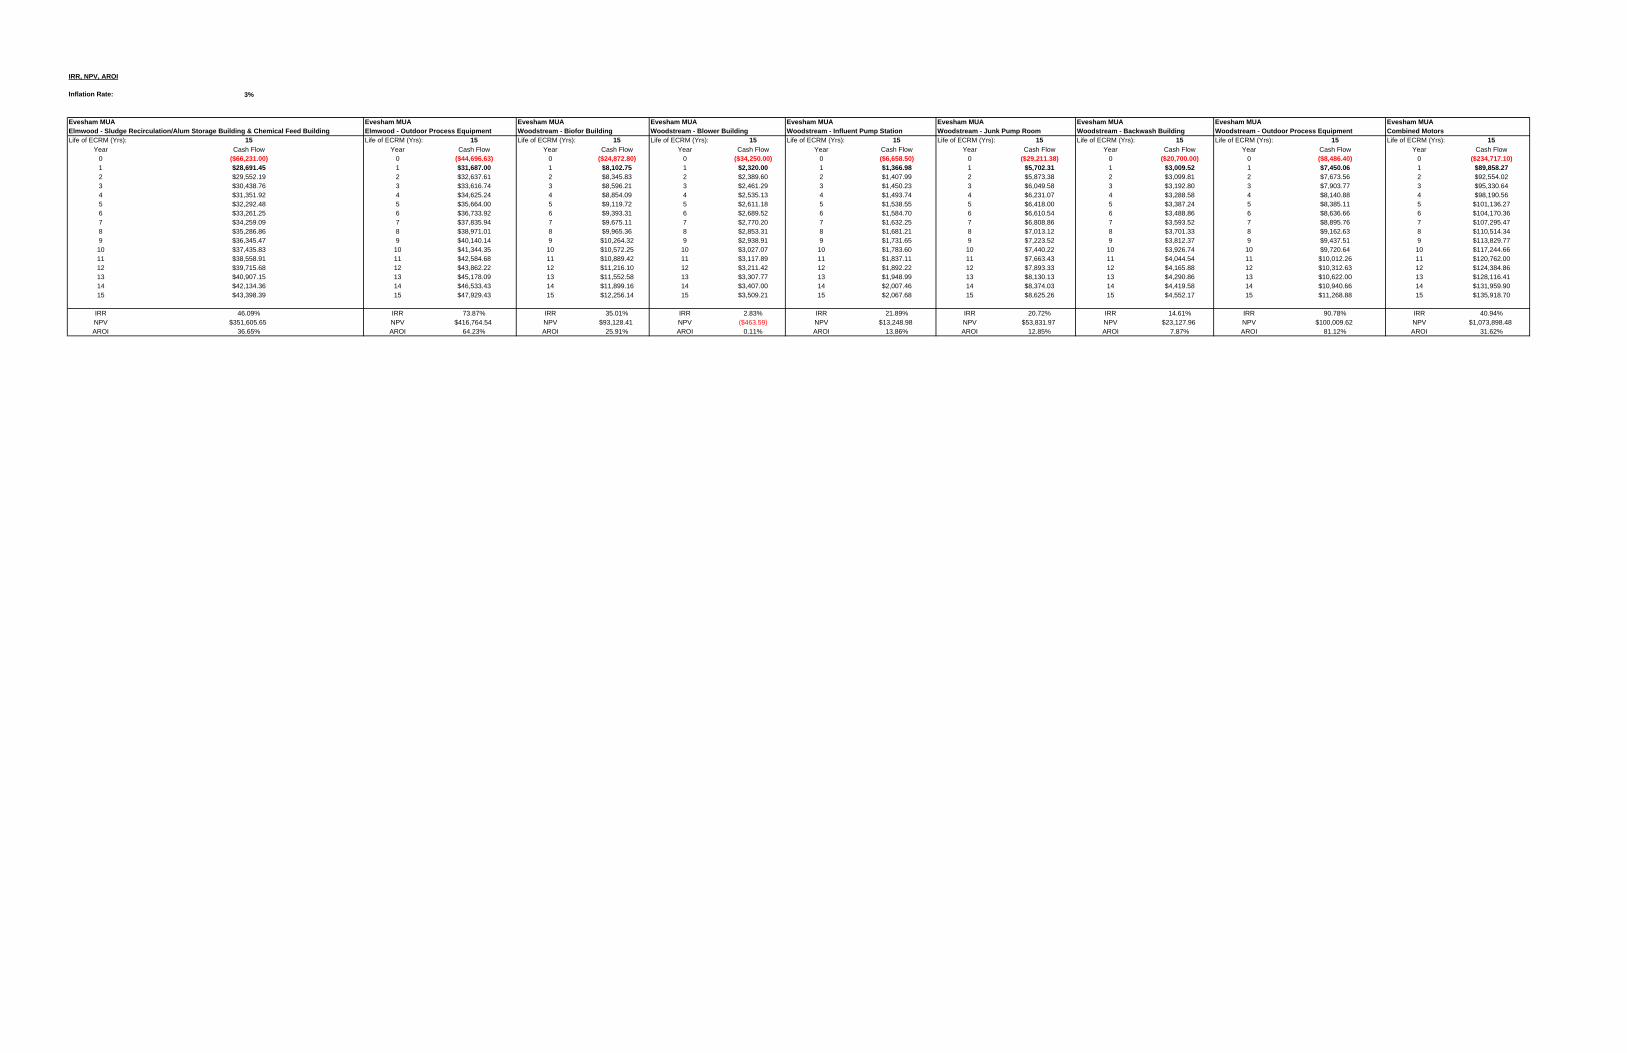
IRR, NPV, AROI
Inflation Rate: 3%
Evesham MUA Evesham MUA Evesham MUA Evesham MUA Evesham MUA Evesham MUA Evesham MUA Evesham MUA Evesham MUAElmwood - Sludge Recirculation/Alum Storage Building & Chemical Feed Building Elmwood - Outdoor Process Equipment Woodstream - Biofor Building Woodstream - Blower Building Woodstream - Influent Pump Station Woodstream - Junk Pump Room Woodstream - Backwash Building Woodstream - Outdoor Process Equipment Combined Motors Life of ECRM (Yrs): 15 Life of ECRM (Yrs): 15 Life of ECRM (Yrs): 15 Life of ECRM (Yrs): 15 Life of ECRM (Yrs): 15 Life of ECRM (Yrs): 15 Life of ECRM (Yrs): 15 Life of ECRM (Yrs): 15 Life of ECRM (Yrs): 15
Year Cash Flow Year Cash Flow Year Cash Flow Year Cash Flow Year Cash Flow Year Cash Flow Year Cash Flow Year Cash Flow Year Cash Flow0 ($66,231.00) 0 ($44,696.63) 0 ($24,872.80) 0 ($34,250.00) 0 ($6,658.50) 0 ($29,211.38) 0 ($20,700.00) 0 ($8,486.40) 0 ($234,717.10)1 $28,691.45 1 $31,687.00 1 $8,102.75 1 $2,320.00 1 $1,366.98 1 $5,702.31 1 $3,009.52 1 $7,450.06 1 $89,858.272 $29,552.19 2 $32,637.61 2 $8,345.83 2 $2,389.60 2 $1,407.99 2 $5,873.38 2 $3,099.81 2 $7,673.56 2 $92,554.023 $30,438.76 3 $33,616.74 3 $8,596.21 3 $2,461.29 3 $1,450.23 3 $6,049.58 3 $3,192.80 3 $7,903.77 3 $95,330.644 $31,351.92 4 $34,625.24 4 $8,854.09 4 $2,535.13 4 $1,493.74 4 $6,231.07 4 $3,288.58 4 $8,140.88 4 $98,190.565 $32,292.48 5 $35,664.00 5 $9,119.72 5 $2,611.18 5 $1,538.55 5 $6,418.00 5 $3,387.24 5 $8,385.11 5 $101,136.276 $33,261.25 6 $36,733.92 6 $9,393.31 6 $2,689.52 6 $1,584.70 6 $6,610.54 6 $3,488.86 6 $8,636.66 6 $104,170.367 $34,259.09 7 $37,835.94 7 $9,675.11 7 $2,770.20 7 $1,632.25 7 $6,808.86 7 $3,593.52 7 $8,895.76 7 $107,295.478 $35,286.86 8 $38,971.01 8 $9,965.36 8 $2,853.31 8 $1,681.21 8 $7,013.12 8 $3,701.33 8 $9,162.63 8 $110,514.349 $36,345.47 9 $40,140.14 9 $10,264.32 9 $2,938.91 9 $1,731.65 9 $7,223.52 9 $3,812.37 9 $9,437.51 9 $113,829.7710 $37,435.83 10 $41,344.35 10 $10,572.25 10 $3,027.07 10 $1,783.60 10 $7,440.22 10 $3,926.74 10 $9,720.64 10 $117,244.6611 $38,558.91 11 $42,584.68 11 $10,889.42 11 $3,117.89 11 $1,837.11 11 $7,663.43 11 $4,044.54 11 $10,012.26 11 $120,762.0012 $39,715.68 12 $43,862.22 12 $11,216.10 12 $3,211.42 12 $1,892.22 12 $7,893.33 12 $4,165.88 12 $10,312.63 12 $124,384.8613 $40,907.15 13 $45,178.09 13 $11,552.58 13 $3,307.77 13 $1,948.99 13 $8,130.13 13 $4,290.86 13 $10,622.00 13 $128,116.4114 $42,134.36 14 $46,533.43 14 $11,899.16 14 $3,407.00 14 $2,007.46 14 $8,374.03 14 $4,419.58 14 $10,940.66 14 $131,959.9015 $43,398.39 15 $47,929.43 15 $12,256.14 15 $3,509.21 15 $2,067.68 15 $8,625.26 15 $4,552.17 15 $11,268.88 15 $135,918.70
IRR 46.09% IRR 73.87% IRR 35.01% IRR 2.83% IRR 21.89% IRR 20.72% IRR 14.61% IRR 90.78% IRR 40.94%NPV $351,605.65 NPV $416,764.54 NPV $93,128.41 NPV ($463.59) NPV $13,248.98 NPV $53,831.97 NPV $23,127.96 NPV $100,009.62 NPV $1,073,898.48AROI 36.65% AROI 64.23% AROI 25.91% AROI 0.11% AROI 13.86% AROI 12.85% AROI 7.87% AROI 81.12% AROI 31.62%

Lighting Maintenance Cost Savings
T12 Bulb Cost T8 Blub Cost T12 Bulb Average Lifetime (Years)
T8 Bulb Average Lifetime (Years)
Quantity of T12 Replacements vs. T8 Replacements
1 Lamp $25.0 $23.5 4.6 5.7 1.252 Lamp $69.9 $67.0 4.6 5.7 1.253 Lamp $94.9 $90.5 4.6 5.7 1.254 Lamp $119.8 $114.0 4.6 5.7 1.25
Incandescent Cost CFL Cost Incandescent Average
Lifetime (Years)CFL Average
Lifetime (Years)Quantity of Incandescent
Replacements vs. CFL Replacements13 Watt $13.0 $25.0 0.5 2.3 525 Watt $18.0 $27.0 0.5 2.3 526 Watt $19.0 $28.5 0.5 2.3 565 Watt $20.0 $37.0 0.5 2.3 5120 Watt $22.0 $48.5 0.5 2.3 5
Metal Halide Cost Induction Cost Metal Halide AverageLifetime ( Years)
Induction Average Lifetime (years)
Quantity of Metal HalideReplacements vs. Induction Replacements
400 Watt $86.0 $485.0 4.6 22.8 5250 Watt $80.0 $390.0 4.6 22.8 5
HPS Cost Induction Cost HPS AverageLifetime ( Years)
Induction Average Lifetime (years)
Quantity of HPSReplacements vs. Induction Replacements
250 Watt $80.0 $390.0 4.6 22.8 5175 Watt $78.0 $380.0 4.6 22.8 5150 Watt $74.0 $380.0 4.6 22.8 5100 Watt $55.0 $380.0 4.6 22.8 570 Watt $25.0 $380.0 4.6 22.8 5
Halogen Cost Induction Cost Halogen AverageLifetime ( Years)
Induction Average Lifetime (years)
Quantity of HalogenReplacements vs. Induction Replacements
500 Watt $20.0 $390.0 0.2 22.8 114.1552511
Metal Halide Cost Fluorescent Cost
Metal Halide AverageLifetime ( Years)
Fluorescent Average Lifetime (years)
Quantity of Metal HalideReplacements vs. Fluorescent Replacements
6 Lamp $86.0 $288.0 4.6 5.7 1.254 Lamp $48.0 $174.0 4.6 5.7 1.25
Interior & Exterior
Building INC-CFL (13W) INC-CFL (25W) INC-CFL (26W) T12->T8 (1 Lamp) T12->T8 (2 Lamp) T12->T8 (3 Lamp)
Elmwood Administration Building - Total $0.0 $3,035.3 $578.3 $0.0 $2,112.5 $498.5Elmwood Sludge Recirculation/Alum Storage Building - Total $0.0 $0.0 $0.0 $0.0 $551.1 $373.9Elmwood Chemical Feed Building - Total $0.0 $0.0 $0.0 $0.0 $0.0 $373.9Elmwood Sludge Dewatering Building - Total $0.0 $0.0 $0.0 $0.0 $229.6 $249.3Elmwood Generator Building - Total $0.0 $0.0 $0.0 $0.0 $0.0 $373.9Woodstream Control/BioFor Building - Total $0.0 $0.0 $0.0 $0.0 $183.7 $0.0Woodstream Blower Building - Total $0.0 $1,103.8 $0.0 $0.0 $91.8 $0.0Elmwood Site Lighting $0.0 $0.0 $0.0 $0.0 $0.0 $0.0Woodstream Site Lighting $0.0 $0.0 $0.0 $0.0 $0.0 $0.0
Interior
Building INC-CFL (13W) INC-CFL (25W) INC-CFL (26W) T12->T8 (1 Lamp) T12->T8 (2 Lamp) T12->T8 (3 Lamp)
Elmwood Administration Building - Total $0.0 $1,103.8 $578.3 $0.0 $1,699.2 $498.5Elmwood Sludge Recirculation/Alum Storage Building - Total $0.0 $0.0 $0.0 $0.0 $551.1 $373.9Elmwood Chemical Feed Building - Total $0.0 $0.0 $0.0 $0.0 $0.0 $373.9Elmwood Sludge Dewatering Building - Total $0.0 $0.0 $0.0 $0.0 $229.6 $249.3Elmwood Generator Building - Total $0.0 $0.0 $0.0 $0.0 $0.0 $373.9Woodstream Control/BioFor Building - Total $0.0 $0.0 $0.0 $0.0 $183.7 $0.0Woodstream Blower Building - Total $0.0 $1,103.8 $0.0 $0.0 $91.8 $0.0
Exterior
Building INC-CFL (25W) 150W HID->INCUCTION 250W HID->INCUCTION Total Maintenance Cost Savings
Annual MaintenanceCost Savings Building
Elmwood Administration Building - Total $1,931.6 $0.0 $0.0 $1,931.6 $128.77 Elmwood Administration Building - TotalElmwood Sludge Recirculation/Alum Storage Building - Total $0.0 $32.4 $0.0 $32.4 $2.16 Elmwood Sludge Recirculation/Alum Storage Building - TotalElmwood Chemical Feed Building - Total $0.0 $32.4 $0.0 $32.4 $2.16 Elmwood Chemical Feed Building - TotalElmwood Sludge Dewatering Building - Total $0.0 $81.0 $0.0 $81.0 $5.40 Elmwood Sludge Dewatering Building - TotalElmwood Generator Building - Total $0.0 $16.2 $0.0 $16.2 $1.08 Elmwood Generator Building - TotalWoodstream Control/BioFor Building - Total $0.0 $32.4 $0.0 $32.4 $2.16 Woodstream Control/BioFor Building - TotalWoodstream Blower Building - Total $0.0 $32.4 $0.0 $32.4 $2.16 Woodstream Blower Building - TotalElmwood Site Lighting $0.0 $0.0 $1,700.0 $1,700.0 $113.33 Elmwood Site LightingWoodstream Site Lighting $0.0 $0.0 $1,000.0 $1,000.0 $66.67 Woodstream Site Lighting
T12 to T8 Retrofit
Incandescent to CFL Retrofit
Metal Halide to Induction Retrofit
HPS to Indcution Retrofit
Metal Halide to Fluorescent
Halogen to Indcution Retrofit

Cost of T12 Replacement over T8 Life T8 Bulb Replacements Over Lifetime (15 Yrs)
$31.2 3$87.4 3
$118.6 3$149.8 3
Cost of Incandescent Replacement over CFL Life CFL Replacements Over Lifetime (15 Yrs)
$65.0 7$90.0 7$95.0 7
$100.0 7$110.0 7
Cost of Metal Halide Replacement over Induction Life Induction Replacements Over Lifetime (15 Yrs)
$430.0 1$400.0 1
Cost of HPSover Induction Life Induction Replacements Over Lifetime (15 Yrs)
$400.0 1$390.0 1$370.0 1$275.0 1$125.0 1
Cost of Halogenover Induction Life Induction Replacements Over Lifetime (15 Yrs)
$2,283.1 1
Cost of Metal Halide Replacement over Fluorescent Life Replacements Over Lifetime (15 Yrs)
$107.5 3$60.0 3
HID->FL (6 Lamp) 150W HID->INCUCTION 250W HID->INCUCTION Total Maintenance Cost Savings
Annual MaintenanceCost Savings Building
$678.0 $0.0 $0.0 $6,902.7 $460.18 Elmwood Administration Building - Total$0.0 $32.4 $0.0 $957.4 $63.83 Elmwood Sludge Recirculation/Alum Storage Building - Total$0.0 $32.4 $0.0 $406.3 $27.09 Elmwood Chemical Feed Building - Total$0.0 $81.0 $0.0 $559.9 $37.33 Elmwood Sludge Dewatering Building - Total$0.0 $16.2 $0.0 $390.1 $26.01 Elmwood Generator Building - Total
$847.5 $32.4 $0.0 $1,063.6 $70.91 Woodstream Control/BioFor Building - Total$0.0 $32.4 $0.0 $1,228.0 $81.87 Woodstream Blower Building - Total$0.0 $0.0 $1,700.0 $1,700.0 $113.33 Elmwood Site Lighting$0.0 $0.0 $1,000.0 $1,000.0 $66.67 Woodstream Site Lighting
T12->T8 (4 Lamp) HID->FL (6 Lamp) Total Maintenance Cost Savings
Annual MaintenanceCost Savings Building
$708.4 $678.0 $5,266.2 $351.08 Elmwood Administration Building - Total$0.0 $0.0 $925.0 $61.67 Elmwood Sludge Recirculation/Alum Storage Building - Total$0.0 $0.0 $373.9 $24.93 Elmwood Chemical Feed Building - Total$0.0 $0.0 $478.9 $31.93 Elmwood Sludge Dewatering Building - Total$0.0 $0.0 $373.9 $24.93 Elmwood Generator Building - Total$0.0 $847.5 $1,031.2 $68.75 Woodstream Control/BioFor Building - Total$0.0 $0.0 $1,195.6 $79.71 Woodstream Blower Building - Total
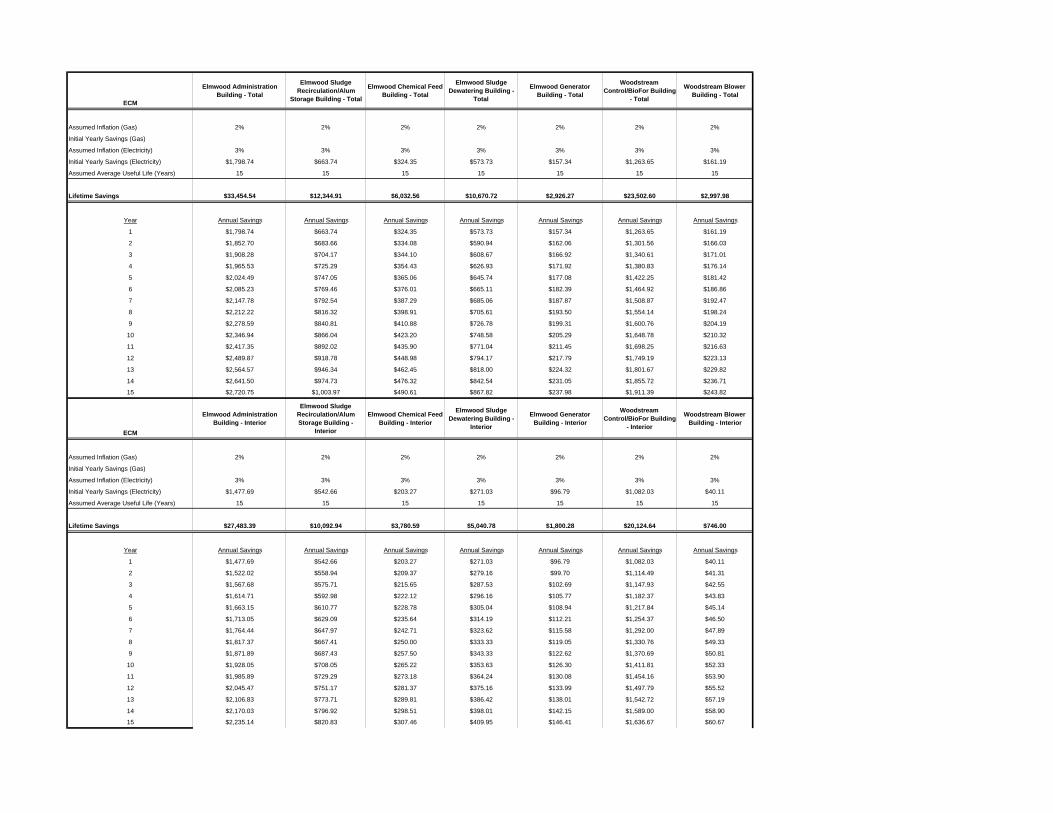
ECM
Elmwood Administration Building - Total
Elmwood Sludge Recirculation/Alum
Storage Building - Total
Elmwood Chemical Feed Building - Total
Elmwood Sludge Dewatering Building -
Total
Elmwood Generator Building - Total
Woodstream Control/BioFor Building
- Total
Woodstream Blower Building - Total
Assumed Inflation (Gas) 2% 2% 2% 2% 2% 2% 2%
Initial Yearly Savings (Gas)
Assumed Inflation (Electricity) 3% 3% 3% 3% 3% 3% 3%
Initial Yearly Savings (Electricity) $1,798.74 $663.74 $324.35 $573.73 $157.34 $1,263.65 $161.19
Assumed Average Useful Life (Years) 15 15 15 15 15 15 15
Lifetime Savings $33,454.54 $12,344.91 $6,032.56 $10,670.72 $2,926.27 $23,502.60 $2,997.98
Year Annual Savings Annual Savings Annual Savings Annual Savings Annual Savings Annual Savings Annual Savings
1 $1,798.74 $663.74 $324.35 $573.73 $157.34 $1,263.65 $161.19
2 $1,852.70 $683.66 $334.08 $590.94 $162.06 $1,301.56 $166.03
3 $1,908.28 $704.17 $344.10 $608.67 $166.92 $1,340.61 $171.01
4 $1,965.53 $725.29 $354.43 $626.93 $171.92 $1,380.83 $176.14
5 $2,024.49 $747.05 $365.06 $645.74 $177.08 $1,422.25 $181.42
6 $2,085.23 $769.46 $376.01 $665.11 $182.39 $1,464.92 $186.86
7 $2,147.78 $792.54 $387.29 $685.06 $187.87 $1,508.87 $192.47
8 $2,212.22 $816.32 $398.91 $705.61 $193.50 $1,554.14 $198.24
9 $2,278.59 $840.81 $410.88 $726.78 $199.31 $1,600.76 $204.19
10 $2,346.94 $866.04 $423.20 $748.58 $205.29 $1,648.78 $210.32
11 $2,417.35 $892.02 $435.90 $771.04 $211.45 $1,698.25 $216.63
12 $2,489.87 $918.78 $448.98 $794.17 $217.79 $1,749.19 $223.13
13 $2,564.57 $946.34 $462.45 $818.00 $224.32 $1,801.67 $229.82
14 $2,641.50 $974.73 $476.32 $842.54 $231.05 $1,855.72 $236.71
15 $2,720.75 $1,003.97 $490.61 $867.82 $237.98 $1,911.39 $243.82
ECM
Elmwood Administration Building - Interior
Elmwood Sludge Recirculation/Alum Storage Building -
Interior
Elmwood Chemical Feed Building - Interior
Elmwood Sludge Dewatering Building -
Interior
Elmwood Generator Building - Interior
Woodstream Control/BioFor Building
- Interior
Woodstream Blower Building - Interior
Assumed Inflation (Gas) 2% 2% 2% 2% 2% 2% 2%
Initial Yearly Savings (Gas)
Assumed Inflation (Electricity) 3% 3% 3% 3% 3% 3% 3%
Initial Yearly Savings (Electricity) $1,477.69 $542.66 $203.27 $271.03 $96.79 $1,082.03 $40.11
Assumed Average Useful Life (Years) 15 15 15 15 15 15 15
Lifetime Savings $27,483.39 $10,092.94 $3,780.59 $5,040.78 $1,800.28 $20,124.64 $746.00
Year Annual Savings Annual Savings Annual Savings Annual Savings Annual Savings Annual Savings Annual Savings
1 $1,477.69 $542.66 $203.27 $271.03 $96.79 $1,082.03 $40.11
2 $1,522.02 $558.94 $209.37 $279.16 $99.70 $1,114.49 $41.31
3 $1,567.68 $575.71 $215.65 $287.53 $102.69 $1,147.93 $42.55
4 $1,614.71 $592.98 $222.12 $296.16 $105.77 $1,182.37 $43.83
5 $1,663.15 $610.77 $228.78 $305.04 $108.94 $1,217.84 $45.14
6 $1,713.05 $629.09 $235.64 $314.19 $112.21 $1,254.37 $46.50
7 $1,764.44 $647.97 $242.71 $323.62 $115.58 $1,292.00 $47.89
8 $1,817.37 $667.41 $250.00 $333.33 $119.05 $1,330.76 $49.33
9 $1,871.89 $687.43 $257.50 $343.33 $122.62 $1,370.69 $50.81
10 $1,928.05 $708.05 $265.22 $353.63 $126.30 $1,411.81 $52.33
11 $1,985.89 $729.29 $273.18 $364.24 $130.08 $1,454.16 $53.90
12 $2,045.47 $751.17 $281.37 $375.16 $133.99 $1,497.79 $55.52
13 $2,106.83 $773.71 $289.81 $386.42 $138.01 $1,542.72 $57.19
14 $2,170.03 $796.92 $298.51 $398.01 $142.15 $1,589.00 $58.90
15 $2,235.14 $820.83 $307.46 $409.95 $146.41 $1,636.67 $60.67

ECM
Elmwood Administration Building - Exterior
Elmwood Sludge Recirculation/Alum Storage Building -
Exterior
Elmwood Chemical Feed Building - Exterior
Elmwood Sludge Dewatering Building -
Exterior
Elmwood Generator Building - Exterior
Woodstream Control/BioFor Building
- Exterior
Woodstream Blower Building - Exterior
Assumed Inflation (Gas) 2% 2% 2% 2% 2% 2% 2%
Initial Yearly Savings (Gas)
Assumed Inflation (Electricity) 3% 3% 3% 3% 3% 3% 3%
Initial Yearly Savings (Electricity) $321.05 $121.08 $121.08 $302.70 $60.54 $181.62 $121.08
Assumed Average Useful Life (Years) 15 15 15 15 15 15 15
Lifetime Savings $5,971.14 $2,251.97 $2,251.97 $5,629.94 $1,125.99 $3,377.96 $2,251.97
Year Annual Savings Annual Savings Annual Savings Annual Savings Annual Savings Annual Savings Annual Savings
1 $321.05 $121.08 $121.08 $302.70 $60.54 $181.62 $121.08
2 $330.68 $124.71 $124.71 $311.78 $62.36 $187.07 $124.71
3 $340.60 $128.45 $128.45 $321.14 $64.23 $192.68 $128.45
4 $350.82 $132.31 $132.31 $330.77 $66.15 $198.46 $132.31
5 $361.34 $136.28 $136.28 $340.69 $68.14 $204.42 $136.28
6 $372.18 $140.37 $140.37 $350.92 $70.18 $210.55 $140.37
7 $383.35 $144.58 $144.58 $361.44 $72.29 $216.87 $144.58
8 $394.85 $148.91 $148.91 $372.29 $74.46 $223.37 $148.91
9 $406.69 $153.38 $153.38 $383.45 $76.69 $230.07 $153.38
10 $418.89 $157.98 $157.98 $394.96 $78.99 $236.97 $157.98
11 $431.46 $162.72 $162.72 $406.81 $81.36 $244.08 $162.72
12 $444.41 $167.60 $167.60 $419.01 $83.80 $251.41 $167.60
13 $457.74 $172.63 $172.63 $431.58 $86.32 $258.95 $172.63
14 $471.47 $177.81 $177.81 $444.53 $88.91 $266.72 $177.81
15 $485.61 $183.15 $183.15 $457.86 $91.57 $274.72 $183.15

IRR, NPV, AROI
Inflation Rate: 3%
Lighting Upgrades Lighting Upgrades Lighting Upgrades Lighting Upgrades Lighting Upgrades Lighting Upgrades Lighting UpgradesElmwood Administration Building - Total Elmwood Sludge Recirculation/Alum Storage Building - Total Elmwood Chemical Feed Building - Total Elmwood Sludge Dewatering Building - Total Elmwood Generator Building - Total Woodstream Control/BioFor Building - Total Woodstream Blower Building - TotalLife of ECRM (Yrs): 15 Life of ECRM (Yrs): 15 Life of ECRM (Yrs): 15 Life of ECRM (Yrs): 15 Life of ECRM (Yrs): 15 Life of ECRM (Yrs): 15 Life of ECRM (Yrs): 15
Year Cash Flow Year Cash Flow Year Cash Flow Year Cash Flow Year Cash Flow Year Cash Flow Year Cash Flow0 ($20,060.09) 0 ($5,721.06) 0 ($2,819.50) 0 ($6,039.31) 0 ($2,076.31) 0 ($10,714.72) 0 ($2,705.99)1 $2,278.58 1 $727.57 1 $351.44 1 $611.06 1 $183.34 1 $1,334.56 1 $243.062 $2,346.94 2 $749.40 2 $361.98 2 $629.39 2 $188.84 2 $1,374.60 2 $250.353 $2,417.35 3 $771.88 3 $372.84 3 $648.27 3 $194.51 3 $1,415.84 3 $257.864 $2,489.87 4 $795.04 4 $384.03 4 $667.72 4 $200.34 4 $1,458.31 4 $265.605 $2,564.57 5 $818.89 5 $395.55 5 $687.75 5 $206.35 5 $1,502.06 5 $273.576 $2,641.50 6 $843.45 6 $407.41 6 $708.38 6 $212.54 6 $1,547.13 6 $281.777 $2,720.75 7 $868.76 7 $419.63 7 $729.63 7 $218.92 7 $1,593.54 7 $290.238 $2,802.37 8 $894.82 8 $432.22 8 $751.52 8 $225.49 8 $1,641.34 8 $298.939 $2,886.44 9 $921.66 9 $445.19 9 $774.07 9 $232.25 9 $1,690.59 9 $307.9010 $2,973.04 10 $949.31 10 $458.55 10 $797.29 10 $239.22 10 $1,741.30 10 $317.1411 $3,062.23 11 $977.79 11 $472.30 11 $821.21 11 $246.40 11 $1,793.54 11 $326.6512 $3,154.09 12 $1,007.13 12 $486.47 12 $845.84 12 $253.79 12 $1,847.35 12 $336.4513 $3,248.72 13 $1,037.34 13 $501.07 13 $871.22 13 $261.40 13 $1,902.77 13 $346.5414 $3,346.18 14 $1,068.46 14 $516.10 14 $897.36 14 $269.24 14 $1,959.85 14 $356.9415 $3,446.56 15 $1,100.52 15 $531.58 15 $924.28 15 $277.32 15 $2,018.65 15 $367.65
IRR 10.28% IRR 12.19% IRR 11.84% IRR 8.45% IRR 6.42% IRR 11.83% IRR 6.67%NPV $13,123.18 NPV $4,874.63 NPV $2,298.52 NPV $2,859.56 NPV $593.72 NPV $8,720.67 NPV $833.71AROI 4.69% AROI 6.05% AROI 5.80% AROI 3.45% AROI 2.16% AROI 5.79% AROI 2.32%
Lighting Upgrades Lighting Upgrades Lighting Upgrades Lighting Upgrades Lighting Upgrades Lighting Upgrades Lighting UpgradesElmwood Administration Building - Interior Elmwood Sludge Recirculation/Alum Storage Building - Interior Elmwood Chemical Feed Building - Interior Elmwood Sludge Dewatering Building - Interior Elmwood Generator Building - Interior Woodstream Control/BioFor Building - Interior Woodstream Blower Building - InteriorLife of ECRM (Yrs): 15 Life of ECRM (Yrs): 15 Life of ECRM (Yrs): 15 Life of ECRM (Yrs): 15 Life of ECRM (Yrs): 15 Life of ECRM (Yrs): 15 Life of ECRM (Yrs): 15
Year Cash Flow Year Cash Flow Year Cash Flow Year Cash Flow Year Cash Flow Year Cash Flow Year Cash Flow0 ($19,788.41) 0 ($4,234.69) 0 ($1,333.13) 0 ($2,323.38) 0 ($1,333.13) 0 ($8,585.16) 0 ($1,279.61)1 $1,828.76 1 $604.33 1 $228.20 1 $302.95 1 $121.72 1 $1,150.78 1 $119.822 $1,883.63 2 $622.46 2 $235.04 2 $312.04 2 $125.37 2 $1,185.30 2 $123.413 $1,940.14 3 $641.13 3 $242.09 3 $321.40 3 $129.13 3 $1,220.86 3 $127.114 $1,998.34 4 $660.37 4 $249.36 4 $331.04 4 $133.01 4 $1,257.49 4 $130.935 $2,058.29 5 $680.18 5 $256.84 5 $340.97 5 $137.00 5 $1,295.21 5 $134.866 $2,120.04 6 $700.58 6 $264.54 6 $351.20 6 $141.11 6 $1,334.07 6 $138.907 $2,183.64 7 $721.60 7 $272.48 7 $361.74 7 $145.34 7 $1,374.09 7 $143.078 $2,249.15 8 $743.25 8 $280.65 8 $372.59 8 $149.70 8 $1,415.32 8 $147.369 $2,316.62 9 $765.55 9 $289.07 9 $383.77 9 $154.19 9 $1,457.78 9 $151.7810 $2,386.12 10 $788.51 10 $297.74 10 $395.28 10 $158.82 10 $1,501.51 10 $156.3311 $2,457.71 11 $812.17 11 $306.68 11 $407.14 11 $163.58 11 $1,546.55 11 $161.0212 $2,531.44 12 $836.53 12 $315.88 12 $419.36 12 $168.49 12 $1,592.95 12 $165.8613 $2,607.38 13 $861.63 13 $325.35 13 $431.94 13 $173.55 13 $1,640.74 13 $170.8314 $2,685.60 14 $887.48 14 $335.11 14 $444.89 14 $178.75 14 $1,689.96 14 $175.9615 $2,766.17 15 $914.10 15 $345.17 15 $458.24 15 $184.11 15 $1,740.66 15 $181.23
IRR 7.08% IRR 14.26% IRR 17.85% IRR 12.63% IRR 6.91% IRR 13.12% IRR 7.28%NPV $6,844.09 NPV $4,566.22 NPV $1,990.12 NPV $2,088.54 NPV $439.52 NPV $8,173.80 NPV $465.30AROI 2.57% AROI 7.60% AROI 10.45% AROI 6.37% AROI 2.46% AROI 6.74% AROI 2.70%
Lighting Upgrades Lighting Upgrades Lighting Upgrades Lighting Upgrades Lighting Upgrades Lighting Upgrades Lighting UpgradesElmwood Administration Building - Exterior Elmwood Sludge Recirculation/Alum Storage Building - Exterior Elmwood Chemical Feed Building - Exterior Elmwood Sludge Dewatering Building - Exterior Elmwood Generator Building - Exterior Woodstream Control/BioFor Building - Exterior Woodstream Blower Building - ExteriorLife of ECRM (Yrs): 15 Life of ECRM (Yrs): 15 Life of ECRM (Yrs): 15 Life of ECRM (Yrs): 15 Life of ECRM (Yrs): 15 Life of ECRM (Yrs): 15 Life of ECRM (Yrs): 15
Year Cash Flow Year Cash Flow Year Cash Flow Year Cash Flow Year Cash Flow Year Cash Flow Year Cash Flow0 ($271.69) 0 ($1,486.38) 0 ($1,486.38) 0 ($3,715.94) 0 ($743.19) 0 ($2,129.56) 0 ($1,426.38)1 $449.82 1 $123.24 1 $123.24 1 $308.10 1 $61.62 1 $183.78 1 $123.242 $463.31 2 $126.94 2 $126.94 2 $317.35 2 $63.47 2 $189.30 2 $126.943 $477.21 3 $130.75 3 $130.75 3 $326.87 3 $65.37 3 $194.97 3 $130.754 $491.53 4 $134.67 4 $134.67 4 $336.67 4 $67.33 4 $200.82 4 $134.675 $506.28 5 $138.71 5 $138.71 5 $346.77 5 $69.35 5 $206.85 5 $138.716 $521.46 6 $142.87 6 $142.87 6 $357.18 6 $71.44 6 $213.05 6 $142.877 $537.11 7 $147.16 7 $147.16 7 $367.89 7 $73.58 7 $219.45 7 $147.168 $553.22 8 $151.57 8 $151.57 8 $378.93 8 $75.79 8 $226.03 8 $151.579 $569.82 9 $156.12 9 $156.12 9 $390.30 9 $78.06 9 $232.81 9 $156.1210 $586.91 10 $160.80 10 $160.80 10 $402.01 10 $80.40 10 $239.79 10 $160.8011 $604.52 11 $165.63 11 $165.63 11 $414.07 11 $82.81 11 $246.99 11 $165.6312 $622.66 12 $170.60 12 $170.60 12 $426.49 12 $85.30 12 $254.40 12 $170.6013 $641.34 13 $175.71 13 $175.71 13 $439.28 13 $87.86 13 $262.03 13 $175.7114 $660.58 14 $180.98 14 $180.98 14 $452.46 14 $90.49 14 $269.89 14 $180.9815 $680.39 15 $186.41 15 $186.41 15 $466.04 15 $93.21 15 $277.99 15 $186.41
IRR 168.57% IRR 5.53% IRR 5.53% IRR 5.53% IRR 5.53% IRR 6.09% IRR 6.11%NPV $6,279.09 NPV $308.41 NPV $308.41 NPV $771.02 NPV $154.20 NPV $546.88 NPV $368.41AROI 158.90% AROI 1.62% AROI 1.62% AROI 1.62% AROI 1.62% AROI 1.96% AROI 1.97%

APPENDIX J
WINDCAD MODELS

Wi dC d T bi P f M d lWindCad Turbine Performance ModelWindCad Turbine Performance ModelEndurance S 343 Wind Turbine Grid IntertieEndurance S-343 Wind Turbine, Grid - IntertieEndurance S 343 Wind Turbine, Grid Intertie
P d F E h MUAPrepared For: Evesham MUApSite Location: Evesham NJSite Location: Evesham, NJData Source: NASA Atmospheric Science Data CenterData Source: NASA Atmospheric Science Data Center
Date: 10/13/2010Date: 10/13/2010
Inputs: Results:Inputs: Results:pA Wi d ( / ) 3 63 H b A Wi d S d ( / ) 3 63Ave. Wind (m/s) = 3.63 Hub Average Wind Speed (m/s) = 3.63( ) g p ( )
Weibull K = 2 Air Density Factor = 0%Weibull K = 2 Air Density Factor = 0%Site Altitude (m) = 0 Average Output Power (kW) = 0 36Site Altitude (m) = 0 Average Output Power (kW) = 0.36Wi d Sh E 0 180 D il E O (kWh) 8 6Wind Shear Exp. = 0.180 Daily Energy Output (kWh) = 8.6Wind Shear Exp. 0.180 Daily Energy Output (kWh) 8.6
Anem Height (m) = 30 Annual Energy Output (kWh) = 3 143Anem. Height (m) = 30 Annual Energy Output (kWh) = 3,143Tower Height (m) = 30 Monthly Energy Output = 262Tower Height (m) = 30 Monthly Energy Output = 262
Turbulence Factor = 8.0% Percent Operating Time = 47.8%Turbulence Factor 8.0% Percent Operating Time 47.8%
Weibull Performance CalculationsWeibull Performance CalculationsWind Speed Bin (m/s) Power (kW) Wind Probability (f) Net kW @ V W ib ll C l l tiWind Speed Bin (m/s) Power (kW) Wind Probability (f) Net kW @ V Weibull Calculations:
1 0.00 11.32% 0.000 Wind speed probability is calculated as a 1 0.00 11.32% 0.0002 0 00 18 91% 0 000 Weibull curve defined by the average wind 2 0.00 18.91% 0.0003 0 00 21 00% 0 000
speed and a shape factor, K. To facilitate 3 0.00 21.00% 0.000
p ppiece-wise integration, the wind speed range
4 0.00 18.38% 0.000p g , p gis broken down into "bins" of 1 m/s in width4 0.00 18.38% 0.000
5 0 49 13 38% 0 066is broken down into bins of 1 m/s in width (Column 1). For each wind speed bin,5 0.49 13.38% 0.066
6 1 10 8 29% 0 091
(Column 1). For each wind speed bin, instantaneous wind turbine power (W6 1.10 8.29% 0.091 instantaneous wind turbine power (W, Column 2)) is multiplied by the Weibull wind
7 2.02 4.42% 0.090Column 2)) is multiplied by the Weibull wind speed probability (f Column 3) This cross7 2.02 4.42% 0.090
8 3 00 2 05% 0 062speed probability (f, Column 3). This cross product (Net W Column 4) is the8 3.00 2.05% 0.062 product (Net W, Column 4) is the contribution to average turbine power output9 3.81 0.83% 0.032 contribution to average turbine power output
t ib t d b i d d i th t bi Th%
10 4 41 0 29% 0 013contributed by wind speeds in that bin. The
f th t ib ti i th10 4.41 0.29% 0.01311 4 80 0 09% 0 004
sum of these contributions is the average f h bi i11 4.80 0.09% 0.004 power output of the turbine on a continuous,
12 4.99 0.03% 0.001 24 hour, basis.12 4.99 0.03% 0.00113 4 90 0 01% 0 000 Best results are achieved using annual or 13 4.90 0.01% 0.00014 4 53 0 00% 0 000
monthly average wind speeds. Use of daily 14 4.53 0.00% 0.000
y g p yor hourly average speeds is not
15 4.00 0.00% 0.000y g p
recommended.15 4.00 0.00% 0.00016 3 52 0 00% 0 000
recommended.16 3.52 0.00% 0.00017 3.19 0.00% 0.00018 2.78 0.00% 0.00018 2.78 0.00% 0.00019 2 78 0 00% 0 00019 2.78 0.00% 0.00020 2.78 0.00% 0.00020 2.78 0.00% 0.000
2008 BWC Totals: 98 99% 0 3592008, BWC Totals: 98.99% 0.359

Wi dC d T bi P f M d lWindCad Turbine Performance ModelWindCad Turbine Performance ModelEndurance S 343 Wind Turbine Grid IntertieEndurance S-343 Wind Turbine, Grid - IntertieEndurance S 343 Wind Turbine, Grid Intertie
P d F E h MUAPrepared For: Evesham MUApSite Location: Evesham NJSite Location: Evesham, NJData Source: NASA Atmospheric Science Data CenterData Source: NASA Atmospheric Science Data Center
Date: 10/13/2010Date: 10/13/2010
Inputs: Results:Inputs: Results:pA Wi d ( / ) 5 22 H b A Wi d S d ( / ) 5 22Ave. Wind (m/s) = 5.22 Hub Average Wind Speed (m/s) = 5.22( ) g p ( )
Weibull K = 2 Air Density Factor = 0%Weibull K = 2 Air Density Factor = 0%Site Altitude (m) = 0 Average Output Power (kW) = 1 14Site Altitude (m) = 0 Average Output Power (kW) = 1.14Wi d Sh E 0 180 D il E O (kWh) 2 4Wind Shear Exp. = 0.180 Daily Energy Output (kWh) = 27.4Wind Shear Exp. 0.180 Daily Energy Output (kWh) 27.4
Anem Height (m) = 30 Annual Energy Output (kWh) = 9 990Anem. Height (m) = 30 Annual Energy Output (kWh) = 9,990Tower Height (m) = 30 Monthly Energy Output = 833Tower Height (m) = 30 Monthly Energy Output = 833
Turbulence Factor = 8.0% Percent Operating Time = 70.1%Turbulence Factor 8.0% Percent Operating Time 70.1%
Weibull Performance CalculationsWeibull Performance CalculationsWind Speed Bin (m/s) Power (kW) Wind Probability (f) Net kW @ V W ib ll C l l tiWind Speed Bin (m/s) Power (kW) Wind Probability (f) Net kW @ V Weibull Calculations:
1 0.00 5.65% 0.000 Wind speed probability is calculated as a 1 0.00 5.65% 0.0002 0 00 10 35% 0 000 Weibull curve defined by the average wind 2 0.00 10.35% 0.0003 0 00 13 43% 0 000
speed and a shape factor, K. To facilitate 3 0.00 13.43% 0.000
p ppiece-wise integration, the wind speed range
4 0.00 14.61% 0.000p g , p gis broken down into "bins" of 1 m/s in width4 0.00 14.61% 0.000
5 0 49 14 05% 0 069is broken down into bins of 1 m/s in width (Column 1). For each wind speed bin,5 0.49 14.05% 0.069
6 1 10 12 25% 0 135
(Column 1). For each wind speed bin, instantaneous wind turbine power (W6 1.10 12.25% 0.135 instantaneous wind turbine power (W, Column 2)) is multiplied by the Weibull wind
7 2.02 9.79% 0.198Column 2)) is multiplied by the Weibull wind speed probability (f Column 3) This cross7 2.02 9.79% 0.198
8 3 00 7 24% 0 217speed probability (f, Column 3). This cross product (Net W Column 4) is the8 3.00 7.24% 0.217 product (Net W, Column 4) is the contribution to average turbine power output9 3.81 4.97% 0.189 contribution to average turbine power output
t ib t d b i d d i th t bi Th%
10 4 41 3 18% 0 140contributed by wind speeds in that bin. The
f th t ib ti i th10 4.41 3.18% 0.14011 4 80 1 90% 0 091
sum of these contributions is the average f h bi i11 4.80 1.90% 0.091 power output of the turbine on a continuous,
12 4.99 1.06% 0.053 24 hour, basis.12 4.99 1.06% 0.05313 4 90 0 56% 0 027 Best results are achieved using annual or 13 4.90 0.56% 0.02714 4 53 0 27% 0 012
monthly average wind speeds. Use of daily 14 4.53 0.27% 0.012
y g p yor hourly average speeds is not
15 4.00 0.13% 0.005y g p
recommended.15 4.00 0.13% 0.00516 3 52 0 05% 0 002
recommended.16 3.52 0.05% 0.00217 3.19 0.02% 0.00118 2.78 0.01% 0.00018 2.78 0.01% 0.00019 2 78 0 00% 0 00019 2.78 0.00% 0.00020 2.78 0.00% 0.00020 2.78 0.00% 0.000
2008 BWC Totals: 99 51% 1 1402008, BWC Totals: 99.51% 1.140
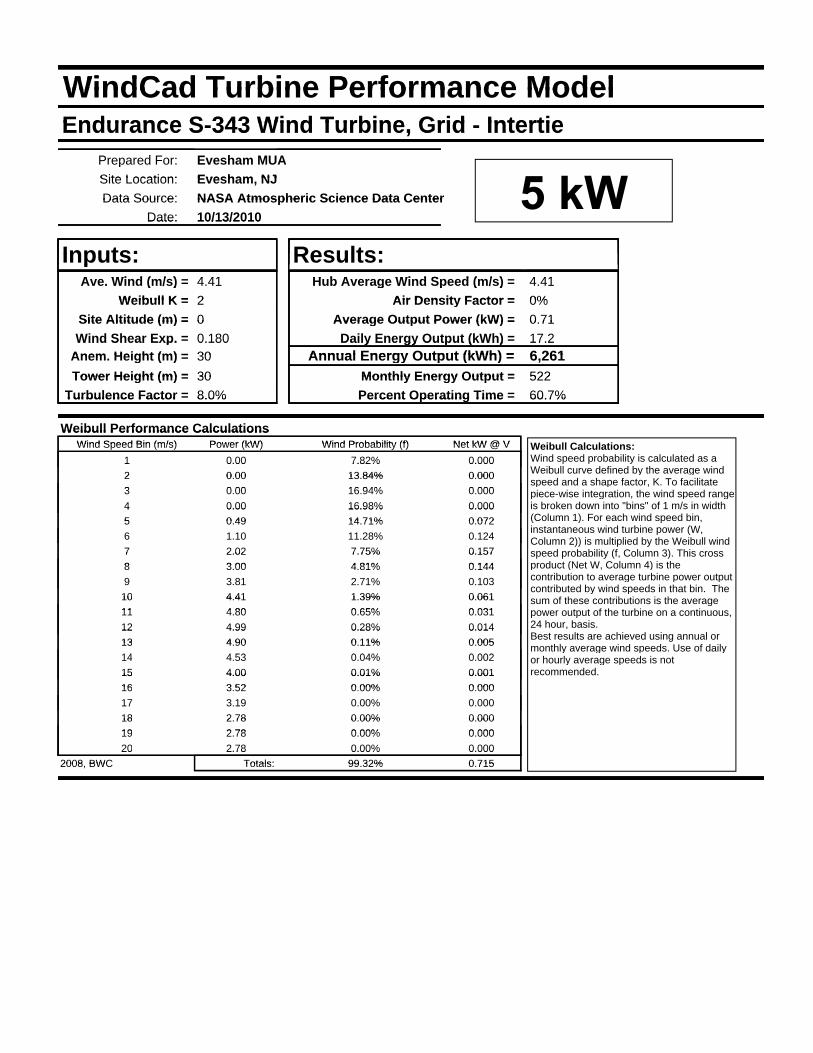
Wi dC d T bi P f M d lWindCad Turbine Performance ModelWindCad Turbine Performance ModelEndurance S 343 Wind Turbine Grid IntertieEndurance S-343 Wind Turbine, Grid - IntertieEndurance S 343 Wind Turbine, Grid Intertie
P d F E h MUAPrepared For: Evesham MUApSite Location: Evesham NJSite Location: Evesham, NJData Source: NASA Atmospheric Science Data CenterData Source: NASA Atmospheric Science Data Center
Date: 10/13/2010Date: 10/13/2010
Inputs: Results:Inputs: Results:pA Wi d ( / ) 4 41 H b A Wi d S d ( / ) 4 41Ave. Wind (m/s) = 4.41 Hub Average Wind Speed (m/s) = 4.41( ) g p ( )
Weibull K = 2 Air Density Factor = 0%Weibull K = 2 Air Density Factor = 0%Site Altitude (m) = 0 Average Output Power (kW) = 0 71Site Altitude (m) = 0 Average Output Power (kW) = 0.71Wi d Sh E 0 180 D il E O (kWh) 1 2Wind Shear Exp. = 0.180 Daily Energy Output (kWh) = 17.2Wind Shear Exp. 0.180 Daily Energy Output (kWh) 17.2
Anem Height (m) = 30 Annual Energy Output (kWh) = 6 261Anem. Height (m) = 30 Annual Energy Output (kWh) = 6,261Tower Height (m) = 30 Monthly Energy Output = 522Tower Height (m) = 30 Monthly Energy Output = 522
Turbulence Factor = 8.0% Percent Operating Time = 60.7%Turbulence Factor 8.0% Percent Operating Time 60.7%
Weibull Performance CalculationsWeibull Performance CalculationsWind Speed Bin (m/s) Power (kW) Wind Probability (f) Net kW @ V W ib ll C l l tiWind Speed Bin (m/s) Power (kW) Wind Probability (f) Net kW @ V Weibull Calculations:
1 0.00 7.82% 0.000 Wind speed probability is calculated as a 1 0.00 7.82% 0.0002 0 00 13 84% 0 000 Weibull curve defined by the average wind 2 0.00 13.84% 0.0003 0 00 16 94% 0 000
speed and a shape factor, K. To facilitate 3 0.00 16.94% 0.000
p ppiece-wise integration, the wind speed range
4 0.00 16.98% 0.000p g , p gis broken down into "bins" of 1 m/s in width4 0.00 16.98% 0.000
5 0 49 14 71% 0 072is broken down into bins of 1 m/s in width (Column 1). For each wind speed bin,5 0.49 14.71% 0.072
6 1 10 11 28% 0 124
(Column 1). For each wind speed bin, instantaneous wind turbine power (W6 1.10 11.28% 0.124 instantaneous wind turbine power (W, Column 2)) is multiplied by the Weibull wind
7 2.02 7.75% 0.157Column 2)) is multiplied by the Weibull wind speed probability (f Column 3) This cross7 2.02 7.75% 0.157
8 3 00 4 81% 0 144speed probability (f, Column 3). This cross product (Net W Column 4) is the8 3.00 4.81% 0.144 product (Net W, Column 4) is the contribution to average turbine power output9 3.81 2.71% 0.103 contribution to average turbine power output
t ib t d b i d d i th t bi Th%
10 4 41 1 39% 0 061contributed by wind speeds in that bin. The
f th t ib ti i th10 4.41 1.39% 0.06111 4 80 0 65% 0 031
sum of these contributions is the average f h bi i11 4.80 0.65% 0.031 power output of the turbine on a continuous,
12 4.99 0.28% 0.014 24 hour, basis.12 4.99 0.28% 0.01413 4 90 0 11% 0 005 Best results are achieved using annual or 13 4.90 0.11% 0.00514 4 53 0 04% 0 002
monthly average wind speeds. Use of daily 14 4.53 0.04% 0.002
y g p yor hourly average speeds is not
15 4.00 0.01% 0.001y g p
recommended.15 4.00 0.01% 0.00116 3 52 0 00% 0 000
recommended.16 3.52 0.00% 0.00017 3.19 0.00% 0.00018 2.78 0.00% 0.00018 2.78 0.00% 0.00019 2 78 0 00% 0 00019 2.78 0.00% 0.00020 2.78 0.00% 0.00020 2.78 0.00% 0.000
2008 BWC Totals: 99 32% 0 7152008, BWC Totals: 99.32% 0.715

APPENDIX K
WIND FINANCIAL WORKSHEETS
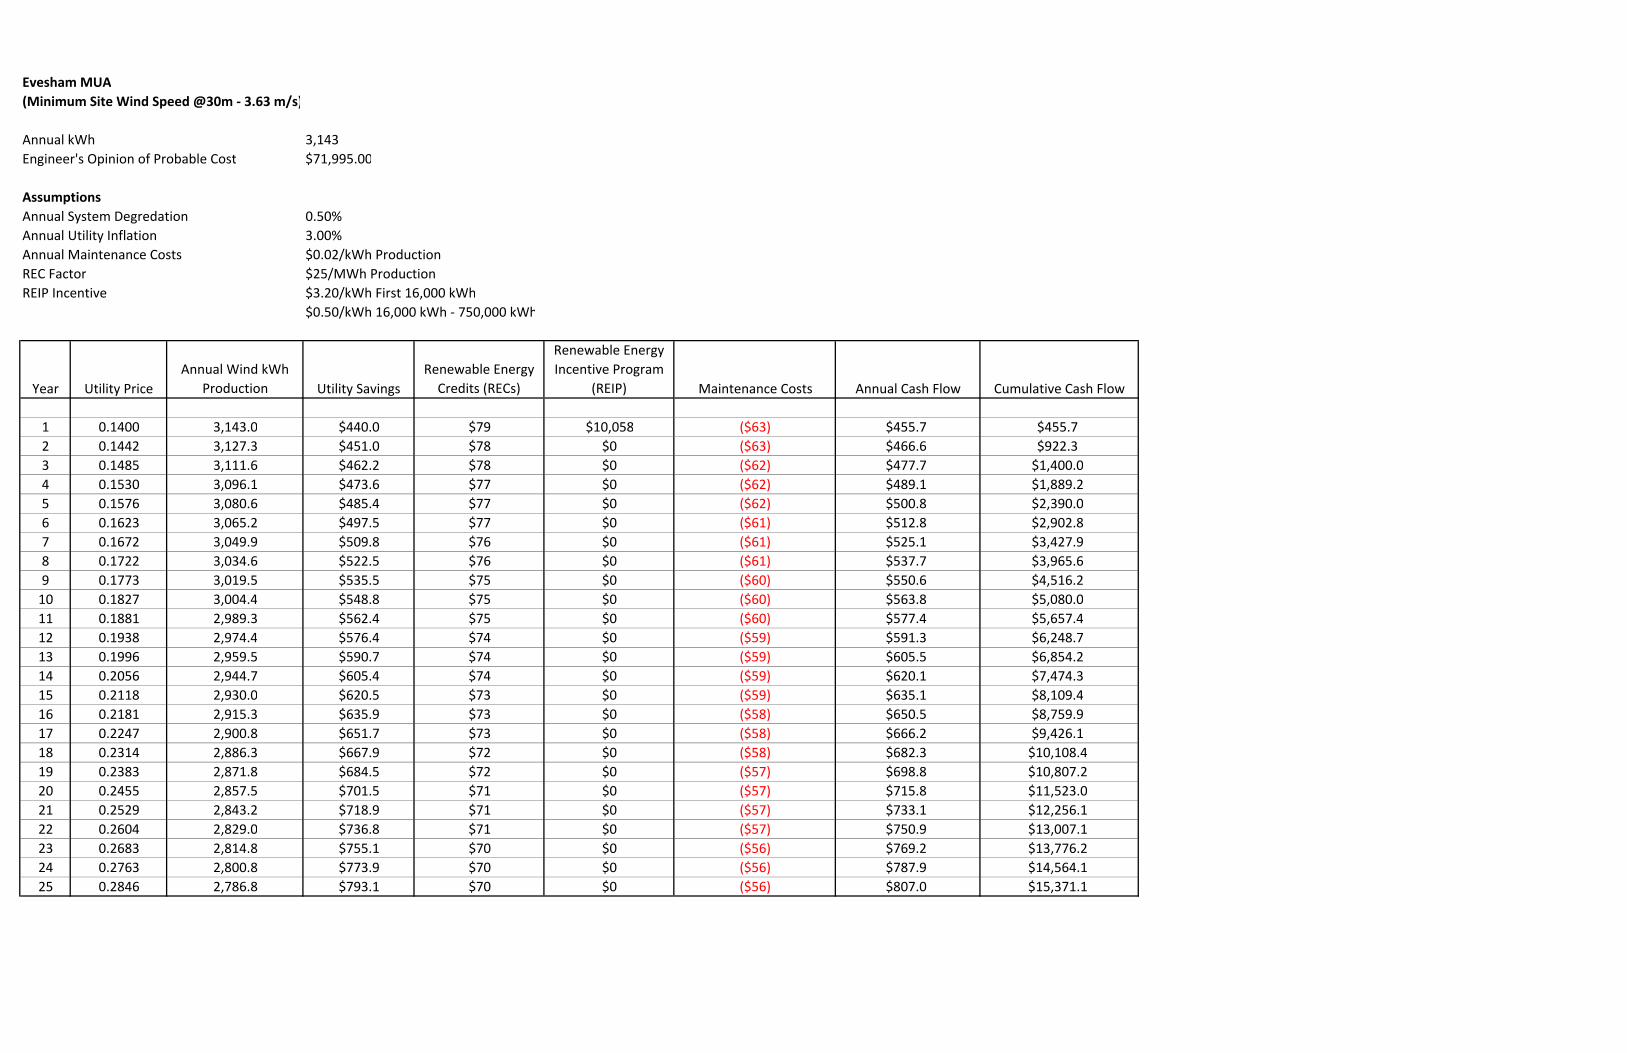
Evesham MUA(Minimum Site Wind Speed @30m ‐ 3.63 m/s)
Annual kWh 3,143Engineer's Opinion of Probable Cost $71,995.00
AssumptionsAnnual System Degredation 0.50%Annual Utility Inflation 3.00%Annual Maintenance Costs $0.02/kWh ProductionREC Factor $25/MWh ProductionREIP Incentive $3.20/kWh First 16,000 kWh
$0.50/kWh 16,000 kWh ‐ 750,000 kWh
Year Utility PriceAnnual Wind kWh
Production Utility SavingsRenewable Energy Credits (RECs)
Renewable Energy Incentive Program
(REIP) Maintenance Costs Annual Cash Flow Cumulative Cash Flow
1 0.1400 3,143.0 $440.0 $79 $10,058 ($63) $455.7 $455.72 0.1442 3,127.3 $451.0 $78 $0 ($63) $466.6 $922.33 0.1485 3,111.6 $462.2 $78 $0 ($62) $477.7 $1,400.04 0.1530 3,096.1 $473.6 $77 $0 ($62) $489.1 $1,889.25 0.1576 3,080.6 $485.4 $77 $0 ($62) $500.8 $2,390.06 0.1623 3,065.2 $497.5 $77 $0 ($61) $512.8 $2,902.87 0.1672 3,049.9 $509.8 $76 $0 ($61) $525.1 $3,427.98 0.1722 3,034.6 $522.5 $76 $0 ($61) $537.7 $3,965.69 0.1773 3,019.5 $535.5 $75 $0 ($60) $550.6 $4,516.210 0.1827 3,004.4 $548.8 $75 $0 ($60) $563.8 $5,080.011 0.1881 2,989.3 $562.4 $75 $0 ($60) $577.4 $5,657.412 0.1938 2,974.4 $576.4 $74 $0 ($59) $591.3 $6,248.713 0.1996 2,959.5 $590.7 $74 $0 ($59) $605.5 $6,854.214 0.2056 2,944.7 $605.4 $74 $0 ($59) $620.1 $7,474.315 0.2118 2,930.0 $620.5 $73 $0 ($59) $635.1 $8,109.416 0.2181 2,915.3 $635.9 $73 $0 ($58) $650.5 $8,759.917 0.2247 2,900.8 $651.7 $73 $0 ($58) $666.2 $9,426.118 0.2314 2,886.3 $667.9 $72 $0 ($58) $682.3 $10,108.419 0.2383 2,871.8 $684.5 $72 $0 ($57) $698.8 $10,807.220 0.2455 2,857.5 $701.5 $71 $0 ($57) $715.8 $11,523.021 0.2529 2,843.2 $718.9 $71 $0 ($57) $733.1 $12,256.122 0.2604 2,829.0 $736.8 $71 $0 ($57) $750.9 $13,007.123 0.2683 2,814.8 $755.1 $70 $0 ($56) $769.2 $13,776.224 0.2763 2,800.8 $773.9 $70 $0 ($56) $787.9 $14,564.125 0.2846 2,786.8 $793.1 $70 $0 ($56) $807.0 $15,371.1
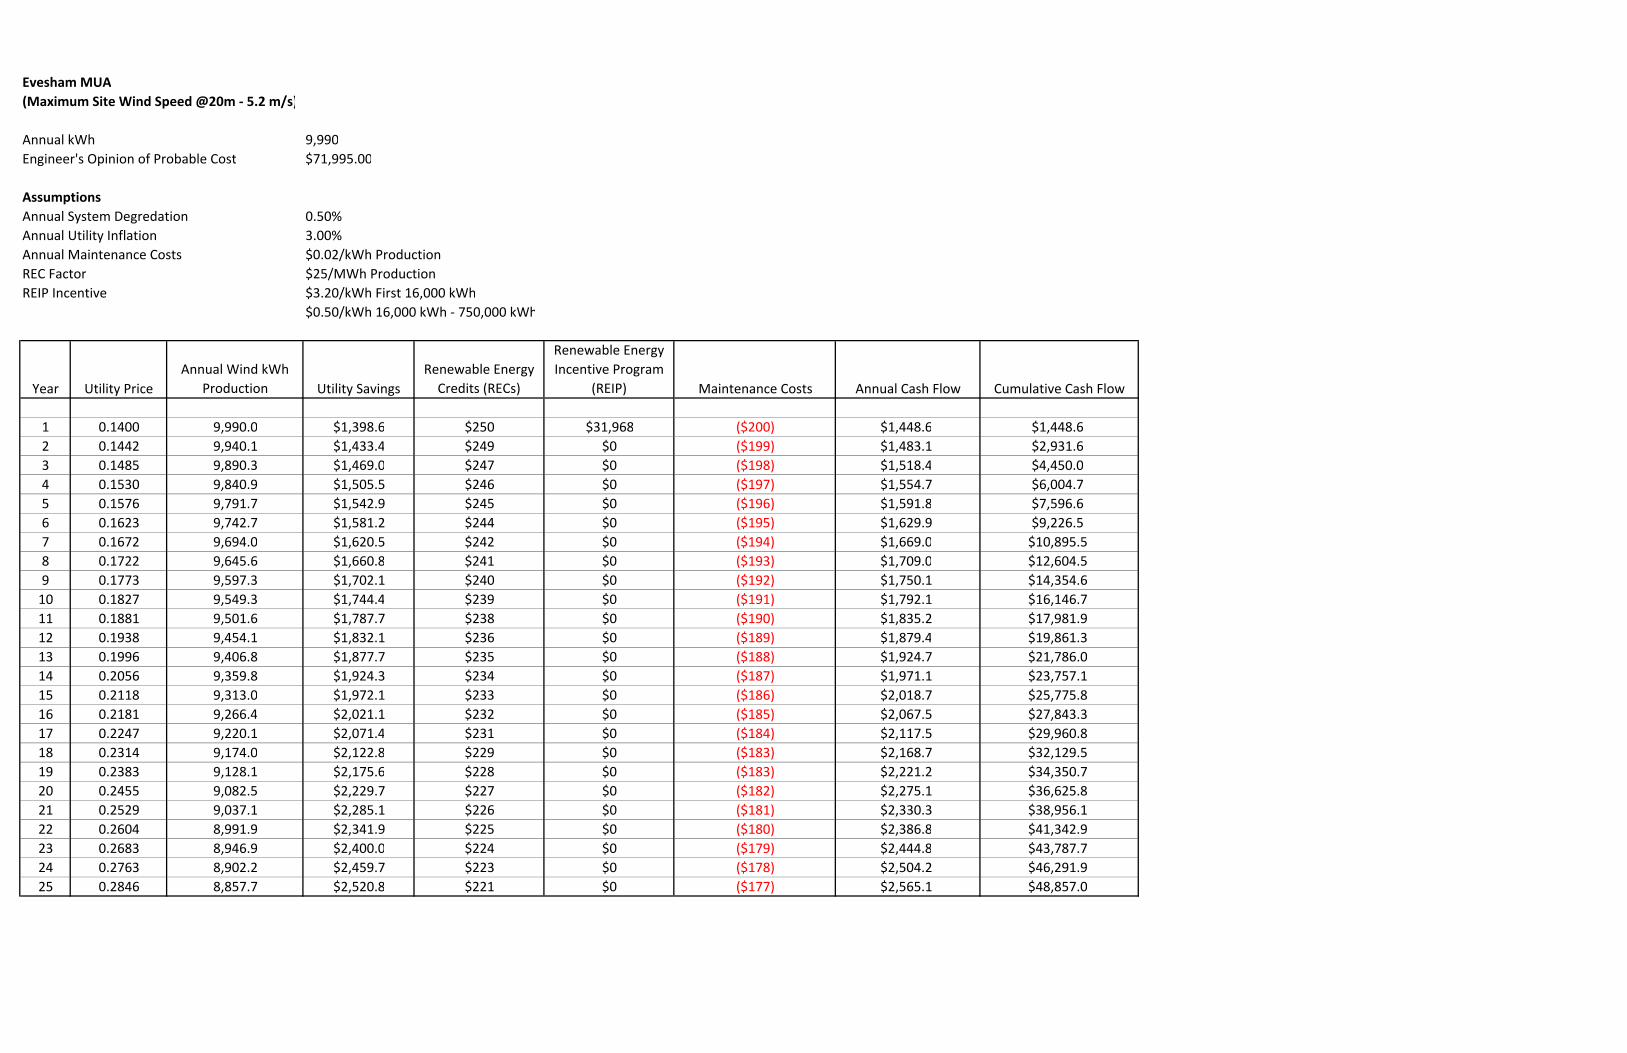
Evesham MUA(Maximum Site Wind Speed @20m ‐ 5.2 m/s)
Annual kWh 9,990Engineer's Opinion of Probable Cost $71,995.00
AssumptionsAnnual System Degredation 0.50%Annual Utility Inflation 3.00%Annual Maintenance Costs $0.02/kWh ProductionREC Factor $25/MWh ProductionREIP Incentive $3.20/kWh First 16,000 kWh
$0.50/kWh 16,000 kWh ‐ 750,000 kWh
Year Utility PriceAnnual Wind kWh
Production Utility SavingsRenewable Energy Credits (RECs)
Renewable Energy Incentive Program
(REIP) Maintenance Costs Annual Cash Flow Cumulative Cash Flow
1 0.1400 9,990.0 $1,398.6 $250 $31,968 ($200) $1,448.6 $1,448.62 0.1442 9,940.1 $1,433.4 $249 $0 ($199) $1,483.1 $2,931.63 0.1485 9,890.3 $1,469.0 $247 $0 ($198) $1,518.4 $4,450.04 0.1530 9,840.9 $1,505.5 $246 $0 ($197) $1,554.7 $6,004.75 0.1576 9,791.7 $1,542.9 $245 $0 ($196) $1,591.8 $7,596.66 0.1623 9,742.7 $1,581.2 $244 $0 ($195) $1,629.9 $9,226.57 0.1672 9,694.0 $1,620.5 $242 $0 ($194) $1,669.0 $10,895.58 0.1722 9,645.6 $1,660.8 $241 $0 ($193) $1,709.0 $12,604.59 0.1773 9,597.3 $1,702.1 $240 $0 ($192) $1,750.1 $14,354.610 0.1827 9,549.3 $1,744.4 $239 $0 ($191) $1,792.1 $16,146.711 0.1881 9,501.6 $1,787.7 $238 $0 ($190) $1,835.2 $17,981.912 0.1938 9,454.1 $1,832.1 $236 $0 ($189) $1,879.4 $19,861.313 0.1996 9,406.8 $1,877.7 $235 $0 ($188) $1,924.7 $21,786.014 0.2056 9,359.8 $1,924.3 $234 $0 ($187) $1,971.1 $23,757.115 0.2118 9,313.0 $1,972.1 $233 $0 ($186) $2,018.7 $25,775.816 0.2181 9,266.4 $2,021.1 $232 $0 ($185) $2,067.5 $27,843.317 0.2247 9,220.1 $2,071.4 $231 $0 ($184) $2,117.5 $29,960.818 0.2314 9,174.0 $2,122.8 $229 $0 ($183) $2,168.7 $32,129.519 0.2383 9,128.1 $2,175.6 $228 $0 ($183) $2,221.2 $34,350.720 0.2455 9,082.5 $2,229.7 $227 $0 ($182) $2,275.1 $36,625.821 0.2529 9,037.1 $2,285.1 $226 $0 ($181) $2,330.3 $38,956.122 0.2604 8,991.9 $2,341.9 $225 $0 ($180) $2,386.8 $41,342.923 0.2683 8,946.9 $2,400.0 $224 $0 ($179) $2,444.8 $43,787.724 0.2763 8,902.2 $2,459.7 $223 $0 ($178) $2,504.2 $46,291.925 0.2846 8,857.7 $2,520.8 $221 $0 ($177) $2,565.1 $48,857.0
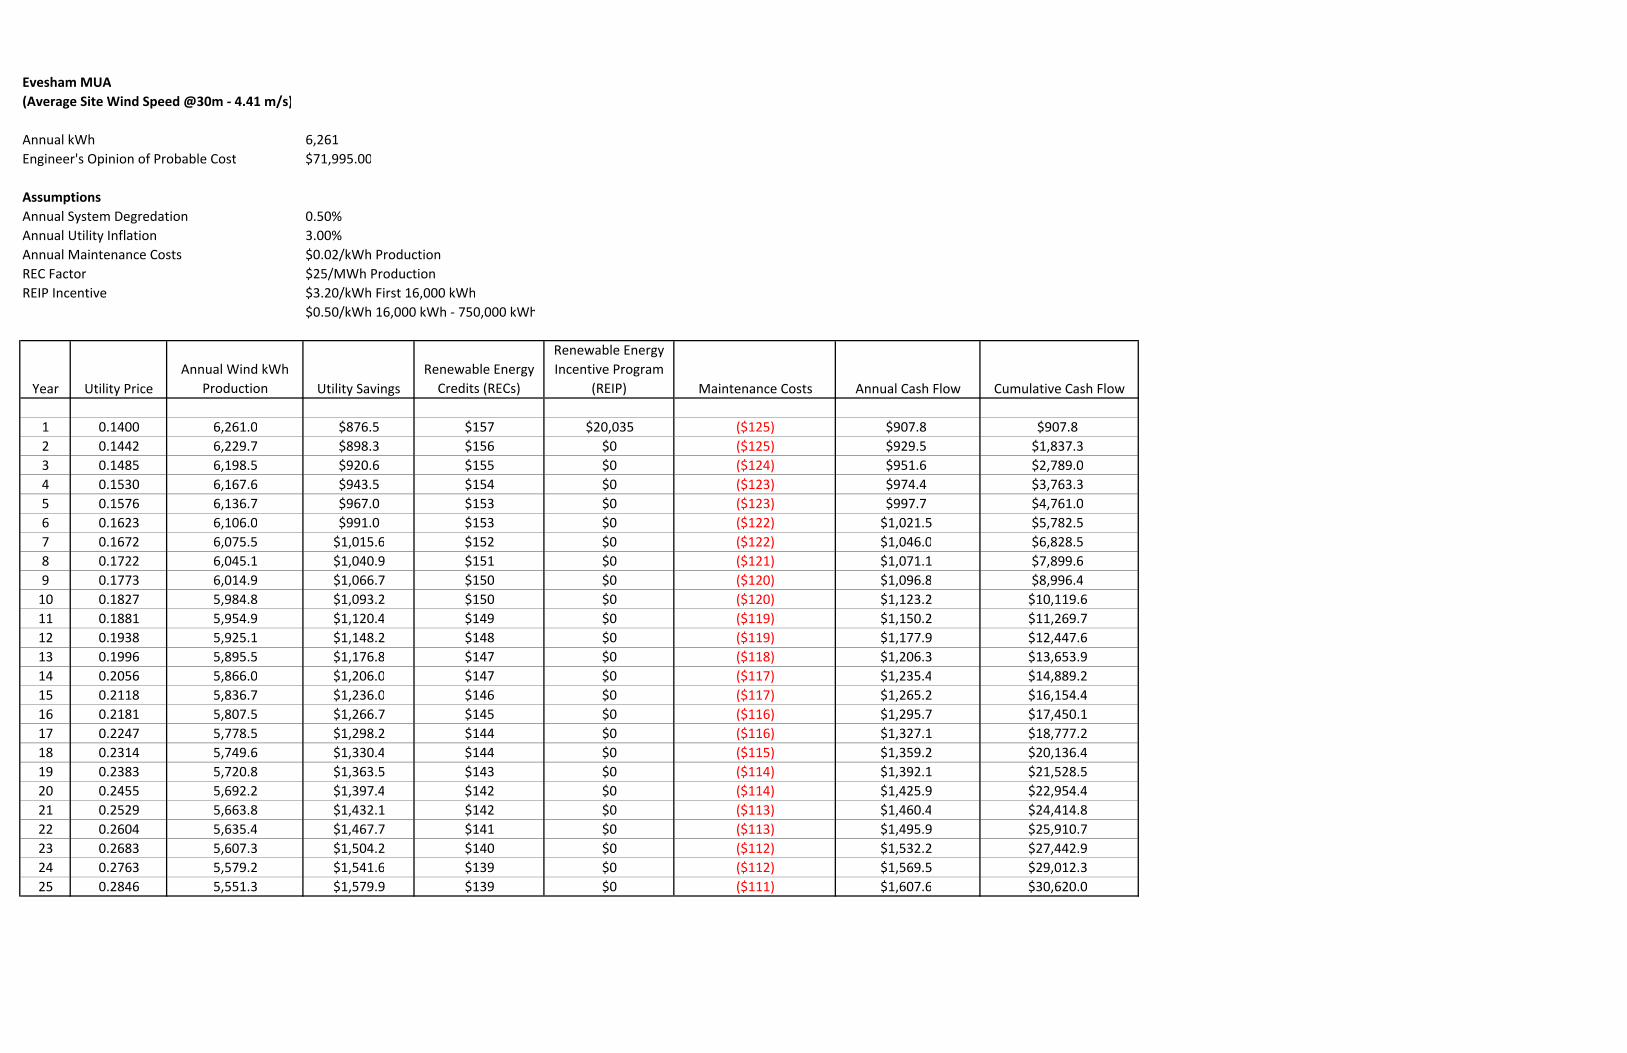
Evesham MUA(Average Site Wind Speed @30m ‐ 4.41 m/s)
Annual kWh 6,261Engineer's Opinion of Probable Cost $71,995.00
AssumptionsAnnual System Degredation 0.50%Annual Utility Inflation 3.00%Annual Maintenance Costs $0.02/kWh ProductionREC Factor $25/MWh ProductionREIP Incentive $3.20/kWh First 16,000 kWh
$0.50/kWh 16,000 kWh ‐ 750,000 kWh
Year Utility PriceAnnual Wind kWh
Production Utility SavingsRenewable Energy Credits (RECs)
Renewable Energy Incentive Program
(REIP) Maintenance Costs Annual Cash Flow Cumulative Cash Flow
1 0.1400 6,261.0 $876.5 $157 $20,035 ($125) $907.8 $907.82 0.1442 6,229.7 $898.3 $156 $0 ($125) $929.5 $1,837.33 0.1485 6,198.5 $920.6 $155 $0 ($124) $951.6 $2,789.04 0.1530 6,167.6 $943.5 $154 $0 ($123) $974.4 $3,763.35 0.1576 6,136.7 $967.0 $153 $0 ($123) $997.7 $4,761.06 0.1623 6,106.0 $991.0 $153 $0 ($122) $1,021.5 $5,782.57 0.1672 6,075.5 $1,015.6 $152 $0 ($122) $1,046.0 $6,828.58 0.1722 6,045.1 $1,040.9 $151 $0 ($121) $1,071.1 $7,899.69 0.1773 6,014.9 $1,066.7 $150 $0 ($120) $1,096.8 $8,996.410 0.1827 5,984.8 $1,093.2 $150 $0 ($120) $1,123.2 $10,119.611 0.1881 5,954.9 $1,120.4 $149 $0 ($119) $1,150.2 $11,269.712 0.1938 5,925.1 $1,148.2 $148 $0 ($119) $1,177.9 $12,447.613 0.1996 5,895.5 $1,176.8 $147 $0 ($118) $1,206.3 $13,653.914 0.2056 5,866.0 $1,206.0 $147 $0 ($117) $1,235.4 $14,889.215 0.2118 5,836.7 $1,236.0 $146 $0 ($117) $1,265.2 $16,154.416 0.2181 5,807.5 $1,266.7 $145 $0 ($116) $1,295.7 $17,450.117 0.2247 5,778.5 $1,298.2 $144 $0 ($116) $1,327.1 $18,777.218 0.2314 5,749.6 $1,330.4 $144 $0 ($115) $1,359.2 $20,136.419 0.2383 5,720.8 $1,363.5 $143 $0 ($114) $1,392.1 $21,528.520 0.2455 5,692.2 $1,397.4 $142 $0 ($114) $1,425.9 $22,954.421 0.2529 5,663.8 $1,432.1 $142 $0 ($113) $1,460.4 $24,414.822 0.2604 5,635.4 $1,467.7 $141 $0 ($113) $1,495.9 $25,910.723 0.2683 5,607.3 $1,504.2 $140 $0 ($112) $1,532.2 $27,442.924 0.2763 5,579.2 $1,541.6 $139 $0 ($112) $1,569.5 $29,012.325 0.2846 5,551.3 $1,579.9 $139 $0 ($111) $1,607.6 $30,620.0

APPENDIX L
MOTOR AND VFD UPGRADES ANALYSIS
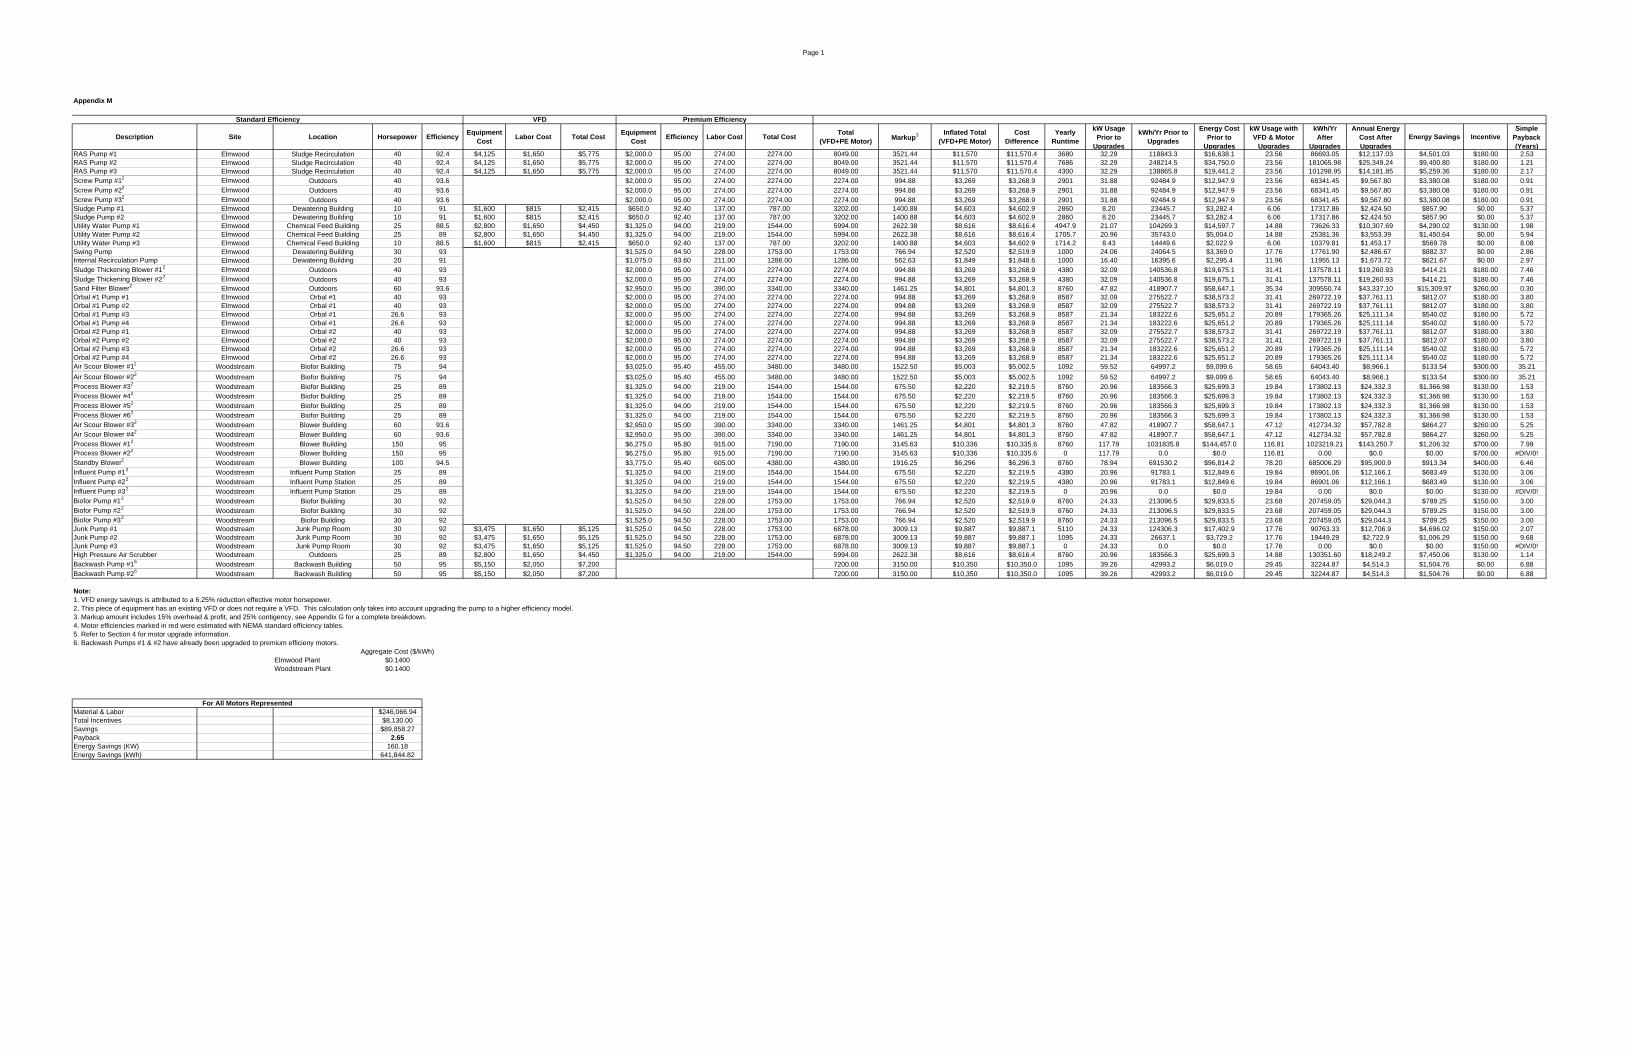
Page 1
Description Site Location Horsepower Efficiency Equipment Cost Labor Cost Total Cost Equipment
Cost Efficiency Labor Cost Total Cost Total(VFD+PE Motor) Markup3 Inflated Total
(VFD+PE Motor)Cost
DifferenceYearly
Runtime
kW Usage Prior to
Upgrades
kWh/Yr Prior to Upgrades
Energy Cost Prior to
Upgrades
kW Usage with VFD & Motor
Upgrades
kWh/Yr After
Upgrades
Annual Energy Cost After Upgrades
Energy Savings IncentiveSimple
Payback (Years)
RAS Pump #1 Elmwood Sludge Recirculation 40 92.4 $4,125 $1,650 $5,775 $2,000.0 95.00 274.00 2274.00 8049.00 3521.44 $11,570 $11,570.4 3680 32.29 118843.3 $16,638.1 23.56 86693.05 $12,137.03 $4,501.03 $180.00 2.53RAS Pump #2 Elmwood Sludge Recirculation 40 92.4 $4,125 $1,650 $5,775 $2,000.0 95.00 274.00 2274.00 8049.00 3521.44 $11,570 $11,570.4 7686 32.29 248214.5 $34,750.0 23.56 181065.98 $25,349.24 $9,400.80 $180.00 1.21RAS Pump #3 Elmwood Sludge Recirculation 40 92.4 $4,125 $1,650 $5,775 $2,000.0 95.00 274.00 2274.00 8049.00 3521.44 $11,570 $11,570.4 4300 32.29 138865.8 $19,441.2 23.56 101298.95 $14,181.85 $5,259.36 $180.00 2.17Screw Pump #12 Elmwood Outdoors 40 93.6 $2,000.0 95.00 274.00 2274.00 2274.00 994.88 $3,269 $3,268.9 2901 31.88 92484.9 $12,947.9 23.56 68341.45 $9,567.80 $3,380.08 $180.00 0.91Screw Pump #22 Elmwood Outdoors 40 93.6 $2,000.0 95.00 274.00 2274.00 2274.00 994.88 $3,269 $3,268.9 2901 31.88 92484.9 $12,947.9 23.56 68341.45 $9,567.80 $3,380.08 $180.00 0.91Screw Pump #32 Elmwood Outdoors 40 93.6 $2,000.0 95.00 274.00 2274.00 2274.00 994.88 $3,269 $3,268.9 2901 31.88 92484.9 $12,947.9 23.56 68341.45 $9,567.80 $3,380.08 $180.00 0.91Sludge Pump #1 Elmwood Dewatering Building 10 91 $1,600 $815 $2,415 $650.0 92.40 137.00 787.00 3202.00 1400.88 $4,603 $4,602.9 2860 8.20 23445.7 $3,282.4 6.06 17317.86 $2,424.50 $857.90 $0.00 5.37Sludge Pump #2 Elmwood Dewatering Building 10 91 $1,600 $815 $2,415 $650.0 92.40 137.00 787.00 3202.00 1400.88 $4,603 $4,602.9 2860 8.20 23445.7 $3,282.4 6.06 17317.86 $2,424.50 $857.90 $0.00 5.37Utility Water Pump #1 Elmwood Chemical Feed Building 25 88.5 $2,800 $1,650 $4,450 $1,325.0 94.00 219.00 1544.00 5994.00 2622.38 $8,616 $8,616.4 4947.9 21.07 104269.3 $14,597.7 14.88 73626.33 $10,307.69 $4,290.02 $130.00 1.98Utility Water Pump #2 Elmwood Chemical Feed Building 25 89 $2,800 $1,650 $4,450 $1,325.0 94.00 219.00 1544.00 5994.00 2622.38 $8,616 $8,616.4 1705.7 20.96 35743.0 $5,004.0 14.88 25381.36 $3,553.39 $1,450.64 $0.00 5.94Utility Water Pump #3 Elmwood Chemical Feed Building 10 88.5 $1,600 $815 $2,415 $650.0 92.40 137.00 787.00 3202.00 1400.88 $4,603 $4,602.9 1714.2 8.43 14449.6 $2,022.9 6.06 10379.81 $1,453.17 $569.78 $0.00 8.08Swing Pump Elmwood Dewatering Building 30 93 $1,525.0 94.50 228.00 1753.00 1753.00 766.94 $2,520 $2,519.9 1000 24.06 24064.5 $3,369.0 17.76 17761.90 $2,486.67 $882.37 $0.00 2.86Internal Recirculation Pump Elmwood Dewatering Building 20 91 $1,075.0 93.60 211.00 1286.00 1286.00 562.63 $1,849 $1,848.6 1000 16.40 16395.6 $2,295.4 11.96 11955.13 $1,673.72 $621.67 $0.00 2.97Sludge Thickening Blower #12 Elmwood Outdoors 40 93 $2,000.0 95.00 274.00 2274.00 2274.00 994.88 $3,269 $3,268.9 4380 32.09 140536.8 $19,675.1 31.41 137578.11 $19,260.93 $414.21 $180.00 7.46Sludge Thickening Blower #22 Elmwood Outdoors 40 93 $2,000.0 95.00 274.00 2274.00 2274.00 994.88 $3,269 $3,268.9 4380 32.09 140536.8 $19,675.1 31.41 137578.11 $19,260.93 $414.21 $180.00 7.46Sand Filter Blower2 Elmwood Outdoors 60 93.6 $2,950.0 95.00 390.00 3340.00 3340.00 1461.25 $4,801 $4,801.3 8760 47.82 418907.7 $58,647.1 35.34 309550.74 $43,337.10 $15,309.97 $260.00 0.30Orbal #1 Pump #1 Elmwood Orbal #1 40 93 $2,000.0 95.00 274.00 2274.00 2274.00 994.88 $3,269 $3,268.9 8587 32.09 275522.7 $38,573.2 31.41 269722.19 $37,761.11 $812.07 $180.00 3.80Orbal #1 Pump #2 Elmwood Orbal #1 40 93 $2,000.0 95.00 274.00 2274.00 2274.00 994.88 $3,269 $3,268.9 8587 32.09 275522.7 $38,573.2 31.41 269722.19 $37,761.11 $812.07 $180.00 3.80Orbal #1 Pump #3 Elmwood Orbal #1 26.6 93 $2,000.0 95.00 274.00 2274.00 2274.00 994.88 $3,269 $3,268.9 8587 21.34 183222.6 $25,651.2 20.89 179365.26 $25,111.14 $540.02 $180.00 5.72Orbal #1 Pump #4 Elmwood Orbal #1 26.6 93 $2,000.0 95.00 274.00 2274.00 2274.00 994.88 $3,269 $3,268.9 8587 21.34 183222.6 $25,651.2 20.89 179365.26 $25,111.14 $540.02 $180.00 5.72Orbal #2 Pump #1 Elmwood Orbal #2 40 93 $2,000.0 95.00 274.00 2274.00 2274.00 994.88 $3,269 $3,268.9 8587 32.09 275522.7 $38,573.2 31.41 269722.19 $37,761.11 $812.07 $180.00 3.80Orbal #2 Pump #2 Elmwood Orbal #2 40 93 $2,000.0 95.00 274.00 2274.00 2274.00 994.88 $3,269 $3,268.9 8587 32.09 275522.7 $38,573.2 31.41 269722.19 $37,761.11 $812.07 $180.00 3.80Orbal #2 Pump #3 Elmwood Orbal #2 26.6 93 $2,000.0 95.00 274.00 2274.00 2274.00 994.88 $3,269 $3,268.9 8587 21.34 183222.6 $25,651.2 20.89 179365.26 $25,111.14 $540.02 $180.00 5.72Orbal #2 Pump #4 Elmwood Orbal #2 26.6 93 $2,000.0 95.00 274.00 2274.00 2274.00 994.88 $3,269 $3,268.9 8587 21.34 183222.6 $25,651.2 20.89 179365.26 $25,111.14 $540.02 $180.00 5.72Air Scour Blower #12 Woodstream Biofor Building 75 94 $3,025.0 95.40 455.00 3480.00 3480.00 1522.50 $5,003 $5,002.5 1092 59.52 64997.2 $9,099.6 58.65 64043.40 $8,966.1 $133.54 $300.00 35.21Air Scour Blower #22 Woodstream Biofor Building 75 94 $3,025.0 95.40 455.00 3480.00 3480.00 1522.50 $5,003 $5,002.5 1092 59.52 64997.2 $9,099.6 58.65 64043.40 $8,966.1 $133.54 $300.00 35.21Process Blower #32 Woodstream Biofor Building 25 89 $1,325.0 94.00 219.00 1544.00 1544.00 675.50 $2,220 $2,219.5 8760 20.96 183566.3 $25,699.3 19.84 173802.13 $24,332.3 $1,366.98 $130.00 1.53Process Blower #42 Woodstream Biofor Building 25 89 $1,325.0 94.00 219.00 1544.00 1544.00 675.50 $2,220 $2,219.5 8760 20.96 183566.3 $25,699.3 19.84 173802.13 $24,332.3 $1,366.98 $130.00 1.53Process Blower #52 Woodstream Biofor Building 25 89 $1,325.0 94.00 219.00 1544.00 1544.00 675.50 $2,220 $2,219.5 8760 20.96 183566.3 $25,699.3 19.84 173802.13 $24,332.3 $1,366.98 $130.00 1.53Process Blower #62 Woodstream Biofor Building 25 89 $1,325.0 94.00 219.00 1544.00 1544.00 675.50 $2,220 $2,219.5 8760 20.96 183566.3 $25,699.3 19.84 173802.13 $24,332.3 $1,366.98 $130.00 1.53Air Scour Blower #32 Woodstream Blower Building 60 93.6 $2,950.0 95.00 390.00 3340.00 3340.00 1461.25 $4,801 $4,801.3 8760 47.82 418907.7 $58,647.1 47.12 412734.32 $57,782.8 $864.27 $260.00 5.25Air Scour Blower #42 Woodstream Blower Building 60 93.6 $2,950.0 95.00 390.00 3340.00 3340.00 1461.25 $4,801 $4,801.3 8760 47.82 418907.7 $58,647.1 47.12 412734.32 $57,782.8 $864.27 $260.00 5.25Process Blower #12 Woodstream Blower Building 150 95 $6,275.0 95.80 915.00 7190.00 7190.00 3145.63 $10,336 $10,335.6 8760 117.79 1031835.8 $144,457.0 116.81 1023219.21 $143,250.7 $1,206.32 $700.00 7.99Process Blower #22 Woodstream Blower Building 150 95 $6,275.0 95.80 915.00 7190.00 7190.00 3145.63 $10,336 $10,335.6 0 117.79 0.0 $0.0 116.81 0.00 $0.0 $0.00 $700.00 #DIV/0!Standby Blower2 Woodstream Blower Building 100 94.5 $3,775.0 95.40 605.00 4380.00 4380.00 1916.25 $6,296 $6,296.3 8760 78.94 691530.2 $96,814.2 78.20 685006.29 $95,900.9 $913.34 $400.00 6.46Influent Pump #12 Woodstream Influent Pump Station 25 89 $1,325.0 94.00 219.00 1544.00 1544.00 675.50 $2,220 $2,219.5 4380 20.96 91783.1 $12,849.6 19.84 86901.06 $12,166.1 $683.49 $130.00 3.06Influent Pump #22 Woodstream Influent Pump Station 25 89 $1,325.0 94.00 219.00 1544.00 1544.00 675.50 $2,220 $2,219.5 4380 20.96 91783.1 $12,849.6 19.84 86901.06 $12,166.1 $683.49 $130.00 3.06Influent Pump #32 Woodstream Influent Pump Station 25 89 $1,325.0 94.00 219.00 1544.00 1544.00 675.50 $2,220 $2,219.5 0 20.96 0.0 $0.0 19.84 0.00 $0.0 $0.00 $130.00 #DIV/0!Biofor Pump #12 Woodstream Biofor Building 30 92 $1,525.0 94.50 228.00 1753.00 1753.00 766.94 $2,520 $2,519.9 8760 24.33 213096.5 $29,833.5 23.68 207459.05 $29,044.3 $789.25 $150.00 3.00Biofor Pump #22 Woodstream Biofor Building 30 92 $1,525.0 94.50 228.00 1753.00 1753.00 766.94 $2,520 $2,519.9 8760 24.33 213096.5 $29,833.5 23.68 207459.05 $29,044.3 $789.25 $150.00 3.00Biofor Pump #32 Woodstream Biofor Building 30 92 $1,525.0 94.50 228.00 1753.00 1753.00 766.94 $2,520 $2,519.9 8760 24.33 213096.5 $29,833.5 23.68 207459.05 $29,044.3 $789.25 $150.00 3.00Junk Pump #1 Woodstream Junk Pump Room 30 92 $3,475 $1,650 $5,125 $1,525.0 94.50 228.00 1753.00 6878.00 3009.13 $9,887 $9,887.1 5110 24.33 124306.3 $17,402.9 17.76 90763.33 $12,706.9 $4,696.02 $150.00 2.07Junk Pump #2 Woodstream Junk Pump Room 30 92 $3,475 $1,650 $5,125 $1,525.0 94.50 228.00 1753.00 6878.00 3009.13 $9,887 $9,887.1 1095 24.33 26637.1 $3,729.2 17.76 19449.29 $2,722.9 $1,006.29 $150.00 9.68Junk Pump #3 Woodstream Junk Pump Room 30 92 $3,475 $1,650 $5,125 $1,525.0 94.50 228.00 1753.00 6878.00 3009.13 $9,887 $9,887.1 0 24.33 0.0 $0.0 17.76 0.00 $0.0 $0.00 $150.00 #DIV/0!High Pressure Air Scrubber Woodstream Outdoors 25 89 $2,800 $1,650 $4,450 $1,325.0 94.00 219.00 1544.00 5994.00 2622.38 $8,616 $8,616.4 8760 20.96 183566.3 $25,699.3 14.88 130351.60 $18,249.2 $7,450.06 $130.00 1.14Backwash Pump #16 Woodstream Backwash Building 50 95 $5,150 $2,050 $7,200 7200.00 3150.00 $10,350 $10,350.0 1095 39.26 42993.2 $6,019.0 29.45 32244.87 $4,514.3 $1,504.76 $0.00 6.88Backwash Pump #26 Woodstream Backwash Building 50 95 $5,150 $2,050 $7,200 7200.00 3150.00 $10,350 $10,350.0 1095 39.26 42993.2 $6,019.0 29.45 32244.87 $4,514.3 $1,504.76 $0.00 6.88
Note:1. VFD energy savings is attributed to a 6.25% reduction effective motor horsepower.2. This piece of equipment has an existing VFD or does not require a VFD. This calculation only takes into account upgrading the pump to a higher efficiency model.3. Markup amount includes 15% overhead & profit, and 25% contigency, see Appendix G for a complete breakdown.4. Motor efficiencies marked in red were estimated with NEMA standard efficiency tables.5. Refer to Section 4 for motor upgrade information.6. Backwash Pumps #1 & #2 have already been upgraded to premium efficieny motors.
Aggregate Cost ($/kWh)Elmwood Plant $0.1400Woodstream Plant $0.1400
Material & Labor $246,066.94Total Incentives $8,130.00Savings $89,858.27Payback 2.65Energy Savings (KW) 160.18Energy Savings (kWh) 641,844.82
Appendix M
Standard Efficiency VFD Premium Efficiency
For All Motors Represented

APPENDIX M
WIND TURBINE ENERGY SYSTEM VENDOR PRICING AND INFORMATION

Fiberglass blades
Rotor Hub
Dual fail safe calipers
16“ brake disk
Main shaft bearings
Induction generator
Gearbox
Tower
Slipring
Turntable yaw bearing
Anemometer
Fiberglass nacelle cover and nose cone
E N D U R A N C E W I N D T U R B I N E S G R E E N E N E R G Y T H AT W O R K S
S-343 5 kW model
C L E A N E N E R G Y . . . J U S T P L U G I T I N
1
2
3
4
5
6
7
8
9
10
11
121
2
3
4
5 6
7
8
910
11
12
S-343

POWER CURVE
ANNUAL ENERGY PRODUCTION (AEP)
S-343
TURBINEConfiguration 3 blades, horizontal axis, upwind
Rated power @ 11 m/s 5.3 kW
Applications Direct grid-tied
Rotor speed 166 rpm
Cut-in wind speed 3.0 m/s (6.7 mph)
Cut-out wind speed 24 m/s (54 mph)
Survival wind speed 53 m/s (119 mph)
Design lifetime 30 years *
Overall weight 272 kg (600 lbs)
ROTORRotor diameter 6.04 m (21 ft)
Swept area 31.9 m2 (343 ft2)
Blade length 3.2 m (10.5 ft)
Blade material Fiberglass / Epoxy
Power regulation Stall control (constant speed)
GENERATORFrequency 60 Hz
Voltage 120-240 VAC
Phase Single phase
Type Induction generator
BRAKE & SAFETY SYSTEMSMain brake system Rapid fail-safe dual redundant brakes on
rotor shaft
Secondary safety system Redundant back-up brake on rotor shaft
Automatic shut - Over speed
down triggered by : - High wind speed
- Grid failure
- All other fault conditions
CONTROLSPLC based Includes remote monitoring software
WARRANTYTurbine, controls 5 years
TOWERSTypes and heights Tubular guyed 19.2 m (63 ft); 25.6 m (84 ft);
32 m (105 ft) and 36.6 m (120 ft)
Standard Monopole 30.5 m (100 ft)
Maintenance Access All are tiltable towers
S P E C I F I C AT I O N S
*Provided service and maintenance schedules are strictly followed
W I N D S P E E D C O N V E R S I O N TA B L E
m/skm/hmph
45160100
259056
3212580
145031
124327
103622
93220
82918
72516
4149
51811
62213
Toll Free 1-888-440-4451info@endurancewindpower.comwww.endurancewindpower.com

1
Flynn, Andrew J.
To: roger dixonSubject: RE: Ballpark Installed Costs
From: roger dixon [mailto:[email protected]] Sent: Tuesday, August 17, 2010 10:18 AM To: Flynn, Andrew J. Cc: 'Brent Krohn' Subject: RE: Ballpark Installed Costs Since this is a school and I presume a non‐profit, the 30% ARRA tax credit on RE systems would not apply. However, there might be other funding available. You can hit this website, www.dsire.com for additional information. You can also Google up the “Wind for Schools” program that the US DOE has. This is a very good program. The equipment cost for the Endurance S‐343 turbine with a 90’ monopole would be $44,995 as a package, plus freight to NJ, approximately $2000. Wind data monitoring instrumentation, etc. will run another $2500. In NJ you will need to use prevailing wage labor rates for excavation, footings, electrical, assembly and erection, etc. on a municipal/school project. I would figure another $20‐$25k or so. The total will be approximately $70‐$75,000 all in. I would appreciate you keeping me in mind if the project moves ahead. With this in mind I have also attached a short bio for your perusal. Thank you, Roger Dixon Skylands Renewable Energy, LLC Certified Wind Site Assessor ASME/IACET Certified Rigging Instructor NJ CEP (Clean Energy Program) Approved Wind Turbine Installer NYSERDA Approved Wind Turbine Installer Distributor & Installer of Solar & Wind Energy Systems 908.337.2057 cell 908.730.6474 fax [email protected] www.skylandsre.com
Note: The information contained in this communication is confidential, may be attorney-client privileged, may constitute inside information, and is intended only for the use of the addressee(s). It is the property of the sender of this e-mail. If you receive this e-mail in error, do not review, disseminate, or copy it. Unauthorized use, disclosure, or copying of this communication or any part thereof is strictly prohibited and may be unlawful. If you have received this communication in error, please notify the sender immediately by return e-mail and destroy this communication and all copies thereof, including all attachments.