Embed Size (px)
Citation preview
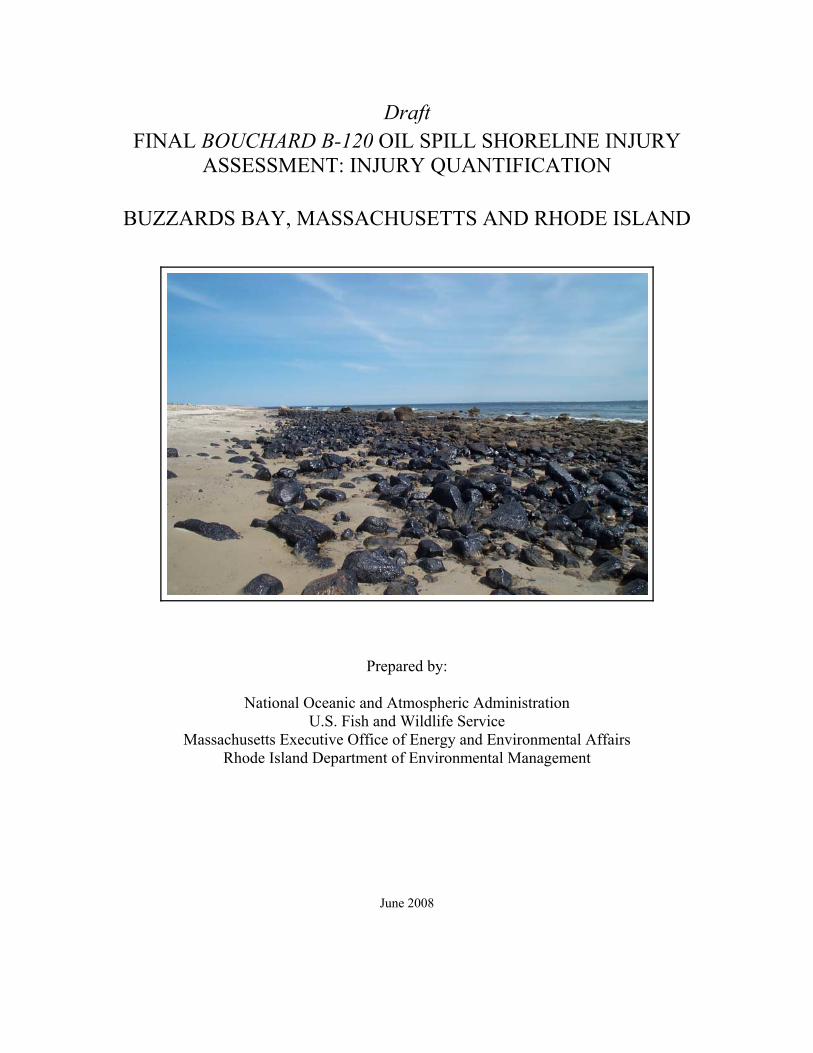
Draft FINAL BOUCHARD B-120 OIL SPILL SHORELINE INJURY
ASSESSMENT: INJURY QUANTIFICATION
BUZZARDS BAY, MASSACHUSETTS AND RHODE ISLAND
Prepared by:
National Oceanic and Atmospheric Administration
U.S. Fish and Wildlife Service Massachusetts Executive Office of Energy and Environmental Affairs
Rhode Island Department of Environmental Management
June 2008

BOUCHARD B-120 OIL SPILL SHORELINE INJURY ASSESSMENT: INJURY QUANTIFICATION
BUZZARDS BAY, MASSACHUSETTS AND RHODE ISLAND
June 2008
Prepared by:
Shoreline Assessment Team:
Jacqueline Michel, Heidi Dunagan, James Turek, David Janik, Veronica Varela, Gary Harmon, and Ralph Markarian1
1 Michel and Dunagan: Research Planning, Inc.; Turek: National Oceanic and Atmospheric Administration, Restoration Center; Janik: Massachusetts Office of Coastal Zone Management; Varela: U.S. Fish and Wildlife Service; Harmon and Markarian: ENTRIX, Inc.

i
Table of Contents List of Acronyms ........................................................................................................................... iii Executive Summary ....................................................................................................................... iv Introduction ..................................................................................................................................... 6 Shoreline Cleanup Methods and Primary Restoration .................................................................... 6
Boom and Sorbent Material ...................................................................................................... 7 Manual Removal ....................................................................................................................... 7 Powerwashing ........................................................................................................................... 7 Excavation and Replacement .................................................................................................... 7 Salt Marsh Replanting............................................................................................................... 8
Habitat Equivalency Analysis ......................................................................................................... 9 Injury Assessment ......................................................................................................................... 12
Chemistry and Sediment Toxicity .......................................................................................... 14 Injury Quantification and Rate of Recovery ................................................................................. 24
Coarse Substrate Habitats ....................................................................................................... 25 Injury by Category ............................................................................................................ 27
Very Lightly Oiled Coarse Substrate .......................................................................... 27 Lightly Oiled Coarse Substrate ................................................................................... 28 Moderately Oiled Coarse Substrate ............................................................................ 31 Heavily Oiled Coarse Substrate .................................................................................. 34 Coarse Substrate Sediment Replacement Projects ...................................................... 41
Sand Beach Habitats ..................................................................................................................... 47 Injury by Category ............................................................................................................ 49
Very Lightly Oiled Sand Beaches ............................................................................... 49 Lightly Oiled Sand Beaches........................................................................................ 50 Moderately Oiled Sand Beaches ................................................................................. 52 Heavily Oiled Sand Beaches ....................................................................................... 54
Marsh Habitat ................................................................................................................................ 57 Injury by Category .................................................................................................................. 59
Very Lightly Oiled Marshes ....................................................................................... 59 Lightly Oiled Marshes ................................................................................................ 61 Moderately Oiled Marshes .......................................................................................... 62 Heavily Oiled Marshes ............................................................................................... 64 Heavily and Moderately Oiled Eroding Marshes ....................................................... 66
Injury Summary ............................................................................................................................ 78 References Cited ........................................................................................................................... 80
Appendix A – Ecological Services and Functions Appendix B – Threatened and Endangered Plant Species Survey
Appendix C – May 2003 Sediment Chemistry Data – Total PAHs, TOCs, and Alkanes
Appendix D – January 2004 Sediment Chemistry Data – EPHs
Appendix E – 2003 Weathered Oil Chemistry Data – Total PAHs
Appendix F – 2004 Weathered Oil Chemistry Data – Total PAHs

ii
Appendix G – Unassessed Shorelines in Rhode Island
Appendix H – Ram Island Erosion Study
Appendix I – Methods for Determining Injury from Oiling and Enhanced Erosion of Marshes on Ram Island, Long Island, and Leisure Shores
Appendix J –Responsible Party Addendum to the Injury Report
iii
List of Acronyms
AAT Aquatics Assessment Team BISRS Brant Island Sediment Replacement Site BWAT Bird and Wildlife Assessment Team CBSRS Crescent Beach Sediment Replacement Site DSAYs Discounted service-acre-years EPH Extractable petroleum hydrocarbons ER-L Effects range-low ER-M Effects range-medium ESI Environmental Sensitivity Index GC/MS Gas chromatography/mass spectrometry HEA Habitat Equivalency Analysis IRAC Immediate Response Action Completion LISRS Long Island Sediment Replacement Site MADEP Massachusetts Department of Environmental Protection MACZM Massachusetts Office of Coastal Zone Management MCP Massachusetts Contingency Plan NHP Natural Heritage and Endangered Species Program NOAA National Oceanic and Atmospheric Administration NRDA Natural resource damage assessment OPA Oil Pollution Act of 1990 PAH Polynuclear aromatic hydrocarbon RIDEM Rhode Island Department of Environmental Management RP Responsible Party SAT Shoreline Assessment Team SCAT Shoreline Cleanup Assessment Team T&E Threatened and endangered THPAH Total high molecular weight polynuclear aromatic hydrocarbon TLPAH Total low molecular weight polynuclear aromatic hydrocarbon TOC Total organic carbon USCG U.S. Coast Guard USFWS U.S. Fish and Wildlife Service
iv
EXECUTIVE SUMMARY
On 27 April 2003, the T/B Bouchard B-120 released an estimated volume up to 98,000 gallons of a heavy fuel oil into Buzzards Bay, Massachusetts and Rhode Island. Over 85 miles of shoreline in Massachusetts (MA) and over 17 miles in Rhode Island (RI) were documented as being oiled.
As part of natural resource damage assessment (NRDA) activities associated with the spill, the Shoreline Assessment Team (SAT) collected and analyzed data to determine the nature and extent of the shoreline injuries caused by the spill. The SAT is made up of natural resource Trustees (Massachusetts Office of Coastal Zone Management – Executive Office of Energy and Environmental Affairs, Rhode Island Department of Environmental Management, U.S. Fish and Wildlife Service, and the National Oceanic and Atmospheric Administration) and the Responsible Party (Bouchard Transportation Company). Research Planning, Inc. provided technical assistance to the Trustees; ENTRIX, Inc. is the technical representative for the Responsible Party. This report presents the cooperative assessment to generate a quantitative measure of shoreline injury as a result of the Bouchard B-120 spill.
Shorelines provide a wide variety of ecological services and functions depending on the composition of the shoreline. The MA and RI shorelines were differentiated into three broad habitat categories for the purpose of the NRDA: coarse substrate, sand beach, and tidal salt marsh (see Shoreline Injury Assessment: Exposure Characterization for more detail on the shoreline types). All three categories provide a habitat for a variety of species from algae to vertebrates and play a major role in food-web support as well as other ecological services.
The Shoreline Cleanup Assessment Team (SCAT) data, data from beached bird surveys, and observations gathered during the September 2003 and August 2004 site surveys were used to define the oil exposure to the shorelines. Four major oiling categories were created for the three shoreline types based on percent cover and oil band width: very light, light, moderate, and heavy. The area of each injury category was estimated using methods described in the report Bouchard B-120 Oil Spill Shoreline Injury Assessment: Exposure Characterization.
The SAT analyzed the data cooperatively, although the Trustees and the Responsible Party had different interpretations of the data. This leads to two versions of 7 of the 23 injury categories. The recovery curves for each injury category that were developed and agreed upon by the Trustees occur in the body of this report and are based on field observations, applicable literature, and data collected as part of the shoreline injury assessment activities. Recovery curves for heavily oiled coarse substrate habitats where sediment replacement activities occurred were also developed. Finally, the injury from accelerated erosion in oiled marsh habitats was determined and injury curves were developed based on field observations and historical erosion rates. The injuries to shoreline habitats were quantified, in terms of acres and discounted service-acre-years (DSAYs)2 as:
2 Refer to Appendix J “Responsible Party Addendum to the Injury Report.” Although the RP agrees with many of the Trustees’ assessment results, the RP disagrees with some of the results noted in this table. The RP has determined that total DSAYs are 58.25 rather than the 84.49 (81.08 plus 3.41). Details of the RP’s calculations and rationale for departure from the Trustees results are provided in Appendix J.

v
Category
Total Acres Injured by
Habitat Total Acres by
State Total DSAYs by
Habitat Total DSAYs by
State MA Marsh 10.27 18.09
Sand Beach 18.43 11.03 Coarse Substrate 56.02 84.72 51.96 81.08
RI Marsh 0.15 0.02 Sand Beach 7.18 1.27
Coarse Substrate 9.74 17.07 2.12 3.41
The seven injury curves developed and supported by the Responsible Party are presented in Appendix J. The Trustees did not comment on the analysis provided by the Responsible Party in the development of the curves presented in Appendix J.
6
INTRODUCTION
On 27 April 2003, the T/B Bouchard B-120 released an estimated 98,000 gallons (Independent Maritime Consulting, Ltd., 2003; USCG, 2003) of a heavy fuel oil into Buzzards Bay, Massachusetts and Rhode Island. Over 85 miles of shoreline in Massachusetts (MA) and over 17 miles in Rhode Island (RI) were contaminated with oil.
The Natural Resource Trustee agencies, consisting of the Massachusetts Executive Office of Energy and Environmental Affairs, Rhode Island Department of Environmental Management (RIDEM), U.S. Fish and Wildlife Service (USFWS), and the National Oceanic and Atmospheric Administration (NOAA), and the Responsible Party (RP; Bouchard Transportation Company) agreed to conduct a cooperative Natural Resource Damage Assessment (NRDA). This is authorized by the Oil Pollution Act of 1990 (OPA 90) and the NRDA regulations promulgated by NOAA in 1996. A NRDA, as described under Section 1006 of OPA (33 U.S.C. Section 2706(c)) and the regulations for natural resource damage assessments under OPA at 15 CFR Part 990, consists of three phases: 1) Preassessment; 2) Restoration Planning; and 3) Restoration Implementation. The injury assessment, which is part of Restoration Planning, is the focus of this report, with the restoration to be addressed in a forthcoming Restoration Plan.
A Shoreline Assessment Team (SAT) was formed to address injuries to shoreline resources within the intertidal oiling footprint. The Aquatics Assessment Team addressed other intertidal and subtidal resources. The SAT produced a report on the extent and degree of oiling of the different types of shoreline habitats, titled Bouchard B-120 Oil Spill Shoreline Injury Assessment: Exposure Characterization (Shoreline Assessment Team, 2006). The Bouchard B-120 Oil Spill Shoreline Injury Assessment: Injury Quantification report summarizes the results of the assessment of the injuries to shoreline resources. Nine appendices present additional data relevant to the shoreline injury assessment. Appendix A contains the table of ecological services by shoreline types. Appendix B contains the threatened and endangered plant survey by the Massachusetts Natural Heritage and Endangered Species Program. Appendix C contains the May 2003 intertidal sediment sampling data and chemistry results. Appendix D shows the January 2004 intertidal sediment sampling data and chemistry results. Appendices E and F show the 2003 and 2004 weathered oil sampling summary and chemistry results, respectively. Appendix G provides the methods of determining injury to the unassessed shorelines in Rhode Island. Appendix H contains the SAT Ram Island Marsh Erosion Study; Appendix I describes the methods to determine injury of oiling and erosion of marshes on Ram Island, Long Island, and Leisure Shores. Appendix J presents the seven injury curves from the RP that differed from the Trustees injury curves.
SHORELINE CLEANUP METHODS AND PRIMARY RESTORATION
A Unified Command, consisting of the U.S. Coast Guard (USCG), Massachusetts Department of Environmental Protection (MADEP), and the RP, was established to direct the Immediate Response Action Completion (IRAC) inspections and oversee clean-up operations. Shoreline cleanup involved up to 700 workers, with most of the federally coordinated cleanup activities completed (119 shorelines cleaned out of a total 149) by IRAC standards by September 3, 2003 (Massachusetts Executive Office of Environmental Affairs et al., 2005). Shoreline cleanup and primary restoration techniques consisted of manual removal, power-washing,

7
sediment removal/replacement, and emergency vegetation replanting. Each of these cleanup methods is summarized below, extracted from the Preassessment Data Report (Massachusetts Executive Office of Environmental Affairs et al., 2005).
Boom and Sorbent Material
Clean-up crews used three types of booms during the response effort: containment, sorbent, and snare. Containment boom was used to prevent the spread of oil to other areas as it was released from the barge. Sorbent boom and pads were placed along the shoreline to collect stranded oil, and snare boom was stretched across impacted areas to collect oil from both shorelines and in between groins and jetties.
Manual Removal
Clean-up crews manually removed oiled debris, wrack, and stranded surface oil (e.g., mats, patties, and tarballs) from the shoreline using shovels. Hand trowels, rakes and hoes were used to remove hardened oil deposits in cobble beaches and marsh. Small tarballs were removed by sifting at Barney’s Joy using pool skimmers and homemade sifting boxes made with window screen or wire-mesh hardware cloth. Surficial sands that were not oiled were incidentally removed during cleanup of some sand beaches. In a limited number of areas, larger gravel sediments were manually wiped then tossed into the lower intertidal zone to be further cleaned by wave action.
Power-washing
Powerwashing using seawater was used at selected areas to clean man-made structures such as docks, seawalls, groins and riprap. The area being cleaned was surrounded by sorbent material and/or containment boom to collect oil washed from the structure. High pressure-hot water washing (i.e., hotsy) was occasionally used on selected natural hard surface substrates such as large cobbles, piles of large cobbles and/or boulders (e.g., rocks too large to move). Hotsy units used seawater or freshwater; freshwater was preferred since the high suspended solid load in the seawater clogged the equipment causing frequent breakdowns. Sorbent material (e.g., boom, snare, and pads) was placed down-gradient from hotsy operations to collect oil mobilized by the activity. Sorbent materials were often removed and replaced with clean material, and used sorbents were placed in large plastic bags and deposited in disposal containers.
Excavation and Replacement
In a few heavily oiled areas, the above methods were not sufficient to reach the clean-up goal. Therefore, oiled substrate was mechanically removed with heavy equipment and replaced with natural materials of similar shape, color and size distribution. This primary restoration technique was applied in areas of cobble beach where heavy oil coated the majority of the exposed cobble surface and oil mixed with sand in the interstitial space to form hardened deposits. Sediment replacement was conducted at the south side of Long Island Point, Howard’s Beach, and Crescent Beach. Prior to initiating work, emergency authorizations/permits were obtained from the U.S. Army Corps of Engineers, MADEP and local conservation commissions. At each site, pre-construction and post-construction beach profiles were surveyed to ensure that the replaced shorelines were graded appropriately.
8
Salt Marsh Replanting
Replanting of salt marsh vegetation was conducted in a few marshes where heavy oil deposits had hardened or heavy foot traffic had worn away vegetation. In most of these locations, the marsh surface was characterized by dense, fibric vegetative root mats rather than inorganic, unconsolidated sediments. During cleanup activities, oil deposits up to several inches thick were manually removed from the marsh surface by scraping and/or raking from the surface using hand tools. The top layer of root mat, including the above ground portion of the vegetation was removed in the process of removing the hardened oil deposit. Native vegetation was replanted in these areas as part of the primary restoration using bare-root seedlings of Spartina alterniflora obtained from a local nursery. Replanting of marsh vegetation was performed at the southern tip of Long Island in Fairhaven and at Ram Island to supplement natural recovery/recolonization and to reduce potential for erosion and loss of habitat.
Cleanup Activities after the Transfer of Oversight Responsibilities from the U.S. Coast Guard to the Commonwealth of Massachusetts
Clean-up activities completed after September 3, 2003 were conducted according to the Massachusetts Contingency Plan [MCP, see Immediate Response Action Status Report (GeoInsight, Inc., 2005) for more detail on activities]. Out of the 149 segments identified within the oiled shorelines of Buzzards Bay, 29 segments were confirmed to be unoiled after cleanup activities were completed. Of the remaining 120 segments, 57 were determined to pose “no significant risk to human health, safety, the environment or public welfare,” leaving 63 segments to be managed under the MCP. A list of these segments can be found in the Immediate Response Action Status Report. The MCP response action strategies included: removal of potentially mobile oil (oil that has the potential to mobilize and impact other areas); and addressing potential Imminent Hazards to human health, public welfare, safety, and the environment, as listed in 310 CMR 40.0321.
The MCP response team surveyed nine segments for possible mobilization of buried oil. Inspections were completed by April 2004, and buried oil was only observed at one site, W1F-02, Brant Island West (Leisure Shores and Howard’s Beach). The MCP response team observed a small seam of buried oil as late as August 2004 in the upper intertidal zone at Leisure Shores. Residual oil (hardened splatters and some tarballs) was found on the surface of Leisure Shores and Howards Beach on October 2004. The oil was removed during this survey by GeoInsight, Inc. personnel. In October 2007 oiled sediment was found and removed from five locations in the cobble beach area of Leisure Shores and from three locations at Howard’s Beach (GeoInsight, Inc., 2008). In December 2007, six 5-gallon pails of oiled cobbles were also removed from Leisure Shores (GeoInsight, Inc., 2008).
Beach profiles and sediment samples, for extractable petroleum hydrocarbons (EPH) and polynuclear aromatic hydrocarbons (PAH) analyses, were taken from Leisure Shores and Howard’s Beach in December 2004. The EPH concentrations were all below detection limits, and the PAH concentrations were below the NOAA’s effects range-low (ER-L) for both total PAH and individual PAHs. The beach profile surveys completed by ENTRIX and GeoInsight, Inc. indicated that both shorelines were relatively stable with no substantial changes in elevations from 2003 to 2004 (GeoInsight, Inc., 2005).
9
The MCP response team also conducted additional inspections at segments adjacent to closed shellfish beds between July and December 2004. These inspections were conducted to evaluate whether there was residual oil in the intertidal and shallow subtidal zones at these locations that would preclude reopening the shellfish beds. Buried oil, tarballs 5-10 centimeters (cm) in diameter, and splatter 5 millimeters (mm) to 1 cm in diameter were observed on the west side of West Island as late as September 2004. An area of “pavement” that was 6 x 9 meters (m) was also observed in the lower intertidal zone on the west side of Long Island in December 2004. Pavement is defined as cohesive, heavily oiled surface sediments. The area consisted of patches of pavement ranging from 20 x 1 cm to 60 x 90 cm areas, and the pavement was tacky and potent when disturbed. Pavement (0.6 x 0.6 m and 1.5 x 1.5 m) was also found on the southeast tip of Long Island.
Segments that were either moderately oiled, heavily oiled, or did not pass the initial IRAC inspections, or were observed with residual oil in early 2004 were re-evaluated between August and December 2004. Patches of dried oil (5-15 cm in diameter) were observed in the peat hummocks on Pope Beach, and the vegetation was not growing through the oil patches. Residual oil was also found on the west side of Strawberry Point as trace splatter, a pavement less than one foot in diameter, and one weathered tar patty.
HABITAT EQUIVALENCY ANALYSIS
Natural Resource Trustees are authorized to act on behalf of the public to protect the resources of the nation’s environment. Under the Oil Pollution Act of 1990, Trustee agencies determine the damage claims to be filed against parties responsible for injuries to natural resources resulting from discharges of oil; injury is defined as "an observable or measurable adverse change in a natural resource or impairment of a natural resource service” (15 CFR § 990.30). Claims can be made for primary restoration (actions taken to directly restore the injured resources) and compensatory restoration (actions taken to replace the interim loss of resources from the time of injury until the resources recover to baseline conditions). For injuries resulting from oil spills, shoreline cleanup is a key part of the primary restoration actions that are taken. Often, there are few additional actions that can be taken to restore the injured resources, thus the injury assessment is based on the loss of services during the recovery to baseline conditions. Habitat equivalency analysis (HEA) is a methodology used to quantify compensation for such resource injuries. The principal concept underlying the HEA method is that lost habitat resources/services can be compensated through habitat replacement projects and provides additional resources/services of the same type (NOAA, 2000).
Under the HEA method, Trustees determine the injury using metrics that can be used to scale appropriate compensatory restoration options. The size of a restoration action is scaled to ensure that the present discounted value of project gains equals the present discounted value of interim losses. That is, the proposed restoration action should provide services of the same type and quality, and of comparable value as those lost due to injury (NOAA, 2000). The losses and gains are discounted at a standard rate to express future quantities in present terms based on the assumption that present services are more valuable than future services. The selection of the metric(s) to quantify the injury and scale restoration options is integral to the successful application of the HEA method. Therefore, the SAT carefully considered the ecological services provided by the shoreline habitats that were injured as result of the Bouchard B-120 oil spill. Table 1 lists the primary ecological services of the shoreline habitats (the full list of services and

10
functions considered by the SAT can be found in Appendix A). Food-web support and habitat usage were common ecological services among all habitat types, and these ecological services were considered to be the most critical, particularly as related to birds, in the shoreline injury and for restoration scaling analysis. These services were also relatively easy to estimate by documenting observations during field studies.
TABLE 1. Principal ecological services of shoreline habitats affected by the Bouchard B-120 oil spill. The services in bold type were the main focus as they were the most critical to the shoreline recovery and were common to all habitat types.
Coarse Substrate Sand Beach Salt Marsh
Food web support Food web support Food web support Habitat usage Habitat usage Habitat usage
Primary production Primary production Fish and shellfish production Sediment/shoreline stabilization
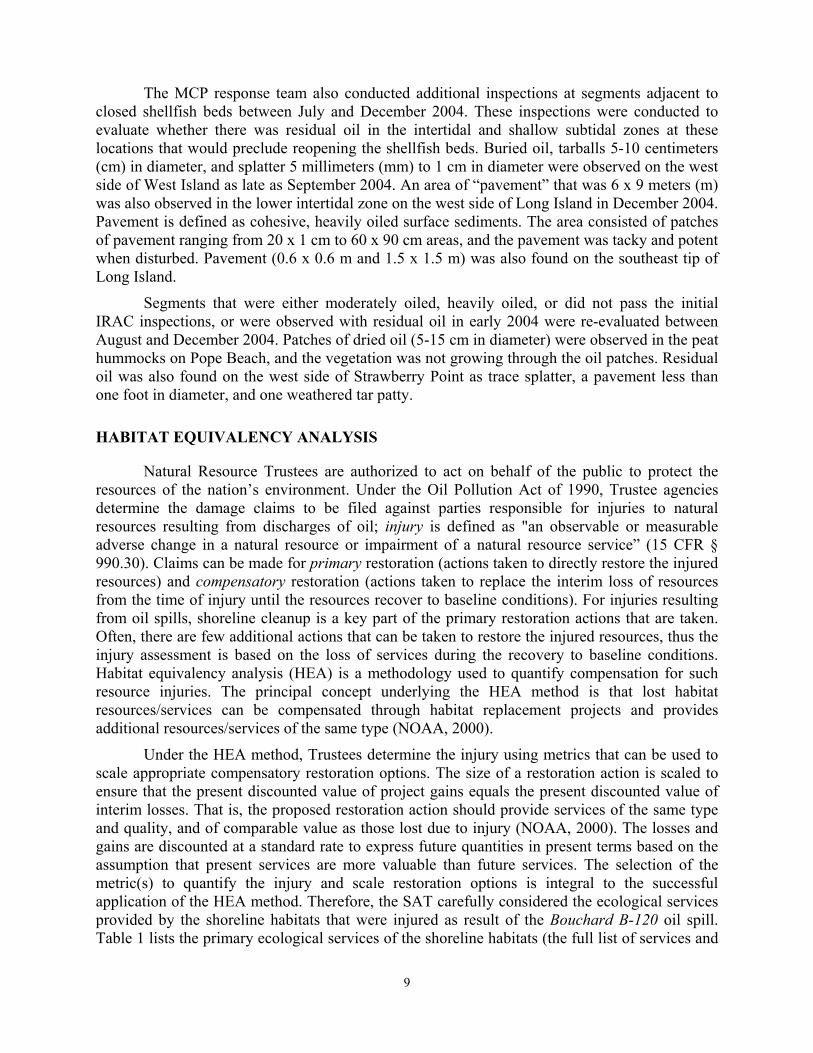
Under the HEA method, the injuries are quantified in terms of the percent loss of ecological services (compared to baseline levels) and the rate at which the lost services recover over time. Figure 1 shows a hypothetical curve of the reduction in services for a habitat after an incident and the expected rate of natural recovery (i.e., the recovery of the habitat to baseline conditions without human intervention after cleanup activities have been terminated). The area labeled “A” in Figure 1 represents the amount of services lost as a result of the incident. The inputs into such curves for each injured habitat are: 1) the percent loss in services immediately after the incident; and 2) the percent of baseline services at key points in time after the injury. These inputs determine the size of the area beneath the curve (Refer to “A” in Figure 1).
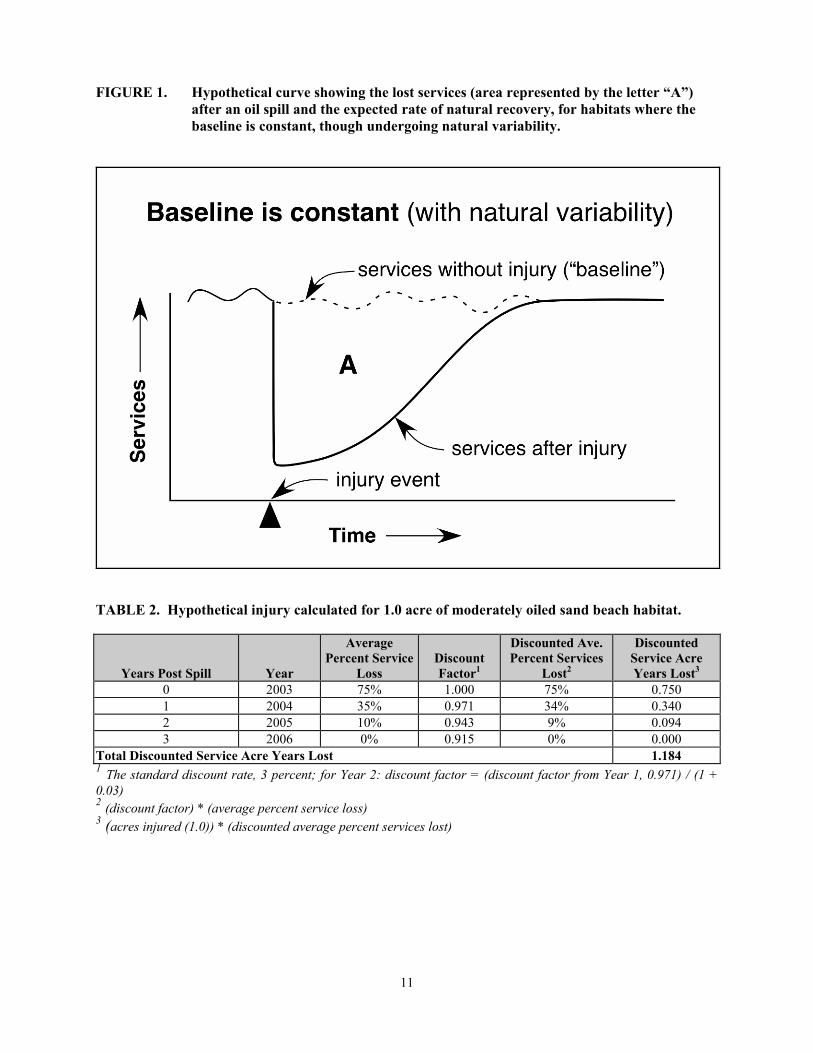
For example, the ecological services as measured by habitat usage and food-web support to birds for a moderately oiled sand beach might be reduced to 25 percent of baseline during the period from the spill to when shoreline cleanup was terminated, because birds would have avoided oiled areas due to the disturbance caused cleanup activities, and their preferred prey items would be substantially reduced in abundance. Recovery would be a function of the rate of oil degradation and the life history of key intertidal biota on which the birds feed. By the end of the first year following the spill, the services might be predicted as 65 percent of baseline; by the end of the second year, services might be predicted to have returned to 90 percent of baseline; full recovery might be predicted to occur at the end of the third year following the spill. The injury or lost interim services is then quantified using a term called a discounted-service-acre-year (i.e., the value or amount of services provided by one acre of habitat over one year). For the above example, if the injured area was one acre of moderately oiled sand beach, the estimated injury would be 1.2 discounted service-acres-years (DSAYs). The calculations for this example are shown in Table 2.
11
FIGURE 1. Hypothetical curve showing the lost services (area represented by the letter “A”) after an oil spill and the expected rate of natural recovery, for habitats where the baseline is constant, though undergoing natural variability.
TABLE 2. Hypothetical injury calculated for 1.0 acre of moderately oiled sand beach habitat.
Years Post Spill Year
Average Percent Service
Loss Discount Factor1
Discounted Ave. Percent Services
Lost2
Discounted Service Acre Years Lost3
0 2003 75% 1.000 75% 0.750 1 2004 35% 0.971 34% 0.340 2 2005 10% 0.943 9% 0.094 3 2006 0% 0.915 0% 0.000
Total Discounted Service Acre Years Lost 1.184 1 The standard discount rate, 3 percent; for Year 2: discount factor = (discount factor from Year 1, 0.971) / (1 + 0.03) 2 (discount factor) * (average percent service loss) 3 (acres injured (1.0)) * (discounted average percent services lost)
12
INJURY ASSESSMENT
There were 15 injury categories for Massachusetts, as shown in Table 3A, and 8 injury categories for Rhode Island, as shown in Table 3B. The area of impacted shoreline for each category was estimated using methods that are described in detail in the Bouchard B-120 Oil Spill Shoreline Injury Assessment Part I: Exposure Characterization, with the exception of unassessed shorelines in Rhode Island and oiled and eroding marshes in Massachusetts. Appendix G provides further detail of the methods used to determine injury to the unassessed shorelines in Rhode Island and Appendix I contain the methods used to determine the injury to oiled and eroding marsh shorelines. In summary, the Shoreline Cleanup Assessment Team (SCAT) data, collected during the cleanup phase, were used to develop the four oiling categories (heavy, moderate, light, and very light) that were defined by the width of the oiling band and the percent oil cover within the oiled band. A matrix, composed of percent oil cover, the width of the oil band, and the oil thickness, was used to define the different oiling categories. Refer to the Bouchard B-120 Oil Spill Shoreline Injury Assessment Part I: Exposure Characterization (Shoreline Assessment Team, 2006) for more detailed information. Environmental Sensitivity Index (ESI) data on shoreline types (NOAA, 1999; 2001) were combined into three broad habitat types, based on an evaluation of their similarity in habitat structure and ecological services: sand beaches; coarse substrates (rocky shores, mixed sand and gravel beaches, gravel beaches, riprap, and seawalls); and salt marshes. The oiling categories were overlain onto the shoreline types using Geographic Information Systems software to identify and subtotal the shoreline lengths by oiling degree and habitat type and to estimate the total area (in acres) for each injury category. This report covers injuries associated with the intertidal oiling footprint only. The Aquatic Technical Working Group (Aquatic TWG) T addressed injuries to the lower intertidal and subtidal areas outside the oil footprint. The Bird and Wildlife Assessment Team (BWAT) assessed habitat service losses in areas not covered by the Aquatic TWG and SAT. Cleanup records were used to estimate the total intertidal area where sediments were removed and replaced with clean material.

13
TABLE 3A. Total estimated area (acres) of impacted shoreline in each exposure category in Massachusetts.*
Habitat Type Oiling Level Estimated Area (Acres) Total By Habitat
Coarse Substrate
Very Light 8.54
56.02
Light 20.72 Moderate 9.77
Heavy 16.13 Sediment Replacement 0.86
Sand Beaches
Very Light 2.39
18.43 Light 6.70 Moderate 2.71
Heavy 6.63
Marshes
Very Light 2.61
10.27
Light 2.86 Moderate 1.57*
Heavy 1.15* Moderate and Eroding 0.26
Heavy and Eroding 1.82 All Habitats Total 84.72
*Note: acres have changed from the Exposure Characterization report due to the evaluation of moderately and heavily oiled and eroding marshes in Massachusetts. See Appendix I.
TABLE 3B. Total estimated area (acres) of impacted shoreline in each exposure category in Rhode Island.*
Habitat Type Oiling Level Estimated Area (Acres) Total By Habitat
Coarse Substrate
Very Light 3.85
9.74
Light 5.60 Moderate 0.29
Heavy 0.00
Sand Beaches
Very Light 1.73
7.18
Light 5.20 Moderate 0.25
Heavy 0.00
Marshes
Very Light 0.09
0.15
Light 0.06 Moderate 0.00
Heavy 0.00 All Habitats Total 17.07
*Note: acres have changed from the Exposure Characterization report due to the evaluation of unassessed shorelines in Rhode Island. See Appendix G.
The next step was to develop the inputs into the recovery curves for each injury category to depict the percent of services lost and the time required to recover to pre-spill conditions. The curves were developed based on site surveys, oil and sediment samples, data from the scientific literature, and best professional judgment. The following sections describe these steps in detail.
14
Surveys of the impacts to threatened and endangered (T&E) plants were also included in shoreline assessment. T&E plants were identified by Dr. Paul Somers, the Massachusetts botanist with the MA Natural Heritage & Endangered Species Program (NHP). The NHP location data (latitude and longitude) that corresponded to the T&E plants were used to determine which occurrences may have been at risk from the oil spill. Two T&E species were identified from this analysis: seabeach knotweed (Polygonum glaucum) on Rocky Point, West Island (heavily oiled sand beach); and sea-pink (Sabatia stellaris), found historically in the salt marsh near the mouth of the Slocum River at Demarest Lloyd State Park (in close proximity to very lightly oiled salt marsh). During the shoreline field survey in August 2004, Dr. Somers conducted a survey to document if the plant species recorded from previous years’ surveys were still present and if they may have been affected by the oil spill and/or clean-up activities. Although a decrease in seabeach knotweed was noted, there was no evidence that the loss was caused as a result of the oiling or cleanup. Sea-pink was not found at the Demarest Lloyd State Park site, although it had not been documented at the site since 1988. From this survey, it was concluded that specific damage to rare plant populations as a result of the oil spill or clean-up efforts could not be determined. A report on the plant field survey is included in Appendix B. Potential impacts to T&E wildlife by the spill and cleanup were assessed by the BWAT.
Chemistry and Sediment Toxicity
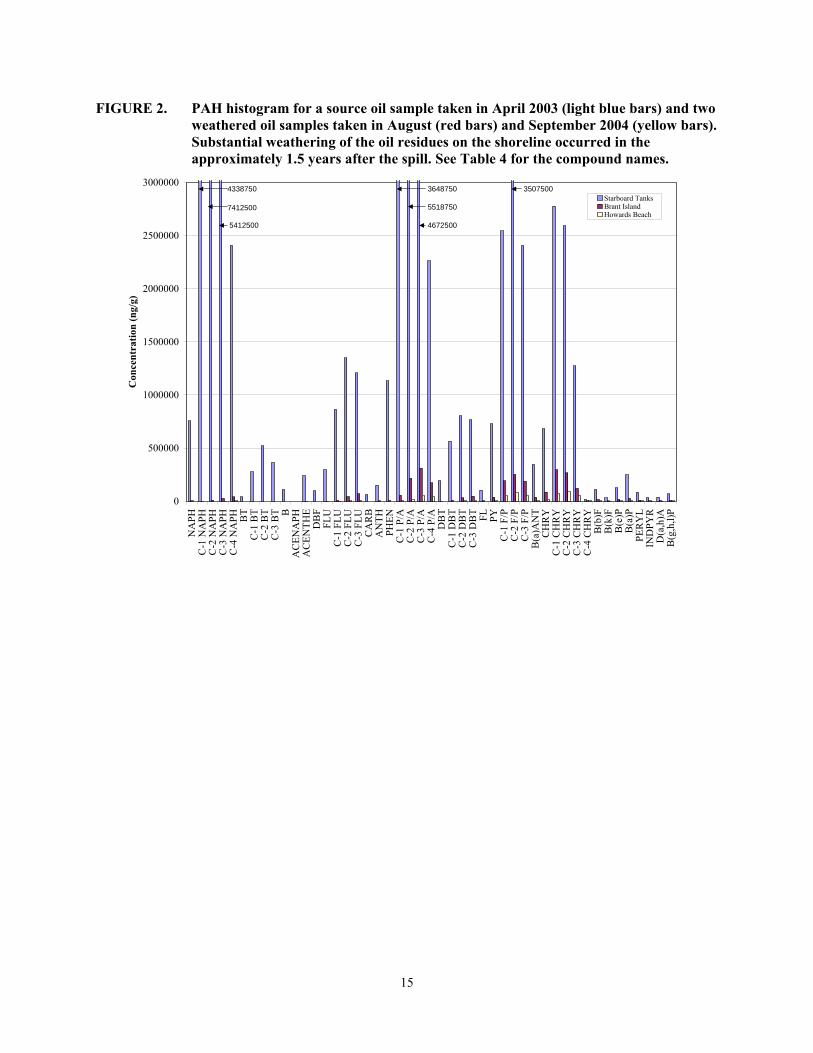
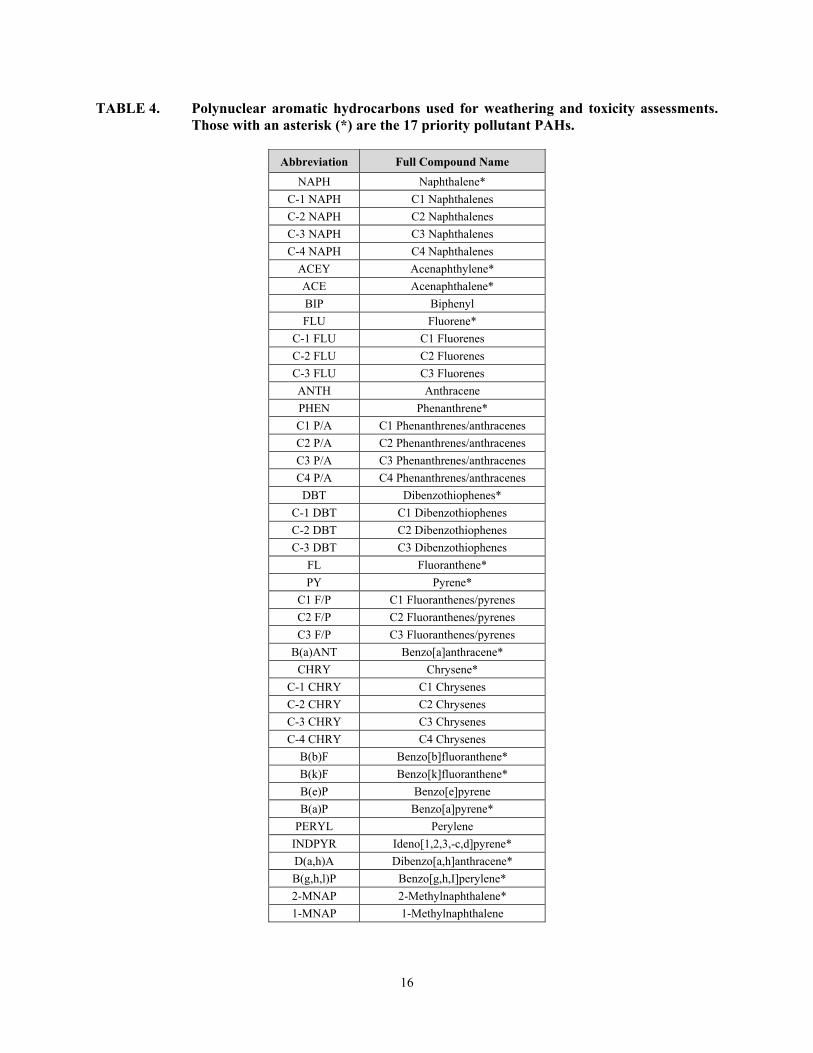
The weathering and toxicity of the spilled oil residues was assessed to determine if there was any significant chronic toxicity associated with oiled sediment remaining after termination of cleanup. Residual toxicity would affect the rate of recovery of injured resources and have to be considered in developing the inputs into the HEA model. Samples of the oil from the T/B Bouchard B-120 were collected directly from the barge tanks and used to characterize the “source” oil. A qualitative assessment of the degree of weathering of residual oil in oil samples collected from contaminated shorelines over time was conducted based on the changes in the relative abundances of PAHs which are known to be resistant to weathering. To show the rate of weathering, a histogram (Fig. 2) was created that compared three samples: 1) a fresh oil sample taken from the starboard tank on the Bouchard B-120; 2) an oil sample taken in August 2004 from Brant Island; and 3) an oil sample taken in September 2004 from Howard’s Beach. The residual oil samples have undergone substantial weathering as is evident from the almost complete removal of parent PAHs (e.g., naphthalene, fluorene, and phenanthrene) as well as the reduced concentrations of alkylated homologues (e.g., C1-napthalenes, C2-napthalenes, C1-fluorenes, C2-fluorenes). See Table 4 for the full compound names.
15
FIGURE 2. PAH histogram for a source oil sample taken in April 2003 (light blue bars) and two weathered oil samples taken in August (red bars) and September 2004 (yellow bars). Substantial weathering of the oil residues on the shoreline occurred in the approximately 1.5 years after the spill. See Table 4 for the compound names.
0
500000
1000000
1500000
2000000
2500000
3000000N
APH
C-1
NA
PHC
-2 N
APH
C-3
NA
PHC
-4 N
APH B
TC
-1 B
TC
-2 B
TC
-3 B
T BA
CEN
APH
AC
ENTH
ED
BF
FLU
C-1
FLU
C-2
FLU
C-3
FLU
CA
RB
AN
THPH
ENC
-1 P
/AC
-2 P
/AC
-3 P
/AC
-4 P
/AD
BT
C-1
DB
TC
-2 D
BT
C-3
DB
T FL PYC
-1 F
/PC
-2 F
/PC
-3 F
/PB
(a)A
NT
CH
RY
C-1
CH
RY
C-2
CH
RY
C-3
CH
RY
C-4
CH
RY
B(b
)FB
(k)F
B(e
)PB
(a)P
PER
YL
IND
PYR
D(a
,h)A
B(g
,h,l)
P
Con
cent
ratio
n (n
g/g)
Starboard TanksBrant IslandHowards Beach
4338750
7412500
5412500
3648750
5518750
4672500
3507500
16
TABLE 4. Polynuclear aromatic hydrocarbons used for weathering and toxicity assessments. Those with an asterisk (*) are the 17 priority pollutant PAHs.
Abbreviation Full Compound Name
NAPH Naphthalene* C-1 NAPH C1 Naphthalenes C-2 NAPH C2 Naphthalenes C-3 NAPH C3 Naphthalenes C-4 NAPH C4 Naphthalenes
ACEY Acenaphthylene* ACE Acenaphthalene* BIP Biphenyl FLU Fluorene*
C-1 FLU C1 Fluorenes C-2 FLU C2 Fluorenes C-3 FLU C3 Fluorenes ANTH Anthracene PHEN Phenanthrene* C1 P/A C1 Phenanthrenes/anthracenes C2 P/A C2 Phenanthrenes/anthracenes C3 P/A C3 Phenanthrenes/anthracenes C4 P/A C4 Phenanthrenes/anthracenes DBT Dibenzothiophenes*
C-1 DBT C1 Dibenzothiophenes C-2 DBT C2 Dibenzothiophenes C-3 DBT C3 Dibenzothiophenes
FL Fluoranthene* PY Pyrene*
C1 F/P C1 Fluoranthenes/pyrenes C2 F/P C2 Fluoranthenes/pyrenes C3 F/P C3 Fluoranthenes/pyrenes
B(a)ANT Benzo[a]anthracene* CHRY Chrysene*
C-1 CHRY C1 Chrysenes C-2 CHRY C2 Chrysenes C-3 CHRY C3 Chrysenes C-4 CHRY C4 Chrysenes
B(b)F Benzo[b]fluoranthene* B(k)F Benzo[k]fluoranthene* B(e)P Benzo[e]pyrene B(a)P Benzo[a]pyrene*
PERYL Perylene INDPYR Ideno[1,2,3,-c,d]pyrene* D(a,h)A Dibenzo[a,h]anthracene* B(g,h,l)P Benzo[g,h,I]perylene* 2-MNAP 2-Methylnaphthalene* 1-MNAP 1-Methylnaphthalene

17
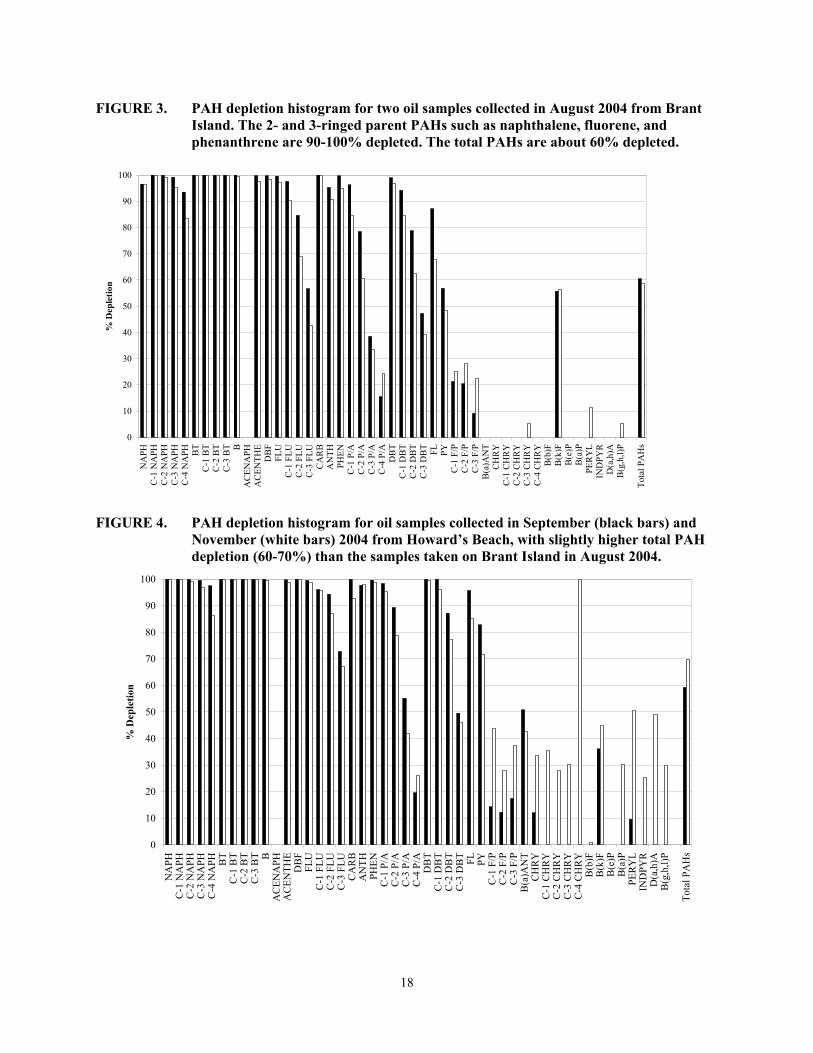
Depletion plots of the oil samples taken in 2004 were used to determine the degree of weathering of individual PAHs and total PAHs (Fig. 3 and Fig. 4). Using the percent of depletion for analysis, it is possible to determine which compounds may have chronic impacts as a result of residual oil in the environment. The depletion of PAHs was based on the ratio of each PAH to hopane, a very stable saturated hydrocarbon present in oil that has been identified as one of the most resistant analytes to weathering and degradation (Douglas et al., 1996). The source oil that was used in this analysis was the sample taken from the starboard tank on the Bouchard B-120. The following formula was used to determine the percent depletion:
% analyte depletion = [1- ((C1/C0)(H0/H1))] * 100
where C1 is the analyte concentration in the degraded oil, and C0 is the analyte concentration in the source oil. H0 is the concentration of hopane in the source oil, and H1 is the concentration of hopane in the weathered oil. Figure 3 shows the percent depletion of samples taken in 2004 from Brant Island, at a location that was characterized as heavily oiled marsh. The 2- and 3-ringed parent PAHs such as naphthalene, fluorene, and phenanthrene are almost completely depleted (>90%). However, as typical for petroleum products, the alkylated homologues degrade more slowly than the parent compounds, resulting in a total PAH depletion of approximately 60% almost 1.5 years after the spill. Figure 4 shows the percent depletion of samples taken in 2004 from Howards Beach, a location that was characterized as heavily oiled coarse substrate. These samples showed slightly higher percent of depletion for total PAH (60-70%) than the samples from Brant Island. However, the pattern of depletion with the nearly complete loss of the 2- and 3-ring PAHs but only partial loss of alkylated homologues was very similar to the Brant Island oil samples.
In May 2003, 22 intertidal sediment samples were taken along the shoreline in Rhode Island and Massachusetts and analyzed using gas chromatography/mass spectrometry (GC/MS) by B&B Laboratories for total PAH concentrations, total alkanes, and total organic carbon (TOC). In January 2004, 153 sediment samples were taken in the lower-, mid-, and upper-intertidal areas along shorelines in both Massachusetts and Rhode Island and analyzed by Groundwater Analytical, Inc. for EPH. The EPH analysis includes a smaller set of mostly parent PAHs known as the priority pollutant PAHs, whereas B&B Laboratories analyzed 47 PAHs that included parent compounds and their alkylated homologues (Table 4). Only 5 out of the 153 sediment samples collected in 2004, approximately 8 months after the spill, were over 1 microgram per gram (µg/g), equivalent to parts per million.
The toxicity analyses completed on the sediment samples were limited to the 17 priority pollutant PAHs so that results could be temporally compared. All sediment samples were taken at a depth of 0-5 cm. Data (e.g., locations, date of collection) for all sediment samples and PAH levels for all 2003 samples and the five samples that were over 1 µg/g are provided in Appendices C and D.
18
FIGURE 3. PAH depletion histogram for two oil samples collected in August 2004 from Brant Island. The 2- and 3-ringed parent PAHs such as naphthalene, fluorene, and phenanthrene are 90-100% depleted. The total PAHs are about 60% depleted.
0
10
20
30
40
50
60
70
80
90
100
NA
PHC
-1 N
APH
C-2
NA
PHC
-3 N
APH
C-4
NA
PH BT
C-1
BT
C-2
BT
C-3
BT B
AC
ENA
PHA
CEN
THE
DB
FFL
UC
-1 F
LUC
-2 F
LUC
-3 F
LUC
AR
BA
NTH
PHEN
C-1
P/A
C-2
P/A
C-3
P/A
C-4
P/A
DB
TC
-1 D
BT
C-2
DB
TC
-3 D
BT FL PY
C-1
F/P
C-2
F/P
C-3
F/P
B(a
)AN
TC
HR
YC
-1 C
HR
YC
-2 C
HR
YC
-3 C
HR
YC
-4 C
HR
YB
(b)F
B(k
)FB
(e)P
B(a
)PPE
RY
LIN
DPY
RD
(a,h
)AB
(g,h
,l)P
Tota
l PA
Hs
% D
eple
tion
FIGURE 4. PAH depletion histogram for oil samples collected in September (black bars) and November (white bars) 2004 from Howard’s Beach, with slightly higher total PAH depletion (60-70%) than the samples taken on Brant Island in August 2004.
0
10
20
30
40
50
60
70
80
90
100
NA
PHC
-1 N
APH
C-2
NA
PHC
-3 N
APH
C-4
NA
PH BT
C-1
BT
C-2
BT
C-3
BT B
AC
ENA
PHA
CEN
THE
DB
FFL
UC
-1 F
LUC
-2 F
LUC
-3 F
LUC
AR
BA
NTH
PHEN
C-1
P/A
C-2
P/A
C-3
P/A
C-4
P/A
DB
TC
-1 D
BT
C-2
DB
TC
-3 D
BT FL PY
C-1
F/P
C-2
F/P
C-3
F/P
B(a
)AN
TC
HR
YC
-1 C
HR
YC
-2 C
HR
YC
-3 C
HR
YC
-4 C
HR
YB
(b)F
B(k
)FB
(e)P
B(a
)PPE
RY
LIN
DPY
RD
(a,h
)AB
(g,h
,l)P
Tota
l PA
Hs
% D
eple
tion
19
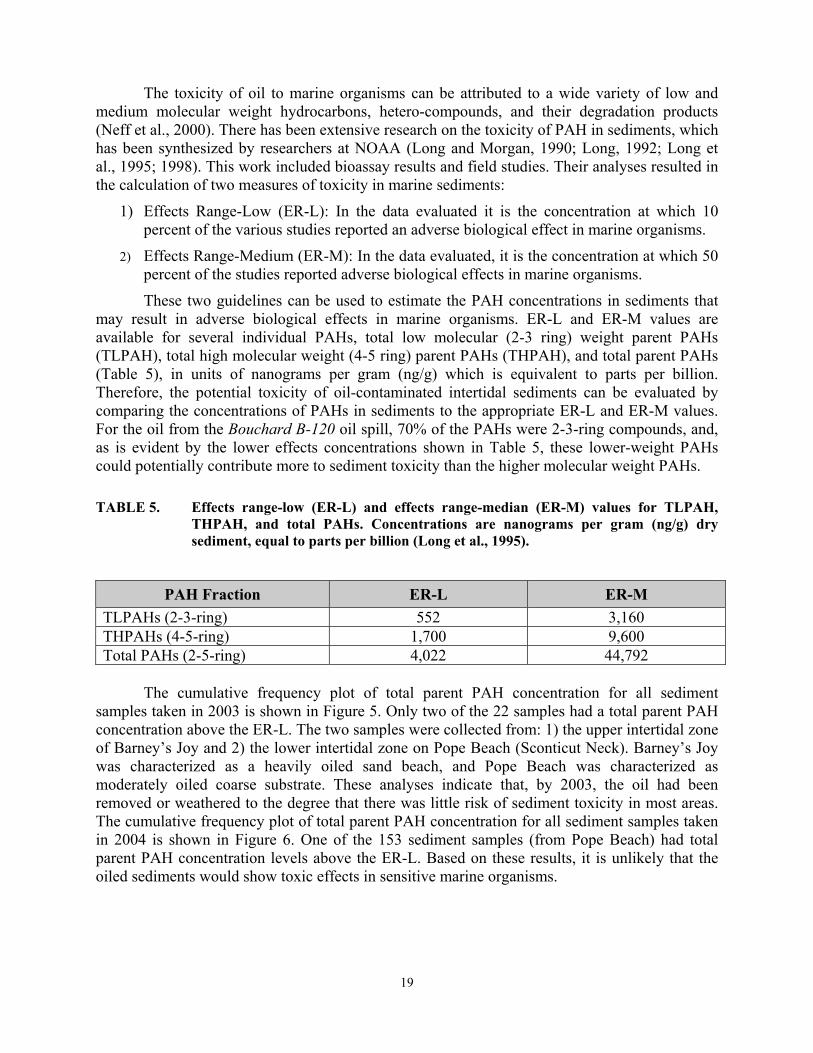
The toxicity of oil to marine organisms can be attributed to a wide variety of low and medium molecular weight hydrocarbons, hetero-compounds, and their degradation products (Neff et al., 2000). There has been extensive research on the toxicity of PAH in sediments, which has been synthesized by researchers at NOAA (Long and Morgan, 1990; Long, 1992; Long et al., 1995; 1998). This work included bioassay results and field studies. Their analyses resulted in the calculation of two measures of toxicity in marine sediments:
1) Effects Range-Low (ER-L): In the data evaluated it is the concentration at which 10 percent of the various studies reported an adverse biological effect in marine organisms.
2) Effects Range-Medium (ER-M): In the data evaluated, it is the concentration at which 50 percent of the studies reported adverse biological effects in marine organisms.
These two guidelines can be used to estimate the PAH concentrations in sediments that may result in adverse biological effects in marine organisms. ER-L and ER-M values are available for several individual PAHs, total low molecular (2-3 ring) weight parent PAHs (TLPAH), total high molecular weight (4-5 ring) parent PAHs (THPAH), and total parent PAHs (Table 5), in units of nanograms per gram (ng/g) which is equivalent to parts per billion. Therefore, the potential toxicity of oil-contaminated intertidal sediments can be evaluated by comparing the concentrations of PAHs in sediments to the appropriate ER-L and ER-M values. For the oil from the Bouchard B-120 oil spill, 70% of the PAHs were 2-3-ring compounds, and, as is evident by the lower effects concentrations shown in Table 5, these lower-weight PAHs could potentially contribute more to sediment toxicity than the higher molecular weight PAHs.
TABLE 5. Effects range-low (ER-L) and effects range-median (ER-M) values for TLPAH, THPAH, and total PAHs. Concentrations are nanograms per gram (ng/g) dry sediment, equal to parts per billion (Long et al., 1995).
PAH Fraction ER-L ER-M TLPAHs (2-3-ring) 552 3,160 THPAHs (4-5-ring) 1,700 9,600 Total PAHs (2-5-ring) 4,022 44,792
The cumulative frequency plot of total parent PAH concentration for all sediment
samples taken in 2003 is shown in Figure 5. Only two of the 22 samples had a total parent PAH concentration above the ER-L. The two samples were collected from: 1) the upper intertidal zone of Barney’s Joy and 2) the lower intertidal zone on Pope Beach (Sconticut Neck). Barney’s Joy was characterized as a heavily oiled sand beach, and Pope Beach was characterized as moderately oiled coarse substrate. These analyses indicate that, by 2003, the oil had been removed or weathered to the degree that there was little risk of sediment toxicity in most areas. The cumulative frequency plot of total parent PAH concentration for all sediment samples taken in 2004 is shown in Figure 6. One of the 153 sediment samples (from Pope Beach) had total parent PAH concentration levels above the ER-L. Based on these results, it is unlikely that the oiled sediments would show toxic effects in sensitive marine organisms.

20
FIGURE 5. Cumulative frequency plot of total parent PAH from the 22 sediment samples taken in 2003. None of the samples had PAH levels above the ER-M and only 2 of the samples had total PAH levels above the ER-L, the PAH concentration where toxic effects to marine organisms may occur.
0.1
1
10
100
1000
10000
100000
0.00 0.10 0.20 0.30 0.40 0.50 0.60 0.70 0.80 0.90 1.00
Percentile
PAH
(ng/
g)
ER-M
ER-L
21
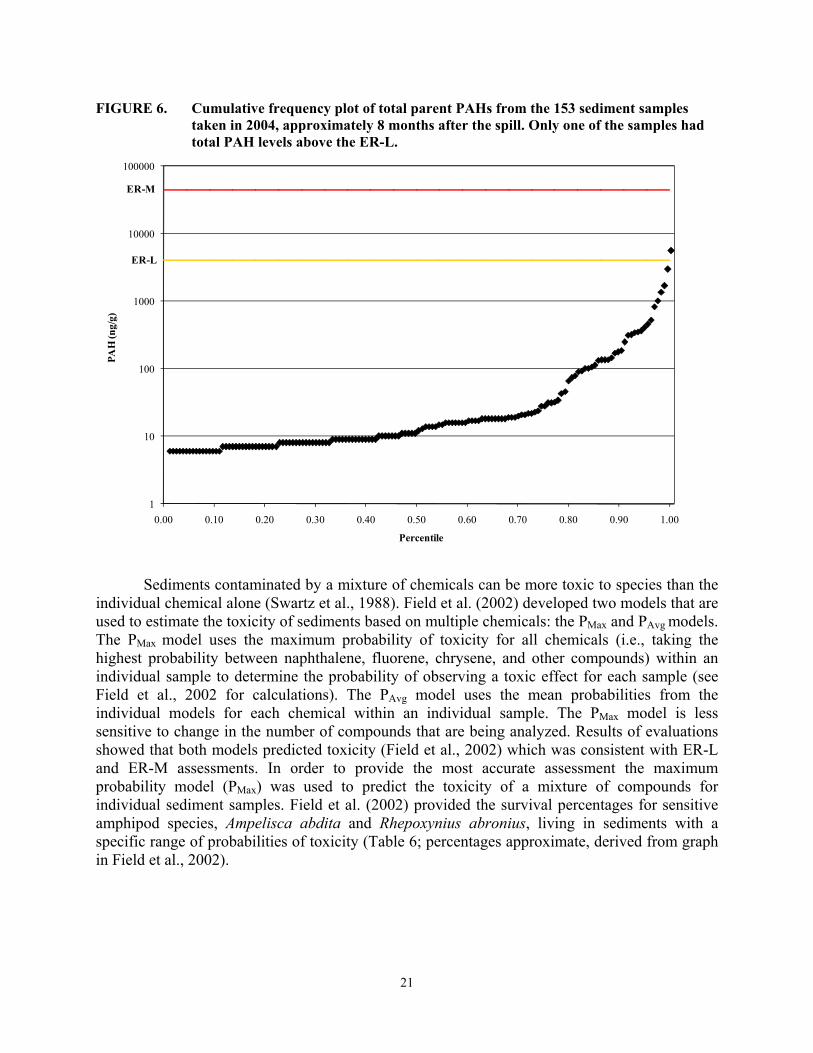
FIGURE 6. Cumulative frequency plot of total parent PAHs from the 153 sediment samples taken in 2004, approximately 8 months after the spill. Only one of the samples had total PAH levels above the ER-L.
1
10
100
1000
10000
100000
0.00 0.10 0.20 0.30 0.40 0.50 0.60 0.70 0.80 0.90 1.00
PAH
(ng/
g)
Percentile
ER-M
ER-L
Sediments contaminated by a mixture of chemicals can be more toxic to species than the individual chemical alone (Swartz et al., 1988). Field et al. (2002) developed two models that are used to estimate the toxicity of sediments based on multiple chemicals: the PMax and PAvg models. The PMax model uses the maximum probability of toxicity for all chemicals (i.e., taking the highest probability between naphthalene, fluorene, chrysene, and other compounds) within an individual sample to determine the probability of observing a toxic effect for each sample (see Field et al., 2002 for calculations). The PAvg model uses the mean probabilities from the individual models for each chemical within an individual sample. The PMax model is less sensitive to change in the number of compounds that are being analyzed. Results of evaluations showed that both models predicted toxicity (Field et al., 2002) which was consistent with ER-L and ER-M assessments. In order to provide the most accurate assessment the maximum probability model (PMax) was used to predict the toxicity of a mixture of compounds for individual sediment samples. Field et al. (2002) provided the survival percentages for sensitive amphipod species, Ampelisca abdita and Rhepoxynius abronius, living in sediments with a specific range of probabilities of toxicity (Table 6; percentages approximate, derived from graph in Field et al., 2002).

22
TABLE 6. Amphipod survival (percent) living in sediments with various probabilities of toxicity (adapted from graph in Field et al., 2002).
Probability of Toxicity Range Survival (%) < 0.25 78
> 0.25 - 0.50 72 > 0.50 - 0.75 60
> 0.75 50
Figure 7 shows the PMax model using the 22 Bouchard B-120 sediment samples taken in 2003. The majority of samples had a probability of toxicity of less than 0.24, indicating that the survival rate for amphipods living in the sediment would be approximately 78% or higher. Only one sample, from a heavily oiled sand beach at Barney’s Joy, had a 0.52 probability of toxicity, indicating only a 60% survival rate of amphipods within the sediment. Three samples had a probability of toxicity between 0.31-0.40 and were taken from Pope Beach on Sconticut Neck and the west side of West Island. These sites were characterized as moderately oiled coarse substrate and heavily oiled coarse substrate, respectively.
FIGURE 7. Toxic probability PMax model for the 22 sediment samples taken in 2003. This model shows that the majority of samples had a probability of 0.24 or less, indicating a higher survival rate (78%) for marine organisms living within the sediment. Only one sample had a 0.52 probability of toxicity, indicating a survival rate of only 60% of marine macro-invertebrates based on studies by Field et al. (2002).
0
0.2
0.4
0.6
0.8
1
0.00 0.10 0.20 0.30 0.40 0.50 0.60 0.70 0.80 0.90 1.00
Percentile
Prob
abili
ty o
f Tox
icity
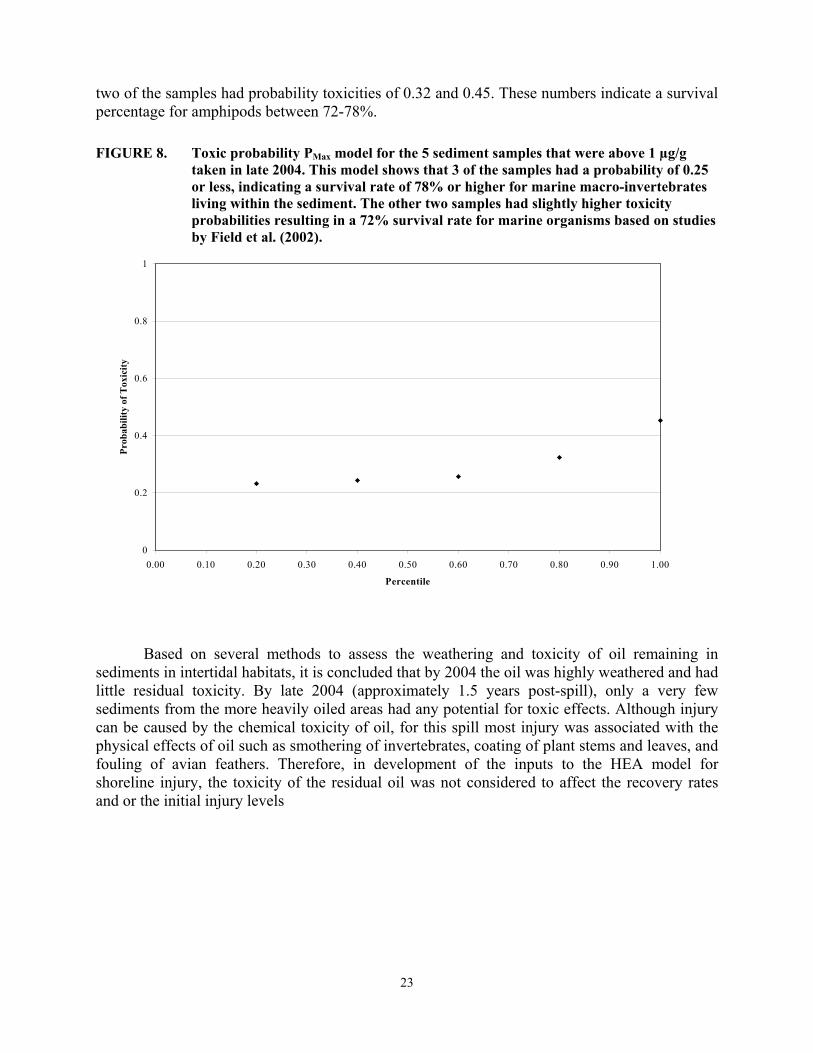
Figure 8 shows the PMax model results, plotting the five sediment samples that were above 1 µg/g taken in late 2004. Three of the samples had probability toxicities of 0.25 or less, while
23
two of the samples had probability toxicities of 0.32 and 0.45. These numbers indicate a survival percentage for amphipods between 72-78%.
FIGURE 8. Toxic probability PMax model for the 5 sediment samples that were above 1 µg/g taken in late 2004. This model shows that 3 of the samples had a probability of 0.25 or less, indicating a survival rate of 78% or higher for marine macro-invertebrates living within the sediment. The other two samples had slightly higher toxicity probabilities resulting in a 72% survival rate for marine organisms based on studies by Field et al. (2002).
0
0.2
0.4
0.6
0.8
1
0.00 0.10 0.20 0.30 0.40 0.50 0.60 0.70 0.80 0.90 1.00
Percentile
Prob
abili
ty o
f Tox
icity
Based on several methods to assess the weathering and toxicity of oil remaining in sediments in intertidal habitats, it is concluded that by 2004 the oil was highly weathered and had little residual toxicity. By late 2004 (approximately 1.5 years post-spill), only a very few sediments from the more heavily oiled areas had any potential for toxic effects. Although injury can be caused by the chemical toxicity of oil, for this spill most injury was associated with the physical effects of oil such as smothering of invertebrates, coating of plant stems and leaves, and fouling of avian feathers. Therefore, in development of the inputs to the HEA model for shoreline injury, the toxicity of the residual oil was not considered to affect the recovery rates and or the initial injury levels
24
INJURY QUANTIFICATION AND RATE OF RECOVERY
Determining the degree of initial injury and rate of recovery for shorelines is a complex process. The shoreline type, amount of oiling, exposure to natural removal processes, and duration of oiling can all affect the recovery of ecological services on an oiled shoreline. There are very few studies available that follow the full recovery of a coarse substrate, sand beach, or marsh shoreline. The recovery rates developed by the SAT focused on the visual observations of oiling, vegetative conditions, and species assemblage and abundance at oiled and reference sites. The SAT determined the percent of baseline services at key points in time to create the recovery curves for each injury category. These time inflections include:
1) April 27, 2003 – initial service losses, immediately after the spill.
2) 0.25 yrs after spill – estimated as the termination of cleanup activities, start of natural recovery process.
3) 0.5 yrs after spill – first survey by SAT was completed 5 months after spill and 6 months from the spill (October) was the end of the first growing season.
4) 1.5 yrs after spill – second SAT field survey took place and it was near the end of the second growing season.
5) 2.5 yrs after spill – the end of the third growing season.
For longer recovery times, the year intervals coincided with the end of the growing season (October) for each year.
Two field surveys, approximately 0.5 and 1.5 yrs following the spill, were conducted to visually assess how much recovery had taken place. Habitat recovery, defined by the percent of services available after the spill, was evaluated by observing how much oil remained on the shoreline as well as the presence or absence of common species (e.g., condition/regrowth of salt marsh grasses; presence of wrack and associated fauna; abundance of periwinkles, blue mussels, algae). The condition and abundance of common shoreline species gives an indication of recovery of habitat services for other species using the shoreline for feeding, nesting, or as a nursery. The sites surveyed during the field visits were used as examples to determine the services lost and recovery rates for other sites with similar habitats and oiling degrees. Further assessment of recovery was based on the analysis of the oil and sediment samples taken over time, as well as the literature.
In the following sections, the general ecological communities and likely impacts from oil are summarized for the three main habitat types: coarse substrate, sand beach, and salt marsh. Within each habitat type, the estimated injury to each oiling category is presented as impact and recovery curves, using the HEA approach. The basis for each point in the curves is discussed. The Responsible Party (RP) did not agree with seven of the recovery curves drawn (heavily and moderately oiled marsh, heavy and moderately oiled coarse substrate, heavily and moderately oiled and eroding shorelines and sediment replacement). Appendix J contains a discussion of the differences between RP and the Trustees on the injury and recovery curves. Comments provided by the RP can be found in several documents including the July 22, 2005 documentation addressed to NOAA (Jim Turek) titled Initial Comments to the Draft Injury Report; November 10, 2005 letter to Jim Turek; March 1, 2006 letter to Jim Turek; July 26, 2007 letter

25
to Jim Turek. These documents are to be part of the Administrative Record. Although agreement on the recovery curves could not be reached between the Trustees and the RP, the SAT agreed to finalize the Shoreline Injury Assessment Report with the understanding that, in the end, the restoration plans and project implementation may embrace the differences present between the RP’s and Trustees’ two proposed recovery curves for those shoreline types and levels of oiling where agreement could not be reached.
Coarse Substrate Habitats
Coarse substrate shorelines in Massachusetts and Rhode Island include sand and gravel beaches, gravel beaches (the dominant type in the MA impact area), rocky shores, and manmade structures (e.g., shoreline protection structures and groins composed of riprap). The oiling of coarse substrates can be detrimental to a wide assemblage of species that are attached to the hard substrate or that use the habitat for feeding, loafing, or as a nursery. Cobbles and boulders on coarse substrate shorelines support algae and crustaceans (e.g., barnacles), while some coarse substrates provide suitable settling habitat for shellfish. Intertidal cobbles and boulders also represent important loafing habitat for birds, and oiled sediment would represent a decrease in available non-hazardous loafing habitat. Several species (e.g., shorebirds, crustaceans, algae) can be negatively affected if their habitats are contaminated with oil, or more seriously affected from direct contact with oil, resulting in mortality of part or of an entire local population.
Determining the impacts to an oiled shoreline and the recovery time requires an understanding of the multiple trophic levels that are involved. Coarse substrates support high algal biomass and consequently, are a major contributor to primary production. Gravel shorelines provide a substrate for epibenthic vascular macroalgae, such as wrackweed (Ascophyllum nodosum) and rockweed (Fucus vesiculosus), to colonize and is the foundation for many grazing food webs. Other, ephemeral algae, such as Ulva spp. and Enteromorpha spp., are also found on coarse substrates and are an important food source for many grazing snails such as the periwinkle (Littorina littorea). When macroalgae die, they decompose and become detritus, a major food source for filter feeders, such as barnacles and mussels. Blue mussels (Mytilus edulis) attach themselves to boulders and cobbles and filter feed during flooded tidal periods. Mussels are an important prey species for crabs and shorebirds. Shorebirds and wading birds congregate in intertidal areas to feed in these highly productive habitats. Shorebirds rely on the transfer of energy from the lower trophic levels for growth and reproduction, and oil contamination can remove some of the lower trophic level species. Observing the recovery of the lower trophic levels (e.g., algae, snails, mussels) can provide an estimation of recovery of habitat services for some of the higher trophic levels (e.g., birds). Using this method to determine the recovery time for an oiled coarse substrate takes into account the food web interactions as well as the services the habitat provides.
No. 6 fuel oil is likely to coat the upper intertidal zone of sheltered coarse substrate shorelines and the splash zone of exposed shorelines. Any oil remaining after cleanup dries, cracks, and is removed by natural processes within a few years (Michel and Hayes, 1993). Some species will not survive being smothered with oil, as Chan (1977) found after crude oil coated a rocky platform shoreline in the Florida Keys, where gastropods (Nerita sp.) decreased slightly in abundance and many empty shells were found in the rocky zone. However, many more survived the oiling, indicated from the growth of the shell past the oil-stained portion of the shell. Several studies have been conducted on the recovery of flora and fauna of rocky and coarse substrates after oil contamination. Peterson (2001) reported a reduction in the dominant algae (Fucus spp.),

26
as well as limpets, barnacles and periwinkles on the intertidal rocky shore after the Exxon Valdez spill (a spill two orders of magnitude larger than the Bouchard B-120 spill). However, two years following the spill, the epibiotic populations on the oiled shoreline began to resemble those present on reference sites. One year following the Eleni V spill, Blackman and Law (1980) observed that, although hydrocarbons in blue mussel tissues still remained elevated, the heavy fuel oil was no longer visible on the shoreline.
Recovery is also dependent on the type of cleanup effort that was used to remove the oil. Coarse substrates that undergo intrusive cleanup, such as mechanical cleaning (i.e., stripped of oily gravel), and are replaced with clean sediment or pressure-washed, have shown much slower rates of recovery than coarse substrates that were cleaned through natural recovery. Mechanical removal methods were used on some heavily oiled coarse substrate shorelines when less intensive cleanup techniques were not sufficient to reach the cleanup endpoint. These methods were used mostly in areas where heavy oil coated cobble surfaces and oil mixed with sand in the interstitial space to form hardened deposits (GeoInsight, 2005). Rolan and Gallagher (1991) found that biological communities that were not mechanically cleaned recovered within one year even though weathered oil still existed, while the biological communities in the mechanically cleaned rocky shores had not fully recovered after nine years following the spill. After studying the results of recovery from twelve different oil spills, Sell et al. (1995) summarized that biotic recolonization on heavily oiled rocky shores with no cleanup treatment could occur between 0.5 and 1.5 years; recolonization was seen between 1 and 3 years from rocky shores that were treated. This synthesis study also suggests that recovery can be visibly progressing between 1-3 years for shorelines that were not treated and 1-10 years for shorelines that had been intensively treated.
The Trustees’ recovery rates for coarse substrate shorelines were based on broad-scale visual differences between oiled and reference sites, as well as sediment replacement sites. The focus was on the impacts of oil on primary production, food web support, and habitat usage. Observations on the assemblage (e.g., size and age structure) and abundance of attached organisms, such as barnacles or algae, as well as epifauna and infauna (e.g., periwinkles and polychaetes, respectively) were considered. The amount of live versus dead blue mussels was considered. The SAT also noted how much oil was still visibly present on coarse substrate shorelines. These observations, applicable literature on past spills, and best professional judgment were used in the development of the recovery curves for coarse substrate shorelines.
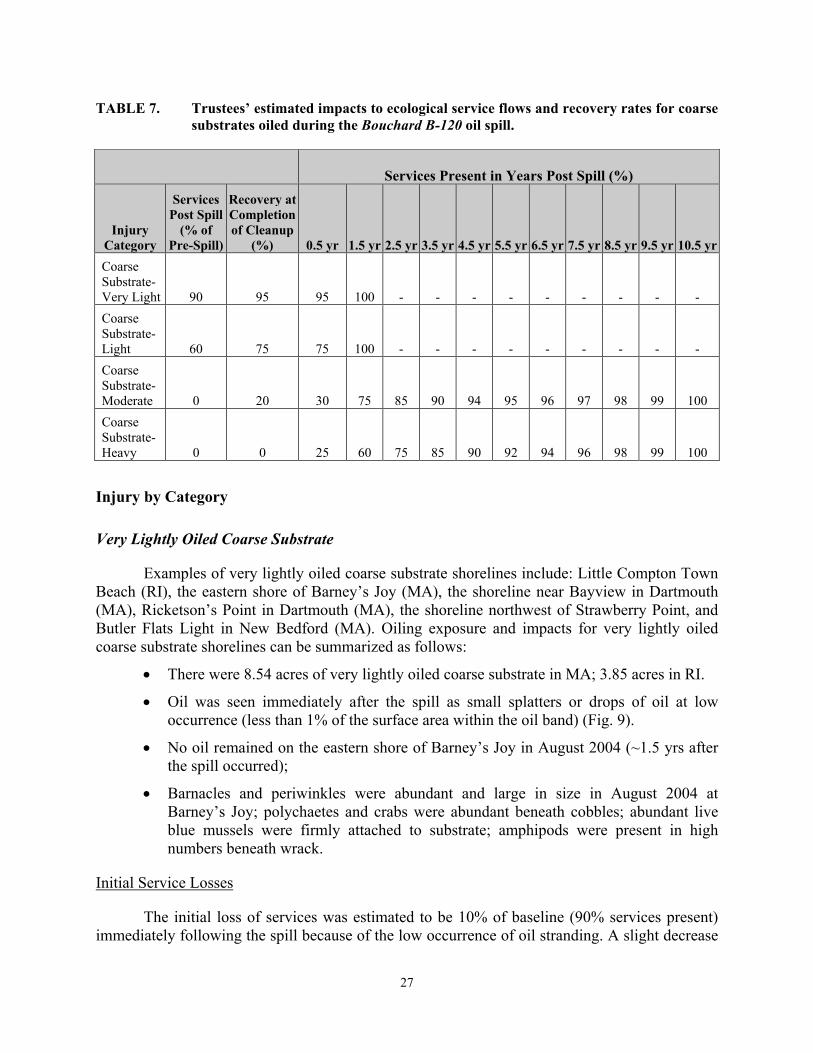
Table 7 summarizes the Trustees’ estimates of the extent and duration of service loss for each injury category for coarse substrate shorelines. Service loss is expressed as the level of services in the oiled area after the spill as a percentage of the pre-spill level of services. The following sections provide more detail on how the recovery curves were developed for each injury category under coarse substrates.
27
TABLE 7. Trustees’ estimated impacts to ecological service flows and recovery rates for coarse substrates oiled during the Bouchard B-120 oil spill.
Services Present in Years Post Spill (%)
Injury Category
Services Post Spill
(% of Pre-Spill)
Recovery at Completion of Cleanup
(%) 0.5 yr 1.5 yr 2.5 yr 3.5 yr 4.5 yr 5.5 yr 6.5 yr 7.5 yr 8.5 yr 9.5 yr 10.5 yrCoarse Substrate- Very Light 90 95 95 100 - - - - - - - - - Coarse Substrate- Light 60 75 75 100 - - - - - - - - - Coarse Substrate- Moderate 0 20 30 75 85 90 94 95 96 97 98 99 100 Coarse Substrate- Heavy 0 0 25 60 75 85 90 92 94 96 98 99 100
Injury by Category
Very Lightly Oiled Coarse Substrate
Examples of very lightly oiled coarse substrate shorelines include: Little Compton Town Beach (RI), the eastern shore of Barney’s Joy (MA), the shoreline near Bayview in Dartmouth (MA), Ricketson’s Point in Dartmouth (MA), the shoreline northwest of Strawberry Point, and Butler Flats Light in New Bedford (MA). Oiling exposure and impacts for very lightly oiled coarse substrate shorelines can be summarized as follows:
• There were 8.54 acres of very lightly oiled coarse substrate in MA; 3.85 acres in RI.
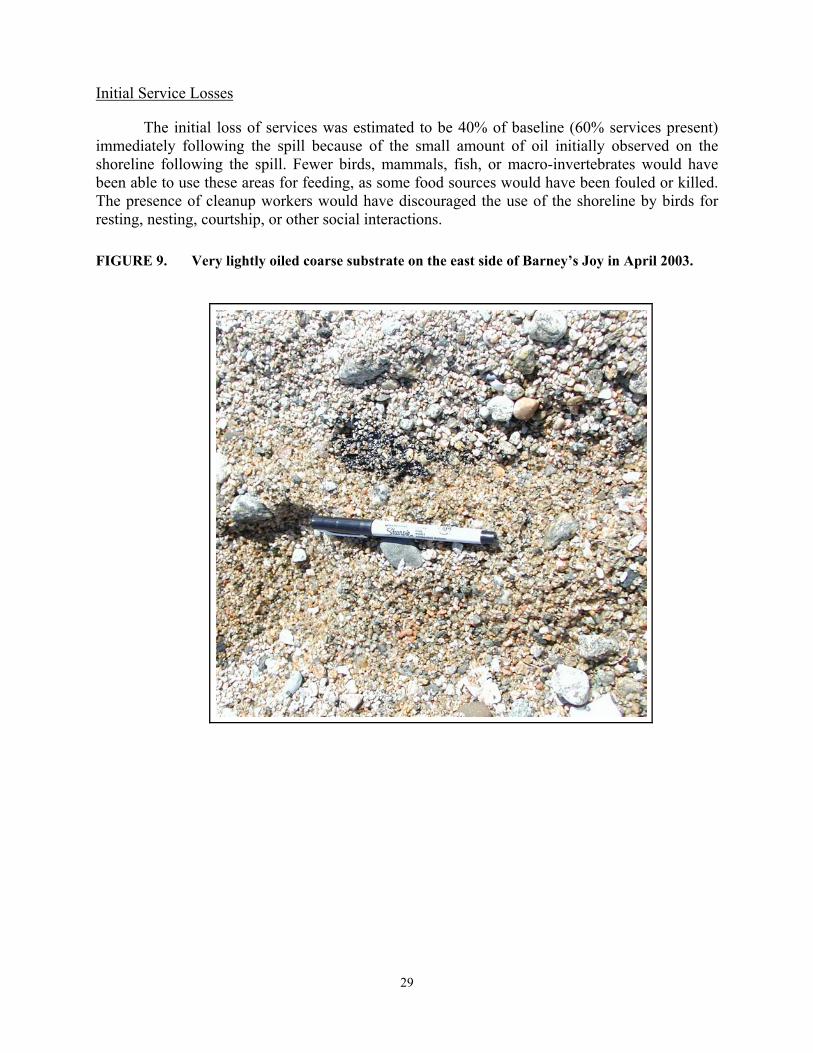
• Oil was seen immediately after the spill as small splatters or drops of oil at low occurrence (less than 1% of the surface area within the oil band) (Fig. 9).
• No oil remained on the eastern shore of Barney’s Joy in August 2004 (~1.5 yrs after the spill occurred);
• Barnacles and periwinkles were abundant and large in size in August 2004 at Barney’s Joy; polychaetes and crabs were abundant beneath cobbles; abundant live blue mussels were firmly attached to substrate; amphipods were present in high numbers beneath wrack.
Initial Service Losses
The initial loss of services was estimated to be 10% of baseline (90% services present) immediately following the spill because of the low occurrence of oil stranding. A slight decrease
28
in primary production would have occurred in the <1% of the areas that were coated with oil. There would be some oil exposure to grazers (e.g., periwinkles) and other invertebrates using the habitat. There was very little cleanup activity in these areas, mostly removal of oiled debris.
Recovery
At 0.25 years post-spill, at the termination of cleanup activities, the loss of services was estimated to be at 5% of baseline (95% services present). Any remaining oil would have become weathered and less sticky over time.
By the end of the first growing season (0.5 years post-spill), the loss of services was estimated to have remained at 5% relative to baseline. The SAT observed a thin, widely scattered coat of oil at Little Compton Town Beach (RI) where thicker patties had been removed during the cleanup effort. The residual oil could have removed some habitats as suitable settling locations for invertebrates (e.g., barnacles, blue mussels). However the majority of the very lightly oiled coarse substrate would be functioning normally.
By the end of the second growing season (1.5 years post-spill), services were estimated to be at 100% of baseline. During the August 2004 field visit (approximately 1.5 years post spill) to the eastern shoreline of Barney’s Joy, no oil was observed at this site. Species with multi-year life spans (periwinkles, barnacles, and blue mussels) were abundant, and all age classes were represented. The SAT observations follow the findings of Gelin et al. (2003) who saw no visual impacts on macro-invertebrate communities in the lightly oiled upper intertidal areas after the Jessica oil spill in the Galapagos between 4 and 11 months after the spill.
The inputs for the recovery curves are shown in Table 7, and the recovery curve for very lightly oiled coarse substrate shorelines is shown in Figure 10.
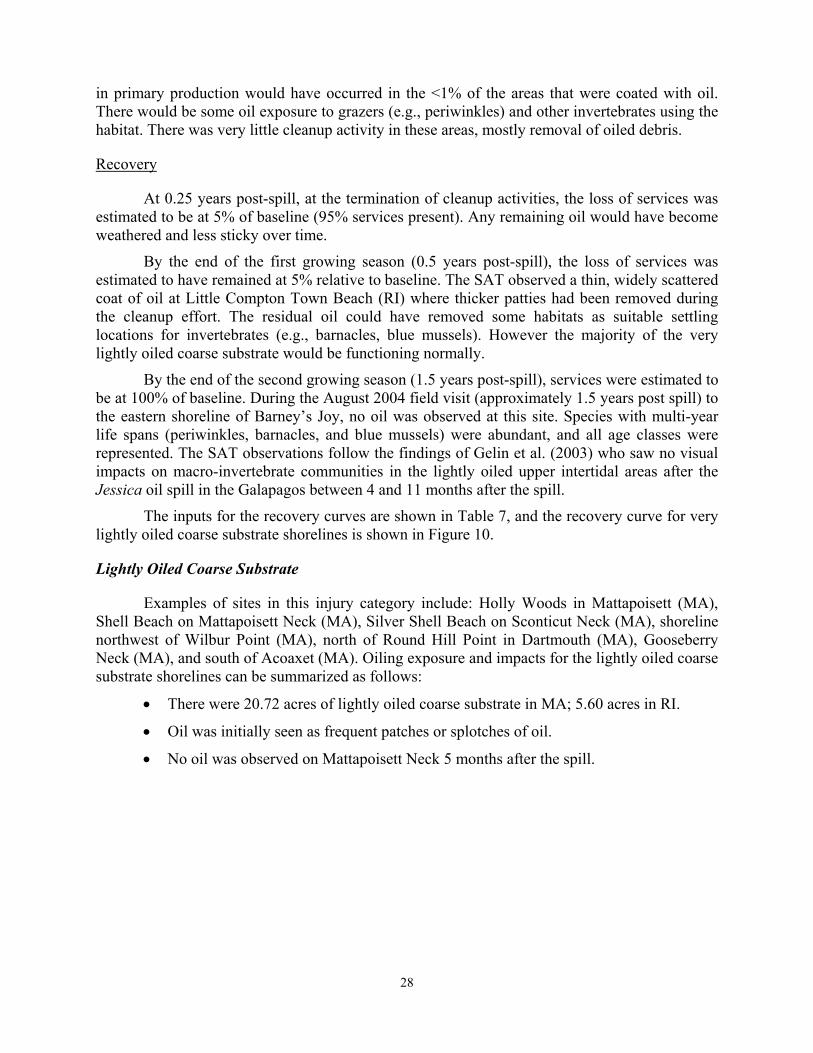
Lightly Oiled Coarse Substrate
Examples of sites in this injury category include: Holly Woods in Mattapoisett (MA), Shell Beach on Mattapoisett Neck (MA), Silver Shell Beach on Sconticut Neck (MA), shoreline northwest of Wilbur Point (MA), north of Round Hill Point in Dartmouth (MA), Gooseberry Neck (MA), and south of Acoaxet (MA). Oiling exposure and impacts for the lightly oiled coarse substrate shorelines can be summarized as follows:
• There were 20.72 acres of lightly oiled coarse substrate in MA; 5.60 acres in RI.
• Oil was initially seen as frequent patches or splotches of oil.
• No oil was observed on Mattapoisett Neck 5 months after the spill.
29
Initial Service Losses
The initial loss of services was estimated to be 40% of baseline (60% services present) immediately following the spill because of the small amount of oil initially observed on the shoreline following the spill. Fewer birds, mammals, fish, or macro-invertebrates would have been able to use these areas for feeding, as some food sources would have been fouled or killed. The presence of cleanup workers would have discouraged the use of the shoreline by birds for resting, nesting, courtship, or other social interactions.
FIGURE 9. Very lightly oiled coarse substrate on the east side of Barney’s Joy in April 2003.

30
FIGURE 10. Very lightly oiled coarse substrate recovery curve.
0%
25%
50%
75%
100%
0 0.5 1 1.5 2
Years Post Spill
Perc
ent S
ervi
ces
Recovery
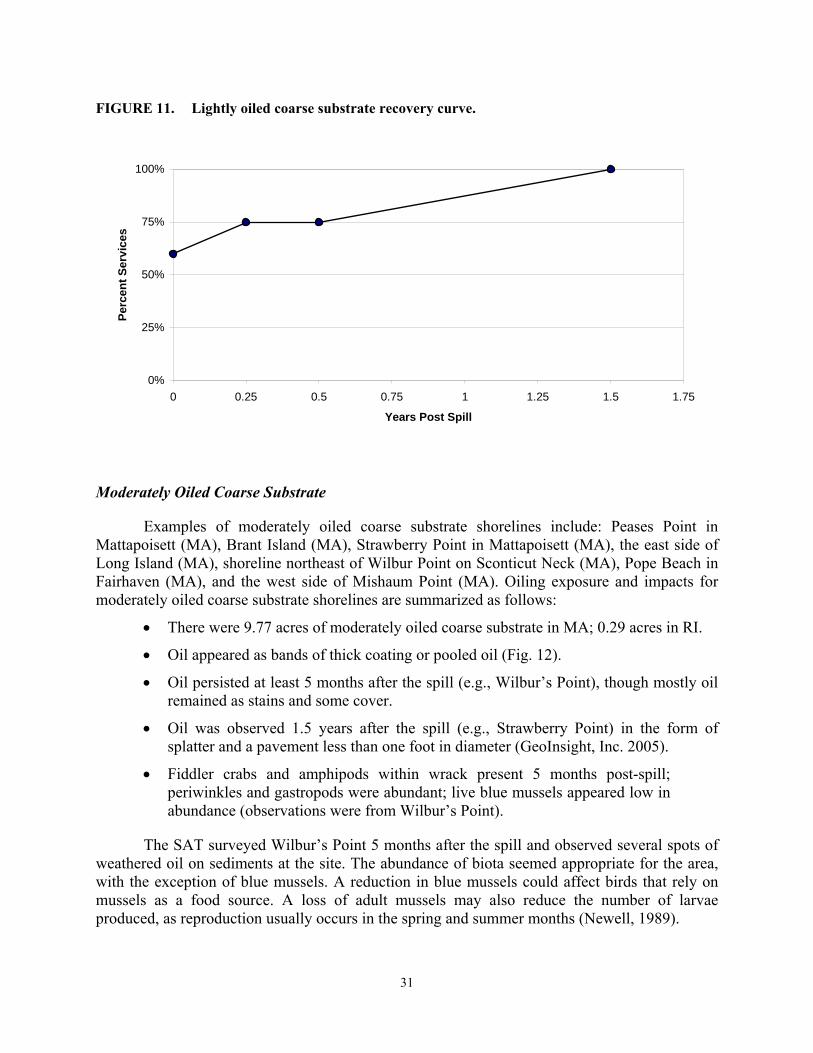
At 0.25 years after the spill, at the termination of cleanup activities, the loss of services was estimated to be at 25% of baseline (75% services present). Cleanup included removal of oiled wrack and manual removal of thicker oil patches. Recolonization processes would have started with the deposition of clean wrack and settling of new larvae on the mostly clean substrates.
By the end of the first growing season (0.5 years post-spill), the loss of services was estimated to remain at 25% of baseline. The SAT surveyed the gravel beach at Mattapoisett Neck in September 2003 and observed no oil in the intertidal zone. Heavy, clean wrack accumulations were noted throughout Buzzards Bay at this time.
By the end of the second growing season (1.5 years post-spill), services were estimated to be at 100% of baseline. Most of the oil on lightly oiled coarse substrates had been removed or reduced to scattered stains. Chan (1977) observed substantial recovery of amphipods and shore crab populations one year following the Florida Keys spill on rocky shores. Sell et al. (1995) analyzed twelve oil spills on sheltered/moderately exposed rocky shores and reported that lightly to moderately oiled sites recovered faster than heavily oiled shores.
The inputs for the recovery curves are shown in Table 7, and the recovery curve for lightly oiled coarse substrate shorelines is shown in Figure 11.
31
FIGURE 11. Lightly oiled coarse substrate recovery curve.
0%
25%
50%
75%
100%
0 0.25 0.5 0.75 1 1.25 1.5 1.75
Years Post Spill
Perc
ent S
ervi
ces
Moderately Oiled Coarse Substrate
Examples of moderately oiled coarse substrate shorelines include: Peases Point in Mattapoisett (MA), Brant Island (MA), Strawberry Point in Mattapoisett (MA), the east side of Long Island (MA), shoreline northeast of Wilbur Point on Sconticut Neck (MA), Pope Beach in Fairhaven (MA), and the west side of Mishaum Point (MA). Oiling exposure and impacts for moderately oiled coarse substrate shorelines are summarized as follows:
• There were 9.77 acres of moderately oiled coarse substrate in MA; 0.29 acres in RI.
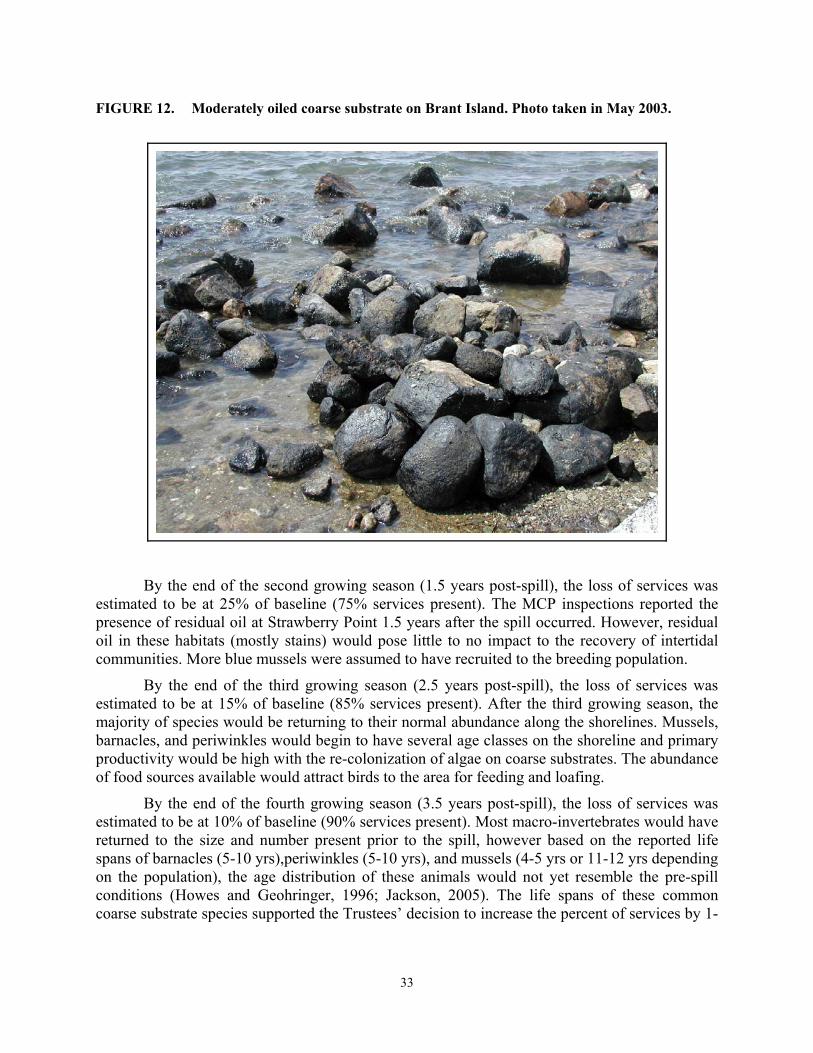
• Oil appeared as bands of thick coating or pooled oil (Fig. 12).
• Oil persisted at least 5 months after the spill (e.g., Wilbur’s Point), though mostly oil remained as stains and some cover.
• Oil was observed 1.5 years after the spill (e.g., Strawberry Point) in the form of splatter and a pavement less than one foot in diameter (GeoInsight, Inc. 2005).
• Fiddler crabs and amphipods within wrack present 5 months post-spill; periwinkles and gastropods were abundant; live blue mussels appeared low in abundance (observations were from Wilbur’s Point).
The SAT surveyed Wilbur’s Point 5 months after the spill and observed several spots of weathered oil on sediments at the site. The abundance of biota seemed appropriate for the area, with the exception of blue mussels. A reduction in blue mussels could affect birds that rely on mussels as a food source. A loss of adult mussels may also reduce the number of larvae produced, as reproduction usually occurs in the spring and summer months (Newell, 1989).
32
Initial Service Losses
The initial loss of services was estimated to be 100% of baseline (0% services present) as a result of the wide bands of thick oil that coated the intertidal habitats. The oil coating would have significantly impacted intertidal macrofauna and flora. A decrease in primary production would have occurred, and food sources necessary for higher trophic levels from the breakdown of algae would have been lost. Birds would not have been able to use the oiled substrates for loafing, and food sources would have been fouled or killed.
Recovery
At 0.25 years after the spill, at the termination of cleanup activities, the loss of services was estimated to be at 80% (20% services present). Most of the wrack had been removed from these areas. Cleanup efforts on moderately oiled shorelines took longer and were more intensive, including the use of high-pressure, hot-water flushing that removed any remaining epibiota from the treated substrates. However, the cleaned substrates were more suitable for recolonization, which would have started after cleanup was terminated in late May.
By the end of the first growing season (0.5 years post-spill), the loss of services had decreased 70% relative to baseline (30% services present). There was still some residual oil and staining on sediments on moderately oiled habitats. During the September 2003 field survey at Wilbur’s Point, the abundance of epifauna (fiddler crabs, amphipods, and periwinkles) seemed appropriate for a coarse substrate shoreline recovering from moderate oiling, with the exception of blue mussels. The Trustees assumed that blue mussels were killed immediately after the spill. The loss of adult mussels represents the loss of larvae for this first growing season, as reproduction usually occurs in the spring and summer months. Blue mussels begin reproducing between 1 and 2 years of age and can live from 4-5 years in southern populations (North Carolina to Massachusetts), or 11-12 years in northern populations (Massachusetts to Canada) (Newell, 1989). With fewer animals available to reproduce and those that survived being stressed from the effects of oil, reproduction would be depressed. This, in turn, affects the birds and other biota that rely on mussels as a food source.
33
FIGURE 12. Moderately oiled coarse substrate on Brant Island. Photo taken in May 2003.
By the end of the second growing season (1.5 years post-spill), the loss of services was
estimated to be at 25% of baseline (75% services present). The MCP inspections reported the presence of residual oil at Strawberry Point 1.5 years after the spill occurred. However, residual oil in these habitats (mostly stains) would pose little to no impact to the recovery of intertidal communities. More blue mussels were assumed to have recruited to the breeding population.
By the end of the third growing season (2.5 years post-spill), the loss of services was estimated to be at 15% of baseline (85% services present). After the third growing season, the majority of species would be returning to their normal abundance along the shorelines. Mussels, barnacles, and periwinkles would begin to have several age classes on the shoreline and primary productivity would be high with the re-colonization of algae on coarse substrates. The abundance of food sources available would attract birds to the area for feeding and loafing.
By the end of the fourth growing season (3.5 years post-spill), the loss of services was estimated to be at 10% of baseline (90% services present). Most macro-invertebrates would have returned to the size and number present prior to the spill, however based on the reported life spans of barnacles (5-10 yrs),periwinkles (5-10 yrs), and mussels (4-5 yrs or 11-12 yrs depending on the population), the age distribution of these animals would not yet resemble the pre-spill conditions (Howes and Geohringer, 1996; Jackson, 2005). The life spans of these common coarse substrate species supported the Trustees’ decision to increase the percent of services by 1-
34
4% for each growing season until reaching the 10th growing season (9.5 years post-spill), when the percent of services present was estimated to be at 99% of baseline.
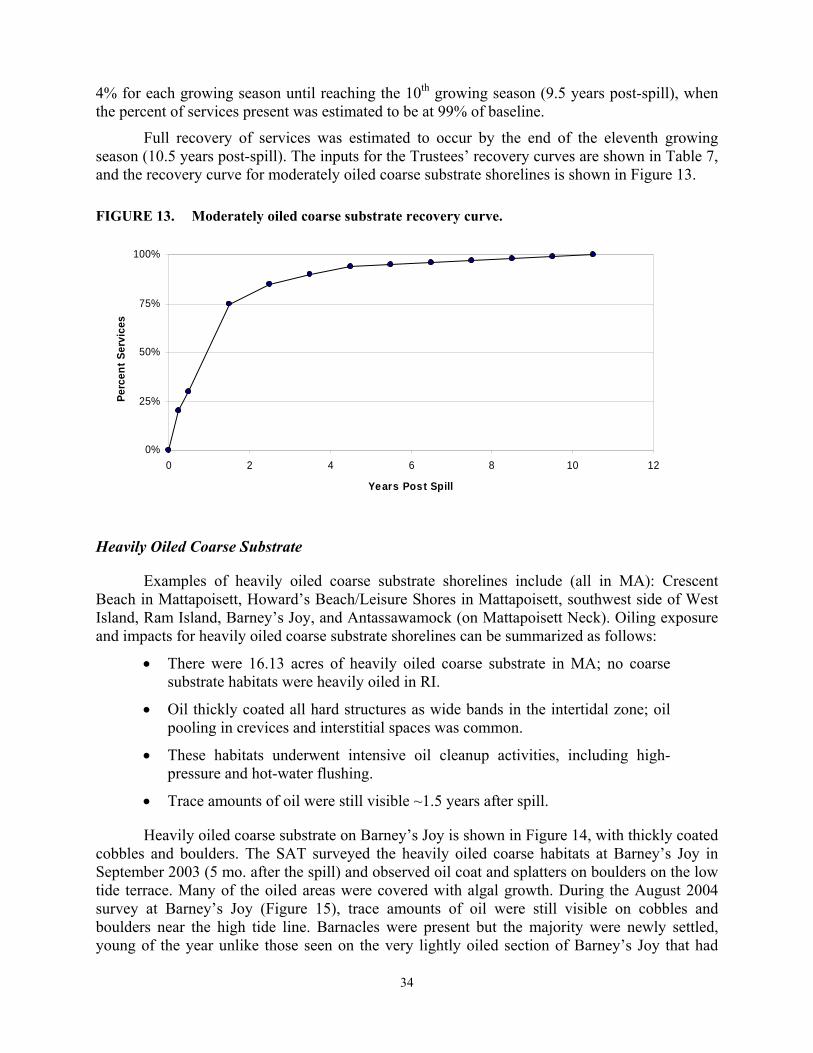
Full recovery of services was estimated to occur by the end of the eleventh growing season (10.5 years post-spill). The inputs for the Trustees’ recovery curves are shown in Table 7, and the recovery curve for moderately oiled coarse substrate shorelines is shown in Figure 13.
FIGURE 13. Moderately oiled coarse substrate recovery curve.
0%
25%
50%
75%
100%
0 2 4 6 8 10 12
Years Post Spill
Perc
ent S
ervi
ces
Heavily Oiled Coarse Substrate
Examples of heavily oiled coarse substrate shorelines include (all in MA): Crescent Beach in Mattapoisett, Howard’s Beach/Leisure Shores in Mattapoisett, southwest side of West Island, Ram Island, Barney’s Joy, and Antassawamock (on Mattapoisett Neck). Oiling exposure and impacts for heavily oiled coarse substrate shorelines can be summarized as follows:
• There were 16.13 acres of heavily oiled coarse substrate in MA; no coarse substrate habitats were heavily oiled in RI.
• Oil thickly coated all hard structures as wide bands in the intertidal zone; oil pooling in crevices and interstitial spaces was common.
• These habitats underwent intensive oil cleanup activities, including high-pressure and hot-water flushing.
• Trace amounts of oil were still visible ~1.5 years after spill.
Heavily oiled coarse substrate on Barney’s Joy is shown in Figure 14, with thickly coated cobbles and boulders. The SAT surveyed the heavily oiled coarse habitats at Barney’s Joy in September 2003 (5 mo. after the spill) and observed oil coat and splatters on boulders on the low tide terrace. Many of the oiled areas were covered with algal growth. During the August 2004 survey at Barney’s Joy (Figure 15), trace amounts of oil were still visible on cobbles and boulders near the high tide line. Barnacles were present but the majority were newly settled, young of the year unlike those seen on the very lightly oiled section of Barney’s Joy that had

35
both juvenile and adult populations of barnacles in greater abundance (Figures 16 and 17). There were also fewer periwinkles and polychaetes seen in the heavily oiled coarse substrate as compared to the very lightly oiled coarse substrate. It should be noted that the very lightly oiled coarse substrate on Barney’s Joy is more sheltered than the heavily oiled section of shoreline, which may account for some of the higher numbers of periwinkles, polychaetes, and barnacles observed.
Figure 18 shows the heavily oiled coarse substrate on Ram Island being cleaned using a pressure wash to remove the oil. The oiling of Ram Island was of major concern because a large population of roseate terns, a federally endangered species, nests on the Island. In the spring of 2000, 988 mating pairs of roseate terns were observed on Ram Island, arriving in late April to early May to establish nests (Massachusetts Office of Coastal Zone Management, 2004a). Their arrival, unfortunately coincided with the time of the spill, and prompted hazing canon operations to be organized to prevent the birds from coming onto the island until cleanup operations were completed (May 30, 2003). The birds returned to the island to nest in June. Bird impacts are addressed by the BWAT, separately.
The SAT also assessed the ecological services provided by the shorelines of Ram Island. During surveys of Ram Island in September 2003 small amounts of oil sheen on tidal pools between the boulders of the low-tide terrace were observed. Sporadic but extensive oil staining and coating was noted. In the middle tidal zone, fewer periwinkles were observed than expected, but the periwinkles in the lower tidal zone were abundant. Algae and barnacles were also abundant in the lower tidal zone. The SAT re-surveyed Ram Island in June 2004 (Figure 19).
Initial Service Losses
The initial loss of services was estimated to be 100% of baseline (0% services present). The thick oil coating rendered the habitat unsuitable for use, primary productivity would have been reduced with the coating of algae, and the oil would have smothered the gastropods and crustaceans (e.g., periwinkles, barnacles, blue mussels) that were attached or present on the surface of the coarse substrate. Birds would not have been able to use this area for loafing or feeding, as most food sources would have been fouled or killed. Birds would have avoided oiled areas, as well as have been disturbed by cleanup activities. Recovery would be a function of the rate of oil degradation and the life history of key intertidal biota on which the birds feed. Birds attempting to use “clean” habitats interspersed between oiled areas were likely exposed to oil from the surrounding coarse substrate. They would also have to expend more time searching for prey, which signifies a reduction in the habitat quality.
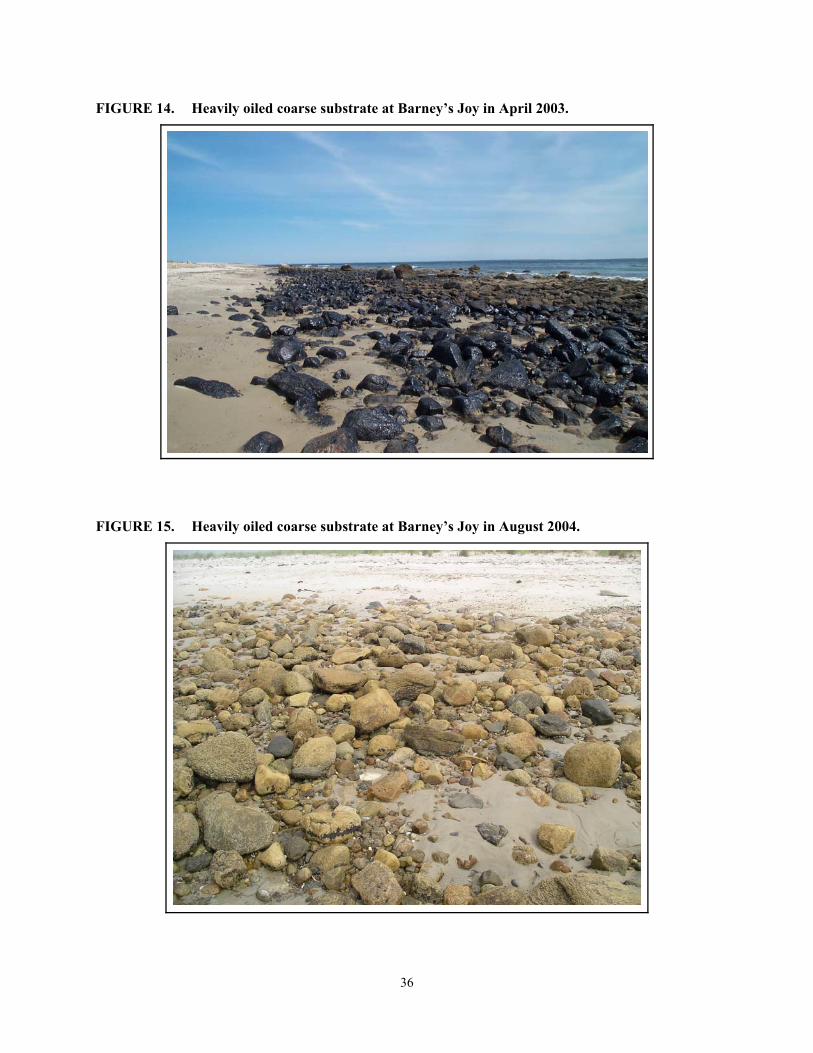
36
FIGURE 14. Heavily oiled coarse substrate at Barney’s Joy in April 2003.
FIGURE 15. Heavily oiled coarse substrate at Barney’s Joy in August 2004.
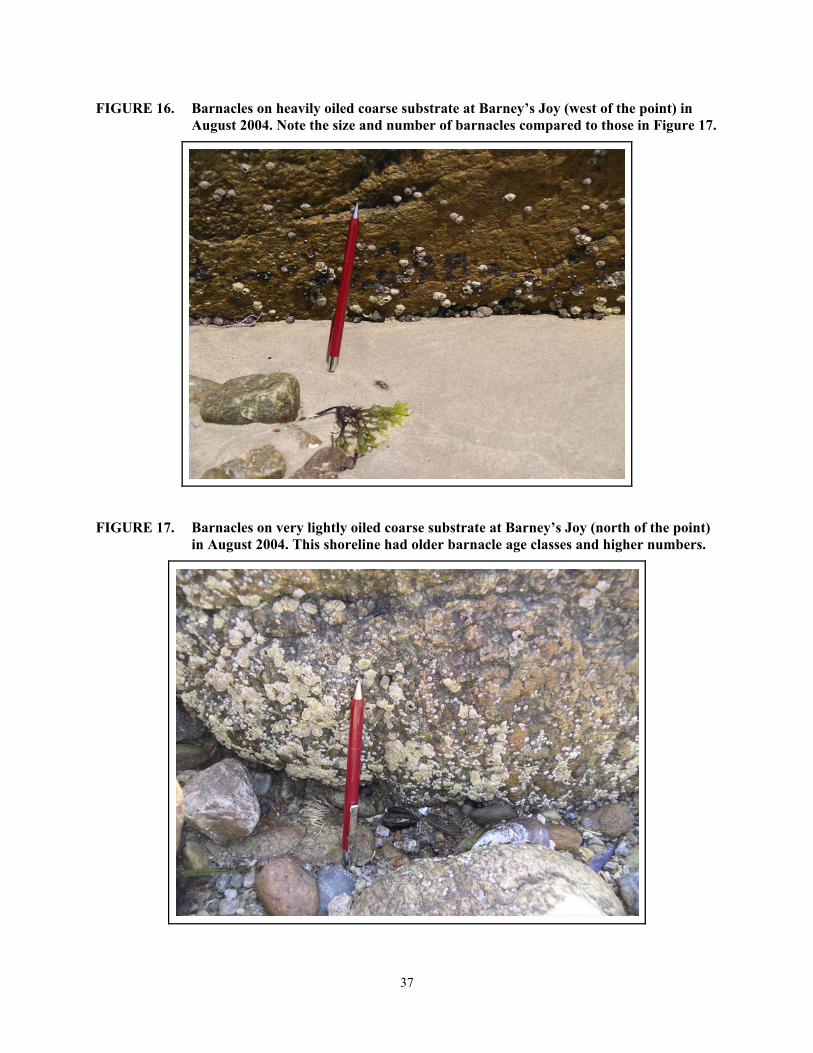
37
FIGURE 16. Barnacles on heavily oiled coarse substrate at Barney’s Joy (west of the point) in August 2004. Note the size and number of barnacles compared to those in Figure 17.
FIGURE 17. Barnacles on very lightly oiled coarse substrate at Barney’s Joy (north of the point) in August 2004. This shoreline had older barnacle age classes and higher numbers.

38
FIGURE 18. Heavily oiled coarse substrate on Ram Island in May 2003.
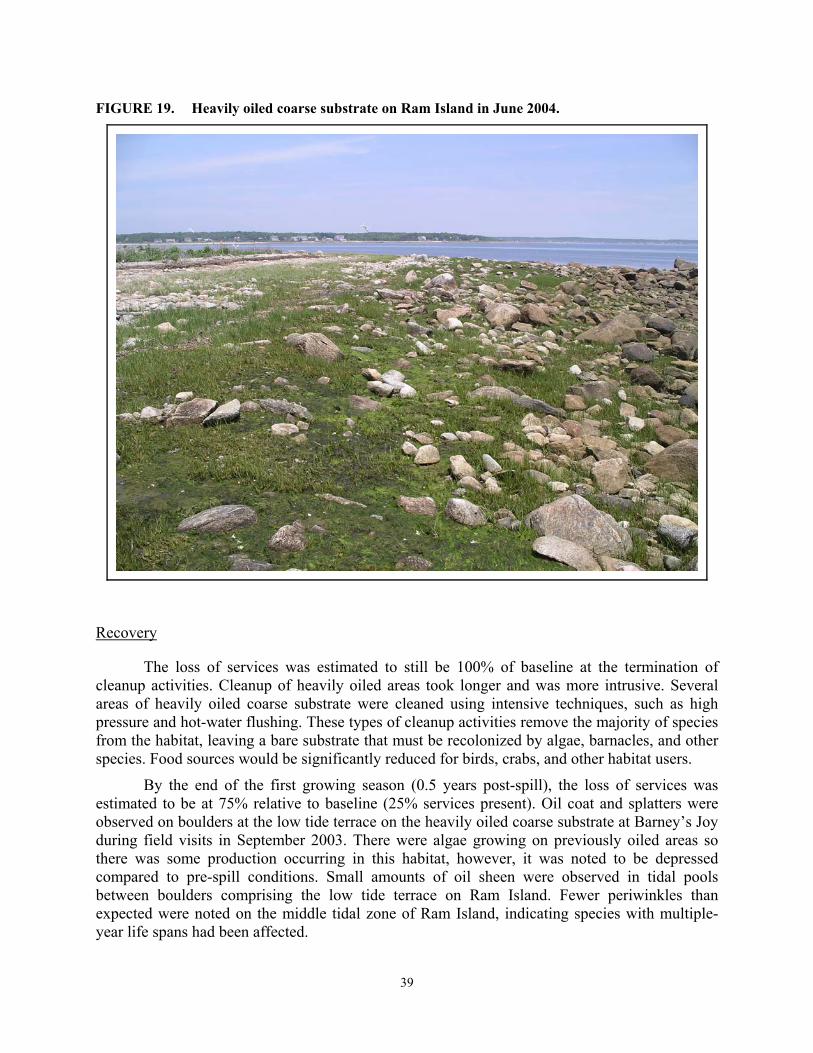
39
FIGURE 19. Heavily oiled coarse substrate on Ram Island in June 2004.
Recovery
The loss of services was estimated to still be 100% of baseline at the termination of cleanup activities. Cleanup of heavily oiled areas took longer and was more intrusive. Several areas of heavily oiled coarse substrate were cleaned using intensive techniques, such as high pressure and hot-water flushing. These types of cleanup activities remove the majority of species from the habitat, leaving a bare substrate that must be recolonized by algae, barnacles, and other species. Food sources would be significantly reduced for birds, crabs, and other habitat users.
By the end of the first growing season (0.5 years post-spill), the loss of services was estimated to be at 75% relative to baseline (25% services present). Oil coat and splatters were observed on boulders at the low tide terrace on the heavily oiled coarse substrate at Barney’s Joy during field visits in September 2003. There were algae growing on previously oiled areas so there was some production occurring in this habitat, however, it was noted to be depressed compared to pre-spill conditions. Small amounts of oil sheen were observed in tidal pools between boulders comprising the low tide terrace on Ram Island. Fewer periwinkles than expected were noted on the middle tidal zone of Ram Island, indicating species with multiple-year life spans had been affected.
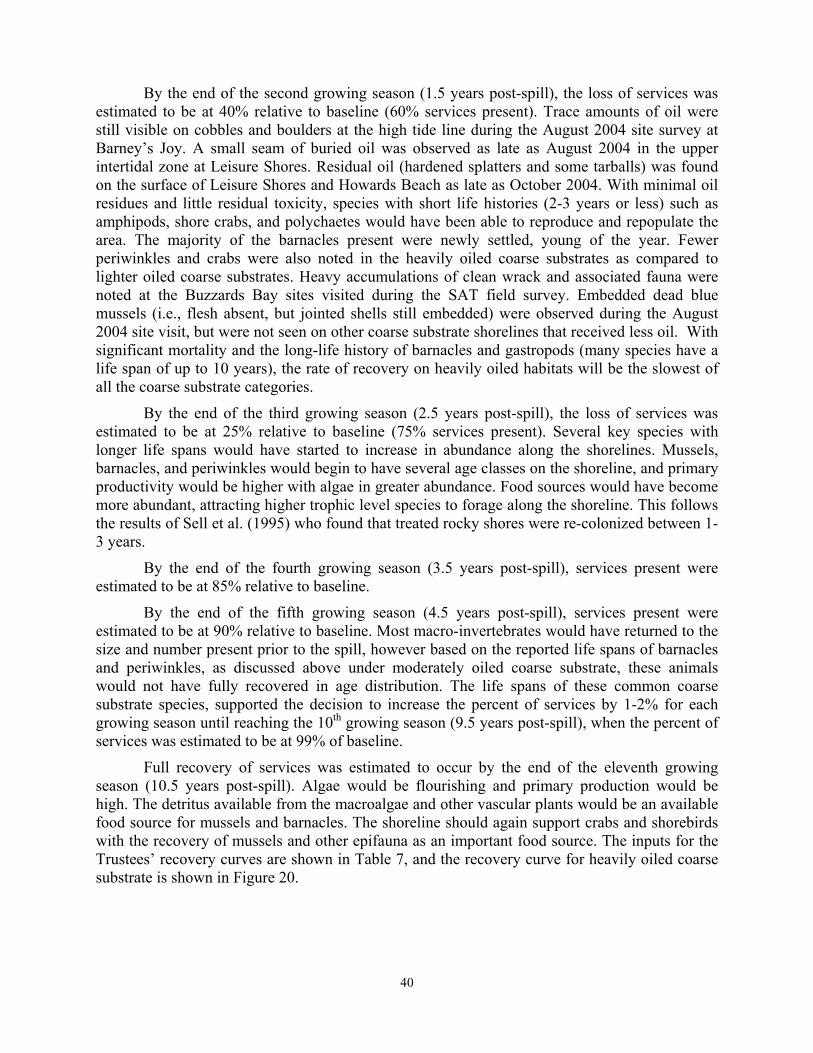
40
By the end of the second growing season (1.5 years post-spill), the loss of services was estimated to be at 40% relative to baseline (60% services present). Trace amounts of oil were still visible on cobbles and boulders at the high tide line during the August 2004 site survey at Barney’s Joy. A small seam of buried oil was observed as late as August 2004 in the upper intertidal zone at Leisure Shores. Residual oil (hardened splatters and some tarballs) was found on the surface of Leisure Shores and Howards Beach as late as October 2004. With minimal oil residues and little residual toxicity, species with short life histories (2-3 years or less) such as amphipods, shore crabs, and polychaetes would have been able to reproduce and repopulate the area. The majority of the barnacles present were newly settled, young of the year. Fewer periwinkles and crabs were also noted in the heavily oiled coarse substrates as compared to lighter oiled coarse substrates. Heavy accumulations of clean wrack and associated fauna were noted at the Buzzards Bay sites visited during the SAT field survey. Embedded dead blue mussels (i.e., flesh absent, but jointed shells still embedded) were observed during the August 2004 site visit, but were not seen on other coarse substrate shorelines that received less oil. With significant mortality and the long-life history of barnacles and gastropods (many species have a life span of up to 10 years), the rate of recovery on heavily oiled habitats will be the slowest of all the coarse substrate categories.
By the end of the third growing season (2.5 years post-spill), the loss of services was estimated to be at 25% relative to baseline (75% services present). Several key species with longer life spans would have started to increase in abundance along the shorelines. Mussels, barnacles, and periwinkles would begin to have several age classes on the shoreline, and primary productivity would be higher with algae in greater abundance. Food sources would have become more abundant, attracting higher trophic level species to forage along the shoreline. This follows the results of Sell et al. (1995) who found that treated rocky shores were re-colonized between 1-3 years.
By the end of the fourth growing season (3.5 years post-spill), services present were estimated to be at 85% relative to baseline.
By the end of the fifth growing season (4.5 years post-spill), services present were estimated to be at 90% relative to baseline. Most macro-invertebrates would have returned to the size and number present prior to the spill, however based on the reported life spans of barnacles and periwinkles, as discussed above under moderately oiled coarse substrate, these animals would not have fully recovered in age distribution. The life spans of these common coarse substrate species, supported the decision to increase the percent of services by 1-2% for each growing season until reaching the 10th growing season (9.5 years post-spill), when the percent of services was estimated to be at 99% of baseline.
Full recovery of services was estimated to occur by the end of the eleventh growing season (10.5 years post-spill). Algae would be flourishing and primary production would be high. The detritus available from the macroalgae and other vascular plants would be an available food source for mussels and barnacles. The shoreline should again support crabs and shorebirds with the recovery of mussels and other epifauna as an important food source. The inputs for the Trustees’ recovery curves are shown in Table 7, and the recovery curve for heavily oiled coarse substrate is shown in Figure 20.

41
FIGURE 20. Heavily oiled coarse substrate recovery curve.
0%
25%
50%
75%
100%
0 2 4 6 8 10 12
Years Post Spill
Perc
ent S
ervi
ces
Coarse Substrate Sediment Replacement Projects
Several sediment replacement projects were completed by June 2003 in areas of heavily oiled coarse substrate. The sites include: Long Island (0.67 acres), Crescent Beach (0.076 acres), and Brant Beach (0.113 acres). The heavily oiled gravel sediments at these sites were removed and replaced with clean sediment. The Trustees decided to create two separate recovery curves to represent: a) Long Island and b) Crescent Beach and Brant Island as the recovery time between these two groups was dissimilar. Table 8 summarizes the estimates of the extent and duration of service loss for the two sediment replacement categories.
Long Island Sediment Replacement Site
The Long Island sediment replacement site (LISRS) was surveyed by the SAT in September 2003, August 2004, and June 2005. Following the spill, the sediments were heavily coated with oil (Fig. 21). Five months after the spill, the sediments were clean (Fig. 22) but there were also very few macrofauna present in the mid to upper tidal zone. There were no epiphytic algae visibly present on the sediments in the mid-to-upper tidal zone, and consequently, few grazers were found in this area. There were also few amphipods found within the wrack on this shoreline. Periwinkles were more abundant in the lower tidal zone and were slowly beginning to recolonize as discussed above. In August 2004 (approximately 1.5 years after the spill), the SAT observed a small increase in epiphytic algae, but very few barnacles had recolonized the area. There were still fewer grazers, polychaetes, and amphipods than would be expected in a coarse substrate in the middle tidal zone. These results are similar to the findings of Sell et al. (1995). The survey in June 2005 revealed that the replacement rocks still appeared to be biologically sterile. Only a few barnacles and periwinkles were observed attached to rocks, particularly in moving up-gradient from the low water line. Rocks closer to the low water line had a more robust community both attached to the rocks and in the interstitial spaces between the rocks. This observation may be related to the greater invertebrate community present below the actual

42
area replaced, or the area is re-colonizing at a faster rate than the higher elevations in this area, potentially attributed to shorter periods of low water exposure.
FIGURE 21. Sediment replacement site on Long Island in May 2003 prior to replacement. Note trees in background relating to Figures 21 and 22 for orientation.
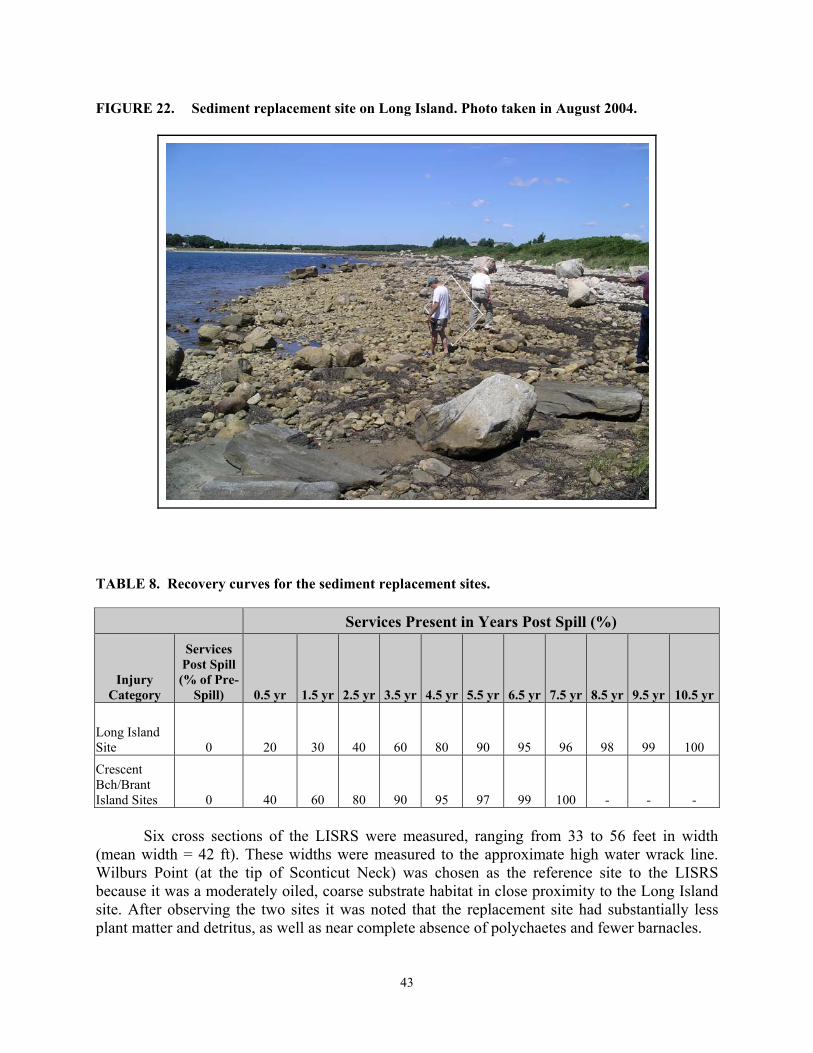
43
FIGURE 22. Sediment replacement site on Long Island. Photo taken in August 2004.
TABLE 8. Recovery curves for the sediment replacement sites.
Services Present in Years Post Spill (%)
Injury Category
Services Post Spill (% of Pre-
Spill) 0.5 yr 1.5 yr 2.5 yr 3.5 yr 4.5 yr 5.5 yr 6.5 yr 7.5 yr 8.5 yr 9.5 yr 10.5 yr
Long Island Site 0 20 30 40 60 80 90 95 96 98 99 100
Crescent Bch/Brant Island Sites 0 40 60 80 90 95 97 99 100 - - -
Six cross sections of the LISRS were measured, ranging from 33 to 56 feet in width
(mean width = 42 ft). These widths were measured to the approximate high water wrack line. Wilburs Point (at the tip of Sconticut Neck) was chosen as the reference site to the LISRS because it was a moderately oiled, coarse substrate habitat in close proximity to the Long Island site. After observing the two sites it was noted that the replacement site had substantially less plant matter and detritus, as well as near complete absence of polychaetes and fewer barnacles.

44
Initial Service Losses
The initial loss of services was estimated to be 100% of baseline (0% services present). This site was considered to have the same initial service loss as the heavily oiled coarse substrates discussed above. The thick oil coating rendered the habitat unsuitable for use, primary productivity would have been considerably reduced, and the oil would have smothered the gastropods and crustaceans that were attached or present on the surface of the coarse substrate. Birds would not have been able to use this area for loafing or feeding, as most food sources would have been fouled or killed. The removal of all oiled substrates and the replacement of clean sediments shortly after the spill provided a nearly biologically sterile habitat, with the exception of a loafing habitat for birds.
Recovery
By the end of the first growing season (0.5 years post-spill), the loss of services was estimated to be at 80% relative to baseline (20% services present). As discussed above, the September field survey revealed few macrofauna and epiphytic algae present in the mid to upper tidal zone. Amphipods were also not abundant within the wrack; however, periwinkles were abundant in the lower tidal zone and beginning to recolonize the mid to upper tidal zone.
By the end of the second growing season (1.5 years post-spill), the loss of services was estimated to be at 70% relative to baseline (30% services present). Species were continuing to repopulate the area as observed with the increase in algae in the August 2004 survey, however, there was still an obvious lack in the numbers of species in the replacement site.
The Trustees estimated a loss of services of 60% of baseline (40% services present), by the end of the third growing season (2.5 years post-spill). The services were only increased by 10% based on the June 2005 survey where the mid to upper tidal rocks still appeared bare. Periwinkles and barnacles were observed in the area, but only the rocks closest to the water line had an increase in the number of species, attached.
The Trustees estimated that the services would increase by 20% during each of the next two seasons and by the sixth growing season (5.5 years post-spill), the services present would have reached 90% of the relative baseline. The services would then continue to increase slowly over the next five years by 1-2% until full recovery.
Full recovery of services was estimated to occur by the end of the eleventh growing season (10.5 years post-spill). The recovery curve inputs are shown in Table 8. The recovery curve for heavily oiled coarse substrate sediment replacement sites is shown in Figure 23.

45
FIGURE 23. Recovery curve for the heavily oiled coarse substrate sediment replacement site at Long Island.
Crescent Beach and Brant Island Sediment Replacement Sites
The Crescent Beach sediment replacement site (CBSRS) is located seaward of private beachfront property. The landowner, who was familiar with the replacement site, stated that he had not observed blue mussels within the replacement area as he had before the spill and sediment replacement. He was also finding fewer hard clams in the area since the replacement. No blue mussels were found in the area during the June 2005 field survey, however multiple life stages of barnacles and abundant periwinkles were noted in the area. Some accumulation of rockweed, deadman’s fingers, and wet wrack had accumulated within the replacement site. The SAT agreed that the CBSRS appeared substantially different from the LISRS, and that the level of biological activity at the CBSRS appeared very similar to a nearby non-replacement area. However, the anecdotal information provided by the homeowner regarding the absence of mussels and clams suggests that the benthic community composition may have been affected by the replacement.
The Brant Island sediment replacement site (BISRS) lies within an active community beach area. The BISRS appeared to have less volume of stone material present, and the sediment was primarily fine-grained material. The cobble appears to be colonized by multiple sized barnacles, and the wet wrack was observed in relatively small quantity. The BISRS and the CBSRS were not observed with the same frequency as the LISRS, however, the comparison of
46
these two sites to the LISRS site allowed the SAT to estimate the inputs to the recovery curve based on their visual observations.
Initial Service Losses
The initial loss of services was estimated to be 100% of baseline (0% services present) for the same reasons as the LISRS that was discussed above. The thick oil coating rendered the habitat unsuitable for use, primary productivity would have been considerably reduced, and the oil would have smothered the organisms that were attached or present on the surface of the coarse substrate. The removal of all oiled substrate and the replacement of clean sediments shortly after the spill provided a nearly biologically sterile habitat, with the exception of loafing areas available to birds.
Recovery
By the end of the first growing season (0.5 years post-spill), the loss of services was estimated to be at 60% relative to baseline (40% services present). As discussed above, both CBSRS and BISRS appeared to be recovering more quickly than the LISRS, and the new wrack that washed onto the shoreline would in turn help amphipods as well as other macrofauna to begin using the area.
By the end of the second growing season (1.5 years post-spill), the loss of services was estimated to be at 40% relative to baseline (60% services present). Amphipods, shore crabs, and polychaetes would have been able to reproduce and repopulate the area. The birds would start to return to the area, as new food sources became available. Primary productivity would begin to increase as more algae grew on the bare cobbles.
The Trustees estimated a loss of services of 20% of baseline (80% services present), by the end of the third growing season (2.5 years post-spill). The field survey in June 2005 showed that the CBSRS had very similar life stages of species to a nearby non-replacement site, with the exception of bivalves that are typically observed in the area. The majority of the macrofauna would be plentiful, within the wrack or attached to the sediments.
The Trustees estimated a loss of services of 10% of baseline (90% services present), by the end of the fourth growing season (3.5 years post-spill). The services would then continue to increase over the next four years until full recovery occurred. The recovery was lengthened to represent the slow return of multiple life stages of bivalves to the area due to their longer life spans.
Full recovery of services was estimated to occur by the end of the eighth growing season (7.5 years post-spill). The inputs for the recovery curves are shown in Table 8, and the recovery curve for heavily oiled coarse substrate sediment replacement sites is shown in Figure 24.
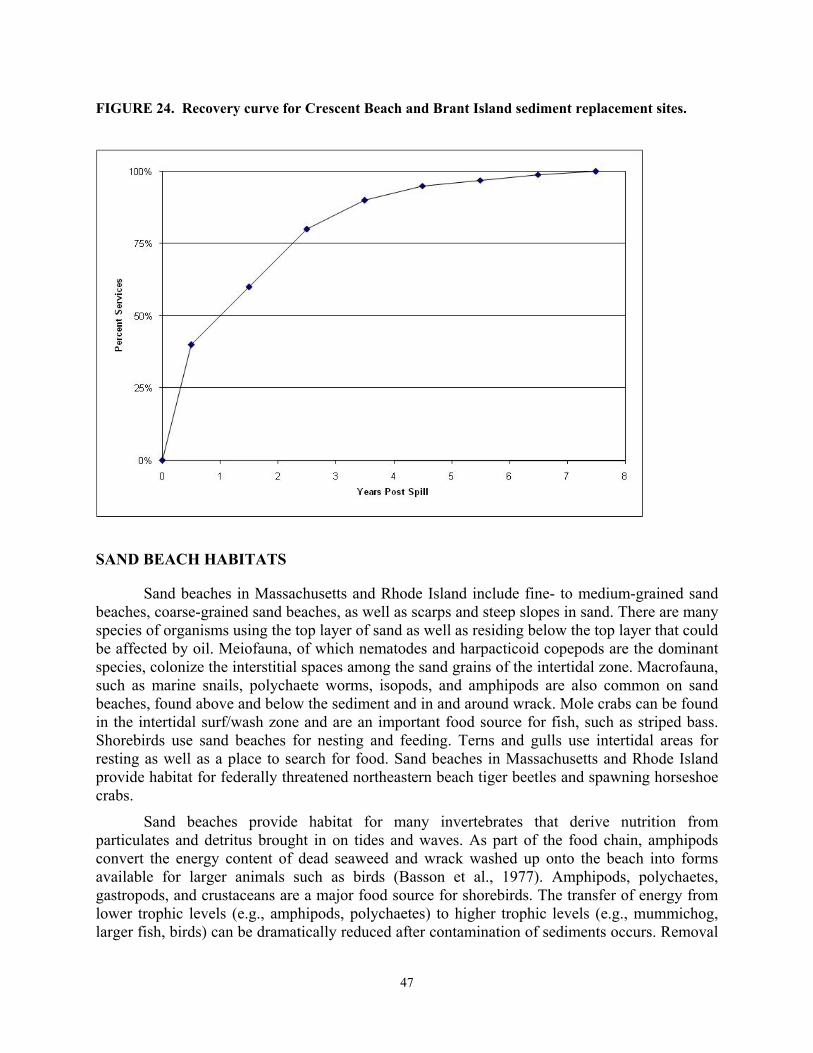
47
FIGURE 24. Recovery curve for Crescent Beach and Brant Island sediment replacement sites.
SAND BEACH HABITATS
Sand beaches in Massachusetts and Rhode Island include fine- to medium-grained sand beaches, coarse-grained sand beaches, as well as scarps and steep slopes in sand. There are many species of organisms using the top layer of sand as well as residing below the top layer that could be affected by oil. Meiofauna, of which nematodes and harpacticoid copepods are the dominant species, colonize the interstitial spaces among the sand grains of the intertidal zone. Macrofauna, such as marine snails, polychaete worms, isopods, and amphipods are also common on sand beaches, found above and below the sediment and in and around wrack. Mole crabs can be found in the intertidal surf/wash zone and are an important food source for fish, such as striped bass. Shorebirds use sand beaches for nesting and feeding. Terns and gulls use intertidal areas for resting as well as a place to search for food. Sand beaches in Massachusetts and Rhode Island provide habitat for federally threatened northeastern beach tiger beetles and spawning horseshoe crabs.
Sand beaches provide habitat for many invertebrates that derive nutrition from particulates and detritus brought in on tides and waves. As part of the food chain, amphipods convert the energy content of dead seaweed and wrack washed up onto the beach into forms available for larger animals such as birds (Basson et al., 1977). Amphipods, polychaetes, gastropods, and crustaceans are a major food source for shorebirds. The transfer of energy from lower trophic levels (e.g., amphipods, polychaetes) to higher trophic levels (e.g., mummichog, larger fish, birds) can be dramatically reduced after contamination of sediments occurs. Removal
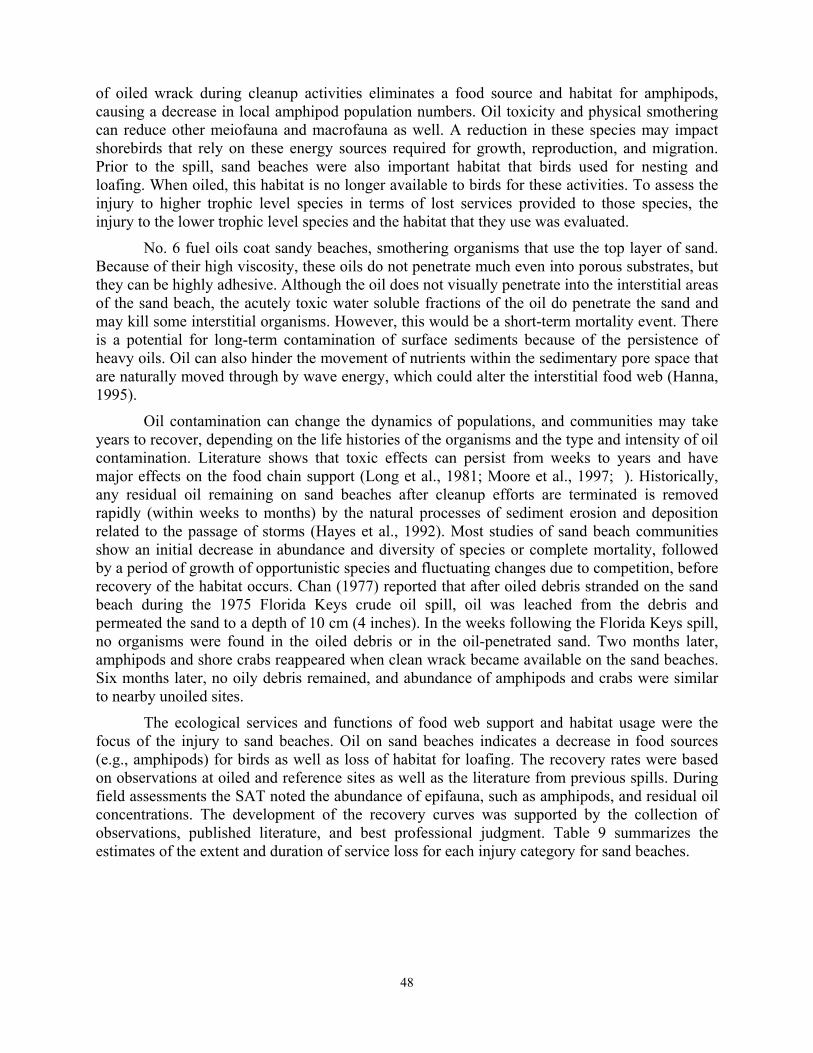
48
of oiled wrack during cleanup activities eliminates a food source and habitat for amphipods, causing a decrease in local amphipod population numbers. Oil toxicity and physical smothering can reduce other meiofauna and macrofauna as well. A reduction in these species may impact shorebirds that rely on these energy sources required for growth, reproduction, and migration. Prior to the spill, sand beaches were also important habitat that birds used for nesting and loafing. When oiled, this habitat is no longer available to birds for these activities. To assess the injury to higher trophic level species in terms of lost services provided to those species, the injury to the lower trophic level species and the habitat that they use was evaluated.
No. 6 fuel oils coat sandy beaches, smothering organisms that use the top layer of sand. Because of their high viscosity, these oils do not penetrate much even into porous substrates, but they can be highly adhesive. Although the oil does not visually penetrate into the interstitial areas of the sand beach, the acutely toxic water soluble fractions of the oil do penetrate the sand and may kill some interstitial organisms. However, this would be a short-term mortality event. There is a potential for long-term contamination of surface sediments because of the persistence of heavy oils. Oil can also hinder the movement of nutrients within the sedimentary pore space that are naturally moved through by wave energy, which could alter the interstitial food web (Hanna, 1995).
Oil contamination can change the dynamics of populations, and communities may take years to recover, depending on the life histories of the organisms and the type and intensity of oil contamination. Literature shows that toxic effects can persist from weeks to years and have major effects on the food chain support (Long et al., 1981; Moore et al., 1997; ). Historically, any residual oil remaining on sand beaches after cleanup efforts are terminated is removed rapidly (within weeks to months) by the natural processes of sediment erosion and deposition related to the passage of storms (Hayes et al., 1992). Most studies of sand beach communities show an initial decrease in abundance and diversity of species or complete mortality, followed by a period of growth of opportunistic species and fluctuating changes due to competition, before recovery of the habitat occurs. Chan (1977) reported that after oiled debris stranded on the sand beach during the 1975 Florida Keys crude oil spill, oil was leached from the debris and permeated the sand to a depth of 10 cm (4 inches). In the weeks following the Florida Keys spill, no organisms were found in the oiled debris or in the oil-penetrated sand. Two months later, amphipods and shore crabs reappeared when clean wrack became available on the sand beaches. Six months later, no oily debris remained, and abundance of amphipods and crabs were similar to nearby unoiled sites.
The ecological services and functions of food web support and habitat usage were the focus of the injury to sand beaches. Oil on sand beaches indicates a decrease in food sources (e.g., amphipods) for birds as well as loss of habitat for loafing. The recovery rates were based on observations at oiled and reference sites as well as the literature from previous spills. During field assessments the SAT noted the abundance of epifauna, such as amphipods, and residual oil concentrations. The development of the recovery curves was supported by the collection of observations, published literature, and best professional judgment. Table 9 summarizes the estimates of the extent and duration of service loss for each injury category for sand beaches.
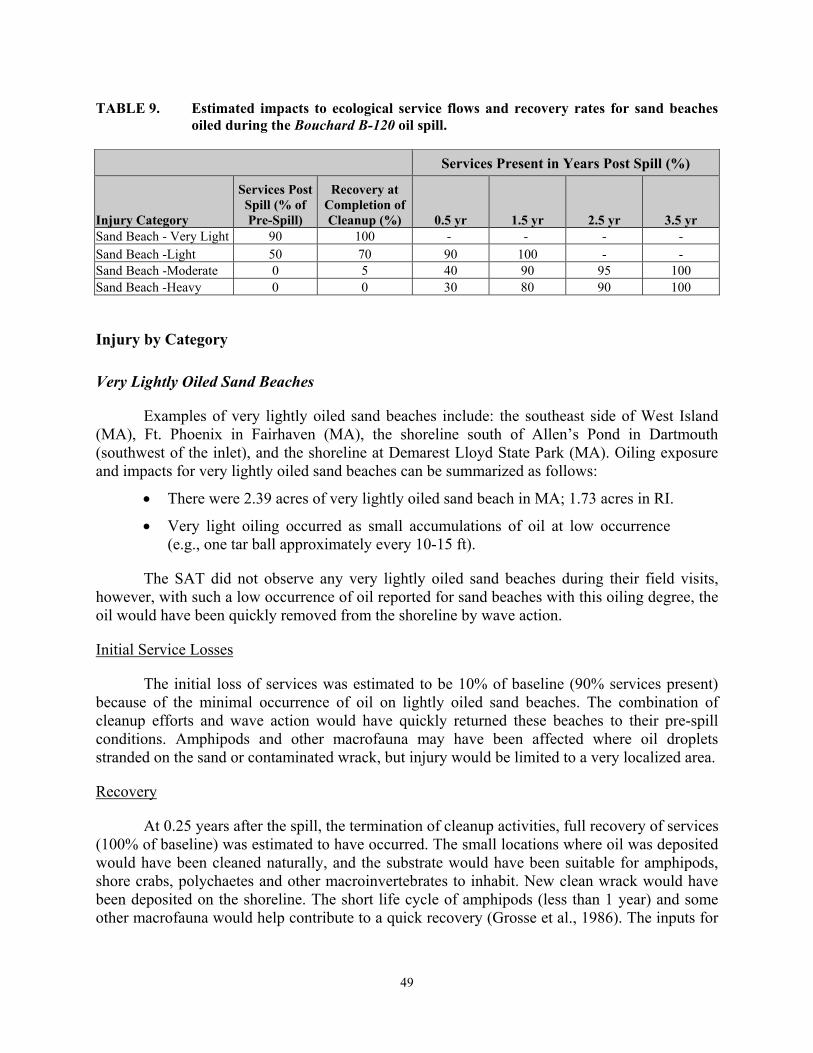
49
TABLE 9. Estimated impacts to ecological service flows and recovery rates for sand beaches oiled during the Bouchard B-120 oil spill.
Services Present in Years Post Spill (%)
Injury Category
Services Post Spill (% of Pre-Spill)
Recovery at Completion of Cleanup (%) 0.5 yr 1.5 yr 2.5 yr 3.5 yr
Sand Beach - Very Light 90 100 - - - - Sand Beach -Light 50 70 90 100 - - Sand Beach -Moderate 0 5 40 90 95 100 Sand Beach -Heavy 0 0 30 80 90 100
Injury by Category
Very Lightly Oiled Sand Beaches
Examples of very lightly oiled sand beaches include: the southeast side of West Island (MA), Ft. Phoenix in Fairhaven (MA), the shoreline south of Allen’s Pond in Dartmouth (southwest of the inlet), and the shoreline at Demarest Lloyd State Park (MA). Oiling exposure and impacts for very lightly oiled sand beaches can be summarized as follows:
• There were 2.39 acres of very lightly oiled sand beach in MA; 1.73 acres in RI.
• Very light oiling occurred as small accumulations of oil at low occurrence (e.g., one tar ball approximately every 10-15 ft).
The SAT did not observe any very lightly oiled sand beaches during their field visits, however, with such a low occurrence of oil reported for sand beaches with this oiling degree, the oil would have been quickly removed from the shoreline by wave action.
Initial Service Losses
The initial loss of services was estimated to be 10% of baseline (90% services present) because of the minimal occurrence of oil on lightly oiled sand beaches. The combination of cleanup efforts and wave action would have quickly returned these beaches to their pre-spill conditions. Amphipods and other macrofauna may have been affected where oil droplets stranded on the sand or contaminated wrack, but injury would be limited to a very localized area.
Recovery
At 0.25 years after the spill, the termination of cleanup activities, full recovery of services (100% of baseline) was estimated to have occurred. The small locations where oil was deposited would have been cleaned naturally, and the substrate would have been suitable for amphipods, shore crabs, polychaetes and other macroinvertebrates to inhabit. New clean wrack would have been deposited on the shoreline. The short life cycle of amphipods (less than 1 year) and some other macrofauna would help contribute to a quick recovery (Grosse et al., 1986). The inputs for
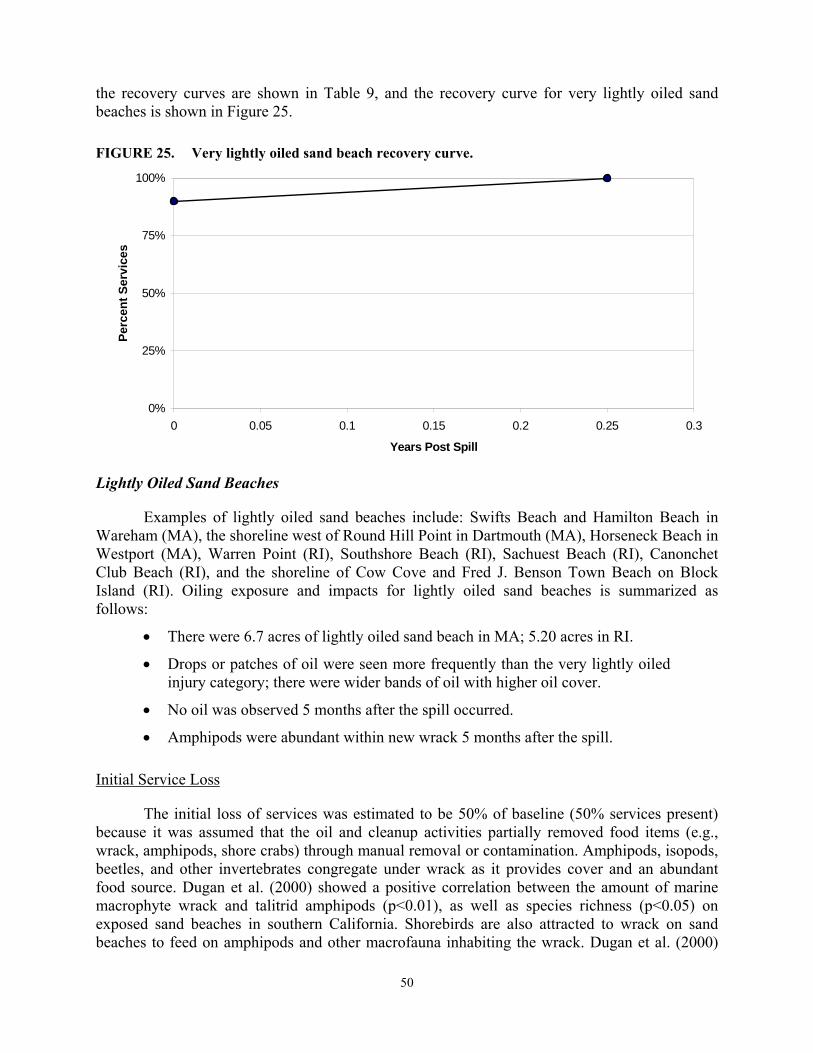
50
the recovery curves are shown in Table 9, and the recovery curve for very lightly oiled sand beaches is shown in Figure 25.
FIGURE 25. Very lightly oiled sand beach recovery curve.
0%
25%
50%
75%
100%
0 0.05 0.1 0.15 0.2 0.25 0.3
Years Post Spill
Perc
ent S
ervi
ces
Lightly Oiled Sand Beaches
Examples of lightly oiled sand beaches include: Swifts Beach and Hamilton Beach in Wareham (MA), the shoreline west of Round Hill Point in Dartmouth (MA), Horseneck Beach in Westport (MA), Warren Point (RI), Southshore Beach (RI), Sachuest Beach (RI), Canonchet Club Beach (RI), and the shoreline of Cow Cove and Fred J. Benson Town Beach on Block Island (RI). Oiling exposure and impacts for lightly oiled sand beaches is summarized as follows:
• There were 6.7 acres of lightly oiled sand beach in MA; 5.20 acres in RI.
• Drops or patches of oil were seen more frequently than the very lightly oiled injury category; there were wider bands of oil with higher oil cover.
• No oil was observed 5 months after the spill occurred.
• Amphipods were abundant within new wrack 5 months after the spill.
Initial Service Loss
The initial loss of services was estimated to be 50% of baseline (50% services present) because it was assumed that the oil and cleanup activities partially removed food items (e.g., wrack, amphipods, shore crabs) through manual removal or contamination. Amphipods, isopods, beetles, and other invertebrates congregate under wrack as it provides cover and an abundant food source. Dugan et al. (2000) showed a positive correlation between the amount of marine macrophyte wrack and talitrid amphipods (p<0.01), as well as species richness (p<0.05) on exposed sand beaches in southern California. Shorebirds are also attracted to wrack on sand beaches to feed on amphipods and other macrofauna inhabiting the wrack. Dugan et al. (2000)
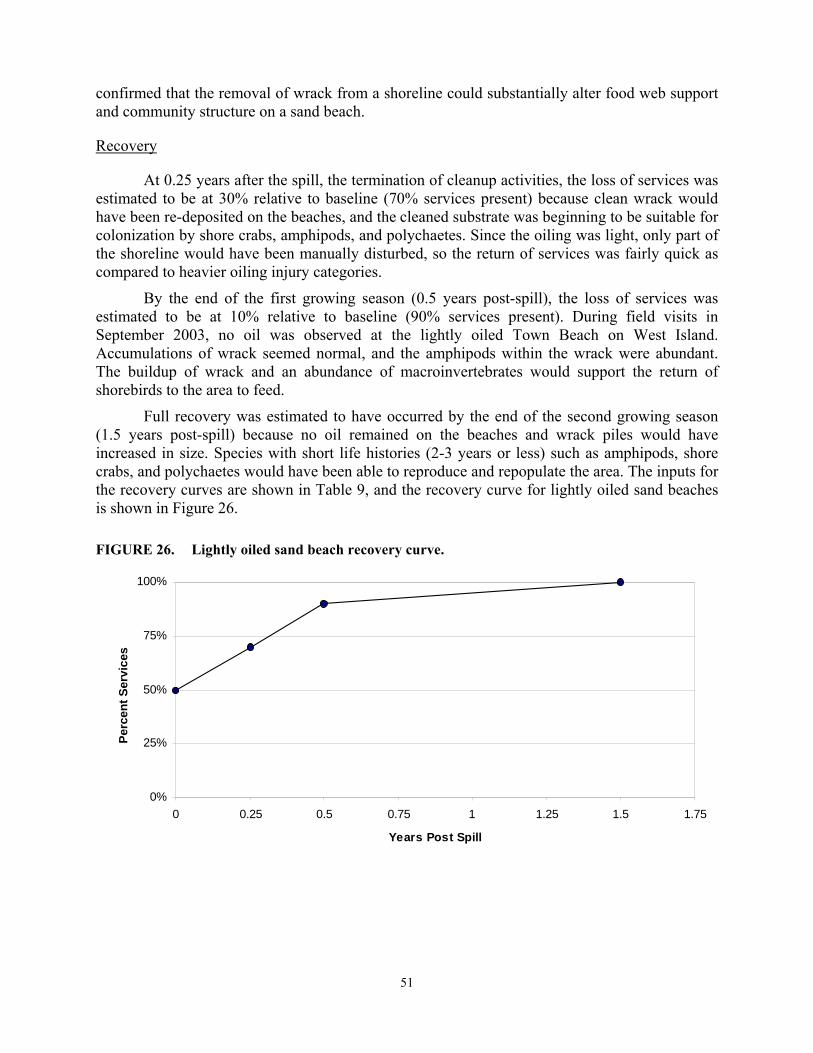
51
confirmed that the removal of wrack from a shoreline could substantially alter food web support and community structure on a sand beach.
Recovery
At 0.25 years after the spill, the termination of cleanup activities, the loss of services was estimated to be at 30% relative to baseline (70% services present) because clean wrack would have been re-deposited on the beaches, and the cleaned substrate was beginning to be suitable for colonization by shore crabs, amphipods, and polychaetes. Since the oiling was light, only part of the shoreline would have been manually disturbed, so the return of services was fairly quick as compared to heavier oiling injury categories.
By the end of the first growing season (0.5 years post-spill), the loss of services was estimated to be at 10% relative to baseline (90% services present). During field visits in September 2003, no oil was observed at the lightly oiled Town Beach on West Island. Accumulations of wrack seemed normal, and the amphipods within the wrack were abundant. The buildup of wrack and an abundance of macroinvertebrates would support the return of shorebirds to the area to feed.
Full recovery was estimated to have occurred by the end of the second growing season (1.5 years post-spill) because no oil remained on the beaches and wrack piles would have increased in size. Species with short life histories (2-3 years or less) such as amphipods, shore crabs, and polychaetes would have been able to reproduce and repopulate the area. The inputs for the recovery curves are shown in Table 9, and the recovery curve for lightly oiled sand beaches is shown in Figure 26.
FIGURE 26. Lightly oiled sand beach recovery curve.
0%
25%
50%
75%
100%
0 0.25 0.5 0.75 1 1.25 1.5 1.75
Years Post Spill
Perc
ent S
ervi
ces
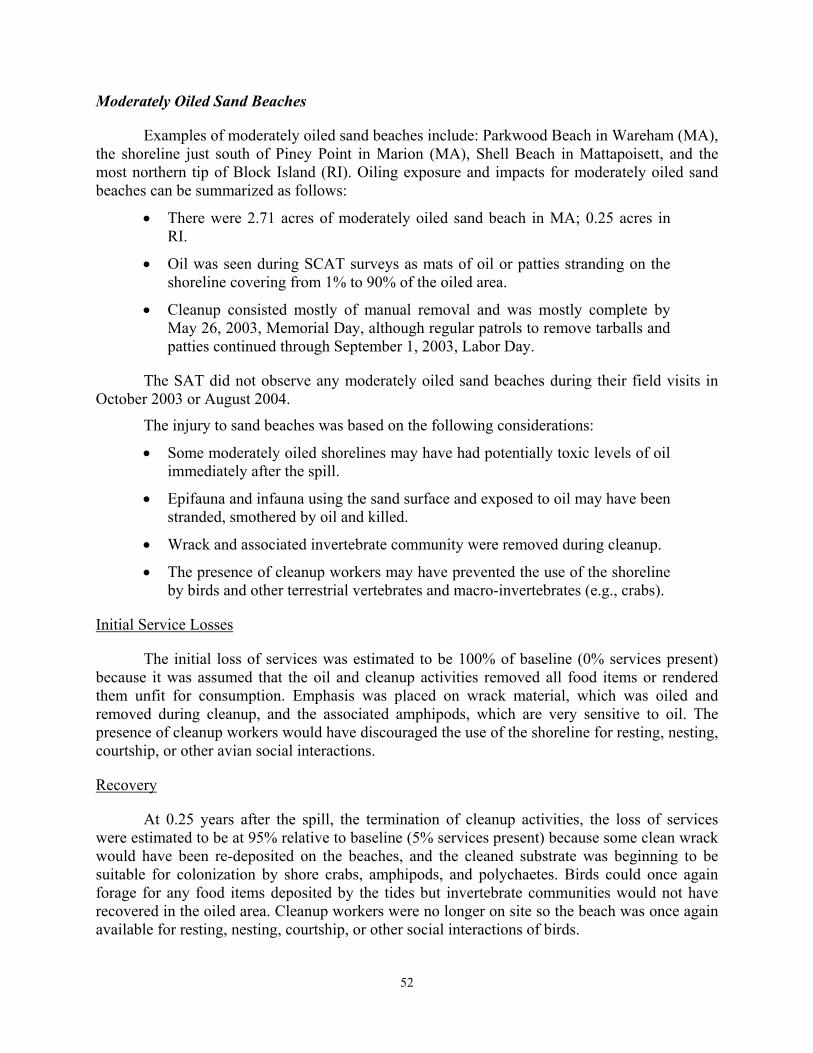
52
Moderately Oiled Sand Beaches
Examples of moderately oiled sand beaches include: Parkwood Beach in Wareham (MA), the shoreline just south of Piney Point in Marion (MA), Shell Beach in Mattapoisett, and the most northern tip of Block Island (RI). Oiling exposure and impacts for moderately oiled sand beaches can be summarized as follows:
• There were 2.71 acres of moderately oiled sand beach in MA; 0.25 acres in RI.
• Oil was seen during SCAT surveys as mats of oil or patties stranding on the shoreline covering from 1% to 90% of the oiled area.
• Cleanup consisted mostly of manual removal and was mostly complete by May 26, 2003, Memorial Day, although regular patrols to remove tarballs and patties continued through September 1, 2003, Labor Day.
The SAT did not observe any moderately oiled sand beaches during their field visits in October 2003 or August 2004.
The injury to sand beaches was based on the following considerations:
• Some moderately oiled shorelines may have had potentially toxic levels of oil immediately after the spill.
• Epifauna and infauna using the sand surface and exposed to oil may have been stranded, smothered by oil and killed.
• Wrack and associated invertebrate community were removed during cleanup.
• The presence of cleanup workers may have prevented the use of the shoreline by birds and other terrestrial vertebrates and macro-invertebrates (e.g., crabs).
Initial Service Losses
The initial loss of services was estimated to be 100% of baseline (0% services present) because it was assumed that the oil and cleanup activities removed all food items or rendered them unfit for consumption. Emphasis was placed on wrack material, which was oiled and removed during cleanup, and the associated amphipods, which are very sensitive to oil. The presence of cleanup workers would have discouraged the use of the shoreline for resting, nesting, courtship, or other avian social interactions.
Recovery
At 0.25 years after the spill, the termination of cleanup activities, the loss of services were estimated to be at 95% relative to baseline (5% services present) because some clean wrack would have been re-deposited on the beaches, and the cleaned substrate was beginning to be suitable for colonization by shore crabs, amphipods, and polychaetes. Birds could once again forage for any food items deposited by the tides but invertebrate communities would not have recovered in the oiled area. Cleanup workers were no longer on site so the beach was once again available for resting, nesting, courtship, or other social interactions of birds.
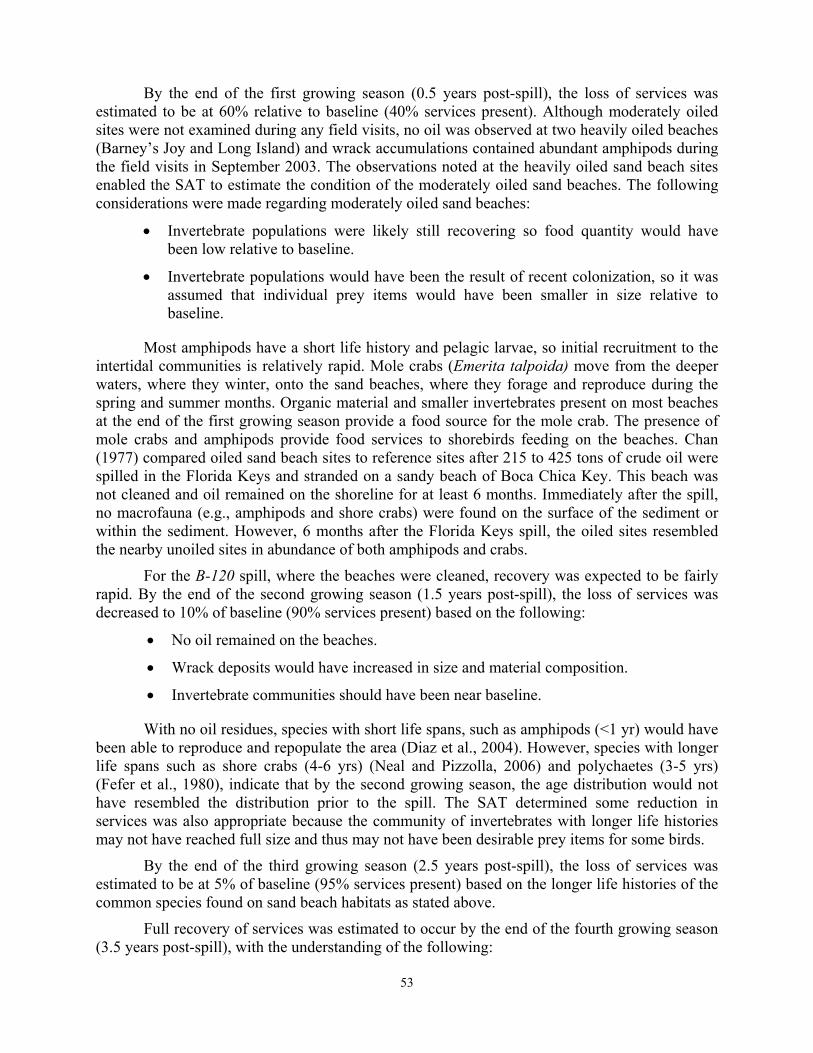
53
By the end of the first growing season (0.5 years post-spill), the loss of services was estimated to be at 60% relative to baseline (40% services present). Although moderately oiled sites were not examined during any field visits, no oil was observed at two heavily oiled beaches (Barney’s Joy and Long Island) and wrack accumulations contained abundant amphipods during the field visits in September 2003. The observations noted at the heavily oiled sand beach sites enabled the SAT to estimate the condition of the moderately oiled sand beaches. The following considerations were made regarding moderately oiled sand beaches:
• Invertebrate populations were likely still recovering so food quantity would have been low relative to baseline.
• Invertebrate populations would have been the result of recent colonization, so it was assumed that individual prey items would have been smaller in size relative to baseline.
Most amphipods have a short life history and pelagic larvae, so initial recruitment to the intertidal communities is relatively rapid. Mole crabs (Emerita talpoida) move from the deeper waters, where they winter, onto the sand beaches, where they forage and reproduce during the spring and summer months. Organic material and smaller invertebrates present on most beaches at the end of the first growing season provide a food source for the mole crab. The presence of mole crabs and amphipods provide food services to shorebirds feeding on the beaches. Chan (1977) compared oiled sand beach sites to reference sites after 215 to 425 tons of crude oil were spilled in the Florida Keys and stranded on a sandy beach of Boca Chica Key. This beach was not cleaned and oil remained on the shoreline for at least 6 months. Immediately after the spill, no macrofauna (e.g., amphipods and shore crabs) were found on the surface of the sediment or within the sediment. However, 6 months after the Florida Keys spill, the oiled sites resembled the nearby unoiled sites in abundance of both amphipods and crabs.
For the B-120 spill, where the beaches were cleaned, recovery was expected to be fairly rapid. By the end of the second growing season (1.5 years post-spill), the loss of services was decreased to 10% of baseline (90% services present) based on the following:
• No oil remained on the beaches.
• Wrack deposits would have increased in size and material composition.
• Invertebrate communities should have been near baseline.
With no oil residues, species with short life spans, such as amphipods (<1 yr) would have been able to reproduce and repopulate the area (Diaz et al., 2004). However, species with longer life spans such as shore crabs (4-6 yrs) (Neal and Pizzolla, 2006) and polychaetes (3-5 yrs) (Fefer et al., 1980), indicate that by the second growing season, the age distribution would not have resembled the distribution prior to the spill. The SAT determined some reduction in services was also appropriate because the community of invertebrates with longer life histories may not have reached full size and thus may not have been desirable prey items for some birds.
By the end of the third growing season (2.5 years post-spill), the loss of services was estimated to be at 5% of baseline (95% services present) based on the longer life histories of the common species found on sand beach habitats as stated above.
Full recovery of services was estimated to occur by the end of the fourth growing season (3.5 years post-spill), with the understanding of the following:
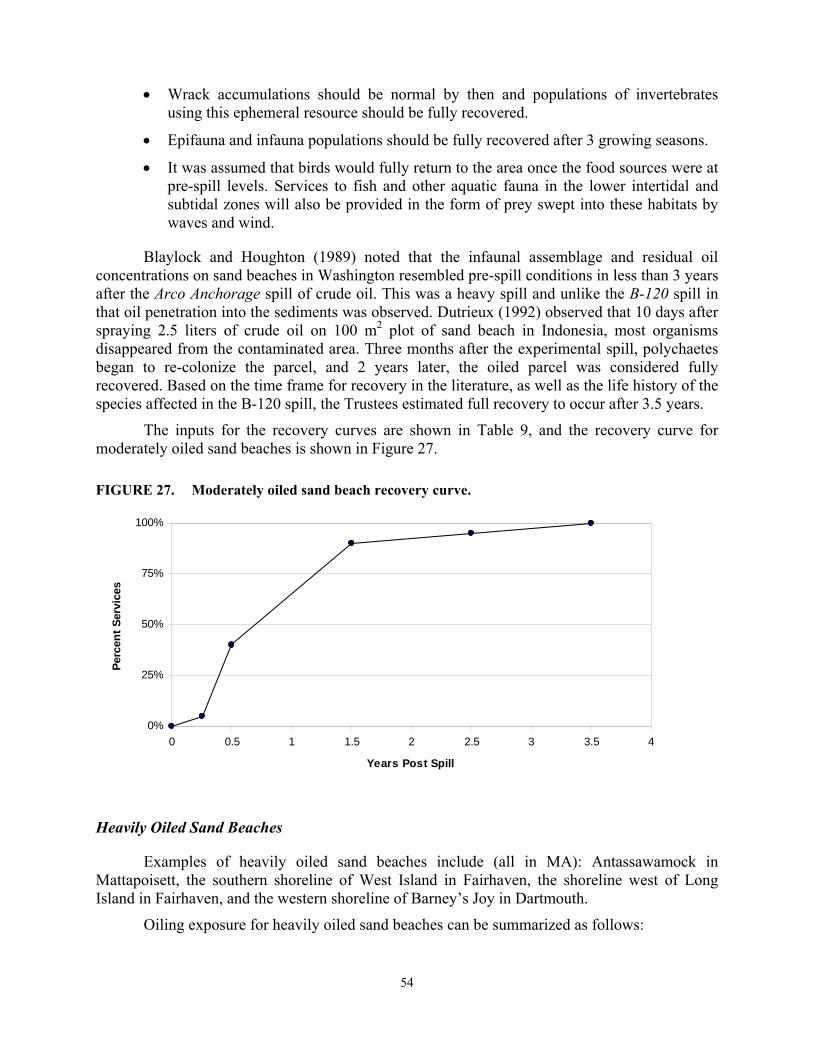
54
• Wrack accumulations should be normal by then and populations of invertebrates using this ephemeral resource should be fully recovered.
• Epifauna and infauna populations should be fully recovered after 3 growing seasons.
• It was assumed that birds would fully return to the area once the food sources were at pre-spill levels. Services to fish and other aquatic fauna in the lower intertidal and subtidal zones will also be provided in the form of prey swept into these habitats by waves and wind.
Blaylock and Houghton (1989) noted that the infaunal assemblage and residual oil concentrations on sand beaches in Washington resembled pre-spill conditions in less than 3 years after the Arco Anchorage spill of crude oil. This was a heavy spill and unlike the B-120 spill in that oil penetration into the sediments was observed. Dutrieux (1992) observed that 10 days after spraying 2.5 liters of crude oil on 100 m2 plot of sand beach in Indonesia, most organisms disappeared from the contaminated area. Three months after the experimental spill, polychaetes began to re-colonize the parcel, and 2 years later, the oiled parcel was considered fully recovered. Based on the time frame for recovery in the literature, as well as the life history of the species affected in the B-120 spill, the Trustees estimated full recovery to occur after 3.5 years.
The inputs for the recovery curves are shown in Table 9, and the recovery curve for moderately oiled sand beaches is shown in Figure 27.
FIGURE 27. Moderately oiled sand beach recovery curve.
0%
25%
50%
75%
100%
0 0.5 1 1.5 2 2.5 3 3.5 4
Years Post Spill
Perc
ent S
ervi
ces
Heavily Oiled Sand Beaches
Examples of heavily oiled sand beaches include (all in MA): Antassawamock in Mattapoisett, the southern shoreline of West Island in Fairhaven, the shoreline west of Long Island in Fairhaven, and the western shoreline of Barney’s Joy in Dartmouth.
Oiling exposure for heavily oiled sand beaches can be summarized as follows:

55
• There were 6.63 acres of heavily oiled sand beach in MA; there were no heavily oiled sand beaches in RI.
• Severe coating of oil on sand beaches; thick mats and patties of oil stranding on the shoreline (Fig. 28).
• Cleanup consisted mostly of manual removal of oiled sediments and wrack.
• Cleanup of sand beaches was mostly complete by May 26, 2003, Memorial Day although regular patrols to remove tarballs continued after September 1, 2003, Labor Day.
• Six months after spill: no oil was found on the surface of previously oiled sand beaches or in wrack; buried oil was observed at two different sites.
Injury to heavily oiled sand beaches was based on the following considerations:
• Some heavily oiled shorelines may have had potentially toxic levels of oil immediately after the spill.
• Epifauna and infauna using the sand surface and exposed to oil may have been stranded and smothered by oil and killed.
• Wrack and associated communities were removed during cleanup.
• The presence of cleanup workers prevented the use of the shoreline by birds and other terrestrial vertebrates.
Stranded oil on a sand beach, as well as the loss of some food sources (meio- and macrofauna) can disrupt the normal activities of birds in Massachusetts and Rhode Island. Piping plover, a federally threatened species, nests on sand beaches in Buzzards Bay between the months of April and June; young are present until the fledglings leave in August. Shorebird mortality and other injury attributed to the spill have been addressed through the BWAT. However, a heavily oiled sand beach indicates a loss of habitat for shorebirds for feeding, nesting, and/or roosting loafing, which is assessed in this report.
Initial Service Losses
The initial loss of services was estimated to be 100% of baseline (0% services present). It was assumed that the oil and cleanup activities removed most wrack and epifauna or rendered them unfit for consumption. Emphasis was placed on wrack material, which was oiled and removed during cleanup, and the associated macroinvertebrates, which are very sensitive to oil.
Recovery
At 0.25 years after the spill, the termination of cleanup activities, the loss of services still remained at 100%. The intense cleanup would have interfered with habitat use, and removal of oiled sediment and wrack would have removed all organisms present. There was some buried oil still present, which would further delay recovery.

56
FIGURE 28. Heavily oiled sand beach at Barney’s Joy. Photo taken in April 2003.
Moore et al. (1997) observed a severe reduction in amphipods and mud snails on sand
beaches 3 months after 72,000 tons of Forties crude and 360 tons of fuel oil spilled from the Sea Empress in southwest Wales. Copepod hatching rates were also still reduced 2 months following the spill, although they began to improve after 4 months. The study surveyed several sand beaches with a range of oiling degrees from light to heavy oil contamination.
By the end of the first growing season (0.5 years post-spill), the loss of services was estimated to be at 70% relative to baseline (30% services present), based on the following:
• During field visits in September 2003, no oil was observed at two heavily oiled beaches (Barney’s Joy and Long Island), and wrack accumulations contained abundant amphipods.
• Buried oil was observed at both sites.
• Macroinvertebrate populations were likely still recovering so food quantity would have been low relative to baseline.
• Macroinvertebrate populations would have been the result of recent colonization, so it was assumed that prey items would have been smaller in size relative to baseline.
• The buildup of wrack and cleaned substrate would begin to support colonization by shore crabs, amphipods, and various other epifauna. However, the buried oil would have contaminated sand below the surface where infauna (e.g., nematodes and
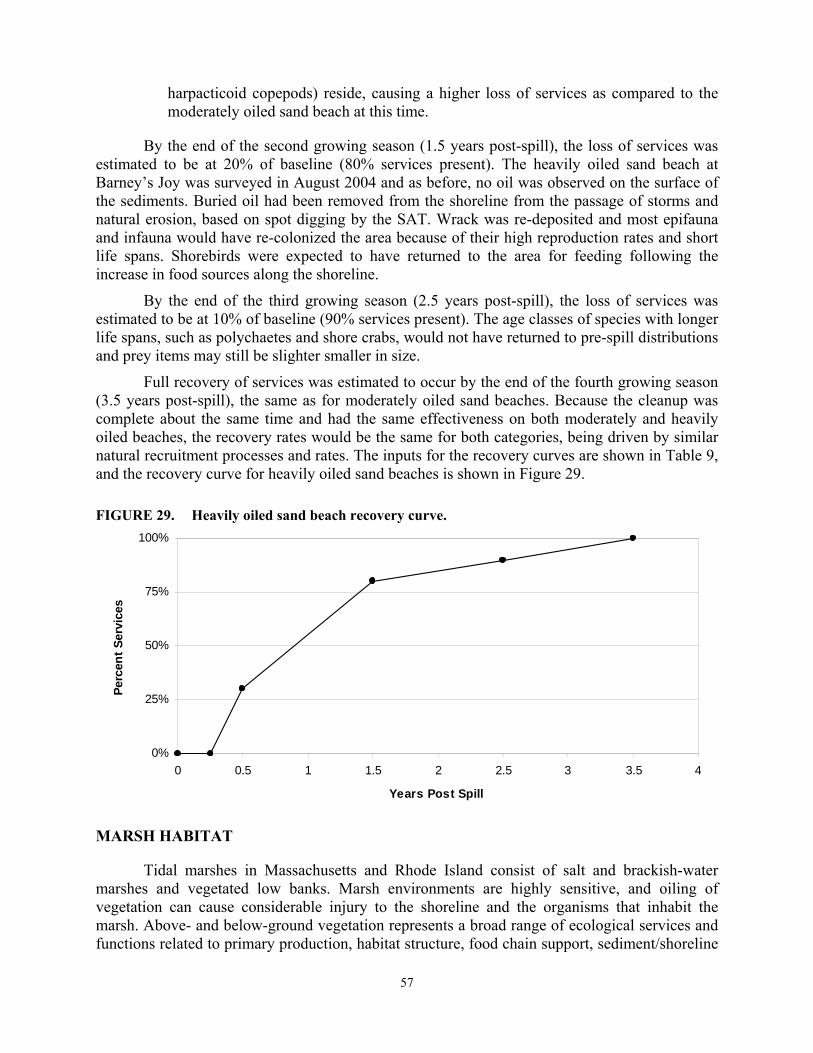
57
harpacticoid copepods) reside, causing a higher loss of services as compared to the moderately oiled sand beach at this time.
By the end of the second growing season (1.5 years post-spill), the loss of services was estimated to be at 20% of baseline (80% services present). The heavily oiled sand beach at Barney’s Joy was surveyed in August 2004 and as before, no oil was observed on the surface of the sediments. Buried oil had been removed from the shoreline from the passage of storms and natural erosion, based on spot digging by the SAT. Wrack was re-deposited and most epifauna and infauna would have re-colonized the area because of their high reproduction rates and short life spans. Shorebirds were expected to have returned to the area for feeding following the increase in food sources along the shoreline.
By the end of the third growing season (2.5 years post-spill), the loss of services was estimated to be at 10% of baseline (90% services present). The age classes of species with longer life spans, such as polychaetes and shore crabs, would not have returned to pre-spill distributions and prey items may still be slighter smaller in size.
Full recovery of services was estimated to occur by the end of the fourth growing season (3.5 years post-spill), the same as for moderately oiled sand beaches. Because the cleanup was complete about the same time and had the same effectiveness on both moderately and heavily oiled beaches, the recovery rates would be the same for both categories, being driven by similar natural recruitment processes and rates. The inputs for the recovery curves are shown in Table 9, and the recovery curve for heavily oiled sand beaches is shown in Figure 29.
FIGURE 29. Heavily oiled sand beach recovery curve.
0%
25%
50%
75%
100%
0 0.5 1 1.5 2 2.5 3 3.5 4
Years Post Spill
Perc
ent S
ervi
ces
MARSH HABITAT
Tidal marshes in Massachusetts and Rhode Island consist of salt and brackish-water marshes and vegetated low banks. Marsh environments are highly sensitive, and oiling of vegetation can cause considerable injury to the shoreline and the organisms that inhabit the marsh. Above- and below-ground vegetation represents a broad range of ecological services and functions related to primary production, habitat structure, food chain support, sediment/shoreline

58
stabilization, and fish and shellfish production. The loss of vegetation can affect a variety of species that inhabit the marsh, and the shoreline itself is at risk of more rapid erosion due to the loss of structural integrity attributed to above-ground plants providing energy dissipation and roots providing a strengthening network.
Low marshes of Buzzards Bay are almost exclusively smooth cordgrass (Spartina alterniflora), whereas the high marshes are composed primarily of salt hay (Spartina patens) and salt grass (Distichlis spicata). S. alterniflora can reach heights as tall as 2 m when found along tidal creek banks and on accreting areas within a marsh (Teal, 1986). The shorter form of this plant, as short as 10 cm, is present on any remaining marsh. Salicornia species, a succulent annual plant, is also found along the marshes, although less frequently than Spartina species. Together, marsh plants are a major contributor to primary production. Heavy oils, such as No. 6 oils, are too viscous to significantly penetrate the marsh soils, but can reduce productivity of marsh plants after coating vegetation (Alexander and Webb, 1985). The coating of oil on plant leaves prevents plants, such as S. alterniflora, from transporting oxygen from the leaves to the roots. The vital task of secreting salt from glands on the plant leaves is also prohibited when oil coats the plant leaves (Teal, 1986). Baca et al. (1985) found reduced stem density two years after a spill in brackish wetlands along the Cape Fear River in North Carolina where the plants had been completely coated with oil, but not where oiling was limited mainly to the plant stems. Alexander and Webb (1983) showed a reduction in biomass for plants where No. 6 fuel oil was applied to the entire plant surface.
Marshes are also important nursery grounds for shellfish, fish, and birds (Burns et al., 2000). Gastropods (Littorina spp.), polychaetes, and nematode species are abundant in marshes, as well as crabs, clams, and mussels. Fish, such as Atlantic silverside and mummichog, spend most of their lives within the marsh, using the protection of the plants to spawn. Some fish such as winter flounder and striped bass use the marsh mainly as a nursery habitat. The diamondback terrapin can also be found using the marsh as a protective habitat in which to forage. Marsh vegetation is crucial for populations of fish and crustaceans that inhabit marshes, many species of which are key prey items for larger fish and birds. Clapper rails, willets, and egrets are just a few of the birds that depend on the prey within the marsh and the plant cover for protection. The loss of marsh vegetation removes a habitat essential for the presence of lower trophic level species, which in turn, affects higher trophic level species.
An oil spill can affect many species through the smothering or coating of oil, however, changes in plant or invertebrate populations within the marsh can have serious implications for higher trophic levels that were not necessarily in direct contact with oil. The loss of S. alterniflora as a result of oil contamination removes an important habitat and food source (e.g., algae found on S. alterniflora) for small fish. The average biomass production from tidal salt marshes in Buzzards Bay is 3,200 tons of carbon per year, and each species of fish can add between 120 – 500 kilograms total of biomass to the marsh system during the summer months (Howes and Goehringer, 1996). Small fish are a main food source for many species of wading birds. The loss of energy or biomass that is normally transferred between the trophic levels is detrimental to major processes such as growth and reproduction that ensure the survival of a population of a species. Decreased food sources may result in less energy available for birds to produce or incubate eggs or to tend to hatchings. Consequently, the undernourished or neglected egg or chick may not survive to produce the next generation of adult birds.
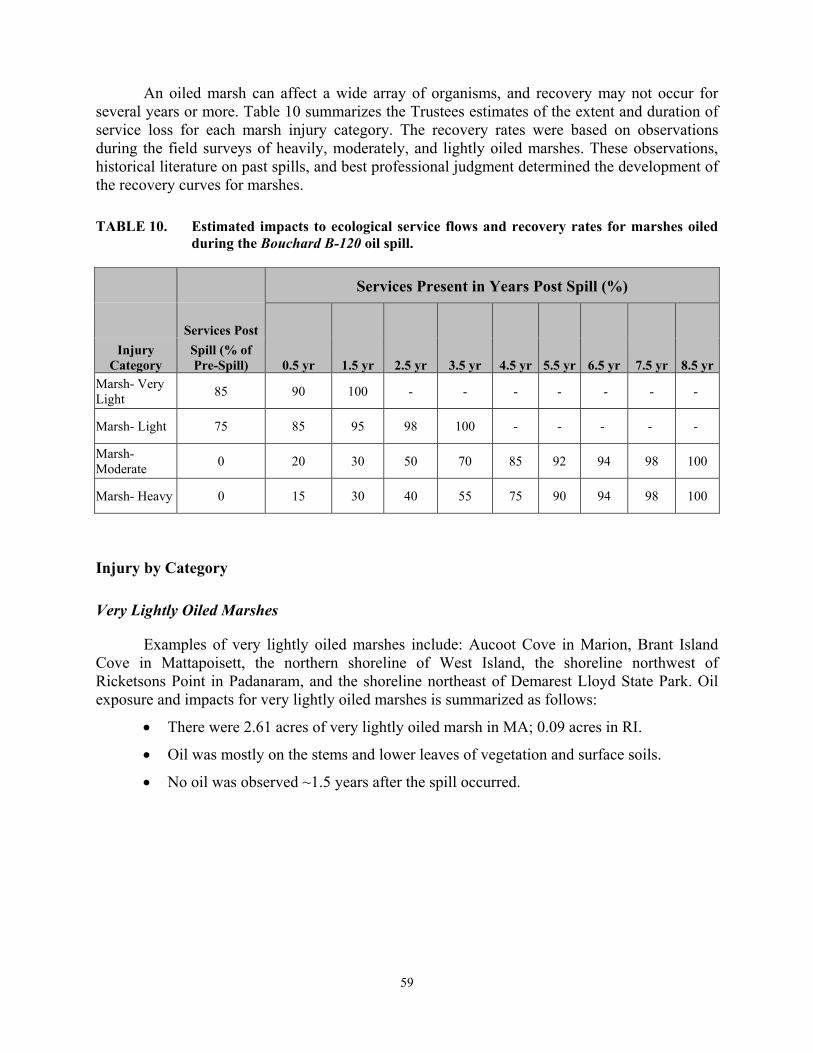
59
An oiled marsh can affect a wide array of organisms, and recovery may not occur for several years or more. Table 10 summarizes the Trustees estimates of the extent and duration of service loss for each marsh injury category. The recovery rates were based on observations during the field surveys of heavily, moderately, and lightly oiled marshes. These observations, historical literature on past spills, and best professional judgment determined the development of the recovery curves for marshes.
TABLE 10. Estimated impacts to ecological service flows and recovery rates for marshes oiled during the Bouchard B-120 oil spill.
Services Present in Years Post Spill (%)
Services Post
0.5 yr 1.5 yr 2.5 yr 3.5 yr 4.5 yr 5.5 yr 6.5 yr 7.5 yr 8.5 yrInjury
Category Spill (% of Pre-Spill)
Marsh- Very Light 85 90 100 - - - - - - -
Marsh- Light 75 85 95 98 100 - - - - -
Marsh- Moderate 0 20 30 50 70 85 92 94 98 100
Marsh- Heavy 0 15 30 40 55 75 90 94 98 100
Injury by Category
Very Lightly Oiled Marshes
Examples of very lightly oiled marshes include: Aucoot Cove in Marion, Brant Island Cove in Mattapoisett, the northern shoreline of West Island, the shoreline northwest of Ricketsons Point in Padanaram, and the shoreline northeast of Demarest Lloyd State Park. Oil exposure and impacts for very lightly oiled marshes is summarized as follows:
• There were 2.61 acres of very lightly oiled marsh in MA; 0.09 acres in RI.
• Oil was mostly on the stems and lower leaves of vegetation and surface soils.
• No oil was observed ~1.5 years after the spill occurred.
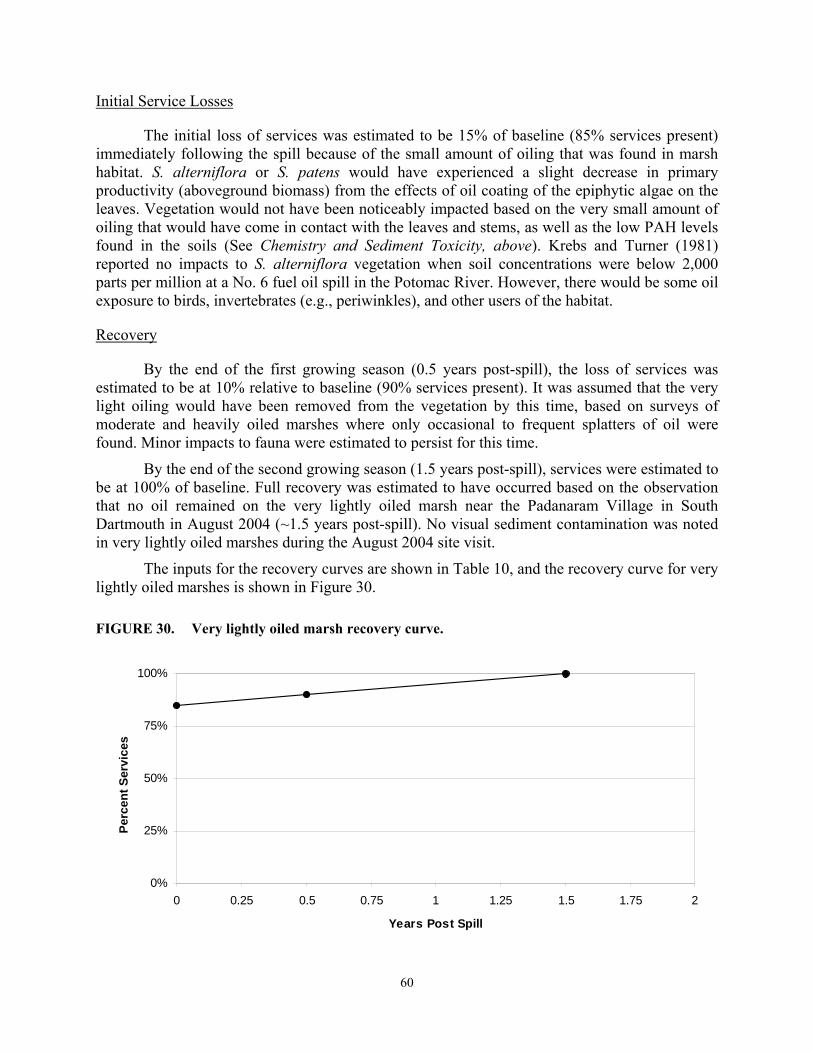
60
Initial Service Losses
The initial loss of services was estimated to be 15% of baseline (85% services present) immediately following the spill because of the small amount of oiling that was found in marsh habitat. S. alterniflora or S. patens would have experienced a slight decrease in primary productivity (aboveground biomass) from the effects of oil coating of the epiphytic algae on the leaves. Vegetation would not have been noticeably impacted based on the very small amount of oiling that would have come in contact with the leaves and stems, as well as the low PAH levels found in the soils (See Chemistry and Sediment Toxicity, above). Krebs and Turner (1981) reported no impacts to S. alterniflora vegetation when soil concentrations were below 2,000 parts per million at a No. 6 fuel oil spill in the Potomac River. However, there would be some oil exposure to birds, invertebrates (e.g., periwinkles), and other users of the habitat.
Recovery
By the end of the first growing season (0.5 years post-spill), the loss of services was estimated to be at 10% relative to baseline (90% services present). It was assumed that the very light oiling would have been removed from the vegetation by this time, based on surveys of moderate and heavily oiled marshes where only occasional to frequent splatters of oil were found. Minor impacts to fauna were estimated to persist for this time.
By the end of the second growing season (1.5 years post-spill), services were estimated to be at 100% of baseline. Full recovery was estimated to have occurred based on the observation that no oil remained on the very lightly oiled marsh near the Padanaram Village in South Dartmouth in August 2004 (~1.5 years post-spill). No visual sediment contamination was noted in very lightly oiled marshes during the August 2004 site visit.
The inputs for the recovery curves are shown in Table 10, and the recovery curve for very lightly oiled marshes is shown in Figure 30.
FIGURE 30. Very lightly oiled marsh recovery curve.
0%
25%
50%
75%
100%
0 0.25 0.5 0.75 1 1.25 1.5 1.75 2
Years Post Spill
Perc
ent S
ervi
ces
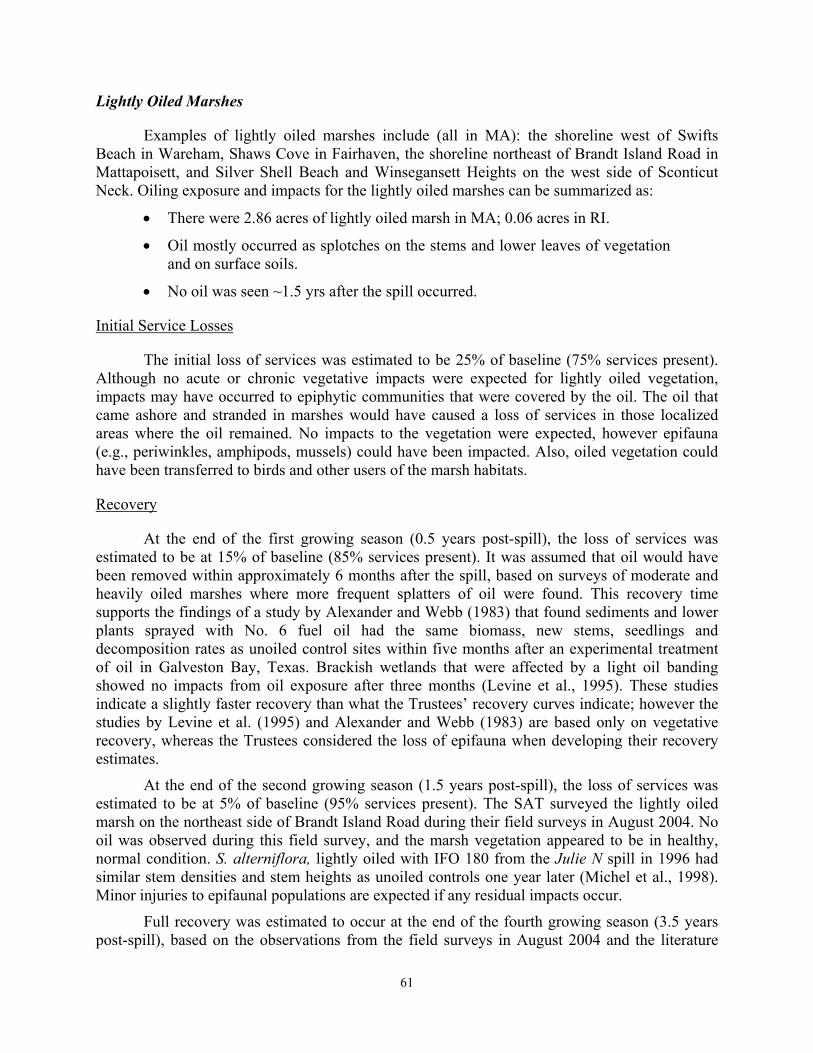
61
Lightly Oiled Marshes
Examples of lightly oiled marshes include (all in MA): the shoreline west of Swifts Beach in Wareham, Shaws Cove in Fairhaven, the shoreline northeast of Brandt Island Road in Mattapoisett, and Silver Shell Beach and Winsegansett Heights on the west side of Sconticut Neck. Oiling exposure and impacts for the lightly oiled marshes can be summarized as:
• There were 2.86 acres of lightly oiled marsh in MA; 0.06 acres in RI.
• Oil mostly occurred as splotches on the stems and lower leaves of vegetation and on surface soils.
• No oil was seen ~1.5 yrs after the spill occurred.
Initial Service Losses
The initial loss of services was estimated to be 25% of baseline (75% services present). Although no acute or chronic vegetative impacts were expected for lightly oiled vegetation, impacts may have occurred to epiphytic communities that were covered by the oil. The oil that came ashore and stranded in marshes would have caused a loss of services in those localized areas where the oil remained. No impacts to the vegetation were expected, however epifauna (e.g., periwinkles, amphipods, mussels) could have been impacted. Also, oiled vegetation could have been transferred to birds and other users of the marsh habitats.
Recovery
At the end of the first growing season (0.5 years post-spill), the loss of services was estimated to be at 15% of baseline (85% services present). It was assumed that oil would have been removed within approximately 6 months after the spill, based on surveys of moderate and heavily oiled marshes where more frequent splatters of oil were found. This recovery time supports the findings of a study by Alexander and Webb (1983) that found sediments and lower plants sprayed with No. 6 fuel oil had the same biomass, new stems, seedlings and decomposition rates as unoiled control sites within five months after an experimental treatment of oil in Galveston Bay, Texas. Brackish wetlands that were affected by a light oil banding showed no impacts from oil exposure after three months (Levine et al., 1995). These studies indicate a slightly faster recovery than what the Trustees’ recovery curves indicate; however the studies by Levine et al. (1995) and Alexander and Webb (1983) are based only on vegetative recovery, whereas the Trustees considered the loss of epifauna when developing their recovery estimates.
At the end of the second growing season (1.5 years post-spill), the loss of services was estimated to be at 5% of baseline (95% services present). The SAT surveyed the lightly oiled marsh on the northeast side of Brandt Island Road during their field surveys in August 2004. No oil was observed during this field survey, and the marsh vegetation appeared to be in healthy, normal condition. S. alterniflora, lightly oiled with IFO 180 from the Julie N spill in 1996 had similar stem densities and stem heights as unoiled controls one year later (Michel et al., 1998). Minor injuries to epifaunal populations are expected if any residual impacts occur.
Full recovery was estimated to occur at the end of the fourth growing season (3.5 years post-spill), based on the observations from the field surveys in August 2004 and the literature
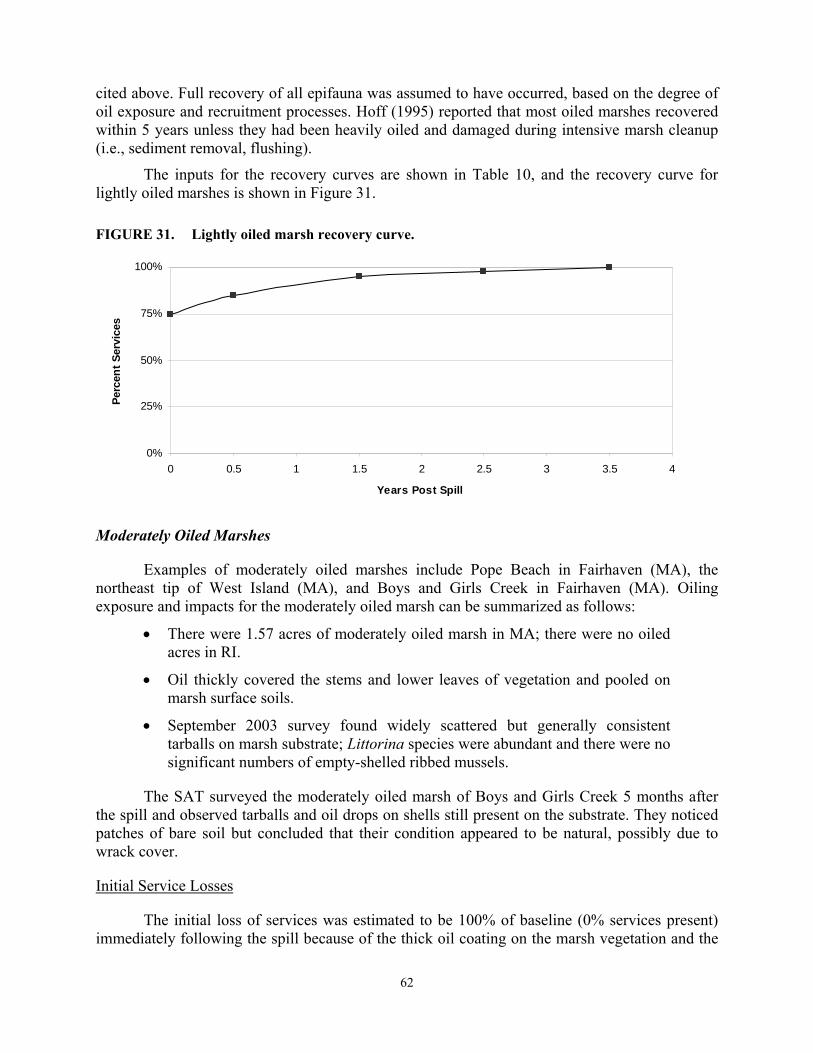
62
cited above. Full recovery of all epifauna was assumed to have occurred, based on the degree of oil exposure and recruitment processes. Hoff (1995) reported that most oiled marshes recovered within 5 years unless they had been heavily oiled and damaged during intensive marsh cleanup (i.e., sediment removal, flushing).
The inputs for the recovery curves are shown in Table 10, and the recovery curve for lightly oiled marshes is shown in Figure 31.
FIGURE 31. Lightly oiled marsh recovery curve.
0%
25%
50%
75%
100%
0 0.5 1 1.5 2 2.5 3 3.5 4
Years Post Spill
Perc
ent S
ervi
ces
Moderately Oiled Marshes
Examples of moderately oiled marshes include Pope Beach in Fairhaven (MA), the northeast tip of West Island (MA), and Boys and Girls Creek in Fairhaven (MA). Oiling exposure and impacts for the moderately oiled marsh can be summarized as follows:
• There were 1.57 acres of moderately oiled marsh in MA; there were no oiled acres in RI.
• Oil thickly covered the stems and lower leaves of vegetation and pooled on marsh surface soils.
• September 2003 survey found widely scattered but generally consistent tarballs on marsh substrate; Littorina species were abundant and there were no significant numbers of empty-shelled ribbed mussels.
The SAT surveyed the moderately oiled marsh of Boys and Girls Creek 5 months after the spill and observed tarballs and oil drops on shells still present on the substrate. They noticed patches of bare soil but concluded that their condition appeared to be natural, possibly due to wrack cover.
Initial Service Losses
The initial loss of services was estimated to be 100% of baseline (0% services present) immediately following the spill because of the thick oil coating on the marsh vegetation and the

63
pooling of oil on the soils. Primary production (aboveground vascular plant biomass) would have been substantially reduced, and epifauna (e.g., periwinkles, mussels, amphipods) would have been killed from the smothering effects of the oil. Food sources would have been unfit for consumption, and birds would not have been able to use the habitat for foraging.
Recovery
At the end of the first growing season (0.5 years post-spill), the loss of services was estimated to be at 80% of baseline (20% services present) based on the field survey of the moderately oiled marsh at Boys and Girls Creek 5 months after the spill. The SAT observed tarballs and oil drops on the shoreline of Boys and Girls Creek. Hershner and Moore (1977) studied a No. 6 fuel oil spill on the lower Chesapeake Bay and reported an increase in net productivity of oiled marshes after one growing season. They attributed the lack of long-term impact to the relatively exposed setting. In contrast, Bender et al. (1977; 1980) conducted a field oiling experiment with fresh and weathered South Louisiana crude oil in an isolated mesohaline marsh off the York River, Virginia. In these studies, oiling of the S. alterniflora vegetation resulted in a 50 percent reduction in biomass one year post-oiling.
At the end of the second growing season (1.5 years post-spill), the loss of services was estimated to be at 70% of baseline (30% services present). The SAT assigned a high loss of services to this category with the assumption that primary productivity would be substantially reduced. Epifauna would begin to return to the habitat but not in the numbers that occurred before the spill and thus foraging birds would not have an abundant food source.
At the end of the third growing season (2.5 years post-spill), the loss of services was estimated to be at 50% of baseline. Residual oil would likely have been removed from the habitat and the vegetation and thus primary production would begin to return.
At the end of the fourth growing season (3.5 years post-spill), the loss of services was estimated at 30% of baseline (70% services present). Primary production from the vegetation would resemble pre-spill conditions. Epifauna would continue to return to the habitat.
At the end of the fifth growing season (4.5 years post-spill), the loss of services was estimated at 15% of baseline (85% services present), as the Trustees estimated that many of the key marsh species (e.g., mussels, periwinkles, fish, birds) would have returned to this habitat. However, due to the life span of the common species, such as the periwinkle (5-10 years) and ribbed mussel (6-7 years), the age distribution of the animals inhabiting marsh would not resemble pre-spill conditions for several more years. As a result, the Trustees increased the percent services slowly for the next four years: sixth growing season (5.5 yrs post-spill) 92% services had returned, seventh growing season (6.5 yrs post-spill) 94% services had returned, and eighth growing season (7.5 yrs post-spill) 98% services had returned.
Full recovery was estimated to have occurred by the end of the ninth growing season (8.5 years post-spill) with the return of birds foraging for epifauna, and fish returning to the area for foraging and protection from predators. The inputs for the recovery curves for moderately oiled marshes are shown in Table 10, and the recovery curve for moderately oiled marsh is shown in Figure 32.

64
FIGURE 32. Moderately oiled marsh recovery curve.
0%
25%
50%
75%
100%
0 1 2 3 4 5 6 7 8 9
Years Post Spill
Perc
ent S
ervi
ces
Heavily Oiled Marshes
Examples of heavily oiled marshes include: the shoreline east of Brant Beach (MA) and a small section of shoreline near Shaw’s Cove (MA). Oiling exposure and impacts for the heavily oiled marsh can be summarized as follows:
• There were 1.15 acres of heavily oiled marsh in MA; there were no heavily oiled marsh acres in RI.
• Marsh oiling occurred as a band of heavy oil or pooled oil on the surface with stain and coating on stems.
• In September 2003, the SAT observed that heavily oiled marshes contained a high amount of residual oil as coat on dead stalks, spots of stain and coating on shells, and small tarballs on Brant Island that had penetrated slightly into the marsh soil surface; Littorina species, live ribbed mussels, and intertidal crabs were abundant in some impacted marshes and less abundant in others.
Even non-toxic oil can kill or stress plants if oil prevents plant gas exchange. Coating of oil on marsh plants reduces their ability to obtain carbon dioxide for photosynthesis (Teal, 1986). A loss of productivity was expected for heavily oiled marsh vegetation. After a No. 6 fuel oil spill in the Potomac River, Krebs and Turner (1981) saw significant impacts to vegetation, and marsh sediments showed no decreasing trend in oil concentration in the first year after the spill. In a study of the recovery of 20 heavily oiled salt marshes, the majority recovered within five years (Sell et al., 1995). Exceptions were the result of extensive mechanical cleanup, thick oil residues that smothered the vegetation, and/or deep penetration of No. 2 fuel oil. These results were similar to those of Mendelssohn (1993) who found that vegetative recovery in a Louisiana brackish marsh was complete 5 years after a spill of 12,600 gallons of Louisiana crude oil.
Initial Service Losses
The initial loss of services losses was estimated to be 100% (0% services present) based on the heavy bands of thick oil and heavy pooling of oil on surface soils. Primary production
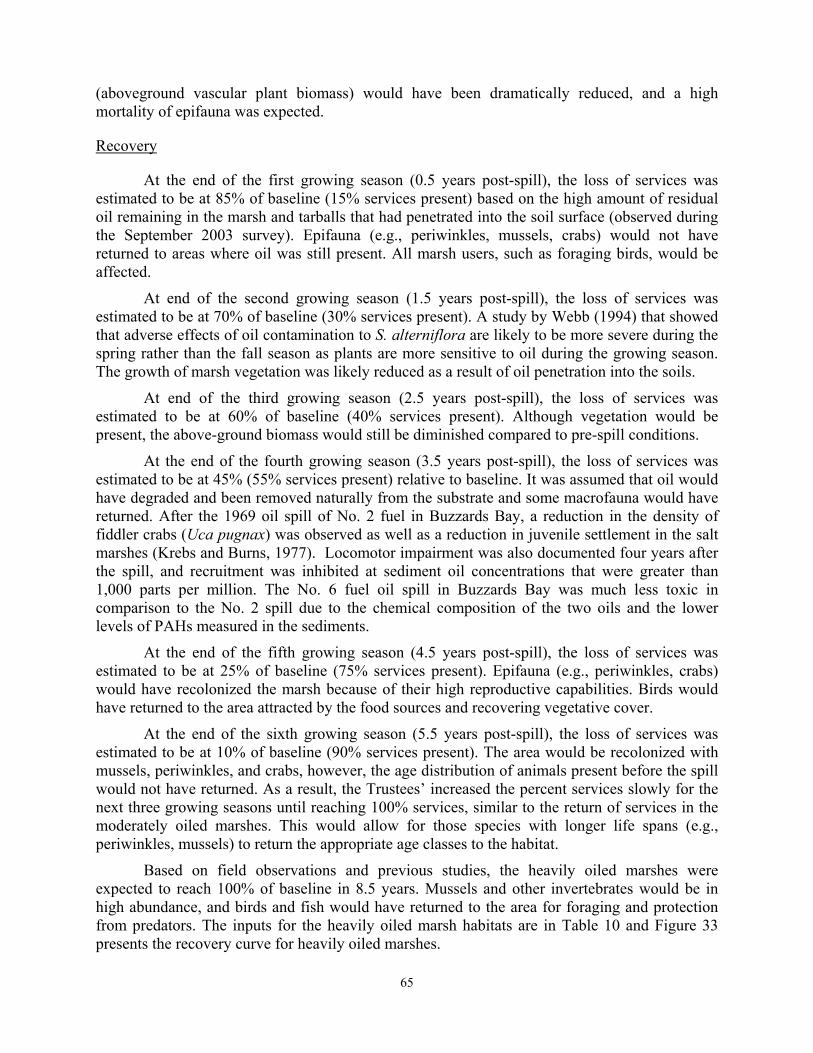
65
(aboveground vascular plant biomass) would have been dramatically reduced, and a high mortality of epifauna was expected.
Recovery
At the end of the first growing season (0.5 years post-spill), the loss of services was estimated to be at 85% of baseline (15% services present) based on the high amount of residual oil remaining in the marsh and tarballs that had penetrated into the soil surface (observed during the September 2003 survey). Epifauna (e.g., periwinkles, mussels, crabs) would not have returned to areas where oil was still present. All marsh users, such as foraging birds, would be affected.
At end of the second growing season (1.5 years post-spill), the loss of services was estimated to be at 70% of baseline (30% services present). A study by Webb (1994) that showed that adverse effects of oil contamination to S. alterniflora are likely to be more severe during the spring rather than the fall season as plants are more sensitive to oil during the growing season. The growth of marsh vegetation was likely reduced as a result of oil penetration into the soils.
At end of the third growing season (2.5 years post-spill), the loss of services was estimated to be at 60% of baseline (40% services present). Although vegetation would be present, the above-ground biomass would still be diminished compared to pre-spill conditions.
At the end of the fourth growing season (3.5 years post-spill), the loss of services was estimated to be at 45% (55% services present) relative to baseline. It was assumed that oil would have degraded and been removed naturally from the substrate and some macrofauna would have returned. After the 1969 oil spill of No. 2 fuel in Buzzards Bay, a reduction in the density of fiddler crabs (Uca pugnax) was observed as well as a reduction in juvenile settlement in the salt marshes (Krebs and Burns, 1977). Locomotor impairment was also documented four years after the spill, and recruitment was inhibited at sediment oil concentrations that were greater than 1,000 parts per million. The No. 6 fuel oil spill in Buzzards Bay was much less toxic in comparison to the No. 2 spill due to the chemical composition of the two oils and the lower levels of PAHs measured in the sediments.
At the end of the fifth growing season (4.5 years post-spill), the loss of services was estimated to be at 25% of baseline (75% services present). Epifauna (e.g., periwinkles, crabs) would have recolonized the marsh because of their high reproductive capabilities. Birds would have returned to the area attracted by the food sources and recovering vegetative cover.
At the end of the sixth growing season (5.5 years post-spill), the loss of services was estimated to be at 10% of baseline (90% services present). The area would be recolonized with mussels, periwinkles, and crabs, however, the age distribution of animals present before the spill would not have returned. As a result, the Trustees’ increased the percent services slowly for the next three growing seasons until reaching 100% services, similar to the return of services in the moderately oiled marshes. This would allow for those species with longer life spans (e.g., periwinkles, mussels) to return the appropriate age classes to the habitat.
Based on field observations and previous studies, the heavily oiled marshes were expected to reach 100% of baseline in 8.5 years. Mussels and other invertebrates would be in high abundance, and birds and fish would have returned to the area for foraging and protection from predators. The inputs for the heavily oiled marsh habitats are in Table 10 and Figure 33 presents the recovery curve for heavily oiled marshes.
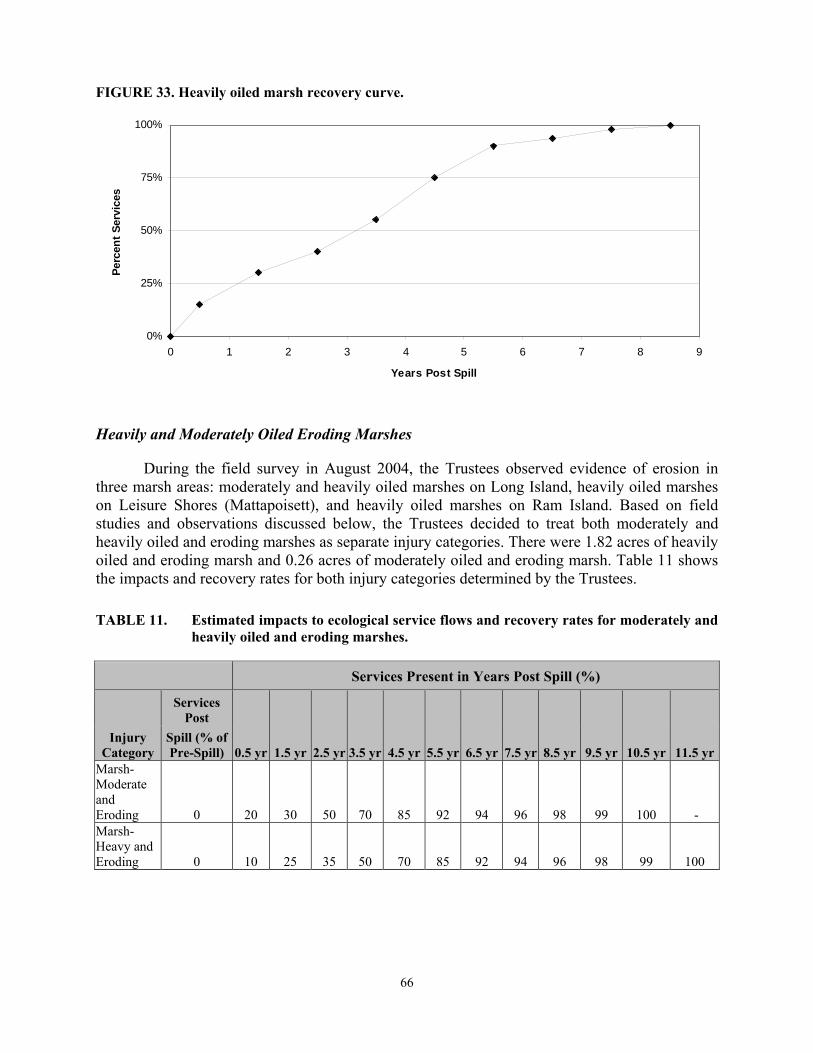
66
FIGURE 33. Heavily oiled marsh recovery curve.
0%
25%
50%
75%
100%
0 1 2 3 4 5 6 7 8 9
Years Post Spill
Perc
ent S
ervi
ces
Heavily and Moderately Oiled Eroding Marshes
During the field survey in August 2004, the Trustees observed evidence of erosion in three marsh areas: moderately and heavily oiled marshes on Long Island, heavily oiled marshes on Leisure Shores (Mattapoisett), and heavily oiled marshes on Ram Island. Based on field studies and observations discussed below, the Trustees decided to treat both moderately and heavily oiled and eroding marshes as separate injury categories. There were 1.82 acres of heavily oiled and eroding marsh and 0.26 acres of moderately oiled and eroding marsh. Table 11 shows the impacts and recovery rates for both injury categories determined by the Trustees.
TABLE 11. Estimated impacts to ecological service flows and recovery rates for moderately and heavily oiled and eroding marshes.
Services Present in Years Post Spill (%)
Services
Post
0.5 yr 1.5 yr 2.5 yr 3.5 yr 4.5 yr 5.5 yr 6.5 yr 7.5 yr 8.5 yr 9.5 yr 10.5 yr 11.5 yrInjury
Category Spill (% of Pre-Spill)
Marsh- Moderate and Eroding 0 20 30 50 70 85 92 94 96 98 99 100 - Marsh- Heavy and Eroding 0 10 25 35 50 70 85 92 94 96 98 99 100
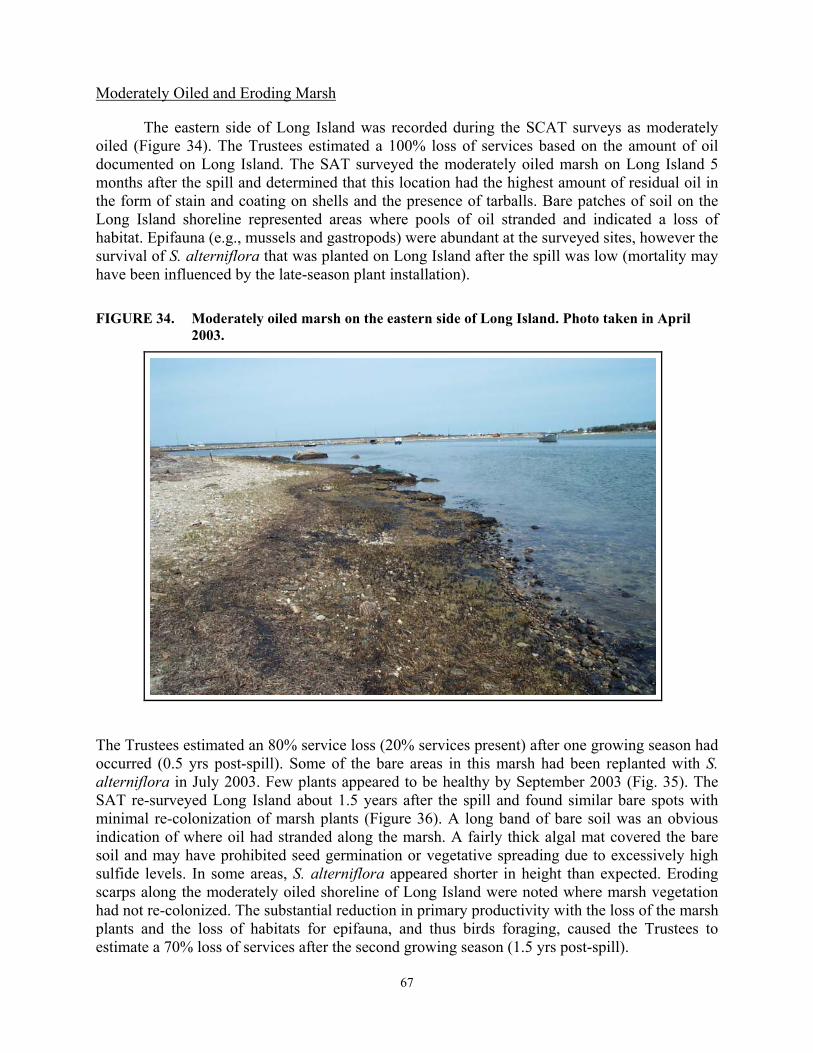
67
Moderately Oiled and Eroding Marsh
The eastern side of Long Island was recorded during the SCAT surveys as moderately oiled (Figure 34). The Trustees estimated a 100% loss of services based on the amount of oil documented on Long Island. The SAT surveyed the moderately oiled marsh on Long Island 5 months after the spill and determined that this location had the highest amount of residual oil in the form of stain and coating on shells and the presence of tarballs. Bare patches of soil on the Long Island shoreline represented areas where pools of oil stranded and indicated a loss of habitat. Epifauna (e.g., mussels and gastropods) were abundant at the surveyed sites, however the survival of S. alterniflora that was planted on Long Island after the spill was low (mortality may have been influenced by the late-season plant installation).
FIGURE 34. Moderately oiled marsh on the eastern side of Long Island. Photo taken in April 2003.
The Trustees estimated an 80% service loss (20% services present) after one growing season had occurred (0.5 yrs post-spill). Some of the bare areas in this marsh had been replanted with S. alterniflora in July 2003. Few plants appeared to be healthy by September 2003 (Fig. 35). The SAT re-surveyed Long Island about 1.5 years after the spill and found similar bare spots with minimal re-colonization of marsh plants (Figure 36). A long band of bare soil was an obvious indication of where oil had stranded along the marsh. A fairly thick algal mat covered the bare soil and may have prohibited seed germination or vegetative spreading due to excessively high sulfide levels. In some areas, S. alterniflora appeared shorter in height than expected. Eroding scarps along the moderately oiled shoreline of Long Island were noted where marsh vegetation had not re-colonized. The substantial reduction in primary productivity with the loss of the marsh plants and the loss of habitats for epifauna, and thus birds foraging, caused the Trustees to estimate a 70% loss of services after the second growing season (1.5 yrs post-spill).

68
FIGURE 35. Moderately oiled marsh on Long Island. Note dead S. alterniflora plantings. Photo taken September 2003.
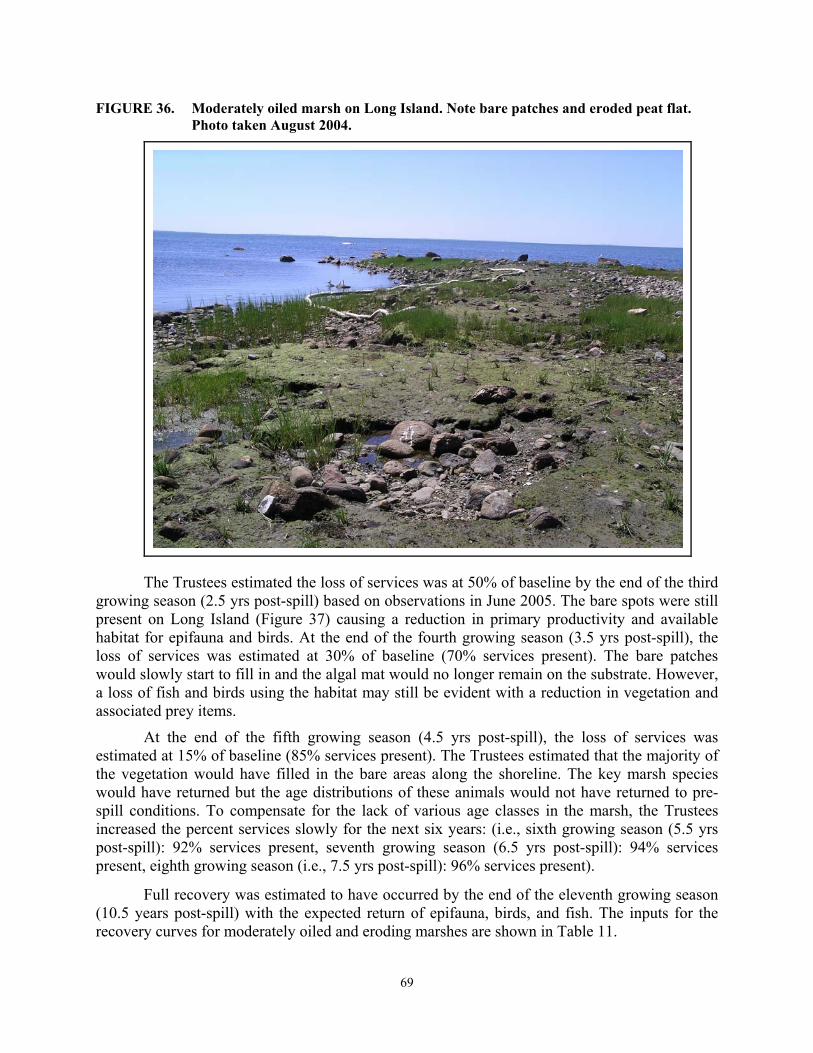
69
FIGURE 36. Moderately oiled marsh on Long Island. Note bare patches and eroded peat flat. Photo taken August 2004.
The Trustees estimated the loss of services was at 50% of baseline by the end of the third growing season (2.5 yrs post-spill) based on observations in June 2005. The bare spots were still present on Long Island (Figure 37) causing a reduction in primary productivity and available habitat for epifauna and birds. At the end of the fourth growing season (3.5 yrs post-spill), the loss of services was estimated at 30% of baseline (70% services present). The bare patches would slowly start to fill in and the algal mat would no longer remain on the substrate. However, a loss of fish and birds using the habitat may still be evident with a reduction in vegetation and associated prey items.
At the end of the fifth growing season (4.5 yrs post-spill), the loss of services was estimated at 15% of baseline (85% services present). The Trustees estimated that the majority of the vegetation would have filled in the bare areas along the shoreline. The key marsh species would have returned but the age distributions of these animals would not have returned to pre-spill conditions. To compensate for the lack of various age classes in the marsh, the Trustees increased the percent services slowly for the next six years: (i.e., sixth growing season (5.5 yrs post-spill): 92% services present, seventh growing season (6.5 yrs post-spill): 94% services present, eighth growing season (i.e., 7.5 yrs post-spill): 96% services present).
Full recovery was estimated to have occurred by the end of the eleventh growing season (10.5 years post-spill) with the expected return of epifauna, birds, and fish. The inputs for the recovery curves for moderately oiled and eroding marshes are shown in Table 11.
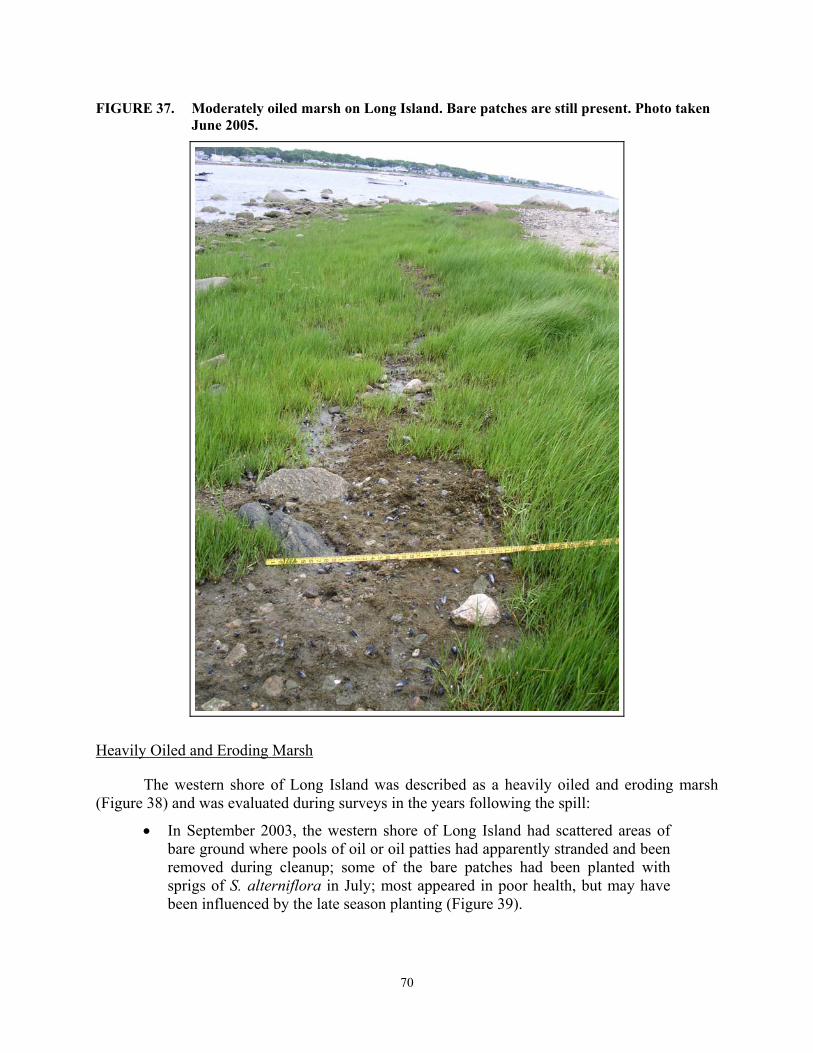
70
FIGURE 37. Moderately oiled marsh on Long Island. Bare patches are still present. Photo taken June 2005.
Heavily Oiled and Eroding Marsh
The western shore of Long Island was described as a heavily oiled and eroding marsh (Figure 38) and was evaluated during surveys in the years following the spill:
• In September 2003, the western shore of Long Island had scattered areas of bare ground where pools of oil or oil patties had apparently stranded and been removed during cleanup; some of the bare patches had been planted with sprigs of S. alterniflora in July; most appeared in poor health, but may have been influenced by the late season planting (Figure 39).

71
• In July 2004, more sprigs of S. alterniflora were planted on Long Island and by August 2004, appeared to be in good condition (Fig. 40); the bare patches of soil were still present in August 2004; infrequent dried spots of oil were also still visible; S. alterniflora seemed shorter than expected heights for this area; an algal mat covered the soil surface over much of the areas that lacked vegetation; eroding scarps were observed along the shoreline with evidence of root mass decay. In December 2004, patches of pavement were observed in the lower intertidal zone on the west side of Long Island (GeoInsight, Inc., 2005).
FIGURE 38. Heavily oiled marsh on Long Island. Photo taken in April 2003.
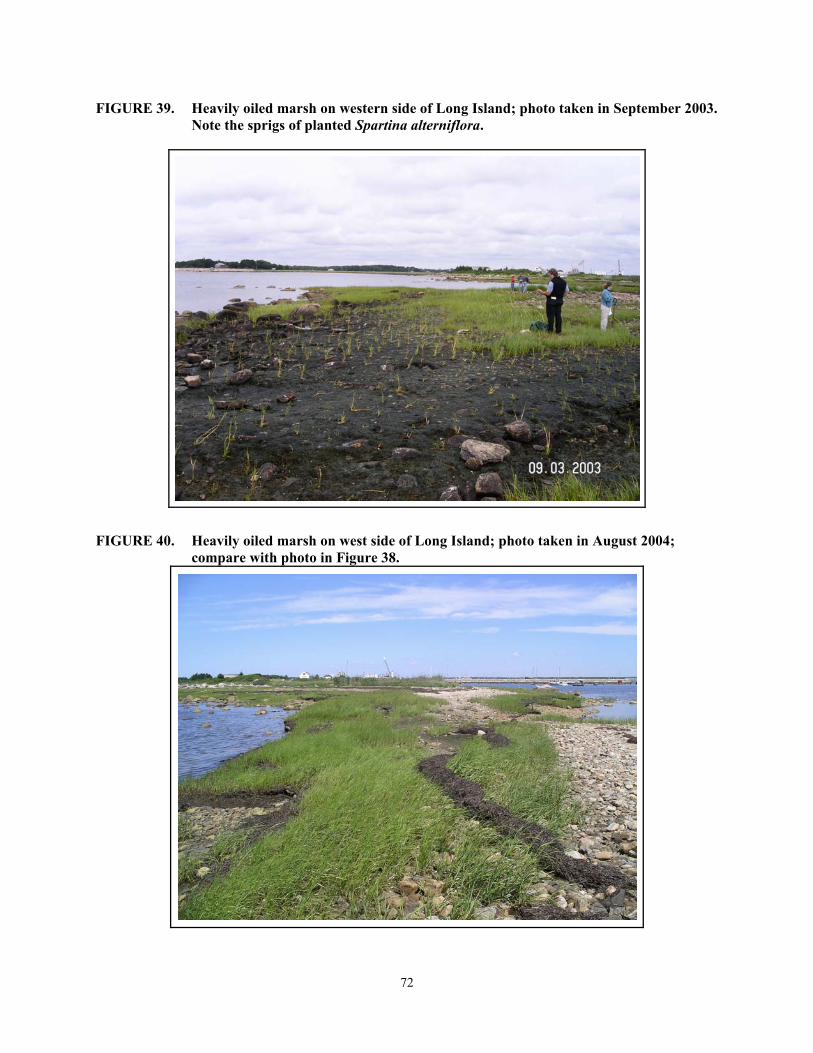
72
FIGURE 39. Heavily oiled marsh on western side of Long Island; photo taken in September 2003. Note the sprigs of planted Spartina alterniflora.
FIGURE 40. Heavily oiled marsh on west side of Long Island; photo taken in August 2004; compare with photo in Figure 38.

73
Ram Island was also described as a heavily oiled and eroding marsh. The SAT conducted
surveys to document the level of injury to the marsh from the heavy oiling. The shoreline was inspected in September 2003, June 2004, and June 2005 to assess the recovery of the marsh vegetation after emergency restoration replanting had occurred. The damage from the oil and the subsequent cleanup activities required 3,500 bare root seedlings of S. alterniflora to be planted on the island in June 2003. In September 2003, two areas had not yet successfully revegetated, and transects were established to estimate the density of the vegetation. The transects were 50 feet long and 6.5 feet wide and were used to count stems of S. alterniflora within an area that could be resurveyed during the following field visit in June 2004. The density counts included those stems that had not been planted (e.g., natural recruitment). The areas assessed using transects included most of the area of poor plant survival. Increased erosion was observed on Ram Island as trampled areas had not re-vegetated and roots were no longer present to stabilize the soil.
Table 12 provides the results from the 2003 and 2004 surveys. In June 2004, the SAT observed that the stems were small and clustered, and significant bare areas existed between the clusters of stems. The greater number of stems in 2004 could be the result of the development of new offshoots from last year’s stems, slight differences in the location of the transect, or differences in the way counts were taken. During the June 2004 field survey, approximately 400 bare root plants were placed into approximately 300 planting holes on transect RI #1 and approximately 200 plants were placed into about 150 planting holes in transect RI #2 (Figures 41A and 41B). Ram Island was also observed in June 2005 and although there had been some regeneration of salt marsh in the oiled habitats, the trampled areas were still clearly defined and covered with an algal mat (Fig. 41C).
TABLE 12. Stem counts of S. alterniflora from the 2003 and 2004 site surveys on Ram Island.
September 2003 June 2004
Transect RI #1 Live 197 848 Dead 38 NA Total 235 848
Transect RI #2
Live 150 1148 Dead 22 NA Total 172 1148
To determine the effect of the oil spill and associated cleanup activities on the rate of
erosion of these shorelines, the SAT conducted a field study on Ram Island between October 2005 and 2006. Historical erosion rates were already available for Leisure Shores and Long Island from the Massachusetts Shoreline Change web site. No historical, pre-spill shoreline erosion data were available for Ram Island, so the SAT monitored the erosion that occurred only during the survey period (one year). Stations on the shoreline were divided into three categories: trampled shorelines with unrecovered vegetation (TU, n=18), trampled shorelines with recovered vegetation (TR, n=10), and control areas with no trampling (C, n=13). Stakes were placed at the
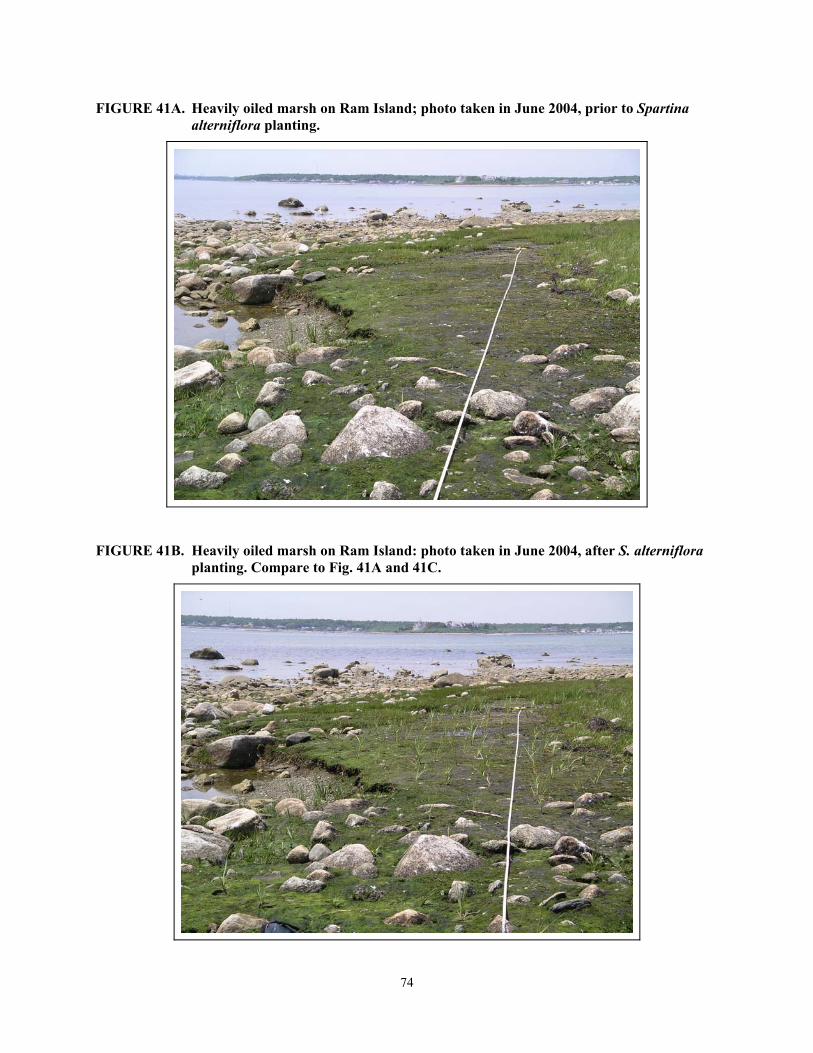
74
FIGURE 41A. Heavily oiled marsh on Ram Island; photo taken in June 2004, prior to Spartina alterniflora planting.
FIGURE 41B. Heavily oiled marsh on Ram Island: photo taken in June 2004, after S. alterniflora planting. Compare to Fig. 41A and 41C.
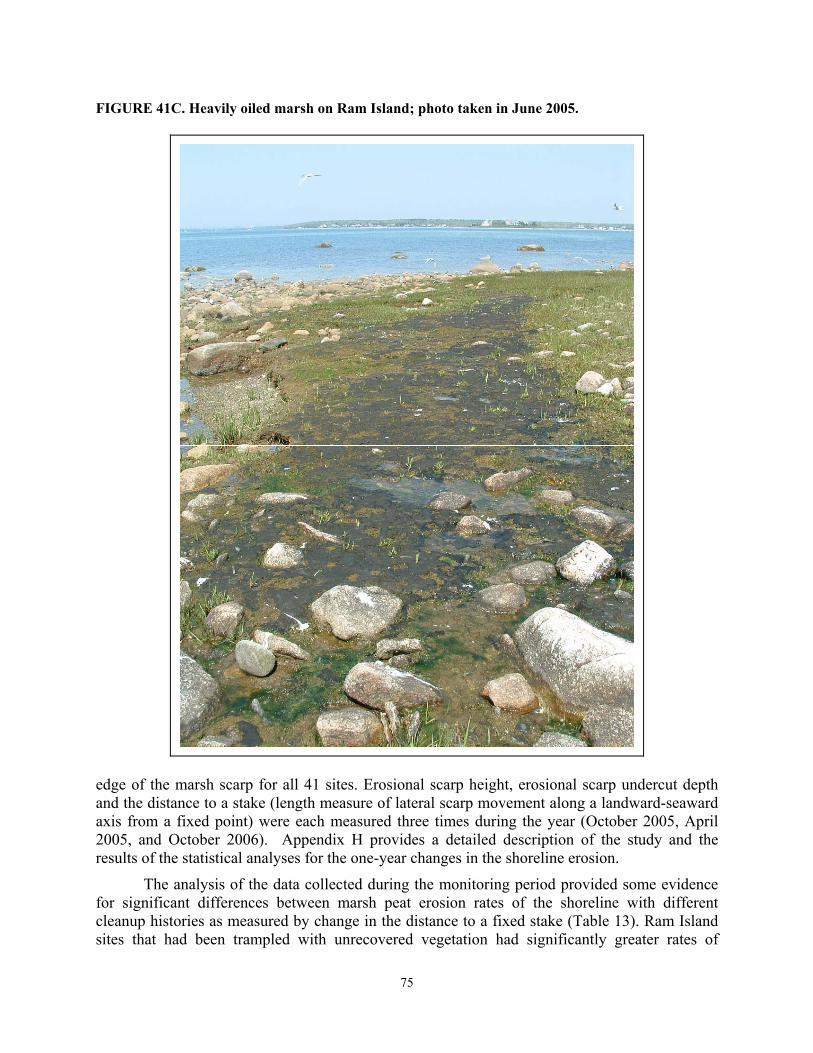
75
FIGURE 41C. Heavily oiled marsh on Ram Island; photo taken in June 2005.
edge of the marsh scarp for all 41 sites. Erosional scarp height, erosional scarp undercut depth and the distance to a stake (length measure of lateral scarp movement along a landward-seaward axis from a fixed point) were each measured three times during the year (October 2005, April 2005, and October 2006). Appendix H provides a detailed description of the study and the results of the statistical analyses for the one-year changes in the shoreline erosion.
The analysis of the data collected during the monitoring period provided some evidence for significant differences between marsh peat erosion rates of the shoreline with different cleanup histories as measured by change in the distance to a fixed stake (Table 13). Ram Island sites that had been trampled with unrecovered vegetation had significantly greater rates of
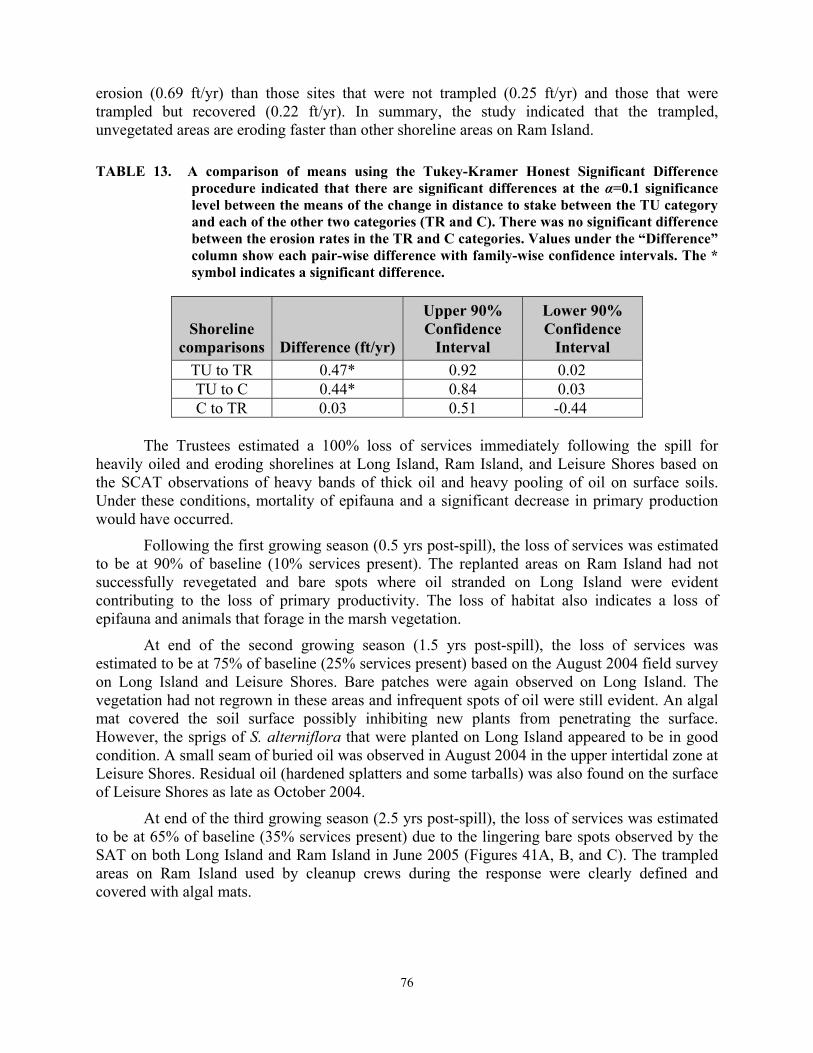
76
erosion (0.69 ft/yr) than those sites that were not trampled (0.25 ft/yr) and those that were trampled but recovered (0.22 ft/yr). In summary, the study indicated that the trampled, unvegetated areas are eroding faster than other shoreline areas on Ram Island.
TABLE 13. A comparison of means using the Tukey-Kramer Honest Significant Difference procedure indicated that there are significant differences at the α=0.1 significance level between the means of the change in distance to stake between the TU category and each of the other two categories (TR and C). There was no significant difference between the erosion rates in the TR and C categories. Values under the “Difference” column show each pair-wise difference with family-wise confidence intervals. The * symbol indicates a significant difference.
Shoreline comparisons Difference (ft/yr)
Upper 90% Confidence
Interval
Lower 90% Confidence
Interval TU to TR 0.47* 0.92 0.02 TU to C 0.44* 0.84 0.03 C to TR 0.03 0.51 -0.44
The Trustees estimated a 100% loss of services immediately following the spill for
heavily oiled and eroding shorelines at Long Island, Ram Island, and Leisure Shores based on the SCAT observations of heavy bands of thick oil and heavy pooling of oil on surface soils. Under these conditions, mortality of epifauna and a significant decrease in primary production would have occurred.
Following the first growing season (0.5 yrs post-spill), the loss of services was estimated to be at 90% of baseline (10% services present). The replanted areas on Ram Island had not successfully revegetated and bare spots where oil stranded on Long Island were evident contributing to the loss of primary productivity. The loss of habitat also indicates a loss of epifauna and animals that forage in the marsh vegetation.
At end of the second growing season (1.5 yrs post-spill), the loss of services was estimated to be at 75% of baseline (25% services present) based on the August 2004 field survey on Long Island and Leisure Shores. Bare patches were again observed on Long Island. The vegetation had not regrown in these areas and infrequent spots of oil were still evident. An algal mat covered the soil surface possibly inhibiting new plants from penetrating the surface. However, the sprigs of S. alterniflora that were planted on Long Island appeared to be in good condition. A small seam of buried oil was observed in August 2004 in the upper intertidal zone at Leisure Shores. Residual oil (hardened splatters and some tarballs) was also found on the surface of Leisure Shores as late as October 2004.
At end of the third growing season (2.5 yrs post-spill), the loss of services was estimated to be at 65% of baseline (35% services present) due to the lingering bare spots observed by the SAT on both Long Island and Ram Island in June 2005 (Figures 41A, B, and C). The trampled areas on Ram Island used by cleanup crews during the response were clearly defined and covered with algal mats.

77
Following the fourth growing season (3.5 yrs post-spill), the Trustees estimated the loss of services to be at 50% of baseline. The bare areas would begin to have some growth of marsh vegetation and a return of some epifauna.
At the end of the fifth growing season (4.5 yrs post-spill), the loss of services was estimated to be at 30% of baseline (70% services present). The marsh vegetation would have regrown, and the bare areas would no longer be evident.
At the end of the sixth growing season (5.5 years post-spill), the loss of services was estimated to be at 15% of baseline (85% services present). The area would be re-colonized with mussels, periwinkles, and crabs, however, the age distribution of animals present before the spill would not have returned. As a result, the Trustees’ increased the percent services slowly for the next six growing seasons until reaching 100% services (Table 11), as was done for moderately oiled and eroding marsh injury category. This would take into account those species with longer life spans (e.g., periwinkles, mussels) to recover as multiple age classes and higher densities in the habitat.
Based on field observations and previous studies, the heavily oiled marshes were expected to be at 100% of baseline in 11.5 years. This is a longer recovery time than some of the literature shows for similar oiling conditions (Hoff, 1995); however, the persistence of the bare spots was a significant consideration. More regrowth was expected, especially with heavy oil where penetration into the soil would have been unlikely.
The SAT concluded that the moderately and heavily oiled and eroding marshes should be treated as separate injury categories. Oiled and eroding marshes will never fully recover; the area that eroded faster than background rates will be lost until the marsh completely erodes, therefore a different set of curves were developed for these habitats. The lost services for these three areas include losses from both oiling and increased erosion. Consequently, they are not included in the calculations of DSAYs for the injury category of heavily or moderately oiled marshes. Appendix I information describes the methods used for determining injury from oiling and erosion on Ram Island, Long Island, and Leisure Shores. The SAT assumed the following key points for all three sites:
• These three areas had a bare substrate band on the marsh edge where the vegetation was killed and did not recover. The loss of the vegetation/roots results in higher rates of erosion.
• The marshes are undergoing natural erosion, which was considered as part of the analysis.
• The marsh loss from increased erosion will continue into the future as long as the marsh is present.
Four separate injury calculations were completed for each of the three marsh locations. The four injury categories were: (1) oiled recovering marsh; (2) 6 ft wide trampled band with no recovery; (3) oiled recovering marsh behind the 6 ft trampled band; and (4) additional area lost to accelerated erosion. Each of these categories is described in further detail in Appendix I.
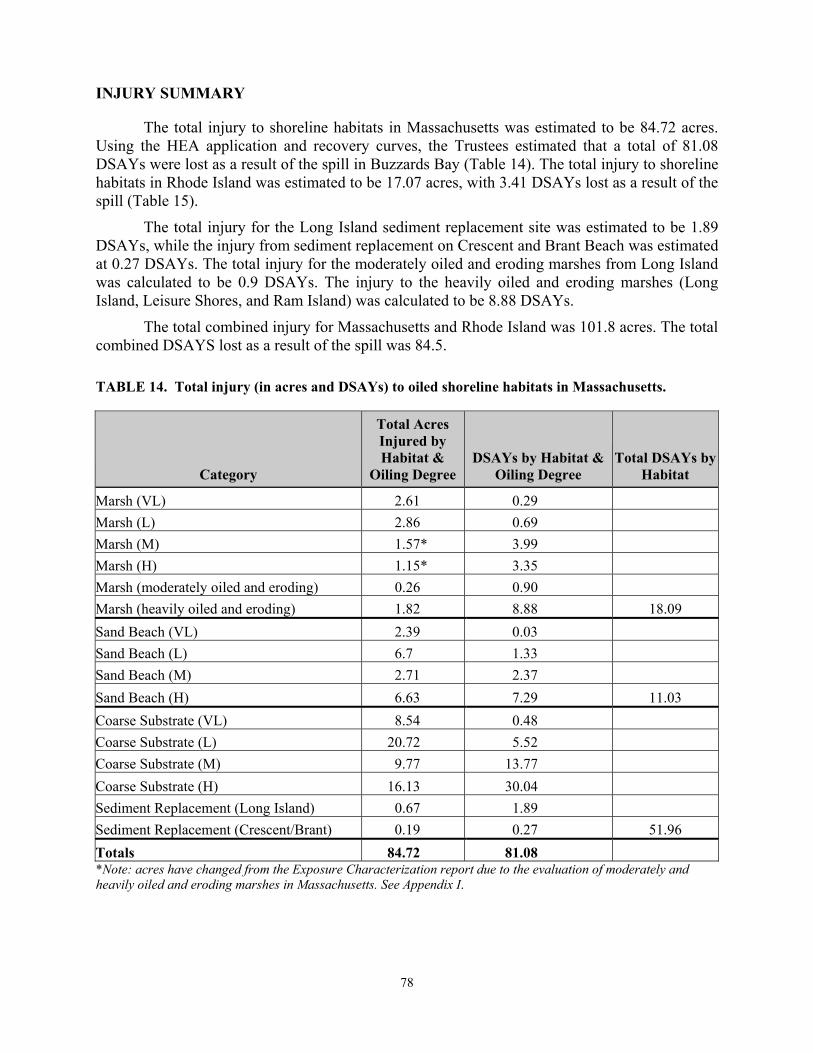
78
INJURY SUMMARY
The total injury to shoreline habitats in Massachusetts was estimated to be 84.72 acres. Using the HEA application and recovery curves, the Trustees estimated that a total of 81.08 DSAYs were lost as a result of the spill in Buzzards Bay (Table 14). The total injury to shoreline habitats in Rhode Island was estimated to be 17.07 acres, with 3.41 DSAYs lost as a result of the spill (Table 15).
The total injury for the Long Island sediment replacement site was estimated to be 1.89 DSAYs, while the injury from sediment replacement on Crescent and Brant Beach was estimated at 0.27 DSAYs. The total injury for the moderately oiled and eroding marshes from Long Island was calculated to be 0.9 DSAYs. The injury to the heavily oiled and eroding marshes (Long Island, Leisure Shores, and Ram Island) was calculated to be 8.88 DSAYs.
The total combined injury for Massachusetts and Rhode Island was 101.8 acres. The total combined DSAYS lost as a result of the spill was 84.5.
TABLE 14. Total injury (in acres and DSAYs) to oiled shoreline habitats in Massachusetts.
Category
Total Acres Injured by Habitat &
Oiling Degree DSAYs by Habitat &
Oiling Degree Total DSAYs by
Habitat
Marsh (VL) 2.61 0.29 Marsh (L) 2.86 0.69 Marsh (M) 1.57* 3.99 Marsh (H) 1.15* 3.35 Marsh (moderately oiled and eroding) 0.26 0.90 Marsh (heavily oiled and eroding) 1.82 8.88 18.09 Sand Beach (VL) 2.39 0.03 Sand Beach (L) 6.7 1.33 Sand Beach (M) 2.71 2.37 Sand Beach (H) 6.63 7.29 11.03 Coarse Substrate (VL) 8.54 0.48 Coarse Substrate (L) 20.72 5.52 Coarse Substrate (M) 9.77 13.77 Coarse Substrate (H) 16.13 30.04 Sediment Replacement (Long Island) 0.67 1.89 Sediment Replacement (Crescent/Brant) 0.19 0.27 51.96 Totals 84.72 81.08 *Note: acres have changed from the Exposure Characterization report due to the evaluation of moderately and heavily oiled and eroding marshes in Massachusetts. See Appendix I.

79
TABLE 15. Total injury (in acres and DSAYs) to oiled shoreline habitats in Rhode Island.
Category
Total Acres Injured by Habitat and Oiling Degree
DSAYS by Habitat and Oiling Degree
Total DSAYs by Habitat
Marsh (VL) 0.09 0.01 Marsh (L) 0.055 0.01 0.02 Sand Beach (VL) 1.73 0.02 Sand Beach (L) 5.2 1.03 Sand Beach (M) 0.25 0.22 1.27 Coarse Substrate (VL) 3.85 0.21 Coarse Substrate (L) 5.6 1.49 Coarse Substrate (M) 0.29 0.41 2.12 Totals 17.07 3.41 *Note: acres have changed from the Exposure Characterization report due to the evaluation of unassessed shorelines in Rhode Island. See Appendix G.

80
REFERENCES CITED
Alexander, S.K. and J.W. Webb. 1983. Effects of oil on growth and decomposition of Spartina alterniflora: Proc. 1983 Oil Spill Conf., American Petroleum Institute, Washington, D.C. pp. 529-532.
Alexander, S.K. and J.W. Webb. 1985. Seasonal response of Spartina alterniflora to oil: Proc. 1985 Oil Spill Conf., American Petroleum Institute, Washington, D.C. pp. 355-358.
Baca, B.J., C.D. Getter, and J. Lindstedt-Siva. 1985. Freshwater oil spill considerations: protection and cleanup. Proc. 1985 Oil Spill Conf., American Petroleum Institute, Washington, D.C., pp. 385-390.
Basson, P.A., J.E. Burchard, J.T. Hardy, A.R.G. Price. 1977. Biotopes of Western Arabian Gulf. Aramco Department of Loss Prevention and Environmental Affairs. Dhahran, Saudi Arabia. 284 pp.
Bender M.E., E.A. Shearls, R.P. Ayres, C.H. Hershner, and R.J. Huggett. 1977. Ecological effects of experimental oil spills on eastern coastal plain estuarine ecosystems. Proc. 1977 Oil Spill Conf., American Petroleum Institute, Washington, D.C., pp. 505-509.
Bender, M.E., E.A. Shearls, L. Murray, and R.J. Huggett. 1980. Ecological effects of experimental oil spills in eastern coastal plain estuaries. Environ. International 3: 121-133.
Blackman, R.A.A. and R.J. Law. 1980. The Eleni V oil spill: fate and effects of the oil over the first twelve months. Marine Pollution Bulletin 11: 217-220.
Blaylock, M. William, and J. P. Houghton. 1989. Infaunal recovery at Ediz Hook following the Arco Anchorage oil spill. Proc. 1989 Oil Spill Conf., American Petroleum Institute, Washington, D.C., pp. 421-426.
Burns, K.A., S. Codi, and N.C. Duke. 2000. Gladstone, Australia Field Studies: Weathering and degradation of hydrocarbons in oiled mangrove and salt marsh sediments with and without the application of an experimental bioremediation protocol. Marine Pollution Bulletin 41 (7-12): 392-402.
Chan, E.I. 1977. Oil pollution and tropical littoral communities: biological effects of the 1975 Florida Keys oil spill. Proc. 1977 Oil Spill Conf., American Petroleum Institute, Washington, D.C., pp. 539-542.
Diaz, R.J., Cutter, G.R., and C.H. Hobbs. 2004. Potential impacts of sand mining offshore of Maryland and Delaware: Part 2 Biological Considerations. J.Coastal Res., 20 (1): 61-69.
Douglas, G.S., A. E Bence, R.C. Prince, S.J. McMillen, and E.L. Butler. 1996. Environmental stability of selected petroleum hydrocarbon source and weathering ratios. Environmental Science and Technology 30(7): 2332-2339.

81
Dugan, J.E., D.M. Hubbard, D.L. Martin, J.M. Engle, D.M. Richards, G.E. Davis, K.D. Lafferty, and R.F. Ambrose. 2000. Macrofauna communities of exposed sandy beaches on the southern California mainland and Channel Islands. In: Fifth California Islands Symposium (D.R. Browne, K.L. Mitchell, and H.W. Chaney, eds.). Minerals Management Report MMS 99-0038, pp. 339-346.
Dutrieux, E. 1992. Experimental study of the impact of hydrocarbons on the interdidal benthic community: the Mahakam delta (East Kalimantan, Indonesia). Oceanologica acta 15(2):197-209.
Fefer, S. and P. Schettig. 1980. An Ecological Characterization of Coastal Maine. 1-3. Department of the Interior.
Field, L.J., D.D. MacDonald, S.B. Norton, C.G. Ingersoll, C.G. Severn, D. Smorong, and R. Lindskoog. 2002. Predicting amphipod toxicity from sediment chemistry using logistic regression models. Environmental Toxicology and Chemistry 21(9): 1993-2005.
Gelin, A., V. Gravez, and G.J. Edgar. 2003. Assessment of Jessica oil spill impacts on intertidal invertebrate communities. Marine Pollution Bulletin 46: 1377-1384.
GeoInsight, Inc. 2005. Immediate response action status report: Barge B120 Spill. Westford, MA. 25 pp.
GeoInsight, Inc. 2008. Phase IV status and modification: Leisure Shores and Howard’s Beach portion of shoreline segment W1F-02 (Brant Island West). GeoInsight Project 3871-002. Westford, MA. 22 pp.
Grosse, D.J., G.B. Pauley, and D. Moran. 1986. Species profiles: life histories and environmental requirements of coastal fishes and invertebrates (Pacific Northwest)-amphipods. U.S. Fish Wildlife Service Biol. Rep. 82(11.69). U.S. Army Corps of Engineers, TR EL-82-4. 15 pp.
Hanna, R.G.M. 1995. An approach to evaluate the application of the vulnerability index for oil spills in tropical Red Sea environments. Spill Science & Technology Bulletin 2(2/3): 171-186.
Hayes, M.O., R. Hoff, J. Michel, D. Scholz, and G. Shigenaka. 1992. An Introduction to Coastal Habitats and Biological Resources for Oil Spill Response. Report No. HMRAD 92-4. Hazardous Materials Response and Assessment Division, National Oceanic and Atmospheric Administration. Seattle, Washington. 10 chapters + appendices.
Hershner, C. and K. Moore. 1977. Effects of the Chesapeake Bay oil spill on salt marshes of the lower bay. Proc. 1977 Oil Spill Conf., American Petroleum Institute, Washington, D.C. pp. 529-533.
Hoff, R.Z. 1995. Responding to oil spills in coastal marshes: The fine line between help and hindrance. Hazardous Materials Response and Assessments Division, National Oceanic and Atmospheric Administration. Seattle, WA. HAZMAT Report 96-1. 14 pp.

82
Howes, B.L. and D.D. Goehringer. 1996. Ecology of Buzzards Bay: An Estuarine Profile. National Biological Service Biological Report 31. vi +141 pp.
Independent Maritime Consulting Ltd. 2003. Report of the investigation of quantity of oil spilled from the barge B 120 at Buzzards Bay April 2003. Prepared for Bouchard Transportation Co. 12 pp. + appendices.
Jackson, A. 2005. Littorina littorea. Common periwinkle. Marine Life Information Network: Biology and Sensitivity Key Information Sub-programme [on-line]. Plymouth: Marine Biological Association of the United Kingdom. Available: http://www.marlin.ac.uk/species/Littorinalittorea.htm.
Krebs, C. T. and K.A. Burns. 1977. Long term effects of an oil spill on populations of the salt marsh crab, Uca pugnax. Science 197: 484-487.
Krebs, C.T. and C.E. Turner. 1981. Restoration of oiled marshes through sediment stripping and Spartina propagation. Proc. 1981 Oil Spill Conf., American Petroleum Institute, Washington, D.C., pp. 375-385.
Levine, E.A., J. Pinckney, and T. Montello. 1995. Follow-up study on oiled vegetation cutting along the Delaware River. Proc. 1995 International Oil Spill Conference, American Petroleum Institute, Washington, D.C., pp. 465-472.
Long, B.F.N., J.H. Vandermeulen, and T.P. Ahern. 1981. The evolution of stranded oil within sandy beaches. Proc. 1981 Oil Spill Conf., American Petroleum Institute, Washington, D.C., pp. 519-524.
Long, E.R. 1992. Ranges in chemical concentrations in sediments associated with adverse biological effects. Marine Pollution Bulletin 24: 38-45.
Long, E.R., L.J. Field, and D.D. MacDonald. 1998. Predicting toxicity in marine sediments with numerical sediment quality guidelines. Environ. Toxicol. Chem. 17: 714-727.
Long, E.R., D.D. Macdonald, S.L. Smith, and F.D. Calder. 1995. Incidence of adverse biological effects with ranges of chemical concentrations in marine and estuarine sediments. Environ. Management 19: 81-97.
Long, E.R. and L.G. Morgan. 1990. The Potential for Biological Effects of Sediment-sorbed Contaminants Tested in the National Status and Trends Program. NOAA Tech. Memo. NOS OMA 52. National Oceanic and Atmospheric Administration, Seattle, WA. 175 pp.
Massachusetts Office of Coastal Zone Management. 2004a. Birds Affected by the Buzzards Bay Bouchard Oil Spill. Buzzards Bay Project, National Estuary Program. Available Sept 1, 2004 at: http://www.buzzardsbay.org/looncormorant.htm.
Massachusetts Office of Coastal Zone Management. 2004b. Shoreline Change Browser. Available: http://www.mass.gov/czm/shorelinechange.htm.

83
Massachusetts Executive Office of Environmental Affairs, U.S. Fish and Wildlife Service, National Oceanic and Atmospheric Administration, Rhode Island Department of Environmental Management, and ENTRIX, Inc. 2005. Pre-assessment Data Report. Bouchard Barge No. 120 Oil Spill, Buzzards Bay, Massachusetts.
Mendelssohn, I.A., M.W. Hester, and J.M. Hill. 1993. Effects of Oil Spills on Coastal Wetlands and Their Recovery: Final Report. Minerals Management Service OCS Study MMS 93-0045, Gulf of Mexico Regional Office, New Orleans, LA, 46 pp.
Michel, J. and M.O. Hayes. 1993. Persistence and weathering of Exxon Valdez oil in the intertidal zone–3.5 years later. Proc. 1993 International. Oil Spill Conf.erence American Petroleum Institute, Washington, D.C., pp. 279-286.
Michel, J., S.M. Lehmann, and C.B. Henry, Jr. 1998. Oiling and cleanup issues in wetlands, M/T Julie N spill, Portland, Maine. Proc. 21st Arctic and Marine Oilspill Program Tech. Seminar, Environment Canada, pp. 841-856.
Moore, C., D. Harries and F. Ware. 1997. The Impact of the Sea Empress Oil Spill on the Sandy Shore Meiofauna of South West Wales. CCW Sea Empress Contract Report No. 230.
Moore, J. and eleven others. 1997. Sea Empress spill: impacts on marine and coastal habitats. Proc. 1997 International Oil Spill Conf., American Petroleum Institute, Washington, D.C., pp. 213-216.
Neal, K.J. and P.F. Pizzolla. 2006. Carcinus maenus. Common shore crab. Marine Life Information Network: Biology and Sensitivity Key Information Sub-programme [on-line]. Plymouth: Marine Biological Association of the United Kingdom. Available: http://www.marlin.ac.uk/species/Carcinusmaenus.htm.
Neff, J.M., S. Ostazeski, W. Gardiner, and I. Stejskal. 2000. Effects of weathering on the toxicity of three offshore Australian crude oils and a diesel fuel to marine animals. Environ. Toxicol. Chem. 19: 1809-1821.
Newell, R.I.E. 1989. Species profiles: life histories and environmental requirements of coastal fishes and invertebrates (North and Mid-Atlantic)-blue mussel. U.S. Fish. Wildlife Service Biol. Rep. 82(11. 102 ). U.S. Army Corps of Engineers, TR El-82-4. 25 pp.
National Oceanic and Atmospheric Administration. 1999. Sensitivity of Coastal Environments and Wildlife to Spilled Oil: Massachusetts, a Coastal Atlas. National Ocean Service, Office of Response and Restoration, Seattle, WA.
National Oceanic and Atmospheric Administration (NOAA). 2000. Habitat Equivalency Analysis: An Overview. Damage Assessment and Restoration Program, National Oceanic and Atmospheric Administration, Silver Spring, Maryland, 23 pp.
National Oceanic and Atmospheric Administration (NOAA). 2001. Coastal Resource Atlas, Rhode Island. National Ocean Service, Office of Response and Restoration. Seattle, WA.

84
Peterson, C. H. 2001. The “Exxon Valdez” Oil Spill in Alaska: Acute, Indirect and Chronic Effects on the Ecosystem. Advances in Marine Biology 39. Academic Press Ltd.
Rolan, R. G. and R. Gallagher. 1991. Recovery of intertidal biotic communities at Sullom Voe following the Esso Bernicia oil spill of 1978. Proc. 1991 Oil Spill Conference, American Petroleum Institute, Washington, D.C., pp. 461-465.
Sell, D., L. Conway, T. Clark, G.B. Picken, J.M. Baker, G.M. Dunnet, A.D. McIntyre, and R.B. Clark. 1995. Scientific criteria to optimize oil spill cleanup. Proc. 1995 International Oil Spill Conf., American Petroleum Institute, pp. 595-610.
Shoreline Assessment Team. 2006. Shoreline Injury Assessment. Part I: Exposure Characterization, Bouchard 120 Oil Spill, Buzzards Bay, Massachusetts And Rhode Island. 10 pp. + app.
Southward, A J. 1982. An ecologist’s view of the implications of the observed physiological and biochemical effects of petroleum compounds on marine organisms and ecosystems. Phil. Trans. R. Soc. Bulletin 297: 241-255.
Swartz, R.C., P.F. Kemp, D.W. Schults, J.O. Lamberson. 1988. Effects of mixtures of sediment contaminants on the marine infaunal amphipod, Rhepoxyinius abronius. Environ. Toxicol. Chem. 14:1977-1987.
Teal, J.M. 1986. The Ecology of Regularly Flooded Salt Marshes of New England: a Community Profile. U.S. Fish and Wildlife Service Biological Report 85 (7.4). 61 pp.
USCG. 2003. Press release. http://www.uscg.mil/d1/newengland/press_releases/035-03.htm.
Webb, J.W. 1994. Effects of oil on saltmarshes. Symposium Proc. Gulf of Mexico and Caribbean Oil Spill in Coastal Ecosystems: Assessing Effects, Natural Recovery, and Progress in Remediation Research. U.S. Department of Interior, Minerals Management Service, OCS Study MMS 95-0063, New Orleans, La, pp.55-61.

A-1
APPENDIX A
ECOLOGICAL SERVICES AND FUNCTIONS

TABLE A-1. Ecological services and functions that have been attributed to salt and brackish marsh habitats.
Ecological Services Function Examples of Metrics Consideration given for Injury Quantification
Primary production Production of plant material that forms the base of the primary food web and the detrital food web. Much of salt marsh vascular plant production is exported to adjacent habitats as detritus.
Above-ground biomass Below-ground biomass Stem density Species composition, richness, diversity, evenness
High: a key service that is related to other services; marsh vegetation was directly oiled; good literature on oil-spill effects
Habitat for biota Marshes serve as physical habitat for a variety of organisms including birds (salt-marsh sharp-tailed sparrow, least tern, willet), mammals, reptiles (diamond back terrapin), insects, fish and a suite of invertebrates. The type and density of the vegetation is often the primary determinant of which species are served.
Canopy architecture of vegetation Above-ground biomass Species composition, richness, diversity, evenness Degree of usage by birds, terrapins, mammals, and other animals.
High: a key service that is related to other services; marsh vegetation was directly oiled; good literature on oil-spill effects and degree of use by different marsh types
Food web support Related to primary productivity but encompasses the entire system including invertebrates that are food for higher trophic levels that may only spend minor amounts of time in the wetland (e.g., dead salt marsh grass→bacteria→crab larvae→mummichog→striped bass→osprey)
Density and biomass of living vegetation, infauna and epifauna Macrophyte and benthic algae detritus Species composition, richness, diversity, evenness Degree of use by higher trophic levels
High: a key service; direct oiling of marsh vegetation and sediment surface; good literature on oil-spill effects
Fish and shellfish production
Marsh edge and ponds are important nursery areas for fish and shellfish Dense shellfish provide microhabitat for a diverse assemblage of organisms that contribute to overall system productivity and species composition.
Density Species composition Diversity, Evenness Biomass Population demographics Size class distributions
High: a key service; oiling highest along marsh edge; larval/juvenile life stages are the most sensitive; good literature on oil-spill effects
Sediment/shore-line stabilization
Marsh vegetation serves to stabilize the soil and prevent erosion during normal tides, wave action or storm events
Changes in shoreline erosion rates High: particularly at sites with intense cleanup efforts
Water Filtration The physical removal of particles and nutrients from water flowing through the wetlands.
Water quality metrics (turbidity) Moderate: Can be related to primary production
Nutrient removal/transformation
Nutrients can be removed and converted to plant material within the wetland and thereby reduce the occurrence of algal blooms and the resulting anoxic conditions in the bay.
Water quality metrics (nutrients) Moderate: Can be related to primary production
A-2
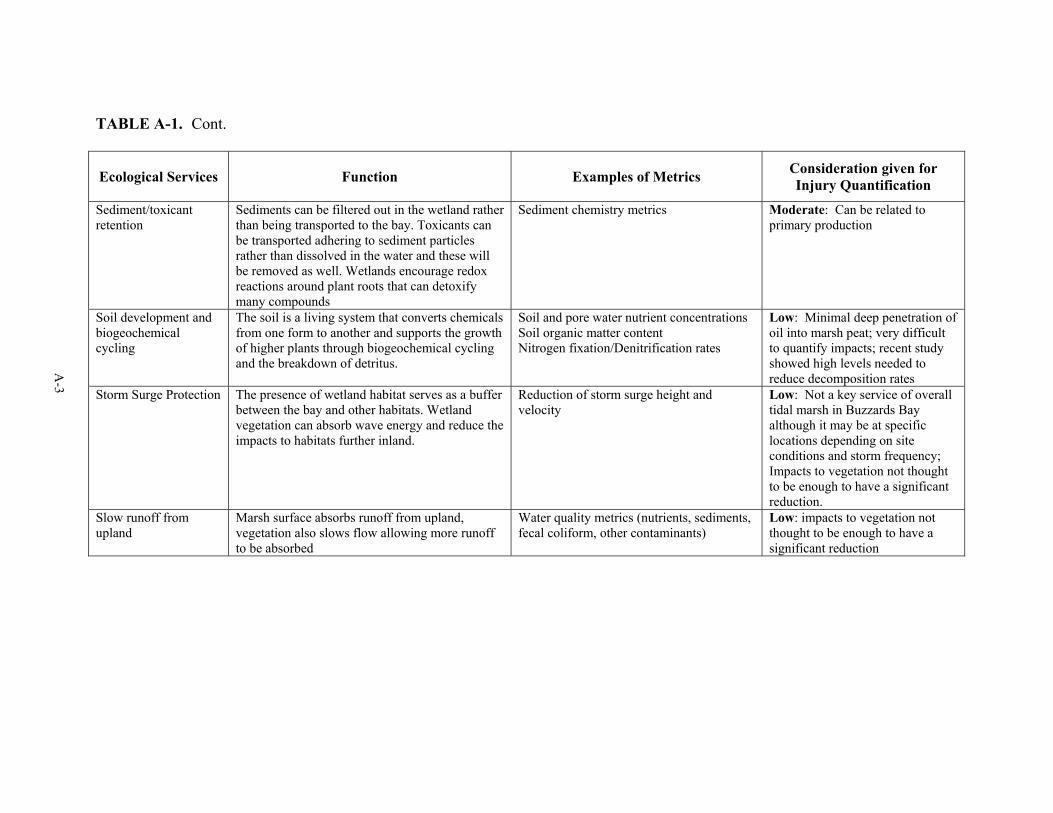
TABLE A-1. Cont.
Ecological Services Function Examples of Metrics Consideration given for Injury Quantification
Sediment/toxicant retention
Sediments can be filtered out in the wetland rather than being transported to the bay. Toxicants can be transported adhering to sediment particles rather than dissolved in the water and these will be removed as well. Wetlands encourage redox reactions around plant roots that can detoxify many compounds
Sediment chemistry metrics Moderate: Can be related to primary production
Soil development and biogeochemical cycling
The soil is a living system that converts chemicals from one form to another and supports the growth of higher plants through biogeochemical cycling and the breakdown of detritus.
Soil and pore water nutrient concentrations Soil organic matter content Nitrogen fixation/Denitrification rates
Low: Minimal deep penetration of oil into marsh peat; very difficult to quantify impacts; recent study showed high levels needed to reduce decomposition rates
Storm Surge Protection The presence of wetland habitat serves as a buffer between the bay and other habitats. Wetland vegetation can absorb wave energy and reduce the impacts to habitats further inland.
Reduction of storm surge height and velocity
Low: Not a key service of overall tidal marsh in Buzzards Bay although it may be at specific locations depending on site conditions and storm frequency; Impacts to vegetation not thought to be enough to have a significant reduction.
Slow runoff from upland
Marsh surface absorbs runoff from upland, vegetation also slows flow allowing more runoff to be absorbed
Water quality metrics (nutrients, sediments, fecal coliform, other contaminants)
Low: impacts to vegetation not thought to be enough to have a significant reduction
A-3

TABLE A-2. Ecological services and functions that have been attributed to coarse substrate (sand and gravel beaches, gravel beaches, and rocky shoreline, seawalls, and riprap habitats).
Ecological Services Function Examples of Metrics Consideration given for
Injury Quantification
Primary production Gravel shorelines serve as a substrate for algal colonization that forms the base of some grazing food webs. Rock ledge or boulders (more stable substrates) support higher algal biomass and consequently higher primary production. Some rocky shore production is exported to adjacent habitats
Above-ground plant biomass Macroalgae biomass for rock ledge/boulder shores
High: particularly for the sediment replacement sites
Food web support Rock and gravel shorelines support algal growth by providing attachments substrates. Many species of sessile invertebrates also attach to rocky substrates. Both the attached algae and invertebrates provide habitat for some smaller algae and invertebrates. They support a different assemblage of organisms, most of which are only found on rocky shores (habitat specialists).
Invertebrate biomass and density Species composition, richness, diversity and evenness Recruitment and larval production Algal and invertebrate growth rates Attached macrophytes/algae, percent cover and biomass Hydrocarbon bioaccumulation Degree of use by higher trophic levels
High: a key service, particularly for birds; substantial number of published literature on oil-spill effects
Fish and shellfish production
Dense shellfish provide microhabitat for a diverse assemblage of organisms that contribute to overall system productivity and species composition
Species biomass and density Species composition, richness, diversity, evenness Species size class distributions
Will be addressed by the Aquatics TWG
Habitat usage These shorelines are used by a variety of invertebrates, birds, mammals and other organisms for nesting and roosting.
Bird densities Bird species composition, diversity, evenness Nesting densities
High: a key service, particularly for birds; High use for nesting and roosting
Filtration of water (filter feeders)
Water is filtered by the filter feeders such as barnacles, amphipods, bivalves, tunicates, hydroids, sponges, polychaetes, brittle stars, etc. Water percolating through the gravel or underlying sand can be filtered prior to re-entering the bay. The particles may then be used by benthic epifauna and infauna.
Water turbidity Phytoplankton chlorophyll-a Phytoplankton primary production
Low: not expected to have been significantly affected as a result of the oil spill; poorly known/quantified
A-4
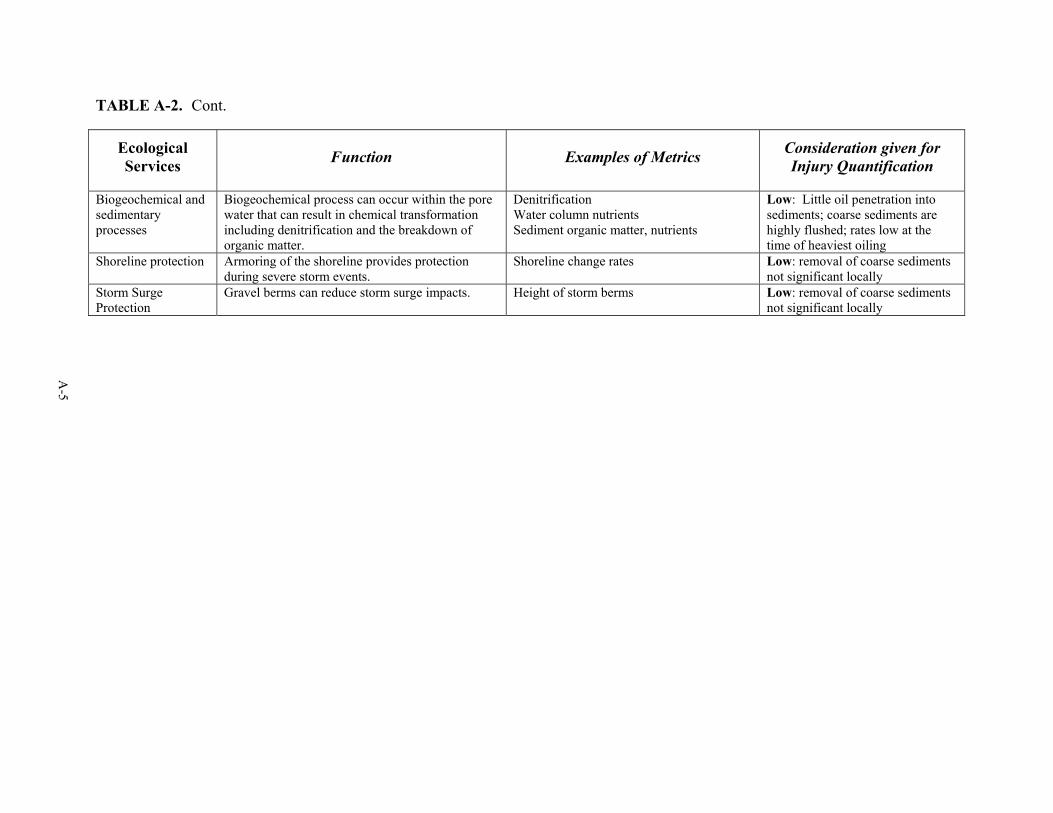
TABLE A-2. Cont.
Ecological Services Function Examples of Metrics Consideration given for
Injury Quantification
Biogeochemical and sedimentary processes
Biogeochemical process can occur within the pore water that can result in chemical transformation including denitrification and the breakdown of organic matter.
Denitrification Water column nutrients Sediment organic matter, nutrients
Low: Little oil penetration into sediments; coarse sediments are highly flushed; rates low at the time of heaviest oiling
Shoreline protection Armoring of the shoreline provides protection during severe storm events.
Shoreline change rates Low: removal of coarse sediments not significant locally
Storm Surge Protection
Gravel berms can reduce storm surge impacts. Height of storm berms Low: removal of coarse sediments not significant locally
A-5

TABLE A-3. Ecological services and functions that have been attributed to sand beach habitats.
Ecological Services
Function Examples of Metrics Consideration given for Injury Quantification
Food web support Sand beaches provide habitat for many invertebrates that derive nutrition from particulates and detritus brought in on tides and waves. These organisms serve as food for higher trophic levels particularly birds and fish.
Microalgae primary production Microalgae chlorophyll-a Infaunal/epifaunal biomass and density Species composition. richness, diversity and evenness Invertebrate re-colonization rate Hydrocarbon bioaccumulation Degree of use by higher trophic levels
High: a key service, particularly for birds; good literature on oil-spill effects
Habitat usage Habitat for invertebrates and other organisms, particularly birds. Listed bird species (e.g., Roseate Terns, Piping plover) and reptile (Diamond backed terrapin) use sandy beaches. Horseshoe crabs nest on sand beaches.
Bird densities Bird species composition, diversity, richness and evenness Bird, terrapin, horseshoe crab nesting densities Behavioral studies Hydrocarbon bioaccumulation
High: a key service; important habitats were directly oiled; good literature on oil-spill effects; good literature on habitat usage
Fish and shellfish production
Dense shellfish provide microhabitat for a diverse assemblage of organisms that contribute to overall system productivity and species composition
Species abundance and density Species composition and richness Species size class distribution Standing crop or density
Will be addressed by the Aquatics TWG
Biogeochemical cycling and sedimentary processes
Biogeochemical process can occur within the pore water that can result in chemical transformation including denitrification and the breakdown of organic matter.
Denitrification Water column nutrients Sediment organic matter, nutrients
Low: sediments are highly flushed; rates low at the time of heaviest oiling
Filtration of water (filter feeders)
Water is filtered by filter feeders such as barnacles, amphipods, bivalves, etc.. Water percolating through the sand is filtered prior to re-entering the bay. The particles may then be used by benthic epifauna and infauna.
Water turbidity Phytoplankton chlorophyll-a
Low: not expected to have been significantly affected as a result of the oil spill; poorly known/quantified.
Storm Surge Protection
Storm damage prevention and flood control. Low: removal of sediments not significant locally; however, when totaled baywide potentially significant cumulatively
A-6
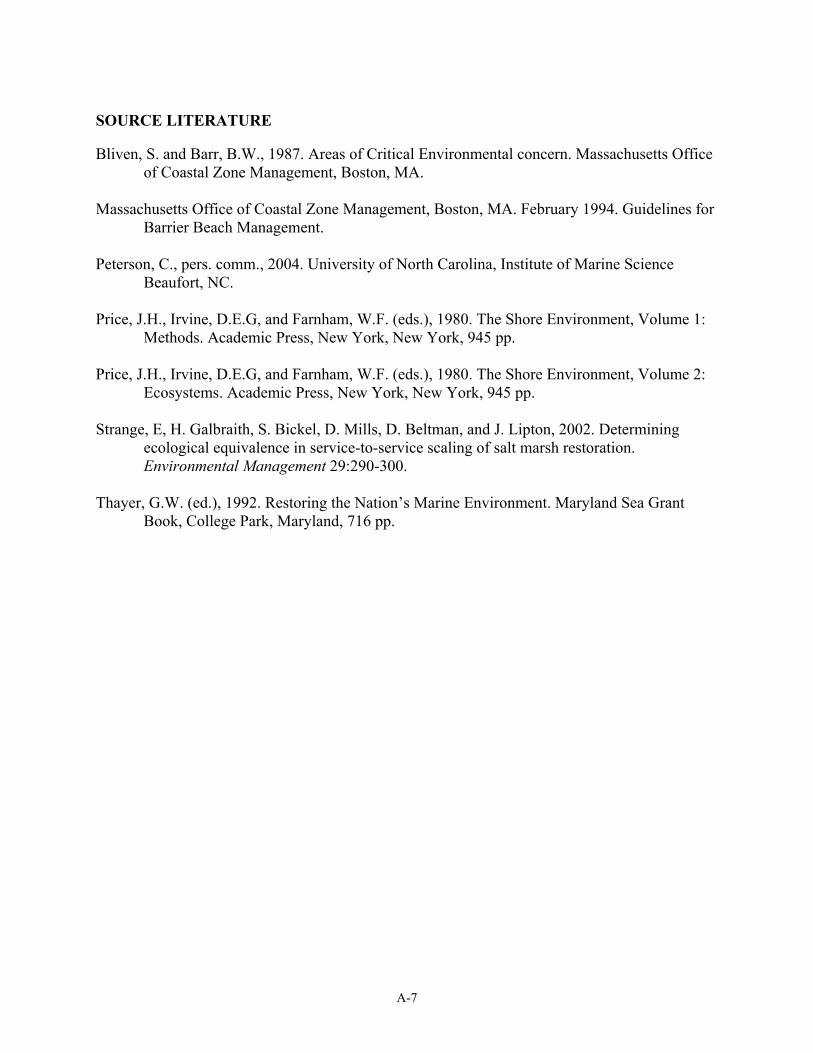
A-7
SOURCE LITERATURE Bliven, S. and Barr, B.W., 1987. Areas of Critical Environmental concern. Massachusetts Office
of Coastal Zone Management, Boston, MA. Massachusetts Office of Coastal Zone Management, Boston, MA. February 1994. Guidelines for
Barrier Beach Management. Peterson, C., pers. comm., 2004. University of North Carolina, Institute of Marine Science
Beaufort, NC. Price, J.H., Irvine, D.E.G, and Farnham, W.F. (eds.), 1980. The Shore Environment, Volume 1:
Methods. Academic Press, New York, New York, 945 pp. Price, J.H., Irvine, D.E.G, and Farnham, W.F. (eds.), 1980. The Shore Environment, Volume 2:
Ecosystems. Academic Press, New York, New York, 945 pp. Strange, E, H. Galbraith, S. Bickel, D. Mills, D. Beltman, and J. Lipton, 2002. Determining
ecological equivalence in service-to-service scaling of salt marsh restoration. Environmental Management 29:290-300.
Thayer, G.W. (ed.), 1992. Restoring the Nation’s Marine Environment. Maryland Sea Grant
Book, College Park, Maryland, 716 pp.

B-1
APPENDIX B
THREATENED AND ENDANGERED PLANT SPECIES SURVEY

w w w . s t a t e . m a . u s / d f w e l e / d f w / n h e s p
N a t u r a l H e r i t a g e & E n d a n g e r e d S p e c i e s P r o g r a m R o u t e 1 3 5 , W e s t b o r o u g h , M A 0 1 5 8 1 T e l : ( 5 0 8 ) 7 9 2 - 7 2 7 0 , e x t 2 0 0 F a x : ( 5 0 8 ) 7 9 2 - 7 8 2 1
H e l p S a v e E n d a n g e r e d W i l d l i f e ! C o n t r i b u t e t o t h e N a t u r a l H e r i t a g e & E n d a n g e r e d S p e c i e s F u n d .
Commonwealth of Massachusetts
Wayne F. MacCallum, Director
B-2
12 August 2004 Ms. Heidi K. Hinkeldey Research Planning, Inc. P.O. Box 328, 1121 Park St. Columbia, SC 29202 Dear Heidi et al., Thank you for organizing the oil spill assessment outing earlier this week. Here is a brief report regarding my observations that day.
1) West Island, Rocky Point:
I found a single plant of the state-listed Seabeach Knotweed (Polygonum glaucum --listed as “Special Concern” under the Mass. Endangered Species Act regulations, 321 CMR 10.60) at the original Rocky Point location where Sorrie had reported observing 3 plants in 1989. It was growing in the upper wrack line of the beach just in front of the snow fence enclosure located on the dune crest at the point. This location matches closely with the originally described and mapped location described as “shortly west of tip.” I completed a field form, took GPS points and photos. I can send the GPS point if it would be useful to you, but it is basically the same as where we had previously mapped it. Although this was the only location where Natural Heritage had a record of its presence, we searched extensively along adjacent portions of the beach and in suitable, open sandy habitat near the salt marsh behind the Rocky Point foredunes for additional plants, but found no more. While I have not visited this site before, it appeared that all plant populations were in good condition and unaffected by the oil spill. Because populations of Polygonum glaucum, as with most annuals, can fluctuate considerably, I cannot easily make the argument in this case that the decline from 3 to 1 plant resulted from the oil spill or activities relating to its cleanup. If you have evidence that there was a considerable amount of oil or intense activity in this area, perhaps a circumstantial case could be made that this represented a probable cause for a decline, but I suspect that it would be a hard thing to defend if challenged. Human traffic in the area could also be at fault.
2) Long Island south of Hoppy’s Landing (Fairhaven):
I visited this area hoping to catch up with your team of people. While there we took some photographs which may be useful to your efforts. They depict 1) a flotation boom stranded on the shoreline, 2) distinct areas where the Spartina and other intertidal shoreline plants have been killed, 3) a dead shorebird on the beach-cause of death unknown. I was curious about the distinct zones or extensive patches of dead vegetation and wondered if this might have been caused by the oil and/or an intensive cleanup effort mounted at the site. It seemed unusual to me, but those more familiar with these coastal areas should also be called on to evaluate this. I showed it to Dr. Scott Melvin, a zoological colleague who does a considerable amount of coastal work, particularly with piping plover recovery; he was unsure about laying the blame on the oil and commented that he had seen such areas blackened with algal mats. I was seeing what
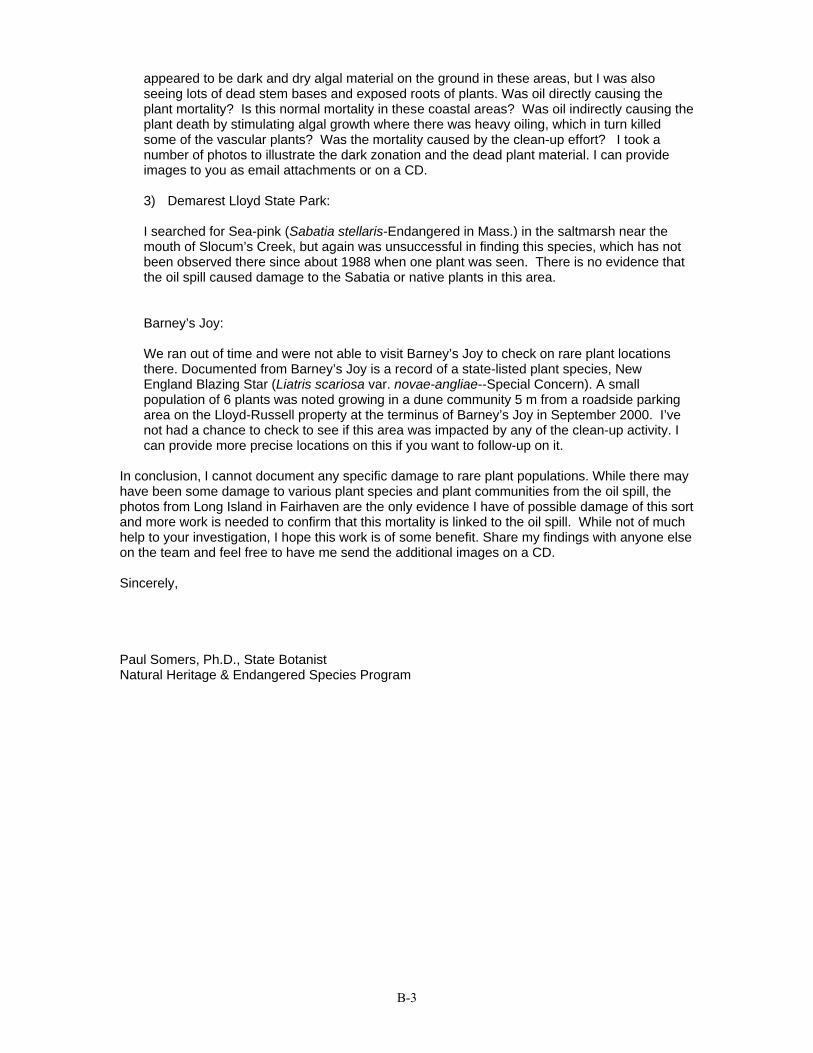
B-3
appeared to be dark and dry algal material on the ground in these areas, but I was also seeing lots of dead stem bases and exposed roots of plants. Was oil directly causing the plant mortality? Is this normal mortality in these coastal areas? Was oil indirectly causing the plant death by stimulating algal growth where there was heavy oiling, which in turn killed some of the vascular plants? Was the mortality caused by the clean-up effort? I took a number of photos to illustrate the dark zonation and the dead plant material. I can provide images to you as email attachments or on a CD. 3) Demarest Lloyd State Park:
I searched for Sea-pink (Sabatia stellaris-Endangered in Mass.) in the saltmarsh near the mouth of Slocum’s Creek, but again was unsuccessful in finding this species, which has not been observed there since about 1988 when one plant was seen. There is no evidence that the oil spill caused damage to the Sabatia or native plants in this area.
Barney’s Joy:
We ran out of time and were not able to visit Barney’s Joy to check on rare plant locations there. Documented from Barney’s Joy is a record of a state-listed plant species, New England Blazing Star (Liatris scariosa var. novae-angliae--Special Concern). A small population of 6 plants was noted growing in a dune community 5 m from a roadside parking area on the Lloyd-Russell property at the terminus of Barney’s Joy in September 2000. I’ve not had a chance to check to see if this area was impacted by any of the clean-up activity. I can provide more precise locations on this if you want to follow-up on it.
In conclusion, I cannot document any specific damage to rare plant populations. While there may have been some damage to various plant species and plant communities from the oil spill, the photos from Long Island in Fairhaven are the only evidence I have of possible damage of this sort and more work is needed to confirm that this mortality is linked to the oil spill. While not of much help to your investigation, I hope this work is of some benefit. Share my findings with anyone else on the team and feel free to have me send the additional images on a CD. Sincerely, Paul Somers, Ph.D., State Botanist Natural Heritage & Endangered Species Program

C-1
APPENDIX C
MAY 2003 SEDIMENT CHEMISTRY DATA – TOTAL PAHs, TOCs, AND ALKANES
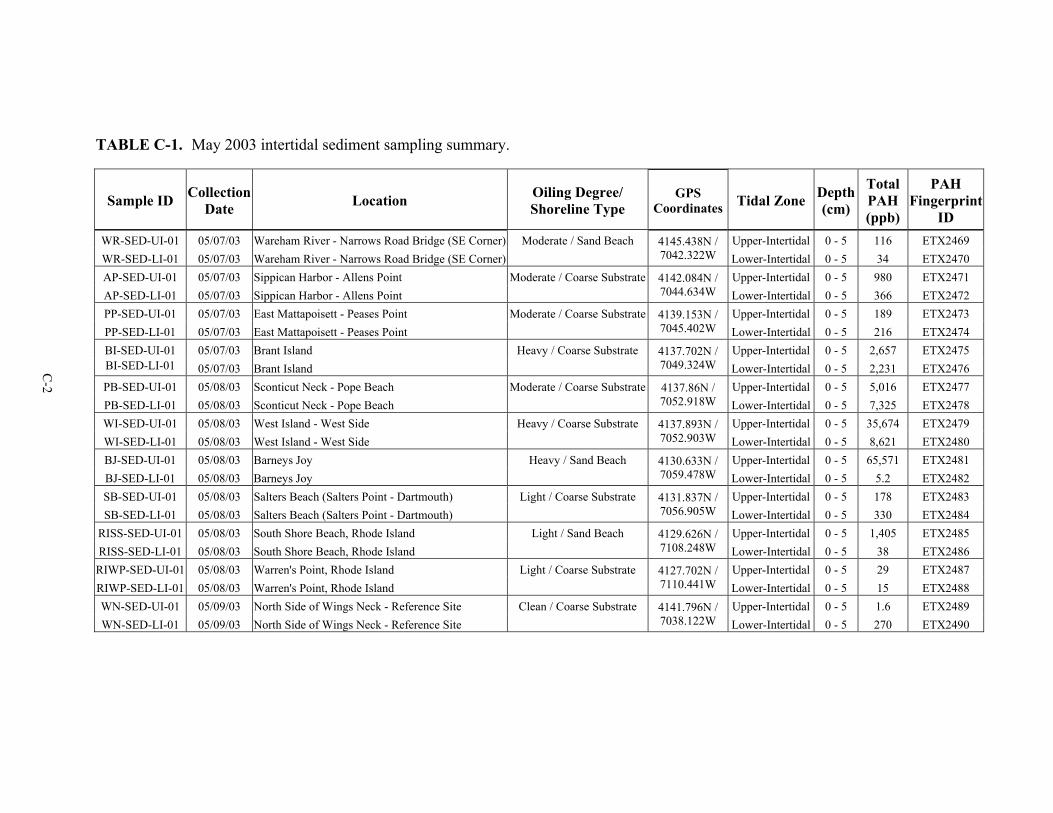
TABLE C-1. May 2003 intertidal sediment sampling summary.
Sample ID Collection Date Location Oiling Degree/
Shoreline Type GPS
Coordinates Tidal Zone Depth(cm)
Total PAH(ppb)
PAH Fingerprint
ID WR-SED-UI-01 05/07/03 Wareham River - Narrows Road Bridge (SE Corner) Moderate / Sand Beach 4145.438N /
7042.322W Upper-Intertidal 0 - 5 116 ETX2469
WR-SED-LI-01 05/07/03 Wareham River - Narrows Road Bridge (SE Corner) Lower-Intertidal 0 - 5 34 ETX2470 AP-SED-UI-01 05/07/03 Sippican Harbor - Allens Point Moderate / Coarse Substrate 4142.084N /
7044.634W Upper-Intertidal 0 - 5 980 ETX2471
AP-SED-LI-01 05/07/03 Sippican Harbor - Allens Point Lower-Intertidal 0 - 5 366 ETX2472 PP-SED-UI-01 05/07/03 East Mattapoisett - Peases Point Moderate / Coarse Substrate 4139.153N /
7045.402W Upper-Intertidal 0 - 5 189 ETX2473
PP-SED-LI-01 05/07/03 East Mattapoisett - Peases Point Lower-Intertidal 0 - 5 216 ETX2474 BI-SED-UI-01 05/07/03 Brant Island Heavy / Coarse Substrate 4137.702N /
7049.324W Upper-Intertidal 0 - 5 2,657 ETX2475
BI-SED-LI-01 05/07/03 Brant Island Lower-Intertidal 0 - 5 2,231 ETX2476 PB-SED-UI-01 05/08/03 Sconticut Neck - Pope Beach Moderate / Coarse Substrate 4137.86N /
7052.918W Upper-Intertidal 0 - 5 5,016 ETX2477
PB-SED-LI-01 05/08/03 Sconticut Neck - Pope Beach Lower-Intertidal 0 - 5 7,325 ETX2478 WI-SED-UI-01 05/08/03 West Island - West Side Heavy / Coarse Substrate 4137.893N /
7052.903W Upper-Intertidal 0 - 5 35,674 ETX2479
WI-SED-LI-01 05/08/03 West Island - West Side Lower-Intertidal 0 - 5 8,621 ETX2480 BJ-SED-UI-01 05/08/03 Barneys Joy Heavy / Sand Beach 4130.633N /
7059.478W Upper-Intertidal 0 - 5 65,571 ETX2481
BJ-SED-LI-01 05/08/03 Barneys Joy Lower-Intertidal 0 - 5 5.2 ETX2482 SB-SED-UI-01 05/08/03 Salters Beach (Salters Point - Dartmouth) Light / Coarse Substrate 4131.837N /
7056.905W Upper-Intertidal 0 - 5 178 ETX2483
SB-SED-LI-01 05/08/03 Salters Beach (Salters Point - Dartmouth) Lower-Intertidal 0 - 5 330 ETX2484 RISS-SED-UI-01 05/08/03 South Shore Beach, Rhode Island Light / Sand Beach 4129.626N /
7108.248W Upper-Intertidal 0 - 5 1,405 ETX2485
RISS-SED-LI-01 05/08/03 South Shore Beach, Rhode Island Lower-Intertidal 0 - 5 38 ETX2486 RIWP-SED-UI-01 05/08/03 Warren's Point, Rhode Island Light / Coarse Substrate 4127.702N /
7110.441W Upper-Intertidal 0 - 5 29 ETX2487
RIWP-SED-LI-01 05/08/03 Warren's Point, Rhode Island Lower-Intertidal 0 - 5 15 ETX2488 WN-SED-UI-01 05/09/03 North Side of Wings Neck - Reference Site Clean / Coarse Substrate 4141.796N /
7038.122W Upper-Intertidal 0 - 5 1.6 ETX2489
WN-SED-LI-01 05/09/03 North Side of Wings Neck - Reference Site Lower-Intertidal 0 - 5 270 ETX2490
C-2
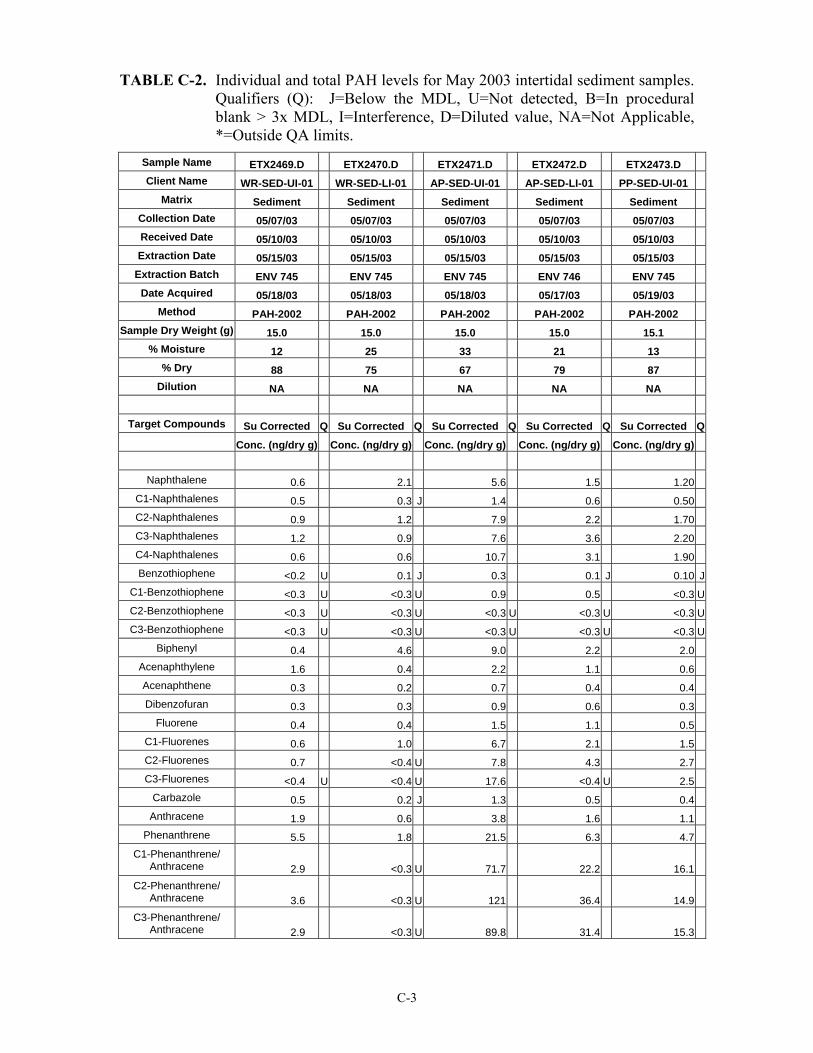
C-3
TABLE C-2. Individual and total PAH levels for May 2003 intertidal sediment samples. Qualifiers (Q): J=Below the MDL, U=Not detected, B=In procedural blank > 3x MDL, I=Interference, D=Diluted value, NA=Not Applicable, *=Outside QA limits.
Sample Name ETX2469.D ETX2470.D ETX2471.D ETX2472.D ETX2473.D Client Name WR-SED-UI-01 WR-SED-LI-01 AP-SED-UI-01 AP-SED-LI-01 PP-SED-UI-01
Matrix Sediment Sediment Sediment Sediment Sediment Collection Date 05/07/03 05/07/03 05/07/03 05/07/03 05/07/03 Received Date 05/10/03 05/10/03 05/10/03 05/10/03 05/10/03 Extraction Date 05/15/03 05/15/03 05/15/03 05/15/03 05/15/03
Extraction Batch ENV 745 ENV 745 ENV 745 ENV 746 ENV 745 Date Acquired 05/18/03 05/18/03 05/18/03 05/17/03 05/19/03
Method PAH-2002 PAH-2002 PAH-2002 PAH-2002 PAH-2002 Sample Dry Weight (g) 15.0 15.0 15.0 15.0 15.1
% Moisture 12 25 33 21 13 % Dry 88 75 67 79 87
Dilution NA NA NA NA NA
Target Compounds Su Corrected Q Su Corrected Q Su Corrected Q Su Corrected Q Su Corrected Q Conc. (ng/dry g) Conc. (ng/dry g) Conc. (ng/dry g) Conc. (ng/dry g) Conc. (ng/dry g)
Naphthalene 0.6 2.1 5.6 1.5 1.20C1-Naphthalenes 0.5 0.3 J 1.4 0.6 0.50C2-Naphthalenes 0.9 1.2 7.9 2.2 1.70C3-Naphthalenes 1.2 0.9 7.6 3.6 2.20C4-Naphthalenes 0.6 0.6 10.7 3.1 1.90Benzothiophene <0.2 U 0.1 J 0.3 0.1 J 0.10 J
C1-Benzothiophene <0.3 U <0.3 U 0.9 0.5 <0.3 UC2-Benzothiophene <0.3 U <0.3 U <0.3 U <0.3 U <0.3 UC3-Benzothiophene <0.3 U <0.3 U <0.3 U <0.3 U <0.3 U
Biphenyl 0.4 4.6 9.0 2.2 2.0Acenaphthylene 1.6 0.4 2.2 1.1 0.6Acenaphthene 0.3 0.2 0.7 0.4 0.4Dibenzofuran 0.3 0.3 0.9 0.6 0.3
Fluorene 0.4 0.4 1.5 1.1 0.5C1-Fluorenes 0.6 1.0 6.7 2.1 1.5C2-Fluorenes 0.7 <0.4 U 7.8 4.3 2.7C3-Fluorenes <0.4 U <0.4 U 17.6 <0.4 U 2.5
Carbazole 0.5 0.2 J 1.3 0.5 0.4Anthracene 1.9 0.6 3.8 1.6 1.1
Phenanthrene 5.5 1.8 21.5 6.3 4.7C1-Phenanthrene/
Anthracene 2.9 <0.3 U 71.7 22.2 16.1C2-Phenanthrene/
Anthracene 3.6 <0.3 U 121 36.4 14.9C3-Phenanthrene/
Anthracene 2.9 <0.3 U 89.8 31.4 15.3
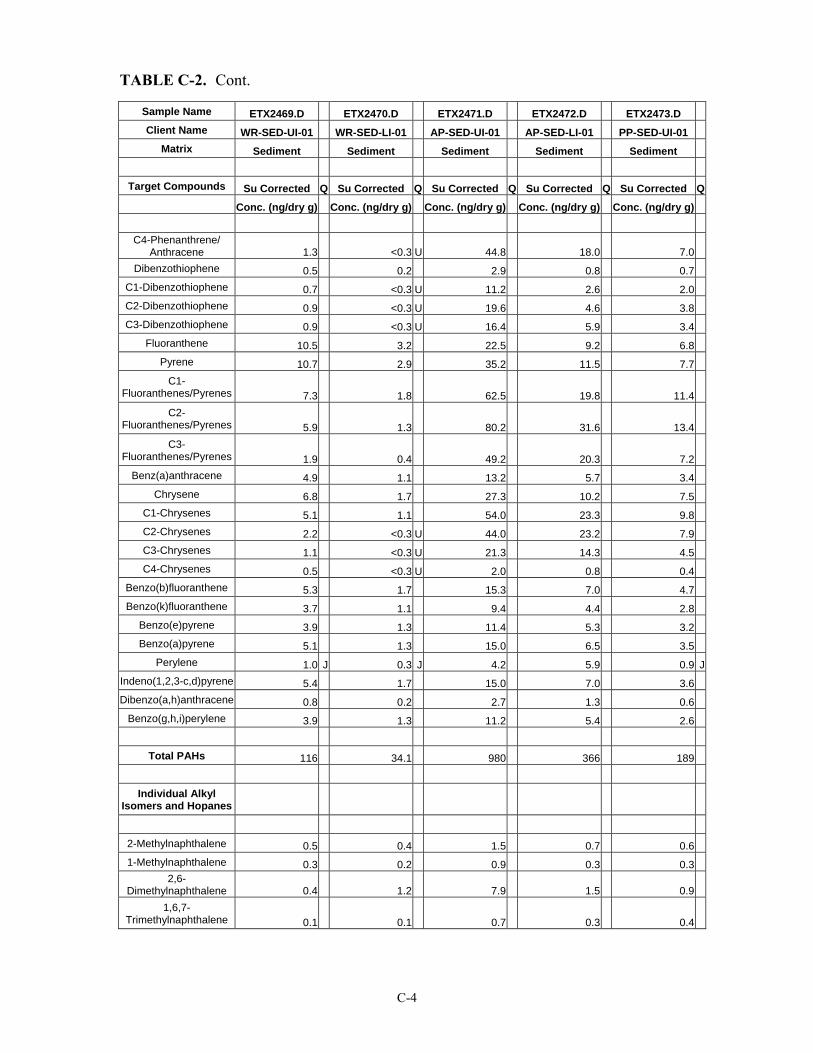
C-4
TABLE C-2. Cont.
Sample Name ETX2469.D ETX2470.D ETX2471.D ETX2472.D ETX2473.D Client Name WR-SED-UI-01 WR-SED-LI-01 AP-SED-UI-01 AP-SED-LI-01 PP-SED-UI-01
Matrix Sediment Sediment Sediment Sediment Sediment
Target Compounds Su Corrected Q Su Corrected Q Su Corrected Q Su Corrected Q Su Corrected Q Conc. (ng/dry g) Conc. (ng/dry g) Conc. (ng/dry g) Conc. (ng/dry g) Conc. (ng/dry g)
C4-Phenanthrene/ Anthracene 1.3 <0.3 U 44.8 18.0 7.0
Dibenzothiophene 0.5 0.2 2.9 0.8 0.7C1-Dibenzothiophene 0.7 <0.3 U 11.2 2.6 2.0C2-Dibenzothiophene 0.9 <0.3 U 19.6 4.6 3.8C3-Dibenzothiophene 0.9 <0.3 U 16.4 5.9 3.4
Fluoranthene 10.5 3.2 22.5 9.2 6.8Pyrene 10.7 2.9 35.2 11.5 7.7
C1-Fluoranthenes/Pyrenes 7.3 1.8 62.5 19.8 11.4
C2-Fluoranthenes/Pyrenes 5.9 1.3 80.2 31.6 13.4
C3-Fluoranthenes/Pyrenes 1.9 0.4 49.2 20.3 7.2
Benz(a)anthracene 4.9 1.1 13.2 5.7 3.4Chrysene 6.8 1.7 27.3 10.2 7.5
C1-Chrysenes 5.1 1.1 54.0 23.3 9.8C2-Chrysenes 2.2 <0.3 U 44.0 23.2 7.9C3-Chrysenes 1.1 <0.3 U 21.3 14.3 4.5C4-Chrysenes 0.5 <0.3 U 2.0 0.8 0.4
Benzo(b)fluoranthene 5.3 1.7 15.3 7.0 4.7Benzo(k)fluoranthene 3.7 1.1 9.4 4.4 2.8
Benzo(e)pyrene 3.9 1.3 11.4 5.3 3.2Benzo(a)pyrene 5.1 1.3 15.0 6.5 3.5
Perylene 1.0 J 0.3 J 4.2 5.9 0.9 JIndeno(1,2,3-c,d)pyrene 5.4 1.7 15.0 7.0 3.6Dibenzo(a,h)anthracene 0.8 0.2 2.7 1.3 0.6
Benzo(g,h,i)perylene 3.9 1.3 11.2 5.4 2.6
Total PAHs 116 34.1 980 366 189
Individual Alkyl Isomers and Hopanes
2-Methylnaphthalene 0.5 0.4 1.5 0.7 0.61-Methylnaphthalene 0.3 0.2 0.9 0.3 0.3
2,6-Dimethylnaphthalene 0.4 1.2 7.9 1.5 0.9
1,6,7-Trimethylnaphthalene 0.1 0.1 0.7 0.3 0.4

C-5
TABLE C-2. Cont.
Sample Name ETX2469.D ETX2470.D ETX2471.D ETX2472.D ETX2473.D Client Name WR-SED-UI-01 WR-SED-LI-01 AP-SED-UI-01 AP-SED-LI-01 PP-SED-UI-01
Matrix Sediment Sediment Sediment Sediment Sediment
1-Methylphenanthrene 0.9 <0.2 U 11.2 2.8 1.9C29-Hopane 3.6 3.0 10.7 4.4 1.8
18a-Oleanane 0.6 J <1.1 U <1.1 U 1.0 J <1.1 UC30-Hopane 5.0 3.7 13.4 8.4 2.7
Surrogate (Su) Su Recovery (%) Su Recovery (%) Su Recovery (%) Su Recovery (%) Su Recovery (%)
Naphthalene-d8 85 90 82 71 89
Acenaphthene-d10 91 93 87 75 92 Phenanthrene-d10 95 88 81 67 81
Chrysene-d12 80 76 79 68 74 Perylene-d12 82 83 80 74 79

C-6
TABLE C-2. Cont.
Sample Name ETX2474.D ETX2475.D ETX2476.D ETX2477.D ETX2478.D Client Name PP-SED-LI-01 BI-SED-UI-01 BI-SED-LI-01 PB-SED-UI-01 PB-SED-LI-01
Matrix Sediment Sediment Sediment Sediment Sediment Collection Date 05/07/03 05/07/03 05/07/03 05/08/03 05/08/03 Received Date 05/10/03 05/10/03 05/10/03 05/10/03 05/10/03 Extraction Date 05/15/03 05/15/03 05/15/03 05/15/03 05/15/03
Extraction Batch ENV 745 ENV 745 ENV 745 ENV 745 ENV 745 Date Acquired 05/19/03 05/19/03 05/19/03 05/19/03 05/19/03
Method PAH-2002 PAH-2002 PAH-2002 PAH-2002 PAH-2002 Sample Dry Weight (g) 15.0 15.0 15.0 15.0 15.0
% Moisture 14 10 15 8 26 % Dry 86 90 85 92 74
Dilution NA NA NA NA NA
Target Compounds Su Corrected Q Su Corrected Q Su Corrected Q Su Corrected Q Su Corrected Q Conc. (ng/dry g) Conc. (ng/dry g) Conc. (ng/dry g) Conc. (ng/dry g) Conc. (ng/dry g)
Naphthalene 1.4 0.5 0.8 33.1 31.8C1-Naphthalenes 0.4 0.7 0.3 J 14.3 15.9C2-Naphthalenes 1.9 1.6 1.7 18.1 24.7C3-Naphthalenes 1.9 4.4 16.7 19.3 28.5C4-Naphthalenes 3.1 18.8 29.5 14.1 16.8Benzothiophene 0.1 J 0.1 J 0.1 J 1.7 1.6
C1-Benzothiophene <0.3 U <0.3 U <0.3 U 1.3 1.3C2-Benzothiophene <0.3 U <0.3 U <0.3 U 1.5 1.9C3-Benzothiophene <0.3 U <0.3 U <0.3 U 1.7 2.6
Biphenyl 1.9 0.6 1.2 4.3 6.5Acenaphthylene 0.7 0.2 0.2 43.8 58.4Acenaphthene 0.4 0.2 0.2 9.8 29.8Dibenzofuran 0.4 0.1 J 0.2 J 9.2 20.9
Fluorene 0.7 0.5 1.4 17.3 42.3C1-Fluorenes <0.4 U 5.1 13.5 15.1 28.1C2-Fluorenes <0.4 U 34.9 41.1 26.7 31.5C3-Fluorenes <0.4 U 71.5 55.5 55.4 22.7
Carbazole 0.8 0.9 1.2 15.8 47.8Anthracene 4.2 1.4 4.6 81.5 157
Phenanthrene 4.0 7.2 29.8 272 544C1-Phenanthrene/
Anthracene 10.7 54.3 164 164 260C2-Phenanthrene/
Anthracene 17.2 216 297 216 216C3-Phenanthrene/
Anthracene 21.3 403 266 180 109C4-Phenanthrene/
Anthracene 11.3 197 129 90.3 37.6Dibenzothiophene 0.2 1.5 5.4 24.2 37.5
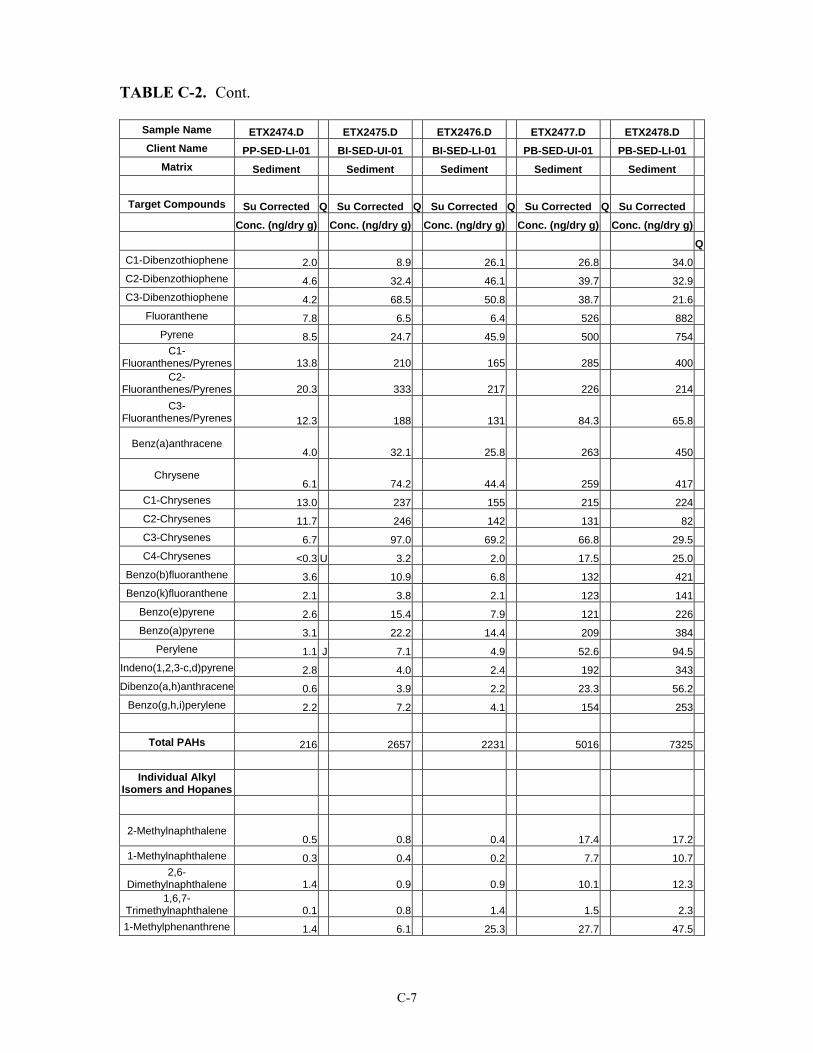
C-7
TABLE C-2. Cont.
Sample Name ETX2474.D ETX2475.D ETX2476.D ETX2477.D ETX2478.D Client Name PP-SED-LI-01 BI-SED-UI-01 BI-SED-LI-01 PB-SED-UI-01 PB-SED-LI-01
Matrix Sediment Sediment Sediment Sediment Sediment
Target Compounds Su Corrected Q Su Corrected Q Su Corrected Q Su Corrected Q Su Corrected Conc. (ng/dry g) Conc. (ng/dry g) Conc. (ng/dry g) Conc. (ng/dry g) Conc. (ng/dry g) Q
C1-Dibenzothiophene 2.0 8.9 26.1 26.8 34.0C2-Dibenzothiophene 4.6 32.4 46.1 39.7 32.9C3-Dibenzothiophene 4.2 68.5 50.8 38.7 21.6
Fluoranthene 7.8 6.5 6.4 526 882Pyrene 8.5 24.7 45.9 500 754
C1-Fluoranthenes/Pyrenes 13.8 210 165 285 400
C2-Fluoranthenes/Pyrenes 20.3 333 217 226 214
C3-Fluoranthenes/Pyrenes 12.3 188 131 84.3 65.8
Benz(a)anthracene 4.0 32.1 25.8 263 450
Chrysene 6.1 74.2 44.4 259 417
C1-Chrysenes 13.0 237 155 215 224C2-Chrysenes 11.7 246 142 131 82C3-Chrysenes 6.7 97.0 69.2 66.8 29.5C4-Chrysenes <0.3 U 3.2 2.0 17.5 25.0
Benzo(b)fluoranthene 3.6 10.9 6.8 132 421Benzo(k)fluoranthene 2.1 3.8 2.1 123 141
Benzo(e)pyrene 2.6 15.4 7.9 121 226Benzo(a)pyrene 3.1 22.2 14.4 209 384
Perylene 1.1 J 7.1 4.9 52.6 94.5Indeno(1,2,3-c,d)pyrene 2.8 4.0 2.4 192 343Dibenzo(a,h)anthracene 0.6 3.9 2.2 23.3 56.2
Benzo(g,h,i)perylene 2.2 7.2 4.1 154 253
Total PAHs 216 2657 2231 5016 7325
Individual Alkyl Isomers and Hopanes
2-Methylnaphthalene 0.5 0.8 0.4 17.4 17.2
1-Methylnaphthalene 0.3 0.4 0.2 7.7 10.72,6-
Dimethylnaphthalene 1.4 0.9 0.9 10.1 12.31,6,7-
Trimethylnaphthalene 0.1 0.8 1.4 1.5 2.31-Methylphenanthrene 1.4 6.1 25.3 27.7 47.5
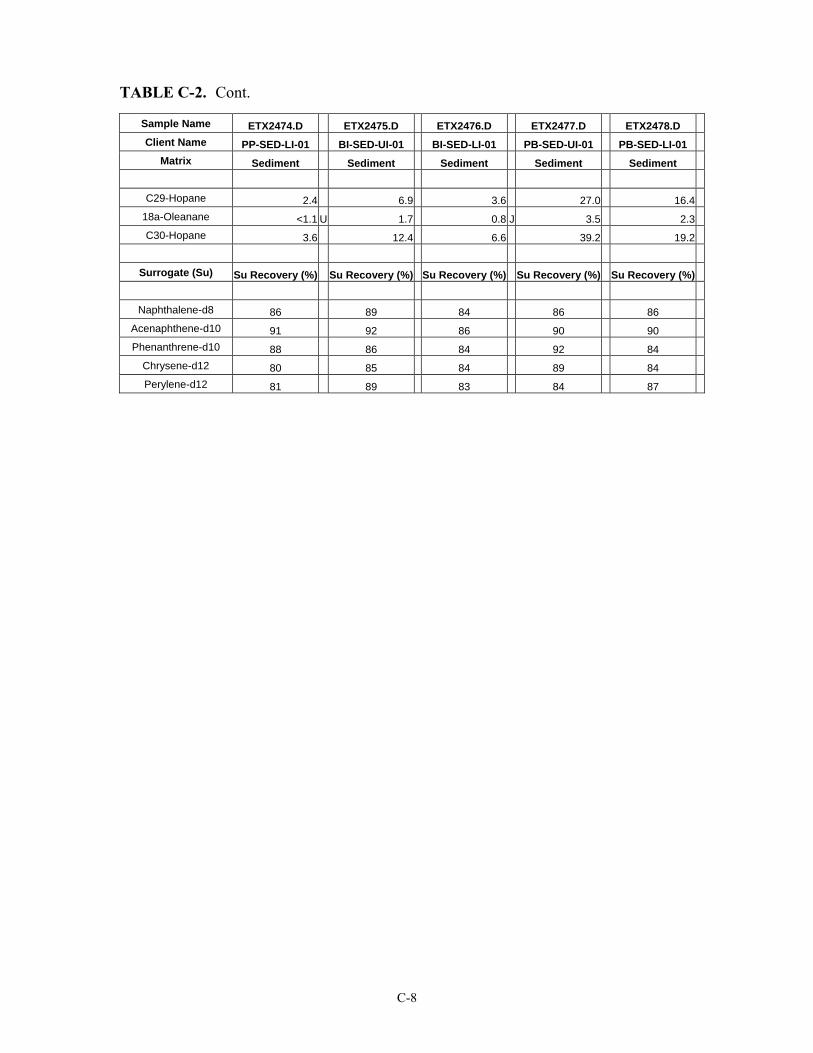
C-8
TABLE C-2. Cont.
Sample Name ETX2474.D ETX2475.D ETX2476.D ETX2477.D ETX2478.D Client Name PP-SED-LI-01 BI-SED-UI-01 BI-SED-LI-01 PB-SED-UI-01 PB-SED-LI-01
Matrix Sediment Sediment Sediment Sediment Sediment
C29-Hopane 2.4 6.9 3.6 27.0 16.418a-Oleanane <1.1 U 1.7 0.8 J 3.5 2.3C30-Hopane 3.6 12.4 6.6 39.2 19.2
Surrogate (Su) Su Recovery (%) Su Recovery (%) Su Recovery (%) Su Recovery (%) Su Recovery (%)
Naphthalene-d8 86 89 84 86 86
Acenaphthene-d10 91 92 86 90 90 Phenanthrene-d10 88 86 84 92 84
Chrysene-d12 80 85 84 89 84 Perylene-d12 81 89 83 84 87

C-9
TABLE C-2. Cont.
Sample Name ETX2479.D ETX2480.D ETX2481.D ETX2482.D ETX2483.D Client Name WI-SED-UI-01 WI-SED-LI-01 BJ-SED-UI-01 BJ-SED-LI-01 SB-SED-UI-01
Matrix Sediment Sediment Sediment Sediment Sediment Collection Date 05/08/03 05/08/03 05/08/03 05/08/03 05/08/03 Received Date 05/10/03 05/10/03 05/10/03 05/10/03 05/10/03 Extraction Date 05/15/03 05/15/03 05/15/03 05/15/03 05/15/03
Extraction Batch ENV 745 ENV 745 ENV 745 ENV 746 ENV 745 Date Acquired 05/19/03 05/19/03 05/19/03 05/17/03 05/19/03
Method PAH-2002 PAH-2002 PAH-2002 PAH-2002 PAH-2002 Sample Dry Weight
(g) 15.0 15.0 15.0 15.0 15.0 % Moisture 8 9 10 20 6
% Dry 92 91 90 80 94 Dilution NA NA NA NA NA
Target Compounds Su Corrected Q Su Corrected Q Su Corrected Q Su Corrected Q Su Corrected Q
Conc. (ng/dry g) Conc. (ng/dry g) Conc. (ng/dry g) Conc. (ng/dry g) Conc. (ng/dry g)
Naphthalene 0.6 0.5 0.4 0.3 0.2C1-Naphthalenes 14.0 7.3 75.0 0.1 J 0.2 JC2-Naphthalenes 339 97.5 1460 <0.4 U 1.8C3-Naphthalenes 1010 197 2790 <0.4 U 3.1C4-Naphthalenes 1080 186 2230 <0.4 U 2.5Benzothiophene 0.1 J <0.2 U 0.1 J <0.2 U <0.2 U
C1-Benzothiophene 1.7 0.9 4.5 <0.3 U <0.3 UC2-Benzothiophene 23.6 5.9 93.5 <0.3 U <0.3 UC3-Benzothiophene 67.1 14.1 275 <0.3 U <0.3 U
Biphenyl 3.3 1.5 13.2 0.6 0.4Acenaphthylene 3.8 1.2 21.4 <0.2 U 0.2Acenaphthene 27.7 7.2 73.7 <0.1 U 0.1 JDibenzofuran 15.1 4.2 43.6 <0.2 U 0.2 J
Fluorene 75.5 14.5 192 <0.2 U 0.3C1-Fluorenes 449 75.3 862 <0.4 U 0.9C2-Fluorenes 981 185 1600 <0.4 U 2.3C3-Fluorenes 1040 219 1590 <0.4 U 1.5
Carbazole 27.1 4.5 55.8 0.1 J 0.1 JAnthracene 94 26.1 210 0.1 J 0.4
Phenanthrene 537 117 1330 0.5 1.6C1-Phenanthrene/
Anthracene 2460 479 5000 <0.3 U 14.0C2-Phenanthrene/
Anthracene 4760 1000 8380 <0.3 U 18.2C3-Phenanthrene/
Anthracene 3990 979 7280 <0.3 U 21.0C4-Phenanthrene/
Anthracene 1800 474 3450 <0.3 U 10.6Dibenzothiophene 104.0 20.1 257 <0.2 U 0.4
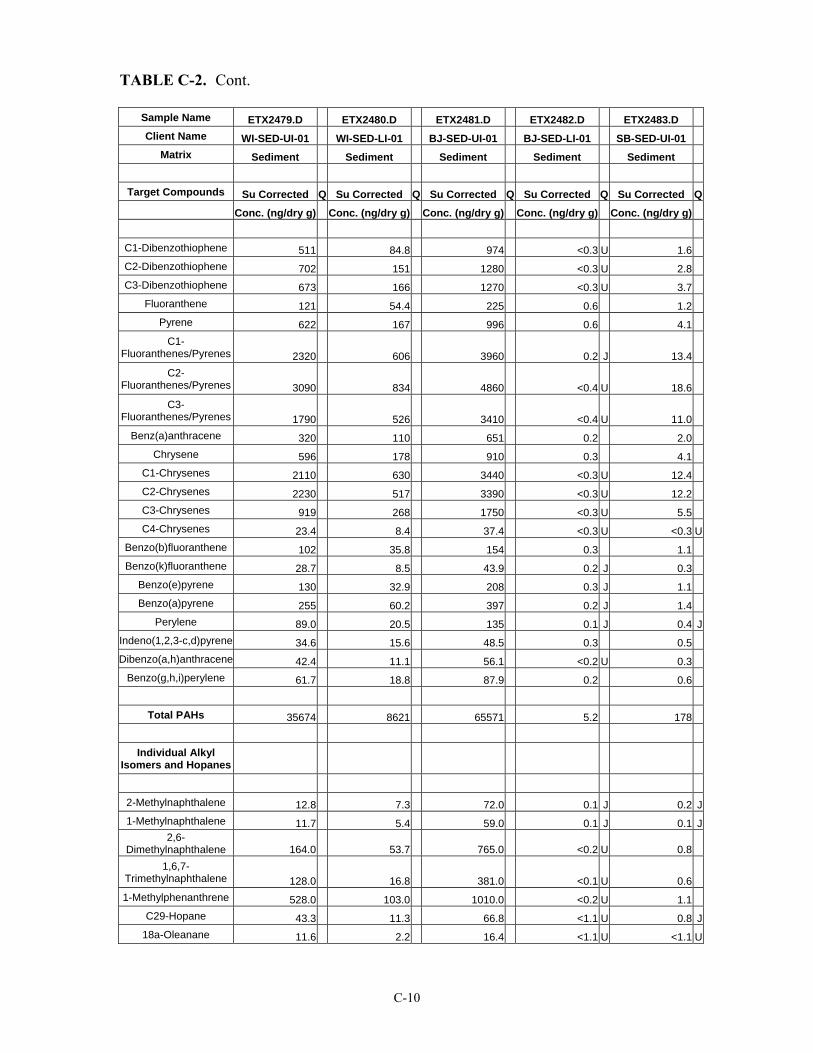
C-10
TABLE C-2. Cont.
Sample Name ETX2479.D ETX2480.D ETX2481.D ETX2482.D ETX2483.D Client Name WI-SED-UI-01 WI-SED-LI-01 BJ-SED-UI-01 BJ-SED-LI-01 SB-SED-UI-01
Matrix Sediment Sediment Sediment Sediment Sediment
Target Compounds Su Corrected Q Su Corrected Q Su Corrected Q Su Corrected Q Su Corrected Q Conc. (ng/dry g) Conc. (ng/dry g) Conc. (ng/dry g) Conc. (ng/dry g) Conc. (ng/dry g)
C1-Dibenzothiophene 511 84.8 974 <0.3 U 1.6C2-Dibenzothiophene 702 151 1280 <0.3 U 2.8C3-Dibenzothiophene 673 166 1270 <0.3 U 3.7
Fluoranthene 121 54.4 225 0.6 1.2Pyrene 622 167 996 0.6 4.1
C1-Fluoranthenes/Pyrenes 2320 606 3960 0.2 J 13.4
C2-Fluoranthenes/Pyrenes 3090 834 4860 <0.4 U 18.6
C3-Fluoranthenes/Pyrenes 1790 526 3410 <0.4 U 11.0
Benz(a)anthracene 320 110 651 0.2 2.0Chrysene 596 178 910 0.3 4.1
C1-Chrysenes 2110 630 3440 <0.3 U 12.4C2-Chrysenes 2230 517 3390 <0.3 U 12.2C3-Chrysenes 919 268 1750 <0.3 U 5.5C4-Chrysenes 23.4 8.4 37.4 <0.3 U <0.3 U
Benzo(b)fluoranthene 102 35.8 154 0.3 1.1Benzo(k)fluoranthene 28.7 8.5 43.9 0.2 J 0.3
Benzo(e)pyrene 130 32.9 208 0.3 J 1.1Benzo(a)pyrene 255 60.2 397 0.2 J 1.4
Perylene 89.0 20.5 135 0.1 J 0.4 JIndeno(1,2,3-c,d)pyrene 34.6 15.6 48.5 0.3 0.5Dibenzo(a,h)anthracene 42.4 11.1 56.1 <0.2 U 0.3
Benzo(g,h,i)perylene 61.7 18.8 87.9 0.2 0.6
Total PAHs 35674 8621 65571 5.2 178
Individual Alkyl Isomers and Hopanes
2-Methylnaphthalene 12.8 7.3 72.0 0.1 J 0.2 J1-Methylnaphthalene 11.7 5.4 59.0 0.1 J 0.1 J
2,6-Dimethylnaphthalene 164.0 53.7 765.0 <0.2 U 0.8
1,6,7-Trimethylnaphthalene 128.0 16.8 381.0 <0.1 U 0.61-Methylphenanthrene 528.0 103.0 1010.0 <0.2 U 1.1
C29-Hopane 43.3 11.3 66.8 <1.1 U 0.8 J18a-Oleanane 11.6 2.2 16.4 <1.1 U <1.1 U
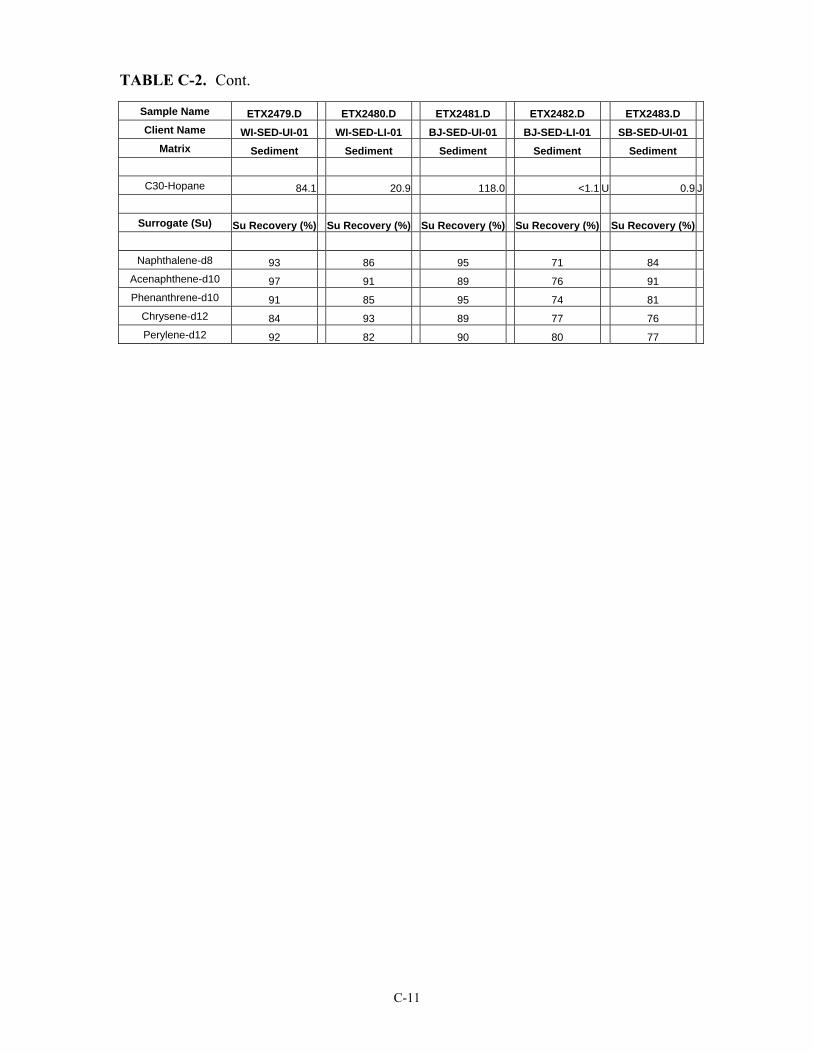
C-11
TABLE C-2. Cont.
Sample Name ETX2479.D ETX2480.D ETX2481.D ETX2482.D ETX2483.D Client Name WI-SED-UI-01 WI-SED-LI-01 BJ-SED-UI-01 BJ-SED-LI-01 SB-SED-UI-01
Matrix Sediment Sediment Sediment Sediment Sediment
C30-Hopane 84.1 20.9 118.0 <1.1 U 0.9 J
Surrogate (Su) Su Recovery (%) Su Recovery (%) Su Recovery (%) Su Recovery (%) Su Recovery (%)
Naphthalene-d8 93 86 95 71 84 Acenaphthene-d10 97 91 89 76 91 Phenanthrene-d10 91 85 95 74 81
Chrysene-d12 84 93 89 77 76 Perylene-d12 92 82 90 80 77

C-12
TABLE C-2. Cont.
Sample Name ETX2484.D ETX2485.D ETX2486.D ETX2487.D ETX2488.D Client Name SB-SED-LI-01 RISS-SED-UI-01 RISS-SED-LI-01 RIWP-SED-UI-01 RIWP-SED-LI-01
Matrix Sediment Sediment Sediment Sediment Sediment Collection Date 05/08/03 05/08/03 05/08/03 05/08/03 05/08/03 Received Date 05/10/03 05/10/03 05/10/03 05/10/03 05/10/03 Extraction Date 05/15/03 05/15/03 05/15/03 05/15/03 05/15/03
Extraction Batch ENV 745 ENV 745 ENV 745 ENV 745 ENV 745 Date Acquired 05/19/03 05/19/03 05/19/03 05/19/03 05/19/03
Method PAH-2002 PAH-2002 PAH-2002 PAH-2002 PAH-2002 Sample Dry Weight (g) 15.0 15.0 15.0 15.0 15.0
% Moisture 18 13 8 15 23 % Dry 82 87 92 85 77
Dilution NA NA NA NA NA
Target Compounds Su Corrected Q Su Corrected Q Su Corrected Q Su Corrected Q Su Corrected Q Conc. (ng/dry g) Conc. (ng/dry g) Conc. (ng/dry g) Conc. (ng/dry g) Conc. (ng/dry g)
Naphthalene 0.4 0.4 0.3 0.2 0.2C1-Naphthalenes 0.2 J 0.6 0.2 J 0.3 J 0.2 JC2-Naphthalenes 0.5 10.9 0.8 0.6 0.2 JC3-Naphthalenes 2.1 50.7 1.1 1.0 <0.4 UC4-Naphthalenes 3.1 48.3 0.4 <0.4 U <0.4 UBenzothiophene <0.2 U <0.2 U <0.2 U <0.2 U <0.2 U
C1-Benzothiophene <0.3 U <0.3 U <0.3 U <0.3 U <0.3 UC2-Benzothiophene <0.3 U <0.3 U <0.3 U <0.3 U <0.3 UC3-Benzothiophene <0.3 U <0.3 U <0.3 U <0.3 U <0.3 U
Biphenyl 0.5 0.6 0.4 0.2 0.3Acenaphthylene 0.3 0.3 0.1 J <0.2 U 0.1 JAcenaphthene 0.1 J 0.7 0.1 J 0.1 J 0.1 JDibenzofuran 0.2 J 0.6 0.2 J 0.2 J 0.3
Fluorene 0.3 3.1 0.1 J 0.1 J 0.1 JC1-Fluorenes 1.4 20.2 <0.4 U <0.4 U <0.4 UC2-Fluorenes 2.9 35.4 <0.4 U <0.4 U <0.4 UC3-Fluorenes 4.2 37.9 <0.4 U <0.4 U <0.4 U
Carbazole 0.1 J 0.8 <0.3 U <0.3 U <0.3 UAnthracene 0.8 3.1 0.1 J 0.1 J 0.1 J
Phenanthrene 3.9 28.3 0.7 0.5 0.3C1-Phenanthrene/
Anthracene 23.4 112 2.3 1.3 0.9C2-Phenanthrene/
Anthracene 30.5 181 3.4 2.6 1.1C3-Phenanthrene/
Anthracene 41.7 161 4.9 3.6 1.8C4-Phenanthrene/
Anthracene 19.5 68.8 2.2 1.8 0.7Dibenzothiophene 0.7 5.2 0.1 J 0.1 J <0.2 U
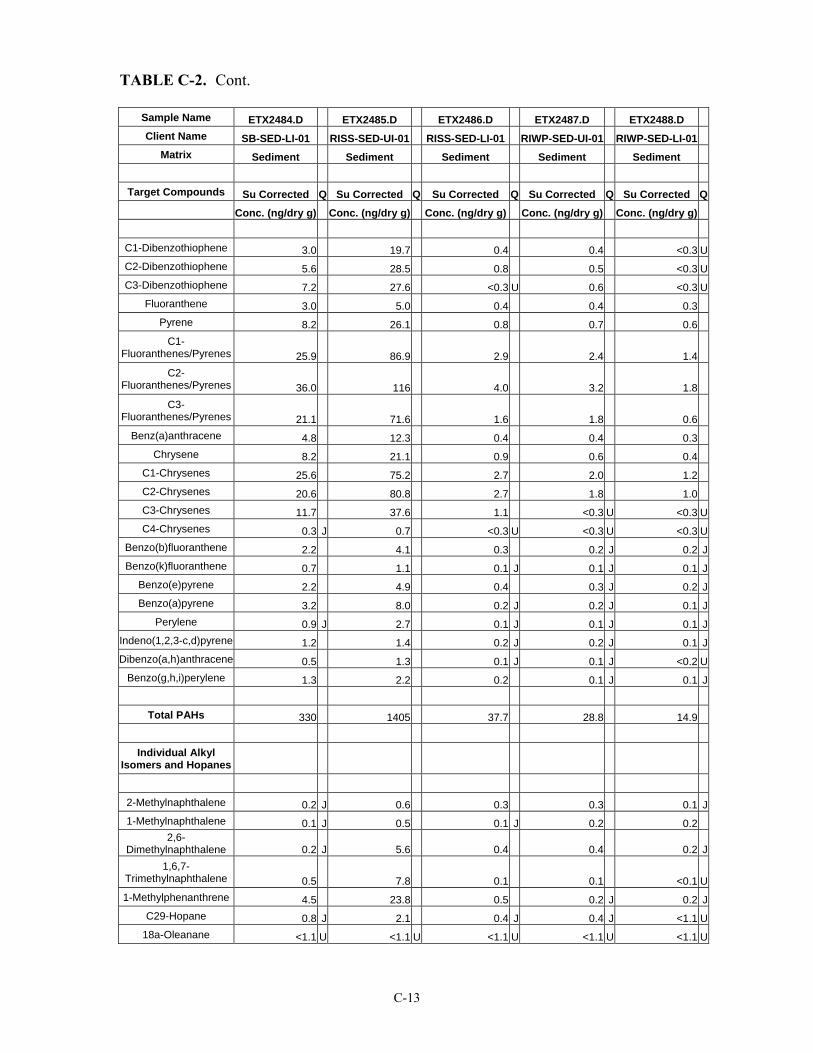
C-13
TABLE C-2. Cont.
Sample Name ETX2484.D ETX2485.D ETX2486.D ETX2487.D ETX2488.D Client Name SB-SED-LI-01 RISS-SED-UI-01 RISS-SED-LI-01 RIWP-SED-UI-01 RIWP-SED-LI-01
Matrix Sediment Sediment Sediment Sediment Sediment
Target Compounds Su Corrected Q Su Corrected Q Su Corrected Q Su Corrected Q Su Corrected Q Conc. (ng/dry g) Conc. (ng/dry g) Conc. (ng/dry g) Conc. (ng/dry g) Conc. (ng/dry g)
C1-Dibenzothiophene 3.0 19.7 0.4 0.4 <0.3 UC2-Dibenzothiophene 5.6 28.5 0.8 0.5 <0.3 UC3-Dibenzothiophene 7.2 27.6 <0.3 U 0.6 <0.3 U
Fluoranthene 3.0 5.0 0.4 0.4 0.3Pyrene 8.2 26.1 0.8 0.7 0.6
C1-Fluoranthenes/Pyrenes 25.9 86.9 2.9 2.4 1.4
C2-Fluoranthenes/Pyrenes 36.0 116 4.0 3.2 1.8
C3-Fluoranthenes/Pyrenes 21.1 71.6 1.6 1.8 0.6
Benz(a)anthracene 4.8 12.3 0.4 0.4 0.3Chrysene 8.2 21.1 0.9 0.6 0.4
C1-Chrysenes 25.6 75.2 2.7 2.0 1.2C2-Chrysenes 20.6 80.8 2.7 1.8 1.0C3-Chrysenes 11.7 37.6 1.1 <0.3 U <0.3 UC4-Chrysenes 0.3 J 0.7 <0.3 U <0.3 U <0.3 U
Benzo(b)fluoranthene 2.2 4.1 0.3 0.2 J 0.2 JBenzo(k)fluoranthene 0.7 1.1 0.1 J 0.1 J 0.1 J
Benzo(e)pyrene 2.2 4.9 0.4 0.3 J 0.2 JBenzo(a)pyrene 3.2 8.0 0.2 J 0.2 J 0.1 J
Perylene 0.9 J 2.7 0.1 J 0.1 J 0.1 JIndeno(1,2,3-c,d)pyrene 1.2 1.4 0.2 J 0.2 J 0.1 JDibenzo(a,h)anthracene 0.5 1.3 0.1 J 0.1 J <0.2 U
Benzo(g,h,i)perylene 1.3 2.2 0.2 0.1 J 0.1 J
Total PAHs 330 1405 37.7 28.8 14.9
Individual Alkyl Isomers and Hopanes
2-Methylnaphthalene 0.2 J 0.6 0.3 0.3 0.1 J1-Methylnaphthalene 0.1 J 0.5 0.1 J 0.2 0.2
2,6-Dimethylnaphthalene 0.2 J 5.6 0.4 0.4 0.2 J
1,6,7-Trimethylnaphthalene 0.5 7.8 0.1 0.1 <0.1 U1-Methylphenanthrene 4.5 23.8 0.5 0.2 J 0.2 J
C29-Hopane 0.8 J 2.1 0.4 J 0.4 J <1.1 U18a-Oleanane <1.1 U <1.1 U <1.1 U <1.1 U <1.1 U
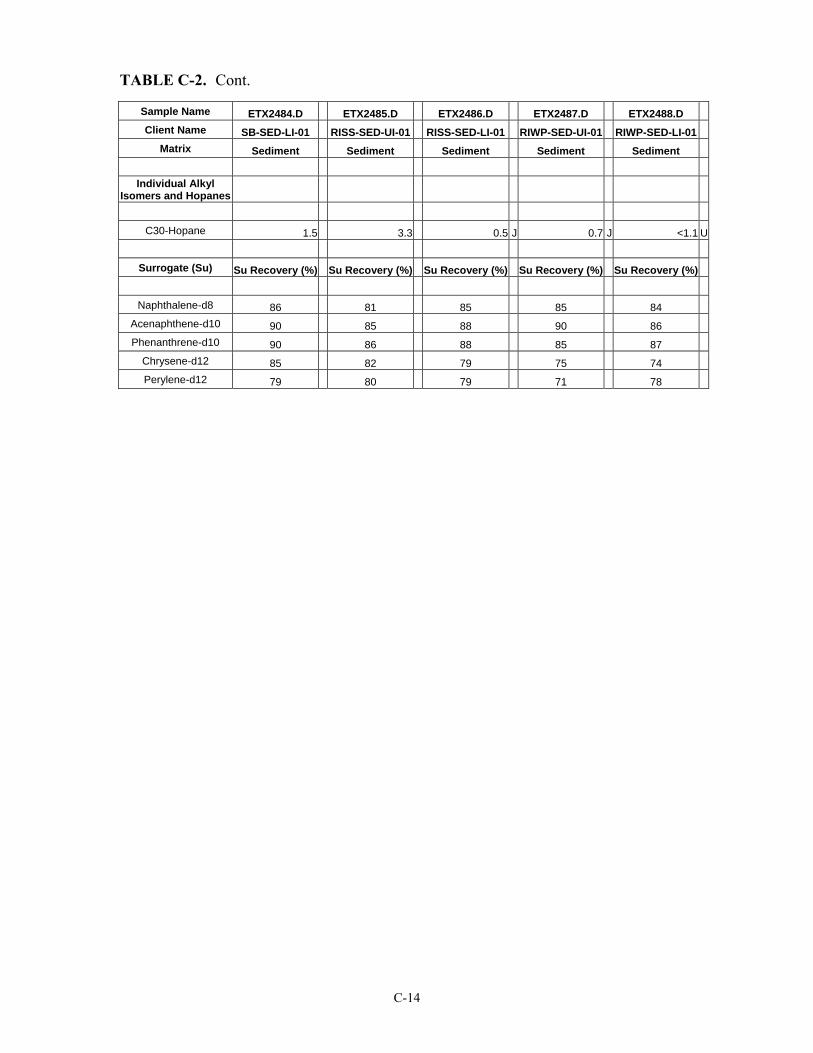
C-14
TABLE C-2. Cont.
Sample Name ETX2484.D ETX2485.D ETX2486.D ETX2487.D ETX2488.D Client Name SB-SED-LI-01 RISS-SED-UI-01 RISS-SED-LI-01 RIWP-SED-UI-01 RIWP-SED-LI-01
Matrix Sediment Sediment Sediment Sediment Sediment
Individual Alkyl Isomers and Hopanes
C30-Hopane 1.5 3.3 0.5 J 0.7 J <1.1 U
Surrogate (Su) Su Recovery (%) Su Recovery (%) Su Recovery (%) Su Recovery (%) Su Recovery (%)
Naphthalene-d8 86 81 85 85 84
Acenaphthene-d10 90 85 88 90 86 Phenanthrene-d10 90 86 88 85 87
Chrysene-d12 85 82 79 75 74 Perylene-d12 79 80 79 71 78
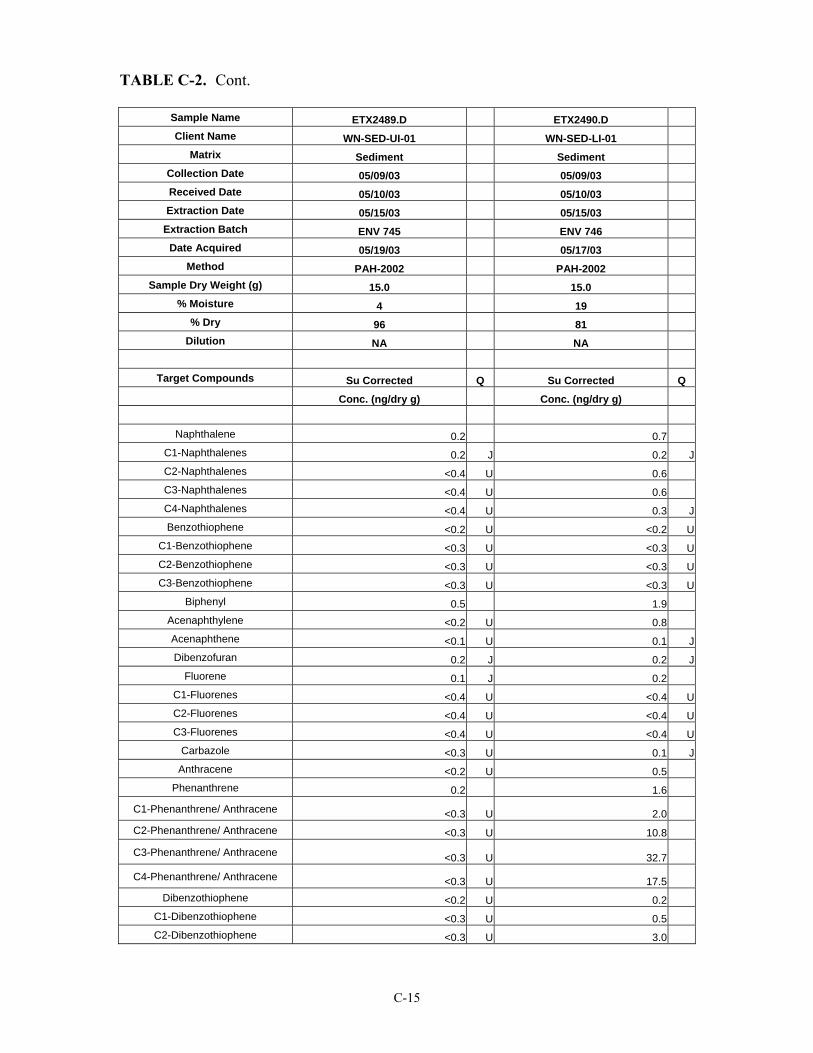
C-15
TABLE C-2. Cont.
Sample Name ETX2489.D ETX2490.D Client Name WN-SED-UI-01 WN-SED-LI-01
Matrix Sediment Sediment Collection Date 05/09/03 05/09/03 Received Date 05/10/03 05/10/03 Extraction Date 05/15/03 05/15/03
Extraction Batch ENV 745 ENV 746 Date Acquired 05/19/03 05/17/03
Method PAH-2002 PAH-2002 Sample Dry Weight (g) 15.0 15.0
% Moisture 4 19 % Dry 96 81
Dilution NA NA
Target Compounds Su Corrected Q Su Corrected Q Conc. (ng/dry g) Conc. (ng/dry g)
Naphthalene 0.2 0.7C1-Naphthalenes 0.2 J 0.2 JC2-Naphthalenes <0.4 U 0.6C3-Naphthalenes <0.4 U 0.6C4-Naphthalenes <0.4 U 0.3 JBenzothiophene <0.2 U <0.2 U
C1-Benzothiophene <0.3 U <0.3 UC2-Benzothiophene <0.3 U <0.3 UC3-Benzothiophene <0.3 U <0.3 U
Biphenyl 0.5 1.9Acenaphthylene <0.2 U 0.8Acenaphthene <0.1 U 0.1 JDibenzofuran 0.2 J 0.2 J
Fluorene 0.1 J 0.2C1-Fluorenes <0.4 U <0.4 UC2-Fluorenes <0.4 U <0.4 UC3-Fluorenes <0.4 U <0.4 U
Carbazole <0.3 U 0.1 JAnthracene <0.2 U 0.5
Phenanthrene 0.2 1.6
C1-Phenanthrene/ Anthracene <0.3 U 2.0C2-Phenanthrene/ Anthracene <0.3 U 10.8
C3-Phenanthrene/ Anthracene <0.3 U 32.7
C4-Phenanthrene/ Anthracene <0.3 U 17.5Dibenzothiophene <0.2 U 0.2
C1-Dibenzothiophene <0.3 U 0.5C2-Dibenzothiophene <0.3 U 3.0
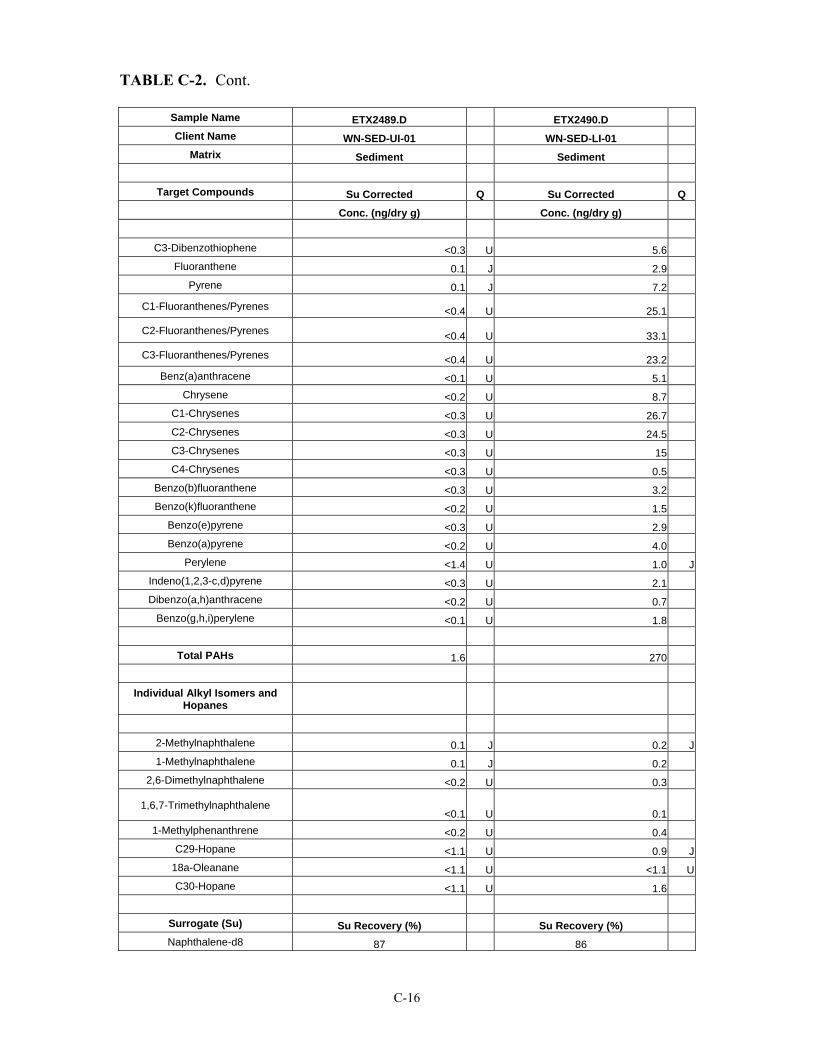
C-16
TABLE C-2. Cont.
Sample Name ETX2489.D ETX2490.D Client Name WN-SED-UI-01 WN-SED-LI-01
Matrix Sediment Sediment
Target Compounds Su Corrected Q Su Corrected Q Conc. (ng/dry g) Conc. (ng/dry g)
C3-Dibenzothiophene <0.3 U 5.6Fluoranthene 0.1 J 2.9
Pyrene 0.1 J 7.2
C1-Fluoranthenes/Pyrenes <0.4 U 25.1
C2-Fluoranthenes/Pyrenes <0.4 U 33.1
C3-Fluoranthenes/Pyrenes <0.4 U 23.2Benz(a)anthracene <0.1 U 5.1
Chrysene <0.2 U 8.7C1-Chrysenes <0.3 U 26.7C2-Chrysenes <0.3 U 24.5C3-Chrysenes <0.3 U 15C4-Chrysenes <0.3 U 0.5
Benzo(b)fluoranthene <0.3 U 3.2Benzo(k)fluoranthene <0.2 U 1.5
Benzo(e)pyrene <0.3 U 2.9Benzo(a)pyrene <0.2 U 4.0
Perylene <1.4 U 1.0 JIndeno(1,2,3-c,d)pyrene <0.3 U 2.1Dibenzo(a,h)anthracene <0.2 U 0.7
Benzo(g,h,i)perylene <0.1 U 1.8
Total PAHs 1.6 270
Individual Alkyl Isomers and Hopanes
2-Methylnaphthalene 0.1 J 0.2 J1-Methylnaphthalene 0.1 J 0.2
2,6-Dimethylnaphthalene <0.2 U 0.3
1,6,7-Trimethylnaphthalene <0.1 U 0.1
1-Methylphenanthrene <0.2 U 0.4C29-Hopane <1.1 U 0.9 J
18a-Oleanane <1.1 U <1.1 UC30-Hopane <1.1 U 1.6
Surrogate (Su) Su Recovery (%) Su Recovery (%) Naphthalene-d8 87 86

C-17
TABLE C-2. Cont.
Sample Name ETX2489.D ETX2490.D Client Name WN-SED-UI-01 WN-SED-LI-01
Matrix Sediment Sediment
Surrogate (Su) Su Recovery (%) Su Recovery (%)
Acenaphthene-d10 91 95 Phenanthrene-d10 87 75
Chrysene-d12 73 77 Perylene-d12 81 83
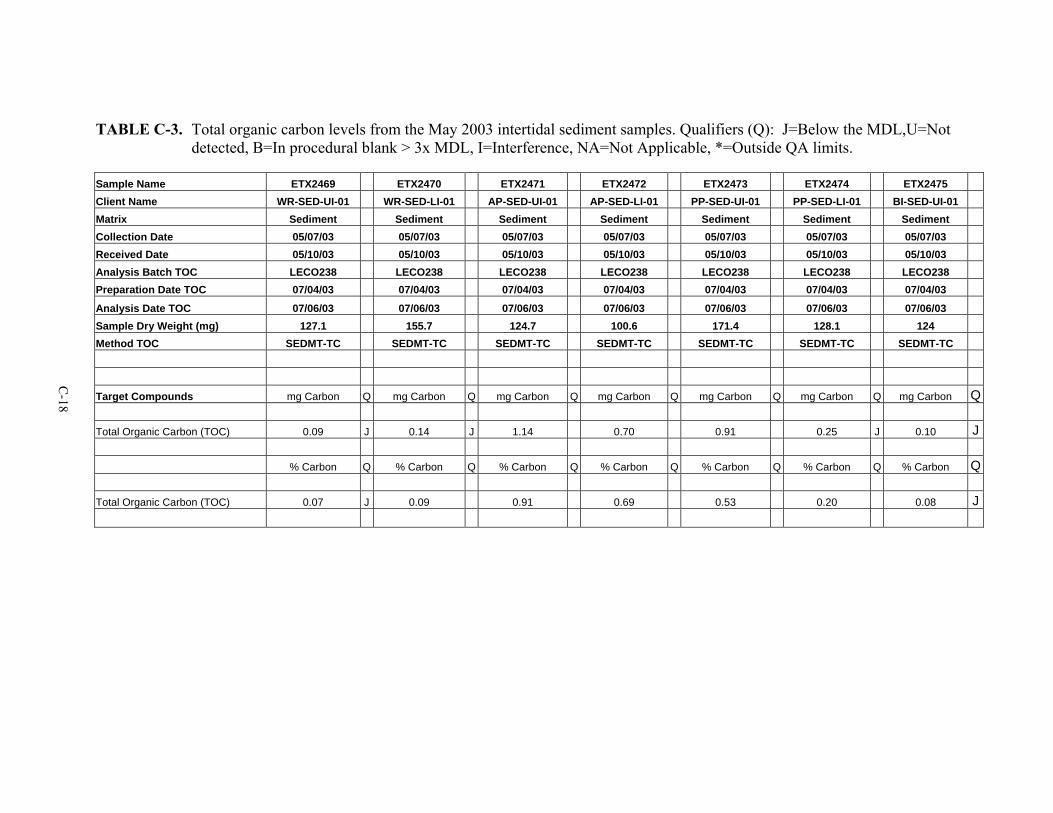
TABLE C-3. Total organic carbon levels from the May 2003 intertidal sediment samples. Qualifiers (Q): J=Below the MDL,U=Not detected, B=In procedural blank > 3x MDL, I=Interference, NA=Not Applicable, *=Outside QA limits.
Sample Name ETX2469 ETX2470 ETX2471 ETX2472 ETX2473 ETX2474 ETX2475 Client Name WR-SED-UI-01 WR-SED-LI-01 AP-SED-UI-01 AP-SED-LI-01 PP-SED-UI-01 PP-SED-LI-01 BI-SED-UI-01 Matrix Sediment Sediment Sediment Sediment Sediment Sediment Sediment Collection Date 05/07/03 05/07/03 05/07/03 05/07/03 05/07/03 05/07/03 05/07/03 Received Date 05/10/03 05/10/03 05/10/03 05/10/03 05/10/03 05/10/03 05/10/03 Analysis Batch TOC LECO238 LECO238 LECO238 LECO238 LECO238 LECO238 LECO238 Preparation Date TOC 07/04/03 07/04/03 07/04/03 07/04/03 07/04/03 07/04/03 07/04/03 Analysis Date TOC 07/06/03 07/06/03 07/06/03 07/06/03 07/06/03 07/06/03 07/06/03 Sample Dry Weight (mg) 127.1 155.7 124.7 100.6 171.4 128.1 124 Method TOC SEDMT-TC SEDMT-TC SEDMT-TC SEDMT-TC SEDMT-TC SEDMT-TC SEDMT-TC Target Compounds mg Carbon Q mg Carbon Q mg Carbon Q mg Carbon Q mg Carbon Q mg Carbon Q mg Carbon Q Total Organic Carbon (TOC) 0.09 J 0.14 J 1.14 0.70 0.91 0.25 J 0.10 J % Carbon Q % Carbon Q % Carbon Q % Carbon Q % Carbon Q % Carbon Q % Carbon Q Total Organic Carbon (TOC) 0.07 J 0.09 0.91 0.69 0.53 0.20 0.08 J
C-18
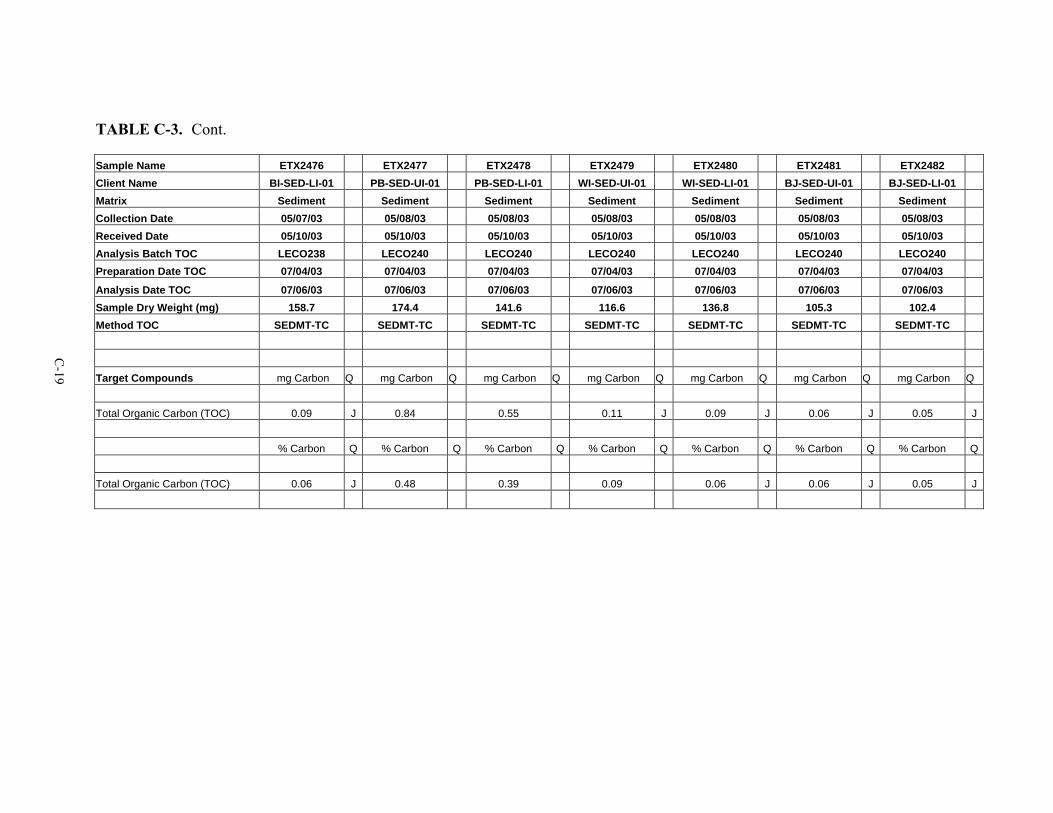
TABLE C-3. Cont.
Sample Name ETX2476 ETX2477 ETX2478 ETX2479 ETX2480 ETX2481 ETX2482 Client Name BI-SED-LI-01 PB-SED-UI-01 PB-SED-LI-01 WI-SED-UI-01 WI-SED-LI-01 BJ-SED-UI-01 BJ-SED-LI-01 Matrix Sediment Sediment Sediment Sediment Sediment Sediment Sediment Collection Date 05/07/03 05/08/03 05/08/03 05/08/03 05/08/03 05/08/03 05/08/03 Received Date 05/10/03 05/10/03 05/10/03 05/10/03 05/10/03 05/10/03 05/10/03 Analysis Batch TOC LECO238 LECO240 LECO240 LECO240 LECO240 LECO240 LECO240 Preparation Date TOC 07/04/03 07/04/03 07/04/03 07/04/03 07/04/03 07/04/03 07/04/03
Analysis Date TOC 07/06/03 07/06/03 07/06/03 07/06/03 07/06/03 07/06/03 07/06/03 Sample Dry Weight (mg) 158.7 174.4 141.6 116.6 136.8 105.3 102.4 Method TOC SEDMT-TC SEDMT-TC SEDMT-TC SEDMT-TC SEDMT-TC SEDMT-TC SEDMT-TC Target Compounds mg Carbon Q mg Carbon Q mg Carbon Q mg Carbon Q mg Carbon Q mg Carbon Q mg Carbon Q Total Organic Carbon (TOC) 0.09 J 0.84 0.55 0.11 J 0.09 J 0.06 J 0.05 J % Carbon Q % Carbon Q % Carbon Q % Carbon Q % Carbon Q % Carbon Q % Carbon Q Total Organic Carbon (TOC) 0.06 J 0.48 0.39 0.09 0.06 J 0.06 J 0.05 J
C-19
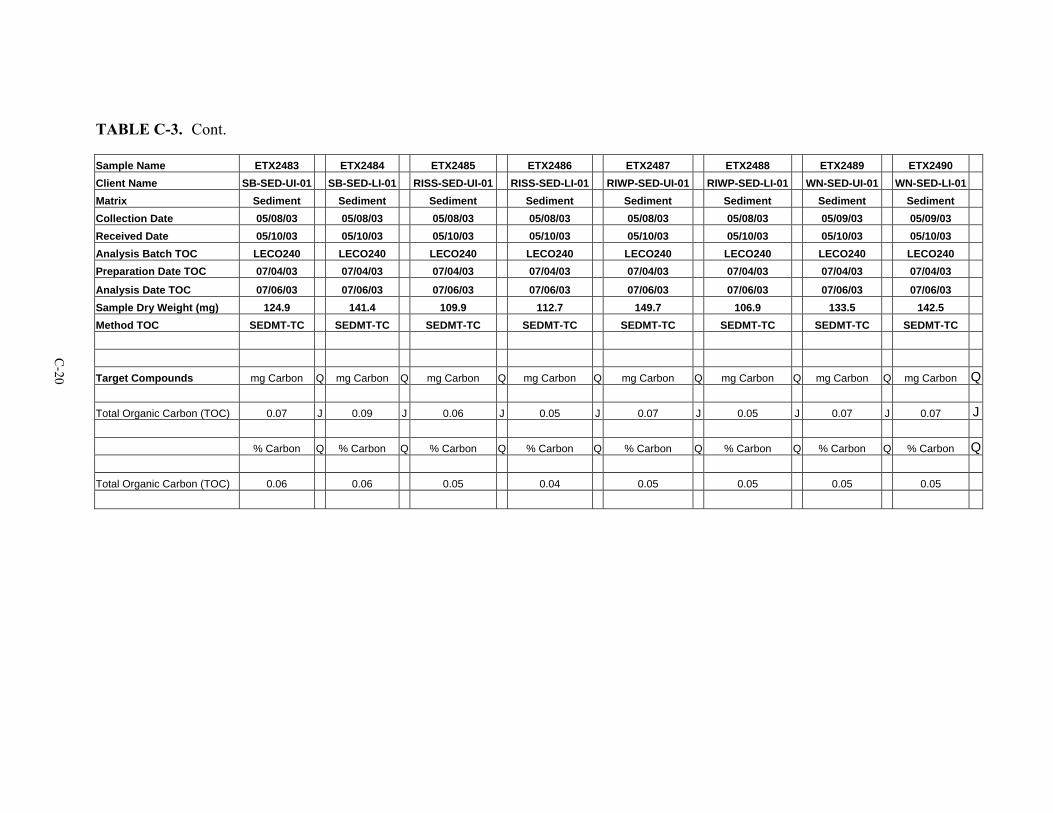
TABLE C-3. Cont.
Sample Name ETX2483 ETX2484 ETX2485 ETX2486 ETX2487 ETX2488 ETX2489 ETX2490 Client Name SB-SED-UI-01 SB-SED-LI-01 RISS-SED-UI-01 RISS-SED-LI-01 RIWP-SED-UI-01 RIWP-SED-LI-01 WN-SED-UI-01 WN-SED-LI-01Matrix Sediment Sediment Sediment Sediment Sediment Sediment Sediment Sediment Collection Date 05/08/03 05/08/03 05/08/03 05/08/03 05/08/03 05/08/03 05/09/03 05/09/03 Received Date 05/10/03 05/10/03 05/10/03 05/10/03 05/10/03 05/10/03 05/10/03 05/10/03 Analysis Batch TOC LECO240 LECO240 LECO240 LECO240 LECO240 LECO240 LECO240 LECO240 Preparation Date TOC 07/04/03 07/04/03 07/04/03 07/04/03 07/04/03 07/04/03 07/04/03 07/04/03
Analysis Date TOC 07/06/03 07/06/03 07/06/03 07/06/03 07/06/03 07/06/03 07/06/03 07/06/03 Sample Dry Weight (mg) 124.9 141.4 109.9 112.7 149.7 106.9 133.5 142.5 Method TOC SEDMT-TC SEDMT-TC SEDMT-TC SEDMT-TC SEDMT-TC SEDMT-TC SEDMT-TC SEDMT-TC Target Compounds mg Carbon Q mg Carbon Q mg Carbon Q mg Carbon Q mg Carbon Q mg Carbon Q mg Carbon Q mg Carbon Q Total Organic Carbon (TOC) 0.07 J 0.09 J 0.06 J 0.05 J 0.07 J 0.05 J 0.07 J 0.07 J % Carbon Q % Carbon Q % Carbon Q % Carbon Q % Carbon Q % Carbon Q % Carbon Q % Carbon Q Total Organic Carbon (TOC) 0.06 0.06 0.05 0.04 0.05 0.05 0.05 0.05
C-20
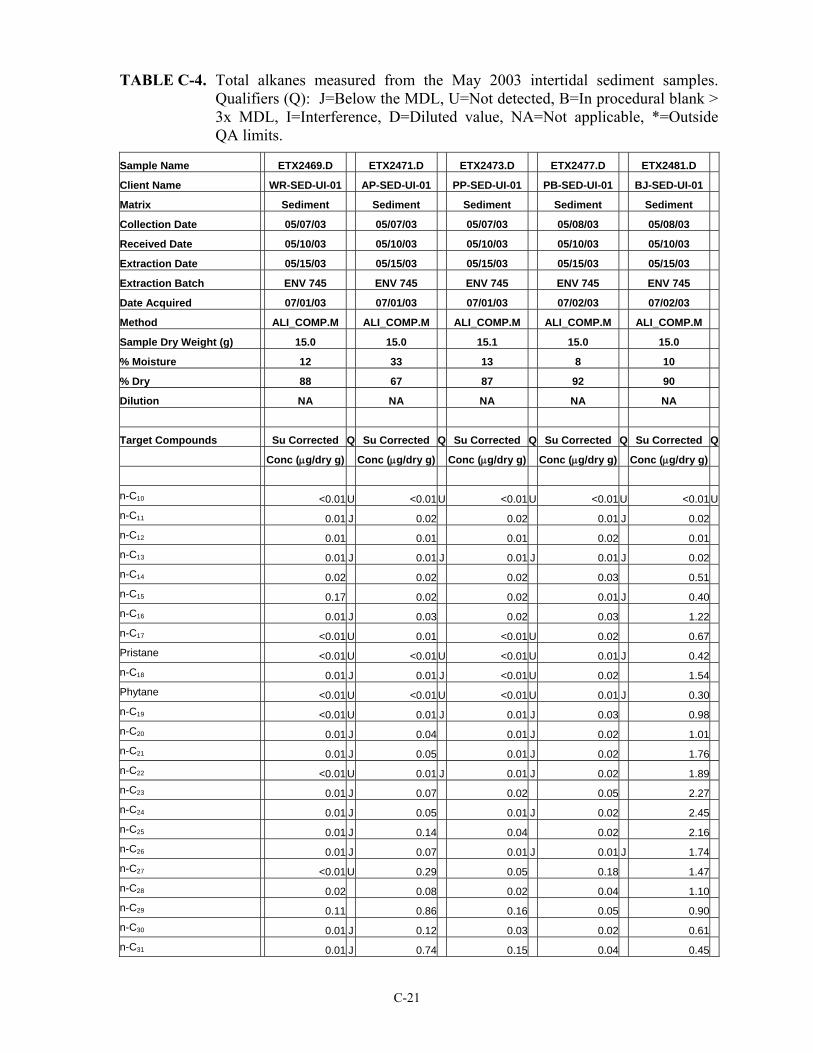
C-21
TABLE C-4. Total alkanes measured from the May 2003 intertidal sediment samples. Qualifiers (Q): J=Below the MDL, U=Not detected, B=In procedural blank > 3x MDL, I=Interference, D=Diluted value, NA=Not applicable, *=Outside QA limits.
Sample Name ETX2469.D ETX2471.D ETX2473.D ETX2477.D ETX2481.D
Client Name WR-SED-UI-01 AP-SED-UI-01 PP-SED-UI-01 PB-SED-UI-01 BJ-SED-UI-01
Matrix Sediment Sediment Sediment Sediment Sediment
Collection Date 05/07/03 05/07/03 05/07/03 05/08/03 05/08/03
Received Date 05/10/03 05/10/03 05/10/03 05/10/03 05/10/03
Extraction Date 05/15/03 05/15/03 05/15/03 05/15/03 05/15/03
Extraction Batch ENV 745 ENV 745 ENV 745 ENV 745 ENV 745
Date Acquired 07/01/03 07/01/03 07/01/03 07/02/03 07/02/03
Method ALI_COMP.M ALI_COMP.M ALI_COMP.M ALI_COMP.M ALI_COMP.M
Sample Dry Weight (g) 15.0 15.0 15.1 15.0 15.0
% Moisture 12 33 13 8 10
% Dry 88 67 87 92 90
Dilution NA NA NA NA NA
Target Compounds Su Corrected Q Su Corrected Q Su Corrected Q Su Corrected Q Su Corrected Q
Conc (μg/dry g) Conc (μg/dry g) Conc (μg/dry g) Conc (μg/dry g) Conc (μg/dry g)
n-C10 <0.01U <0.01U <0.01U <0.01 U <0.01Un-C11 0.01 J 0.02 0.02 0.01 J 0.02n-C12 0.01 0.01 0.01 0.02 0.01n-C13 0.01 J 0.01 J 0.01 J 0.01 J 0.02n-C14 0.02 0.02 0.02 0.03 0.51n-C15 0.17 0.02 0.02 0.01 J 0.40n-C16 0.01 J 0.03 0.02 0.03 1.22n-C17 <0.01U 0.01 <0.01U 0.02 0.67Pristane <0.01U <0.01U <0.01U 0.01 J 0.42n-C18 0.01 J 0.01 J <0.01U 0.02 1.54Phytane <0.01U <0.01U <0.01U 0.01 J 0.30n-C19 <0.01U 0.01 J 0.01 J 0.03 0.98n-C20 0.01 J 0.04 0.01 J 0.02 1.01n-C21 0.01 J 0.05 0.01 J 0.02 1.76n-C22 <0.01U 0.01 J 0.01 J 0.02 1.89n-C23 0.01 J 0.07 0.02 0.05 2.27n-C24 0.01 J 0.05 0.01 J 0.02 2.45n-C25 0.01 J 0.14 0.04 0.02 2.16n-C26 0.01 J 0.07 0.01 J 0.01 J 1.74n-C27 <0.01U 0.29 0.05 0.18 1.47n-C28 0.02 0.08 0.02 0.04 1.10n-C29 0.11 0.86 0.16 0.05 0.90n-C30 0.01 J 0.12 0.03 0.02 0.61n-C31 0.01 J 0.74 0.15 0.04 0.45
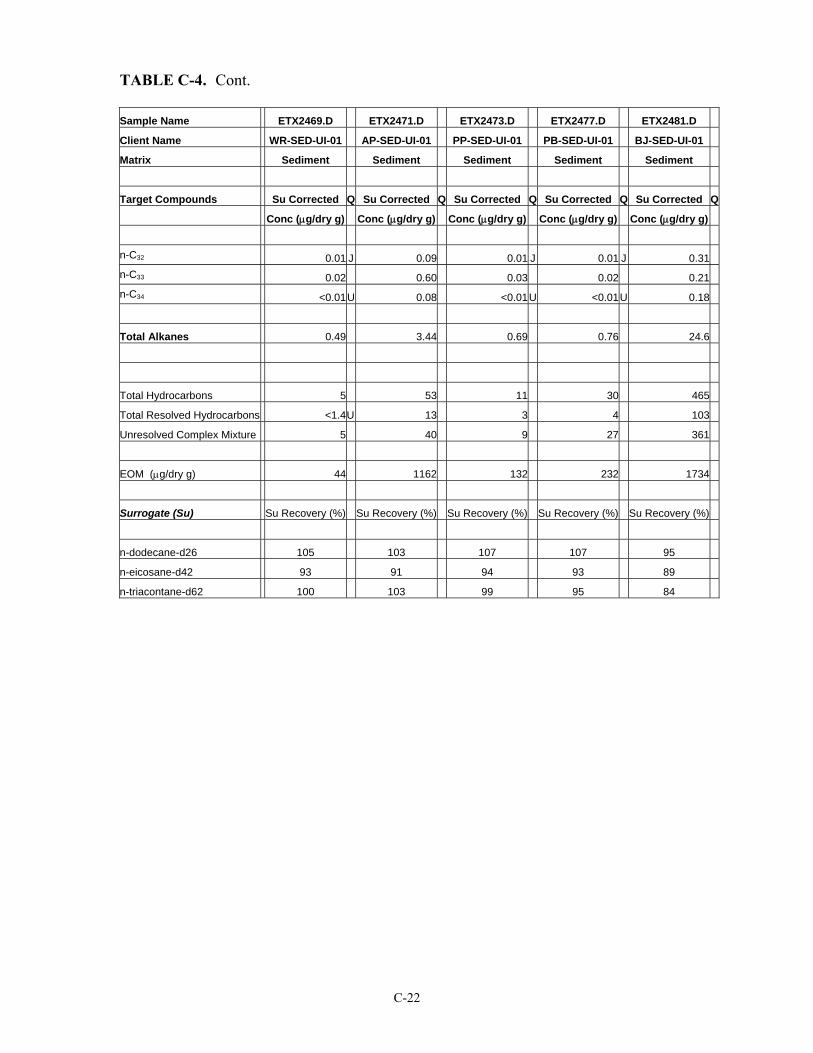
C-22
TABLE C-4. Cont. Sample Name ETX2469.D ETX2471.D ETX2473.D ETX2477.D ETX2481.D
Client Name WR-SED-UI-01 AP-SED-UI-01 PP-SED-UI-01 PB-SED-UI-01 BJ-SED-UI-01
Matrix Sediment Sediment Sediment Sediment Sediment
Target Compounds Su Corrected Q Su Corrected Q Su Corrected Q Su Corrected Q Su Corrected Q
Conc (μg/dry g) Conc (μg/dry g) Conc (μg/dry g) Conc (μg/dry g) Conc (μg/dry g) n-C32 0.01 J 0.09 0.01 J 0.01 J 0.31n-C33 0.02 0.60 0.03 0.02 0.21n-C34 <0.01U 0.08 <0.01U <0.01U 0.18
Total Alkanes 0.49 3.44 0.69 0.76 24.6
Total Hydrocarbons 5 53 11 30 465
Total Resolved Hydrocarbons <1.4U 13 3 4 103
Unresolved Complex Mixture 5 40 9 27 361
EOM (μg/dry g) 44 1162 132 232 1734
Surrogate (Su) Su Recovery (%) Su Recovery (%) Su Recovery (%) Su Recovery (%) Su Recovery (%)
n-dodecane-d26 105 103 107 107 95
n-eicosane-d42 93 91 94 93 89
n-triacontane-d62 100 103 99 95 84
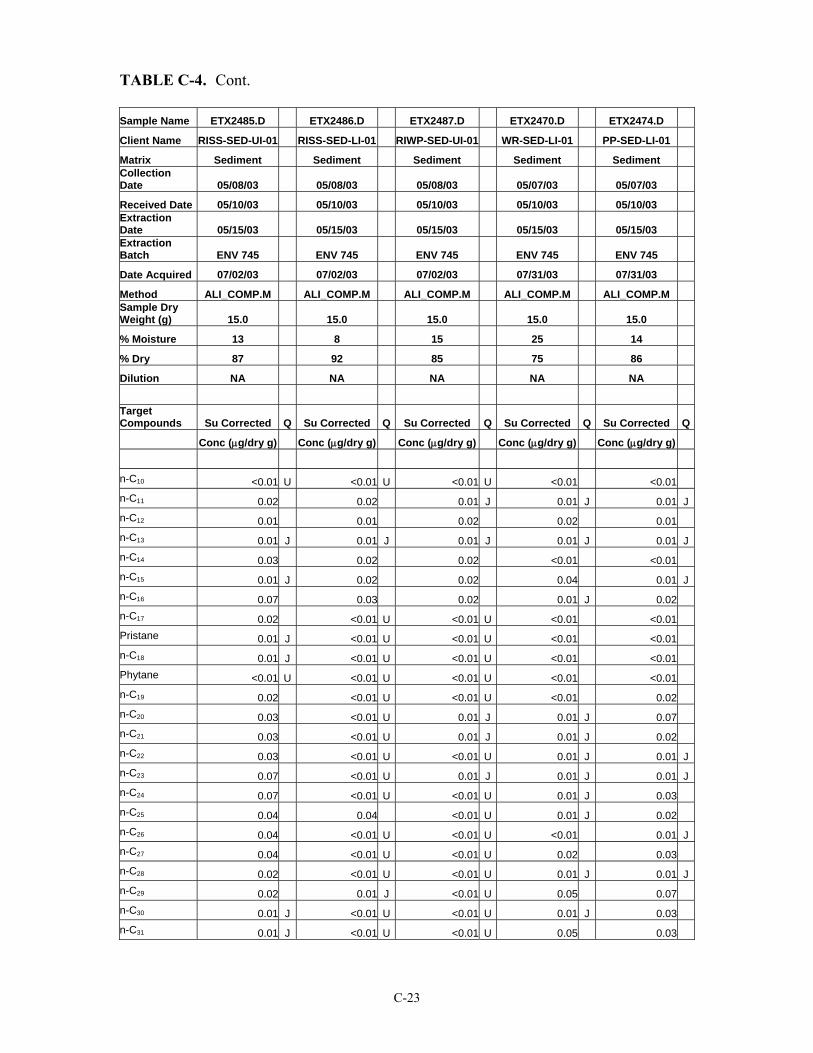
C-23
TABLE C-4. Cont. Sample Name ETX2485.D ETX2486.D ETX2487.D ETX2470.D ETX2474.D
Client Name RISS-SED-UI-01 RISS-SED-LI-01 RIWP-SED-UI-01 WR-SED-LI-01 PP-SED-LI-01
Matrix Sediment Sediment Sediment Sediment Sediment Collection Date 05/08/03 05/08/03 05/08/03 05/07/03 05/07/03
Received Date 05/10/03 05/10/03 05/10/03 05/10/03 05/10/03 Extraction Date 05/15/03 05/15/03 05/15/03 05/15/03 05/15/03 Extraction Batch ENV 745 ENV 745 ENV 745 ENV 745 ENV 745
Date Acquired 07/02/03 07/02/03 07/02/03 07/31/03 07/31/03
Method ALI_COMP.M ALI_COMP.M ALI_COMP.M ALI_COMP.M ALI_COMP.M Sample Dry Weight (g) 15.0 15.0 15.0 15.0 15.0
% Moisture 13 8 15 25 14
% Dry 87 92 85 75 86
Dilution NA NA NA NA NA
Target Compounds Su Corrected Q Su Corrected Q Su Corrected Q Su Corrected Q Su Corrected Q
Conc (μg/dry g) Conc (μg/dry g) Conc (μg/dry g) Conc (μg/dry g) Conc (μg/dry g)
n-C10 <0.01 U <0.01 U <0.01 U <0.01 <0.01 n-C11 0.02 0.02 0.01 J 0.01 J 0.01 Jn-C12 0.01 0.01 0.02 0.02 0.01 n-C13 0.01 J 0.01 J 0.01 J 0.01 J 0.01 Jn-C14 0.03 0.02 0.02 <0.01 <0.01 n-C15 0.01 J 0.02 0.02 0.04 0.01 Jn-C16 0.07 0.03 0.02 0.01 J 0.02 n-C17 0.02 <0.01 U <0.01 U <0.01 <0.01 Pristane 0.01 J <0.01 U <0.01 U <0.01 <0.01 n-C18 0.01 J <0.01 U <0.01 U <0.01 <0.01 Phytane <0.01 U <0.01 U <0.01 U <0.01 <0.01 n-C19 0.02 <0.01 U <0.01 U <0.01 0.02 n-C20 0.03 <0.01 U 0.01 J 0.01 J 0.07 n-C21 0.03 <0.01 U 0.01 J 0.01 J 0.02 n-C22 0.03 <0.01 U <0.01 U 0.01 J 0.01 Jn-C23 0.07 <0.01 U 0.01 J 0.01 J 0.01 Jn-C24 0.07 <0.01 U <0.01 U 0.01 J 0.03 n-C25 0.04 0.04 <0.01 U 0.01 J 0.02 n-C26 0.04 <0.01 U <0.01 U <0.01 0.01 Jn-C27 0.04 <0.01 U <0.01 U 0.02 0.03 n-C28 0.02 <0.01 U <0.01 U 0.01 J 0.01 Jn-C29 0.02 0.01 J <0.01 U 0.05 0.07 n-C30 0.01 J <0.01 U <0.01 U 0.01 J 0.03 n-C31 0.01 J <0.01 U <0.01 U 0.05 0.03
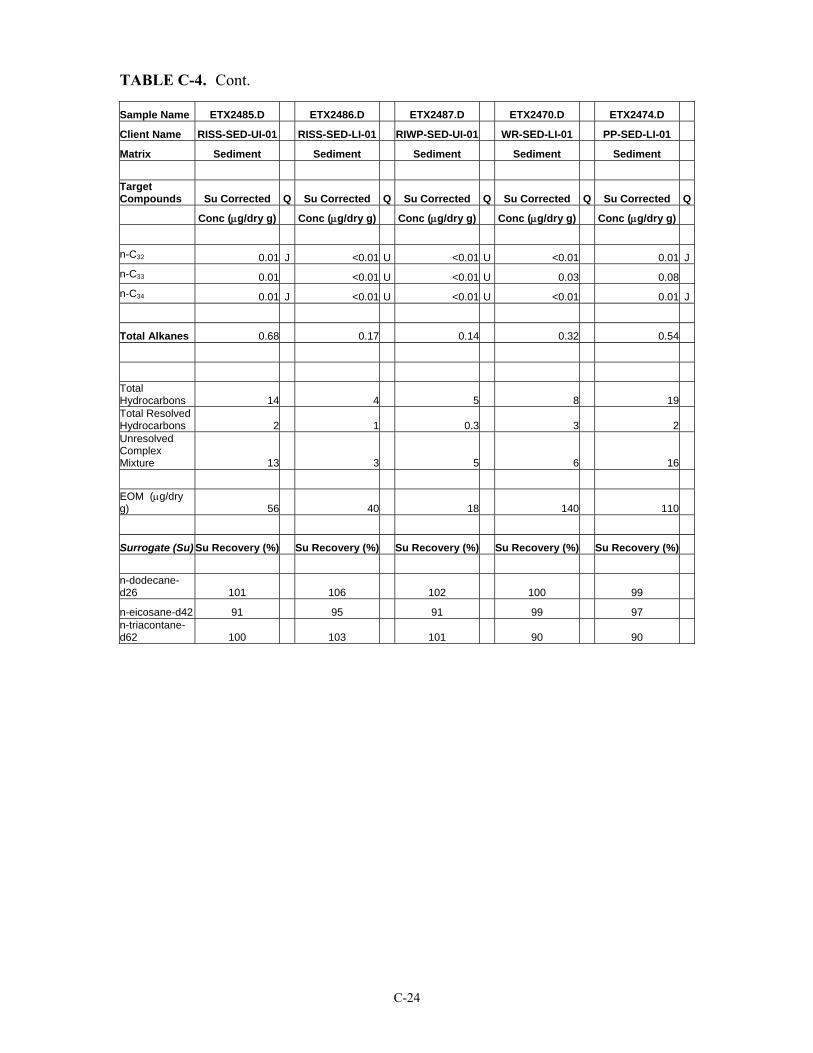
C-24
TABLE C-4. Cont.
Sample Name ETX2485.D ETX2486.D ETX2487.D ETX2470.D ETX2474.D
Client Name RISS-SED-UI-01 RISS-SED-LI-01 RIWP-SED-UI-01 WR-SED-LI-01 PP-SED-LI-01
Matrix Sediment Sediment Sediment Sediment Sediment Target Compounds Su Corrected Q Su Corrected Q Su Corrected Q Su Corrected Q Su Corrected Q
Conc (μg/dry g) Conc (μg/dry g) Conc (μg/dry g) Conc (μg/dry g) Conc (μg/dry g) n-C32 0.01 J <0.01 U <0.01 U <0.01 0.01 Jn-C33 0.01 <0.01 U <0.01 U 0.03 0.08 n-C34 0.01 J <0.01 U <0.01 U <0.01 0.01 J
Total Alkanes 0.68 0.17 0.14 0.32 0.54
Total Hydrocarbons 14 4 5 8 19 Total Resolved Hydrocarbons 2 1 0.3 3 2 Unresolved Complex Mixture 13 3 5 6 16
EOM (μg/dry g) 56 40 18 140 110
Surrogate (Su) Su Recovery (%) Su Recovery (%) Su Recovery (%) Su Recovery (%) Su Recovery (%)
n-dodecane-d26 101 106 102 100 99
n-eicosane-d42 91 95 91 99 97 n-triacontane-d62 100 103 101 90 90
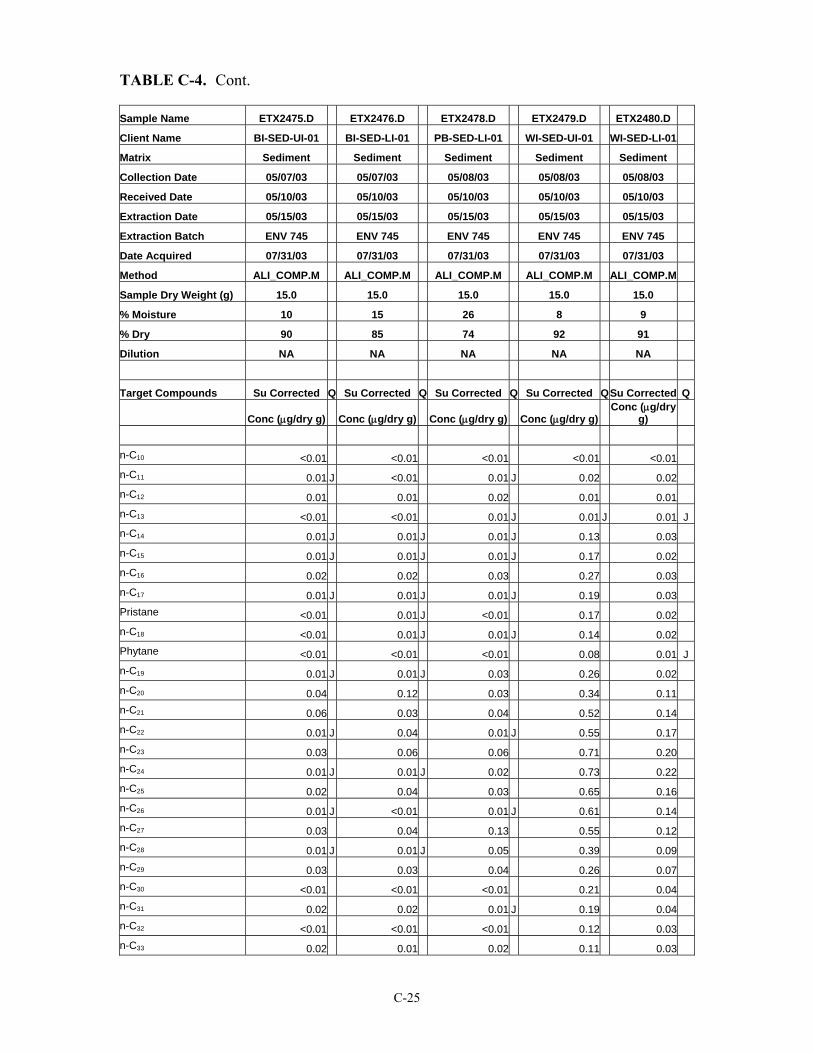
C-25
TABLE C-4. Cont.
Sample Name ETX2475.D ETX2476.D ETX2478.D ETX2479.D ETX2480.D
Client Name BI-SED-UI-01 BI-SED-LI-01 PB-SED-LI-01 WI-SED-UI-01 WI-SED-LI-01
Matrix Sediment Sediment Sediment Sediment Sediment
Collection Date 05/07/03 05/07/03 05/08/03 05/08/03 05/08/03
Received Date 05/10/03 05/10/03 05/10/03 05/10/03 05/10/03
Extraction Date 05/15/03 05/15/03 05/15/03 05/15/03 05/15/03
Extraction Batch ENV 745 ENV 745 ENV 745 ENV 745 ENV 745
Date Acquired 07/31/03 07/31/03 07/31/03 07/31/03 07/31/03
Method ALI_COMP.M ALI_COMP.M ALI_COMP.M ALI_COMP.M ALI_COMP.M
Sample Dry Weight (g) 15.0 15.0 15.0 15.0 15.0
% Moisture 10 15 26 8 9
% Dry 90 85 74 92 91
Dilution NA NA NA NA NA
Target Compounds Su Corrected Q Su Corrected Q Su Corrected Q Su Corrected Q Su Corrected Q
Conc (μg/dry g) Conc (μg/dry g) Conc (μg/dry g) Conc (μg/dry g) Conc (μg/dry
g)
n-C10 <0.01 <0.01 <0.01 <0.01 <0.01 n-C11 0.01 J <0.01 0.01 J 0.02 0.02 n-C12 0.01 0.01 0.02 0.01 0.01 n-C13 <0.01 <0.01 0.01 J 0.01 J 0.01 Jn-C14 0.01 J 0.01 J 0.01 J 0.13 0.03 n-C15 0.01 J 0.01 J 0.01 J 0.17 0.02 n-C16 0.02 0.02 0.03 0.27 0.03 n-C17 0.01 J 0.01 J 0.01 J 0.19 0.03 Pristane <0.01 0.01 J <0.01 0.17 0.02 n-C18 <0.01 0.01 J 0.01 J 0.14 0.02 Phytane <0.01 <0.01 <0.01 0.08 0.01 Jn-C19 0.01 J 0.01 J 0.03 0.26 0.02 n-C20 0.04 0.12 0.03 0.34 0.11 n-C21 0.06 0.03 0.04 0.52 0.14 n-C22 0.01 J 0.04 0.01 J 0.55 0.17 n-C23 0.03 0.06 0.06 0.71 0.20 n-C24 0.01 J 0.01 J 0.02 0.73 0.22 n-C25 0.02 0.04 0.03 0.65 0.16 n-C26 0.01 J <0.01 0.01 J 0.61 0.14 n-C27 0.03 0.04 0.13 0.55 0.12 n-C28 0.01 J 0.01 J 0.05 0.39 0.09 n-C29 0.03 0.03 0.04 0.26 0.07 n-C30 <0.01 <0.01 <0.01 0.21 0.04 n-C31 0.02 0.02 0.01 J 0.19 0.04 n-C32 <0.01 <0.01 <0.01 0.12 0.03 n-C33 0.02 0.01 0.02 0.11 0.03
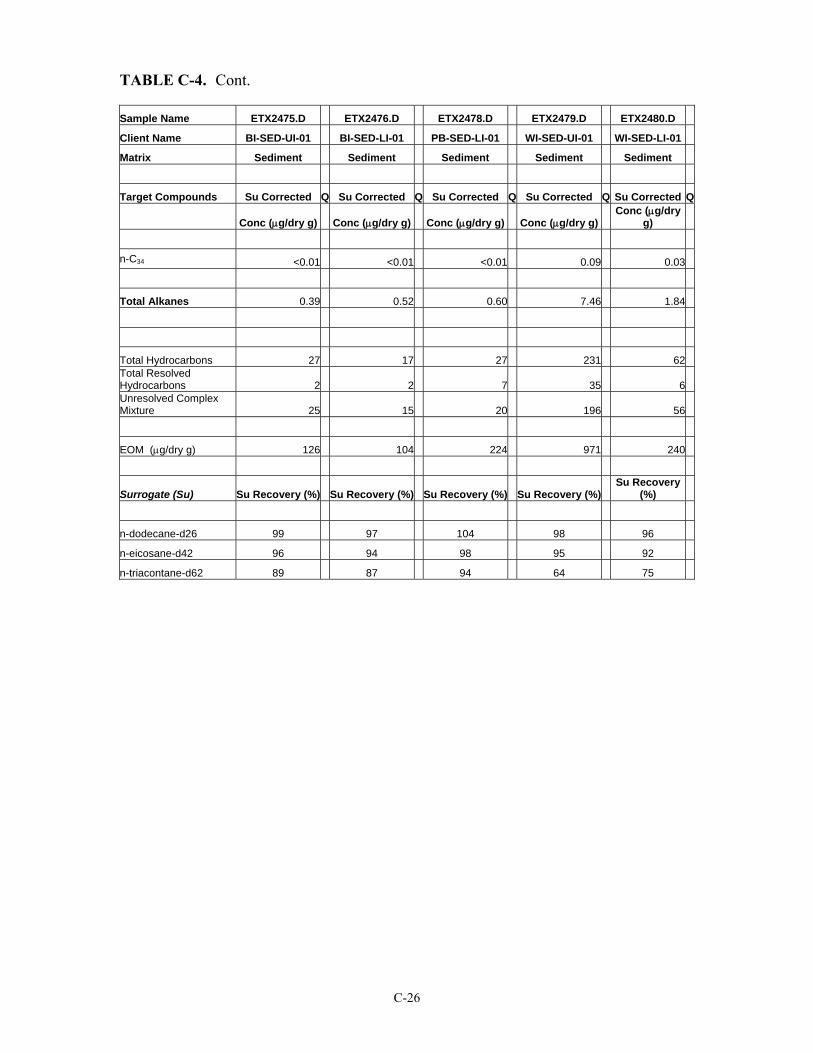
C-26
TABLE C-4. Cont.
Sample Name ETX2475.D ETX2476.D ETX2478.D ETX2479.D ETX2480.D
Client Name BI-SED-UI-01 BI-SED-LI-01 PB-SED-LI-01 WI-SED-UI-01 WI-SED-LI-01
Matrix Sediment Sediment Sediment Sediment Sediment
Target Compounds Su Corrected Q Su Corrected Q Su Corrected Q Su Corrected Q Su Corrected Q
Conc (μg/dry g) Conc (μg/dry g) Conc (μg/dry g) Conc (μg/dry g) Conc (μg/dry
g)
n-C34 <0.01 <0.01 <0.01 0.09 0.03
Total Alkanes 0.39 0.52 0.60 7.46 1.84
Total Hydrocarbons 27 17 27 231 62 Total Resolved Hydrocarbons 2 2 7 35 6 Unresolved Complex Mixture 25 15 20 196 56
EOM (μg/dry g) 126 104 224 971 240
Surrogate (Su) Su Recovery (%) Su Recovery (%) Su Recovery (%) Su Recovery (%) Su Recovery
(%)
n-dodecane-d26 99 97 104 98 96
n-eicosane-d42 96 94 98 95 92
n-triacontane-d62 89 87 94 64 75
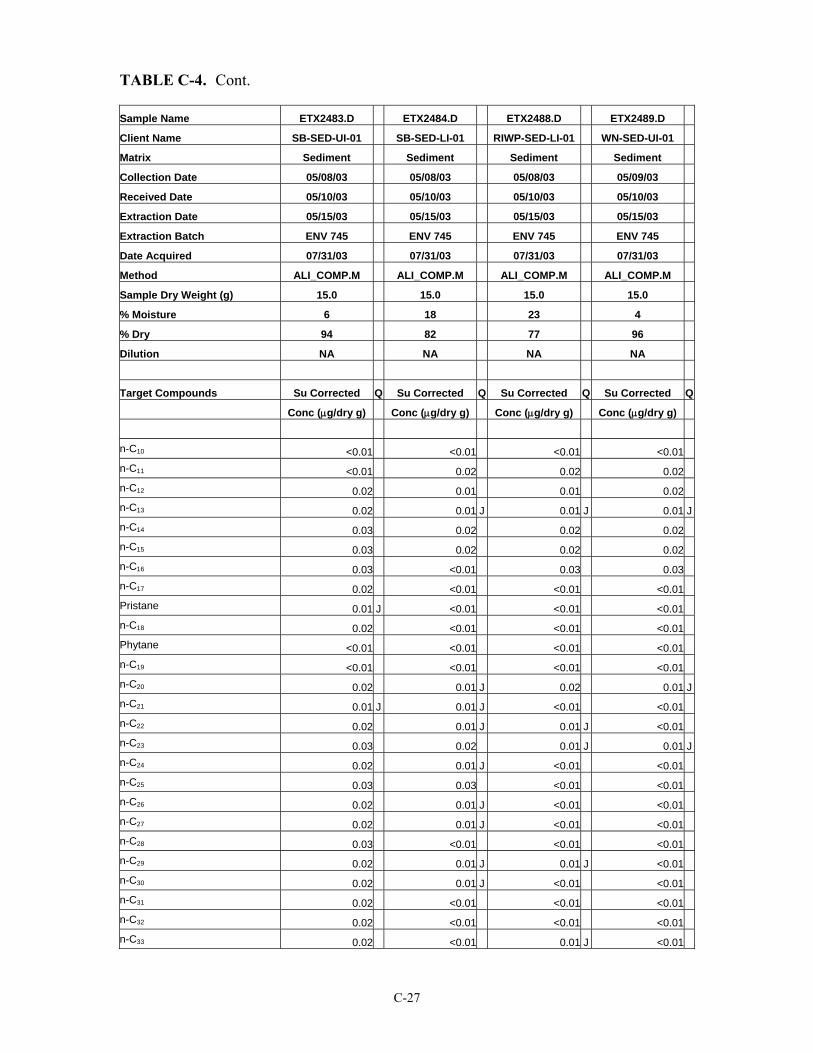
C-27
TABLE C-4. Cont.
Sample Name ETX2483.D ETX2484.D ETX2488.D ETX2489.D
Client Name SB-SED-UI-01 SB-SED-LI-01 RIWP-SED-LI-01 WN-SED-UI-01
Matrix Sediment Sediment Sediment Sediment
Collection Date 05/08/03 05/08/03 05/08/03 05/09/03
Received Date 05/10/03 05/10/03 05/10/03 05/10/03
Extraction Date 05/15/03 05/15/03 05/15/03 05/15/03
Extraction Batch ENV 745 ENV 745 ENV 745 ENV 745
Date Acquired 07/31/03 07/31/03 07/31/03 07/31/03
Method ALI_COMP.M ALI_COMP.M ALI_COMP.M ALI_COMP.M
Sample Dry Weight (g) 15.0 15.0 15.0 15.0
% Moisture 6 18 23 4
% Dry 94 82 77 96
Dilution NA NA NA NA
Target Compounds Su Corrected Q Su Corrected Q Su Corrected Q Su Corrected Q
Conc (μg/dry g) Conc (μg/dry g) Conc (μg/dry g) Conc (μg/dry g)
n-C10 <0.01 <0.01 <0.01 <0.01n-C11 <0.01 0.02 0.02 0.02n-C12 0.02 0.01 0.01 0.02n-C13 0.02 0.01 J 0.01 J 0.01 Jn-C14 0.03 0.02 0.02 0.02n-C15 0.03 0.02 0.02 0.02n-C16 0.03 <0.01 0.03 0.03n-C17 0.02 <0.01 <0.01 <0.01Pristane 0.01 J <0.01 <0.01 <0.01n-C18 0.02 <0.01 <0.01 <0.01Phytane <0.01 <0.01 <0.01 <0.01n-C19 <0.01 <0.01 <0.01 <0.01n-C20 0.02 0.01 J 0.02 0.01 Jn-C21 0.01 J 0.01 J <0.01 <0.01n-C22 0.02 0.01 J 0.01 J <0.01n-C23 0.03 0.02 0.01 J 0.01 Jn-C24 0.02 0.01 J <0.01 <0.01n-C25 0.03 0.03 <0.01 <0.01n-C26 0.02 0.01 J <0.01 <0.01n-C27 0.02 0.01 J <0.01 <0.01n-C28 0.03 <0.01 <0.01 <0.01n-C29 0.02 0.01 J 0.01 J <0.01n-C30 0.02 0.01 J <0.01 <0.01n-C31 0.02 <0.01 <0.01 <0.01n-C32 0.02 <0.01 <0.01 <0.01n-C33 0.02 <0.01 0.01 J <0.01
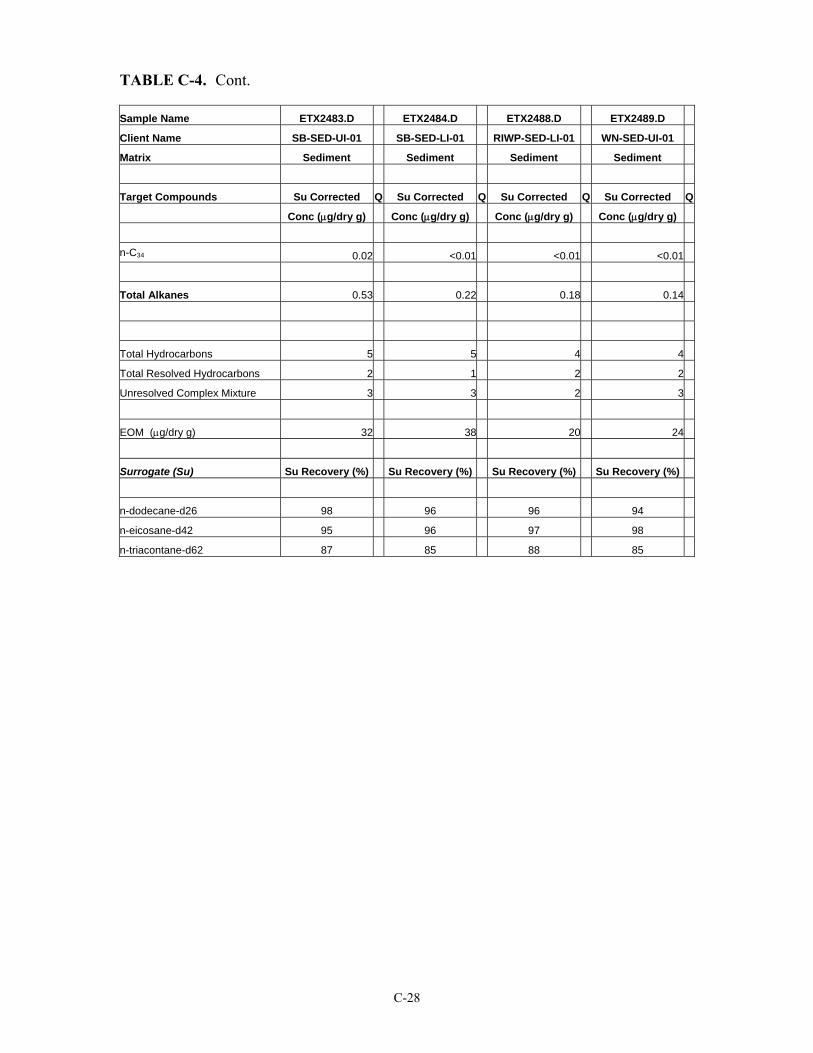
C-28
TABLE C-4. Cont.
Sample Name ETX2483.D ETX2484.D ETX2488.D ETX2489.D
Client Name SB-SED-UI-01 SB-SED-LI-01 RIWP-SED-LI-01 WN-SED-UI-01
Matrix Sediment Sediment Sediment Sediment
Target Compounds Su Corrected Q Su Corrected Q Su Corrected Q Su Corrected Q
Conc (μg/dry g) Conc (μg/dry g) Conc (μg/dry g) Conc (μg/dry g)
n-C34 0.02 <0.01 <0.01 <0.01
Total Alkanes 0.53 0.22 0.18 0.14
Total Hydrocarbons 5 5 4 4
Total Resolved Hydrocarbons 2 1 2 2
Unresolved Complex Mixture 3 3 2 3
EOM (μg/dry g) 32 38 20 24
Surrogate (Su) Su Recovery (%) Su Recovery (%) Su Recovery (%) Su Recovery (%)
n-dodecane-d26 98 96 96 94
n-eicosane-d42 95 96 97 98
n-triacontane-d62 87 85 88 85

D-1
APPENDIX D
JANUARY 2004 SEDIMENT CHEMISTRY DATA - EPHs
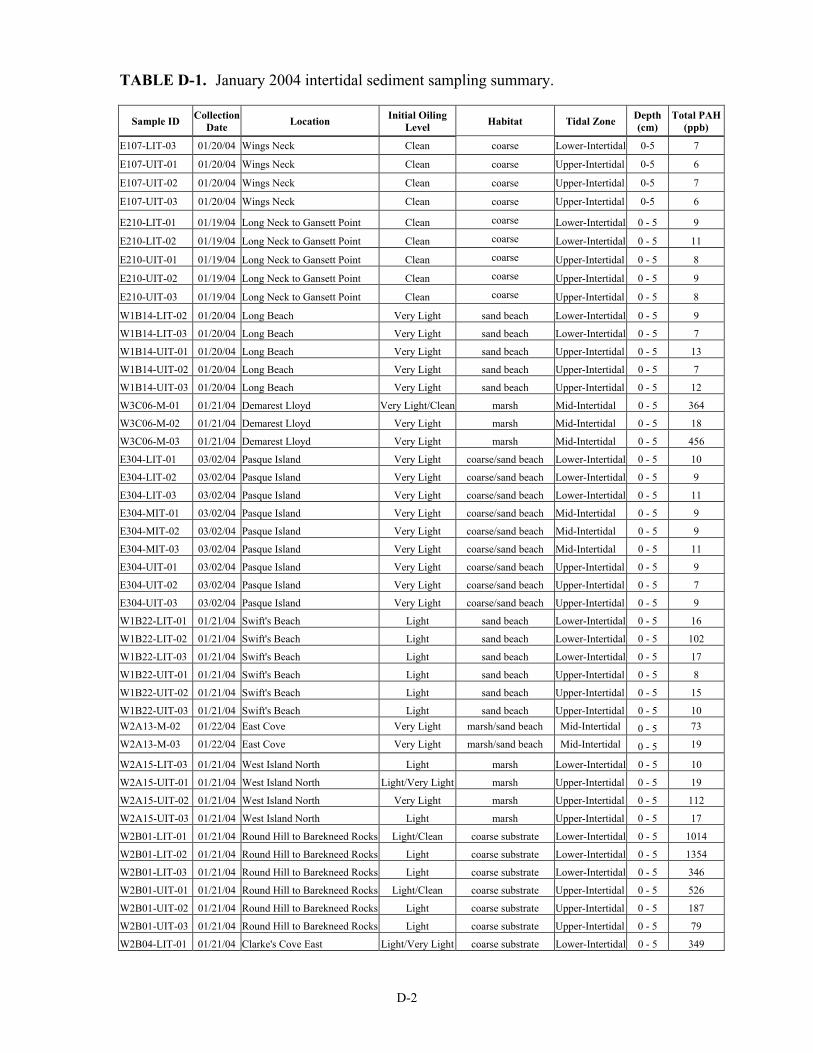
D-2
TABLE D-1. January 2004 intertidal sediment sampling summary.
Sample ID Collection Date Location Initial Oiling
Level Habitat Tidal Zone Depth(cm)
Total PAH(ppb)
E107-LIT-03 01/20/04 Wings Neck Clean coarse Lower-Intertidal 0-5 7
E107-UIT-01 01/20/04 Wings Neck Clean coarse Upper-Intertidal 0-5 6
E107-UIT-02 01/20/04 Wings Neck Clean coarse Upper-Intertidal 0-5 7
E107-UIT-03 01/20/04 Wings Neck Clean coarse Upper-Intertidal 0-5 6
E210-LIT-01 01/19/04 Long Neck to Gansett Point Clean coarse Lower-Intertidal 0 - 5 9
E210-LIT-02 01/19/04 Long Neck to Gansett Point Clean coarse Lower-Intertidal 0 - 5 11
E210-UIT-01 01/19/04 Long Neck to Gansett Point Clean coarse Upper-Intertidal 0 - 5 8
E210-UIT-02 01/19/04 Long Neck to Gansett Point Clean coarse Upper-Intertidal 0 - 5 9
E210-UIT-03 01/19/04 Long Neck to Gansett Point Clean coarse Upper-Intertidal 0 - 5 8
W1B14-LIT-02 01/20/04 Long Beach Very Light sand beach Lower-Intertidal 0 - 5 9
W1B14-LIT-03 01/20/04 Long Beach Very Light sand beach Lower-Intertidal 0 - 5 7
W1B14-UIT-01 01/20/04 Long Beach Very Light sand beach Upper-Intertidal 0 - 5 13
W1B14-UIT-02 01/20/04 Long Beach Very Light sand beach Upper-Intertidal 0 - 5 7
W1B14-UIT-03 01/20/04 Long Beach Very Light sand beach Upper-Intertidal 0 - 5 12
W3C06-M-01 01/21/04 Demarest Lloyd Very Light/Clean marsh Mid-Intertidal 0 - 5 364
W3C06-M-02 01/21/04 Demarest Lloyd Very Light marsh Mid-Intertidal 0 - 5 18
W3C06-M-03 01/21/04 Demarest Lloyd Very Light marsh Mid-Intertidal 0 - 5 456
E304-LIT-01 03/02/04 Pasque Island Very Light coarse/sand beach Lower-Intertidal 0 - 5 10
E304-LIT-02 03/02/04 Pasque Island Very Light coarse/sand beach Lower-Intertidal 0 - 5 9
E304-LIT-03 03/02/04 Pasque Island Very Light coarse/sand beach Lower-Intertidal 0 - 5 11
E304-MIT-01 03/02/04 Pasque Island Very Light coarse/sand beach Mid-Intertidal 0 - 5 9
E304-MIT-02 03/02/04 Pasque Island Very Light coarse/sand beach Mid-Intertidal 0 - 5 9
E304-MIT-03 03/02/04 Pasque Island Very Light coarse/sand beach Mid-Intertidal 0 - 5 11
E304-UIT-01 03/02/04 Pasque Island Very Light coarse/sand beach Upper-Intertidal 0 - 5 9
E304-UIT-02 03/02/04 Pasque Island Very Light coarse/sand beach Upper-Intertidal 0 - 5 7
E304-UIT-03 03/02/04 Pasque Island Very Light coarse/sand beach Upper-Intertidal 0 - 5 9
W1B22-LIT-01 01/21/04 Swift's Beach Light sand beach Lower-Intertidal 0 - 5 16
W1B22-LIT-02 01/21/04 Swift's Beach Light sand beach Lower-Intertidal 0 - 5 102
W1B22-LIT-03 01/21/04 Swift's Beach Light sand beach Lower-Intertidal 0 - 5 17
W1B22-UIT-01 01/21/04 Swift's Beach Light sand beach Upper-Intertidal 0 - 5 8
W1B22-UIT-02 01/21/04 Swift's Beach Light sand beach Upper-Intertidal 0 - 5 15
W1B22-UIT-03 01/21/04 Swift's Beach Light sand beach Upper-Intertidal 0 - 5 10 W2A13-M-02 01/22/04 East Cove Very Light marsh/sand beach Mid-Intertidal 0 - 5 73
W2A13-M-03 01/22/04 East Cove Very Light marsh/sand beach Mid-Intertidal 0 - 5 19
W2A15-LIT-03 01/21/04 West Island North Light marsh Lower-Intertidal 0 - 5 10
W2A15-UIT-01 01/21/04 West Island North Light/Very Light marsh Upper-Intertidal 0 - 5 19
W2A15-UIT-02 01/21/04 West Island North Very Light marsh Upper-Intertidal 0 - 5 112
W2A15-UIT-03 01/21/04 West Island North Light marsh Upper-Intertidal 0 - 5 17
W2B01-LIT-01 01/21/04 Round Hill to Barekneed Rocks Light/Clean coarse substrate Lower-Intertidal 0 - 5 1014
W2B01-LIT-02 01/21/04 Round Hill to Barekneed Rocks Light coarse substrate Lower-Intertidal 0 - 5 1354
W2B01-LIT-03 01/21/04 Round Hill to Barekneed Rocks Light coarse substrate Lower-Intertidal 0 - 5 346
W2B01-UIT-01 01/21/04 Round Hill to Barekneed Rocks Light/Clean coarse substrate Upper-Intertidal 0 - 5 526
W2B01-UIT-02 01/21/04 Round Hill to Barekneed Rocks Light coarse substrate Upper-Intertidal 0 - 5 187
W2B01-UIT-03 01/21/04 Round Hill to Barekneed Rocks Light coarse substrate Upper-Intertidal 0 - 5 79
W2B04-LIT-01 01/21/04 Clarke's Cove East Light/Very Light coarse substrate Lower-Intertidal 0 - 5 349
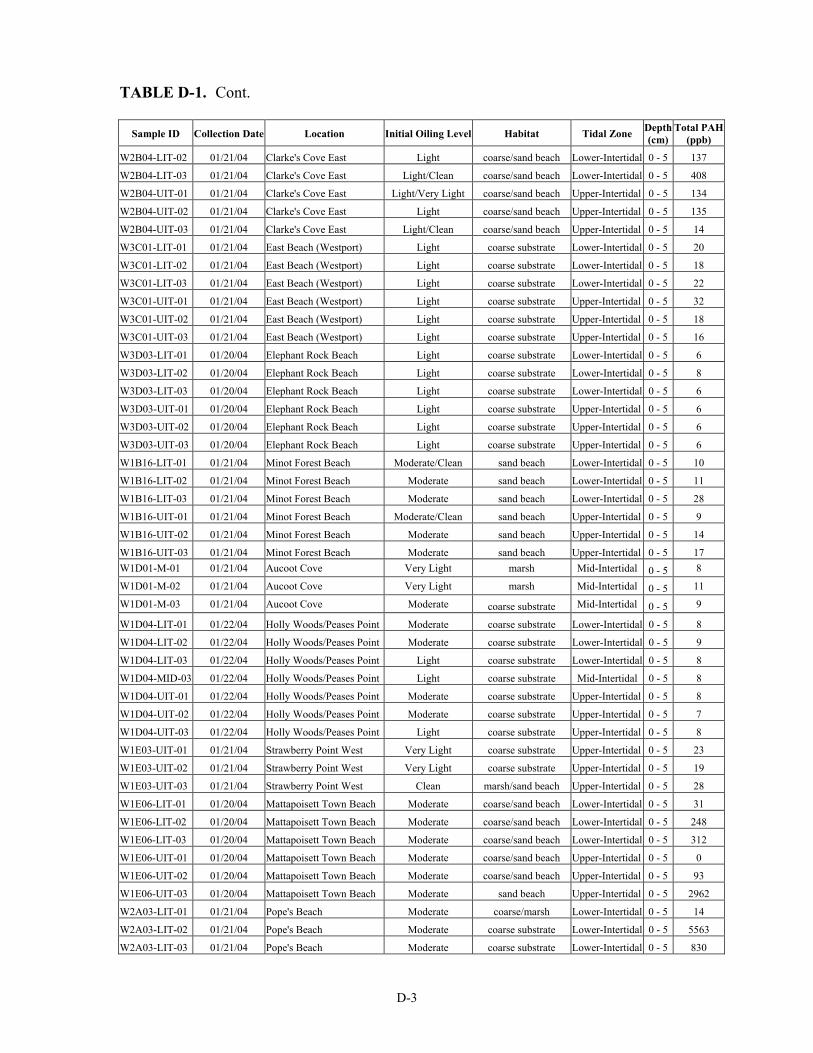
D-3
TABLE D-1. Cont.
Sample ID Collection Date Location Initial Oiling Level Habitat Tidal Zone Depth(cm)
Total PAH(ppb)
W2B04-LIT-02 01/21/04 Clarke's Cove East Light coarse/sand beach Lower-Intertidal 0 - 5 137
W2B04-LIT-03 01/21/04 Clarke's Cove East Light/Clean coarse/sand beach Lower-Intertidal 0 - 5 408
W2B04-UIT-01 01/21/04 Clarke's Cove East Light/Very Light coarse/sand beach Upper-Intertidal 0 - 5 134
W2B04-UIT-02 01/21/04 Clarke's Cove East Light coarse/sand beach Upper-Intertidal 0 - 5 135
W2B04-UIT-03 01/21/04 Clarke's Cove East Light/Clean coarse/sand beach Upper-Intertidal 0 - 5 14
W3C01-LIT-01 01/21/04 East Beach (Westport) Light coarse substrate Lower-Intertidal 0 - 5 20
W3C01-LIT-02 01/21/04 East Beach (Westport) Light coarse substrate Lower-Intertidal 0 - 5 18
W3C01-LIT-03 01/21/04 East Beach (Westport) Light coarse substrate Lower-Intertidal 0 - 5 22
W3C01-UIT-01 01/21/04 East Beach (Westport) Light coarse substrate Upper-Intertidal 0 - 5 32
W3C01-UIT-02 01/21/04 East Beach (Westport) Light coarse substrate Upper-Intertidal 0 - 5 18
W3C01-UIT-03 01/21/04 East Beach (Westport) Light coarse substrate Upper-Intertidal 0 - 5 16
W3D03-LIT-01 01/20/04 Elephant Rock Beach Light coarse substrate Lower-Intertidal 0 - 5 6
W3D03-LIT-02 01/20/04 Elephant Rock Beach Light coarse substrate Lower-Intertidal 0 - 5 8
W3D03-LIT-03 01/20/04 Elephant Rock Beach Light coarse substrate Lower-Intertidal 0 - 5 6
W3D03-UIT-01 01/20/04 Elephant Rock Beach Light coarse substrate Upper-Intertidal 0 - 5 6
W3D03-UIT-02 01/20/04 Elephant Rock Beach Light coarse substrate Upper-Intertidal 0 - 5 6
W3D03-UIT-03 01/20/04 Elephant Rock Beach Light coarse substrate Upper-Intertidal 0 - 5 6
W1B16-LIT-01 01/21/04 Minot Forest Beach Moderate/Clean sand beach Lower-Intertidal 0 - 5 10
W1B16-LIT-02 01/21/04 Minot Forest Beach Moderate sand beach Lower-Intertidal 0 - 5 11
W1B16-LIT-03 01/21/04 Minot Forest Beach Moderate sand beach Lower-Intertidal 0 - 5 28
W1B16-UIT-01 01/21/04 Minot Forest Beach Moderate/Clean sand beach Upper-Intertidal 0 - 5 9
W1B16-UIT-02 01/21/04 Minot Forest Beach Moderate sand beach Upper-Intertidal 0 - 5 14
W1B16-UIT-03 01/21/04 Minot Forest Beach Moderate sand beach Upper-Intertidal 0 - 5 17 W1D01-M-01 01/21/04 Aucoot Cove Very Light marsh Mid-Intertidal 0 - 5 8
W1D01-M-02 01/21/04 Aucoot Cove Very Light marsh Mid-Intertidal 0 - 5 11
W1D01-M-03 01/21/04 Aucoot Cove Moderate coarse substrate Mid-Intertidal 0 - 5 9
W1D04-LIT-01 01/22/04 Holly Woods/Peases Point Moderate coarse substrate Lower-Intertidal 0 - 5 8
W1D04-LIT-02 01/22/04 Holly Woods/Peases Point Moderate coarse substrate Lower-Intertidal 0 - 5 9
W1D04-LIT-03 01/22/04 Holly Woods/Peases Point Light coarse substrate Lower-Intertidal 0 - 5 8
W1D04-MID-03 01/22/04 Holly Woods/Peases Point Light coarse substrate Mid-Intertidal 0 - 5 8
W1D04-UIT-01 01/22/04 Holly Woods/Peases Point Moderate coarse substrate Upper-Intertidal 0 - 5 8
W1D04-UIT-02 01/22/04 Holly Woods/Peases Point Moderate coarse substrate Upper-Intertidal 0 - 5 7
W1D04-UIT-03 01/22/04 Holly Woods/Peases Point Light coarse substrate Upper-Intertidal 0 - 5 8
W1E03-UIT-01 01/21/04 Strawberry Point West Very Light coarse substrate Upper-Intertidal 0 - 5 23
W1E03-UIT-02 01/21/04 Strawberry Point West Very Light coarse substrate Upper-Intertidal 0 - 5 19
W1E03-UIT-03 01/21/04 Strawberry Point West Clean marsh/sand beach Upper-Intertidal 0 - 5 28
W1E06-LIT-01 01/20/04 Mattapoisett Town Beach Moderate coarse/sand beach Lower-Intertidal 0 - 5 31
W1E06-LIT-02 01/20/04 Mattapoisett Town Beach Moderate coarse/sand beach Lower-Intertidal 0 - 5 248
W1E06-LIT-03 01/20/04 Mattapoisett Town Beach Moderate coarse/sand beach Lower-Intertidal 0 - 5 312
W1E06-UIT-01 01/20/04 Mattapoisett Town Beach Moderate coarse/sand beach Upper-Intertidal 0 - 5 0
W1E06-UIT-02 01/20/04 Mattapoisett Town Beach Moderate coarse/sand beach Upper-Intertidal 0 - 5 93
W1E06-UIT-03 01/20/04 Mattapoisett Town Beach Moderate sand beach Upper-Intertidal 0 - 5 2962
W2A03-LIT-01 01/21/04 Pope's Beach Moderate coarse/marsh Lower-Intertidal 0 - 5 14
W2A03-LIT-02 01/21/04 Pope's Beach Moderate coarse substrate Lower-Intertidal 0 - 5 5563
W2A03-LIT-03 01/21/04 Pope's Beach Moderate coarse substrate Lower-Intertidal 0 - 5 830
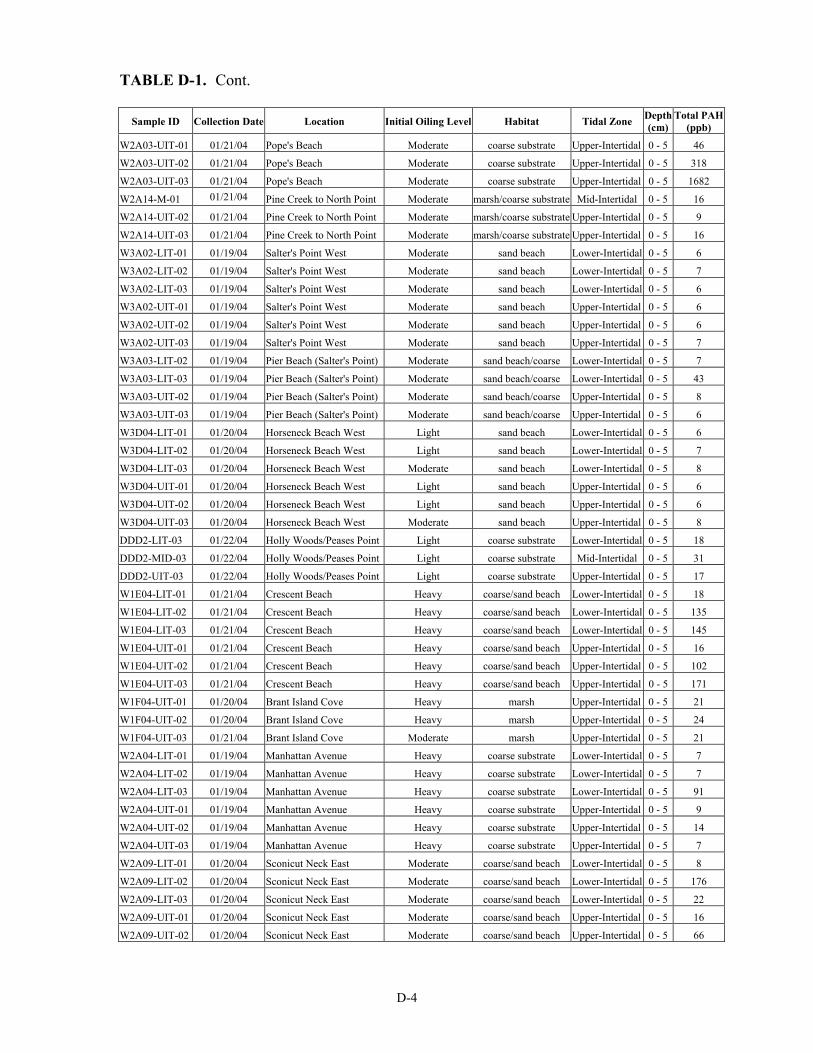
D-4
TABLE D-1. Cont.
Sample ID Collection Date Location Initial Oiling Level Habitat Tidal Zone Depth(cm)
Total PAH(ppb)
W2A03-UIT-01 01/21/04 Pope's Beach Moderate coarse substrate Upper-Intertidal 0 - 5 46
W2A03-UIT-02 01/21/04 Pope's Beach Moderate coarse substrate Upper-Intertidal 0 - 5 318
W2A03-UIT-03 01/21/04 Pope's Beach Moderate coarse substrate Upper-Intertidal 0 - 5 1682
W2A14-M-01 01/21/04 Pine Creek to North Point Moderate marsh/coarse substrate Mid-Intertidal 0 - 5 16
W2A14-UIT-02 01/21/04 Pine Creek to North Point Moderate marsh/coarse substrate Upper-Intertidal 0 - 5 9
W2A14-UIT-03 01/21/04 Pine Creek to North Point Moderate marsh/coarse substrate Upper-Intertidal 0 - 5 16
W3A02-LIT-01 01/19/04 Salter's Point West Moderate sand beach Lower-Intertidal 0 - 5 6
W3A02-LIT-02 01/19/04 Salter's Point West Moderate sand beach Lower-Intertidal 0 - 5 7
W3A02-LIT-03 01/19/04 Salter's Point West Moderate sand beach Lower-Intertidal 0 - 5 6
W3A02-UIT-01 01/19/04 Salter's Point West Moderate sand beach Upper-Intertidal 0 - 5 6
W3A02-UIT-02 01/19/04 Salter's Point West Moderate sand beach Upper-Intertidal 0 - 5 6
W3A02-UIT-03 01/19/04 Salter's Point West Moderate sand beach Upper-Intertidal 0 - 5 7
W3A03-LIT-02 01/19/04 Pier Beach (Salter's Point) Moderate sand beach/coarse Lower-Intertidal 0 - 5 7
W3A03-LIT-03 01/19/04 Pier Beach (Salter's Point) Moderate sand beach/coarse Lower-Intertidal 0 - 5 43
W3A03-UIT-02 01/19/04 Pier Beach (Salter's Point) Moderate sand beach/coarse Upper-Intertidal 0 - 5 8
W3A03-UIT-03 01/19/04 Pier Beach (Salter's Point) Moderate sand beach/coarse Upper-Intertidal 0 - 5 6
W3D04-LIT-01 01/20/04 Horseneck Beach West Light sand beach Lower-Intertidal 0 - 5 6
W3D04-LIT-02 01/20/04 Horseneck Beach West Light sand beach Lower-Intertidal 0 - 5 7
W3D04-LIT-03 01/20/04 Horseneck Beach West Moderate sand beach Lower-Intertidal 0 - 5 8
W3D04-UIT-01 01/20/04 Horseneck Beach West Light sand beach Upper-Intertidal 0 - 5 6
W3D04-UIT-02 01/20/04 Horseneck Beach West Light sand beach Upper-Intertidal 0 - 5 6
W3D04-UIT-03 01/20/04 Horseneck Beach West Moderate sand beach Upper-Intertidal 0 - 5 8
DDD2-LIT-03 01/22/04 Holly Woods/Peases Point Light coarse substrate Lower-Intertidal 0 - 5 18
DDD2-MID-03 01/22/04 Holly Woods/Peases Point Light coarse substrate Mid-Intertidal 0 - 5 31
DDD2-UIT-03 01/22/04 Holly Woods/Peases Point Light coarse substrate Upper-Intertidal 0 - 5 17
W1E04-LIT-01 01/21/04 Crescent Beach Heavy coarse/sand beach Lower-Intertidal 0 - 5 18
W1E04-LIT-02 01/21/04 Crescent Beach Heavy coarse/sand beach Lower-Intertidal 0 - 5 135
W1E04-LIT-03 01/21/04 Crescent Beach Heavy coarse/sand beach Lower-Intertidal 0 - 5 145
W1E04-UIT-01 01/21/04 Crescent Beach Heavy coarse/sand beach Upper-Intertidal 0 - 5 16
W1E04-UIT-02 01/21/04 Crescent Beach Heavy coarse/sand beach Upper-Intertidal 0 - 5 102
W1E04-UIT-03 01/21/04 Crescent Beach Heavy coarse/sand beach Upper-Intertidal 0 - 5 171
W1F04-UIT-01 01/20/04 Brant Island Cove Heavy marsh Upper-Intertidal 0 - 5 21
W1F04-UIT-02 01/20/04 Brant Island Cove Heavy marsh Upper-Intertidal 0 - 5 24
W1F04-UIT-03 01/21/04 Brant Island Cove Moderate marsh Upper-Intertidal 0 - 5 21
W2A04-LIT-01 01/19/04 Manhattan Avenue Heavy coarse substrate Lower-Intertidal 0 - 5 7
W2A04-LIT-02 01/19/04 Manhattan Avenue Heavy coarse substrate Lower-Intertidal 0 - 5 7
W2A04-LIT-03 01/19/04 Manhattan Avenue Heavy coarse substrate Lower-Intertidal 0 - 5 91
W2A04-UIT-01 01/19/04 Manhattan Avenue Heavy coarse substrate Upper-Intertidal 0 - 5 9
W2A04-UIT-02 01/19/04 Manhattan Avenue Heavy coarse substrate Upper-Intertidal 0 - 5 14
W2A04-UIT-03 01/19/04 Manhattan Avenue Heavy coarse substrate Upper-Intertidal 0 - 5 7
W2A09-LIT-01 01/20/04 Sconicut Neck East Moderate coarse/sand beach Lower-Intertidal 0 - 5 8
W2A09-LIT-02 01/20/04 Sconicut Neck East Moderate coarse/sand beach Lower-Intertidal 0 - 5 176
W2A09-LIT-03 01/20/04 Sconicut Neck East Moderate coarse/sand beach Lower-Intertidal 0 - 5 22
W2A09-UIT-01 01/20/04 Sconicut Neck East Moderate coarse/sand beach Upper-Intertidal 0 - 5 16
W2A09-UIT-02 01/20/04 Sconicut Neck East Moderate coarse/sand beach Upper-Intertidal 0 - 5 66

D-5
TABLE D-1. Cont.
Sample ID Collection Date Location Initial Oiling Level Habitat Tidal Zone Depth(cm)
Total PAH(ppb)
W2A09-UIT-03 01/20/04 Sconicut Neck East Moderate coarse/sand beach Upper-Intertidal 0 - 5 15
W2A11-LIT-01 01/20/04 West Island West Heavy coarse/sand beach Lower-Intertidal 0 - 5 18
W2A11-LIT-02 01/20/04 West Island West Heavy coarse/sand beach Lower-Intertidal 0 - 5 10
W2A11-LIT-03 01/20/04 West Island West Heavy coarse/sand beach Lower-Intertidal 0 - 5 10
W2A11-UIT-01 01/20/04 West Island West Heavy coarse/sand beach Upper-Intertidal 0 - 5 10
W2A11-UIT-02 01/20/04 West Island West Heavy coarse/sand beach Upper-Intertidal 0 - 5 9
W2A11-UIT-03 01/20/04 West Island West Heavy coarse/sand beach Upper-Intertidal 0 - 5 16
W3C03-LIT-01 01/22/04 Barney's Joy (W of barbed) Heavy sand beach Lower-Intertidal 0 - 5 7
W3C03-LIT-02 01/22/04 Barney's Joy (W of barbed) Heavy sand beach Lower-Intertidal 0 - 5 8
W3C03-LIT-03 01/22/04 Barney's Joy (W of barbed) Heavy sand beach Lower-Intertidal 0 - 5 6
W3C03-MIT-01 01/22/04 Barney's Joy (W of barbed) Heavy sand beach Mid-Intertidal 0 - 5 34
W3C03-MIT-02 01/22/04 Barney's Joy (W of barbed) Heavy sand beach Mid-Intertidal 0 - 5 8
W3C03-MIT-03 01/22/04 Barney's Joy (W of barbed) Heavy sand beach Mid-Intertidal 0 - 5 7
W3C03-UIT-01 01/22/04 Barney's Joy (W of barbed) Heavy sand beach Upper-Intertidal 0 - 5 18
W3C03-UIT-02 01/22/04 Barney's Joy (W of barbed) Heavy sand beach Upper-Intertidal 0 - 5 7
W3C03-UIT-03 01/22/04 Barney's Joy (W of barbed) Heavy sand beach Upper-Intertidal 0 - 5 7
DDD01-LIT-01 01/21/04 Crescent Beach Heavy coarse substrate Lower-Intertidal 0 - 5 18
DDD01-UIT-01 01/21/04 Crescent Beach Heavy coarse substrate Upper-Intertidal 0 - 5 106
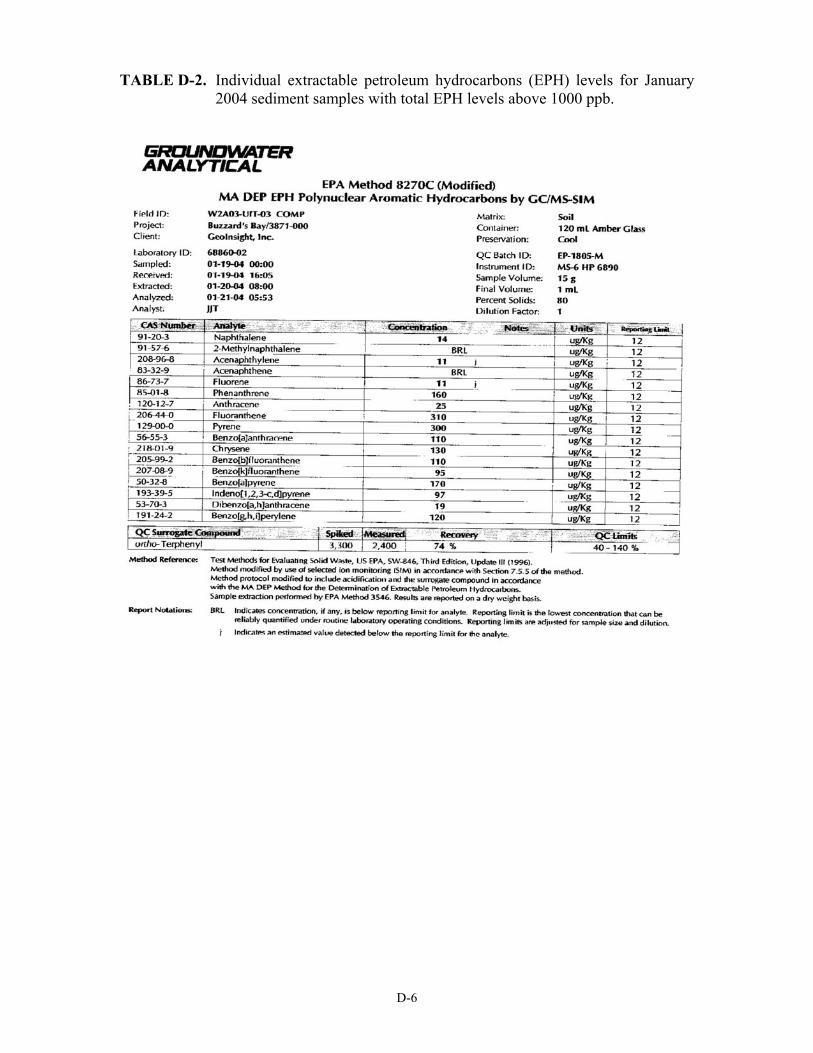
D-6
TABLE D-2. Individual extractable petroleum hydrocarbons (EPH) levels for January 2004 sediment samples with total EPH levels above 1000 ppb.
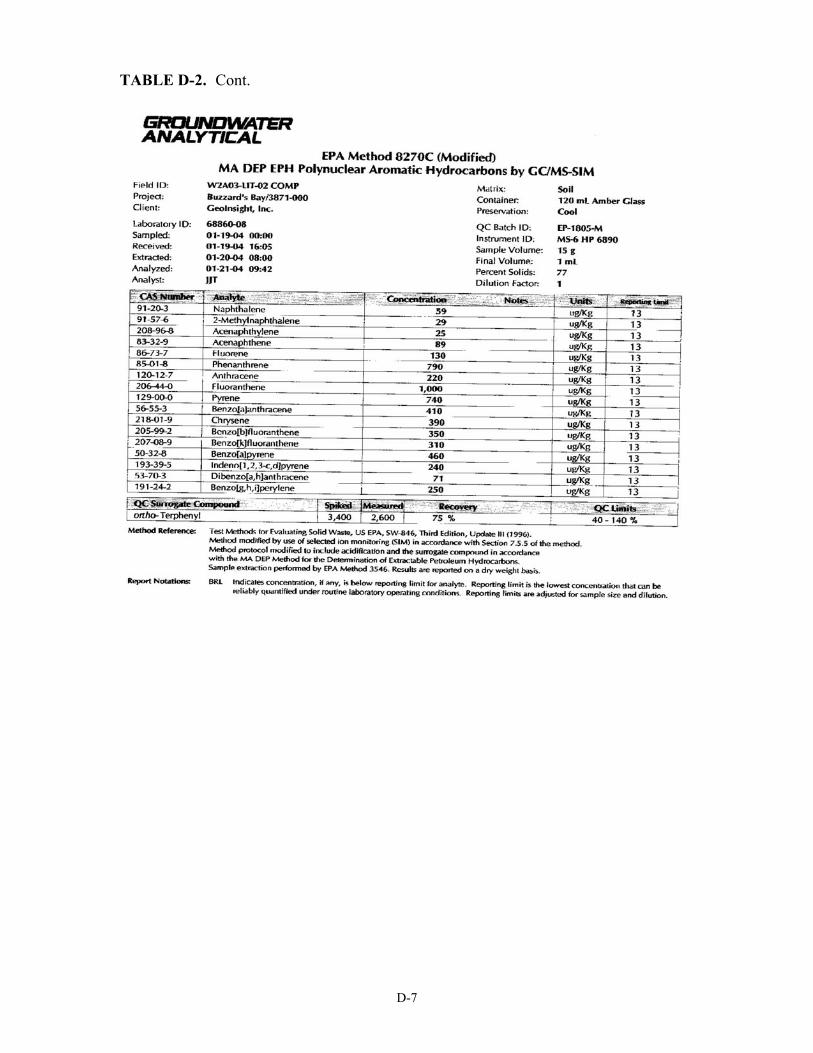
D-7
TABLE D-2. Cont.
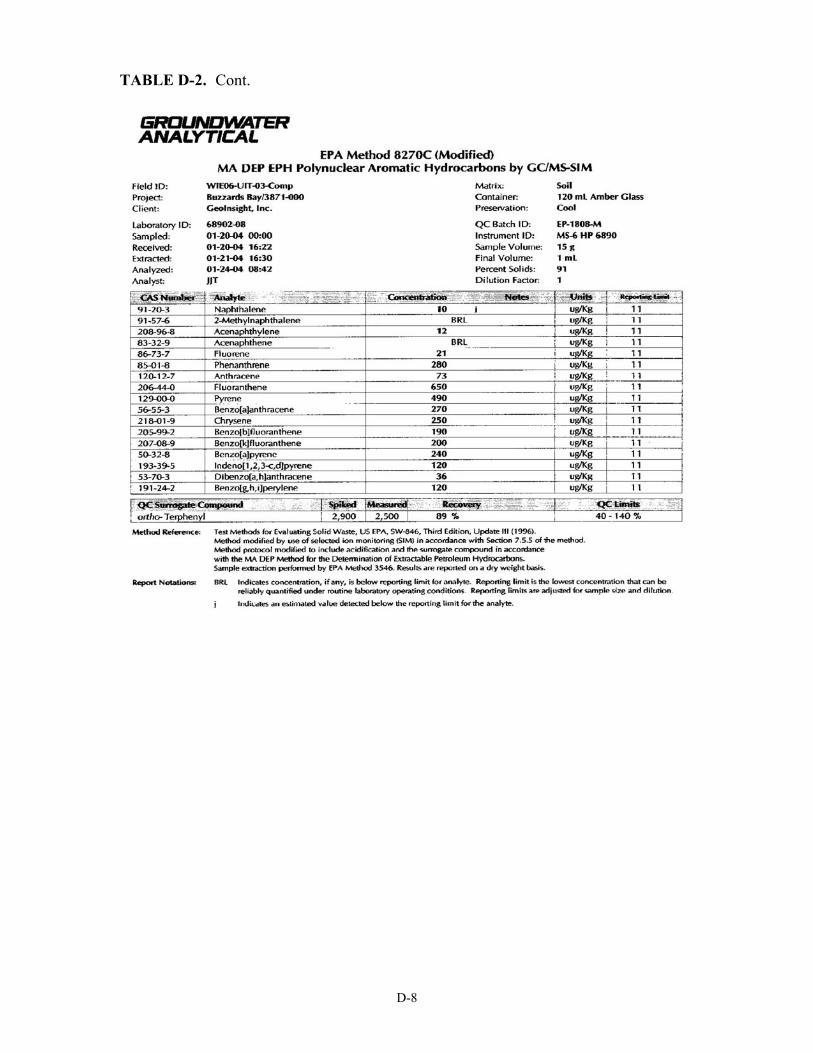
D-8
TABLE D-2. Cont.
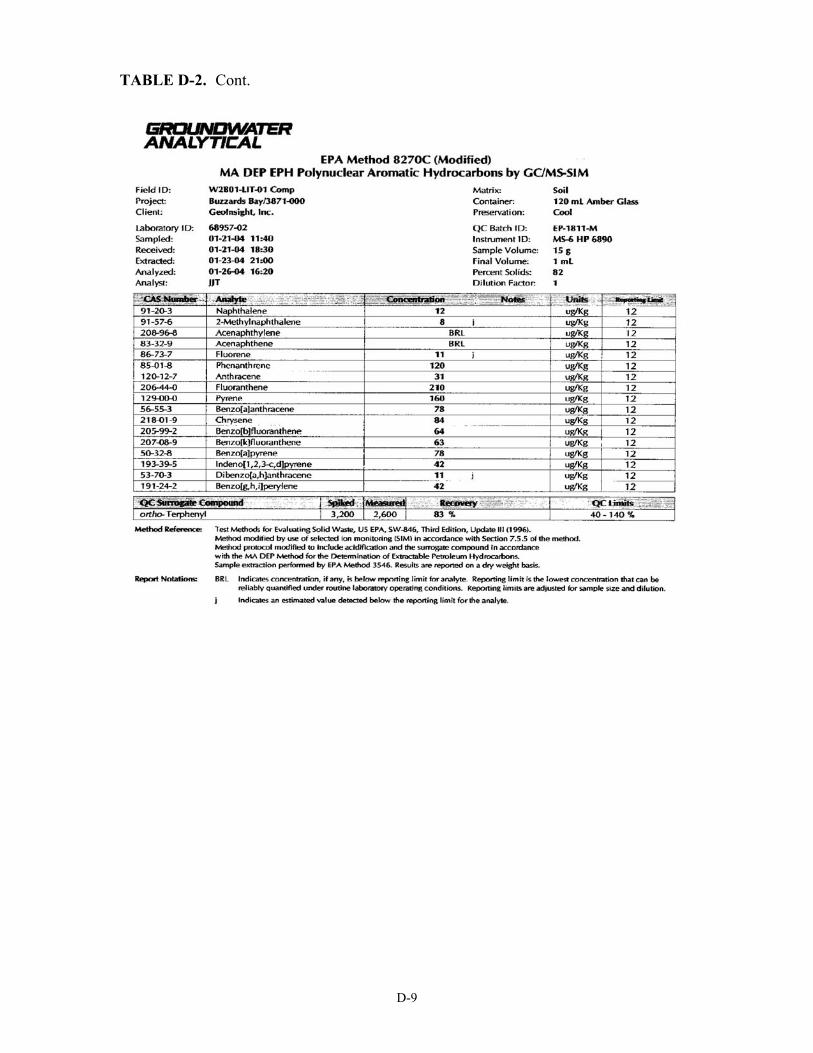
D-9
TABLE D-2. Cont.

D-10
TABLE D-2. Cont.

E-1
APPENDIX E
SEPTEMBER 2003 OIL CHEMISTRY DATA – TOTAL PAHs
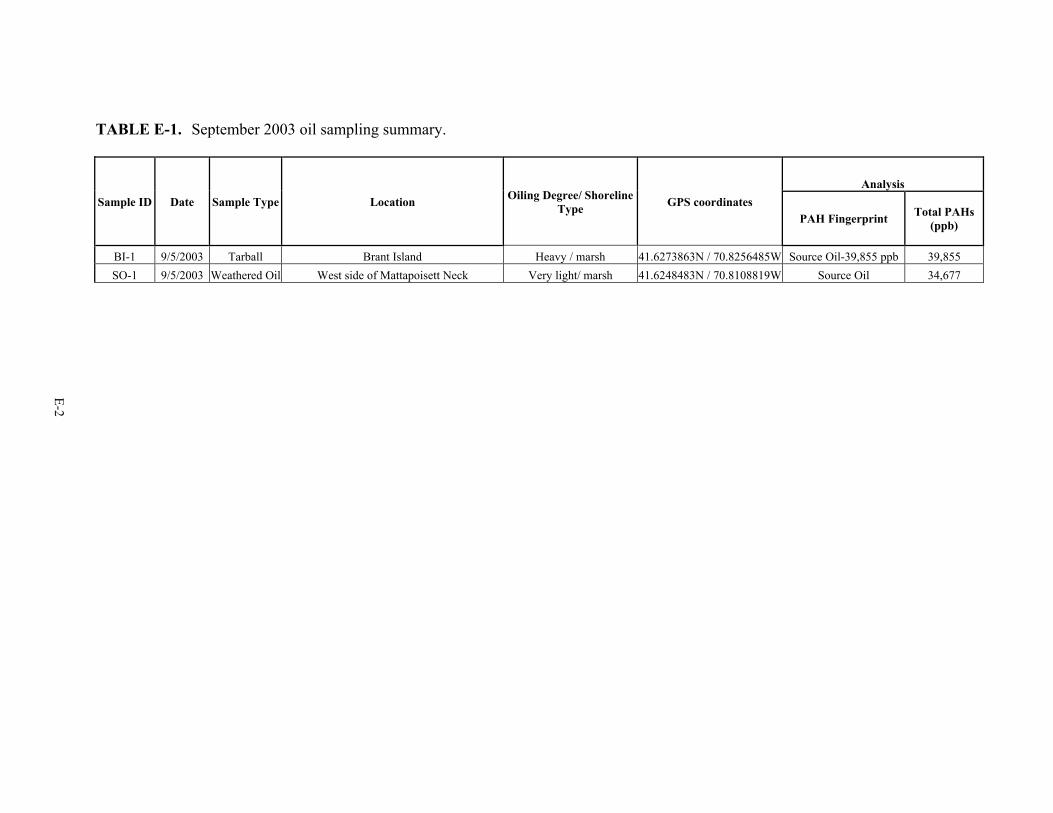
TABLE E-1. September 2003 oil sampling summary.
Sample ID Date Sample Type Location Oiling Degree/ Shoreline Type GPS coordinates
Analysis
PAH Fingerprint Total PAHs (ppb)
BI-1 9/5/2003 Tarball Brant Island Heavy / marsh 41.6273863N / 70.8256485W Source Oil-39,855 ppb 39,855 SO-1 9/5/2003 Weathered Oil West side of Mattapoisett Neck Very light/ marsh 41.6248483N / 70.8108819W Source Oil 34,677
E-2
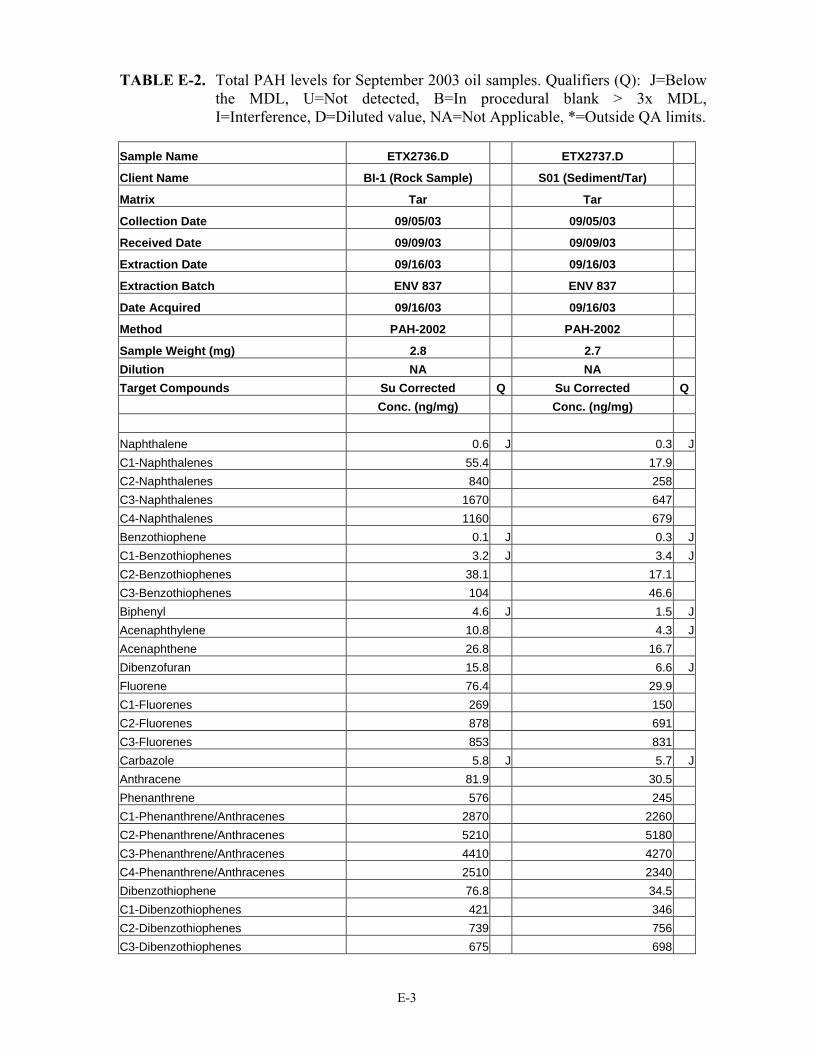
E-3
TABLE E-2. Total PAH levels for September 2003 oil samples. Qualifiers (Q): J=Below the MDL, U=Not detected, B=In procedural blank > 3x MDL, I=Interference, D=Diluted value, NA=Not Applicable, *=Outside QA limits.
Sample Name ETX2736.D ETX2737.D
Client Name BI-1 (Rock Sample) S01 (Sediment/Tar)
Matrix Tar Tar
Collection Date 09/05/03 09/05/03
Received Date 09/09/03 09/09/03
Extraction Date 09/16/03 09/16/03
Extraction Batch ENV 837 ENV 837
Date Acquired 09/16/03 09/16/03
Method PAH-2002 PAH-2002
Sample Weight (mg) 2.8 2.7 Dilution NA NA Target Compounds Su Corrected Q Su Corrected Q Conc. (ng/mg) Conc. (ng/mg) Naphthalene 0.6 J 0.3 JC1-Naphthalenes 55.4 17.9C2-Naphthalenes 840 258C3-Naphthalenes 1670 647C4-Naphthalenes 1160 679Benzothiophene 0.1 J 0.3 JC1-Benzothiophenes 3.2 J 3.4 JC2-Benzothiophenes 38.1 17.1C3-Benzothiophenes 104 46.6Biphenyl 4.6 J 1.5 JAcenaphthylene 10.8 4.3 JAcenaphthene 26.8 16.7Dibenzofuran 15.8 6.6 JFluorene 76.4 29.9C1-Fluorenes 269 150C2-Fluorenes 878 691C3-Fluorenes 853 831Carbazole 5.8 J 5.7 JAnthracene 81.9 30.5Phenanthrene 576 245C1-Phenanthrene/Anthracenes 2870 2260C2-Phenanthrene/Anthracenes 5210 5180C3-Phenanthrene/Anthracenes 4410 4270C4-Phenanthrene/Anthracenes 2510 2340Dibenzothiophene 76.8 34.5C1-Dibenzothiophenes 421 346C2-Dibenzothiophenes 739 756C3-Dibenzothiophenes 675 698
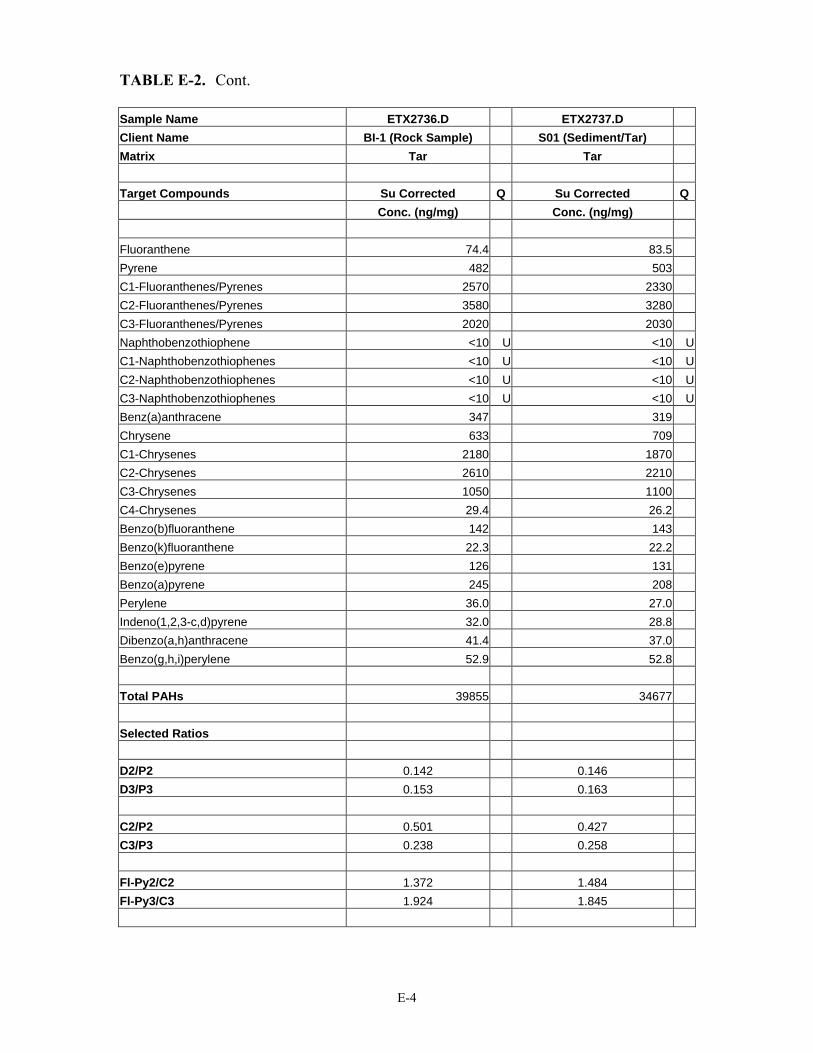
E-4
TABLE E-2. Cont. Sample Name ETX2736.D ETX2737.D Client Name BI-1 (Rock Sample) S01 (Sediment/Tar) Matrix Tar Tar Target Compounds Su Corrected Q Su Corrected Q Conc. (ng/mg) Conc. (ng/mg) Fluoranthene 74.4 83.5Pyrene 482 503C1-Fluoranthenes/Pyrenes 2570 2330C2-Fluoranthenes/Pyrenes 3580 3280C3-Fluoranthenes/Pyrenes 2020 2030Naphthobenzothiophene <10 U <10 UC1-Naphthobenzothiophenes <10 U <10 UC2-Naphthobenzothiophenes <10 U <10 UC3-Naphthobenzothiophenes <10 U <10 UBenz(a)anthracene 347 319Chrysene 633 709C1-Chrysenes 2180 1870C2-Chrysenes 2610 2210C3-Chrysenes 1050 1100C4-Chrysenes 29.4 26.2Benzo(b)fluoranthene 142 143Benzo(k)fluoranthene 22.3 22.2Benzo(e)pyrene 126 131Benzo(a)pyrene 245 208Perylene 36.0 27.0Indeno(1,2,3-c,d)pyrene 32.0 28.8Dibenzo(a,h)anthracene 41.4 37.0Benzo(g,h,i)perylene 52.9 52.8 Total PAHs 39855 34677 Selected Ratios D2/P2 0.142 0.146 D3/P3 0.153 0.163 C2/P2 0.501 0.427 C3/P3 0.238 0.258 Fl-Py2/C2 1.372 1.484 Fl-Py3/C3 1.924 1.845
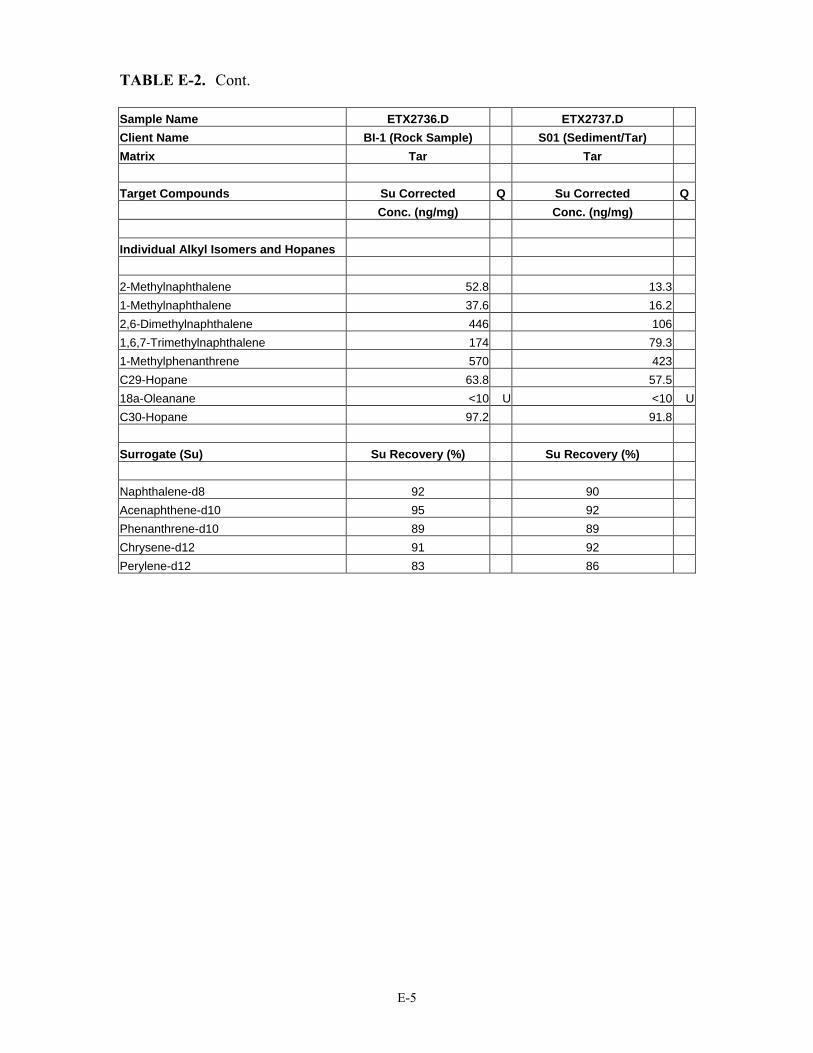
E-5
TABLE E-2. Cont. Sample Name ETX2736.D ETX2737.D Client Name BI-1 (Rock Sample) S01 (Sediment/Tar) Matrix Tar Tar Target Compounds Su Corrected Q Su Corrected Q Conc. (ng/mg) Conc. (ng/mg) Individual Alkyl Isomers and Hopanes 2-Methylnaphthalene 52.8 13.31-Methylnaphthalene 37.6 16.22,6-Dimethylnaphthalene 446 1061,6,7-Trimethylnaphthalene 174 79.31-Methylphenanthrene 570 423C29-Hopane 63.8 57.518a-Oleanane <10 U <10 UC30-Hopane 97.2 91.8 Surrogate (Su) Su Recovery (%) Su Recovery (%) Naphthalene-d8 92 90 Acenaphthene-d10 95 92 Phenanthrene-d10 89 89 Chrysene-d12 91 92 Perylene-d12 83 86

F-1
APPENDIX F
2004 WEATHERED OIL CHEMISTRY DATA – TOTAL PAHs

TABLE F-1. 2004 Weathered Oil Sampling Summary.
Sample ID Date Sample Type Location Oiling Degree/ Shoreline Type GPS coordinates
Total PAHs (ppb)
EXT3731 8/26/04 Weathered oil W1F-061Brant Island Heavy / Marsh N41.62457/W70.81033 2,461,330 EXT3732 8/26/04 Weathered oil W1F-06Brant Island Heavy / Marsh 41.62447/70.80995 2,615,082
EXT3747 9/07/04 Weathered oil W1F-01, Howards Beach Heavy / Coarse
Between N41°37.685/ W70°49.510 and N41°37.703/
W70°49.475 673,748 EXT3797 11/09/04 Weathered oil Howards Beach Heavy / Coarse 41°37.671/ 70 ° 49.534 9,780
F-2
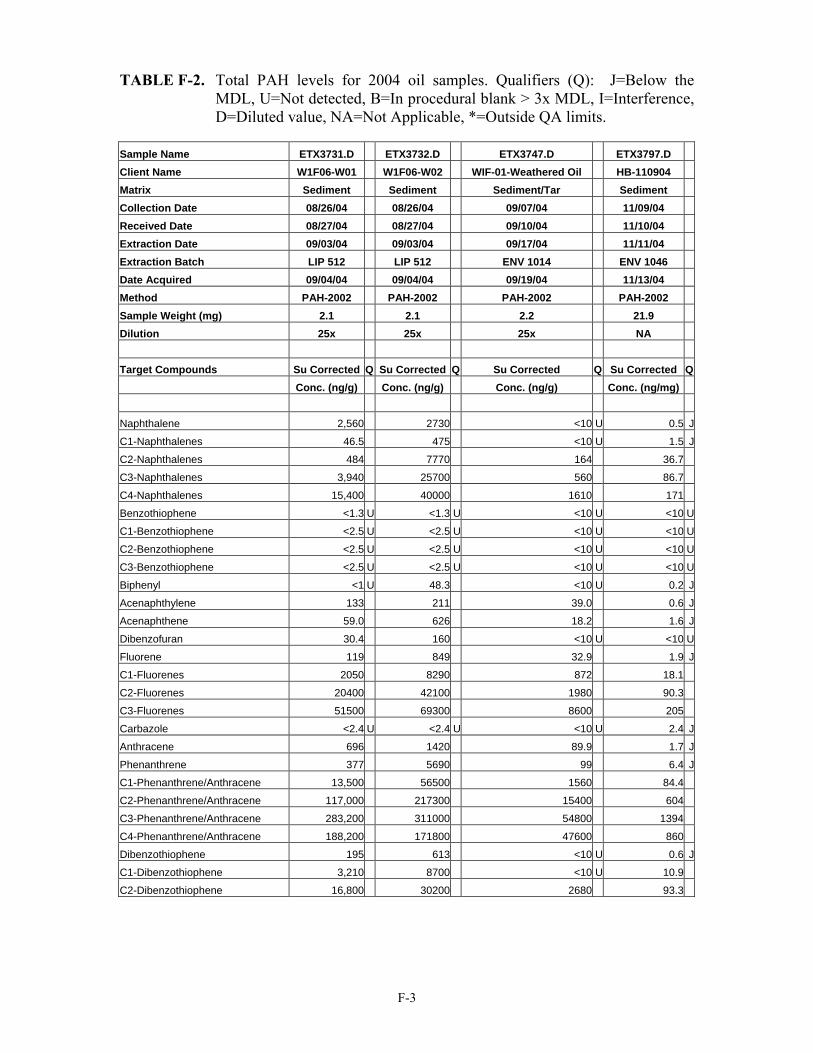
F-3
TABLE F-2. Total PAH levels for 2004 oil samples. Qualifiers (Q): J=Below the MDL, U=Not detected, B=In procedural blank > 3x MDL, I=Interference, D=Diluted value, NA=Not Applicable, *=Outside QA limits.
Sample Name ETX3731.D ETX3732.D ETX3747.D ETX3797.D Client Name W1F06-W01 W1F06-W02 WIF-01-Weathered Oil HB-110904 Matrix Sediment Sediment Sediment/Tar Sediment Collection Date 08/26/04 08/26/04 09/07/04 11/09/04 Received Date 08/27/04 08/27/04 09/10/04 11/10/04 Extraction Date 09/03/04 09/03/04 09/17/04 11/11/04 Extraction Batch LIP 512 LIP 512 ENV 1014 ENV 1046 Date Acquired 09/04/04 09/04/04 09/19/04 11/13/04 Method PAH-2002 PAH-2002 PAH-2002 PAH-2002 Sample Weight (mg) 2.1 2.1 2.2 21.9 Dilution 25x 25x 25x NA
Target Compounds Su Corrected Q Su Corrected Q Su Corrected Q Su Corrected Q Conc. (ng/g) Conc. (ng/g) Conc. (ng/g) Conc. (ng/mg)
Naphthalene 2,560 2730 <10 U 0.5 J
C1-Naphthalenes 46.5 475 <10 U 1.5 J
C2-Naphthalenes 484 7770 164 36.7
C3-Naphthalenes 3,940 25700 560 86.7
C4-Naphthalenes 15,400 40000 1610 171
Benzothiophene <1.3 U <1.3 U <10 U <10 U
C1-Benzothiophene <2.5 U <2.5 U <10 U <10 U
C2-Benzothiophene <2.5 U <2.5 U <10 U <10 U
C3-Benzothiophene <2.5 U <2.5 U <10 U <10 U
Biphenyl <1 U 48.3 <10 U 0.2 J
Acenaphthylene 133 211 39.0 0.6 J
Acenaphthene 59.0 626 18.2 1.6 J
Dibenzofuran 30.4 160 <10 U <10 U
Fluorene 119 849 32.9 1.9 J
C1-Fluorenes 2050 8290 872 18.1
C2-Fluorenes 20400 42100 1980 90.3
C3-Fluorenes 51500 69300 8600 205
Carbazole <2.4 U <2.4 U <10 U 2.4 J
Anthracene 696 1420 89.9 1.7 J
Phenanthrene 377 5690 99 6.4 J
C1-Phenanthrene/Anthracene 13,500 56500 1560 84.4
C2-Phenanthrene/Anthracene 117,000 217300 15400 604
C3-Phenanthrene/Anthracene 283,200 311000 54800 1394
C4-Phenanthrene/Anthracene 188,200 171800 47600 860
Dibenzothiophene 195 613 <10 U 0.6 J
C1-Dibenzothiophene 3,210 8700 <10 U 10.9
C2-Dibenzothiophene 16,800 30200 2680 93.3
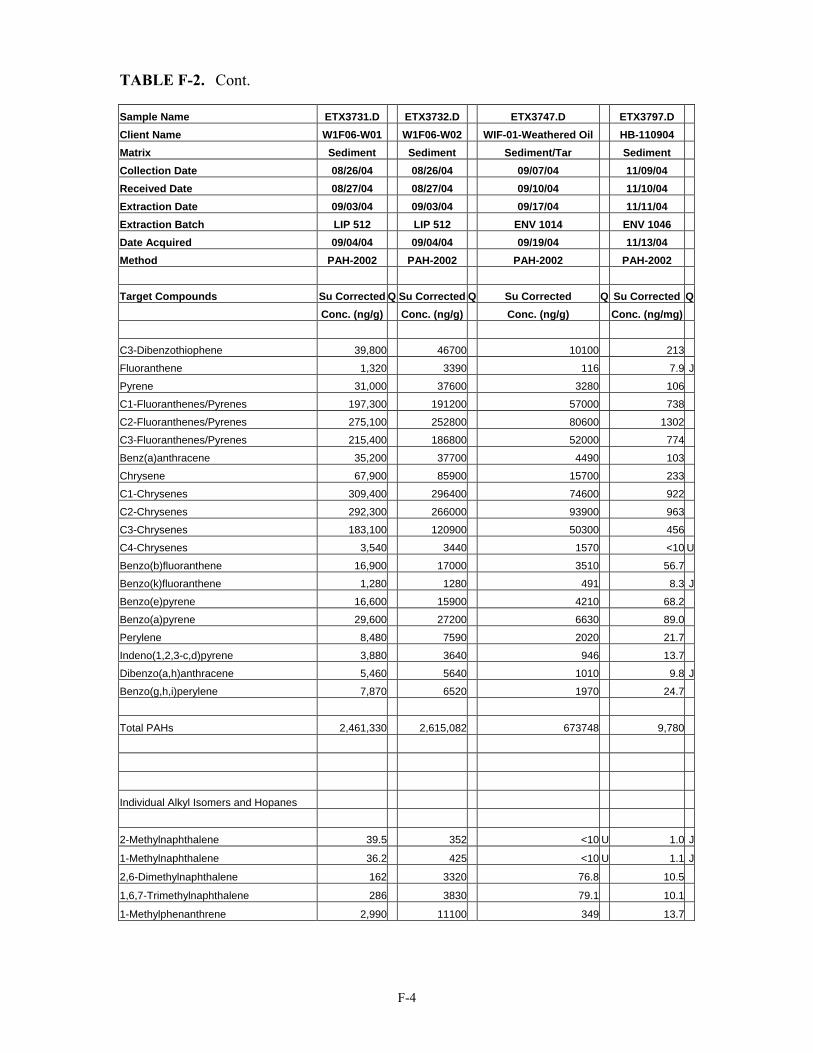
F-4
TABLE F-2. Cont. Sample Name ETX3731.D ETX3732.D ETX3747.D ETX3797.D Client Name W1F06-W01 W1F06-W02 WIF-01-Weathered Oil HB-110904 Matrix Sediment Sediment Sediment/Tar Sediment Collection Date 08/26/04 08/26/04 09/07/04 11/09/04 Received Date 08/27/04 08/27/04 09/10/04 11/10/04 Extraction Date 09/03/04 09/03/04 09/17/04 11/11/04 Extraction Batch LIP 512 LIP 512 ENV 1014 ENV 1046 Date Acquired 09/04/04 09/04/04 09/19/04 11/13/04 Method PAH-2002 PAH-2002 PAH-2002 PAH-2002
Target Compounds Su Corrected Q Su Corrected Q Su Corrected Q Su Corrected Q Conc. (ng/g) Conc. (ng/g) Conc. (ng/g) Conc. (ng/mg)
C3-Dibenzothiophene 39,800 46700 10100 213
Fluoranthene 1,320 3390 116 7.9 J
Pyrene 31,000 37600 3280 106
C1-Fluoranthenes/Pyrenes 197,300 191200 57000 738
C2-Fluoranthenes/Pyrenes 275,100 252800 80600 1302
C3-Fluoranthenes/Pyrenes 215,400 186800 52000 774
Benz(a)anthracene 35,200 37700 4490 103
Chrysene 67,900 85900 15700 233
C1-Chrysenes 309,400 296400 74600 922
C2-Chrysenes 292,300 266000 93900 963
C3-Chrysenes 183,100 120900 50300 456
C4-Chrysenes 3,540 3440 1570 <10 U
Benzo(b)fluoranthene 16,900 17000 3510 56.7
Benzo(k)fluoranthene 1,280 1280 491 8.3 J
Benzo(e)pyrene 16,600 15900 4210 68.2
Benzo(a)pyrene 29,600 27200 6630 89.0
Perylene 8,480 7590 2020 21.7
Indeno(1,2,3-c,d)pyrene 3,880 3640 946 13.7
Dibenzo(a,h)anthracene 5,460 5640 1010 9.8 J
Benzo(g,h,i)perylene 7,870 6520 1970 24.7
Total PAHs 2,461,330 2,615,082 673748 9,780
Individual Alkyl Isomers and Hopanes
2-Methylnaphthalene 39.5 352 <10 U 1.0 J
1-Methylnaphthalene 36.2 425 <10 U 1.1 J
2,6-Dimethylnaphthalene 162 3320 76.8 10.5
1,6,7-Trimethylnaphthalene 286 3830 79.1 10.1
1-Methylphenanthrene 2,990 11100 349 13.7
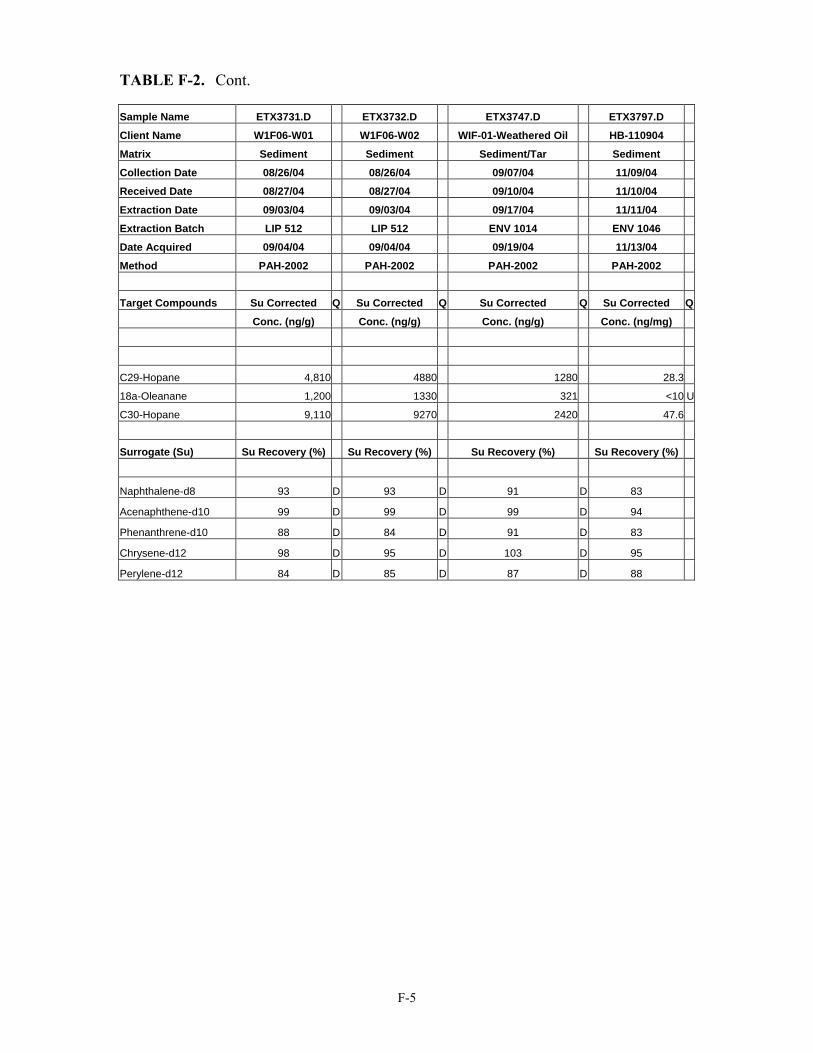
F-5
TABLE F-2. Cont. Sample Name ETX3731.D ETX3732.D ETX3747.D ETX3797.D
Client Name W1F06-W01 W1F06-W02 WIF-01-Weathered Oil HB-110904
Matrix Sediment Sediment Sediment/Tar Sediment
Collection Date 08/26/04 08/26/04 09/07/04 11/09/04
Received Date 08/27/04 08/27/04 09/10/04 11/10/04
Extraction Date 09/03/04 09/03/04 09/17/04 11/11/04
Extraction Batch LIP 512 LIP 512 ENV 1014 ENV 1046
Date Acquired 09/04/04 09/04/04 09/19/04 11/13/04
Method PAH-2002 PAH-2002 PAH-2002 PAH-2002
Target Compounds Su Corrected Q Su Corrected Q Su Corrected Q Su Corrected Q
Conc. (ng/g) Conc. (ng/g) Conc. (ng/g) Conc. (ng/mg)
C29-Hopane 4,810 4880 1280 28.3
18a-Oleanane 1,200 1330 321 <10 U
C30-Hopane 9,110 9270 2420 47.6
Surrogate (Su) Su Recovery (%) Su Recovery (%) Su Recovery (%) Su Recovery (%)
Naphthalene-d8 93 D 93 D 91 D 83
Acenaphthene-d10 99 D 99 D 99 D 94
Phenanthrene-d10 88 D 84 D 91 D 83
Chrysene-d12 98 D 95 D 103 D 95
Perylene-d12 84 D 85 D 87 D 88

G-1
APPENDIX G
UNASSESSED SHORELINES IN RHODE ISLAND
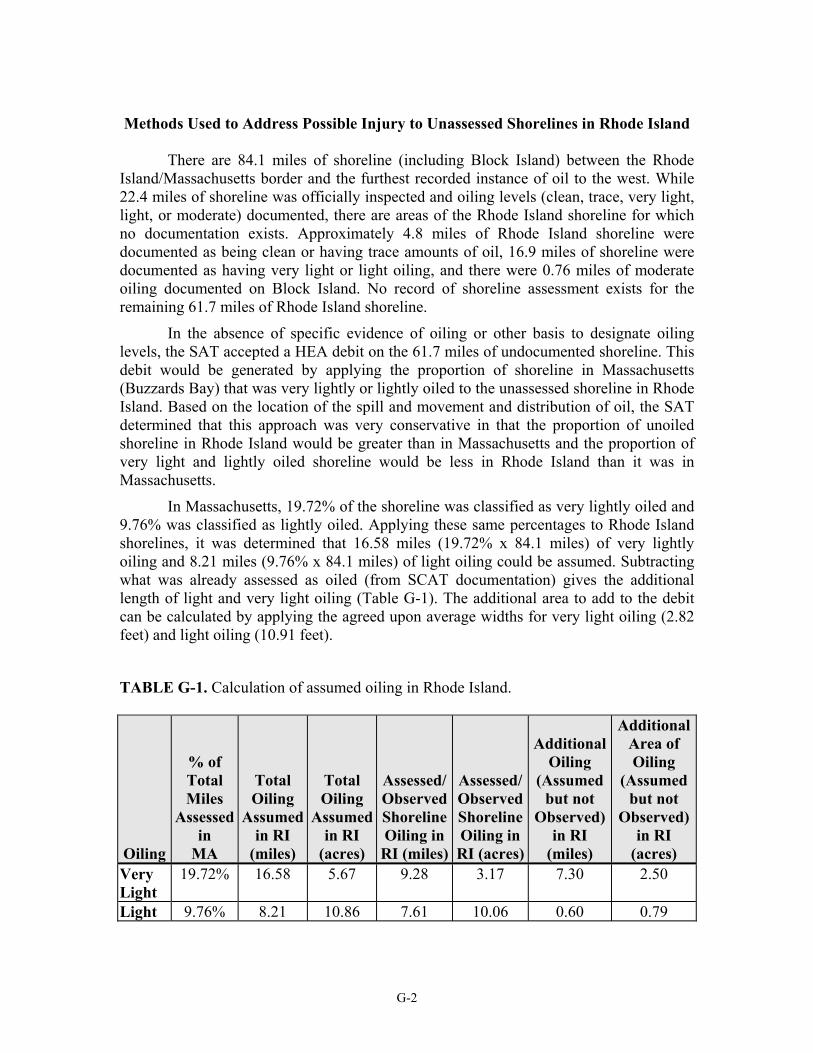
G-2
Methods Used to Address Possible Injury to Unassessed Shorelines in Rhode Island
There are 84.1 miles of shoreline (including Block Island) between the Rhode
Island/Massachusetts border and the furthest recorded instance of oil to the west. While 22.4 miles of shoreline was officially inspected and oiling levels (clean, trace, very light, light, or moderate) documented, there are areas of the Rhode Island shoreline for which no documentation exists. Approximately 4.8 miles of Rhode Island shoreline were documented as being clean or having trace amounts of oil, 16.9 miles of shoreline were documented as having very light or light oiling, and there were 0.76 miles of moderate oiling documented on Block Island. No record of shoreline assessment exists for the remaining 61.7 miles of Rhode Island shoreline.
In the absence of specific evidence of oiling or other basis to designate oiling levels, the SAT accepted a HEA debit on the 61.7 miles of undocumented shoreline. This debit would be generated by applying the proportion of shoreline in Massachusetts (Buzzards Bay) that was very lightly or lightly oiled to the unassessed shoreline in Rhode Island. Based on the location of the spill and movement and distribution of oil, the SAT determined that this approach was very conservative in that the proportion of unoiled shoreline in Rhode Island would be greater than in Massachusetts and the proportion of very light and lightly oiled shoreline would be less in Rhode Island than it was in Massachusetts.
In Massachusetts, 19.72% of the shoreline was classified as very lightly oiled and 9.76% was classified as lightly oiled. Applying these same percentages to Rhode Island shorelines, it was determined that 16.58 miles (19.72% x 84.1 miles) of very lightly oiling and 8.21 miles (9.76% x 84.1 miles) of light oiling could be assumed. Subtracting what was already assessed as oiled (from SCAT documentation) gives the additional length of light and very light oiling (Table G-1). The additional area to add to the debit can be calculated by applying the agreed upon average widths for very light oiling (2.82 feet) and light oiling (10.91 feet).
TABLE G-1. Calculation of assumed oiling in Rhode Island.
Oiling
% of Total Miles
Assessed in
MA
Total Oiling
Assumed in RI
(miles)
Total Oiling
Assumed in RI
(acres)
Assessed/ Observed Shoreline Oiling in RI (miles)
Assessed/ Observed Shoreline Oiling in RI (acres)
Additional Oiling
(Assumed but not
Observed) in RI
(miles)
Additional Area of Oiling
(Assumed but not
Observed) in RI
(acres) Very Light
19.72% 16.58 5.67 9.28 3.17 7.30 2.50
Light 9.76% 8.21 10.86 7.61 10.06 0.60 0.79

G-3
The additional length of oiling was divided into habitats in proportion to the occurrence of those habitats in the unassessed areas of Rhode Island. Of the 61.7 miles of unassessed shorelines, 58.17 miles (94%) are coarse substrate shorelines, 3.16 miles (5%) are sandy shorelines, and 0.35 miles (1%) are marsh. The additional oiling by habitat type is shown in Table G-2.
TABLE G-2. Length and area of additional oiling in Rhode Island by habitat type.
Very Light Light
Habitat Length (miles) Area (acres) Length (miles) Area (acres)
Coarse 6.88 2.35 0.57 0.75 Sand 0.37 0.13 0.03 0.04 Marsh 0.04 0.01 0.003 0.005 Total 7.3 2.5 0.6 0.8
The total acreage (assessed + assumed) for each injury category in Rhode Island is shown in Table G-3. A total of 5.68 acres of very light and 10.85 acres of light oiling for Rhode Island shorelines (in addition to the 0.76 miles or 0.57 acres of moderate oiling) is proposed for the basis of injury calculations for the Rhode Island shoreline. TABLE G-3. Total area in each injury category in Rhode Island. Very Light (acres) Light (acres)
Assessed Assumed Assessed Assumed Coarse 1.5 2.35 4.85 0.75 Sand 1.6 0.13 5.16 0.04 Marsh 0.08 0.01 0.05 0.005 Total 3.18 2.5 10.06 0.79 5.68 10.85

H-1
APPENDIX H
RAM ISLAND EROSION STUDY
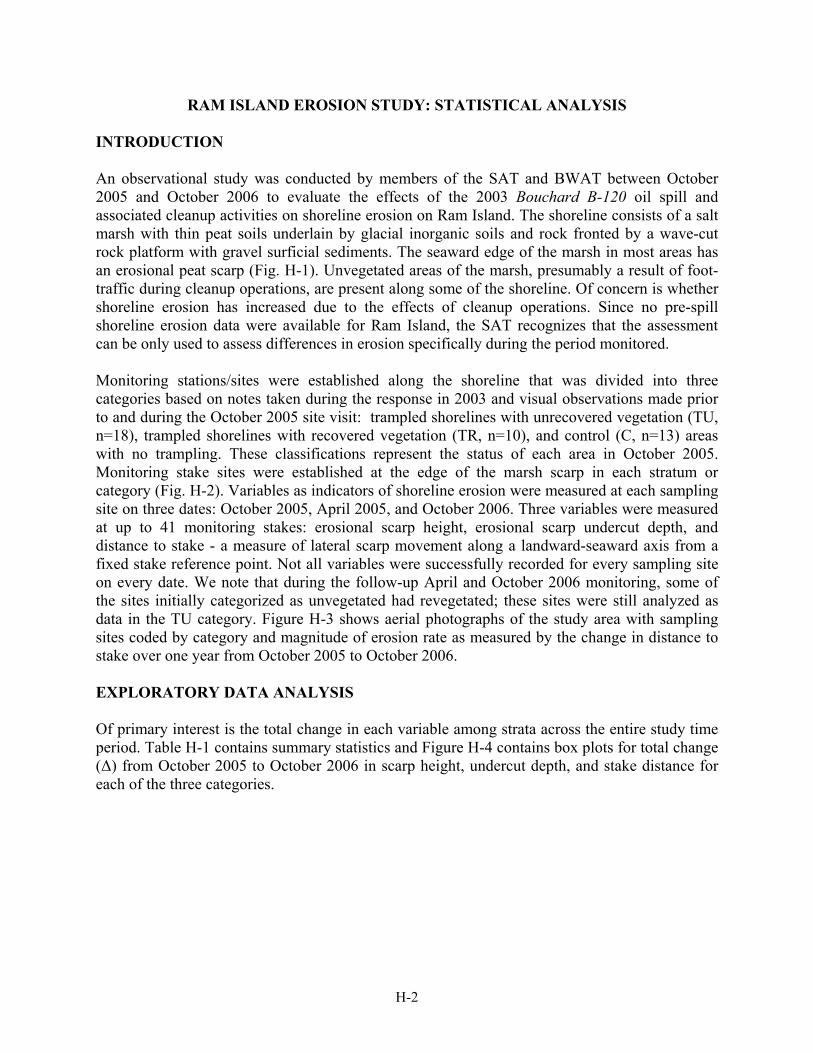
H-2
RAM ISLAND EROSION STUDY: STATISTICAL ANALYSIS INTRODUCTION An observational study was conducted by members of the SAT and BWAT between October 2005 and October 2006 to evaluate the effects of the 2003 Bouchard B-120 oil spill and associated cleanup activities on shoreline erosion on Ram Island. The shoreline consists of a salt marsh with thin peat soils underlain by glacial inorganic soils and rock fronted by a wave-cut rock platform with gravel surficial sediments. The seaward edge of the marsh in most areas has an erosional peat scarp (Fig. H-1). Unvegetated areas of the marsh, presumably a result of foot-traffic during cleanup operations, are present along some of the shoreline. Of concern is whether shoreline erosion has increased due to the effects of cleanup operations. Since no pre-spill shoreline erosion data were available for Ram Island, the SAT recognizes that the assessment can be only used to assess differences in erosion specifically during the period monitored. Monitoring stations/sites were established along the shoreline that was divided into three categories based on notes taken during the response in 2003 and visual observations made prior to and during the October 2005 site visit: trampled shorelines with unrecovered vegetation (TU, n=18), trampled shorelines with recovered vegetation (TR, n=10), and control (C, n=13) areas with no trampling. These classifications represent the status of each area in October 2005. Monitoring stake sites were established at the edge of the marsh scarp in each stratum or category (Fig. H-2). Variables as indicators of shoreline erosion were measured at each sampling site on three dates: October 2005, April 2005, and October 2006. Three variables were measured at up to 41 monitoring stakes: erosional scarp height, erosional scarp undercut depth, and distance to stake - a measure of lateral scarp movement along a landward-seaward axis from a fixed stake reference point. Not all variables were successfully recorded for every sampling site on every date. We note that during the follow-up April and October 2006 monitoring, some of the sites initially categorized as unvegetated had revegetated; these sites were still analyzed as data in the TU category. Figure H-3 shows aerial photographs of the study area with sampling sites coded by category and magnitude of erosion rate as measured by the change in distance to stake over one year from October 2005 to October 2006. EXPLORATORY DATA ANALYSIS Of primary interest is the total change in each variable among strata across the entire study time period. Table H-1 contains summary statistics and Figure H-4 contains box plots for total change (Δ) from October 2005 to October 2006 in scarp height, undercut depth, and stake distance for each of the three categories.
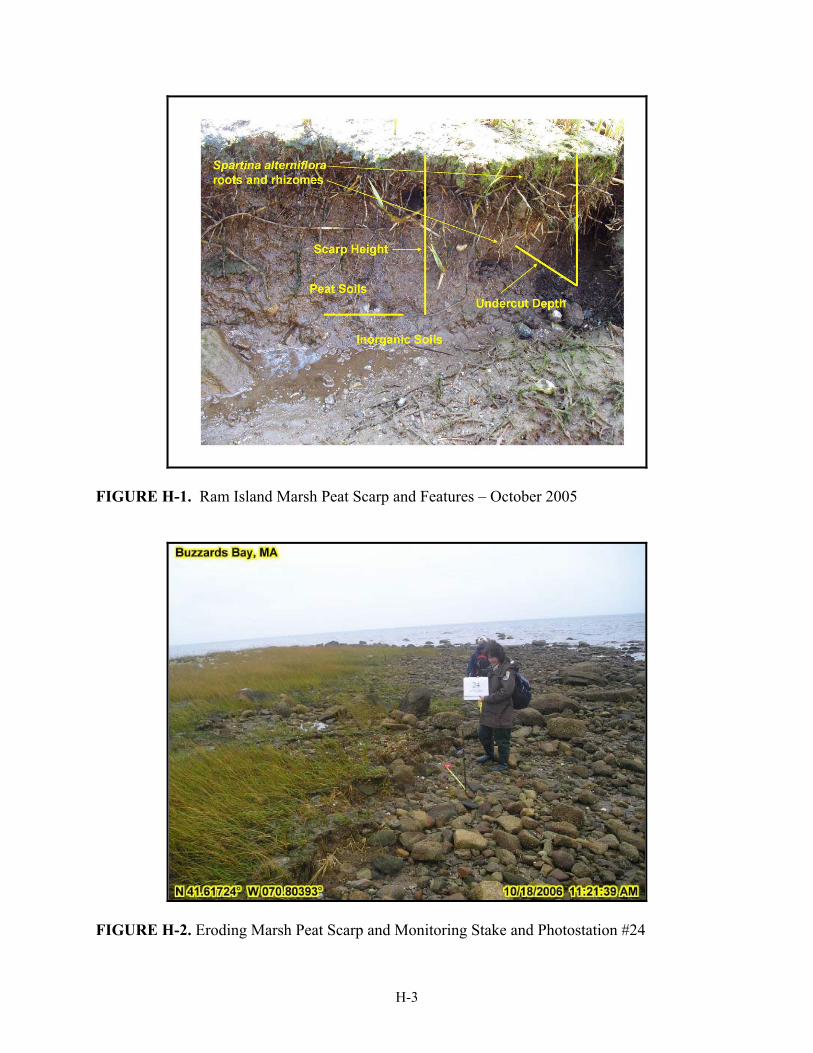
H-3
FIGURE H-1. Ram Island Marsh Peat Scarp and Features – October 2005
FIGURE H-2. Eroding Marsh Peat Scarp and Monitoring Stake and Photostation #24

H-4
TABLE H-1. Summary statistics for one-year changes in shoreline erosion variables across
shoreline type categories.
Δ in scarp height (ft) Δ in undercut depth (ft) Δ in distance to stake (ft)
Strata N Min
Med
Max
Mea
n
SD
N Min
Med
Max
Mea
n
SD
N Min
Med
Max
Mea
n
SD
C 12 -0.1 0 0.4 0.01 0.13 11 -0.4 0.07 0.3 0.03 0.19 13 0 0.15 0.9 0.25 0.26
TR 9 -0.45 -0.1 0.05 -
0.13 0.18 9 -1 0.05 0.75 -0.04 0.49 9 0 0.15 0.97 0.22 0.30
TU 17 -0.68 0 0.35 -
0.02 0.26 16 -0.7 0 0.45 -0.04 0.27 17 0 0.15 2.6 0.69 0.71

A. B. FIGURE H-3. Aerial photographs of the study area at Ram Island (A) and Long Island (B) with sampling sites coded by category
(green = C, yellow = TR, red = TU) and magnitude of erosion rate as measured by the year-change in distance to stake from October 2005 to October 2006.
H-5
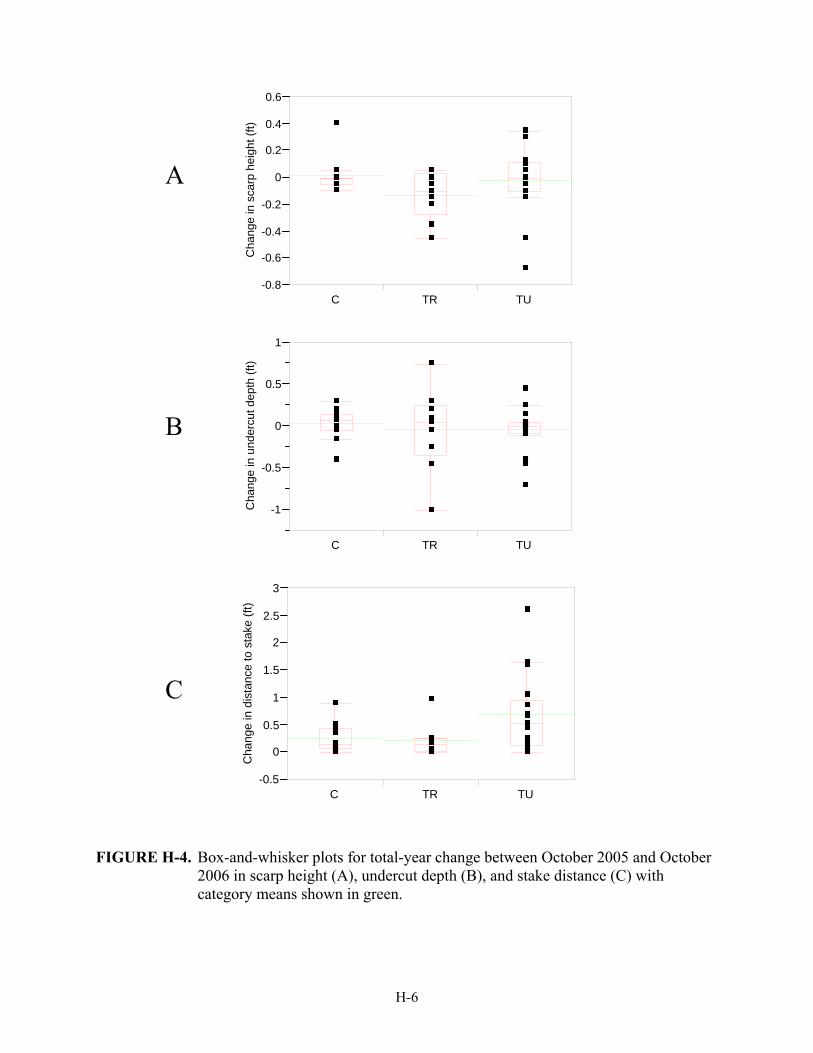
H-6
Cha
nge
in s
carp
hei
ght (
ft)
-0.8
-0.6
-0.4
-0.2
0
0.2
0.4
0.6
C TR TU
Cha
nge
in u
nder
cut d
epth
(ft)
-1
-0.5
0
0.5
1
C TR TU
Cha
nge
in d
ista
nce
to s
take
(ft)
-0.5
0
0.5
1
1.5
2
2.5
3
C TR TU
FIGURE H-4. Box-and-whisker plots for total-year change between October 2005 and October
2006 in scarp height (A), undercut depth (B), and stake distance (C) with category means shown in green.
A
B
C
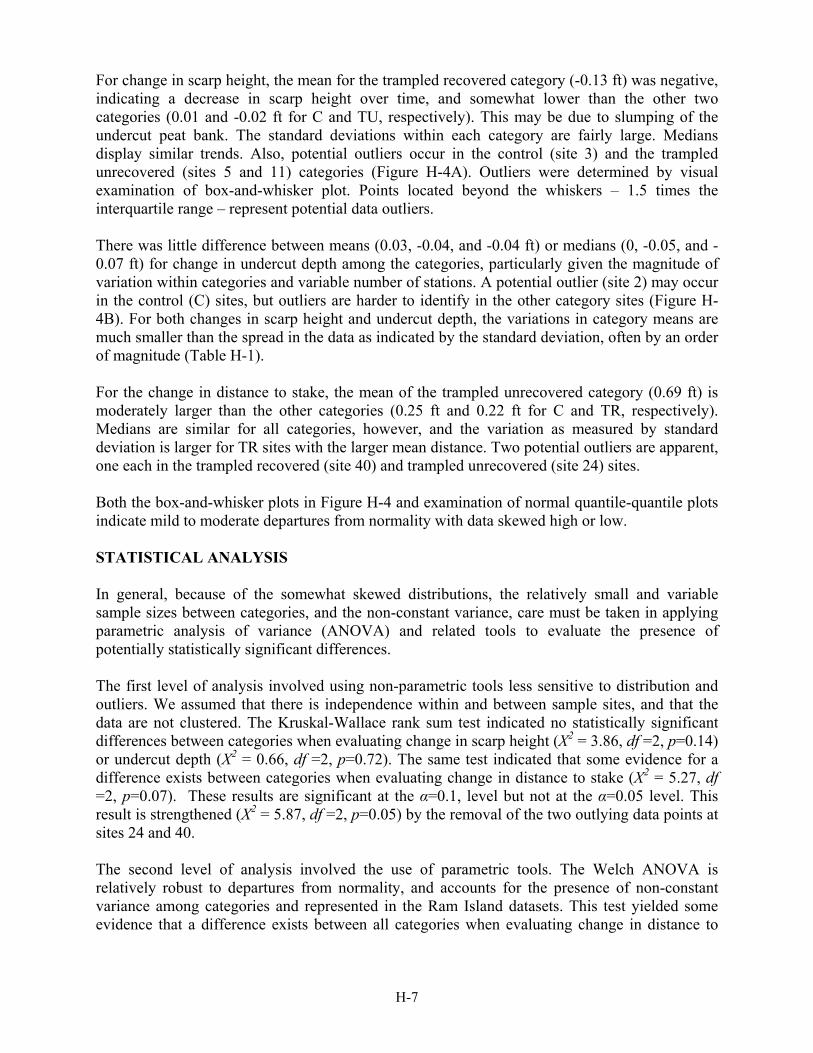
H-7
For change in scarp height, the mean for the trampled recovered category (-0.13 ft) was negative, indicating a decrease in scarp height over time, and somewhat lower than the other two categories (0.01 and -0.02 ft for C and TU, respectively). This may be due to slumping of the undercut peat bank. The standard deviations within each category are fairly large. Medians display similar trends. Also, potential outliers occur in the control (site 3) and the trampled unrecovered (sites 5 and 11) categories (Figure H-4A). Outliers were determined by visual examination of box-and-whisker plot. Points located beyond the whiskers – 1.5 times the interquartile range – represent potential data outliers. There was little difference between means (0.03, -0.04, and -0.04 ft) or medians (0, -0.05, and -0.07 ft) for change in undercut depth among the categories, particularly given the magnitude of variation within categories and variable number of stations. A potential outlier (site 2) may occur in the control (C) sites, but outliers are harder to identify in the other category sites (Figure H-4B). For both changes in scarp height and undercut depth, the variations in category means are much smaller than the spread in the data as indicated by the standard deviation, often by an order of magnitude (Table H-1). For the change in distance to stake, the mean of the trampled unrecovered category (0.69 ft) is moderately larger than the other categories (0.25 ft and 0.22 ft for C and TR, respectively). Medians are similar for all categories, however, and the variation as measured by standard deviation is larger for TR sites with the larger mean distance. Two potential outliers are apparent, one each in the trampled recovered (site 40) and trampled unrecovered (site 24) sites. Both the box-and-whisker plots in Figure H-4 and examination of normal quantile-quantile plots indicate mild to moderate departures from normality with data skewed high or low. STATISTICAL ANALYSIS In general, because of the somewhat skewed distributions, the relatively small and variable sample sizes between categories, and the non-constant variance, care must be taken in applying parametric analysis of variance (ANOVA) and related tools to evaluate the presence of potentially statistically significant differences. The first level of analysis involved using non-parametric tools less sensitive to distribution and outliers. We assumed that there is independence within and between sample sites, and that the data are not clustered. The Kruskal-Wallace rank sum test indicated no statistically significant differences between categories when evaluating change in scarp height (Χ2 = 3.86, df =2, p=0.14) or undercut depth (Χ2 = 0.66, df =2, p=0.72). The same test indicated that some evidence for a difference exists between categories when evaluating change in distance to stake (Χ2 = 5.27, df =2, p=0.07). These results are significant at the α=0.1, level but not at the α=0.05 level. This result is strengthened (Χ2 = 5.87, df =2, p=0.05) by the removal of the two outlying data points at sites 24 and 40. The second level of analysis involved the use of parametric tools. The Welch ANOVA is relatively robust to departures from normality, and accounts for the presence of non-constant variance among categories and represented in the Ram Island datasets. This test yielded some evidence that a difference exists between all categories when evaluating change in distance to
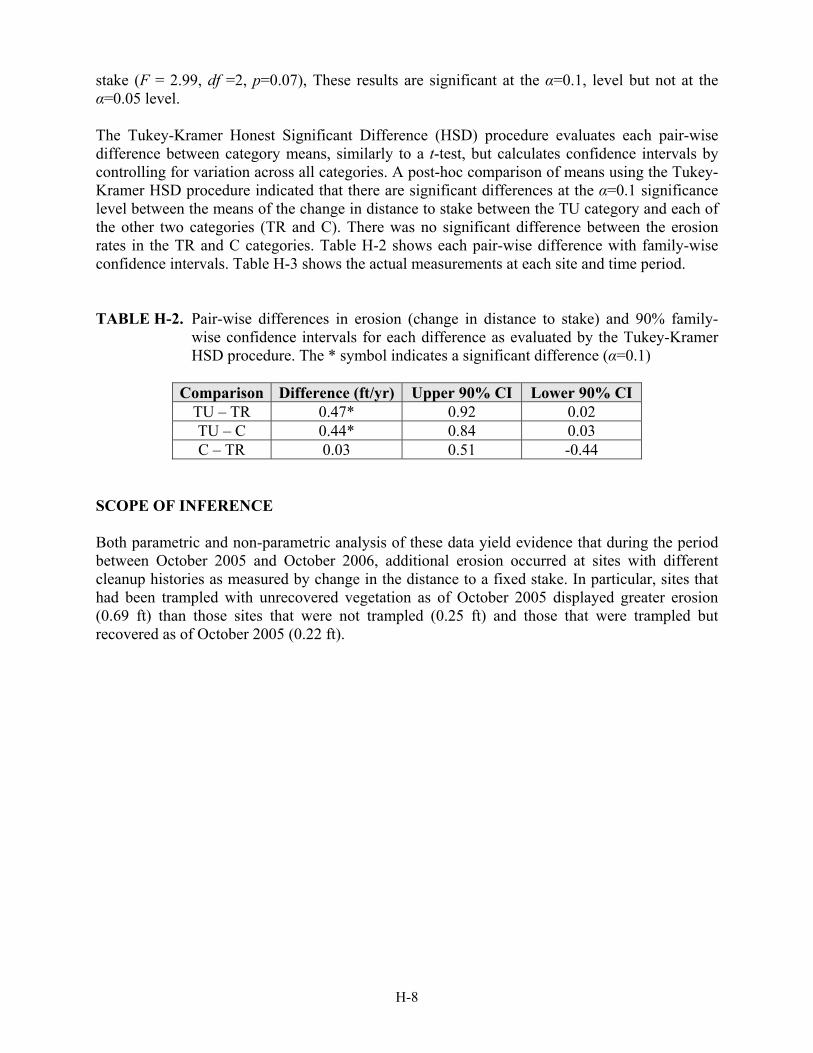
H-8
stake (F = 2.99, df =2, p=0.07), These results are significant at the α=0.1, level but not at the α=0.05 level. The Tukey-Kramer Honest Significant Difference (HSD) procedure evaluates each pair-wise difference between category means, similarly to a t-test, but calculates confidence intervals by controlling for variation across all categories. A post-hoc comparison of means using the Tukey-Kramer HSD procedure indicated that there are significant differences at the α=0.1 significance level between the means of the change in distance to stake between the TU category and each of the other two categories (TR and C). There was no significant difference between the erosion rates in the TR and C categories. Table H-2 shows each pair-wise difference with family-wise confidence intervals. Table H-3 shows the actual measurements at each site and time period. TABLE H-2. Pair-wise differences in erosion (change in distance to stake) and 90% family-
wise confidence intervals for each difference as evaluated by the Tukey-Kramer HSD procedure. The * symbol indicates a significant difference (α=0.1)
Comparison Difference (ft/yr) Upper 90% CI Lower 90% CI
TU – TR 0.47* 0.92 0.02 TU – C 0.44* 0.84 0.03 C – TR 0.03 0.51 -0.44
SCOPE OF INFERENCE Both parametric and non-parametric analysis of these data yield evidence that during the period between October 2005 and October 2006, additional erosion occurred at sites with different cleanup histories as measured by change in the distance to a fixed stake. In particular, sites that had been trampled with unrecovered vegetation as of October 2005 displayed greater erosion (0.69 ft) than those sites that were not trampled (0.25 ft) and those that were trampled but recovered as of October 2005 (0.22 ft).

H-9
TABLE H-3. Raw data collected in the field by location (RI = Ram Island, LI = Long Island) and cleanup history category. MS indicates a missing stake. NA indicates not assessed.
Site
Loc
atio
n C
ateg
ory W
idth
Scarp Height (ft) Undercut Depth (ft) Scarp Edge Distance To Stake (ft)
Oct05 Apr06 Oct06 Oct05 Apr06 Oct06 Oct05 Apr06 Oct061 LI C NA 1.50 1.30 1.50 0.00 0.15 0.20 0.00 0.15 0.10 2 LI C NA 1.00 1.10 1.05 0.50 0.25 0.10 0.00 0.15 0.15 3 LI C NA 0.60 0.60 1.00 0.00 0.10 0.15 0.00 0.00 0.08 4 LI C NA 1.70 1.30 1.60 0.33 0.45 0.40 0.00 0.10 0.15 5 RI TU NA 1.20 1.20 0.52 0.15 NA NA 0.00 0.20 0.53 6 RI TU 52.50 0.45 0.40 0.40 0.00 0.45 0.25 0.00 0.35 0.85 7 RI C 77.60 0.20 0.30 0.15 0.00 0.00 NA 0.00 0.15 0.35 8 RI TU 39.90 0.80 0.70 0.70 0.30 0.30 0.30 0.00 0.20 0.15 9 RI C 70.00 0.45 0.50 0.45 0.10 0.10 0.10 0.00 0.10 0.90
10 RI TR 34.00 0.85 0.80 MS 0.45 0.75 MS 0.00 0.85 MS 11 RI TU 24.80 0.75 0.40 0.30 0.80 1.70 0.10 0.00 1.50 1.65 12 RI TU 19.50 0.60 0.55 0.50 0.50 0.00 0.10 0.00 0.65 0.65 13 RI C 32.00 0.45 0.40 0.40 0.20 0.10 0.05 0.00 0.05 0.10 14 RI C 6.40 0.40 0.35 0.40 0.05 0.20 0.00 0.00 0.00 0.45 15 RI C 9.20 0.30 0.25 0.30 0.00 0.50 0.10 0.00 0.00 0.00 16 RI C 6.80 0.45 0.20 0.40 0.00 0.10 0.10 0.00 0.05 0.05 17 RI C 58.70 0.30 0.30 0.25 0.15 0.15 0.13 0.00 0.00 0.45 18 RI C 64.60 0.00 0.00 NA 0.00 0.00 NA 0.00 0.15 0.50 19 RI TU 46.80 0.00 0.10 0.00 0.00 0.00 0.00 0.00 0.10 0.10 20 RI TU 40.95 0.00 0.00 NA 0.00 0.00 NA 0.00 0.00 NA 21 RI TR 19.30 0.55 0.70 0.60 0.20 0.30 0.50 0.00 0.00 0.00 22 RI TU 16.90 0.10 0.10 0.40 0.00 0.00 0.05 0.00 0.50 0.70 23 RI TU 43.00 0.60 0.85 0.90 0.15 0.75 0.10 0.00 0.50 1.60 24 RI TU 35.00 0.45 0.70 0.80 0.00 2.55 0.00 0.00 2.10 2.60 25 RI TU 35.00 0.45 0.40 0.45 0.10 0.00 0.00 0.00 0.20 0.45 26 RI TR 46.50 0.30 0.20 0.20 0.00 0.00 0.05 0.00 0.00 0.05 27 RI TR 32.40 0.50 0.40 0.50 0.15 0.20 0.10 0.00 0.10 0.25 28 RI TR 30.30 0.50 0.50 0.35 0.45 0.00 0.00 0.00 0.00 0.00 29 RI TU 27.30 0.60 0.55 0.73 0.50 0.55 0.05 0.00 0.30 0.85 30 RI TU 20.50 0.40 0.50 0.45 0.25 0.20 0.25 0.00 0.00 0.25 31 RI TR 11.10 0.40 0.45 0.20 0.25 0.50 1.00 0.00 0.00 0.25 32 RI TR 31.90 1.15 1.00 0.70 1.10 0.70 0.10 0.00 0.15 0.05 33 RI TR 37.40 1.15 1.30 1.10 0.60 0.60 0.70 0.00 0.00 0.15 34 RI TU 20.00 0.70 0.50 0.55 0.60 0.50 0.60 0.00 0.00 0.00 35 RI TR 21.60 0.50 0.40 0.15 0.55 0.30 0.30 0.00 0.05 0.25 36 RI TU 48.70 0.60 0.60 0.70 0.10 0.25 0.55 0.00 0.00 0.00 37 RI C 84.60 0.30 0.45 0.30 0.15 0.15 0.45 0.00 0.00 0.00 38 RI TU 47.00 0.20 0.15 0.30 0.00 0.10 0.05 0.00 0.00 0.20 39 RI TU 20.60 0.30 0.30 0.25 0.00 0.00 0.05 0.00 0.00 0.10 40 RI TR 44.00 0.50 0.30 0.55 0.10 0.70 0.30 0.00 0.40 0.97 41 RI TU 39.50 1.05 0.60 1.00 0.35 1.00 0.50 0.00 0.15 1.05

I-1
APPENDIX I
METHODS FOR DETERMINING INJURY FROM OILING AND ENHANCED EROSION OF MARSHES ON RAM ISLAND, LONG ISLAND, AND LEISURE
SHORES
I-2
METHODS FOR DETERMINING INJURY FROM OILING AND ENHANCED EROSION OF MARSHES ON RAM ISLAND, LONG ISLAND, AND LEISURE SHORES
19 April 2007
INTRODUCTION
The Shoreline Assessment Team (SAT) has developed methods to address the injury from oiling and increased erosion of three marshes from the Bouchard B-120 oil spill (Long Island, Ram Island, and Leisure Shores). The SAT conducted field surveys at two of the areas of concern (Ram Island and Long Island) to determine the most appropriate methods for determining injury from oiling and accelerated erosion. This memo outlines these methods. The key points are that:
• These three marshes had a bare band on the marsh edge where the vegetation was killed as a result of the oil spill and did not recover. The loss of the vegetation/roots resulted in an accelerated rate of erosion. These areas were designated as trampled and unrecovered.
• There were areas where trampling did occur and the vegetation grew back. These areas were designated as trampled and recovered.
• The seaward edges of these marshes are undergoing natural erosion, which was considered as part of the analysis.
• The marsh loss from increased erosion will continue into the future as long as the marsh remains.
• The lost services for these three areas include losses from both oiling and accelerated erosion, so they are not included in the calculations of discounted service acre-years (DSAYs) for the injury category of heavily or moderately oiled marshes.
The following sections discuss how the approach, inputs, and results were determined for the three impact areas. The same methods were used for all three marsh sites; however, there were differences among the three sites in the oiling degree, width measurements, and erosion rates that were incorporated into the calculations. The inputs for each area are shown in Table I-1.
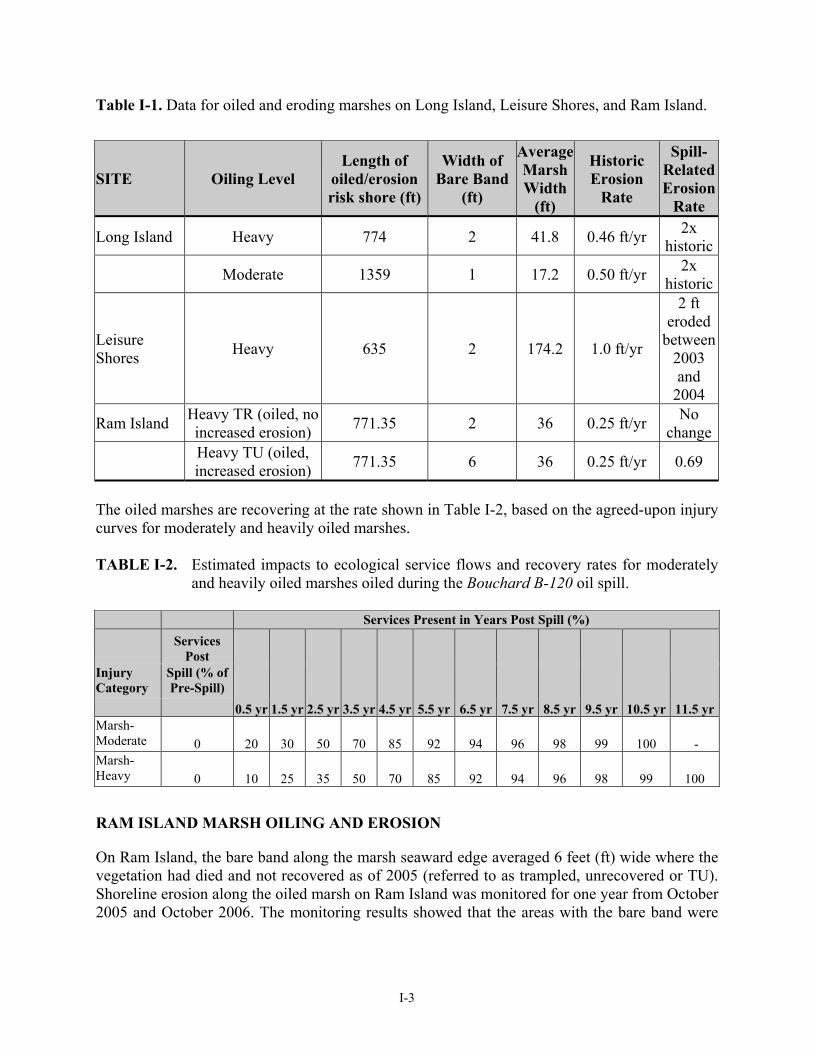
I-3
Table I-1. Data for oiled and eroding marshes on Long Island, Leisure Shores, and Ram Island.
SITE Oiling Level Length of
oiled/erosion risk shore (ft)
Width of Bare Band
(ft)
Average Marsh Width
(ft)
Historic Erosion
Rate
Spill-Related Erosion
Rate
Long Island Heavy 774 2 41.8 0.46 ft/yr 2x historic
Moderate 1359 1 17.2 0.50 ft/yr 2x historic
Leisure Shores Heavy 635 2 174.2 1.0 ft/yr
2 ft eroded
between 2003 and
2004
Ram Island Heavy TR (oiled, no increased erosion) 771.35 2 36 0.25 ft/yr No
change
Heavy TU (oiled, increased erosion) 771.35 6 36 0.25 ft/yr 0.69
The oiled marshes are recovering at the rate shown in Table I-2, based on the agreed-upon injury curves for moderately and heavily oiled marshes. TABLE I-2. Estimated impacts to ecological service flows and recovery rates for moderately
and heavily oiled marshes oiled during the Bouchard B-120 oil spill. Services Present in Years Post Spill (%)
Services
Post
0.5 yr 1.5 yr 2.5 yr 3.5 yr 4.5 yr 5.5 yr 6.5 yr 7.5 yr 8.5 yr 9.5 yr 10.5 yr 11.5 yr
Injury Category
Spill (% of Pre-Spill)
Marsh- Moderate 0 20 30 50 70 85 92 94 96 98 99 100 - Marsh- Heavy 0 10 25 35 50 70 85 92 94 96 98 99 100
RAM ISLAND MARSH OILING AND EROSION
On Ram Island, the bare band along the marsh seaward edge averaged 6 feet (ft) wide where the vegetation had died and not recovered as of 2005 (referred to as trampled, unrecovered or TU). Shoreline erosion along the oiled marsh on Ram Island was monitored for one year from October 2005 and October 2006. The monitoring results showed that the areas with the bare band were
I-4
eroding at an average of 0.69 ft/year compared with an average of 0.25 ft/year along shorelines without the bare band (referred to as trampled, recovered or TR). The following assumptions were made:
• The historical erosion rate for the marsh was assumed to be 0.25 ft per year, based on the actual erosion rate measured for one year between 2005-2006 along the sections of the Ram Island marsh shoreline that did not have the bare vegetation band. There are no data for Ram Island on the MASS GIS shoreline change maps, and there were no other long-term erosion data available.
• The accelerated erosion rate for the trampled unrecovered areas is 0.69 ft per year. • The total width of the marsh is an average of 36 ft based on SAT field measurements in
October 2005. • The average oiled width of all the heavily oiled marshes is 26.88 ft, based on SCAT data;
this value appears to be consistent with the observed conditions on Ram Island where approximately 75% of the total average marsh width (36-ft width) was determined to be oiled (27 ft width) based on field work and observations after the spill (C. Mostello, pers. comm., 2007).
• The total length of marsh is 1,542.7 ft based on the GIS data developed for the shoreline injury assessment.
• A 6-ft wide band along half the length of the marsh was trampled and unrecovered. • For the trampled unrecovered marshes the first 6 ft of width is assumed to have no
recovery.
INJURY CALCULATIONS
The injury calculations to the Ram Island marsh were adjusted for the historical and accelerated erosion rates of the marsh. Four separate injury calculations were completed. The four injury categories were (1) oiled recovering marsh, (2) 6 ft-wide trampled band with no recovery, (3) oiled recovering marsh behind the 6 ft-wide trampled band, and (4) additional area lost to accelerated erosion. Figure I-1 provides a visual description of the four injury categories. Oiled and recovering marsh (TR marshes)
• Area measurements: 26.88 ft-wide by 771.35 ft-long (total length of marsh divided in half to provide the measurement for TR marshes: 1542.7/2 = 771.35).
• Recovery rate: Marsh recovers from the impacts of the heavy oiling in 11.5 yrs (independent of erosion), as shown in Table I-2.
• Erosion rate: Historic rate of 0.25 ft per year. • Model method: The area on which the DSAYs are calculated is reduced by 0.25 ft by
771.35 ft (192.8 sq. ft.) every year. After 11.5 years there is no longer an oiling-related injury to the marsh but the model continues to erode the shoreline until all of the marsh is eroded away. This is done to determine the life of the marsh.
• Calculated Injury: 1.53 DSAYs. 6 ft-wide trampled band with no recovery
• Area measurement: 6 ft-wide by 771.35 ft-long.
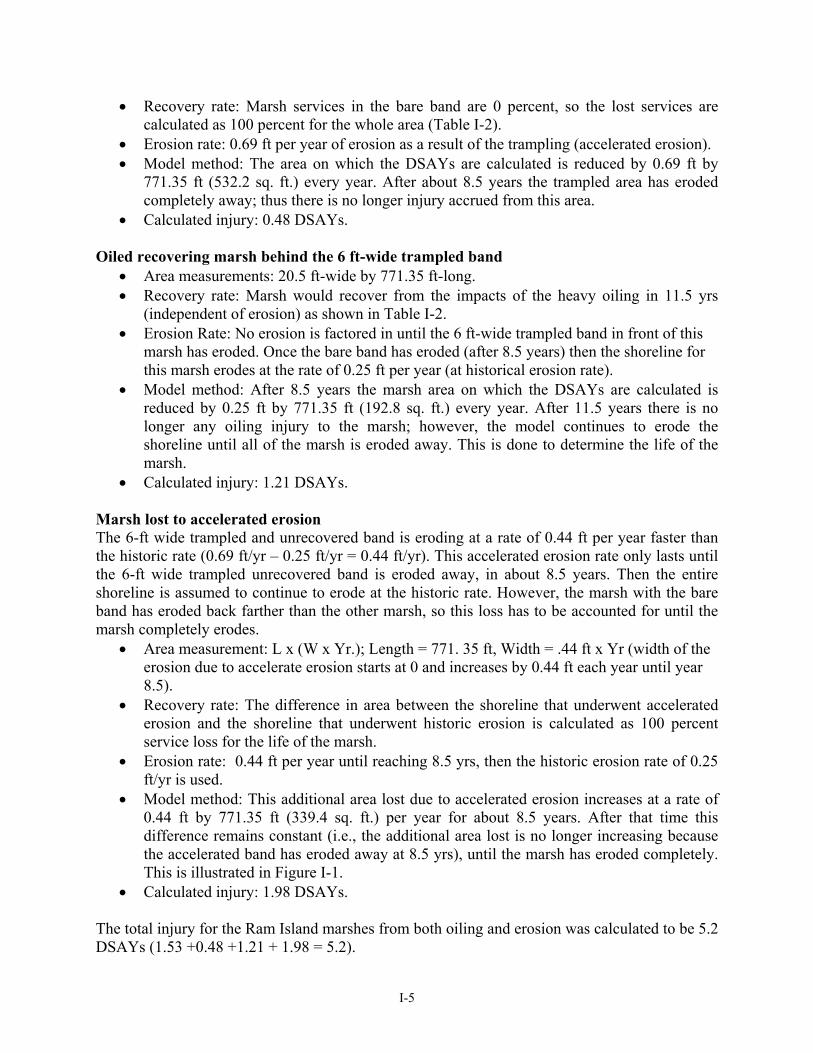
I-5
• Recovery rate: Marsh services in the bare band are 0 percent, so the lost services are calculated as 100 percent for the whole area (Table I-2).
• Erosion rate: 0.69 ft per year of erosion as a result of the trampling (accelerated erosion). • Model method: The area on which the DSAYs are calculated is reduced by 0.69 ft by
771.35 ft (532.2 sq. ft.) every year. After about 8.5 years the trampled area has eroded completely away; thus there is no longer injury accrued from this area.
• Calculated injury: 0.48 DSAYs. Oiled recovering marsh behind the 6 ft-wide trampled band
• Area measurements: 20.5 ft-wide by 771.35 ft-long. • Recovery rate: Marsh would recover from the impacts of the heavy oiling in 11.5 yrs
(independent of erosion) as shown in Table I-2. • Erosion Rate: No erosion is factored in until the 6 ft-wide trampled band in front of this
marsh has eroded. Once the bare band has eroded (after 8.5 years) then the shoreline for this marsh erodes at the rate of 0.25 ft per year (at historical erosion rate).
• Model method: After 8.5 years the marsh area on which the DSAYs are calculated is reduced by 0.25 ft by 771.35 ft (192.8 sq. ft.) every year. After 11.5 years there is no longer any oiling injury to the marsh; however, the model continues to erode the shoreline until all of the marsh is eroded away. This is done to determine the life of the marsh.
• Calculated injury: 1.21 DSAYs. Marsh lost to accelerated erosion The 6-ft wide trampled and unrecovered band is eroding at a rate of 0.44 ft per year faster than the historic rate (0.69 ft/yr – 0.25 ft/yr = 0.44 ft/yr). This accelerated erosion rate only lasts until the 6-ft wide trampled unrecovered band is eroded away, in about 8.5 years. Then the entire shoreline is assumed to continue to erode at the historic rate. However, the marsh with the bare band has eroded back farther than the other marsh, so this loss has to be accounted for until the marsh completely erodes.
• Area measurement: L x (W x Yr.); Length = 771. 35 ft, Width = .44 ft x Yr (width of the erosion due to accelerate erosion starts at 0 and increases by 0.44 ft each year until year 8.5).
• Recovery rate: The difference in area between the shoreline that underwent accelerated erosion and the shoreline that underwent historic erosion is calculated as 100 percent service loss for the life of the marsh.
• Erosion rate: 0.44 ft per year until reaching 8.5 yrs, then the historic erosion rate of 0.25 ft/yr is used.
• Model method: This additional area lost due to accelerated erosion increases at a rate of 0.44 ft by 771.35 ft (339.4 sq. ft.) per year for about 8.5 years. After that time this difference remains constant (i.e., the additional area lost is no longer increasing because the accelerated band has eroded away at 8.5 yrs), until the marsh has eroded completely. This is illustrated in Figure I-1.
• Calculated injury: 1.98 DSAYs. The total injury for the Ram Island marshes from both oiling and erosion was calculated to be 5.2 DSAYs (1.53 +0.48 +1.21 + 1.98 = 5.2).
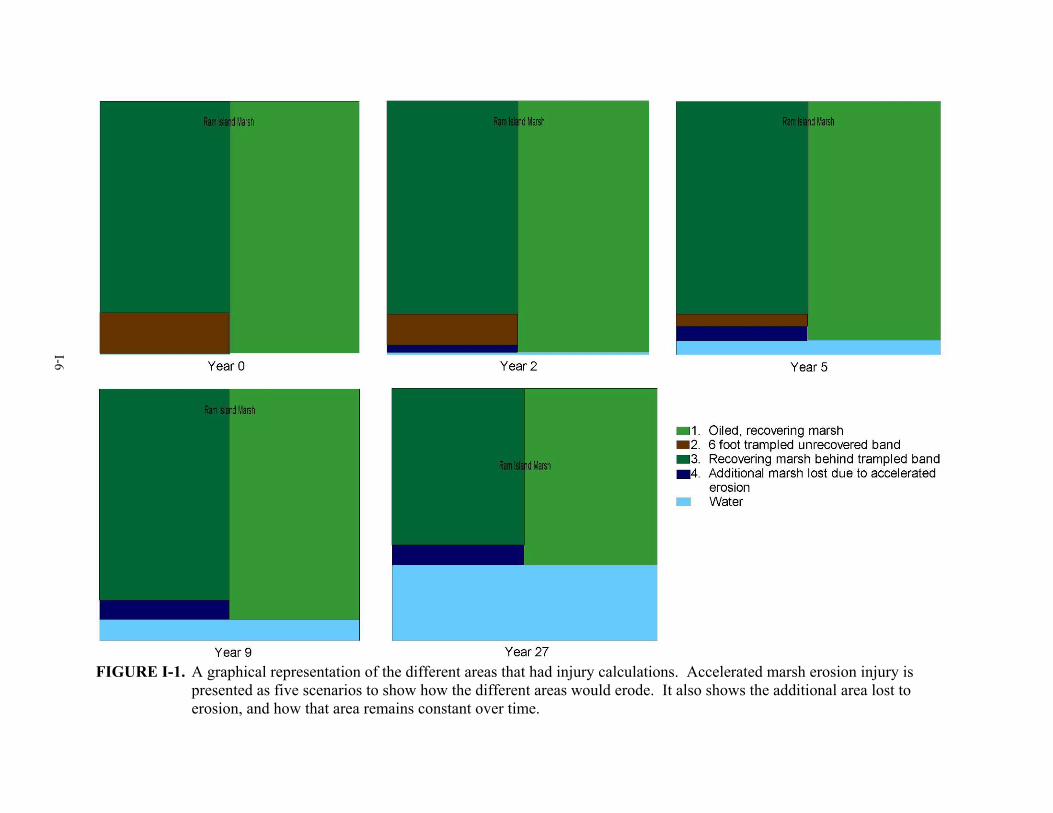
FIGURE I-1. A graphical representation of the different areas that had injury calculations. Accelerated marsh erosion injury is
presented as five scenarios to show how the different areas would erode. It also shows the additional area lost to erosion, and how that area remains constant over time.
I-6
I-7
LONG ISLAND MARSH OILING AND EROSION
The same methods described above for Ram Island were used to calculate the injury to the marsh from oiling and increased erosion of the bare band on Long Island. However, there were differences between the two sites in the oiling degree, width measurements, and erosion rates that were incorporated into the calculations. On Long Island, there were two different oiling categories of marsh where the outer edge was bare of vegetation, thus susceptible to increased erosion. On the heavily oiled marsh habitat, the bare band was an average of 2 ft. On moderately oiled marsh habitat, the bare band was an average of 1 foot (based on field surveys in 2004). The lengths of these two areas were determined using the GIS data developed for the shoreline injury assessment and verified by SAT-agency field measurement in April 2007. The MASS GIS shoreline change maps (Massachusetts Office of Coastal Zone Management, 2004b) were used to estimate the historical rates of shoreline erosion on Long Island as 0.5 ft/year for the east side of the island and 0.46 ft/year for the west side of the island. Long Island is not as exposed as Ram Island so erosion rates on Long Island would be more episodic. It was assumed that the erosion of the bare bands along the outer marsh edge would erode at two times the historic rate based on the integrity of the root system, until the bare band was eroded. Then the rest of the marsh would continue to erode at the historic rate. The average width of the marsh on Long Island was estimated to be 17.2 ft. on the east side and 41.8 ft on the west side, based on field measurements made in April 2007. The marsh losses from the historical erosion rates are considered (and excluded) in the calculations. The total injury for the Long Island marshes from both oiling and erosion was calculated to be 2.93 DSAYs.
LEISURE SHORES MARSH OILING AND EROSION
Again, the same methods described above for Ram Island were used to calculate the injury to the marsh from oiling and increased erosion on Leisure Shores, with some differences. By the time of the site visits to the Leisure Shores marsh in 2005, the bare band observed in 2003 was no longer present. Therefore, it was assumed that the estimated 2 ft of bare vegetation at the marsh edge had already eroded over the two-year period between 2003 and 2005. The background erosion rate for this shoreline is 1 ft/yr. Thus it is assumed that the erosion of the bare area would be about 2 ft/yr. This is consistent with the accelerated erosion rates (two times the historical rate) used on Long Island. It is assumed that the marsh will continue to erode at the historic erosion rate of 1 ft/year, as determined from the MASS GIS shoreline change maps (Massachusetts Office of Coastal Zone Management, 2004b). The length of oiled/eroded marsh was determined using the GIS data developed for the shoreline injury assessment. The width of the marsh was determined by measuring the average distance from the shoreline to the edge of the tidal creek using April 2001 aerial photography obtained from MASS GIS (Massachusetts Office of Coastal Zone Management, 2004b). This average was based on measurements every 50 feet along the impacted length of shoreline.

I-8
The marsh losses from the historical erosion rates are considered (and excluded) in the calculations. The total injury for the Leisure Shores marshes from both oiling and erosion was calculated to be 1.64 DSAYs.

J-1
APPENDIX J RESPONSIBLE PARTY ADDENDUM TO THE INJURY REPORT
J-2
Table of Contents
1.0 ESTIMATES OF SHORELINE INJURY .................. Error! Bookmark not defined. 1.1 Coarse Substrate Injury ................................................... Error! Bookmark not defined.
1.1.1 Moderately Oiled Coarse Substrate .......................... Error! Bookmark not defined. 1.1.2 Heavily Oiled Coarse Substrate ................................ Error! Bookmark not defined. 1.1.3 Sediment Replacement Projects ................................ Error! Bookmark not defined.
1.2 MARSH INJURY ........................................................... Error! Bookmark not defined. 1.2.1 Moderately Oiled Marsh .......................................... Error! Bookmark not defined. 1.2.2 Heavily Oiled Marsh ................................................ Error! Bookmark not defined. 1.2.3 Oiled and Eroding Marshes ..................................... Error! Bookmark not defined.
1.2.3.1 Ram Island Heavily Oiled and Eroding Marsh……………………...........1Error! Bookmark not defined. 1.2.3.2 Long Island Heavily Oiled and Eroding Marsh and Moderately
Oiled and Eroding Marsh……………………………………..…………….2Error! Bookmark not defined.
1.2.3.3 Summary of Oiled and Eroding Marsh Injury……………………………2Error! Bookmark not defined.
2.0 SUMMARY OF INJURY.................................... ….....Error! Bookmark not defined.
LIST OF TABLES Table 1 Percentage of SCAT Forms for Moderately Oiled Habitats (all types) in Each
Oiling Category ................................................................................................................... 5
Table 2. The RP’s estimated impacts to ecological service flows and recovery rates for moderately oiled coarse substrates oiled during the Bouchard B-120 oil spill.................. 7
Table 3. Percentage of SCAT Forms for Heavily Oiled Habitats (all types) in Each Oiling Category ................................................................................................................... 9
Table 4. The RP’s estimated impacts to ecological service flows and recovery rates for heavily oiled coarse substrates oiled during the Bouchard B-120 oil spill. ............... 11
Table 5. The RP’s estimated impacts to ecological service flows and recovery rates for sediment replacement areas oiled during the Bouchard B-120 oil spill. ................... 13
Table 6. The distribution of moderately oiled marshes in Buzzards Bay (excluding oiled and eroding marshes) ............................................................................................... 15
Table 7. Estimated impacts to ecological service flows and recovery rates for marshes moderately oiled during the Bouchard B-120 oil spill..................................................... 18
Table 8. The distribution of heavily oiled marshes in Buzzards Bay (excluding oiled and eroding marshes) ........................................................................................................ 19
Table 9. Estimated impacts to ecological service flows and recovery rates for marshes heavily oiled during the Bouchard B-120 oil spill. ........................................................... 24

J-3
Table 10. The RP’S estimated impacts to ecological service flows and recovery rates for heavily oiled and eroding marshes. ............................................................................. 26
Table 11. The RP’S estimated impacts to ecological service flows and recovery rates for moderately oiled and eroding marshes. ....................................................................... 29
Table 12. Total estimated area (acres) of impacted shoreline in each exposure category in Massachusetts. . ............................................................................................. 30
Table 13. Total injury (in acres and DSAYs) to oiled shoreline habitats in Massachusetts. .......... 31
LIST OF FIGURES Figure 1. Moderately oiled coarse substrate recovery curve. ................................................................. 8
Figure 2. Heavily oiled coarse substrate recovery curve ...................................................................... 12
Figure 3. Sediment replacement recovery curves. ................................................................................ 14
Figure 4. Popes Beach September 2003 ............................................................................................... 17
Figure 5. Moderately oiled marsh recovery curve. ............................................................................... 18
Figure 6. Brant Island Cove, September, 2003 .................................................................................... 20
Figure 7. Brant Island Cove, August 2004 ........................................................................................... 21
Figure 8. Heavily oiled marsh recovery curve. .................................................................................... 23
Figure 9. Heavily oiled and eroding marsh recovery curve ................................................................. 27
Figure 10. Moderately oiled and eroding marsh recovery curve .......................................................... 29

J-4
APPENDIX J RESPONSIBLE PARTY ADDENDUM TO THE SHORELINE INJURY REPORT
The Responsible Party (RP) and the Trustees have worked cooperatively throughout the injury assessment for shorelines and have reached consensus on many of the injury scenarios and the general magnitude of the shoreline injury. However, the RP does not agree with the Trustees on the magnitude of injury and recovery for several injury scenarios and in certain specific areas of the shoreline injury assessment. This Appendix identifies where the RP’s evaluation of shoreline injury departs from that of the Trustees and provides explanations for alternate interpretations of the cooperatively collected shoreline injury data.
The RP’s comments are presented below in the order in which they appear in the report.
ESTIMATES OF SHORELINE INJURY
The cooperative injury assessment process was successful in reaching consensus between the Trustees and the RP on many of the injury categories. However, differences remain in the estimated service losses and recovery for seven injury categories – heavily oiled marshes, moderately oiled marshes, heavily oiled coarse substrate, moderately oiled coarse substrate, sediment replacement areas, moderately oiled and eroding marshes, and heavily oiled and eroding marshes.
In general the RP feels that curves contained in the main body of the shoreline injury report are overly conservative and inconsistent with field observations. Some of this conservativeness appears to result from injury estimates being based on the most heavily impacted sections of shoreline within each category rather than being representative of all conditions (i.e., average) within the injury category. The RP used the information provided below to develop estimates that the RP believes more accurately reflect the range of injury within each of the injury categories while still being sufficiently conservative to protect the public’s interests. These points are described in more detail below but two general conclusions in this regard are:
• Oil distribution data demonstrates that some of the worst case locations used in the TWG’s initial considerations of shoreline injury were given excessive weight by the Trustees in certain categories. Although the Trustees reduced injury levels for heavily oiled areas when they moved the most heavily impacted marshes to the “oiled and eroding” category, the RP believes the resulting injury estimates are still too conservative and overstate the overall injury.
• A greater balance is needed so that both injured services and uninjured services are considered. All services were not equally impacted within a given habitat and some of these unaffected or minimally affected services were present even in early stages of the spill. The RP feels that the Trustees focused at times on one or two key injured aspects of a habitat without adequate consideration of the remaining uninjured or less injured services of the habitat. Also, field observations indicated more rapid recovery than
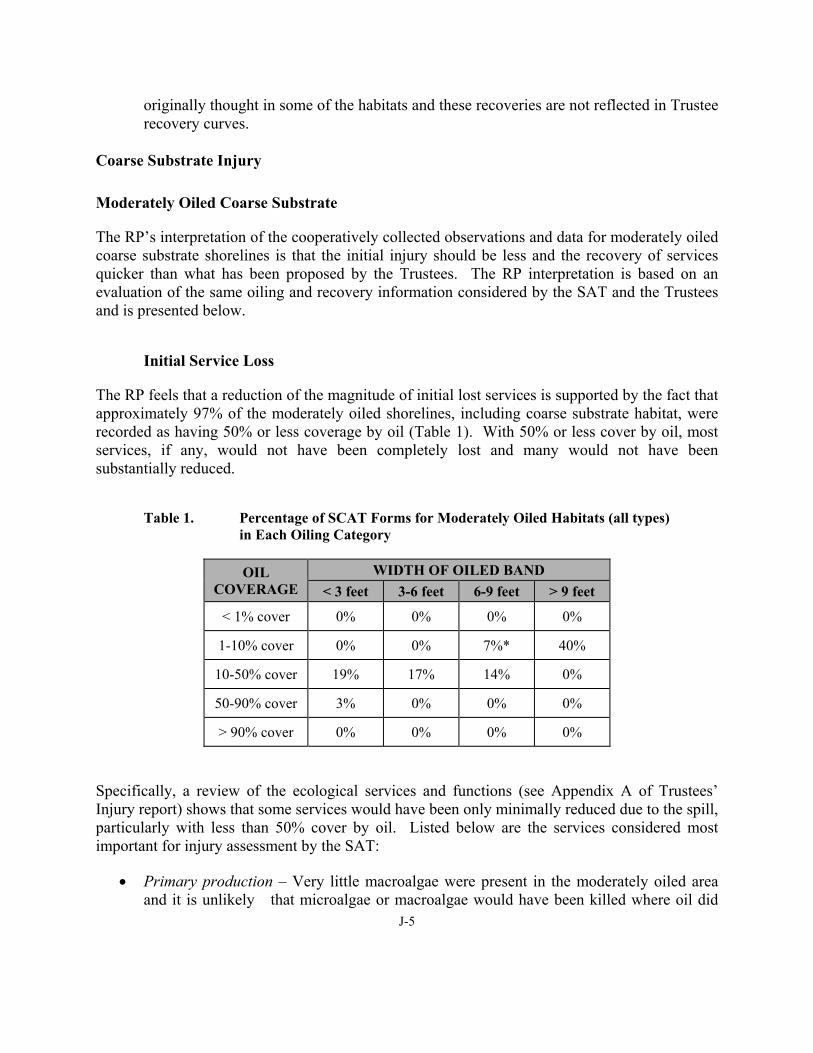
J-5
originally thought in some of the habitats and these recoveries are not reflected in Trustee recovery curves.
Coarse Substrate Injury
Moderately Oiled Coarse Substrate
The RP’s interpretation of the cooperatively collected observations and data for moderately oiled coarse substrate shorelines is that the initial injury should be less and the recovery of services quicker than what has been proposed by the Trustees. The RP interpretation is based on an evaluation of the same oiling and recovery information considered by the SAT and the Trustees and is presented below.
Initial Service Loss
The RP feels that a reduction of the magnitude of initial lost services is supported by the fact that approximately 97% of the moderately oiled shorelines, including coarse substrate habitat, were recorded as having 50% or less coverage by oil (Table 1). With 50% or less cover by oil, most services, if any, would not have been completely lost and many would not have been substantially reduced.
Table 1. Percentage of SCAT Forms for Moderately Oiled Habitats (all types) in Each Oiling Category
OIL COVERAGE
WIDTH OF OILED BAND < 3 feet 3-6 feet 6-9 feet > 9 feet
< 1% cover 0% 0% 0% 0%
1-10% cover 0% 0% 7%* 40%
10-50% cover 19% 17% 14% 0%
50-90% cover 3% 0% 0% 0%
> 90% cover 0% 0% 0% 0%
Specifically, a review of the ecological services and functions (see Appendix A of Trustees’ Injury report) shows that some services would have been only minimally reduced due to the spill, particularly with less than 50% cover by oil. Listed below are the services considered most important for injury assessment by the SAT:
• Primary production – Very little macroalgae were present in the moderately oiled area and it is unlikely that microalgae or macroalgae would have been killed where oil did

J-6
not adhere to the substrate. In areas coated with oil, the reduction in primary production by microalgae attached to the rocks would have been roughly equivalent to the percent cover by oil. Therefore in most areas there would have been less than a 50% reduction in primary production.
• Food web support – With 50% or less cover by oil, most organisms would have survived. No large aggregation of dead crabs, bivalves or other organisms were reported anywhere in the spill zone. With many animals and microalgae still present in the moderately oiled area, many food web support services were still being provided.
• Habitat usage – Larger terrestrial organisms such as birds may have been displaced out of these areas by the cleanup workers. There is little evidence for or against fish avoidance of oiled shorelines. Given that little mortality would have occurred in these areas, the total loss of this service is unlikely.
The RP’s interpretation of this information is that a 100% initial service loss as indicated by the Trustees is not supported by the available data and observations and that a 70 % initial service loss is more representative of potential actual losses in moderately oiled coarse substrate habitats while still being conservative.
Quicker time to recovery
The RP believes that natural resource services recovered more quickly than indicated in the Trustee recovery curve for moderately oiled coarse substrate shorelines. The RP’s interpretation is based on the observations, data, and information cooperatively collected and considered by the SAT and summarized below.
Notes made during the September 3-5, 2003 shoreline monitoring field effort indicate that many populations of invertebrates had largely recovered by 5 months post-spill. For example, the following quotes are taken from the field notes of the September 2003 trip in the section titled “General observations on the condition of intertidal habitats” which are provided as an appendix to the exposure report.
• “Residual oil on gravel beaches and riprap occurred mostly as widely scattered spots of stain and coat. There was some oil staining of shells. Little of the oil was tacky to the touch. At Barney’s Joy, algae covered the oil coat.”
• “Wrack accumulations appeared normal, with abundant numbers of amphipods in most places. The exception was in the area of sediment replacement on Long Island, where the extensive wrack (1 to 2.5 feet deep) contained few amphipods and significantly more gnat-like flying invertebrates than amphipods. No oiled wrack was observed.”
• “In most oiled areas, intertidal fauna were abundant. The exception was in the area of sediment replacement, where the gravel was very clean, lacking an epiphytic cover and thus grazing organisms that were normally abundant elsewhere.”
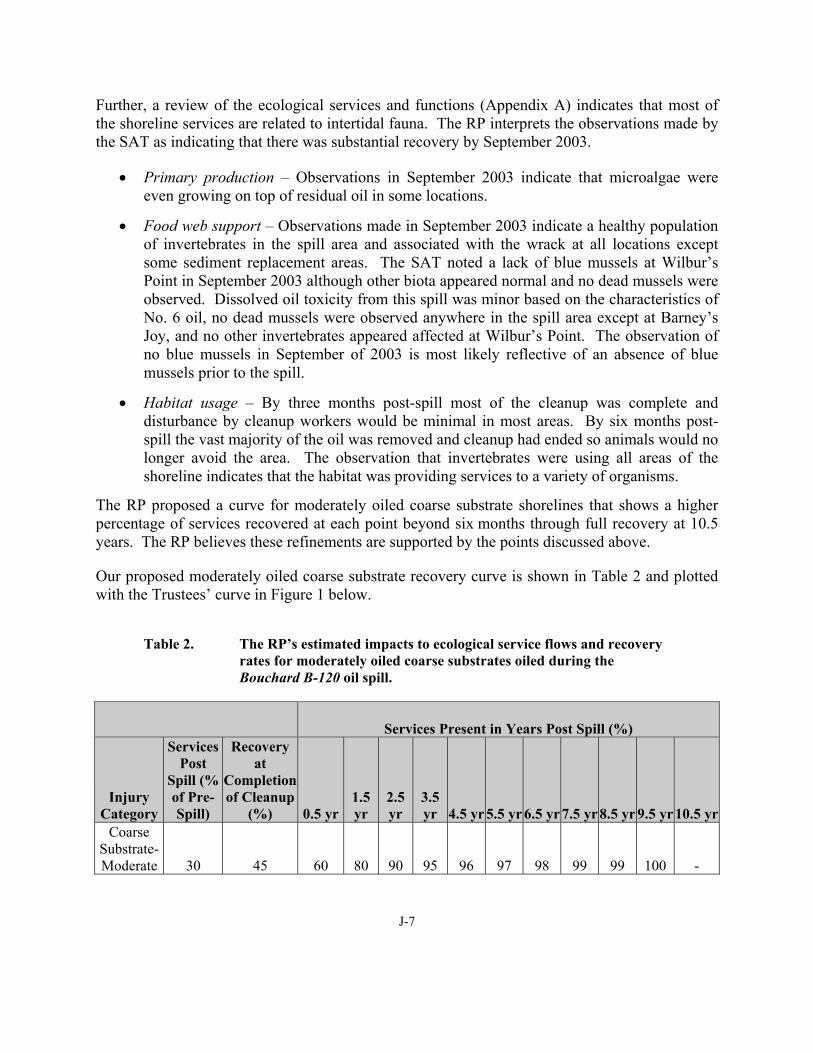
J-7
Further, a review of the ecological services and functions (Appendix A) indicates that most of the shoreline services are related to intertidal fauna. The RP interprets the observations made by the SAT as indicating that there was substantial recovery by September 2003.
• Primary production – Observations in September 2003 indicate that microalgae were even growing on top of residual oil in some locations.
• Food web support – Observations made in September 2003 indicate a healthy population of invertebrates in the spill area and associated with the wrack at all locations except some sediment replacement areas. The SAT noted a lack of blue mussels at Wilbur’s Point in September 2003 although other biota appeared normal and no dead mussels were observed. Dissolved oil toxicity from this spill was minor based on the characteristics of No. 6 oil, no dead mussels were observed anywhere in the spill area except at Barney’s Joy, and no other invertebrates appeared affected at Wilbur’s Point. The observation of no blue mussels in September of 2003 is most likely reflective of an absence of blue mussels prior to the spill.
• Habitat usage – By three months post-spill most of the cleanup was complete and disturbance by cleanup workers would be minimal in most areas. By six months post-spill the vast majority of the oil was removed and cleanup had ended so animals would no longer avoid the area. The observation that invertebrates were using all areas of the shoreline indicates that the habitat was providing services to a variety of organisms.
The RP proposed a curve for moderately oiled coarse substrate shorelines that shows a higher percentage of services recovered at each point beyond six months through full recovery at 10.5 years. The RP believes these refinements are supported by the points discussed above.
Our proposed moderately oiled coarse substrate recovery curve is shown in Table 2 and plotted with the Trustees’ curve in Figure 1 below.
Table 2. The RP’s estimated impacts to ecological service flows and recovery rates for moderately oiled coarse substrates oiled during the Bouchard B-120 oil spill.
Services Present in Years Post Spill (%)
Injury Category
Services Post
Spill (% of Pre-Spill)
Recovery at
Completion of Cleanup
(%) 0.5 yr1.5 yr
2.5 yr
3.5 yr 4.5 yr 5.5 yr 6.5 yr 7.5 yr 8.5 yr 9.5 yr 10.5 yr
Coarse Substrate- Moderate 30 45 60 80 90 95 96 97 98 99 99 100 -
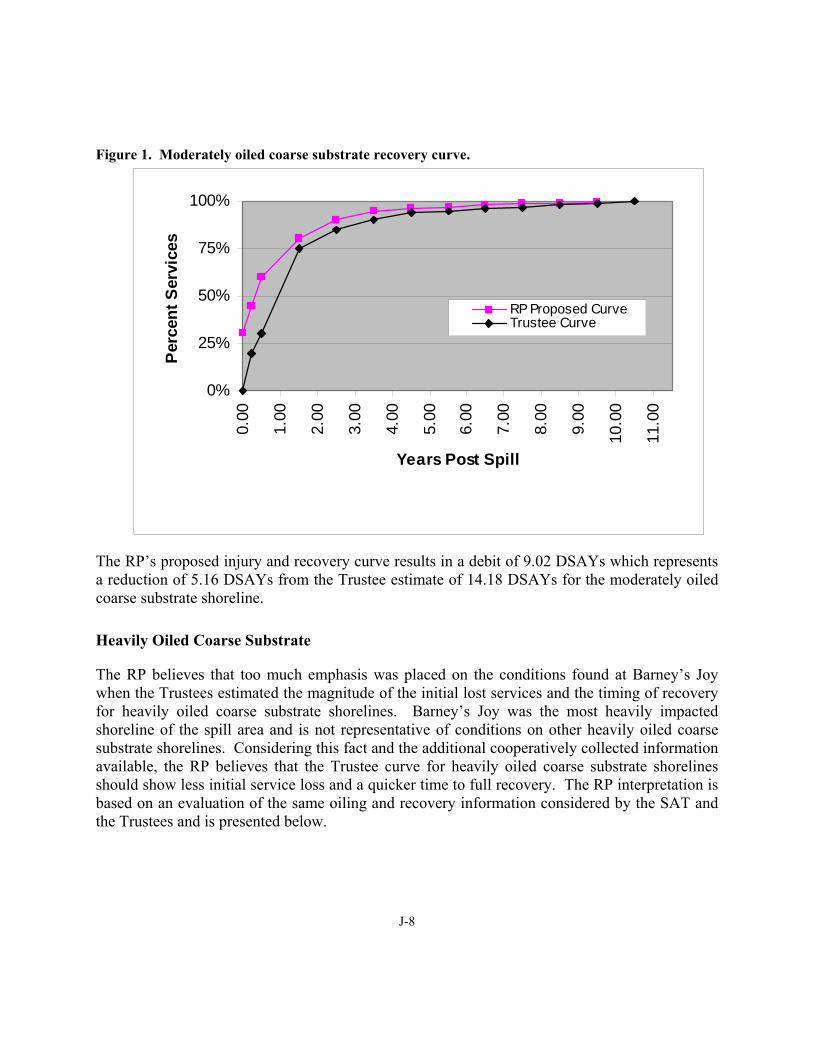
J-8
Figure 1. Moderately oiled coarse substrate recovery curve.
0%
25%
50%
75%
100%
0.00
1.00
2.00
3.00
4.00
5.00
6.00
7.00
8.00
9.00
10.0
0
11.0
0
Years Post Spill
Per
cent
Ser
vice
s
RP Proposed CurveTrustee Curve
The RP’s proposed injury and recovery curve results in a debit of 9.02 DSAYs which represents a reduction of 5.16 DSAYs from the Trustee estimate of 14.18 DSAYs for the moderately oiled coarse substrate shoreline.
Heavily Oiled Coarse Substrate
The RP believes that too much emphasis was placed on the conditions found at Barney’s Joy when the Trustees estimated the magnitude of the initial lost services and the timing of recovery for heavily oiled coarse substrate shorelines. Barney’s Joy was the most heavily impacted shoreline of the spill area and is not representative of conditions on other heavily oiled coarse substrate shorelines. Considering this fact and the additional cooperatively collected information available, the RP believes that the Trustee curve for heavily oiled coarse substrate shorelines should show less initial service loss and a quicker time to full recovery. The RP interpretation is based on an evaluation of the same oiling and recovery information considered by the SAT and the Trustees and is presented below.
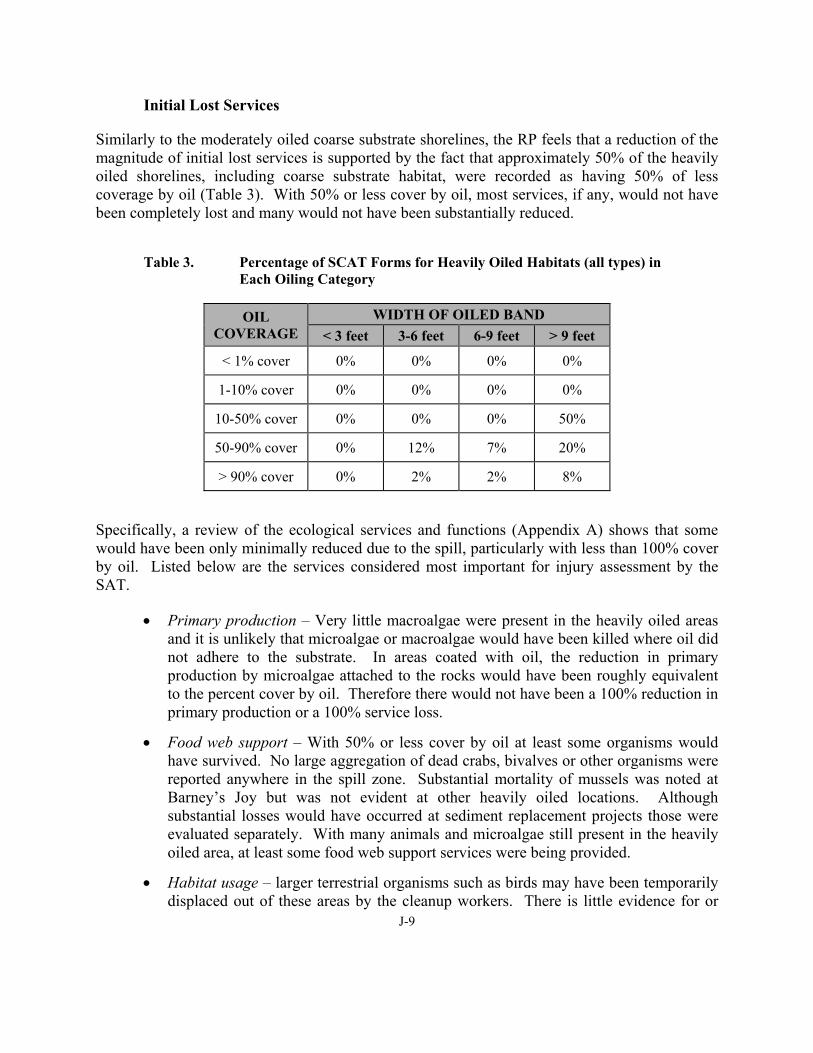
J-9
Initial Lost Services
Similarly to the moderately oiled coarse substrate shorelines, the RP feels that a reduction of the magnitude of initial lost services is supported by the fact that approximately 50% of the heavily oiled shorelines, including coarse substrate habitat, were recorded as having 50% of less coverage by oil (Table 3). With 50% or less cover by oil, most services, if any, would not have been completely lost and many would not have been substantially reduced.
Table 3. Percentage of SCAT Forms for Heavily Oiled Habitats (all types) in Each Oiling Category
OIL COVERAGE
WIDTH OF OILED BAND < 3 feet 3-6 feet 6-9 feet > 9 feet
< 1% cover 0% 0% 0% 0%
1-10% cover 0% 0% 0% 0%
10-50% cover 0% 0% 0% 50%
50-90% cover 0% 12% 7% 20%
> 90% cover 0% 2% 2% 8%
Specifically, a review of the ecological services and functions (Appendix A) shows that some would have been only minimally reduced due to the spill, particularly with less than 100% cover by oil. Listed below are the services considered most important for injury assessment by the SAT.
• Primary production – Very little macroalgae were present in the heavily oiled areas and it is unlikely that microalgae or macroalgae would have been killed where oil did not adhere to the substrate. In areas coated with oil, the reduction in primary production by microalgae attached to the rocks would have been roughly equivalent to the percent cover by oil. Therefore there would not have been a 100% reduction in primary production or a 100% service loss.
• Food web support – With 50% or less cover by oil at least some organisms would have survived. No large aggregation of dead crabs, bivalves or other organisms were reported anywhere in the spill zone. Substantial mortality of mussels was noted at Barney’s Joy but was not evident at other heavily oiled locations. Although substantial losses would have occurred at sediment replacement projects those were evaluated separately. With many animals and microalgae still present in the heavily oiled area, at least some food web support services were being provided.
• Habitat usage – larger terrestrial organisms such as birds may have been temporarily displaced out of these areas by the cleanup workers. There is little evidence for or
J-10
against fish avoidance of oiled shorelines. However, the oiled areas still contained a certain percentage of the populations present prior to the spill so it is not likely that this service would have been completely lost.
The RP’s interpretation of this information is that a 100% initial service loss as indicated by the Trustees is not supported by the available data and observations and that a 80 % initial service loss is more representative of potential actual losses in heavily oiled coarse substrate habitats while still being conservative.
Quicker time to recovery
The RP believes that natural resource services recovered more quickly than indicated in the Trustee recovery curve for heavily oiled coarse substrate shorelines. The RP’s interpretation is based on the observations, data, and information cooperatively collected and considered by the SAT and summarized below.
• Clean up was completed in most heavily oiled areas by the end of July. Thus, disturbance by cleanup workers was greatly reduced after 3 months and had ended after about 5 months post-spill.
• Notes made during the September 3-5 2003 shoreline monitoring field effort indicate that many populations of invertebrates had largely recovered by 5 months post-spill. For example, the following quotes are taken from the field notes of the September 2003 trip in the section titled “General observations on the condition of intertidal habitats” which are provided as an appendix to the exposure report.
• “Residual oil on gravel beaches and riprap occurred mostly as widely scattered spots of stain and coat. There was some oil staining of shells. Little of the oil was tacky to the touch. At Barney’s Joy, algae covered the oil coat.”
• “Wrack accumulations appeared normal, with abundant numbers of amphipods in most places. The exception was in the area of sediment replacement on Long Island, where the extensive wrack (1 to 2.5 feet deep) contained few amphipods and significantly more gnat-like flying invertebrates than amphipods. No oiled wrack was observed.”
• “In most oiled areas, intertidal fauna were abundant. The exception was in the area of sediment replacement, where the gravel was very clean, lacking an epiphytic cover and thus grazing organisms that were normally abundant elsewhere.”
Further, a review of the ecological services and functions (Appendix A) indicates most of the services are related to intertidal fauna and the observations made by the SAT indicate that recovery was substantial by September 2003.
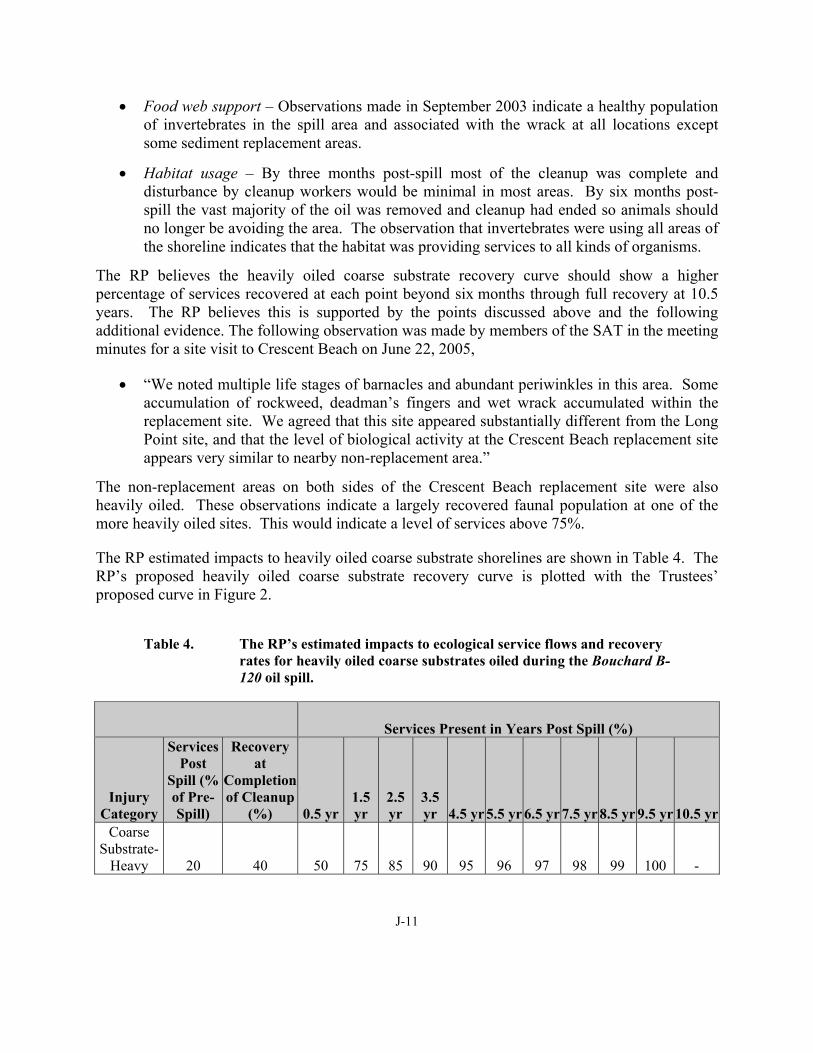
J-11
• Food web support – Observations made in September 2003 indicate a healthy population of invertebrates in the spill area and associated with the wrack at all locations except some sediment replacement areas.
• Habitat usage – By three months post-spill most of the cleanup was complete and disturbance by cleanup workers would be minimal in most areas. By six months post-spill the vast majority of the oil was removed and cleanup had ended so animals should no longer be avoiding the area. The observation that invertebrates were using all areas of the shoreline indicates that the habitat was providing services to all kinds of organisms.
The RP believes the heavily oiled coarse substrate recovery curve should show a higher percentage of services recovered at each point beyond six months through full recovery at 10.5 years. The RP believes this is supported by the points discussed above and the following additional evidence. The following observation was made by members of the SAT in the meeting minutes for a site visit to Crescent Beach on June 22, 2005,
• “We noted multiple life stages of barnacles and abundant periwinkles in this area. Some accumulation of rockweed, deadman’s fingers and wet wrack accumulated within the replacement site. We agreed that this site appeared substantially different from the Long Point site, and that the level of biological activity at the Crescent Beach replacement site appears very similar to nearby non-replacement area.”
The non-replacement areas on both sides of the Crescent Beach replacement site were also heavily oiled. These observations indicate a largely recovered faunal population at one of the more heavily oiled sites. This would indicate a level of services above 75%.
The RP estimated impacts to heavily oiled coarse substrate shorelines are shown in Table 4. The RP’s proposed heavily oiled coarse substrate recovery curve is plotted with the Trustees’ proposed curve in Figure 2.
Table 4. The RP’s estimated impacts to ecological service flows and recovery rates for heavily oiled coarse substrates oiled during the Bouchard B-120 oil spill.
Services Present in Years Post Spill (%)
Injury Category
Services Post
Spill (% of Pre-Spill)
Recovery at
Completion of Cleanup
(%) 0.5 yr1.5 yr
2.5 yr
3.5 yr 4.5 yr 5.5 yr 6.5 yr 7.5 yr 8.5 yr 9.5 yr 10.5 yr
Coarse Substrate-
Heavy 20 40 50 75 85 90 95 96 97 98 99 100 -
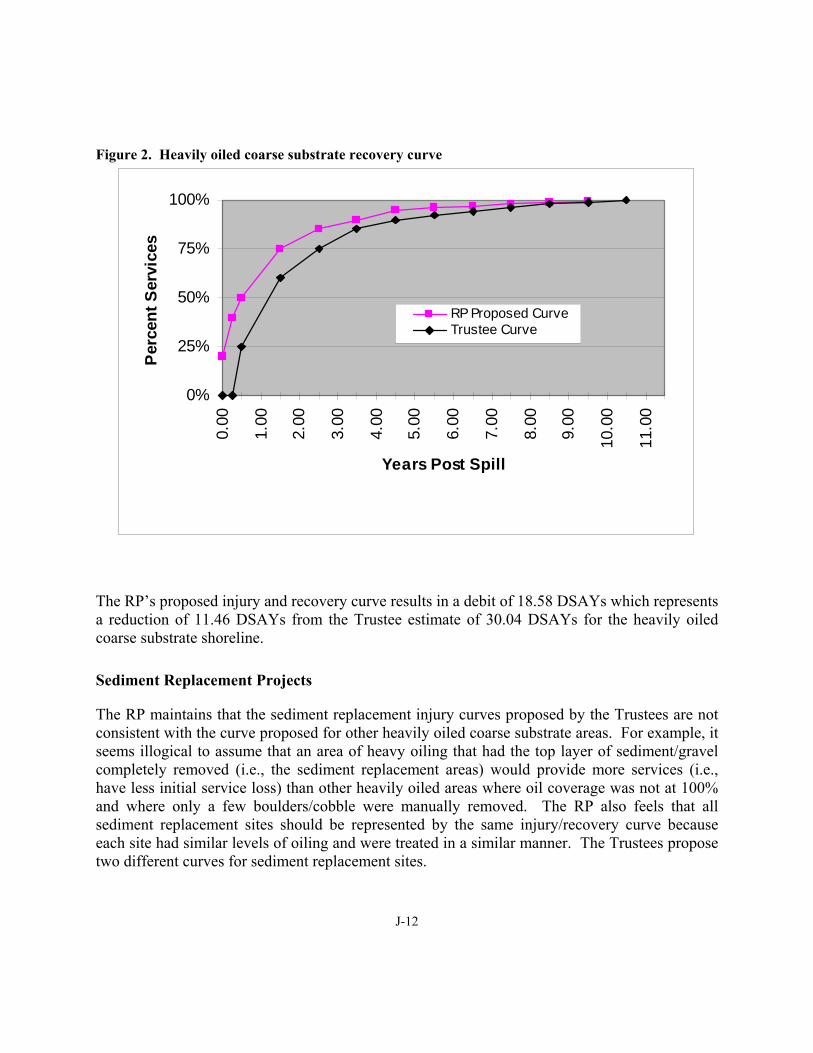
J-12
Figure 2. Heavily oiled coarse substrate recovery curve
0%
25%
50%
75%
100%0.
00
1.00
2.00
3.00
4.00
5.00
6.00
7.00
8.00
9.00
10.0
0
11.0
0
Years Post Spill
Per
cent
Ser
vice
s
RP Proposed CurveTrustee Curve
The RP’s proposed injury and recovery curve results in a debit of 18.58 DSAYs which represents a reduction of 11.46 DSAYs from the Trustee estimate of 30.04 DSAYs for the heavily oiled coarse substrate shoreline.
Sediment Replacement Projects
The RP maintains that the sediment replacement injury curves proposed by the Trustees are not consistent with the curve proposed for other heavily oiled coarse substrate areas. For example, it seems illogical to assume that an area of heavy oiling that had the top layer of sediment/gravel completely removed (i.e., the sediment replacement areas) would provide more services (i.e., have less initial service loss) than other heavily oiled areas where oil coverage was not at 100% and where only a few boulders/cobble were manually removed. The RP also feels that all sediment replacement sites should be represented by the same injury/recovery curve because each site had similar levels of oiling and were treated in a similar manner. The Trustees propose two different curves for sediment replacement sites.
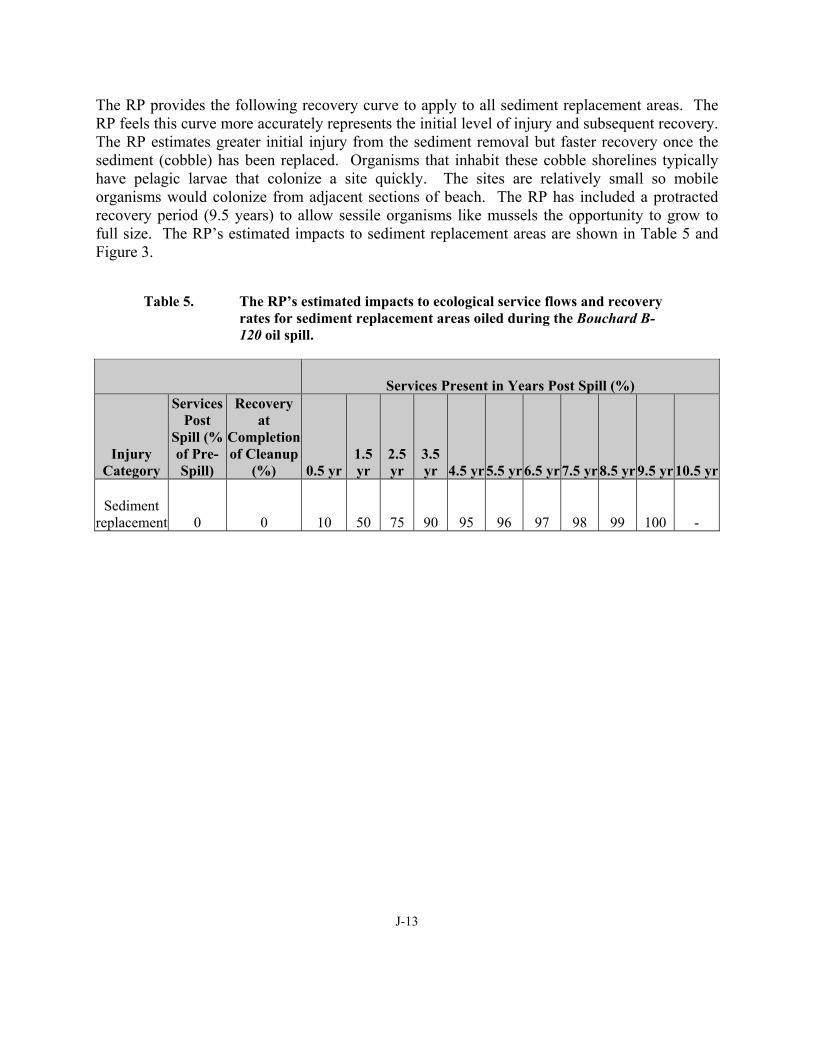
J-13
The RP provides the following recovery curve to apply to all sediment replacement areas. The RP feels this curve more accurately represents the initial level of injury and subsequent recovery. The RP estimates greater initial injury from the sediment removal but faster recovery once the sediment (cobble) has been replaced. Organisms that inhabit these cobble shorelines typically have pelagic larvae that colonize a site quickly. The sites are relatively small so mobile organisms would colonize from adjacent sections of beach. The RP has included a protracted recovery period (9.5 years) to allow sessile organisms like mussels the opportunity to grow to full size. The RP’s estimated impacts to sediment replacement areas are shown in Table 5 and Figure 3.
Table 5. The RP’s estimated impacts to ecological service flows and recovery rates for sediment replacement areas oiled during the Bouchard B-120 oil spill.
Services Present in Years Post Spill (%)
Injury Category
Services Post
Spill (% of Pre-Spill)
Recovery at
Completion of Cleanup
(%) 0.5 yr1.5 yr
2.5 yr
3.5 yr 4.5 yr 5.5 yr 6.5 yr 7.5 yr 8.5 yr 9.5 yr 10.5 yr
Sediment replacement 0 0 10 50 75 90 95 96 97 98 99 100 -
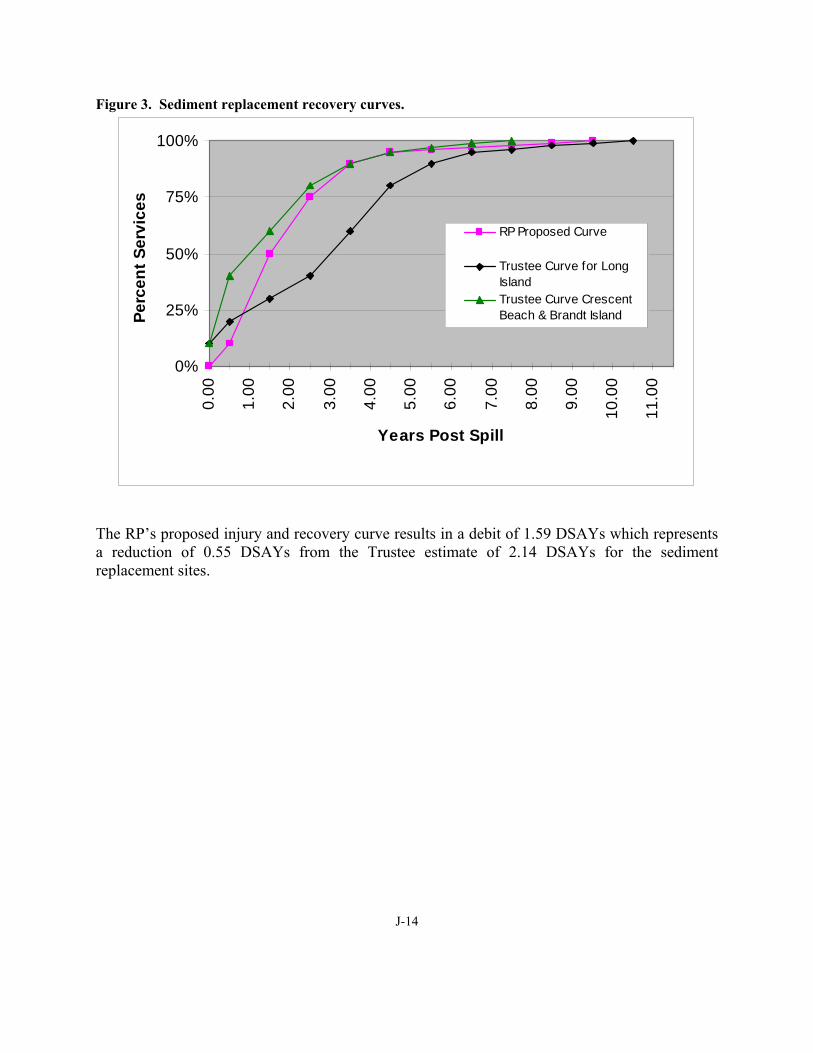
J-14
Figure 3. Sediment replacement recovery curves.
0%
25%
50%
75%
100%
0.00
1.00
2.00
3.00
4.00
5.00
6.00
7.00
8.00
9.00
10.0
0
11.0
0
Years Post Spill
Perc
ent S
ervi
ces
RP Proposed Curve
Trustee Curve for LongIslandTrustee Curve CrescentBeach & Brandt Island
The RP’s proposed injury and recovery curve results in a debit of 1.59 DSAYs which represents a reduction of 0.55 DSAYs from the Trustee estimate of 2.14 DSAYs for the sediment replacement sites.
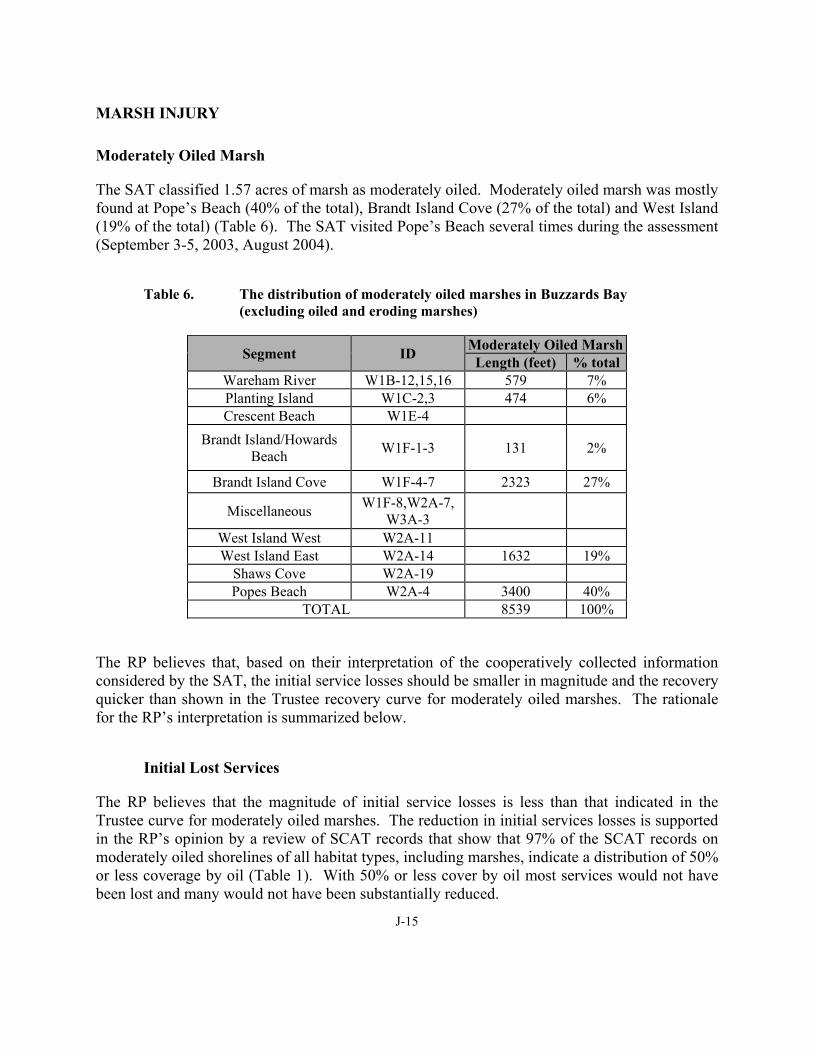
J-15
MARSH INJURY
Moderately Oiled Marsh
The SAT classified 1.57 acres of marsh as moderately oiled. Moderately oiled marsh was mostly found at Pope’s Beach (40% of the total), Brandt Island Cove (27% of the total) and West Island (19% of the total) (Table 6). The SAT visited Pope’s Beach several times during the assessment (September 3-5, 2003, August 2004).
Table 6. The distribution of moderately oiled marshes in Buzzards Bay (excluding oiled and eroding marshes)
Segment ID Moderately Oiled Marsh Length (feet) % total
Wareham River W1B-12,15,16 579 7% Planting Island W1C-2,3 474 6% Crescent Beach W1E-4
Brandt Island/Howards Beach W1F-1-3 131 2%
Brandt Island Cove W1F-4-7 2323 27%
Miscellaneous W1F-8,W2A-7, W3A-3
West Island West W2A-11 West Island East W2A-14 1632 19%
Shaws Cove W2A-19 Popes Beach W2A-4 3400 40%
TOTAL 8539 100%
The RP believes that, based on their interpretation of the cooperatively collected information considered by the SAT, the initial service losses should be smaller in magnitude and the recovery quicker than shown in the Trustee recovery curve for moderately oiled marshes. The rationale for the RP’s interpretation is summarized below.
Initial Lost Services
The RP believes that the magnitude of initial service losses is less than that indicated in the Trustee curve for moderately oiled marshes. The reduction in initial services losses is supported in the RP’s opinion by a review of SCAT records that show that 97% of the SCAT records on moderately oiled shorelines of all habitat types, including marshes, indicate a distribution of 50% or less coverage by oil (Table 1). With 50% or less cover by oil most services would not have been lost and many would not have been substantially reduced.
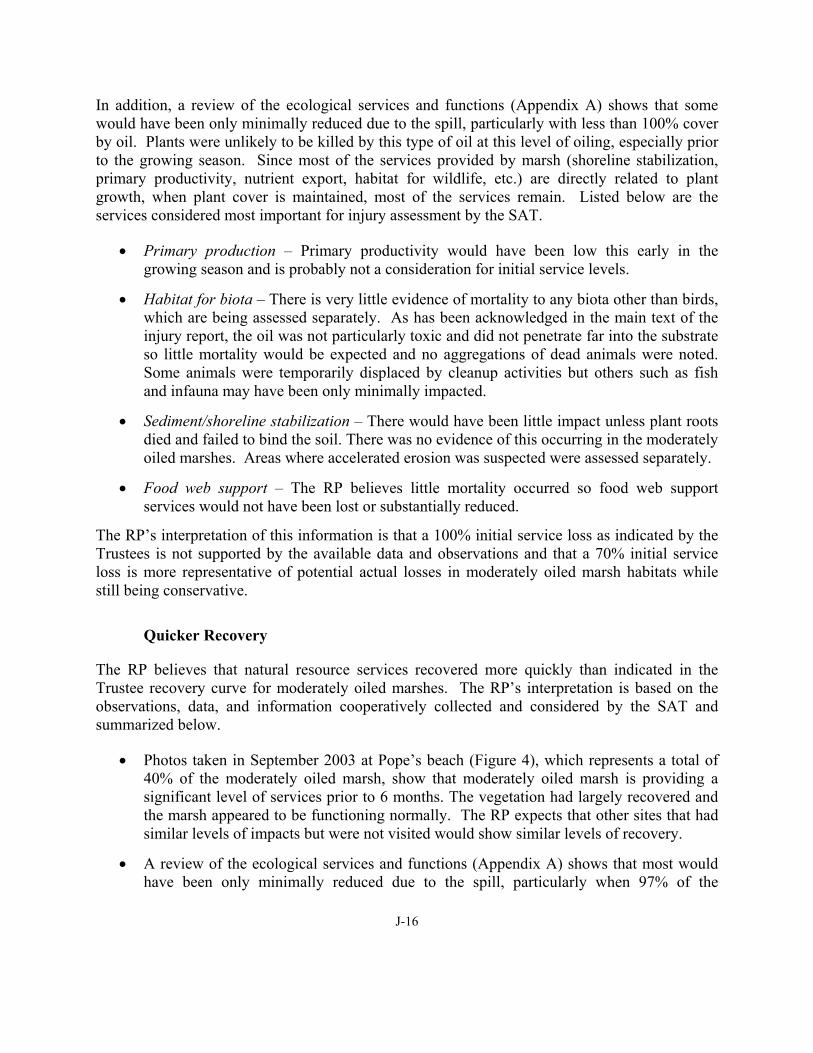
J-16
In addition, a review of the ecological services and functions (Appendix A) shows that some would have been only minimally reduced due to the spill, particularly with less than 100% cover by oil. Plants were unlikely to be killed by this type of oil at this level of oiling, especially prior to the growing season. Since most of the services provided by marsh (shoreline stabilization, primary productivity, nutrient export, habitat for wildlife, etc.) are directly related to plant growth, when plant cover is maintained, most of the services remain. Listed below are the services considered most important for injury assessment by the SAT.
• Primary production – Primary productivity would have been low this early in the growing season and is probably not a consideration for initial service levels.
• Habitat for biota – There is very little evidence of mortality to any biota other than birds, which are being assessed separately. As has been acknowledged in the main text of the injury report, the oil was not particularly toxic and did not penetrate far into the substrate so little mortality would be expected and no aggregations of dead animals were noted. Some animals were temporarily displaced by cleanup activities but others such as fish and infauna may have been only minimally impacted.
• Sediment/shoreline stabilization – There would have been little impact unless plant roots died and failed to bind the soil. There was no evidence of this occurring in the moderately oiled marshes. Areas where accelerated erosion was suspected were assessed separately.
• Food web support – The RP believes little mortality occurred so food web support services would not have been lost or substantially reduced.
The RP’s interpretation of this information is that a 100% initial service loss as indicated by the Trustees is not supported by the available data and observations and that a 70% initial service loss is more representative of potential actual losses in moderately oiled marsh habitats while still being conservative.
Quicker Recovery
The RP believes that natural resource services recovered more quickly than indicated in the Trustee recovery curve for moderately oiled marshes. The RP’s interpretation is based on the observations, data, and information cooperatively collected and considered by the SAT and summarized below.
• Photos taken in September 2003 at Pope’s beach (Figure 4), which represents a total of 40% of the moderately oiled marsh, show that moderately oiled marsh is providing a significant level of services prior to 6 months. The vegetation had largely recovered and the marsh appeared to be functioning normally. The RP expects that other sites that had similar levels of impacts but were not visited would show similar levels of recovery.
• A review of the ecological services and functions (Appendix A) shows that most would have been only minimally reduced due to the spill, particularly when 97% of the
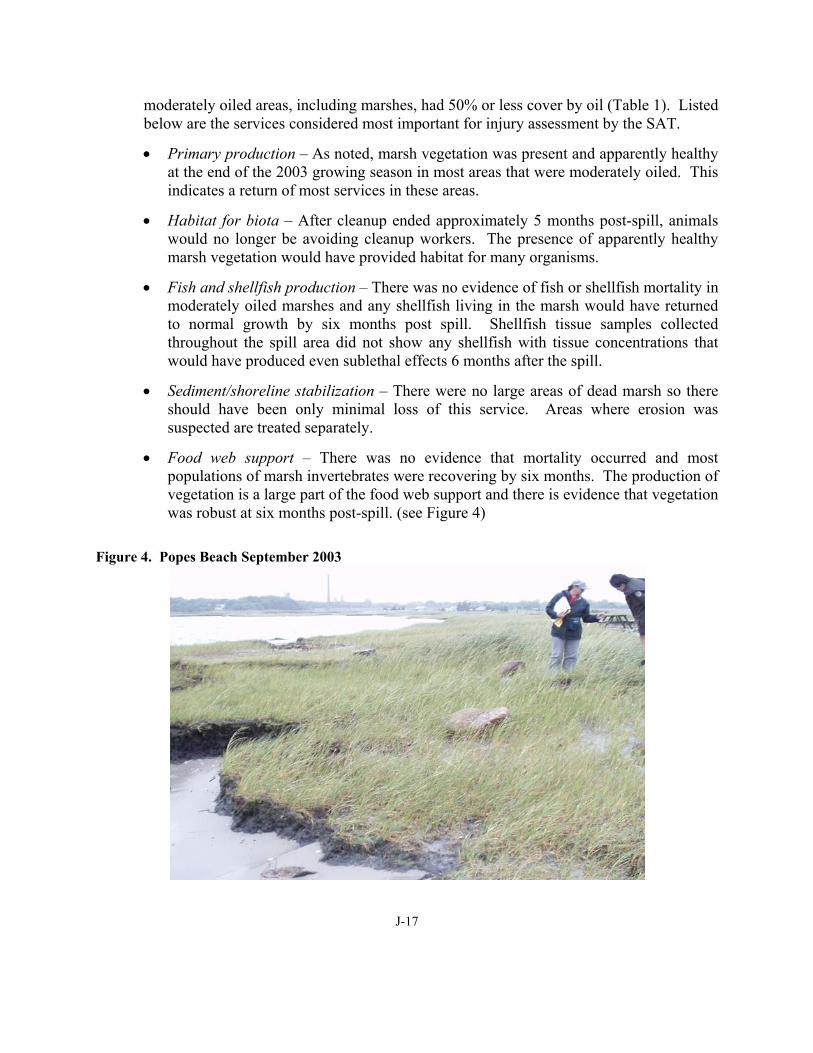
J-17
moderately oiled areas, including marshes, had 50% or less cover by oil (Table 1). Listed below are the services considered most important for injury assessment by the SAT.
• Primary production – As noted, marsh vegetation was present and apparently healthy at the end of the 2003 growing season in most areas that were moderately oiled. This indicates a return of most services in these areas.
• Habitat for biota – After cleanup ended approximately 5 months post-spill, animals would no longer be avoiding cleanup workers. The presence of apparently healthy marsh vegetation would have provided habitat for many organisms.
• Fish and shellfish production – There was no evidence of fish or shellfish mortality in moderately oiled marshes and any shellfish living in the marsh would have returned to normal growth by six months post spill. Shellfish tissue samples collected throughout the spill area did not show any shellfish with tissue concentrations that would have produced even sublethal effects 6 months after the spill.
• Sediment/shoreline stabilization – There were no large areas of dead marsh so there should have been only minimal loss of this service. Areas where erosion was suspected are treated separately.
• Food web support – There was no evidence that mortality occurred and most populations of marsh invertebrates were recovering by six months. The production of vegetation is a large part of the food web support and there is evidence that vegetation was robust at six months post-spill. (see Figure 4)
Figure 4. Popes Beach September 2003

J-18
The RP believes that a faster recovery of natural resource services is justified based on the information presented above. The RP estimated impacts to moderately oiled marsh are shown in Table 7 and the RP’s proposed moderately oiled marsh recovery curve, plotted with the Trustee curve is shown in Figure 5.
Table 7. Estimated impacts to ecological service flows and recovery rates for marshes moderately oiled during the Bouchard B-120 oil spill.
Injury Category
Services Post Spill (% of Pre-
Spill)
Services Present in Years Post Spill (%)
0.5 yr 1.5 yr 2.5 yr 3.5 yr 4.5 yr 5.5 yr 6.5 yr 7.5 yr 8.5 yrMarsh-
Moderate 30 50 70 80 90 95 98 100 - -
Figure 5. Moderately oiled marsh recovery curve.
0%
25%
50%
75%
100%
0.00
1.00
2.00
3.00
4.00
5.00
6.00
7.00
8.00
9.00
10.0
0
11.0
0
Years Post Spill
Perc
ent S
ervi
ces
RP Proposed CurveTrustee Curve
The RP’s proposed injury and recovery curve results in a debit of 1.83 DSAYs which represents a reduction of 2.16 DSAYs from the Trustee estimate of 3.99 DSAYs for the moderately oiled marsh shoreline.

J-19
Heavily Oiled Marsh
Approximately 2.00 acres of marsh3 (The RP estimate) were classified as heavily oiled. These marshes were located at Brandt Island Cove (80%), Shaw’s Cove (6%), Crescent Beach (12%) and a small amount (68 feet of shoreline, 2%) at miscellaneous locations (Table 8). The indication from all available evidence is that these areas suffered only minor injury from the oiling. The oiling was ear1y in the growing season before above ground shoots had developed which avoided any smothering effect and the oil was generally not in toxic concentrations in the sediments. Based on these considerations, information on percent cover, and photographic documentation of the recovery of many of the marsh areas, the RP feels the injury/recovery curves for heavily oiled marshes should show less initial service losses and a quicker recovery of natural resource services.
Table 8. The distribution of heavily oiled marshes in Buzzards Bay (excluding oiled and eroding marshes)
Segment ID Heavily Oiled Marsh Length (feet) % total
Wareham River W1B-12,15,16 Planting Island W1C-2,3 Crescent Beach W1E-4 377 12%
Brandt Island/Howards Beach W1F-1-3
Brandt Island Cove W1F-4-7 2534 80%
Miscellaneous W1F-8,W2A-7, W3A-3 68 2%
West Island West W2A-11 West Island East W2A-14
Shaws Cove W2A-19 174 6% Popes Beach W2A-4
TOTAL 3153 100%
Initial Lost Services
The RP believes that the magnitude of initial service losses is less than that indicated in the Trustee curve for heavily oiled marshes. The reduction in initial services losses is supported in the RP’s opinion by the fact that none of the observations or photographs taken of the Brandt Island shoreline, which comprises about 80% of the heavily oiled marsh shoreline (Table 8),
3 The RP and the Trustees differ in their estimates of area in this category due to the way oiled and eroding shorelines are treated. See Table 9 for RP and Trustee area estimates.
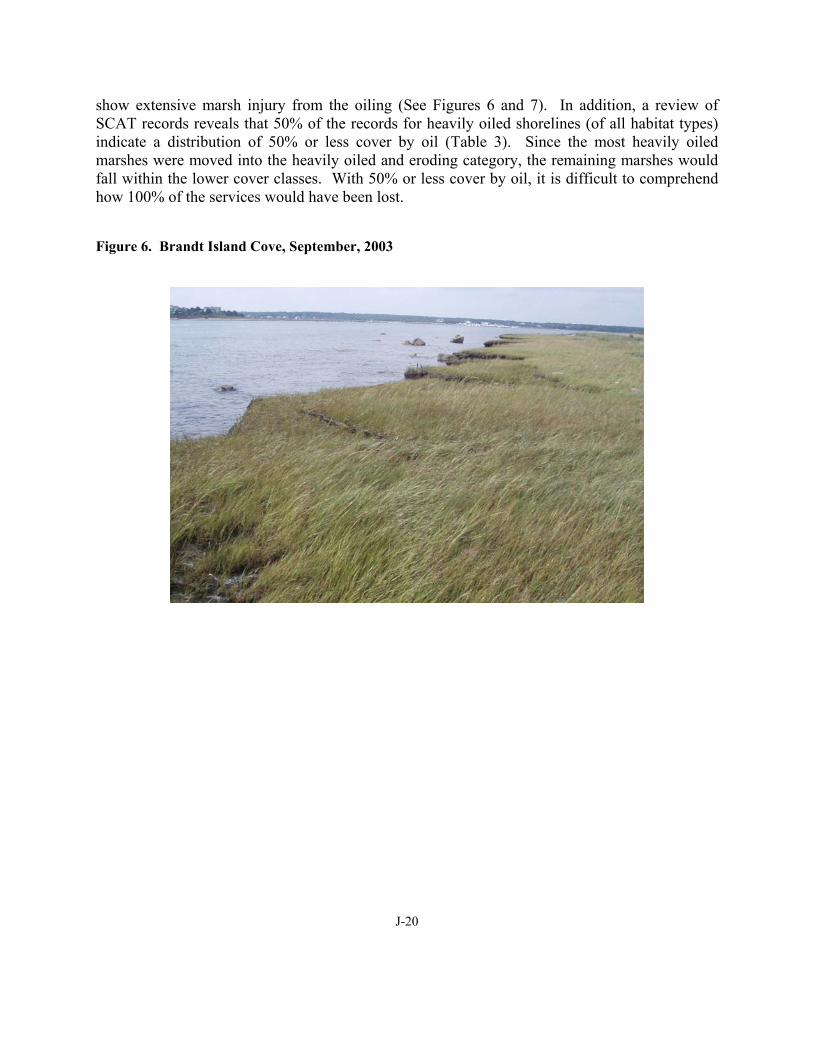
J-20
show extensive marsh injury from the oiling (See Figures 6 and 7). In addition, a review of SCAT records reveals that 50% of the records for heavily oiled shorelines (of all habitat types) indicate a distribution of 50% or less cover by oil (Table 3). Since the most heavily oiled marshes were moved into the heavily oiled and eroding category, the remaining marshes would fall within the lower cover classes. With 50% or less cover by oil, it is difficult to comprehend how 100% of the services would have been lost.
Figure 6. Brandt Island Cove, September, 2003
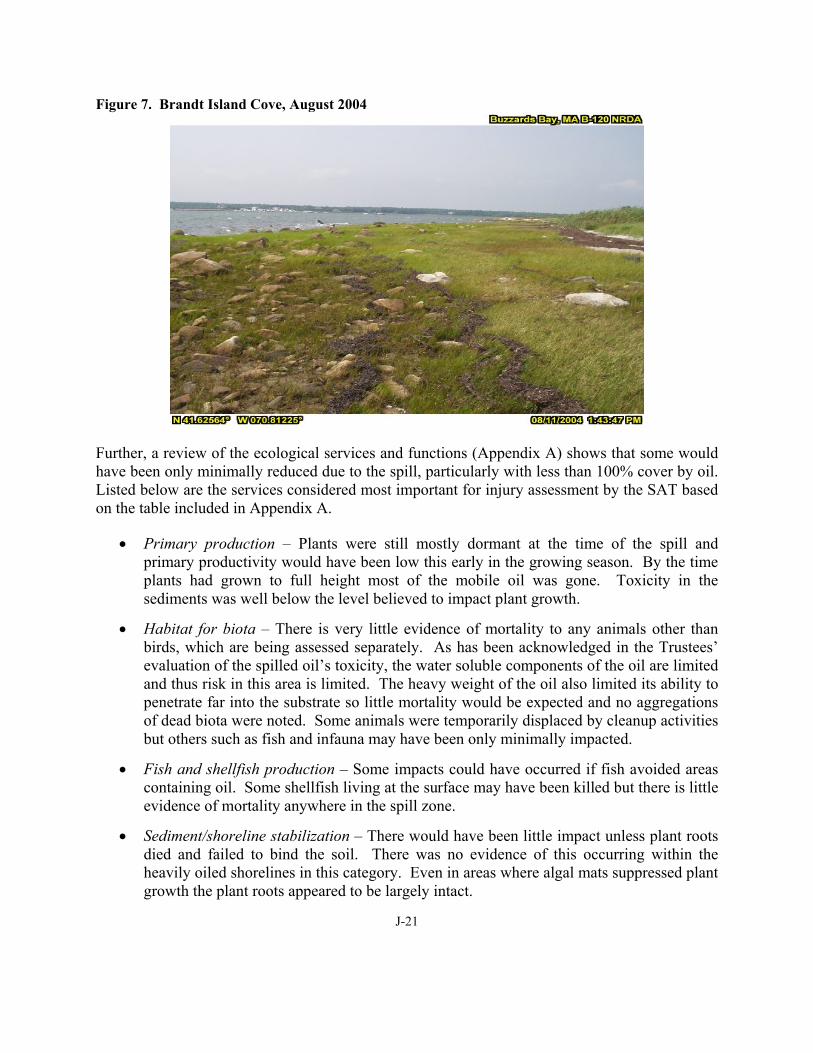
J-21
Figure 7. Brandt Island Cove, August 2004
Further, a review of the ecological services and functions (Appendix A) shows that some would have been only minimally reduced due to the spill, particularly with less than 100% cover by oil. Listed below are the services considered most important for injury assessment by the SAT based on the table included in Appendix A.
• Primary production – Plants were still mostly dormant at the time of the spill and primary productivity would have been low this early in the growing season. By the time plants had grown to full height most of the mobile oil was gone. Toxicity in the sediments was well below the level believed to impact plant growth.
• Habitat for biota – There is very little evidence of mortality to any animals other than birds, which are being assessed separately. As has been acknowledged in the Trustees’ evaluation of the spilled oil’s toxicity, the water soluble components of the oil are limited and thus risk in this area is limited. The heavy weight of the oil also limited its ability to penetrate far into the substrate so little mortality would be expected and no aggregations of dead biota were noted. Some animals were temporarily displaced by cleanup activities but others such as fish and infauna may have been only minimally impacted.
• Fish and shellfish production – Some impacts could have occurred if fish avoided areas containing oil. Some shellfish living at the surface may have been killed but there is little evidence of mortality anywhere in the spill zone.
• Sediment/shoreline stabilization – There would have been little impact unless plant roots died and failed to bind the soil. There was no evidence of this occurring within the heavily oiled shorelines in this category. Even in areas where algal mats suppressed plant growth the plant roots appeared to be largely intact.

J-22
• Food web support – The RP believes little mortality occurred so food web support should not have been completely reduced.
The RP’s interpretation of this information is that a 100% initial service loss as indicated by the Trustees is not supported by the available data and observations and that a 75% initial service loss is more representative of potential actual losses in heavily oiled marsh habitats while still being conservative.
Quicker Recovery
The RP believes that the field observations support the contention that natural resource services recovered more quickly than indicated in the Trustee recovery curve for heavily oiled marshes. The RP’s interpretation is based on the observations, data, and information cooperatively collected and considered by the SAT and summarized below.
Photographs taken in September 2003, about 6 months after the spill, show marsh growth on Brandt Island Cove (Figure 6). Brandt Island contained 80% of the heavily oiled marsh (Table 8) and appears on the surface to be mostly recovered in September 2003. A review of the ecological services and functions assigned to the marsh habitat by the SAT (Appendix A) shows that many of the services are related to plant growth and aboveground biomass. The near complete recovery of approximately 80% of the heavily oiled marsh areas 6 months after the spill as documented in the photographs suggests that the majority of services had recovered by that time. Note in Figure 8 below that the Trustees view the September 2003 levels of marsh recovery at 20%. The observations and photographic evidence do not support this level of injury.
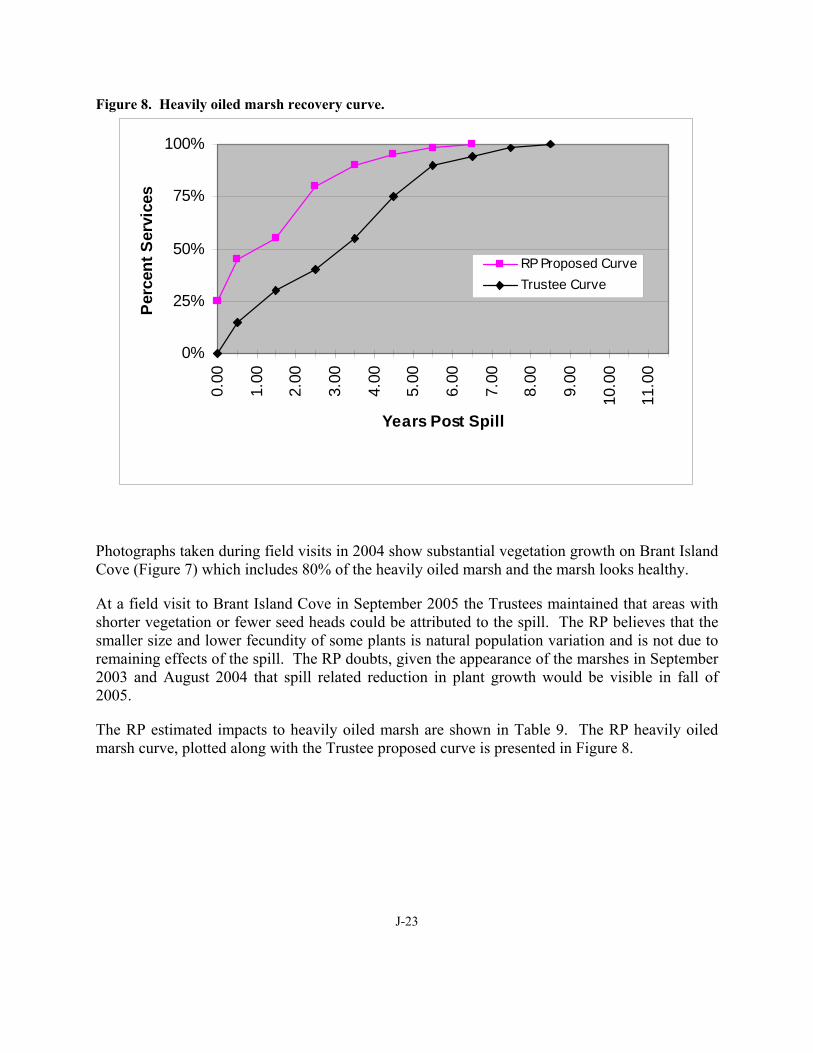
J-23
Figure 8. Heavily oiled marsh recovery curve.
0%
25%
50%
75%
100%
0.00
1.00
2.00
3.00
4.00
5.00
6.00
7.00
8.00
9.00
10.0
0
11.0
0
Years Post Spill
Per
cent
Ser
vice
s
RP Proposed CurveTrustee Curve
Photographs taken during field visits in 2004 show substantial vegetation growth on Brant Island Cove (Figure 7) which includes 80% of the heavily oiled marsh and the marsh looks healthy.
At a field visit to Brant Island Cove in September 2005 the Trustees maintained that areas with shorter vegetation or fewer seed heads could be attributed to the spill. The RP believes that the smaller size and lower fecundity of some plants is natural population variation and is not due to remaining effects of the spill. The RP doubts, given the appearance of the marshes in September 2003 and August 2004 that spill related reduction in plant growth would be visible in fall of 2005.
The RP estimated impacts to heavily oiled marsh are shown in Table 9. The RP heavily oiled marsh curve, plotted along with the Trustee proposed curve is presented in Figure 8.
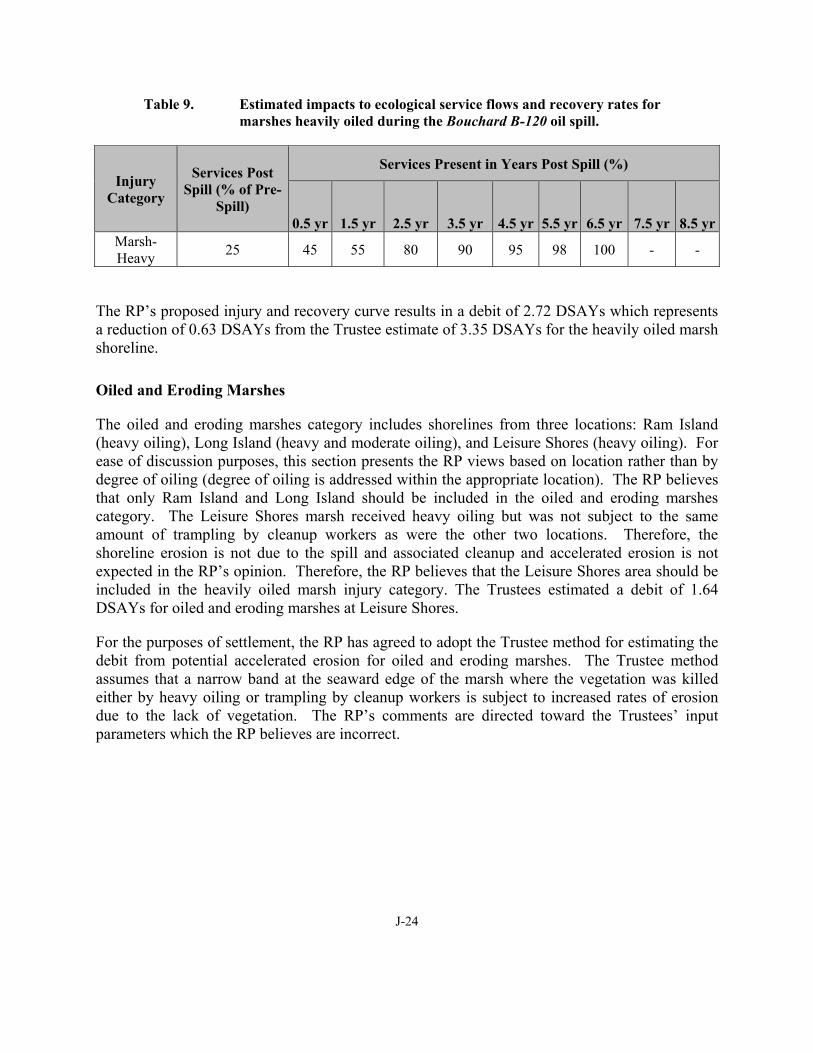
J-24
Table 9. Estimated impacts to ecological service flows and recovery rates for marshes heavily oiled during the Bouchard B-120 oil spill.
Injury Category
Services Post Spill (% of Pre-
Spill)
Services Present in Years Post Spill (%)
0.5 yr 1.5 yr 2.5 yr 3.5 yr 4.5 yr 5.5 yr 6.5 yr 7.5 yr 8.5 yrMarsh- Heavy 25 45 55 80 90 95 98 100 - -
The RP’s proposed injury and recovery curve results in a debit of 2.72 DSAYs which represents a reduction of 0.63 DSAYs from the Trustee estimate of 3.35 DSAYs for the heavily oiled marsh shoreline.
Oiled and Eroding Marshes
The oiled and eroding marshes category includes shorelines from three locations: Ram Island (heavy oiling), Long Island (heavy and moderate oiling), and Leisure Shores (heavy oiling). For ease of discussion purposes, this section presents the RP views based on location rather than by degree of oiling (degree of oiling is addressed within the appropriate location). The RP believes that only Ram Island and Long Island should be included in the oiled and eroding marshes category. The Leisure Shores marsh received heavy oiling but was not subject to the same amount of trampling by cleanup workers as were the other two locations. Therefore, the shoreline erosion is not due to the spill and associated cleanup and accelerated erosion is not expected in the RP’s opinion. Therefore, the RP believes that the Leisure Shores area should be included in the heavily oiled marsh injury category. The Trustees estimated a debit of 1.64 DSAYs for oiled and eroding marshes at Leisure Shores.
For the purposes of settlement, the RP has agreed to adopt the Trustee method for estimating the debit from potential accelerated erosion for oiled and eroding marshes. The Trustee method assumes that a narrow band at the seaward edge of the marsh where the vegetation was killed either by heavy oiling or trampling by cleanup workers is subject to increased rates of erosion due to the lack of vegetation. The RP’s comments are directed toward the Trustees’ input parameters which the RP believes are incorrect.
J-25
Ram Island Heavily Oiled and Eroding Marsh
The RP’s injury estimate for the heavily oiled and eroding marshes on Ram Island uses the Trustee assumptions for the length of recovered and unrecovered trampled bands, the width of the trampled band, the total width of marsh on Ram Island. The RP also agrees with the Trustees that unrecovered trampled band does not recover prior to being eroded away. The RP differs with the Trustees on assumptions for the width of oiled marsh, the recovery rate of recovering marsh, and the background erosion rate.
Width of Oiled Marsh
The RP believes that the width of oiled marsh on Ram Island should be 13.44 feet instead of the 27 foot width used by the Trustees. Ram Island was originally classified in the Environmental Sensitivity Index (ESI) database as cobble shoreline. The ESI was generally used to classify the habitat types along the Buzzards Bay shoreline for the purpose of developing the injury categories. When the SAT visited Ram Island it noted significant areas of marsh behind the cobble some of which had been oiled. At that time the SAT agreed that the shoreline oiling would be divided between coarse substrate habitats and marsh habitat by assigning half the width of oiling to each. Everywhere else in the Buzzards Bay spill zone the total width of heavy oiling was assumed to be 26.88 feet and where 2 shoreline types were present 13.44 feet would be assigned to each type. The evidence that the Trustees present that the Ram Island impact width should be 27 feet is limited (personal observations by one individual), is not consistent with the exposure report (Shoreline Injury Assessment Part 1: Exposure Characterization, Bouchard 120 Oil Spill, Buzzards Bay, Massachusetts and Rhode Island November 2005), and is not borne out by the photographic evidence that is available. The RP estimate of the Ram Island shoreline width is consistent with the documented shoreline assessment approach used in other heavily oiled areas and with the photographic evidence.
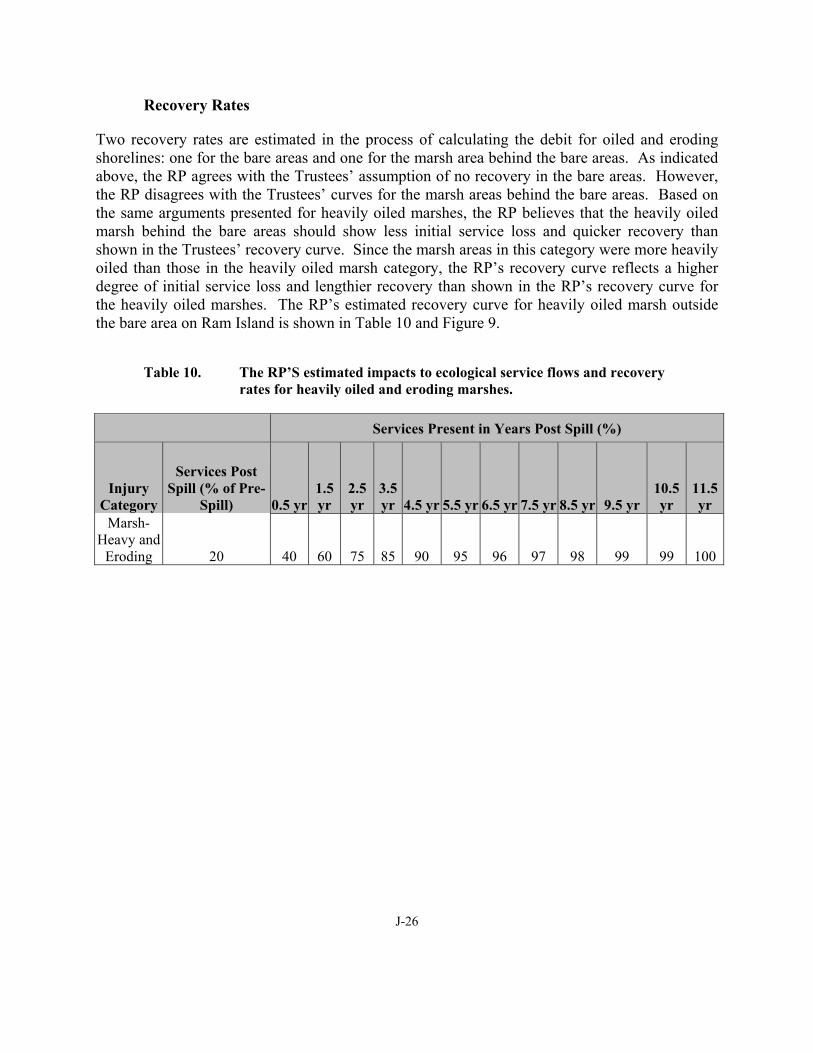
J-26
Recovery Rates
Two recovery rates are estimated in the process of calculating the debit for oiled and eroding shorelines: one for the bare areas and one for the marsh area behind the bare areas. As indicated above, the RP agrees with the Trustees’ assumption of no recovery in the bare areas. However, the RP disagrees with the Trustees’ curves for the marsh areas behind the bare areas. Based on the same arguments presented for heavily oiled marshes, the RP believes that the heavily oiled marsh behind the bare areas should show less initial service loss and quicker recovery than shown in the Trustees’ recovery curve. Since the marsh areas in this category were more heavily oiled than those in the heavily oiled marsh category, the RP’s recovery curve reflects a higher degree of initial service loss and lengthier recovery than shown in the RP’s recovery curve for the heavily oiled marshes. The RP’s estimated recovery curve for heavily oiled marsh outside the bare area on Ram Island is shown in Table 10 and Figure 9.
Table 10. The RP’S estimated impacts to ecological service flows and recovery rates for heavily oiled and eroding marshes.
Services Present in Years Post Spill (%)
Injury Category
Services Post Spill (% of Pre-
Spill) 0.5 yr 1.5 yr
2.5 yr
3.5 yr 4.5 yr 5.5 yr 6.5 yr 7.5 yr 8.5 yr 9.5 yr
10.5 yr
11.5 yr
Marsh- Heavy and
Eroding 20 40 60 75 85 90 95 96 97 98 99 99 100
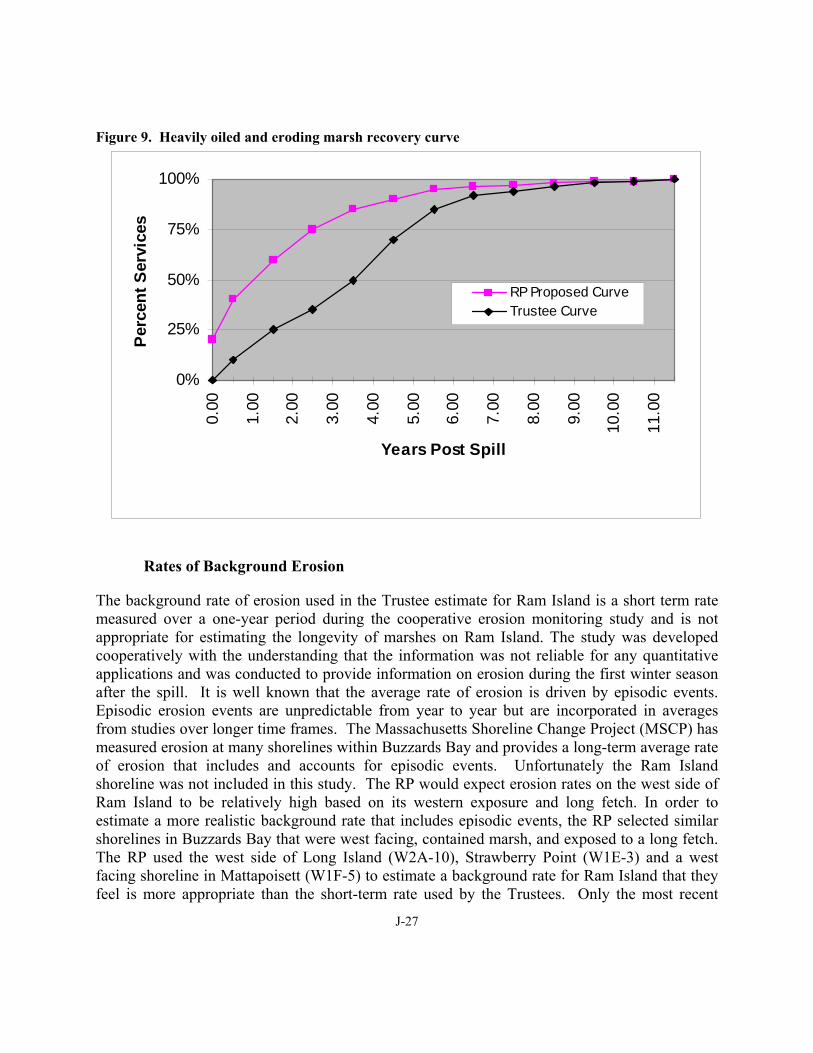
J-27
Figure 9. Heavily oiled and eroding marsh recovery curve
0%
25%
50%
75%
100%
0.00
1.00
2.00
3.00
4.00
5.00
6.00
7.00
8.00
9.00
10.0
0
11.0
0
Years Post Spill
Perc
ent S
ervi
ces
RP Proposed CurveTrustee Curve
Rates of Background Erosion
The background rate of erosion used in the Trustee estimate for Ram Island is a short term rate measured over a one-year period during the cooperative erosion monitoring study and is not appropriate for estimating the longevity of marshes on Ram Island. The study was developed cooperatively with the understanding that the information was not reliable for any quantitative applications and was conducted to provide information on erosion during the first winter season after the spill. It is well known that the average rate of erosion is driven by episodic events. Episodic erosion events are unpredictable from year to year but are incorporated in averages from studies over longer time frames. The Massachusetts Shoreline Change Project (MSCP) has measured erosion at many shorelines within Buzzards Bay and provides a long-term average rate of erosion that includes and accounts for episodic events. Unfortunately the Ram Island shoreline was not included in this study. The RP would expect erosion rates on the west side of Ram Island to be relatively high based on its western exposure and long fetch. In order to estimate a more realistic background rate that includes episodic events, the RP selected similar shorelines in Buzzards Bay that were west facing, contained marsh, and exposed to a long fetch. The RP used the west side of Long Island (W2A-10), Strawberry Point (W1E-3) and a west facing shoreline in Mattapoisett (W1F-5) to estimate a background rate for Ram Island that they feel is more appropriate than the short-term rate used by the Trustees. Only the most recent
J-28
estimates of erosion from 1978 – 1994 were used because the RP felt that earlier rates would be less representative of current conditions in Buzzards Bay. These calculations gave a background erosion rate of -1.99 feet per year. This erosion rate when compared to the background erosion rate assumed by the Trustees (-0.25 feet per year) provides a better estimate of marsh longevity than the Trustee assumptions since it accounts for episodic erosion events. Using The RP’s assumptions the marsh would disappear in approximately 2029 without additional shoreline protection. Under the Trustee assumptions some marsh would still be present in the year 2147.
The RP realizes that the rate of erosion measured on Ram Island must be considered at least for the first few years after the spill, especially in the absence of a significant episodic event. Therefore, in the RP’s estimate, the short-term rate measured on Ram Island (0.25 feet in unimpacted shorelines and 0.69 feet in areas with an unrecovered trampled band) persists until the 6 foot wide band is eroded away in a little over 8 years. After 8 years, erosion rates estimated from similar shorelines in Buzzards Bay (-1.99 feet per year) are used as background erosion rates to estimate the longevity of the remaining marsh.
Ram Island Summary
Applying the RP assumptions discussed above in lieu of the Trustee assumption for the same parameters yields an estimated debit for Ram Island heavily oiled and eroded shorelines of 2.00 DSAYs which represents a reduction of 3.2 DSAYs from the Trustee estimate of 5.2 DSAYs for the oiled and eroding marshes on Ram Island.
Long Island Heavily Oiled and Eroding Marsh and Moderately Oiled and Eroding Marsh
For the Long Island injury estimates, the RP had concerns regarding some of the Trustees’ assumptions that are similar to those for Ram Island. The RP used the Trustees’ estimates and assumptions for the width of the bare band, the width of the marsh, the length of marsh impacted, and the fact that no recovery occurred within the bare band. The RP differs from the Trustees in the recovery rate for marshes behind the bare areas and in the estimated background rate of erosion for Long Island.
Based on the same arguments presented for heavily and moderately oiled marshes, the RP believes that the moderately and heavily oiled marsh behind the bare areas on Long Island should show less initial service loss and quicker recovery than shown in the Trustees’ recovery curves. Since the marsh areas in these categories were more heavily oiled than those in the moderately and heavily oiled marsh categories, the RP’s recovery curves reflects a higher degree of initial service loss and lengthier recovery than shown in the RP recovery curves for the moderately and heavily oiled marshes. The RP recovery curve for the heavily oiled and eroded marshes on Long Island is the same as for this category on Ram Island and is shown in Table 10 and Figure 9. The RP recovery curve for the moderately oiled and eroded marshes is shown in Table 11 and Figure 10.
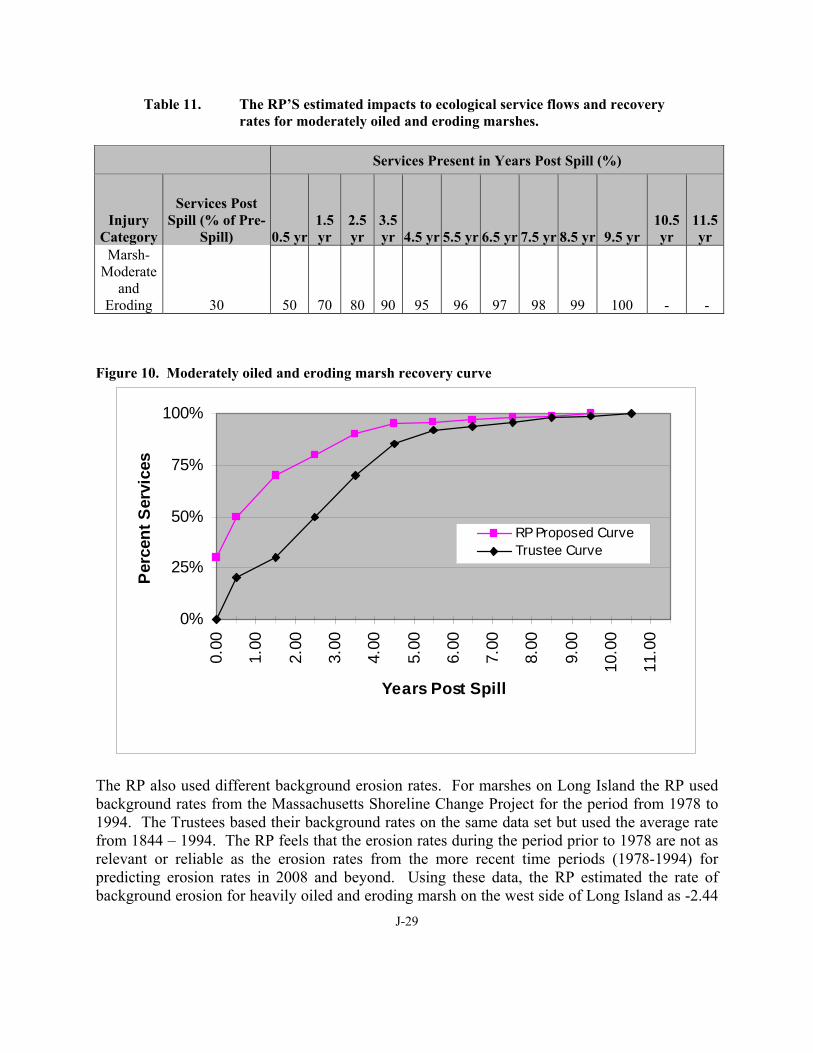
J-29
Table 11. The RP’S estimated impacts to ecological service flows and recovery rates for moderately oiled and eroding marshes.
Services Present in Years Post Spill (%)
Injury Category
Services Post Spill (% of Pre-
Spill) 0.5 yr 1.5 yr
2.5 yr
3.5 yr 4.5 yr 5.5 yr 6.5 yr 7.5 yr 8.5 yr 9.5 yr
10.5 yr
11.5 yr
Marsh- Moderate
and Eroding 30 50 70 80 90 95 96 97 98 99 100 - -
Figure 10. Moderately oiled and eroding marsh recovery curve
0%
25%
50%
75%
100%
0.00
1.00
2.00
3.00
4.00
5.00
6.00
7.00
8.00
9.00
10.0
0
11.0
0
Years Post Spill
Perc
ent S
ervi
ces
RP Proposed CurveTrustee Curve
The RP also used different background erosion rates. For marshes on Long Island the RP used background rates from the Massachusetts Shoreline Change Project for the period from 1978 to 1994. The Trustees based their background rates on the same data set but used the average rate from 1844 – 1994. The RP feels that the erosion rates during the period prior to 1978 are not as relevant or reliable as the erosion rates from the more recent time periods (1978-1994) for predicting erosion rates in 2008 and beyond. Using these data, the RP estimated the rate of background erosion for heavily oiled and eroding marsh on the west side of Long Island as -2.44
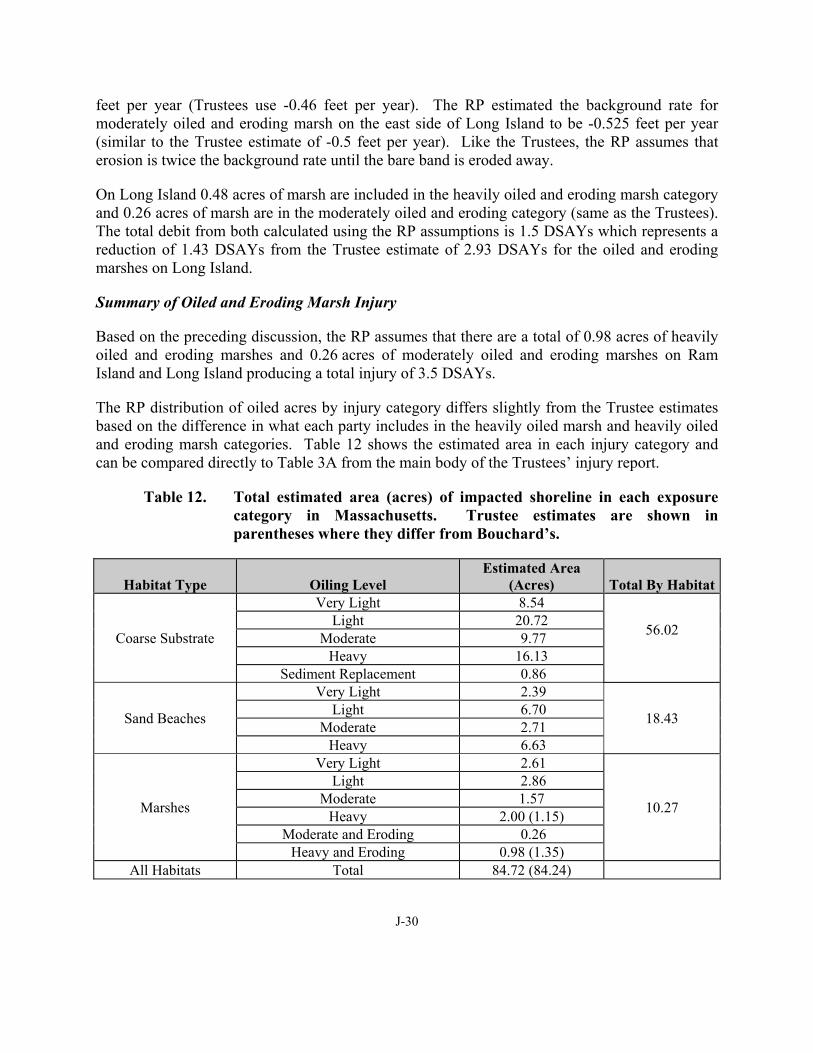
J-30
feet per year (Trustees use -0.46 feet per year). The RP estimated the background rate for moderately oiled and eroding marsh on the east side of Long Island to be -0.525 feet per year (similar to the Trustee estimate of -0.5 feet per year). Like the Trustees, the RP assumes that erosion is twice the background rate until the bare band is eroded away.
On Long Island 0.48 acres of marsh are included in the heavily oiled and eroding marsh category and 0.26 acres of marsh are in the moderately oiled and eroding category (same as the Trustees). The total debit from both calculated using the RP assumptions is 1.5 DSAYs which represents a reduction of 1.43 DSAYs from the Trustee estimate of 2.93 DSAYs for the oiled and eroding marshes on Long Island.
Summary of Oiled and Eroding Marsh Injury
Based on the preceding discussion, the RP assumes that there are a total of 0.98 acres of heavily oiled and eroding marshes and 0.26 acres of moderately oiled and eroding marshes on Ram Island and Long Island producing a total injury of 3.5 DSAYs.
The RP distribution of oiled acres by injury category differs slightly from the Trustee estimates based on the difference in what each party includes in the heavily oiled marsh and heavily oiled and eroding marsh categories. Table 12 shows the estimated area in each injury category and can be compared directly to Table 3A from the main body of the Trustees’ injury report.
Table 12. Total estimated area (acres) of impacted shoreline in each exposure category in Massachusetts. Trustee estimates are shown in parentheses where they differ from Bouchard’s.
Habitat Type Oiling Level Estimated Area
(Acres) Total By Habitat
Coarse Substrate
Very Light 8.54
56.02
Light 20.72 Moderate 9.77
Heavy 16.13 Sediment Replacement 0.86
Sand Beaches
Very Light 2.39
18.43 Light 6.70 Moderate 2.71
Heavy 6.63
Marshes
Very Light 2.61
10.27
Light 2.86 Moderate 1.57
Heavy 2.00 (1.15) Moderate and Eroding 0.26
Heavy and Eroding 0.98 (1.35) All Habitats Total 84.72 (84.24)
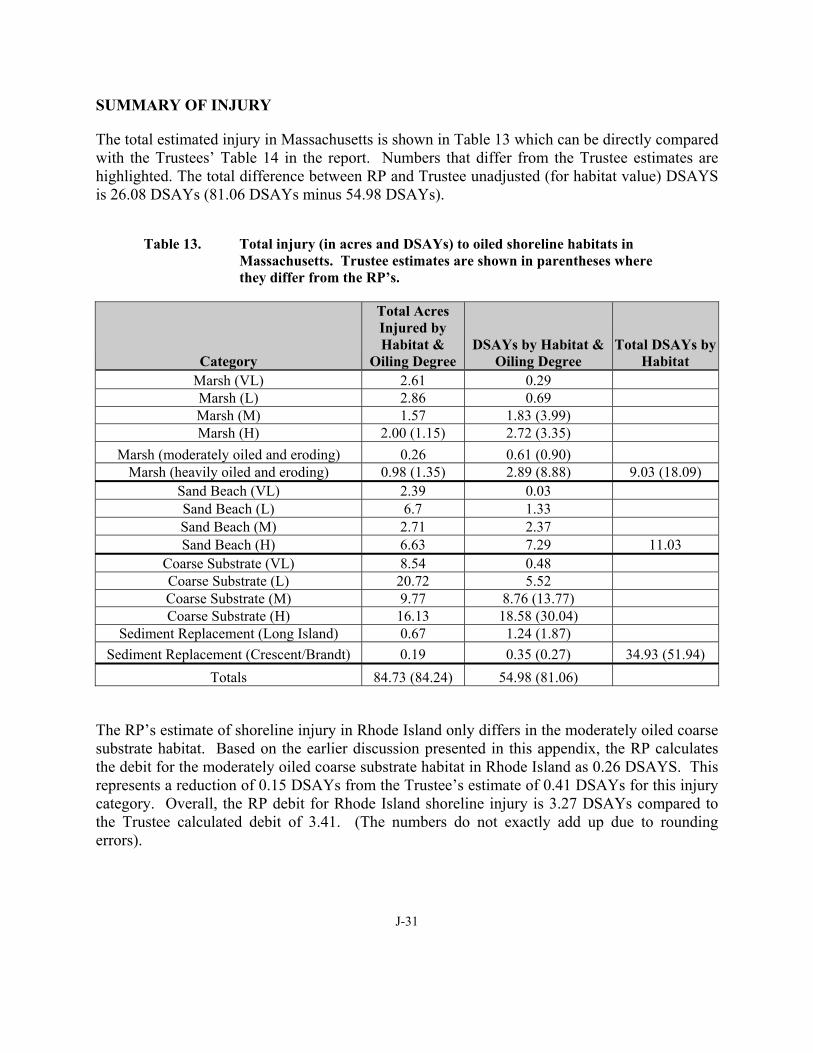
J-31
SUMMARY OF INJURY
The total estimated injury in Massachusetts is shown in Table 13 which can be directly compared with the Trustees’ Table 14 in the report. Numbers that differ from the Trustee estimates are highlighted. The total difference between RP and Trustee unadjusted (for habitat value) DSAYS is 26.08 DSAYs (81.06 DSAYs minus 54.98 DSAYs).
Table 13. Total injury (in acres and DSAYs) to oiled shoreline habitats in Massachusetts. Trustee estimates are shown in parentheses where they differ from the RP’s.
Category
Total Acres Injured by Habitat &
Oiling Degree DSAYs by Habitat &
Oiling Degree Total DSAYs by
Habitat Marsh (VL) 2.61 0.29 Marsh (L) 2.86 0.69 Marsh (M) 1.57 1.83 (3.99) Marsh (H) 2.00 (1.15) 2.72 (3.35)
Marsh (moderately oiled and eroding) 0.26 0.61 (0.90) Marsh (heavily oiled and eroding) 0.98 (1.35) 2.89 (8.88) 9.03 (18.09)
Sand Beach (VL) 2.39 0.03 Sand Beach (L) 6.7 1.33 Sand Beach (M) 2.71 2.37 Sand Beach (H) 6.63 7.29 11.03
Coarse Substrate (VL) 8.54 0.48 Coarse Substrate (L) 20.72 5.52 Coarse Substrate (M) 9.77 8.76 (13.77) Coarse Substrate (H) 16.13 18.58 (30.04)
Sediment Replacement (Long Island) 0.67 1.24 (1.87) Sediment Replacement (Crescent/Brandt) 0.19 0.35 (0.27) 34.93 (51.94)
Totals 84.73 (84.24) 54.98 (81.06)
The RP’s estimate of shoreline injury in Rhode Island only differs in the moderately oiled coarse substrate habitat. Based on the earlier discussion presented in this appendix, the RP calculates the debit for the moderately oiled coarse substrate habitat in Rhode Island as 0.26 DSAYS. This represents a reduction of 0.15 DSAYs from the Trustee’s estimate of 0.41 DSAYs for this injury category. Overall, the RP debit for Rhode Island shoreline injury is 3.27 DSAYs compared to the Trustee calculated debit of 3.41. (The numbers do not exactly add up due to rounding errors).