Embed Size (px)
Citation preview

Table of Contents
Final City Sanitation Plan
Nagar Palika Parishad Loni,
Ghaziabad, Uttar Pradesh
2014
JT Urja Pvt. Ltd.
JT URJA PVT. LTD. NPP LONI
FINAL CSP, LONI ii
Chapter 1. INTRODUCTION ....................................................................................................... 3
1.1 Background ........................................................................................................................ 3
1.2 THE NATIONAL URBAN SANITATION POLICY ....................................................................... 3
1.2.1 THE OBJECTIVES OF THE POLICY ..................................................................................... 4
1.2.2 UTTAR PRADESH SANITATION POLICY ............................................................................ 5
1.2.3 GOVERNMENT OF INDIA SUPPORT ................................................................................ 9
1.3 UIDSSMT SHCEME ............................................................................................................ 14
1.3.1 OBJECTIVES.................................................................................................................. 14
1.3.2 DURATION OF THE SCHEME ......................................................................................... 14
1.3.3 COVERAGE ................................................................................................................... 14
1.3.4 COMPONENTS ............................................................................................................. 14
1.3.5 FUNDING PATTERN OF THE SCHEME ............................................................................ 15
1.4 OBJECTIVES OF THE CITY SANITATION PLAN IN LONI CITY ................................................. 15
1.5 OVERVIEW OF THE SCOPE OF WORK ................................................................................ 16
1.6 PROGRESS UPDATE .......................................................................................................... 21
Chapter 2. THE APPROACH & METHODOLOGY................................................................. 23
2.1 KEY ASPECTS OF THE APPROACH ...................................................................................... 23
2.1.1 ACHIEVING 100% SANITATION ..................................................................................... 23
2.1.2 BUILDING LOCAL INSTITUTIONS AND COMMUNITY PARTICIPATION ............................. 24
2.1.3 METHODOLOGY ........................................................................................................... 25
2.1.4 THE CITY SANITATION TASK FORCE .............................................................................. 25
2.1.5 THE 100% SANITATION CAMPAIGN .............................................................................. 26
2.2 CITY SANITATION PLAN .................................................................................................... 26
2.2.1 PREPARATION OF BASE MAP ....................................................................................... 26
2.2.2 OVERLAYING SECONDARY INFORMATION ON THE BASE MAP ...................................... 28
2.2.3 LAND-USE AND SANITATION SURVEY ........................................................................... 29
2.2.4 DEMAND – SUPPLY GAP ASSESSMENT ......................................................................... 30
2.2.5 CONSULTATION WITH THE CTF .................................................................................... 30
2.2.6 ASSESSING TECHNOLOGY OPTIONS .............................................................................. 31
2.2.7 STRATEGIES AND PROJECT FORMULATION .................................................................. 31
2.2.8 DRAFT CITY SANITATION PLAN ..................................................................................... 31
2.2.9 FINAL CITY SANITATION PLAN ...................................................................................... 31
2.3 CAPACITY BUILDING & TRAINING NEEDS ASSESSMENT ..................................................... 31
Chapter 3. AN INTRODUCTION TO LONI .............................................................................. 32
JT URJA PVT. LTD. NPP LONI
FINAL CSP, LONI iii
3.1 LOCATION AND KEY CHARACTERISTICS ............................................................................. 32
3.1.1 Topography ................................................................................................................. 32
3.2 DEMOGRAPHY ................................................................................................................. 35
3.2.1 Population Trend ......................................................................................................... 35
3.2.2 Population Density ...................................................................................................... 36
3.2.3 SEX RATIO .................................................................................................................... 37
3.2.4 LITERACY ..................................................................................................................... 37
3.2.5 EXISTING LAND USE IN THE CITY .................................................................................. 37
3.2.6 OVERALL CITY and INFRASTRUCTURE STATUS ............................................................ 38
3.3 CITY LEVEL POPULATION PROJECTIONS ............................................................................ 38
3.3.1 ARITHMETIC INCREASE METHOD: ................................................................................ 38
3.3.2 GEOMETRIC INCREASE METHOD: ................................................................................. 39
3.3.3 INCREMENTAL INCREASE METHOD: (METHOD OF VARYING INCREMENT) .................... 39
3.4 WARD WISE POPULATION PROJECTIONS .......................................................................... 40
3.5 POPULATION PROJECTIONS AND SANITATION SERVICES DEMAND ................................... 41
Chapter 4. ACCESS TO TOILETS FACILITIES ...................................................................... 44
4.1 CITY LEVEL STATUS ........................................................................................................... 44
4.2 RESULTS OF PRIMARY SURVEYS ........................................................................................ 45
4.3 SWOT, ISSUES AND PRIORITIES ......................................................................................... 48
4.4 CONCEPTUAL BASIS AND BEST PRACTICES ........................................................................ 48
4.4.1 OPTIONS FOR IMPROVING SERVICE DELIVERY .............................................................. 49
4.5 VISION AND GOALS .......................................................................................................... 50
4.5.1 VISION ......................................................................................................................... 50
4.5.2 GOALS ......................................................................................................................... 50
4.6 GAP ANALYSIS .................................................................................................................. 50
4.7 RECOMMENDATIONS ....................................................................................................... 52
Chapter 5. WATER SUPPLY ...................................................................................................... 54
5.1 CITY LEVEL STATUS ........................................................................................................... 54
5.1.1 CITY LEVEL STATUS ...................................................................................................... 55
5.1.2 CURRENT AND PROJECTED WATER DEMAND ............................................................... 56
5.2 SWOT, ISSUES AND PRIORITIES ......................................................................................... 59
5.3 CONCEPTUAL BASIS AND BEST PRACTICES ........................................................................ 60
5.4 VISION AND GOALS .......................................................................................................... 60
5.4.1 VISION ......................................................................................................................... 60
JT URJA PVT. LTD. NPP LONI
FINAL CSP, LONI iv
5.4.2 GOALS ......................................................................................................................... 60
5.5 RECOMMENDATIONS ....................................................................................................... 61
Chapter 6. WASTE WATER MANAGEMENT ......................................................................... 63
6.1 CITY LEVEL STATUS ........................................................................................................... 63
6.1.1 SERVICE LEVEL BENCHMARK FOR SEWERAGE SYSTEM ................................................. 66
6.1.2 FROM PRIMARY SURVEY .............................................................................................. 66
6.2 SWOT ISSUES AND PRIORITIES.......................................................................................... 68
6.3 CONCEPTUAL BASIS AND BEST PRACTICES ........................................................................ 69
6.4 VISION AND GOAL ............................................................................................................ 71
6.4.1 VISION ......................................................................................................................... 71
6.4.2 GOAL ........................................................................................................................... 71
6.5 RECOMMENDATIONS ....................................................................................................... 71
Chapter 7. STORM WATER MANAGEMENT ......................................................................... 73
7.1 CITY LEVEL STATUS ........................................................................................................... 73
7.1.1 ISSUES AND PRIORITIES................................................................................................ 73
7.2 VISION AND GOALS .......................................................................................................... 73
7.2.1 VISION ......................................................................................................................... 73
7.2.2 GOAL ........................................................................................................................... 73
7.3 RECOMMENDATIONS ....................................................................................................... 73
Chapter 8. SOLID WASTE MANAGEMENT ........................................................................... 74
8.1 CITY LEVEL STATUS ........................................................................................................... 74
8.1.1 WASTE GENERATION ................................................................................................... 74
8.1.2 TYPES OF WASTE ......................................................................................................... 75
8.1.3 COLLECTION & TRANSPORTATION ............................................................................... 76
8.1.4 TREATMENT AND DISPOSAL ......................................................................................... 81
8.1.5 Service Level Benchmarks ............................................................................................ 82
8.2 SWOT ISSUES AND PRIORITIES.......................................................................................... 84
8.3 CONCEPTUAL BASIS AND BEST PRACTICES ........................................................................ 85
8.4 VISION AND GOALS .......................................................................................................... 86
8.4.1 VISION ......................................................................................................................... 86
8.4.2 GOALS ......................................................................................................................... 86
8.5 RECCOMENDATIONS ........................................................................................................ 87
Chapter 9. CITY SANITATION TASK FORCE........................................................................ 89
9.1 CITY SANITATION TASK FORCE MEMBERS ......................................................................... 89
JT URJA PVT. LTD. NPP LONI
FINAL CSP, LONI v
9.2 RESPONSIBILITIES OF CSTF ............................................................................................... 90
9.3 Stakeholders Workshop Feedback .................................................................................... 93
Chapter 10. GOVERNANCE AND INSTITUTIONAL FRAMEWORK .................................... 96
10.1 CITY LEVEL STATUS ........................................................................................................... 96
10.2 CAPACITY BUILDING ......................................................................................................... 97
10.2.1 TRAINING .................................................................................................................... 97
10.2.2 PERSONNEL MANAGEMENT AND OCCUPATIONAL HEALTH .......................................... 99
10.2.3 INFORMATION MANAGEMENT .................................................................................... 99
10.2.4 IMPLEMENTATION STRATEGY .................................................................................... 100
10.3 RECOMMENDATIONS ..................................................................................................... 101
References ANNEXURE-1: LIST OF CITY SANITATION TASK FORCE MEMBERS
ANNEXURE-2: MINUTES OF MEETING OF CITY SANITATION TASK FORCE
ANNEXURE-3: SURVEY QUESTIONNAIRE
ANNEXURE-4: VARIOUS KINDS OF WASTE WATER MANAGEMENT SYSTEM
ANNEXURE-5: DETAILS OF VARIOUS SCHEMES FOR IMPLEMENTATION OF CITY SANITATION PROJECTS
ANNEXURE-6: MUNICIPAL SOLID WASTE PROCESSING TECHNOLOGIES
ANNEXURE-7: Appraisal Report, Reviewer 1 JE, NPP Loni ANNEXURE-8: Appraisal Report, Reviewer 2 EO, NPP Loni
JT URJA PVT. LTD. NPP LONI
FINAL CSP, LONI vi
List of Figures
Figure 1: Community Efforts & Figure 2: Community Efforts ........................................................... 4
Figure 3: CSP Goals ............................................................................................................................ 7
Figure 4: Generic Elements of Planning, Implementation and M&E of City Wide Sanitation ............... 8
Figure 5: Scope of CSP, Loni ............................................................................................................. 16
Figure 6 : Steps for Deliverables ....................................................................................................... 17
Figure 7: Stakeholders Discussion .................................................................................................... 19
Figure 8: Stakeholders Discussion .................................................................................................... 20
Figure 9: Stakeholders Discussion .................................................................................................... 20
Figure 10: Implementing Strategies ................................................................................................. 24
Figure 11 : Pillars Supporting Inclusive Sanitation ............................................................................ 25
Figure 12: Situation Analysis from Primary & Secondary Data .......................................................... 29
Figure 13 : Gap Analysis ................................................................................................................... 30
Figure 14: Loni, Connectivity with Surrounding Areas ...................................................................... 33
Figure 15: Population Trend (1981 -2011) ........................................................................................ 35
Figure 16: City Wise Projected Population (2016-2041) using Average Deduced Projections ............ 40
Figure 17: Population and Sanitation Projection (1981-2021) .......................................................... 42
Figure 18: Access to Toilet, Coverage ............................................................................................... 44
Figure 20: Access to Community Toilet ............................................................................................ 44
Figure 19: Access to Toilet ............................................................................................................... 44
Figure 21: Open Defecation, Ward 35 .............................................................................................. 45
Figure 22: Access to Toilets in Industries .......................................................................................... 45
Figure 23: Access to Toilets in School ............................................................................................... 46
Figure 24: Sources of Water ............................................................................................................ 55
Figure 25: Quality of Water ............................................................................................................. 56
Figure 26: Dumping of Waste in Water Bodies, Ward -16................................................................. 60
Figure 27: Sewage Status, Ward 12 Figure 28: Sewage Status, Ward 15..................... 63
Figure 29: Water and Waste Water Projections ............................................................................... 64
Figure 30: Solid Waste Generation Projections ................................................................................ 74
Figure 31: Types of Waste Generation in Kg per capita per day ........................................................ 75
Table 31: List of existing Primary Collection Centre Figure 32, Ward 25: Arbitrary Waste Dumping
........................................................................................................................................................ 77
Figure 33: Method of Solid Waste Disposal ...................................................................................... 78
Figure 34: Frequency of Waste Collection @HH Level ...................................................................... 78
Figure 35: Dumping Wastes in Water Bodies ................................................................................... 78
Figure 36: Willingness to pay for Door to Door Service @HH Level .................................................. 79
Figure 37: Distance of Waste Disposal Sites ..................................................................................... 79
Figure 38: Frequency of Waste Collection in Public Places ............................................................... 80
Figure 39: Distance of Waste Disposal from Public Places ................................................................ 80
Figure 40: Disposal of Industrial Waste ............................................................................................ 81
Figure 41: Frequency of Waste Collection from School .................................................................... 81
Figure 42: CTF Representatives ........................................................................................................ 89

JT URJA PVT. LTD. NPP LONI
FINAL CSP, LONI vii
Figure 43: Goals of City Sanitation ................................................................................................... 93
Figure 44: Key Projects linked to Sanitation of City .......................................................................... 94
Figure 45: Key Issues related to Sanitation of the City ...................................................................... 94
JT URJA PVT. LTD. NPP LONI
FINAL CSP, LONI viii
List of Tables
Table 1: Progress CSP, Loni .............................................................................................................. 21
Table 2: Layers Used In Map Preparation ......................................................................................... 27
Table 3 : Population Trend (1981 -2011) .......................................................................................... 36
Table 4: City Status .......................................................................................................................... 38
Table 5: City Wise Projected Population (2016-2041)....................................................................... 39
Table 6: Ward Wise Projected Population ........................................................................................ 40
Table 7: Infrastructure and Population Demand .............................................................................. 41
Table 8: Access to Toilets in Public Places ........................................................................................ 46
Table 9: Current Overall Status ........................................................................................................ 46
Table 10: Access to Toilet SWOT ...................................................................................................... 48
Table 11: Access to Toilet Supply, SML Term Targets ....................................................................... 50
Table 12: Ward Wise Toilets Required in Slum (10 Seater) ............................................................... 51
Table 13: Recommendation, Access to Toilets ................................................................................. 52
Table 14: Water Infrastructure ........................................................................................................ 55
Table 15: Present & Projected Water Demand ................................................................................. 56
Table 16 : Estimated Cost and Contribution (WS DPR) ..................................................................... 57
Table 17: Ward Wise Water Demand Projections ............................................................................ 57
Table 18: Water Supply SWOT ......................................................................................................... 59
Table 19: Goals, SML Term Targets .................................................................................................. 61
Table 20: 13th Finance Commission: Declaration of Service Level Benchmarks ............................... 61
Table 21: Recommendation, Water Supply ...................................................................................... 62
Table 22: Present and Projected Water and Waste Water in MLD.................................................... 64
Table 23: 13th Finance Commission: Declaration of Service Level Benchmarks ................................ 67
Table 24: Ward Wise Projected Waste Generation .......................................................................... 67
Table 25: Waste Water Management SWOT .................................................................................... 68
Table 26: Waste Water Management, SML Term Targets ................................................................ 71
Table 27: Recommendations, Waste Water Management ............................................................... 71
Table 28: Storm Water Management, SWOT ................................................................................... 73
Table 29: Storm Water Management, SML Term Targets ................................................................. 73
Table 30: Present Waste Generation and Projections ...................................................................... 74
Table 31: List of existing Primary Collection Centre Figure 32, Ward 25: Arbitrary Waste Dumping
........................................................................................................................................................ 77
Table 32: Lit of existing vehicles & equipments with Nagar Palika .................................................... 77
Table 33: Service Benchmark for Solid Waste Management ............................................................. 82
Table 34: Ward Wise Projected Solid Waste Generation .................................................................. 83
Table 35: Solid Waste Management SWOT ...................................................................................... 84
Table 36: Solid Waste Management, SML Term Targets ................................................................... 86
Table 37 : Estimated Cost and Contribution (SWM DPR) .................................................................. 87
Table 38 : Existing Organizational Chart ........................................................................................... 96
Table 39: Revised Institutional Responsibilities for Basic Services .................................................... 97
Table 40: List of Information from HH Survey ................................................................................ 100
Table 41: Approach to Address Awareness Generation .................................................................. 101

JT URJA PVT. LTD. NPP LONI
FINAL CSP, LONI ix
List of Maps
Map 1: Ghaziabad, Loni Location ..................................................................................................... 32
Map 2: NCR, Ghaziabad Location ..................................................................................................... 32
Map 3: Ward Wise Population Density, 2001 ................................................................................... 36
Map 4: Master Plan, Loni Ghaziabad ................................................................................................ 37
Map 5: Water Bodies in Loni ............................................................................................................ 54
Map 6: Location of Existing Arbitrary Dumping Sites ........................................................................ 82
List of Abbreviations
CSP City Sanitation Plan
NUSP National Urban Sanitation Policy
JNNURM Jawaharlal Nehru National Urban Renewal Mission
MDG Millennium Developments Goals
GOUP Government of Uttar Pradesh
UIDSSMT Urban Infrastructure Development for Small and Medium Towns
NPP Nagar Palika Parishad
ULB Urban Local Body
CSTF City Sanitation Task Force
HUPA Housing and Urban Poverty Alleviation
ILCS Integrated Low Cost Service
IEC Information Education and Communication
DPR Detailed Project Report
O & M Operation and Maintenance
ODF Open Defecation Fee
M & E Monitoring and Evaluation
NGO Non Government Organization
GIS Geographic Information System
VAMBAY Valmiki Ambedkar Awas Yojna
ILCS Integrated Low Cost Sanitation
DFID Department for International Development
ADB Asian Development Bank
PPP Public Private Partnership
TSC Total Sanitation Campaign
AUWSP Urban Water Sanitation Programme
BIA Bureau of Indian Affairs
MOWR Ministry of Water Resources
MOF Ministry of Finance
MOEF Ministry of Environment and Forests
AUSAID-WB Australian Agency for International Development –World bank Group
JT URJA PVT. LTD. NPP LONI
FINAL CSP, LONI 2
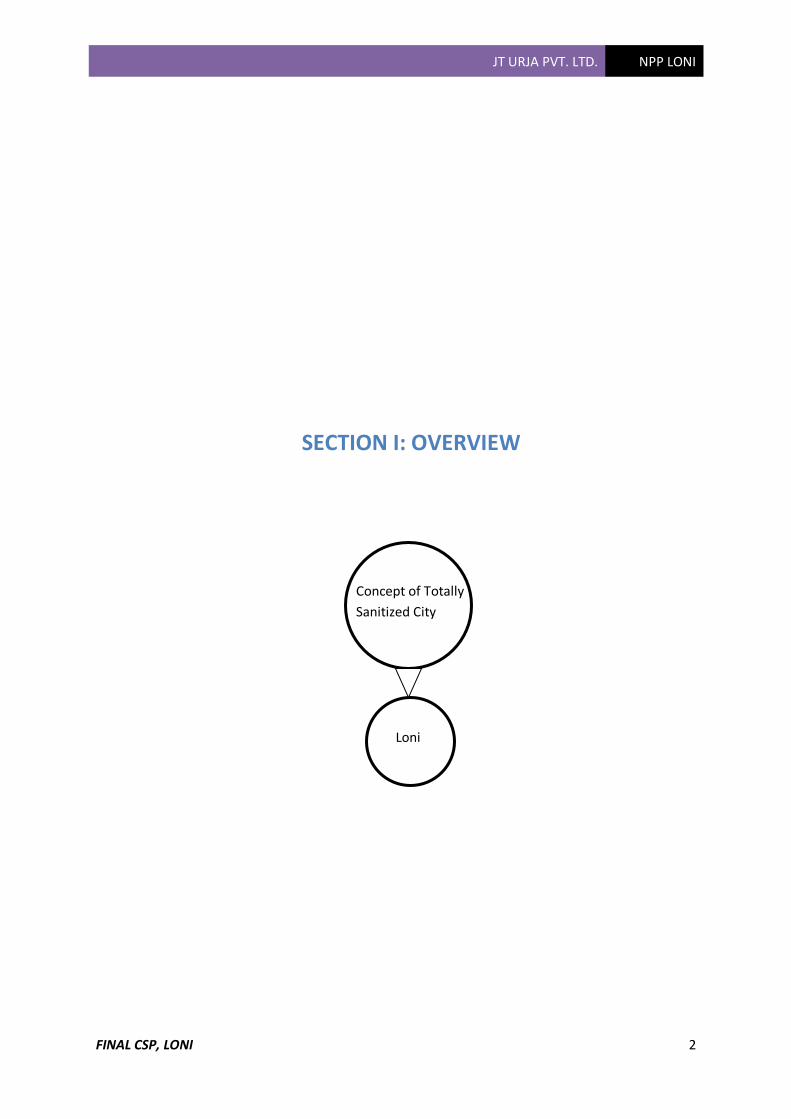
SECTION I: OVERVIEW
Concept of Totally
Sanitized City
Loni
,U

JT URJA PVT. LTD. NPP LONI
FINAL CSP, LONI 3
Chapter 1. INTRODUCTION
1.1 Background
The sanitation situation in India depicts a very grim picture as about 30 million* people
in urban India do not have adequate sanitation facilities. This problem is compounded
by the fact that as high as 70% of the waste water generated in urban areas is not treated
find.
Realizing the vastness and implications of this serious environmental and socio
economic issue, the Ministry of Urban Development, Government of India (GOI)
announced the National Urban Sanitation Policy (NUSP) in December 2008. As
directed by the policy, cities are to prepare City Sanitation Plans (CSPs) addressing all
aspects of sanitation in the city. The Jawaharlal Nehru National Urban Renewal
Mission (JNNURM) is another initiative of GOI aiming at better infrastructure service
provision in selected Indian cities.
Despite being one of the better served state in terms of sanitation services, according to
2001 Census out of 4,64,213 urban households, 33.07 percent do not have any kind of
toilet facilities in the state of Uttar Pradesh. More than 37% of the Human excreta
generated in Urban India, is unsafely disposed. The loss due to diseases caused by poor
sanitation to children less than 14 years in urban areas amount to Rs. 500 crore are 2001
prices (Planning commission-United Nations International Children’s Emergency Fund
(UNICEF) , 2006). Discharge of Municipal waste water has resulted in contamination
of 70% of all surface water. Signatory nations of Millennium Developments Goals
enjoin to extend access to improved sanitation to at least half the urban population by
the 2015 and 100% access by 2025. The national urban sanitation policy was launched
on November 2008. This policy outlines that each of the states develops its own
specific strategy to achieve the policy goals.
JT Urja Pvt. Ltd. has been entrusted with the task of preparation of City Sanitation Plan
for Loni. The present report captures the status of sanitation in Loni, which is broadly
based on available project reports, studies, databases of Loni Nagar Palika, and field
investigations carried out in the course of CSP preparation.
1.2 THE NATIONAL URBAN SANITATION POLICY
The National Urban Sanitation Policy (NUSP) seeks to address the gap in sanitation
infrastructure and move Indian cities towards “total sanitation through a “systems driven
approach”. NUSP tries to create a more coordinated institutional roles and
responsibilities to reach the poor and the un-served. Under the NUSP, Loni Nagar Palika
JT URJA PVT. LTD. NPP LONI
FINAL CSP, LONI 4
has to prepare City Sanitation Plan (CSP), with the active participation of the city level
stakeholders.
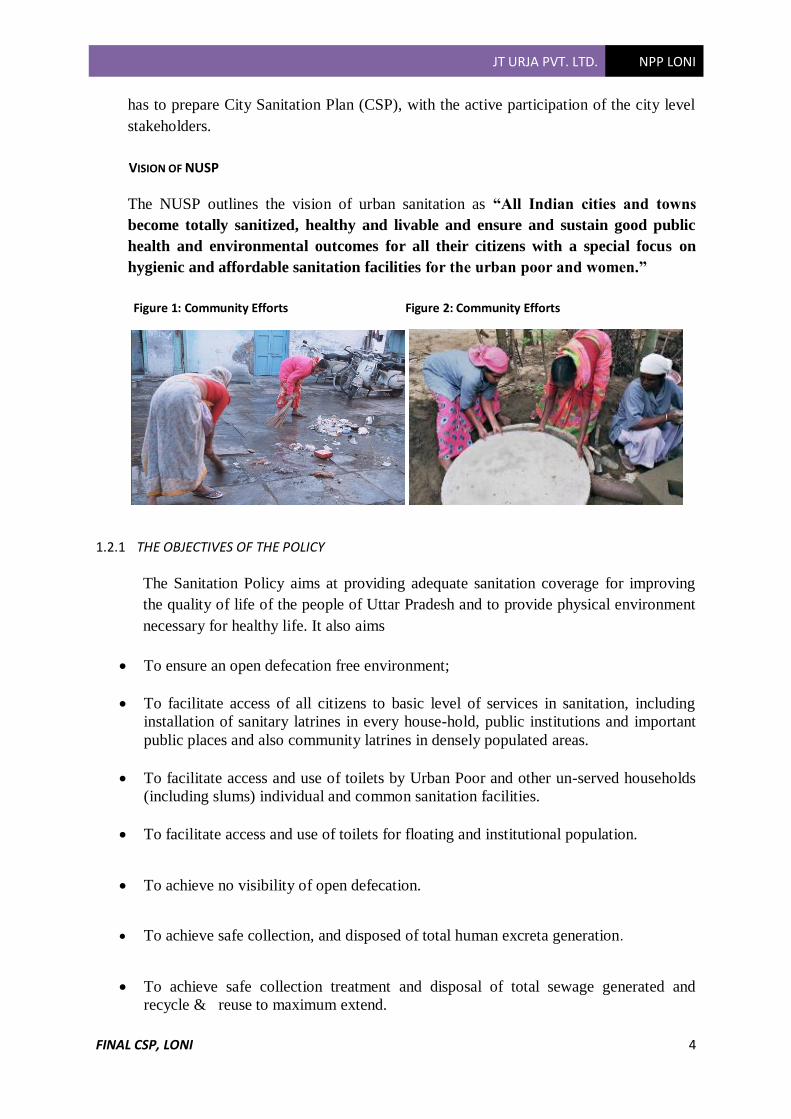
VISION OF NUSP
The NUSP outlines the vision of urban sanitation as “All Indian cities and towns
become totally sanitized, healthy and livable and ensure and sustain good public
health and environmental outcomes for all their citizens with a special focus on
hygienic and affordable sanitation facilities for the urban poor and women.”
Figure 1: Community Efforts Figure 2: Community Efforts
1.2.1 THE OBJECTIVES OF THE POLICY
The Sanitation Policy aims at providing adequate sanitation coverage for improving
the quality of life of the people of Uttar Pradesh and to provide physical environment
necessary for healthy life. It also aims
• To ensure an open defecation free environment;
• To facilitate access of all citizens to basic level of services in sanitation, including
installation of sanitary latrines in every house-hold, public institutions and important
public places and also community latrines in densely populated areas.
• To facilitate access and use of toilets by Urban Poor and other un-served households
(including slums) individual and common sanitation facilities.
• To facilitate access and use of toilets for floating and institutional population.
• To achieve no visibility of open defecation.
• To achieve safe collection, and disposed of total human excreta generation.
• To achieve safe collection treatment and disposal of total sewage generated and
recycle & reuse to maximum extend.
JT URJA PVT. LTD. NPP LONI
FINAL CSP, LONI 5
• To achieve safe collection, transportation, segregation and treatment of Municipal
Solid Waste and ensure quantity of refuse for Landfill site should not be more than
20%.
• To ensure city wastes should not cause adverse impact on surrounding areas outside
city limit.
• To facilitate the provision of safe drinking water to all citizens.
• To facilitate adequate collection and disposal of storm water.
• To link and integrate sanitation programmes with city and regional planning policies,
health, environment, housing and education.
• To develop guidelines for the evolution of an effective institutional and financial
framework.
• To enhance capacity building of government agencies and other stakeholders at all
levels for better sanitation, particularly avoiding incidents of water borne diseases,
industrial, hazardous and hospital and clinical wastes of national, provincial and local
levels, and
• To change the attitude and behaviour on the use of sanitation.
• To increase mass awareness on sanitation and community mobilization.
• To improve the ‘quality of life’ of sanitation workers. Engage civil societies and
communities (women in particular) in awareness generation, hygiene education,
creation of sanitation infrastructure and its maintenance.
• To strengthen institutional setup and build the capacity of municipal staff for effective
programme implementation and meeting the challenges of technology and
management.
• To encourage Public Private Partnerships (PPPs) to ensure generation of funds and
sustainable programme implementation. 1.2.2 UTTAR PRADESH SANITATION POLICY
VISION
All the cities and towns become totally sanitized healthy and liveable.

JT URJA PVT. LTD. NPP LONI
FINAL CSP, LONI 6
KEY SANITATION ISSUES
• Poor awareness, sanitation has been given low priority and about its consequent
linkage with public health.
• Social and occupational hazard faced by sanitation workers daily.
• Fragmented Institutional roles and responsibilities: - There are considerable gaps and
overlaps in the institutional roles and responsibilities at the state and city levels.
• Lack of an integrated city-wide approach: - Sanitation investments are currently
planned in a piece-meal and do not take into account the full cycle of safe
confinement Treatment and safe disposal.
• Serving the un-served and poor.
• Lack of facilities in slums. There are no provisions for proper defecation.
• Lack of Demand Responsiveness: - sanitation has been provided in a supply manner,
with little regard for demands and preferences of households as customer of sanitation
services.
Services to
the poor
Concept of
Totally
Sanitized City
Recycle or
Reuse of
treated Waste
Water
Free from
Open
Defecation
Improved
public health
&
Environment
al standards
Safe
collection
treatment &
disposal of
waste water
Safe
collection
treatment &
disposal of
solid waste
JT URJA PVT. LTD. NPP LONI
FINAL CSP, LONI 7
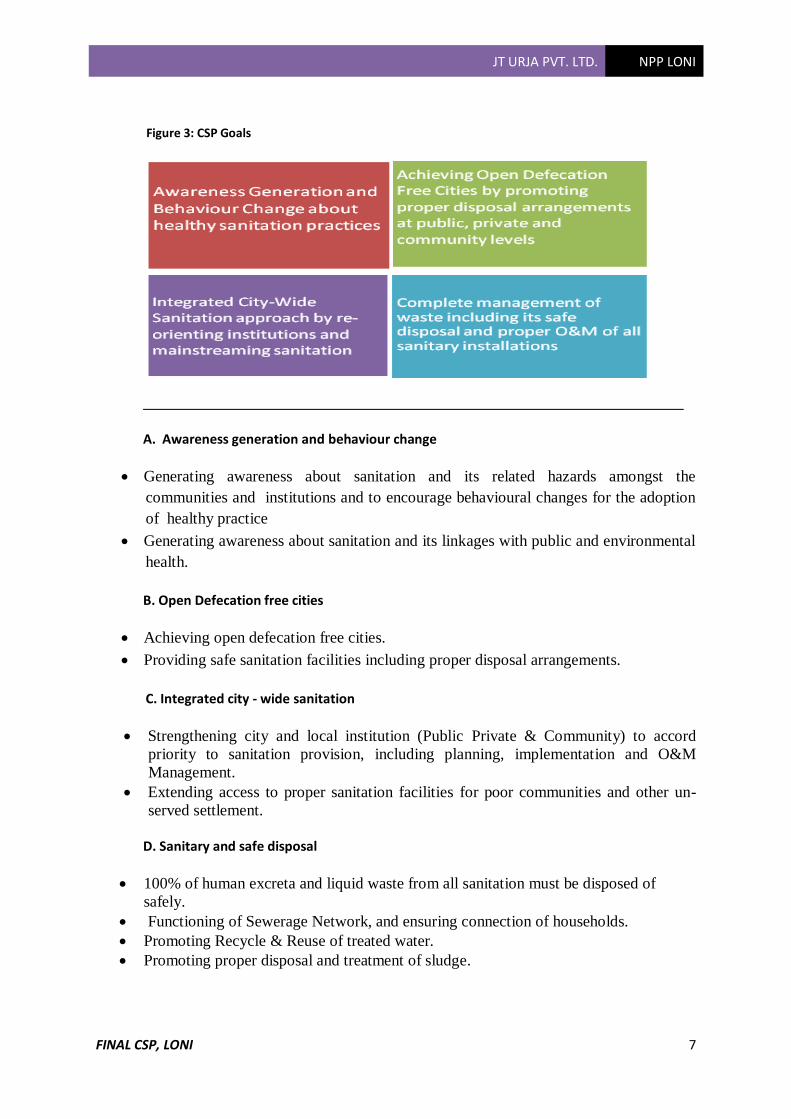
Figure 3: CSP Goals
A. Awareness generation and behaviour change
• Generating awareness about sanitation and its related hazards amongst the
communities and institutions and to encourage behavioural changes for the adoption
of healthy practice
• Generating awareness about sanitation and its linkages with public and environmental
health.
B. Open Defecation free cities
• Achieving open defecation free cities.
• Providing safe sanitation facilities including proper disposal arrangements.
C. Integrated city - wide sanitation
• Strengthening city and local institution (Public Private & Community) to accord
priority to sanitation provision, including planning, implementation and O&M
Management.
• Extending access to proper sanitation facilities for poor communities and other un-
served settlement. D. Sanitary and safe disposal
• 100% of human excreta and liquid waste from all sanitation must be disposed of
safely.
• Functioning of Sewerage Network, and ensuring connection of households.
• Promoting Recycle & Reuse of treated water.
• Promoting proper disposal and treatment of sludge.
JT URJA PVT. LTD. NPP LONI
FINAL CSP, LONI 8
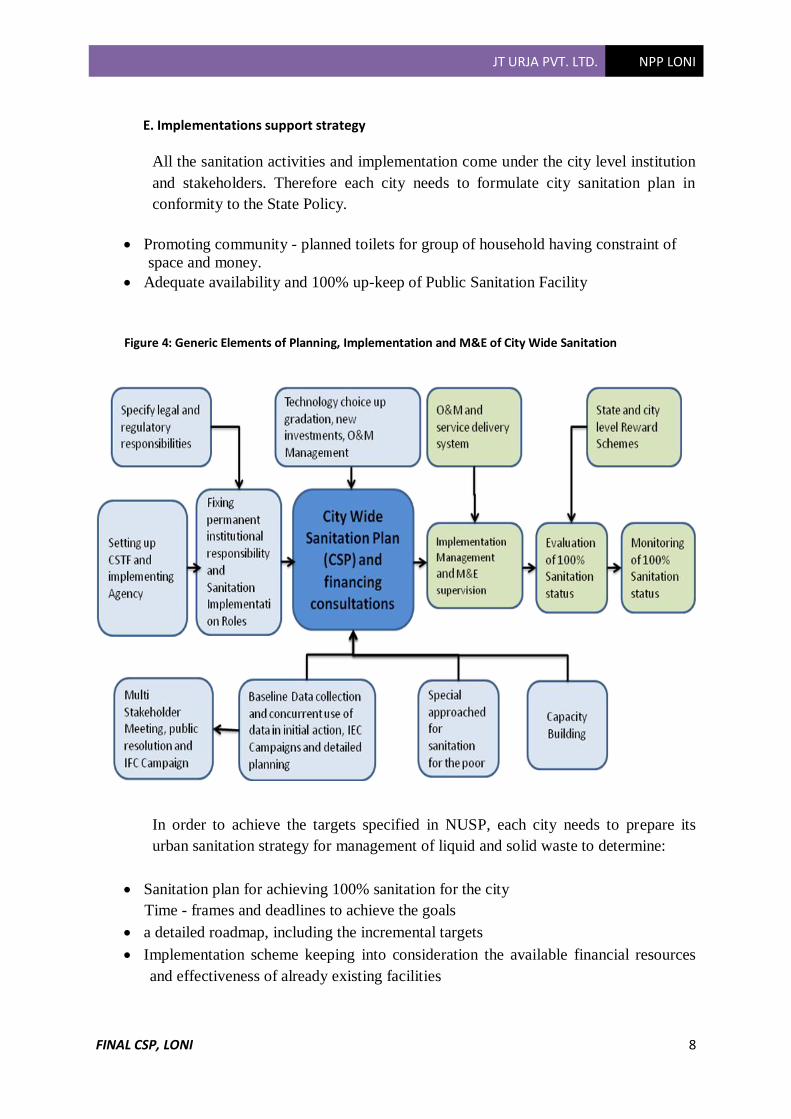
E. Implementations support strategy
All the sanitation activities and implementation come under the city level institution
and stakeholders. Therefore each city needs to formulate city sanitation plan in
conformity to the State Policy.
• Promoting community - planned toilets for group of household having constraint of
space and money.
• Adequate availability and 100% up-keep of Public Sanitation Facility
Figure 4: Generic Elements of Planning, Implementation and M&E of City Wide Sanitation
In order to achieve the targets specified in NUSP, each city needs to prepare its
urban sanitation strategy for management of liquid and solid waste to determine:
• Sanitation plan for achieving 100% sanitation for the city
Time - frames and deadlines to achieve the goals
• a detailed roadmap, including the incremental targets
• Implementation scheme keeping into consideration the available financial resources
and effectiveness of already existing facilities
JT URJA PVT. LTD. NPP LONI
FINAL CSP, LONI 9
1.2.3 GOVERNMENT OF INDIA SUPPORT
Ministry of Housing and Urban Poverty Alleviation (HUPA) is supporting a centrally
sponsored scheme for Integrated Low Cost Sanitation (ILCS). Under the scheme
Central Subsidy to extent of 75%, State subsidy to the extent of 15 % and beneficiary
contribution to the extent of 10% is provided for construction of latrines. The main
objective of the scheme is to convert around 6 lakh dry latrines into low cost pour
flush latrines by 31st March 2010. 75% of the central allocation will be used for
conversion and the remaining 25% will be used for construction of new toilets for
EWS households who have no toilets in urban areas. This scheme focuses on the
provision of latrines/toilets and the elimination of open defecation and scavenging. It
does not cover the problem of inadequate sanitation, including treatment and disposal
of sewage and solid waste management, which has considerable environmental and
health implications. The scope of urban sanitation is much larger than the issues
covered under the Scheme for Integrated Low Cost Sanitation which essentially
focuses on provision of latrines to prevent open defecation in order to eliminate
manual scavenging.
The sharing of funds would be in the ratio of 80: 20 between Central Government &
State Government. Out of 20% of state share 10% will be borne by the ULB which
could be raised by the nodal/implementing agencies from the financial institutions or
internal resources for funds.
Towards achievement of the Urban Sanitation Policy Goals, the Government of India
will support:
• States will be encouraged to prepare State level strategies within a period of 2 years.
Chapter on draft framework for developing state level strategies gives an outline of
the strategy.
• Identified cities will be urged to prepare model city sanitation plans within a period of
2 years. Chapter on draft framework for a city sanitation plan gives an outline of the
plan.
• Providing assistance for the preparation of detailed project report (DPR) as per city
sanitation plan as soon as requests for funding are received;
• Promote public-private partnership in respect of key projects/activities identified in
the city sanitation plan;
• Provide technical assistance and support for awareness generation and capacity
building to states and cities within this financial year.
• Periodic rating of cities in respect of sanitation and recognition of best performers by
instituting a National Award within this financial Year.
• Funding projects wherever possible from existing schemes. The Ministry of Urban
Development is implementing schemes such as the Jawaharlal Nehru National Urban
Renewal Mission (UIDSSMT). These schemes have a time span of 7 years (2005-
JT URJA PVT. LTD. NPP LONI
FINAL CSP, LONI 10
2012) with a budget of Rs. 1,00,000 crore of which the share of the central
government is Rs. 50,000 crore. Out of 3243 projects sanctioned up to 31.03.08, 125
Pertain to sewerage, storm water drainage & solid waste management.
Government of India will support states in developing and implementing innovative
Strategies to accord priority to urban sanitation. States and cities can explore a
number of options in achieving sanitation goals including:
• Using existing provisions with regard to sanitation in Municipal and other
Acts to promote compliance;
• Amending Municipal Acts, Framing of Bye Laws and Regulations (e.g.
Building and Construction Bye-Laws) to promote sanitation by Public and
Private agencies, prohibit discharge of untreated sewage into open areas
wherever possible;
• Create a system of incentives and disincentives including punitive actions and
levies and charges on pollutants wherever appropriate;
• Re-orienting policies to ensure that urban poor households or residents in
informal settlements obtain access to improved sanitation facilities;
• Ear-marking and making land available for community and public sanitation
facilities;
• Promoting partnerships with public, private and non-governmental agencies
for improved provision, maintenance and management of sanitation facilities;
• Mainstreaming sanitation in all public activities (e.g. by coordinating with
health, education and infrastructure sectors3);
• Taking up sanitation in a mission mode in order to mobilize joint actions from
different public and non-government agencies. This can be accomplished by
forming an urban sanitation steering committee at the state level and a task
force at the city level;
• Exploring other options and innovations that may be suitable locally.
HOW TO ACHIEVE GOALS
• As mentioned above Urban local bodies suffer from constraint of finance, staff
and face public who has no awareness about sanitation. Therefore, first priority
is to make public aware for financial strengthening of Urban Local Bodies.
• Poor sanitation results in many health hazards due to fly, rubbish, human
excreta. Public is not aware of these hazard so they never put an effort to
strengthen the local bodies. For these different seminars, meeting audio visual
documentary should be organized by the ULBs and NGO’s.
• Present sanitation situation about the state of Uttar Pradesh indicates that the
production of waste water in the state is about 1872.5 million daily. In the
entire state only 55 towns have partial sewerage facility; and out of 51 towns
JT URJA PVT. LTD. NPP LONI
FINAL CSP, LONI 11
having population of more than one lakh, 14 towns still do not have sewerage
system at all. Sewage treatment plants constructed under different River
Action Plans are grossly inadequate. The Capacity of these plants is reported
to be only 795.54 million litres daily. Thus only two-fifth water generated is
being treated before disposal into water bodies. Therefore, every city has to
prepare its city sanitation plan and submit the plan to state as an immediate
step towards achieving 100% sanitation.
Hence, a meeting was held on 9.12.2009 of all Nagar Ayuktas in U.P. for formulating
City Sanitation policy as desired in State Urban Sanitation policy to achieve goals for
making cities open defecation free & better Living conditions of Urban Poor.
PREPARATORY ACTIONS
City Sanitation Task Force
Mobilize Stakeholders : The first step in making the cities 100% sanitized is to elevate
the consciousness about sanitation in the mind of municipal agencies, government
agencies and most importantly, amongst the people of the city.
1. To achieve the aim constitute a multi-stakeholder city sanitation task force
comprising representation from:
i. Representative from shops and establishments,
ii. Representative of the large institutions in the city (e.g. Cantonment
boards, housing boards, development authority Govt. of India and state
Govt. Enterprise campuses, etc.
iii. NGO’s working on water and sanitation, urban development and
slums, health and environment,
iv. Representatives of unions of safai karamcharies, sewerage sanitary
workers etc.
v. Representatives from educational and cultural institution.
vi. Any other significant or interested stakeholder
vii. Some of the elected members of the ULB
2. The task force should be headed by the Mayor with the executive head (e.g.
Municipal Commissioner) as the convener.
3. Political parties must be involved from all shades and thinking. So that sanitation
campaign has the full support of all stakeholders.
4. The task force should appoint preferably ULB, to implement the City Sanitation
Plan. For this City Sanitation Implementing Agency will involve NGOs(through
Memorandum of Understanding ) Maintaining a comprehensive GIS- based

JT URJA PVT. LTD. NPP LONI
FINAL CSP, LONI 12
database, implementing physical works , letting out and supervising O&M
management contracts etc.
5. The Implementing agency will examine the laws and rules in this regard and
make recommendations for the task force to make rules.
SPECIFYING LEGAL AND REGULATORY INSTITUTIONAL RESPONSIBILITIES
Even though many of the Municipal laws refer to sanitation responsibilities of
households and ULB etc., these are not clearly laid out or comprehensive. The
implementing Agency will examine the laws and rules in this regard and make
recommendations for the Task Force to make the rules explicit regarding:
▪ Safe sanitary arrangements at unit level (household, establishment)
▪ Design and systems for safe collection
▪ Norms for transport/conveyance
▪ Treatment and final disposal
National Award scheme for sanitation for State Cities (National Rating Scheme for Sanitation)
In order to rapidly promote sanitation in urban areas of the country (as provided
for in the National Urban Sanitation Policy and Goals, 2008), and to recognize
excellent performance in this area, the Government of India has instituted an
annual rating and award scheme for cities. The award (Nirmal Shahar Puraskar) is
based on the premise that improved public health and environmental standards
are two key outcomes that cities must seek to ensure for their citizens. In doing
so, governments in states and urban areas will need to plan and implement
holistic citywide sanitation plans, thereby putting in place processes that help
achieve outputs pertaining to safe collection, confinement and disposal (including
conveyance, treatment, and / or reuse without adverse impacts on the
environment in and around the cities) of waste.
The exercise rated 423 cities (with population greater than 100,000) for their
performance across various aspects of sanitation. This was measured through
indicators that included physical infrastructure, systems, processes, and outcomes
related to achievement of total sanitation (Refer Box-I). The first national rating
was carried out in 2009 and results were published in May, 2010 (See
www.urbanindia.nic.in for details.)
The rating exercise was carried out to:
• Compare intra-city and inter-city data on sanitation.
JT URJA PVT. LTD. NPP LONI
FINAL CSP, LONI 13
• Monitor and measure improvement of cities against standard indicators
over time.
• Generate awareness on the need to create totally sanitized cities.
• Allow states and cities to use the results to identify and address areas of
poor performance.
• Enable cities to think city-wide, with an emphasis on smarter planning and
investments that lead to improved sanitation in the country.
• Instill a sense of healthy competition amongst cities.
• Motivate and recognize excellent performance in sanitation through
national reward
Each city has been scored on 19 indicators which are divided into three categories:
Output (50 points), Process (30 points) and Outcome (20 points). The methodology
for the exercise was designed incorporating standardized methods for measurement
and scoring and was evolved after extensive stakeholder consultations. The rating
makes use of both primary data collection during field visits and secondary data
from published sources such as census. Each agency was required to follow the
prescribed methodology, ensuring uniformity and comparability of data. The data
was collected from cities in a consultative and collaborative manner. Based on the
scores for output, process and outcome indicators, cities were then classified under
four color categories; red, black, blue and green.
The exercise reveals that more than half of the cities are in the Blue or Black
categories. There are four cities in the blue category which have scored above 66
but less than 90 marks out of hundred. Almost all cities report complete
elimination of manual scavenging. More than 50 cities report 90 percent or above
safe collection of human excreta. Twenty four cities collect more than 80 percent
of their solid wastes – another six show an outstanding performance of nearly 100
percent primary collection. While treatment is a big challenge for most, 17 cities
have achieved treating at least 60 percent of their wastes. Most cities have
performed well in the process indicators, especially the larger cities, but results for
the output and outcome indicators are mixed.
The exercise also highlights that considerable efforts are required to improve
access to community and public toilets for the urban poor and to stop open-
defecation. Wastewater treatment poses considerable challenges – 380 cities collect
and treat less than 40% of their human excreta, though there are six cities that treat
more than 90% of their human excreta.
Loni city is in red category (Rank 391) with a score of 22.15 out of 423 cities. Among 54
cities of Uttar Pradesh reviewed, Mau ranks 44th. (19 U.P cities are in black category
with the score in the range of 33.6-60, remaining cities are in red category with the
score in the range of 33.5 and below. Chandigarh ranks first with the score of
73.48.)

JT URJA PVT. LTD. NPP LONI
FINAL CSP, LONI 14
1.3 UIDSSMT SHCEME Urban Infrastructure Development Scheme aims at improvement in urban
infrastructure in towns and cities in a planned manner. The scheme seeks to enhance
public and private investments in infrastructural development of urban areas.
1.3.1 OBJECTIVES
The objectives of the scheme are to:
a) Improve infrastructural facilities and help create durable public assets and quality-
oriented services in cities & towns.
b) Enhance public-private partnership in infrastructural development.
c) Decentralize urbanization and promote planned development of towns, cities and
metros.
1.3.2 DURATION OF THE SCHEME
The duration of the Scheme will be for five years beginning from 2005-06. An
evaluation of the outcomes of the Scheme will be undertaken before the
commencement of the 11th Five Year P\an and, if necessary, the scheme would be
suitably calibrated.
1.3.3 COVERAGE
The scheme will apply to all cities/towns as per 2001 census, excepting cities/towns
covered under JNNURM. Allocation of funds among states will be on the basis of the
state's urban population to total urban population in the country. States may allocate
funds to towns/cities based on similar formula. However, funds would be provided to
only those towns and cities where elections to local bodies have been held and elected
bodies are in position.
The State Governments may prioritize towns and cities on the basis of their felt-need.
1.3.4 COMPONENTS
The components for assistance under the scheme will include all urban
infrastructure development projects including water supply and sewerage. Cost of
land for such infrastructure projects will not be provided under the programme.
Admissible Components
JT URJA PVT. LTD. NPP LONI
FINAL CSP, LONI 15
i. Urban Renewal i.e. redevelopment of inner (old) city areas (this would include items
like widening of narrow streets, shifting of industrial/commercial establishments from
non-conforming (inner-city) areas to 'conforming' (outer-city) areas to reduce
congestion, replacement of old and worn-out water pipes by new/higher capacity
ones, renewal of sewerage/drainage/solid waste disposal systems, etc), land
acquisition cost will not be financed under this component of the program me.
ii. Water Supply and sanitation, including setting up de-salination plants, where
necessary;
iii. Sewerage and Solid Waste Management
iv. Construction and improvement of drains/storm water drains
v. Laying/improvement /widening of arterial/sub-arterial roads and bridges to remove
transport bottlenecks,
vi Construction and development of bus and truck terminals
vi. Environmental improvement and city beautification schemes,
vii. Construction of working women hostels, marriage halls, old age and
Destitute Children's homes, night shelters with community toilets, street lighting and Slaughter houses
xi. Civic amenities like playgrounds/stadia, community halls,
xii. Hospital Waste Management
1.3.5 FUNDING PATTERN OF THE SCHEME
The sharing of funds would be in the ratio of 80: 20 between Central Government &
State Government. Out of 20% of state share 10% will be borne by the ULB which
could be raised by the nodal/implementing agencies from the financial institutions or
internal resources for funds.
1.4 OBJECTIVES OF THE CITY SANITATION PLAN IN LONI CITY
• The City Sanitation Plan will be prepared after carrying out a situation analysis and
after a structured consultation with stakeholders. The Plan will attempt to achieve the
following objectives:
• To adopt locally suitable methods, technology and materials, and provide necessary
facilitation support to Nagar Palika Parishad Loni.
JT URJA PVT. LTD. NPP LONI
FINAL CSP, LONI 16
• To encourage community and private participation and define their role in creation
and maintenance of sanitation infrastructure, thereby ensuring a sense of ownership.
• To ensure coordination between various departments working in the field of water
supply and sanitation, such as departments of health, education, public health and
engineering, industry, environment, transport, pollution control board, etc.
• To ensure an optimum use of funds allocated by 13th Finance Commissions for solid
waste management and other sanitation related projects. To coordinate various
externally aided projects for their optimum results.
• To promote novel ideas in mobilization of funds, including reforms in tax regime,
public private partnerships, exploring the private market, user charges, beneficiary
contribution, etc.
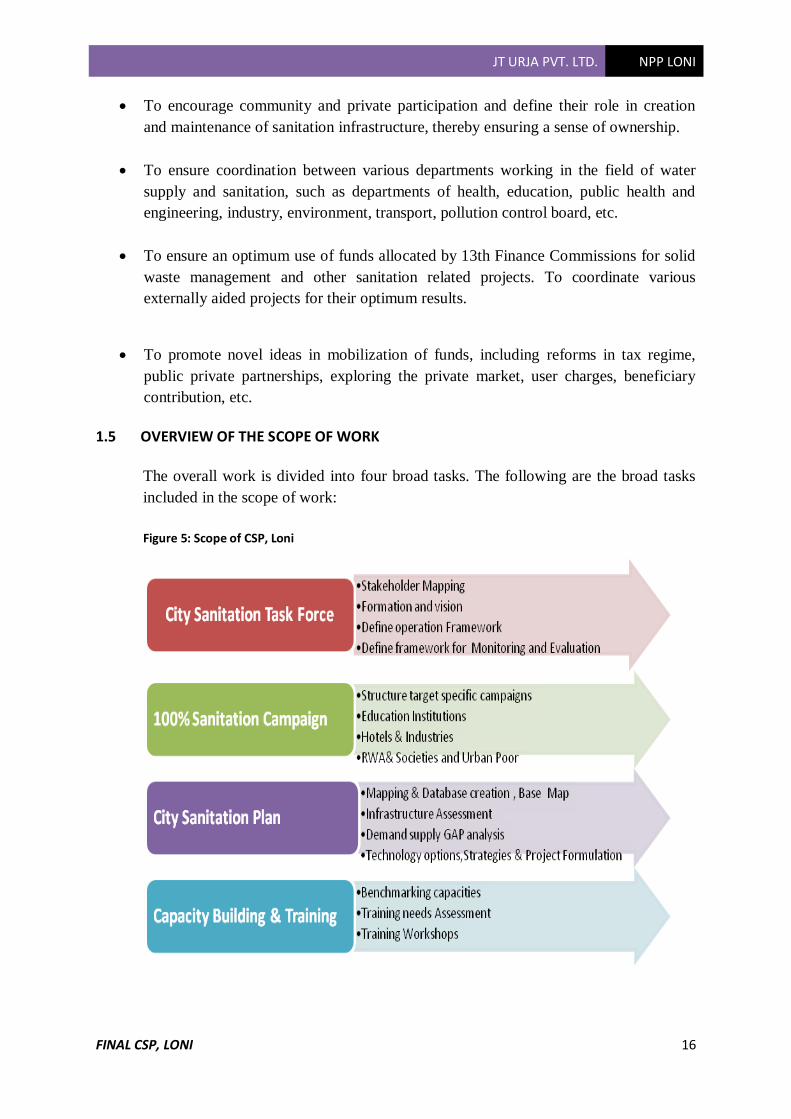
1.5 OVERVIEW OF THE SCOPE OF WORK
The overall work is divided into four broad tasks. The following are the broad tasks
included in the scope of work:
Figure 5: Scope of CSP, Loni

JT URJA PVT. LTD. NPP LONI
FINAL CSP, LONI 17
City-Sanitation Task Force (CTF)
A City Sanitation Task Force (CTF), which is a multi-stakeholder agency having
representation from various walks of life, has been formed. CTF will launch the
awareness campaign and the 100% sanitation campaign for the city in addition to
approving the studies and implementation works to achieve the goals of NUSP. The
objectives and participants of the City Sanitation Task Force are discussed in detail in
Chapter 2.
100% Sanitation Campaign
Sanitation issues and target groups are identified to formulate an action plan on
awareness generation. A pilot awareness campaign has to be conducted by the City
Sanitation Task Force in Past, similar kind of campaigns would be conducted at
regular intervals.
City Sanitation Plan (CSP)
The sanitation situation of the city is analysed based on the rapid land use survey,
secondary data collection and consultations. A Geographic Information System (GIS)
based database on sanitation in Loni would be created as part of this plan. The
sanitation plan and project proposals will be prepared based on the situation analysis
and consultation with CTF
Capacity Building and Training
The existing human resources and infrastructure of the Nagar Parishad is assessed for
its adequateness and capacity. Based on this, training needs will be identified and
workshops shall be conducted on a pilot basis.
THE STEPS TAKEN AND DELIVERABLES AS PER THE ABOVE MENTIONED TASKS IS PROVIDED BELOW Figure 6 : Steps for Deliverables
JT URJA PVT. LTD. NPP LONI
FINAL CSP, LONI 18
Step 1 - Formation of City-level Implementation Committee/Cell
A city-level committee consisting of government and private sector stakeholders is to
be formed for the purpose of overseeing preparation and implementation of the City
Sanitation Plan.
Step 2 - Conduct 1st Consultation
A first level consultation is envisaged to orient the city stakeholders on the objectives
of the UPSP and NUSP, and on the process and methodology of preparing the City
Sanitation Plan. This has been carried out in the form of individual meetings with key
stakeholders at the start of this project.
Step 3 - Reconnaissance Survey (to be carried out by a separate team of NPP).
A detailed reconnaissance survey to be conducted by a separate team of Motivators
and Trainers.
Step 4 - Preparation of Situation Analysis
A ward-wise and slum-wise situation analysis report has to be prepared after assessing
existing secondary data, outputs of the reconnaissance survey, and additional surveys
will be conducted as part of this assignment. The situational analysis report, presented
here, details out existing household sanitation arrangements, public sanitary
conveniences, waste water disposal, solid waste management and water supply. It
highlights the deficiencies in sanitation facilities, which particularly affect women and
the urban poor. The analysis also projects the future demand for sanitation services.
Step 5 - Conduct 2nd Consultation
A second consultation workshop will be held with the city implementation cell to
present the findings of the situation analysis for feedback and suggestions.
Step 6 - Preparation of Draft City Sanitation Plan
A draft city sanitation plan will be prepared for Loni Nagar Palika Parishad
incorporating assessment of strategies and technology options for safe collection,
transportation, treatment and disposal of both solid and liquid wastes in the city. The
analysis of options will include costs of capital investment, operation and
maintenance, monitoring, and evaluation.
Step 7 - Preparation of Implementation Plan
A strategic implementation plan (short-, medium- and long-term) and an immediate
action plan (1-3 years) that will include a multi-year financial plan for implementing

JT URJA PVT. LTD. NPP LONI
FINAL CSP, LONI 19
the City Sanitation Plan for Loni Nagar Parishad in a time- bound manner will be
prepared.
Step 8 - Conduct 3rd Consultation
The draft City Sanitation Plan for Loni City for Loni Nagar Palika Parishad and
implementation plan will be presented to the city-level implementation
committee/cell. The recommendations of the Loni City CSP committee and other
stakeholders will be documented for their incorporation into the final version of the
City Sanitation Plan for Loni .
Step 9 - Final City Sanitation Plan
The final version of the City Sanitation Plan for Loni City will be prepared after
appropriately addressing all comments and suggestions of the 3rd consultation
meeting of the city-level sanitation committee/cell.
In order to achieve the targets specified in NUSP/UPSP, each city needs to prepare its
urban sanitation strategy for management of liquid and solid waste to determine:
• Sanitation plan for achieving 100% sanitation for the city
• Time-frames and deadlines to achieve the goals
• A detailed roadmap, including the incremental targets
• Implementation scheme keeping into consideration the
available financial resources and effectiveness of already existing facilities
Following are steps followed in the Stakeholder Workshop -
Stage 1: To introduce the Concept of CSP with the participation of various
stakeholders, as deemed appropriate could also serve as a mean to identify other
interested & appropriate stake holders.
Figure 7: Stakeholders Discussion
JT URJA PVT. LTD. NPP LONI
FINAL CSP, LONI 20
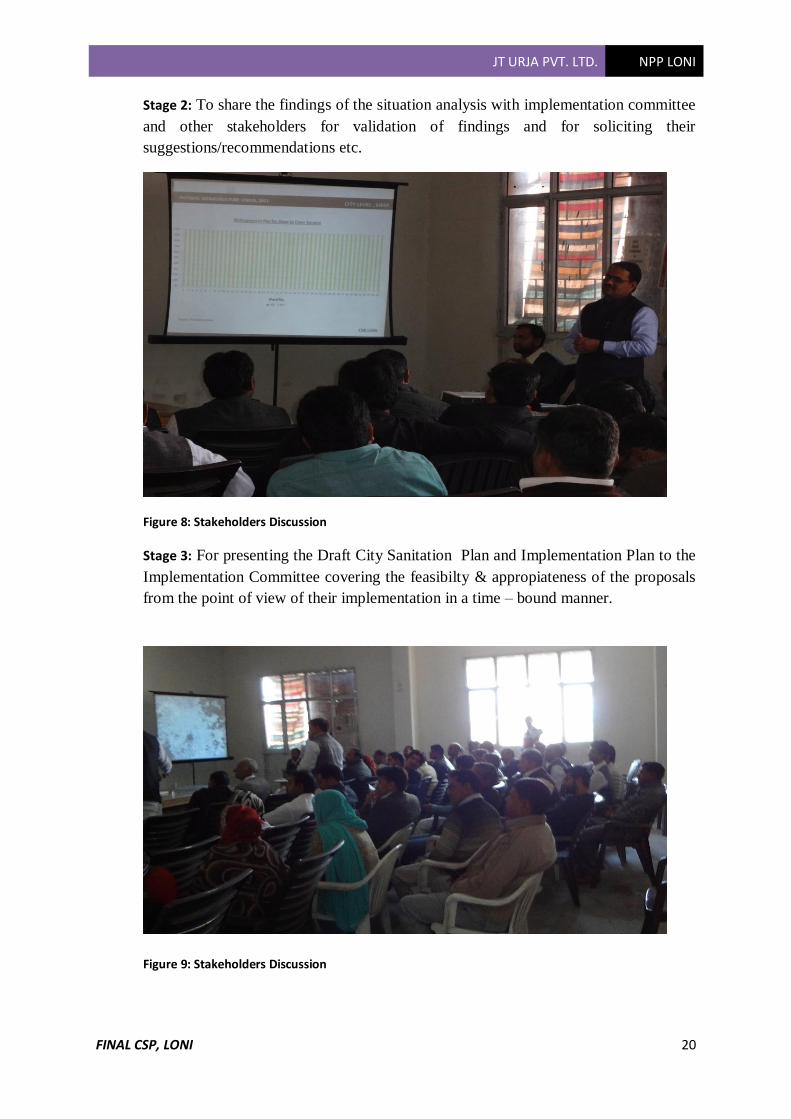
Stage 2: To share the findings of the situation analysis with implementation committee
and other stakeholders for validation of findings and for soliciting their
suggestions/recommendations etc.
Figure 8: Stakeholders Discussion
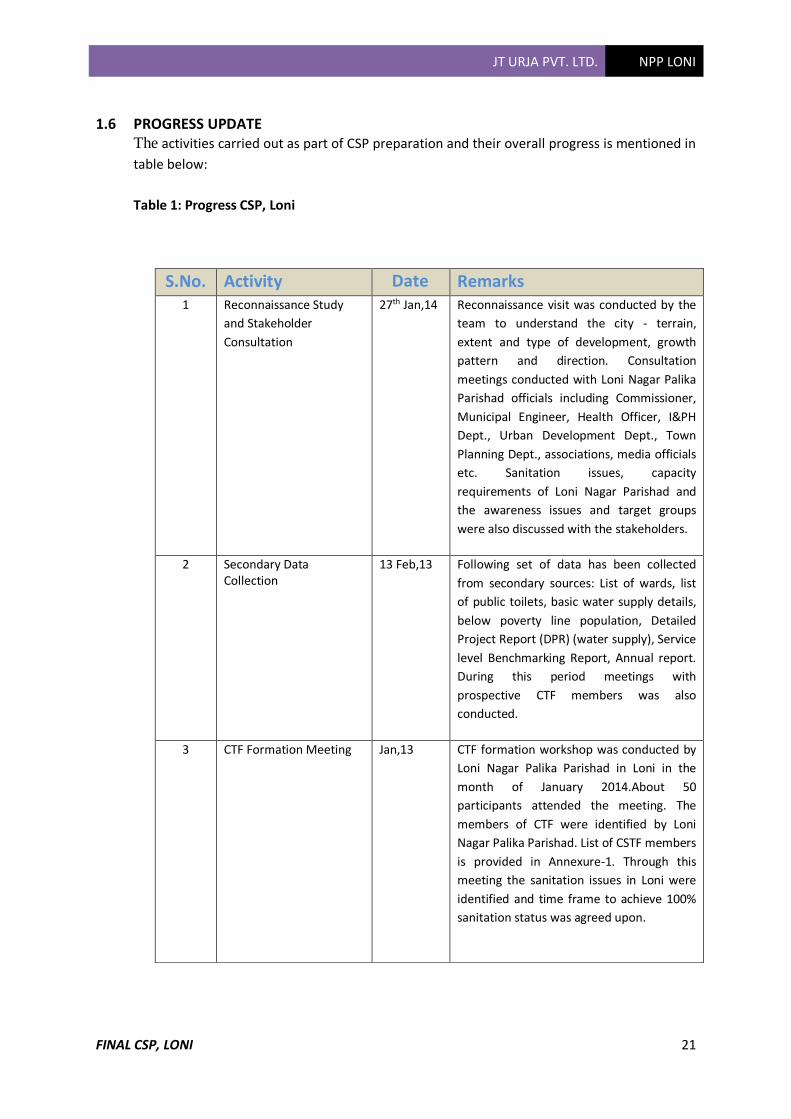
Stage 3: For presenting the Draft City Sanitation Plan and Implementation Plan to the
Implementation Committee covering the feasibilty & appropiateness of the proposals
from the point of view of their implementation in a time – bound manner.
Figure 9: Stakeholders Discussion
JT URJA PVT. LTD. NPP LONI
FINAL CSP, LONI 21
1.6 PROGRESS UPDATE
The activities carried out as part of CSP preparation and their overall progress is mentioned in
table below:
Table 1: Progress CSP, Loni
S.No. Activity Date Remarks 1 Reconnaissance Study
and Stakeholder
Consultation
27th Jan,14 Reconnaissance visit was conducted by the
team to understand the city - terrain,
extent and type of development, growth
pattern and direction. Consultation
meetings conducted with Loni Nagar Palika
Parishad officials including Commissioner,
Municipal Engineer, Health Officer, I&PH
Dept., Urban Development Dept., Town
Planning Dept., associations, media officials
etc. Sanitation issues, capacity
requirements of Loni Nagar Parishad and
the awareness issues and target groups
were also discussed with the stakeholders.
2 Secondary Data Collection
13 Feb,13 Following set of data has been collected
from secondary sources: List of wards, list
of public toilets, basic water supply details,
below poverty line population, Detailed
Project Report (DPR) (water supply), Service
level Benchmarking Report, Annual report.
During this period meetings with
prospective CTF members was also
conducted.
3 CTF Formation Meeting
Jan,13 CTF formation workshop was conducted by
Loni Nagar Palika Parishad in Loni in the
month of January 2014.About 50
participants attended the meeting. The
members of CTF were identified by Loni
Nagar Palika Parishad. List of CSTF members
is provided in Annexure-1. Through this
meeting the sanitation issues in Loni were
identified and time frame to achieve 100%
sanitation status was agreed upon.
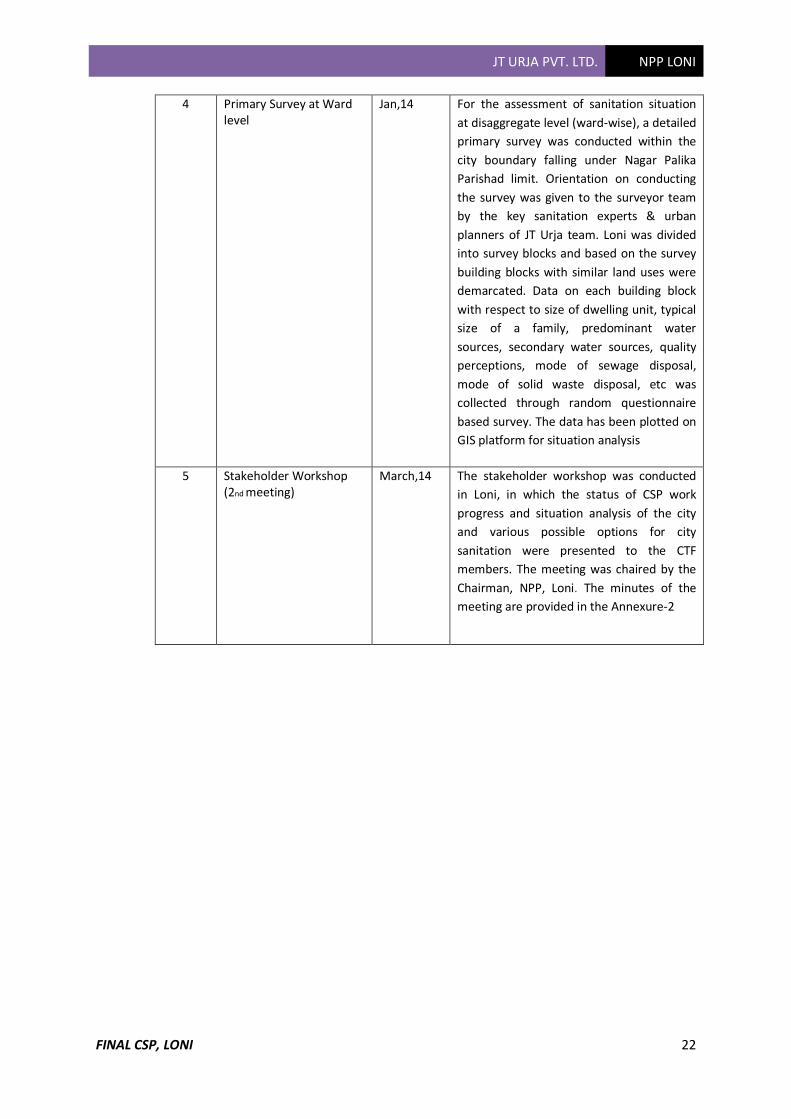
JT URJA PVT. LTD. NPP LONI
FINAL CSP, LONI 22
4 Primary Survey at Ward level
Jan,14 For the assessment of sanitation situation
at disaggregate level (ward-wise), a detailed
primary survey was conducted within the
city boundary falling under Nagar Palika
Parishad limit. Orientation on conducting
the survey was given to the surveyor team
by the key sanitation experts & urban
planners of JT Urja team. Loni was divided
into survey blocks and based on the survey
building blocks with similar land uses were
demarcated. Data on each building block
with respect to size of dwelling unit, typical
size of a family, predominant water
sources, secondary water sources, quality
perceptions, mode of sewage disposal,
mode of solid waste disposal, etc was
collected through random questionnaire
based survey. The data has been plotted on
GIS platform for situation analysis
5 Stakeholder Workshop (2nd meeting)
March,14 The stakeholder workshop was conducted
in Loni, in which the status of CSP work
progress and situation analysis of the city
and various possible options for city
sanitation were presented to the CTF
members. The meeting was chaired by the
Chairman, NPP, Loni. The minutes of the
meeting are provided in the Annexure-2

JT URJA PVT. LTD. NPP LONI
FINAL CSP, LONI 23
Chapter 2. THE APPROACH & METHODOLOGY
2.1 KEY ASPECTS OF THE APPROACH
2.1.1 ACHIEVING 100% SANITATION
The goal of the exercise is to achieve 100% sanitation in the project cities. The
following are the indicators of 100% sanitation in a city: Primary Indicators As Mandated By National Urban Sanitation Policy
• Every citizen has access to a toilet & the city is “Open Defecation Free (ODF)”
• All the sewage generated is collected, treated, and disposed off safely
Secondary Indicators
Secondary indicators are optional and are not mandated by the NUSP. However, for
holistic sanitation in a city it is important that the following indicators are also
addressed. We will advocate for the inclusion of these indicators into the city
sanitation planning
• All the solid waste generated is collected, treated, and disposed off safely
• All water bodies and drainages are preserved and kept clean
• All the storm water drains are kept clean
Every aspect of the process and infrastructure provision must integrate community
participation and must be inclusive. In addition, water and wastewater management
must be carried out in an environmentally sustainable manner, thus recycling and
reusing the by-products as far as possible.
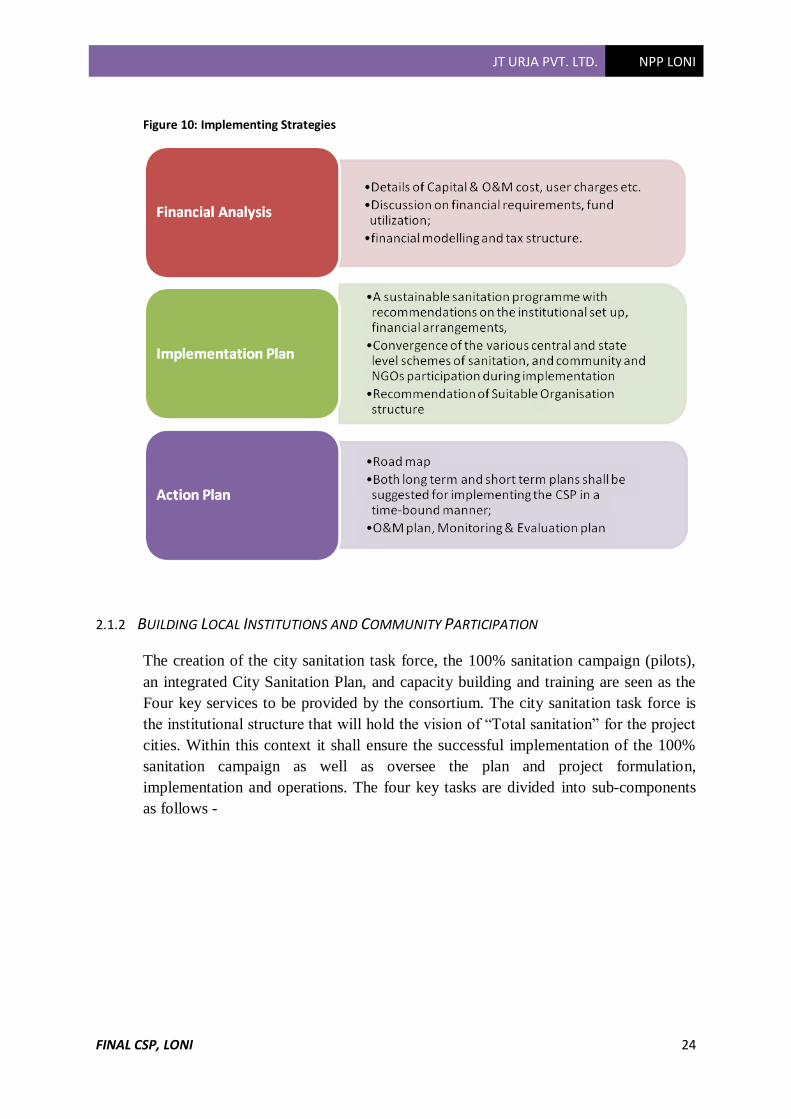
Implementation Strategy
• There should be complete financial analysis of all sectors like water, access to toilet,
sewerage network, solid waste management etc which will also include details of
operation and maintenance charges, funds required and sources of fund. Then for
implementation of plan recommendations on its institutional framework is necessary
to analyse additional fund arrangement. This would include Convergence of the
various central and state level schemes of sanitation, and community and NGOs
participation during implementation. This would lead to action plan.
JT URJA PVT. LTD. NPP LONI
FINAL CSP, LONI 24
Figure 10: Implementing Strategies
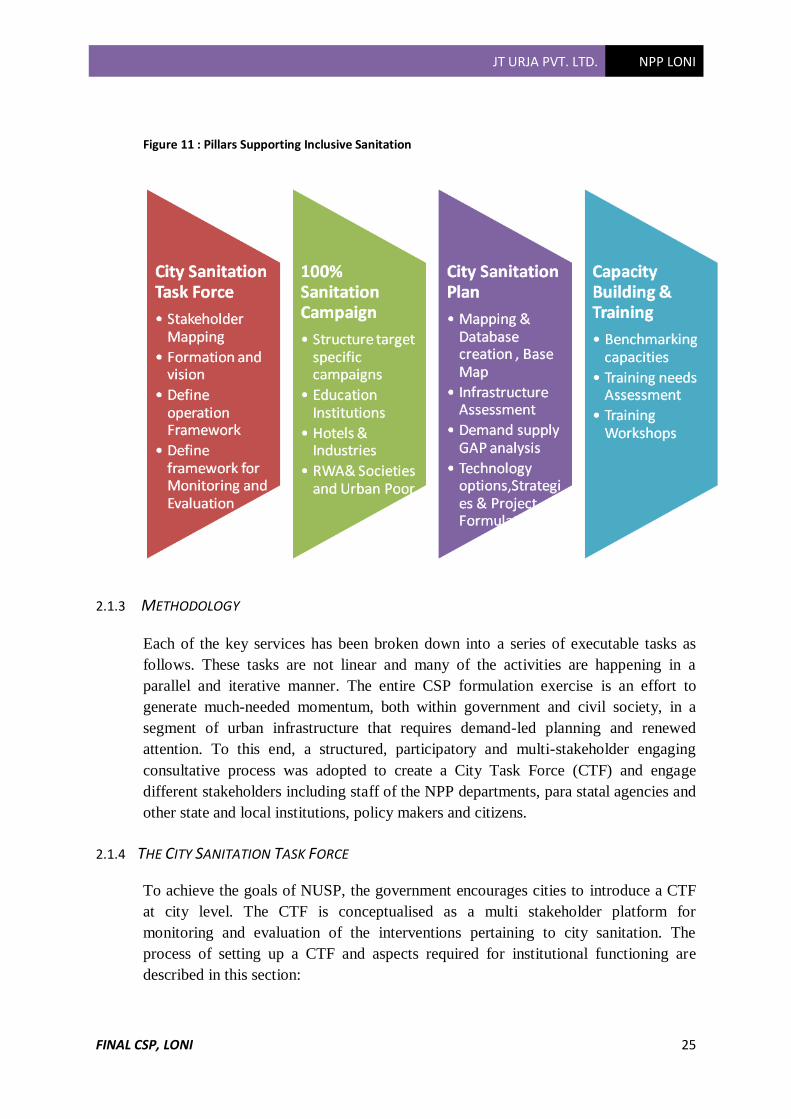
2.1.2 BUILDING LOCAL INSTITUTIONS AND COMMUNITY PARTICIPATION
The creation of the city sanitation task force, the 100% sanitation campaign (pilots),
an integrated City Sanitation Plan, and capacity building and training are seen as the
Four key services to be provided by the consortium. The city sanitation task force is
the institutional structure that will hold the vision of “Total sanitation” for the project
cities. Within this context it shall ensure the successful implementation of the 100%
sanitation campaign as well as oversee the plan and project formulation,
implementation and operations. The four key tasks are divided into sub-components
as follows -
JT URJA PVT. LTD. NPP LONI
FINAL CSP, LONI 25
Figure 11 : Pillars Supporting Inclusive Sanitation
2.1.3 METHODOLOGY
Each of the key services has been broken down into a series of executable tasks as
follows. These tasks are not linear and many of the activities are happening in a
parallel and iterative manner. The entire CSP formulation exercise is an effort to
generate much-needed momentum, both within government and civil society, in a
segment of urban infrastructure that requires demand-led planning and renewed
attention. To this end, a structured, participatory and multi-stakeholder engaging
consultative process was adopted to create a City Task Force (CTF) and engage
different stakeholders including staff of the NPP departments, para statal agencies and
other state and local institutions, policy makers and citizens.
2.1.4 THE CITY SANITATION TASK FORCE
To achieve the goals of NUSP, the government encourages cities to introduce a CTF
at city level. The CTF is conceptualised as a multi stakeholder platform for
monitoring and evaluation of the interventions pertaining to city sanitation. The
process of setting up a CTF and aspects required for institutional functioning are
described in this section:

JT URJA PVT. LTD. NPP LONI
FINAL CSP, LONI 26
• Stakeholder mapping and Interaction
• Defining agenda, institutional structure, roles and responsibilities for the CTF
• Conducting the CTF formation meeting
• Preparing the Operations Manual
✓ Detailed roles and responsibilities of the various entities involved
✓ Standard operating procedures for meetings, decision making, carrying out of
other functions etc.
•Preparation of Guidelines
✓ For updating city sanitation GIS and data base
✓ For facilitating and overseeing the implementation of awareness generation
programs and meeting relevant stakeholders from time to time
✓ For facilitating and overseeing implementation of CSP proposals, managing
bids and selection of consultants and contractors
✓ For facilitating and overseeing periodic capacity building activities
• Preparing the Monitoring and Evaluation (M & E) Manual
✓ Procedures for evaluating CSP proposal
✓ Procedures for periodically evaluating 100% sanitation status based on set of
objective indicators of outputs, processes and outcomes
✓ Procedures for monitoring sanitation status from time to time based on similar
indicators in addition to preparing the material required for functioning of the
CTF
2.1.5 THE 100% SANITATION CAMPAIGN
• Mapping of sanitation issues & target groups
• Formulating an action plan for awareness generation
• Preparation of target specific Information and Education Campaign (IEC) material
• Conducting awareness generation programs
• Formulation of community based information system
2.2 CITY SANITATION PLAN
2.2.1 PREPARATION OF BASE MAP
JT URJA PVT. LTD. NPP LONI
FINAL CSP, LONI 27
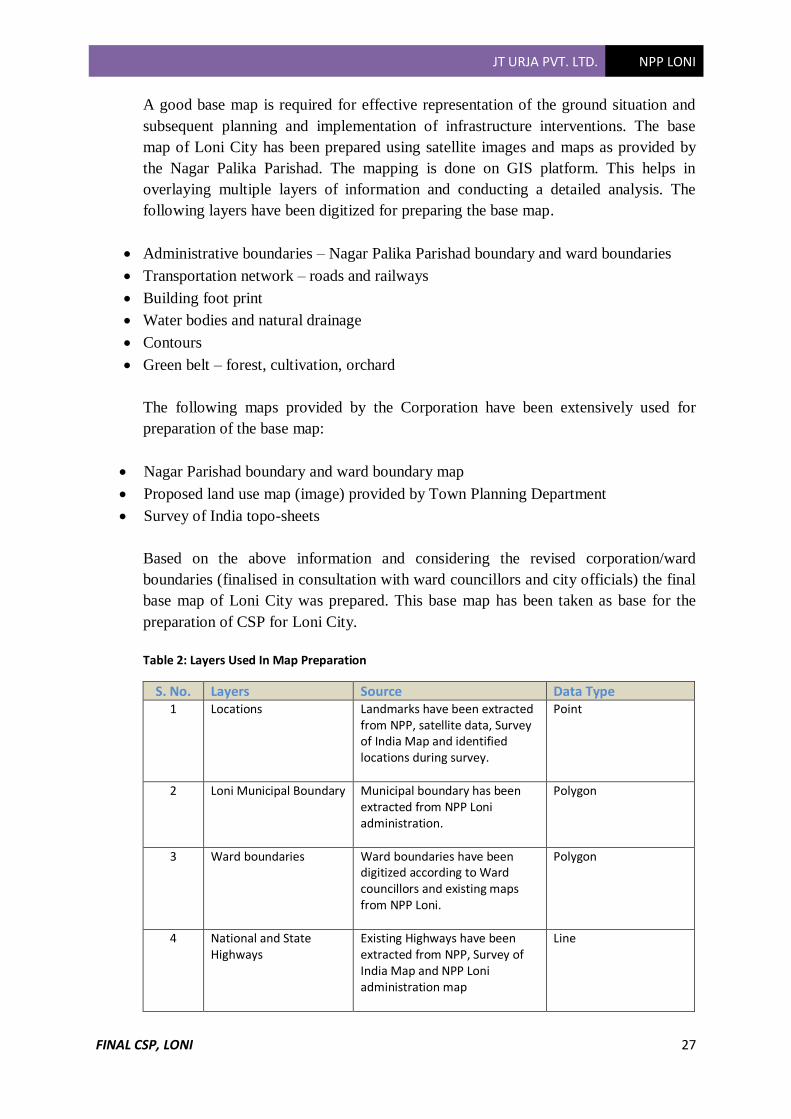
A good base map is required for effective representation of the ground situation and
subsequent planning and implementation of infrastructure interventions. The base
map of Loni City has been prepared using satellite images and maps as provided by
the Nagar Palika Parishad. The mapping is done on GIS platform. This helps in
overlaying multiple layers of information and conducting a detailed analysis. The
following layers have been digitized for preparing the base map.
• Administrative boundaries – Nagar Palika Parishad boundary and ward boundaries
• Transportation network – roads and railways
• Building foot print
• Water bodies and natural drainage
• Contours
• Green belt – forest, cultivation, orchard
The following maps provided by the Corporation have been extensively used for
preparation of the base map:
• Nagar Parishad boundary and ward boundary map
• Proposed land use map (image) provided by Town Planning Department
• Survey of India topo-sheets
Based on the above information and considering the revised corporation/ward
boundaries (finalised in consultation with ward councillors and city officials) the final
base map of Loni City was prepared. This base map has been taken as base for the
preparation of CSP for Loni City.
Table 2: Layers Used In Map Preparation
S. No. Layers Source Data Type 1 Locations
Landmarks have been extracted from NPP, satellite data, Survey of India Map and identified locations during survey.
Point
2 Loni Municipal Boundary
Municipal boundary has been extracted from NPP Loni administration.
Polygon
3 Ward boundaries
Ward boundaries have been digitized according to Ward councillors and existing maps from NPP Loni.
Polygon
4 National and State Highways
Existing Highways have been extracted from NPP, Survey of India Map and NPP Loni administration map
Line
JT URJA PVT. LTD. NPP LONI
FINAL CSP, LONI 28
5 Major District Road, City Main Road and Streets, Rail road
Existing District roads have been extracted from NPP, satellite data, Survey of India Map and NPP Loni administration map.
Line
6 Nallah / water bodies / drains / ponds
Existing Nallah/water bodies/drains/ponds have been extracted from NPP, jal nigam, Survey of India Map and identified from satellite image.
Line
7 Building Footprints
Existing building footprints have been digitized from satellite image
Polygon
8 Landuse map
Landuse map has been extracted from prescribed govt. authority of the state of U.P.
Polygon
9 Handpump/ Overhead tank
Existing locations and number of Handpump / Overhead tanks have been extracted from NPP / jalnigam of Loni city
Point
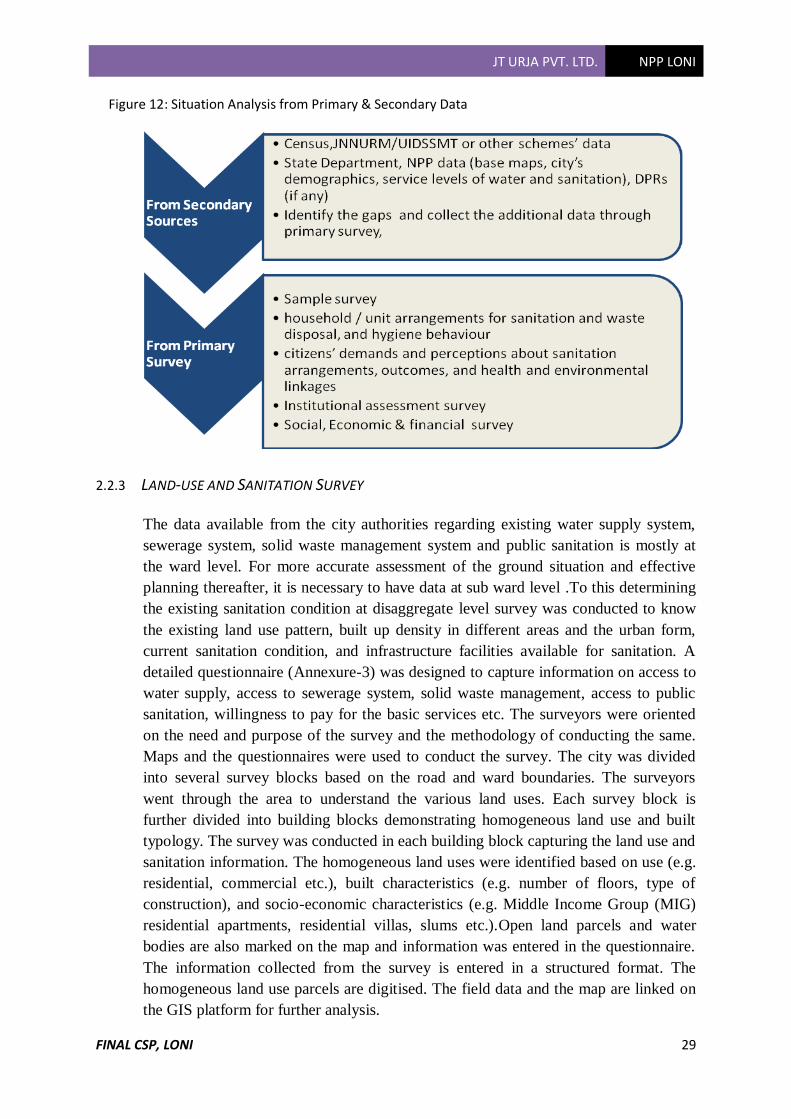
2.2.2 OVERLAYING SECONDARY INFORMATION ON THE BASE MAP
For the preparation of sanitation maps (including water supply, sewerage system,
solid waste management and public sanitation) various primary (collected through
field surveys) and secondary data has been collected and overlapped on the base map
in GIS platform. The following layers of information have been added to the base map
for the purpose of preparing thematic sanitation maps and thereafter demand supply
gap analysis:
• Sewerage network – existing and proposed sewer lines (diameter and length),
sewerage zones, location of existing and proposed Sewage Treatment Plant (STP)
• Storm water drainage network and natural drains
• Water supply network – existing and proposed water supply network, water
supply zones, rising main and feeder network, storage reservoirs
• Location of public toilets
• Location of dumper containers (for solid was collection)
JT URJA PVT. LTD. NPP LONI
FINAL CSP, LONI 29
Figure 12: Situation Analysis from Primary & Secondary Data
2.2.3 LAND-USE AND SANITATION SURVEY
The data available from the city authorities regarding existing water supply system,
sewerage system, solid waste management system and public sanitation is mostly at
the ward level. For more accurate assessment of the ground situation and effective
planning thereafter, it is necessary to have data at sub ward level .To this determining
the existing sanitation condition at disaggregate level survey was conducted to know
the existing land use pattern, built up density in different areas and the urban form,
current sanitation condition, and infrastructure facilities available for sanitation. A
detailed questionnaire (Annexure-3) was designed to capture information on access to
water supply, access to sewerage system, solid waste management, access to public
sanitation, willingness to pay for the basic services etc. The surveyors were oriented
on the need and purpose of the survey and the methodology of conducting the same.
Maps and the questionnaires were used to conduct the survey. The city was divided
into several survey blocks based on the road and ward boundaries. The surveyors
went through the area to understand the various land uses. Each survey block is
further divided into building blocks demonstrating homogeneous land use and built
typology. The survey was conducted in each building block capturing the land use and
sanitation information. The homogeneous land uses were identified based on use (e.g.
residential, commercial etc.), built characteristics (e.g. number of floors, type of
construction), and socio-economic characteristics (e.g. Middle Income Group (MIG)
residential apartments, residential villas, slums etc.).Open land parcels and water
bodies are also marked on the map and information was entered in the questionnaire.
The information collected from the survey is entered in a structured format. The
homogeneous land use parcels are digitised. The field data and the map are linked on
the GIS platform for further analysis.
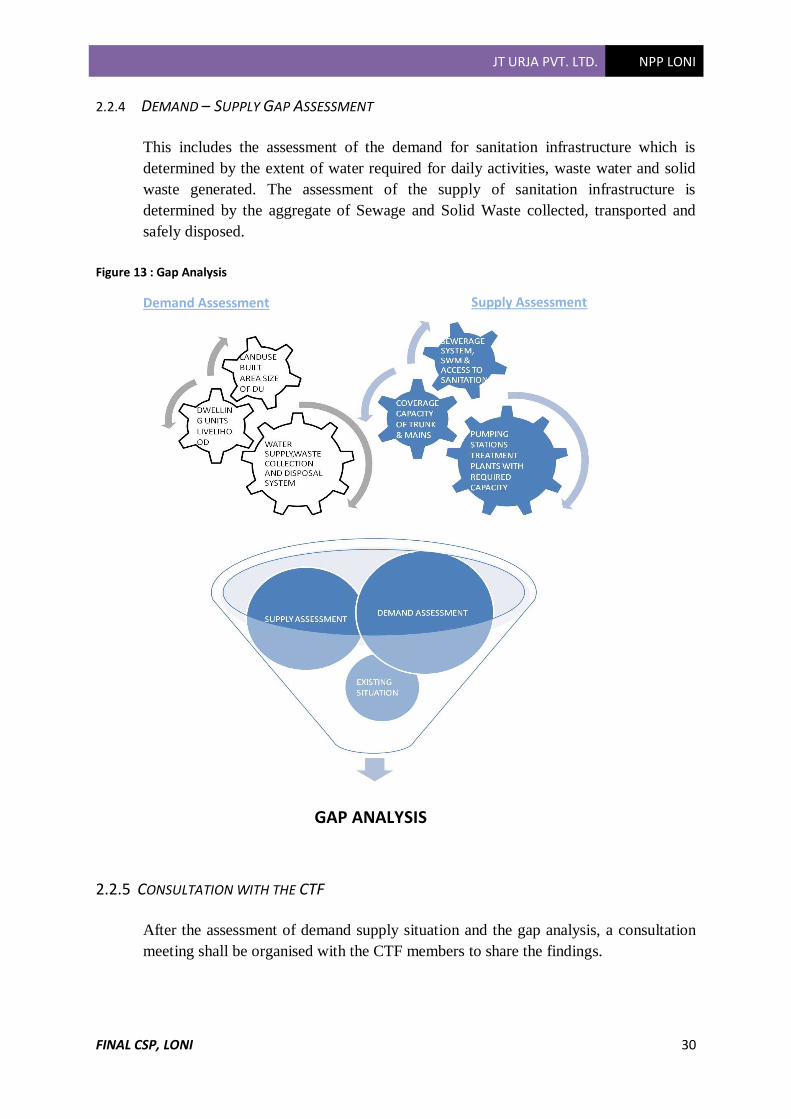
JT URJA PVT. LTD. NPP LONI
FINAL CSP, LONI 30
2.2.4 DEMAND – SUPPLY GAP ASSESSMENT
This includes the assessment of the demand for sanitation infrastructure which is
determined by the extent of water required for daily activities, waste water and solid
waste generated. The assessment of the supply of sanitation infrastructure is
determined by the aggregate of Sewage and Solid Waste collected, transported and
safely disposed.
Figure 13 : Gap Analysis
Demand Assessment
GAP ANALYSIS
2.2.5 CONSULTATION WITH THE CTF
After the assessment of demand supply situation and the gap analysis, a consultation
meeting shall be organised with the CTF members to share the findings.
Supply Assessment

JT URJA PVT. LTD. NPP LONI
FINAL CSP, LONI 31
2.2.6 ASSESSING TECHNOLOGY OPTIONS
Based on the situation analysis an internal workshop will be organised to discuss
possible strategies and approaches for solving the sanitation issues. Here technology
options will be discussed and decided upon by the experts in the team. Based on this
discussion, schematic designs will be prepared.
2.2.7 STRATEGIES AND PROJECT FORMULATION
Strategies and solutions shall be prepared for all the un-served areas in the city. In
addition, a strategy to address the sanitation needs of future population growth shall
also be formulated through project solutions as well as recommendations to policy
and legislation.
2.2.8 DRAFT CITY SANITATION PLAN
Based on the situation analysis, strategy formulation and technology selection, a draft
city sanitation plan shall be prepared for Loni. This shall include schematic designs,
broad cost estimates and an implementation strategy.
2.2.9 FINAL CITY SANITATION PLAN
In consultation with the CTF, the city sanitation plan will be finalised.
2.3 CAPACITY BUILDING & TRAINING NEEDS ASSESSMENT
• Benchmarking of capacities of the Nagar Palika Parishad
• Training needs Assessment
• Formation of a Technical Core Group & Training Workshop Series

JT URJA PVT. LTD. NPP LONI
FINAL CSP, LONI 32
Chapter 3. AN INTRODUCTION TO LONI
3.1 LOCATION AND KEY CHARACTERISTICS
Loni town in situated on the National Highway from Delhi to Saharanpur at a distance
of 9 kms from National Capital Delhi, 69 kms from Meerut, 19 kms from district
headquarter Ghaziabad and 499 kms. from State Capital Lucknow. It is just 8 KM
from Shahdara Metro Station (Delhi) and 12 km from ISBT Kashmiri Gate and Anand
Vihar Terminal. After third phase expansion of Delhi Metro, the DMRC has a station
within Loni at Johari Enclave, which is proposed to be built on a 3km extension of the
Yamuna Vihar line to Shiv Vihar in the third phase of expansion of the Metro network
It is very well connected with all the neighboring towns by all weather motorable
roads.
Loni Assembly comes under Ghaziabad (Lok Sabha constituency).As per the
notification No. 282/UP/2006 Loni also become a separate Assembly Constituency as
53-loni .Loni has its own independent urban local body (Nagar Palika Parishad) and
this town is also head quarter of block Loni of district Ghaziabad.
Map 1: Ghaziabad, Loni Location Map 2: NCR, Ghaziabad Location
3.1.1 Topography
The old town, which is central part, is situated on a hillock with a level variation from
206 to 224 m above m.s.l. The topography of the old town is very undulating, while
the other parts, of the town have quite flat topography. The sub soil water level is 7.0
to 10.0 m below ground level.
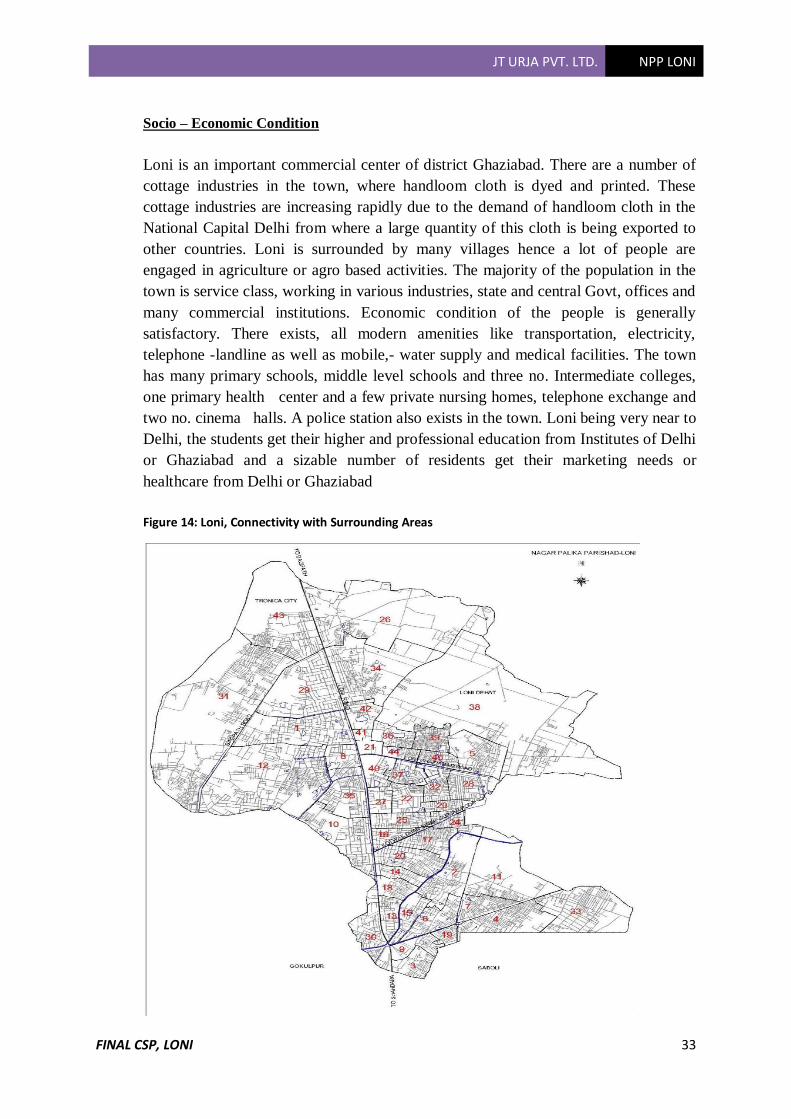
JT URJA PVT. LTD. NPP LONI
FINAL CSP, LONI 33
Socio – Economic Condition
Loni is an important commercial center of district Ghaziabad. There are a number of
cottage industries in the town, where handloom cloth is dyed and printed. These
cottage industries are increasing rapidly due to the demand of handloom cloth in the
National Capital Delhi from where a large quantity of this cloth is being exported to
other countries. Loni is surrounded by many villages hence a lot of people are
engaged in agriculture or agro based activities. The majority of the population in the
town is service class, working in various industries, state and central Govt, offices and
many commercial institutions. Economic condition of the people is generally
satisfactory. There exists, all modern amenities like transportation, electricity,
telephone -landline as well as mobile,- water supply and medical facilities. The town
has many primary schools, middle level schools and three no. Intermediate colleges,
one primary health center and a few private nursing homes, telephone exchange and
two no. cinema halls. A police station also exists in the town. Loni being very near to
Delhi, the students get their higher and professional education from Institutes of Delhi
or Ghaziabad and a sizable number of residents get their marketing needs or
healthcare from Delhi or Ghaziabad
Figure 14: Loni, Connectivity with Surrounding Areas
JT URJA PVT. LTD. NPP LONI
FINAL CSP, LONI 34
Being in close proximity of Delhi, this town is one of the important urban center of
National Capital Region (N.C.R.). Tronica city, an industrial area, has been developed
by U.P. Industrial Development Corporation, (UPSIDC) which is about 6 km from the
town.
Housing Development Schemes in Loni are controlled by GDA (Ghaziabad
Development authority).Indrapuri (ABCD Blocks) is the largest and one of the oldest
residential colony approved by GDA in Loni. Some GDA approved colonies are best
to live in Loni. Famous colonies in Loni include Lal Bagh /(best in loni), Balram
Nagar,Laxmi Garden, Paramhans Vihar, Khanna Nagar, Ram Park, Rameshwar Park,
SLF Vihar and DLF Ankur Vihar and 80% population lives in colonies,20%
population lives in village. It is situated on the main State Highway 57 (Delhi
Yamunotri Marg). The colonies are mostly inhabited by a large number of
retired/serving Government Employees and private sector employees. Here most
amenities are within walking distance, such as The State Bank of India, Balram Nagar
& Telephone Exchange office, Electric Power House, Punjab National Bank,
Community Health Center and Police Station.SLF Ved Vihar and DLF Ankur Vihar
are located along the Khajuri pusta road and the Delhi border.The periphery of the
colony touches Shiv Vihar and Shanti Nagar area of Delhi. DLF Ankur Vihar is one
of residential colony situated near to Delhi Karawal Nagar.
In Loni, GAIL commissioned world’s longest and India's first Cross Country LPG
Transmission Pipeline from Jamnagar to Loni in 2001.GAIL's LPG transmission
business includes the 1927-km LPG pipeline networks that connect the Western,
Northern and Southern part of India. These include the world's longest exclusive LPG
pipeline from Jamnagar, Gujarat, to Loni, near Delhi (another 70 km has been added
to this system between Kandla and Samakhiali, in Gujarat, to facilitate the
transportation of LPG imported at Kandla port).
Thus, due to all the reasons mentioned above, Loni has become a fast growing town in
all spheres and all round development is taking place at a faster pace. There is no
sewerage system in the town so far, but the projects for sewerage system, proper
drainage system and municipal solid waste management are being prepared under
UIDSSMT programme and it is expected that the town will be having sewerage,
drainage and organized municipal solid waste management system in near future.
Before 1968, Loni was a Gram Sabha comprising of villages Vikas Nagar, Sale Nagar
and Sadullabad. In the year 1968, Loni was notified as a town area committee. Village
Vikas Nagar and Sadullabad were not included in Loni TAC. The colonies included in
the town area were old Loni town on hillock, Balram Nagar, Lalbagh, Indrapuri,
Naipura and Industrial Estate. In due course of time, it was upgraded as Nagar Palika
Parishad due to increase in size and population.
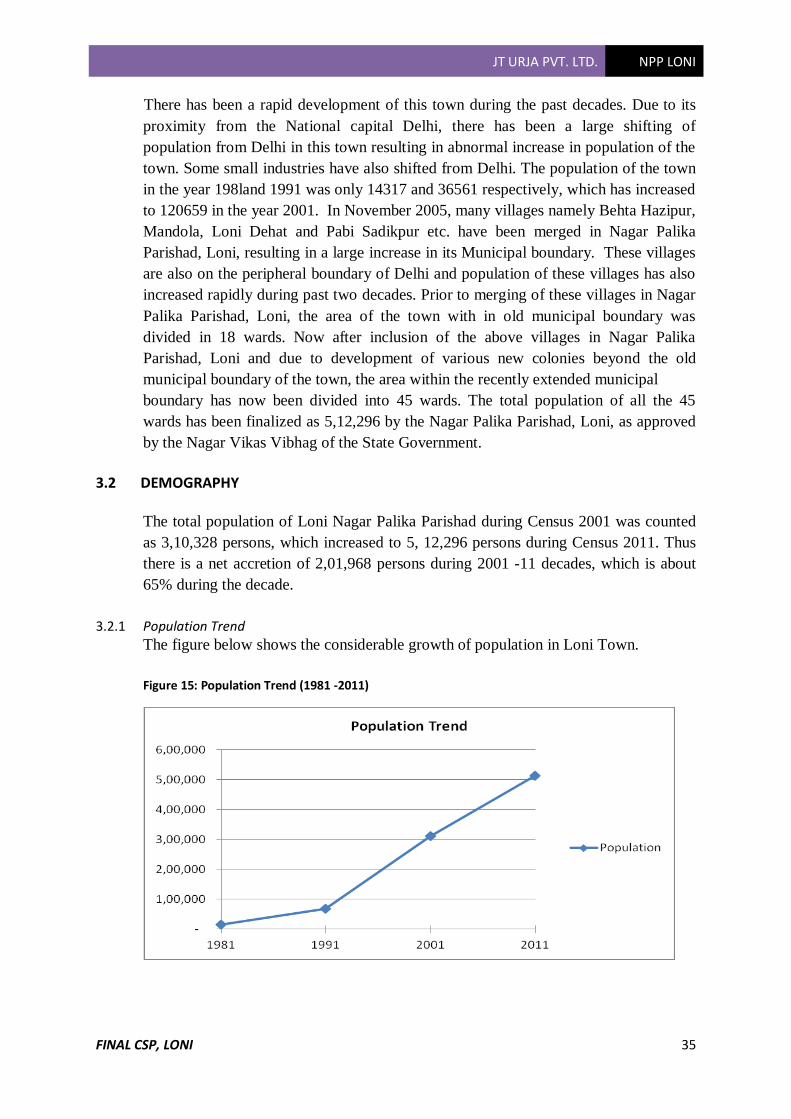
JT URJA PVT. LTD. NPP LONI
FINAL CSP, LONI 35
There has been a rapid development of this town during the past decades. Due to its
proximity from the National capital Delhi, there has been a large shifting of
population from Delhi in this town resulting in abnormal increase in population of the
town. Some small industries have also shifted from Delhi. The population of the town
in the year 198land 1991 was only 14317 and 36561 respectively, which has increased
to 120659 in the year 2001. In November 2005, many villages namely Behta Hazipur,
Mandola, Loni Dehat and Pabi Sadikpur etc. have been merged in Nagar Palika
Parishad, Loni, resulting in a large increase in its Municipal boundary. These villages
are also on the peripheral boundary of Delhi and population of these villages has also
increased rapidly during past two decades. Prior to merging of these villages in Nagar
Palika Parishad, Loni, the area of the town with in old municipal boundary was
divided in 18 wards. Now after inclusion of the above villages in Nagar Palika
Parishad, Loni and due to development of various new colonies beyond the old
municipal boundary of the town, the area within the recently extended municipal
boundary has now been divided into 45 wards. The total population of all the 45
wards has been finalized as 5,12,296 by the Nagar Palika Parishad, Loni, as approved
by the Nagar Vikas Vibhag of the State Government.
3.2 DEMOGRAPHY
The total population of Loni Nagar Palika Parishad during Census 2001 was counted
as 3,10,328 persons, which increased to 5, 12,296 persons during Census 2011. Thus
there is a net accretion of 2,01,968 persons during 2001 -11 decades, which is about
65% during the decade.
3.2.1 Population Trend
The figure below shows the considerable growth of population in Loni Town.
Figure 15: Population Trend (1981 -2011)
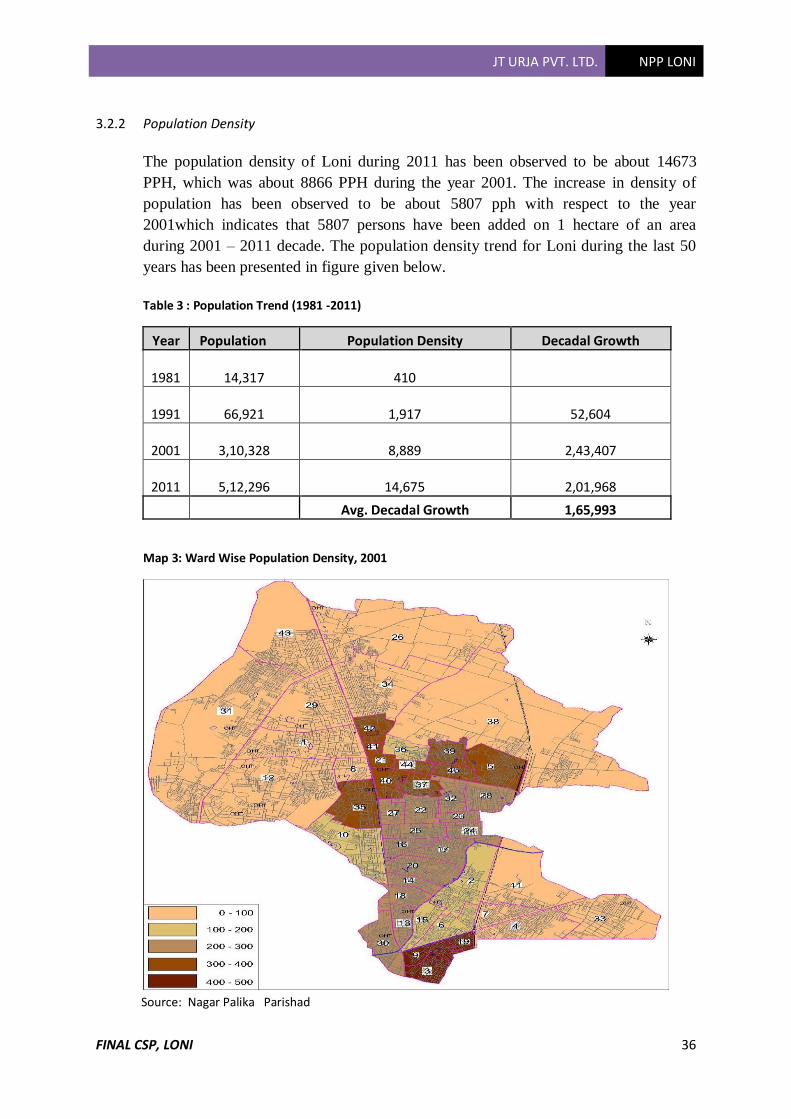
JT URJA PVT. LTD. NPP LONI
FINAL CSP, LONI 36
3.2.2 Population Density
The population density of Loni during 2011 has been observed to be about 14673
PPH, which was about 8866 PPH during the year 2001. The increase in density of
population has been observed to be about 5807 pph with respect to the year
2001which indicates that 5807 persons have been added on 1 hectare of an area
during 2001 – 2011 decade. The population density trend for Loni during the last 50
years has been presented in figure given below.
Table 3 : Population Trend (1981 -2011)
Year Population Population Density Decadal Growth
1981
14,317 410
1991
66,921 1,917 52,604
2001
3,10,328 8,889 2,43,407
2011
5,12,296 14,675 2,01,968
Avg. Decadal Growth 1,65,993
Map 3: Ward Wise Population Density, 2001
Source: Nagar Palika Parishad
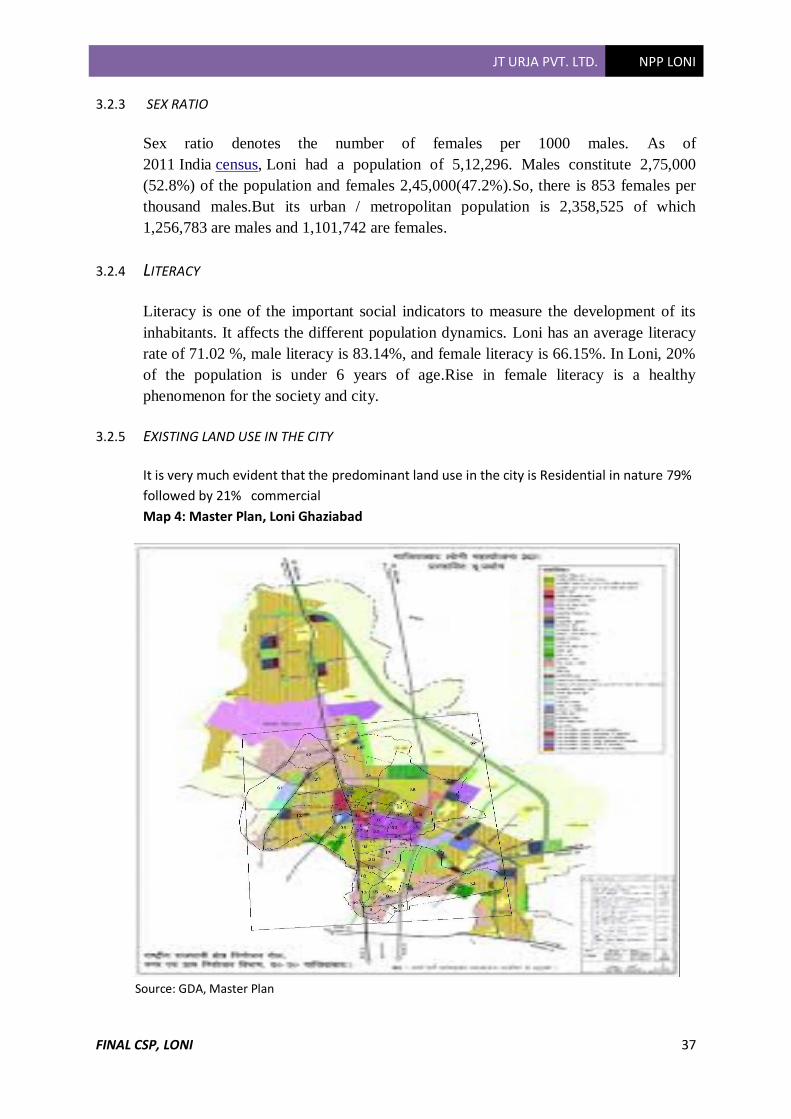
JT URJA PVT. LTD. NPP LONI
FINAL CSP, LONI 37
3.2.3 SEX RATIO
Sex ratio denotes the number of females per 1000 males. As of
2011 India census, Loni had a population of 5,12,296. Males constitute 2,75,000
(52.8%) of the population and females 2,45,000(47.2%).So, there is 853 females per
thousand males.But its urban / metropolitan population is 2,358,525 of which
1,256,783 are males and 1,101,742 are females.
3.2.4 LITERACY
Literacy is one of the important social indicators to measure the development of its
inhabitants. It affects the different population dynamics. Loni has an average literacy
rate of 71.02 %, male literacy is 83.14%, and female literacy is 66.15%. In Loni, 20%
of the population is under 6 years of age.Rise in female literacy is a healthy
phenomenon for the society and city.
3.2.5 EXISTING LAND USE IN THE CITY
It is very much evident that the predominant land use in the city is Residential in nature 79%
followed by 21% commercial
Map 4: Master Plan, Loni Ghaziabad
Source: GDA, Master Plan
JT URJA PVT. LTD. NPP LONI
FINAL CSP, LONI 38
3.2.6 OVERALL CITY and INFRASTRUCTURE STATUS
Table 4: City Status
Parameters Value and Ranges Municipal Area 34.68 sq km
Population, (2011) 5,12,296
No. of Election Wards 45
House Holds 9,1220
Slum House Hold Population 1,06,148
Literacy Rate 71.02%
Literacy Growth Rate 1.247%
No. of Sabzi Mandi 2
No. of Bus Terminus 2
No. of Railway Stations 1
Gov. Hospital 1 ( 100 Bed)
Nursing Home 41 (80 Bed) & 22 Pathology Centre
No. of Pvt. Schools and Institutions 120
No. of Degree Collage 1
Source: Nagar Palika Parishad
3.3 CITY LEVEL POPULATION PROJECTIONS
The population is one of the major factors in determining future patterns of progress
and development of the city. As per Census 2011 Loni has population of 5,12,296
persons. The population of Loni has increased from 3,10,328 persons in 2001 to
5,12,296 in 2011, recording a decadal growth rate of 65 percent.
There are 3 commonly used methods to assess population projection namely,
Arithmetic Increase method, Geometric increase method and Incremental increase
method.
3.3.1 ARITHMETIC INCREASE METHOD:
In this method, the rate of growth of population is assumed to be constant. This method
a low estimate, and can be adopted for forecasting populations of large cities which
have achieved saturation conditions. The average decadal increase in population as
forms the basis of projections.
Pn = P (last year known) + n*x where Pn, Population of the year to be known n = number of decades x = average arithmetic increase per decade
JT URJA PVT. LTD. NPP LONI
FINAL CSP, LONI 39
3.3.2 GEOMETRIC INCREASE METHOD:
This method assumes that the percentage of increase in population from decade to
decade is constant. This method gives high results, as the percentage increase gradually
drops when the growth of the cities reach the saturation point. This method is useful for
cities which have unlimited scope for expansion and where a constant rate of growth is
anticipated.
Geometric mean, rg =3.66
Population, Pn = Pyear known (1+rg)n
3.3.3 INCREMENTAL INCREASE METHOD: (METHOD OF VARYING INCREMENT)
In this technique, the average of the increase in the population is taken as per arithmetic
method and to this, is added the average of the net incremental increase, one for every
future decade whose population figure is to be estimated. In this method, a progressive
increasing or decreasing rate rather than constant rate is adopted.
P n=P1+ n*x+ {n (n+1)/2} x y
where Pn = population of the year to be known
n = number of decades x = average arithmetic increase per decade y = average incremental increase per decade
The population projection for Loni has been carried out for 30 years at an interval of 5
years and result are summarized in Table below -
Table 5: City Wise Projected Population (2016-2041)
Year Arithmetic Geometric Incremental Average Population Density
2011
5,12,296
5,12,296
5,12,296
5,12,296
14,675
2016
5,95,293
9,29,963
6,23,298
7,16,185 20,515
2021
6,78,289
16,88,148
7,52,971
10,39,803
29,785
2026
7,61,286
30,64,470
9,01,314
15,75,690
45,136
2031
8,44,282
55,62,887
10,68,328
24,91,832
71,379
2036
9,27,279
1,00,98,226
12,54,012
40,93,172
1,17,249
2041
10,10,275
1,83,31,158
14,58,367
69,33,267
1,98,604
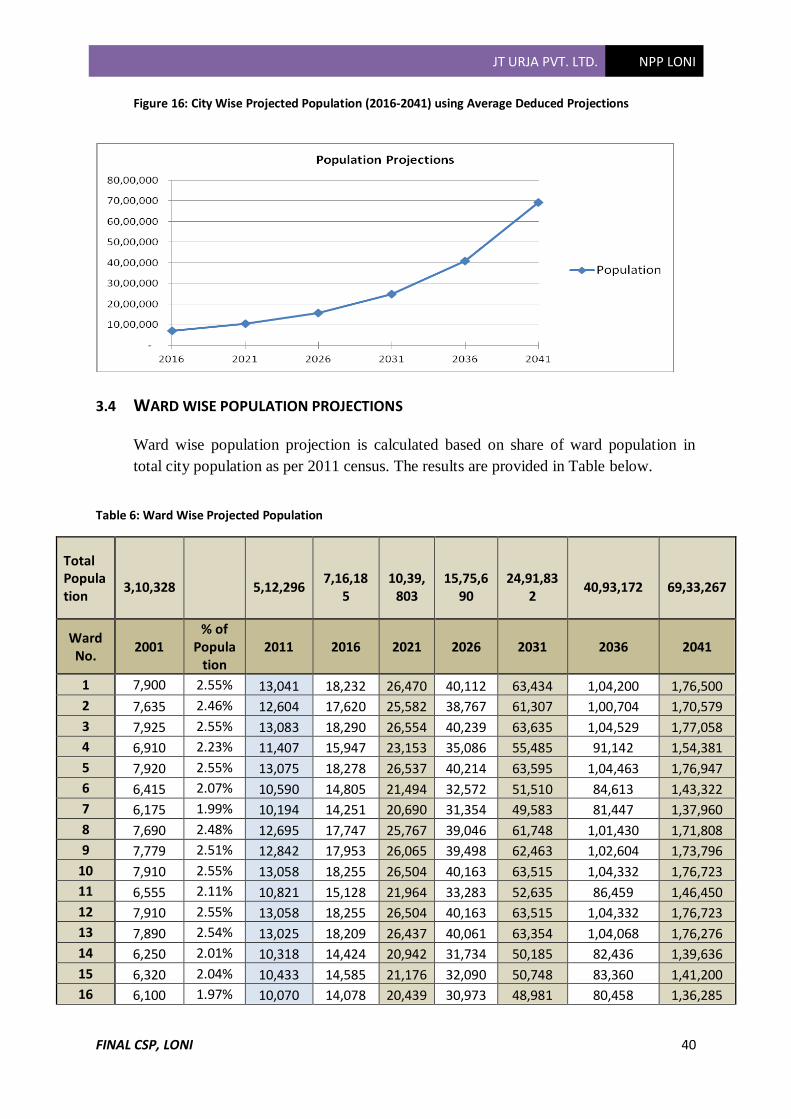
JT URJA PVT. LTD. NPP LONI
FINAL CSP, LONI 40
Figure 16: City Wise Projected Population (2016-2041) using Average Deduced Projections
3.4 WARD WISE POPULATION PROJECTIONS
Ward wise population projection is calculated based on share of ward population in
total city population as per 2011 census. The results are provided in Table below.
Table 6: Ward Wise Projected Population
Total Population
3,10,328
5,12,296
7,16,18
5
10,39,
803
15,75,6
90
24,91,83
2
40,93,172
69,33,267
Ward No.
2001 % of
Population
2011 2016 2021 2026 2031 2036 2041
1 7,900 2.55% 13,041 18,232 26,470 40,112 63,434 1,04,200 1,76,500
2 7,635 2.46% 12,604 17,620 25,582 38,767 61,307 1,00,704 1,70,579
3 7,925 2.55% 13,083 18,290 26,554 40,239 63,635 1,04,529 1,77,058
4 6,910 2.23% 11,407 15,947 23,153 35,086 55,485 91,142 1,54,381
5 7,920 2.55% 13,075 18,278 26,537 40,214 63,595 1,04,463 1,76,947
6 6,415 2.07% 10,590 14,805 21,494 32,572 51,510 84,613 1,43,322
7 6,175 1.99% 10,194 14,251 20,690 31,354 49,583 81,447 1,37,960
8 7,690 2.48% 12,695 17,747 25,767 39,046 61,748 1,01,430 1,71,808
9 7,779 2.51% 12,842 17,953 26,065 39,498 62,463 1,02,604 1,73,796
10 7,910 2.55% 13,058 18,255 26,504 40,163 63,515 1,04,332 1,76,723
11 6,555 2.11% 10,821 15,128 21,964 33,283 52,635 86,459 1,46,450
12 7,910 2.55% 13,058 18,255 26,504 40,163 63,515 1,04,332 1,76,723
13 7,890 2.54% 13,025 18,209 26,437 40,061 63,354 1,04,068 1,76,276
14 6,250 2.01% 10,318 14,424 20,942 31,734 50,185 82,436 1,39,636
15 6,320 2.04% 10,433 14,585 21,176 32,090 50,748 83,360 1,41,200
16 6,100 1.97% 10,070 14,078 20,439 30,973 48,981 80,458 1,36,285
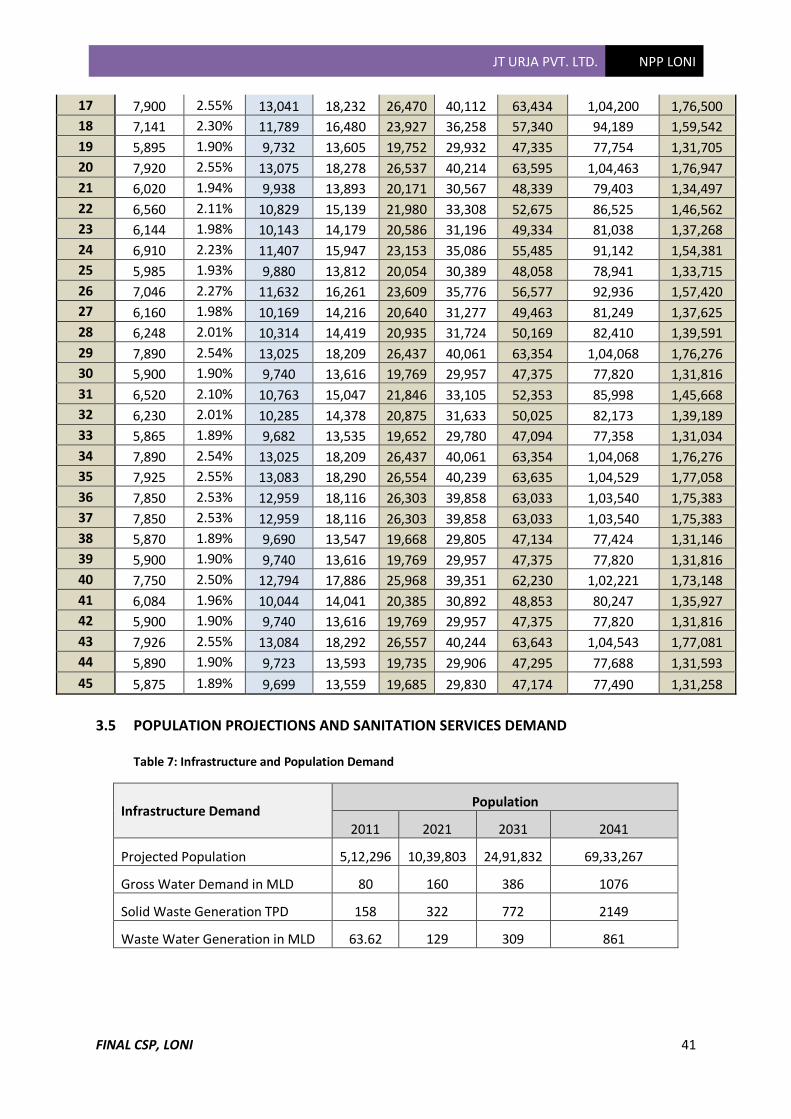
JT URJA PVT. LTD. NPP LONI
FINAL CSP, LONI 41
17 7,900 2.55% 13,041 18,232 26,470 40,112 63,434 1,04,200 1,76,500
18 7,141 2.30% 11,789 16,480 23,927 36,258 57,340 94,189 1,59,542
19 5,895 1.90% 9,732 13,605 19,752 29,932 47,335 77,754 1,31,705
20 7,920 2.55% 13,075 18,278 26,537 40,214 63,595 1,04,463 1,76,947
21 6,020 1.94% 9,938 13,893 20,171 30,567 48,339 79,403 1,34,497
22 6,560 2.11% 10,829 15,139 21,980 33,308 52,675 86,525 1,46,562
23 6,144 1.98% 10,143 14,179 20,586 31,196 49,334 81,038 1,37,268
24 6,910 2.23% 11,407 15,947 23,153 35,086 55,485 91,142 1,54,381
25 5,985 1.93% 9,880 13,812 20,054 30,389 48,058 78,941 1,33,715
26 7,046 2.27% 11,632 16,261 23,609 35,776 56,577 92,936 1,57,420
27 6,160 1.98% 10,169 14,216 20,640 31,277 49,463 81,249 1,37,625
28 6,248 2.01% 10,314 14,419 20,935 31,724 50,169 82,410 1,39,591
29 7,890 2.54% 13,025 18,209 26,437 40,061 63,354 1,04,068 1,76,276
30 5,900 1.90% 9,740 13,616 19,769 29,957 47,375 77,820 1,31,816
31 6,520 2.10% 10,763 15,047 21,846 33,105 52,353 85,998 1,45,668
32 6,230 2.01% 10,285 14,378 20,875 31,633 50,025 82,173 1,39,189
33 5,865 1.89% 9,682 13,535 19,652 29,780 47,094 77,358 1,31,034
34 7,890 2.54% 13,025 18,209 26,437 40,061 63,354 1,04,068 1,76,276
35 7,925 2.55% 13,083 18,290 26,554 40,239 63,635 1,04,529 1,77,058
36 7,850 2.53% 12,959 18,116 26,303 39,858 63,033 1,03,540 1,75,383
37 7,850 2.53% 12,959 18,116 26,303 39,858 63,033 1,03,540 1,75,383
38 5,870 1.89% 9,690 13,547 19,668 29,805 47,134 77,424 1,31,146
39 5,900 1.90% 9,740 13,616 19,769 29,957 47,375 77,820 1,31,816
40 7,750 2.50% 12,794 17,886 25,968 39,351 62,230 1,02,221 1,73,148
41 6,084 1.96% 10,044 14,041 20,385 30,892 48,853 80,247 1,35,927
42 5,900 1.90% 9,740 13,616 19,769 29,957 47,375 77,820 1,31,816
43 7,926 2.55% 13,084 18,292 26,557 40,244 63,643 1,04,543 1,77,081
44 5,890 1.90% 9,723 13,593 19,735 29,906 47,295 77,688 1,31,593
45 5,875 1.89% 9,699 13,559 19,685 29,830 47,174 77,490 1,31,258
3.5 POPULATION PROJECTIONS AND SANITATION SERVICES DEMAND
Table 7: Infrastructure and Population Demand
Infrastructure Demand Population
2011 2021 2031 2041
Projected Population 5,12,296 10,39,803 24,91,832 69,33,267
Gross Water Demand in MLD 80 160 386 1076
Solid Waste Generation TPD 158 322 772 2149
Waste Water Generation in MLD 63.62 129 309 861
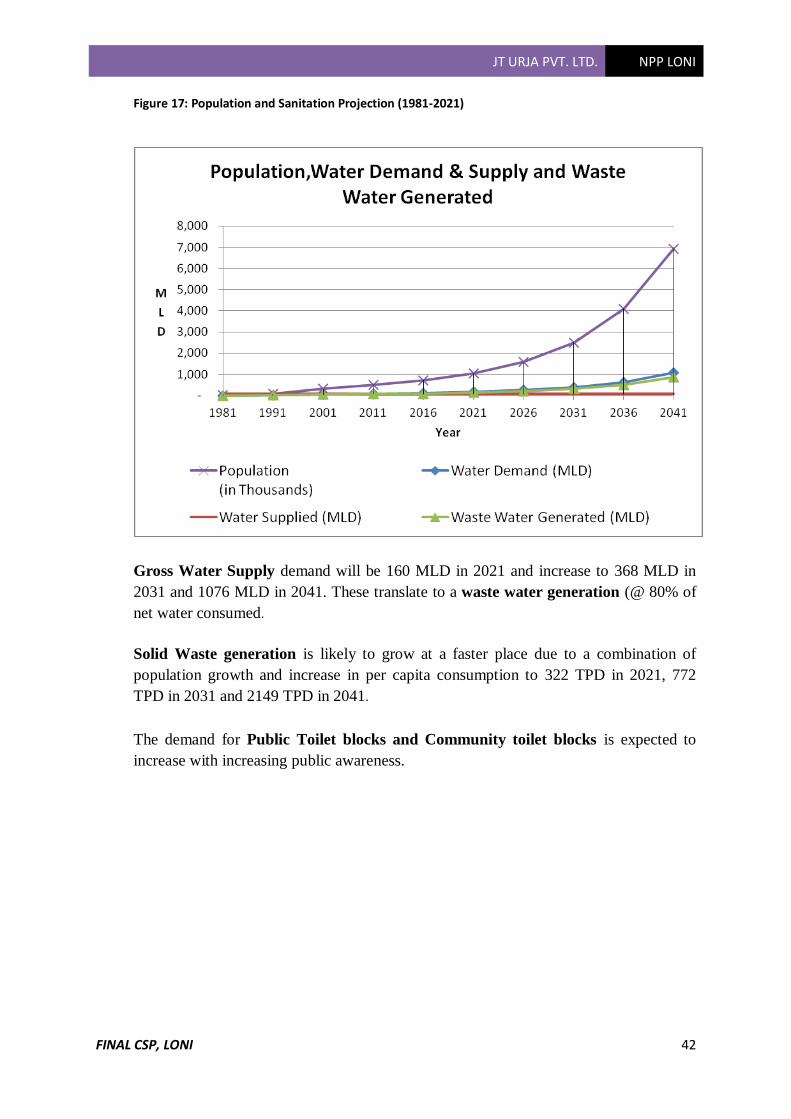
JT URJA PVT. LTD. NPP LONI
FINAL CSP, LONI 42
Figure 17: Population and Sanitation Projection (1981-2021)
Gross Water Supply demand will be 160 MLD in 2021 and increase to 368 MLD in
2031 and 1076 MLD in 2041. These translate to a waste water generation (@ 80% of
net water consumed.
Solid Waste generation is likely to grow at a faster place due to a combination of
population growth and increase in per capita consumption to 322 TPD in 2021, 772
TPD in 2031 and 2149 TPD in 2041.
The demand for Public Toilet blocks and Community toilet blocks is expected to
increase with increasing public awareness.
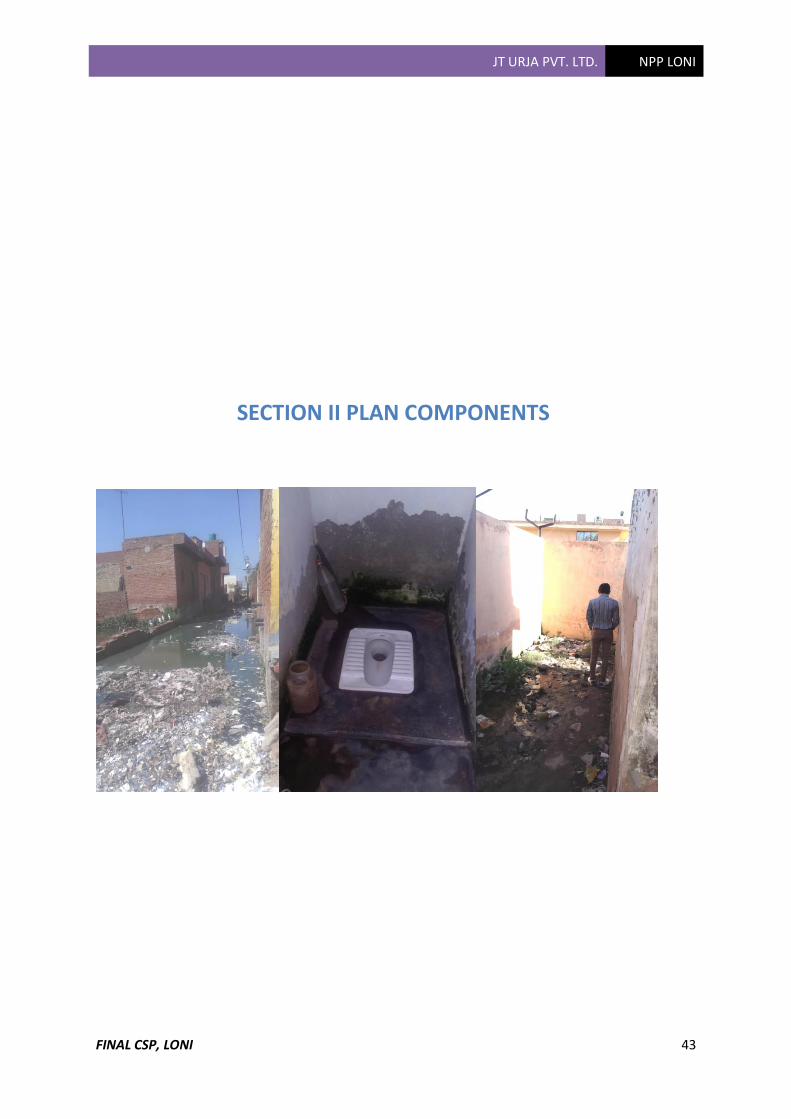
JT URJA PVT. LTD. NPP LONI
FINAL CSP, LONI 43
SECTION II PLAN COMPONENTS

JT URJA PVT. LTD. NPP LONI
FINAL CSP, LONI 44
Chapter 4. ACCESS TO TOILETS FACILITIES
4.1 CITY LEVEL STATUS
Our specific observations on baseline status with respect to access to toilets are
summarised below:
• Coverage:
The primary household survey conducted as part of the CSP exercise concerning toilet
facilities reveals nearly 96% of respondents having access to toilets which are
temporary but they desire individual in-house toilet facilities.
Figure 18: Access to Toilet, Coverage
Source: Primary Survey
Figure 20: Access to Community Toilet
Source: Primary Survey Source: Primary Survey
Figure 19: Access to Toilet

JT URJA PVT. LTD. NPP LONI
FINAL CSP, LONI 45
• Open defecation
Prevalence of Open Defecation is rare and limited to areas near slum pockets Open
urination is rampant in commercial areas particularly in ward 35-36, which suggests
the need for greater awareness generation and creation of public toilet facilities in
busy commercial areas or unused spots.
Figure 21: Open Defecation, Ward 35
Source: Primary Survey
4.2 RESULTS OF PRIMARY SURVEYS
Figure 22: Access to Toilets in Industries
Source Primary Survey
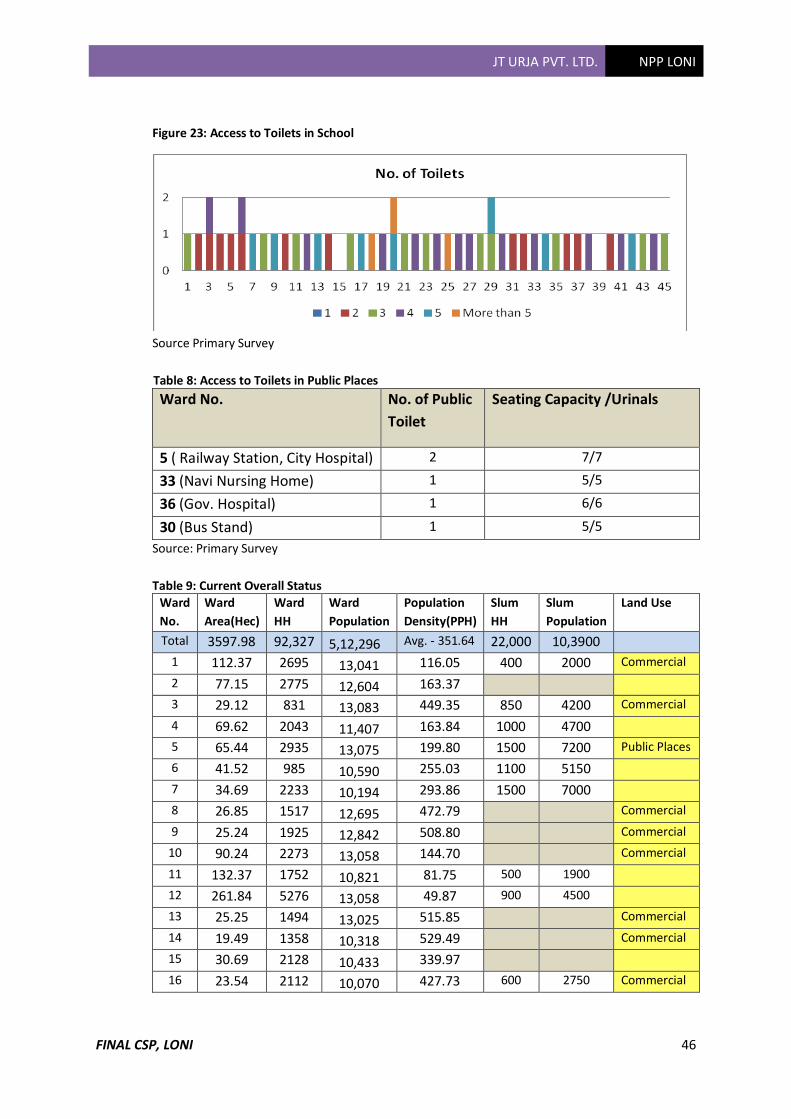
JT URJA PVT. LTD. NPP LONI
FINAL CSP, LONI 46
Figure 23: Access to Toilets in School
Source Primary Survey
Table 8: Access to Toilets in Public Places
Ward No. No. of Public
Toilet
Seating Capacity /Urinals
5 ( Railway Station, City Hospital) 2 7/7
33 (Navi Nursing Home) 1 5/5
36 (Gov. Hospital) 1 6/6
30 (Bus Stand) 1 5/5
Source: Primary Survey
Table 9: Current Overall Status
Ward
No.
Ward
Area(Hec)
Ward
HH
Ward
Population
Population
Density(PPH)
Slum
HH
Slum
Population
Land Use
Total 3597.98 92,327 5,12,296 Avg. - 351.64 22,000 10,3900
1 112.37 2695 13,041 116.05 400 2000 Commercial
2 77.15 2775 12,604 163.37
3 29.12 831 13,083 449.35 850 4200 Commercial
4 69.62 2043 11,407 163.84 1000 4700
5 65.44 2935 13,075 199.80 1500 7200 Public Places
6 41.52 985 10,590 255.03 1100 5150
7 34.69 2233 10,194 293.86 1500 7000
8 26.85 1517 12,695 472.79 Commercial
9 25.24 1925 12,842 508.80 Commercial
10 90.24 2273 13,058 144.70 Commercial
11 132.37 1752 10,821 81.75 500 1900
12 261.84 5276 13,058 49.87 900 4500
13 25.25 1494 13,025 515.85 Commercial
14 19.49 1358 10,318 529.49 Commercial
15 30.69 2128 10,433 339.97
16 23.54 2112 10,070 427.73 600 2750 Commercial
JT URJA PVT. LTD. NPP LONI
FINAL CSP, LONI 47
17 36.94 3678 13041 352.99 1300 6200
18 30.53 1736 11789 386.10 600 2800 Commercial
19 12.62 1094 9732 771.01 300 1200
20 49.13 4094 13075 266.13 1900 9000 Commercial
21 13.20 1145 9938 752.87 Commercial,
Sabzi Mandi
22 32.83 2395 10829 329.84 Industrial
23 14.87 1639 10143 682.22 700 3100
24 26.30 2930 11407 433.66 800 3700
25 31.46 1781 9880 314.06 1100 5200 Industrial,
Commercial
26 311.81 2219 11632 37.30 500 2300
27 19.61 1191 10169 518.50 Industrial,
Commercial
28 40.95 2092 10314 251.86
29 128.22 2724 13025 101.59 Commercial
30
51.93 755 9740 187.56 Bus Stand,
Commercial
31 425.01 4985 10763 25.32 1200 5700
32 30.36 1172 10285 338.77
33 119.54 966 9682 80.99 600 2700 Public Places
34 161.33
2063 13025 80.73 1000 5000 Commercial
35 67.14 1574 13083 194.87 Commercial
36 27.23 1404 12959 475.82 Public Places
37 26.23 1246 12959 494.04 Industrial
38 557.05 2100 9690 17.40 450 2100
39 29.41 2098 9740 331.23
40 30.03 1879 12794 426.11 Industrial,
Commercial
41
5.89 1146 10,044 1706.48 Commercial,
Sabzi Mandi
42 29.03 2079 9740 335.52 900 4500 Commercial
43 189.44 4082 13084 69.07 2300 11000 Commercial
44 14.83 881 9723 655.73
45 19.64 847 9697 493.82
In Loni predominant Land use is Residential with some percentage of Commercial
(in the wards abutting highway all along the length on both sides), Industrial,
Institutional and Public places (Table no.8) as shown in the respective wards.
Population Density, Presence of Slums and Land uses clearly indicates the
Predominant Land Use – Residential (R)
Absence of Slum
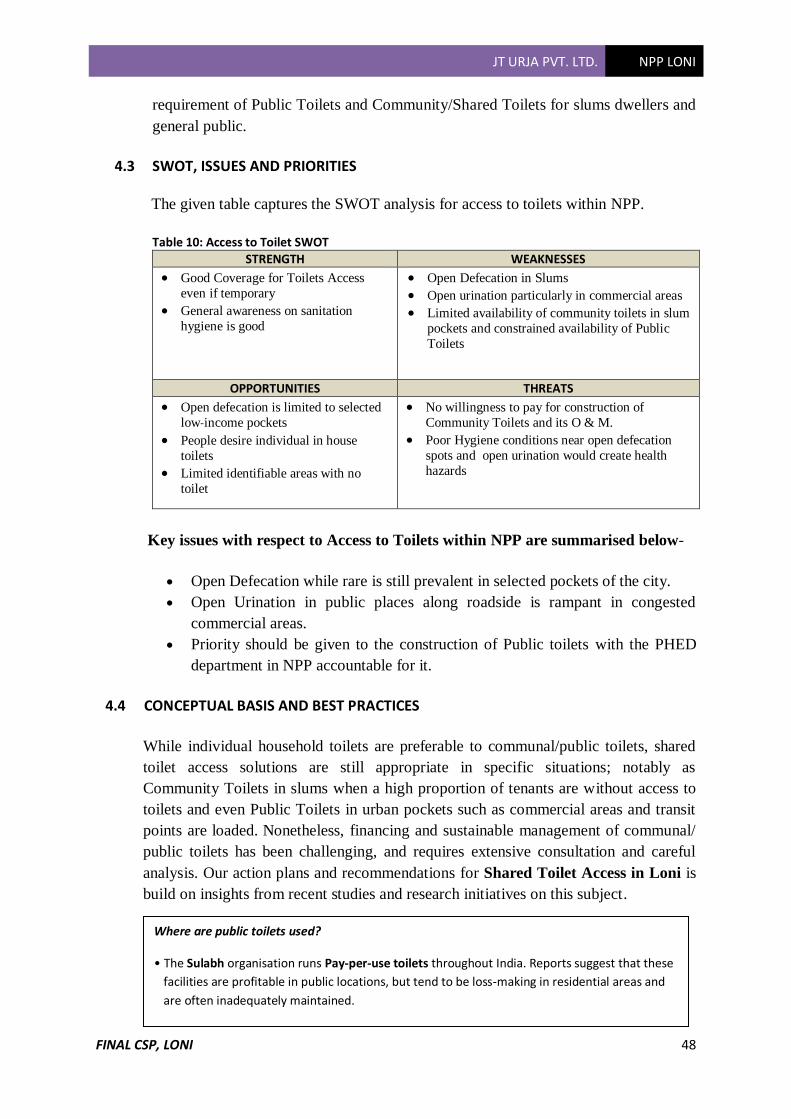
JT URJA PVT. LTD. NPP LONI
FINAL CSP, LONI 48
requirement of Public Toilets and Community/Shared Toilets for slums dwellers and
general public.
4.3 SWOT, ISSUES AND PRIORITIES
The given table captures the SWOT analysis for access to toilets within NPP.
Table 10: Access to Toilet SWOT
STRENGTH WEAKNESSES
• Good Coverage for Toilets Access
even if temporary
• General awareness on sanitation
hygiene is good
• Open Defecation in Slums
• Open urination particularly in commercial areas
• Limited availability of community toilets in slum
pockets and constrained availability of Public
Toilets
OPPORTUNITIES THREATS
• Open defecation is limited to selected
low-income pockets
• People desire individual in house
toilets
• Limited identifiable areas with no
toilet
• No willingness to pay for construction of
Community Toilets and its O & M.
• Poor Hygiene conditions near open defecation
spots and open urination would create health
hazards
Key issues with respect to Access to Toilets within NPP are summarised below-
• Open Defecation while rare is still prevalent in selected pockets of the city.
• Open Urination in public places along roadside is rampant in congested
commercial areas.
• Priority should be given to the construction of Public toilets with the PHED
department in NPP accountable for it.
4.4 CONCEPTUAL BASIS AND BEST PRACTICES
While individual household toilets are preferable to communal/public toilets, shared
toilet access solutions are still appropriate in specific situations; notably as
Community Toilets in slums when a high proportion of tenants are without access to
toilets and even Public Toilets in urban pockets such as commercial areas and transit
points are loaded. Nonetheless, financing and sustainable management of communal/
public toilets has been challenging, and requires extensive consultation and careful
analysis. Our action plans and recommendations for Shared Toilet Access in Loni is
build on insights from recent studies and research initiatives on this subject.
Where are public toilets used?
• The Sulabh organisation runs Pay-per-use toilets throughout India. Reports suggest that these
facilities are profitable in public locations, but tend to be loss-making in residential areas and
are often inadequately maintained.
JT URJA PVT. LTD. NPP LONI
FINAL CSP, LONI 49
4.4.1 OPTIONS FOR IMPROVING SERVICE DELIVERY
Advertising rights potential does make toilet complexes profitable, so that
maintenance is commercially viable. The challenge is to develop contracts so that the
public service is delivered to an acceptable standard. The following could help:
• Assess Local Demand before developing New Toilet Blocks. Where demand is
high, toilets can be profitable without advertising revenue. Demand is a
prerequisite for contracts based on user charges.
• Revitalize Monitoring and Strengthen Accountability. Municipalities need to
enforce contract compliance. Media interest, municipal accountability, consumer
feedback are possible solutions. Further, service level parameters should be
defined and monitored. Punitive measures should be contractually enforced to
disincentives in case of poor maintenance.
• Increase the Lease Period. Longer lease periods could enable longer term cost
recovery plans with proper attention to maintenance when backed by
contractually enforcing penalties for poor performance.
• Bundle Contracts. Bundling toilets into single contract would simplify
administration and reduce monitoring burden.
Key conclusions
• Communal or public toilets should only be introduced after exploration of the social and
economic context.
• People will generally prefer communal toilets closer to home over public toilets located
far-off.
• Communal or public toilets are only acceptable if they provide effective service for
women and children.
• Communal toilets serving small groups of households and charging a monthly per
household fee will be preferred by users, especially women, than pay-per-use public
toilets. However, per-capita capital cost tend to be higher.
• Community toilets are seen in low-income communities of many African and Asian cities. The
SPARC model, implemented in Pune and Mumbai are constructed and managed by NGOs
under contract from municipality with community involvement. A moderate per-household
monthly fee is collected.
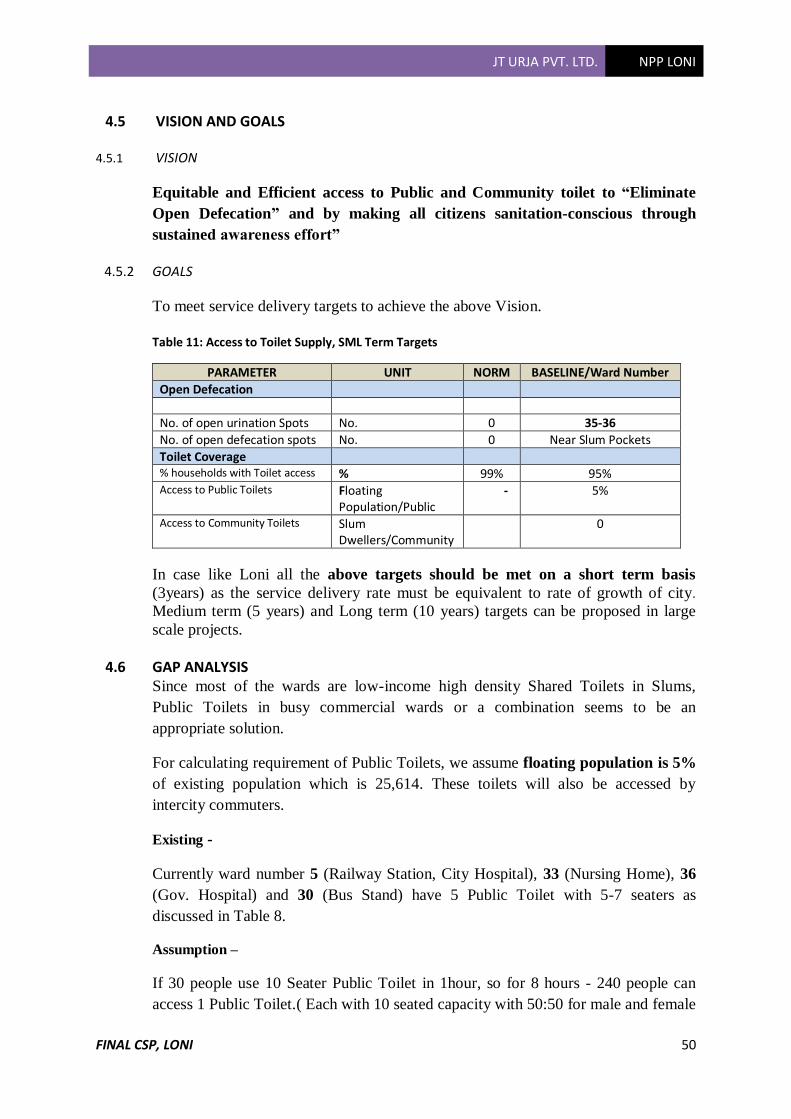
JT URJA PVT. LTD. NPP LONI
FINAL CSP, LONI 50
4.5 VISION AND GOALS
4.5.1 VISION
Equitable and Efficient access to Public and Community toilet to “Eliminate
Open Defecation” and by making all citizens sanitation-conscious through
sustained awareness effort”
4.5.2 GOALS
To meet service delivery targets to achieve the above Vision.
Table 11: Access to Toilet Supply, SML Term Targets
PARAMETER UNIT NORM BASELINE/Ward Number
Open Defecation
No. of open urination Spots No. 0 35-36
No. of open defecation spots No. 0 Near Slum Pockets
Toilet Coverage % households with Toilet access % 99% 95% Access to Public Toilets Floating
Population/Public - 5%
Access to Community Toilets Slum Dwellers/Community
0
In case like Loni all the above targets should be met on a short term basis
(3years) as the service delivery rate must be equivalent to rate of growth of city.
Medium term (5 years) and Long term (10 years) targets can be proposed in large
scale projects.
4.6 GAP ANALYSIS Since most of the wards are low-income high density Shared Toilets in Slums,
Public Toilets in busy commercial wards or a combination seems to be an
appropriate solution.
For calculating requirement of Public Toilets, we assume floating population is 5%
of existing population which is 25,614. These toilets will also be accessed by
intercity commuters.
Existing -
Currently ward number 5 (Railway Station, City Hospital), 33 (Nursing Home), 36
(Gov. Hospital) and 30 (Bus Stand) have 5 Public Toilet with 5-7 seaters as
discussed in Table 8.
Assumption –
If 30 people use 10 Seater Public Toilet in 1hour, so for 8 hours - 240 people can
access 1 Public Toilet.( Each with 10 seated capacity with 50:50 for male and female
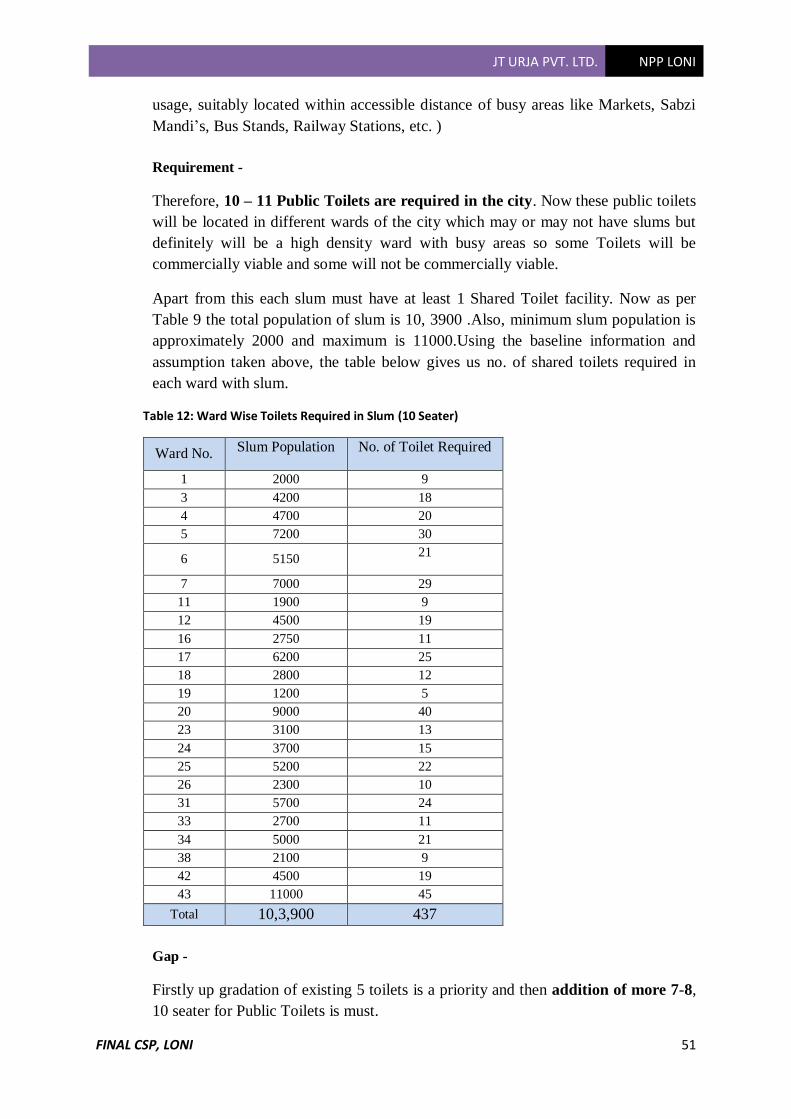
JT URJA PVT. LTD. NPP LONI
FINAL CSP, LONI 51
usage, suitably located within accessible distance of busy areas like Markets, Sabzi
Mandi’s, Bus Stands, Railway Stations, etc. )
Requirement -
Therefore, 10 – 11 Public Toilets are required in the city. Now these public toilets
will be located in different wards of the city which may or may not have slums but
definitely will be a high density ward with busy areas so some Toilets will be
commercially viable and some will not be commercially viable.
Apart from this each slum must have at least 1 Shared Toilet facility. Now as per
Table 9 the total population of slum is 10, 3900 .Also, minimum slum population is
approximately 2000 and maximum is 11000.Using the baseline information and
assumption taken above, the table below gives us no. of shared toilets required in
each ward with slum.
Table 12: Ward Wise Toilets Required in Slum (10 Seater)
Ward No. Slum Population No. of Toilet Required
1 2000 9
3 4200 18
4 4700 20
5 7200 30
6 5150 21
7 7000 29
11 1900 9
12 4500 19
16 2750 11
17 6200 25
18 2800 12
19 1200 5
20 9000 40
23 3100 13
24 3700 15
25 5200 22
26 2300 10
31 5700 24
33 2700 11
34 5000 21
38 2100 9
42 4500 19
43 11000 45
Total 10,3,900 437
Gap -
Firstly up gradation of existing 5 toilets is a priority and then addition of more 7-8,
10 seater for Public Toilets is must.
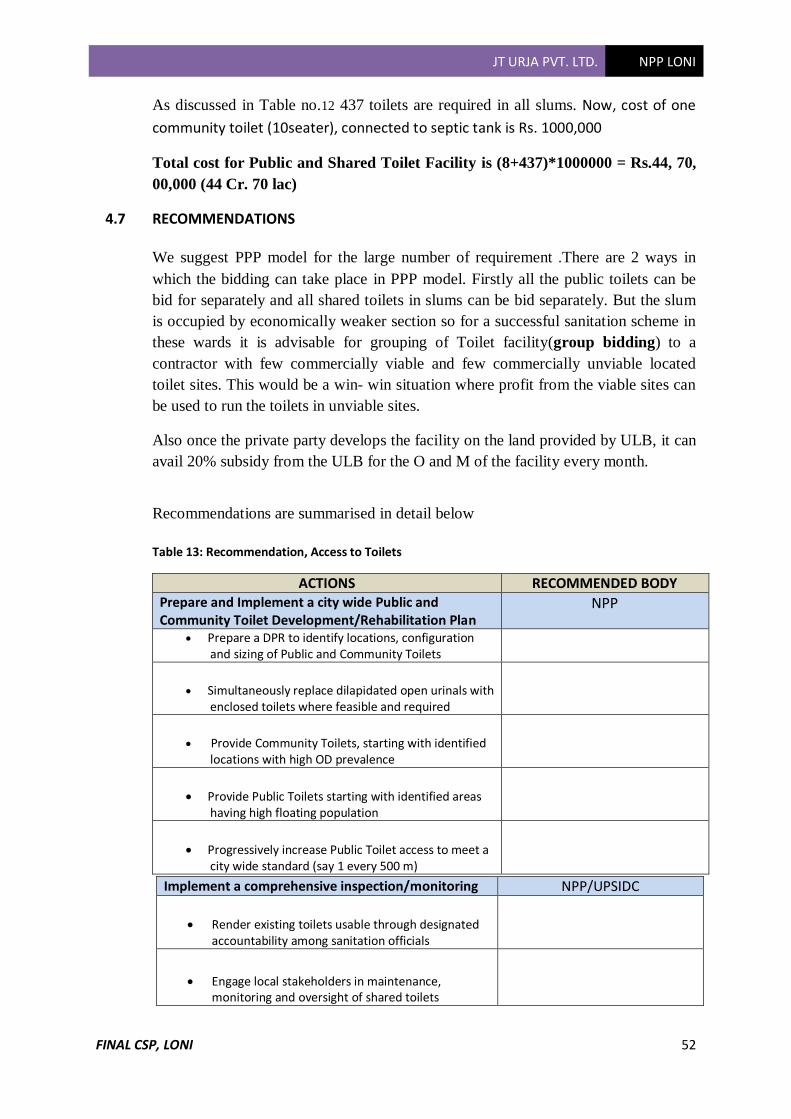
JT URJA PVT. LTD. NPP LONI
FINAL CSP, LONI 52
As discussed in Table no.12 437 toilets are required in all slums. Now, cost of one
community toilet (10seater), connected to septic tank is Rs. 1000,000
Total cost for Public and Shared Toilet Facility is (8+437)*1000000 = Rs.44, 70,
00,000 (44 Cr. 70 lac)
4.7 RECOMMENDATIONS
We suggest PPP model for the large number of requirement .There are 2 ways in
which the bidding can take place in PPP model. Firstly all the public toilets can be
bid for separately and all shared toilets in slums can be bid separately. But the slum
is occupied by economically weaker section so for a successful sanitation scheme in
these wards it is advisable for grouping of Toilet facility(group bidding) to a
contractor with few commercially viable and few commercially unviable located
toilet sites. This would be a win- win situation where profit from the viable sites can
be used to run the toilets in unviable sites.
Also once the private party develops the facility on the land provided by ULB, it can
avail 20% subsidy from the ULB for the O and M of the facility every month.
Recommendations are summarised in detail below
Table 13: Recommendation, Access to Toilets
ACTIONS RECOMMENDED BODY Prepare and Implement a city wide Public and Community Toilet Development/Rehabilitation Plan
NPP
• Prepare a DPR to identify locations, configuration and sizing of Public and Community Toilets
• Simultaneously replace dilapidated open urinals with
enclosed toilets where feasible and required
• Provide Community Toilets, starting with identified
locations with high OD prevalence
• Provide Public Toilets starting with identified areas
having high floating population
• Progressively increase Public Toilet access to meet a
city wide standard (say 1 every 500 m)
Implement a comprehensive inspection/monitoring NPP/UPSIDC
• Render existing toilets usable through designated
accountability among sanitation officials
• Engage local stakeholders in maintenance,
monitoring and oversight of shared toilets
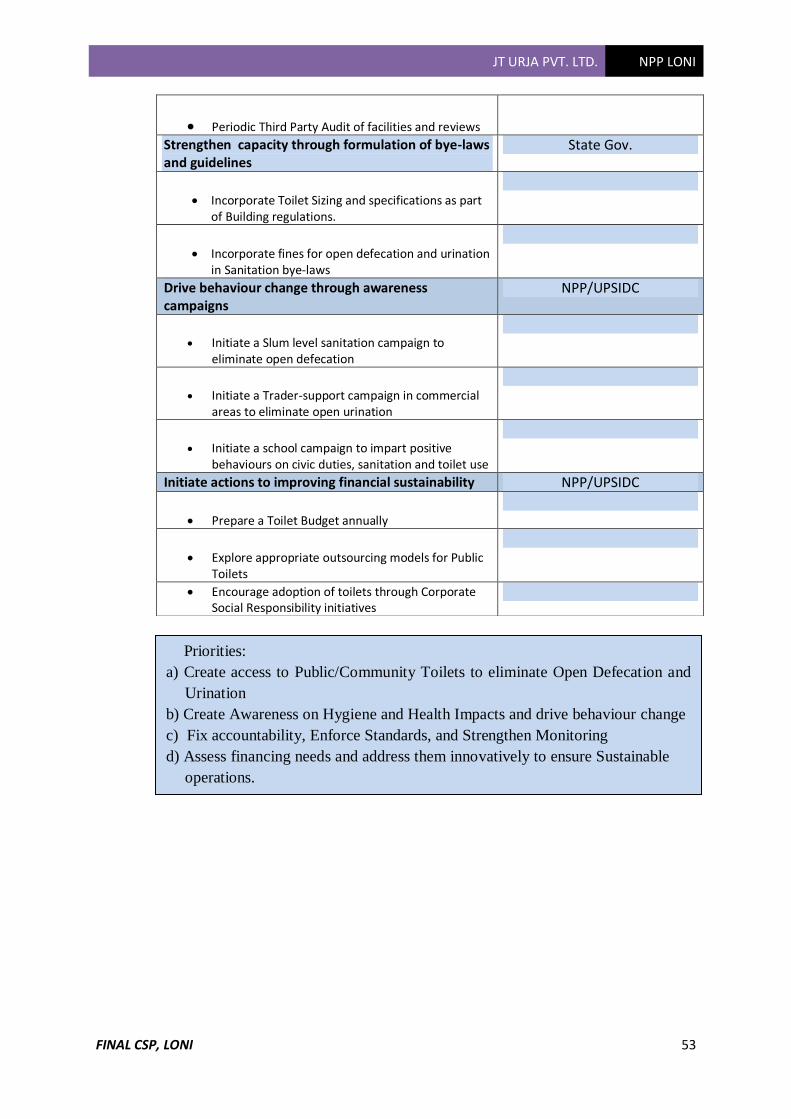
JT URJA PVT. LTD. NPP LONI
FINAL CSP, LONI 53
• Periodic Third Party Audit of facilities and reviews
Strengthen capacity through formulation of bye-laws and guidelines
State Gov.
• Incorporate Toilet Sizing and specifications as part
of Building regulations.
• Incorporate fines for open defecation and urination
in Sanitation bye-laws
Drive behaviour change through awareness campaigns
NPP/UPSIDC
• Initiate a Slum level sanitation campaign to
eliminate open defecation
• Initiate a Trader-support campaign in commercial
areas to eliminate open urination
• Initiate a school campaign to impart positive
behaviours on civic duties, sanitation and toilet use
Initiate actions to improving financial sustainability NPP/UPSIDC
• Prepare a Toilet Budget annually
• Explore appropriate outsourcing models for Public
Toilets
• Encourage adoption of toilets through Corporate Social Responsibility initiatives
Priorities:
a) Create access to Public/Community Toilets to eliminate Open Defecation and
Urination
b) Create Awareness on Hygiene and Health Impacts and drive behaviour change
c) Fix accountability, Enforce Standards, and Strengthen Monitoring
d) Assess financing needs and address them innovatively to ensure Sustainable
operations.
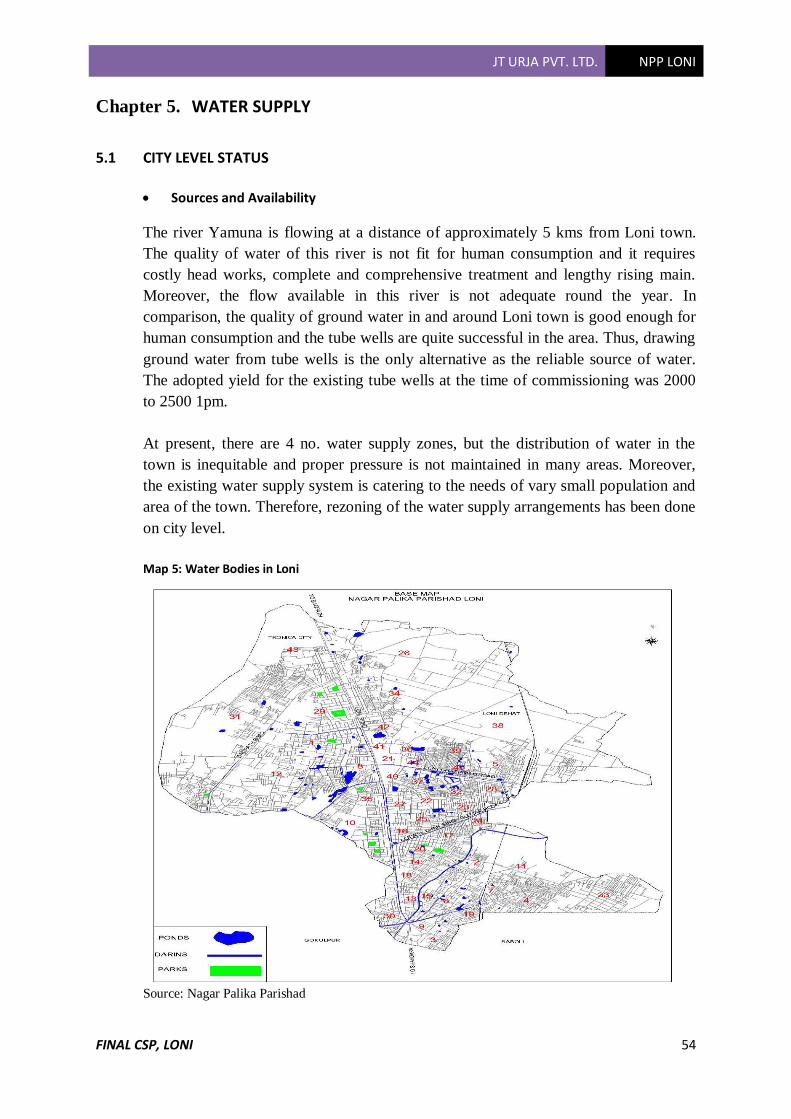
JT URJA PVT. LTD. NPP LONI
FINAL CSP, LONI 54
Chapter 5. WATER SUPPLY
5.1 CITY LEVEL STATUS
• Sources and Availability
The river Yamuna is flowing at a distance of approximately 5 kms from Loni town.
The quality of water of this river is not fit for human consumption and it requires
costly head works, complete and comprehensive treatment and lengthy rising main.
Moreover, the flow available in this river is not adequate round the year. In
comparison, the quality of ground water in and around Loni town is good enough for
human consumption and the tube wells are quite successful in the area. Thus, drawing
ground water from tube wells is the only alternative as the reliable source of water.
The adopted yield for the existing tube wells at the time of commissioning was 2000
to 2500 1pm.
At present, there are 4 no. water supply zones, but the distribution of water in the
town is inequitable and proper pressure is not maintained in many areas. Moreover,
the existing water supply system is catering to the needs of vary small population and
area of the town. Therefore, rezoning of the water supply arrangements has been done
on city level.
Map 5: Water Bodies in Loni
Source: Nagar Palika Parishad

JT URJA PVT. LTD. NPP LONI
FINAL CSP, LONI 55
• Services in Waters Infrastructure
Table 14: Water Infrastructure
Sources of Water Ground Water(most reliable)
Water Supply Zones 4 (inequitable distribution with lack in adequate pressure
maintenance in many cases)
Coverage of Water Supply 12.16%
Per capita supply of Water 148 lpcd
No. of Tube Wells 37
No. of Over Head Tanks 11
No. of Hand Pumps 1508
Water Treatment Plant
(WTP)-
NA
No. of Drain 15
Length of Line 20400metres
5.1.1 CITY LEVEL STATUS
To explain the city level status ward wise data from primary surveys was collected
and then has been analysed and presented in the form of charts and tables.
Figure 24: Sources of Water
Sources: Primary Survey
As analysed by the feedback of respondents in various wards the dependency of
people is on the Ground Water and only 12-20% coverage by Nagar Palika. The use
of Ground water resources at rate higher than its recharge rate should be thoughtfully
done.
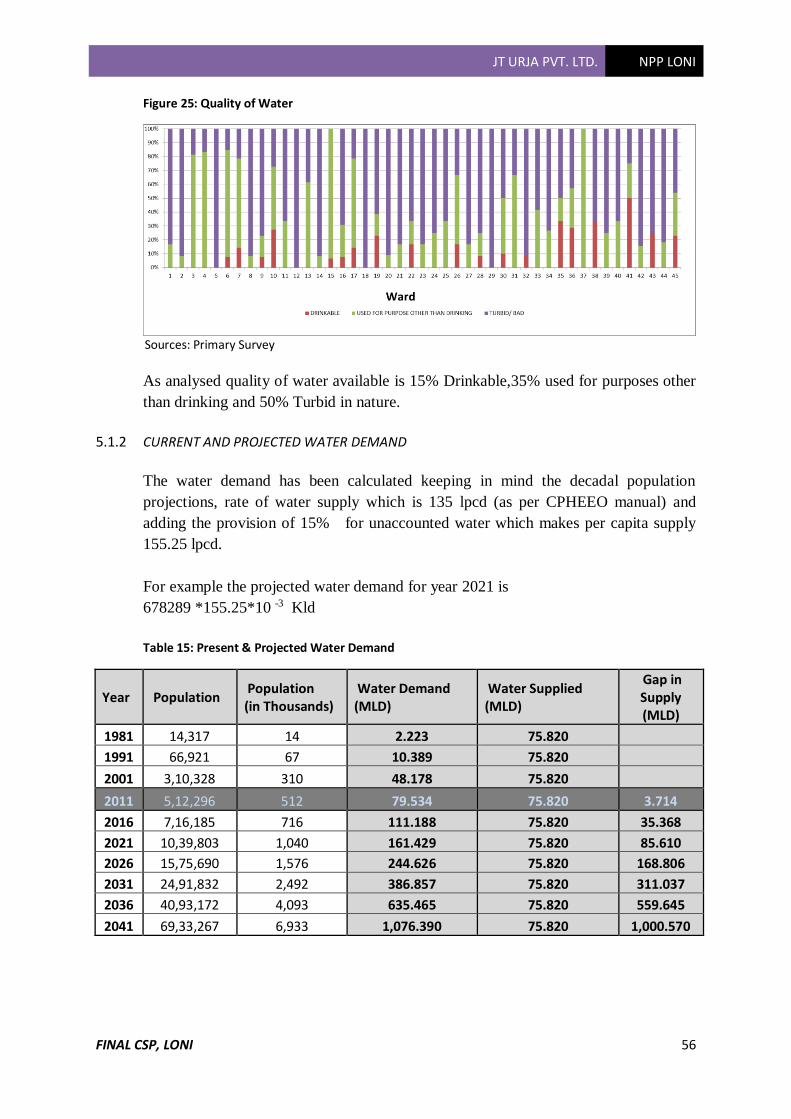
JT URJA PVT. LTD. NPP LONI
FINAL CSP, LONI 56
Figure 25: Quality of Water
Sources: Primary Survey
As analysed quality of water available is 15% Drinkable,35% used for purposes other
than drinking and 50% Turbid in nature.
5.1.2 CURRENT AND PROJECTED WATER DEMAND
The water demand has been calculated keeping in mind the decadal population
projections, rate of water supply which is 135 lpcd (as per CPHEEO manual) and
adding the provision of 15% for unaccounted water which makes per capita supply
155.25 lpcd.
For example the projected water demand for year 2021 is
678289 *155.25*10 -3 Kld
Table 15: Present & Projected Water Demand
Year Population Population (in Thousands)
Water Demand (MLD)
Water Supplied (MLD)
Gap in Supply (MLD)
1981 14,317 14 2.223 75.820 1991 66,921 67 10.389 75.820 2001 3,10,328 310 48.178 75.820 2011 5,12,296 512 79.534 75.820 3.714
2016 7,16,185 716 111.188 75.820 35.368
2021 10,39,803 1,040 161.429 75.820 85.610
2026 15,75,690 1,576 244.626 75.820 168.806
2031 24,91,832 2,492 386.857 75.820 311.037
2036 40,93,172 4,093 635.465 75.820 559.645
2041 69,33,267 6,933 1,076.390 75.820 1,000.570
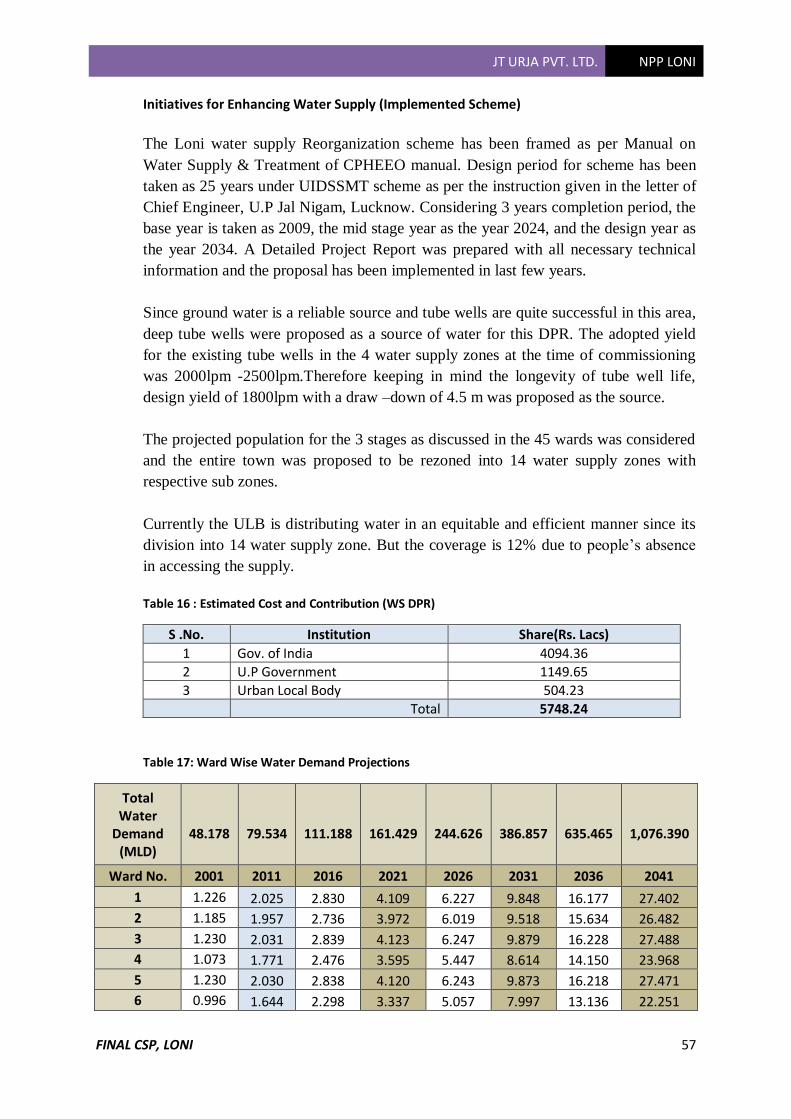
JT URJA PVT. LTD. NPP LONI
FINAL CSP, LONI 57
Initiatives for Enhancing Water Supply (Implemented Scheme)
The Loni water supply Reorganization scheme has been framed as per Manual on
Water Supply & Treatment of CPHEEO manual. Design period for scheme has been
taken as 25 years under UIDSSMT scheme as per the instruction given in the letter of
Chief Engineer, U.P Jal Nigam, Lucknow. Considering 3 years completion period, the
base year is taken as 2009, the mid stage year as the year 2024, and the design year as
the year 2034. A Detailed Project Report was prepared with all necessary technical
information and the proposal has been implemented in last few years.
Since ground water is a reliable source and tube wells are quite successful in this area,
deep tube wells were proposed as a source of water for this DPR. The adopted yield
for the existing tube wells in the 4 water supply zones at the time of commissioning
was 2000lpm -2500lpm.Therefore keeping in mind the longevity of tube well life,
design yield of 1800lpm with a draw –down of 4.5 m was proposed as the source.
The projected population for the 3 stages as discussed in the 45 wards was considered
and the entire town was proposed to be rezoned into 14 water supply zones with
respective sub zones.
Currently the ULB is distributing water in an equitable and efficient manner since its
division into 14 water supply zone. But the coverage is 12% due to people’s absence
in accessing the supply.
Table 16 : Estimated Cost and Contribution (WS DPR)
S .No. Institution Share(Rs. Lacs)
1 Gov. of India 4094.36
2 U.P Government 1149.65
3 Urban Local Body 504.23
Total 5748.24
Table 17: Ward Wise Water Demand Projections
Total Water
Demand (MLD)
48.178
79.534
111.188
161.429
244.626
386.857
635.465
1,076.390
Ward No. 2001 2011 2016 2021 2026 2031 2036 2041
1 1.226 2.025 2.830 4.109 6.227 9.848 16.177 27.402
2 1.185 1.957 2.736 3.972 6.019 9.518 15.634 26.482
3 1.230 2.031 2.839 4.123 6.247 9.879 16.228 27.488
4 1.073 1.771 2.476 3.595 5.447 8.614 14.150 23.968
5 1.230 2.030 2.838 4.120 6.243 9.873 16.218 27.471
6 0.996 1.644 2.298 3.337 5.057 7.997 13.136 22.251
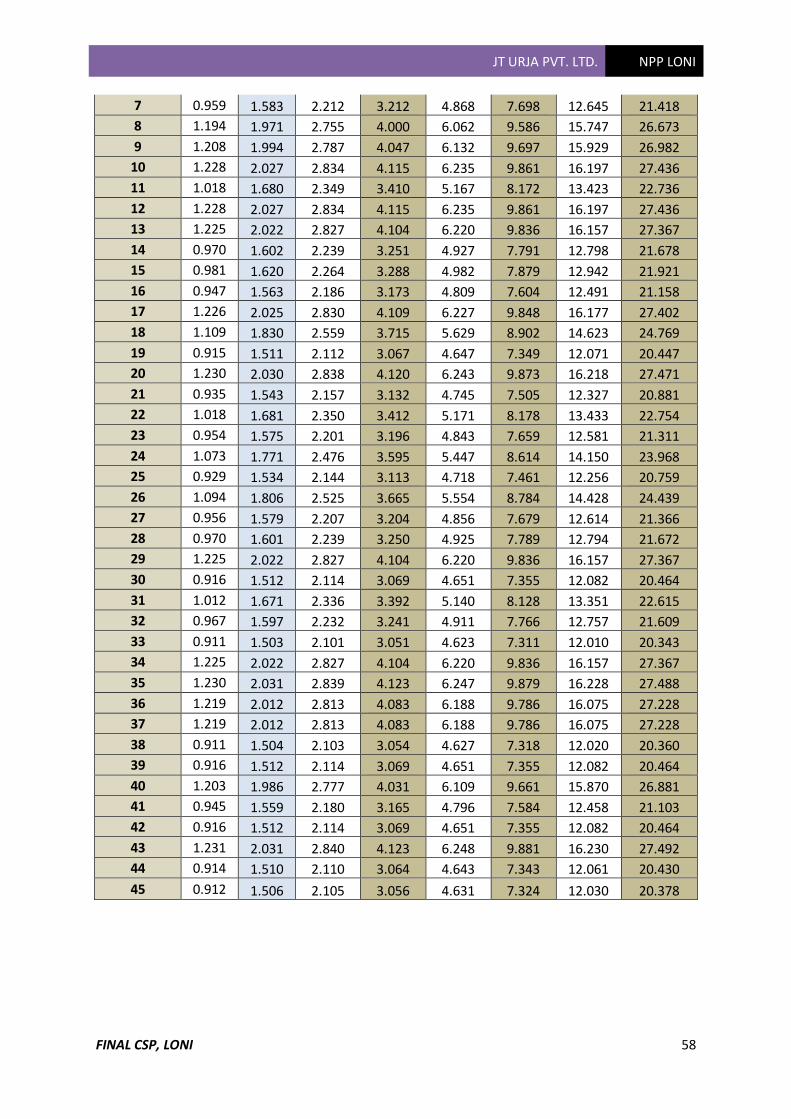
JT URJA PVT. LTD. NPP LONI
FINAL CSP, LONI 58
7 0.959 1.583 2.212 3.212 4.868 7.698 12.645 21.418
8 1.194 1.971 2.755 4.000 6.062 9.586 15.747 26.673
9 1.208 1.994 2.787 4.047 6.132 9.697 15.929 26.982
10 1.228 2.027 2.834 4.115 6.235 9.861 16.197 27.436
11 1.018 1.680 2.349 3.410 5.167 8.172 13.423 22.736
12 1.228 2.027 2.834 4.115 6.235 9.861 16.197 27.436
13 1.225 2.022 2.827 4.104 6.220 9.836 16.157 27.367
14 0.970 1.602 2.239 3.251 4.927 7.791 12.798 21.678
15 0.981 1.620 2.264 3.288 4.982 7.879 12.942 21.921
16 0.947 1.563 2.186 3.173 4.809 7.604 12.491 21.158
17 1.226 2.025 2.830 4.109 6.227 9.848 16.177 27.402
18 1.109 1.830 2.559 3.715 5.629 8.902 14.623 24.769
19 0.915 1.511 2.112 3.067 4.647 7.349 12.071 20.447
20 1.230 2.030 2.838 4.120 6.243 9.873 16.218 27.471
21 0.935 1.543 2.157 3.132 4.745 7.505 12.327 20.881
22 1.018 1.681 2.350 3.412 5.171 8.178 13.433 22.754
23 0.954 1.575 2.201 3.196 4.843 7.659 12.581 21.311
24 1.073 1.771 2.476 3.595 5.447 8.614 14.150 23.968
25 0.929 1.534 2.144 3.113 4.718 7.461 12.256 20.759
26 1.094 1.806 2.525 3.665 5.554 8.784 14.428 24.439
27 0.956 1.579 2.207 3.204 4.856 7.679 12.614 21.366
28 0.970 1.601 2.239 3.250 4.925 7.789 12.794 21.672
29 1.225 2.022 2.827 4.104 6.220 9.836 16.157 27.367
30 0.916 1.512 2.114 3.069 4.651 7.355 12.082 20.464
31 1.012 1.671 2.336 3.392 5.140 8.128 13.351 22.615
32 0.967 1.597 2.232 3.241 4.911 7.766 12.757 21.609
33 0.911 1.503 2.101 3.051 4.623 7.311 12.010 20.343
34 1.225 2.022 2.827 4.104 6.220 9.836 16.157 27.367
35 1.230 2.031 2.839 4.123 6.247 9.879 16.228 27.488
36 1.219 2.012 2.813 4.083 6.188 9.786 16.075 27.228
37 1.219 2.012 2.813 4.083 6.188 9.786 16.075 27.228
38 0.911 1.504 2.103 3.054 4.627 7.318 12.020 20.360
39 0.916 1.512 2.114 3.069 4.651 7.355 12.082 20.464
40 1.203 1.986 2.777 4.031 6.109 9.661 15.870 26.881
41 0.945 1.559 2.180 3.165 4.796 7.584 12.458 21.103
42 0.916 1.512 2.114 3.069 4.651 7.355 12.082 20.464
43 1.231 2.031 2.840 4.123 6.248 9.881 16.230 27.492
44 0.914 1.510 2.110 3.064 4.643 7.343 12.061 20.430
45 0.912 1.506 2.105 3.056 4.631 7.324 12.030 20.378

JT URJA PVT. LTD. NPP LONI
FINAL CSP, LONI 59
5.2 SWOT, ISSUES AND PRIORITIES
The given table captures the SWOT analysis for access to toilets within NPP.
Table 18: Water Supply SWOT
STRENGTH WEAKNESSES
• Reliable Ground water availability with
adopting yield of existing tube wells at
2000-2500 lpm
• Poor coverage of pipe network by Nagar Palika
• No previous audit data on loss levels
• Likely water shortage in medium term
• Groundwater exploitation and pollution are key
concerns
• No data available to show coverage in slums
• Low connections
OPPORTUNITIES THREATS
• Plans to augment supply in Future under
UIDSSMT scheme.
• Potential to expand access to entire
35sqkm area under Nagar Palika by
initiating a water master plan
• Potential to address service delivery
gaps through a time-bound performance
improvement program
• Inadequate coverage indicates least focus on
O&M, poor delivery and therefore low cost
recovery.
• Execution capacity and weak local financials
could constrain implementation
• Over use of Ground water resource
• Mixing of Industrial waste with Ground water is
concern.
Key issues and priorities with respect to water supply within MCT are summarised below
• Service delivery in Water Supply within NPP falls significantly short of service
level norms as it not even close to 90% coverage. There is a need to explore and
implement options to bring water to NPP and other extended areas within Nagar
Palika.
• Information discrepancies and inadequacies constrain analysis and decision
making .No information regarding presence of metered connections and need to
validate higher dependency on ground water (primary source)when municipal
connections can are be made available.
• Absence of Water Treatment plant and water quality monitoring station.
• Institutional issues included inadequate capacity, multiplicity of agencies and
weak monitoring
Inadequate enforcement of groundwater conservation is leading to indiscriminate
extraction. Further there is need for clarity on processes for dealing with
unauthorized water connections and action in case of user charge defaulters.
Since the UP Jal Nigam is responsible for planning and designing the water supply
and sewerage projects of the State However Implementation , operation and
Maintenance is done by the Nagar Palika Parishad and there is insufficient
involvement of Nagar Palika in planning for water supply during planning and
execution as a result of which ownership, capacity and accountability for O&M
within Palika is weak. Inadequate exposure to modern water management practices
is also a constraint.
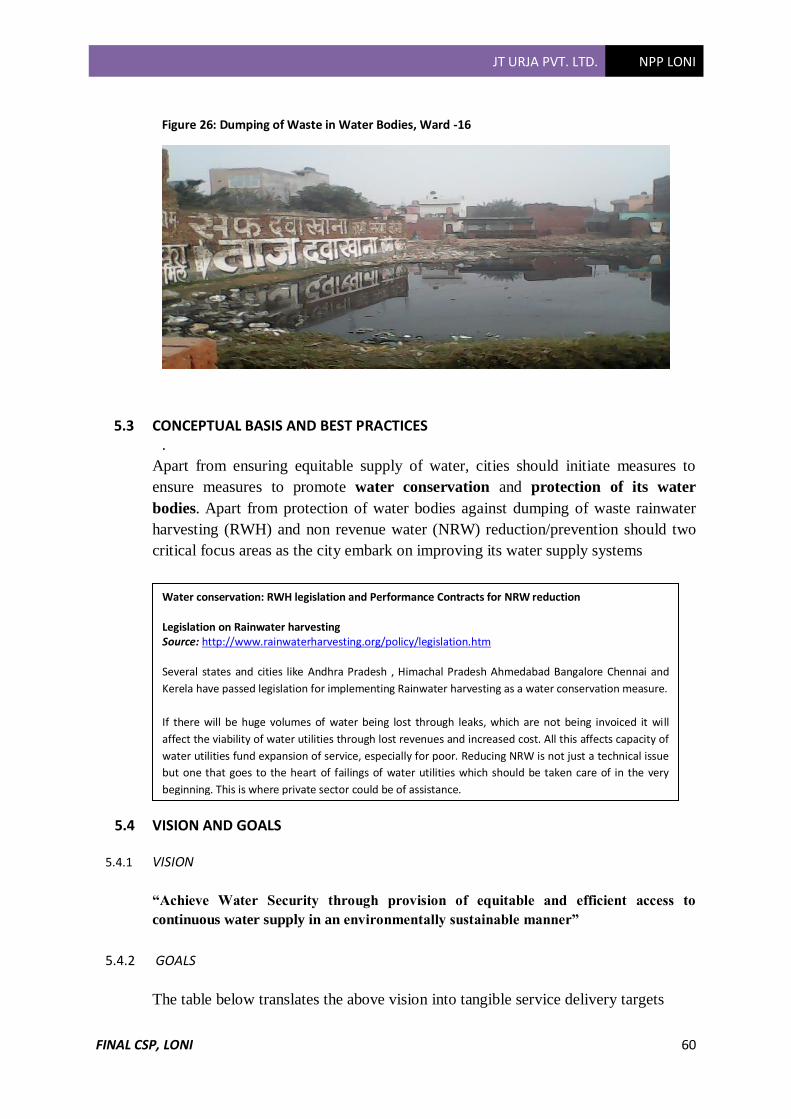
JT URJA PVT. LTD. NPP LONI
FINAL CSP, LONI 60
Figure 26: Dumping of Waste in Water Bodies, Ward -16
5.3 CONCEPTUAL BASIS AND BEST PRACTICES .
Apart from ensuring equitable supply of water, cities should initiate measures to
ensure measures to promote water conservation and protection of its water
bodies. Apart from protection of water bodies against dumping of waste rainwater
harvesting (RWH) and non revenue water (NRW) reduction/prevention should two
critical focus areas as the city embark on improving its water supply systems
5.4 VISION AND GOALS
5.4.1 VISION
“Achieve Water Security through provision of equitable and efficient access to
continuous water supply in an environmentally sustainable manner”
5.4.2 GOALS
The table below translates the above vision into tangible service delivery targets
Water conservation: RWH legislation and Performance Contracts for NRW reduction
Legislation on Rainwater harvesting Source: http://www.rainwaterharvesting.org/policy/legislation.htm
Several states and cities like Andhra Pradesh , Himachal Pradesh Ahmedabad Bangalore Chennai and
Kerela have passed legislation for implementing Rainwater harvesting as a water conservation measure.
If there will be huge volumes of water being lost through leaks, which are not being invoiced it will
affect the viability of water utilities through lost revenues and increased cost. All this affects capacity of
water utilities fund expansion of service, especially for poor. Reducing NRW is not just a technical issue
but one that goes to the heart of failings of water utilities which should be taken care of in the very
beginning. This is where private sector could be of assistance.

JT URJA PVT. LTD. NPP LONI
FINAL CSP, LONI 61
Table 19: Goals, SML Term Targets
PARAMETER UNIT NORM SLB Short Term Medium. T Long. T
Coverage % 100% 12% ✓
Per Capita Supply LPCD 135 148 ✓
Non-Revenue
Water
% 20% - ✓
Metered
connections
% 100%
- ✓
Continuity Hours 24.00 - ✓
Complaints Redress % 80% - ✓
Quality of Supply* % 100%
15 ✓
Cost Recovery % 100%
- ✓
Collection
Efficiency
% 90% - ✓
Table 20: 13th Finance Commission: Declaration of Service Level Benchmarks
WATER SUPPLY INDICATORS
Coverage of water Supply Connections
Per capita supply of water
Extent of metering of water Connections
Extent of Non Revenue Water
Continuity of Water Supply
Quality of Water Supplied
Efficiency in redresal of customer complaints
Cost Recovery in water Supply Service
Efficiency in collection of water supply related
BENCHMARKS
100% 135lpcd 100% 20% 24hrs 100% 80% 100% 90%
C T C T C T C T C T C T C T C T C T
4 4 148 148 0 22 21 5 6 80 84 100 100 23 24 41 43
C =Current, T= Target
5.5 RECOMMENDATIONS
The DPR proposed and implemented had carefully rezoned water supply zones to
develop a comprehensive system of water supply and for distribution of water in the
most equitable and efficient manner in Loni.
The various considerations on which zoning was based –
• Optimum utilization of existing works
• No valley line was traverse.
• No Crossing of National Highway and Railway track
• Size of zone considered was neither very large nor very small.
• Well defined zonal boundaries or at least along the main roads or other
geographical features as far as possible.
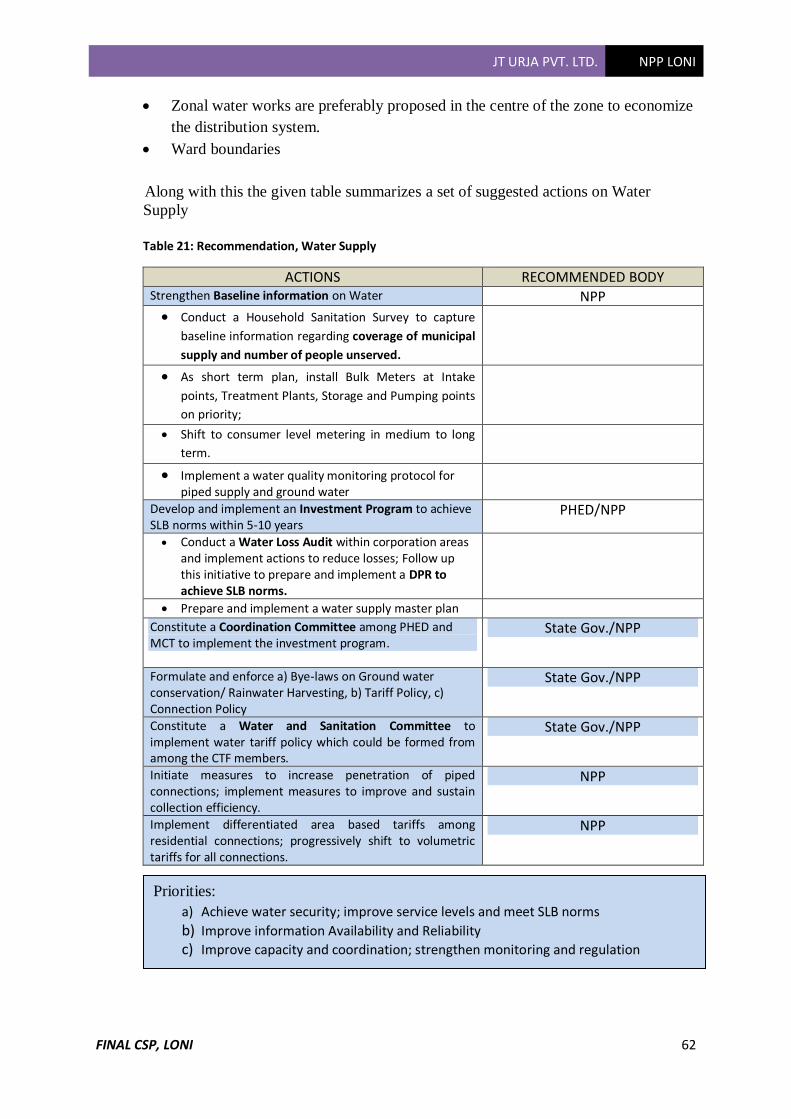
JT URJA PVT. LTD. NPP LONI
FINAL CSP, LONI 62
• Zonal water works are preferably proposed in the centre of the zone to economize
the distribution system.
• Ward boundaries
Along with this the given table summarizes a set of suggested actions on Water
Supply
Table 21: Recommendation, Water Supply
ACTIONS RECOMMENDED BODY Strengthen Baseline information on Water NPP
• Conduct a Household Sanitation Survey to capture
baseline information regarding coverage of municipal
supply and number of people unserved.
• As short term plan, install Bulk Meters at Intake
points, Treatment Plants, Storage and Pumping points
on priority;
• Shift to consumer level metering in medium to long
term.
• Implement a water quality monitoring protocol for piped supply and ground water
Develop and implement an Investment Program to achieve SLB norms within 5-10 years
PHED/NPP
• Conduct a Water Loss Audit within corporation areas and implement actions to reduce losses; Follow up this initiative to prepare and implement a DPR to achieve SLB norms.
• Prepare and implement a water supply master plan Constitute a Coordination Committee among PHED and MCT to implement the investment program.
State Gov./NPP
Formulate and enforce a) Bye-laws on Ground water conservation/ Rainwater Harvesting, b) Tariff Policy, c) Connection Policy
State Gov./NPP
Constitute a Water and Sanitation Committee to implement water tariff policy which could be formed from among the CTF members.
State Gov./NPP
Initiate measures to increase penetration of piped connections; implement measures to improve and sustain collection efficiency.
NPP
Implement differentiated area based tariffs among residential connections; progressively shift to volumetric tariffs for all connections.
NPP
Priorities:
a) Achieve water security; improve service levels and meet SLB norms
b) Improve information Availability and Reliability c) Improve capacity and coordination; strengthen monitoring and regulation
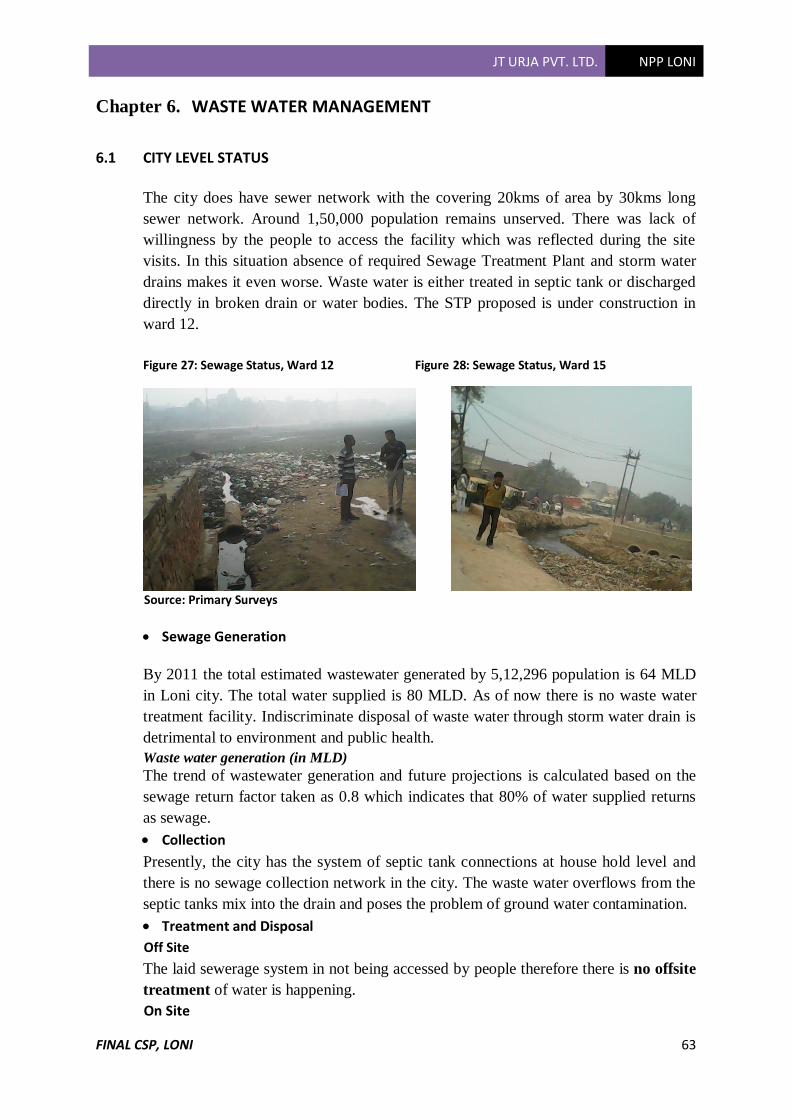
JT URJA PVT. LTD. NPP LONI
FINAL CSP, LONI 63
Chapter 6. WASTE WATER MANAGEMENT
6.1 CITY LEVEL STATUS
The city does have sewer network with the covering 20kms of area by 30kms long
sewer network. Around 1,50,000 population remains unserved. There was lack of
willingness by the people to access the facility which was reflected during the site
visits. In this situation absence of required Sewage Treatment Plant and storm water
drains makes it even worse. Waste water is either treated in septic tank or discharged
directly in broken drain or water bodies. The STP proposed is under construction in
ward 12.
Figure 27: Sewage Status, Ward 12 Figure 28: Sewage Status, Ward 15
Source: Primary Surveys
• Sewage Generation
By 2011 the total estimated wastewater generated by 5,12,296 population is 64 MLD
in Loni city. The total water supplied is 80 MLD. As of now there is no waste water
treatment facility. Indiscriminate disposal of waste water through storm water drain is
detrimental to environment and public health.
Waste water generation (in MLD)
The trend of wastewater generation and future projections is calculated based on the
sewage return factor taken as 0.8 which indicates that 80% of water supplied returns
as sewage.
• Collection
Presently, the city has the system of septic tank connections at house hold level and
there is no sewage collection network in the city. The waste water overflows from the
septic tanks mix into the drain and poses the problem of ground water contamination.
• Treatment and Disposal
Off Site
The laid sewerage system in not being accessed by people therefore there is no offsite
treatment of water is happening.
On Site
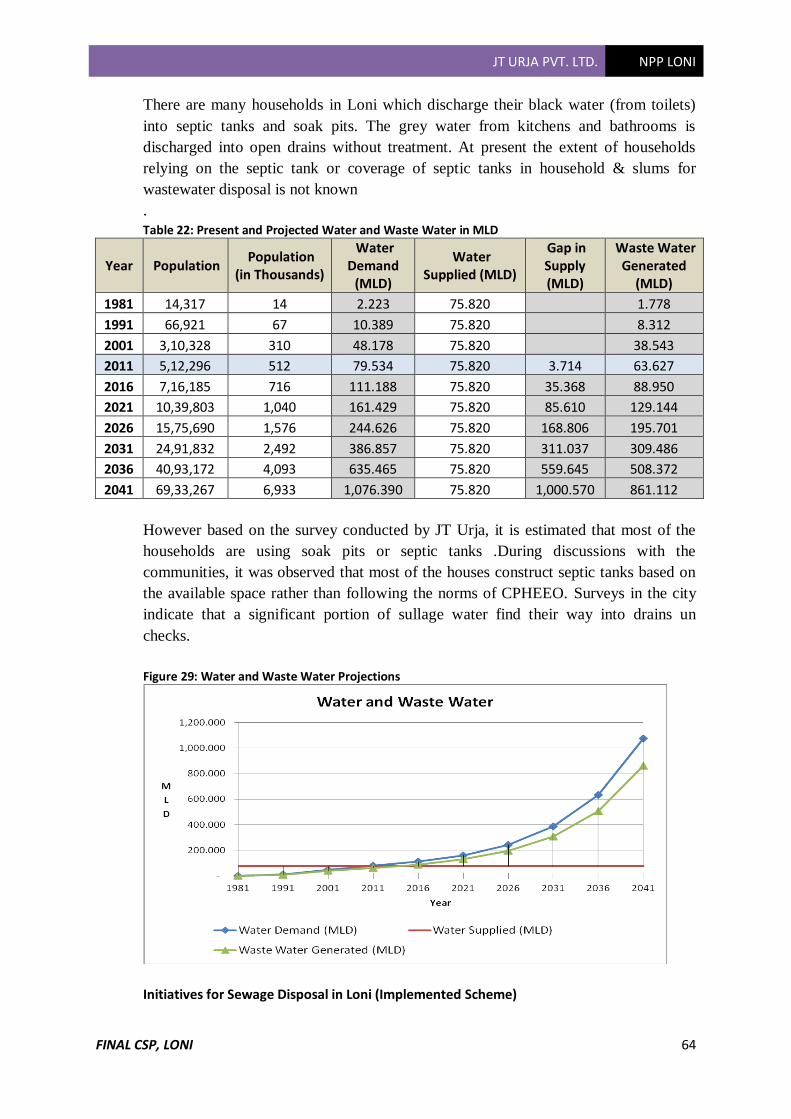
JT URJA PVT. LTD. NPP LONI
FINAL CSP, LONI 64
There are many households in Loni which discharge their black water (from toilets)
into septic tanks and soak pits. The grey water from kitchens and bathrooms is
discharged into open drains without treatment. At present the extent of households
relying on the septic tank or coverage of septic tanks in household & slums for
wastewater disposal is not known
.
Table 22: Present and Projected Water and Waste Water in MLD
Year Population Population
(in Thousands)
Water Demand
(MLD)
Water Supplied (MLD)
Gap in Supply (MLD)
Waste Water Generated
(MLD)
1981 14,317 14 2.223 75.820
1.778
1991 66,921 67 10.389 75.820
8.312
2001 3,10,328 310 48.178 75.820
38.543
2011 5,12,296 512 79.534 75.820 3.714 63.627
2016 7,16,185 716 111.188 75.820 35.368 88.950
2021 10,39,803 1,040 161.429 75.820 85.610 129.144
2026 15,75,690 1,576 244.626 75.820 168.806 195.701
2031 24,91,832 2,492 386.857 75.820 311.037 309.486
2036 40,93,172 4,093 635.465 75.820 559.645 508.372
2041 69,33,267 6,933 1,076.390 75.820 1,000.570 861.112
However based on the survey conducted by JT Urja, it is estimated that most of the
households are using soak pits or septic tanks .During discussions with the
communities, it was observed that most of the houses construct septic tanks based on
the available space rather than following the norms of CPHEEO. Surveys in the city
indicate that a significant portion of sullage water find their way into drains un
checks.
Figure 29: Water and Waste Water Projections
Initiatives for Sewage Disposal in Loni (Implemented Scheme)
JT URJA PVT. LTD. NPP LONI
FINAL CSP, LONI 65
The Loni Sewerage project for was prepared at an estimated cost of 95.70 crore
seeking technical appraisal from CPHEEO for sanctioning under UIDSSMT. The
DPR was examined in CPHEEO in consultation with following UP Jal Nigam
officials on 31.12.2007,04.01,2008, 08.01.2008,12.02.2008, 13.02.2008 and by now
has been implemented.
The scheme was accorded top priority by Government of Uttar Pradesh due to the fact
that a PIL No. 914/1996 is under consideration in Hon’bIe Supreme Court for
abatement of pollution of river Yamuna. The Govt. of Uttar Pradesh submitted the
development made so far in compliance with the directive of Hon’ble Supreme Court
of India, wherein, it has been mentioned to stop the flow of waste water from the
catchment of Loni to river Yamuna through' Shahadra drain. It has been directed to
stop the waste water flowing from loni catchment at U.P border and the same should
be disposed to river Yamuna directly after proper treatment without putting into
Shahadra drain.
In above respect, the DPR for Loni Sewerage System was earlier also submitted at an
estimated cost of Rs. 231-97 crore for entire Loni Municipal area. The scheme was
considered in second State Level Sanctioning Committee held in November. 2006,
and was deferred due to the fact that there was no existing scheme for providing water
supply in the town, so as to ensure that the sewerage system could function
efficiently.
Moreover, due to the limited availability of funds under UIDSSMT and to cover other
towns also in the state, which are facing acute shortage of water supply, it was
found more appropriate to phase out the DPR into two parts. In the (Part-I)currently
implemented under UIDSSMT mainly those areas have been considered which
are contributing major portion of waste water, which is flowing through
Indrapuri drain and East Yamuna Canal drain and ultimately falls in river
Yamuna through Shahadra drain, thus to quickly solve the major portion of the
problem. The remaining areas which relatively less developed may be taken up in
second part of the project by State Government from their own funds so as to address
the problem of waste water in holistic manner.
The DPR was approved and the proposal was examined under salient features like
distance from Delhi, census population, area in sq km etc. Based on the topography of
the area and demographic conditions, the entire town has been divided into four
zones: The zone 4 is undeveloped. Therefore; sewerage and STP for zone 4 shall be
taken up as and when need arises separately by State Government. The proposal
implemented had provision for branches, laterals, mains and trunk main ,pumping
station, STP for part 1 area of ULB & GDA for zone 1 and 2 for 30MLD and
provision for effluent pipes carrying treated waste water of 74MLD from STP to
downstream of Wazirabad in river Yamuna.
JT URJA PVT. LTD. NPP LONI
FINAL CSP, LONI 66
Also the total O&M cost for sewer line and STP worked out was Rs. 216.20 lacs.
Revenue shall be generated from sale of sludge as manure and beneficiaries falling in
the sewered area shall be charged with sewer tax @ 500 per annum. Thus, the total
revenue from sewerage system worked out to Rs 368.91 lacs. Thus, the scheme is self
sustainable since beginning.
The balance cost after the deductions of GDA share for colonies in zone 1 and 2
falling within ULB area was 13516.07.Below is the fund sharing pattern for the
balance cost.
S .No. Institution Share(Rs. Lacs)
1 Gov. of India (80%) 10812.8
2 U.P Government (10%) 1351.60
3 Urban Local Body (10%) 1351.60
Total 13516.07
6.1.1 SERVICE LEVEL BENCHMARK FOR SEWERAGE SYSTEM
Performance Indicator Benchmarks Status
Coverage of Toilets 100% 0%
Coverage of Sewerage Network 100% 0%
Coll. Eff. of Sewerage Network 100% 0%
Adequacy of Sewage Treatment Capacity 100% 0%
Quality of Sewage Treatment 100% 0%
Extent of Reuse and Recycling of Sewage 20% 0%
Extent of cost recovery 100% 0%
Eff. in re-dressal of customer complaints 80% 0%
Eff. In Collection of Sewage Water Charges 90% 0%
6.1.2 FROM PRIMARY SURVEY
• Management of septic tanks: No information from respondents reported that the
septic tank maintenance and cleaning in managed by individuals directly.
• Cleaning frequency: No information from respondents about cleaning their septic
tanks which seems to suggest that there could be either percolation or leakage into
available drains or ground water.
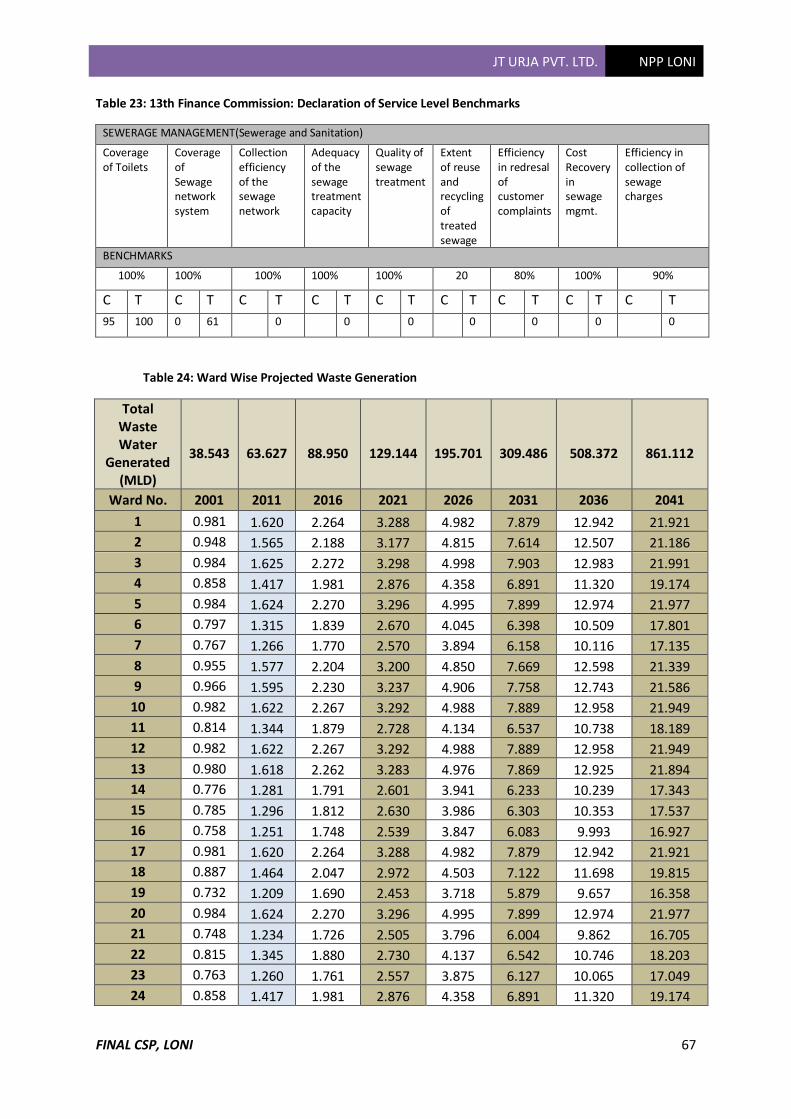
JT URJA PVT. LTD. NPP LONI
FINAL CSP, LONI 67
Table 23: 13th Finance Commission: Declaration of Service Level Benchmarks
SEWERAGE MANAGEMENT(Sewerage and Sanitation)
Coverage of Toilets
Coverage of Sewage network system
Collection efficiency of the sewage network
Adequacy of the sewage treatment capacity
Quality of sewage treatment
Extent of reuse and recycling of treated sewage
Efficiency in redresal of customer complaints
Cost Recovery in sewage mgmt.
Efficiency in collection of sewage charges
BENCHMARKS
100% 100% 100% 100% 100% 20 80% 100% 90%
C T C T C T C T C T C T C T C T C T
95 100 0 61 0 0 0 0 0 0 0
Table 24: Ward Wise Projected Waste Generation
Total Waste Water
Generated (MLD)
38.543
63.627
88.950
129.144
195.701
309.486
508.372
861.112
Ward No. 2001 2011 2016 2021 2026 2031 2036 2041
1 0.981 1.620 2.264 3.288 4.982 7.879 12.942 21.921
2 0.948 1.565 2.188 3.177 4.815 7.614 12.507 21.186
3 0.984 1.625 2.272 3.298 4.998 7.903 12.983 21.991
4 0.858 1.417 1.981 2.876 4.358 6.891 11.320 19.174
5 0.984 1.624 2.270 3.296 4.995 7.899 12.974 21.977
6 0.797 1.315 1.839 2.670 4.045 6.398 10.509 17.801
7 0.767 1.266 1.770 2.570 3.894 6.158 10.116 17.135
8 0.955 1.577 2.204 3.200 4.850 7.669 12.598 21.339
9 0.966 1.595 2.230 3.237 4.906 7.758 12.743 21.586
10 0.982 1.622 2.267 3.292 4.988 7.889 12.958 21.949
11 0.814 1.344 1.879 2.728 4.134 6.537 10.738 18.189
12 0.982 1.622 2.267 3.292 4.988 7.889 12.958 21.949
13 0.980 1.618 2.262 3.283 4.976 7.869 12.925 21.894
14 0.776 1.281 1.791 2.601 3.941 6.233 10.239 17.343
15 0.785 1.296 1.812 2.630 3.986 6.303 10.353 17.537
16 0.758 1.251 1.748 2.539 3.847 6.083 9.993 16.927
17 0.981 1.620 2.264 3.288 4.982 7.879 12.942 21.921
18 0.887 1.464 2.047 2.972 4.503 7.122 11.698 19.815
19 0.732 1.209 1.690 2.453 3.718 5.879 9.657 16.358
20 0.984 1.624 2.270 3.296 4.995 7.899 12.974 21.977
21 0.748 1.234 1.726 2.505 3.796 6.004 9.862 16.705
22 0.815 1.345 1.880 2.730 4.137 6.542 10.746 18.203
23 0.763 1.260 1.761 2.557 3.875 6.127 10.065 17.049
24 0.858 1.417 1.981 2.876 4.358 6.891 11.320 19.174
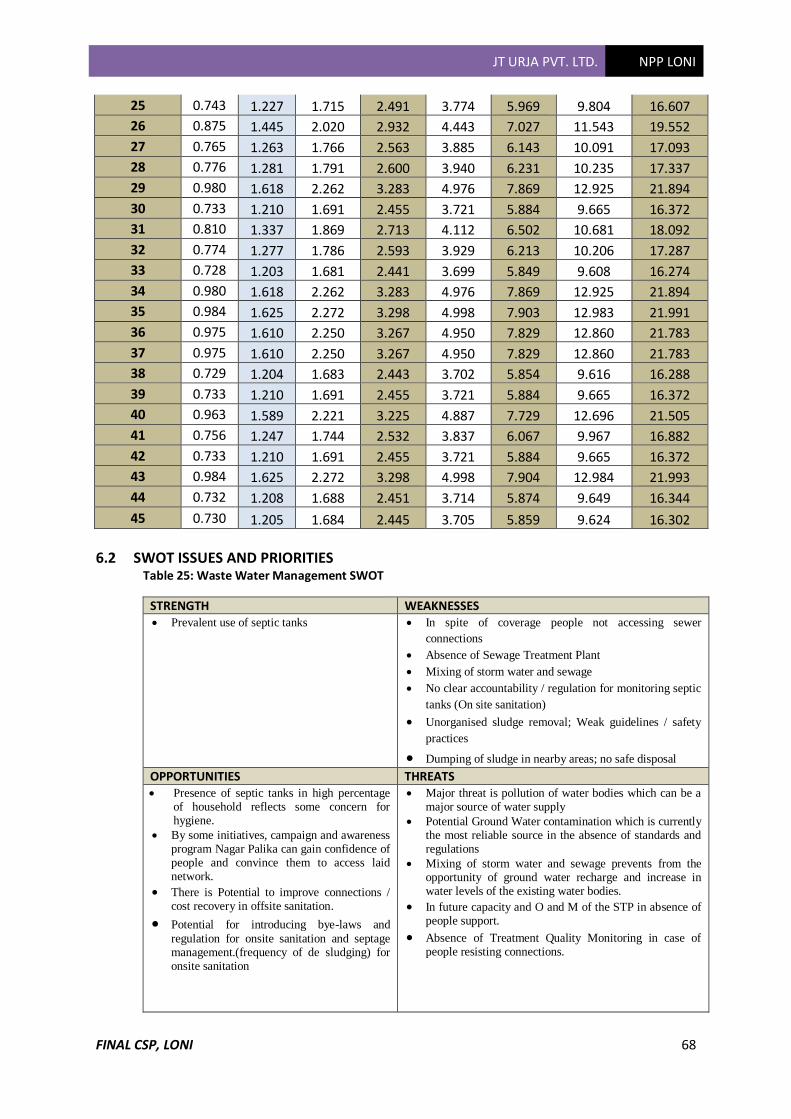
JT URJA PVT. LTD. NPP LONI
FINAL CSP, LONI 68
25 0.743 1.227 1.715 2.491 3.774 5.969 9.804 16.607
26 0.875 1.445 2.020 2.932 4.443 7.027 11.543 19.552
27 0.765 1.263 1.766 2.563 3.885 6.143 10.091 17.093
28 0.776 1.281 1.791 2.600 3.940 6.231 10.235 17.337
29 0.980 1.618 2.262 3.283 4.976 7.869 12.925 21.894
30 0.733 1.210 1.691 2.455 3.721 5.884 9.665 16.372
31 0.810 1.337 1.869 2.713 4.112 6.502 10.681 18.092
32 0.774 1.277 1.786 2.593 3.929 6.213 10.206 17.287
33 0.728 1.203 1.681 2.441 3.699 5.849 9.608 16.274
34 0.980 1.618 2.262 3.283 4.976 7.869 12.925 21.894
35 0.984 1.625 2.272 3.298 4.998 7.903 12.983 21.991
36 0.975 1.610 2.250 3.267 4.950 7.829 12.860 21.783
37 0.975 1.610 2.250 3.267 4.950 7.829 12.860 21.783
38 0.729 1.204 1.683 2.443 3.702 5.854 9.616 16.288
39 0.733 1.210 1.691 2.455 3.721 5.884 9.665 16.372
40 0.963 1.589 2.221 3.225 4.887 7.729 12.696 21.505
41 0.756 1.247 1.744 2.532 3.837 6.067 9.967 16.882
42 0.733 1.210 1.691 2.455 3.721 5.884 9.665 16.372
43 0.984 1.625 2.272 3.298 4.998 7.904 12.984 21.993
44 0.732 1.208 1.688 2.451 3.714 5.874 9.649 16.344
45 0.730 1.205 1.684 2.445 3.705 5.859 9.624 16.302
6.2 SWOT ISSUES AND PRIORITIES Table 25: Waste Water Management SWOT
STRENGTH WEAKNESSES • Prevalent use of septic tanks
• In spite of coverage people not accessing sewer
connections
• Absence of Sewage Treatment Plant
• Mixing of storm water and sewage
• No clear accountability / regulation for monitoring septic
tanks (On site sanitation)
• Unorganised sludge removal; Weak guidelines / safety
practices
• Dumping of sludge in nearby areas; no safe disposal OPPORTUNITIES THREATS • Presence of septic tanks in high percentage
of household reflects some concern for hygiene.
• By some initiatives, campaign and awareness program Nagar Palika can gain confidence of people and convince them to access laid network.
• There is Potential to improve connections / cost recovery in offsite sanitation.
• Potential for introducing bye-laws and
regulation for onsite sanitation and septage management.(frequency of de sludging) for onsite sanitation
• Major threat is pollution of water bodies which can be a major source of water supply
• Potential Ground Water contamination which is currently the most reliable source in the absence of standards and regulations
• Mixing of storm water and sewage prevents from the opportunity of ground water recharge and increase in water levels of the existing water bodies.
• In future capacity and O and M of the STP in absence of people support.
• Absence of Treatment Quality Monitoring in case of people resisting connections.
JT URJA PVT. LTD. NPP LONI
FINAL CSP, LONI 69
The key issues and priorities with respect to waste-water management within NPP are
summarised below
• Limitations of existing sewerage system due to lack of access by people.
• Flows of grey water and in some cases black water into water bodies going
unchecked.
6.3 CONCEPTUAL BASIS AND BEST PRACTICES
A. Options for waste-water management
Fully on-site sanitation: Fully on-site sanitation arrangements will involve on-plot
treatment and disposal of all waste water and involves septic tank and soak pits - to
receive and treat waste water. Septage (sludge from septic tanks) is transferred to
another location for treatment. Onsite sanitation typically covers:
• Improvements in existing household disposal facilities: Existing household
sanitation arrangements, which do not have proper disposal, can be improved by
a) Construction of soak pits for existing toilets having only septic tanks, and
b) Providing a septic tank / soak pits.
• Public toilets: Community/public toilets could also be provided with a septic
tank based on-site system with a soak pit or soakage trenches (for effluent
disposal).
• Septage management: An efficient septage collection system, operated by the
ULB or private agencies is required along with regulation and monitoring of
septic tanks and septage disposal.
Small-bore sewerage
• Septic tank is connected to small-bore sewerage network: all domestic waste
water is partially treated in septic tank and the effluent is disposed into small-bore
sewerage network. Septage is periodically cleared.
• Twin pit latrine waste water is disposed into soak pits. Small diameter sewer pipe
(< 200 mm) is laid at a flatter gradient to carry the effluent from septic tanks.
Centralized or decentralized sewerage system
This alternative includes the regular sewerage network to collect the waste water from
the households. The network is normally laid through most of the town. A detailed
JT URJA PVT. LTD. NPP LONI
FINAL CSP, LONI 70
topographical and land availability survey will be necessary to determine the
feasibility and required number of decentralized waste water treatment plants.
In the area covered with a sewerage network, efforts should be made to connect all
households to the sewerage network. Even in this alternative, there is a possibility that
a few households will still be served by on-site sanitation systems – mainly pit
latrines. And Public sanitary conveniences will be directly connected to the nearest
sewer line of the network.
Combined system
Following arrangements are envisaged for household/public sanitation and waste
water treatment and disposal arrangements.
Household sanitation:
a) Septic tank with soak pits receives the entire household waste water. Septage is
periodically cleared and taken away to a common treatment facility.
b) Sewerage network receives all the household waste water and conveys it to the
centralized or decentralized treatment plant(s).
Public conveniences:
Waste water discharge is disposed into the sewerage network for further treatment and
final disposal, in areas where some sewer network is provided and in other areas,
waste water is discharged into a septic tank with soak pits.
Disposal of septage: For households served by on-site sanitation systems, an efficient
septage collection system, operated by the ULB or private agencies is required along
with regulation / monitoring of septage disposal.
Waste water conveyance and treatment: Domestic waste water, disposed into the
sewerage network, is transported to the waste water treatment site(s) for treatment and
final disposal. Treatment will meet the disposal standards
B. Challenges and practices in regulating onsite sanitation
ULBs and Governments have realised the importance of onsite systems as long-term
solutions to domestic wastewater treatment and disposal. The NUSP makes specific
reference to on-site sanitation systems. However, institutional structure,
organizational resources and personnel dedicated to the task of septage management is
largely not yet in place.
Municipal laws typically contain provisions for punitive actions against properties
causing nuisance, including letting out untreated human excreta into drains and open
areas; but enforcement is patchy. Most references to on-site sanitation regulation exist
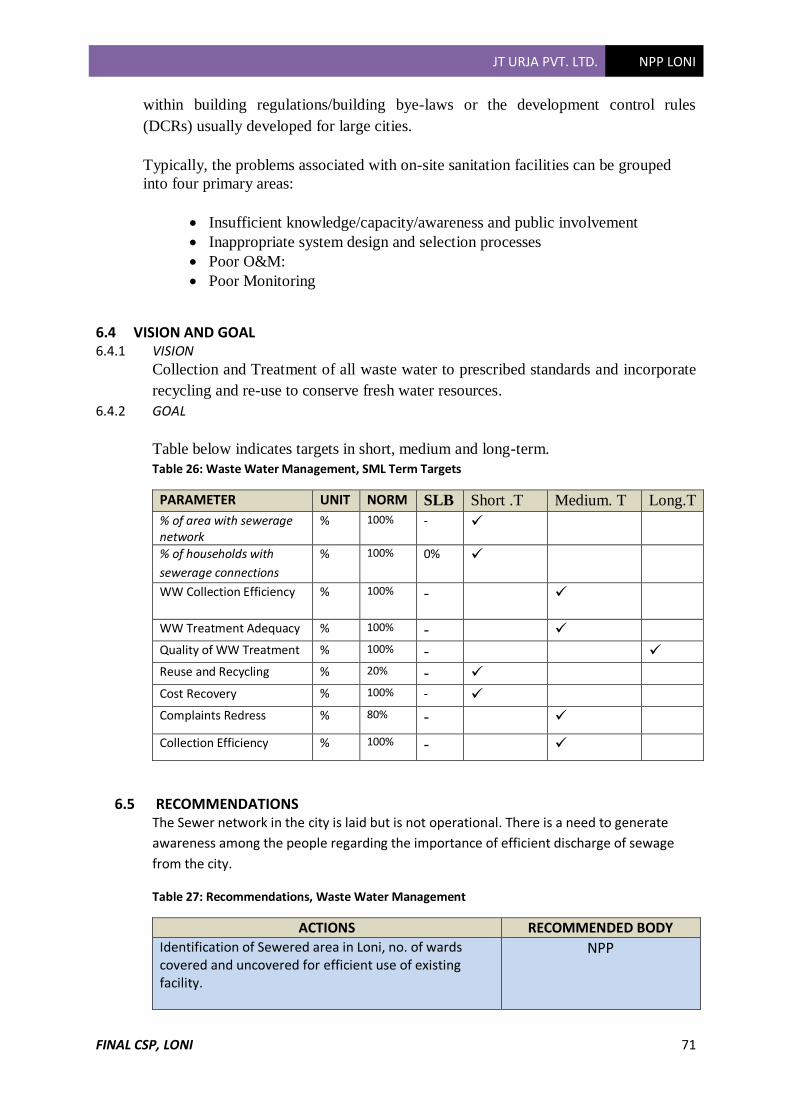
JT URJA PVT. LTD. NPP LONI
FINAL CSP, LONI 71
within building regulations/building bye-laws or the development control rules
(DCRs) usually developed for large cities.
Typically, the problems associated with on-site sanitation facilities can be grouped
into four primary areas:
• Insufficient knowledge/capacity/awareness and public involvement
• Inappropriate system design and selection processes
• Poor O&M:
• Poor Monitoring
6.4 VISION AND GOAL 6.4.1 VISION
Collection and Treatment of all waste water to prescribed standards and incorporate
recycling and re-use to conserve fresh water resources.
6.4.2 GOAL
Table below indicates targets in short, medium and long-term.
Table 26: Waste Water Management, SML Term Targets
PARAMETER UNIT NORM SLB Short .T Medium. T Long.T
% of area with sewerage network
% 100% - ✓
% of households with
sewerage connections
% 100% 0% ✓
WW Collection Efficiency % 100% - ✓
WW Treatment Adequacy % 100% - ✓
Quality of WW Treatment % 100% - ✓
Reuse and Recycling % 20% - ✓
Cost Recovery % 100% - ✓
Complaints Redress % 80% - ✓
Collection Efficiency % 100% - ✓
6.5 RECOMMENDATIONS The Sewer network in the city is laid but is not operational. There is a need to generate
awareness among the people regarding the importance of efficient discharge of sewage
from the city.
Table 27: Recommendations, Waste Water Management
ACTIONS RECOMMENDED BODY Identification of Sewered area in Loni, no. of wards covered and uncovered for efficient use of existing facility.
NPP
JT URJA PVT. LTD. NPP LONI
FINAL CSP, LONI 72
Awareness generation about the necessity of using existing sewered area for Public.
Initiate a drive to increase penetration of sewerage connections covering black and grey water flows;
Regulate and monitor de-sludging by keeping a check on available equipment, trained staff & their frequency of activity as per as per standards
NPP/PHED
Waste-water recycling should be priority therefore further opportunities should be explored to meet SLB norms in the medium to long term.
NPP/PHED
As a medium term initiative action plan for using treated sewage for horticulture, irrigation, industrial & other non potable us to conserve fresh water should be aimed for.
Formulation of bye-laws / guidelines on septage management and on-site sanitation
Efforts to involve PPP in O & M and STP’s & other components
NPP/State Gov.
Establish a waste-water quality monitoring protocol in coordination with CPCB
NPP
Priorities:
a) Need to improve service levels and bring sewerage system operational.
b) Clarify accountability; articulate/ enforce monitoring processes and regulation.
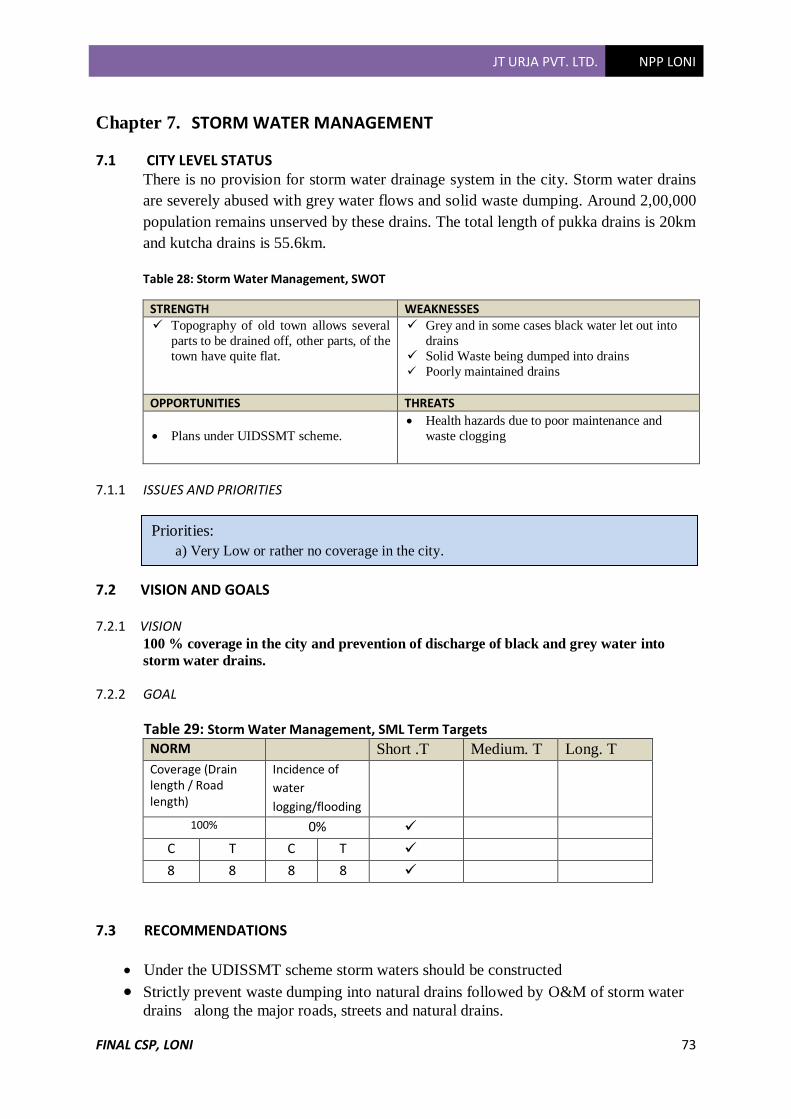
JT URJA PVT. LTD. NPP LONI
FINAL CSP, LONI 73
Chapter 7. STORM WATER MANAGEMENT
7.1 CITY LEVEL STATUS There is no provision for storm water drainage system in the city. Storm water drains
are severely abused with grey water flows and solid waste dumping. Around 2,00,000
population remains unserved by these drains. The total length of pukka drains is 20km
and kutcha drains is 55.6km.
Table 28: Storm Water Management, SWOT
STRENGTH WEAKNESSES ✓ Topography of old town allows several
parts to be drained off, other parts, of the
town have quite flat.
✓ Grey and in some cases black water let out into
drains
✓ Solid Waste being dumped into drains
✓ Poorly maintained drains
OPPORTUNITIES THREATS
• Plans under UIDSSMT scheme.
• Health hazards due to poor maintenance and
waste clogging
7.1.1 ISSUES AND PRIORITIES
7.2 VISION AND GOALS 7.2.1 VISION
100 % coverage in the city and prevention of discharge of black and grey water into
storm water drains.
7.2.2 GOAL
Table 29: Storm Water Management, SML Term Targets
NORM Short .T Medium. T Long. T
Coverage (Drain length / Road length)
Incidence of
water
logging/flooding
100% 0% ✓
C T C T ✓
8 8 8 8 ✓
7.3 RECOMMENDATIONS
• Under the UDISSMT scheme storm waters should be constructed
• Strictly prevent waste dumping into natural drains followed by O&M of storm water
drains along the major roads, streets and natural drains.
Priorities:
a) Very Low or rather no coverage in the city.
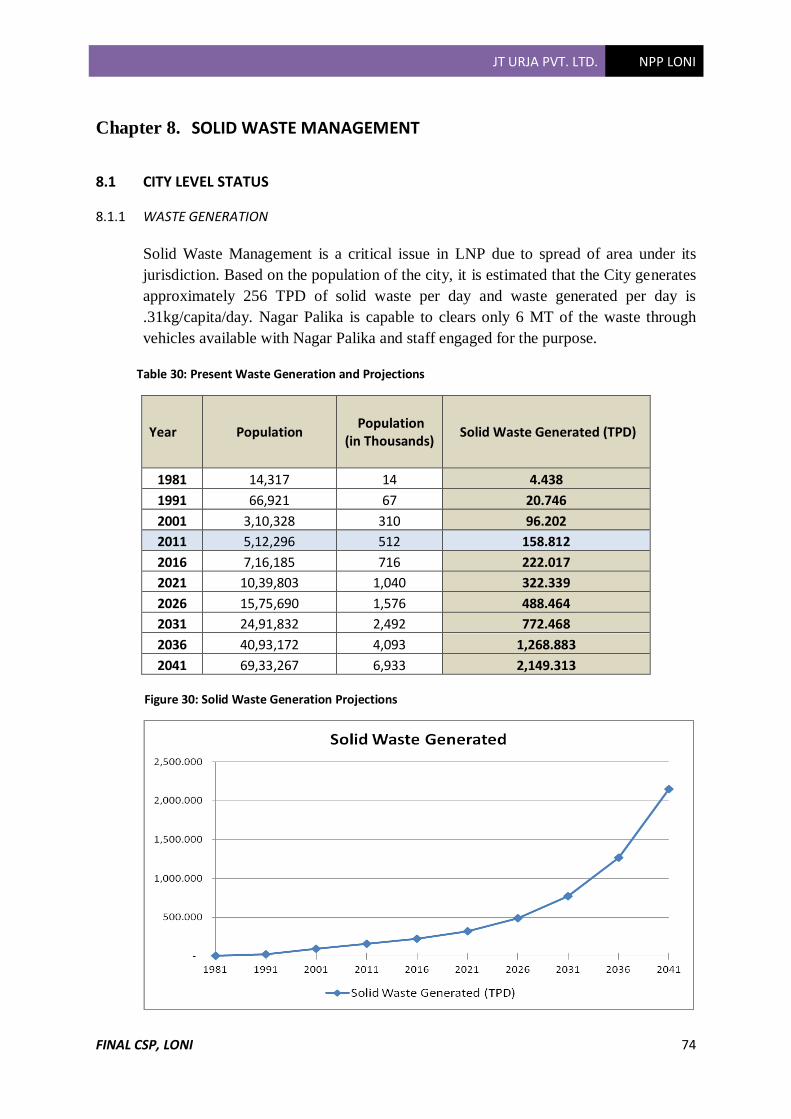
JT URJA PVT. LTD. NPP LONI
FINAL CSP, LONI 74
Chapter 8. SOLID WASTE MANAGEMENT
8.1 CITY LEVEL STATUS
8.1.1 WASTE GENERATION
Solid Waste Management is a critical issue in LNP due to spread of area under its
jurisdiction. Based on the population of the city, it is estimated that the City generates
approximately 256 TPD of solid waste per day and waste generated per day is
.31kg/capita/day. Nagar Palika is capable to clears only 6 MT of the waste through
vehicles available with Nagar Palika and staff engaged for the purpose.
Table 30: Present Waste Generation and Projections
Year Population Population
(in Thousands) Solid Waste Generated (TPD)
1981 14,317 14 4.438
1991 66,921 67 20.746
2001 3,10,328 310 96.202
2011 5,12,296 512 158.812
2016 7,16,185 716 222.017
2021 10,39,803 1,040 322.339
2026 15,75,690 1,576 488.464
2031 24,91,832 2,492 772.468
2036 40,93,172 4,093 1,268.883
2041 69,33,267 6,933 2,149.313 Figure 30: Solid Waste Generation Projections

JT URJA PVT. LTD. NPP LONI
FINAL CSP, LONI 75
The waste generated from the city includes household waste, commercial waste, bio-
medical waste and industrial waste. The major sources of generation of waste at city
level are Residential establishments, commercial establishments, Bazaar and vegetable
markets, Industrial establishments, Hospitals and dispensaries, Slaughter houses, Street
sweeping, Construction debris.
8.1.2 TYPES OF WASTE
TOTAL = 0.31KG/C/DAY
As of now there is no system of bio-medical waste management in Loni. The waste
generated from the Hospitals, Nursing homes, and Pathologies, is being collected and
disposed of, by dumping along with solid waste.
There is no slaughterhouse in Loni city. Slaughtering is being done in open places
waste produced from slaughter house is dumped in the private land. There are
approximately 50 meat shops and about 400 Kg of waste from these shops is being
generated. Part of the meat shop waste is consumed by dogs & the rest is disposed off
along with Municipal Solid Waste.
Municipal council maintains 50 km bituminous road out of 650 km total road length
including brick and Kutcha road. Road sweepings in 3 km length of bituminous road
in the city areas was recorded during survey and investigation carried out during DPR
2006-2007 preparation -
Day one - 70.50 kg
Day two - 110.70 kg
Day three- 98.00 kg
Total 279.20kg = 31.02 kg /km/ day (average)
Total road sweeping = 31.02 x 50 = 1551 kg/day from bituminous road only. There
are only 19 sweepers deployed in sweeping. Each sweeper is capable to clean
0.02
Figure 31: Types of Waste Generation in Kg per capita per day
JT URJA PVT. LTD. NPP LONI
FINAL CSP, LONI 76
approximately 0.50 km only. Roads are not clean on daily basis due to lack of staff,
therefore road sweeping is a major problem.
Study on waste generation from bituminous road was conducted and it is found that
waste produced by road sweeping is approximately 31 kg/km/day for bituminous
road. It is very difficult to quantify daily sweepings. Municipal officials have
informed that approximately 7000kg waste would be produced, had there been
sweeping on daily basis.
Assuming 7000kg per day, average per capita works out to 7000/356877 = 0.0196
Say = 0.02 kg/capita/day
In city, vegetable market is located in Lai Bagh Loni. During 2006-07 surveys it was
gathered that 21-22 tractor trolley load of waste from vegetable market, shops, fruit
market etc. is being collected daily.
Capacity of each trolley = 1.00 Mt
Therefore total waste generation = 21.50 x 1.00 = 21.50 tons
Waste generation per capita = 21.5 x 1000/ 356877 = 0.060 kg/capita/day
With coming up of new buildings and renovation of some houses, shops etc.
dismantled materials in shape of debris is being produced daily in the tune of 9 to 11
tons per day as informed by Nagar Palika Officials, which amounts to approximately
0.03 kg per capita per day.
As per the information given by Nagar Palika Parishad, there is one Govt. Hospital
having 100 beds and 41 nursing homes having capacity of 80 beds, and around 22
pathology centers. Thus, total capacity of towns is 160 beds. The bio - waste from the
hospital and nursing home is approximately 350 kg / day and is being disposed of
along with Municipal Solid Waste without any prevention and care. It is also to
mention here that in Loni there is no centralized incinerator provided by the
Government or by any agency.
8.1.3 COLLECTION & TRANSPORTATION
Primary Collection System - Door to door collection service does not exist in the city.
Machinery and equipment available with the Nagar Palika are not capable to lift and
clear total daily waste generated. The residents throw their waste outside their houses
which is manually collected by wheel carts and transported to exiting temporary
collection centres.
Primary Storage - In Loni there are 10 masonry type temporary collection centers.
The wastes from these centers are transported to low-lying area for dumping without
any cover and treatment. The present system is absolutely against the norms of proper

JT URJA PVT. LTD. NPP LONI
FINAL CSP, LONI 77
Solid Waste Management system as per MSW rule 2000.The Nagar Palika Parishad
does not have sufficient staff and proper infrastructure for solid waste management.
Man Power deployed on SWM
Sanitary Inspector -1
Sub-ordinate staff including sweeper -19
Table 31: List of existing Primary Collection Centre Figure 32, Ward 25: Arbitrary Waste Dumping
Table 32: Lit of existing vehicles & equipments with Nagar Palika
S.No. Description Number available Functional
1 JCB for loading purpose 4 3
2 Tractor 10 10
3 Trolly 3Cum capacity 10 8
4 Dumper 5 5
5 Sewerjet 1 1
6 Three wheeler 1 Cum capacity 1 1
7 Hand cart 200 200
8 Metalicbin 100 100
9 Rickshaw trolly
As per the surveys conducted by team of JT Urja company, the method of Solid waste
disposal is open in 90% of the wards .The frequency of waste collection is once in two
days in 70% of the wards followed by 20% twice a day in all the wards .The charts
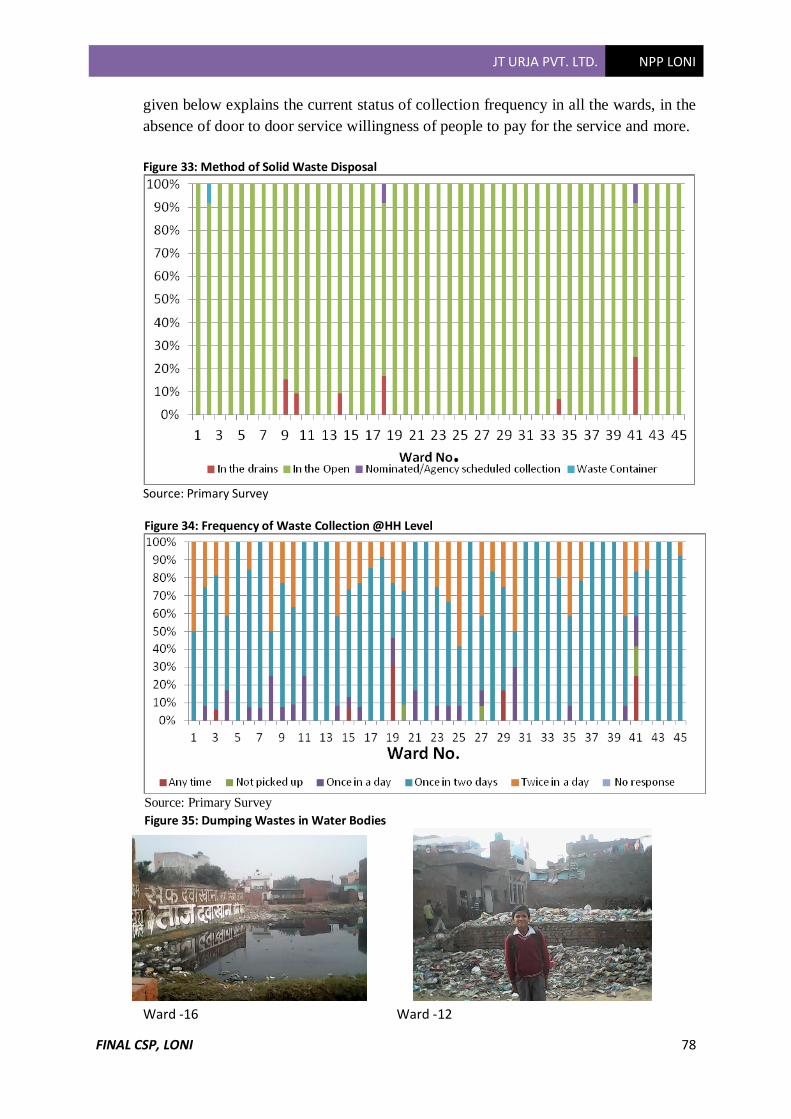
JT URJA PVT. LTD. NPP LONI
FINAL CSP, LONI 78
given below explains the current status of collection frequency in all the wards, in the
absence of door to door service willingness of people to pay for the service and more.
Figure 33: Method of Solid Waste Disposal
Source: Primary Survey
Figure 34: Frequency of Waste Collection @HH Level
Source: Primary Survey
Figure 35: Dumping Wastes in Water Bodies
Ward -16 Ward -12
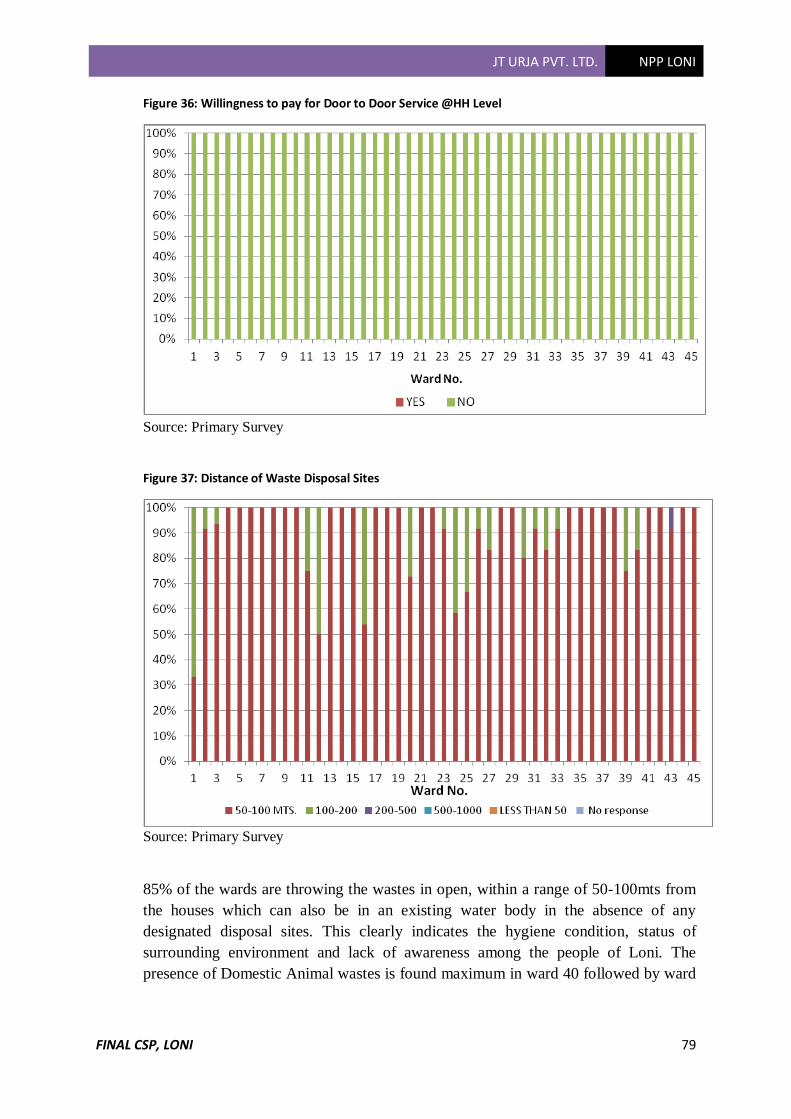
JT URJA PVT. LTD. NPP LONI
FINAL CSP, LONI 79
Figure 36: Willingness to pay for Door to Door Service @HH Level
Source: Primary Survey
Figure 37: Distance of Waste Disposal Sites
Source: Primary Survey
85% of the wards are throwing the wastes in open, within a range of 50-100mts from
the houses which can also be in an existing water body in the absence of any
designated disposal sites. This clearly indicates the hygiene condition, status of
surrounding environment and lack of awareness among the people of Loni. The
presence of Domestic Animal wastes is found maximum in ward 40 followed by ward
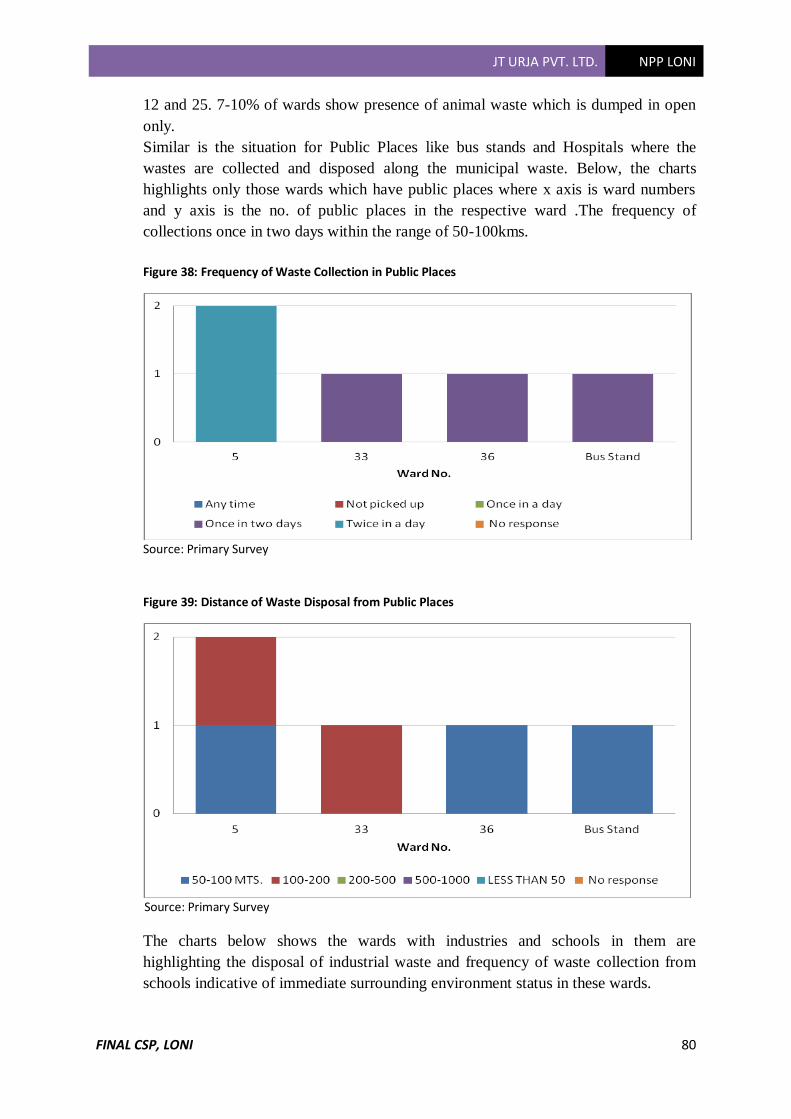
JT URJA PVT. LTD. NPP LONI
FINAL CSP, LONI 80
12 and 25. 7-10% of wards show presence of animal waste which is dumped in open
only.
Similar is the situation for Public Places like bus stands and Hospitals where the
wastes are collected and disposed along the municipal waste. Below, the charts
highlights only those wards which have public places where x axis is ward numbers
and y axis is the no. of public places in the respective ward .The frequency of
collections once in two days within the range of 50-100kms.
Figure 38: Frequency of Waste Collection in Public Places
Source: Primary Survey
Figure 39: Distance of Waste Disposal from Public Places
Source: Primary Survey
The charts below shows the wards with industries and schools in them are
highlighting the disposal of industrial waste and frequency of waste collection from
schools indicative of immediate surrounding environment status in these wards.

JT URJA PVT. LTD. NPP LONI
FINAL CSP, LONI 81
Figure 40: Disposal of Industrial Waste
Source: Primary Survey
Figure 41: Frequency of Waste Collection from School
Source: Primary Survey
Here x axis is indicative of ward numbers and y axis, is the number of schools in
shown wards.
8.1.4 TREATMENT AND DISPOSAL
Loni town does not have any recognized system of Solid waste disposal due to lack of
proper and sufficient number of equipments and lack of Public Awareness.Currently
there is no waste treatment facility in the city and the waste is disposed randomly in
low lying areas or local pond areas.Only 30% of waste is being cleared & transported
to dumping sites without treatment along with municipal waste.
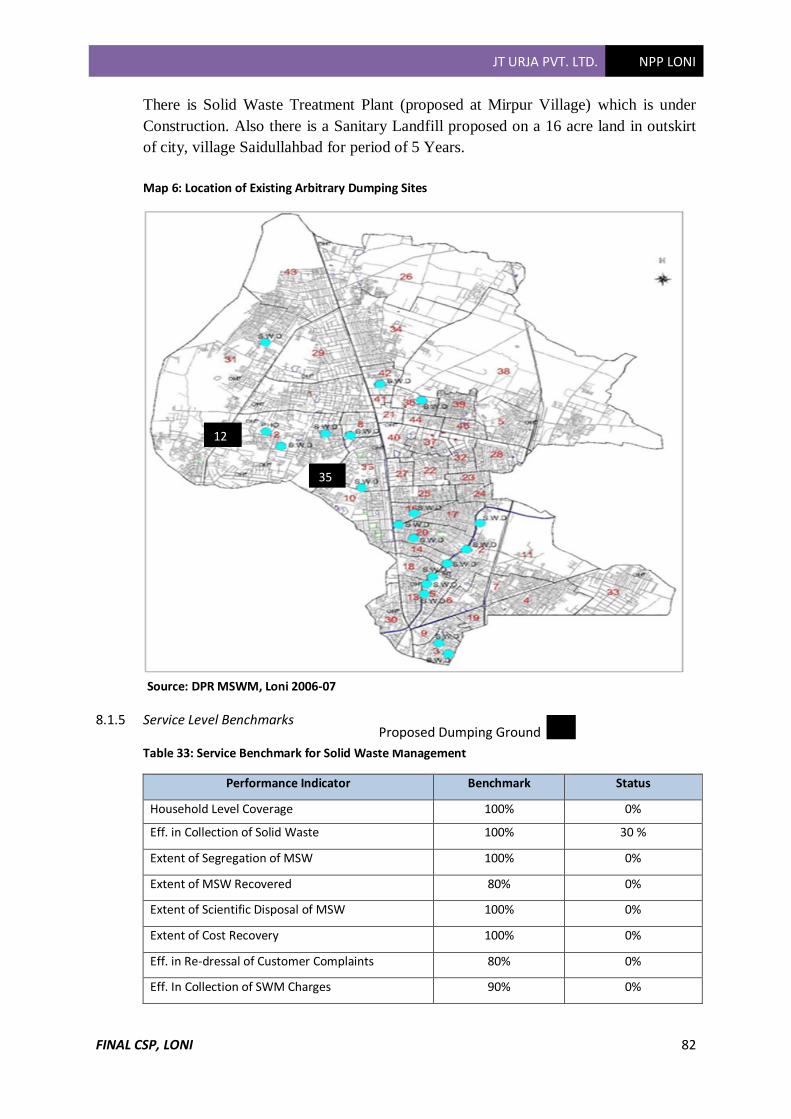
JT URJA PVT. LTD. NPP LONI
FINAL CSP, LONI 82
There is Solid Waste Treatment Plant (proposed at Mirpur Village) which is under
Construction. Also there is a Sanitary Landfill proposed on a 16 acre land in outskirt
of city, village Saidullahbad for period of 5 Years.
Map 6: Location of Existing Arbitrary Dumping Sites
Source: DPR MSWM, Loni 2006-07
8.1.5 Service Level Benchmarks
Table 33: Service Benchmark for Solid Waste Management
Performance Indicator Benchmark Status
Household Level Coverage 100% 0%
Eff. in Collection of Solid Waste 100% 30 %
Extent of Segregation of MSW 100% 0%
Extent of MSW Recovered 80% 0%
Extent of Scientific Disposal of MSW 100% 0%
Extent of Cost Recovery 100% 0%
Eff. in Re-dressal of Customer Complaints 80% 0%
Eff. In Collection of SWM Charges 90% 0%
12 12
35
Proposed Dumping Ground

JT URJA PVT. LTD. NPP LONI
FINAL CSP, LONI 83
Table 34: Ward Wise Projected Solid Waste Generation
Solid Waste Generated
(MTPD)
96.202
158.812
222.017
322.339
488.464
772.468
1,268.883
2,149.313
Ward No. 2001 2011 2016 2021 2026 2031 2036 2041
1 2.449 4.043 5.652 8.206 12.435 19.665 32.302 54.715
2 2.367 3.907 5.462 7.931 12.018 19.005 31.218 52.880
3 2.457 4.056 5.670 8.232 12.474 19.727 32.404 54.888
4 2.142 3.536 4.944 7.177 10.877 17.200 28.254 47.858
5 2.455 4.053 5.666 8.227 12.466 19.714 32.384 54.853
6 1.989 3.283 4.589 6.663 10.097 15.968 26.230 44.430
7 1.914 3.160 4.418 6.414 9.720 15.371 25.249 42.768
8 2.384 3.935 5.502 7.988 12.104 19.142 31.443 53.260
9 2.411 3.981 5.565 8.080 12.244 19.363 31.807 53.877
10 2.452 4.048 5.659 8.216 12.451 19.690 32.343 54.784
11 2.032 3.355 4.690 6.809 10.318 16.317 26.802 45.400
12 2.452 4.048 5.659 8.216 12.451 19.690 32.343 54.784
13 2.446 4.038 5.645 8.195 12.419 19.640 32.261 54.646
14 1.938 3.198 4.471 6.492 9.838 15.557 25.555 43.287
15 1.959 3.234 4.522 6.565 9.948 15.732 25.842 43.772
16 1.891 3.122 4.364 6.336 9.602 15.184 24.942 42.248
17 2.449 4.043 5.652 8.206 12.435 19.665 32.302 54.715
18 2.214 3.654 5.109 7.417 11.240 17.775 29.198 49.458
19 1.827 3.017 4.217 6.123 9.279 14.674 24.104 40.828
20 2.455 4.053 5.666 8.227 12.466 19.714 32.384 54.853
21 1.866 3.081 4.307 6.253 9.476 14.985 24.615 41.694
22 2.034 3.357 4.693 6.814 10.326 16.329 26.823 45.434
23 1.905 3.144 4.396 6.382 9.671 15.294 25.122 42.553
24 2.142 3.536 4.944 7.177 10.877 17.200 28.254 47.858
25 1.855 3.063 4.282 6.217 9.421 14.898 24.472 41.452
26 2.184 3.606 5.041 7.319 11.091 17.539 28.810 48.800
27 1.910 3.152 4.407 6.398 9.696 15.333 25.187 42.664
28 1.937 3.197 4.470 6.490 9.835 15.553 25.547 43.273
29 2.446 4.038 5.645 8.195 12.419 19.640 32.261 54.646
30 1.829 3.019 4.221 6.128 9.287 14.686 24.124 40.863
31 2.021 3.337 4.665 6.772 10.263 16.230 26.659 45.157
32 1.931 3.188 4.457 6.471 9.806 15.508 25.474 43.149
33 1.818 3.001 4.196 6.092 9.232 14.599 23.981 40.621
34 2.446 4.038 5.645 8.195 12.419 19.640 32.261 54.646
35 2.457 4.056 5.670 8.232 12.474 19.727 32.404 54.888
36 2.434 4.017 5.616 8.154 12.356 19.540 32.097 54.369
37 2.434 4.017 5.616 8.154 12.356 19.540 32.097 54.369
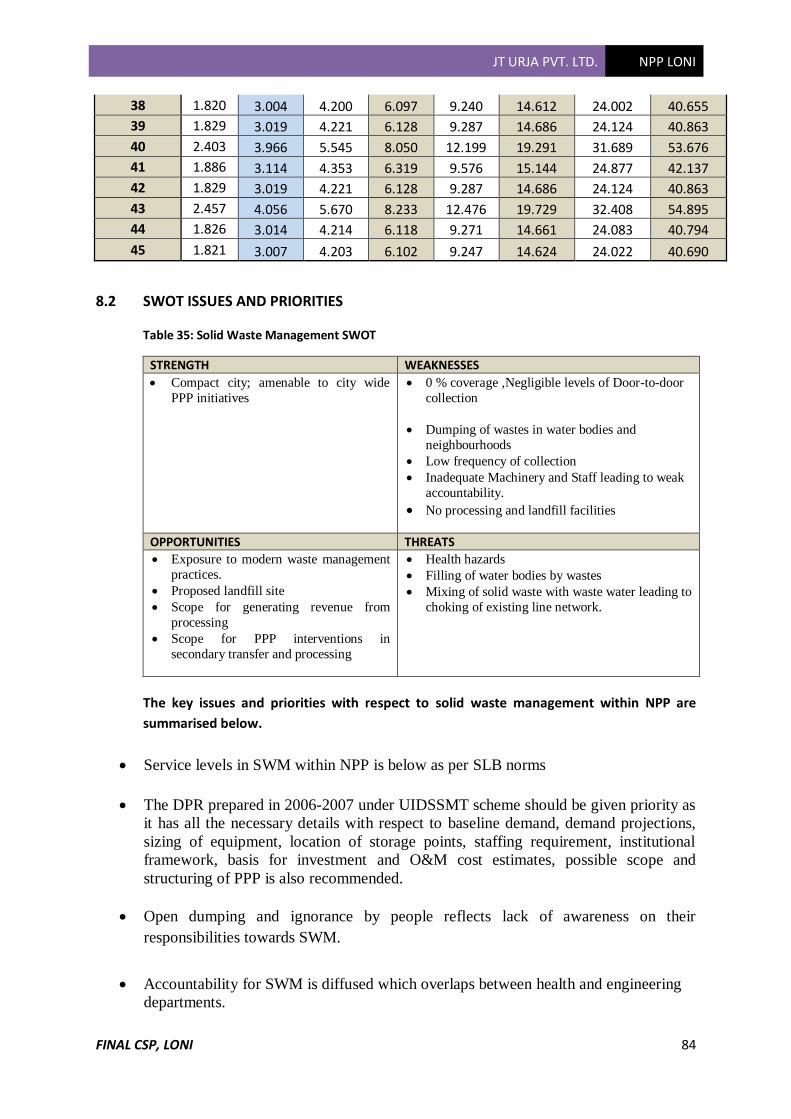
JT URJA PVT. LTD. NPP LONI
FINAL CSP, LONI 84
38 1.820 3.004 4.200 6.097 9.240 14.612 24.002 40.655
39 1.829 3.019 4.221 6.128 9.287 14.686 24.124 40.863
40 2.403 3.966 5.545 8.050 12.199 19.291 31.689 53.676
41 1.886 3.114 4.353 6.319 9.576 15.144 24.877 42.137
42 1.829 3.019 4.221 6.128 9.287 14.686 24.124 40.863
43 2.457 4.056 5.670 8.233 12.476 19.729 32.408 54.895
44 1.826 3.014 4.214 6.118 9.271 14.661 24.083 40.794
45 1.821 3.007 4.203 6.102 9.247 14.624 24.022 40.690
8.2 SWOT ISSUES AND PRIORITIES
Table 35: Solid Waste Management SWOT
STRENGTH WEAKNESSES
• Compact city; amenable to city wide
PPP initiatives
• 0 % coverage ,Negligible levels of Door-to-door
collection
• Dumping of wastes in water bodies and
neighbourhoods
• Low frequency of collection
• Inadequate Machinery and Staff leading to weak
accountability.
• No processing and landfill facilities
OPPORTUNITIES THREATS
• Exposure to modern waste management
practices.
• Proposed landfill site
• Scope for generating revenue from
processing
• Scope for PPP interventions in
secondary transfer and processing
• Health hazards
• Filling of water bodies by wastes
• Mixing of solid waste with waste water leading to
choking of existing line network.
The key issues and priorities with respect to solid waste management within NPP are
summarised below.
• Service levels in SWM within NPP is below as per SLB norms
• The DPR prepared in 2006-2007 under UIDSSMT scheme should be given priority as
it has all the necessary details with respect to baseline demand, demand projections,
sizing of equipment, location of storage points, staffing requirement, institutional
framework, basis for investment and O&M cost estimates, possible scope and
structuring of PPP is also recommended.
• Open dumping and ignorance by people reflects lack of awareness on their
responsibilities towards SWM.
• Accountability for SWM is diffused which overlaps between health and engineering
departments.
JT URJA PVT. LTD. NPP LONI
FINAL CSP, LONI 85
8.3 CONCEPTUAL BASIS AND BEST PRACTICES
Municipal solid waste management activities are inter-related, and there are several
technical options for every activity in the chain.
Segregation Source segregation is a requirement as per MSWM Rules 2000. However, when source
level sorting is not developed, then sorting at the community level/ storage / processing
facility may be considered till a house level sorting is established. Pre-sorting at
processing facilities is desirable to ensure that output (such as compost) meets regulatory
standards.
Sorting
Manual sorting comprises activities like unloading of waste collected, manually
spreading the waste, handpicking visually identifiable waste for reuse, and collecting the
remaining waste.
Semi-mechanized sorting comprises mechanized unloading, mechanized loading on
conveyor belts, handpicking reusable waste, and mechanized collection, stocking and
reloading of remaining waste; and
Fully-mechanized sorting comprises mechanized unloading, size reduction through
shredders, size separation/ screening, density and magnetic separation and compaction
Storage, Collection and Transportation
Doorstep collection of waste through containerized handcarts/tricycles or motorized
vehicles having non-conventional/ sounding horns deployed for doorstep waste
collection with active community participation.
Bin-free collection systems are becoming popular. The commonly used waste storage
include (i) metal containers/dumpers and (ii) plastic bins:
• A maximum loaded weight of around 30 kg if the collection is manual
• Devices that facilitate its movement between its place in the building and the place of
collection
• Closable in order to avoid waste spillage or exposure
• Economical and affordable for the general public
• Not producing excessive noise while handling
• Easy to empty without leaving waste at the bottom
Transfer Stations: Transfer stations are considered when the distance between the location
of large-scale collection activities and the landfill is greater than 20 km.
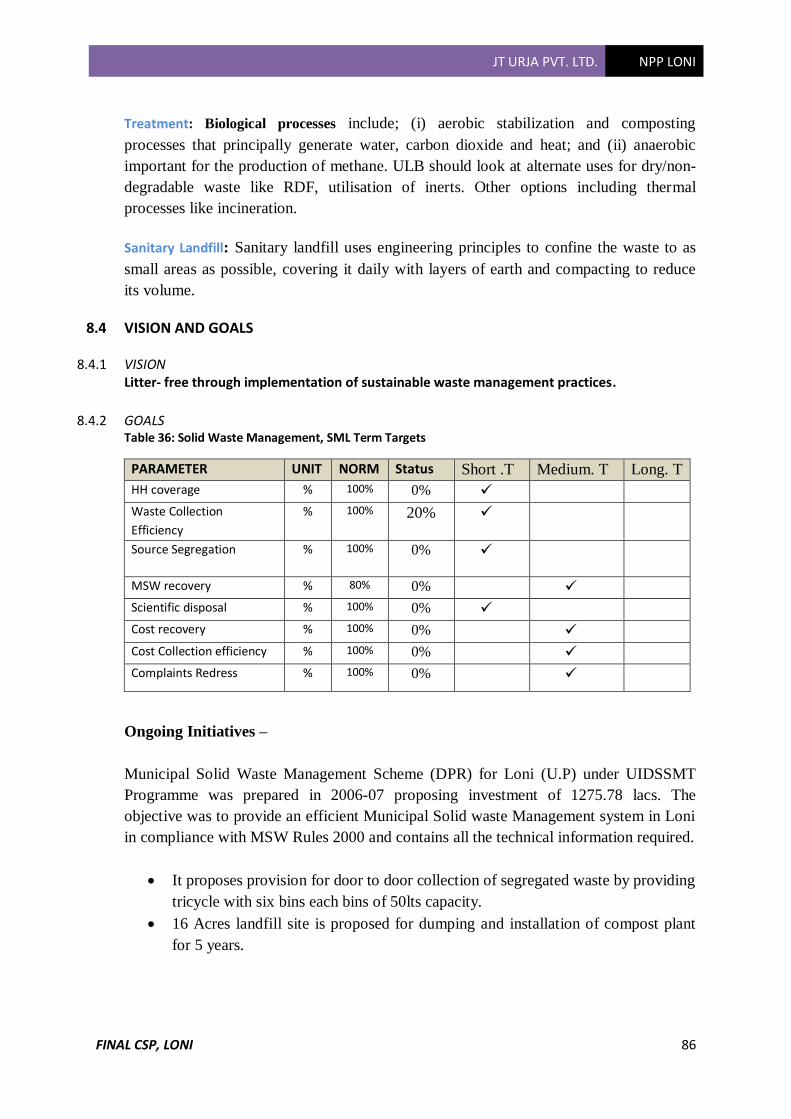
JT URJA PVT. LTD. NPP LONI
FINAL CSP, LONI 86
Treatment: Biological processes include; (i) aerobic stabilization and composting
processes that principally generate water, carbon dioxide and heat; and (ii) anaerobic
important for the production of methane. ULB should look at alternate uses for dry/non-
degradable waste like RDF, utilisation of inerts. Other options including thermal
processes like incineration.
Sanitary Landfill: Sanitary landfill uses engineering principles to confine the waste to as
small areas as possible, covering it daily with layers of earth and compacting to reduce
its volume.
8.4 VISION AND GOALS
8.4.1 VISION Litter- free through implementation of sustainable waste management practices.
8.4.2 GOALS
Table 36: Solid Waste Management, SML Term Targets
PARAMETER UNIT NORM Status Short .T Medium. T Long. T
HH coverage % 100% 0% ✓
Waste Collection
Efficiency
% 100% 20% ✓
Source Segregation % 100% 0% ✓
MSW recovery % 80% 0% ✓
Scientific disposal % 100% 0% ✓
Cost recovery % 100% 0% ✓
Cost Collection efficiency % 100% 0% ✓
Complaints Redress % 100% 0% ✓
Ongoing Initiatives –
Municipal Solid Waste Management Scheme (DPR) for Loni (U.P) under UIDSSMT
Programme was prepared in 2006-07 proposing investment of 1275.78 lacs. The
objective was to provide an efficient Municipal Solid waste Management system in Loni
in compliance with MSW Rules 2000 and contains all the technical information required.
• It proposes provision for door to door collection of segregated waste by providing
tricycle with six bins each bins of 50lts capacity.
• 16 Acres landfill site is proposed for dumping and installation of compost plant
for 5 years.
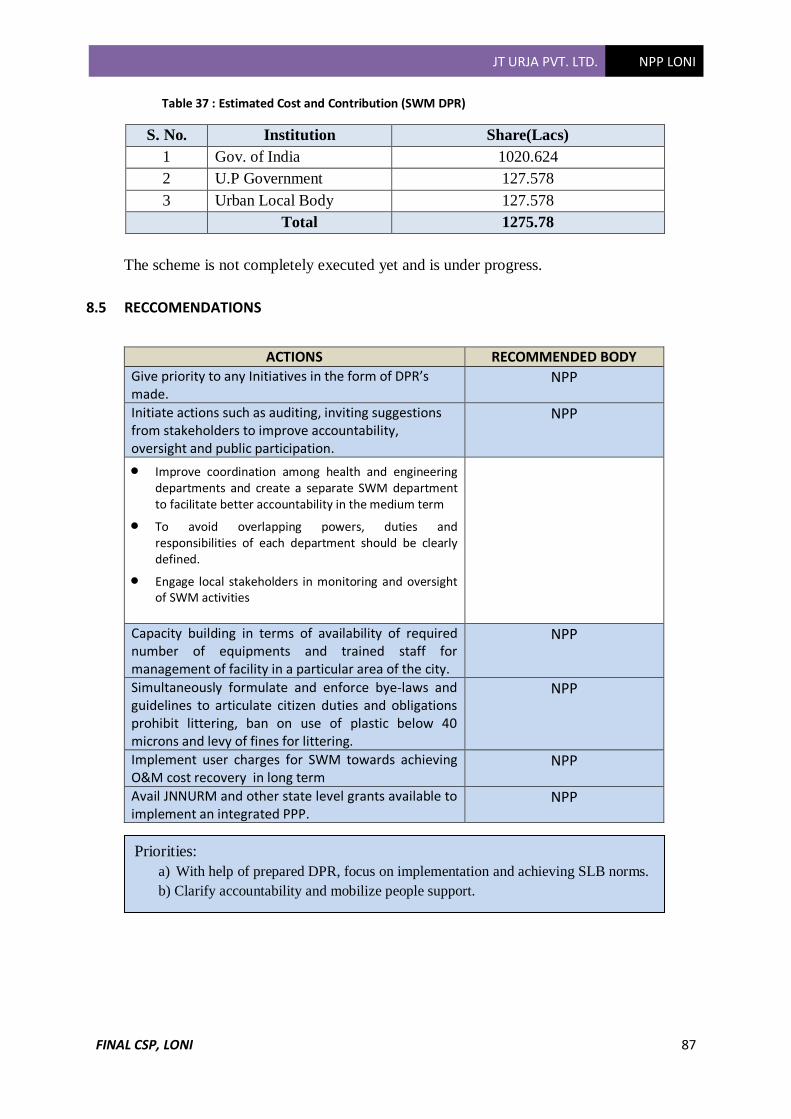
JT URJA PVT. LTD. NPP LONI
FINAL CSP, LONI 87
Table 37 : Estimated Cost and Contribution (SWM DPR)
S. No. Institution Share(Lacs)
1 Gov. of India 1020.624
2 U.P Government 127.578
3 Urban Local Body 127.578
Total 1275.78
The scheme is not completely executed yet and is under progress.
8.5 RECCOMENDATIONS
ACTIONS RECOMMENDED BODY Give priority to any Initiatives in the form of DPR’s made.
NPP
Initiate actions such as auditing, inviting suggestions from stakeholders to improve accountability, oversight and public participation.
NPP
• Improve coordination among health and engineering departments and create a separate SWM department to facilitate better accountability in the medium term
• To avoid overlapping powers, duties and responsibilities of each department should be clearly defined.
• Engage local stakeholders in monitoring and oversight of SWM activities
Capacity building in terms of availability of required number of equipments and trained staff for management of facility in a particular area of the city.
NPP
Simultaneously formulate and enforce bye-laws and guidelines to articulate citizen duties and obligations prohibit littering, ban on use of plastic below 40 microns and levy of fines for littering.
NPP
Implement user charges for SWM towards achieving O&M cost recovery in long term
NPP
Avail JNNURM and other state level grants available to implement an integrated PPP.
NPP
Priorities:
a) With help of prepared DPR, focus on implementation and achieving SLB norms.
b) Clarify accountability and mobilize people support.
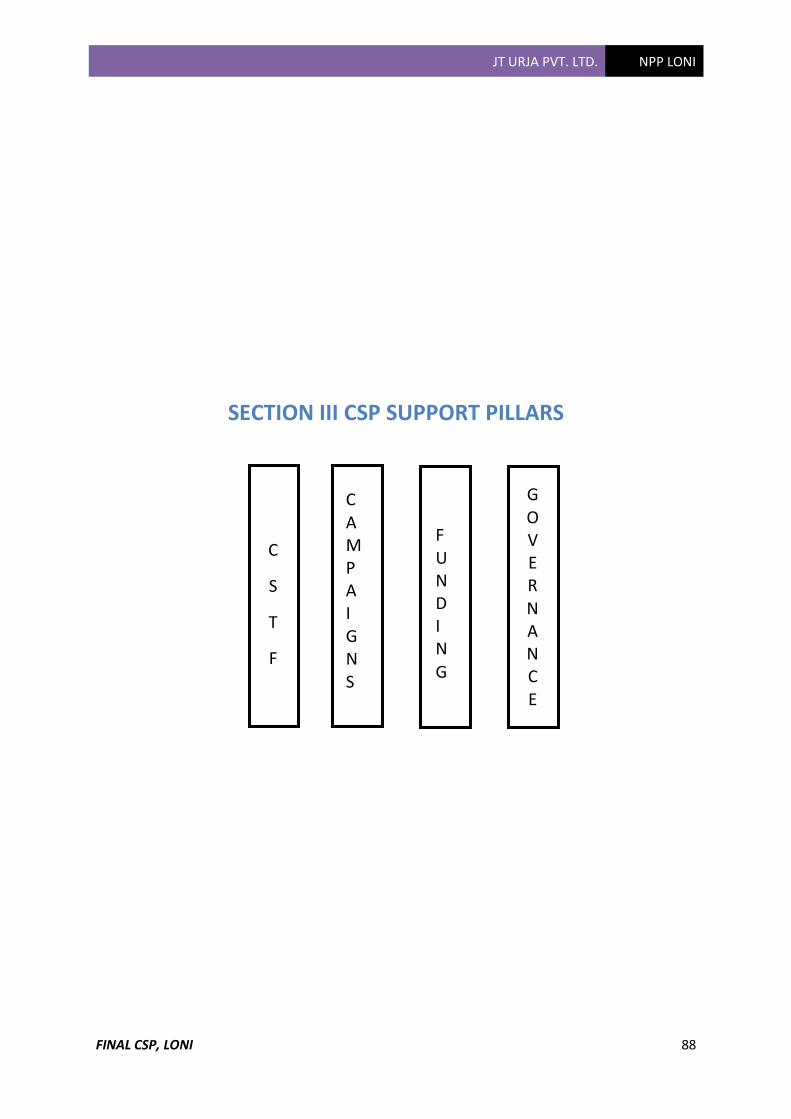
JT URJA PVT. LTD. NPP LONI
FINAL CSP, LONI 88
SECTION III CSP SUPPORT PILLARS
C
S
T
F
GOVERNANCE
CAMPA I GNS
FUND I N
G
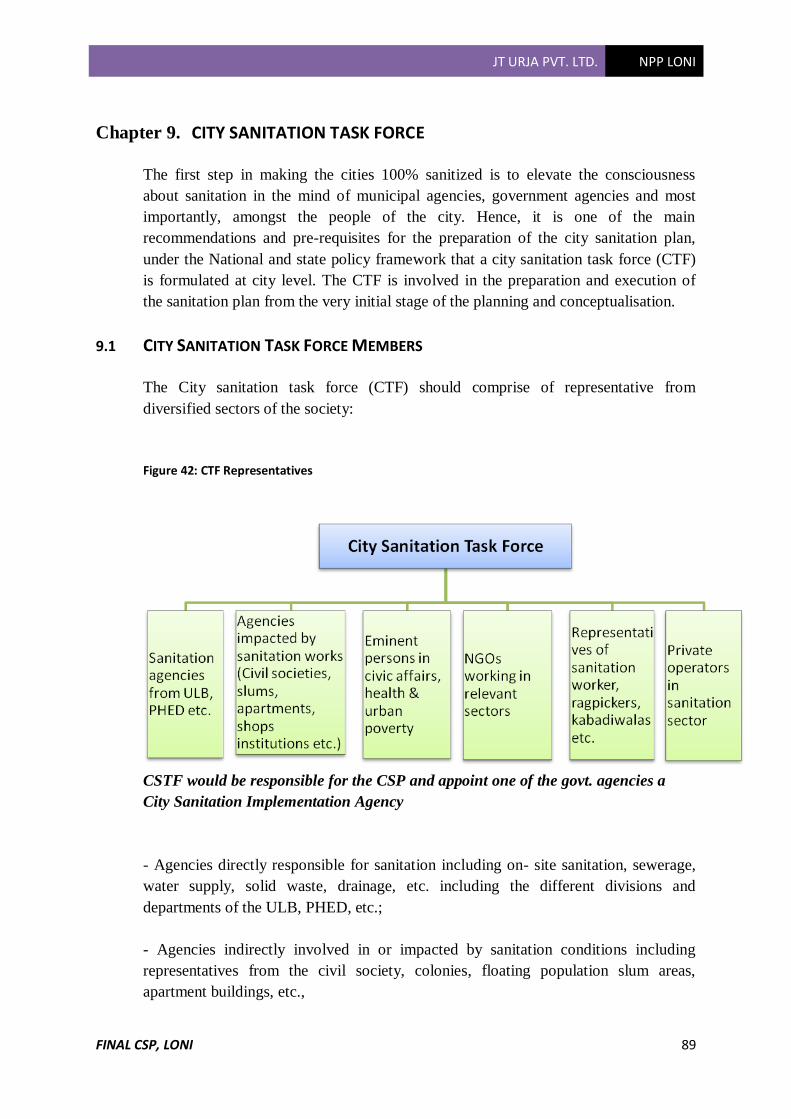
JT URJA PVT. LTD. NPP LONI
FINAL CSP, LONI 89
Chapter 9. CITY SANITATION TASK FORCE
The first step in making the cities 100% sanitized is to elevate the consciousness
about sanitation in the mind of municipal agencies, government agencies and most
importantly, amongst the people of the city. Hence, it is one of the main
recommendations and pre-requisites for the preparation of the city sanitation plan,
under the National and state policy framework that a city sanitation task force (CTF)
is formulated at city level. The CTF is involved in the preparation and execution of
the sanitation plan from the very initial stage of the planning and conceptualisation.
9.1 CITY SANITATION TASK FORCE MEMBERS
The City sanitation task force (CTF) should comprise of representative from
diversified sectors of the society:
Figure 42: CTF Representatives
CSTF would be responsible for the CSP and appoint one of the govt. agencies a
City Sanitation Implementation Agency
- Agencies directly responsible for sanitation including on- site sanitation, sewerage,
water supply, solid waste, drainage, etc. including the different divisions and
departments of the ULB, PHED, etc.;
- Agencies indirectly involved in or impacted by sanitation conditions including
representatives from the civil society, colonies, floating population slum areas,
apartment buildings, etc.,
JT URJA PVT. LTD. NPP LONI
FINAL CSP, LONI 90
- Eminent persons and practitioners in civic affairs, health, urban poverty,
- Representatives from shops, industries and establishments,
- Representatives of other large institutions in the city (e.g. Cantonment Boards, Govt.
of India or State Govt. Enterprise campuses, etc.).
- NGOs working on water and sanitation, urban development and slums, health and
environment,
- Representatives of unions of safai karamcharies, sewerage sanitary, recycling agents/
kabaries etc.
- Representatives from private firms/ contractors formally or informally working in
the sanitation sector (e.g. garbage collectors, septic tank de-sludging firms etc.)
- Representatives from educational and cultural institutions
- any other significant or interested stakeholders
9.2 RESPONSIBILITIES OF CSTF
• Launching the City 100% Sanitation Campaign
• Generating awareness amongst the city’s citizens and stakeholders
Some of the elected Members of the ULB must be members of the Task Force. The Task
Force should be headed by the Mayor / Chairman with the executive head (e.g. Municipal
commissioner / Executive Officer) as the Convener. Cities can also choose to appoint, as a
part of the Task force, City Sanitation Ambassadors chosen from Draft City Sanitation
Plan for Loni 2014 eminent people who enjoy outstanding credibility and influence
amongst the city’s leadership and population.
Political leadership must be involved from all political parties and persuasions so
that the sanitation campaign has the full support of all stakeholders and no
opposition from any group. One of the things to be considered by the Task Force is
to organize a multi stakeholder, multi- party meeting in the preparatory stage, and
take a formal resolution to make the city 100% Sanitized, and publicize the same,
with all signatories.
JT URJA PVT. LTD. NPP LONI
FINAL CSP, LONI 91
• Approving materials and progress reports provided by the implementing agency, other
public agencies as well as NGOs and private parties contracted by the implementing
Agency, for different aspects of implementation
• Approving the City Sanitation Plan for the city prepared by the Sanitation
Implementation Agency after consultations with citizens
• Implementation of Information System Improvement Plan (ISIP)
• Undertaking field visits from time to time to supervise progress
• Issue briefings to the press/ media and state government about progress
• Providing overall guidance to the Implementation- Agency
• Implementation of Performance Improvement Plan (PIP)
• Recommend to the ULB fixing of responsibilities for city- wide sanitation on a
permanent basis
The Task Force should meet formally frequently (at least once in two months) in the
initial stages to monitor and guide the process of planning and implementation. At a
later stage, meetings and field visits can be on an as- needed basis. In some cities,
the City Sanitation Task Force may divide up roles and responsibilities amongst
smaller sub- committees to focus on different aspects closely while keeping the
overall character of the Task Force intact.
(a) The Task Force should appoint one of the key agencies, preferably the ULBs, to
become the City Sanitation Implementing Agency for the CSP for the city. This
agency will be responsible for day to day coordination, management and
implementation of the sanitation programmes on a city- wide basis. The agency will
coordinate with and agree on joint actions with other public agencies, and contract in
and supervise the services of NGOs (through Memorandum of Understanding) and
private parties (through contracts) for preparing and disseminating materials for IEC,
conducting baseline surveys and stakeholder consultations, maintaining a
comprehensive GIS- based database of better reliability, implementing the
Performance Improvement Plan (PIP) and physical works, letting out and
supervising O&M management contracts, etc. The Loni Nagar Palika formally
appointed City Sanitation Task Force and intimated to the Implementing Agency.
(b) Assign Institutional Responsibilities:
One of the key gaps in urban sanitation is lack of clear and complementary
institutional responsibilities. This comprises two aspects: a) roles and responsibilities
JT URJA PVT. LTD. NPP LONI
FINAL CSP, LONI 92
institutionalized on a permanent basis; and b) roles and responsibilities for the
immediate campaign, planning and implementation of the City’s Sanitation Plan
based on which the former can be outlined experimented with, and finally
institutionalized.
The Sanitation Task Force will recommend the assigning of permanent
responsibilities for city- wide sanitation to the ULB including the following aspects:
• The ULB to have final overall responsibility for city- wide sanitation, including
devolving power, functions functionaries and funds to them
• Planning and Financing including State Government and Govt. of India schemes
• Asset creation including improvement, augmentation
• Operations and Management(O&M) Arrangements for all network, on -site,
individual, community and public sanitation facilities and systems(including
transportation up to final treatment and disposal of wastes)
• Fixing tariffs and revenue collections in order to make O&M sustainable
• Improving access and instituting special O&M arrangements for the urban poor and
un served populations in slum areas and in mixed areas
• Adopting standards- for
✓ Environment Outcomes (e.g. State pollution Control Board standards on
effluent parameters).
✓ Public- Health Outcomes(e.g. State Health Departments),
✓ Processes(e.g. safe disposal of on- site septage)
✓ Infrastructure( e.g. design standards and criteria) (PHEDs/ Para statals)
• Service Delivery standards( e.g. by Urban Development departments)
✓ Adoption of Regulatory roles including environmental standards (e.g. State
pollution Control Boards), Health outcomes (e.g. Health Departments).
✓ Measures in case specific stakeholders do not discharge their responsibilities
properly
✓ Training and Capacity Building of implementing agency and related personnel
- Redressal of public complaints regarding sanitation, water supply and solid
waste management.

JT URJA PVT. LTD. NPP LONI
FINAL CSP, LONI 93
✓ Monitoring of 100% Sanitation involving multiple stakeholders. The roles and
responsibilities for the Sanitation Plan implementation will also be the task of
the City Sanitation Task Force.
9.3 Stakeholders Workshop Feedback
Before finalizing the CSP of Loni it is critical for the stakeholders to agree on the key
goals of the CSP of the CSP. The results of discussions are presented below:
Figure 43: Goals of City Sanitation
As evidenced from the figure above, 100% coverage and accessibility of sanitation
services was given top most priority followed by affordability good public health and
100% efficiency.
Goals like 3R principal, Compliance with government rules were not given too much
of priority. Surprisingly, awareness among people of Loni which is an equally
important issue was not recommended by stakeholders. In light of above situation it is
pertinent that immediate steps are taken to increase coverage and accessibility of
sanitation facility along with quarterly campaigning to sensitise public on sanitation
issues affecting their health’s.
Below are the results of deliberation by CTFM and stakeholders on the key issues
related to sanitation of the city.
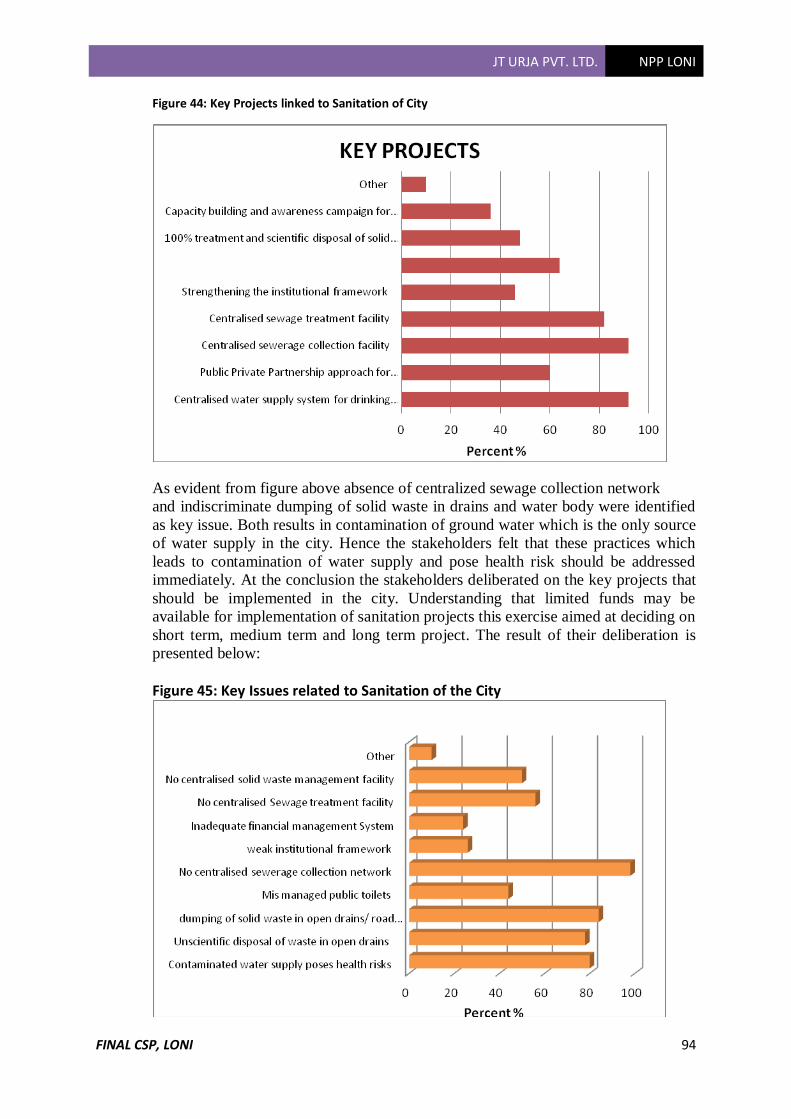
JT URJA PVT. LTD. NPP LONI
FINAL CSP, LONI 94
Figure 44: Key Projects linked to Sanitation of City
As evident from figure above absence of centralized sewage collection network
and indiscriminate dumping of solid waste in drains and water body were identified
as key issue. Both results in contamination of ground water which is the only source
of water supply in the city. Hence the stakeholders felt that these practices which
leads to contamination of water supply and pose health risk should be addressed
immediately. At the conclusion the stakeholders deliberated on the key projects that
should be implemented in the city. Understanding that limited funds may be
available for implementation of sanitation projects this exercise aimed at deciding on
short term, medium term and long term project. The result of their deliberation is
presented below:
Figure 45: Key Issues related to Sanitation of the City
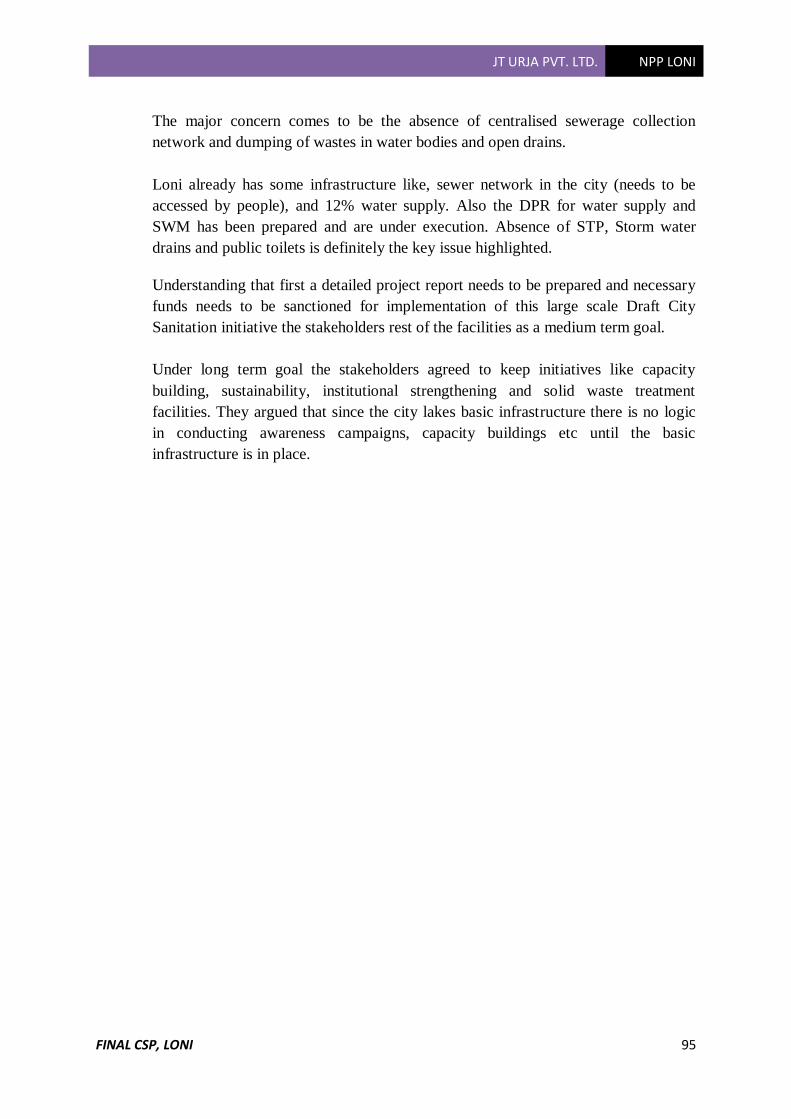
JT URJA PVT. LTD. NPP LONI
FINAL CSP, LONI 95
The major concern comes to be the absence of centralised sewerage collection
network and dumping of wastes in water bodies and open drains.
Loni already has some infrastructure like, sewer network in the city (needs to be
accessed by people), and 12% water supply. Also the DPR for water supply and
SWM has been prepared and are under execution. Absence of STP, Storm water
drains and public toilets is definitely the key issue highlighted.
Understanding that first a detailed project report needs to be prepared and necessary
funds needs to be sanctioned for implementation of this large scale Draft City
Sanitation initiative the stakeholders rest of the facilities as a medium term goal.
Under long term goal the stakeholders agreed to keep initiatives like capacity
building, sustainability, institutional strengthening and solid waste treatment
facilities. They argued that since the city lakes basic infrastructure there is no logic
in conducting awareness campaigns, capacity buildings etc until the basic
infrastructure is in place.
JT URJA PVT. LTD. NPP LONI
FINAL CSP, LONI 96
Chapter 10. GOVERNANCE AND INSTITUTIONAL FRAMEWORK
10.1 CITY LEVEL STATUS
NPP, as in the case of other ULBs in Uttar Pradesh, is responsible for providing basic
infrastructure services and other civic services within its jurisdiction. Apart from NPP,
a number of state level agencies are involved in planning and providing urban services
within city.
Table 38 : Existing Organizational Chart
S. No. Designation NO. 1 Adhishasi Adhikari, Grade II (EO 1 2 Junior Engineer (Civil) 1 3 Supervisor 1
4 Pump operating staff ( Water) 11
6 Centralised Employees(Total approved / existing) 11
7 Total Sanitation Sweepers 464 8 Daily wagers 3 9 Total office staff( permanent) 11
10 Total Water Work staff( permanent) 11 11 Sanitation staff (permanent) 18
Loni is constantly plagued by the issues of irregular absenteeism, sub-standard work
practices, non-compliance with occupation health and safety rules, non-cooperation
with communities and several disciplinary issues. It also lacks the training programs to
orient the workers towards best management practices, service delivery methods, and
general code of conduct.
Loni sewerage service management is further affected adversely owing to the vacancies
in its department with respect to key positions. Large absenteeism, disciplinary issues,
non -compliance to best management practices, occupational health and safety rules,
lack of training, regular vacancies in Loni department are evidently the major issues.
RECOMMENDED STRUCTURE
According to the Model Municipal Law (MML) the municipal bodies should be
responsible for basic facilities for the city including:
1. Water supply;
2. Drainage, waste management (sewerage & solid waste);
3. Economic and social development plans;
4. Transportation systems;
5. Community health and protection of environment;
6. Construction and maintenance of slaughterhouses.
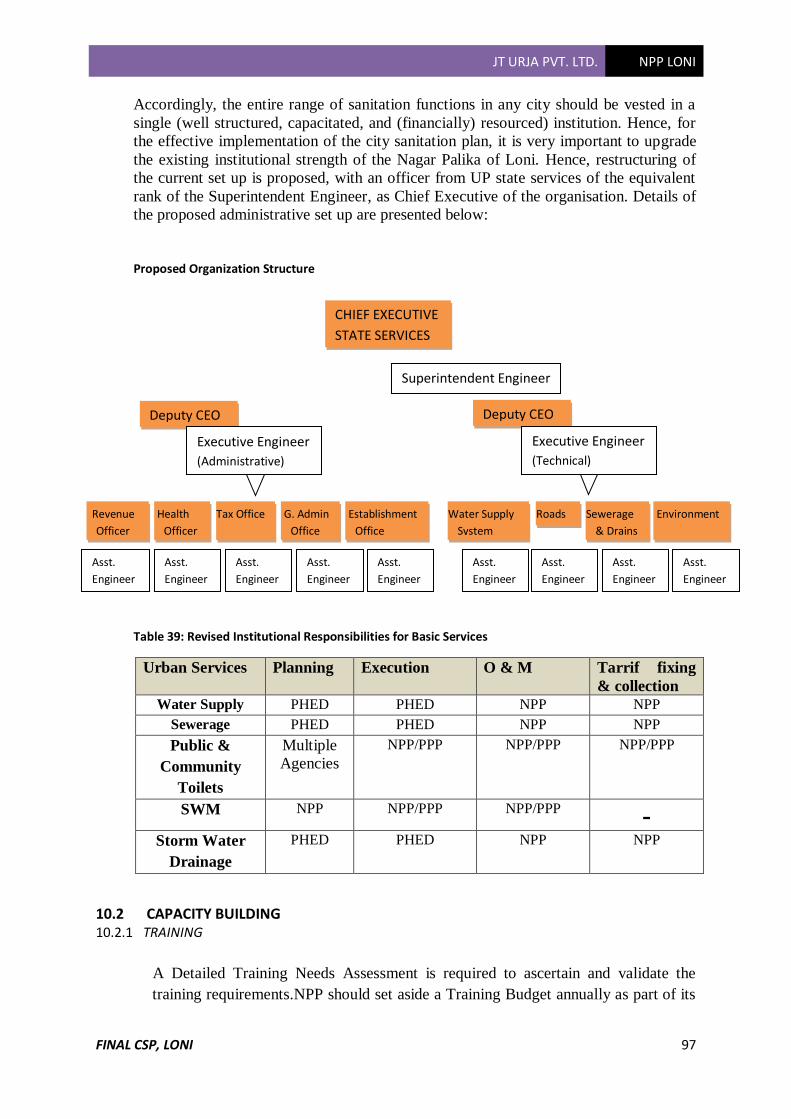
JT URJA PVT. LTD. NPP LONI
FINAL CSP, LONI 97
Accordingly, the entire range of sanitation functions in any city should be vested in a
single (well structured, capacitated, and (financially) resourced) institution. Hence, for
the effective implementation of the city sanitation plan, it is very important to upgrade
the existing institutional strength of the Nagar Palika of Loni. Hence, restructuring of
the current set up is proposed, with an officer from UP state services of the equivalent
rank of the Superintendent Engineer, as Chief Executive of the organisation. Details of
the proposed administrative set up are presented below:
Proposed Organization Structure
Table 39: Revised Institutional Responsibilities for Basic Services
Urban Services Planning Execution O & M Tarrif fixing
& collection
Water Supply PHED PHED NPP NPP Sewerage PHED PHED NPP NPP Public &
Community
Toilets
Multiple
Agencies
NPP/PPP NPP/PPP NPP/PPP
SWM NPP NPP/PPP NPP/PPP - Storm Water
Drainage
PHED PHED NPP NPP
10.2 CAPACITY BUILDING 10.2.1 TRAINING
A Detailed Training Needs Assessment is required to ascertain and validate the
training requirements.NPP should set aside a Training Budget annually as part of its
CHIEF EXECUTIVE
STATE SERVICES
Superintendent Engineer
Deputy CEO Deputy CEO
Executive Engineer
(Administrative)
Executive Engineer
(Technical)
Revenue
Officer
Health
Officer
Tax Office G. Admin
Office
Establishment
Office
Water Supply
System
Roads Sewerage
& Drains
Environment
Asst.
Engineer
Asst.
Engineer
Asst.
Engineer
Asst.
Engineer
Asst.
Engineer
Asst.
Engineer
Asst.
Engineer
Asst.
Engineer
Asst.
Engineer
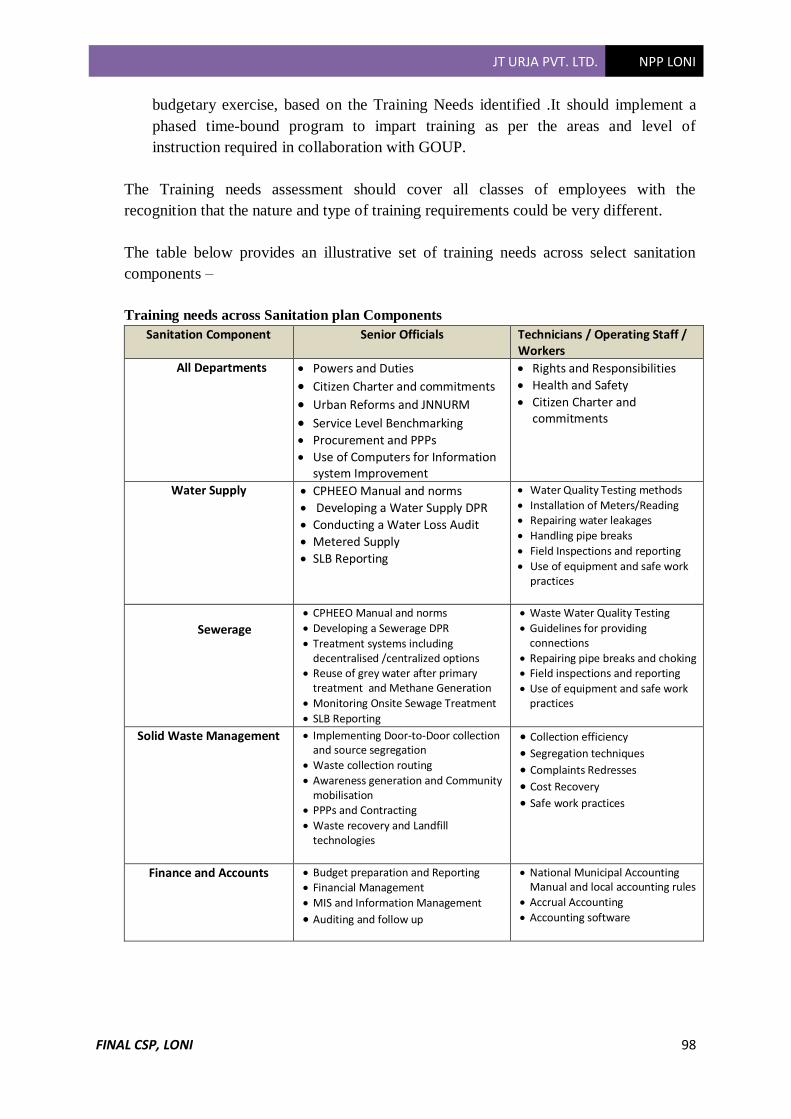
JT URJA PVT. LTD. NPP LONI
FINAL CSP, LONI 98
budgetary exercise, based on the Training Needs identified .It should implement a
phased time-bound program to impart training as per the areas and level of
instruction required in collaboration with GOUP.
The Training needs assessment should cover all classes of employees with the
recognition that the nature and type of training requirements could be very different.
The table below provides an illustrative set of training needs across select sanitation
components –
Training needs across Sanitation plan Components
Sanitation Component Senior Officials Technicians / Operating Staff / Workers
All Departments • Powers and Duties
• Citizen Charter and commitments • Urban Reforms and JNNURM
• Service Level Benchmarking • Procurement and PPPs
• Use of Computers for Information system Improvement
• Rights and Responsibilities
• Health and Safety
• Citizen Charter and commitments
Water Supply • CPHEEO Manual and norms
• Developing a Water Supply DPR
• Conducting a Water Loss Audit
• Metered Supply
• SLB Reporting
• Water Quality Testing methods
• Installation of Meters/Reading • Repairing water leakages
• Handling pipe breaks
• Field Inspections and reporting
• Use of equipment and safe work practices
Sewerage
• CPHEEO Manual and norms
• Developing a Sewerage DPR
• Treatment systems including decentralised /centralized options
• Reuse of grey water after primary treatment and Methane Generation
• Monitoring Onsite Sewage Treatment
• SLB Reporting
• Waste Water Quality Testing
• Guidelines for providing connections
• Repairing pipe breaks and choking • Field inspections and reporting
• Use of equipment and safe work practices
Solid Waste Management • Implementing Door-to-Door collection and source segregation
• Waste collection routing
• Awareness generation and Community mobilisation
• PPPs and Contracting
• Waste recovery and Landfill technologies
• Collection efficiency • Segregation techniques • Complaints Redresses • Cost Recovery • Safe work practices
Finance and Accounts • Budget preparation and Reporting • Financial Management
• MIS and Information Management
• Auditing and follow up
• National Municipal Accounting Manual and local accounting rules
• Accrual Accounting
• Accounting software
JT URJA PVT. LTD. NPP LONI
FINAL CSP, LONI 99
10.2.2 PERSONNEL MANAGEMENT AND OCCUPATIONAL HEALTH
Sanitation operations especially waste management essentially involve significant role
of manpower especially sanitation workers and safai karamcharis with most of them
working on contract (temporary basis). Majority of these workers are unskilled and
poorly educated. Further, the problems of low level of awareness, poor commitment,
and discipline; resource diversion; absenteeism; alcoholism; drug addiction; etc. have
also been commonly observed among these workers.
Further, due to the very nature of their occupation, the sanitation workers are exposed
to a plethora of disease vectors at various stages of handling waste. As a result of this
high exposure, typically, morbidity rate is found to be high among them, resulting in
poor productivity as well as in generally high mortality.
In order to address these issues, it is recommended that NPP, Loni allocate adequate
resources to ensure appropriate interventions for management of personnel and their
health and safety. These interventions will comprise of a range of short-term training
courses round the year on a regular basis for all grades of sanitation workers on the
significance and importance of their work to the city to enhance self-esteem, on
handling the issues of alcoholism and drug addiction and occupational health and safety
aspects, personal health protection, etc.
NPP should arrange to conduct regular medical check-up of all MSW/sanitation
workers with the provision of appropriate and commensurate support for curative
treatment for those found to have chronic ailments.
Arrangement to provide uniforms, caps with NPP, Loni logos, and personal protective
equipment on a regular basis to impart a sense of identity.
Further the institutional set up and capacity for effective sanitation can be enhanced by
NPP, Loni by participatory approach:
• Engaging a group of NGOs and social workers with good communication skills to
commence a sustainable campaign on effective sanitation practices all across the city;
• Involving civil society/ community-based organizations such as resident welfare
associations, mohalla committees, market/traders associations, women’s groups, and
rag-pickers’ groups in various municipal services & evolving a participatory
monitoring system for sanitation services.
• Adopt a system of organizing regular consultations with stakeholders on the issues of,
environmental sanitation, MSW management, public health and hygiene, quality of
life and urban governance/development in general.
10.2.3 INFORMATION MANAGEMENT
House Level Baseline Sanitation Information
Updation of baseline information on sanitation indicators at a household level is
critical for NPP planning, analysis and decision making with respect to sanitation
services. A possible periodic approach is suggested below –
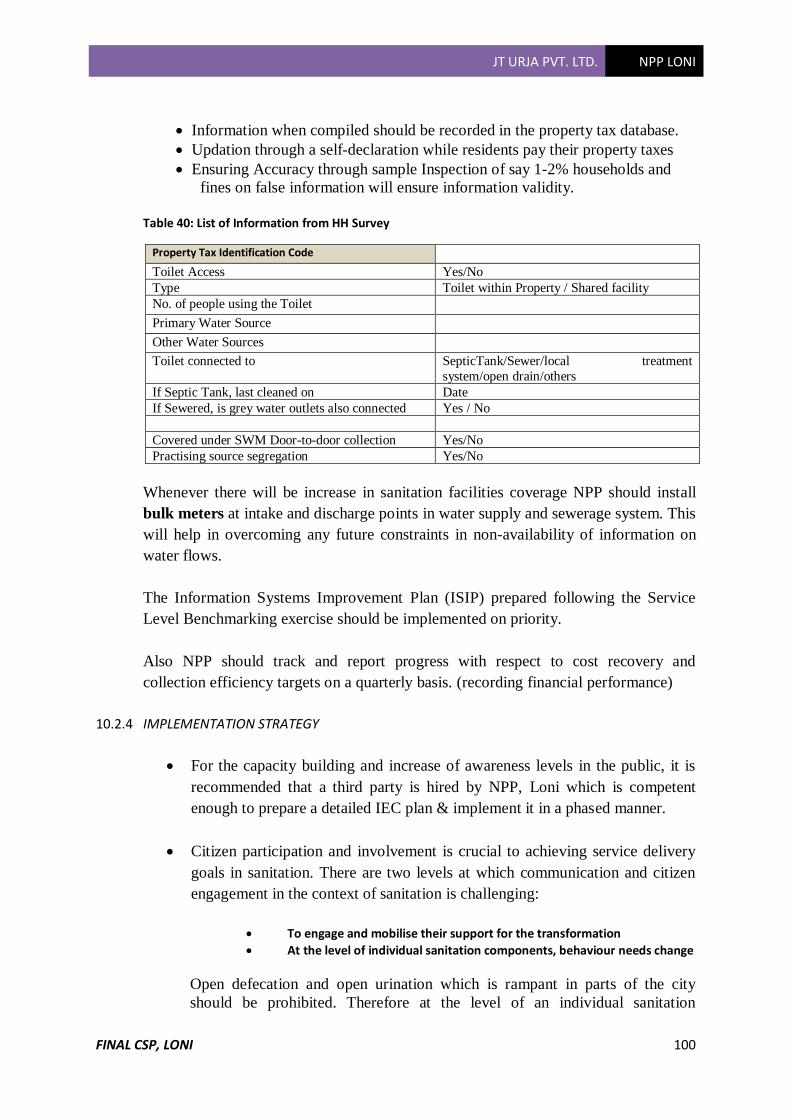
JT URJA PVT. LTD. NPP LONI
FINAL CSP, LONI 100
• Information when compiled should be recorded in the property tax database.
• Updation through a self-declaration while residents pay their property taxes • Ensuring Accuracy through sample Inspection of say 1-2% households and
fines on false information will ensure information validity. Table 40: List of Information from HH Survey
Property Tax Identification Code Toilet Access Yes/No
Type Toilet within Property / Shared facility
No. of people using the Toilet Primary Water Source Other Water Sources Toilet connected to SepticTank/Sewer/local treatment
system/open drain/others
If Septic Tank, last cleaned on Date
If Sewered, is grey water outlets also connected Yes / No
Covered under SWM Door-to-door collection Yes/No
Practising source segregation Yes/No
Whenever there will be increase in sanitation facilities coverage NPP should install
bulk meters at intake and discharge points in water supply and sewerage system. This
will help in overcoming any future constraints in non-availability of information on
water flows.
The Information Systems Improvement Plan (ISIP) prepared following the Service
Level Benchmarking exercise should be implemented on priority.
Also NPP should track and report progress with respect to cost recovery and
collection efficiency targets on a quarterly basis. (recording financial performance)
10.2.4 IMPLEMENTATION STRATEGY
• For the capacity building and increase of awareness levels in the public, it is
recommended that a third party is hired by NPP, Loni which is competent
enough to prepare a detailed IEC plan & implement it in a phased manner.
• Citizen participation and involvement is crucial to achieving service delivery
goals in sanitation. There are two levels at which communication and citizen
engagement in the context of sanitation is challenging:
• To engage and mobilise their support for the transformation
• At the level of individual sanitation components, behaviour needs change
Open defecation and open urination which is rampant in parts of the city
should be prohibited. Therefore at the level of an individual sanitation
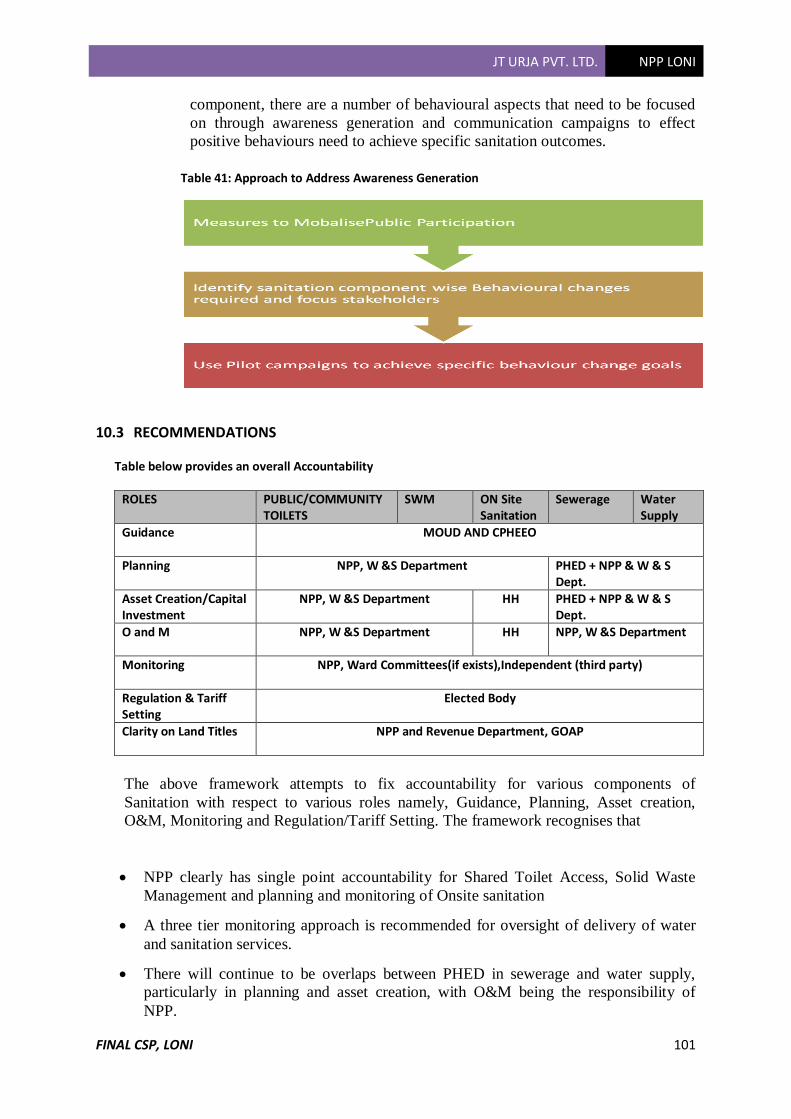
JT URJA PVT. LTD. NPP LONI
FINAL CSP, LONI 101
component, there are a number of behavioural aspects that need to be focused
on through awareness generation and communication campaigns to effect
positive behaviours need to achieve specific sanitation outcomes.
Table 41: Approach to Address Awareness Generation
10.3 RECOMMENDATIONS
Table below provides an overall Accountability
ROLES PUBLIC/COMMUNITY TOILETS
SWM ON Site Sanitation
Sewerage Water Supply
Guidance MOUD AND CPHEEO
Planning NPP, W &S Department PHED + NPP & W & S Dept.
Asset Creation/Capital Investment
NPP, W &S Department HH PHED + NPP & W & S Dept.
O and M NPP, W &S Department HH NPP, W &S Department
Monitoring NPP, Ward Committees(if exists),Independent (third party)
Regulation & Tariff Setting
Elected Body
Clarity on Land Titles NPP and Revenue Department, GOAP
The above framework attempts to fix accountability for various components of
Sanitation with respect to various roles namely, Guidance, Planning, Asset creation,
O&M, Monitoring and Regulation/Tariff Setting. The framework recognises that
• NPP clearly has single point accountability for Shared Toilet Access, Solid Waste
Management and planning and monitoring of Onsite sanitation
• A three tier monitoring approach is recommended for oversight of delivery of water
and sanitation services.
• There will continue to be overlaps between PHED in sewerage and water supply,
particularly in planning and asset creation, with O&M being the responsibility of
NPP.
JT URJA PVT. LTD. NPP LONI
FINAL CSP, LONI 102
REFERENCES
• National Urban Sanitation Policy
• Uttar Pradesh State Sanitation Policy
• Urban Infrastructure Development Small and Medium Towns
• Municipal Solid Waste Management Scheme for Loni (U.P) under UIDSSMT
Programme Year 2006-2007
• Loni Water Supply Re-organisation Scheme (UNDER UIDSSMT)
• Loni Sewerage Scheme under UIDSSMT – District Ghaziabad
• Nagar Palika Parishad, Loni–Statistical Summary Report
• Service Level Benchmarking –General Information of City
JT URJA PVT. LTD. NPP LONI
FINAL CSP, LONI 103
ANNEXURES
JT URJA PVT. LTD. NPP LONI
FINAL CSP, LONI 104
ANNEXURE-1: LIST OF CSTF MEMEBERS
flVh lsfuVs'ku Iyku rS;kj fd;s tkus gsrq VkLd QkslZ lfefr
,

JT URJA PVT. LTD. NPP LONI
FINAL CSP, LONI 105
JT URJA PVT. LTD. NPP LONI
FINAL CSP, LONI 106
JT URJA PVT. LTD. NPP LONI
FINAL CSP, LONI 107
ANNEXURE-2: MINUTES OF MEETING OF CITY SANITATION TASK FORCE
MINUTES OF MEETING OF STAKEHOLDERS CONSULTATION
Date : 27th January 2014
Time : 13:30 p.m. – 3:30 p.m.
Venue : Nagar Palika Conference Hall, Loni
The Chairman welcomed all the CSTF members and introduced the consultants and briefly
explained the process of City Sanitation Plan and asked Mr. Jawed to give the presentation on
situation analysis based on the survey results and analysis, conducted by the survey team and
explained the prioritization setting exercise as proposed to be carried out at the conclusion of
the meeting. The points discussed are as follows:
I. Participants highlighted the problems faced by them in their respective wards. Mostly,
it was related to Collection, Disposal & Proper Management of Solid Waste. They
also suggested that water supply & quality of water should be given top priority.
II. One of the participant highlighted that there should be an individual centre in every
ward to look after sanitation problems.
III. There should be a multipurpose community centre in each ward with having facilities
like dispensary and community toilets.
IV. Chairman assured that they will organize a meeting with all the representatives of
nursing homes and hospitals to understand the issue in detail and propose an
appropriate solution. He also mentioned that the GIS based satellite mapping and e-
governance initiative has been carried out and GIS map was being shown to all
participants.
V. NGO and RWA should be used for awareness generation in the people, particularly
for improved sanitation.
VI. One of the participants highlighted Talab ka Saundarikaran aur Viriksha ropan
activity should be done near every water body exists in Nagar Palika area.
VII. One of the CSTF member highlighted problems of road and slum and laid more
emphasis on sanitation and also expressed their feeling on quality of water supplied,
water related health problems and told that quality of ground water is not too good for
drinking purposes in Loni.
JT URJA PVT. LTD. NPP LONI
FINAL CSP, LONI 108
VIII. One of the CSTF member expressed his views on operation and maintenance that how
to make city clean. Installation of a centralized sewerage system and provision of
clean drinking water forms the need of the hour. He mentioned that the process should
not stop at planning stage but implementation should also be given importance.
IX. Unsystematic disposal of solid waste and waste water from industries in low lying
areas will lead to contamination of ground water and the same should be checked
immediately.
X. EO assured that the problems of city will be resolved as soon as possible specially for
improved sanitation and water supply systems in the city with the positive cooperation
from public.
XI. The chairman thanked to all stakeholders for their participation and assured that
problems raised by participants will be resolved. In addition chairman needs public
cooperation to increase the awareness in the public regarding sanitation.
JT URJA PVT. LTD. NPP LONI
FINAL CSP, LONI 109
ANNEXURE-3: SURVEY QUETIONNAIRE
Questionnaire for Household Survey
Personal information
Name: __________________________ H. No.:__________________________
No. of members in the household: ____ Ward No.:_______________________
Employment Type: ________________ Zone: ___________________________
Income Category: _______________
Q. No. Questions Responses Count
I. Sanitation System
1.
Is there toilet facility available in house? Yes
No
Total
2
Type of Toilet (Wet-Flush/dry- soak pit
3 If yes.
a. How many members of household use it?
b. Is the toilet shared by houses OR Individuals?
4. If No, do you use a public/community
toilet OR defecate openly?
5 Are there community toilets/ Urinals in
your locality?
Yes
No
Total
If Yes:
6 What is the condition of the public toilet?
7 Who is responsible for maintenance of
the public toilet?
8 Is there any user fee/charges for the
usage of public toilet?
9 If yes, what are the charges?
10 How many people use the public toilet
(average daily number of visitors)
11. Any toilet for physically disabled persons
in your community
JT URJA PVT. LTD. NPP LONI
FINAL CSP, LONI 110
12 If Not, are you willing to contribute to
such facilities?
Yes
No
Total
13
Will you also contribute to O&M of such
facilities?
Yes
No
Total
14 What type of toilet do you use and where
the waste is disposed?
Open drains
Manual Scavenging
Septic Tank (if yes, go to
section …)
Connected to sewerage
system (if yes, go to
section II)
II. Sewerage System
1. Do you have sewer connection? Yes
No
2. If yes, what is the cost of the connection
you paid?
Any monthly fee?
3. If no, are you willing to pay for sewerage
connection and how much?
Yes
No
4. Do you face any problem with your sewer
connection?
Chocking
Frequent
leakage/rupture
Foul smell
Overflowing in rainy
season
5. Who is responsible for cleaning the
sewerage system of your locality?
Pvt./ Municipality/any
other agency
6. How often the corporation people visit
you for health/sewerage purpose
Quarterly
Half yearly
Annually
Need base
When complaint is
made
7 Where does the sewage go from your
place
STP/open drains/storm
drain/river/any other
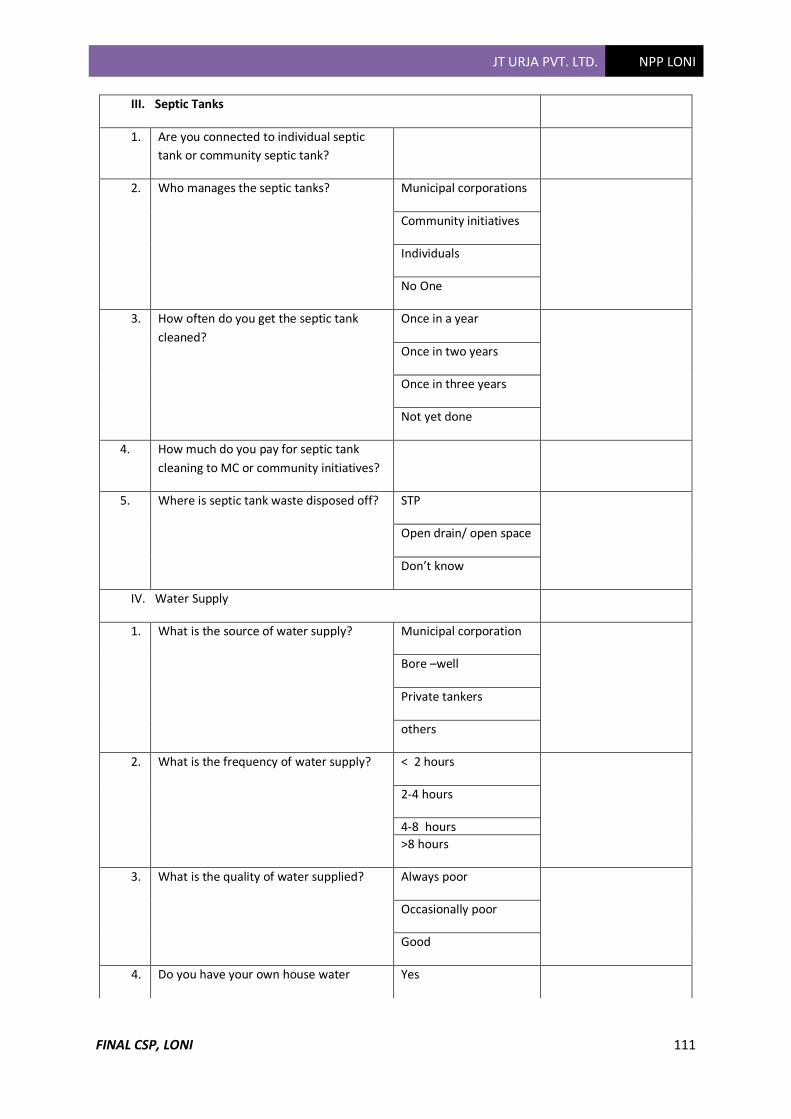
JT URJA PVT. LTD. NPP LONI
FINAL CSP, LONI 111
III. Septic Tanks
1. Are you connected to individual septic
tank or community septic tank?
2. Who manages the septic tanks? Municipal corporations
Community initiatives
Individuals
No One
3. How often do you get the septic tank
cleaned?
Once in a year
Once in two years
Once in three years
Not yet done
4. How much do you pay for septic tank
cleaning to MC or community initiatives?
5. Where is septic tank waste disposed off? STP
Open drain/ open space
Don’t know
IV. Water Supply
1. What is the source of water supply? Municipal corporation
Bore –well
Private tankers
others
2. What is the frequency of water supply? < 2 hours
2-4 hours
4-8 hours
>8 hours
3. What is the quality of water supplied? Always poor
Occasionally poor
Good
4. Do you have your own house water Yes
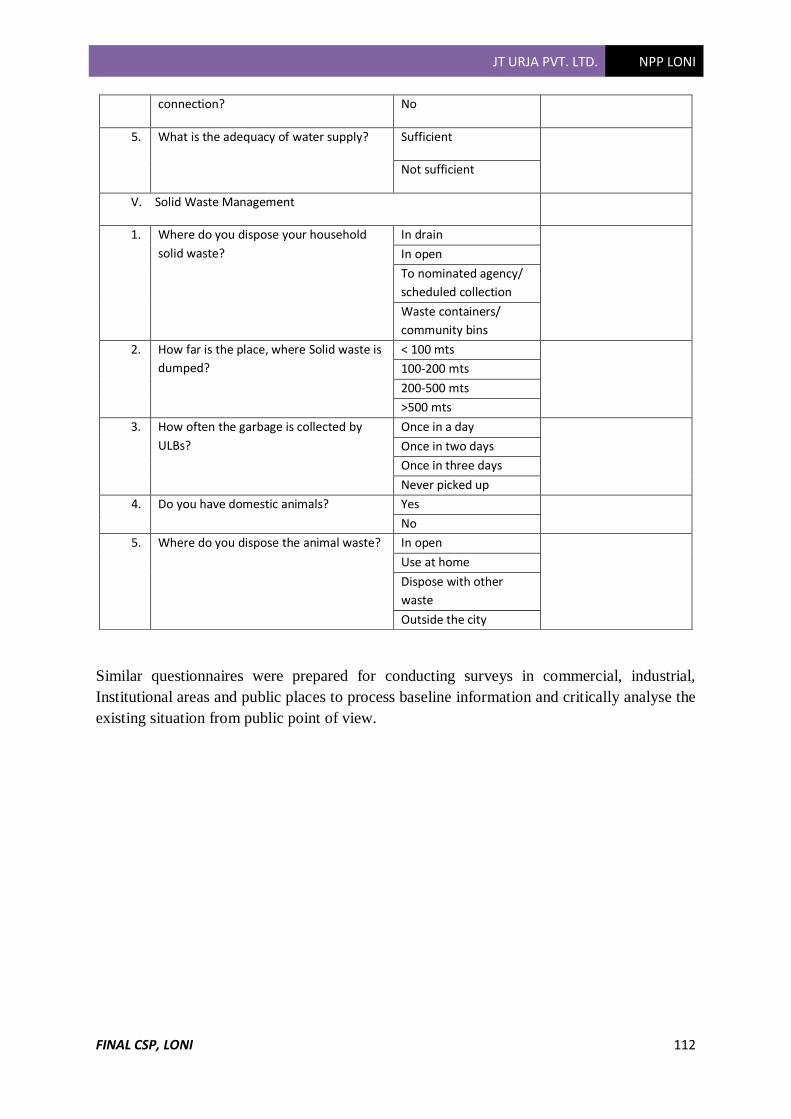
JT URJA PVT. LTD. NPP LONI
FINAL CSP, LONI 112
Similar questionnaires were prepared for conducting surveys in commercial, industrial,
Institutional areas and public places to process baseline information and critically analyse the
existing situation from public point of view.
connection? No
5. What is the adequacy of water supply? Sufficient
Not sufficient
V. Solid Waste Management
1. Where do you dispose your household
solid waste?
In drain
In open
To nominated agency/
scheduled collection
Waste containers/
community bins
2. How far is the place, where Solid waste is
dumped?
< 100 mts
100-200 mts
200-500 mts
>500 mts
3. How often the garbage is collected by
ULBs?
Once in a day
Once in two days
Once in three days
Never picked up
4. Do you have domestic animals? Yes
No
5. Where do you dispose the animal waste? In open
Use at home
Dispose with other
waste
Outside the city
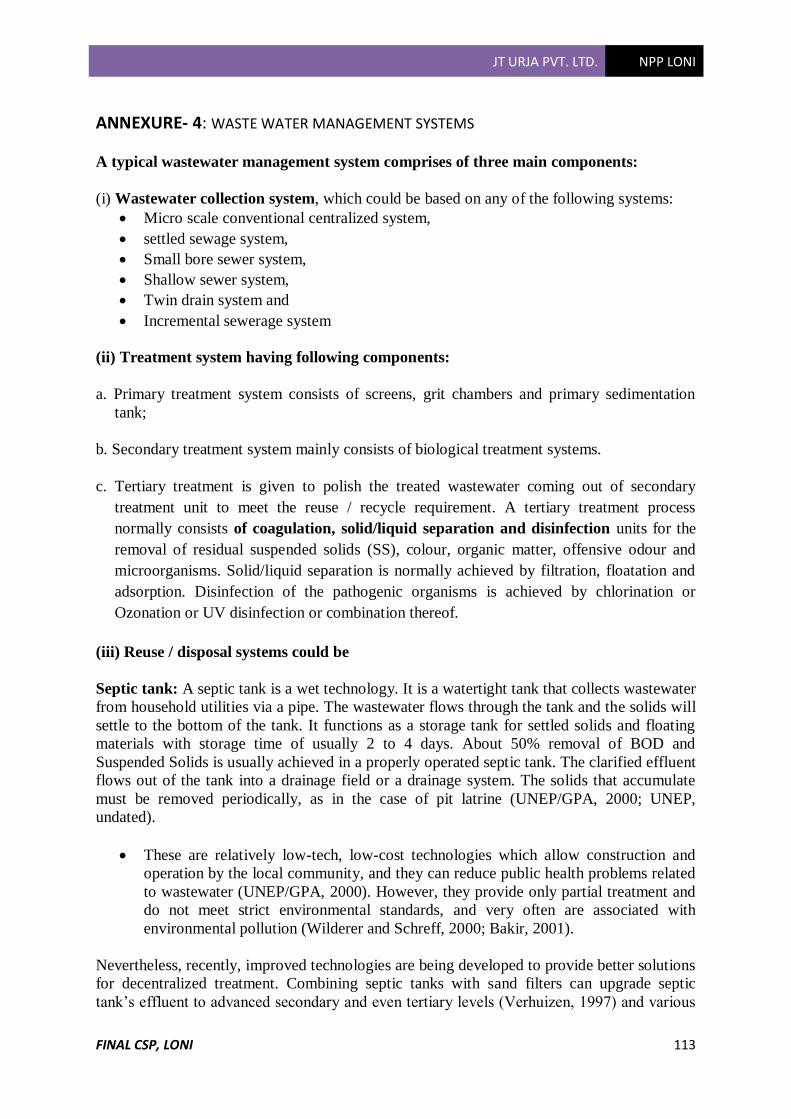
JT URJA PVT. LTD. NPP LONI
FINAL CSP, LONI 113
ANNEXURE- 4: WASTE WATER MANAGEMENT SYSTEMS
A typical wastewater management system comprises of three main components:
(i) Wastewater collection system, which could be based on any of the following systems:
• Micro scale conventional centralized system,
• settled sewage system,
• Small bore sewer system,
• Shallow sewer system,
• Twin drain system and
• Incremental sewerage system
(ii) Treatment system having following components:
a. Primary treatment system consists of screens, grit chambers and primary sedimentation
tank;
b. Secondary treatment system mainly consists of biological treatment systems.
c. Tertiary treatment is given to polish the treated wastewater coming out of secondary
treatment unit to meet the reuse / recycle requirement. A tertiary treatment process
normally consists of coagulation, solid/liquid separation and disinfection units for the
removal of residual suspended solids (SS), colour, organic matter, offensive odour and
microorganisms. Solid/liquid separation is normally achieved by filtration, floatation and
adsorption. Disinfection of the pathogenic organisms is achieved by chlorination or
Ozonation or UV disinfection or combination thereof.
(iii) Reuse / disposal systems could be
Septic tank: A septic tank is a wet technology. It is a watertight tank that collects wastewater
from household utilities via a pipe. The wastewater flows through the tank and the solids will
settle to the bottom of the tank. It functions as a storage tank for settled solids and floating
materials with storage time of usually 2 to 4 days. About 50% removal of BOD and
Suspended Solids is usually achieved in a properly operated septic tank. The clarified effluent
flows out of the tank into a drainage field or a drainage system. The solids that accumulate
must be removed periodically, as in the case of pit latrine (UNEP/GPA, 2000; UNEP,
undated).
• These are relatively low-tech, low-cost technologies which allow construction and
operation by the local community, and they can reduce public health problems related
to wastewater (UNEP/GPA, 2000). However, they provide only partial treatment and
do not meet strict environmental standards, and very often are associated with
environmental pollution (Wilderer and Schreff, 2000; Bakir, 2001).
Nevertheless, recently, improved technologies are being developed to provide better solutions
for decentralized treatment. Combining septic tanks with sand filters can upgrade septic
tank’s effluent to advanced secondary and even tertiary levels (Verhuizen, 1997) and various

JT URJA PVT. LTD. NPP LONI
FINAL CSP, LONI 114
processes for on-site aerobic treatment systems have been developed and are available
commercially (Bakir, 2001.) Further developments include combination of hi-tech
components such Membrane Bioreactor (MBR) with the aerobic systems. The advanced
aerobic systems, however, require power for aeration and possibly pumping. These improved
technologies can meet high environmental standards and can indeed be considered as viable
alternatives for wastewater treatment. In this case smaller flows of wastewater will be
collected and treated in several small treatment facilities in the community (Bakir, 2001).
• Constructed wetland,
• Anaerobic baffled reactor,
• Green toilets with separation of urine and faeces.
JT URJA PVT. LTD. NPP LONI
FINAL CSP, LONI 115
ANNEXURE-5: DETAILS OF VARIOUS SCHEMES FOR IMPLEMENTATION OF CITY
SANITATION PROJECTS
Valmiki Ambedkar Awas Yojana’s component - Nirmal Bharat Abhiyan
Though the National Slum Policy was never finalized, yet on 15 August 2001 the Prime
Minister of India announced a new Centrally Sponsored Scheme called the Valmiki
Ambedkar Awas Yojana (VAMBAY), to ameliorate the conditions of the urban slum
dwellers living below the poverty line. The main objective being to provide shelter or
upgrade the existing shelter for people living below the poverty line in urban slums in a
march towards the goal of slum less cities with a healthy and enabling urban environment.
The guidelines of the scheme say: “Another very important basic amenity for slum dwellers
especially in congested metropolitan cities is the lack of rudimentary toilet facilities. A new
National City Sanitation Project under the title of ‘Nirmal Bharat Abhiyan’ is an integral sub
component of VAMBAY. 20% of the total allocation under VAMBAY will be used for the
same. The State Governments/ Local Bodies will be free to supplement the Government of
India subsidy with their own grant.
Integrated Low Cost Sanitation (ILCS) Scheme, 2008
The Centrally Sponsored Scheme of Low Cost Sanitation for Liberation of Scavengers started
from 1980-81 initially through the Ministry of Home Affairs and later on through the
Ministry of Welfare. From 1989-90, it was operated through the Ministry of Urban
Development and later on through Ministry of Urban Employment and Poverty Alleviation
now titled Ministry of Housing & Urban Poverty Alleviation. A revised set of guidelines
were released in January 2008. (The scheme is now called the “Integrated Low Cost
Sanitation” Scheme)
The main objectives of the Scheme is to convert the existing dry latrines into low cost pour
flush latrines and to construct new ones where EWS (Economically Weaker Section)
households have no latrines and follow open defecation practices.
The scheme is on an ‘All Town’ coverage basis. The proposal can be submitted by the urban
local body duly authorized by the State Government to the State Urban Development
Authority for undertaking the programme. The concerned urban local body/ organisation has
to give an undertaking prohibiting dry latrines in the towns thereafter.
The programme can be implemented by any state selected local NGO having adequate
experience in this field , with the maximum funding of 15% over and above the total project
cost to be borne by the Centre and States based on the ratio of 5:1 at different stages of
implementation.
Further, the NGO shall be given the responsibility to look after operation and maintenance of
the converted units, and organise training/ seminars for preparation of project reports and
estimates by the ULBs/Development Authorities (DAs) after ensuring willingness of
identified beneficiaries.
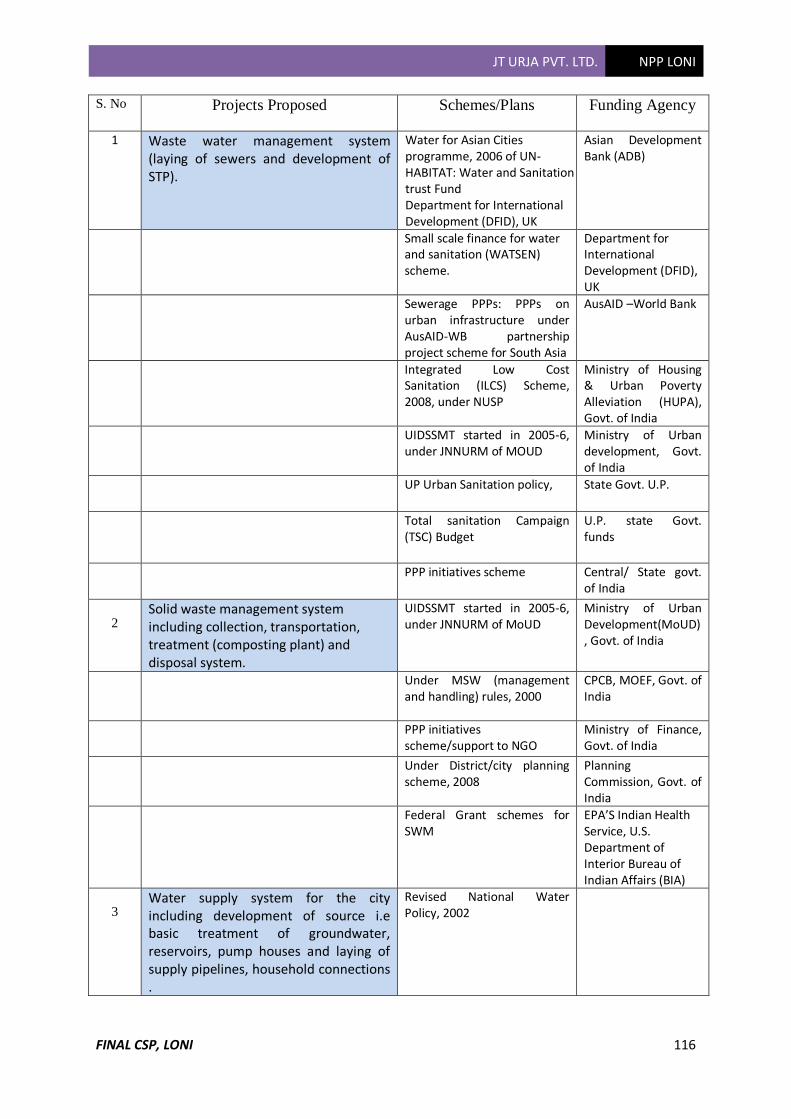
JT URJA PVT. LTD. NPP LONI
FINAL CSP, LONI 116
S. No Projects Proposed Schemes/Plans Funding Agency
1 Waste water management system (laying of sewers and development of STP).
Water for Asian Cities programme, 2006 of UN-HABITAT: Water and Sanitation trust Fund Department for International Development (DFID), UK
Asian Development Bank (ADB)
Small scale finance for water and sanitation (WATSEN) scheme.
Department for International Development (DFID), UK
Sewerage PPPs: PPPs on urban infrastructure under AusAID-WB partnership project scheme for South Asia
AusAID –World Bank
Integrated Low Cost Sanitation (ILCS) Scheme, 2008, under NUSP
Ministry of Housing & Urban Poverty Alleviation (HUPA), Govt. of India
UIDSSMT started in 2005-6, under JNNURM of MOUD
Ministry of Urban development, Govt. of India
UP Urban Sanitation policy,
State Govt. U.P.
Total sanitation Campaign (TSC) Budget
U.P. state Govt. funds
PPP initiatives scheme
Central/ State govt. of India
2 Solid waste management system including collection, transportation, treatment (composting plant) and disposal system.
UIDSSMT started in 2005-6, under JNNURM of MoUD
Ministry of Urban Development(MoUD), Govt. of India
Under MSW (management and handling) rules, 2000
CPCB, MOEF, Govt. of India
PPP initiatives scheme/support to NGO
Ministry of Finance, Govt. of India
Under District/city planning scheme, 2008
Planning Commission, Govt. of India
Federal Grant schemes for SWM
EPA’S Indian Health Service, U.S. Department of Interior Bureau of Indian Affairs (BIA)
3
Water supply system for the city including development of source i.e basic treatment of groundwater, reservoirs, pump houses and laying of supply pipelines, household connections .
Revised National Water Policy, 2002
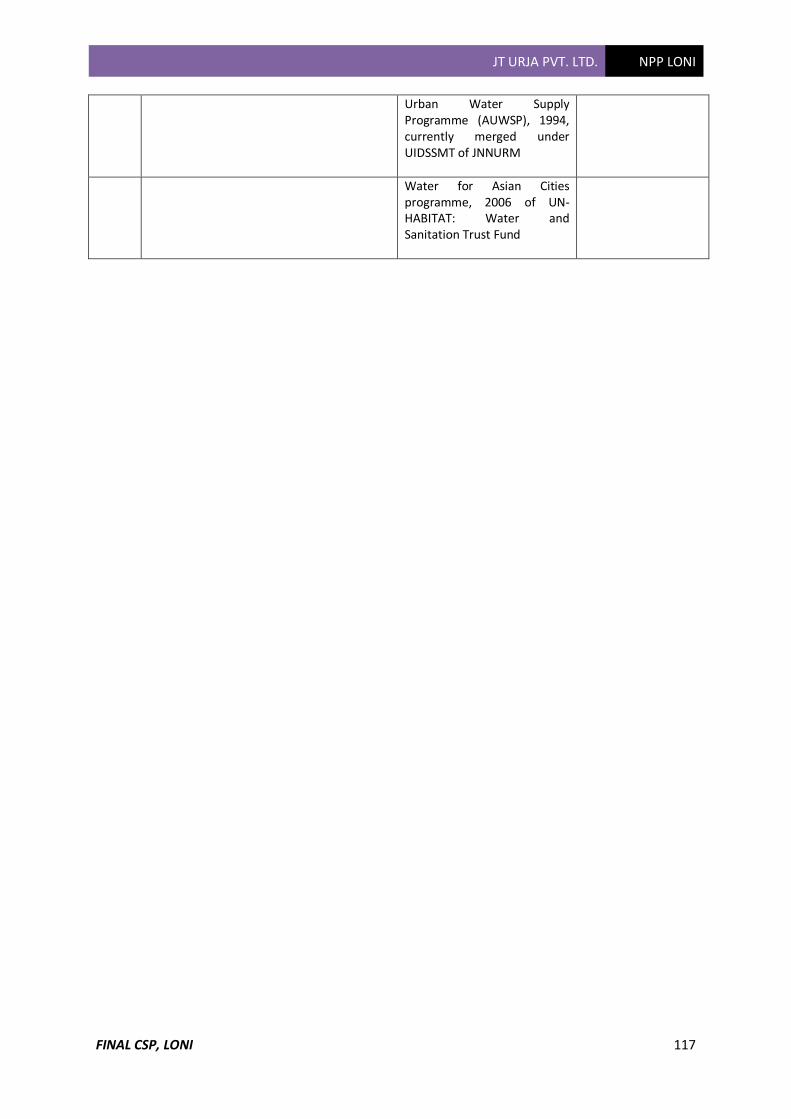
JT URJA PVT. LTD. NPP LONI
FINAL CSP, LONI 117
Urban Water Supply Programme (AUWSP), 1994, currently merged under UIDSSMT of JNNURM
Water for Asian Cities programme, 2006 of UN-HABITAT: Water and Sanitation Trust Fund
JT URJA PVT. LTD. NPP LONI
FINAL CSP, LONI 118
ANNEXURE-6: MUNICIPAL SOLID WASTE PROCESSING TECHNOLOGIES
THERMAL PROCESSING TECHNOLOGIES
Thermal processing technologies are mainly adopted to treat the hazardous waste with high
calorific values. Thermal technologies are those technologies that operate at temperatures
greater than 200°C and have higher reaction rates. They typically operate in a temperature
range of 375°C to 5,500°C. Thermal technologies include advanced thermal recycling (a
state-of-the-art form of waste to-energy facilities) and thermal conversion (a process that
converts the organic carbon based portion of the MSW waste stream into a synthetic gas
which is subsequently used to produce products such as electricity, chemicals, or green fuels).
These technologies are briefly described below.
INCINERATION
Mass-burn systems are the predominant form of the MSW incineration. Mass-burn systems
generally consist of either two or three incineration units ranging in capacity from 50 to 1,000
tons per day; thus, facility capacity ranges from about 100 to 3,000 tons per day. It involves
combustion of unprocessed or minimally processed refuse. The major components of a mass
burn facility include: (1) Refuse receiving, handling, and storage systems; (2) Combustion
and steam generation system (a boiler); (3) Flue gas cleaning system; (4) Power generation
equipment (steam turbine and generator); (5) Condenser cooling water system; and (6)
Residue hauling and storage system. This technology is predominantly applicable for
hazardous waste.
PYROLYSIS
In Pyrolysis, at high temperatures of 700°C to 1200 °C, thermal degradation of organic
carbon-based materials is achieved through the use of an indirect, external source of heat, in
the absence or almost complete absence of free oxygen. This thermally decomposes and
drives off the volatile portions of the organic materials, resulting in a syngas composed
primarily of hydrogen (H2), carbon monoxide (CO), carbon dioxide (CO2), and methane
(CH4). Some of the volatile components form tar and oil, which can be removed and reused
as a fuel. Most Pyrolysis systems are closed systems and there are no waste gases or air
emission sources (if the syngas is combusted to produce electricity, the power system will
have air emissions through a stack and air emission control system). After cooling and
cleaning in emission control systems, the syngas can be utilized in boilers, gas turbines, or
internal combustion engines to generate electricity or used as raw stock in chemical
industries. The balance of the organic materials that are not volatile or liquid that is left as a
char material, can be further processed or used for its adsorption properties (activated
carbon). Inorganic materials form a bottom ash that requires disposal, although some
pyrolysis ash can be used for manufacturing brick materials. Similar to incineration, Pyrolysis
is also applicable for hazardous waste treatment.
GASIFICATION
In the Gasification process, thermal conversion of organic carbon based materials is achieved
in the presence of internally produced heat, typically at temperatures of 660°C to 1800°C,
and in a limited supply of air/oxygen (less than stoichiometric, or less than is needed for
complete combustion) to produce a syngas composed primarily of H2 and CO. Inorganic

JT URJA PVT. LTD. NPP LONI
FINAL CSP, LONI 119
materials are converted either to bottom ash (low-temperature gasification) or to a solid,
vitreous slag (high temperature gasification that operates above the melting temperature of
inorganic components). Some of the oxygen injected into the system is used in reactions that
produce heat, so that Pyrolysis (endothermic) gasification reactions can initiate; after which,
the exothermic reactions control and cause the gasification process to be self-sustaining. Most
gasification systems, like Pyrolysis, are closed systems and do not generate waste gases or air
emission sources during the gasification phase. After cooling and cleaning in emission
control systems, the syngas can be utilized in boilers, gas turbines, or internal combustion
engines to generate electricity, or to make chemicals.
PLASMA ARC GASIFICATION
In Plasma Arc Gasification process, alternating current (AC) and/or direct current (DC)
electricity is passed through graphite or carbon electrodes, with steam and/or oxygen/air
injection (less than stoichiometric), to produce an electrically conducting gas (a plasma)
typically at temperatures greater than 2,200°C. This system converts organic carbon-based
materials, including tar, oil, and char, to syngas composed primarily of H2 and CO and
inorganic materials to solid, vitreous slag. Like Pyrolysis and conventional Gasification,
Plasma Arc Gasification is a closed system; therefore there are no waste gases and no
emission sources in the Plasma Arc Gasification process. After cooling and cleaning in
emission control systems, the syngas produced by plasma arc gasification can be utilized in
boilers, gas turbines, or internal combustion engines to generate electricity or to make
chemicals. The final emission products are CO2 and water. The furans and dioxins in the
emissions are extremely low and lower than the recommended USEPA or EU emission
norms.
BIOLOGICAL PROCESSING TECHNOLOGIES
Biological technologies are widely used to treat Municipal Solid Wastes (MSW) and are
operated at lower temperatures with lower reaction rates. Biological processing technologies
are essentially focused on the conversion of organics in the MSW consisting of dry matter
and moisture. The dry matter further consists of organics (i.e., whose molecules are carbon-
based), and minerals, also referred to as the ash fraction. The organics can be further
subdivided into biodegradables or refractory organics, such as food waste, and non-
biodegradables, such as plastic. Biological technologies can only convert biodegradables
component of the MSW. Byproducts can vary, which include: electricity, compost and
chemicals. Various biological processing technologies are briefly described below.
COMPOSTING
Composting is a natural micro-biological process where bacteria break down the organic
fractions of the MSW stream under controlled conditions to produce a pathogen-free material
called “Compost” that can be used for potting soil, soil amendments (for example, to lighten
and improve the soil structure of clay soils), and mulch. The microbes, fungi, and macro-
organisms that contribute to this biological decomposition are generally aerobic. A mixture of
organic materials is placed into one or more piles (windrows), and the natural microbial
action will cause the pile to heat up to 65-80°C, killing most pathogens and weed seeds. A
properly designed compost heap will reach 70°C within 6 to10 days, and slowly cool off back

JT URJA PVT. LTD. NPP LONI
FINAL CSP, LONI 120
to ambient temperatures as the biological decomposition is completed. Systematic turning of
the material, which mixes the different components and aerates the mixture, generally
accelerates the process of breaking down the organic fraction, and a proper carbon/nitrogen
balance (carbon to nitrogen or C/N ratio of 20:1) in the feedstock insures complete and rapid
composting. The composting process takes from 17 to 180 days. For composting process, the
moisture content of the MSW should be ideally > 45%. There are two fundamental types of
composting techniques: open or windrow composting, which is done out of doors with simple
equipment and is a slower process, and enclosed system composting, where the composting is
performed in some enclosure (e.g., a tank, a box, a container or a vessel).
ANAEROBIC DIGESTION
In anaerobic digestion (AD), biodegradable material is converted by a series of bacteria
groups into methane and CO2. A first group breaks down large organic molecules into small
units like sugar. This step is referred to as hydrolysis. Another group of bacteria converts the
resulting smaller molecules into volatile fatty acids, mainly acetate, but also hydrogen (H2)
and CO2. This process is called acidification. The last group of bacteria, the methane
producers or methanogens, produce biogas (methane and CO2) from the acetate and
hydrogen and CO2. This biogas can be used to fuel boilers or reciprocating engines with
minimal pre treatment. In addition to biogas, anaerobic bioconversion generates a residue
consisting of in organics, non-degradable organics, non degraded biodegradables, and
bacterial biomass. If the feedstock entering the process is sufficiently free of objectionable
materials like colorful plastic, this residue can have market value as compost. AD process is
also referred to as Bio methanation process.
BIOREACTOR LANDFILL
A bioreactor landfill is a wet landfill designed and operated with the objective of converting
and stabilizing biodegradable organic components of the waste within a reasonable time
frame by enhancing the microbiological decomposition processes. The technology
significantly increases the extent of waste decomposition, conversion rates and process
effectiveness over what would otherwise occur in a conventional wet landfill. Stabilization in
this context means that landfill gas and leachate emissions are managed within one
generation (twenty to thirty years) and that any failure of the containment system after this
time would not result in environmental pollution. There is better energy recovery including
increased total gas available for energy use and increased greenhouse reduction from reduced
emissions and increase in fossil fuel offsets. These factors lead to increased community
acceptance of this waste technology. Management of a bioreactor landfill requires a different
operating protocol to conventional landfills. Liquid addition and recirculation is the single
most important operational variable to enhance the microbiological decomposition processes.
Other strategies can also be used to optimize the stabilization process, including waste
shredding, pH adjustment, nutrient addition and temperature management.
JT URJA PVT. LTD. NPP LONI
FINAL CSP, LONI 121
PHYSICAL PROCESSING TECHNOLOGIES
Physical technologies involve altering the physical characteristics of the MSW feedstock. The
MSW is subjected to various physical processes that reduce the quantity of total feedstock,
increase its heating value, and provide a feedstock. It may be densified or palletized into
homogeneous fuel pellets and transported and combusted as a supplementary fuel in utility
boilers. These technologies are briefly described below.
REFUSED DERIVED FUEL OR RDF
The RDF process typically includes thorough pre-separation of recyclables, shredding,
drying, and densification to make a product that is easily handled. Glass and plastics are
removed through manual picking and by commercially available separation devices. This is
followed by shredding to reduce the size of the remaining feedstock to about eight inches or
less, for further processing and handling. Magnetic separators are used to remove ferrous
metals. Eddy-current separators are used for aluminum and other non-ferrous metals. The
resulting material contains mostly food wastes, non-separated paper, some plastics
(recyclable and non-recyclable), green wastes, wood, and other materials. Drying to less than
12% moisture is typically accomplished through the use of forced-draft air. Additional
sieving and classification equipment may be utilized to increase the removal of contaminants.
After drying, the material often undergoes densification processing such as pelletizing to
produce a pellet that can be handled with typical conveying equipment and fed through
bunkers and feeders. The RDF can be immediately combusted on-site or transported to
another facility for burning alone, or with other fuels. The densification is even more
important when RDF is transported off-site to another facility, in order to reduce volumes
being transported. RDF is often used in waste to energy plants as the primary or supplemental
feedstock, or co-fired with coal or other fuels in power plants, in kilns of cement plants, and
with other fuels for industrial steam production.
MECHANICAL SEPARATION
Mechanical separation is utilized for removing specific materials or contaminants from the
inlet MSW stream as a part of the pre-treatment process. Contaminants may include
construction and demolition (C&D) debris, tires, dirt, wet paper, coarse materials, and fine
materials. Generally, MSW reaching the dumping sites is unsegregated and mixed containing
C&D debris and other contaminants. Therefore, it is essential to remove these contaminants
from the incoming MSW by mechanical separation before processing the waste further by
either biological, physical and thermal technologies (except Plasma Arc Technology).
However, in MBIR project source segregation will be adopted and the C&D debris (if
generated) is expected to be reused for daily cover of the landfill. Therefore, the MSW
reaching the dumping grounds may not require the elaborate mechanical separation process.
This MSW has high organic content, fit to be directly used for various technologies after
manual sorting only.
JT URJA PVT. LTD. NPP LONI
FINAL CSP, LONI 122
Size reduction is often required to allow for more efficient and easier handling of materials,
particularly when the feed stream is to be used in follow-on processes. Sizing processes
include passive, moving, and vibrating screens and trommels. In order to reduce the size of
the entire stream, or portions of it, mechanical equipment, such as shredders, is utilized. This
allows for other physical processes, such as dryers, magnetic and eddy current separators, and
densification equipment to work more efficiently. Magnetic and eddy current separators may
be installed both up- and down-stream of shredders to increase the recovery of metals.
LANDFILLING
Land filling means disposal of residual solid wastes on land in a facility designed with
protective measures against pollution of ground water, surface water and air fugitive dust,
wind-blown litter, bad odour, fire hazard, bird menace, pests or rodents, greenhouse gas
emission, slope instability and erosion. Both for MSW and industrial hazardous waste land
filling is an essential component of solid waste management plan to accommodate the residue
of treatment and the inert coming from the waste streams.
The technical requirement and design criteria for disposal of MSW and hazardous waste are
different and is depends upon the quantity and characteristics of the waste. Therefore, in the
solid waste management plan for MBIR two separate disposal strategy will be adopted for
MSW and hazardous waste.