Embed Size (px)
Citation preview

7-0 Attachment 7 – Operating expenditure | Jemena distribution determination final decision 2016–20
FINAL DECISION
Jemena distribution
determination
2016 to 2020
Attachment 7 – Operating
expenditure
May 2016

7-1 Attachment 7 – Operating expenditure | Jemena distribution determination final decision 2016–20
© Commonwealth of Australia 2016
This work is copyright. In addition to any use permitted under the Copyright Act 1968,
all material contained within this work is provided under a Creative Commons
Attributions 3.0 Australia licence, with the exception of:
the Commonwealth Coat of Arms
the ACCC and AER logos
any illustration, diagram, photograph or graphic over which the Australian
Competition and Consumer Commission does not hold copyright, but which may be
part of or contained within this publication. The details of the relevant licence
conditions are available on the Creative Commons website, as is the full legal code
for the CC BY 3.0 AU licence.
Requests and inquiries concerning reproduction and rights should be addressed to the:
Director, Corporate Communications
Australian Competition and Consumer Commission
GPO Box 4141, Canberra ACT 2601
Inquiries about this publication should be addressed to:
Australian Energy Regulator
GPO Box 520
Melbourne Vic 3001
Tel: (03) 9290 1444
Fax: (03) 9290 1457
Email: [email protected]

7-2 Attachment 7 – Operating expenditure | Jemena distribution determination final decision 2016–20
Note
This attachment forms part of the AER's final decision on Jemena's distribution
determination for 2016–20. It should be read with all other parts of the final decision.
The final decision includes the following documents:
Overview
Attachment 1 – Annual revenue requirement
Attachment 2 – Regulatory asset base
Attachment 3 – Rate of return
Attachment 4 – Value of imputation credits
Attachment 5 – Regulatory depreciation
Attachment 6 – Capital expenditure
Attachment 7 – Operating expenditure
Attachment 8 – Corporate income tax
Attachment 9 – Efficiency benefit sharing scheme
Attachment 10 – Capital expenditure sharing scheme
Attachment 11 – Service target performance incentive scheme
Attachment 12 – Demand management incentive scheme
Attachment 13 – Classification of services
Attachment 14 – Control mechanisms
Attachment 15 – Pass through events
Attachment 16 – Alternative control services
Attachment 17 – Negotiated services framework and criteria
Attachment 18 – f-factor scheme

7-3 Attachment 7 – Operating expenditure | Jemena distribution determination final decision 2016–20
Contents
Note ...............................................................................................................7-2
Contents .......................................................................................................7-3
Shortened forms ..........................................................................................7-5
7 Operating expenditure ..........................................................................7-7
7.1 Final decision ..................................................................................7-7
7.2 Jemena's revised proposal ............................................................7-8
7.3 Assessment approach .................................................................. 7-10
7.3.1 Interrelationships ....................................................................... 7-20
7.4 Reasons for final decision ........................................................... 7-20
7.4.1 Base opex ................................................................................. 7-22
7.4.2 Rate of change .......................................................................... 7-23
7.4.3 Step changes ............................................................................ 7-24
7.4.4 Other costs not included in the base year .................................. 7-26
7.4.5 Assessment of opex factors ...................................................... 7-26
A Base opex ............................................................................................. 7-29
A.1 Final decision ................................................................................ 7-29
A.2 Jemena's revised proposal and submissions ............................ 7-29
A.3 Assessment approach .................................................................. 7-30
A.4 Reasons for final decision ........................................................... 7-31
A.5 Allocation of AMI costs ................................................................ 7-39
A.6 Other adjustments to base opex ................................................. 7-47
B Rate of change ..................................................................................... 7-48
B.1 Position .......................................................................................... 7-48
B.2 Preliminary position ..................................................................... 7-49
7-4 Attachment 7 – Operating expenditure | Jemena distribution determination final decision 2016–20
B.3 Jemena's revised proposal and submissions ............................ 7-50
B.4 Reasons for position .................................................................... 7-50
B.4.1 Overall rate of change ............................................................... 7-50
B.4.2 Forecast price growth ................................................................ 7-51
B.4.3 Forecast output growth .............................................................. 7-53
B.4.4 Forecast productivity growth...................................................... 7-60
C Step changes ....................................................................................... 7-64
C.1 Final position ................................................................................ 7-64
C.2 Preliminary position ..................................................................... 7-65
C.3 Jemena's revised proposal and submissions ............................ 7-66
C.4 Assessment approach .................................................................. 7-67
C.5 Reasons for position .................................................................... 7-69
C.5.1 Service inspection and testing program ..................................... 7-69
C.5.2 Enclosed substation inspection and rectification ........................ 7-70
C.5.3 Electricity distribution price review ............................................. 7-74
C.5.4 Vegetation management ........................................................... 7-75
C.5.5 Vulnerable customer initiative .................................................... 7-82
C.5.6 New technology trial: pole-top fire detection .............................. 7-85
C.5.7 Demand management opex/capex trade-off .............................. 7-86
C.5.8 C-i-c .......................................................................................... 7-87
C.5.9 New tariff implementation .......................................................... 7-87
C.5.10 RIN reporting ............................................................................. 7-90
C.5.11 Increased guaranteed service level obligations ......................... 7-92
C.5.12 Power of choice ......................................................................... 7-92
C.5.13 Adoption of chapter 5A .............................................................. 7-92
C.6 Other costs not included in the base year .................................. 7-93
C.6.1 Guaranteed service level payments .......................................... 7-93
C.6.2 Debt raising costs ...................................................................... 7-95

7-5 Attachment 7 – Operating expenditure | Jemena distribution determination final decision 2016–20
Shortened forms Shortened form Extended form
ABS Australian Bureau of Statistics
AEMC Australian Energy Market Commission
AEMO Australian Energy Market Operator
AER Australian Energy Regulator
AMI Advanced metering infrastructure
augex augmentation expenditure
CAM cost allocation method
capex capital expenditure
CCP Consumer Challenge Panel
CESS capital expenditure sharing scheme
CPI consumer price index
DRP debt risk premium
DMIA demand management innovation allowance
DMIS demand management incentive scheme
distributor distribution network service provider
DUoS distribution use of system
EBSS efficiency benefit sharing scheme
ERP equity risk premium
Expenditure Assessment Guideline Expenditure Forecast Assessment Guideline for Electricity
Distribution
F&A framework and approach
MFP multifactor productivity
MPFP multilateral partial factor productivity
MRP market risk premium
MTFP multilateral total factor productivity
NEL national electricity law
NEM national electricity market
NEO national electricity objective
NER national electricity rules
NSP network service provider

7-6 Attachment 7 – Operating expenditure | Jemena distribution determination final decision 2016–20
Shortened form Extended form
opex operating expenditure
PFP partial factor productivity
PPI partial performance indicators
PTRM post-tax revenue model
RAB regulatory asset base
RBA Reserve Bank of Australia
repex replacement expenditure
RFM roll forward model
RIN regulatory information notice
RPP revenue and pricing principles
SAIDI system average interruption duration index
SAIFI system average interruption frequency index
SLCAPM Sharpe-Lintner capital asset pricing model
STPIS service target performance incentive scheme
VBRC Victorian Bushfire Royal Commission
WACC weighted average cost of capital

7-7 Attachment 7 – Operating expenditure | Jemena distribution determination final decision 2016–20
7 Operating expenditure
Operating expenditure (opex) refers to the operating, maintenance and other non-
capital expenses incurred in the provision of network services. Forecast opex for
standard control services is one of the building blocks we use to determine a service
provider's total revenue requirement.
This attachment provides an overview of our assessment of opex. Detailed analysis of
our assessment of opex is in the following appendices:
Appendix A—base opex
Appendix B—rate of change
Appendix C—step changes.
7.1 Final decision
We are not satisfied that Jemena's forecast opex reasonably reflects the opex criteria.1
We therefore do not accept the forecast opex Jemena included in its building block
proposal.2 We compare our substitute estimate of Jemena's opex for the 2016–20
regulatory control period with its initial regulatory proposal, our preliminary decision
and Jemena's revised regulatory proposal in Table 7.1.3
Table 7.1 Our final decision on total opex ($ million, 2015)
2016 2017 2018 2019 2020 Total
Jemena's initial proposal 94.1 94.0 97.1 101.7 105.0 491.9
AER preliminary decision 75.8 76.1 77.0 78.3 79.5 386.7
Jemena's revised proposal 93.2 91.2 92.6 94.9 95.6 467.4
AER final decision 89.8 88.0 89.0 90.8 91.2 448.8
Source: AER analysis.
Note: Excludes debt raising costs.
Figure 7.1 shows our final and preliminary decision compared to Jemena's past actual
opex, previous regulatory decisions and its initial and revised proposals.
1 NER, cl. 6.5.6(c).
2 NER, cl. 6.5.6(d).
3 NER, cl. 6.12.1(4)(ii).

7-8 Attachment 7 – Operating expenditure | Jemena distribution determination final decision 2016–20
Figure 7.1 AER final decision compared to Jemena's past and proposed
opex ($ million, 2015)
Source: AER analysis.
Note: Includes debt raising costs.
We note the main reason we and Jemena expect standard control services opex to
increase in the 2016–20 regulatory control period is because of changes in the
regulation of costs associated with the Advanced Metering Infrastructure (AMI) rollout.
Previously these costs were regulated under an AMI Cost Recovery Order. From 2016
these costs are regulated under the NER.
7.2 Jemena's revised proposal
In its revised proposal, Jemena proposed a forecast opex of $467.4 million ($2015) for
the 2016–20 regulatory control period.4 This is a 5.0 per cent decrease from the
$491.9 million ($2015) it initially proposed.
In Figure 7.2 we separate Jemena's forecast opex into the different elements that
make up its forecast.
4 Jemena, Opex forecast model.xlsx, January 2016, excludes debt raising costs.
0
20
40
60
80
100
120
2001 2003 2005 2007 2009 2011 2013 2015 2017 2019
Op
ex
($m
illio
n,
20
15
)
Reported opex Estimated opex
Approved forecast opex Initial proposal
Preliminary decision Revised proposal
Final decision

7-9 Attachment 7 – Operating expenditure | Jemena distribution determination final decision 2016–20
Figure 7.2 Jemena's revised opex forecast ($ million, 2015)
Source: Jemena, Revised regulatory proposal, opex model, January 2016; AER analysis.
We describe each of these elements below:
Jemena used the actual opex it incurred in 2014 as the base for forecasting its
opex for the 2016–20 regulatory control period. This results in a base opex of
$368.7 million ($2015) over the 2016–20 regulatory control period. This is $2.7
million ($2015) lower than our preliminary decision due to an updated estimate of
inflation in 2015.
Jemena's 2014 regulatory accounts include one-off accounting adjustments relating
to provision changes. It adjusted base opex to remove the movement in provisions
in 2014. The effect of this is to set the net forecast expenditure in this cost category
to zero. This reduced Jemena’s forecast by $0.1 million ($2015). This is consistent
with our preliminary decision.
To forecast the increase in opex between 2014 and 2015 Jemena added the
difference between its opex allowances for 2014 and 2015. This is consistent with
the approach set out in the Expenditure Forecast Assessment Guideline (the
Guideline). This reduced Jemena's forecast by $5.6 million ($2015). This is
consistent with our preliminary decision.
$368.7
$467.4
$46.0 $6.7$23.6
$26.8 $1.2
–$0.1 –$5.6
0
50
100
150
200
250
300
350
400
450
500
$million, 2015

7-10 Attachment 7 – Operating expenditure | Jemena distribution determination final decision 2016–20
Jemena also adjusted its base opex to add opex that is classified as standard
control services in the 2016–20 regulatory control period. This increased Jemena’s
forecast by $46.0 million ($2015). This is $43.3 million ($2015) higher than our
preliminary decision. This reflects different approaches to the allocation of AMI
costs. In our preliminary decision we allocated these costs to alternative control
services metering.
Jemena proposed output growth using our approach to forecasting output growth.
However, Jemena forecast higher customer numbers growth than it did in its initial
proposal. Output growth increased Jemena's opex forecast by $23.6 million. This is
$14.9 million ($2015) higher than our preliminary decision.
Jemena adopted the forecast of price growth in our preliminary decision in its
revised regulatory proposal. Price growth increased Jemena's opex forecast by
$6.7 million. This is $0.6 million ($2015) higher than our preliminary decision
because it was applied to a higher base opex.
Jemena identified step changes in costs it forecast to incur during the forecast
period, which were not incurred in 2014. This increased Jemena’s forecast by
$26.8 million ($2015). This is $23.6 million ($2015) higher than the step changes in
our preliminary decision.
Jemena included a category specific forecast for guaranteed service level (GSL)
payments. This increased its forecast by $1.2 million ($2015). This is $0.9 million
($2015) higher than the GSL payments we forecast in our preliminary decision. The
increase in GSL payments reflects new Electricity Distribution Code (EDC)
requirements.
7.3 Assessment approach
This section sets out our general approach to assessment.5 Our approach to
assessment of particular aspects of the opex forecast is set out in more detail in the
relevant appendices.
Our assessment approach, outlined below, is for the most part consistent with the
Guideline.
There are two tasks that the NER requires us to undertake in assessing total forecast
opex. In the first task, we form a view about whether we are satisfied a service
provider’s proposed total opex forecast reasonably reflects the opex criteria.6 If we are
satisfied, we accept the service provider’s forecast.7 In the second task, we determine
a substitute estimate of the required total forecast opex that we are satisfied
5 The discussion in this section, to the extent it differs from that set out in the preliminary decision, clarifies the
assessment approach that we applied in both the preliminary decision and this final decision. 6 NER, cll. 6.5.6(c), 6.12.1(4).
7 NER, cll. 6.5.6(c), 6.12.1(4)(i).

7-11 Attachment 7 – Operating expenditure | Jemena distribution determination final decision 2016–20
reasonably reflects the opex criteria.8 We only undertake the second task if we do not
accept the service provider's forecast after undertaking the first task.
In both tasks, our assessment begins with the service provider’s proposal. We also
develop an alternative forecast to assess the service provider's proposal at the total
opex level. The alternative estimate we develop, along with our assessment of the
component parts that form the total forecast opex, inform us of whether we are
satisfied that the total forecast opex reasonably reflects the opex criteria.
It is important to note that we make our assessment about the total forecast opex and
not about particular categories or projects in the opex forecast. The Australian Energy
Market Commission (AEMC) has expressed our role in these terms:9
The opex criteria that we must be satisfied a total forecast opex reasonably reflects
are:10
1. the efficient costs of achieving the operating expenditure objectives
2. the costs that a prudent operator would require to achieve the operating
expenditure objectives
3. a realistic expectation of the demand forecast and cost inputs required to achieve
the operating expenditure objectives.
The AEMC noted that '[t]hese criteria broadly reflect the NEO [National Electricity
Objective]'.11
The service provider’s forecast is intended to cover the expenditure that will be needed
to achieve the opex objectives. The opex objectives are:12
1. meeting or managing the expected demand for standard control services over the
regulatory control period
2. complying with all applicable regulatory obligations or requirements associated with
providing standard control services
3. where there is no regulatory obligation or requirement, maintaining the quality,
reliability and security of supply of standard control services and maintaining the
reliability and security of the distribution system
4. maintaining the safety of the distribution system through the supply of standard
control services.
8 NER, cll. 6.5.6(d), 6.12.1(4)(ii).
9 AEMC, Final Rule Determination: National Electricity Amendment (Economic Regulation of Network Service
Providers) Rule 2012, 29 November 2012, p. vii. 10
NER, cl. 6.5.6(c). 11
AEMC, Final Rule Determination: National Electricity Amendment (Economic Regulation of Network Service
Providers) Rule 2012, 29 November 2012, p. 113. 12
NER, cl. 6.5.6(a).
7-12 Attachment 7 – Operating expenditure | Jemena distribution determination final decision 2016–20
Whether we are satisfied that the service provider's total forecast reasonably reflects
the opex criteria is a matter for judgment. This involves us exercising discretion.
However, in making this decision we treat each opex criterion objectively and as
complementary. When assessing a proposed forecast, we recognise that efficient
costs are not simply the lowest sustainable costs. They are the costs that an
objectively prudent service provider would require to achieve the opex objectives
based on realistic expectations of demand forecasts and cost inputs. It is important to
keep in mind that the costs a service provider might have actually incurred or will incur
due to particular arrangements or agreements that it has committed to may not be the
same as those costs that an objectively prudent service provider requires to achieve
the opex objectives.
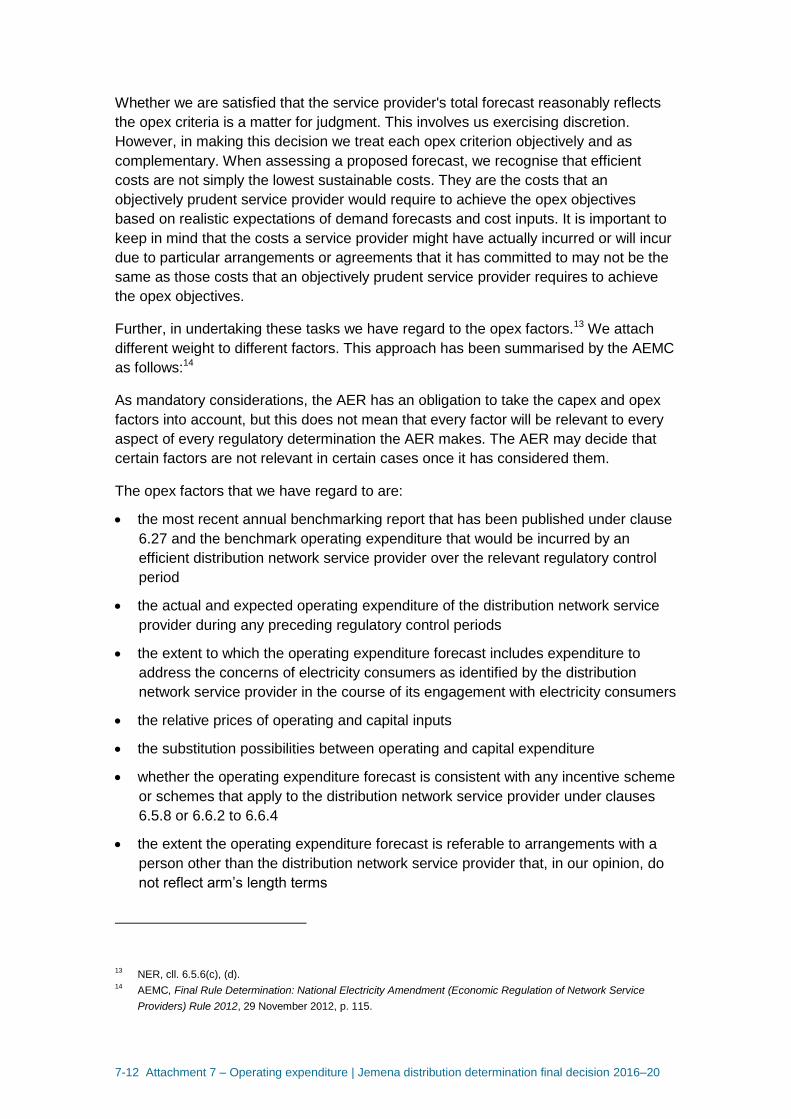
Further, in undertaking these tasks we have regard to the opex factors.13 We attach
different weight to different factors. This approach has been summarised by the AEMC
as follows:14
As mandatory considerations, the AER has an obligation to take the capex and opex
factors into account, but this does not mean that every factor will be relevant to every
aspect of every regulatory determination the AER makes. The AER may decide that
certain factors are not relevant in certain cases once it has considered them.
The opex factors that we have regard to are:
the most recent annual benchmarking report that has been published under clause
6.27 and the benchmark operating expenditure that would be incurred by an
efficient distribution network service provider over the relevant regulatory control
period
the actual and expected operating expenditure of the distribution network service
provider during any preceding regulatory control periods
the extent to which the operating expenditure forecast includes expenditure to
address the concerns of electricity consumers as identified by the distribution
network service provider in the course of its engagement with electricity consumers
the relative prices of operating and capital inputs
the substitution possibilities between operating and capital expenditure
whether the operating expenditure forecast is consistent with any incentive scheme
or schemes that apply to the distribution network service provider under clauses
6.5.8 or 6.6.2 to 6.6.4
the extent the operating expenditure forecast is referable to arrangements with a
person other than the distribution network service provider that, in our opinion, do
not reflect arm’s length terms
13
NER, cll. 6.5.6(c), (d). 14
AEMC, Final Rule Determination: National Electricity Amendment (Economic Regulation of Network Service
Providers) Rule 2012, 29 November 2012, p. 115.

7-13 Attachment 7 – Operating expenditure | Jemena distribution determination final decision 2016–20
whether the operating expenditure forecast includes an amount relating to a project
that should more appropriately be included as a contingent project under clause
6.6A.1(b)
the extent to which the distribution network service provider has considered and
made provision for efficient and prudent non-network alternatives
any relevant final project assessment conclusions report published under
5.17.4(o),(p) or (s)
any other factor we consider relevant and which we have notified the distribution
network service provider in writing, prior to the submission of its revised regulatory
proposal under clause 6.10.3, is an operating expenditure factor.
For transparency and ease of reference, we have included a summary of how we have
had regard to each of the opex factors in our assessment at the end of this attachment.
As we noted above, the two tasks that the NER requires us to undertake involve us
exercising our discretion. In exercising discretion, the National Electricity Law (NEL)
requires us to take into account the revenue and pricing principles (RPPs).15 In the
overview we discussed how we generally have taken into account the RPPs in making
this final decision. Our assessment approach to forecast opex ensures that the amount
of forecast opex that we are satisfied reasonably reflects the opex criteria is an amount
that provides the service provider with a reasonable opportunity to recover at least its
efficient costs.16 By us taking into account the relevant capex/opex trade-offs, our
assessment approach also ensures that the service provider faces the appropriate
incentives to promote efficient investment in, and provision and use of, the network and
minimises the costs and risks associated with the potential for under and over
investment and utilisation of the network.17
Expenditure Forecast Assessment Guideline
After conducting an extensive consultation process with service providers, users,
consumers and other interested stakeholders, we issued the Expenditure Forecast
Assessment Guideline in November 2013 together with an explanatory statement.18
The Guideline sets out our intended approach to assessing opex in accordance with
the NER.19
While the Guideline provides for regulatory transparency and predictability, it is not
binding. We may depart from the approach set out in the Guideline but we must give
15
NEL, ss. 7A, 16(2). 16
NEL, s. 7A(2). 17
That is, the trade-offs that may arise having considered the substitution possibilities between opex and capex, and
the relative prices of operating and capital inputs: NER, cll. 6.5.6(e)(6) and 6.5.6(e)(7); NEL, ss. 7A(3), 7A(6) and
7A(7). 18
AER, Expenditure forecast assessment guideline - explanatory statement, November 2013. 19
NER, cl. 6.5.6.

7-14 Attachment 7 – Operating expenditure | Jemena distribution determination final decision 2016–20
reasons for doing so.20 For the most part, we have not departed from the approach set
out in the Guideline in this final decision.21 In our framework and approach paper, we
set out our intention to apply the Guideline approach in making this determination.22
There are several parts of our assessment:
1. We develop an alternative estimate to assess a service provider's proposal at the
total opex level.23 We recognise that a service provider may be able to adequately
explain any differences between its forecast and our estimate. We take into
account any such explanations on a case by case basis using our judgment,
analysis and stakeholder submissions.
2. We assess whether the service provider's forecasting method, assumptions, inputs
and models are reasonable, and assess the service provider's explanation of how
its method results in a prudent and efficient forecast.
3. We assess the service provider's proposed base opex, step changes and rate of
change if the service provider has adopted this methodology to forecast its opex.
Each of these assessments informs our first task, namely, whether we are satisfied
that the service provider's proposal reasonably reflects the opex criteria.
If we are not satisfied with the service provider’s proposal, we approach our second
task by using our alternative estimate as our substitute estimate. The AEMC expressly
endorsed this approach in its decision on the major rule changes that were introduced
in November 2012. The AEMC stated:24
While the AER must form a view as to whether a NSP's proposal is reasonable,
this is not a separate exercise from determining an appropriate substitute in the
event the AER decides the proposal is not reasonable. For example,
benchmarking the NSPs against others will provide an indication of both
whether the proposal is reasonable and what a substitute should be. Both the
consideration of 'reasonable' and the determination of the substitute must be in
respect of the total for capex and opex.
We recognise that our alternative estimate may not exactly match the service
provider's forecast. The service provider may have adopted a different forecasting
method. However, if the service provider's inputs and assumptions are reasonable and
efficient, we expect that its method should produce a forecast consistent with our
estimate. We discuss below how we develop our alternative estimate.
20
NER, cl. 6.2.8(c). 21
We did not apply the DEA benchmarking technique. We outlined the reasons why we did not apply this technique
in appendix A of our all NSW distribution determinations for the 2015–20 regulatory control period. 22
AER, Stage 2 Framework and approach—NSW electricity distribution network service providers, January 2014,
p. 50. 23
AER, Expenditure forecast assessment guideline, November 2013, p. 7. 24
AEMC, Final Rule Determination: National Electricity Amendment (Economic Regulation of Network Service
Providers) Rule 2012, 29 November 2012, p. 112.

7-15 Attachment 7 – Operating expenditure | Jemena distribution determination final decision 2016–20
Building an alternative estimate of total forecast opex
The method we use to develop our alternative estimate involves five key steps. We
outline these steps below in Figure 7.3.

7-16 Attachment 7 – Operating expenditure | Jemena distribution determination final decision 2016–20
Figure 7.3 How we build our alternative estimate
This results in our alternative estimate. We use this in the first task to assess the service provider's proposal at the total opex level. We also use this as our substitute estimate, should we not be satisfied the service provider's
proposal reasonably reflects the opex criteria.
Step 5—Other opex
Finally we add any additional opex components which have not been forecast using this approach. For instance, we forecast debt raising costs based on the costs incurred by a benchmark efficient service provider.
Step 4—Add or subtract any step changes
We then adjust our estimate to account for any forecast cost changes over the regulatory control period that would meet the opex critieria that are not otherwise captured in base opex or rate of change. This may be due to new regulatory obligations in the forecast period and efficient capex/opex trade-offs. We call these step changes.
Step 3—Add a rate of change to base opex.
As the opex of an efficient service provider tends to change over time due to price changes, output and productivity we trend our estimate of base opex forward over the regulatory control period to take account of these changes. We
refer to this as the rate of change.
Step 2—Assess, and if necessary adjust, base opex
We assess whether the base opex forms the starting point of a total forecast opex that we would be satisfied reasonably reflects the opex criteria. We may do this by testing the base opex against a number of quantitative and qualtiative techniques. This includes economic benchmarking and detailed reviews. We adjust the base opex only to
the extent that we find that it is materially inefficient.
Step 1—Start with service provider's base opex.
We typically use the service provider's actual opex in a single year as the starting point for our assessment. While categories of opex can vary from year to year, total opex is relatively recurrent. We typically choose a recent year for
the base year. We call this base opex.

7-17 Attachment 7 – Operating expenditure | Jemena distribution determination final decision 2016–20
Underlying our approach are two general assumptions:
1. the efficiency criterion and the prudency criterion in the NER are complementary
2. actual operating expenditure was sufficient to achieve the opex objectives in the
past.
We have used this general approach in our past decisions. It is a well-regarded top-
down forecasting model that a number of Australian regulators have employed over the
last fifteen years. We refer to it as a ‘revealed cost method’ in the Guideline (and we
have sometimes referred to it as the base-step-trend method in our past regulatory
decisions).25
While these general steps are consistent with our past determinations, we have
adopted a significant change in how we give effect to this approach, following the
major changes to the NER made in November 2012. Those changes placed significant
new emphasis on the use of benchmarking in our opex analysis. We will now issue
benchmarking reports annually and have regard to those reports. These benchmarking
reports provide us with one of a number of inputs for determining forecast opex.
We have set out more detail about each of the steps we follow in developing our
alternative estimate below.
Step 1—Base year choice
The starting point for our analysis is to use a recent year for which audited figures are
available as the starting point for our analysis. We call this the base year. This is for a
number of reasons:
As total opex tends to be relatively recurrent, total opex in a recent year typically
best reflects a service provider's current circumstances.
During the past regulatory control period, there are incentives in place to reward the
service provider for making efficiency improvements by allowing it to retain a
portion of the efficiency savings it makes. Similarly, the incentive regime works to
penalise the service provider when it is relatively less efficient. This provides
confidence that the service provider did not spend more in the proposed base year
to try to inflate its opex forecast for the next regulatory control period.
Service providers also face many regulatory obligations in delivering services to
consumers. These regulatory obligations ensure that obligations to deliver services
safely and reliably balance the financial incentives a service provider faces to
reduce its costs. In general, this gives us confidence that recent historical opex will
be at least enough to achieve the opex objectives.
In choosing a base year, we need to make a decision whether to remove any
categories of opex incurred in that year. For instance:
25
AER, Expenditure forecast assessment guideline, November 2013, p. 22.

7-18 Attachment 7 – Operating expenditure | Jemena distribution determination final decision 2016–20
If a material cost was incurred in the base year that is unrepresentative of a service
provider's future opex, we may remove it from the base year in undertaking our
assessment.
Rather than use all of the opex that a service provider incurs in the base year,
service providers also often forecast specific categories of opex using different
methods. We must also assess these methods in deciding what the starting point
should be. If we agree that we should assess these categories of opex differently,
we will also remove them from the base year.
As part of this step we also need to consider any interactions with the incentive
scheme for opex, the Efficiency Benefit Sharing Scheme (EBSS). We designed the
EBSS to achieve a fair sharing of efficiency gains and losses between a service
provider and its consumers. Under the EBSS, service providers receive a financial
reward for reducing their costs in the regulatory control period and a financial penalty
for increasing their costs. The benefits of a reduction in opex flow through to
consumers as long as base year opex is no higher than the opex incurred in that year.
Similarly, the costs of an increase in opex flow through to consumers if base opex is no
lower than the opex incurred in that year. If the starting point is not consistent with the
EBSS, service providers could be excessively rewarded for efficiency gains or
excessively penalised for efficiency losses in the prior regulatory control period.
Step 2—Assessing base opex
The service provider's actual expenditure in the base year may not form the starting
point of a total forecast opex that we are satisfied reasonably reflects the opex criteria.
For example, it may not be efficient or management may not have acted prudently in
its governance and decision-making processes. We must therefore test the actual
expenditure in the base year.
As we set out in the Guideline, to assess the service provider's actual expenditure, we
use a number of different qualitative and quantitative techniques.26 This includes
benchmarking and detailed reviews.
Benchmarking is particularly important in comparing the relative efficiency of different
service providers. The AEMC highlighted the importance of benchmarking in its
changes to the NER in November 2012:27
The Commission views benchmarking as an important exercise in assessing
the efficiency of a NSP and informing the determination of the appropriate
capex or opex allowance.
By benchmarking a service provider's expenditure we can compare its productivity
over time, and to other service providers. In our preliminary decision we used
26
AER, Expenditure forecast assessment guideline, November 2013, p. 22. 27
AEMC, Final Rule Determination: National Electricity Amendment (Economic Regulation of Network Service
Providers) Rule 2012, 29 November 2012, p. 97.

7-19 Attachment 7 – Operating expenditure | Jemena distribution determination final decision 2016–20
multilateral total factor productivity, partial factor productivity measures and several
opex cost function models.28
We also have regard to trends in total opex and category specific data to construct
category benchmarks to inform our assessment of the base year expenditure. In
particular, we can use this category analysis data to identify sources of spending that
are unlikely to reflect the opex criteria over the forecast period. It may also lend support
to, or identify potential inconsistencies with, the results of our broader benchmarking.
If we find that a service provider's base year expenditure is materially inefficient, the
question arises about whether we would be satisfied that a total forecast opex
predicated upon that expenditure reasonably reflects the opex criteria. Should this be
the case, for the purposes of forming our starting point for our alternative estimate, we
will adjust the base year expenditure to remove any material inefficiency.
Step 3—Rate of change
We also assess an annual escalator that we apply to take account of the likely ongoing
changes to opex over the forecast regulatory control period. Opex that reflects the
opex criteria in the forecast regulatory control period could reasonably differ from the
starting point due to changes in:
price growth
output growth
productivity growth.
We estimate the change by adding expected changes in prices (such as the price of
labour and non-labour) and outputs (such as changes in customer numbers and
demand for electricity). We then incorporate reasonable estimates of changes in
productivity.
Step 4—Step changes
Next we consider if any other opex is required to achieve the opex objectives in the
forecast period. We refer to these as ‘step changes’. Step changes may be for cost
drivers such as new, changed or removed regulatory obligations, or efficient
capex/opex trade-offs. As the Guideline explains, we will typically include a step
change only if efficient base opex and the rate of change in opex of an efficient service
provider do not already include the proposed cost.29
Step 5—Other costs that are not included in the base year
In our final step, we assess the need to make any further adjustments to our opex
forecast. For instance, our approach is to forecast debt raising costs based on a
28
We discuss the benchmarking models in detail in appendix A. 29
AER, Expenditure forecast assessment guideline, November 2013, p. 24.

7-20 Attachment 7 – Operating expenditure | Jemena distribution determination final decision 2016–20
benchmarking approach rather than a service provider’s actual costs. This is to be
consistent with the forecast of the cost of debt in the rate of return building block.
After applying these five steps, we arrive at our alternative estimate.
7.3.1 Interrelationships
In assessing Jemena's total forecast opex we took into account other components of
its regulatory proposal, including:
the operation of the EBSS in the 2010–15 regulatory control period, which provided
Jemena an incentive to reduce opex in the 2014 base year
the impact of cost drivers that affect both forecast opex and forecast capex. For
instance, forecast maximum demand affects forecast augmentation capex and
forecast output growth used in estimating the rate of change in opex
the inter-relationship between capex and opex, for example, in considering
Jemena's proposed step change for demand management
the approach to assessing the rate of return, to ensure there is consistency
between our determination of debt raising costs and the rate of return building
block
changes to the classification of services from standard control services to
alternative control services
concerns of electricity consumers identified in the course of its engagement with
consumers.
7.4 Reasons for final decision
Generally we agree with Jemena on the approach to forecasting total opex. However,
due to some differences with forecasts of the inputs used we are not satisfied
Jemena's proposed total forecast opex of $467.4 million ($2015) reasonably reflects
the opex criteria. We must not, therefore, accept Jemena's proposed total forecast
opex.30 As discussed above, we have used our alternative estimate of $448.8 million
($2015) as our substitute estimate.31
Figure 7.4 illustrates how we constructed our forecast. The starting point on the left is
what Jemena's opex for each year of the 2016–20 regulatory control period would be if
it was set equal to its reported opex in 2014.
30
NER, cl. 6.5.6(d). 31
NER, cll. 6.5.6(d), 6.12.1(4)(ii).

7-21 Attachment 7 – Operating expenditure | Jemena distribution determination final decision 2016–20
Figure 7.4 AER final decision opex forecast ($ million, 2015)
Source: AER analysis.
Table 7.2 outlines the quantum of the difference between Jemena’s revised proposed
total opex and our final decision estimate for each year of the 2016–20 regulatory
control period.
Table 7.2 Proposed vs final decision total forecast opex ($ million, 2015)
2016 2017 2018 2019 2020 Total
Jemena's revised proposal 93.2 91.2 92.6 94.9 95.6 467.4
AER final decision 89.8 88.0 89.0 90.8 91.2 448.8
Difference –3.4 –3.2 –3.6 –4.1 –4.4 –18.6
Source: AER analysis.
Note: Excludes debt raising costs.
We outline the key elements of our alternative opex forecast and areas of difference
between our estimate of opex and Jemena's estimate below.
$368.5
$448.8
$44.7 $4.5$19.0 $17.1 $0.6
–$0.1 –$5.6
0
50
100
150
200
250
300
350
400
450
500
$million, 2015

7-22 Attachment 7 – Operating expenditure | Jemena distribution determination final decision 2016–20
7.4.1 Base opex
Starting point for base opex
Consistent with our preliminary decision, we have based our opex forecast on
Jemena's actual opex in 2014. We consider this leads to an opex forecast that
reasonably reflects the opex criteria.
Our benchmarking indicates that the Victorian network service providers, including
Jemena, are amongst the most efficient in the NEM. This suggests that it would be
reasonable to rely on its actual opex when forecasting the base opex amount.
We also note that we regulate Jemena under an incentive-based regulatory framework.
We would expect that Jemena, as a profit maximising service provider, would be
responding to the financial incentives in the framework and would only incur cost
increases where prudent. The incentive based framework gives us further confidence
that in total Jemena's current opex is reasonably reflective of efficient levels.
We received some submissions that raised queries about the recent decline in
productivity of the Victorian services providers and what it may mean for using actual
opex in 2014 as the base opex.32
We have considered the recent productivity trend but it has not caused us to change
our position on the efficiency of Jemena and the other Victorian service providers. We
consider external drivers such as increases in bushfire mitigation obligations following
the Black Saturday bushfires of 2009 and high labour price growth over the previous
regulatory control period are the most significant drivers of the recent increases in opex
for the Victorian service providers.
We outline our assessment of base opex in appendix A.
Adjustment for Advanced Metering Infrastructure (AMI) costs
We have included an adjustment to our base opex forecast of AMI IT and
communications costs. This is a change in position from the preliminary decision.
Following the expiry of the AMI Order-in-Council, opex associated with AMI is to be
regulated under the NER. In the preliminary decision we allocated all these costs to
alternative control services. This was intended to be an interim position before we
considered this issue in more detail through the development of the Distribution Ring
Fencing Guideline.
We received a number of submissions which disagreed with our preliminary position.
We reconsidered our approach in light of these submissions.
32
VECUA, Submission to the AER Preliminary 2016‐20 Revenue Determinations for the Victorian DNSPs, 6 January
2016, p. 4, pp. 60-62; Consumer Challenge Panel Sub Panel 3, Response to Preliminary Decisions made by the
AER in response to proposals from Victorian electricity distribution network service providers for a revenue reset
for the 2016–20 regulatory period, 25 February 2016, p. 11–12.

7-23 Attachment 7 – Operating expenditure | Jemena distribution determination final decision 2016–20
While there would be some benefit in waiting to consider this issue through the Ring
Fencing Guideline process, given advanced meters have already been rolled out in
Victoria, we acknowledge the cost allocation issues the Victorian service providers
currently face are different to those that may potentially be faced by other service
providers in other states. Therefore we agree that, on balance, there is no strong
reason why we need hold all these costs in alternative control services until the
Distribution Ring Fencing Guideline is completed. We therefore have developed a
revised position on how such costs should be allocated. We have allocated shared AMI
costs across standard control services and alternative control services in accordance
with cost allocation principles consistent with our Cost Allocation Guidelines and the
cost allocation principles in the NER.
By applying these principles we have made an adjustment to Jemena's base opex of
$8.4 million ($2015). As discussed in Attachment 16 the revised approach leads to a
commensurate reduction in metering opex from our preliminary decision.
Table 7.3 illustrates how we have constructed base opex.
Table 7.3 AER position on base opex ($ million, 2015)
Our final decision
Reported 2014 opex 74.2
Remove movement in provisions –0.0
Remove DMIA expenditure –0.1
GSL payments –0.1
Remove scrapping of assets –0.4
AMI cost reallocation 8.4
Other service classification changes 0.5
Adjusted 2014 opex 82.6
2015 increment –1.1
Estimated 2015 opex 81.5
Source: AER analysis.
7.4.2 Rate of change
The efficient level of expenditure required by a service provider in the 2016–20
regulatory control period may differ from that required in the final year of the 2011–15
regulatory control period. Once we have determined the opex required in the final year
of the 2011–15 regulatory control period, we apply a forecast annual rate of change to
forecast opex for the 2016–20 regulatory control period. This accounts for the forecast
change in opex due to price, output and productivity growth.

7-24 Attachment 7 – Operating expenditure | Jemena distribution determination final decision 2016–20
Our forecast of the overall rate of change used to derive our alternative estimate of
opex is lower than Jemena's over the forecast period. Table 7.1 below compares
Jemena's and our overall rate of change in percentage terms for the 2016–20
regulatory control period.
Table 7.1 Forecast annual rate of change in opex (per cent)
2016 2017 2018 2019 2020
Jemena 2.32 2.24 2.54 2.59 2.55
AER 1.77 1.74 1.99 2.05 2.16
Difference –0.55 –0.50 –0.55 –0.54 –0.39
Source: AER analysis.
The following factors drive the difference between our forecast rate of change and
Jemena’s:
Jemena used the forecast price change we determined in our preliminary decision
in its revised regulatory proposal. However, it did not update its forecast of labour
price growth to account for changes in economic conditions since we published our
preliminary decision. Our preliminary decision used an average of the WPI growth
rates forecast by Deloitte Access Economics (DAE) prepared in June 2015 and BIS
Shrapnel prepared in November 2014. Our updated forecast uses an average of
forecasts from DAE prepared in February 2016 and CIE prepared in November
2015. Consequently, our forecast of price growth is on average 0.22 percentage
points lower than Jemena’s forecast.
Jemena forecast higher output growth due to a higher forecast growth in customer
numbers. Jemena forecast future customer numbers using a projection of
population growth in local government areas. We used historical growth in
customer numbers to forecast future growth. Also, Jemena did not ratchet its
maximum demand forecast. We have also updated our output weights to match
those in our latest benchmarking report. Consequently, we have forecast output
growth 0.28 percentage points lower, on average, than Jemena did.
We outline our detailed assessment of the rate of change in appendix B.
7.4.3 Step changes
We have included step changes in our alternative opex forecast for the following
proposals:
service testing and inspection program
enclosed substation inspection and rectification
vegetation management
demand management opex/capex trade-off
new tariff implementation

7-25 Attachment 7 – Operating expenditure | Jemena distribution determination final decision 2016–20
new RIN reporting requirements
power of choice
adoption of chapter 5A.
In total these step changes contribute $17.1 million ($2015) or 3.8 per cent to our total
opex forecast for Jemena for the 2016–20 regulatory control period. We consider these
step changes represent the efficient and prudent costs of meeting new regulatory
obligations or represent an efficient capex/opex trade-off. We were not satisfied there
were reasons to change our opex forecast for other step changes.
Table 7.4 summarises our final position on each of Jemena's proposed step changes.
Table 7.4 Step changes ($ million, 2015)
Proposal Initial proposal Preliminary
decision
Revised
proposal Final decision
Service inspection and testing program 6.2 0 6.2 5.8
Overhead switch inspection 2.2 0 0 0
Enclosed substation inspection and
rectification 0.8 0 0.6 0.2
Electricity distribution price review 8.0 Included in
base year
Vegetation management 15.9 0 6.9 2.3
ESV code of practice changes 0.9 0 0 0
Vulnerable customer initiative 1.0 0 1.0 0
Customer engagement 0.9 Included in
base year
New technology trial: pole-top fire
detection 1.4 0 1.4 0
Demand management opex/capex trade-
off 0.7 0.7 0.7 0.7
Cic cic 0 cic 0
New tariff implementation 2.5 2.5 2.5 0.5
RIN reporting 19.7 0 5.9 5.9
Increased GSL obligations 0.9
Included as a
category
specific forecast
Power of choice 0.9 0.9
Adoption of chapter 5A 0.7 0.7
Total 60.3 3.2 27.7a 17.1
Source: AER analysis.
Note: a) Excludes cic step change.

7-26 Attachment 7 – Operating expenditure | Jemena distribution determination final decision 2016–20
We discuss each step change in more detail in appendix C.
7.4.4 Other costs not included in the base year
We have included debt raising costs and guaranteed service level payments in our
final decision opex forecast. We have not included any other category specific
forecasts.
We discuss our assessment of GSL payments in appendix C and debt raising costs in
attachment 3.
7.4.5 Assessment of opex factors
In deciding whether we are satisfied the service provider's forecast reasonably reflects
the opex criteria we have regard to the opex factors.33
Table 7.5 summarises how we have taken the opex factors into account in making our
final decision.
Table 7.5 AER consideration of opex factors
Opex factor Consideration
The most recent annual benchmarking report that has
been published under rule 6.27 and the benchmark
operating expenditure that would be incurred by an
efficient distribution network service provider over the
relevant regulatory control period.
There are two elements to this factor. First, we must have
regard to the most recent annual benchmarking report.
Second, we must have regard to the benchmark operating
expenditure that would be incurred by an efficient
distribution network service provider over the period. The
annual benchmarking report is intended to provide an
annual snapshot of the relative efficiency of each service
provider.
The second element, that is, the benchmark operating
expenditure that would be incurred an efficient provider
during the forecast period, necessarily provides a different
focus. This is because this second element requires us to
construct the benchmark opex that would be incurred by a
hypothetically efficient provider for that particular network
over the relevant period.
We have used several assessment techniques that
enable us to estimate the benchmark opex that an
efficient service provider would require over the forecast
period. These techniques include economic benchmarking
and opex cost function modelling. We have used our
judgment based on the results from all of these
techniques to holistically form a view on the efficiency of
Jemena's proposed total forecast opex compared to the
benchmark efficient opex that would be incurred over the
relevant regulatory control period.
The actual and expected operating expenditure of the
Distribution Network Service Provider during any
proceeding regulatory control periods.
Our forecasting approach uses the service provider's
actual opex as the starting point. We have compared
several years of Jemena's actual past opex with that of
33
NER, cl. 6.5.6(e).

7-27 Attachment 7 – Operating expenditure | Jemena distribution determination final decision 2016–20
other service providers to form a view about whether or
not its revealed expenditure is sufficiently efficient to rely
on it as the basis for forecasting required opex in the
forthcoming period.
The extent to which the operating expenditure forecast
includes expenditure to address the concerns of electricity
consumers as identified by the Distribution Network
Service Provider in the course of its engagement with
electricity consumers.
We understand the intention of this particular factor is to
require us to have regard to the extent to which service
providers have engaged with consumers in preparing their
regulatory proposals, such that they factor in the needs of
consumers.34
We have considered the concerns of electricity
consumers as identified by Jemena– particularly in
considering Jemena's proposed step changes.
The relative prices of capital and operating inputs
We have considered capex/opex trade-offs in considering
Jemena's proposed step changes. For instance we have
provided a step change for demand management on the
basis that it is an efficient capex/opex trade-off. We
considered the relative expense of capex and opex
solutions in considering this step change.
We have had regard to multilateral total factor productivity
benchmarking when deciding whether or not forecast
opex reflects the opex criteria. Our multilateral total factor
productivity analysis considers the overall efficiency of
networks in the use of both capital and operating inputs
with respect to the prices of capital and operating inputs.
The substitution possibilities between operating and
capital expenditure.
As noted above we considered capex/opex trade-offs in
considering a step change for Jemena's demand
management. We considered the substitution possibilities
in considering this step change.
Some of our assessment techniques examine opex in
isolation—either at the total level or by category. Other
techniques consider service providers' overall efficiency,
including their capital efficiency. We have relied on
several metrics when assessing efficiency to ensure we
appropriately capture capex and opex substitutability.
In developing our benchmarking models we have had
regard to the relationship between capital, opex and
outputs.
We also had regard to multilateral total factor productivity
benchmarking when deciding whether or not forecast
opex reflects the opex criteria. Our multilateral total factor
productivity analysis considers the overall efficiency of
networks with in the use of both capital and operating
inputs.
Whether the operating expenditure forecast is consistent
with any incentive scheme or schemes that apply to the
Distribution Network Service Provider under clauses 6.5.8
or 6.6.2 to 6.6.4.
The incentive scheme that applied to Jemena's opex in
the 2010–15 regulatory control period, the EBSS, was
intended to work in conjunction with a revealed cost
forecasting approach.
We have applied our estimate of base opex consistently in
applying the EBSS and forecasting Jemena's opex for the
2016–20 regulatory control period.
34
AEMC, Rule Determination, 29 November 2012, pp. 101, 115.

7-28 Attachment 7 – Operating expenditure | Jemena distribution determination final decision 2016–20
The extent the operating expenditure forecast is referable
to arrangements with a person other than the Distribution
Network Service Provider that, in the opinion of the AER,
do not reflect arm's length terms.
Some of our techniques assess the total expenditure
efficiency of service providers and some assess the total
opex efficiency. Given this, we are not necessarily
concerned whether arrangements do or do not reflect
arm's length terms. A service provider which uses related
party providers could be efficient or it could be inefficient.
Likewise, for a service provider who does not use related
party providers. If a service provider is inefficient, we
adjust their total forecast opex proposal, regardless of
their arrangements with related providers.
Whether the operating expenditure forecast includes an
amount relating to a project that should more
appropriately be included as a contingent project under
clause 6.6A.1(b).
This factor is only relevant in the context of assessing
proposed step changes (which may be explicit projects or
programs). We did not identify any contingent projects in
reaching our final decision.
The extent the Distribution Network Service Provider has
considered, and made provision for, efficient and prudent
non-network alternatives.
We have not found this factor to be significant in reaching
our final decision.
Source: AER analysis.

7-29 Attachment 7 – Operating expenditure | Jemena distribution determination final decision 2016–20
A Base opex
As opex is relatively recurrent, we typically forecast based on a single year of opex.
We call this the base opex amount. In this section, we set out our assessment of
Jemena's base opex.
A.1 Final decision
We have used a base opex amount of $81.5 million in our final decision opex amount.
The comparison of the base opex amount in our preliminary decision, Jemena's
revised proposal and our final decision is outlined below in Table A.1.
Table A.1 AER position on base opex ($ million, 2015)
Preliminary decision Revised proposal Our final decision
Reported 2014 opex 74.8 74.3 74.2
Remove movement in provisions 0.0 0.0 0.0
Remove DMIA expenditure -0.1 -0.1 –0.1
GSL payments -0.1 -0.1 –0.1
Remove scrapping of assets -0.4 -0.4 –0.4
AMI cost reallocation 8.7 8.4
Other service classification
changes 0.5 0.5 0.5
Adjusted 2014 opex 74.8 82.9 82.6
2015 increment -1.1 -1.1 –1.1
Estimated 2015 opex 73.7 81.8 81.5
Source: AER, Jemena preliminary decision opex model, October 2015; Jemena, Attachment 08-03 JGN SCS
Distribution - Opex Forecast Model, January 2016; AER, Jemena final decision opex model, May 2016.
A.2 Jemena's revised proposal and submissions
In Jemena's revised proposal it proposed a base opex amount of $81.8 million ($2015)
The only material difference between our preliminary decision base opex amount and
Jemena's revised proposal reflected a different allocation of AMI costs. In our
preliminary decision we proposed to allocate all these costs to alternative control
services opex. Jemena did not agree to this allocation in its revised proposal.
There were also some minor differences on the reported amount for 2014 opex and the
2015 increment. This reflected differences in inflation estimates.
We received several submissions in response to our preliminary decisions for the
Victorian service providers which either disagreed with our conclusions on base opex

7-30 Attachment 7 – Operating expenditure | Jemena distribution determination final decision 2016–20
or requested further evidence to support our decision. In particular, VECUA considered
there is extensive evidence of material inefficiencies in some Victorian distributors’
opex. It considered this has been revealed by our benchmarking. As a result it
considered using a revealed cost method to be flawed and a benchmarking approach
should be used. It considered CitiPower to be the benchmark provider.35
More generally, VECUA considered that in setting base opex we have had insufficient
regard to:
the decline in the Victorian distributors’ productivity over the previous regulatory
control period
increases in the Victorian distributors' opex over the previous regulatory control
period
the opex reductions that should be realised from the Victorian distributors' major
capex programs over the previous regulatory period.36
The CCP was concerned we have presumed 2014 opex is efficient and that we have
relied on it to set forecast expenditure in light of the recent decline in productivity. It
also urged we review this in detail. It was not convinced that increased bushfire
mitigation expenditure and expansion of the network were driving the decline in
productivity.37
Further specific comments we received are addressed below.
A.3 Assessment approach
In the Expenditure Forecast Assessment Guideline (the Guideline), we explain that a
'revealed cost' approach is our preferred approach to assessing base opex. If actual
expenditure in the base year reasonably reflects the opex criteria, we will set base
opex equal to actual expenditure for those cost categories forecast using the revealed
cost approach.
We will use a combination of techniques to assess whether base opex reasonably
reflects the opex criteria. If our economic benchmarking indicates a service provider's
base year opex is materially inefficient, our approach is to complement our
benchmarking findings with other analysis such as PPIs, category-based techniques
and detailed review.
35
VECUA, Submission to the AER Preliminary 2016-20 Revenue Determinations for the Victorian DNSPs, 6 January
2016, p. 60. 36
VECUA, Submission to the AER Preliminary 2016--‐20 Revenue Determinations for the Victorian DNSPs, 6
January 2016, pp. 4, 60–62. 37
Consumer Challenge Panel Sub Panel 3, Response to Preliminary Decisions made by the AER in response to
proposals from Victorian electricity distribution network service providers for a revenue reset for the 2016–20
regulatory period, 25 February 2016, pp. 11–12.

7-31 Attachment 7 – Operating expenditure | Jemena distribution determination final decision 2016–20
Where a service provider proposes adjustments to base opex, then we assess whether
those adjustments would lead to a total opex forecast that reasonably reflects the opex
criteria.
A.4 Reasons for final decision
Incentive regulation and the revealed cost forecasting approach
We have maintained our approach to setting Jemena's opex based on its actual opex
in 2014. This approach is consistent with the approach we set out in the Guideline.
Network services are monopoly services with little scope in any given location for a
competitor to duplicate the network efficiently.38 Monopoly businesses do not have an
incentive to set prices at an efficient level because there is no competitive discipline on
their decisions. They do not need to consider how and whether or not rivals will
respond to their prices. Monopolies' profits depend only on the behaviour of
consumers, their cost functions, and their prices or the amount supplied.39
Without regulation, the resulting market power would lead to high prices and probably
insufficient investment. Accordingly, we must regulate the prices and other aspects of
these services to ensure reliable and affordable electricity.40
Information asymmetries make it difficult for us to accurately assess the efficiency of
the network businesses’ proposals. We need to make judgements about ‘efficient’
costs.41
Incentive regulation is used to partially overcome information asymmetries. We apply
incentive-based regulation across all energy networks we regulate—consistent with the
NER.42 This is a fundamental aspect of the regime. As stated by the AEMC:
Set out in Chapter 6 of the NER, the incentive regulation framework is designed
to encourage distribution businesses to spend efficiently and to share the
benefits of efficiency gains with consumers. Specifically, it is designed to
encourage distribution businesses to make efficient decisions on when and
what type of expenditure to incur in order to meet their network reliability,
safety, security and quality requirements.43
38
Productivity Commission, Electricity Network Regulatory Frameworks, inquiry report no. 62, 2013, p. 65. 39
ACCC, Submission to the Productivity Commission’s inquiry into the economic regulation of airport services, March
2011, p. 8. 40
Productivity Commission, Electricity Network Regulatory Frameworks, inquiry report no. 62, 2013, p. 65. 41
Productivity Commission, Electricity Network Regulatory Frameworks, inquiry report no. 62, 2013, p. 190. 42
Clause 6.2.6(a) of the NER states that for standard control services, the control mechanism must be of the
prospective CPI minus X form, or some incentive-based variant of the prospective CPI minus X form, in
accordance with Part C (Building Block Determinations for standard control services). Further, the RPPs state a
regulated network service provider should be provided with effective incentives in order to promote economic
efficiency with respect to direct control network services the operator provides. 43
AEMC, Consultation paper: National Electricity Amendment (Demand Management Incentive Scheme) Rule 2015,
February 2015, p. 3.

7-32 Attachment 7 – Operating expenditure | Jemena distribution determination final decision 2016–20
Broadly speaking, incentive regulation is designed to align the commercial goals of the
business to the goals of society or, in the case of energy regulation, the NEO.44 It relies
on the principle that the network businesses’ objective is to maximise profits.45
Businesses that are able to improve their efficiency are rewarded with higher profits.46
Businesses that allow their efficiency to deteriorate earn lower-than-expected profits.
The actual revenue allowance set by the regulator should not influence the basic
incentive of network businesses to minimise costs and, thereby, maximise profits. The
drive to maximise shareholder returns should, in theory, push the businesses to
become more efficient and productive over time. This allows us to leave the minutiae of
input and output decision-making to the businesses.47
The revealed cost forecasting approach is consistent with this framework. As opex is
relatively recurrent from year to year, the incentive framework gives us confidence that
we can rely on a service provider's actual opex when forecasting their efficient opex for
the next regulatory control period.
By using a revealed cost forecasting approach, we assume that any efficiencies which
have occurred since our previous regulatory determination have already been reflected
in a service provider's actual opex. For instance, to the extent there are any opex
efficiencies that the businesses have realised through a recent capex program, we
assume it would be reflected in its existing opex. Similarly, given the financial
incentives these service providers face in avoiding unnecessary cost increases, we
assume that any cost increases that have occurred since the last regulatory
determination reflect a prudent and efficient response to particular changes in a service
provider's operating environment.
For Victorian service providers, strong incentives have applied to opex for three
regulatory control periods. We would expect a priori that in responding to these
incentives, these service providers would already be delivering a service that is
relatively efficient. As this provides a strong theoretical reason why the Victorian
service providers would be operating relatively efficiently, to conclude one is in fact
operating inefficiently, we would require a convincing alternative body of evidence
across a number of sources. We are not aware of any such evidence.
The main tool we have to assess whether incentive regulation is working is
benchmarking. However, all the benchmarking we have undertaken, which was
presented in our preliminary decision 48 shows that, on the whole, the Victorian service
providers are operating relatively efficiently when compared to their counterparts in
44
Productivity Commission, Electricity Network Regulatory Frameworks, inquiry report no. 62, 2013, p. 188. 45
Put simply, it is assumed that shareholders want the business to maximise profits because the greater the profits,
the greater their income. 46
As stated by the AER in its Expenditure Forecast Assessment Guideline explanatory statement, ‘the ex-ante
incentive regime provides an incentive to improve efficiency (that is, by spending less than the AER's forecast)
because network businesses can retain a portion of cost savings made during the regulatory control period.’, p. 42. 47
Productivity Commission, Electricity Network Regulatory Frameworks, inquiry report no. 62, 2013, pp. 27–28. 48
AER, Preliminary decision, Attachment 7, October 2015, pp. 31–40.

7-33 Attachment 7 – Operating expenditure | Jemena distribution determination final decision 2016–20
New South Wales and Queensland.49 We do acknowledge the gap between the
Victorian service providers and the NSW and Queensland service providers has
narrowed in recent years on the MTFP and Opex MPFP benchmarks. However, as
discussed in our annual benchmarking report50, and below, changes in bushfire
mitigation requirements including vegetation management are a significant driver of
this outcome.
On this basis we have continued to rely on each of the Victorian service providers'
actual opex to forecast and we have chosen not to undertake a forensic review of each
of their opex. We consider this is a reasonable position to take in undertaking our task
in assessing opex under the NER.
We also note that VECUA has inferred that because CitiPower is the best performer on
one benchmarking model, the opex of all other Victorian service providers should be
deemed to be inefficient.51 We do not agree with this finding. Because benchmarking
models are subject to limitations regarding specification of outputs and inputs, data
imperfections and other uncertainties, we consider it is preferable to interpret the
findings of any benchmarking conservatively. We do not consider it is reasonable to
conclude that because one service provider is ranked highest in one model then all
other service providers must be inefficient.52
Reasons for productivity decline/increase in opex in Victoria
In response to the VECUA and CCP submissions, we have considered the reasons for
the decline in opex productivity across the Victorian service providers in the past
period. This has not caused us to change our position on base opex from the
preliminary decision.
In total the Victorian service providers' opex have, on average, increased by 3.8 per
cent per annum in real terms since 2009. We have observed the opex partial factor
productivity (PFP) of the five Victorian service providers has declined by an average of
2.5 per cent per annum in this time. The opex PFP measure takes into account
changes in customer numbers, circuit length, ratcheted maximum demand, energy
49
Our preliminary decision was based on benchmarking we had presented in our most recent distribution
benchmarking report published in November 2014 (AER, 2014 Annual benchmarking report, November 2014).
After releasing our preliminary decision in October 2015 we published an additional distribution benchmarking
report in November 2015 (AER, 2015 Annual benchmarking report, November 2015). The 2015 version of the
report still indicates that the Victorian service providers are operating relatively efficiently compared to their
counterparts in New South Wales and Queensland. 50
AER, 2015 Annual benchmarking report, November 2015, p. 8. 51
VECUA, Submission on the AER Preliminary 2016-20 Revenue Determinations for the Victorian DNSPs,
6 January 2016, p. 60. 52
We also note the model VECUA refers to measured average opex efficiency over an eight year period (2006 to
2013). For the purposes of setting base opex we are reaching a conclusion on efficient opex for 2014 As the costs
facing the Victorian service providers are different in 2014 to the average costs they faced from 2006 to 2013, it is
not possible to directly infer 2014 efficiency by assessing 2006 to 2013 efficiency.

7-34 Attachment 7 – Operating expenditure | Jemena distribution determination final decision 2016–20
delivered and customer minutes off supply. This suggests that a significant proportion
of the growth in opex since 2009 is due to other cost drivers.
As outlined below in Figure A.1, the trend in opex and opex PFP has been relatively
flat between 2009 and 2011. There is a significant increase in opex (and decline in
opex PFP) across the Victorian service providers' between 2011 and 2012 and then a
relatively flat trend in both opex and opex PFP between 2012 and 2014.
Figure A.1 Victorian service providers - trend in opex and partial factor
productivity in opex - 2009 to 2014 ($ million, 2015)
Source: AER analysis
Figure A.2 aggregates total opex for each of the Victorian service providers by
category and demonstrates the change in categories of opex in this time. It shows that
increases in vegetation management opex followed by increases in maintenance opex
are the main reasons why the Victorian service providers' opex has increased since
our last determination.

7-35 Attachment 7 – Operating expenditure | Jemena distribution determination final decision 2016–20
Figure A.2 Change in Victorian service providers' opex relative to 2009
($ million, 2015)
Source: AER analysis.
Figure A.3 illustrates the growth of each category on an index based measure. Opex
on vegetation management has increased proportionally by a much greater amount
than other categories of opex. There has been a moderate increase in maintenance
expenditure relative to 2009 levels. Network overheads allocated to opex and
emergency response opex have increased only marginally relative to 2009 levels.
Opex on corporate overheads has declined.
-40
-20
0
20
40
60
80
100
120
140
2009 2010 2011 2012 2013 2014
Vegetation management Maintenance
Emergency response Network overheads and non-network opex
Corporate overheads

7-36 Attachment 7 – Operating expenditure | Jemena distribution determination final decision 2016–20
Figure A.3 Change in opex relative to 2009 - index measure
($ million, 2015)
Source: AER analysis.
A major driver of the increase in vegetation management opex across the industry is
attributable to the changes in regulatory requirements as a result of the Electrical
Safety (Electric Line Clearance) Regulations 2010 which was introduced in June 2010
following the Black Saturday bushfires. These new regulations introduced the following
key changes to the Victorian service provider's regulatory requirements.
Minimum clearance spaces surrounding aerial bundled cable or insulated cable
now applied to small tree branches. Under the previous version of the regulations,
the minimum clearance spaces did not apply to small tree branches under specified
conditions.
Minimum clearance spaces surrounding powerlines in hazardous bushfire risk
areas now applied to tree branches above a powerline of 22kV. Under the previous
version of the regulations the minimum clearance space did not apply under
specified conditions.53
We signalled that the Electrical Safety (Electric Line Clearance) Regulations 2010
would be a significant cost driver affecting the Victorian service providers' opex when
we forecast large step changes in opex in our final decisions for the 2011 to 2015
53
Victorian Competition and Efficiency Commission, Proposed Electrical Safety (Electric Line Clearance) Regulations
2010 Regulatory Impact Statement, pp. xviii-xix.
0
0.5
1
1.5
2
2.5
2009 2010 2011 2012 2013 2014
Vegetation management Maintenance
Emergency response Network overheads and non-network opex
Corporate overheads Total opex

7-37 Attachment 7 – Operating expenditure | Jemena distribution determination final decision 2016–20
regulatory control period.54 At the time, we forecast increases in opex of $206 million
($2015) from 2011 to 2015 due to these new regulations.55
Vegetation management expenditure across the industry was also likely affected by
heavy rainfall during the period. The year 2010 was the fifth wettest year on record in
Victoria following one of the wettest springs on record,56 and 2011 was the twelfth
wettest year on record.57 While we have not collected evidence on the effects of this
pattern on vegetation growth in Victoria, we did observe that above average rainfall in
South Australia in 2010 and 2011 led to significant increases in vegetation growth and
vegetation management expenditure.58
The moderate increase in maintenance expenditure across the industry in part also
reflects other increases in regulatory obligations following the Black Saturday
bushfires. For instance, one of the Victorian Bushfire Royal Commission's (VBRC)
recommendations was to mandate maximum thirty seven month inspection cycles of
single wire earth return lines (SWER) and 22KV feeders in high bushfire risk areas.59
This came into force in the Electrical Safety Amendment (Bushfire Mitigation)
Regulations 201160 and is now mandated by the Electrical Safety (Bushfire Mitigation)
Regulations 2013.61 This has contributed to the increase in pole inspection expenditure
in Figure A.4.
54
AER, Victorian electricity distribution network service providers distribution determination 2011–15, October 2010,
p. 301; AER, Opex step changes - final decision model; AER analysis. 55
Following an Australian Competition Tribunal decision, we reconsidered the amount we had forecast for Powercor
and CitiPower. This led to a further increase in our forecast for Powercor and CitiPower of $27 million ($2015). See
AER, Vegetation management forecast operating expenditure step change 2011-15. 56
Bureau of Meteorology, http://www.bom.gov.au/climate/current/annual/vic/archive/2010.summary.shtml, 4 January
2011. 57
Bureau of Meteorology, http://www.bom.gov.au/climate/current/annual/vic/archive/2011.summary.shtml, 3 January
2012. 58
AER, SA Power Networks cost pass through application for vegetation management costs arising from an
unexpected increase in vegetation management. 59
Victorian Bushfires Royal Commission, Final Report - Summary, July 2010, p. 29. 60
Electrical Safety Amendment (Bushfire Mitigation) Regulations 2011, Cl. 5A(j); Electrical Safety Amendment
(Bushfire Mitigation) Regulations 2011, cl. 5A(j). 61
Electrical Safety Amendment (Bushfire Mitigation) Regulations 2011, cl. 6(i).

7-38 Attachment 7 – Operating expenditure | Jemena distribution determination final decision 2016–20
Figure A.4 Pole inspection and pole inspection expenditure ($ million,
2015)
Source: AER analysis.
Another factor contributing to the increase in maintenance opex and opex more
generally is the strength in wage growth across the industry. Labour costs are the most
significant component of opex for utility businesses.
Since 2009, wage growth in the ABS' Electricity Gas Water and Wastewater (EGWWS)
classification has been on average 3.7 per cent per annum in nominal terms. In real
terms EGWWS wage growth has been on average 1.3 per cent. As indicated in Figure
A.5, this has largely matched the rate of wage growth in the mining industry and has
exceeded wage growth across the Australian economy. This, in part, is likely to reflect
the impact of the mining boom on the EGWWS sector. The impact of the demand for
mining labour has previously been recognised as a driver of utilities wages by Deloitte
and BIS Shrapnel.62
62
Access Economics, Forecast growth in labour costs: update of March 2010 report, September 2010, p. vii; BIS
Shrapnel, Labour Cost Escalation Forecasts to 2016–17 - Australia and Queensland, January 2012, p. 21.
-
100
200
300
400
500
-
5
10
15
20
25
2009 2010 2011 2012 2013 2014
Number of poles inspected
Opex ($m, 2015)
Routine Pole Inspection and Treatment Costs
Number of poles inspected (000s)

7-39 Attachment 7 – Operating expenditure | Jemena distribution determination final decision 2016–20
Figure A.5 Wage growth, ABS classifications
Source: ABS, 6345.0 Wage Price Index, December 2015.
In our view, the above drivers do not suggest that the Victorian service providers'
operating efficiency has materially declined over the previous regulatory period. In our
view, it suggests it is a number of changes in business conditions that helps to explain
the trend since our last revenue determination in Victoria.
Importantly, we do not expect these drivers to persist in the 2016–20 regulatory control
period. For instance, the Electrical Safety (Electric Line Clearance) Regulations 2015
led to relatively minimal changes to the Victorian service providers' regulatory
requirements for vegetation management. As discussed in Appendix B, we also expect
efficient wage growth in the utility sector to slow. This is in part attributable to the
reduced competition for labour from the mining sector.63
A.5 Allocation of AMI costs
Our final position on base opex incorporates an adjustment of $8.4 million for
Advanced Metering Infrastructure (AMI) costs. This is a change in position from our
preliminary decision where we allocated all AMI costs to alternative control services
(ACS) metering. Our revised approach is based on advice on cost allocation principles
for IT and communications systems from Energy Market Consulting Associates
63
Deloitte Access Economics, Forecast growth in labour costs in NEM regions of Australia, February 2016, p. 39.
100.0
105.0
110.0
115.0
120.0
125.0
130.0
Jun-2009 Jun-2010 Jun-2011 Jun-2012 Jun-2013 Jun-2014 Jun-2015
EGWWS Mining All industries

7-40 Attachment 7 – Operating expenditure | Jemena distribution determination final decision 2016–20
(EMCa). These principles are aligned with the cost allocation principles in our Cost
Allocation Guidelines and in the NER.
Preliminary decision approach and consideration of stakeholder views
During the 2011–15 regulatory control period, incremental costs associated with
implementing and operating smart meters were regulated under the Advanced
Metering Infrastructure Order in Council (AMI OIC). This included costs associated with
new or upgraded IT systems.
With the expiry of the AMI OIC, opex associated with AMI is now to be regulated under
the NER. Jemena initially proposed an adjustment to its SCS base opex of $10.9
million ($2015) for AMI opex previously regulated under the AMI OIC. Other opex
associated with smart meters was allocated to ACS metering. Jemena's proposed
base opex amount for ACS metering was $10.1 million ($2015). Jemena did not
specify in its initial proposal how it had determined its allocation of AMI costs across
SCS and ACS metering.
In our preliminary decision we did not allocate any AMI costs to SCS. Each of the
Victorian service providers had adopted a different approach to allocating AMI costs in
their initial proposals. Presently, metering services are not subject to competition but,
following NER changes, competition is scheduled to begin from December 2017.64 We
considered that a different approach to allocating costs across each of the Victorian
service providers would not help in promoting effective competition. We considered a
consistent approach to be preferable which could be dealt with through our Distribution
Ring Fencing Guideline in accordance with a national framework.65 We are scheduled
to publish a Distribution Ring Fencing Guideline by 1 December 2016.
In the interim, before this Guideline is developed, we considered it was preferable to
allocate all AMI costs to ACS. As this is similar to the historical approach where AMI
costs are recovered separately to most distribution network costs, we also considered
this approach will help in promoting transparency around trends in metering and SCS
opex.
Jemena's revised SCS opex base year adjustment for AMI was $8.7 million ($2015).
Its revised base opex amount for ACS metering was $11.5 million ($2015). For IT costs
previously regulated under the AMI OIC, Jemena allocated 44 per cent to metering
ACS and 56 per cent to SCS. This allocation percentage was identical to Jemena's
initial proposal. The allocation of IT costs was based on the estimated utilisation of
each main system by Jemena staff. For all other AMI costs Jemena either allocated
100 per cent wholly to SCS or ACS metering based on the primary driver for each
category.66
64
AEMC, National Electricity Amendment (Expanding Competition in Metering and Related Services) Rule 2015,
26 November 2015, p. i. 65
AER, CitiPower preliminary decision, Attachment 7, October 2015, p. 44. 66
Jemena, Response to information request JEN AER #031 [email to AER], 5 February 2016.

7-41 Attachment 7 – Operating expenditure | Jemena distribution determination final decision 2016–20
In response to our preliminary decisions, the Victorian service providers disagreed with
our decision to allocate all AMI costs to metering ACS. All of the Victorian service
providers maintained that certain AMI costs should be allocated to SCS.
The Victorian service providers' arguments to support their proposals to allocate some
AMI costs to SCS can be summarised as follows:
a number of the IT systems rolled out as part of the AMI metering service are
needed even if the service providers did not provide a metering service e.g. for
customer billing and providing data to the market, and should therefore be
considered to contribute to the distribution network SCS67
as some of these costs should be allocated to SCS, in the event of metering
competition, they would be at an unfair disadvantage if all AMI costs are allocated
to ACS68
costs must be correctly allocated now in line with the regulatory framework.69
Several service providers considered costs should be allocated in accordance with
their Cost Allocation Methods (CAM).70
different DNSPs adopted different approaches to the AMI roll out (e.g. purpose built
IT systems compared to upgrades / lifecycle replacement of existing systems) and
these differences limit the extent to which cost allocation between standard control
services and alternative control services will or can be consistent across all
DNSPs.71
The Victorian Government also disagreed with our preliminary decisions on this issue.
It considered we must resolve this issue to the best of our ability now.72 It considered
that if all AMI costs are allocated to ACS then metering charges will be higher than
they should be. It considered that there is a risk that this may encourage inefficient
entry from new competitors.73 The CCP agreed with our preliminary decision to
allocate all AMI costs to ACS metering pending development of the Distribution Ring
Fencing Guideline.74
67
AusNet Services, Revised regulatory proposal, Attachment 11-6; CitiPower, Revised regulatory proposal, p. 151;
Powercor, Revised regulatory proposal, January 2016, pp. 150–151. 68
AusNet Services, Revised regulatory proposal, Attachment 11-7; CitiPower, Revised regulatory proposal, p. 151;
Jemena, Revised regulatory proposal, Attachment 9-1, p. 23; Powercor, Revised regulatory proposal, p. 151;
United Energy, Revised regulatory proposal, January 2016, p. 106. 69
Jemena, Revised proposal, Attachment 9-1, p. 22; United Energy, Revised proposal, pp. 104–105. 70
AusNet Services, Revised regulatory proposal, Attachment 11-7; CitiPower, Revised regulatory proposal, pp. 152–
153; Powercor, Revised regulatory proposal, January 2016, pp. 152–153. 71
CitiPower, Revised proposal, p. 152; Jemena, Revised regulatory proposal, Attachment 9-1, p. 24; Powercor,
Revised regulatory proposal, p. 152; United Energy, Revised regulatory proposal, January 2016, p. 105. 72
Victorian Government, Submission on preliminary decisions, p. 10. 73
Victorian Government, Submission on preliminary decisions, p. 10. 74
CCP, Report on AER preliminary decision, p. 23.

7-42 Attachment 7 – Operating expenditure | Jemena distribution determination final decision 2016–20
In light of the several submissions we received from stakeholders that disagreed with
our preliminary position, we reconsidered whether we should continue to hold all AMI
costs in ACS metering until we considered this issue further in developing the
Distribution Ring Fencing Guideline. We have determined that a change in position
from our preliminary decision is appropriate. We note that the mandated AMI roll-out
involved upgrades not just to metering services but also other network services, such
as IT and other systems which previously were being recovered in aggregate under the
AMI OIC regime, but are now regulated under the NER. This means certain systems
should be seen as part of SCS.
While there would be some benefit in waiting to consider this issue through the
Distribution Ring Fencing Guideline process, given advanced meters have already
been rolled out in Victoria, the cost allocation issues the Victorian service providers
currently face are different to those that may potentially be faced by other service
providers in other states. Therefore, on balance, it is appropriate to consider the
allocation of AMI costs between SCS and ACS, notwithstanding we have not yet
completed the Distribution Ring Fencing Guideline. We therefore have developed a
revised position on how such costs should be allocated for the 2016–20 regulatory
control period.75
EMCa advice on cost allocation
We engaged EMCa to help develop a cost allocation approach that could be applied
across the Victorian service providers. We asked EMCa to focus on IT and
communications costs as this was the main area where the service providers proposed
to allocate costs to SCS.
EMCa carried out a desktop review of the AMI information submitted by the Victorian
service providers as part of their regulatory submissions. It also reviewed relevant AMI
regulatory decision and guidance documents. It compared the allocation approach for
AMI-related IT and communications expenditure and collated evidence on the key
drivers and rationale provided by each business to justify the allocation approaches
taken.76
EMCa also reviewed the allocations proposed by the businesses against our cost
allocation framework, which include:
1. the cost allocation principles in the NER77
2. our Cost Allocation Guideline78
3. approved Cost Allocation Methods for each service provider.79
75
We note that our decision to allocate these costs in this way for the 2016–2020 regulatory control period does not
prevent us from re-considering this issue through the Ring Fencing Guideline process. 76
EMCa, Advice on allocation of advanced metering infrastructure (AMI) IT and communications expenditure, 6 April
2016, p. 2. 77
NER, s. 6.15.2. 78
AER, Electricity distribution network service providers - Cost allocation guideline, June 2008.

7-43 Attachment 7 – Operating expenditure | Jemena distribution determination final decision 2016–20
EMCa agreed that it is reasonable that some proportion of the costs relating to AMI
should be allocated to SCS as some aspects of AMI were geared towards providing
greater network benefits beyond metering services.
While EMCa considered it reasonable to suggest that the allocation of AMI costs
should be consistent with each service provider's CAM, for the most part it did not
consider their CAMs are sufficiently prescriptive or granular as to provide a clear
method for allocating AMI costs between metering ACS and SCS:
While noting the AER’s Decisions approving the CAMs, given the high-level
nature of the documents it is not possible to assess from the CAMs alone,
whether the DNSPs have adopted a cost allocation approach for metering-
related IT and communications that is consistent with NER’s CAG. Moreover
the variety of methods used by the DNSPs in allocating costs between SCS
and metering ACS directly demonstrates the latitude in interpretation that has
been applied in the CAMs.80
EMCa considers it is more instructive to allocate such costs by direct reference to the
NER’s Cost Allocation Principles (CAP) and our Cost Allocation Guidelines (CAG). By
basing the allocation of AMI costs on consistent principles with reference to the main
reason the system was put in place (i.e. driver), EMCa considers this would provide a
more reasonable platform for metering competition.81
In line with our CAG and the NER’s CAP, EMCa considers that costs should be directly
attributed (to distribution network SCS or metering ACS) only where the relevant
systems are solely used to provide that service or where use for the other services can
be considered immaterial as defined by Australian accounting standards. Where costs
are shared and material, EMCa recommends the costs be allocated on a causal
basis.82
On this basis EMCa would expect DNSPs to propose an attribution / allocation of IT
opex and communications opex broadly as set out in Table A.2.
79
AusNet Services, Cost Allocation Method, November 2014; CitiPower, Cost Allocation Method, April 2014;
Jemena, Cost Allocation Method, July 2014; Powercor, Cost Allocation Method, April 2014; United Energy Cost
Allocation Method, October 2014. 80
EMCa, Advice on allocation of advanced metering infrastructure (AMI) IT and communications expenditure,
6 April 2016, p. 22. 81
EMCa, Advice on allocation of advanced metering infrastructure (AMI) IT and communications expenditure,
6 April 2016, p. iii. 82
EMCa, Advice on allocation of advanced metering infrastructure (AMI) IT and communications expenditure,
6 April 2016, p. iii.

7-44 Attachment 7 – Operating expenditure | Jemena distribution determination final decision 2016–20
Table A.2 Proposed allocation of AMI IT and communications costs
Allocation between ACS/SCS
Allocated solely to ACS metering
Communications infrastructure opex including Network
Management Systems (NMS), Metering Management
Systems (MMS), Network Operations and Control Centre
(NOCC)
Metering data management systems
Allocated solely to SCS
Field force mobility systems
Network billing systems
Customer Information Systems
Outage management systems
Shared between ACS and SCS
B2B systems for managing AMI- related transactions with
other market participants
GIS
Asset management systems
Performance and reporting regulatory systems
Middleware / integration bus technology
Data analysis systems
New / upgraded IT infrastructure to support the additional
AMI functionality
Source: EMCa, Advice on allocation of advanced metering infrastructure (AMI) IT and communications expenditure,
6 April 2016, p. iii.
Several service providers considered that a common allocation method would be
challenging to apply given they implemented AMI at different stages of their IT
lifecycles. However, EMCa did not afford this much weight given it had recommended
the service providers apply a causal allocation method. This gives consideration to the
reason the cost was incurred and recognises the different stage of the service
providers’ IT lifecycles. EMCa considered the service providers’ arguments would only
be relevant if it were advocating the same fixed allocation percentage be used across
all service providers.83
83
EMCa, Advice on allocation of advanced metering infrastructure (AMI) IT and communications expenditure, 6 April
2016, p. iii.

7-45 Attachment 7 – Operating expenditure | Jemena distribution determination final decision 2016–20
Application of cost allocation principles to Jemena's AMI costs
We invited Jemena to comment on EMCa's draft framework for allocating AMI costs to
which it responded on 24 March. We also requested that Jemena allocate its costs in
accordance with EMCa’s framework.84
Jemena limited its comments to the issue of the cost apportionment of the MDMS
system. It notes the MDMS has multiple functions that would still be required by the
DNSP even in the absence of the AMI OIC and metrology obligations currently
imposed on JEN. Given this, and the lack of time it considers it has to properly
consider an appropriate cost allocation, Jemena proposed costs associated with this
system be allocated on a 50:50 basis.85
As requested, Jemena also provided an alternative cost allocation model based on its
understanding of EMCa's recommended methodology. In doing so, Jemena reviewed
each line item of IT cost, and assigned an allocator to each item to determine whether
the cost should be SCS or ACS metering.86 As a result Jemena's allocation of IT costs
between ACS metering and SCS changed from 44:56 (revised proposal) to 30:70
(EMCa allocation). However, in its written response Jemena noted that EMCa’s
allocation framework did not reflect Jemena's preferred cost allocation methodology.87
Allocation of MDMS
To identify whether a system should be solely related to the provision of metering
services, EMCa considered the main reason the system was implemented (i.e. driver).
As a MDMS captures, processes, stores and makes available metering data it
considers MDMS should be solely allocated to metering. EMCa does not consider the
fact that the metering data is also used within the distribution business should mean
the parts of the cost of the system should be allocated to SCS. EMCa notes future
metering service providers in the NEM would all require an MDMS in providing a
metering service which indicates that an MDMS is central to provide a metering
service. It therefore maintained its advice to allocate all these costs to ACS.88
Based on EMCa's advice, we are satisfied that the driver of implementing a MDMS is
to provide a metering service. Therefore we agree that these costs should be solely
allocated to alternative control services. As competitors for metering will all require an
MDMS that cannot be recovered through network tariffs, this allocation approach will
help to ensure that future competitors for metering are not unfairly disadvantaged.
84
Jemena, AER information request – Jemena - #049 – Advanced Metering Infrastructure costs [email to AER], 24
March 2014. 85
Jemena, AER information request – Jemena - #049 – Advanced Metering Infrastructure costs. Pdf [email to AER],
24 March 2014, p. 3. 86
JEN - AMI IT Cost Allocation - IR049 - 2016.03.24.xlsx. 87
Jemena, Response to AER information request – Jemena - #049 – Advanced Metering Infrastructure costs. Pdf
[email to AER], 24 March 2014, p. 3. 88
EMCa, Advice on allocation of advanced metering infrastructure (AMI) IT and communications expenditure, 6 April
2016, p. iii.

7-46 Attachment 7 – Operating expenditure | Jemena distribution determination final decision 2016–20
We also consider EMCa's advice is consistent with our approach to service
classification which classifies metering data services as an alternative control service.89
These services are defined as the collection, processing, storage, delivery and
management of metering data.
Methodology for allocating IT costs
We considered Jemena's cost allocation approach in response to EMCa's draft report.
However, it was not clear how Jemena's revised approach aligned with EMCa's
framework. Jemena's model included specific allocators for hundreds of different tasks
and costs but Jemena provided limited supporting information to explain its approach.
Jemena was also explicit in stating that it considered its revised proposal contained a
more appropriate allocation approach, emphasising the limited time it had to reallocate
its costs in accordance with EMCa’s framework.90
On balance, we were not satisfied we could place any significant weight on Jemena’s
revised allocation approach. In light of this we consider Jemena's revised proposal
allocation method is the most appropriate basis for allocating IT costs in this final
decision. However, we identified and made changes to the apportionment of FTEs in
Jemena’s revised proposal allocation approach where it was clearly inconsistent with
EMCa's framework. For instance, in accordance with EMCa's framework, Jemena's
MDMS (Itron) and its network management system (SSN) should be wholly allocated
to alternative control services. Jemena's SAP/ISU system is mainly utilised for network
billing as its customer information system, so this can be allocated 100% to SCS under
EMCa's framework.
Applying such changes leads to small changes in the allocation of costs from Jemena's
revised proposal. On the one hand, a revised allocation of MDMS and NMS increase
the costs allocated to alternative control services metering. On the other hand, this is
largely offset by a reduced allocation as a result of a revised allocation of SAP-ISU
costs to SCS. The net result is that $8.4 million ($2015) rather than $8.7 million
($2015) is allocated to standard control services base opex.
Table A.3 illustrates how (in percentage terms) the allocation of IT and
communications costs has changed between Jemena’s initial proposal, revised
proposal and our final decision.
89
AER, Final framework and approach for the Victorian electricity distributors, 24 October 2014, p. 49. 90
Jemena, Response to AER information request – Jemena - #049 – Advanced Metering Infrastructure costs. pdf
[email to AER], 24 March 2014, p. 3.

7-47 Attachment 7 – Operating expenditure | Jemena distribution determination final decision 2016–20
Table A.3 Allocation of IT and communications costs (per cent)
Initial proposal Revised
proposal Final decision
SCS ACS SCS ACS SCS ACS
56 44 56 44 54 46
Source: Jemena, Regulatory proposal, Attachment 8-4, 30 April 2015; Jemena, Revised Regulatory proposal,
Attachment 9-1, January 2016; AER analysis.
A.6 Other adjustments to base opex
Inflation
The other change to our preliminary decision base opex estimate reflects an update of
how we have inflated base opex from nominal dollars to real $2015. For our
preliminary decision we estimated the annual inflation rate to December 2015 would be
2.5 per cent, based on the RBA’s forecast in its statement on monetary policy.91 For
this final decision we have used the actual inflation rate of 1.7 per cent as reported by
the ABS.92 This actual inflation rate was not available at the time of our preliminary
decision.
91
Reserve Bank of Australia, Reserve Bank of Australia statement of monetary policy, August 2015, p. 67. 92
ABS catalogue 6401.0, December 2015.

7-48 Attachment 7 – Operating expenditure | Jemena distribution determination final decision 2016–20
B Rate of change
Once we have determined the efficient opex required in 2015 we apply a forecast
annual rate of change to forecast opex for the 2016–20 regulatory control period. We
do this to account for likely changes in demand and cost inputs for each year of the
forecast period. As set out in the Expenditure Forecast Assessment Guideline (the
Guideline), the rate of change accounts for forecast:93
price growth
output growth
productivity growth.
This appendix contains our assessment of the opex rate of change for use in
developing our estimate of total forecast opex.
B.1 Position
We are not satisfied Jemena's proposed rate of change for the 2016–20 regulatory
control period reasonably reflects a realistic expectation of the demand forecast and
cost inputs required to achieve the opex objectives.94
We consider that applying our methodology to derive an alternative estimate of opex
will result in a forecast that reasonably reflects the efficient and prudent costs faced by
Jemena given a realistic expectation of demand forecasts and cost inputs because:
our labour price growth measure reasonably reflects current and forecast economic
conditions
our output growth measure reasonably reflects the forecast increase in services
that customers require.
We note that we and Jemena have applied a zero estimate of forecast productivity
growth.
In the sections below we discuss the reasons why we consider our rate of change
forecast is preferable to Jemena's forecast. We have applied the same rate of change
methodology to derive our alternative estimate of opex as we used in our preliminary
decision. We have updated our estimate of the rate of change in opex to reflect the
most recent forecasts of labour price growth in the Victorian utilities industry from
Deloitte Access Economics (DAE) and the Centre for International Economics (CIE).
We used DAE and BIS Shrapnel in our preliminary decision but none of the DNSPs
submitted an up to date forecast from BIS Shrapnel with their revised regulatory
proposals. We have also updated our forecasts of customer numbers growth and
93
AER. Better Regulation explanatory statement expenditure forecast assessment guideline, November 2013, p. 61. 94
NER, cl. 6.5.6(c)(3).

7-49 Attachment 7 – Operating expenditure | Jemena distribution determination final decision 2016–20
ratcheted peak demand growth. The net impact of these changes results in an annual
rate of change of 1.94 per cent, which is on average 0.52 per cent higher than our
preliminary decision estimate.
Our forecast of the overall rate of change used to derive our alternative estimate of
opex is lower than Jemena's over the forecast period. Table B.1 shows Jemena's and
our overall rate of change in percentage terms for the 2016–20 regulatory control
period.
The differences in the forecast rate of change components are:
our forecast of annual price growth is on average 0.22 percentage points lower
than Jemena's
our forecast of annual output growth is on average 0.28 percentage points lower
than Jemena's.
We discuss the reasons for the difference between us and Jemena for the rate of
change components below.
Table B.1 Jemena and AER rate of change (per cent)
2016 2017 2018 2019 2020 Average
Jemena 2.32 2.24 2.54 2.59 2.55 2.45
AER 1.77 1.74 1.99 2.05 2.16 1.94
Difference –0.55 –0.50 –0.55 –0.54 –0.39 –0.51
Source: AER analysis.
B.2 Preliminary position
For our preliminary decision, we did not adopt Jemena's forecast growth in price and
output in our forecast rate of change and thus our alternative estimate of opex. We
have summarised our preliminary position for each rate of change component below:
Price growth: for labour price growth we adopted an average of DAE's and BIS
Shrapnel's wage price index (WPI) forecasts for the Victorian electricity, gas, water
and waste services (utilities) industry. For non-labour we adopted the forecast
change in the CPI. We applied Economic Insights' benchmark opex price
weightings for labour and non-labour.
Output growth: we applied the weighted average forecast change in customer
numbers, circuit length and ratcheted maximum demand. We based the weights of
each of these outputs on Economic Insights' opex cost function analysis. We used
the circuit length forecasts from Jemena’s reset RIN and ratcheted maximum
demand forecasts from AEMO. We used our own forecast of customer numbers.
Productivity growth: we applied a zero per cent productivity growth estimate. We
based this estimate on our considerations of recent productivity trends and whether

7-50 Attachment 7 – Operating expenditure | Jemena distribution determination final decision 2016–20
this would be applicable to the forecast period. This was also consistent with
Economic Insights' recommendations.
Refer to appendix B of attachment 7 in our preliminary decision for a detailed
explanation of our considerations.
B.3 Jemena's revised proposal and submissions
Jemena made several adjustments to its rate of change methodology from its initial
proposal. In its revised proposal Jemena:95
adopted the forecast price growth in our preliminary decision
adopted the output growth forecasting method in our preliminary decision
revised its forecasts of customers numbers growth and peak demand growth
adopted the forecast productivity growth in our preliminary decision.
These changes have resulted in a decrease in the average annual rate of change
estimated by Jemena from 2.52 per cent in its initial proposal to 2.45 per cent in its
revised proposal.
B.4 Reasons for position
We have separated the sections below into the three rate of change components.
Where relevant we compare these components to Jemena's proposed rate of change
using information provided in its reset RIN and opex model.
B.4.1 Overall rate of change
We are not satisfied that Jemena's forecast of the rate of change will provide an opex
forecast that reasonably reflects the opex criteria. We have adopted a rate of change
lower than that proposed by Jemena to forecast our alternative estimate of opex.
Jemena's higher forecast output growth is the primary driver of this difference.
CitiPower also forecast higher price growth than we have.
Jemena forecast no growth in productivity for the 2016–20 regulatory control period.
This is consistent with our forecast of productivity growth.
Table B.2 shows Jemena's and our overall rate of change and each rate of change
component for each regulatory year of the 2016–20 regulatory control period.
In estimating our rate of change, we considered Jemena's proposed forecast growth in
prices, output and productivity and the methodology used to forecast these.
95
Jemena, Revised regulatory proposal, 6 January 2016, p. 46.

7-51 Attachment 7 – Operating expenditure | Jemena distribution determination final decision 2016–20
Table B.2 Jemena and AER rate of change (per cent real)96
2016 2017 2018 2019 2020 Average
Jemena revised proposal
Price growth 0.22 0.50 0.79 0.92 0.85 0.66
Output growth 2.09 1.74 1.73 1.66 1.69 1.78
Productivity growth – – – – – –
Overall rate of change 2.32 2.24 2.54 2.59 2.55 2.45
AER
Price growth 0.25 0.23 0.49 0.59 0.63 0.44
Output growth 1.51 1.51 1.50 1.45 1.52 1.50
Productivity growth – – – – – –
Overall rate of change 1.77 1.74 1.99 2.05 2.16 1.94
Overall difference –0.55 –0.50 –0.55 –0.54 –0.39 –0.51
Source: AER analysis.
B.4.2 Forecast price growth
We are not satisfied Jemena's proposed average annual price growth of 0.7 per cent
for the 2016–20 regulatory control period reasonably reflects the increase in prices a
prudent and efficient service provider would require to meet the opex objectives. We
forecast an average annual price growth of 0.4 per cent for the 2016–20 regulatory
control period.
We forecast price growth based on the forecast growth in labour and non-labour
prices. We used the forecast change in the wage price index (WPI) for the electricity,
gas, water and waste services industry (the utilities industry) as the forecast change in
the labour price.97 Specifically, we have used the average of the utilities WPI growth
forecasts from DAE and CIE. We assumed non-labour prices grow with CPI. We
applied input price weights of 62 per cent for labour and 38 per cent for non-labour.
96
The rate of change = (1+ price growth) × (1+ output growth) × (1+ productivity growth) – 1. 97
We consider the utilities industry is an appropriate comparison point because the electricity industry makes up a
majority of the ABS' utilities classification. We recognised that the utilities industry is a broad measure that includes
other workers but captures all electricity workers. Deloitte Access Economics considered that electricity labour is
large component of the utilities sector and therefore it would have a notable impact on the WPI series. It also
considered that a difference between electricity labour and non-electricity labour does not mean electricity labour
would necessarily have higher wage growth.

7-52 Attachment 7 – Operating expenditure | Jemena distribution determination final decision 2016–20
We are satisfied that this approach to forecasting labour price growth reasonably
reflects a realistic expectation of the labour price growth faced by a prudent and
efficient firm. This forward looking approach draws on available current market
information from multiple sources, including from enterprise agreements, on the
expected changes to the drivers of labour price. This is particularly important when
labour drivers have changed significantly in recent times and wage price growth, for
both the economy as a whole, and the utilities industry more specifically, is at the
lowest level on record.98
Jemena adopted the forecast of price growth in our preliminary decision in its revised
regulatory proposal. However, our standard practice is to update our forecast of price
growth in our final decisions to reflect the most up to date information practicably
available at the time of our final decision.
For our preliminary decision we used an average of the WPI growth rates forecast by
DAE and BIS Shrapnel. DAE prepared its forecast in June 2015. BIS Shrapnel
prepared its forecasts in November 2014.
We received updated forecasts from DAE in February 2016. However, none of the
Victorian DNSPs provided updated WPI forecasts from BIS Shrapnel.
AusNet Services, CitiPower and Powercor all provided WPI growth forecasts from CIE
with their revised regulatory proposals, as they did with their initial proposals. In our
preliminary decision for AusNet Services we raised a number of concerns with CIE's
WPI growth forecasts. Specifically, we stated that CIE WPI growth forecasts looked
inconsistent with the prevailing labour market conditions in that they peaked in 2016
and remained above the historic average over the entire forecast period.99 However
CIE has addressed these concerns in its revised forecasts, which we discuss further
below. We compare the Victorian utilities WPI forecasts from all three forecasters in
Table B.3.
Table B.3 Forecast annual WPI growth, Victoria, EGWWS (per cent)
2016 2017 2018 2019 2020 Average
BIS Shrapnel (November 2014) 0.9 1.3 1.8 2.1 1.8 1.6
DAE (February 2016) 0.1 –0.2 0.5 0.9 1.1 0.5
CIE (November 2015) 0.7 1.0 1.1 1.0 1.0 0.9
Source: DAE, Forecast growth in labour costs in NEM regions of Australia, 22 February 2016, p. 8; CIE, Labour price
forecasts, 23 November 2015, p.76; BIS Shrapnel, Real labour and material cost escalation forecasts to
2020, November 2014, p. ii.
98
ABS, Catalogue 6345.0, Table 9b. 99
AER, Preliminary decision: AusNet Services, Attachment 7, October 2015, p 56.

7-53 Attachment 7 – Operating expenditure | Jemena distribution determination final decision 2016–20
The forecast Victorian utilities WPI growth rates from BIS Shrapnel are higher on
average than the historic average rate at the national level of 1.2 per cent per annum.
By contrast, the forecast utilities WPI growth rates from both DAE and CIE are lower,
on average, than the historic average rate. We noted in our preliminary decision that
WPI growth rates, both at the Australian all industries level and for the utilities industry
more specifically, were at their lowest level on record.100 WPI growth rates, both at the
Australian all industries level and for the utilities industry more specifically, have since
fallen further.101
We note that CIE's revised forecasts are significantly lower than its initial forecasts
from December 2014. Its revised average annual WPI growth forecasts are
0.8 per cent lower. CIE stated that the primary driver of this reduction was a
downgrade to its forecast GDP growth and an upgrade to its forecast labour supply
growth.102 Consequently it is clear that CIE considered changes in economic
conditions between December 2014, when it released its initial forecasts, and
November 2015, when it released its revised forecasts, have had a significant impact
on wage growth expectations. BIS Shrapnel's December 2014 forecasts do not
account for these changed conditions. Consequently we consider BIS Shrapnel's
outdated forecasts should not be included in our average. Instead we have used CIE's
forecasts because they reflect up to date economic information.
B.4.3 Forecast output growth
We are not satisfied Jemena's proposed average annual output growth of 1.8 per cent
for the 2016–20 regulatory control period reflects the increase in output an efficient
service provider requires to meet its opex objectives. We forecast average annual
output growth of 1.5 per cent for the 2016–20 regulatory control period.
Our approach to forecasting output growth
We have maintained our preliminary decision methodology to forecast output
growth.103 We updated our output weights to match those in our latest benchmarking
report. The output growth factors we used and their respective weights are:
customer numbers (73.9 per cent)
circuit line length (8.7 per cent)
ratcheted maximum demand (17.4 per cent).
Jemena adopted our approach to forecasting output growth in its revised regulatory
proposal.
100
AER, Preliminary decision, Jemena determination 2016–20, Attachment 7, October 2015, p. 57. 101
ABS, 6345.0 Wage price index, Table 9b. 102
CIE, Labour price forecasts, 23 November 2015, p. 25. 103
AER, Preliminary decision, Jemena determination 2016–20, Attachment 7, October 2015, pp. 53–54.

7-54 Attachment 7 – Operating expenditure | Jemena distribution determination final decision 2016–20
We have used the forecast circuit length adopted by Jemena in its revised regulatory
proposal opex model, which was consistent with our preliminary decision and
Jemena's initial regulatory proposal. This produces an average annual growth rate of
2.02 per cent for circuit length.
Consequently the difference between the output growth forecast in Jemena's revised
proposal and our preliminary decision is due to different forecasts for the growth in
customer numbers and ratcheted peak demand. We discuss these below.
Forecast growth in customer numbers
We are not satisfied Jemena's proposed average annual customer numbers growth of
1.90 per cent for the 2016–20 regulatory control period reasonably reflects the
increase in output a prudent and efficient service provider would require to achieve the
opex objectives. We forecast average annual customer numbers growth of 1.54 per
cent for the 2016–20 regulatory control period.
Jemena updated its customer numbers forecast using updated population forecasts.104
This increased its forecast annual average customer numbers growth rate from
1.2 per cent to 1.9 per cent. ACIL Allen forecast Jemena's customer numbers.105 It
forecast the growth in residential customer numbers based on the forecast growth in
population, as forecast by the Victorian Department of Planning and Community
Development using the following method:106
1. Forecasting the population of each LGA using the LGA specific forecasts.
2. Converting population to the number of households by dividing the population
forecasts for each LGA by the average number of individuals per household in that
LGA.
3. Applying a weighting to the number of households within each LGA based on the
estimated proportion within JEN’s distribution area and aggregating the results
across all LGAs.
4. Calculating the yearly growth in households within Jemena's region using the
number of households in step 3.
5. Applying the forecast annual growth in households in step 4 and applying it to the
number of residential customers in Jemena's 2014 annual RIN.
In our preliminary decision we raised concerns with this forecasting approach. We
noted that residential customer numbers, as reported by Jemena in its economic
benchmarking RIN, grew on average by 0.8 per cent per year between 2007 and 2014.
Over the same period the estimated residential population in the LGAs Jemena serves
grew on average by 2.0 per cent. Consequently we concluded that at least one of the
assumptions made by ACIL Allen did not hold during this period. For this reason we
104
Jemena, Revised regulatory proposal, Attachment 7-7, 6 January 2016, p. v. 105
Jemena, Revised regulatory proposal, Attachment 7-7, 6 January 2016, p. 2. 106
Jemena, Revised regulatory proposal, Attachment 7-7, 6 January 2016, p. 2.

7-55 Attachment 7 – Operating expenditure | Jemena distribution determination final decision 2016–20
were not satisfied that Jemena's forecast of customer number growth reflected a
realistic expectation of the customers Jemena will need to serve.107
We then looked at the forecast of total population growth in the LGAs that Jemena
serves.108 The Victorian Government forecast the total population in the LGAs that
Jemena serves will grow by 2.0 per cent per year on average between 2015 and 2020.
This is the same growth rate as over the period 2007 to 2014. Consequently we were
satisfied that the historic average growth in residential customer numbers of
0.8 per cent per year would reasonably reflects the increase in customer numbers
Jemena will need to serve.109
Jemena considered our preliminary decision method for forecasting residential
customer numbers was inappropriate because it considered:
our forecast method incorrectly represented the customer numbers growth rate for
Jemena's network
evidence does not support rejecting its method and assumptions for forecasting
residential customer numbers.
We discuss both of these issues below.
Which source of historic customer numbers data should we use?
For our preliminary decision we based our forecast on the number of residential
customer numbers reported by Jemena in its economic benchmarking RIN. However,
we consider the residential customer numbers reported by Jemena in its economic
benchmarking RIN understate the growth in Jemena's residential customer numbers,
due to the definitions used in the RIN.110 Consequently, for this final decision, we have
used the residential customer numbers reported by Jemena in its annual RINs, which
we are satisfied better reflect the growth in customer numbers.
We note that customers are defined differently in the economic benchmarking RIN than
they are in the annual RIN.111 Jemena also noted that in undertaking the AMI rollout, it
identified services that had long standing disconnections. It removed a number of
these services rather than replacing the legacy meter with an AMI meter.112 We are
satisfied that for these reasons that the customer numbers reported by Jemena in its
economic benchmarking RIN understate the growth in its residential customer
107
AER, Preliminary decision, Jemena determination 2016–20, Attachment 7, October 2015, p. 56. 108
We note that, contrary to Jemena's assertions in its revised regulatory proposal, we did use the 2015 population
forecasts. 109
AER, Preliminary decision, Jemena determination 2016–20, Attachment 7, October 2016, p. 56. 110
We note that total customer numbers growth in the economic benchmarking RIN is similar to the growth in total
customer numbers reported in Jemena's annual RINs. 111
One important different between the customer numbers reported in the economic benchmarking RIN is that they
include de-energised meters. Jemena allocated its de-energised meters to the different customer categories by
using the same proportions as for active meters. 112
Jemena, Revised regulatory proposal, Attachment 7-7, 6 January 2016, p. 7.

7-56 Attachment 7 – Operating expenditure | Jemena distribution determination final decision 2016–20
numbers. Consequently we have instead used the residential customer numbers
reported by Jemena in its annual RINs.
Does evidence support the method and assumptions Jemena used to forecast
residential customer numbers?
Consistent with our preliminary decision, we are not satisfied that evidence supports
the method and assumptions Jemena used to forecast residential customer numbers.
Particularly, we are not satisfied that Jemena has demonstrated that its estimates of
household number growth reflect actual household number growth. We have instead
used the historic average residential customer number growth between 1996 and
2014, as reported by Jemena in its annual RINs, to forecast residential customer
number growth. Residential customer numbers growth has been relatively stable
historically and there is no evidence to suggest this will change in the forecast period.
We compared Jemena's forecast of customer number growth to its estimates of
historic household number growth and historic actual customer numbers growth
(Figure B.1). It is clear that the assumed one to one relationship between customer
number growth and estimated household numbers growth does not hold historically.
We also found that forecast customer number growth is higher for every year of the
2016–20 regulatory control period than actual customer numbers growth in every year
since 2002.
Figure B.1 Annual growth in estimated households and residential
customers (per cent)
Source: AER analysis; ACIL Allen, Forecast customer numbers model.
0.0%
0.5%
1.0%
1.5%
2.0%
2.5%
3.0%
3.5%
1997 1999 2001 2003 2005 2007 2009 2011 2013 2015 2017 2019
Estimated households Customers Forecast households/customers

7-57 Attachment 7 – Operating expenditure | Jemena distribution determination final decision 2016–20
Consequently we sought further information from Jemena. We asked it if it could
identify a reason why its actual annual customer numbers growth did not align with
annual household numbers growth as estimated by ACIL Allen.113 Jemena provided a
response from ACIL Allen.114 ACIL Allen stated that the historical household numbers
series, which it estimated, were not robust estimates. It stated that estimating the
number of households in Jemena's region was challenging because the Victorian
Government published its population forecasts on a local government area (LGA)
basis.115 This makes forecasting challenging because other DNSPs also operate in
eight of the nine LGAs in which Jemena operates. ACIL Allen consequently stated that
the problem with its historical estimated households series is that it relied on a single
static estimate of the proportion of the population for each LGA that is supplied by
Jemena. However, it considered that that proportion will have changed due to the
differences in growth rates and due to where the growth has occurred within each
LGA.116
Given this, ACIL Allen considered that the reason that its estimated annual household
growth differed from actual customer number growth for the period from 1997 until
2010 was because its estimates of household numbers were not robust. However, it
considered the problem was not as clear in recent years.117
We agree with ACIL Allen that the most likely cause of the divergence between
estimated household number growth and customer number growth was the allocation
of population growth within each LGA to the different DNSPs that operate in those
LGAs. However, we consider that this issue is equally relevant for the forecast period
as it was for estimating historic household numbers growth.
Figure B.1 shows that from 1997 until 2006, actual annual customer number growth
was higher than estimated household number growth. Actual annual customer number
growth averaged 1.8 per cent while estimated household number growth average
0.9 per cent. However, from 2007 estimated household number growth has been
higher in every year except 2011. Since 2007, actual annual customer number growth
averaged 1.4 per cent while estimated household number growth averaged
1.9 per cent. This suggests that prior to 2007 ACIL Allen assumed too little of the
population growth within the nine LGAs was within Jemena's network. However, since
2007 ACIL Allen has assumed too much of the population growth within the nine LGAs
was within Jemena's network. Although the difference between estimated household
number growth and actual customer number growth has been smaller since 2007, we
consider the difference is still material.
This is why we asked Jemena if it could disaggregate its actual customer numbers by
LGA. We asked it to provide customer numbers for each LGA within its distribution
113
AER, Information request 034 [email to Jemena], 3 February 2016. 114
Jemena, Response to information request 034 [email to AER], 10 February 2016, p. 3. 115
ACIL Allen, Letter to Jemena, 10 February 2016 , p. 3. 116
ACIL Allen, Letter to Jemena, 10 February 2016 , p. 3. 117
ACIL Allen, Letter to Jemena, 10 February 2016 , p. 3.

7-58 Attachment 7 – Operating expenditure | Jemena distribution determination final decision 2016–20
area if it could do so. Jemena did not state that it could not derive this information. It
stated that it did not maintain customer numbers by LGA in the ordinary course of
business and was therefore unable to provide the information requested.118 Without
this information, and a better understanding of where within the nine LGAs the
population growth is occurring, we consider it is not possible to use the LGA population
forecasts to produce a forecast of Jemena's residential customer numbers growth.
Since 1997 residential customer numbers growth has been relatively stable around
1.6 per cent each year; more stable than ACIL Allen's estimates of household growth.
Consequently we tested whether historic average customer numbers growth, or
estimated household number growth, was more reflective of actual customer numbers
growth. We found the mean absolute difference between the historic average customer
numbers growth and actual customer numbers growth (0.35 per cent) was less than
half the mean absolute difference for estimated household growth (0.73 per cent). This
shows that ACIL Allen's estimates of household numbers growth have been a poor
predictor of actual customer number growth and that actual customer numbers growth
has been relatively stable.
Given we do not know how much of the forecast population growth in the nine LGAs
will occur in Jemena's distribution area the population forecasts are of limited value.
However they do not suggest that population growth in Jemena's distribution area will
be materially different to what it has been historically.
Given these considerations, we consider the historic average residential customer
numbers growth of 1.59 per cent each year will reasonably reflect Jemena's actual
residential customer numbers growth in the forecast period.
The impact of embedded networks
In our preliminary decision we suggested that one possible reason why estimated
household growth did not match actual customer numbers growth was because some
apartment blocks, with multiple households, are embedded networks that Jemena
would treat as a single customer.119
Jemena stated that it reviewed its customer connections from 2010 to 2015. It found
that, on average, only 4 embedded network connections occurred per year in its
distribution area. Those networks had on average 58 apartments per site, meaning
232 customers per year connected to its network as part of an embedded network.
This is less than two per cent of new connections. 120 Given this, we are satisfied that
embedded networks are not a key driver of the divergence between Jemena's
estimated household growth and its actual residential customer numbers growth.
118
Jemena, Response to information request 034 [email to AER], 10 February 2016. 119
AER, Preliminary decision, Jemena determination 2016–20, Attachment 7, October 2015, p. 55. 120
Jemena, Revised regulatory proposal, Attachment 7-7, 6 January 2016, p. 6.

7-59 Attachment 7 – Operating expenditure | Jemena distribution determination final decision 2016–20
Consistency with customer growth forecasts for other networks
Jemena noted that we used ACIL Allen's customer numbers forecasts in our 2013–17
access arrangement decision for AusNet Services' gas distribution network. Jemena
noted that AusNet Services gas distribution network overlaps Jemena's network area
and that ACIL Allen used the same method for those forecasts as it did for
Jemena's.121
AusNet Services' gas distribution area does overlap Jemena's distribution area, but it is
also significantly larger. It covers an area that includes towns as far apart as Portland,
Horsham and Bendigo. Consequently AusNet Services' distribution area covers
significantly more LGAs and it would be the sole distributor operating in many of these
LGAs. As a result, the problem of allocating forecast population growth between
multiple network service providers operating in the same LGA was not significant in our
access arrangement decision for AusNet Services. However, even if this problem had
existed for AusNet Services' gas distribution network, we should not ignore it for
Jemena simply because we did not consider it in that decision.
Forecast growth in peak demand
We are not satisfied Jemena's proposed average annual ratcheted peak demand
growth of 1.28 per cent for the 2016–20 regulatory control period reasonably reflects
the increase in output a prudent and efficient service provider would require to achieve
the opex objectives. We forecast average annual ratcheted peak demand growth of
1.06 per cent for the 2016–20 regulatory control period.
For the reasons discussed in attachment 6, appendix C, we are satisfied that Jemena's
forecasts of maximum demand reasonably reflect a realistic expectation of the demand
forecast required to achieve the opex objectives. However, Jemena did not ratchet its
maximum demand forecasts.
We ratcheted the maximum demand we use as an output measure in our output
specification. Ratcheted maximum demand is the highest value of maximum demand
observed up to the year in question. It recognises capacity Jemena used to satisfy
demand and gives it credit for this capacity in subsequent years, even if annual
maximum demand is lower in subsequent years.
Jemena's weather corrected peak demand hit a local peak of 968.7 MW in 2013.122 It
did not forecast peak demand to surpass this level again until 2016. Consequently we
set ratchet peak demand to this level for 2014 and 2015.
121
Jemena, Revised regulatory proposal, Attachment 7-7, 6 January 2016, p. 6. 122
Consistent with our preliminary decision and Jemena's revised regulatory proposal we used non-coincident
summated weather adjusted system annual maximum demand with a 50 per cent probability of exceedance
measure at the transmission connection point in MW. Jemena did not provide weather corrected peak demand
values in its annual benchmarking RIN for 2006 to 2013. Consequently we used the weather corrected historic
peak demand values published by AEMO instead.

7-60 Attachment 7 – Operating expenditure | Jemena distribution determination final decision 2016–20
B.4.4 Forecast productivity growth
We have applied a zero per cent productivity growth forecast in our estimate of the
overall rate of change. This reflects our expectations of the forecast productivity for a
prudent and efficient service provider in the short to medium term. This is consistent
with Economic Insights' recommendation to apply zero forecast productivity growth for
other distribution network service providers such as Ergon Energy.123 This is also
consistent with our preliminary decision.
Jemena also included forecast productivity growth of zero in its rate of change.
The Guideline states that we will incorporate forecast productivity in the rate of change
we apply to base opex when assessing opex. Forecast productivity growth will be the
best estimate of the shift in the productivity frontier.124
We consider past performance to be a good indicator of future performance under a
business as usual situation. We have applied forecast productivity based on historical
data for the electricity transmission and gas distribution industries where we consider
historical data to be representative of the forecast period.
To reach our best estimate of forecast productivity we considered Economic Insights'
economic benchmarking, Jemena' proposal, our expectations of the distribution
industry in the short to medium term, and observed productivity outcomes from
electricity transmission and gas distribution industries. We discuss these further in our
preliminary decision.125
VECUA, however, stated that our decision to apply zero productivity growth 'is illogical
and is not supported by the evidence'. It stated that we need to forecast positive
productivity growth for the Victorian distributors to bring their productivity back into line
with their previous productivity levels and into line with the levels the electricity
transmission, gas distribution and other asset intensive industry sectors achieve.126
VECUA asserted that a key reason for the distributors’ productivity declines during the
previous regulatory period was our provision of excessive opex allowances. It
considered these been a strong driver of the networks’ inefficient labour practices. It
stated that such factors must not be used to justify poor productivity outcomes in future
years.127 VECUA, however, provided no evidence to support these assertions.
Productivity declines, however, have not been unique to Australian electricity
distribution networks. We have seen similar declines in productivity in Ontario and New
123
Economic Insights, Response to Ergon Energy’s Consultants’ Reports on Economic Benchmarking,
7 October 2015, p. 29. 124
AER, Better regulation explanatory statement expenditure forecast assessment guideline, November 2013, p. 65. 125
AER, Preliminary decision, Jemena determination 2016–20, Attachment 7, October 2015, pp. 68–73. 126
VECUA, Submission on the AER Preliminary 2016–20 Revenue Determinations for the Victorian DNSPs, 6
January 2016, p. 5. 127
VECUA, Submission on the AER Preliminary 2016–20 Revenue Determinations for the Victorian DNSPs, 6
January 2016, p. 67.

7-61 Attachment 7 – Operating expenditure | Jemena distribution determination final decision 2016–20
Zealand, which operate different regulatory frameworks. Further, we are unaware of
any incentive for the Victorian DNSPs to increase their actual opex when it is not
efficient to do so.
Although it stated that forecast productivity growth should be positive, VECUA did not
suggest a basis on which to forecast positive productivity growth. VECUA did state that
some of its participants operate in asset intensive industries that have delivered
positive productivity growth during the 2006–13 period.128 However it did not identify
which industries it was referring to or why those industries would be an appropriate
benchmark for electricity distribution. The CCP also considered forecast productivity
should be positive. However, it did suggest we should consider the approach IPART
uses to forecast productivity growth for the industries it regulates.129 The approach the
CCP referred to was the approach used by IPART to regulate rural and regional buses
and local council rates. IPART forecast productivity based on the 15-year average of
the ABS market sector value-added multifactor productivity (MFP) based on quality
adjusted hours worked. They set forecast productivity growth to zero when the 15 year
average is negative.130 The 15 year average productivity growth for the EGWWS
industry is –3.3 per cent. Consequently IPART’s approach to forecasting productivity
also results in a forecast growth of zero.
Consistent with previous submissions, the Victorian Department of Economic
Development, Jobs, Transport and Resources (DEDJTR) stated that:131
… with the rollout of smart meters in Victoria substantially complete, the AER
should expect the Victorian DNSPs to realise efficiency gains from the rollout.
These efficiency gains should be passed through to customers as the benefits
are realised, as it is their customers, rather than the DNSPs, that have funded
the investment in smart meters through a cost recovery regulatory regime.
We stated in our preliminary decision that DEDJTR had not identified or quantified the
'value added benefits' or the further benefits it expected to be realised over the 2016–
20 regulatory control period. We stated that without this information we could not
incorporate them into our opex forecast. We also note that DEDJTR had not provided
us the independent assessment of the benefits of the AMI program that it had referred
to.132
DEDJTR stated in its submission on our preliminary decisions that Deloitte forecast the
benefits associated with the rollout of smart meters in a public report it prepared in
2011 for the Department of Treasury and Finance.133 The most significant benefits
identified in this report relate to capex and metering expenditure. Deloitte also
128
VECUA, Submission on the AER Preliminary 2016–20 Revenue Determinations for the Victorian DNSPs,
6 January 2016, p. 67. 129
CCP, Submission, 25 February 2016, p. 30. 130
IPART, IPART cost indices—productivity factor, Fact sheet, October 2014, pp. 1–2. 131
DEDJTR, Submission, 14 January 2016, p. 1. 132
AER, Preliminary decision, Jemena determination 2016–20, Attachment 7, October 2015, p. 72. 133
Deloitte, Advanced metering infrastructure cost benefit analysis, 2 August 2011.

7-62 Attachment 7 – Operating expenditure | Jemena distribution determination final decision 2016–20
identified some ‘other smaller benefits’ that may be relevant to standard control
services opex. Of these smaller benefits, the most material reductions in standard
control services opex were from:134
the avoided cost of investigation of customer complaints about voltage and quality
of supply
the avoided cost of investigation of customer complaints about loss of supply which
turn out not to be a loss of supply
reduction in calls to faults and emergencies lines
reduced cost of network loading studies for network planning.
DEDJTR stated that a recent review it undertook indicates that the DNSPs are in the
early stages of realising these benefits and therefore their revealed 2014 operating
expenditure would not reflect them.135 DEDJTR did not provide this review. It also did
not identify how the savings are allocated across the DNSPs and the extent to which
these savings are reflected in base opex.
Jemena stated in its revised regulatory proposal that the benefits of the Advanced
Metering Infrastructure (AMI) rollout that it has realised to date have largely been
realised through savings in alternative control services opex. It stated the same was
true of standard control services opex and its standard control services opex forecast
already reflected the productivity benefits of AMI.136 It expected future benefits of the
AMI rollout will relate to capex, rather than opex.137
Jemena stated that, although the Deloitte report provides useful input into the benefits
from AMI meters to Victorian electricity users at the time it was developed; we should
not rely on it to adjust Jemena's revenue requirement for the 2016–20 regulatory
control period because:138
it was released five years ago and does not reflect more recent legislative,
regulatory and market developments including recent rule changes expanding
competition in metering and related services, and changes to the value of customer
reliability
it does not provide sufficient detail to accurately apply adjustments to the individual
Victorian DNSPs
initiatives may require additional investment to realise the benefits and Jemena did
not include specific allowances for the initiatives
some of the benefits are already captured in base year opex
134
DEDJTR, Submission, 14 January 2016, p. 3. 135
DEDJTR, Submission, 14 January 2016, p. 3. 136
Jemena, Revised regulatory proposal, 6 January 2016, p. 159. 137
Jemena, Revised regulatory proposal, 6 January 2016, p. 159. 138
Jemena, Submission, 4 January 2016, pp. 12–14.

7-63 Attachment 7 – Operating expenditure | Jemena distribution determination final decision 2016–20
the Deloitte report identifies issues which could 'impact the legitimacy of its
findings'.
Given this, Jemena considered it was not possible to rely on the Deloitte report to
inform adjustments to the revenue required of the Victorian DNSPs.
We have considered the evidence provided to us and are satisfied that any future
benefits arising from the AMI rollout will not materially impact standard control services
opex. We are satisfied that base opex sufficiently captures the benefits of the AMI
rollout, as they relate to standard control services opex, because the AMI meters were
largely rolled out by the start of the base year. We also note that any benefits that have
not yet been realised will be shared with consumers through our revealed cost
forecasting framework and the EBSS.

7-64 Attachment 7 – Operating expenditure | Jemena distribution determination final decision 2016–20
C Step changes
In assessing a service provider's total opex forecast, we recognise that there may be
changed circumstances in the forecast period that may impact on the service
provider's expenditure requirements. We consider those changed circumstances as
potential 'step changes'.
We typically allow step changes for changes to ongoing costs in the forecast period
associated with new regulatory obligations and for efficient capex/opex trade-offs. Step
changes may be positive or negative. We would not include a step change if the opex
that would otherwise be incurred to reasonably reflect the opex criteria is already
covered in another part of the opex forecast, such as base opex or the rate of change.
This appendix sets out our consideration of step changes in determining our opex
forecast for Jemena for the 2016–20 regulatory control period.
C.1 Final position
We have included step changes in our final decision opex forecast for the following
proposals:
service testing and inspection program
enclosed substation inspection and rectification
vegetation management
demand management opex/capex trade-off
new tariff implementation
new RIN reporting requirements
power of choice
adoption of chapter 5A.
In total these step changes contribute $17.1 million ($2015) or 3.8 per cent to our total
opex forecast for Jemena for the 2016–20 regulatory control period.
Table C.1 sets out our position on Jemena's proposed step changes.

7-65 Attachment 7 – Operating expenditure | Jemena distribution determination final decision 2016–20
Table C.1 Proposed step changes ($ million, 2015)
Proposal Initial proposal Preliminary
decision
Revised
proposal Final decision
Service inspection and testing program 6.2 0 6.2 5.8
Overhead switch inspection 2.2 0 0 0
Enclosed substation inspection and
rectification 0.8 0 0.6 0.2
Electricity distribution price review 8.0 Included in
base year
Vegetation management 15.9 0 6.9 2.3
ESV code of practice changes 0.9 0 0 0
Vulnerable customer initiative 1.0 0 1.0 0
Customer engagement 0.9 Included in
base year
New technology trial: pole-top fire
detection 1.4 0 1.4 0
Demand management opex/capex trade-
off 0.7 0.7 0.7 0.7
Cic cic 0 cic 0
New tariff implementation 2.5 2.5 2.5 0.5
RIN reporting 19.7 0 5.9 5.9
Increased GSL obligations 0.9
Included as a
category
specific forecast
Power of choice 0.9 0.9
Adoption of chapter 5A 0.7 0.7
Total 60.3 3.2 27.7a 17.1
Source: Jemena, Regulatory proposal, Attachment 8-6, 30 April 2015; AER, Jemena preliminary decision opex
model; Jemena, Revised regulatory proposal, Attachment 8-2, 6 January 2016; AER, Jemena Final decision
opex model ─ final decision.
Note: a) Total excludes cic step change. Numbers may not add due to rounding.
C.2 Preliminary position
In its initial regulatory proposal Jemena proposed 13 step changes above its base
opex equal to $60.3 million ($2015).139
139
In its initial proposal Jemena identified $29.6 million ($2015) in step changes. Subsequent to its proposal, Jemena
identified a further $29.9 million in step changes.

7-66 Attachment 7 – Operating expenditure | Jemena distribution determination final decision 2016–20
The step changes were for costs not incurred in 2014. These costs broadly related to
changes in regulatory and legal obligations, operating costs arising from capital
program impacts, and delivering on customer expectations identified during its
customer engagement program.
In our preliminary decision, we included two step changes in our opex forecast.140 We
included a step change in opex for two demand management programs which were
efficient capex/opex trade-offs. We also included a step change for costs associated
with introducing cost reflective tariffs which we considered were driven by a regulatory
change.
C.3 Jemena's revised proposal and submissions
In its revised proposal, Jemena proposed 16 step changes totalling $27.7 million
($2015) or 5.9 per cent of its revised total opex forecast.141 It accepted our position on
six of the 13 step changes assessed in our preliminary decision and it proposed three
new step changes. The proposed step changes in Jemena's revised proposal are set
out above in Table C.1.
We received general comments about our consideration of step changes from:
• the Victorian Energy Consumer and User Alliance (VECUA)
• the Consumer Challenge Panel (CCP)
• the Victorian Government.
While VECUA has some residual concerns with the step changes we allowed in our
preliminary decision, overall, it agreed with our assessments of the Victorian service
providers' proposed step changes.142 The CCP considered we were correct to reject
most of the step changes in the Victorian service providers' proposals. It considered
there is a tendency for the service providers to present a range of small cost increases
without considering the overall ups and downs from year to year. It considered this
results in a cumulative bias in the DNSPs’ proposals.
The Victorian Government submitted that in our preliminary decisions we did not
accept step changes in operating expenditure that were not considered material. It
stated it expects us to adopt the same approach in assessing the operating
expenditure forecasts in the revised regulatory proposals.143
140
AER, Preliminary decision, Jemena determination 2016–20, Attachment 7 Opex, October 2015, p. 7-25. 141
Jemena, Revised regulatory proposal, 6 January 2016, pp. 50-51. 142
VECUA, Submission on the AER Preliminary 2016–20 Revenue Determinations for the Victorian DNSPs, 6
January 2016, p. 63. 143
Victorian Government, Submission on the revised regulatory proposals, Victorian EDPR 2016-20, 12 February
2016, p. 4.

7-67 Attachment 7 – Operating expenditure | Jemena distribution determination final decision 2016–20
C.4 Assessment approach
We have adopted the same assessment approach we used in our preliminary decision.
This was set out in section C.3 of the preliminary decision.
Our assessment of proposed step changes must be understood in the context of our
overall method of assessing total required opex using the "base step trend" approach.
When assessing a service provider's proposed step changes, we consider whether
they are needed for the total opex forecast to reasonably reflect the opex criteria. Our
assessment approach is specified in the Guideline and is more fully described in
section 7.3 of this attachment.
As a starting point, we consider whether the proposed step changes in opex are
already compensated through other elements of our opex forecast, such as base opex
or the 'rate of change' component. Step changes should not double count costs
included in other elements of the opex forecast.
We generally consider an efficient base level of opex (rolled forward each year with an
appropriate rate of change) is sufficient for a prudent and efficient service provider to
meet all existing regulatory obligations. This is the same regardless of whether we
forecast an efficient base level of opex based on the service provider's own costs or
the efficient costs of comparable benchmark providers. We only include a step change
in our opex forecast if we are satisfied a prudent and efficient service provider would
need an increase in its opex to reasonably reflect the opex criteria.
We forecast opex by applying an annual 'rate of change' to the base year for each year
of the forecast regulatory control period. The annual rate of change accounts for
efficient changes in opex over time. It incorporates adjustments for forecast changes in
output, price and productivity. Therefore, when we assess the proposed step changes
we need to ensure that the cost of the step change is not already accounted for in any
of those three elements included in the annual rate of change. The following explains
this principle in more detail.
For example, a step change should not double count the costs of increased volume or
scale compensated through the forecast change in output. We account for output
growth by applying a forecast output growth factor to the opex base year. If the output
growth measure used captures all changes in output then step changes that relate to
forecast changes in output will not be required. To give another example, a step
change is not required for the maintenance costs of new office space required due to
the service provider's expanding network. The opex forecast has already been
increased (from the base year) to account for forecast network growth.
By applying the rate of change to the base year opex, we also adjust our opex forecast
to account for real price increases. A step change should not double count price
increases already compensated through this adjustment. Applying a step change for
costs that are forecast to increase faster than CPI is likely to yield a biased forecast if
we do not also apply a negative step change for costs that are increasing by less than
CPI. A good example is insurance premiums. A step change is not required if
insurance premiums are forecast to increase faster than CPI because within total opex
7-68 Attachment 7 – Operating expenditure | Jemena distribution determination final decision 2016–20
there will be other opex items where the price may be forecast to increase by less than
CPI. If we add a step change to account for higher insurance premiums we might
provide a more accurate forecast for the insurance category in isolation; however, our
forecast for opex as a whole will be too high.
Further, to assess whether step changes are captured in other elements of our opex
forecast, we will assess the reasons for, and the efficient level of, the incremental costs
(relative to that funded by base opex and the rate of change) that the service provider
has proposed. In particular, we have regard to:
whether there is a change in circumstances that affects the level of expenditure a
prudent service provider requires to meet the opex objectives efficiently
what options were considered to respond to the change in circumstances
whether the option selected was the most efficient option––that is, whether the
service provider took appropriate steps to minimise its expected cost of compliance
the efficient costs associated with the step change and whether the proposal
appropriately quantified all costs savings and benefits
when this change event occurs and when it is efficient to incur expenditure,
including whether it can be completed over the regulatory period
whether the costs can be met from existing regulatory allowances or from other
elements of the expenditure forecasts.
One important consideration is whether each proposed step change is driven by an
external obligation (such as new legislation or regulations) or an internal management
decision (such as a decision to use contractors). Step changes should generally relate
to a new obligation or some change in the service provider's operating environment
beyond its control in order to be expenditure that reasonably reflects the opex criteria.
It is not enough to simply demonstrate an efficient cost will be incurred for an activity
that was not previously undertaken. As noted above, the opex forecasting approach
may capture these costs elsewhere.
Usually increases in costs are not required for discretionary changes in inputs.
Efficient discretionary changes in inputs (not required to increase output) should
normally have a net negative impact on expenditure. For example, a service provider
may choose to invest capex and opex in a new IT solution. The service provider should
not be provided with an increase in its total opex to finance the new IT since the outlay
should be at least offset by a reduction in other costs if it is efficient. This means we
will not allow step changes for any short-term cost to a service provider of
implementing efficiency improvements. We expect the service provider to bear such
costs and thereby make efficient trade-offs between bearing these costs and achieving
future efficiencies.
One situation where a step change to total opex may be required is when a service
provider chooses an operating solution to replace a capital one. For example, it may
choose to lease vehicles when it previously purchased them. For these capex/opex
trade-off step changes, we will assess whether it is prudent and efficient to substitute

7-69 Attachment 7 – Operating expenditure | Jemena distribution determination final decision 2016–20
capex for opex or vice versa. In doing so we will assess whether the forecast opex
over the life of the alternative capital solution is less than the capex in NPV terms.
C.5 Reasons for position
We have included eight step changes in our opex forecast. We explain the reasons for
our position on each of Jemena's proposed step changes in more detail below.
C.5.1 Service inspection and testing program
We have included a service inspection and testing program step change of $5.8 million
($2015) in our final decision opex forecast.
In its initial proposal, Jemena proposed an opex step change for service testing of
$6.2 million.144 The Victorian DNSPs are required to undertake service inspection and
testing at least every ten years. Jemena included service testing as a step change
because it did not undertake this activity in the base year.
In our preliminary decision, we did not include the step change in our total opex
forecast because we considered service testing was an existing obligation.145
In its revised proposal, Jemena explained that it last met the ten year requirement to
inspect and test services during the installation of the AMI meters.146 It stated the
additional cost of testing services at the time of installation was negligible and was
included in the capital cost of installing the meters. Therefore, it was not included in
revealed standard control opex in the base year.
In our final decision we have revised our position on the service inspection and testing
program step change.
One situation where a step change to total opex may be required is when a service
provider chooses an operating solution to replace a capital one.147 The service
inspection and testing step change is similar to a capex/opex trade-off. This is because
the costs of service inspection were recovered as capex in the 2011–15 regulatory
control period, however they will be recovered as opex in the 2016–20 regulatory
control period. Because this program is similar to a capex/opex trade-off, we have now
included it as a step change in our total opex forecast.
In assessing the efficiency of these proposed costs, we reviewed Jemena’s business
case materials and sought further information from Jemena. Jemena based its forecast
for this step change on the per unit service costs it incurred when it last undertook a full
144
Jemena, Regulatory proposal, Attachment 8-6 Operating expenditure step changes, 30 April 2015, pp. 5-6. 145
AER, Preliminary decision, Jemena determination 2016-20, Attachment 7 Opex, October 2015, p. 7-67. 146
Jemena, Revised regulatory proposal, Attachment 8-2 Operating expenditure step changes, 6 January 2016, pp.
1–4. 147
AER, Better regulation, Expenditure forecast assessment guideline for electricity distribution, November 2013, pp.
15, 35.

7-70 Attachment 7 – Operating expenditure | Jemena distribution determination final decision 2016–20
service inspection between 2002 and 2009.148 It then added $1.29 per inspection to
increase the scope of works to include a photograph of defects. We consider the use of
revealed unit costs is an appropriate forecasting method. However, we do not consider
Jemena needs additional opex to photograph defects. Photography is not required by
the regulatory obligation; rather Jemena included it in the scope of works because it is
an efficient inspection technique.149 Consistent with our expenditure forecast
assessment guideline we consider efficiency measures should be self-funding.150 We
expect the service provider to bear such costs and thereby make efficient trade-offs
between bearing these costs and achieving future efficiencies.
We have included a step change for the service inspection and testing program of
$5.8 million ($2015) which is based on the revealed unit costs but does not include the
incremental cost of taking a photo.
C.5.2 Enclosed substation inspection and rectification
We have included an enclosed substation inspection step change of $0.2 million
($2015) in our final decision opex forecast. We are satisfied this cost increase is driven
by a changed regulatory obligation.
In its initial proposal, Jemena forecast an increase in opex of $0.8 million ($2015) for
enclosed substation inspection and rectification.151 Jemena stated the step change was
driven by a change in the electricity safety (bushfire mitigation) regulations.152
The bulk of the costs associated with the electricity safety (bushfire mitigation)
regulations result from inspection requirements. The Electricity Safety (Bushfire
Mitigation) Regulations 2013 require that Jemena inspect its supply network at least
every three years in hazardous bushfire risk areas (HBRA) and at least every five
years in other areas.153 The previous regulations, the Electricity Safety (Bushfire
Mitigation) Regulations 2003 (amended 2010), also required Jemena to inspect its at-
risk supply network at least every three years. However, the 2003 regulations did not
seem to include inspection requirements for the supply network in other areas.154
148
Jemena, Revised regulatory proposal, Attachment 8-2 Operating expenditure step changes, 6 January 2016, p. 3. 149
Jemena, Revised regulatory proposal, Attachment 8-2 Operating expenditure step changes, 6 January 2016, p. 3. 150
AER, Better regulation, Expenditure forecast assessment guideline for electricity distribution, November 2013,
p. 16. 151
Jemena, Regulatory proposal, Attachment 8-6 Operating expenditure step changes, 30 April 2015, pp. 12–13. 152
On 20 June 2013 new Electricity Safety (Bushfire Mitigation) Regulations 2013 came into effect. 153
Electricity Safety (Bushfire Mitigation) Regulations 2013, section 7(1)(i) states the business must provide a plan for
inspection that ensures that—
(i) the parts of the major electricity company's supply network in hazardous bushfire risk areas are inspected at
intervals not exceeding 37 months from the date of the previous inspection and
(ii) the parts of the major electricity company's supply network in other areas are inspected at specified intervals
not exceeding 61 months from the date of the previous inspection. 154
Electricity Safety (Bushfire Mitigation) Regulations 2003 Version incorporating amendments as at 21 October 2010
5A(j) states a plan for inspection that ensures that all of the major electricity company's at-risk supply networks are
inspected at regular intervals of no longer than 37 months.

7-71 Attachment 7 – Operating expenditure | Jemena distribution determination final decision 2016–20
In our preliminary decision, we did not include a step change for this program.155 We
recognised there was a regulatory change; however, we considered that the regulatory
burden on Jemena had not materially increased. We considered the Electricity Safety
(Bushfire Mitigation) Regulations 2013 largely mirrored the position that had been in
place since 2010.
We also noted that almost two thirds of the cost of this step change was for rectification
work on enclosed substations found to be defective. We considered rectification work
is part of asset maintenance which is business as usual for a network service provider.
Consumers would be paying double if we added rectification costs as a step change
when asset maintenance is already accounted for in the base opex forecast.
In its revised proposal, Jemena reproposed a step change for its enclosed substation
inspection and rectification program but reduced the proposed amount from $0.8
million to $0.6 million ($2015).156 Jemena reduced the amount of the step change
because it undertook more rectification work in the 2014 base year than anticipated.157
Of the proposed $0.6 million, $0.3 million was for the inspection program and $0.3
million was for the rectification of defects.
In support of the proposed step change Jemena stated:158
the new obligation requires it to increase the scope of its routine inspection
program
the forecast opex step change is only for the consequential incremental rectification
costs – not all rectification costs.
Jemena stated the updated regulations include a requirement to inspect all parts of the
network, including enclosed substations whereas the previous regulations applied to
poles and lines only. Jemena stated it had not previously included the inspection of
enclosed substations in its inspection plan.159
We have revised our position on the enclosed substation inspection and rectification
step change since our preliminary decision. We consider Jemena will incur increased
inspection costs as a result of the changed regulations but we are still not satisfied it
will incur increased rectification costs.
Where the Electricity Safety Act 1998 defines the supply network as a network consisting of electric lines,
substations, circuits and any other thing required for the purposes of the transmission, distribution or supply of
electricity. 155
AER, Preliminary decision, Jemena determination 2016-20, Attachment 7 Opex, October 2015, p. 7-70. 156
Jemena, Revised regulatory proposal, Attachment 8-2 Operating expenditure step changes, 6 January 2016, p. 10. 157
Jemena, Revised regulatory proposal, Attachment 8-2 Operating expenditure step changes, 6 January 2016, p. 10. 158
Jemena, Revised regulatory proposal, Attachment 8-2 Operating expenditure step changes, 6 January 2016, pp.
6–10. 159
We disagree with Jemena that the previous regulations only applied to poles and lines. The Electricity Safety
(Bushfire Mitigation) Regulations 2003 required Jemena to inspect all of its at-risk supply network at least every
three years.

7-72 Attachment 7 – Operating expenditure | Jemena distribution determination final decision 2016–20
Inspection costs
We agree the Electricity Safety (Bushfire Mitigation) Regulations 2013 place an
increased regulatory burden on Jemena. We consider Jemena will incur increased
costs to inspect its supply network in low bushfire risk areas, including enclosed
substations, at least every six years, which the previous regulations did not require.
However, we disagree with Jemena that the scope of its HBRA inspection program has
increased under the 2013 regulations. The Electricity Safety (Bushfire Mitigation)
Regulations 2003 (amended 2010) required Jemena to inspect all of its at-risk supply
network at least every three years. At that time, the Electricity Safety Act 1998 defined
'at-risk supply network' as the parts of the supply network above the surface of land
and in a hazardous bushfire risk area.160 Accordingly, it appears that Jemena has been
subject to a regulatory requirement to inspect substations in HBRA in the previous
regulatory period.
In our preliminary decision we were concerned that we did not know how often Jemena
inspected its enclosed substations prior to the new regulatory requirement. Jemena
stated in its revised proposal that it undertook a one-off inspection program of enclosed
substations during 2012 and 2013 but before that its usual approach was to reactively
undertake rectification work.
We consider that to comply with the new requirement in the 2013 regulations, Jemena
will need to inspect its enclosed substations in low bushfire risk areas once in the
2016–20 regulatory control period. While it may need to inspect some of its enclosed
substations in HBRA more often than that, this does not appear to be a new
requirement given the relevant definition of 'at-risk supply network' included all assets
in HBRA. However, the majority of Jemena's enclosed substations are in low bushfire
risk areas.
We consider Jemena's use of revealed unit rates multiplied by the number of
inspections is a valid forecasting approach. Jemena reported it will have 2067
enclosed substations at the start of the 2016–20 regulatory control period.161 It also
reported that the revealed inspection rate is $120 per unit. Using this data, we estimate
it will cost Jemena $0.25 million ($2015) to inspect all of its enclosed substations once
in the 2016–20 regulatory control period.162
We note our forecast inspection costs are lower than Jemena's because it proposed a
higher number of inspections in the regulatory control period. One reason for this is
because it proposed a four yearly inspection cycle rather than a five yearly inspection
cycle for enclosed substations in low bushfire risk areas. It stated it could achieve
160
Section 98AA of the relevant version of the Electricity Safety Act (version no. 057, incorporating amendments as at
21 October 2010), definition of “at-risk supply area”. 161
Jemena, Revised regulatory proposal, Attachment 8-2 Operating expenditure step changes, 6 January 2016, Table
3-1, p. 8. 162
2067 * $120 = $248,040. We have not included new substations since 2015 as these will not need to be inspected
until the following regulatory control period.

7-73 Attachment 7 – Operating expenditure | Jemena distribution determination final decision 2016–20
efficiencies by aligning the enclosed substation inspection program with the existing
four yearly pole and line inspection program. We do not consider consumers should
pay extra for Jemena to realise this efficiency.
Rectification costs
We were concerned in our preliminary decision that Jemena included a step change in
opex for rectification work. We considered rectification work was business as usual for
a network service provider and therefore would already be included in the base year
forecast.
We do not consider Jemena provided sufficient evidence in its revised proposal for us
to change our position on rectification costs.
The Electricity Safety (Bushfire Mitigation) Regulations 2013 address how regularly
Jemena is required to inspect its supply network. It does not address the amount of
rectification work Jemena is required to undertake. While the intention of the ESV
would be that Jemena rectifies any defects it identifies, rectifying defects is not a new
requirement and should not drive an increase in opex. Rectifying defects is business
as usual for a network service provider and such costs should be already included in
the base year opex forecast. While Jemena proposed removing rectification costs from
the base year to avoid double counting costs already included in the base year, this is
not our preferred approach. Our preferred approach is to leave rectification costs in the
base year and to forecast total opex based on revealed costs in that year. This
approach is consistent with the Guideline.163
Even if the regulations specifically required Jemena to undertake rectification work, on
the basis of the information before us, we are not satisfied Jemena's submission that it
requires a step change is valid. Jemena stated its rectification costs would increase as
a result of regular inspections because previously it incurred rectifications costs only
when an issue was reported from the public or its crews.164 However, we consider
Jemena has not adequately justified its position. According to its revised proposal, in
2013 and 2014 Jemena undertook a substantial rectification program where it rectified
70 per cent of its enclosed substations. All else equal, we consider this recent
rectification work would reduce the rectification work Jemena would need to undertake
in the forecast period. Further, in the event Jemena does need to undertake additional
rectification work in the forecast period, the associated costs should be offset by cost
savings in other areas of opex, such as reactive maintenance. On balance, therefore,
(and consistent with our preliminary decision) we are not satisfied that a step change
for rectification costs would result in a total opex forecast that reasonably reflects the
opex criteria.
163
AER, Better regulation, Expenditure forecast assessment guideline for electricity distribution, November 2013, p.
32. 164
Jemena, Revised regulatory proposal, Attachment 8-2 Operating expenditure step changes, 6 January 2016, p. 8.

7-74 Attachment 7 – Operating expenditure | Jemena distribution determination final decision 2016–20
In summary we have included a step change of $0.2 million ($2015) for the changed
regulatory obligation to inspect enclosed substations at least every five years in low
bushfire risk areas. We have not included a step change for increased rectification
costs.
C.5.3 Electricity distribution price review
Consistent with our preliminary decision, we have not included a step change in our
final decision opex forecast for the costs of preparing Jemena's proposal for its
electricity distribution price review. Rather we have included these costs in our base
year forecast.
In its initial proposal, Jemena proposed removing the costs of preparing its regulatory
proposal from the base year and adding them as a category specific forecast, or step
change of $8 million ($2015).165 It did this because it considered these costs were
overrepresented in the base year.
In our preliminary decision, we did not include a category specific forecast for this
program. Instead we did not remove these costs from the base year opex.166
In its revised proposal, Jemena did not agree with our preliminary decision not to
include a category specific forecast for the costs of preparing its regulatory proposal.167
However, it accepted our preliminary position to leave these costs in the base year and
not include a step change because it did not significantly change the outcome. Jemena
stated it does not agree with our overall forecasting approach to forecast total opex
and not to provide for category specific forecasts for certain costs. Jemena stated
category specific forecasts for certain categories of opex will promote the national
electricity objective (NEO) where:
the costs are not in the base year opex
a penalty under the EBSS would result.168
When we assess opex, we do not assess whether the costs for a particular category
are sufficiently reflected in base year opex or not. This is because we make our
assessment about the total forecast opex and not about particular categories in the
opex forecast.
In relying on a base year to forecast a service provider's future opex, we are not
forecasting that the cost of each of the projects and programs a service provider
undertook in the base year would be representative of the cost of each of the projects
and programs it will undertake in the forward regulatory control period. Nor are we
forecasting that opex on each category of opex will be similar to the base year. We are
165
Jemena, Regulatory proposal, Attachment 8-6 Operating expenditure step changes, 30 April 2015, pp. 14–15. 166
AER, Preliminary decision, Jemena determination 2016-20, Attachment 7 Opex, October 2015, p. 7-71. 167
Jemena, Revised regulatory proposal, Attachment 8-2 Operating expenditure step changes, 6 January 2016, p. 11. 168
Jemena, Revised regulatory proposal, Attachment 8-2 Operating expenditure step changes, 6 January 2016, p. 11.

7-75 Attachment 7 – Operating expenditure | Jemena distribution determination final decision 2016–20
forecasting the total amount of opex we consider that a prudent service provider would
need to meet the opex criteria. While expenditure on projects and categories of opex
vary from year to year, a service provider can often adjust its opex to meet changing
priorities.
We agree using a category specific forecasting method for some opex categories may
produce better forecasts of expenditure for those categories in isolation but it may not
produce a better forecast of total opex. Unless we identify every category of
expenditure that is higher or lower than the efficient level, applying a base-step-trend
forecasting approach to total revealed costs produces a better total opex forecast than
including category specific forecasts.
We also disagree with Jemena's statement that category specific forecasts for certain
categories of opex are necessary where a penalty under the EBSS would result
otherwise. We assume Jemena is saying that if the amount reflected in the base year
for a particular category is too low, the base year forecast for that category will be too
low and the EBSS may penalise it for spending more than the forecast. This is
incorrect. The EBSS does not provide rewards and penalties at a category level.
Rather the EBSS compares total opex with the total opex forecast.
C.5.4 Vegetation management
We have included a step change of $2.3 million ($2015) for increased costs to comply
with Electrical Safety (Electric Line Clearance) Regulations 2015 (ELC 2015). We are
satisfied that the proposed costs are driven by a new regulatory obligation. The step
change includes the costs to comply with new amenity tree standards and advice
provided to local councils.
Jemena initially proposed a step change of $5.6 million ($2015) for additional costs it
expected to incur to comply with changes to ELC 2015.169 It based its initial proposal
on expected draft changes to the ELC regulations. Following the release of the final
version of ELC 2015, Jemena revised its proposal to $15.8 million ($2015).170
In our preliminary decision, we considered the change in costs to comply with ELC
2015 was uncertain and we did not include a step change for costs to comply with ELC
2015. We based this on advice from Energy Safe Victoria (ESV) which indicated that
the costs proposed by Jemena did not reflect the final regulations and ESV intended to
issue guidance notes to all Victorian DNSPs.171
In its revised proposal, Jemena revised its forecast step change to $6.9 million
($2015).172
169
Jemena, Regulatory proposal, Attachment 8-6 Operating expenditure step changes, 30 April 2015, pp. 16–19. 170
Jemena, Submission to the Victorian EDPR, July 2015. 171
AER, Preliminary decision, Jemena determination 2016-20, Attachment 7 Opex, October 2015, p. 7-72. 172
Jemena, Revised regulatory proposal, Attachment 8-2 Operating expenditure step changes, 6 January 2016, p. 14.

7-76 Attachment 7 – Operating expenditure | Jemena distribution determination final decision 2016–20
Jemena identified the following key changes to the ELC regulations that would result in
an increase in costs to comply with its vegetation management obligations:
amenity tree standard required to comply with Australian Standard 4373
enhanced notification and consultation provisions
obligations to provide assistance to Councils.173
We discuss our position on each of these changes and potential offsetting costs in the
sections below.
Amenity tree standards
Jemena considered it would require changes to its current tree management practices
to comply with AS 4373. Jemena identified the following cost drivers:
it previously engaged Certificate 2 qualified arborists for inspections but is now
required to utilise Certificate 3 inspectors
it must engage Certificate 2 qualified arborists for the cutting of trees
removal of the ability to use mechanical cutters such as 'jarrafs'.174
The total forecast cost proposed by Jemena to comply with these requirements is $1.2
million ($2015).
We have assessed the changes to ELC 2015 regarding amenity tree standards and we
consider Jemena's proposed changes are consistent with AS 4373 and will require a
change from its current vegetation management practices to comply with ELC 2015.
We have also assessed Jemena's cost build up and we agree that the changes in the
obligations relating to amenity tree cutting practices will require Jemena to incur
additional costs to engage more qualified labour and changes in cutting equipment to
comply with ELC 2015. We consider the proposed costs are prudent and efficient.
Notification requirements
We do not consider the changes to notification requirements in ELC 2015 are
materially different from Jemena's current notification requirements.
Jemena considered ELC 2015 introduced additional notification and consultation
obligations. Jemena identified the following new requirements:
notices to owners/occupiers of contiguous land
bespoke notices to owners/occupiers of private land
notices to councils
173
Jemena, Revised regulatory proposal, Attachment 8-2 Operating expenditure step changes, 6 January 2016, pp.
14–15. 174
Jemena, Revised regulatory proposal, Attachment 8-2 Operating expenditure step changes, 6 January 2016, p. 17.

7-77 Attachment 7 – Operating expenditure | Jemena distribution determination final decision 2016–20
publication of notices in a generally circulating newspaper.
Jemena proposed $4.6 million ($2015) to comply with ELC 2015 notification and
consultation requirements. Jemena considered the increase in costs is driven both by
the increase in the number of notices it must send out and additional information it
must put in each notice.
Quantity of notices sent to customers
Based on legal advice from Susan Brennan SC, Jemena considered that it would be
required to send a three-fold increase in the number of notices because there would be
a 'notable change' between ELC 2010 requirements and ELC 2015 requirements.175
Jemena considered the ELC 2015 changes require it to give written notice not only to
owners and occupiers of the land on which the tree is located, but also to owners and
occupiers of contiguous properties where the use of the property may be affected,
which would include all nearby landowners rather than immediately adjacent owners.
The definition of "affected person" in ELC 2010 is:176
affected person, in relation to the cutting or removal of a tree on land, means an owner or occupier (including a person who is responsible for the management of public land) of adjacent land where the cutting or removal will affect the use of that adjacent land
The relevant provision in ELC 2015 states:177
(3) A written notice under subclause (2) must be given to—
(c) If the tree is on land that is contiguous to private property and the use of that property may be affected during the cutting or removal—an owner or occupier of that property
Ms Brennan's advice suggests the ELC 2010 requirements were broader than the ELC
2015 requirements because:178
the 2010 requirements were arguably limited to the owner and occupier of private
property on which the tree was related and did not extend to adjoining property
the 2010 requirements did not expressly require notification to "contiguous"
landowners (which is not defined in ELC 2015)
a broad definition of "contiguous" is warranted, which is not limited to landowners
on directly abutting land, because 'the intention of the provision is fuller disclosure
and more open and transparent communication between responsible persons, the
175
Jemena, Revised regulatory proposal, Attachment 8-2 Operating expenditure step changes, 6 January 2016, p. 20. 176
Electricity Safety (Electric Line Clearance) Regulations 2010, clause 1(1). 177
Electricity Safety (Electric Line Clearance) Regulations 2015, clause 15(3)(c). 178
Jemena, Attachment 8–6 Susan Brennan SC - Advice on vegetation management matters, 6 January 2016, pp.
12–14.

7-78 Attachment 7 – Operating expenditure | Jemena distribution determination final decision 2016–20
community in general and those occupying or managing the land on which trees
are located'179
the 'clear intent' of ELC 2015 is to ensure owners and occupiers of properties
affected by work are duly notified of works which will affect them and, by ELC 2015
focussing on "use" of the land, Jemena obligation would extend to people whose
use of land may be impacted by the emission of noise or dust and is not limited to
directly abutting land.
We disagree with Jemena's submission for the following reasons.
First, the 2010 definition does not suggest an affected person was limited to private
land, or that it did not extend to adjoining property. It explicitly includes references to
public land and to adjacent land.
Second, we agree that the 2010 requirements do not refer to "contiguous" landowners
and the lack of definition in ELC 2015 creates uncertainty as to its interpretation.
Jemena's legal advice identified two dictionary definitions of 'contiguous' to be:
touching, in contact
in close proximity without actually touching, near.180
Ms Brennan's advice considered the second, broader definition was the appropriate
interpretation because of statements in the regulatory impact statement (RIS) (referred
to above). We have examined the RIS and agree the intention of the 2015 provision is
to enhance communication between responsible persons and land users.181
However, our interpretation of the reason for amendments to notification provisions
was not to extend notification requirements to more properties or parties than ELC
2010. Rather, the RIS suggests a lack of clarity was the driver. For example, the RIS
identifies the following issues with ELC 2010 notification requirements:182
the perceived level of variability in notification practices across different responsible
persons
a lack of consistent understanding among different stakeholders of the term
“affected persons”
a lack of guidance as to how to consult an affected person.
179
Ms Brennan refers to page 44 of the Regulatory Impact Statement for the ELC 2015. 180
Jemena, Attachment 8–6 Susan Brennan SC - Advice on vegetation management matters, 6 January 2016, 6
January 2016, p. 13. 181
Jemena, Attachment 8–6 Susan Brennan SC - Advice on vegetation management matters, 6 January 2016, pp.
12–14. 182
Jaguar Consulting, Regulatory impact statement Electricity Safety (Electric Line Clearance) Regulation 2015,
September 2014, p. 30.

7-79 Attachment 7 – Operating expenditure | Jemena distribution determination final decision 2016–20
The RIS goes on to state that the changes between ELC 2010 and ELC 2015 are to
enhance communication by 'specify[ing] in greater detail the notification and
consultation requirements applying to responsible persons'.183
In our view, therefore, a broad interpretation of "contiguous" is unwarranted. Rather,
the first of the two definitions identified by Ms Brennan (that is, the narrower definition)
would be more appropriate because:
it is consistent with the term "adjacent" used in the ELC 2010 definition and the
apparent lack of an intention in the RIS to increase the number parties that a
responsible person must notify
accords with written advice provided by ESV that it would consider use of
contiguous land may be affected if vegetation cutting or removal causes limitations
in accessing the property or requires vegetation workers require to have access to
the property.184
Third, while we agree that an intention of ELC 2015 is to ensure owners of affected
properties are duly notified of works that will affect them, we disagree that ELC 2015
warrants a wider obligation to notify than ELC 2010. Ms Brennan's advice relies on
"use" of land as the reason for extending notification requirements to non-adjacent
landowners affected by noise and dust. However, as can be seen from the extract
above, the 2010 definition of "affected person" also includes "use" of land. On this
basis, even if notification requirements did extend to non-adjacent landowners (which,
for the above reasons, we disagree) there is no apparent change in the requirements
between 2010 and 2015.
Finally, no other Victorian DNSPs (who are subject to the same requirements)
proposed an increase in costs for changes in notification requirements between ELC
2010 and ELC 2015.
It follows that Jemena appears to have adopted an overly conservative interpretation of
the change in notification requirements. In our view, a prudent and efficient business
would not adopt Jemena's interpretation so we cannot be satisfied that the additional
expenditure proposed by Jemena reasonably reflects the opex criteria.
Information included in notices to customers
Jemena considered that each notice required additional work to comply with ELC 2015
such as including a diagram of specific tree details, including a dispute resolution
procedure and researching whether a tree is of cultural, environmental, historical,
ecological or aesthetic significance. Jemena identified the following cost drivers for the
additional information it was required to put in its notices:
183
Jaguar Consulting, Regulatory impact statement Electricity Safety (Electric Line Clearance) Regulation 2015,
September 2014, p. 44. 184
Energy Safe Victoria, Electricity Safety (Electric Line Clearance) Regulations 2015 – Guidance information,
November 27, p. 5.

7-80 Attachment 7 – Operating expenditure | Jemena distribution determination final decision 2016–20
Include a photo of the tree to be cut because it disagreed with the ESV's advice
that a generic depiction of a tree was sufficient in its notices.185
Engage additional staff to conduct research and planning to identify trees of
cultural, environmental, ecological, historical or aesthetic significance.
Develop a dispute resolution procedure and to train employees on the procedure
and administer the process.
Jemena also identified similar requirements for the notices it would provide to local
councils.
We do not consider there would be a material increase in the work required to provide
notices to individual customers and local councils for the following reasons:
It is clear from ESV's guidance that a representation of the tree to be cut is
acceptable and it is not necessary to use a photograph.186 We also do not consider
the requirement to provide a diagram is onerous. The primary driver of Jemena's
proposed costs is the increase in the volume of notices rather than the increase in
complexity of the notices. We note the other Victorian DNSPs (who are subject to
the same requirements) did not propose an increase in costs to provide a
diagrammatic representation of the tree to be cut in its notices to customers.
The requirement to identify trees of cultural or environmental impact was already a
requirement in ELC 2010.187 We do not consider the additional requirement of
identifying trees as listed in a planning scheme to be of ecological, historical or
aesthetic significance to be onerous. This is because ELC 2010 already required
the 'responsible person' to keep track of these trees in its vegetation management
plan.188 Further, many councils provide a register of significant vegetation online or
is available through direct contract with council officers.189
ELC 2010 already requires a responsible person to establish procedures for the
independent resolution of disputes relating to electric line clearance.190 The new
requirement in ELC 2015 is to include information on how to access a dispute
procedure.
The requirement to provide notices to councils is mentioned explicitly in ELC 2015,
however ELC 2010 already required Jemena to provide a notice to all affected
persons. The definition of affected person in ELC 2010 (provided above) included a
person who is responsible for the management of public land. We consider this
definition includes the local councils.
185
Jemena, Revised regulatory proposal, Attachment 8-2 Operating expenditure step changes, 6 January 2016, p. 22. 186
ESV 27 November, p. 3. 187
Electricity Safety (Electric Line Clearance) Regulations 2010, Section 1 Clause 5(c). 188
Electricity Safety (Electric Line Clearance) Regulations 2010, Section 9 Clause 3(g). 189
For example, Maribyrnong council heritage overlay is available at
http://planningschemes.dpcd.vic.gov.au/schemes/maribyrnong/ordinance/43_01s_mari.pdf. 190
Electrical Safety (Electric Line Clearance) Regulations 2010, Clause 9.

7-81 Attachment 7 – Operating expenditure | Jemena distribution determination final decision 2016–20
We also note that ESV has explicitly stated that it "would have no issue with a direct
notice to the properties close to the trees instead of a notice in a newspaper, as an
equivalent safety outcome."191 Based on this we do not consider Jemena requires
additional opex to publish notices in a newspaper because it would already be
providing notices directly for affected customers.
Assistance provided to councils
We consider the requirement for Jemena to provide assistance to local councils
represents a new regulatory obligation. Under ELC 2015, if requested by a Council,
Jemena is required to provide advice on:
safe limits of approach to electric lines for cutting or removing a tree
methods for cutting or removing a tree.192
Jemena proposed costs of $1.15 million ($2015) to provide this advice to its local
councils.
In its guidance to Victorian DNSPs, ESV stated:
For many years now the DB's have had in place resources to support their
stakeholders when electrical safety concerns were raised about work in the
vicinity of their power lines. Despite the absence of this clause in previous ELC
regulations, it has always been ESV's expectation that the DB's would have
provided the same or similar support on request.
We note prior to ELC 2015, Jemena did not provide support to its local councils on
safety issues.193 Although ESV considers providing support to local councils is good
industry practice, this is a new obligation in ELC 2015. We consider Jemena's forecast
to provide information on safe cutting methods and sag and sway information is
efficient and prudent.
Offsetting costs
In our preliminary decision, we identified potential cost savings due to the
reintroduction of exceptions for structural branches. Since we provided Jemena with a
step change for the removal of these exceptions in ELC 2010 in our previous
regulatory determination, we considered there may be potential for cost savings as
these exceptions are reintroduced in ELC 2015.
191
Energy Safe Victoria, Electricity Safety (Electric Line Clearance) Regulations 2015 – Guidance information,
November 27, p. 4. 192
Jemena, Revised regulatory proposal, Attachment 8-2, 6 January 2016, p. 24. On 2 February 2016, Jemena
removed the confidentiality claim for this information. 193
Jemena, Revised regulatory proposal, Attachment 8-2, 6 January 2016, p. 24. On 2 February 2016, Jemena
removed the confidentiality claim for this information.

7-82 Attachment 7 – Operating expenditure | Jemena distribution determination final decision 2016–20
In its submission to our preliminary decision, the Victorian Government identified
increases in vegetation management expenditure under ELC 2010 (in 2013) compared
ELC 2005 (in 2009) for AusNet Services, Powercor and United Energy. It considered
that the AER should assess both negative and positive step changes associated with
the introduction of ELC 2015.194
Jemena in its revised proposal, considered there would be no offsetting costs as a
result of ELC 2015 for the following reasons:
ESV did not expect the change in regulations to translate into cost savings for JEN,
however ESV did not provide its reasons for this position.
Its arborist reports noted that it was compliant with ELC 2010 in 2014.
Based on arborist advice, Jemena considered the reintroduction of exceptions for
maintenance of structural branches will not result in any cost savings for JEN.
Based on the information provided by Jemena and the ESV's advice, we are satisfied
that there are unlikely to be cost savings as a result of the reintroduction of structural
branches exceptions in ELC 2015.
Since Jemena's base year was already compliant with the ELC 2010 structural
branches requirements, we are satisfied that its base year opex reflects vegetation
management costs related to structural branches in the 2016–20 regulatory control
period.
C.5.5 Vulnerable customer initiative
Consistent with our preliminary decision, we have not included a step change in our
final decision opex forecast for a vulnerable customer initiative step change.
In its initial proposal, Jemena forecast an increase in opex of $1.0 million ($2015) to
provide assistance to vulnerable customers.195 Jemena proposed four initiatives to
assist vulnerable customers:
1. an in-home display trial for 500 customers to improve their understanding of their
energy usage
2. a no interest loan scheme: Jemena would provide some funding to a community
organisation which provides no or low-interest loans to vulnerable people so they
buy new, more energy efficient appliances
3. improved communications for culturally and linguistically diverse customers via pilot
low-literacy communications material which covers energy safety issues
194
Victorian Government, Submission on the Victorian electricity distribution network service providers' preliminary
distribution determinations for 2016–20, January 2016, p. 7. 195
Jemena, Regulatory proposal, Attachment 8-6 Operating expenditure step changes, 30 April 2015, pp. 21–23.

7-83 Attachment 7 – Operating expenditure | Jemena distribution determination final decision 2016–20
4. community partnerships with local welfare agencies to develop energy literacy
material to help vulnerable community groups better understand energy efficiency
and costs.
In our preliminary decision, we did not consider an increase in opex was needed for
this program.196 In its submission, the Victorian Department of Economic Development,
Jobs, Transport and Resources (DEDJTR) stated that the Essential Services
Commission (ESC) was undertaking an inquiry into best practice financial hardship
programs of energy retailers.197 The DEDJTR submitted that if the inquiry reveals there
is a role for the distribution network service providers in providing assistance to
vulnerable customers, the AER should consider the level of expenditure required at
that time, rather than seek to pre-empt the outcomes of the inquiry.198Given these
factors, we did not include these costs in our forecast.
In its revised proposal, Jemena reproposed a $1.0 million vulnerable customer
assistance step change.199 It stated:
The ESC’s hardship review is retailer focused and in no way duplicates, nor effects,
the initiatives Jemena was proposing.
We had not considered the support Jemena received from its customers on its
initial proposal, for example, CUAC.200
Jemena's Customer Council supported the customer support package.
Jemena's proposed initiatives were targeted and reflected its advantages as a
distributor in providing effective support for vulnerable customers in its network
area.
In assessing this step change we re-examined Jemena's proposed vulnerable
customer initiatives. We do not consider Jemena provided sufficient new information
for us to change our preliminary position.
The ESC released its energy hardship inquiry draft report in September 2015.201 It did
not identify a role for distribution network service providers in providing assistance to
vulnerable customers in the new framework. Jemena stated the review is retailer
focused and does not affect the initiatives it is proposing.
196
AER, Preliminary decision, Jemena determination 2016-20, Attachment 7, October 2015, p. 7-74. 197
Essential Services Commission 2015, Inquiry into the financial hardship arrangements of energy retailers: Our
approach, March 2015. 198
Victorian Department of Economic Development, Jobs, Transport and Resources, Submission to Victorian
electricity distribution pricing review 2016 –20, 13 July 2015, p. 8. 199
Jemena, Revised regulatory proposal, Attachment 8-2, 6 January 2016, pp. 34–35. 200
CUAC, Submission to the Victorian electricity distribution pricing review, 2016 -20, 13 July 2015. 201
Essential Services Commission 2015, Supporting Customers, Avoiding Labels. Energy Hardship Inquiry draft
report, September 2015.

7-84 Attachment 7 – Operating expenditure | Jemena distribution determination final decision 2016–20
We agree the inquiry into financial hardship programs is retailer focused. However, we
consider the focus on retailers indicates that policy makers consider retailers are best
placed to address customer hardship.
The current role of retailers in mitigating hardship originated from recommendations
made in the 2005 Victorian Government Committee of Inquiry into the Financial
Hardship of Energy Consumers. The inquiry identified three stakeholders as having
responsibility for mitigating hardship:
government
retailers
community based groups.202
Its report stated that submissions made to the inquiry almost universally supported the
current framework for assisting energy customers in hardship, and the allocation of
responsibilities among government, retailers and community groups in their various
efforts.203 A key recommendation of the inquiry was that energy retailers develop and
implement best practice hardship policies. Subsequently, the Energy Act 2006 required
licensed energy retailers to prepare financial hardship policies. The legislation also
empowered the ESC to develop guidelines to assist retailers and to approve their
financial hardship policies.204
Policy makers' allocation of this responsibility to retailers makes sense given the direct
relationship retailers have with customers compared to the limited relationship
distribution businesses have. Retailers have information concerning customer energy
consumption, payment records and the range of tariff products available. They also
have direct experience in administering hardship programs and energy concessions for
vulnerable customers that are provided by the state government.205
As policy makers have not clearly identified a role for distributors in providing support
for vulnerable customers, we are not in a position to conclude that a step change in
this instance would be required to achieve the opex objectives.
The NER also requires us to have regard to the extent to which the operating
expenditure forecast includes expenditure to address the concerns of electricity
consumers identified during customer engagement.206 Jemena noted in its revised
proposal that the Consumer Utilities Advocacy Centre (CUAC) strongly supported its
202
Committee of inquiry into the financial hardship of energy consumers, Main report, September 2005.
http://www.energyandresources.vic.gov.au/energy/gas/your-bill/concessions-and-hardship/hardship/hardship-
inquiry-main-report?SQ_DESIGN_NAME=mobile&SQ_ACTION=set_design_name. 203
Committee of inquiry into the financial hardship of energy consumers, Main report, September 2005,
Recommendation 5. 204
Essential Services Commission, Victoria 2006, Energy retailers’ financial hardship policies: Framework Paper,
December 2006, p. III. 205
The Department of Health & Human Services (DHHS) offers a variety of concessions and benefits to eligible
cardholders to assist low-income Victorians with energy bills. 206
NER, cl. 6.5.6(e)(5A).

7-85 Attachment 7 – Operating expenditure | Jemena distribution determination final decision 2016–20
proposed assistance to vulnerable customers.207 CUAC has particular regard to low
income, disadvantaged, and rural consumers. We acknowledge its active role on
Jemena's Electricity Customer Council and in the choice of programs to assist
vulnerable customers. We have had regard to CUAC's submission but note that it
represents one community group.
While we received no other submissions on this particular step change we did receive
a submission from the Victorian Energy Consumer and User Alliance (VECUA), who
considered that our total opex forecasts for the Victorian distributors were well above
the efficient levels. Further, it supported our approach to decline the majority of step
changes proposed by the Victorian network service providers.
On balance, in the long term interest of all consumers, we consider we should not
include an increase in opex for these projects. However, we consider it is open to
Jemena to re-prioritise its total opex allowance to accommodate expenditure on this
project.208 Alternatively, Jemena has the option of re-directing funds from categories of
opex expected to decline during the 2016–20 period.
C.5.6 New technology trial: pole-top fire detection
Consistent with our preliminary decision, we have not included a step change in our
final decision opex forecast to trial new technology for pole-top fire detection.
In its initial proposal, Jemena forecast an increase in opex of $1.4 million ($2015) to
trial new technology for pole-top fire detection.209 Jemena proposed to lease multiple
pole top early fault detection (EFD) systems to test the system on a number of feeders.
In our preliminary decision, we did not include a step change for this program.210 We
did not consider the program was a response to a new regulatory obligation and should
be funded by reallocating the existing opex budget.
In its revised proposal, Jemena reproposed a step change of $1.4 million for a pole-top
fire early detection program.211 It stated the trial will:
enable it to make better decisions about possible future implementation
if successful, could reduce opex associated with responding to pole top fire faults
and reduce the capital cost of replacing damaged assets
Jemena stated there is no incentive for it to undertake the trial as the benefits will
not be realised until subsequent periods. It considered our preliminary decision
shows a bias against initiatives that facilitate dynamic efficiency.212
207
VECUA, Submission to the Victorian electricity distribution pricing review, 2016–20, July 2015, p. 3. 208
We have not conducted a detailed analysis of the costs associated with this step change. 209
Jemena, Regulatory proposal, Attachment 8-6 Operating expenditure step changes, 30 April 2015, p. 28. 210
AER, Preliminary decision, Jemena determination 2016–20, Attachment 7, October 2015, pp. 7-75 to 7-76. 211
Jemena, Revised regulatory proposal, Attachment 8-2, 6 January 2016, pp. 37–40. 212
Jemena, Revised regulatory proposal, Attachment 8-2, 6 January 2016, p. 37.

7-86 Attachment 7 – Operating expenditure | Jemena distribution determination final decision 2016–20
In assessing this project we examined the business case submitted by Jemena.
However, we are not satisfied that the material provided by Jemena justifies a change
to our position.
We recognise that trialling technology may be prudent and consistent with good
industry practice. However, as there are no new regulatory obligations or other
exogenous circumstances underpinning Jemena's proposal to trial pole-top fire
detection, we maintain our draft decision position that this project is discretionary.
Typically, we do not allow step changes for any short–term cost to a service provider of
investigating new technologies or processes. We expect the service provider to bear
such costs and thereby make efficient trade–offs between these costs and future
efficiencies.
Generally, an efficient base level of opex (rolled forward each year with an appropriate
rate of change) is sufficient for a prudent and efficient service provider to meet all
existing regulatory obligations including bushfire mitigation. In our view Jemena's base
opex already includes the cost of maintaining the quality, safety, reliability and security
of supply of its network. As discussed in our assessment of the vulnerable customers
step change above, Jemena has the option of allocating the funds required for this
project from its total opex allowance .
We do not agree that our preliminary decision shows a bias against initiatives that
facilitate dynamic efficiency. We apply various incentive schemes such as the EBSS
and capital expenditure sharing scheme (CESS) to provide network service providers
with a continuous incentive to improve their efficiency in supplying electricity services.
In addition, the Victorian Government applies an ‘f-factor scheme’. This scheme
provides incentives for distribution network service providers to reduce the risk of fire
starts and to reduce the risk of loss or damage caused by fire starts.213
Jemena stated the benefit of undertaking the program is to gain further information to
inform better decisions about future implementation.214 We expect Jemena to weigh
the cost of the trial with the value of the information it will gain. We do not consider it
needs a step change in opex for this.
C.5.7 Demand management opex/capex trade-off
Consistent with our preliminary decision, we have included a step change of
$0.7 million ($2015) in our final decision opex forecast for a demand management
opex/capex trade-off.
In its initial proposal, Jemena proposed two demand response opex programs to
mitigate two network constraints which it stated it would otherwise need to be
addressed through a capex response. The areas were:
213
AER, Victoria F-factor scheme determination 2012–15, December 2011. 214
Jemena, Revised regulatory proposal, Attachment 8-2, 6 January 2016, p. 37.

7-87 Attachment 7 – Operating expenditure | Jemena distribution determination final decision 2016–20
Footscray East (FE)
North Heidelberg and Watsonia (NH-WT).
Jemena stated the demand response programs would enable it to defer related
network augmentation works to the 2021–25 regulatory control period.215
In our preliminary decision, after reviewing the cost benefit analysis Jemena provided,
we agreed the size of the deferred capex savings outweighed the respective costs for
each of the demand response programs.216 We received no submissions on our
preliminary position so we maintain our position in the final decision.
C.5.8 C-i-c
This step change is discussed in a confidential appendix because the information is
commercial in confidence.
C.5.9 New tariff implementation
In our preliminary decision, we included a step change of $2.5 million for Jemena to
implement new cost reflective tariffs. However, in our final decision, we have revised
the amount of the step change from $2.5 million to $0.5 million.
In November 2014, the Australian Energy Market Commission (AEMC) made a new
rule to require network businesses to set prices that reflect the efficient cost of
providing network services to individual consumers.217 Prices based on these new
rules were to apply in Victoria from 1 January 2017.
In its initial proposal, Jemena proposed a step change of $2.5 million for costs to notify
its customers of the new pricing structures, respond to customer enquiries and to
migrate customers to the new tariff.218 We considered these itemised costs were
reasonable and we included them as a step change in our total opex forecast in our
preliminary decision.
In December 2015, the Victorian Government announced that customers must opt-in
to, rather than opt-out of, cost reflective network tariffs.
In its revised proposal, Jemena updated its cost build up for the step change to
account for the Victorian Government’s policy statement. The revised costs were
marginally less than the initial proposal and Jemena reproposed a step change of
$2.5 million.
Jemena proposed costs for:
215
Jemena, Regulatory proposal, Attachment 8-6 Operating expenditure step changes, 30 April 2015, pp. 29–30. 216
AER, Preliminary decision, Jemena determination 2016-20, Attachment 7, October 2015, p. 7-77. 217
AEMC, Rule Determination, National Electricity Amendment (Distribution Network Pricing Arrangements) Rule
2014, 27 November 2014. 218
Jemena, Regulatory proposal, Attachment 8-6 Operating expenditure step changes, 30 April 2015, pp. 35–38.

7-88 Attachment 7 – Operating expenditure | Jemena distribution determination final decision 2016–20
additional staff to migrate customers to the new tariff structure
an expected increase in call volumes, written enquiries, billing enquiries and
disputes
mass mail-outs to notify customers of the new tariffs and to promote the take-up of
cost reflective tariffs (in light of the change to the opt-in approach).
In reassessing these costs, we realised that some of the costs were for activities that
were not specifically required by the new rule. We need to be satisfied that our
estimate of total forecast opex reasonably reflects the opex criteria. An estimate that
includes costs not required to comply with regulatory obligations (or the other opex
objectives) would not reasonably reflect the opex criteria.
The new rule requires distribution businesses to consult with consumers and retailers
to develop a tariff structure statement that outlines the price structures that they will
apply for the regulatory period. The businesses will also publish an indicative pricing
schedule each year to provide consumers and retailers with up to date information on
likely price levels throughout the regulatory period.
However, the AEMC rule change does not oblige Jemena to conduct mail-outs to notify
customers of the new tariffs. Rather, the onus will be on the retailers to offer the new
tariff structures as part of their product offerings. Similarly, customers will direct most of
their inquiries to the retailers. The AEMC agrees that the role of retailers in providing
information to facilitate understanding of pricing signals is critical. In its rule
determination the AEMC stated:
Most consumers will gain an understanding of pricing signals through the retail
tariffs they are charged. This is because for most consumers, their primary
relationship will be with their retailer. As such, the role of retailers in providing
information to facilitate understanding of pricing signals is critical.219
Similarly, the rule change does not require Jemena to promote the take-up of cost
reflective tariffs. While we agree promoting cost reflective tariffs will help achieve the
policy's objectives, we consider retailers are better placed to undertake this task than
distributors. Distributors are not best placed to promote the take-up of cost reflective
tariffs for the following reasons:
The cost reflective tariff will not necessarily be reflected in retail electricity offers.
Consequently, it is uncertain whether or not the distributor's cost reflective tariffs
will have the impact on the retail offers that the distributor claims.
The way in which consumers will see the networks tariffs will depend on how
energy retailers choose to represent the new tariffs in their bills.
219
AEMC, Rule Determination, National Electricity Amendment (Distribution Network Pricing Arrangements) Rule
2014, 27 November 2014, p. 67.

7-89 Attachment 7 – Operating expenditure | Jemena distribution determination final decision 2016–20
Distribution charges only make up around 37 per cent of the bill for one of
Jemena’s typical residential customers.220
We informed Jemena of our changed position from our preliminary decision and invited
it to comment.
In its response, Jemena stated we need to consider the case for successful distribution
tariff reform. 221 We support the case for successful distribution tariff reform. This is
outlined in our submission to the AEMC's draft decision and draft rules.222 However, as
outlined above, we consider retailers, rather than distributors are best placed to
promote the take-up of such tariffs.
Jemena also stated because it is required to comply with the network pricing principles,
the rule change compels it to take steps to encourage customers to adopt the more
cost-reflective tariffs where they are faced with a choice.223 Jemena also stated:
The customer impact pricing principles include that ‘each tariff must be
reasonably capable of being understood by retail customers’. This pricing
principle directly relates to the elements the AER is considering excluding from
its step change, particularly in relation to communicating with customers and
having the means and ability to respond to their enquiries.224
The pricing principles specifically apply when a network business is determining the
structure and level of its network prices.225 They require Jemena to develop tariff
structures that are reasonably capable of being understood by its retail consumers.226
Being required to develop understandable tariff structures is not the same as being
required to actively encourage customers to adopt cost reflective tariffs. Nor does it
imply that Jemena is required to ensure customers understand the tariffs once
developed. As discussed above, we consider that it is the role of retailers to provide
information to facilitate understanding of pricing signals.
Consistent with the provisions of the new rule, in our final decision:
we include costs for migrating customers to the new tariffs and for consultation with
retailers ($0.5 million)
220
AER, Preliminary decision, Jemena 2016–20, Fact sheet. October 2015. 221
Jemena, Response to information request IR#045 - New tariff implementation step change [email to AER], 8 March
2016. 222
AER, Submission to AEMC Draft Decision Rule changes—Distribution network pricing arrangements, October
2014, p. 1. 223
Jemena, Response to information request IR#045 - New tariff implementation step change [email to AER], 8 March
2016, p. 5. 224
Jemena, Response to information request IR#045 - New tariff implementation step change [email to AER], 8 March
2016, p. 5. 225
AEMC, Rule Determination, National Electricity Amendment (Distribution Network Pricing Arrangements) Rule
2014, 27 November 2014, p. i. 226
NER, cl. 6.18.5(i).

7-90 Attachment 7 – Operating expenditure | Jemena distribution determination final decision 2016–20
we do not include costs associated with customer education, customer enquiries or
customer mail-outs ($2 million).
In its submission on the revised proposals the Victorian Government stated we will
need to assess whether the expenditure proposed by the network service providers for
this step change is consistent with an opt-in rather than an opt-out approach.
While the impost on the network service providers could be less under an opt-in
arrangement, it is difficult to predict the magnitude of this outcome. Jemena identified
that the switch from opt-out to opt-in would not have a material impact on its forecast.
Since we are proposing to provide a step change in opex only for costs related to
transitioning customers to the new tariff structure, we do not consider the switch from
opt-out to opt-in will materially affect Jemena's costs.
Our final decision is to include a step change of $0.5 million for costs related to the
AEMC network pricing arrangement rule change in our total opex forecast.227
C.5.10 RIN reporting
We have included a RIN reporting step change of $5.9 million ($2015) in our final
decision opex forecast. We are satisfied the revised costs Jemena provided are the
efficient costs of complying with the new RIN reporting requirements.
As of 2015, we require economic benchmarking and category analysis regulatory
information notice (RIN) reporting to be based on actual rather than estimated data. All
the Victorian network service providers, except AusNet Services, proposed increases
in opex and capex to make changes to their IT systems and business processes to
meet our requirements for actual data.
While the other DNSPs proposed mostly capex solutions, Jemena initially proposed a
$19.7 million opex step change.228 The step change was to set up procedures, systems
and training to provide actual RIN data.
In our preliminary decision, we acknowledged RIN compliance is a new regulatory
obligation that may give rise to a justifiable step change. However, we did not include a
step change for Jemena's proposed RIN reporting costs because we considered:229
the total proposed cost of the step change was not reasonable compared to
Jemena’s total opex
the proposed costs of some of the components of the step changes were not
reasonable.
In its revised proposal, Jemena proposed an alternate RIN solution involving a mix of
both capex and opex. It proposed a materially reduced step change of $5.9 million
227
$389,341 includes Business analyst, Business SME backfill, and reporting framework. 228
Jemena, Submission to its Regulatory proposal, 13 July 2015, pp. 3–6. 229
AER, Preliminary decision, Jemena determination 2016–20, Attachment 7, October 2015, pp. 7-78 to 7-79.

7-91 Attachment 7 – Operating expenditure | Jemena distribution determination final decision 2016–20
(down from $19.7 million) with additional $2.1 million capex.230 Jemena's total revised
RIN compliance costs of $8.0 million ($2015) is a reduction of $11.7 million or 59 per
cent from its initial proposal.
In examining this step change we assessed the process Jemena undertook to estimate
the costs it would incur to comply with its RIN obligations. We consider the process it
applied was sound. Jemena's process was to:
identify what percentage of data would be currently defined as actual and
estimated information.
where information was identified as estimated, identify the activities required to
produce actual information
estimate the cost for each activity
identify and compare options to achieve compliance.
Jemena engaged KPMG (its external auditors) to determine what percentage of
information it reported in the 2014 RINs was actual information. KPMG stated 32 per
cent of the financial data Jemena reported in the EB RINs and 10 per cent of the
financial data it reported in the CA RINs was actual information.231 We consider
KPMG's estimates are reasonable given the definitions of actual data provided in the
RINs.
Jemena engaged Parson Brinkerhoff (PB) to review what measures were required to
transition from estimated to actual information.232 The PB report formed the basis for
Jemena's cost estimate. Jemena stated it needs to implement significant changes to its
processes for data collection, management and reporting to provide actual information
and the associated assurances of compliance.233 We agree Jemena would need to
implement significant changes to its data collection processes. Jemena stated the
detail provided by its consultants allowed it to be more specific in its cost calculations.
This resulted in a sizeable decrease in its cost estimates.234
Jemena provided a detailed business case to support the changes to systems and
information collection processes it considers it requires to comply with the RINs.235 It
assessed four options. We consider it chose the least cost option that allows it to be
compliant with RIN obligations.
Overall, we consider the proposed expenditure (capex and opex) reflects the efficient
costs of a prudent service provider.
230
Jemena, Revised regulatory proposal, Attachment 8-2, 6 January 2016, pp. 49–67. 231
Jemena, Revised regulatory proposal, Attachment 8-10, KPMG, Letter outlining the definition of actual information,
17 December 2015, p. 3. 232
Jemena, Revised regulatory proposal, Attachment 8-12, Parsons Brinckerhoff, Jemena Electricity Network
Conversion of Regulatory Information Notice information to actual, October 2015. 233
Jemena, Revised regulatory proposal, Attachment 8-2 Operating expenditure step changes, 6 January 2016, p. 51. 234
Jemena, Revised regulatory proposal, Attachment 8-2 Operating expenditure step changes, 6 January 2016, p. 56. 235
Jemena, Revised regulatory proposal, Attachment 8-11, Business case for RIN actuals, 6 January 2016.

7-92 Attachment 7 – Operating expenditure | Jemena distribution determination final decision 2016–20
Jemena's forecast RIN compliance capex is discussed in attachment 6 of this final
decision.
New step changes
In its revised proposal, Jemena proposed three new step changes that were not
included in its initial proposal.
C.5.11 Increased guaranteed service level obligations
Jemena proposed a step change of $0.9 million ($2015) for the incremental costs of
new GSL obligations in response to a rule change that was finalised after our
preliminary decision.236 It proposed the step change in addition to a category specific
forecast for GSL costs. Rather than assess the step change and the category specific
forecast separately, we have assessed them together as one category specific forecast
in section C.6.1 below.
C.5.12 Power of choice
We have included a $0.9 million ($2015) step change for Jemena's costs to comply
with the Power of Choice program in our final decision opex forecast. We are satisfied
this cost increase is driven by a changed regulatory obligation.
In its revised proposal, Jemena proposed a $0.9 million ($2015) new step change for
the AEMC's final rule changes for the Power of Choice program.
Jemena noted that its Power of Choice program is principally capex in nature, however
it included once-off opex costs for initial set up costs to comply with changes to its
regulatory, technical and operational environment.
We have assessed Jemena's cost build up and we consider the opex costs proposed
by Jemena are efficient, prudent and reflect the initial set up costs to comply with its
Power of Choice obligations. We are satisfied that the proposed costs do not relate to
Jemena's participation in a contestable metering market and other unregulated
activities.
C.5.13 Adoption of chapter 5A
We have included a $0.7 million ($2015) step change to comply with the Victorian
Government's adoption of Chapter 5A of the NER in our final decision opex forecast.
We are satisfied this cost increase is driven by a changed regulatory obligation.
236
Essential Services Commission, Electricity Distribution Code Version 9, December 2015, pp. 19–20; ESCV,
Review of the Victorian electricity distributors' GSL payment scheme, final decision, 23 December 2015.

7-93 Attachment 7 – Operating expenditure | Jemena distribution determination final decision 2016–20
In its revised proposal, Jemena proposed a new step change of $0.7 million ($2015)
following the Victorian Government's decision to implement Chapter 5A of the NER in
Victoria, to commence no later than 1 January 2017.237
To comply with its new obligations, Jemena must develop and publish its basic model
standing offers for connection services in accordance with Chapter 5A of the NER. We
are satisfied that the intention of the Victorian Government to adopt Chapter 5A of the
rules to apply no later than 1 January 2017 will result in an increased regulatory
obligation for Jemena.
We have assessed Jemena's cost-build up including its initial implementation costs
and on-going costs associated with responding to enquiries. We consider the costs are
efficient and prudent. These costs are also broadly comparable to United Energy,
CitiPower and Powercor's proposed costs.238
C.6 Other costs not included in the base year
We prefer a 'base-step-trend' approach to assessing most opex categories. However,
when appropriate, we may asses some opex categories using other forecasting
techniques, such as an efficient benchmark amount. We also assess whether using
alternative forecasting techniques in combination with a 'base-step-trend' approach
produces a total opex forecast consistent with the opex criteria.
In our final decision opex forecast, we have included category specific forecasts for:
GSL payments
debt raising costs.
We forecast GSL costs using a five year historical averaging approach to maintain
consistency with our forecasting method for previous regulatory control periods. The
incentives provided by using a five year historical average are consistent with adopting
a single year revealed cost approach and applying the EBSS. We forecast debt raising
costs using the costs incurred by a benchmark firm.
C.6.1 Guaranteed service level payments
We have included a category specific forecast of $0.6 million ($2015) for GSL
payments in our opex forecast for the 2016–20 regulatory control period.
The Electricity Distribution Code (EDC) requires Victorian electricity distributors to
make payments to customers who receive a level of service that is worse than a
specific threshold or level. The Essential Services Commission (ESC) updated the
237
Jemena, Revised regulatory proposal, Attachment 8-2 Operating expenditure step changes, 6 January 2016, p. 76. 238
United Energy, Revised regulatory proposal, 6 January 2016, p. 204; CitiPower, Revised proposal, January 2016,
p. 185. Powercor, Revised regulatory proposal, 6 January 2016, p. 178.

7-94 Attachment 7 – Operating expenditure | Jemena distribution determination final decision 2016–20
EDC in December 2015, increasing the Victorian network service providers' GSL
obligations.239
In its initial proposal, Jemena forecast GSL payments of $0.4 million ($2015). Jemena
used a single base year to forecast GSL costs for the 2016–20 regulatory control
period.240 Jemena did not account for the regulatory changes in its initial proposal
because the new EDC rules were not finalised at the time.
In our preliminary decision, we included a category specific forecast of $0.3 million
($2015) for GSL payments in our opex forecast. We forecast GSL payments as the
average of GSL payments made by Jemena between 2010 and 2014. We adopted the
historical averaging approach to maintain consistency with our GSL payment
forecasting methodology for previous regulatory control periods.241
In its revised proposal, Jemena forecast GSL payments of $1.2 million ($2015). Its
forecast included:
a base level of GSL payments of $0.3 million
a step change of $0.9 million to comply with the GSL rule change.
As noted above, we have assessed both components of Jemena's forecast GSL
payments as a single category specific forecast.
The Victorian Government submitted that the basis for Jemena’s revised proposal was
the draft EDC rules published in November rather than the final EDC rules published in
December.242 On 24 February 2016, in response to our information request, Jemena
amended its total GSL forecast from $1.2 million to $0.9 million ($2015)243.
In its amended GSL forecast, Jemena:
anticipated increases in the size and the frequency of GSL payments under the
final EDC rules
included spending for quality of supply monitoring and recording.
We discuss each component of Jemena's forecast step change in the sections below.
Electricity Distribution Code
In its amended forecast, Jemena proposed costs of $0.6 million ($2015) to comply with
the final EDC rules. We have assessed the likely increase in the size and frequency of
239
Essential Services Commission, Electricity Distribution Code Version 9, December 2015, pp. 19–20; ESCV,
Review of the Victorian electricity distributors' GSL payment scheme, final decision, 23 December 2015. 240
Jemena, Regulatory proposal, Attachment 8-6 Operating expenditure forecasting method and base year efficiency,
30 April 2015, p. 17. 241
AER, Preliminary decision Jemena – Opex model, October 2015. 242
Victorian Government, Submission on the Victorian electricity distribution network service providers’ revised
regulatory proposals for 2016-20, 12 February 2016, p. 4. 243
Jemena, Response to AER information request – Jemena #039 [email to AER], 24 February 2016.
7-95 Attachment 7 – Operating expenditure | Jemena distribution determination final decision 2016–20
GSL payments due to the changes to the EDC and we consider Jemena’s forecast is
reasonable. This is because Jemena adopted an averaging approach rather than a
single base year to forecast the expected increase in GSL payments as a result of the
rule change.
Quality of supply monitoring
Jemena also included $0.3 million ($2015) in the proposed step change to establish
better quality monitoring. However, Jemena is under no obligation to perform
monitoring as part of the GSL framework. We do not consider Jemena is required to
incur such costs under the EDC and therefore we have removed this increment from
our forecast of the GSL step change.
Other submissions
The CCP noted the increased GSL payment forecast and suggested that the AER
examine the forecast.244 The CCP suggested that GSL costs "could be recovered
during the course of the regulatory period".245 We consider providing for GSL payments
in our ex-ante opex forecast provides network service providers with an incentive to
minimise those payments and to maintain service levels at an efficient level. Actual
GSL costs may be either higher or lower than forecast as they depend on the
frequency of unplanned outages. Recovering GSL costs ex-post, as the CCP suggests
may remove the incentive for the distributor to maintain service levels.
C.6.2 Debt raising costs
Consistent with our preliminary decision, we have forecast debt raising costs using the
costs incurred by a benchmark firm. Our assessment approach and the reasons for
those forecasts are set out in the debt and equity raising costs appendix in the rate of
return attachment.
244
Consumer Challenge Panel Sub Panel 3, Submission to the AER, 25 February 2016, p. 33. 245
Consumer Challenge Panel Sub Panel 3, Submission to the AER, an overview, 22 February 2016, p. 16.