Embed Size (px)
Citation preview
DEPARTMENT OF TRADE AND INDUSTRY POLICY SUPPORT PROGRAMME PROGRAMME MANAGEMENT UNIT
BANK FORUM (EAST),1ST FLOOR, CNR. FEHRSEN & BRONKHORST STR , NEW MUCLENEUCK - PRETORIA
P O BOX 12139, HATFIELD, 0028 Tel: +(27-12) 346-8335 - Fax: (27-12) 346-8350 - E-mail: [email protected]
DTI Policy Support Programme Website: www.tips.org.za/research/dtipsp
the dti
THE DEPARTMENT OF TRADE AND INDUSTRY SOUTH AFRICA
DEPARTMENT OF TRADE AND INDUSTRY
POLICY SUPPORT PROGRAMME
INDUSTRIAL SECTORS POLICY SUPPORT PROJECT CODE: A.1.008
D8 FINAL REPORT ON FACTORS IMPACTING ON THE COMPETITIVENESS OF
KEY EXPORT VALUE CHAINS IN THE FURNITURE SECTOR
JUNE 2002
Submitted by
Prof. M. Morris and Ms Carey Ann Jackson Industrial Restructuring Project School of Development Studies
University of Natal
DEPARTMENT OF TRADE AND INDUSTRY POLICY SUPPORT PROGRAMME PROGRAMME MANAGEMENT UNIT
i
FOREWORD The Industrial Restructuring Project (IRP) was initiated at the beginning of 1996 as the KwaZulu-Natal Industrial Restructuring Project (KZN IRP). The project initially focused exclusively on KwaZulu-Natal, but is now aimed at supporting industrial policy in South Africa at the national, provincial and local levels. It is facilitated by international experts and is based at the School of Development Studies, University of Natal Durban. The project has two important features. Firstly, it focuses on critical issues that are impacting on the competitiveness of manufacturing sectors that are under threat from increased international competition and the liberalisation of the South African trade regime. Secondly, it is action-oriented in design. The findings that have been generated have, for example, been presented to numerous industry stakeholders, including government, business associations and trade unions. The project consequently has the support of various regional and national stakeholders.
This particular report/working paper has arisen out of both new research and the cumulative knowledge that has been generated from previous studies. These cover a number of IRP reports, working papers, journal articles and conference papers. Some of the themes covered include South Africa’s manufacturing competitiveness, the automotive industry, the clothing and textiles sectors, footwear, middle -management capacity, human resource development, institutional support for industrial restructuring, and business services for manufacturing competitiveness. Enquiries regarding IRP material should be addressed to: The Librarian, Centre for Social and Development Studies, University of Natal, Durban, 4041. Tel: 031 2601031; Fax: 031 2602359; email: [email protected].
Prof. Mike Morris
Head: IRP
DEPARTMENT OF TRADE AND INDUSTRY POLICY SUPPORT PROGRAMME PROGRAMME MANAGEMENT UNIT
ii
ACKNOWLEDGEMENTS
As per the previous IRP reports compiled over the course of the last three years, the European Union through the Department of Trade and Industry’s Policy Support Programme provided the principal funding for the writing of this research report. The financial support received from the European Union for not only this report, but for all of the others as well, is sincerely appreciated and hereby acknowledged.
At an academic level, special thanks for their assistance should be accorded to colleagues in the Industrial Restructuring Project at the University of Natal and the Institute of Development Studies at the University of Sussex - Prof Mike Morris, Prof Raphael Kaplinsky, Dr Justin Barnes, Dr Richard Ballard, Mr Sagren Moodley, Dr Myriam Velia, Mr Sean Gannon, Ms Jane Kennan, Ms Nicci Earle. Thanks are also accorded to all the firms and individuals who participated in the study.
DEPARTMENT OF TRADE AND INDUSTRY POLICY SUPPORT PROGRAMME PROGRAMME MANAGEMENT UNIT
iii
TABLE OF CONTENTS
1. INTRODUCTION......................................................................................................... 1 1.1. The virtues of exporting ....................................................................................................................................2 1.2. Exporting and the conferring of benefits......................................................................................................3 1.3. A value chain perspective on upgrading .......................................................................................................6 1.4. General methodological issues .........................................................................................................................7
2. THE WOODEN FURNITURE VALUE CHAIN ......................................................... 10
3. SECTOR AND TRADE DATA.................................................................................... 13 3.1. Sales...................................................................................................................................................................... 13 3.2. Employment....................................................................................................................................................... 14 3.3. Gross salaries..................................................................................................................................................... 14 3.4. Trade .................................................................................................................................................................... 16 3.5. Capital expenditure ......................................................................................................................................... 17 3.6. Productivity........................................................................................................................................................ 18 3.7. Unit price and market share ......................................................................................................................... 21
4. FIRM DATA................................................................................................................ 27 4.1. Sample selection................................................................................................................................................ 27 4.2. Upgrading ........................................................................................................................................................... 31 4.3. Governance and coordination....................................................................................................................... 38
5. CONCLUSION............................................................................................................ 44 5.1. Key issues............................................................................................................................................................ 44 5.2. Policy implications ........................................................................................................................................... 45
REFERENCES................................................................................................................ 48
DEPARTMENT OF TRADE AND INDUSTRY POLICY SUPPORT PROGRAMME PROGRAMME MANAGEMENT UNIT
1
1. INTRODUCTION
The past two decades have seen a growing homogenisation of economic policy as the Washington Consensus has swept through the global economy. South Africa has not been immune to this shift in the policy agenda, particularly in the post apartheid era, manifested primarily through a new trade regime, with the gradual reduction in import tariffs,1 and a reduction in the exceptionally large tariff dispersion.
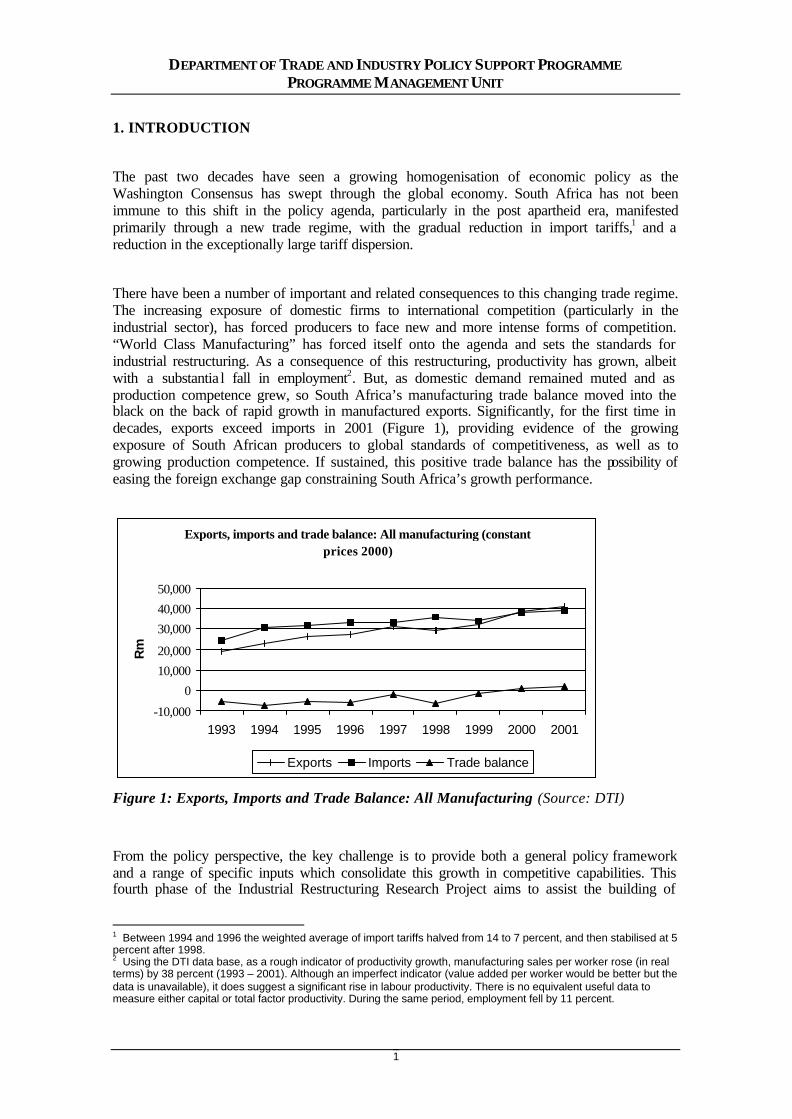
There have been a number of important and related consequences to this changing trade regime. The increasing exposure of domestic firms to international competition (particularly in the industrial sector), has forced producers to face new and more intense forms of competition. “World Class Manufacturing” has forced itself onto the agenda and sets the standards for industrial restructuring. As a consequence of this restructuring, productivity has grown, albeit with a substantia l fall in employment2. But, as domestic demand remained muted and as production competence grew, so South Africa’s manufacturing trade balance moved into the black on the back of rapid growth in manufactured exports. Significantly, for the first time in decades, exports exceed imports in 2001 (Figure 1), providing evidence of the growing exposure of South African producers to global standards of competitiveness, as well as to growing production competence. If sustained, this positive trade balance has the possibility of easing the foreign exchange gap constraining South Africa’s growth performance.
Exports, imports and trade balance: All manufacturing (constant prices 2000)
-10,000
010,00020,000
30,00040,00050,000
1993 1994 1995 1996 1997 1998 1999 2000 2001
Rm
Exports Imports Trade balance
Figure 1: Exports, Imports and Trade Balance: All Manufacturing (Source: DTI)
From the policy perspective, the key challenge is to provide both a general policy framework and a range of specific inputs which consolidate this growth in competitive capabilities. This fourth phase of the Industrial Restructuring Research Project aims to assist the building of
1 Between 1994 and 1996 the weighted average of import tariffs halved from 14 to 7 percent, and then stabilised at 5 percent after 1998. 2 Using the DTI data base, as a rough indicator of productivity growth, manufacturing sales per worker rose (in real terms) by 38 percent (1993 – 2001). Although an imperfect indicator (value added per worker would be better but the data is unavailable), it does suggest a significant rise in labour productivity. There is no equivalent useful data to measure either capital or total factor productivity. During the same period, employment fell by 11 percent.
DEPARTMENT OF TRADE AND INDUSTRY POLICY SUPPORT PROGRAMME PROGRAMME MANAGEMENT UNIT
2
sectoral policy implementation capacity within DTI by providing insights into those factors promoting international competitiveness (and exporting) in manufacturing. We focus on four value chains – two consumer goods products (clothing, furniture) and two intermediate goods products (auto components and leather). Loosely, they respectively group into buyer driven value chains and producer driven value chains.
The specific focus of this research programme is to better understand the dynamics of exporting firms. By focusing on the most successful exporting firms in each of the four value chains, (and in nominated sub-sectors), the study hopes to determine:
• what the characteristics are of successful exporting firms and the value chains in which they participate;
• whether successful South African exporters are locked into virtuous or vicious circles of global specialisation;
• to what extent exporting firms are able to change their positions in their value chains by upgrading their operations through a greater input of knowledge-intensive activities.
1.1. The virtue s of exporting
Based on the successful experience of both first- and second-tier newly industrialising economies, a new orthodoxy has grown on the virtue of exporting (see, for example, the World Bank’s 1993 study of East Asian economic success). This posits benefits arising both for the economy as a whole, and for the corporate sector.
From the economy-wide perspective, it is argued that exporting provides the capacity to specialise in areas of comparative advantage. The previous import-substituting regime meant that economies were insufficiently focused on what they could do best with resources being put into activities which were unlikely to add to real GDP over time (or to do so at high opportunity cost). A second virtue of growing exports is a positive trade balance which provides the resources to promote rapid overall economic growth. And, thirdly, growing foreign demand (especially for labour-intensive products which are the comparative advantage of low-income economies) creates employment. This latter point is especially attractive for South Africa where the unemployment rate is so high that no conceivable increase in domestic demand would have much impact on reducing the rate of unemployment.
From the firms-perspective, growing exports offers a number of advantages. First, it allows the firm to specialise in those activities where it clearly holds a comparative advantage. Allied to this, the large volumes which can be sold on global markets makes it possible for the firm to reap economies of scale, not just in production but also possibly in design, marketing and logistics. Further, when exporting is accompanied by a competitive exchange rate, it may provide greater profits than when products are sold in the domestic market. And, finally, exposure to more demanding customers forces the firm to upgrade its products and processes and is thus a transmission belt for enhanced learning.
DEPARTMENT OF TRADE AND INDUSTRY POLICY SUPPORT PROGRAMME PROGRAMME MANAGEMENT UNIT
3
For all these reasons there is a growing orthodoxy on the benefits to be reaped from greater exporting.
1.2. Exporting and the conferring of benefits
But does exporting always confer benefits to producers? It is widely known that primary commodity prices as a whole have been characterised by falling terms of trade; as well as extreme price volatility. For this reason economic policy in many countries has concentrated on encouraging a transition from the production and export of primary products to the production and export of manufactures.
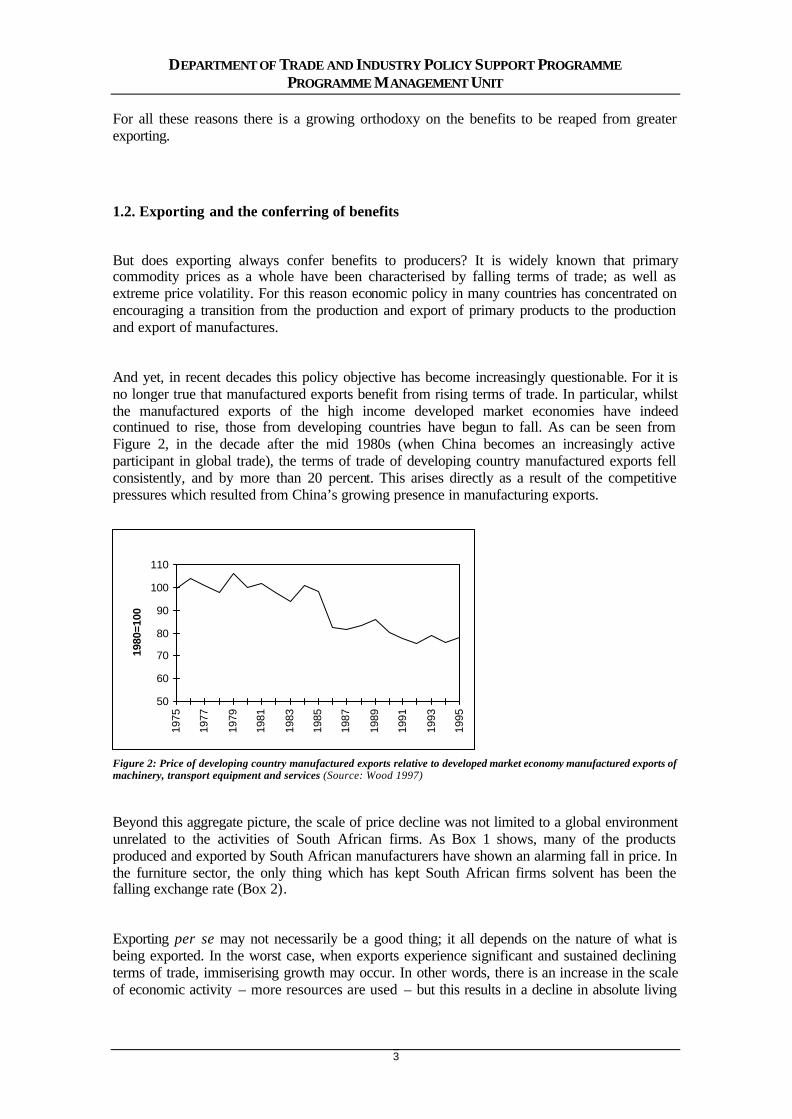
And yet, in recent decades this policy objective has become increasingly questionable. For it is no longer true that manufactured exports benefit from rising terms of trade. In particular, whilst the manufactured exports of the high income developed market economies have indeed continued to rise, those from developing countries have begun to fall. As can be seen from Figure 2, in the decade after the mid 1980s (when China becomes an increasingly active participant in global trade), the terms of trade of developing country manufactured exports fell consistently, and by more than 20 percent. This arises directly as a result of the competitive pressures which resulted from China’s growing presence in manufacturing exports.
50
60
70
80
90
100
110
1975
1977
1979
1981
1983
1985
1987
1989
1991
1993
1995
1980
=100
Figure 2: Price of developing country manufactured exports relative to developed market economy manufactured exports of machinery, transport equipment and services (Source: Wood 1997)
Beyond this aggregate picture, the scale of price decline was not limited to a global environment unrelated to the activities of South African firms. As Box 1 shows, many of the products produced and exported by South African manufacturers have shown an alarming fall in price. In the furniture sector, the only thing which has kept South African firms solvent has been the falling exchange rate (Box 2).
Exporting per se may not necessarily be a good thing; it all depends on the nature of what is being exported. In the worst case, when exports experience significant and sustained declining terms of trade, immiserising growth may occur. In other words, there is an increase in the scale of economic activity – more resources are used – but this results in a decline in absolute living
DEPARTMENT OF TRADE AND INDUSTRY POLICY SUPPORT PROGRAMME PROGRAMME MANAGEMENT UNIT
4
standards. A less severe, but still troubling outcome is when the resultant growth rate is positive, but at sub-optimal levels. In other words, had the resources being utilised to increase exports been used in a different manner, then the outcome would have been more beneficial to income growth.
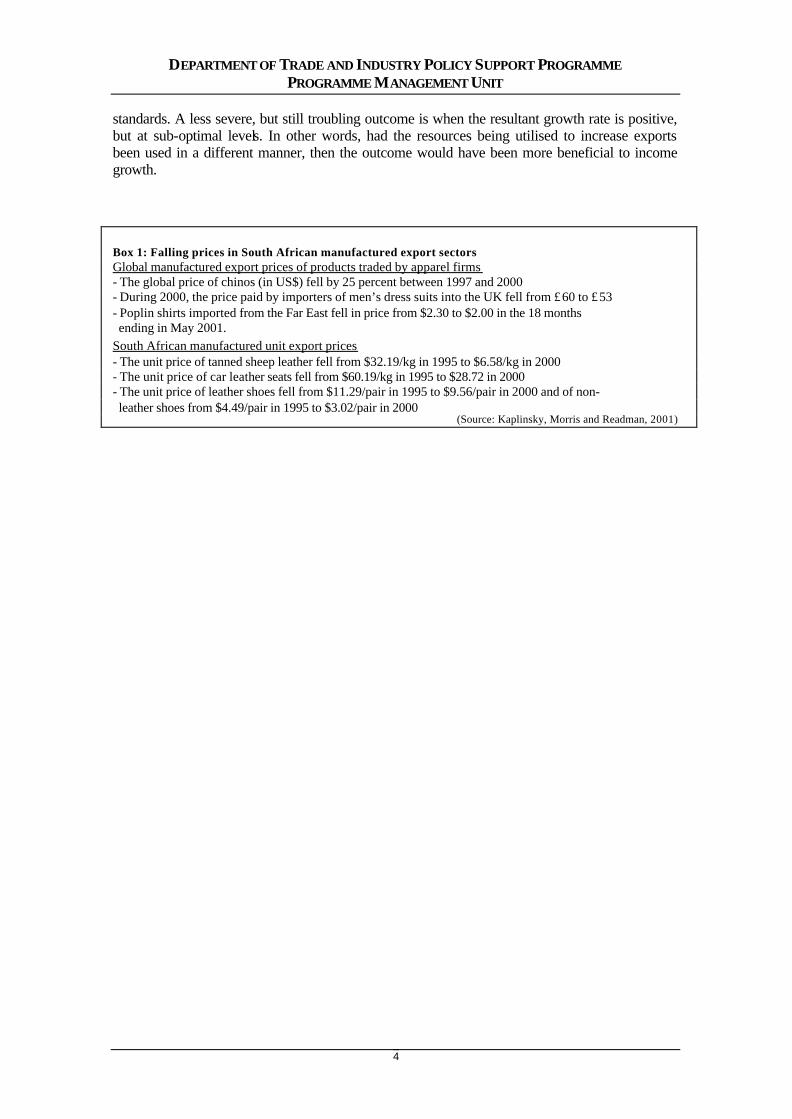
Box 1: Falling prices in South African manufactured export sectors Global manufactured export prices of products traded by apparel firms - The global price of chinos (in US$) fell by 25 percent between 1997 and 2000 - During 2000, the price paid by importers of men’s dress suits into the UK fell from £60 to £53 - Poplin shirts imported from the Far East fell in price from $2.30 to $2.00 in the 18 months ending in May 2001.
South African manufactured unit export prices - The unit price of tanned sheep leather fell from $32.19/kg in 1995 to $6.58/kg in 2000 - The unit price of car leather seats fell from $60.19/kg in 1995 to $28.72 in 2000 - The unit price of leather shoes fell from $11.29/pair in 1995 to $9.56/pair in 2000 and of non- leather shoes from $4.49/pair in 1995 to $3.02/pair in 2000
(Source: Kaplinsky, Morris and Readman, 2001)
DEPARTMENT OF TRADE AND INDUSTRY POLICY SUPPORT PROGRAMME PROGRAMME MANAGEMENT UNIT
5
The blunt policy prescription arising from this is that it is not so much a matter of whether South African manufacturers should be induced to export, but what they export. If they are locked into the production and export of products exhibiting a sustained and significant decline in prices (without a concomitant decline in production costs), then the outcome will be deleterious.
So, what determines whether firms are locked into these harmful export niches? The answer is the extent of competition which exists in each of these market segments. Unless firms find some way of escaping these competitive pressures – which, as we have seen, from the perspective of developing countries have been severely heightened by China’s entry into global markets – they
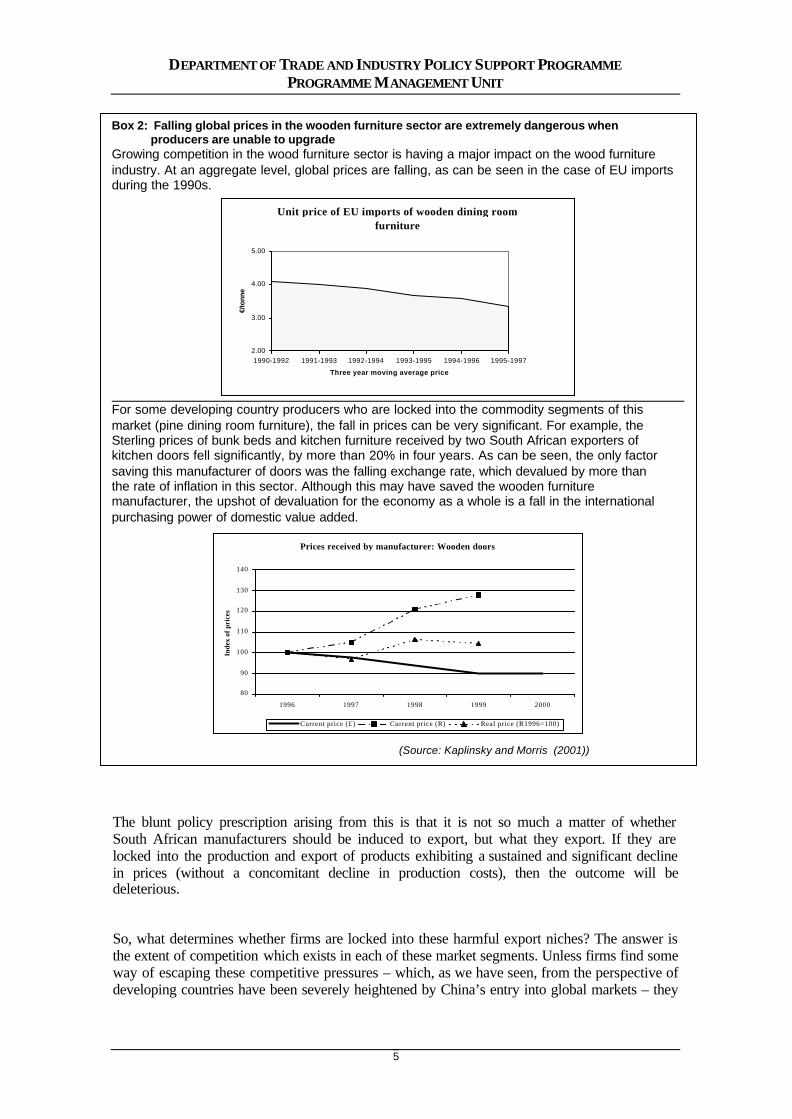
Box 2: Falling global prices in the wooden furniture sector are extremely dangerous when producers are unable to upgrade Growing competition in the wood furniture sector is having a major impact on the wood furniture industry. At an aggregate level, global prices are falling, as can be seen in the case of EU imports during the 1990s.
Unit price of EU imports of wooden dining room furniture
2.00
3.00
4.00
5.00
1990-1992 1991-1993 1992-1994 1993-1995 1994-1996 1995-1997
Three year moving average price
€/to
nn
e
For some developing country producers who are locked into the commodity segments of this market (pine dining room furniture), the fall in prices can be very significant. For example, the Sterling prices of bunk beds and kitchen furniture received by two South African exporters of kitchen doors fell significantly, by more than 20% in four years. As can be seen, the only factor saving this manufacturer of doors was the falling exchange rate, which devalued by more than the rate of inflation in this sector. Although this may have saved the wooden furniture manufacturer, the upshot of devaluation for the economy as a whole is a fall in the international purchasing power of domestic value added.
Prices received by manufacturer: Wooden doors
80
90
100
110
120
130
140
1996 1997 1998 1999 2000
Inde
x of
pri
ces
Current price (£) Current price (R) Real price (R1996=100)
(Source: Kaplinsky and Morris (2001))

DEPARTMENT OF TRADE AND INDUSTRY POLICY SUPPORT PROGRAMME PROGRAMME MANAGEMENT UNIT
6
will not prosper. How do they avoid these competitive markets? By developing the capacity to upgrade. This is now increasingly recognised as the challenge facing industrial policy throughout the global economy, influencing not just national strategies, but corporate strategies as well.
1.3. A value chain perspective on upgrading
How would we know if firms had managed to upgrade their activities? Two schools of thought have addressed this issue in recent years. The first has focused on core competences (Hamel and Pralahad, 1994). The thinking here is that firms need to examine their capabilities to determine those of its attributes which:
• provide value to the final customer
• are relatively unique in the sense that few competitors possess them
• are difficult to copy, that is where there are barriers to entry.
The capacity to innovate therefore arises from concentration in these competences and the concomitant outsourcing of those functions which do not meet these three criteria. A useful supplement to this line of thinking is that in a dynamic world, core competences can easily become core-rigidities (Leonard-Barton, 1995), and part of the task of upgrading is to relinquish areas of past expertise.
Closely related is a school of thought focusing on dynamic capabilities (Teece and Pisano, 1994). It argues that corporate profitability in the long run cannot be sustained by control over the market (for example, through using quasi-monopolistic practices), but through the development of dynamic capabilities which arise as a result of its:
• internal processes which facilitate learning, including the capacity to reconfigure what the firm has done in the past
• position, that is its access to specific competences either within its own activities, or those which are drawn from the regional or national system of innovation
• path, that is, its trajectory, because change is always path-dependent.
Both of these related concepts provide an important backdrop for understanding the phenomenon of upgrading. They are especially helpful in understanding the factors both driving and facilitating improvements in product and processes which arise from the activities of the firm itself. But they are also weak because they stop at the level of the firm, and fail to capture upgrading processes which are systemic in nature and which involves groups of firms linked together in value chains. This is particularly damaging for the core competences approach which explicitly neglects the chain through its normative conclusion that upgrading almost always involves outsourcing.
Consequently, we need to view the upgrading challenge in a wider perspective, capturing the central idea that it may involve changes in the nature and mix of activities, both within each link in the chain, and in the distribution of intra-chain activities. This relates both to the achievement

DEPARTMENT OF TRADE AND INDUSTRY POLICY SUPPORT PROGRAMME PROGRAMME MANAGEMENT UNIT
7
of new product and process development, and in the functional reconfiguration of who does what in the chain as a whole. It is thus possible to identify four trajectories which firms can adopt in pursuing the objective of upgrading, namely:
• Process upgrading: increasing the efficiency of internal processes such that these are significantly better than those of rivals, both within individual links in the chain (for example, increased inventory turns, lower scrap), and between the links in the chain (for example, more frequent, smaller and on-time deliveries)
• Product upgrading: introducing new products or improving old products faster than rivals. This involves changing new product development processes both within individual links in the value chain and in the relationship between different chain links
• Functional upgrading: increasing value added by changing the mix of activities conducted within the firm (for example, taking responsibility for, or outsourcing accounting, logistics and quality functions) or moving the locus of activities to different links in the value chain (for example from manufacturing to design)
• Chain upgrading: moving to a new value chain (for example, Taiwanese firms moved from the manufacture of transistor radios to calculators, to TVs, to computer monitors, to laptops and now to WAP phones)
1.4. General methodological issues
The four value chain/sectoral studies have adopted a broad common methodological approach combining macro and micro data, utilising quantitative and qualitative sources. This general methodology has been adapted in each of the sectoral studies to cover the specificity of conditions in each of the separate sectors, as well as the need to disaggregate each sector into the various sub-sectors which exhibit the greatest exporting propensity. Furthermore each study differs with respect to the number of exporting sub-sectors, as well as the number of firms interviewed.
The macro data covers two data sets. The first provides a birds-eye, sectoral view of production, value added, employment and factor productivities in each of the broad sectors in which the specific researched value chains operate. This provides a broad sectoral background in which to view the behaviour of the researched chains. This data is drawn from a variety of data-bases, including those held by the DTI, the IDC and TIPS.
The second set of macro data focuses on South African export performance in each of the researched chains, but at a high level of disaggregation. Specifically, it focuses on the nature of export performance in the three major buying markets, Europe, the USA and Japan. Three sets of detailed analysis have been undertaken:
• The growth of South African exports in each of these markets over the past decade
• The share of South African producers in each of these markets
• The performance of South African exports in relation to unit prices.
DEPARTMENT OF TRADE AND INDUSTRY POLICY SUPPORT PROGRAMME PROGRAMME MANAGEMENT UNIT
8
Unlike the sectoral data, where we have drawn on established data bases, we have undertaken detailed original analysis to produce this data, involving extensive analysis of import trends in each of these three major consuming markets.
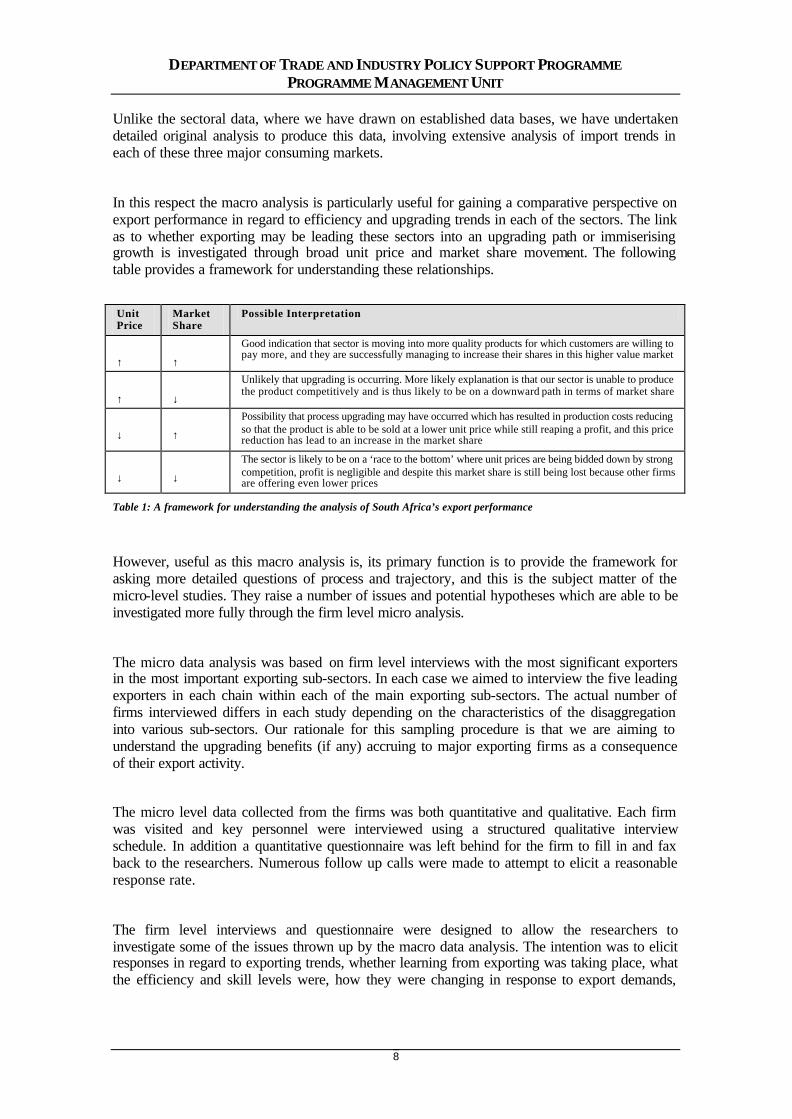
In this respect the macro analysis is particularly useful for gaining a comparative perspective on export performance in regard to efficiency and upgrading trends in each of the sectors. The link as to whether exporting may be leading these sectors into an upgrading path or immiserising growth is investigated through broad unit price and market share movement. The following table provides a framework for understanding these relationships.
Unit Price
Market Share
Possible Interpretation
↑
↑
Good indication that sector is moving into more quality products for which customers are willing to pay more, and they are successfully managing to increase their shares in this higher value market
↑
↓
Unlikely that upgrading is occurring. More likely explanation is that our sector is unable to produce the product competitively and is thus likely to be on a downward path in terms of market share
↓
↑
Possibility that process upgrading may have occurred which has resulted in production costs reducing so that the product is able to be sold at a lower unit price while still reaping a profit, and this price reduction has lead to an increase in the market share
↓
↓
The sector is likely to be on a ‘race to the bottom’ where unit prices are being bidded down by strong competition, profit is negligible and despite this market share is still being lost because other firms are offering even lower prices
Table 1: A framework for understanding the analysis of South Africa’s export performance
However, useful as this macro analysis is, its primary function is to provide the framework for asking more detailed questions of process and trajectory, and this is the subject matter of the micro-level studies. They raise a number of issues and potential hypotheses which are able to be investigated more fully through the firm level micro analysis.
The micro data analysis was based on firm level interviews with the most significant exporters in the most important exporting sub-sectors. In each case we aimed to interview the five leading exporters in each chain within each of the main exporting sub-sectors. The actual number of firms interviewed differs in each study depending on the characteristics of the disaggregation into various sub-sectors. Our rationale for this sampling procedure is that we are aiming to understand the upgrading benefits (if any) accruing to major exporting firms as a consequence of their export activity.
The micro level data collected from the firms was both quantitative and qualitative. Each firm was visited and key personnel were interviewed using a structured qualitative interview schedule. In addition a quantitative questionnaire was left behind for the firm to fill in and fax back to the researchers. Numerous follow up calls were made to attempt to elicit a reasonable response rate.
The firm level interviews and questionnaire were designed to allow the researchers to investigate some of the issues thrown up by the macro data analysis. The intention was to elicit responses in regard to exporting trends, whether learning from exporting was taking place, what the efficiency and skill levels were, how they were changing in response to export demands,
DEPARTMENT OF TRADE AND INDUSTRY POLICY SUPPORT PROGRAMME PROGRAMME MANAGEMENT UNIT
9
how firms were responding to raised technical demands from foreign customers, and finally whether process, product and functional upgrading was occurring.
The micro data collection was also designed to lay the basis for understanding the various value chains operating in these sectors, and identify the driving forces governing these value chains. From the perspective of exporting firms it was important to identify the provision of access within these chains, how standards are set, how conformance to standards occurred, what room for manoeuvre exists with respect to changing roles and function, and finally whether exporting firms were locked into value chains which were locked into immiserising trajectories.
In addition the firm level interviews were intended to yield rich qualitative information a host of issues acting as ‘enablers’ and ‘blockers’ for exporting firms, and hence feed into any policy recommendations for the DTI in its role of export facilitation.
DEPARTMENT OF TRADE AND INDUSTRY POLICY SUPPORT PROGRAMME PROGRAMME MANAGEMENT UNIT
10
2. THE WOODEN FURNITURE VALUE CHAIN
The capacity to upgrade industrially is increasingly recognised as transforming a developing country’s ability to export on a sustainable basis so as to participate successfully in competitive global markets. Upgrading is difficult and mastering the upgrading challenge involves mastery of changes in the nature and mix of activities, both within each link in a value chain as well as between links. Exploring the extent to which South African wooden furniture manufacturers are mastering the upgrading challenge is the primary focus of this report. Prefacing the exploration of upgrading and exporting is a description of some characteristics of the global furniture market and a clarification of what is meant by a wooden furniture value chain.
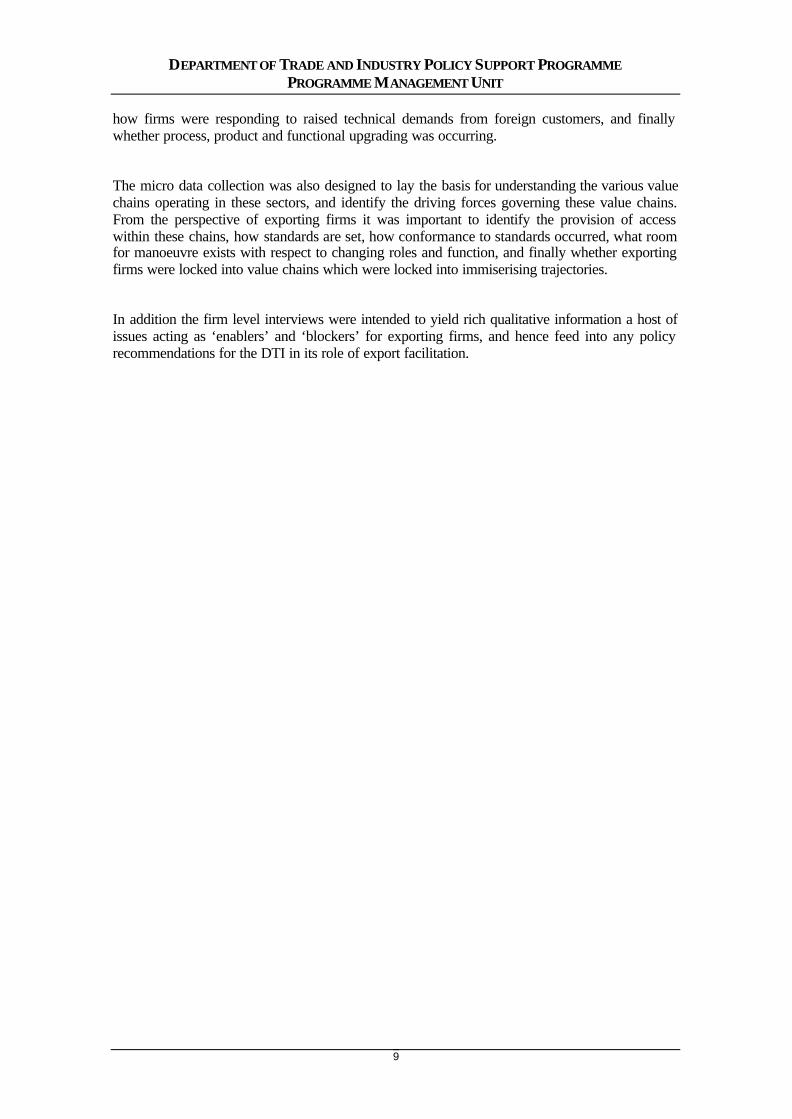
At the three-digit SITC level, furniture was, in 1998, the 19th largest traded goods sector out of 261 product groupings, with a total value of global trade of $44.9bn (www.intracen.org cited in Kaplinsky et al, 2001). Furniture is the largest traditional, low-tech sector and the value of its global trade exceeded that of the apparel industry ($40.6bn) and the footwear industry ($33.8bn). Furniture imports, too, have grown and as a proportion of imports into the European Union (“EU”), furniture3 was the 17th largest sector with a 81% growth rate between 1989 and 1997, making it the 21st most rapidly growing import sector (Kaplinsky et al, 2001). Furniture is a labour-intensive product and it is apparent from table 2 that in the list of major furniture exporting countries, the major furniture exporting countries are the industrially advanced economies, and there are emerging and developing countries listed in the group of the largest net exporters. Gross Export Value
1998 Net Export Value 1994
Net Export Value 1998
Net Export
(% Change1994-98)
Italy 8,630,577 6,105,304 7,831,184 28%
China 2,821,435 1,381,813 2,725,245 97%
Canada 4,252,591 325,575 1,804,207 454%
Denmark 2,022,567 1,412,453 1,323,069 -6%
Mexico 1,841,054 259,010 1,190,136 359%
Malaysia 1,115,158 698,678 1,052,131 51%
Spain 1,443,719 251,493 741,453 195%
Sweden 1,341,673 254,047 494,747 95%
Romania 435,571 375,898 382,337 2%
Indonesia 355,065 754,535 339,029 -55%
Czech Rep 639,630 123,825 331,622 168%
Hungary 430,546 -1,126 228,092 2,0157%
Brazil 342,880 229,978 135,197 -41%
Korea rep. 187,803 28,289 76,515 170%
Slovakia 195,571 107,176 63,424 -41%
Total of rest 18,866,371 -12,225,777 -21,999,129 -280%
Total 44,922,211
*SITC821, Furniture and stuffed furnishings Table 2: Global Furniture Trade: Top 15 Net Exporting Countries ($,000) (Source: UNCTAD/ITC (www.intracen.org) in Kaplinsky et al, 2001)
3 Taking as the definition for this purpose harmonised System 94 code.

DEPARTMENT OF TRADE AND INDUSTRY POLICY SUPPORT PROGRAMME PROGRAMME MANAGEMENT UNIT
11
Furniture is neither an homogenous product nor an homogenous sector but can divided into a number of different product groupings and distinct market segments. Using the Harmonised System (“HS”) of classification, the following can be distinguished:
• HS 94 which includes furniture; bedding, mattresses, mattress supports, cushions and similar stuffed furnishings; lamps and lighting fittings, illuminated signs, illuminated name-plates and prefabricated buildings (and which is directly related to SITC 821);
• HS 943 wooden furniture products which has four subdivisions, namely office furniture (HS 94033); kitchen furniture (HS94034); bedroom furniture (HS94035); and dining room, living room and shop furniture (HS94036).
The wooden furniture sector is becoming increasingly competitive and growing numbers of producers are entering the global market. World prices are declining and detailed analysis of data by product sub-group and countries of origin (see Kaplinsky et al’s (2001) discussion for more detailed information) portrays an industry in the throes of intense global competition. This is a situation suggestive of either falling barriers to entry and new entrants, or of increasing efficiency and falling costs (or both) (Kaplinsky et al, 2001). Within this context, the capacity to upgrade is critical to successful participation in the global furniture market.
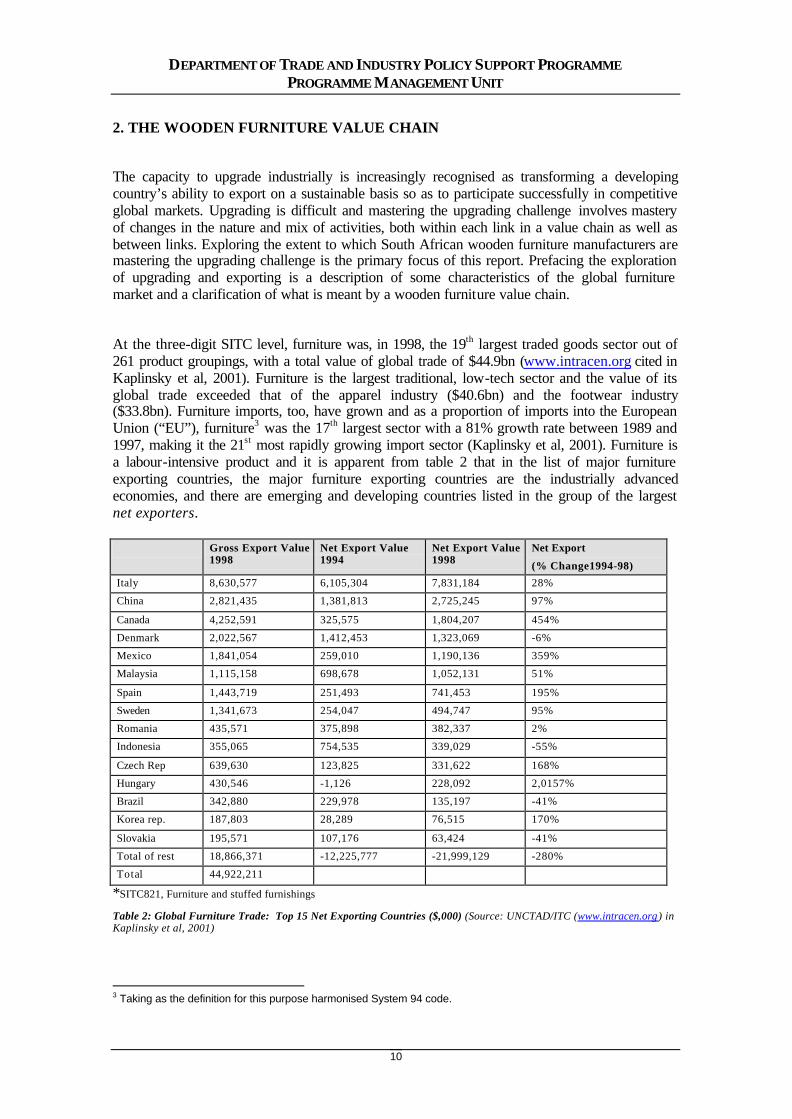
Having described some characteristics of the global furniture market, it is necessary to clarify what is implied by the term “wooden furniture value chain”. The term “value chain” in its simplest form, refers to the links, interactions and full range of activities required to bring a product from conception, through the different phases of production (involving a combination of physical transformation and the input of various producer services), delivery to final consumers, and final disposal after use (Kaplinsky et al, 2001). The wooden furniture value chain (see Figure 3), specifically, consists of activities, links and interactions spanning the forestry, saw-milling, manufacturing and service sectors and involves, among others, the following:
• Provision of seed inputs, chemicals, equipment and water for the forestry sector;
• Processing and movement of sawn logs through the sawmill sector which obtains its primary inputs from the machinery sector;
• Transformation of sawn board into furniture products by furniture manufacturers who, in turn, obtain inputs from the machinery, adhesives and paint industries, and design and branding skills from the service sector;
• Depending on which market is served, the movement of furniture through various intermediary stages until it reaches the final customer, who after use, consigns the furniture for recycling (Kaplinsky et al, 2001).
In the sections which follow, the exploration of upgrading and exporting begins with a discussion of some key sector and trade macro-data. Included in that discussion is an attempt to ascertain what macro-level data trends suggest about upgrading among export-oriented South African wooden furniture manufacturers. Following directly thereafter is a detailed discussion of firm-level data and a presentation of some key issues and policy considerations based on the trends emerging from this study.
DEPARTMENT OF TRADE AND INDUSTRY POLICY SUPPORT PROGRAMME PROGRAMME MANAGEMENT UNIT
12
Figure 3 : The Wooden Furniture Value Chain (Source: Kaplinsky, Morris & Readman: 2001)
Forestry
Sawmills Machinery, technology
Water Machinery Seeds
Chemicals
Furniture manufacturers
Design Logistics,
quality advice
Machinery, technology
Paint, adhesives, etc. Buyers
Domestic wholesale
Foreign wholesale
Domestic retail Foreign retail
Consumers
Recycling
DEPARTMENT OF TRADE AND INDUSTRY POLICY SUPPORT PROGRAMME PROGRAMME MANAGEMENT UNIT
13
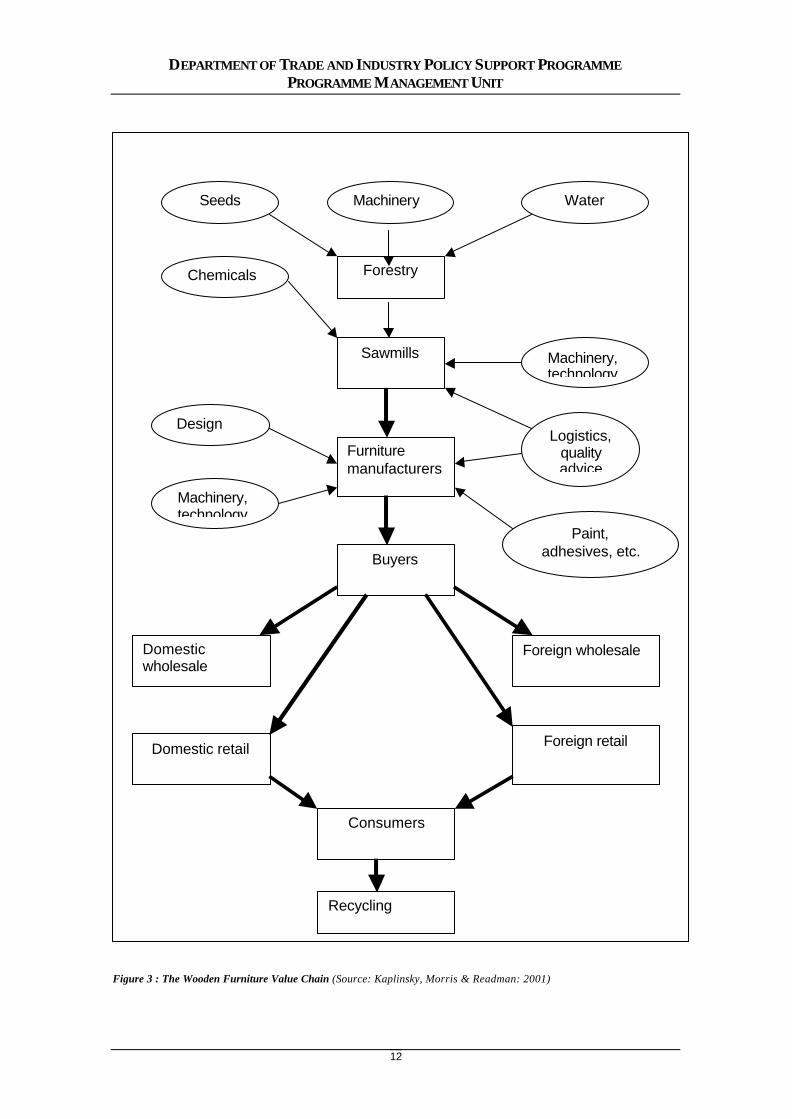
3. SECTOR AND TRADE DATA Section 3 discusses the performance of the local wooden furniture sector based on data sourced from the Department of Trade and Industry (“DTI”), Trade and Industrial Policy Secretariat (“TIPS”), Industria l Development Corporation (“IDC”), South African Reserve Bank, and Eurostat. 3.1. Sales Furniture sector sales were static over the decade, rising in the post-transition boom, but falling back thereafter to 1994 levels.
Value of sales R 000 (constant 2000 prices)
1,000,0001,200,0001,400,0001,600,0001,800,0002,000,0002,200,0002,400,000
1993 1994 1995 1996 1997 1998 1999 2000 2001
Year
Sal
es
Furniture Wood products
Figure 4: Value of Sales for Furniture and Wood Sectors (Source: DTI)
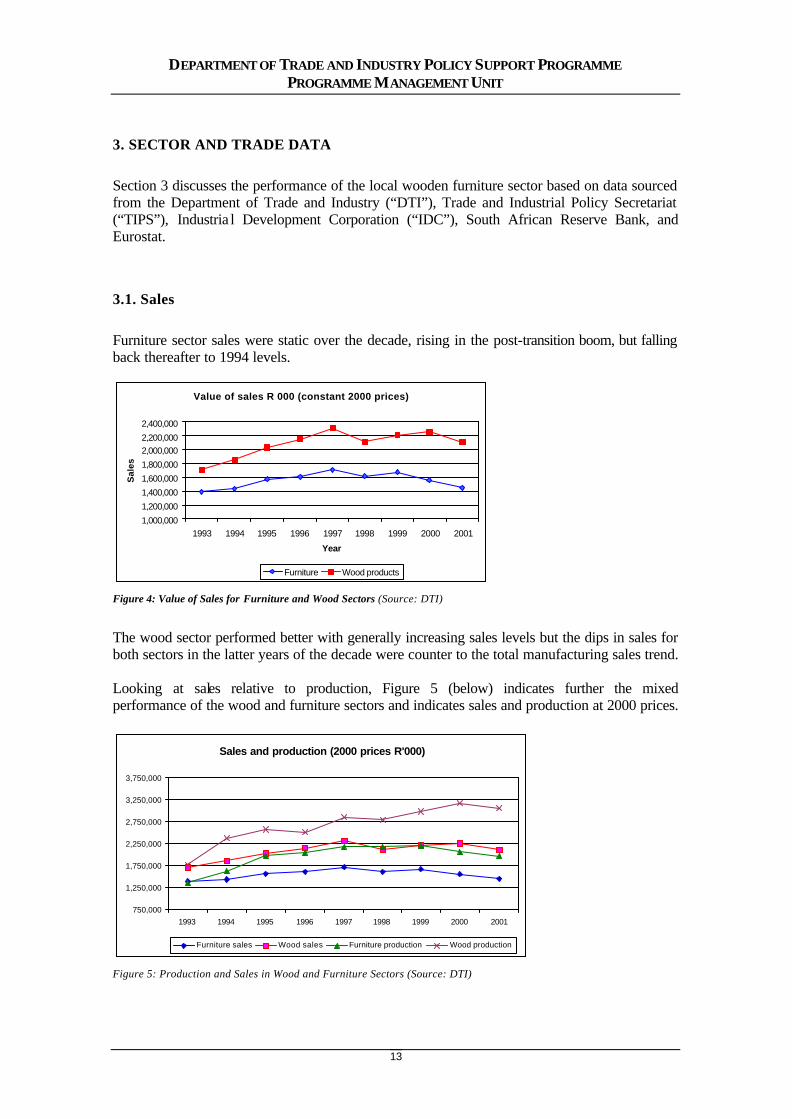
The wood sector performed better with generally increasing sales levels but the dips in sales for both sectors in the latter years of the decade were counter to the total manufacturing sales trend. Looking at sales relative to production, Figure 5 (below) indicates further the mixed performance of the wood and furniture sectors and indicates sales and production at 2000 prices.
Sales and production (2000 prices R'000)
750,000
1,250,000
1,750,000
2,250,000
2,750,000
3,250,000
3,750,000
1993 1994 1995 1996 1997 1998 1999 2000 2001
Furniture sales Wood sales Furniture production Wood production
Figure 5: Production and Sales in Wood and Furniture Sectors (Source: DTI)
DEPARTMENT OF TRADE AND INDUSTRY POLICY SUPPORT PROGRAMME PROGRAMME MANAGEMENT UNIT
14
Between 1993 and 2001, there was a 5% annual average growth in production in the furniture sector but a –3% annual average decline between 1998 and 2001 and 0% growth between 1995 and 2001. This production decline in furniture co-exists alongside some significant data on employment shedding by the sector.
3.2. Employment
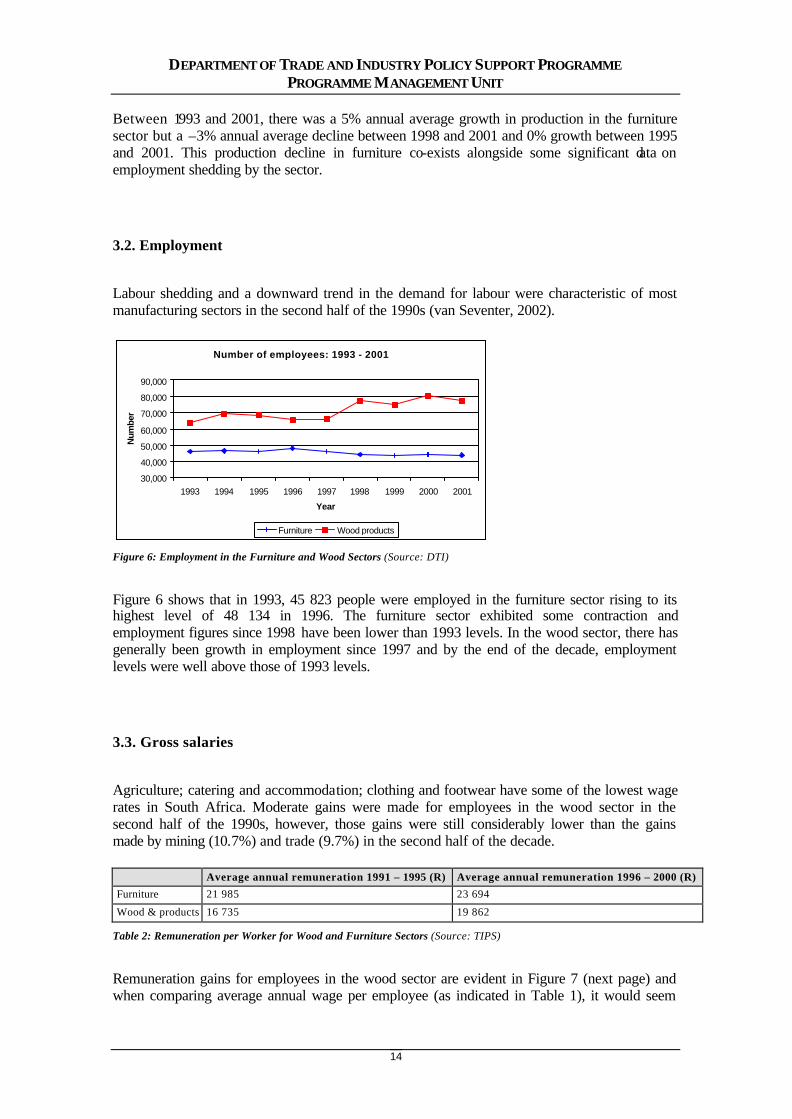
Labour shedding and a downward trend in the demand for labour were characteristic of most manufacturing sectors in the second half of the 1990s (van Seventer, 2002).
Number of employees: 1993 - 2001
30,000
40,000
50,000
60,000
70,000
80,000
90,000
1993 1994 1995 1996 1997 1998 1999 2000 2001
Year
Num
ber
Furniture Wood products
Figure 6: Employment in the Furniture and Wood Sectors (Source: DTI)
Figure 6 shows that in 1993, 45 823 people were employed in the furniture sector rising to its highest level of 48 134 in 1996. The furniture sector exhibited some contraction and employment figures since 1998 have been lower than 1993 levels. In the wood sector, there has generally been growth in employment since 1997 and by the end of the decade, employment levels were well above those of 1993 levels.
3.3. Gross salaries
Agriculture; catering and accommodation; clothing and footwear have some of the lowest wage rates in South Africa. Moderate gains were made for employees in the wood sector in the second half of the 1990s, however, those gains were still considerably lower than the gains made by mining (10.7%) and trade (9.7%) in the second half of the decade. Average annual remuneration 1991 – 1995 (R) Average annual remuneration 1996 – 2000 (R)
Furniture 21 985 23 694
Wood & products 16 735 19 862
Table 2: Remuneration per Worker for Wood and Furniture Sectors (Source: TIPS)
Remuneration gains for employees in the wood sector are evident in Figure 7 (next page) and when comparing average annual wage per employee (as indicated in Table 1), it would seem
DEPARTMENT OF TRADE AND INDUSTRY POLICY SUPPORT PROGRAMME PROGRAMME MANAGEMENT UNIT
15
that workers in the forestry and saw milling sectors “generally [do] enjoy better conditions than their counterparts in agriculture, but they are not as good as in manufacturing” (DWAF, 1997).
Gross salaries R 000 (constant 2000 prices)
250,000
300,000
350,000
400,000
450,000
500,000
550,000
1993 1994 1995 1996 1997 1998 1999 2000 2001
Year
R '0
00
Furniture Wood products
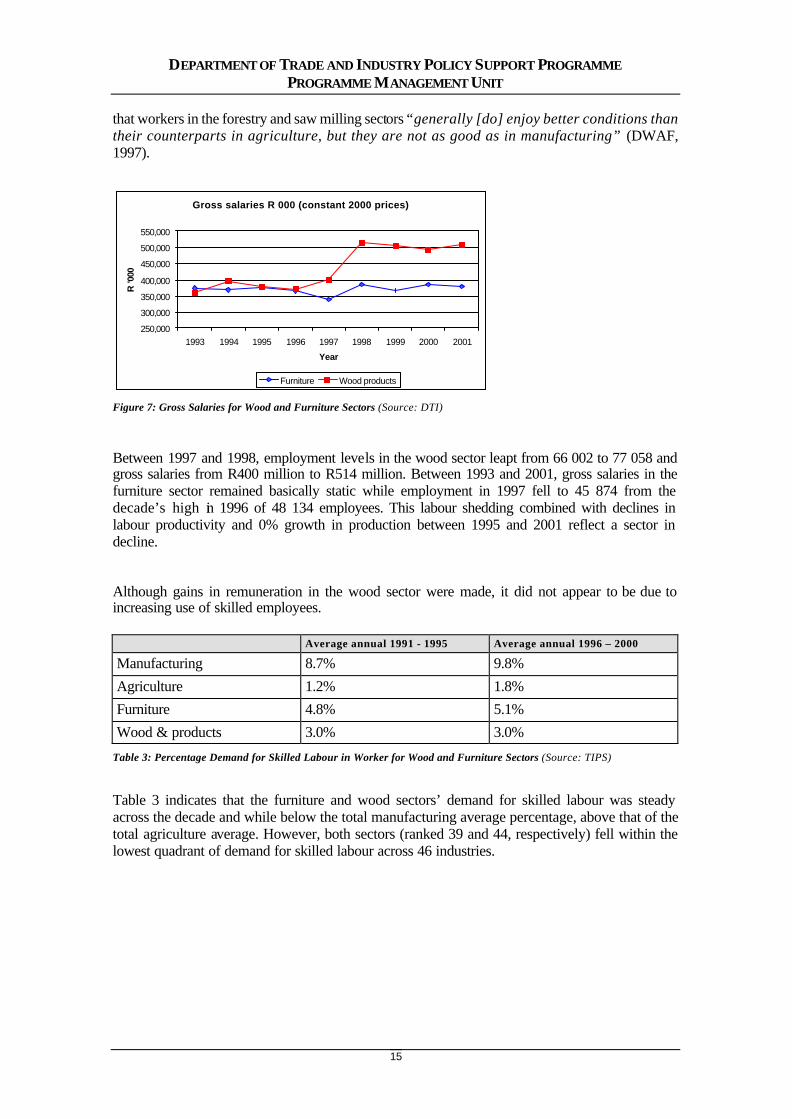
Figure 7: Gross Salaries for Wood and Furniture Sectors (Source: DTI)
Between 1997 and 1998, employment levels in the wood sector leapt from 66 002 to 77 058 and gross salaries from R400 million to R514 million. Between 1993 and 2001, gross salaries in the furniture sector remained basically static while employment in 1997 fell to 45 874 from the decade’s high in 1996 of 48 134 employees. This labour shedding combined with declines in labour productivity and 0% growth in production between 1995 and 2001 reflect a sector in decline.
Although gains in remuneration in the wood sector were made, it did not appear to be due to increasing use of skilled employees. Average annual 1991 - 1995 Average annual 1996 – 2000
Manufacturing 8.7% 9.8% Agriculture 1.2% 1.8% Furniture 4.8% 5.1% Wood & products 3.0% 3.0%
Table 3: Percentage Demand for Skilled Labour in Worker for Wood and Furniture Sectors (Source: TIPS)
Table 3 indicates that the furniture and wood sectors’ demand for skilled labour was steady across the decade and while below the total manufacturing average percentage, above that of the total agriculture average. However, both sectors (ranked 39 and 44, respectively) fell within the lowest quadrant of demand for skilled labour across 46 industries.
DEPARTMENT OF TRADE AND INDUSTRY POLICY SUPPORT PROGRAMME PROGRAMME MANAGEMENT UNIT
16
3.4. Trade
In the second half of the 1990s, the manufacturing sector’s contribution towards exports leapt from 39% to 51%. At a detailed level, the wood sector had the third highest weighted average annual growth rate trailing motor vehicles and parts and television (“TV”) and communication equipment.
Furniture: Exports, imports and trade balance (constant prices, 2000)
-1000
100200300400500600700800
1993 1994 1995 1996 1997 1998 1999 2000 2001
Rm
Exports Imports Trade balance
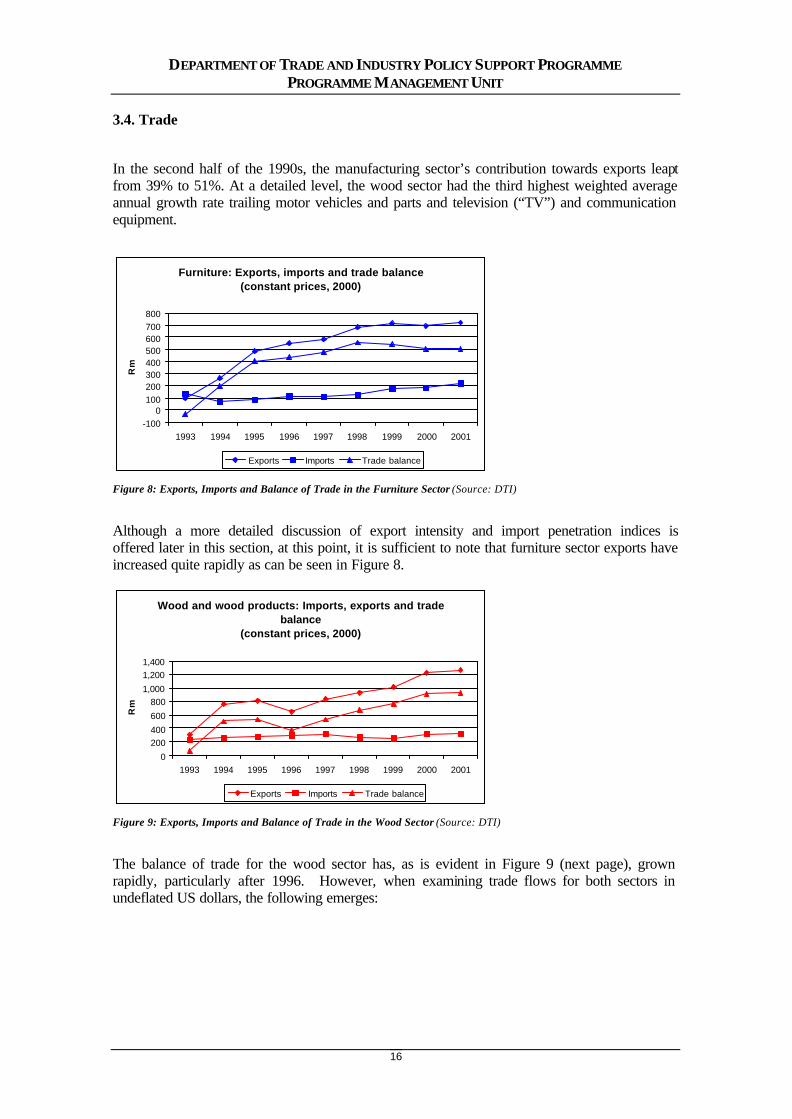
Figure 8: Exports, Imports and Balance of Trade in the Furniture Sector (Source: DTI)
Although a more detailed discussion of export intensity and import penetration indices is offered later in this section, at this point, it is sufficient to note that furniture sector exports have increased quite rapidly as can be seen in Figure 8.
Wood and wood products: Imports, exports and trade balance
(constant prices, 2000)
0200400600800
1,0001,2001,400
1993 1994 1995 1996 1997 1998 1999 2000 2001
Rm
Exports Imports Trade balance
Figure 9: Exports, Imports and Balance of Trade in the Wood Sector (Source: DTI)
The balance of trade for the wood sector has, as is evident in Figure 9 (next page), grown rapidly, particularly after 1996. However, when examining trade flows for both sectors in undeflated US dollars, the following emerges:
DEPARTMENT OF TRADE AND INDUSTRY POLICY SUPPORT PROGRAMME PROGRAMME MANAGEMENT UNIT
17
Trade Flows: Current Prices (US $)
0
50
100
150
200
1993 1994 1995 1996 1997 1998 1999 2000 2001
Wood exports Wood imports
Furniture exports Furniture imports
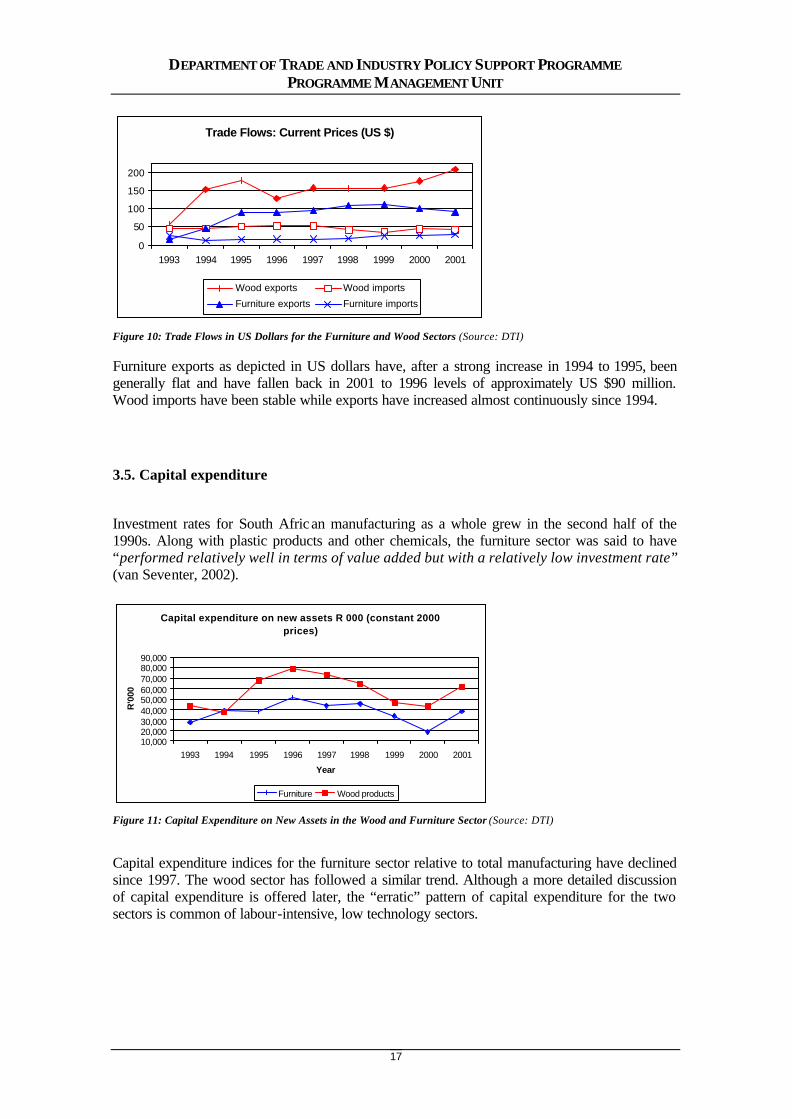
Figure 10: Trade Flows in US Dollars for the Furniture and Wood Sectors (Source: DTI)
Furniture exports as depicted in US dollars have, after a strong increase in 1994 to 1995, been generally flat and have fallen back in 2001 to 1996 levels of approximately US $90 million. Wood imports have been stable while exports have increased almost continuously since 1994.
3.5. Capital expenditure
Investment rates for South African manufacturing as a whole grew in the second half of the 1990s. Along with plastic products and other chemicals, the furniture sector was said to have “performed relatively well in terms of value added but with a relatively low investment rate” (van Seventer, 2002).
Capital expenditure on new assets R 000 (constant 2000 prices)
10,00020,00030,00040,00050,00060,00070,00080,00090,000
1993 1994 1995 1996 1997 1998 1999 2000 2001
Year
R'0
00
Furniture Wood products
Figure 11: Capital Expenditure on New Assets in the Wood and Furniture Sector (Source: DTI)
Capital expenditure indices for the furniture sector relative to total manufacturing have declined since 1997. The wood sector has followed a similar trend. Although a more detailed discussion of capital expenditure is offered later, the “erratic” pattern of capital expenditure for the two sectors is common of labour-intensive, low technology sectors.

DEPARTMENT OF TRADE AND INDUSTRY POLICY SUPPORT PROGRAMME PROGRAMME MANAGEMENT UNIT
18
3.6. Productivity
Productivity data provide an indication of the extent of efficiencies and investment within a sector. In a scenario where value addition increases but labour demand decreases, gains in labour productivity improvement are thought to be a possible explanation (van Seventer, 2002). Across all sectors, labour productivity in the second half of the 1990s rose by 3.9%, while manufacturing and agriculture rose at 3.7% and 2.7%, respectively.
According to TIPS data, labour productivity in the wood and furniture sectors was less than spectacular. The wood sector exhibited a decline in labour productivity and furniture was generally unchanged. Both sectors’ labour productivity, however, remained very low as is indicated by the rankings included in Table 4.
1991-1995 rank 1991-1995 average 1996-2000 average
Furniture 36 -0.1% 0.3%
Wood & products 26 2.1% -0.5%
Table 4: Labour Productivity for Wood and Furniture Sectors (Source: TIPS)
Figure 12 below indicates labour productivity indices for both sectors using TIPS data.
Labour productivity Indices (1993=100)
50
60
70
80
90
100
110
120
130
140
1993 1994 1995 1996 1997 1998 1999 2000 2001
Furniture Wood Manufacturing
Figure 12: Labour Productivity in the Wood and Furniture Sectors (Source: TIPS)
The decline and plateau in labour productivity in the furniture sector is clearly evident in Figure 12 and the sector ended the decade with levels much lower than 1993 levels. Labour productivity in the wood sector has been generally more stable. Interestingly, this co-exists with an increase in employment levels (i.e. 1998 = 77 058) and in gross salaries (i.e. 1998 = R514 241 000) but with a very low demand for skilled labour. Before considering what this means, it is necessary to examine capital productivity indices for the two sectors relative to the total manufacturing industry (Figure 13, next page).
DEPARTMENT OF TRADE AND INDUSTRY POLICY SUPPORT PROGRAMME PROGRAMME MANAGEMENT UNIT
19
Capital productivity indices (1993=100)
30405060708090
100110120130
1990 1991 1992 1993 1994 1995 1996 1997 1998 1999 2000 2001
Manufacturing Wood Furniture
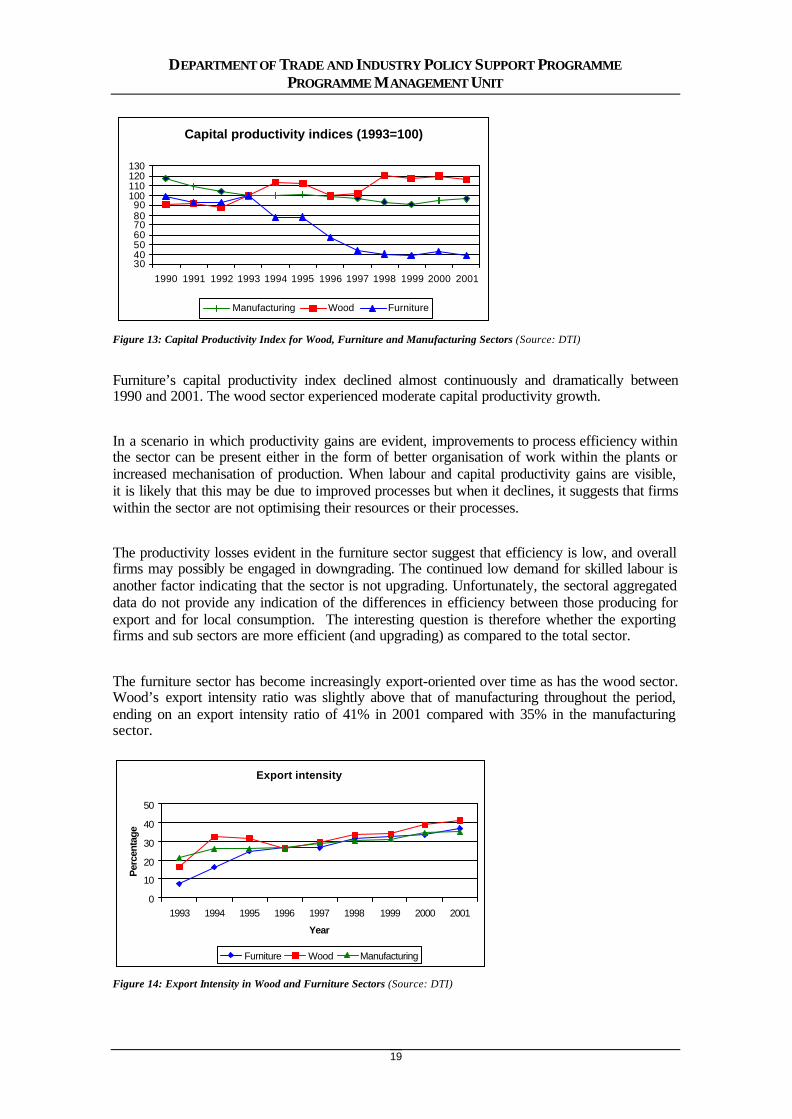
Figure 13: Capital Productivity Index for Wood, Furniture and Manufacturing Sectors (Source: DTI)
Furniture’s capital productivity index declined almost continuously and dramatically between 1990 and 2001. The wood sector experienced moderate capital productivity growth. In a scenario in which productivity gains are evident, improvements to process efficiency within the sector can be present either in the form of better organisation of work within the plants or increased mechanisation of production. When labour and capital productivity gains are visible, it is likely that this may be due to improved processes but when it declines, it suggests that firms within the sector are not optimising their resources or their processes. The productivity losses evident in the furniture sector suggest that efficiency is low, and overall firms may possibly be engaged in downgrading. The continued low demand for skilled labour is another factor indicating that the sector is not upgrading. Unfortunately, the sectoral aggregated data do not provide any indication of the differences in efficiency between those producing for export and for local consumption. The interesting question is therefore whether the exporting firms and sub sectors are more efficient (and upgrading) as compared to the total sector. The furniture sector has become increasingly export-oriented over time as has the wood sector. Wood’s export intensity ratio was slightly above that of manufacturing throughout the period, ending on an export intensity ratio of 41% in 2001 compared with 35% in the manufacturing sector.
Export intensity
0
10
20
30
40
50
1993 1994 1995 1996 1997 1998 1999 2000 2001
Year
Per
cent
age
Furniture Wood Manufacturing
Figure 14: Export Intensity in Wood and Furniture Sectors (Source: DTI)
DEPARTMENT OF TRADE AND INDUSTRY POLICY SUPPORT PROGRAMME PROGRAMME MANAGEMENT UNIT
20
Export intensity for furniture, at 37% in 2001, while increasing is also a sector with increasing import levels. For that reason, it is important to examine import penetration within the sector. Lowered trade tariffs and liberalisation are said to “make export oriented industries more competitive in terms of imported intermediates, although local suppliers may be pushed out of the market, resulting in job losses” (van Seventer, 2002, 12). Noting this, it is interesting to consider import penetration levels:
Import penetration
05
10152025303540
1993 1994 1995 1996 1997 1998 1999 2000 2001
Percentage
Yea
r
Furniture Wood Manufacturing
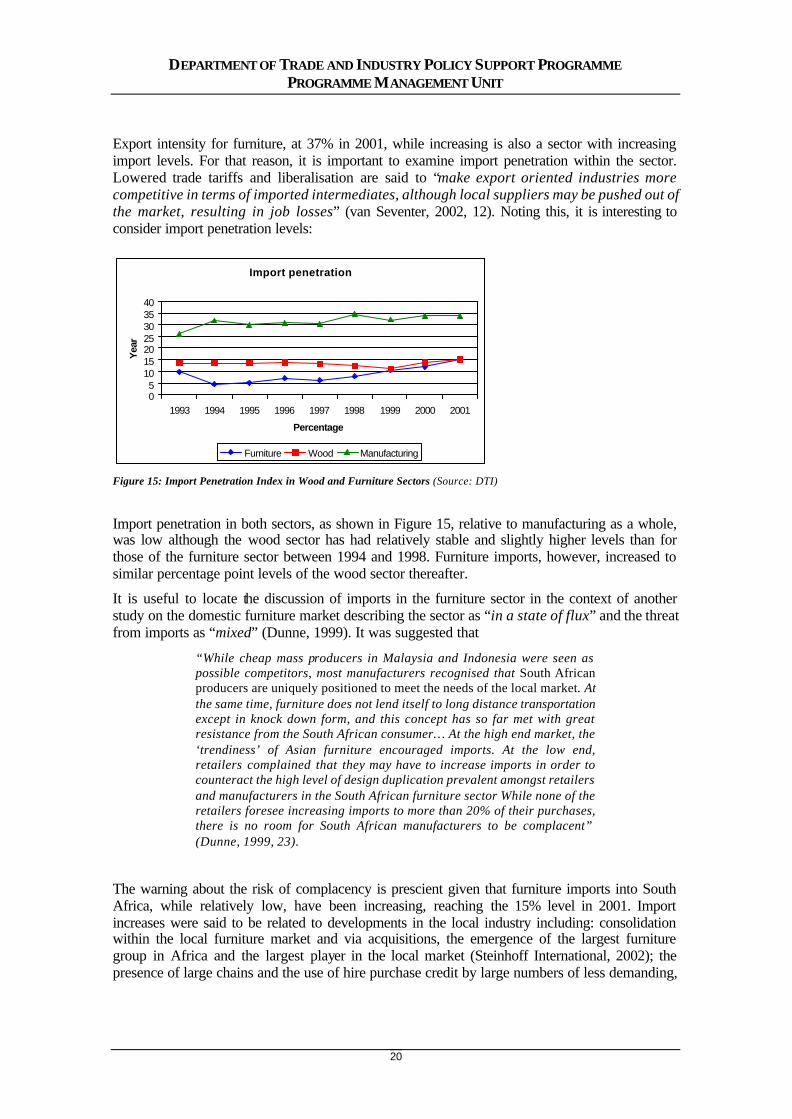
Figure 15: Import Penetration Index in Wood and Furniture Sectors (Source: DTI)
Import penetration in both sectors, as shown in Figure 15, relative to manufacturing as a whole, was low although the wood sector has had relatively stable and slightly higher levels than for those of the furniture sector between 1994 and 1998. Furniture imports, however, increased to similar percentage point levels of the wood sector thereafter.
It is useful to locate the discussion of imports in the furniture sector in the context of another study on the domestic furniture market describing the sector as “in a state of flux” and the threat from imports as “mixed” (Dunne, 1999). It was suggested that
“While cheap mass producers in Malaysia and Indonesia were seen as possible competitors, most manufacturers recognised that South African producers are uniquely positioned to meet the needs of the local market. At the same time, furniture does not lend itself to long distance transportation except in knock down form, and this concept has so far met with great resistance from the South African consumer… At the high end market, the ‘trendiness’ of Asian furniture encouraged imports. At the low end, retailers complained that they may have to increase imports in order to counteract the high level of design duplication prevalent amongst retailers and manufacturers in the South African furniture sector While none of the retailers foresee increasing imports to more than 20% of their purchases, there is no room for South African manufacturers to be complacent” (Dunne, 1999, 23).
The warning about the risk of complacency is prescient given that furniture imports into South Africa, while relatively low, have been increasing, reaching the 15% level in 2001. Import increases were said to be related to developments in the local industry including: consolidation within the local furniture market and via acquisitions, the emergence of the largest furniture group in Africa and the largest player in the local market (Steinhoff International, 2002); the presence of large chains and the use of hire purchase credit by large numbers of less demanding,
DEPARTMENT OF TRADE AND INDUSTRY POLICY SUPPORT PROGRAMME PROGRAMME MANAGEMENT UNIT
21
local consumers who purchase at the lower and middle end of the market are additional contributing factors (Dunne, 1999).
However, the increases in imports need to be considered from the perspective of value addition by local manufacturers.
Value added indices (1993=100)
30
50
7090
110
130
150
1993 1994 1995 1996 1997 1998 1999 2000 2001
Furniture Wood Manufacturing
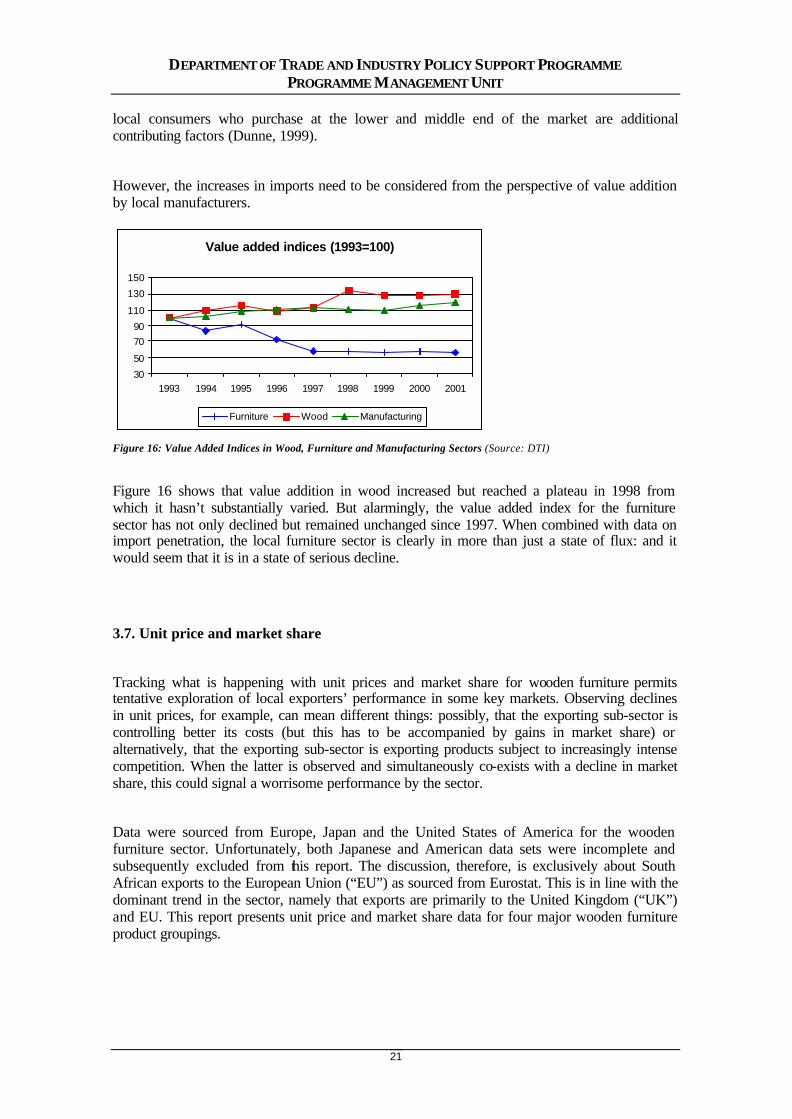
Figure 16: Value Added Indices in Wood, Furniture and Manufacturing Sectors (Source: DTI)
Figure 16 shows that value addition in wood increased but reached a plateau in 1998 from which it hasn’t substantially varied. But alarmingly, the value added index for the furniture sector has not only declined but remained unchanged since 1997. When combined with data on import penetration, the local furniture sector is clearly in more than just a state of flux: and it would seem that it is in a state of serious decline.
3.7. Unit price and market share
Tracking what is happening with unit prices and market share for wooden furniture permits tentative exploration of local exporters’ performance in some key markets. Observing declines in unit prices, for example, can mean different things: possibly, that the exporting sub-sector is controlling better its costs (but this has to be accompanied by gains in market share) or alternatively, that the exporting sub-sector is exporting products subject to increasingly intense competition. When the latter is observed and simultaneously co-exists with a decline in market share, this could signal a worrisome performance by the sector.
Data were sourced from Europe, Japan and the United States of America for the wooden furniture sector. Unfortunately, both Japanese and American data sets were incomplete and subsequently excluded from this report. The discussion, therefore, is exclusively about South African exports to the European Union (“EU”) as sourced from Eurostat. This is in line with the dominant trend in the sector, namely that exports are primarily to the United Kingdom (“UK”) and EU. This report presents unit price and market share data for four major wooden furniture product groupings.
DEPARTMENT OF TRADE AND INDUSTRY POLICY SUPPORT PROGRAMME PROGRAMME MANAGEMENT UNIT
22
3.7.1. Office wooden furniture
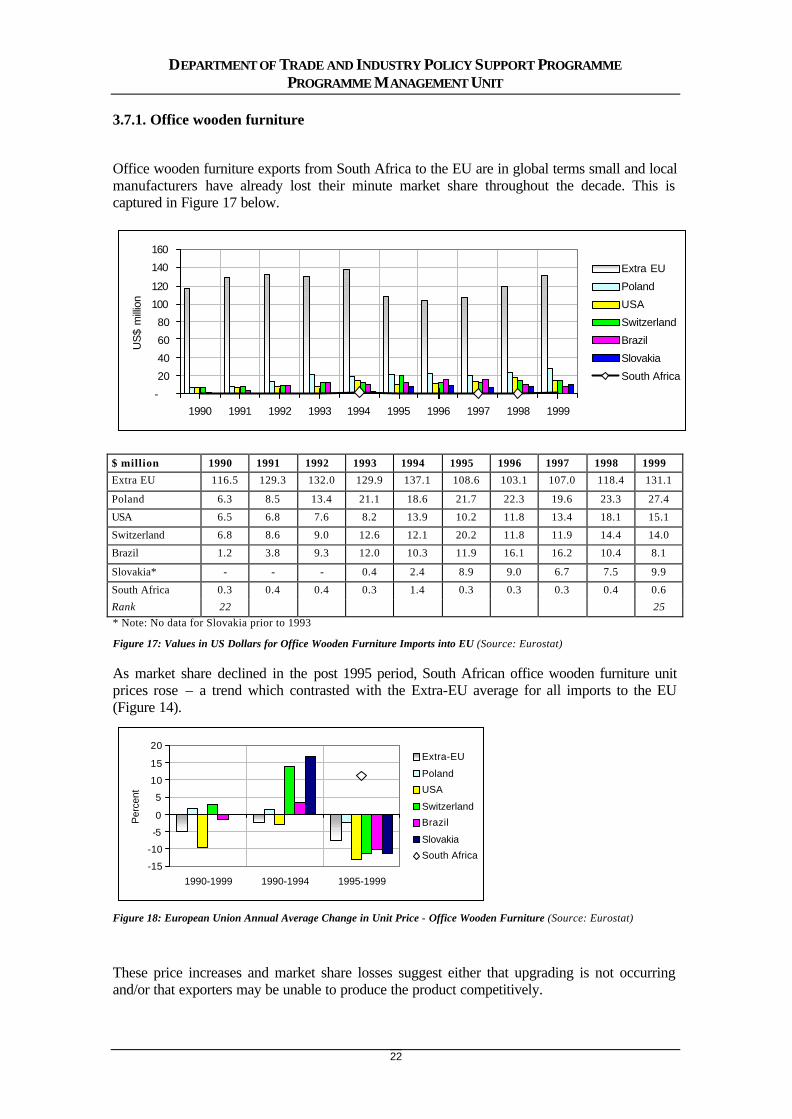
Office wooden furniture exports from South Africa to the EU are in global terms small and local manufacturers have already lost their minute market share throughout the decade. This is captured in Figure 17 below.
-
20
40
60
80
100
120
140
160
1990 1991 1992 1993 1994 1995 1996 1997 1998 1999
US
$ m
illion
Extra EU
Poland
USA
Switzerland
Brazil
Slovakia
South Africa
$ million 1990 1991 1992 1993 1994 1995 1996 1997 1998 1999
Extra EU 116.5 129.3 132.0 129.9 137.1 108.6 103.1 107.0 118.4 131.1
Poland 6.3 8.5 13.4 21.1 18.6 21.7 22.3 19.6 23.3 27.4
USA 6.5 6.8 7.6 8.2 13.9 10.2 11.8 13.4 18.1 15.1
Switzerland 6.8 8.6 9.0 12.6 12.1 20.2 11.8 11.9 14.4 14.0
Brazil 1.2 3.8 9.3 12.0 10.3 11.9 16.1 16.2 10.4 8.1
Slovakia* - - - 0.4 2.4 8.9 9.0 6.7 7.5 9.9
South Africa 0.3 0.4 0.4 0.3 1.4 0.3 0.3 0.3 0.4 0.6 Rank 22 25
* Note: No data for Slovakia prior to 1993
Figure 17: Values in US Dollars for Office Wooden Furniture Imports into EU (Source: Eurostat)
As market share declined in the post 1995 period, South African office wooden furniture unit prices rose – a trend which contrasted with the Extra-EU average for all imports to the EU (Figure 14).
-15
-10
-5
0
5
10
15
20
1990-1999 1990-1994 1995-1999
Per
cent
Extra-EU
Poland
USA
Switzerland
Brazil
Slovakia
South Africa
Figure 18: European Union Annual Average Change in Unit Price - Office Wooden Furniture (Source: Eurostat)
These price increases and market share losses suggest either that upgrading is not occurring and/or that exporters may be unable to produce the product competitively.
DEPARTMENT OF TRADE AND INDUSTRY POLICY SUPPORT PROGRAMME PROGRAMME MANAGEMENT UNIT
23
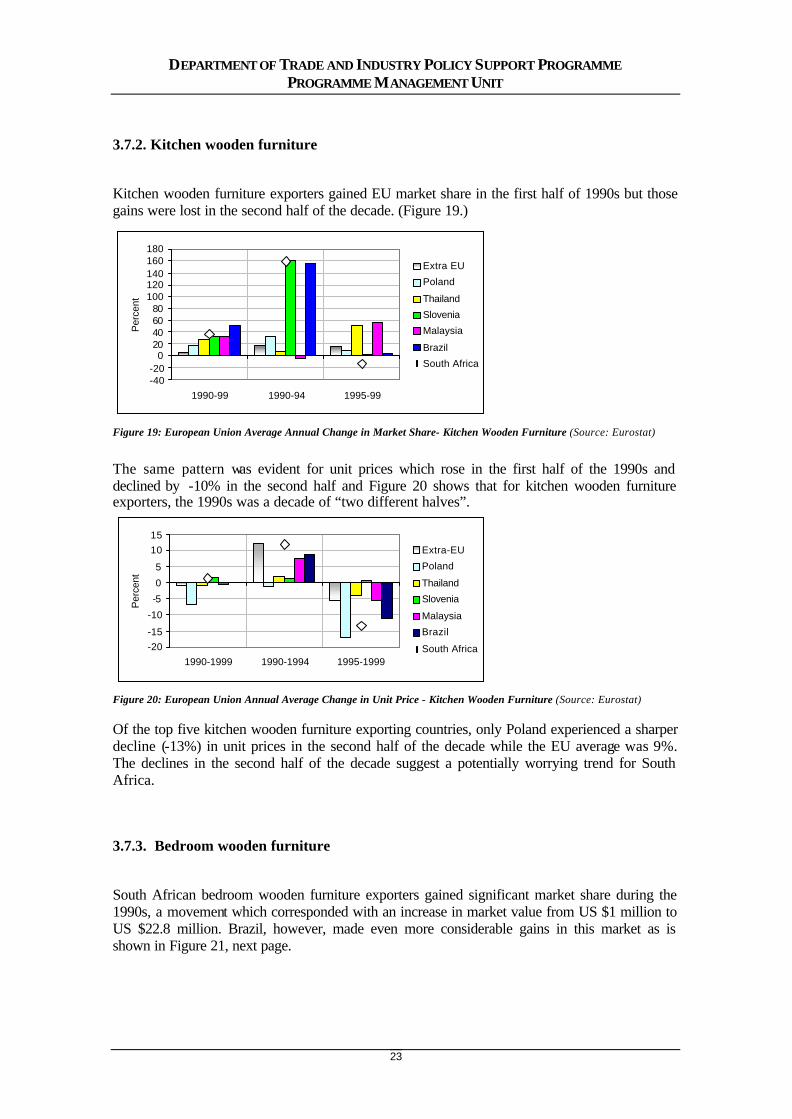
3.7.2. Kitchen wooden furniture
Kitchen wooden furniture exporters gained EU market share in the first half of 1990s but those gains were lost in the second half of the decade. (Figure 19.)
-40-20
020406080
100120140160180
1990-99 1990-94 1995-99
Per
cent
Extra EU
Poland
Thailand
Slovenia
Malaysia
Brazil
South Africa
Figure 19: European Union Average Annual Change in Market Share- Kitchen Wooden Furniture (Source: Eurostat)
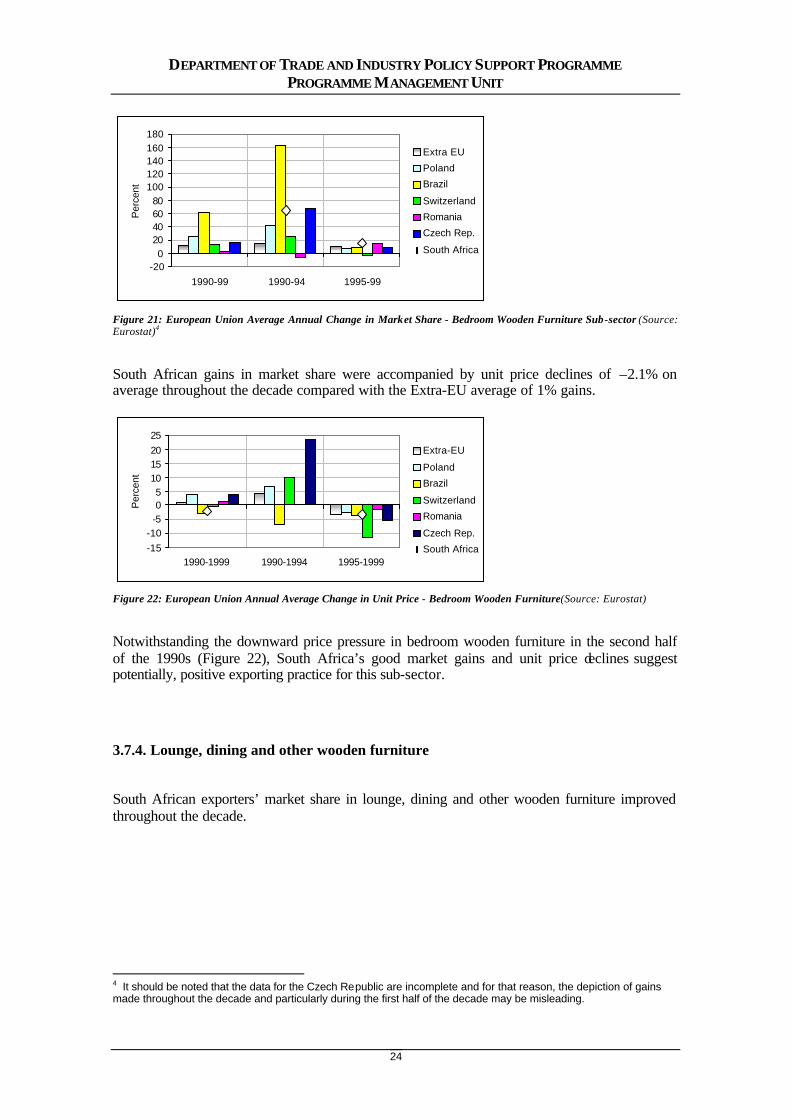
The same pattern was evident for unit prices which rose in the first half of the 1990s and declined by -10% in the second half and Figure 20 shows that for kitchen wooden furniture exporters, the 1990s was a decade of “two different halves”.
-20-15
-10
-5
0
5
1015
1990-1999 1990-1994 1995-1999
Per
cent
Extra-EU
Poland
Thailand
Slovenia
Malaysia
Brazil
South Africa
Figure 20: European Union Annual Average Change in Unit Price - Kitchen Wooden Furniture (Source: Eurostat)
Of the top five kitchen wooden furniture exporting countries, only Poland experienced a sharper decline (-13%) in unit prices in the second half of the decade while the EU average was 9%. The declines in the second half of the decade suggest a potentially worrying trend for South Africa.
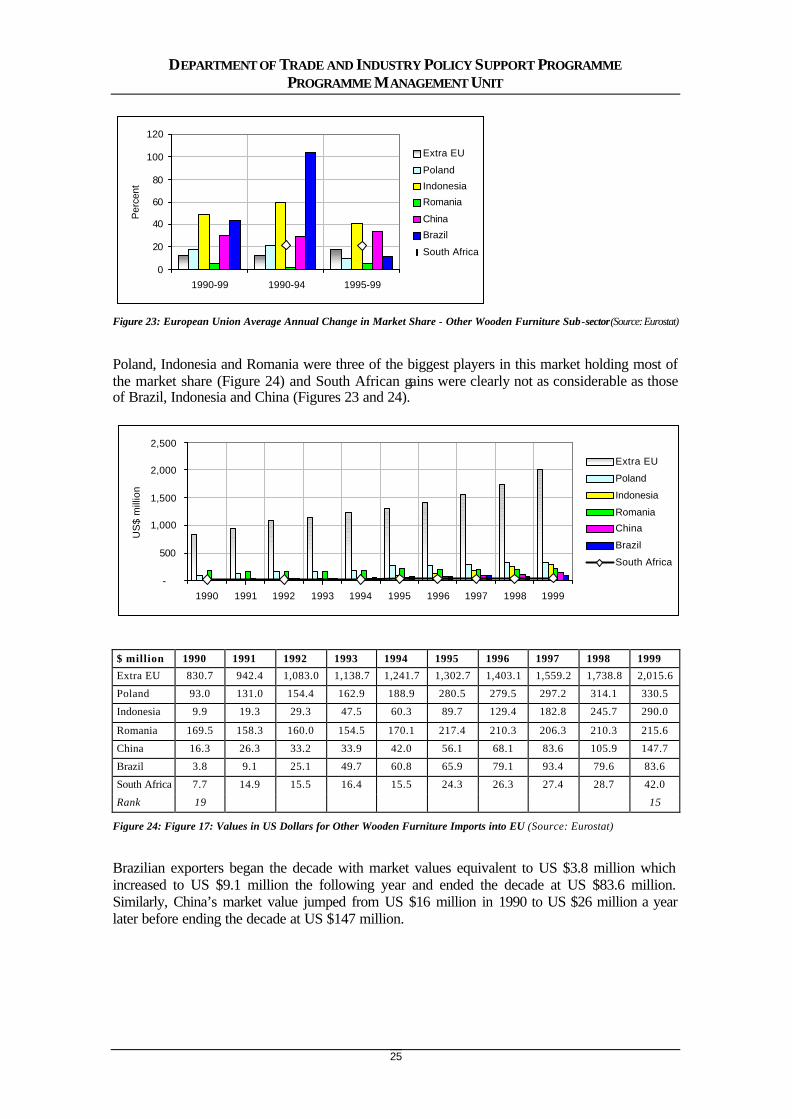
3.7.3. Bedroom wooden furniture
South African bedroom wooden furniture exporters gained significant market share during the 1990s, a movement which corresponded with an increase in market value from US $1 million to US $22.8 million. Brazil, however, made even more considerable gains in this market as is shown in Figure 21, next page.
DEPARTMENT OF TRADE AND INDUSTRY POLICY SUPPORT PROGRAMME PROGRAMME MANAGEMENT UNIT
24
-200
20406080
100120140160180
1990-99 1990-94 1995-99
Per
cent
Extra EU
Poland
Brazil
Switzerland
Romania
Czech Rep.
South Africa
Figure 21: European Union Average Annual Change in Market Share - Bedroom Wooden Furniture Sub-sector (Source: Eurostat)4
South African gains in market share were accompanied by unit price declines of –2.1% on average throughout the decade compared with the Extra-EU average of 1% gains.
-15-10
-505
10152025
1990-1999 1990-1994 1995-1999
Per
cent
Extra-EU
Poland
Brazil
Switzerland
Romania
Czech Rep.
South Africa
Figure 22: European Union Annual Average Change in Unit Price - Bedroom Wooden Furniture(Source: Eurostat)
Notwithstanding the downward price pressure in bedroom wooden furniture in the second half of the 1990s (Figure 22), South Africa’s good market gains and unit price declines suggest potentially, positive exporting practice for this sub-sector.
3.7.4. Lounge, dining and other wooden furniture
South African exporters’ market share in lounge, dining and other wooden furniture improved throughout the decade.
4 It should be noted that the data for the Czech Republic are incomplete and for that reason, the depiction of gains made throughout the decade and particularly during the first half of the decade may be misleading.
DEPARTMENT OF TRADE AND INDUSTRY POLICY SUPPORT PROGRAMME PROGRAMME MANAGEMENT UNIT
25
0
20
40
60
80
100
120
1990-99 1990-94 1995-99
Per
cent
Extra EU
Poland
Indonesia
Romania
China
Brazil
South Africa
Figure 23: European Union Average Annual Change in Market Share - Other Wooden Furniture Sub-sector (Source: Eurostat)
Poland, Indonesia and Romania were three of the biggest players in this market holding most of the market share (Figure 24) and South African gains were clearly not as considerable as those of Brazil, Indonesia and China (Figures 23 and 24).
-
500
1,000
1,500
2,000
2,500
1990 1991 1992 1993 1994 1995 1996 1997 1998 1999
US
$ m
illio
n
Extra EU
Poland
Indonesia
Romania
China
Brazil
South Africa
$ million 1990 1991 1992 1993 1994 1995 1996 1997 1998 1999
Extra EU 830.7 942.4 1,083.0 1,138.7 1,241.7 1,302.7 1,403.1 1,559.2 1,738.8 2,015.6
Poland 93.0 131.0 154.4 162.9 188.9 280.5 279.5 297.2 314.1 330.5
Indonesia 9.9 19.3 29.3 47.5 60.3 89.7 129.4 182.8 245.7 290.0
Romania 169.5 158.3 160.0 154.5 170.1 217.4 210.3 206.3 210.3 215.6
China 16.3 26.3 33.2 33.9 42.0 56.1 68.1 83.6 105.9 147.7
Brazil 3.8 9.1 25.1 49.7 60.8 65.9 79.1 93.4 79.6 83.6
South Africa 7.7 14.9 15.5 16.4 15.5 24.3 26.3 27.4 28.7 42.0
Rank 19 15
Figure 24: Figure 17: Values in US Dollars for Other Wooden Furniture Imports into EU (Source: Eurostat)
Brazilian exporters began the decade with market values equivalent to US $3.8 million which increased to US $9.1 million the following year and ended the decade at US $83.6 million. Similarly, China’s market value jumped from US $16 million in 1990 to US $26 million a year later before ending the decade at US $147 million.
DEPARTMENT OF TRADE AND INDUSTRY POLICY SUPPORT PROGRAMME PROGRAMME MANAGEMENT UNIT
26
-8
-6
-4
-2
0
2
4
1990-1999 1990-1994 1995-1999
Per
cent
Extra-EU
Poland
Indonesia
Romania
China
Brazil
South Africa
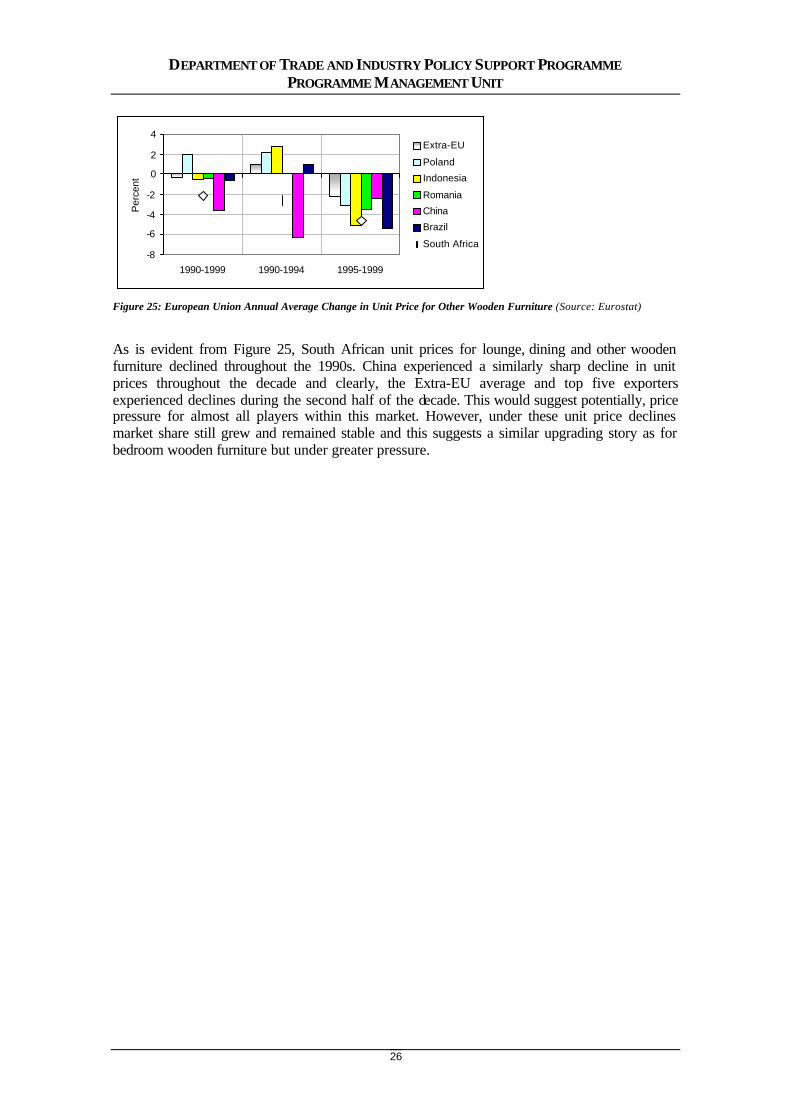
Figure 25: European Union Annual Average Change in Unit Price for Other Wooden Furniture (Source: Eurostat)
As is evident from Figure 25, South African unit prices for lounge, dining and other wooden furniture declined throughout the 1990s. China experienced a similarly sharp decline in unit prices throughout the decade and clearly, the Extra-EU average and top five exporters experienced declines during the second half of the decade. This would suggest potentially, price pressure for almost all players within this market. However, under these unit price declines market share still grew and remained stable and this suggests a similar upgrading story as for bedroom wooden furniture but under greater pressure.
DEPARTMENT OF TRADE AND INDUSTRY POLICY SUPPORT PROGRAMME PROGRAMME MANAGEMENT UNIT
27
4. FIRM DATA
Upgrading is identified commonly as the most viable response to enhancing competitive performance in the global market (Humphrey and Schmitz, 2002), and four possible trajectories are commonly identified, namely:
• Increased efficiency of internal processes such that they are better than those of rivals. This may involve better internal procedures (e.g. reducing stock levels) and improved inter-firm procedures (e.g. more frequent deliveries to customers);
• Introduction of new products or improvement of old products faster than rivals;
• A changed mix of activities conducted within the firm which could be internal to operations (e.g. outsourcing assembly, responsibility for quality) or could involve movement into activities formerly undertaken by other firms in the chain (e.g. responsibility for design); and
• A movement into a new value chain.
The micro-level data presented in Part 4 contribute towards understanding what upgrading is happening within the firms. It is worth noting here that while firms have been, historically, the central focus of studies of innovation and upgrading, value chain analysis shows that a firm-level focus renders only part of the picture and underlies the point that a firm’s efforts to improve its own efficiency may be of little consequence if it is simultaneously embedded in a “sea of inefficiency”. For that reason, and in an attempt to look at upgrading more holistically, this section includes a discussion on value chain governance and coordination as well as policy implications.
4.1. Sample selection
4.1.1. Number of employees
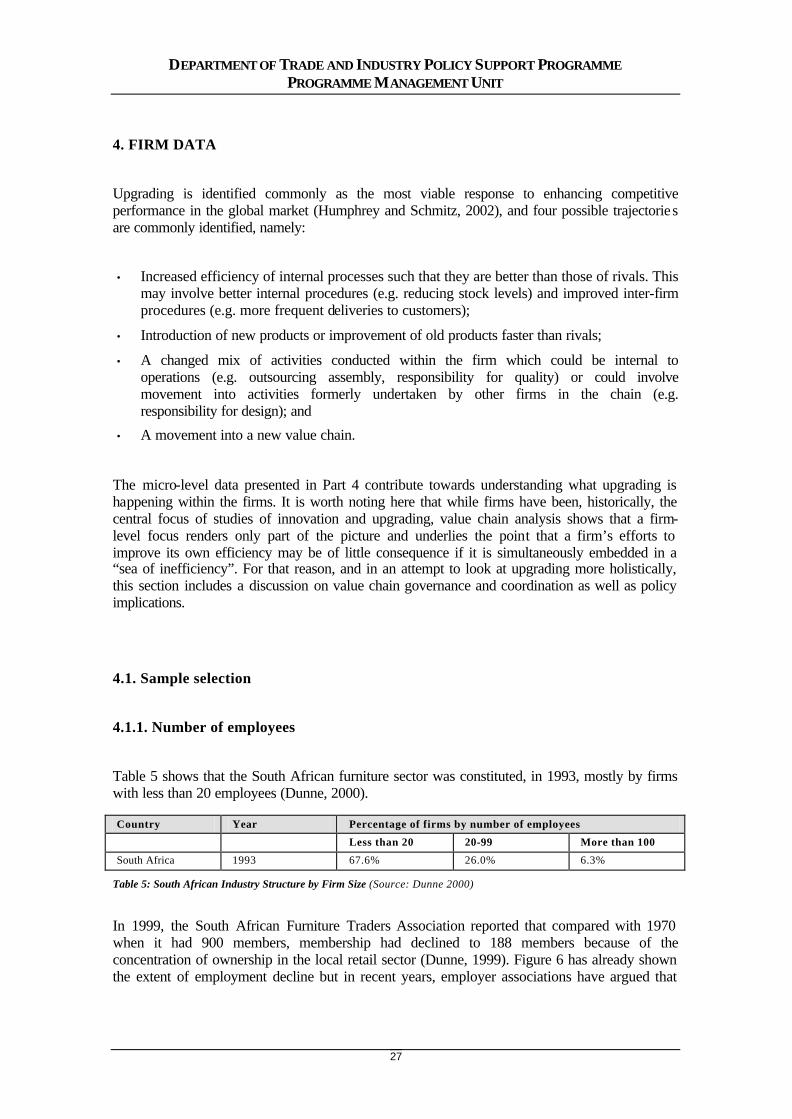
Table 5 shows that the South African furniture sector was constituted, in 1993, mostly by firms with less than 20 employees (Dunne, 2000). Country Year Percentage of firms by number of employees
Less than 20 20-99 More than 100
South Africa 1993 67.6% 26.0% 6.3%
Table 5: South African Industry Structure by Firm Size (Source: Dunne 2000)
In 1999, the South African Furniture Traders Association reported that compared with 1970 when it had 900 members, membership had declined to 188 members because of the concentration of ownership in the local retail sector (Dunne, 1999). Figure 6 has already shown the extent of employment decline but in recent years, employer associations have argued that

DEPARTMENT OF TRADE AND INDUSTRY POLICY SUPPORT PROGRAMME PROGRAMME MANAGEMENT UNIT
28
employment levels have declined even more than official statistics would suggest5. It is alleged that the average number of employees per firm in the sector has dropped from 33 per employer to 13 per employer. In the context of these employment declines, Table 6 indicates the employment levels of participating firms in this study.
Percentage of firms by number of employees
Less than 20 20-99 More than 100 No response - 20% 56% 28%
Table 6: Percentage of Firms by Total Number of Employees
Overwhelmingly, exporting firms had large employee bases as compared to the average for the sector as a whole. On average, the exporting firms interviewed employed 266 employees.
4.1.2. Export intensity
On the dimension of export-orientation, Table 7 shows that half of the firms who responded exported more than two thirds of their output. In an earlier discussion on export intensity (Section 3), it was noted that the furniture sector had a 37% export intensity ratio. The firms participating in this study had, on average, much higher levels of export intensity. Percentage of firms by percentage of output exported Less than 33% 33% to 66% More than 66% No response 12% (21%) 12% (21%) 32% (57%) 44%
Table 7: Percentage of Firms Participating in Study by Percentage of Output Exported
4.1.3. Geographic location
Forty six percent of firms interviewed in this study were based in KwaZulu-Natal compared with 31% from Gauteng and 23% from the Western Cape. These three provinces have been dominant in the local furniture manufacturing sector and it is clear that the study’s sample captures the traditional base of furniture manufacturing.
5 Data from Mike Gibbs report for the Federation of Furniture Manufacturers in South Africa was described by one of the firms participating in this study.
DEPARTMENT OF TRADE AND INDUSTRY POLICY SUPPORT PROGRAMME PROGRAMME MANAGEMENT UNIT
29
4.1.4. Membership of groups
Seven firms (27%) interviewed were companies within the same large, corporate group and two other firms (18%) reported that they were part of other corporate groups.
4.1.5. Markets and products
The firms surveyed during this study provided information about their two most important regions of export. The UK and Ireland was identified by 50% as their most important exporting region while 30% identified Western Europe. Four of the firms exported to two regions while six firms exported to only one region.
Among the interviewed firms, 75% identified the UK and Ireland as their most important export market. Thirteen percent and 4.2% identified North America and countries within Sub-Saharan Africa and Australasia. Firms reported that their second most important region was Western Europe (38%), North America (31%), Australasia (19%) and the United Arab Emirates (6%).
The trend in exporting regions within the sample is clearly towards the UK, Ireland and Western Europe and this is in line with data showing that most SACU exports were directed at European Community member countries (see http://www.tips.org.za). A recent review of South African industrial performance suggested that 32.5% of all South African 2001 exports (at current prices) were exported to the EU followed by 16.2% to SADC and 13% to NAFTA (DTI, 2002).
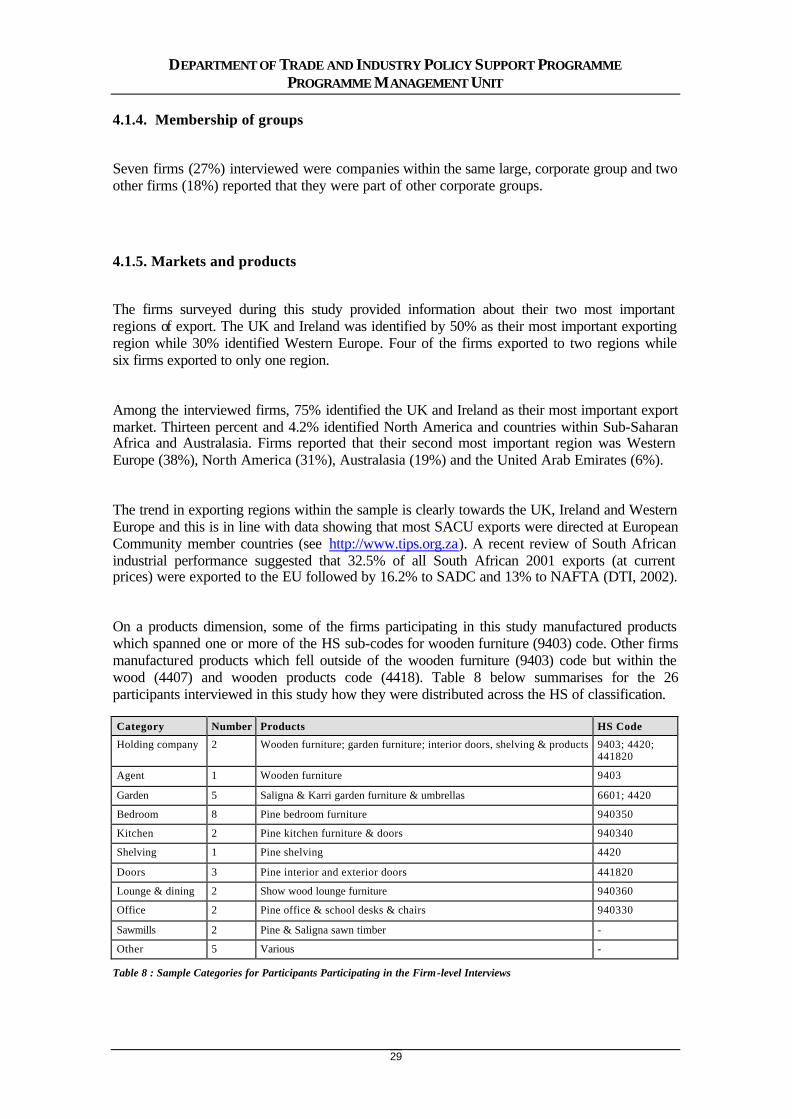
On a products dimension, some of the firms participating in this study manufactured products which spanned one or more of the HS sub-codes for wooden furniture (9403) code. Other firms manufactured products which fell outside of the wooden furniture (9403) code but within the wood (4407) and wooden products code (4418). Table 8 below summarises for the 26 participants interviewed in this study how they were distributed across the HS of classification.
Category Number Products HS Code
Holding company 2 Wooden furniture; garden furniture; interior doors, shelving & products 9403; 4420; 441820
Agent 1 Wooden furniture 9403
Garden 5 Saligna & Karri garden furniture & umbrellas 6601; 4420
Bedroom 8 Pine bedroom furniture 940350
Kitchen 2 Pine kitchen furniture & doors 940340
Shelving 1 Pine shelving 4420
Doors 3 Pine interior and exterior doors 441820
Lounge & dining 2 Show wood lounge furniture 940360
Office 2 Pine office & school desks & chairs 940330
Sawmills 2 Pine & Saligna sawn timber -
Other 5 Various -
Table 8 : Sample Categories for Participants Participating in the Firm-level Interviews
DEPARTMENT OF TRADE AND INDUSTRY POLICY SUPPORT PROGRAMME PROGRAMME MANAGEMENT UNIT
30
4.1.6. Pine and Saligna
Most firms participating in the interviews used pine in the manufacture of their products. One of the holding companies indicated that it used a variety of soft and hardwoods within its group of companies while five firms reported using Saligna; one using Karri (a species of Eucalyptus) and some Saligna (also a species of Eucalyptus); and another using imported hardwoods for its show wood lounge suites and local pine in its upholstered suites.
4.1.7. Garden furniture
The garden and outdoor furniture has traditionally been a major South African export item. Five firms manufacturing garden wooden furniture participated in the study and reported that they produced garden furniture and umbrellas classified under the four-digit HS codes of 4420 and 6601, respectively. They have traditionally been a major exporter of wooden furniture (usually Saligna), which is primarily why they are included.
4.1.8. Doors and shelving
The major reason for including doors and shelving is because they are major exporting sub-sectors. The global door market is commonly divided into two segments, exterior doors and interior doors. Additional segmentation occurs on the basis of material used such as wood, aluminium, steel, glass, etc. It has been estimated that about 50% of exterior doors are steel, 40% are aluminium and 5% are wood or other material while for interior doors, 99% are wooden (FSC, 2001). Three of the largest exporters were included in the sample to provide insights into activities within that sub-sector.
4.1.10. Office furniture
Office wooden furniture is an important category within the sub-sector. Two firms were included in the sample and provided an indication of exporting activities by office, conference room and schoolroom desk and chair products.
4.1.11. Household furniture
Wooden furniture used in a bedroom, kitchen, lounge or dining room was included in the study because it constitutes a significant portion of global trade in household furniture. Almost €3.93 billion worth of dining room, living room and shop furniture was imported annually into the EU

DEPARTMENT OF TRADE AND INDUSTRY POLICY SUPPORT PROGRAMME PROGRAMME MANAGEMENT UNIT
31
between 1995 and 1997 while for the same period, €1.319 billion and €636 billion worth of bedroom and kitchen wooden furniture, respectively, was imported (Kaplinsky et al, 2001). Several firms were interviewed because they provided an indication of how South African exporters connected into the household furniture global market place and its concomitant trends in household spending, investment and consumption patterns under conditions of globalisation.
4.2. Upgrading
Simply stated, upgrading refers to several kinds of shifts that firms or groups of firms might undertake to improve their competitive position in global value chains (Gereffi et al, 2001). The typical trajectory of process, product, functional and new chain upgrading has been used as an ordering logic for presenting data findings (below) but it is not intended to indicate that a linear trajectory of upgrading is the absolute within South Africa. Before presenting the data, however, a short explanation is required of how the tabulated numbers included in this section were obtained.
The interview schedule included four questions about process, product and functional upgrading and the movement into new value chains measured over the last five years, projected for the next five years, and rated according to extent of effect upon the firm. Responses by firms have been collated and are presented in the tabulated cells labelled “total firms upgrading”. These are firms’ ratings of their own upgrading activities. Additional tabulated numbers are included and represent the results of the researcher’s iterative analysis of firm’s responses to questions regarding quality, delivery, design, and so forth. Caution is thus urged in use of the tabulated data.
4.2.1. Process upgrading
Process upgrading entails transforming more efficiently inputs into outputs through either the use of superior technology or the reorganisation of production systems (Gereffi et al, 2001). Table 9 (below) summarises the extent of process upgrading among sample participants (based on interview data) and shows a bias towards upgrading rendering quality rather than cost or delivery gains. Total firms
upgrading Quality Cost Delivery
Intra firm 15 15 4 1
Table 9: Process Upgrading as Reported by Interview Sample It was not unexpected that delivery-related process upgrading would be minimal among the sample and there are several reasons for this: Firstly, only one firm (a pine bed manufacturer) identified delivery and distribution as critical success factors in a firm’s exporting strategy, declaring that:
‘Price is a factor but distribution is all important in exporting’.
DEPARTMENT OF TRADE AND INDUSTRY POLICY SUPPORT PROGRAMME PROGRAMME MANAGEMENT UNIT
32
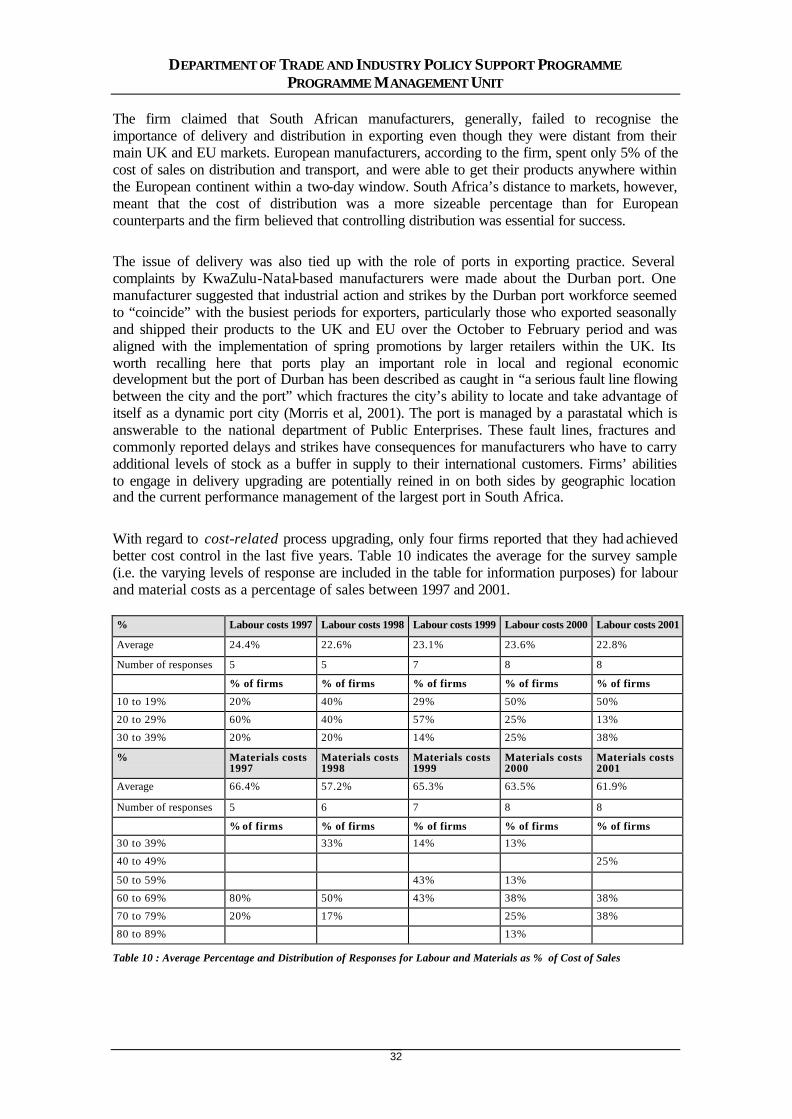
The firm claimed that South African manufacturers, generally, failed to recognise the importance of delivery and distribution in exporting even though they were distant from their main UK and EU markets. European manufacturers, according to the firm, spent only 5% of the cost of sales on distribution and transport, and were able to get their products anywhere within the European continent within a two-day window. South Africa’s distance to markets, however, meant that the cost of distribution was a more sizeable percentage than for European counterparts and the firm believed that controlling distribution was essential for success. The issue of delivery was also tied up with the role of ports in exporting practice. Several complaints by KwaZulu-Natal-based manufacturers were made about the Durban port. One manufacturer suggested that industrial action and strikes by the Durban port workforce seemed to “coincide” with the busiest periods for exporters, particularly those who exported seasonally and shipped their products to the UK and EU over the October to February period and was aligned with the implementation of spring promotions by larger retailers within the UK. Its worth recalling here that ports play an important role in local and regional economic development but the port of Durban has been described as caught in “a serious fault line flowing between the city and the port” which fractures the city’s ability to locate and take advantage of itself as a dynamic port city (Morris et al, 2001). The port is managed by a parastatal which is answerable to the national department of Public Enterprises. These fault lines, fractures and commonly reported delays and strikes have consequences for manufacturers who have to carry additional levels of stock as a buffer in supply to their international customers. Firms’ abilities to engage in delivery upgrading are potentially reined in on both sides by geographic location and the current performance management of the largest port in South Africa. With regard to cost-related process upgrading, only four firms reported that they had achieved better cost control in the last five years. Table 10 indicates the average for the survey sample (i.e. the varying levels of response are included in the table for information purposes) for labour and material costs as a percentage of sales between 1997 and 2001. % Labour costs 1997 Labour costs 1998 Labour costs 1999 Labour costs 2000 Labour costs 2001
Average 24.4% 22.6% 23.1% 23.6% 22.8%
Number of responses 5 5 7 8 8
% of firms % of firms % of firms % of firms % of firms
10 to 19% 20% 40% 29% 50% 50%
20 to 29% 60% 40% 57% 25% 13%
30 to 39% 20% 20% 14% 25% 38%
% Materials costs 1997
Materials costs 1998
Materials costs 1999
Materials costs 2000
Materials costs 2001
Average 66.4% 57.2% 65.3% 63.5% 61.9%
Number of responses 5 6 7 8 8
% of firms % of firms % of firms % of firms % of firms
30 to 39% 33% 14% 13%
40 to 49% 25%
50 to 59% 43% 13%
60 to 69% 80% 50% 43% 38% 38%
70 to 79% 20% 17% 25% 38%
80 to 89% 13%
Table 10 : Average Percentage and Distribution of Responses for Labour and Materials as % of Cost of Sales
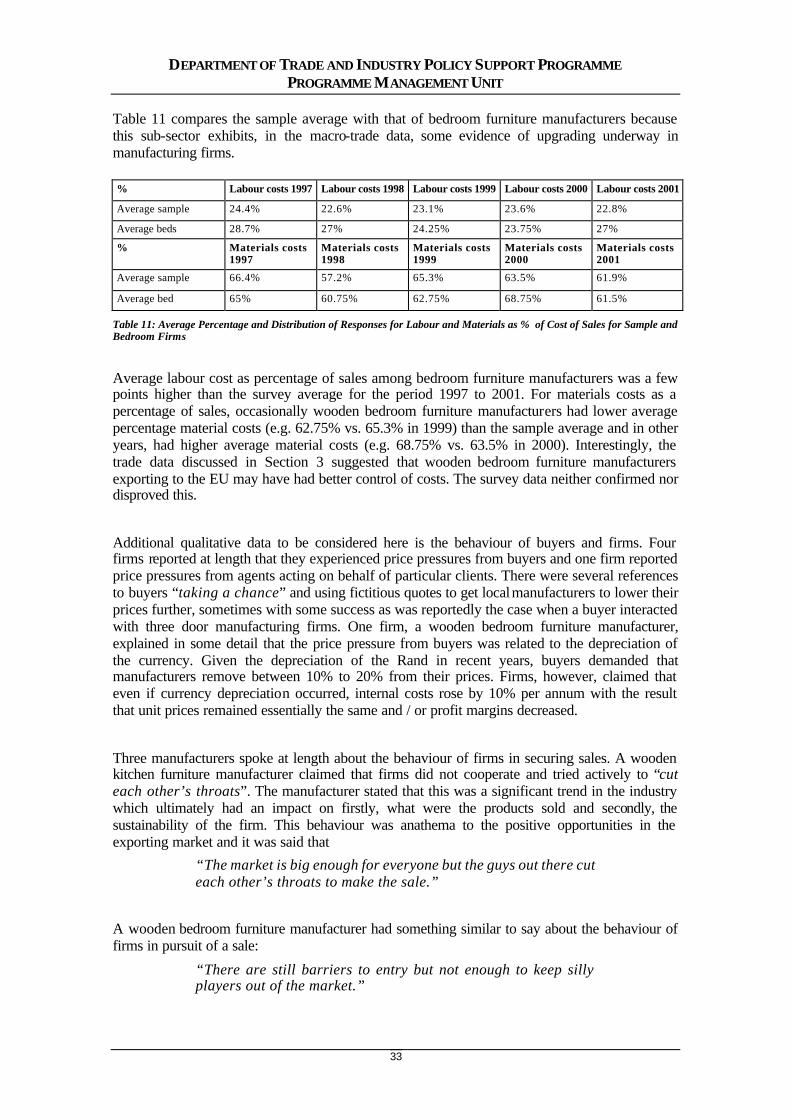
DEPARTMENT OF TRADE AND INDUSTRY POLICY SUPPORT PROGRAMME PROGRAMME MANAGEMENT UNIT
33
Table 11 compares the sample average with that of bedroom furniture manufacturers because this sub-sector exhibits, in the macro-trade data, some evidence of upgrading underway in manufacturing firms. % Labour costs 1997 Labour costs 1998 Labour costs 1999 Labour costs 2000 Labour costs 2001
Average sample 24.4% 22.6% 23.1% 23.6% 22.8%
Average beds 28.7% 27% 24.25% 23.75% 27%
% Materials costs 1997
Materials costs 1998
Materials costs 1999
Materials costs 2000
Materials costs 2001
Average sample 66.4% 57.2% 65.3% 63.5% 61.9%
Average bed 65% 60.75% 62.75% 68.75% 61.5%
Table 11: Average Percentage and Distribution of Responses for Labour and Materials as % of Cost of Sales for Sample and Bedroom Firms
Average labour cost as percentage of sales among bedroom furniture manufacturers was a few points higher than the survey average for the period 1997 to 2001. For materials costs as a percentage of sales, occasionally wooden bedroom furniture manufacturers had lower average percentage material costs (e.g. 62.75% vs. 65.3% in 1999) than the sample average and in other years, had higher average material costs (e.g. 68.75% vs. 63.5% in 2000). Interestingly, the trade data discussed in Section 3 suggested that wooden bedroom furniture manufacturers exporting to the EU may have had better control of costs. The survey data neither confirmed nor disproved this.
Additional qualitative data to be considered here is the behaviour of buyers and firms. Four firms reported at length that they experienced price pressures from buyers and one firm reported price pressures from agents acting on behalf of particular clients. There were several references to buyers “taking a chance” and using fictitious quotes to get local manufacturers to lower their prices further, sometimes with some success as was reportedly the case when a buyer interacted with three door manufacturing firms. One firm, a wooden bedroom furniture manufacturer, explained in some detail that the price pressure from buyers was related to the depreciation of the currency. Given the depreciation of the Rand in recent years, buyers demanded that manufacturers remove between 10% to 20% from their prices. Firms, however, claimed that even if currency depreciation occurred, internal costs rose by 10% per annum with the result that unit prices remained essentially the same and / or profit margins decreased.
Three manufacturers spoke at length about the behaviour of firms in securing sales. A wooden kitchen furniture manufacturer claimed that firms did not cooperate and tried actively to “cut each other’s throats”. The manufacturer stated that this was a significant trend in the industry which ultimately had an impact on firstly, what were the products sold and secondly, the sustainability of the firm. This behaviour was anathema to the positive opportunities in the exporting market and it was said that
“The market is big enough for everyone but the guys out there cut each other’s throats to make the sale.”
A wooden bedroom furniture manufacturer had something similar to say about the behaviour of firms in pursuit of a sale:
“There are still barriers to entry but not enough to keep silly players out of the market.”
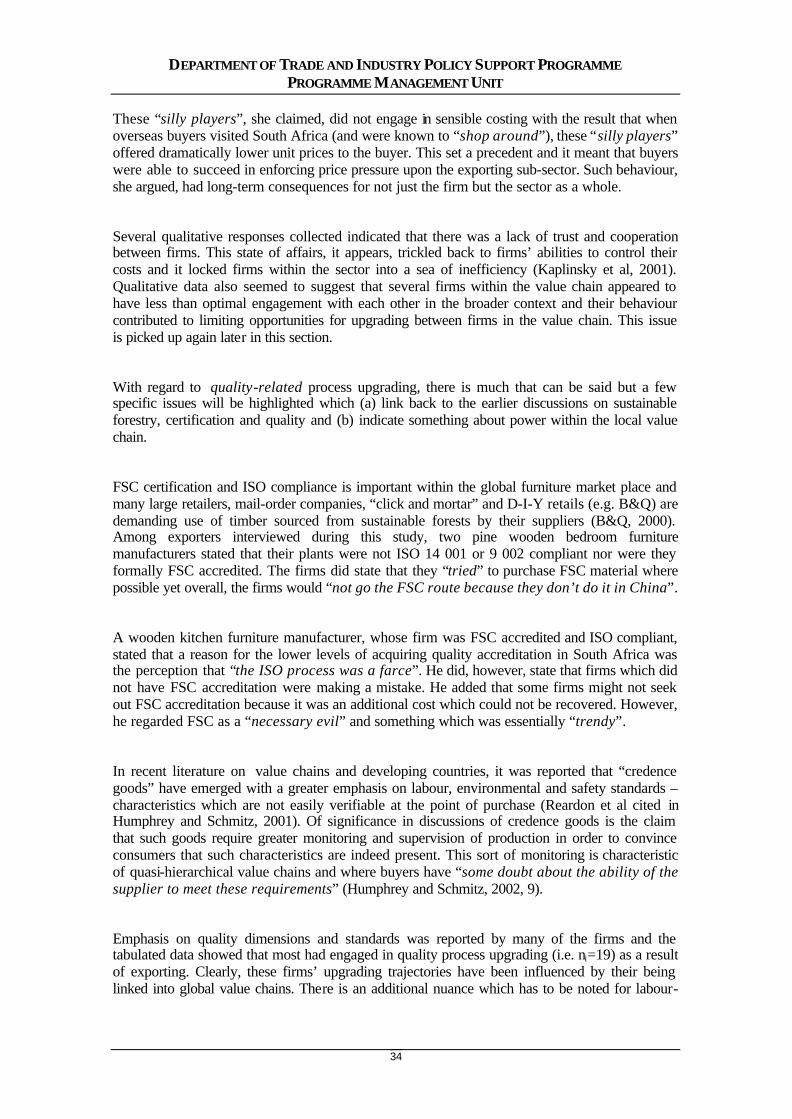
DEPARTMENT OF TRADE AND INDUSTRY POLICY SUPPORT PROGRAMME PROGRAMME MANAGEMENT UNIT
34
These “silly players”, she claimed, did not engage in sensible costing with the result that when overseas buyers visited South Africa (and were known to “shop around”), these “silly players” offered dramatically lower unit prices to the buyer. This set a precedent and it meant that buyers were able to succeed in enforcing price pressure upon the exporting sub-sector. Such behaviour, she argued, had long-term consequences for not just the firm but the sector as a whole.
Several qualitative responses collected indicated that there was a lack of trust and cooperation between firms. This state of affairs, it appears, trickled back to firms’ abilities to control their costs and it locked firms within the sector into a sea of inefficiency (Kaplinsky et al, 2001). Qualitative data also seemed to suggest that several firms within the value chain appeared to have less than optimal engagement with each other in the broader context and their behaviour contributed to limiting opportunities for upgrading between firms in the value chain. This issue is picked up again later in this section.
With regard to quality-related process upgrading, there is much that can be said but a few specific issues will be highlighted which (a) link back to the earlier discussions on sustainable forestry, certification and quality and (b) indicate something about power within the local value chain.
FSC certification and ISO compliance is important within the global furniture market place and many large retailers, mail-order companies, “click and mortar” and D-I-Y retails (e.g. B&Q) are demanding use of timber sourced from sustainable forests by their suppliers (B&Q, 2000). Among exporters interviewed during this study, two pine wooden bedroom furniture manufacturers stated that their plants were not ISO 14 001 or 9 002 compliant nor were they formally FSC accredited. The firms did state that they “tried” to purchase FSC material where possible yet overall, the firms would “not go the FSC route because they don’t do it in China”.
A wooden kitchen furniture manufacturer, whose firm was FSC accredited and ISO compliant, stated that a reason for the lower levels of acquiring quality accreditation in South Africa was the perception that “the ISO process was a farce”. He did, however, state that firms which did not have FSC accreditation were making a mistake. He added that some firms might not seek out FSC accreditation because it was an additional cost which could not be recovered. However, he regarded FSC as a “necessary evil” and something which was essentially “trendy”.
In recent literature on value chains and developing countries, it was reported that “credence goods” have emerged with a greater emphasis on labour, environmental and safety standards – characteristics which are not easily verifiable at the point of purchase (Reardon et al cited in Humphrey and Schmitz, 2001). Of significance in discussions of credence goods is the claim that such goods require greater monitoring and supervision of production in order to convince consumers that such characteristics are indeed present. This sort of monitoring is characteristic of quasi-hierarchical value chains and where buyers have “some doubt about the ability of the supplier to meet these requirements” (Humphrey and Schmitz, 2002, 9).
Emphasis on quality dimensions and standards was reported by many of the firms and the tabulated data showed that most had engaged in quality process upgrading (i.e. ni=19) as a result of exporting. Clearly, these firms’ upgrading trajectories have been influenced by their being linked into global value chains. There is an additional nuance which has to be noted for labour-
DEPARTMENT OF TRADE AND INDUSTRY POLICY SUPPORT PROGRAMME PROGRAMME MANAGEMENT UNIT
35
intensive sectors: global buyers frequently seek out new suppliers as a means of reducing costs. For the supplier from the developing world, this means that they are expected to meet requirements that frequently do not (yet) apply to their domestic markets. In this study, several manufacturers of pine bunk beds for children explained how products exported to the UK had to comply with British safety standards while bunk beds produced for the local market were said to be “only this side of hazardous”. This suggests a widening gap between capabilities for of local manufacturers producing for the local market and for the export market.
4.2.2. Product upgrading
Commonly, product upgrading is said to entail more sophisticated product lines defined in terms of increased unit values (Gereffi et al, 2001). Table 12 indicates that the diversity of product upgrading options available is wider than that traditionally depicted. Not added to Table 12 is an additional differentiation of “new products” into wholly new products which are more than just “new to the firm”, but “new to the world” products. No examples of wholly new products were found in this sector study.
For the purposes of clarification, the following examples are provided to explain what is meant by the terms used in Table 12:
• Differentiation is an incremental change to a generic product, which essentially can be manufactured by others. For example: the addition of grooved, rounded edges to a generic wooden bookshelf.
• Technical specification changes are incremental changes to a product’s manufacture based on precise detailing of dimensions and materials to be used. For example: specifying more clearly the minimum acceptance levels of furniture grade timber to be procured for and used in dining room furniture manufacture.
• Design for manufacture is an advanced change to a product to ensure that it can be manufactured in a way that suits a manufacturer’s capabilities. For example: converging iterations in design incorporating the aesthetic and production dimensions in the design and development of leather upholstered lounge suites.
• Functional change to a product entails modifying, usually extending, its functionality. For example: the addition of a storage space to a bunk bed adds storage functionality to a product essentially designed for the function of sleeping.
• Materials substitution entails the use of different materials in a product’s manufacture. For example: the addition of wood oils rather than wood stains to pine to imitate the particular look-and-feel associated with rubber wood products.
• New products which are new to the firm is an advanced product upgrade. For example: the manufacture of kitchen furniture products by a bedroom furniture manufacturer.
An important dimension of product upgrading is the change demanded to the firm’s capabilities and relationships with other firms. Incremental upgrading can happen at an operational level (i.e. on the factory floor) while advanced upgrading demands cross-functional cooperation between different units within the firm such as the R&D unit, the marketing unit and the factory floor. The movement into discontinuous innovation requires cooperation with other players such
DEPARTMENT OF TRADE AND INDUSTRY POLICY SUPPORT PROGRAMME PROGRAMME MANAGEMENT UNIT
36
as those in the national system of innovation as this sort of innovation commonly falls outside of a single, small firm’s capability.
Total firms
upgrading Differen-tiation
Technical specifi -cation
Design for manufac-ture
Functional change
Materials substi -tution
New to firm product
Intra firm
13 8 6 5 5 6 2
Table 12: Product Upgrading among Interview Sample
Thirteen firms reported that, within the last five years, they had engaged in product upgrading, which had rendered significant or minor improvements. When looking at the different dimensions thereof, eight of the 13 firms had directed effort at differentiation of their products while only two firms had introduced “new to the firm” products.
Local upgrading opportunities, it has been shown, vary according to the ways in which value chains are governed. Global value chain literature suggests that developing country producers are frequently involved in quasi-hierarchical relationships and have associated with them the buyer’s “perceived risk of losses from the suppliers’ performance failure [or in] other words, there are some doubts [in the buyer’s mind] about the competence of the supply chain” (Humphrey and Schmitz, 2002, 13).
On average, 52% of the survey sample’s customers were based outside of South Africa and firms typically had 11 international customers. Data reported earlier (sub-section C.1.c.) showed most firms were clearly and overwhelmingly locked into the UK and EU market. Only limited, tentative movement into new markets had occurred. But most importantly, and linked to this “market locking”, was the lack of evidence that manufacturers were making adaptations and modifications to a product design supplied by a major customer for other customers in different markets. It is also worth recalling that in quasi-hierarchical relationship, firms can “become tied into relationships that prevent functional upgrading and leave them dependent on one or two powerful customers [and] in some cases, exclusive relationships with large buyers [can] prevent them from diversifying their customer base” (Humphrey and Schmitz, 2002). Being a latecomer to the global market, as some of these firms clearly are, carries consequences such as being technologically behind and dislocated from the markets to which they supply (Hobday cited in Humphrey and Schmitz, 2002). It also puts firms in a precarious situation in which failure to comply with “credence goods”-type requirements specified by a buyer and / or the presence of one or more “set-backs” (e.g. strikes in the port) can compromise seriously a firm’s connection to the global market place and its very sustainability.
4.2.3. Functional upgrading
Upgrading within a particular value chain can take several forms. However upgrading is enabled or limited by the nature of power relationships within the chain. Some of the common permutations of intra-chain upgrading are (Gereffi et al, 2001):
• Acquisition of new functions within a chain such as moving from production to design to marketing;
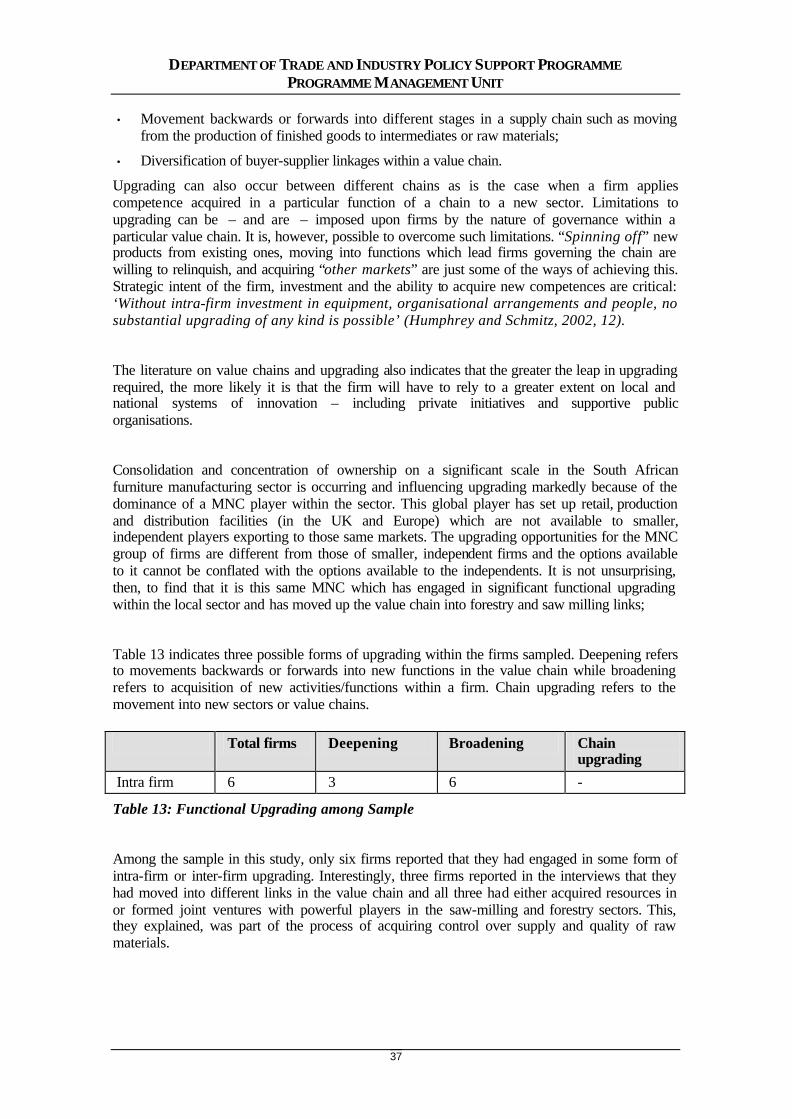
DEPARTMENT OF TRADE AND INDUSTRY POLICY SUPPORT PROGRAMME PROGRAMME MANAGEMENT UNIT
37
• Movement backwards or forwards into different stages in a supply chain such as moving from the production of finished goods to intermediates or raw materials;
• Diversification of buyer-supplier linkages within a value chain.
Upgrading can also occur between different chains as is the case when a firm applies competence acquired in a particular function of a chain to a new sector. Limitations to upgrading can be – and are – imposed upon firms by the nature of governance within a particular value chain. It is, however, possible to overcome such limitations. “Spinning off” new products from existing ones, moving into functions which lead firms governing the chain are willing to relinquish, and acquiring “other markets” are just some of the ways of achieving this. Strategic intent of the firm, investment and the ability to acquire new competences are critical: ‘Without intra-firm investment in equipment, organisational arrangements and people, no substantial upgrading of any kind is possible’ (Humphrey and Schmitz, 2002, 12).
The literature on value chains and upgrading also indicates that the greater the leap in upgrading required, the more likely it is that the firm will have to rely to a greater extent on local and national systems of innovation – including private initiatives and supportive public organisations.
Consolidation and concentration of ownership on a significant scale in the South African furniture manufacturing sector is occurring and influencing upgrading markedly because of the dominance of a MNC player within the sector. This global player has set up retail, production and distribution facilities (in the UK and Europe) which are not available to smaller, independent players exporting to those same markets. The upgrading opportunities for the MNC group of firms are different from those of smaller, independent firms and the options available to it cannot be conflated with the options available to the independents. It is not unsurprising, then, to find that it is this same MNC which has engaged in significant functional upgrading within the local sector and has moved up the value chain into forestry and saw milling links;
Table 13 indicates three possible forms of upgrading within the firms sampled. Deepening refers to movements backwards or forwards into new functions in the value chain while broadening refers to acquisition of new activities/functions within a firm. Chain upgrading refers to the movement into new sectors or value chains. Total firms Deepening Broadening Chain
upgrading
Intra firm 6 3 6 -
Table 13: Functional Upgrading among Sample
Among the sample in this study, only six firms reported that they had engaged in some form of intra-firm or inter-firm upgrading. Interestingly, three firms reported in the interviews that they had moved into different links in the value chain and all three had either acquired resources in or formed joint ventures with powerful players in the saw-milling and forestry sectors. This, they explained, was part of the process of acquiring control over supply and quality of raw materials.

DEPARTMENT OF TRADE AND INDUSTRY POLICY SUPPORT PROGRAMME PROGRAMME MANAGEMENT UNIT
38
Among the six firms who reported that they had broadened their linkages within the value chain, mini-branding, marketing and after-sales service were the new functions acquired. A door manufacturer, for example, reported that it had included its company logo as a brand on the cardboard protective packaging in which it encased its wooden doors. A Saligna garden furniture manufacturer reported that it had moved into after-sales service which included supplying information via a newsletter and website about wood repair and maintenance.
These six firms represented the larger corporate firms, and most of the other participants (i.e. the independent, smaller firms) in the sample were not engaged in functional upgrading. In section 4.3, this issue will be examined in more detail as it is linked closely to governance issues.
4.2.4. Upgrading Summary
Among the wooden furniture and products manufacturers participating in this study, it was clear that process upgrading and product upgrading were being undertaken by approximately half of the participants. Process Product Functional New chains Intra firm 15 13 6 -
Table 14: Upgrading Summary for Sample based on Actual Responses to Interview Questions
Very few participants engaged in functional upgrading and among those which did, broadening rather than deepening was possible. If one moves away from the sample as a discrete set of individual firms and rather takes cogniscance of the emergence of the process of consolidation into manufacturing groups dominating the furniture sector, then the view one gets is somewhat different. For it is very important that, within at least two of these groups which make up a significant sample of the exporting firms in the sector, significant vertical integration is occurring with them in different ways taking on new functions up and down (e.g. sawmilling, plantations, log buying, international showrooms, distribution) the value chain. None of the firms reported movement into new sectors or value chains. Exploring why this might be the case demands closer attention to issues of governance and it is to that which this report now turns.
4.3. Governance and coordination
Governance is a central concept in global value chain literature and refers to the fact that some firms in a value chain set and enforce the parameters under which others operate (Kaplinsky and Morris, 2001). From the point of view of upgrading governance is important for several reasons including: market access is sometimes controlled by lead firms’ sourcing strategies and their actions can cause particular suppliers to lose out; relationships with lead firms can lead to fast-track acquisition of production capabilities; and developing country firms can be locked into low barrier-to-entry and low-return production compared with developed country firms which are more likely to receive higher yielding returns associated with intangible competences such as branding.
DEPARTMENT OF TRADE AND INDUSTRY POLICY SUPPORT PROGRAMME PROGRAMME MANAGEMENT UNIT
39
Five key parameters of governance can be identified:
• The production definition or the definition of what is to be done;
• The production process definition or how it is to be produced (e.g. quality systems, labour standards, environmental standards, etc.);
• When it is to be produced;
• How much is to be produced; and
• Price or where a major customer insists that suppliers design processes and products to meet a particular target price.
Coordination is a second, important concept and it is worth noting the difference between it and governance: governance refers to parameters which have consequences up and down the value chain, while coordination refers to activities of coordination and management undertaken to ensure that these consequences are directed in particular ways (Kaplinsky and Morris 2001). Multiple points of governance and coordination functions can exist within a chain and they are both dynamic phenomena subject to change over time (Morris, 2001).
4.3.1. Production definition and design competence
Overwhelmingly, independent manufacturers in the local wooden furniture value chain do not possess significant design capacity within their firms and manufacture products to design specifications set by an international customer. Several of the manufacturers interviewed in this study claimed that South Africa did little more than “imitate European design”. In the words of one manufacturer, the situation was one where:
“We are making European furniture in South Africa which means that buyers can quite easily find others such as China to make the furniture they want at a cheaper price… If South Africa can become unique at innovation and design then we can be able to be truly competitive in the global furniture market place”.
Six manufacturers spoke at length about design capacity in South Africa and even a corporate participant identified design competence as a weakness within its group but added that two firms within the group had good design competence which made a measurable difference to their margins on exports.
This is indicative of two, inter-dependent forces at work within the local value chain. The first is that ownership of design capacity by international customers and the second relates to the dearth of design capacity within firms and the national system of innovation in South Africa.
With regard to ownership and coordination of design capacity, buyers set the parameters regarding what was to be produced and how it was to be produced. “Made-to-order” contracting was common and buyers, or their agents, provided firms with product design specifications with which firms complied. Usually, this was preceded by development of a sample product which was then air freighted to the customer for approval. Isolated examples were provided of “made-
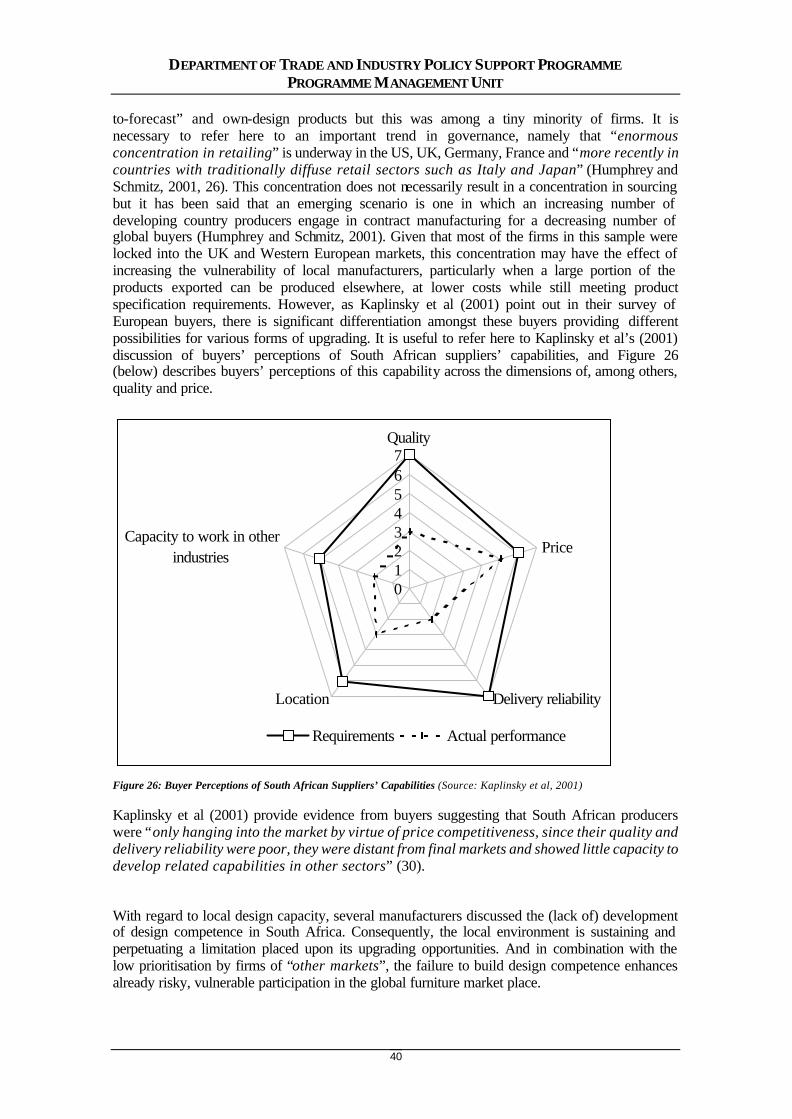
DEPARTMENT OF TRADE AND INDUSTRY POLICY SUPPORT PROGRAMME PROGRAMME MANAGEMENT UNIT
40
to-forecast” and own-design products but this was among a tiny minority of firms. It is necessary to refer here to an important trend in governance, namely that “enormous concentration in retailing” is underway in the US, UK, Germany, France and “more recently in countries with traditionally diffuse retail sectors such as Italy and Japan” (Humphrey and Schmitz, 2001, 26). This concentration does not necessarily result in a concentration in sourcing but it has been said that an emerging scenario is one in which an increasing number of developing country producers engage in contract manufacturing for a decreasing number of global buyers (Humphrey and Schmitz, 2001). Given that most of the firms in this sample were locked into the UK and Western European markets, this concentration may have the effect of increasing the vulnerability of local manufacturers, particularly when a large portion of the products exported can be produced elsewhere, at lower costs while still meeting product specification requirements. However, as Kaplinsky et al (2001) point out in their survey of European buyers, there is significant differentiation amongst these buyers providing different possibilities for various forms of upgrading. It is useful to refer here to Kaplinsky et al’s (2001) discussion of buyers’ perceptions of South African suppliers’ capabilities, and Figure 26 (below) describes buyers’ perceptions of this capability across the dimensions of, among others, quality and price.
01234567
Quality
Price
Delivery reliabilityLocation
Capacity to work in otherindustries
Requirements Actual performance
Figure 26: Buyer Perceptions of South African Suppliers’ Capabilities (Source: Kaplinsky et al, 2001)
Kaplinsky et al (2001) provide evidence from buyers suggesting that South African producers were “only hanging into the market by virtue of price competitiveness, since their quality and delivery reliability were poor, they were distant from final markets and showed little capacity to develop related capabilities in other sectors” (30).
With regard to local design capacity, several manufacturers discussed the (lack of) development of design competence in South Africa. Consequently, the local environment is sustaining and perpetuating a limitation placed upon its upgrading opportunities. And in combination with the low prioritisation by firms of “other markets”, the failure to build design competence enhances already risky, vulnerable participation in the global furniture market place.
DEPARTMENT OF TRADE AND INDUSTRY POLICY SUPPORT PROGRAMME PROGRAMME MANAGEMENT UNIT
41
4.3.2. Production processes definition and quality and environmental standards
Credence goods are defined as:
“A complex, new product with quality and / or safety aspects that cannot be known to consumers through sensory inspection or observation-in-consumption… The quality and safety characteristics that constitute credence attributes include the following: (1) food safety; (2) healthier, more nutritional foods (low-fat, low-salt, etc.); (3) authenticity; (4) production processes that promote a safe environment and sustainable agriculture; (5) ‘fair trade’ attributes (e.g. working conditions)” (Reardon et al in Humphrey and Schmitz, 2001, 24).
Parameters regarding production process definition are required for credence goods because consumers cannot directly verify these attributes and retailers might not be able to verify them through product inspection alone. In some consumer markets wooden furniture is evolving into a credence good. This is evident in increased concerns with safety (e.g. use of fire-retardant foam in upholstered furniture or country-specific safety standards for glass, bunk beds, etc.), supplier working conditions and the use of timber from sustainable forests (e.g. FSC accreditation), among others.
Enforcement of process parameters, particularly for suppliers of credence goods, happens at multiple points and by different actors within the value chain. For example, some buyers – and their agents – expect suppliers to use FSC material or to be ISO 14 001 compliant, and, in order to comply with these expectations, firms are “encouraged” to acquire this accreditation from an authentic, independent certification authority. This issue is also discussed in Kaplinsky et al (2001) and reference is made to the growing importance of standards and the significance ascribed to such standards by global retail buyers and multi-store retailers). Several firms in this sample supplied pine storage and shelving to the UK’s B&Q, a large retail chain in the home improvement and garden furniture market. B&Q stated that by the end of 1999 it intended to buy wood and wooden products which were FSC certified. South Africa was a major source accounting for 100 lines and 5% of B&Q’s total volume of wood in 1997 (B&Q, 1998). Although there have been some revisions and clarifications regarding what is meant by “FSC labelling”, essentially B&Q has committed itself to sourcing primarily from FSC-accredited suppliers or from country-accredited systems which are FSC compliant (British Hardware and Houseware Manufacturers Association, undated).
A second example – and one reported by firms in this study – is an “independent” decision made by the firm that it has to adopt particular environmental and quality standards. In the words of one manufacturer, this was a “necessary evil” and “non-recoverable cost” associated with the market without which firms have limited opportunities to sell their products.
These issues have to also be understood as systemic ones. Non-tariff restrictions – labelled by the United Nations Commission on Trade and Development (“UNCTAD”) as “green protectionism” (Dunne, 2000) – on trade in wood and wooden products have particular effects on developing countries. Again it is worth recalling that environmental certification (or green
DEPARTMENT OF TRADE AND INDUSTRY POLICY SUPPORT PROGRAMME PROGRAMME MANAGEMENT UNIT
42
protectionism) is increasingly a barrier to entry for developing countries which some are better at overcoming than others.
4.3.3. Production scheduling
A third key parameter in the value chain is related to “when it is to be produced” or, what has been termed here, “production scheduling”. Moving into export markets is said to provide Southern Hemisphere-located, developing countries with a means for overcoming counter-seasonal production cycles to Northern Hemisphere markets to which they export.
In this study, many firms reported that they experienced particular kinds of seasonal fluctuations related to the promotions run by retail customers. Among garden furniture manufacturers, all firms reported that they produced and exported the bulk of their products between October and February as this corresponded with retailers’ use of promotions prior to the Northern Hemisphere’s spring. One of the garden manufacturers, for example, which was 100% export-oriented stated quite simply that:
“Our busiest time is October to January and February… [but] the rest of the time, we are scrambling to make turnover”.
The main trend in production scheduling among the smaller, independent firms was that given most were supplying “made-to-order” products to mainly retailers in the UK and Western Europe, production scheduling was largely determined by the buyer with only some input from the supplier.
4.3.4. Quantity of production output
“How much is to be produced” is a fourth parameter often defined by buyers. There was evidence of buyer’s exercising this power over local manufacturers but a more important issue to be discussed here relates to that of buffering.
As was noted earlier, several KwaZulu-Natal-based manufacturers complained at length about the impact of inefficiencies at the Durban port upon their business. This issue was discussed with other Western Cape and Gauteng manufacturers regarding other ports and no complaints were received about ports in the Western and Eastern Cape Provinces. Among the KwaZulu-Natal group, some manufacturers carried additional levels of stock as a buffer in supply to international customers. Although buffer stocks in some industries are statistically formulated, buffering can be less “systematically” calculated and managed in supply chains vulnerable to a range of financial, decision, market and chaos risks (Christoper and Lee, 2001). Chaos risks include over-reactions, unnecessary interventions, mistrust, second guessing and distorted information about the supply chain. Hence supply chains which are susceptible to chaos risks have been observed to engage in buffering. Buffering or a build-up of excessive inventory (and / or capacity) is a way of dealing with supply chain uncertainties and risks but it in turn, contributes towards information about problems and status within the supply chain being less
DEPARTMENT OF TRADE AND INDUSTRY POLICY SUPPORT PROGRAMME PROGRAMME MANAGEMENT UNIT
43
available. Hence, a spiral of a lack of visibility, leading to a lack of trust, leading to buffering, leading to longer pipelines is made manifest. This is exacerbated in the local furniture industry which is not well known for the adoption of world class manufacturing principles, and control over inventory (raw material stocks, work in progress and final goods) is notably weak.
The extent of buffering highlights that the absence of a coordinated sectoral response to the Durban port inefficiencies are potentially exacerbating vulnerabilities in the supply chain. One high-end furniture manufacturer, for example, explained that as a direct result of delays in the Durban port, his firm had not only lost a contract with an international customer but had had to pay the customer full costs associated with the order. This sort of inefficiency and the nature of the relationship with powerful customers has important consequences for local manufacturers, particularly when they have limited say over production scheduling coordination and experience growing price pressure from buyers.
4.3.5. Price pressure
Although factors such as quality, brand and speed (i.e. non-price factors) are recognised as playing an increasingly important role in the global market, price is still a critical success factor especially in the lower end commodity market sector. Price competition continues to be “unrelenting, leading to a downward pressure on prices, particularly in labour-intensive products sourced from developing countries” (Humphrey and Schmitz, 2001, 27). Buyers constantly look for producers who can offer lower labour costs.
Price pressure from buyers was a very real feature of the local wooden furniture value chain. Example after example was provided of buyers’ price pressure. But more importantly, examples were provided of suppliers’ reactions towards this price pressure. It has already been pointed out that some of the firms were concerned about the behaviour of “new entrants” (also referred to as “silly players”) and the practice of under-cutting already low prices for products such as interior doors or bunk beds. Although buyers may be driving the process of price pressure, some firms are acting in ways that sustain it – with potentially deleterious consequences for the local value chain.
DEPARTMENT OF TRADE AND INDUSTRY POLICY SUPPORT PROGRAMME PROGRAMME MANAGEMENT UNIT
44
5. CONCLUSION
5.1. Key issues
Several findings and issues have arisen from this study but deliberate effort has been made to focus on the most salient. And these are that:
• The wooden furniture manufacturing sector has continued to increase its export orientation. Overwhelmingly, however, South African furniture exports are directed at the UK and Western European market. The concentration of these markets carries several consequences for developing country suppliers. Depending on which markets and buyers domestic firms are selling into, this includes, among others, limited opportunities for upgrading along certain dimensions and continuing price pressure.
• Wooden furniture manufacturers may not be engaged in “smart exporting” practice and very few are exploring “other markets” or developing “spin off products” which are (in addition to acquiring deepening or additional capabilities within the chain) essential for overcoming limitations to upgrading imposed by dominant, usually international, players.
• The intensification of export orientation does not appear to be impacting on increased capital and labour productivity generally within the sector (as suggested by the trade data in Section 3), nor is the sector as a whole substantially increasing or transforming its demand for skilled labour. In the sector jobs have been lost, labour productivity and value addition have declined and the sector has one of the lowest demands for skilled labour across 46 industries.
• Wooden furniture is regarded as a buyer-driven value chain and in South Africa, given the concentration in the retail and manufacturing sector, there are differences in how diverse firms respond to power dynamics within the chain. Larger, more powerful firms are entering joint ventures with powerful players in the raw material supplier levels of the value chain. Smaller firms are either facing closure or operating in survivalist mode and not exporting “smartly”.
• The local environment within which the wooden furniture value chain is located is a difficult one in which this chain is squeezed between the dominant pulp and paper value chain and the increasing export of unbeneficiated raw materials (i.e. logs) out of the country. Combined with a lack of trust between different players in these intersecting value chains and ongoing inefficiencies in, for example, the supporting environment (including but not limited to the port of Durban), local wooden furniture manufacturers face significant challenges simultaneously from the local and global contexts; and
• There is essentially a “mixed picture” on upgrading in the local wooden furniture value chain which makes it difficult to focus on one particular issue or phenomenon. Process upgrading was reported to be underway by most manufacturers participating in this study. Product upgrading was also reported by some but a most interesting finding was that of functional upgrading underway by an elite, powerful, few firms including the dominant, MNC firm in the local furniture manufacturing and retail sectors.
DEPARTMENT OF TRADE AND INDUSTRY POLICY SUPPORT PROGRAMME PROGRAMME MANAGEMENT UNIT
45
5.2. Policy implications
Section 5’s discussion of policy implications is prefaced by a pragmatic consideration offered by Andrew Wood in his discussion of intervention, upgrading and value chains:
“Whether and how governments should assist upgrading in firms in developing countries are crucial questions to which the sceptical and grudging answers of economists deserve to be heard, especially because financial and administrative resources are scarce and because firms have obvious private motives for getting government money. The presumption of economists is not to intervene, on the principle that firms themselves will take care of their upgrading if (and the extent that) it is economically worthwhile. To override this presumption, it is necessary to establish two things. First, that there is a ‘market failure’ of some sort – a lack of finance or information, say, that makes it unprofitable to introduce socially desirable innovation. Second, that benefits of intervention to correct this failure exceed the costs – and that the proposed method of intervention is the best of the possible alternatives. Some proposals for government or external donor intervention to assist firm upgrading would pass both these tests, but others – perhaps the majority – would fail one or other of them” (Wood, 2001, 45).
Overcoming limitations to upgrading was discussed at some length in Section 4 of this report and it is worth recalling here that factors such as firms’ strategic intent, “other markets” and production of “spin offs”, among others, are key to combating limitations imposed by dominant players in the value chain. Particular emphasis will be placed here on two of these issues, i.e. the issue of “other markets” given that most firms in this study exported to the UK and Western European markets and the issue of investment in product upgrading and related skilled competence building in firms. The policy considerations emerging from this report can be addressed under a number of key headings: incentives, market access, process and product upgrading, and logistics.
The simplest message emerging about incentives to export is that firstly, there has been an intensification of exporting within the wooden furniture manufacturing sector and secondly, that this intensification has continued despite the scaling down and removal of the General Export Incentive Scheme (“GEIS”). The trade data shows clearly the continuing growth in exports while the interview data shows that only one firm argued that with the removal of GEIS the incentive to export had been removed. Most other firms were non-committal about incentive schemes, pointing out that GEIS did not fit in the era of General Agreement on Tariffs and Trade (“GATT”) but that if GEIS was available, firms would use it. Four firms, however, explained at length that because GEIS cushioned local players from the true, often harsh, realities of the global market, ultimately their competitiveness suffered over the long term.
The DTI can provide salient support to firms by assisting them in securing “other markets” by:
• Sharing information about the importance of securing other markets as part of a firm’s exporting strategy and practice. The provision of information about the importance of other
DEPARTMENT OF TRADE AND INDUSTRY POLICY SUPPORT PROGRAMME PROGRAMME MANAGEMENT UNIT
46
markets is required as there is no small amount of risk for South African firms exporting to the UK and EU given that buyers openly scout around for developing country suppliers with ever lower labour costs meaning that unless upgrading occurs targeting niche and / or high-end markets, buyers can source elsewhere.
• Reviewing and extending how its export marketing research grant is used by firms. This could include formulating a more strategic framework underlying the use of export marketing support (i.e. the Export Marketing and Investment Assistance Schemes or EMIA) with the primary intention of using it to secure other markets and with a supplementary intention of using it to build more strategic relationships with diverse customers in existing markets. Unless local firms secure footholds in “other markets”, their vulnerability in the global value chain may be further exacerbated.
• Providing more comprehensive support to firms participating in the South African pavilions at international fairs. While buyer – seller matches made at such fairs may not always result in immediate sales contracts for manufacturers (Dunne, 2000, 17), these fairs play an important role in ensuring that local firms are exposed to potential buyers and global trends. It seems as if the channels of communication between TISA and manufacturers is less than optimal and attention should be directed at opening those channels and facilitating discussions with the intention of improving all future South African delegations’ visits to the Cologne Fair, among others.
The DTI can assist firms to engage in process upgrading by:
• Ensuring that exporting firms in this sector are aware of the various process upgrading supply side measures available - the Competitiveness Fund, Workplace Challenge, and the Sector Partnership Fund. Many of the firms surveyed had never heard of these supply side measures or had only a cursory understanding of their functioning.
• Flooding firms with information about the importance of investment in skills development within the firm and the sector. In conjunction with the Department of Labour, the DTI can encourage formulation of “stretching skills development goals” by firms and encourage firms to link with the relevant SETAs in building those skills.
The DTI can provide additional support to firms to assist them in undertaking product upgrading in the medium to long-term by:
• Facilitating the establishment of tertiary educationally based design programs with appropriate qualifications through the national system of innovation;
• Designing and implementing learnerships, particularly in the area of wooden furniture product (aesthetic and technical) design;
• Providing firms with clear, simple information about research and development funding opportunities available to firms. In this study, most of the small, independent manufacturers had not even heard of general government R&D funding opportunities, such as THRIP or the Innovation Fund. The way in which information is provided is also key and operating as a networking node means that the DTI should, for example, seek to link local manufacturers to science councils or technikons which regularly apply to the Innovation Fund. Another example of how this could be achieved is by pointing out to firms that involving their international customers in, for example, a THRIP funded project is a way of building more strategic, long-term relationships with their customers and export markets and of shifting towards high-value, increasingly competitive furniture production.
DEPARTMENT OF TRADE AND INDUSTRY POLICY SUPPORT PROGRAMME PROGRAMME MANAGEMENT UNIT
47
As regards the thorny of issue of logistics, a final point to be made relates specifically to the need for facilitation by the DTI of discussions between export furniture manufacturers using the Durban port, PortNet and its employees. At present, enmity exists and, as discussed in section 4, the combined effects of PortNet’s erratic management and certain manufacturers’ reactions, weakens the supply chain further. In a fiercely competitive global industry such as furniture, weakening supply chains can least be afforded by developing countries such as South Africa.
DEPARTMENT OF TRADE AND INDUSTRY POLICY SUPPORT PROGRAMME PROGRAMME MANAGEMENT UNIT
48
REFERENCES B&Q. (2000). Timber Policy: http://www.diy.com/aboutbandq/sustainability/documents/Timber_buying_policy_doc_reports.pdf. B&Q. (1998). How Green is My Patio? B&Q’s Third Environmental Review. Eastleigh: B&Q plc. British Hardware and Housewares Manufacturers Association. (Undated). http://www.bhhma.co.uk/bhhma/news/environmentdata5.htm Christopher, M. and Lee, H.L. (6 November 2001). Supply Chain Confidence: The Key to Effective Supply Chain Through Increased Visibility and Reliability. http://www.stanford.edu/group/scforum/Welcome/Supply%20Chain%20Confidence%20021402.pdf Department of Water Affairs and Forestry. (1997). Forestry White Paper. http://www.dwaf.gov.za/Dir_Forestry Dunne, N. (1999). The Importance of Understanding Market Demand: South African Furniture Manufacturers in the Global Economy. Research Report Number 22. Durban: School of Development Studies, University of Natal. Dunne, N. (2000). International Trends in the Timber Furniture Industry and the Implications for South African Exporters. CSDS Working Paper Number 25. Durban: School of Development Studies, University of Natal. DTI. (2002). A Review of Industrial Performance and the Prospects for the Short-Medium Term. Unpublished Paper. FSC (2001). FCS 2000 Door Sector Analysis: Japanese Door Market Research 380 Billion Yen in 2000. http://www.wwwood.net/NewsDetail.pf?&newsitemid=4158 Gereffi, G., Humphrey, J., Kaplinsky, R. and Sturgeon, T.J. (2001). Introduction: Globalisation, Value Chains and Development. IDS Bulletin, Vol. 32, No. 3. Hamel, G. and Pralahad, C.K. (1994), Competing for the Future. Cambridge: Harvard Business School Press. Humphrey, J. and Schmitz, H. (2002). How does Insertion in Global Value Chains Affect Upgrading in Industrial Clusters. Paper presented at the Value Chain Meeting, Rockport, April 2002: http://www.ids.ac.uk/ids/global/rockport.html Humphrey, J. and Schmitz, H. (2001). Governance in Global Value Chains. In IDS Bulletin, Vol. 32, No. 3. Kaplinsky, R., and Morris, M.L. (2001). A Handbook for Value Chain Research, mimeo, Institute of Development Studies, University of Sussex and School of Development Studies, University of Natal, (www.ids.ac.uk/global, and www.nu.ac.za/csds).
DEPARTMENT OF TRADE AND INDUSTRY POLICY SUPPORT PROGRAMME PROGRAMME MANAGEMENT UNIT
49
Kaplinsky, R., Morris, M.L. and Readman, J. (2001). Globalisation and Upgrading: Innovation and Learning in the Wood Furniture Value Chain. Paper prepared for UNIDO World Industrial Development Report, (forthcoming 2002). Kaplinsky, R., Morris, M.L. and Readman, J. (2002). The Globalisation of Product Markets and Immiserising Growth: Lessons from the South African Furniture Industry. World Development, (forthcoming) 30, 7. Leonard-Barton, D. (1995), Wellsprings of Knowledge. Cambridge: Harvard Business School Press. Morris, M., Barnes, J. and Dunne, N. (16 June 2001). Globalisation and Industrial Restructuring in a South African City. In Economic and Political Weekly, Vol. 36, No. 24. Pages 2157 – 2158. Movelsul (February 2002). Representatividade Do Setor Moveleiro. Pamphlet. Steinhoff International (2002). http://www.steinhoffinternational.com/ourbus.htm Teece, D., and Pisano, G. (1994). The dynamic capabilities of firms: an introduction. Industrial and Corporate Change, 3. Van Seventer, D.E.N. (January 2002). The Changing Industry Composition of the South African Economy in the 1990s. Pretoria: TIPS. Wood, A. (1997), 'Openness and wage inequality in developing countries: the Latin American challenge to East Asian conventional wisdom', World Bank Economic Review, 11, 1. Wood, A. (2001). Value Chains: An Economist’s Perspective. In IDS Bulletin, Vol. 32, No. 3. World Bank (1993). The East Asian Miracle: Economic Growth and Public Policy. New York: Oxford University Press.