Embed Size (px)
Citation preview
FINAL EIR APPENDIX G TRAFFIC STUDY

Los Angeles State Historic ParkDraft Transportation Impact Analysis
Prepared for:
AECOM1420 Kettner Blvd., Suite 500 San Diego, CA 92101
Prepared by:
Fehr & Peers201 Santa Monica Blvd., Suite 500Santa Monica, CA 90401
November 2011

TABLE OF CONTENTS
EXECUTIVE SUMMARY ............................................................................................................................... i Existing (2010) Conditions ....................................................................................................................... i Cumulative (2035) Conditions ................................................................................................................. i Congestion Management Program Analysis ........................................................................................... i
CHAPTER 1. Introduction ..................................................................................................................... 1
Report Organization ............................................................................................................................... 1
Study Area .............................................................................................................................................. 1
Analysis Methodology ............................................................................................................................. 3
CHAPTER 2. Existing (2010) Conditions ............................................................................................. 6
Data Collection And Data Sources ......................................................................................................... 6
Existing (2010) Traffic Conditions........................................................................................................... 8
CHAPTER 3. Cumulative (2035) Conditions ...................................................................................... 10
Project Description................................................................................................................................ 10
Cumulative (2035) Traffic Projections .................................................................................................. 10
Transportation System Improvements.................................................................................................. 11
Project Traffic Volumes ........................................................................................................................ 11
Project Trip Generation ............................................................................................................. 11
Project Trip Distribution............................................................................................................. 13
Project Trip Assignment ............................................................................................................ 14
Cumulative (2035) Plus Project Traffic Projections .............................................................................. 14
CHAPTER 4. Traffic Impact Analysis ................................................................................................. 17
Significant Impact Criteria ..................................................................................................................... 17
Cumulative (2035) No Project Operating Conditions ........................................................................... 18
Cumulative (2035) Plus Project Operating Conditions ......................................................................... 18
Mitigation Measures ............................................................................................................................. 18
CHAPTER 5. Congestion Management Program Analysis .............................................................. 20
CMP Threshold of SIgnificance ............................................................................................................ 20
CMP Analysis ....................................................................................................................................... 20
CHAPTER 6. Traffic Management Plan .............................................................................................. 21
Potential Off Site Parking Locations & Routes ..................................................................................... 22
Carpooling Incentives ........................................................................................................................... 23
LIST OF FIGURES
Figure 1 Study Area and Analyzed Intersections ...................................................................................... 2
Figure 2 Existing (2010) Peak Hour Traffic Volumes ................................................................................ 7
Figure 3 Cumulative (2035) No Project Peak Hour Traffic Volumes ...................................................... 12
Figure 4 Project Trip Distribution............................................................................................................. 15
Figure 5 Cumulative (2035) Plus Project Peak Hour Traffic Volumes .................................................... 16
LIST OF TABLES
Table 1 Level of Service Definitions for Signalized Intersections ................................................................. 4
Table 2 Level of Service Definitions for Unsignalized Intersections ............................................................. 5
Table 3 Intersection Traffic Operations – Existing (2010) Conditions .......................................................... 9
Table 4 Trip Generation Estimates – LASHP Project ................................................................................. 13
Table 5 City of Los Angeles Significant Transportation Impact Criteria ..................................................... 17
Table 6 Intersection Traffic Operations – Future (2035) Conditions ........................................................... 19
APPENDICES
Appendix A: Lane Configurations
Appendix B: Traffic Count Sheets
Appendix C: Level of Service Worksheets
Appendix D: Signal Warrants Worksheets
Appendix E: Existing (2010) Plus Project Conditions
Draft Transportation Impact Analysis for the Los Angeles State Historic Park Project
November 2011
i
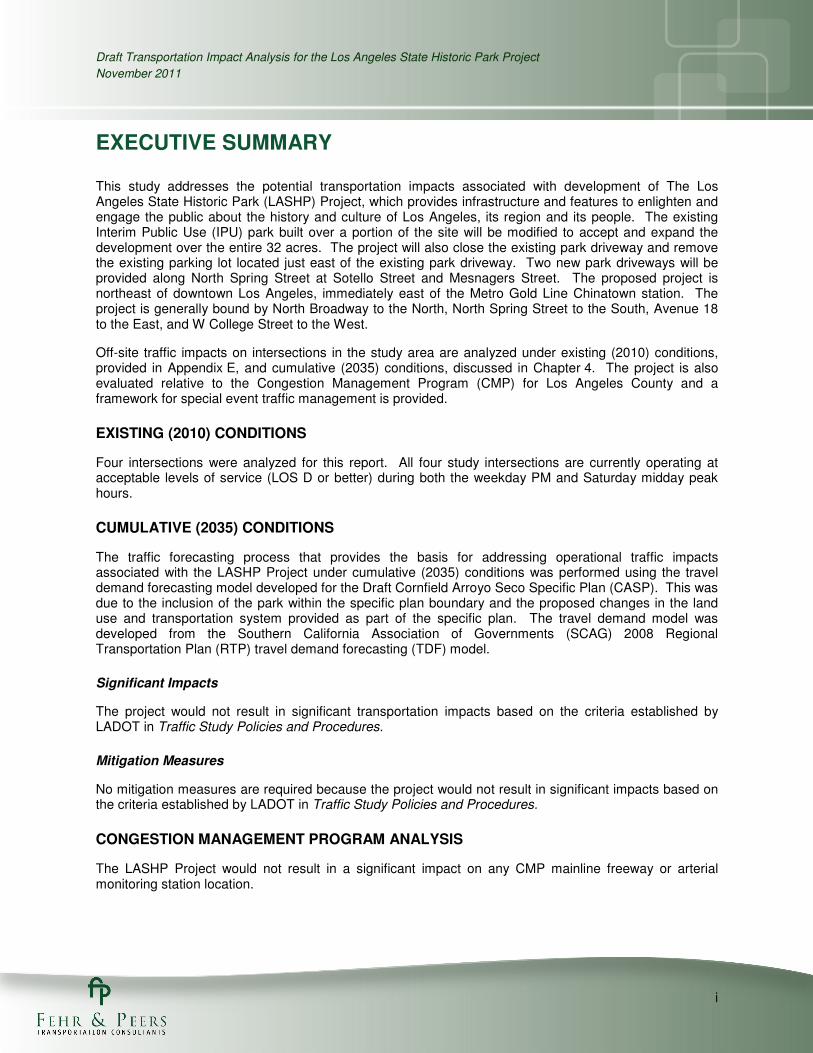
EXECUTIVE SUMMARY
This study addresses the potential transportation impacts associated with development of The Los Angeles State Historic Park (LASHP) Project, which provides infrastructure and features to enlighten and engage the public about the history and culture of Los Angeles, its region and its people. The existing Interim Public Use (IPU) park built over a portion of the site will be modified to accept and expand the development over the entire 32 acres. The project will also close the existing park driveway and remove the existing parking lot located just east of the existing park driveway. Two new park driveways will be provided along North Spring Street at Sotello Street and Mesnagers Street. The proposed project is northeast of downtown Los Angeles, immediately east of the Metro Gold Line Chinatown station. The project is generally bound by North Broadway to the North, North Spring Street to the South, Avenue 18 to the East, and W College Street to the West.
Off-site traffic impacts on intersections in the study area are analyzed under existing (2010) conditions, provided in Appendix E, and cumulative (2035) conditions, discussed in Chapter 4. The project is also evaluated relative to the Congestion Management Program (CMP) for Los Angeles County and a framework for special event traffic management is provided.
EXISTING (2010) CONDITIONS
Four intersections were analyzed for this report. All four study intersections are currently operating at acceptable levels of service (LOS D or better) during both the weekday PM and Saturday midday peak hours.
CUMULATIVE (2035) CONDITIONS
The traffic forecasting process that provides the basis for addressing operational traffic impacts associated with the LASHP Project under cumulative (2035) conditions was performed using the travel demand forecasting model developed for the Draft Cornfield Arroyo Seco Specific Plan (CASP). This was due to the inclusion of the park within the specific plan boundary and the proposed changes in the land use and transportation system provided as part of the specific plan. The travel demand model was developed from the Southern California Association of Governments (SCAG) 2008 Regional Transportation Plan (RTP) travel demand forecasting (TDF) model.
Significant Impacts
The project would not result in significant transportation impacts based on the criteria established by LADOT in Traffic Study Policies and Procedures.
Mitigation Measures
No mitigation measures are required because the project would not result in significant impacts based on the criteria established by LADOT in Traffic Study Policies and Procedures.
CONGESTION MANAGEMENT PROGRAM ANALYSIS
The LASHP Project would not result in a significant impact on any CMP mainline freeway or arterial monitoring station location.
Draft Transportation Impact Analysis for the Los Angeles State Historic Park Project
November 2011
1
CHAPTER 1. INTRODUCTION
This study addresses the potential transportation impacts associated with development of the Los Angeles State Historic Park (LASHP) Project. Off-site traffic impacts on intersections in the study area are analyzed under existing (2010) conditions, provided in Appendix E, and cumulative (2035) conditions, discussed in Chapter 4. The project is also evaluated relative to the Congestion Management Program (CMP) for Los Angeles County and a framework for special event traffic management is provided.
REPORT ORGANIZATION
The report consists of six chapters:
• Chapter 1 – Introduction
• Chapter 2 – Existing (2010) Conditions
• Chapter 3 – Cumulative (2035) Conditions
• Chapter 4 – Traffic Impact Analysis
• Chapter 5 – Congestion Management Program Analysis
• Chapter 6 – Traffic Management Plan Framework
STUDY AREA
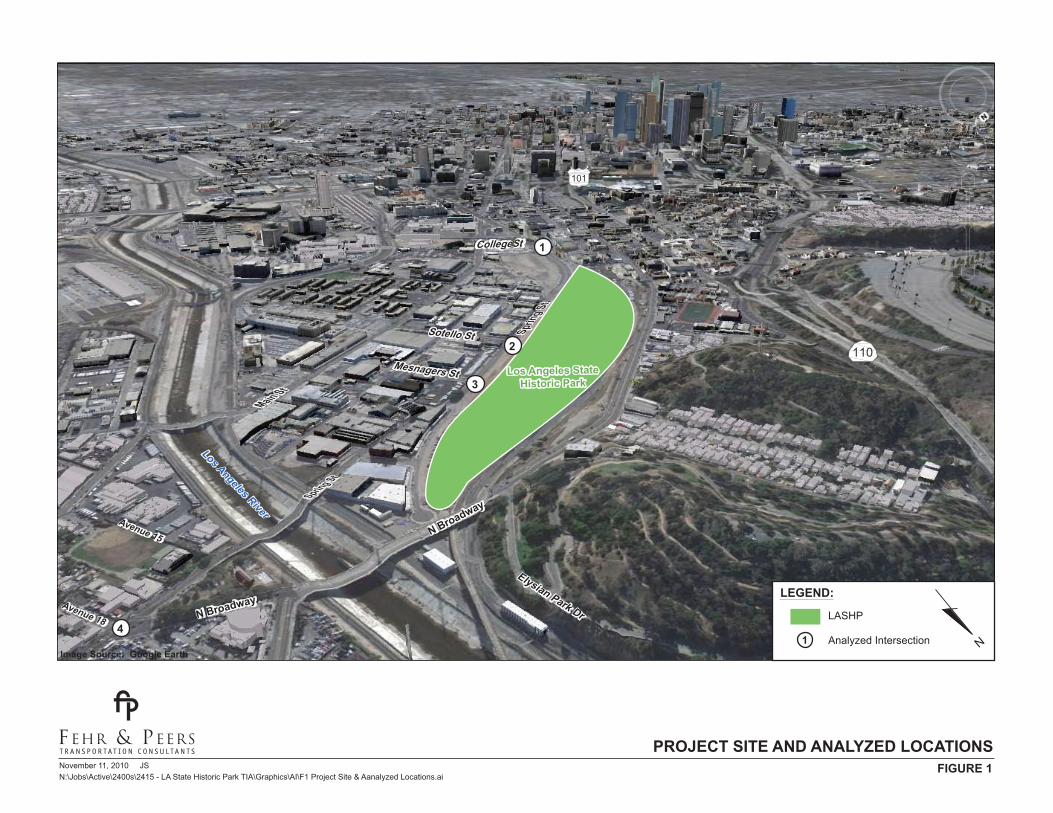
The proposed project is located northeast of downtown Los Angeles, immediately east of the Metro Gold Line Chinatown station. The project study area is generally bound by North Broadway to the north, North Spring Street to the south, Avenue 18 to the east, and West College Street to the west. Figure 1 illustrates the location of the Los Angeles State Historic Park project site and the surrounding roadways. The project study area along with study intersections were approved by the City of Los Angeles Department of Transportation (LADOT) staff.
Primary regional access to the project is provided by the Pasadena Freeway (I-110), which runs north-south, the Golden State Freeway (I-5), which runs north-south, and the Santa Ana Freeway (I-101), which runs east-west. The main arterial streets serving the project area are North Broadway, North Spring Street, and North Main Street.
Study Area Roadways
The key roadways providing access to the LASHP area include these facilities:
• Pasadena Freeway (I-110) runs north-south west of the study area and extends from its southern terminus in San Pedro to its northern terminus in South Pasadena. The Pasadena freeway generally provides three lanes in each direction through the study area. Ramps located in the study area provide access to/from Hill Street and Bishop Road/Stadium Way.
Golden State Freeway (I-5) runs north-south east of the study area and extends from Mexico in the south to Canada in the north. The Golden State Freeway generally provides four lanes in each direction through the study area. Ramps located in the study area provide access to/from Daly Street, North Broadway, and Pasadena Avenue.
November 11, 2010 JSN:\Jobs\Active\2400s\2415 - LA State Historic Park TIA\Graphics\AI\F1 Project Site & Aanalyzed Locations.ai
FIGURE 1
Image Source: Google Earth
PROJECT SITE AND ANALYZED LOCATIONS
Los Angeles StateHistoric Park
Los Angeles StateHistoric Park
4
1
3
2
Elysian Park Dr Avenue 18
N Broadway
N Broadway.
Elysian Park Dr.Avenue 18
Main StMain St.
Avenue 15
Avenue 15
Spring St
Spring St.
Sprin
g St
Sprin
g St.
Mesnagers StMesnagers St
Sotello StSotello St
College StCollegeSt
N BroadwayN Broadway.
Los Angeles River
Los Angeles River
110
101
Analyzed Intersection
LEGEND:
1
N
LASHP
Draft Transportation Impact Analysis for the Los Angeles State Historic Park Project
November 2011
3
• Santa Ana Freeway (I-101) runs in a east-west direction south of the study area and extends from its’ southern terminus at I-5 in East Los Angeles northwest along the California Coast. The Santa Ana Freeway generally provides three lanes in each direction through the study area. Ramps located in the study area provide access to/from Pleasant Avenue, Vignes Street, Commercial Street, Alameda Street, Grand Avenue, and Temple Street.
• North Broadway is classified as a Class II Major Highway that runs east-west with two lanes in each direction plus left-turn channelization at most intersections through the study area. Parking is generally allowed along most of North Broadway and the posted speed limit is 35 mph.
• North Spring Street is classified as a Class II Major Highway that runs east-west with two lanes in each direction through the study area. Parking is generally not allowed along most of North Spring Street and the posted speed limit is 35 mph.
• North Main Street is classified as a Secondary Highway that runs east-west with two lanes in each direction through the study area. Parking is generally not allowed along most of North Spring Street and the posted speed limit ranges from 30 to 35 mph.
Study Intersections
The analyzed study intersections were selected in conjunction with LADOT. Four intersections were selected for analysis; two signalized intersections were selected for operational analysis, while two unsignalized intersections were selected for signal warrant analysis. These locations are shown on Figure 1:
1. North Spring Street & West College Street (signalized)
2. North Spring Street & Sotello Street (unsignalized)
3. North Spring Street & Mesnagers Street (unsignalized)
4. North Spring Street/North Broadway & South Avenue 18 (signalized)
ANALYSIS METHODOLOGY
Level of service (LOS) is a qualitative measure describing the operating condition of intersections and roadways. LOS ranges from A through F, which represents driving conditions from best to worst, respectively. In general, LOS A represents free-flow conditions with no congestion, and LOS F represents severe congestion and delay under stop-and-go conditions.
Intersection level of service was calculated using the Critical Movement Analysis (CMA) methodology or the Highway Capacity Manual (HCM) (Transportation Research Board, 2000) unsignalized methodology to assess the estimated operating conditions in the weekday PM and Saturday midday peak hours. Both analysis methodologies use intersection geometries, traffic control, and traffic volumes to determine level of service.
LADOT requires that the CMA methodology of intersection capacity analysis be used to determine the intersection volume-to-capacity (V/C) ratio and corresponding level of service at signalized intersections within the City of Los Angeles. The signalized intersection analysis was performed using the City’s CalcaDB intersection analysis software. This software, developed by LADOT, is used to determine the ratio of critical turning movements at the intersection to its capacity.
In accordance with LADOT analysis procedures, the V/C ratio calculated using the CMA methodology is further reduced by 0.07 for those intersections included in the Automated Traffic Surveillance and Control
Draft Transportation Impact Analysis for the Los Angeles State Historic Park Project
November 2011
4
(ATSAC) system and an additional 0.03 for intersections with Adaptive Traffic Control System (ATSC), to account for the improved operation and increased efficiency from the ATSAC/ATCS system that is not captured in the CMA methodology. Intersection V/C reductions were applied outside the CalcaDB intersection analysis software.
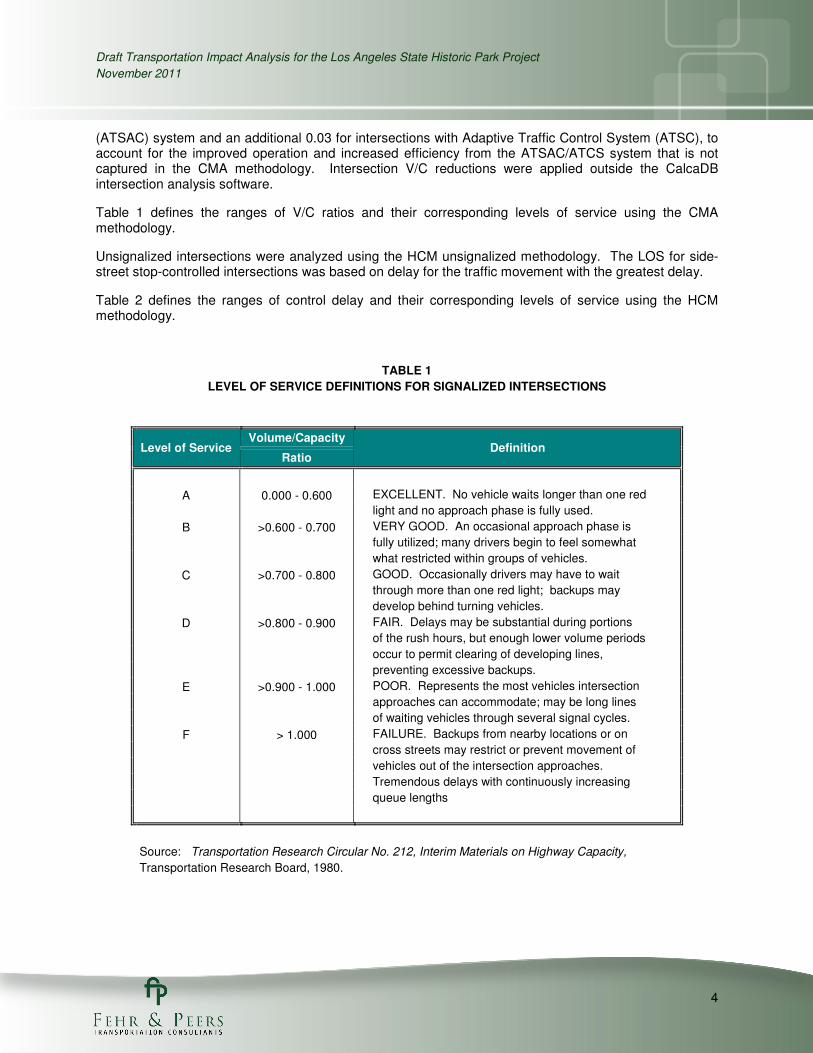
Table 1 defines the ranges of V/C ratios and their corresponding levels of service using the CMA methodology.
Unsignalized intersections were analyzed using the HCM unsignalized methodology. The LOS for side-street stop-controlled intersections was based on delay for the traffic movement with the greatest delay.
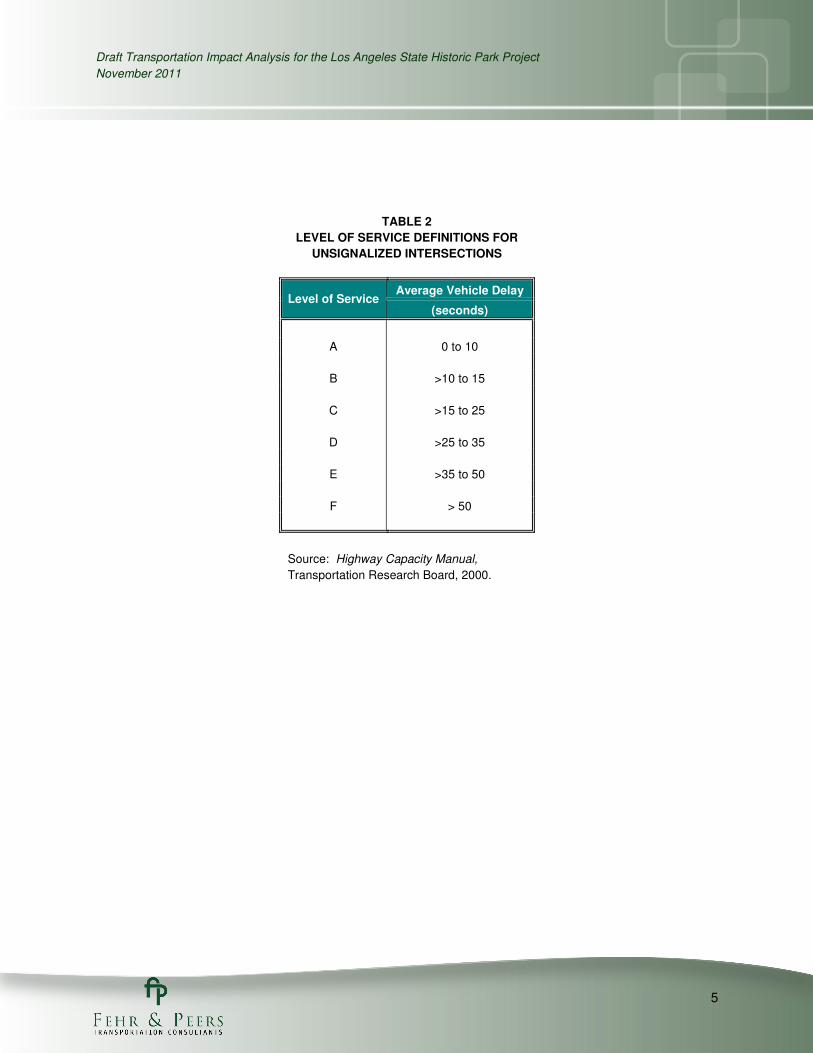
Table 2 defines the ranges of control delay and their corresponding levels of service using the HCM methodology.
TABLE 1
LEVEL OF SERVICE DEFINITIONS FOR SIGNALIZED INTERSECTIONS
Level of Service Volume/Capacity
Definition Ratio
A 0.000 - 0.600 EXCELLENT. No vehicle waits longer than one red
light and no approach phase is fully used.
B >0.600 - 0.700 VERY GOOD. An occasional approach phase is
fully utilized; many drivers begin to feel somewhat
what restricted within groups of vehicles.
C >0.700 - 0.800 GOOD. Occasionally drivers may have to wait
through more than one red light; backups may
develop behind turning vehicles.
D >0.800 - 0.900 FAIR. Delays may be substantial during portions
of the rush hours, but enough lower volume periods
occur to permit clearing of developing lines,
preventing excessive backups.
E >0.900 - 1.000 POOR. Represents the most vehicles intersection
approaches can accommodate; may be long lines
of waiting vehicles through several signal cycles.
F > 1.000 FAILURE. Backups from nearby locations or on
cross streets may restrict or prevent movement of
vehicles out of the intersection approaches.
Tremendous delays with continuously increasing
queue lengths
Source: Transportation Research Circular No. 212, Interim Materials on Highway Capacity,
Transportation Research Board, 1980.
Draft Transportation Impact Analysis for the Los Angeles State Historic Park Project
November 2011
5
TABLE 2
LEVEL OF SERVICE DEFINITIONS FOR
UNSIGNALIZED INTERSECTIONS
Level of Service Average Vehicle Delay
(seconds)
A 0 to 10
B >10 to 15
C >15 to 25
D >25 to 35
E >35 to 50
F > 50
Source: Highway Capacity Manual,
Transportation Research Board, 2000.
Draft Transportation Impact Analysis for the Los Angeles State Historic Park Project
November 2011
6
CHAPTER 2. EXISTING (2010) CONDITIONS
This chapter contains details of the comprehensive data collection effort undertaken to develop a detailed description of existing conditions in the study area. The assessment of conditions relevant to this study includes traffic control and geometry at study intersections, traffic volumes at these facilities, the public transit service and bicycle/pedestrian facilities in the study area, and operating conditions at study intersections.
DATA COLLECTION AND DATA SOURCES
Intersection Traffic Control and Geometry
Information concerning traffic control was determined during field observations. LADOT provided information on whether the signalized study intersections were under the control of ATSAC/ATCS. The ATSAC system provides for monitoring of intersection traffic conditions and the flexibility to adjust traffic signal timing in response to current conditions. The ATCS system continuously detects vehicular traffic volumes and computes “optimal” signal timings based on the detected volumes that can be implemented in the field. The following intersections are included in the ATSAC and ATCS systems:
2. North Spring Street & West College Street (ATCS assumed only under 2035 conditions)
4. North Spring Street/North Broadway & South Avenue 18
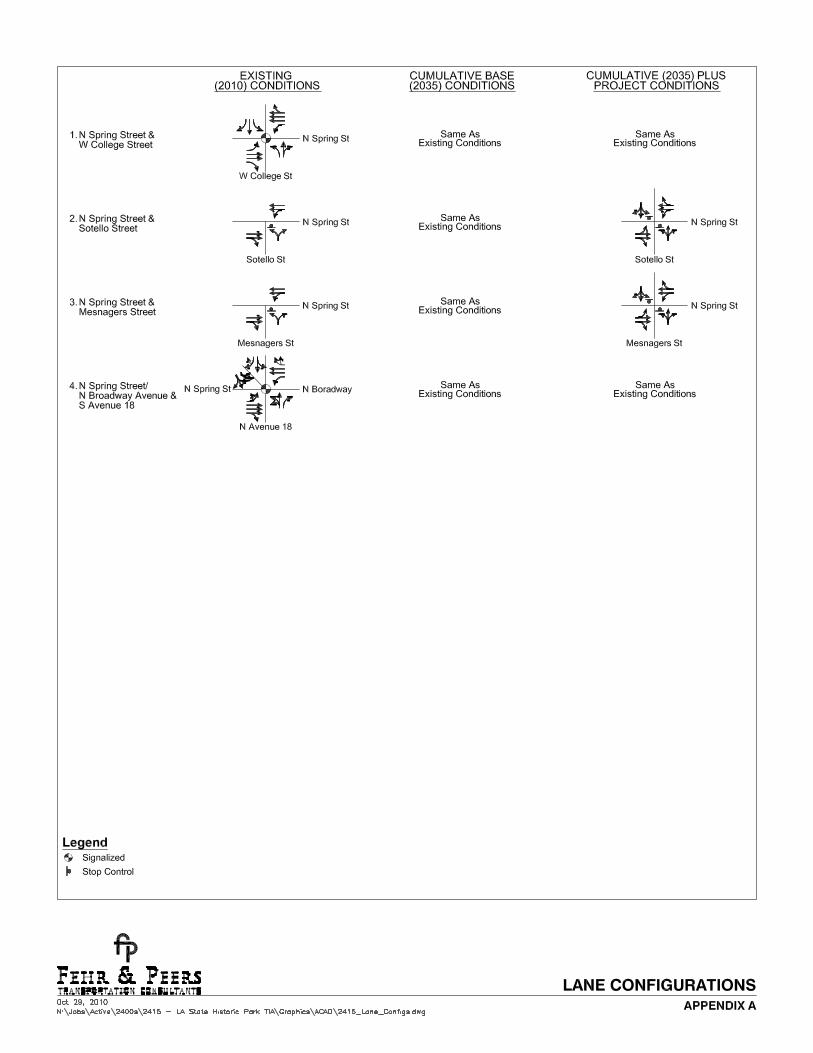
In addition to the information regarding intersection traffic control, detailed information was collected concerning the lane configurations on all approaches to the study intersections and can be found in Appendix A. Signal phasing information was also collected to determine the presence of protected, permitted, split, and right-turn overlap phasing.
Traffic Count Data
Traffic counts were collected at the study intersections listed in Chapter 1. The study intersections were counted during the weekday PM (4:00 to 6:00 PM) and Saturday midday (11:00 AM to 4:00 PM) peak periods and the peak hour traffic volumes were determined at each study intersection and used as the basis for the existing traffic operations analysis. Typically the weekday AM and PM peak periods are selected for the traffic operations analysis. However, limited vehicle activity was observed at the project site during weekday AM peak period field visits. A Saturday midday peak period analysis was supplemented for the weekday AM peak period analysis due to higher vehicle activity levels observed at the project site.
Traffic counts were collected in September 2010 at the four study intersections. Traffic count data sheets are provided in Appendix B, and the existing traffic volumes are illustrated on Figure 2.
Traffic counts were also collected at the existing park driveway, which will be closed as part of the proposed project, to determine existing park trip generation rates. During field observations at the existing park, it was determined that park patrons also utilized the on-street parking along North Spring Street and the parking lot outside the existing project driveway. Therefore, a parking survey was conducted on the parking lot just east of the existing park driveway and along North Spring Street. Particular attention was paid to whether vehicles parking either in the lot or along North Spring Street utilized the park since it was observed that the parking facilities were also used for other uses in the area.

Novermber 10, 2010 JSN:\Jobs\Active\2400s\2415 - LA State Historic Park TIA\Graphics\AI\F3-F6 Vols
Image Source: Google Earth
Los Angeles StateHistoric Park
Los Angeles StateHistoric Park
4
1
3
2
Elysian Park Dr
Avenue 18
Townsend St.
Elysian Park Dr
De Haro St.
12th St.
N Broadway
12th St.
N Broadway.
Elysian Park Dr.Avenue 18
Townsend St.
Main StMain St.
Elysian Park Dr
De Haro St.
101
110 Avenue 15
Avenue 15
Spring St
Spring St.
Bak
er S
tB
aker
St.
College StCollege St Sprin
g St
Sprin
g St.
Mesnagers StMesnagers St
Sotello StSotello St
College StCollegeSt
N BroadwayN Broadway.
Los Angeles River
Los Angeles River
101
Analyzed Intersection
LEGEND:
1
Weekday PM(Saturday MID)Peak Hour
N
LASHP
X(Y)
1
3
2
4
N
N
N
N
32 (16)
12 (9
)42
(10)
1,327 (524)
Broadway
Spring St
Sot
ello
St
282 (345)
N A
venu
e 18
Col
lege
St
Spring St
37 (36)
1,155 (316)
21 (1
2)53
(53)
19 (1
1)11 (13)
484 (156)
288 (281)43 (58)
4 (6)
102
(132
)71
(64)
103
(72)
Spring St
Mes
nage
rs S
t12 (15)
2 (2
)23
(4)
1,357 (519)
317 (379)10 (3)
Spring St
13 (2
0)17
(12)
12 (7
)8
(16)
25 (1
1)15
(2)
31 (2
8)
270 (327)547 (317)
23 (20)
906 (491)
15 (12)
125 (19)
18 (12)
10 (8)520 (341)
5 (1
)
0 (4)
19 (8)
7 (24)
EXISTING (2010)PEAK HOUR TRAFFIC VOLUMES
FIGURE 2
Draft Transportation Impact Analysis for the Los Angeles State Historic Park Project
November 2011
8
Existing Public Transit Service
The project study area is currently being served by eight different transit lines. These transit lines are listed below and consist of Los Angeles County Transportation Authority (Metro) lines and Santa Clarita Transit lines. Given the proximity of the projects to existing transit lines, it is likely patrons will use transit service to access the project. However, no park patron was observed using the transit system during the collection of traffic count data.
Metro
• Metro Gold Line (Light Rail)
• Metro Local and Limited Lines: 45, 76, 83, and 84 (Bus)
• Metro DASH Line B (Bus)
• Metro DASH Lincoln Heights/Chinatown Line (Bus)
San Clarita Transit
• Santa Clarita Transit Line 799 (Bus)
Existing Bicycle and Pedestrian Facilities
Bicycle and pedestrian facilities exist near the project throughout the study area. Crosswalks are generally provided at signalized intersections, and sidewalks exist along the frontage of most developed properties. However, Class II (on-street with signing and striping) bike lanes are generally not provided through the study area, and bicyclists must “share the road” with vehicles.
EXISTING (2010) TRAFFIC CONDITIONS
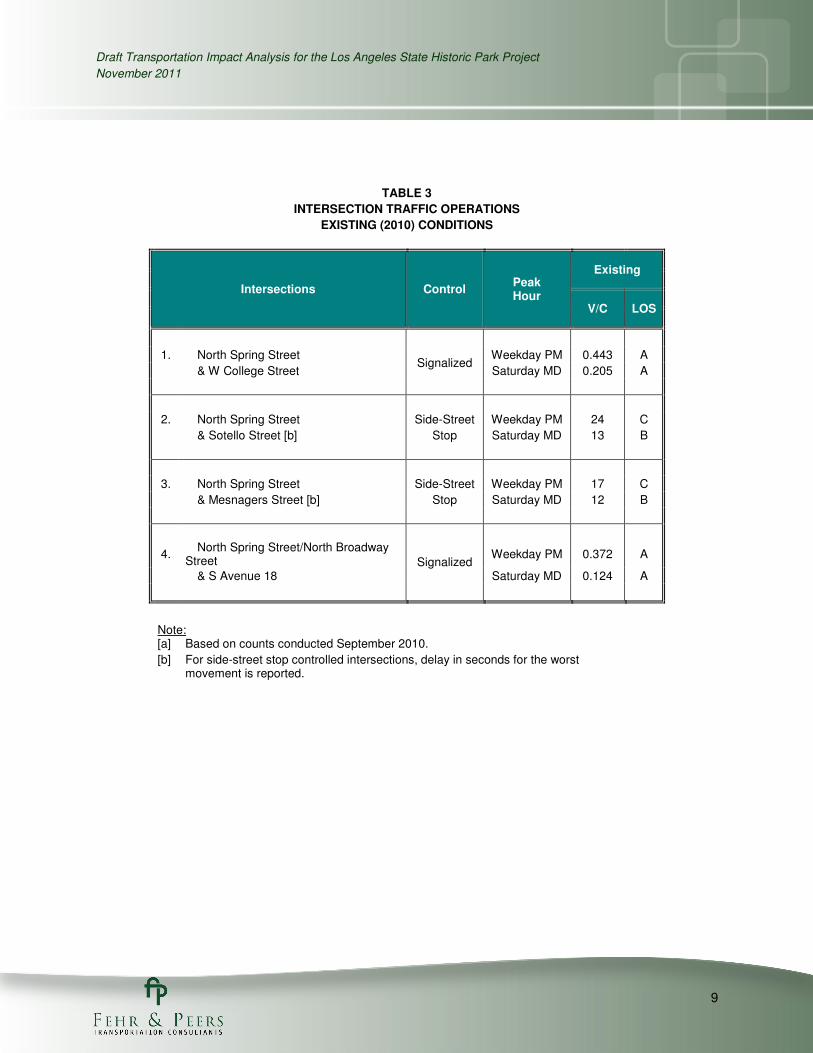
Traffic operations were analyzed at each study intersection using the procedures described in Chapter 1. Table 3 summarizes the weekday PM and Saturday midday peak hour V/C or delay and corresponding LOS at each of the study intersections. Refer to Appendix B for technical calculations (including traffic control, signal phasing, and lane geometries).
As shown in Table 3, the four study intersections currently operate at acceptable levels of service (LOS D or better) during both the weekday PM and Saturday midday peak hours.
Draft Transportation Impact Analysis for the Los Angeles State Historic Park Project
November 2011
9
TABLE 3
INTERSECTION TRAFFIC OPERATIONS
EXISTING (2010) CONDITIONS
Intersections Control Peak Hour
Existing
V/C LOS
1. North Spring Street Signalized
Weekday PM 0.443 A
& W College Street Saturday MD 0.205 A
2. North Spring Street Side-Street Weekday PM 24 C
& Sotello Street [b] Stop Saturday MD 13 B
3. North Spring Street Side-Street Weekday PM 17 C
& Mesnagers Street [b] Stop Saturday MD 12 B
4. North Spring Street/North Broadway
Street Signalized Weekday PM 0.372 A
& S Avenue 18 Saturday MD 0.124 A
Note: [a] Based on counts conducted September 2010.
[b] For side-street stop controlled intersections, delay in seconds for the worst movement is reported.
Draft Transportation Impact Analysis for the Los Angeles State Historic Park Project
November 2011
10
CHAPTER 3. CUMULATIVE (2035) CONDITIONS
This chapter analyses cumulative (2035) transportation conditions in the study area without and with the proposed project. In order to evaluate the potential impacts of the proposed project on the local street system, it was necessary to develop estimates of future conditions both without and with the proposed project. The cumulative (2035) no project traffic scenario represents future traffic conditions without the addition of the proposed project. The cumulative (2035) plus project scenario represents future traffic conditions with the development of the proposed project.
PROJECT DESCRIPTION
The LASHP project represents significant open space within the City of Los Angeles - Cornfield Arroyo Seco Area Specific Plan which is classified as a community redevelopment area (CRA). It will provide infrastructure and features to enlighten and engage the public about the history and culture of Los Angeles, its region and its people – a theme that is not adequately covered in other units of the State Park System. The project scope includes a multi-use plaza, flexible outdoor spaces to accommodate a variety and size of public events, a “great lawn” featuring an amphitheater/stage space for special events/performances for up to 25,000 people and for unstructured activities, interpretive paths and portals for engaging historic themes and content using traditional and new technologies, permanent restrooms, operations yard with access road, a “Welcome Station” structure, an interpretive and administration center, pedestrian and vehicle circulation systems, an interactive fountain/water feature(s), a children’s play area and cultural gardens. The existing Interim Public Use (IPU) park built over a portion of the site will be modified to accept and expand the development over the entire 32 acres. The project will also close the existing park driveway and remove the existing parking lot located just east of the existing park driveway. Two new park driveways will be provided along North Spring Street at Sotello Street and Mesnagers Street.
CUMULATIVE (2035) TRAFFIC PROJECTIONS
The traffic forecasting process that provides the basis for addressing operational traffic impacts associated with the LASHP Project under cumulative (2035) conditions was performed using the travel demand forecasting model developed for the Draft Cornfield Arroyo Seco Specific Plan (CASP) Transportation Impact Analysis. This was due to the inclusion of the park within the specific plan boundary and the proposed changes in the land use and transportation system provided as part of the specific plan. The travel demand model was developed from the Southern California Association of Governments (SCAG) 2008 Regional Transportation Plan (RTP) travel demand forecasting (TDF) model. The SCAG 2008 RTP model focuses on estimating regional travel for the entire southern California region. Since the CASP is a local, rather than a regional, planning document, it was necessary to supplement the SCAG 2008 RTP model with a more detailed sub-area model.
The Draft CASP 2035 traffic forecasts were developed by modifying the SCAG 2008 RTP model roadway network to match the roadway network of the CASP Preferred Alternative. Land use in the project study area was also modified based on the Preferred Alternative land use plan. Vehicle trips generated by the Preferred Alternative were distributed and assigned to the regional roadway network by the model. This method was chosen over manually assigning trips to the model roadway network due to the size of the CASP project study area as well as to account for the redistribution that would likely occur from the project’s proximity to downtown Los Angeles and other neighboring communities.
Since the Draft CASP 2035 traffic forecasts were based on the SCAG 2008 RTP model, they account for the forecasted growth in population, employment, households, and housing units in the SCAG region by 2035, as forecasted by the SCAG 2008 “Integrated Growth Forecasting” process. This process provided the basis for developing the land use assumptions at the regional as well as small area levels of the
Draft Transportation Impact Analysis for the Los Angeles State Historic Park Project
November 2011
11
model. Additionally, the model was checked to ensure infrastructure projects such as high-occupancy vehicle lanes on I-5 and the North Spring Street Bridge Widening project were included as well as development projects such as the Ritz Carlton/Marriott Convention Center Hotel, New Genesis Apartments, and China Town Gateway, which were not completed when traffic counts were collected in September 2010.
The projected traffic volumes representing cumulative (2035) no project conditions are shown on Figure 3.
TRANSPORTATION SYSTEM IMPROVEMENTS
Physical street system improvements included as part of the Draft CASP were included in the analysis of cumulative (2035) conditions. Physical street system improvements in the vicinity of the study area include the reduction in travel lanes along Pasadena Avenue between N Broadway and Avenue 26 from two to one lane in each direction, the reduction in travel lanes along Avenue 26 between Lacy Street and Spring Street from two to one lane in each direction, and the reclassification of Spring Street between College Street and N Broadway from a modified secondary to a modified collector.
PROJECT TRAFFIC VOLUMES
Projection of project traffic volumes involved a three-step process including trip generation, trip distribution, and trip assignment.
Project Trip Generation
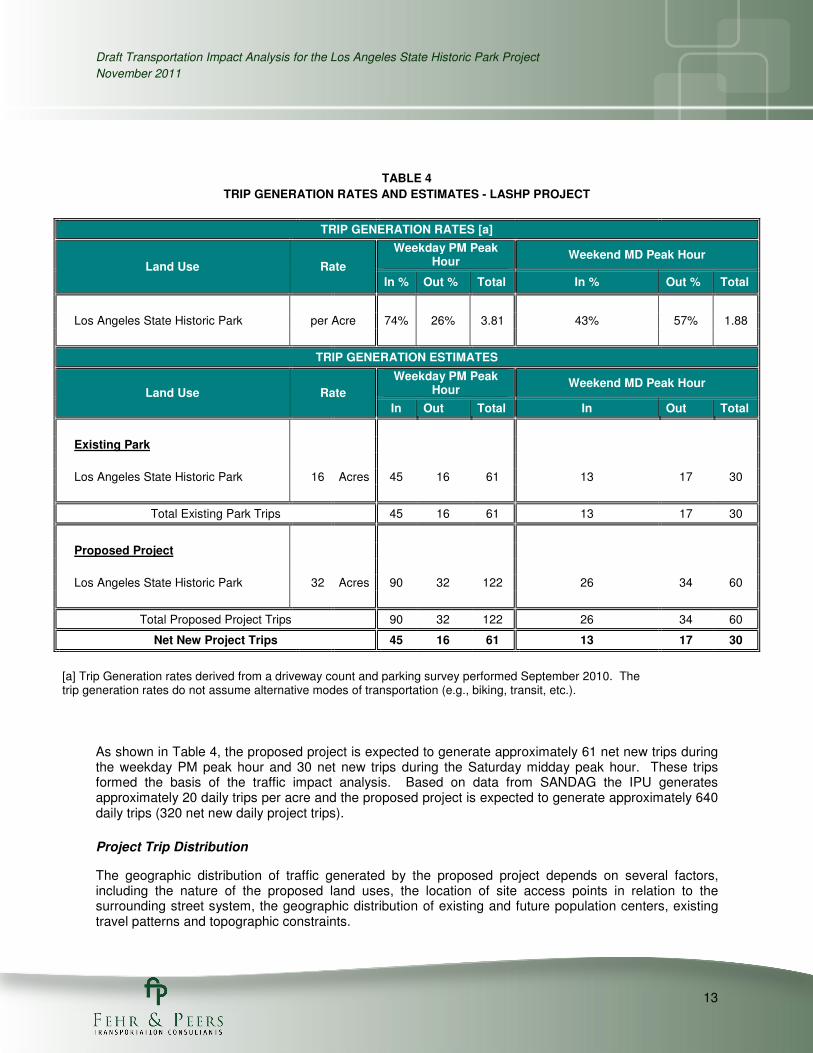
Vehicle trip generation rates for the proposed park expansion were derived from traffic counts collected at the existing park driveway and a parking survey conducted at the parking lot located just east of the existing project driveway and on-street parking along North Spring Street. The observed park trip generation rates were then compared against data from the Institute of Transportation Engineers (ITE) and the San Diego Association of Governments (SANDAG). The observed vehicle trip generation rates exceeded ITE’s PM peak hour regional park rate of 1.1 and Saturday midday peak hour rate of 1.68, as well as SANDAG’s PM peak hour regional developed park rate of 1.8. The observed trip generation rates and resulting trip generation estimates for the LASHP project are summarized in Table 4.

Novermber 10, 2010 JSN:\Jobs\Active\2400s\2415 - LA State Historic Park TIA\Graphics\AI\F3-F6 Vols
Image Source: Google Earth
Los Angeles StateHistoric Park
Los Angeles StateHistoric Park
4
1
3
2
Elysian Park Dr
Avenue 18
N Broadway
N Broadway.
Elysian Park Dr.Avenue 18
Main StMain St.
Avenue 15
Avenue 15
Spring St
Spring St.
Sprin
g St
Sprin
g St.
Mesnagers StMesnagers St
Sotello StSotello St
College StCollegeSt
N BroadwayN Broadway.
Los Angeles River
Los Angeles River
101
Analyzed Intersection
LEGEND:
1
Weekday PM(Saturday MID)Peak Hour
N
LASHP
X(Y)
1
3
2
4
N
N
N
N
40 (20)
180
(140
)28
0 (1
70)
1,285 (504)
Broadway
Spring St
Sot
ello
St
183 (275)
N A
venu
e 18
Col
lege
St
Spring St
200 (200)
1,108 (304)30 (40)
10 (10)
321 (321)10 (20)
20 (30)
10 (2
0)16
0 (1
50)
10 (1
0)
Spring St
Mes
nage
rs S
t20 (30)
40 (4
0)19
0 (1
40)
1,545 (644)
343 (435)60 (20)
Spring St
30 (5
0)90
(70)
30 (2
0)30
(60)
50 (3
0)60
(10)
90 (9
0)
313 (395)480 (280)
30 (30)
1,715 (934)
30 (30)
10 (10)
20 (20)
20 (20)1,000 (660)
10 (1
0)
10 (10)
10 (10)
40 (140)
CUMULATIVE (2035) NO PROJECTPEAK HOUR TRAFFIC VOLUMES
FIGURE 3
60 (4
0)12
0 (1
20)
30 (2
0)
Draft Transportation Impact Analysis for the Los Angeles State Historic Park Project
November 2011
13
TABLE 4
TRIP GENERATION RATES AND ESTIMATES - LASHP PROJECT
TRIP GENERATION RATES [a]
Land Use Rate
Weekday PM Peak Hour
Weekend MD Peak Hour
In % Out % Total In % Out % Total
Los Angeles State Historic Park per Acre 74% 26% 3.81 43% 57% 1.88
TRIP GENERATION ESTIMATES
Land Use Rate
Weekday PM Peak Hour
Weekend MD Peak Hour
In Out Total In Out Total
Existing Park
Los Angeles State Historic Park 16 Acres 45 16 61 13 17 30
Total Existing Park Trips 45 16 61 13 17 30
Proposed Project
Los Angeles State Historic Park 32 Acres 90 32 122 26 34 60
Total Proposed Project Trips 90 32 122 26 34 60
Net New Project Trips 45 16 61 13 17 30
[a] Trip Generation rates derived from a driveway count and parking survey performed September 2010. The trip generation rates do not assume alternative modes of transportation (e.g., biking, transit, etc.).
As shown in Table 4, the proposed project is expected to generate approximately 61 net new trips during the weekday PM peak hour and 30 net new trips during the Saturday midday peak hour. These trips formed the basis of the traffic impact analysis. Based on data from SANDAG the IPU generates approximately 20 daily trips per acre and the proposed project is expected to generate approximately 640 daily trips (320 net new daily project trips).
Project Trip Distribution
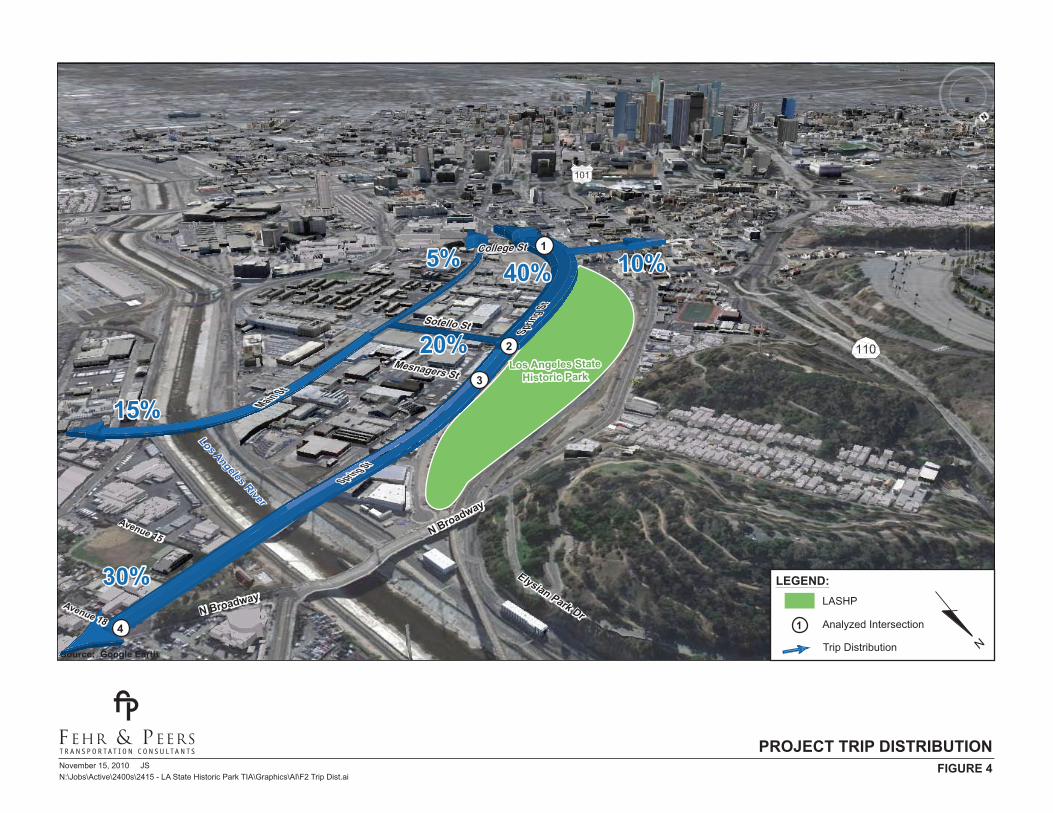
The geographic distribution of traffic generated by the proposed project depends on several factors, including the nature of the proposed land uses, the location of site access points in relation to the surrounding street system, the geographic distribution of existing and future population centers, existing travel patterns and topographic constraints.
Draft Transportation Impact Analysis for the Los Angeles State Historic Park Project
November 2011
14
The estimated distribution of trips generated by the proposed project was developed with the aid of traffic counts performed at the park driveway and the parking survey conducted at the parking lot located just east of the existing park driveway and on the on-street parking along North Spring Street. Following approval from City staff, the trip distribution pattern illustrated in Figure 4 and described below was used in this analysis:
• 10% to/from the north
• 45% to/from the east
• 45% to/from the west
Project Trip Assignment
The trip generation estimates summarized in Table 4 and the trip distribution pattern illustrated on Figure 4 were used to assign the project-related traffic to the local and regional roadway system. Existing traffic, which currently uses the existing park driveway and adjacent parking lot, both of which will be closed as part of the proposed project, was rerouted to the two new project driveways proposed by the project under cumulative (2035) plus project conditions.
CUMULATIVE (2035) PLUS PROJECT TRAFFIC PROJECTIONS
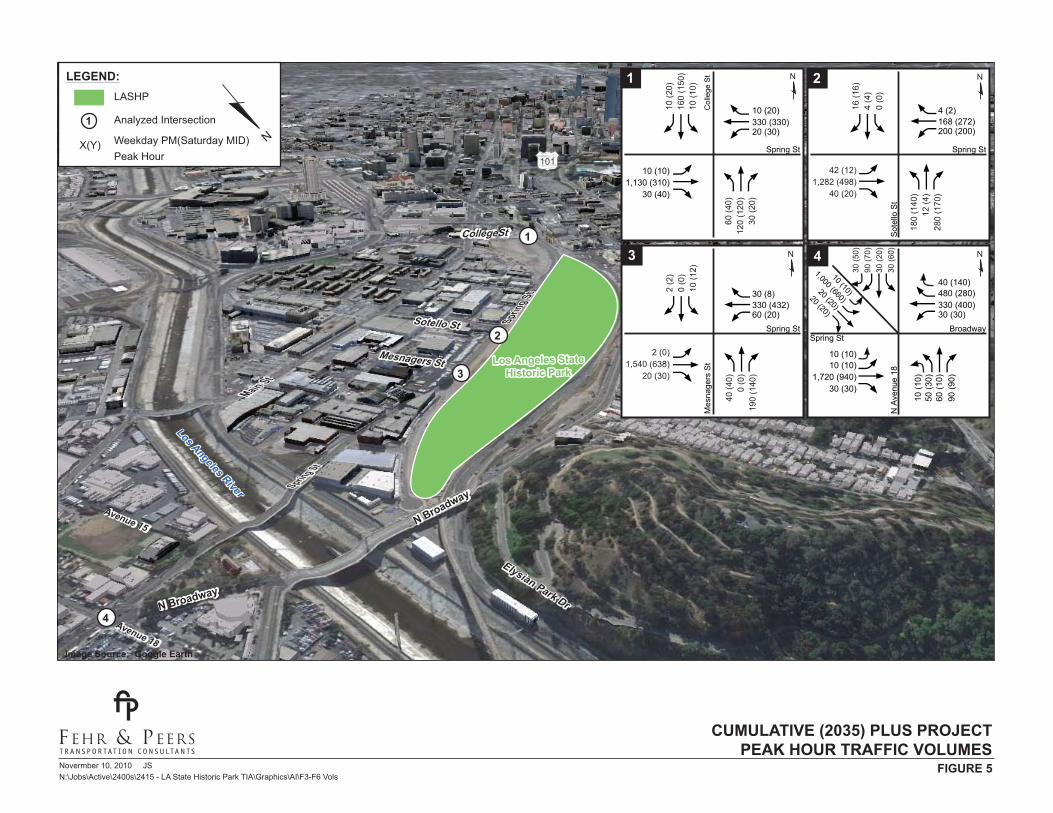
The proposed project traffic volumes were then added to the cumulative (2035) no project traffic projections to develop the cumulative (2035) plus project traffic projections. Figure 5 illustrates the resulting projected cumulative (2035) plus project traffic volumes for a typical weekday PM and Saturday midday peak hour, representing future traffic conditions following completion of the proposed project.
November 15, 2010 JSN:\Jobs\Active\2400s\2415 - LA State Historic Park TIA\Graphics\AI\F2 Trip Dist.ai
FIGURE 4
Source: Google Earth
PROJECT TRIP DISTRIBUTION
Los Angeles StateHistoric Park
Los Angeles StateHistoric Park
FIGURE 2
NORTH-SOUTH CORRIDORS FORECASTED TRAFFIC GROWTH
5%5%
15%15%
10%10%
30%30%
40%40%
20%20%
4
1
3
2
Elysian Park Dr Avenue 18
N Broadway
N Broadway.
Elysian Park Dr.Avenue 18
Main StMain St.
Avenue 15
Avenue 15
Spring StSpring St.
Sprin
g St
Sprin
g St.
Mesnagers StMesnagers St
Sotello StSotello St
College StCollege St
N BroadwayN Broadway.
Los Angeles River
Los Angeles River
110
101N
Trip Distribution
Analyzed Intersection
LEGEND:
1
LASHP
Novermber 10, 2010 JSN:\Jobs\Active\2400s\2415 - LA State Historic Park TIA\Graphics\AI\F3-F6 Vols
Image Source: Google Earth
Los Angeles StateHistoric Park
Los Angeles StateHistoric Park
4
1
3
2
Elysian Park Dr
Avenue 18
N Broadway
N Broadway.
Elysian Park Dr.Avenue 18
Main StMain St.
Avenue 15
Avenue 15
Spring St
Spring St.
Sprin
g St
Sprin
g St.
Mesnagers StMesnagers St
Sotello StSotello St
College StCollegeSt
N BroadwayN Broadway.
Los Angeles River
Los Angeles River
101
Analyzed Intersection
LEGEND:
1
Weekday PM(Saturday MID)Peak Hour
N
LASHP
X(Y)
1
3
2
4
N
N
N
N
Broadway
Spring St
Sot
ello
St
168 (272)
N A
venu
e 18
Col
lege
St
Spring St
200 (200)
1,130 (310)30 (40)
10 (10)
330 (330)10 (20)
20 (30)
10 (2
0)16
0 (1
50)
10 (1
0)
Spring St
Mes
nage
rs S
t
Spring St
30 (5
0)90
(70)
30 (2
0)30
(60)
50 (3
0)60
(10)
90 (9
0)
330 (400)480 (280)
30 (30)
1,720 (940)
30 (30)
10 (10)
20 (20)
20 (20)1,000 (660)
10 (1
0)
10 (10)
10 (10)
40 (140)
CUMULATIVE (2035) PLUS PROJECTPEAK HOUR TRAFFIC VOLUMES
FIGURE 5
60 (4
0)12
0 (1
20)
30 (2
0)
180
(140
)12
(4)
280
(170
)
16 (1
6)4
(4)
0 (0
)
4 (2)
42 (12)1,282 (498)
40 (20)
330 (432)60 (20)
40 (4
0)0
(0)
190
(140
)
2 (2)
0 (0
)10
(12)
30 (8)
2 (0)1,540 (638)
20 (30)
Draft Transportation Impact Analysis for the Los Angeles State Historic Park Project
November 2011
17
CHAPTER 4. TRAFFIC IMPACT ANALYSIS
This section presents an analysis of the projected future volumes to determine the potential impacts of the proposed project on the operating conditions of the surrounding street system.
SIGNIFICANT IMPACT CRITERIA
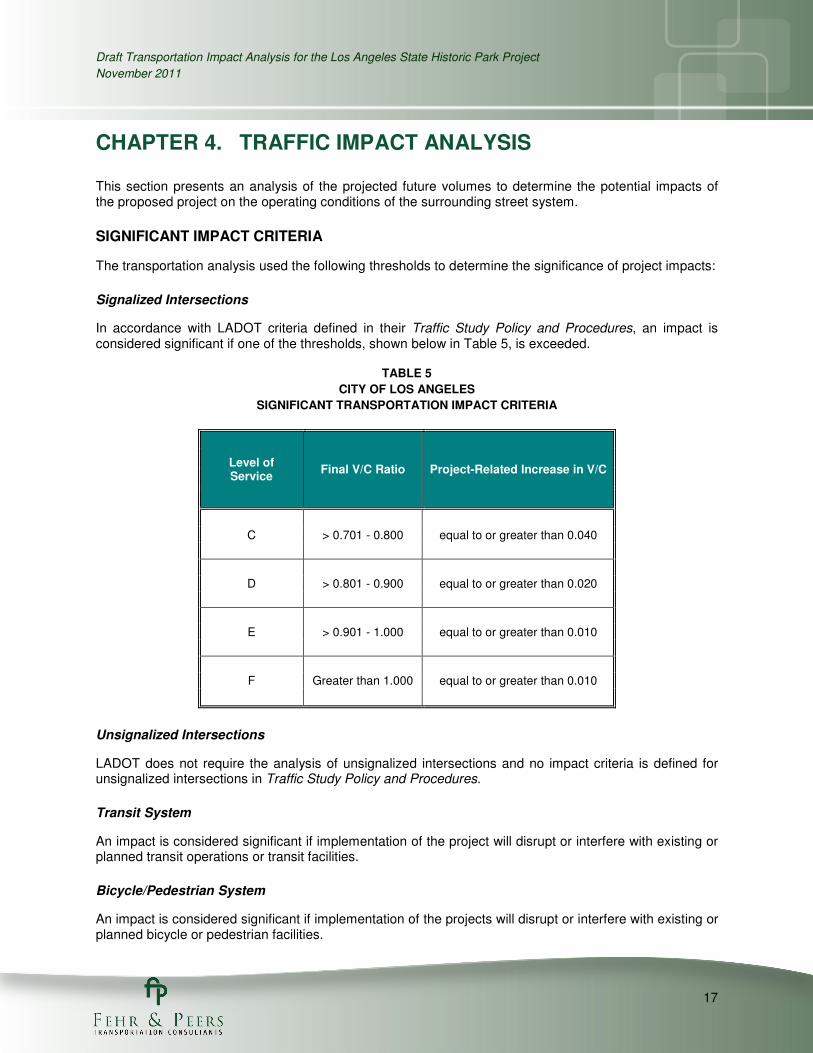
The transportation analysis used the following thresholds to determine the significance of project impacts:
Signalized Intersections
In accordance with LADOT criteria defined in their Traffic Study Policy and Procedures, an impact is considered significant if one of the thresholds, shown below in Table 5, is exceeded.
TABLE 5
CITY OF LOS ANGELES
SIGNIFICANT TRANSPORTATION IMPACT CRITERIA
Level of Service
Final V/C Ratio Project-Related Increase in V/C
C > 0.701 - 0.800 equal to or greater than 0.040
D > 0.801 - 0.900 equal to or greater than 0.020
E > 0.901 - 1.000 equal to or greater than 0.010
F Greater than 1.000 equal to or greater than 0.010
Unsignalized Intersections
LADOT does not require the analysis of unsignalized intersections and no impact criteria is defined for unsignalized intersections in Traffic Study Policy and Procedures.
Transit System
An impact is considered significant if implementation of the project will disrupt or interfere with existing or planned transit operations or transit facilities.
Bicycle/Pedestrian System
An impact is considered significant if implementation of the projects will disrupt or interfere with existing or planned bicycle or pedestrian facilities.
Draft Transportation Impact Analysis for the Los Angeles State Historic Park Project
November 2011
18
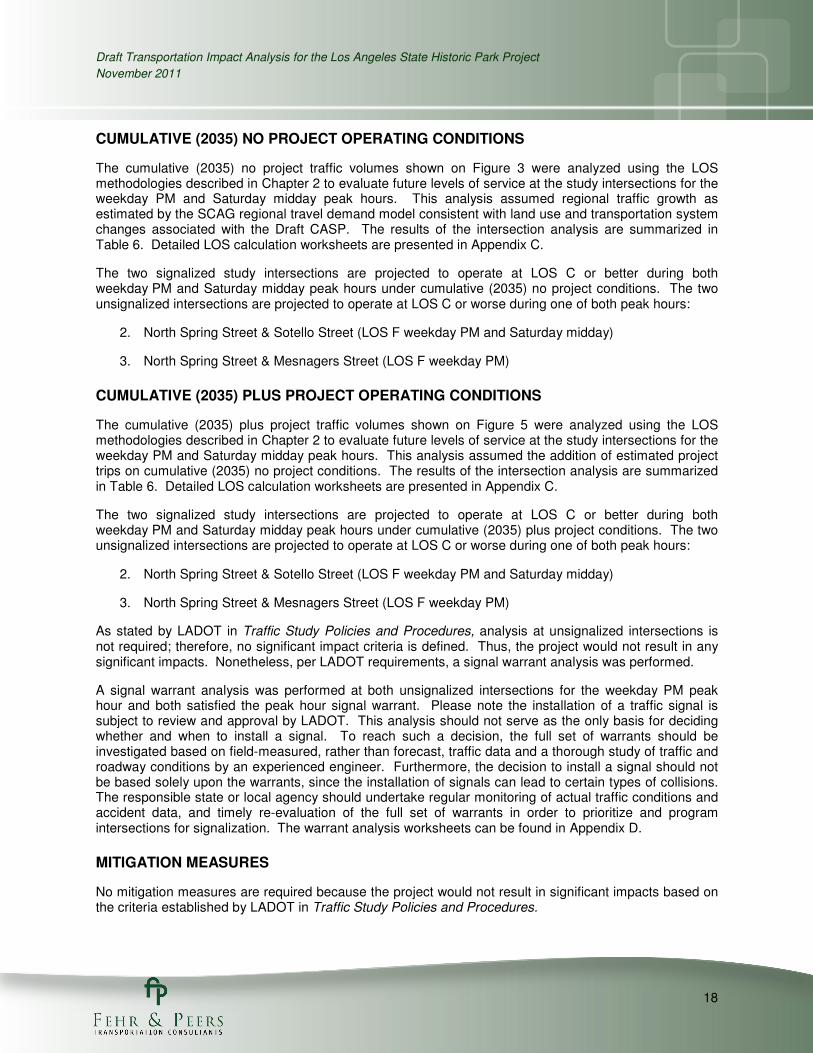
CUMULATIVE (2035) NO PROJECT OPERATING CONDITIONS
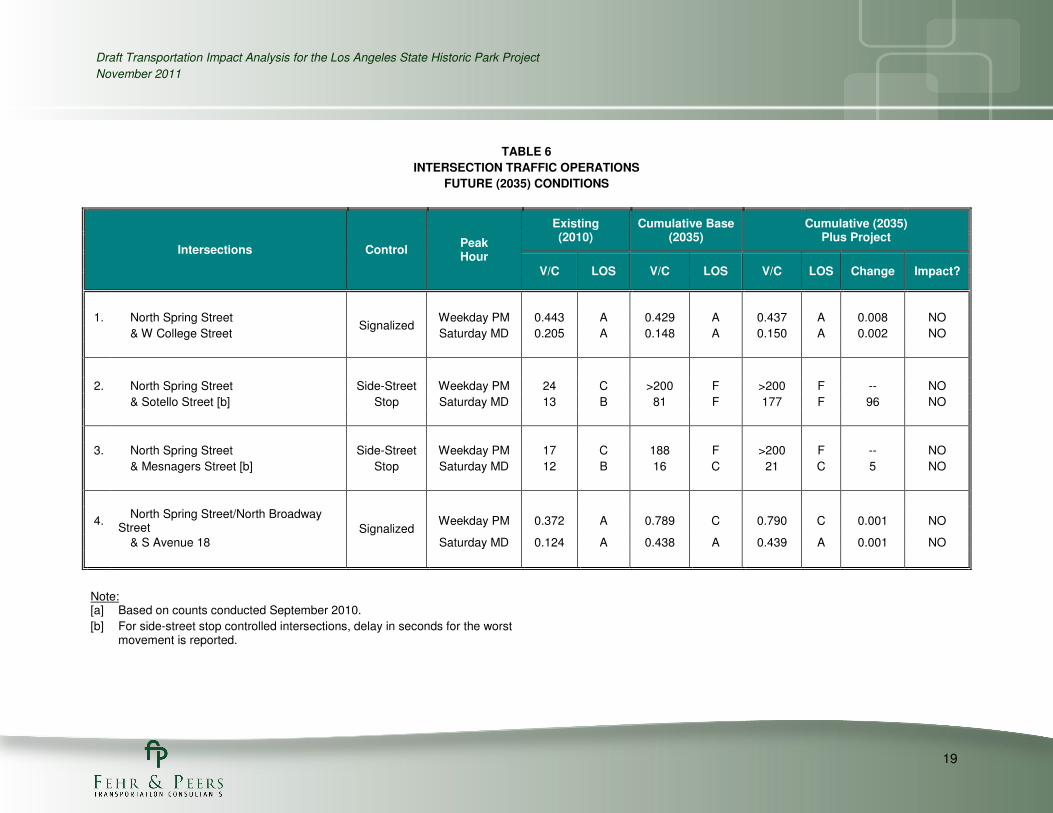
The cumulative (2035) no project traffic volumes shown on Figure 3 were analyzed using the LOS methodologies described in Chapter 2 to evaluate future levels of service at the study intersections for the weekday PM and Saturday midday peak hours. This analysis assumed regional traffic growth as estimated by the SCAG regional travel demand model consistent with land use and transportation system changes associated with the Draft CASP. The results of the intersection analysis are summarized in Table 6. Detailed LOS calculation worksheets are presented in Appendix C.
The two signalized study intersections are projected to operate at LOS C or better during both weekday PM and Saturday midday peak hours under cumulative (2035) no project conditions. The two unsignalized intersections are projected to operate at LOS C or worse during one of both peak hours:
2. North Spring Street & Sotello Street (LOS F weekday PM and Saturday midday)
3. North Spring Street & Mesnagers Street (LOS F weekday PM)
CUMULATIVE (2035) PLUS PROJECT OPERATING CONDITIONS
The cumulative (2035) plus project traffic volumes shown on Figure 5 were analyzed using the LOS methodologies described in Chapter 2 to evaluate future levels of service at the study intersections for the weekday PM and Saturday midday peak hours. This analysis assumed the addition of estimated project trips on cumulative (2035) no project conditions. The results of the intersection analysis are summarized in Table 6. Detailed LOS calculation worksheets are presented in Appendix C.
The two signalized study intersections are projected to operate at LOS C or better during both weekday PM and Saturday midday peak hours under cumulative (2035) plus project conditions. The two unsignalized intersections are projected to operate at LOS C or worse during one of both peak hours:
2. North Spring Street & Sotello Street (LOS F weekday PM and Saturday midday)
3. North Spring Street & Mesnagers Street (LOS F weekday PM)
As stated by LADOT in Traffic Study Policies and Procedures, analysis at unsignalized intersections is not required; therefore, no significant impact criteria is defined. Thus, the project would not result in any significant impacts. Nonetheless, per LADOT requirements, a signal warrant analysis was performed.
A signal warrant analysis was performed at both unsignalized intersections for the weekday PM peak hour and both satisfied the peak hour signal warrant. Please note the installation of a traffic signal is subject to review and approval by LADOT. This analysis should not serve as the only basis for deciding whether and when to install a signal. To reach such a decision, the full set of warrants should be investigated based on field-measured, rather than forecast, traffic data and a thorough study of traffic and roadway conditions by an experienced engineer. Furthermore, the decision to install a signal should not be based solely upon the warrants, since the installation of signals can lead to certain types of collisions. The responsible state or local agency should undertake regular monitoring of actual traffic conditions and accident data, and timely re-evaluation of the full set of warrants in order to prioritize and program intersections for signalization. The warrant analysis worksheets can be found in Appendix D.
MITIGATION MEASURES
No mitigation measures are required because the project would not result in significant impacts based on the criteria established by LADOT in Traffic Study Policies and Procedures.
Draft Transportation Impact Analysis for the Los Angeles State Historic Park Project
November 2011
19
TABLE 6
INTERSECTION TRAFFIC OPERATIONS
FUTURE (2035) CONDITIONS
Intersections Control Peak Hour
Existing (2010)
Cumulative Base (2035)
Cumulative (2035) Plus Project
V/C LOS V/C LOS V/C LOS Change Impact?
1. North Spring Street Signalized
Weekday PM 0.443 A 0.429 A 0.437 A 0.008 NO
& W College Street Saturday MD 0.205 A 0.148 A 0.150 A 0.002 NO
2. North Spring Street Side-Street Weekday PM 24 C >200 F >200 F -- NO
& Sotello Street [b] Stop Saturday MD 13 B 81 F 177 F 96 NO
3. North Spring Street Side-Street Weekday PM 17 C 188 F >200 F -- NO
& Mesnagers Street [b] Stop Saturday MD 12 B 16 C 21 C 5 NO
4. North Spring Street/North Broadway
Street Signalized Weekday PM 0.372 A 0.789 C 0.790 C 0.001 NO
& S Avenue 18 Saturday MD 0.124 A 0.438 A 0.439 A 0.001 NO
Note: [a] Based on counts conducted September 2010.
[b] For side-street stop controlled intersections, delay in seconds for the worst movement is reported.
Draft Transportation Impact Analysis for the Los Angeles State Historic Park Project
November 2011
20
CHAPTER 5. CONGESTION MANAGEMENT PROGRAM ANALYSIS
Analyses were conducted to comply with the Los Angeles County CMP requirements. This analysis was conducted in accordance with the procedures outlined in 2004 Congestion Management Program for Los Angeles County. The CMP requires that when a traffic impact analysis is prepared for a project, traffic impacts analysis be conducted for select regional facilities based on the quantity of project traffic expected to use those facilities.
CMP THRESHOLD OF SIGNIFICANCE
The guidelines set forth in the CMP indicate that if a proposed project would add 150 or more trips in either direction during either the morning or evening peak hour to the mainline freeway monitoring location, then a CMP freeway analysis must be conducted. If a proposed project would add 50 or more peak hour trips in either the AM or PM peak hour (of adjacent street traffic) to a CMP arterial intersection, then a CMP arterial intersection analysis must be conducted.
For the purpose of a CMP traffic impact analysis, a project impact is considered to be significant if the proposed project increases traffic demand, as determined by comparing cumulative plus project (2035) to cumulative base (2035), on a CMP facility by 2% of capacity (V/C ≥ 0.02), causing or worsening LOS F (V/C ≥ 1.00). Under these criteria, a project would not be considered to have a regionally significant impact if the analyzed facility is operating at LOS E or better after the addition of project traffic regardless of the increase in V/C ratio caused by the project. If the facility is operating at LOS F with project traffic, and the incremental change in the V/C ratio caused by the project is 0.02 or greater, the project would be considered to have a significant impact.
CMP ANALYSIS
Five freeway mainline locations and no arterial monitoring locations were identified within the sphere of influence of the project. These mainline locations are located on three major freeways, namely I-5, I-10, and I-110. The following five mainline locations are identified as CMP freeway monitoring stations in 2004 Congestion Management Program for Los Angeles County:
• Route 5, at postmile 21.80, at Stadium Way
• Route 10, at postmile 19.67, at East LA City Limit
• Route 110, at postmile 23.50, south of Route 101
• Route 110, at postmile 23.96, at Alpine Street
• Route 110, at postmile 26.50, at Pasadena Avenue
A regional analysis was not required because the project would add fewer than 150 trips in each direction during both analyzed peak hours to all mainline freeway monitoring locations. Therefore, the LASHP would not result in a significant impact on any CMP mainline freeway.
Draft Transportation Impact Analysis for the Los Angeles State Historic Park Project
November 2011
21
CHAPTER 6. TRAFFIC MANAGEMENT PLAN
The LASHP intends to hold a small number of special events during each year. These may include events such as an outdoor concert that has the potential to attract visitors in the thousands. This chapter presents a framework to be used to develop a traffic management plan for such events.
The occasional increase in congestion that may result from a special event at the LASHP may require the implementation of improved traffic management. Los Angeles Police Department (LAPD) personnel and traffic control officers may be required, in the future, to provide sufficient level of traffic management needed by such an event. In addition, collaboration with LADOT, California Department of Transportation (Caltrans), and the California Highway Patrol may also be required.
The traffic management plan would consist of numerous strategies designed to help manage traffic and minimize the effect in areas surrounding the LASHP. The roadways that provide access to the LASHP on which most of the traffic congestion would likely occur are listed below:
• North Spring Street/North Alameda Street
• North Main Street
• North Broadway
• West College Street
• East Cesar E. Chavez Avenue
• Mission Road
• Daly Street/Avenue 26
During one of the special events, the majority of these streets may be very heavily congested. A series of strategies can be put into effect to counteract the increased congestion. LAPD Officers and LADOT Traffic Officers may need to be on hand to help implement a traffic management plan. The following steps describe the framework of procedures for such a plan:
• To facilitate movement of vehicles, LAPD and LADOT staff must have the authority to implement turn restrictions, parking prohibitions, lane closures, barriers/cones, and flexible signage. A temporary command post can also be made available on site to control and monitor traffic conditions. The area may be split up into zones, with an engineer assigned to each zone. These engineers would have the authority to react to situations and change restrictions if necessary.
• Real time radio alerts and broadcasts via Highway Advisory Radio (HAR) may be used. These are portable units and could be located wherever LADOT deems appropriate. These units are particularly useful for incident management and special events such as outdoor concerts. The units also require very little set-up by trained officers. They can be programmed remotely via cellular phones, and traditionally have a range of three to five miles on an AM frequency. LASHP or event employees could be trained and authorized to staff the HAR.
• In conjunction with the aforementioned measures, Changeable Message Signs (CMS) can be used to direct vehicles from the freeways and surface streets to the designated parking lots. The signs/messages could consist of advance warning for motorists telling them where they can and cannot park/turn.
Draft Transportation Impact Analysis for the Los Angeles State Historic Park Project
November 2011
22
• As part of special events signage, the CMS could be augmented with the addition of designated routes that direct traffic along travel paths that are not immediately obvious. These routes could be designed and linked by colored arrows that direct drivers to specific locations. Temporary signage would indicate these routes. The routes could provide alternate locations such as the lesser-utilized parking lots and any designated overspill parking facilities.
• Coordination with Dodger Stadium, Staples Center, the Los Angeles Convention Center, and other organizations to ensure that large, publicly attended events are not overlapping, thus minimizing possible traffic conflicts and congestion.
• There is also a need to encourage the use of carpools, transit, and bicycles for special events. These measures can be incentivized either by reducing the cost of parking for carpools or by special ticket pricing. This can have the effect of reducing overall vehicle trips.
• Encourage the use of alternate parking sites.
• The California Department of Parks and Recreation shall be responsible for creating a traffic
management plan for special events, and for approving any and all modifications to the plan by
the individual event organizer.
• The traffic management plan shall be approved by LAPD, LADOT, Caltrans, and the CHP.
• All special event permit fees shall be required to implement the traffic management plan.
• CDPR staff shall ensure that the traffic management plan is implemented and enforced during the special events.
These are a series of strategies that can form the framework of a Traffic Management Plan. These measures must be used together to combat the traffic generated by the special events at the LASHP. They are designed to work together to have a maximum effect on reducing the effects of a planned event. Specifics relating to select strategies that seem most appropriate for events that would likely occur at the LASHP are described in detail below.
POTENTIAL OFF SITE PARKING LOCATIONS & ROUTES
Due to the limited on-site parking at the LASHP, off-site parking should be explored in order to accommodate the demand during these special events. Three candidate off-site parking locations are identified for accommodating the demand associated with a special event:
• Dodger Stadium
• Union Station/Metro Building
• Staples Center/LA Convention Center
Due to the proximity and ease of access to the LASHP, Dodger Stadium is the recommended off-site parking location. Dodger Stadium has over 16,000 parking spaces, supplying more than the necessary amount required for a special event at the LASHP.
If the LASHP were to reach an agreement with the Dodgers, a shuttle service to the park would be required. The shuttle would have to travel just over 1 mile from the stadium to reach the LASHP.
Draft Transportation Impact Analysis for the Los Angeles State Historic Park Project
November 2011
23
CARPOOLING INCENTIVES
Providing incentives for carpooling would likely reduce the number of vehicles in and around the LASHP during a special event. However, due to the difficulty in enforcing carpooling policies and the lack of city owned parking in the vicinity of the park that could offer free or reduced parking costs for carpool vehicles, carpooling should instead be encouraged through the public information program associated with the event.
REFERENCES
2004 Congestion Management Program for Los Angeles, Los Angeles County Transportation Authority, July 2004.
Highway Capacity Manual, Transportation Research Board, 2000.
Traffic Study Policies and Procedures, Los Angeles Department of Transportation, August 2003.
Los Angeles City Planning Department. Draft Cornfield Arroyo Seco Specific Plan. November 1, 2010.

APPENDIX A: LANE CONFIGURATIONS
APPENDIX B: TRAFFIC COUNT SHEETS
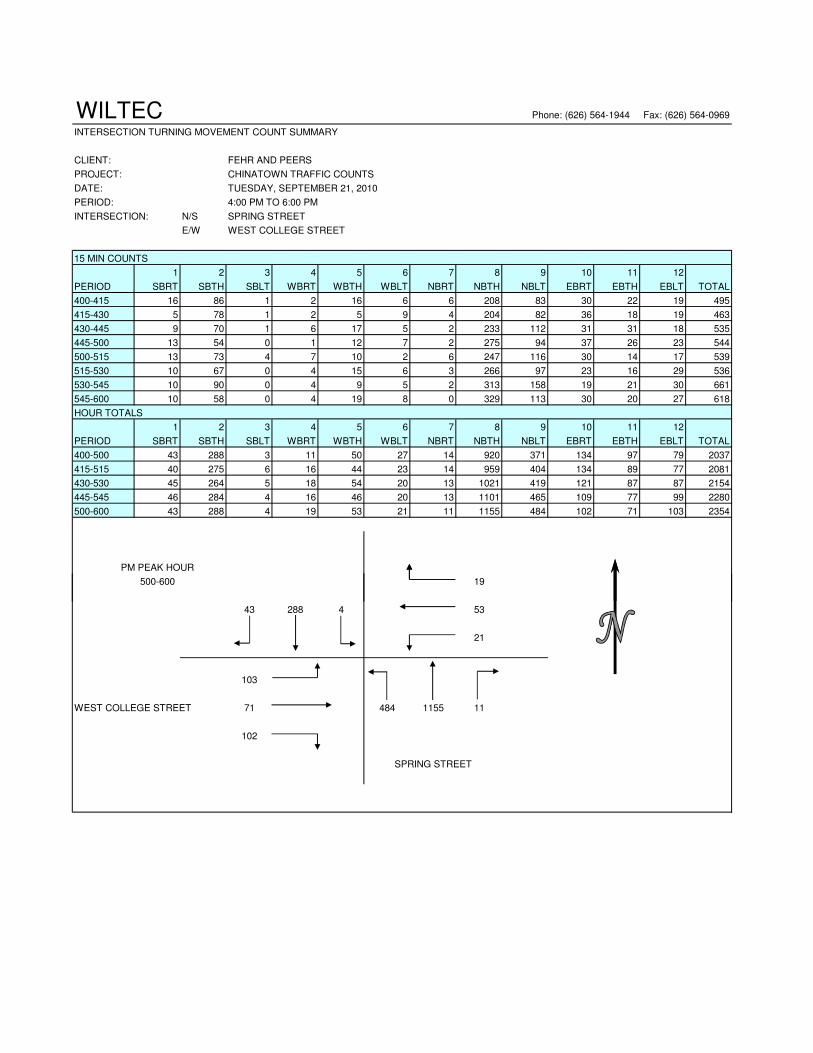
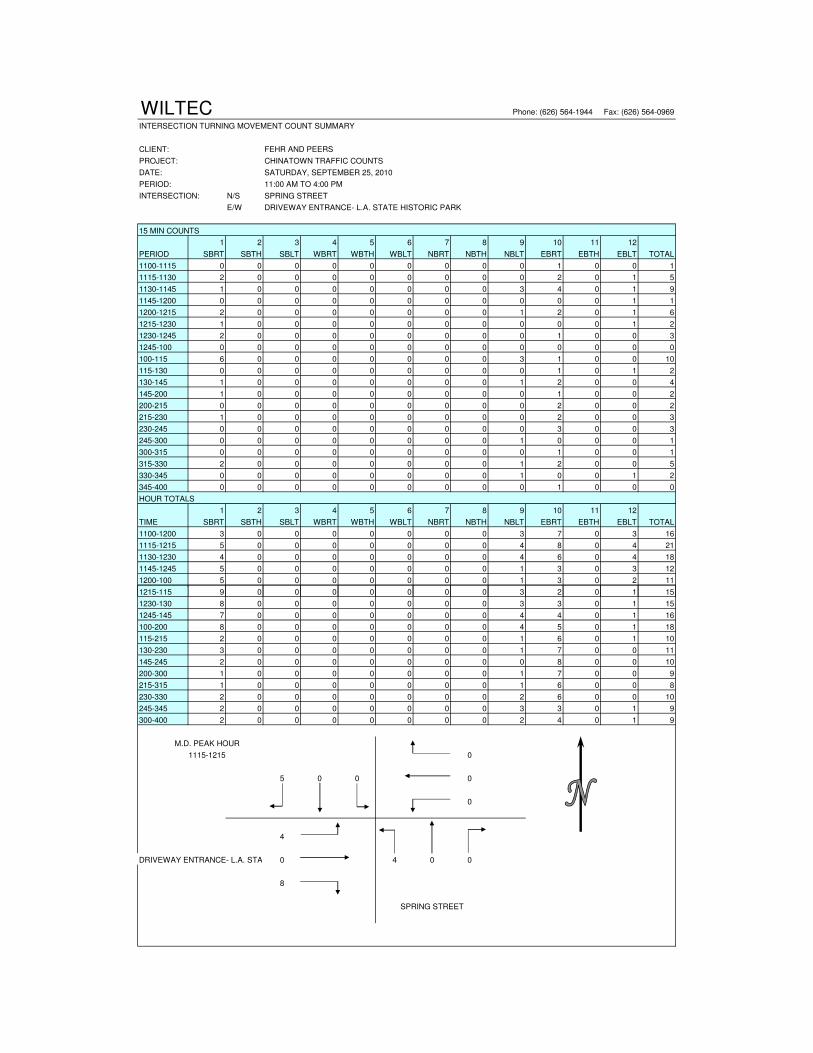
WILTEC Phone: (626) 564-1944 Fax: (626) 564-0969
INTERSECTION TURNING MOVEMENT COUNT SUMMARY
CLIENT: FEHR AND PEERS
PROJECT: CHINATOWN TRAFFIC COUNTS
DATE: TUESDAY, SEPTEMBER 21, 2010
PERIOD: 4:00 PM TO 6:00 PM
INTERSECTION: N/S SPRING STREET
E/W WEST COLLEGE STREET
15 MIN COUNTS
1 2 3 4 5 6 7 8 9 10 11 12
PERIOD SBRT SBTH SBLT WBRT WBTH WBLT NBRT NBTH NBLT EBRT EBTH EBLT TOTAL
400-415 16 86 1 2 16 6 6 208 83 30 22 19 495
415-430 5 78 1 2 5 9 4 204 82 36 18 19 463
430-445 9 70 1 6 17 5 2 233 112 31 31 18 535
445-500 13 54 0 1 12 7 2 275 94 37 26 23 544
500-515 13 73 4 7 10 2 6 247 116 30 14 17 539
515-530 10 67 0 4 15 6 3 266 97 23 16 29 536
530-545 10 90 0 4 9 5 2 313 158 19 21 30 661
545-600 10 58 0 4 19 8 0 329 113 30 20 27 618
HOUR TOTALS
1 2 3 4 5 6 7 8 9 10 11 12
PERIOD SBRT SBTH SBLT WBRT WBTH WBLT NBRT NBTH NBLT EBRT EBTH EBLT TOTAL
400-500 43 288 3 11 50 27 14 920 371 134 97 79 2037
415-515 40 275 6 16 44 23 14 959 404 134 89 77 2081
430-530 45 264 5 18 54 20 13 1021 419 121 87 87 2154
445-545 46 284 4 16 46 20 13 1101 465 109 77 99 2280
500-600 43 288 4 19 53 21 11 1155 484 102 71 103 2354
PM PEAK HOUR
500-600 19500-600 19
43 288 4 53
21
103
WEST COLLEGE STREET 71 484 1155 11
102
SPRING STREET
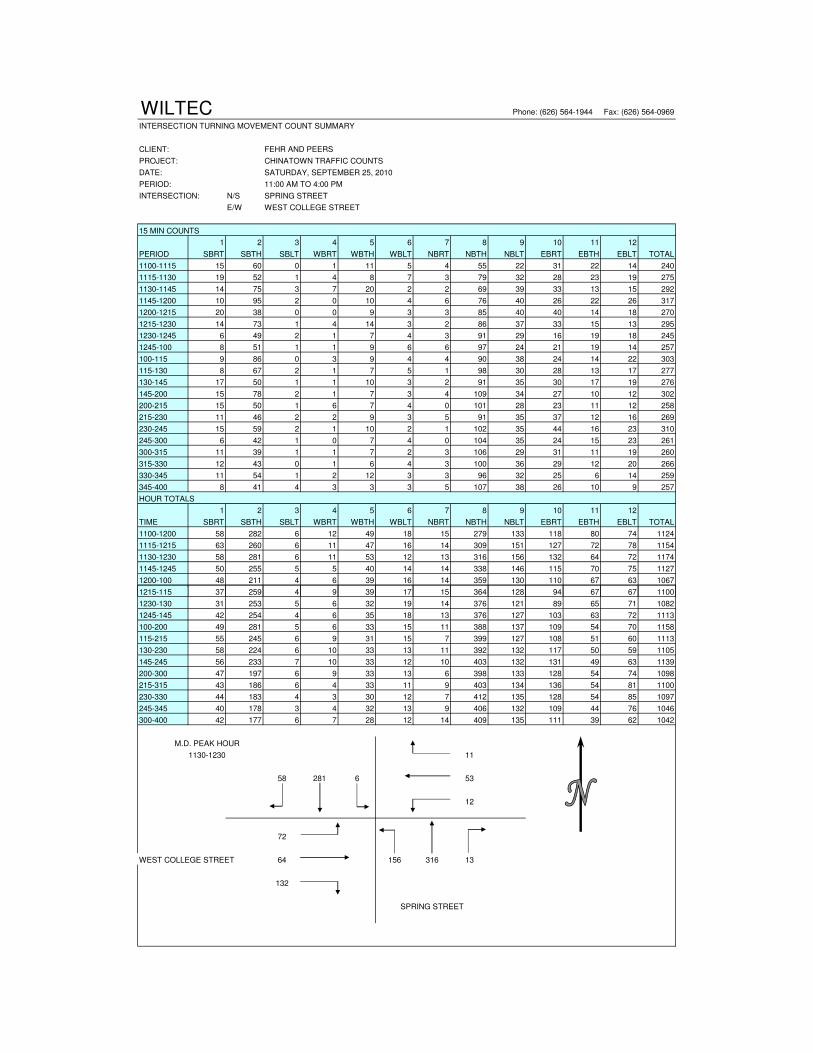
WILTEC Phone: (626) 564-1944 Fax: (626) 564-0969
INTERSECTION TURNING MOVEMENT COUNT SUMMARY
CLIENT: FEHR AND PEERS
PROJECT: CHINATOWN TRAFFIC COUNTS
DATE: SATURDAY, SEPTEMBER 25, 2010
PERIOD: 11:00 AM TO 4:00 PM
INTERSECTION: N/S SPRING STREET
E/W WEST COLLEGE STREET
15 MIN COUNTS
1 2 3 4 5 6 7 8 9 10 11 12
PERIOD SBRT SBTH SBLT WBRT WBTH WBLT NBRT NBTH NBLT EBRT EBTH EBLT TOTAL
1100-1115 15 60 0 1 11 5 4 55 22 31 22 14 240
1115-1130 19 52 1 4 8 7 3 79 32 28 23 19 275
1130-1145 14 75 3 7 20 2 2 69 39 33 13 15 292
1145-1200 10 95 2 0 10 4 6 76 40 26 22 26 317
1200-1215 20 38 0 0 9 3 3 85 40 40 14 18 270
1215-1230 14 73 1 4 14 3 2 86 37 33 15 13 295
1230-1245 6 49 2 1 7 4 3 91 29 16 19 18 245
1245-100 8 51 1 1 9 6 6 97 24 21 19 14 257
100-115 9 86 0 3 9 4 4 90 38 24 14 22 303
115-130 8 67 2 1 7 5 1 98 30 28 13 17 277
130-145 17 50 1 1 10 3 2 91 35 30 17 19 276
145-200 15 78 2 1 7 3 4 109 34 27 10 12 302
200-215 15 50 1 6 7 4 0 101 28 23 11 12 258
215-230 11 46 2 2 9 3 5 91 35 37 12 16 269
230-245 15 59 2 1 10 2 1 102 35 44 16 23 310
245-300 6 42 1 0 7 4 0 104 35 24 15 23 261
300-315 11 39 1 1 7 2 3 106 29 31 11 19 260
315-330 12 43 0 1 6 4 3 100 36 29 12 20 266
330-345 11 54 1 2 12 3 3 96 32 25 6 14 259
345-400 8 41 4 3 3 3 5 107 38 26 10 9 257
HOUR TOTALS
1 2 3 4 5 6 7 8 9 10 11 12
TIME SBRT SBTH SBLT WBRT WBTH WBLT NBRT NBTH NBLT EBRT EBTH EBLT TOTAL
1100-1200 58 282 6 12 49 18 15 279 133 118 80 74 1124
1115-1215 63 260 6 11 47 16 14 309 151 127 72 78 1154
1130-1230 58 281 6 11 53 12 13 316 156 132 64 72 1174
1145-1245 50 255 5 5 40 14 14 338 146 115 70 75 1127
1200-100 48 211 4 6 39 16 14 359 130 110 67 63 1067
1215-115 37 259 4 9 39 17 15 364 128 94 67 67 11001215-115 37 259 4 9 39 17 15 364 128 94 67 67 1100
1230-130 31 253 5 6 32 19 14 376 121 89 65 71 1082
1245-145 42 254 4 6 35 18 13 376 127 103 63 72 1113
100-200 49 281 5 6 33 15 11 388 137 109 54 70 1158
115-215 55 245 6 9 31 15 7 399 127 108 51 60 1113
130-230 58 224 6 10 33 13 11 392 132 117 50 59 1105
145-245 56 233 7 10 33 12 10 403 132 131 49 63 1139
200-300 47 197 6 9 33 13 6 398 133 128 54 74 1098
215-315 43 186 6 4 33 11 9 403 134 136 54 81 1100
230-330 44 183 4 3 30 12 7 412 135 128 54 85 1097
245-345 40 178 3 4 32 13 9 406 132 109 44 76 1046
300-400 42 177 6 7 28 12 14 409 135 111 39 62 1042
M.D. PEAK HOUR
1130-1230 11
58 281 6 53
12
72
WEST COLLEGE STREET 64 156 316 13
132
SPRING STREET
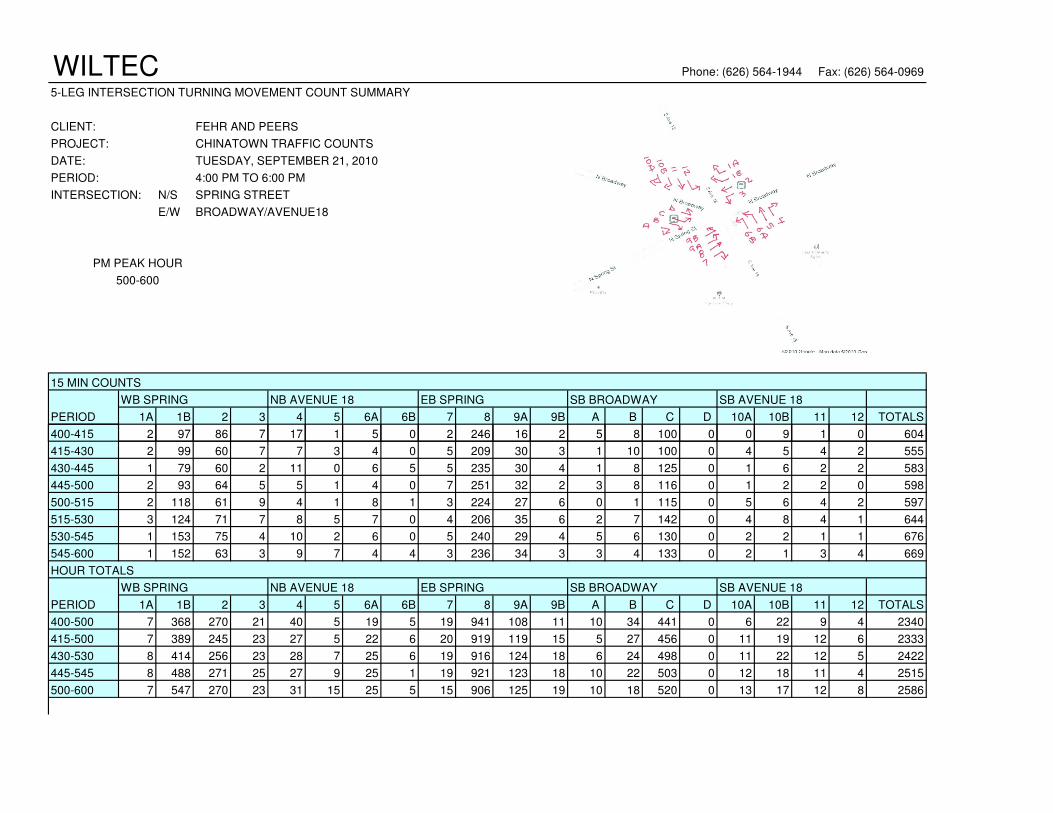
WILTEC Phone: (626) 564-1944 Fax: (626) 564-0969
5-LEG INTERSECTION TURNING MOVEMENT COUNT SUMMARY
CLIENT: FEHR AND PEERS
PROJECT: CHINATOWN TRAFFIC COUNTS
DATE: TUESDAY, SEPTEMBER 21, 2010
PERIOD: 4:00 PM TO 6:00 PM
INTERSECTION: N/S SPRING STREET
E/W BROADWAY/AVENUE18
PM PEAK HOUR
500-600
15 MIN COUNTS
WB SPRING NB AVENUE 18 EB SPRING SB BROADWAY SB AVENUE 18
PERIOD 1A 1B 2 3 4 5 6A 6B 7 8 9A 9B A B C D 10A 10B 11 12 TOTALS
400-415 2 97 86 7 17 1 5 0 2 246 16 2 5 8 100 0 0 9 1 0 604400-415 2 97 86 7 17 1 5 0 2 246 16 2 5 8 100 0 0 9 1 0 604
415-430 2 99 60 7 7 3 4 0 5 209 30 3 1 10 100 0 4 5 4 2 555
430-445 1 79 60 2 11 0 6 5 5 235 30 4 1 8 125 0 1 6 2 2 583
445-500 2 93 64 5 5 1 4 0 7 251 32 2 3 8 116 0 1 2 2 0 598
500-515 2 118 61 9 4 1 8 1 3 224 27 6 0 1 115 0 5 6 4 2 597
515-530 3 124 71 7 8 5 7 0 4 206 35 6 2 7 142 0 4 8 4 1 644
530-545 1 153 75 4 10 2 6 0 5 240 29 4 5 6 130 0 2 2 1 1 676
545-600 1 152 63 3 9 7 4 4 3 236 34 3 3 4 133 0 2 1 3 4 669
HOUR TOTALS
WB SPRING NB AVENUE 18 EB SPRING SB BROADWAY SB AVENUE 18
PERIOD 1A 1B 2 3 4 5 6A 6B 7 8 9A 9B A B C D 10A 10B 11 12 TOTALS
400-500 7 368 270 21 40 5 19 5 19 941 108 11 10 34 441 0 6 22 9 4 2340
415-500 7 389 245 23 27 5 22 6 20 919 119 15 5 27 456 0 11 19 12 6 2333
430-530 8 414 256 23 28 7 25 6 19 916 124 18 6 24 498 0 11 22 12 5 2422
445-545 8 488 271 25 27 9 25 1 19 921 123 18 10 22 503 0 12 18 11 4 2515
500-600 7 547 270 23 31 15 25 5 15 906 125 19 10 18 520 0 13 17 12 8 2586
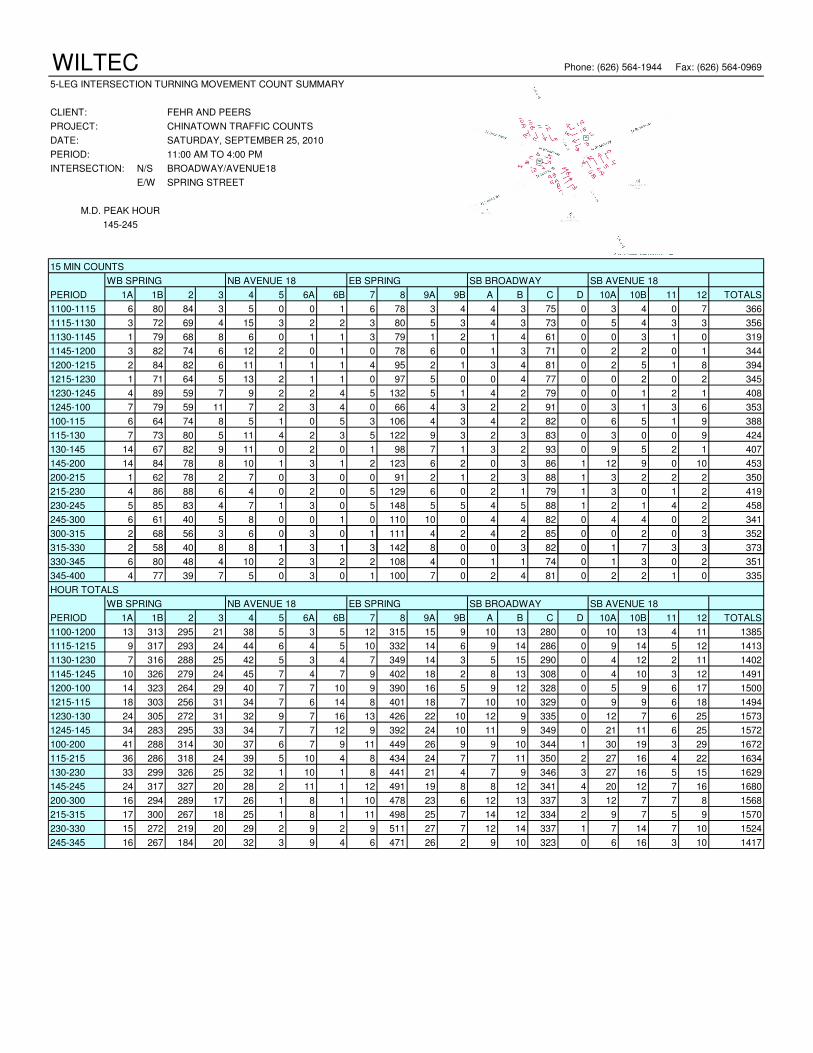
WILTEC Phone: (626) 564-1944 Fax: (626) 564-0969
5-LEG INTERSECTION TURNING MOVEMENT COUNT SUMMARY
CLIENT: FEHR AND PEERS
PROJECT: CHINATOWN TRAFFIC COUNTS
DATE: SATURDAY, SEPTEMBER 25, 2010
PERIOD: 11:00 AM TO 4:00 PM
INTERSECTION: N/S BROADWAY/AVENUE18
E/W SPRING STREET
M.D. PEAK HOUR
145-245
15 MIN COUNTS
WB SPRING NB AVENUE 18 EB SPRING SB BROADWAY SB AVENUE 18
PERIOD 1A 1B 2 3 4 5 6A 6B 7 8 9A 9B A B C D 10A 10B 11 12 TOTALS
1100-1115 6 80 84 3 5 0 0 1 6 78 3 4 4 3 75 0 3 4 0 7 366
1115-1130 3 72 69 4 15 3 2 2 3 80 5 3 4 3 73 0 5 4 3 3 356
1130-1145 1 79 68 8 6 0 1 1 3 79 1 2 1 4 61 0 0 3 1 0 319
1145-1200 3 82 74 6 12 2 0 1 0 78 6 0 1 3 71 0 2 2 0 1 344
1200-1215 2 84 82 6 11 1 1 1 4 95 2 1 3 4 81 0 2 5 1 8 394
1215-1230 1 71 64 5 13 2 1 1 0 97 5 0 0 4 77 0 0 2 0 2 345
1230-1245 4 89 59 7 9 2 2 4 5 132 5 1 4 2 79 0 0 1 2 1 408
1245-100 7 79 59 11 7 2 3 4 0 66 4 3 2 2 91 0 3 1 3 6 353
100-115 6 64 74 8 5 1 0 5 3 106 4 3 4 2 82 0 6 5 1 9 388
115-130 7 73 80 5 11 4 2 3 5 122 9 3 2 3 83 0 3 0 0 9 424
130-145 14 67 82 9 11 0 2 0 1 98 7 1 3 2 93 0 9 5 2 1 407
145-200 14 84 78 8 10 1 3 1 2 123 6 2 0 3 86 1 12 9 0 10 453
200-215 1 62 78 2 7 0 3 0 0 91 2 1 2 3 88 1 3 2 2 2 350
215-230 4 86 88 6 4 0 2 0 5 129 6 0 2 1 79 1 3 0 1 2 419
230-245 5 85 83 4 7 1 3 0 5 148 5 5 4 5 88 1 2 1 4 2 458
245-300 6 61 40 5 8 0 0 1 0 110 10 0 4 4 82 0 4 4 0 2 341
300-315 2 68 56 3 6 0 3 0 1 111 4 2 4 2 85 0 0 2 0 3 352300-315 2 68 56 3 6 0 3 0 1 111 4 2 4 2 85 0 0 2 0 3 352
315-330 2 58 40 8 8 1 3 1 3 142 8 0 0 3 82 0 1 7 3 3 373
330-345 6 80 48 4 10 2 3 2 2 108 4 0 1 1 74 0 1 3 0 2 351
345-400 4 77 39 7 5 0 3 0 1 100 7 0 2 4 81 0 2 2 1 0 335
HOUR TOTALS
WB SPRING NB AVENUE 18 EB SPRING SB BROADWAY SB AVENUE 18
PERIOD 1A 1B 2 3 4 5 6A 6B 7 8 9A 9B A B C D 10A 10B 11 12 TOTALS
1100-1200 13 313 295 21 38 5 3 5 12 315 15 9 10 13 280 0 10 13 4 11 1385
1115-1215 9 317 293 24 44 6 4 5 10 332 14 6 9 14 286 0 9 14 5 12 1413
1130-1230 7 316 288 25 42 5 3 4 7 349 14 3 5 15 290 0 4 12 2 11 1402
1145-1245 10 326 279 24 45 7 4 7 9 402 18 2 8 13 308 0 4 10 3 12 1491
1200-100 14 323 264 29 40 7 7 10 9 390 16 5 9 12 328 0 5 9 6 17 1500
1215-115 18 303 256 31 34 7 6 14 8 401 18 7 10 10 329 0 9 9 6 18 1494
1230-130 24 305 272 31 32 9 7 16 13 426 22 10 12 9 335 0 12 7 6 25 1573
1245-145 34 283 295 33 34 7 7 12 9 392 24 10 11 9 349 0 21 11 6 25 1572
100-200 41 288 314 30 37 6 7 9 11 449 26 9 9 10 344 1 30 19 3 29 1672
115-215 36 286 318 24 39 5 10 4 8 434 24 7 7 11 350 2 27 16 4 22 1634
130-230 33 299 326 25 32 1 10 1 8 441 21 4 7 9 346 3 27 16 5 15 1629
145-245 24 317 327 20 28 2 11 1 12 491 19 8 8 12 341 4 20 12 7 16 1680
200-300 16 294 289 17 26 1 8 1 10 478 23 6 12 13 337 3 12 7 7 8 1568
215-315 17 300 267 18 25 1 8 1 11 498 25 7 14 12 334 2 9 7 5 9 1570
230-330 15 272 219 20 29 2 9 2 9 511 27 7 12 14 337 1 7 14 7 10 1524
245-345 16 267 184 20 32 3 9 4 6 471 26 2 9 10 323 0 6 16 3 10 1417
WILTEC Phone: (626) 564-1944 Fax: (626) 564-0969
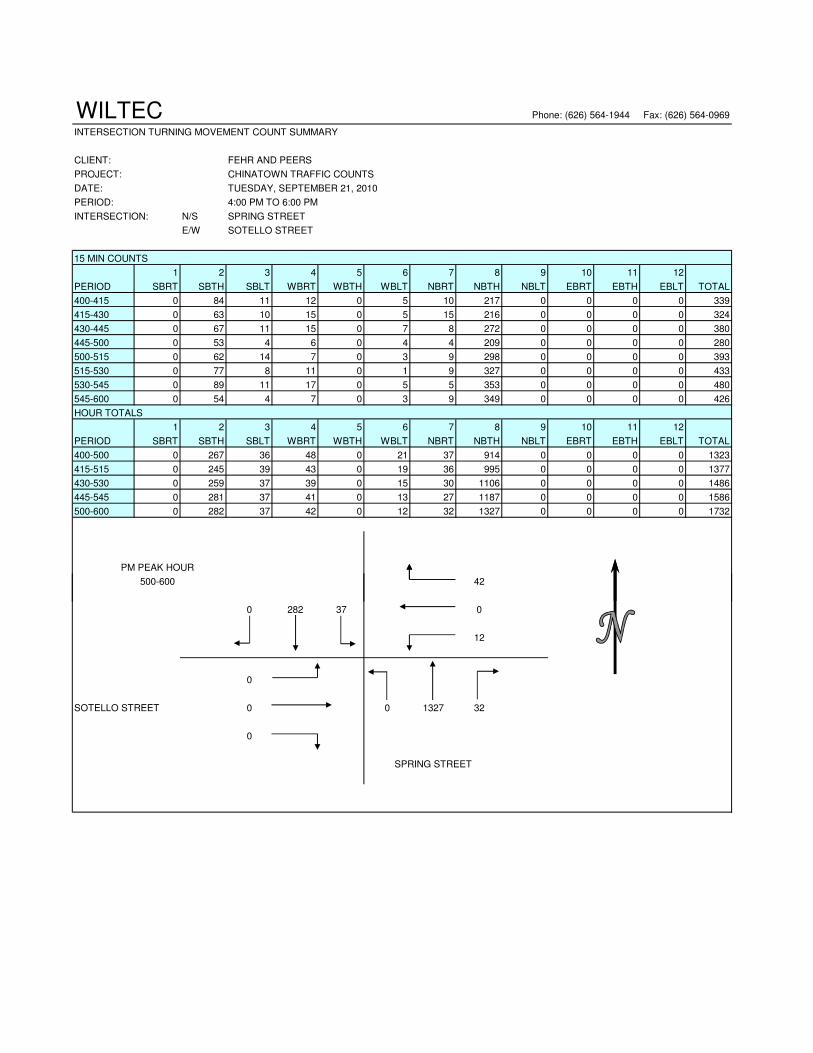
INTERSECTION TURNING MOVEMENT COUNT SUMMARY
CLIENT: FEHR AND PEERS
PROJECT: CHINATOWN TRAFFIC COUNTS
DATE: TUESDAY, SEPTEMBER 21, 2010
PERIOD: 4:00 PM TO 6:00 PM
INTERSECTION: N/S SPRING STREET
E/W SOTELLO STREET
15 MIN COUNTS
1 2 3 4 5 6 7 8 9 10 11 12
PERIOD SBRT SBTH SBLT WBRT WBTH WBLT NBRT NBTH NBLT EBRT EBTH EBLT TOTAL
400-415 0 84 11 12 0 5 10 217 0 0 0 0 339
415-430 0 63 10 15 0 5 15 216 0 0 0 0 324
430-445 0 67 11 15 0 7 8 272 0 0 0 0 380
445-500 0 53 4 6 0 4 4 209 0 0 0 0 280
500-515 0 62 14 7 0 3 9 298 0 0 0 0 393
515-530 0 77 8 11 0 1 9 327 0 0 0 0 433
530-545 0 89 11 17 0 5 5 353 0 0 0 0 480
545-600 0 54 4 7 0 3 9 349 0 0 0 0 426
HOUR TOTALS
1 2 3 4 5 6 7 8 9 10 11 12
PERIOD SBRT SBTH SBLT WBRT WBTH WBLT NBRT NBTH NBLT EBRT EBTH EBLT TOTAL
400-500 0 267 36 48 0 21 37 914 0 0 0 0 1323
415-515 0 245 39 43 0 19 36 995 0 0 0 0 1377
430-530 0 259 37 39 0 15 30 1106 0 0 0 0 1486
445-545 0 281 37 41 0 13 27 1187 0 0 0 0 1586
500-600 0 282 37 42 0 12 32 1327 0 0 0 0 1732
PM PEAK HOUR
500-600 42500-600 42
0 282 37 0
12
0
SOTELLO STREET 0 0 1327 32
0
SPRING STREET

WILTEC Phone: (626) 564-1944 Fax: (626) 564-0969
INTERSECTION TURNING MOVEMENT COUNT SUMMARY
CLIENT: FEHR AND PEERS
PROJECT: CHINATOWN TRAFFIC COUNTS
DATE: SATURDAY, SEPTEMBER 25, 2010
PERIOD: 11:00 AM TO 4:00 PM
INTERSECTION: N/S SPRING STREET
E/W SOTELLO STREET
15 MIN COUNTS
1 2 3 4 5 6 7 8 9 10 11 12
PERIOD SBRT SBTH SBLT WBRT WBTH WBLT NBRT NBTH NBLT EBRT EBTH EBLT TOTAL
1100-1115 0 88 6 0 0 0 7 98 0 0 0 0 199
1115-1130 0 77 5 7 0 4 3 85 0 0 0 0 181
1130-1145 0 70 5 3 0 2 4 70 0 0 0 0 154
1145-1200 0 57 10 5 0 3 9 73 0 0 0 0 157
1200-1215 0 84 5 4 0 8 2 97 0 0 0 0 200
1215-1230 0 68 7 5 0 1 6 96 0 0 0 0 183
1230-1245 0 64 6 3 0 1 2 104 0 0 0 0 180
1245-100 0 67 6 2 0 2 3 102 0 0 0 0 182
100-115 0 93 7 2 0 1 1 119 0 0 0 0 223
115-130 0 60 5 3 0 6 2 116 0 0 0 0 192
130-145 0 73 7 2 0 5 0 107 0 0 0 0 194
145-200 0 95 7 2 0 5 6 128 0 0 0 0 243
200-215 0 80 7 1 0 1 5 116 0 0 0 0 210
215-230 0 85 15 1 0 0 2 136 0 0 0 0 239
230-245 0 82 7 6 0 3 3 122 0 0 0 0 223
245-300 0 42 6 3 0 2 4 117 0 0 0 0 174
300-315 0 54 10 6 0 1 2 133 0 0 0 0 206
315-330 0 50 5 2 0 3 5 114 0 0 0 0 179
330-345 0 55 4 1 0 0 0 123 0 0 0 0 183
345-400 0 46 2 4 0 4 4 117 0 0 0 0 0
HOUR TOTALS
1 2 3 4 5 6 7 8 9 10 11 12
TIME SBRT SBTH SBLT WBRT WBTH WBLT NBRT NBTH NBLT EBRT EBTH EBLT TOTAL
1100-1200 0 292 26 15 0 9 23 326 0 0 0 0 691
1115-1215 0 288 25 19 0 17 18 325 0 0 0 0 692
1130-1230 0 279 27 17 0 14 21 336 0 0 0 0 694
1145-1245 0 273 28 17 0 13 19 370 0 0 0 0 720
1200-100 0 283 24 14 0 12 13 399 0 0 0 0 745
1215-115 0 292 26 12 0 5 12 421 0 0 0 0 7681215-115 0 292 26 12 0 5 12 421 0 0 0 0 768
1230-130 0 284 24 10 0 10 8 441 0 0 0 0 777
1245-145 0 293 25 9 0 14 6 444 0 0 0 0 791
100-200 0 321 26 9 0 17 9 470 0 0 0 0 852
115-215 0 308 26 8 0 17 13 467 0 0 0 0 839
130-230 0 333 36 6 0 11 13 487 0 0 0 0 886
145-245 0 342 36 10 0 9 16 502 0 0 0 0 915
200-300 0 289 35 11 0 6 14 491 0 0 0 0 846
215-315 0 263 38 16 0 6 11 508 0 0 0 0 842
230-330 0 228 28 17 0 9 14 486 0 0 0 0 782
245-345 0 201 25 12 0 6 11 487 0 0 0 0 742
300-400 0 205 21 13 0 8 11 487 0 0 0 0 745
M.D. PEAK HOUR
145-245 10
0 342 36 0
9
0
SOTELLO STREET 0 0 502 16
0
SPRING STREET

WILTEC Phone: (626) 564-1944 Fax: (626) 564-0969
INTERSECTION TURNING MOVEMENT COUNT SUMMARY
CLIENT: FEHR AND PEERS
PROJECT: CHINATOWN TRAFFIC COUNTS
DATE: TUESDAY, SEPTEMBER 21, 2010
PERIOD: 4:00 PM TO 6:00 PM
INTERSECTION: N/S SPRING STREET
E/W MESNAGERS STREET
15 MIN COUNTS
1 2 3 4 5 6 7 8 9 10 11 12
PERIOD SBRT SBTH SBLT WBRT WBTH WBLT NBRT NBTH NBLT EBRT EBTH EBLT TOTAL
400-415 0 112 0 11 0 2 3 245 0 0 0 0 373
415-430 0 71 3 7 0 2 3 213 0 0 0 0 299
430-445 0 78 3 7 0 1 3 272 0 0 0 0 364
445-500 0 56 1 5 0 1 0 255 0 0 0 0 318
500-515 0 72 4 12 0 2 4 315 0 0 0 0 409
515-530 0 71 2 3 0 0 2 275 0 0 0 0 353
530-545 0 86 3 4 0 0 3 292 0 0 0 0 388
545-600 0 74 1 4 0 0 3 325 0 0 0 0 407
HOUR TOTALS
1 2 3 4 5 6 7 8 9 10 11 12
PERIOD SBRT SBTH SBLT WBRT WBTH WBLT NBRT NBTH NBLT EBRT EBTH EBLT TOTAL
400-500 0 317 7 30 0 6 9 985 0 0 0 0 1354
415-515 0 277 11 31 0 6 10 1055 0 0 0 0 1390
430-530 0 277 10 27 0 4 9 1117 0 0 0 0 1444
445-545 0 285 10 24 0 3 9 1137 0 0 0 0 1468
500-600 0 303 10 23 0 2 12 1207 0 0 0 0 1557
PM PEAK HOUR
500-600 23500-600 23
0 303 10 0
2
0
MESNAGERS STREET 0 0 1207 12
0
SPRING STREET
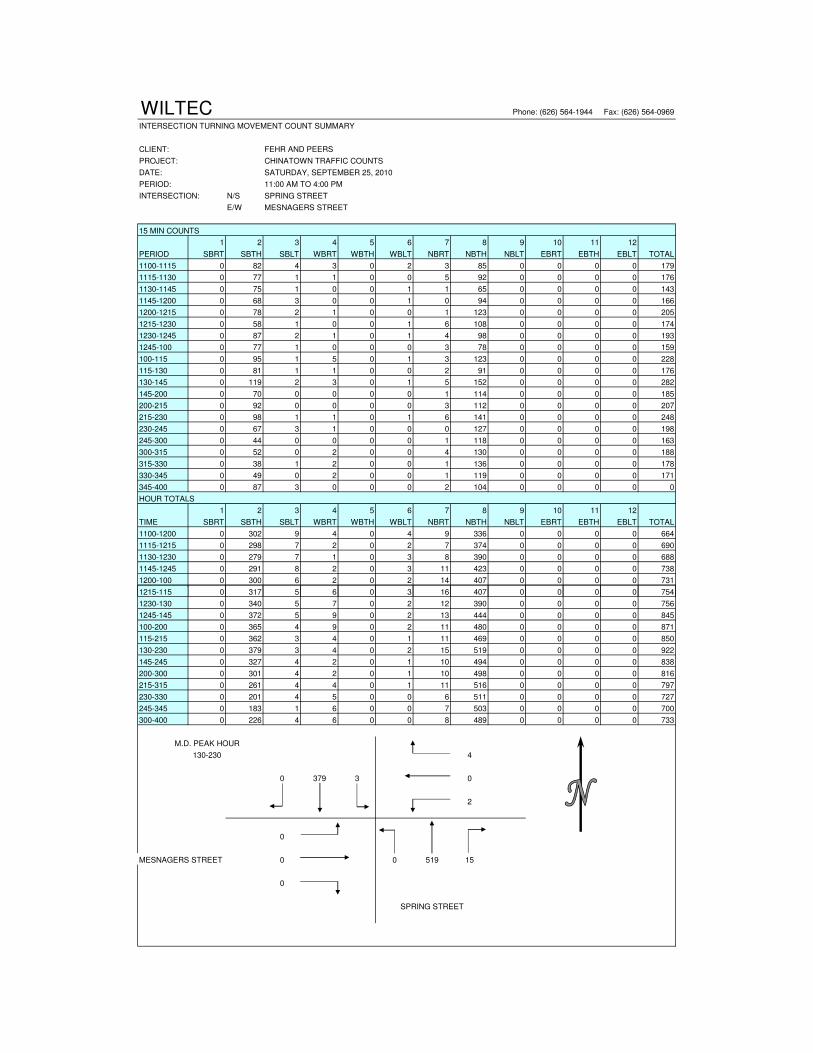
WILTEC Phone: (626) 564-1944 Fax: (626) 564-0969
INTERSECTION TURNING MOVEMENT COUNT SUMMARY
CLIENT: FEHR AND PEERS
PROJECT: CHINATOWN TRAFFIC COUNTS
DATE: SATURDAY, SEPTEMBER 25, 2010
PERIOD: 11:00 AM TO 4:00 PM
INTERSECTION: N/S SPRING STREET
E/W MESNAGERS STREET
15 MIN COUNTS
1 2 3 4 5 6 7 8 9 10 11 12
PERIOD SBRT SBTH SBLT WBRT WBTH WBLT NBRT NBTH NBLT EBRT EBTH EBLT TOTAL
1100-1115 0 82 4 3 0 2 3 85 0 0 0 0 179
1115-1130 0 77 1 1 0 0 5 92 0 0 0 0 176
1130-1145 0 75 1 0 0 1 1 65 0 0 0 0 143
1145-1200 0 68 3 0 0 1 0 94 0 0 0 0 166
1200-1215 0 78 2 1 0 0 1 123 0 0 0 0 205
1215-1230 0 58 1 0 0 1 6 108 0 0 0 0 174
1230-1245 0 87 2 1 0 1 4 98 0 0 0 0 193
1245-100 0 77 1 0 0 0 3 78 0 0 0 0 159
100-115 0 95 1 5 0 1 3 123 0 0 0 0 228
115-130 0 81 1 1 0 0 2 91 0 0 0 0 176
130-145 0 119 2 3 0 1 5 152 0 0 0 0 282
145-200 0 70 0 0 0 0 1 114 0 0 0 0 185
200-215 0 92 0 0 0 0 3 112 0 0 0 0 207
215-230 0 98 1 1 0 1 6 141 0 0 0 0 248
230-245 0 67 3 1 0 0 0 127 0 0 0 0 198
245-300 0 44 0 0 0 0 1 118 0 0 0 0 163
300-315 0 52 0 2 0 0 4 130 0 0 0 0 188
315-330 0 38 1 2 0 0 1 136 0 0 0 0 178
330-345 0 49 0 2 0 0 1 119 0 0 0 0 171
345-400 0 87 3 0 0 0 2 104 0 0 0 0 0
HOUR TOTALS
1 2 3 4 5 6 7 8 9 10 11 12
TIME SBRT SBTH SBLT WBRT WBTH WBLT NBRT NBTH NBLT EBRT EBTH EBLT TOTAL
1100-1200 0 302 9 4 0 4 9 336 0 0 0 0 664
1115-1215 0 298 7 2 0 2 7 374 0 0 0 0 690
1130-1230 0 279 7 1 0 3 8 390 0 0 0 0 688
1145-1245 0 291 8 2 0 3 11 423 0 0 0 0 738
1200-100 0 300 6 2 0 2 14 407 0 0 0 0 731
1215-115 0 317 5 6 0 3 16 407 0 0 0 0 7541215-115 0 317 5 6 0 3 16 407 0 0 0 0 754
1230-130 0 340 5 7 0 2 12 390 0 0 0 0 756
1245-145 0 372 5 9 0 2 13 444 0 0 0 0 845
100-200 0 365 4 9 0 2 11 480 0 0 0 0 871
115-215 0 362 3 4 0 1 11 469 0 0 0 0 850
130-230 0 379 3 4 0 2 15 519 0 0 0 0 922
145-245 0 327 4 2 0 1 10 494 0 0 0 0 838
200-300 0 301 4 2 0 1 10 498 0 0 0 0 816
215-315 0 261 4 4 0 1 11 516 0 0 0 0 797
230-330 0 201 4 5 0 0 6 511 0 0 0 0 727
245-345 0 183 1 6 0 0 7 503 0 0 0 0 700
300-400 0 226 4 6 0 0 8 489 0 0 0 0 733
M.D. PEAK HOUR
130-230 4
0 379 3 0
2
0
MESNAGERS STREET 0 0 519 15
0
SPRING STREET
WILTEC Phone: (626) 564-1944 Fax: (626) 564-0969
INTERSECTION TURNING MOVEMENT COUNT SUMMARY
CLIENT: FEHR AND PEERS
PROJECT: CHINATOWN TRAFFIC COUNTS
DATE: TUESDAY, SEPTEMBER 21, 2010
PERIOD: 4:00 PM TO 6:00 PM
INTERSECTION: N/S SPRING STREET
E/W DRIVEWAY ENTRANCE- L.A. STATE HISTORIC PARK
15 MIN COUNTS
1 2 3 4 5 6 7 8 9 10 11 12
PERIOD SBRT SBTH SBLT WBRT WBTH WBLT NBRT NBTH NBLT EBRT EBTH EBLT TOTAL
400-415 1 0 0 0 0 0 0 0 1 1 0 1 4
415-430 0 0 0 0 0 0 0 0 2 3 0 3 8
430-445 0 0 0 0 0 0 0 0 2 1 0 2 5
445-500 1 0 0 0 0 0 0 0 2 2 0 0 5
500-515 4 0 0 0 0 0 0 0 3 0 0 1 8
515-530 4 0 0 0 0 0 0 0 3 2 0 1 10
530-545 2 0 0 0 0 0 0 0 5 1 0 0 8
545-600 5 0 0 0 0 0 0 0 3 4 0 2 14
HOUR TOTALS
1 2 3 4 5 6 7 8 9 10 11 12
PERIOD SBRT SBTH SBLT WBRT WBTH WBLT NBRT NBTH NBLT EBRT EBTH EBLT TOTAL
400-500 2 0 0 0 0 0 0 0 7 7 0 6 22
415-515 5 0 0 0 0 0 0 0 9 6 0 6 26
430-530 9 0 0 0 0 0 0 0 10 5 0 4 28
445-545 11 0 0 0 0 0 0 0 13 5 0 2 31
500-600 15 0 0 0 0 0 0 0 14 7 0 4 40
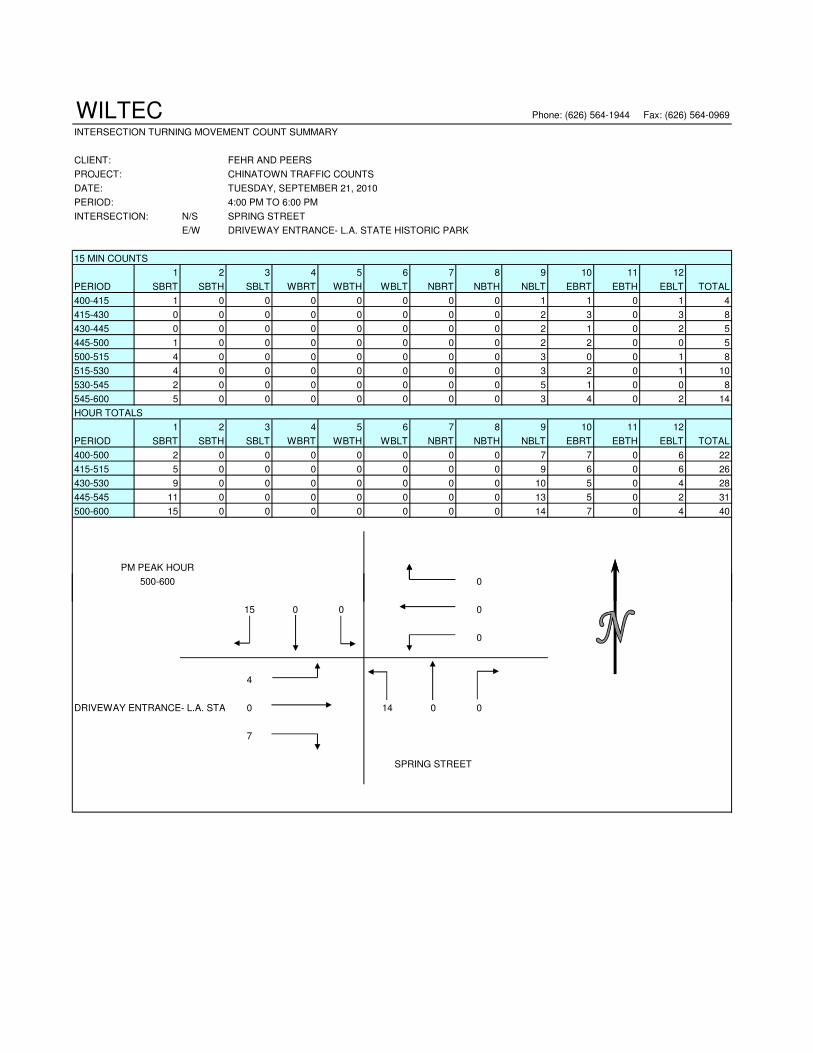
PM PEAK HOUR
500-600 0500-600 0
15 0 0 0
0
4
DRIVEWAY ENTRANCE- L.A. STATE HISTORIC PARK0 14 0 0
7
SPRING STREET
WILTEC Phone: (626) 564-1944 Fax: (626) 564-0969
INTERSECTION TURNING MOVEMENT COUNT SUMMARY
CLIENT: FEHR AND PEERS
PROJECT: CHINATOWN TRAFFIC COUNTS
DATE: SATURDAY, SEPTEMBER 25, 2010
PERIOD: 11:00 AM TO 4:00 PM
INTERSECTION: N/S SPRING STREET
E/W DRIVEWAY ENTRANCE- L.A. STATE HISTORIC PARK
15 MIN COUNTS
1 2 3 4 5 6 7 8 9 10 11 12
PERIOD SBRT SBTH SBLT WBRT WBTH WBLT NBRT NBTH NBLT EBRT EBTH EBLT TOTAL
1100-1115 0 0 0 0 0 0 0 0 0 1 0 0 1
1115-1130 2 0 0 0 0 0 0 0 0 2 0 1 5
1130-1145 1 0 0 0 0 0 0 0 3 4 0 1 9
1145-1200 0 0 0 0 0 0 0 0 0 0 0 1 1
1200-1215 2 0 0 0 0 0 0 0 1 2 0 1 6
1215-1230 1 0 0 0 0 0 0 0 0 0 0 1 2
1230-1245 2 0 0 0 0 0 0 0 0 1 0 0 3
1245-100 0 0 0 0 0 0 0 0 0 0 0 0 0
100-115 6 0 0 0 0 0 0 0 3 1 0 0 10
115-130 0 0 0 0 0 0 0 0 0 1 0 1 2
130-145 1 0 0 0 0 0 0 0 1 2 0 0 4
145-200 1 0 0 0 0 0 0 0 0 1 0 0 2
200-215 0 0 0 0 0 0 0 0 0 2 0 0 2
215-230 1 0 0 0 0 0 0 0 0 2 0 0 3
230-245 0 0 0 0 0 0 0 0 0 3 0 0 3
245-300 0 0 0 0 0 0 0 0 1 0 0 0 1
300-315 0 0 0 0 0 0 0 0 0 1 0 0 1
315-330 2 0 0 0 0 0 0 0 1 2 0 0 5
330-345 0 0 0 0 0 0 0 0 1 0 0 1 2
345-400 0 0 0 0 0 0 0 0 0 1 0 0 0
HOUR TOTALS
1 2 3 4 5 6 7 8 9 10 11 12
TIME SBRT SBTH SBLT WBRT WBTH WBLT NBRT NBTH NBLT EBRT EBTH EBLT TOTAL
1100-1200 3 0 0 0 0 0 0 0 3 7 0 3 16
1115-1215 5 0 0 0 0 0 0 0 4 8 0 4 21
1130-1230 4 0 0 0 0 0 0 0 4 6 0 4 18
1145-1245 5 0 0 0 0 0 0 0 1 3 0 3 12
1200-100 5 0 0 0 0 0 0 0 1 3 0 2 11
1215-115 9 0 0 0 0 0 0 0 3 2 0 1 151215-115 9 0 0 0 0 0 0 0 3 2 0 1 15
1230-130 8 0 0 0 0 0 0 0 3 3 0 1 15
1245-145 7 0 0 0 0 0 0 0 4 4 0 1 16
100-200 8 0 0 0 0 0 0 0 4 5 0 1 18
115-215 2 0 0 0 0 0 0 0 1 6 0 1 10
130-230 3 0 0 0 0 0 0 0 1 7 0 0 11
145-245 2 0 0 0 0 0 0 0 0 8 0 0 10
200-300 1 0 0 0 0 0 0 0 1 7 0 0 9
215-315 1 0 0 0 0 0 0 0 1 6 0 0 8
230-330 2 0 0 0 0 0 0 0 2 6 0 0 10
245-345 2 0 0 0 0 0 0 0 3 3 0 1 9
300-400 2 0 0 0 0 0 0 0 2 4 0 1 9
M.D. PEAK HOUR
1115-1215 0
5 0 0 0
0
4
DRIVEWAY ENTRANCE- L.A. STATE HISTORIC PARK0 4 0 0
8
SPRING STREET

APPENDIX C: LEVEL OF SERVICE WORKSHEETS

Existing Conditions Weekday PMPM
W College Street N Spring StreetN/S: W/E: 1I/S No:
AM/PM: Comments:
COUNT DATE: GROWTH FACTOR:STUDY DATE:
4
A:
B:
110
102A:
B: 103
21
A:
B:
72
0.513 =
+
+
+++ 11072 484103
1500
578A:
B: 484
V/C =
West/East Critical Movements =
North/South Critical Movements =
SouthBound
WestBoundEastBound
NorthBound
A = Adjusted Through/Right VolumeB = Adjusted Left Volume* = ATSAC Benefit
Results
V/C RATIO LOS
0.00 - 0.60 A
0.61 - 0.70 B
0.71 - 0.80 C
0.81 - 0.90 D
0.91 - 1.00 E
A(W/B)
A(N/B)
B(E/B)
B(S/B)
ALOS =
Critical Movements Diagram
TH RT LT THLT TH RT LT TH RT
Phasing RTOR Phasing Phasing PhasingRTOR RTOR
NORTHBOUND SOUTHBOUND WESTBOUND EASTBOUND
EXISTING
RTOR
RT
21
AMBIENT
RELATED
PROJECT
TOTAL 21
LANE
SIGNAL Perm
1
Perm Perm PermAuto Auto Auto Auto
1 1 1 1 1 2 1 1 2 1
LT
53 19 103 71 102 4 288 43 484 1155 11
4 43288102711031953 111155484
Volume/Lane/Signal Configurations
Developed by Chun Wong, 12/94
October 13, 2010 ,Wednesday 04:31:01 PMCalcaDB
01_EX_~1
INTERSECTION DATA SUMMARY SHEET

Existing Conditions Saturday MDMD
W College Street N Spring StreetN/S: W/E: 1I/S No:
AM/PM: Comments:
COUNT DATE: GROWTH FACTOR:STUDY DATE:
6
A:
B:
113
72
A:
B:
132
64A:
B: 12
0.275 =
+
+
+++ 113132 15612
1500
158A:
B: 156
V/C =
West/East Critical Movements =
North/South Critical Movements =
SouthBound
WestBoundEastBound
NorthBound
A = Adjusted Through/Right VolumeB = Adjusted Left Volume* = ATSAC Benefit
Results
V/C RATIO LOS
0.00 - 0.60 A
0.61 - 0.70 B
0.71 - 0.80 C
0.81 - 0.90 D
0.91 - 1.00 E
A(W/B)
B(N/B)
B(E/B)
A(S/B)
ALOS =
Critical Movements Diagram
TH RT LT THLT TH RT LT TH RT
Phasing RTOR Phasing Phasing PhasingRTOR RTOR
NORTHBOUND SOUTHBOUND WESTBOUND EASTBOUND
EXISTING
RTOR
RT
12
AMBIENT
RELATED
PROJECT
TOTAL 12
LANE
SIGNAL Perm
1
Perm Perm PermAuto Auto Auto Auto
1 1 1 1 1 2 1 1 2 1
LT
53 11 72 64 132 6 281 58 156 316 13
6 5828113264721153 13316156
Volume/Lane/Signal Configurations
Developed by Chun Wong, 12/94
October 13, 2010 ,Wednesday 04:31:43 PMCalcaDB
02_EX_~1
INTERSECTION DATA SUMMARY SHEET
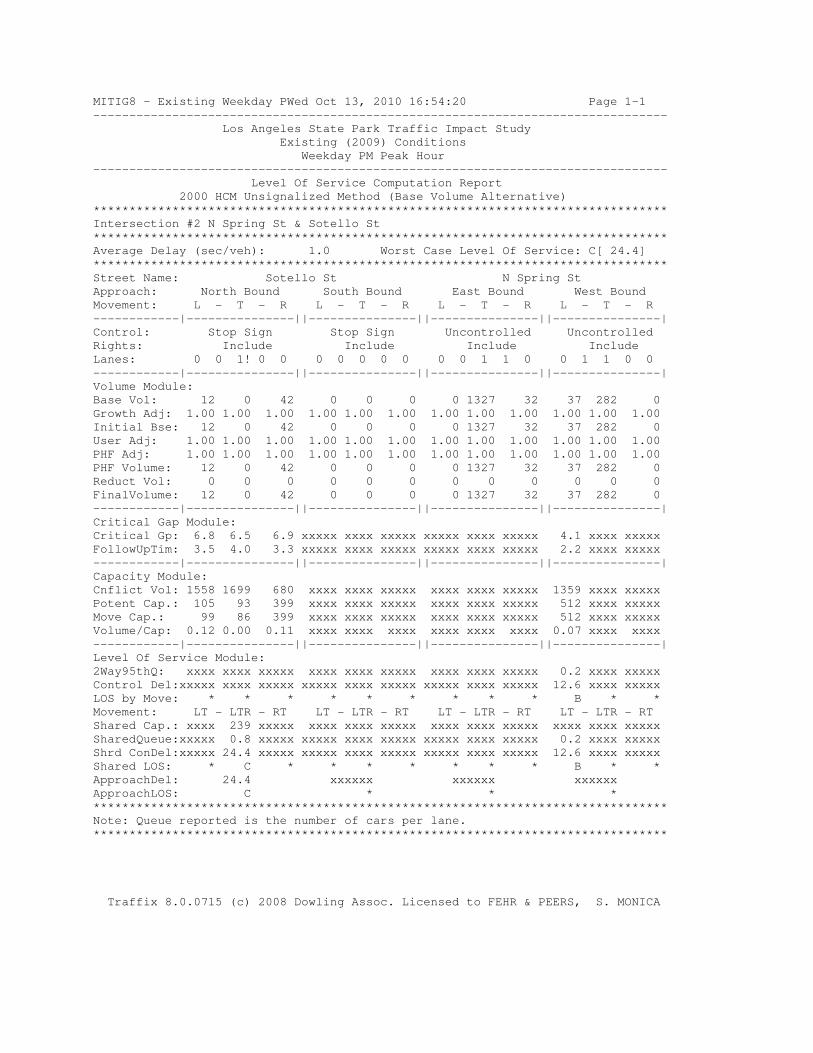
MITIG8 - Existing Weekday PWed Oct 13, 2010 16:54:20 Page 1-1
--------------------------------------------------------------------------------
Los Angeles State Park Traffic Impact Study
Existing (2009) Conditions
Weekday PM Peak Hour
--------------------------------------------------------------------------------
Level Of Service Computation Report
2000 HCM Unsignalized Method (Base Volume Alternative)
********************************************************************************
Intersection #2 N Spring St & Sotello St
********************************************************************************
Average Delay (sec/veh): 1.0 Worst Case Level Of Service: C[ 24.4]
********************************************************************************
Street Name: Sotello St N Spring St
Approach: North Bound South Bound East Bound West Bound
Movement: L - T - R L - T - R L - T - R L - T - R
------------|---------------||---------------||---------------||---------------|
Control: Stop Sign Stop Sign Uncontrolled Uncontrolled
Rights: Include Include Include Include
Lanes: 0 0 1! 0 0 0 0 0 0 0 0 0 1 1 0 0 1 1 0 0
------------|---------------||---------------||---------------||---------------|
Volume Module:
Base Vol: 12 0 42 0 0 0 0 1327 32 37 282 0
Growth Adj: 1.00 1.00 1.00 1.00 1.00 1.00 1.00 1.00 1.00 1.00 1.00 1.00
Initial Bse: 12 0 42 0 0 0 0 1327 32 37 282 0
User Adj: 1.00 1.00 1.00 1.00 1.00 1.00 1.00 1.00 1.00 1.00 1.00 1.00
PHF Adj: 1.00 1.00 1.00 1.00 1.00 1.00 1.00 1.00 1.00 1.00 1.00 1.00
PHF Volume: 12 0 42 0 0 0 0 1327 32 37 282 0
Reduct Vol: 0 0 0 0 0 0 0 0 0 0 0 0
FinalVolume: 12 0 42 0 0 0 0 1327 32 37 282 0
------------|---------------||---------------||---------------||---------------|
Critical Gap Module:
Critical Gp: 6.8 6.5 6.9 xxxxx xxxx xxxxx xxxxx xxxx xxxxx 4.1 xxxx xxxxx
FollowUpTim: 3.5 4.0 3.3 xxxxx xxxx xxxxx xxxxx xxxx xxxxx 2.2 xxxx xxxxx
------------|---------------||---------------||---------------||---------------|
Capacity Module:
Cnflict Vol: 1558 1699 680 xxxx xxxx xxxxx xxxx xxxx xxxxx 1359 xxxx xxxxx
Potent Cap.: 105 93 399 xxxx xxxx xxxxx xxxx xxxx xxxxx 512 xxxx xxxxx
Move Cap.: 99 86 399 xxxx xxxx xxxxx xxxx xxxx xxxxx 512 xxxx xxxxx
Volume/Cap: 0.12 0.00 0.11 xxxx xxxx xxxx xxxx xxxx xxxx 0.07 xxxx xxxx
------------|---------------||---------------||---------------||---------------|
Level Of Service Module:
2Way95thQ: xxxx xxxx xxxxx xxxx xxxx xxxxx xxxx xxxx xxxxx 0.2 xxxx xxxxx
Control Del:xxxxx xxxx xxxxx xxxxx xxxx xxxxx xxxxx xxxx xxxxx 12.6 xxxx xxxxx
LOS by Move: * * * * * * * * * B * *
Movement: LT - LTR - RT LT - LTR - RT LT - LTR - RT LT - LTR - RT
Shared Cap.: xxxx 239 xxxxx xxxx xxxx xxxxx xxxx xxxx xxxxx xxxx xxxx xxxxx
SharedQueue:xxxxx 0.8 xxxxx xxxxx xxxx xxxxx xxxxx xxxx xxxxx 0.2 xxxx xxxxx
Shrd ConDel:xxxxx 24.4 xxxxx xxxxx xxxx xxxxx xxxxx xxxx xxxxx 12.6 xxxx xxxxx
Shared LOS: * C * * * * * * * B * *
ApproachDel: 24.4 xxxxxx xxxxxx xxxxxx
ApproachLOS: C * * *
********************************************************************************
Note: Queue reported is the number of cars per lane.
********************************************************************************
Traffix 8.0.0715 (c) 2008 Dowling Assoc. Licensed to FEHR & PEERS, S. MONICA
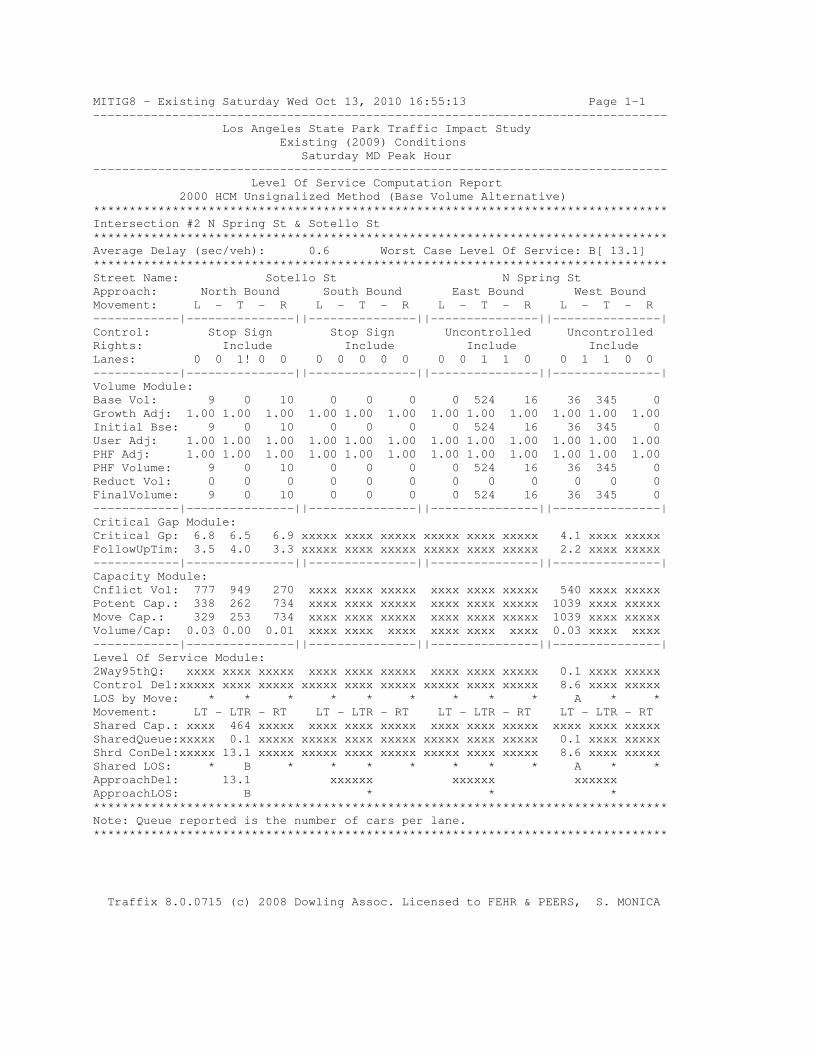
MITIG8 - Existing Saturday Wed Oct 13, 2010 16:55:13 Page 1-1
--------------------------------------------------------------------------------
Los Angeles State Park Traffic Impact Study
Existing (2009) Conditions
Saturday MD Peak Hour
--------------------------------------------------------------------------------
Level Of Service Computation Report
2000 HCM Unsignalized Method (Base Volume Alternative)
********************************************************************************
Intersection #2 N Spring St & Sotello St
********************************************************************************
Average Delay (sec/veh): 0.6 Worst Case Level Of Service: B[ 13.1]
********************************************************************************
Street Name: Sotello St N Spring St
Approach: North Bound South Bound East Bound West Bound
Movement: L - T - R L - T - R L - T - R L - T - R
------------|---------------||---------------||---------------||---------------|
Control: Stop Sign Stop Sign Uncontrolled Uncontrolled
Rights: Include Include Include Include
Lanes: 0 0 1! 0 0 0 0 0 0 0 0 0 1 1 0 0 1 1 0 0
------------|---------------||---------------||---------------||---------------|
Volume Module:
Base Vol: 9 0 10 0 0 0 0 524 16 36 345 0
Growth Adj: 1.00 1.00 1.00 1.00 1.00 1.00 1.00 1.00 1.00 1.00 1.00 1.00
Initial Bse: 9 0 10 0 0 0 0 524 16 36 345 0
User Adj: 1.00 1.00 1.00 1.00 1.00 1.00 1.00 1.00 1.00 1.00 1.00 1.00
PHF Adj: 1.00 1.00 1.00 1.00 1.00 1.00 1.00 1.00 1.00 1.00 1.00 1.00
PHF Volume: 9 0 10 0 0 0 0 524 16 36 345 0
Reduct Vol: 0 0 0 0 0 0 0 0 0 0 0 0
FinalVolume: 9 0 10 0 0 0 0 524 16 36 345 0
------------|---------------||---------------||---------------||---------------|
Critical Gap Module:
Critical Gp: 6.8 6.5 6.9 xxxxx xxxx xxxxx xxxxx xxxx xxxxx 4.1 xxxx xxxxx
FollowUpTim: 3.5 4.0 3.3 xxxxx xxxx xxxxx xxxxx xxxx xxxxx 2.2 xxxx xxxxx
------------|---------------||---------------||---------------||---------------|
Capacity Module:
Cnflict Vol: 777 949 270 xxxx xxxx xxxxx xxxx xxxx xxxxx 540 xxxx xxxxx
Potent Cap.: 338 262 734 xxxx xxxx xxxxx xxxx xxxx xxxxx 1039 xxxx xxxxx
Move Cap.: 329 253 734 xxxx xxxx xxxxx xxxx xxxx xxxxx 1039 xxxx xxxxx
Volume/Cap: 0.03 0.00 0.01 xxxx xxxx xxxx xxxx xxxx xxxx 0.03 xxxx xxxx
------------|---------------||---------------||---------------||---------------|
Level Of Service Module:
2Way95thQ: xxxx xxxx xxxxx xxxx xxxx xxxxx xxxx xxxx xxxxx 0.1 xxxx xxxxx
Control Del:xxxxx xxxx xxxxx xxxxx xxxx xxxxx xxxxx xxxx xxxxx 8.6 xxxx xxxxx
LOS by Move: * * * * * * * * * A * *
Movement: LT - LTR - RT LT - LTR - RT LT - LTR - RT LT - LTR - RT
Shared Cap.: xxxx 464 xxxxx xxxx xxxx xxxxx xxxx xxxx xxxxx xxxx xxxx xxxxx
SharedQueue:xxxxx 0.1 xxxxx xxxxx xxxx xxxxx xxxxx xxxx xxxxx 0.1 xxxx xxxxx
Shrd ConDel:xxxxx 13.1 xxxxx xxxxx xxxx xxxxx xxxxx xxxx xxxxx 8.6 xxxx xxxxx
Shared LOS: * B * * * * * * * A * *
ApproachDel: 13.1 xxxxxx xxxxxx xxxxxx
ApproachLOS: B * * *
********************************************************************************
Note: Queue reported is the number of cars per lane.
********************************************************************************
Traffix 8.0.0715 (c) 2008 Dowling Assoc. Licensed to FEHR & PEERS, S. MONICA
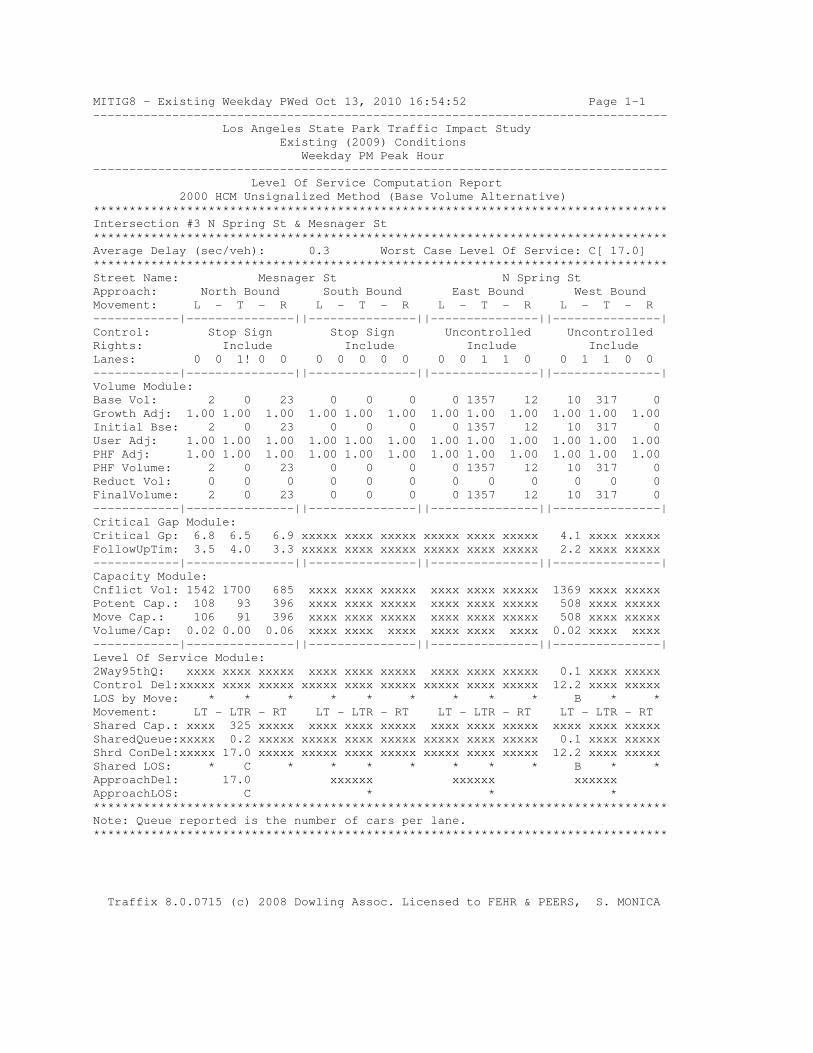
MITIG8 - Existing Weekday PWed Oct 13, 2010 16:54:52 Page 1-1
--------------------------------------------------------------------------------
Los Angeles State Park Traffic Impact Study
Existing (2009) Conditions
Weekday PM Peak Hour
--------------------------------------------------------------------------------
Level Of Service Computation Report
2000 HCM Unsignalized Method (Base Volume Alternative)
********************************************************************************
Intersection #3 N Spring St & Mesnager St
********************************************************************************
Average Delay (sec/veh): 0.3 Worst Case Level Of Service: C[ 17.0]
********************************************************************************
Street Name: Mesnager St N Spring St
Approach: North Bound South Bound East Bound West Bound
Movement: L - T - R L - T - R L - T - R L - T - R
------------|---------------||---------------||---------------||---------------|
Control: Stop Sign Stop Sign Uncontrolled Uncontrolled
Rights: Include Include Include Include
Lanes: 0 0 1! 0 0 0 0 0 0 0 0 0 1 1 0 0 1 1 0 0
------------|---------------||---------------||---------------||---------------|
Volume Module:
Base Vol: 2 0 23 0 0 0 0 1357 12 10 317 0
Growth Adj: 1.00 1.00 1.00 1.00 1.00 1.00 1.00 1.00 1.00 1.00 1.00 1.00
Initial Bse: 2 0 23 0 0 0 0 1357 12 10 317 0
User Adj: 1.00 1.00 1.00 1.00 1.00 1.00 1.00 1.00 1.00 1.00 1.00 1.00
PHF Adj: 1.00 1.00 1.00 1.00 1.00 1.00 1.00 1.00 1.00 1.00 1.00 1.00
PHF Volume: 2 0 23 0 0 0 0 1357 12 10 317 0
Reduct Vol: 0 0 0 0 0 0 0 0 0 0 0 0
FinalVolume: 2 0 23 0 0 0 0 1357 12 10 317 0
------------|---------------||---------------||---------------||---------------|
Critical Gap Module:
Critical Gp: 6.8 6.5 6.9 xxxxx xxxx xxxxx xxxxx xxxx xxxxx 4.1 xxxx xxxxx
FollowUpTim: 3.5 4.0 3.3 xxxxx xxxx xxxxx xxxxx xxxx xxxxx 2.2 xxxx xxxxx
------------|---------------||---------------||---------------||---------------|
Capacity Module:
Cnflict Vol: 1542 1700 685 xxxx xxxx xxxxx xxxx xxxx xxxxx 1369 xxxx xxxxx
Potent Cap.: 108 93 396 xxxx xxxx xxxxx xxxx xxxx xxxxx 508 xxxx xxxxx
Move Cap.: 106 91 396 xxxx xxxx xxxxx xxxx xxxx xxxxx 508 xxxx xxxxx
Volume/Cap: 0.02 0.00 0.06 xxxx xxxx xxxx xxxx xxxx xxxx 0.02 xxxx xxxx
------------|---------------||---------------||---------------||---------------|
Level Of Service Module:
2Way95thQ: xxxx xxxx xxxxx xxxx xxxx xxxxx xxxx xxxx xxxxx 0.1 xxxx xxxxx
Control Del:xxxxx xxxx xxxxx xxxxx xxxx xxxxx xxxxx xxxx xxxxx 12.2 xxxx xxxxx
LOS by Move: * * * * * * * * * B * *
Movement: LT - LTR - RT LT - LTR - RT LT - LTR - RT LT - LTR - RT
Shared Cap.: xxxx 325 xxxxx xxxx xxxx xxxxx xxxx xxxx xxxxx xxxx xxxx xxxxx
SharedQueue:xxxxx 0.2 xxxxx xxxxx xxxx xxxxx xxxxx xxxx xxxxx 0.1 xxxx xxxxx
Shrd ConDel:xxxxx 17.0 xxxxx xxxxx xxxx xxxxx xxxxx xxxx xxxxx 12.2 xxxx xxxxx
Shared LOS: * C * * * * * * * B * *
ApproachDel: 17.0 xxxxxx xxxxxx xxxxxx
ApproachLOS: C * * *
********************************************************************************
Note: Queue reported is the number of cars per lane.
********************************************************************************
Traffix 8.0.0715 (c) 2008 Dowling Assoc. Licensed to FEHR & PEERS, S. MONICA

MITIG8 - Existing Saturday Wed Oct 13, 2010 16:55:26 Page 1-1
--------------------------------------------------------------------------------
Los Angeles State Park Traffic Impact Study
Existing (2009) Conditions
Saturday MD Peak Hour
--------------------------------------------------------------------------------
Level Of Service Computation Report
2000 HCM Unsignalized Method (Base Volume Alternative)
********************************************************************************
Intersection #3 N Spring St & Mesnager St
********************************************************************************
Average Delay (sec/veh): 0.1 Worst Case Level Of Service: B[ 11.6]
********************************************************************************
Street Name: Mesnager St N Spring St
Approach: North Bound South Bound East Bound West Bound
Movement: L - T - R L - T - R L - T - R L - T - R
------------|---------------||---------------||---------------||---------------|
Control: Stop Sign Stop Sign Uncontrolled Uncontrolled
Rights: Include Include Include Include
Lanes: 0 0 1! 0 0 0 0 0 0 0 0 0 1 1 0 0 1 1 0 0
------------|---------------||---------------||---------------||---------------|
Volume Module:
Base Vol: 2 0 4 0 0 0 0 519 15 3 379 0
Growth Adj: 1.00 1.00 1.00 1.00 1.00 1.00 1.00 1.00 1.00 1.00 1.00 1.00
Initial Bse: 2 0 4 0 0 0 0 519 15 3 379 0
User Adj: 1.00 1.00 1.00 1.00 1.00 1.00 1.00 1.00 1.00 1.00 1.00 1.00
PHF Adj: 1.00 1.00 1.00 1.00 1.00 1.00 1.00 1.00 1.00 1.00 1.00 1.00
PHF Volume: 2 0 4 0 0 0 0 519 15 3 379 0
Reduct Vol: 0 0 0 0 0 0 0 0 0 0 0 0
FinalVolume: 2 0 4 0 0 0 0 519 15 3 379 0
------------|---------------||---------------||---------------||---------------|
Critical Gap Module:
Critical Gp: 6.8 6.5 6.9 xxxxx xxxx xxxxx xxxxx xxxx xxxxx 4.1 xxxx xxxxx
FollowUpTim: 3.5 4.0 3.3 xxxxx xxxx xxxxx xxxxx xxxx xxxxx 2.2 xxxx xxxxx
------------|---------------||---------------||---------------||---------------|
Capacity Module:
Cnflict Vol: 722 912 267 xxxx xxxx xxxxx xxxx xxxx xxxxx 534 xxxx xxxxx
Potent Cap.: 366 276 737 xxxx xxxx xxxxx xxxx xxxx xxxxx 1044 xxxx xxxxx
Move Cap.: 365 275 737 xxxx xxxx xxxxx xxxx xxxx xxxxx 1044 xxxx xxxxx
Volume/Cap: 0.01 0.00 0.01 xxxx xxxx xxxx xxxx xxxx xxxx 0.00 xxxx xxxx
------------|---------------||---------------||---------------||---------------|
Level Of Service Module:
2Way95thQ: xxxx xxxx xxxxx xxxx xxxx xxxxx xxxx xxxx xxxxx 0.0 xxxx xxxxx
Control Del:xxxxx xxxx xxxxx xxxxx xxxx xxxxx xxxxx xxxx xxxxx 8.5 xxxx xxxxx
LOS by Move: * * * * * * * * * A * *
Movement: LT - LTR - RT LT - LTR - RT LT - LTR - RT LT - LTR - RT
Shared Cap.: xxxx 550 xxxxx xxxx xxxx xxxxx xxxx xxxx xxxxx xxxx xxxx xxxxx
SharedQueue:xxxxx 0.0 xxxxx xxxxx xxxx xxxxx xxxxx xxxx xxxxx 0.0 xxxx xxxxx
Shrd ConDel:xxxxx 11.6 xxxxx xxxxx xxxx xxxxx xxxxx xxxx xxxxx 8.5 xxxx xxxxx
Shared LOS: * B * * * * * * * A * *
ApproachDel: 11.6 xxxxxx xxxxxx xxxxxx
ApproachLOS: B * * *
********************************************************************************
Note: Queue reported is the number of cars per lane.
********************************************************************************
Traffix 8.0.0715 (c) 2008 Dowling Assoc. Licensed to FEHR & PEERS, S. MONICA
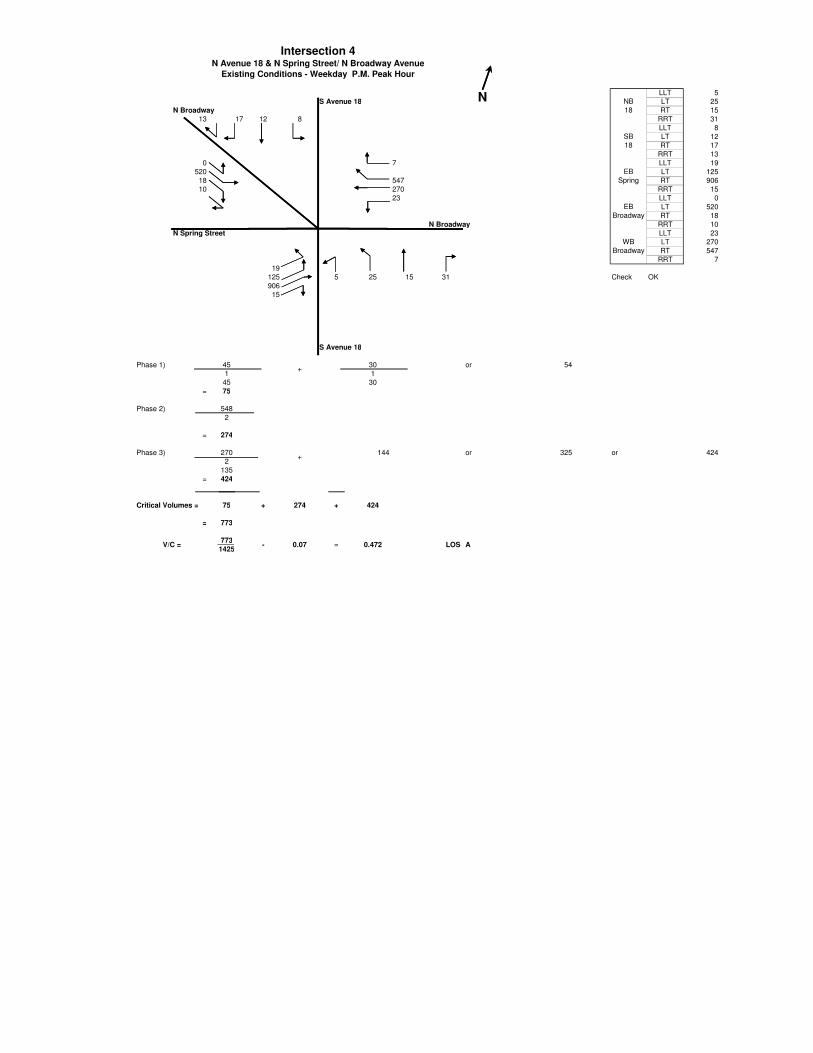
LLT 5
S Avenue 18 LT 25
N Broadway RT 15
13 17 12 8 RRT 31
LLT 8
LT 12
RT 17
RRT 13
0 7 LLT 19
520 LT 125
18 547 RT 906
10 270 RRT 15
23 LLT 0
LT 520
RT 18
N Broadway RRT 10
N Spring Street LLT 23
LT 270
RT 547
RRT 7
19
125 5 25 15 31 Check OK
906
15
S Avenue 18
Phase 1) 45 30 or 54
1 1
45 30
= 75
Phase 2) 548
2
= 274
Phase 3) 270 144 or 325 or 424
2
135
= 424
Critical Volumes = 75 + 274 + 424
= 773
773
Intersection 4N Avenue 18 & N Spring Street/ N Broadway Avenue
Existing Conditions - Weekday P.M. Peak Hour
N
+
+
NB
18
SB
18
EB
Spring
EB
Broadway
WB
Broadway
773
1425LOS AV/C = - 0.07 = 0.472
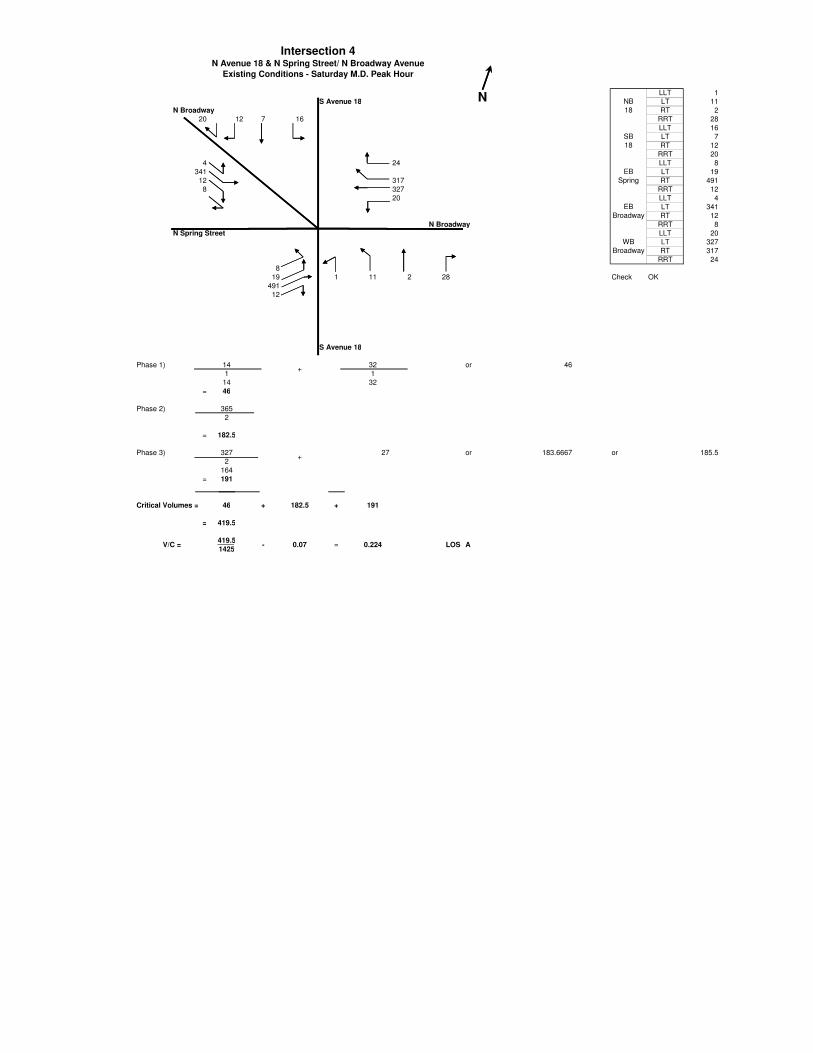
LLT 1
S Avenue 18 LT 11
N Broadway RT 2
20 12 7 16 RRT 28
LLT 16
LT 7
RT 12
RRT 20
4 24 LLT 8
341 LT 19
12 317 RT 491
8 327 RRT 12
20 LLT 4
LT 341
RT 12
N Broadway RRT 8
N Spring Street LLT 20
LT 327
RT 317
RRT 24
8
19 1 11 2 28 Check OK
491
12
S Avenue 18
Phase 1) 14 32 or 46
1 1
14 32
= 46
Phase 2) 365
2
= 182.5
Phase 3) 327 27 or 183.6667 or 185.5
2
164
= 191
Critical Volumes = 46 + 182.5 + 191
= 419.5
419.5
WB
Broadway
+
NB
18
SB
18
EB
Spring
EB
Broadway
+
Intersection 4
Existing Conditions - Saturday M.D. Peak Hour
N
N Avenue 18 & N Spring Street/ N Broadway Avenue
419.5
1425= 0.224 LOS AV/C = - 0.07
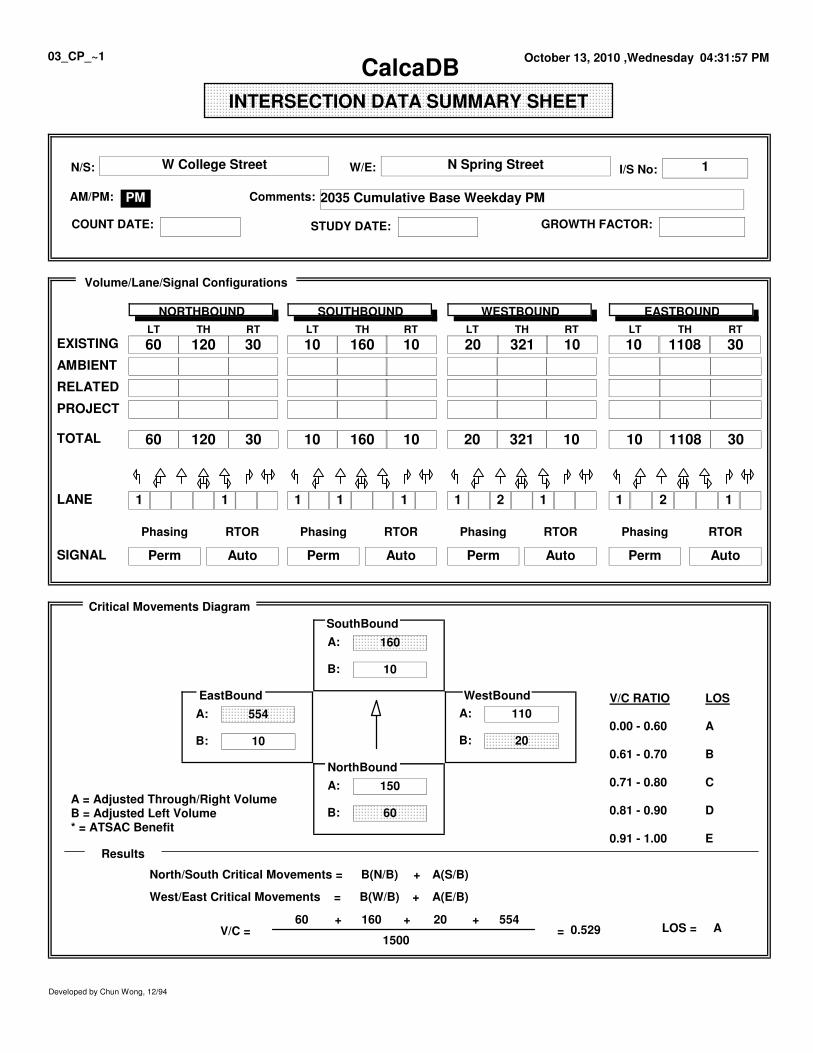
2035 Cumulative Base Weekday PMPM
W College Street N Spring StreetN/S: W/E: 1I/S No:
AM/PM: Comments:
COUNT DATE: GROWTH FACTOR:STUDY DATE:
110A:
B: 20
10
A:
B:
160
150A:
B: 60
0.529 =
+
+
+++ 554160 2060
1500
10
A:
B:
554
V/C =
West/East Critical Movements =
North/South Critical Movements =
SouthBound
WestBoundEastBound
NorthBound
A = Adjusted Through/Right VolumeB = Adjusted Left Volume* = ATSAC Benefit
Results
V/C RATIO LOS
0.00 - 0.60 A
0.61 - 0.70 B
0.71 - 0.80 C
0.81 - 0.90 D
0.91 - 1.00 E
B(W/B)
B(N/B)
A(E/B)
A(S/B)
ALOS =
Critical Movements Diagram
TH RT LT THLT TH RT LT TH RT
Phasing RTOR Phasing Phasing PhasingRTOR RTOR
NORTHBOUND SOUTHBOUND WESTBOUND EASTBOUND
EXISTING
RTOR
RT
60
AMBIENT
RELATED
PROJECT
TOTAL 60
LANE
SIGNAL Perm
1
Perm Perm PermAuto Auto Auto Auto
1 1 1 1 1 2 1 1 2 1
LT
120 30 10 160 10 20 321 10 10 1108 30
20 10321101601030120 30110810
Volume/Lane/Signal Configurations
Developed by Chun Wong, 12/94
October 13, 2010 ,Wednesday 04:31:57 PMCalcaDB
03_CP_~1
INTERSECTION DATA SUMMARY SHEET
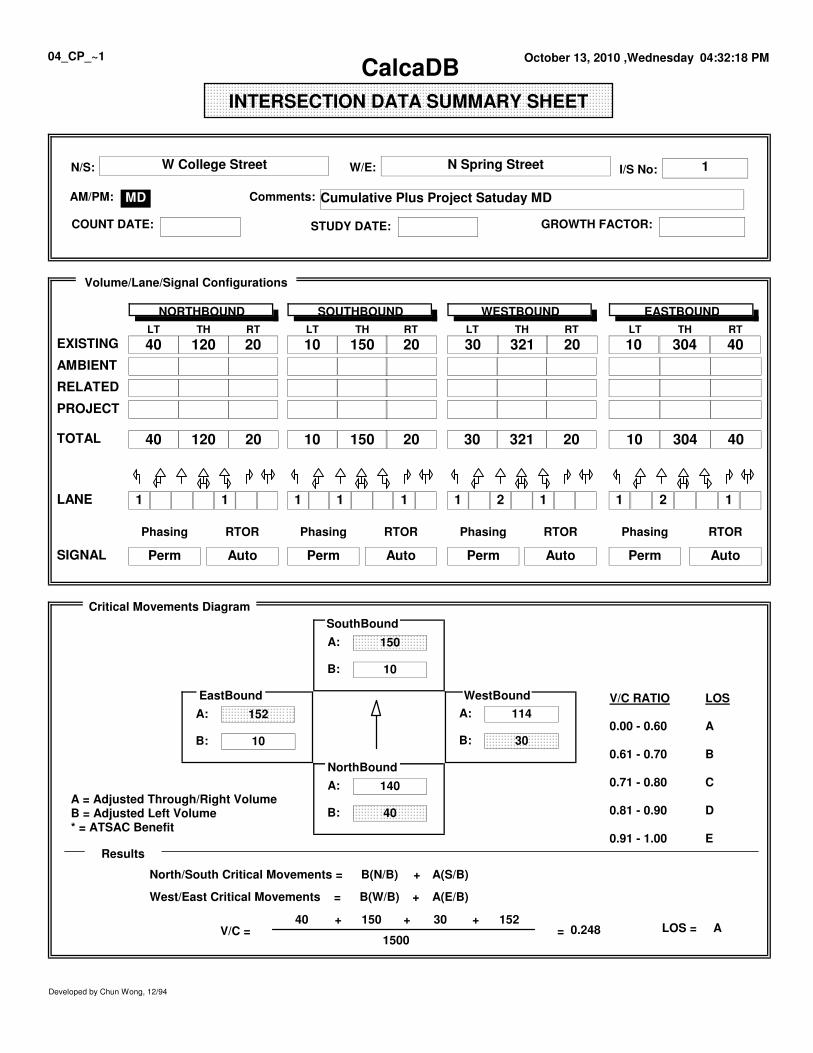
Cumulative Plus Project Satuday MDMD
W College Street N Spring StreetN/S: W/E: 1I/S No:
AM/PM: Comments:
COUNT DATE: GROWTH FACTOR:STUDY DATE:
114A:
B: 30
10
A:
B:
150
140A:
B: 40
0.248 =
+
+
+++ 152150 3040
1500
10
A:
B:
152
V/C =
West/East Critical Movements =
North/South Critical Movements =
SouthBound
WestBoundEastBound
NorthBound
A = Adjusted Through/Right VolumeB = Adjusted Left Volume* = ATSAC Benefit
Results
V/C RATIO LOS
0.00 - 0.60 A
0.61 - 0.70 B
0.71 - 0.80 C
0.81 - 0.90 D
0.91 - 1.00 E
B(W/B)
B(N/B)
A(E/B)
A(S/B)
ALOS =
Critical Movements Diagram
TH RT LT THLT TH RT LT TH RT
Phasing RTOR Phasing Phasing PhasingRTOR RTOR
NORTHBOUND SOUTHBOUND WESTBOUND EASTBOUND
EXISTING
RTOR
RT
40
AMBIENT
RELATED
PROJECT
TOTAL 40
LANE
SIGNAL Perm
1
Perm Perm PermAuto Auto Auto Auto
1 1 1 1 1 2 1 1 2 1
LT
120 20 10 150 20 30 321 20 10 304 40
30 20321201501020120 4030410
Volume/Lane/Signal Configurations
Developed by Chun Wong, 12/94
October 13, 2010 ,Wednesday 04:32:18 PMCalcaDB
04_CP_~1
INTERSECTION DATA SUMMARY SHEET
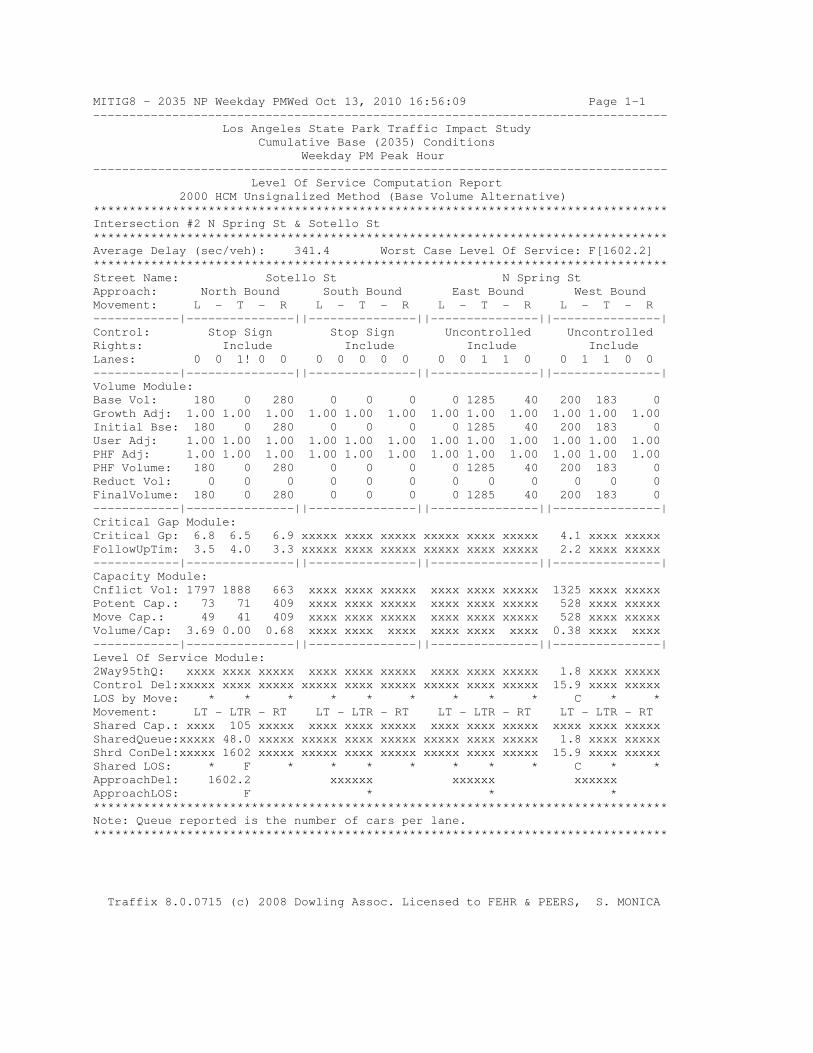
MITIG8 - 2035 NP Weekday PMWed Oct 13, 2010 16:56:09 Page 1-1
--------------------------------------------------------------------------------
Los Angeles State Park Traffic Impact Study
Cumulative Base (2035) Conditions
Weekday PM Peak Hour
--------------------------------------------------------------------------------
Level Of Service Computation Report
2000 HCM Unsignalized Method (Base Volume Alternative)
********************************************************************************
Intersection #2 N Spring St & Sotello St
********************************************************************************
Average Delay (sec/veh): 341.4 Worst Case Level Of Service: F[1602.2]
********************************************************************************
Street Name: Sotello St N Spring St
Approach: North Bound South Bound East Bound West Bound
Movement: L - T - R L - T - R L - T - R L - T - R
------------|---------------||---------------||---------------||---------------|
Control: Stop Sign Stop Sign Uncontrolled Uncontrolled
Rights: Include Include Include Include
Lanes: 0 0 1! 0 0 0 0 0 0 0 0 0 1 1 0 0 1 1 0 0
------------|---------------||---------------||---------------||---------------|
Volume Module:
Base Vol: 180 0 280 0 0 0 0 1285 40 200 183 0
Growth Adj: 1.00 1.00 1.00 1.00 1.00 1.00 1.00 1.00 1.00 1.00 1.00 1.00
Initial Bse: 180 0 280 0 0 0 0 1285 40 200 183 0
User Adj: 1.00 1.00 1.00 1.00 1.00 1.00 1.00 1.00 1.00 1.00 1.00 1.00
PHF Adj: 1.00 1.00 1.00 1.00 1.00 1.00 1.00 1.00 1.00 1.00 1.00 1.00
PHF Volume: 180 0 280 0 0 0 0 1285 40 200 183 0
Reduct Vol: 0 0 0 0 0 0 0 0 0 0 0 0
FinalVolume: 180 0 280 0 0 0 0 1285 40 200 183 0
------------|---------------||---------------||---------------||---------------|
Critical Gap Module:
Critical Gp: 6.8 6.5 6.9 xxxxx xxxx xxxxx xxxxx xxxx xxxxx 4.1 xxxx xxxxx
FollowUpTim: 3.5 4.0 3.3 xxxxx xxxx xxxxx xxxxx xxxx xxxxx 2.2 xxxx xxxxx
------------|---------------||---------------||---------------||---------------|
Capacity Module:
Cnflict Vol: 1797 1888 663 xxxx xxxx xxxxx xxxx xxxx xxxxx 1325 xxxx xxxxx
Potent Cap.: 73 71 409 xxxx xxxx xxxxx xxxx xxxx xxxxx 528 xxxx xxxxx
Move Cap.: 49 41 409 xxxx xxxx xxxxx xxxx xxxx xxxxx 528 xxxx xxxxx
Volume/Cap: 3.69 0.00 0.68 xxxx xxxx xxxx xxxx xxxx xxxx 0.38 xxxx xxxx
------------|---------------||---------------||---------------||---------------|
Level Of Service Module:
2Way95thQ: xxxx xxxx xxxxx xxxx xxxx xxxxx xxxx xxxx xxxxx 1.8 xxxx xxxxx
Control Del:xxxxx xxxx xxxxx xxxxx xxxx xxxxx xxxxx xxxx xxxxx 15.9 xxxx xxxxx
LOS by Move: * * * * * * * * * C * *
Movement: LT - LTR - RT LT - LTR - RT LT - LTR - RT LT - LTR - RT
Shared Cap.: xxxx 105 xxxxx xxxx xxxx xxxxx xxxx xxxx xxxxx xxxx xxxx xxxxx
SharedQueue:xxxxx 48.0 xxxxx xxxxx xxxx xxxxx xxxxx xxxx xxxxx 1.8 xxxx xxxxx
Shrd ConDel:xxxxx 1602 xxxxx xxxxx xxxx xxxxx xxxxx xxxx xxxxx 15.9 xxxx xxxxx
Shared LOS: * F * * * * * * * C * *
ApproachDel: 1602.2 xxxxxx xxxxxx xxxxxx
ApproachLOS: F * * *
********************************************************************************
Note: Queue reported is the number of cars per lane.
********************************************************************************
Traffix 8.0.0715 (c) 2008 Dowling Assoc. Licensed to FEHR & PEERS, S. MONICA
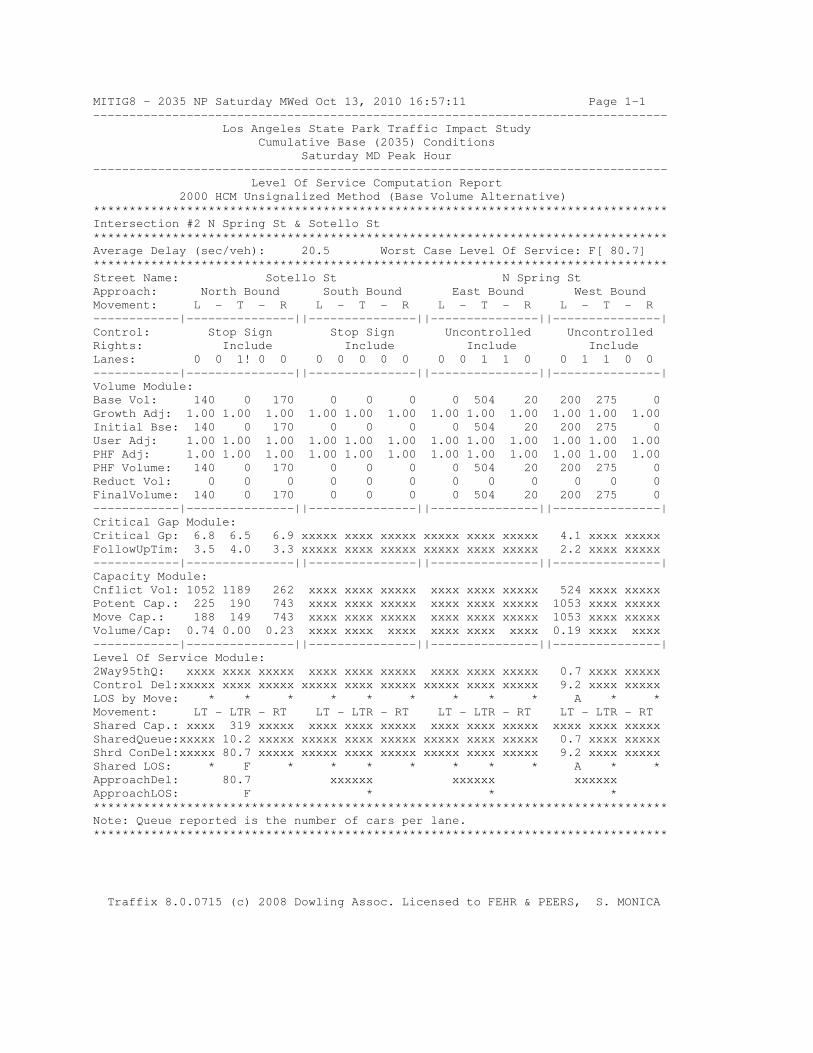
MITIG8 - 2035 NP Saturday MWed Oct 13, 2010 16:57:11 Page 1-1
--------------------------------------------------------------------------------
Los Angeles State Park Traffic Impact Study
Cumulative Base (2035) Conditions
Saturday MD Peak Hour
--------------------------------------------------------------------------------
Level Of Service Computation Report
2000 HCM Unsignalized Method (Base Volume Alternative)
********************************************************************************
Intersection #2 N Spring St & Sotello St
********************************************************************************
Average Delay (sec/veh): 20.5 Worst Case Level Of Service: F[ 80.7]
********************************************************************************
Street Name: Sotello St N Spring St
Approach: North Bound South Bound East Bound West Bound
Movement: L - T - R L - T - R L - T - R L - T - R
------------|---------------||---------------||---------------||---------------|
Control: Stop Sign Stop Sign Uncontrolled Uncontrolled
Rights: Include Include Include Include
Lanes: 0 0 1! 0 0 0 0 0 0 0 0 0 1 1 0 0 1 1 0 0
------------|---------------||---------------||---------------||---------------|
Volume Module:
Base Vol: 140 0 170 0 0 0 0 504 20 200 275 0
Growth Adj: 1.00 1.00 1.00 1.00 1.00 1.00 1.00 1.00 1.00 1.00 1.00 1.00
Initial Bse: 140 0 170 0 0 0 0 504 20 200 275 0
User Adj: 1.00 1.00 1.00 1.00 1.00 1.00 1.00 1.00 1.00 1.00 1.00 1.00
PHF Adj: 1.00 1.00 1.00 1.00 1.00 1.00 1.00 1.00 1.00 1.00 1.00 1.00
PHF Volume: 140 0 170 0 0 0 0 504 20 200 275 0
Reduct Vol: 0 0 0 0 0 0 0 0 0 0 0 0
FinalVolume: 140 0 170 0 0 0 0 504 20 200 275 0
------------|---------------||---------------||---------------||---------------|
Critical Gap Module:
Critical Gp: 6.8 6.5 6.9 xxxxx xxxx xxxxx xxxxx xxxx xxxxx 4.1 xxxx xxxxx
FollowUpTim: 3.5 4.0 3.3 xxxxx xxxx xxxxx xxxxx xxxx xxxxx 2.2 xxxx xxxxx
------------|---------------||---------------||---------------||---------------|
Capacity Module:
Cnflict Vol: 1052 1189 262 xxxx xxxx xxxxx xxxx xxxx xxxxx 524 xxxx xxxxx
Potent Cap.: 225 190 743 xxxx xxxx xxxxx xxxx xxxx xxxxx 1053 xxxx xxxxx
Move Cap.: 188 149 743 xxxx xxxx xxxxx xxxx xxxx xxxxx 1053 xxxx xxxxx
Volume/Cap: 0.74 0.00 0.23 xxxx xxxx xxxx xxxx xxxx xxxx 0.19 xxxx xxxx
------------|---------------||---------------||---------------||---------------|
Level Of Service Module:
2Way95thQ: xxxx xxxx xxxxx xxxx xxxx xxxxx xxxx xxxx xxxxx 0.7 xxxx xxxxx
Control Del:xxxxx xxxx xxxxx xxxxx xxxx xxxxx xxxxx xxxx xxxxx 9.2 xxxx xxxxx
LOS by Move: * * * * * * * * * A * *
Movement: LT - LTR - RT LT - LTR - RT LT - LTR - RT LT - LTR - RT
Shared Cap.: xxxx 319 xxxxx xxxx xxxx xxxxx xxxx xxxx xxxxx xxxx xxxx xxxxx
SharedQueue:xxxxx 10.2 xxxxx xxxxx xxxx xxxxx xxxxx xxxx xxxxx 0.7 xxxx xxxxx
Shrd ConDel:xxxxx 80.7 xxxxx xxxxx xxxx xxxxx xxxxx xxxx xxxxx 9.2 xxxx xxxxx
Shared LOS: * F * * * * * * * A * *
ApproachDel: 80.7 xxxxxx xxxxxx xxxxxx
ApproachLOS: F * * *
********************************************************************************
Note: Queue reported is the number of cars per lane.
********************************************************************************
Traffix 8.0.0715 (c) 2008 Dowling Assoc. Licensed to FEHR & PEERS, S. MONICA
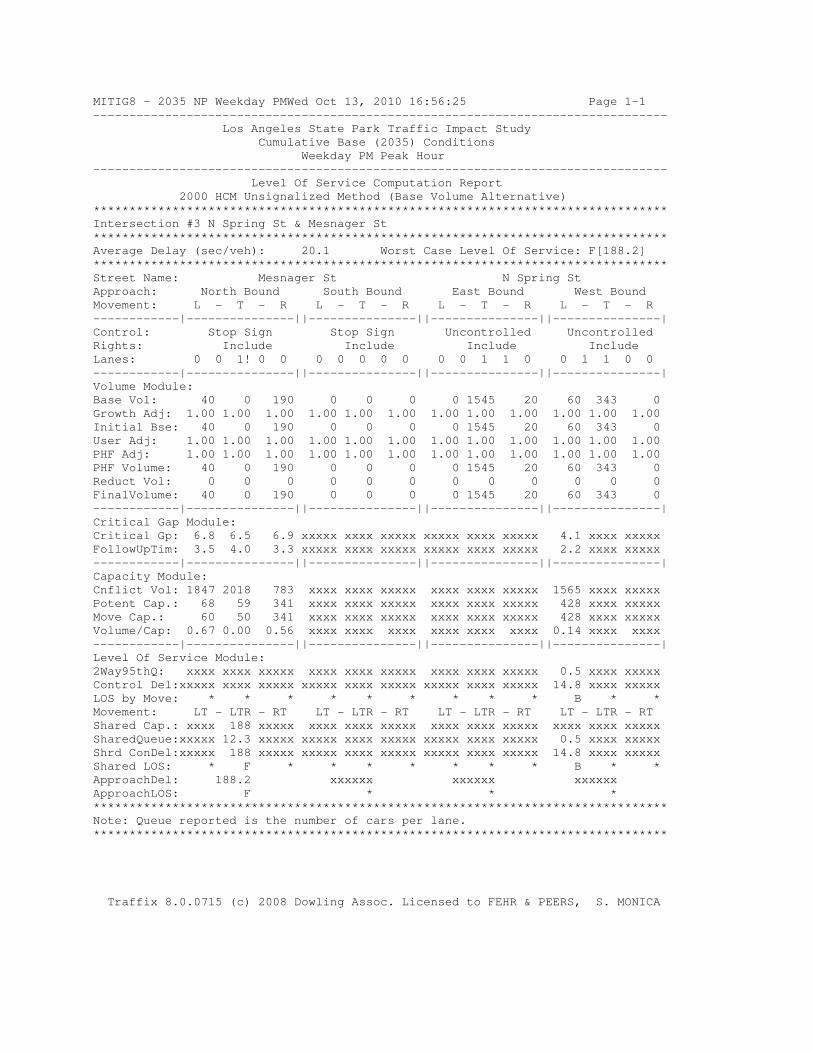
MITIG8 - 2035 NP Weekday PMWed Oct 13, 2010 16:56:25 Page 1-1
--------------------------------------------------------------------------------
Los Angeles State Park Traffic Impact Study
Cumulative Base (2035) Conditions
Weekday PM Peak Hour
--------------------------------------------------------------------------------
Level Of Service Computation Report
2000 HCM Unsignalized Method (Base Volume Alternative)
********************************************************************************
Intersection #3 N Spring St & Mesnager St
********************************************************************************
Average Delay (sec/veh): 20.1 Worst Case Level Of Service: F[188.2]
********************************************************************************
Street Name: Mesnager St N Spring St
Approach: North Bound South Bound East Bound West Bound
Movement: L - T - R L - T - R L - T - R L - T - R
------------|---------------||---------------||---------------||---------------|
Control: Stop Sign Stop Sign Uncontrolled Uncontrolled
Rights: Include Include Include Include
Lanes: 0 0 1! 0 0 0 0 0 0 0 0 0 1 1 0 0 1 1 0 0
------------|---------------||---------------||---------------||---------------|
Volume Module:
Base Vol: 40 0 190 0 0 0 0 1545 20 60 343 0
Growth Adj: 1.00 1.00 1.00 1.00 1.00 1.00 1.00 1.00 1.00 1.00 1.00 1.00
Initial Bse: 40 0 190 0 0 0 0 1545 20 60 343 0
User Adj: 1.00 1.00 1.00 1.00 1.00 1.00 1.00 1.00 1.00 1.00 1.00 1.00
PHF Adj: 1.00 1.00 1.00 1.00 1.00 1.00 1.00 1.00 1.00 1.00 1.00 1.00
PHF Volume: 40 0 190 0 0 0 0 1545 20 60 343 0
Reduct Vol: 0 0 0 0 0 0 0 0 0 0 0 0
FinalVolume: 40 0 190 0 0 0 0 1545 20 60 343 0
------------|---------------||---------------||---------------||---------------|
Critical Gap Module:
Critical Gp: 6.8 6.5 6.9 xxxxx xxxx xxxxx xxxxx xxxx xxxxx 4.1 xxxx xxxxx
FollowUpTim: 3.5 4.0 3.3 xxxxx xxxx xxxxx xxxxx xxxx xxxxx 2.2 xxxx xxxxx
------------|---------------||---------------||---------------||---------------|
Capacity Module:
Cnflict Vol: 1847 2018 783 xxxx xxxx xxxxx xxxx xxxx xxxxx 1565 xxxx xxxxx
Potent Cap.: 68 59 341 xxxx xxxx xxxxx xxxx xxxx xxxxx 428 xxxx xxxxx
Move Cap.: 60 50 341 xxxx xxxx xxxxx xxxx xxxx xxxxx 428 xxxx xxxxx
Volume/Cap: 0.67 0.00 0.56 xxxx xxxx xxxx xxxx xxxx xxxx 0.14 xxxx xxxx
------------|---------------||---------------||---------------||---------------|
Level Of Service Module:
2Way95thQ: xxxx xxxx xxxxx xxxx xxxx xxxxx xxxx xxxx xxxxx 0.5 xxxx xxxxx
Control Del:xxxxx xxxx xxxxx xxxxx xxxx xxxxx xxxxx xxxx xxxxx 14.8 xxxx xxxxx
LOS by Move: * * * * * * * * * B * *
Movement: LT - LTR - RT LT - LTR - RT LT - LTR - RT LT - LTR - RT
Shared Cap.: xxxx 188 xxxxx xxxx xxxx xxxxx xxxx xxxx xxxxx xxxx xxxx xxxxx
SharedQueue:xxxxx 12.3 xxxxx xxxxx xxxx xxxxx xxxxx xxxx xxxxx 0.5 xxxx xxxxx
Shrd ConDel:xxxxx 188 xxxxx xxxxx xxxx xxxxx xxxxx xxxx xxxxx 14.8 xxxx xxxxx
Shared LOS: * F * * * * * * * B * *
ApproachDel: 188.2 xxxxxx xxxxxx xxxxxx
ApproachLOS: F * * *
********************************************************************************
Note: Queue reported is the number of cars per lane.
********************************************************************************
Traffix 8.0.0715 (c) 2008 Dowling Assoc. Licensed to FEHR & PEERS, S. MONICA

MITIG8 - 2035 NP Saturday MWed Oct 13, 2010 16:57:27 Page 1-1
--------------------------------------------------------------------------------
Los Angeles State Park Traffic Impact Study
Cumulative Base (2035) Conditions
Saturday MD Peak Hour
--------------------------------------------------------------------------------
Level Of Service Computation Report
2000 HCM Unsignalized Method (Base Volume Alternative)
********************************************************************************
Intersection #3 N Spring St & Mesnager St
********************************************************************************
Average Delay (sec/veh): 2.4 Worst Case Level Of Service: C[ 16.1]
********************************************************************************
Street Name: Mesnager St N Spring St
Approach: North Bound South Bound East Bound West Bound
Movement: L - T - R L - T - R L - T - R L - T - R
------------|---------------||---------------||---------------||---------------|
Control: Stop Sign Stop Sign Uncontrolled Uncontrolled
Rights: Include Include Include Include
Lanes: 0 0 1! 0 0 0 0 0 0 0 0 0 1 1 0 0 1 1 0 0
------------|---------------||---------------||---------------||---------------|
Volume Module:
Base Vol: 40 0 140 0 0 0 0 644 30 20 435 0
Growth Adj: 1.00 1.00 1.00 1.00 1.00 1.00 1.00 1.00 1.00 1.00 1.00 1.00
Initial Bse: 40 0 140 0 0 0 0 644 30 20 435 0
User Adj: 1.00 1.00 1.00 1.00 1.00 1.00 1.00 1.00 1.00 1.00 1.00 1.00
PHF Adj: 1.00 1.00 1.00 1.00 1.00 1.00 1.00 1.00 1.00 1.00 1.00 1.00
PHF Volume: 40 0 140 0 0 0 0 644 30 20 435 0
Reduct Vol: 0 0 0 0 0 0 0 0 0 0 0 0
FinalVolume: 40 0 140 0 0 0 0 644 30 20 435 0
------------|---------------||---------------||---------------||---------------|
Critical Gap Module:
Critical Gp: 6.8 6.5 6.9 xxxxx xxxx xxxxx xxxxx xxxx xxxxx 4.1 xxxx xxxxx
FollowUpTim: 3.5 4.0 3.3 xxxxx xxxx xxxxx xxxxx xxxx xxxxx 2.2 xxxx xxxxx
------------|---------------||---------------||---------------||---------------|
Capacity Module:
Cnflict Vol: 917 1134 337 xxxx xxxx xxxxx xxxx xxxx xxxxx 674 xxxx xxxxx
Potent Cap.: 275 204 665 xxxx xxxx xxxxx xxxx xxxx xxxxx 927 xxxx xxxxx
Move Cap.: 271 200 665 xxxx xxxx xxxxx xxxx xxxx xxxxx 927 xxxx xxxxx
Volume/Cap: 0.15 0.00 0.21 xxxx xxxx xxxx xxxx xxxx xxxx 0.02 xxxx xxxx
------------|---------------||---------------||---------------||---------------|
Level Of Service Module:
2Way95thQ: xxxx xxxx xxxxx xxxx xxxx xxxxx xxxx xxxx xxxxx 0.1 xxxx xxxxx
Control Del:xxxxx xxxx xxxxx xxxxx xxxx xxxxx xxxxx xxxx xxxxx 9.0 xxxx xxxxx
LOS by Move: * * * * * * * * * A * *
Movement: LT - LTR - RT LT - LTR - RT LT - LTR - RT LT - LTR - RT
Shared Cap.: xxxx 502 xxxxx xxxx xxxx xxxxx xxxx xxxx xxxxx xxxx xxxx xxxxx
SharedQueue:xxxxx 1.6 xxxxx xxxxx xxxx xxxxx xxxxx xxxx xxxxx 0.1 xxxx xxxxx
Shrd ConDel:xxxxx 16.1 xxxxx xxxxx xxxx xxxxx xxxxx xxxx xxxxx 9.0 xxxx xxxxx
Shared LOS: * C * * * * * * * A * *
ApproachDel: 16.1 xxxxxx xxxxxx xxxxxx
ApproachLOS: C * * *
********************************************************************************
Note: Queue reported is the number of cars per lane.
********************************************************************************
Traffix 8.0.0715 (c) 2008 Dowling Assoc. Licensed to FEHR & PEERS, S. MONICA
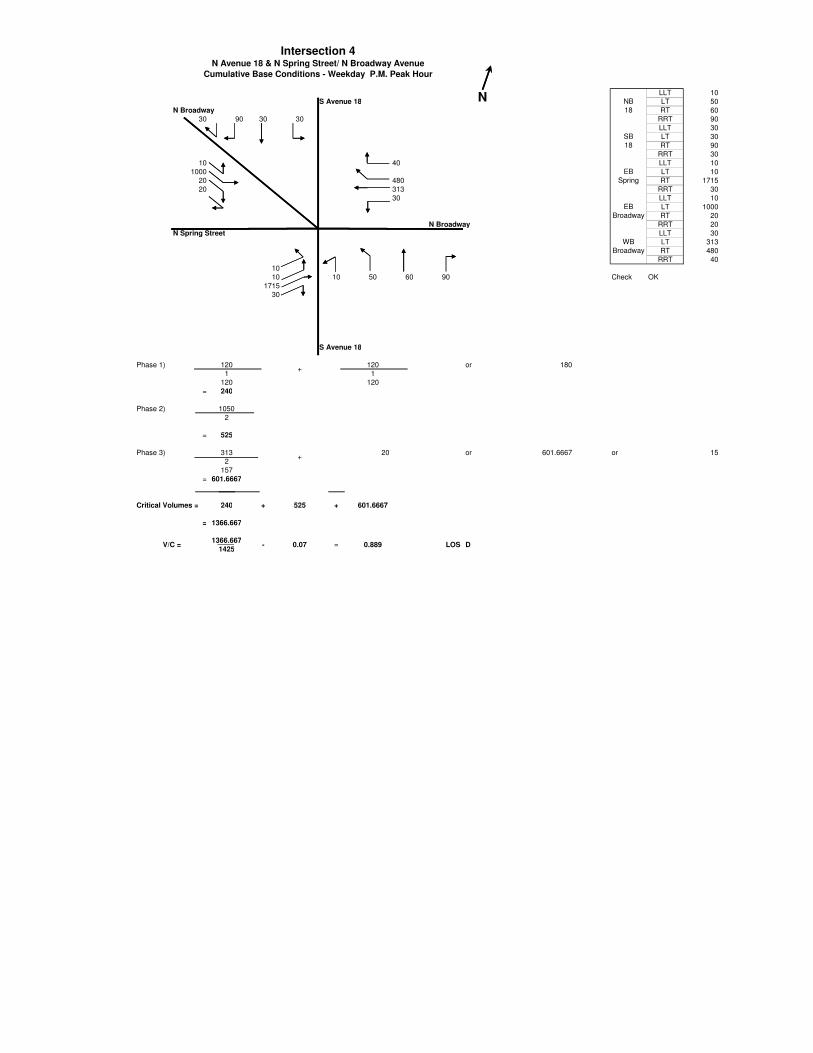
LLT 10
S Avenue 18 LT 50
N Broadway RT 60
30 90 30 30 RRT 90
LLT 30
LT 30
RT 90
RRT 30
10 40 LLT 10
1000 LT 10
20 480 RT 1715
20 313 RRT 30
30 LLT 10
LT 1000
RT 20
N Broadway RRT 20
N Spring Street LLT 30
LT 313
RT 480
RRT 40
10
10 10 50 60 90 Check OK
1715
30
S Avenue 18
Phase 1) 120 120 or 180
1 1
120 120
= 240
Phase 2) 1050
2
= 525
Phase 3) 313 20 or 601.6667 or 15
2
157
= 601.6667
Critical Volumes = 240 + 525 + 601.6667
= 1366.667
1366.667
NB
18
SB
18
EB
Spring
EB
Broadway
WB
Broadway
Intersection 4N Avenue 18 & N Spring Street/ N Broadway Avenue
Cumulative Base Conditions - Weekday P.M. Peak Hour
N
+
+
1366.667
1425V/C = - 0.07 = 0.889 LOS D

LLT 10
S Avenue 18 LT 30
N Broadway RT 10
50 70 20 60 RRT 90
LLT 60
LT 20
RT 70
RRT 50
10 140 LLT 10
660 LT 10
20 280 RT 934
20 395 RRT 30
30 LLT 10
LT 660
RT 20
N Broadway RRT 20
N Spring Street LLT 30
LT 395
RT 280
RRT 140
10
10 10 30 10 90 Check OK
934
30
S Avenue 18
Phase 1) 50 120 or 160
1 1
50 120
= 170
Phase 2) 710
2
= 355
Phase 3) 395 20 or 341.3333 or 85
2
198
= 341.3333
Critical Volumes = 170 + 355 + 341.3333
= 866.3333
866.3333
NB
18
SB
18
EB
Spring
EB
Broadway
WB
Broadway
Intersection 4N Avenue 18 & N Spring Street/ N Broadway Avenue
Cumulative Base Conditions - Saturday M.D. Peak Hour
N
+
+
866.3333
1425V/C = - 0.07 = 0.538 LOS A

2035 Plus Project Conditions Weekday PMPM
W College Street N Spring StreetN/S: W/E: 1I/S No:
AM/PM: Comments:
COUNT DATE: GROWTH FACTOR:STUDY DATE:
113A:
B: 20
10
A:
B:
160
150A:
B: 60
0.537 =
+
+
+++ 565160 2060
1500
10
A:
B:
565
V/C =
West/East Critical Movements =
North/South Critical Movements =
SouthBound
WestBoundEastBound
NorthBound
A = Adjusted Through/Right VolumeB = Adjusted Left Volume* = ATSAC Benefit
Results
V/C RATIO LOS
0.00 - 0.60 A
0.61 - 0.70 B
0.71 - 0.80 C
0.81 - 0.90 D
0.91 - 1.00 E
B(W/B)
B(N/B)
A(E/B)
A(S/B)
ALOS =
Critical Movements Diagram
TH RT LT THLT TH RT LT TH RT
Phasing RTOR Phasing Phasing PhasingRTOR RTOR
NORTHBOUND SOUTHBOUND WESTBOUND EASTBOUND
EXISTING
RTOR
RT
60
AMBIENT
RELATED
PROJECT
TOTAL 60
LANE
SIGNAL Perm
1
Perm Perm PermAuto Auto Auto Auto
1 1 1 1 1 2 1 1 2 1
LT
120 30 10 160 10 20 330 10 10 1130 30
20 10330101601030120 30113010
Volume/Lane/Signal Configurations
Developed by Chun Wong, 12/94
October 13, 2010 ,Wednesday 04:32:33 PMCalcaDB
05_CP_~1
INTERSECTION DATA SUMMARY SHEET
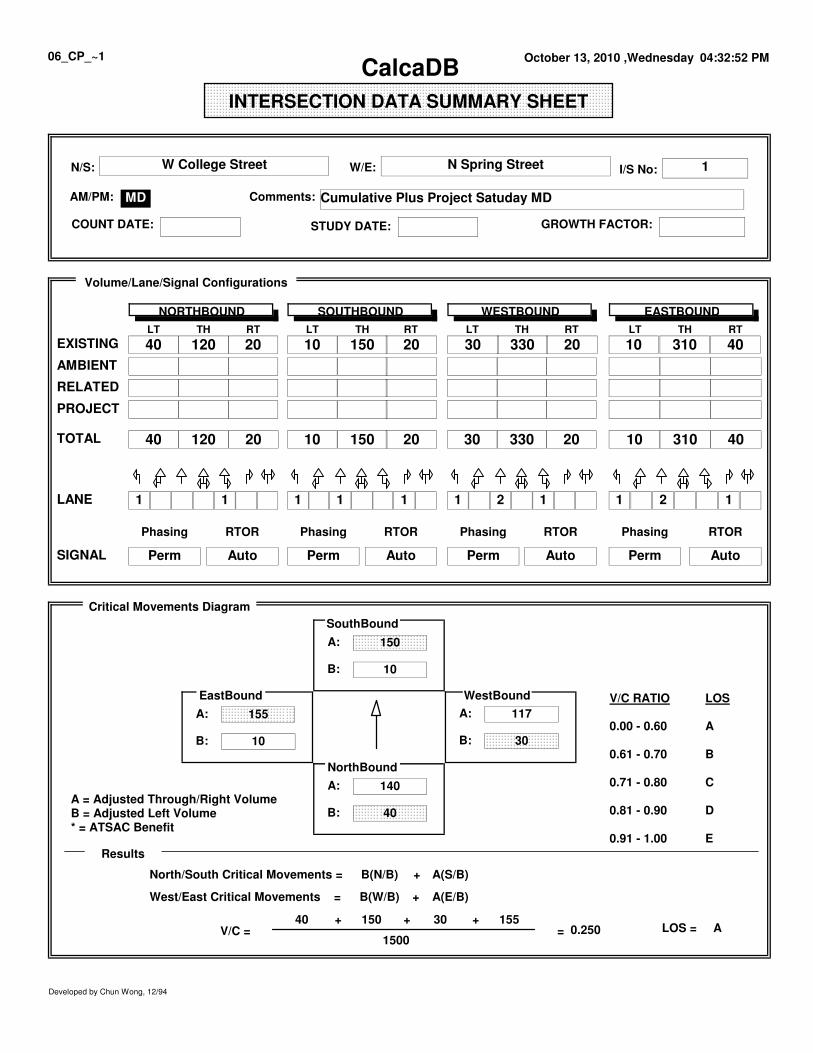
Cumulative Plus Project Satuday MDMD
W College Street N Spring StreetN/S: W/E: 1I/S No:
AM/PM: Comments:
COUNT DATE: GROWTH FACTOR:STUDY DATE:
117A:
B: 30
10
A:
B:
150
140A:
B: 40
0.250 =
+
+
+++ 155150 3040
1500
10
A:
B:
155
V/C =
West/East Critical Movements =
North/South Critical Movements =
SouthBound
WestBoundEastBound
NorthBound
A = Adjusted Through/Right VolumeB = Adjusted Left Volume* = ATSAC Benefit
Results
V/C RATIO LOS
0.00 - 0.60 A
0.61 - 0.70 B
0.71 - 0.80 C
0.81 - 0.90 D
0.91 - 1.00 E
B(W/B)
B(N/B)
A(E/B)
A(S/B)
ALOS =
Critical Movements Diagram
TH RT LT THLT TH RT LT TH RT
Phasing RTOR Phasing Phasing PhasingRTOR RTOR
NORTHBOUND SOUTHBOUND WESTBOUND EASTBOUND
EXISTING
RTOR
RT
40
AMBIENT
RELATED
PROJECT
TOTAL 40
LANE
SIGNAL Perm
1
Perm Perm PermAuto Auto Auto Auto
1 1 1 1 1 2 1 1 2 1
LT
120 20 10 150 20 30 330 20 10 310 40
30 20330201501020120 4031010
Volume/Lane/Signal Configurations
Developed by Chun Wong, 12/94
October 13, 2010 ,Wednesday 04:32:52 PMCalcaDB
06_CP_~1
INTERSECTION DATA SUMMARY SHEET
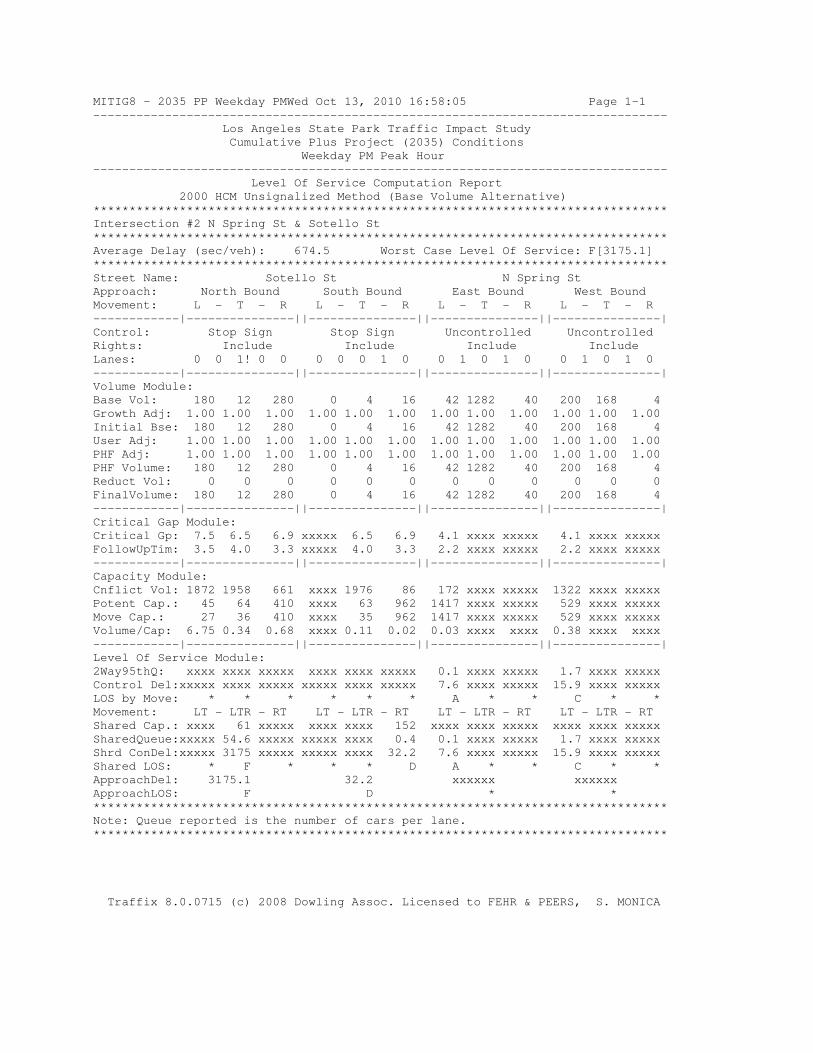
MITIG8 - 2035 PP Weekday PMWed Oct 13, 2010 16:58:05 Page 1-1
--------------------------------------------------------------------------------
Los Angeles State Park Traffic Impact Study
Cumulative Plus Project (2035) Conditions
Weekday PM Peak Hour
--------------------------------------------------------------------------------
Level Of Service Computation Report
2000 HCM Unsignalized Method (Base Volume Alternative)
********************************************************************************
Intersection #2 N Spring St & Sotello St
********************************************************************************
Average Delay (sec/veh): 674.5 Worst Case Level Of Service: F[3175.1]
********************************************************************************
Street Name: Sotello St N Spring St
Approach: North Bound South Bound East Bound West Bound
Movement: L - T - R L - T - R L - T - R L - T - R
------------|---------------||---------------||---------------||---------------|
Control: Stop Sign Stop Sign Uncontrolled Uncontrolled
Rights: Include Include Include Include
Lanes: 0 0 1! 0 0 0 0 0 1 0 0 1 0 1 0 0 1 0 1 0
------------|---------------||---------------||---------------||---------------|
Volume Module:
Base Vol: 180 12 280 0 4 16 42 1282 40 200 168 4
Growth Adj: 1.00 1.00 1.00 1.00 1.00 1.00 1.00 1.00 1.00 1.00 1.00 1.00
Initial Bse: 180 12 280 0 4 16 42 1282 40 200 168 4
User Adj: 1.00 1.00 1.00 1.00 1.00 1.00 1.00 1.00 1.00 1.00 1.00 1.00
PHF Adj: 1.00 1.00 1.00 1.00 1.00 1.00 1.00 1.00 1.00 1.00 1.00 1.00
PHF Volume: 180 12 280 0 4 16 42 1282 40 200 168 4
Reduct Vol: 0 0 0 0 0 0 0 0 0 0 0 0
FinalVolume: 180 12 280 0 4 16 42 1282 40 200 168 4
------------|---------------||---------------||---------------||---------------|
Critical Gap Module:
Critical Gp: 7.5 6.5 6.9 xxxxx 6.5 6.9 4.1 xxxx xxxxx 4.1 xxxx xxxxx
FollowUpTim: 3.5 4.0 3.3 xxxxx 4.0 3.3 2.2 xxxx xxxxx 2.2 xxxx xxxxx
------------|---------------||---------------||---------------||---------------|
Capacity Module:
Cnflict Vol: 1872 1958 661 xxxx 1976 86 172 xxxx xxxxx 1322 xxxx xxxxx
Potent Cap.: 45 64 410 xxxx 63 962 1417 xxxx xxxxx 529 xxxx xxxxx
Move Cap.: 27 36 410 xxxx 35 962 1417 xxxx xxxxx 529 xxxx xxxxx
Volume/Cap: 6.75 0.34 0.68 xxxx 0.11 0.02 0.03 xxxx xxxx 0.38 xxxx xxxx
------------|---------------||---------------||---------------||---------------|
Level Of Service Module:
2Way95thQ: xxxx xxxx xxxxx xxxx xxxx xxxxx 0.1 xxxx xxxxx 1.7 xxxx xxxxx
Control Del:xxxxx xxxx xxxxx xxxxx xxxx xxxxx 7.6 xxxx xxxxx 15.9 xxxx xxxxx
LOS by Move: * * * * * * A * * C * *
Movement: LT - LTR - RT LT - LTR - RT LT - LTR - RT LT - LTR - RT
Shared Cap.: xxxx 61 xxxxx xxxx xxxx 152 xxxx xxxx xxxxx xxxx xxxx xxxxx
SharedQueue:xxxxx 54.6 xxxxx xxxxx xxxx 0.4 0.1 xxxx xxxxx 1.7 xxxx xxxxx
Shrd ConDel:xxxxx 3175 xxxxx xxxxx xxxx 32.2 7.6 xxxx xxxxx 15.9 xxxx xxxxx
Shared LOS: * F * * * D A * * C * *
ApproachDel: 3175.1 32.2 xxxxxx xxxxxx
ApproachLOS: F D * *
********************************************************************************
Note: Queue reported is the number of cars per lane.
********************************************************************************
Traffix 8.0.0715 (c) 2008 Dowling Assoc. Licensed to FEHR & PEERS, S. MONICA
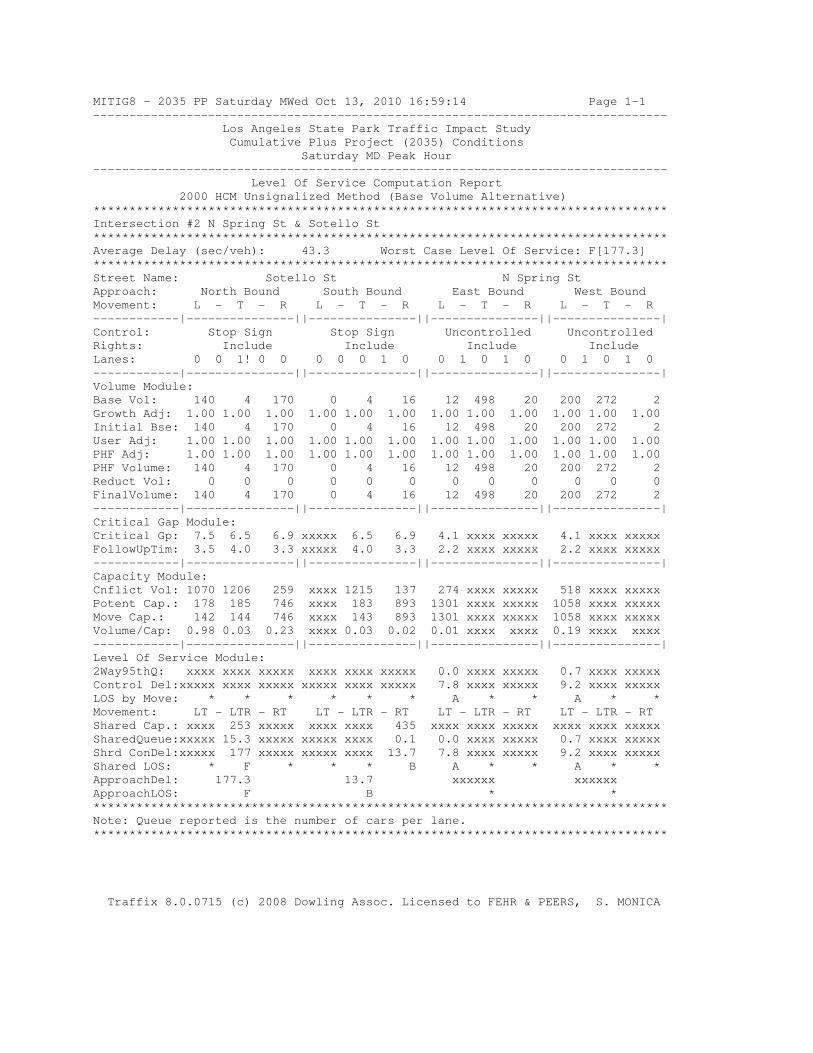
MITIG8 - 2035 PP Saturday MWed Oct 13, 2010 16:59:14 Page 1-1
--------------------------------------------------------------------------------
Los Angeles State Park Traffic Impact Study
Cumulative Plus Project (2035) Conditions
Saturday MD Peak Hour
--------------------------------------------------------------------------------
Level Of Service Computation Report
2000 HCM Unsignalized Method (Base Volume Alternative)
********************************************************************************
Intersection #2 N Spring St & Sotello St
********************************************************************************
Average Delay (sec/veh): 43.3 Worst Case Level Of Service: F[177.3]
********************************************************************************
Street Name: Sotello St N Spring St
Approach: North Bound South Bound East Bound West Bound
Movement: L - T - R L - T - R L - T - R L - T - R
------------|---------------||---------------||---------------||---------------|
Control: Stop Sign Stop Sign Uncontrolled Uncontrolled
Rights: Include Include Include Include
Lanes: 0 0 1! 0 0 0 0 0 1 0 0 1 0 1 0 0 1 0 1 0
------------|---------------||---------------||---------------||---------------|
Volume Module:
Base Vol: 140 4 170 0 4 16 12 498 20 200 272 2
Growth Adj: 1.00 1.00 1.00 1.00 1.00 1.00 1.00 1.00 1.00 1.00 1.00 1.00
Initial Bse: 140 4 170 0 4 16 12 498 20 200 272 2
User Adj: 1.00 1.00 1.00 1.00 1.00 1.00 1.00 1.00 1.00 1.00 1.00 1.00
PHF Adj: 1.00 1.00 1.00 1.00 1.00 1.00 1.00 1.00 1.00 1.00 1.00 1.00
PHF Volume: 140 4 170 0 4 16 12 498 20 200 272 2
Reduct Vol: 0 0 0 0 0 0 0 0 0 0 0 0
FinalVolume: 140 4 170 0 4 16 12 498 20 200 272 2
------------|---------------||---------------||---------------||---------------|
Critical Gap Module:
Critical Gp: 7.5 6.5 6.9 xxxxx 6.5 6.9 4.1 xxxx xxxxx 4.1 xxxx xxxxx
FollowUpTim: 3.5 4.0 3.3 xxxxx 4.0 3.3 2.2 xxxx xxxxx 2.2 xxxx xxxxx
------------|---------------||---------------||---------------||---------------|
Capacity Module:
Cnflict Vol: 1070 1206 259 xxxx 1215 137 274 xxxx xxxxx 518 xxxx xxxxx
Potent Cap.: 178 185 746 xxxx 183 893 1301 xxxx xxxxx 1058 xxxx xxxxx
Move Cap.: 142 144 746 xxxx 143 893 1301 xxxx xxxxx 1058 xxxx xxxxx
Volume/Cap: 0.98 0.03 0.23 xxxx 0.03 0.02 0.01 xxxx xxxx 0.19 xxxx xxxx
------------|---------------||---------------||---------------||---------------|
Level Of Service Module:
2Way95thQ: xxxx xxxx xxxxx xxxx xxxx xxxxx 0.0 xxxx xxxxx 0.7 xxxx xxxxx
Control Del:xxxxx xxxx xxxxx xxxxx xxxx xxxxx 7.8 xxxx xxxxx 9.2 xxxx xxxxx
LOS by Move: * * * * * * A * * A * *
Movement: LT - LTR - RT LT - LTR - RT LT - LTR - RT LT - LTR - RT
Shared Cap.: xxxx 253 xxxxx xxxx xxxx 435 xxxx xxxx xxxxx xxxx xxxx xxxxx
SharedQueue:xxxxx 15.3 xxxxx xxxxx xxxx 0.1 0.0 xxxx xxxxx 0.7 xxxx xxxxx
Shrd ConDel:xxxxx 177 xxxxx xxxxx xxxx 13.7 7.8 xxxx xxxxx 9.2 xxxx xxxxx
Shared LOS: * F * * * B A * * A * *
ApproachDel: 177.3 13.7 xxxxxx xxxxxx
ApproachLOS: F B * *
********************************************************************************
Note: Queue reported is the number of cars per lane.
********************************************************************************
Traffix 8.0.0715 (c) 2008 Dowling Assoc. Licensed to FEHR & PEERS, S. MONICA
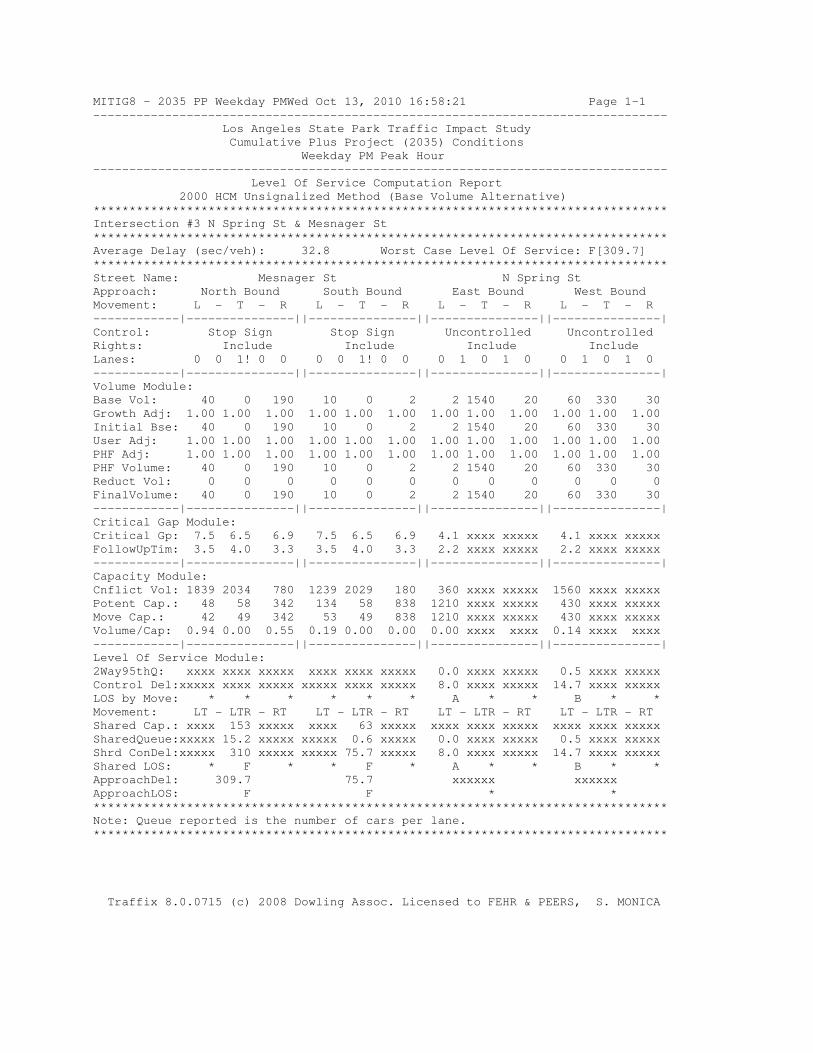
MITIG8 - 2035 PP Weekday PMWed Oct 13, 2010 16:58:21 Page 1-1
--------------------------------------------------------------------------------
Los Angeles State Park Traffic Impact Study
Cumulative Plus Project (2035) Conditions
Weekday PM Peak Hour
--------------------------------------------------------------------------------
Level Of Service Computation Report
2000 HCM Unsignalized Method (Base Volume Alternative)
********************************************************************************
Intersection #3 N Spring St & Mesnager St
********************************************************************************
Average Delay (sec/veh): 32.8 Worst Case Level Of Service: F[309.7]
********************************************************************************
Street Name: Mesnager St N Spring St
Approach: North Bound South Bound East Bound West Bound
Movement: L - T - R L - T - R L - T - R L - T - R
------------|---------------||---------------||---------------||---------------|
Control: Stop Sign Stop Sign Uncontrolled Uncontrolled
Rights: Include Include Include Include
Lanes: 0 0 1! 0 0 0 0 1! 0 0 0 1 0 1 0 0 1 0 1 0
------------|---------------||---------------||---------------||---------------|
Volume Module:
Base Vol: 40 0 190 10 0 2 2 1540 20 60 330 30
Growth Adj: 1.00 1.00 1.00 1.00 1.00 1.00 1.00 1.00 1.00 1.00 1.00 1.00
Initial Bse: 40 0 190 10 0 2 2 1540 20 60 330 30
User Adj: 1.00 1.00 1.00 1.00 1.00 1.00 1.00 1.00 1.00 1.00 1.00 1.00
PHF Adj: 1.00 1.00 1.00 1.00 1.00 1.00 1.00 1.00 1.00 1.00 1.00 1.00
PHF Volume: 40 0 190 10 0 2 2 1540 20 60 330 30
Reduct Vol: 0 0 0 0 0 0 0 0 0 0 0 0
FinalVolume: 40 0 190 10 0 2 2 1540 20 60 330 30
------------|---------------||---------------||---------------||---------------|
Critical Gap Module:
Critical Gp: 7.5 6.5 6.9 7.5 6.5 6.9 4.1 xxxx xxxxx 4.1 xxxx xxxxx
FollowUpTim: 3.5 4.0 3.3 3.5 4.0 3.3 2.2 xxxx xxxxx 2.2 xxxx xxxxx
------------|---------------||---------------||---------------||---------------|
Capacity Module:
Cnflict Vol: 1839 2034 780 1239 2029 180 360 xxxx xxxxx 1560 xxxx xxxxx
Potent Cap.: 48 58 342 134 58 838 1210 xxxx xxxxx 430 xxxx xxxxx
Move Cap.: 42 49 342 53 49 838 1210 xxxx xxxxx 430 xxxx xxxxx
Volume/Cap: 0.94 0.00 0.55 0.19 0.00 0.00 0.00 xxxx xxxx 0.14 xxxx xxxx
------------|---------------||---------------||---------------||---------------|
Level Of Service Module:
2Way95thQ: xxxx xxxx xxxxx xxxx xxxx xxxxx 0.0 xxxx xxxxx 0.5 xxxx xxxxx
Control Del:xxxxx xxxx xxxxx xxxxx xxxx xxxxx 8.0 xxxx xxxxx 14.7 xxxx xxxxx
LOS by Move: * * * * * * A * * B * *
Movement: LT - LTR - RT LT - LTR - RT LT - LTR - RT LT - LTR - RT
Shared Cap.: xxxx 153 xxxxx xxxx 63 xxxxx xxxx xxxx xxxxx xxxx xxxx xxxxx
SharedQueue:xxxxx 15.2 xxxxx xxxxx 0.6 xxxxx 0.0 xxxx xxxxx 0.5 xxxx xxxxx
Shrd ConDel:xxxxx 310 xxxxx xxxxx 75.7 xxxxx 8.0 xxxx xxxxx 14.7 xxxx xxxxx
Shared LOS: * F * * F * A * * B * *
ApproachDel: 309.7 75.7 xxxxxx xxxxxx
ApproachLOS: F F * *
********************************************************************************
Note: Queue reported is the number of cars per lane.
********************************************************************************
Traffix 8.0.0715 (c) 2008 Dowling Assoc. Licensed to FEHR & PEERS, S. MONICA
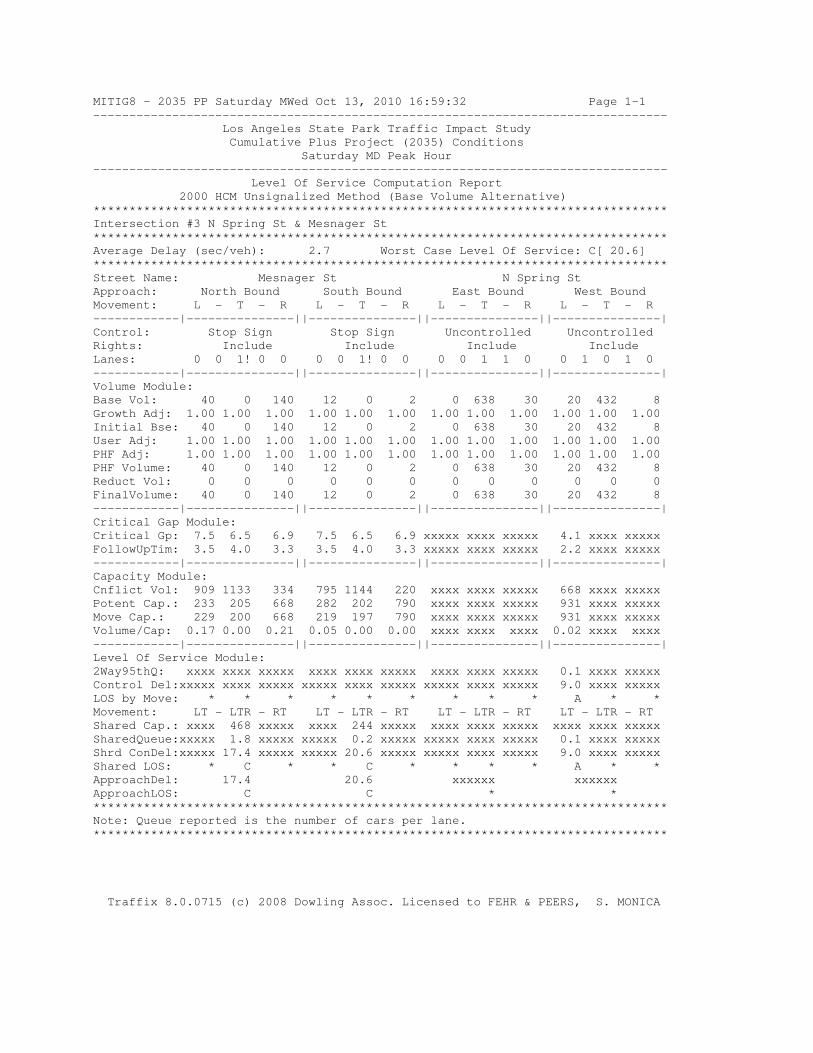
MITIG8 - 2035 PP Saturday MWed Oct 13, 2010 16:59:32 Page 1-1
--------------------------------------------------------------------------------
Los Angeles State Park Traffic Impact Study
Cumulative Plus Project (2035) Conditions
Saturday MD Peak Hour
--------------------------------------------------------------------------------
Level Of Service Computation Report
2000 HCM Unsignalized Method (Base Volume Alternative)
********************************************************************************
Intersection #3 N Spring St & Mesnager St
********************************************************************************
Average Delay (sec/veh): 2.7 Worst Case Level Of Service: C[ 20.6]
********************************************************************************
Street Name: Mesnager St N Spring St
Approach: North Bound South Bound East Bound West Bound
Movement: L - T - R L - T - R L - T - R L - T - R
------------|---------------||---------------||---------------||---------------|
Control: Stop Sign Stop Sign Uncontrolled Uncontrolled
Rights: Include Include Include Include
Lanes: 0 0 1! 0 0 0 0 1! 0 0 0 0 1 1 0 0 1 0 1 0
------------|---------------||---------------||---------------||---------------|
Volume Module:
Base Vol: 40 0 140 12 0 2 0 638 30 20 432 8
Growth Adj: 1.00 1.00 1.00 1.00 1.00 1.00 1.00 1.00 1.00 1.00 1.00 1.00
Initial Bse: 40 0 140 12 0 2 0 638 30 20 432 8
User Adj: 1.00 1.00 1.00 1.00 1.00 1.00 1.00 1.00 1.00 1.00 1.00 1.00
PHF Adj: 1.00 1.00 1.00 1.00 1.00 1.00 1.00 1.00 1.00 1.00 1.00 1.00
PHF Volume: 40 0 140 12 0 2 0 638 30 20 432 8
Reduct Vol: 0 0 0 0 0 0 0 0 0 0 0 0
FinalVolume: 40 0 140 12 0 2 0 638 30 20 432 8
------------|---------------||---------------||---------------||---------------|
Critical Gap Module:
Critical Gp: 7.5 6.5 6.9 7.5 6.5 6.9 xxxxx xxxx xxxxx 4.1 xxxx xxxxx
FollowUpTim: 3.5 4.0 3.3 3.5 4.0 3.3 xxxxx xxxx xxxxx 2.2 xxxx xxxxx
------------|---------------||---------------||---------------||---------------|
Capacity Module:
Cnflict Vol: 909 1133 334 795 1144 220 xxxx xxxx xxxxx 668 xxxx xxxxx
Potent Cap.: 233 205 668 282 202 790 xxxx xxxx xxxxx 931 xxxx xxxxx
Move Cap.: 229 200 668 219 197 790 xxxx xxxx xxxxx 931 xxxx xxxxx
Volume/Cap: 0.17 0.00 0.21 0.05 0.00 0.00 xxxx xxxx xxxx 0.02 xxxx xxxx
------------|---------------||---------------||---------------||---------------|
Level Of Service Module:
2Way95thQ: xxxx xxxx xxxxx xxxx xxxx xxxxx xxxx xxxx xxxxx 0.1 xxxx xxxxx
Control Del:xxxxx xxxx xxxxx xxxxx xxxx xxxxx xxxxx xxxx xxxxx 9.0 xxxx xxxxx
LOS by Move: * * * * * * * * * A * *
Movement: LT - LTR - RT LT - LTR - RT LT - LTR - RT LT - LTR - RT
Shared Cap.: xxxx 468 xxxxx xxxx 244 xxxxx xxxx xxxx xxxxx xxxx xxxx xxxxx
SharedQueue:xxxxx 1.8 xxxxx xxxxx 0.2 xxxxx xxxxx xxxx xxxxx 0.1 xxxx xxxxx
Shrd ConDel:xxxxx 17.4 xxxxx xxxxx 20.6 xxxxx xxxxx xxxx xxxxx 9.0 xxxx xxxxx
Shared LOS: * C * * C * * * * A * *
ApproachDel: 17.4 20.6 xxxxxx xxxxxx
ApproachLOS: C C * *
********************************************************************************
Note: Queue reported is the number of cars per lane.
********************************************************************************
Traffix 8.0.0715 (c) 2008 Dowling Assoc. Licensed to FEHR & PEERS, S. MONICA
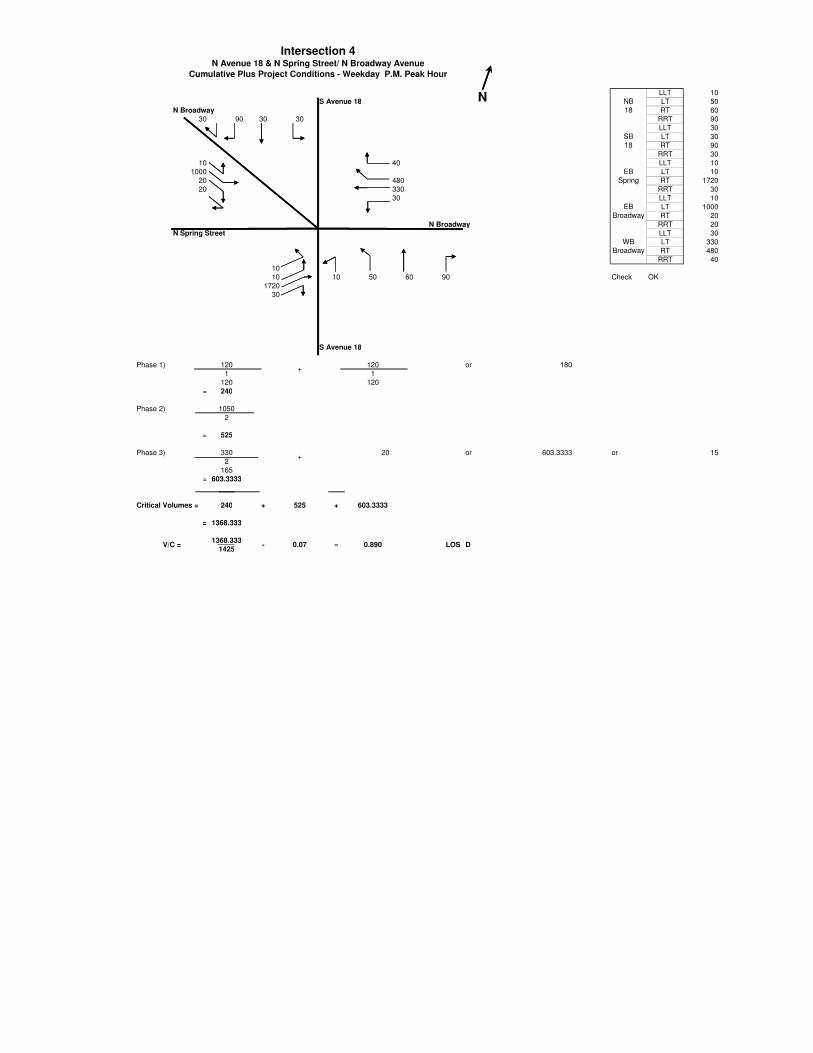
LLT 10
S Avenue 18 LT 50
N Broadway RT 60
30 90 30 30 RRT 90
LLT 30
LT 30
RT 90
RRT 30
10 40 LLT 10
1000 LT 10
20 480 RT 1720
20 330 RRT 30
30 LLT 10
LT 1000
RT 20
N Broadway RRT 20
N Spring Street LLT 30
LT 330
RT 480
RRT 40
10
10 10 50 60 90 Check OK
1720
30
S Avenue 18
Phase 1) 120 120 or 180
1 1
120 120
= 240
Phase 2) 1050
2
= 525
Phase 3) 330 20 or 603.3333 or 15
2
165
= 603.3333
Critical Volumes = 240 + 525 + 603.3333
= 1368.333
1368.333
NB
18
SB
18
EB
Spring
EB
Broadway
WB
Broadway
Intersection 4N Avenue 18 & N Spring Street/ N Broadway Avenue
Cumulative Plus Project Conditions - Weekday P.M. Peak Hour
N
+
+
1368.333
1425V/C = - 0.07 = 0.890 LOS D
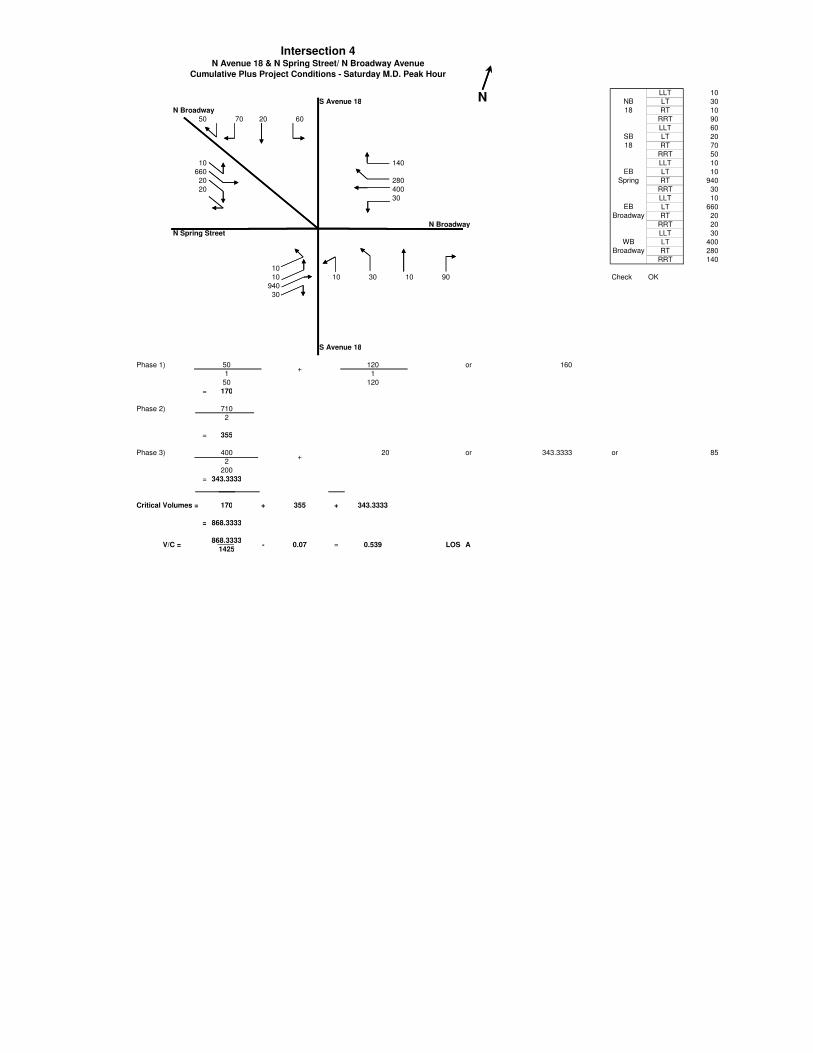
LLT 10
S Avenue 18 LT 30
N Broadway RT 10
50 70 20 60 RRT 90
LLT 60
LT 20
RT 70
RRT 50
10 140 LLT 10
660 LT 10
20 280 RT 940
20 400 RRT 30
30 LLT 10
LT 660
RT 20
N Broadway RRT 20
N Spring Street LLT 30
LT 400
RT 280
RRT 140
10
10 10 30 10 90 Check OK
940
30
S Avenue 18
Phase 1) 50 120 or 160
1 1
50 120
= 170
Phase 2) 710
2
= 355
Phase 3) 400 20 or 343.3333 or 85
2
200
= 343.3333
Critical Volumes = 170 + 355 + 343.3333
= 868.3333
868.3333
NB
18
SB
18
EB
Spring
EB
Broadway
WB
Broadway
Intersection 4N Avenue 18 & N Spring Street/ N Broadway Avenue
Cumulative Plus Project Conditions - Saturday M.D. Peak Hour
N
+
+
868.3333
1425V/C = - 0.07 = 0.539 LOS A

APPENDIX D: SIGNAL WARRANTS WORKSHEETS
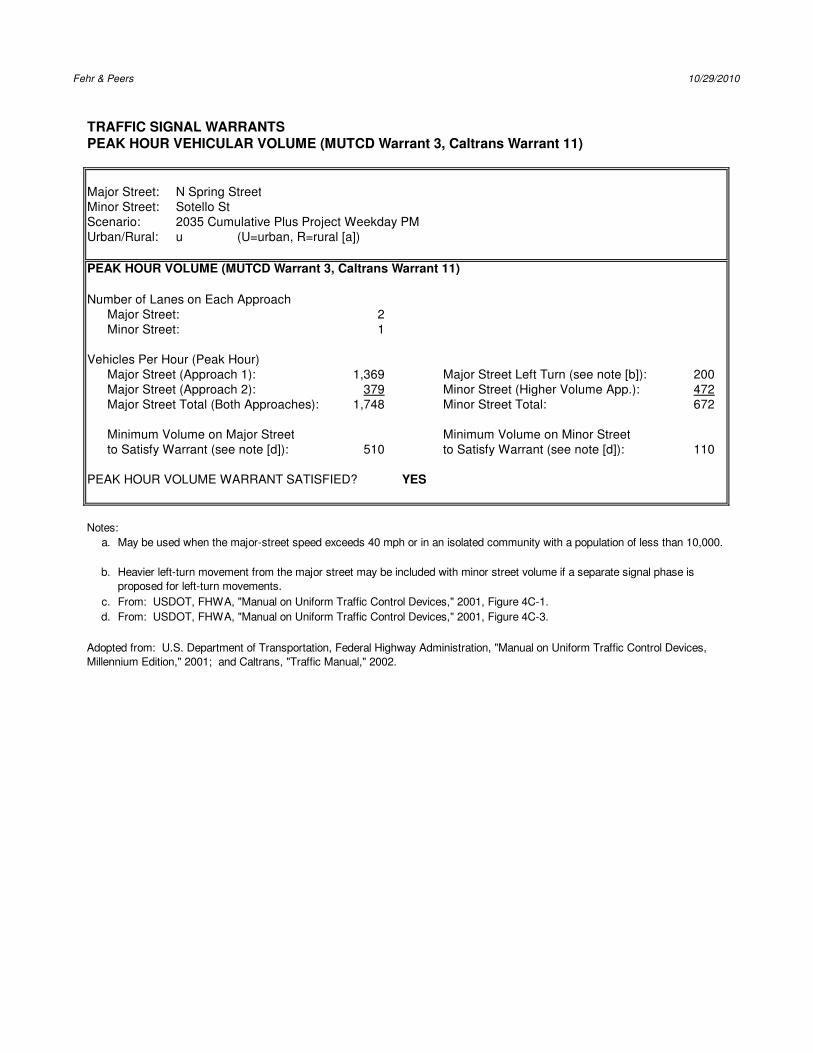
Fehr & Peers 10/29/2010
TRAFFIC SIGNAL WARRANTS
PEAK HOUR VEHICULAR VOLUME (MUTCD Warrant 3, Caltrans Warrant 11)
Major Street: N Spring Street
Minor Street: Sotello St
Scenario: 2035 Cumulative Plus Project Weekday PM
Urban/Rural: u (U=urban, R=rural [a])
PEAK HOUR VOLUME (MUTCD Warrant 3, Caltrans Warrant 11)
Number of Lanes on Each Approach
Major Street: 2
Minor Street: 1
Vehicles Per Hour (Peak Hour)
Major Street (Approach 1): 1,369 Major Street Left Turn (see note [b]): 200
Major Street (Approach 2): 379 Minor Street (Higher Volume App.): 472
Major Street Total (Both Approaches): 1,748 Minor Street Total: 672
Minimum Volume on Major Street Minimum Volume on Minor Street
to Satisfy Warrant (see note [d]): 510 to Satisfy Warrant (see note [d]): 110
PEAK HOUR VOLUME WARRANT SATISFIED? YES
Notes:
a.
b.
c. From: USDOT, FHWA, "Manual on Uniform Traffic Control Devices," 2001, Figure 4C-1.
d. From: USDOT, FHWA, "Manual on Uniform Traffic Control Devices," 2001, Figure 4C-3.
Adopted from: U.S. Department of Transportation, Federal Highway Administration, "Manual on Uniform Traffic Control Devices,
Millennium Edition," 2001; and Caltrans, "Traffic Manual," 2002.
Heavier left-turn movement from the major street may be included with minor street volume if a separate signal phase is
proposed for left-turn movements.
May be used when the major-street speed exceeds 40 mph or in an isolated community with a population of less than 10,000.
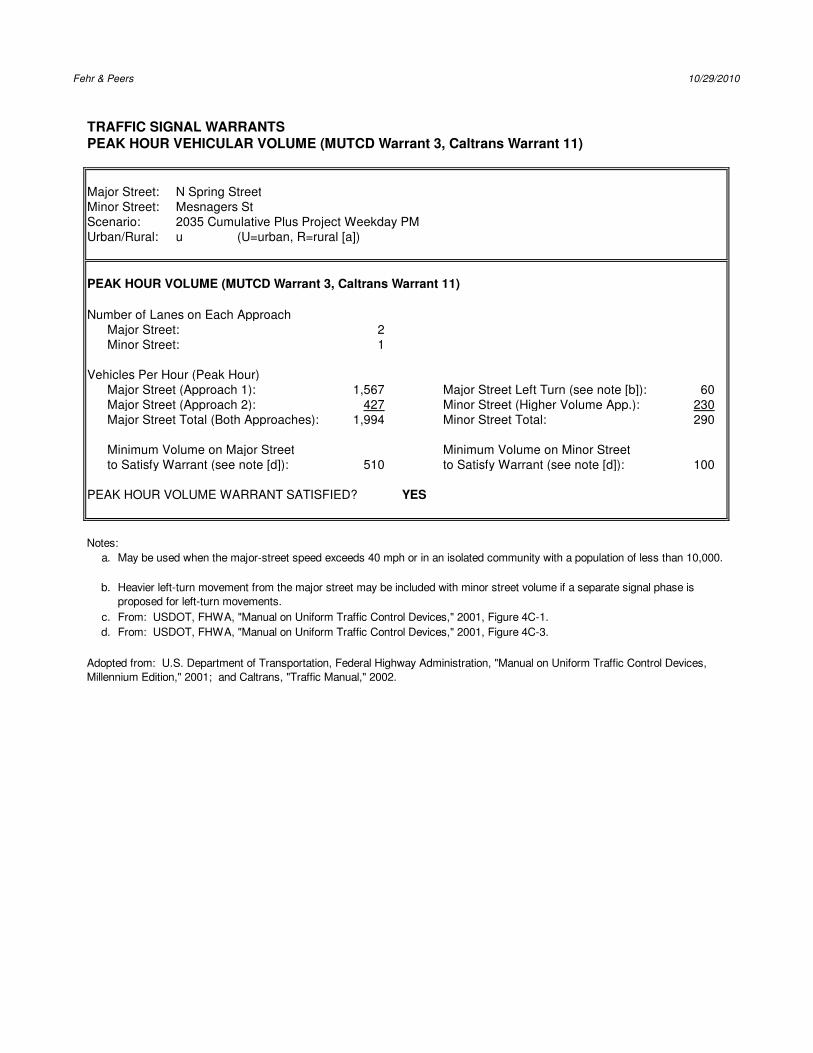
Fehr & Peers 10/29/2010
TRAFFIC SIGNAL WARRANTS
PEAK HOUR VEHICULAR VOLUME (MUTCD Warrant 3, Caltrans Warrant 11)
Major Street: N Spring Street
Minor Street: Mesnagers St
Scenario: 2035 Cumulative Plus Project Weekday PM
Urban/Rural: u (U=urban, R=rural [a])
PEAK HOUR VOLUME (MUTCD Warrant 3, Caltrans Warrant 11)
Number of Lanes on Each Approach
Major Street: 2
Minor Street: 1
Vehicles Per Hour (Peak Hour)
Major Street (Approach 1): 1,567 Major Street Left Turn (see note [b]): 60
Major Street (Approach 2): 427 Minor Street (Higher Volume App.): 230
Major Street Total (Both Approaches): 1,994 Minor Street Total: 290
Minimum Volume on Major Street Minimum Volume on Minor Street
to Satisfy Warrant (see note [d]): 510 to Satisfy Warrant (see note [d]): 100
PEAK HOUR VOLUME WARRANT SATISFIED? YES
Notes:
a.
b.
c. From: USDOT, FHWA, "Manual on Uniform Traffic Control Devices," 2001, Figure 4C-1.
d. From: USDOT, FHWA, "Manual on Uniform Traffic Control Devices," 2001, Figure 4C-3.
Adopted from: U.S. Department of Transportation, Federal Highway Administration, "Manual on Uniform Traffic Control Devices,
Millennium Edition," 2001; and Caltrans, "Traffic Manual," 2002.
Heavier left-turn movement from the major street may be included with minor street volume if a separate signal phase is
proposed for left-turn movements.
May be used when the major-street speed exceeds 40 mph or in an isolated community with a population of less than 10,000.

APPENDIX E: EXISTING (2010) PLUS PROJECT CONDITIONS
Appendix E: Draft Existing (2010) Plus Project Transportation Impact Analysis
October 2011
1
CHAPTER 1. EXISTING (2010) PLUS PROJECT CONDITIONS
This chapter analyses existing (2010) transportation conditions in the study area with the proposed project. In order to evaluate the potential impacts of the proposed project on the local street system, it was necessary to develop estimates of existing conditions with the proposed project. The existing (2010) plus project scenario represents existing traffic conditions with the development of the proposed project.
PROJECT DESCRIPTION
The LASHP project represents significant open space within the City of Los Angeles - Cornfield Arroyo Seco Area Specific Plan which is classified as a community redevelopment area (CRA). It will provide infrastructure and features to enlighten and engage the public about the history and culture of Los Angeles, its region and its people – a theme that is not adequately covered in other units of the State Park System. The project scope includes a multi-use plaza, flexible outdoor spaces to accommodate a variety and size of public events, a “great lawn” featuring an amphitheater/stage space for special events/performances for up to 25,000 people and for unstructured activities, interpretive paths and portals for engaging historic themes and content using traditional and new technologies, permanent restrooms, operations yard with access road, a “Welcome Station” structure, an interpretive and administration center, pedestrian and vehicle circulation systems, an interactive fountain/water feature(s), a children’s play area and cultural gardens. The existing Interim Public Use (IPU) park built over a portion of the site will be modified to accept and expand the development over the entire 32 acres. The project will also close the existing park driveway and remove the existing parking lot located just east of the existing park driveway. Two new park driveways will be provided along North Spring Street at Sotello Street and Mesnagers Street.
PROJECT TRAFFIC VOLUMES
Projection of project traffic volumes involved a three-step process including trip generation, trip distribution, and trip assignment.
Project Trip Generation
Vehicle trip generation rates for the proposed park expansion were derived from traffic counts collected at the existing park driveway and a parking survey conducted at the parking lot located just east of the existing project driveway and on-street parking along North Spring Street. The observed park trip generation rates were then compared against data from the Institute of Transportation Engineers (ITE) and the San Diego Association of Governments (SANDAG). The observed vehicle trip generation rates exceeded ITE’s PM peak hour regional park rate of 1.1 and Saturday midday peak hour rate of 1.68, as well as SANDAG’s PM peak hour regional developed park rate of 1.8. The observed trip generation rates and resulting trip generation estimates for the LASHP project are summarized in Table 1.
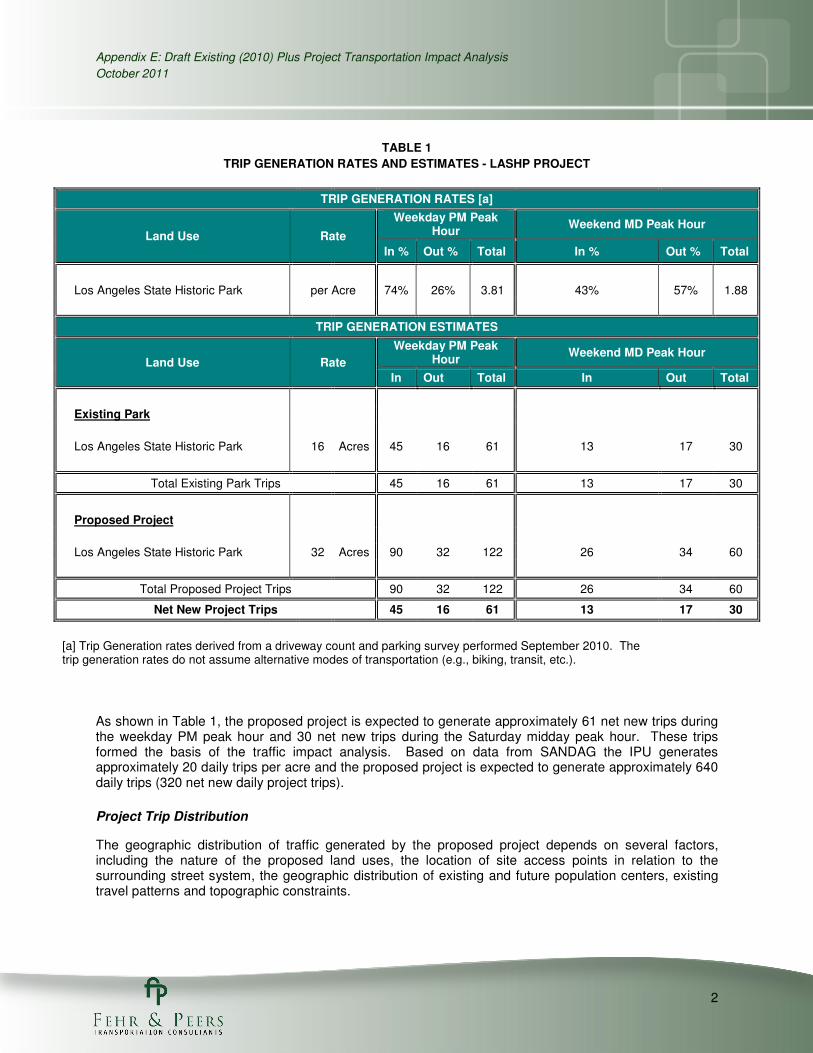
Appendix E: Draft Existing (2010) Plus Project Transportation Impact Analysis
October 2011
2
TABLE 1
TRIP GENERATION RATES AND ESTIMATES - LASHP PROJECT
TRIP GENERATION RATES [a]
Land Use Rate
Weekday PM Peak Hour
Weekend MD Peak Hour
In % Out % Total In % Out % Total
Los Angeles State Historic Park per Acre 74% 26% 3.81 43% 57% 1.88
TRIP GENERATION ESTIMATES
Land Use Rate
Weekday PM Peak Hour
Weekend MD Peak Hour
In Out Total In Out Total
Existing Park
Los Angeles State Historic Park 16 Acres 45 16 61 13 17 30
Total Existing Park Trips 45 16 61 13 17 30
Proposed Project
Los Angeles State Historic Park 32 Acres 90 32 122 26 34 60
Total Proposed Project Trips 90 32 122 26 34 60
Net New Project Trips 45 16 61 13 17 30
[a] Trip Generation rates derived from a driveway count and parking survey performed September 2010. The trip generation rates do not assume alternative modes of transportation (e.g., biking, transit, etc.).
As shown in Table 1, the proposed project is expected to generate approximately 61 net new trips during the weekday PM peak hour and 30 net new trips during the Saturday midday peak hour. These trips formed the basis of the traffic impact analysis. Based on data from SANDAG the IPU generates approximately 20 daily trips per acre and the proposed project is expected to generate approximately 640 daily trips (320 net new daily project trips).
Project Trip Distribution
The geographic distribution of traffic generated by the proposed project depends on several factors, including the nature of the proposed land uses, the location of site access points in relation to the surrounding street system, the geographic distribution of existing and future population centers, existing travel patterns and topographic constraints.
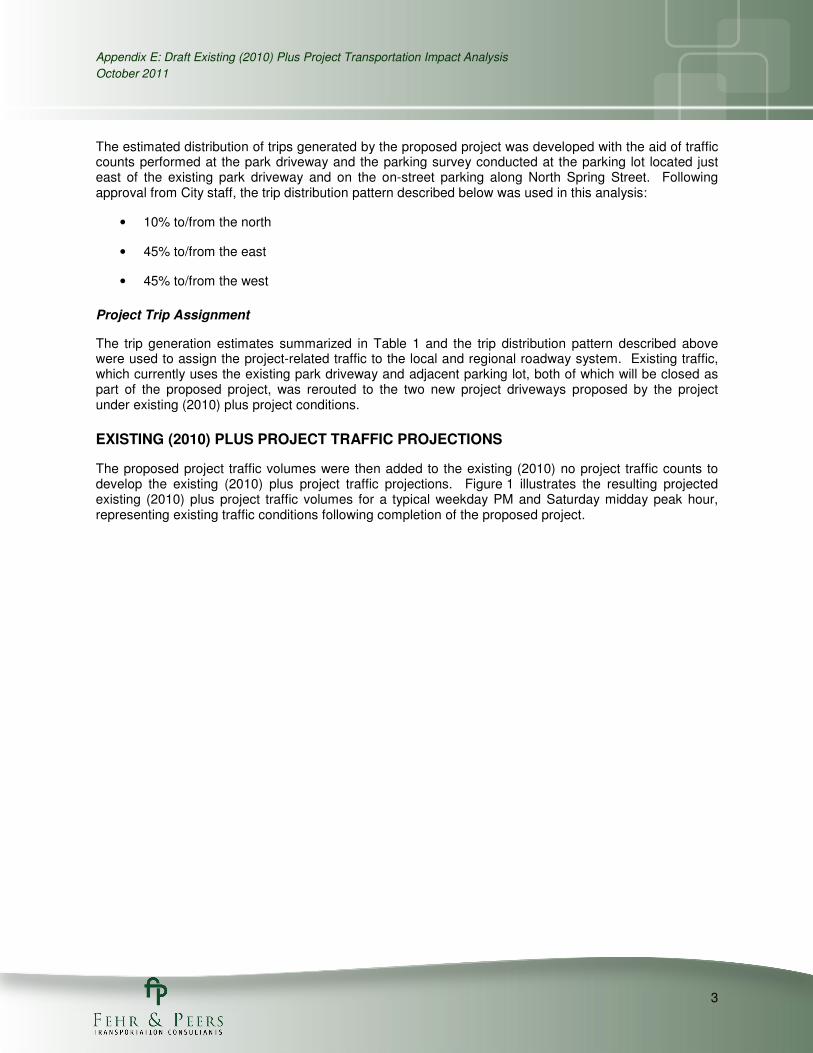
Appendix E: Draft Existing (2010) Plus Project Transportation Impact Analysis
October 2011
3
The estimated distribution of trips generated by the proposed project was developed with the aid of traffic counts performed at the park driveway and the parking survey conducted at the parking lot located just east of the existing park driveway and on the on-street parking along North Spring Street. Following approval from City staff, the trip distribution pattern described below was used in this analysis:
• 10% to/from the north
• 45% to/from the east
• 45% to/from the west
Project Trip Assignment
The trip generation estimates summarized in Table 1 and the trip distribution pattern described above were used to assign the project-related traffic to the local and regional roadway system. Existing traffic, which currently uses the existing park driveway and adjacent parking lot, both of which will be closed as part of the proposed project, was rerouted to the two new project driveways proposed by the project under existing (2010) plus project conditions.
EXISTING (2010) PLUS PROJECT TRAFFIC PROJECTIONS
The proposed project traffic volumes were then added to the existing (2010) no project traffic counts to develop the existing (2010) plus project traffic projections. Figure 1 illustrates the resulting projected existing (2010) plus project traffic volumes for a typical weekday PM and Saturday midday peak hour, representing existing traffic conditions following completion of the proposed project.
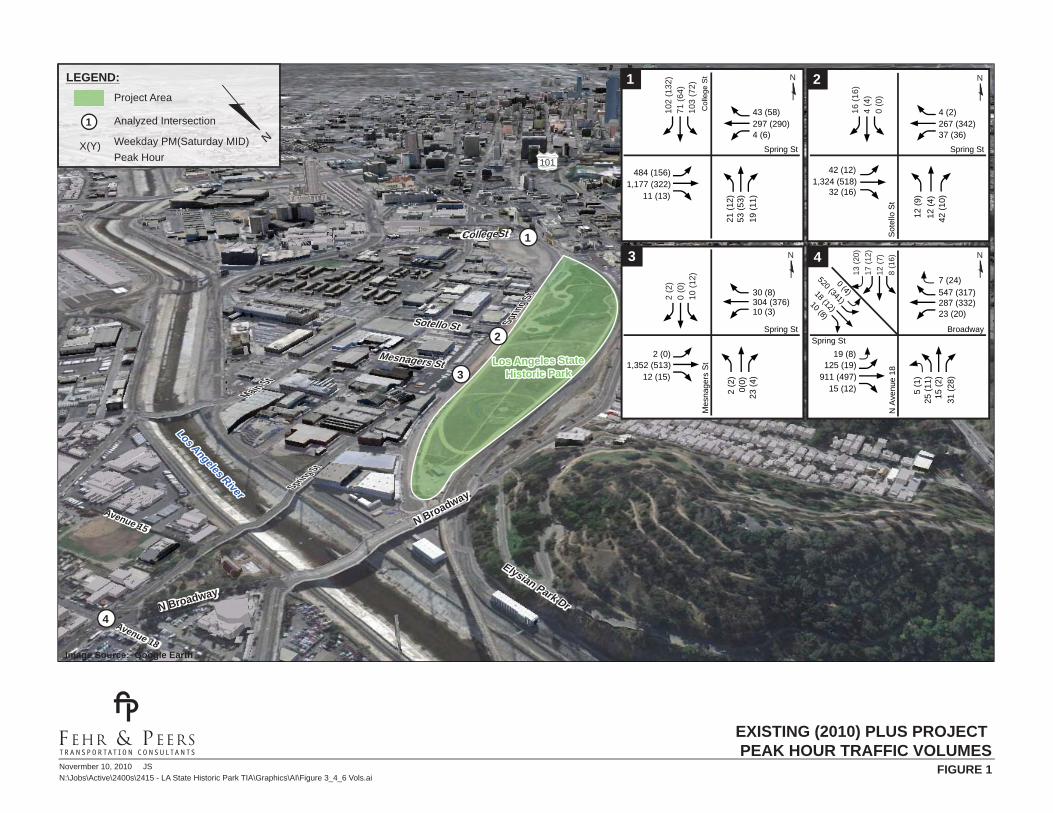
Novermber 10, 2010 JS
N:\Jobs\Active\2400s\2415 - LA State Historic Park TIA\Graphics\AI\Figure 3_4_6 Vols.ai
Image Source: Google Earth
Los Angeles StateLos Angeles StateHistoric ParkHistoric Park
Los Angeles StateHistoric Park
4
1
3
2
Elysian Park Dr
Elysian Park Dr
Avenue 18
Avenue 18
N Broadway
N Broadway
N Broadway.
Elysian Park Dr.
Avenue 18
Main St
Main St
Main St.
Avenue 15
Avenue 15
Avenue 15
Spring St
Spring St
Spring St.
Sprin
g St
Sprin
g St
Sprin
g St.
Mesnagers StMesnagers StMesnagers St
Sotello StSotello StSotello St
College StCollege StCollegeSt
N BroadwayN Broadway
N Broadway.
Los Angeles River
Los Angeles River
Los Angeles River
101
Analyzed Intersection
LEGEND:
1
Weekday PM(Saturday MID)
Peak Hour
N
Project Area
X(Y)
1
3
2
4
N
N
N
N
32 (16)
12 (
9)
42 (
10)
12 (
4)
1,324 (518)42 (12)
Broadway
Spring St
Sot
ello
St
267 (342)4 (2)
N A
venu
e 18
Col
lege
St
Spring St
37 (36)
1,177 (322)
21 (
12)
53 (
53)
19 (
11)11 (13)
484 (156)
297 (290)43 (58)
4 (6)
102
(132
)71
(64
)10
3 (7
2)16
(16)
4 (4
)0
(0)
2 (2)
0 (0
)10
(12
)
Spring St
Mes
nage
rs S
t
12 (15)
2 (2
)0(
0)23
(4)
1,352 (513)2 (0)
304 (376)30 (8)
10 (3)
Spring St
13 (
20)
17 (
12)
12 (
7)
8 (1
6)
25 (
11)
15 (
2)
31 (
28)
287 (332)547 (317)
23 (20)
911 (497)
15 (12)
125 (19)
18 (12)
10 (8)520 (341)
5 (1
)
0 (4)
19 (8)
7 (24)
EXISTING (2010) PLUS PROJECT PEAK HOUR TRAFFIC VOLUMES
FIGURE 1
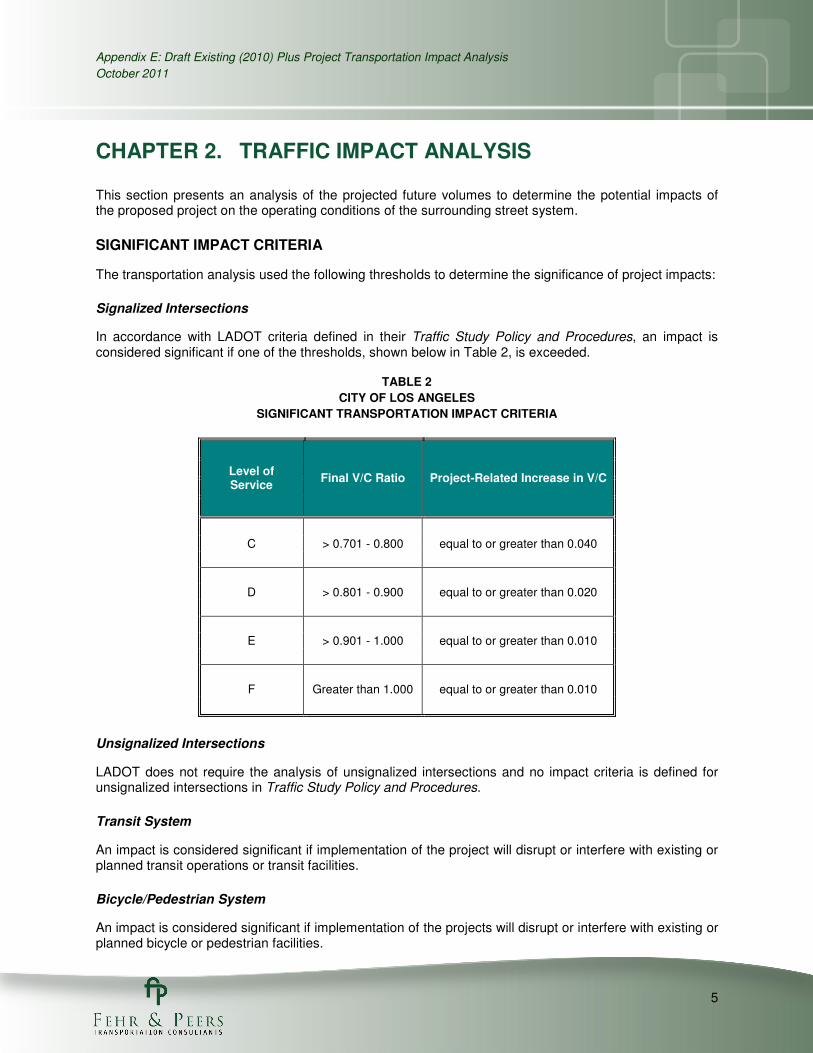
Appendix E: Draft Existing (2010) Plus Project Transportation Impact Analysis
October 2011
5
CHAPTER 2. TRAFFIC IMPACT ANALYSIS
This section presents an analysis of the projected future volumes to determine the potential impacts of the proposed project on the operating conditions of the surrounding street system.
SIGNIFICANT IMPACT CRITERIA
The transportation analysis used the following thresholds to determine the significance of project impacts:
Signalized Intersections
In accordance with LADOT criteria defined in their Traffic Study Policy and Procedures, an impact is considered significant if one of the thresholds, shown below in Table 2, is exceeded.
TABLE 2
CITY OF LOS ANGELES
SIGNIFICANT TRANSPORTATION IMPACT CRITERIA
Level of Service
Final V/C Ratio Project-Related Increase in V/C
C > 0.701 - 0.800 equal to or greater than 0.040
D > 0.801 - 0.900 equal to or greater than 0.020
E > 0.901 - 1.000 equal to or greater than 0.010
F Greater than 1.000 equal to or greater than 0.010
Unsignalized Intersections
LADOT does not require the analysis of unsignalized intersections and no impact criteria is defined for unsignalized intersections in Traffic Study Policy and Procedures.
Transit System
An impact is considered significant if implementation of the project will disrupt or interfere with existing or planned transit operations or transit facilities.
Bicycle/Pedestrian System
An impact is considered significant if implementation of the projects will disrupt or interfere with existing or planned bicycle or pedestrian facilities.
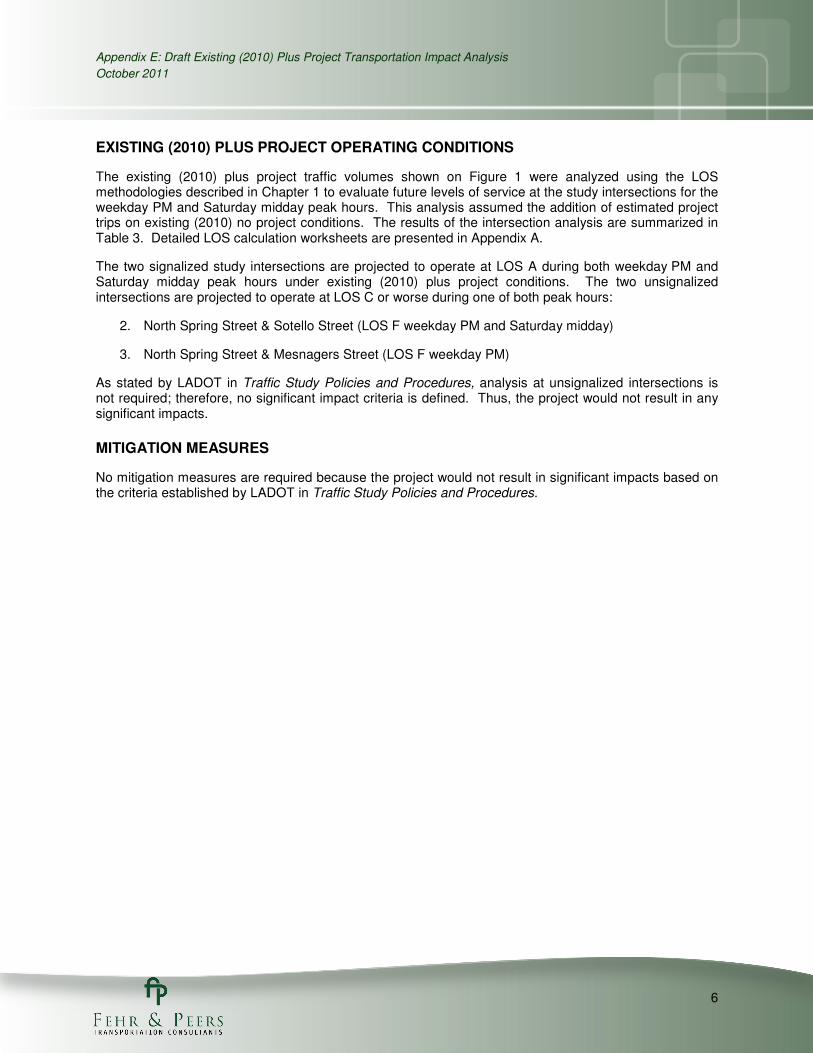
Appendix E: Draft Existing (2010) Plus Project Transportation Impact Analysis
October 2011
6
EXISTING (2010) PLUS PROJECT OPERATING CONDITIONS
The existing (2010) plus project traffic volumes shown on Figure 1 were analyzed using the LOS methodologies described in Chapter 1 to evaluate future levels of service at the study intersections for the weekday PM and Saturday midday peak hours. This analysis assumed the addition of estimated project trips on existing (2010) no project conditions. The results of the intersection analysis are summarized in Table 3. Detailed LOS calculation worksheets are presented in Appendix A.
The two signalized study intersections are projected to operate at LOS A during both weekday PM and Saturday midday peak hours under existing (2010) plus project conditions. The two unsignalized intersections are projected to operate at LOS C or worse during one of both peak hours:
2. North Spring Street & Sotello Street (LOS F weekday PM and Saturday midday)
3. North Spring Street & Mesnagers Street (LOS F weekday PM)
As stated by LADOT in Traffic Study Policies and Procedures, analysis at unsignalized intersections is not required; therefore, no significant impact criteria is defined. Thus, the project would not result in any significant impacts.
MITIGATION MEASURES
No mitigation measures are required because the project would not result in significant impacts based on the criteria established by LADOT in Traffic Study Policies and Procedures.
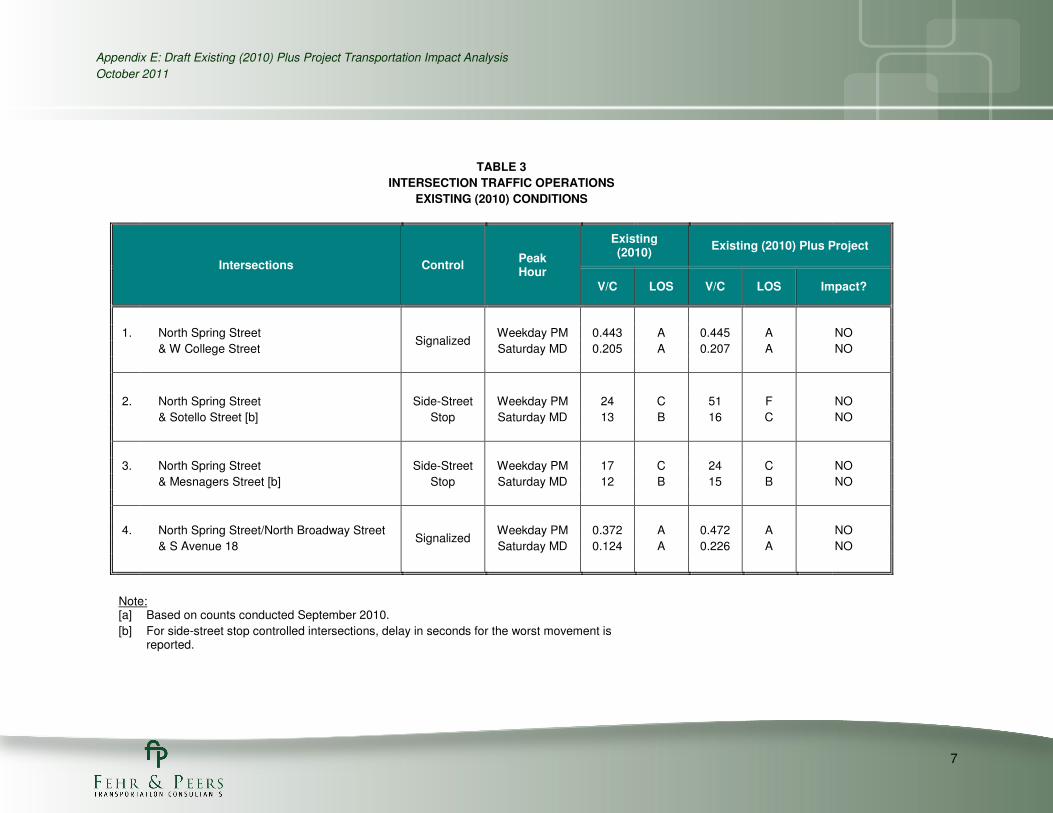
Appendix E: Draft Existing (2010) Plus Project Transportation Impact Analysis
October 2011
7
TABLE 3
INTERSECTION TRAFFIC OPERATIONS
EXISTING (2010) CONDITIONS
Intersections Control Peak Hour
Existing (2010)
Existing (2010) Plus Project
V/C LOS V/C LOS Impact?
1. North Spring Street Signalized
Weekday PM 0.443 A 0.445 A NO
& W College Street Saturday MD 0.205 A 0.207 A NO
2. North Spring Street Side-Street Weekday PM 24 C 51 F NO
& Sotello Street [b] Stop Saturday MD 13 B 16 C NO
3. North Spring Street Side-Street Weekday PM 17 C 24 C NO
& Mesnagers Street [b] Stop Saturday MD 12 B 15 B NO
4. North Spring Street/North Broadway Street Signalized
Weekday PM 0.372 A 0.472 A NO
& S Avenue 18 Saturday MD 0.124 A 0.226 A NO
Note: [a] Based on counts conducted September 2010.
[b] For side-street stop controlled intersections, delay in seconds for the worst movement is reported.
EXISTING (2010) PLUS PROJECT APPENDIX: LEVEL OF SERVICE WORKSHEETS

Existing Plus Project Weekday PMPM
W College Street N Spring StreetN/S: W/E: 1I/S No:
AM/PM: Comments:
COUNT DATE: GROWTH FACTOR:STUDY DATE:
4
A:
B:
113
102A:
B: 103
21
A:
B:
72
0.515 =
+
+
+++ 11372 484103
1500
589A:
B: 484
V/C =
West/East Critical Movements =
North/South Critical Movements =
SouthBound
WestBoundEastBound
NorthBound
A = Adjusted Through/Right VolumeB = Adjusted Left Volume* = ATSAC Benefit
Results
V/C RATIO LOS
0.00 - 0.60 A
0.61 - 0.70 B
0.71 - 0.80 C
0.81 - 0.90 D
0.91 - 1.00 E
A(W/B)
A(N/B)
B(E/B)
B(S/B)
ALOS =
Critical Movements Diagram
TH RT LT THLT TH RT LT TH RT
Phasing RTOR Phasing Phasing PhasingRTOR RTOR
NORTHBOUND SOUTHBOUND WESTBOUND EASTBOUND
EXISTING
RTOR
RT
21
AMBIENT
RELATED
PROJECT
TOTAL 21
LANE
SIGNAL Perm
1
Perm Perm PermAuto Auto Auto Auto
1 1 1 1 1 2 1 1 2 1
LT
53 19 103 71 102 4 297 43 484 1177 11
4 43297102711031953 111177484
Volume/Lane/Signal Configurations
Developed by Chun Wong, 12/94
October 14, 2011 ,Friday 10:51:41 AMCalcaDB
01_E_P~1
INTERSECTION DATA SUMMARY SHEET

COMPARE Fri Oct 14 11:45:10 2011 Page 2-1
Traffix 8.0.0715 Copyright (c) 2008 Dowling Associates, Inc. Licensed to FEHR & PEERS, S. MONICA
Los Angeles State Park Traffic Impact Study Existing (2009) Conditions Weekday PM Peak Hour
Level Of Service Computation Report 2000 HCM Unsignalized (Base Volume Alternative)
Existing Plus Project Weekday PM
Intersection #2: N Spring St & Sotello St Signal=Stop/Rights=Include
Final Vol: 16 4 0
Lanes: 0 0 1! 0 0
Signal=Uncontrol
Signal=Uncontrol
Final Vol: Lanes: Rights=Include Vol Cnt Date: n/a Rights=Include Lanes: Final Vol:
42
0
Cycle Time (sec): 100 0
4
1
Loss Time (sec): 0 1
1324 0
Critical V/C: 0.203 0 267
1
Avg Crit Del (sec/veh): 2.5 1
32 0
Avg Delay (sec/veh): 2.5 0 37
LOS: F
Lanes: 0 0 1! 0 0
Final Vol: 12 12 42
Signal=Stop/Rights=Include
Street Name: Sotello St N Spring St
Approach: North Bound South Bound East Bound West Bound
Movement: L - T - R L - T - R L - T - R L - T - R
------------|---------------||---------------||---------------||---------------|
Volume Module:
Base Vol: 12 12 42 0 4 16 42 1324 32 37 267 4
Growth Adj: 1.00 1.00 1.00 1.00 1.00 1.00 1.00 1.00 1.00 1.00 1.00 1.00
Initial Bse: 12 12 42 0 4 16 42 1324 32 37 267 4
User Adj: 1.00 1.00 1.00 1.00 1.00 1.00 1.00 1.00 1.00 1.00 1.00 1.00
PHF Adj: 1.00 1.00 1.00 1.00 1.00 1.00 1.00 1.00 1.00 1.00 1.00 1.00
PHF Volume: 12 12 42 0 4 16 42 1324 32 37 267 4
Reduct Vol: 0 0 0 0 0 0 0 0 0 0 0 0
FinalVolume: 12 12 42 0 4 16 42 1324 32 37 267 4
------------|---------------||---------------||---------------||---------------|
Critical Gap Module:
Critical Gp: 7.5 6.5 6.9 xxxxx 6.5 6.9 4.1 xxxx xxxxx 4.1 xxxx xxxxx
FollowUpTim: 3.5 4.0 3.3 xxxxx 4.0 3.3 2.2 xxxx xxxxx 2.2 xxxx xxxxx
------------|---------------||---------------||---------------||---------------|
Capacity Module:
Cnflict Vol: 1634 1769 678 xxxx 1783 136 271 xxxx xxxxx 1356 xxxx xxxxx
Potent Cap.: 68 84 399 xxxx 83 895 1304 xxxx xxxxx 514 xxxx xxxxx
Move Cap.: 59 76 399 xxxx 74 895 1304 xxxx xxxxx 514 xxxx xxxxx
Volume/Cap: 0.20 0.16 0.11 xxxx 0.05 0.02 0.03 xxxx xxxx 0.07 xxxx xxxx
------------|---------------||---------------||---------------||---------------|
Level Of Service Module:
2Way95thQ: xxxx xxxx xxxxx xxxx xxxx xxxxx 0.1 xxxx xxxxx 0.2 xxxx xxxxx
Control Del:xxxxx xxxx xxxxx xxxxx xxxx xxxxx 7.9 xxxx xxxxx 12.6 xxxx xxxxx
LOS by Move: * * * * * * A * * B * *
Movement: LT - LTR - RT LT - LTR - RT LT - LTR - RT LT - LTR - RT
Shared Cap.: xxxx 141 xxxxx xxxx xxxx 278 xxxx xxxx xxxxx xxxx xxxx xxxxx
SharedQueue:xxxxx 2.1 xxxxx xxxxx xxxx 0.2 0.1 xxxx xxxxx 0.2 xxxx xxxxx
Shrd ConDel:xxxxx 51.0 xxxxx xxxxx xxxx 18.9 7.9 xxxx xxxxx 12.6 xxxx xxxxx
Shared LOS: * F * * * C A * * B * *
ApproachDel: 51.0 18.9 xxxxxx xxxxxx
ApproachLOS: F C * *
Note: Queue reported is the number of cars per lane.

COMPARE Fri Oct 14 11:45:10 2011 Page 2-2
Traffix 8.0.0715 Copyright (c) 2008 Dowling Associates, Inc. Licensed to FEHR & PEERS, S. MONICA
Los Angeles State Park Traffic Impact Study Existing (2009) Conditions Weekday PM Peak Hour
Level Of Service Computation Report 2000 HCM Unsignalized (Base Volume Alternative)
Existing Plus Project Weekday PM
Intersection #3: N Spring St & Mesnager St Signal=Stop/Rights=Include
Final Vol: 2 0 10
Lanes: 0 0 1! 0 0
Signal=Uncontrol
Signal=Uncontrol
Final Vol: Lanes: Rights=Include Vol Cnt Date: n/a Rights=Include Lanes: Final Vol:
2
0
Cycle Time (sec): 100 0
30
1
Loss Time (sec): 0 1
1352 0
Critical V/C: 0.058 0 304
1
Avg Crit Del (sec/veh): 0.5 1
12 0
Avg Delay (sec/veh): 0.5 0 10
LOS: C
Lanes: 0 0 1! 0 0
Final Vol: 2 0 23
Signal=Stop/Rights=Include
Street Name: Mesnager St N Spring St
Approach: North Bound South Bound East Bound West Bound
Movement: L - T - R L - T - R L - T - R L - T - R
------------|---------------||---------------||---------------||---------------|
Volume Module:
Base Vol: 2 0 23 10 0 2 2 1352 12 10 304 30
Growth Adj: 1.00 1.00 1.00 1.00 1.00 1.00 1.00 1.00 1.00 1.00 1.00 1.00
Initial Bse: 2 0 23 10 0 2 2 1352 12 10 304 30
User Adj: 1.00 1.00 1.00 1.00 1.00 1.00 1.00 1.00 1.00 1.00 1.00 1.00
PHF Adj: 1.00 1.00 1.00 1.00 1.00 1.00 1.00 1.00 1.00 1.00 1.00 1.00
PHF Volume: 2 0 23 10 0 2 2 1352 12 10 304 30
Reduct Vol: 0 0 0 0 0 0 0 0 0 0 0 0
FinalVolume: 2 0 23 10 0 2 2 1352 12 10 304 30
------------|---------------||---------------||---------------||---------------|
Critical Gap Module:
Critical Gp: 7.5 6.5 6.9 7.5 6.5 6.9 4.1 xxxx xxxxx 4.1 xxxx xxxxx
FollowUpTim: 3.5 4.0 3.3 3.5 4.0 3.3 2.2 xxxx xxxxx 2.2 xxxx xxxxx
------------|---------------||---------------||---------------||---------------|
Capacity Module:
Cnflict Vol: 1534 1716 682 1019 1707 167 334 xxxx xxxxx 1364 xxxx xxxxx
Potent Cap.: 81 91 397 194 92 854 1237 xxxx xxxxx 510 xxxx xxxxx
Move Cap.: 80 89 397 180 90 854 1237 xxxx xxxxx 510 xxxx xxxxx
Volume/Cap: 0.03 0.00 0.06 0.06 0.00 0.00 0.00 xxxx xxxx 0.02 xxxx xxxx
------------|---------------||---------------||---------------||---------------|
Level Of Service Module:
2Way95thQ: xxxx xxxx xxxxx xxxx xxxx xxxxx 0.0 xxxx xxxxx 0.1 xxxx xxxxx
Control Del:xxxxx xxxx xxxxx xxxxx xxxx xxxxx 7.9 xxxx xxxxx 12.2 xxxx xxxxx
LOS by Move: * * * * * * A * * B * *
Movement: LT - LTR - RT LT - LTR - RT LT - LTR - RT LT - LTR - RT
Shared Cap.: xxxx 301 xxxxx xxxx 207 xxxxx xxxx xxxx xxxxx xxxx xxxx xxxxx
SharedQueue:xxxxx 0.3 xxxxx xxxxx 0.2 xxxxx 0.0 xxxx xxxxx 0.1 xxxx xxxxx
Shrd ConDel:xxxxx 18.0 xxxxx xxxxx 23.5 xxxxx 7.9 xxxx xxxxx 12.2 xxxx xxxxx
Shared LOS: * C * * C * A * * B * *
ApproachDel: 18.0 23.5 xxxxxx xxxxxx
ApproachLOS: C C * *
Note: Queue reported is the number of cars per lane.
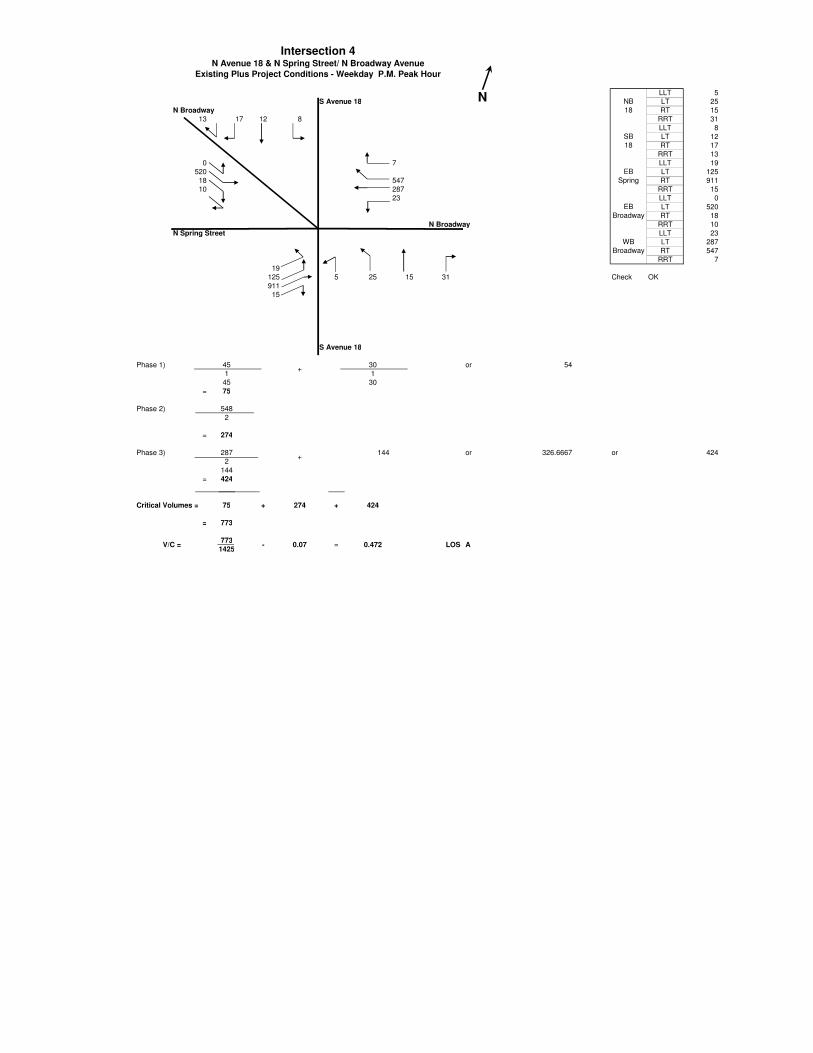
LLT 5
S Avenue 18 LT 25
N Broadway RT 15
13 17 12 8 RRT 31
LLT 8
LT 12
RT 17
RRT 13
0 7 LLT 19
520 LT 125
18 547 RT 911
10 287 RRT 15
23 LLT 0
LT 520
RT 18
N Broadway RRT 10
N Spring Street LLT 23
LT 287
RT 547
RRT 7
19
125 5 25 15 31 Check OK
911
15
S Avenue 18
Phase 1) 45 30 or 54
1 1
45 30
= 75
Phase 2) 548
2
= 274
Phase 3) 287 144 or 326.6667 or 424
2
144
= 424
Critical Volumes = 75 + 274 + 424
= 773
773
EB
Spring
EB
Broadway
WB
Broadway
+
+
Intersection 4N Avenue 18 & N Spring Street/ N Broadway Avenue
Existing Plus Project Conditions - Weekday P.M. Peak Hour
N NB
18
SB
18
773
1425LOS AV/C = - 0.07 = 0.472
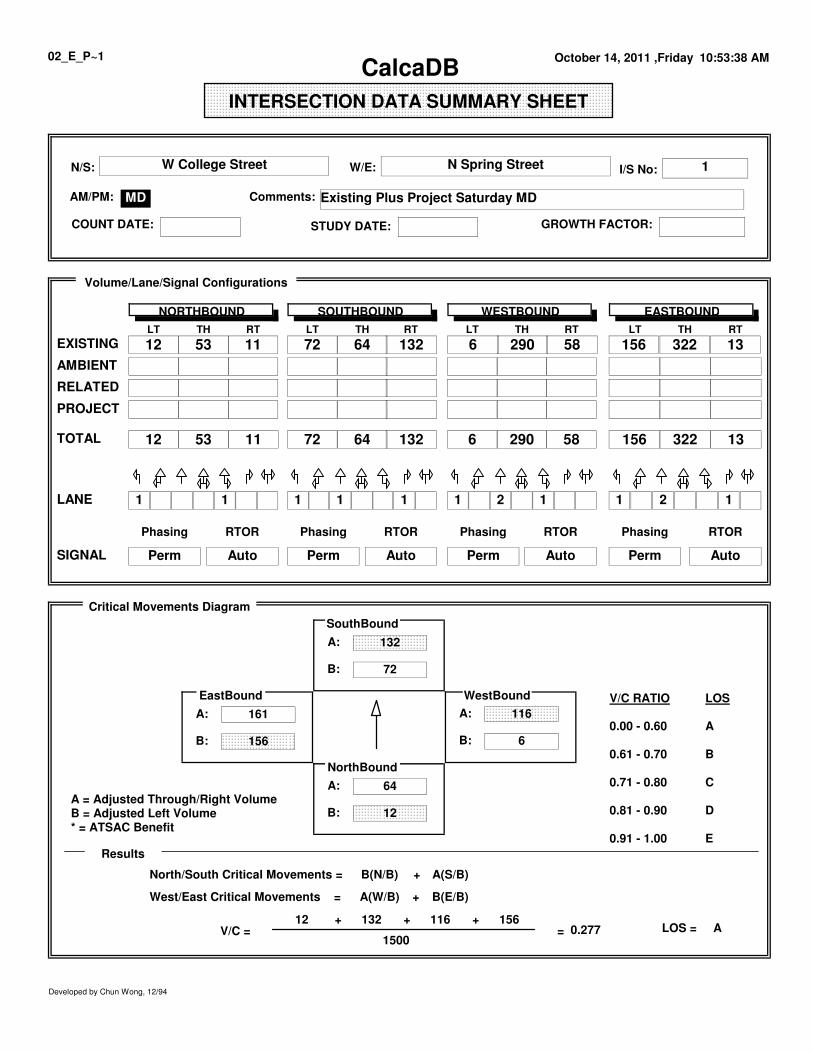
Existing Plus Project Saturday MDMD
W College Street N Spring StreetN/S: W/E: 1I/S No:
AM/PM: Comments:
COUNT DATE: GROWTH FACTOR:STUDY DATE:
6
A:
B:
116
72
A:
B:
132
64A:
B: 12
0.277 =
+
+
+++ 116132 15612
1500
161A:
B: 156
V/C =
West/East Critical Movements =
North/South Critical Movements =
SouthBound
WestBoundEastBound
NorthBound
A = Adjusted Through/Right VolumeB = Adjusted Left Volume* = ATSAC Benefit
Results
V/C RATIO LOS
0.00 - 0.60 A
0.61 - 0.70 B
0.71 - 0.80 C
0.81 - 0.90 D
0.91 - 1.00 E
A(W/B)
B(N/B)
B(E/B)
A(S/B)
ALOS =
Critical Movements Diagram
TH RT LT THLT TH RT LT TH RT
Phasing RTOR Phasing Phasing PhasingRTOR RTOR
NORTHBOUND SOUTHBOUND WESTBOUND EASTBOUND
EXISTING
RTOR
RT
12
AMBIENT
RELATED
PROJECT
TOTAL 12
LANE
SIGNAL Perm
1
Perm Perm PermAuto Auto Auto Auto
1 1 1 1 1 2 1 1 2 1
LT
53 11 72 64 132 6 290 58 156 322 13
6 5829013264721153 13322156
Volume/Lane/Signal Configurations
Developed by Chun Wong, 12/94
October 14, 2011 ,Friday 10:53:38 AMCalcaDB
02_E_P~1
INTERSECTION DATA SUMMARY SHEET
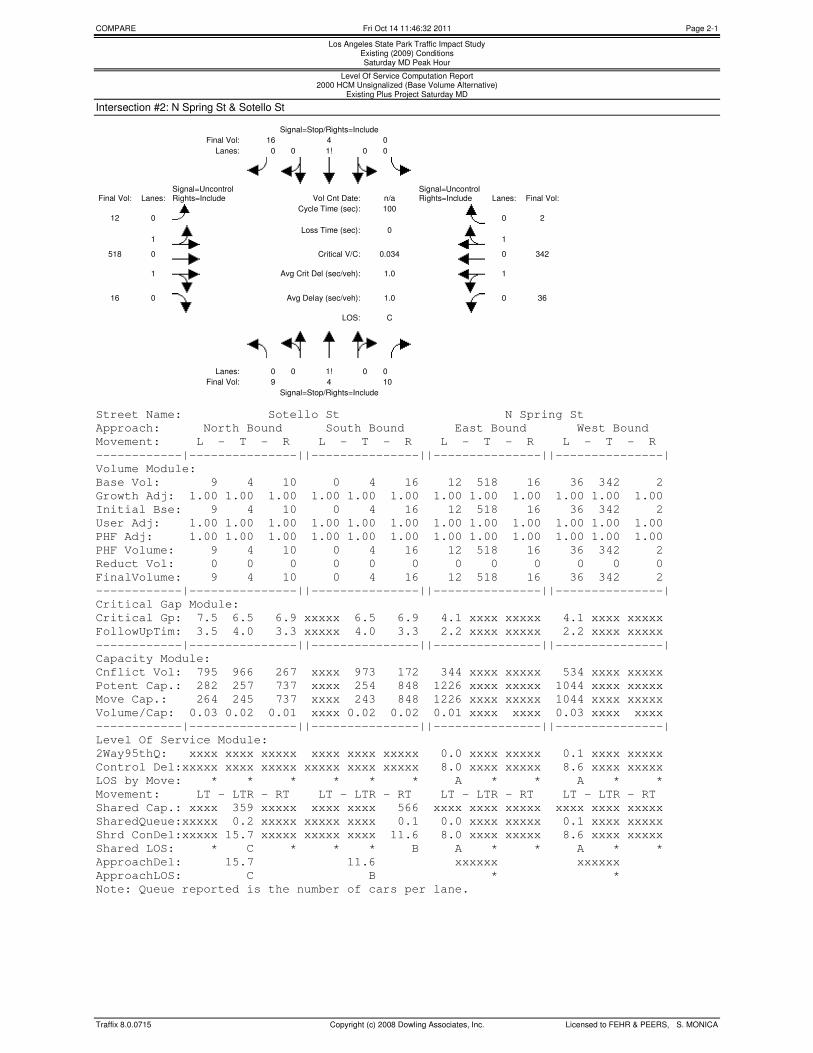
COMPARE Fri Oct 14 11:46:32 2011 Page 2-1
Traffix 8.0.0715 Copyright (c) 2008 Dowling Associates, Inc. Licensed to FEHR & PEERS, S. MONICA
Los Angeles State Park Traffic Impact Study Existing (2009) Conditions Saturday MD Peak Hour
Level Of Service Computation Report 2000 HCM Unsignalized (Base Volume Alternative)
Existing Plus Project Saturday MD
Intersection #2: N Spring St & Sotello St Signal=Stop/Rights=Include
Final Vol: 16 4 0
Lanes: 0 0 1! 0 0
Signal=Uncontrol
Signal=Uncontrol
Final Vol: Lanes: Rights=Include Vol Cnt Date: n/a Rights=Include Lanes: Final Vol:
12
0
Cycle Time (sec): 100 0
2
1
Loss Time (sec): 0 1
518 0
Critical V/C: 0.034 0 342
1
Avg Crit Del (sec/veh): 1.0 1
16 0
Avg Delay (sec/veh): 1.0 0 36
LOS: C
Lanes: 0 0 1! 0 0
Final Vol: 9 4 10
Signal=Stop/Rights=Include
Street Name: Sotello St N Spring St
Approach: North Bound South Bound East Bound West Bound
Movement: L - T - R L - T - R L - T - R L - T - R
------------|---------------||---------------||---------------||---------------|
Volume Module:
Base Vol: 9 4 10 0 4 16 12 518 16 36 342 2
Growth Adj: 1.00 1.00 1.00 1.00 1.00 1.00 1.00 1.00 1.00 1.00 1.00 1.00
Initial Bse: 9 4 10 0 4 16 12 518 16 36 342 2
User Adj: 1.00 1.00 1.00 1.00 1.00 1.00 1.00 1.00 1.00 1.00 1.00 1.00
PHF Adj: 1.00 1.00 1.00 1.00 1.00 1.00 1.00 1.00 1.00 1.00 1.00 1.00
PHF Volume: 9 4 10 0 4 16 12 518 16 36 342 2
Reduct Vol: 0 0 0 0 0 0 0 0 0 0 0 0
FinalVolume: 9 4 10 0 4 16 12 518 16 36 342 2
------------|---------------||---------------||---------------||---------------|
Critical Gap Module:
Critical Gp: 7.5 6.5 6.9 xxxxx 6.5 6.9 4.1 xxxx xxxxx 4.1 xxxx xxxxx
FollowUpTim: 3.5 4.0 3.3 xxxxx 4.0 3.3 2.2 xxxx xxxxx 2.2 xxxx xxxxx
------------|---------------||---------------||---------------||---------------|
Capacity Module:
Cnflict Vol: 795 966 267 xxxx 973 172 344 xxxx xxxxx 534 xxxx xxxxx
Potent Cap.: 282 257 737 xxxx 254 848 1226 xxxx xxxxx 1044 xxxx xxxxx
Move Cap.: 264 245 737 xxxx 243 848 1226 xxxx xxxxx 1044 xxxx xxxxx
Volume/Cap: 0.03 0.02 0.01 xxxx 0.02 0.02 0.01 xxxx xxxx 0.03 xxxx xxxx
------------|---------------||---------------||---------------||---------------|
Level Of Service Module:
2Way95thQ: xxxx xxxx xxxxx xxxx xxxx xxxxx 0.0 xxxx xxxxx 0.1 xxxx xxxxx
Control Del:xxxxx xxxx xxxxx xxxxx xxxx xxxxx 8.0 xxxx xxxxx 8.6 xxxx xxxxx
LOS by Move: * * * * * * A * * A * *
Movement: LT - LTR - RT LT - LTR - RT LT - LTR - RT LT - LTR - RT
Shared Cap.: xxxx 359 xxxxx xxxx xxxx 566 xxxx xxxx xxxxx xxxx xxxx xxxxx
SharedQueue:xxxxx 0.2 xxxxx xxxxx xxxx 0.1 0.0 xxxx xxxxx 0.1 xxxx xxxxx
Shrd ConDel:xxxxx 15.7 xxxxx xxxxx xxxx 11.6 8.0 xxxx xxxxx 8.6 xxxx xxxxx
Shared LOS: * C * * * B A * * A * *
ApproachDel: 15.7 11.6 xxxxxx xxxxxx
ApproachLOS: C B * *
Note: Queue reported is the number of cars per lane.
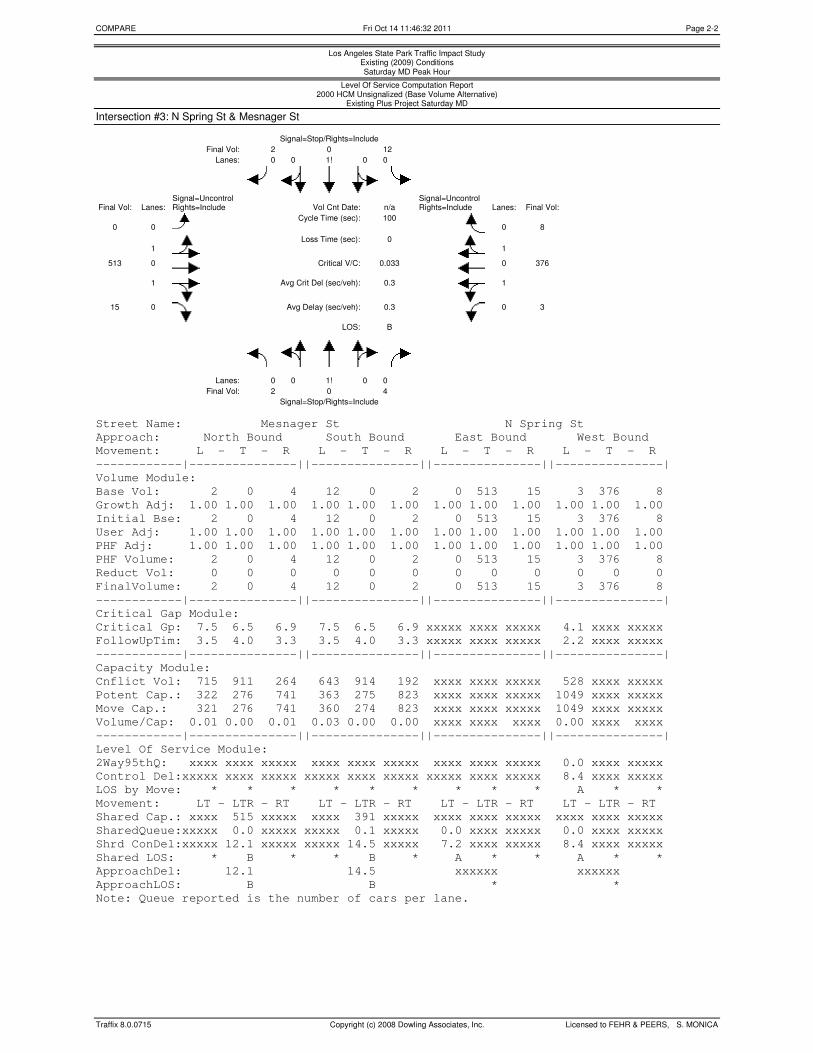
COMPARE Fri Oct 14 11:46:32 2011 Page 2-2
Traffix 8.0.0715 Copyright (c) 2008 Dowling Associates, Inc. Licensed to FEHR & PEERS, S. MONICA
Los Angeles State Park Traffic Impact Study Existing (2009) Conditions Saturday MD Peak Hour
Level Of Service Computation Report 2000 HCM Unsignalized (Base Volume Alternative)
Existing Plus Project Saturday MD
Intersection #3: N Spring St & Mesnager St Signal=Stop/Rights=Include
Final Vol: 2 0 12
Lanes: 0 0 1! 0 0
Signal=Uncontrol
Signal=Uncontrol
Final Vol: Lanes: Rights=Include Vol Cnt Date: n/a Rights=Include Lanes: Final Vol:
0
0
Cycle Time (sec): 100 0
8
1
Loss Time (sec): 0 1
513 0
Critical V/C: 0.033 0 376
1
Avg Crit Del (sec/veh): 0.3 1
15 0
Avg Delay (sec/veh): 0.3 0 3
LOS: B
Lanes: 0 0 1! 0 0
Final Vol: 2 0 4
Signal=Stop/Rights=Include
Street Name: Mesnager St N Spring St
Approach: North Bound South Bound East Bound West Bound
Movement: L - T - R L - T - R L - T - R L - T - R
------------|---------------||---------------||---------------||---------------|
Volume Module:
Base Vol: 2 0 4 12 0 2 0 513 15 3 376 8
Growth Adj: 1.00 1.00 1.00 1.00 1.00 1.00 1.00 1.00 1.00 1.00 1.00 1.00
Initial Bse: 2 0 4 12 0 2 0 513 15 3 376 8
User Adj: 1.00 1.00 1.00 1.00 1.00 1.00 1.00 1.00 1.00 1.00 1.00 1.00
PHF Adj: 1.00 1.00 1.00 1.00 1.00 1.00 1.00 1.00 1.00 1.00 1.00 1.00
PHF Volume: 2 0 4 12 0 2 0 513 15 3 376 8
Reduct Vol: 0 0 0 0 0 0 0 0 0 0 0 0
FinalVolume: 2 0 4 12 0 2 0 513 15 3 376 8
------------|---------------||---------------||---------------||---------------|
Critical Gap Module:
Critical Gp: 7.5 6.5 6.9 7.5 6.5 6.9 xxxxx xxxx xxxxx 4.1 xxxx xxxxx
FollowUpTim: 3.5 4.0 3.3 3.5 4.0 3.3 xxxxx xxxx xxxxx 2.2 xxxx xxxxx
------------|---------------||---------------||---------------||---------------|
Capacity Module:
Cnflict Vol: 715 911 264 643 914 192 xxxx xxxx xxxxx 528 xxxx xxxxx
Potent Cap.: 322 276 741 363 275 823 xxxx xxxx xxxxx 1049 xxxx xxxxx
Move Cap.: 321 276 741 360 274 823 xxxx xxxx xxxxx 1049 xxxx xxxxx
Volume/Cap: 0.01 0.00 0.01 0.03 0.00 0.00 xxxx xxxx xxxx 0.00 xxxx xxxx
------------|---------------||---------------||---------------||---------------|
Level Of Service Module:
2Way95thQ: xxxx xxxx xxxxx xxxx xxxx xxxxx xxxx xxxx xxxxx 0.0 xxxx xxxxx
Control Del:xxxxx xxxx xxxxx xxxxx xxxx xxxxx xxxxx xxxx xxxxx 8.4 xxxx xxxxx
LOS by Move: * * * * * * * * * A * *
Movement: LT - LTR - RT LT - LTR - RT LT - LTR - RT LT - LTR - RT
Shared Cap.: xxxx 515 xxxxx xxxx 391 xxxxx xxxx xxxx xxxxx xxxx xxxx xxxxx
SharedQueue:xxxxx 0.0 xxxxx xxxxx 0.1 xxxxx 0.0 xxxx xxxxx 0.0 xxxx xxxxx
Shrd ConDel:xxxxx 12.1 xxxxx xxxxx 14.5 xxxxx 7.2 xxxx xxxxx 8.4 xxxx xxxxx
Shared LOS: * B * * B * A * * A * *
ApproachDel: 12.1 14.5 xxxxxx xxxxxx
ApproachLOS: B B * *
Note: Queue reported is the number of cars per lane.
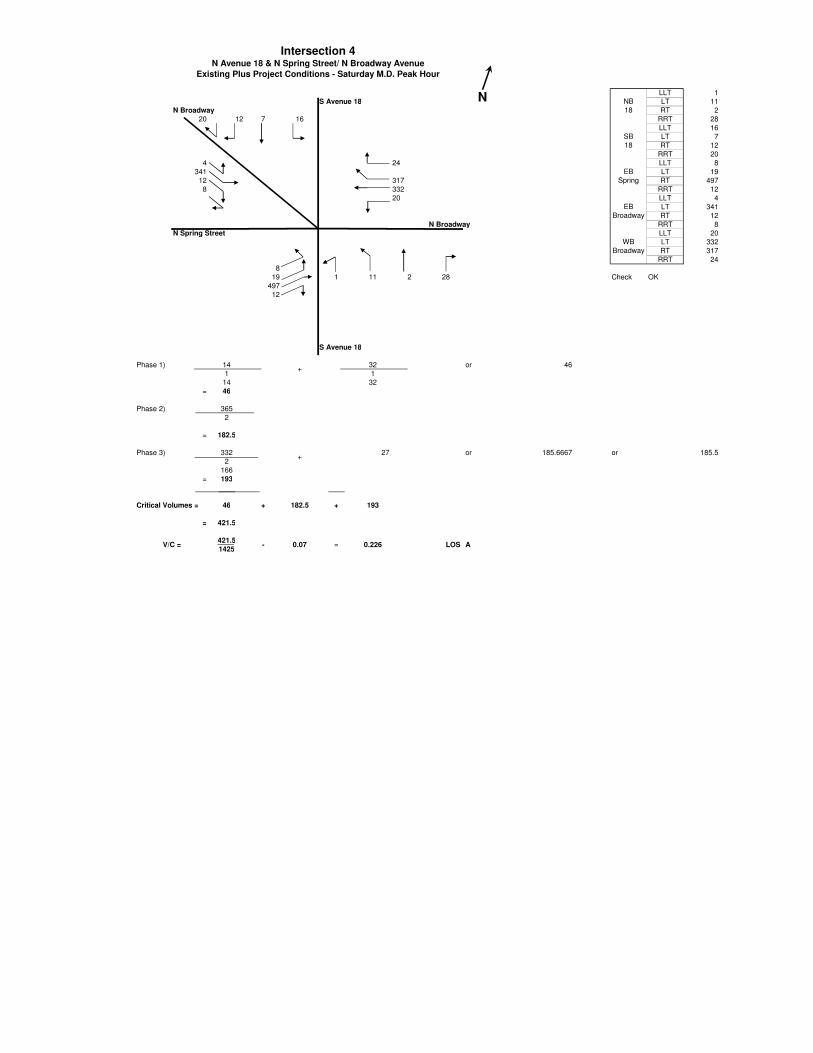
LLT 1
S Avenue 18 LT 11
N Broadway RT 2
20 12 7 16 RRT 28
LLT 16
LT 7
RT 12
RRT 20
4 24 LLT 8
341 LT 19
12 317 RT 497
8 332 RRT 12
20 LLT 4
LT 341
RT 12
N Broadway RRT 8
N Spring Street LLT 20
LT 332
RT 317
RRT 24
8
19 1 11 2 28 Check OK
497
12
S Avenue 18
Phase 1) 14 32 or 46
1 1
14 32
= 46
Phase 2) 365
2
= 182.5
Phase 3) 332 27 or 185.6667 or 185.5
2
166
= 193
Critical Volumes = 46 + 182.5 + 193
= 421.5
421.5
EB
Spring
EB
Broadway
WB
Broadway
+
+
Intersection 4N Avenue 18 & N Spring Street/ N Broadway Avenue
Existing Plus Project Conditions - Saturday M.D. Peak Hour
N NB
18
SB
18
421.5
1425LOS AV/C = - 0.07 = 0.226