Embed Size (px)
Citation preview

1
BIKE SHARE IN SAN JOSE: WHO WILL USE IT, HOW MUCH MONEY PEOPLE WILL
PAY FOR IT, AND WHAT THEY WILL USE IT FOR
Kenneth Antonio Rosales
Environmental Studies 198: Senior Seminar
December 13, 2011

2
ABSTRACT
In the Bay Area, 36.4% of Greenhouse gases come from transportation, thus
significantly contributing to global climate change. In response to this issue, the cities of San
Francisco, Redwood City, Palo Alto, Mountain View, and San Jose will implement a pilot Bike
Share program funded by the Metropolitan Commission, Bay Area Air Quality Management
District, and Valley Transportation Authority in the summer of 2012. One hundred and fifteen
(115) surveys were conducted throughout the principal areas where the Bike Share program
kiosk stations will be disseminated to find out if a significant correlation between participants'
age and their willingness to pay exists. The average age and willingness to pay, information
about whether survey participants will use Bike Share or not, why they wouldn’t use Bike Share,
and what they would use Bike Share for were also acquired. No significant correlations between
people’s age and willingness to pay were found because of an imbalanced distribution of young
people over older individuals surveyed. However, most people who would use Bike Share would
use it to run errands, and those who would not use Bike Share would rather use another mode of
transportation. Most survey participants would use Bike Share at Diridon Station over any other
area, and would on average, pay much more compared to Washington D.C. or Boston,
Massachusetts’ Bike Share Programs . Therefore, San Jose’s Bike Share vendor can make their
prices more expensive to provide innovative public education and outreach programs in terms of
safety and training or can fund their maintenance, vandalism, and theft costs with ease. However,
the Bike Share should be a non-profit organization that survives through low costs from in-kind
sponsorships, subsidies, subscriptions, and local affiliates.
INTRODUCTION
Motivation
The United States of America is plagued with air quality issues, traffic congestion, and
inadequate land use by reason of insufficient private and governmental actions, and the lack of
citizen demands for change in transportation reform. For example, in 1923 General Motors (GM)
and several other motor transit companies such as Greyhound, Rex Finance, and Omnibus
Corporation to name a few bought out electric street car systems in the entire country (Snell
2010). By 1950, GM had converted 900 electric street car systems to single occupancy vehicles
(SOV) and motorized bus systems from coast to coast (Snell, 2010). Six years later, President
Eisenhower signed the Federal Highway Aid Act of 1956 to expand highway systems across the
country and in turn increased the use of SOV’s at an unimaginable level (Weingroff 1996). The
United States has now exhausted most of its own supply of petroleum, imports over 70% of its
oil, consumes over 25% of the world supply of gasoline, pumps over 85 million barrels a day,
but only withholds 2.5% of the world’s reserves (Gerston, 2009). Consequently, the United

3
States faces air pollution, Global Warming and Climate Change from greenhouse gas emissions,
and an oil dependency that all simultaneously adversely affects the contemporary daily lives of
individuals and the sustainability for future generations (EPA, 2011)
The Environmental Protection Agency releases information about national air pollutants
released on an annual basis to the public. In 1999, transportation accounted for 27.6% of
particulate matter (pm2) released into the air (EPA, 2011). Based off the EPA’s study on
analyzing different pollutants, averages of 1.794 parts per million (ppm) of carbon monoxide
from 388 different site visits, 0.00966 ppm of nitrogen oxide from 230 different sites visited, and
0.0028 ppm from 480 different sites visited were all emitted (EPA, 2011). It must be stated that
95% of non-work related trips are used by car and are linked to health concerns (Freeman, 2010).
Other pollutants listed are sulfur and toxic air pollutants such as benzene, carbonyl sulfide, and
chloroform out of the188 different regulated chemicals dispersed. Sulfur dioxide is connected to
premature death, respiratory, and cardiovascular disease, and nitrogen dioxide is linked to
photochemical smog that disturbs various cities in the summer and consequently causes asthma
attacks (Logan). Asthma, birth defects, cancer, chronic obstructive pulmonary disorder, and
negative cardiovascular and neurological effects come from the combustion of fossil fuels
(Nazelle et. Al, 2011).
Transportation also contributes to the release of greenhouse gases (GHGs). About one-
third of greenhouse gases come from transportation and in 2008, the U.S. emitted slightly less
than 7 billon metric tons of greenhouse gases (EPA, 2011). In the Bay Area, 36.4% of
Greenhouse gases come from transportation alone (BAAQMD, 2010).
Obesity is also an issue that has arisen in the United States and beyond. The U.S. Center
for Disease Control and Prevention (2004) published an increase of obesity among adults
(Gerston 2009, 72). The amount of obese adults increased from 14% in 1980 to 32.9% in 2004
(Gerston 2009, 72). Obesity is also linked to serious health concerns such as Type-2 diabetes,
heart disease, hypertension, congestive heart failure, premature death, and pregnancy issues. This
may be correlated to the fact that 95% of non-related work trips are used by car (Freeman, 2010).
Over the last 25 years, global, social, and economic growth has also had a great impact
with the demand of journeys in large urban areas, ensuing and increasing the use of the car (dell
‘Ollio 2011, 1). Currently, 50% of the world lives in urban areas, but is projected to increase to
70%, thus a decrease of urban sprawl dwellers (Nazelle, 2011 767). Therefore issues in the
United States also reflect the world and vice versa through globalization.
The World Health Organization has recently suggested that 2.8 million deaths come from
overweight and obesity issues (Nazelle, 2011). Physical inactivity is responsible for 2.8 million
deaths a year (Nazelle, 2011). The population mostly impacted by these issues is the suburbanite
populace. Studies have shown that suburbanites “suffer more from hypertension and other
chronic diseases” (Nazelle 2011, 769).
However, bicycling as a transportation alternative can be a great solution to reduce air
pollutants and greenhouse gas emissions because it emits none other than an individual’s steam.
Communities that have great pedestrian and bicycle infrastructure, parks, and high density are
interrelated with neighborhoods that are physically active and thus have a “healthier weight

4
status and better mental health” (Nazelle, 2011). In the United States, bicycle trips have
increased from 1,272 (millions) annual bike trips in 1977 to 4,081 bike trips [millions] (Pucher
et.al, 2011). While 1% of total trips are made by the bike in the United States, the entire country
must emulate cities like Copenhagen, Denmark where “as nearly 38% of all transportation trips
in Copenhagen are done by bike” (Pucher et.al, 2011; Streetfilms, 2010). Also, the United States
needs to emulate countries like Germany who have greater trips by public transport, foot, and
bikes fourfold than the United States, and drive 25% less than United States citizens (Buehler
2010, 644). Furthermore, 27% of all trips including business and non-business related trips in the
Netherlands are made by the bicycle and similarly, 12% in Germany (Martens, 2006; DeMaio
and Gifford 2004, 5). In medium-sized cities, bicycle trips increases at a whopping 35%
(Martens 2006, 327). Increased physical activity has further and evidently suggested that it
develops major health benefits such as the enhanced fitness levels within the adult population
(Titze, et.al. 2008,252) A bicycle dependent society may lead to a lifestyle that is car-free and
increase the competitiveness of environmentally sound modes of transportation such as public
transport and walking (Martens 2006, 326).
Background
Bike Share programs can be of tremendous aid by promoting bicycle use, connecting
people to public transit stations, reducing energy use, decreasing congestion and consequently
giving access to public transportation corridors, and shrinking the emissions of air pollutants and
greenhouse gases (Martens, 2006). In addition, the launch of a public bicycle sharing program
enables the augment in the use of personal bike use in the long run, and could reduce over one
million car trips per year and decrease carbon-dioxide emissions larger than 3.5 million pounds
on an annual basis per municipality (Dossett 2008, 6). Public Bike Sharing programs can be the
cornerstone of a transcending movement to a bike-oriented society in the United States (Dossett
2008, 6).
Bike Share is a program that is distinguishable to bike rental services.
To utilize Bike Share, an individual has to purchase a pass at an available station or through the
internet (dell ‘Ollio 2011). Passes for Bike Share vary from system to system. Some Bike Share
initiatives may have daily, weekly, monthly, and annual passes available to sell and some may
mix and match the different time scales of passes (dell ‘Ollio 2011). After the purchase of a pass,
the first 30 minutes of use of a shared bike is free (the pass is still purchased so it is not
technically free). After the first 30 minutes expires, a “penalty” charge is placed in the user’s
account (Dossett 2008). An incrementing charge is imposed after every thirty minutes and
eventually the charge increment is capped. The automated electronic and solar powered system
continues to charge the user after every thirty minutes of use at the capped price until the shared
bike is returned to a station (Dossett 2008).
History Bike Share systems has existed for about 43 years since 1968 and has been
plagued with theft, liability issues, and lack of demand (dell ‘Olio 2010, 90; DeMaio and Gifford
2004, 3). However, Bike Share programs have gone through an absolute overhaul than what it
used to be. When Bike Share first launched in Amsterdamn, The Netherlands, regular bikes
colored in white were supplied to the public without permanent pick-up and drop off points, were

5
subsequently stolen, and the entire system failed within days (dell ‘Olio 2010, 90; DeMaio and
Gifford 2004, 3). In the next generation of Bike Sharing, Copenhagen, Denmark launched its
program called the Bycyklen with pick up and returning stations and a coin deposit system that
still exists today. The Bycyklen encountered numerous theft issues; however, the third wave of
Bike Share was heavily influenced by Copenhagen’s work and therefore gave rise to Smart
Bikes. The Smart Bike program utilizes electronic bike or rack locks, credit cards, magnetic
stripe cards, or smartcards, and telecommunication systems (dell ‘Olio 2010, 90; DeMaio and
Gifford 2004, 3). More recently, Bike Share programs have people subscribe for daily passes at a
respective station with the use of a credit or debit card. Passes or special card keys that require
longer periods of usage such as weekly or annual passes are subscribed for online. The Smart
Bikes program transformed itself over three generations and has generated results of
improvement.
Theft and problems with liability have been dealt with in a similar fashion with many
Bike Share programs in the United States. Minneapolis, Minnesota, Washington D.C., and
Boston Massachusetts all require that any theft or accident be reported immediately to the local
police station and/or to their Bike Share vendor depending on the situation and city laws (Capital
Bikeshare 2011; Hubway 2011; Nice Ride MN2011). Users may be charged for a loss or theft of
a bike, depending on the notification and facts behind a person’s story. Since a person is held
responsible of following all street laws once acquiring a bicycle, a person who gets in an
accident must return the bicycle at a docking station or contact the vendor varying under the
circumstance a person goes through (Capital Bikeshare 2011; Hubway 2011; Nice Ride MN
2011).Currently, Minnestoa’s Nice Ride spends $99,400 in replacing bicycle units from theft and
vandalism from an annual replacement rate of five percent (Dossett 2008, 44). Therefore, safety
is usually made apparent from the Bike Share vendor to its customers by encouraging them to
wear helmets and to take bicycle training classes about road rules. Generally, helmets are for sale
near Bike Share stations. Additionally in terms of theft, the Smart Bikes are made with puncture
proof tires, a rigid frame, illuminating colors, require unique disassembly components, and
unusual dimensions to stand out from other bicycles [Figure 1] (DeMaio and Gifford 2004, 10).

6
Figure 1 Bike Share Bicycle depicted in VTA’s Bike Share Pilot Project PHASE 1
Implementation Plan
Bike Share in the bay area The Bay Area is in development of a Bike Share program led
by the Bay Area Air Quality Management District (BAAQMD) and is going to launch its pilot
program next summer in June to last only one year until the final implementation plans go
through (Cuenco, 2011; Wenzinger, 2011; Zenobi, 2011). About 1,000 bikes will be available in
the whole region of three counties: San Francisco, Santa Clara, and San Mateo. In the County of
Santa Clara, San Jose, Mountain View, and Palo Alto will have bikes, and in San Mateo, only
Redwood City will have bikes (Cuenco, 2011; Wenzinger, 2011; Zenobi, 2011). About 100 bikes
will be given to each city (Cuenco, 2011; Wenzinger, 2011; Zenobi, 2011). The Safe Roots to
Transit Regional Measure 2 has extracted one dollar from bridge toll increases to go into the
Bike Share program via the Valley Transportation Authority (VTA) in the Santa Clara County
(Cuenco, 2011; Wenzinger, 2011; Zenobi, 2011). VTA controlled the Bike Share program until
the Metropolitan Transportation Commission stepped in along with the BAAQMD due to a
federal grant from Federal Transportation Dollars (Cuenco, 2011; Wenzinger, 2011; Zenobi,
2011). The total amount of money for the entire program will be 7.9 million dollars (Cuenco,
2011; Wenzinger, 2011; Zenobi, 2011; San Francisco Chronicle 2011). The Valley
Transportation Authority (VTA) provides San Jose public transit services and is in charge of
finding a Bike Share vendor for pricing and locations of the bikes and stations (aka pods or
kioks) respectively. Furthermore, the cities of San Jose, Mountain View, Redwood City, Palo
Alto, and San Francisco will receive about 100 bicycles each and 10 to 12 stations will be
available for Bike Share within a 1 to 3 mile radius from a main public transit station. VTA’s
Bike Share Pilot Project PHASE 1 Implementation Plan states that “priority areas considered for
potential pod sites include the downtowns, universities (if located in either San Jose or Palo Alto)
and City Halls” ( 2010, 7). However, the exact locations and prices are unkown.
Bike Share programs are supposed to have a high demand in order for it to be successful.
Even though bicycle use in the United States is low, it is still growing. It had risen from 0.6% to
0.9% within the years 1977 to 1995, and is now at 1% (Pucher et.al, 2011). The area of this study
was in San Jose, California since it is one of the Bay Area cities that received funding for the
pilot Bike Share Program that will launch in the summer of 2012 (Pucher et.al, 2011). However,
according to the United Stated Census, San Jose’s population is 945,942 and has a low
population density of 5,256.2 people per square mile. San Jose’s General Plan: Envision 2040
shows that 1.2% of commuter trips are made by bicycle and San Jose’s Bike Plan 2020 states
that 1% of all trips in San Jose are made by bicycles, just like the national percentage. San Jose is
known for its wide spread of single-family homes and car friendly infrastructure, but in order to
survive, Bike Share Programs need demand, infrastructure, facilities, safety, profitability or
surplus revenues, and multi-modal connectivity (DeMaio and Gifford 2004, 10). Bike Share
programs are inclusively a good start to reduce vehicle miles traveled (VOTs). For example, the
Twin-Cities in Minnesota have started a successful Bike Share program that focuses on high
density areas in which to connect the public to public transportation (Dossett 2008).

7
Objective of study
• To evaluate whether there was a significant correlation between people’s ages and
their willingness to pay for daily, weekly, monthly, and annual passes San Jose’s Bike
Share pilot program will provide.
• To find quantitative and qualitative measures as to why, why not, and what people
would use the Bike Share program to ultimately determine where stations should be
placed.
METHODS
Study Design
The design of this study is to evaluate whether there is a significant correlation between
people’s ages and their willingness to pay for San Jose’s Bike Share pilot program (figure 2).
Qualitative meaures such as why or why not people would use the Bike Share program were also
analyzed. By 2012, 10 to 12 stations will be available for bikeshare within a 1 to 3 mile radius
from the Diridon Station located at Santa Clara and Montgomery St (VTA 2011, 7). The Valley
Transportation Authority (VTA) provides San Jose public transit services and is in charge of
finding a Bike Share vendor for pricing and locations of the bikes and stations (aka pods or
kiosks) respectively. VTA’s Bike Share Pilot Project PHASE 1 Implementation Plan states that
“priority areas considered for potential pod sites include the downtowns, universities (if located
in either San Jose or Palo Alto) and City Halls” ( 2010, 7). However, the exact locations and
prices are unkown. Therefore, three different cities’s bikeshare programs such as Boston
Massachusettes’s Hubway Bike Share, Washington D.C.’s Capital Bike Share, and Minneapolis
Minesota’s Nice Ride Bike Share have been analyzed for pricing.Exactly 115 out of 120 surveys
in five different regions were conducted. Within the three regions, 40 surveys were carried out
(figure 3). Every region had four subregions in which 10 surveys were filled out.
8
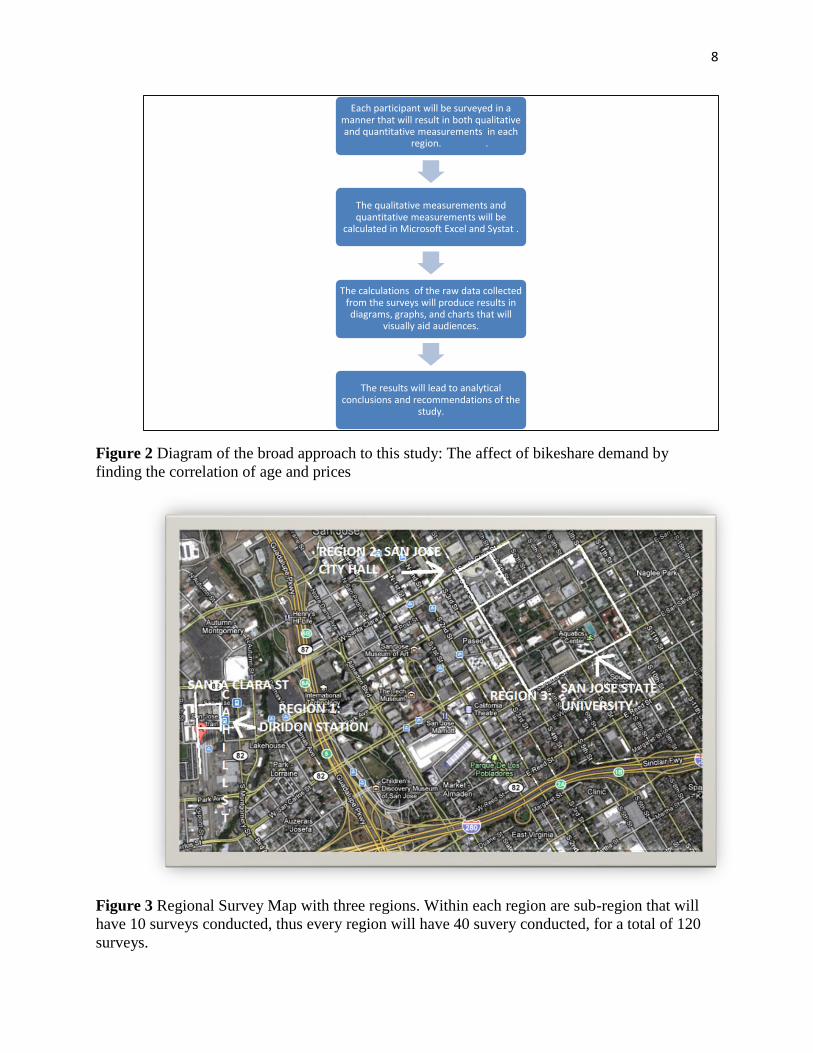
Figure 2 Diagram of the broad approach to this study: The affect of bikeshare demand by
finding the correlation of age and prices
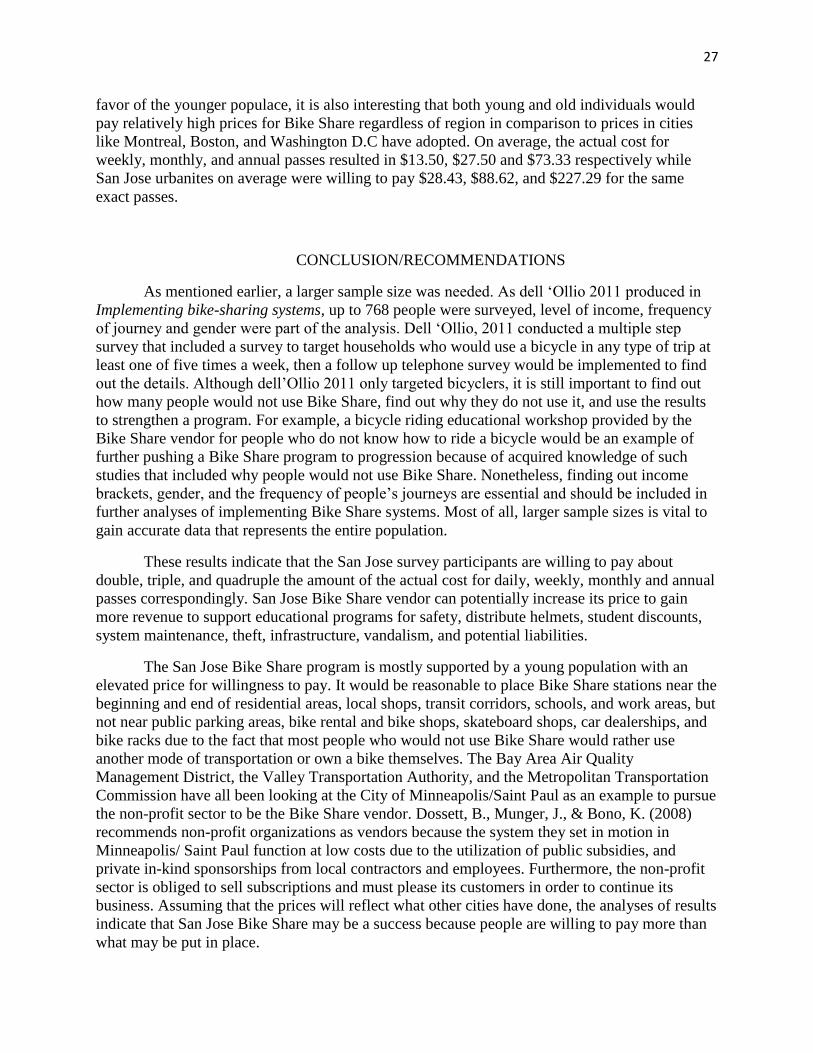
Figure 3 Regional Survey Map with three regions. Within each region are sub-region that will
have 10 surveys conducted, thus every region will have 40 suvery conducted, for a total of 120
surveys.
Each participant will be surveyed in a manner that will result in both qualitative and quantitative measurements in each
region. .
The qualitative measurements and quantitative measurements will be
calculated in Microsoft Excel and Systat .
The calculations of the raw data collected from the surveys will produce results in diagrams, graphs, and charts that will
visually aid audiences.
The results will lead to analytical conclusions and recommendations of the
study.

9
Data Collection
The exact locations of the bikeshare stations are currently unkown. The pilot program for
the Bay Area wide bikeshare project will launch in either June or July next summer of 2012
(Wenzinger, 2011). The prices for the pilot program is also in its developmental phases. Patrick
E. Wenzinger, the Administrative Analyst Strategic Incentive Division for the Bay Area Air
Quality District projects that the Bike Share program extending from the san Francisco County,
San Mateo County, and all the way down to Santa Clara County will emulate Boston,
Massachusette’s Bike Share paying/pricing system, where the first 30 minutes of utilization will
be free. To keep the program a “sharing” system rather than “renting,” an ascending fee will be
imposed on the user after each 30 minute increments are up after the first “free” 30 minutes.
The VTA Implementation Plan Phase 1 mentions that the Bike Share stations will most
likely be placed near station areas (Diridon Station), city government (San JoseCity Hall), and
universities (San Jose State University).
With 120 surveys printed out, a clipboard, and multiple pens, the three different regions
illustrated in figure 3 were visited. Survey participants were randomly selected based off of
flipping a coin to a group or in range of the survey area. If the flipped coin landed on heads, then
that result would be “yes” or affirmatively approving whether the individual(s) would be
surveyed. However, if the coin were to land on tails, then it would result to “no” and the next
individual(s) in range would be be potentially surveyed (figure 4).
Prior to filling out surveys, participants were educated on how Bike Share systems work.
Once the randomly slected people were given surveys, they were allowed to answer all
questions freely. Although participants were given a range within the questions about their
willingess to pay, it was verbally stated to them that they were free to go beyond the range. The
ranges only served as an indicator to show that the price’s range can be as low as free to
significantly expensive based off their personal opinion.

10
Figure 4 a copy of the survey handed out to randomly selected participants.
The first region that was surveyed was the Diridon Station located on West Santa Clara
Street and Cahill Street in San Jose, California from 12pm to 6pm on Thursday, October 20th,
2011 during commute and non-commuting hours (figure 5). The four sub-regions visited in order
were: the bus stop area as the first, the first and second train tracks (Caltrain, Altamont
Commuter Express, and Amtrak) as the second sub-region, the third and fourth train tracks (also
Caltrain, Altamont Commuter Express, and Amtrak) as the third sub-region, and the Valley
Transporation Authority lightrail tracks as the fourth survey set (sub-region).

11
Figure 5 The figure shows the sub-regions of Region 1: Diridon Station
The second region was located at San Jose City Hall, 200 E. Santa Clara Street, San Jose
California and conducted at 5:30 pm on Tuesday, October 18th, 2011 during commuting hours
(figure 6). The sub-regions in the City Hall region were also divided into four sub-regions, the
streets that surround City Hall. Fourth Street as the first survey sub-region, Santa Clara Street as
the second, San Fernando Street as the third, and 6th Street as the fourth.
The third survey region was San Jose State University, 1 Washington Square San Jose,
California at 5:30 p.m. on Wednesday October 20th, 2011 during commute hours. Broken up into
four sub-regions, the first survey area was on 4th Street, the second on San Fernando Street , the
third on San Salvador Street, and the fourth on 10th Street (Figure 6).

12
Figure 6 This figure shows Regions 2 and 3 and its sub-regions of surveys conducted
Within each survey, people were asked if they would use Bike Share; why or why they
would not use it; how much they are willing to pay for a daily, weekly, monthly, and annual
passes; and finally their age. Participants were free to answer the questions however they wanted.
For example, if they stated they did not want to use the program, but felt like it was a great idea
and wished to hypothetically fill out their willingess to pay questions, then they were granted to
do so. Furthermore, if the surveyed individual wished to fill in a price beyond the range listed,
then they were allowed to do so. If a applicant wished not to answer certain questions, they did
not have to.

13
Data Analysis
After all 120 surveys were collected, a quantitative analysis in the form of a linear
regression analyis was conducted. Using Microsoft Excel 2007 and Systat 13, a visual
demonstration was produced to observe whether there was a significant correlation between two
continuous variables: age and the prices people were willing to pay for Bike Share. Qualitiative
measurements were also conducted with the aid of Microsoft Excel 2007 and Systat 13. Several
graphs were created based on the type of paying methods they were asked in the survey. The r-
square (R2) to find a line of best fit was specifically looked for in the linear regression analysis.
The R2 is used as a prediction measurement and in a scatter plot, the better the line of best fit is
(when plots fit on the line), the more a person can make a prediction about a relationship. The p-
values were evaluated in which it allowed the determination of whether there was a significant
linear correlation between the continuous variables. A p-value less than .05 indicated whether
something was considered significant. An R2 between .5 and 1 was considered to be a good
value to indicate that the plots on a graph were closer to the line of best fit. Averages of age and
willingness to pay at large and by regions were calculated for quantitative purposes and chi-
square test of associations were also evaluated for both qualitative and quantitative measures
such as the reasons why people would use Bike Share or not at large or by its region,.
Furthermore, people’s age in relation to Bike Share use, and age distribution by region
respectively were part of the qualitative measurements. The actual cost of Bike Share was
calculated through Microsoft Excel 2007 by finding the average costs of Boston, Massachusetts,
Minneapolis/Saint Paul, Minnesota, and Washington D.C.’s prices (figure 7).

14
Washington D.C.- http://www.capitalbikeshare.com/pricing
Minneapolis, MN/St.Paul- https://secure.niceridemn.org/map/
Boston, MA -https://secure.niceridemn.org/map/
Figure 7 Price scheme for Washington D.C., Minneapolis/Saint Paul Minnesota, and
Boston, Massachusetts
Hypotheses
1) The older a person is, the less they are willing to use Bike Share.
2) The younger a person is, the more they are willing to use Bike Share.
3) The younger a person is, the more they are likely to pay lower prices for Bike Share.
4) The older the person is, the more they are likely to pay higher prices for Bike Share.
5) People who would not use Bike Share would tend to not use it because they would
rather drive.
6) People who would use Bike Share would use it for recreational purposes.
Null hypothesis:
7) The older a person is, the more they are willing to use Bike Share.
8) The younger a person is, the less they are willing to use Bike Share.
9) The younger a person is, the more they are likely to pay higher prices for Bike Share.
10) The older the person is, the more they are likely to pay lower prices for Bike Share.
11) People who would not use Bike Share would tend to use it because they would rather
not drive.
12) People who would use Bike Share would, on average, would not use it for
recreational purposes.

15
RESULTS
Regression Analysis: Age vs. Willingness to Pay
The regression analysis performed between people’s willingness to pay and their age
showed no significant correlations (figures 1-4). All p-values resulted in scores over .05 and all
squared multiple R numbers were well below 0.5. In order of daily, weekly, monthly, and annual
passes, the p-values resulted in 0.309, 0.099, 0.570, and 0.082(figures 7-10). For the squared
multiple R in the same order the values were 0.006, 0.042, 0.045, and 0.002. The actual costs of
Bike Share from daily to annual passes were: $5.67, $13.50, $27.50, and $73.33.
p-Value
0.309
Figure 8 Regression Analysis, the estimate line shows a negative correlation between daily
passes and age. The older a person is, the less they are willing to pay. However, there is no
significant correlation between age and the willingness to pay for a Bike Share pass due to its p-
value of .309. There are also many plots missing on the estimate line and several outlying plots
such as the 22 year old willing to pay $35 for a daily pass. The R squared value is 0.0064, thus
giving no prediction of future outcomes.
y = -0.0315x + 5.071R² = 0.0064
0
5
10
15
20
25
30
35
40
0 20 40 60 80
D
A
I
L
Y
P
A
S
S
AGE
Bike Share: Age vs DailyPass
Actual Cost
Linear (Bike Share: Agevs Daily Pass)
Linear (Actual Cost )
Bike Share: Age vs Daily Pass

16
p-Value
0.099
Figure 9 Regression Analysis, the estimate line shows a negative correlation between daily
passes and age. The older a person is, the less they are willing to pay. There is no significant
correlation between age and the willingness to pay for a Bike Share weekly pass due to its p-
value of 0.099. However, 0.099 indicates a trend. There are also many plots missing on the
estimate line and several outlying plots such as the 22 year old willing to pay over $100 for a
weekly pass. The R squared value is 0.042, thus giving no prediction of future outcomes.
y = -0.308x + 26.83R² = 0.042
0
20
40
60
80
100
120
0 20 40 60 80
W
E
E
K
L
Y
P
A
S
S
AGE
Bike Share: Age vs WeeklyPass
Actual Cost
Linear (Bike Share: Age vsWeekly Pass)
Linear (Actual Cost)
Bike Share: Age vs Weekly Pass

17
p-Value
0.570
Figure 10 Regression Analysis, the estimate line shows a negative correlation between daily
passes and age. The older a person is, the less they are willing to pay. There is no significant
correlation between age and the willingness to pay for a Bike Share weekly pass due to its p-
value of 0.570. There are also many plots missing on the estimate line and several outlying plots
such as the 57 year old willing to pay over $250 for a monthly pass. The R squared value is
0.0045, thus giving no prediction of future outcomes.
y = -0.3112x + 63.876R² = 0.0045
0
50
100
150
200
250
300
0 20 40 60 80
M
O
N
T
H
L
Y
P
A
S
S
AGE
Bike Share: Age vs Monthly Pass
Actual Cost
Linear (Bike Share: Age vsMonthly Pass)
Linear (Actual Cost)
Bike Share: Age vs Monthly Pass

18
p-Value
0.082
Figure 11 Regression Analysis, the estimate line shows a negative correlation between annual
passes and age. The older a person is, the more they are willing to pay. However, there is no
significant correlation between age and the willingness to pay for a Bike Share pass due to its p-
value of .082. The p-value for this result indicates an even stronger trend than the weekly pass.
There are many plots missing on the estimate line and thus outlying plots such as the 62 year old
willing to pay over $500. The R2 is 0.001, thus showing no significant correlation between age
and willingness to pay for a daily pass and the fact that plots are far away from the line of best fit
fives no prediction model.
Bike Share Use
Although there were no significant correlations between age and the willingness to pay,
several other figures had arisen. The number of people surveyed, 115, are almost exactly split in
half in either using Bike Share or not. The number of people who chose to use it was 58 persons
while 57 chose not to (Table 1).
y = -0.390x + 150.3
R² = 0.001
0
100
200
300
400
500
600
0 20 40 60 80
A
N
N
U
A
L
P
A
S
S
AGE
Bike Share: Age vsAnnual Pass
Actual Cost
Linear (Bike Share:Age vs Annual Pass)
Linear (Actual Cost)
Bike Share: Age vs Annual Pass

19
People Who Would Either Use Bike Share or Not
Yes No
58 57
Total: 115
Figure 12 Preference of using Bike Share or not was split right down the middle. However, more
people preferred to use Bike Share by one score, 58 to 57.
Calculated Averages
The average willingness to pay for a daily pass is $6.44, $28.43 for a weekly pass, $88.62
for a monthly pass, and $227.29 for an annual pass (table 1). The average age of all participants
was 29.44.
0
50
Yes No
P
e
o
p
l
e
Would You Use Bike Share?
Bike Share Use
Bike ShareUse

20
Table 1 All the averages put together from all regions and the averages in each region for
the willingness to pay and the ages for all the survey participants are found here.
Qualitative Measurements
The reasons for using Bike Share or not were split into five main categories, two for using
Bike Share and three for not using Bike Share. The first two main reasons for using Bike Share
were either for errands or for leisure. The three main reasons for not using Bike Share were
because the participant neither can use, will not, or would rather use something else other than
Bike Share. Just as there are categories for the reasons to use Bike Share or not, there are
subdivisions within those categories as well.
The following subcategories made up the sum of the leisure category:
1) Sports
2) Recreation
3) Kids
4) Exercise
5) Friends or family
6) Trails
The following subcategories made up the sum of the errands category:
1) Get around Downtown
2) Practice
3) Work related
4) Transit stations

21
5) Shopping
6) Save gas
7) Safety
8) School
9) Home
10) Library
11) Convenience
12) Everything important
13) Emergencies
14) Hassle
The following subcategories made up the sum of people who said they cannot use
Bike Share because:
1) Does not know how
2) Too lazy
3) Exhausted
4) Disabilities
5) Does not bike
6) Poor
7) No, kids
The following subcategories made up the sum of people who said they will not use
Bike Share because:
1) Already Owns long board
2) Already owns bike
3) Theft
4) Accidents
5) Maintenance
6) No need
The following subcategories made up the sum of people who said they rather:
1) Own bike
2) Use public transportation
3) Walk
4) Drive
5) Not because only within walking/driving range
6) Not use because hardly travels
7) Not use it because lives nearby
8) Use something else because a non San Jose resident
9) Not because not near public transportation

22
Leisure and errands Most of the participants who would use Bike Share for reasons of
leisure came from San Jose State University. However, the case is different when it comes to
errands. Diridon Station carried most of the reasons for errands.
There were nine reasons for Bike Share leisure uses in San Jose State University (SJSU)
while City Hall and Diridon Station resulted in four (table 2). For reasons of errands, Diridon
Station had 26 reasons while City Hall had 25, and SJSU produced 19 reasons (table 3).
Table 2 Number of reasons to use Bike Share for leisure by region
Table 3 Number of reasons to use Bike Share for errands by region
Errands(rows) by Region(columns)
Number of
Reasons
Diridon City
Hall
SJS
U
Total
0 3 1 6 10
1 11 8 11 30
2 6 7 1 14
3 1 1 2 4
Total 21 17 20 58
Cannot, will not, and rather not People who did not want to use Bike Share centered at
San Jose City Hall. Eight reasons for people who cannot use Bike Share at City Hall
outnumbered the five reasons produced from both San Jose State University and Diridon Station.
In the same order, but for people who will not use Bike Share for their own reasoning numbered
at 14 at City Hall, six for SJSU, and five at Diridon Station. For reasons of rather using some
other mode of transportation over Bike Share, City Hall again outnumbers other regions by
generating 15 reasons, 13 reasons at SJSU, and nine reasons at Diridon Station.
Leisure (rows) by Region(columns)
Number of
Reasons
Diridon
Station
City
Hall
SJS
U
Total
0 17 13 12 42
1 3 3 7 13
2 1 1 1 3
Total 21 17 20 58

23
Table 4 Number of reasons people cannot use Bike Share by region
Cannot Use (rows) by Region (columns)
Number of Reasons Diridon Station City Hall SJSU Total
0 9 15 15 39
1 5 8 5 18
Total 14 23 20 57
Table 5 Number of reasons people will not to use Bike Share by region
Will Not Use(rows) by Region (columns)
Number of Reasons Diridon Station City Hall SJSU Total
0 11 9 14 34
1 2 14 6 22
3 1 0 0 1
Total 14 23 20 57
Table 6 Number of reasons people would rather use something else by region.
Rather Use Something Else(rows) by Region (columns)
Number of Reasons Diridon
Station
City Hall SJSU Total
0 6 10 10 26
1 7 11 8 26
2 1 2 1 4
3 0 0 1 1
Total 14 23 20 57
Furthermore on Age and Bike Share Use
There are more people who were the ages of 18 through 27 than 28 through 76. Ages 18
through 27 had at least four people who had been surveyed and the rest of the ages were either
one, two , or three (tables 7 and 8). While San Jose State University had the youngest population,
Diridon Station had the oldest and City Hall was in the middle (table 8). Most people said they
would use Bike Share at Dirdon Station (21 scores) as opposed to City Hall which is the exact
opposite (23 scores). People near San Jose State University were neutral, with 20 saying yes and
20 saying no about using Bike Share (table 9).

24
Table 7 This table shows the distribution of age (rows) and whether the individual would like to
use Bike Share or not.
Age (rows) by Bike Share Use
(columns)
Age No Yes Total
18 6 4 10
19 2 5 7
20 2 4 6
21 3 6 9
22 7 3 10
23 3 2 5
24 4 5 9
25 2 3 5
26 4 5 9
27 2 2 4
28 0 2 2
29 1 2 3
30 3 0 3
31 1 1 2
32 0 1 1
33 1 2 3
34 1 0 1
35 2 1 3
37 0 1 1
38 0 1 1
40 0 1 1
41 1 1 2
42 1 0 1
43 0 1 1
45 3 0 3
47 1 0 1
50 1 0 1
51 1 1 2
52 1 0 1
55 1 0 1
57 0 1 1
58 1 0 1
60 0 1 1
61 0 1 1
71 0 1 1
75 1 0 1
76 1 0 1
Total 57 58 115

25
Table 8 This table shows the distribution of age within each region of surveys conducted.
Age (rows) by Region (columns)
Diridon Station City Hall SJSU Total
18 2 2 6 10
19 1 2 4 7
20 2 1 3 6
21 3 4 2 9
22 3 3 4 10
23 0 2 3 5
24 2 4 3 9
25 0 2 3 5
26 1 5 3 9
27 3 0 1 4
28 2 0 0 2
29 2 0 1 3
30 0 1 2 3
31 1 1 0 2
32 1 0 0 1
33 1 2 0 3
34 0 1 0 1
35 1 0 2 3
37 1 0 0 1
38 0 0 1 1
40 1 0 0 1
41 0 1 1 2
42 0 1 0 1
43 0 1 0 1
45 1 2 0 3
47 1 0 0 1
50 0 1 0 1
51 1 1 0 2
52 0 0 1 1
55 0 1 0 1
57 1 0 0 1
58 1 0 0 1
60 1 0 0 1
61 0 1 0 1
71 1 0 0 1
75 0 1 0 1
76 1 0 0 1
Total 35 40 40 115

26
Table 9 People who would either use or not use Bike Share are split up in the three regions of
survey collection.
Region (rows) by Bike Share Use
(columns)
Region No Yes Total
Diridon 14 21 35
City Hall 23 17 40
SJSU 20 20 40
Total 57 58 115
DISCUSSION
In response to the hypotheses proposed:
1) The older a person is, the less they are willing to use Bike Share.
2) The younger a person is, the more they are willing to use Bike Share.
The results to this research suggested that these hypotheses are true; however, there was
an imbalance of the number of older people surveyed.
3) The younger a person is, the more they are likely to pay higher prices for Bike Share.
4) The older the person is, the more they are likely to pay higher prices for Bike Share.
This section of hypotheses was rather surprising. All parties were willing to pay higher prices
than the actual cost. However, again, a larger sample size is needed to make a better judgment
because for weekly and annual passes, a trend is evident and the line of best fit is negative, thus
indicating that older people would prefer to pay lower passes.
5) People who would not use Bike Share would tend to not use it because they would
rather drive.
6) People who would use Bike Share would use it for recreational purposes.
Both of these hypotheses are true, however, many people did not want to use Bike Share
because they would rather own their own bike, would rather take public transit, or would rather
walk or drive because their mandatory daily trips require long distances to use a car or they are
so close to their destination that they would rather walk. Many reasons such as not being able to
walk, laziness or exhaustion were made apparent. Also, people stated that they will not use Bike
Share because they are afraid hypothesis did not support the bigger picture of the outcome the
results gave. The sum of multiple reasons as to whether someone would use Bike Share or not
was calculated because there were great similarities within all the types of responses survey
participants had.
The regression analyses between age and willingness to pay were all considered
insignificant because of their p-values. Therefore, it was surprising that there was no perceptible
significant correlation between the two. However, a trend was indicated between age and
willingness to pay for weekly and annual passes due to their p-values, 0.099 and 0.082
respectively were close to reaching 0.05. While the study’s age distribution was unequal and in
27
favor of the younger populace, it is also interesting that both young and old individuals would
pay relatively high prices for Bike Share regardless of region in comparison to prices in cities
like Montreal, Boston, and Washington D.C have adopted. On average, the actual cost for
weekly, monthly, and annual passes resulted in $13.50, $27.50 and $73.33 respectively while
San Jose urbanites on average were willing to pay $28.43, $88.62, and $227.29 for the same
exact passes.
CONCLUSION/RECOMMENDATIONS
As mentioned earlier, a larger sample size was needed. As dell ‘Ollio 2011 produced in
Implementing bike-sharing systems, up to 768 people were surveyed, level of income, frequency
of journey and gender were part of the analysis. Dell ‘Ollio, 2011 conducted a multiple step
survey that included a survey to target households who would use a bicycle in any type of trip at
least one of five times a week, then a follow up telephone survey would be implemented to find
out the details. Although dell’Ollio 2011 only targeted bicyclers, it is still important to find out
how many people would not use Bike Share, find out why they do not use it, and use the results
to strengthen a program. For example, a bicycle riding educational workshop provided by the
Bike Share vendor for people who do not know how to ride a bicycle would be an example of
further pushing a Bike Share program to progression because of acquired knowledge of such
studies that included why people would not use Bike Share. Nonetheless, finding out income
brackets, gender, and the frequency of people’s journeys are essential and should be included in
further analyses of implementing Bike Share systems. Most of all, larger sample sizes is vital to
gain accurate data that represents the entire population.
These results indicate that the San Jose survey participants are willing to pay about
double, triple, and quadruple the amount of the actual cost for daily, weekly, monthly and annual
passes correspondingly. San Jose Bike Share vendor can potentially increase its price to gain
more revenue to support educational programs for safety, distribute helmets, student discounts,
system maintenance, theft, infrastructure, vandalism, and potential liabilities.
The San Jose Bike Share program is mostly supported by a young population with an
elevated price for willingness to pay. It would be reasonable to place Bike Share stations near the
beginning and end of residential areas, local shops, transit corridors, schools, and work areas, but
not near public parking areas, bike rental and bike shops, skateboard shops, car dealerships, and
bike racks due to the fact that most people who would not use Bike Share would rather use
another mode of transportation or own a bike themselves. The Bay Area Air Quality
Management District, the Valley Transportation Authority, and the Metropolitan Transportation
Commission have all been looking at the City of Minneapolis/Saint Paul as an example to pursue
the non-profit sector to be the Bike Share vendor. Dossett, B., Munger, J., & Bono, K. (2008)
recommends non-profit organizations as vendors because the system they set in motion in
Minneapolis/ Saint Paul function at low costs due to the utilization of public subsidies, and
private in-kind sponsorships from local contractors and employees. Furthermore, the non-profit
sector is obliged to sell subscriptions and must please its customers in order to continue its
business. Assuming that the prices will reflect what other cities have done, the analyses of results
indicate that San Jose Bike Share may be a success because people are willing to pay more than
what may be put in place.

28
The results produced in this study suggest that San Jose urbanites are willing to pay high
costs for a Bike Share program. Therefore, San Jose’s Bike Share vendor may be able to afford
improvement costs of its own system while still maintaining a low cost and affordable program.
San Jose needs to actively support programs like Bike Share in order to take advantage of any
benefit such as its relatively level, flat land and its increasing demand in bicycle use. Addressing
the reduction of greenhouse gases, toxicity, and energy usage, and the promotion of a healthy
lifestyle through biking are essential in a low dense city like San Jose that is constituted as a car-
oriented place. The assumption that cheap oil will live forever has come to an end as global
petroleum reserves dwindle in a world that excessively demands it. Mitigation measures must
take place to reduce immense environmental impacts. Bike Share may be a promising foundation
of the transition from a car demanding society to one that relies on alternative transportation.

29
Figures
1. Envision 2040 San Jose and VTA Implementation Plan Bike Share
Bicycle…………………………………………………………………………………..Cover
2. Figure 1 VTA Implementation Plan Bike Share Bicycle ....…………………………….. 5
3. Figure 2 Study Design ……….. ……………………………………………………8
4. Figure 3 Regional Survey Map…………………..……………………………….. 8
5. Figure 4 Copy of Survey………………………………………………………….. 10
6. Figure 5 Sub-Regional Map of Diridon Station….……………………………….. 11
7. Figure 6 Sub-Regional Map of San Jose City Hall and San Jose State University..12
8. Figure 7 Price Scheme of other Bike Share Vendors………..……………………. 14
9. Figure 8 Bike Share: Age vs. Daily Pass……………………...……………………15
10. Figure 9 Bike Share: Age vs. Weekly Pass ………………………………………...16
11. Figure 10 Bike Share: Age vs. Monthly Pass……………………………………... 17
12. Figure 11 Bike Share: Age vs. Annual Pass………………………………………. 18
13. Figure 12 Bike Share Use……………………..…………………………………... 19
14. Table 1 Age and Willingness to Pay Averages……………………………………..20
15. Table 2 Number of Leisure Reasons to Use Bike Share…………………………....22
16. Figure 3 Number of Errands Reasons to Use Bike Share by Region.…………… …22
17. Table 4 Number of Reasons People Cannot Use Bike Share by Region …………...23
18. Table 5 Number of Reasons People Will Not Use Bike Share by Region .…………23
19. Table 6 Number of Reasons People Rather Not Use Bike Share by Region ….……23
20. Table 7Age by rows and Bike Share Use by Columns….…………………………..24
21. Table 8 Age by Region ……………………………………………………………..25
22. Table 9 Bike Share Use by Region………………………………………………….26

30
REFERENCES
"American Fact Finder ." U.S. Census Bureau.
http://factfinder2.census.gov/faces/nav/jsf/pages/index.xhtml (accessed December 11,
2011).
"Bay Area Air Pollution Summaries” Bay Area Air Quality Management District.
http://www.baaqmd.gov/~/media/Files/Communications%20and%20Outreach/Annual%
20Bay%20Area%20Air%20Quality%20Summaries/pollsum09.ashx (accessed September
9, 2011).
"Bike Plan 2020." City of San Jose Transportation
Department.
http://www.sanjoseca.gov/transportation/bikeped/supportFiles/bikeped/2010/BikePlan/Bi
ke_Plan_2020,_Complete_Document.pdf (accessed December 12, 2011).
Buehler, R. "Determinants of transport mode choice: a comparison of Germany and the USA."
Journal of Transport Geography 19 (2010), www.elsevier.com/locate/jtrangeo (accessed
September 9, 2011).
"Climate Change." Environmental Protection Agency.
http://www.epa.gov/climatechange/basicinfo.html#emissions (accessed September 9,
2011).
"Capital Bike Share." http://www.capitalbikeshare.com/ (accessed September 1st, 2011).
Cuenco, A. Valley Transportation Authority. (personal communication, September 1, 2011).
"Currently Designated Nonattainment Areas for all Criteria Pollutants Environmental
Protection
Agency. http://epa.gov/oaqps001/greenbk/ancl.html (accessed September 9, 2011).

31
DeMaio, P and J Gifford. "Will Smart Bikes Succeed as Public Transportation in the United
States?." Journal of Public Transportation 7 (2004): 1-15.
Dossett, B., Munger, J., & Bono, K. (2008). Non‐profit business plan for twin cities Bike Share
system. The City of Minneapolis Community Planning and Economic Development
Department, Public, 1-49.
"Draft Envision San Jose 2040 Goals, Policies, & Actions Circulation Section." City of San Jose
Planning Division.
http://www.sanjoseca.gov/planning/gp_update/documents/Transportation_Goals_and_Pol
icies_6-7-10TF_000.pdf (accessed December 12, 2011).
Freeman, D. (2010). Changing employee parking and eco pass policies at san josé state
university. 1-89.
"Data Tables." Environmental Protection Agency.
http://www.epa.gov/air/airtrends/aqtrnd99/pdfs/Appena.pdf (accessed September 9,
2011).
dell, L., Ibeas, A., & Moura, J. L. (2011). Implementing bike-sharing systems. Intitution of Civil
engineers, 164(ME2), 89-101.
Gerston, L. (2009). Confronting reality. (pp. 1-207). Dubuque: Kendall Hunt.
Gordon, R. "Bike-sharing project expected to begin next year." San Fracnsico Chronicle ,
October 27, 2010, Collections section, http://articles.sfgate.com/2010-10-
27/news/24223536_1_bike-sharing-car-sharing-programs-timothy-papandreou (accessed
September 1st, 2011).
"Hubway." http://www.thehubway.com/ (accessed September 1st, 2011).
Logan, Michael. “Coal Should Not Be The Energy Of The Future. EJ3010502207 ”
Opposing Viewpoints: Coal. Web. (2008).

32
Martens, K. (2007). Promoting bike-and-ride: the dutch experience. Transportation Research
Part A, 41, 326-338.
Nazelle, Audrey, M.J Nieuwenhuijsen and J.P Anton'. "Improving health through policies
that promote active travel: A review of evidence to support integrated health impact
assessment." Environment International 37 (2011), www.elsevi e r.com/locate/envint
(accessed September 9, 2011).
"Nice Ride MN." https://www.niceridemn.org/ (accessed September 1st, 2011).
Pucher, J, R Buehler and M Seinin. "Bicycling renaissance in North America? An update and re-
appraisal of cycling trends and policies." Transportation Research Part A 45 (2011),
sciencedirect.com (accessed September 9, 2011).
Wenzinger, P. Bay Area Air Quality Management District. (personal communication, September
16, 2011).
Snell, B. (n.d.). The streetcar conspiracy how general motors deliberately destroyed public
transit. Retrieved from
http://webcache.googleusercontent.com/search?q=cache:5gyumw8qPXMJ:www.lovearth
.net/gmdeliberatelydestroyed.htm+When+GM+buys+out+Los+Angeles+public+
transportation%3F&cd=2&hl=en&ct=clnk&gl=us&client=firefox-a
Streetfilms. “Cycling Copenhagen, Through North American Eyes.”
http://www.streetfilms.org/cycling-copenhagen-through-north-american-eyes/
(accessed August 5, 2011).
"Source Inventory of Bay Area Greenhouse Gas Emissions” Bay Area Air Quality Management
District.
http://www.baaqmd.gov/~/media/Files/Planning%20and%20Research/Emission%
20Inventory/regionalinventory2007_2_10.ashx (accessed September 9, 2011).
Titze, S., Stronegger, W. J., Janschitz, S., & Oja, P. (2008). Association of built-environment,

33
social-environment and personal factors with bicycling as a mode of transportation
among austrian city dwellers. Preventive Medicine, 47, 252-259.
Valley Transportation Authority, (2010). Bike Share Pilot Project Phase 1 Implementation Plan
Draft .
Zenobi, E. San Jose State University Associated Students: Transportation Solutions. (personal
communication, September, 1, 2011).