Embed Size (px)
Citation preview

Final
Fort Yukon, Chalkyitsik, & Venetie Biomass Boiler Feasibility Study
Greg Koontz, M.E. Bill Wall, PhD
1

Section 1 Executive Summary
1.1 Goals and Objectives 1.2 Project Scale 1.3 Resource Assumptions 1.4 Assessment Summary
1.4.1 Fort Yukon 1.4.2 Venetie 1.4.3 Chalkyitsik
1.5 Lessons Learned
Section 2 Wood Heating Systems, Distribution, and Building Integration
2.1 Wood Heating Systems 2.1.1 Stick-Fired Boilers
2.1.1.1 Sizing, Boiler Control, and Utilization Rate 2.1.1.2 End-user Issues 2.1.1.3 Material Handling 2.1.1.4 Emissions Controls/Efficiency 2.1.1.5 Maintenance 2.1.1.6 Siting Issues
2.1.2 Chip-Fired Boilers 2.1.2.1 Sizing, Boiler Control, and Utilization Rate 2.1.2.2 End-user Issues 2.1.2.3 Material Handling 2.1.2.4 Emissions Controls/Efficiency 2.1.2.5 Maintenance 2.1.2.6 Siting Issues
2.2 Distribution 2.3 Building Integration
Section 3 System Analysis
3.1 Limits 3.2 Methodology
3.2.1 Energy Savings 3.2.2 Cost Estimates
3.3 Fort Yukon 3.3.1 Buildings Included in Study 3.3.2 Single Building Plant Summary 3.3.3 District Heating Plants
3.3.3.1 Summary of Results 3.3.3.2 Building Integration
3.4 Venetie 3.5 Chalkyitsik
Section 4 Biomass Resource Evaluation
4.1 Forest Stewardship Plan 4.2 Sustainability 4.3 Harvest Costs
Section 5. Financial Metrics, Sensitivity Analysis
5.1 Financial Metrics 5.2 Sensitivity Analysis
2

Section 6. Generating Power with Biomass
6.1 Introduction
6.2 Organic Rankine Cycle 6.3 Stirling Engine 6.4 Steam Cycle 6.5 Gasification
Section 7. Village Demographics
7.1 Fort Yukon 7.2 Chalkyitsik 7.3 Venetie
3
Section 1: Executive Summary
1.0 Goals and Objectives:
1.1 Goals: The goal of this report is to develop a Level 2 feasibility study to determine maximum displacement of fuel oil for heat in commercial buildings in Fort Yukon, Chalkyitsik and Venetie. Data on current fuel usage, boiler types, building layouts, and building construction, and biomass availability and cost were collected from each of the villages to support the study.
1.2 Objective: 1) To determine the cost/savings and technical differences in the installation of stick fired Garn boilers with chip-fired Köb boilers at both single building installations and in district heating systems in Fort Yukon, Venetie and Chalkyitsik. 2) To determine if it is feasible to convert a village from primarily fuel oil for heating commercial buildings to wood energy in a way that economically, socially, and ecologically feasible.
1.3 Project Scale: All villages in the CATG area were contacted to determine immediate interest in developing a biomass energy project. Site visits under this study were made to Venetie, Chalkyitsik, Circle, Beaver and Fort Yukon to determine overall potential, economy of scale, local capacity and interest. Venetie, Chalkyitsik and Fort Yukon were selected to conduct a Level 2 feasibility analysis. Site visits with the selected engineer were conducted for site assessment and collection of fuel use data. Discussion of details for each village’s demography is developed in section 7.
Briefly, Fort Yukon is a hub village with population of approximately 600 people. Yukon Flats is an area of approximately 56,000 square miles, about the size of Iowa, with 1700 residents. The region is flat with a very wet topography and multiple rivers flowing into the primary drainage of the Yukon River. The territory is covered in Boreal Forest, brush and tundra wetlands. All access is via airplane to each of the villages. The villages on the main stem of the Yukon River have barge service to deliver diesel fuel; all other villages have to fly fuel in via airplane. A road services Circle and a small locally owned power barge delivers some cargo to Fort Yukon from Circle.
1.4 Resource Assumptions: All three of the villages in this study are surrounded by forest composed of Aspen, Black and White Spruce, Balsam Poplar, white spruce, and many species of willow. Multiple forest fires have burned in the region over the past 50 years. Fire is a threat to most of the villages and thinning is needed as a fuel mitigation strategy in and around the village. Harvest strategies are being developed to work in both summer and winter conditions. During summer, harvest equipment must be sized so it can be moved across the open water of rivers and harvests must be planned to stay on dry ground. During winter, harvest equipment must work in sub-zero weather, snow up to 3 feet and move across frozen wetlands and rivers. Most of the biomass will be hauled in winter. Concern exists by some whether chips systems are too complicated to be successful in rural Alaska off road conditions. A workshop will be held in summer of 2009 to discuss this issue in detail and to determine and address all the issues of concern.
A Forest Stewardship Plan was developed for Fort Yukon in July 2007 to determine if biomass harvest would be ecologically sustainable. Forest surveys were conducted in July 2008 in Venetie and Chalkyitsik to determine if forest conditions were similar to Fort Yukon. This study has determined that the maximum amount of wood chips needed for the largest district heating plant is approximately 2000 tons per year at 40% moisture. Combined with the amount needed for the clinic and the Vocational Education complex the total amount needed annually is 2500 tons. An estimated 400-500 cords of firewood could also be produced and sold for local consumption. This total approximately 3000 tons annually. The estimate of 18-25 tons per acre was used as an average tonnage with an annual growth for chip quality material being a ton per acre per year. So an annual harvest of 125 acres would be required on an annual basis. A conservative 60-
4

year rotation age is used for reforestation to chip quality materials. A total of 7200 acres is required to meet the heating needs of Fort Yukon. If biomass to electricity were installed, this number could easily double in size to 14,400 acres for a 60-year rotation. Gwitchyaa Zhee Corporation owns 214,500 acres of mixed forestlands and wetlands in the Yukon Flats Region. The ecosystem is a fire climax system that is constantly disturbed by forest fires ranging in size from vey small to as large as 80,000 acres. With a disturbance regime of this magnitude, a harvest disturbance of up to 50,000 acres annually would be considered as sustainable from both a supply and ecological standpoint.
Both Venetie and Chalkyitsik have similar types of forest in the same ecosystem. Their annual requirements for heat are 403 and 618 tons per year respectively. Ecological sustainability is not an issue for any of the villages in Yukon Flats.
A very conservative harvest cost model has been developed specifically for Fort Yukon. In most places where a road system and a forest management infrastructure exist, costs of $40-60 per ton are expected. In Fort Yukon, a harvest system must be developed which can work in summer and winter conditions with essentially no roads. Discussions are still underway with a workshop planned for summer of 2009 to discuss all the issues of harvesting and handling chips in remote villages. A cost of $175 per green ton was used in our modeling in this feasibility study. That is 3 times the cost usually considered. Expected moisture content is approximately 40%, but it is hoped that a harvest system can be developed which will allow chips to season for at least 6 months prior to chipping and delivery. We fully expect that once the issues are worked out that the real price will be much less than the current conservative projection.
1.5 Assessment Summary: Each of the three villages Fort Yukon, Venetie, and Chalkyitsik had three assessments conducted; commercial building stick-fire analysis, commercial building chip-fired analysis, a district heating chip-fired assessment. The comparison was made on cost benefit measured in amount of fuel displaced, net simple savings and a technical analysis to determine which type of boiler system makes the most sense as infrastructure. Key issues are discussed.
1.5.1 Fort Yukon: Ten buildings in Fort Yukon were evaluated for energy savings potential and cost. In addition, one small district heating plant was included in this group; this is a small cul-de-sac of 12 homes adjacent the north end of the runway. This small plant is capable of being served by a stick-fired boiler (the others are too large, based on the criteria in Section 2). Key results for stick-fired boilers were as follows: • Stick-fired boilers Net Simple Payback ranged from 3.0 to 9.0 years with an average
of 5 years for all installations at individual buildings; • The largest installation at the School and Gym would require 3 boilers with up to 4
burns per day on coldest days; • To displace 90% of the 151,617 gallons of fuel oil used in 10 buildings would require
installation of 16 boilers at 9 different locations; • Net Simple Savings at $7.00/gallon was estimated at $747,755 on $3.7 million dollars
at 4.9 years; • Since stick-fired boilers are hand fed and ignited, on the coldest days of the year the
16 boilers would require 36 separate firings at 9 different locations during a 24 hour period to keep up with heat load demand;
Key results for chip-fired boilers: • Net Simple Payback was calculated for small chip-fired boilers to be installed at
individual buildings with Net Simple Paybacks ranging from 3.3 to 21 years with an average of 7.5 across all buildings; This was done only as a comparison to
5
the stick-fired boilers as the intent is actually to calculate the potential for district heating;
• Net Simple Payback for the two stand alone chip-fired systems were at the CATG Clinic and Vocational Education Building and were 4.5 and 5.8 years respectively;
• Net Simple Payback for the six district heating scenarios ranged from 6.34 to 7.11 years with the largest displacing approximately 120,000 gallons at nine buildings with an annual cost savings of $511,578 on a $3.26 million project;
• The best chip-fired scenario installs 4 chip-fired boilers at 3 locations and displaces 151,218 gallons with annual fuel savings of $623,480.
Conclusions Fort Yukon: Fort Yukon is a hub village with a population of approximately 600 people. The capacity exists within the village to operate a biomass harvesting system to deliver the required amount of biomass to displace 90 percent of the fuel oil used to heat commercial buildings. The amount of cost savings generated in a vertically structured heat utility company would provide the needed local incentives to support such a company and provide good jobs. The largest chip fired district heating system pays back in 6.5 years even at $175 per green ton of chips delivered.
Chip fired systems are more complicated with more moving parts than stick fired boilers. However, a true economy of scale for wood harvest, delivery and boiler operations is not feasible with only a few stick-fired boilers at a few locations. Operating 16 boilers at 9 different locations and firing them a total of 36 times during the coldest times is not a workable business model, even if it does theoretically payback in 2 less years; if the boilers are fed at -40 to -60. Thus the real choice is whether to put in a few small systems that can pay back quickly or invest in a new local sustainable economy, which can help grow local capacity.
1.5.2 Venetie: Three buildings in Venetie were evaluated, the school, school housing, and the washeteria. The evaluation compared stick-fired boiler at individual buildings and as a 3 building system to chip-fired boilers at individual buildings and as a 3 building system. Economies of scale demonstrate that in both scenarios the 3 building system makes the most sense. The stick-fired boiler pays back in 5.9 years and the chip-fired boiler pays back in 5.8 years, so nearly no difference. The stick-fired system would use about 290 cords annually to displace 33,390 gallons of fuel and the chip system would use 403 green tons to displace approximately 27,000 gallons. The tradeoff between the two systems is that the stick-fired boilers will have to be fired more than 4 times per day on the coldest days which if staggered would require almost constant firing. The chip-fired system requires a small chipper to produce and handle 403 tons of chips annually. If a small systematic approach to producing chips can be developed then this may be the best scenario. However, more complexity at a small scale is an issue and must be decided with significant local input.
1.5.3 Chalkyitsik: Two different building complexes were evaluated, the schools, school housing, and water treatment plant as on complex and the second was the community center/washeteria and tribal office as the second. The evaluation compared the each as a system and as individual buildings. Each scenario works best as two systems rather than as individual buildings. Similar results were gained as with the Venetie analysis but would result in two different installations of either chip fired or stick fired boilers. Payback on the school complex is 5.2 years with 3 stick fired boilers with 4 burns per day on coldest days and 4.8 years with a single chip fired system. These would burn either 285 cords of round wood or 398 green tons of chips. The village center system pays back in 3.2 years with 2 stick-fired boilers and 6.3 years for a small chip fired system. These would use either 157 cords
6

of round wood or 220 green tons of chips. Chip systems are more complex and at this scale a decision must be made locally based on local capacity as to which system would work bets.
Section 2: Wood Heating Systems, Distribution, and Building Integration.
2.1 Wood Heating Systems
2.1.1 Stick-fired Boilers. As the name implies, stick-fired boilers burn round or split wood in relatively straight pieces. The wood is minimally processed, being selected for a range of diameters and trimmed only for length. If the diameter of the wood is too large, the wood may be split. These minimal processing results in relatively low unit costs for the wood. However, it also means that much of the available biomass cannot be used. Wood that is too large or too small, or smaller tops and limbs that are bent and/or tangled, or which contain needles are more difficult to handle. The wood is generally air-dried, not mechanically dried.
The stick-fired boilers used as the basis of evaluation for this study are the following models manufactured by Garn. Garn is owned by Dectra Corporation, located in St Anthony, Minnesota. A number of Garn Boilers are already installed in Alaska. Figure 2.1 is summary of the models that were included in this study.
figure 2.1, Garn Boiler characteristics
Note that a Garn boiler can also burn clean construction waste, slab wood, and densified wood products (briquettes, etc). However, neither construction waste nor slab wood was considered to be a reliable resource at the sites considered, and one of the primary reasons to consider a stick-fired boiler was minimize the processing required for the fuel.
2.1.1.1 Sizing, Boiler Control, and Utilization Rate. A primary feature of the Garn boiler is the built-in thermal storage. Physically, this is a large hot water tank that surrounds the combustion chamber. Functionally, the tank decouples the burn rate of the boiler from the actual heat load requirements. In essence, the process of combustion heats the tank and the tank serves the load (through pumps and a piping system), but not at the same rate. This is shown in figure 2.1 above. In the WHS 3200, for instance, the process of combustion generates up to 950 KBTU/h. The storage tank can hold 2,064 KBTU. So, if the “burn” lasts a little over two hours, it will completely charge the tank. If the heating load is 500 KBTU/h, however, it will take a little over four hours to deplete the tank – thus the rate of combustion is decoupled from the heat load by the storage tank.
This decoupling effect eliminates the need for sophisticated combustion controls that would allow the boiler to track the load; that is, to match the burn rate to the load. The boiler is manually fed, and manual started. This results in a very simple boiler, which holds down first cost. The primary control function of the Garn is combustion control – simply ensuring that the combustion air is controlled such that the wood burns hot and clean.
The decoupling effect also means that sizing is less of an issue than it is with a chip-fired boiler (see 2.1.2.1 below). If more capacity is needed to meet load, the operator can
7

simply conduct more “burns” per day. When less capacity is needed, fewer burns are performed.
There are limits to this, of course. An operator would not want to have to feed the boiler once every three hours round the clock, especially in the -60 deg F temperatures that can occur in the interior of Alaska. In this study, the assumption was that if more than 4 burns per day were required to meet peak heating load, another boiler would be added to the installation. Four burns per day implies a minimum of six hours between burns. Adding another boiler increases the time between burns, but it adds significant cost as well.
In addition, the number of stick-fired boilers per installation was limited to three. Beyond this limit, it was felt, the installations got too large and too expensive. Because of the thermal storage, the boilers are quite large, and they require at a minimum a covered roof and flat slab floor; ideally they would be completely enclosed. Equally important, the utilization rate of the equipment drops as the number of boilers increases. If one boiler is adequate in “warm” weather, two required for “cool” weather, and all three for “cold” weather, then the overall utilization rate of the plant is probably no more than about one half (50 percent). Installing equipment in the interior of Alaska is expensive; the higher the utilization rate, the more cost-effective the installation.
In the summer, heat loss from the tank may become a significant factor. The seasonal range of heating loads in the interior of Alaska is the highest in the country. The heat load at -60 deg F is 20 times higher (or more) than the load at 80 deg F (when the load is probably only domestic hot water). So a burn that only lasts six hours at peak theoretically lasts 120 hours in the summer. Obviously, in 120 hours, more heat is going to be lost through the tank insulation than is going to be actually used. It might therefore be more practical to run the existing oil-fired boilers when the load drops too low. However, for the purposes of this study, although insulation losses were accounted for, it was assumed that the Garn boilers met 100 percent of the load – no oil was used, even in summer.
2.1.1.2 End-user Issues. All of the facilities included in this study already exist, thus any installation of a wood-fired boiler would by necessity be a retrofit to an existing heating system. The intent is that the boilers be installed in such a way as to be transparent to the end-user. That is, the occupants cannot tell whether the heat is coming from the existing oil-fired equipment or from the proposed wood-fired equipment. Moreover, the mechanical heating system must operate the same way regardless of heat source; switching from one source to the other must be as simple as opening and closing valves. Finally, the systems will be installed in such a way that a failure of a wood-fired boiler automatically starts the oil-fired back-up, and ideally, notifies the operator of the failure.
The Garn boilers do have one major limitation in terms of end-user transparency; they cannot control the hot water supply throughout the burn cycle. When a burn finishes, the storage tank is at design temperature (200 deg F is the design temperature for Garn). However, as the hot water is pumped through the heating system, it gives up heat to the space. As a result, when it gets back to the tank it is colder than when it left – the difference between supply and return temperature, called the delta T (or change in T) depends on the type of heating equipment (air handling unit, baseboard heat, radiator, etc) and the heating load.
The cooler return water immediately begins to dilute the 200 deg F water, cooling it. Once the burn is done, no more heat is being added to the tank, but heat is continuously being removed to heat the space – thus the tank temperature falls throughout the tank’s “draw-down” cycle. Garn considers the tank to be “depleted” when it reaches 120 deg F. The basis of the heat storage capacities listed in figure 2.1 is the assumption that the
8

tank is heated to 200 deg F, and then heat is extracted until it reaches 120 deg F, at which time, another burn is initiated.
However, in a retrofit situation, 120 deg F hot water may not be suitable. Many hot water heating systems are designed to use hot water at 180 deg F or more when at peak load. For instance, the heating coil in an air handling unit may have been sized to provide the required peak heating output using 180 deg F supply water (180 deg F is a very common coil temperature). In such a case, with the heating load at or near peak, the Garn boiler will be able to meet load as long as the storage tank temperature equals or exceeds 180 deg F, but as it falls below that value, the air handling unit may no longer be able to meet the load. By the time the supply temperature falls to 120 deg F, the air-handling unit will be operating significantly below design capacity.
In load conditions less than peak, air handling units can try to compensate for dropping supply temperatures by increasing the hot water flow rate. However, some heating systems do not have such automatic compensation. For these types of systems, the varying supply temperature may also present problems for the end-user. For example, some hot water radiators or baseboard-heating units are locally controlled – the user manually opens and closes a valve at the unit to control space temperature. Obviously, a supply temperature that varies from 200 deg F to 120 deg F several times a day presents a challenge to anyone trying to control space temperature manually. Below about 140 deg F, a true radiator (which is different than a baseboard heater, although they look superficially the same) will not even work – there is not enough difference between the room temperature and the radiator surface temperature for the radiant effect to work efficiently.
The point is that in a retrofit situation, the effective storage capacity may be less than the specified capacity, and thus the time between burns may be shorter than desired.
As an example, if an air handling unit requires 180 deg F supply water at peak load (i.e., there was no spare capacity in the coil at peak load), then in effect the storage capacity of the Garn boiler would be reduced by 3/4: 1 - [(200 – 180) / (200 – 120)] = 0.75. The WHS 3200 that has been used as an example above would have a storage capacity of only 516 kBTU, rather than 2,064 kBTU. At the same time, the time between burns would also be cut to 1/4 of the calculated time, although each “burn” would be much shorter, since the burn only had to raise the temperature of the tank by 20 deg F (see 2.1.1.3 below).
Practically speaking, most heating systems use hot water in the 140 deg F – 200 deg F range. Only radiant floor systems typically use hot water as low as 120 deg F. Thus, in almost all cases, the storage capacity of the Garn units would be de-rated. This study (at this level of depth) did not de-rate capacity of the Garn for two reasons: 1) there was not sufficient time to survey all the existing equipment, and related drawings and specs, to determine the design supply temperatures, and 2) In all cases, at load conditions not at or close to peak, 120 deg F water may suffice – thus the number of hours per year when the de-rate must be applied may be quite small (however, this is when the weather is coldest, and the most labor is required to maintain the fuel supply and burn rate). It was therefore assumed that the specified storage capacity could be used in full; in reality, this is unlikely to be true in all cases.
2.1.1.3 Material Handling. As noted above, the Garn boilers are manually fed. For each burn, the operator must clean out any ash remaining from the previous burn, load the combustion chamber with new stick-wood, and manually start the fire. Once the fire is lit, the chamber door is shut, and the fire burns until all the fuel is consumed.
9

However, as noted above, it would take a little over two hours of burn to fully heat the storage tank (using the WS 3200 as an example again). A single load of wood will not burn for two hours, meaning that each burn must consist of more than one load of wood. In addition, during that time that the burn is taking place, heat is being extracted from tank to meet the heating load. So although a “burn” is treated as a single event in this study, it is important to note that at or near peak load, a burn could take as long as three hours to complete, and require two to three “reloads” of the combustion chamber. (A complete burn is defined herein as burning enough fuel to raise the storage tank from 120 deg F to 200 deg F, even as heat is being extracted from the tank for ongoing heating.) Thus although the number of burns is limited to no more than four a day, this could still imply roughly 12 hours a day of loading and cleaning the combustion chamber.
As with any stick-fired appliance, the fuel should be kept dry, and should be located close to the point of use. Therefore, any building or structure constructed to house the boiler should have sufficient space to stack cord wood. The amount of wood to be stored within the building (as opposed to in a wood yard) depends on the site conditions. In harsh conditions, it may be desirable to store several day’s worth of cord wood (at peak load consumption rate) in the boiler building, in case weather keeps the operator from being able to re-stock the building from the wood yard. On the other hand, in all cases the existing oil-fired system is assumed to be left in place as back-up, so this may limit how much wood the operator chooses to store in the boiler building.
Regardless of how much wood is stored in the boiler building, considerable manual labor would be required to get the sticks from the wood yard to the building; labor to load, unload, and stack the wood. Because no equipment is required (except transporting the wood), the material handling, though labor intensive, is not subject to equipment breakdowns.
There are a number of options for discarding the ash. It is likely the ash would be collected in a small bin or dumpster, and emptied only as this gets full.
2.1.1.4 Emissions Controls/Efficiency. The Garn boilers have no active emissions controls. The boiler uses an induced draft (ID) fan to ensure that enough air is present to provide complete combustion. This alone helps eliminate or mitigate many emissions. It prevents the formation of carbon monoxide (CO), which forms as a result of incomplete combustion. It minimizes smoke and particulates, by burning clean and hot thus leaving very little behind but incombustible ash.
Using more air than is strictly necessary simplifies the control, and makes for a clean burn, but it also reduces efficiency. Excess air cools the boiler down as it enters, and requires excess heat to bring it up to combustion temperature.
The Garn does provide good transfer from the stack gas to the hot water storage tank. The stack gas essentially passes through the tank five times (a five-pass heat exchanger); see 2.1.1.5 below. There are four horizontal passes and one vertical pass. Overall, the efficiency of the Garn is quite good – in excess of 80 percent of the heat content of the wood is transferred into the tank.
2.1.1.5 Maintenance. There is very little maintenance required on a Garn boiler, and in fact, there is not much that an operator could do. Figure 2.2 below shows a cross section of a Garn boiler. The wood is burned in the primary combustion chamber, “E”. In the secondary combustion chamber, “F”, only gases are burned. As long is the ash is removed from “E” before each burn, there is not much to maintain. The ID fan (“H”) must be repaired or replaced if it fails.
10

Figure 2.2 also shows the “tubes” that transfer heat to the storage tank. The tubes (from the end of “F” through the end of “I”, must be cleaned; if not, then any scaling or fouling of the tubes is not removed, and these will gradually erode the efficiency of the boiler (or even cause the tubes to fail). Running a wire brush through them can generally clean the tubes. The frequency of cleaning depends in part on how clean the wood is; clean forest wood should have no inclusions, while scrap and construction debris often do. If these inclusions (adhesives, preservatives, etc) do not burn completely, they often plate out on the tubes, degrading performance.
Between cleanings, efficiency will slowly degrade as deposits accumulate, until the next cleaning.
figure 2.2, cross section through a Garn boiler
2.1.1.6 Siting Issues. As noted above, the Garn boilers are quite large as a consequence of the storage tank. The WHS 3200, the largest Garn boiler considered in this study, is 14’ – 3” long, 7’ -2” wide, and 7’ – 9” high. Each unit (full of water) weighs 34,500 lb. The largest Garn plant considered in this study included three WHS 3200 units. Not including interior wood storage (but including clearance around each unit), this would require a minimum of 678 square feet (20’ – 3” long by 33’ – 6” wide) with an average floor loading of 153 lb/sf. This floor loading will likely require a relatively thick reinforced concrete slab to prevent differential settlement.
Assuming that the storage tank is not de-rated, and the minimum time between burns is 6 hours, this plant could produce 1,032,000 BTU/h.
2.1.2 Chip-fired Boilers. These boilers burn chipped up biomass, which can come from virtually any size of tree, or any part of the tree, although there are limits on the amount of needles. The fuel is more highly processed than stick fuel in order to achieve uniform chip size, and thus more expensive on a unit basis. Where practical and cost effective, the fuel is mechanically dried, although it need not be (and was not assumed to be dried for this study). Generally it is only cost-effective to dry the chips if they need to be transported significant distances – drying reduces weight as the water is driven off. The flip side of the higher cost of processing is that a much higher fraction of the available
11

biomass can generally be used in a chip-fired boiler; this is important in an area where biomass yields are low.
The basis of calculations for the chip-fired boilers evaluated are the Pyrot and Pyrtec lines, manufactured by Köb of Austria. The North American office of Köb is located in Vancouver, BC, Canada. Köb was chosen for this study because: A) it comes in a wide range of sizes (see figure 2.3, below), 2) because the line has many useful features and has proven to be very reliable, and 3) because they have recently gotten the required ASME and UL certification for these two lines, which means they can now be installed in the US. Figure 2.3 below shows the characteristics of the two lines included in the study.
figure 2.3, Köb Boiler characteristics
2.1.2.1 Sizing, Boiler Control, and Utilization Rate. Chip-fired boilers are fed mechanically; as long as the fuel bin is kept loaded, and the feed mechanism maintained, a boiler will continue to operate until an operator shuts it down. The firing rate can be matched to the load, within limits. The Köb boilers can generally turn down 3:1 – that is, the minimal firing rate is 1/3 of the maximum rate. Although thermal storage can be used with a chip-fired boiler, it is not integral to the boiler, and in this study, no thermal storage was assumed. Thus the firing rate of the boiler is not decoupled from the load, and must modulate (within the 3:1 range) output to meet load. When it cannot meet load on the low end, it must shut down; on the high end, it needs supplemental heat from a back-up source.
As noted above, a high utilization rate is critical to creating a cost-effective installation. At the same time, the firing range of the boiler is limited by the 3:1 turndown ratio. For these reasons, sizing a chip-fired boiler is critical. Space heating loads peak in the winter, and tail off to little or nothing in the summer (if domestic hot water is generated using the boilers, the summer load increases slightly); thus the boiler sizing is a compromise.
The intent is to keep the boiler on as many hours as possible per year, thus displacing the maximum amount of oil. For that reason, the boiler is generally sized below the peak-heating load. Even so, the summer load is generally too small to fit within the 3:1 turndown. For that reason, supplemental heat from existing oil-fired boilers is generally needed in winter (to meet peak loads) and in summer (to meet the very small loads). A good measure of the effectiveness of the boiler sizing is what fraction of the annual oil use it would displace. Figure 2.4 below shows some examples of the effect of boiler sizing on utilization rate.
12
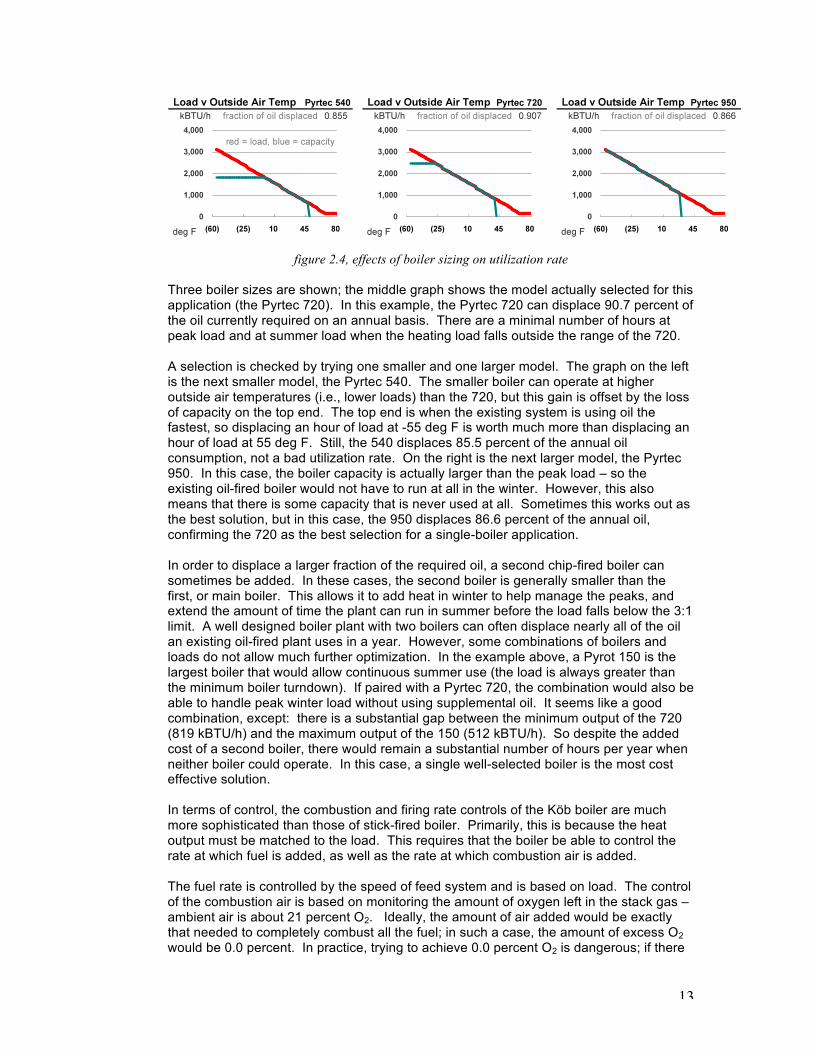
figure 2.4, effects of boiler sizing on utilization rate
Three boiler sizes are shown; the middle graph shows the model actually selected for this application (the Pyrtec 720). In this example, the Pyrtec 720 can displace 90.7 percent of the oil currently required on an annual basis. There are a minimal number of hours at peak load and at summer load when the heating load falls outside the range of the 720.
A selection is checked by trying one smaller and one larger model. The graph on the left is the next smaller model, the Pyrtec 540. The smaller boiler can operate at higher outside air temperatures (i.e., lower loads) than the 720, but this gain is offset by the loss of capacity on the top end. The top end is when the existing system is using oil the fastest, so displacing an hour of load at -55 deg F is worth much more than displacing an hour of load at 55 deg F. Still, the 540 displaces 85.5 percent of the annual oil consumption, not a bad utilization rate. On the right is the next larger model, the Pyrtec 950. In this case, the boiler capacity is actually larger than the peak load – so the existing oil-fired boiler would not have to run at all in the winter. However, this also means that there is some capacity that is never used at all. Sometimes this works out as the best solution, but in this case, the 950 displaces 86.6 percent of the annual oil, confirming the 720 as the best selection for a single-boiler application.
In order to displace a larger fraction of the required oil, a second chip-fired boiler can sometimes be added. In these cases, the second boiler is generally smaller than the first, or main boiler. This allows it to add heat in winter to help manage the peaks, and extend the amount of time the plant can run in summer before the load falls below the 3:1 limit. A well designed boiler plant with two boilers can often displace nearly all of the oil an existing oil-fired plant uses in a year. However, some combinations of boilers and loads do not allow much further optimization. In the example above, a Pyrot 150 is the largest boiler that would allow continuous summer use (the load is always greater than the minimum boiler turndown). If paired with a Pyrtec 720, the combination would also be able to handle peak winter load without using supplemental oil. It seems like a good combination, except: there is a substantial gap between the minimum output of the 720 (819 kBTU/h) and the maximum output of the 150 (512 kBTU/h). So despite the added cost of a second boiler, there would remain a substantial number of hours per year when neither boiler could operate. In this case, a single well-selected boiler is the most cost effective solution.
In terms of control, the combustion and firing rate controls of the Köb boiler are much more sophisticated than those of stick-fired boiler. Primarily, this is because the heat output must be matched to the load. This requires that the boiler be able to control the rate at which fuel is added, as well as the rate at which combustion air is added.
The fuel rate is controlled by the speed of feed system and is based on load. The control of the combustion air is based on monitoring the amount of oxygen left in the stack gas – ambient air is about 21 percent O2. Ideally, the amount of air added would be exactly that needed to completely combust all the fuel; in such a case, the amount of excess O2 would be 0.0 percent. In practice, trying to achieve 0.0 percent O2 is dangerous; if there
13

is too little air, the result is incomplete combustion, which generates carbon monoxide (CO), and may even cause explosions when sufficient air eventually reaches the fuel. So for each point in the load curve, the boiler controls have a corresponding excess O2 value they control to (in the 4.0 to 10.0 percent range). Minimizing the amount of excess air (measured by excess O2) ensures that efficiency is kept as high as possible.
Combining an auto-start feature with the controls noted above means that the boiler plant can be started remotely (by a signal from a control system, for instance), and will then continue to run and meet load until A) the fuel runs out, or 2) the load falls below the minimum turndown of the boiler.
2.1.2.2 End-user Issues. As with the stick-fired boilers, the chip-fired boilers must be installed in such a way as to be transparent to the end-user and the mechanical system. In addition to starting the oil-fired back-up in the event of a boiler failure, the chip-fired boiler must also be able to start the oil-fired back-up when: A) load exceeds the maximum capacity of the chip-fired boiler, or B) load falls below the minimum output of the chip-fired boiler.
With regard to the end-user heating systems in the buildings, the Köb boilers are completely transparent; they can produce hot water at any constant temperature up to 210 deg F. Further, they can automatically reset the supply temperature as load decreases. An air-handling unit that requires 200 deg F water in winter may be able to meet load with 140 deg F water in spring and fall. Using the boiler controls, the hot water supply temperature can be reset based on outside air temperature, or any other parameter that can be measured. This is important because the lower the supply temperature, the more efficient the boiler.
2.1.2.3 Material Handling. A boiler that is intended to run for long periods with no supervision is dependent on its material handling systems. Fuel must be introduced into the boiler automatically, and the ashes removed. Köb can provide the systems needed to fuel and de-ash the boilers, but the trade-off for this automation is additional maintenance, and more potential failure points.
In order to make chip-fired boilers feasible in the interior of Alaska, it will be important to minimize the length of the material handling “chain”, as well as the number of moving parts. Ideally, a single auger would pull fuel out of a fuel bin, which would be manually filled periodically (manual here implies a person running a front loader or similar machine). The chips would slide by gravity to the auger inlet, minimizing failure points. In practice, the feed process can be fully automated, but this is not feasible on the scale of boiler plants considered in this study, and it presents too many potential points of failure.
The design of the material handling systems will be key to successful implementation of chip-fired boilers. Figure 2.5 below shows some of the material handling elements. On the right of the picture is the fuel inlet – the chips must be augured to this point; from here the boiler modulates the flow into the boiler. On the left is the de-ashing auger. This automatically removes ashes from the boiler and deposits them in the bin shown.
14

figure 2.5, Köb Pyrot boiler
2.1.2.4 Emissions Controls/Efficiency. As noted above, the Köb boiler controls the combustion airflow to minimize excess air. As with the Garn, this provides complete combustion, which helps to minimize both CO and particulate. In addition, however, the Köb can be installed with flue gas recirculation (FGR). By injecting a fraction of the flue gas back into the combustion chamber, the combustion temperature is lowered, reducing the formation of oxides of nitrogen. Commonly labeled as NOx, these oxides are major air pollutant, and they contribute to acid rain. Finally, a cyclone can be installed to mitigate particulates. A cyclone, as the name implies, causes the stack gas to spin as it enters the unit. This throws the solids (the particulates) to the sides of the unit, where they fall to the bottom of the unit. The gas exits up the center of the unit, and out the flue to the atmosphere.
Combustion efficiency is a function of the difference between the temperature of combustion air entering the boiler and the stack gas leaving the boiler – the cooler the stack gas is, the more efficient the boiler. This difference in temperature is itself a function of how hot the hot water return temperature is (the cooler the better, as noted above), and the efficiency of the heat transfer from stack gas to hot water (how clean the tubes are).
The Köb boiler addresses both of these issues. Using the boiler controls intelligently, the hot water supply temperature can be automatically reset down as load decreases. In addition, the Köb can be equipped with soot-blowers. These are nozzles that direct high-pressure compressed air onto the tubes at regular intervals to keep them clean. The material blown off the tubes is removed by the de-ashing system. Using soot blowers does require a small air compressor, but it more than pays for itself by keeping boiler efficiency high. Figure 2.6 below shows the soot-blower array on a Köb Pyrtec boiler.
15

figure 2.6, Köb Pyrtec boiler
The soot blowers are the twelve black nozzles on the front of the boiler. On the left is the fuel in-feed system. Note that in the Köb boilers, the tubes are all straight – they run from front to back. This makes them easier to manually clean than the bent tubes in the Garn. However, with the soot blowers in place, the tubes would only need to be manually brushed out every three months or so.
As result of good design, good control, and automatic tube cleaning, the efficiency of the Köb boilers approaches 90 percent.
2.1.2.5 Maintenance. There are obviously quite a few more moving parts on the Köb boilers. However, these boilers have been in service for many years in Europe. They are designed to start up at the end of summer, and to run continuously until the next summer. Most maintenance is performed once a year, generally during the summer downtime. The only cleaning that is expected to occur more often that once a year is the brushing out of the tubes.
The only Köb boiler currently installed in the US is in Oregon; it has been running for a little over a year at the time of this report. The operator reports that he looks in at the boiler once a day, and that he brushes out the tubes every two to three months.
A key will be minimizing the complexity of the material (fuel) handling systems; these typically require more maintenance than the boilers. This material handling will be evaluated site-to-site for the best solution.
2.1.2.6 Siting Issues. Because the chip-fired boilers do not incorporate an integral storage tank, they are much smaller than the stick-fired units. The boilers in the Köb Pyrot line can be pre-packaged into a shipping container. The package contains the boiler, pumps, a heat exchanger, the ash removal bin, and the compressor for the soot blowers. The interior is completely pre-wired, pre-piped, and all controls are in place. The only site requirement is a slab to sit on, with supply and return pipes, power and control wiring available to hook into. Figure 2.7 below shows a Köb boiler installed in shipping container.
16

figure 2.7, a Köb boiler installed in OR
The Pyrtec series boilers are too tall for a standard shipping container, but there may be options for pre-packaging these boilers as well. Being able to in essence build the boiler plant in a fabrication shop rather than in the field in the interior of Alaska will lower costs, reduce construction time, and result in a better quality product.
In addition to the advantage of being able to pre-package chip-fired boilers, they have a much higher energy density than the stick-fired boilers. In 2.1.1.6 above, it was noted that it required a 678 sq.ft. building to house a stick-fired plant that could produce just over 1 million BTU/h in heat output. The largest Köb boiler, the Pyrtec 1250, produces 4.3 million BTU/h. The boiler itself is 14’ – 4’ long and 5’ – 3” wide. The building required to enclose the boiler and its support equipment would be about 20’ – 0” long by 15’ – 0” wide (300 sq.ft.); that is over four times the BTU output in less than half the space required for the stick-fired boiler plant.
In both cases, however, the fuel storage is an issue. It should be covered, and in the case of wood chips, it would be ideal if a truck could dump into a covered bin with a floor that sloped to the auger inlet. This will require more extensive construction than a flat covered space suitable for stacking cordwood. For either type of boiler, fuel storage will require considerable thought, and will need to be adapted to the specific site conditions.
2.2 Distribution. The existing oil-fired boiler plants are located within buildings; the proposed wood-fired boilers would be located outside the existing building’s shell. Thus the heat must be piped to the location within each building from which it can be distributed to the end-users (see 2.3 below).
In almost all cases, it is assumed that some below-grade piping will be required to get from the boiler to the existing building. Ideally, the piping would enter the building directly into the existing mechanical room. However, piping within a building is significantly cheaper than buried piping, so the buried piping may be routed as directly as possible to the building, and if need be, piped within the building to get to the mechanical room. Once in the mechanical room, the piping will be tied into the existing hot water supply and return lines that feed the existing boilers (2.3 below).
Installing exterior piping above ground is also significantly cheaper than installing buried pipe. However, leaving piping exposed to -60 deg F ambient conditions is not an option;
17

the heat loss from the piping would be enormous. The only option for running pipe above ground, therefore, is to construct an utilidor (a small, enclosed “tunnel” just large enough for the piping and insulation). Utilidors have a removable lid, for access to the piping, and can be constructed of wood or metal. Utilidors can also be buried in the ground, which is more expensive, but provides more protection from low temperature. In this report, all utilidors are assumed to be on grade, and all piping below grade is assumed to be direct buried (in contact with the ground).
Above-ground utilidors are currently utilized in both Venetie and Chalkyitsik. They are supported at intervals by wooden blocks or some other support; these supports rest directly on grade. This is a relatively inexpensive way to run pipe, and it allows for significant insulation (both the pipe and the utilidor walls can be insulated) – as noted above, an above-grade utilidor will be exposed to -60 deg F temperatures. However, there are significant and obvious issues with running a utilidor above grade. An above-ground utilidor is an eyesore, an obstruction and a trip hazard. In addition, it cannot be run across a road, unless the road is raised over the utilidor much like a speed bump. The utilidor would need to be designed for the weight of vehicles (standard construction would not support a vehicle). Figure 2.8 below shows a utilidor in Venetie (the rectangular metal structure in the foreground).
figure 2.8, a piping utilidor
Nevertheless, above-grade utilidors may be appropriate in many smaller applications. For larger district heating plants, however, all piping was assumed to be below grade.
The standard type of below-grade piping in the interior of Alaska is arctic pipe. This is a rigid double wall, pre-insulated system, shown in figure 2.9 below.
figure 2.9, arctic pipe
18

The carrier (inner) pipe is steel, and must be welded; the connection points are left clear to allow the weld to be made, and insulated after. The outer wall is spiral wound metal, and rigid insulation is sandwiched in between. Because it is pre-insulated, it is difficult to cut the pipe in the field to adapt to site conditions. As a result, the system must be designed very tightly before fabrication, and each pipe length and fitting placed very exactly. Because the system is rigid, it is not installed in the frost heave zone above the permafrost. At the same time, no matter how well insulated, it cannot be installed in the permafrost zone, because it would eventually melt the permafrost. Therefore, it is generally installed below the permafrost – in Ft Yukon, for example, this means 15 – 20 feet deep.
Properly installed, arctic pipe provides a piping system with a very long service life, and very high insulation values (low heat loss). However, it is very expensive. The required depth of bury requires specialized equipment, and in most cases, outside contractors.
The intent of this study is to provide cost effective biomass-fired heat (and perhaps power) to native villages. Part of that concept is that much of the required labor can be done using village labor, with equipment already at hand. This implies that the piping will be installed in the frost heave zone above the permafrost, which dictates that the piping must be flexible.
The piping system used as a basis of calculations in this study is the Insulpex system by Rehau. The flexible PEX (cross-linked polyethylene) piping is contained within an outer pipe, with flexible insulation between. The outer pipe is corrugated. The system allows for a single carrier pipe or a double carrier pipe (supply and return) within the outer casing (see figure 2.10 below)
figure 2.10, flexible pre-insulated PEX piping with two carrier pipes
This system has limitations; the largest carrier pipe size is 4”, meaning that for large flow rates, two sets of pipes may be required. The insulation value is less than that of arctic pipe, meaning that more heat is lost to the ground.
At the same time, the flexible piping has several potential advantages. The pipe comes in long rolls, ranging from 130 ft to 1,220 ft long (the smaller the pipe diameter, the longer the roll). This allows for very long runs of pipe with no required connections. When needed, connections are made with standard metal fittings developed specifically for the PEX product. No welding is required. As a result, both labor and material costs are significantly lower for installed flexible pipe versus arctic pipe.
The PEX piping will be installed in a trench (see figure 2.11 below) excavated using relatively simple machinery, available in most villages. Figure 2.11 does not show it, but an impervious cloth layer will be laid over the top of the piping, extending 1-2 feet either side of the pipe, to provide extra resistance to vertical heaving. In addition, the piping
19

can be laid in the trench in a serpentine fashion, ensuring that there is slack to allow for frost heaving without undue strain on the pipe.
figure 2.11, installation detail for PEX piping
This detail been discussed conceptually with several civil engineers with many years of experience installing pipe in Alaska, and none have expressed concern that it would not work. Although the heat loss will be greater than would be experienced with arctic pipe, the two main advantages are believed to more than outweigh the heat loss: 1) the PEX installation is much less expensive, and 2) the installation can be done using village labor, with equipment commonly found in the villages.
2.3 Building Integration. Once in the building mechanical room, the new hot water piping will be tied into the existing hot water supply and return lines that feed the existing boilers. Typically, four 2-position, 2-way automatic isolation valves will be installed in the piping, as shown in figures 2.13, 14, and 15 below. The position of these valves will determine whether the heat comes from the oil-fired boiler, the wood fired boiler, or both. The existing pumps will continue to serve the building-heating load.
The valves that control the origin of the heat will be controlled by the existing building controls where they exist, or by a small-dedicated control panel if needed. If this proves too costly for very small installations, the switchover can always be done with manual valves, but this relies on an operator being present.
Figure 2.12 below shows a typical installation for two oil-fired boilers. In this scenario, each boiler is sized for 100 percent of the load; the boilers are manually alternated so that they get roughly equal run time. In all cases (figures 2.12, 13, 14, and 15), light solid lines indicate existing equipment and piping, dark solid lines depict new equipment and piping, and light dashed lines show the water flow through the system. For convenience, it is assumed in all cases that Oil Fired Boiler – 1 is the active boiler, and boiler 2 would be isolated using the associated manual isolation valve. HWS is hot water supply to the building; HWR is hot water return from the building.
20

figure 2.12, oil-fired heating plant
As noted in Section 2.1 above, the proposed systems must be installed such that the source of heat is transparent to the end-user, and the switchover from oil to wood should be fully automatic if possible.
The sequence of operations that controls the heat source can be fully or partly automated. If automated it would perform approximately as below. For this example, the following is assumed: > The capacity of the oil-fired boiler is 1,000 kBTU/h each. > The wood-fired boiler has a maximum capacity of 900 kBTU/h, and a minimum
capacity of 900 / 3 = 300 kBTU/h. > The actual heating load varies from 100 kBTU/h in the summer to 1,000 kBTU/h
(peak winter load). > Both boilers are designed to heat the water 20 deg F at peak (160 deg F return, 180
deg F supply set point).
Figure 2.13 shows the initial configuration of the combined oil and wood fired plant, with the oil-fired boiler operating:
21

figure 2.13, combined oil and wood fired plant, firing on oil
A. In summer, with minimal load, the oil-fired boiler fires as needed to maintain hot water supply temperature at 180 deg F. Valve 1 is open, valves 2, 3, and 4 are closed. The control system monitors the hot water return (HWR) temperature. 1. The difference between supply and return temperature is proportional to load. At
peak load, the boiler generates a 20 deg F delta T; at 1/10th of peak load, the delta T would be 2.0 deg F.
2. When the difference between the supply and return reaches a set value, the changeover to the wood-fired boiler plant will be initiated. When the delta T reaches 6 deg F, for instance, the heating load is approximately 1,000 kBTU/h * 6 deg F / 20 deg F = 300 kBTU/h (the minimum capacity of the wood-fired boiler).
3. However, the operator does not want to start up the wood fired boiler only to have it cycle off due to low load. So to be safe, the control system would operate approximately as follows: a. If delta T exceeds 6.5 deg F, start a timer. This timer will continue to run
until: 1) It reaches 48 hours, or 2) The delta T falls below 6.0 deg F.
b. If the timer reaches 48 hours, initiate the switchover to wood-fired heat. c. If the delta T falls below 6.0 deg F before the 48 hour mark is reached, reset
the timer to zero. Timer remains at zero until the delta T reaches 6.5 deg F again.
B. Once the switchover is initiated, the wood-fired boiler starts up. Once it heats its own small boiler loop (not shown) to 180 deg F, valve 1 closes, and valves 2 and 3 open. This is shown in figure 2.14 below. The building pump(s) continue to run as normal. The oil-fired boiler is shut down.
figure 2.14, combined oil and wood fired plant, firing on wood
1. The wood fired boiler modulates its firing rate to maintain hot water supply temperature at 180 deg F.
2. The oil fired boiler remains off until one of three events occurs: a. The wood-fired boiler sends a signal to the building controls that it has failed.
In this case, the valves reverse their positions, and the oil-fired boiler is started.
22

b. The wood fired boiler cycles off on low load, or the delta T drops below 6.0 deg F. In this case, the valves reverse their positions and the oil-fired boiler is started.
c. The supply temperature drops below setpoint by 2.5 deg F (177.5 deg F) and stays there for 5 minutes, or it drops 5 deg F or more below setpoint (175 deg F or lower), whichever occurs first. As with the switchover sequence, when the supply temperature drops below setpoint by 2.5 deg F, a timer is started. If the hot water supply temperature remains 2.5 deg F or more below setpoint for five continuous minutes (or it drops more than 5 deg F below setpoint for any amount of time), that is an indication the heating load has exceeded the capacity of the boiler. 1) In this case, the valves move into a configuration that puts the two
boilers in series (see figure 2.15 below). By definition, if the load exceeds the capacity of the wood-fired boiler, it cannot generate the full delta T required. Valves 2 and 4 open, and valves 1 and 3 are closed.
2) The cool return water is routed to the wood-fired boiler first. The boiler will try to maintain supply setpoint (but cannot, because load exceeds capacity), and so will run at full fire. The supply water leaving the wood-fired boiler will be less than 180 deg F. This water then enters the oil-fired boiler (i.e., they are in series). The oil fired boiler will add whatever heat is needed to raise the water to setpoint (180 deg F).
3) By putting the boilers in series, with the wood-fired boiler first in line, it assures that the wood-fired unit runs at full capacity, and the oil-fired boiler adds only the additional peak heat needed – this maximizes the amount of oil displaced.
3. When the hot water coming from the wood-fired boiler reaches 180 deg F (load is dropping), and stays at or above 180 deg F for five minutes, the oil fired boiler will be stopped, and the valves will reconfigure for wood-fired heat only.
figure 2.15, combined oil and wood fired plant, firing on wood and oil in series
Section 3: System Analysis
3.1 Limits. As with any performance evaluations, the quality and validity of the outputs and subsequent conclusions depends on (and are limited by) the quality of the inputs and the
23

methodology. Methodology is discussed in Section 3.2 below. The input data gathered for used in the analyses performed as a part of this study include:
> Building specific data > Heating plant equipment data > Annual oil consumption, by building > Annualized weather data (bin data) > Site observations > Interviews with operating personnel > Interviews and meetings with Village and Corporation personnel > Village maps and plans > Interviews with Civil Engineers, contractors, and consultants with significant
experience in the interior of Alaska > Pricing data from boiler manufacturers, piping suppliers and other AK vendors > Performance data from Garn and Köb
What was not performed a part of this analysis was detailed measurements of loads and existing equipment performance. A building heating load profile is central to predicting annual fuel consumption (see 3.2 below). Ideally, this would be generated by directly measuring heating load throughout the year. At the same time, the actual operating efficiency of the existing boilers and distribution system would be measured. This would provide a highly detailed profile of heating load and the energy required to meet that load, for any condition throughout the year.
In practical terms, however, the required measurements are difficult to perform, and not cost-effective. The equipment needed to make these measurements is not present at any of the installations in the villages, and would have to be flown in and installed. The measurements would need to continue from winter to summer, to generate a complete load profile. The resulting incremental increase in the accuracy of the load profile cannot justify that level of cost. As Section 3.2 explains, even without the measurements, the data that were collected limit the load profiles to within a narrow range of values.
3.2 Methodology.
3.2.1 Energy Savings. The performance of the existing and proposed heating systems was modeled using a spreadsheet; the type of model used is known as a “bin model”. In this case, the bins are ranges of outside air temperatures (OATs). Temperature bins are used because heating load is very closely correlated to OAT. Each “bin” of OAT is 2 deg F wide – for instance, 40 – 42 deg F is a bin, with the midpoint temperature of 41 deg F. For each OAT bin, the heating load profile assigns a heating load to that bin. Bins are arranged in columns down left side of the page, the ensuing calculations then proceed from left to right. Figure 3.1 below shows a portion of a bin calculation used in this study.
figure 3.1, partial bin model
In the left column, figure 3.1 shows four temperature bins; from 36/38 to 30/32 deg F. The next column is the midpoint temperature of the bin. The next column is how many hours per year the OAT is expected to fall within each bin. This three columns constitute
24

the bin data; the temperature range, midpoint, and number of hours per year that the OAT falls into each bin. The bin data represents long term average weather data – it is not specific to any year. It is therefore very useful when trying to predict performance over long periods of time. The data shows, for example, that on average, in the Fort Yukon area, there are 175 hours per year when the OAT is between 30 and 32 deg F.
The next two columns (space heat and DHW – in gal/hr) represent the load profile in this case. As noted above, the load profile is central to the analysis. Often the load profile represents the actual space heating and domestic hot water (DHW) heating load in BTU/h. However, in this case the variable that is best documented is the oil consumption. In Section 3.1, it was stated that the load profile can estimated to within a tight range of values. The load profile is limited in two ways by the available data; the oil consumption predicted by the model must be very close to the known annual consumption, and the peak load cannot exceed the capacity of the boiler (if it did, the spaces would get cold near peak load, and the operating personnel would have reported that).
Additional key load profile assumptions: > Space heating load varies linearly with OAT (a 10 deg F drop in OAT results in
twice the increase in load that a 5 deg F drop causes) > The DHW load is constant – this is not true (in fact, DHW load is more a function
of time of day), but since these OAT temperatures can occur at any time of day, and the DHW load is very small compared to the space heating load, this simplifying assumption is considered justified.
> There is an OAT at which space heating stops – the OAT combined with the internal loads in the building (people, lights, equipment) are such that no additional heat is required; beyond this temperature, the only load is DHW.
With these assumptions, and the limits placed on the load by the equipment capacity (peak load) and annual consumption, a profile can be constructed that results in the predicted oil consumption matching the known consumption to within 2-3 percent. An example is shown in figure 3.2 below; this is the combined load profile for the Ft Yukon School and Gym buildings.
figure 3.2, Ft Yukon School/Gym load profile
In this profile, it is assumed that above 65 deg F OAT, no further space heating takes place; the only oil being consumed is basically heating DHW. The load profile peaks at 9.12 gal/hr at -55 deg F OAT. The predicted annual consumption using this load profile is 30,002 gal/yr; versus the reported annual consumption is 30,000 gal/yr.
25
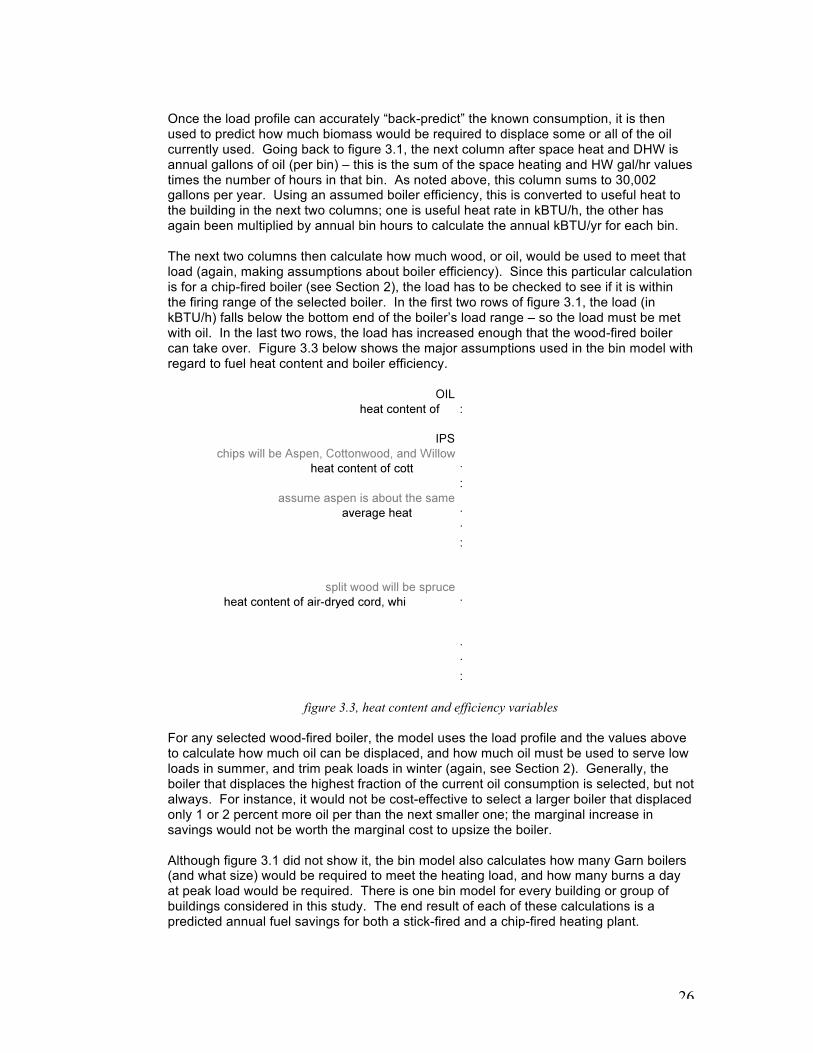
Once the load profile can accurately “back-predict” the known consumption, it is then used to predict how much biomass would be required to displace some or all of the oil currently used. Going back to figure 3.1, the next column after space heat and DHW is annual gallons of oil (per bin) – this is the sum of the space heating and HW gal/hr values times the number of hours in that bin. As noted above, this column sums to 30,002 gallons per year. Using an assumed boiler efficiency, this is converted to useful heat to the building in the next two columns; one is useful heat rate in kBTU/h, the other has again been multiplied by annual bin hours to calculate the annual kBTU/yr for each bin.
The next two columns then calculate how much wood, or oil, would be used to meet that load (again, making assumptions about boiler efficiency). Since this particular calculation is for a chip-fired boiler (see Section 2), the load has to be checked to see if it is within the firing range of the selected boiler. In the first two rows of figure 3.1, the load (in kBTU/h) falls below the bottom end of the boiler’s load range – so the load must be met with oil. In the last two rows, the load has increased enough that the wood-fired boiler can take over. Figure 3.3 below shows the major assumptions used in the bin model with regard to fuel heat content and boiler efficiency.
figure 3.3, heat content and efficiency variables
For any selected wood-fired boiler, the model uses the load profile and the values above to calculate how much oil can be displaced, and how much oil must be used to serve low loads in summer, and trim peak loads in winter (again, see Section 2). Generally, the boiler that displaces the highest fraction of the current oil consumption is selected, but not always. For instance, it would not be cost-effective to select a larger boiler that displaced only 1 or 2 percent more oil per than the next smaller one; the marginal increase in savings would not be worth the marginal cost to upsize the boiler.
Although figure 3.1 did not show it, the bin model also calculates how many Garn boilers (and what size) would be required to meet the heating load, and how many burns a day at peak load would be required. There is one bin model for every building or group of buildings considered in this study. The end result of each of these calculations is a predicted annual fuel savings for both a stick-fired and a chip-fired heating plant.
26

For single-building applications, it is assumed that the existing building hot water pumps are used for both the oil and wood-fired boilers, so there is no net change in electrical energy. For district heating plants, however, the plant must have pumps to distribute the heat. The calculated energy use of these pumps is counted as a new cost (a negative savings).
3.2.2 Cost Estimates. The other component required to calculate the payback of any given scenario is the cost. In an investment grade study, actual contractor’s estimates (or even better, bids) are used. For this study, engineering estimates were used. Pricing data for all major pieces of equipment were obtained from the manufacturers. Cost estimates are broken up into hard costs and soft costs. Hard costs are subcontractor costs – what one would expect to see if the projects were put out to bid. The soft costs are design, construction administration, contingency, etc, and general contractor mark-up.
Soft costs are calculated as a percentage of hard costs, and do not include any sales tax that might be applicable. The soft costs for a district heating plant were slightly higher than those for a single building, reflecting the greater complexity.
Figures 3.4 and 3.5 below show the soft costs used in this study, as a percent of hard costs.
figure 3.4, soft costs for single building installations
figure 3.5, soft costs for district heating plants
For the building-by-building analyses, the estimates include material costs for the boilers and material handling systems, installation costs on site, a building or enclosure to house the installation, the costs of shipping the equipment, and the piping and wiring required to make a complete and working system.
The estimates for district heating plants are more detailed, it particular the costs of the required distribution piping are detailed out, based on village maps. The piping is assumed to be the InsulPex systems, direct buried in the frost heave layer as detailed in Section 2.
27

3.3 Fort Yukon. Ten buildings in Fort Yukon were evaluated for energy savings potential and cost. In addition, one small district heating plant was included in this group; this is a small cul-de-sac of 12 homes adjacent the north end of the runway. Unlike the larger district heating plants below, this small plant is capable of being served by a stick-fired boiler (the others are too large, based on the criteria in Section 2).
3.3.1 Buildings Included in the Study. Figure 3.6 below provides a summary of the Fort Yukon buildings included in this study, and the characteristics of the building heat loads.
figure 3.6, Fort Yukon buildings included in study
3.3.2. Single-building Plant Summary. In Sections 1 and 2 above, it is indicated that stick-wood is cheaper than wood chips on a BTU basis, and that the stick-fired Garn boilers are less expensive than the chip-fired Köb boilers. So it is no surprise that for smaller installations, a stick-fire boiler is indicated.
This study placed a limit of four burns per day for the Garn boilers, so as the building size (and heating load) increases, there reaches a point at which two or even three Garn boilers are required to maintain the limit of no more than four burns per day. At this point, the chip-fired boilers begin to become the more economical solution, because a single Köb boiler can be used in place of three Garn boilers.
In addition, in Section 2 it noted that the “energy density” of the Köb boilers is over eight times as high as that of the Garn boilers (energy density here means the number of BTUs of boiler output per square foot of required boiler plant building). As a result, even when the payback for a stick-fired plant is better than that of a chip-fired plant, there may not be physical space for multiple Garn boilers on the site.
Figure 3.7 compares the net simple payback of stick-fired boilers vs chip fired boilers for the eleven applications listed in figure 3.6. Figures 3.8 and 3.9 break out the details of each type of plant.
28

figure 3.7, simple financial summary for Fort Yukon facilities
In all cases except the combined School/Gym (the largest consumer of oil), the stick-fired option has a lower net simple payback. The details in Figure 3.8 indicate why that facility fares better with a chip-fired boiler.
figure 3.8, summary of stick-fired plants (Fort Yukon) Figure 3.8 shows that the combined School/Gym is the only facility that requires three Garn boilers to maintain the limit of no more than 4 burns per day at peak – and even with three Garn boilers, it still would require 3.9 burns per day at peak load. Despite the greater savings achieved with the Garn boilers (see figure 3.9 below), the cost of buying three boilers means that, despite the very good NSP of 3.8 years, the NSP for the chip-fired boiler is lower still. In addition, figure 3.8 shows that the School/Gym plant basically represents the upper limit on building/load size for the stick-fired plants. Above about 30,000 gallons per year of oil consumption, a stick-fired plant would require more than three boilers, or more than 4.0 burns per day (the limits set for this study). This basically rules out the stick-fired boilers for any large-scale village heating plant. Note that many of the estimated costs are the same for a plant with the same number of boilers. This is because at this level of study, the site piping and building integration costs were assumed to be the same for all buildings.
29

Figure 3.9 shows basically the same data for the Köb boilers.
figure 3.9, summary of chip-fired plants (Fort Yukon)
The data in Figure 3.9 show why the stick-fired plants generally provide a better NSP for single buildings. In the six of the eleven applications, the selected boiler is the Pyrot 100; the smallest commercial boiler Köb makes. Even then, as the final column shows, in most cases the Pyrot 100 is significantly oversized. This is reflected in the low values for fraction of oil displaced (e.g., the School District Office at 11.6 percent); the boilers simply can not run very hours per year because they are too large for the actual load. When the selected boilers are the Pyrot 150 or 220, the utilization rate (measured by fraction of oil displaced) is much higher – as high as 96.3 percent in the case of the Pump house. It was noted above that the School/Gym, at 30,000 gallons per year of oil, represented the practical upper limit for a stick-fired heating plant. Note when using a chip-fired boiler for the same application, a single boiler is required; further, it is the third smallest boiler in the Köb line. The largest Köb, the Pyrtec 1250 has a little over five times as much capacity as the Pyrot 220. Because a single boiler can replace three, the NSP for the chip-fired plant is better than that of the stick-fired plant (3.4 years vs 3.8 years).
3.3.3. District Heating Plants. Many of the single-building plants above have very good paybacks. However, they are not flexible in terms of possible expansion, and they impose a large labor burden on the village. Eleven individual plants, most or all manually stoked and cleaned 24 hours a day represents a very large input of labor. The Garn boilers have the (cost) advantage of simplicity, but it also means that the boiler controls are not sophisticated enough to tell an operator when the boiler needs to be loaded or cleaned. Juggling eleven plants with different burn rates would in essence almost require eleven separate sets of operators (a single operator cannot keep the boiler going 24 hours per day). Finally, in most cases, adding another building to an existing system would require a new boiler – most of the boilers above are sized such that spare capacity is minimal.
From a business point of view, it can make more sense to serve buildings that are physically close with a single plant, a single wood yard, and distributed piping – a district heating plant. For smaller buildings that are physically remote, the stick-fired option may
30

represent the best value for money, if the issue of stoking and cleaning out the boilers can be resolved.
Three District Heating (DH) Plants were evaluated, a Small Plant, an Intermediate Plant and a Large Plant. All three were sited behind the existing School/Gym. Not only does there appear to be sufficient space, and an existing building that could serve as fuel storage, but also this locates the plant closest to the largest single load – the School/Gym. From a piping standpoint, this makes sense because once the largest load is served, the piping can get smaller (and successively smaller as each load is served. It is also about in the center of the area served, meaning that the only a very small length of pipe needs to be sized to carry the entire load – once it splits into two branches (and serves the school), the piping requirements are much reduced.
Regardless of pipe size, piping costs are significant, although this is primarily a result of the cost of digging and backfilling a trench rather than the cost of the actual pipe. For that reason, the paybacks for the district plants are higher than those of many of the single-building plants. Unlike a series of single building plants, however, a chip-fired plant requires only one, or at most two boilers. The boilers are fueled, cleaned, and de-ashed automatically, and are capable of notifying an operator when they fail. Thus a crew of two to four people could operate a plant that feeds multiple buildings.
It is thought that the village might provide the labor to install the piping as an “in-kind” contribution to the project (required by some grants) – this would of course have a significant beneficial impact on the project financials. At this point, however, the cost estimates reflect all material and labor being paid for at current rates.
3.3.3.1 Summary of Results. Figure 3.10 shows which buildings are included in the three plants. The Small Plant includes the buildings in closest proximity (note that the DH plants include the State Building across the street from the School and the school shop, neither of which were included in the single-building plant analysis). Each successive plant extends the piping further out from the plant.
figure 3.10, list of buildings in proposed District Heating Plants (Fort Yukon)
In the Summary that follows (Figure 3.11), there are two scenarios for each plant. The first, always labeled “A” is a single boiler DH scenario. The second scenario, labeled “B”, adds a second, smaller boiler to the DH Plant. The smaller boiler extends the time that the plant can run in the summer without shutting down due to low load and also provides
31

extra capacity at or near peak loads to prevent the need for additional heat from oil-fired boilers. In Section 2, it was noted that for some combinations of boiler capacity and load, adding a second boiler does not result in more economical plant. This can be seen in figure 3.11.
figure 3.11, financial and performance summary for District Heating Plants (Fort Yukon) As the summary shows, adding a second boiler results is a more cost effective project in two of the three Plants (Intermediate and Large), but not for the Small plant. This summary also points out an additional aspect of district heating vs single-building plants – larger heat losses due to the extended piping system. Total system losses are estimated at between five and seven percent of the output. Despite the fact that many of the single-building plants have better paybacks, the District Heating Plant may represent a better investment for the village. Piping has been sized to allow for additional loads (buildings) to be added to the system in the future. Although adding load to the plant may change the operating profile, it does not require adding additional equipment. It is already assumed that at peak loads, additional heat may be required from the existing oil-fired boilers in the various buildings, so adding load to the plant may simply mean that the associated oil-fired boilers run more hours per year. Or, the plant could simply start out as a single boiler District Heating Plant (option “A”), and add the second boiler when load is added. Finally, a District Heating Plant has the capacity to serve individual houses, if an economical business model can be found to accommodate this. Because of the high cost of the connection to the system, the model commonly used by natural gas utilities may be a good model. The homeowner signs a multi-year contract, with a minimum yearly purchase amount. The “utility” then hooks up the client for free, and recovers the cost over the term of the contract by adding a small amount to each bill. This type of contract avoids the need for an initial high capital outlay by the homeowner.
3.3.3.2 Building Integration. The integration of a separate wood fired boiler with existing oil-fired boilers was discussed in detail in Section 2, and detailed in figures 2.13, 14, and 15. In the case of a District Heating Plant, the installation would be similar, but with one major difference. Each facility hooked in the Plant would be supplied with a flat plate heat
32

exchanger. A heat exchanger (see figure 3.12 below) has no moving parts, it simply transfers heat from one pumped system to another.
figure 3.12, a flat plate heat exchanger
Heat transfer depends on large amounts of surface area; the flat plate exchanger uses multiple metal plates sandwiched together to provide the surface area. At the same time, a heat exchanger keeps the two water streams physically separate. As figure 3.12 shows, the frame allows for the addition of as many plates are required for the application (this exchanger is only about half-full).
Each building has a design hot water supply temperature, which is based on the heating equipment installed. The DH Plant hot water must be higher than the highest of the building supply temperatures – this drives the heat from the DH loop to the building loops through the heat exchanger. In figure 3.12 above, the hot water supply from the DH Plant might enter the exchanger at top right pipe connection, and exit bottom right. On the other side, heating return water from building loop would enter bottom left, and the building hot water supply would exit top left. As the building loop heats up, the DH loop cools down, and is then returned to the DH Plant to be reheated.
In a District Heating scenario, the heat exchanger performs several functions: > It provides a distinct and recognizable separation between the DH system and
the building systems. By contract, the heat exchangers would belong to one party; assume here that they belong to the individual building owners. In this case, everything on the DH side up to the point of connection to the exchanger belongs to the DH Plant (piping, valves, etc), and they maintain it, and replace it as needed. The exchanger itself, and everything on the building side of the exchanger belong to the buildings. They in turn maintain that equipment, and replace it as needed. This separation of ownership eliminates the potential for conflict when repairs or replacement are needed.
> It provides a physical separation between the two streams of water. The water in the piping systems must be treated; with glycol to prevent freezing, and with chemicals to inhibit corrosion. With a physical separation in place, if either party neglects the chemical treatment, it affects only their own equipment. Likewise, a leak in one system does not affect the other.
> To the building owner, the heat exchanger performs exactly like a remote boiler would. In Section 2, the integration of a wood-fired boiler into an existing oil-fired mechanical room was detailed. In a District Heating scenario, the heat exchanger takes the place of the wood-fired boiler. Figure 3.13 below is a variation on figure 2.14, with a heat exchanger rather than a remote boiler.
In figure 3.13, the heat exchanger (HX) takes the place of the boiler from Section 2. As in Section 2, light lines indicated existing equipment and piping, while dark lines indicated new. In addition, the dashed heavy lines are the District Heating supply and return lines.
33

In the single-building boiler scenario, the wood-fired boiler modulates the boiler firing rate to control the building supply temperature; in this case, the control valve on the DH return line performs that function. By controlling the flow of DH water to the HX, it modulates the building supply temperature.
figure 3.13, building integration using a flat plate heat exchanger
3.4 Venetie. In addition to Fort Yukon, two other villages in the Yukon Flats area were evaluated for potential biomass applications as a part of this study; Venetie and Chalkyitsik (see 3.5 below for Chalkyitsik). In terms of applying wood-fired boilers to these villages, the same equipment, methods and methodology were applied to these villages as to Fort Yukon.
However, due to the smaller size, no District Heating Plants were evaluated in Venetie. However, as in the Fort Yukon analysis, the definition of a “District Heating Plant” is one that is too large to be served by a stick-fired plant, using the limits defined in Section 2. Three buildings were evaluated in Venetie, and in addition, a single plant serving all three was included. Because this plant could (nominally) be served by a stick-fired plant, it is counted as a single-building plant.
The three Venetie buildings included were the School, the School Housing, and the Washeteria. Figures 3.14 and 3.15 below summarize the performance the stick-fired and chip fired plants (respectively) considered.
figure 3.14, summary of results (Venetie), stick-fired boiler plants
34

Figure 3.14 shows that technically, the Combined Plant does not meet the requirements for a single-building plant – the three Garn boilers would require 4.1 burns per day at peak load. Since each “burn” can require two to three actual loads of wood, this could mean as many as 12 loads of wood burned per day, more or less equally spaced through the day. However, to avoid losing all heat, the three boilers would probably be staggered in their burns; in essence, at peak this plant would require constant loading all day. This would be a very labor-intensive plant in the winter. Figure 3.15 shows a summary of results for chip-fired boilers serving the same loads.
figure 3.15, summary of results(Venetie), chip-fired boiler plants
The Washeteria and School Housing buildings show very poor paybacks. This is because the building heat loads are so small, that even the smallest Köb boiler is too large – there are too many hours per year when the load is too small for the boiler to run. For the two scenarios where the selected Köb boiler is not too big, the paybacks are essentially equal to those of stick-fired plants – each varies by only 1/10th of a year between the two. At this level of evaluation, that is a tie. The relative strengths of the Garn and Köb boilers (and associated plants) are discussed in detail in Section 2. What figures 3.14 and 15 do show is that there is potential for implementing biomass-fired boilers in Venetie, and the resulting savings and payback would be significant.
3.5 Chalkyitsik. In Chalkyitsik, four separate buildings were evaluated for potential biomass
heating plants, as well as two “combined” plants.
The buildings included were in two clusters, and one of them (the Village Office), was too small to be considered for a single-boiler plant, even using a Garn boiler. It was therefore combined with the Community Center. The summary of results is in figure 3.16 below:
35

figure 3.16, summary of results(Chalkyitsik), stick-fired boiler plants
As noted, the Village Office was considered too small for a single-building plant; as the payback for the School Housing shows (9.6 years), practically speaking, it is too small also. Since the plant cannot get smaller than one boiler, the minimum cost is fixed; at the same time the savings are relatively small due to the small size of the building, thus the payback goes up. The remaining buildings (the School, the Water Treatment Plant, and the Community Center) and the combined plants all show paybacks of six year or less. As with Venetie, however, short payback periods come at the cost of a high burns rate (i.e., high utilization rate), and the resulting high labor requirements that are associated with a high burn rate.
The combined plant, consisting of the School, Water Treatment and the School Housing, shows a very good payback of 5.2 years. The other combined plant, the Community Center and the Village Office, also shows a good payback of 6.2 years. The two combined plants cannot be further combined, because they are physically located quite far apart.
Figure 3.17 below shows a summary of the same facilities, served with chip-fired boilers. Again, the smaller buildings are simply too small for even the smallest Köb boiler, as evidenced by the high payback periods.
figure 3.17, summary of results(Chalkyitsik), chip-fired boiler plants
The only clear advantage for the chip-fired boilers, based on simple payback alone, is the larger combined plant; 4.8 years vs 5.2 years. The second combined plant is a virtual tie between the two technologies, and while the chip-fired performance on the School is good, the payback for the stick-fired plant is better. Again, these summaries do not account for the labor required to feed the stick-fired plant. On the other hand, this labor requirement has to also be balanced against the simplicity of the Garn boiler and the fact that there is almost nothing to fail on the Garn units.
As in Venetie, there is a potential to implement biomass-fired heating plants in Chalkyitsik with significant savings and paybacks.
Section 4: Biomass Resource
4.1 Forest Stewardship Plan: A Forest Stewardship Plan was completed in July 2007. The plan was developed to support a potential biomass to energy program and discussed most of the issues and costs of harvesting wood, both round wood and chips. This document can be made available with permission from Gwitchyaa Zhee Corporation. Only a brief overview will be discussed in this document.
4.2 Sustainable Supply: This study has determined that the maximum amount of wood chips needed for the largest district heating plant is approximately 2000 tons per year at 40% moisture.
36

Combined with the amount needed for the clinic and the Vocational Education complex the total amount needed annually is 2500 tons. An estimated 400-500 cords of firewood could also be produced and sold for local consumption. This total approximately 3000 tons annually. The estimate of 18-25 tons per acre was used as an average tonnage with an annual growth for chip quality material being a ton per acre per year. So an annual harvest of 125 acres would be required on an annual basis. A conservative 60-year rotation age is used for reforestation to chip quality materials. A total of 7200 acres is required to meet the heating needs of Fort Yukon. If biomass to electricity were installed, this number could easily double in size to 14,400 acres for a 60-year rotation. Gwitchyaa Zhee Corporation owns 214,500 acres of mixed forestlands and wetlands in the Yukon Flats Region. The ecosystem is a fire climax system that is constantly disturbed by forest fires ranging in size from vey small to as large as 80,000 acres. With a disturbance regime of this magnitude, harvest disturbance of up to 50,000 acres annually would be considered as sustainable from both a supply and ecological standpoint.
Both Venetie and Chalkyitsik have similar types of forest in the same ecosystem. Their annual requirements for heat are 403 and 618 tons per year respectively. Ecological sustainability is not an issue for any of the villages in Yukon Flats.
4.3 Harvest Costs: A very conservative harvest cost model has been developed specifically for Fort Yukon. In most places where a road system and a forest management infrastructure exist, costs of $40-60 per ton are expected. In Fort Yukon, a harvest system must be developed which can work in summer and winter conditions with essentially no roads. Discussions are still underway with a workshop planned for summer of 2009 to discuss all the issues of harvesting and handling chips in remote villages. A cost of $175 per ton was used in our modeling in this feasibility study. That is 3 times the amount usually used. We fully expect that once the issues are worked out that the real price will be much less than the current conservative projection.
Section 5: Financial Metrics, Sensitivity Analysis
5.1 Financial Metrics. There are any numbers of financial metrics that can be employed to evaluate a project. Many of these require that the source and means of financing the project be known. Many require knowing the expected interest rate that money could be borrowed at, and even the rate of return the client would expect to achieve if they invested the capital elsewhere (not in the project).
In the case of projects in the villages of Fort Yukon, Venetie, and Chalkyitsik, much of this information is not known at this time. The exact funding mechanisms are not known. The in-kind participation of the village, if any, is not defined, and therefore the value of it cannot yet be determined. Finally, forward-looking interest rates are not very predictable at this point in time.
At the same time, this study is not an investment grade study. As such, it does not seem justified to make assumptions about all of the relevant financial variables. For all these reasons, this study has used a single financial metric to evaluate each potential heating plant – both as a stand-alone investment and as a way to compare different technologies and combinations of buildings.
Net simple payback (NSP) as used herein is defined simply as the implementation cost of the project divided by the annual energy savings. Year one savings are specified; it is assumed that resource rates will change year to year (or faster).
All financial summaries used in this study use NSP as the sole financial metric for evaluating each option. There are number of factors which do not factor into the NSP as defined herein; perhaps the two most relevant here are the labor cost and the maintenance cost.
37

It is not known how the plants would be manned. The chip-fired boilers require very little labor. The fuel bin must be filled, the ashbin emptied, and in the event a failure, the material handling elements must be fixed. In a district-heating scenario, two to four people could operate a plant that supplied 10 buildings or more.
The stick-fired boilers, on the other hand, require up to 12 loads of wood per day, manually fed, at peak load. However, in such cold weather, the operator(s) may choose to simply feed the boiler during the day, and let the oil-fired boilers take over at night.
This kind of variation in amount of labor that would actually be applied to each plant makes estimating labor costs difficult at best. In addition, there is the question of what the labor would cost. An organization might simply assign someone already employed in the building to load the boiler(s) and count the cost as zero. They might equally well hire an outside contractor. If a District Heating Plant is installed, that would in likelihood imply the existence of a company specially formed to implement and operate the plant.
Similarly, judging the maintenance costs of the boiler plants in the harsh climate of the interior of Alaska presents an issue. The Garn boilers are very simple, with not much to break. The Köb boilers, originally built in Austria, are deployed throughout Europe, including Scandinavia – an area with harsh winter climates as well. Nevertheless, they have more moving parts to maintain, and possibly fail.
Labor and maintenance costs are annual, and thus deduct directly from the energy savings (lengthening the NSP). The point being made above is simply that the range of possible values for annual labor and maintenance costs is so wide that they should not be used to make financial decisions as a part of this study. Instead, as the project is developed in each village, the decisions on boiler technology and plant size should go hand-in-hand with discussions of how the boilers will be operated and maintained so that the true cost can be determined prior to making the investment.
5.2 Sensitivity Analysis. A sensitivity analysis is performed to determine the effect on project financial metrics of changes in the underlying assumptions. In 5.1 above, it was noted that the sole financial metric used in this report is net simple payback. NSP has only two inputs, first cost and annual energy savings.
Energy savings in turn depend on the cost of oil (which is being displaced), and the cost of the wood in one form or another (which is displacing the oil). Electrical energy costs/savings are so small compared to the oil/wood costs that they are trivial in a sensitivity analysis.
Wood fuel costs are at this time are simply estimates of what the authors of this study believe to be a valid estimate of the cost to obtain, process and deliver the wood. There is no site-specific history to base these estimates on. Equally important, there is no reason to believe that the costs will be volatile from year to year. So while the estimated value is most likely not the correct value, a sensitivity analysis is meant to answer the question “what happens to the financials if this variable changes significantly”. Significant year-on-year changes are not expected in wood prices, so no analysis was done on this variable.
At the same time, it is very straightforward to say that if the construction cost doubles, so does the NSP – there is no point in graphing that. Once the project is bid out and constructed, that variable is frozen forever in the financials.
38

Ultimately, the only variable that merits a sensitivity analysis is the cost of oil. Because the cost of one fuel is being held constant (wood) while the other varies, the relationship between cost of oil and NSP is not linear (see figure 5.1 below).
Figure 5.1 below shows a sensitivity analysis for three plants; the “A” option of the three Fort Yukon District Heating Plants (the “A” option being the single boiler option). For any other plant, the location of the curve on the graph would move, but the “shape” of the curve would be very similar.
figure 5.1, sensitivity graph
The basis of this study was an oil cost of $7.00 per gallon (dashed maroon line). What the graph makes very clear is that the downside project risk is greater than the upside project gain. In other words, the negative effect on NSP on a $1.00/gallon drop in oil price is much greater than the positive effect of a $1/gallon increase in oil price.
This does not mean that the projects should not be implemented until the future cost of oil is known – it never will be. There is also a “cost of doing nothing”, which includes the continued dependency on an oil supplier that is currently the only primary energy source available to the villages. As long as that continues, the villages have no leverage against the supplier(s), and very little option but to pay. Finally, there are social benefits to producing energy locally.
All of these factors must be weighed in deciding which projects and technologies, if any, to implement, and at what time.
Section 6: Generating Power with Biomass
6.1 The focus of this study has been displacing the No. 1 oil used for home and building heating with biomass. However, heating is not the only use for oil in the villages. Because of the remoteness, all electrical energy for the villages is generated with diesel generators firing the same No. 1 oil. As a result, the villages are almost totally dependent on barged-in oil as the primary energy source.
This section provides a summary of options for producing electricity using biomass, thus displacing even more oil. By comparison, displacing oil for heating is simple. Electrical energy can be generated from biomass in a number of ways, but in practical application, most villages lack the scale needed to make them economically feasible. In addition, some of these technologies are “not ready for prime time”; in other cases, there are regulatory hurdles. All of them must be evaluated based not only how they perform technically, but how would they be applied in the unique environment of a native village in
39

Alaska – what are the costs of operation, what training is required to operate and maintain them, if it breaks, who fixes it, and so on.
The cost and complexity of generating heat from biomass is much less than that of generating electricity. In any village, therefore, the intent would be to get the heating “business” up and running before attempting electrical generation. Once the wood harvesting, processing, distribution systems are proven, electrical generation becomes the next step. At the same time, it makes sense to plan all aspects of the village biomass systems with the ultimate goal of producing both heat and power.
Four potential means of generating electrical energy from biomass are summarized below: Organic Rankine Cycle, Stirling Engine, Steam Cycle, and Gasification. Further off in the future is ethanol from wood, which could fire a boiler or an engine.
6.2 Organic Rankine Cycle. The ORC is a very simple thermodynamic cycle (see figure 6.1 below). A working fluid under pressure is heated up, which causes the fluid to vaporize. The high pressure vapor is fed into a turbine; the hot gas expands through the turbine, performing work. The work performed is the spinning of the turbine, and the attached electrical generator. The gas that exits the turbine is now a low pressure, low temperature gas. In the condenser, the gas is condensed to a liquid, which then starts the cycle over. Figure 6.1 below shows the principal elements of the cycle.
figure 6.1, schematic of the organic Rankine cycle.
The key determinants of efficiency are the temperature of the heat source and that of the heat sink (the higher and lower, respectively, the better). The key determinant of power output is the rate of heat flow into and out of the cycle (the mass rates of the working fluids at the given temperatures).
Obviously, a biomass-fired boiler can produce hot water or steam, thus acting as the heat source. The heat sink is even easier; it can be groundwater, a river, or even the air.
The temperature of biomass-fired hot water systems is generally limited to 212 deg F or below; at that temperature, ORC efficiencies are less than 10 percent (less than 10 percent of the heat content of the biomass is converted to electrical energy). Steam is hotter, but steam suffers from both scale issues and regulatory issues (see 6.4 below). The most economical commercially available biomass-fired ORC machines actually use a thermal fluid as the working fluid. These fluids do not boil even at high temperatures, thus achieving high efficiency while bypassing some of the regulatory issues.
40

However, the scale of these machines is an issue. The average size (in kW of generator output) of the available machines is generally much larger than the electrical demand requirements of a native village. Cost is another issue; the units are custom built for each application, so on a dollar / kW basis, they are very expensive (and the smaller they get, the higher the unit cost goes).
The Carrier Corporation, realizing that the high unit cost was an issue, modified a standard centrifugal chiller to become an ORC generator. The chiller essentially runs backwards. With very little modification, the chiller impellor is changed to a turbine, and the vapor compression cycle becomes the organic Rankine cycle. Existing refrigerants are used as the working fluid, which limits the temperature of the heat source and sink (and therefore the efficiency). Because the machine is variation of a standard design, sold by the thousands, the cost per kW is very low. However, because of the temperature limitations of the working fluid, efficiency, as noted above, is less than 10 percent.
The Carrier ORC machine has been installed with great results in Chena Hotsprings; they currently have two units operating. However, reason for the success is the hot spring themselves. At Chena, water pumped from the hot springs is the heat source, and pumped ground or river water is the heat sink (one unit uses the atmosphere as the sink). Other than the cost of pumping, the “fuel” for these units is free. When the fuel is essentially free, the efficiency of the generator is irrelevant – the only issue is how much mass flow (or water volume) can Chena get from the hot springs.
The authors of this study performed a more in-depth study of ORC potential in the native villages. Three potential heat sinks were looked at (for those villages not fortunate enough to have a hot springs or waste heat source nearby): heat from a biomass boiler, waste heat from an engine generator, and a combination of both. The stand-alone boiler scenario was killed by the inefficiency of the ORC at low water temperatures. The waste heat from a generator is “free” in the sense that it would otherwise be rejected to the air. However, in order to power a single 200 kW ORC machine (the standard size), the engine generator would need to be on the order of 2 MW output capacity to generate enough waste heat. None of the villages studied require anywhere near 2 MW of power (let alone the extra 200 kW from the ORC).
The combination of boiler heat and waste generator heat was close to being feasible. It would depend on long-term high prices for oil. The determination of whether to use this technology in any given village is definitely site-specific, but should be considered. It has one advantage the other technologies do not – it has been successfully implemented in the interior of Alaska.
At the same time, this low temperature ORC cycle has a major disadvantage; the low temperature heat sink is so cold (70 deg F or colder) that it cannot be used for space heating; thus the Carrier ORC cannot easily be made to be part of a conventional combined heat and power plant (CHP).
6.3 Stirling Engine. The Stirling engine is an external combustion engine. Like internal combustion engines, it uses pistons in a cylinder to turn a shaft and generator power, but unlike an internal combustion engine, the combustion takes place outside the cylinder. This is useful in several ways: 1) the energy source being combusted need not be particularly clean, because the combustion is outside the moving parts, and 2), the combustion can be remote from the engine.
41

The main biomass fired Stirling engine generator sets commercially available come from Stirling DK, a Danish company. They currently come in 35 and 70 kW units. In this sense, this option is the only one where perhaps the scale is too small for some villages.
Like any other thermodynamic cycle, the efficiency is largely dependent on the temperature of the heat source. With a Stirling engine, the combustion can take place anywhere, as long as the heat source on the engine is exposed to the hot products of combustion.
Stirling DK provides a biomass boiler, with the heat sink portion of the Stirling engine inserted directly into the hot stack gas. As long as the boiler runs, the engine produces power. The heat sink for the engine is the return water from a heating system – thus the Stirling engine can be part of a CHP plant. Heat for space (and DHW) heating comes not only from the heat sink of the engine, but from the boiler itself (see figure 6.2 below). Of course, the boiler efficiency is not as great as a straight heating boiler, because the engine absorbs much of the heat before it gets to the boiler. Nonetheless, the Stirling DK machine is a true CHP plant.
figure 6.2, Stirling DK biomass-fired CHP plant
In figure 6.2, the heating water is the green lines – it picks up heat from the engine and from the boiler. The engine picks up heat from the products of combustion (stack gas) from the biomass before it enters the boiler.
As a base load boiler/generator, this machine could have widespread application in Alaska. There are no regulatory hurdles, and it is commercially available. Although it is smaller than many villages might like, it can applied in multiple units to increase output.
6.4 Steam Cycle. The steam cycle goes back several hundred years, is well understood, and requires no new technology at all. The operator burns biomass in a boiler to create steam, which is run through a steam turbine-generator to make power. The outlet temperature (and pressure) of the turbine can be set to produce hot water at any desired temperature, thus making this a true CHP system.
There are three problems with applying the steam cycle to native villages. First, state regulations require that a steam boiler be manned continuously by a licensed operator. Second, scale is an issue – most biomass-fired steam boilers are significantly larger than a native village would require. Third, the higher the pressure, the more efficient the
42

turbine (and thus the smaller the boiler can be); at the same time, though, higher pressure means more costly components, and more danger should a leak occur.
For the steam cycle to be applied to the interior of Alaska, the village would have to be the right fit for the equipment, but equally important, to make it really viable, the continuous operator requirement would have to be waived.
6.5 Gasification. Gasification is the process of heating biomass at high temperatures in the absence of oxygen. The biomass cannot burn without oxygen; instead, the volatile compounds in the wood gasify, leaving behind char (basically ash, the non-combustibles). The resulting gas can be combusted in a boiler, but that is pointless – the biomass could have been combusted directly in the boiler. The real promise of gasification is that the gas could be combusted in an engine, like natural gas.
Unfortunately, the gas derived from wood gasification contains a lot of contaminants, like tar, that would gum up and fail a typical internal combustion engine. Most of the current R&D in gasification is an effort to clean up the gas to avoid there issues. This is one technology that is promising, but perhaps not quite ready for deployment in an environment like the interior of Alaska, where everything must be very robust.
One promising direction is the use of gasification with Stirling engines. Because they are external combustion engines, the contaminants in the gas are much less critical. In fact, Stirling DK offers a version of their Stirling engine with an updraft gasifier, rather than biomass boiler pictured in figure 6.2 above.
In this case, the Stirling engine is primarily a power generator – the heat output is less than in the configuration shown in figure 6.2 above. However, in many villages, a CHP plant that produced more power than heat would be ideal. Finally, in the gasifier configuration, the Stirling engine output can be as high as 140 kW – a significant fraction of many villages power demand.
There are many companies working on gasification; the Stirling DK version may be the best fit for many native villages due to simplicity and output capacity. Whether powered by a boiler or a gasifier, the Stirling engine may be the best bet for economically producing power from biomass in the interior of Alaska.
Section 7: Villages Demographics
7.0 Fort Yukon Demographics – Population: 591
7.1. Location: Fort Yukon is located at the confluence of the Yukon River and the Porcupine River, about 145 air miles northeast of Fairbanks. Fort Yukon is located in the Fairbanks Recording District. The area encompasses 7.0 sq. miles of land and 0.4 sq. miles of water. The winters are long and harsh and the summers are short but warm. After freeze-up the plateau is a source of cold, continental arctic air. Daily minimum temperatures between November and March are usually below 0. Extended periods of -50 to -60 are common. Summer high temperatures run 65 to 72; a high of 97 degrees has been recorded. Total annual precipitation averages 6.58 inches, with 43.4 inches of snowfall. The Yukon River is ice-free from the end of May through mid-September.
7.2. History: Alexander Murray founded Fort Yukon in 1847 as a Canadian outpost in Russian Territory. It became an important trade center for the Gwich'in Indians, who inhabited the vast lowlands of the Yukon Flats and River valleys. The Hudson Bay Company, a British trading company, operated at Fort Yukon from 1846 until 1869. In 1862, a mission school was established. In 1867, the U.S. purchased Alaska and two
43

years later it was determined that Fort Yukon was on American soil. Moses Mercier, a trader with the Alaska Commercial Company, took over operation of the Fort Yukon Trading Post. A post office was established in 1898. The fur trade of the 1800s, the whaling boom on the Arctic coast (1889-1904), and the Klondike gold rush spurred economic activity and provided some economic opportunities for the Natives. However, major epidemics of introduced diseases struck the Fort Yukon population from the 1860s until the 1920s. In 1949, a flood damaged or destroyed many homes in Fort Yukon. During the 1950s, a White Alice radar site and an Air Force station were established. Fort Yukon incorporated as a city in 1959.
7.3. Culture: Most Fort Yukon residents are descendants of the Yukon Flats, Chandalar River, Birch Creek, Black River, and Porcupine River Gwich'in Athabascan tribes. Subsistence is an important component of the local culture. The sale of alcohol is restricted to the City-owned package store.
7.4. Economy: City, state, federal agencies and the Native Corporation are the primary employers in Fort Yukon. The School District is the largest employer. Winter tourism is becoming increasingly popular -- Fort Yukon experiences spectacular Northern Lights. The BLM operates an emergency fire-fighting base at the airport. The U.S. Air Force operates a White Alice Radar Station in Fort Yukon. Trapping and Native handicrafts also provide income. Residents rely on subsistence foods -- salmon, whitefish, moose, bear, caribou, and waterfowl provide most meat sources. One resident holds a commercial fishing permit.
7.5. Facilities: Water is derived from two wells, is treated and stored in a 110,000-gal. tank. A combination of piped water, water delivery and individual wells serve households. A flush/haul system, septic tanks, honey-buckets and outhouses are used for sewage disposal. Approximately half of all homes are plumbed. The piped water system and household septic tanks were installed in 1984. The City has begun repairs to the piped water system and to construct a piped gravity sewer system to serve 250 residents and businesses.
7.6. Transportation: Fort Yukon is accessible by air, and barge during the summer months. Heavy cargo is brought in by barge from the end of May through mid-September; there is a barge off-loading area, but no dock. Riverboats and skiffs are used for recreation, hunting, fishing and other subsistence activities. A State-owned 5,810' long by 150' wide lighted gravel airstrip is available; float- planes use Hospital Lake, adjacent to the airport. There are 17 miles of local roads, and over 100 automobiles and trucks. The City Transit Bus system provides transport throughout the town. Snow-machines and dog sleds are used on area trails or the frozen river, which becomes an ice road to area villages during winter.
7.7. Climate: The winters are long and harsh and the summers are short but warm. After freeze-up the plateau is a source of cold, continental arctic air. Daily minimum temperatures between November and March are usually below 0. Extended periods of -50 to -60 are common. Summer high temperatures run 65 to 72; a high of 97 degrees has been recorded. Total annual precipitation averages 6.58 inches, with 43.4 inches of snowfall. The Yukon River is ice-free from the end of May through mid-September.
7.1. Chalkyitsik: Population 72
44

7.2. Location: Chalkyitsik is located on the Black River about 50 miles east of Fort Yukon. It lies at approximately 66.654440 North Latitude and -143.722220 West Longitude. (Sec. 12, T021N, R018E, Fairbanks Meridian.) Chalkyitsik is located in the Fairbanks Recording District. The area encompasses 8.7 sq. miles of land and 0.3 sq. miles of water. Chalkyitsik has a continental arctic climate, characterized by seasonal extremes of temperature. Winters are long and harsh, and summers warm and short. The average high temperature during July ranges from 65 to 72 degrees Fahrenheit. The average low temperature during January is well below zero. Extended periods of -50 to -60 degrees Fahrenheit are common. Extreme temperatures have been measured, ranging from a low of -71 to a high of 97 degrees Fahrenheit. Annual precipitation averages 6.5 inches and annual snowfall averages 43.4 inches. The Black River is ice-free from mid-June to mid-October.
7.3. History: Chalkyitsik means "fish hooking place," and has traditionally been an important seasonal fishing site for the Gwich'in. Archaeological excavations in the area reveal use and occupancy of the region as early as 10,000 B.C. Village elders remember a highly nomadic way of life, living at the headwaters of the Black River from autumn to spring, and then floating downriver to fish in summer. Early explorers of the region refer briefly to the Black River Gwich'in Natives. Archdeacon MacDonald encountered them on the Black and Porcupine Rivers, as well as trading and socializing in Fort Yukon and Rampart, on a number of occasions from 1863 to 1868. Around the turn of the century, the Black River band began to settle in Salmon Village, about 70 miles upriver from the present site. William Salmon, a Canadian Indian who married a Black River woman, built the first permanent structure there. In the late 1930s, a boat bound for Salmon Village with construction materials for a school had to unload at Chalkyitsik because of low water. The site was used as a seasonal fishing camp, and four cabins existed at that time. The decision was made to build the school there, and the Black River people began to settle around the school. By 1969, there were 26 houses, a store, two churches and a community hall in Chalkyitsik.
7.4. Culture: Chalkyitsik is a traditional Gwich'in Athabascan village, with a subsistence lifestyle. The sale or importation of alcohol is banned in the village.
7.5. Economy: Wage opportunities are limited and primarily part-time with the school district, village council, clinic, or state and federal agencies. Seasonal work is found fire firefighting for the BLM, making sleds and snowshoes, trapping and handicrafts. Subsistence plays an important role in the village economy. Moose, caribou, sheep, salmon and whitefish provide a relatively stable source of food.
7.6. Facilities: Water is derived from a well under the Black River, treated and stored in a 100,000-gal. tank. Residents haul water from the new water treatment plant/washeteria/clinic building, and use honey-buckets or outhouses for sewage disposal. No homes are plumbed. The village provides water to the school. Water is often inadequate; a second well has been funded. A feasibility study was completed to serve piped water and sewer system to the school and 10 homes on the west side. A landfill relocation study is also being conducted. Construction of a piped water and sewer system is in progress.
7.7. Transportation: Access is primarily by air; there is a State-owned 4,000' long by 90' wide gravel runway. Residents own ATVs, snow-machines and skiffs for fishing, hunting and recreation. No roads connect Chalkyitsik with other villages, although there is a winter trail to Fort Yukon. It is accessible by small riverboat. Chalkyitsik received cargo by barge at one time, but the service is no longer provided.
45

7.8. Climate: Chalkyitsik has a continental arctic climate, characterized by seasonal extremes of temperature. Winters are long and harsh, and summers warm and short. The average high temperature during July ranges from 65 to 72 degrees Fahrenheit. The average low temperature during January is well below zero. Extended periods of -50 to -60 degrees Fahrenheit are common. Extreme temperatures have been measured, ranging from a low of -71 to a high of 97 degrees Fahrenheit. Annual precipitation averages 6.5 inches and annual snowfall averages 43.4 inches. The Black River is ice-free from mid-June to mid-October.
7.9. Location: Venetie is located on the north side of the Chandalar River, 45 miles northwest of Fort Yukon. It lies at approximately 67.013890 North Latitude and -146.418610 West Longitude. (Sec. 10, T025N, R006E, Fairbanks Meridian.) Venetie is located in the Fairbanks Recording District. The area encompasses 20.8 sq. miles of land and 0.0 sq. miles of water. The winters are long and harsh and the summers are short but warm. Daily minimum temperatures between November and March are usually below 0. Extended periods of -50 to -60 are common. Summer high temperatures run 65 to 72; a high of 97 degrees has been recorded. Total annual precipitation averages 6.58 inches, with 43.4 inches of snowfall. The Chandalar River is ice-free from the end of May through mid-September.
7.10. History: Known to early explorers as Old Robert's Village or Chandalar Village, Venetie was founded in 1895 by a man named Old Robert who chose Venetie because of its plentiful fish and game. In 1899, the U.S. Geological Survey noted about 50 Natives living on the Chandalar, some in small settlements of cabins about 7 miles above the mouth of the River, but most in the mountainous part of the country beyond the Yukon Flats. He noted that the Natives spent only the coldest winter months in cabins and the remainder of the year traveling for various food sources. In 1905, Venetie was a settlement of a half a dozen cabins and 25 or 30 residents. The gold rush to the Chandalar region in 1906-07 brought a large number of miners. A mining camp of nearly 40 cabins and attendant services was established at Caro upriver from Venetie, and another store was located near the mouth of the East Fork. By 1910, the Chandalar was largely played out and Caro almost completely abandoned. In 1943, the Venetie Indian Reservation was established, due to the combined efforts of the residents of Venetie, Arctic Village, Christian Village and Robert's Fish Camp, who worked together to protect their land for subsistence use. At about this same time, a school was established at Venetie, encouraging additional families to settle in the village. Eventually an airstrip, post office and store were built. During the 1950s and 60s, the use of seasonal camps declined, but the advent of the snow-machine enabled Venetie residents to renew use of areas which had traditionally been occupied seasonally. When the Alaska Native Claims Settlement Act (ANCSA) was passed in 1971, Venetie and Arctic Village opted for title to the 1.8 million acres of land in the former Reservation, which they own as tenants in common through the Native Village of Venetie Tribal Government.
7.11. Culture: Venetie is comprised largely of descendants of the Neets'ai Gwich'in, and to a lesser extent the Gwichyaa and Dihaii Gwich'in. The village council is combined with Arctic Village. Subsistence activities are an important part of the local culture.
7.12. Economics: Venetie is heavily dependent on subsistence. Salmon, whitefish, moose, caribou, bear, waterfowl and small game provide meat sources. Most employment is through the school, clinic, post office, store and village council. The National Guard has used Venetie as a cold weather survival training school. BLM employs residents as fire fighters seasonally. The village is interested in developing a small mill to process local lumber for housing and other projects, and in tourism promotion. Cabins manufactured from local logs could house visitors, developing arts and crafts activities, cultural activities and a museum.
46

7.13. Facilities: Water is derived from a well near the Chandalar River, then is treated and stored in a tank. Residents haul water and honey-buckets. A circulating water utilidor system and 49 households service connections were constructed in 1980, however, the east loop froze in 1981 and the west loop in 1982. 29 individual household septic tanks were installed in 1980, and also froze during their first winter of operation. Currently, only 8 homes have functioning plumbing. A flush/haul system is under construction in Venetie; 6 homes are currently served. The Stanley Frank Washeteria and Water Treatment Plant were recently completed. It uses a small solar power system to provide some electricity.
7.14. Transportation: Access to Venetie is almost exclusively by air. The Venetie Tribal Council owns and operates the 4,100' long by 65' wide dirt/gravel airstrip. The Chandalar River provides access by boat from May to October, but there is no barge service, due to shallow water. Motorbikes, 4-wheelers, snowmobiles and dog teams are used for local travel.
7.15. Climate: The winters are long and harsh and the summers are short but warm. Daily minimum temperatures between November and March are usually below 0. Extended periods of -50 to -60 are common. Summer high temperatures run 65 to 72; a high of 97 degrees has been recorded. Total annual precipitation averages 6.58 inches, with 43.4 inches of snowfall. The Chandalar River is ice-free from the end of May through mid-September.
7.16. Venetie Population 177
7.17. Venetie is located on the north side of the Chandalar River, 45 miles northwest of Fort Yukon. It lies at approximately 67.013890 North Latitude and -146.418610 West Longitude. (Sec. 10, T025N, R006E, Fairbanks Meridian.) Venetie is located in the Fairbanks Recording District. The area encompasses 20.8 sq. miles of land and 0.0 sq. miles of water. The winters are long and harsh and the summers are short but warm. Daily minimum temperatures between November and March are usually below 0. Extended periods of -50 to -60 are common. Summer high temperatures run 65 to 72; a high of 97 degrees has been recorded. Total annual precipitation averages 6.58 inches, with 43.4 inches of snowfall. The Chandalar River is ice-free from the end of May through mid-September.
7.18. History: Known to early explorers as Old Robert's Village or Chandalar Village, Venetie was founded in 1895 by a man named Old Robert who chose Venetie because of its plentiful fish and game. In 1899, the U.S. Geological Survey noted about 50 Natives living on the Chandalar, some in small settlements of cabins about 7 miles above the mouth of the River, but most in the mountainous part of the country beyond the Yukon Flats. He noted that the Natives spent only the coldest winter months in cabins and the remainder of the year traveling for various food sources. In 1905, Venetie was a settlement of a half a dozen cabins and 25 or 30 residents. The gold rush to the Chandalar region in 1906-07 brought a large number of miners. A mining camp of nearly 40 cabins and attendant services was established at Caro upriver from Venetie, and another store was located near the mouth of the East Fork. By 1910, the Chandalar was largely played out and Caro almost completely abandoned. In 1943, the Venetie Indian Reservation was established, due to the combined efforts of the residents of Venetie, Arctic Village, Christian Village and Robert's Fish Camp, who worked together to protect their land for subsistence use. At about this same time, a school was established at Venetie, encouraging additional families to settle in the village. Eventually an airstrip, post office and store were built. During the 1950s and 60s, the use of seasonal camps declined, but the advent of the snow-machine enabled Venetie residents to renew use of areas which had traditionally been occupied seasonally. When the Alaska Native Claims Settlement Act (ANCSA) was passed in 1971, Venetie and Arctic Village opted for title to
47

the 1.8 million acres of land in the former Reservation, which they own as tenants in common through the Native Village of Venetie Tribal Government.
7.19. Culture: Venetie is comprised largely of descendants of the Neets'ai Gwich'in, and to a lesser extent the Gwichyaa and Dihaii Gwich'in. The village council is combined with Arctic Village. Subsistence activities are an important part of the local culture.
7.20. Economy: Venetie is heavily dependent on subsistence. Salmon, whitefish, moose, caribou, bear, waterfowl and small game provide meat sources. Most employment is through the school, clinic, post office, store and village council. The National Guard has used Venetie as a cold weather survival training school. BLM employs residents as fire fighters seasonally. The village is interested in developing a small mill to process local lumber for housing and other projects, and in tourism promotion. Cabins manufactured from local logs could house visitors, developing arts and crafts activities, cultural activities and a museum.
7.21. Facilities: Water is derived from a well near the Chandalar River, then is treated and stored in a tank. Residents haul water and honey-buckets. A circulating water utilidor system and 49 households service connections were constructed in 1980, however, the east loop froze in 1981 and the west loop in 1982. 29 individual household septic tanks were installed in 1980, and also froze during their first winter of operation. Currently, only 8 homes have functioning plumbing. A flush/haul system is under construction in Venetie; 6 homes are currently served. The Stanley Frank Washeteria and Water Treatment Plant were recently completed. It uses a small solar power system to provide some electricity.
7.22. Transportation: Access to Venetie is almost exclusively by air. The Venetie Tribal Council owns and operates the 4,100' long by 65' wide dirt/gravel airstrip. The Chandalar River provides access by boat from May to October, but there is no barge service, due to shallow water. Motorbikes, 4-wheelers, snowmobiles and dog teams are used for local travel.
48