Embed Size (px)
Citation preview
BHP BILLITON
Final Internship Report 2011
Elliot Payne 30787477 18/11/2011
A report submitted to the school of Engineering and
Energy, Murdoch University in partial fulfilment of the
requirements for the degree of Bachelor of Engineering
Page | I
Abstract
BHP Billiton Worsley Alumina and Murdoch University have a strong relationship, and as a result a
selection of students studying their final year of Instrumentation and Control Engineering have the
opportunity to complete an internship at the Worsley Alumina Refinery, located in the South West
region of WA. The purpose of this report is to present the work completed on assigned projects during
the internship.
In order to provide a substantial contribution to the project work, an understanding of the refinery’s
process and operations, overall control system and the tools utilised by control engineers on site was
required. A summary of this background information is detailed within this report.
This report summarises the work completed on all major projects assigned during the time spent at the
Worsley refinery. The project work completed covers a wide range of Process Control applications from
the design of operator graphics to configuring networks. A contribution has been made to six projects
which are listed within the report. Four projects will be covered in greater detail, highlighting required
background information, methodologies applied, project constraints and a description of the projects`
outcomes. The following projects to be discussed in greater detail are as follows;
Experion Development Test System
Reclaimer System Faults
E&G Commissioning - Bauxite Shuttle Conveyors
E&G Commissioning - Sulphate Removal Filters
This report will also cover the work on the remaining two projects and additional work completed
outside of the assigned projects. Brief project summaries are provided for the migration of lab update
values to Experion and the fault rest functionality for the alumina loud out sequence at the Bunbury
port.
The internship allows the student to gain experience with industry projects that a Process Control
engineer is involved with on a daily basis, creating an invaluable learning experience. This will help the
student apply the knowledge gained from university and to develop skills needed for the workplace
personally and professionally.
Page | II
Disclaimer
All of the work discussed in this report is the work of the author unless otherwise referenced.
I declare the following to be my own work, unless otherwise referenced, as defined by Murdoch
University’s policy on plagiarism.
…………………………………..
Elliot Payne
November 2011
Page | III
Acknowledgments
I would firstly like to thank BHP Billiton Worsley Alumina Pty Ltd for providing the opportunity to
complete an internship with their Process Control engineering group. This internship has given me the
chance to be involved with first hand, real world Process Control engineering projects.
My sincere gratitude is expressed towards the entire Process Control group at the Worsley Refinery.
Their guidance and relentless assistance has contributed greatly to the success of this internship. Special
thanks should be reserved for project supervisors Ben Marler, Julian Leitch, Stephen Gray, George
Boaden and Ryan Peters who have guided progression through the assigned projects. I would also like to
highlight my gratitude towards my industry supervisors; Process Control Superintendent Arnold Oliver;
Senior Process Control Engineer Angelo D’Agostino; and Process Control Consultant Rob Duggan who
have donated their valuable time to contribute to my development as a professional engineer.
Thanks should be reserved for all the staff at Murdoch University who have been involved with my
learning during my degree. Special thanks is required for my academic supervisor Doctor Gareth Lee
who has overseen the internship with ongoing support and direction. Associate Professor Graeme Cole
and Professor Parisa Bahri should also be mentioned for their substantial contribution towards my
learnings at university.
Page | IV
Table of Contents
Abstract ......................................................................................................................................................... I
Disclaimer ..................................................................................................................................................... II
Acknowledgments ....................................................................................................................................... III
List of Figures .............................................................................................................................................. VII
List of Tables ............................................................................................................................................... VII
1 Introduction .......................................................................................................................................... 1
2 Background ........................................................................................................................................... 2
2.1 The Worsley Bayer Process .......................................................................................................... 2
2.1.1 Raw Materials ....................................................................................................................... 2
2.1.2 Area 1 – Digestion ................................................................................................................ 3
2.1.3 Area 2 – Clarification ............................................................................................................ 4
2.1.4 Area 3 – Precipitation ........................................................................................................... 6
2.1.5 Area 4 – Calcination .............................................................................................................. 7
2.1.6 Liquor Burner ........................................................................................................................ 8
2.1.7 Powerhouse and Cogeneration Plant ................................................................................... 9
2.2 Worsley Control System Overview ............................................................................................. 10
2.3 Engineering Tools/Applications utilised ..................................................................................... 11
2.3.1 Honeywell HMI Web Builder .............................................................................................. 11
2.3.2 Honeywell Configuration Studio: Quick builder ................................................................. 11
2.3.3 Honeywell Configuration Studio: Control Builder .............................................................. 11
2.3.4 Honeywell Experion Station ............................................................................................... 11
2.3.5 Honeywell PlantScape Station ............................................................................................ 12
2.3.6 Honeywell Doc4000 ............................................................................................................ 12
2.3.7 Honeywell PHD Uniformace ............................................................................................... 12
2.3.8 ProWORX 32 ....................................................................................................................... 12
2.3.9 Microsoft Office Applications ............................................................................................. 12
3 Project Work ....................................................................................................................................... 13
3.1 Experion Development Test System .......................................................................................... 13
3.1.1 Background ......................................................................................................................... 13
3.1.2 Scope .................................................................................................................................. 14
3.1.3 Implementation/Method ................................................................................................... 14
3.1.4 Technical Issues/Project Constraints .................................................................................. 15

Page | V
3.1.5 Project Status ..................................................................................................................... 15
3.1.6 Project Conclusion .............................................................................................................. 16
3.2 Reclaimer System Faults ............................................................................................................. 16
3.2.1 Background ......................................................................................................................... 16
3.2.2 Engineering Tools utilised................................................................................................... 17
3.2.3 Scope .................................................................................................................................. 17
3.2.4 Time Allocation and Management ..................................................................................... 18
3.2.5 Implementation/Method ................................................................................................... 18
3.2.6 Technical Issues/Constraints .............................................................................................. 20
3.2.7 Project Status ..................................................................................................................... 20
3.2.8 Project Conclusion .............................................................................................................. 21
3.3 E&G Commissioning Shuttle Conveyors ..................................................................................... 22
3.3.1 Background ......................................................................................................................... 22
3.3.2 Scope .................................................................................................................................. 23
3.3.3 Implementation/Method ................................................................................................... 23
3.3.4 Project Status ..................................................................................................................... 25
3.3.5 Project Conclusion .............................................................................................................. 25
3.4 E&G Commissioning Sulphate Removal Filters .......................................................................... 25
3.4.1 Background ......................................................................................................................... 25
3.4.2 Scope .................................................................................................................................. 25
3.4.3 Filter Sequence ................................................................................................................... 26
3.4.4 Implementation/Method ................................................................................................... 27
3.4.5 Technical Issues/Constraints .............................................................................................. 28
3.4.6 Project Status ..................................................................................................................... 28
3.4.7 Project Conclusion .............................................................................................................. 28
4 Remaining Project Summaries ........................................................................................................... 29
4.1 Migrate Lab Update System to Profit Sensor Pro ...................................................................... 29
4.1.1 Project Summary ................................................................................................................ 29
4.2 Fault Reset Button – Uticor ........................................................................................................ 29
4.2.1 Project Summary ................................................................................................................ 29
5 Additional Tasks Completed ............................................................................................................... 31
5.1 Morning and KPI Meetings ......................................................................................................... 31
5.2 Engineering Open Day ................................................................................................................ 31
5.3 Honeywell User Group Demo ..................................................................................................... 31
Page | VI
6 Time Management ............................................................................................................................. 32
7 Internship Review ............................................................................................................................... 34
8 Conclusion .......................................................................................................................................... 35
Bibliography ................................................................................................................................................ 36
Acronyms and Abbreviations ..................................................................................................................... 38
Appendices ................................................................................................................................................. 40
Appendix A: Industry and Academic Endorsement ................................................................................ 40
Appendix B: Area and Flow Overview of BHP Billiton’s Worsley Alumina Refinery .............................. 41
Appendix C: Development Network Switch Connections ...................................................................... 42
Appendix D: Project Work Gantt Chart .................................................................................................. 44
Appendix E: Reclaimer Common and Sequence Fault Alarms Address Table ....................................... 45
Appendix F: Reclaimer Alarm Diagnostic Graphic Page ......................................................................... 47
Appendix G: Sulphate Plate Pack Filter Sequence modes ...................................................................... 48
Page | VII
List of Figures
Figure 1 - Bauxite Grinding Mill Circuit Flow Diagram ................................................................................. 3
Figure 2 - Area 2 Flow Diagram .................................................................................................................... 5
Figure 3 - Area 3 Precipitator Vessels ........................................................................................................... 6
Figure 4 - Area 4 Calciners ............................................................................................................................ 7
Figure 5 - Rotary Kiln Viewed from the Northern (Feed) End ...................................................................... 8
Figure 6 - Powerhouse and Cogeneration Plant ........................................................................................... 9
Figure 7 - Control System History ............................................................................................................... 10
Figure 8 - Common Alarm Grouping Advantage ........................................................................................ 16
Figure 9 - Reclaimer Control System Architecture ..................................................................................... 19
Figure 10 - Bauxite Feed Bin Filling System ................................................................................................ 22
Figure 11 - Sulphate Plate Pack Filter System Standby mode .................................................................... 26
Figure 12 - Refinery Area and Flow Overview ............................................................................................ 41
Figure 13 - Development Network Switch Connections ............................................................................ 42
Figure 14 – Develop Network System Layout ............................................................................................ 43
Figure 15 - Project Work Gantt Chart ......................................................................................................... 44
Figure 16 - Reclaimer Alarm Diagnostic Graphic Page ............................................................................... 47
Figure 17 – Filter Filling mode .................................................................................................................... 48
Figure 18 - Filtration Mode ......................................................................................................................... 48
Figure 19 - Pressure Release mode ............................................................................................................ 49
Figure 20 - Core Blow mode ....................................................................................................................... 49
Figure 21 - Stop Core Blow mode ............................................................................................................... 50
Figure 22 - Filtrate Line Blow mode ........................................................................................................... 50
Figure 23 - Plate Pack Opening mode ........................................................................................................ 51
Figure 24 - Deluge mode ............................................................................................................................ 51
Figure 25 - Optional Internal Wash mode .................................................................................................. 52
List of Tables
Table 1 - Journal Week 7 ............................................................................................................................ 33
Table 2 - Reclaimer Alarm Address Table ................................................................................................... 45
Page | 1
1 Introduction
During the final year of Murdoch University’s Bachelor of Engineering, students are required to
complete a thesis project or undertake a workplace internship program. This year BHP Billiton Worsley
Alumina has accepted two internship positions, allowing the selected students to complete a 16 week
internship with the Worsley Alumina Process Control group. Worsley is a joint venture operation, with
BHP Billiton the largest stake holder. The refinery was first opened in 1984 and is located approximately
20km North West of Collie in the South West region of Western Australia. The refinery is one of the
world’s largest and most efficient alumina refineries, producing 3.55 million tons per year of calcined
alumina, with an upgrade in progress to increase production to 4.6 million.
The Worsley refinery applies an extremely complex process to maintain its high production and
efficiency. This process is consequently controlled by a highly sophisticated control system, configured,
monitored and maintained by the Process Control group. The process operation and control system
history are presented in this report and form the information required by a Process Control Engineer
prior to commencing work on projects.
The purpose of this report is to inform the reader of all the activities the student has been involved with
during the internship at Worsley Alumina. This will detail the projects assigned during the internship and
specific engineering methodology applied to achieve the desired outcomes for projects. Due to the
amount of content covered in each project, only four projects have been covered in detail. Additional
tasks completed will also be detailed along with a time management plan that has been applied to
balance workload and ensure outcomes are met.
Page | 2
2 Background
In order to provide a detailed analysis of the project work completed during the internship, some
additional background information must be provided on the refinery’s operation, along with a brief
overview of the control system history and the engineering tools and applications used during the
internship.
2.1 The Worsley Bayer Process At Worsley, a modified Bayer Process is carried out to refine alumina from bauxite ore. This extraction
process utilises the properties of alumina that allow it to be readily dissolved in caustic soda solutions.
This property allows the unwanted portion of bauxite to be separated from the alumina by remaining
undissolved. The Bayer process is named after the German chemist Karl Bayer who originally discovered
the commercial possibility of digesting alumina out of bauxite using a hot caustic soda solution. The
following background information is not intended to detail every aspect of the refinery process, rather
highlight the key areas used in the process and detail facility numbers and equipment names used when
specific knowledge may be required further within the report.
The refinery is divided into seven different areas of operation, three of these areas are used for
operations outside the specific Bayer process where the remaining four areas are used accordingly with
the four major steps of the Bayer process. The refinery areas are as follows:
Raw Materials
Area 1 – Digestion
Area 2 – Clarification
Area 3 – Precipitation
Area 4 – Calcination
Liquor Burner
Powerhouse and Cogeneration Plant
Each of these areas will be discussed further to provide a general overview of each area and its
contribution to the Bayer process. The relative locations of each area mentioned above can be found in
Appendix B: Area and Flow Overview of BHP Billiton’s Worsley Alumina Refinery.
2.1.1 Raw Materials
The Raw Materials area is located at the northern and eastern sides of the refinery and is primarily
responsible for providing the refinery with a surplus supply of crushed bauxite. The area is fed with
crushed bauxite transported from the Boddington Bauxite Mine (BBM) via a 51km overland conveyor, it
is then blended as it is stored by two feeders. The ore is reclaimed from the stockpiles by two reclaiming
systems which can feed either two transfer conveyors via flop gates, which supply bauxite into Area 1.
This area also operates to receive, store and distribute coal, caustic soda and lime which are delivered
by train. Control of the alumina train loading and port is also placed within this area.

Page | 3
2.1.2 Area 1 – Digestion
Area 1 is located on the westerly side of the production area and is responsible for the first stage of the
Bayer process, digestion. This stage dissolves the alumina out of the bauxite and into a hot caustic soda
solution. The digestion process carried out in this area is divided into three main stages:
Bauxite Grinding – Facility 024
Desilication – Facility 026
Digestion – facility 030
Bauxite is fed into either one of four mill circuits by the bauxite feed bins via conveyors. The bauxite
mixed with spent liquor in the rod and ball mills to form a slurry of approximately 45% solids. The rod
mills initially grind the bauxite to approximately 4mm. This slurry then passes through DSM screens
which cycle larger particles to the ball mill and direct smaller particles to the Desilication facility
(Worsley Alumina Pty. Ltd, 2002). This process is detailed below in Figure 1.
Figure 1 - Bauxite Grinding Mill Circuit Flow Diagram
(Worsley Alumina Pty. Ltd, 2002)
Page | 4
The Desilication process is used to remove the reactive silica content within the ground bauxite and
caustic soda solution. If this silica is not removed it begins to form a hard coating on the slurry that
contaminates the solution and restricts flow through heaters and pipes causing more problems. The
reactive silica is converted to an un-reactive form by heating it to approximately 98oC for seven to nine
hours, with the use of 450kPa steam to form DSP. The residence time is achieved by recycling slurry
along five tanks as well as returning some of the discharge of each tank back into the same tank via
splitter boxes. The output DSP of three of the five tanks is sent to digestion in facility 30 (Worsley
Alumina Pty. Ltd, 2002).
The Digestion facility is used to heat up the slurry to dissolve the contained alumina, the final step in the
digestion process. The bauxite slurry from desilication is mixed with spent liquor in order to achieve a
desired alumina to caustic (A/C) ratio and is then heated up by a series of slurry heaters to 175oC and
700 kPa. Heat and pressure assist the alumina to dissolve into caustic soda and is given a residence time
of approximately twenty minutes in the digester tank. Once leaving the digester tank the slurry is passed
through the line of flash vessels to cool to about 107oC and is referred to as Digester Blow-off (DBO)
(Worsley Alumina Pty. Ltd, 2002).
2.1.3 Area 2 – Clarification
Area 2 is located in the south west corner of the refinery and is primarily responsible for the clarification
and filtration of the DBO slurry to separate the mud and caustic soda rich in dissolved alumina. This area
is also responsible for washing the un-dissolved mud solids and recovering caustic from settler tanks.
The DBO slurry is pumped to one of five settlers and is mixed with flocculent which aids the bauxite mud
residue to settle at the bottom of the settler tanks. Overflow from these settler tanks is the alumina-
enriched liquor which has been clarified excluding the very fine mud particles. This alumina-enriched
liquor is mixed with a filtering agent, Tri-Calcium Aluminate, which acts as a filter agent to aid the
filtration process in Facility 035 to remove the fine bauxite residue from the alumina hydrate which is
dissolved in solution and discharged to Area 3 (Worsley Alumina Pty. Ltd, 2002).
The underflow from the settling tanks, referred to as mud is mixed with washed liquor then pumped
into a series of hydrocyclones which separate the coarse sand particles from the slurry using centrifugal
force. The hydrocyclones underflow is washed to receive caustic soda using multi-stage sand spiral
classifiers, where the sand and mud are discharged to the Bauxite Residue Disposal Areas (BRDA’s). The
hydrocyclones overflow, containing liquor and fine mud particles is discharged to the first in a series of
four washers. The mud is washed by a dilute stream of filtrate from downstream washer tanks overflow,
in a process known as a Counter-Current Decantation (CCD) circuit. The circuit moves washed liquor
upstream to increase the liquor concentration to be recycled with settler underflow and mud
downstream where it is filtered and sent to the BRDA. Liquor overflow from the first washer tank is
combined with lime and recycled with DBO slurry (Worsley Alumina Pty. Ltd, 2002). A complete flow
diagram of Area 2 is illustrated in Figure 2 below.

Page | 5
Figure 2 - Area 2 Flow Diagram
(Worsley Alumina Pty. Ltd, 2002)
Page | 6
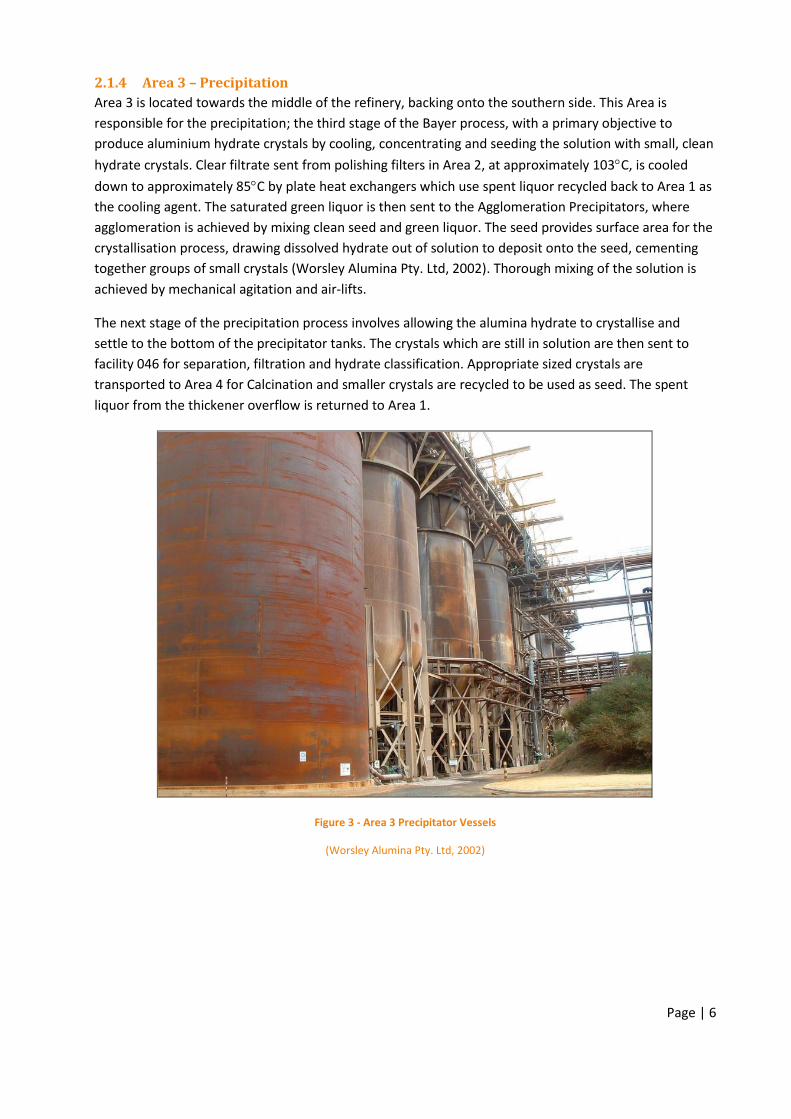
2.1.4 Area 3 – Precipitation
Area 3 is located towards the middle of the refinery, backing onto the southern side. This Area is
responsible for the precipitation; the third stage of the Bayer process, with a primary objective to
produce aluminium hydrate crystals by cooling, concentrating and seeding the solution with small, clean
hydrate crystals. Clear filtrate sent from polishing filters in Area 2, at approximately 103C, is cooled
down to approximately 85C by plate heat exchangers which use spent liquor recycled back to Area 1 as
the cooling agent. The saturated green liquor is then sent to the Agglomeration Precipitators, where
agglomeration is achieved by mixing clean seed and green liquor. The seed provides surface area for the
crystallisation process, drawing dissolved hydrate out of solution to deposit onto the seed, cementing
together groups of small crystals (Worsley Alumina Pty. Ltd, 2002). Thorough mixing of the solution is
achieved by mechanical agitation and air-lifts.
The next stage of the precipitation process involves allowing the alumina hydrate to crystallise and
settle to the bottom of the precipitator tanks. The crystals which are still in solution are then sent to
facility 046 for separation, filtration and hydrate classification. Appropriate sized crystals are
transported to Area 4 for Calcination and smaller crystals are recycled to be used as seed. The spent
liquor from the thickener overflow is returned to Area 1.
Figure 3 - Area 3 Precipitator Vessels
(Worsley Alumina Pty. Ltd, 2002)
Page | 7
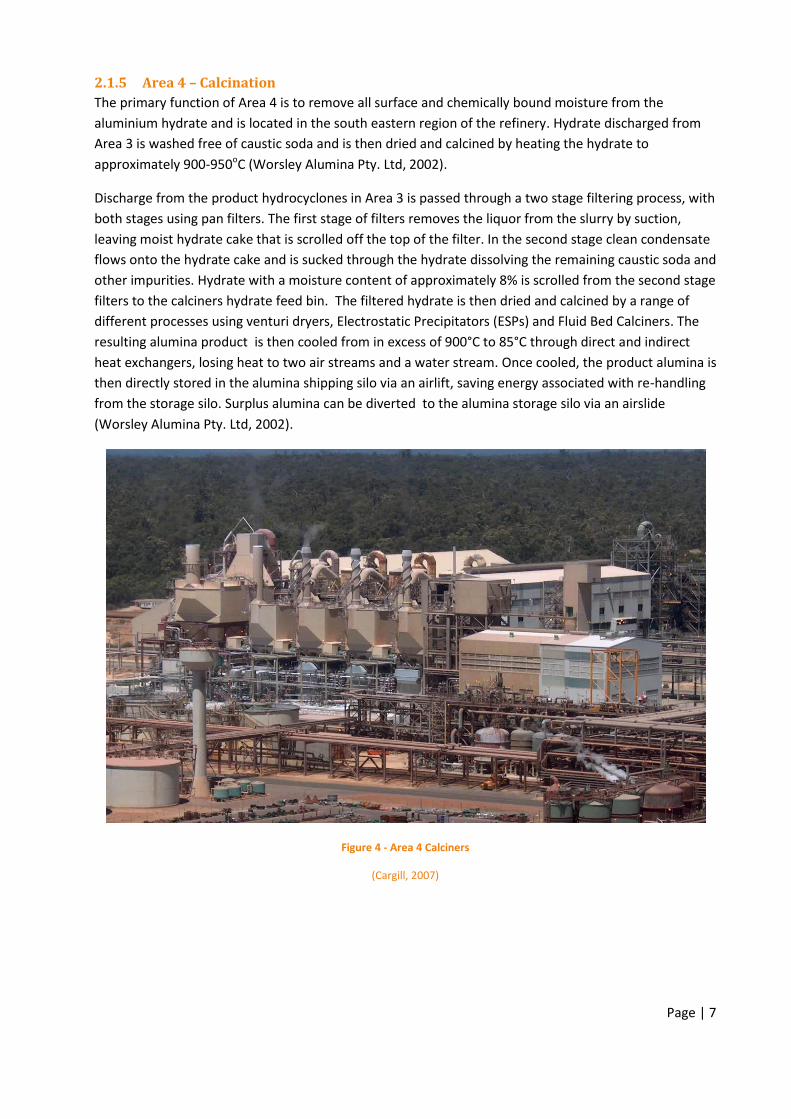
2.1.5 Area 4 – Calcination
The primary function of Area 4 is to remove all surface and chemically bound moisture from the
aluminium hydrate and is located in the south eastern region of the refinery. Hydrate discharged from
Area 3 is washed free of caustic soda and is then dried and calcined by heating the hydrate to
approximately 900-950oC (Worsley Alumina Pty. Ltd, 2002).
Discharge from the product hydrocyclones in Area 3 is passed through a two stage filtering process, with
both stages using pan filters. The first stage of filters removes the liquor from the slurry by suction,
leaving moist hydrate cake that is scrolled off the top of the filter. In the second stage clean condensate
flows onto the hydrate cake and is sucked through the hydrate dissolving the remaining caustic soda and
other impurities. Hydrate with a moisture content of approximately 8% is scrolled from the second stage
filters to the calciners hydrate feed bin. The filtered hydrate is then dried and calcined by a range of
different processes using venturi dryers, Electrostatic Precipitators (ESPs) and Fluid Bed Calciners. The
resulting alumina product is then cooled from in excess of 900°C to 85°C through direct and indirect
heat exchangers, losing heat to two air streams and a water stream. Once cooled, the product alumina is
then directly stored in the alumina shipping silo via an airlift, saving energy associated with re-handling
from the storage silo. Surplus alumina can be diverted to the alumina storage silo via an airslide
(Worsley Alumina Pty. Ltd, 2002).
Figure 4 - Area 4 Calciners
(Cargill, 2007)
Page | 8
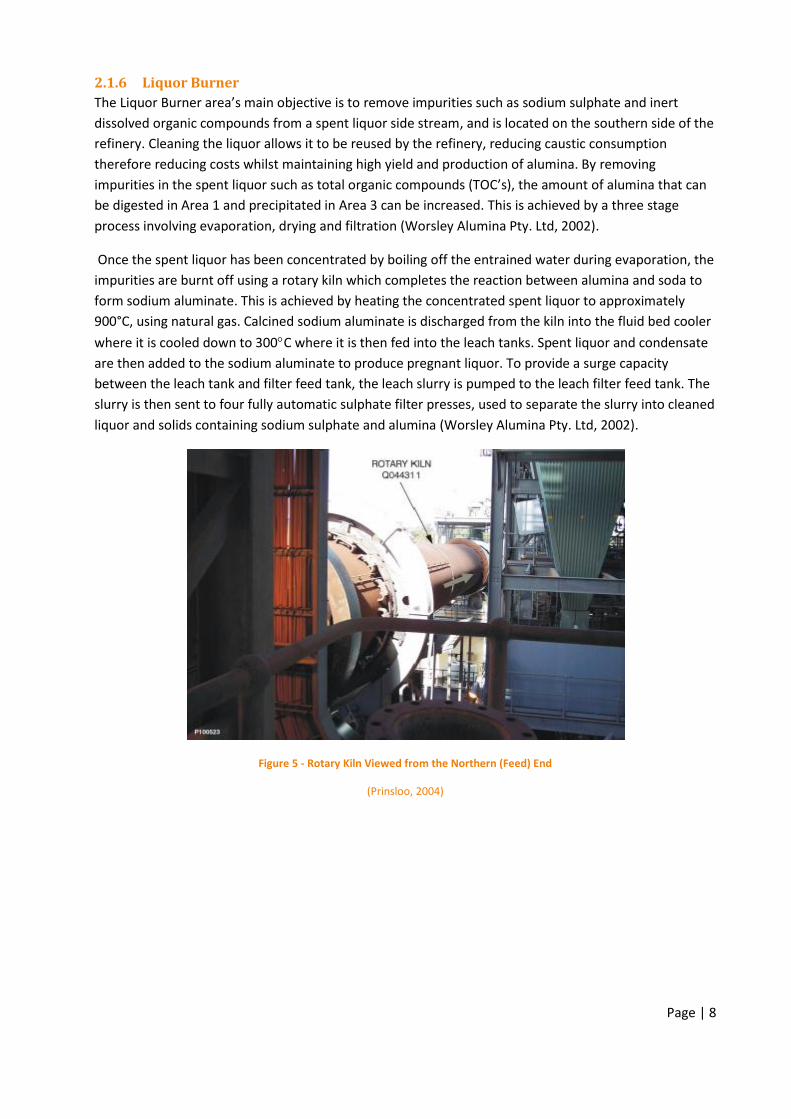
2.1.6 Liquor Burner
The Liquor Burner area’s main objective is to remove impurities such as sodium sulphate and inert
dissolved organic compounds from a spent liquor side stream, and is located on the southern side of the
refinery. Cleaning the liquor allows it to be reused by the refinery, reducing caustic consumption
therefore reducing costs whilst maintaining high yield and production of alumina. By removing
impurities in the spent liquor such as total organic compounds (TOC’s), the amount of alumina that can
be digested in Area 1 and precipitated in Area 3 can be increased. This is achieved by a three stage
process involving evaporation, drying and filtration (Worsley Alumina Pty. Ltd, 2002).
Once the spent liquor has been concentrated by boiling off the entrained water during evaporation, the
impurities are burnt off using a rotary kiln which completes the reaction between alumina and soda to
form sodium aluminate. This is achieved by heating the concentrated spent liquor to approximately
900°C, using natural gas. Calcined sodium aluminate is discharged from the kiln into the fluid bed cooler
where it is cooled down to 300C where it is then fed into the leach tanks. Spent liquor and condensate
are then added to the sodium aluminate to produce pregnant liquor. To provide a surge capacity
between the leach tank and filter feed tank, the leach slurry is pumped to the leach filter feed tank. The
slurry is then sent to four fully automatic sulphate filter presses, used to separate the slurry into cleaned
liquor and solids containing sodium sulphate and alumina (Worsley Alumina Pty. Ltd, 2002).
Figure 5 - Rotary Kiln Viewed from the Northern (Feed) End
(Prinsloo, 2004)

Page | 9
2.1.7 Powerhouse and Cogeneration Plant
The Powerhouse is responsible for generating electricity, steam and compressed air for the refinery and
is located in the northern region of the refinery near the Raw Materials Area. Electricity and steam are
generated using coal-fired boilers and steam-driven turbines, where as compressed air is generated by
five large air compressors. The Powerhouse exists on the refinery as it would be too expensive to source
electricity and steam elsewhere due to the amount required by the refinery. This Area is also one of the
most crucial areas of the refinery, as all areas are dependent upon it. The boilers are designed for an
output of 10MPa steam at 515C by burning Collie coal transported to the powerhouse from the Raw
Materials Area via conveyor. The steam produced by the boilers is fed to the turbines to produce
electricity and steam at 1300kPa and 450kPa (Worsley Alumina Pty. Ltd, 2002).
The refinery uses various voltages, which are dependent upon the size of electric motors, generally large
motors use 3.3kV, while smaller motors use 415VAC. There are two different types of compressed air
used in the refinery; process and instrument air. Process air is used to agitate various tanks and is by far
the largest user of compressed air, instrument air is highly refined and used to operate instrumentation.
The Cogeneration plant is connected to the powerhouse steam ranges and can be used to supplement
the steam or power generation of the Powerhouse, or provide emergency power. This plant is Worsley
operated but externally owned and is made up of a 120MW base-load gas turbine and a Heat Recovery
Steam Generator (HRSG).
Figure 6 - Powerhouse and Cogeneration Plant
(Worsley Alumina Pty. Ltd, 2002)
Page | 10
2.2 Worsley Control System Overview The control system architecture at the Worsley refinery is a complex combination of different networks
and distributed control systems (DCS). This is due to the size of the refinery and the fact that it has been
in continuous operation for 26 years. The upgrade between major control systems is a time consuming
and costly process as small areas of the refinery must be upgraded once at a time, in order to avoid
production downtime whilst maintaining refinery integrity and redundancy. The wide range of different
networks can be attributed to the evolution of different control systems applied to the refinery over the
years of operation. The following section will give a brief outline of the history of different DCS’s and
associated networks applied to the refinery, as well as an overview of the current configuration. The
history of distributed control systems at Worsley involves two major upgrades, TDC 2000/3000 to TPS
and then TPS to Experion EPKS which is currently in progress.
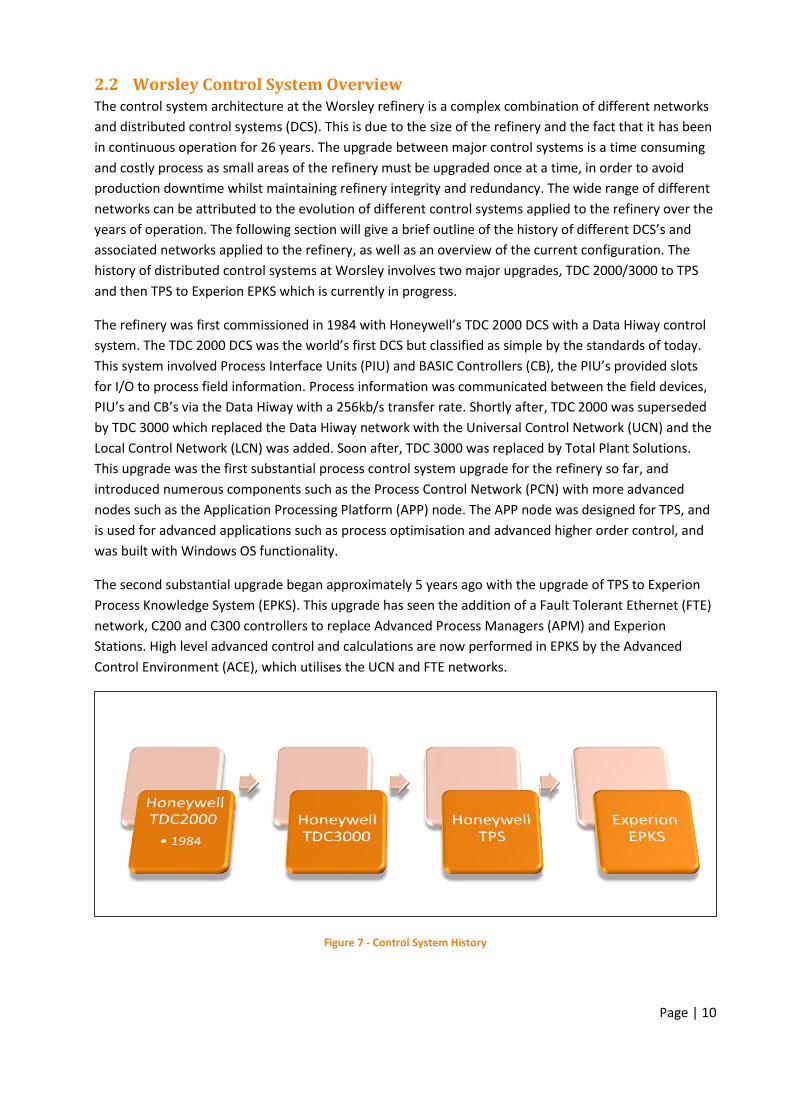
The refinery was first commissioned in 1984 with Honeywell’s TDC 2000 DCS with a Data Hiway control
system. The TDC 2000 DCS was the world’s first DCS but classified as simple by the standards of today.
This system involved Process Interface Units (PIU) and BASIC Controllers (CB), the PIU’s provided slots
for I/O to process field information. Process information was communicated between the field devices,
PIU’s and CB’s via the Data Hiway with a 256kb/s transfer rate. Shortly after, TDC 2000 was superseded
by TDC 3000 which replaced the Data Hiway network with the Universal Control Network (UCN) and the
Local Control Network (LCN) was added. Soon after, TDC 3000 was replaced by Total Plant Solutions.
This upgrade was the first substantial process control system upgrade for the refinery so far, and
introduced numerous components such as the Process Control Network (PCN) with more advanced
nodes such as the Application Processing Platform (APP) node. The APP node was designed for TPS, and
is used for advanced applications such as process optimisation and advanced higher order control, and
was built with Windows OS functionality.
The second substantial upgrade began approximately 5 years ago with the upgrade of TPS to Experion
Process Knowledge System (EPKS). This upgrade has seen the addition of a Fault Tolerant Ethernet (FTE)
network, C200 and C300 controllers to replace Advanced Process Managers (APM) and Experion
Stations. High level advanced control and calculations are now performed in EPKS by the Advanced
Control Environment (ACE), which utilises the UCN and FTE networks.
Figure 7 - Control System History

Page | 11
2.3 Engineering Tools/Applications utilised In order to work on projects and maintain plant support, Process Control engineers at the Worsley
refinery use a wide range of tools. In order to productively contribute to project work, plant
maintenance and configurations, a selection of the tools were used. Each resource utilised is briefly
introduced and described in the following section in order for the reader to understand the context
where the resource is mentioned further in the report.
2.3.1 Honeywell HMI Web Builder
The HMI Web Builder application is used to create custom page graphics to be used in Experion Station.
This application allows the user to design and manipulate the page layout with click and drag ease.
Graphics and shapes are configured with tag or point names linking various control networks to the DCS
so that information can be graphically represented. The use of Visual Basic program coding can also be
utilised by the application to perform more complex functions and behind the scene actions. Site
standards are applied to follow Advanced Process Graphics (APG) when graphics are created that are
intended for operator use, for example square boxes are used for status indication. Site standards for
creating graphics have been developed by following Abnormal Situation Management (ASM) standards
for all pages created for operator use. These standards encourage a grey on grey design with colours
reserved for events requiring urgent operator attention such as alarms.
2.3.2 Honeywell Configuration Studio: Quick builder
The Quick Builder application forms a part of the Control Configuration studio suite and is used to create
relational database of points, controllers and flex stations. Process Control engineers at the refinery use
this application specifically to provide HMI Web Builder the ability to interface information from SCADA
networks such as PLC addresses to the DCS.
2.3.3 Honeywell Configuration Studio: Control Builder
The Control Builder application forms a part of the Control Configuration studio suite and is used to
program control strategies by creating control modules (CM). This application uses a graphical approach
to program with function blocks, document and implement programs that are run in EPKS. In addition,
online monitoring is included with this application and is highly useful for debugging and problem
solving, particularly during commissioning of new equipment and control solutions.
2.3.4 Honeywell Experion Station
Experion Station is used by Control Room Operators (CRO) to interface to the Worsley Refinery control
system in real time. This application is primarily used by the CRO’s to monitor and make changes to how
the refinery is run. The application involves a wide range of functions including alarm summaries, event
management, trending displays and graphics processing. Process Control engineers utilise this
application for a wide range of tasks including testing new graphics and referencing tags or points within
the DCS.
Page | 12
2.3.5 Honeywell PlantScape Station
PlantScape station is an older version of Experion station and is used as a window to the process outside
of the control room. This application is extensively used with view-only configurations to monitor
system information on the DCS and SCADA systems. PlantScape is primarily used by Process engineers,
operations and management personnel as it can be accessed on any computer on the WAPL APAC
network and does not require engineering access.
2.3.6 Honeywell Doc4000
This resource is used to provide the Worsley Refinery with simplified management of the automation
system information. This is used at the Worsley refinery to query points and tags of interest within all
assets of operation and manage changes to the control system, resulting in detailed information and
references to points and tags. This application is used by Process Control engineers in all areas of work
to read process information from both DCS and SCADA systems, but mainly to cross reference tags
across all networks. This application is the primary documentation tool for the control system at
Worsley.
2.3.7 Honeywell PHD Uniformace
Process Historian Database (PHD) is used to gather data from control systems and a range of data
sources into a unified database for long term storage (Honeywell International, 2009). This application is
used at Worsley as a corporate historian to analyse performance and as part of the laboratory system
that requires process information at specific sample times.
2.3.8 ProWORX 32
This application provides a programming interface to create, download, monitor and modify PLC code.
ProWORX 32 is a flexible and powerful application allowing the user to program on-line or off-line and
analyse refinery activity in real time (Schneider Electrical). This resource is specifically used at the
Worsley refinery with Quantum PLC’s where Process Control engineers perform a range of tasks
including diagnosing errors and adding additional features not incorporating into the original PLC code.
It should be noted that the majority of PLC code work completed using this software is done using
online code, therefore changes made are effective on the live system immediately.
2.3.9 Microsoft Office Applications
Applications within the Microsoft Office suite are extensively used throughout the Worsley refinery.
Specifically the Word, Excel, Visio and Project applications are used by the Process Control group to
create documents, databases, diagrams and time management charts. Microsoft applications are also
used based on their compatibility with Honeywell applications, for example exporting queries from
Doc4000 to Excel.
Page | 13
3 Project Work
During the progression of the internship, contributions were made to number of projects. The projects
have been selected as they contain relative significance to the Process Control field, achievable
outcomes and valuable learnings. A contribution has been made to six projects but it has been decided
to discuss four projects in specific detail. The selection of projects has been based upon valuable
experience obtained and interest to the reader, these projects include:
Experion Development Test System
Reclaimer System Faults
E&G Commissioning - Bauxite Shuttle System
E&G Commissioning - Sulphate Removal Filters
The remaining projects will be mentioned and briefly summarised in later sections of the report.
3.1 Experion Development Test System
3.1.1 Background
The Experion Development Test network is a process control test network that has been developed to
simulate the entire process control system. This allows engineers to test changes and upgrades without
implementing them on the online system, avoiding safety and refinery performance risks. This is a
project that has been started by previous interns, and has been left unfinished. It should be noted that
parts of the development network were once used to assist the mine server firewall, and since
components have been added and removed from the network since it was last worked on, unknown
components of the network should be taken into consideration.
As a part of the current migration from TPS to EPKS, Fault Tolerant Ethernet (FTE) networks have been
added site-wide and are used in the majority of the refinery. In order for the development network to
test control solutions that are incorporated on FTE networks, the network must provide FTE
functionality. The development network has previously been given a low priority to receive FTE
functionality as production networks have taken precedence, but as the migration has progressed,
priority has been granted to the development network to receive FTE functionality.
Page | 14
3.1.2 Scope
The objective of this project is to start where previous years interns have left off, to implement some
final functionality of the development network. The development network project requires an
investigation into the current network, detailing the current configuration, removing parts of the
network that are not needed, safely avoiding interaction with production networks and implementing
the designed FTE functionality for the network. The scope of this project can be broken up into three
phases, these being:
Phase I - Investigation into the current network. This means combining all the documentation on
the current network configuration, specifically the 'CCR-141 Switch Connections' (Edwards, CCR-
141 Switch Connections for the FTE Network Development System, 2010) with current
components and configurations physically installed.
Phase II - Decision on networks capability and function. Meeting with responsible engineers and
IM personnel to decide on the configurations and connection properties the connection to the
core of the network will have.
Phase III - Implementation of network configuration. This Phase involves the physical cable
connections and the software configurations for the head switches, switches and machines.
3.1.3 Implementation/Method
Due to both of the intern`s work, the project has progressed through phases I and II, and work on phase
III of the project has been undertaken. Roughly three days were spent on phase I, which involved
studying the current network against documentation of the network. Whilst physically checking the
switch connections within this network, unidentified cables (not labelled) were found. These cables had
to be identified as they were occupying ports within switches that were needed for FTE capabilities. In
order to remove the cables, confirmation was needed that the cables were not being used as a part of
any production networks. This was achieved by contacting Ryan Peters – Process Control System Admin,
who helped trace the unknown cables back to empty switches. Within this phase, the configuration
schematics of the network have been updated to include what is currently connected to the network
and cable types required. These schematics have been included in Appendix C: Development Network
Switch Connections.
Phase II involved meeting with IM personnel to decide upon the network’s uplink to core. This meeting
took place on Tuesday 13th of September. During this meeting both interns, along with Ryan Peters
discussed with Patrick Baldwin - Information Management Infrastructure consultant, the network’s
uplink to core via the Juniper Switches, which are used at Worsley for high level network control. The
outcome of the meeting was that a connection for the development network is to be configured in the
Junipers as a production network with full FTE capabilities. The specific firewall rules that are to be
configured within the junipers will be left to implement when more about the head switch
configurations and required network functionality are know

Page | 15
The final phase is currently in progress but has been placed on hold awaiting delivery of cable. This
phase involves final configuring of the FTE components of the network. The configuring started from
each head switch and will work outwards within the network. The head switches have been successfully
configured with the assistance of Ryan Peters by establishing a hard connection to switches. These head
switches have had any previous configurations removed and configuration details from a head switch on
a production FTE network have been applied.
The next step in this final phase was to establish a network connection between the two head switches.
This involved the physical cabling of the head switches to fibre optic break out panels, and highlighted
the fact that incorrect cables had been ordered for this project.
3.1.4 Technical Issues/Project Constraints
The major technical issues that delayed the project back from the proposed and desired progression
were unknown network components, remnants of previous production networks on the development
network and incorrect cable types.
During a step within the final phase of the project, a connection between the two head switches was
required. It was previously assumed and not physically tested that the cables previously ordered would
match the required cable connections. However on closer inspection of the cabling, it was determined
that the cables did not match the required connection types. This placed a hold in the progression of
this project. In response to the issue, the required cable type connectors were indentified and a search
was conducted within the equipment room to locate the cables. As the search proved unsuccessful, the
required cables were documented, a quote requested and an order submitted.
Time management has also hindered the progression of this project. Due to commitments working off-
site on commissioning projects, days were missed when Ryan Peters was available to work on the
project. This setback has been foreseen and sufficient catch up time when Ryan will be available has
been arranged when commissioning is scheduled to be completed.
3.1.5 Project Status
The current status of this project is on hold and as a result the time allocation and finish date have been
pushed back. The project had been progressing productively, but due to unforseen cable issues has been
placed on hold, awaiting cable delivery. Once the cable has been delivered, the project can be resumed,
and has been allocating a time extension within the interns` time available at Worsley. This time
allocation adjustment can be seen in Appendix C: Development Network Switch Connections.
This project will continue to the future and can be extended to include physical Honeywell C300
controllers on the development network. These controllers have recently become available to be
incorporating into the network and should be used to provide an extra level of testing, as control
solutions are currently loaded into simulations of C300’s. The use of actual C300s over simulated
hardware by Process Control Engineers should be encouraged.
Page | 16
3.1.6 Project Conclusion
This project has provided important hands-on experience dealing with industrial scale networks through
work configuring switches and network diagnostics. The FTE functionality added to the development
network is a feature that will remain with the refinery long after the internship and prove a valuable
contribution to the company. As a direct result from the work on this project, control solutions designed
for FTE networks will be able to be sufficienly tested before being applied to production networks. This
will then reduce problems encountered with loading new solutions into the refinery and hence reduce
process downtime, an obvious economical advantage to the refinery.
3.2 Reclaimer System Faults
3.2.1 Background
In order for the refinery to operate continuously it must be fed constantly and reliably with crushed
bauxite. The Raw Materials Area is responsible for this and utilises two bauxite reclaiming systems to
reclaim bauxite from stockpiles. Each reclaiming system uses a bucket wheel and reclaim carriage to
reclaim bauxite where it is then conveyed using bridge and reclaim conveyors to either one of two
transfer conveyors. Flop gates are used to direct bauxite from both reclaiming systems to either transfer
conveyor.
Currently there is a ‘Common Alarm’ generated for each of the two reclaimer systems that groups
together several different low level alarms into one low level alarm. The sources for this common alarm
are spread across three PLC’s, these being:
PLC 310-1
Reclaimer 1 PLC
Reclaimer 2 PLC
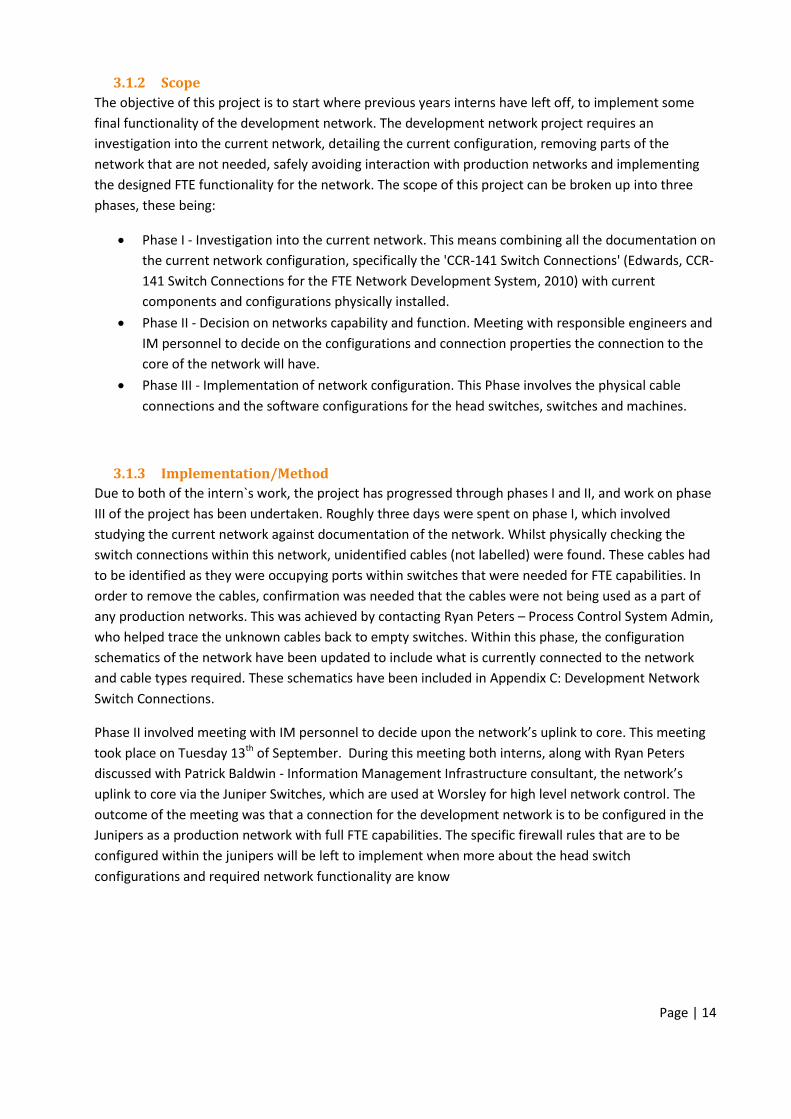
The advantage of this alarm grouping is evident in the case where several alarms activate and are
overlapped. Due to the grouping, one alarm will activate rather than several alarms. This advantage is
illustrated below in Figure 8, where one alarm is activated rather than three, reducing the load on the
CRO
.
Figure 8 - Common Alarm Grouping Advantage
Page | 17
An alarm is defined as an event indicating a problem requiring operator attention (The Engineering
Equipment and Materials Users Association, 1999). The Worsley group defines a low level alarm as any
event which requires operator action that prevents a plant upset and escalation to a higher priority
(Thwaites, 2003). The response of the CRO to this common alarm is to communicate to electrical
technicians so that they can diagnose the cause of the alarm and resolve the problem. Due to the CRO
not being able to communicate the cause of the common alarm and the fact that the electrical
technicians are currently rarely familiar with the specific details of the process, the common alarm
requires an undesirable amount of time to resolve, resulting in unnecessary reclaimer downtime.
Abnormal Situation Management
ASM is a body of knowledge and best practises developed by the ASM Consortium (Abnormal Situation
Management Consortium, n.d). The ASM Consortium is a research and development team of 12
companies such as Shell, Chevron Texaco and is led by Honeywell. Since the team’s beginning 17 years
ago it has conducted comprehensive research onsite into the root causes of incidents and large scale
industrial disasters. Their findings include ways to detect precursors of abnormal situations, prevent
incidents and more effective ways to manage abnormal situations before they spiral out of control
(Honeywell Internation, n.d).
Standards created by the ASM Consortium are applied onsite at the refinery for operator interfaces, as
they have proven measurable improvements on how quickly operators respond to faults and detect
events (Abnormal Situation Management Consortium, n.d).
3.2.2 Engineering Tools utilised
This project required the use of tools such as;
MS Excel – Spread sheet construction of alarm causes and addresses
MS Visio – Document Control System Architecture
Experion Station – Test graphics created and reference common and fault alarms
ProWORX 32 – Investigate and trace PLC code
HMI Web Builder – Graphic design
3.2.3 Scope
This project has been suggested to aid the CRO and electrical technicians responsible for the bauxite
reclaimer systems in the Raw Materials area of the refinery, in an effort to reduce reclaimer downtime.
This is to be achieved by creating a means of alarm diagnostics on both reclaim common alarms. After
discussions with Ben Marler (Supervising Engineer) it was decided that the scope this project was to
identify all the possible causes to the common alarms and create operator graphics that highlight all
causes triggering the alarm. Discussions on the project also concluded that the work could be completed
individually with assistance from supervising engineers Ben Marler and Julian Leitch. The scope of this
project can be broken up into three phases, these being:

Page | 18
Phase I - Identify all of the alarms that trigger the common alarms. This includes tracing the
causes of these individual alarms all the way back to physical inputs and investigating all the
possible causes for the activation of these alarms.
Phase II – Database of points. This phase involves creating points that can relate PLC addresses
to DCS points, allowing the operator on the DCS to view PLC information.
Phase III – Experion Alarm Page. This phase involves creating HMI graphics for the operator to
view which will show all the possible causes for the common alarm, and highlight what is
activating the alarm.
During the progression of the project it became clear that there were additional alarms on each reclaim
system that required necessary diagnosing. Similar to the reclaimer common alarms, causes of the
reclaimer sequence systems 1 and 2 fault alarms were not obvious, and operators and technicians could
benefit from alarm diagnostics graphics on these alarms. Therefore the reclaimer sequence system fault
alarms for each reclaimer were added to the project scope. This significantly increased the scope of the
project, therefore substantial time was added to the time allocation for this project.
3.2.4 Time Allocation and Management
The initial time allocation required to complete this project was estimated at three weeks, but as the
project progressed and the scope broadened to include sequence faults, a two week extension was
added to the time allocation. As the majority of the work for this project can be completed individually,
it was possible to push forward the project’s start date, and spend the required time on the project
intermittently, reflecting the availability of supervising engineers for other projects. For the phases that
required external consultation with area operators, a day was reserved where the operator was
available and this project received priority over others.
3.2.5 Implementation/Method
Phase I
Phase I involved the identification of all the PLC code associated with activating the common alarms and
sequence faulted alarms. Before the alarm causes could be traced, general knowledge of the control
system architecture of the area was required to identify system components and connection interfaces.
The reclaimer field I/O is connected to the associated reclaimer Quantum PLC through Quantum Remote
I/O. Each Reclaimer PLC is connected to a ModBus Plus (MB+) interface where information is transferred
to PLC 310-1. As PLC 310-1 is connected to the Fault Tolerant Ethernet (FTE) network, information can
then be transferred to the Raw Materials Experion server, Experion stations on the DCS and eventually
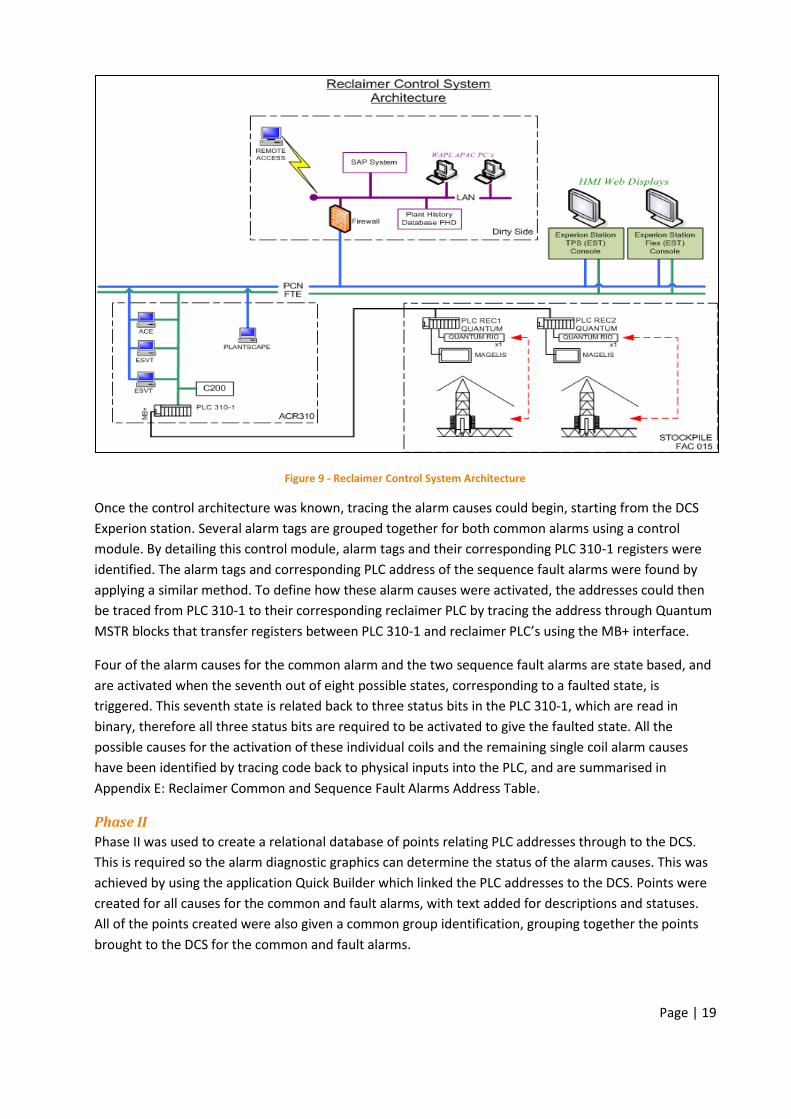
to WAPL computers on the LAN network. This control system can be seen below in Figure 9.
Page | 19
Figure 9 - Reclaimer Control System Architecture
Once the control architecture was known, tracing the alarm causes could begin, starting from the DCS
Experion station. Several alarm tags are grouped together for both common alarms using a control
module. By detailing this control module, alarm tags and their corresponding PLC 310-1 registers were
identified. The alarm tags and corresponding PLC address of the sequence fault alarms were found by
applying a similar method. To define how these alarm causes were activated, the addresses could then
be traced from PLC 310-1 to their corresponding reclaimer PLC by tracing the address through Quantum
MSTR blocks that transfer registers between PLC 310-1 and reclaimer PLC’s using the MB+ interface.
Four of the alarm causes for the common alarm and the two sequence fault alarms are state based, and
are activated when the seventh out of eight possible states, corresponding to a faulted state, is
triggered. This seventh state is related back to three status bits in the PLC 310-1, which are read in
binary, therefore all three status bits are required to be activated to give the faulted state. All the
possible causes for the activation of these individual coils and the remaining single coil alarm causes
have been identified by tracing code back to physical inputs into the PLC, and are summarised in
Appendix E: Reclaimer Common and Sequence Fault Alarms Address Table.
Phase II
Phase II was used to create a relational database of points relating PLC addresses through to the DCS.
This is required so the alarm diagnostic graphics can determine the status of the alarm causes. This was
achieved by using the application Quick Builder which linked the PLC addresses to the DCS. Points were
created for all causes for the common and fault alarms, with text added for descriptions and statuses.
All of the points created were also given a common group identification, grouping together the points
brought to the DCS for the common and fault alarms.
Page | 20
Phase III
In phase III an online, graphical representation of the common and fault alarm diagnostics was created.
This involved representing the status of the alarms and all causes by linking status objects and text to
control module parameters and points created in Quick Builder. The design and physical layout of the
graphic page was created using the HMI Web Builder application, applying Worsley site standards and
template which are derived from ASM standards. The Worsley graphic template was used for the
bottom operator dashboard, which is the operators` interface to view point descriptors and make
changes. The layout of the page consisted of four different areas for each reclaimer sequence fault and
common alarms and was modified several times after consulting the area operator, regarding graphics
the flow.
Status Lights were used to indicate the statuses of all the alarm causes, arrows to indicate the
orientation of OR and AND arrangements within the code and text to detail the alarm causes. Remaining
within the site standards for graphics the status lights show grey when the alarm cause is inactive, white
when active and cyan blue when active with an alarm. The status light objects were then linked to their
associated control module reference or Quick Builder point, and graphics were extensively tested for
errors using Experion Station. The final design for the alarm diagnostic page can be seen in Appendix F:
Reclaimer Alarm Diagnostic Graphic Page.
3.2.6 Technical Issues/Constraints
The technical issues and constraints encountered with this project involved the interrogation of the
reclaimer PLC code and MB+ interface. Issues were raised on the communication between the two PLC’s
using the MSTR block, and the manipulation of bits between the PLC and the DCS. These issues were
solved by consulting with responsible project engineer Julian Leitch – Process Control Engineer and by
applying a debugging methodology gained from university studies. This methodology involved research
on the MSTR block, specifically the MB+ interface specification used in this block and how they were
applied in this specific example.
The HMI graphic developed was constrained to displaying the status of PLC addresses within PLC 310-1.
This was due to the fact that there was no room to send addition registers on the MB+ interface
between PLC 310-1 and the reclaimer PLC’s. This restricted the registers that could be brought from
reclaimer PLCS’s to PLC 310-1 and hence to the DCS graphics to what was already being transferred. This
limited how detailed the graphic diagnostic could go in highlighting what was activating the alarms.
3.2.7 Project Status
The current status of the project is complete and is simply awaiting graphic rollout to the CRO. This
project was completed on time and within the allocated time based on a revised project work Gantt
chart found in Appendix D: Project Work Gantt Chart.
This project can be extending into the future once additional hardware is installed on the reclaimer
PLC’s that could allow more detailed alarm diagnostic graphics. There are plans in the near future for the
reclaimer PLC’s to be added to the FTE network, this would allow information from each reclaimer PLCs
to be sent directly to the DCS without being sent to PLC 310-1 via MB+. This would allow a more detailed
alarm diagnostic page highlighting how the causes of the alarms were activated.
Page | 21
3.2.8 Project Conclusion
This project has provided important hands-on experience using industrial grade PLCs, process control
networks, Experion graphics and alarm management. The alarm diagnostic graphics created will
continue to be used long after the internship and will prove of great value for the refinery. The graphics
created have proven to reduce the time taken to diagnose and resolve the common and fault alarms,
resulting in reduced equipment downtime, an obvious economical advantage to the refinery.
In order to complete this project successfully the identified engineering methodologies have been
followed, particularly when encountering issues. The project has been specifically chosen to build upon
experience and skills gained at university such as extensive debugging and PLC logic interrogation. This
project has provided the means to apply university learning, whilst creating new experiences with
applications and workplace procedures.

Page | 22
3.3 E&G Commissioning Shuttle Conveyors
3.3.1 Background
The E&G expansion construction is currently being finalised in certain areas of the plant. In order to
make sure all the hardware, software and the interface between them, involved in the expansion is
operating correctly, commissioning of the Process Control Equipment must take place. This project will
focus commissioning on Facility 024B Bauxite Grinding – Shuttle Conveyors. This area is responsible for
the Bauxite Feed Bin Conveyor system which fills the Bauxite Feed Bins.
Crushed bauxite is transferred to the shuttle conveyors via two transfer conveyors which convey bauxite
from the bauxite stockpiles. The transfer conveyors feed bauxite to the top of three bauxite feed bins in
facility 024, it is then discharged through a bifurcated chute onto two reversible shuttle conveyors. The
function of the shuttle conveyors is to maintain an adequate supply of bauxite to each of the bauxite
feed bins by controlling which bin is filled. The three bauxite feed bins feed four mill circuits, making it
important that there is always sufficient bauxite in the feed bins, to maintain continuous production.
Figure 10 - Bauxite Feed Bin Filling System
Figure 10 above details the bauxite feed bin filling system, highlighting the components that are moved
by the shuttle travel drive and two possible different filling positions. System 1 is filling bin 5, and in
order to change positions to fill another bin, shuttle 1 must move in a westerly direction so the bauxite
feed falls in one of two easterly chutes on the shuttle travel. This situation is reversed in the second
example on system 2, as system 2 is filling bin 3, and in order to fill any of the other westerly bins, the
shuttle travel must move in an easterly direction.

Page | 23
The E&G expansion in this area involves the addition of a fourth bauxite feed bin, which requires a new
set of conveyors to feed the fourth bauxite bin. Replacement conveyors for C024111-2 and C0242111-2
are also needed to feed the new conveyors. New VSDs for shuttle travel drives and new Dust Fogging
systems for dust suppression are also to be installed
3.3.2 Scope
This project will focus specifically on the commissioning of the replacement shuttle conveyors C024211-
2, the new VSD for shuttle travel drive for system 2 and the migration of PLC code to C300 Control
environment. This will involve Factory Acceptance Testing (FAT), pre commissioning testing and the
commissioning of the final control solution. The scope of this project can be broken up into four phases,
these being:
Phase I – Familiarisation with the Control System Functional Description (CSFD) for Facility 24B
Bauxite Grinding – Shuttle conveyors. This document provides a detailed description of the
Process Control System which should be known to commissioning personnel.
Phase II – FAT. Testing of the code on a simulated process.
Phase III - Pre commissioning tests. This phase involves testing certain aspects of the drive
functionality that have been raised during the FAT that must be cleared before commissioning.
Phase IV- On site commissioning. This phase involves the testing of the shuttle drive and
replacement C024211-2 conveyor, which will test all the functionality including all involved I/O,
interrupts, trips and operational modes.
3.3.3 Implementation/Method
The project’s start date can be traced back to when the CSFD was first received for area 024B. Studying
this document was treated as a priority for approximately one week. This week was used to gain
sufficient understanding of how the shuttle conveyors and drives are controlled and the scope of the
upgrade, so that a FAT could be carried out on the proposed upgrade.
The FAT for this E&G upgrade has been completed by the interns and responsible engineers successfully.
The tests were successful as all the possible functionality of the drives was tested thoroughly, raising
crucial issues that required addressing prior to commissioning. During the several days of the FAT, there
were various errors and undesired behaviour picked up in the code that required changes before
commissioning. The three major technical issues picked up by the FAT were the stopping functionality of
the travel drive, a difference in how the process was simulated compared to on site conditions and a
priority level of a local direction hand switch.
During the testing of the stopping functionality of the shuttle drive, it was picked up that in the case that
the local stop button was pushed while the drive was in between the bins, the drive would not stop until
it reached a bin proxy. This feature was specified within the CSFD, but after discussing this functionality
with the responsible engineers it was agreed that the shuttle drive should stop where ever it is located
on the tracks when a local stop is activated.
Page | 24
The FAT was conducted on a simulation of the bin filling system, and it was picked up on that the
simulation execution time of the control module was 200ms. This execution time is not representative
of what can be achieved by this specific system on site, as the expected onsite execution speed is
approximately 500ms to 1000ms. Having a different execution time, testing the code compared to that
of the refinery on-site can cause problems with code based on timer functionality. Changing the
simulation execution speed to 1000ms created some issues with feedback for commands. As the
execution time had been increased, feedback would take longer to be received from the drive, and this
resultantly triggered some timers in PLC code that had been programmed accordingly to the 200ms
simulation execution time. This issue was solved during the FAT by changing the timers accordingly
based upon a realistic on site execution time.
Testing the functionality of the different modes highlighted an error with a shuttle direction hand
switch. When operating in ‘Local’ mode a shuttle direction hand switch is used to control which
direction the shuttle moves. When moving from ‘Local’ to ‘Program’ it was found that this direction
from the hand switch remained a priority, rather than the direction coming from the program. This
meant that the shuttle always travelled in the direction of the hand switch rather than the direction the
program intended. This was fixed by setting a priority on the hand switch to only activate during ‘Local’
mode.
Phase III involved conducting any pre-commissioning tests to be conducted. As there had been some
concerns raised about the stopping and starting ability of the shuttle drive, a test was conducted to
control a small motor using the drive. This highlighted a part of the process that could not have been
tested during the FAT, the ABB Drive Controller. During testing it was found that the drive did not always
start when expected. For the drive to start several commands are sent to the controller in sequence and
it was determined that on some cycles not all of the commands were received in sequence, as the drive
controller was not designed to receive commands as quick as the controller was sending them. This
problem was overcome by inserting null commands in between each sequenced start up command,
therefore sending one start up command each cycle.
The final phase of the commissioning project saw 24 hour engineering assistance in the initial runs of
the system. This phase highlighted several design flaws of the new shuttle drive and conveyors involving
the shuttle striker plates and conveyor design. As the shuttle moved during testing with high flow of
bauxite, the shuttle would get lost and keep moving until hitting the final over travel limits. This was due
to the fact that the proxies over each bin are only activated upon contact of the striker plates of the
shuttle and not when there is no contact. The shuttle had too much momentum to stop in time, moving
past the striker plates. This meant that when the shuttle’s striker plate hit the bin proxies, the shuttle
would get a stop command, but not stop in time and the shuttle’s striker pads would pass the proxies,
meaning the shuttle did not know it was over the bin and therefore kept moving. This problem was
overcome by welding extensions to the striker pads, and proved functional when the shuttle was
operating under maximum bauxite load.
There have been many more variations and changes made during this final commissioning phase, with
several overlapping changes that have been itemised for further development.
Page | 25
3.3.4 Project Status
The current status of the project is complete, with minor issues still remaining. The project was finished
slightly over the time allocated due to the numerous commissioning issues encountered. A modified
project Gantt found in Appendix D: Project Work Gantt Chart, highlights the projects start and finish
dates, with the amount of time allocated.
3.3.5 Project Conclusion
This project has provided an invaluable and interesting hands-on experience introducing new equipment
into the refinery. The integration of the upgraded bauxite shuttle conveyor system has proven to be
successful as operation of the system has been ongoing. The issues highlighted during this
commissioning project have been noted so that they can be prevented in future commissioning projects
on the remaining shuttle conveyor system, and applied to other commissioning projects.
3.4 E&G Commissioning Sulphate Removal Filters
3.4.1 Background
The E&G expansion construction is currently being finalised in certain areas of the plant. In order to
make sure all the hardware, software and the interface between them, involved in the expansion are
operating correctly, commissioning of the Process Control Equipment must take place. This project will
focus commissioning on Facility 044 Sulphate Removal – Sulphate Removal Filters, located in the Liquor
Burner area. This area is responsible for removing impurities from a side stream of spent liquor so it can
be reused in Areas one and two. Facility 044 is specifically designed to provide additional sulphate
removal.
Due to the E&G upgrade, Facility 044 is required to increase its sulphate removal capacity. This is
achieved by an additional evaporator, crystalliser and thickener tanks and upgraded sulphate plate pack
filters. The additional evaporator is designed to increase the spent liquor concentration, crystalliser and
thickener tanks are added to increase residence time of the process, allowing for a higher capacity and
the upgraded plate pack sulphate filters are designed for a higher process filter flow.
3.4.2 Scope
The scope of this commissioning project is to integrate two new sulphate plate pack filters. As the FAT
has previously been completed for these filters by supervising engineer George Boaden, this project will
involve pre commissioning testing and the commissioning of the final control solution. The work to be
completed on this project can be broken up into three phases, these being:
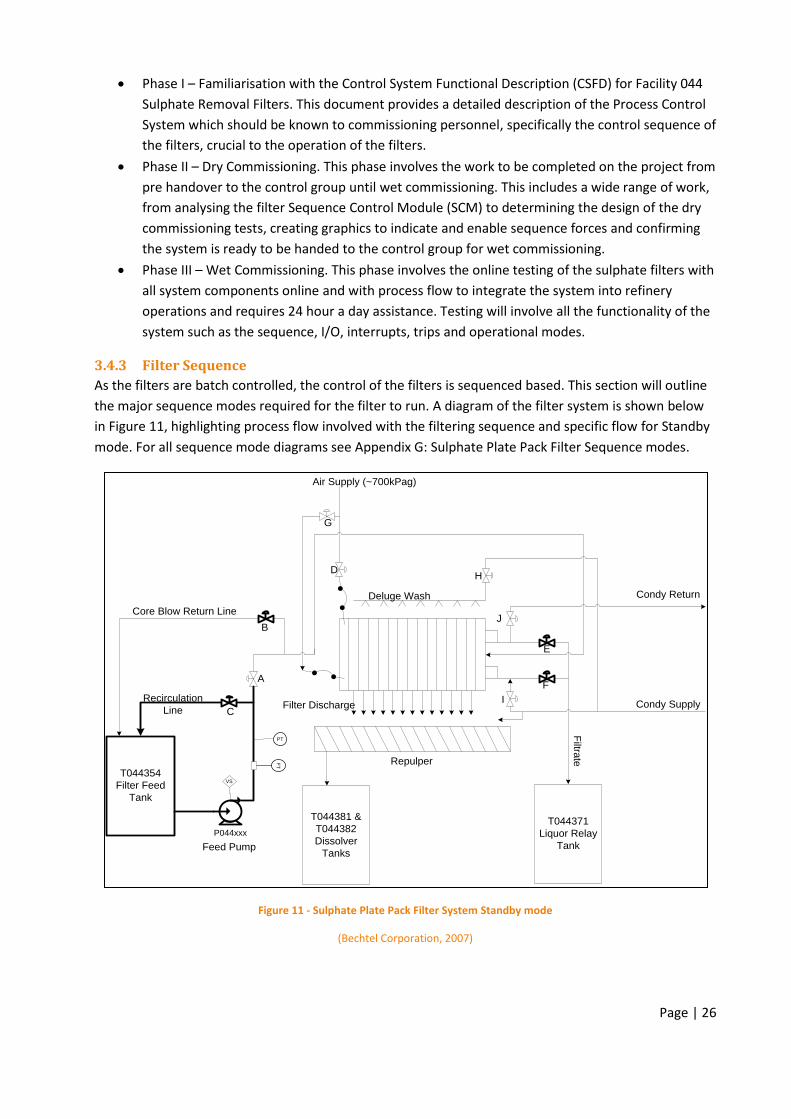
Page | 26
Phase I – Familiarisation with the Control System Functional Description (CSFD) for Facility 044
Sulphate Removal Filters. This document provides a detailed description of the Process Control
System which should be known to commissioning personnel, specifically the control sequence of
the filters, crucial to the operation of the filters.
Phase II – Dry Commissioning. This phase involves the work to be completed on the project from
pre handover to the control group until wet commissioning. This includes a wide range of work,
from analysing the filter Sequence Control Module (SCM) to determining the design of the dry
commissioning tests, creating graphics to indicate and enable sequence forces and confirming
the system is ready to be handed to the control group for wet commissioning.
Phase III – Wet Commissioning. This phase involves the online testing of the sulphate filters with
all system components online and with process flow to integrate the system into refinery
operations and requires 24 hour a day assistance. Testing will involve all the functionality of the
system such as the sequence, I/O, interrupts, trips and operational modes.
3.4.3 Filter Sequence
As the filters are batch controlled, the control of the filters is sequenced based. This section will outline
the major sequence modes required for the filter to run. A diagram of the filter system is shown below
in Figure 11, highlighting process flow involved with the filtering sequence and specific flow for Standby
mode. For all sequence mode diagrams see Appendix G: Sulphate Plate Pack Filter Sequence modes.
Figure 11 - Sulphate Plate Pack Filter System Standby mode
(Bechtel Corporation, 2007)
T044354
Filter Feed
Tank
P044xxx
PT
VS
T044381 &
T044382
Dissolver
Tanks
Repulper
T044371
Liquor Relay
Tank
Filtra
te
Condy Supply
Condy ReturnDeluge Wash
A
I
G
F
E
J
DH
C
B
Core Blow Return Line
Recirculation
LineFilter Discharge
Air Supply (~700kPag)
FT
Feed Pump
Page | 27
When a filter is brought back from being offline, or from any state where it is awaiting to begin filtering,
it is brought into Standby mode. During this mode the feed pump is on at a minimal level and is simply
recirculated back into the filter feed tank to ensure the system can remain fully automated. When start
filtering is initiated, Filter Filling mode is entered and sulphate slurry is pumped into the filter at high
rates with the bottom filter port closed to fill the filter. When the feed line pressure measures 150kPag
the filter mode should switch to Filtration mode. During this mode the bottom filter port is closed and
filtration can occur, accumulating cake. This mode will continue until the feed flow rate has reached a
minimal level or the 20 minute filtration timer has expired (Bechtel Corporation, 2007).
Pressure Release mode will then be entered to stop the filtration. It is during this transition where there
is a maximum potential to cause damage to the feed pump bearings and recirculation valve ‘C’, due to
the immense pressure drop in the feed line, approximately 600kPag to atmospheric pressure. To avoid
damage the feed pump must be reduced to minimum speed for 5 seconds prior to this transition, this is
then followed by closing valve ‘A’ and opening ‘C’. Once the pressure has been released, excess slurry is
returned to the feed tank using air supply in Core Blow mode. Once the Core Blow mode timers are
expired, air supply is channelled through the bottom filter ports in Filtrate Line Blow mode to blow
filtrate to the liquor relay tank. Once the Filtrate Line Blow timers are expired, the plate packs are then
opened releasing filter discharge to the dissolver tanks in Plate Pack Opening mode, excess discharge is
then washed through to the dissolver tanks using condensate supply in Deluge mode. The filters can
then enter the optional Internal Wash mode, which will be intermittently selected by the operator and
uses condensate supply to internally wash the filter from the bottom to top filtrate ports (Bechtel
Corporation, 2007).
3.4.4 Implementation/Method
Based on previous experience with commissioning projects, the advantages of extensive pre-
commissioning tests became clear. It was evident that the more testing and analysis into the system
prior to wet commissioning would see problems and issues encountered and resolved before affecting
the commissioning process, where they have the potential to affect production. It was initially decided
to test the functionality of the valves, as they controlled the sequence modes as a part of dry
commissioning. In order to achieve this during dry commissioning (with no online process flow) it was
determined that graphics would be required to indicate sequence states and force through transitions
that required process flow, such as flow measurements.
A detailed analysis of the filter SCM in which the filters are controlled by, has been completed to
highlight which transitions require forcing to test all the filtration sequences with only valve action
online. This information has been applied to the creation of the test graphics which provides the
capability to force the required components of the SCM. This graphic will be used to run the system
through the main filtration sequence modes during dry commissioning.

Page | 28
3.4.5 Technical Issues/Constraints
The technical issues and constraints encountered during this project include continuous delays in the
handover to the Process Control group, numerous faults being identified with the system. This has
delayed the actual dry commissioning tests that can only be conducted once handover has been
achieved.
Handover had been rejected due to ongoing issues with the valves which included feedback of the valve
positions. As mentioned further in the report, the work between engineers in the Process Control group
is interrelated, and hence an issue with valve standards used for the filter valves was uncovered by
another Process Control Engineer - Vishwesh Soni. In other valves using the same standards as the
valves used in the filtering process, a feedback error has been identified when instrument air has been
cut off. In the case where instrument air to the valves has been cut off, the valves are still reading back
feedback from valve actions requested by the DCS, meaning the feedback on the valves is not accurate
as the valves cannot possibly be activating without instrument air. Specific plans have been designed to
test for this issue and can be implemented to ensure the system is ready for handover.
3.4.6 Project Status
The current status of this project is ongoing, while work is being completed on pre-commissioning tests
awaiting the handover to the Process Control group. During this time, work has been focused on
analysing the filter SCM to design specific dry commissioning tests on issues that have hindered the
handover.
Handover to the Process Control group has yet to be received and the wet commissioning of the process
is resultantly delayed. This has however allowed for a more in depth pre-commissioning analysis which
has proved advantageous.
3.4.7 Project Conclusion
This project has provided a unique learning experience based on real engineering methodologies
applied on a commissioning project with numerous issues and constraints. Although the project has
encountered various issues and delays, this has highlighted issues that would have otherwise delayed
and hindered the wet commissioning, affecting online process production, and eventually reducing
downtime of the online filters. The experience gained from this commissioning project has been
invaluable, and can be applied to future commissioning projects.
Page | 29
4 Remaining Project Summaries
Additional project work has been completed outside the four projects previously presented. These
projects will be outlined with a project overview in the following section. These projects include;
Migrate Lab Update System to Profit Sensor Pro
Fault Reset Button – Uticor
4.1 Migrate Lab Update System to Profit Sensor Pro
4.1.1 Project Summary
Results from Lab testing are crucial to the performance of the refinery process. These results are used in
the process for online calculations, but for this to be possible the results must be sent through to the
DCS. Currently there is no standardised approach in achieving this within the new Experion system, but
using software like Profit Sensor Pro it can be achieved in an easy and efficient process. This project has
been created due to the increasing number of lab calculations required due to the refinery upgrade.
The intern has been tasked along with Chemical Engineer - Stephen Gray to create a standardised
approach to update readings from the lab to the Experian system. This project will involve research into
how lab results are currently updated to the DCS, the design of a method and the standardisation of this
approach so that all current lab update tags, and tags in the future can update to the DCS using the
same method. The specific role of the intern during this project has been to research the current lab
update system and provide support in the standardisation of the new method.
Research into the current lab update system involved finding every tag that was being added into the
historian. As lab results take time to generate, the conditions surrounding the results must be known at
the time the sample was taken. Tags then needed to be queried to highlight only the tags found in
application modules, therefore highlighting tags used in lab calculations as the application module is
used for calculations. This information was used to create a list of lab tags that required migration to the
new method of updating lab values to the DCS.
The new method of updating lab values to the DCS was created and documented by Stephen Gray. It
was tasked to the intern to trial the documentation created to incorporate additional lab update values
into the DCS. This standardised approach has been concluded successful, based upon trials conducted
by the intern and Stephen Gray.
4.2 Fault Reset Button – Uticor
4.2.1 Project Summary
The primarily sequence-based alumina load-out process at the Bunbury port, loads alumina from
alumina storage silos onto the receiving ship. When an event causes a fault in the loading sequence, the
sequence is stopped. Due to the way that faults have been coded into the port PLC, some faults require
a fault reset to clear the fault. Currently this fault reset functionality exists only in the field on a Uticor
HMI device, requiring field operators to manually activate the reset fault functionality, in the field.

Page | 30
The objective of this project was to implement the same reset fault functionality on the Port Alumina
load-out graphics, allowing the operator to immediately reset faults. The consequences of adding this
functionality to the DCS graphics were discussed with project supervisor – Julian Leitch. Specifically
discussed was the fact that currently field operators are forced to debug and diagnose faults, whereas
this additional feature can potentially bypass that problem analysis. After discussions and a closer
examination of the PLC fault code, it was decided to implement the change. This decision was based
upon the fact that in order for the fault to be unlatched, the cause of the fault must no longer be active.
The change was implemented by creating a point using Quick Builder that would allow the DCS graphics
to alter a PLC address. Additional code was created in the Quantum Port 550-1 PLC to receive this signal
and map it to the fault reset address. In order to confirm the point created in Quick Builder matched the
correct PLC, a heartbeat function was also added to PLC 550-1, and associated points created to view
this heartbeat on the DCS graphics. This check was necessary as writing memory to an address inside the
wrong PLC could have severe and unknown consequences.
It should be noted that the ProWORX 32 application was used to implement PLC code, and that changes
were made to the system live. This required confirmation that any new addresses to be used were not
already taken up and that code would not hinder the function of the PLC in any way. Once the correct
PLC was confirmed, code was written to insure that the bit address of the reset fault functionality did
not remain activated, and only activate momentarily for one cycle of code. Small timers were used to
highlight this since one cycle of code is too fast to be seen. This has been seen as a project priority due
to the fact that, if the reset functionality were to remain activated, faults may activate, then deactivate
without the fault being acknowledged.
The current status of the project is complete, and is awaiting approval for the graphics to be linked to
the fault reset functionality point created in Quick Builder. This is the only remaining task to be
completed for this project. This project provided experience with the use of online code, and has
highlighted different engineering methodologies required when working with online code.

Page | 31
5 Additional Tasks Completed
There is also work expected of the intern’s that has not been outlined within the project work. This work
includes the day to day activities and issues involved with the running of the refinery and administrative
duties expected. The additional tasks completed are discussed below.
5.1 Morning and KPI Meetings Every Monday, Wednesday and Friday, time in the morning is reserved for morning meetings with the
Process Control group. This time is reserved for general safety discussions, encouraged the ‘way we
work’ safety example discussions, important project work completed and to be completed and changes
made relevant to the group. These meetings are used to inform the entire Process Control group of
work affecting the larger group, as work between the engineers is closely related, and requires frequent
communication. These meetings have helped develop a change in the intern’s attitude towards safety
and helped develop communication skills by relaying technical information, for example sharing a
problem found a certain type of valve.
Key Performance Indicator (KPI) meetings are held every Thursday. During these meetings the Process
Control Group is to present individually, their progress throughout the week. One of the key concepts
behind these meetings is for the Control group to meet and discuss how the group has been providing
assistance to other groups such as Operations and Process Engineers. These meetings have been used to
further develop communication skills and to work towards additional goals.
5.2 Engineering Open Day The engineering department at the Worsley Alumina Refinery, in association with Engineers Australia,
hosted an open day for year 12 students. This day was created to give the year 12 students of the South
West region of Western Australia a grasp on the work that an engineer does. The intern-specific role in
this event was to give an overview of the process to becoming an engineer and answer questions
relating to the process control engineering discipline.
5.3 Honeywell User Group Demo The intern participated in the Honeywell User Group Demo. The User group demo is an open day to
learn about some of the changes to existing Honeywell software and any new Honeywell software
developments. This day was used to gain contacts and networking within the Honeywell Company as the
intern was required to contact vendors for certain projects, such as Profit Sensor Pro.

Page | 32
6 Time Management
Time management is a very important skill utilised by an engineer, and is key in assuring projects are
completed and deadlines are adhered to. As numerous projects have been assigned, it is important that
the intern apply a time management program to ensure sufficient time is spent on different projects,
and that the time spent is useful. An example of an advantage of using time management is that
responsible engineers are available during the time allocation of the project. The time management
approach applied, involves creating a Gantt chart, keeping a daily journal with rough estimates on the
time spent on projects, which provides a brief breakdown of the intern’s working week and
incorporating responsible project engineer’s availability into the project time allocation.
A Gantt chart has been created to outline the amount of time and estimated start and finish dates for all
the important projects that the intern has been assigned. This chart has been used to manage the
progression of each project and has been constantly modified throughout the internship as projects
time management plans differ due to external factors.
These external factors have affected the original Gantt chart previously presented in the ‘Progress
Report’, such as additional tasks outside of the projects required priority and responsible engineer’s
availability, but mainly the priority of the commissioning projects. The duration time given for each
project in the chart consider that projects are worked on separately, and that a week is broken down to
working on several projects. The time duration also factors in the busy nature of work at the refinery,
with time allowed to be spent on additional tasks such as plant support. A final updated version of the
Gantt chart can be found in Appendix D: Project Work Gantt Chart. This chart has been modified since
the previously presented chart in the ‘Progress Report’ based on numerous external factors previously
explained with each project discussion.
In addition to the Gantt chart, a Journal has been created which is used to document what the intern
has spent time on during each particular day. The document is used to recall the amount of work and
progression spent on all projects, as well as providing a reminder for activities completed weeks earlier.
Below is extract from the Journal detailing the intern’s activities for week 7 of the internship in Table 1.
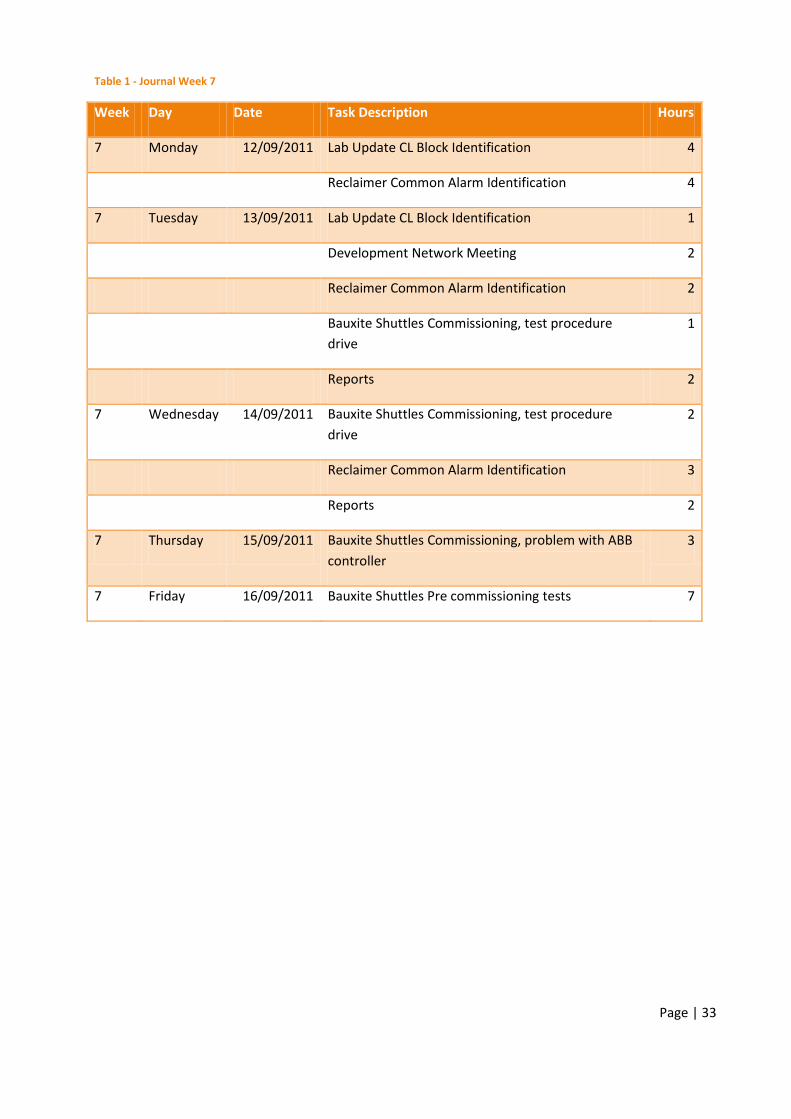
Page | 33
Table 1 - Journal Week 7
Week Day Date Task Description Hours
7 Monday 12/09/2011 Lab Update CL Block Identification 4
Reclaimer Common Alarm Identification 4
7 Tuesday 13/09/2011 Lab Update CL Block Identification 1
Development Network Meeting 2
Reclaimer Common Alarm Identification 2
Bauxite Shuttles Commissioning, test procedure
drive
1
Reports 2
7 Wednesday 14/09/2011 Bauxite Shuttles Commissioning, test procedure
drive
2
Reclaimer Common Alarm Identification 3
Reports 2
7 Thursday 15/09/2011 Bauxite Shuttles Commissioning, problem with ABB
controller
3
7 Friday 16/09/2011 Bauxite Shuttles Pre commissioning tests 7

Page | 34
7 Internship Review
The internship program provided by BHP Billiton Worsley Alumina has been an invaluable experience
with extensive exposure to the field of Process Control Engineering. The projects assigned have been
carefully selected and structured to portray real engineering work and continue learnings relevant to
university studies whilst remaining interesting and stimulating. All of the projects have created
opportunities to apply skills and knowledge from both Industrial Computer Systems and Instrumental
and Control Engineering fields. These projects have been used as the foundation to develop
professional, personal and technical engineering skills.
Working with the Process Control Group at Worsley has highlighted the exact role of a Process Control
Engineer, and how this role is interconnected with other technical fields such as Process and Chemical
Engineering and Electrical Technicians. Valuable lessons on time management have also been gained by
applying management plans to juggle working on numerous projects, plant support and administrative
duties simultaneously.
Worsley’s extensive and state-of-the-art control systems, have created the opportunity to learn and
interact with Honeywell and Schneider technology. This has provided not only technical skills required to
operate the technology, but also the engineering methodology required for operating similar complex
systems that can be applied throughout the interns career.
The safety culture within Worsley and specifically the Process Control group has been one of the major
experiences to take from the time spent at the refinery. Through daily safety discussions where safety
examples and experiences are shared, the intern’s attitude towards safety has been permanently
changed inside and outside of the workplace for the better. It has been a pleasure to be a part of a
safety culture which places such importance on personal wellbeing, with activities to encourage safe
practises in all aspects of the workplace.
This internship has provided an insight into the transition between an engineering student and
professional engineer through the application of university studies into the workplace. The time and
effort of the Process Control group at the Worsley Alumina placed into the internship has produced a
beneficial, interesting and enjoyable experience.

Page | 35
8 Conclusion
The Worsley refinery is one of the world’s largest and most efficient alumina refineries. A large scale
refinery such as this requires a high level of quality from all fields of engineering, specifically Process
Control engineering, in regards to the configuration and maintenance of operations. The internship
position provided by Worsley Alumina has been an invaluable learning experience throughout the 16
week period of the placement. The internship has exposed unique and rare learnings that could have
only been experienced in this specific time of growth for the Worsley refinery. The project work
assigned has been challenging, rewarding and directly applicable to the field of Process Control
Engineering.
This report has presented the project work completed during the placement, highlighting specific
engineering methodologies applied to achieve desired outcomes for the project. It has been shown that
the outcomes achieved from the project work completed will have a direct benefit to the operations of
the refinery, with decreases in equipment downtime and an increases in functionality. Through working
towards these outcomes, experience has been gained on the tasks required of a Process Control
Engineer in a productive and helpful environment. In addition to the project work completed, the intern
has been exposed to realistic workplace situations involving communications to inter relating fields,
administrative duties and unplanned engineering issues.
This internship has been a successful learning opportunity, providing a leading edge industry to gain
experience in the Process Control field. The time spent at Worsley Alumina has facilitated the transition
from an engineering student to a professional engineer.
Page | 36
Bibliography
Abnormal Situation Management Consortium. (n.d). ASM Handout Display. Retrieved November 2011,
from http://www.asmconsortium.net/Documents/ASM_Handout_Display.pdf
Bechtel Corporation. (2007). Facility Functional Description for Process Facility 044 Sulpahte Removal.
Bechtel Corporation. (2011). Control System Functional Description for Facility 24B Bauxite Grinding -
Shuttle Conveyors.
Cargill, G. (2007). Calciner Shutdown Evolution. Presentation.
Cicchillitti, M. (2001). Alumina Load Out Air Duct Improvements.
Edwards, K. (2010, December 15). CCR-141 Switch Connections for the FTE Network Development
System.
Edwards, K. (2010, December 1). WAPL Sim/Dev System Network Layout.
Efficieny & Growth. (2010). Control System Functional Description for Facility 110/112.
Graham, M. (2007). Reclaim Position Paper. Collie: Worsley Alumina Pty Ltd.
Honeywell Internation. (n.d). The ASM Consortium: Improving Safety and Operational Performance.
Retrieved November 7, 2011, from Honeywell Process Solutions:
http://hpsweb.honeywell.com/Cultures/en-
US/AboutUs/PartnershipsAlliances/AbnormalSituationManagement/default.htm
Honeywell International. (2007). Experion Station. Application.
Honeywell International. (2007). Quick Builder. Application.
Honeywell International. (2009). Uniformance PHD. Retrieved November 2011, from Honeywell Process
Solutions: http://hpsweb.honeywell.com/Cultures/en-
US/Products/BusinessApplications/InformationManagement/UniformancePHD/default.htm
Honeywell International/PAS. (2009). Doc4000. Application .
Marler, B. (n.d.). APG Training for E/I Techs.
Prinsloo, P. (2004). Liquor Burning Plant Overview. Worsley Alumina Pty. Ltd.
Schneider Electric. (2010). ProWORX 32 Ladder Logic Block Library.
Schneider Electric. (n.d.). ProWORX 32. Application.
Schneider Electrical. (n.d.). ProWORX 32 Programming Software. Retrieved November 5, 2011, from
Products: http://products.schneider-electric.us/products-services/products/plc-programming-
software/industrial-end-user-oem-programming-software/proworx-32-programming-software/
The Engineering Equipment and Materials Users Association. (1999). Alarm Systems. London: EEMUA.

Page | 37
Thwaites, M. (2003). Alarm Philosophy Definition.
Weston, R. (2011). Fac 051 Dense Phase Op Procedure.
Worsley Alumina Pty. Ltd. (2002). Introductory Bayer Process Training Manual. Perth, Western
Australian: Technical Illustrators Group.

Page | 38
Acronyms and Abbreviations
Abbreviations
APAC Asia Pacific
APG Advanced Process Graphic
APM Advanced Process Module
APP Application Processing Platform
ASM Abnormal Situation Management
CM Control Module
CRO Control Room Operator
CSFD Control System Function Description
DCS Distributed Control System
DSM Dutch State Mines
DSP Desilicated Product
EPKS Experion Process Knowledge System
E&G Efficiency and Growth
FAT Factory Acceptance Test
FTE Fault Tolerant Ethernet
HMI Human Machine Interface
IM Information Management
I/O Input and Output
KPI Key Performance Indicator
LCN Local Control Network
MSTR Master Transfer
MVC Multivariable Control
NYS Not Yet Started
OS Operating System

Page | 39
PCDI Peer Control Data Interface
PCN Process Control Network
PCS Process Control System
PHD Process Historian Database
PLC Programmable Logic Controller
SCADA Supervisory Control And Data Acquisition
SCM Sequence Control Module
TDC Total Distributed Control
TOC Total Organic Compounds
TPS Total Plant Solutions
UCN Universal Control Network
WAPL Worsley Alumina Pty Ltd
Page | 40
Appendices
Appendix A: Industry and Academic Endorsement
ENG450 Engineering Internship
Industry and Academic Supervisor endorsement pro forma This is to be signed by both the industry and academic supervisor and attached to the final report submitted for the internship. We are satisfied with the progress of this internship project and that the attached report is an accurate reflection of the work undertaken. Signed: Industry Supervisor Signed: Academic Supervisor
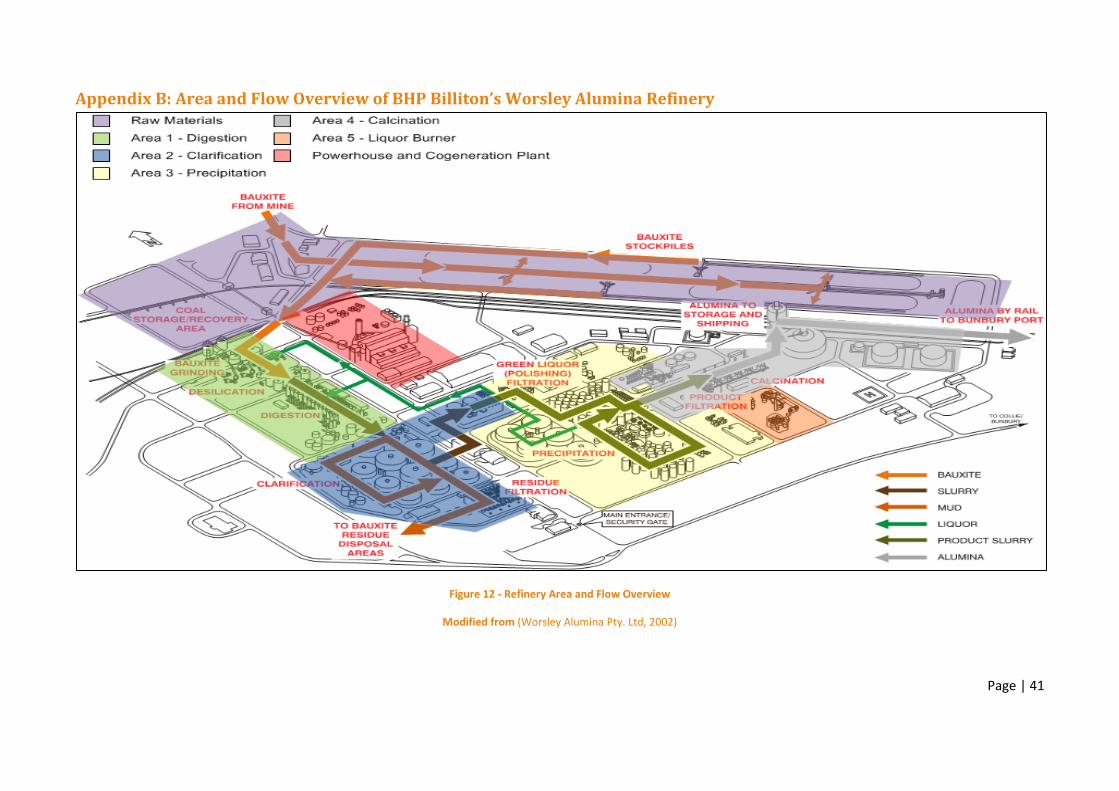
Page | 41
Appendix B: Area and Flow Overview of BHP Billiton’s Worsley Alumina Refinery
Figure 12 - Refinery Area and Flow Overview
Modified from (Worsley Alumina Pty. Ltd, 2002)
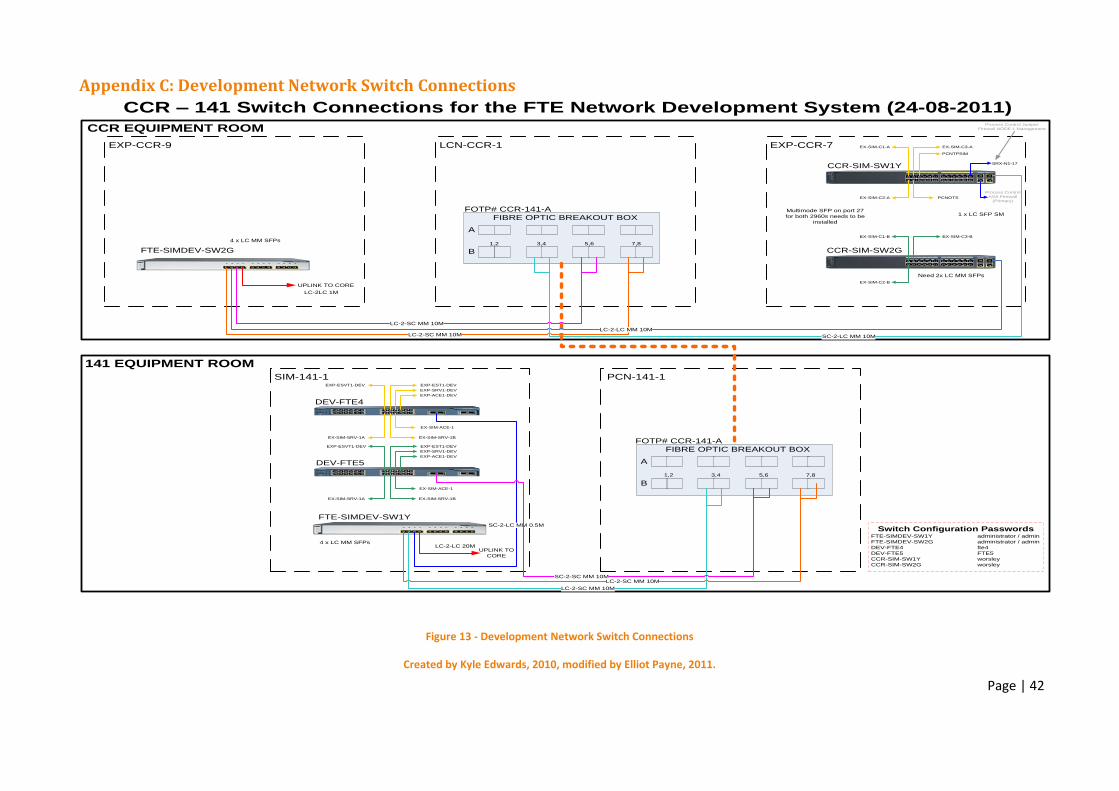
Page | 42
Appendix C: Development Network Switch Connections
CCR-SIM-SW1Y
CCR-SIM-SW2GFTE-SIMDEV-SW2G
FTE-SIMDEV-SW1Y
DEV-FTE4
DEV-FTE5
141 EQUIPMENT ROOM
CCR EQUIPMENT ROOM
FIBRE OPTIC BREAKOUT BOX
A
B
FIBRE OPTIC BREAKOUT BOX
A
B
FOTP# CCR-141-A
1,2 3,4 5,6 7,8
LC-2-SC MM 10M
LC-2-SC MM 10M
EXP-CCR-9 LCN-CCR-1 EXP-CCR-7
SIM-141-1 PCN-141-1
LC-2-LC MM 10M
LC-2-SC MM 10M
UPLINK TO CORE
LC-2-SC MM 10M
1,2 3,4 5,6 7,8
SC-2-LC MM 0.5M
UPLINK TO
CORE
SC-2-LC MM 10M
SC-2-SC MM 10M
EX-SIM-C1-A
EX-SIM-C2-A
EX-SIM-C3-A
PCNOTS
PCNTPSIM
EX-SIM-C1-B
EX-SIM-C2-B
EX-SIM-C3-B
EXP-ESVT1-DEV
EX-SIM-SRV-1A
EX-SIM-SRV-1A EX-SIM-SRV-1B
EX-SIM-SRV-1B
EX-SIM-ACE-1
EX-SIM-ACE-1
EXP-EST1-DEV
EXP-ESVT1-DEV EXP-EST1-DEV
EXP-SRV1-DEV
EXP-ACE1-DEV
EXP-SRV1-DEV
EXP-ACE1-DEV
FOTP# CCR-141-A
SRX-N1-17
Process Control Juniper
Firewall NODE 1 Management
Process Control
ASA Firewall
(Primary)
CCR – 141 Switch Connections for the FTE Network Development System (24-08-2011)
Switch Configuration PasswordsFTE-SIMDEV-SW1Y administrator / admin
FTE-SIMDEV-SW2G administrator / admin
DEV-FTE4 fte4
DEV-FTE5 FTE5
CCR-SIM-SW1Y worsley
CCR-SIM-SW2G worsley
01
02
03
04
05
06
07
08
09
10
11
12
13
14
15
16
17
18
19
20
21
22
23
24
25
26
27
28
01
02
03
04
05
06
07
08
09
10
11
12
13
14
15
16
17
18
19
20
21
22
23
24
25
26
27
28
01
02
03
04
05
06
07
08
09
10
11
12
13
14
15
16
17
18
19
20
21
22
23
24 25 26
01
02
03
04
05
06
07
08
09
10
11
12
13
14
15
16
17
18
19
20
21
22
23
24 25 26
01 02 03 04 05 06 07 08 09 10 11 12
01 02 03 04 05 06 07 08 09 10 11 12
Multimode SFP on port 27
for both 2960s needs to be
installed
4 x LC MM SFPs
1 x LC SFP SM
4 x LC MM SFPs
LC-2LC 1M
LC-2-LC 20M
Need 2x LC MM SFPs
Figure 13 - Development Network Switch Connections
Created by Kyle Edwards, 2010, modified by Elliot Payne, 2011.

Page | 43
KVM
KVM
KVM
DEV FTE
DEV LCN
GUS-147-1DEV HM
PCNOTS1
EX-SIM-C2 (ES-CE)
EX-SIM-C3 (ES-F)
PCNOTS2
EX-SIM-SRV-MFC
PCNSCE1 PCNSCE2
EX-SIM-MFC
EXP-EST1-DEV
EXP-ESVT1-DEVEXP-SVR1-DEVEXP-ACE1-DEV
CCR Equip. Rm.
141 Equip. Rm.MFC Training (Black Cabinet)
WAPL Sim/Dev System Network Layout
(24/08/11)
172.20.254.20/21
172.20.254.22/23
172.20.254.28 172.20.254.24/25 172.20.254.26/27
3750
T410
PowerEdgePowerEdge
PCNSIMC300
EX-SIM-SRV-1BEX-SIM-SRV-1A
FTE-SIM-SW2G FTE-SIMDEV-SW2G
PCNTPSIM
EX-SIM-C1 (ES-T)
DEV-FTE4
DEV-FTE5
172.20.254.100/101 172.20.254.102/103 172.20.254.59/60
172.20.254.160/161
172.20.254.51/52 172.20.254.53/54172.20.254.111/112
172.20.254.63/64
172.20.254.65/66
172.20.254.67/68
172.20.254.71
172.20.254.69
E&G – Calciner 6 (Future)
CCR Simulator Room
EX-SIM-EG
EX-EG-SRV-1BEX-EG-SRV-1A EX-C6-SRV
EG_OTS1
3750
FTE-SIMDEV-SW1Y
2960
2960
2960
2960172.20.254.8
172.20.254.9
FFB Training Stations
EG_C300
FAC 307
EX-SIM-MFC2
STATION NAME
STATION NAME
STATION NAME
VLAN6 I/F
MFC Training Stations
312 Equip. Rm. 312 Control Rm.
EXPSTATION01 EXPSTATION02 EXPSTATION03 EXPSTATION04 EXPSTATION05HOST 172.20.244.101
VM-YL 172.20.244.102
VM-GN 172.20.244.103
HOST 172.20.244.104
VM-YL 172.20.244.105
VM-GN 172.20.244.106
HOST 172.20.244.107
VM-YL 172.20.244.108
VM-GN 172.20.244.109
HOST 172.20.244.110
VM-YL 172.20.244.111
VM-GN 172.20.244.112
HOST 172.20.244.113
VM-YL 172.20.244.114
VM-GN 172.20.244.115
Honeywell
Controller
Power
Status
OKFTE A B
Honeywell
Controller
Power
Status
OKFTE A B
VMDEV-SRV-1 C300-DEV-1
Honeywell
Controller
Power
Status
OKFTE A B
Honeywell
Controller
Power
Status
OKFTE A B
VLAN6 I/F
172.20.254.29/30
NOT FTE YET
DOMAIN CTRL
172.20.244.13
172.20.244.11
FTE-SIM-SW1Y
EX-SIM-ACE-1
172.20.254.3
Figure 14 – Develop Network System Layout
Created by Kyle Edwards, 2010, modified by Elliot Payne, 2011.
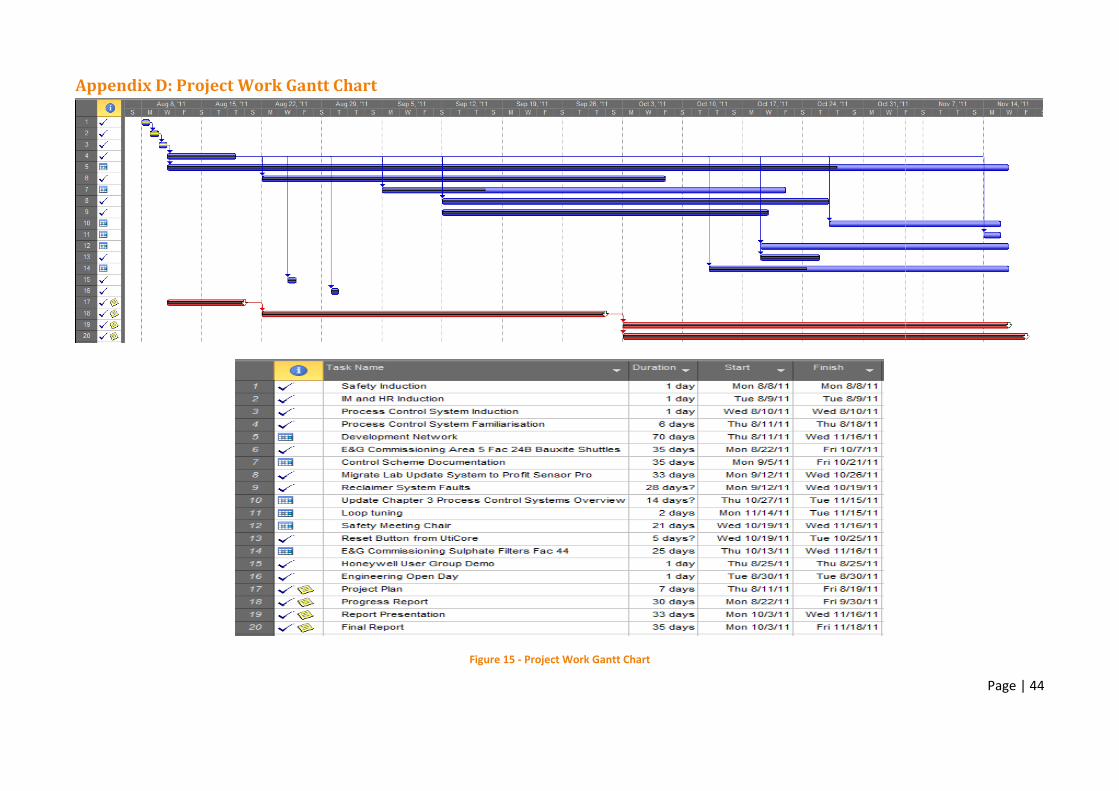
Page | 44
Appendix D: Project Work Gantt Chart
Figure 15 - Project Work Gantt Chart
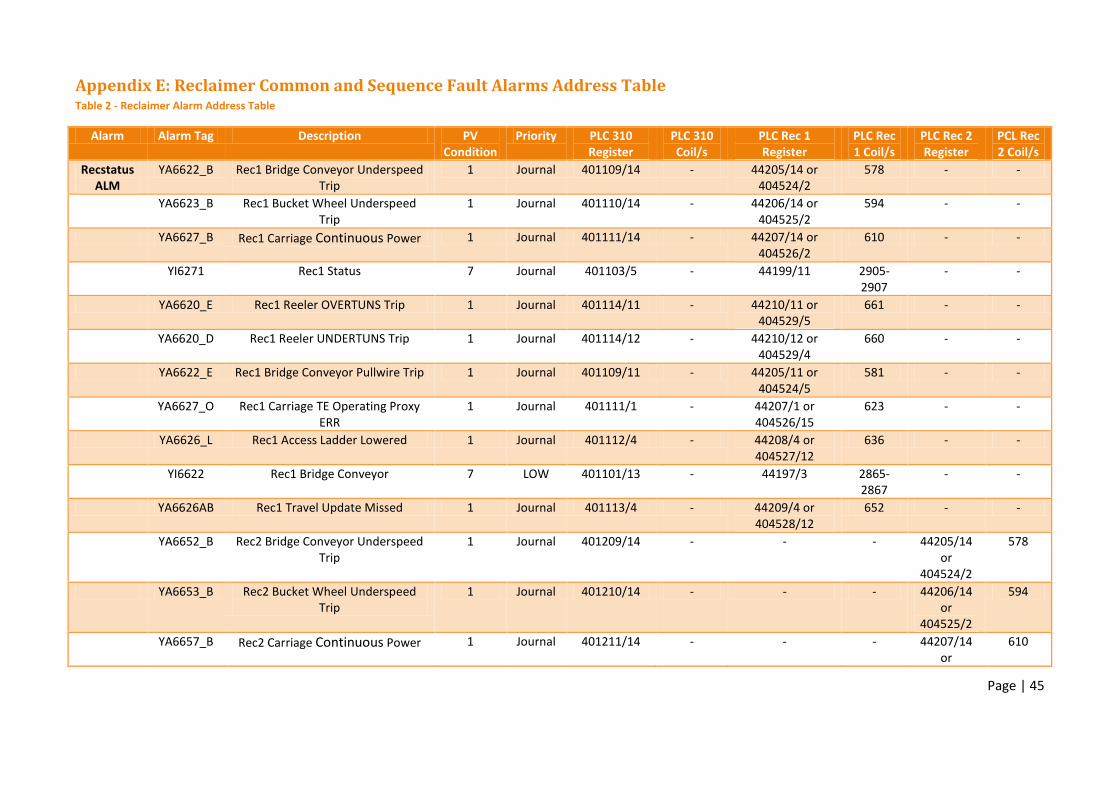
Page | 45
Appendix E: Reclaimer Common and Sequence Fault Alarms Address Table Table 2 - Reclaimer Alarm Address Table
Alarm Alarm Tag Description PV Condition
Priority PLC 310 Register
PLC 310 Coil/s
PLC Rec 1 Register
PLC Rec 1 Coil/s
PLC Rec 2 Register
PCL Rec 2 Coil/s
Recstatus ALM
YA6622_B Rec1 Bridge Conveyor Underspeed Trip
1 Journal 401109/14 - 44205/14 or 404524/2
578 - -
YA6623_B Rec1 Bucket Wheel Underspeed Trip
1 Journal 401110/14 - 44206/14 or 404525/2
594 - -
YA6627_B Rec1 Carriage Continuous Power 1 Journal 401111/14 - 44207/14 or 404526/2
610 - -
YI6271 Rec1 Status 7 Journal 401103/5 - 44199/11 2905-2907
- -
YA6620_E Rec1 Reeler OVERTUNS Trip 1 Journal 401114/11 - 44210/11 or 404529/5
661 - -
YA6620_D Rec1 Reeler UNDERTUNS Trip 1 Journal 401114/12 - 44210/12 or 404529/4
660 - -
YA6622_E Rec1 Bridge Conveyor Pullwire Trip 1 Journal 401109/11 - 44205/11 or 404524/5
581 - -
YA6627_O Rec1 Carriage TE Operating Proxy ERR
1 Journal 401111/1 - 44207/1 or 404526/15
623 - -
YA6626_L Rec1 Access Ladder Lowered 1 Journal 401112/4 - 44208/4 or 404527/12
636 - -
YI6622 Rec1 Bridge Conveyor 7 LOW 401101/13 - 44197/3 2865-2867
- -
YA6626AB Rec1 Travel Update Missed 1 Journal 401113/4 - 44209/4 or 404528/12
652 - -
YA6652_B Rec2 Bridge Conveyor Underspeed Trip
1 Journal 401209/14 - - - 44205/14 or
404524/2
578
YA6653_B Rec2 Bucket Wheel Underspeed Trip
1 Journal 401210/14 - - - 44206/14 or
404525/2
594
YA6657_B Rec2 Carriage Continuous Power 1 Journal 401211/14 - - - 44207/14 or
610
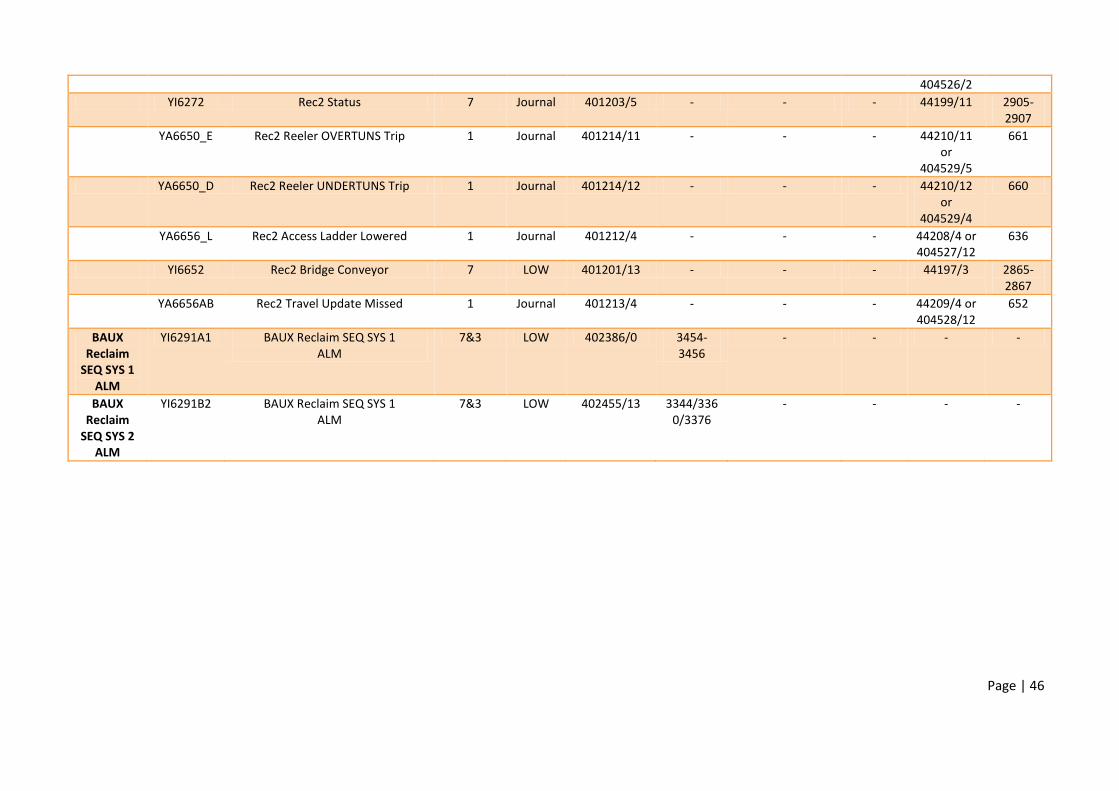
Page | 46
404526/2
YI6272 Rec2 Status 7 Journal 401203/5 - - - 44199/11 2905-2907
YA6650_E Rec2 Reeler OVERTUNS Trip 1 Journal 401214/11 - - - 44210/11 or
404529/5
661
YA6650_D Rec2 Reeler UNDERTUNS Trip 1 Journal 401214/12 - - - 44210/12 or
404529/4
660
YA6656_L Rec2 Access Ladder Lowered 1 Journal 401212/4 - - - 44208/4 or 404527/12
636
YI6652 Rec2 Bridge Conveyor 7 LOW 401201/13 - - - 44197/3 2865-2867
YA6656AB Rec2 Travel Update Missed 1 Journal 401213/4 - - - 44209/4 or 404528/12
652
BAUX Reclaim
SEQ SYS 1 ALM
YI6291A1 BAUX Reclaim SEQ SYS 1 ALM
7&3 LOW 402386/0 3454-3456
- - - -
BAUX Reclaim
SEQ SYS 2 ALM
YI6291B2 BAUX Reclaim SEQ SYS 1 ALM
7&3 LOW 402455/13 3344/3360/3376
- - - -
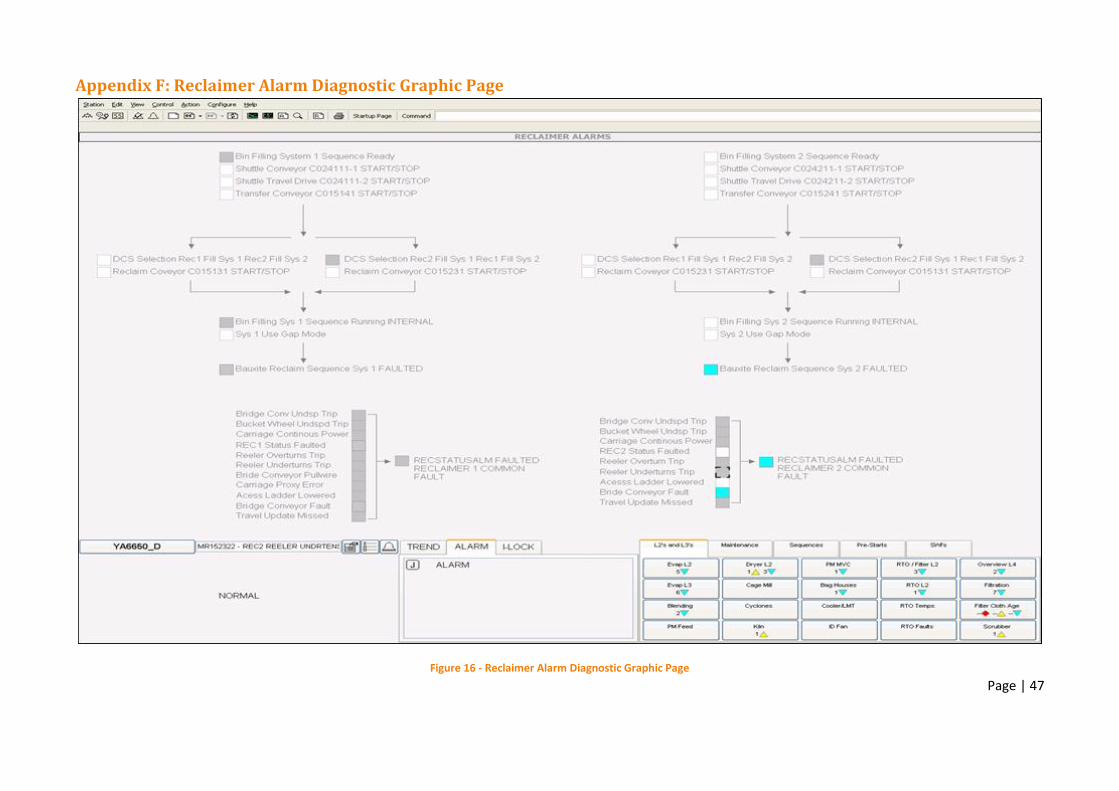
Page | 47
Appendix F: Reclaimer Alarm Diagnostic Graphic Page
Figure 16 - Reclaimer Alarm Diagnostic Graphic Page

Page | 48
Appendix G: Sulphate Plate Pack Filter Sequence modes
Figure 17 – Filter Filling mode
Figure 18 - Filtration Mode
T044354
Filter Feed
Tank
P044xxx
PT
VS
T044381 &
T044382
Dissolver
Tanks
Repulper
T044371
Liquor Relay
Tank
Filtra
te
Condy Supply
Condy ReturnDeluge Wash
A
I
G
F
E
J
DH
C
B
Core Blow Return Line
Recirculation
LineFilter Discharge
Air Supply (~700kPag)
FT
Feed Pump
T044354
Filter Feed
Tank
P044xxx
PT
VS
T044381 &
T044382
Dissolver
Tanks
Repulper
T044371
Liquor Relay
Tank
Filtra
te
Condy Supply
Condy ReturnDeluge Wash
A
I
G
F
E
J
DH
C
B
Core Blow Return Line
Recirculation
LineFilter Discharge
Air Supply (~700kPag)
FT
Feed Pump
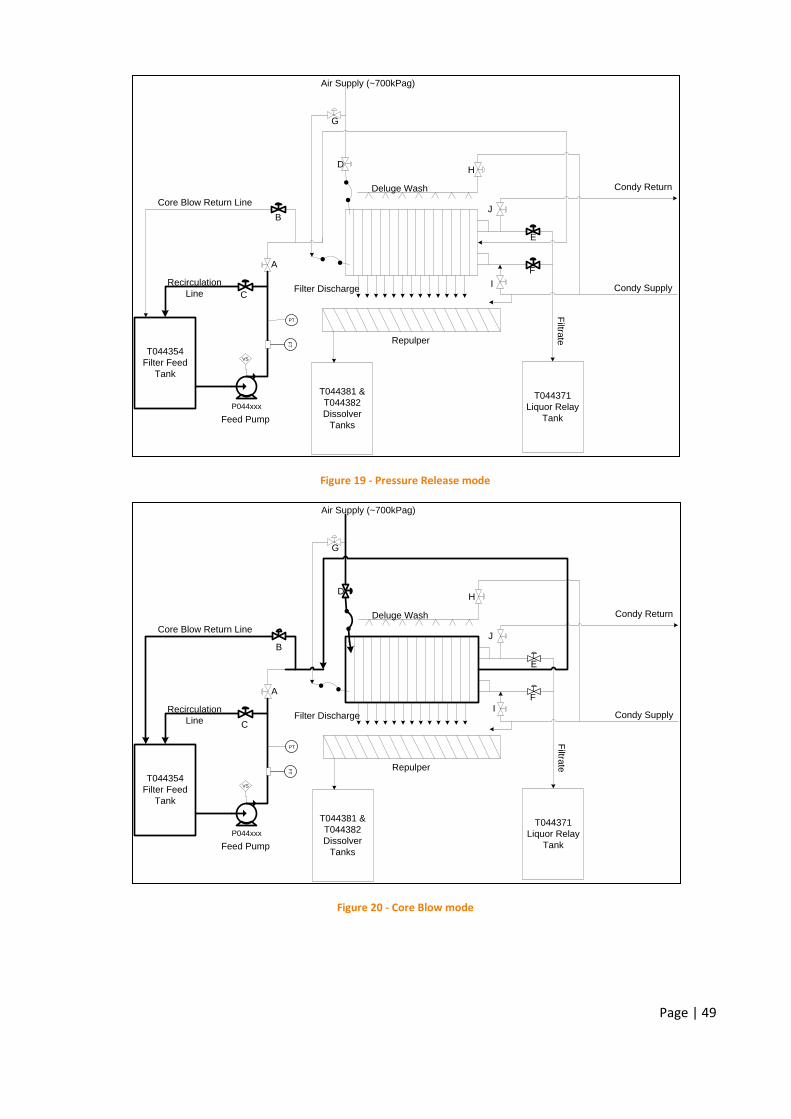
Page | 49
Figure 19 - Pressure Release mode
Figure 20 - Core Blow mode
T044354
Filter Feed
Tank
P044xxx
PT
VS
T044381 &
T044382
Dissolver
Tanks
Repulper
T044371
Liquor Relay
Tank
Filtra
te
Condy Supply
Condy ReturnDeluge Wash
A
I
G
F
E
J
DH
C
B
Core Blow Return Line
Recirculation
LineFilter Discharge
Air Supply (~700kPag)
FT
Feed Pump
T044354
Filter Feed
Tank
P044xxx
PT
VS
T044381 &
T044382
Dissolver
Tanks
Repulper
T044371
Liquor Relay
Tank
Filtra
te
Condy Supply
Condy ReturnDeluge Wash
A
I
G
F
E
J
DH
C
B
Core Blow Return Line
Recirculation
LineFilter Discharge
Air Supply (~700kPag)
FT
Feed Pump
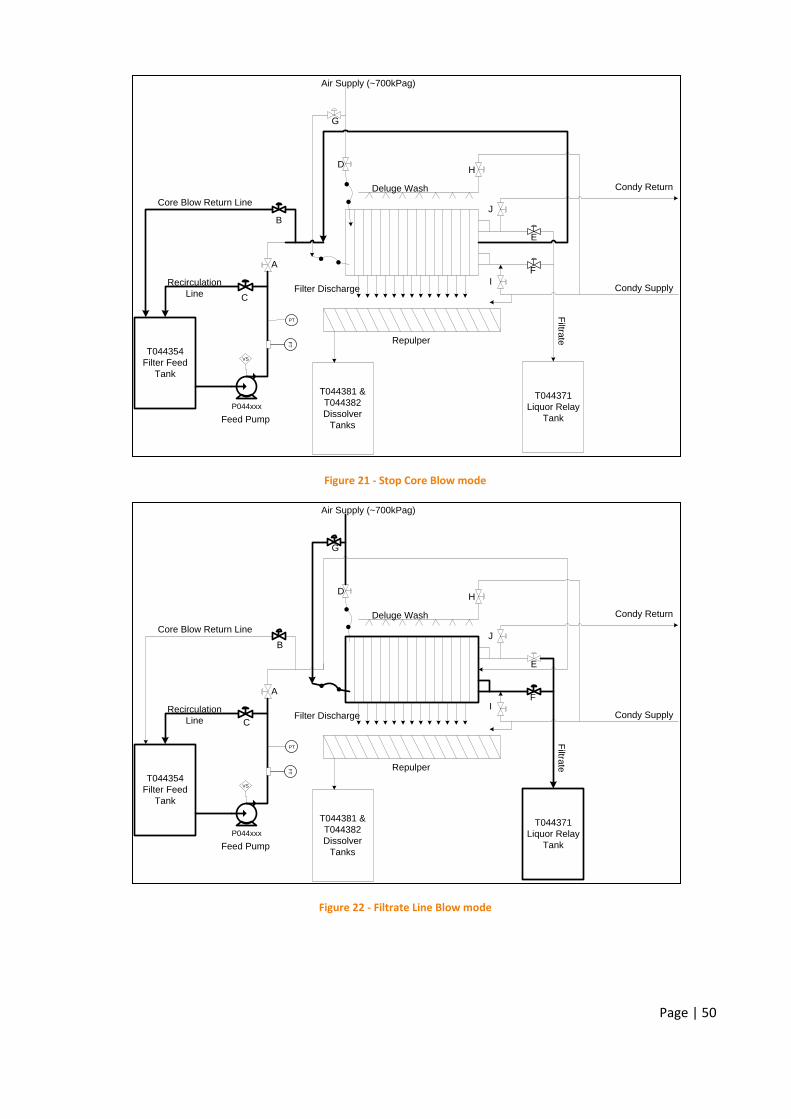
Page | 50
Figure 21 - Stop Core Blow mode
Figure 22 - Filtrate Line Blow mode
T044354
Filter Feed
Tank
P044xxx
PT
VS
T044381 &
T044382
Dissolver
Tanks
Repulper
T044371
Liquor Relay
Tank
Filtra
te
Condy Supply
Condy ReturnDeluge Wash
A
I
G
F
E
J
DH
C
B
Core Blow Return Line
Recirculation
LineFilter Discharge
Air Supply (~700kPag)
FT
Feed Pump
T044354
Filter Feed
Tank
P044xxx
PT
VS
T044381 &
T044382
Dissolver
Tanks
Repulper
T044371
Liquor Relay
Tank
Filtra
te
Condy Supply
Condy ReturnDeluge Wash
A
I
G
F
E
J
DH
C
B
Core Blow Return Line
Recirculation
LineFilter Discharge
Air Supply (~700kPag)
FT
Feed Pump

Page | 51
Figure 23 - Plate Pack Opening mode
Figure 24 - Deluge mode
T044354
Filter Feed
Tank
P044xxx
PT
VS
T044381 &
T044382
Dissolver
Tanks
Repulper
T044371
Liquor Relay
Tank
Filtra
te
Condy Supply
Condy ReturnDeluge Wash
A
I
G
F
E
J
DH
C
B
Core Blow Return Line
Recirculation
LineFilter Discharge
Air Supply (~700kPag)
FT
Feed Pump
T044354
Filter Feed
Tank
P044xxx
PT
VS
T044381 &
T044382
Dissolver
Tanks
Repulper
T044371
Liquor Relay
Tank
Filtra
te
Condy Supply
Condy ReturnDeluge Wash
A
I
G
F
E
J
DH
C
B
Core Blow Return Line
Recirculation
LineFilter Discharge
Air Supply (~700kPag)
FT
Feed Pump
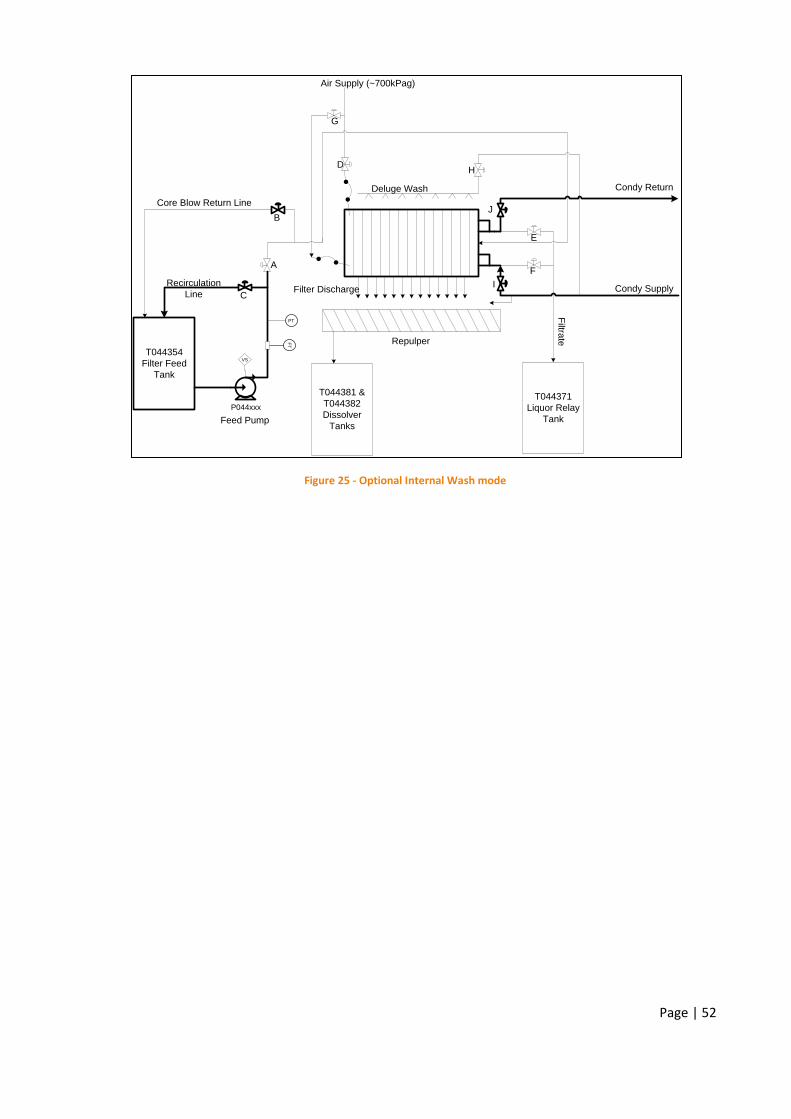
Page | 52
Figure 25 - Optional Internal Wash mode
T044354
Filter Feed
Tank
P044xxx
PT
VS
T044381 &
T044382
Dissolver
Tanks
Repulper
T044371
Liquor Relay
Tank
Filtra
te
Condy Supply
Condy ReturnDeluge Wash
A
I
G
F
E
J
DH
C
B
Core Blow Return Line
Recirculation
LineFilter Discharge
Air Supply (~700kPag)
FT
Feed Pump


![Internship Handbook - Arkansas State Universitymyweb.astate.edu/.../2012_MSE_Internship_Handbook.pdf · Internship Handbook [Type text] Page 5 Overview of the Internship The internship](https://img.pdfslide.net/doc/110x75/5f0d5b6a7e708231d439f328/internship-handbook-arkansas-state-internship-handbook-type-text-page-5-overview.jpg)