Embed Size (px)
Citation preview
OSTRICH INDUSTRY JUNE 2009
LONG TERM BIODIVERSITY MANAGEMENT STRATEGY FOR THE SOUTH AFRICAN
Telephone: 044 272 2210
Fax: 044 272 3337
Email: [email protected]
This document has been compiled by the South African Ostrich Business
Chamber Biodiversity Unit in collaboration with all the Project
Partners
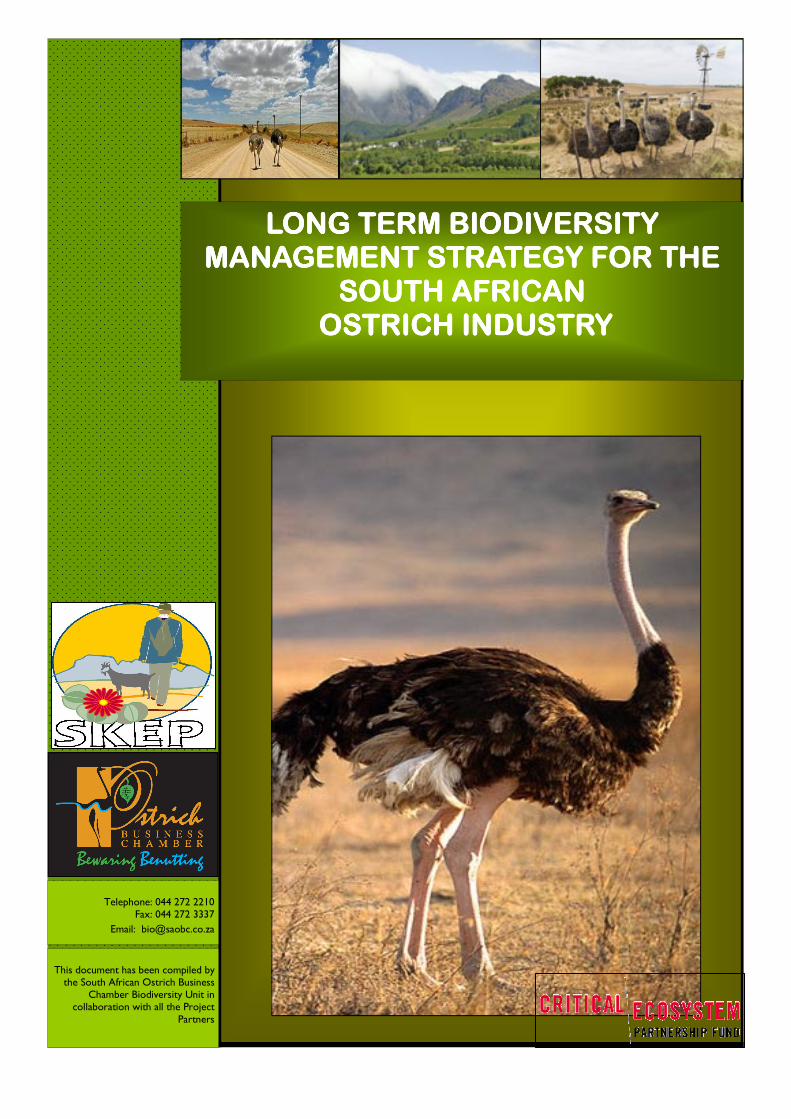
LONG TERM BIODIVERSILONG TERM BIODIVERSILONG TERM BIODIVERSILONG TERM BIODIVERSITY TY TY TY
MANAGEMENT STRATEGY MANAGEMENT STRATEGY MANAGEMENT STRATEGY MANAGEMENT STRATEGY FOR THE FOR THE FOR THE FOR THE
SOUTH AFRICASOUTH AFRICASOUTH AFRICASOUTH AFRICANNNN
OSTRICH INDUSTRY OSTRICH INDUSTRY OSTRICH INDUSTRY OSTRICH INDUSTRY
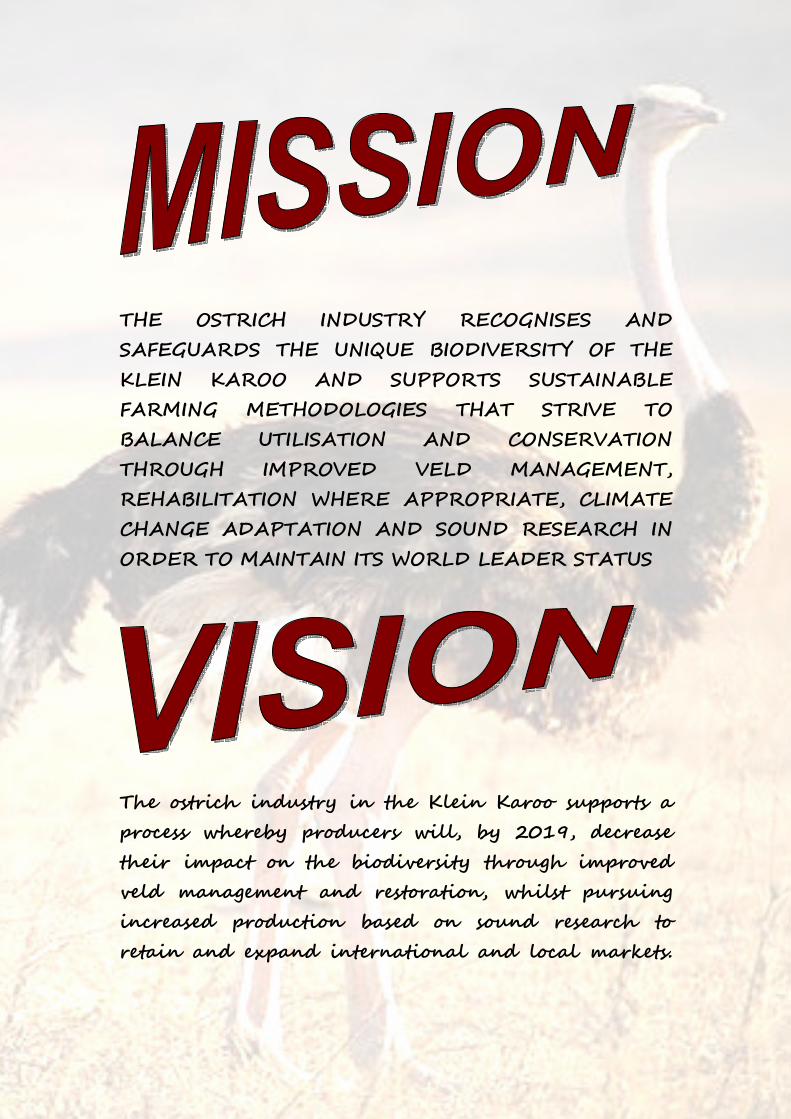
THE OSTRICH INDUSTRY RECOGNISES AND
SAFEGUARDS THE UNIQUE BIODIVERSITY OF THE
KLEIN KAROO AND SUPPORTS SUSTAINABLE
FARMING METHODOLOGIES THAT STRIVE TO
BALANCE UTILISATION AND CONSERVATION
THROUGH IMPROVED VELD MANAGEMENT,
REHABILITATION WHERE APPROPRIATE, CLIMATE
CHANGE ADAPTATION AND SOUND RESEARCH IN
ORDER TO MAINTAIN ITS WORLD LEADER STATUS
The ostrich industry in the Klein Karoo supports a
process whereby producers will, by 2019, decrease
their impact on the biodiversity through improved
veld management and restoration, whilst pursuing
increased production based on sound research to
retain and expand international and local markets.
LONG TERM BIODIVERSITY MANAGEMENT STRATEGY FOR THE SOUTH AFRICAN
OSTRICH INDUSTRY JUNE 2009
a
TABLE OF CONTENTS
LIST OF ACRONYMNS, PARTNERS, ACKNOWLEDGEMENTS ...............1
INTRODUCTION – SUMMARY....................................................................2
BACKGROUND............................................................................................3
SECTION A: DESCRIPTION OF THE BIODIVERSITY IMPORTANCE OF THE KLEIN KAROO, ECONOMIC IMPORTANCE OF THE OSTRICH INDUSTRY IN THE KLEIN KAROO, VISION AND OVERALL MANAGEMENT OBJECTIVES ....................................................................5
1. BIODIVERSITY IMPORTANCE OF THE KLEIN KAROO.....................5
2. ECONOMIC IMPORTANCE OF THE OSTRICH INDUSTRY IN THE
KLEIN KAROO......................................................................................7
2.1 BRIEF HISTORY OF THE INDUSTRY ..........................................7
2.2 SOCIO-ECONOMIC SITUATION IN THE KLEIN KAROO.............7
2.3 KLEIN KAROO REGIONAL ECONOMY........................................8
2.3.1 Regional Output ......................................................................8
2.3.2 Agriculture’s Importance to Regional Employment .................8
2.3.3 The Ostrich Industry’s Dominant Role in Klein Karoo Agriculture...............................................................................8
3. MAKING AN ECONOMIC CASE FOR PEN BREEDING AS ONE
ALTERNATIVE OVER FLOCK BREEDING..........................................9
3.1 THE ECONOMICS OF OSTRICH PEN-BREEDING......................9
3.1.1 Pen Breeding ..........................................................................9
3.1.2 Pen Breeding Cost..................................................................9
3.1.3 Economic Benefits of Pen-Breeding .......................................9
3.1.4 The Economics of “Tropparing” and Pen-Breeding Compared …………………………………………………………………….10
4. CURRENT SITUATION: OSTRICHES IN THE KLEIN KAROO.........11
4.1 THE FOOTPRINT OF THE OSTRICH INDUSTY ........................11
4.1.1 History...................................................................................11
4.1.2 Current..................................................................................11
4.1.3 Prospects..............................................................................12
4.1.4 Markets .................................................................................12
5. CURRENT SITUATION: BIODIVERSITY STATUS OF THE KLEIN
KAROO ...............................................................................................14
5.1 MAP OF ENDANGERED VEGETATION REMNANTS................14
5.2 CONSERVATION STATUS .........................................................14
LONG TERM BIODIVERSITY MANAGEMENT STRATEGY FOR THE SOUTH AFRICAN
OSTRICH INDUSTRY JUNE 2009
b
6. MISSION AND VISION – Working Towards a Win-Win Situation .......16
7. OVERALL MANAGEMENT PRINCIPLES...........................................17
SECTION B: IMPLEMENTATION .............................................................18
8. OBJECTIVES......................................................................................18
8.1 OBJECTIVE 1: Ostrich farmers in the Klein Karoo are improving
management of sensitive and endangered veld as well as their ostrich production.........................................................................18
8.2 OBJECTIVE 2: A sustainable biodiversity unit for the ostrich industry in the Klein Karoo has been established and is working effectively by means of an integrated approach to Biodiversity Management, compliance and sustainable funding .....................19
8.3 OBJECTIVE 3: The Ostrich Industry has developed a climate change mitigation and adaptation strategy which is mainstreamed into the “best practice guidelines” ................................................19
8.4 OBJECTIVE 4: The ostrich industry has created an enabling environment for and is supporting research that supports biodiversity conservation and improved production .....................19
9. METHODOLOGY................................................................................20
9.1 BIODIVERSITY UNIT...................................................................20
9.1.1 Main functions of the Biodiversity Unit ..................................20
9.1.2 Staffing of the BU..................................................................21
9.1.3 Capacity Building and Training .............................................21
9.1.4 Data Capturing......................................................................21
9.1.5 Liaison and Awareness Raising............................................21
9.1.6 Provision of Services ............................................................22
9.1.7 Ostrich Standards / “Best Practice” Guidelines.....................22
9.1.8 Monitoring and Compliance ..................................................22
9.1.9 Rehabilitation ........................................................................22
9.1.10 Implementing Authority .........................................................23
9.1.11 Potential Funding..................................................................23
SECTION C: ALTERNATIVES TO FLOCK BREEDING .........................25
SECTION D: SUMMARY BUDGET FOR ESTABLISHING A BIODIVERSITY UNIT FOR THE OSTRICH INDUSTRY .........................25
SECTION E: ADDENDUMS.......................................................................26
LONG TERM BIODIVERSITY MANAGEMENT STRATEGY FOR THE SOUTH AFRICAN
OSTRICH INDUSTRY JUNE 2009
1
LIST OF ACRONYMNS, PARTNERS, ACKNOWLEDGEMENTS
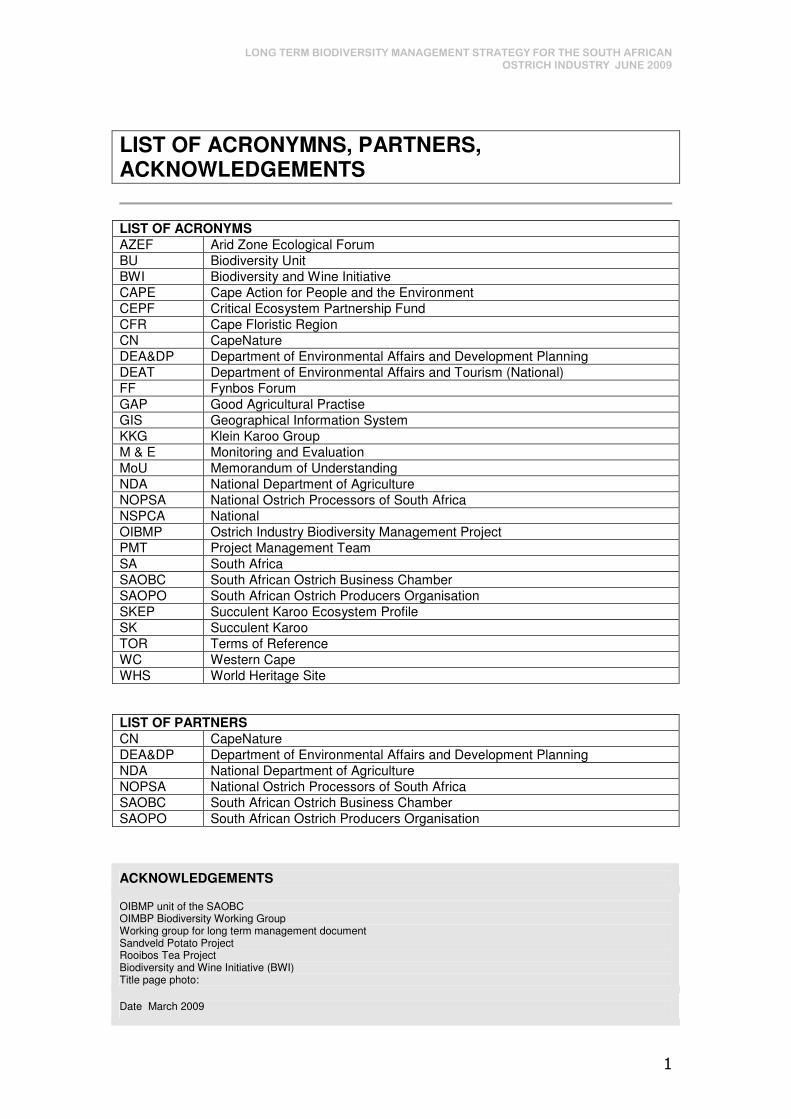
LIST OF ACRONYMS
AZEF Arid Zone Ecological Forum
BU Biodiversity Unit
BWI Biodiversity and Wine Initiative
CAPE Cape Action for People and the Environment
CEPF Critical Ecosystem Partnership Fund
CFR Cape Floristic Region
CN CapeNature
DEA&DP Department of Environmental Affairs and Development Planning
DEAT Department of Environmental Affairs and Tourism (National)
FF Fynbos Forum
GAP Good Agricultural Practise
GIS Geographical Information System
KKG Klein Karoo Group
M & E Monitoring and Evaluation
MoU Memorandum of Understanding
NDA National Department of Agriculture
NOPSA National Ostrich Processors of South Africa
NSPCA National
OIBMP Ostrich Industry Biodiversity Management Project
PMT Project Management Team
SA South Africa
SAOBC South African Ostrich Business Chamber
SAOPO South African Ostrich Producers Organisation
SKEP Succulent Karoo Ecosystem Profile
SK Succulent Karoo
TOR Terms of Reference
WC Western Cape
WHS World Heritage Site
LIST OF PARTNERS
CN CapeNature
DEA&DP Department of Environmental Affairs and Development Planning
NDA National Department of Agriculture
NOPSA National Ostrich Processors of South Africa
SAOBC South African Ostrich Business Chamber
SAOPO South African Ostrich Producers Organisation
ACKNOWLEDGEMENTS
OIBMP unit of the SAOBC OIMBP Biodiversity Working Group Working group for long term management document Sandveld Potato Project Rooibos Tea Project Biodiversity and Wine Initiative (BWI) Title page photo:
Date March 2009
LONG TERM BIODIVERSITY MANAGEMENT STRATEGY FOR THE SOUTH AFRICAN
OSTRICH INDUSTRY JUNE 2009
2
INTRODUCTION – SUMMARY
This strategy is a direct result of the “Ostrich Industry Biodiversity Management Project” (OIBMP), a project that was funded by the Critical Ecosystem Partnership Fund (CEPF) with the aim to (i.a.) initiate a process whereby ostrich farmers in the Klein Karoo are encouraged to engage in improved veld management in the sensitive, fragile Succulent Karoo, with a number of critically endangered and endangered vegetation types. This project has confirmed that there is a need, from the industry’s side, for a biodiversity component/unit within or for the ostrich industry. This document aims to provide a pro-active road map for the industry to ensure that ostrich farmers in the Klein Karoo safeguard the unique biodiversity of the Klein Karoo, whilst. maintaining a sustainable production system. The purpose of the strategy is to identify ways of getting to this aim – identifying the strategic focus and anticipated outcomes. This plan will provide the SAOBC with useful guidelines regarding the strategic approach in pursuing the vision (see p16). SECTION A involves the description of the economic importance of the ostrich industry to the Klein Karoo region, as well as the biodiversity importance of the same region. It will also give an “economic case” for pen breeding as one of the preferred breeding methodologies, as well as overall management objectives related to the vision. SECTION B deals specifically with the implementation of these management objectives through various activities/projects and management actions (as well as the relevant party responsible for these). SECTION C addresses alternative strategies to be researched and investigated to achieve the aim and vision of maintaining biodiversity within a sustainable production system. SECTION D provides a summary budget for establishing a Biodiversity Unit for the Ostrich Industry, based on the detail provided in Section B. SECTION E contains the appendices mentioned in the strategic plan, providing additional information. All information used in this document is based on the biodiversity of the area, as well as the economic importance of the ostrich industry to the region. It aims to balance utilisation and conservation, specifically in the highly sensitive Succulent Karoo with its associated endangered vegetation. This document is particularly aimed at: � SAOBC Board of Directors � SA and WC Ostrich Producers Associations � Ostrich Industry in the Klein Karoo, particularly KKG and Mosstrich � Ostrich Marketers � Potential funders
LONG TERM BIODIVERSITY MANAGEMENT STRATEGY FOR THE SOUTH AFRICAN
OSTRICH INDUSTRY JUNE 2009
3
BACKGROUND
Ostrich production consists of a number of production functions including breeding, hatching, chick-raising, and growing of ostriches to slaughter weight. It is only the breeding function that makes use of the veld, where "tropparing" involves flocks of breeding birds being kept in veld camps, where they are fed complete rations and provided with water, and where eggs are also collected for incubation. Breeding can last for 8 months after which birds have a 4-month rest period. A detailed vegetation degradation assessment of the Klein Karoo indicates that poor grazing practices have resulted in 28.2% of the region having been severely transformed, 60.1% moderately transformed, with only 1.8% described as pristine (Thompson et al. 2005). In some studies it was found to be ostrich veld-based breeding that has caused some of this severe transformation and degradation of the vegetation (Hoffman 1996; Cupido 2005) Much of this degradation is attributable to feeding activities and territorial behaviour of ostriches where it is the trampling that leads to soil compaction, the removal of the biological soil crust (Cupido 2005), which increases the risk of soil erosion by wind (Belnap 2001), destruction of sensitive plants and loss of biodiversity (Lombard & Wolf 2004; Cupido 2005). Little, if any, feed benefit exists in breeding ostriches on the severely to moderately transformed veld. The Succulent Karoo, the Fynbos biome (which is part of the Cape Floristic Region) and the Subtropical Thicket Biome are internationally recognised biodiversity hotspots. Safeguarding this unique biodiversity in the ostrich producing areas of the Klein Karoo, whilst ensuring continued international market access for the industry, lies at the bottom of this strategy. The two main drivers of this strategy are:
� Activities/projects emanating from this, MUST benefit biodiversity � Activities/projects emanating from this MUST benefit the industry and
individual farmers For this reason the strategic approach to support these drivers will assist in the optimal utilisation of resources and capacity of all the partners involved in biodiversity management and ostrich production, and will eventually contribute significantly to the reaching the goals set and vision.
LONG TERM BIODIVERSITY MANAGEMENT STRATEGY FOR THE SOUTH AFRICAN
OSTRICH INDUSTRY JUNE 2009
4
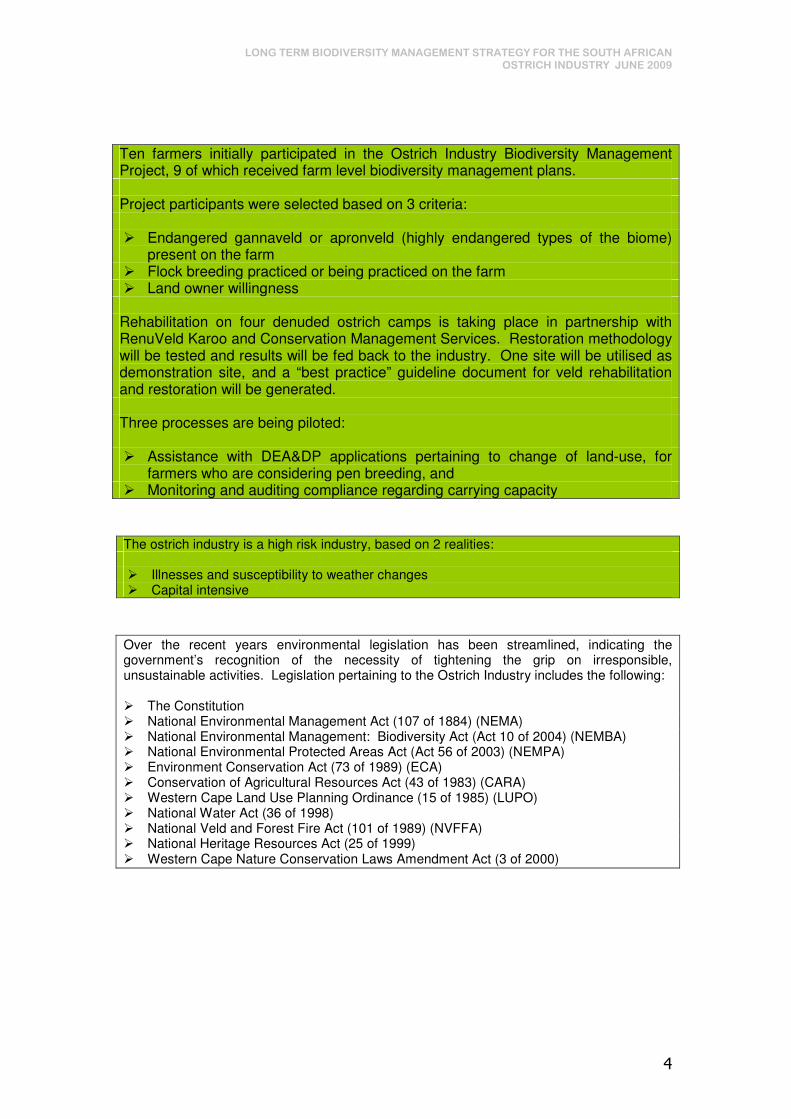
Ten farmers initially participated in the Ostrich Industry Biodiversity Management Project, 9 of which received farm level biodiversity management plans. Project participants were selected based on 3 criteria: � Endangered gannaveld or apronveld (highly endangered types of the biome)
present on the farm � Flock breeding practiced or being practiced on the farm � Land owner willingness Rehabilitation on four denuded ostrich camps is taking place in partnership with RenuVeld Karoo and Conservation Management Services. Restoration methodology will be tested and results will be fed back to the industry. One site will be utilised as demonstration site, and a “best practice” guideline document for veld rehabilitation and restoration will be generated. Three processes are being piloted: � Assistance with DEA&DP applications pertaining to change of land-use, for
farmers who are considering pen breeding, and � Monitoring and auditing compliance regarding carrying capacity
The ostrich industry is a high risk industry, based on 2 realities: � Illnesses and susceptibility to weather changes � Capital intensive
Over the recent years environmental legislation has been streamlined, indicating the government’s recognition of the necessity of tightening the grip on irresponsible, unsustainable activities. Legislation pertaining to the Ostrich Industry includes the following: � The Constitution � National Environmental Management Act (107 of 1884) (NEMA) � National Environmental Management: Biodiversity Act (Act 10 of 2004) (NEMBA) � National Environmental Protected Areas Act (Act 56 of 2003) (NEMPA) � Environment Conservation Act (73 of 1989) (ECA) � Conservation of Agricultural Resources Act (43 of 1983) (CARA) � Western Cape Land Use Planning Ordinance (15 of 1985) (LUPO) � National Water Act (36 of 1998) � National Veld and Forest Fire Act (101 of 1989) (NVFFA) � National Heritage Resources Act (25 of 1999) � Western Cape Nature Conservation Laws Amendment Act (3 of 2000)
LONG TERM BIODIVERSITY MANAGEMENT STRATEGY FOR THE SOUTH AFRICAN
OSTRICH INDUSTRY JUNE 2009
5
SECTION A: DESCRIPTION OF THE BIODIVERSITY IMPORTANCE OF THE KLEIN KAROO, ECONOMIC IMPORTANCE OF THE OSTRICH INDUSTRY IN THE KLEIN KAROO, VISION AND OVERALL MANAGEMENT OBJECTIVES
1. BIODIVERSITY IMPORTANCE OF THE KLEIN KAROO
(See Addendum A (p 26), from which this is an excerpt.) The Klein Karoo is recognised internationally as an area in which three of the 34 global biodiversity hotspots occur, the Succulent Karoo, Maputaland – Pondoland - Albany and the Cape Floristic Region Biodiversity hotspots. Biodiversity hotspots are recognised as earth’s biologically richest and most endangered terrestrial eco-regions. Each contains at least 1500 species of vascular plants as endemic species and have lost 70% or more original habitat. In addition to its floral diversity, the biome is a centre of diversity for reptiles and many groups of invertebrates. The Klein Karoo is extremely unique, in that it houses all three biomes – nowhere else in the world does one get this convergence of vegetation, which makes for exciting ecotone displays. The Klein Karoo forms part of the Southern Karoo (SK) Priority Area as described in the Succulent Karoo Ecosystem Profile1. It also forms part of the Cape Floristic Region (CFR), specifically the fynbos biome within the CFR. Eight portions of the CFR have been awarded World Heritage Site (WHS) status – of which there are only 175 in the world. The Greater Swartberg Mountain Range that is Central to the Klein Karoo, forms part of this WHS. This alone makes it an exceptionally unique and bio-diverse area; one that warrants action to safeguard, protect and conserve this natural jewel. A fine-scale map of the Klein Karoo vegetation and habitats that was done by Jan Vlok, revealed remarkable biological diversity - no less than 369 vegetation units in 56 habitat types. Each of the individual vegetation units constitute critical components of the Little Karoo environment that need to be understood before rational decisions and actions are taken to conserve the biodiversity of the region. It is recognised that the rich biodiversity of the Succulent Karoo is due to an extensive and complex array of habitat types derived from topographical and climatic diversity in the region’s rugged mountains and semi-arid shrub lands. Unfortunately much of this biodiversity has been degraded - a large proportion of the vegetation of the lower lying areas of the Klein Karoo has undergone severe degradation. The severity of the degradation resulted in a number of vegetation types being critically endangered, endangered or vulnerable (see Addendum A, p 26). In the lower lying areas of the Little Karoo where livestock farming, of which ostrich farming is most predominant the degradation of biodiversity results in long term detrimental impacts that affect not only the ecological systems but also the agricultural potential of the land and the wellbeing of society. Apart from the reasons given above, there are numerous other reasons why biodiversity needs to be
1 Succulent Karoo Ecosystem Profile: South African and Namibia, 2001
LONG TERM BIODIVERSITY MANAGEMENT STRATEGY FOR THE SOUTH AFRICAN
OSTRICH INDUSTRY JUNE 2009
6
conserved in the Klein Karoo, including human encroachment on sensitive habitats, climate change, etc.
The loss of vegetation usually results in the loss of soil through water and wind erosion. This has a direct impact on agriculture and biodiversity. Vegetation plays a crucial role in water retention and water infiltration into the soil by reducing rainfall splash effect, slowing water runoff, providing dead plant material mulch that serve as natural erosion barriers and creating suitable habitat for biological soil crusts (mosses and lichens) that are so important in keeping these systems healthy. The healthy environment in which vegetation diversity and cover is sound provides critical natural services in terms of preventing excessive water run-off on the Klein Karoo plains. This prevents excessive flooding events and prevents salutation of water courses. The cost of damage incurred by extreme flooding events in the Klein Karoo is well known. Resilience of the ecological system is a crucial survival mechanism especially in harsh environments such as the Klein Karoo. Plants interact, some provide suitable environments for seeds to germinate and grow, larger species provide protection from the sun, provide shade and keep soils cooler, and others provide traps for wind blown seed and keep seed banks. Some species cover the gaps created by erosion or dying plants until other longer lived plants can develop. A diversity of plants allows for greater resilience to the impacts of periods of stress such as found in this normal arid biome. Climatic excessive droughts however greatly enhance the losses. It has also been shown that the open sky and unspoiled landscapes of the Klein Karoo are the number one draw cards for tourism (a major economic sector of the Klein Karoo). These are recognized critical tourist attractions. Degradation of biodiversity will have obvious impacts on this economic sector. As ostrich farming is the largest contributor to the economy of the Klein Karoo and because this activity has had such an impact on the biodiversity of the area, improved and sustainable ostrich farming methods need to be developed that will ensure the sustainability of the ostrich farming industry and the conservation of globally important biodiversity. (See Addendum A for full report.)
LONG TERM BIODIVERSITY MANAGEMENT STRATEGY FOR THE SOUTH AFRICAN
OSTRICH INDUSTRY JUNE 2009
7
2. ECONOMIC IMPORTANCE OF THE OSTRICH INDUSTRY IN THE KLEIN KAROO
This section will briefly describe the economic significance of the ostrich industry for the Klein Karoo region. Please see Addendum B, p 33 for a detailed report.
2.1 BRIEF HISTORY OF THE INDUSTRY
Since the beginning of the ostrich industry in South Africa, the Klein Karoo played a leading role. Ostrich feather export increased with 100+% over a 30 year period between 1835 and 1865. This lead to a dramatic increase in the domestication and breeding of ostriches, particularly in the Oudtshoorn district and resulted in ostrich feathers being the fourth largest export commodity of the republic by 1913. From these humble beginnings (and experiencing some dramatic economic dips as well), the industry has developed into a highly sophisticated entity that slaughters between 200 000 and 300 000 ostriches per annum, mainly for leather and meat, with feathers playing a smaller role (with a peak in the late 90’s of around 300 000) . Some 75% of output originates from the Western Cape where the Klein Karoo dominates production. More than 65% of the world’s ostriches are now found in South Africa and South Africa accounts for 90% of ostrich products traded internationally, contributing R1, 2 billion per annum (2008) to the SA Economy.
2.2 SOCIO-ECONOMIC SITUATION IN THE KLEIN KAROO
The Klein Karoo region is largely accommodated within the Eden District Municipality (the third largest District within the Western Cape Province) and is specifically covered by the local municipalities of Oudtshoorn and Kannaland. Some of the challenges faced by the District are rapid urbanisation, in-migration of population, unemployment, poverty and rising health indicators (TB, HIV etc) Unemployment is a particular concern; particularly due to the region's geographic isolation and low levels of education (only 15.1% of Klein Karoo adults have attained Grade 8 schooling). Household incomes are very low, with three quarters of all households earning less than R3200 per month. Combining population sizes and production levels, Oudtshoorn has the lowest per capita income levels of the large towns in the Southern Cape, i.e. R21 855 (2000 constant prices) in 2004 compared to R32 500 of George, R31 400 of Knysna and R28 200 of Mosselbay (Development Information Unit: DBSA Global Insight database, 2004). The poverty problem in the Klein Karoo has become more acute since 1998 with almost 30% (almost one out of three) of the population living in poverty in 2004 as opposed to 25% (one out of four) in 1998. Although still not on a national level, the percentage of people in Oudtshoorn living in poverty is much higher than the Provincial figure (23%) and higher than the percentages in George (18%); Knysna (19%) and Mossel Bay (25%).
LONG TERM BIODIVERSITY MANAGEMENT STRATEGY FOR THE SOUTH AFRICAN
OSTRICH INDUSTRY JUNE 2009
8
2.3 KLEIN KAROO REGIONAL ECONOMY
2.3.1 Regional Output
Regional agriculture (predominantly ostriches and related lucerne production, small stock, and seed production) and tourism are the main sources of income. The ostrich industry plays a particular dominant economic role within the Oudtshoorn municipal area economy.
2.3.2 Agriculture’s Importance to Regional Employment
Within this area, the agricultural sector directly provides for 21% of all employment but indirectly obviously contributes heavily to other sector employment such as wholesale, retail, transport and commercial services if one considers the multiplier effect of the agricultural economy within the region. In the Kannaland, there is an even greater reliance on agriculture and the sector provides directly for 56% of all employment. Within the overall Klein Karoo, 29.2% of all employment is agricultural sector related (7366 jobs). The high contributions of the agricultural, construction and services sectors compared to their output contributions indicate how labour intensive these sectors are.
2.3.3 The Ostrich Industry’s Dominant Role in Klein Karoo Agriculture
Currently most of the farms in the Oudtshoorn area are involved in various segments of ostrich farming, with about 150 000 to 200 000 ostriches kept on some 500 farms. The climate of Oudtshoorn is favourable for ostrich farming. Moreover, the economics of such is better than that for any potential substitute livestock enterprise. Furthermore, the regular Klein Karoo drought phenomenon is a real agricultural constraint, but the ostrich enterprise does give farmers a degree of flexibility to contend this ever present threat (e.g. by changing breeding flock replacement rates). Klein Karoo ostrich production represents 72% of total farm output in the region, and in the Oudtshoorn district this figure is even higher. Thus the whole economic backbone of the Klein Karoo is the ostrich industry - a capital intensive enterprise with high risk due to exposure to the vagaries of the export market, the international financial situation, and threat of disease, droughts, and now the need to pay greater attention to biodiversity conservation. The industry has had many crisis points in its history, yet its regional advantage, good organisation and tight management, insistence on quality and meeting international standards, as well as a conservative financial strategy (e.g. its farmer debt to income ratio is 23% better than that of the Provincial average) has meant that it has ably played a dominant role in meeting the economic challenges of the region.
LONG TERM BIODIVERSITY MANAGEMENT STRATEGY FOR THE SOUTH AFRICAN
OSTRICH INDUSTRY JUNE 2009
9
3. MAKING AN ECONOMIC CASE FOR PEN BREEDING AS ONE ALTERNATIVE OVER FLOCK BREEDING
This section will briefly describe the economic benefit of doing pen breeding instead of flock breeding. Please see Addendum C, p 38 for a detailed report.
3.1 THE ECONOMICS OF OSTRICH PEN-BREEDING
In considering various strategies to conserve the succulent Karoo, the SAOBC has identified a possible industry switch to pen-breeding as a key strategic initiative.
3.1.1 Pen Breeding
An industry adoption of pen-based ostrich breeding or strictly regulated and monitored “veld based trop paring” (as opposed to uncontrolled veld-based "tropparing) would seem to be a "win-win" option open to both conservationists and farmers. Under such a production switch, veld (low to moderate degradation) previously occupied by breeding ostriches would have a chance to rehabilitate due to breeding ostriches being brought off the veld and into breeding camps.
3.1.2 Pen Breeding Cost
Under a pen-breeding regime, breeding duos, or preferably trios, would be kept in 0.25 ha.
The only significant cost differences between pen-breeding and "tropparing" are those associated with the capital and management costs of pen construction. (Costs related to theft, disease, nutrition, etc are unknown and will vary.) The capital cost of a pen or 0.25 ha. breeding camp (to house 1 breeding male and 2 breeding females under a trio system) has been estimated at R5035. See addendum C. Assuming that a farmer would require 100% funding to finance pen construction, and if such funds were obtained by means of a Land Bank-type loan over 10 years @ 17%, annual repayments on the amount borrowed for each pen would be R1080. In other words, based on assumptions and calculations, any annual benefit from pen-breeding in excess of R1080 per 2 breeding females would more than compensate for the extra capital cost incurred.
3.1.3 Economic Benefits of Pen-Breeding
The extent of the economic benefit of pen-breeding will depend on individual farmer management ability, but some practitioners of the system show productivity levels that can be significantly higher than those of farmers who participated in a study done on 10 farmers’ ostrich production systems by the OIBMP. For example, the average no. of chicks produced per female in the 2008 OIBMP study was 25.5 chicks, but monitored individual records of pen-breeding farmers indicate performances in excess of 40 chicks per female. Recognising that it would take a few years to feel the greater potential of pen-breeding, and in order to err on the side of conservatism, 2 scenarios for pen-breeding have been adopted in the following economics models of pen-breeding - one at a an annual productivity increase of 2.5% for year 2 and year 3, and the other at a 5% increase.
LONG TERM BIODIVERSITY MANAGEMENT STRATEGY FOR THE SOUTH AFRICAN
OSTRICH INDUSTRY JUNE 2009
10
3.1.4 The Economics of “Tropparing” and Pen-Breeding Compared
A comparison of the 2 systems under full production was made by constructing models which are based on 100 breeding ostriches: These showed: � there would be no farm benefit from changing to the system in Year 1. In fact the
gross margin on the pen-breeding operation actually decreases in Year 1 compared to the tropparing option. It would only be after the 1st year that the potential productivity increases are likely to manifest themselves i.e. after the commencement of individual bird records and the ability to select ostriches for future breeding material based on past performance.
� Thereafter, by the end of Year 3, output should have climbed to an increase of some 19% (if productivity increases by 2.5% per year) over the static potential for "tropparing", or by nearly 42% if productivity increases by 5% per year. Furthermore it should be noted that increases of such magnitude are possible even after annual loan repayment has been made.
(This model will be tested with participating farmers in future.)
LONG TERM BIODIVERSITY MANAGEMENT STRATEGY FOR THE SOUTH AFRICAN
OSTRICH INDUSTRY JUNE 2009
11
4. CURRENT SITUATION: OSTRICHES IN THE KLEIN KAROO
4.1 THE FOOTPRINT OF THE OSTRICH INDUSTY
4.1.1 History
The South African Ostrich Industry became established in 1864 with large-scale exports of feathers to Europe. The Industry flourished during what was referred to as the second ostrich feather boom between 1900 and 1914. Soon afterwards, the industry virtually collapsed as a result of changes in world fashion trends and the First World War. During the 1960s, the Industry was transformed into an intensively managed farming activity. The emphasis shifted from feather to leather production. More recently, ostrich meat became popular because of health aspects such as almost no fat and cholesterol, and richness in protein and iron. This increasing focus on a healthy lifestyle leads to a growing demand for ostrich meat worldwide and South Africa is the main supplier.
Since the deregulation of the marketing of agricultural products in South Africa during the 1990s, farming with ostriches has spread from the Little Karoo region to other parts of the country as well as to several other countries.
4.1.2 Current
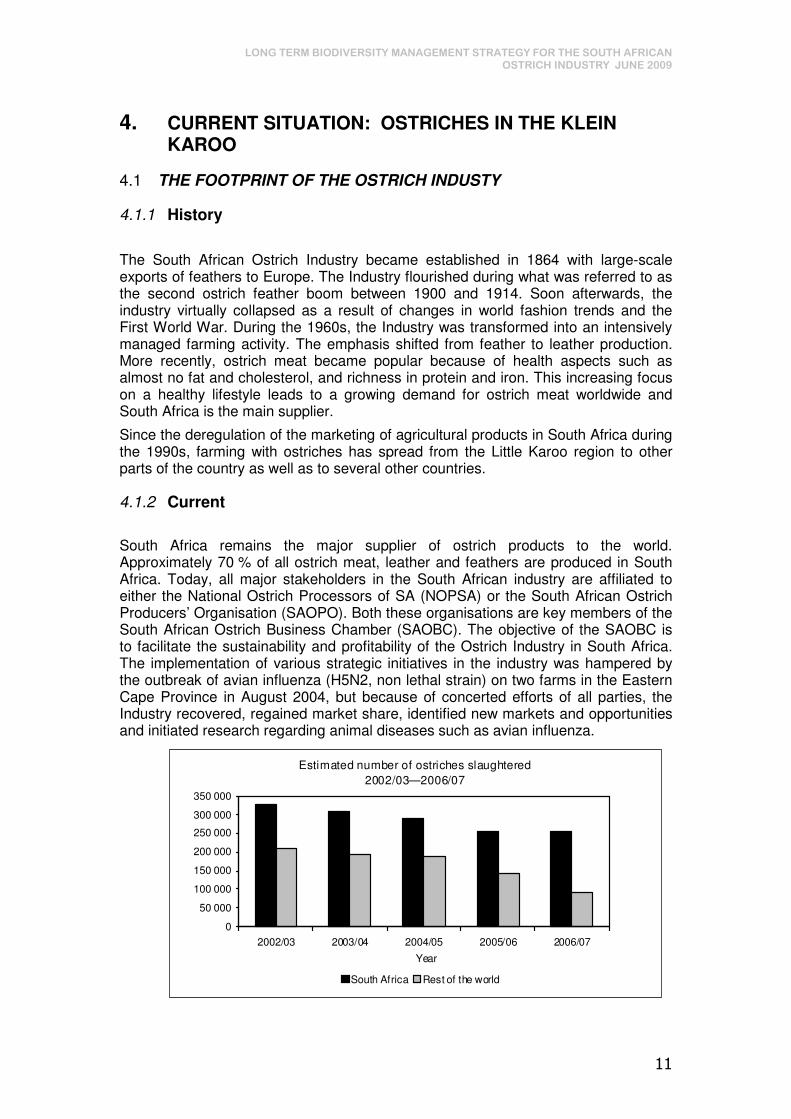
South Africa remains the major supplier of ostrich products to the world. Approximately 70 % of all ostrich meat, leather and feathers are produced in South Africa. Today, all major stakeholders in the South African industry are affiliated to either the National Ostrich Processors of SA (NOPSA) or the South African Ostrich Producers’ Organisation (SAOPO). Both these organisations are key members of the South African Ostrich Business Chamber (SAOBC). The objective of the SAOBC is to facilitate the sustainability and profitability of the Ostrich Industry in South Africa. The implementation of various strategic initiatives in the industry was hampered by the outbreak of avian influenza (H5N2, non lethal strain) on two farms in the Eastern Cape Province in August 2004, but because of concerted efforts of all parties, the Industry recovered, regained market share, identified new markets and opportunities and initiated research regarding animal diseases such as avian influenza.
Estimated number of ostriches slaughtered
2002/03—2006/07
0
50 000
100 000
150 000
200 000
250 000
300 000
350 000
2002/03 2003/04 2004/05 2005/06 2006/07
Year
South Africa Rest of the world
LONG TERM BIODIVERSITY MANAGEMENT STRATEGY FOR THE SOUTH AFRICAN
OSTRICH INDUSTRY JUNE 2009
12
The number of birds slaughtered worldwide was estimated at approximately 300 000 for 2007/08, 214 000 of which were slaughtered in South Africa. In Europe the demand for ostrich meat remained high and the local consumption of ostrich meat showed a continued increase.
Income from leather varies significantly because of large price differences between raw skin grades. The SAOBC’s aim is that only higher-grade leather be placed on the market and therefore various research programmes regarding quality improvement and genetics are being launched. A producer earns approximately R1 500 for a raw first-grade skin and around R800 for a third-grade skin. The current worldwide economic crisis has lead to a dramatic drop in these prices, as ostrich-derived products are being perceived as luxury goods.
The average price that producers of ostrich meat received during 2008/09 was R32/kg and R150 for feathers per bird (depending on the quality).
4.1.3 Prospects
During the 2008/09 season, the number of ostriches slaughtered in South Africa is expected to remain at about 200 000, mainly as a result of the after-effects of avian influenza and the severe drought followed by floods in the main production areas during 2006. The situation could continue well into 2009, with even a further drop in slaughter numbers because of the fact that an ostrich can only be slaughtered after 14 months as well as increasing input costs (mainly feed, transport and labour) and interest rates, linked to the factors mentioned. A large reduction in breeder numbers were also observed as result of economic realities and disease outbreaks.
The SAOBC, being the representative body of the South Africa ostrich industry, accepted its role as partner with the Department of Agriculture in ensuring compliance with international export requirements. Generic marketing activities take place in collaboration with the Department of Trade and Industry to try and increase the ostrich industry’s contribution of R1, 75 billion per annum to the South African economy, as well as to safeguard more than 20 000 jobs.
4.1.4 Markets
Export statistics for 2007/2008 indicates the following: Meat comprises the bulk of income per ostrich (55%), with Europe (4 000 tonnes) and the Far East (350 tonnes) being the main importers. Ostrich meat is not a commodity, but an exotic, lifestyle product for health conscious consumers and customers are prepared to bay for quality, based on consistent supply. Distribution is done mainly through agents, wholesalers, reprocesses and repackages. Promotion of ostrich meat includes the development of a SA brand (SA Ostrich), educational campaigns via the healthy-living industry, joint promotions with selected retailers and/or restaurants and participating in international trade shows and food fairs. 42% of income per ostrich is derived from leather – some 200 000 skins were exported, the bulk of which to USA/Mexico, Europe and the Far East. Ostrich leather is used to manufacture handbags, boots, purses, belts, jackets, coats and dresses, and distribution is mainly done through agents, designer buyers and marketers. It is seen to be a high quality, luxury, exotic, durable item, and buyers pay a premium price due to quality and positioning. Promotion is done through fashion magazines (Versace, Gucci), participation in trade shows (Bologna, Hong Kong) and sponsorships to designers who participate in international fashion shows (Paris, Moscow).

LONG TERM BIODIVERSITY MANAGEMENT STRATEGY FOR THE SOUTH AFRICAN
OSTRICH INDUSTRY JUNE 2009
13
The exotic feather market comprises the smallest income per ostrich, with feather dusters selling 1 million per annum. Other uses are for the fashion industry (handbags, clothing) and the entertainment industry (Rio Carnival, Moulin Rouge). Prices vary according to applications and marketing is done mainly through joint ventures and relationships.
LONG TERM BIODIVERSITY MANAGEMENT STRATEGY FOR THE SOUTH AFRICAN
OSTRICH INDUSTRY JUNE 2009
14
5. CURRENT SITUATION: BIODIVERSITY STATUS OF THE KLEIN KAROO
5.1 MAP OF ENDANGERED VEGETATION REMNANTS
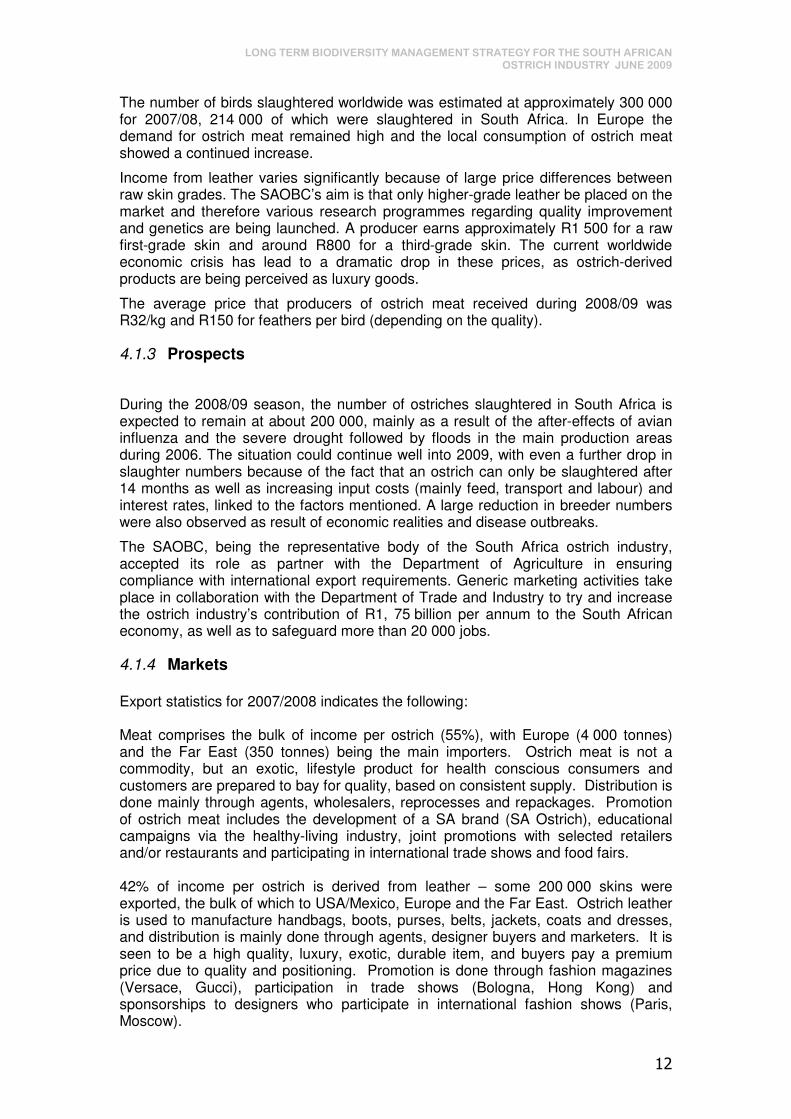
Below is a map of the Klein Karoo Oudtshoorn/Calitzdorp basin, indicating critically endangered (red) and endangered (orange) vegetation.
5.2 CONSERVATION STATUS
South Africa falls within two of the worlds six floral kingdoms, the Paleotropical Floral Kingdom and the Cape Floral Kingdom and is divided into 9 biomes (Mucina & Rutherford, 2004) representing the 9 major habitat types (Rouget et al. 2004) (Table 1). Biomes are major biotic communities, grouped according to dominant and co dominant plant life forms, vegetation structure, floristic community and climate (Rutherford & Westfall 1994). The Cape Floral Kingdom contains Fynbos, Forest, Nama Karoo, Succulent Karoo and Thicket biomes.
Table 1. The biomes of South Africa showing area in km2 covered by the biome, the percentage of South Africa covered by the biome and the percentage of the biome protected in Type 1 Protected Areas ((Rouget et al. 2004).
Biome Area (km2) % total area % protected
Fynbos 84,580 6.7 11
Grassland 373,984 29.5 1.9
Savanna 412,753 32.6 8.9
Albany Thicket 30,256 2.4 6.3
Wetlands 16,790 1.3 4.6
Desert 8,548 0.7 12.5
Forest 4,730 0.4 39.6
Succulent Karoo 85,207 6.7 3.1
LONG TERM BIODIVERSITY MANAGEMENT STRATEGY FOR THE SOUTH AFRICAN
OSTRICH INDUSTRY JUNE 2009
15
Nama-Karoo 250,069 19.7 0.6
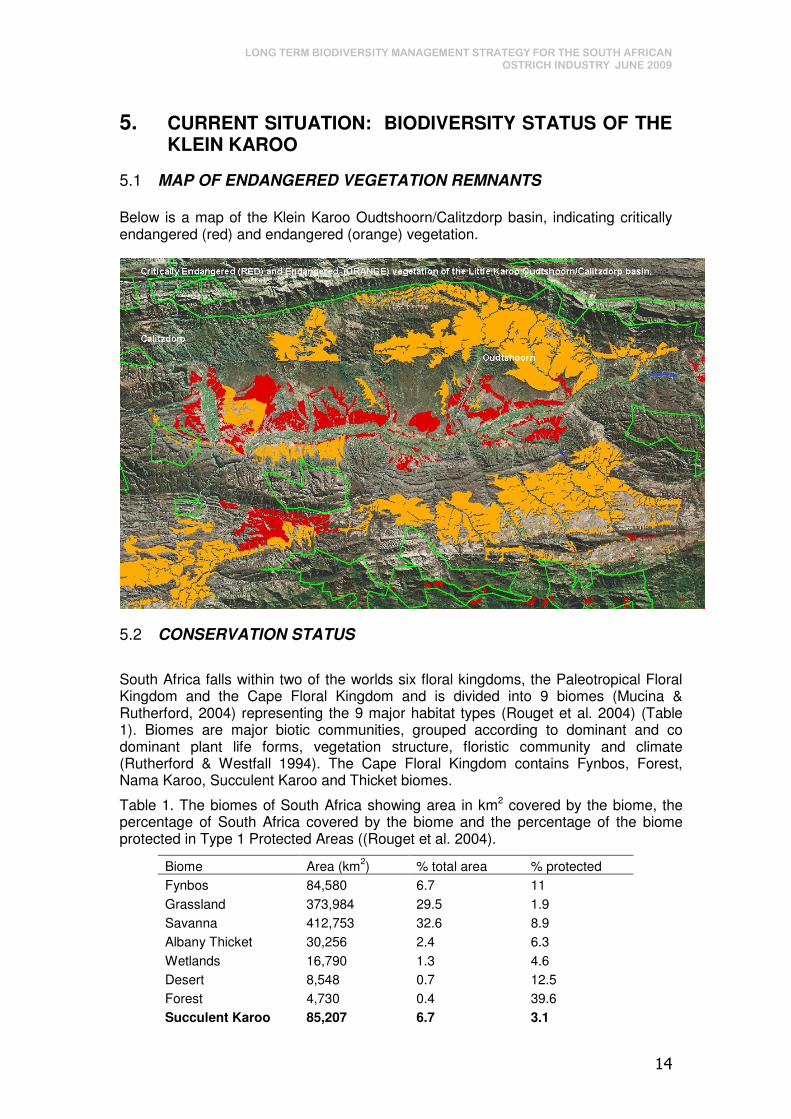
Jan Vlok’s vegetation map of the Klein Karoo shows amazing biological diversity. However, a transformation layer that was done by Mark Thompson showed that a large proportion of the vegetation of the lower lying areas of the Klein Karoo have undergone severe degradation. The severity of the degradation indicates that 25 vegetation units are critically endangered (there is less natural veld left than the minimum size needed to protect the unit), 29 vegetation units are endangered (there is less than the minimum area needed + 15%) and 30 vulnerable vegetation units (less than 60% of the vegetation type left). A high percentage of the Klein Karoo vegetation in the ostrich farming areas in particular is critically endangered or endangered. However, less than approximately 7.5% of the Succulent Karoo biome vegetation types in the Klein Karoo are formally protected. The biome’s biodiversity is under pressure from a range of factors, including urban development, lack of knowledge, overgrazing, water extraction, illegal collection of fauna and flora, and anthropogenic climate change. Hence the urgency to address the question of conservation targets (Desmet and Cowling 2004). CapeNature manages formally protected state land (mostly Nature Reserves), but the conservation of biodiversity outside of formally protected state land lies in the hands of the private landowners. A combination of environmental legislation for all land, landowner willingness and the Provincial Conservation Agency (CN) stewardship programme and incentives combine to form strategies for biodiversity conservation off state reserves. The map below shows areas hat are under formal protection (green outlines), as well as privately owned land that form part of CapeNature’s stewardship programme (green).
LONG TERM BIODIVERSITY MANAGEMENT STRATEGY FOR THE SOUTH AFRICAN
OSTRICH INDUSTRY JUNE 2009
16
6. MISSION AND VISION – Working Towards a Win-Win Situation
An agreed upon vision has been developed through various meetings and workshops with stakeholders – at the base of this lies the following principles: � Balance between utilisation and conservation – sustaining a balance between the
environment and the industry � Improved ostrich production, based on research � Ostrich industry to have less impact on biodiversity � Rehabilitation where appropriate � Climate change mitigation and adaptation
MISSION
The ostrich industry recognises and safeguards the unique biodiversity of the Klein Karoo and supports sustainable farming methodologies that strive to balance utilisation and conservation through improved veld management, rehabilitation where appropriate, climate change adaptation and sound research in order to maintain its world leader status.
VISION
The ostrich industry in the Klein Karoo supports a process whereby producers will, by 2019, decrease their impact on the biodiversity through improved veld management and restoration, whilst pursuing increased production based on sound research to retain and expand international and local markets.

LONG TERM BIODIVERSITY MANAGEMENT STRATEGY FOR THE SOUTH AFRICAN
OSTRICH INDUSTRY JUNE 2009
17
7. OVERALL MANAGEMENT PRINCIPLES
Improved biodiversity and improved ostrich production in the ostrich producing areas of the Klein Karoo will be managed to meet the following strategic management objectives: � Maintaining and improving the image of South African ostriches in the export
market � Maintaining the status as the world leader in quality ostrich products � Conforming to the consumer standards for export markets, including the national
and international animal welfare standards � Ensuring the conservation of important biodiversity – focussing on vegetation
types and not on individual farmers (an area-based approach) � Accepting that most ostriches and other animals should be removed from
sensitive areas or managed in a different way � Establishing solid partnerships with relevant conservation and agriculture experts,
statutory bodies, research institutions and other initiatives that promote the conservation of the natural environment in harmony with ostrich production
� Ensuring compliance to the guidelines for veld management that was produced � Raising awareness about the interdependency of and partnerships between the
industry and conservation � Making a contribution to the socio-economic wellbeing of the area � Promoting a phased approach to adopt pen breeding as an alternative to flock
breeding in natural veld � Accepting the existing and generating supporting data that underwrites this
strategy
18
SECTION B: IMPLEMENTATION
8. OBJECTIVES
In order to work towards achieving the vision and the mission, four objectives have been identified. Those objectives will form the basis of the strategy, and will play out over a 5 year time span in the Klein Karoo, initially focussing on sensitive vegetation. Thereafter it will be extrapolated to the rest of the Klein Karoo, and later to other ostrich producing regions, like the Eastern and Northern Cape.
8.1 OBJECTIVE 1: Ostrich farmers in the Klein Karoo are improving management of sensitive and endangered veld as well as their ostrich production
Means of verification: � An assessment of veld condition in the Klein Karoo against the footprint of the
industry is guiding biodiversity planning in the Klein Karoo � A GIS map has been produced and conservation targets for sensitive vegetation
have been set � A Klein Karoo Biodiversity Management Plan for the Ostrich Industry is guiding
farm level Biodiversity Management Plans � A systematic switch over to pen breeding has taken place where appropriate and
necessary � Farmers are recording their production systems and are showing an improvement
in production based on pen breeding or alternative systems � # ha under improved management / stewardship � The Industry, through commitment from partners, is providing an extension
service to the ostrich farmers � A monitoring system for improved veld management has been developed and is
implemented � A long term uniform system for auditing compliance has been set up and is
functional (M&E) � Appropriate rehabilitation of identified degraded veld is taking place and
information on rehabilitation methodology is relayed to the Industry � Awareness about the sensitive nature of the area, the benefits of the effect on
veld when ostriches are removed etc, is being raised at appropriate forums and during 1:1 visits – as well as awareness about the strategy and its implementation
� A 10-year time frame for achieving some results are suggested for the Klein Karoo
� By 2019 the # of ostriches in natural veld is acceptable (legally, ecologically, financially)
� An investigation pertaining to determining a realistic average ostrich stocking rate for sensitive and other areas in the Klein Karoo has been done and is guiding DEA&DP applications
� The Industry has adopted a Standard (“best practice”) Document and a Biodiversity Management Plan for the Klein Karoo
19
8.2 OBJECTIVE 2: A sustainable biodiversity unit for the ostrich industry in the Klein Karoo has been established and is working effectively by means of an integrated approach to Biodiversity Management, compliance and sustainable funding
Means of verification: � Opportunities for partnerships have been explored, fine-tuned and solidified by
year 5. � Various working groups (i.e. providing extension services and developing a
monitoring system for improved veld management; assisting with change of land-use applications; developing guideline documents; assisting with compliance, monitoring) have been established and are operational
� Compliance and monitoring systems and functions are established and functional � MoUs have been signed by partners with specific Service Level Agreements � Functions related to the Biodiversity Unit have been embedded in the TOR’s of
partner organisations � Ongoing fundraising and partnerships are supporting the BU � Farmers are engaging with “liaison basket” who assists with Biodiversity
Management Plans on farm level and on vegetation type level � Effective liaison w.r.t. extension, guideline documents, compliance, monitoring etc
is taking place
8.3 OBJECTIVE 3: The Ostrich Industry has developed a climate change mitigation and adaptation strategy which is mainstreamed into the “best practice guidelines”
Means of verification: � The likely impact of climate change for the Ostrich Industry has been determined � Adaptation strategies that can be undertaken and built into best practices have
been identified � The “green” footprint of the Industry has been established and recommendations
on how can it be reduced are considered by the Industry � Data in GIS analysis threshold has been developed � Recommendations for mitigation opportunities have been developed � Potential of carbon exchange has been investigated
8.4 OBJECTIVE 4: The ostrich industry has created an enabling environment for and is supporting research that supports biodiversity conservation and improved production
Means of verification: � Partnerships with various tertiary institutions and study groups have been
established � Research results are being conveyed at relevant groupings / meetings � Assistance is given to proposal writing
20
9. METHODOLOGY
9.1 BIODIVERSITY UNIT
A Biodiversity Unit for the Ostrich Industry, managed by the SAOBC, will be set up. This will require of the current biodiversity project to write a funding proposal and to source external funds. This BU will act as one-stop-shop for biodiversity matters within the Ostrich Industry, and will function to serve the Industry’s Biodiversity needs.
9.1.1 Main functions of the Biodiversity Unit
The main functions of the BU will be the execution of the 4 objectives, as described in B1. However, one of the main drives of Output 1 will be: By 2019 all ostrich producing farms in the Klein Karoo will engage in pen breeding or alternative practices, with acceptable numbers (ecologically and legally) of breeding birds in natural veld.
For this outcome, a phased approach will be adopted: The Industry, through the SAOBC’s Biodiversity Unit, will engage in a process whereby farmers are encouraged to: � place new ostrich stock in preferred alternative system from the start � reduce ostriches on natural veld by 10% per year � do record keeping in order to select better producers (and put in pens, based on
genetic capability) and slaughter non performers This will be done through extension and awareness raising. The BU will set up a “basket” of partners, consisting of representatives from the following institutions, to assist a designated extension officer to the ostrich industry with both extension and awareness raising: � Department of Agriculture (National and Provincial) � LandCare � Organised Agriculture � Veterinarian Services – Ostrich Industry � CapeNature � Department of Environmental Affairs and Development Planning (DEA&DP -
Provincial) / Department of Environmental Affairs and Tourism (DEAT - National) � NSPCA This grouping will also assist with environmental / biodiversity monitoring and compliance issues within the ostrich industry. To back this up, the following documents will be produced and communicated to the farmers through relevant forums and meetings: � Maps: current situation / vegetation / ideal situation in future � Economic case for alternative breeding options � Record keeping guidelines/templates � Climate change strategy In order to assist farmers with switching over to alternative breeding practices from flock breeding, the BU will:
21
� Use the following documents to lobby for support from government: o Economic value of Ostrich Industry in the Klein Karoo o Economic case for pen breeding over flock breeding o Economic case for alternative breeding practices over flock breeding
� Engage with relevant partners for in-kind support and shared resources
9.1.2 Staffing of the BU
� Co-ordinator: ensuring effective partnerships, project management and liaison. � Intern / trainees: student enrolled at NMMU (Saasveld) – to shadow extension
officer and extension teams, to assist project wherever possible (trainee funding to be sourced from government funding)
� Extension officer: to provide extension and other services in partnership with extension team . (Other services: i.e. disease surveillance, farm auditing etc)
� Unit assistant / admin person: to assist with administration, logistics etc � Consultants: to be appointed when necessary � Partnerships: to be sought and solidified with institutions mentioned in 12.1
9.1.3 Capacity Building and Training
� Training in the effective use of the newly acquired GIS system: extension officer,
intern, 1 current SAOBC staff member � Insights training: SAOBC and BU staff � Relevant knowledge exchange trips for staff and ostrich producers � Biodiversity and Ostrich related information sharing at Dept of Agriculture
Information Days � Selected study group meetings when necessary � Training in communication related practices (website / newsletters etc)
9.1.4 Data Capturing
� Generating relevant maps: current situation / vegetation / ideal situation in future � Capturing data re successes and failures of pen breeding systems � M&E data and procedures � Compliance data and procedures
9.1.5 Liaison and Awareness Raising
To be done continuously, and specifically at forums / meetings / workshops / conferences such as:
o Fynbos Forum / Arid Zone Ecological Forum (AZEF) o CAPE / SKEP conferences / opportunities o Agricultural Information Days o Field Trips o Agricultural Unions o CapeNature liaison days
� Liaison with CN/NDA/DEA&DP w.r.t. legislation: ensuring that compliance issues, listed activities etc are smoothed out in order to ease the switch over from flock to pen breeding
� A structured awareness raising campaign, carrying across the message of the importance of complying to veld management guidelines, will be designed and implemented
22
� A marketing strategy and awareness raising w.r.t. climate change adaptation and mitigation strategy
9.1.6 Provision of Services
The extension team (“basket” of partners as stipulated in 12.1) will meet quarterly to discuss in which ways they could provide the following services to individual farmers: � Extension w.r.t. biodiversity and agricultural matters � Raising awareness of preferred farming methodologies � Raising awareness of endangered vegetation and uniqueness of biodiversity � Recommendations w.r.t. switching from flock to pen breeding or alternative
systems � Recommendations w.r.t. placing camsp � Recommendations w.r.t. rehabilitation methodology and options � Guidance w.r.t. stewardship options and participation � Collective farm level and area wide planning � Other recommendations
9.1.7 Ostrich Standards / “Best Practice” Guidelines
The Industry is currently engaging in a process whereby ostrich producers and processors are developing a “best practice” for biodiversity document based on the GlobalGAP® model. The function of the BU is to ensure that biodiversity “best practices” are incorporated in this document. Also to assist in obtaining the buy-in from the industry to adopt this document. “Tropparing” on natural veld being phased out to acceptable and legal levels – pen breeding and alternative practices being promoted, with continual research into improved or alternative strategies. Climate change adaptation to form part of this document – ostrich industry to calculate carbon footprint and plan to get it down – use as marketing tool.
9.1.8 Monitoring and Compliance
A long term biodiversity monitoring and compliance function will be established, with the following functions: � Establishing a working group to meet quarterly in order to streamline applications,
monitoring and system � This will include biological monitoring (including rehabilitation) in order to
measure successes and the benefit of the effect on the veld if ostriches are removed
� This will include the monitoring of the implementation of the biodiversity management plans per farm
� Establishing a system whereby non-compliance is identified, recommendations for rectification is given, and ultimately given over to NDA and temporarily de-registered
� Establishing a system whereby compliance is recognised and awarded � Monitoring carrying capacity -
9.1.9 Rehabilitation
Areas for effective rehabilitation, based on realistic goals for specific vegetation types, will be identified, business plans for rehabilitation will be drawn up and
23
rehabilitation will be implemented. Information sign boards along the road will be put up, adding to the awareness raising of the uniqueness of the area. A monitoring system will be established to ensure that veld is rehabilitated
9.1.10 Implementing Authority
The SAOBC and the BU will start engaging with partners i.t.o. sustainable funding for the Biodiversity Unit. The SAOBC will remain the implementing authority, until partners decide otherwise and it is so accepted by the PMT.
9.1.11 Potential Funding
Climate change strategy – Industry – rapid assessment (1 year) – build outcomes into best practice / De Beers / Nat Dept Agric / German funder – land management / Dept Science and Technology Strategic Climate Change Funding / Conservation International Biodiversity Unit: KKG/ Mosstrich / SAOBC / Partners Funding for training of permanent staff member in GIS - SAOBC Rehab – SKEPPIES / De Beers (Tessa Oliver) Capacity Building – CAPE CI – Sarshen Marais – CAP (Climate Action Partnership)
24
SECTION C: ALTERNATIVES TO FLOCK BREEDING The Ostrich Industry engages in various methods of ostrich breeding. This biodiversity management strategy focuses on pen breeding as the preferred alternative, as this methodology encourages continuous genetic improvement through proper record keeping and selection and shows huge potential for increased production. The rationale behind promoting pen breeding is to decrease the pressure on the natural veld – if a farmer can achieve increased production from a pen breeding system, he will take ostriches off the natural veld and do breeding in pens. However, many ostrich farmers show resistance to switch from flock breeding to pen breeding – for various reasons (ranging from lack of knowledge, costs of pen construction and management adaptation to preferring the current style of farming based on history). Alternative strategies to achieve the aim and vision of maintaining biodiversity within a sustainable production system thus have to be investigated, researched, proved and communicated. One of the strategies would be to consider “trade-offs” – i.e. to sacrifice portions of land (albeit endangered vegetation) for concentrated flock breeding. This would mean allowing more ostriches per hectare on natural veld than the prescribed stocking rate, BUT signing an agreement with the mandated conservation authority to improve veld management on other parts of the property. This would include making an official application to the Department of Environmental Affairs and Development Planning, for changed land use. Another strategy would be to investigate the optimum ostrich numbers in pen breeding systems. Where pen breeding normally houses 2, 3 or 4 ostriches per pen, it could be investigated to increase the number of ostriches per pen (and increasing the pen size). These and other strategies need to be work shopped with producers, processors, conservation authorities and other role-players.
25
SECTION D: SUMMARY BUDGET FOR ESTABLISHING A BIODIVERSITY UNIT FOR THE OSTRICH INDUSTRY
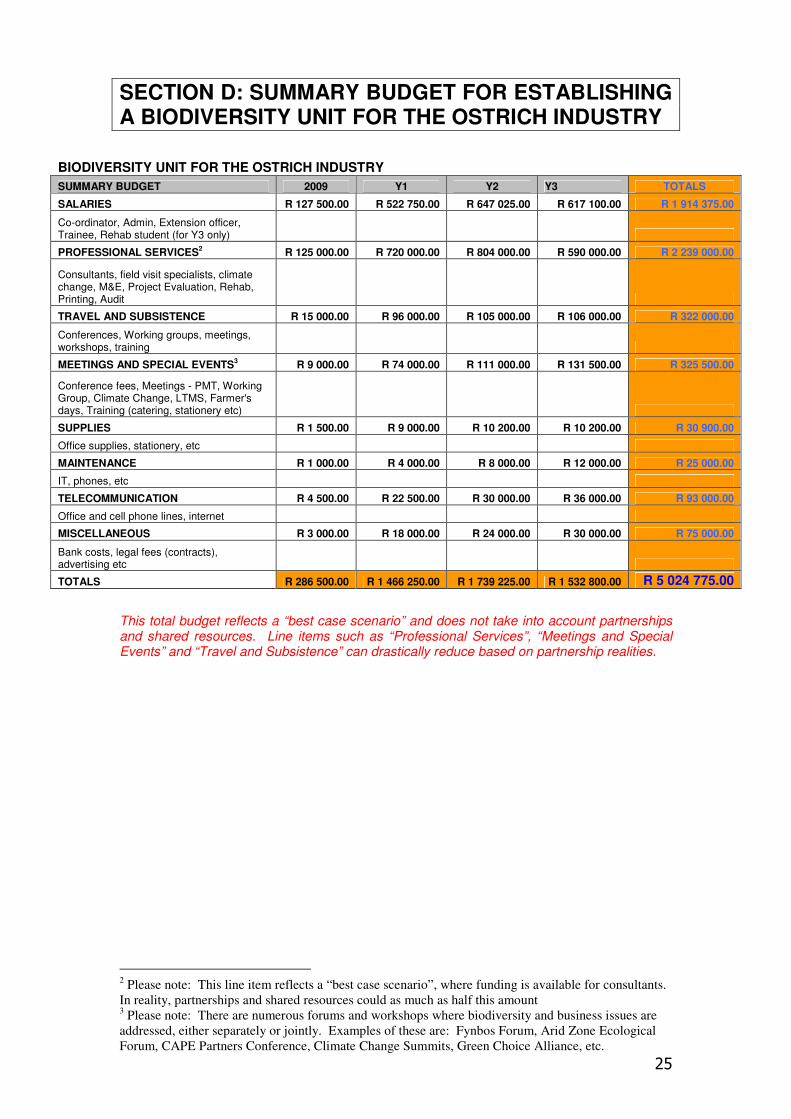
This total budget reflects a “best case scenario” and does not take into account partnerships and shared resources. Line items such as “Professional Services”, “Meetings and Special Events” and “Travel and Subsistence” can drastically reduce based on partnership realities.
2 Please note: This line item reflects a “best case scenario”, where funding is available for consultants.
In reality, partnerships and shared resources could as much as half this amount 3 Please note: There are numerous forums and workshops where biodiversity and business issues are
addressed, either separately or jointly. Examples of these are: Fynbos Forum, Arid Zone Ecological
Forum, CAPE Partners Conference, Climate Change Summits, Green Choice Alliance, etc.
BIODIVERSITY UNIT FOR THE OSTRICH INDUSTRY
SUMMARY BUDGET 2009 Y1 Y2 Y3 TOTALS
SALARIES R 127 500.00 R 522 750.00 R 647 025.00 R 617 100.00 R 1 914 375.00
Co-ordinator, Admin, Extension officer, Trainee, Rehab student (for Y3 only)
PROFESSIONAL SERVICES2 R 125 000.00 R 720 000.00 R 804 000.00 R 590 000.00 R 2 239 000.00
Consultants, field visit specialists, climate change, M&E, Project Evaluation, Rehab, Printing, Audit
TRAVEL AND SUBSISTENCE R 15 000.00 R 96 000.00 R 105 000.00 R 106 000.00 R 322 000.00
Conferences, Working groups, meetings, workshops, training
MEETINGS AND SPECIAL EVENTS3 R 9 000.00 R 74 000.00 R 111 000.00 R 131 500.00 R 325 500.00
Conference fees, Meetings - PMT, Working Group, Climate Change, LTMS, Farmer's days, Training (catering, stationery etc)
SUPPLIES R 1 500.00 R 9 000.00 R 10 200.00 R 10 200.00 R 30 900.00
Office supplies, stationery, etc
MAINTENANCE R 1 000.00 R 4 000.00 R 8 000.00 R 12 000.00 R 25 000.00
IT, phones, etc
TELECOMMUNICATION R 4 500.00 R 22 500.00 R 30 000.00 R 36 000.00 R 93 000.00
Office and cell phone lines, internet
MISCELLANEOUS R 3 000.00 R 18 000.00 R 24 000.00 R 30 000.00 R 75 000.00
Bank costs, legal fees (contracts), advertising etc
TOTALS R 286 500.00 R 1 466 250.00 R 1 739 225.00 R 1 532 800.00 R 5 024 775.00
26
SECTION E: ADDENDUMS
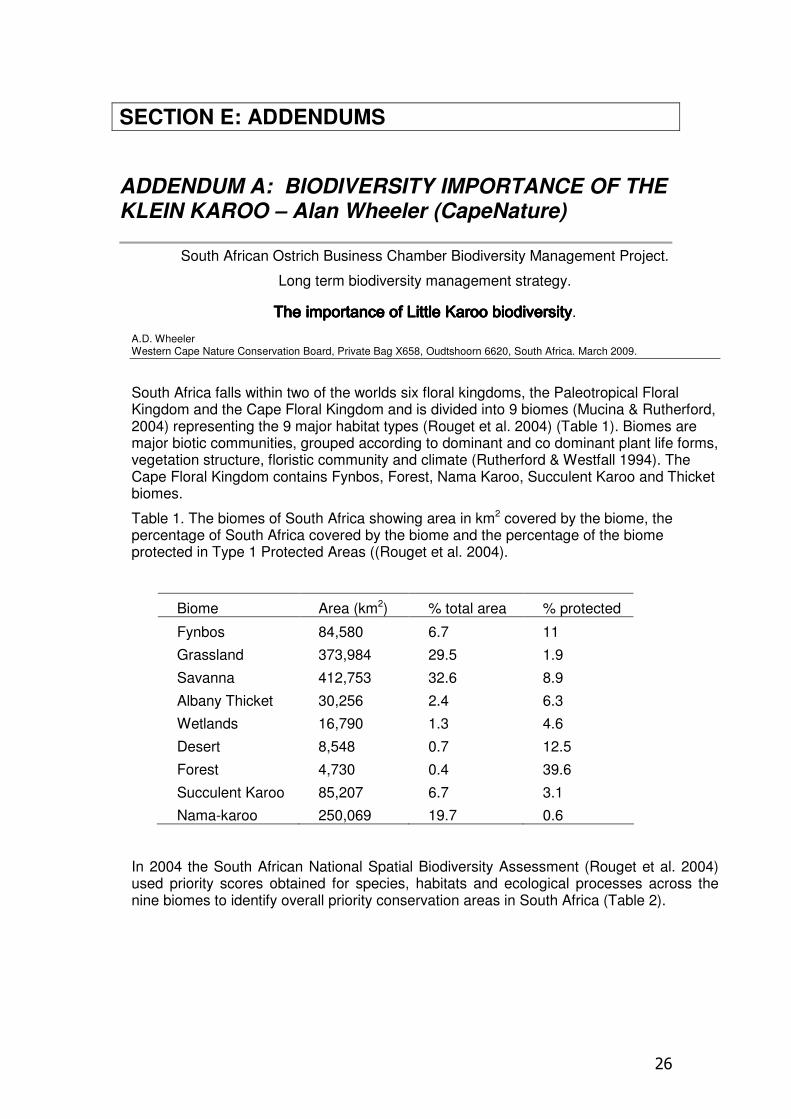
ADDENDUM A: BIODIVERSITY IMPORTANCE OF THE KLEIN KAROO – Alan Wheeler (CapeNature)
South African Ostrich Business Chamber Biodiversity Management Project.
Long term biodiversity management strategy.
The importance of Little Karoo biodiversityThe importance of Little Karoo biodiversityThe importance of Little Karoo biodiversityThe importance of Little Karoo biodiversity.
A.D. Wheeler Western Cape Nature Conservation Board, Private Bag X658, Oudtshoorn 6620, South Africa. March 2009.
South Africa falls within two of the worlds six floral kingdoms, the Paleotropical Floral Kingdom and the Cape Floral Kingdom and is divided into 9 biomes (Mucina & Rutherford, 2004) representing the 9 major habitat types (Rouget et al. 2004) (Table 1). Biomes are major biotic communities, grouped according to dominant and co dominant plant life forms, vegetation structure, floristic community and climate (Rutherford & Westfall 1994). The Cape Floral Kingdom contains Fynbos, Forest, Nama Karoo, Succulent Karoo and Thicket biomes.
Table 1. The biomes of South Africa showing area in km2 covered by the biome, the percentage of South Africa covered by the biome and the percentage of the biome protected in Type 1 Protected Areas ((Rouget et al. 2004).
Biome Area (km2) % total area % protected
Fynbos 84,580 6.7 11
Grassland 373,984 29.5 1.9
Savanna 412,753 32.6 8.9
Albany Thicket 30,256 2.4 6.3
Wetlands 16,790 1.3 4.6
Desert 8,548 0.7 12.5
Forest 4,730 0.4 39.6
Succulent Karoo 85,207 6.7 3.1
Nama-karoo 250,069 19.7 0.6 In 2004 the South African National Spatial Biodiversity Assessment (Rouget et al. 2004) used priority scores obtained for species, habitats and ecological processes across the nine biomes to identify overall priority conservation areas in South Africa (Table 2).
27
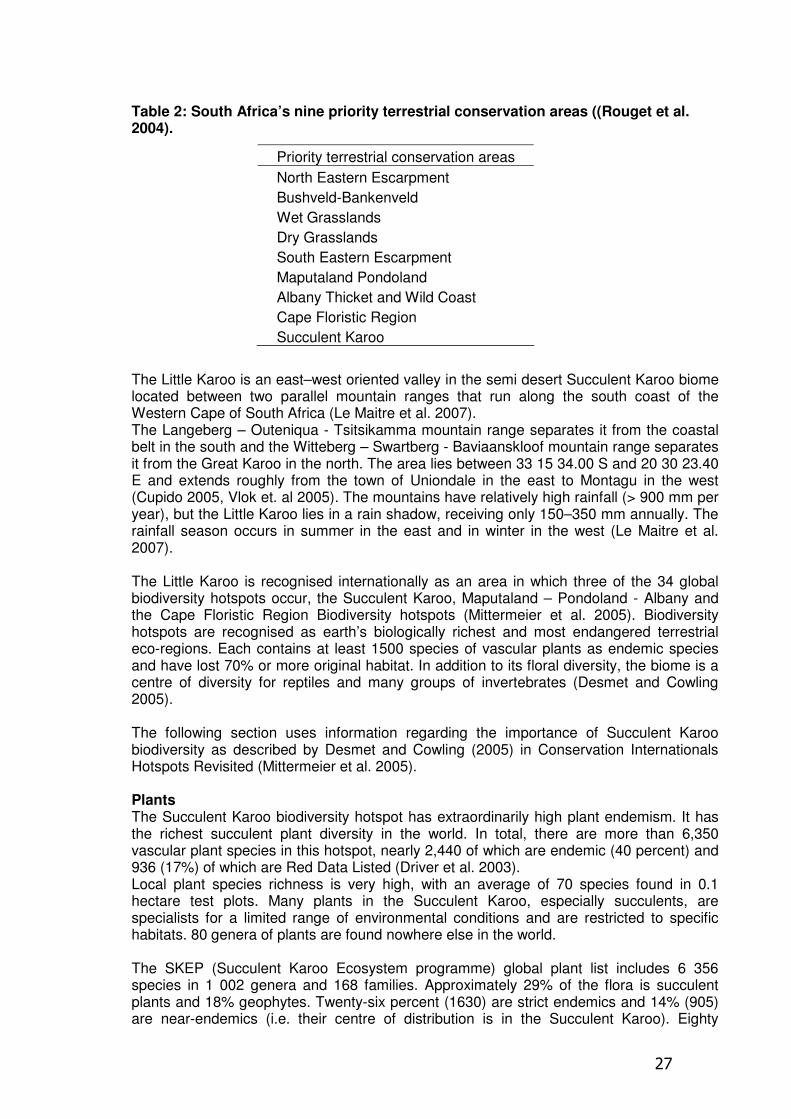
Table 2: South Africa’s nine priority terrestrial conservation areas ((Rouget et al. 2004).
Priority terrestrial conservation areas
North Eastern Escarpment
Bushveld-Bankenveld
Wet Grasslands
Dry Grasslands
South Eastern Escarpment
Maputaland Pondoland
Albany Thicket and Wild Coast
Cape Floristic Region
Succulent Karoo
The Little Karoo is an east–west oriented valley in the semi desert Succulent Karoo biome located between two parallel mountain ranges that run along the south coast of the Western Cape of South Africa (Le Maitre et al. 2007). The Langeberg – Outeniqua - Tsitsikamma mountain range separates it from the coastal belt in the south and the Witteberg – Swartberg - Baviaanskloof mountain range separates it from the Great Karoo in the north. The area lies between 33 15 34.00 S and 20 30 23.40 E and extends roughly from the town of Uniondale in the east to Montagu in the west (Cupido 2005, Vlok et. al 2005). The mountains have relatively high rainfall (> 900 mm per year), but the Little Karoo lies in a rain shadow, receiving only 150–350 mm annually. The rainfall season occurs in summer in the east and in winter in the west (Le Maitre et al. 2007). The Little Karoo is recognised internationally as an area in which three of the 34 global biodiversity hotspots occur, the Succulent Karoo, Maputaland – Pondoland - Albany and the Cape Floristic Region Biodiversity hotspots (Mittermeier et al. 2005). Biodiversity hotspots are recognised as earth’s biologically richest and most endangered terrestrial eco-regions. Each contains at least 1500 species of vascular plants as endemic species and have lost 70% or more original habitat. In addition to its floral diversity, the biome is a centre of diversity for reptiles and many groups of invertebrates (Desmet and Cowling 2005). The following section uses information regarding the importance of Succulent Karoo biodiversity as described by Desmet and Cowling (2005) in Conservation Internationals Hotspots Revisited (Mittermeier et al. 2005). Plants The Succulent Karoo biodiversity hotspot has extraordinarily high plant endemism. It has the richest succulent plant diversity in the world. In total, there are more than 6,350 vascular plant species in this hotspot, nearly 2,440 of which are endemic (40 percent) and 936 (17%) of which are Red Data Listed (Driver et al. 2003). Local plant species richness is very high, with an average of 70 species found in 0.1 hectare test plots. Many plants in the Succulent Karoo, especially succulents, are specialists for a limited range of environmental conditions and are restricted to specific habitats. 80 genera of plants are found nowhere else in the world. The SKEP (Succulent Karoo Ecosystem programme) global plant list includes 6 356 species in 1 002 genera and 168 families. Approximately 29% of the flora is succulent plants and 18% geophytes. Twenty-six percent (1630) are strict endemics and 14% (905) are near-endemics (i.e. their centre of distribution is in the Succulent Karoo). Eighty
28
genera are endemic, mostly succulent and bulb genera. Seventeen percent (936) of Succulent Karoo plant species are Red Data Listed. Birds The avifauna of the Succulent Karoo includes more than 225 species. This includes the black harrier (Circus maurus), which has the most restricted range of the world’s 13 harrier species, Karoo bustard (Eupodotis vigorsii), Ludwig's bustard (Neotis ludwigii), Karoo chat (Cercomela schlegelii), dune lark (Certhilauda erythrochlamys), and dusky sunbird (Nectarinia fusca). Mammals There are roughly 75 mammal species in the Succulent Karoo hotspot, of which two are endemic: De Winton's golden mole (Cryptochloris wintoni), and the Namaqua dune mole rat (Bathyergus janetta). An important flagship species in the region is the Critically Endangered riverine rabbit (Bunolagus monticularis), found in the Succulent Karoo, and whose population is thought to have declined by 60 percent over the past 70 years. The endangered Cape Mountain Zebra occurs in Provincially Protected Areas in the Little Karoo. Reptiles Reptile diversity is relatively high in the Succulent Karoo, with more than 90 species, about 15 of which are endemic. All of the endemics are geckos and lizards, representing about a quarter of the nearly 60 gecko and lizard species in the hotspot. These endemics include seven species of girdled lizards of the genus Cordylus, including the armadillo girdled lizard (Cordylus cataphractus). This lizard has a heavily armoured body and spiny tail and is known for rolling into a tight ball when threatened. As in the rest of South Africa, tortoise diversity is very high in the Succulent Karoo, with seven species. Amphibians Amphibians are poorly represented in the Succulent Karoo with just over 20 species. All of these species are frogs (5 (29%) strict endemics). Freshwater fishes There are about 26 species of freshwater fish in the Succulent Karoo, none of which are endemic. Invertebrates Invertebrate diversity is quite high in the Succulent Karoo, and evidence suggests that more than half of the species in some insect groups are endemic. Of the 70 species of scorpions found in the hotspot, nearly 20 are endemic. Monkey beetles, which are almost exclusively found in southern Africa, are concentrated in the area. Along with many types of wasps and bees, these beetles pollinate the hotspot's diverse plant species. There are 177 recorded bee and termite species (68 (38%) strict endemics). Apart from being recognised internationally as one of the worlds most biologically diverse and most threatened environments, the Little Karoo has also been recognised as a critical biodiversity area at a more local level. The Little Karoo falls within an area (named the Central Little Karoo) identified by the biodiversity conservation initiative SKEP (Succulent Karoo Ecosystem Programme) as one of nine geographic priority areas of South Africa and Namibia for conservation in the Succulent Karoo biome (Driver et al. 2003). The Gouritz Initiative is another biodiversity conservation initiative in the area that has, through a number of scientific and stakeholder workshops, identified the area as a critically important biodiversity area. The Gouritz Initiative serves as an anchor project that aims to support a system of sustainable living landscapes that is representative of the regions biodiversity through the co-existence of all stakeholders.
29
One of the most revealing documents published recently in terms of the complexity and diversity of the Little Karoo vegetation and habitats is the Vegetation map of the Little Karoo (Vlok et al. 2005). This fine scale vegetation mapping project has revealed no less than 369 vegetation units in 56 habitat types that occur in the Little Karoo. As Vegetation maps serve as convenient and effective ways of mapping habitats (Rouget et al. 2004), and as it is recognised that the rich biodiversity of the Succulent Karoo is due to an extensive and complex array of habitat types derived from topographical and climatic diversity in the region’s rugged mountains and semi-arid shrublands (Driver et al. 2003) the vegetation map of the Little Karoo shows that the area encompasses a remarkable biological diversity. Each of the individual vegetation units constitute critical components of the Little Karoo environment that need to be understood before rational decisions and actions are taken to conserve the biodiversity of the region (Vlok et al. 2005).
Unfortunately much of this biodiversity has been degraded. A study of the transformation of Little Karoo vegetation (Thompson et al. 2005) shows a large proportion of the vegetation of the lower lying areas of the Little Karoo having undergone severe degradation. A conservation assessment by Reyers (2008) highlights the severity of the degradation showing that 25 vegetation units are critically endangered (there is less natural veld left than the minimum size needed to protect the unit), 29 vegetation units are endangered (there is less than the minimum area needed + 15%) and 30 vulnerable vegetation units (less than 60% of the vegetation type left). Kirkwood et al. (2007) show a high percentage of the Little Karoo vegetation in the ostrich farming areas in particular to be critically endangered or endangered. However, less than approximately 7.5% of the Succulent Karoo biome vegetation types (Vlok et al. 2005) in the Little Karoo are formally protected. The biome’s biodiversity is under pressure from a range of human impacts including crop agriculture, ostrich farming, overgrazing, illegal collection of fauna and flora, and anthropogenic climate change (Driver et al. 2003, Cupido 2005, Vlok and Coetzee 2008, Vlok and Schutte-Vlok 2008, Murray 2008, Shaw 2008). Hence the urgency to address the question of conservation targets (Desmet and Cowling 2004).
In the lower lying areas of the Little Karoo where ostrich farming is most predominant the degradation of biodiversity results in long term detrimental impacts that effect not only the ecological systems but also the agricultural potential of the land and the wellbeing of society. Apart from the reasons given above, there are numerous other reasons why biodiversity needs to be conserved in the Little Karoo and a few relevant to this chapter are briefly mentioned below.
The loss of vegetation usually results in the loss of soil through water and wind erosion. This has a direst impact on agriculture and biodiversity. Vegetation plays a crucial role in water retention and water infiltration into the soil by reducing rainfall splash effect, slowing water runoff, providing dead plant material mulch that serve as natural erosion barriers and creating suitable habitat for biological soil crusts (mosses and lichens) that are so important in keeping these systems healthy. The healthy environment in which vegetation diversity and cover is sound provides critical natural services in terms of preventing excessive water run-off on the Klein Karoo plains. This prevents excessive flooding events and prevents siltation of water courses. The cost of damage incurred by flooding events in the Klein Karoo is well known. Resilience of the ecological system is a crucial survival mechanism especially in harsh environments such as the Little Karoo. Plants interact, some provide suitable environments for seeds to germinate and grow, larger species provide protection from the sun, provide shade and keep soils cooler, others provide traps for wind blown seed and keep seed banks. Some species cover the gaps created by erosion or dying plants until other longer lived plants can develop. A diversity of plants allows for greater resilience to the impacts of periods of stress such as drought.
30
It has also been shown (Gelderblom 2006) that the open sky and unspoiled landscapes of the Little Karoo are the number one draw cards for tourism (a major economic sector of the Little Karoo). These are recognized critical tourist attractions. Degradation of biodiversity will have obvious impacts on this economic sector. As ostrich farming is the largest contributor to the economy of the Little Karoo and because this activity has had such an impact on the biodiversity of the area, improved ostrich farming methods need to be developed that will ensure the sustainability of the ostrich farming industry and the conservation of globally important biodiversity.
31
References: Cowling, R.M., Pressey R., Lombard A., Desmet P. and Ellis A. 1999. From representation to persistence: requirements for a sustainable reserve system in the species-rich Mediterranean-climate deserts of southern Africa. Diversity and Distributions 5:51–71. Cupido C. 2005. Assessment of veld utilization practices and veld condition in the Little Karoo. M.Sc. Thesis. Department of Conservation Ecology. University of Stellenbosch. Dean W. and S.J Milton (eds) 1999. The Karoo: ecological patterns and processes. Cambridge University Press, Cambridge, UK. Desmet P. and Cowling R. M. 2005. Succulent Karoo Biodiversity Hotspot. In Mittermeier, R. A., Gil, P.R., Hoffman, M., Pilgrim, J., Brooks, T., Mittermeier, C.G., Lamoreux, J., & de Fonseca, G.A.B. (2005) Hotspots Revisited: Earth's Biologically Richest and Most Endangered Ecoregions. The University of Chicago Press. Desmet P.G. and R. Cowling. 2004. Using the species–area relationship to set baseline targets for conservation. Ecology and Society 9(2). Driver A., Desmet P.G., Rouget M., Cowling R.M. and Maze K.E. 2003. Succulent Karoo Ecosystem Plan Biodiversity Component Technical Report. Cape Conservation Unit, Botanical Society of South Africa, Cape Town, South Africa. Driver A., Maze K. E., Rouget M., Lombard A.T., Nel J.j Turpie J.K., Cowling, R.M., Desmet,P.G., Goodman P., Harris J., Jonas Z., Reyers B., Sink K. and Strauss, T. 2005. National Spatial Biodiversity Assessment 2004. Priorities for Biodiversity Conservation in South Africa. Strelitzia 17. South African National Biodiversity Institute, Pretoria. Gelderblom C. 2006. What attracts tourists to the Little Karoo? Internal CSIR Technical Report. Kirkwood D., Ralston S., Manual J., Pence G. and Wolfaardt A. 2007. Integrated Biodiversity Layer for Land-use Decision making in the Western Cape. An unpublished biodiversity conservation assessment and compilation of existing products for the Western Cape. CapeNature, DEA&DP & SANBI. Le Maitre D. C., Milton S.J., Jarmain C., Colvin C.A., Saayman I. and Vlok J.H.J. 2007. Linking ecosystem services and water resources: landscape-scale hydrology of the Little Karoo. Frontiers in Ecology and the Environment. 5 (5): 261 – 270. Lombard A. T., Cowling R. M., Pressey R. L., and A. G. Rebelo. 2003. Effectiveness of land classes as surrogates for species in conservation planning for the Cape Floristic Region. Biological Conservation 112(1-2):45–62. Mittermeier, R. A., Gil, P.R., Hoffman, M., Pilgrim, J., Brooks, T., Mittermeier, C.G., Lamoreux, J., and de Fonseca, G.A.B. 2005. Hotspots Revisited: Earth's Biologically Richest and Most Endangered Ecoregions. The University of Chicago Press. Mittermeier R. A., Myers N., Thomsen J. B., da Fonseca G. A. B., and Olivieri S. 1998. Biodiversity hotspots and major tropical wilderness areas: approaches to setting conservation priorities. Conservation Biology 12:516–520. Mucina L. and Rutherford M.C. (eds.) 2004. Vegetation map of South Africa, Lesotho and Swaziland. Strelitzia 18. South African National Biodiversity Institute, Pretoria.

32
Murray M.I. 2008. Biodiversity-economics aspects of Klein Karoo ostrich breeding practices. Unpublished report for the South African Ostrich Business Chamber Biodiversity Management Project supported by CEPF. Pressey R. L., Cowling R. M. and Rouget M. 2003. Formulating conservation targets for biodiversity pattern and process in the Cape Floristic Region, South Africa. Biological Conservation 112(1-2):99–127. Reyers B. 2008. Conservation Assessment for the Little Karoo. Unpublished assessment based on Thompson et. al. 2005. A Land Transformation Map for the Little Karoo. Unpublished maps and report for a SKEP project supported by CEPF. Rutherford M.C. and Westfall R.H. 1994. Biomes of southern Africa - an objective categorization. Second Edition. Memoirs of the Botanical Survey of South Africa 63: 1-94. Shaw G. 2008. Farm level biodiversity assessment. Unpublished report for the South African Ostrich Business Chamber Biodiversity Management Project supported by CEPF. Thompson M.W., Vlok J.H.J., Cowling R.M., Cundill S.M. and Mudau N. 2005. A land transformation map for the Little Karoo Unpublished maps and report for a SKEP project supported by CEPF. Vlok J.H.J and Coetzee K. 2008. Ecological capacity of the Little Karoo for Larger Wildlife, matching game species to habitat and recommended densities. Regalis Environmental Services and Conservation Management Services unpublished maps and report supported by CEPF. Vlok J.H.J and Schutte-Vlok A. 2008. Recommendations for biodiversity sensitive and ecologically sustainable farming with ostriches in the Klein Karoo. Regalis Environmental Services report to Gouritz Initiative. Vlok J.H.J., Cowling R.M. and Wolf T. 2005. A vegetation map for the Little Karoo. Unpublished maps and report for a SKEP project supported by CEPF grant no 1064410304.
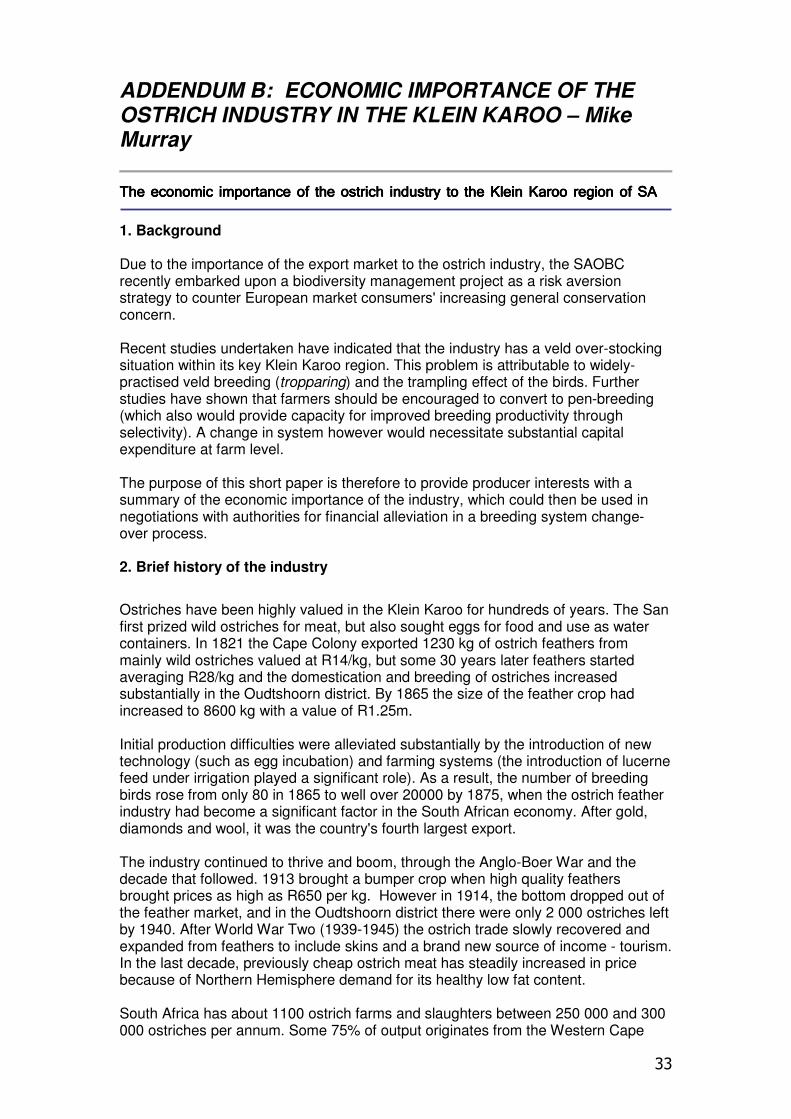
33
ADDENDUM B: ECONOMIC IMPORTANCE OF THE OSTRICH INDUSTRY IN THE KLEIN KAROO – Mike Murray
The economic importance of the ostrich industry to the Klein Karoo region of SAThe economic importance of the ostrich industry to the Klein Karoo region of SAThe economic importance of the ostrich industry to the Klein Karoo region of SAThe economic importance of the ostrich industry to the Klein Karoo region of SA
1. Background
Due to the importance of the export market to the ostrich industry, the SAOBC recently embarked upon a biodiversity management project as a risk aversion strategy to counter European market consumers' increasing general conservation concern. Recent studies undertaken have indicated that the industry has a veld over-stocking situation within its key Klein Karoo region. This problem is attributable to widely-practised veld breeding (tropparing) and the trampling effect of the birds. Further studies have shown that farmers should be encouraged to convert to pen-breeding (which also would provide capacity for improved breeding productivity through selectivity). A change in system however would necessitate substantial capital expenditure at farm level. The purpose of this short paper is therefore to provide producer interests with a summary of the economic importance of the industry, which could then be used in negotiations with authorities for financial alleviation in a breeding system change-over process.
2. Brief history of the industry
Ostriches have been highly valued in the Klein Karoo for hundreds of years. The San first prized wild ostriches for meat, but also sought eggs for food and use as water containers. In 1821 the Cape Colony exported 1230 kg of ostrich feathers from mainly wild ostriches valued at R14/kg, but some 30 years later feathers started averaging R28/kg and the domestication and breeding of ostriches increased substantially in the Oudtshoorn district. By 1865 the size of the feather crop had increased to 8600 kg with a value of R1.25m. Initial production difficulties were alleviated substantially by the introduction of new technology (such as egg incubation) and farming systems (the introduction of lucerne feed under irrigation played a significant role). As a result, the number of breeding birds rose from only 80 in 1865 to well over 20000 by 1875, when the ostrich feather industry had become a significant factor in the South African economy. After gold, diamonds and wool, it was the country's fourth largest export. The industry continued to thrive and boom, through the Anglo-Boer War and the decade that followed. 1913 brought a bumper crop when high quality feathers brought prices as high as R650 per kg. However in 1914, the bottom dropped out of the feather market, and in the Oudtshoorn district there were only 2 000 ostriches left by 1940. After World War Two (1939-1945) the ostrich trade slowly recovered and expanded from feathers to include skins and a brand new source of income - tourism. In the last decade, previously cheap ostrich meat has steadily increased in price because of Northern Hemisphere demand for its healthy low fat content. South Africa has about 1100 ostrich farms and slaughters between 250 000 and 300 000 ostriches per annum. Some 75% of output originates from the Western Cape
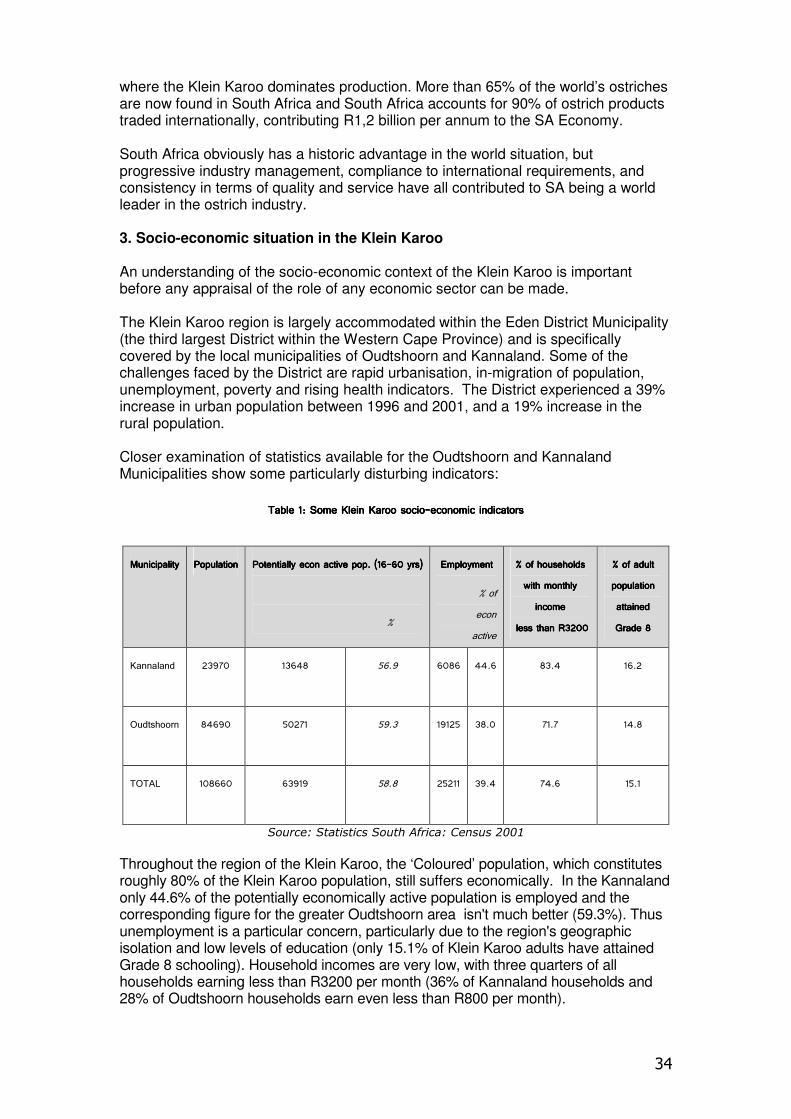
34
where the Klein Karoo dominates production. More than 65% of the world’s ostriches are now found in South Africa and South Africa accounts for 90% of ostrich products traded internationally, contributing R1,2 billion per annum to the SA Economy. South Africa obviously has a historic advantage in the world situation, but progressive industry management, compliance to international requirements, and consistency in terms of quality and service have all contributed to SA being a world leader in the ostrich industry. 3. Socio-economic situation in the Klein Karoo
An understanding of the socio-economic context of the Klein Karoo is important before any appraisal of the role of any economic sector can be made. The Klein Karoo region is largely accommodated within the Eden District Municipality (the third largest District within the Western Cape Province) and is specifically covered by the local municipalities of Oudtshoorn and Kannaland. Some of the challenges faced by the District are rapid urbanisation, in-migration of population, unemployment, poverty and rising health indicators. The District experienced a 39% increase in urban population between 1996 and 2001, and a 19% increase in the rural population. Closer examination of statistics available for the Oudtshoorn and Kannaland Municipalities show some particularly disturbing indicators:
Table 1: Some Klein Karoo socioTable 1: Some Klein Karoo socioTable 1: Some Klein Karoo socioTable 1: Some Klein Karoo socio----economic indicatorseconomic indicatorseconomic indicatorseconomic indicators
MuniciMuniciMuniciMunicipalitypalitypalitypality PopulationPopulationPopulationPopulation Potentially econ active pop. (16Potentially econ active pop. (16Potentially econ active pop. (16Potentially econ active pop. (16----60 yrs) 60 yrs) 60 yrs) 60 yrs)
%
EmploymentEmploymentEmploymentEmployment
% of
econ
active
% of households % of households % of households % of households
with monthly with monthly with monthly with monthly
incomeincomeincomeincome
less than R3200 less than R3200 less than R3200 less than R3200
% of adult % of adult % of adult % of adult
populationpopulationpopulationpopulation
attainedattainedattainedattained
Grade 8Grade 8Grade 8Grade 8
Kannaland 23970 13648 56.9 6086 44.6
83.4 16.2
Oudtshoorn 84690 50271 59.3 19125 38.0
71.7 14.8
TOTAL 108660 63919 58.8 25211 39.4
74.6 15.1
Source: Statistics South Africa: Census 2001
Throughout the region of the Klein Karoo, the ‘Coloured’ population, which constitutes roughly 80% of the Klein Karoo population, still suffers economically. In the Kannaland only 44.6% of the potentially economically active population is employed and the corresponding figure for the greater Oudtshoorn area isn't much better (59.3%). Thus unemployment is a particular concern, particularly due to the region's geographic isolation and low levels of education (only 15.1% of Klein Karoo adults have attained Grade 8 schooling). Household incomes are very low, with three quarters of all households earning less than R3200 per month (36% of Kannaland households and 28% of Oudtshoorn households earn even less than R800 per month).
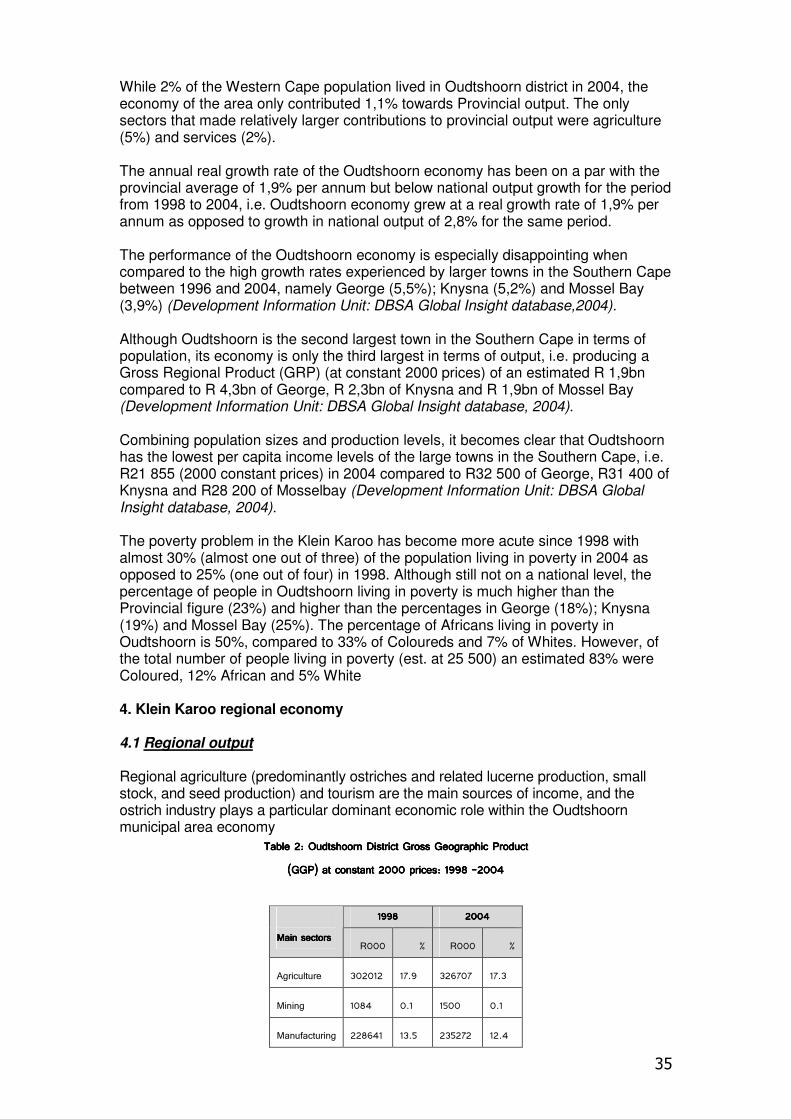
35
While 2% of the Western Cape population lived in Oudtshoorn district in 2004, the economy of the area only contributed 1,1% towards Provincial output. The only sectors that made relatively larger contributions to provincial output were agriculture (5%) and services (2%). The annual real growth rate of the Oudtshoorn economy has been on a par with the provincial average of 1,9% per annum but below national output growth for the period from 1998 to 2004, i.e. Oudtshoorn economy grew at a real growth rate of 1,9% per annum as opposed to growth in national output of 2,8% for the same period.
The performance of the Oudtshoorn economy is especially disappointing when compared to the high growth rates experienced by larger towns in the Southern Cape between 1996 and 2004, namely George (5,5%); Knysna (5,2%) and Mossel Bay (3,9%) (Development Information Unit: DBSA Global Insight database,2004). Although Oudtshoorn is the second largest town in the Southern Cape in terms of population, its economy is only the third largest in terms of output, i.e. producing a Gross Regional Product (GRP) (at constant 2000 prices) of an estimated R 1,9bn compared to R 4,3bn of George, R 2,3bn of Knysna and R 1,9bn of Mossel Bay (Development Information Unit: DBSA Global Insight database, 2004). Combining population sizes and production levels, it becomes clear that Oudtshoorn has the lowest per capita income levels of the large towns in the Southern Cape, i.e. R21 855 (2000 constant prices) in 2004 compared to R32 500 of George, R31 400 of Knysna and R28 200 of Mosselbay (Development Information Unit: DBSA Global Insight database, 2004). The poverty problem in the Klein Karoo has become more acute since 1998 with almost 30% (almost one out of three) of the population living in poverty in 2004 as opposed to 25% (one out of four) in 1998. Although still not on a national level, the percentage of people in Oudtshoorn living in poverty is much higher than the Provincial figure (23%) and higher than the percentages in George (18%); Knysna (19%) and Mossel Bay (25%). The percentage of Africans living in poverty in Oudtshoorn is 50%, compared to 33% of Coloureds and 7% of Whites. However, of the total number of people living in poverty (est. at 25 500) an estimated 83% were Coloured, 12% African and 5% White
4. Klein Karoo regional economy 4.1 Regional output Regional agriculture (predominantly ostriches and related lucerne production, small stock, and seed production) and tourism are the main sources of income, and the ostrich industry plays a particular dominant economic role within the Oudtshoorn municipal area economy
Table 2: Oudtshoorn DTable 2: Oudtshoorn DTable 2: Oudtshoorn DTable 2: Oudtshoorn District Gross Geographic Product istrict Gross Geographic Product istrict Gross Geographic Product istrict Gross Geographic Product
(GGP) at constant 2000 prices: 1998 (GGP) at constant 2000 prices: 1998 (GGP) at constant 2000 prices: 1998 (GGP) at constant 2000 prices: 1998 ----2004200420042004
1998199819981998 2004200420042004
Main sectorsMain sectorsMain sectorsMain sectors R000 % R000 %
Agriculture 302012 17.9 326707 17.3
Mining 1084 0.1 1500 0.1
Manufacturing 228641 13.5 235272 12.4
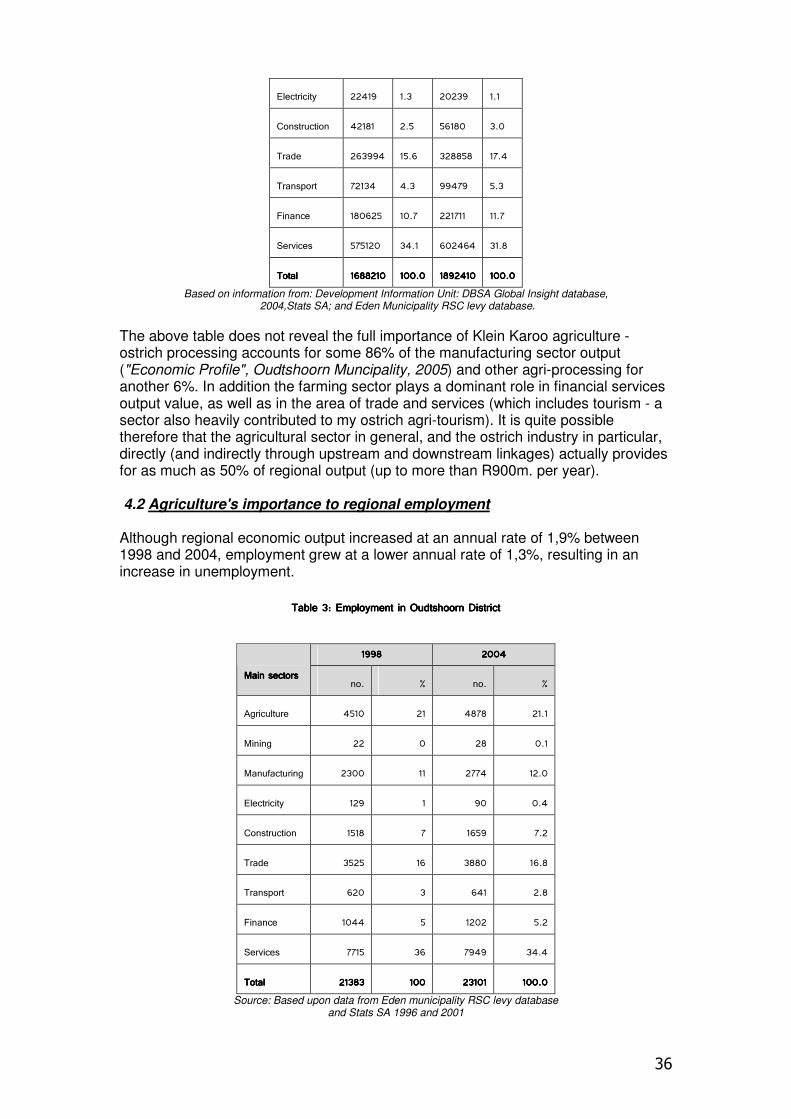
36
Electricity 22419 1.3 20239 1.1
Construction 42181 2.5 56180 3.0
Trade 263994 15.6 328858 17.4
Transport 72134 4.3 99479 5.3
Finance 180625 10.7 221711 11.7
Services 575120 34.1 602464 31.8
TotalTotalTotalTotal 1688210168821016882101688210 100.0100.0100.0100.0 1892410189241018924101892410 100.0100.0100.0100.0
Based on information from: Development Information Unit: DBSA Global Insight database, 2004,Stats SA; and Eden Municipality RSC levy database.
The above table does not reveal the full importance of Klein Karoo agriculture - ostrich processing accounts for some 86% of the manufacturing sector output ("Economic Profile", Oudtshoorn Muncipality, 2005) and other agri-processing for another 6%. In addition the farming sector plays a dominant role in financial services output value, as well as in the area of trade and services (which includes tourism - a sector also heavily contributed to my ostrich agri-tourism). It is quite possible therefore that the agricultural sector in general, and the ostrich industry in particular, directly (and indirectly through upstream and downstream linkages) actually provides for as much as 50% of regional output (up to more than R900m. per year). 4.2 Agriculture's importance to regional employment Although regional economic output increased at an annual rate of 1,9% between 1998 and 2004, employment grew at a lower annual rate of 1,3%, resulting in an increase in unemployment.
Table 3: Employment in Oudtshoorn DistrictTable 3: Employment in Oudtshoorn DistrictTable 3: Employment in Oudtshoorn DistrictTable 3: Employment in Oudtshoorn District
1998199819981998 2004200420042004
Main sectorsMain sectorsMain sectorsMain sectors no. % no. %
Agriculture 4510 21 4878 21.1
Mining 22 0 28 0.1
Manufacturing 2300 11 2774 12.0
Electricity 129 1 90 0.4
Construction 1518 7 1659 7.2
Trade 3525 16 3880 16.8
Transport 620 3 641 2.8
Finance 1044 5 1202 5.2
Services 7715 36 7949 34.4
TotalTotalTotalTotal 21383213832138321383 100100100100 23101231012310123101 100.0100.0100.0100.0
Source: Based upon data from Eden municipality RSC levy database and Stats SA 1996 and 2001
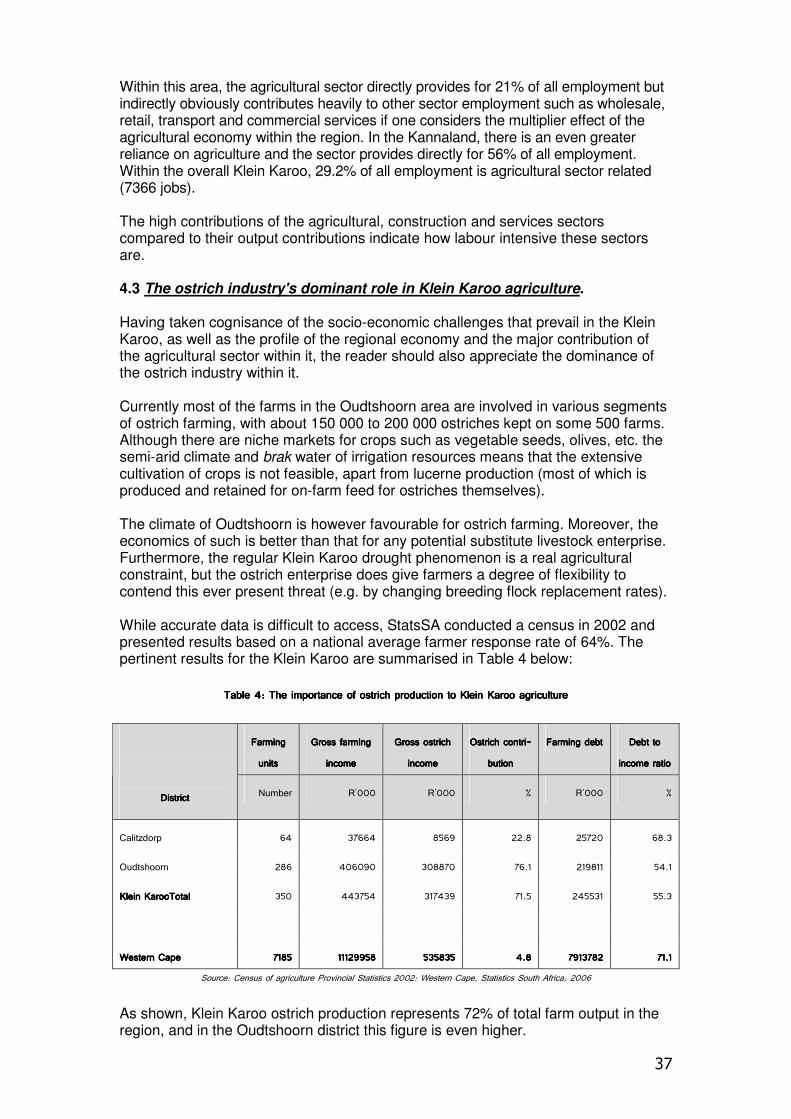
37
Within this area, the agricultural sector directly provides for 21% of all employment but indirectly obviously contributes heavily to other sector employment such as wholesale, retail, transport and commercial services if one considers the multiplier effect of the agricultural economy within the region. In the Kannaland, there is an even greater reliance on agriculture and the sector provides directly for 56% of all employment. Within the overall Klein Karoo, 29.2% of all employment is agricultural sector related (7366 jobs). The high contributions of the agricultural, construction and services sectors compared to their output contributions indicate how labour intensive these sectors are. 4.3 The ostrich industry's dominant role in Klein Karoo agriculture. Having taken cognisance of the socio-economic challenges that prevail in the Klein Karoo, as well as the profile of the regional economy and the major contribution of the agricultural sector within it, the reader should also appreciate the dominance of the ostrich industry within it. Currently most of the farms in the Oudtshoorn area are involved in various segments of ostrich farming, with about 150 000 to 200 000 ostriches kept on some 500 farms. Although there are niche markets for crops such as vegetable seeds, olives, etc. the semi-arid climate and brak water of irrigation resources means that the extensive cultivation of crops is not feasible, apart from lucerne production (most of which is produced and retained for on-farm feed for ostriches themselves). The climate of Oudtshoorn is however favourable for ostrich farming. Moreover, the economics of such is better than that for any potential substitute livestock enterprise. Furthermore, the regular Klein Karoo drought phenomenon is a real agricultural constraint, but the ostrich enterprise does give farmers a degree of flexibility to contend this ever present threat (e.g. by changing breeding flock replacement rates). While accurate data is difficult to access, StatsSA conducted a census in 2002 and presented results based on a national average farmer response rate of 64%. The pertinent results for the Klein Karoo are summarised in Table 4 below:
Table 4: The importance of ostrich production to Klein Karoo agricultureTable 4: The importance of ostrich production to Klein Karoo agricultureTable 4: The importance of ostrich production to Klein Karoo agricultureTable 4: The importance of ostrich production to Klein Karoo agriculture
Farming Farming Farming Farming
unitsunitsunitsunits
Gross farming Gross farming Gross farming Gross farming
incomeincomeincomeincome
Gross ostrich Gross ostrich Gross ostrich Gross ostrich
incomeincomeincomeincome
Ostrich contriOstrich contriOstrich contriOstrich contri----
butionbutionbutionbution
Farming debtFarming debtFarming debtFarming debt Debt to Debt to Debt to Debt to
income ratioincome ratioincome ratioincome ratio
DistrictDistrictDistrictDistrict Number R'000 R'000 % R'000 %
Calitzdorp 64 37664 8569 22.8 25720 68.3
Oudtshoorn 286 406090 308870 76.1 219811 54.1
Klein KarooTotalKlein KarooTotalKlein KarooTotalKlein KarooTotal 350 443754 317439 71.5 245531 55.3
Western CapeWestern CapeWestern CapeWestern Cape 7185718571857185 11129958111299581112995811129958 535835535835535835535835 4.84.84.84.8 7913782791378279137827913782 71.171.171.171.1
Source: Census of agriculture Provincial Statistics 2002: Western Cape, Statistics South Africa, 2006
As shown, Klein Karoo ostrich production represents 72% of total farm output in the region, and in the Oudtshoorn district this figure is even higher.

38
Thus the whole economic backbone of the Klein Karoo is the ostrich industry - a capital intensive enterprise with high risk due to exposure to the vagaries of the export market, the international financial situation, threat of disease, droughts, and now the need to pay greater attention to biodiversity conservation. The industry has had many crisis points in its history, yet its regional advantage, good organisation and tight management, insistence on quality and meeting international standards, as well as a conservative financial strategy (e.g. its farmer debt to income ratio is 23% better than that of the Provincial average) has meant that it has ably played a dominant role in meeting the economic challenges of the region.
39
ADDENDUM C: ECONOMIC CASE FOR PEN BREEDING – Mike Murray
The economics of ostrich penThe economics of ostrich penThe economics of ostrich penThe economics of ostrich pen----breeding breeding breeding breeding 1. Background and introduction This document has been produced as a result of an ostrich producer request for the SA Ostrich Business Chamber's biodiversity project to make available a single document that captures the economics of pen-breeding, and its likely economic effect on ostrich production. The request follows a SAOBC study carried out in August 2008 ("Biodiversity-economics aspects of Klein Karoo ostrich breeding practices). 2. Document focus explained For the benefit of the non-agriculturalist, ostrich production consists of a no. of production functions including breeding, hatching, chick-raising, and growing of ostriches to slaughter weight. It is only the breeding function that usually makes use of the veld, where "tropparing" involves flocks of breeding birds being kept in veld camps, where they are fed mixed rations and watered, and where eggs are also collected for hatching. Breeding can last for 8 months after which birds should be housed in pens during a 4-month rest period. The Klein Karoo falls within the Succulent Karoo Biome which is internationally recognised as being one of only two biodiversity hotspots found in world arid regions. The region has high levels of plant endemism but its transformation is extensive, estimated to be at least 70% (Myers et al. 2000). A detailed vegetation degradation assessment of the Little Karoo indicates that poor grazing practices have resulted in 28.2% of the region having been severely transformed, 60.1% moderately transformed, with only 1.8% described as pristine (Thompson et al. 2005). It is ostrich veld-based breeding that has caused this severe transformation and degradation of the vegetation (Hoffman 1996; Cupido 2005) and much of this degradation is attributable to active and territorial behaviour of ostriches where it is the trampling that leads to soil compaction, the removal of the biological soil crust (Cupido 2005), which increases the risk of soil erosion by wind (Belnap 2001), destruction of sensitive plants and loss of biodiversity (Lombard & Wolf 2004; Cupido 2005). Little, if any, feed benefit exists in breeding ostriches on the veld. In considering various strategies to conserve the succulent Karoo, the SAOBC has obviously identified a possible industry switch to pen-breeding as a key strategic initiative. 3. Basic "tropparing" economic data Base data from the 2008 study is used for the purpose of this study of the relative economics of pen-breeding. This data was obtained from a sample of 11 farms chosen by the Ostrich Industry Biodiversity Management Project as subjects for the study. All farms were known ostrich breeders with differing farm sizes and ostrich outputs, and all were situated within the Gannaveld between Calitzdorp and De Rust. In the final event, 2 were dropped from the sample for various reasons. Thus the data was obtained from a very small sample which would not survive any rigorous statistical examination and therefore cannot be said to be necessarily representative of the area. Nevertheless, the 2008 survey covered some 20% of Klein Karoo
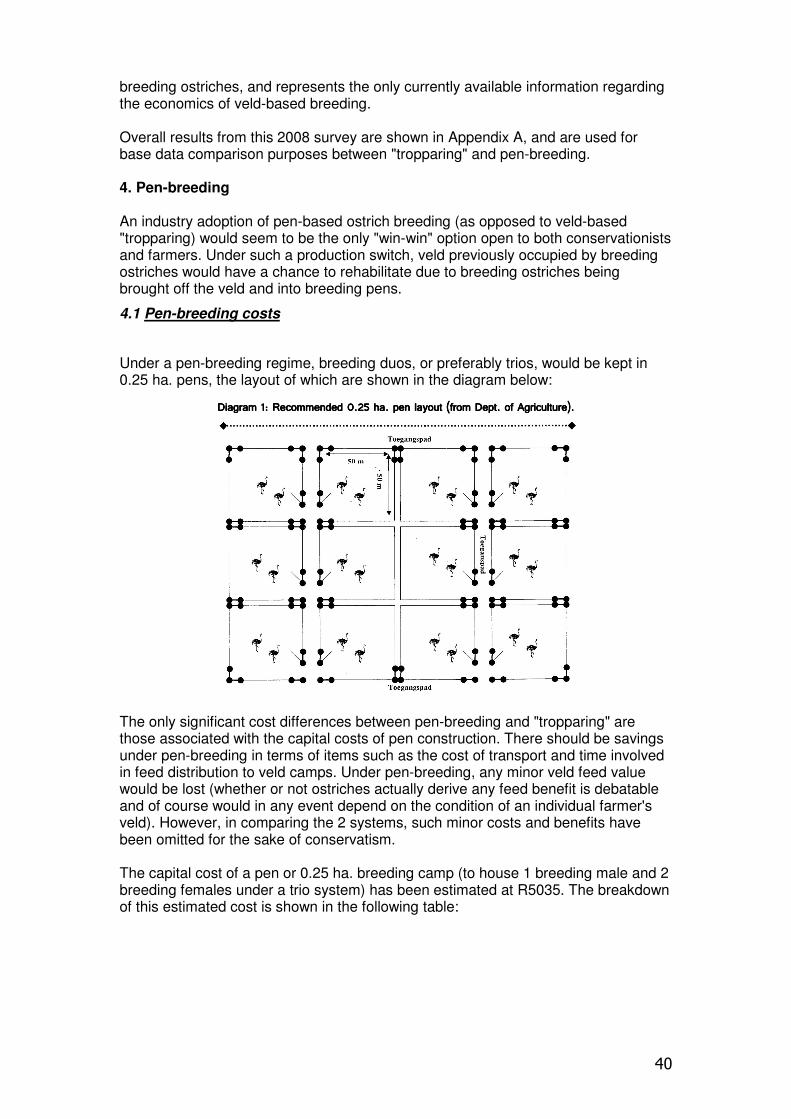
40
breeding ostriches, and represents the only currently available information regarding the economics of veld-based breeding. Overall results from this 2008 survey are shown in Appendix A, and are used for base data comparison purposes between "tropparing" and pen-breeding. 4. Pen-breeding An industry adoption of pen-based ostrich breeding (as opposed to veld-based "tropparing) would seem to be the only "win-win" option open to both conservationists and farmers. Under such a production switch, veld previously occupied by breeding ostriches would have a chance to rehabilitate due to breeding ostriches being brought off the veld and into breeding pens.
4.1 Pen-breeding costs
Under a pen-breeding regime, breeding duos, or preferably trios, would be kept in 0.25 ha. pens, the layout of which are shown in the diagram below:
Diagram 1: Recommended 0.25 Diagram 1: Recommended 0.25 Diagram 1: Recommended 0.25 Diagram 1: Recommended 0.25 ha. pen layout (from Dept. of Agriculture).ha. pen layout (from Dept. of Agriculture).ha. pen layout (from Dept. of Agriculture).ha. pen layout (from Dept. of Agriculture).
The only significant cost differences between pen-breeding and "tropparing" are those associated with the capital costs of pen construction. There should be savings under pen-breeding in terms of items such as the cost of transport and time involved in feed distribution to veld camps. Under pen-breeding, any minor veld feed value would be lost (whether or not ostriches actually derive any feed benefit is debatable and of course would in any event depend on the condition of an individual farmer's veld). However, in comparing the 2 systems, such minor costs and benefits have been omitted for the sake of conservatism. The capital cost of a pen or 0.25 ha. breeding camp (to house 1 breeding male and 2 breeding females under a trio system) has been estimated at R5035. The breakdown of this estimated cost is shown in the following table:
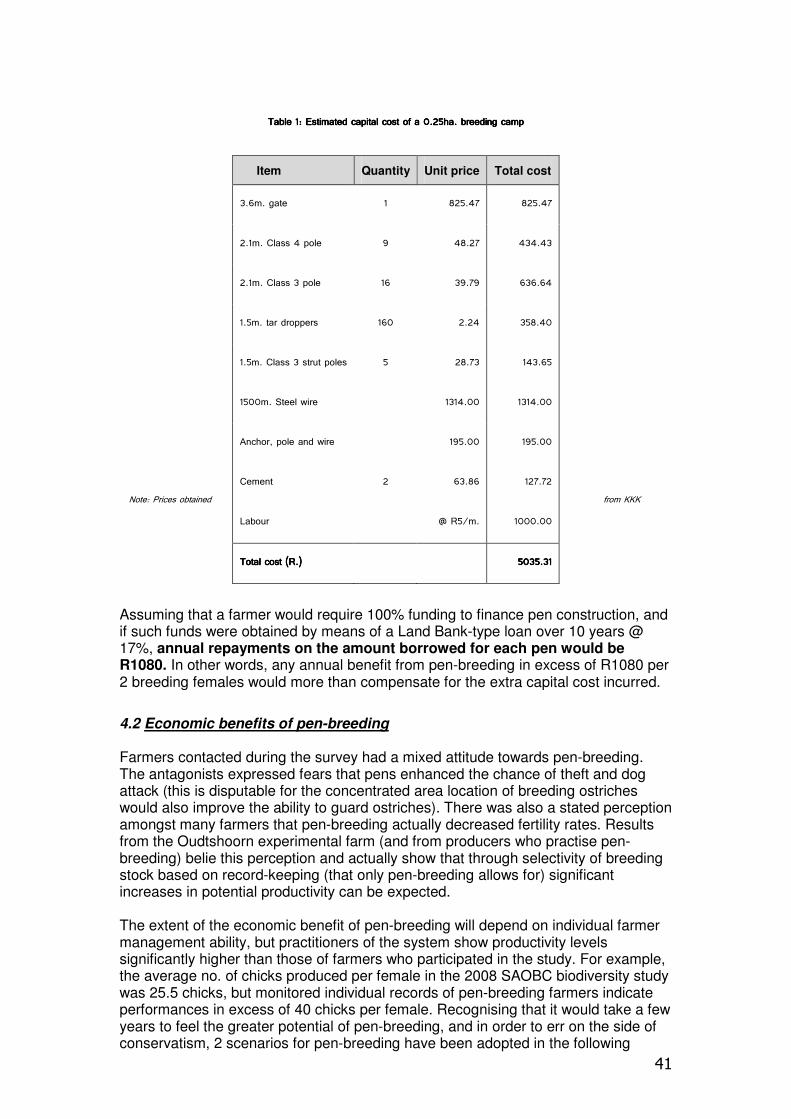
41
Table 1: Estimated capital cost of a 0.25ha. breeding campTable 1: Estimated capital cost of a 0.25ha. breeding campTable 1: Estimated capital cost of a 0.25ha. breeding campTable 1: Estimated capital cost of a 0.25ha. breeding camp
Note: Prices obtained from KKK
Assuming that a farmer would require 100% funding to finance pen construction, and if such funds were obtained by means of a Land Bank-type loan over 10 years @ 17%, annual repayments on the amount borrowed for each pen would be R1080. In other words, any annual benefit from pen-breeding in excess of R1080 per 2 breeding females would more than compensate for the extra capital cost incurred.
4.2 Economic benefits of pen-breeding Farmers contacted during the survey had a mixed attitude towards pen-breeding. The antagonists expressed fears that pens enhanced the chance of theft and dog attack (this is disputable for the concentrated area location of breeding ostriches would also improve the ability to guard ostriches). There was also a stated perception amongst many farmers that pen-breeding actually decreased fertility rates. Results from the Oudtshoorn experimental farm (and from producers who practise pen-breeding) belie this perception and actually show that through selectivity of breeding stock based on record-keeping (that only pen-breeding allows for) significant increases in potential productivity can be expected. The extent of the economic benefit of pen-breeding will depend on individual farmer management ability, but practitioners of the system show productivity levels significantly higher than those of farmers who participated in the study. For example, the average no. of chicks produced per female in the 2008 SAOBC biodiversity study was 25.5 chicks, but monitored individual records of pen-breeding farmers indicate performances in excess of 40 chicks per female. Recognising that it would take a few years to feel the greater potential of pen-breeding, and in order to err on the side of conservatism, 2 scenarios for pen-breeding have been adopted in the following
Item Quantity Unit price Total cost
3.6m. gate 1 825.47 825.47
2.1m. Class 4 pole 9 48.27 434.43
2.1m. Class 3 pole 16 39.79 636.64
1.5m. tar droppers 160 2.24 358.40
1.5m. Class 3 strut poles 5 28.73 143.65
1500m. Steel wire 1314.00 1314.00
Anchor, pole and wire
Cement
2
195.00
63.86
195.00
127.72
Labour @ R5/m. 1000.00
Total cost (R.)Total cost (R.)Total cost (R.)Total cost (R.) 5035.315035.315035.315035.31
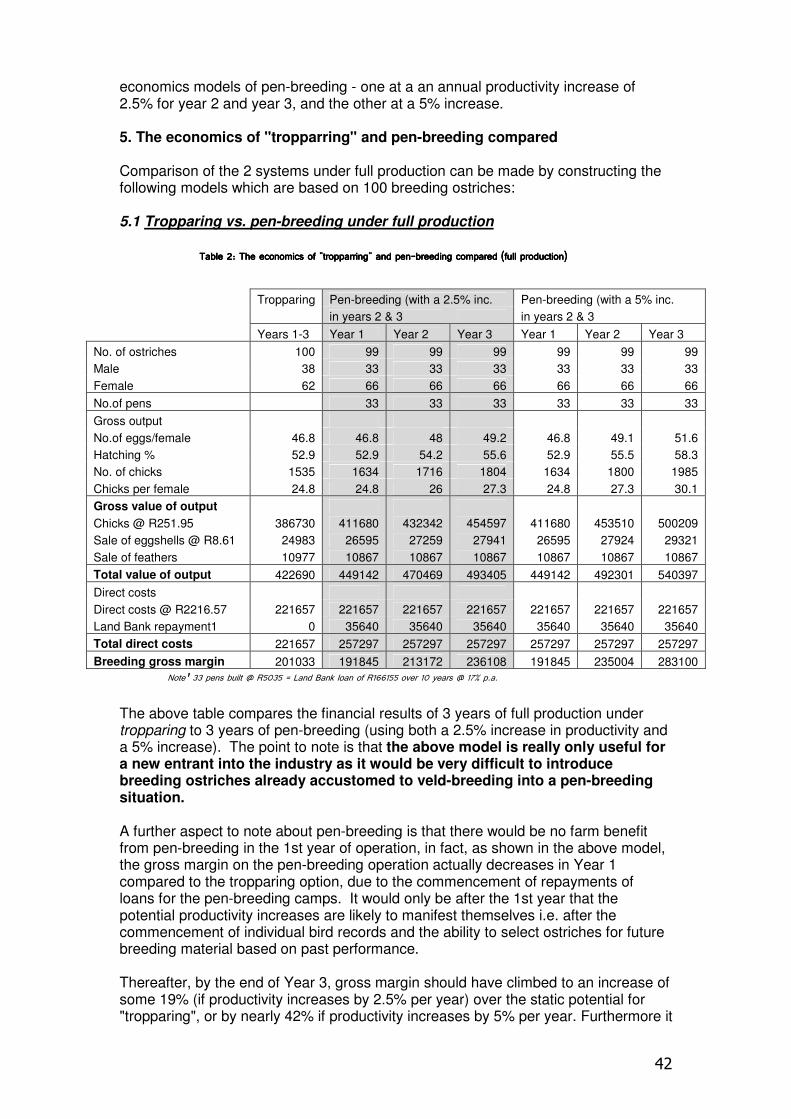
42
economics models of pen-breeding - one at a an annual productivity increase of 2.5% for year 2 and year 3, and the other at a 5% increase. 5. The economics of "tropparring" and pen-breeding compared Comparison of the 2 systems under full production can be made by constructing the following models which are based on 100 breeding ostriches: 5.1 Tropparing vs. pen-breeding under full production
Table 2: The economics of "tropparring" and penTable 2: The economics of "tropparring" and penTable 2: The economics of "tropparring" and penTable 2: The economics of "tropparring" and pen----breeding compared (full production)breeding compared (full production)breeding compared (full production)breeding compared (full production)
Tropparing Pen-breeding (with a 2.5% inc. Pen-breeding (with a 5% inc.
in years 2 & 3 in years 2 & 3
Years 1-3 Year 1 Year 2 Year 3 Year 1 Year 2 Year 3
No. of ostriches 100 99 99 99 99 99 99
Male 38 33 33 33 33 33 33
Female 62 66 66 66 66 66 66
No.of pens 33 33 33 33 33 33
Gross output
No.of eggs/female 46.8 46.8 48 49.2 46.8 49.1 51.6
Hatching % 52.9 52.9 54.2 55.6 52.9 55.5 58.3
No. of chicks 1535 1634 1716 1804 1634 1800 1985
Chicks per female 24.8 24.8 26 27.3 24.8 27.3 30.1
Gross value of output
Chicks @ R251.95 386730 411680 432342 454597 411680 453510 500209
Sale of eggshells @ R8.61 24983 26595 27259 27941 26595 27924 29321
Sale of feathers 10977 10867 10867 10867 10867 10867 10867
Total value of output 422690 449142 470469 493405 449142 492301 540397
Direct costs
Direct costs @ R2216.57 221657 221657 221657 221657 221657 221657 221657
Land Bank repayment1 0 35640 35640 35640 35640 35640 35640
Total direct costs 221657 257297 257297 257297 257297 257297 257297
Breeding gross margin 201033 191845 213172 236108 191845 235004 283100
Note 1111 33 pens built @ R5035 = Land Bank loan of R166155 over 10 years @ 17% p.a.
The above table compares the financial results of 3 years of full production under tropparing to 3 years of pen-breeding (using both a 2.5% increase in productivity and a 5% increase). The point to note is that the above model is really only useful for a new entrant into the industry as it would be very difficult to introduce breeding ostriches already accustomed to veld-breeding into a pen-breeding situation. A further aspect to note about pen-breeding is that there would be no farm benefit from pen-breeding in the 1st year of operation, in fact, as shown in the above model, the gross margin on the pen-breeding operation actually decreases in Year 1 compared to the tropparing option, due to the commencement of repayments of loans for the pen-breeding camps. It would only be after the 1st year that the potential productivity increases are likely to manifest themselves i.e. after the commencement of individual bird records and the ability to select ostriches for future breeding material based on past performance. Thereafter, by the end of Year 3, gross margin should have climbed to an increase of some 19% (if productivity increases by 2.5% per year) over the static potential for "tropparing", or by nearly 42% if productivity increases by 5% per year. Furthermore it
43
should be noted that increases of such magnitude are possible even after annual loan repayment has been made. 5.2 The economics of switching over from "tropparing" to pen-breeding Of greater interest to both the current ostrich farmer and the conservationist would be the question of what is the economic effect of a gradual changeover (10% of breeding flock per year) from veld-breeding to pen-breeding. This is examined in Table 3, comparing a 10 year continuation of tropparing to a 10-year change-over to pen-breeding. In this analysis, a 2.5% annual increase in productivity has been assumed for the 2nd, 3rd and 4th year after breeding birds are introduced to pens. It is considered that such an assumption errs on the conservative side and that, in reality, greater increased production potential would be presented (performance would depend to a large extent on individual farmer management ability). It should also be noted that all financial figures are presented in constant value terms (no inflation has been built in). Examination of the data reveals that based on these assumptions, total farm gross margin for the 10-year period would be 21% higher in the case of pen-breeding (an extra R420800) than it would be under tropparing.
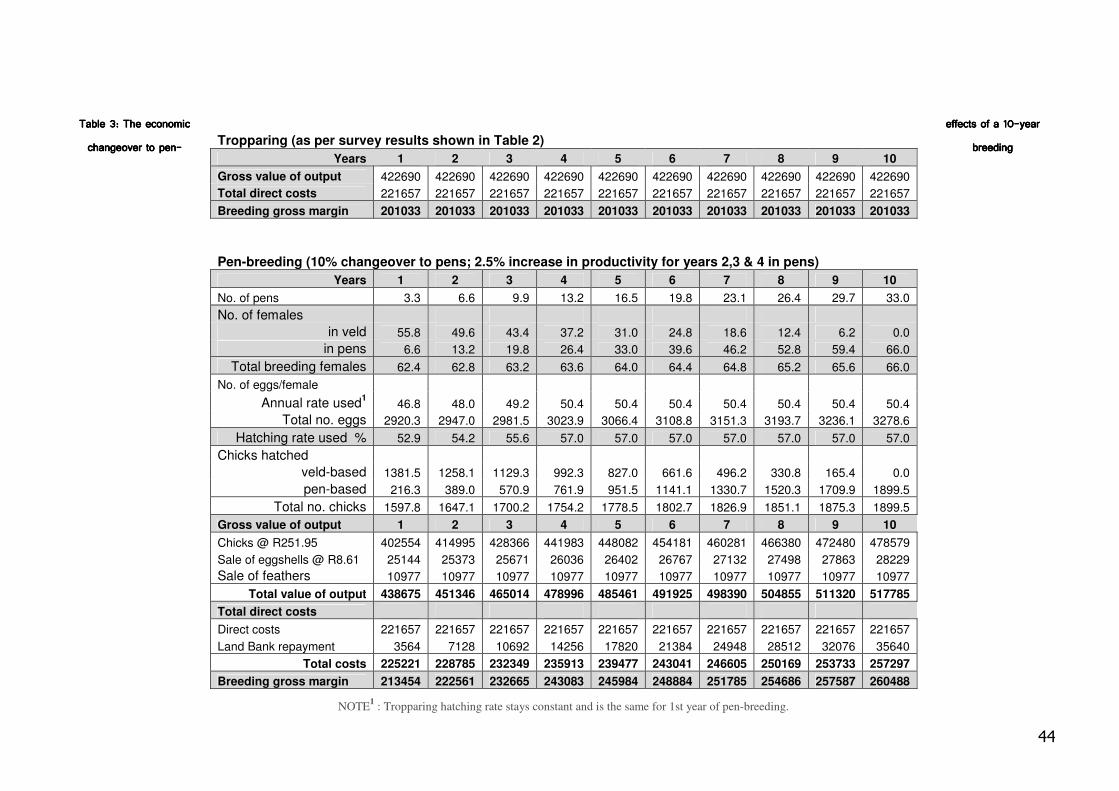
44
Table 3: The economic Table 3: The economic Table 3: The economic Table 3: The economic effects of a 10effects of a 10effects of a 10effects of a 10----year year year year
changeover to penchangeover to penchangeover to penchangeover to pen---- breedingbreedingbreedingbreeding
NOTE1 : Tropparing hatching rate stays constant and is the same for 1st year of pen-breeding.
Tropparing (as per survey results shown in Table 2)
Years 1 2 3 4 5 6 7 8 9 10
Gross value of output 422690 422690 422690 422690 422690 422690 422690 422690 422690 422690
Total direct costs 221657 221657 221657 221657 221657 221657 221657 221657 221657 221657
Breeding gross margin 201033 201033 201033 201033 201033 201033 201033 201033 201033 201033
Pen-breeding (10% changeover to pens; 2.5% increase in productivity for years 2,3 & 4 in pens)
Years 1 2 3 4 5 6 7 8 9 10
No. of pens 3.3 6.6 9.9 13.2 16.5 19.8 23.1 26.4 29.7 33.0
No. of females
in veld 55.8 49.6 43.4 37.2 31.0 24.8 18.6 12.4 6.2 0.0
in pens 6.6 13.2 19.8 26.4 33.0 39.6 46.2 52.8 59.4 66.0
Total breeding females 62.4 62.8 63.2 63.6 64.0 64.4 64.8 65.2 65.6 66.0
No. of eggs/female
Annual rate used1 46.8 48.0 49.2 50.4 50.4 50.4 50.4 50.4 50.4 50.4
Total no. eggs 2920.3 2947.0 2981.5 3023.9 3066.4 3108.8 3151.3 3193.7 3236.1 3278.6
Hatching rate used % 52.9 54.2 55.6 57.0 57.0 57.0 57.0 57.0 57.0 57.0
Chicks hatched
veld-based 1381.5 1258.1 1129.3 992.3 827.0 661.6 496.2 330.8 165.4 0.0
pen-based 216.3 389.0 570.9 761.9 951.5 1141.1 1330.7 1520.3 1709.9 1899.5
Total no. chicks 1597.8 1647.1 1700.2 1754.2 1778.5 1802.7 1826.9 1851.1 1875.3 1899.5
Gross value of output 1 2 3 4 5 6 7 8 9 10
Chicks @ R251.95 402554 414995 428366 441983 448082 454181 460281 466380 472480 478579
Sale of eggshells @ R8.61 25144 25373 25671 26036 26402 26767 27132 27498 27863 28229
Sale of feathers 10977 10977 10977 10977 10977 10977 10977 10977 10977 10977
Total value of output 438675 451346 465014 478996 485461 491925 498390 504855 511320 517785
Total direct costs
Direct costs 221657 221657 221657 221657 221657 221657 221657 221657 221657 221657
Land Bank repayment 3564 7128 10692 14256 17820 21384 24948 28512 32076 35640
Total costs 225221 228785 232349 235913 239477 243041 246605 250169 253733 257297
Breeding gross margin 213454 222561 232665 243083 245984 248884 251785 254686 257587 260488
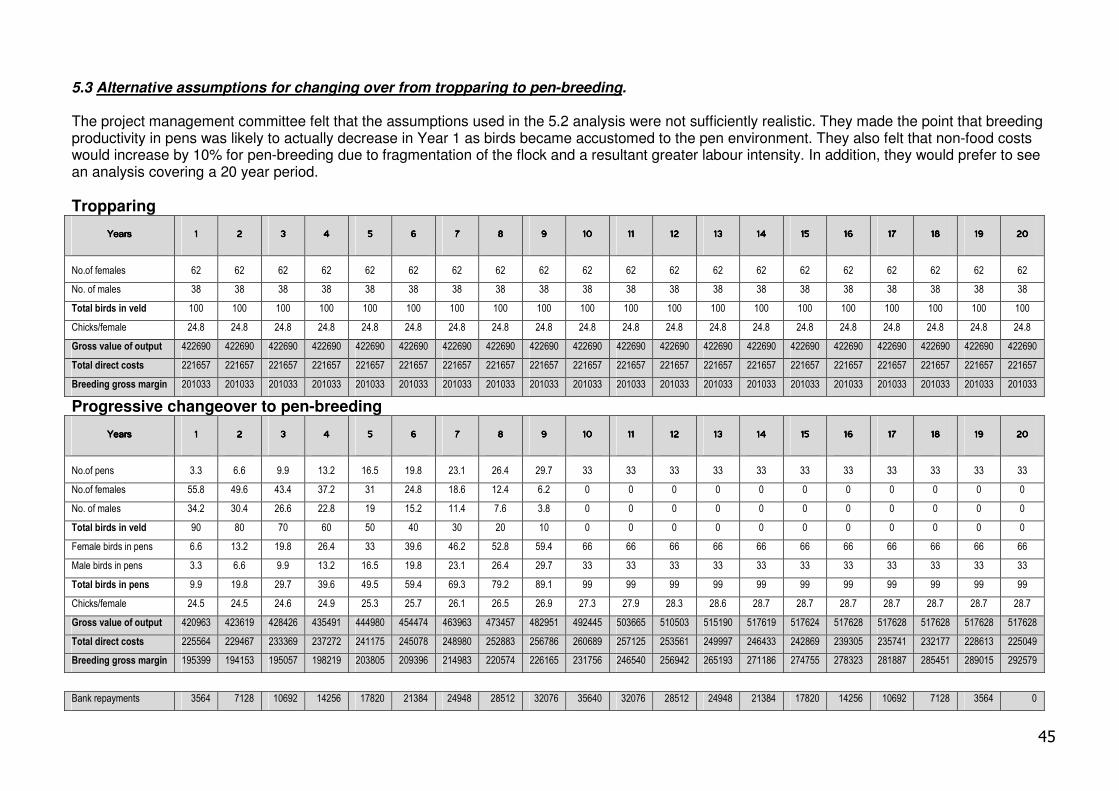
45
5.3 Alternative assumptions for changing over from tropparing to pen-breeding. The project management committee felt that the assumptions used in the 5.2 analysis were not sufficiently realistic. They made the point that breeding productivity in pens was likely to actually decrease in Year 1 as birds became accustomed to the pen environment. They also felt that non-food costs would increase by 10% for pen-breeding due to fragmentation of the flock and a resultant greater labour intensity. In addition, they would prefer to see an analysis covering a 20 year period.
Tropparing
YearsYearsYearsYears 1111 2222 3333 4444 5555 6666 7777 8888 9999 10101010 11111111 12121212 13131313 14141414 15151515 16161616 17171717 18181818 19191919 20202020
No.of females 62 62 62 62 62 62 62 62 62 62 62 62 62 62 62 62 62 62 62 62
No. of males 38 38 38 38 38 38 38 38 38 38 38 38 38 38 38 38 38 38 38 38
Total birds in veld 100 100 100 100 100 100 100 100 100 100 100 100 100 100 100 100 100 100 100 100
Chicks/female 24.8 24.8 24.8 24.8 24.8 24.8 24.8 24.8 24.8 24.8 24.8 24.8 24.8 24.8 24.8 24.8 24.8 24.8 24.8 24.8
Gross value of output 422690 422690 422690 422690 422690 422690 422690 422690 422690 422690 422690 422690 422690 422690 422690 422690 422690 422690 422690 422690
Total direct costs 221657 221657 221657 221657 221657 221657 221657 221657 221657 221657 221657 221657 221657 221657 221657 221657 221657 221657 221657 221657
Breeding gross margin 201033 201033 201033 201033 201033 201033 201033 201033 201033 201033 201033 201033 201033 201033 201033 201033 201033 201033 201033 201033
Progressive changeover to pen-breeding
YearsYearsYearsYears 1111 2222 3333 4444 5555 6666 7777 8888 9999 10101010 11111111 12121212 13131313 14141414 15151515 16161616 17171717 18181818 19191919 20202020
No.of pens 3.3 6.6 9.9 13.2 16.5 19.8 23.1 26.4 29.7 33 33 33 33 33 33 33 33 33 33 33
No.of females 55.8 49.6 43.4 37.2 31 24.8 18.6 12.4 6.2 0 0 0 0 0 0 0 0 0 0 0
No. of males 34.2 30.4 26.6 22.8 19 15.2 11.4 7.6 3.8 0 0 0 0 0 0 0 0 0 0 0
Total birds in veld 90 80 70 60 50 40 30 20 10 0 0 0 0 0 0 0 0 0 0 0
Female birds in pens 6.6 13.2 19.8 26.4 33 39.6 46.2 52.8 59.4 66 66 66 66 66 66 66 66 66 66 66
Male birds in pens 3.3 6.6 9.9 13.2 16.5 19.8 23.1 26.4 29.7 33 33 33 33 33 33 33 33 33 33 33
Total birds in pens 9.9 19.8 29.7 39.6 49.5 59.4 69.3 79.2 89.1 99 99 99 99 99 99 99 99 99 99 99
Chicks/female 24.5 24.5 24.6 24.9 25.3 25.7 26.1 26.5 26.9 27.3 27.9 28.3 28.6 28.7 28.7 28.7 28.7 28.7 28.7 28.7
Gross value of output 420963 423619 428426 435491 444980 454474 463963 473457 482951 492445 503665 510503 515190 517619 517624 517628 517628 517628 517628 517628
Total direct costs 225564 229467 233369 237272 241175 245078 248980 252883 256786 260689 257125 253561 249997 246433 242869 239305 235741 232177 228613 225049
Breeding gross margin 195399 194153 195057 198219 203805 209396 214983 220574 226165 231756 246540 256942 265193 271186 274755 278323 281887 285451 289015 292579
Bank repayments 3564 7128 10692 14256 17820 21384 24948 28512 32076 35640 32076 28512 24948 21384 17820 14256 10692 7128 3564 0
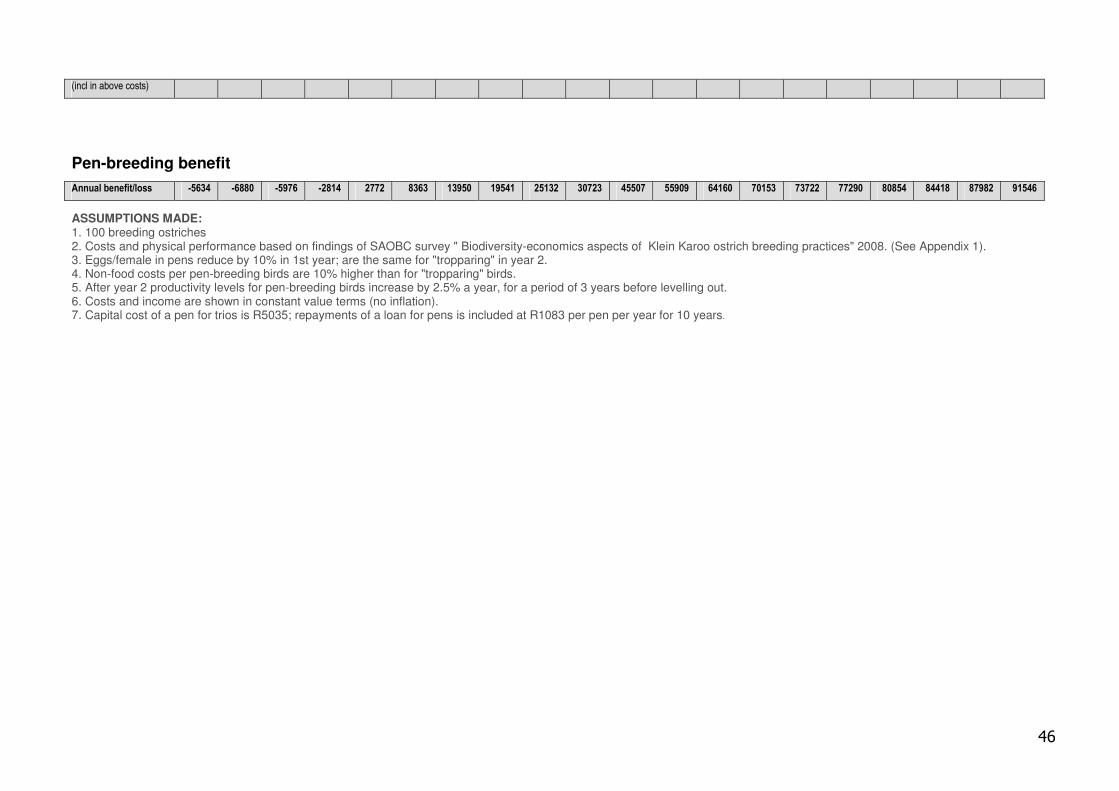
46
(incl in above costs)
Pen-breeding benefit
Annual benefit/loss -5634 -6880 -5976 -2814 2772 8363 13950 19541 25132 30723 45507 55909 64160 70153 73722 77290 80854 84418 87982 91546
ASSUMPTIONS MADE: 1. 100 breeding ostriches 2. Costs and physical performance based on findings of SAOBC survey " Biodiversity-economics aspects of Klein Karoo ostrich breeding practices" 2008. (See Appendix 1). 3. Eggs/female in pens reduce by 10% in 1st year; are the same for "tropparing" in year 2. 4. Non-food costs per pen-breeding birds are 10% higher than for "tropparing" birds. 5. After year 2 productivity levels for pen-breeding birds increase by 2.5% a year, for a period of 3 years before levelling out. 6. Costs and income are shown in constant value terms (no inflation). 7. Capital cost of a pen for trios is R5035; repayments of a loan for pens is included at R1083 per pen per year for 10 years.
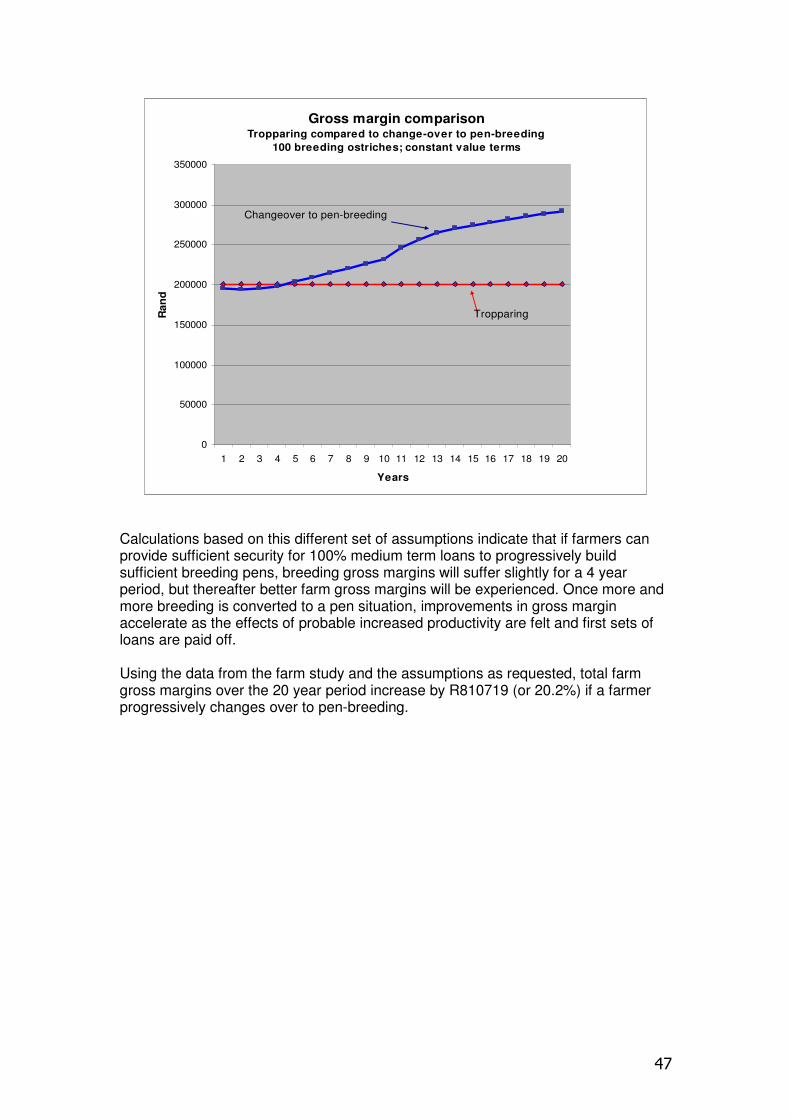
47
Gross margin comparisonTropparing compared to change-over to pen-breeding
100 breeding ostriches; constant value terms
0
50000
100000
150000
200000
250000
300000
350000
1 2 3 4 5 6 7 8 9 10 11 12 13 14 15 16 17 18 19 20
Years
Ran
d
Tropparing
Changeover to pen-breeding
Calculations based on this different set of assumptions indicate that if farmers can provide sufficient security for 100% medium term loans to progressively build sufficient breeding pens, breeding gross margins will suffer slightly for a 4 year period, but thereafter better farm gross margins will be experienced. Once more and more breeding is converted to a pen situation, improvements in gross margin accelerate as the effects of probable increased productivity are felt and first sets of loans are paid off. Using the data from the farm study and the assumptions as requested, total farm gross margins over the 20 year period increase by R810719 (or 20.2%) if a farmer progressively changes over to pen-breeding.

48
Appendix A: Base economic data captured by the Appendix A: Base economic data captured by the Appendix A: Base economic data captured by the Appendix A: Base economic data captured by the
SAOBC biodiversity survey sample 2008SAOBC biodiversity survey sample 2008SAOBC biodiversity survey sample 2008SAOBC biodiversity survey sample 2008 This information has been used in the comparison of the economics of breeding methods contained in this paper.
1. No. of breeding birds in sample
No. of breeding birds
Farmer No. Male Female Total
Veld used (ha.)
1
21
3
4
5
6
7
8
9
10
25
0
100
50
25
40
280
33
170
124
45
0
139
100
35
40
420
57
300
264
70
0
239
150
60
80
700
90
470
388
600
0
620
2000
17
123
4040
70
5800
1282
Total 847 1400 2247 14552
1NOTE: This farmer was not a breeder, but hired his veld out for breeding purposes.
2. Average sample stocking rate
Total no. of
birds
Birds removed
for the 4 month
rest period
Effective no. of
birds
Total veld area
utilised for
breeding (ha.)
Weighted
average
stocking rate
(ha/bird)
2466 1545 1940.7 15698 8.1
Best farmer 310.2 5800 18.7
Worst farmer 59.4 70 1.2
NOTE: Total bird nos. and land area differ from those in Table 1 as these figures include land rented out for breeding purposes. In addition, birds used for pen-breeding are omitted from the above.
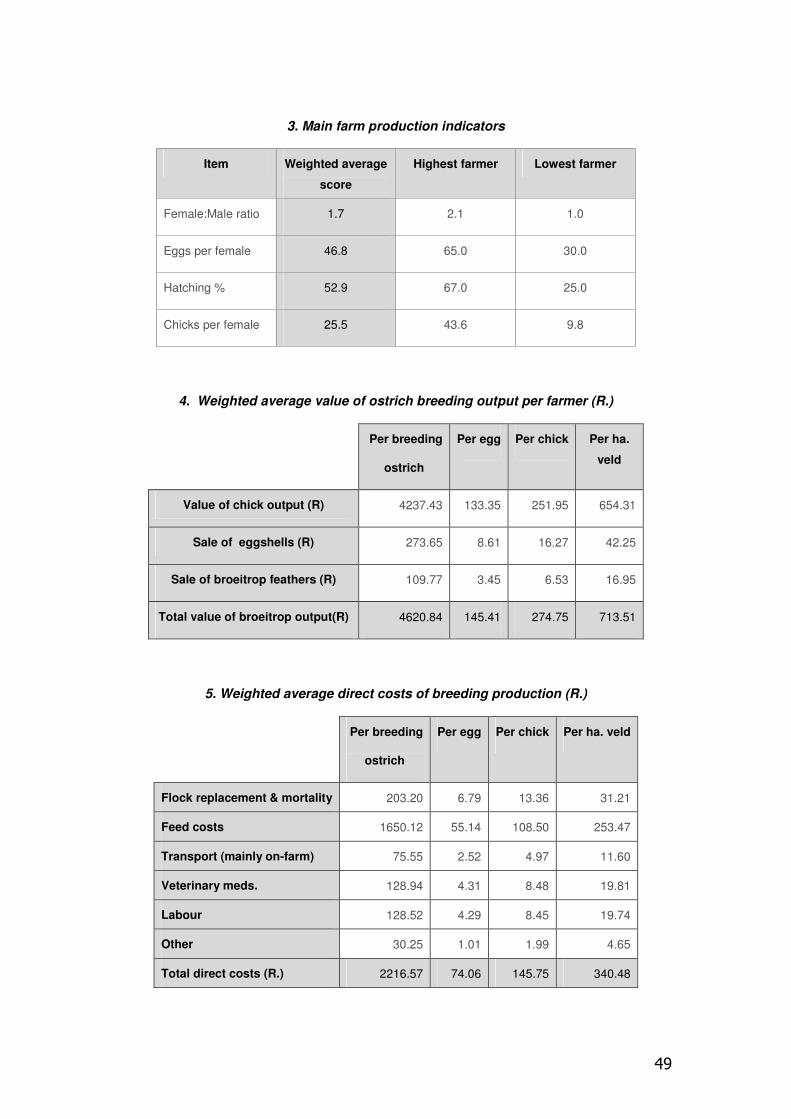
49
3. Main farm production indicators
Item Weighted average
score
Highest farmer Lowest farmer
Female:Male ratio 1.7 2.1 1.0
Eggs per female 46.8 65.0 30.0
Hatching % 52.9 67.0 25.0
Chicks per female 25.5 43.6 9.8
4. Weighted average value of ostrich breeding output per farmer (R.)
Per breeding
ostrich
Per egg Per chick Per ha.
veld
Value of chick output (R) 4237.43 133.35 251.95 654.31
Sale of eggshells (R) 273.65 8.61 16.27 42.25
Sale of broeitrop feathers (R) 109.77 3.45 6.53 16.95
Total value of broeitrop output(R) 4620.84 145.41 274.75 713.51
5. Weighted average direct costs of breeding production (R.)
Per breeding
ostrich
Per egg Per chick Per ha. veld
Flock replacement & mortality 203.20 6.79 13.36 31.21
Feed costs 1650.12 55.14 108.50 253.47
Transport (mainly on-farm) 75.55 2.52 4.97 11.60
Veterinary meds. 128.94 4.31 8.48 19.81
Labour 128.52 4.29 8.45 19.74
Other 30.25 1.01 1.99 4.65
Total direct costs (R.) 2216.57 74.06 145.75 340.48
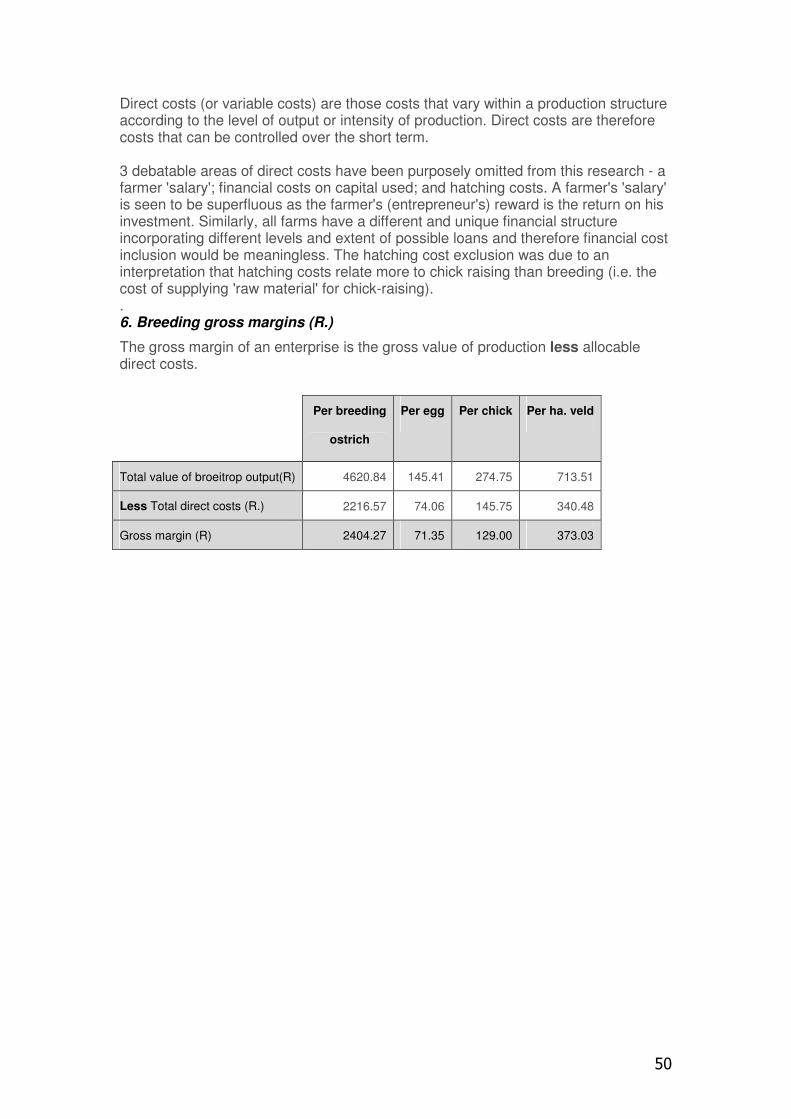
50
Direct costs (or variable costs) are those costs that vary within a production structure according to the level of output or intensity of production. Direct costs are therefore costs that can be controlled over the short term. 3 debatable areas of direct costs have been purposely omitted from this research - a farmer 'salary'; financial costs on capital used; and hatching costs. A farmer's 'salary' is seen to be superfluous as the farmer's (entrepreneur's) reward is the return on his investment. Similarly, all farms have a different and unique financial structure incorporating different levels and extent of possible loans and therefore financial cost inclusion would be meaningless. The hatching cost exclusion was due to an interpretation that hatching costs relate more to chick raising than breeding (i.e. the cost of supplying 'raw material' for chick-raising). . 6. Breeding gross margins (R.)
The gross margin of an enterprise is the gross value of production less allocable direct costs.
Per breeding
ostrich
Per egg Per chick Per ha. veld
Total value of broeitrop output(R) 4620.84 145.41 274.75 713.51
Less Total direct costs (R.) 2216.57 74.06 145.75 340.48
Gross margin (R) 2404.27 71.35 129.00 373.03
51