Embed Size (px)
Citation preview
Funded by:
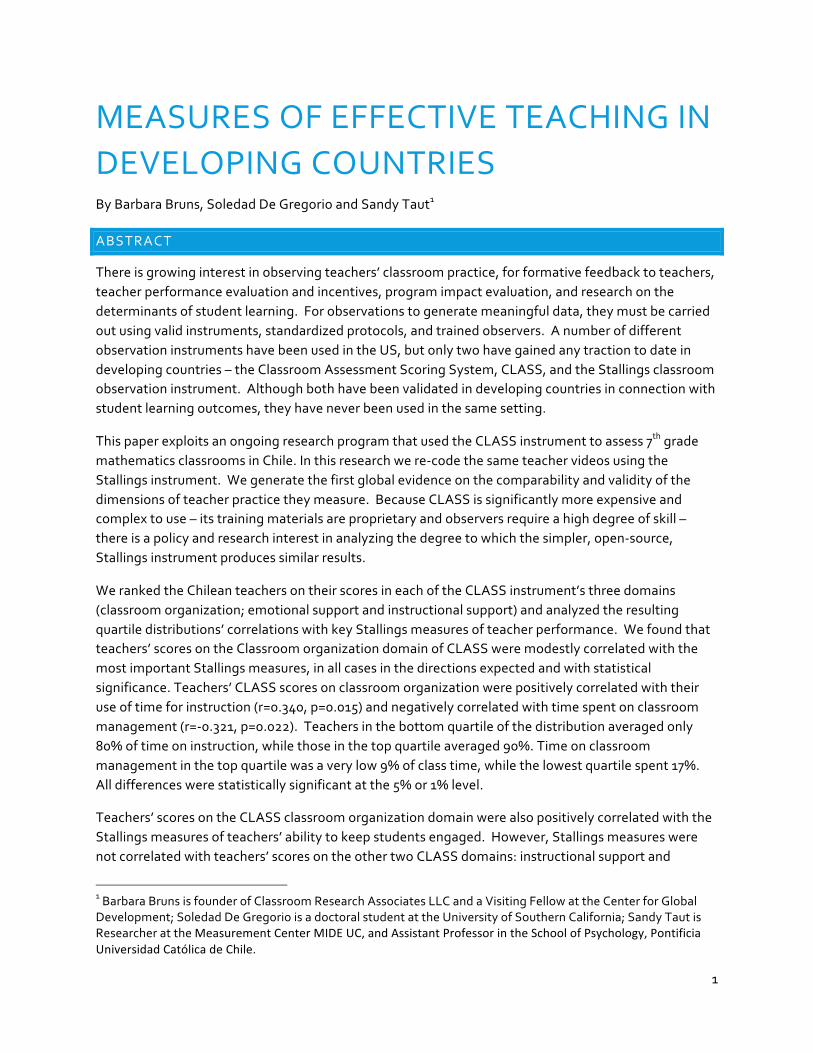
Measures of Effective Teaching in Developing Countries
Barbara Bruns, Soledad De Gregorio and Sandy Taut
RISE-WP-16/009September 2016
WORKING PAPERSeptember 2016
The findings, interpretations, and conclusions expressed in RISE Working Papers are entirely those of the author(s). Copyright for RISE Working Papers remains with the author(s). www.riseprogramme.org
1
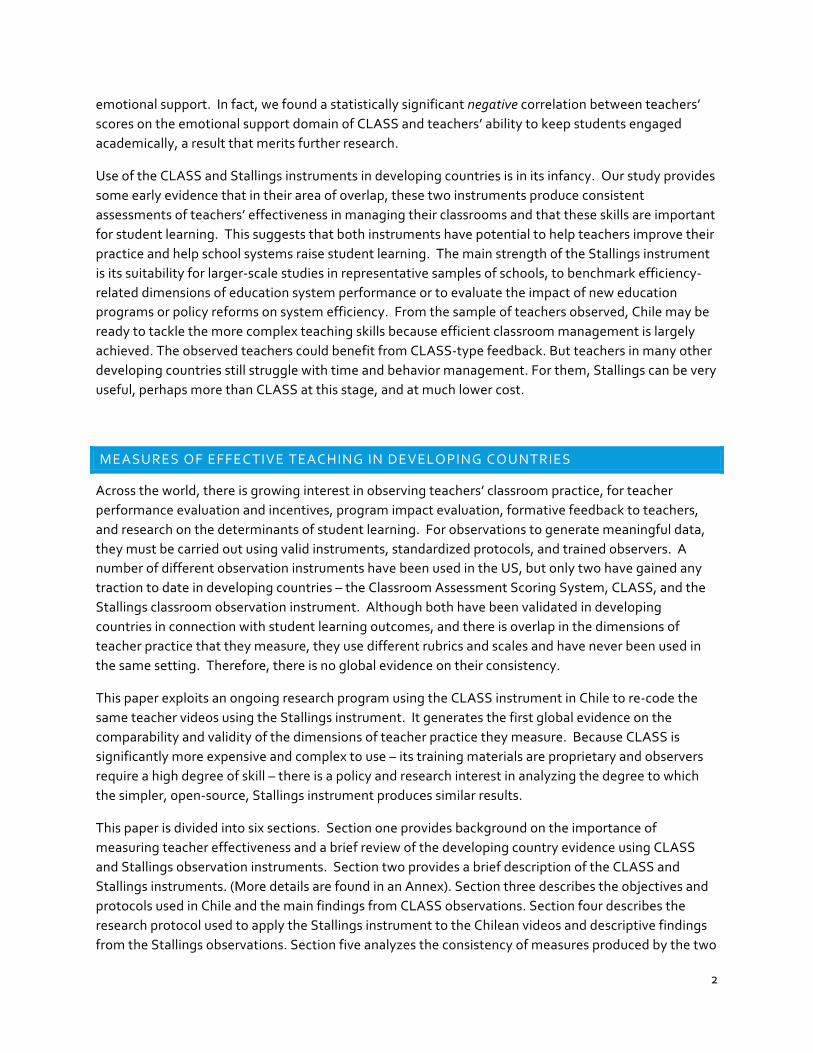
MEASURES OF EFFECTIVE TEACHING IN DEVELOPING COUNTRIES By Barbara Bruns, Soledad De Gregorio and Sandy Taut1
ABSTRACT
There is growing interest in observing teachers’ classroom practice, for formative feedback to teachers, teacher performance evaluation and incentives, program impact evaluation, and research on the determinants of student learning. For observations to generate meaningful data, they must be carried out using valid instruments, standardized protocols, and trained observers. A number of different observation instruments have been used in the US, but only two have gained any traction to date in developing countries – the Classroom Assessment Scoring System, CLASS, and the Stallings classroom observation instrument. Although both have been validated in developing countries in connection with student learning outcomes, they have never been used in the same setting.
This paper exploits an ongoing research program that used the CLASS instrument to assess 7th grade mathematics classrooms in Chile. In this research we re-‐code the same teacher videos using the Stallings instrument. We generate the first global evidence on the comparability and validity of the dimensions of teacher practice they measure. Because CLASS is significantly more expensive and complex to use – its training materials are proprietary and observers require a high degree of skill – there is a policy and research interest in analyzing the degree to which the simpler, open-‐source, Stallings instrument produces similar results.
We ranked the Chilean teachers on their scores in each of the CLASS instrument’s three domains (classroom organization; emotional support and instructional support) and analyzed the resulting quartile distributions’ correlations with key Stallings measures of teacher performance. We found that teachers’ scores on the Classroom organization domain of CLASS were modestly correlated with the most important Stallings measures, in all cases in the directions expected and with statistical significance. Teachers’ CLASS scores on classroom organization were positively correlated with their use of time for instruction (r=0.340, p=0.015) and negatively correlated with time spent on classroom management (r=-‐0.321, p=0.022). Teachers in the bottom quartile of the distribution averaged only 80% of time on instruction, while those in the top quartile averaged 90%. Time on classroom management in the top quartile was a very low 9% of class time, while the lowest quartile spent 17%. All differences were statistically significant at the 5% or 1% level.
Teachers’ scores on the CLASS classroom organization domain were also positively correlated with the Stallings measures of teachers’ ability to keep students engaged. However, Stallings measures were not correlated with teachers’ scores on the other two CLASS domains: instructional support and
1 Barbara Bruns is founder of Classroom Research Associates LLC and a Visiting Fellow at the Center for Global Development; Soledad De Gregorio is a doctoral student at the University of Southern California; Sandy Taut is Researcher at the Measurement Center MIDE UC, and Assistant Professor in the School of Psychology, Pontificia Universidad Católica de Chile.
2
emotional support. In fact, we found a statistically significant negative correlation between teachers’ scores on the emotional support domain of CLASS and teachers’ ability to keep students engaged academically, a result that merits further research.
Use of the CLASS and Stallings instruments in developing countries is in its infancy. Our study provides some early evidence that in their area of overlap, these two instruments produce consistent assessments of teachers’ effectiveness in managing their classrooms and that these skills are important for student learning. This suggests that both instruments have potential to help teachers improve their practice and help school systems raise student learning. The main strength of the Stallings instrument is its suitability for larger-‐scale studies in representative samples of schools, to benchmark efficiency-‐related dimensions of education system performance or to evaluate the impact of new education programs or policy reforms on system efficiency. From the sample of teachers observed, Chile may be ready to tackle the more complex teaching skills because efficient classroom management is largely achieved. The observed teachers could benefit from CLASS-‐type feedback. But teachers in many other developing countries still struggle with time and behavior management. For them, Stallings can be very useful, perhaps more than CLASS at this stage, and at much lower cost.
MEASURES OF EFFECTIVE TEACHING IN DEVELOPING COUNTRIES
Across the world, there is growing interest in observing teachers’ classroom practice, for teacher performance evaluation and incentives, program impact evaluation, formative feedback to teachers, and research on the determinants of student learning. For observations to generate meaningful data, they must be carried out using valid instruments, standardized protocols, and trained observers. A number of different observation instruments have been used in the US, but only two have gained any traction to date in developing countries – the Classroom Assessment Scoring System, CLASS, and the Stallings classroom observation instrument. Although both have been validated in developing countries in connection with student learning outcomes, and there is overlap in the dimensions of teacher practice that they measure, they use different rubrics and scales and have never been used in the same setting. Therefore, there is no global evidence on their consistency.
This paper exploits an ongoing research program using the CLASS instrument in Chile to re-‐code the same teacher videos using the Stallings instrument. It generates the first global evidence on the comparability and validity of the dimensions of teacher practice they measure. Because CLASS is significantly more expensive and complex to use – its training materials are proprietary and observers require a high degree of skill – there is a policy and research interest in analyzing the degree to which the simpler, open-‐source, Stallings instrument produces similar results.
This paper is divided into six sections. Section one provides background on the importance of measuring teacher effectiveness and a brief review of the developing country evidence using CLASS and Stallings observation instruments. Section two provides a brief description of the CLASS and Stallings instruments. (More details are found in an Annex). Section three describes the objectives and protocols used in Chile and the main findings from CLASS observations. Section four describes the research protocol used to apply the Stallings instrument to the Chilean videos and descriptive findings from the Stallings observations. Section five analyzes the consistency of measures produced by the two
3
instruments in the domain they both measure – classroom management – and the correlation of these with measures of teacher performance in other domains that are captured by the CLASS instrument but not the Stallings. It also examines the correlations between CLASS and Stallings measures of teachers’ classroom performance and the learning outcomes of their students. Section six draws conclusions and recommendations for future research in this area.
I. BACKGROUND: THE IMPORTANCE OF MEASURING TEACHERS’ CLASSROOM EFFECTIVENESS
A central education policy question is how to improve teachers' classroom effectiveness. Research on teacher value-‐added in the United States (Jackson et al, 2014; Chetty et al, 2014; Hanushek and Rivkin, 2010; Rockoff, 2004) and in Latin America (Araujo et al, 2016; Bruns and Luque 2015) using observed classroom practice has consistently documented that teachers’ practice and classroom-‐level results are highly variable, even among teachers within the same school teaching the same grade and subject.
In the US, Hanushek and Rivkin (2010) have documented that student learning gains produced by different classroom teachers in the same school and grade can range from 0.5 to 1.5 years of curriculum mastery. In six different countries in Latin America and the Caribbean, Bruns and Luque (2015) found consistently large variation in the share of total class time different teachers in the same school spend on instruction, irrespective of the average level of teacher performance in the school or even in the school system. While the median school in the Latin American countries studied spends 65 percent of class time teaching, the lowest-‐performing teachers in the median school average less than 50% of class time on instruction and the best-‐performing teachers spend over 80% of class time on instruction. This is a striking degree of classroom level heterogeneity given the fact that within a given school all teachers serve a roughly homogenous student population, deliver the same curriculum, and work under the same set of management and institutional conditions.
These and other studies have stimulated new research interest in observing teachers’ classroom practice and unpacking what affects it. First, over the past five years there is evidence that the quality of teachers’ classroom practice, as measured through classroom observations, is important for student learning and other key outcomes, such as students’ socio-‐emotional skills. The influential, large-‐scale Measures of Effective Teaching study in the US found that classroom observations, using three different instruments, could predict differences in individual teachers’ ability to produce classroom-‐level learning gains (MET, Kane and Staiger 2012). Other US researchers have also found that children exposed to teachers with better scores on the CLASS instrument have higher learning gains, better self-‐regulation and fewer behavioral problems (Howes et al, 2008; Grossman et al, 2010).
The only research to date using CLASS in a developing country, by Araujo et al (2016) in Ecuador, has produced similar findings. By randomly assigning pre-‐school students to different teachers, Araujo and colleagues found that a one standard deviation increase in teachers’ classroom quality, measured using the CLASS observation instrument, resulted in 0.11, 0.11 and 0.07 standard deviation higher student test scores in language, math and executive function.
Beyond these studies, which have directly linked teachers’ classroom practice to classroom level outcomes, there is a larger body of research that has linked classroom-‐level outcomes to individual teachers, without observing teachers’ classroom practice. This literature has established convincingly
4
that individual teachers have large impacts on their students and that impacts on students’ socio-‐emotional development and life outcomes may be even longer-‐lasting than impacts on learning (Chetty et al, 2014; Jackson et al, 2014; Jennings and DiPrete, 2010).
What factors cause some teachers to be so much more effective than others? There is substantial US research that “observable” teacher characteristics, such as age, education, qualifications, and contract status do not explain differences in individual teachers’ ability to produce classroom level learning gains – except for a consistent finding that all teachers tend to be less effective during their first three-‐to-‐five years of teaching (Kane and Staiger, 2012).
Similarly, Araujo et al (2016) found that differences in teachers’ classroom practice are not explained by teacher background and status. Except for “rookie” teachers with less than three years of service, the quality of teachers’ classroom practice was not correlated with teachers’ tenure status, salary, and age, or even with an unusually rich set of data the researchers were able to collect, such as teacher IQ, Big Five personality traits, and executive function.
In sum, the growing body of global evidence that teachers’ individual effectiveness 1) differs widely, 2) has crucial importance for student outcomes, 3) is not predicted by teachers’ formal qualifications but 4) is correlated with differences in teacher practice that are observable in the classroom, has stimulated both increased interest in classroom observations and increased research on classroom observation instruments and protocols.
I I. THE CLASSROOM ASSESSMENT SCORING SYSTEM (CLASS) AND STALLINGS INSTRUMENTS
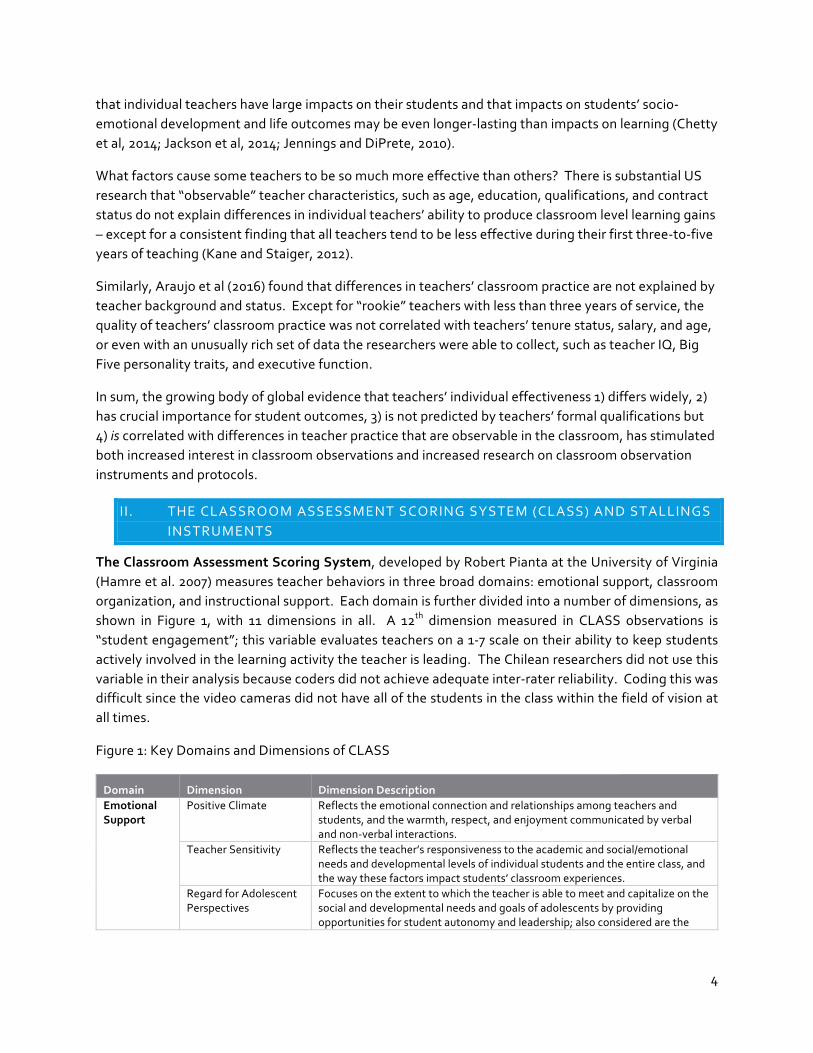
The Classroom Assessment Scoring System, developed by Robert Pianta at the University of Virginia (Hamre et al. 2007) measures teacher behaviors in three broad domains: emotional support, classroom organization, and instructional support. Each domain is further divided into a number of dimensions, as shown in Figure 1, with 11 dimensions in all. A 12th dimension measured in CLASS observations is “student engagement”; this variable evaluates teachers on a 1-‐7 scale on their ability to keep students actively involved in the learning activity the teacher is leading. The Chilean researchers did not use this variable in their analysis because coders did not achieve adequate inter-‐rater reliability. Coding this was difficult since the video cameras did not have all of the students in the class within the field of vision at all times.
Figure 1: Key Domains and Dimensions of CLASS
Domain Dimension Dimension Description Emotional Support
Positive Climate Reflects the emotional connection and relationships among teachers and students, and the warmth, respect, and enjoyment communicated by verbal and non-‐verbal interactions.
Teacher Sensitivity Reflects the teacher’s responsiveness to the academic and social/emotional needs and developmental levels of individual students and the entire class, and the way these factors impact students’ classroom experiences.
Regard for Adolescent Perspectives
Focuses on the extent to which the teacher is able to meet and capitalize on the social and developmental needs and goals of adolescents by providing opportunities for student autonomy and leadership; also considered are the
5
extent to which student ideas and opinions are valued and content is made useful and relevant to adolescents.
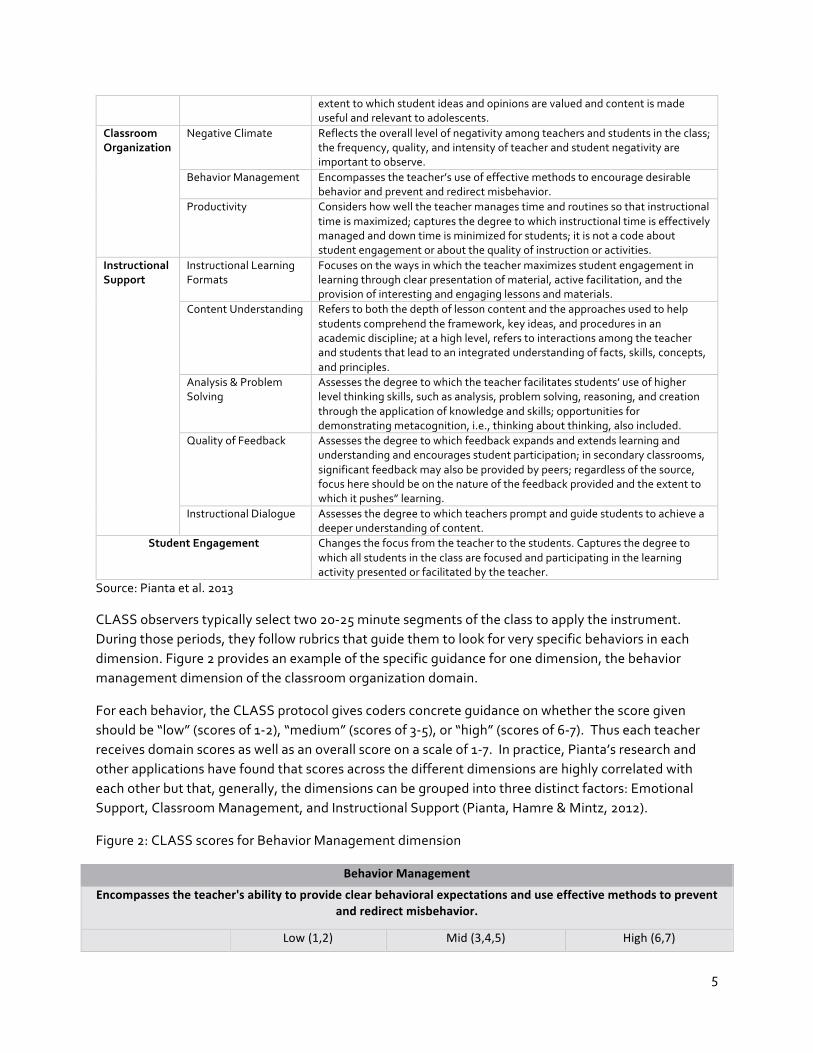
Classroom Organization
Negative Climate Reflects the overall level of negativity among teachers and students in the class; the frequency, quality, and intensity of teacher and student negativity are important to observe.
Behavior Management Encompasses the teacher’s use of effective methods to encourage desirable behavior and prevent and redirect misbehavior.
Productivity Considers how well the teacher manages time and routines so that instructional time is maximized; captures the degree to which instructional time is effectively managed and down time is minimized for students; it is not a code about student engagement or about the quality of instruction or activities.
Instructional Support
Instructional Learning Formats
Focuses on the ways in which the teacher maximizes student engagement in learning through clear presentation of material, active facilitation, and the provision of interesting and engaging lessons and materials.
Content Understanding Refers to both the depth of lesson content and the approaches used to help students comprehend the framework, key ideas, and procedures in an academic discipline; at a high level, refers to interactions among the teacher and students that lead to an integrated understanding of facts, skills, concepts, and principles.
Analysis & Problem Solving
Assesses the degree to which the teacher facilitates students’ use of higher level thinking skills, such as analysis, problem solving, reasoning, and creation through the application of knowledge and skills; opportunities for demonstrating metacognition, i.e., thinking about thinking, also included.
Quality of Feedback Assesses the degree to which feedback expands and extends learning and understanding and encourages student participation; in secondary classrooms, significant feedback may also be provided by peers; regardless of the source, focus here should be on the nature of the feedback provided and the extent to which it pushes” learning.
Instructional Dialogue Assesses the degree to which teachers prompt and guide students to achieve a deeper understanding of content.
Student Engagement Changes the focus from the teacher to the students. Captures the degree to which all students in the class are focused and participating in the learning activity presented or facilitated by the teacher.
Source: Pianta et al. 2013
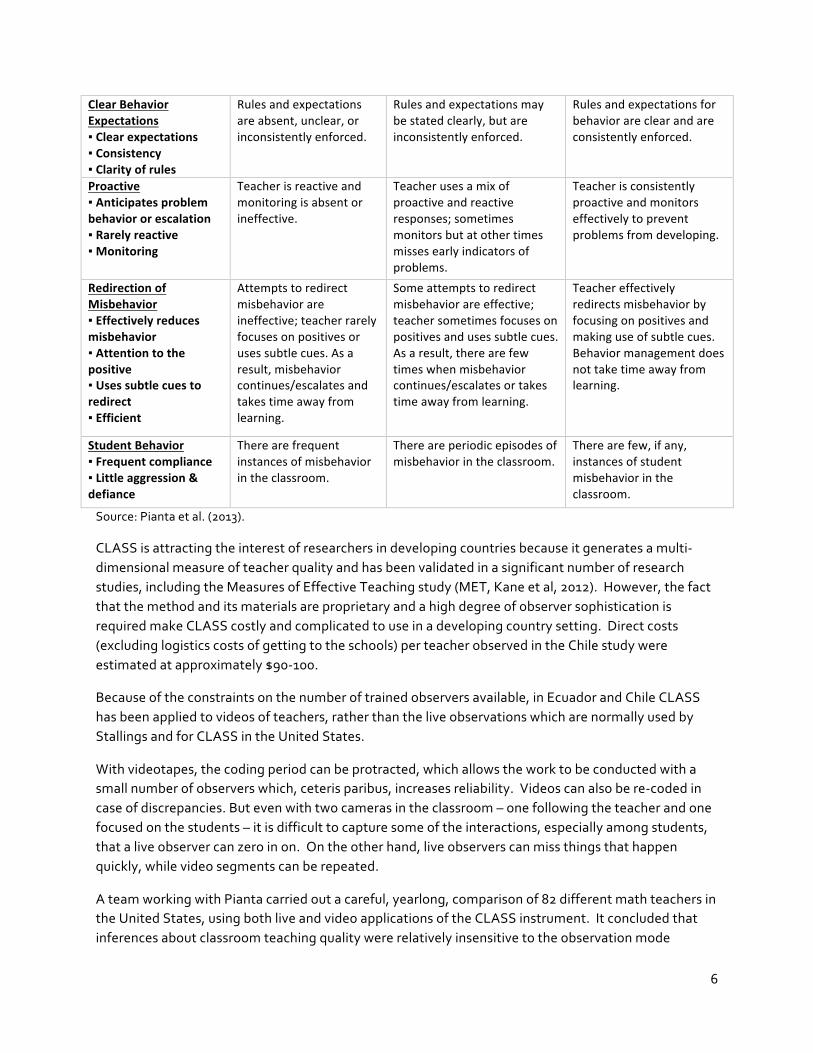
CLASS observers typically select two 20-‐25 minute segments of the class to apply the instrument. During those periods, they follow rubrics that guide them to look for very specific behaviors in each dimension. Figure 2 provides an example of the specific guidance for one dimension, the behavior management dimension of the classroom organization domain.
For each behavior, the CLASS protocol gives coders concrete guidance on whether the score given should be “low” (scores of 1-‐2), “medium” (scores of 3-‐5), or “high” (scores of 6-‐7). Thus each teacher receives domain scores as well as an overall score on a scale of 1-‐7. In practice, Pianta’s research and other applications have found that scores across the different dimensions are highly correlated with each other but that, generally, the dimensions can be grouped into three distinct factors: Emotional Support, Classroom Management, and Instructional Support (Pianta, Hamre & Mintz, 2012).
Figure 2: CLASS scores for Behavior Management dimension
Behavior Management
Encompasses the teacher's ability to provide clear behavioral expectations and use effective methods to prevent and redirect misbehavior.
Low (1,2) Mid (3,4,5) High (6,7)
6
Clear Behavior Expectations ▪ Clear expectations ▪ Consistency ▪ Clarity of rules
Rules and expectations are absent, unclear, or inconsistently enforced.
Rules and expectations may be stated clearly, but are inconsistently enforced.
Rules and expectations for behavior are clear and are consistently enforced.
Proactive ▪ Anticipates problem behavior or escalation ▪ Rarely reactive ▪ Monitoring
Teacher is reactive and monitoring is absent or ineffective.
Teacher uses a mix of proactive and reactive responses; sometimes monitors but at other times misses early indicators of problems.
Teacher is consistently proactive and monitors effectively to prevent problems from developing.
Redirection of Misbehavior ▪ Effectively reduces misbehavior ▪ Attention to the positive ▪ Uses subtle cues to redirect ▪ Efficient
Attempts to redirect misbehavior are ineffective; teacher rarely focuses on positives or uses subtle cues. As a result, misbehavior continues/escalates and takes time away from learning.
Some attempts to redirect misbehavior are effective; teacher sometimes focuses on positives and uses subtle cues. As a result, there are few times when misbehavior continues/escalates or takes time away from learning.
Teacher effectively redirects misbehavior by focusing on positives and making use of subtle cues. Behavior management does not take time away from learning.
Student Behavior ▪ Frequent compliance ▪ Little aggression & defiance
There are frequent instances of misbehavior in the classroom.
There are periodic episodes of misbehavior in the classroom.
There are few, if any, instances of student misbehavior in the classroom.
Source: Pianta et al. (2013).
CLASS is attracting the interest of researchers in developing countries because it generates a multi-‐dimensional measure of teacher quality and has been validated in a significant number of research studies, including the Measures of Effective Teaching study (MET, Kane et al, 2012). However, the fact that the method and its materials are proprietary and a high degree of observer sophistication is required make CLASS costly and complicated to use in a developing country setting. Direct costs (excluding logistics costs of getting to the schools) per teacher observed in the Chile study were estimated at approximately $90-‐100.
Because of the constraints on the number of trained observers available, in Ecuador and Chile CLASS has been applied to videos of teachers, rather than the live observations which are normally used by Stallings and for CLASS in the United States.
With videotapes, the coding period can be protracted, which allows the work to be conducted with a small number of observers which, ceteris paribus, increases reliability. Videos can also be re-‐coded in case of discrepancies. But even with two cameras in the classroom – one following the teacher and one focused on the students – it is difficult to capture some of the interactions, especially among students, that a live observer can zero in on. On the other hand, live observers can miss things that happen quickly, while video segments can be repeated.
A team working with Pianta carried out a careful, yearlong, comparison of 82 different math teachers in the United States, using both live and video applications of the CLASS instrument. It concluded that inferences about classroom teaching quality were relatively insensitive to the observation mode
7
(Casabianca et al., 2013). A bigger issue appears to be trends in individual observers’ scoring patterns – for example, becoming more stringent or more forgiving over time. Research protocols for both live and video-‐based observations need to address this with regular efforts to check the consistency of coders’ work and re-‐calibrate as necessary.
The Stallings method, technically called the Stanford Research Institute Classroom Observation System, was developed by Professor Jane Stallings for research on the efficiency and quality of basic education teachers in the United States in the 1970s. (Stallings, 1977; Stallings and Mohlman, 1988). The Stallings instrument generates robust quantitative data on teachers’ practice and interaction with students in the classroom, with a high degree of inter-‐rater reliability (0.8 or higher) among observers with relatively little training. The instrument’s relative simplicity makes it suitable for large scale samples in developing country settings (Jukes et al., 2006; Abadzi, 2007; DeStefano et al, 2010; Schuh-‐Moore et al, 2010; World Bank 2014). The instrument is language and curriculum-‐neutral, so even observers with limited proficiency in the language being used for instruction can produce reliable observations. Results are directly comparable across different types of schools and country contexts, and a growing body of comparative country data – from more than 18,000 teachers in six developing countries as of end-‐2015 – is available on the World Bank open data website for benchmarking.
The strength of the Stallings method is that it converts the qualitative activities and interactions between the teacher and students that occur during a class into robust quantitative data on teachers’ instructional practice and students’ engagement. Observations are coded at ten different moments in every class, at exact intervals whose spacing depends on the length of the class; every 3 minutes in a 30-‐minute class, every 5 minutes in a 50-‐minute class, etc. Because all Stallings variables are expressed as a share of official class time, it is essential that the observer be present in the classroom before the first official moment of class and stay through the official end time of the class, whether or not the teacher is present.
Each observation consists of a 15-‐second scan of the classroom, starting with the teacher and proceeding clockwise around the room. Observers code what the teacher is doing; what materials s/he is using; and what the students are doing.
For the purposes of generating quantitative estimates of time on task, student engagement, and core pedagogical practices, the coded activities are grouped into four categories: academic activities, classroom management, teacher off-‐task and students off-‐task.
Core Pedagogical Practices Coded Activities 1. Academic Activities /
Instruction - Reading Aloud - Demonstration/Lecture - Debate/Discussion/Question and Answer - Practice & Memorization - Assignment/Class Work - Copying
2. Classroom Management - Verbal Instruction - Disciplining students - Classroom Management with Students - Classroom Management Alone
8
3. Teacher Off-‐Task - Teacher in Social Interaction with Students - Teacher in Social Interaction with Outsiders or Teacher
Uninvolved - Teacher out of the classroom
4. Students Off-‐Task - Students being disciplined - Students in Social Interaction - Students not Engaged
In order to generate quantitative estimates of the intensity of teachers’ use of available learning materials, the coding options are: No Materials; Textbooks; Notebooks/Workbooks; Blackboard or whiteboard; Learning aids (maps, blocks, calculators); ITC (LCD projectors, computers, TV/radio).
Unlike CLASS, the Stallings instrument does not produce a summative evaluation score for individual teachers. Instead, it produces a set of quantitative measures, all related to the teacher’s use of class time: the share of class time used for instruction, classroom management, and off-‐task; the share of time the teacher kept all students engaged; the share of time the teacher used different pedagogical practices such as question/answer, discussion/debate, copying, or seat work; and the share of time the teacher used available materials, such as the blackboard, textbooks, ICT, etc. These data can be benchmarked against other teachers in the same school, and the averages for teachers in other schools, districts, states and countries.
The original Stallings instrument is a dense-‐looking, one-‐page coding grid with classroom materials listed across the top and activities down the left side. Within each resulting cell, there is one row labeled “T”, for coding what the teacher is doing and what materials s/he is using at the moment of observation and one row labeled “P” for marking what the pupils are doing and what materials they are using. Each 15-‐second observation is coded on a single sheet, thus each class observed generates 10 coded sheets. As the paper-‐based version has no in-‐built consistency checks to guard against mistaken double-‐coding or inconsistent coding (for example, if a student is being disciplined, both the teacher row and the student row must be coded with this activity), a full week (40 hour) training course with substantial time practicing in schools has typically been required to achieve .80 inter-‐rater reliability among observers.
Since 2015, the World Bank has used an Open Data Kit (ODK) software version of the instrument on electronic tablets. Teams have had low error rates with the tablet-‐based program, which is very intuitive and where the sequence of questions permits built-‐in consistency checks. In the Latin America region, it has not been necessary to hire specialized academic observers; education ministry staff trained in the Stallings method on tablets typically achieve 0.8 inter-‐rater reliability with 2 days of training. This, plus the open source software, makes it feasible to apply the Stallings instrument to large scale samples. Typically, a representative sample of 200-‐600 schools can be observed by a group of 80-‐100 trained observers in a period of one month. Depending on school size, teams of 1-‐3 observers typically visit 3-‐5 schools per week, spend the day in each school, and observe as many different teachers as possible over the course of that day, typically 5 or 6 classrooms per day each. This scale makes the “software” costs of Stallings observations low: less than $5 per class/teacher observed – excluding the logistics costs of getting observers out to the schools for unannounced visits. The tablet version of Stallings was used for the present study.
9
III. RESEARCH OBJECTIVES, PROTOCOLS AND RESULTS OF THE CHILE STUDY USING CLASS
In 2004, Chile was the first country in Latin America to adopt a system of regular teacher performance evaluation, called Docentemas. Hallmarks that have made Docentemas a model for other countries in the region include explicit standards for good teaching (Marco de la Buena Ensenanza) and teacher portfolios which include expert classroom observation as the most important component of a teacher’s overall performance review. As part of Docentemas’ comprehensive evaluation approximately every four years, teachers are videotaped teaching a sample class and a team of academic experts contracted by the Ministry of Education evaluates the videos, rates the teacher on a 1-‐4 scale, and prepares written feedback. The evaluators follow detailed rubrics that are kept confidential. Although data on classroom-‐level learning gains are not typically available, one study using large-‐scale national data from teachers and students found Docentemas’ teacher evaluation ratings to be correlated with teachers’ value-‐added indicators (Taut et al., 2016). Research questions. Between 2012 and 2015, a group of Chilean researchers has launched a deeper study of whether teachers’ scores on Docentemas evaluations are consistent with the scores they would receive using CLASS, an internationally validated observation instrument, as well as other instruments measuring different aspects of teaching quality, such as student perceptions of their teachers, student learning on standardized and unit-‐specific tests, and teachers’ subject knowledge. Some of this analysis is still in progress, but the team agreed to share its results analyzing the mean group differences on CLASS scores between teachers rated as basic and competent in their Docentemas evaluations.
The team applied the CLASS instrument to 51 teachers of 7th grade math in municipal schools in the Santiago Metropolitan region and two adjacent regions. All 51 teachers had previously been evaluated by Docentemas and were in the two middle performance categories of the 4-‐point scale (unsatisfactory/basic/competent/outstanding). N=22 of the sample teachers were in the “basic” performance category, while N=29 were in the “competent” performance category. Researchers focused on teachers in this range, reasoning that it might be most difficult to make performance distinctions in this range around the threshold of being deemed a competent teacher or not. The schools were of mid-‐to-‐low SES, and most had results on the national (SIMCE) math test that were below the average for their SES group.
Protocol. Each teacher was videotaped at two different times of the school year, for either a 45, 60 or 90-‐minute lesson. The videos used two cameras and high-‐quality audio equipment. The cameras were positioned using TIMSS (Trends in International Mathematics and Science Study) methodology: a student camera was fixed at the front of the classroom – generally at the teacher’s desk pointing towards the students – and a teacher camera was in the back of the classroom following the teachers’ movements and was taken off the tripod for close ups when the teacher worked with individual students at their desks.
The research team translated the Manual for the “Classroom Assessment Scoring System for Secondary School (CLASS-‐S)” to Spanish and trained and certified four raters. During the first half of 2015, the team applied the CLASS observation protocol to all 104 classroom videos. Fifty percent of the videos (i.e., one video of each teacher) were double-‐coded and any differences larger than one point on the seven-‐point rating scale were resolved through master coding. Raters did not know teachers’ Docentemas evaluation results.
10
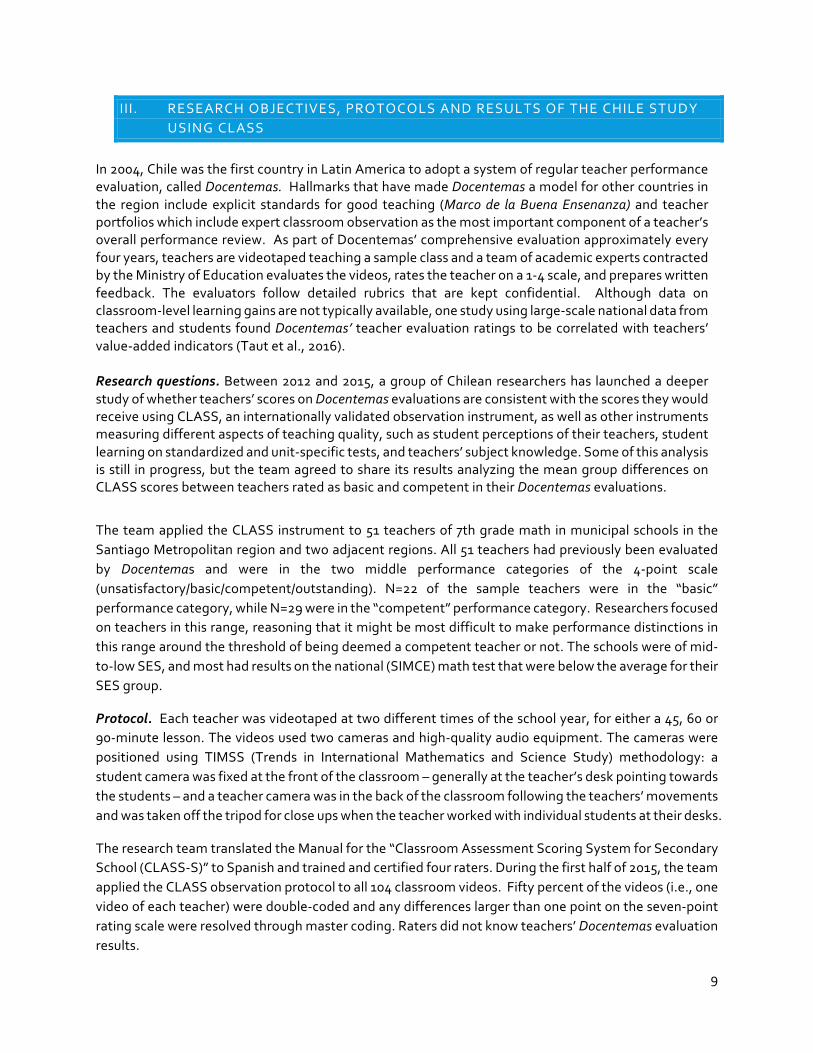
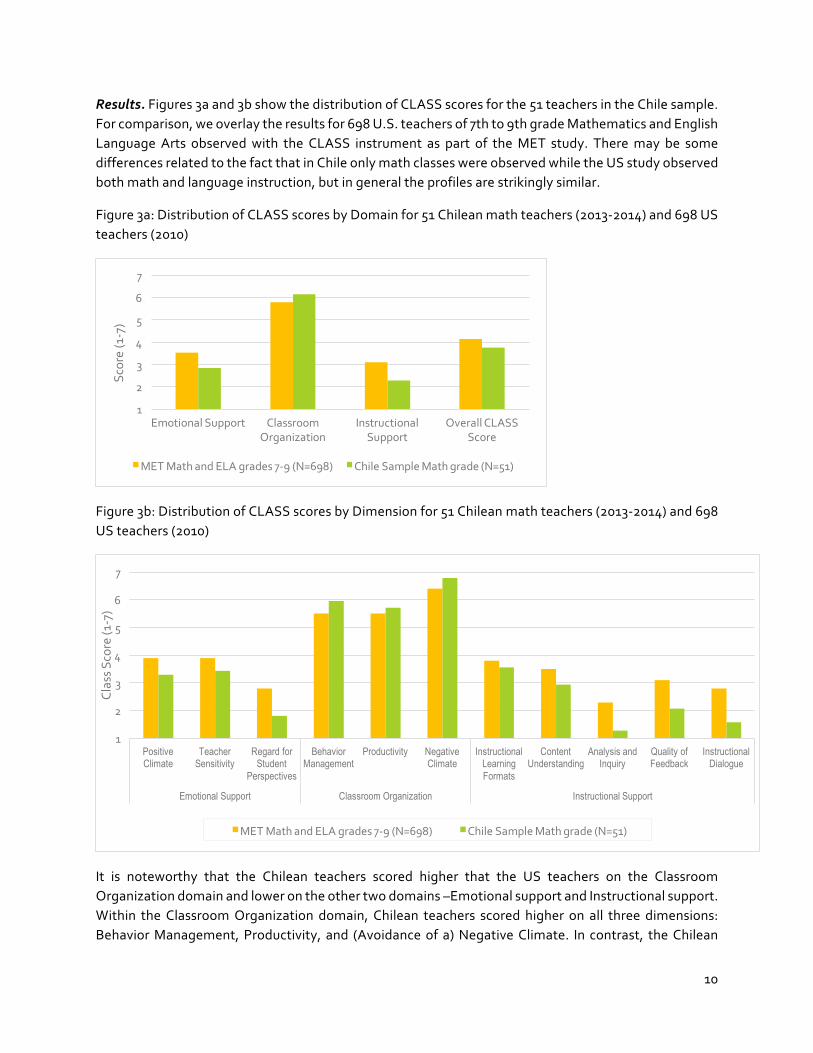
Results. Figures 3a and 3b show the distribution of CLASS scores for the 51 teachers in the Chile sample. For comparison, we overlay the results for 698 U.S. teachers of 7th to 9th grade Mathematics and English Language Arts observed with the CLASS instrument as part of the MET study. There may be some differences related to the fact that in Chile only math classes were observed while the US study observed both math and language instruction, but in general the profiles are strikingly similar.
Figure 3a: Distribution of CLASS scores by Domain for 51 Chilean math teachers (2013-‐2014) and 698 US teachers (2010)
Figure 3b: Distribution of CLASS scores by Dimension for 51 Chilean math teachers (2013-‐2014) and 698 US teachers (2010)
It is noteworthy that the Chilean teachers scored higher that the US teachers on the Classroom Organization domain and lower on the other two domains –Emotional support and Instructional support. Within the Classroom Organization domain, Chilean teachers scored higher on all three dimensions: Behavior Management, Productivity, and (Avoidance of a) Negative Climate. In contrast, the Chilean
1
2
3
4
5
6
7
Emotional Support Classroom Organization
Instructional Support
Overall CLASS Score
Score (1-‐7)
MET Math and ELA grades 7-‐9 (N=698) Chile Sample Math grade (N=51)
1
2
3
4
5
6
7
Positive Climate
Teacher Sensitivity
Regard for Student
Perspectives
Behavior Management
Productivity Negative Climate
Instructional Learning Formats
Content Understanding
Analysis and Inquiry
Quality of Feedback
Instructional Dialogue
Emotional Support Classroom Organization Instructional Support
Class S
core (1
-‐7)
MET Math and ELA grades 7-‐9 (N=698) Chile Sample Math grade (N=51)
11
teachers were very weak on three of the five dimensions of Instructional Support. In both the US and Chilean samples, Analysis and Inquiry, Quality of Feedback and Instructional Dialogue received some of the lowest scores, but the Chilean teachers’ scores were particularly low – 2 or below on the 7-‐point scale. Chilean teachers also scored below 2 on Regard for Student perspectives, one of the dimensions of Emotional Support.
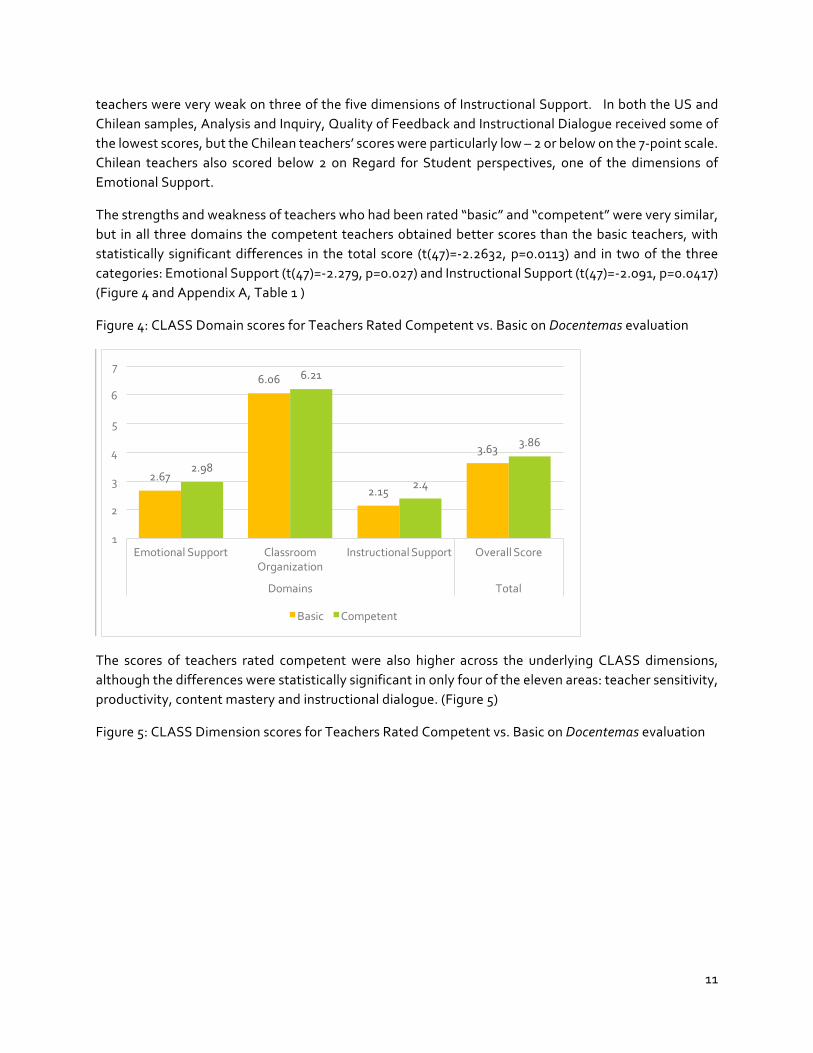
The strengths and weakness of teachers who had been rated “basic” and “competent” were very similar, but in all three domains the competent teachers obtained better scores than the basic teachers, with statistically significant differences in the total score (t(47)=-‐2.2632, p=0.0113) and in two of the three categories: Emotional Support (t(47)=-‐2.279, p=0.027) and Instructional Support (t(47)=-‐2.091, p=0.0417) (Figure 4 and Appendix A, Table 1 )
Figure 4: CLASS Domain scores for Teachers Rated Competent vs. Basic on Docentemas evaluation
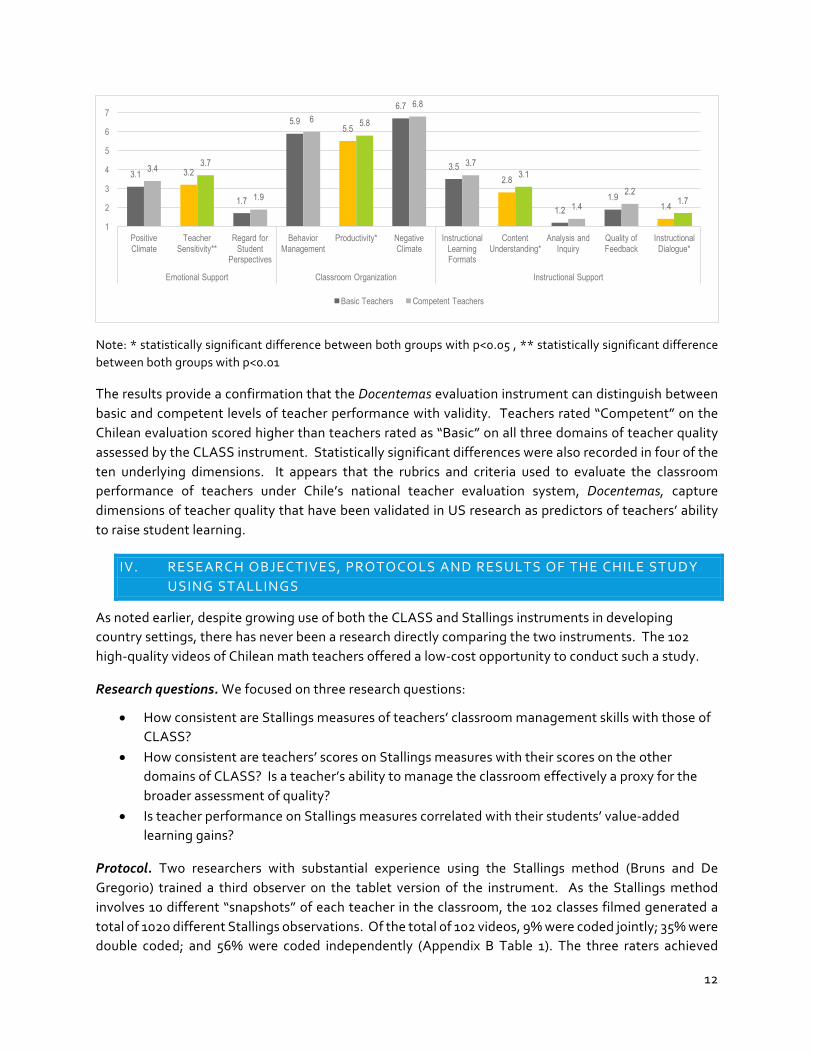
The scores of teachers rated competent were also higher across the underlying CLASS dimensions, although the differences were statistically significant in only four of the eleven areas: teacher sensitivity, productivity, content mastery and instructional dialogue. (Figure 5)
Figure 5: CLASS Dimension scores for Teachers Rated Competent vs. Basic on Docentemas evaluation
2.67
6.06
2.15
3.63
2.98
6.21
2.4
3.86
1
2
3
4
5
6
7
Emotional Support Classroom Organization
Instructional Support Overall Score
Domains Total
Basic Competent
12
Note: * statistically significant difference between both groups with p<0.05 , ** statistically significant difference between both groups with p<0.01
The results provide a confirmation that the Docentemas evaluation instrument can distinguish between basic and competent levels of teacher performance with validity. Teachers rated “Competent” on the Chilean evaluation scored higher than teachers rated as “Basic” on all three domains of teacher quality assessed by the CLASS instrument. Statistically significant differences were also recorded in four of the ten underlying dimensions. It appears that the rubrics and criteria used to evaluate the classroom performance of teachers under Chile’s national teacher evaluation system, Docentemas, capture dimensions of teacher quality that have been validated in US research as predictors of teachers’ ability to raise student learning.
IV. RESEARCH OBJECTIVES, PROTOCOLS AND RESULTS OF THE CHILE STUDY USING STALLINGS
As noted earlier, despite growing use of both the CLASS and Stallings instruments in developing country settings, there has never been a research directly comparing the two instruments. The 102 high-‐quality videos of Chilean math teachers offered a low-‐cost opportunity to conduct such a study.
Research questions. We focused on three research questions:
• How consistent are Stallings measures of teachers’ classroom management skills with those of CLASS?
• How consistent are teachers’ scores on Stallings measures with their scores on the other domains of CLASS? Is a teacher’s ability to manage the classroom effectively a proxy for the broader assessment of quality?
• Is teacher performance on Stallings measures correlated with their students’ value-‐added learning gains?
Protocol. Two researchers with substantial experience using the Stallings method (Bruns and De Gregorio) trained a third observer on the tablet version of the instrument. As the Stallings method involves 10 different “snapshots” of each teacher in the classroom, the 102 classes filmed generated a total of 1020 different Stallings observations. Of the total of 102 videos, 9% were coded jointly; 35% were double coded; and 56% were coded independently (Appendix B Table 1). The three raters achieved
3.1 3.2
1.7
5.95.5
6.7
3.52.8
1.21.9
1.4
3.4 3.7
1.9
6 5.8
6.8
3.73.1
1.42.2
1.7
1
2
3
4
5
6
7
Positive Climate
Teacher Sensitivity**
Regard for Student
Perspectives
Behavior Management
Productivity* Negative Climate
Instructional Learning Formats
Content Understanding*
Analysis and Inquiry
Quality of Feedback
Instructional Dialogue*
Emotional Support Classroom Organization Instructional Support
Basic Teachers Competent Teachers
13
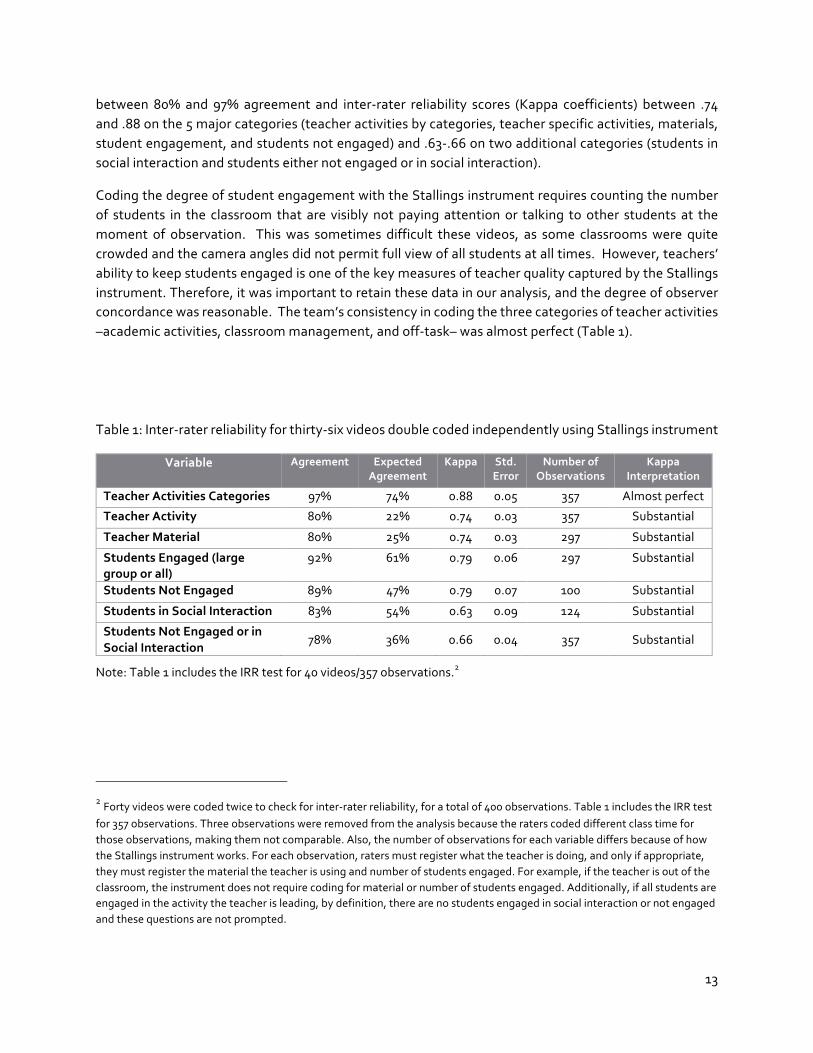
between 80% and 97% agreement and inter-‐rater reliability scores (Kappa coefficients) between .74 and .88 on the 5 major categories (teacher activities by categories, teacher specific activities, materials, student engagement, and students not engaged) and .63-‐.66 on two additional categories (students in social interaction and students either not engaged or in social interaction).
Coding the degree of student engagement with the Stallings instrument requires counting the number of students in the classroom that are visibly not paying attention or talking to other students at the moment of observation. This was sometimes difficult these videos, as some classrooms were quite crowded and the camera angles did not permit full view of all students at all times. However, teachers’ ability to keep students engaged is one of the key measures of teacher quality captured by the Stallings instrument. Therefore, it was important to retain these data in our analysis, and the degree of observer concordance was reasonable. The team’s consistency in coding the three categories of teacher activities –academic activities, classroom management, and off-‐task– was almost perfect (Table 1).
Table 1: Inter-‐rater reliability for thirty-‐six videos double coded independently using Stallings instrument
Variable Agreement Expected Agreement
Kappa Std. Error
Number of Observations
Kappa Interpretation
Teacher Activities Categories 97% 74% 0.88 0.05 357 Almost perfect
Teacher Activity 80% 22% 0.74 0.03 357 Substantial
Teacher Material 80% 25% 0.74 0.03 297 Substantial
Students Engaged (large group or all)
92% 61% 0.79 0.06 297 Substantial
Students Not Engaged 89% 47% 0.79 0.07 100 Substantial
Students in Social Interaction 83% 54% 0.63 0.09 124 Substantial
Students Not Engaged or in Social Interaction
78% 36% 0.66 0.04 357 Substantial
Note: Table 1 includes the IRR test for 40 videos/357 observations.2
2 Forty videos were coded twice to check for inter-‐rater reliability, for a total of 400 observations. Table 1 includes the IRR test for 357 observations. Three observations were removed from the analysis because the raters coded different class time for those observations, making them not comparable. Also, the number of observations for each variable differs because of how the Stallings instrument works. For each observation, raters must register what the teacher is doing, and only if appropriate, they must register the material the teacher is using and number of students engaged. For example, if the teacher is out of the classroom, the instrument does not require coding for material or number of students engaged. Additionally, if all students are engaged in the activity the teacher is leading, by definition, there are no students engaged in social interaction or not engaged and these questions are not prompted.
14
This study is the first application of the Stallings instrument in Chile. Therefore, we devote some time to descriptive results for the Chilean teachers compared with results in six other LAC countries that have carried out Stallings observations.
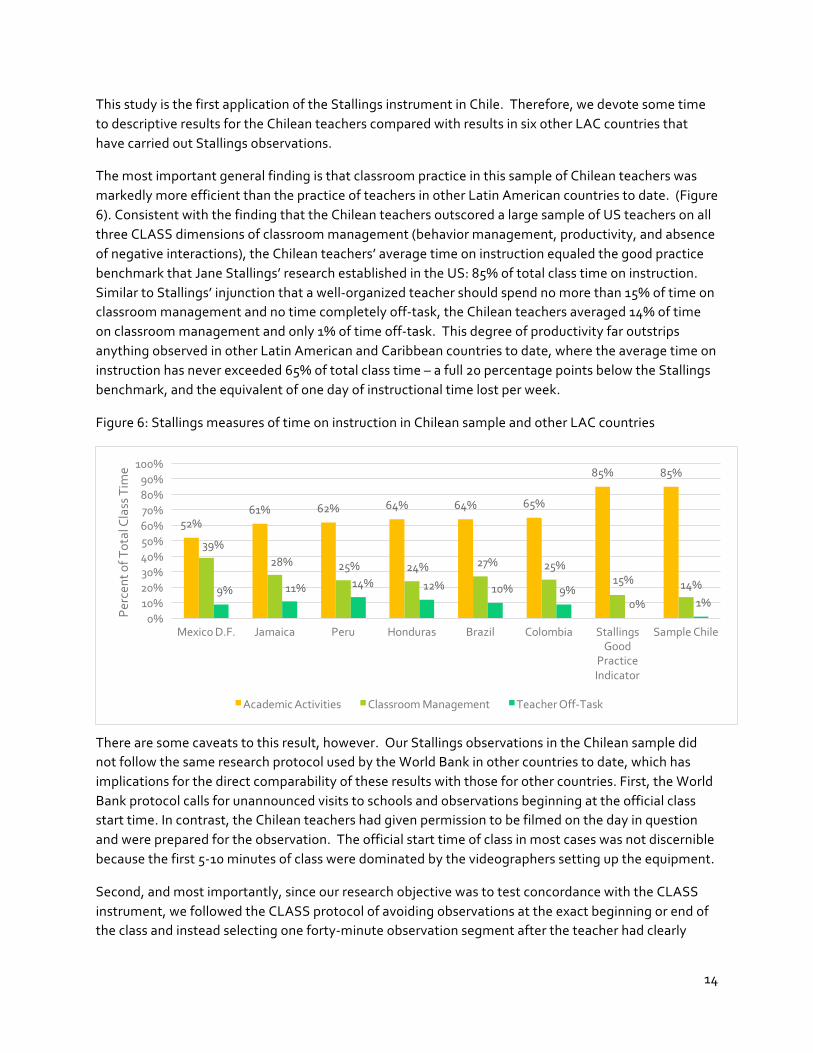
The most important general finding is that classroom practice in this sample of Chilean teachers was markedly more efficient than the practice of teachers in other Latin American countries to date. (Figure 6). Consistent with the finding that the Chilean teachers outscored a large sample of US teachers on all three CLASS dimensions of classroom management (behavior management, productivity, and absence of negative interactions), the Chilean teachers’ average time on instruction equaled the good practice benchmark that Jane Stallings’ research established in the US: 85% of total class time on instruction. Similar to Stallings’ injunction that a well-‐organized teacher should spend no more than 15% of time on classroom management and no time completely off-‐task, the Chilean teachers averaged 14% of time on classroom management and only 1% of time off-‐task. This degree of productivity far outstrips anything observed in other Latin American and Caribbean countries to date, where the average time on instruction has never exceeded 65% of total class time – a full 20 percentage points below the Stallings benchmark, and the equivalent of one day of instructional time lost per week.
Figure 6: Stallings measures of time on instruction in Chilean sample and other LAC countries
There are some caveats to this result, however. Our Stallings observations in the Chilean sample did not follow the same research protocol used by the World Bank in other countries to date, which has implications for the direct comparability of these results with those for other countries. First, the World Bank protocol calls for unannounced visits to schools and observations beginning at the official class start time. In contrast, the Chilean teachers had given permission to be filmed on the day in question and were prepared for the observation. The official start time of class in most cases was not discernible because the first 5-‐10 minutes of class were dominated by the videographers setting up the equipment.
Second, and most importantly, since our research objective was to test concordance with the CLASS instrument, we followed the CLASS protocol of avoiding observations at the exact beginning or end of the class and instead selecting one forty-‐minute observation segment after the teacher had clearly
52%61% 62% 64% 64% 65%
85% 85%
39%28% 25% 24% 27% 25%
15% 14%9% 11% 14% 12% 10% 9%0% 1%
0%10%20%30%40%50%60%70%80%90%100%
Mexico D.F. Jamaica Peru Honduras Brazil Colombia Stallings Good
Practice Indicator
Sample Chile
Percen
t of T
otal Class Tim
e
Academic Activities Classroom Management Teacher Off-‐Task
15
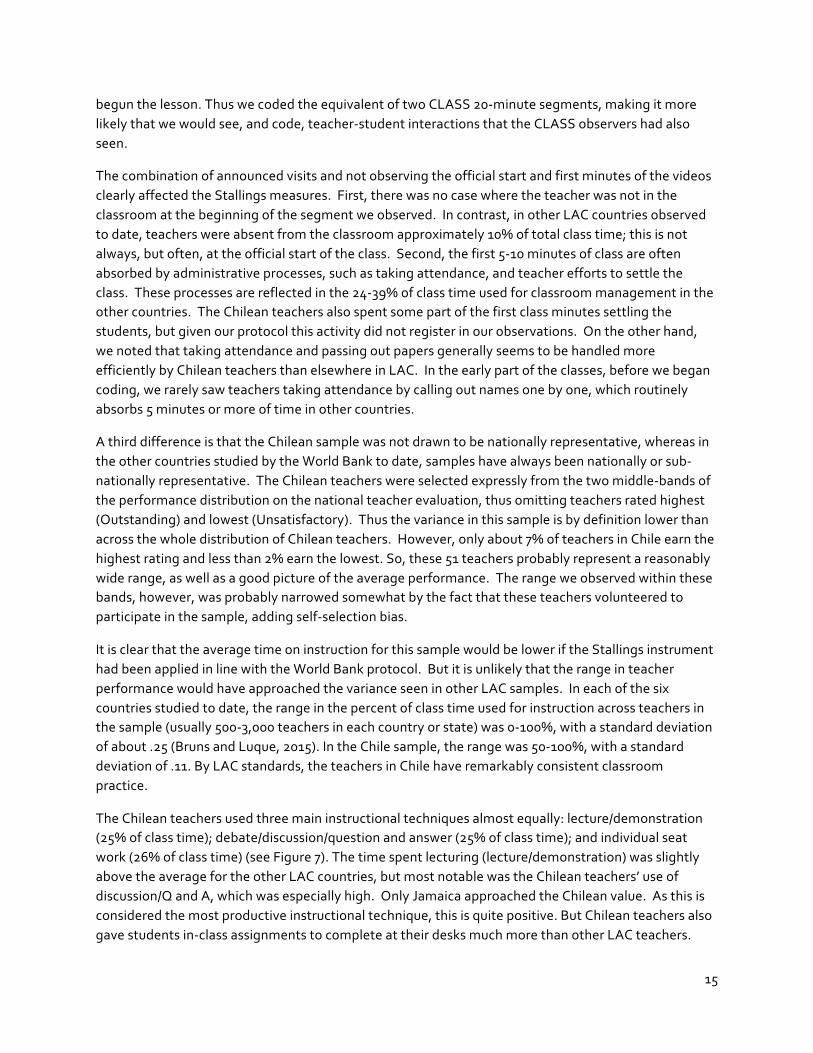
begun the lesson. Thus we coded the equivalent of two CLASS 20-‐minute segments, making it more likely that we would see, and code, teacher-‐student interactions that the CLASS observers had also seen.
The combination of announced visits and not observing the official start and first minutes of the videos clearly affected the Stallings measures. First, there was no case where the teacher was not in the classroom at the beginning of the segment we observed. In contrast, in other LAC countries observed to date, teachers were absent from the classroom approximately 10% of total class time; this is not always, but often, at the official start of the class. Second, the first 5-‐10 minutes of class are often absorbed by administrative processes, such as taking attendance, and teacher efforts to settle the class. These processes are reflected in the 24-‐39% of class time used for classroom management in the other countries. The Chilean teachers also spent some part of the first class minutes settling the students, but given our protocol this activity did not register in our observations. On the other hand, we noted that taking attendance and passing out papers generally seems to be handled more efficiently by Chilean teachers than elsewhere in LAC. In the early part of the classes, before we began coding, we rarely saw teachers taking attendance by calling out names one by one, which routinely absorbs 5 minutes or more of time in other countries.
A third difference is that the Chilean sample was not drawn to be nationally representative, whereas in the other countries studied by the World Bank to date, samples have always been nationally or sub-‐nationally representative. The Chilean teachers were selected expressly from the two middle-‐bands of the performance distribution on the national teacher evaluation, thus omitting teachers rated highest (Outstanding) and lowest (Unsatisfactory). Thus the variance in this sample is by definition lower than across the whole distribution of Chilean teachers. However, only about 7% of teachers in Chile earn the highest rating and less than 2% earn the lowest. So, these 51 teachers probably represent a reasonably wide range, as well as a good picture of the average performance. The range we observed within these bands, however, was probably narrowed somewhat by the fact that these teachers volunteered to participate in the sample, adding self-‐selection bias.
It is clear that the average time on instruction for this sample would be lower if the Stallings instrument had been applied in line with the World Bank protocol. But it is unlikely that the range in teacher performance would have approached the variance seen in other LAC samples. In each of the six countries studied to date, the range in the percent of class time used for instruction across teachers in the sample (usually 500-‐3,000 teachers in each country or state) was 0-‐100%, with a standard deviation of about .25 (Bruns and Luque, 2015). In the Chile sample, the range was 50-‐100%, with a standard deviation of .11. By LAC standards, the teachers in Chile have remarkably consistent classroom practice.
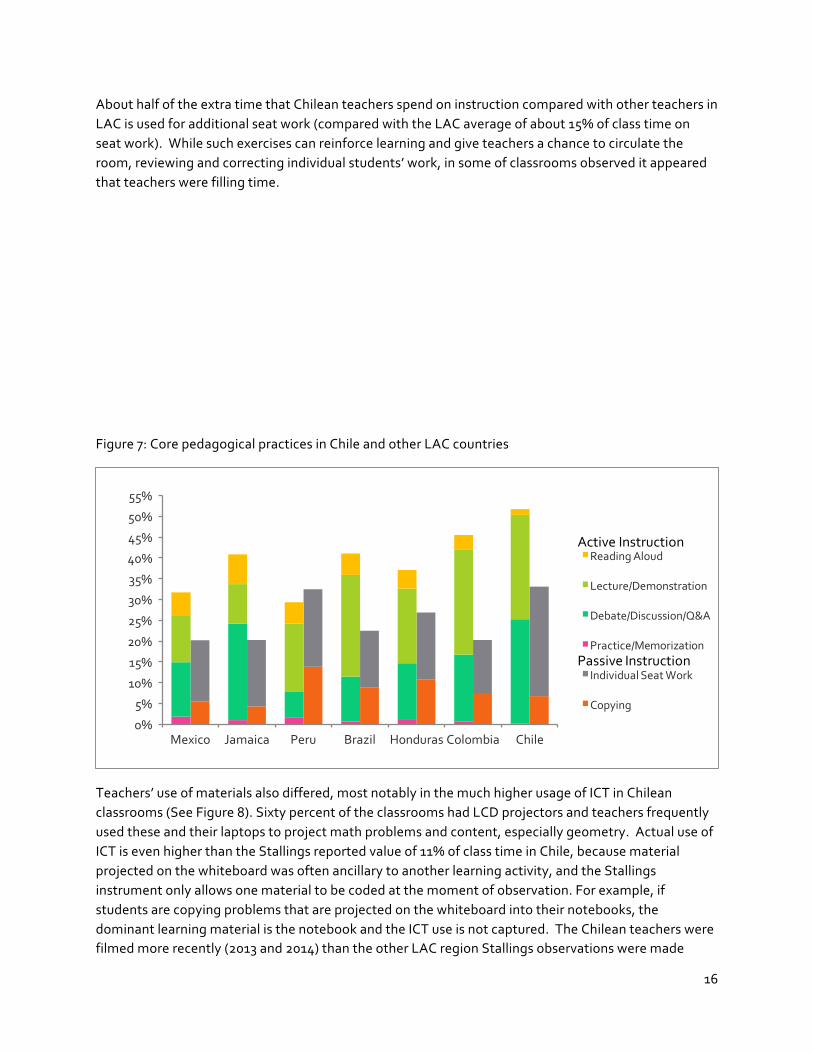
The Chilean teachers used three main instructional techniques almost equally: lecture/demonstration (25% of class time); debate/discussion/question and answer (25% of class time); and individual seat work (26% of class time) (see Figure 7). The time spent lecturing (lecture/demonstration) was slightly above the average for the other LAC countries, but most notable was the Chilean teachers’ use of discussion/Q and A, which was especially high. Only Jamaica approached the Chilean value. As this is considered the most productive instructional technique, this is quite positive. But Chilean teachers also gave students in-‐class assignments to complete at their desks much more than other LAC teachers.
16
About half of the extra time that Chilean teachers spend on instruction compared with other teachers in LAC is used for additional seat work (compared with the LAC average of about 15% of class time on seat work). While such exercises can reinforce learning and give teachers a chance to circulate the room, reviewing and correcting individual students’ work, in some of classrooms observed it appeared that teachers were filling time.
Figure 7: Core pedagogical practices in Chile and other LAC countries
Teachers’ use of materials also differed, most notably in the much higher usage of ICT in Chilean classrooms (See Figure 8). Sixty percent of the classrooms had LCD projectors and teachers frequently used these and their laptops to project math problems and content, especially geometry. Actual use of ICT is even higher than the Stallings reported value of 11% of class time in Chile, because material projected on the whiteboard was often ancillary to another learning activity, and the Stallings instrument only allows one material to be coded at the moment of observation. For example, if students are copying problems that are projected on the whiteboard into their notebooks, the dominant learning material is the notebook and the ICT use is not captured. The Chilean teachers were filmed more recently (2013 and 2014) than the other LAC region Stallings observations were made
Mexico Jamaica Peru Brazil Honduras Colombia Chile0%
5%
10%
15%
20%
25%
30%
35%
40%
45%
50%
55%
Reading Aloud
Lecture/Demonstration
Debate/Discussion/Q&A
Practice/Memorization
Individual Seat Work
Copying
Active Instruction
Passive Instruction
17
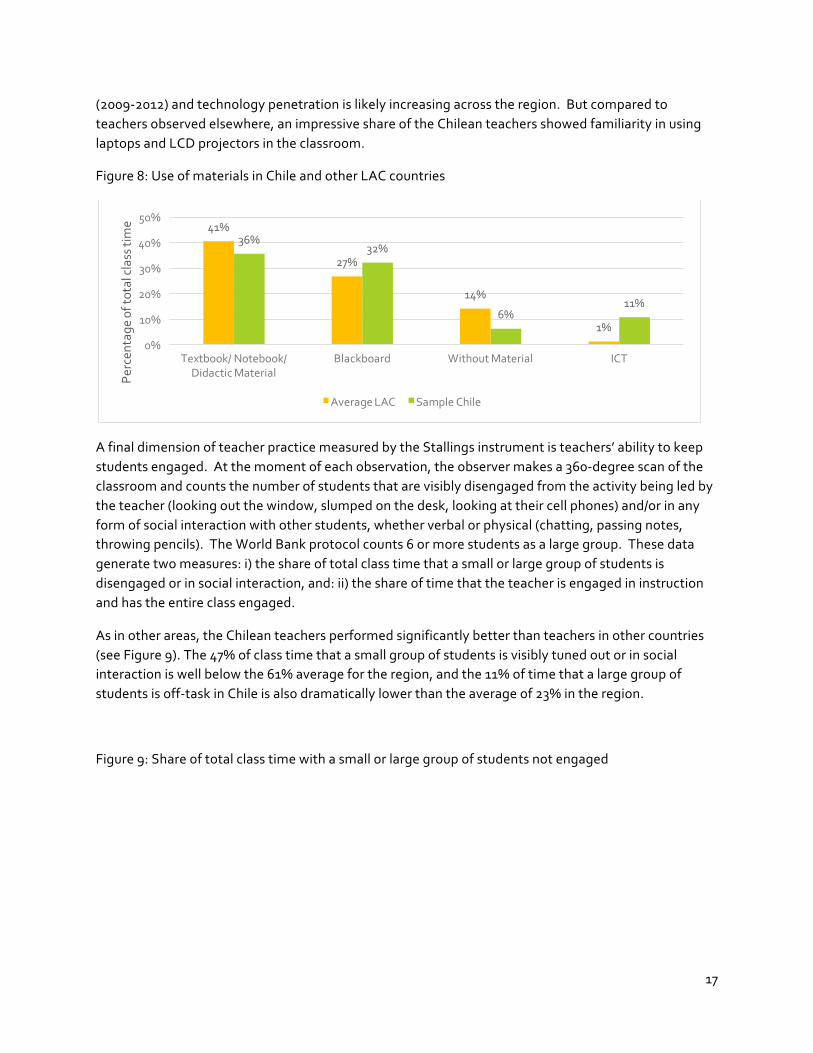
(2009-‐2012) and technology penetration is likely increasing across the region. But compared to teachers observed elsewhere, an impressive share of the Chilean teachers showed familiarity in using laptops and LCD projectors in the classroom.
Figure 8: Use of materials in Chile and other LAC countries
A final dimension of teacher practice measured by the Stallings instrument is teachers’ ability to keep students engaged. At the moment of each observation, the observer makes a 360-‐degree scan of the classroom and counts the number of students that are visibly disengaged from the activity being led by the teacher (looking out the window, slumped on the desk, looking at their cell phones) and/or in any form of social interaction with other students, whether verbal or physical (chatting, passing notes, throwing pencils). The World Bank protocol counts 6 or more students as a large group. These data generate two measures: i) the share of total class time that a small or large group of students is disengaged or in social interaction, and: ii) the share of time that the teacher is engaged in instruction and has the entire class engaged.
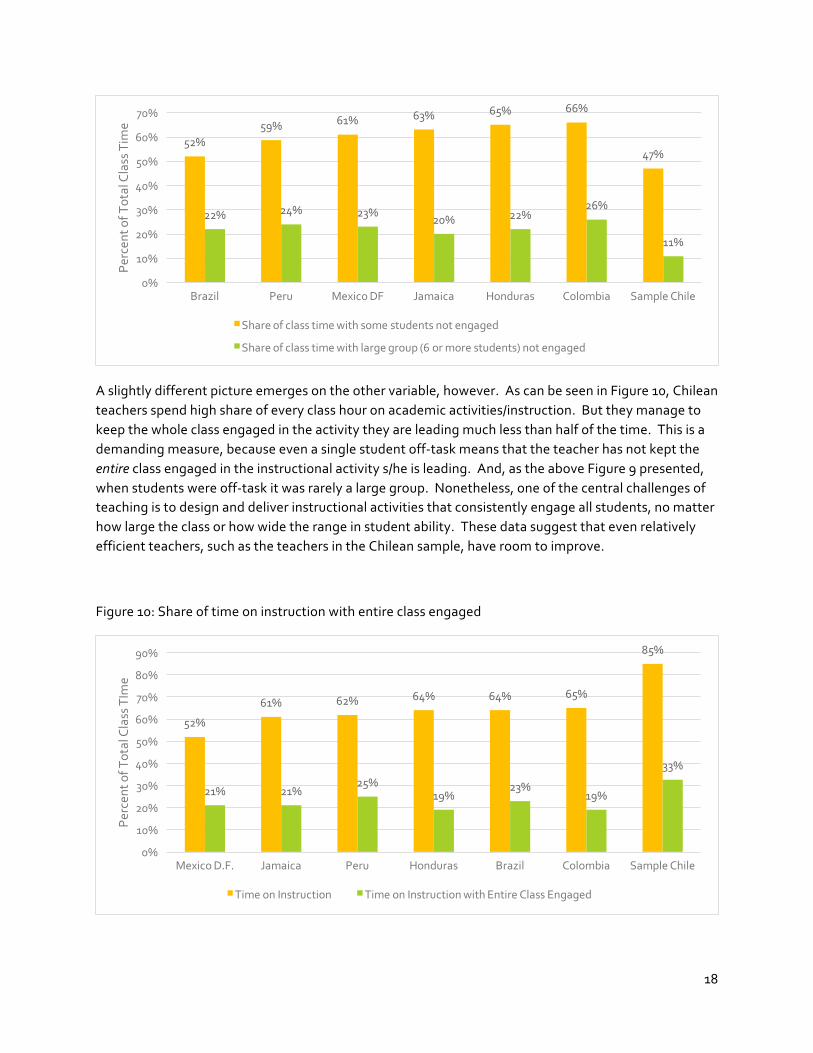
As in other areas, the Chilean teachers performed significantly better than teachers in other countries (see Figure 9). The 47% of class time that a small group of students is visibly tuned out or in social interaction is well below the 61% average for the region, and the 11% of time that a large group of students is off-‐task in Chile is also dramatically lower than the average of 23% in the region.
Figure 9: Share of total class time with a small or large group of students not engaged
41%
27%
14%
1%
36%32%
6%11%
0%
10%
20%
30%
40%
50%
Textbook/ Notebook/ Didactic Material
Blackboard Without Material ICT
Percen
tage
of total class t
ime
Average LAC Sample Chile
18
A slightly different picture emerges on the other variable, however. As can be seen in Figure 10, Chilean teachers spend high share of every class hour on academic activities/instruction. But they manage to keep the whole class engaged in the activity they are leading much less than half of the time. This is a demanding measure, because even a single student off-‐task means that the teacher has not kept the entire class engaged in the instructional activity s/he is leading. And, as the above Figure 9 presented, when students were off-‐task it was rarely a large group. Nonetheless, one of the central challenges of teaching is to design and deliver instructional activities that consistently engage all students, no matter how large the class or how wide the range in student ability. These data suggest that even relatively efficient teachers, such as the teachers in the Chilean sample, have room to improve.
Figure 10: Share of time on instruction with entire class engaged
52%59% 61% 63% 65% 66%
47%
22% 24% 23%20% 22%
26%
11%
0%
10%
20%
30%
40%
50%
60%
70%
Brazil Peru Mexico DF Jamaica Honduras Colombia Sample Chile
Percen
t of T
otal Class Tim
e
Share of class time with some students not engaged
Share of class time with large group (6 or more students) not engaged
52%
61% 62% 64% 64% 65%
85%
21% 21%25%
19%23%
19%
33%
0%
10%
20%
30%
40%
50%
60%
70%
80%
90%
Mexico D.F. Jamaica Peru Honduras Brazil Colombia Sample Chile
Percen
t of T
otal Class TIm
e
Time on Instruction Time on Instruction with Entire Class Engaged
19
V. HOW CONSISTENT ARE THE STALLINGS AND CLASS METHODS IN MEASURING TEACHER PERFORMANCE?
Our core research questions concern how the Stallings instrument compares with CLASS in measuring teacher performance. Conceptually, the dimensions of classroom dynamics that the Stallings instrument measures align most closely with the Classroom organization domain of the CLASS instrument, and especially the closely with its “productivity” dimension. The Stallings instrument also maps closely onto the CLASS dimension which measures “student engagement”. However, as explained earlier, this 12th dimension of the CLASS instrument was not included in the analysis by the Chilean research team.
Table 3: Classroom organization domain of CLASS instrument
Domain: Classroom Organization
Dimension Dimension Description Negative Climate Reflects the overall level of negativity among teachers and students in the class; the
frequency, quality, and intensity of teacher and student negativity are important to observe.
Behavior Management Encompasses the teacher’s use of effective methods to encourage desirable behavior and prevent and redirect misbehavior.
Productivity Considers how well the teacher manages time and routines so that instructional time is maximized; captures the degree to which instructional time is effectively managed and down time is minimized for students; it is not a code about student engagement or about the quality of instruction or activities.
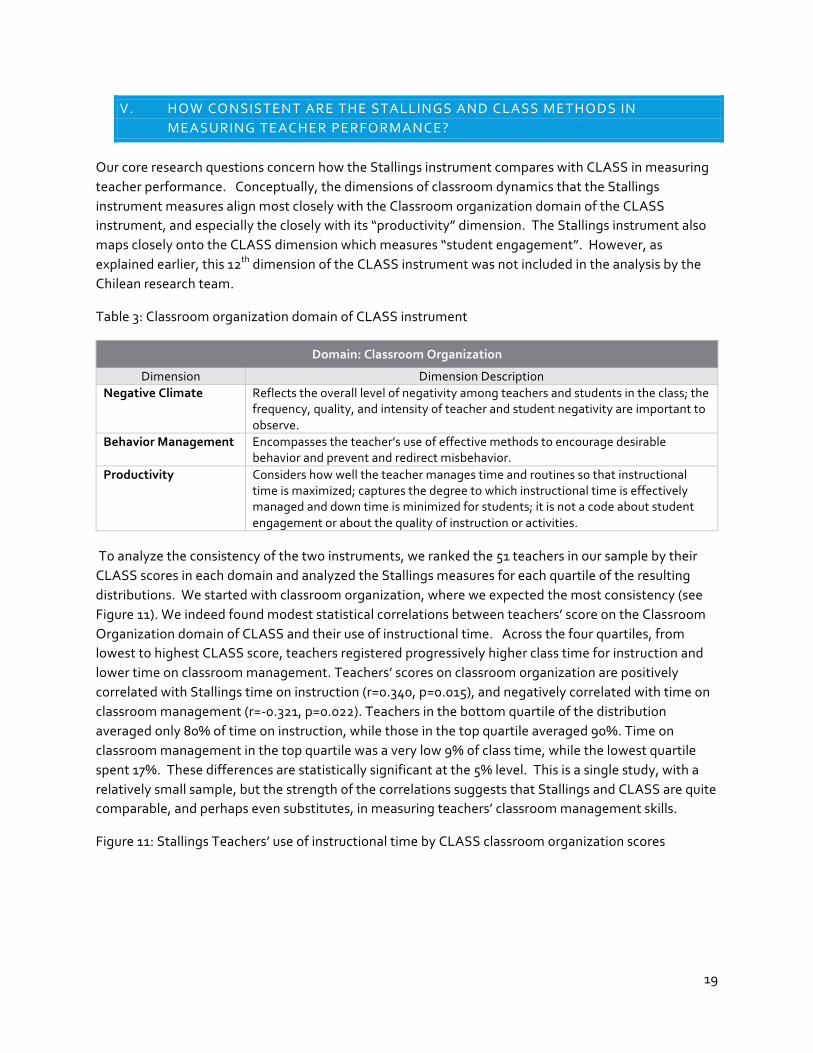
To analyze the consistency of the two instruments, we ranked the 51 teachers in our sample by their CLASS scores in each domain and analyzed the Stallings measures for each quartile of the resulting distributions. We started with classroom organization, where we expected the most consistency (see Figure 11). We indeed found modest statistical correlations between teachers’ score on the Classroom Organization domain of CLASS and their use of instructional time. Across the four quartiles, from lowest to highest CLASS score, teachers registered progressively higher class time for instruction and lower time on classroom management. Teachers’ scores on classroom organization are positively correlated with Stallings time on instruction (r=0.340, p=0.015), and negatively correlated with time on classroom management (r=-‐0.321, p=0.022). Teachers in the bottom quartile of the distribution averaged only 80% of time on instruction, while those in the top quartile averaged 90%. Time on classroom management in the top quartile was a very low 9% of class time, while the lowest quartile spent 17%. These differences are statistically significant at the 5% level. This is a single study, with a relatively small sample, but the strength of the correlations suggests that Stallings and CLASS are quite comparable, and perhaps even substitutes, in measuring teachers’ classroom management skills.
Figure 11: Stallings Teachers’ use of instructional time by CLASS classroom organization scores
20
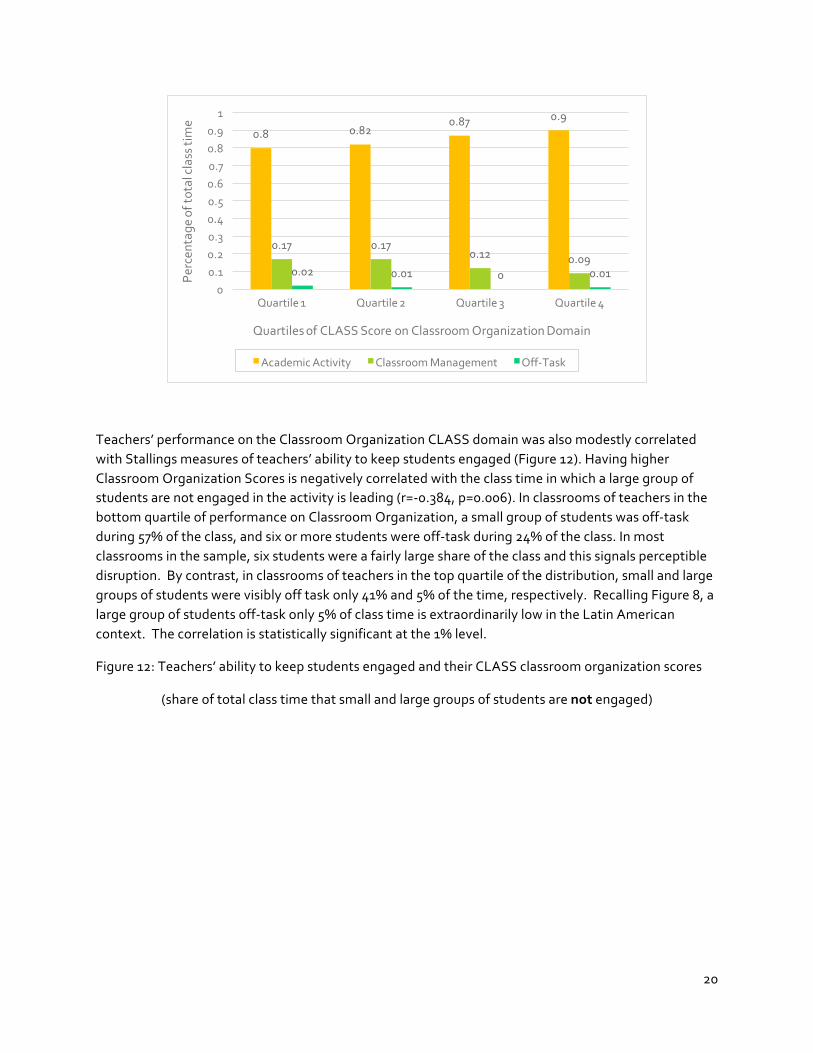
Teachers’ performance on the Classroom Organization CLASS domain was also modestly correlated with Stallings measures of teachers’ ability to keep students engaged (Figure 12). Having higher Classroom Organization Scores is negatively correlated with the class time in which a large group of students are not engaged in the activity is leading (r=-‐0.384, p=0.006). In classrooms of teachers in the bottom quartile of performance on Classroom Organization, a small group of students was off-‐task during 57% of the class, and six or more students were off-‐task during 24% of the class. In most classrooms in the sample, six students were a fairly large share of the class and this signals perceptible disruption. By contrast, in classrooms of teachers in the top quartile of the distribution, small and large groups of students were visibly off task only 41% and 5% of the time, respectively. Recalling Figure 8, a large group of students off-‐task only 5% of class time is extraordinarily low in the Latin American context. The correlation is statistically significant at the 1% level.
Figure 12: Teachers’ ability to keep students engaged and their CLASS classroom organization scores
(share of total class time that small and large groups of students are not engaged)
0.8 0.820.87 0.9
0.17 0.170.12 0.09
0.02 0.01 0 0.010
0.10.20.30.40.50.60.70.80.91
Quartile 1 Quartile 2 Quartile 3 Quartile 4
Percen
tage
of total class t
ime
Quartiles of CLASS Score on Classroom Organization Domain
Academic Activity Classroom Management Off-‐Task
21
Note: Large group is defined as six or more students
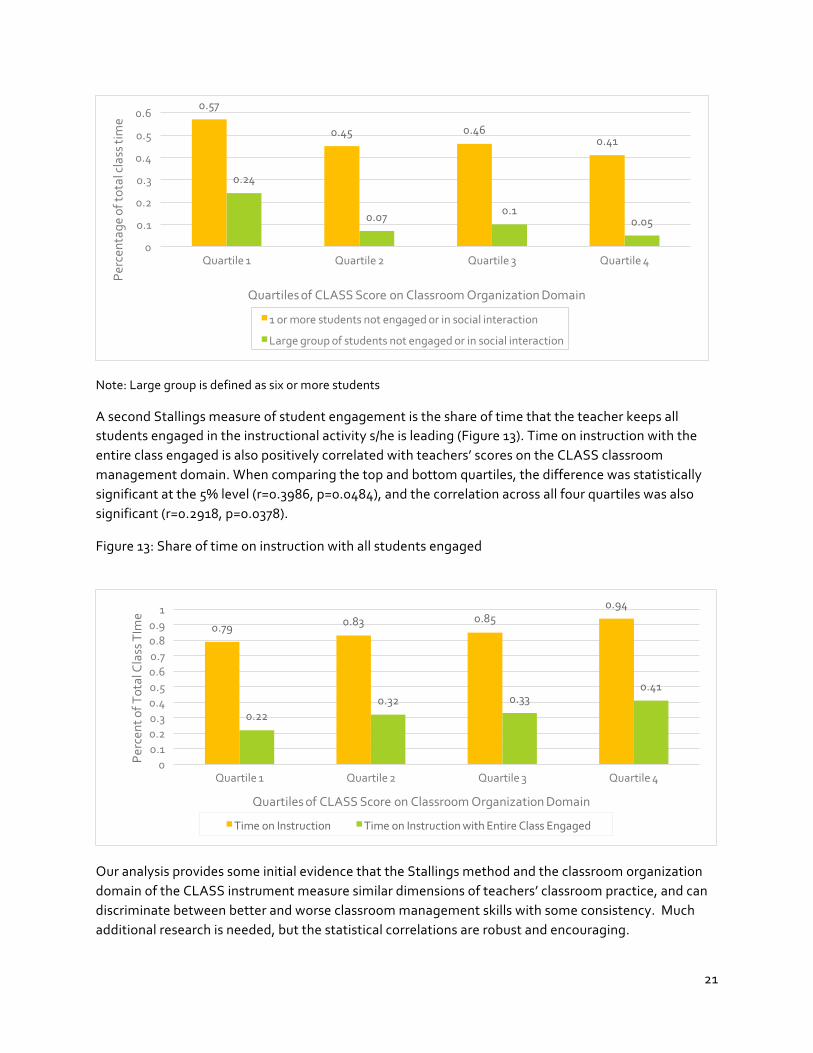
A second Stallings measure of student engagement is the share of time that the teacher keeps all students engaged in the instructional activity s/he is leading (Figure 13). Time on instruction with the entire class engaged is also positively correlated with teachers’ scores on the CLASS classroom management domain. When comparing the top and bottom quartiles, the difference was statistically significant at the 5% level (r=0.3986, p=0.0484), and the correlation across all four quartiles was also significant (r=0.2918, p=0.0378).
Figure 13: Share of time on instruction with all students engaged
Our analysis provides some initial evidence that the Stallings method and the classroom organization domain of the CLASS instrument measure similar dimensions of teachers’ classroom practice, and can discriminate between better and worse classroom management skills with some consistency. Much additional research is needed, but the statistical correlations are robust and encouraging.
0.57
0.45 0.460.41
0.24
0.07 0.10.05
0
0.1
0.2
0.3
0.4
0.5
0.6
Quartile 1 Quartile 2 Quartile 3 Quartile 4
Percen
tage
of total class t
ime
Quartiles of CLASS Score on Classroom Organization Domain
1 or more students not engaged or in social interaction
Large group of students not engaged or in social interaction
0.79 0.83 0.850.94
0.220.32 0.33
0.41
00.10.20.30.40.50.60.70.80.91
Quartile 1 Quartile 2 Quartile 3 Quartile 4
Percen
t of T
otal Class TIm
e
Quartiles of CLASS Score on Classroom Organization Domain
Time on Instruction Time on Instruction with Entire Class Engaged
22
If Stallings measures can predict teachers’ scores on the classroom management domain of CLASS, are they also correlated with teacher performance in the other two domains—emotional support and instructional support? We conducted a parallel comparison of the Stallings measures with the quartile distributions of teachers ranked by their scores on the other two CLASS domains. We began with emotional support, which is defined by CLASS to incorporate three main dimensions: positive climate, teacher sensitivity, and regard for student perspectives.
Table 4: Classroom organization domain of CLASS instrument
Domain: Emotional Support
Dimension Dimension Description
Positive Climate Reflects the emotional connection and relationships among teachers and students, and the warmth, respect, and enjoyment communicated by verbal and non-‐verbal interactions.
Teacher Sensitivity Reflects the teacher’s responsiveness to the academic and social/emotional needs and developmental levels of individual students and the entire class, and the way these factors impact students’ classroom experiences.
Regard for Adolescent Perspectives
Focuses on the extent to which the teacher is able to meet and capitalize on the social and developmental needs and goals of adolescents by providing opportunities for student autonomy and leadership; also considered are the extent to which student ideas and opinions are valued and content is made useful and relevant to adolescents.
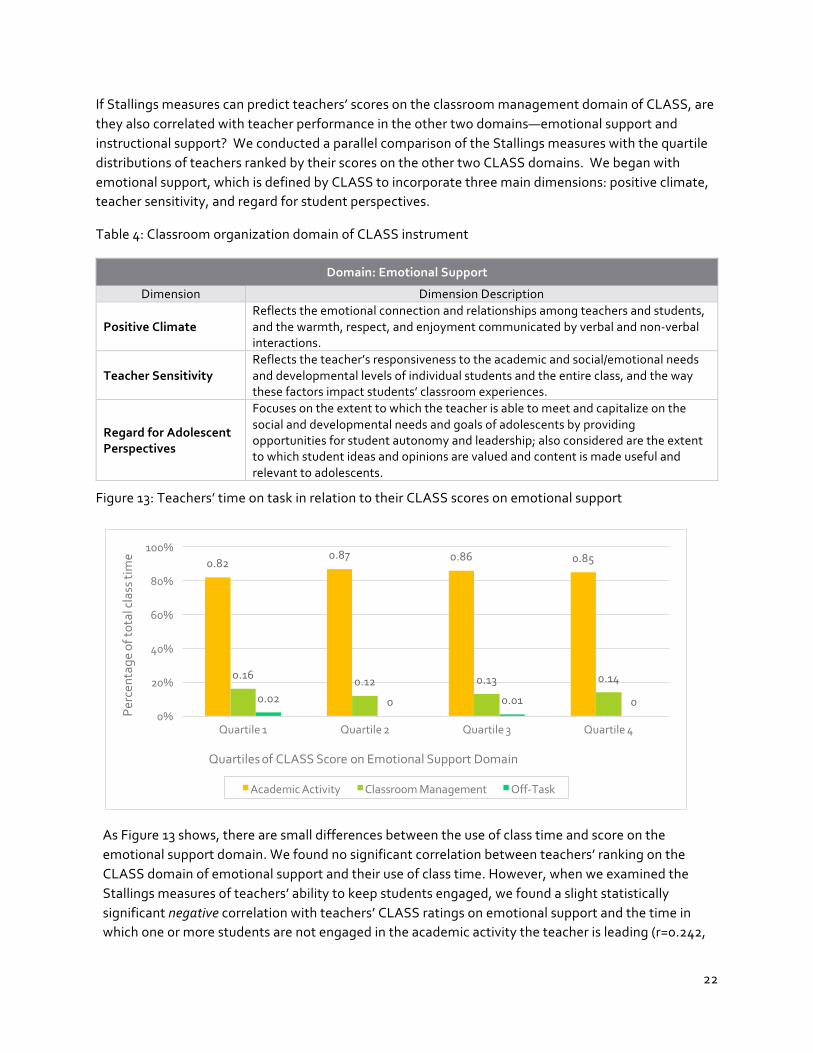
Figure 13: Teachers’ time on task in relation to their CLASS scores on emotional support
As Figure 13 shows, there are small differences between the use of class time and score on the emotional support domain. We found no significant correlation between teachers’ ranking on the CLASS domain of emotional support and their use of class time. However, when we examined the Stallings measures of teachers’ ability to keep students engaged, we found a slight statistically significant negative correlation with teachers’ CLASS ratings on emotional support and the time in which one or more students are not engaged in the academic activity the teacher is leading (r=0.242,
0.820.87 0.86 0.85
0.16 0.12 0.13 0.14
0.02 0 0.01 00%
20%
40%
60%
80%
100%
Quartile 1 Quartile 2 Quartile 3 Quartile 4
Percen
tage
of total class t
ime
Quartiles of CLASS Score on Emotional Support Domain
Academic Activity Classroom Management Off-‐Task
23
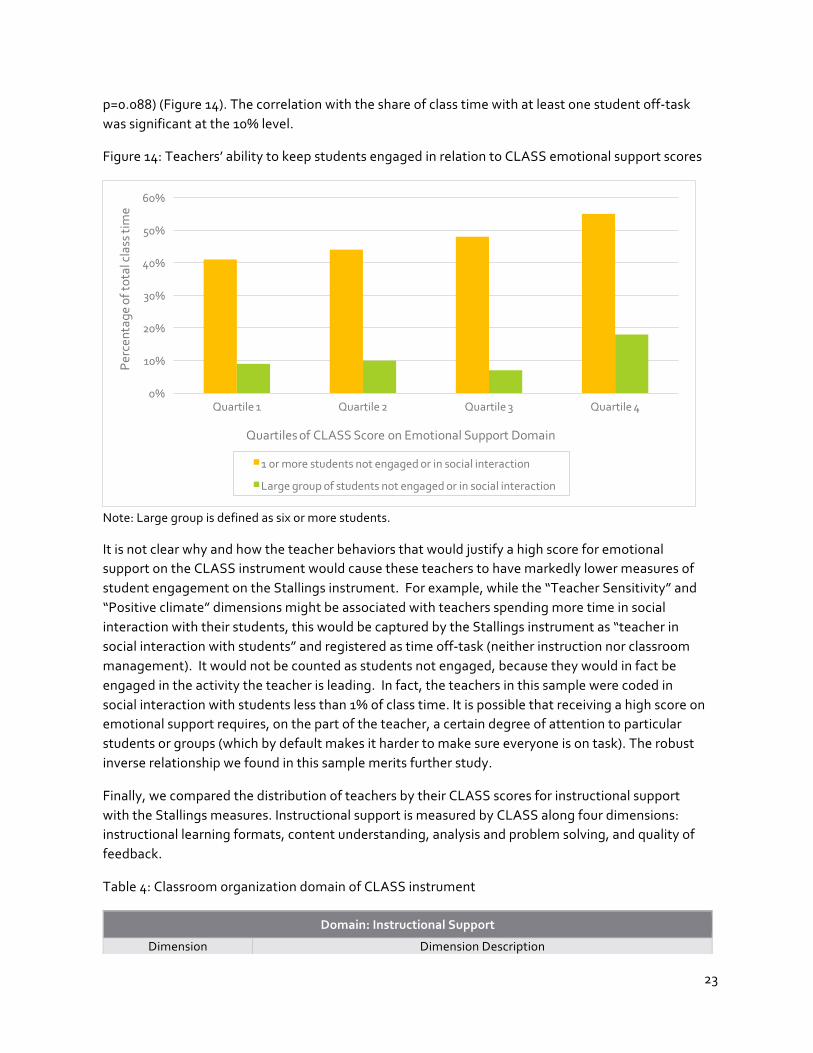
p=0.088) (Figure 14). The correlation with the share of class time with at least one student off-‐task was significant at the 10% level.
Figure 14: Teachers’ ability to keep students engaged in relation to CLASS emotional support scores
Note: Large group is defined as six or more students.
It is not clear why and how the teacher behaviors that would justify a high score for emotional support on the CLASS instrument would cause these teachers to have markedly lower measures of student engagement on the Stallings instrument. For example, while the “Teacher Sensitivity” and “Positive climate” dimensions might be associated with teachers spending more time in social interaction with their students, this would be captured by the Stallings instrument as “teacher in social interaction with students” and registered as time off-‐task (neither instruction nor classroom management). It would not be counted as students not engaged, because they would in fact be engaged in the activity the teacher is leading. In fact, the teachers in this sample were coded in social interaction with students less than 1% of class time. It is possible that receiving a high score on emotional support requires, on the part of the teacher, a certain degree of attention to particular students or groups (which by default makes it harder to make sure everyone is on task). The robust inverse relationship we found in this sample merits further study.
Finally, we compared the distribution of teachers by their CLASS scores for instructional support with the Stallings measures. Instructional support is measured by CLASS along four dimensions: instructional learning formats, content understanding, analysis and problem solving, and quality of feedback.
Table 4: Classroom organization domain of CLASS instrument
Domain: Instructional Support
Dimension Dimension Description
0%
10%
20%
30%
40%
50%
60%
Quartile 1 Quartile 2 Quartile 3 Quartile 4
Percen
tage
of total class t
ime
Quartiles of CLASS Score on Emotional Support Domain
1 or more students not engaged or in social interaction
Large group of students not engaged or in social interaction
24
Instructional Learning Formats
Focuses on the ways in which the teacher maximizes student engagement in learning through clear presentation of material, active facilitation, and the provision of interesting and engaging lessons and materials.
Content Understanding
Refers to both the depth of lesson content and the approaches used to help students comprehend the framework, key ideas, and procedures in an academic discipline; at a high level, refers to interactions among the teacher and students that lead to an integrated understanding of facts, skills, concepts, and principles.
Analysis & Problem Solving
Assesses the degree to which the teacher facilitates students’ use of higher level thinking skills, such as analysis, problem solving, reasoning, and creation through the application of knowledge and skills; opportunities for demonstrating metacognition, i.e., thinking about thinking, also included.
Quality of Feedback
Assesses the degree to which feedback expands and extends learning and understanding and encourages student participation; in secondary classrooms, significant feedback may also be provided by peers; regardless of the source, focus here should be on the nature of the feedback provided and the extent to which it “pushes” learning.
Instructional Dialogue Assesses the degree to which teachers prompt and guide students to achieve a deeper understanding of content.
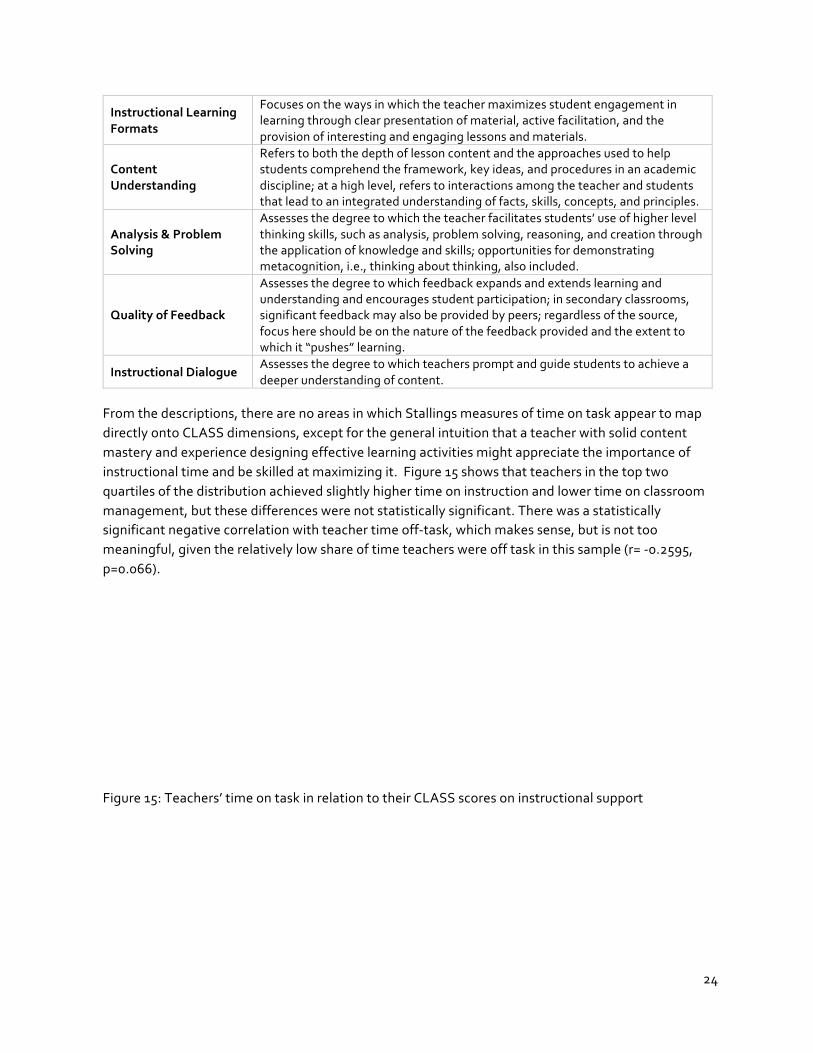
From the descriptions, there are no areas in which Stallings measures of time on task appear to map directly onto CLASS dimensions, except for the general intuition that a teacher with solid content mastery and experience designing effective learning activities might appreciate the importance of instructional time and be skilled at maximizing it. Figure 15 shows that teachers in the top two quartiles of the distribution achieved slightly higher time on instruction and lower time on classroom management, but these differences were not statistically significant. There was a statistically significant negative correlation with teacher time off-‐task, which makes sense, but is not too meaningful, given the relatively low share of time teachers were off task in this sample (r= -‐0.2595, p=0.066).
Figure 15: Teachers’ time on task in relation to their CLASS scores on instructional support
25
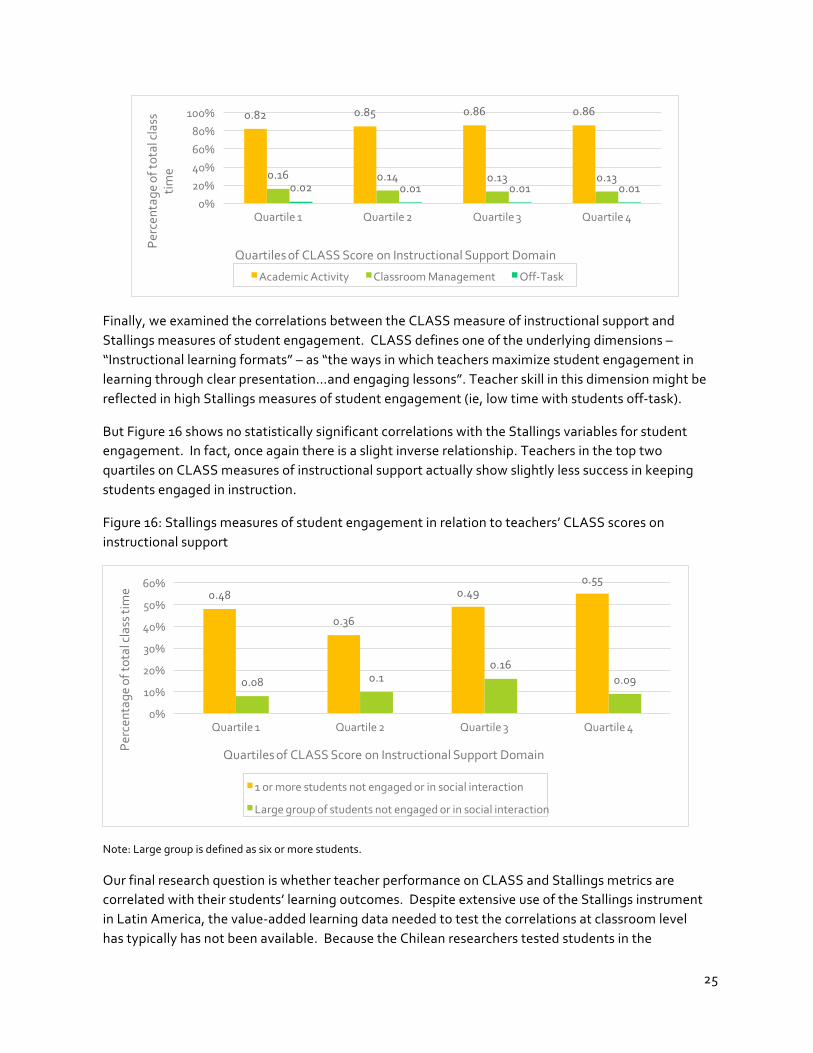
Finally, we examined the correlations between the CLASS measure of instructional support and Stallings measures of student engagement. CLASS defines one of the underlying dimensions – “Instructional learning formats” – as “the ways in which teachers maximize student engagement in learning through clear presentation…and engaging lessons”. Teacher skill in this dimension might be reflected in high Stallings measures of student engagement (ie, low time with students off-‐task).
But Figure 16 shows no statistically significant correlations with the Stallings variables for student engagement. In fact, once again there is a slight inverse relationship. Teachers in the top two quartiles on CLASS measures of instructional support actually show slightly less success in keeping students engaged in instruction.
Figure 16: Stallings measures of student engagement in relation to teachers’ CLASS scores on instructional support
Note: Large group is defined as six or more students.
Our final research question is whether teacher performance on CLASS and Stallings metrics are correlated with their students’ learning outcomes. Despite extensive use of the Stallings instrument in Latin America, the value-‐added learning data needed to test the correlations at classroom level has typically has not been available. Because the Chilean researchers tested students in the
0.82 0.85 0.86 0.86
0.16 0.14 0.13 0.130.02 0.01 0.01 0.01
0%
20%
40%
60%
80%
100%
Quartile 1 Quartile 2 Quartile 3 Quartile 4
Percen
tage
of total class
time
Quartiles of CLASS Score on Instructional Support Domain
Academic Activity Classroom Management Off-‐Task
0.48
0.36
0.490.55
0.08 0.10.16
0.09
0%
10%
20%
30%
40%
50%
60%
Quartile 1 Quartile 2 Quartile 3 Quartile 4
Percen
tage
of total class t
ime
Quartiles of CLASS Score on Instructional Support Domain
1 or more students not engaged or in social interaction
Large group of students not engaged or in social interaction
26
classrooms filmed at both the beginning and end of the school year, the Chile research project offered a unique opportunity to study this. While the availability of classroom level measures of learning gains that can be attributed to individual teachers is rare and valuable, our sample is very small. Thus, these results must be considered tentative.
The instrument used to assess student learning was a standardized 7th grade mathematics test called Learning Progress Evaluation System (SEPA for its initials in Spanish) that was applied at the beginning and end of the school year. Students scored a mean of 569 points in the beginning of the year test with a standard deviation of 28.3 (minimum score of 485 and maximum of 657), and scored a mean of 587 in the end of the year test with a standard deviation of 25.7 (minimum score of 495 and maximum of 690).
We regressed the end of the year student scores on their beginning of the year scores at the classroom level, clustering for each student. With the available data we were able to obtain student learning outcomes for 47 teachers. This allowed examining the correlations between these teachers’ student learning results and their performance on CLASS and Stallings measures.
We find that of the three CLASS domains, only classroom organization is significant and positively correlated with student learning (r=10.91, p=.005) (see Table 1, Table 4 and Figure 1 of Appendix D). Emotional support and Instructional support showed no significant correlation with student learning. Particularly for instructional support, this is a surprising finding which is not consistent with results for CLASS in US settings. Recalling that the average score of this sample of teachers on the CLASS instructional support domain was a very low 2.29 (on a 7-‐point scale), we hypothesize that real weaknesses in instructional quality explain an overall lack of impact on learning and that the variance in teacher performance was also insufficient to produce clear positive effects.
Examining the relationship between Stallings and student learning, we find that none of the three categories of teacher use of class time – academic activities, classroom management, off-‐task– are significantly correlated with how much their students learn. This is not surprising, given that although all three of the Stallings measures were significantly correlated with the CLASS domain of classroom organization, and that the CLASS measure was predictive of student learning gains, the correlations were modest (between 0.3 and 0.4) considering the two instruments measure similar constructs. However, we did find a significant correlation between student engagement with student learning. More class time with students who are not engaged or in social interaction is negatively associated with student learning gains at the classroom level. Findings are presented in Tables 2 and 3, and in Figure 2 of Appendix D.
We consider these very initial findings, due to the small sample size we have in this study.
VI. CONCLUSIONS
27
We exploited the opportunity to collaborate with Chilean researchers on the first direct comparison of the Stallings and CLASS instruments for standardized classroom observation. We used the Stallings instrument to code 102 high-‐quality videos of 51 Chilean secondary school math teachers that had previously been coded with CLASS. Our team carried out the coding without seeing either the CLASS scores of these teachers or their ratings on the Chilean national teacher evaluation, Docentemas.
We gave priority to applying the Stallings instrument to the video segments that the CLASS coders had also observed, so we followed part of the CLASS protocol of not coding immediately when the video started, but instead code a 40-‐minute segment after the teacher had clearly begun the lesson. This choice affected the Stallings results, because a key aspect of the Stallings method is to analyze teachers’ use of time across the entire (official) class period, and the opening minutes of class are most likely to find teachers engaged in classroom administration (taking attendance, etc.) or off task (chatting with students or arriving late). Given the special coding protocol we used for this study, it is not surprising that the Chilean teachers in this sample registered a very high 85% of time on instruction, which equals the good practice benchmark established by Jane Stallings and colleagues through studies in the US, and is well above the 65% average observed across other LAC countries.
Compared with teachers observed elsewhere in LAC, these Chilean math teachers also kept students more engaged, made more use of question and answer/discussion teaching techniques, and integrated ICT much more extensively into their practice, typically by projecting content from their laptops via LCD projectors onto the whiteboard.
To compare the two instruments, we ranked the Chilean secondary school math teachers on their scores in each of the CLASS instrument’s three domains (classroom organization; emotional support and instructional support) and analyzed the resulting quartile distributions’ correlations with key Stallings measures of teacher performance. We found that teachers’ scores on the Classroom organization domain of CLASS were modestly correlated with the most important Stallings measures: teachers’ use of time for instruction; classroom management; and teachers’ ability to keep students engaged (see Appendix C, Table 1).
However, Stallings measures were not correlated with teachers’ scores on the other two CLASS domains: instructional support and emotional support. In fact, we found a statistically significant negative correlation between teachers’ scores on the emotional support domain of CLASS and teachers’ ability to keep students engaged academically. This result merits further research. One might hypothesize that teachers who spend more time engaged with their students in social interaction – and not academic activity as defined by the Stallings instrument-‐-‐ might have higher scores on teacher sensitivity to student perspectives or positive classroom climate on the CLASS instrument. However, if students are engaged with the teacher in social interaction (the activity being led by the teacher at that moment) they are not recorded as “not engaged”.
This study is a first, small-‐scale effort to explore the comparability of the Stallings and CLASS instruments. It confirmed that in the domain of classroom organization, where they are
28
conceptually most aligned, the two instruments produce measures that are well correlated and can differentiate between stronger and weaker teachers in these dimensions with consistency. It suggests that the Stallings measures may be considered a substitute for CLASS measures in this domain.
This consistency in the area of overlap is reassuring. But the two instruments have distinct strengths and weaknesses that are the most relevant drivers of which to use in a particular setting. The most important is the degree of observer skill. The CLASS instrument requires observers to make qualitative judgments in highly consistent ways, which requires skill and training. In most developing country contexts, it is difficult to find individuals with the background and ability to become certified CLASS observers outside of academia. This increases the costs of these observers and, most importantly, limits the supply. For applications where a comprehensive assessment of teacher quality is essential – for example, for individual teacher performance evaluations—these costs are justified, because of the high stakes around getting the evaluation right. In most developing country settings, using the CLASS instrument will require videotaping teachers, so that a relatively small team can code the observations. This increases costs, but also has some advantages, as videos can be coded multiple times and used for downstream training.
The Stallings instrument is too crude to be used for individual teacher performance evaluations. As our analysis showed, teachers’ ability to deliver high quality instruction and to support students emotionally are not captured by the Stallings instrument. The main strength of the Stallings instrument is its suitability for larger-‐scale studies in representative samples of schools, to benchmark efficiency-‐related dimensions of education system performance or to evaluate the impact of new education programs or policy reforms on system efficiency. Because the instrument focuses on dimensions of classroom dynamics that are curriculum and language neutral, and require little observer discretion, it has been possible to train hundreds of education ministry and secretariat staff across Latin America and the Caribbean in the use of the instrument with high inter-‐rater reliability. By many accounts, this has had useful spillover benefits in making education staff more aware of the importance of maximizing instructional time, managing administrative tasks efficiently and keeping students engaged. Education staff consistently report that they come away from Stallings training and research experiences with “eyes opened” as to how much variance exists in teacher practice in their system, and a new capacity to provide teachers with useful feedback.
A final difference between the two instruments is the feedback they generate for teachers. The strength of CLASS is the comprehensiveness of the assessment it provides to individual teachers, and, in aggregate, to an education system. Training materials developed in the US context support teachers in analyzing their results in each of the 12 CLASS dimensions and suggesting actions and strategies for “providing more effective instructional learning formats” or “reducing a negative climate”. Because it is difficult to convey what a “4” or “3” score on any of these dimensions means for a teacher, and how much effort would be required to move up a notch, the main differences in the CLASS rubrics are drawn between “low”, “medium” and “high”. The three performance bands are described with sufficient detail in the rubrics, anchored in observable indicators, and provide formative feedback.
29
In contrast, the feedback the Stallings instrument generates for teachers, schools and school systems is conceptually easy to understand, and comes in a form that facilitates benchmarking and tracking over time. A teacher spending 40% of every class on classroom administration can be coached on how to streamline this, especially by seeing that a colleague in the next classroom spends only 20%. Finally, the things that Stallings measures –teachers’ classroom management, time on instruction, and ability to keep students engaged– may be the most malleable aspects of teacher quality and may constitute necessary baseline skills in order for more complex dimensions of instructional quality to improve. If a classroom is struggling with time and behavior management, how can the teacher focus on giving students autonomy, asking challenging questions and providing constructive feedback?
As an example of Stallings feedback, a randomized experiment in Ceara, Brasil over the past two years has provided 150 treatment schools with a bulletin detailing their Stallings results and how these compared with other schools in their district, state and country, and offered the schools self-‐help materials (a translated copy of the Doug Lemov book Teach Like a Champion) and access to a Skype-‐mediated coaching program designed to improve classroom dynamics. A repeat round of classroom observations one year later found treatment schools spent 10% more time on instruction (.26 SD), lowered the time with students not-‐engaged and increased use of interactive, question and answer, teaching techniques (Costa, Bruns and Cunha, forthcoming.)
Use of the CLASS and Stallings instruments in developing countries is in its infancy. Our study provides some early evidence that in their area of overlap, these two instruments produce consistent assessments of teachers’ effectiveness in managing their classrooms and that these skills are important for student learning. This suggests that both instruments have potential to help teachers improve their practice and help school systems raise student learning. From the sample of teachers observed, Chile may be ready to tackle the more complex teaching skills because efficient classroom management is largely achieved. The observed teachers could benefit from CLASS-‐type feedback. But teachers in many other LAC countries still struggle with time and behavior management. For them, Stallings can be very useful, perhaps more than CLASS at this stage, and at much lower cost.
There is much more to be learned about how feedback from these observations affects teacher practice – which is the ultimate goal. School systems using one, or both, of these instruments can help advance this understanding by building in research on the loop from standardized classroom observation to individual teacher feedback to evolving practice.
30
References
Abadzi, H. 2007. “Absenteeism and Beyond: Instructional Time Loss and Consequences.” Policy Research Working Paper 4376, World Bank, Washington, DC.
Araujo, M. C., Carneiro, P., Cruz-‐Aguayo, Y., & Schady, N. (2014). A helping hand? Teacher quality and learning outcomes in kindergarten. Banco Interamericano de Desarrollo, Washington, DC. Inédito.
Boyd, D., P. Grossman, H. Lankford, S. Loeb, and J. Wyckoff. (2006). “How Changes in Entry Requirements Alter the Teacher Workforce and Affect Student Achievement.” Education Finance and Policy 1 (2): 176-‐216.
Boyd, D., P. Grossman, H. Lankford, S. Loeb, and J. Wyckoff. (2008). “Who Leaves? Teacher Attrition and Student Achievement”. Working Paper 14022, National Bureau of Economic Research, Cambridge, MA.
Bruns, B., & Luque, J. (2014). Great teachers: How to raise student learning in Latin America and the Caribbean. World Bank.
Casabianca, J. M., D. McCaffrey, D. H. Gitomer, C.A. Bell, B. K. Hamre and R. C. Pianta. 2013. “Effect of Observation Mode on Measures of Secondary Mathematics Teaching” Educational and Psychological Measurement 2013 73: 757.
Chetty, R, J. N. Friedman, and J. E. Rockoff. (2014). “Measuring the Impacts of Teachers I: Evaluating Bias in Teacher Value-‐Added Estimates.” American Economic Review, vol. 2014, nº 9, p. 2593-‐2632.
Costa, L., Bruns, B., and Cunha, N. Through the looking glass: can classroom observation and coaching improve teacher performance in Brazil? Forthcoming.
DeStefano, J., E. Adelman, and A.-‐M. Schuh Moore. 2010. Using Opportunity to Learn and Early Grade Reading Fluency to Measure School Effectiveness in Nepal. Washington, DC: EQUIP2, AED, and USAID.
Grossman, P., and S. Loeb, J. Cohen, K. Hammerness, J. Wyckoff, D. Boyd, and H. Lankford. (2010). “Measure for Measure: The Relationship between Measures of Instructional Practice in Middle School English Language Arts and Teachers’ Value Added Scores.” NBER Working Paper 16015.
———. (2009). “Teacher Preparation and Student Achievement”. Educational Evaluation and Policy Analysis 31 (4): 416–40.
Hamre, B. K., Pianta, R. C., Mashburn, A. J., & Downer, J. T. (2007). Building a science of classrooms: Application of the CLASS framework in over 4,000 US early childhood and elementary classrooms.
Hanushek, E., and S. Rivkin. (2010). “Using Value-‐Added Measures of Teacher Quality.” Policy Brief 9, National Center for Analysis of Longitudinal Data in Education Research, Washington, DC.
Hanushek, E. A., and S. G. Rivkin. (2006). “Teacher Quality.” In vol. 2. of Handbook of the Economics of Education, edited by F. Welch, 1051–78. Amsterdam: North-‐Holland.
Heckman, J. J. (1979), “Sample Selection Bias as a Specification Error,” Econometrica, 47, 153-‐161.
Howes, C., and M. Burchinal, R. Pianta, R., D. Bryant, D. Early, R. M. Clifford, and O. Barbarin. (2008). “Ready to Learn? Children’s pre-‐academic achievement in pre-‐kindergarten programs.” Early Childhood Research Quarterly, 23, 17-‐50.
Jackson, C. Kirabo, J. Rockoff and D. O. Staiger. (2014). “Teacher Effects and Teacher-‐Related Policies.” Annual Review of Economics 6:34. 1-‐34.
31
Jennings, J. L., and T. A. DiPrete. (2010). “Teacher Effects on Social and Behavioral Skills in Early Elementary School.” Sociology of Education, April 2010 83: 135-‐159.
Jukes, M., S.B. Vagh, and Y.S. Kim. (2006). “Development of Assessments of Reading Ability and Classroom Practice”. Unpublished manuscript. World Bank, Washington, D.C.
Kane, T. J., J. E. Rockoff, and D. O. Staiger. (2008). “What Does Certification Tell Us about Teacher Effectiveness? Evidence from New York City.” Economics of Education Review 27 (6): 615–31.
Kane, T. J., and D. O. Staiger. (2008). “Estimating Teacher Impacts on Student Achievement: An Experimental Evaluation.” Working Paper 14607, National Bureau of Economic Research, Cambridge, MA.
Kane, T. J., & Staiger, D. O. (2012). Gathering Feedback for Teaching: Combining High-‐Quality Observations with Student Surveys and Achievement Gains. Research Paper. MET Project. Bill & Melinda Gates Foundation.
Pianta, R. C., Hamre, B. K., & Mintz, S. (2012). Classroom assessment scoring system: Secondary manual. Teachstone.
Rivkin, S. G., E. A. Hanushek, and J. F. Kain. (2005). “Teachers, Schools, and Academic Achievement.” Econometrica 73 (2): 417–58.
Rockoff, J. E. (2004). “The Impact of Individual Teachers on Student Achievement: Evidence from Panel Data.” American Economic Review 94 (2): 247–52.
Rockoff, J. E., B. A. Jacob, T. J. Kane, and D. O. Staiger. (2011). “Can You Recognize an Effective Teacher When You Recruit One?” Education Finance and Policy 6 (1): 43–74.
Schuh Moore, A.-‐M., J. DeStefano, and E. Adelman. 2010. Using Opportunity to Learn and Early Grade Reading Fluency to Measure School Effectiveness in Ethiopia, Guatemala, Honduras, and Nepal. Washington, DC: EQUIP2, AED, and USAID.
Stallings, J. 1977. Learning to Look: A Handbook on Classroom Observation and Teaching Models. Belmont, CA: Wadsworth Publishing.
Stallings, J. A., & Mohlman, G. G. (1988). Classroom observation techniques. Educational research, methodology, and measurement: An international handbook, 469-‐474.
Taut, S., M. Santelices, C. Araya, and J. Manzi. 2011. “Perceived Effects and Uses of the Naitonal Teacher Evaluation System in Chilean Elementary Schools.” Studies in Educational Evaluation 37 (4): 218-‐29.
Taut, S., Valencia, E., Palacios, D., Santelices, V., Jimenez, D. & Manzi, J. (2016). Teacher performance and student learning: Linking evidence from two national assessment programs. Assessment in Education: Principles, Policy & Practice, 23(1), 53-‐76. DOI: 10.1080/0969594X.2014.961406
World Bank. (2014). Conducting Classroom Observations Using the Stallings Classroom Snapshot Method: Manual and User Guide. Washington, DC: World Bank.
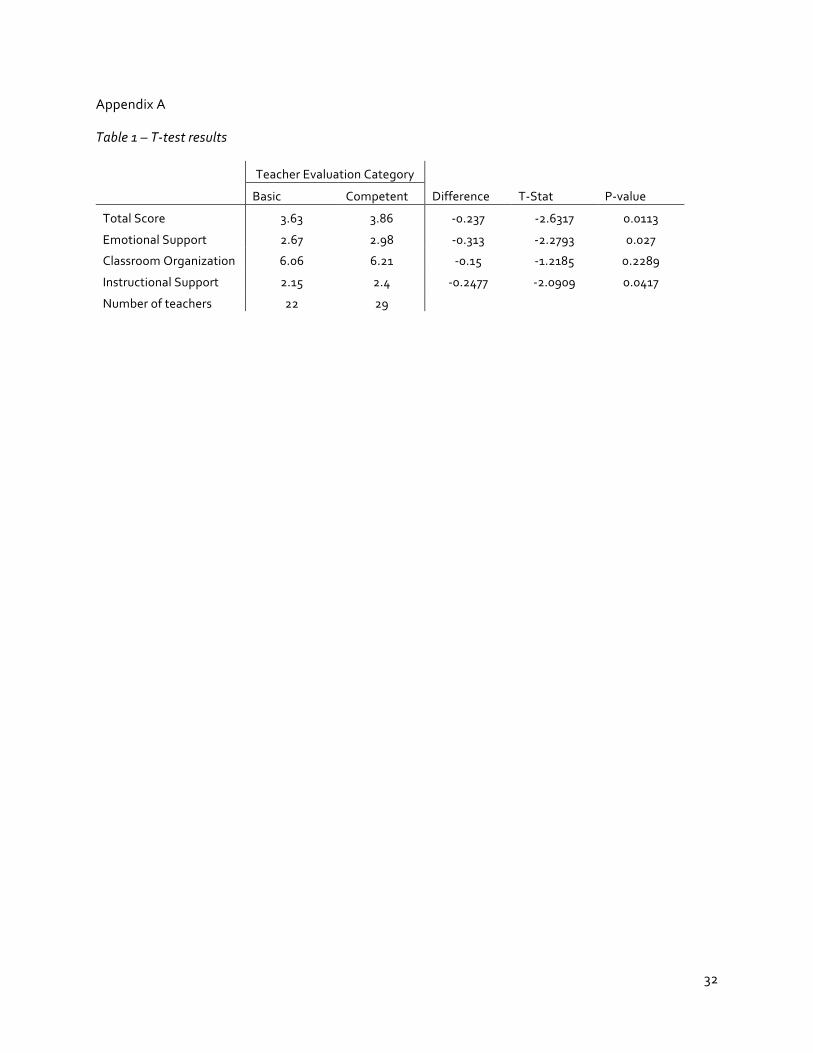
32
Appendix A
Table 1 – T-‐test results
Teacher Evaluation Category
Basic Competent Difference T-‐Stat P-‐value
Total Score 3.63 3.86 -‐0.237 -‐2.6317 0.0113
Emotional Support 2.67 2.98 -‐0.313 -‐2.2793 0.027
Classroom Organization 6.06 6.21 -‐0.15 -‐1.2185 0.2289
Instructional Support 2.15 2.4 -‐0.2477 -‐2.0909 0.0417
Number of teachers 22 29
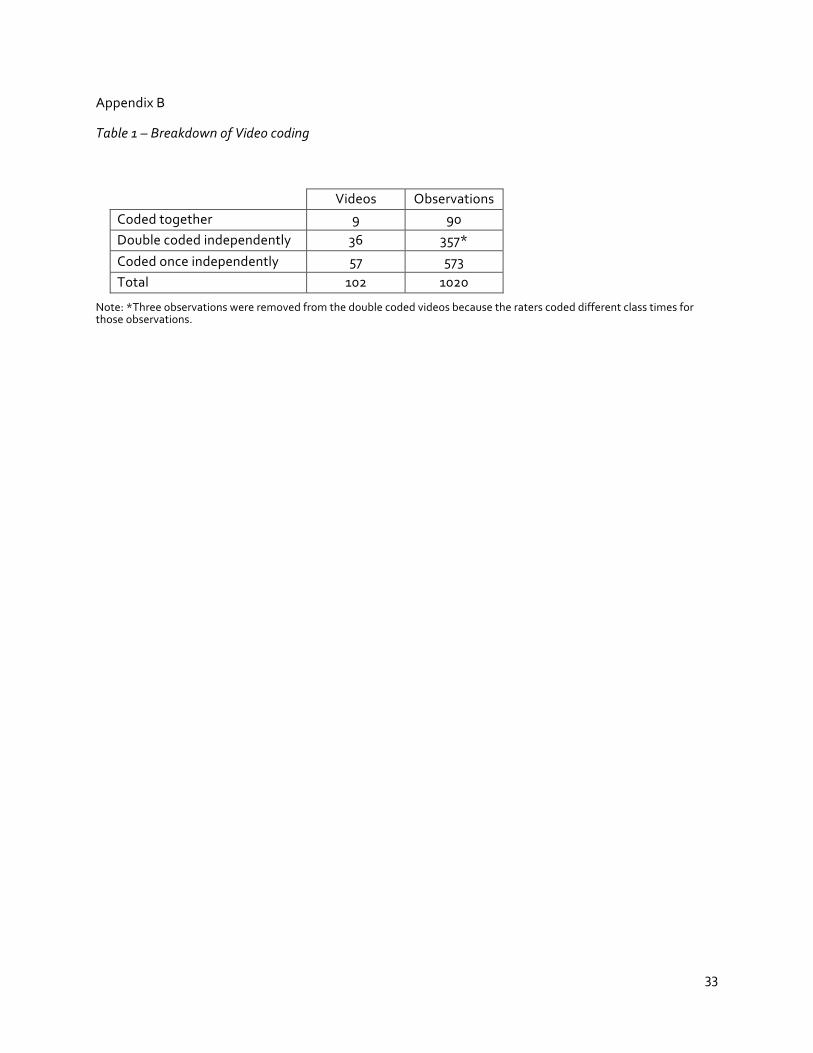
33
Appendix B
Table 1 – Breakdown of Video coding
Videos Observations Coded together 9 90 Double coded independently 36 357*
Coded once independently 57 573 Total 102 1020
Note: *Three observations were removed from the double coded videos because the raters coded different class times for those observations.
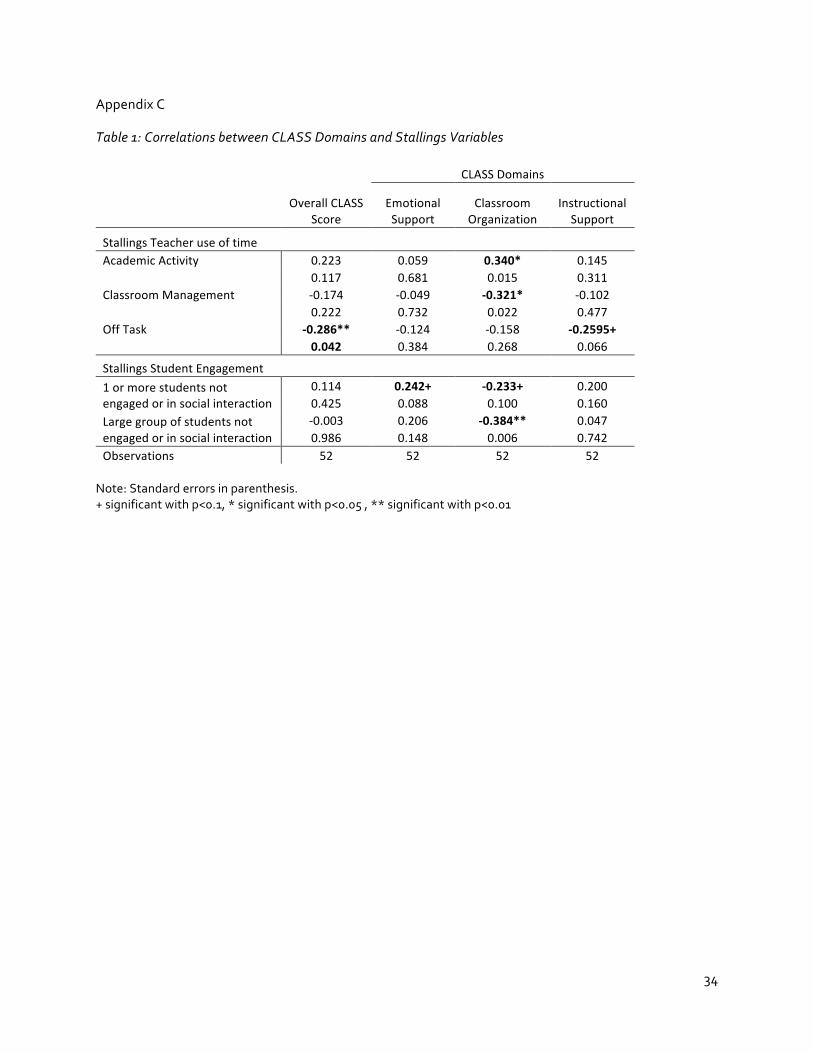
34
Appendix C
Table 1: Correlations between CLASS Domains and Stallings Variables
CLASS Domains
Overall CLASS
Score Emotional Support
Classroom Organization
Instructional Support
Stallings Teacher use of time Academic Activity 0.223 0.059 0.340* 0.145 0.117 0.681 0.015 0.311 Classroom Management -‐0.174 -‐0.049 -‐0.321* -‐0.102 0.222 0.732 0.022 0.477 Off Task -‐0.286** -‐0.124 -‐0.158 -‐0.2595+ 0.042 0.384 0.268 0.066
Stallings Student Engagement 1 or more students not engaged or in social interaction
0.114 0.242+ -‐0.233+ 0.200 0.425 0.088 0.100 0.160
Large group of students not engaged or in social interaction
-‐0.003 0.206 -‐0.384** 0.047 0.986 0.148 0.006 0.742
Observations 52 52 52 52 Note: Standard errors in parenthesis. + significant with p<0.1, * significant with p<0.05 , ** significant with p<0.01
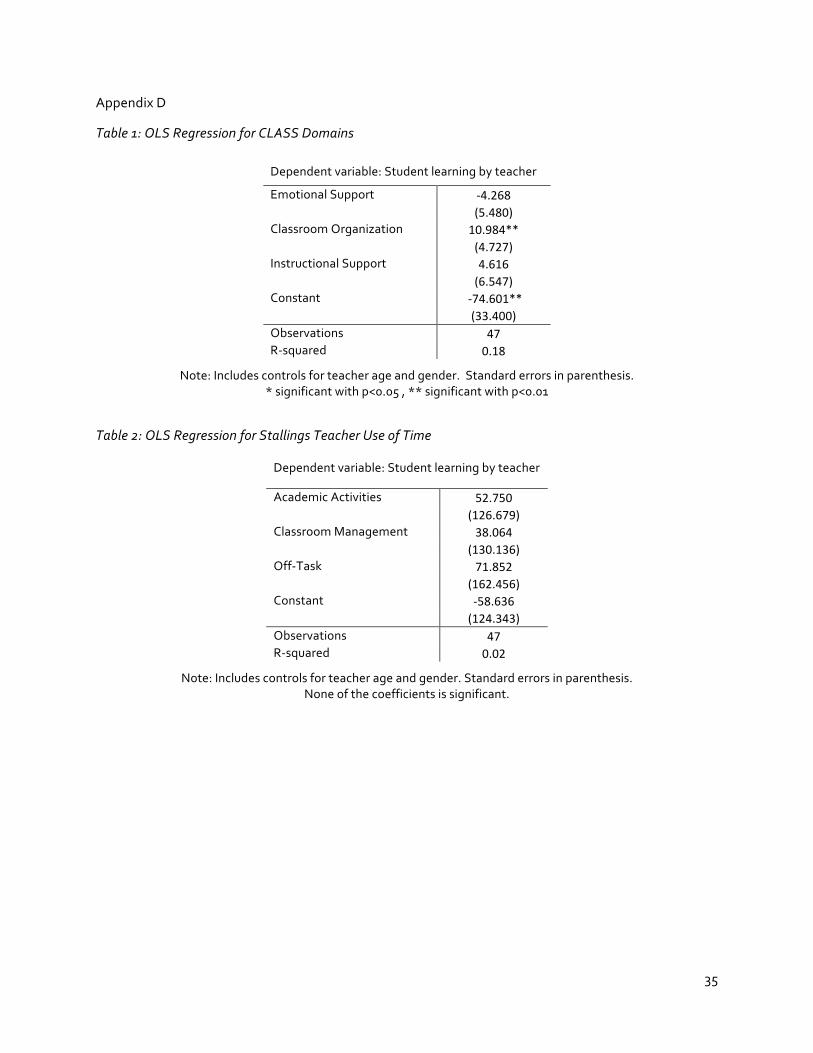
35
Appendix D
Table 1: OLS Regression for CLASS Domains
Dependent variable: Student learning by teacher
Emotional Support -‐4.268 (5.480)
Classroom Organization 10.984** (4.727)
Instructional Support 4.616 (6.547)
Constant -‐74.601** (33.400)
Observations 47 R-‐squared 0.18
Note: Includes controls for teacher age and gender. Standard errors in parenthesis. * significant with p<0.05 , ** significant with p<0.01
Table 2: OLS Regression for Stallings Teacher Use of Time
Dependent variable: Student learning by teacher
Academic Activities 52.750 (126.679)
Classroom Management 38.064 (130.136)
Off-‐Task 71.852 (162.456)
Constant -‐58.636 (124.343)
Observations 47 R-‐squared 0.02
Note: Includes controls for teacher age and gender. Standard errors in parenthesis. None of the coefficients is significant.
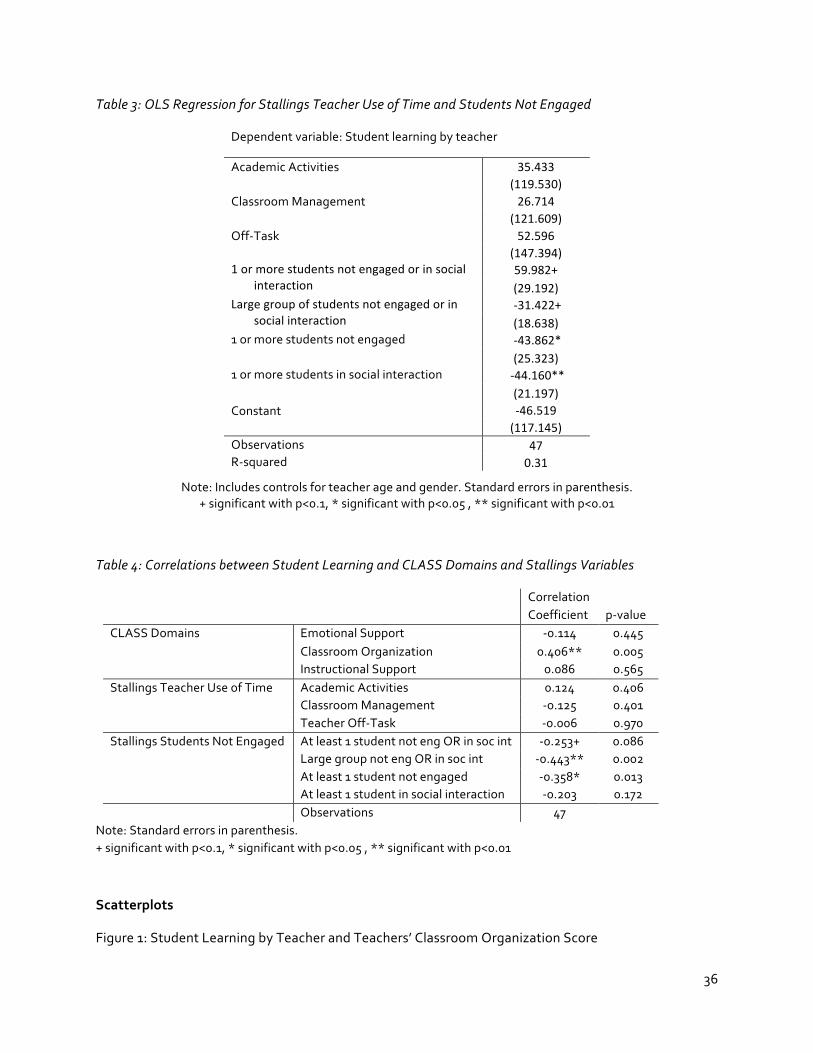
36
Table 3: OLS Regression for Stallings Teacher Use of Time and Students Not Engaged
Dependent variable: Student learning by teacher
Academic Activities 35.433 (119.530)
Classroom Management 26.714 (121.609)
Off-‐Task 52.596 (147.394)
1 or more students not engaged or in social interaction
59.982+ (29.192)
Large group of students not engaged or in social interaction
-‐31.422+ (18.638)
1 or more students not engaged -‐43.862* (25.323)
1 or more students in social interaction -‐44.160** (21.197)
Constant -‐46.519 (117.145)
Observations 47 R-‐squared 0.31
Note: Includes controls for teacher age and gender. Standard errors in parenthesis. + significant with p<0.1, * significant with p<0.05 , ** significant with p<0.01
Table 4: Correlations between Student Learning and CLASS Domains and Stallings Variables
Correlation Coefficient p-‐value
CLASS Domains Emotional Support -‐0.114 0.445 Classroom Organization 0.406** 0.005 Instructional Support 0.086 0.565
Stallings Teacher Use of Time Academic Activities 0.124 0.406 Classroom Management -‐0.125 0.401 Teacher Off-‐Task -‐0.006 0.970
Stallings Students Not Engaged At least 1 student not eng OR in soc int -‐0.253+ 0.086 Large group not eng OR in soc int -‐0.443** 0.002 At least 1 student not engaged -‐0.358* 0.013 At least 1 student in social interaction -‐0.203 0.172
Observations 47 Note: Standard errors in parenthesis. + significant with p<0.1, * significant with p<0.05 , ** significant with p<0.01
Scatterplots
Figure 1: Student Learning by Teacher and Teachers’ Classroom Organization Score
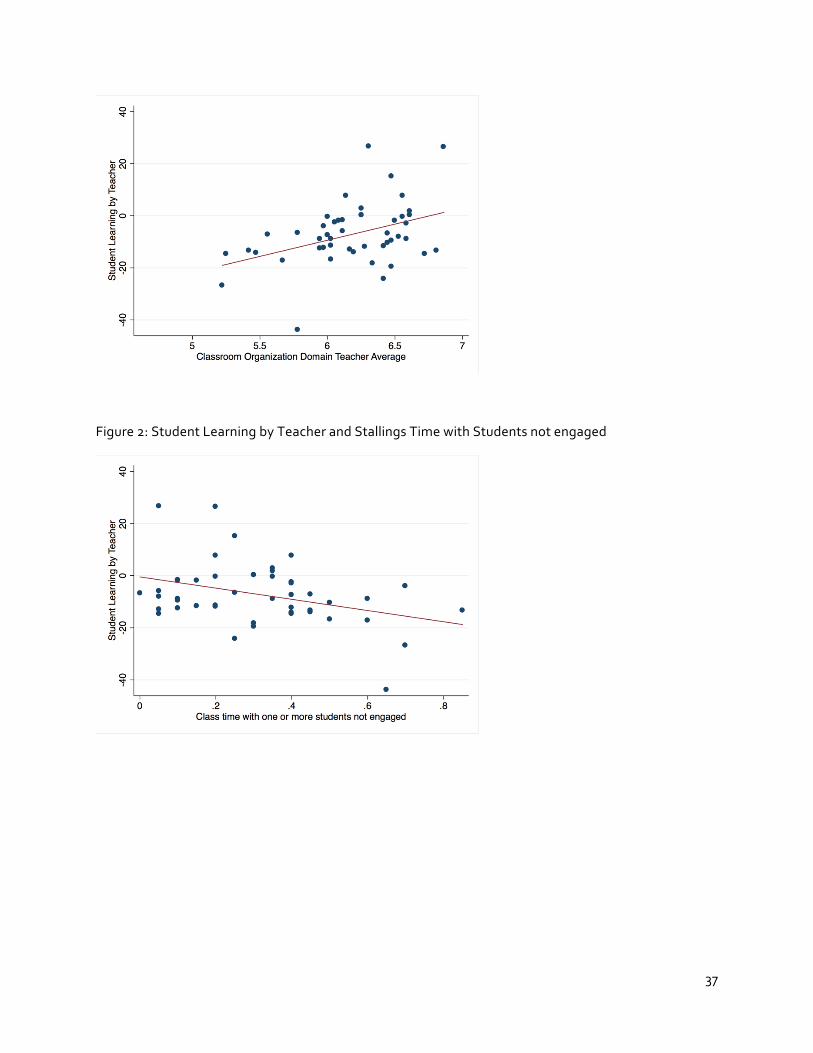
37
Figure 2: Student Learning by Teacher and Stallings Time with Students not engaged