Embed Size (px)
Citation preview

SEDIMENT MANAGEMENT
ANNUAL REVIEW MEETING
FINAL
MEETING MINUTES
JUNE 2014
Prepared by DMMP Agencies:
United States Army Corps of Engineers Washington Department of Ecology
United States Environmental Protection Agency Washington Department of Natural Resources

June 2014 i SMARM Meeting Minutes
Table of Contents Welcome and Opening Remarks .........................................................................................................1
1. Ecology, SMS Rule Implementation Updates, Regional Background & Draft Sediment Cleanup Users Manual II, Chance Asher/Ivy Anderson (Ecology):……………………………………………………………..2
2. DMMP Issue Paper: Adoption of Chemistry Freshwater guidance, Laura Inouye (Ecology):……… 5
3. DMMP Clarification: Freshwater Bioassay Requirements & Interpretation, Laura Inouye (Ecology):…………………………………………………………………………………………………………………………………...8
4. DMMP Project Testing summary, David Fox (Corps):………………………………………………………………….9
5. DMMP Clarifications and Updates, Lauran Warner (Corps):………………………………………………….….11
6. DNR Update & Disposal Site Management Activities, Celia Barton (DNR) & David Fox (Corps)...13
7. Lower Duwamish Waterway Update, Allison Hiltner (EPA):………………………………………………………16
8. SMS/MTCA Cleanup Projects Update, Kathy Taylor (Ecology): ..................................................... 19
9. Sediment Characterization: Core Sampling Issues, James McMillan (Corps):…………………………….22
10. Results of PCB Homologue Studies, Laura Inouye (Ecology) & Kelsey van der Elst (Corps):………………………………………………………………………………………………………………………………………………....25
11. Bioavailabiliy Assessment Using Passive Porewater Samplers, Mandy Michalsen (Corps):………..28
12. Public Issue Papers:………………………………………………………………………………………………………………….31
Summary and Closing ....................................................................................................................... 31
Appendices
Appendix I: DMMP Response to Public Issues
Appendix II: Meeting Agenda
Appendix III: List of Attendees
Appendix IV: PowerPoint Slides for Each Speaker
Appendix V: 2014 Agency Issue and Clarification Papers

June 2014 ii SMARM Meeting Minutes
List of Acronyms and Abbreviations AFDW ash free dry weight BMP best management practice CERCLA Comprehensive Environmental Response Compensation and Liability Act CSL Cleanup Screening Level CSMP Cooperative Sediment Management Program (Washington State) CWA Clean Water Act DEQ Oregon Department of Environmental Quality DMMO Dredged Material Management Office DMMP Dredged Material Management Program DNR Washington State Department of Natural Resources DY14 Dredge Year 2014 EPA U.S. Environmental Protection Agency ESA Endangered Species Act FCR fish consumption rate FPM Floating Percentile Method LEKT Lower Elwha Klallam Tribe MTCA Model Toxics Control Act NEP National Estuary Program NEPA National Environmental Policy Act NMFS National Marine Fisheries Service PCB polychlorinated biphenyl PLP Potentially Liable Party PNWA Pacific Northwest Waterway Association PQL practical quantification limit PRG Project Review Group PSDDA Puget Sound Dredged Disposal Analysis PSEP Puget Sound Estuary Program PSET Portland Sediment Evaluation Team QA/QC quality assurance/quality control RDT Regional Dredging Team RI/FS Remedial Investigation/Feasibility Study RSET Regional Sediment Evaluation Team SEF Sediment Evaluation Framework SL Screening Level SMARM Sediment Management Annual Review Meeting SMS Sediment Management Standards SQS Sediment Quality Standards SQV Sediment Quality Value SRM Sediment Reference Material TEQ toxic equivalence TOC total organic carbon TSS total suspended solids USACE United States Army Corps of Engineers WAC Washington Administrative Code Ecology Washington State Department of Ecology

June 2014 iii SMARM Meeting Minutes
This page is intentionally blank.

SMARM Meeting Minutes 1 June 2014
The 26th annual review of sediment management issues in the Pacific Northwest region was held on May 7, 2014 by the Cooperative Sediment Management Program (CSMP). The Sediment Management Annual Review Meeting (SMARM) was hosted by the Washington State Department of Natural Resources (WDNR), at the Salish Sea Conference Room, in the new Seattle District Oxbow Headquarters Building in Seattle, Washington. Comments from the public were welcomed, with prior invitation to submit issues for consideration and discussion.
The Dredged Material Management Program (DMMP) is an interagency cooperative program that includes the U.S. Army Corps of Engineers (USACE), Seattle District; the Environmental Protection Agency (EPA), Region 10; the Washington Department of Natural Resources (DNR); and the Washington Department of Ecology (Ecology). These minutes include the DMMP’s response to public issues raised at this year’s SMARM meeting (Appendix I), meeting agenda (Appendix II), list of attendees (Appendix III), the speaker’s presentation slides (Appendix IV), and the 2014 SMARM Clarification Papers (Appendix V).
WELCOME AND OPENING REMARKS
Justine Barton (Moderator, EPA), welcomed everyone to the 26th consecutive annual SMARM meeting. She briefly reviewed the history of the DMMP, stressing the collaborative process of the DMMP and its important role in the state’s goal of cleaning up Puget Sound by 2020. According to Justine, a hallmark of the program is the civil discourse among all parties. She briefly summarized the 25th anniversary historical summary that was held last year. Justine introduced the members of the head table, including Christine Reichgott (EPA, Manager, Environmental Review and Sediment Management Unit), Erika Shaffer (DNR, Manager, Aquatic Resources Division), and Jim Pendowski (Ecology, Manager, Toxic Cleanup Program). This is the second meeting in the new Corps Building and Salish Sea Conference Room. Justine advised everyone to please sign in at the table outside the door if they haven’t already. She addressed a few “housekeeping” issues. She reminded everyone that the 30 day public comment period was June 6, 2014 to provide input on the SMARM topics and/or proposed changes to the program. The host for these meetings rotates each year, and this year the host is Washington State Department of Natural Resources. The meeting location continues to remain at the Corps because of free parking.
LTC Andrew Park (Deputy District Engineer). Justine then introduced LTC Andrew Park, Deputy District Engineer, who welcomed those in attendance at the 26th consecutive SMARM to the 2nd meeting in the new Corps headquarters building. He then provided opening remarks and a brief summary of why the DMMP has been so successful over the past twenty-six years. He indicated that he wished it the same success for the next twenty-six years.
Justine then asked David Kendall and Wayne Wagner to come up to the front of the room. David then read a brief summary acknowledging the many contributions that Wayne Wagner (Seattle District Chief, Technical Support Branch) has provided to the Dredged Material Management Program over the years. Wayne is scheduled to retire this year and this will be his last SMARM. The DMMP agencies wanted to acknowledge their respect for all the support he has provided over the years, and wanted to wish him the very best in his well earned retirement.
Justine Barton.
PP-1 Panel Best
Justine Barton (Moderator), introduced the first agency speaker, Chance Asher, Ecology.

June 2014 2 SMARM Meeting Minutes
SMS RULE IMPLEMENTATION UPDATES
1. Ecology/TCP, Chance Asher, Ivy Anderson
Chance Asher (Ecology/TCP). Ecology's presentation on the Sediment Management Standards (SMS) rule included updates on the progress implementing the newly adopted rule. The focus of the SMS implementation updates was the Sediment Cleanup Users Manual II (SCUM II) and establishment of sediment regional background. The update on SCUM II included a high level summary of the public comments received to date, Ecology's plans to convene technical workshops to work with stakeholders to resolve issues raised in the public comments, and the timeline for completing the final SCUM II document. The SCUM II technical workshops will be convened on July 17, July 31, and August 6 at Ecology's NWRO Bellevue office from 9 AM - 1 PM. The update on establishment of regional background included a high level summary of how Ecology has responded to comments received over the past year on the Port Gardner Bay and Port Angeles regional background work. This included presenting the supplemental sampling design and framework for Port Gardner Bay in response to comments, the timeline for establishing regional background in Port Gardner Bay and Port Angeles, as well as a brief update on the outreach Ecology will conduct in 2014 for the regional background work in the Lower Duwamish Waterway.
Chance Asher
PP1.1 Sediment Policy Updates Toxi cs Cleanup Program
PP1.2 Goals for Today, Provide Updates On:
PP1.3 Revised Sediment Cleanup Users Manual II:
PP1.4 Acknowledgements
PP1.5 A Tale of Two SCUMs
PP1.6 Draft SCUM II – Summary of Content
PP1.7 Draft SCUM II – Summary of Content (Continued)
PP1.8 Appendices
PP1.9 Public Comments – Big Picture Topics
PP1.10 Public Comments – Big Picture Topics (Continued)
PP1.11 Public Comments – Big Picture Topics (Continued)
PP1.12 SCUM II Technical Workshops
PP1.13 SCUM II Timeline & Next Steps
PP1.14 SCUM II – Future Opportunities for Revisions

SMARM Meeting Minutes 3 June 2014
PP1.15 Now for Something completely different…
PP1.16 Regional Background Updates
PP1.17 Background & SMS rule – Establishing Cleanup Levels
PP1.18 Intent of Regional Background
PP1.19 Regional Background – What it is Not
PP1,20 Ecology’s Regional Background Engagement process
PP1.21 How Ecology Considered Comments
PP1.22 Why Did We Conduct Supplemental Sampling?
PP1.23 Changes to the Port Gardner Supplemental SAP
PP1.24 These Changes Resulted In:
PP1.25 Conceptual Bay Model, Evaluation of Sources, Sites, and Areas of Influence
PP1.26 % Total Organic Carbon & Grain Size Distribution
PP1.27 Existing Sediment Concentrations: cPAHs & Dioxins/Furans
PP1.28 Existing Sediment Concentrations: Cadmium & Arsenic
PP1.29 Port Gardner Revised Sampling Area
PP1.30 Phase II Baseline & Secondary Sampling Locations
PP1.31 Regional Background/SCUM II Timeline
Comments and Questions
Q: Deborah Williston (King County) - Please clarify your statement saying that the SAPA would become obsolete.
A: Chance Asher (ECY) - SAPA information has been folded into SCUM II and old information updated. All the SAPA information has been captured, just in a different document. Once SCUM II is final, the SAPA will be taken off the web site. SAPA had a lot of old and outdated sections. ECY saw no sense in having two documents, one updated and one outdated.
Q: Joyce Mercuri (ECY) - Will SCUM II be web based or will future changes be incorporated into a new document or via SMARM documentation?

June 2014 4 SMARM Meeting Minutes
A: Chance Asher (ECY) - SCUM II will be web based in terms of being posted on internet but there will be an actual document for printing as well. As we make future revisions, changes may be indicated as redline in a given chapter as a SMARM Issue or Clarification Paper or could be reflected in an additional appendix. ECY still not sure how to track changes. Alternatively, appendix B (past SMARM Issue and Clarification Papers) could house the updates plus they could be folded into SCUM II where sensible. ECY would appreciate hearing ideas on how to make the updates more user-friendly. In any event, there will be a date change on front of document to show its updated status. Any changes will be presented at SMARM for public comment before inclusion.
Q: Alan Chartrand (SFS) - What is the schedule for developing natural/regional background for other embayments?
A: Chance Asher (ECY) - Other embayments are being considered by ECY and we have some funds but the agency isn’t ready yet to announce which ones. Remember that ECY is paying for all this expensive work. ECY will let people know more about this in the next few months.
Q: Tad Deshler (Coho Environmental) - Can you give more information on how stormwater outfalls were modeled?
A: Chance Asher (ECY) - King County has described their extensive work on modeling outfalls (mostly by Bruce Nairn - KC) on their website. There is a link to the presentation King County gave at the September 2013 Ecology workshop to discuss regional background for Elliott Bay and the Lower Duwamish on our website:
(http://www.ecy.wa.gov/programs/tcp/smu/EB_LDW_2013_SAP_Workshop_Presentations.pdf)
Their studies have shown that depositional zones area for CSOs and stormwater outfalls is more limited than originally thought. This may not be case for large wastewater outfalls with diffusers, however. This information has informed ECY’s decision to move the supplemental sampling for regional background to locations that are closer to storm water outfalls.
Q: Roger McGinnis (Hart Crowser) - These embayments are dynamic systems. Have you thought about updating the information for Regional Background? I also have noticed that Port Gardner Regional Background values are greater than SLs used by the COE to determine sediment suitability for open water disposal. If this true, won’t more dredged material have to go upland?!
A: Chance Asher (ECY) - We’ve been thinking about how often regional background values will need to be updated. The answer will be specific to the area and its sediment deposition rate. We don’t anticipate dramatic change in any of the current embayments we’re working on over
SMARM Meeting Minutes 5 June 2014
timeframes of less than 10 yrs. Decisions to resample will also depend on whether there are funds available.
Port Gardner regional background values do not conflict with open water disposal criteria, if the CSL is considered. We are paying close attention to both sets of values because we don’t want open water disposal at designated sites to create cleanup sites.
Q: Kathy Godfredtsen (Windward Environmental) - You’ve done a great job with making adjustments to the sampling for regional background at Port Gardner. Are you planning to apply similar adjustments to Port Angeles?
A: Chance Asher (ECY) - Right now we’re just focusing our revised sampling framework on Port Gardner to see what happens. If the new data make a big difference than we may rethink other regional background datasets in the future. I can’t say whether this will apply to Port Angeles as we would need to see the data before answering that question.
A: Teresa Michelsen (Avocet) - Remember that developing Regional Background for large river systems like the Lower Duwamish may rely more on particulate data and modeling as opposed to using bedded sediment data as was done for Port Gardner and Port Angeles. This should be kept in mind during stakeholder deliberations in the future.
2. DMMP Issue: Adoption of Chemistry Freshwater Guidelines, Laura Inouye
Laura Inouye (Ecology): The SMS benthic criteria only account for chemical toxicity to benthic invertebrate communities and may not be protective of sensitive fish species and other organisms. This presentation presents a proposed approach of screening level overlays for the new freshwater benthic screening levels (FW benthic SLs) for dredging projects, which includes the FW benthic SLs, water quality-based screening levels (WQ-based SLs) and background for metals. Fish and bioaccumulative SLs are still under development. The SMS benthic criteria will be adopted with the exception of ammonia and sulfides, which will only be used to inform bioassay testing and water quality monitoring. WQ-based SLs are based on the SEF Chapter 10 elutriate testing approach. For background, Washington proposes adopting state soil background for nickel at this time, due to lack of statistically robust freshwater sediment background datasets. Tiered testing for benthic SL exceedances relies on bioassays, and a wide range of tests for WQ-based SLs exceedances including elutriate tests, development of site-specific SLs and/or WQ criteria, or modeling. Impact analysis indicates that PCP detection limits may be an issue for the WQ-based SLs. DMMP will not require special analytical methods unless there is a reason to believe that PCP may be present at the dredge location. Instead, data must be reported down to the MDL and only detected exceedances will trigger tiered testing. Since fish and bioaccumulative SLs are still under development, when ESA-listed species are present, the Federal action agency may need to contact NMFS and/or USFWS (as appropriate) to discern whether
June 2014 6 SMARM Meeting Minutes
additional analyses are needed, and whether those analyses should be done as part of an ESA consultation.
Laura Inouye.
PP2.1 Implementation of Revised Freshwater Sediment Screening Values
PP2.2 Introduction: a bit of history
PP2.3 Introduction: Benthic standards and the SMS rule:
PP2.4 Introduction
PP2.5 Problem Statements
PP2.6 Approach
PP2.7 Benthic FW screening levels
PP2.8 Benthic freshwater screening levels (continued)
PP2.9 Benthic freshwater screening levels (continued)
PP2.10 Benthic freshwater screening levels (continued)
PP2.11 Water-Quality Criteria-based SLs
PP2.12 Water-Quality Criteria-based SLs (Continued)
PP2.13 Water-Quality Criteria-based SLs (Continued)
PP2.14 Background Based SLs
PP2.15 Background Based SLs (Continued)
PP2.16 Background Based SLs: Washington Sediment Data
PP2.17 Background Based SLs
PP2.18 Background Based SLs: Washington Soil data
PP2.19 Background Based SLs
PP2.20 The FW Screening Level Table
PP2.21 Using the FW Screening Level Table
PP2.22 Using the FW Screening Level Table (Continued)
PP2.23 Using the FW Screening Level Table (Continued)
PP2.24 Using the FW Screening Level Table, Tiered Testing Option

SMARM Meeting Minutes 7 June 2014
PP2.25 Using the FW Screening Level Table (Continued)
PP2.26 Impact Analysis
PP2.27 Impact Analysis (Continued)
PP2.28 Questions?
Comments and Questions
Q: Allan Chartrand (SFS) - This is a great use of the EPA toxicity database. I know that there is tons of data there for PAHs and dioxin. Why are these not represented in your FW values?
A: Laura Inouye (ECY) - We’re working with Lyndal Johnson (NOAA) to develop a PAH fish screening level. The value is approx. 2000 ppb, but we are still deliberating on this. As for Dioxins – toxicity to benthos and fish are much less sensitive than bioaccumulation.
Q: Roger McGinnis (Hart Crowser) – I understand that your Water Quality-based SLs used a default hardness of 18.9. The calculations are meant to be used for hardness between 25 – 400. If < 25 default to 25 mg/L.
A: Laura Inouye (ECY) – I’m not sure of how/why the equations in Chapter 10 auto default. If standard procedure is to do that for fresh water, then we will. Remember that these values are for adoption by a greater regulatory community and IDEQ is questioning some of the default parameters. This may need more discussion. For now we’ve agreed to these defaults in order to have some sediment guidelines rather than to have nothing or under-protective values
Q: Teresa Michelsen (Avocet) – Mark Sippola (formerly COE), if he were here, would say that sediment nickel is elevated on the Oregon coast. Are you concerned about that issue? On that basis, I would caution against using Portland Harbor data to represent background for sites on the coast.
A: Laura Inouye (ECY) - That’s why the WA background evaluation was done. Results did show that some COCs in Washington freshwater sediments were higher than in the Williamette.
Q: Teresa Michelsen (Avocet) – The difference between SL1/SL2 does not represent toxicity associated with acute vs chronic exposures. Why would one apply a chronic endpoint to a dredging project (whose direct water quality effects are short-lived)? Why not use acute endpoints which would be more applicable to the short-term nature of dredging projects?
A: Laura Inouye (ECY) – If you look at the defined time-frame associated with acute and chronic Water Quality criteria, they are 1-day and 4-days. Since the criteria definitions include these time frames, the chronic criteria can be applied to dredging projects (which typically last longer than 4-days).
Q: Teresa Michelsen (Avocet) – Why is the WQ Criteria approach only being used to develop fresh water sediment guidelines? Why not develop similar guidelines for the marine/estuarine context as well?

June 2014 8 SMARM Meeting Minutes
A: Laura Inouye (ECY) – Because fresh water SLs are priority for the RSET group. We are working our way through the process in RSET to determine guidelines that will be acceptable to all the agencies. Lessons learned from this process will inform future efforts.
Q: Deborah Williston (King County) – Was the EPA copper criteria value back calculated using the Biotic Ligand model? Would that require steady-state data on hardness?
A: Laura Inouye (ECY) – We used an EPA 2007 document that used a species sensitivity distribution approach; not the Biotic Ligand model. An acute to chronic ratio was also used. [Post SMARM clarification from Ecology: While not discussed in the meeting, development of a site-specific WQ-based SL could use biotic ligand model for metals, rather than the spreadsheet. Again, it would be proponent-developed and would require agency approval.]
Q: Tim Thompson (SEE) –A clarification paper for the future should elaborate on the procedure to be used to conduct a modified dredge elutriate test.
A: Laura Inouye (ECY) – We agree that this will be needed. [Post SMARM clarification from Ecology: This will be discussed within RSET and an approach presented in the fall RSET meeting.]
Q: Jennifer Sutter (OR DEQ) – Clarify if/how these new freshwater values will affect cleanups.
Laura Inouye (ECY) – Actually, the process has gone the opposite way. The tiered approach being used is similar to what was developed for the cleanup rule. WQ-based values are new, though.
A: Chance Asher (ECY) – We want to hear feedback on this approach before we put it into SCUM II and apply it to cleanups
Morning Break
3. DMMP Clarification: Freshwater Bioassays, Laura Inouye
Laura Inouye, Ecology: The current Sediment Evaluation Framework (SEF 2009) requires only 10-day bioassays for tiered testing when exceedances of freshwater screening levels (FW SLs) occur. This is inconsistent with the new Sediment Management Standards (WAC 173-204-563), which requires at least one chronic exposure and one sublethal endpoint. Additionally, the new proposed FW SLs are often based on chronic exposures and sublethal endpoints, so it makes sense that tiered testing should require one of the more sensitive bioassays. The proposed required suite of freshwater bioassays will be aligned with WAC 173-204-563. When bioassays are triggered, they will include:
• Two different test species (Hyalella and Chironomus) • Three endpoints • One chronic test; and • One sublethal endpoint
SMARM Meeting Minutes 9 June 2014
Test protocols, control and reference QAQC, and 1-hit/2-hit definitions for 10 and 20-day Chironomus growth and mortality bioassays and 10 and 28-day Hyalella bioassays were presented (see slides for details).
Laura Inouye
PP3.1 Freshwater Bioassays
PP3.2 Introduction
PP3.3 Problem Statement
PP3.4 Proposed Modifications
PP3.5 Proposed Modifications (Continued)
PP3.6 Proposed Modifications (Continued)
PP3.7 Proposed Modifications – Bioassay Performance Standards
PP3.8 Proposed Modifications – Hit definitions: 2-hit and 1-hit interpretive criteria (Hyalla azteca)
PP3.9 Proposed Modifications – Hit definitions: 2-hit and 1-hit interpretive criteria (Chironomus dilutus)
PP3.10 Questions?
Questions and Answers.
There were no questions
DMMP Updates
4. DMMP Project Testing Summary, David Fox (Corps)
David Fox (Corps): David Fox (Corps) presented the DMMP project evaluation activities for DY2014. DMMP activities are documented in memoranda that get posted to the DMMO website, including suitability determinations, recency extensions, tier 1 evaluations, volume revisions, design modifications and antidegradation determinations. There were eleven suitability determinations and fifteen other completed actions in DY14. Project locations were distributed throughout the State of Washington.
Twelve projects required chemical testing, with nine of these tested for dioxins/furans. Only two projects ran bioassays. There was no bioaccumulation testing. Six projects included antidegradation testing. Projects with DMMP chemical guideline exceedances (excluding dioxins/furans) included Duwamish Yacht Club, Kittitas County Boat Ramp, Port of Seattle T5 and T91, USACE Hylebos and USACE Snake/Clearwater Rivers. Six projects had failures based on dioxins/furans or partially due to dioxins/furans, including Duwamish Yacht Club, MJB Properties, Port of Olympia berthing area, Port of Seattle T5 and T91, and USACE Hylebos.

June 2014 10 SMARM Meeting Minutes
The two projects subjected to bioassays were Kittitas County Boat Ramp (cadmium) and USACE Snake/Clearwater Rivers (phenol and 4-methylphenol). Freshwater bioassays were used for both projects. There were no hits in any of the bioassays.
Five projects had material found unsuitable for open-water disposal, including Duwamish Yacht Club, MJB Properties, Port of Seattle T5 and T91, and USACE Hylebos. A total of 70,835 cubic yards were determined to be unsuitable out of a total of 920,644 cubic yards (7.7% unsuitable). This compares to a 5.4% unsuitable rate over the last eight years and 4.6% over the last 26 years. The volume of material tested in DY14 was well below the average tested volume of 2.1 million cubic yards over the last 26 years.
Antidegradation testing resulted in failures or partial failures in five of the six projects tested. Overdredging with subsequent placement of a sand cover is required at Duwamish Yacht Club, Port of Olympia berthing area and Port of Seattle T5 to address the degraded nature of the sediment surface exposed by dredging. The remedy at the Port of Seattle T91 is yet to be determined as additional sediment evaluation is ongoing at that site. The Hylebos Waterway will not be dredged, so the degraded subsurface sediment will not be exposed.
USACE Hylebos had unexpectedly high concentrations of dioxins/furans in the five shoals that were tested. The five shoals spanned the length of the waterway. None of the material tested met the dioxin/furan evaluation guidelines for open-water disposal. Concentrations were highest in Shoal D, located at approximately the midpoint of the waterway.
David Fox
PP4.1 DMMP Evaluation Activities, Dredging Year 2014
PP4.2 Dredging Year Actions
PP4.3 DY14 Completed Actions
PP4.4 DY 2014 Project Locations
PP4.5 DY14 Testing
PP4.6 Projects with guideline exceedances (excluding dioxin)
PP4.7 Dioxin Testing DY14
PP4.8 Biological Testing DY14
PP4.9 Projects with Unsuitable Dredged Material
PP4.10 Suitability of Volume Tested
PP4.11 Multiyear Comparison
PP4.12 DMMP Testing History

SMARM Meeting Minutes 11 June 2014
PP4.13 Antidegradation Testing
PP4.14 USACE Hylebos – Dioxin
PP4.15 Projects underway, but incomplete
PP4.16 DMMO Website
PP4.17 Questions?
Comments and Questions
There were no questions.
5. DMMP Clarifications and Updates, Lauran Warner (Corps)
Lauran Warner (Corps): presented a brief summary of DMMP clarifications and DMMP program updates. Clarifications are modifications to existing DMMP guidance that do not substantively change program or policy. But important nonetheless: they may or may not be adopted as proposed based on comments received from stakeholders and public.
Clarification: Recency Guideline Modifications. Two modifications proposed:
1. Change the recency period for high-ranked areas from 2 years to 3 years. 2. Discontinue the use of the “frequency” term; roll “frequency” concept into recency.
The caveat for all projects under recency guidelines is that they are guidelines ONLY. If there are changes to the proposed dredge area that could alter the usefulness of collected data, the DMMP may request additional testing.
Five updates to previous DMMP programs or interests were highlighted:
1. Puget Sound SRM is now in its third year and performing well. Those using the SRM are required to submit data per guidance on the DMMP website.
2. Ammonia/Sulfides in bioassays. This is an example of a DMMP clarification that will NOT be implemented based on stakeholder feedback. Proposals for programmatic modifications of bioassays to control for ammonia and sulfides will not be implemented. They may be used on a project-specific basis if requested by the proponent.
3. DAIS to EIM transition is almost entirely finished, largely due to extra work by David Fox of the DMMO. DAIS is no longer used for DMMP data; all data is submitted via the DMMO project manager to EIM.
4. A new EPA document on dioxin validation is now available: Data Validation and Review Guidelines for Polychlorinated Dibenzo-p-Dioxin and Polychlorinated Dibenzofuran (PCDD/PCDF) Data Using

June 2014 12 SMARM Meeting Minutes
Method 1613B and SW846 Method 8209A. For copies, contact Ginna Grepo-Grove at [email protected]
5. ESA Rockfish listings: larval rockfish were collected in the area of Puget Sound disposal sites during 2012 as part of a study to determine whether there are disposal effected on listed rockfish species. Preserved larval rockfish will be genetically identified to species to determine whether any collected were listed species.
Finally: the DMMP User Manual will be updated with SMARM modifications after the SMARM comment period.
Lauran Warner
PP5.1 DMMP Clarifications & Updates
PP5.2 Clarification: Recency/Frequency
PP5.3 Recency/Frequency (definitions)
PP5.4 Recency
PP5.5 Frequency
PP5.6 Updates, Puget Sound SRM, Ammonia/Sulfides in bioassays, Status of EIM transition
PP5.7 Puget Sound SRM
PP5.8 Puget Sound SRM (Continued)
PP5.9 SRM: Required Deliverables
PP5.10 Ammonia/Sulfides in Bioassays
PP5.11 DAIS to EIM transition
PP5.12 To be updated after SMARM comment period – Dredged Material Evaluation and Disposal Procedures User Manual July 2013 (version)
PP5.13 Corps Website Address for Dredged Material Management Office
PP5.14 Questions?
Comments and Questions
Kathy Taylor (ECY): I’d like to introduce Hugo Froyland – a new coordinator and analyst at ECY.
Tuan Vu (U.S. EIM) – Good job to Dave Fox for EIM migration.
Q: Joyce Mercuri (ECY) – Where are EPA’s Dioxin validation guidelines published?

SMARM Meeting Minutes 13 June 2014
A: Justine Barton (EPA) –You will need to talk with Ginna Greppo-Grove about that. The report does not have an official EPA # yet nor has it been peer reviewed. Probably best to email her ([email protected]) to get a final copy. I also assume will be posted on the R10 EPA web site.
Q: Maria Peeler (CHB) - How long do we have to submit comments and questions on SMARM presentations?
A: Lauran Warner (COE) - There is a 30 day comment period (due June 6th).
Q: Joyce Mercuri (ECY) – Is there an official public notice for the comment period? How does general public know about the comment period? What’s the formal process?
A: Lauran Warner (COE) - The SMARM is the public notice and the mailing list announcing the SMARM amounts to public notification. The comment period starts today and goes for 30 days. We will consider extensions on that period if requested.
Afternoon Lunch Break
6. DNR Update & Disposal Site Monitoring Results, Celia Barton (DNR) and David Fox (Corps)
Celia Barton (DNR) and David Fox (Corps). Celia Barton and David Fox provided updates on monitoring conducted during the past year. Monitoring occurred at 3 disposal sites in Puget Sound in Dredge Year 2014: multibeam hydrographic survey (multibeam) and sediment profile imaging (SPI) at Commencement Bay (CB) and Elliott Bay (EB), partial monitoring at EB, and multibeam at Anderson/Ketron (A/K). In addition, there was disposal modeling at A/K and targeted disposal at EB. Near future plans include a crab and shrimp trawl study at the A/K site.
The EB site had received 603,000 cubic yards (cy) of material since the last full monitoring event in 2002, exceeding the soft monitoring trigger of 500,000 cy. A decision was made to conduct a partial monitoring event at EB in the summer of 2013 to address the first two monitoring questions. Partial monitoring was determined to be sufficient due to the relatively low volume of disposal and a 25-year history of monitoring in Elliott Bay; partial monitoring also resulted in a considerable cost savings over full or tiered-full monitoring. Commencement Bay site had received 433,000 cy of material since the last monitoring event and was not used last year for disposal. However, it had been 6 years since the shift in disposal coordinates and multibeam and SPI surveys were warranted to check performance of the new coordinates.
The multibeam survey at the CB site showed a slight flattening and elongation of the disposal mound, indicating that the shift in disposal coordinates was having its intended effect. The SPI results corroborated the multibeam data, with the 3-cm dredged material accumulation boundary clearly shifted southeast of the center of the site. A minor quantity of dredged material (less than 1 cm in depth) extended outside of the disposal site to the southeast, indicating that the shift in disposal coordinates had not resulted in inordinate movement of material offsite in the direction of the disposal

June 2014 14 SMARM Meeting Minutes
coordinate shift. A larger lobe of dredged material extended north from the site beyond the disposal site boundary. However, the depth of offsite deposition was less than 1 cm. This pattern of offsite movement to the north had been documented in previous monitoring events at CB.
The multibeam survey at the EB site showed a much less pronounced mound when compared to CB, reflecting the smaller volume that has been deposited over the years. The center of the disposal mound is near the disposal coordinates for the site, which had been shifted 300 feet to the south of the center of the site in the early 90’s to prevent material from moving into the submarine canyon to the north of the site. The SPI survey showed a well-defined deposition pattern, with the 3-cm accumulation boundary completely encircling the disposal zone. All recently-placed material remained onsite.
Partial monitoring was conducted at EB in 2013 by Integral Consulting Inc., with significant funding assistance from the Department of Ecology. Sampling occurred August 5-14, 2013 at 19 EB stations and two Carr Inlet reference stations, including seven random onsite stations for dioxin testing. The first two PSDDA Monitoring Framework questions were answered by addressing four testable hypotheses. It was concluded that dredged material was not moving offsite and onsite biological effects conditions were being met.
The DMMP agencies established revised dioxin guidelines in 2010. The site management objective was set to four parts-per-trillion toxic equivalents (pptr TEQ). The monitoring design for non-dispersive sites was modified to include ten onsite stations. The dioxin results for EB indicated that dioxin concentrations within the dredged material footprint were meeting the site management objective, although some stations outside the footprint were still above the objective. Of most concern was station EBS04, which had a concentration of 30 pptr TEQ. This same station had a concentration of 17 pptr TEQ in 2007. Since the dredged material footprint did not extend as far as EBS04, the difference between the 2007 and 2013 concentrations is likely attributable to spatial heterogeneity.
Data from the partial monitoring event at EB are available in EIM, and the monitoring report will be finalized and posted sometime after SMARM.
One of the recommendations from the report was to adjust the disposal coordinates to cover the elevated dioxin levels at EBS04. This was accomplished by the Corps at the end of 2013 with the placement of 20 barge loads of clean material from navigation dredging in the Duwamish turning basin.
The A/K Shoreline permit expires in September 2014. The process of securing a new permit involves an extensive public process. The Corps and DNR received many comments on the use of this site over the last 2 years. The Corps conducted work in 2013, including a multibeam survey and fate/transport modeling study to begin to address these comments. The multibeam survey indicated that the hydrodynamics responsible for development of sand waves in the Nisqually delta appear to have no effect on material placed at the A/K disposal site. The fate and transport modeling supported the conclusions that had been reached during the siting study in the late 80’s. Approximately 95% of the dredged material placed at the site comes to rest within the site boundary within 2 hours of disposal. Half of the 5% that remains in suspension after two hours eventually comes to rest within the site boundary as well. The remaining 2-3% of material does move offsite but is constrained to the very deep

SMARM Meeting Minutes 15 June 2014
water between Anderson and Ketron Islands. It does not move into shallower subtidal areas or into the Nisqually delta where biological resources are more abundant.
The Corps will also conduct a four-season beam trawl study starting in July 2014 with a focus on Dungeness crab and Pandalid shrimp densities. The DMMP agencies are working with the Washington Department of Fish and Wildlife, the agency responsible for the management of these resources, to investigate any resource changes since the original 1987 siting work. Two additional transects have been added through the disposal site to increase definition. Use of this site is not anticipated in the next two years, and DNR will not apply to renew the Shoreline permit until late 2015, when this study is expected to be completed.
The DNR managed disposal volumes for Puget Sound continue to decline, while Grays Harbor continues to require maintenance dredging. These uses provide revenue for the Dredged Management Account which pays for management and monitoring of the disposal sites. The combined revenue for DY 2014 is slightly over $36,000. DNR is developing a plan to take to the co-managers and user groups as we work toward a solution to the Dredged Management Account decline.
Celia Barton
PP6.1 Disposal Site Monitoring Results
PP6.2 Highlights of 2014
PP6.3 Puget Sound, Grays Harbor and Willapa Disposal Sites
PP6.4 Site Monitoring
PP6.5 Cumulative Volumes Since Last Monitoring, Elliott Bay
PP6.6 Cumulative Volumes Since Last Monitoring, Commencement Bay
PP6.7 Monitoring in DY14
PP6.8 2013 Commencement Bay Multibeam Survey, Corps of Engineers
PP6.9 Commencement Bay SPI
PP6.10 2013 Elliott Bay Multibeam Survey, Corps of Engineers
PP6.11 Elliott Bay SPI
PP6.12 Elliott Bay Partial Monitoring
PP6.13 PSDDA Monitoring Framework
PP6.14 2013 Sediment Sampling
PP6.15 2013 Sediment Analyses
PP6.16 2013 Results – Chemistry
June 2014 16 SMARM Meeting Minutes
PP6.17 Chemical Tracking System (CTS) Evaluation
PP6.18 2013 Results – Bioassays
PP6.19 2010 Dioxin Guidelines
PP6.20 Elliott Bay Dioxin Results, highlighting S4 results
PP6.21 2013 Monitoring Conclusions, Hypothesis No. 1
PP6.22 2013 Monitoring Conclusions, Hypothesis No. 2
PP6.23 2013 Monitoring Conclusions, Hypotheis No. 3
PP6.24 2013 Monitoring Conclusions, Hypothesis No. 4
PP6.25 Recommendations
PP6.26 Target Disposal at Dioxin Hotspot
PP6.27 Shoreline Permit
PP6.28 Anderson/Ketron Disposal Site
PP6.29 A-K Fate and Transport Modeling
PP6.30 A-K Fate and Transport Modeling
PP6.31 Anderson/Ketron Disposal Site
PP6.32 DNR Managed Disposal
PP6.33 Grays Harbor DNR volumes
PP6.34 Questions?
Comments and Questions:
There were no questions.
CERCLA / SMS / MTCA Cleanup Updates
7. Lower Duwamish Waterway Update, Allison Hiltner (EPA)
Allison Hiltner (EPA), presented an update on cleanup activities at the Lower Duwamish Waterway Superfund site, including:
• Boeing Plant 2 cleanup – 2 seasons of dredging completed and habitat project built; cleanup will be completed in 2015
• Terminal 117 cleanup nearly complete. Some additional cleanup and habitat restoration will be completed in 2015.

SMARM Meeting Minutes 17 June 2014
• Jorgensen Forge cleanup to start in 2104.
• Fishers Study to learn more about who is consuming fish from the LDW is underway.
• Clam arsenic laboratory study completed.
• Carbon amendment pilot study is in initial stages.
• Numerous source control activities and studies underway (Ecology lead).
• EPA is considering public comments on Proposed Cleanup Plan and developing draft Record of Decision. We anticipate Record of Decision will be released by the end of this year.
Allison Hiltner
PP7.1 Lower Duwamish Waterway Update
PP7.2 Lower Duwamish Waterway
PP7.3 Key parts of the Duwamish cleanup
PP7.4 Lower Duwamish Waterway – What’s new
PP7.5 Lower Duwamish Waterway Project Team
PP7.6 Lower Duwamish Early Action Areas
PP7.7 Lower Duwamish Early Action Activity
PP7.8 Boeing Plant 2 Progress
PP7.9 Boeing Plant 2
PP7.10 Boeing Plant 2 Dredging Overview
PP7.11 Backfilling with clean sand
PP7.12 Boeing Plant 2, Construction Season 2 Production Summary
PP7.13 Boeing Plant 2 Project Status
PP7.14 New fish & Wildlife Habitat
PP7.15 New Fish & Wildlife Habitat
PP7.16 Terminal 117 project status
PP7.17 T-117 uplands/sediments cleanup, looking east
PP7.18 T-117 uplands/sediments, looking NE to Boeing Plant 2
PP7.19 T-117 uplands/sediments cleanup, looking north to south Park bridge
PP7.20 Jorgensen Forge

June 2014 18 SMARM Meeting Minutes
PP7.21 LDW Early Action Overview
PP7.22 Protecting Fish Consumers in EPA’s Superfund Cleanup – the LDW Fishers Study
PP7.23 Do Advisories Work?
PP7.24 Why don’t advisories work?
PP7.25 What’s Next
PP7.26 Activated Carbon Pilot Study
PP7.27 Evaluation of Exposure to Arsenic of the Eastern Soft Shell Clam
PP7.28 Lab-Based Questions
PP7.29 Sediment Collections Fractions
PP7.30 Exposure Methods
PP7.31 Tissue Results Comparison (mg/kg WW)
PP7.32 Source Control
PP7.33 Site Cleanup & Inspections: Ecology, EPA
PP7.34 Site Cleanup & Inspections Compliance Assurance
PP7.35 Source Control Studies
PP7.36 Record of Decision
PP7.37 For More Information
Comments and Questions:
Q: Jennifer Sutter (OR DEQ) – Can you give more details on the activated carbon study? Are the results of the workshop available to public?
A: Allison Hiltner (EPA) – Currently, we’re working on developing a Scope of Work (SOW). So this project is still in the early stages. We don’t yet know what activated carbon product will be used. Meeting notes from the February 2012 activated carbon workshop are EPA’s web site.
Q: Maria Peeler (CHB) – Is EPA going to give presentation on this work to the University of Washington CAFÉ meetings? This is a W. Seattle forum where UW and EPA provide information on the Lower Duwamish project in W Seattle.
A: Allison Hiltner (EPA) – I’ve never heard of these meetings. Let’s talk.
Q: James Keithly (ERM) – What is the overall schedule for the LDW cleanup? How long is it expected to take?

SMARM Meeting Minutes 19 June 2014
A: Allison Hiltner (EPA) – It will take a long time. After we sign the Record of Decision we will negotiate a cleanup agreement with potentially responsible parties. The proposed active remediation timeframe is 7-yrs. It may take 20-yrs for the whole thing if you include 10-yrs allowed for natural recovery.
Q: Jeff Stern (KC) – Why does the Jorgensen early action project have to be out of the water by Sept 7?
A: Allison Hiltner (EPA) – I don’t know. You will have to ask the Project Manager, Becky Chu.
8. SMS/MTCA Cleanup Projects Update, Kathy Taylor (Ecology)
Kathy Taylor (Ecology/Toxics Cleanup Program). Kathy Taylor presented an update regarding Ecology's sediment cleanup sites focused in Puget Sound. The presentation included an overview of the work conducted in Bellingham Bay, Fidalgo and Padilla Bays, Port Gardner and the Snohomish River Estuary, Seattle, Commencement Bay, Port Angeles, and Port Gamble. Additional detail was provided regarding the Custom Plywood cleanup in Anacortes and Ecology's cleanup and restoration activities in Port Gamble Bay. In-water cleanup work at Custom Plywood involved the removal of marine decaying structures, debris and pilings, sediment remediation for dioxin and wood waste, and habitat restoration and shoreline protection. The Port Gamble Bay cleanup is on schedule to begin implementation in July 2015. It involves removal of creosote and overwater structures, excavating intertidal sediments, removing and isolating wood waste, thin layer capping of moderate wood waste impacts, and long term monitoring of recovery after removing creosote sources from the bay. Ecology's other work in Port Gamble Bay includes providing funding for the recent acquisition of the western shoreline of Port Gamble Bay for ownership by Kitsap County. Ecology is also working with partners to conduct studies on pacific herring (with WDFW), restore eelgrass (with DNR), enhance native oyster populations (with the Puget Sound Restoration Fund), remove debris, derelict vessels and an unused pier from the bay (with the Port Gamble S'Klallam Tribe) and acquire additional land with surface water connections to Port Gamble Bay (with Kitsap County). In summary, many sediment cleanups are underway and Ecology is using innovative approaches, where possible, to restore and protect habitat on cleanup sites. Additional details are available at https://fortress.wa.gov/ecy/tcpwebreporting/Default.aspx.
Kathy Taylor
PP8.1 SMS/MTCA Cleanup Projects Update
PP8.2 Sediment Cleanup Sites
PP8.3 Major sediment cleanup areas in Puget Sound
PP8.4 Map depicting cleanup areas
PP8.5 Map depicting Bellingham cleanup sites
PP8.6 Map depicting all cleanup areas
PP8.7 Map depicting Anacortes cleanup sites
PP8.8 Anacortes cleanup sites

June 2014 20 SMARM Meeting Minutes
PP8.9 Map depicting Anacortes cleanup sites
PP8.10 Anacortes: Custom Plywood cleanup site
PP8.11 Anacortes: Custom Plywood cleanup site (Continued)
PP8.12 Anacortes: Custom Plywood, In-water Cleanup Work
PP8.13 Picture of cleanup area
PP8.14 – pp8.18 Picture of cleanup area (Continued)
PP8.19 Custom Plywood, Pete Adolphson (sediments) and Hun-Seak Park
PP8.20 Picture of cleanup area
PP8.21 – pp8.33 Picture of cleanup area (Continued)
PP8.34 Map of Cleanup areas
PP8.35 Port Gardner Cleanup areas
PP8.36 Map of cleanup areas
PP8.37 Map of Seattle cleanup sites
PP8.38 Seattle Cleanup Sites
PP8.39 – pp8.40 Seattle Cleanup Sites (Continued)
PP8.41 Map of cleanup areas
PP8.42 Map of Tacoma Cleanup sites
PP8.43 Tacoma Cleanup sites
PP8.44 Map of cleanup areas
PP8.45 Map of Port Angeles Cleanup sites
PP8.46 Port Angeles Cleanup sites
PP8.47 Map of cleanup areas
PP8.48 Map of Port Gamble cleanup sites
PP8.49 Port Gamble historical figure
PP8.50 Port Gamble historical figure (Continued)
PP8.51 Port Gamble Bay Cleanup Actions, Russ McMillan
PP8.52 – pp8.54 Port Gamble Figure (Continued)
PP8.55 Port Gamble Bay Proposed Cleanup

SMARM Meeting Minutes 21 June 2014
PP8.56 Proposed Site Cleanup Mill Site North
PP8.57 Proposed Site Cleanup Mill Site South
PP8.58 Proposed Site Cleanup Central Bay
PP8.59 Proposed Site Cleanup Former Lease Area
PP8.60 Proposed Cleanup Background Area
PP8.61 Port Gamble Bay Source Control, Habitat Preservation and Cleanup Sustainability (Celina Abercrombie)
PP8.62 Restoration and Preservation Projects:
PP8.63 Land Acquisition and Preservation, Western Shoreline block
PP8.64 Pacific Herring Studies
PP8.65 Eelgrass Restoration
PP8.66 Olympia Oyster Enhancement
PP8.67 Debris and Derelict Gear and Vessel Removal
PP8.68 Upcoming Restoration and Preservation Projects
PP8.69 Summary
Comments and Questions:
Q: Allan Chartrand (SFS): Is any of the Port Gamble wood waste being disposed of in open water? How about wood waste from other cleanups? A: Kathy Taylor (ECY) – They haven’t done the testing yet for disposal of Port Gamble sediments. Material from the Custom Plywood cleanup has gone to upland disposal sites only. [Post SMARM clarification from DMMP: Sediments from some wood waste projects have been evaluated and allowed to be disposed at open water disposal sites. Examples are Manke Lumber (2005) and more recently, a restoration project in Thatcher Bay (2009). Currently, wood waste material from the Port Gamble cleanup is being evaluated for open water disposal options. See DMMP guidance on wood waste for evaluation protocols.] http://www.nws.usace.army.mil/Portals/27/docs/civilworks/dredging/Updates/1997-arm_wood.pdf Q: Janet Knox (PGG): Is Sinclair Inlet on Ecology’s map of cleanup projects? If so what role does Ecology have there? A: Adam Harris (ECY) – Yes, Ecology is involved but the cleanup in Sinclair Inlet (PSNS) is an EPA CERCLA site.

June 2014 22 SMARM Meeting Minutes
Q: Ken Pelton (APEX Labs): Is TCP doing any work on ocean acidification? A: Kathy Taylor (ECY) – Ecology’s Toxics Cleanup Program is not studying it but there is lots of work on this topic being conducted by others. A: Joyce Mercuri (ECY) – For example, Taylor Shellfish is doing a lot of research on ocean acidification as it affects oysters.
Break and Poster Session
9. Sediment Characterization Core Sampling Issues, James McMillan (Corps)
James McMillan (Corps) presented a summary of sediment characterization sampling issues. Introduction: The Washington Dredged Material Management Program (DMMP) and the Portland Sediment Evaluation Team (PSET) review dozens of dredging projects annually. Under the auspices of the Clean Water Act and Ocean Dumping Act, the regulatory decisions made regarding the fate of dredged material depend on representative sediment characterization data.
Core sampling is often required to adequately characterize the physical and chemical makeup of the dredge material and in-situ residuals (aka, the new surface material, Z-layer, leave surface, or post-dredge surface). To adequately characterize the dredging project, core samples must be collected on-station, in thickest parts of the dredge prism. High core recovery helps ensure that samples/subsamples are collected from the target depths.
Staff from the DMMP and PSET met on 4 December 2013 to discuss core sediment sampling issues as they pertain to dredged material characterization. The DMMP and PSET agencies identified a wide range of core sampling issues and core sampling error caused by human negligence. The agencies also discussed potential guidelines and contingencies for these core sampling issues. The DMMP’s/PSET’s findings are the subject of this presentation.
Low Core Recovery: Percent core recovery is calculated by dividing the length of core sample retrieved by the depth the core barrel is advanced into the sediment profile (multiplied by 100). For example, if 5.25 ft. of sediment is collected from a core advanced 7.0 ft. into the sediment profile, then the core recovery is 75%. Low recovery is typically caused by substrate limitations; material may be lost from the core if there is wood debris present in the profile, or if the profile is composed of coarse-grained (sandy) sediment. If the substrate contains gravelly or cobbly material, the core may not penetrate at all; this is referred to a core refusal. Two types of phenomena that can lead to low core recoveries (and uncertainty in sediment sample collection) include: 1) sample shortening and 2) stratigraphic bypass. Sample shortening can be linear or non-linear, and most practitioners assume the former. Stratigraphic bypass is rarely assumed to occur. When core recovery is high, the occurrence of shortening and/or bypass is likely minimal. However, as

SMARM Meeting Minutes 23 June 2014
core recovery decreases, it is unclear whether shortening, bypass, or a combination of both, contributed to the low recovery (McGuire et al., 2012). If recovery is low and it is unclear if the correct dredge prism and Z-layer intervals were characterized, then the DMMP and PSET will err on the side of the resource. The DMMP and PSET agencies propose the following guidelines to minimize potential sampling error that may result from low core recovery:
1. Samplers must attempt to achieve 75% minimum core recovery. Multiple attempts must be made to attain 75% recovery.
2. If core refusal or low core recovery may be an issue, or if site conditions are unknown, then the practitioner should bring a grab sampler as a contingency.
3. If subsurface dredge prism units or the Z-layer cannot be sampled, or if the location of the interval in the core is uncertain, then post-dredge grab sampling may be required to characterize post-dredge conditions.
4. To minimize the core length and potential for sampling error, the DMMP and PSET agencies also recommend advancing the core nose no more than 1 ft. below the maximum depth of characterization.
Human Sampling Error: In recent years, the DMMP and PSET agencies have observed an increase in poorly executed sediment sampling events. Poor methodology, field notes, and core logging practices have contributed to mischaracterization of multiple dredging projects in both Washington and Oregon. Examples of human error include:
• Not correcting for tides or river levels • Not measuring the depth to mudline • Not measuring the depth of core penetration • Not calculated core recovery (or assuming 100% recovery without measuring depth of
penetration) • Incomplete and/or incorrect field records and data reporting
The DMMP and PSET agencies are proposing the following preventive measures to address human-related core sampling error:
• Pre-sampling meetings w/ DMMP/PSET • Standardize fields in sediment core (and grab) sample logs • Develop a field checklist for samplers
When sampling team negligence is evident, the DMMP and PSET agencies will always err on the side of the resource. Poorly executed core sampling events will take longer to review, because the agencies must determine which data are usable. If the project is incorrectly sampled, portions of the data may be rejected, and additional sampling and analysis may be required. Post-dredge characterization may also be required if the Z-layer was not characterized. The DMMP and PSET are seeking technical recommendations from the public to better inform the DMMP and PSET agencies and enhance/improve the proposed core sampling guidelines. After full consideration of public comments, these guidelines will be incorporated into local and regional dredged material evaluation guidance.

June 2014 24 SMARM Meeting Minutes
Reference: McGuire, C., P. McGuire, D. Richardson, & J. Holmstadt. 2012. Core sampling: influence on sediment profile interpretation. Presentation by TetraTech staff at the PIANC-COPRI Dredging 2012 Conference, 24 October 2012, San Diego, CA. http://dredging12.pianc.us/agd_detailss.cfml?ssid=166
Contact Information: Tel: 503.808.4376; email: [email protected]
James McMillan
PP9.1 Sediment Characterization: Core Sampling Issues
PP9.2 Sampling Objectives
PP9.3 Core Sampling Objectives
PP9.4 Presentation Objectives
PP9.5 Issue No. 1: Low Core Recovery
PP9.6 Low Recovery: substrate Limitations
PP9.7 Low Recovery: Sample shortening
PP9.8 Low Recovery: Stratigraphic bypass
PP9.9 Low Recovery – the Regulatory perspective
PP9.10 Core Sampling guidelines
PP9.11 Core Sampling guidelines (Continued)
PP9.12 Issue No. 2: Human Error
PP9.13 Human Error
PP9.14 Core Sample Log (depicting errors)
PP9.15 Human Error (Continued)
PP9.16 Human Error: What We’re Going to Do About it
PP9.17 We Need Your Help
PP9.18 Reference
PP9.19 Questions?
Comments and Questions:

SMARM Meeting Minutes 25 June 2014
Q: Roger McGinnis (Hart Crowser) – If your dredge prism extends into native material would you still have some of these concerns about core sampling? There are some areas where you can collect 20 cores and not get 75% recovery no matter what you do.
A: James McMillan (Portland COE) – It really depends on the project. If it involves new work dredging and it’s on the Columbia River, then you are likely to get into native sand. Generally, when you can’t get good recoveries no matter what technologies you use, the agencies may then require collection of the z after the dredge event.
Q: Tim Thompson (SEE) – I’m very surprised that you are asking if 75% is a reasonable minimum recovery; it’s more than reasonable. Here in Puget Sound, we have this as a minimum plus we typically will try collection 3 times and then only move the station after checking in with the agencies. I’m surprised that others think that 75% recover isn’t achievable. As for core logs, “gINT” software has standardized format logs that may work well and can be edited to add features. The upshot is, that standardized log forms shouldn’t be a problem to implement.
A: James McMillan (Portland COE) – I don't think we want to standardize the forms, just the information that's collected. Regardless of the agency or contractor doing the work, each form should have the same fields. I really don't want to impose the use of gINT core logs & database on everyone.
Q: Jeff Stern (KC) – Since It’s difficult to know if you are really sampling the z-layer, why not just always require post dredge z sampling? When we sample beforehand, we don’t really know if we’ve characterized the z layer; we’re just guessing.
A: Laura Inouye (ECY) – The reason we typically characterize the z-layer before dredging is that many agencies and applicants need/want to know beforehand if the z-layer fails. When the z-layer fails, it may require different construction depth/volumes to accommodate over dredging. The planning and placement and time needed will change as a result. Furthermore, a different type of permit could be required.
A: James McMillan (Portland COE) – In addition, the Services want to see this information before the project is permitted. Anti-degradation policy requires it.
Q: Matt Childs (American Construction) – Do you envision pre-sampling meetings to be over the phone or must they be a face-to-face meeting?
A: James McMillan (Portland COE) and Laura Inouye (ECY) – We are thinking that a phone call will usually be sufficient.
10. Results of PCB Homologue Studies, Laura Inouye (Ecology) and Kelsey Van der Elst (Corps)
Laura Inouye (Ecology): Two studies (Corps, Ecology) on alternative PCB analysis were discussed. Aroclor analysis has issues with weathering, high detection limits, and inability to determine dioxin-like PCB-TEQs. These studies investigated the potential of low resolution GC-MS methods (LRMS) as a lower

June 2014 26 SMARM Meeting Minutes
cost surrogate for total PCBs and for calculating dioxin-like PCB-TEQs. The Corps dataset, which had higher concentrations of PCBs as compared to the Ecology dataset, showed that PCB-Aroclor over-estimated total PCBs, while the Ecology dataset showed Aroclor PCBs slightly lower than that calculated by GCMS methods. Both studies had excellent, almost 1:1 correlation between high resolution MS (HRMS) and LRMS methods, even when different LRMS methods were used. The second part of the study, the development of homolog TEFs, was based on Ecology’s dataset only, since the approach could not be conducted with the Corps dataset due to elevated detection limits. All the dioxin-like PCB congeners fall into four of the homolog groups. Using the HRMS data, TEF’s were calculated for each sample by: 1) summing the congeners into homolog groups, 2) summing the HRMS congener TEQs in each homolog group, and 3) dividing the HR-MS homolog TEQ by the HR-MS homolog concentrations. All 10 samples were analyzed and the resulting TEFs averaged. The average homolog TEF was then used to calculate HRMS sum homolog TEQ and LRMS sum homolog TEQ, which were compared to the HRMS sum congener TEQs (calculated by using the standard congener specific TEF approach). The LRMS homolog sum TEQ correlated well with both HRMS homolog sum TEQs and HRMS congener sum TEQ. A single sample what was analyzed by both studies (PS-SRM), and application of the homolog TEFs indicated that the LRMS homolog approach likely provides a better estimate of PCB-TEQ than Kaplan Meier sum TEQ when detection limits are elevated. Due to new sediment regulations, the DMMP agencies may need to evaluate new guidance for PCBs, depending on regional background results, which are still being developed. While there are no proposals at this time, a summed PCB and dioxin TEQ approach may be appropriate for the disposal sites. What little data is available for samples with both HRMS PCBs and dioxins indicates that in typical samples away from known PCB sources, about 4-11% of the total TEQ is due to PCBs, the rest to dioxins. Although the LRMS TEQ approach is promising, more studies are needed prior to application of the approach for dredging. Laura Inouye
PP10.1 PCB Alternative Analysis, Comparison of Aroclor to low and high-resolution GCMS
PP10.2 Introduction
PP10.3 Approach
PP10.4 USACE Study, Total PCBs
PP10.5 USACE Total PCB Results
PP10.6 Ecology Study, Total PCBs
PP10.7 Combined Studies, Total PCBs

SMARM Meeting Minutes 27 June 2014
PP10.8 Ecology Study, Total PCBs
PP10.9 Comparison of Studies, Total PCBs
PP10.10 Combined Studies, Total PCBs
PP10.11 Total PCB Summary
PP10.12 Developing PCB Homolog TEFs
PP10.13 TEQ definition
PP10.14 Homolog-TEF derivation
PP10.15 Sample-specific homolog TEF calculations: ECY HRMS data
PP10.16 Sample-specific homolog TEF calculations: ECY HRMS data (Continued)
PP10.17 Sample-specific homolog TEF calculations: ECY HRMS data (Continued)
PP10.18 Average homolog TEF: ECY HRMS data
PP10.19 TEFhomo Analysis
PP10.20 HR-GCMS congener sum TEQ vs sum TEQ from homolog TEF
PP10.21 How Robust is the Homolog TEF?
PP10.22 Homolog TEF and PS-SRM results:
PP10.23 Homolog TEF Summary
PP10.24 So What?
PP10.25 So What? (Continued)
PP10.26 Next Steps
PP10.27 Comments? Questions?
Comments and Questions:
Q: Susan McGroddy (Windward) – Homologue analysis is a great approach for measuring total PCBs. ARI says that the homologue method costs approximately $300. But I would urge extreme caution in using homologue data to estimate PCB TEQ. Have you performed pattern analysis? Have you looked at the different distributions of congeners? East Waterway has tons of PCB data. There are other sites too.
A: Laura Inouye (ECY) – I’ve done a lot of analyses with this data that I don’t have time to present here. And there appears to be very little HRMS data out there with good enough detection limits. [Post SMARM clarification from Ecology: Laura was referring to available data within Ecology’s EIM database, which was the data being used in this analysis]. What I did find was that some the data sets I had gave the same data pattern. Other datasets had an odd split with some of the data having a 1:1 correlation
June 2014 28 SMARM Meeting Minutes
between High Res congener TEQ and homolog TEF-calculated TEQ results, and some data having a different correlation between the two methods (falling off the 1:1 relationship). Identifying these may be the way to determine if PCBs are from a specific source or characterized by ambient patterns. I will follow up on getting more data for future presentations.
Q: Roger McGinnis (Hart Crowser) – The congener composition of each Aroclor is different. Do you know what Aroclor(s) you had in your samples? My concern with your approach to developing homologue TEFs is as you change predominant Aroclor, the congener compositions will change. You could be comparing different data sets with different predominant Aroclor patterns.
A: Laura Inouye (ECY) - We have some Aroclor info on these samples but the different labs disagreed on which Aroclors were present. I have tried this comparison with some data sets where the relationship held – these were samples with PCBs from mixed sources.
Q: Roger McGinnis (Hart Crowser) - PCB TEFs are low compared to dioxin. Will the PCB contribution really make a difference if your dioxin concentrations are close to 4 pptr TEQ?
A: Laura Inouye (ECY) – Agreed. For most projects to date, if data approaches or exceed the 4 pptr TEQ based on dioxin concentrations, then data (especially volume-weighted averages) are typically already over the threshold. In that case, PCB contribution to TEQs won’t be the make-or-break element.
Tim Thompson (SEE) – Is this data available for public review? Did you correct for Axys’ diff homologue method?
A: Laura Inouye (ECY) – My analysis and homologue TEF calculations aren’t available at this point. The raw data is all available in an ECY publication. [Post SMARM clarification from Ecology: the report can be found at:
https://fortress.wa.gov/ecy/publications/SummaryPages/1403009.html
11. Bioavailability Assessment Using Passive Porewater Samplers, Mandy Michalsen (Corps)
Mandy Michalsen (Corps). Passive samplers permit direct measurement of freely dissolved contaminant concentrations in sediment porewater, which provide a better proxy for contaminant bioavailability. Results of three passive sampler field demonstrations were presented. Solid-phase microfiber extraction (SPME) fiber samplers were used to quantify depth-discreet porewater concentrations of PAHs at two creosote-contaminated sediment sites to assess performance of sediment cap remedies. Polyethylene (PE) samplers were used similarly to quantify porewater concentrations of PCBs in sediment. In all demonstrations, the passive samplers permitted direct, in situ measurement of freely dissolved contaminant concentrations at the ng/L level. Each passive sampler was sectioned into depth-discreet sections, which permitted an assessment of concentration gradients at each location, thereby permitting an assessment of both compliance with surface water quality critera near the sediment surface, as well as evidence of bottom-up contaminant recontamination through sediment caps.

SMARM Meeting Minutes 29 June 2014
Mandy Michalsen
PP11.1 Sediment Bioavailability Assessment Using Passive Porewater Samplers
PP11.2 Bulk Sediment Concentrations are Poor Predictors of Toxicity
PP11.3 Estimating Bioavailability from Bulk Sediment has limitations
PP11.4 Measuring Porewater Contaminants
PP11.5 Porewater Sampler Demonstration, Lower Duwamish Waterway Superfund Site, EPA Region 10
PP11.6 Polyethylene (PE) Porewater Sampler Field Demonstration Objective
PP11.7 PE Deployment Locations in Lower Duwamish Waterway
PP11.8 Sampling/Analysis Program Schematic
PP11.9 PE Sampler visuals
PP11.10 Results by Key Congeners
PP11.11 Pacific Sound Resources (PSR) Superfund Site
PP11.12 Solid-Phase Microextraction (SPME)
PP11.13 SPME Fiber Field Demonstration at PSR
PP11.14 SPME Fiber Results
PP11.15 SPME Fiber Results
PP11.16 SPME Porewater Sampler Demonstration at Wyckoff/Eagle Harbor Superfund Site
PP11.17 SPME Fiber Demonstration at Wyckoff/Eagle Harbor
PP11.18 Corrections for Steady State
PP11.19 Concentration Depth Profiles Allow Assessment of Through-Cap Migration
PP11.20 Bulk Sediment Estimated Porewater vs. Measured Porewater
PP11.21 Take Home Message
PP11.22 Standard Methods and Laboratories
Comments and Questions:
Q: Are these methods published?
A: Mandy Michalsen – The standard method document has not yet been released. It will contain field and analytical information. Method scientific information is also in the recently published SETAC journal

June 2014 30 SMARM Meeting Minutes
[Post SMARM clarification from COE: The journal is titled Integrated Environmental Assessment and Management and can be found at: http://www.onlinelibrary.wiley.com/doi/10.1002/ieam.v10.2/issuetoc This issue has 6 “free” articles describing scientific consensus on methods and applications for passive sampling. A second manual is coming out in the next year that will give information on the relevance and application of the results of passive porewater sampling. The reference for this is ER-201216 Sediment Bioavailability Initiative (SBI): Development of Standard Methods and Approaches for the Use of Passive Samplers in Assessment and Management of Contaminated Sediment and can be found at: http://www.serdp.org/Program-Areas/Environmental-Restoration/Contaminated-Sediments/ER-201216/ER-201216/(language)/eng-US Some key URLs to find out more are:
• http://www.serdp.org/Program-Areas/Environmental-Restoration/Contaminated-Sediments/ER-200915
• http://www.serdp.org/Program-Areas/Environmental-Restoration/Contaminated-Sediments/ER-201216/(language)/eng-US
• http://www.serdp.org/content/download/16022/182923/file/Sediment%20Workshop%20Report_October%202012.pdf ]
Q: Alan Chartrand (SFS) – Have correlations been made with standard bioaccumulation test organisms?
A: John Wakeman (COE) – There is a large body of information both from the lab and the field showing a high level correlation between porewater and tissue for lots of species (both freshwater and marine). There is also information from the Feb 2012 Lower Duwamish Waterway meetings on Activated Carbon (some of which is on the LDW web site).
[Post SMARM clarification from COE: Additional information on Activation Carbon can be found in the following articles:
• http://www.serdp.org/Program-Areas/Environmental-Restoration/Risk-Assessment/ER-1552 • Millward RN. Bridges TS, Ghosh U, Zimmerman JR, Luthy R. 2012. Addition of Activated Carbon
to Sediments to Reduce PCB Bioaccumulation by a Polychaete (Neanthes arenaceodentata) and an Amphipod (Leptocheirus plumulosus)Lampert, DJ, WV Sarchet, DD Reible. 2011. Assessing the Effectiveness of Thin-Layer Sand Caps for Contaminated Sediment Management through Passive Sampling. Environ. Sci. Technol. 2011, 45, 8437–8443
Lu, X.; Skwarski, A.; Drake, B.; Reible, D. Predicting Bioavailability of Polycyclic Aromatic Hydrocarbons and Polychlorinated Biphenyls with Pore Water Concentrations Measured by Solid-Phase Micro-Extraction Fibers. Environ. Toxicol. Chem. 2011, 30, 1109–1116.
Q: Alan Chartrand (SFS) – How did you measure porewater?
A: Mandy Michalsen – Porewater was measured directly from the sampler, which was secured within a perforated protective stainless steel casing and inserted directly into the sediment. The sampler polymer is deployed for a period of time (typically weeks) required to reach equilibrium with the freely dissolved contaminants present in the porewater. Following retrieval, the polymer sampled is sectioned into discreet intervals, the polymer is extracted in solvent, and then the extract analyzed using standard analytical methods. This approach is not new – SPME fibers have been used in the laboratory for years

SMARM Meeting Minutes 31 June 2014
to obtain low-level detection limits in aqueous samples. This commonly used laboratory method was simply modified for use directly in the field for exposure in situ, i.e. SPME deployment directly in sediment using the protective stainless steel samplers. Otherwise, we used a standard extraction process. Afterwards you convert the result to a porewater concentration using known partition coefficients specific to the polymer.
Q: Joyce Mercuri (ECY) – Pore water concentrations were back-calculated from bulk concs in sediment, right?
A: Mandy Michalsen – No. The porewater concentrations were derived from the sorbed PCBs directly quantified using polymer extracts, then adjusted for progress towards equilibrium using deuterated Performance Reference Standards pre-loaded into the sampler polymer. In the case of the Pacific Sound Resources site, the first one illustrated for PAHs, another calibration method was used (association rates with thicker and thinner fibers).
Q: Roger McGinnis (Hart Crowser) – where did you get Passive Sampler association constants for PCBs?
A: Tim Thompson (SEE) – The SETAC paper referenced above has 40 different people (Pellston workshop), and gives consensus partition coefficients for SPMES. They standardized the process. Phil Gschwend and Danny Reible also compared methods in 2011 paper. They compared porewater measurement from a sample and the SPME methods. Upshot is that there is good science backing this methodology up.
12. Public Issue Papers.
There were no public issue papers presented prior to or during the 26th SMARM.
SUMMARY AND CLOSING
Justine Barton, thanked everyone for coming to the 26th SMARM. She concluded the 26th annual SMARM by announcing that the clarification and issue papers were currently on the website and that the SMARM presentations will be posted to the website soon. She reminded everyone that the deadline for submitting comments on the SMARM topics and Ecology SMS/MTCA topics is June 6, 2014.
Meeting Adjourned

June 2014 32 SMARM Meeting Minutes
This page is intentionally blank.

APPENDIX I
DMPP Response to Public Issues

This page is intentionally blank.

APPENDIX II
Meeting Agenda

This page is intentionally blank.

2014 Sediment Management Annual Review Meeting
Corps of Engineers, Seattle District May 7, 2014
Comments on SMARM issues accepted through June 6, 2014
8:30 REGISTRATION AND COFFEE
9:00 Welcome Moderator, Justine Barton, EPA
9:05 Opening Remarks Lt. Col. Andrew Park, Deputy Commander, Seattle District Corps of Engineers
9:15 SMS Rule Implementation Updates (Regional Background, Draft Sediment Cleanup Users Manual II, etc.)
Chance Asher, Ecology
10:00 DMMP Issue: Adoption of Chemistry Freshwater Guidance Laura Inouye, Ecology
10:30 BREAK
10:45 DMMP Clarification: Freshwater Bioassay Requirements & Interpretation Laura Inouye, Ecology
11:15 DMMP Project Testing Summary David Fox, Corps
11:35 DMMP Clarifications and Updates Lauran Warner, Corps
11:45 LUNCH
12:45 DNR Update & Disposal Site Monitoring Results Celia Barton, DNR & David Fox, Corps
1:15 Lower Duwamish Waterway Update Allison Hiltner, EPA
1:45 SMS/MTCA Cleanup Projects Update Kathy Taylor, Ecology
2:15 BREAK
2:35 Sediment Characterization: Core Sampling Issues James McMillan, Corps
2:55 Results of PCB Homologue Studies Laura Inouye, Ecology
3:15 Bioavailability Assessment Using Passive Porewater Samplers Mandy Michalsen, Corps
3:45 Public Issues and Discussion
4:30 SUMMARY & CLOSING

This page is intentionally blank.

APPENDIX III
List of Attendees

This page is intentionally blank.
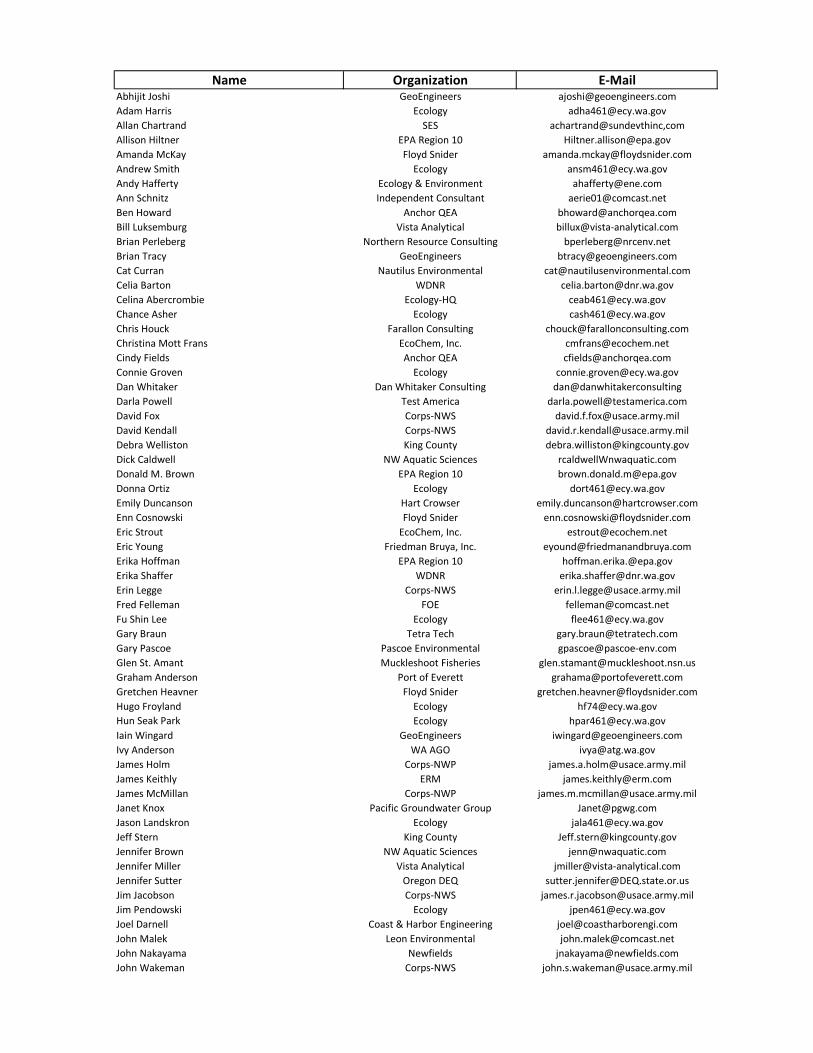
Name Organization E-MailAbhijit Joshi GeoEngineers [email protected] Harris Ecology [email protected] Chartrand SES achartrand@sundevthinc,comAllison Hiltner EPA Region 10 [email protected] McKay Floyd Snider [email protected] Smith Ecology [email protected] Hafferty Ecology & Environment [email protected] Schnitz Independent Consultant [email protected] Howard Anchor QEA [email protected] Luksemburg Vista Analytical [email protected] Perleberg Northern Resource Consulting [email protected] Tracy GeoEngineers [email protected] Curran Nautilus Environmental [email protected] Barton WDNR [email protected] Abercrombie Ecology-HQ [email protected] Asher Ecology [email protected] Houck Farallon Consulting [email protected] Mott Frans EcoChem, Inc. [email protected] Fields Anchor QEA [email protected] Groven Ecology [email protected] Whitaker Dan Whitaker Consulting dan@danwhitakerconsultingDarla Powell Test America [email protected] Fox Corps-NWS [email protected] Kendall Corps-NWS [email protected] Welliston King County [email protected] Caldwell NW Aquatic Sciences rcaldwellWnwaquatic.comDonald M. Brown EPA Region 10 [email protected] Ortiz Ecology [email protected] Duncanson Hart Crowser [email protected] Cosnowski Floyd Snider [email protected] Strout EcoChem, Inc. [email protected] Young Friedman Bruya, Inc. [email protected] Hoffman EPA Region 10 [email protected] Shaffer WDNR [email protected] Legge Corps-NWS [email protected] Felleman FOE [email protected] Shin Lee Ecology [email protected] Braun Tetra Tech [email protected] Pascoe Pascoe Environmental [email protected] St. Amant Muckleshoot Fisheries [email protected] Anderson Port of Everett [email protected] Heavner Floyd Snider [email protected] Froyland Ecology [email protected] Seak Park Ecology [email protected] Wingard GeoEngineers [email protected] Anderson WA AGO [email protected] Holm Corps-NWP [email protected] Keithly ERM [email protected] McMillan Corps-NWP [email protected] Knox Pacific Groundwater Group [email protected] Landskron Ecology [email protected] Stern King County [email protected] Brown NW Aquatic Sciences [email protected] Miller Vista Analytical [email protected] Sutter Oregon DEQ [email protected] Jacobson Corps-NWS [email protected] Pendowski Ecology [email protected] Darnell Coast & Harbor Engineering [email protected] Malek Leon Environmental [email protected] Nakayama Newfields [email protected] Wakeman Corps-NWS [email protected]
Jonathan Freedman EPA Region 10 [email protected] Smith URS [email protected] Dunay Anchor QEA [email protected] Mercuri Ecology [email protected] Barton EPA Region 10 [email protected] Karen Tobiason Windward Environmental [email protected] Godfredsen Windward Environmental [email protected] Kreps Test America [email protected] Taylor Ecology [email protected] van der Elst Corps-NWS [email protected] Kroeger Geosyntec kkroeger@geosynteccomKen Johnson Weyerhaeuser [email protected] Patton APEX Labs [email protected] Kerns Corps-NWS [email protected] Anderson Port of Seattle [email protected] Dunn Lower Elwha Klallam Tribe [email protected] Inouye Ecology [email protected] Johnson Pacific Groundwater Group [email protected] Warner Corps-NWS [email protected] Anderson-Carnahan EPA Region 10 [email protected] Read Terra Stat [email protected] Andrew Park Corps-NWS Deputy DE [email protected] Michalsen Corps-NWS [email protected] Datin Public [email protected] Victoria Peeler CHB [email protected] Novak WSDOT [email protected] Rettmann Port of Tacoma [email protected] Childs American Construction [email protected] O'Brien Ecology [email protected] Hollis Port of Portland [email protected] Woodward Leon Environmental [email protected] Ott Crete [email protected] Garjuilo AECOM [email protected] Leon Leon Environmental [email protected] Striplin Ecology [email protected] A. Weiss Corps-NWS [email protected] McGinnis Hart Crowser [email protected] Freier-Coppinger Ecology [email protected] McMillan Ecology [email protected] Bowerman The Intelligence Group [email protected] Browning Integral Consulting [email protected] Brown Corps-NWS [email protected] Hooton Port of Tacoma [email protected] R. Brown EPA Region 10 [email protected] Carrubba Corps-NWD [email protected] Mairs EPA Region 10 [email protected] Shaw Landau Associates [email protected] Dunnihoo ARI [email protected] Edwards Ecology [email protected] McGroddy Windward Environmental [email protected] Deshler Coho Environmenal [email protected] Reichgott EPA Region 10 [email protected] Michelsen Avocet [email protected] Thompson SEE [email protected] Poyfair ALS Environmental [email protected] Vu U.S. EIM [email protected] Sutton Ecology [email protected] Do University of Washington [email protected] England Berger Abam [email protected] Wagner Corps-NWS [email protected]

APPENDIX IV
PowerPoint Slides for Each Speaker

This page is intentionally blank.

pp-1
SMARM
Sediment Policy UpdatesToxics Cleanup Program
Chance AsherMay 7, 2014
pp-1-1
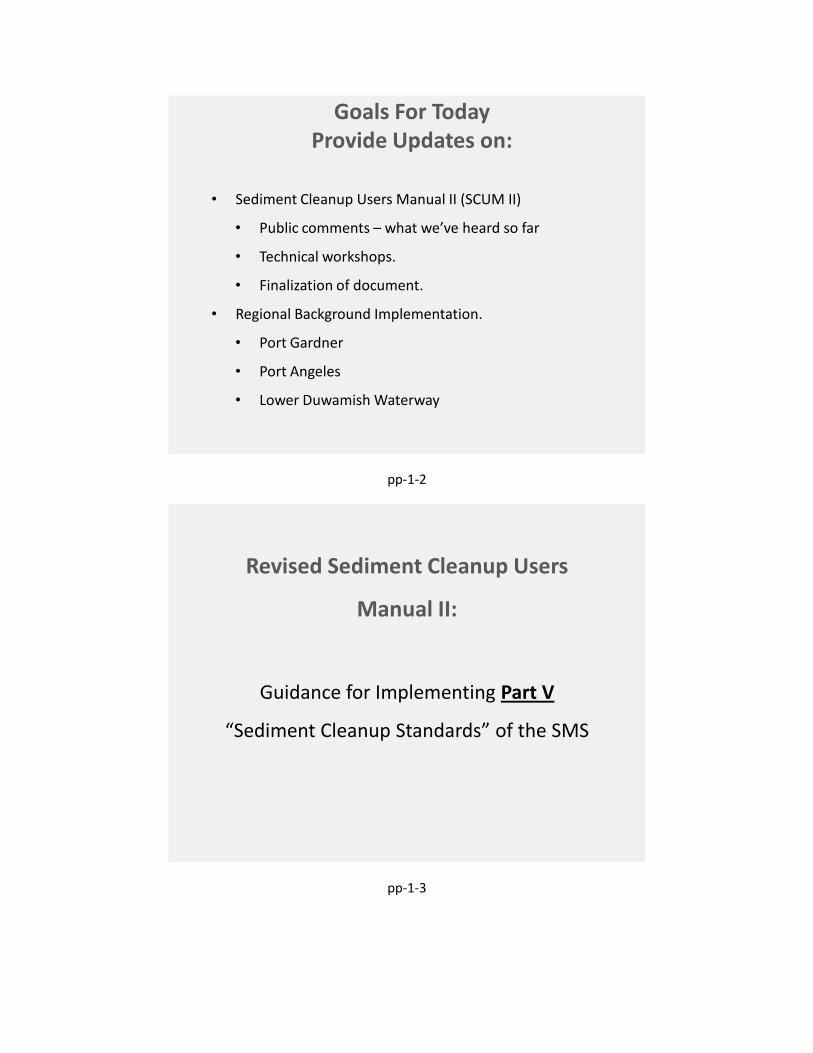
Goals For TodayProvide Updates on:
• Sediment Cleanup Users Manual II (SCUM II)
• Public comments – what we’ve heard so far
• Technical workshops.
• Finalization of document.
• Regional Background Implementation.
• Port Gardner
• Port Angeles
• Lower Duwamish Waterway
pp-1-2
Revised Sediment Cleanup Users
Manual II:
Guidance for Implementing Part V
“Sediment Cleanup Standards” of the SMS
pp-1-3

Acknowledgements• Laura Inouye, Ecology
• Russ McMillan, Ecology
• Dave Bradley, Ecology
• Pete Adolphson, Ecology
• Pete Kmet, Ecology
• Craig McCormack, Ecology
• Teresa Michelsen, Avocet Consulting
• Chris Waldron, Pioneer
• Lorraine Read, TerraStat Consulting
• Mike Ehlebracht & Roger McGinnis, Hart Crowser
• Taku Fuji, Anchor QEA
• Lon Kissinger, EPA
• Sediment Management Standards Advisory Group Members
pp-1-4
A Tale of Two SCUMs
• SCUM I• Source Control Users Manual.• Published in 1993.• In need of updating.
• SCUM II• Sediment Cleanup Users Manual.• Published in 1991.• 2013 revised version includes:
• Process of sediment cleanup from “start” to “finish”.• Focused mainly on implementation of Part V of the 2013
SMS rule.• Includes the information in the Sediment Sampling and
Analysis Plan (SAPA).• The SAPA will become obsolete once SCUM II is final.
pp-1-5

Draft SCUM II – Summary of Content
• Incorporated newer science, reorganized to follow the cleanup process from site identification to compliance monitoring, and reflects the 2013 SMS rule revisions.
• Chapter 1: SMS rule framework & guidance document organization.
• Chapter 2: Site identification of sites, screening CoCs, development of a conceptual site model.
• Chapter 3: Remedial investigation, sampling guidance.
• Chapters 4 - 6: Updated tests, lab analysis and QA/QC procedures, data analysis and reporting.
pp-1-6
Draft SCUM II – Summary of Content • Chapter 7: Cleanup standards framework
• Chapter 8: Benthic criteria.
• Chapter 9: Human health criteria.
• Chapter 10: Higher trophic level criteria.
• Chapter 11: Natural and regional background.
• Chapter 12: Practical quantitation limits.
• Chapter 13: Sediment cleanup units.
• Chapter 14: Feasibility study & remedy selection:
• Chapter 15: Sediment recovery zones.
• Chapter 16: Compliance monitoring.
• Chapter 17: Applicable laws and authorizations required.
pp-1-7
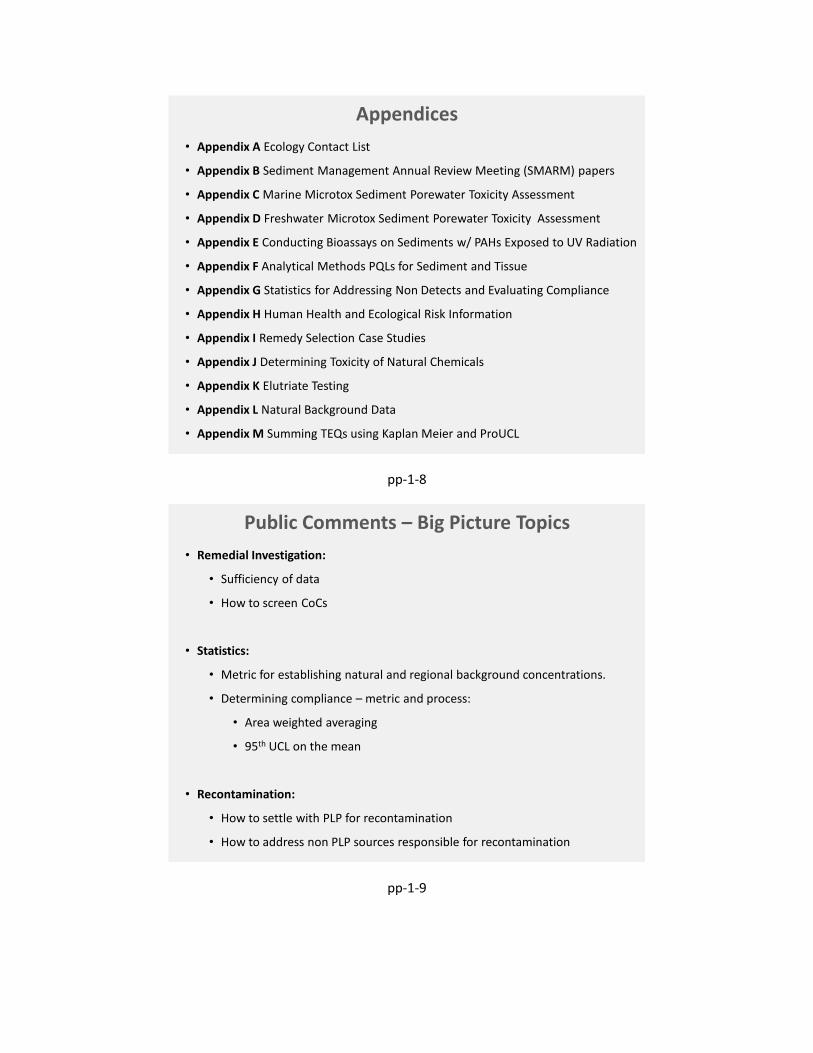
Appendices• Appendix A Ecology Contact List
• Appendix B Sediment Management Annual Review Meeting (SMARM) papers
• Appendix C Marine Microtox Sediment Porewater Toxicity Assessment
• Appendix D Freshwater Microtox Sediment Porewater Toxicity Assessment
• Appendix E Conducting Bioassays on Sediments w/ PAHs Exposed to UV Radiation
• Appendix F Analytical Methods PQLs for Sediment and Tissue
• Appendix G Statistics for Addressing Non Detects and Evaluating Compliance
• Appendix H Human Health and Ecological Risk Information
• Appendix I Remedy Selection Case Studies
• Appendix J Determining Toxicity of Natural Chemicals
• Appendix K Elutriate Testing
• Appendix L Natural Background Data
• Appendix M Summing TEQs using Kaplan Meier and ProUCL
pp-1-8
Public Comments – Big Picture Topics• Remedial Investigation:
• Sufficiency of data
• How to screen CoCs
• Statistics:
• Metric for establishing natural and regional background concentrations.
• Determining compliance – metric and process:
• Area weighted averaging
• 95th UCL on the mean
• Recontamination:
• How to settle with PLP for recontamination
• How to address non PLP sources responsible for recontamination
pp-1-9

Public Comments – Big Picture Topics• Bioavailability:
• Use of tissue data to:
• Determine cleanup levels
• Determine compliance with cleanup levels
• Incorporate into assessment for selecting the preferred remedy
• Remedy Selection:
• Alternative ideas for conducting the disproportionate cost analysis.
• More emphasis on remedial technologies “preference” based on:
• Bioavailability: bioaccumulation vs. acute/chronic benthic impact
• Adverse environmental impacts from dredging
• Sediment Recovery Zones: How and what to monitor
pp-1-10
Public Comments – Big Picture Topics• Human Health:
• Exposure parameters:
• Fish consumption rate – more detail on how to establish
• Site use factor – how this can or should be incorporated
• Fish diet fraction – inclusion of salmon or other pelagic fish
• QA / QC:
• Laboratory methods for bioaccumulative chemicals
• Use of non approved methods
• Regional Background:
• Conservative framework results in values below recontamination potential
pp-1-11

SCUM II Technical Workshops• Purpose. Provide an opportunity for Ecology to collaboratively work with people to
resolve key issues to finalize SCUM II.
• Logistics: Workshops will be held at the Ecology Bellevue Office from 9 AM – 1 PM.
July 17, 2014 July 31, 2014 August 6, 2014
Screening CoCs Remedial Investigations Establishing Cleanup Levels
Natural/Regional Background
Human/Ecological Health Risk Assessments
Remedy Selection
Compliance Monitoring Bioavailability Sediment Recovery Zones
pp-1-12
SCUM II Timeline & Next Steps
75 Day Public
Comment Period Ends
Conduct Technical
Workshops to Discuss
Comments & Resolve
Technical Issues
Process Public
Comments
March 2014 May 16, 2014
Utilize Collective
Feedback to Finalize SCUM II
May – June 2014
Draft posted for a
60 Day Public
Comment Period
July/August 2014 Fall 2014
pp-1-13

SCUM II – Future Opportunities for Revisions
• SCUM II is intended to be a “living” guidance document.
• Regular and focused revisions will be made through SMARM to:
• Reflect newer science as appropriate
• Correct errors as they are discovered
• Update policy
• Incorporate lessons learned from experience as the SMS rule
and SCUM II are implemented
14
pp-1-14
Now for something
completely different……
15
pp-1-15

Regional Background Updates
• Briefly describe the regional background concept.
• Provide context for how and why we’re conducting supplemental sampling for Port Gardner based on feedback received.
• Communicate next steps and our timeline for:
• Completing the Port Gardner regional background work.
• Completing the Port Angeles data report.
• Completing the initial development of the LDW SAP.
16
pp-1-16
Benthic Community RiskHuman Health Risk
Ecological Risk ARARs
Risk based criteriaLowest of:
Sediment Cleanup ObjectiveHighest of:
Cleanup Screening LevelHighest of:
Regional Background
PQL
Sediment Cleanup Level
Background & SMS rule - Establishing Cleanup Levels
Risk based criteriaLowest of:
Natural Background
PQL
Benthic Community RiskHuman Health Risk
Ecological Risk ARARs
17
pp-1-17

Intent of Regional Background
18
• To address the reality of ubiquitous contaminants continuously
entering the environment .
• To provide a technically implementable structure to meet and
maintain cleanup standards given the potential for recontamination
from diffuse and uncontrollable sources.
• Can include some influence from definable sources such as piped
stormwater, but not the direct influence (that is, the primary
contributor).
pp-1-18
Regional Background - What it is NOT
19
• Not primarily influenced by definable sources (e.g. a cleanup site).
• Not defined by “recontamination potential” that is primarily from
definable sources (e.g. a stormwater discharge from a pipe).
• Cannot solely sample within an area of relatively elevated
concentrations due to the direct impact of a definable source. For
example:
• Within the depositional zone of an outfall, if a clear depositional zone exists.
• Within an established cleanup site (that hasn’t been cleaned up).
• Not natural background – if there’s a statistically significant
difference between regional and natural background.
pp-1-19

Ecology’s Regional Background Engagement Process
20
Port Gardner:
• 2013 Draft SAP reviewed by stakeholders/tribes & discussed at a workshop.
• 2013 data package (data and summary statistics) reviewed by stakeholders.
Port Angeles:
• 2013 Draft SAP reviewed by public & discussed at public meetings.
• 2013 data made available to public.
Elliott Bay / Lower Duwamish Waterway:
• September 2013: Technical workshop to discuss establishing regional
background and SAP sampling design options due to feedback received for
Port Gardner and Port Angeles work.
pp-1-20
How Ecology Considered Comments
21
• We considered the collective comments received over the past year on our regional background approaches and decided to re-focus our efforts on Port Gardner Bay.
• We analyzed the usefulness and technical feasibility of:
• Developing a conceptual bay model to guide a more appropriate selection of sampling stations representative of regional background.
• Conducting alternate types of sampling (sediment traps).
• Using bay-specific data to define the appropriate distance from the shoreline and historic, current, and potential sources.
pp-1-21
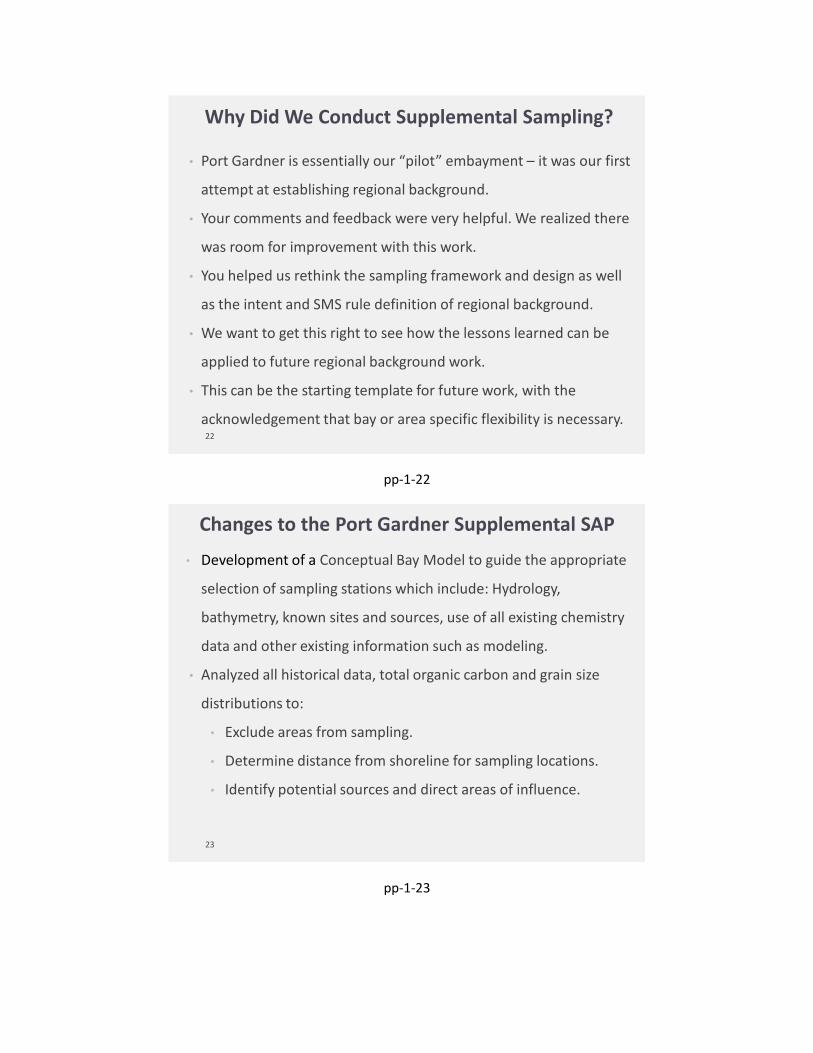
Why Did We Conduct Supplemental Sampling?
22
• Port Gardner is essentially our “pilot” embayment – it was our first
attempt at establishing regional background.
• Your comments and feedback were very helpful. We realized there
was room for improvement with this work.
• You helped us rethink the sampling framework and design as well
as the intent and SMS rule definition of regional background.
• We want to get this right to see how the lessons learned can be
applied to future regional background work.
• This can be the starting template for future work, with the
acknowledgement that bay or area specific flexibility is necessary.
pp-1-22
Changes to the Port Gardner Supplemental SAP
23
• Development of a Conceptual Bay Model to guide the appropriate
selection of sampling stations which include: Hydrology,
bathymetry, known sites and sources, use of all existing chemistry
data and other existing information such as modeling.
• Analyzed all historical data, total organic carbon and grain size
distributions to:
• Exclude areas from sampling.
• Determine distance from shoreline for sampling locations.
• Identify potential sources and direct areas of influence.
pp-1-23

These Changes Resulted In:
24
• Refined sampling area by adding nearshore areas potentially
influenced by diffuse urban sources but excluding areas primarily
influenced by sites or sources.
• Exclusion of approximately ½ of the original 2013 sampling area
(Phase I) to avoid sampling in areas primarily influenced by natural
background sources as opposed to the urban environment.
• Combined the remaining Phase I sampling area with the new
Phase II sampling area in a statistically appropriate manner.
pp-1-24
Conceptual Bay ModelEvaluation of Sources, Sites, and Areas of Influence
25
• Ecology is currently focusing on cleaning up ten identified
contaminated sites. The influence of these sites was considered.
• Three additional areas of potential influence were further
evaluated:
• Deep water diffuser outfall southwest of Weyerhaeuser Mill A.
• Historical disposal area (1954 – 1966) - had not been used.
• Dredged Material Management disposal site - currently active.
pp-1-25

% Total Organic Carbon & Grain Size DistributionsSampling area guided by < 30% fines and < 1% TOC contours (solid line)
Original sampling area (dotted line)
26
pp-1-26
Existing Sediment Concentrations: cPAHs & Dioxins/Furans
27
pp-1-27

Existing Sediment Concentrations: Cadmium & Arsenic
28
pp-1-28
Port Gardner Revised
Sampling Area
Original Study Area(White Dotted Line)
Revised Study Area(Yellow Solid Line)
29
pp-1-29

Phase II Baseline & Secondary
Sampling Locations
Phase II:12 Baseline Samples3 Secondary Samples
Phase I: 15 original samples
30
pp-1-30
Ongoing in 2015
Regional Background/SCUM II Timeline Spring 2014
Port Angeles: Draft Data Report Public Review & Public Meetings to Discuss
Comments
Summer 2014
Lower Duwamish: •2014 - Continue stakeholder engagement to plan and inform development of the SAP.
•2015 - Begin SAP development – completion dependent on Green River studies results and complexity of the SAP.
Fall / Winter2014
Port Gardner:Supplemental SAP&
Field Sampling
Draft Data Report Public Review & Conduct Technical Workshops to Discuss
Comments
Finalize Data Report
Draft SCUM II Public Comment Period
SCUM II Technical Workshops to Discuss & Resolve Comments
Finalize SCUM II
31
Finalize Data Report
pp-1-31

Implementation of Revised Freshwater Sediment Screening
Values
Laura Inouye (Ecology) and the DMMP and RSET agenciesMay 7, 2014
pp-2-1
Introduction: a bit of history• 2002: Ecology evaluated existing freshwater (FW)
screening values• 2003: Ecology published report using the
Floating Percentile Method (FPM) to generate FW benthic screening levels
• 2007: RSET freshwater group responded to comments by gathering more data for input into the model (greater geographical coverage and more biological endpoints).
• 2011: Ecology published the final FPM report• 2013: Ecology adopts the freshwater FPM-
derived benthic SQS and CSL values in part V of the SMS rule.
pp-2-2

Introduction: Benthic standards and the SMS rule:
Benthic Cleanup Screening LevelWAC 173-204-562 or -563
SCUM II Ch 8
Benthic Sediment Cleanup ObjectiveWAC 173-204-562 or -563
SCUM II Ch 8
Human Health Risk HQ = 1; 10-5
WAC 173-204-561(3) SCUM II Ch 9
Ecological Risk NarrativeWAC 173-204-564; SCUM II Ch 10
Human Health Risk HQ = 1; 10-6
WAC 173-204-561(2); SCUM II Ch 9
Ecological Risk NarrativeWAC 173-204-564; SCUM II Ch 10
ARARs: Federal, State, Local, TribalWAC 173-204-560(4); SCUM II Ch 17
Risk based criteriaLowest of:
Sediment Cleanup ObjectiveWAC 173-204-560(3)
SCUM II Ch 7 Highest of:
Regional BackgroundWAC 173-204-560(4)
SCUM II Ch 11
PQLWAC 173-204-560(4)
SCUM II Ch 12
Sediment Cleanup LevelWAC 173-204-560(2)
SCUM II Ch 7: Adjusted upwards from SCO based on
technical possibility & net adverse environmental impacts
Risk based criteriaLowest of:
Natural BackgroundWAC 173-204-560(3)
SCUM II Ch 11
PQLWAC 173-204-560(3)
SCUM II Ch 12
ARARs: Federal, State, Local, TribalWAC 173-204-560(4); SCUM II Ch 17
Cleanup Screening LevelWAC 173-204-560(4)
SCUM II Ch 7 Highest of:
pp-2-3
Introduction• Benthic standards and dredging- need to have
similar overlays as the rule• 2013: The RSET Freshwater Technical Working
Group intended to propose a multi-tiered approach to address toxicity to other species (fish) and bioaccumulative issues.– Use the elutriate test trigger approach (SEF, Chapter
10) to develop water quality-based sediment screening values
– fish and wildlife-based screening values (including bioaccumulative compounds)
– background-based screening values (for selected metals).
pp-2-4
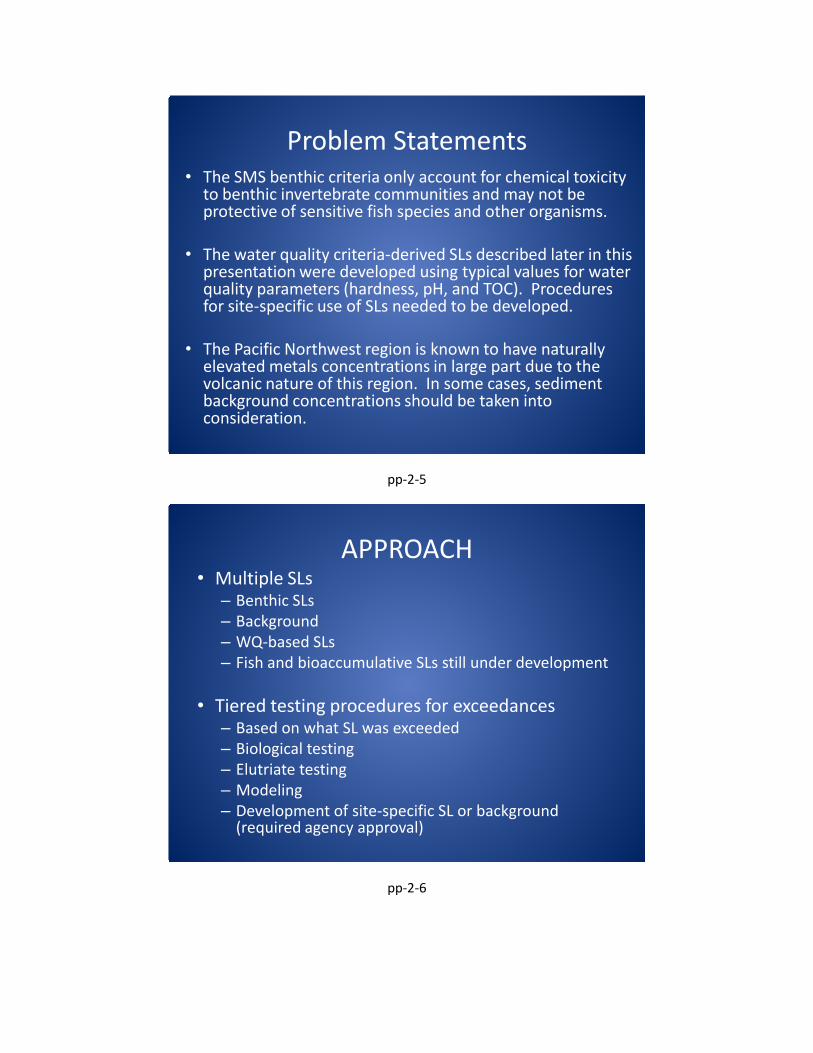
Problem Statements• The SMS benthic criteria only account for chemical toxicity
to benthic invertebrate communities and may not be protective of sensitive fish species and other organisms.
• The water quality criteria-derived SLs described later in this presentation were developed using typical values for water quality parameters (hardness, pH, and TOC). Procedures for site-specific use of SLs needed to be developed.
• The Pacific Northwest region is known to have naturally elevated metals concentrations in large part due to the volcanic nature of this region. In some cases, sediment background concentrations should be taken into consideration.
pp-2-5
APPROACH• Multiple SLs
– Benthic SLs– Background– WQ-based SLs– Fish and bioaccumulative SLs still under development
• Tiered testing procedures for exceedances– Based on what SL was exceeded– Biological testing– Elutriate testing– Modeling– Development of site-specific SL or background
(required agency approval)
pp-2-6

Benthic FW screening levels
• Benthic screening level development described in in Ecology’s publication #11-09-05, “Development of Benthic SQVs for Freshwater Sediments in Washington, Oregon, and Idaho” (Avocet, 2011).
• The development and evaluation of these SLs have been presented in previous SMARMs and will not be covered in this presentation.
pp-2-7
Benthic freshwater screening levels
“>” values: > “Greater than” value indicates that the toxic level is unknown, but above the concentration shown. If concentrations abovethis level are encountered, bioassays should be run to evaluate the potential for toxicity.
pp-2-8

Benthic freshwater screening levels
pp-2-9
Benthic freshwater screening levels
• Ammonia and sulfides will not be used to determine suitability of the material for open water disposal or in-water placement.
• Sulfide and ammonia SLs will be used to inform bioassay testing (e.g. special handling to remove ammonia/sulfides prior to bioassays) and water quality monitoring requirements at the dredging site.
pp-2-10

Water- Quality Criteria-based SLs• It was recognized that SLs were needed to protect
other species• In the absence of other SLs, it was proposed to
use the “Elutriate Trigger” approach in Chapter 10 of the SEF.
• WQ-based SLs are based on equilibrium partitioning, EPA water quality criteria, and reasonably protective assumptions of WQ parameters– pH 7– Hardness 18.9 mg/L – TOC 1%– Total suspended solids 100 mg/L
pp-2-11
Water- Quality Criteria-based SLs
pp-2-12

Water- Quality Criteria-based SLs
pp-2-13
Background Based SLs• RSET proposed Willamette upstream data for
background (LDWG 2012). However, background varies over geographic areas.
• Data from Ecology’s publication #09-03-032 (“Baseline characterization of nine proposed freshwater sediment reference sites, 2008”) was used to evaluate Washington sediment metals background
pp-2-14

Background Based SLsMetal
(lowest risk-based SL in parentheses)
Willamette sed bkg (95th %ile)
WA sed
(90/90UTL)
Arsenic (14) 3.8 17
Cadmium (2.1) 0.2 0.7
Chromium (72) 32.7 60
Copper (110) 38.0 146
Lead (360) 14.3 53
Mercury (0.66) 0.1 0.22
Nickel (26) 26.1 57
Selenium (11) 0.4 2
Silver (0.6) 0.7 0.19
Zinc (459) 105.0 110
Metals background appears to be higher in Washington compared to that of Willamette.
To determine which metals may need background based SLs, soil and sediment background data was compared to the benthic and WQ-based SLs.
pp-2-15
Background Based SLs: Washington Sediment data
• Sediment data for the metals were looked at more closely to determine if they could be used as background.
• Non-normal distribution• Apparent outliers were present in all but nickel
datasets• In absence of other data, outliers removed and the
90/90 UTL calculated• Only nickel had background higher than SLs.• Statistical evaluation indicated that more data is
needed for all metals to establish reliable background sediment values.
pp-2-16

Background Based SLsMetal
(lowest risk-based SL in parentheses)
Willamette sed bkg (95th %ile)
WA sed
(all data) (90/90UTL)
WA sed
(outliers removed) (90/90UTL)
Arsenic (14) 3.8 17 6.5
Cadmium (2.1) 0.2 0.7 0.5
Chromium (72) 32.7 60 no outliers
Copper (110) 38.0 146 49
Lead (360) 14.3 53 12
Mercury (0.66) 0.1 0.22 0.14
Nickel (26) 26.1 57 no outliers
Selenium (11) 0.4 2 0.6
Silver (0.6) 0.7 0.19 0.13
Zinc (459) 105.0 110 no outliers
pp-2-17
Background Based SLs: Washington Soil data
• Ecology’s publication #94-115 (Natural Background Soil Metals Concentrations in Washington State) was evaluated to determine if it could provide an interim SL
• 90th percentile = 38 ppm• Soil data will be adopted until sufficient
sediment data is available to develop statistically supported sediment background.
pp-2-18

Background Based SLsMetal
(lowest risk-based SL in parentheses)
Willamette sed bkg (95th %ile)
WA sed
(all data) (90/90UTL)
WA sed
(outliers removed) (90/90UTL)
WA soil
(90th %ile)
Arsenic (14) 3.8 17 6.5 7
Cadmium (2.1) 0.2 0.7 0.5 1
Chromium (72) 32.7 60 no outliers 42
Copper (110) 38.0 146 49 36
Lead (360) 14.3 53 12 17
Mercury (0.66) 0.1 0.22 0.14 0.04
Nickel (26) 26.1 57 no outliers 38
Selenium (11) 0.4 2 0.6 na
Silver (0.6) 0.7 0.19 0.13 na
Zinc (459) 105.0 110 no outliers 85
pp-2-19
The FW Screening Level Table
SL is the lowest risk-based value (benthic or WQ-based SL) unless background is higher than risk (nickel)
SL2 or acute WQ-based SL: used primarily for antidegradation evaluations
pp-2-20
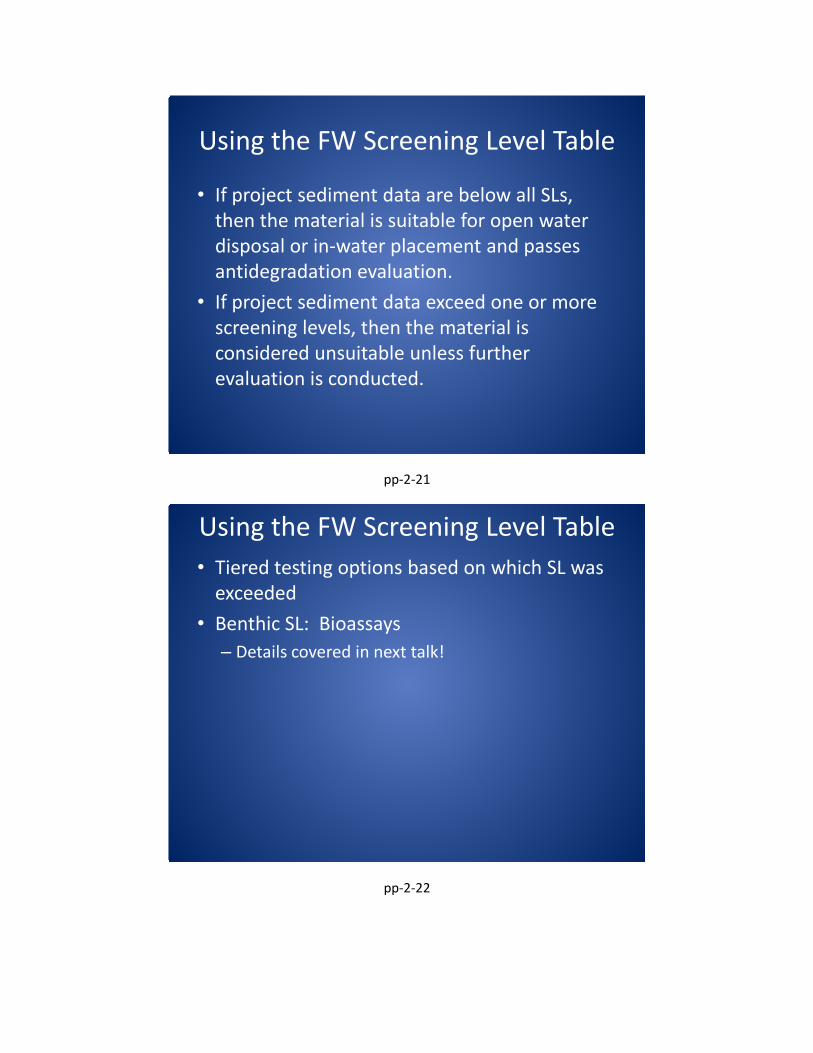
Using the FW Screening Level Table
• If project sediment data are below all SLs, then the material is suitable for open water disposal or in-water placement and passes antidegradation evaluation.
• If project sediment data exceed one or more screening levels, then the material is considered unsuitable unless further evaluation is conducted.
pp-2-21
Using the FW Screening Level Table• Tiered testing options based on which SL was
exceeded• Benthic SL: Bioassays
– Details covered in next talk!
pp-2-22

Using the FW Screening Level Table• Tiered testing options based on which SL was
exceeded• Water Quality-based SL
– Elutriate tests: details of testing may differ depending on informational needs (whether WQ criteria are based on whole water or dissolved phase).
– Development of site-specific water quality criteria and SLs based on site specific pH, hardness, and/or TOC
• Spreadsheet available• Subject to approval by the agencies
– Site specific modeling to determine if water quality criteria will be met at the point of compliance
pp-2-23
Using the FW Screening Level Table• Tiered Testing Options
comparison CoCs
If the SL is exceeded, material is unsuitable for
open water disposal/placement*
unless the appropriate tiered testing listed below
passes Pass SLBenthic SL all compounds Bioassay testing- must use
both species (Hyalella and Chironomus), at least one chronic exposure, and at least one sub-lethal (growth) endpoint.
If a sample is at or below all SLs, then the material is suitable for dredging/disposal/in-
water placementand meets the antidegradation standard.
However, when ESA-listed species are present, the Federal action agency may need to contact
NMFS and/or USFWS (as appropriate) to discern whether additional analyses are
needed, and whether those analyses should be done as part of an ESA consultation.
WQC-based SL metals, dieldrin, PCP, sum DDT, PCB Aroclors, TBT
WQC-based testing options-elutriate tests show WQC will be met; develop and pass site- specific WQC SL; or model to show standards will be met at the point of compliance.
pp-2-24

Using the FW Screening Level Table
• Antidegradation– DMMP 2008 clarification paper – Both benthic and WQ-based SLs would be
considered
pp-2-25
Impact Analysis• 12 projects between 2009 and 2013• 43 DMMUs evaluated• Columbia River, Lake Washington and Lake
UnionAll COCs are less than or
equal to proposed SLs
One or more detected exceedance of proposed SLs
One or more non-detects exceed proposed SLs
All COCs are less than or equal to
2006 SLs6 2 (Ni) 12 (5 Ag, 5 PCP, 2 PCB)
One or more detected
exceedance of 2006 SLs
0 16 3 (PCP)
One or more non-detects exceeded
2006 SLs0
1 (2006 Hg, proposed Ni)
3
pp-2-26
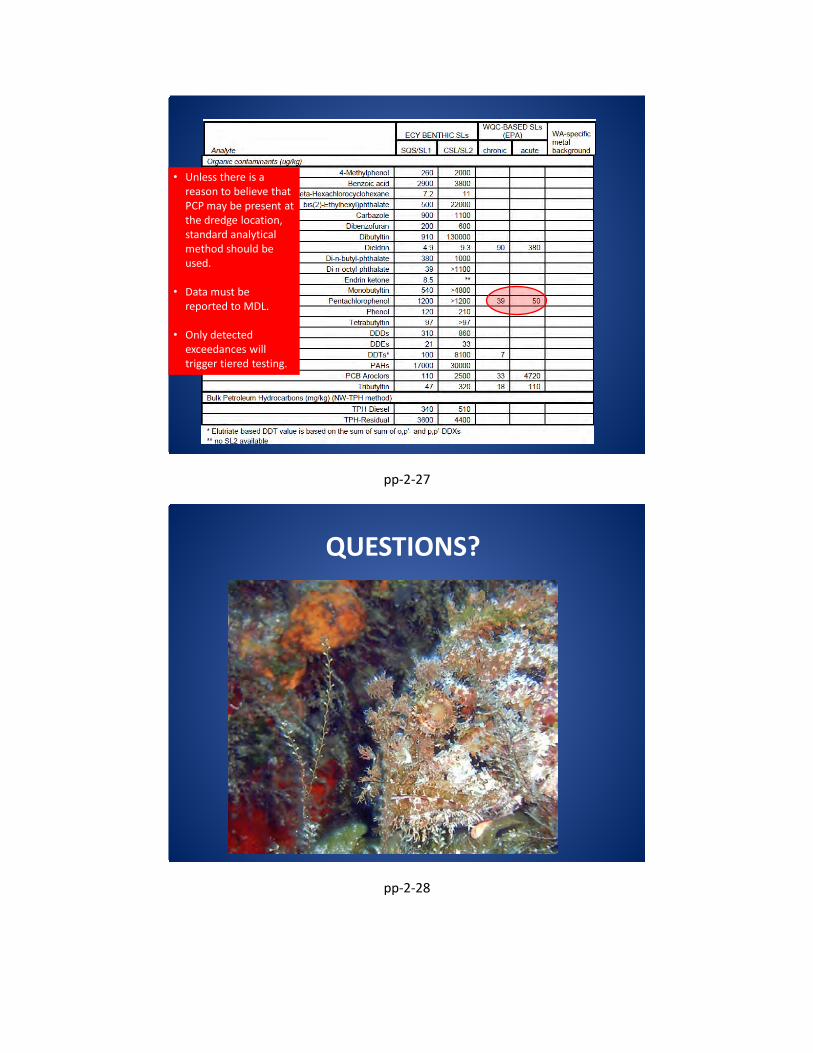
• Unless there is a reason to believe that PCP may be present at the dredge location, standard analytical method should be used.
• Data must be reported to MDL.
• Only detected exceedances will trigger tiered testing.
pp-2-27
QUESTIONS?
pp-2-28

Freshwater Bioassays
Laura Inouye (Ecology), for the RSET and DMMP agencies
May 7, 2014
pp-3-1
Introduction• The floating percentile model (FPM) used to develop the new
Washington State freshwater sediment standards (WAC 173-204-563) used input from both acute (10-day Chironomus and Hyalella) and chronic (28-day Hyalella) tests.
• The resulting standards were based on the most sensitive test, which was often the chronic 28-day Hyalella growth bioassay.
pp-3-2

Problem Statement
• Currently, the Sediment Evaluation Framework for the Pacific Northwest (SEF 2009) and the DMMP User Manual (DMMP 2013) require only short-term bioassays (10-day) using either Hyalella or Chironomus.
• The SEF and the DMMP User Manual should be consistent with the standards in requiring at least one chronic exposure measuring a sublethal endpoint
pp-3-3
Proposed ModificationsRequirements for freshwater sediment:
• Two different test species • Three endpoints• One chronic test; and • One sublethal endpoint
Species, biological
test, and endpoint
Acute effects
biological test
Chronic effects
biological test
Lethal effects
biological test
Sub-lethal effects
biological test
Amphipod: Hyallela azteca
10-Day mortality X X
28-Day mortality X X
28-Day growth X X
Midge: Chironomus dilutus
10-Day mortality X X
10-Day growth X X
20-Day mortality X X
20-Day growth X X
Typical combination:• One 10-day mortality test• One chronic test with
mortality and growth
pp-3-4

Proposed ModificationsBioassay protocolsAcute Effects Tests • Hyalella azteca 10-day mortality: ASTM E1706-05 (2010)/EPA
Method 100.1 (US EPA, 2000) • Chironomus dilutus 10-day mortality: ASTM E1706-05 (2010)/EPA
Method 100.2 (US EPA, 2000) • Chironomus dilutus 10-day growth: ASTM E1706-05 (2010)/EPA
Method 100.2 (US EPA, 2000)
Chronic Effects Tests • Hyalella azteca 28-day mortality: EPA Method 100.4 (US EPA, 2000) • Hyalella azteca 28-day growth: EPA Method 100.4 (US EPA, 2000) • Chironomus dilutus 20-day mortality: EPA Method 100.5 (US EPA,
2000) • Chironomus dilutus 20-day growth: EPA Method 100.5 (US EPA,
2000)
pp-3-5
Proposed ModificationsBioassay protocols• Unlike marine biological criteria, the freshwater
biological criteria are based on a comparison to control treatments
• Due to the lack of established freshwater reference sites in Washington.
• Not necessary to collect reference sediments for freshwater bioassays.
- Dredging projects wishing to use reference sediments must have the reference location approved prior to collection of the reference sediments.
pp-3-6

Proposed ModificationsBioassay Performance Standards
Biological Test/ Endpoint
Performance StandardControl* Reference
Hyalella azteca10-day mortality MC ≤ 20% MR ≤ 25%
28-day mortality MC ≤ 20% MR ≤ 30%
28-day growth MIGC ≥ 0.15 mg/individual MIGR ≥ 0.15 mg/individualChironomus dilutus10-day mortality MC ≤ 30% MR ≤ 30%
10-day growth MIGC ≥ 0.48 mg/individual MIGR/MIGC ≥ 0.820-day mortality MC ≤ 32% MR ≤ 35%
20-day growth MIGC ≥ 0.60 mg/individual MIGR/MIGC ≥ 0.8
M = Mortality; C = Control; R = Reference; T = Test; F = Final; MIG = Mean Individual Growth at time final; mg = milligrams.
* ASTM is currently considering updating performance standards. Ecology will adopt the new performance standards once they are released.
pp-3-7
Proposed ModificationsHit definitions: 2-hit and 1 hit interpretive criteria
Biological Test/ Endpoint
Sediment Cleanup Objective for each biological test (2 hit criteria)
Cleanup Screening Level for each biological test (one hit criteria)
Hyalella azteca
10-day mortalityMT - MC > 15% MT - MC > 25%
and andMT vs MC SD (p ≤ 0.05) MT vs MC SD (p ≤ 0.05)
28-day mortalityMT - MC > 10% MT - MC > 25%
and andMT vs MC SD (p ≤ 0.05) MT vs MC SD (p ≤ 0.05)
28-day growth(MIGC - MIGT)/MIGC > 0.25 and (MIGC - MIGT)/MIGC > 0.40 and
MIGT vs MIGC SD (p ≤ 0.05) MIGT vs MIGC SD (p ≤ 0.05)
M = Mortality; C = Control; R = Reference; T = Test; F = Final; MIG = Mean Individual Growth at time final; mg = milligrams; SD=significant difference.
pp-3-8
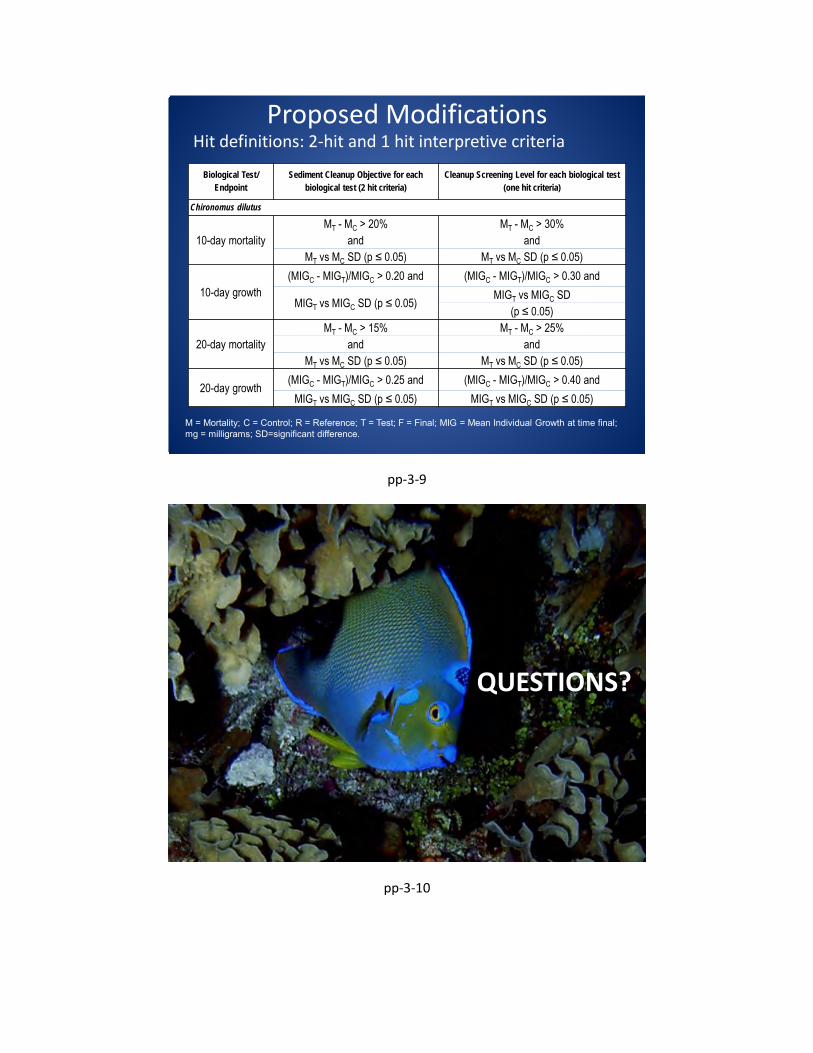
Proposed ModificationsHit definitions: 2-hit and 1 hit interpretive criteria
Biological Test/ Endpoint
Sediment Cleanup Objective for each biological test (2 hit criteria)
Cleanup Screening Level for each biological test (one hit criteria)
Chironomus dilutus
10-day mortalityMT - MC > 20% MT - MC > 30%
and andMT vs MC SD (p ≤ 0.05) MT vs MC SD (p ≤ 0.05)
10-day growth(MIGC - MIGT)/MIGC > 0.20 and (MIGC - MIGT)/MIGC > 0.30 and
MIGT vs MIGC SD (p ≤ 0.05) MIGT vs MIGC SD (p ≤ 0.05)
20-day mortalityMT - MC > 15% MT - MC > 25%
and andMT vs MC SD (p ≤ 0.05) MT vs MC SD (p ≤ 0.05)
20-day growth (MIGC - MIGT)/MIGC > 0.25 and (MIGC - MIGT)/MIGC > 0.40 andMIGT vs MIGC SD (p ≤ 0.05) MIGT vs MIGC SD (p ≤ 0.05)
M = Mortality; C = Control; R = Reference; T = Test; F = Final; MIG = Mean Individual Growth at time final; mg = milligrams; SD=significant difference.
pp-3-9
QUESTIONS?
pp-3-10

Dredging Year 2014
David Fox, P.E.US Army Corps of EngineersSeattle District
pp-4-1
DY 2014:16 June 2013 to 15 June 2014
Decision Documents: Suitability Determinations Others:
▪ Recency Extensions▪ Tier 1 Evaluations▪ Volume Revisions/Design Modifications▪ Antidegradation Determinations
pp-4-2
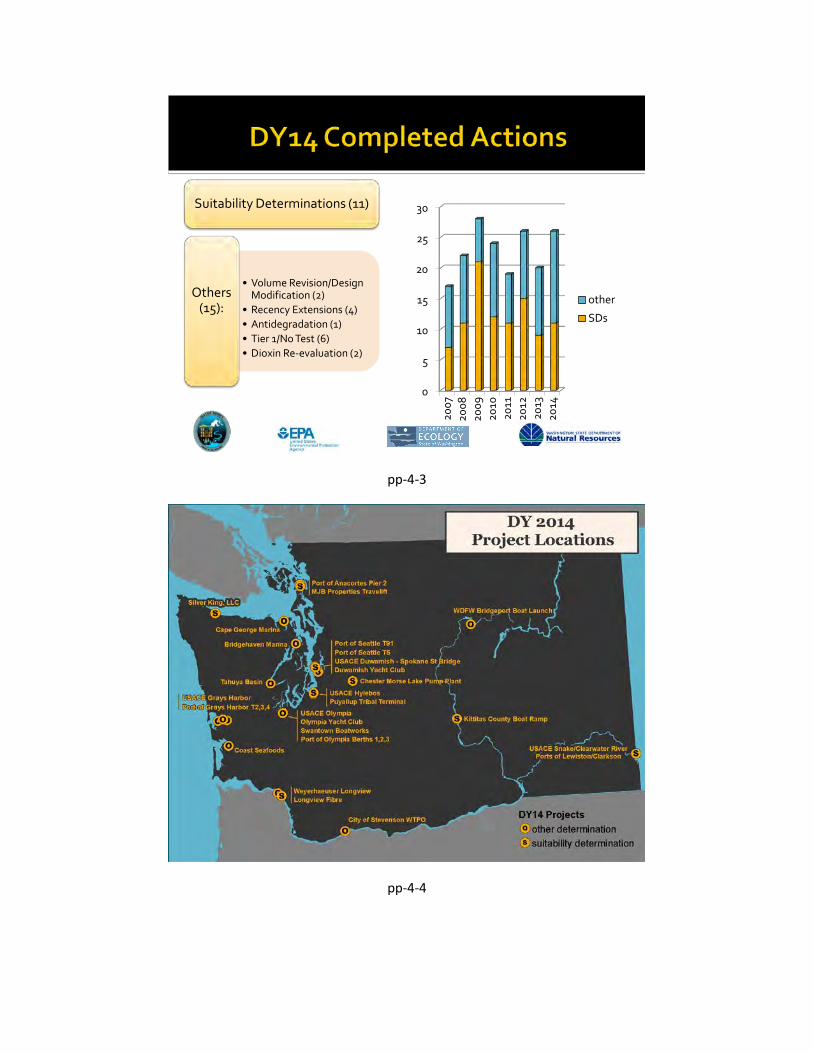
Suitability Determinations (11)
• Volume Revision/Design Modification (2)
• Recency Extensions (4)• Antidegradation (1)• Tier 1/No Test (6)• Dioxin Re-evaluation (2)
Others (15):
0
5
10
15
20
25
30
2007
2008
2009
2010
2011
2012
2013
2014
other
SDs
pp-4-3
pp-4-4

Out of 26 completed actions: 12 projects - chemical testing 9 projects - dioxin testing 2 projects - bioassays No bioaccumulation testing 6 projects – antidegradation testing
pp-4-5
Project ChemicalsDuwamish Yacht Club diethyl phthalate, butyl benzyl phthalate, total chlordane
Kittitas County BoatRamp cadmium
Port of Seattle T5 TBT, PCBs, mercury
Port of Seattle T91 TBT, PCBs, PAHs, mercury
USACE Hylebos TBT, PCBs; 2,4-dimethylphenol, hexachlorobenzene, hexachlorobutadiene, dieldrin
USACE Snake/Clearwater phenol, 4-methylphenol
pp-4-6
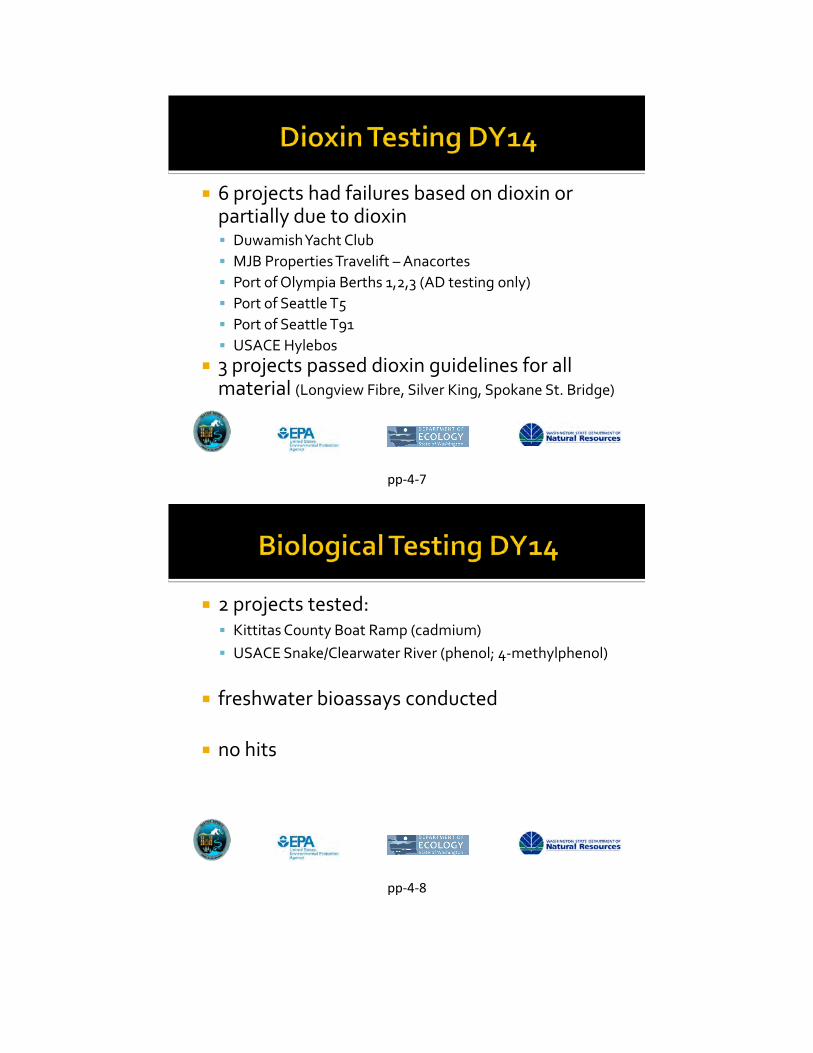
6 projects had failures based on dioxin or partially due to dioxin Duwamish Yacht Club MJB Properties Travelift – Anacortes Port of Olympia Berths 1,2,3 (AD testing only) Port of Seattle T5 Port of Seattle T91 USACE Hylebos
3 projects passed dioxin guidelines for all material (Longview Fibre, Silver King, Spokane St. Bridge)
pp-4-7
2 projects tested: Kittitas County Boat Ramp (cadmium) USACE Snake/Clearwater River (phenol; 4-methylphenol)
freshwater bioassays conducted
no hits
pp-4-8
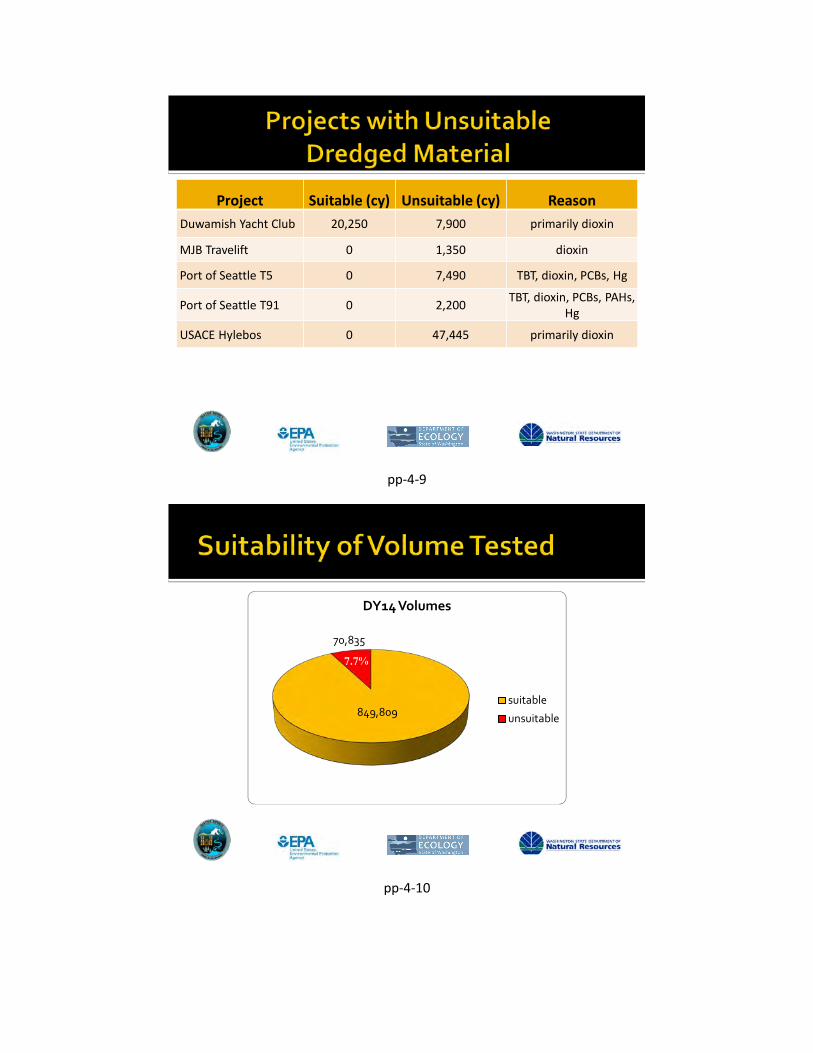
Project Suitable (cy) Unsuitable (cy) ReasonDuwamish Yacht Club 20,250 7,900 primarily dioxin
MJB Travelift 0 1,350 dioxin
Port of Seattle T5 0 7,490 TBT, dioxin, PCBs, Hg
Port of Seattle T91 0 2,200 TBT, dioxin, PCBs, PAHs, Hg
USACE Hylebos 0 47,445 primarily dioxin
pp-4-9
849,809
70,835
DY14 Volumes
suitable
unsuitable
7.7%
pp-4-10
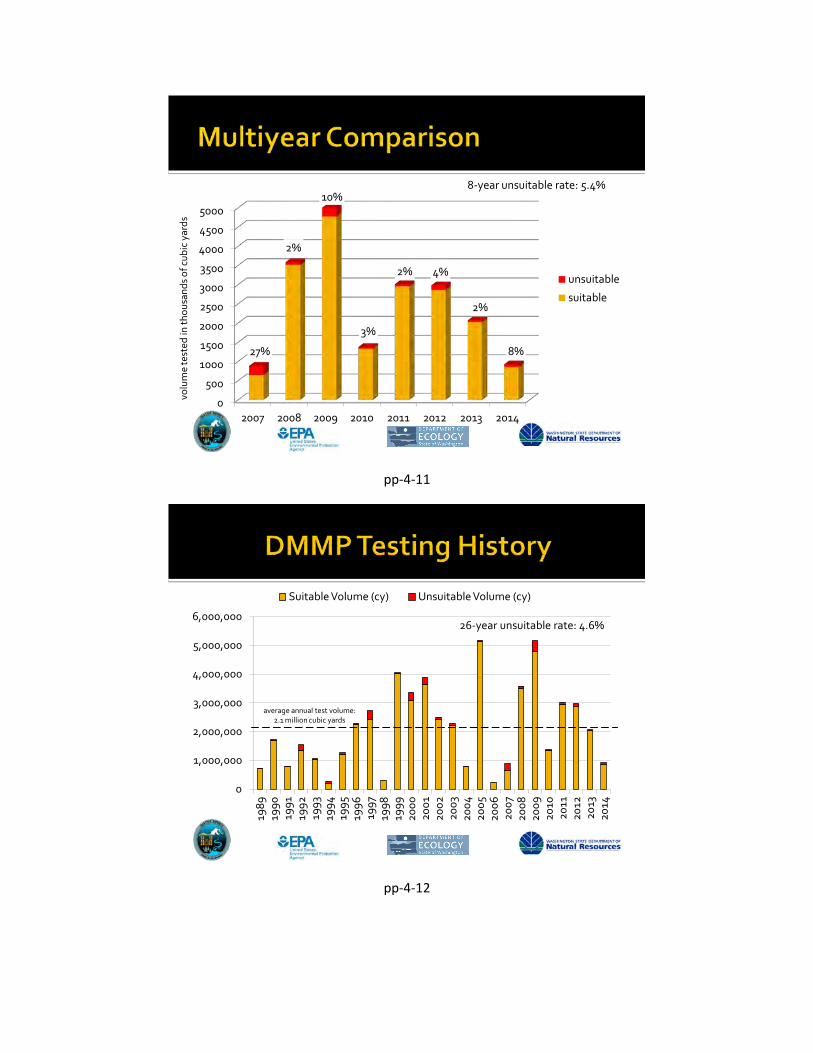
0
500
1000
1500
2000
2500
3000
3500
4000
4500
5000
2007 2008 2009 2010 2011 2012 2013 2014
27%
2%
10%
3%
2% 4%
2%
8%
unsuitable
suitable
volu
me
test
ed in
thou
sand
s of c
ubic
yar
ds8-year unsuitable rate: 5.4%
pp-4-11
0
1,000,000
2,000,000
3,000,000
4,000,000
5,000,000
6,000,000
1989
1990
1991
1992
1993
1994
1995
1996
1997
1998
1999
2000
2001
2002
2003
2004
2005
2006
2007
2008
2009
2010
2011
2012
2013
2014
Suitable Volume (cy) Unsuitable Volume (cy)
26-year unsuitable rate: 4.6%
average annual test volume: 2.1 million cubic yards
pp-4-12
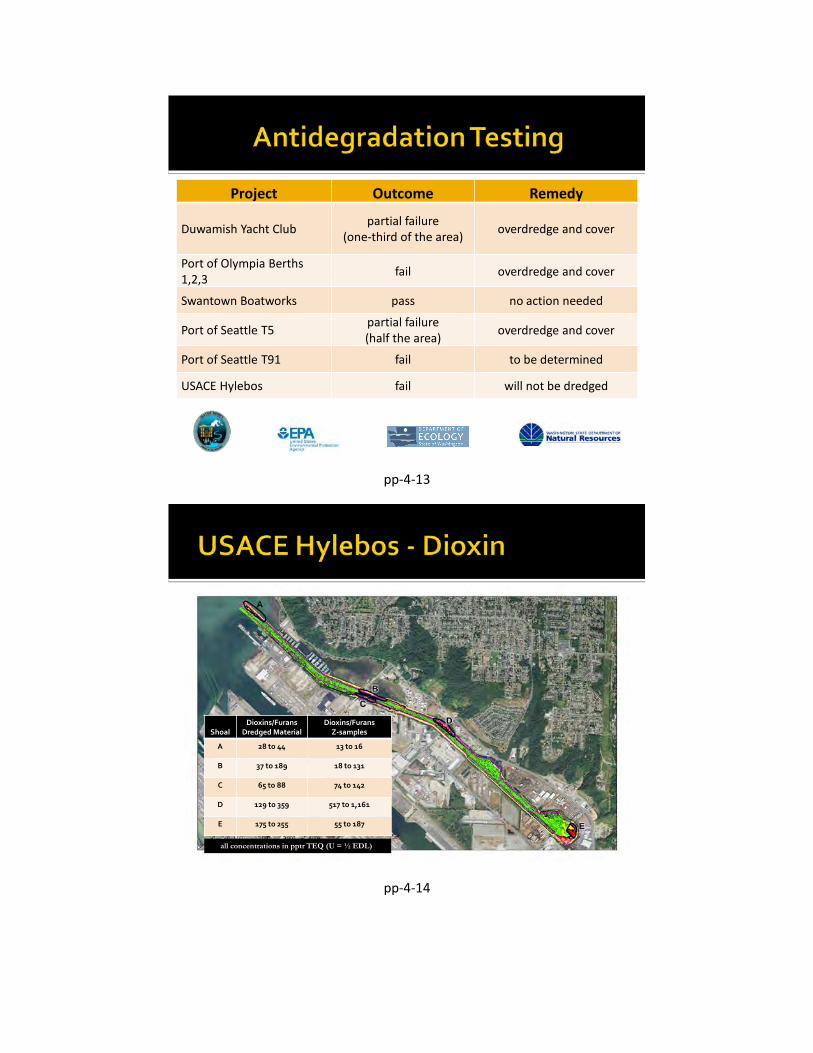
Project Outcome Remedy
Duwamish Yacht Club partial failure(one-third of the area) overdredge and cover
Port of Olympia Berths 1,2,3 fail overdredge and cover
Swantown Boatworks pass no action needed
Port of Seattle T5 partial failure(half the area) overdredge and cover
Port of Seattle T91 fail to be determined
USACE Hylebos fail will not be dredged
pp-4-13
ShoalDioxins/Furans
Dredged MaterialDioxins/Furans
Z-samples
A 28 to 44 13 to 16
B 37 to 189 18 to 131
C 65 to 88 74 to 142
D 129 to 359 517 to 1,161
E 175 to 255 55 to 187
all concentrations in pptr TEQ (U = ½ EDL))
pp-4-14

Cenex Harvest States, Kennewick*City of Renton, Cedar RiverLa Conner MarinaNorthwest Grain Growers, Wallula*Port Gamble RestorationPort of Tacoma Pier 4Shelter Bay MarinaUSACE Kenmore*USACE Westhaven Cove, Westport*USACE Willapa Bay*US Navy Electromagnetic Measurement Ranging
*pre-SAP stage
pp-4-15
All DMMP evaluation documents Biennial reports – including DY12/DY13
Website URL:
http://www.nws.usace.army.mil
Search for: Dredged Material Management
pp-4-16

Questions ?
pp-4-17
DMMP CLARIFICATIONS & UPDATES
Lauran WarnerDredged Material Management Office
SMARM 2014
pp-5-1

Clarification Recency/Frequency
pp-5-2
Recency/Frequency
Recency = duration of time for which chemical and biological characterization data continue to be representative of the material to be dredged
Frequency = extent of time a given dredging project can be maintained with repeated dredging without further testing
pp-5-3

Recency
RankPresent
GuidelinesProposed
Guidelines
Low 7 7
Low-Moderate
6 6
Moderate 5 5
High 2 3
pp-5-4
Frequency
tested material already dredged testing results still considered representative additional cycles of dredging without further
testing until expiration of the frequency period.
Proposed change: include concept in “Recency”; drop “Frequency” term
pp-5-5

Updates
1. Puget Sound Sediment Reference Material (SRM)2. Ammonia/sulfides in bioassays3. Status of EIM transition4. EPA dioxin/furan validation guidelines5. Larval rockfish genetic species ID
pp-5-6
1. Puget Sound SRM
Technical Memorandum: Development and Production of the Puget Sound Sediment Reference Material SR0431
EPA SRM Manager: Donald Brown [email protected]
Updated guidance on DMMP website
pp-5-7

DYBottles
Requested# of
ProjectsProjects
fromData
received
2012 5 31 DMMP
1 EPA1 Ecology
2/3
2013 38 2111 DMMP
3 EPA7 Ecology
13/21
2014 15 107 DMMP
1 EPA2 Ecology
3/10
Puget Sound SRM
pp-5-8
SRM: Required Deliverables
1. Data Validation Report
2. Electronic Data Deliverable (EDD)
3. SRM Sample Data Summary Report
•CAS numbers•Laboratory name•Project number•Project name•Sample ID number (SRM bottle bar code)•Agency sample number (if applicable)•Laboratory sample number•Date SRM received by the lab•Date and time of analysis•For Aroclor data, lab RLs and MDLs•For Chlorinated Biphenyl Congener and Dioxin/Furan data, RLs and EDLs•Laboratory qualifiers and definitions•Validation qualifiers
pp-5-9

2. Ammonia/Sulfides in Bioassays
Paper presented last year will NOT be implemented programmatically
Will be addressed on a project/specific basis
pp-5-10
3. DAIS to EIM transition
FINISHED!(For the most part)
Some bioaccumulation and monitoring data still need to be added
DMMO PMs submit project data to EIM
pp-5-11

4. EPA Dioxin/Furan Validation Guidelines
Now available: Data Validation and Review Guidelines for Polychlorinated Dibenzo-p-Dioxin and Polychlorinated Dibenzofuran (PCDD/PCDF) Data Using Method 1613B and SW846 Method 8209A
for copies, contact Ginna Grepo-Grove at [email protected]
pp-5-12
5. Larval rockfish genetic species ID
Disposal effect to ESA-listed species? From 2012 study, have 217 preserved larval
rockfish None are boccacio; no other species ID
visually possible
pp-5-13

Dredged Material Evaluation and Disposal Procedures
USER MANUAL July 2013
pp-5-14
http://www.nws.usace.army.mil/Missions/CivilWorks/Dredging.aspx
pp-5-15

Questions?
pp-5-16
Disposal Site Monitoring Results
Celia Barton, WDNRDavid Fox, USACE
SMARM May 7, 2014
pp-6-1

Highlights of 2014 Multibeam and SPI at Elliott Bay and
Commencement Bay Partial Monitoring at Elliott Bay Targeted Disposal at Elliott Bay Multibeam at Anderson/Ketron Disposal modeling at Anderson/Ketron Future trawls at Anderson/Ketron
pp-6-2
Puget Sound: 8 disposal sites
5 non-dispersive sites 3 dispersive sites
Grays Harbor / Willapa: 4 estuarine and 1
ocean disposal sites All dispersive sites
pp-6-3

Site MonitoringMoved to volume based monitoring trigger in 1997 and reduced frequency and scope of monitoring based on past documented compliance with site management objectives.
Following 2002 SMARM increased disposal volume trigger to 500,000 cubic yards at Commencement Bay, Elliott Bay and Port Gardner
Corps lead on Physical Monitoring, DNR lead on Chemical and Biological Monitoring
pp-6-4
Cumulative Volumes Since Last Monitoring
pp-6-5
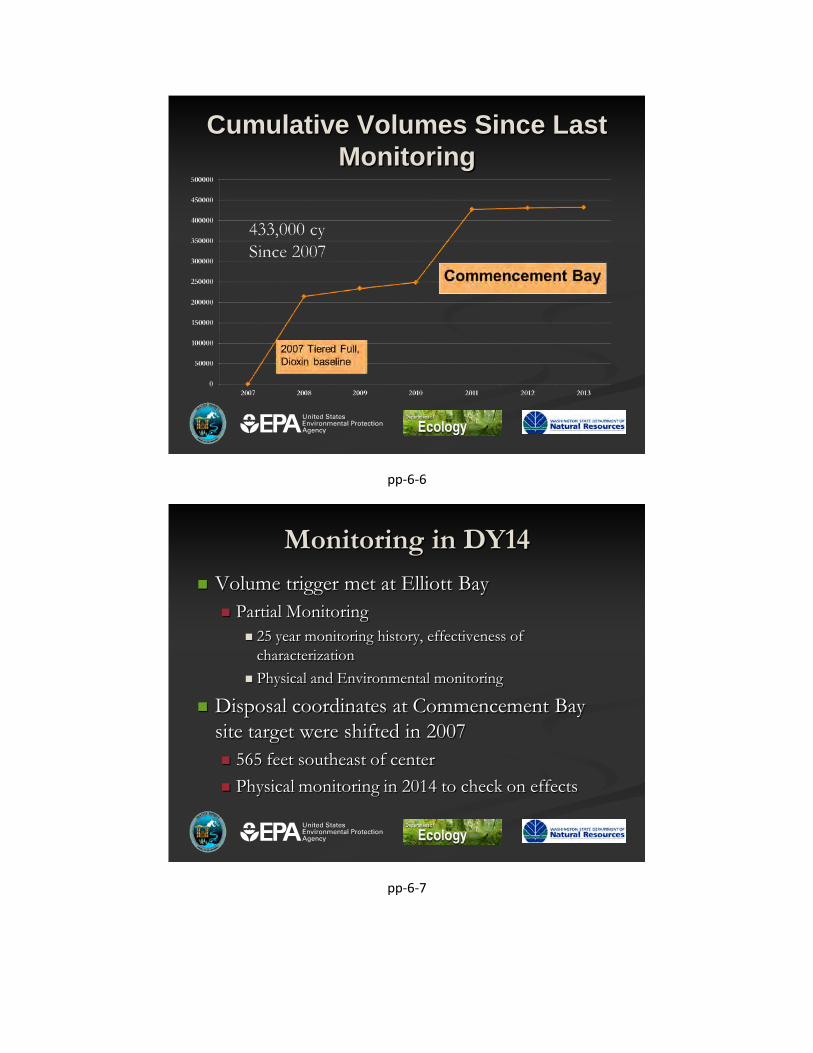
Cumulative Volumes Since Last Monitoring
pp-6-6
Monitoring in DY14 Volume trigger met at Elliott Bay
Partial Monitoring 25 year monitoring history, effectiveness of
characterization Physical and Environmental monitoring
Disposal coordinates at Commencement Bay site target were shifted in 2007 565 feet southeast of center Physical monitoring in 2014 to check on effects
pp-6-7

2013 Commencement Bay Multibeam SurveyCorps of Engineers
pp-6-8
Commencement Bay SPI
< 1 cm beyondthe site boundary
3-cm dredgedmaterial
accumulation
pp-6-9

2013 Elliott Bay Multibeam SurveyCorps of Engineers
disposal coordinates
pp-6-10
Elliott Bay SPI
3-cm accumulation
pp-6-11

2013 Elliott Bay Partial Monitoring
PSDDA Monitoring Framework
2013 Findings Recommendations Report finalized and
posted after SMARM Data is in EIM
pp-6-12
PSDDA Monitoring Framework
1. Does dredged material remain onsite?2. Have biological effects conditions been
exceeded?3. Any adverse effects to offsite biological
resources?
pp-6-13
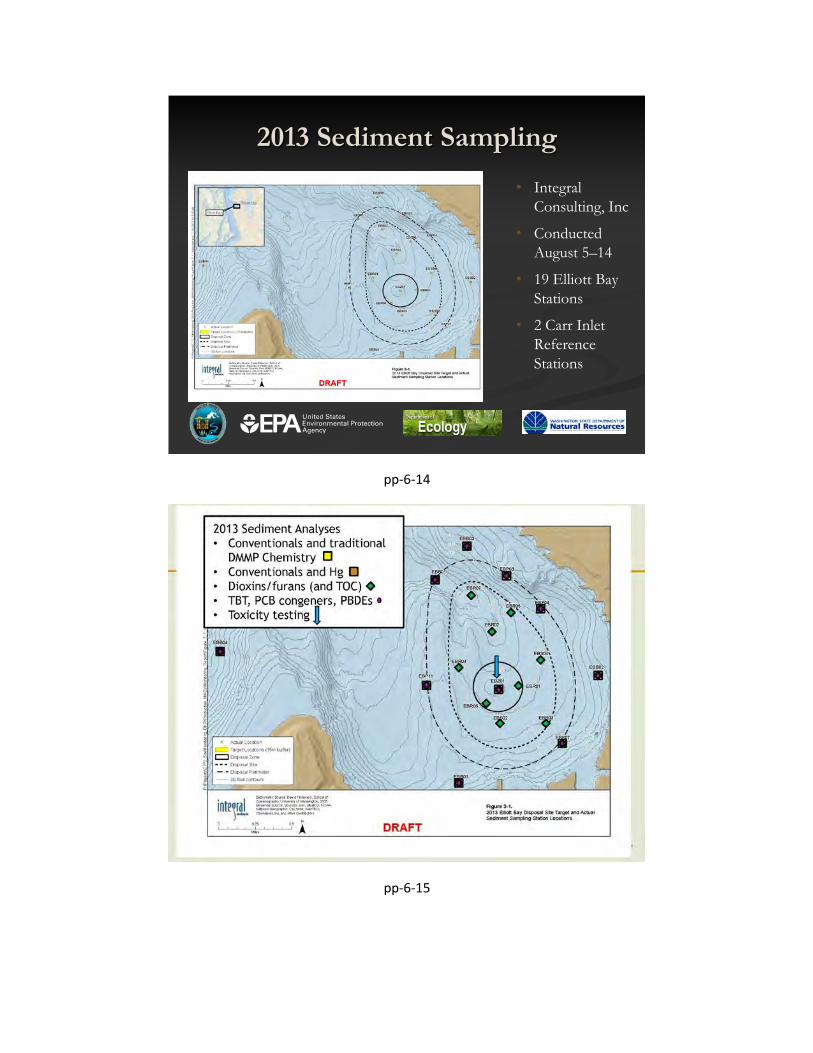
2013 Sediment Sampling
Add Graphic Here
• Integral Consulting, Inc
• Conducted August 5–14
• 19 Elliott Bay Stations
• 2 Carr Inlet Reference Stations
pp-6-14
pp-6-15

2013 Results – Chemistry
No SL exceedances at the on-site station Z01 Mercury > SL at some perimeter and benchmark
stations PCB Aroclors > SL at some perimeter stations Elevated mercury and PCBs are widespread in Elliott
Bay and there is no evidence of off-site movement of these chemicals
Dioxins/furans – addressed on a later slide
pp-6-16
Chemical Tracking System (CTS) Evaluation
Statistical time-trend analysis at perimeter stations Some statistically significant increasing and decreasing
trends for individual chemicals Nothing alarming – the chemicals with SL exceedances (Hg
and Aroclors) did not show statistically significant increasing trends
Chemical concentrations are lower in onsite sediment than in perimeter stations on average, suggesting that statistically significant increases are due to sources other than dredged material
pp-6-17

2013 Results - Bioassays Bioassays test results for Station EBZ01
Amphipod mortality: 14 percent Larval normalized combined mortality and abnormality: 10
percent Neanthes growth: 0.77 mg/individual-day (or 0.63
mg/individual-day on an AFDW basis)
EBZ01 passed DMMP non-dispersive disposal site interpretation guidelines.
pp-6-18
2010 Dioxin Guidelines
Site management objective = 4 pptr TEQ Up to 10 pptr TEQ allowed at non-dispersive
sites as long as the project volume-weighted average <= 4 pptr TEQ
4 pptr TEQ maximum at dispersive sites Updated monitoring design for non-dispersive
sites
pp-6-19

0-10 cm : Z01, S02, S04, and 7 Random stations, single samples
2013 Results—Dioxins/Furans• TEQ < 4 pptr• TEQ > 4 pptr• TEQ > 10 pptr
30 ng/kg TEQ10 on-site stations:
3 traditional 7 random
range: 1.3 to 30 pptr TEQmean = 6.9 pptr TEQ
3-cm dredged material
accumulation
dredged material footprint
5 stations within DM footprint:range: 1.3 to 5.3 pptr TEQ
mean = 3.3 pptr TEQ
pp-6-20
2013 Monitoring Conclusions
Hypothesis No.1: Dredged material remains within the disposal site boundary.
SPI Survey: 3-cm dredged material boundary is within the disposal site perimeter.
Hypothesis No. 1 is not rejected
pp-6-21
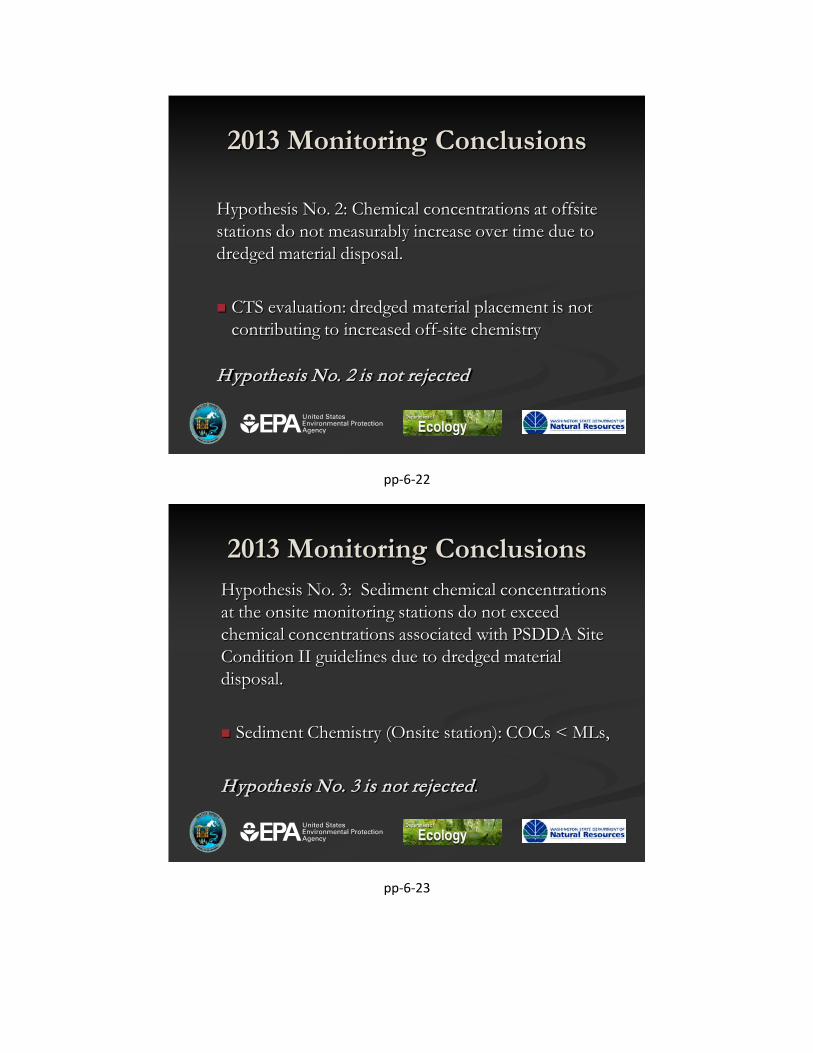
2013 Monitoring Conclusions
Hypothesis No. 2: Chemical concentrations at offsite stations do not measurably increase over time due to dredged material disposal.
CTS evaluation: dredged material placement is not contributing to increased off-site chemistry
Hypothesis No. 2 is not rejected
pp-6-22
2013 Monitoring ConclusionsHypothesis No. 3: Sediment chemical concentrations at the onsite monitoring stations do not exceed chemical concentrations associated with PSDDA Site Condition II guidelines due to dredged material disposal.
Sediment Chemistry (Onsite station): COCs < MLs,
Hypothesis No. 3 is not rejected.
pp-6-23

2013 Monitoring ConclusionsHypothesis No. 4: Sediment toxicity at the onsite stations does not exceed the PSDDA Site Condition II biological response guidelines due to dredged material disposal.
Sediment Toxicity: Onsite sediment met bioassay interpretive criteria
Hypothesis No. 4 is not rejected.
pp-6-24
Recommendations1. Consider Replacing Station EBP03 with EBP042. Consider update to CTS Software3. Move disposal target eastward to manage
dioxin/furan concentrations (next slide)4. Look at DMMP disposal site management
objectives and revised SMS5. Comprehensive Program Review
pp-6-25

tracklines for 20 disposal loads at S04
S04
Targeted Disposal atDioxin Hotspot
pp-6-26
Shoreline Permit Anderson/Ketron site (Pierce Co) extended to
expire Sept 2014 Public process to secure new permit Have received public comments from use of the site
Sand waves Impacts to biological resources Offsite movement due to currents
Additional work has been / will be done Apply for new Shoreline Permit in 2015
pp-6-27

Anderson/Ketron Disposal SiteWork done in 2014 Corps Multibeam survey
of disposal site and adjacent area Site remains in intact Sand waves to South
Corps fate and transport modeling (next slides)
pp-6-28
A-K Fate and Transport Modeling
MPFATE modeling of 160,000cubic yards of dredged material
pp-6-29

A-K Fate and Transport Modeling
Particle tracking model results showeven finest particles remain in deep water
pp-6-30
Anderson/Ketron Disposal Site
Corps will conduct a 4 season study of demersalresources in area Based on original siting
information Beam trawl
Working with WDFW ROV survey
pp-6-31
pp-6-32

Grays Harbor DNR Volumes
31,500 33,112 32,936 33,099
77,57692,504
201,153
78,270
124,492
0
50,000
100,000
150,000
200,000
250,000
2006 2007 2008 2009 2010 2011 2012 2013 2014
Dred
ge V
olum
e (C
ubic
Yar
ds)
Dredge Year
pp-6-33
Questions?
pp-6-34
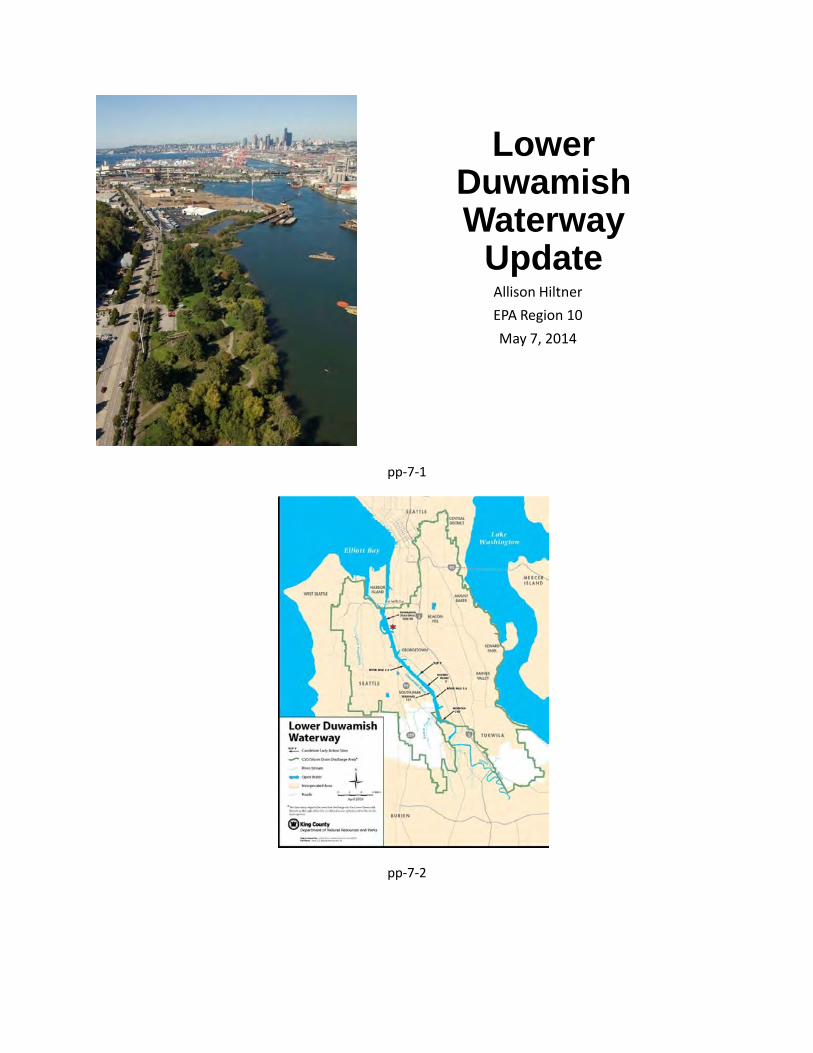
Lower Duwamish Waterway
UpdateAllison HiltnerEPA Region 10May 7, 2014
pp-7-1
pp-7-2

Clean up early
action areas
SedimentCleanup
Source control
Key parts of the Duwamish cleanup
pp-7-3
Lower Duwamish Waterway – what’s new• Boeing Plant 2 cleanup underway• Terminal 117 cleanup underway• Jorgensen Forge cleanup to start 2104• Fishers Study underway• Clam arsenic laboratory study completed• Carbon amendment pilot study in initial stages• Numerous source control activities and studies underway (Ecology)• EPA is considering public comments on Proposed Cleanup Plan and
developing draft Record of Decision
pp-7-4

Lower Duwamish Waterway Project Team• EPA:
• Melissa Blankenship - Boeing Plant 2• Piper Peterson - Terminal 117• Becky Chu - Jorgensen Forge, Fishers Study, Source Control coordination• Bruce Duncan – Clam Arsenic study• Allison Hiltner - Carbon Amendment Pilot Study, Record of Decision
• Ecology: Dan Cargill, Rick Thomas, Rachel McCrea, Ron Timm and many others –Source Control
• Corps of Engineers tech support: John Wakeman, Kristen Kerns, Veronica Henzi, Mandy Michalsen
• Lower Duwamish Waterway Group: Port of Seattle, City of Seattle, King County, The Boeing Company
pp-7-5
Lower Duwamish Early Action Areas
• Norfolk completed 1999 (King County)• Duwamish/Diagonal completed 2005 (King
County)• Slip 4 completed 2012 (City of Seattle and
King County)• Boeing Plant 2 to be completed 2015
(Boeing)• Terminal 117 to be completed 2014 (Port
and City of Seattle)• Jorgensen Forge to be completed 2015
(Green = completed Red = underway)
pp-7-6

Lower Duwamish Early Action Activity
7
pp-7-7
Boeing Plant 2 Progress
pp-7-8

Boeing Plant 2Two Seasons of Dredging Completed
9
pp-7-9
Boeing Plant 2 | Dredging Overview
10
pp-7-10

Backfilling with Clean Sand
11
pp-7-11
Boeing Plant 2Construction Season 2 Production Summary
12
pp-7-12
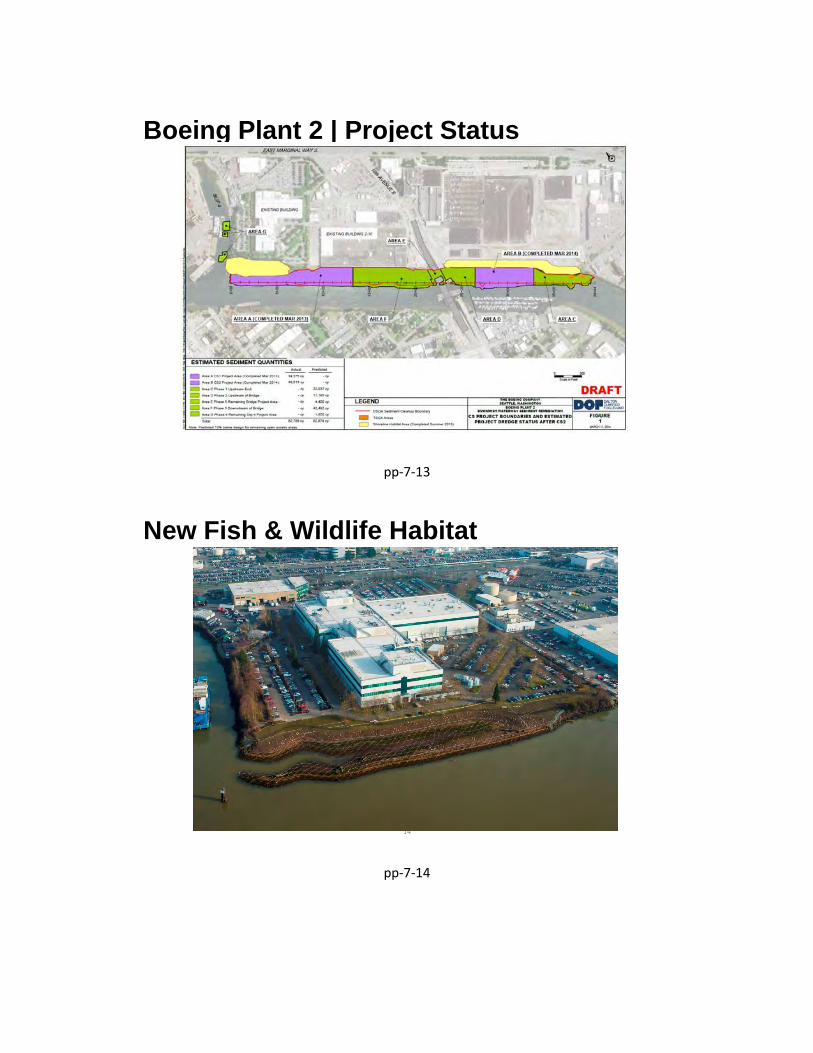
Boeing Plant 2 | Project Status
13
pp-7-13
New Fish & Wildlife Habitat
14
pp-7-14

New Fish & Wildlife Habitat
15
pp-7-15
Terminal 117 project status• Dredged 10,000 cy• Will complete backfill/capping this
year• 12 acre restoration project to be
built summer 2016
pp-7-16

pp-7-17
pp-7-18

pp-7-19
Jorgensen Forge• Completed a sheet pile wall this
spring• Construction will start July 20; to be
completed by Sept 7• Will dredge 15,000 cy and backfill
pp-7-20

LDW Early Action Overview• In 2013/14 dredging season – 48,000 cy contaminated sediments
removed from Boeing Plant 2 and 10,000 cy from T-117• Remaining contaminated sediments will be removed by the end of
the 2015/16 dredging season • Overall, Early Actions will:
• Clean up 29 acres of contaminated sediments• Remove over 300,000 cy of contaminated sediments from the LDW• Reduce PCB concentrations in surface sediments by 50%
pp-7-21
Protecting Fish Consumers in EPA’s Superfund Cleanup – the LDW Fishers Study
pp-7-22

pp-7-23
Why don’t advisories work?
Cultural Component
Consumer responsible for addressing risk
Requires food alternatives
pp-7-24

What’s Next?Finalize Implementation PlanPilot ProjectInitiate Study
DRCC
pp-7-25
What’s Next?Finalize Implementation PlanPilot ProjectInitiate Study
DRCC
pp-7-26

Activated Carbon Pilot Study• LDW proposed plan calls for placing sand + activated carbon (AC) if pilot
studies are successful• EPA, Ecology, and LDWG are discussing doing some of the groundwork to
implement pilot studies prior to issuing EPA’s Record of Decision• EPA and Ecology are consulting with Tribes and other stakeholders• Currently discussing Scope of Work• Plan is to initiate the pilot studies in 2015/16 dredging season
pp-7-27
Evaluation of Exposure to Arsenic of the Eastern Soft Shell
ClamRegional Applied Research Effort (RARE):
“Bioaccumulation of Arsenic in Mya arenaria Exposed for 60 Days to
Suspended Sediments and Undisturbed Bed Sediments from the Lower Duwamish
Waterway”
pp-7-28

Lab-Based QuestionsExperimental objective: half of the risk from seafood
consumption arises from clam inorganic arsenic; so, lab studies asked:
1. Which is a more important exposure route: suspended material or sediment? (If sediment, a better likelihood of remedial intervention.)
2. Is high inorganic arsenic a Mya pattern or a site-specific pattern? (Is there something special going on in the LDW?)
pp-7-29
Sediment Collections Sediment Fractions
214
309
999
66
0
200
400
600
800
1000
1200
Whole sediment >2 mm 250µm>x<2mm < 250µm
Tota
l As,
mg/
kg -
dw
Whole or Sediment Fraction
Shell Fragments, 5% by weight of whole sediment
Fine Sands, Silts and Clays
Used for suspended and bedded exposures
Intertidal collections: • North of Kellogg Island • Slip 1• ~60% inorganic arsenic in
composite sample shown• Bulk of arsenic was in shell
fragments!
pp-7-30
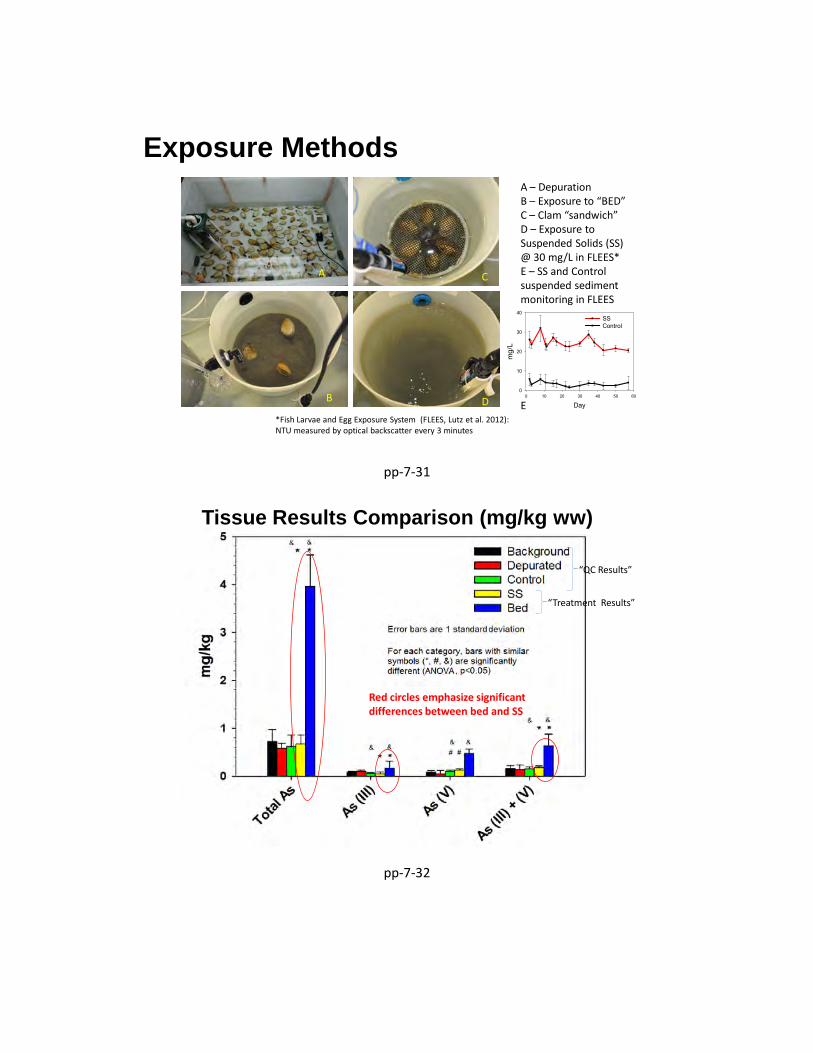
Exposure Methods
Day0 10 20 30 40 50 60
mg/
L
0
10
20
30
40SSControl
A
D
C
BE
A – DepurationB – Exposure to “BED”C – Clam “sandwich”D – Exposure to Suspended Solids (SS) @ 30 mg/L in FLEES*E – SS and Control suspended sediment monitoring in FLEES
*Fish Larvae and Egg Exposure System (FLEES, Lutz et al. 2012): NTU measured by optical backscatter every 3 minutes
pp-7-31
“QC Results”
“Treatment Results”
Tissue Results Comparison (mg/kg ww)
Red circles emphasize significant differences between bed and SS
pp-7-32

Source Control
pp-7-33
Site Cleanup & Inspections:Site Cleanups
Ecology18 facilities with Agreed Orders
13 in Toxics Cleanup Program5 in Hazardous Waste Program
6 site investigations4 voluntary cleanup program
sites
EPA6 facilities with CERCLA, RCRA
or TSCA orders
pp-7-34

Site Cleanup & InspectionsCompliance Assurance
• Business Inspections – 2013• Seattle – 284 inspections at 177 businesses• Ecology Urban Waters – 207 Inspections at 176
businesses• King County - 15 Inspections at 12 businesses• Level III stormwater treatment • Engineering design reviews
“Source control is like laundry. It is never finished.” (Kris Flint, USEPA, retired)
pp-7-35
Source Control Studies• Air Deposition• Stormwater Pollution Prevention Plans & Outfall
Inventory• Industrial Facilities Stormwater Characterization Study• Green-Duwamish River Scoping Study• Green-Duwamish River Loading Study• Cement Kiln Dust• Site Hazard Assessments• King county also conducting numerous studies in
Green/Duwamish
pp-7-36

Record of Decision• Public comment period on proposed cleanup plan Feb – June 2013• EPA received 2327 public comments on the Proposed Plan• We are considering public comments as we develop our Record of
Decision (ROD)• ROD will be issued by the end of 2014
• Will include summary of all significant comments and responses
pp-7-37
For More Information • EPA’s web site: www.epa.gov/region10/duwamish.html
(for April 15 presentations, click on “documents”, scroll to bottom of page)
• Ecology’s web site:http://www.ecy.wa.gov/programs/tcp/sites_brochure/lower_duwamish/lower_duwamish_hp.html
• Terminal 117 updates: www.t117.com
pp-7-38

SMS/MTCA Cleanup Projects Update
Kathy Taylor, SupervisorAquatic Lands Cleanup Unit
Toxics Cleanup Program
Sediment Management Annual Review MeetingMay 7, 2014
pp-8-1
Sediment Cleanup Sites
• 172 total state led sediment sites
• 136 in Western Washington (not including NFAs)
pp-8-2
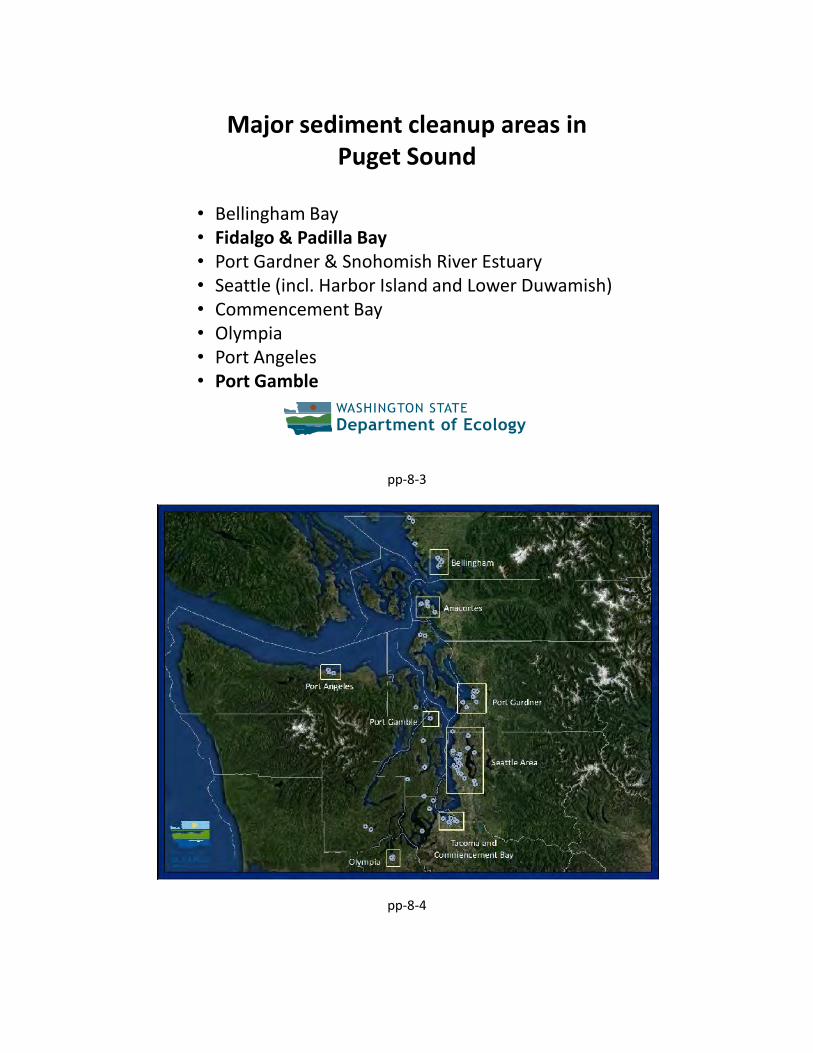
Major sediment cleanup areas in Puget Sound
• Bellingham Bay • Fidalgo & Padilla Bay • Port Gardner & Snohomish River Estuary • Seattle (incl. Harbor Island and Lower Duwamish)• Commencement Bay • Olympia• Port Angeles • Port Gamble
pp-8-3
pp-8-4

pp-8-5
pp-8-6

pp-8-7
pp-8-8

pp-8-9
pp-8-10

Anacortes: Custom Plywood
pp-8-11
In-Water Cleanup Work Removal of Marine Construction Debris and Pilings Sediment Remediation – Dioxin and Wood Waste Shoreline Protection & Habitat Restoration Work
Anacortes: Custom Plywood
pp-8-12

pp-8-13
pp-8-14

pp-8-15
pp-8-16

pp-8-17
pp-8-18

Custom PlywoodPete Adolphson (sediments) and Hun-Seak Park
The first phase cleaned up 4 upland acres contaminated with TPH and metals:
• (1) over 24,800 cubic yards of contaminated soil was removed,• (2) 970 creosote pilings were removed,• (3) 51,000 cubic yards of clean material was imported,• (4) an on-site mitigation wetland was created, and• (5) a damaged storm drain to the site area was repaired and a bioswale system was created and installed.
The second project phase completed early this year• (1) removed over 45,000 cubic yards of contaminated materials• (2) removed nearly 1,400 creosote pilings from the waters of Fidalgo Bay, and• (3) imported 130,000 cubic yards of habitat friendly substrate.
Completed on time and under budget.
Viable surf smelt spawning returned immediately on the remediated areas.
We are conducting a study at this site on thin layer sediment placement and carbon amendments in existing eelgrass beds located in areas containing lower levels of contaminated sediment.
pp-8-19
pp-8-20

pp-8-21
pp-8-22

pp-8-23
pp-8-24

pp-8-25
pp-8-26

pp-8-27
pp-8-28

pp-8-29
pp-8-30

pp-8-31
pp-8-32

pp-8-33
pp-8-34

pp-8-35
pp-8-36

pp-8-37
pp-8-38

Site Name Also known as Causes of Contamination Site Cleanup Status Authority
Elliot Bay & Harbor Island
Coleman Dock Sediments
Recontamination of clean cap as result of
DOT activities to renovate Seattle Ferry
Terminal
RI/FS Completed MTCA
Central Seattle Waterfront Pier 53-55, WaterfrontIndustrial, Combined Sewer Overflow, Spill
Remedial Investigation/Feasibility Study In
ProcessSMS
Coleman Creosoting Works
EB28- Colman Dock, Pier 58, Crawford Sea Grill, Ivar's
Captain's Table, US Vining & The Furnance Oil Company
Industrial, CSO, Stormwater, Spills
Early Notice Letters Completed MTCA
Crowley Marine Services Inc
This includes sites known as parcels D and E
unknown Initial Investigation Completed MTCA
King Denny Way CSO EB26 - Denny Way CSOCombined Sewer
OverflowMonitoring MTCA
GATX Facility
EB17 - East Waterwaypart of Harbor Island Superfund
SiteGATX Tank Storage Terminals, GATX Terminals Corp, TOSCO
GATX Term Tank S
Petroleum bulk plant Early Notice Letters Completed MTCA
Harbor Island East Waterway EB8 - , partial T18
Shipyard, Industrial, Combined Sewer
OverflowRecord of Decision (CERCLA) SMS
Pier 1 United Marine Shipbuilding Harbor Ave
Industrial, Combined Sewer Overflow
Site Hazard Assessment Completed, Hazardous Site
Listing CompletedMTCA
Seattle City Harbor Ave SW Project unknown
Site Discovery, Report Received Completed
SMS
Seattle Term 48 EB18 - Piers 48-52Industrial, Combined Sewer Overflow, Spill
Initial Investigation In Progress SMS
Seattle Terminal 46 EB27 - Piers 46-48Terminal 46
Combined Sewer Overflow
Early Notice Letters In Progress SMS
SW H b P j W k ff EB6 - Pacific Sound Resources I d t i l
Site Discovery, Report Received CERCLA
pp-8-39
Site Name Also known as Causes of Contamination Site Cleanup Status Authority
Lower Duwamish River
Duwamish Shipyard Inc Marine Lines, Machine Works, DR36 - Duwamish Shipyard
Shipyard
Site Hazard Assessment Completed, Hazardous Sites
Listing Completed, Negotiations for AO started Feb 2008
CWA
Lower Duwamish Waterway acreage unspecified for parcels ()
Brandon ST CSO; Duwamish River Main Channel; Duwamish Shipyard; Duwamish; Diagonal
CSO; Slip 3, MP&E; South Harbor Island; DR31 -
Duwamish
Industrial, spill, combined sewer
overflow, stormwater run-off
Remedial Investigation/Feasibility Study in
processCERCLA/SMS
Northwest Enviroservice 2W Spill Awaiting cleanup MTCA
Boeing Renton Industrial, Metals Cleanup Started MTCA
Northwest Auto Wrecking
Northwest Auto and Truck Wrecking
Cleanup Started MTCA
Seattle City Light Steam Plant Georgetown Steam Plant, Light Unknown
Interim Action Completed. Negotiations for AO start April
2008MTCA
pp-8-40

pp-8-41
pp-8-42

Site Also known as Causes of Contamination Site Cleanup Status Authority
Tacoma Silver Cloud Inn LLC
Silver Cloud Inn LLC, Silver Cloud Inn
Industrial, leaking underground storage tank
Cleanup Operation & Maintenance In Process
MTCA
Cascade Pole MCF Sitcum
McFarland Sitcum, Sitcum Waterway
Industrial Interim Action Completed MTCA
Dickman Mill Wood, timber, paper Interim Action Completed MTCA
Hylebos Wood Debris Site Sediments
Bay Superfund Site, Hylebos Waterway Problem
Industrial Cleanup Construction In Process MTCA
Occidental Chemical Corp
Pioneer Americas Inc, Pioneer Americas LLC, Pioneer Chlor
Alkali Co Inc, Hylebos Waterway
IndustrialRemedial Investigation/Feasibility
Study In ProcessMTCA
US Army WSMC Pier 23 Pier 23, US Army Reserve Industrial, ShipyardRemedial Investigation/Feasibility
Study In ProcessMTCA
Arkema, Inc
ATO Chem, ATOFINA Chemicals Inc, Elf ATOCHEM
2901 Taylor Way, Elf ATOCHEM North America
Tacoma, Pennwalt Corporation
unknownCleanup Operation &
Maintenance In Process; Cleanup Action Plan
CWA
General Metals of unknownCleanup Complete, periodic
reviewCERCLA
pp-8-43
pp-8-44
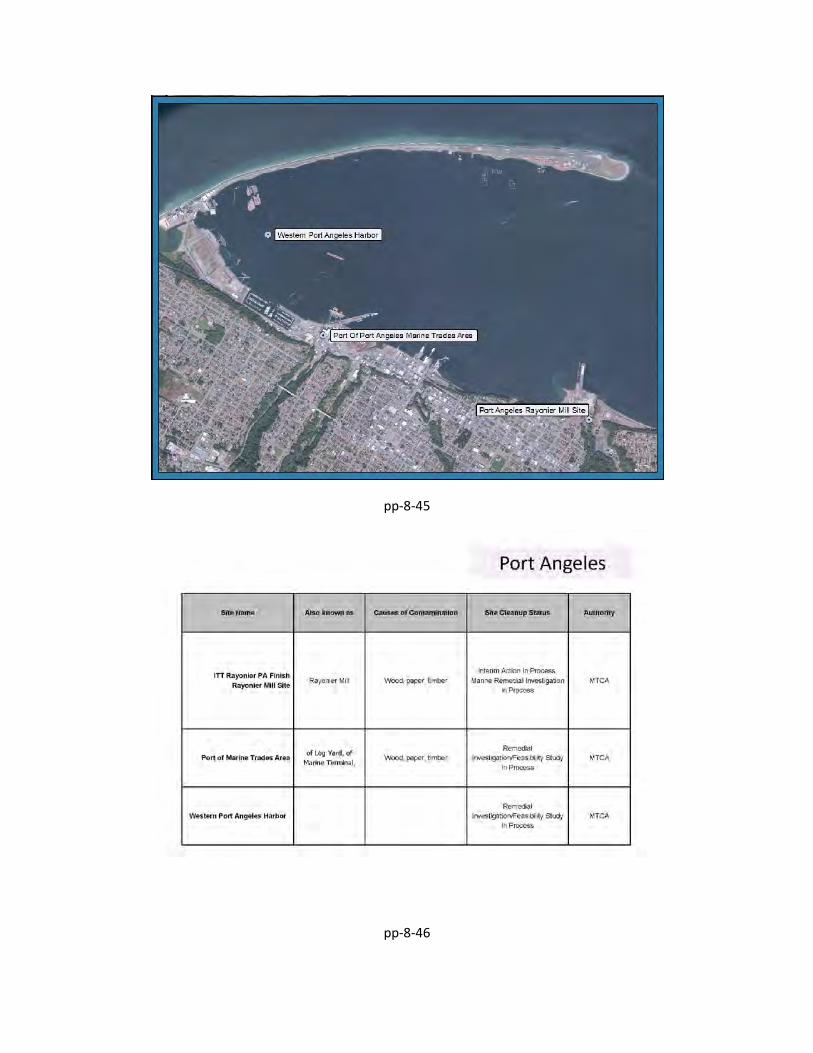
pp-8-45
pp-8-46

pp-8-47
pp-8-48

Port Gamble
pp-8-49
pp-8-50

51
December 18, 2012Port Gamble
Port Gamble Bay Cleanup Actions (Russ McMillan)
Remove creosoted pilings and overwater structures
Excavate contaminated intertidal sediments (~14,000 cys) Remove and isolate wood waste at Mill Site
Dredging from shallow subtidal areas (~30,000 to 45,000 cys) Capping deeper subtidal deposits and (~10 acres)
Thin layer capping of moderate wood waste impacts (~100 acres, 6” layer)
Long term monitoring of recovery after removing creosote sources (throughout all of Port Gamble Bay ~600 acres)
pp-8-51
Port Gamble
pp-8-52

pp-8-53
pp-8-54

55
May 7, 2014 Port Gamble
Port Gamble Bay Proposed Cleanup
Sediment Management Areas (SMAs)
Mill North (6 acres) Mill South (19 acres) Central Bay (77 acres) Former Lease Area (19 acres) Background Area (602 acres)
pp-8-55
56
December 18, 2012Port Gamble
Proposed Site Cleanup Mill Site North
Mill Site North Cleanup, SMA-1
Piling and structure removal
Intertidal excavation/backfill (5,000 cubic yards)
Dredge wood waste (10,000 to 15,000 cubic yards)
1 ft Sand cap (3 acres)
Long term monitoring
pp-8-56

57
December 18, 2012Port Gamble
Proposed Site Cleanup Mill Site South
Mill Site South Cleanup, SMA-2 Piling and structure removal Intertidal excavation (9,000 cubic yards) Dredge wood waste (20,000 to 30,000
cubic yards) Place 4 ft cap Place 6” emnr cap Long term monitoring
pp-8-57
58
December 18, 2012Port Gamble
Proposed Site Cleanup Central Bay
Central Bay Cleanup, SMA-3
Place 6” emnr cap (77 acres, 90,000 to 100,000 tons sand)
Long term monitoring
pp-8-58

59
December 18, 2012Port Gamble
Proposed Site Cleanup Former Lease Area
Former Lease Area Cleanup, SMA-4 Place 6” emnr cap (19 acres,
20,000 to 25,000 tons sand) Long term monitoring
pp-8-59
60
December 18, 2012Port Gamble
Proposed Site Cleanup Background Area
Background Area Cleanup, SMA-5
Long term monitoring (602 acres)
pp-8-60

61
May 7, 2014 Port Gamble
Port Gamble Bay Source Control, Habitat Preservation and Cleanup Sustainability (Celina Abercrombie)
pp-8-61
62
May 7, 2014 Port Gamble
Restoration and Preservation Projects and Locations Western Shoreline Block Land Acquisition
Forested Upland Block Land Acquisition
Pacific Herring Studies
Eelgrass Restoration
Olympia Oyster Enhancement
Baywide Debris and Derelict Gear and Vessel Removal
Riparian Restoration
Point Julia Pier Removal and Beach Restoration
Martha John Estuary Pile Removal (combined with debris removal)
Forage Fish Rebuilding (combined with debris removal)
pp-8-62

63
May 7, 2014 Port Gamble
Land Acquisition and Preservation
Western Shoreline Block• Approx. 450 acres of upland and 70 acres of
tideland
• Approx. 1.5 miles of shoreline
• Owned by Kitsap County
pp-8-63
64
May 7, 2014 Port Gamble
Pacific Herring Studies
Embryo Mortality Study
• Provide baseline information on herring embryo contamination and health focusing on PAHs
• Provide insight to trend of decreasing herring spawning in the bay
Genetics Study
• Obtain genetics samples from several herring populations to better identify relationships among spawning stocks
pp-8-64
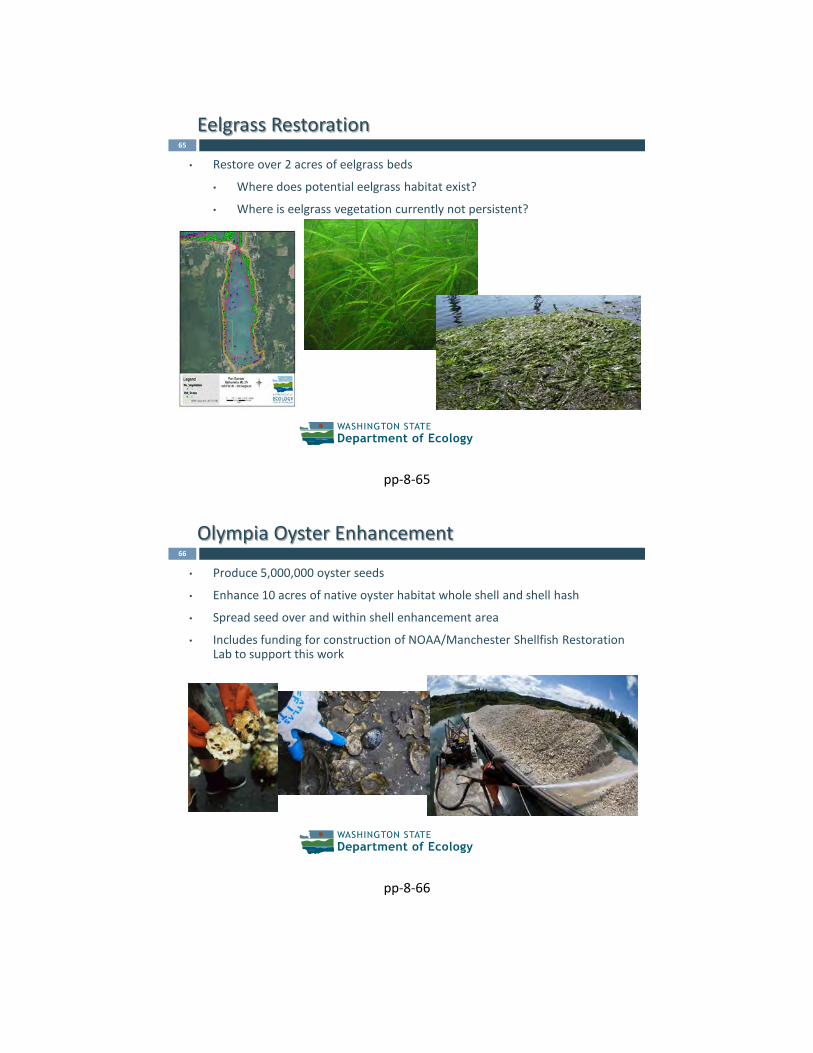
65
May 7, 2014 Port Gamble
Eelgrass Restoration
• Restore over 2 acres of eelgrass beds
• Where does potential eelgrass habitat exist?
• Where is eelgrass vegetation currently not persistent?
pp-8-65
66
May 7, 2014 Port Gamble
Olympia Oyster Enhancement
• Produce 5,000,000 oyster seeds
• Enhance 10 acres of native oyster habitat whole shell and shell hash
• Spread seed over and within shell enhancement area
• Includes funding for construction of NOAA/Manchester Shellfish Restoration Lab to support this work
pp-8-66

67
May 7, 2014 Port Gamble
Debris and Derelict Gear and Vessel Removal
• Remove scattered intertidal debris and derelict gear and vessels throughout the Bay
• Remove remaining pilings (not removed as part of cleanup)
• Restore riparian vegetation as appropriate
pp-8-67
68
May 7, 2014 Port Gamble
Upcoming Restoration and Preservation Projects
Purchase Forested Upland Parcels• 20-acre forested upland lots that contain wetland and stream resources
Point Julia Pier Removal and Beach Restoration• Remove the pier and a concrete boat ramp
• Restore beach where pier and boat launch were located
Riparian Restoration on Western Shoreline Block• Restore approximately 1.5 acres of degraded riparian habitat
pp-8-68

Summary
• Many cleanups are underway in Puget Sound• We are using innovative approaches, where
possible, to restore and protect habitat on cleanup sites.
• Details are available in newly updated Ecology website, Toxic Cleanup Program Web Reporting https://fortress.wa.gov/ecy/tcpwebreporting/Default.aspx and from project managers
pp-8-69
Washington Dredged Material Management Program& Portland Sediment Evaluation Team
2014 SMARMMay 7, 2014
James M. McMillanUS Army Corps of Engineers, Portland District
pp-9-1

Sampling Objectives DMMP & PSET regulatory decisions
depend on representative sediment characterization data
Samples must adequately characterize the intended decision unit(s) (dredge prism & Z-layer)
A(-25 to -33)
B(-33 to -40)
Z (-40 to -42)
-32
-50
-26
-28
-46
-44
-42
-40
-38
-36
-34
-48
-30
Below Dredge Depth
In-situ Profile
ft. M
LLWCWA
MPRSAAnti-deg.
pp-9-2
Core Sampling Objectives Sample on station Sample the thickest (i.e., most
representative) parts of the dredge prism
Achieve highest possible core recovery
Collect samples/subsamples from the targeted depths (dredge prism & Z-layer samples)
pp-9-3

Presentation Objectives Cover the issues:
Low core recovery Human-related error
Propose guidelines and contingencies for core sampling
pp-9-4
Issue No. 1:Low Core Recovery
-41
-50
-38
-39
-48
-47
-46
-45
-44
-43
-42
-49
-40
ft. M
LLW A (-42 to -46)
Z (-46 to -48)
Below Dredge Depth
penetration: 7 ft.
% Recovery =Length of Sed. Retrieved
Depth of PenetrationX 100
5.25 ft.
5.25 ft.
7.0 ft.X 100
= 75% Recovery
pp-9-5
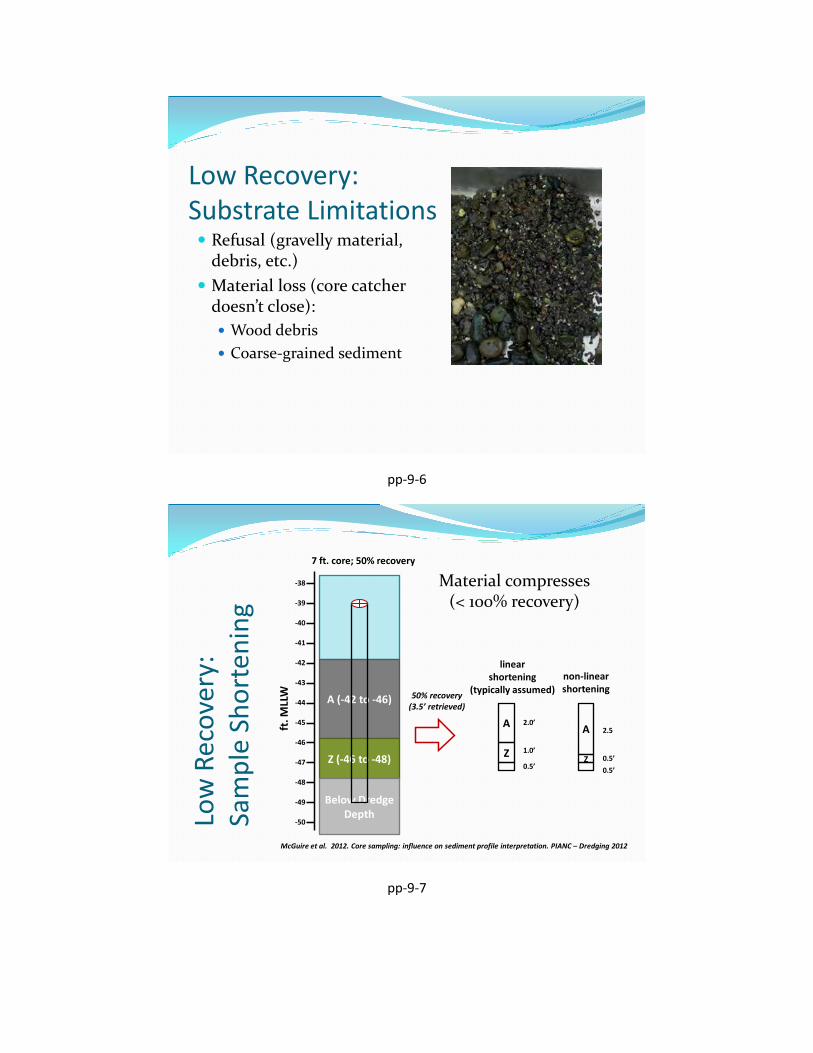
Low Recovery: Substrate Limitations Refusal (gravelly material,
debris, etc.) Material loss (core catcher
doesn’t close): Wood debris Coarse-grained sediment
pp-9-6
Low
Rec
over
y:
Sam
ple
Shor
teni
ng
Material compresses (< 100% recovery)
-41
-50
-38
-39
-48
-47
-46
-45
-44
-43
-42
-49
-40
ft. M
LLW A (-42 to -46)
Z (-46 to -48)
Below Dredge Depth
A
Z
7 ft. core; 50% recovery
linearshortening
(typically assumed)
A
Z
2.0’
1.0’
0.5’
2.5
0.5’0.5’
non-linearshortening
50% recovery(3.5’ retrieved)
McGuire et al. 2012. Core sampling: influence on sediment profile interpretation. PIANC – Dredging 2012
pp-9-7
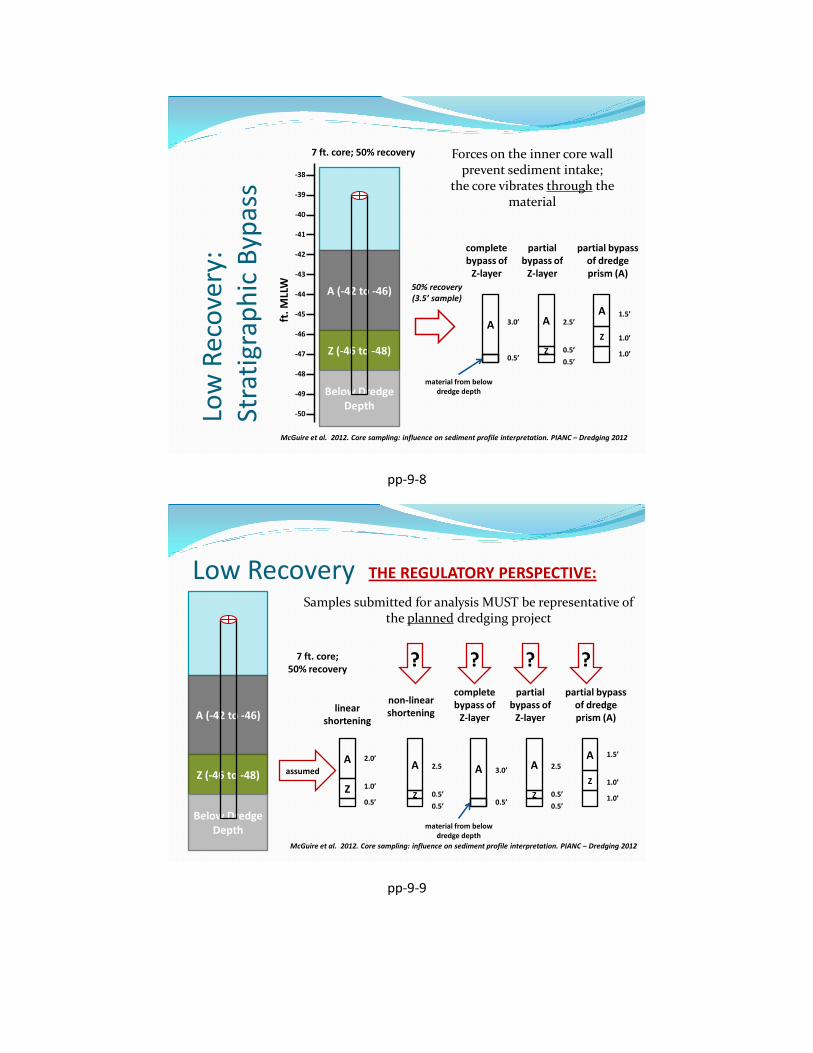
Low
Rec
over
y:
Stra
tigra
phic
Byp
ass
Forces on the inner core wall prevent sediment intake;
the core vibrates through the material
-41
-50
-38
-39
-48
-47
-46
-45
-44
-43
-42
-49
-40
ft. M
LLW A (-42 to -46)
Z (-46 to -48)
Below Dredge Depth
A
7 ft. core; 50% recovery
completebypass of
Z-layer
A
Z
3.0’
0.5’
2.5’
0.5’0.5’
partialbypass of
Z-layer50% recovery(3.5’ sample)
material from below dredge depth
McGuire et al. 2012. Core sampling: influence on sediment profile interpretation. PIANC – Dredging 2012
partial bypass of dredge prism (A)
A
Z
1.5’
1.0’
1.0’
pp-9-8
Low Recovery
A
completebypass of
Z-layer
A
Z
3.0’
0.5’
2.5
0.5’0.5’
partialbypass of
Z-layer
material from below dredge depth
A
Z
A
Z
2.0’
1.0’
0.5’
2.5
0.5’0.5’
non-linearshorteninglinear
shortening
?
assumed
McGuire et al. 2012. Core sampling: influence on sediment profile interpretation. PIANC – Dredging 2012
? ?
A (-42 to -46)
Z (-46 to -48)
Below Dredge Depth
7 ft. core; 50% recovery
partial bypass of dredge prism (A)
A
Z
1.5’
1.0’
1.0’
?
Samples submitted for analysis MUST be representative of the planned dredging project
THE REGULATORY PERSPECTIVE:
pp-9-9

Core Sampling Guidelines Guideline: MINIMUM CORE RECOVERY
If at first you don’t succeed, try, try again Contingency: bring a grab sampler in case
of refusal/low recovery in coarse-grained material
Contingency: post-dredge sampling may be required to characterize Z-layer if: subsurface unit(s) cannot be sampled (refusal)
OR Z-layer sample collection is uncertain (low
recovery)
= 75%
A 3.0’
0.5’
material from below dredge depth; Z-
layer bypass
pp-9-10
Core Sampling Guidelines (cont.)Advance the core nose no more than 1 ft. below the Z-layer
-11
-3
-10
-9
-8
-7
-6
-4
-5
-2
-1
0
Below dredge limit (>-8 ft.)
DredgePrism (A)(mudline to -6 ft.)
-2.0
Z-7.0
-8.0
Z Layer(-6 to -8 ft.)
1
ft. N
GVD
29
-12
2
A
Z
OUT
A
Z?
Core 1(4.5 ft.)
Core 2(7.5 ft.)
75% recovery
6 ft.Core
10 ft.Core
pp-9-11

Issu
e N
o. 2
: Hum
an E
rror “We’re Not Gonna Take It”
pp-9-12
Human Error Poor methodology, field notes,
core logging practices Vertical correction for tide/river
level Depth to mudline Depth of core barrel penetration Not calculating core recovery Incomplete/incorrect data
recording/reporting
The Z-sample should have been taken here
The Z-sample was taken here
pp-9-13

Core log provided on4 Sept 2013 (uncorrected)
Log revised w/vertical corrections on 25 Sept 2013
Tidal corrections made 3 mos. after sampling!
Sampled on 19 June 2013
pp-9-14
Human ErrorContractor collected Z-sample from the core bottom
West East
-3
-9
-8
-7
-6
-4
-5
-2
-1
0
+1
Below dredge limit (>7 ft.)
Z-layer(-5 to -7 ft.)
Dredge Prism (A)(mudline to -5 ft.)
-4.8
-1.5
-0.6-0.1
A
Z
AA
Z
A
Z
-5.8
-7.8
-4.5
-6.5
-3.6
-6.6
-2.1
-5.1Zft
. NG
VD 2
9
Z
-1.5 A
Z
Mudline elevation (ft. NGVD 29)
Sample data rejected for intended purpose
Incomplete sample interval (e.g., partial A) or sample combines intervals (A+Z); limited usability
Sample data accepted for intended purpose
X
X Discarded core material
-8.0
Data Usability Analysis
pp-9-15

Human Error:What We’re Going to Do About It Preventive measures:
Pre-sampling meetings w/ DMMP/PSET Standardize fields in core (and grab) sample logs Develop field checklist for samplers
Negligent sampling = err on the side of resources Longer review times Reject some or all sample data Re-sample project (& re-analyze samples) Post-dredge characterization
pp-9-16
We Need Your HelpPlease provide comments to help us improve our core sampling guidelines
pp-9-17

ReferenceMcGuire, C., P. McGuire, D. Richardson, & J. Holmstadt. 2012. Core sampling: influence on sediment profile interpretation. Presentation by TetraTech staff at the PIANC-COPRI Dredging 2012 Conference, 24 October 2012, San Diego, CA.
http://dredging12.pianc.us/agd_detailss.cfml?ssid=166
pp-9-18
Questions?
pp-9-19

PCB Alternative AnalysisComparison of Aroclor to low and high-resolution GCMS
Laura Inouye (Ecology)Kelsey Van der Elst (USACE)
pp-10-1
Introduction• Aroclor analysis is standard for sediments, but has
its issues– Weathering and mixtures: impact to identification of
Aroclors– Detection limits (Ecology background issue)– Cannot calculated dioxin-like TEQs
• High resolution gas chromatograph/mass spectra (HR-GCMS) is the “gold standard” of analysis, but is expensive. Is an alternative available?
• This study investigated low resolution GC-MS (LR-GCMS) methods and its potential as a surrogate for total PCB and for calculating dioxin-like PCB TEQs
pp-10-2

Approach• Two different studies were initiated in 2012.
– USACE Duwamish• 9 samples from the Duwamish plus PS-SRM• HR-GCMS (EPA 1668), LR-GCMS (EPA 680), and Aroclor• Total PCB HR-GCMS concentration range 12-1744 ppb
– Ecology Study: freshwater and marine sediments from region
• 3 marine samples from 3 different locations, 5 FW samples from 2 locations, plus PS-SRM
• HR-GCMS (EPA 1668), LR-GCMS (EPA 8270C/D GC/LRMS), and Aroclor
• Total PCB HR-GCMS concentration range from 4-191 ppb
pp-10-3
USACE Study, Total PCBs
• Initial LRMS results confounded by sulfur • Sulfur clean-up added and samples re-analyzed.• Total PCB HR-GCMS concentration range
12-1744 ppb
• Aroclor results always higher than GC-MS results.• HR and LR-GCMS methods correlated well
(y = 1.13x – 19.417; R² = 0.998)
pp-10-4

Regression of (1) sum of the HR-congeners (U=1/2 RL) vs. total Aroclors and (2) sum EPA 680 LR-homologs vs. total Aroclors
USACE Total PCB Results
sum PCBs by Aroclor (ppb)
0 500 1000 1500 2000 2500 3000 3500
sum
PC
Bs
by G
CM
S (p
pb)
0
500
1000
1500
2000
2500
3000
3500
HR-GCMS LR-GCMS
sum PCBs by Aroclor (ppb)
0 500 1000 1500 2000 2500 3000 3500
sum
PC
Bs
by G
CM
S (p
pb)
0
500
1000
1500
2000
2500
3000
3500
HR-GCMS LR-GCMS
y = 0.5543x + 1.0293R² = 0.9937
y = 0.4898x + 18.643R² = 0.9923
pp-10-5
sum PCBs by Aroclor (ppb)
0 20 40 60 80 100 120 140 160
sum
PC
Bs
by G
CM
S (p
pb)
0
50
100
150
200
250
HR-GCMS LR-GCMS
sum PCBs by Aroclor (ppb)
0 20 40 60 80 100 120 140 160
sum
PC
Bs
by G
CM
S (p
pb)
0
50
100
150
200
250
HR-GCMS LR-GCMS
Aroclor v HRr 2 0.865slope 0.734intercept -0.824
Sum PCBs, Aroclors v HR-GCMS congeners and LR-GCMS homologs
Aroclor v LRr 2 0.928slope 0.652intercept -6.115
Ecology Study, Total PCBs
x
pp-10-6

Combined Studies, Total PCBs
sum PCBs by Aroclor (ppb)
0 500 1000 1500 2000 2500 3000 3500
sum
PC
Bs
by G
CM
S (p
pb)
0
500
1000
1500
2000
2500
3000
3500
HR-GCMS (combined datasets)LR-GCMS (combined datasets)
sum PCBs by Aroclor (ppb)
0 500 1000 1500 2000 2500 3000 3500
sum
PC
Bs b
y G
CM
S (p
pb)
0
500
1000
1500
2000
2500
3000
3500
HR-GCMS (combined datasets)LR-GCMS (combined datasets)
pp-10-7
Ecology Study, Total PCBs
• Total PCB HR-GCMS concentration range 4-191 ppb
• Aroclor results always equal to or lower than GC-MS results.
• HR and LR-GCMS methods correlated well (y = 1.1384x – 7.27; R² = 0.952)
pp-10-8

Comparison of Studies, Total PCBs
COE: Aroclor > GC-MS ECY: Aroclor ≤ GC-MS– Different concentrations ranges?– Differences in lab Aroclor analysis?– Differences in sample mixture composition?
pp-10-9
sum PCBs by HR-GCMS (ppb)
0 200 400 600 800
sum
PC
Bs
by L
R-G
CM
S (p
pb)
0
200
400
600
800
sum PCBs by HR-GCMS (ppb)
0 200 400 600 800
sum
PC
Bs
by L
R-G
CM
S (p
pb)
0
200
400
600
800
Combined Studies, Total PCBs
HRMS vs LRMSr 2 0.996slope 1.129intercept -22.315
pp-10-10

Total PCBs summary• Sulfur cleanup is essential for EPA680• Both studies showed good correlation between HRMS
and LRMS.• Even though different LRMS methods were used,
combined comparison of Aroclor vs HRMS and HRMS vs LRMS resulted in good correlations.
• When samples have lower concentrations, Aroclor NDs become an issue. This becomes problematic if a large part of the dataset is ND (i.e. background determinations).
pp-10-11
Developing PCB Homolog TEFs
• Given HRMS and LRMS results are well correlated, can TEFs be developed for homologs?
• All dioxin-like PCBs fall into 4 homolog groups
• Overview development of homolog TEFs based on HR-GCMS dioxin-like congeners, and sum homologs for tetra, penta, hexa, and heptachlorinated PCBs.
pp-10-12

TEQ definition
Congener-based TEQ:TEFcong x Conccong = TEQ
Homolog-based TEQ:TEFhomo x Conchomo = TEQhomo
pp-10-13
Homolog-TEF derivationSince
TEFhomo x Conchomo = TEQhomo
and from HR-GCMS, we can obtainConchomo and TEQhomo
then we can solve for TEFhomo usingTEFhomo = TEQhomo / Conchomo
pp-10-14

Sample-specific homolog TEF calculations: ECY HRMS data1. For each sample, sum all congeners (both dioxin-like and non-
dioxin like) for each homolog group.
1. gather HR homolog dataHRMS
RM01
Monochlorobiphenyl 43.9Dichlorobiphenyl 5710Trichlorobiphenyl 11000Tetrachlorobiphenyl 32600Pentachlorobiphenyl 62800Hexachlorobiphenyl 44900Heptachlorobiphenyl 15600Octachlorobiphenyl 1010Nonachlorobiphenyl 99.2Decachlorobiphenyl 739
SUM 171502
pp-10-15
Sample-specific homolog TEF calculations: ECY HRMS data2. For each sample, HR-MS TEQs summed for each homolog group
with dioxin-like PCBs (tetra, penta, hexa, and heptachlorinatedPCBs). Can’t use KM, so used ND=DL, which was closest to KM sum.
2. Gather the HRMS dioxin-like PCB congeners, calculated TEQs, and sum based on homolog groups.
HRMS Actual TEQs# chlorines RM
77 4 0.01281 4 0.001
105 5 0.034114 5 0.002118 5 0.095123 5 0.013126 5 1.380167 6 0.010169 6 0.570
156/157 6 0.022189 7 0.005
pp-10-16
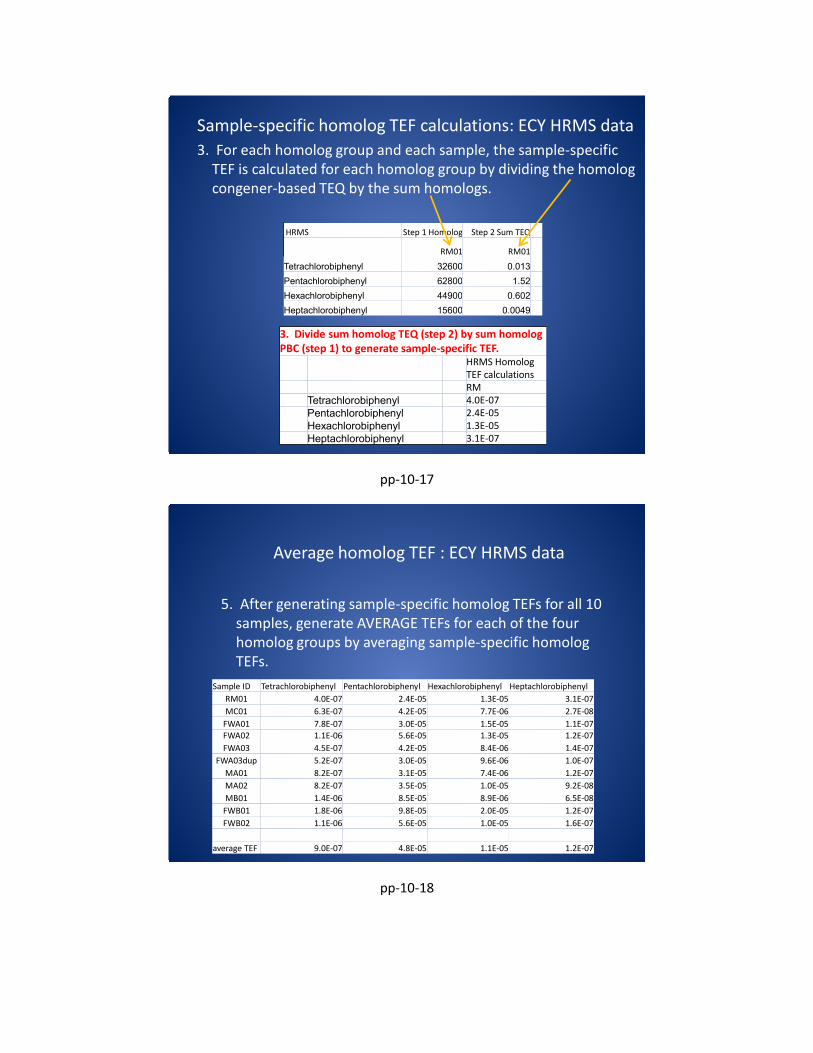
Sample-specific homolog TEF calculations: ECY HRMS data3. For each homolog group and each sample, the sample-specific
TEF is calculated for each homolog group by dividing the homolog congener-based TEQ by the sum homologs.
3. Divide sum homolog TEQ (step 2) by sum homolog PBC (step 1) to generate sample-specific TEF.
HRMS Homolog TEF calculationsRM
Tetrachlorobiphenyl 4.0E-07Pentachlorobiphenyl 2.4E-05Hexachlorobiphenyl 1.3E-05Heptachlorobiphenyl 3.1E-07
HRMS Step 1 Homolog Step 2 Sum TEQ
RM01 RM01
Tetrachlorobiphenyl 32600 0.013Pentachlorobiphenyl 62800 1.52Hexachlorobiphenyl 44900 0.602Heptachlorobiphenyl 15600 0.0049
pp-10-17
Average homolog TEF : ECY HRMS data
5. After generating sample-specific homolog TEFs for all 10 samples, generate AVERAGE TEFs for each of the four homolog groups by averaging sample-specific homolog TEFs.
Sample ID Tetrachlorobiphenyl Pentachlorobiphenyl Hexachlorobiphenyl HeptachlorobiphenylRM01 4.0E-07 2.4E-05 1.3E-05 3.1E-07MC01 6.3E-07 4.2E-05 7.7E-06 2.7E-08
FWA01 7.8E-07 3.0E-05 1.5E-05 1.1E-07FWA02 1.1E-06 5.6E-05 1.3E-05 1.2E-07FWA03 4.5E-07 4.2E-05 8.4E-06 1.4E-07
FWA03dup 5.2E-07 3.0E-05 9.6E-06 1.0E-07MA01 8.2E-07 3.1E-05 7.4E-06 1.2E-07MA02 8.2E-07 3.5E-05 1.0E-05 9.2E-08MB01 1.4E-06 8.5E-05 8.9E-06 6.5E-08
FWB01 1.8E-06 9.8E-05 2.0E-05 1.2E-07FWB02 1.1E-06 5.6E-05 1.0E-05 1.6E-07
average TEF 9.0E-07 4.8E-05 1.1E-05 1.2E-07
pp-10-18

TEFhomo Analysis
Compare TEQs for:1. HRMS congeners, using
congener-specific TEFs
2. HRMS homologs, using average homolog TEF
3. LRMS homologs using average homolog TEF
congener TEF homolog TEFsHRMS HRMS LRMS
sum TEQ sum TEQ sum TEQRM01 2.1 3.6 2.3MC01 0.4 0.5 0.6
FWA01 0.2 0.3 0.2FWA02 0.1 0.1 0.1FWA03 3.1 4.1 3.5MA01 2.7 4.1 3.6MA02 1.6 2.1 1.8MB01 0.6 0.4 0.3
FWB01 1.4 0.7 0.8
FWB02 0.6 0.5 0.7
pp-10-19
sum PCB-TEQs by HR-GCMS congeners (pptr)
0 1 2 3 4 5
sum
PC
B T
EQ
s by
hom
olog
s (p
ptr)
0
1
2
3
4
5
HR homolog PCB TEQLR homolog PCB TEQ
sum PCB-TEQs by HR-GCMS congeners (pptr)
0 1 2 3 4 5
sum
PC
B T
EQ
s by
hom
olog
s (p
ptr)
0
1
2
3
4
5
HR homolog PCB TEQLR homolog PCB TEQ
r 2 0.927Slope 0.778Intercept 0.222
HR-GCMS congener sum TEQ vs sum TEQ from homolog TEF
r 2 0.917Slope 0.614Intercept 0.285
pp-10-20

• Use other datasets to compare actual HRMS TEQ to homolog generated TEQ
• Comparison with Corps data difficult due to high DLs for PCB 169 and PCB 126, the highest TEF congeners.
• PS SRM analyzed in both COE and ECY studies• Compare sum TEQ from both studies using HR
and LR data
How Robust is the Homolog TEF?
pp-10-21
Homolog TEF and PS-SRM results: • Comparison of PS-SRM for Ecology and USACE study.
Ecology data
HR-GCMS congener (KM sum) 2.1
LR-GCMS using homolog TEF 2.3
Corps data
HR-GCMS congener (KM sum) 8.4
LR-GCMS using homolog TEF 2.1
pp-10-22

Homolog TEF summary
• Used a set of 10 samples from ECY study of widely distributed water bodies.
• Sum TEQ calculated using average homolog TEFs correlate well with HR-GCMS sum TEQs (R2>0.9)
• Need more samples from different areas to check performance (N=10 is insufficient)
pp-10-23
So What? DMMP disposal sites in the dawn of the new sediment rule.
– Need to stay below CSL– Regional and natural background: what does it
look like?– No answers now, but if PCBs are below standard
Aroclor analytical limits, GCMS may be required and LRMS may offer a lower cost alternative to HRMS.
pp-10-24

So What? Summed PCB and dioxin TEQ approach
– PCB contribution to TEQ • Preliminary Port Gardner Regional Background dataset:
– PCB = 0.008 to 0.38 pptr TEQ– Dioxin = 0.1-3.6 pptr TEQ. – PCB % of total TEQ ranges from 4-11%
• Port Angeles Regional Background dataset (90/90UTL, 5 areas)
– PCB = 0.12 – 0.39 pptr TEQ– Dioxin = 1.9-6.0 pptr TEQ. – PCB % of total TEQ ranges from 4-8%
– Other concerns- non-dioxin-like PCB carcinogenicity
pp-10-25
Next Steps
• NO PROPOSAL AT THIS TIME, but potential approaches are being discussed– If no “reason to believe” PCBs would be detected,
use Aroclor analysis.– If “reason to believe” use LRMS and the sum PCB
dioxin TEQ approach.
• Initial studies are promising, but we need more information for the homolog TEF approach
pp-10-26
COMMENTS? QUESTIONS?
pp-10-27
Sediment Bioavailability Assessment Using Passive Porewater Samplers
Mandy Michalsen, PhD, PE Kristen Kerns; John Wakeman Seattle District USACE
Prof. Phil Gschwend, PE; Eric Adams; Katherine von Stackelberg Massachusetts Institute of Technology
Howard Orlean RPM, Ravi Sanga RPM, Allison Hiltner RPM, Justine Barton, Rene Fuentes, Maja Tritt, Sean Sheldrake EPA Region 10
Prof. Danny Reible, PE; Xioang LuUniversity of Texas at Austin
1Illustration by W. Scavone
5/7/2014
pp-11-1
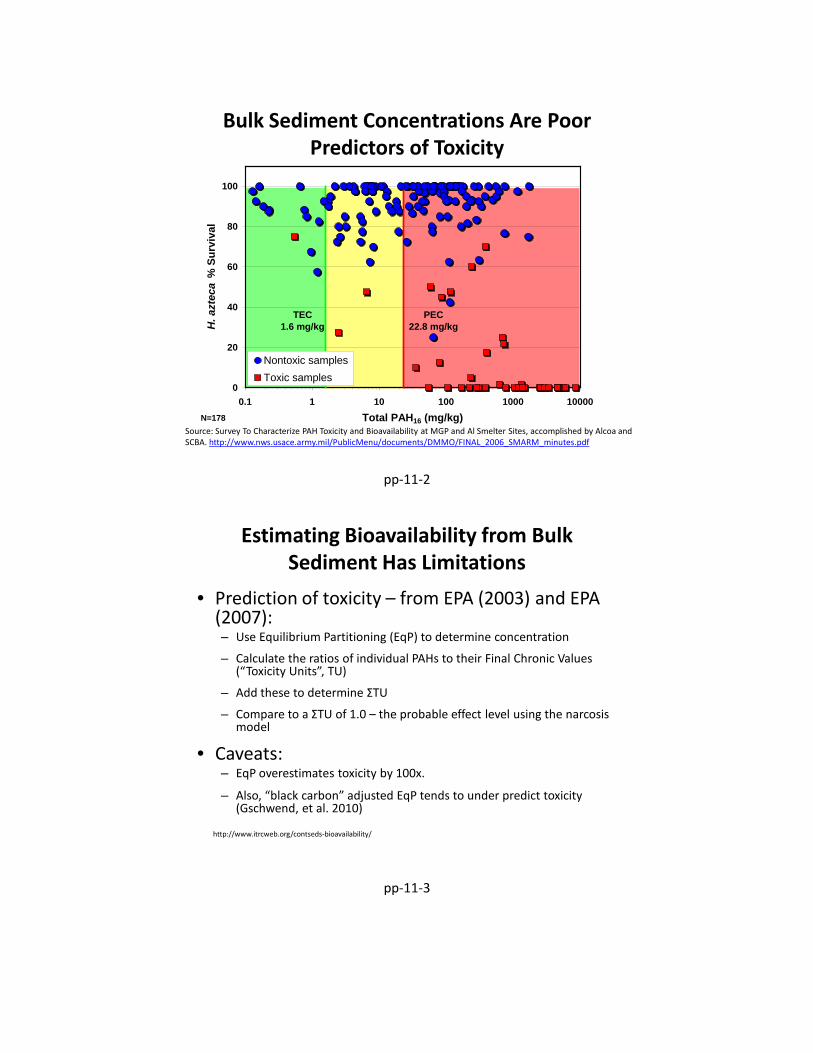
Bulk Sediment Concentrations Are Poor Predictors of Toxicity
0
20
40
60
80
100
0.1 1 10 100 1000 10000Total PAH16 (mg/kg)
H. a
ztec
a %
Sur
viva
l
Nontoxic samplesToxic samples
TEC1.6 mg/kg
PEC22.8 mg/kg
N=178Source: Survey To Characterize PAH Toxicity and Bioavailability at MGP and Al Smelter Sites, accomplished by Alcoa and SCBA. http://www.nws.usace.army.mil/PublicMenu/documents/DMMO/FINAL_2006_SMARM_minutes.pdf
pp-11-2
Estimating Bioavailability from Bulk Sediment Has Limitations
• Prediction of toxicity – from EPA (2003) and EPA (2007):– Use Equilibrium Partitioning (EqP) to determine concentration
– Calculate the ratios of individual PAHs to their Final Chronic Values (“Toxicity Units”, TU)
– Add these to determine ΣTU
– Compare to a ΣTU of 1.0 – the probable effect level using the narcosis model
• Caveats: – EqP overestimates toxicity by 100x.
– Also, “black carbon” adjusted EqP tends to under predict toxicity (Gschwend, et al. 2010)
http://www.itrcweb.org/contseds-bioavailability/
pp-11-3

Measuring Porewater Contaminants• Solid Phase MicroExtraction (SPME)
• Sorbent Polymer: PDMS (poly-dimethylsiloxane) – Thickness of glass core: 114-108 µm– Thickness of PDMS coating: 30-31 µm– Volume of coating: 13.55 (±0.02) µL
PDMS per meter of fiber• ng/L detection with 1 cm resolution
• Polyethylene (PE) Sampler• Sorbent Polymer: Polyethlyene (PE)• Thickness of PE: ~ 51 µm• ng/L detection with 1 cm resolution
x
SPME
Polyethylene (PE) Sampler
http://www.clu-in.org/download/contaminantfocus/sediments/sediment-er-1496-fr.pdf
http://www.caee.utexas.edu/reiblegroup/reible-materials/PassiveSamplingofPorewaterfortheIn-situAssessment.pdf
pp-11-4
Porewater Sampler Demonstration, Lower Duwamish Waterway Superfund Site, EPA Region 10
http://yosemite.epa.gov/r10/cleanup.nsf/sites/lduwamish
pp-11-5

• Do the measured Cpw PCBs at five sites representative of the Lower Duwamish Waterway compare well to values estimated using equilibrium partitioning
Cpw = Csed/ (foc *Kow)
• Do measured Cpw PCB porewater concentrations compare well to values estimated using black carbon adjusted estimate below?
Cpw ≈ Csed / Kd ≈ Csed / (foc * Koc + fbc * Kbc * Cpwn-1)
Kbc is fraction of sediment OC which is black carbonn is the Freundlich exponent (0.7) to account for nonlinearity
Polyethylene (PE) Porewater Sampler Field Demonstration Objectives
pp-11-6
PE Deployment Locations in
Lower Duwamish Waterway
pp-11-7

Sampling/Analysis Program Schematic
Bulk sedimentPorewater samplers (-10 to 0 cm)Bottom water samplers (0 to 10cm)Near-surface surface water samplersArchive
LDW River Flow
Surface waterSediment
pp-11-8
0-10 cm“stick up”
0-10 cm“in sediment”
near-bottomsurface water
sediment/porewater
Conceptual In-Place PED Sampler with Collection Intervals Identified in LDW ProjectPE Sampler Visuals
Passive sampler retrieval by divers in Lower Duwamish Waterway
Post-retrieval processing of passive samplers in on-shore laboratory
pp-11-9

Results by Key Congeners
Comparison of PW concentrations of individual PCB conger sets estimated by sediment concentration divided (1) foc*koc (blue), (2) estimate of the sorption coefficient expressed as funciton of foc and fbc (red), and (3) PE concentrations divided by Kpew(green)
Traditional Equilibrium Partitioning overestimates Cpw by about 7 times
Using an EqPadjustment with standard black carbon Kbc underestimates the observed Cpw by 3-4 times
The predominant form of black carbon is coal/coke derived
pp-11-10
11
Pacific Sound Resources (PSR) Superfund Site, EPA Region 10
• Site Background– Wood Treatment Operation 1909-
1994– Upland area unit
25 acres– Marine sediment unit
58 acres– Remedial action included dredging,
capping and institutional controls and upland source control measures
• Study Objectives– Measure near-surface porewater
concentrations• Exceedance of surface water
quality criteria?– Measure porewater concentrations
with depth in the sediment cap• Concentration gradients
indicate contaminant migration through cap?
pp-11-11
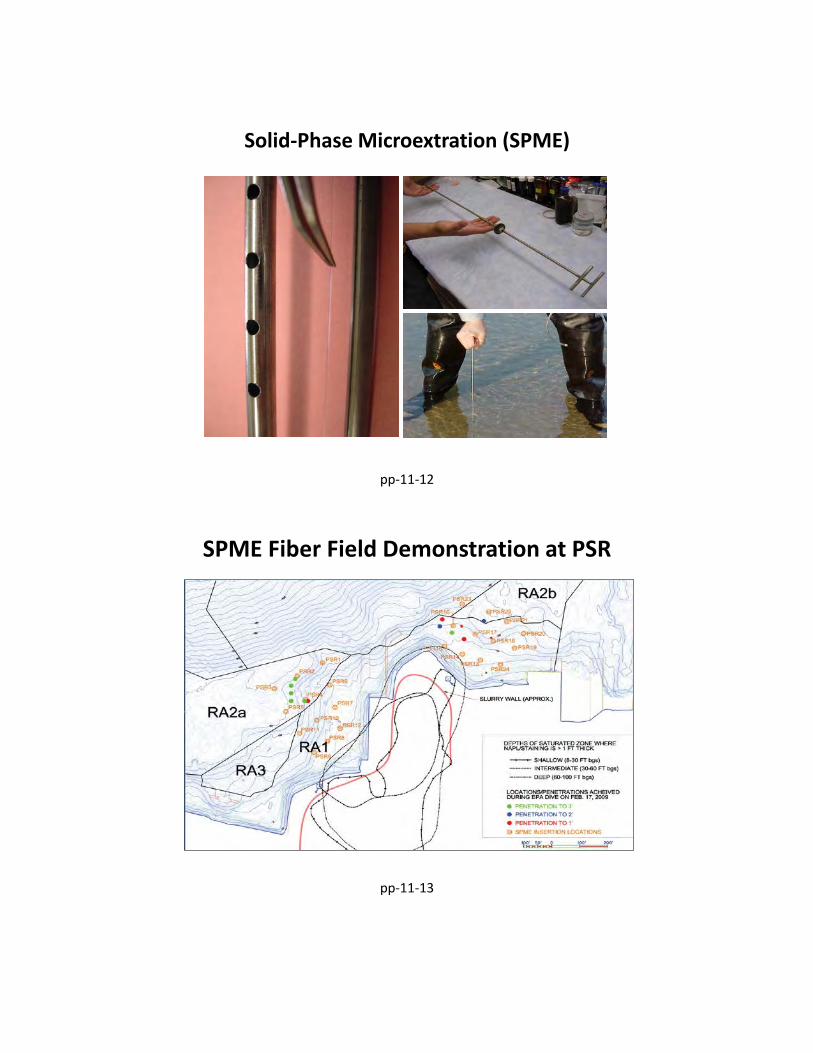
Solid-Phase Microextration (SPME)
pp-11-12
SPME Fiber Field Demonstration at PSR
13
pp-11-13

14
SPME Fiber Results
pp-11-14
SPME Fiber Results
15
1 2 3 4 5 6 7 8 9 10 11 12 13 14 15 16 17 18 19 20 21 22 23 24
pp-11-15

16
• Site Background– Wood treatment operation– Added to NPL in 1987– COCs include PAHs, PCP and metals– Remedial actions included capping ~ 70 acres with clean sediment in
addition to upland source control measures
• SPME Study Objectives– Measure near-surface porewater concentrations
• Exceedance of surface water quality criteria?
– Measure porewater concentrations with depth in the sediment cap• Concentration gradients indicate contaminant migration through cap?
– Compare colocated bulk sediment and porewater results• Would the two methods support different conclusions if used alone?
SPME Porewater Sampler Demonstration at Wyckoff/Eagle Harbor Superfund Site,
EPA Region 10
pp-11-16
17
SPME Fiber Field Demonstration at Wyckoff/Eagle Harbor
pp-11-17

Corrections for Steady State
• Deuterated PAHs are ideal performance reference compounds (Gschwend et al. 2009)– fluoranthene-d10
chrysene-d12 benzo[b]fluoranthene-d12 and dibenz[a,h]anthracene-d14
Compound logKowCorrection Factor for 1000/1071μm
fiber
Correction Factor for
1000/1060 μm fiber
Naphthalene 3.37 0.90 0.91Acenaphthene 3.92 0.84 0.87Fluorene 4.18 0.81 0.84Anthracene 4.54 0.76 0.79Phenanthrene 4.57 0.75 0.79Pyrene 5.18 0.64 0.68Fluoranthene 5.22 0.63 0.67Benzo[b]fluroanthene 5.8 0.51 0.56Chrysene 5.86 0.50 0.54Benz[a]anthracene 5.91 0.49 0.53Benzo[k]fluroanthene 6 0.47 0.51Benzo[a]pyrene 6.04 0.46 0.50Benzo[ghi]perylene+Indeno(1,2,3-cd)pyrene
6.5 0.36 0.41
Dibenz[a,h]anthracene
6.75 0.32 0.36
pp-11-18
Concentration Depth Profiles Allow Assessment of Through-Cap Migration
0
5
10
15
20
25
30
35
0.01 0.10 1.00 10.00 100.00
Dept
h (in
)
Concentration (ng/L)
Chrysene
Benz[a]anthracene
Benzo[b]fluoranthene
Benzo[k]fluoranthene
Benzo[a]pyrene
Dibenz[a,h]anthracene
Benzo[ghi]+Indeno
pp-11-19

Bulk Sediment Estimated Porewater vs. Measured Porewater
1.E-06
1.E-05
1.E-04
1.E-03
1.E-02
1.E-01
1.E+00
1.E+01
1.E+02
1.00E-06 1.00E-04 1.00E-02 1.00E+00 1.00E+02
Pore
wat
er C
once
ntra
tion
deriv
ed
from
Gra
b Sa
mpl
e (u
g/L)
Porewater Concentration measured using SPME (ug/L)
I-8I-9I-10I-10 DuplicateG-8J-9aJ-9bJ-9b DuplicateJ-9cH-9G-9F-91:1 Line
pp-11-20
Take Home Messages• Benefits of direct porewater measure
– Better proxy for bioavailability– Deployable in near surface sediment/surface water column– cm-level depth resolution and ng/L DLs allow assessment
of concentration gradients/migration potential– Not cost prohibitive compared to bulk sediment analysis,
though commercial laboratories offering passive porewater samplers/analysis is limited
• Ideal approach for monitoring activated carbon-amended sediments (Gidley et al. Environ. Sci. Technol. 2012, 46, 5032−5039)
pp-11-21

Standard Methods and Laboratories
• EPA and SERDP/ESTCP Guidance Document
• Accredited Labs– Axys (BC)– ALS– Pace Analytical– Test America
Contact for User’s Manual:
Tim Thompson
pp-11-22

APPENDIX V
CLARIFICATION PAPERS & ISSUE PAPER
1. Recency Guidelines Modifications (Clarification) 2. Freshwater Bioassays (Clarification) 3. Implementation of Revised Freshwater Sediment
Screening Values (Issue) ______________________________________________

This page is intentionally blank.

June 6, 2014 - Final
DMMP Clarification Paper: Recency Guideline Modifications Prepared by David Fox (Corps) for the DMMP agencies
INTRODUCTION
The DMMP User Manual (DMMP 2013) provides “recency” guidelines for dredged material characterization data. These guidelines apply to material that has been sampled and tested for open-water disposal or beneficial-use placement, but not yet dredged. The recency guidelines specify the duration of time for which chemical and biological characterization data continue to be representative of the material to be dredged. For high-ranked projects, the recency guidelines allow characterization data to be valid for a period of 2 years. The recency periods for moderate, low-moderate and low-ranked projects are 5, 6 and 7 years respectively. A related concept is addressed by the DMMP “frequency” guidelines. Frequency guidelines specify the extent of time a given dredging project can be maintained with repeated dredging without further testing. Once the sampled and tested material has been dredged, the frequency guidelines apply. Time durations for the frequency guidelines are the same as for the recency guidelines: two years for high-ranked areas; and 5, 6 and 7 years for moderate, low-moderate, and low-ranked areas respectively. PROBLEM IDENTIFICATION There are two problems with the current recency/frequency guidelines addressed by this clarification paper. The first is the length of time required for high-ranked projects to complete the permitting process prior to dredging. The second is general confusion over the difference between, and applicability of, the two related concepts of recency and frequency. Recency guidelines for high-ranked projects: The 2-year recency period for high-ranked projects was established when the Puget Sound Dredged Disposal Analysis (PSDDA) program was implemented in 1988 (PSDDA 1988). The complexity and duration of the regulatory process for dredging projects has increased over the years, in large part due to the number of species that have been designated under the Endangered Species Act (ESA). Due to the increased length of the permitting process, some high-ranked projects cannot be dredged prior to expiration of the DMMP recency period. When this occurs, the DMMP agencies must decide whether to require supplemental sampling and testing to verify the continued representativeness of the original characterization data, or grant an extension of the recency period. Supplemental testing generally takes several months to complete and would further delay the dredging. Therefore, if upon examination of project details, there has been no change in conditions at the dredging location, the DMMP agencies will generally approve reasonable extensions (e.g. one year in high-ranked areas) to the recency period without additional characterization to allow the dredging to proceed more expeditiously.

SMARM 2014 Recency Guideline Modifications DMMP Clarification
2
Recency vs. frequency: As defined in the introduction, recency and frequency are terms that apply to two different dredging scenarios. Recency applies to a scenario in which dredged material has been tested, but not yet dredged. Frequency applies to a scenario in which the tested material has already been dredged, but the testing results are still considered representative of additional material that accumulates after the first cycle of dredging has been completed. Under the frequency guidelines, additional cycles of dredging may occur without further testing until the expiration of the frequency period. While these two concepts have distinct meanings, there is often confusion about the difference between the two. From a practical standpoint maintaining this distinction is unnecessary, because the ultimate consequence from application of the recency and frequency guidelines is exactly the same. Both determine the length of time a specific project can go without sampling and testing. Or, put another way, both dictate how often a dredging proponent needs to characterize the dredged material for their project. PROPOSED CLARIFICATION Increase the recency period for high-ranked projects The DMMP agencies propose increasing the recency period for high-ranked projects from two to three years to accommodate longer permit processing times. The following table lists the proposed recency periods by rank:
Rank Recency Period (years)
High 3 Moderate 5
Low-Moderate 6 Low 7
The agencies recognize that high-ranked projects are located in areas with active sources of contamination, so are more prone to changed conditions than projects in lower-ranked areas. However, the DMMP User Manual already includes a provision that applies to this situation. The manual states that the recency guidelines do not apply when a changed condition (e.g. accidental spills or new discharges) has occurred since the most recent samples were obtained. Therefore, if changed conditions warrant, the DMMP agencies may require supplemental testing prior to the expiration of the recency period. Expand the definition of recency to include frequency The DMMP agencies propose using the term “recency” to include the dredging scenario currently covered separately by “frequency”. Therefore, the term “recency” will be used more generically to indicate how often sediment characterization needs to be conducted for a specific

SMARM 2014 Recency Guideline Modifications DMMP Clarification
3
project. The terms “frequency guidelines”, “frequency period”, “frequency extension” and “frequency determination” will no longer be used. This modification of terminology will not affect the notification procedure in place for multiyear maintenance dredging permits. At least four months prior to each maintenance dredging activity, the permittee must contact the U.S. Army Corps of Engineers, Dredged Material Management Office to determine whether additional sediment characterization is required. If additional characterization is required, no disposal of dredged material will be allowed at a DMMP open-water disposal site or placement at a beneficial-use site until the material has been determined suitable by the DMMP agencies. REFERENCES:
DMMP (2013). Dredged Material Evaluation and Disposal Procedures – User Manual; prepared by the Corps of Engineers for the Dredged Material Management Program, July 2013. PSDDA (1988). Evaluation Procedures Technical Appendix – Phase I; prepared by the Army Corps of Engineers, Environmental Protection Agency, Department of Ecology and Department of Natural Resources for the Puget Sound Dredged Disposal Analysis Program, June 1988.

June 6, 2014 - Final
DMMP/RSET Clarification Paper: Freshwater Bioassays
Prepared by Laura Inouye (Washington Department of Ecology) for the DMMP and RSET agencies.
INTRODUCTION The Washington State Sediment Management Standards (SMS) and DMMP/RSET dredging guidance regards bioassay results as more informative of potential resource impacts than exceedence of numeric chemical sediment standards, including the new freshwater benthic SLs (DMMP/RSET 2014). Thus bioassay results always take precedence over chemical results. This structure exists largely because chemical standards are informed by biological observations from some of the same suite of biological tests used to evaluate dredged material. The floating percentile model (FPM) used to develop the new Washington State freshwater sediment standards (WAC 173-204-563) used input from both acute (10-day Chironomus and Hyalella) and chronic (28-day Hyalella) tests. The standards were based on the most sensitive test, which was often the chronic 28-day Hyalella growth bioassay.
Currently, the Sediment Evaluation Framework for the Pacific Northwest (SEF 2009) and the DMMP User Manual (DMMP 2013) require only short-term bioassays using either Hyalella or Chironomus. Since the standards were often based on the results from a chronic bioassay, however, it is imperative that at least one of the bioassays conducted to override exceedances of the numeric standards should evaluate a chronic exposure measuring a sublethal endpoint.
PROBLEM STATEMENTS 1. Current freshwater guidance requires only 10-day acute endpoint bioassays to override the
chemical testing results, although the freshwater benthic screening levels (FW benthic SLs) were often based on longer-term exposures and sublethal endpoints.
2. When the new Washington State freshwater sediment chemical standards (WAC 173-204-563) were implemented in September 2013, chronic tests with sublethal endpoints for Chironomus and Hyalella were added to the list of approved SMS bioassays. Testing under SMS now requires a chronic test and a sublethal endpoint to be included in the suite of three bioassays used to identify toxicity in test sediments. Current DMMP/RSET guidance for conducting freshwater bioassays is inconsistent with the revised state standards.
PROPOSED PROGRAM MODIFICATION In order to address the issues identified above, the DMMP/RSET agencies propose making the freshwater bioassay testing requirements for dredged material consistent with WAC 173-204-563.

SMARM 2014 Freshwater Bioassays DMMP/RSET Clarification
2
Bioassay Selection:
The SMS rule includes the following requirements for freshwater sediment:
• Two different test species • Three endpoints • One chronic test; and • One sublethal endpoint
Table 1 indicates which bioassay endpoints fall into which of the categories.
Table 1. Freshwater biological tests, species, and applicable endpoints. These tests and parameters were developed based on the most current American Society for Testing and Materials and EPA protocols for establishing appropriate biological test.
Species, biological test, and endpoint
Acute effects biological test
Chronic effects biological test
Lethal effects biological test
Sub-lethal effects biological test
Amphipod: Hyallela azteca 10-Day mortality X X 28-Day mortality X X 28-Day growth X X Midge: Chironomus dilutus 10-Day mortality X X 10-Day growth X X 20-Day mortality X X 20-Day growth X X
Bioassay Methods:
The bioassays should follow the protocols specified below:
Acute Effects Tests
• Hyalella azteca 10-day mortality: ASTM E1706-05 (2010)/EPA Method 100.1 (US EPA, 2000)
• Chironomus dilutus 10-day mortality: ASTM E1706-05 (2010)/EPA Method 100.2 (US EPA, 2000)
• Chironomus dilutus 10-day growth: ASTM E1706-05 (2010)/EPA Method 100.2 (US EPA, 2000)
Chronic Effects Tests
• Hyalella azteca 28-day mortality: EPA Method 100.4 (US EPA, 2000) • Hyalella azteca 28-day growth: EPA Method 100.4 (US EPA, 2000) • Chironomus dilutus 20-day mortality: EPA Method 100.5 (US EPA, 2000) • Chironomus dilutus 20-day growth: EPA Method 100.5 (US EPA, 2000)
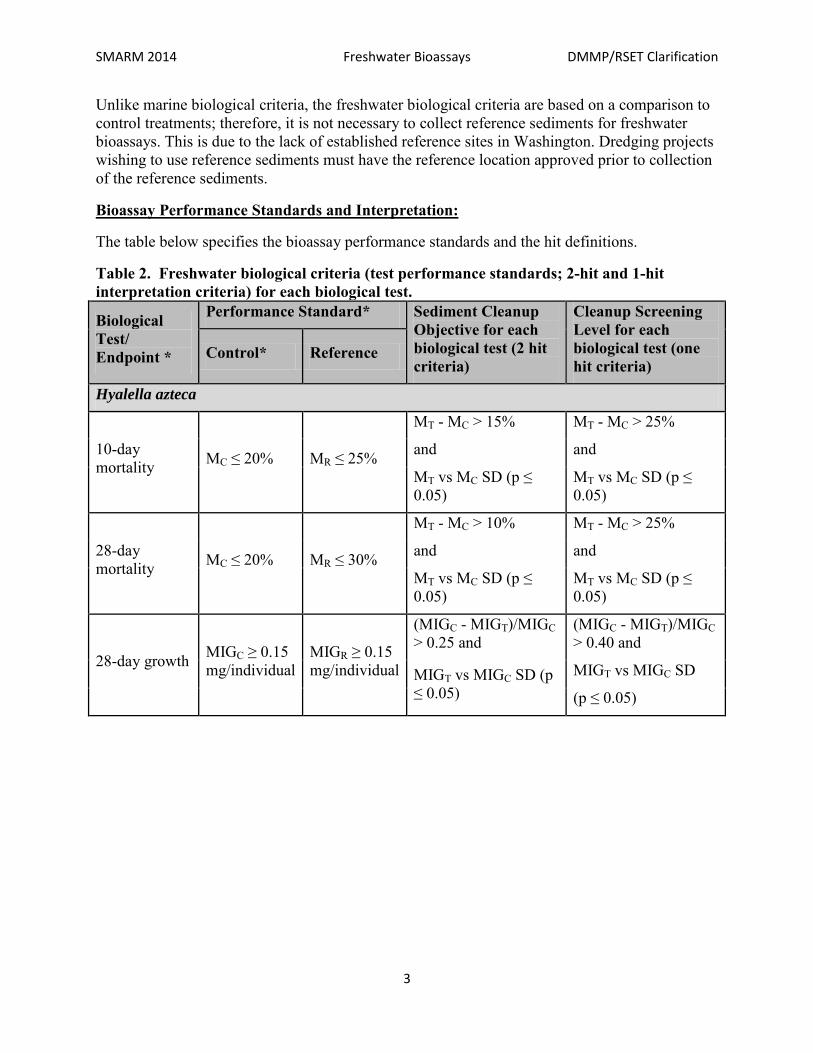
SMARM 2014 Freshwater Bioassays DMMP/RSET Clarification
3
Unlike marine biological criteria, the freshwater biological criteria are based on a comparison to control treatments; therefore, it is not necessary to collect reference sediments for freshwater bioassays. This is due to the lack of established reference sites in Washington. Dredging projects wishing to use reference sediments must have the reference location approved prior to collection of the reference sediments.
Bioassay Performance Standards and Interpretation:
The table below specifies the bioassay performance standards and the hit definitions.
Table 2. Freshwater biological criteria (test performance standards; 2-hit and 1-hit interpretation criteria) for each biological test.
Biological Test/ Endpoint *
Performance Standard* Sediment Cleanup Objective for each biological test (2 hit criteria)
Cleanup Screening Level for each biological test (one hit criteria)
Control* Reference
Hyalella azteca
10-day mortality MC ≤ 20% MR ≤ 25%
MT - MC > 15% MT - MC > 25%
and and
MT vs MC SD (p ≤ 0.05)
MT vs MC SD (p ≤ 0.05)
28-day mortality MC ≤ 20% MR ≤ 30%
MT - MC > 10% MT - MC > 25%
and and
MT vs MC SD (p ≤ 0.05)
MT vs MC SD (p ≤ 0.05)
28-day growth MIGC ≥ 0.15 mg/individual
MIGR ≥ 0.15 mg/individual
(MIGC - MIGT)/MIGC > 0.25 and
(MIGC - MIGT)/MIGC > 0.40 and
MIGT vs MIGC SD (p ≤ 0.05)
MIGT vs MIGC SD
(p ≤ 0.05)

SMARM 2014 Freshwater Bioassays DMMP/RSET Clarification
4
Table 2. Freshwater biological criteria (test performance standards; 2-hit and 1-hit interpretation criteria) for each biological test.
Biological Test/ Endpoint *
Performance Standard* Sediment Cleanup Objective for each biological test (2 hit criteria)
Cleanup Screening Level for each biological test (one hit criteria)
Control* Reference
Chironomus dilutus
10-day mortality MC ≤ 30% MR ≤ 30%
MT - MC > 20% MT - MC > 30%
and And
MT vs MC SD (p ≤ 0.05)
MT vs MC SD (p ≤ 0.05)
10-day growth MIGC ≥ 0.48 mg/individual
MIGR/MIGC ≥ 0.8
(MIGC - MIGT)/MIGC > 0.20 and
(MIGC - MIGT)/MIGC > 0.30 and
MIGT vs MIGC SD (p ≤ 0.05)
MIGT vs MIGC SD
(p ≤ 0.05)
20-day mortality MC ≤ 32% MR ≤ 35%
MT - MC > 15% MT - MC > 25%
and and
MT vs MC SD (p ≤ 0.05)
MT vs MC SD (p ≤ 0.05)
20-day growth MIGC ≥ 0.60 mg/individual
MIGR/MIGC ≥ 0.8
(MIGC - MIGT)/MIGC > 0.25 and
(MIGC - MIGT)/MIGC > 0.40 and
MIGT vs MIGC SD (p ≤ 0.05)
MIGT vs MIGC SD (p ≤ 0.05)
Notes:
M = Mortality; C = Control; R = Reference; T = Test; F = Final; MIG = Mean Individual Growth at time final; mg = milligrams. a These tests and parameters were developed based on the most updated American Society for Testing and Materials protocols. b Reference performance standards are provided for sites where the department has approved a freshwater reference sediment site(s) and reference results will be substituted for control in comparing test sediments to criteria. c An exceedance of the sediment cleanup objective and cleanup screening level requires statistical significance at p = 0.05. d The control performance standard for the 20 day test (0.60 mg/individual) is more stringent than for the 10 day test and the agencies may consider, on a case-by-case basis, a 20 day control has met QA/QC requirements if the mean individual growth is at least 0.48 mg/individual.