Embed Size (px)
Citation preview

Flame Retardants
Group 4—April 8th
Danielle KeeseJeff MueggenborgEsan SavannahHa Nguyen

Dangers of Fire(United States in 2002)
Someone died in a fire every 3 hrs and someone was injured every 37 minutes
401,000 home fires
Residential fires caused more than $6.1 billion in property damage

What is a Flame Retardant?A chemical added to combustible materials to render them more resistant to ignition
Minimizes the risk of fire starting
Increases the safety of lives and property

What is a Flame Retardant?
4 major family of Flame Retardant
Provides for a safer material without compromising performance
Flame retardants work to slow or stop the combustion cycle

Combustion Cycle
Flammable materials are decomposed to release energy in the form of heat and lightCombustion of hydrocarbon:
Examples of combustion:Phosphorus
CH3PH4 +4O2 → CO2 + 2H2O + H3PO4 +∆HMethane Chloride
CH3ClH2 + 2O2 → CO2 + H2O + HCl + ∆H
HOHnnCOOHC sparkyx ∆+′+⎯⎯ →⎯+ 222

Polymeric Plastic Combustion
The combustion reaction takes place in the vapor phase3 phases of
products of pyrolysis:
LiquidSolidVapor

Flame Retardant Families

Halogenated FRs
ChlorinatedWider Temperature range for radical releaseUsed most commonly as a paraffin additive
BrominatedMost common FR in productionFive classifications, with over 75 compounds on the marketHigh degree of control over release temperature
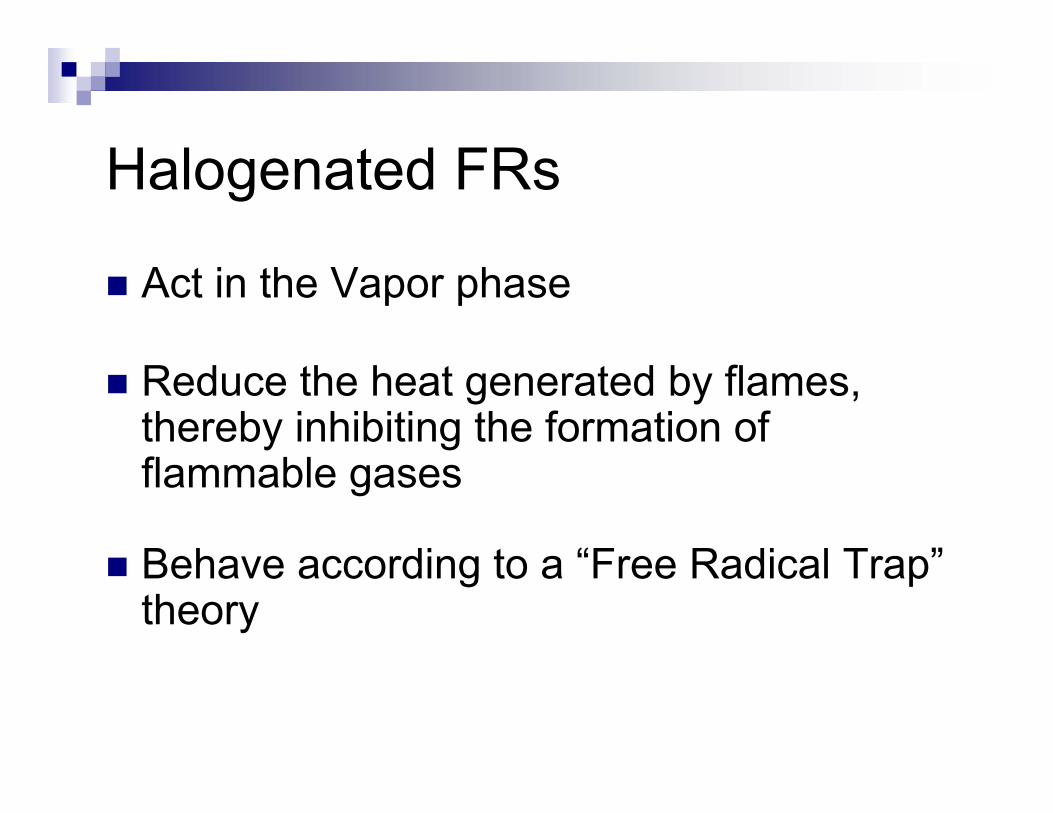
Halogenated FRs
Act in the Vapor phase
Reduce the heat generated by flames, thereby inhibiting the formation of flammable gases
Behave according to a “Free Radical Trap”theory

HOHOHHBrOHHBrOH
HHBrHBrBrRBrR n
heatxn
∆+→⋅+⋅⋅+→+⋅
∆−→⋅+⋅⋅+⋅⎯⎯→⎯
2
2
)(
Halogenated FR Mechanism
Free Radical Trap mechanism
Process regenerates halogen radicals to perpetuate the reaction.

Phosphorus Containing FRs
Additive to material it’s protecting
Acts in solid phaseReacts to form phosphoric acidAcid coats to form “char”Char slows down pyrolysis step of combustion cycle

Phosphorus Containing FR Mechanism
Thermal decomposition leads to the formation of phosphoric acid:

Phosphorus Containing FR Mechanism
Phosphoric acid formed esterifies, dehydrates the oxygen-containing polymer and causes charring:

Phosphorus FR Pros
Efficient FR PerformanceNeeded Dosage Lower than Halogenated FRsDoes Not Produce Toxic SmokeDoes Not Produce Toxic Dioxins and Furans
described in more detail later

Phosphorus FR Cons
Higher price/kg than Halogenated
Have Limited Industrial Uses because of Mechanism
Char layer undesired in FR pajamas and similar products

Uses of Phosphorus Containing FRs
Common UsesPlasticizersPlasticsPolyurethane Foam

Nitrogen Containing FR Mechanism
Not a fully understood mechanismWhat is known:
Nitrogen gas is released into the atmosphereInert gas lowers the concentration of flammable vapors
Melamine transforms into cross-linked structures which promotes char formation
Uses: Foams, Nylons and Polymers

Nitrogen FR Pros/Cons
ProsCan partially replace other FRs
ConsMust be used in high concentrationsUsually needs to be with other FRsMore experimentation needed to determine if it will work, because the mechanisms are not well understood

Inorganic FRs
Undergo decomposition reactions
Release of water or non-flammable gases which dilute the gases feeding flames
Adsorption of heat energy cools the fire
Production of non-flammable, resistant layer on the material’s surface
Uses: PVC, Wires and Propylene
Common of Inorganic FRs
Aluminum HydroxideMagnesium HydroxideBoron containing compoundsAntimony OxidesInorganic Phosphorus compounds

Inorganic FRs Pros/Cons
ProsLow CostIncorporate Easily into Plastics
ConsLarge Concentrations Needed

Problem Statement
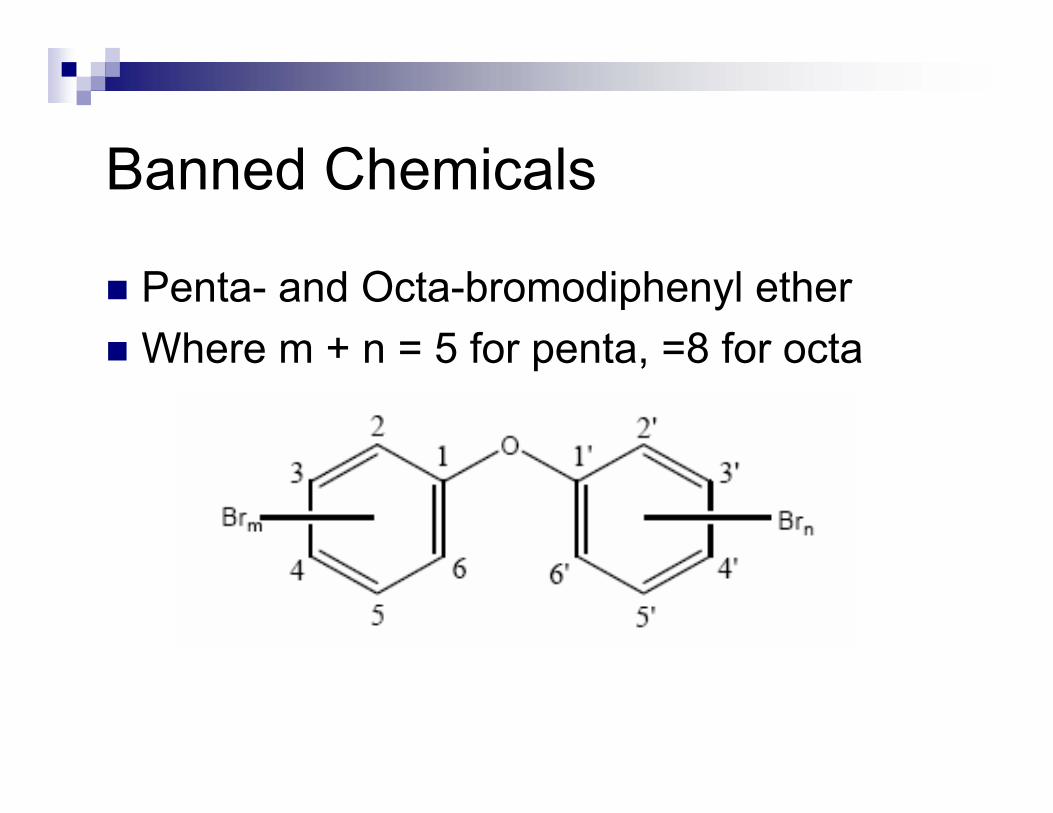
Banned Chemicals
Penta- and Octa-bromodiphenyl etherWhere m + n = 5 for penta, =8 for octa

Banned Chemicals
Penta- and Octa-bromodiphenyl ether banned in:
California by 2008Europe as of next year
Banned because of Environmental Concerns

Environmental Concerns
Ignition of brominated FR produces toxins found in soot
Toxins have not been detected in fire’s gases
No deaths have been documented to date
Toxins are known as dioxins and furans

Toxins
Dioxin Furan

Dioxin and Furan
Unintentional by-product of many industrial processes
Causes cancer in animals
Causes severe reproductive and developmental problems
Damages the immune system and interferes with hormonal
systems
Formed by burning halogen-based chemical compounds with
hydrocarbons

Molecular Discovery

Molecular Discovery
Molecular simulation involves using computer algorithms “derived from statistical mechanics to predict the properties of molecules and molecular assemblies”
Models depend on intra- and inter-molecular interactions and computed group contributions (which come from published tables)

Molecular Discovery
Desired CharacteristicsEase of ignitionRate of DecompositionFuel contributionIntensity of burningProducts of combustion

Molecular Discovery
Group Contribution equations can be used to simulate relevant properties:
Auto-ignition TempUpper and Lower Flammability limitsDiffusivity in Air and WaterVapor Density and PressureNormal Melting and Boiling PointsGibbs Free Energy

Molecular DiscoveryMolecule simulation performed using excel spreadsheet
Group contribution data were input from Perry’s Handbook and Boethling & Mackay
Calculated Boiling Point, Critical Constants, Enthalpies of Vaporization, and Fusion
These properties were used to determine flame retardant capabilities of each molecule

Molecular Discovery
Determination of Phosphate Group Properties
Critical Constants for phosphoric acid from Pro-II
Using Excel spreadsheet and Pro-II data, solve for phosphate group contribution to Tboil, Tc, Pc, and Vc
We can now simulate properties for molecules containing the phosphate group

Discovery ProcessLimitations of group contribution method will not allow for ideal molecule discovery
Approach changed to simulation of known organic molecules containing phosphate (LINK)
Excluded aromatic molecules and transition metals based on desired properties of final productDiscarded molecules with BP lower than 513KRanked remaining four molecules according to vapor pressure at plastic melting point

Ranked Molecules & Properties
(± 10 - 30%)
TC (K)
PC (MPa)
VC (m3/kmol)
Vapor P @ 513K
Rank Molecule eq 2-3 eq 2-7 Eq 2-14 (MPa) (atm) 1 Tri-n-Butyl Phosphate 800.5 1.379 0.959 0.0019 0.0187 2 Tri-ethyl Phosphate 804.8 1.969 0.629 0.1996 1.970 3 Tri-Isopropyl Ester 771.1 1.667 0.782 0.2556 2.523
** Tris(2,3dibromopropyl) phosphate 613.1 1.579 0.782 6.05 x10⁶ 59.71x10⁶

Tris(2,3-dibromopropyl) Phosphate
Molecule simulated with strong performance indicators
Structurally capable of retarding flames in both solid and vapor phases
Unfortunately, already on the market as “Firemastert23p” by the Great Lakes Chemical Co.

Properties of Tri-n-Butyl Phosphate
Flame-O 1000™

Flame-O 1000 ™ Properties
Critical Temperature800K
Critical Pressure1.38 MPa
Critical Volume0.943 m3/kmol
Vapor Pressure @ 513K0.019 atm
Boiling Point562K

Synthesis Path-Final
Creation of Tri-n-Butyl PhosphateN-butanolPhosphoryl Chloride

Raw Materials
N-butanolReadily availableCan be purchased from a number of sources
Phosphoryl chlorideLess commonMore expensiveHighly Reactive

Reasoning for Final Synthesis
Occurs at room temperature due to high reactivity of phosphoryl chloride
Occurs quickly due to high reactivity
Occurs with a high conversion
Should Test for the kinetics

Synthesis Path-Alternate
Creation of Tri-n-Butyl Phosphate1-BromobutanePhosphoric Acid

Raw Materials
1-bromobutaneReadily AvailableRelatively Cheap
Phosphoric AcidReadily AvailableRelatively Cheap

Reasons Eliminated
Requires heat for reaction to occur
Slow reaction
Low conversions

Testing

Tri-n-Butyl Phosphate Testing Materials
Tri-n-Butyl PhosphatePolypropyleneMetal GrillsAcetylene Torch2 BricksCamera

Tri-n-Butyl Phosphate TestingSet Up
Set up a horizontal metal grill with consistent and uniform flames provided below
Flames should come from the side to prevent melted plastic from dripping on the burners
Set-up mimicked 94 HB Horizontal Burn Test

Tri-n-Butyl Phosphate TestingSet Up

Tri-n-Butyl Phosphate Testing Procedure
Prepare samples (10g total weight)1 as Standard1 as Coated1 as Additives
Applied flames underneath keeping constant distance until samples ignited then removed flame
Observe and document melting point and other characteristics of each sample

Tri-n-Butyl Phosphate Testing

Testing Results
78.7 s112.8 s--Go Out/Consumed23.4 s21.4 s--Start Burning4
53.6 s67.7 s30.5 sGo Out/Consumed25.0 s21.6 s15.0 sStart Burning3
43.2 s75.5 s30.9 sGo Out/Consumed14.5 s14.6 s11.5 sStart Burning2
CoatedTreatedUntreatedRun
All times signify the time when it occurs, from zero

Testing ConclusionsNoticeable difference between treated and untreated
At least twice as much time to catch fire and be fully consumed
Coated samples produced the most smoke and overall performance was less effective than the treated samples
Preferred method of applying Flame-O1000™ to plastic is as an internal additive as opposed to coating

The Market

World Market
Global production: 2.2 billion poundsGlobal value: $2.1 billionAs of 2002, the global market
24% phosphorus27% inorganic6% chlorine39% bromine4% other

US Market
50% of the global marketUnited States production:1.1 billion poundsUnited States value: $1.3 billionUS breakdown is very similar in-group distribution to the global breakdown.

Brominated Market
Major market contributor being phased outLarge void to fill
Brominated FRs account for Globally: $819 millionUS: $507 million

Brominated Market
Brominated FR Market Breakdown
TransportBuilding and constructionTextile/otherElectrical & electronics

Phosphorus Market
Phosphorus FRs account forGlobally: $504 millionUS: $312 million
Good market for our product to breach

Sellers
BrominatedGreat Lakes ChemicalAlbemarleDead Sea Bromine Group
PhosphorusGreat Lakes ChemicalAlbemarleDow Chemicals

Market Status
Demand to increaseProduction:
Up 3.6% per year from 1.1 billion pounds in 2003Value:
Grow 5.9% annuallyDue to higher standards and higher use in industryDue to specialty FRs that increase their share of the market

Market Status
More items are being made from plastics
Plastics reduce weight by eliminating:Glass and metalLower production costsImproving design and production flexibility
Need for more FRs in specialized plastic FRswill increase as well.

Business Plan

Business Plan
Computers are cased in plastics
Cost of computers are becoming cheaper
Demand for computers is a necessity
Computer market is growing
KSM will target the computer industry

Potential Buyers
Hewlett – Packard / Compaq
Dell Computers
IBM
Apple


Location
Hewlett – Packard / CompaqBased in Palo Alto, CaliforniaCompaq based in Houston, TexasResponsible for 44% of Texas computer employment
Dell ComputersBased in Austin, TexasResponsible for 52% of Texas computer employment

Target Company
Dell ComputersMajor Contributor to Computer SalesSell a Variety of Electronic Devices
Desk Top ComputersLap Top ComputersMP3 Players
Convenient Plant Location

Investment Opportunity
Initial Investment$4 Million to license the chemical modeling of Flame-O 1000TM
Plant Addition will be constructed in six months
Start construction with initial payment

Economics of Plant Design

Flow diagram

Cost of equipment
$ 283,943 $ 157,800 $40,100 14.10$86,043 14.107
$ 261,398 $ 151,277 $37,100 10.34$73,021 10.346
$ 235,827 $ 144,754 $26,400 8.22$64,673 8.225
$ 223,534 $ 138,231 $25,900 7.00$59,403 7.004
$210,341 $ 131,708 $25,300 5.71$53,333 5.713
$ 192,121 $ 125,185 $24,000 3.79$42,936 3.792
$ 180,964 $ 118,662 $23,500 3.13$38,802 3.131
Total equipment
costStorage tank
(500m3)$Vflash Drum
m3$VBatch Reactor
m3

Cost of Raw Materials
$5,241,577 1.802.612.507
$4,381,958 1.512.182.096
$3,878,767 1.331.931.855
$3,564,272 1.221.771.704
$3,228,811 1.111.611.543
$2,578,856 0.881.281.232
$2,327,260 0.801.161.111
Total costPOCl3 mi kg/yr
n-Butanol mi kg/yr
Product (TBP) mi kg/yr
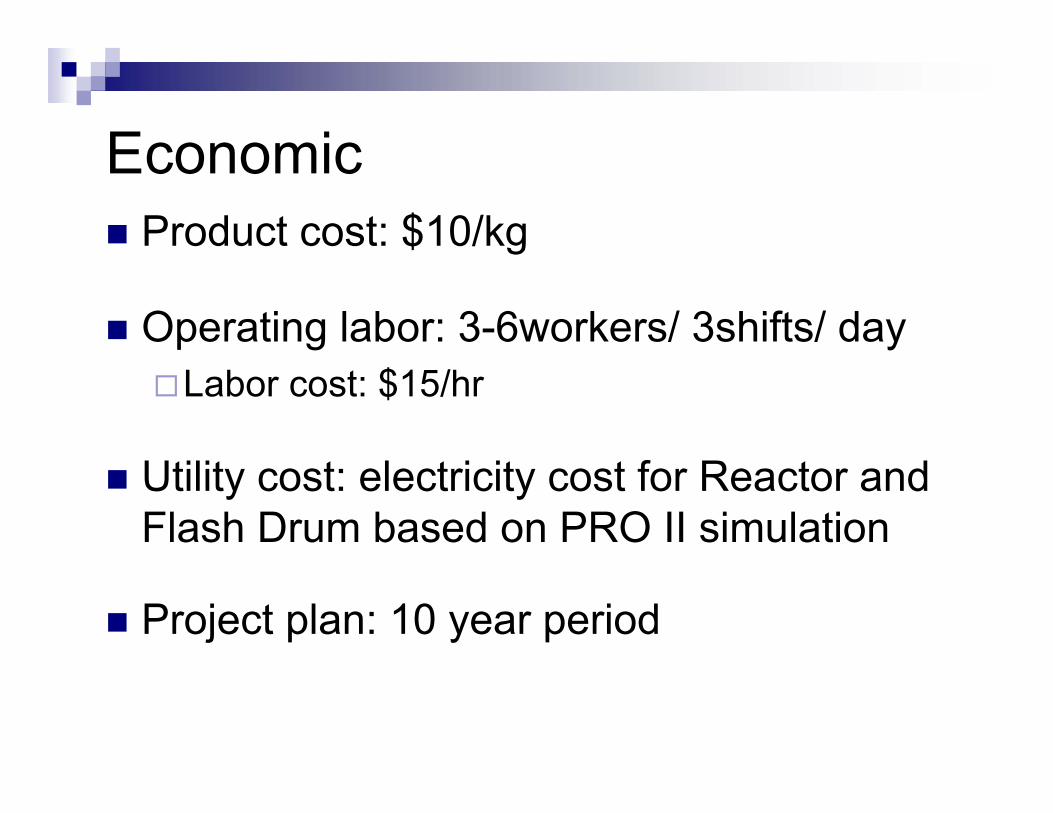
EconomicProduct cost: $10/kg
Operating labor: 3-6workers/ 3shifts/ dayLabor cost: $15/hr
Utility cost: electricity cost for Reactor and Flash Drum based on PRO II simulation
Project plan: 10 year period
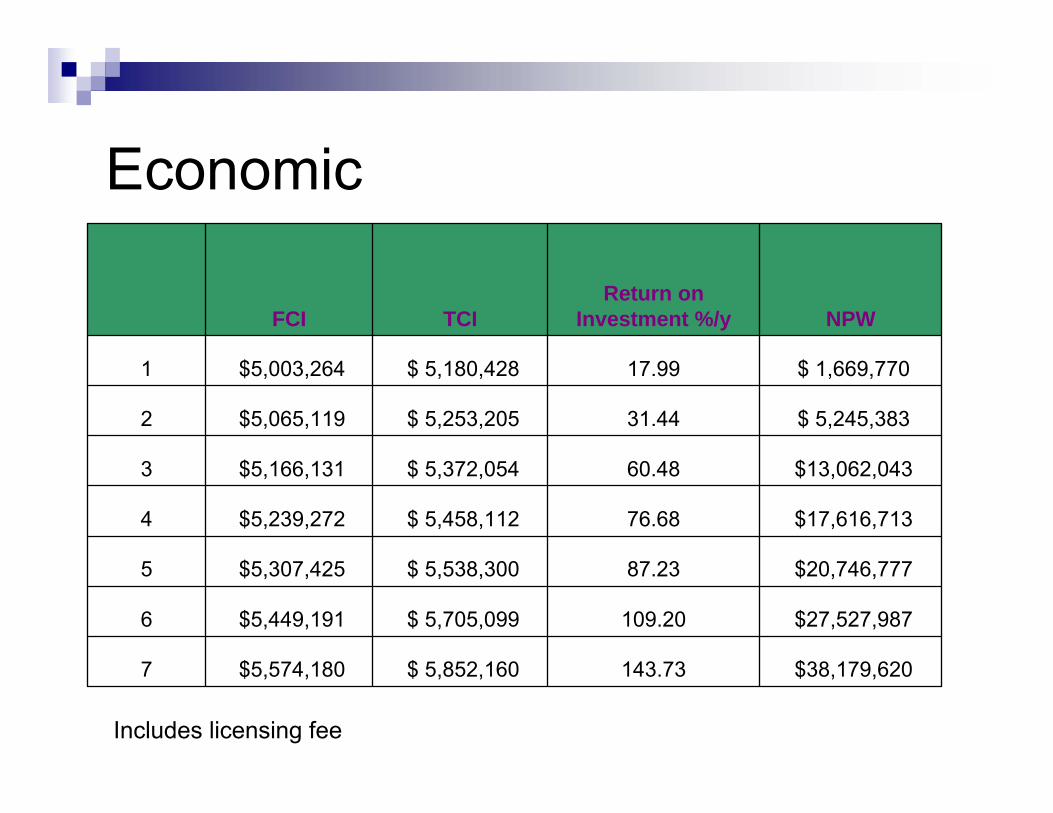
Economic
$38,179,620 143.73$ 5,852,160 $5,574,180 7
$27,527,987 109.20$ 5,705,099 $5,449,191 6
$20,746,777 87.23$ 5,538,300 $5,307,425 5
$17,616,713 76.68$ 5,458,112 $5,239,272 4
$13,062,043 60.48$ 5,372,054 $5,166,131 3
$ 5,245,383 31.44$ 5,253,205 $5,065,119 2
$ 1,669,770 17.99$ 5,180,428 $5,003,264 1
NPWReturn on
Investment %/yTCIFCI
Includes licensing fee

Net Present Worth vs. CapacityNPW vs Capacity
$-
$10,000,000
$20,000,000
$30,000,000
$40,000,000
$50,000,000
1.00E+06 1.50E+06 2.00E+06 2.50E+06 3.00E+06
Capacity, kg/yr
NPW
, $

Risk Analysis
Base capacity of 1,230,000 kgs/yr was proposedThe capacity was picked by:
Taking the available US market (1.1 billion pounds)Multiplying by 39%
wt% brominated FRs
Multiplied by 20%assumed fraction missing due to the ban/phase out
Multiplied by 3.5%fraction of the market our product will replace

Risk Analysis
Product-selling price was $10/kgBased on Great Lakes Chemical’s average phosphorus price of $12/kg
Capacity range:1,110,000 to 2,500,000 kg/year
Base standard deviation of 40% for:CapacityProduct price
Net present worth (NPW) was exported to create risk curves, seven risk curves were made

Risk Curve Distribution for 23. Net present worth, 106$ =/D37
D37: X <=-31.385%
D37: X <=26.2795%
0
0.2
0.4
0.6
0.8
1
-80 -40 0 40 80 120
@RISK Student VersionFor Academic Use Only
@RISK Student VersionFor Academic Use Only
@RISK Student VersionFor Academic Use Only
@RISK Student VersionFor Academic Use Only
@RISK Student VersionFor Academic Use Only
@RISK Student VersionFor Academic Use Only
@RISK Student VersionFor Academic Use Only
@RISK Student VersionFor Academic Use Only
@RISK Student VersionFor Academic Use Only
@RISK Student VersionFor Academic Use Only

Economic
Risk curve #5 was chosen
Capacity: 1.85 million kg/yr
NPW: $20,700,000
ROI: 87%

Questions