Embed Size (px)
Citation preview
FINAL PROGRAMMATIC
ENVIRONMENTAL ASSESSMENT FOR THE
OFFICE OF COAST SURVEY HYDROGRAPHIC SURVEY PROJECTS
MAY 2013
Prepared by: National Oceanic and Atmospheric Administration National Ocean Service Office of Coast Survey 1315 East-West Highway Silver Spring, Maryland 20910
For additional information, contact: Jeffrey Ferguson Chief, Hydrographic Surveys Division Office of Coast Survey 1315 East-West Highway Silver Spring, Maryland 20910 Phone: (301) 713-2700 Email: [email protected]

TABLE OF CONTENTS TABLE OF CONTENTS 2
LIST OF FIGURES 5
LIST OF TABLES 6
ACRONYMS AND ABBREVIATIONS 7
EXECUTIVE SUMMARY 8
1. BACKGROUND 10
2. PURPOSE AND NEED FOR ACTION 11 2.1 Safe Navigation 11 2.2 Economic Security 12 2.3 Environmental Sustainability 13
3. PROPOSED ACTION AND ALTERNATIVES 14 3.1 Proposed Action (Preferred Alternative) 14
3.1.1 Hydrographic surveys 14 3.1.1.1 Echosounder Characteristics 15 3.1.1.2 Office of Coast Survey Echosounders 16 3.1.1.3 Acquisition Windows and Survey Duration 16
3.1.2 Lidar Surveys 16 3.1.3 Vessel Transit Operations 17 3.1.4 Anchoring 18 3.1.5 Bottom Sample Collection 19 3.1.6 Sound Speed Data Collection 20 3.1.7 Tide Gauge Installation, Maintenance and Removal 20
3.1.7.1 Components of a Tide Gauge 21 3.1.7.2 Tide Gauge Installation 22 3.1.7.3 Tide Gauge Maintenance and Removal 23
3.1.8 Coast Survey Development Laboratory Activities 23 3.1.8.1 Ellipsoidally Referenced Surveys 24 3.1.8.2 GPS Tide Buoys 24 3.1.8.3 Autonomous Underwater Vehicles 26 3.1.8.4 Phase Measuring Bathymetric Sonars 27
3.2 No Action Alternative 27 3.3 Alternatives Considered but Eliminated from Further Analysis 28
3.3.1 Surveying with Lidar Exclusively 28 3.3.2 Deriving Water Levels Exclusively from Ellipsoidally Referenced Surveys 28
4. AFFECTED ENVIRONMENT 29 2
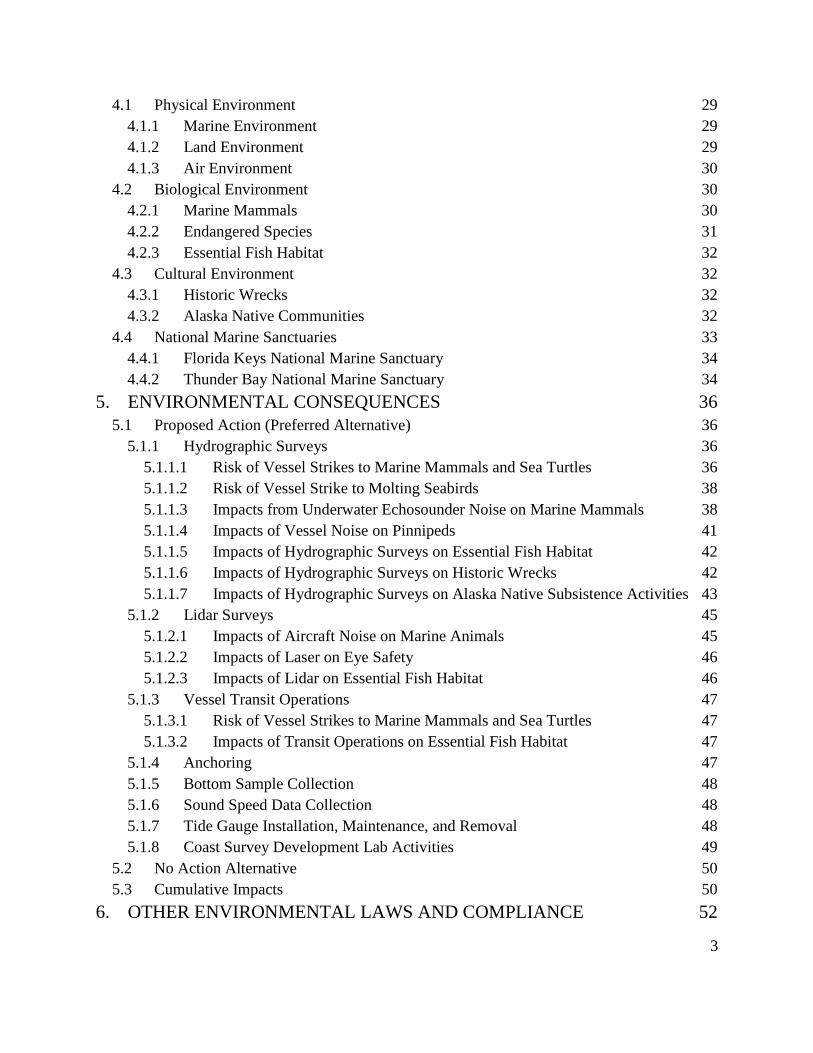
4.1 Physical Environment 29 4.1.1 Marine Environment 29 4.1.2 Land Environment 29 4.1.3 Air Environment 30
4.2 Biological Environment 30 4.2.1 Marine Mammals 30 4.2.2 Endangered Species 31 4.2.3 Essential Fish Habitat 32
4.3 Cultural Environment 32 4.3.1 Historic Wrecks 32 4.3.2 Alaska Native Communities 32
4.4 National Marine Sanctuaries 33 4.4.1 Florida Keys National Marine Sanctuary 34 4.4.2 Thunder Bay National Marine Sanctuary 34
5. ENVIRONMENTAL CONSEQUENCES 36 5.1 Proposed Action (Preferred Alternative) 36
5.1.1 Hydrographic Surveys 36 5.1.1.1 Risk of Vessel Strikes to Marine Mammals and Sea Turtles 36 5.1.1.2 Risk of Vessel Strike to Molting Seabirds 38 5.1.1.3 Impacts from Underwater Echosounder Noise on Marine Mammals 38 5.1.1.4 Impacts of Vessel Noise on Pinnipeds 41 5.1.1.5 Impacts of Hydrographic Surveys on Essential Fish Habitat 42 5.1.1.6 Impacts of Hydrographic Surveys on Historic Wrecks 42 5.1.1.7 Impacts of Hydrographic Surveys on Alaska Native Subsistence Activities 43
5.1.2 Lidar Surveys 45 5.1.2.1 Impacts of Aircraft Noise on Marine Animals 45 5.1.2.2 Impacts of Laser on Eye Safety 46 5.1.2.3 Impacts of Lidar on Essential Fish Habitat 46
5.1.3 Vessel Transit Operations 47 5.1.3.1 Risk of Vessel Strikes to Marine Mammals and Sea Turtles 47 5.1.3.2 Impacts of Transit Operations on Essential Fish Habitat 47
5.1.4 Anchoring 47 5.1.5 Bottom Sample Collection 48 5.1.6 Sound Speed Data Collection 48 5.1.7 Tide Gauge Installation, Maintenance, and Removal 48 5.1.8 Coast Survey Development Lab Activities 49
5.2 No Action Alternative 50 5.3 Cumulative Impacts 50
6. OTHER ENVIRONMENTAL LAWS AND COMPLIANCE 52
3
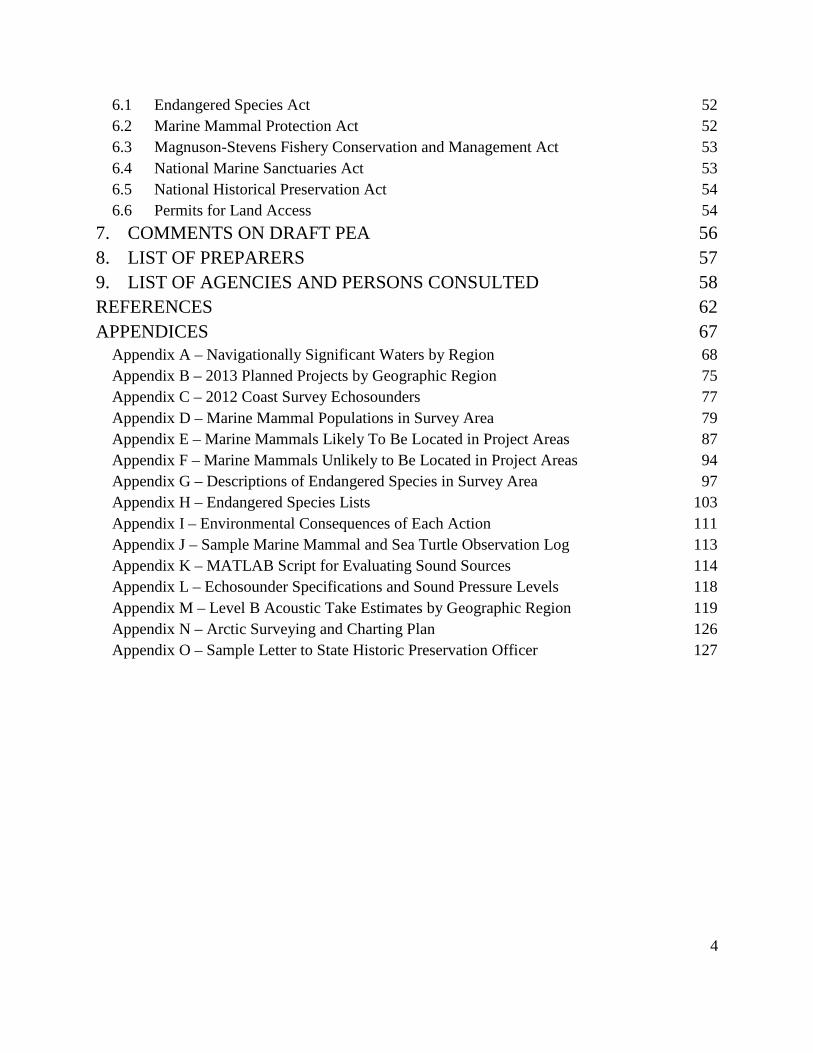
6.1 Endangered Species Act 52 6.2 Marine Mammal Protection Act 52 6.3 Magnuson-Stevens Fishery Conservation and Management Act 53 6.4 National Marine Sanctuaries Act 53 6.5 National Historical Preservation Act 54 6.6 Permits for Land Access 54
7. COMMENTS ON DRAFT PEA 56
8. LIST OF PREPARERS 57
9. LIST OF AGENCIES AND PERSONS CONSULTED 58
REFERENCES 62
APPENDICES 67 Appendix A – Navigationally Significant Waters by Region 68 Appendix B – 2013 Planned Projects by Geographic Region 75 Appendix C – 2012 Coast Survey Echosounders 77 Appendix D – Marine Mammal Populations in Survey Area 79 Appendix E – Marine Mammals Likely To Be Located in Project Areas 87 Appendix F – Marine Mammals Unlikely to Be Located in Project Areas 94 Appendix G – Descriptions of Endangered Species in Survey Area 97 Appendix H – Endangered Species Lists 103 Appendix I – Environmental Consequences of Each Action 111 Appendix J – Sample Marine Mammal and Sea Turtle Observation Log 113 Appendix K – MATLAB Script for Evaluating Sound Sources 114 Appendix L – Echosounder Specifications and Sound Pressure Levels 118 Appendix M – Level B Acoustic Take Estimates by Geographic Region 119 Appendix N – Arctic Surveying and Charting Plan 126 Appendix O – Sample Letter to State Historic Preservation Officer 127
4
LIST OF FIGURES Figure 1. Bathymetric survey of an Arctic seamount 14 Figure 2. Multibeam swath ensonifying the seafloor 15 Figure 3. Reson Seabat 8125 multibeam echosounder 15 Figure 4. L-3 Klein 5000 side scan sonar 15 Figure 5. Bathymetric airborne lidar 17 Figure 6. NOAA Ship Thomas Jefferson 17 Figure 7. 6" x 6" Ponar Wildco grab sampler 19 Figure 8. Bottom sediment characteristics M f S portrayed on a nautical chart 19 Figure 9. Conductivity, temperature and depth instrument inside cage 20 Figure 10. Moving vessel profiler mounted on fantail 20 Figure 11. Pier-mounted acoustic sensor tide gauge 21 Figure 12. Pressure sensor tide gauge and tubing 21 Figure 13. Leveling a tide gauge 23 Figure 14. GPS tide buoy 26 Figure 15. Hydrographers deploy an autonomous underwater vehicle 26 Figure 16. Alaska Native Claims Settlement Act native regional corporations 33 Figure 17. Alaska boroughs 33 Figure 18. National Marine Sanctuary System 34
5

LIST OF TABLES Table 1. Marine Mammal Functional Hearing Frequency Ranges 31 Table 2. Listed marine mammals in navigationally significant waters 31 Table 3. Arctic Subsistence Species Take Estimates 43
6
ACRONYMS AND ABBREVIATIONS ASRC Arctic Slope Regional Corporation AUV Autonomous Underwater Vehicle CEQ Council on Environmental Quality DPS Distinct Population Segment EEZ Exclusive Economic Zone ERS Ellipsoidally Referenced Survey ESA Endangered Species Act ESU Evolutionarily Significant Unit GPS Global Positioning System LIDAR Light Detection and Ranging MMPA Marine Mammal Protection Act NAO NOAA Administrative Order NEPA National Environmental Policy Act NMFS National Marine Fisheries Service NOAA National Oceanic and Atmospheric Administration PEA Programmatic Environmental Assessment SPL Sound Pressure Level USFWS U.S. Fish and Wildlife Service
7
EXECUTIVE SUMMARY This Programmatic Environmental Assessment (PEA) analyzes the potential environmental impacts associated with the National Ocean Service, Office of Coast Survey program of conducting hydrographic surveys and related activities in the marine environment. Hydrographic survey projects support Coast Survey’s mandated mission to provide reliable nautical charts and other products necessary for safe navigation, economic security, and environmental sustainability in U.S. ocean and coastal waters. Coast Survey’s proposed action would be to continue surveying approximately 3,000 square nautical miles of coastal waters each year. In order to conduct these surveys, Coast Survey would engage in a combination of some or all of the following field activities: use of high frequency echosounders mounted on or towed behind vessels traveling at a slow speed, use of aircraft-mounted lasers during light detection and ranging (lidar) surveys, vessel transits to and from survey areas, anchoring, sound speed data collection, bottom sample collection, tide gauge installation on land, and testing of survey products in development, such as autonomous underwater vehicles. Coast Survey conducts surveys primarily in shallow waters critical for safe navigation using high frequency echosounders during operations. This PEA focuses on aspects of the physical, biological and cultural marine environment that could be affected by the activities listed above, including marine mammals, sea turtles, essential fish habitat, historic wrecks, Alaska Native community subsistence hunts, and National Marine Sanctuary resources. Hydrographic surveys could cause temporary, non-significant, low impact adverse effects on the environment. Examples of these effects include avoidance behavior of whales and dolphins in the presence of a survey vessel or disturbance of wildlife while drilling during tide gauge installation. The risk of vessel strike to marine mammals and sea turtles is present, but unlikely due to slow survey speeds. Serious damage to marine mammals from underwater echosounder noise is also unlikely since Coast Survey uses downward-facing, high frequency echosounders out of most species’ hearing range. Additionally, Coast Survey incorporates mitigation measures into its survey activities to reduce or avoid these impacts wherever practicable. While there is a low risk of serious adverse impacts to the environment, the environmental consequences section of this PEA includes a detailed analysis of echosounder noise and the potential effects on marine mammals. Coast Survey’s conclusions are based on the best available scientific data and consultations with underwater acoustic experts and biologists from the National Marine Fisheries Service and the U.S. Fish and Wildlife Service, with a special emphasis on the impacts to marine mammals, endangered species, and essential fish habitat. Coast Survey’s analysis also includes special discussions on the effects of vessel or aircraft noise on seabirds, nesting sea turtles, and hauled-out pinnipeds, as well as the temporary land disturbances during tide gauge installation. The positive and negative effects of conducting surveys locating historic wrecks, as well as those of surveying in Alaska Native subsistence hunt waters, are also discussed in the analysis.
8

Potential impacts resulting from the proposed action and the no-action alternative were analyzed for the physical, biological, and cultural environment. Coast Survey acquires data vital to safe navigation, economic security, and environmental sustainability in U.S. and coastal and Great Lake waters, reducing the risk of maritime accidents that can be potentially devastating to the coastal environment. In its analysis, Coast Survey identified no significant negative environmental impacts associated with its program of conducting hydrographic surveys.
9
1. BACKGROUND This PEA analyzes the potential impacts on the human and natural environment associated with the National Ocean Service, Office of Coast Survey program of conducting hydrographic surveys and related activities in the marine environment. In accordance with the National Environmental Policy Act, Coast Survey has prepared this PEA to ensure that environmental impacts resulting from survey activities are incorporated into the decision-making process (42 U.S.C. §§ 4321 et seq). The Council on Environmental Quality (CEQ) directs the National Oceanic and Atmospheric Administration (NOAA), as a federal agency, to “interpret and administer the policies, regulations, and public laws of the United States in accordance with the policies set forth in the Act” (40 C.F.R. § 1500.2(a)). NOAA defines the proposed action described in this PEA in NOAA Administrative Order (NAO) 216-6 as a “Routine Program Function,” which includes “mapping, charting and surveying services…ship and aircraft operations…basic environmental services and monitoring…environmental data and information services…and for which any cumulative effects are negligible” (NAO 216-6, Section 6.03c.3(d)). Coast Survey hydrographic survey and charting services have traditionally fallen under a Categorical Exclusion. However, given the recent attention surrounding the issue of high-frequency underwater sound and its potential effects on marine mammals, Coast Survey has decided to perform a PEA for its field activities. Coast Survey involved the public early in the decision-making process by publishing a draft of this PEA in the Federal Register for a 30-day public comment period in June 2012. In addition to adhering to the requirements set forth in NAO 216-6, Coast Survey has followed CEQ guidance on the use of appendices and incorporation by reference wherever possible. In particular, NOAA has limited the main body text of this environmental assessment to a “plain language summary,” and has included research papers directly relevant to the proposal, lists of affected species, discussion of the methodology of models used in the analysis of impacts, and extremely detailed responses to comments in the appendices (CEQ 1981, question 25a). Throughout the preparation of this PEA, Coast Survey collaborated with biologists from NOAA’s National Marine Fisheries Service and the U.S. Fish and Wildlife Service. Both Services provided expertise on marine mammals protected under the Marine Mammal Protection Act, marine species listed under the Endangered Species Act, and essential fish habitat as defined by the Magnuson-Stevens Fishery Conservation and Management Act, or Magnuson-Stevens Act. Coast Survey’s preferred alternative is to continue its hydrographic survey program and related activities with mitigation measures incorporated into its standard protocols wherever practicable. Through research using the best available science and consultations with biologists and underwater acoustic experts, Coast Survey has concluded that this preferred alternative does not result in any significant changes to the human or natural environment.
10
2. PURPOSE AND NEED FOR ACTION Hydrographic survey projects support the Coast Survey mission to provide reliable nautical charts and other products necessary for safe navigation and sound decision-making in U.S. ocean and coastal waters. These surveys provide the foundation for navigational charts required by all domestic ships moving people and products in and out of U.S. ports every year. Charts help prevent mariners from running ships aground or hitting dangerous obstructions (e.g., ship wrecks, marine debris, or pinnacle rocks). Groundings or collisions with other objects in the sea can result in the release of oil or dangerous chemicals into the marine environment. Additionally, surveys and charts help planners manage competing demands for ocean “space” for navigation, alternative energy, and other commercial purposes, and provide the foundation for improving essential fish habitats. Survey data also support port and harbor maintenance, bottom type classification, and submerged cultural resources management.
2.1 Safe Navigation Surveying and charting is a principle responsibility of NOAA, pursuant to the Coast and Geodetic Survey Act (33 U.S.C. §§ 883a et seq.) and the Hydrographic Services Improvement Act, as amended (33 U.S.C. §§ 892). NOAA’s surveying and charting responsibility includes, but is not limited to, the states’ offshore waters as well as the U.S. territorial sea, contiguous zone and Exclusive Economic Zone (EEZ) – well over 3 million square nautical miles of U.S. waters. Through this program, Coast Survey collects survey data, and creates and maintains products to support safe navigation for commercial shipping, the fishing industry, recreational boaters, and state and local governments. The data and products also support U.S. military and domestic government operations throughout U.S. waters. Within the EEZ, NOAA has identified 500,000 square nautical miles as “navigationally significant waters,” which are areas in greatest need of modern hydrographic surveys. These waters are further defined in Hydrographic Survey Priorities, a document that is updated annually (NOAA 2011a). Many areas portrayed on NOAA’s approximately 1,000 nautical charts have never been adequately surveyed, largely because of the limitations of technology when the earlier surveys were conducted. Other areas are dynamic and include shifting shoals, wrecks, and changing shorelines that warrant routine measurement. Navigationally significant waters are further prioritized based on shipping tonnage and trends, age of surveys in the area, changes in under-keel clearance of vessels, potential for unknown dangers to navigation due to dynamic bottom or human influence, and requests for surveys from the marine community. Over 40 percent of the most critical survey areas are in Alaskan waters. A breakdown by region of navigationally significant waters and prioritization of areas within those waters is displayed graphically in Appendix A.
11

2.2 Economic Security The nation’s economic security relies on safe waterways within the U.S. marine transportation system – America's network of coastal waterways, navigable channels, rivers, ports, and marine terminals. Shipping on these "marine highways" moves people and goods around the country and connects them to the global marketplace for international trade and affordable goods, according to the Maritime Administration, U.S. Department of Transportation (Maritime Administration 2011a). In 2010, United States imports and exports totaled $1.4 trillion (Maritime Administration 2011b), contributing nearly half (46 percent) of the overall gross domestic product growth in 2010 (Bureau of Economic Analysis 2011). American businesses cannot participate in the global economy if they cannot get their products to foreign markets in a cost-effective, reliable, and expeditious manner. Ninety-nine percent of U.S. foreign trade by volume, and 62% by value, enters or leaves the Nation’s ports by ship (Maritime Administration 2011a). Vessels carrying cargo are becoming larger and have deeper drafts than ever before. These vessels include bulk ships carrying iron, coal and grain for export; heavy-load vessels carrying project cargo; container ships carrying general export and import cargo for markets around the United States and the world; and tankers carrying petroleum and other liquids used to power U.S. transportation systems and industry. Port authorities and mariners depend on navigational information that is up-to-date, accurate, and precise to make informed decisions. Alaska and the portion of U.S. waters in the Arctic, defined by the Arctic Research and Policy Act as “contiguous seas, including the Arctic Ocean and the Beaufort, Bering and Chukchi Seas; and the Aleutian Chain” (U.S. Arctic Research Commission 2009), provide an additional need for modern surveys. With 6,640 miles of coastline, Alaska’s waters include a wealth of natural resources that are spurring a steady increase in economic activity ‒ which means additional ships transiting Alaska’s waterways to transport oil, natural gas, minerals, fish, and other resources into and out of ports (Marine Chart Division 2011). Currently, survey and charting data in much of the Arctic is out of date or nonexistent. Some areas in Alaska waters have not seen more than superficial depth measurements since Captain Cook explored the northern regions in the late 1700s. In February 2013, NOAA’s Office of Coast Survey issued an updated edition of the Arctic Nautical Charting Plan (Marine Chart Division 2013), a major effort to update Arctic nautical charts that are inadequate for modern needs. The plan anticipates additional or improved charts necessary to support the future maritime transportation infrastructure in the coastal areas north of the Aleutian Islands. To guide new chart improvements, Coast Survey updates its Arctic hydrographic survey priority areas in consultation with Alaska Native communities, regional governments, local pilots and commercial maritime interests, and the U.S. Coast Guard, Navy, and Army Corps of Engineers. U.S. economic security requires reliable marine transportation throughout the Arctic, with an infrastructure that supports safety, environmental protection, and commercial efficiency (Marine Chart Division 2013). In the Alaska North Slope transportation hub town of Barrow, Alaska, for example, vessel traffic ‒ which is heaviest during the summer after the subsistence whaling season ends ‒ consists of tugs carrying fuel and supply barges. Barrow has no pier facilities, and marine cargo bound for Barrow must be “lightered” from barges to landing craft for delivery.
12
While anchored to receive supplies and transfer personnel to or from smaller vessels, cargo ships are often exposed to harsh weather from all directions.
2.3 Environmental Sustainability Hydrographic survey data support healthy, resilient coastal communities and ecosystems by providing valuable bathymetric “base layers.” To protect and restore ecological resources, managers of NOAA’s National Marine Sanctuaries and National Estuarine Research Reserves, as well as managers of Marine Protected Areas and coastal zones around the country, rely on this bathymetric data to map the marine environment, including critical habitat for endangered seabird, coral, seagrass, fish, sea turtle, and marine mammal species. By establishing a baseline resource assessment, coastal managers measure change over time to the environment, including the impacts of sea level change.
13
3. PROPOSED ACTION AND ALTERNATIVES
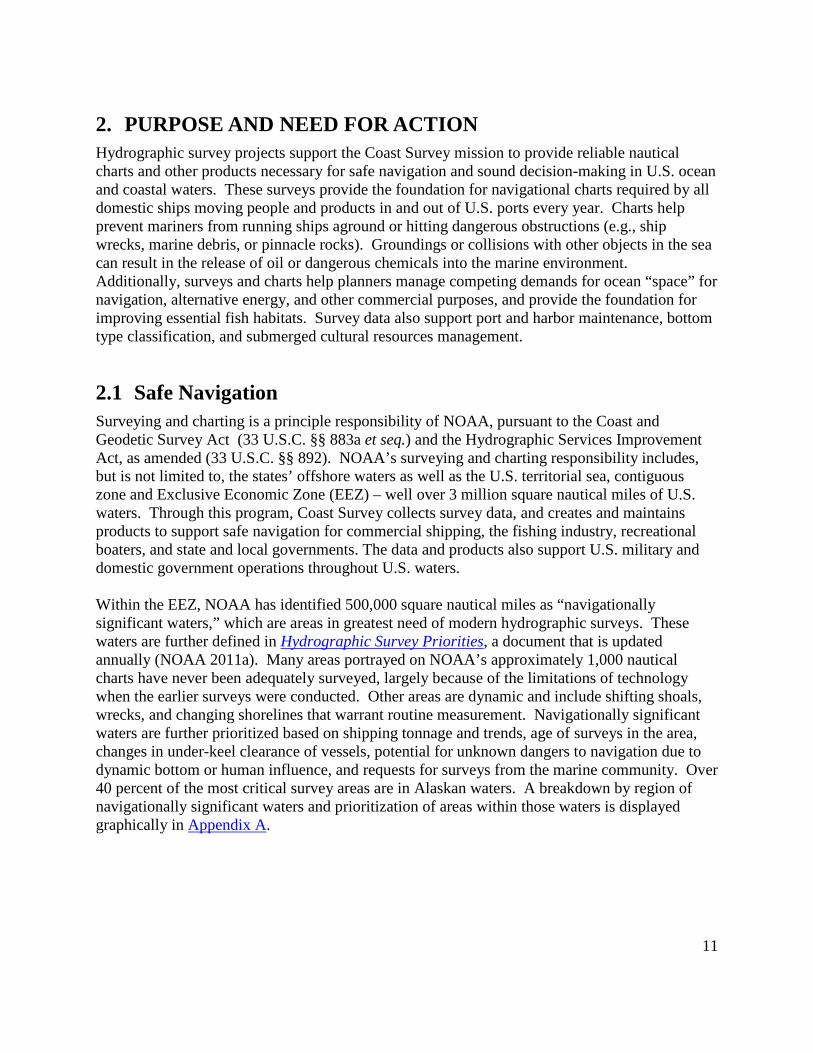
3.1 Proposed Action (Preferred Alternative) The proposed action is Coast Survey’s preferred alternative. To meet its mandate to survey and chart ocean and coastal waters, Coast Survey would continue to survey approximately 3,000 square nautical miles of selected navigationally significant areas each year (Appendix A). Using four NOAA ships (three of which are equipped with small boats for near shore work), six 28-foot survey boats, a 54-foot research vessel, and private contractors, Coast Survey would acquire hydrographic data that would update the nation’s nautical charts with the accuracy and precision that is essential to maintain the public trust in navigational products (Figure 1). Following field survey operations, Coast Survey cartographers would use the data to update the nation’s nautical charts. The public can access survey data at NOAA’s National Geophysical Data Center, and nautical charts are available from a variety of sources, including Coast Survey’s website.
Each year, Coast Survey would survey approximately 30 discrete locations. Many survey projects carry over from year to year, although some surveys require only one year’s effort. The list of planned 2013 projects and locations in Appendix B provides a good example of a typical year’s survey projects. (Note: this list includes only 2013 projects.) Hydrographic survey plans are available on the Coast Survey compliance website before each field season (approximately mid-March). The actions listed below include all survey-related field activities in support of the Coast Survey mandate to survey and chart navigationally significant waters. All of the elements listed below in the remainder of Section 3.1 would be undertaken if the proposed action is selected.
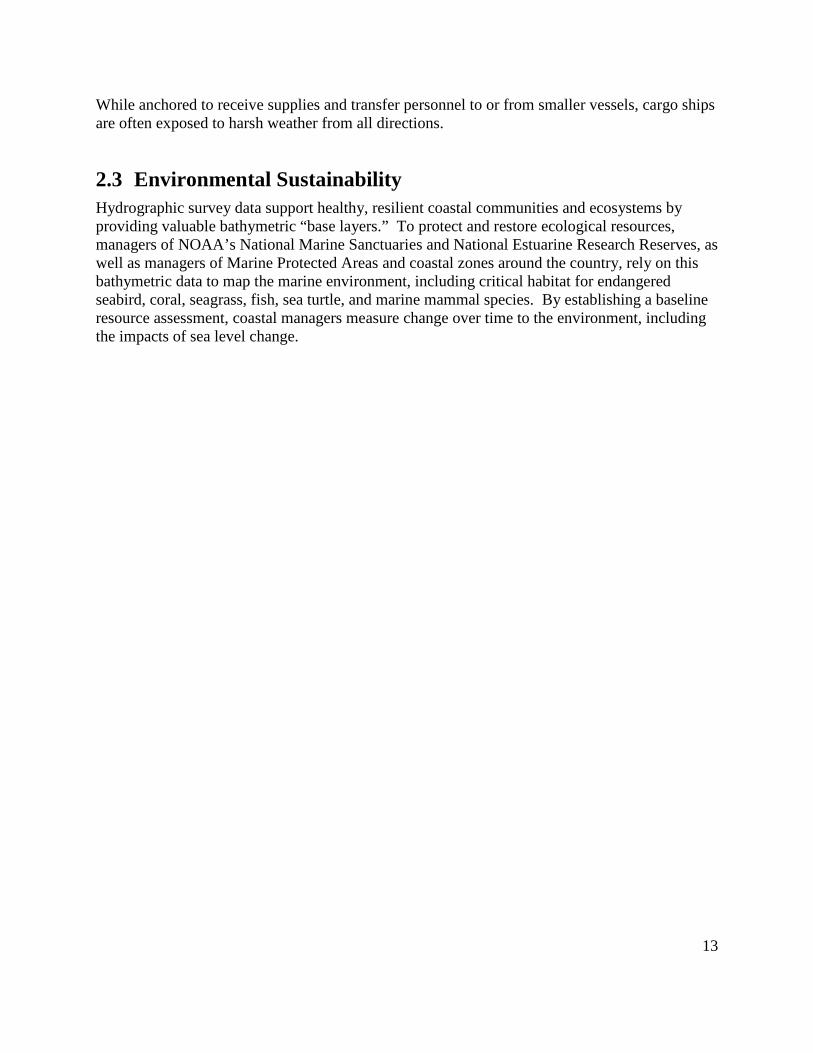
3.1.1 Hydrographic surveys Coast Survey conducts hydrographic surveys with high-frequency side scan sonar, and with single beam and multibeam echosounders, which use sound waves to find and identify objects in the water and to determine water depth. During a survey, a vessel equipped with one or more echosounders “mows the lawn” at a slow speed to ensonify (or visualize) the seafloor bottom and ensure full coverage of the seafloor within each project area (Figure 2). Single beam and
Figure 1. Bathymetric survey of an Arctic seamount
14
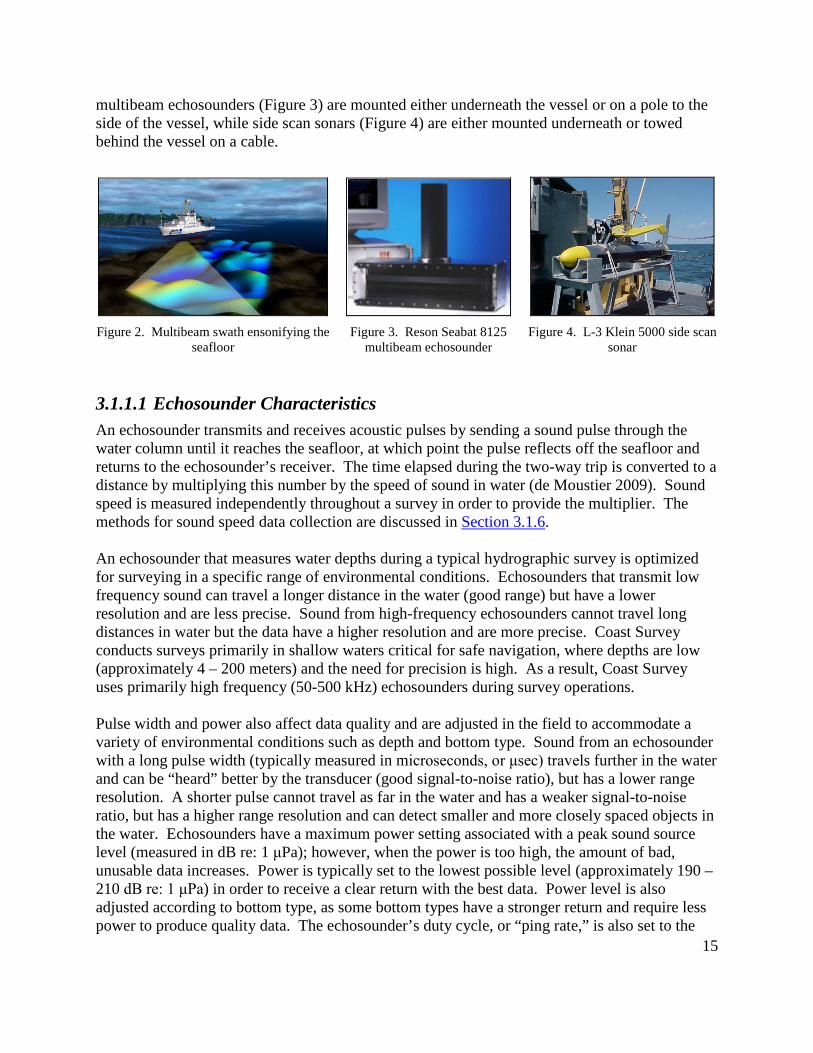
multibeam echosounders (Figure 3) are mounted either underneath the vessel or on a pole to the side of the vessel, while side scan sonars (Figure 4) are either mounted underneath or towed behind the vessel on a cable.
Figure 2. Multibeam swath ensonifying the
seafloor
Figure 3. Reson Seabat 8125
multibeam echosounder
Figure 4. L-3 Klein 5000 side scan
sonar
3.1.1.1 Echosounder Characteristics An echosounder transmits and receives acoustic pulses by sending a sound pulse through the water column until it reaches the seafloor, at which point the pulse reflects off the seafloor and returns to the echosounder’s receiver. The time elapsed during the two-way trip is converted to a distance by multiplying this number by the speed of sound in water (de Moustier 2009). Sound speed is measured independently throughout a survey in order to provide the multiplier. The methods for sound speed data collection are discussed in Section 3.1.6. An echosounder that measures water depths during a typical hydrographic survey is optimized for surveying in a specific range of environmental conditions. Echosounders that transmit low frequency sound can travel a longer distance in the water (good range) but have a lower resolution and are less precise. Sound from high-frequency echosounders cannot travel long distances in water but the data have a higher resolution and are more precise. Coast Survey conducts surveys primarily in shallow waters critical for safe navigation, where depths are low (approximately 4 – 200 meters) and the need for precision is high. As a result, Coast Survey uses primarily high frequency (50-500 kHz) echosounders during survey operations. Pulse width and power also affect data quality and are adjusted in the field to accommodate a variety of environmental conditions such as depth and bottom type. Sound from an echosounder with a long pulse width (typically measured in microseconds, or μsec) travels further in the water and can be “heard” better by the transducer (good signal-to-noise ratio), but has a lower range resolution. A shorter pulse cannot travel as far in the water and has a weaker signal-to-noise ratio, but has a higher range resolution and can detect smaller and more closely spaced objects in the water. Echosounders have a maximum power setting associated with a peak sound source level (measured in dB re: 1 μPa); however, when the power is too high, the amount of bad, unusable data increases. Power is typically set to the lowest possible level (approximately 190 – 210 dB re: 1 μPa) in order to receive a clear return with the best data. Power level is also adjusted according to bottom type, as some bottom types have a stronger return and require less power to produce quality data. The echosounder’s duty cycle, or “ping rate,” is also set to the
15
lowest possible level (approximately 10-30 Hz), regardless of the manufacturer’s stated “max ping rate.”
3.1.1.2 Office of Coast Survey Echosounders In-house and contractor vessels may be equipped with more than one type of echosounder; side scan sonar, single beam echosounders, and multibeam echosounders each have different advantages. Survey vessels can also be equipped with echosounders that can be adjusted between one of two frequencies, or with multiple echosounders of varying frequencies. In 2012, Coast Survey conducted survey operations using 18 sound sources (side scan sonar, single beam echosounders, and multibeam echosounders). Coast Survey anticipates acquiring new echosounders and discontinuing the use of others over the next few years. While Coast Survey cannot provide a complete list for the future, the 2012 table of echosounders (by vessel) in Appendix C provides a typical list of echosounders used each year. Although the specific brand or model of the listed echosounders may change on board each vessel, the frequency or power of the systems is unlikely to change significantly over the next few years.
3.1.1.3 Acquisition Windows and Survey Duration Hydrographic surveying occurs year-round, although projects are limited by environmental windows. Typically, Alaska projects in the Arctic or Bering Sea operate between June and September to avoid dangerous, icy conditions. Projects in Southeast, Central, and Southwest Alaska take place between March and November. West Coast, Northeast, and Mid-Atlantic projects are also conducted between March and November. Projects in the Southeast or Gulf of Mexico are conducted-year round. Actual time surveying averages approximately 15 days per month over the course of a survey project, although larger ships can often survey 20-25 days per month under good conditions. Bad weather or equipment repairs are the most common reasons for a non-survey day. Smaller boats operate 8-12 hours per day. (Sometimes, the large vessels carry the small boats to the survey area, and those small boats conduct the surveys.) When the large ships are surveying, they often operate 24 hours per day. The total time required for a project can vary from a few days to several months over multiple years.
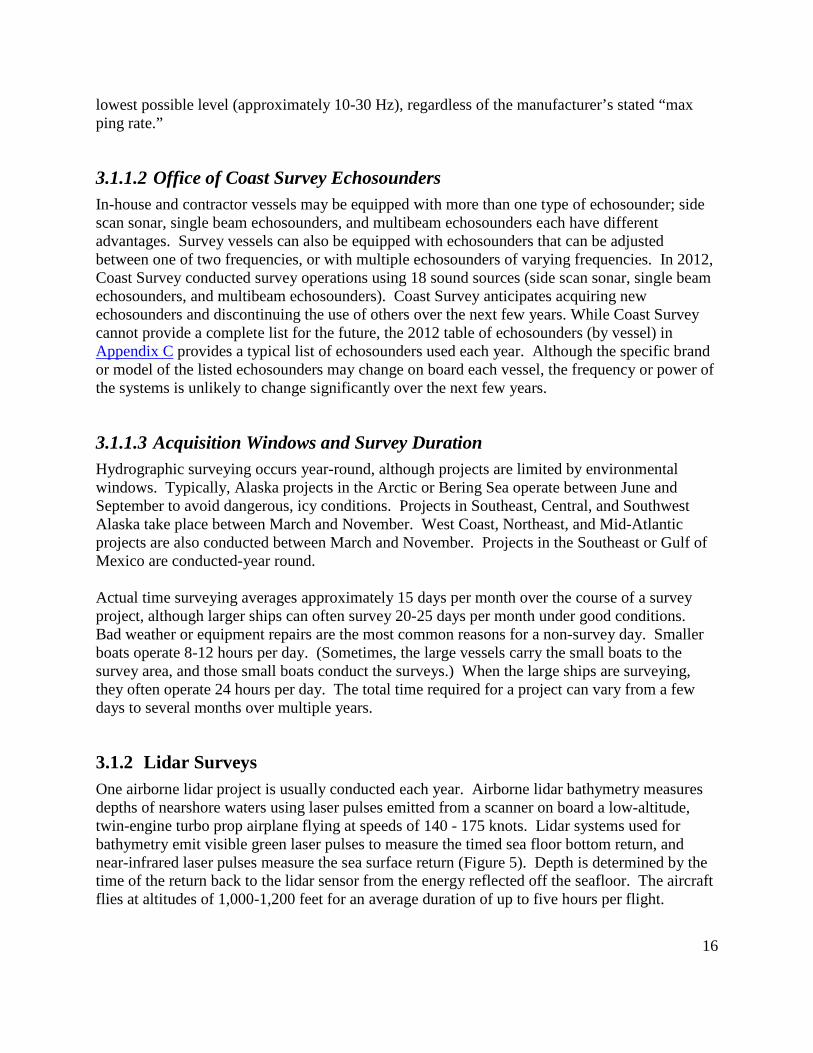
3.1.2 Lidar Surveys One airborne lidar project is usually conducted each year. Airborne lidar bathymetry measures depths of nearshore waters using laser pulses emitted from a scanner on board a low-altitude, twin-engine turbo prop airplane flying at speeds of 140 - 175 knots. Lidar systems used for bathymetry emit visible green laser pulses to measure the timed sea floor bottom return, and near-infrared laser pulses measure the sea surface return (Figure 5). Depth is determined by the time of the return back to the lidar sensor from the energy reflected off the seafloor. The aircraft flies at altitudes of 1,000-1,200 feet for an average duration of up to five hours per flight.
16
Aircraft would transit between a home base (determined by the location of the contractor or subcontractor providing the aircraft) and an airport near the survey site before and after lidar operations.
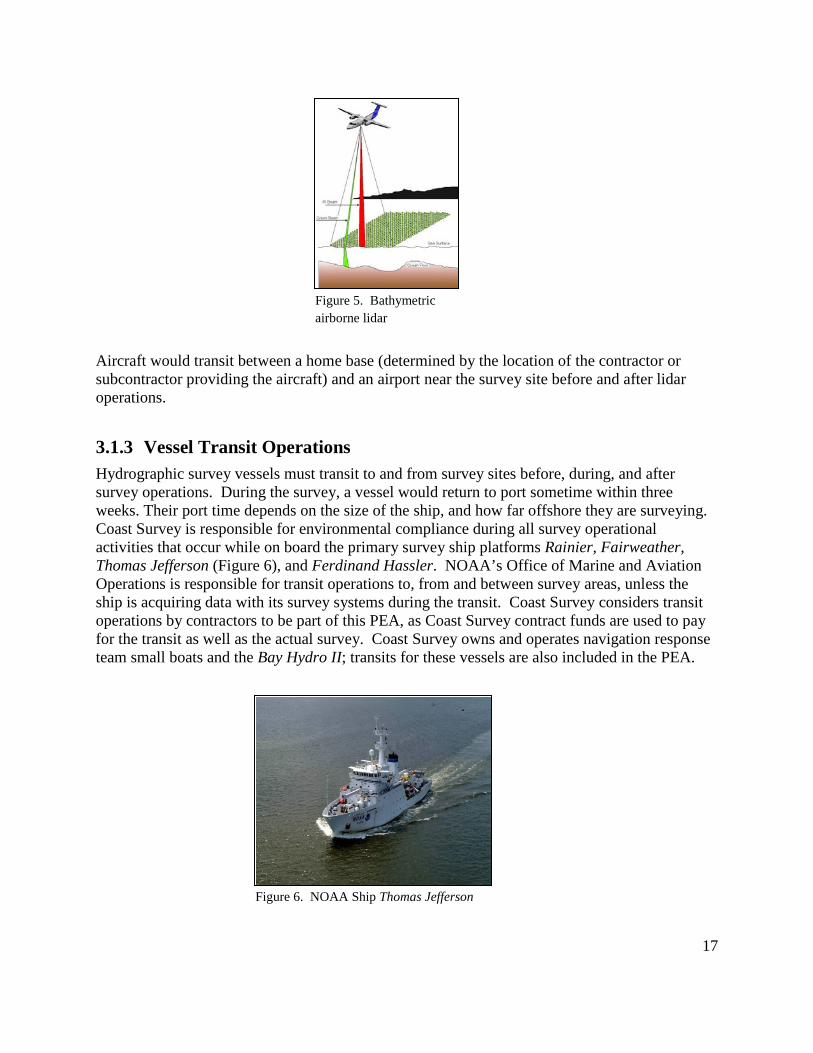
3.1.3 Vessel Transit Operations Hydrographic survey vessels must transit to and from survey sites before, during, and after survey operations. During the survey, a vessel would return to port sometime within three weeks. Their port time depends on the size of the ship, and how far offshore they are surveying. Coast Survey is responsible for environmental compliance during all survey operational activities that occur while on board the primary survey ship platforms Rainier, Fairweather, Thomas Jefferson (Figure 6), and Ferdinand Hassler. NOAA’s Office of Marine and Aviation Operations is responsible for transit operations to, from and between survey areas, unless the ship is acquiring data with its survey systems during the transit. Coast Survey considers transit operations by contractors to be part of this PEA, as Coast Survey contract funds are used to pay for the transit as well as the actual survey. Coast Survey owns and operates navigation response team small boats and the Bay Hydro II; transits for these vessels are also included in the PEA.
Figure 5. Bathymetric airborne lidar
Figure 6. NOAA Ship Thomas Jefferson
17
Coast Survey contracts approximately half of its hydrographic survey projects (measured by square nautical mile) from several firms. Contracts are firm-fixed price and performance-based, covering all services and personnel required to complete a survey from start to finish. Coast Survey is operating under five-year contracts and has initiated a new contract for FY 2014-18. Each year, task orders are issued against these contracts for several projects, each to be performed by a different contractor. In addition to compensating firms for the cost of surveying and data processing, task orders include the cost of transiting to and from the project site from the contract vessel’s home port, as well as the cost of transiting back into a port closer to the survey site as frequently as every day and as infrequently as every three weeks. Contractors often use the same vessels from year to year, regardless of whether the vessels are chartered (“vessels of opportunity”) or owned by the contract firm. In 2011, for example, one contractor used two survey vessels for a project in the Mississippi Sound. One vessel was transported from its homeport in Vancouver, Washington, across the country on a trailer to Biloxi, Mississippi, where the other vessel was already home ported. Since this project was only conducted during the daytime, each day the vessels returned to port in Biloxi for groceries, fuel, and crew change. Also in 2011, another contractor sailed its survey vessel from Seattle to the survey site in the Krenitzin Islands, Alaska. The transit lasted eight days in each direction. Every two to three weeks during the survey, the vessel made port calls to Dutch Harbor, Alaska, for groceries, fuel, and crew change. The transits for port calls lasted five hours in each direction. During transits, contractors operate under all of the normal regulations for vessels in the area, using shipping lanes, recommended routes, and natural channels as appropriate.
3.1.4 Anchoring When survey ships (NOAA and contractor) are not performing survey operations, the vessels are anchored either within the project area or just outside the project area. NOAA’s survey launches return to the ship each day and do not require anchoring. Navigation response team boats, the Bay Hydro II, and some contractor vessels return to port every day and are tied up to a pier, eliminating the need for anchoring. Ships usually anchor within the survey area to reduce the transit time to the working grounds and to save on fuel consumption. Vessel operators select the anchor location based on depth, protection from seas and wind, and bottom type. Preferred bottom types are sticky mud or sand, as those characteristics allow the flukes of the anchor to dig into the bottom and hold the chain in place. Sensitive areas such as coral reefs are avoided when they are known to exist; however, project areas have often not been surveyed for many decades, and not all coral areas are charted. When working in an unsurveyed area or in an area that has not been surveyed in many years, the ship will try to anchor in bays where data has already been collected, providing the ship with better information on where to drop the anchor. Coral reefs in particular show up well in the multibeam data and can be avoided for anchoring. Vessels avoid coral reefs and hard bottom areas as part of their protocol because these bottom types do not provide for good anchoring. Reefs can snag an anchor and the ship might not get the anchor back aboard, and corals or hard bottoms do not provide for good holding, leaving the ship vulnerable to dragging anchor and shifting around. However, a vessel can anchor to a hard bottom in a weather-protected area if
18
there are no soft bottom (mud or sand) areas available, as is often the case in rocky seafloor areas off the coast of Alaska.
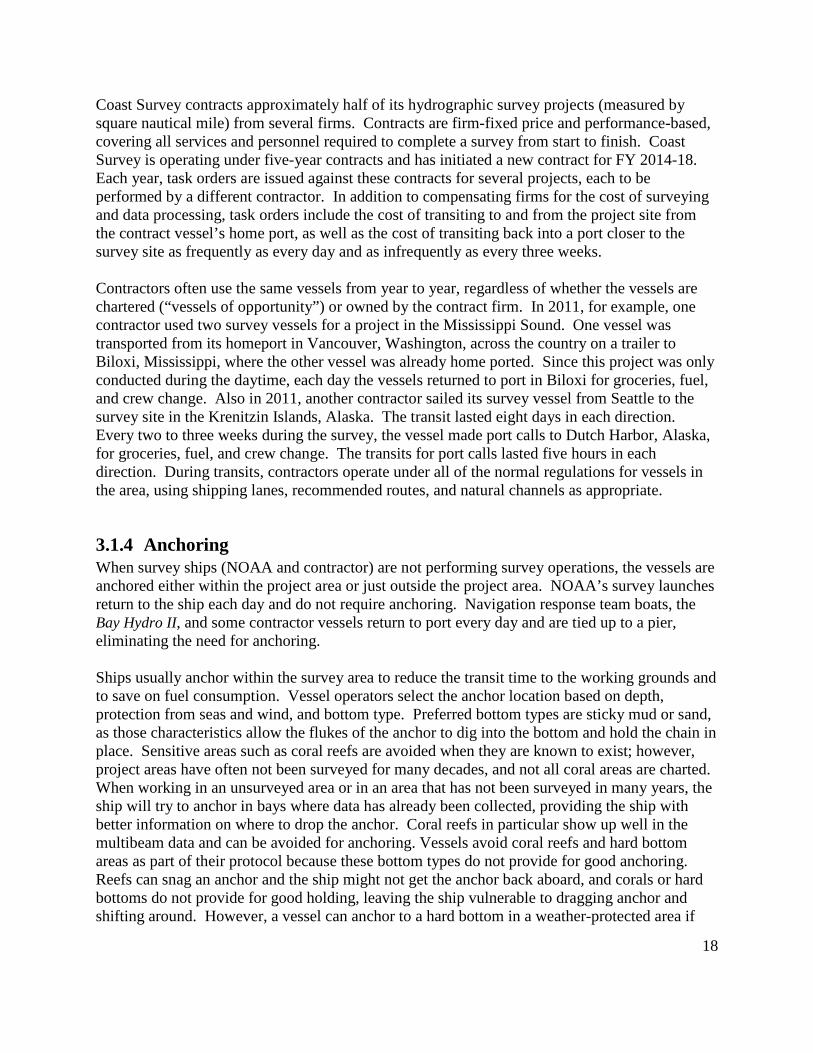
3.1.5 Bottom Sample Collection Coast Survey would grab samples of seafloor sediment during survey operations by lowering a grab sampler through the water column. During survey operations, bottom samples are characterized and charted primarily so mariners can better select their anchorages. Typically, surveyors use a clamshell bottom snapper (Figure 7) or similar type of grab sampler to obtain samples of the surface sediment layer (approximately the first two inches of sediment). As the sampler is lowered, two hinged upper lids swing open to let water pass through. When the sampler reaches the bottom, the overlapping spring-loaded scoops are tripped on the line, and the lids close to contain the sediment and prevent sample washout. The line is lowered and raised, at a rate of about one meter per second. After the sediment is collected, analyzed, and photographed, the crew releases it from the sampler underwater.
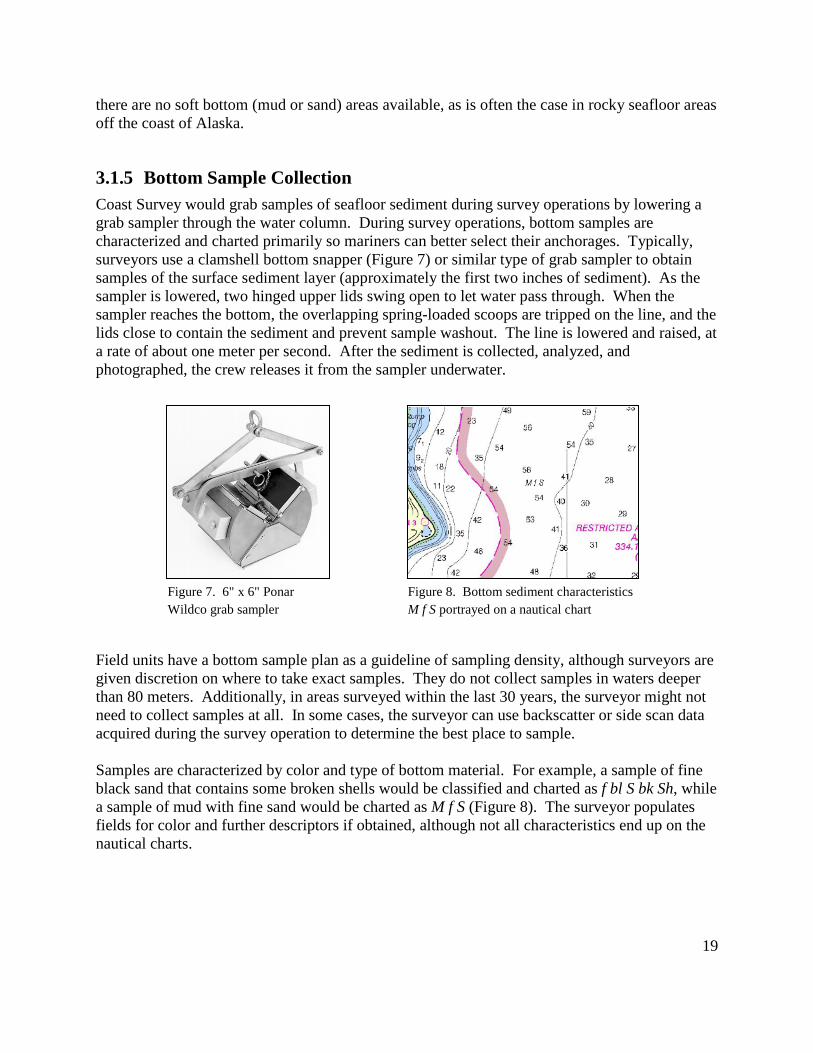
Field units have a bottom sample plan as a guideline of sampling density, although surveyors are given discretion on where to take exact samples. They do not collect samples in waters deeper than 80 meters. Additionally, in areas surveyed within the last 30 years, the surveyor might not need to collect samples at all. In some cases, the surveyor can use backscatter or side scan data acquired during the survey operation to determine the best place to sample. Samples are characterized by color and type of bottom material. For example, a sample of fine black sand that contains some broken shells would be classified and charted as f bl S bk Sh, while a sample of mud with fine sand would be charted as M f S (Figure 8). The surveyor populates fields for color and further descriptors if obtained, although not all characteristics end up on the nautical charts.
Figure 7. 6" x 6" Ponar Wildco grab sampler
Figure 8. Bottom sediment characteristics M f S portrayed on a nautical chart
19
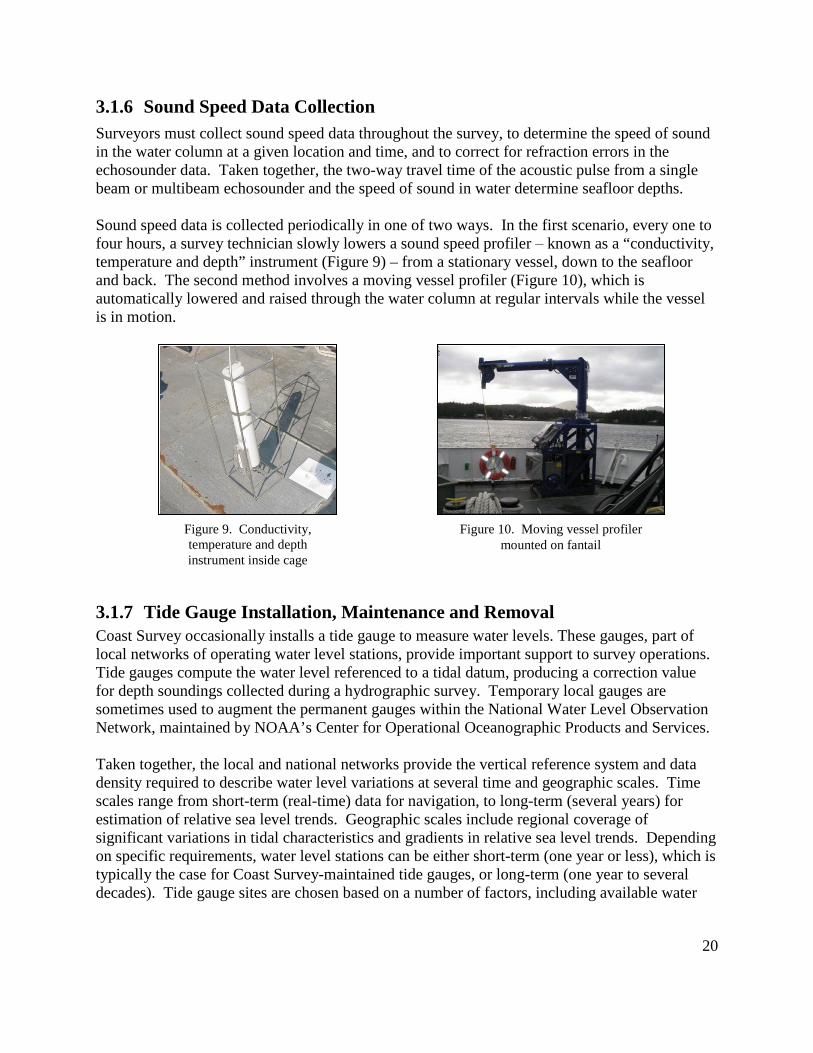
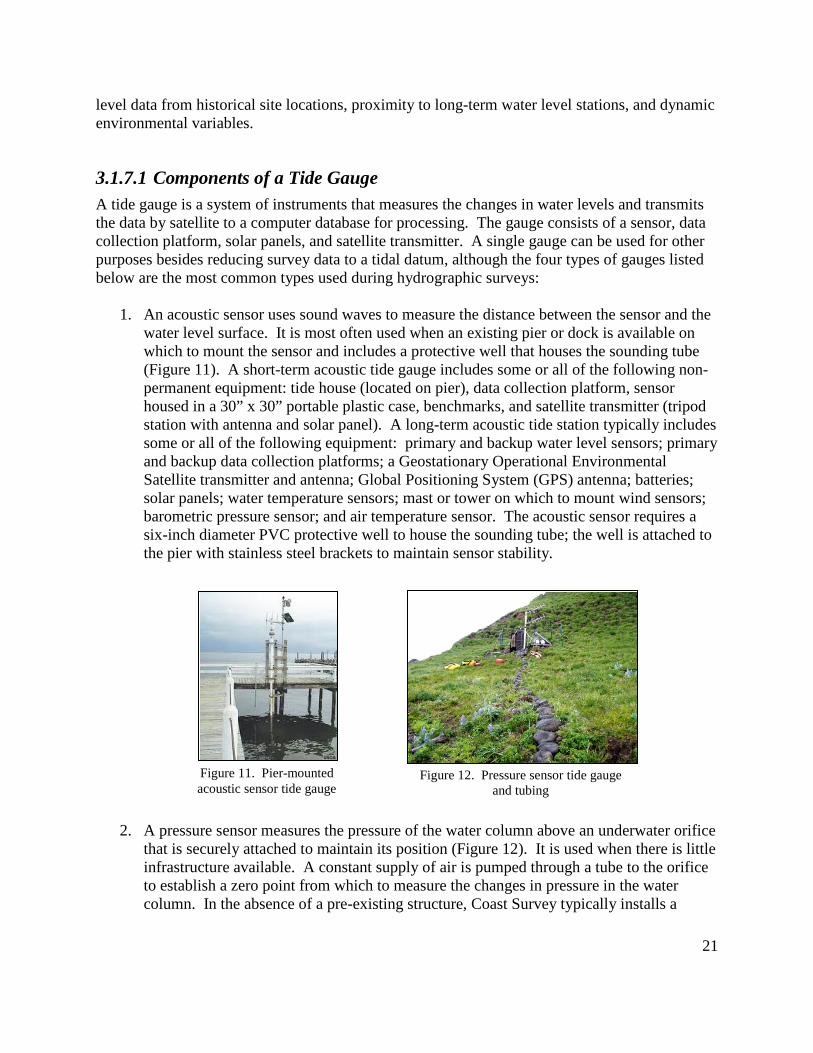
3.1.6 Sound Speed Data Collection Surveyors must collect sound speed data throughout the survey, to determine the speed of sound in the water column at a given location and time, and to correct for refraction errors in the echosounder data. Taken together, the two-way travel time of the acoustic pulse from a single beam or multibeam echosounder and the speed of sound in water determine seafloor depths. Sound speed data is collected periodically in one of two ways. In the first scenario, every one to four hours, a survey technician slowly lowers a sound speed profiler ‒ known as a “conductivity, temperature and depth” instrument (Figure 9) – from a stationary vessel, down to the seafloor and back. The second method involves a moving vessel profiler (Figure 10), which is automatically lowered and raised through the water column at regular intervals while the vessel is in motion.
3.1.7 Tide Gauge Installation, Maintenance and Removal Coast Survey occasionally installs a tide gauge to measure water levels. These gauges, part of local networks of operating water level stations, provide important support to survey operations. Tide gauges compute the water level referenced to a tidal datum, producing a correction value for depth soundings collected during a hydrographic survey. Temporary local gauges are sometimes used to augment the permanent gauges within the National Water Level Observation Network, maintained by NOAA’s Center for Operational Oceanographic Products and Services. Taken together, the local and national networks provide the vertical reference system and data density required to describe water level variations at several time and geographic scales. Time scales range from short-term (real-time) data for navigation, to long-term (several years) for estimation of relative sea level trends. Geographic scales include regional coverage of significant variations in tidal characteristics and gradients in relative sea level trends. Depending on specific requirements, water level stations can be either short-term (one year or less), which is typically the case for Coast Survey-maintained tide gauges, or long-term (one year to several decades). Tide gauge sites are chosen based on a number of factors, including available water
Figure 9. Conductivity, temperature and depth instrument inside cage
Figure 10. Moving vessel profiler mounted on fantail
20
level data from historical site locations, proximity to long-term water level stations, and dynamic environmental variables.
3.1.7.1 Components of a Tide Gauge A tide gauge is a system of instruments that measures the changes in water levels and transmits the data by satellite to a computer database for processing. The gauge consists of a sensor, data collection platform, solar panels, and satellite transmitter. A single gauge can be used for other purposes besides reducing survey data to a tidal datum, although the four types of gauges listed below are the most common types used during hydrographic surveys:
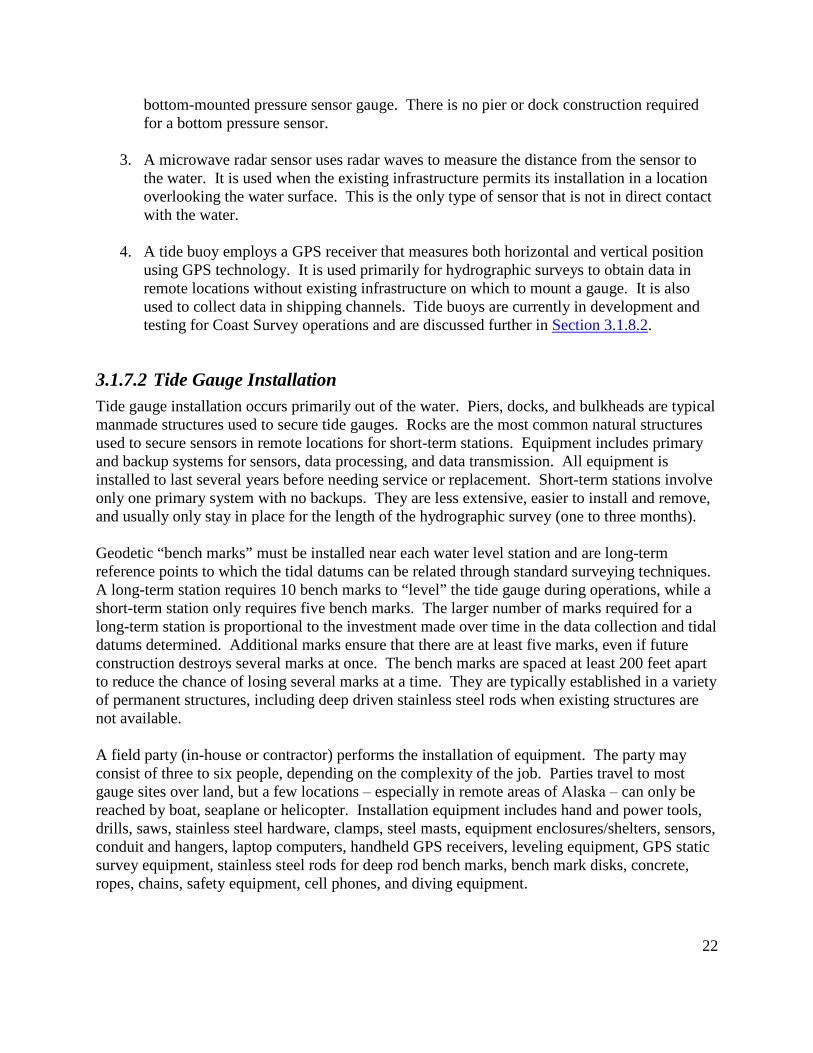
1. An acoustic sensor uses sound waves to measure the distance between the sensor and the water level surface. It is most often used when an existing pier or dock is available on which to mount the sensor and includes a protective well that houses the sounding tube (Figure 11). A short-term acoustic tide gauge includes some or all of the following non-permanent equipment: tide house (located on pier), data collection platform, sensor housed in a 30” x 30” portable plastic case, benchmarks, and satellite transmitter (tripod station with antenna and solar panel). A long-term acoustic tide station typically includes some or all of the following equipment: primary and backup water level sensors; primary and backup data collection platforms; a Geostationary Operational Environmental Satellite transmitter and antenna; Global Positioning System (GPS) antenna; batteries; solar panels; water temperature sensors; mast or tower on which to mount wind sensors; barometric pressure sensor; and air temperature sensor. The acoustic sensor requires a six-inch diameter PVC protective well to house the sounding tube; the well is attached to the pier with stainless steel brackets to maintain sensor stability.
2. A pressure sensor measures the pressure of the water column above an underwater orifice that is securely attached to maintain its position (Figure 12). It is used when there is little infrastructure available. A constant supply of air is pumped through a tube to the orifice to establish a zero point from which to measure the changes in pressure in the water column. In the absence of a pre-existing structure, Coast Survey typically installs a
Figure 11. Pier-mounted acoustic sensor tide gauge
Figure 12. Pressure sensor tide gauge and tubing
21
bottom-mounted pressure sensor gauge. There is no pier or dock construction required for a bottom pressure sensor.
3. A microwave radar sensor uses radar waves to measure the distance from the sensor to
the water. It is used when the existing infrastructure permits its installation in a location overlooking the water surface. This is the only type of sensor that is not in direct contact with the water.
4. A tide buoy employs a GPS receiver that measures both horizontal and vertical position
using GPS technology. It is used primarily for hydrographic surveys to obtain data in remote locations without existing infrastructure on which to mount a gauge. It is also used to collect data in shipping channels. Tide buoys are currently in development and testing for Coast Survey operations and are discussed further in Section 3.1.8.2.
3.1.7.2 Tide Gauge Installation Tide gauge installation occurs primarily out of the water. Piers, docks, and bulkheads are typical manmade structures used to secure tide gauges. Rocks are the most common natural structures used to secure sensors in remote locations for short-term stations. Equipment includes primary and backup systems for sensors, data processing, and data transmission. All equipment is installed to last several years before needing service or replacement. Short-term stations involve only one primary system with no backups. They are less extensive, easier to install and remove, and usually only stay in place for the length of the hydrographic survey (one to three months). Geodetic “bench marks” must be installed near each water level station and are long-term reference points to which the tidal datums can be related through standard surveying techniques. A long-term station requires 10 bench marks to “level” the tide gauge during operations, while a short-term station only requires five bench marks. The larger number of marks required for a long-term station is proportional to the investment made over time in the data collection and tidal datums determined. Additional marks ensure that there are at least five marks, even if future construction destroys several marks at once. The bench marks are spaced at least 200 feet apart to reduce the chance of losing several marks at a time. They are typically established in a variety of permanent structures, including deep driven stainless steel rods when existing structures are not available. A field party (in-house or contractor) performs the installation of equipment. The party may consist of three to six people, depending on the complexity of the job. Parties travel to most gauge sites over land, but a few locations ‒ especially in remote areas of Alaska ‒ can only be reached by boat, seaplane or helicopter. Installation equipment includes hand and power tools, drills, saws, stainless steel hardware, clamps, steel masts, equipment enclosures/shelters, sensors, conduit and hangers, laptop computers, handheld GPS receivers, leveling equipment, GPS static survey equipment, stainless steel rods for deep rod bench marks, bench mark disks, concrete, ropes, chains, safety equipment, cell phones, and diving equipment.
22
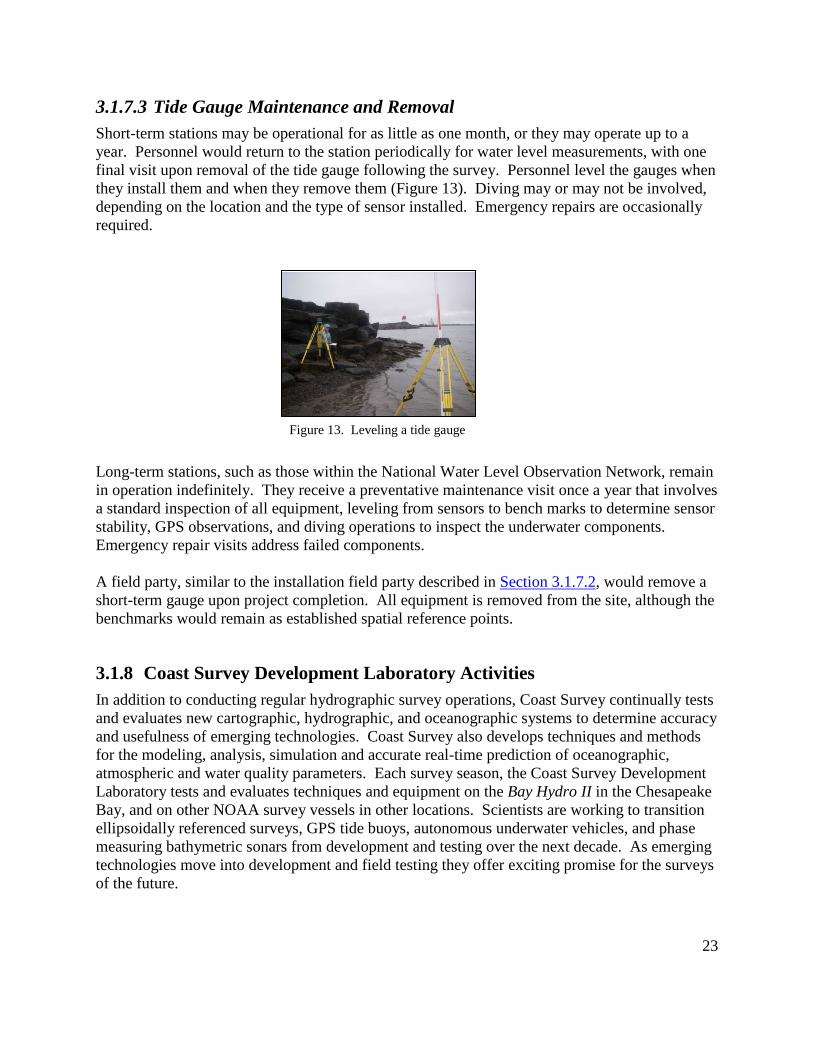
3.1.7.3 Tide Gauge Maintenance and Removal Short-term stations may be operational for as little as one month, or they may operate up to a year. Personnel would return to the station periodically for water level measurements, with one final visit upon removal of the tide gauge following the survey. Personnel level the gauges when they install them and when they remove them (Figure 13). Diving may or may not be involved, depending on the location and the type of sensor installed. Emergency repairs are occasionally required.
Long-term stations, such as those within the National Water Level Observation Network, remain in operation indefinitely. They receive a preventative maintenance visit once a year that involves a standard inspection of all equipment, leveling from sensors to bench marks to determine sensor stability, GPS observations, and diving operations to inspect the underwater components. Emergency repair visits address failed components. A field party, similar to the installation field party described in Section 3.1.7.2, would remove a short-term gauge upon project completion. All equipment is removed from the site, although the benchmarks would remain as established spatial reference points.
3.1.8 Coast Survey Development Laboratory Activities In addition to conducting regular hydrographic survey operations, Coast Survey continually tests and evaluates new cartographic, hydrographic, and oceanographic systems to determine accuracy and usefulness of emerging technologies. Coast Survey also develops techniques and methods for the modeling, analysis, simulation and accurate real-time prediction of oceanographic, atmospheric and water quality parameters. Each survey season, the Coast Survey Development Laboratory tests and evaluates techniques and equipment on the Bay Hydro II in the Chesapeake Bay, and on other NOAA survey vessels in other locations. Scientists are working to transition ellipsoidally referenced surveys, GPS tide buoys, autonomous underwater vehicles, and phase measuring bathymetric sonars from development and testing over the next decade. As emerging technologies move into development and field testing they offer exciting promise for the surveys of the future.
Figure 13. Leveling a tide gauge
23
3.1.8.1 Ellipsoidally Referenced Surveys In ellipsoidally referenced surveys, height and depth are measured with respect to a geodetic datum (“ellipsoid”) rather than to a tidal datum. In the traditional approach to hydrography, depths are referenced to a tidal datum via in situ water level measurements derived from instantaneous water level observations. Ellipsoidally referenced surveys improve the efficiency of hydrographic surveys by removing the requirement for concurrent water level observations and hydrographic survey data collection. The technology also improves vertical and horizontal measurement precision through the use of kinematic GPS-based positioning techniques. Hydrographic data acquired from ellipsoidally referenced surveys is referenced to a common, worldwide datum, which increases the long-term utility of the data for future users and applications. Equipment used in ellipsoidally referenced surveys includes a ship-based inertially-aided GPS system and a shore-based GPS reference station. If an existing network, such as the Continually Operating Reference System, is not available, the field unit must establish a new network by using a tripod, an antenna, a receiver housed in a hardened waterproof “suitcase,” and data storage connected to a radio modem for remote downloads. If electrical service is not available at the reference station site, the network system requires a set of 12-volt marine, deep-cycle re-chargeable batteries and a solar panel array. The site chosen on shore must provide an obstruction-free view to GPS satellites and accommodate line-of-sight radio communications. No equipment maintenance is required, although if no remote data download capability is available the field unit must visit the site periodically to download data vital for survey processing. Coast Survey is currently conducting quality control tests on the effectiveness and reliability of ellipsoidally referenced surveys compared to surveys that employ traditional tide gauge-derived water levels. Ellipsoidally referenced surveys also rely on a vertical datum transformation tool in order to translate the vertical component of survey data from the geodetic datum (ellipsoid) to the localized mean lower low water datum for nautical chart products. VDatum (NOAA’s vertical transformation software) is important to the success of ellipsoidally referenced surveys and is operational in the coterminous United States, Puerto Rico, and the Virgin Islands.
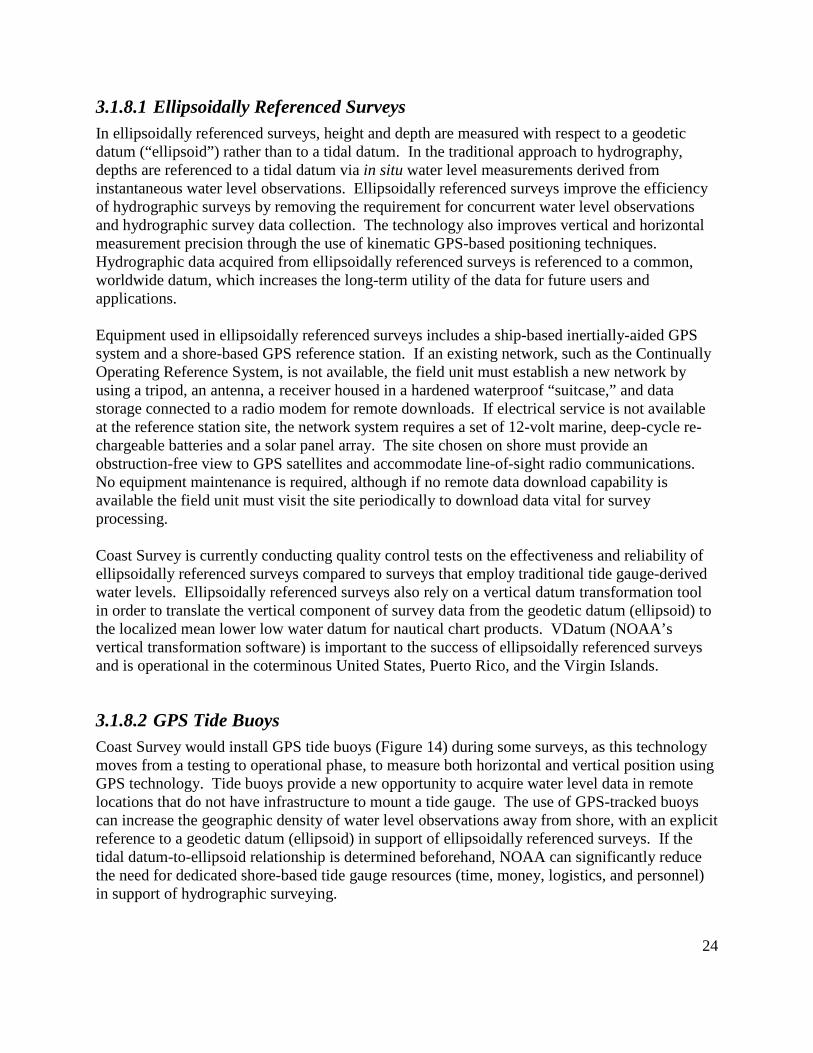
3.1.8.2 GPS Tide Buoys Coast Survey would install GPS tide buoys (Figure 14) during some surveys, as this technology moves from a testing to operational phase, to measure both horizontal and vertical position using GPS technology. Tide buoys provide a new opportunity to acquire water level data in remote locations that do not have infrastructure to mount a tide gauge. The use of GPS-tracked buoys can increase the geographic density of water level observations away from shore, with an explicit reference to a geodetic datum (ellipsoid) in support of ellipsoidally referenced surveys. If the tidal datum-to-ellipsoid relationship is determined beforehand, NOAA can significantly reduce the need for dedicated shore-based tide gauge resources (time, money, logistics, and personnel) in support of hydrographic surveying.
24

GPS tide buoys remain operational for the same duration of time as traditional, short-term tide gauges (typically for the length of the survey or 30 days, whichever is greater) in order to establish the required ellipsoid and tidal datum relationship for ellipsoidally referenced surveys. Buoy deployment requires a limited area of flat and preferably sandy seafloor, similar to the type of bottom characteristics sought for small boat anchoring. Since the survey has not yet taken grab samples of the sea bottom, however, the team chooses the location based on the information on a nautical chart that may be outdated. Buoy deployments are made in water depths of approximately 10 meters. A typical mooring configuration includes 100-150 pounds of anchoring mass (usually a combination of a 50-pound primary anchor and several 15-pound “mushroom” anchors) and a heavy chain, with a total footprint of approximately one square meter. The two Hydrolevel™ GPS tide buoys currently owned by the Coast Survey Development Laboratory are approximately 26” in diameter, weigh 128 pounds, have amber U.S. Coast Guard LED lights visible from three miles away, and use sealed lithium batteries. During installation, GPS tide buoys are tethered to the anchoring hardware with a 15-meter, 1" diameter rubber cord, followed by a section of 3/16" Amsteel rope. The rubber cord attaches to the bottom of the buoy, and the rope attaches the rubber cord to the anchor. The combined length of the rubber cord and the rope exceeds the nominal water depth by a factor of approximately two (i.e., “mooring scope” = 2). The GPS buoy is deployed by floating the buoy away from the vessel to the extent of the rubber cord and rope. The anchor is then lowered slowly to the point where the rope attaches to the rubber cord, at which point the anchor is released. During recovery, the GPS buoy (float) is brought aboard the vessel along with the length of the rubber cord. The total anchoring hardware is then hauled in by rope. There is very little maintenance of the buoys required during a survey deployment. Occasionally the batteries must be replaced or recharged, and field units must retrieve the buoy with a small boat and bring it back to the ship or shore. When they bring the buoy on board, the team attaches a temporary float to the end of the mooring so that it can be re-used after the buoy batteries have been refreshed. At the end of the survey, the field unit recovers all components of the buoy. The Hydrolevel™ buoys are programmed to send out a "health message" email to a predetermined distribution list at regular intervals using the Iridium satellite service. Currently, Coast Survey buoys are configured to send a message once every hour. If the buoy reports its position outside of a certain radius (“watch circle”), it issues a separate alert. Field personnel respond to emergencies where the buoy breaks its mooring or stops sending messages.
25
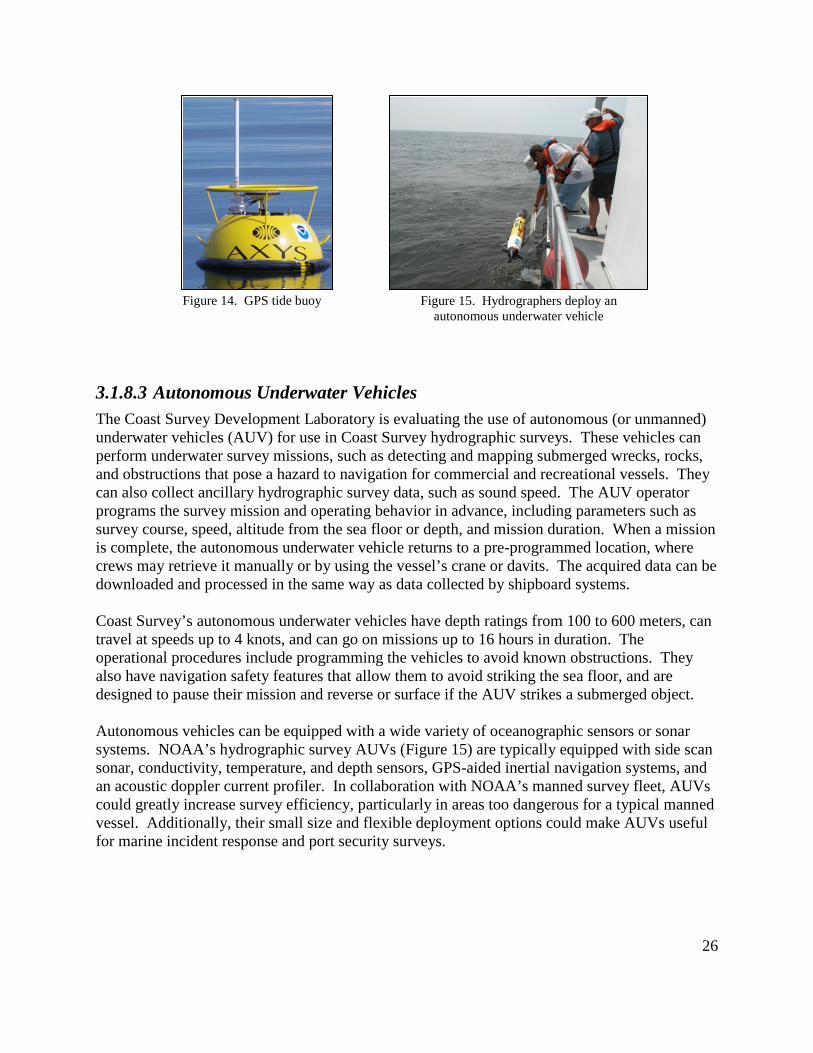
3.1.8.3 Autonomous Underwater Vehicles The Coast Survey Development Laboratory is evaluating the use of autonomous (or unmanned) underwater vehicles (AUV) for use in Coast Survey hydrographic surveys. These vehicles can perform underwater survey missions, such as detecting and mapping submerged wrecks, rocks, and obstructions that pose a hazard to navigation for commercial and recreational vessels. They can also collect ancillary hydrographic survey data, such as sound speed. The AUV operator programs the survey mission and operating behavior in advance, including parameters such as survey course, speed, altitude from the sea floor or depth, and mission duration. When a mission is complete, the autonomous underwater vehicle returns to a pre-programmed location, where crews may retrieve it manually or by using the vessel’s crane or davits. The acquired data can be downloaded and processed in the same way as data collected by shipboard systems. Coast Survey’s autonomous underwater vehicles have depth ratings from 100 to 600 meters, can travel at speeds up to 4 knots, and can go on missions up to 16 hours in duration. The operational procedures include programming the vehicles to avoid known obstructions. They also have navigation safety features that allow them to avoid striking the sea floor, and are designed to pause their mission and reverse or surface if the AUV strikes a submerged object. Autonomous vehicles can be equipped with a wide variety of oceanographic sensors or sonar systems. NOAA’s hydrographic survey AUVs (Figure 15) are typically equipped with side scan sonar, conductivity, temperature, and depth sensors, GPS-aided inertial navigation systems, and an acoustic doppler current profiler. In collaboration with NOAA’s manned survey fleet, AUVs could greatly increase survey efficiency, particularly in areas too dangerous for a typical manned vessel. Additionally, their small size and flexible deployment options could make AUVs useful for marine incident response and port security surveys.
Figure 14. GPS tide buoy Figure 15. Hydrographers deploy an autonomous underwater vehicle
26
3.1.8.4 Phase Measuring Bathymetric Sonars The Coast Survey Development Laboratory is testing phase measuring bathymetric sonar systems, also referred to as interferometric sonar or swath bathymetry sonar, to determine the suitability of this technology for main scheme hydrographic survey operations. These systems use the measurement of acoustic signal phase at each of several receive elements, spaced at precisely known distances, to determine the angle from which the acoustic return originates. This angle of origin, in combination with range calculated from the two-way travel time, provides a discrete location on the seafloor. This sampling is done thousands of times per acoustic ping, providing a cross-track profile of bathymetry. A number of consecutive profiles are then combined to build a three dimensional model of the seafloor. Coast Survey is studying several commercially available phase measuring bathymetric sonar systems and has procured some for operational testing. Initial studies indicate that these systems may be capable of providing high quality data while significantly increasing efficiency and safety of operations in nearshore and very shallow water areas. The gains in efficiency and safety are attributable to the wider swath width that phase measuring bathymetric sonar produces, relative to traditional shallow water multibeam systems. This increased swath width, coupled with co-registered imagery, may increase survey efficiency and allow hydrographers to survey twice the shallow water area per given time. It may also allow vessel operators to stand further off of hazardous features and the shoreline. At the same time, they could acquire more data than is possible with technologies used today. Coast Survey is currently testing the 455 kHz Klein HydroChart 5000 Swath Bathymetry Sonar System.
3.2 No Action Alternative Under the No Action Alternative, Coast Survey would:
• discontinue its program of conducting approximately 3,000 square nautical miles of hydrographic surveys in U.S. coastal and Great Lakes waters each year;
• no longer use waterborne vessels with active acoustic sensors or airborne platforms with lidar sensors to measure seafloor depths; and
• discontinue other field operations that support hydrographic surveys, such as the collection of bottom samples, lowering of instruments to collect sound speed data, or the installation and maintenance of tide gauges and GPS stations on land.
Other ancillary activities required to conduct a survey, such as transiting to and from a survey area or anchoring, would also discontinue under the No Action Alternative. Additionally, Coast Survey research and development activities to improve hydrographic survey technologies would cease.
27
3.3 Alternatives Considered but Eliminated from Further Analysis Council on Environmental Quality guidance requires that an environmental assessment discuss only “reasonable alternatives” in detail for an action (40 C.F.R. §§ 1500-1508). The following alternatives were considered but eliminated from further analysis because they do not satisfy the purpose and need for Coast Survey to support safe navigation, economic security, and environmental sustainability.
3.3.1 Surveying with Lidar Exclusively Although airborne lidar has demonstrated several advantages over traditional hydrographic survey techniques, particularly in complex nearshore areas, lidar has distinct limitations as a function of water depth and environmental conditions. Lidar systems can efficiently survey a large area and identify features in a short period of time, and can safely survey nearshore areas that are hazardous for boats. However, even in the best environmental conditions, reliable laser “returns” from the seafloor diminish in waters deeper than 20-30 meters. Environmental variables such as water clarity (turbidity), sea state, and sea surface also limit the effectiveness of bathymetric lidar. In particular, lidar does not produce good results when used in turbid waters. When conditions are not ideal, lidar fails to identify small, potentially hazardous objects on the seafloor. Ultimately. lidar does not meet the object detection accuracy standards of most Coast Survey hydrographic survey projects. Because of these shortcomings, Coast Survey has concluded that it cannot survey exclusively with lidar to meet its mission to support safe navigation.
3.3.2 Deriving Water Levels Exclusively from Ellipsoidally Referenced Surveys
Ellipsoidally referenced surveys (discussed in Section 3.1.8.1) can only provide water levels where V-Datum is available and fully validated. Coast Survey is working toward installation of fewer tide gauges and increasing reliance on ellipsoidally referenced surveys for deriving water levels. At present, the technology is not sufficiently reliable in all coastal waters.
28
4. AFFECTED ENVIRONMENT Coast Survey could potentially survey in any “navigationally significant” areas of U.S. coastal and continental shelf waters as defined in the Hydrographic Survey Priorities document (NOAA 2011a). The following discussion of the affected environment includes all 500,000 square nautical miles of navigationally significant waters. This section discusses the physical, biological and cultural environment in which Coast Survey operates. Each year, Coast Survey would prepare a list of planned project areas at the beginning of the field season that would be publicly available on the Coast Survey environmental website. The 2013 list of planned project areas (Appendix B) provides an example of that list.
4.1 Physical Environment
4.1.1 Marine Environment Coast Survey operates in coastal and nearshore waters, primarily in depths greater than four meters and over the continental shelf. Each year, Coast Survey would survey approximately 3,000 square nautical miles of navigationally significant waters around the coast and in the Great Lakes. Water depths vary for each survey, although the survey vessel would rarely move into waters shallower than four meters. Most Coast Survey projects occur in nearshore, coastal and continental shelf areas with depth ranges from 4-200 meters, although some projects, particularly in the “steep and deep” waters of Alaska, extend into deeper waters at the shelf break. Temporal constraints (i.e., the best time of year to survey in a given location) also dictate the marine physical environment of hydrographic surveys (see Section 3.1.1.3). Physical characteristics of the seafloor vary for each survey, from flat and sandy in the Gulf of Mexico to steep and rocky in much of Alaska. Wrecks, oil and gas platforms, pipelines, and other man-made obstructions are also located in many of the survey areas, particularly on the east coast and in the Gulf of Mexico. Existing ambient underwater noise from natural and anthropogenic sources is part of the physical marine environment. Surface waves and animal vocalizations provide the greatest source of naturally occurring ocean noise. Sources of anthropogenic noise include vessel propellers, seismic airguns, explosives, construction, naval sonars, and standard vessel depth finders (National Research Council 2003). The number of large shipping vessels in the water has nearly tripled in the second half of the twentieth century, with ambient noise levels rising almost 12 decibels during this period (NOAA 2004).
4.1.2 Land Environment Tide gauges that support hydrographic surveys are typically installed on land, near the edge of the water, preferably on a pier face or wharf. The portion of land used during installation and maintenance of a tide gauge includes the intertidal region and a small strip of land extending approximately 10 to 20 meters upland. GPS stations for ellipsoidally referenced surveys are also installed on land near the shoreline, although stations require a clear line-of-sight to the satellites.
29
Occasionally, then, the GPS stations must be installed at a higher elevation if the shore area is blocked from the satellites. The physical environment on land can vary from a populated urban area to a secluded forested area.
4.1.3 Air Environment One airborne lidar project is planned for the Florida Keys National Marine Sanctuary. The Sanctuary is exposed daily to noise from aircraft. Vessel noise from recreational boaters also adds to the baseline of noise pollution.
4.2 Biological Environment
4.2.1 Marine Mammals All marine mammals located in U.S. waters are included in the affected biological environment for the purpose of this assessment. As of 2013, there are 68 distinct marine mammal species located within the EEZ, including 14 pinniped and 51 cetacean species, the West Indian manatee, polar bear, and sea otter. The National Marine Fisheries Service manages 64 of these species, including all cetaceans and all pinnipeds except the walrus. The U.S. Fish and Wildlife Service manages the polar bear, sea otter, walrus, and West Indian manatee species. For the purpose of this environmental assessment, Coast Survey assumes that it could potentially operate anywhere within navigationally significant waters (Appendix A). Marine mammals are listed with their estimated populations in Appendix D. Descriptions of each marine mammal likely to occur within a hydrographic survey area, including the species’ distribution and typical habitat, are described in Appendix E. Marine mammals unlikely to be found within survey areas because of their preference for deeper (i.e., non-navigationally significant) waters are described briefly in Appendix F. Marine mammals can vocalize and hear in a variety of frequency ranges under water, although most have a peak frequency range, even at lower decibel levels (Richardson et al. 1995, Southall et al. 2007). Southall, et al. (2007) report that large mysticete, “or baleen whale” cetaceans typically hear on the low end of that range, from 7 Hz - 22 kHz, while odontocetes, or “toothed whales,” can hear sounds from 150 Hz – 160 kHz, with some porpoises and dolphins able to hear frequencies up to 180 kHz. The final report of the NOAA International Symposium, “Shipping Noise and Marine Mammals: A Forum for Science, Management, and Technology” (NOAA 2004) states that otariids, or “eared seals” and manatees hear in the 1 – 30 kHz range underwater, while phocids, or “true seals,” and walruses can hear in the 200 Hz - 50 kHz range underwater, although Southall, et al. (2007) state that some phocids can hear frequencies as low as 75 Hz and up to 75 kHz. A joint National Science Foundation and U.S. Geological Survey environmental assessment for marine geophysical surveys (2011) reports that polar bears display the best hearing sensitivity in the range of 11 – 23 kHz. Wartzok and Ketten (1999) report that sea otters have an in-air
30
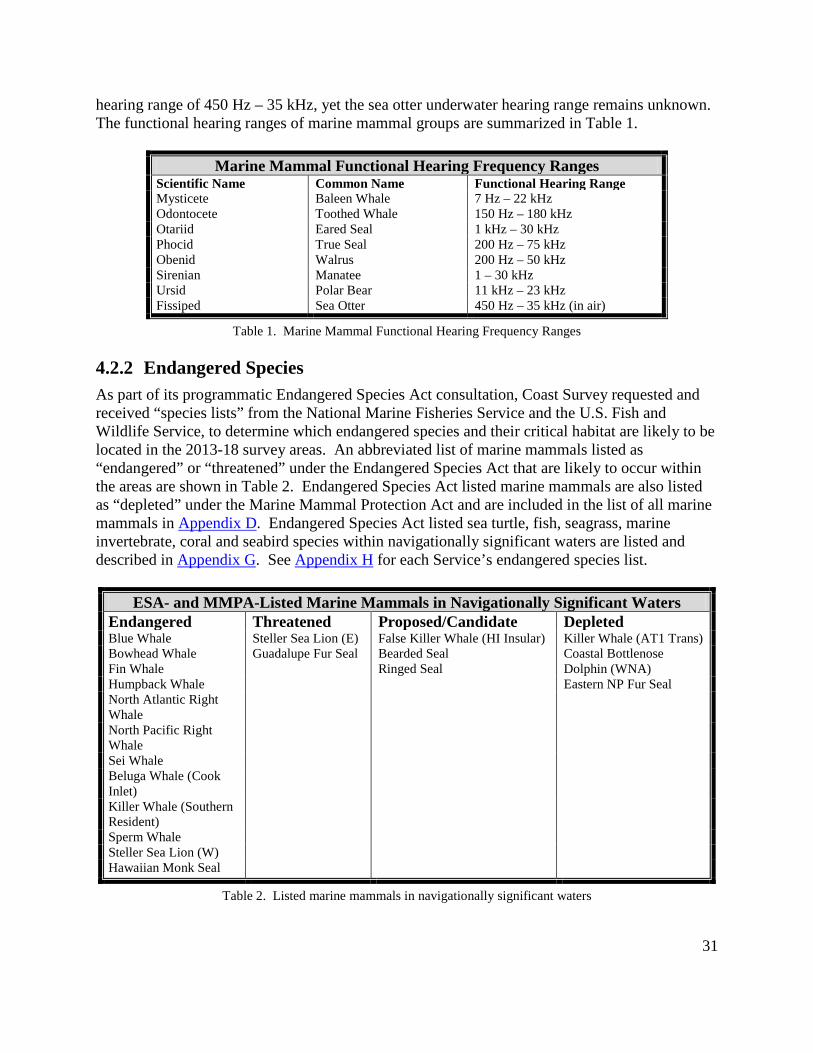
hearing range of 450 Hz – 35 kHz, yet the sea otter underwater hearing range remains unknown. The functional hearing ranges of marine mammal groups are summarized in Table 1.
Marine Mammal Functional Hearing Frequency Ranges Scientific Name Common Name Functional Hearing Range Mysticete Baleen Whale 7 Hz – 22 kHz Odontocete Toothed Whale 150 Hz – 180 kHz Otariid Eared Seal 1 kHz – 30 kHz Phocid True Seal 200 Hz – 75 kHz Obenid Walrus 200 Hz – 50 kHz Sirenian Manatee 1 – 30 kHz Ursid Polar Bear 11 kHz – 23 kHz Fissiped Sea Otter 450 Hz – 35 kHz (in air)
Table 1. Marine Mammal Functional Hearing Frequency Ranges
4.2.2 Endangered Species As part of its programmatic Endangered Species Act consultation, Coast Survey requested and received “species lists” from the National Marine Fisheries Service and the U.S. Fish and Wildlife Service, to determine which endangered species and their critical habitat are likely to be located in the 2013-18 survey areas. An abbreviated list of marine mammals listed as “endangered” or “threatened” under the Endangered Species Act that are likely to occur within the areas are shown in Table 2. Endangered Species Act listed marine mammals are also listed as “depleted” under the Marine Mammal Protection Act and are included in the list of all marine mammals in Appendix D. Endangered Species Act listed sea turtle, fish, seagrass, marine invertebrate, coral and seabird species within navigationally significant waters are listed and described in Appendix G. See Appendix H for each Service’s endangered species list.
ESA- and MMPA-Listed Marine Mammals in Navigationally Significant Waters Endangered Threatened Proposed/Candidate Depleted Blue Whale Steller Sea Lion (E) False Killer Whale (HI Insular) Killer Whale (AT1 Trans) Bowhead Whale Guadalupe Fur Seal Bearded Seal Coastal Bottlenose Fin Whale Ringed Seal Dolphin (WNA) Humpback Whale Eastern NP Fur Seal North Atlantic Right Whale
North Pacific Right Whale
Sei Whale Beluga Whale (Cook Inlet)
Killer Whale (Southern Resident)
Sperm Whale Steller Sea Lion (W) Hawaiian Monk Seal
Table 2. Listed marine mammals in navigationally significant waters
31
4.2.3 Essential Fish Habitat Essential fish habitat includes all types of aquatic habitat such as wetlands, coral reefs, seagrasses, and rivers where fish spawn, breed, feed, or grow to maturity. Coral reefs and seagrasses, including ESA-listed Johnson’s seagrass, elkhorn and staghorn coral, are located within navigationally significant waters. More detailed descriptions of these ESA-listed species comprising essential fish habitat are included in Appendix G. The Magnuson-Stevens Act defines essential fish habitat as “those waters and substrate necessary to fish for spawning, breeding, feeding or growth to maturity” (16 U.S.C. 1802) and includes a variety of aquatic habitat types, including wetlands, coral reefs, seagrasses, rivers, and muddy and rocky substrates in state and federal waters. Essential fish habitat for every life stage of each federally-managed species has been codified in fishery management plans that are prepared by the fishery management councils and approved by the Fisheries Service. All habitat descriptions use the best available scientific information. NOAA and the fishery management councils also identify habitat areas of particular concern. These areas are high priority areas for conservation, management, or research because they are rare, sensitive, stressed by development, or important to ecosystem function. Descriptions and geographic boundaries, as well as links to additional information about essential fish habitat, are available through the Habitat Mapper. The Magnuson-Stevens Act is described further in Section 6.3.
4.3 Cultural Environment
4.3.1 Historic Wrecks Historic wrecks can be anywhere in navigationally significant waters due to storms, collisions, and groundings. Typically, one can find a clustering of wrecks around a point, reef, or other natural navigational hazard near a shipping lane. Wrecks are also found near commercial ports and harbors where the vessels have been abandoned due to age or neglect. Some areas are “ship graveyards,” where vessel hulls are intentionally abandoned after their commercial life has ended and the working equipment has been removed.
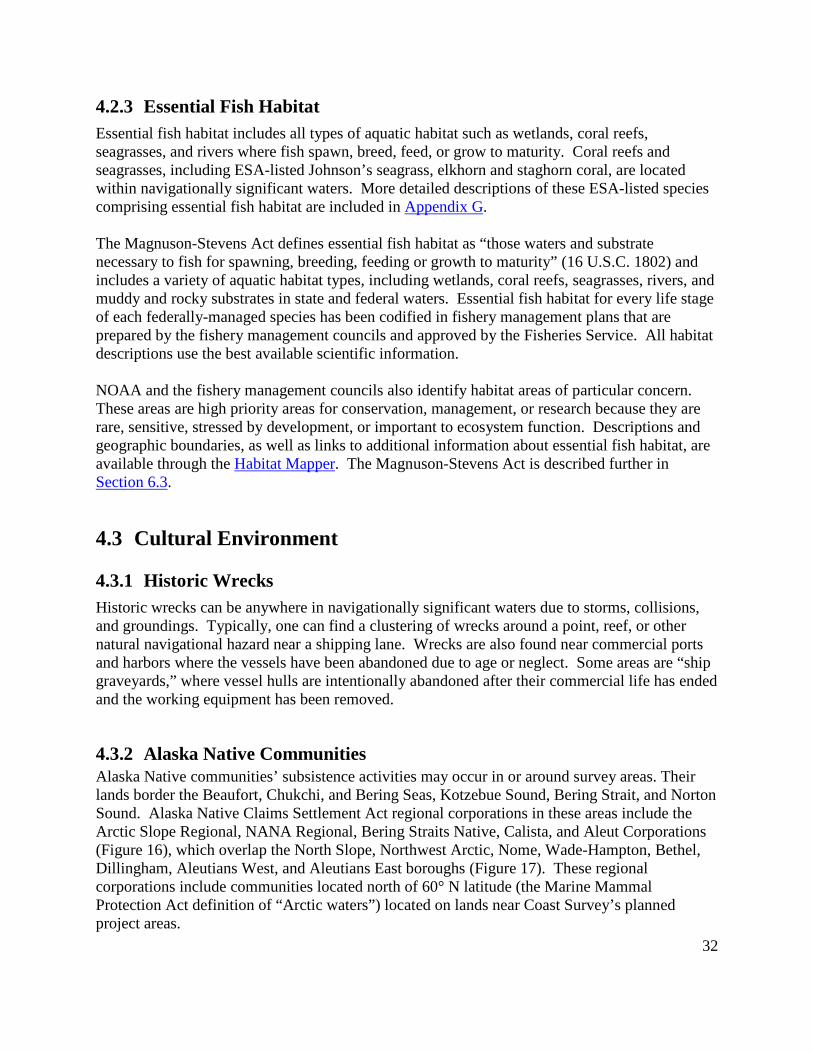
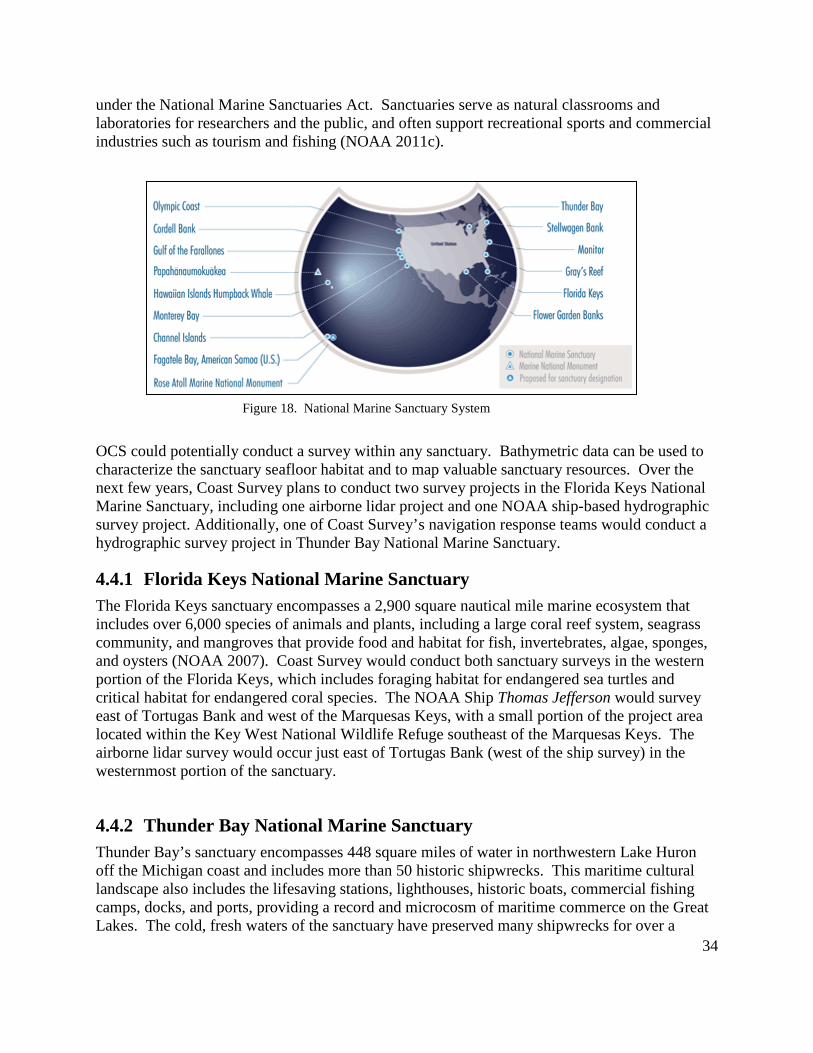
4.3.2 Alaska Native Communities Alaska Native communities’ subsistence activities may occur in or around survey areas. Their lands border the Beaufort, Chukchi, and Bering Seas, Kotzebue Sound, Bering Strait, and Norton Sound. Alaska Native Claims Settlement Act regional corporations in these areas include the Arctic Slope Regional, NANA Regional, Bering Straits Native, Calista, and Aleut Corporations (Figure 16), which overlap the North Slope, Northwest Arctic, Nome, Wade-Hampton, Bethel, Dillingham, Aleutians West, and Aleutians East boroughs (Figure 17). These regional corporations include communities located north of 60° N latitude (the Marine Mammal Protection Act definition of “Arctic waters”) located on lands near Coast Survey’s planned project areas.
32
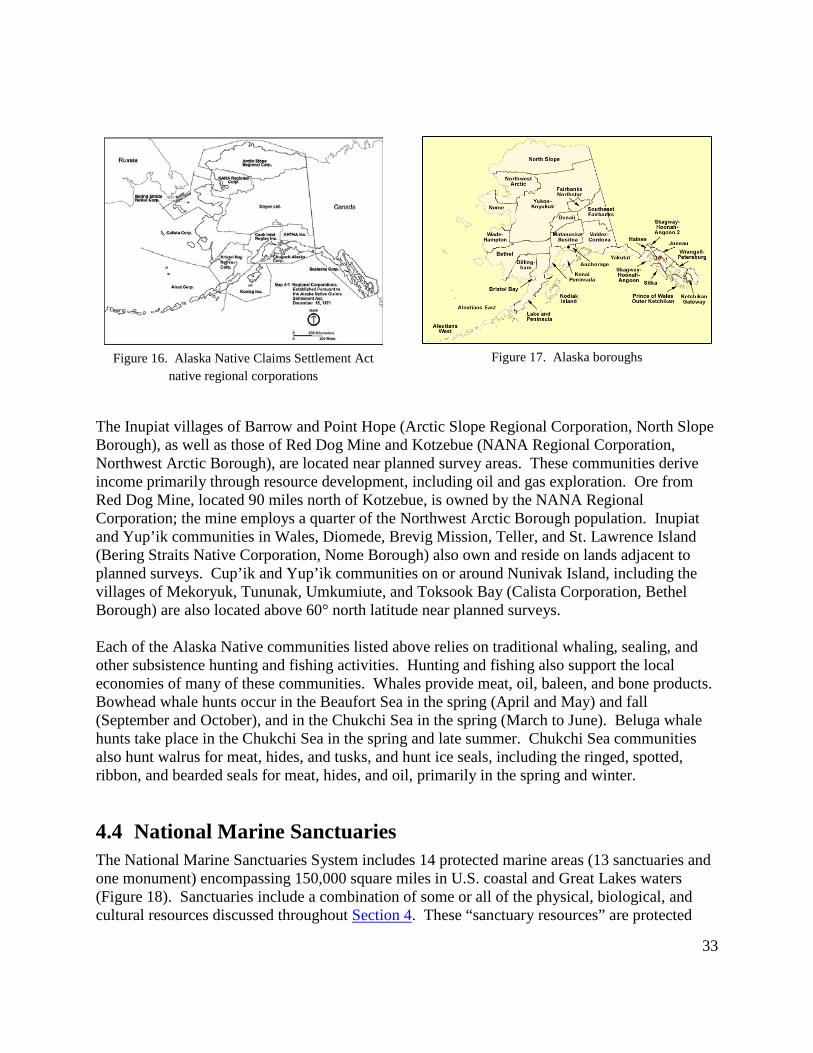
The Inupiat villages of Barrow and Point Hope (Arctic Slope Regional Corporation, North Slope Borough), as well as those of Red Dog Mine and Kotzebue (NANA Regional Corporation, Northwest Arctic Borough), are located near planned survey areas. These communities derive income primarily through resource development, including oil and gas exploration. Ore from Red Dog Mine, located 90 miles north of Kotzebue, is owned by the NANA Regional Corporation; the mine employs a quarter of the Northwest Arctic Borough population. Inupiat and Yup’ik communities in Wales, Diomede, Brevig Mission, Teller, and St. Lawrence Island (Bering Straits Native Corporation, Nome Borough) also own and reside on lands adjacent to planned surveys. Cup’ik and Yup’ik communities on or around Nunivak Island, including the villages of Mekoryuk, Tununak, Umkumiute, and Toksook Bay (Calista Corporation, Bethel Borough) are also located above 60° north latitude near planned surveys. Each of the Alaska Native communities listed above relies on traditional whaling, sealing, and other subsistence hunting and fishing activities. Hunting and fishing also support the local economies of many of these communities. Whales provide meat, oil, baleen, and bone products. Bowhead whale hunts occur in the Beaufort Sea in the spring (April and May) and fall (September and October), and in the Chukchi Sea in the spring (March to June). Beluga whale hunts take place in the Chukchi Sea in the spring and late summer. Chukchi Sea communities also hunt walrus for meat, hides, and tusks, and hunt ice seals, including the ringed, spotted, ribbon, and bearded seals for meat, hides, and oil, primarily in the spring and winter.
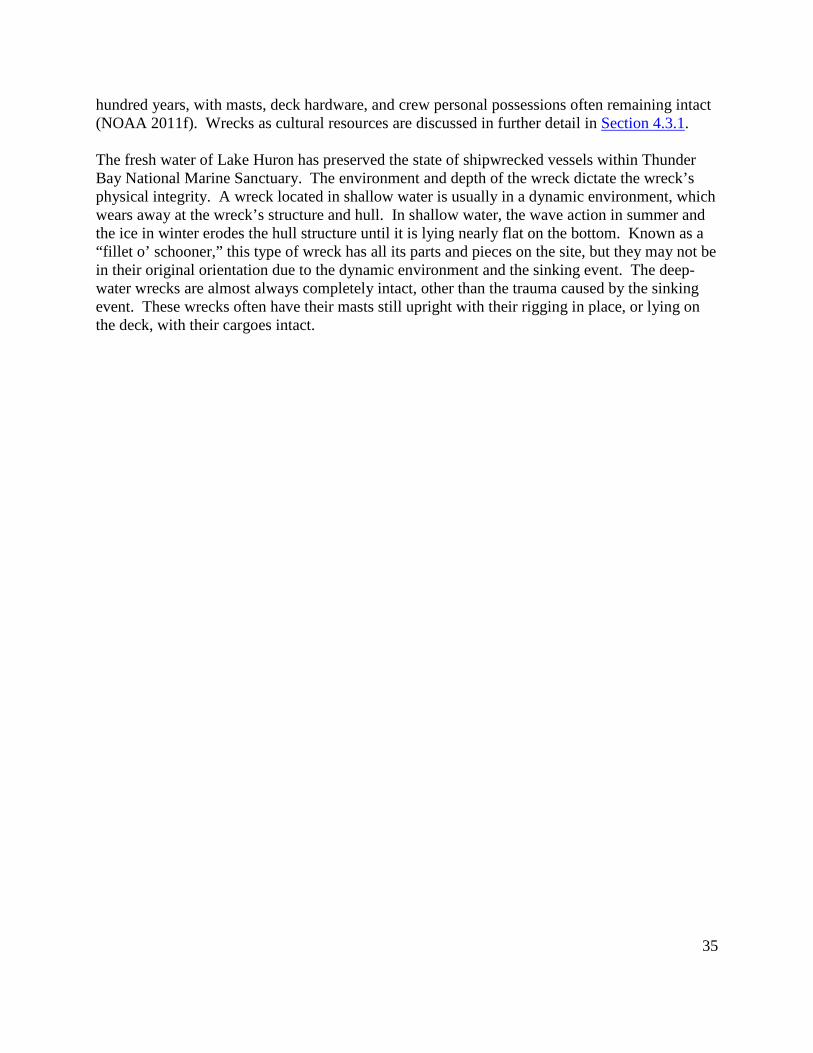
4.4 National Marine Sanctuaries The National Marine Sanctuaries System includes 14 protected marine areas (13 sanctuaries and one monument) encompassing 150,000 square miles in U.S. coastal and Great Lakes waters (Figure 18). Sanctuaries include a combination of some or all of the physical, biological, and cultural resources discussed throughout Section 4. These “sanctuary resources” are protected
Figure 16. Alaska Native Claims Settlement Act native regional corporations
Figure 17. Alaska boroughs
33
under the National Marine Sanctuaries Act. Sanctuaries serve as natural classrooms and laboratories for researchers and the public, and often support recreational sports and commercial industries such as tourism and fishing (NOAA 2011c).
OCS could potentially conduct a survey within any sanctuary. Bathymetric data can be used to characterize the sanctuary seafloor habitat and to map valuable sanctuary resources. Over the next few years, Coast Survey plans to conduct two survey projects in the Florida Keys National Marine Sanctuary, including one airborne lidar project and one NOAA ship-based hydrographic survey project. Additionally, one of Coast Survey’s navigation response teams would conduct a hydrographic survey project in Thunder Bay National Marine Sanctuary.
4.4.1 Florida Keys National Marine Sanctuary The Florida Keys sanctuary encompasses a 2,900 square nautical mile marine ecosystem that includes over 6,000 species of animals and plants, including a large coral reef system, seagrass community, and mangroves that provide food and habitat for fish, invertebrates, algae, sponges, and oysters (NOAA 2007). Coast Survey would conduct both sanctuary surveys in the western portion of the Florida Keys, which includes foraging habitat for endangered sea turtles and critical habitat for endangered coral species. The NOAA Ship Thomas Jefferson would survey east of Tortugas Bank and west of the Marquesas Keys, with a small portion of the project area located within the Key West National Wildlife Refuge southeast of the Marquesas Keys. The airborne lidar survey would occur just east of Tortugas Bank (west of the ship survey) in the westernmost portion of the sanctuary.
4.4.2 Thunder Bay National Marine Sanctuary Thunder Bay’s sanctuary encompasses 448 square miles of water in northwestern Lake Huron off the Michigan coast and includes more than 50 historic shipwrecks. This maritime cultural landscape also includes the lifesaving stations, lighthouses, historic boats, commercial fishing camps, docks, and ports, providing a record and microcosm of maritime commerce on the Great Lakes. The cold, fresh waters of the sanctuary have preserved many shipwrecks for over a
Figure 18. National Marine Sanctuary System
34
hundred years, with masts, deck hardware, and crew personal possessions often remaining intact (NOAA 2011f). Wrecks as cultural resources are discussed in further detail in Section 4.3.1. The fresh water of Lake Huron has preserved the state of shipwrecked vessels within Thunder Bay National Marine Sanctuary. The environment and depth of the wreck dictate the wreck’s physical integrity. A wreck located in shallow water is usually in a dynamic environment, which wears away at the wreck’s structure and hull. In shallow water, the wave action in summer and the ice in winter erodes the hull structure until it is lying nearly flat on the bottom. Known as a “fillet o’ schooner,” this type of wreck has all its parts and pieces on the site, but they may not be in their original orientation due to the dynamic environment and the sinking event. The deep-water wrecks are almost always completely intact, other than the trauma caused by the sinking event. These wrecks often have their masts still upright with their rigging in place, or lying on the deck, with their cargoes intact.
35
5. ENVIRONMENTAL CONSEQUENCES This section addresses the environmental consequences of each action from the preferred alternative (proposed action) and the No Action Alternative. The table in Appendix I ranks each activity’s relative impact (including the impact of the No Action Alternative) on the physical, biological and cultural environment. Effects may include direct, indirect, and cumulative impacts. Direct impacts are caused by the activity that occur at the same time and place as the activity. Indirect impacts are caused or induced by the activity that occur later in time, or are removed in distance from the location activity. Cumulative impacts are those that result from the incremental effect of the activity, added to other past, present, or reasonably foreseeable future actions. Direct and indirect impacts are discussed for each proposed activity under the preferred alternative in Section 5.1. Direct and indirect impacts are discussed for the No Action Alternative in Section 5.2. Cumulative impacts are discussed for all activities in Section 5.3.
5.1 Proposed Action (Preferred Alternative) This section addresses the direct and indirect impacts of the proposed action on the environment. Examples of direct impacts from the proposed action are survey vessels striking marine mammals or sea turtles, sound from active echosounders harassing marine mammals, or noise from tide gauge installation operations harassing seabirds, nesting sea turtles, or pinnipeds. The sub-sections (activities) within Section 5.1 correspond to the sub-sections within Section 3.1. Mitigation measures incorporated into the preferred alternative are included within the discussion of impacts by activity.
5.1.1 Hydrographic Surveys
5.1.1.1 Risk of Vessel Strikes to Marine Mammals and Sea Turtles Large whales, including many of the endangered baleen whales, as well as pinnipeds, sea otters, manatees, and sea turtles, are at a general risk for injury from a vessel strike. In the case of the North Atlantic right whale, for example, ship strikes are the greatest threat to the species’ recovery, accounting for 11 deaths or serious injuries over the five years from 2003 to 2007. (Total population estimates for the North Atlantic right whale are currently 300-400 animals.) (Glass et al. 2009). Of 323 recorded historical ship strikes in the International Whaling Commission database, 142 (44%) resulted in death of the cetacean. Injuries from collisions (which may or may not result in death) include broken bones, hemorrhaging, and propeller cuts (Silber, Slutsky and Bettridge 2010). Polar bears are unlikely to be located in Coast Survey project areas since they are in areas of sea ice (Perrin, Würsig and Thewissen 2009). Sea otters are at higher risk for a vessel strike, given their likelier presence in Coast Survey project areas and the difficulty of spotting them in high sea state conditions (USFWS 2011b). Manatees migrating to and from warm water refuges in
36
Florida and Georgia are vulnerable to vessel strikes, although the small boats used for surveys in manatee habitat operate at very slow speeds (4-6 knots). While vessel strikes pose a direct threat to marine mammals and sea turtles, Coast Survey does not anticipate a vessel strike during survey operations. (NOTE: Impacts of transiting activities are discussed later in this document, beginning at Section 5.1.3.) Excessive speed is an important factor in determining the severity of injury during a vessel strike. Survey vessels typically operate at 4-8 knots during a survey, although larger ships can operate at up to 10 knots and still collect high-quality data during deeper water surveys. North Atlantic right whale ship strike rules require an operating speed of 10 knots or less in known right whale areas. Coast Survey would follow this protocol during its surveys. Mitigation Measures: Survey vessels operate at slow speeds (4-8 knots) by necessity to achieve high-resolution data during survey operations. The potential for a ship strike is mitigated further by the presence of lookout observers who alert the vessel operator if a marine mammal or sea turtle appears in the path of the vessel during the survey. OCS requires that a designated lookout stand watch on the ship’s bridge during transit and survey operations, scanning the water for humans, animals, vessels, and other objects. Personnel on board NOAA and contractor vessels are required to monitor and report locations of marine mammal sightings as part of their regular operational protocol. Currently, the lookout records any sightings of marine mammals on either a paper marine mammal log or by an automated marine mammal report logging system such as AMVER/SEAS, which many NOAA ships also use for weather reporting. NOAA Fisheries’ Office of Science and Technology is developing a smartphone application for filing reports. Regardless of format or mode of delivery, the observation report records the species, number of animals, behavior, time, and location of the sighting. Appendix J includes an example of a marine mammal and sea turtle observation log. On smaller vessels, the coxswain is required to perform lookout duties in addition to steering the boat. The launches do not have logs but the launch personnel call in any unique sightings to the ship. In congested areas, the coxswain is required to asks that an additional person stand on the bow to scan the water for dangerous objects. Lookouts are trained to call out any obstructions they see, including boats, kelp, logs, or marine mammals, and call them out as soon as possible to avoid a collision. Each year, NOAA ships are required to include 24 hours of “safety stand down” training activities for on-board personnel. NOAA is incorporating basic strategies for marine mammal detection and monitoring into standard ocean observatory roles for personnel. The Office of Science and Technology is working with other NOAA Fisheries offices and universities to establish a uniform submission site for recorded observations of marine mammals and sea turtles. They also want to develop a marine mammal and sea turtle identification book to aid personnel scanning the water for animals. Contractor vessels would also be required to incorporate these basic strategies for marine mammal detection and monitoring as they are developed. As a general precaution, vessel operators follow entry restrictions to protected areas for marine mammals, which are depicted on NOAA’s nautical charts and described in detail in the U.S.
37
Coast Pilot, both used for navigation during surveys. Important updates to restricted areas are broadcast through the U.S. Coast Guard “Local Notice to Mariners” and, in more urgent cases, are released through broadcast on VHF channel 16 or 22. Coast Survey applies Local Notice to Mariners updates to all charting products. Vessels are required to follow the U.S. Fish and Wildlife “Skiff Operation Guidance” for avoiding sea otter strike (USFWS 2011b) and the “Polar Bear Interaction Guidelines” for avoiding polar bear strikes (USFWS 2011a). The survey crews also comply with all federal and state speed restrictions while operating in and while transiting through manatee areas, particularly in critical habitat areas. Typical nearshore survey speed (4-6 knots) is below the speed restriction in manatee areas. Additionally, the survey crews follow all local, state, and federal regulations and tie up closely to the dock when in port to avoid crushing manatees between the vessel and the pier.
5.1.1.2 Risk of Vessel Strike to Molting Seabirds Steller’s eiders, an ESA-listed seabird species, typically go through their molting season anytime from mid-August to mid-October in Southwest Alaska nearshore waters. During this time, the eiders are flightless and must preserve their energy for their wintering period. If disturbed by the presence of a survey vessel, these birds are likely to swim out of the way, exhibiting avoidance behavior, and so would not be struck. However, the effort of swimming out of the way while unable to fly may consume too much energy for the birds to survive the Alaskan winter. Mitigation Measures: Small vessels (which are used in the nearshore areas of a survey) operate 8-12 hours per day. Often these nearshore areas may only take one or two days to survey. In most cases, survey technicians and boat operators can survey the areas further offshore while performing daily observations and waiting for the seabirds to leave the area. Coast Survey would work toward incorporating seabird molting seasons into its survey planning over the next few years. Survey environmental windows can coincide with molting seasons of any protected seabird, particularly in Alaska but, in most cases, it is practicable to work with the U.S. Fish and Wildlife Service to determine the best times to survey in sensitive areas. Coast Survey would obtain information on the locations of molting areas in order to implement this coordination into its planning.
5.1.1.3 Impacts from Underwater Echosounder Noise on Marine Mammals Injury from echosounder-generated noise is difficult to measure empirically. While the immediate and cumulative effects of sound from high frequency echosounders on marine mammals are uncertain, high frequency underwater noise could lead to avoidance behavior in those species whose hearing range overlaps the frequency range of the sound source (Wartzok and Ketten 1999). To acquire bathymetric data, Coast Survey uses side scan sonar and multibeam echosounders ranging from 50 – 500 kHz, and single beam echosounders ranging from 12 – 100 kHz. Mysticetes, otariids and manatees cannot typically hear in the 50 – 500 kHz
38
frequency range underwater, and are not at risk for acoustic harassment from side scan sonar and multibeam echosounders. Single beam echosounders can operate as low as 12 kHz, but due to their narrow, downward-facing orientation, these echosounders do not exhibit spherical spreading (see further discussion below). Walruses can hear in frequencies up to 50 kHz, and many odontocetes and phocids can hear in frequencies greater than 50 kHz, putting these marine mammal groups at risk for exhibiting avoidance behavior in the presence of high frequency sound from Coast Survey operational side scan sonar and multibeam echosounders (Richardson et al. 1995, Southall et al. 2007). Coast Survey’s multibeam and side scan sonar systems have a high peak source level (~215-235 dB) at the moment the sound wave is generated in the water from the echosounder. The sound intensity level decreases rapidly, however, as the energy per unit area is reduced (“transmission loss”) through spreading loss and absorbed as sound is converted to heat through attenuation (Urick 1983, Au and Hastings 2008). The sound from higher frequency echosounders used by Coast Survey for typical coastal surveys attenuates much more quickly than the lower frequency sound used in deep water or seismic surveys, such as those surveys often associated with naval operations, and decreases in intensity as it moves away from the sound source. To overcome the effects of absorption, shallow water bathymetric echosounders use a high output power in order to visualize a clear return and accurately measure water depths with high precision. Sound from echosounders used during regular hydrographic survey operations could lead to behavioral changes in marine mammals that might affect migration, feeding, breeding, and the ability to avoid predators (Au and Hastings 2008). One method for estimating the potential effects of high frequency underwater sound on marine mammals is to assess the minimum distance the animal needs to be from the sound source in order to avoid a change in behavior. The method described below is based on the Southall, et al. (2007) and Richardson, et al. (1995) method of calculating threshold radii of echosounders (Weber 2008). The sound pressure level (SPL) at a distance R from an echosounder received by an animal in the water is dependent upon the peak source pressure level at the sound source (SLpeak) and transmission loss due to spherical spreading (20log10R) and absorption loss (αR), where α is the absorption coefficient for the echosounder at a given frequency (Richardson et al. 1995). At a distance R from the echosounder, the SPL experienced by the animal would be:
SPL = SLpeak – 20log10R - αR
where
α = 0.036(freq 1.5)
(Richardson et al. 1995, Southall et al. 2007)
The equation above demonstrates how sound from a higher frequency echosounder experiences a much more rapid absorption loss than a low frequency echosounder with the same peak source pressure level. The MATLAB script in Appendix K solves for R at the 190, 180, and 160 dB received SPL with user inputs of frequency and peak sound source pressure level of each
39
echosounder that would be used during Coast Survey in-house and contractor surveys in 2012. The calculated radii (R) for the 190, 180, and 160 dB received SPLs are included in the table of echosounders with specifications and SPLs in Appendix L. Note that these radii are theoretical and based on the assumption of spherical spreading from an acoustic source. In practice, the acoustic energy of hydrographic echosounders and side scan sonars is limited by the downward-facing orientation of the transmit beam (Weber 2008)in water depths shallower than most of the 190, 180, and 160 dB radii, resulting in the majority of the energy lost to interaction with the seabed before reaching the maximum range possible in the water column. This is true particularly for single-beam echosounders, whose narrow along-track and across-track beam widths would be barely noticeable among a background of standard depth sounders found on almost all small and large vessels. Coast Survey estimated take (“Level B harassment” under the Marine Mammal Protection Act) by underwater acoustic harassment of marine mammals based on animal density and the total ensonified area of each survey. This method, although simplistic, produces conservative estimates based on the assumption of spherical spreading and assumes the entire seafloor within each survey area to be ensonified twice (“200 percent coverage”) during each survey. Acoustic take estimations were grouped by major geographic region as required under the Marine Mammal Protection Act and included the following regions: Alaska (Beaufort/Chukchi Seas, Bering Sea, and Gulf of Alaska estimated separately), Pacific Coast, Atlantic Coast, and Gulf of Mexico. Coast Survey did not calculate take estimates for marine mammals in the Pacific Islands and Caribbean geographic regions, since no hydrographic survey projects are planned for those areas in the next several years. Animal densities were derived from several different sources, which are listed for each species in Appendix M. In cases where a source provided densities for more than one season, Coast Survey chose the season with the highest density. When Coast Survey could not locate species-specific animal densities, a proxy or surrogate species’ density was used to derive a population-adjusted density. The method for estimating take included the following steps:
1. Total planned survey area (in square nautical miles) per year for all projects in each major geographic region was estimated based on the average percentage of surveys occurring in that region (completed and planned projects) 2010-13.
2. For each region, this value was multiplied by two (each area is assumed to be ensonified at least twice during a survey to meet Coast Survey’s “full bottom coverage” standards for hydrographic surveys).
3. For each region, take estimates were calculated by multiplying this value by the animal density for each non-deep water marine mammal species.
The table in Appendix M summarizes Level B take estimations for affected marine mammal species in each major geographic region calculated from the steps listed above. Estimates were made for one year based on the assumption that Coast Survey would survey approximately 3,000
40
square nautical miles per year based on a typical appropriations year. Of that number, approximately 1,700 square nautical miles would be surveyed in Alaska waters (300 in Beaufort/Chukchi Seas, 400 in Bering Sea, and 1,000 in the Gulf of Alaska), 100 in Pacific coastal waters, 800 in Atlantic coastal waters, and 400 in Gulf of Mexico waters. For example, killer whales in Alaska have a mean density of 0.034299 animals per square nautical mile (Zerbini et al. 2007). Each year, Coast Survey would survey approximately 300 square nautical miles in the Beaufort and Chukchi Seas. The annual take estimate for killer whales in the Beaufort and Chukchi Seas (21 animals/year) was calculated using the steps outlined above:
Beaufort/Chukchi annual survey area = 300 square nautical miles/year
300 square nautical miles/year x 2 = 600 square nautical miles/year ensonified
600 square nautical miles/year x 0.034299 killer whales/square nautical mile = 21 killer whales/year
In some cases there were no density values for a particular species and Coast Survey used proxy or surrogate values that were then adjusted for population values, when known. For example, when estimating bowhead whale densities in the Beaufort and Chukchi Seas, Coast Survey used density values for killer whales based on the predator/prey relationship between bowheads and killer whales. The mean killer whale density of 0.034299 animals per square nautical mile was multiplied by the ratio between the latest bowhead population estimate (10,545) and killer whale population estimate (3,213) for an estimated bowhead whale density of 0.112569 animals per square nautical mile. The annual take estimate (68 animals/year) for bowhead whales in the Beaufort and Chukchi Seas would be calculated using the derived density value as follows:
Beaufort/Chukchi annual survey area = 300 square nautical miles/year
300 square nautical miles/year x 2 = 600 square nautical miles/year ensonified
600 square nautical miles/year x 0.112569 bowhead whales/square nautical mile = 68 bowheads/year
Based on the results of its evaluation, Coast Survey has concluded that underwater sound associated with hydrographic survey operations may lead to temporary avoidance behavior (acoustic harassment), but is unlikely to injure marine mammals in the long term. These mammals include the toothed whales, true seals, and walruses that can hear within the lower end of the frequency range of Coast Survey echosounders.
5.1.1.4 Impacts of Vessel Noise on Pinnipeds Vessel noise (in air) has the potential to result in the disturbance of pinnipeds on land or foraging in the water during nearshore operations. Some projects occur in or near rookeries or haulouts during mating or pupping seasons. In 2011, for example, one survey project in the Krenitzin Islands occurred near a Steller sea lion rookery on Akun Island, Alaska. Vessel noise could scare male pinnipeds into the water, crushing newborn pups. There is no scientific evidence
41
supporting a disturbance of nesting or breeding sea turtles and seabirds in the presence of a ship surveying in nearshore waters. Mitigation Measures: NOAA and contractor small vessels (used in the nearshore areas of a survey) operate 8-12 hours per day. Depending on the size of the colony and how close one would need to be to disturb the pinnipeds, these nearshore areas may only take one or two days to survey. Survey technicians and boat operators can survey areas further offshore while performing daily observations and waiting for the animals to leave the rookery, haulout, or foraging area before moving closer to shore to complete nearshore survey work. Coast Survey would incorporate mating and pupping seasons, particularly those of depleted pinniped species such as the Steller sea lion, into its survey planning over the next few years. Survey environmental windows often coincide with pinniped pupping or mating seasons, particularly in Alaska but, in most cases, it is practicable to work with the Fisheries Service to determine the best times to survey in sensitive areas. Coast Survey would obtain information on the locations of rookeries, haulouts and molting areas to implement this coordination into its planning.
5.1.1.5 Impacts of Hydrographic Surveys on Essential Fish Habitat Performing hydrographic surveys would not reduce the quantity or quality of essential fish habitat. Hydrographic survey equipment does not come into contact with sensitive bottom habitat and the survey devices would have no adverse effect on fish habitat in the water-column. If Coast Survey changed practices described in Section 3.1, such that essential fish habitat could be adversely affected, Coast Survey would contact NOAA’s Office of Habitat Conservation to reevaluate the impacts and potentially initiate consultation as described in the Department of Commerce’s essential fish habitat consultation regulations (50 C.F.R. §§ 600.905 - 930).
5.1.1.6 Impacts of Hydrographic Surveys on Historic Wrecks As a federal agency that manages public resources, NOAA is subject to Section 106 and Section 110 of the National Historic Preservation Act (42 U.S.C. §§ 4321 et seq). NOAA is responsible for the identification and protection of historic, cultural, and archaeological properties within areas that it manages. For Thunder Bay National Marine Sanctuary, the National Marine Sanctuaries Act designates NOAA as the responsible party for identifying and protecting the historic, cultural, and archaeological properties (e.g., historic shipwrecks) within the sanctuary limits. As part of an existing protocol between Coast Survey and the Office of National Marine Sanctuaries, Coast Survey would notify state historic preservation officers and state archaeologists, as well as other managers of federally protected areas (e.g., sanctuary supervisors) of its intent to conduct a hydrographic survey. Coast Survey would provide these managers, including the state historic preservation officer, a description of the project, including any tide gauges that must be installed on shore, and a graphic of the survey area. These managers have 30 days to comment about known historic properties or to request an additional survey. Upon completion of a hydrographic survey, Coast Survey would notify the appropriate
42
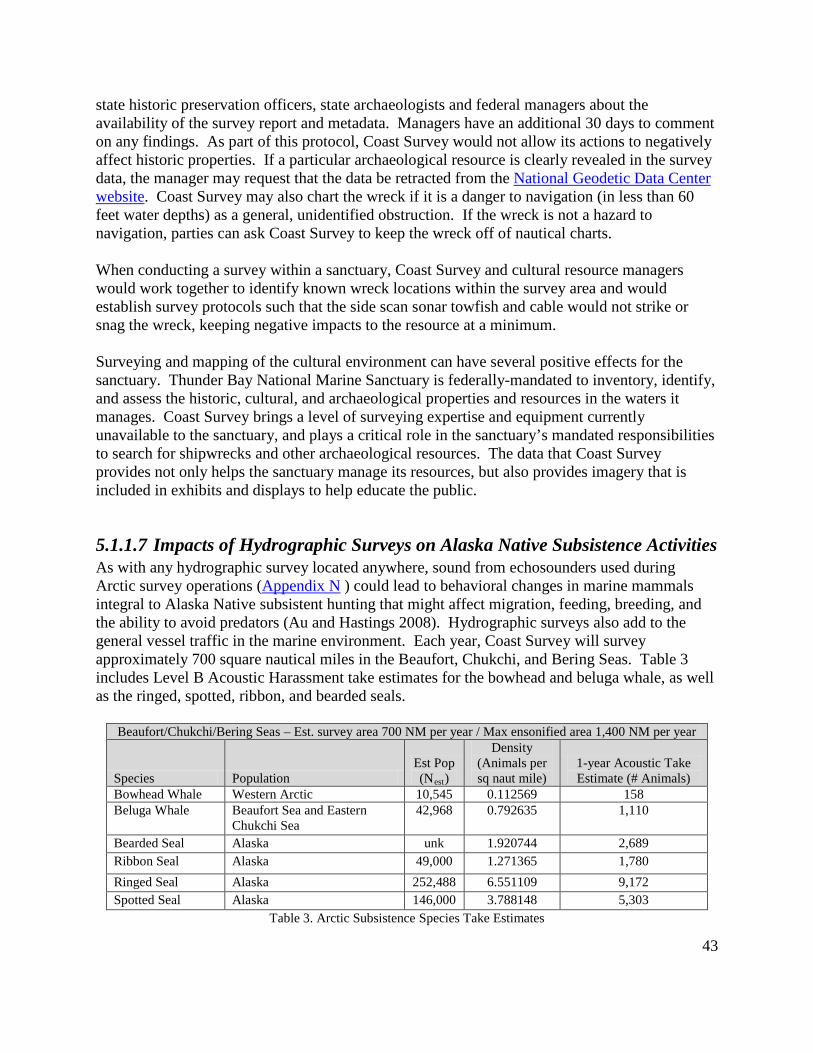
state historic preservation officers, state archaeologists and federal managers about the availability of the survey report and metadata. Managers have an additional 30 days to comment on any findings. As part of this protocol, Coast Survey would not allow its actions to negatively affect historic properties. If a particular archaeological resource is clearly revealed in the survey data, the manager may request that the data be retracted from the National Geodetic Data Center website. Coast Survey may also chart the wreck if it is a danger to navigation (in less than 60 feet water depths) as a general, unidentified obstruction. If the wreck is not a hazard to navigation, parties can ask Coast Survey to keep the wreck off of nautical charts. When conducting a survey within a sanctuary, Coast Survey and cultural resource managers would work together to identify known wreck locations within the survey area and would establish survey protocols such that the side scan sonar towfish and cable would not strike or snag the wreck, keeping negative impacts to the resource at a minimum. Surveying and mapping of the cultural environment can have several positive effects for the sanctuary. Thunder Bay National Marine Sanctuary is federally-mandated to inventory, identify, and assess the historic, cultural, and archaeological properties and resources in the waters it manages. Coast Survey brings a level of surveying expertise and equipment currently unavailable to the sanctuary, and plays a critical role in the sanctuary’s mandated responsibilities to search for shipwrecks and other archaeological resources. The data that Coast Survey provides not only helps the sanctuary manage its resources, but also provides imagery that is included in exhibits and displays to help educate the public.
5.1.1.7 Impacts of Hydrographic Surveys on Alaska Native Subsistence Activities As with any hydrographic survey located anywhere, sound from echosounders used during Arctic survey operations (Appendix N ) could lead to behavioral changes in marine mammals integral to Alaska Native subsistent hunting that might affect migration, feeding, breeding, and the ability to avoid predators (Au and Hastings 2008). Hydrographic surveys also add to the general vessel traffic in the marine environment. Each year, Coast Survey will survey approximately 700 square nautical miles in the Beaufort, Chukchi, and Bering Seas. Table 3 includes Level B Acoustic Harassment take estimates for the bowhead and beluga whale, as well as the ringed, spotted, ribbon, and bearded seals.
Beaufort/Chukchi/Bering Seas – Est. survey area 700 NM per year / Max ensonified area 1,400 NM per year
Species Population Est Pop (Nest)
Density (Animals per sq naut mile)
1-year Acoustic Take Estimate (# Animals)
Bowhead Whale Western Arctic 10,545 0.112569 158 Beluga Whale Beaufort Sea and Eastern
Chukchi Sea 42,968 0.792635 1,110
Bearded Seal Alaska unk 1.920744 2,689 Ribbon Seal Alaska 49,000 1.271365 1,780 Ringed Seal Alaska 252,488 6.551109 9,172 Spotted Seal Alaska 146,000 3.788148 5,303
Table 3. Arctic Subsistence Species Take Estimates
43
Avoidance behavior among Arctic subsistence marine mammal species is the most common behavioral change to be expected, particularly as survey ships approach, with beluga whales in particular traveling several kilometers away from the ship’s track (Richardson et al. 1995). Bowhead whales will typically try to outswim the vessel, but will swim away from the ship as it moves closer (Richardson et al. 1995). Beluga and bowhead whales will usually return to the site following displacement after one or two days if the ship has moved to a different area (Richardson et al. 1995). Arctic seals are typically associated with the sea ice and are therefore unlikely to be located near survey ships, which must avoid the ice; however, if seals are swimming far away from the ice, they will most likely exhibit shorter term avoidance behavior in the presence of a ship (Richardson et al. 1995). Coast Survey will make every possible effort to avoid areas where these animals are known to be concentrated or if they are observed during operations in order to minimize disturbances, and does not expect to observe a reduction in species numbers a result of its operations. The above take estimates are very conservative, with a “take” defined as any exposure to an operational single beam or multibeam echosounder. In reality, the animals are not likely to remain within the ensonified area during operations and injury would be minimal or negligible; however, for the purpose of this analysis, avoidance behavior is considered a Level B acoustic harassment “take.” Throughout the year, the Anchorage-based Alaska navigation manager, who undertakes Coast Survey customer service and outreach in the region, works with local Alaska Native communities and Alaska Native Claims Settlement Act Native Corporations to discuss planned surveys. The navigation manager works with his or her shipping contacts around the state to contact the appropriate local shipping, political, and Alaska Native representatives in each coastal village. Typically, Native leadership (political and Native governmental) is interested in where Coast Survey is surveying, which activities would take place during the survey, and how the survey could affect their communities. These meetings also provide Coast Survey with valuable insights into local knowledge. They inform Coast Survey about particular areas where surveys would disturb subsistence fishing or hunting activities, and give Coast Survey notice on areas to avoid surveying. In the summer of 2011, the Director of Coast Survey, Marine Chart Division Chief, and Alaska navigation manager met with local and regional Alaska Native leadership in Kotzebue, AK and participated in a radio interview on Radio KOTZ (AM 720) to discuss survey plans and navigation products in the approaches to Kotzebue Sound. Further, the NOAA Ship Fairweather engaged in public outreach during the 2011 survey operations in Kotzebue Sound. Scientific support stations were located on shore and many local residents were very interested and supportive of these activities. The Fairweather engaged in a similar type of outreach when conducting the Bering Strait Survey in 2010. Select local village residents of Little Diomede were hosted aboard the Fairweather for a tour of survey operations. The village also hosted the crew of the Fairweather for an evening of traditional song, dance, and food. The village residents were very engaged in the survey activities and provided guide services for installation of support stations atop Little Diomede Island. The lessons learned from these two surveys have
44

provided invaluable outreach lessons that continue to be implemented in planning for future surveys. In 2012, the Alaska navigation manager attended the Arctic Open Water Meeting (March 6-8, 2012) in Anchorage in order to develop and strengthen relationships with Alaska Native advocacy groups throughout the state. He also met with members of the Kawerak community in Nome (April 26, 2012) and Inupiat communities as part of the North Slope Borough Assembly Meeting (August 7, 2012) to discuss planned surveys in those areas. The aforementioned meetings in the Alaskan villages were broadcast on local AM radio stations throughout the region. Mitigation Measures: Coast Survey’s principal mitigation measure is avoidance of areas used by Alaska Native communities for the bowhead whale, beluga whale, and Arctic seal hunts during each hunting season. The Coast Survey Alaska navigation manager will continue to work with communities to avoid surveying in known subsistence hunting areas at the times of year when the hunt will occur. Coast Survey will make every attempt possible to avoid interfering with bowhead and beluga whale, and Arctic seal subsistence activities. The Coast Survey Alaska navigation manager will continue to work with local Alaska Native communities to avoid surveying in known subsistence hunting areas at the times of year when the hunt will occur. Coast Survey would make every attempt possible to avoid interfering with bowhead and beluga whale, Arctic seal, walrus, and polar bear subsistence activities. Coast Survey developed a Plan of Cooperation, as required under the Marine Mammal Protection Act, as an evolving, working document that outlines plans for and results of meetings with Alaska Native communities.
5.1.2 Lidar Surveys
5.1.2.1 Impacts of Aircraft Noise on Marine Animals Lidar operations, as well as the aircraft transit between its home base and the airport nearest the survey site, would introduce noise into the environment. While any small propeller-driven aircraft could be used, the “straight and level” noise level from NOAA’s contractor aircraft would be approximately 81 – 97 dB (Federal Aviation Administration 2010). Effects from bathymetric lidar survey operations, including noise or collision, are similar to those of ordinary commercial and personal aircraft flights. In discussions with the National Marine Fisheries Service and the U.S. Fish and Wildlife Service, Coast Survey has reviewed the potential effects of aircraft noise on marine mammals and fish, as well as sea turtles and seabirds during nesting. While operations would temporarily add to the general noise in the air, aircraft noise from lidar operations would not have a long-term adverse impact on the environment based on the short duration (five hour sorties), low intensity (aircraft flies 1,000 – 1,200 feet above the land and sea surface), and limited survey locations (less than one lidar survey per year). Mitigation Measures: To mitigate the effects of aircraft noise on marine mammals and nesting sea turtles, aircraft operators would follow Federal Aviation Administration and state or
45
territorial regulations and limitations on aircraft operations in sensitive areas, including minimum altitude requirements. Federal Aviation Administration Advisory Circular 91-36D, Visual Flight Rules Flight Near Noise-Sensitive Areas states:
Excessive aircraft noise can result in annoyance, inconvenience, or interference with the uses and enjoyment of property, and can adversely affect wildlife. It is particularly undesirable in areas where it interferes with normal activities associated with the area’s use, including residential, educational, health, and religious structures and sites, and parks, recreational areas (including areas with wilderness characteristics), wildlife refuges, and cultural and historical sites where a quiet setting is a generally recognized feature or attribute (Federal Aviation Administration 2004).
The Federal Aviation Administration encourages pilots making flights near noise-sensitive areas to fly at altitudes higher than the minimum permitted by regulation, and on flight paths that reduce aircraft noise in such areas.
5.1.2.2 Impacts of Laser on Eye Safety Bathymetric lidar systems typically use a “Class 4” laser, which includes pulsed lasers with beamwidths greater than 700 nanometers and power greater than 30 megawatts. Manufacturers are required to design laser systems that conform to federally mandated regulations, including the Occupational Safety and Health Administration guidelines, concerning eye safety for lasers operated over populated areas. Manufacturers assure compliance to eye safety standards by: 1) setting power output limits; 2) establishing a minimum safe operating altitude above the sea surface and/or terrain; and 3) reducing the laser’s intensity by spreading the beam at the point where it intersects the water column. Mitigation Measures: Aircraft operators would maintain survey speeds between 120 to 140 knots, which limits the instantaneous contact time of the laser with marine life. After the beam penetrates the water column, it is spread further by sea state refraction and turbidity-related absorption.
5.1.2.3 Impacts of Lidar on Essential Fish Habitat Use of airborne lidar and increased aircraft activity would have no adverse effect on essential fish habitat, as these actions would not reduce the quantity or quality of the habitat. If Coast Survey changed practices described in Section 3.1 such that essential fish habitat could be adversely affected, Coast Survey would contact the Office of Habitat Conservation to reevaluate the impacts to essential fish habitat and potentially initiate consultation as described in the Department of Commerce’s essential fish habitat consultation regulations (50 C.F.R. §§ 600.905 - 930).
46
5.1.3 Vessel Transit Operations Environmental consequences of transit operations to, from, and between survey sites are similar to the risks involved in operating vessels during the survey operation itself, although without the added impact of echosounders used only during survey operations.
5.1.3.1 Risk of Vessel Strikes to Marine Mammals and Sea Turtles The risk of vessel strike to marine mammals and sea turtles during transits is similar to the risk of vessel strike during survey operations, as described in Section 5.1.1.1. While vessel strikes pose a direct threat to marine mammals and sea turtles, Coast Survey does not anticipate a vessel strike during transit operations on contractor ships, navigation response team small boats, or the Bay Hydro II (NOAA ships operate under the direction and control of NOAA’s Office of Marine and Aviation Operations during transits). Large vessels that would cause the greatest injury to the animal operate at slow (less than 10 knots) transit speeds. North Atlantic right whale ship strike rules require an operating speed of 10 knots or less in known right whale areas. Coast Survey would follow this protocol during transit operations. During transits, ships may travel at higher speeds than 10 knots, but lookouts are required by OCS; these lookouts would alert the captain when right whales or other large whales are observed in the ship’s path, and would slow to a safe speed of 10 knots, remaining at least 500 yards away from observed whales. Mitigation Measures: Monitoring requirements for transits (contractor, navigation response team, and Bay Hydro II) are the same as those associated with survey operations as described in Section 5.1.1.1.
5.1.3.2 Impacts of Transit Operations on Essential Fish Habitat Transit operations would have no adverse effect on essential fish habitat, as these actions would not reduce the quantity or quality of the habitat. If Coast Survey changed practices described in Section 3.1 such that essential fish habitat could be adversely affected, Coast Survey would contact the Office of Habitat Conservation to reevaluate the impacts to essential fish habitat and potentially initiate consultation as described in the Department of Commerce’s essential fish habitat consultation regulations (50 C.F.R. §§ 600.905 - 930).
5.1.4 Anchoring Anchoring during survey operations as described in Section 3.1.4 would not adversely affect essential fish habitat, individually or cumulatively. Preferred bottom types for anchoring are sticky mud or sand, which would not be permanently harmed. Ships are required to avoid coral reefs, seagrass beds, and other sensitive areas during anchoring. Due to the small footprint of anchoring activities and the vessel operator’s preference for anchoring away from submerged aquatic vegetation and hard bottoms, anchoring would not likely alter the water column habitat for managed fish species or otherwise adversely affect the quality or quantity of essential fish habitat. If Coast Survey changed practices described in Section 3.1.4 such that essential fish
47
habitat could be adversely affected, Coast Survey would contact the Office of Habitat Conservation to reevaluate the impacts and potentially initiate consultation as described in the Department of Commerce’s essential fish habitat consultation regulations (50 C.F.R. §§ 600.905 - 930). Mitigation Measures: No additional mitigation measures would be undertaken during anchoring beyond those that are already incorporated into the action. Anchoring in preferred bottom types, such as sticky mud or sand, will not permanently harm the seafloor.
5.1.5 Bottom Sample Collection Bottom sample collection during survey operations as described in Section 3.1.5 would not reduce the quantity or quality of essential fish habitat. Bottom sample collections have a small, one square meter footprint and are taken approximately 2,400 to 4,800 meters apart. In addition, samples are not collected in the same area year after year. Individually or cumulatively, these samples would not adversely affect the quality or quantity of essential fish habitat, due to the small footprint and low intensity of the activity. If Coast Survey changed practices described in Section 3.1.5 such that essential fish habitat could be adversely affected, Coast Survey would contact the Office of Habitat Conservation to reevaluate the impacts and potentially initiate consultation as described in Department of Commerce’s essential fish habitat consultation regulations (50 C.F.R. §§ 600.905 - 930).
5.1.6 Sound Speed Data Collection Sound speed data collection using a sound speed profiler, a conductivity, temperature, and depth instrument, or a moving vessel profiler would not reduce the quality or quantity of essential fish habitat. These small instruments do not drag on the bottom and are lowered periodically. If Coast Survey changed practices described in Section 3.1.5 such that essential fish habitat could be adversely affected, Coast Survey would contact the Office of Habitat Conservation to reevaluate the impacts and potentially initiate consultation as described in Department of Commerce’s essential fish habitat consultation regulations (50 C.F.R. §§ 600.905 - 930).
5.1.7 Tide Gauge Installation, Maintenance, and Removal Ground disturbances such as clearing rock, debris, and brush by hand tools during installation may have a temporary impact on the land environment. Coast Survey does not install permanent water level stations such as those that are part of the National Water Level Operating Network. Temporary stations such as those installed by Coast Survey teams during a hydrographic survey have approximately a 30” x 30” footprint. Each year, Coast Survey would install six to eight temporary stations. Teams would remove all equipment except benchmarks following this type of short-term installation. Access to the site itself can cause a temporary displacement of animals. Noise from drilling during benchmark installation can also disturb nesting seabirds, turtles, or resting pinnipeds. Coast Survey would work closely with the land owner (private, state, federal, or Native American) during the permitting process before the beginning of the
48
field season to reduce these effects. The installation schedule would be coordinated with survey vessel schedules. See Section 6.6 on permitting procedures and land access for the installation of tide gauges. Tide station batteries contain lead acid, which is a hazardous material. A permanent station may have three to four batteries and a short-term station may have one or two batteries to provide power to the equipment. Batteries used to supply power to subordinate tide gauges are fully sealed, maintenance-free, deep-cycle marine batteries. Under normal operational conditions, lead acid would not leak from these batteries. Inspection plans, including a diving accident management plan, are always prepared prior to a visit. Communications would always be maintained between the field party and field office. For short-term survey stations, the field party is in constant communication with the ship to ensure the safety of the crew. Personal safety equipment is always used on highways, bridges, or other dangerous venues, and fire extinguishers are kept on each vehicle or boat. None of the activities associated with the installation or maintenance of tide stations would reduce the quality or quantity of essential fish habitat, which occurs in coastal and estuarine areas. The methods used to install these devices as described in Section 3.1.7 are minimally invasive and would not affect natural processes such as flow, temperature, prey availability or other functions necessary to provide essential fish habitat to federally-managed fish species. Therefore, these activities would not adversely affect essential fish habitat. If Coast Survey changed practices described in Section 3.1.5 such that essential fish habitat could be adversely affected, Coast Survey would contact the Office of Habitat Conservation to reevaluate the impacts and potentially initiate consultation as described in Department of Commerce’s essential fish habitat consultation regulations (50 C.F.R. §§ 600.905 - 930).
5.1.8 Coast Survey Development Lab Activities Ground disturbing effects from GPS stations for ellipsoidally referenced surveys are similar to those associated with the installation of tide gauges described in Section 5.1.7. Effects are minor and include the clearing of rock, debris, and brush by hand tools. As with tide gauges, teams remove all equipment following a short-term installation. Impacts from phase measuring bathymetric sonar surveys are the same as those impacts listed for hydrographic surveys using traditional echosounders with frequencies at or greater than 200 kHz discussed in Section 5.1.1. None of the Coast Survey Development Lab activities would reduce the quality or quantity of essential fish habitat. The methods used to install a GPS station as described in Section 3.1.8.1 are minimally invasive and do not affect natural processes such as flow, temperature, prey availability or other functions necessary to provide essential fish habitat to federally-managed fish species. Therefore, these activities would not adversely affect essential fish habitat. If Coast Survey changed practices described in Section 3.1.8 such that essential fish habitat could be adversely affected, Coast Survey would contact the Office of Habitat Conservation to reevaluate the impacts and potentially initiate consultation as described in Department of Commerce’s essential fish habitat consultation regulations (50 C.F.R. §§ 600.905 - 930).
49
Mitigation Measures: Permits for the installation of tide gauges may stipulate the avoidance of vessel landings or ground personnel activities at known locations of nests or haulouts which can mitigate these impacts. If requested, a GPS station can be camouflaged to blend in with the environment.
5.2 No Action Alternative Under the No Action Alternative, NOAA would no longer acquire hydrographic survey data vital to safe navigation, economic security, and environmental sustainability in U.S. and coastal and Great Lake waters. While some data is acquired from other federal and non-federal entities, the vast majority of survey data in U.S. waters is currently acquired by NOAA or its contractors. Were NOAA to cease these operations, as the data on nautical charting products aged over time and no longer accurately portrayed the real-world conditions in the water, the marine transportation system would face an increased risk of maritime accidents.
As part of its survey program, NOAA also responds to regional requests for emergency surveys following natural and anthropogenic incidents. U.S. commerce relies on rapid response surveys in order to re-open major shipping ports following these events (e.g., oil spills, hurricanes). Under the No Action Alternative, NOAA would no longer be able to provide rapid response survey support following incidents, even when those events are of national significance, resulting in a major disruption of the import and export of goods vital to the U.S. economy. Indirect effects from the No Action Alternative include a loss of mission readiness and personnel proficiency. Hydrography is a highly specialized field and relies upon continuity of education and training. If NOAA’s mapping and charting programs (which includes in-house and contracted personnel and equipment) were to discontinue for a significant time, the pool of highly trained personnel would experience major losses. No other public or private organization in the United States conducts hydrographic surveys at the scale of the Coast Survey program. NOAA relies on the program’s continuity of regular operations for maintaining a well-trained workforce that is prepared to conduct emergency surveys when the need arises. Under the No Action Alternative, NOAA would no longer maintain this highly specialized workforce. Moreover, it is doubtful that such a workforce would be sustained by other entities in the United States.
5.3 Cumulative Impacts Hydrographic surveys and the associated transit operations would add to the general vessel traffic in the marine environment. Survey vessels introduce a new source of vessel noise into the existing baseline of underwater ambient sound, particularly in heavy commercial traffic areas. However, the cumulative impact of this one new source of vessel noise is negligible in the context of thousands of much larger and louder ships that travel in and out of busy harbors. Large ships, such as tankers and container ships, produce low frequency (1 – 500 Hz) sound source levels of 172 - 198 dB re 1 μPa (Richardson et al. 1995). Sound from smaller ships and
50
boats, such as Coast Survey vessels, produces low-medium frequency (1 Hz – 6 kHz) sound source levels of approximately 145 – 170 dB re 1 μPa (Richardson et al. 1995). All vessels in the water, except for the smallest boats, are typically equipped with a single-beam depth finder that is used for navigational safety in conjunction with nautical charts. These depth finders determine the instantaneous depth underneath the vessel in real-time, although they operate in the same manner as a typical survey single beam echosounder. Depth finders usually operate at 50 and 200 kHz (Husick 2009). Coast Survey echosounders would add to the existing levels of high frequency sound in the marine environment, but the baseline level of such sound is low since standard depth finders (as with all single beam echosounders) are downward-facing with a minimal beam range. The principles of spherical spreading discussed in Section 5.1.1.2 do not apply to these types of single-beam echosounders. Climate change effects, particularly in the higher latitudes where melting sea ice and major shifts in temperature bands are predicted, could lead to behavioral changes in marine mammals. Ice seals, beluga and bowhead whales, polar bears, and walruses conduct each major life history function in relation to the position of the sea ice. These animals might shift their migration, breeding, and birthing patterns to adjust to climate change effects (Perrin et al. 2009). If these same animals exhibit avoidance behavior in the presence of survey vessels, the effects could be compounded during survey projects. Energy depletion and disorientation are the direct behavioral effects of vessel avoidance, but could lead to indirect, yet more serious effects such as the inability to reach the sea ice in time for breeding and giving birth, which ultimately could affect the survival of some species (Perrin et al. 2009). However, the vast range of area in which NOAA vessels operate coupled with the low number of vessel hours per project point to low cumulative impacts on species even when the effects of climate change are taken into account. Given the uncertainty and degree of climate change effects, Coast Survey has evaluated the effects of its actions on the environment using conservative range estimates at every stage, including the spatial and temporal habitat range, as well as the functional hearing ranges for marine mammals.
51
6. OTHER ENVIRONMENTAL LAWS AND COMPLIANCE
6.1 Endangered Species Act Endangered Species Act Section 7(a)(2) requires federal agencies to consult with the U.S. Fish and Wildlife Service and the National Marine Fisheries Service before implementing an action that may affect listed species or their critical habitat (16 U.S.C. §§ 1531-1544). In 2011, the Alaska and Southeast Fish and Wildlife Service offices concurred with Coast Survey’s determination that its actions “may effect, but are not likely to adversely affect” listed seabird and U.S. Fish and Wildlife Service-managed marine mammal (polar bear, sea otter, walrus, and manatee) species. Coast Survey concluded its Endangered Species Act Section 7 consultation on April 30, 2013 with Protected Resources’ issuance of a Biological Opinion concluding a “may affect, but not likely to adversely affect” listed species. Coast Survey anticipates an Incidental Take Statement for limited incidental take of the Cook Inlet beluga whale, Southern Resident killer whale, Steller sea lion (Western DPS), and Guadaloupe fur seal on or around October 1, 2013. As part of the Endangered Species Act consultation, Coast Survey worked with biologists from the National Marine Fisheries Service, Office of Protected Resources and the U.S. Fish and Wildlife Service to develop this environmental assessment in order to meet the requirements of the Endangered Species Act for a programmatic consultation. Each of the Services provided a “species list” of all Endangered Species Act listed species that could occur within navigationally significant waters. The species lists are located in Appendix H. Descriptions of each Endangered Species Act listed marine mammal species are located in Appendix E. Descriptions of all other Endangered Species Act listed species are located in Appendix G. Additionally, Coast Survey would incorporate “reasonable and prudent measures” specified by the Services during consultation in order to minimize the impact to any species.
6.2 Marine Mammal Protection Act Under the Marine Mammal Protection Act, all marine mammals are protected. Sections 101(a)(5)(A) and (D) allow the incidental take of marine mammals only under special circumstances, where “take” is defined as “to harass, hunt, capture, or kill, or attempt to harass, hunt, capture, or kill any marine mammal” (16 U.S.C. §§ 1361-1421h). Harassment includes any annoyance which has the potential to injure a marine mammal or stock (Level A) or disrupt its behavioral patterns (Level B). Coast Survey’s main concern is that of Level B harassment during survey activities due to the use of active acoustic sources in the water. Through Section 101(a)(5)(D), Coast Survey anticipates a Letter of Authorization under the Marine Mammal Protection Act for limited incidental take on or around October 1, 2013. This PEA supports the issuance of a Letter of Authorization for five years of activities. Coast Survey worked closely in consultation with National Marine Fisheries Service, Office of
52
Protected Resources and the U.S. Fish and Wildlife Service in conjunction with the preparation of this environmental assessment in order to properly analyze the potential effects of its activities on marine mammals. The assessment includes marine mammal descriptions, population and density estimates, acoustic “take” estimates by geographic region, mitigation measures, and a plan of cooperation with Alaska Native communities for those surveys occurring above 60° North latitude. Any of the 68 marine mammal species located within the U.S. EEZ could potentially be located in the action area; therefore, for the purpose of this PEA and for its Marine Mammal Protection Act consultation, Coast Survey is assumed that it could potentially operate within the habitat of any U.S. marine mammals, although survey operations are usually conducted closer to shore and are unlikely to overlap with the habitat of offshore species. Marine mammals are listed with their estimated populations in Appendix D. Descriptions of each marine mammal likely to occur in hydrographic survey project areas, including distribution and typical habitat, are located in Appendix E. Coast Survey estimated “take” by underwater acoustic harassment of marine mammals likely to occur within the survey areas based the method described in Section 5.1.1.2. The Marine Mammal Protection Act also required the action agency to develop a Plan of Cooperation with Alaska Native communities whose Arctic water (defined by the Act as those waters north of 60° North latitude) subsistence hunting of marine mammals could be affected by project activities. The Coast Survey Plan of Cooperation is discussed in Section 5.1.1.4.
6.3 Magnuson-Stevens Fishery Conservation and Management Act The Magnuson-Stevens Fishery Conservation and Management Act requires that federal agencies consult with the National Marine Fisheries Service on actions that “may adversely affect” essential fish habitat (16 U.S.C. § 1855(b)(2)). Textual descriptions and geographic boundaries of essential fish habitat for multiple life stages of each managed species are codified in fishery management plans prepared by the Fishery Management Council and approved by the Fisheries Service. Currently, essential fish habitat includes a variety of aquatic habitat, including wetlands, coral reefs, seagrasses, and rivers, where fish spawn, breed, feed, or grow to maturity. Adverse effects are defined as any reduction in quantity or quality of essential fish habitat and may include direct or indirect physical, chemical, or biological alterations of the waters or substrate and loss of, or injury to, benthic organisms, prey species and their habitat, and other ecosystem components. In parallel with the preparation of this PEA, Coast Survey initiated and completed an informal consultation with NMFS’ Office of Habitat Conservation under the Magnuson-Stevens Act Coast Survey and collaborated with the Office of Habitat Conservation to assess impacts to essential fish habitat, which are described throughout Section 5.1.
6.4 National Marine Sanctuaries Act Section 304(d) of the National Marine Sanctuaries Act requires the “action agency” to consult with the Office of National Marine Sanctuaries if the action is “likely to destroy, cause the loss of, or injure a sanctuary resource” (16 U.S.C. §§ 1431 et seq.) As the action agency, Coast
53
Survey consulted with Sanctuaries for those projects occurring in national marine sanctuaries. Coast Survey plans to conduct two survey projects in the Florida Keys National Marine Sanctuary 2013-18, including one airborne lidar project and one NOAA ship-based hydrographic survey project. During the ship project, Coast Survey would collect bottom samples for the purpose of updating nautical charting. Due to the sensitive nature of the coral reefs within the Florida Keys, Coast Survey is working with the national permit coordinator and the sanctuary superintendent to avoid damage to coral reefs during the collection of bottom samples. Coast Survey also plans to continue its hydrographic survey project from a navigation response team boat in the Thunder Bay National Marine Sanctuary during this time. Survey data would map historical wrecks in the sanctuary. Coast Survey could survey any of the other sanctuaries, if requested by the sanctuary, to characterize habitat or map cultural resources. If requested to collect mapping data, Coast Survey would work closely with that sanctuary’s superintendent to maximize the quality of data. When required, Coast Survey would submit annual permit applications to the appropriate sanctuary superintendent.
6.5 National Historical Preservation Act The National Historic Preservation Act Section 106 requires federal agencies to take into account the effects of their actions on historic resources (16 U.S.C. §§ 470 et seq). As part of this process, Coast Survey has identified shipwrecks as potential historic resources. While Coast Survey has established a finding of no adverse effect on shipwrecks from its actions, it recognizes that survey projects designed to detect and display underwater wrecks and other obstructions could be misused by recreational divers following the discovery of a historical wreck. Therefore, at the beginning of each survey season, Coast Survey would contact the state historic preservation officer from each state where a survey is going to be conducted in state waters. Where a tide gauge is to be installed on land, the location of this tide gauge would be identified. An example of this letter is in Appendix O. Following the conclusion of each survey, Coast Survey would submit survey data to the officer for comment, before charting any wrecks or releasing data to the public, so the officer can determine the appropriate action to preserve historic resources.
6.6 Permits for Land Access During survey planning, Coast Survey would work with NOAA’s Center for Operational Oceanographic Products and Services to determine the best tide gauge locations to use for each survey. Tide gauges and GPS base stations can be located on private, public, or Native American lands. The procedure for obtaining land access and necessary permits varies depending on the type of land:
1. Private lands: For short-term stations (less than 12 months), written permissions are not always pursued. Verbal permission and documentation of the landowner’s contact information is generally sufficient. License Agreements (access permits) are established and maintained with the property owner for long-term installations. The License
54
Agreement typically is valid for five years and allows NOAA access to the property for annual inspections and emergency visits. NOAA discusses the agreement with the property owner during the reconnaissance of the site and secures permission before the actual agreement is prepared and signed. The License Agreement is a standard format approved by National Ocean Service General Counsel and the NOAA Real Property Office that has delegated signature authority to a Coast Survey representative.
2. State-owned lands: Before installation of stations on land owned by a state, NOAA
pursues agreements or permits with the appropriate state permitting agency, such as a state’s department of environmental protection or similar state agency. Coast Survey can use the National Ocean Service-approved License Agreement or a state agency form.
3. Native American lands: Agreements or permits on Native American lands are prepared
after consultation between NOAA representatives and the appropriate Native American tribe legal counsel. Coast Survey can use the National Ocean Service-approved License Agreement or a form used by the Native American tribe.
4. Federal lands: Before installation of stations located on federal lands, NOAA pursues
agreement or permits with the appropriate federal agency, such as the U.S. Fish and Wildlife Service, U.S. Army Corps of Engineers, U.S. Forest Service, National Park Service, or Bureau of Land Management. Any agreements or permits for federal land use are negotiated between the legal counsels of each agency, and Coast Survey can use the National Ocean Service-approved License Agreement or a form used by the other federal agency.
55
7. COMMENTS ON DRAFT PEA While the draft version of this PEA was available for public review, Coast Survey received one comment on July 22, 2012 from the Arctic Slope Regional Corporation (ASRC) supporting Coast Survey’s efforts to provide nautical charts in Arctic Waters, yet stressed the importance for NOAA to assess the impacts of its activities on Alaska Native subsistence marine mammals. ASRC identifies two areas of concern: identification and mitigation of potential impacts and the effects of climate change.
ASRC supports Coast Survey’s current efforts to incorporate mitigation measures into vessel operations and outreach activities between the Alaska Navigation Manager and local communities; however, ASRC requests that Coast Survey explain how it will enforce specific measures. Since the draft PEA was available for public review, Coast Survey has worked closely with NMFS’ Office of Protected Resources under the Marine Mammal Protection Act as it developed its application for a Letter of Authorization. Coast Survey anticipates a Letter of Authorization under the Marine Mammal Protection Act for limited incidental take on or around October 1, 2013. The final PEA and the Letter of Authorization application include much more detailed discussions of Coast Survey’s actions in the Arctic, including mitigation measures and outreach activities, than what was provided in the draft of this PEA. The application also includes a Plan of Cooperation.
ASRC expressed concern with take estimates from underwater sound harassment of marine mammals. In response, Coast Survey recalculated its take estimates for regions within Alaska rather than for the entire state, with the primary region for Arctic subsistence species in the Beaufort, Chukchi, and Bering Seas. Earlier take estimates also included a mathematical error that has been corrected. The revised take estimates are listed in Section 5.1.1.7.
Coast Survey’s principal mitigation measure is avoidance of areas used by Alaska Native communities for the bowhead whale, beluga whale, and Arctic seal hunts during each hunting season. As ASRC has requested, the Coast Survey Alaska navigation manager will continue to work with communities to avoid surveying in known subsistence hunting areas at the times of year when the hunt will occur. Coast Survey will make every attempt possible to avoid interfering with bowhead and beluga whale, and Arctic seal subsistence activities.
ASRC also identified a concern with Coast Survey’s discussion of potential climate change effects in the “Cumulative Impacts” Section 5.3 based on the uncertainty around climate change effects in general and the speculative nature of the discussion in this section. Coast Survey has noted ASRC’s concern and reviewed this section; however, Coast Survey has decided that the cumulative impacts dicussion is inherently speculative and the language should be left unchanged to meet its requirements under NEPA.
56
8. LIST OF PREPARERS Kathleen Jamison Program Analyst Office of Coast Survey National Ocean Service 1315 East West Hwy Silver Spring, MD 20910 301-713-2777 Rachel Medley Chief, Customer Affairs Branch Navigation Services Division Office of Coast Survey National Ocean Service 1315 East West Hwy Silver Spring, MD 20910 301-713-2700 Lorraine Robidoux Physical Scientist Coast Survey Development Lab Office of Coast Survey National Ocean Service 1315 East West Hwy Silver Spring, MD 20910 301-713-2653
57
9. LIST OF AGENCIES AND PERSONS CONSULTED
NOAA Karen Abrams Marine Resources Management Specialist Habitat Protection Division Office of Habitat Conservation National Marine Fisheries Service 1315 East West Hwy Silver Spring, MD 20910 301-427-8629 Expertise: Essential Fish Habitat Tane Casserly Maritime Archaeologist Monitor National Marine Sanctuary Office of National Marine Sanctuaries 500 West Fletcher St Alpena, MI 49707 989-356-8805 Expertise: National Historic Preservation Act, historic wrecks Jennifer Schultz Fishery Biologist Endangered Species Division Office of Protected Resources National Marine Fisheries Service 1315 East West Hwy Silver Spring, MD 20910 301-427-8443 Expertise: Endangered Species Act Jason Gedamke Ocean Acoustics Program Manager Office of Science and Technology National Marine Fisheries Service 1315 East West Hwy Silver Spring, MD 20910 301-427-8133 Expertise: Ocean bioacoustics
58
Janine Harris Fisheries Habitat Protection Specialist Habitat Protection Division Office of Habitat Conservation National Marine Fisheries Service 1315 East West Hwy Silver Spring, MD 20910 301-427-8635 Expertise: Essential Fish Habitat Ben Laws Fishery Biologist Permits, Conservation and Education Division Office of Protected Resources National Marine Fisheries Service 1315 East West Hwy Silver Spring, MD 20910 301-427-8425 Expertise: Marine Mammal Protection Act Vicki Wedell Program Analyst Conservation Policy and Planning Division Office of National Marine Sanctuaries National Ocean Service 1305 East West Hwy Silver Spring, MD 20910 301-713-3125 Expertise: National Marine Sanctuaries Act USFWS Judy Jacobs Biologist U.S. Fish and Wildlife Service AFWFO Endangered Species Program 605 W. 4th Avenue, Rm G-61 Anchorage, Alaska 99501 907-271-2768 Expertise: Endangered Species Act, Alaska endangered species protection Heath Rauschenberger, PhD Project Consultation Chief
59
U.S. Fish and Wildlife Service 7915 Baymeadows Way, Suite 200 Jacksonville, Florida 32256-7517 904-731-3203 Expertise: Endangered Species Act, manatee protection Marine Mammal Commission Tim Ragen Executive Director Marine Mammal Commission 4340 East-West Hwy, Ste. 700 Bethesda, MD 20814 301-504-0087 Expertise: Marine Mammal Protection Act, marine biology Echosounder Manufacturers Kim Dailey Teledyne Odom Hydrographic 1450 Seaboard Avenue Baton Rouge, LA 70810 225-769-3051 Expertise: Odom Single Beam Technology Justin P. Friesner Senior Field Engineer RESON Inc. 100 Lopez Road Goleta, CA 93117 805-708-5059 Expertise: Reson Multibeam Technology Darren Gibson Technical Operations Manager Knudsen Engineering Ltd. 10 Industrial Rd. Perth, Ontario Canada, K7H 3P2 613-267-1165 Expertise: Knudsen Single Beam Technology Chuck Hohing
60
Sonar Field Engineer Kongsberg Underwater Technology, Inc 19210 33rd Avenue West, Suite A Lynnwood, WA 98036 425-712-1107 Expertise: Kongsberg Multibeam Echosounder Technology Gary Kozak L-3 Klein Associates, Inc. 11 Klein Drive Salem, NH 03079 603-893-6131 Expertise: Klein Side Scan Sonar Technology Rob Morris EdgeTech 4 Little Brook Rd. West Wareham, MA 02576 508-356-9712 Expertise: EdgeTech Side Scan Sonar Technology Cris Sabo R2Sonic, LLC 1503-A Cook Place Santa Barbara, CA 93117 805-967-9192 Expertise: R2Sonic Multibeam Echosounder Technology University of New Hampshire Tom Weber Research Professor University of New Hampshire Center for Coastal and Ocean Mapping Jere A. Chase Ocean Engineering Laboratory 24 Colovos Road Durham, NH 03824 603-862-1659 Expertise: Underwater Acoustics
61
REFERENCES 1947. Coast and Geodetic Survey Act. In 33 U.S.C. §§ 883a et seq. 1966. National Historic Preservation Act. In 16 U.S.C. §§ 470 et seq. 1970. National Environmental Policy Act. In 42 U.S.C. §§ 4321 et seq. 1972a. Marine Mammal Protection Act. In 16 U.S.C. §§ 1361-1421h. 1972b. National Marine Sanctuaries Act. In 16 U.S.C. §§ 1431 et seq. 1973. Endangered Species Act. In 16 U.S.C. §§ 1531-1544. 1976. Magnuson-Stevens Fishery Conservation and Management Act. In 16 U.S.C. §§ 1801 et
seq. 1978. CEQ Regulations for Implementing the Procedural Provisions of the National
Environmental Policy Act. In 40 C.F.R. §§ 1500-1508. 1997. Department of Commerce’s EFH consultation regulations. In 50 C.F.R. §§ 600.905 - 930. 1998. Hydrographic Services Improvement Act. In 33 U.S.C. §§ 892, 892a-892d. Alaska Department of Fish and Game (2012) Alaska Department of Fish and Game.
http://www.adfg.alaska.gov/ (last accessed February 9, 2012). Allen, B. M. & R. P. Angliss (2011) Draft Alaska Marine Mammal Stock Assessments, 2011.
http://www.nmfs.noaa.gov/pr/pdfs/sars/ak2011_draft.pdf (last accessed February 2, 2012).
Au, W. W. L. & M. C. Hastings. 2008. Principles of Marine Bioacoustics. New York: Springer. Barlow, J., M. C. Ferguson, E. A. Becker, J. V. Redfern, K. A. Forney, I. L. Vilchis, P. C.
Fiedler, T. Gerrodette & L. T. Ballance (2009) Predictive Modeling of Marine Mammal Density from existing survey data and model validation using upcoming surveys. NOAA Technical Memorandum. NOAA-TMNMFS-SWFSC-XXX, 196. http://seamap.env.duke.edu/serdp/serdp_map.php (last accessed February 11, 2012).
Bengtson, J. L., L. M. Hiruki-Raring, M. A. Simpkins & P. L. Boveng (2005) Ringed and bearded seal densities in the eastern Chukchi Sea, 1999-2000. Polar Biology, 28, 833-845.
BOEMRE (2006) Biological Evaluation of Steller's Eider (Polysticta stelleri), Spectacled Eider (Somateria fischeri), and Kittlitz's Murrelet (Brachyramphus brevirostris) for Seismic Surveys in the Northeast Chukchi Sea and Western Beaufort Sea Planning Areas. http://www.alaska.boemre.gov/ref/BioEvalations/final_be_birds.pdf (last accessed February 11, 2012).
Bureau of Economic Analysis (2011) BEA National Economic Accounts. http://www.bea.gov/national/index.htm#gdp (last accessed February 11, 2012).
Calambokidis, J., R. Lumper, J. Laake, M. Gosho & P. Gearin (2004) Gray Whale Photographic Identification in 1998-2003: Collaborative Research in the Pacific Northwest. http://www.cascadiaresearch.org/reports/rep-ER-98-03rev.pdf (last accessed February 11, 2012).
Carretta, J. V., K. A. Forney, E. Oleson, K. Martien, M. M. Muto, M. S. Lowry, J. Barlow, J. Baker, B. Hanson, D. Lynch, L. Carswell, R. L. Brownell Jr., J. Robbins, D. K. Mittila, K. Ralls & M. C. Hill (2011) Draft U.S. Pacific Marine Mammal Stock Assessments: 2011. http://www.nmfs.noaa.gov/pr/pdfs/sars/po2011_draft.pdf (last accessed February 2, 2012).
62
CEQ (1981) Forty Most Asked Questions Concerning CEQ's National Environmental Policy Act Regulations. http://ceq.hss.doe.gov/NEPA/regs/40/40p1.htm (last accessed February 11, 2012).
de Moustier, C. 2009. Fundamentals of Echo-Sounding. In 49th Multibeam Sonar Training Course, ed. U. o. N. B. a. J.-C. Ocean Mapping Group, University of New Hampshire. Norfolk, VA.
Department of the Navy (2007a) Navy OPAREA Density Estimate (NODE) for the Gulf of Mexico. Prepared for the Department of the Navy, U.S. Fleet Forces Command, Norfolk, Virginia. Contract #N62470-02-D-9997, CTO 0030. Prepared by Geo-Marine, Inc., Hampton, Virginia. http://seamap.env.duke.edu/serdp/serdp_map.php (last accessed February 11, 2012).
--- (2007b) Navy OPAREA Density Estimate (NODE) for the Northeast OPAREAs. Prepared for the Department of the Navy, U.S. Fleet Forces Command, Norfolk, Virginia. Contract #N62470-02-D-9997, CTO 0030. Prepared by Geo-Marine, Inc., Hampton, Virginia. http://seamap.env.duke.edu/serdp/serdp_map.php (last accessed February 11, 2012).
--- (2007c) Navy OPAREA Density Estimate (NODE) for the Southeast OPAREAs. Prepared for the Department of the Navy, U.S. Fleet Forces Command, Norfolk, Virginia. Contract #N62470-02-D-9997, CTO 0030. Prepared by Geo-Marine, Inc., Hampton, Virginia. http://seamap.env.duke.edu/serdp/serdp_map.php (last accessed February 11, 2012).
--- (2008) Request for Letter of Authorization for the Incidental Harassment of Marine Mammals Resulting from Navy Training Activities Conducted Within the Northwest Training Range Complex. http://www.cpf.navy.mil/content/foia/NWTRC_Ltr_of_Authorization.pdf (last accessed February 24, 2012).
--- (2009) Request for Letter of Authorization for the Incidental Harassment of Marine Mammals Resulting from Navy Training Activities in the Gulf of Alaska Temporary Maritime Activities Area. http://www.nmfs.noaa.gov/pr/pdfs/permits/goa_loa_application.pdf (last accessed February 11, 2012).
--- (2010) Final NAVSEA NUWC Keyport Range Complex Extension Environmental Impact Statement/Overseas Environmental Impact Statement. http://www.navsea.navy.mil/nuwc/keyport/Environmental/Documents.aspx (last accessed February 24, 2012).
Federal Aviation Administration (2004) Advisory Circular 91-36D Visual Flight Rules (VFR) Flight Near Noise-Sensitive Areas. http://rgl.faa.gov/Regulatory_and_Guidance_Library/rgAdvisoryCircular.nsf/0/208330d7efad2bf9862570650070769f/$FILE/AC91-36d.pdf (last accessed February 11, 2012).
--- (2010) Aircraft Noise Levels. http://www.faa.gov/about/office_org/headquarters_offices/apl/noise_emissions/aircraft_noise_levels/ (last accessed February 11, 2012).
Forney, K. A. (2007) Preliminary Estimates of Cetacean Abundance Along the U.S. West Coast and Within Four National Marine Sanctuaries During 2005. NOAA Technical Memorandum, NOAA-TM-NMFS-SWFSC-406. http://swfsc.noaa.gov/publications/TM/SWFSC/NOAA-TM-NMFS-SWFSC-406.PDF (last accessed February 24, 2012).
63
Glass, A. H., T. V. N. Cole, M. Garron, R. M. Pace & Northeast Fisheries Science Center (U.S.) (2009) Mortality and serious injury determinations for baleen whale stocks along the United States eastern seaboard and adjacent Canadian maritimes, 2003-2007. Northeast Fisheries Science Center reference document ; 09-04, Electronic text document (28 p.). http://www.nefsc.noaa.gov/nefsc/publications/crd/crd0904/ (last accessed February 11, 2012).
Huber, H. R., S. J. Jeffries, R. F. Brown, R. L. DeLong & G. VanBlaricom (2001) Correcting Aerial Survey Counts of Harbor Seals in Washington and Oregon. Marine Mammal Science, 17, 276-293.
Husick, C. (2009) Depth Finders. Boat U.S. http://www.boatus.com/husick/nd_dfinder.asp (last accessed February 11, 2012).
Jeffries, S. J., H. R. Huber, J. Calambokidis & J. Laake (2003) Trends and Status of Harbor Seals in Washington State: 1978-1999. Journal of Wildlife Management, 67, 208-219.
Marine Chart Division (2011) Arctic Nautical Charting Plan. http://www.nauticalcharts.noaa.gov/mcd/docs/Arctic_Nautical_Charting_Plan.pdf (last accessed February 11, 2012).
--- (2013) Arctic Nautical Charting Plan. http://www.nauticalcharts.noaa.gov/mcd/docs/Arctic_Nautical_Charting_Plan.pdf (last accessed February 13, 2013).
Maritime Administration (2011a) Marine Transportation System (MTS). http://www.marad.dot.gov/ports_landing_page/marine_transportation_system/MTS.htm (last accessed February 11, 2012).
--- (2011b) U.S. Waterborne Foreign Trade by Custom District. http://www.marad.dot.gov/library_landing_page/data_and_statistics/Data_and_Statistics.htm (last accessed February 11, 2012).
Moore, S. E., K. M. Wynne, J. Clement-Kinney & J. M. Grebmeier (2007) Gray whale occurrence and forage southeast of Kodiak Island, Alaska. Marine Mammal Science, 23, 419-428.
National Research Council. 2003. Ocean Noise and Marine Mammals. Washington, D.C.: National Academies Press.
National Science Foundation & U.S. Geological Survey (2011) Environmental Assessment of a Marine Geophysical Survey by the R/V Marcus G. Langseth in the Central-Western Bering Sea, August 2011. http://www.nsf.gov/geo/oce/envcomp/usgs-bering-sea-2011-ea-final-20-june.pdf (last accessed February 10, 2012).
NOAA. 1999. NOAA Administrative Order (NAO) 216-6: Environmental Review Procedures for Implementing the National Environmental Policy Act.
---. 2004. Final Report of the National Oceanic and Atmospheric Administration (NOAA) International Symposium: "Shipping Noise and Marine Mammals: A Forum for Science, Management, and Technology," 18-19 May 2004. Arlington, VA.
--- (2007) Florida Keys National Marine Sanctuary Revised Management Plan. December 15, 2011. http://floridakeys.noaa.gov/mgmtplans/2_env.pdf (last accessed February 11, 2012).
--- (2011a) Hydrographic Survey Priorities, 2011 Edition. http://www.nauticalcharts.noaa.gov/hsd/docs/NHSP_2011.pdf (last accessed February 11, 2012).
64
---. 2011b. Marine Mammals - Office of Protected Resources - NOAA Fisheries. http://www.nmfs.noaa.gov/pr/species/mammals/ (last accessed February 9, 2012).
--- (2011c) National Marine Sanctuaries Frequently Asked Questions. http://sanctuaries.noaa.gov/about/faqs/welcome.html (last accessed February 11, 2012).
--- (2011d) Species Information - Office of Protected Resources - NOAA Fisheries. http://www.nmfs.noaa.gov/pr/species/ (last accessed February 11, 2012).
---. 2011e. Species Protected Under the Endangered Species Act (ESA). NOAA Fisheries, Office of Protected Resources. http://www.nmfs.noaa.gov/pr/species/esa/ (last accessed June 24, 2011).
--- (2011f) Thunder Bay National Marine Sanctuary. http://thunderbay.noaa.gov/about/welcome.html (last accessed February 11, 2012).
Perrin, W. F., B. G. Würsig & J. G. M. Thewissen. 2009. Encyclopedia of marine mammals. London: Academic.
Richardson, W. J., C. R. Greene Jr., C. I. Malme & D. H. Thomson. 1995. Marine Mammals and Noise. San Diego, CA: Academic Press.
Rone, B. K., A.B. Douglas, P. Clapham, A. Martinez, L. J. Morse, A. N. Zerbini & J. Calambokidis (2009) Final Report for the April 2009 Gulf of Alaska Line-Transect Survey (GOALS) in the Navy Training Exercise Area. 28. http://www.cascadiaresearch.org/reports/GOA_April_2009_Final_Report-Resubmit.pdf (last accessed February 11, 2012).
Silber, G. K., J. Slutsky & S. Bettridge (2010) Hydrodynamics of a ship/whale collision. Journal of Experimental Marine Biology and Ecology, 391, 10-19.
Southall, B. L., A. E. Bowles, W. T. Ellison, J. J. Finneran, R. L. Gentry, C. R. Green, D. Kastak, D. R. Ketten, J. H. Miller, P. E. Nachtigall, W. J. Richardson, J. A. Thomas & P. L. Tyack (2007) Marine Mammal Noise Exposure Criteria: Initial Scientific Recommendations. Aquatic Mammals, 33, 411-509.
U.S. Arctic Research Commission (2009) Arctic Boundary as defined by the Arctic Research and Policy Act (ARPA). http://www.arctic.gov/maps/ARPA_Alaska_only.pdf (last accessed February 11, 2012).
U.S. Fish & Wildlife Service (2009) Final Florida Manatee Stock Assessment Report. http://www.fws.gov/northflorida/Manatee/manatees.htm (last accessed February 11, 2012).
--- (2012) Alaska Region - Marine Mammals Management: Stock Assessment Reports. http://alaska.fws.gov/fisheries/mmm/stock/stock.htm (last accessed February 11, 2012).
Urick, R. J. 1983. Principles of Underwater Sound (3rd Edition). Los Altos, CA: Peninsula Publishing.
USFWS. 2011a. Polar Bear Interaction Guidelines (unpbl). Marine Mammals Management Office, 1011 East Tudor Road, MS 341, Anchorage, Alaska 99503.
---. 2011b. Skiff Operation Guidance to Avoid Disturbing Sea Otters (unpbl). Marine Mammals Management Office, 1011 East Tudor Road, MS341, Anchorage, Alaska 99503.
Waite, J. (2003) Cetacean Assessment and Ecology Program: Cetacean Survey. AFSC Quarterly Research Reports, July-September.
Waring, G. T., E. Josephson, K. Maze-Foley & P. E. Rosel (2011) Draft US Atlantic and Gulf of Mexico marine mammal stock assessments 2011. NOAA technical memorandum NMFS-NE-219, 1 electronic document (532 p.).
65
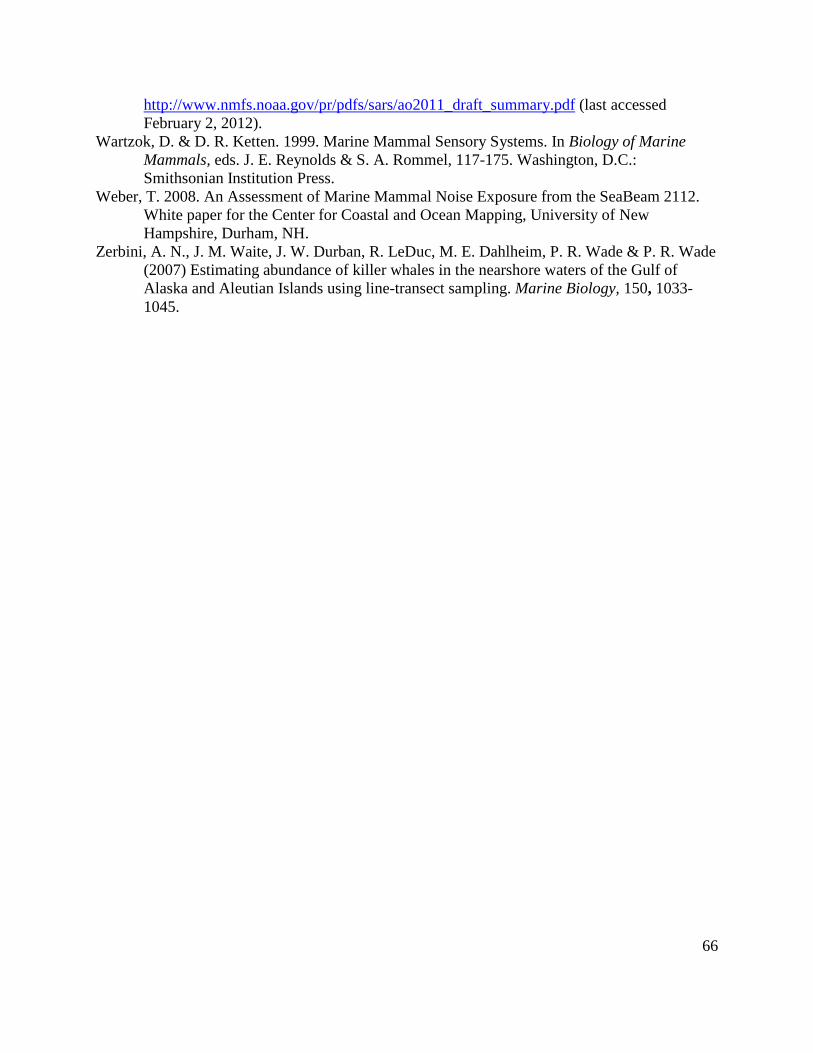
http://www.nmfs.noaa.gov/pr/pdfs/sars/ao2011_draft_summary.pdf (last accessed February 2, 2012).
Wartzok, D. & D. R. Ketten. 1999. Marine Mammal Sensory Systems. In Biology of Marine Mammals, eds. J. E. Reynolds & S. A. Rommel, 117-175. Washington, D.C.: Smithsonian Institution Press.
Weber, T. 2008. An Assessment of Marine Mammal Noise Exposure from the SeaBeam 2112. White paper for the Center for Coastal and Ocean Mapping, University of New Hampshire, Durham, NH.
Zerbini, A. N., J. M. Waite, J. W. Durban, R. LeDuc, M. E. Dahlheim, P. R. Wade & P. R. Wade (2007) Estimating abundance of killer whales in the nearshore waters of the Gulf of Alaska and Aleutian Islands using line-transect sampling. Marine Biology, 150, 1033-1045.
66

APPENDICES
67
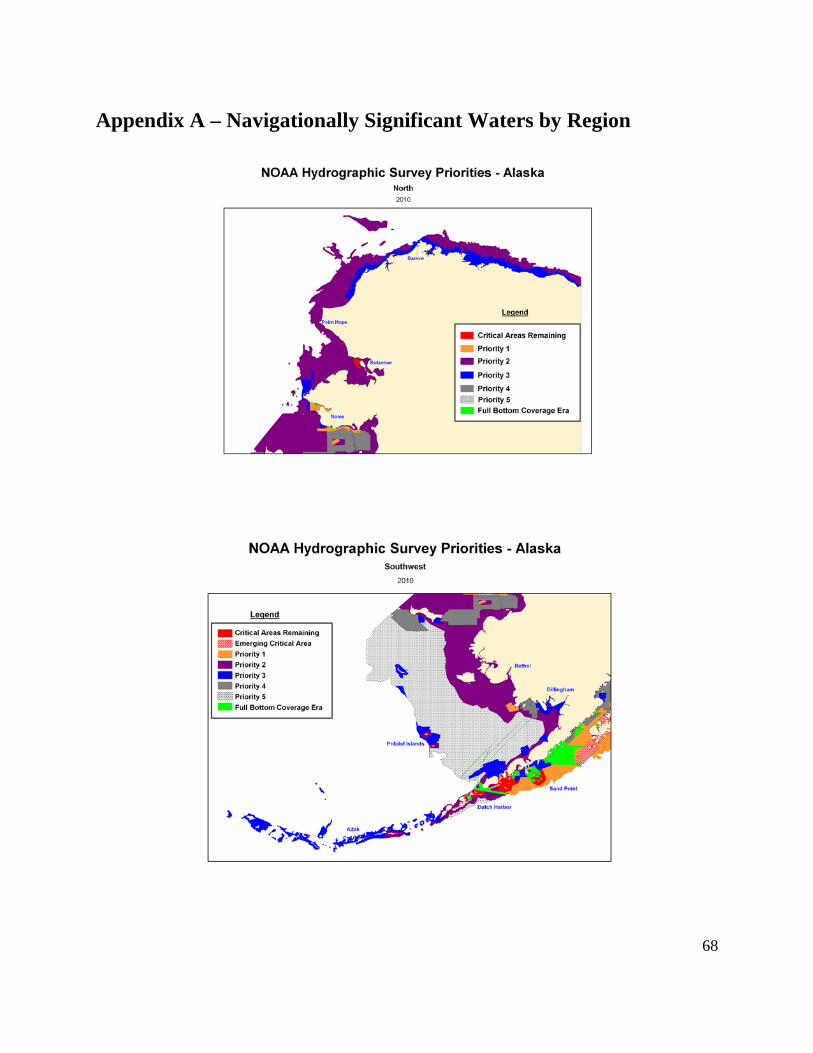
Appendix A – Navigationally Significant Waters by Region
68
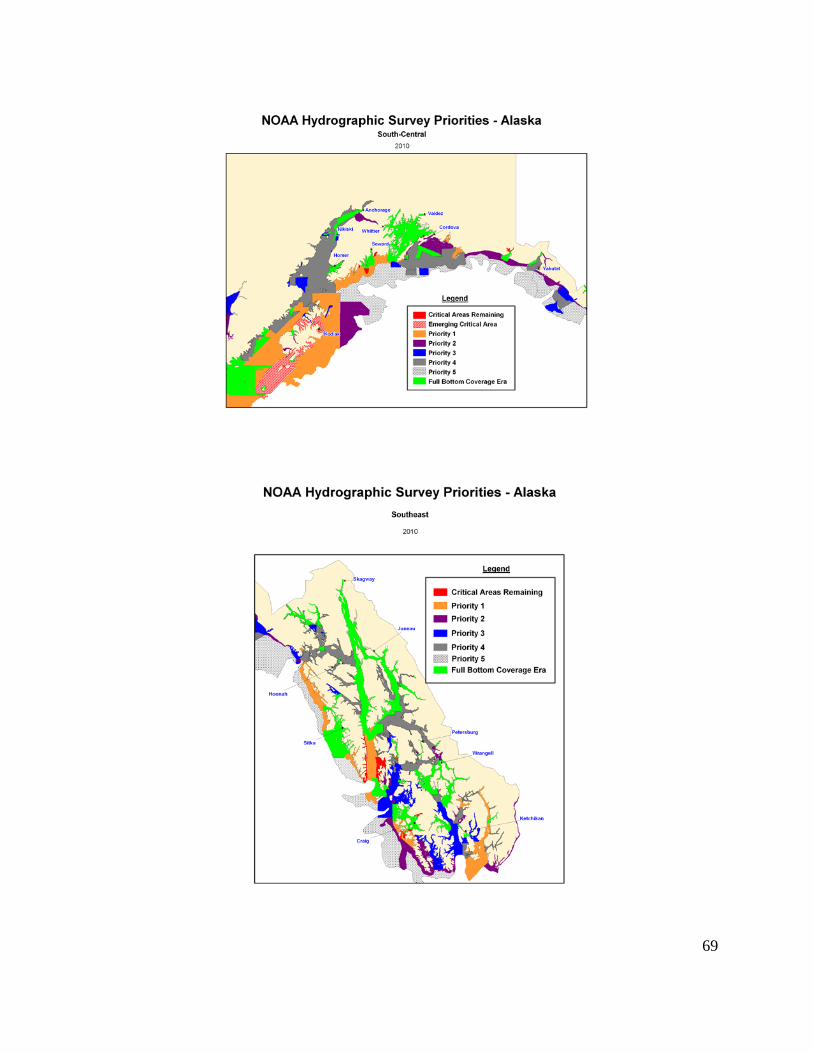
69
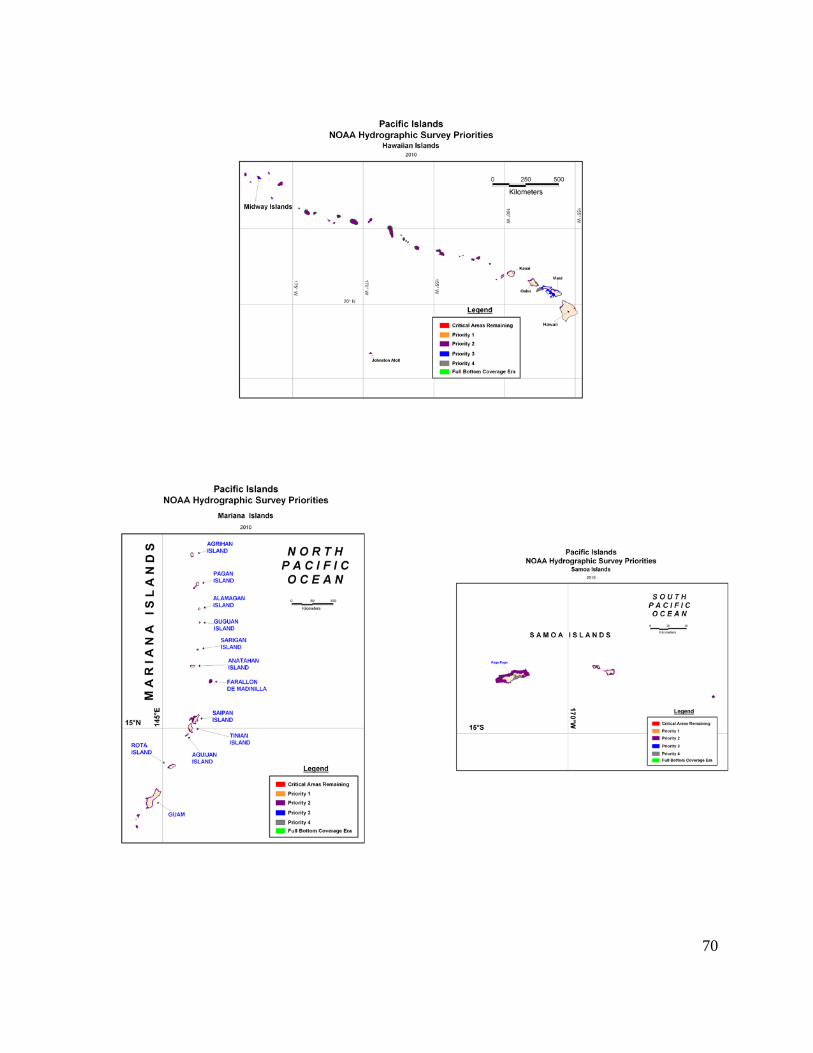
70
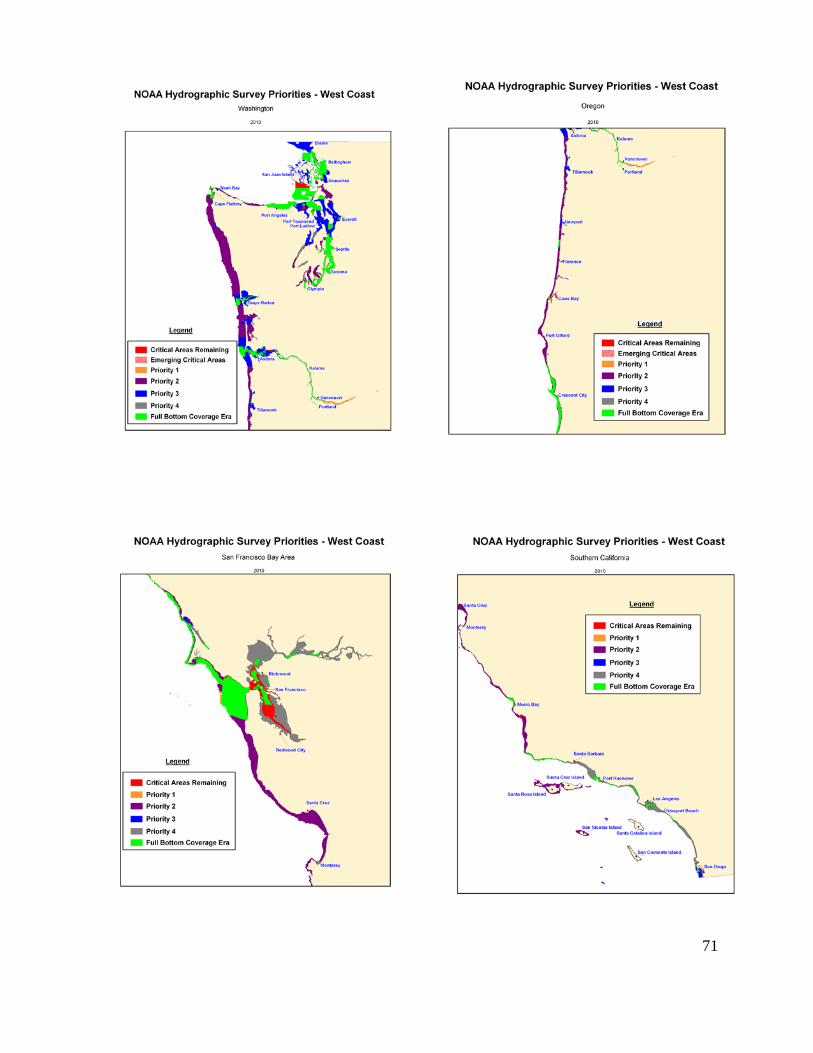
71
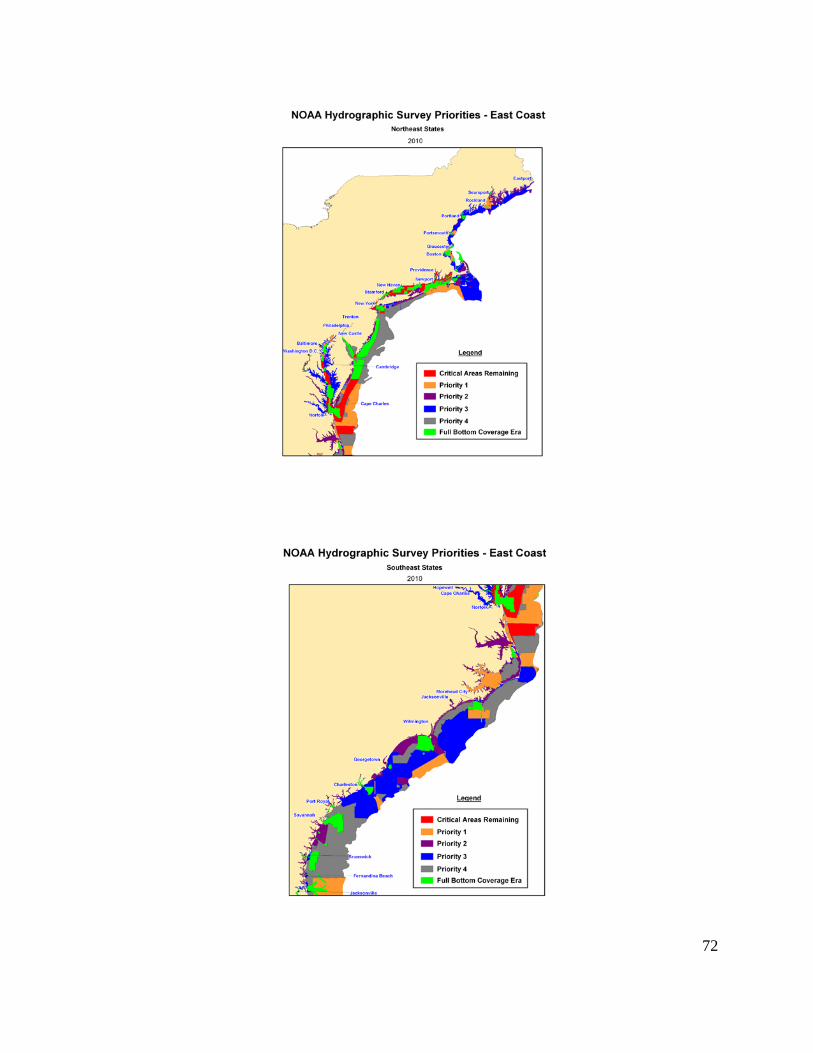
72
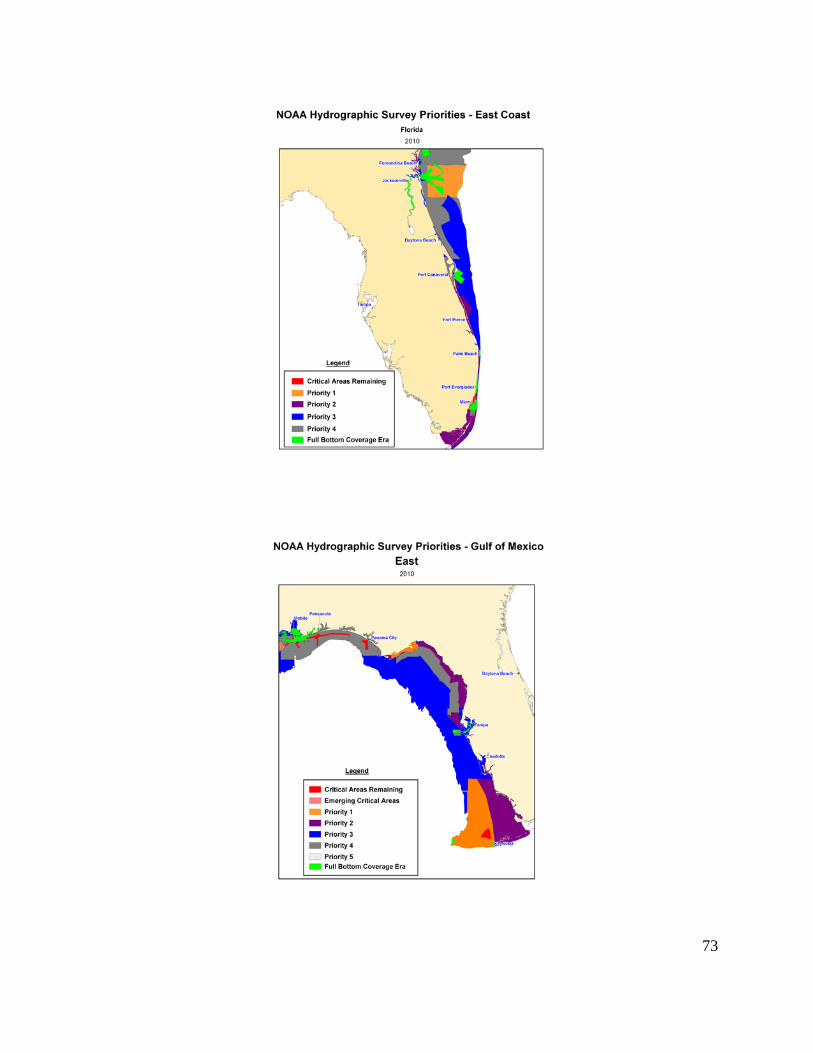
73
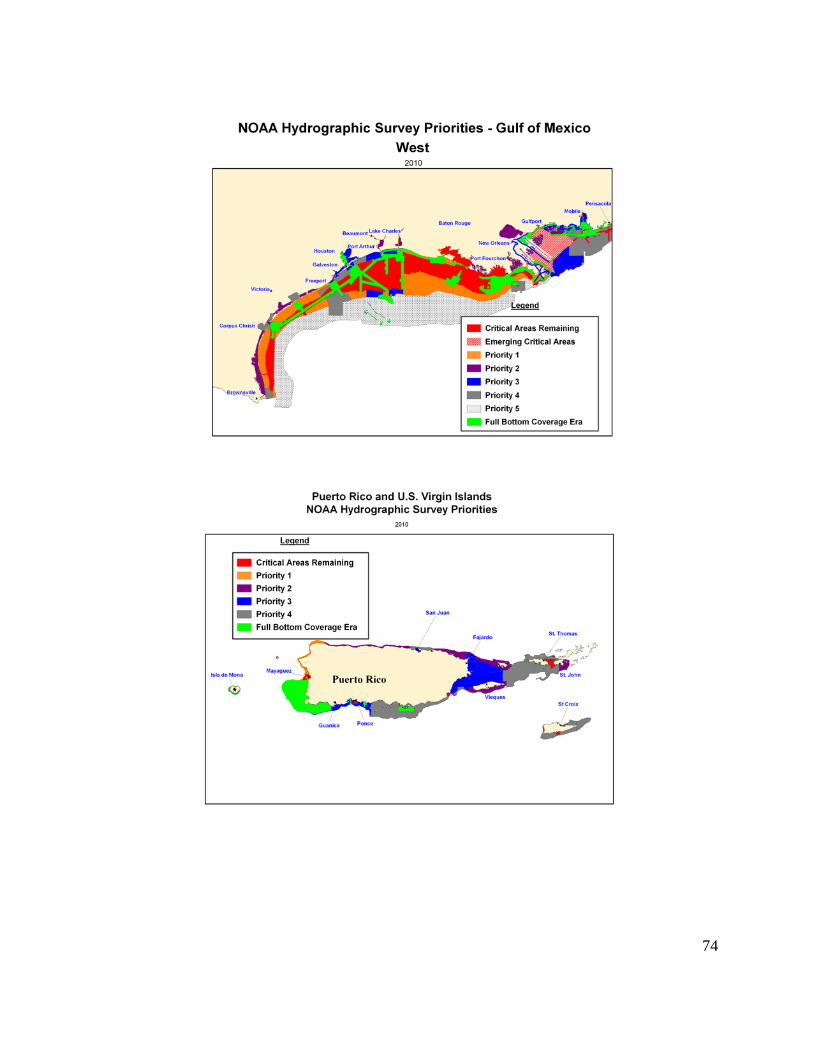
74
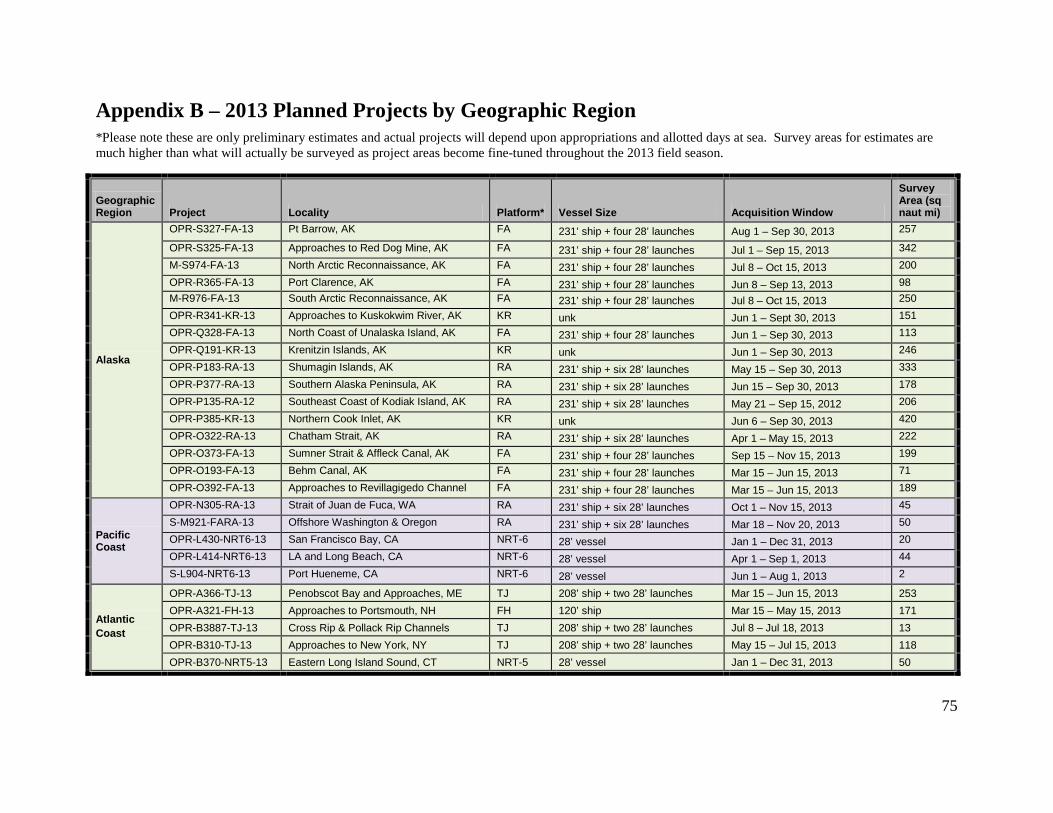
Appendix B – 2013 Planned Projects by Geographic Region *Please note these are only preliminary estimates and actual projects will depend upon appropriations and allotted days at sea. Survey areas for estimates are much higher than what will actually be surveyed as project areas become fine-tuned throughout the 2013 field season.
Geographic Region Project Locality Platform* Vessel Size Acquisition Window
Survey Area (sq naut mi)
Alaska
OPR-S327-FA-13 Pt Barrow, AK FA 231’ ship + four 28’ launches Aug 1 – Sep 30, 2013 257
OPR-S325-FA-13 Approaches to Red Dog Mine, AK FA 231’ ship + four 28’ launches Jul 1 – Sep 15, 2013 342 M-S974-FA-13 North Arctic Reconnaissance, AK FA 231’ ship + four 28’ launches Jul 8 – Oct 15, 2013 200 OPR-R365-FA-13 Port Clarence, AK FA 231’ ship + four 28’ launches Jun 8 – Sep 13, 2013 98 M-R976-FA-13 South Arctic Reconnaissance, AK FA 231’ ship + four 28’ launches Jul 8 – Oct 15, 2013 250 OPR-R341-KR-13 Approaches to Kuskokwim River, AK KR unk Jun 1 – Sept 30, 2013 151 OPR-Q328-FA-13 North Coast of Unalaska Island, AK FA 231’ ship + four 28’ launches Jun 1 – Sep 30, 2013 113 OPR-Q191-KR-13 Krenitzin Islands, AK KR unk Jun 1 – Sep 30, 2013 246 OPR-P183-RA-13 Shumagin Islands, AK RA 231’ ship + six 28’ launches May 15 – Sep 30, 2013 333 OPR-P377-RA-13 Southern Alaska Peninsula, AK RA 231’ ship + six 28’ launches Jun 15 – Sep 30, 2013 178 OPR-P135-RA-12 Southeast Coast of Kodiak Island, AK RA 231’ ship + six 28’ launches May 21 – Sep 15, 2012 206 OPR-P385-KR-13 Northern Cook Inlet, AK KR unk Jun 6 – Sep 30, 2013 420 OPR-O322-RA-13 Chatham Strait, AK RA 231’ ship + six 28’ launches Apr 1 – May 15, 2013 222 OPR-O373-FA-13 Sumner Strait & Affleck Canal, AK FA 231’ ship + four 28’ launches Sep 15 – Nov 15, 2013 199 OPR-O193-FA-13 Behm Canal, AK FA 231’ ship + four 28’ launches Mar 15 – Jun 15, 2013 71 OPR-O392-FA-13 Approaches to Revillagigedo Channel FA 231’ ship + four 28’ launches Mar 15 – Jun 15, 2013 189
Pacific Coast
OPR-N305-RA-13 Strait of Juan de Fuca, WA RA 231’ ship + six 28’ launches Oct 1 – Nov 15, 2013 45 S-M921-FARA-13 Offshore Washington & Oregon RA 231’ ship + six 28’ launches Mar 18 – Nov 20, 2013 50 OPR-L430-NRT6-13 San Francisco Bay, CA NRT-6 28’ vessel Jan 1 – Dec 31, 2013 20 OPR-L414-NRT6-13 LA and Long Beach, CA NRT-6 28’ vessel Apr 1 – Sep 1, 2013 44 S-L904-NRT6-13 Port Hueneme, CA NRT-6 28’ vessel Jun 1 – Aug 1, 2013 2
Atlantic Coast
OPR-A366-TJ-13 Penobscot Bay and Approaches, ME TJ 208’ ship + two 28’ launches Mar 15 – Jun 15, 2013 253 OPR-A321-FH-13 Approaches to Portsmouth, NH FH 120’ ship Mar 15 – May 15, 2013 171 OPR-B3887-TJ-13 Cross Rip & Pollack Rip Channels TJ 208’ ship + two 28’ launches Jul 8 – Jul 18, 2013 13 OPR-B310-TJ-13 Approaches to New York, NY TJ 208’ ship + two 28’ launches May 15 – Jul 15, 2013 118 OPR-B370-NRT5-13 Eastern Long Island Sound, CT NRT-5 28’ vessel Jan 1 – Dec 31, 2013 50
75
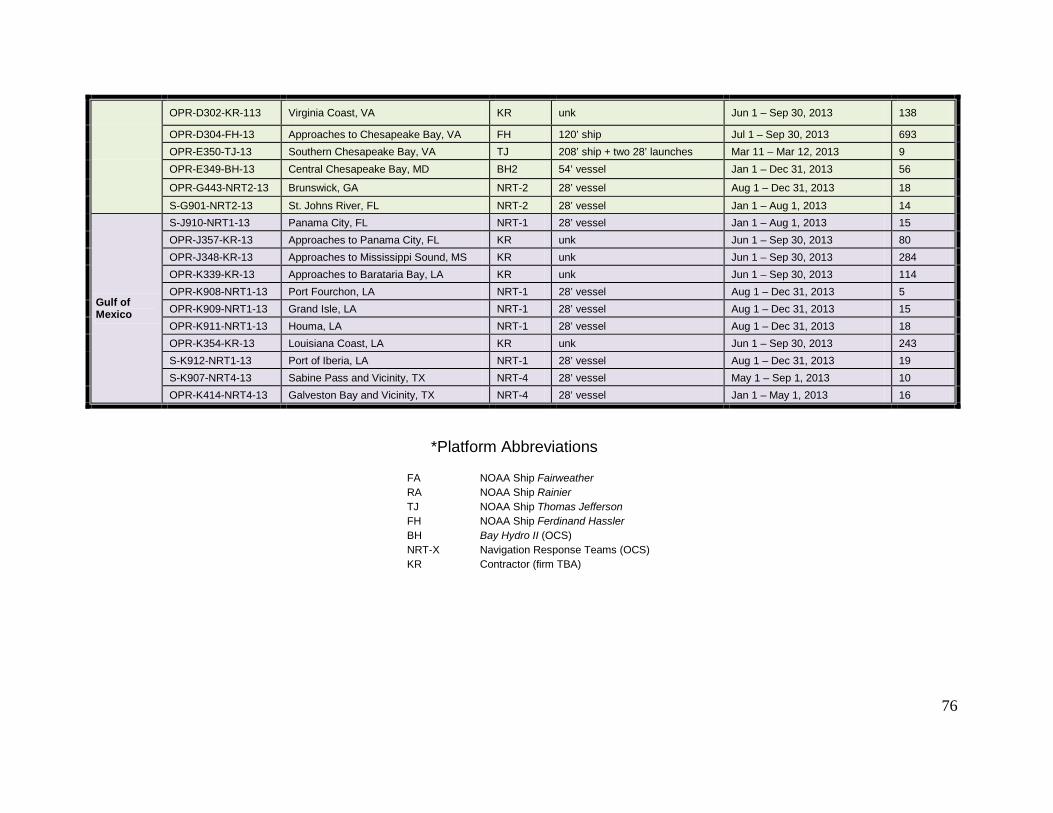
OPR-D302-KR-113 Virginia Coast, VA KR unk Jun 1 – Sep 30, 2013 138
OPR-D304-FH-13 Approaches to Chesapeake Bay, VA FH 120’ ship Jul 1 – Sep 30, 2013 693 OPR-E350-TJ-13 Southern Chesapeake Bay, VA TJ 208’ ship + two 28’ launches Mar 11 – Mar 12, 2013 9 OPR-E349-BH-13 Central Chesapeake Bay, MD BH2 54’ vessel Jan 1 – Dec 31, 2013 56
OPR-G443-NRT2-13 Brunswick, GA NRT-2 28’ vessel Aug 1 – Dec 31, 2013 18
S-G901-NRT2-13 St. Johns River, FL NRT-2 28’ vessel Jan 1 – Aug 1, 2013 14
Gulf of Mexico
S-J910-NRT1-13 Panama City, FL NRT-1 28’ vessel Jan 1 – Aug 1, 2013 15 OPR-J357-KR-13 Approaches to Panama City, FL KR unk Jun 1 – Sep 30, 2013 80 OPR-J348-KR-13 Approaches to Mississippi Sound, MS KR unk Jun 1 – Sep 30, 2013 284 OPR-K339-KR-13 Approaches to Barataria Bay, LA KR unk Jun 1 – Sep 30, 2013 114 OPR-K908-NRT1-13 Port Fourchon, LA NRT-1 28’ vessel Aug 1 – Dec 31, 2013 5 OPR-K909-NRT1-13 Grand Isle, LA NRT-1 28’ vessel Aug 1 – Dec 31, 2013 15 OPR-K911-NRT1-13 Houma, LA NRT-1 28’ vessel Aug 1 – Dec 31, 2013 18 OPR-K354-KR-13 Louisiana Coast, LA KR unk Jun 1 – Sep 30, 2013 243 S-K912-NRT1-13 Port of Iberia, LA NRT-1 28’ vessel Aug 1 – Dec 31, 2013 19 S-K907-NRT4-13 Sabine Pass and Vicinity, TX NRT-4 28’ vessel May 1 – Sep 1, 2013 10 OPR-K414-NRT4-13 Galveston Bay and Vicinity, TX NRT-4 28’ vessel Jan 1 – May 1, 2013 16
*Platform Abbreviations
FA NOAA Ship Fairweather RA NOAA Ship Rainier TJ NOAA Ship Thomas Jefferson FH NOAA Ship Ferdinand Hassler BH Bay Hydro II (OCS) NRT-X Navigation Response Teams (OCS) KR Contractor (firm TBA)
76
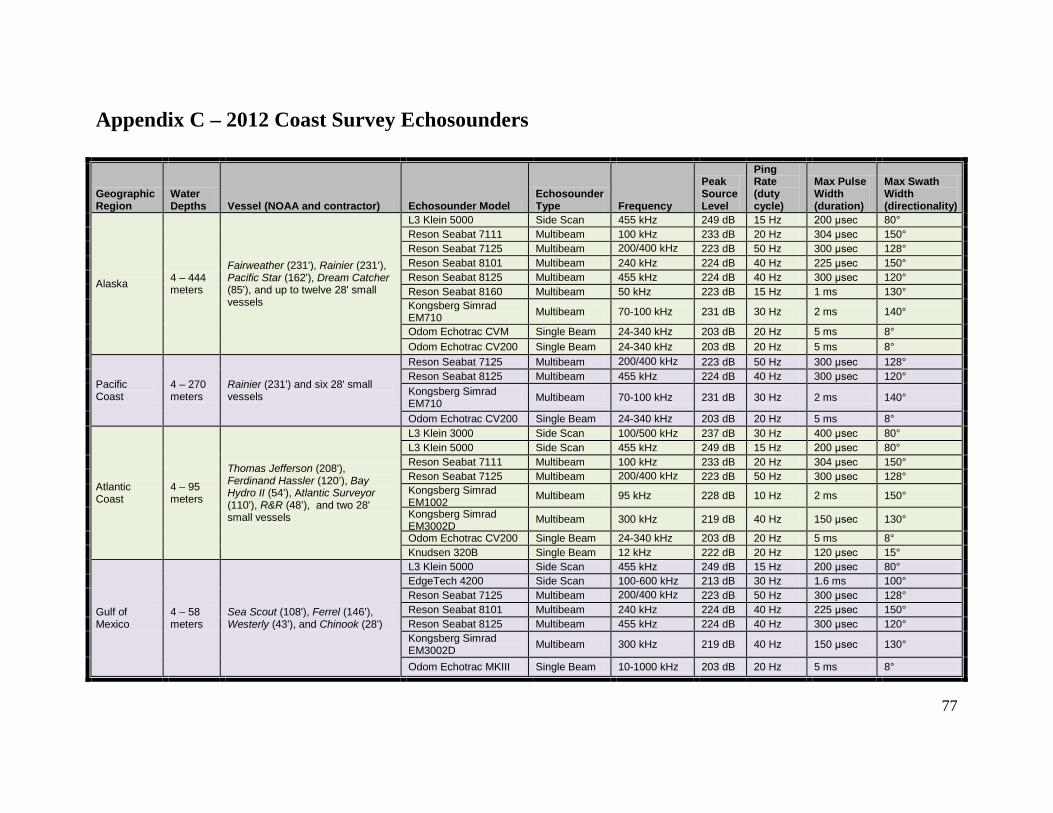
Appendix C – 2012 Coast Survey Echosounders
Geographic Region
Water Depths Vessel (NOAA and contractor) Echosounder Model
Echosounder Type Frequency
Peak Source Level
Ping Rate (duty cycle)
Max Pulse Width (duration)
Max Swath Width (directionality)
Alaska 4 – 444 meters
Fairweather (231'), Rainier (231’), Pacific Star (162'), Dream Catcher (85'), and up to twelve 28' small vessels
L3 Klein 5000 Side Scan 455 kHz 249 dB 15 Hz 200 μsec 80° Reson Seabat 7111 Multibeam 100 kHz 233 dB 20 Hz 304 μsec 150° Reson Seabat 7125 Multibeam 200/400 kHz
223 dB 50 Hz 300 μsec 128°
Reson Seabat 8101 Multibeam 240 kHz 224 dB 40 Hz 225 μsec 150° Reson Seabat 8125 Multibeam 455 kHz 224 dB 40 Hz 300 μsec 120° Reson Seabat 8160 Multibeam 50 kHz 223 dB 15 Hz 1 ms 130° Kongsberg Simrad EM710 Multibeam 70-100 kHz 231 dB 30 Hz 2 ms 140°
Odom Echotrac CVM Single Beam 24-340 kHz 203 dB 20 Hz 5 ms 8° Odom Echotrac CV200 Single Beam 24-340 kHz 203 dB 20 Hz 5 ms 8°
Pacific Coast
4 – 270 meters
Rainier (231') and six 28' small vessels
Reson Seabat 7125 Multibeam 200/400 kHz
223 dB 50 Hz 300 μsec 128° Reson Seabat 8125 Multibeam 455 kHz 224 dB 40 Hz 300 μsec 120° Kongsberg Simrad EM710 Multibeam 70-100 kHz 231 dB 30 Hz 2 ms 140°
Odom Echotrac CV200 Single Beam 24-340 kHz 203 dB 20 Hz 5 ms 8°
Atlantic Coast
4 – 95 meters
Thomas Jefferson (208'), Ferdinand Hassler (120’), Bay Hydro II (54'), Atlantic Surveyor (110'), R&R (48’), and two 28' small vessels
L3 Klein 3000 Side Scan 100/500 kHz 237 dB 30 Hz 400 μsec 80° L3 Klein 5000 Side Scan 455 kHz 249 dB 15 Hz 200 μsec 80° Reson Seabat 7111 Multibeam 100 kHz 233 dB 20 Hz 304 μsec 150° Reson Seabat 7125 Multibeam 200/400 kHz
223 dB 50 Hz 300 μsec 128°
Kongsberg Simrad EM1002 Multibeam 95 kHz 228 dB 10 Hz 2 ms 150°
Kongsberg Simrad EM3002D Multibeam 300 kHz 219 dB 40 Hz 150 μsec 130°
Odom Echotrac CV200 Single Beam 24-340 kHz 203 dB 20 Hz 5 ms 8° Knudsen 320B Single Beam 12 kHz 222 dB 20 Hz 120 μsec 15°
Gulf of Mexico
4 – 58 meters
Sea Scout (108'), Ferrel (146’), Westerly (43'), and Chinook (28')
L3 Klein 5000 Side Scan 455 kHz 249 dB 15 Hz 200 μsec 80° EdgeTech 4200 Side Scan 100-600 kHz 213 dB 30 Hz 1.6 ms 100° Reson Seabat 7125 Multibeam 200/400 kHz
223 dB 50 Hz 300 μsec 128°
Reson Seabat 8101 Multibeam 240 kHz 224 dB 40 Hz 225 μsec 150° Reson Seabat 8125 Multibeam 455 kHz 224 dB 40 Hz 300 μsec 120° Kongsberg Simrad EM3002D Multibeam 300 kHz 219 dB 40 Hz 150 μsec 130°
Odom Echotrac MKIII Single Beam 10-1000 kHz 203 dB 20 Hz 5 ms 8°
77
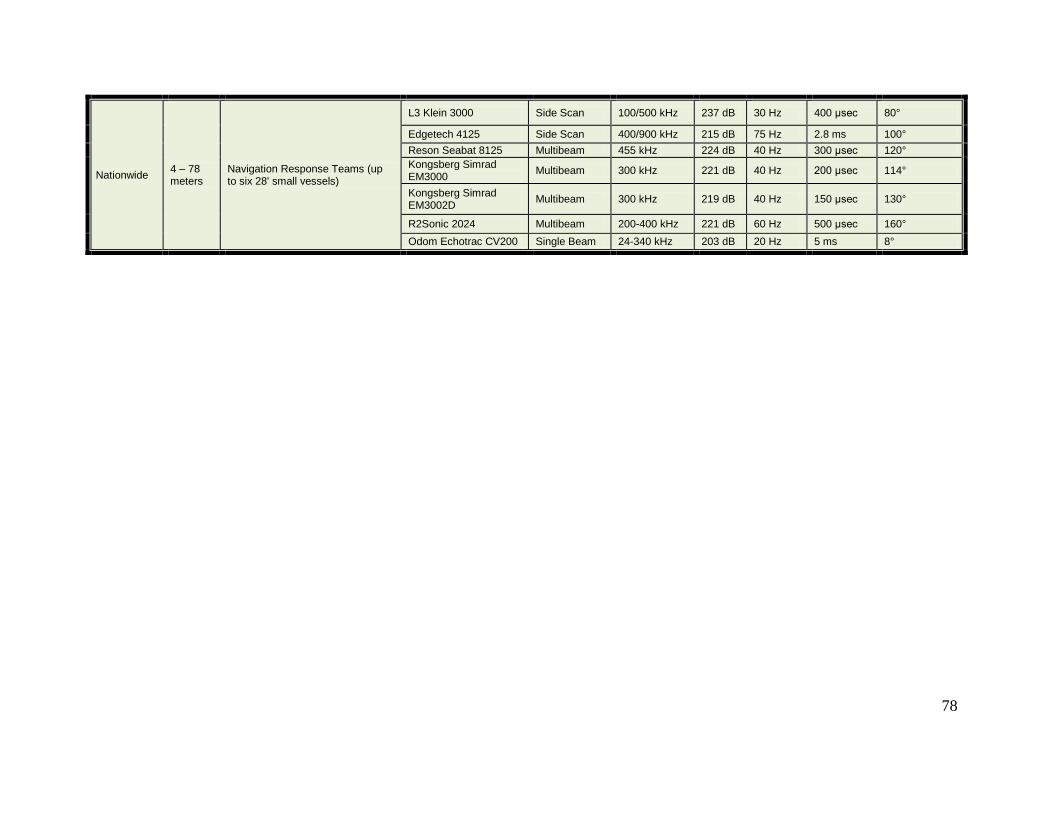
Nationwide 4 – 78 meters
Navigation Response Teams (up to six 28' small vessels)
L3 Klein 3000 Side Scan 100/500 kHz 237 dB 30 Hz 400 μsec 80°
Edgetech 4125 Side Scan 400/900 kHz 215 dB 75 Hz 2.8 ms 100° Reson Seabat 8125 Multibeam 455 kHz 224 dB 40 Hz 300 μsec 120° Kongsberg Simrad EM3000 Multibeam 300 kHz 221 dB 40 Hz 200 μsec 114°
Kongsberg Simrad EM3002D Multibeam 300 kHz 219 dB 40 Hz 150 μsec 130°
R2Sonic 2024 Multibeam 200-400 kHz 221 dB 60 Hz 500 μsec 160° Odom Echotrac CV200 Single Beam 24-340 kHz 203 dB 20 Hz 5 ms 8°
78
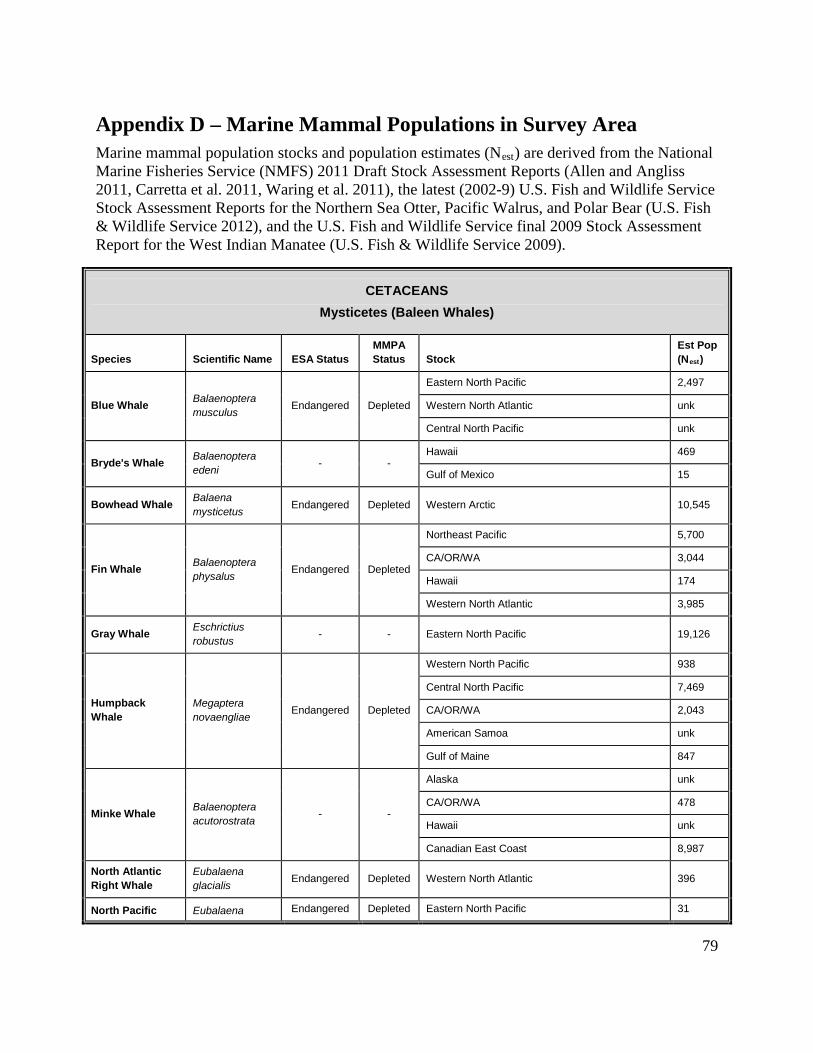
Appendix D – Marine Mammal Populations in Survey Area Marine mammal population stocks and population estimates (Nest) are derived from the National Marine Fisheries Service (NMFS) 2011 Draft Stock Assessment Reports (Allen and Angliss 2011, Carretta et al. 2011, Waring et al. 2011), the latest (2002-9) U.S. Fish and Wildlife Service Stock Assessment Reports for the Northern Sea Otter, Pacific Walrus, and Polar Bear (U.S. Fish & Wildlife Service 2012), and the U.S. Fish and Wildlife Service final 2009 Stock Assessment Report for the West Indian Manatee (U.S. Fish & Wildlife Service 2009).
CETACEANS Mysticetes (Baleen Whales)
Species Scientific Name ESA Status MMPA Status Stock
Est Pop (Nest)
Blue Whale Balaenoptera musculus Endangered Depleted
Eastern North Pacific 2,497
Western North Atlantic unk
Central North Pacific unk
Bryde's Whale Balaenoptera edeni - -
Hawaii 469
Gulf of Mexico 15
Bowhead Whale Balaena mysticetus Endangered Depleted Western Arctic 10,545
Fin Whale Balaenoptera physalus Endangered Depleted
Northeast Pacific 5,700
CA/OR/WA 3,044
Hawaii 174
Western North Atlantic 3,985
Gray Whale Eschrictius robustus - - Eastern North Pacific 19,126
Humpback Whale
Megaptera novaengliae Endangered Depleted
Western North Pacific 938
Central North Pacific 7,469
CA/OR/WA 2,043
American Samoa unk
Gulf of Maine 847
Minke Whale Balaenoptera acutorostrata - -
Alaska unk
CA/OR/WA 478
Hawaii unk
Canadian East Coast 8,987
North Atlantic Right Whale
Eubalaena glacialis Endangered Depleted Western North Atlantic 396
North Pacific Eubalaena Endangered Depleted Eastern North Pacific 31
79
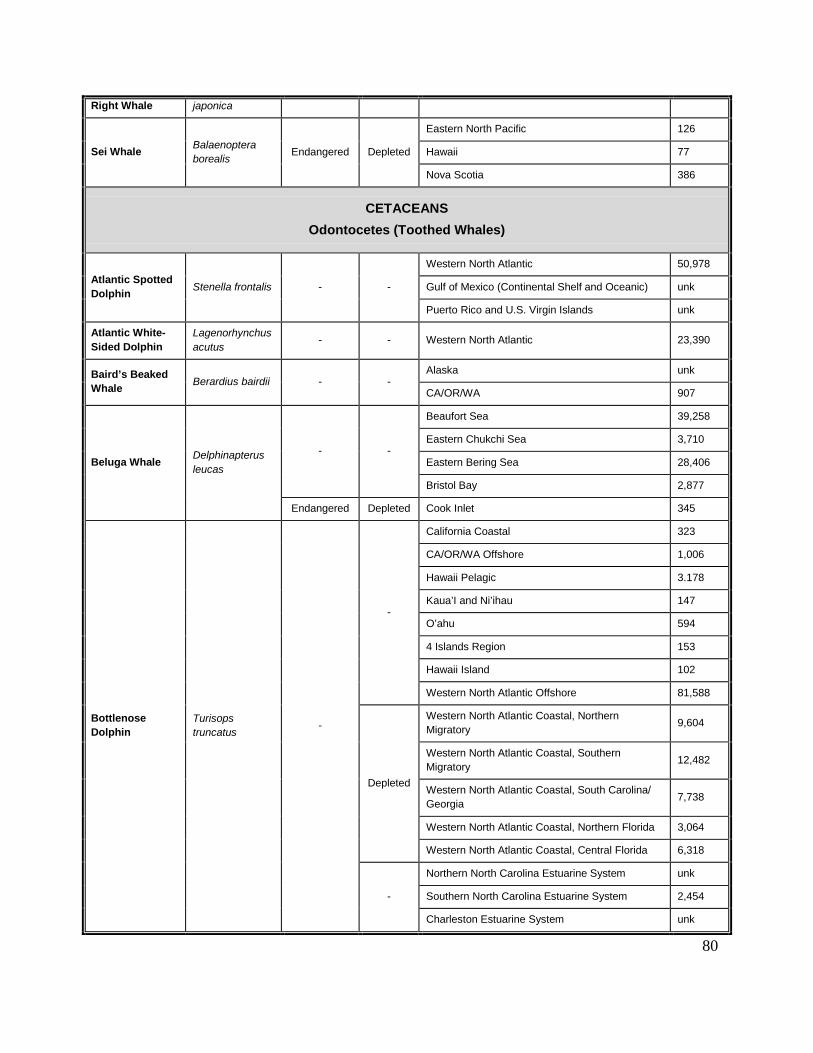
Right Whale japonica
Sei Whale Balaenoptera borealis Endangered Depleted
Eastern North Pacific 126
Hawaii 77
Nova Scotia 386
CETACEANS Odontocetes (Toothed Whales)
Atlantic Spotted Dolphin Stenella frontalis - -
Western North Atlantic 50,978
Gulf of Mexico (Continental Shelf and Oceanic) unk
Puerto Rico and U.S. Virgin Islands unk
Atlantic White-Sided Dolphin
Lagenorhynchus acutus
- - Western North Atlantic 23,390
Baird’s Beaked Whale Berardius bairdii - -
Alaska unk
CA/OR/WA 907
Beluga Whale Delphinapterus leucas
- -
Beaufort Sea 39,258
Eastern Chukchi Sea 3,710
Eastern Bering Sea 28,406
Bristol Bay 2,877
Endangered Depleted Cook Inlet 345
Bottlenose Dolphin
Turisops truncatus -
-
California Coastal 323
CA/OR/WA Offshore 1,006
Hawaii Pelagic 3.178
Kaua’I and Ni’ihau 147
O’ahu 594
4 Islands Region 153
Hawaii Island 102
Western North Atlantic Offshore 81,588
Depleted
Western North Atlantic Coastal, Northern Migratory 9,604
Western North Atlantic Coastal, Southern Migratory 12,482
Western North Atlantic Coastal, South Carolina/ Georgia 7,738
Western North Atlantic Coastal, Northern Florida 3,064
Western North Atlantic Coastal, Central Florida 6,318
-
Northern North Carolina Estuarine System unk
Southern North Carolina Estuarine System 2,454
Charleston Estuarine System unk
80
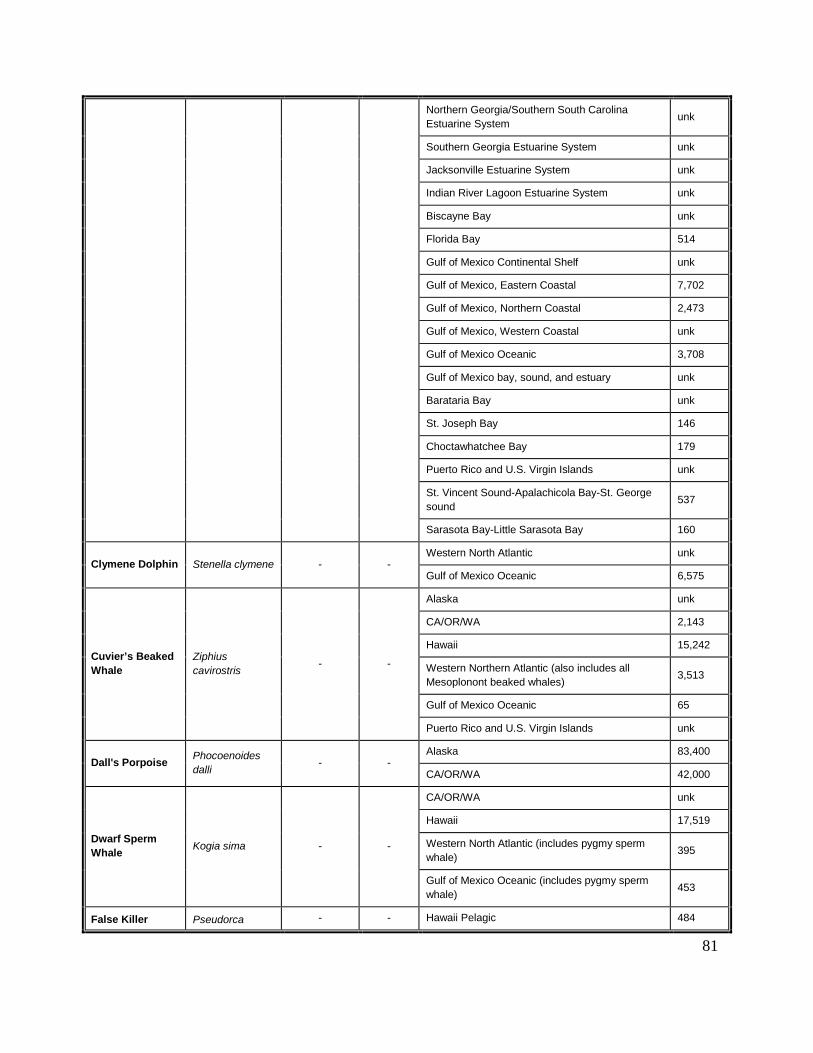
Northern Georgia/Southern South Carolina Estuarine System unk
Southern Georgia Estuarine System unk
Jacksonville Estuarine System unk
Indian River Lagoon Estuarine System unk
Biscayne Bay unk
Florida Bay 514
Gulf of Mexico Continental Shelf unk
Gulf of Mexico, Eastern Coastal 7,702
Gulf of Mexico, Northern Coastal 2,473
Gulf of Mexico, Western Coastal unk
Gulf of Mexico Oceanic 3,708
Gulf of Mexico bay, sound, and estuary unk
Barataria Bay unk
St. Joseph Bay 146
Choctawhatchee Bay 179
Puerto Rico and U.S. Virgin Islands unk
St. Vincent Sound-Apalachicola Bay-St. George sound 537
Sarasota Bay-Little Sarasota Bay 160
Clymene Dolphin Stenella clymene - - Western North Atlantic unk
Gulf of Mexico Oceanic 6,575
Cuvier’s Beaked Whale
Ziphius cavirostris - -
Alaska unk
CA/OR/WA 2,143
Hawaii 15,242
Western Northern Atlantic (also includes all Mesoplonont beaked whales) 3,513
Gulf of Mexico Oceanic 65
Puerto Rico and U.S. Virgin Islands unk
Dall's Porpoise Phocoenoides dalli - -
Alaska 83,400
CA/OR/WA 42,000
Dwarf Sperm Whale Kogia sima - -
CA/OR/WA unk
Hawaii 17,519
Western North Atlantic (includes pygmy sperm whale) 395
Gulf of Mexico Oceanic (includes pygmy sperm whale) 453
False Killer Pseudorca - - Hawaii Pelagic 484
81
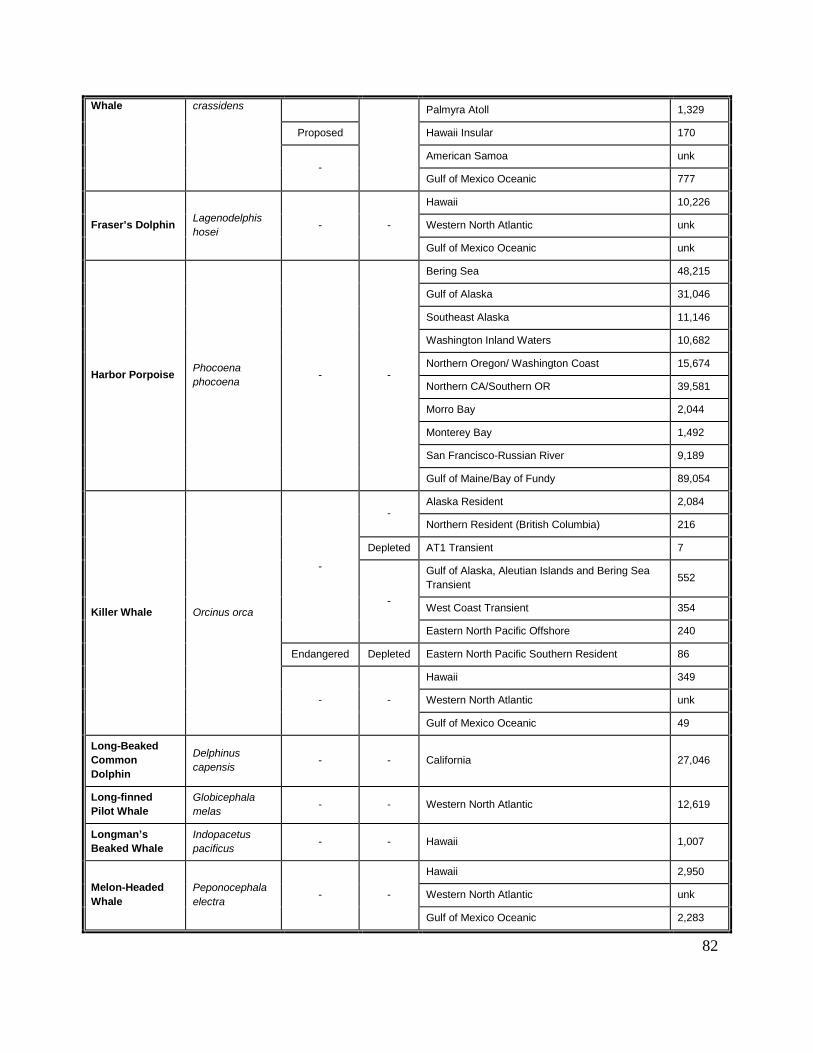
Whale crassidens Palmyra Atoll 1,329
Proposed Hawaii Insular 170
- American Samoa unk
Gulf of Mexico Oceanic 777
Fraser’s Dolphin Lagenodelphis hosei - -
Hawaii 10,226
Western North Atlantic unk
Gulf of Mexico Oceanic unk
Harbor Porpoise Phocoena phocoena - -
Bering Sea 48,215
Gulf of Alaska 31,046
Southeast Alaska 11,146
Washington Inland Waters 10,682
Northern Oregon/ Washington Coast 15,674
Northern CA/Southern OR 39,581
Morro Bay 2,044
Monterey Bay 1,492
San Francisco-Russian River 9,189
Gulf of Maine/Bay of Fundy 89,054
Killer Whale Orcinus orca
-
- Alaska Resident 2,084
Northern Resident (British Columbia) 216
Depleted AT1 Transient 7
-
Gulf of Alaska, Aleutian Islands and Bering Sea Transient 552
West Coast Transient 354
Eastern North Pacific Offshore 240
Endangered Depleted Eastern North Pacific Southern Resident 86
- -
Hawaii 349
Western North Atlantic unk
Gulf of Mexico Oceanic 49
Long-Beaked Common Dolphin
Delphinus capensis - - California 27,046
Long-finned Pilot Whale
Globicephala melas - - Western North Atlantic 12,619
Longman’s Beaked Whale
Indopacetus pacificus - - Hawaii 1,007
Melon-Headed Whale
Peponocephala electra
- -
Hawaii 2,950
Western North Atlantic unk
Gulf of Mexico Oceanic 2,283
82
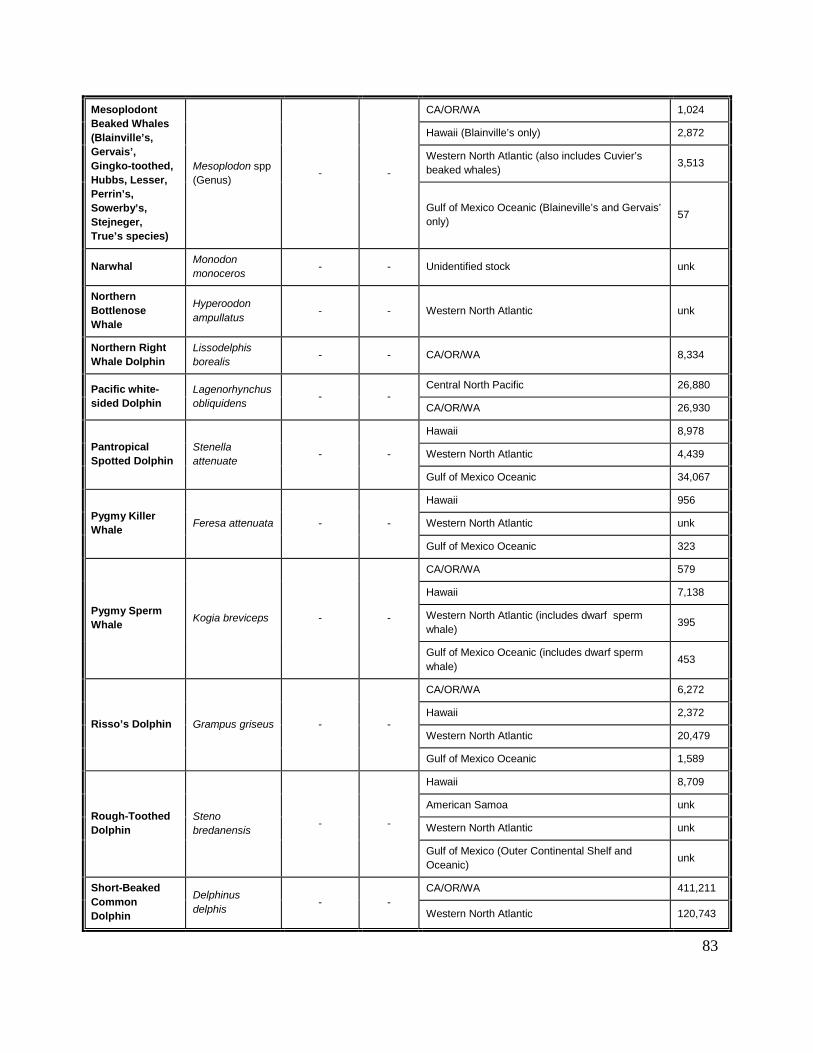
Mesoplodont Beaked Whales (Blainville’s, Gervais’, Gingko-toothed, Hubbs, Lesser, Perrin’s, Sowerby’s, Stejneger, True’s species)
Mesoplodon spp (Genus) - -
CA/OR/WA 1,024
Hawaii (Blainville’s only) 2,872
Western North Atlantic (also includes Cuvier’s beaked whales) 3,513
Gulf of Mexico Oceanic (Blaineville’s and Gervais’ only) 57
Narwhal Monodon monoceros - - Unidentified stock unk
Northern Bottlenose Whale
Hyperoodon ampullatus - - Western North Atlantic unk
Northern Right Whale Dolphin
Lissodelphis borealis - - CA/OR/WA 8,334
Pacific white-sided Dolphin
Lagenorhynchus obliquidens - -
Central North Pacific 26,880
CA/OR/WA 26,930
Pantropical Spotted Dolphin
Stenella attenuate - -
Hawaii 8,978
Western North Atlantic 4,439
Gulf of Mexico Oceanic 34,067
Pygmy Killer Whale Feresa attenuata - -
Hawaii 956
Western North Atlantic unk
Gulf of Mexico Oceanic 323
Pygmy Sperm Whale Kogia breviceps - -
CA/OR/WA 579
Hawaii 7,138
Western North Atlantic (includes dwarf sperm whale) 395
Gulf of Mexico Oceanic (includes dwarf sperm whale)
453
Risso’s Dolphin Grampus griseus - -
CA/OR/WA 6,272
Hawaii 2,372
Western North Atlantic 20,479
Gulf of Mexico Oceanic 1,589
Rough-Toothed Dolphin
Steno bredanensis - -
Hawaii 8,709
American Samoa unk
Western North Atlantic unk
Gulf of Mexico (Outer Continental Shelf and Oceanic) unk
Short-Beaked Common Dolphin
Delphinus delphis - -
CA/OR/WA 411,211
Western North Atlantic 120,743
83
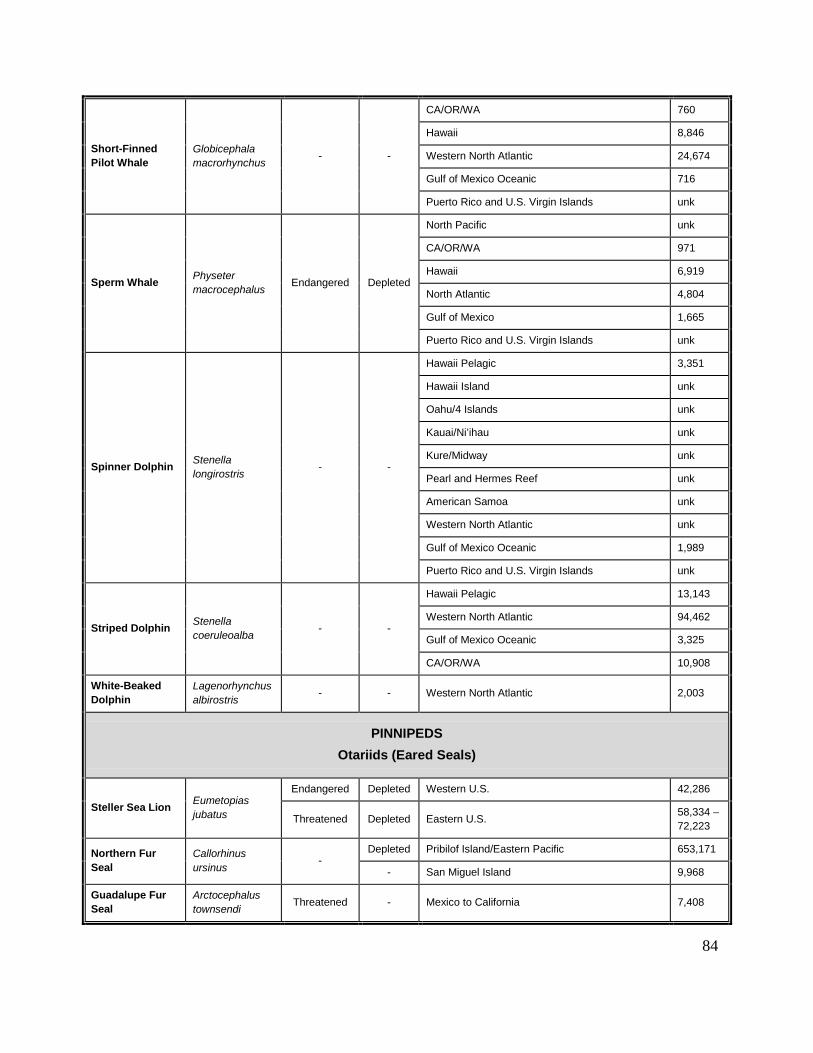
Short-Finned Pilot Whale
Globicephala macrorhynchus - -
CA/OR/WA 760
Hawaii 8,846
Western North Atlantic 24,674
Gulf of Mexico Oceanic 716
Puerto Rico and U.S. Virgin Islands unk
Sperm Whale Physeter macrocephalus Endangered Depleted
North Pacific unk
CA/OR/WA 971
Hawaii 6,919
North Atlantic 4,804
Gulf of Mexico 1,665
Puerto Rico and U.S. Virgin Islands unk
Spinner Dolphin Stenella longirostris - -
Hawaii Pelagic 3,351
Hawaii Island unk
Oahu/4 Islands unk
Kauai/Ni’ihau unk
Kure/Midway unk
Pearl and Hermes Reef unk
American Samoa unk
Western North Atlantic unk
Gulf of Mexico Oceanic 1,989
Puerto Rico and U.S. Virgin Islands unk
Striped Dolphin Stenella coeruleoalba - -
Hawaii Pelagic 13,143
Western North Atlantic 94,462
Gulf of Mexico Oceanic 3,325
CA/OR/WA 10,908
White-Beaked Dolphin
Lagenorhynchus albirostris - - Western North Atlantic 2,003
PINNIPEDS Otariids (Eared Seals)
Steller Sea Lion Eumetopias jubatus
Endangered Depleted Western U.S. 42,286
Threatened Depleted Eastern U.S. 58,334 –72,223
Northern Fur Seal
Callorhinus ursinus
- Depleted Pribilof Island/Eastern Pacific 653,171
- San Miguel Island 9,968
Guadalupe Fur Seal
Arctocephalus townsendi Threatened - Mexico to California 7,408
84
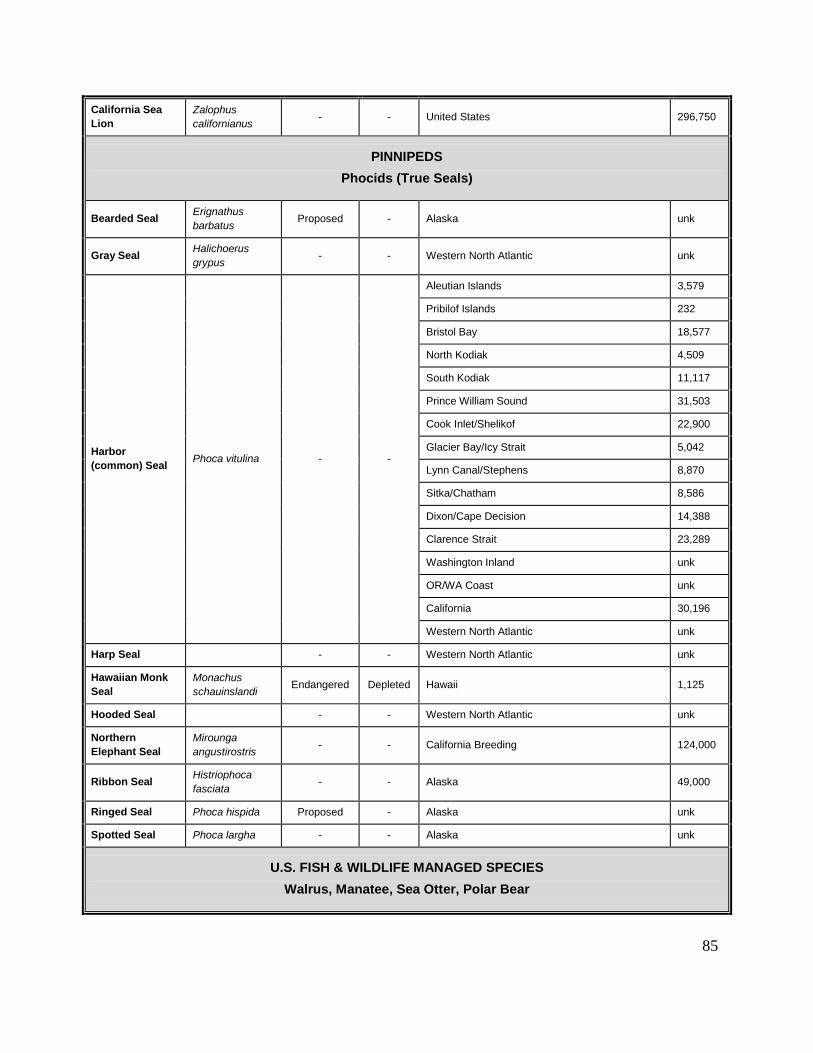
California Sea Lion
Zalophus californianus - - United States 296,750
PINNIPEDS Phocids (True Seals)
Bearded Seal Erignathus barbatus Proposed - Alaska unk
Gray Seal Halichoerus grypus - - Western North Atlantic unk
Harbor (common) Seal Phoca vitulina - -
Aleutian Islands 3,579
Pribilof Islands 232
Bristol Bay 18,577
North Kodiak 4,509
South Kodiak 11,117
Prince William Sound 31,503
Cook Inlet/Shelikof 22,900
Glacier Bay/Icy Strait 5,042
Lynn Canal/Stephens 8,870
Sitka/Chatham 8,586
Dixon/Cape Decision 14,388
Clarence Strait 23,289
Washington Inland unk
OR/WA Coast unk
California 30,196
Western North Atlantic unk
Harp Seal - - Western North Atlantic unk
Hawaiian Monk Seal
Monachus schauinslandi Endangered Depleted Hawaii 1,125
Hooded Seal - - Western North Atlantic unk
Northern Elephant Seal
Mirounga angustirostris - - California Breeding 124,000
Ribbon Seal Histriophoca fasciata - - Alaska 49,000
Ringed Seal Phoca hispida Proposed - Alaska unk
Spotted Seal Phoca largha - - Alaska unk
U.S. FISH & WILDLIFE MANAGED SPECIES Walrus, Manatee, Sea Otter, Polar Bear
85
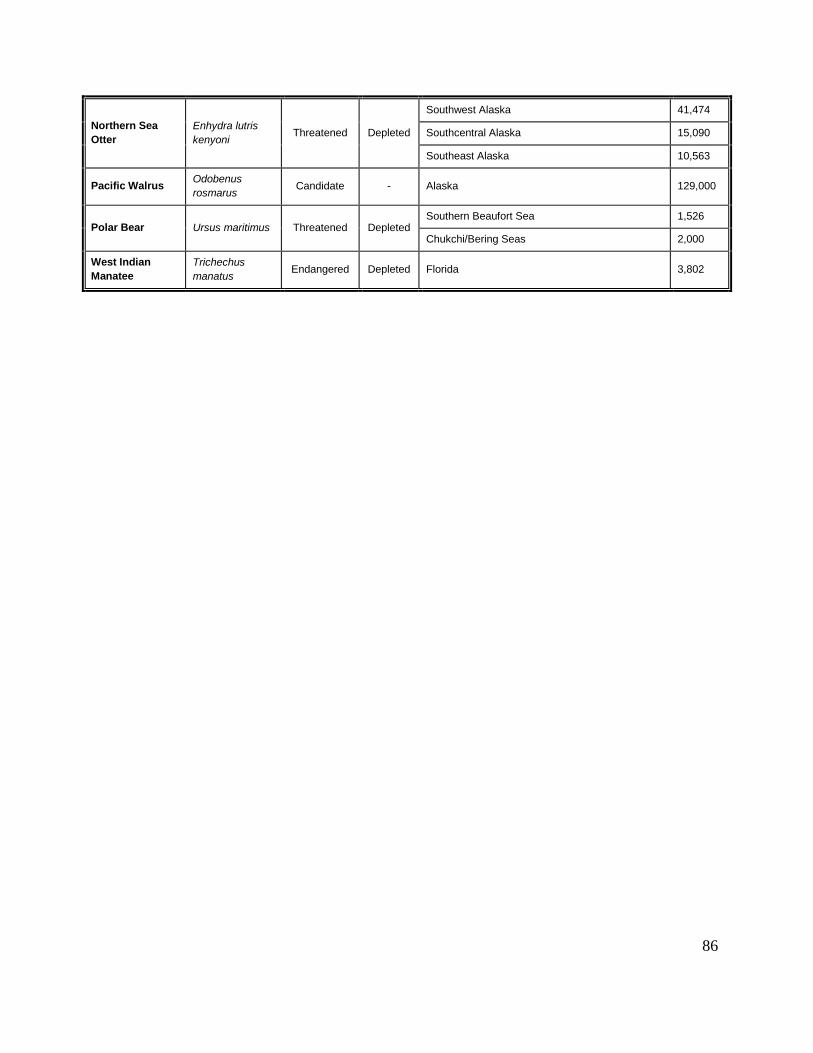
Northern Sea Otter
Enhydra lutris kenyoni Threatened Depleted
Southwest Alaska 41,474
Southcentral Alaska 15,090
Southeast Alaska 10,563
Pacific Walrus Odobenus rosmarus Candidate - Alaska 129,000
Polar Bear Ursus maritimus Threatened Depleted Southern Beaufort Sea 1,526
Chukchi/Bering Seas 2,000
West Indian Manatee
Trichechus manatus Endangered Depleted Florida 3,802
86
Appendix E – Marine Mammals Likely To Be Located in Project Areas Descriptions of marine mammal species listed below are condensed versions of more detailed characterizations found on the NMFS/Office of Protected Resources website (NOAA 2011e) The following species are likely to be located in Coast Survey project areas based on their geographic distribution and their occurrence in coastal, nearshore, or continental shelf waters. Deeper marine mammal species (several of the odontocetes) are described briefly in Appendix F. CETACEANS - MYSTICETES Blue Whale Blue whales are found in all oceans around the world, in coastal and oceanic waters, although they are primarily a deep water species. Blue whales are rarely seen in U.S. Atlantic waters. In the summer and fall, the Eastern North Pacific stock of whales feed along the continental shelf break, slope, and upwelling regions from California to Alaska. Most animals migrate south to Mexico and Central America in the winter for breeding and calving, although some blue whales are residential and remain off the coast of California year round. Blue whales are an ESA-listed Endangered and MMPA-listed Depleted species. Bowhead Whale Bowhead whales are distributed in seasonally ice-covered waters of the Arctic and near-Arctic between 60° N and 70° N. The Western Arctic population is the only stock found within U.S waters. Bowhead whales are closely associated with the sea ice. The majority of the Western Arctic stock migrates annually from wintering areas (November to March) in the northern Bering Sea, through the Chukchi Sea in the spring (March through June), to the Beaufort Sea, where they spend much of the summer (mid-May through September) before returning again to the Bering Sea in the fall (September through November) to overwinter. Bowhead whales are an ESA-listed Endangered and MMPA-listed Depleted species. Bryde’s Whale Bryde’s whales are distributed in tropical and subtropical waters worldwide. The Northern Gulf of Mexico stock is located in coastal, shelf, slope, and oceanic waters, and is believed to be a resident population. Gray Whale The Eastern North Pacific stock of gray whale is distributed between the Arctic Alaskan waters to California, primarily in harbors, lagoons, and nearshore, shallow shelf waters within two kilometers of the shore. In the summer, most animals feed near the polar ice break in the Beaufort and Chukchi Seas, although some gray whales feed in the Gulf of Alaska and Pacific Northwest. In the fall, animals migrate south to breeding and calving grounds off the coast of Baja California, returning north to feeding grounds in the spring.
87
Humpback Whale Humpback whales are found in all oceans around the world, in coastal and oceanic waters. Animals prefer to feed on the shelf break and continental slope, and travel along specific migration routes in deep water along coasts or submarine mountains. North Pacific stocks of humpback whales feed along the entire Pacific and Alaska Coast into the Bering Sea in the summer and breed in the winter in Hawaii. The Gulf of Maine stock of whales feed in the Gulf of Maine in the summer. Most humpback whales migrate to the West Indies to breed in winter, although some animals will continue feeding in the mid-Atlantic area in the winter. Humpback whales are an ESA-listed Endangered and MMPA-listed Depleted species. Minke Whale Minke whales in U.S. waters are found in the Pacific Ocean from the Chukchi Sea to California, and in the Atlantic Ocean from New England to the Gulf of Mexico, primarily in bays, estuaries, and continental shelf waters. This abundant species of baleen whale is highly migratory, feeding primarily in polar and subpolar waters in the spring and summer, and heading south to warmer waters in the winter, although minke whales can be found in all waters at all times of the year. North Atlantic Right Whale Right whales prefer temperate and subpolar latitudes in coastal and shallow shelf waters, with the North Atlantic species ranging from calving and breeding grounds in North Florida and Southern Georgia to feeding grounds in New England. Whales migrate between the feeding and breeding grounds, primarily in nearshore waters. North Atlantic right whales feed primarily on zooplankton, and their population numbers are concentrated around high food source locations year-round. There are ESA-designated Critical Habitat areas in Cape Cod Bay, Stellwagen Bank, and off the coast of Forth Florida and Southern Georgia. North Atlantic Right Whales are an ESA-listed Endangered and MMPA-listed Depleted species. North Pacific Right Whale The eastern stock of the North Pacific right whale is typically observed in the south Bering Sea, Aleutian Islands, and Gulf of Alaska in waters over the mid to outer continental shelf, with ESA-designated Critical Habitat areas in the southeast Bering Sea and in the Gulf of Alaska off the coast of Kodiak Island. Very little is known about breeding and calving locations. Abundance estimates are numbered in the tens for the eastern stock. North Pacific right whales are an ESA-listed Endangered and MMPA-listed Depleted species. CETACEANS – ODONTOCETES Atlantic Spotted Dolphin Atlantic spotted dolphins are found along the U.S. Atlantic coast south of southern New England and in the northern Gulf of Mexico, primarily in continental shelf waters between 20 and 200 meters, and occasionally in slope waters less than 500 meters. Inshore and coastal pods typically include 5-15 animals and are often seen bowriding along moving vessels.
88
Atlantic White-Sided Dolphin Atlantic white-sided dolphins are found along the U.S. Atlantic coast in temperate waters north of North Carolina, primarily in continental shelf and slope waters, moving closer inshore in the summer and offshore and south in the winter. This highly social species travels in groups of up to 500 animals. Breading season is from May to August, and most calves are born in June and July. Beluga Whale Beluga whales are found in shallow coastal waters, often in waters barely deep enough to cover their bodies, but have also been seen in deep waters. Beluga whales are distributed throughout seasonally ice-covered arctic and subarctic waters of the Northern Hemisphere. The Eastern Chukchi Sea stock’s summer distribution extends south into the waters near Kotzebue, AK. The Cook Inlet stock of Beluga whales is listed as ESA Endangered and MMPA Depleted. Bottlenose Dolphin Bottlenose dolphins are found in all U.S. Atlantic and Gulf of Mexico coastal and oceanic waters, and in Pacific coastal and oceanic waters south of Washington. Some coastal stocks migrate inshore into bays and estuaries. The Western North Atlantic Coastal stock of bottlenose dolphins is listed as Depleted under the MMPA. Dall’s Porpoise Dall’s Porpoises occur throughout the North Pacific Ocean, and are found in U.S. waters along the Pacific coast, from the Bering Sea in Alaska to California. Dall’s porpoises prefer shelf break, slope, and oceanic waters deeper than 180 meters. Dwarf Sperm Whale Dwarf sperm whales are a cosmopolitan species and can be found in the Atlantic and Pacific Oceans, including the Caribbean Sea and Gulf of Mexico. The species prefers continental shelf break and slope waters, but is occasionally found in waters over the continental shelf. Harbor Porpoise Harbor porpoises are found in coastal and inland waters, primarily over shelf waters in depths shallower than 150 meters, from Point Barrow and the Bering Strait in Alaska to southern California on the Pacific coast, and from Maine to North Carolina on the Atlantic coast. Pacific harbor porpoises typically do not migrate extensively. In the Atlantic, the Bay of Fundy stock is concentrated off the coast of Maine from July to September, between Maine and New Jersey from October to December and April to June, and between New Jersey and North Carolina from January to March, although some animals remain in Maine and Canadian waters year-round. Killer Whale Killer whales are one of the most abundant and highly distributed marine mammal species in U.S waters, with population stocks located in Alaska from the Beaufort, Chukchi, and Bering Seas to Southeast Alaska, in Washington intercoastal waterways, along the Pacific and Atlantic coasts, and in the Gulf of Mexico. Animals are found on shelf, break, slope, and oceanic waters, except for the northern Gulf of Mexico stock, where killer whales are primarily observed in shelf break
89
or slope waters. Killer whale stocks can be resident, transient or offshore. The Southern Resident stock of killer whales is listed as Endangered under the ESA and Depleted under the MMPA, with Critical Habitat located in the Puget Sound. The Alaska AT1 Transient population is also listed as Depleted under the MMPA. Long-Beaked Common Dolphin Long-beaked common dolphins prefer shallow, tropical, subtropical and warmer temperate waters closer to the coast and on the continental shelf. Within U.S. waters, the California stock of long-beaked common dolphins is typically found within 50 nautical miles of the coast, from central to southern California. Long-beaked dolphins are usually found in large social groups averaging from 100-500 animals, and will often approach ships to bow ride for long periods of time. Pacific White-Sided Dolphin Pacific white-sided dolphins are found in temperate waters of the North Pacific, from the continental shelf to deep oceanic waters. In U.S. waters, the species extends from Bristol Bay and the Aleutian Islands in Alaska to California. Pacific white-sided dolphins are extremely playful and highly social animals, and are often observed bow riding and doing acrobatic somersaults. Pantropical Spotted Dolphin The pantropical spotted dolphin is distributed worldwide in tropical and some sub-tropical oceans. Although specific migratory patterns have not been clearly described, the animals appear to move inshore in the fall and winter months and offshore in the spring. Spotted dolphins spend the majority of their day waters100-300 meters. At night they dive into deeper waters to search for prey. Short-Beaked Common Dolphin In U.S. waters, this species is typically found in warm tropical to cool temperate slope and oceanic waters off the Pacific and Atlantic coasts, although animals have been known to frequent shallower waters. Short-Finned Pilot Whale Short-finned pilot whales are found off the Pacific and Atlantic coasts of the United States and in the Gulf of Mexico. Animals typically remain in deeper areas of sharp relief, such as shelf break or slope waters, but have been known to swim onto continental shelf waters in the Gulf of Mexico. Pilot whales tend to occupy areas of high relief or submerged banks. Because of the difficulty in distinguishing short-finned and long-finned pilot whales, the two species are often mistaken for one another. White-Beaked Dolphin In U.S. waters, white-beaked dolphins are found in cold temperate and subpolar waters in New England north of Massachusetts, both in inshore and offshore waters. Groups of white-beaked dolphins are usually found in groups from 5-50 animals, and are often seen bowriding along vessels.
90
PINNIPEDS Bearded Seal As the largest species of ice seal, bearded seals reside in Arctic waters and are commonly found with drifting sea ice. In Alaska waters, bearded seals are distributed over the continental shelf of the Bering, Chukchi, and Beaufort Seas. Many of the seals that winter in the Bering Sea move north through the Bering Strait from late April through June, and spend the summer along the ice edge in the Chukchi Sea. The overall summer distribution is quite broad, with seals rarely hauled out on land, and some seals may not follow the ice northward but remain in open-water areas of the Bering and Chukchi Seas. Bearded seals are proposed to be listed as Threatened under the ESA. California Sea Lion The U.S. stock of California sea lions is distributed from the United States-Mexico border to southwestern Canada, with breeding areas and rookeries located on islands off the coast of southern California. California sea lions typically reside in shallow coastal and estuarine waters and haul out on sandy beaches and marina docks. Gray Seal Gray seals are found in coastal waters. The Western North Atlantic stock ranges from New York to Labrador, although stranded gray seals have been sighted as far south as North Carolina. On land, gray seals inhabit rocky coasts and islands, sandbars, and ice shelves and icebergs. During mating, pupping, and molting, the animals gather into large groups. At sea, they are usually found alone or in small dispersed groups. Pups are born January-February in the western Atlantic Ocean. Guadalupe Fur Seal Guadalupe fur seals reside in the tropical waters of Southern California and Mexico. During breeding season, the seals are found in coastal rocky habitats and caves. Little is known about their whereabouts during the non-breeding season (May to September). Guadalupe fur seals are an ESA-listed Threatened and MMPA-listed Depleted species. Harbor (Common) Seal Harbor seals are found in nearshore and estuarine waters in Atlantic and Pacific waters, from Maine to North Carolina in the western Atlantic, and from the Bering Sea to southern California in the eastern Pacific. Harbor Seals are typically non-migratory, although animals south of New England off the Atlantic coast are observed only in fall, winter and spring, primarily in very shallow waters. Northern Elephant Seal Northern elephant seals are distributed along the Pacific coast, from the Aleutian Islands to southern California. Animals breed and give birth primarily on the sandy beaches of California offshore islands in the winter, and migrate north to Alaska, Washington, Oregon, and northern California waters to feed during the summer. When animals are not on land for breeding, giving
91
birth, and molting, northern elephant seals spend most of their time underwater during dives in shelf, slope, and oceanic waters. Northern Fur Seal The eastern Pacific stock of Northern fur seals is distributed from the Bering Sea to the coast of southern California. The seals spend most of the year at sea in shelf, slope, and high-relief waters, coming to shore only in the summer to haulout sites and rookeries on the Pribilof Islands in the Bering Sea. For the rest of the year, females and pups migrate south to the coasts of Washington, Oregon, and California, while males remain in colder waters in the Gulf of Alaska. Northern fur seals are not ESA-listed, although the eastern Pacific stock is considered Depleted under the MMPA. Ribbon Seal Ribbon seals inhabit the North Pacific Ocean and parts of the Arctic Ocean, including the Chukchi, eastern Siberian, and western Beaufort Seas. In Alaskan waters, ribbon seals are found primarily in the open sea and on the pack ice. Recent sightings suggest that many ribbon seals migrate into the Chukchi Sea for the summer. When the ice recedes and the breeding and molting seasons come to an end, ribbon seals move northward until the ice gets too thick and then remain in the water for the rest of the year. Little is known about the distribution of ribbon seals while they are pelagic. Ringed Seal Ringed seals reside in Arctic waters and are commonly associated with ice floes and pack ice. In Alaska, ringed seals are found throughout the Beaufort, Chukchi, and Bering Seas, as far south as Bristol Bay in years of extensive ice coverage. Animals prefer large floes, remaining in contact with sea ice most of the years, and pup on the ice in late winter and early spring. Ringed seals are an ESA Proposed Threatened species. Spotted Seal Spotted seals are distributed over continental shelf waters. Although primarily located in Arctic waters near the ice break, spotted seals are also found south of the Bering Strait, particularly in coastal haulout areas near the Pribilof Islands, Bristol Bay, and the eastern Aleutian Islands. Steller Sea Lion Steller sea lions are found in U.S. waters from the Aleutian Islands to California, with major rookeries and haulout sites in Southwest Alaska, the Gulf of Alaska, and off the coasts of Oregon and California. Steller sea lions are non-migratory, but will forage up to 15 nautical miles from land in nearshore and continental shelf waters up to 500 meter water depths. The Western U.S. population stock (west of 144° West) is listed as Endangered, and the Eastern U.S. population stock (east of 144° West) is listed as Threatened under the ESA. All Steller sea lions are listed as Depleted under the MMPA. ESA-designated Critical Habitat areas are defined for Steller sea lions as a 20 nautical mile buffer around all major haulouts and rookeries, associated terrestrial aquatic zones, and three offshore foraging areas.
92
FISH & WILDLIFE SERVICE MANAGED SPECIES Northern Sea Otter Northern sea otters are found in Alaskan waters off the coast of the Aleutian Islands, and in the Gulf of Alaska from the Alaskan Peninsula to Southeast Alaska, primarily in shallow, nearshore waters less than 20 meters deep. The southwest Alaska sea otter population is listed under the ESA as Threatened, with more than 5,000 square nautical miles of Critical Habitat designated from the western end of the Aleutian Islands chain to the lower western Cook Inlet, and includes the Kodiak Archipelago. All northern sea otter populations in the United States are listed as Depleted under the MMPA. Pacific Walrus The Pacific walrus is found in shallow continental shelf waters in the Bering and Chukchi Seas. Although most of the population migrates north of the Bering Strait during the summer months as the pack ice retreats, some concentrations of animals are found on coastal haulouts in the Bering Sea throughout the summer. The Pacific walrus is an ESA Candidate species. Polar Bear Polar bears are found in the Northern Hemisphere on the Arctic ice cap, spend most of their time in coastal areas, and are strongly associated with the movement of sea ice. Some polar bears may make extensive north-south migrations as the pack ice recedes northward in the spring and advances southward in the fall. They also may travel long distances during the breeding season to find mates or in search of food. Polar bear distribution is highly correlated to the abundance of ringed seals. The polar bear is an ESA-listed Threatened and MMPA-listed Depleted species, with Critical Habitat along the Alaskan coast in waters less than 300 meters and on Alaskan barrier islands in the northern Bering, Chukchi, and Beaufort Seas. West Indian Manatee The Florida subspecies of the West Indian Manatee is found in coastal and inshore waters in the Gulf of Mexico and off the southeast U.S. coast. Manatees migrate between warm water areas, swimming north in the warm summer months, occasionally as far north as the Chesapeake Bay, and south to the Gulf of Mexico and southeast coast of Florida during the winter. Animals leave saltwater areas frequently and swim inshore to obtain freshwater. The Florida subspecies of the West Indian Manatee is an ESA-listed Endangered and MMPA-listed Depleted species, with Critical Habitat areas designated along the Atlantic coast of Florida, and along the Gulf of Mexico coast of Florida south of Tampa.
93
Appendix F – Marine Mammals Unlikely to Be Located in Project Areas The marine mammal species listed below are unlikely to be found within Coast Survey project areas due to their preference for deeper waters far offshore from Coast Survey project areas (NOAA 2011b, Perrin et al. 2009). Additionally, some species below are located in Hawaii or in portions of the non-U.S. Arctic Ocean; Coast Survey does not plan to survey these areas over the next few years. The brief descriptions of deep water cetaceans below are condensed versions of more detailed characterizations found on the NMFS/Office of Protected Resources website (NOAA 2011b). CETACEANS Baird’s Beaked Whale Baird’s beaked whales are found in U.S. waters off the Pacific coast from California to Alaska as far north as the Bering Sea, migrating north and closer to shore during the summer, returning south and further offshore during winter. Clymene Dolphin In U.S. waters, Clymene dolphins are found in offshore deep waters of the Atlantic Ocean in depths of 250 – 5,000 meters from New Jersey to the Caribbean Sea. Cuvier’s Beaked Whale Cuvier’s beaked whales are a cosmopolitan species and can be found in the Atlantic and Pacific Oceans, including the Caribbean Sea, Gulf of Mexico, and Gulf of Alaska. The species prefers slope waters deeper than 1,000 meters. False Killer Whale In U.S. waters, false killer whales occur in Hawaii, the Pacific coast, southeast Atlantic coast, Gulf of Mexico, and Caribbean Sea. The species prefers tropical and temperate waters deeper than 1,000 meters. The Hawaii Insular stock of false killer whale is ESA Proposed Endangered. Fin Whale Fin whales are found primarily in oceanic waters. Fin whales are the most common large whale observed off the Atlantic coast of the United States, yet are rarely seen in the Gulf of Mexico. Pacific fin whale stocks in U.S. waters are distributed between the Bering Strait and California. Fin whales are an ESA-listed Endangered and MMPA-listed Depleted species. Fraser’s Dolphin Fraser’s dolphins occur off the coast of Florida and in the Gulf of Mexico and Caribbean Sea. The species prefers waters deeper than 1,000 meters, particularly in areas of upwelling.
94
Long-Finned Pilot Whale Long-finned pilot whales prefer deep pelagic temperate to subpolar oceanic waters. The portion of the Western North Atlantic stock located in U.S. waters is found from North Carolina to Maine. Pilot whales tend to occupy areas of high relief or submerged banks. Longman’s Beaked Whale In U.S. waters, this rare whale species is located throughout the Hawaiian Islands. The species prefers to inhabit pelagic waters deeper than 1,000 meters, and are often seen in groups of 10-20 animals. Melon-Headed Whale Melon-headed whales are located in tropical areas throughout the world. In U.S. waters, the species is located in Hawaii, Gulf of Mexico, and the Atlantic Coast, primarily in deep waters, and often are seen in groups of over 1,000 animals. Mesoplodont Beaked Whales (Blaineville’s, Gervais’, Gingko-toothed, Hubbs, Lesser, Perrin’s, Sowerby’s, Stejneger) As beaked whales often appear similar, these species of the genus mesoplodon are grouped together for characterization. Mesoplodont beaked whales are cosmopolitan and occur in all oceans around the world, primarily in deeper, offshore waters. Narwhal Narwhals are located in the Arctic Ocean. Although rare, narwhals are occasionally found in the Bering, Chukchi, and Beaufort Seas. Northern Bottlenose Whale In U.S. waters, northern bottlenose whales are found in deep, cold oceanic waters greater than 2,000 meters off the coast of New England. Northern Right Whale Dolphin Northern right whale dolphins are found primarily in slope waters off the Pacific Coast, from Washington to California, with some seasonal north-south migrations along the coast. Pygmy Killer Whale Pygmy killer whales prefer deep, tropical and subtropical waters. In U.S. waters, this species is found in Hawaii, Gulf of Mexico, and off the Atlantic coast. Pygmy Sperm Whale In U.S. waters, this species is most often found in slope and oceanic waters off the Pacific coast, Atlantic coast, and the Gulf of Mexico, often in small groups. Risso’s Dolphin Risso’s dolphins are found throughout the world in temperate, subtropical, and tropical waters on the continental slope and in depths greater than 1,000 meters.
95
Rough-Toothed Dolphin Rough-toothed dolphins are found throughout the world in deep, warmer temperate waters. In U.S. waters, this species includes two stocks, Hawaii and Northern Gulf of Mexico. Animals are often seen in groups of 10-20 and associate with other dolphin species. Sei Whale Sei whales in the eastern North Pacific Ocean are located off the coasts of Washington, Oregon, and California and primarily feed in waters near steep slopes, such as the continental shelf break or oceanic canyons. Very little is known about sei whale breeding and calving location preferences. Sei whales are an ESA-listed Endangered and MMPA-listed Depleted species. Sperm Whale Sperm whales are a widely distributed large whale species, and can be found in all U.S. waters in the Gulf of Mexico, Atlantic coast, and the Pacific Coast from the Bering Sea to California, primarily in shelf break, slope, and deep oceanic waters. Sperm whales are an ESA-listed Endangered and MMPA-listed Depleted species. Spinner Dolphin Spinner dolphins are typically found in deep waters; however, the Hawaii population is found in coastal waters, where they rest in bays and protected areas, during the day. The species is often seen leaping above water, and often occurs in groups of several hundred to several thousand animals. The eastern spinner dolphin stock is listed as Depleted under the MMPA. Striped Dolphin Striped dolphins are a cosmopolitan species found in tropical to warm temperate oceanic waters off the Pacific and Atlantic coasts and in the Gulf of Mexico. PINNIPEDS Harp Seal Harp seals are found primarily near pack ice in Arctic waters, with a range extending south to New Brunswick in the North Atlantic Ocean, although in recent years harp seals have been spotted in the winter further south in U.S. waters. Hawaiian Monk Seal Hawaiian monk seals live in the warm subtropical waters of Hawaii, with breeding populations throughout the Northwest Hawaiian Islands. Hooded Seal Hooded seals are found primarily in Arctic waters, with a range extending south to New Brunswick in the Atlantic Ocean, although hooded seals occasionally are spotted further south in U.S. waters. The seals are typically associated with the pack ice.
96
Appendix G – Descriptions of Endangered Species in Survey Area Descriptions of ESA-listed sea turtle, fish, plant and coral species below are condensed versions of more detailed characterizations found on the NMFS/Office of Protected Resources website (NOAA 2011d). Seabird descriptions below are based on more detailed characterizations found on the Alaska U.S. Fish & Wildlife Service endangered species website (2012), the Alaska Department of Fish and Game website (2012) and a 2006 biological evaluation submitted by Minerals Management Service (now Bureau of Ocean Energy Management) for Alaska seismic surveys (BOEMRE 2006). SEA TURTLES Green Sea Turtle In the Atlantic Ocean and Gulf of Mexico, green turtles are found in offshore and nearshore waters from Texas to Massachusetts, the U.S. Virgin Islands, and Puerto Rico. In the Pacific Ocean, green turtles are found primarily south of San Diego and around the Hawaiian Islands. Peak nesting season occurs in June and July on beaches. Juveniles feed offshore near the surface of the water, while adults feed on sea grass and algae in near shore. The Florida and Mexico colonies are listed as Endangered, while all other colonies are listed as Threatened. Critical Habitat is designated for green turtles in coastal waters around Culebra Island, Puerto Rico. Hawksbill Sea Turtle In the U.S, hawksbill turtles are located in the pelagic waters and coral reefs off the coast of Florida, and in the Gulf of Mexico and Caribbean Sea. Hawksbills use coral reef ledges for resting and return to the beaches where they were born for nesting. Major threats to the species include coral reef habitat loss, fishing gear entanglement, marine debris entanglement or ingestion, environmental contamination, and disease. All hawksbill sea turtles are listed as Endangered. Critical Habitat is designated for hawksbill turtles in coastal waters around Mona and Monito Islands, Puerto Rico. Kemp’s ridley Sea Turtle Kemp’s ridley turtles are distributed throughout the Gulf of Mexico and the U.S. Atlantic Coast, preferring muddy or sandy bottoms. Major threats to the species include fishing gear entanglement, marine debris entanglement or ingestion, environmental contamination, and disease. All Kemp’s ridley sea turtles are listed as Endangered. NMFS and USFWS are reviewing a petition for Kemp's ridley sea turtle Critical Habitat for nesting beaches along the Texas coast and marine habitats in the Gulf of Mexico and Atlantic Ocean. Leatherback Sea Turtle The largest turtle species in the world, leatherbacks inhabit the coastal and pelagic waters in the Caribbean, Gulf of Mexico, and the U.S. Atlantic coast. Major threats to the species include fishing gear entanglement, marine debris entanglement or ingestion, environmental contamination, and disease. All leatherback sea turtles are listed as Endangered. Critical Habitat is designated for leatherback sea turtles in the coastal waters near Sandy Point, St. Croix, U.S.
97
Virgin Islands. Additional Critical Habitat is proposed for portions of the West Coast and Puerto Rico. Loggerhead Sea Turtle In the U.S. loggerhead turtles occur in the Atlantic, Pacific, Gulf of Mexico, and Caribbean in temperate and tropical waters. Loggerheads occupy beaches during nesting before moving into coastal and oceanic waters as juveniles and adults. Major threats to the species include fishing gear entanglement, marine debris entanglement or ingestion, environmental contamination, and disease. The Northwest Atlantic Ocean Distinct Population Segment (DPS) is listed as Threatened, and the North Pacific Ocean DPS is listed as Endangered. Olive Ridley Sea Turtle A small but abundant sea turtle species, olive ridley turtles are located in pelagic and coastal waters in the tropical regions of the Atlantic and Pacific coasts. Major threats to the species include fishing gear entanglement, marine debris entanglement or ingestion, environmental contamination, and disease. The Mexico’s Pacific coast breeding colonies are listed as Endangered, while all other colonies are listed as Threatened. MARINE AND ANADROMOUS FISHES Atlantic Salmon (Gulf of Maine) Atlantic Salmon spend their first two-three years in freshwater, migrate to the ocean for two-three years, and then return to freshwater rivers to spawn. Each spring, migrating Gulf of Maine DPS Atlantic Salmon leave the Maine rivers to spend a couple years feeding off the coast of Newfoundland, Labrador, and Greenland before returning to the Maine freshwater river. Major threats to the species include acidified water, aquaculture, bird predation, climate change, poor water quality, incidental capture, and loss of habitat connectivity. The Gulf of Maine DPS is listed as Endangered. Critical Habitat is designated for the Gulf of Maine DPS in the freshwater rivers and estuaries connected to the waters off the coast of Maine. Atlantic Sturgeon Atlantic sturgeon spend most of their lives in coastal waters and estuaries when not spawning in shallow areas with gravel and sand bottoms, and are distributed from Maine to north Florida. Major threats to the species include incidental bycatch, habitat degradation from dredging, locks, and dams, and vessel strikes. The Gulf of Maine DPS is proposed to be listed as Threatened, and the New York Bight, Chesapeake Bay, Carolina, and South Atlantic DPS are proposed to be listed as Endangered. Chinook Salmon (Central Valley Spring-run, Puget Sound, and Sacramento River Winter-run) Chinook salmon in the U.S. are found from the Bering Strait to southern California. Juveniles live in freshwater for up to two years before migrating to estuaries and ocean waters where they live as adults. Chinook salmon return to freshwater to spawn once before they die. The Central Valley Spring-run and Puget Sound Evolutionarily Significant Units (ESUs) are listed as
98
Threatened, and the Sacramento River Winter-run ESU is listed as Endangered. Critical Habitat is designated for all ESA-listed Chinook salmon ESUs in Washington, Oregon, and California. Chum Salmon (Hood Canal Summer-run) Chum salmon in the U.S. are found from the Arctic Ocean to southern California. The salmon migrate immediately after hatching into estuaries and ocean waters where they live as adults. Chum salmon return to freshwater to spawn once before they die. The Hood Canal Summer-run ESU is listed as Threatened. Critical Habitat is designated for all chum salmon in the Puget Sound and Columbia River. Coho Salmon (Central California Coast and Oregon Coast) Coho salmon in the U.S. are found from the Bering Sea to northern California. The salmon are born in freshwater streams, where they feed and spawn until they migrate out into estuaries and the ocean. The Central California Coast ESU is listed as Endangered, and the Oregon Coast ESU is listed as Threatened. Critical Habitat is designated for the Central California Coast and Oregon Coast coho salmon in the Columbia River and Oregon streams. Gulf Sturgeon Gulf sturgeon inhabit coastal rivers from Louisiana to Florida during the summer estuaries and bays connected to the Gulf of Mexico in the winter. Sturgeon migrate into rivers to spawn in the spring, then migrate back to the marine environment to forage. The entire species is listed as Threatened. Fourteen distinct river and estuary spawning areas are designated as Critical Habitat. Green Sturgeon (Southern) In North America, green sturgeon are located in oceanic waters, bays, and estuaries from San Francisco Bay to British Columbia, returning to freshwater only to spawn. Major threats include insufficient freshwater flow, contamination, bycatch, and impassable barriers. The Southern DPS is listed as Threatened, with Critical Habitat located from Washington to just south of San Francisco. Shortnose Sturgeon Shortnose sturgeon are found in and around most large river systems of the U.S. Atlantic coast in the nearshore marine, estuarine and riverine habitat. Major threats include habitat alteration from discharges, dredging, or disposal of material into rivers. The entire species is listed as Endangered. Smalltooth Sawfish Smalltooth sawfish are located in the Atlantic Ocean and Gulf of Mexico in the shallow, coastal waters and estuaries over muddy and sandy bottoms. Threats to the species include bycatch and loss of juvenile and nursery shallow water and mangrove habitat. The U.S. DPS is listed as Endangered. Critical Habitat is designated in southwest Florida.
99
Bocaccio (Georgia Basin) Bocaccio range from Baja California to the Gulf of Alaska, although they are most often found south of Oregon. The Puget Sound DPS is found south of Tacoma Narrows. Juveniles prefer shallow waters near reefs, kelp, and artificial structures, while adults prefer deeper, rocky bottoms. Bycatch is the most serious threat to this species. The Puget Sound/Georgia Basin DPS is listed as Endangered, and the Southern DPS (Northern California to Mexico) is listed as a Species of Concern. Yelloweye Rockfish (Georgia Basin) Yelloweye rockfish range from Baja California to the Aleutian Islands, although they are most often found between central California and the Gulf of Alaska. Juveniles prefer shallow waters near reefs, kelp, and artificial structures, while adults prefer deeper, rocky bottoms. Bycatch is the most serious threat to this species. The Puget Sound/Georgia Basin DPS is listed as Threatened. Canary Rockfish (Georgia Basin) Canary rockfish range from Baja California to the Western Gulf of Alaska, although they are most often found off the coast of central Oregon. Juveniles prefer shallow waters near reefs, kelp, and artificial structures, while adults prefer deeper, rocky bottoms. Bycatch is the most serious threat to this species. The Puget Sound/Georgia Basin DPS is listed as Threatened. Pacific Eulachon Pacific eulachon range from northern California to the Bering Sea, although they are most often found in the Columbia River. Eulachon prefer nearshore ocean waters up to 300 meters, returning to the streams where they were born to spawn over sand or coarse gravel bottoms. The Southern DPS is listed as Threatened. Critical Habitat is designated in the riverine and estuarine waters in California, Oregon, and Washington. Steelhead (Central California Coast, California Central Valley, Puget Sound, and Southern California) In the U.S, steelhead trout are located along the entire Pacific Coast. The Central California Coast, California Central Valley, Puget Sound DPS are listed as Threatened, and the Southern California DPS is listed as Endangered. Critical Habitat is designated for all steelhead trout in the rivers and estuaries associated with the Puget Sound, Columbia River, and California Coasts.
MARINE INVERTEBRATES AND PLANTS Elkhorn Coral Elkhorn coral is located on coral reefs in southern Florida and the Caribbean, with a northern distribution limit in Biscayne National Park, Florida. Colonies are important to reef growth and provide essential fish habitat. Elkhorn corals can be located in waters out to 20 meter depths, but prefer shallow waters in less than six meters, particularly in the fore reef and reef crest environments. Major threats to the species include disease, hurricanes, predation, bleaching, algae overgrowth, sedimentation, temperature and salinity variation, and low genetic diversity.
100
The entire species is listed as Threatened. Critical habitat is designated in the southeast Florida Atlantic coast, the Florida Keys, Puerto Rico and the U.S. Virgin Islands. Staghorn Coral Staghorn corals are found in the Florida Keys and the Caribbean, with a northern distribution limit in Boca Raton, Florida. Colonies are important to reef growth and provide essential fish habitat. Staghorn corals are located in fore reef and back reef environments in 0-30 meter depths. As with elkhorn coral, major threats to staghorn coral include disease, hurricanes, predation, bleaching, algae overgrowth, sedimentation, temperature and salinity variation, and low genetic diversity. The entire species is listed as Threatened. Critical habitat is designated in the southeast Florida Atlantic coast, the Florida Keys, Puerto Rico and the U.S. Virgin Islands. White Abalone White Abalone are bottom-dwelling gastropods located off the Pacific coast of southern California in the U.S. and Baja California in Mexico. White abalone are found in rocky waters such as open low and high relief rock interspersed with sand channels. Major threats to the species include overfishing, reproductive failure due to low densities, and infection. The entire species is listed as Endangered. Black Abalone Black Abalone are marine gastropods located off the Pacific coast of California the U.S. and Baja California in Mexico. Black abalone are found in rocky intertidal and subtidal habitats, often wedged into crevices or holes in the rocks. Major threats to the species include overfishing, disease, illegal harvest, and habitat destruction. The entire species is listed as Endangered. In October 2011, NMFS designated critical habitat for the black abalone within intertidal segments off the California coast and nearby islands. Johnson’s Seagrass Johnson’s seagrass is located off the Florida Atlantic coast from Biscayne Bay to Sebastian Inlet. This species of seagrass prefers coarse sand and muddy substrates and areas with high tidal currents and turbidity. Johnson’s seagrass provides an important food source for manatees and green sea turtles. Major threats to the species include propeller scarring, dredging, storm action and sedimentation, and degraded water quality. The entire species is listed as Threatened. Critical habitat is designated for Johnson’s seagrass in small portions in and around inlets, lagoons, and bays within its range in southeast Florida. SEABIRDS Kittlitz’s murrelet In the United States, this small (10 inches long) diving seabird species is located in Alaskan waters from Southeast Alaska to Point Barrow in the Chukchi Sea, with major population centers in Prince William Sound and Glacier Bay. Kittlitz’s murrelets prefer waters within 200 meters
101
of shore during the summer, returning to nest at higher elevations on land, and molt twice each year. Major threats to the species include habitat degradation and glacial retreat. Kittlitz’s murrelets are listed as a Candidate Species. Short-tailed albatross This large seabird is found near islands and mainland coastlines over the ocean from the Bering Sea and Gulf of Alaska to California, going to land only to nest. Major threats to the species include habitat loss within its main nesting colony on an active volcanic island in Japan, incidental mortality in fisheries from entanglement, and marine debris. The species is listed as Endangered throughout its range. Spectacled eider This large (20 inches long) sea duck is located along the Arctic Alaskan Coastal Plain east to the Alaska-Canadian border and during the summer, and in areas of unfrozen ocean in the Bering Sea south of St. Lawrence Island during the winter, with nesting grounds on St. Lawrence Island and in near the Yukon-Kuskokwim Delta. Animals molt along coastal areas in late summer and early fall, with major molting areas in Ledyard Bay in the northeastern Chukchi Sea and Norton Sound in the Bering Sea. Major threats to the species include habitat loss, hunting, predation, lead poisoning, and ecosystem change. Critical Habitat for the spectacled eider includes the Yukon-Kuskokwim Delta nesting area, the Ledyard Bay and Norton Sound molting areas, and the St. Matthew/St. Lawrence Island wintering area. The entire species is listed as Threatened throughout its range. Steller’s eider (North American Breeding) The Pacific portion of the North American breeding population of Steller’s eider, a shallow-diving sea duck, is found primarily in shallow, nearshore Alaskan waters from Cook Inlet in the winter to Prudhoe Bay in the summer. Major threats to the species include habitat loss, hunting, predation, lead poisoning, and ecosystem change. Critical Habitat for the Steller’s eider includes the Yukon-Kuskokwim Delta nesting areas, Kuskokwim Shoals fall molting and spring staging area, and several molting lagoons along the north coast of the Alaska Peninsula. The North American breeding population of Steller’s eider is listed as Threatened throughout its range. Yellow-billed loon Yellow-billed loons are found in Alaska from the North Slope in the summer to southwest, southcentral, and southeast Alaska nearshore waters. Loons are harvested by Alaska Natives in the Bering Strait and North Slope regions for their feathers, skin, and eggs. Major threats to the species include breeding habitat loss, overfishing, incidental mortality in fisheries, subsistence harvest, and predation. The yellow-billed loon is listed as a Candidate Species.
102
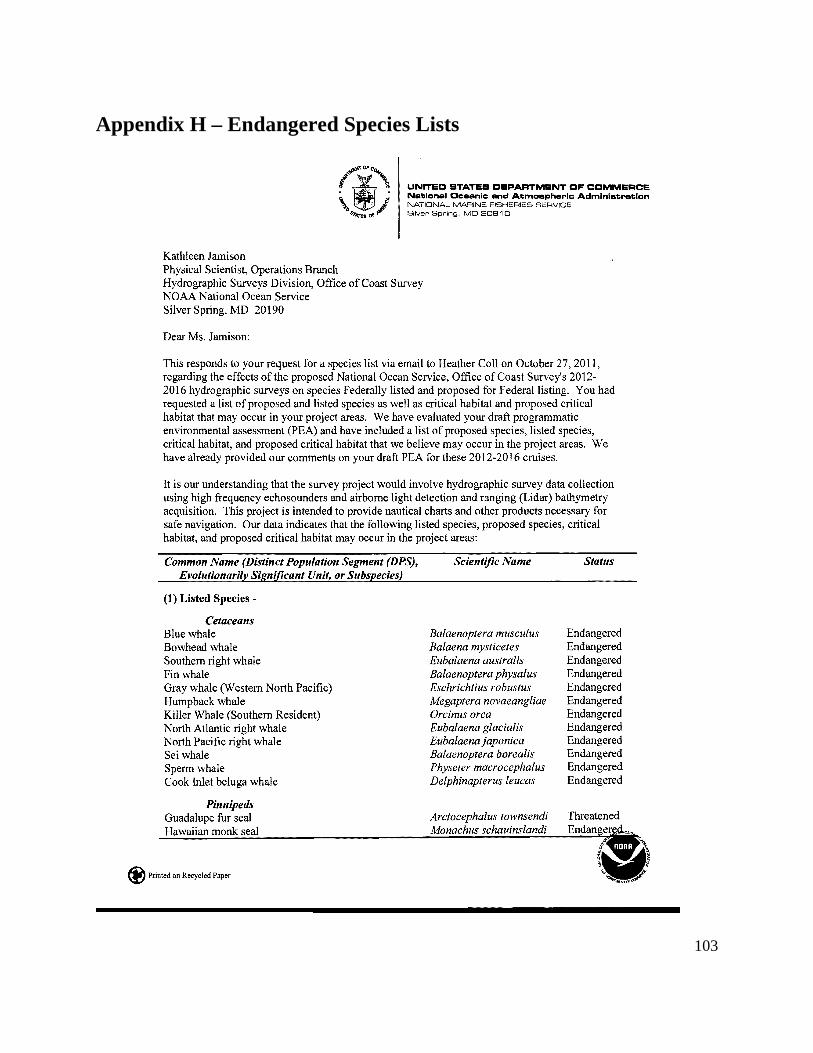
Appendix H – Endangered Species Lists
103
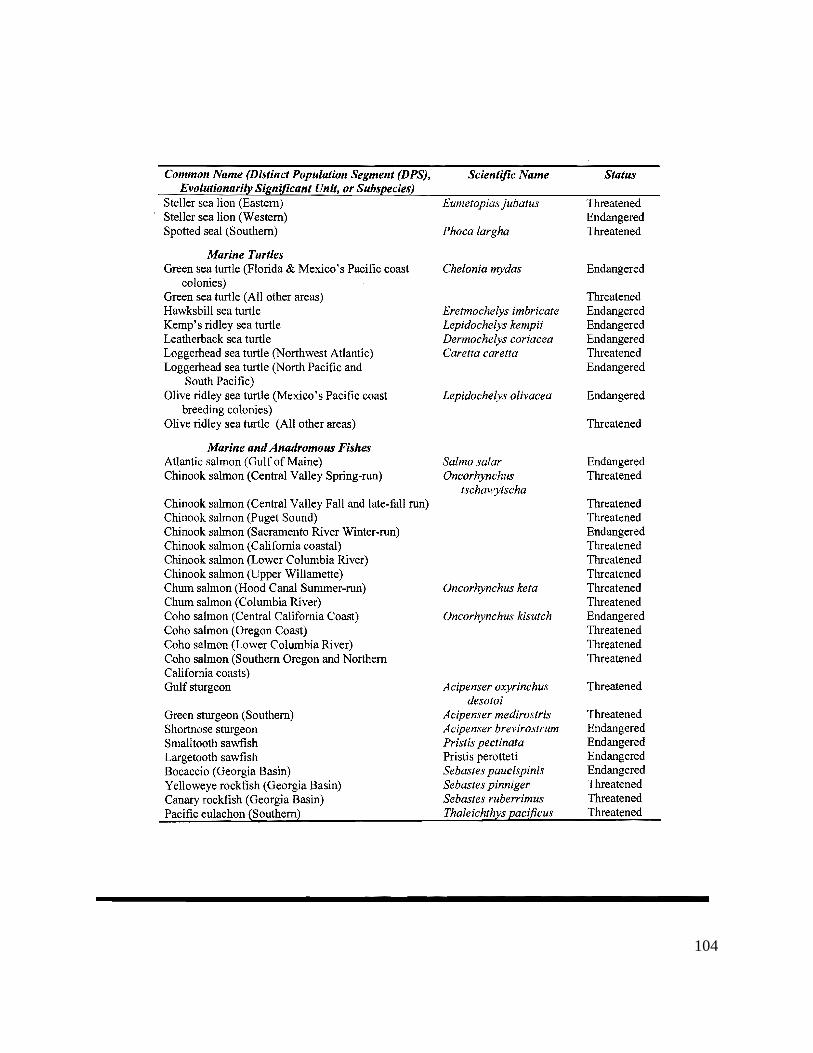
104
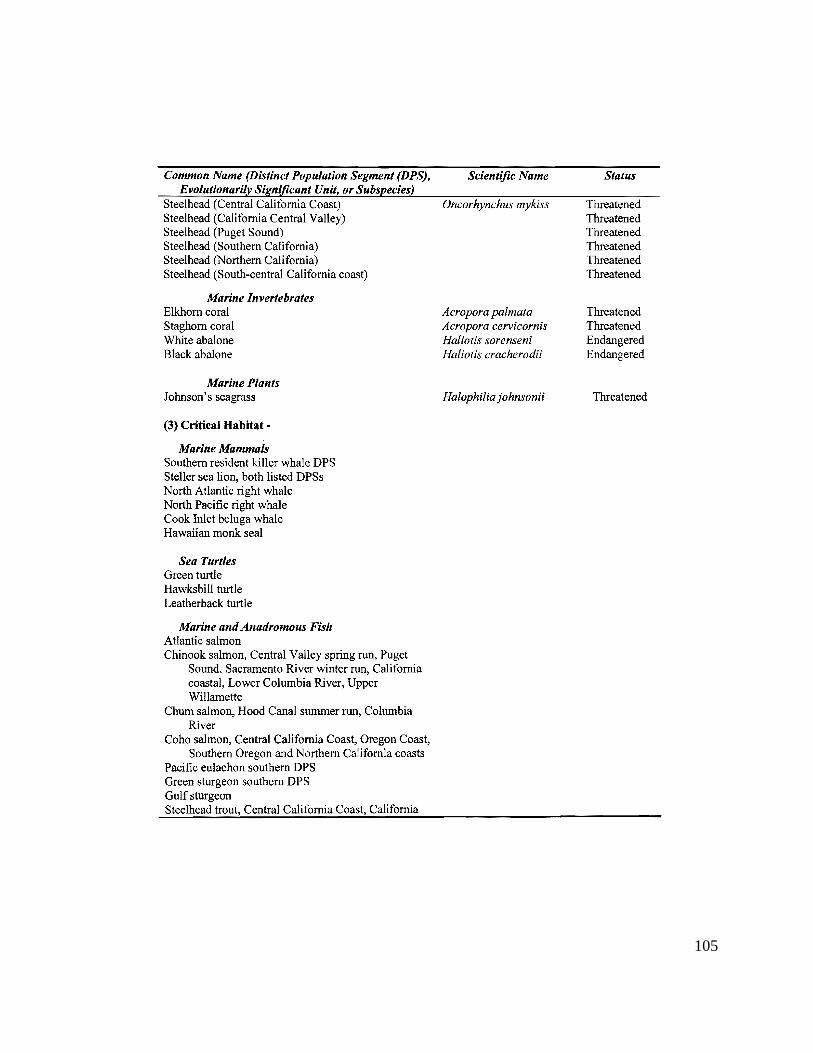
105
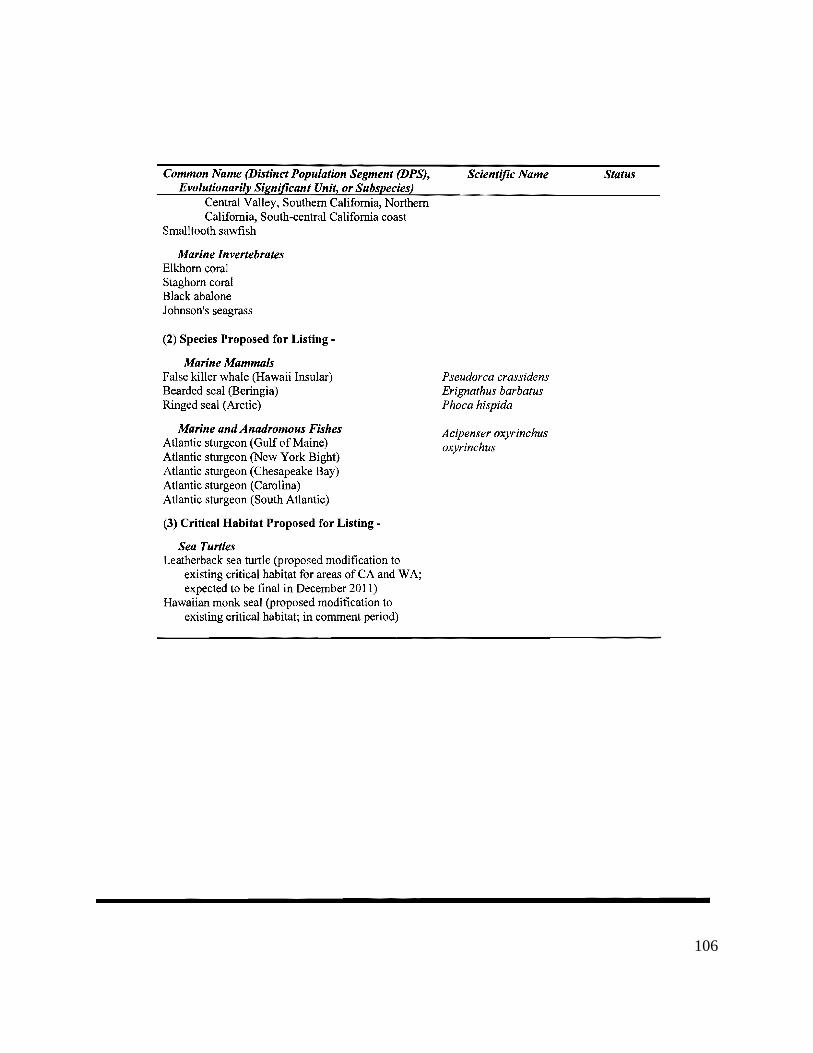
106
107
108
109
110
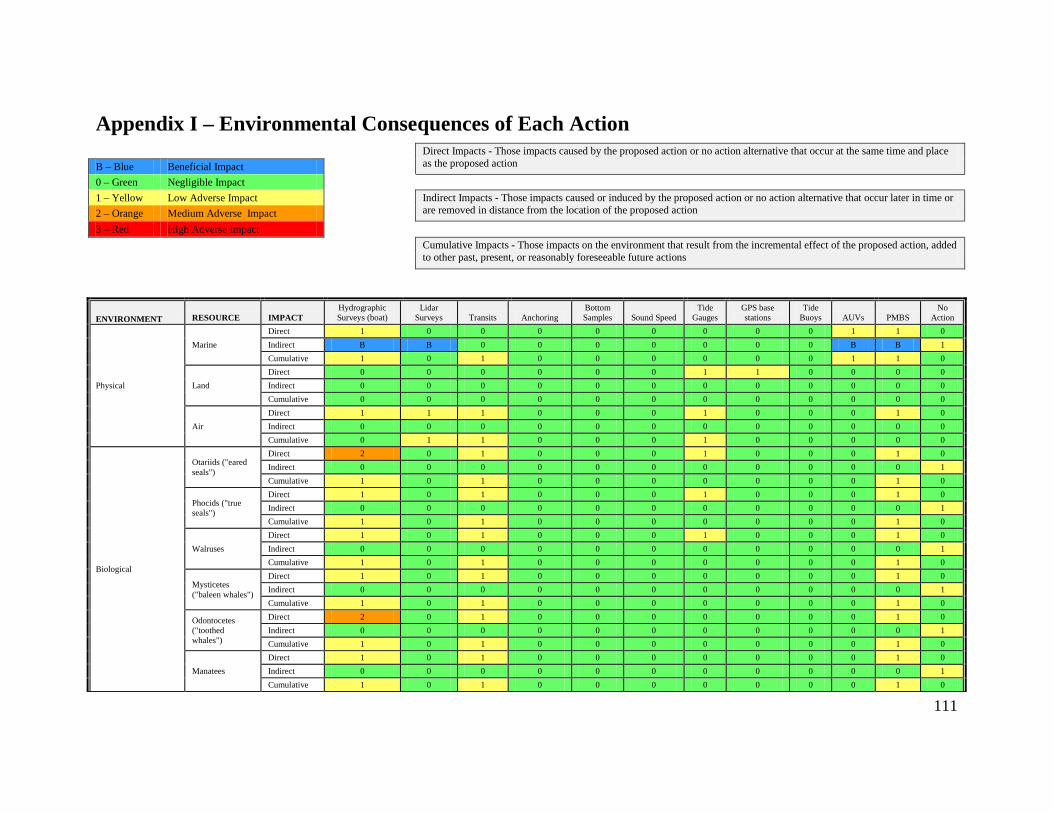
Appendix I – Environmental Consequences of Each Action Direct Impacts - Those impacts caused by the proposed action or no action alternative that occur at the same time and place
as the proposed action B – Blue Beneficial Impact 0 – Green Negligible Impact 1 – Yellow Low Adverse Impact Indirect Impacts - Those impacts caused or induced by the proposed action or no action alternative that occur later in time or
are removed in distance from the location of the proposed action 2 – Orange Medium Adverse Impact 3 – Red High Adverse Impact Cumulative Impacts - Those impacts on the environment that result from the incremental effect of the proposed action, added
to other past, present, or reasonably foreseeable future actions
ENVIRONMENT RESOURCE IMPACT Hydrographic Surveys (boat)
Lidar Surveys Transits Anchoring
Bottom Samples Sound Speed
Tide Gauges
GPS base stations
Tide Buoys AUVs PMBS
No Action
Physical
Marine Direct 1 0 0 0 0 0 0 0 0 1 1 0 Indirect B B 0 0 0 0 0 0 0 B B 1 Cumulative 1 0 1 0 0 0 0 0 0 1 1 0
Land Direct 0 0 0 0 0 0 1 1 0 0 0 0 Indirect 0 0 0 0 0 0 0 0 0 0 0 0 Cumulative 0 0 0 0 0 0 0 0 0 0 0 0
Air Direct 1 1 1 0 0 0 1 0 0 0 1 0 Indirect 0 0 0 0 0 0 0 0 0 0 0 0 Cumulative 0 1 1 0 0 0 1 0 0 0 0 0
Biological
Otariids ("eared seals")
Direct 2 0 1 0 0 0 1 0 0 0 1 0 Indirect 0 0 0 0 0 0 0 0 0 0 0 1 Cumulative 1 0 1 0 0 0 0 0 0 0 1 0
Phocids ("true seals")
Direct 1 0 1 0 0 0 1 0 0 0 1 0 Indirect 0 0 0 0 0 0 0 0 0 0 0 1 Cumulative 1 0 1 0 0 0 0 0 0 0 1 0
Walruses Direct 1 0 1 0 0 0 1 0 0 0 1 0 Indirect 0 0 0 0 0 0 0 0 0 0 0 1 Cumulative 1 0 1 0 0 0 0 0 0 0 1 0
Mysticetes ("baleen whales")
Direct 1 0 1 0 0 0 0 0 0 0 1 0 Indirect 0 0 0 0 0 0 0 0 0 0 0 1 Cumulative 1 0 1 0 0 0 0 0 0 0 1 0
Odontocetes ("toothed whales")
Direct 2 0 1 0 0 0 0 0 0 0 1 0 Indirect 0 0 0 0 0 0 0 0 0 0 0 1 Cumulative 1 0 1 0 0 0 0 0 0 0 1 0
Manatees Direct 1 0 1 0 0 0 0 0 0 0 1 0 Indirect 0 0 0 0 0 0 0 0 0 0 0 1 Cumulative 1 0 1 0 0 0 0 0 0 0 1 0
111
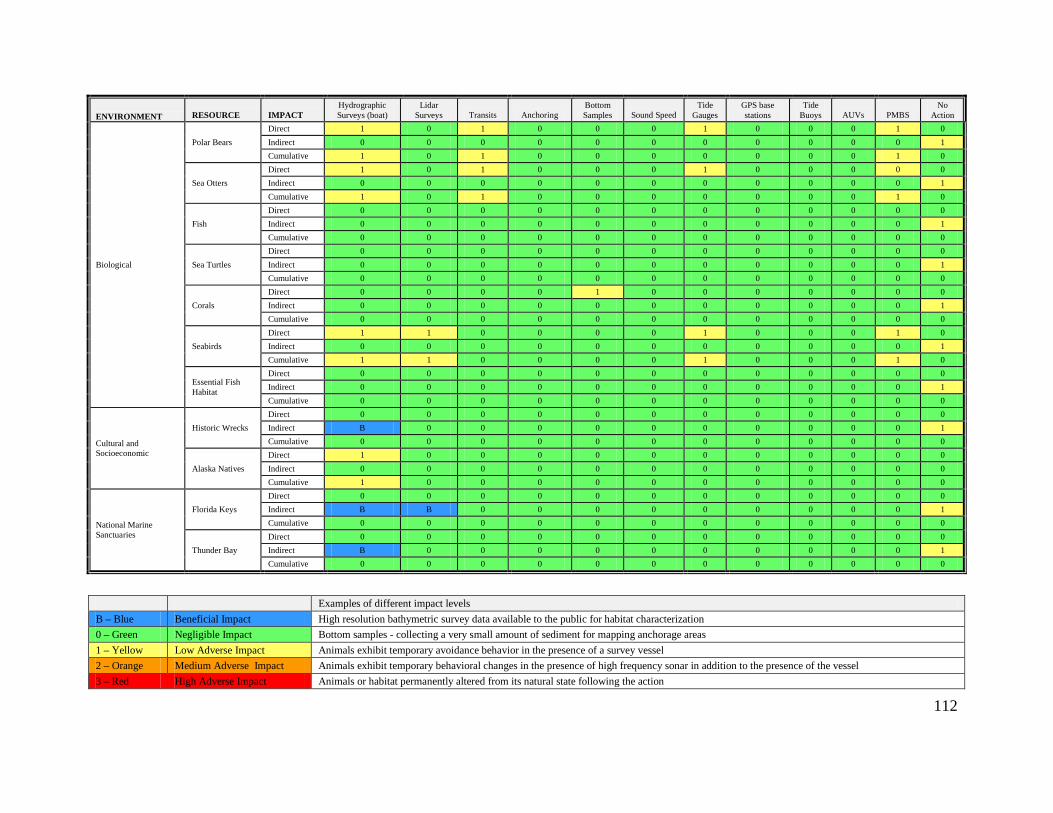
ENVIRONMENT RESOURCE IMPACT Hydrographic Surveys (boat)
Lidar Surveys Transits Anchoring
Bottom Samples Sound Speed
Tide Gauges
GPS base stations
Tide Buoys AUVs PMBS
No Action
Biological
Polar Bears Direct 1 0 1 0 0 0 1 0 0 0 1 0 Indirect 0 0 0 0 0 0 0 0 0 0 0 1 Cumulative 1 0 1 0 0 0 0 0 0 0 1 0
Sea Otters Direct 1 0 1 0 0 0 1 0 0 0 0 0 Indirect 0 0 0 0 0 0 0 0 0 0 0 1 Cumulative 1 0 1 0 0 0 0 0 0 0 1 0
Fish Direct 0 0 0 0 0 0 0 0 0 0 0 0 Indirect 0 0 0 0 0 0 0 0 0 0 0 1 Cumulative 0 0 0 0 0 0 0 0 0 0 0 0
Sea Turtles Direct 0 0 0 0 0 0 0 0 0 0 0 0 Indirect 0 0 0 0 0 0 0 0 0 0 0 1 Cumulative 0 0 0 0 0 0 0 0 0 0 0 0
Corals Direct 0 0 0 0 1 0 0 0 0 0 0 0 Indirect 0 0 0 0 0 0 0 0 0 0 0 1 Cumulative 0 0 0 0 0 0 0 0 0 0 0 0
Seabirds Direct 1 1 0 0 0 0 1 0 0 0 1 0 Indirect 0 0 0 0 0 0 0 0 0 0 0 1 Cumulative 1 1 0 0 0 0 1 0 0 0 1 0
Essential Fish Habitat
Direct 0 0 0 0 0 0 0 0 0 0 0 0 Indirect 0 0 0 0 0 0 0 0 0 0 0 1 Cumulative 0 0 0 0 0 0 0 0 0 0 0 0
Cultural and Socioeconomic
Historic Wrecks Direct 0 0 0 0 0 0 0 0 0 0 0 0 Indirect B 0 0 0 0 0 0 0 0 0 0 1 Cumulative 0 0 0 0 0 0 0 0 0 0 0 0
Alaska Natives Direct 1 0 0 0 0 0 0 0 0 0 0 0 Indirect 0 0 0 0 0 0 0 0 0 0 0 0 Cumulative 1 0 0 0 0 0 0 0 0 0 0 0
National Marine Sanctuaries
Florida Keys Direct 0 0 0 0 0 0 0 0 0 0 0 0 Indirect B B 0 0 0 0 0 0 0 0 0 1 Cumulative 0 0 0 0 0 0 0 0 0 0 0 0
Thunder Bay Direct 0 0 0 0 0 0 0 0 0 0 0 0 Indirect B 0 0 0 0 0 0 0 0 0 0 1 Cumulative 0 0 0 0 0 0 0 0 0 0 0 0
Examples of different impact levels B – Blue Beneficial Impact High resolution bathymetric survey data available to the public for habitat characterization 0 – Green Negligible Impact Bottom samples - collecting a very small amount of sediment for mapping anchorage areas 1 – Yellow Low Adverse Impact Animals exhibit temporary avoidance behavior in the presence of a survey vessel 2 – Orange Medium Adverse Impact Animals exhibit temporary behavioral changes in the presence of high frequency sonar in addition to the presence of the vessel 3 – Red High Adverse Impact Animals or habitat permanently altered from its natural state following the action
112
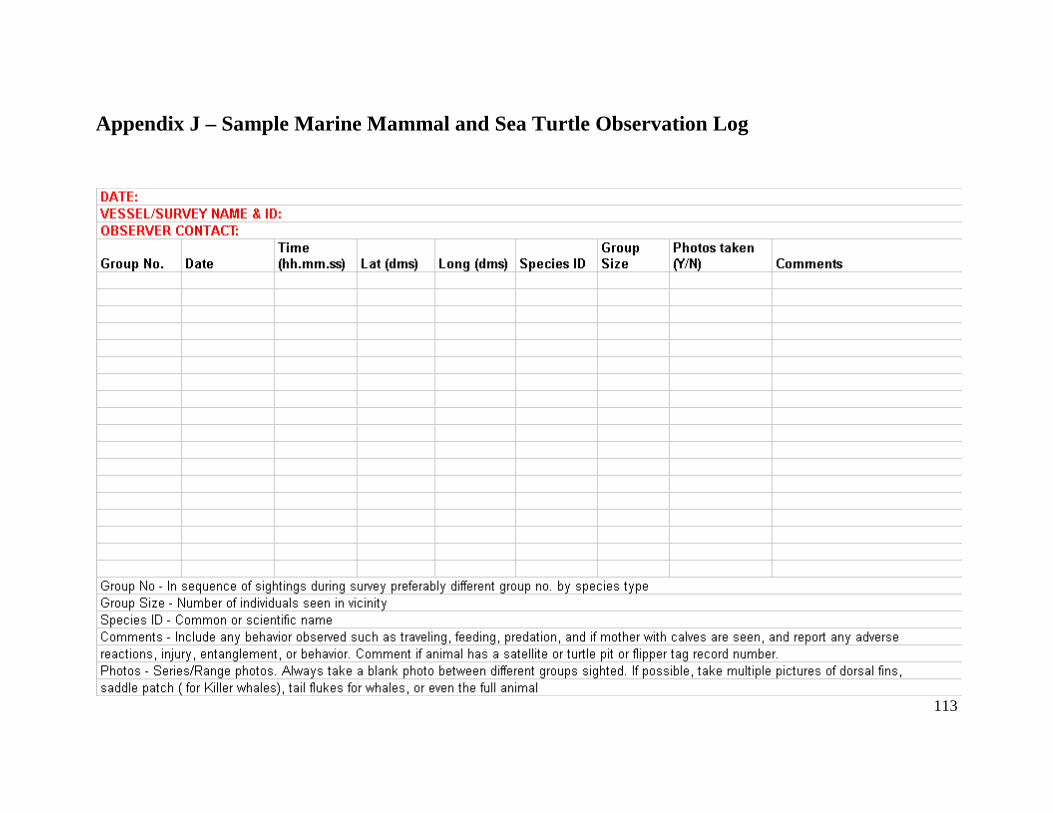
Appendix J – Sample Marine Mammal and Sea Turtle Observation Log
113
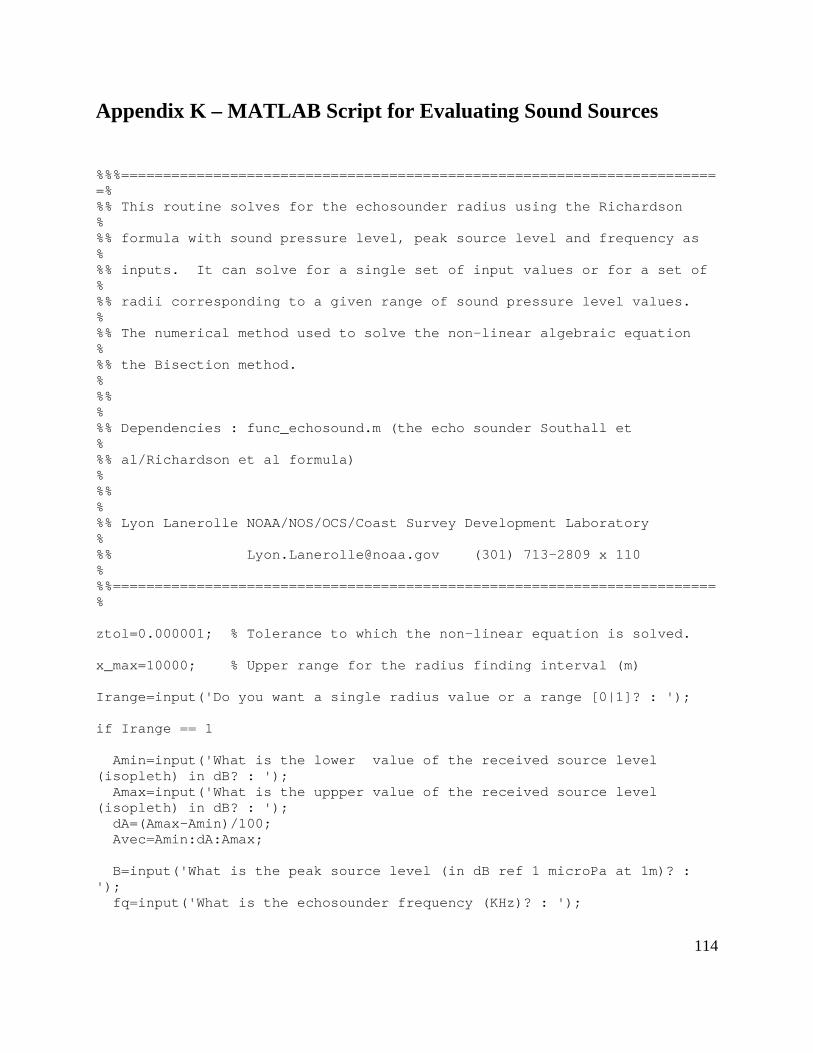
Appendix K – MATLAB Script for Evaluating Sound Sources %%%========================================================================% %% This routine solves for the echosounder radius using the Richardson % %% formula with sound pressure level, peak source level and frequency as % %% inputs. It can solve for a single set of input values or for a set of % %% radii corresponding to a given range of sound pressure level values. % %% The numerical method used to solve the non-linear algebraic equation % %% the Bisection method. % %% % %% Dependencies : func_echosound.m (the echo sounder Southall et % %% al/Richardson et al formula) % %% % %% Lyon Lanerolle NOAA/NOS/OCS/Coast Survey Development Laboratory % %% [email protected] (301) 713-2809 x 110 % %%========================================================================% ztol=0.000001; % Tolerance to which the non-linear equation is solved. x_max=10000; % Upper range for the radius finding interval (m) Irange=input('Do you want a single radius value or a range [0|1]? : '); if Irange == 1 Amin=input('What is the lower value of the received source level (isopleth) in dB? : '); Amax=input('What is the uppper value of the received source level (isopleth) in dB? : '); dA=(Amax-Amin)/100; Avec=Amin:dA:Amax; B=input('What is the peak source level (in dB ref 1 microPa at 1m)? : '); fq=input('What is the echosounder frequency (KHz)? : ');
114
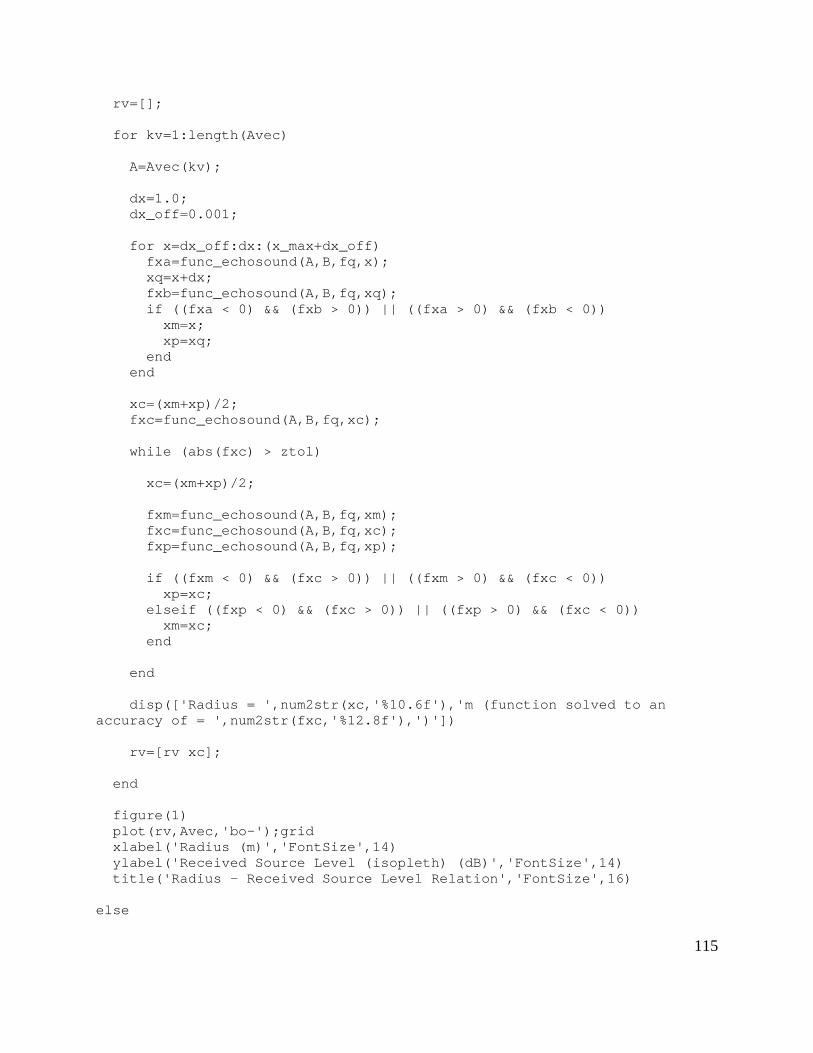
rv=[]; for kv=1:length(Avec) A=Avec(kv); dx=1.0; dx_off=0.001; for x=dx_off:dx:(x_max+dx_off) fxa=func_echosound(A,B,fq,x); xq=x+dx; fxb=func_echosound(A,B,fq,xq); if ((fxa < 0) && (fxb > 0)) || ((fxa > 0) && (fxb < 0)) xm=x; xp=xq; end end xc=(xm+xp)/2; fxc=func_echosound(A,B,fq,xc); while (abs(fxc) > ztol) xc=(xm+xp)/2; fxm=func_echosound(A,B,fq,xm); fxc=func_echosound(A,B,fq,xc); fxp=func_echosound(A,B,fq,xp); if ((fxm < 0) && (fxc > 0)) || ((fxm > 0) && (fxc < 0)) xp=xc; elseif ((fxp < 0) && (fxc > 0)) || ((fxp > 0) && (fxc < 0)) xm=xc; end end disp(['Radius = ',num2str(xc,'%10.6f'),'m (function solved to an accuracy of = ',num2str(fxc,'%12.8f'),')']) rv=[rv xc]; end figure(1) plot(rv,Avec,'bo-');grid xlabel('Radius (m)','FontSize',14) ylabel('Received Source Level (isopleth) (dB)','FontSize',14) title('Radius - Received Source Level Relation','FontSize',16) else
115
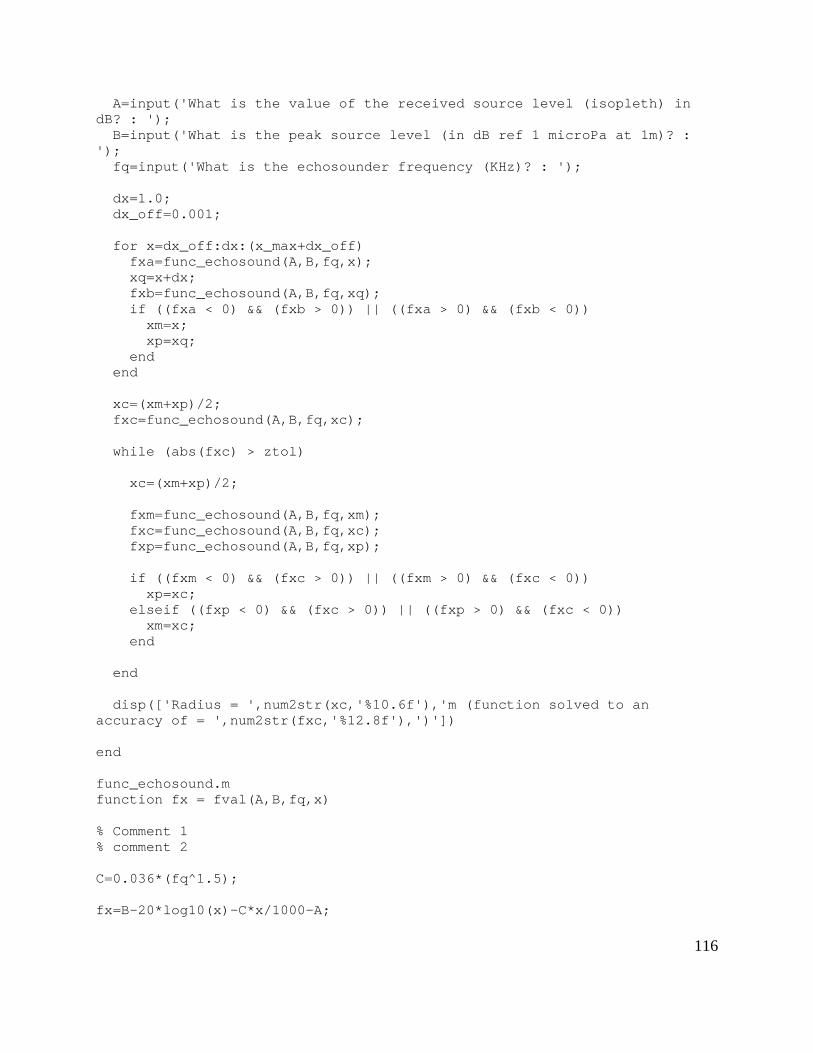
A=input('What is the value of the received source level (isopleth) in dB? : '); B=input('What is the peak source level (in dB ref 1 microPa at 1m)? : '); fq=input('What is the echosounder frequency (KHz)? : '); dx=1.0; dx_off=0.001; for x=dx_off:dx:(x_max+dx_off) fxa=func_echosound(A,B,fq,x); xq=x+dx; fxb=func_echosound(A,B,fq,xq); if ((fxa < 0) && (fxb > 0)) || ((fxa > 0) && (fxb < 0)) xm=x; xp=xq; end end xc=(xm+xp)/2; fxc=func_echosound(A,B,fq,xc); while (abs(fxc) > ztol) xc=(xm+xp)/2; fxm=func_echosound(A,B,fq,xm); fxc=func_echosound(A,B,fq,xc); fxp=func_echosound(A,B,fq,xp); if ((fxm < 0) && (fxc > 0)) || ((fxm > 0) && (fxc < 0)) xp=xc; elseif ((fxp < 0) && (fxc > 0)) || ((fxp > 0) && (fxc < 0)) xm=xc; end end disp(['Radius = ',num2str(xc,'%10.6f'),'m (function solved to an accuracy of = ',num2str(fxc,'%12.8f'),')']) end func_echosound.m function fx = fval(A,B,fq,x) % Comment 1 % comment 2 C=0.036*(fq^1.5); fx=B-20*log10(x)-C*x/1000-A;
116
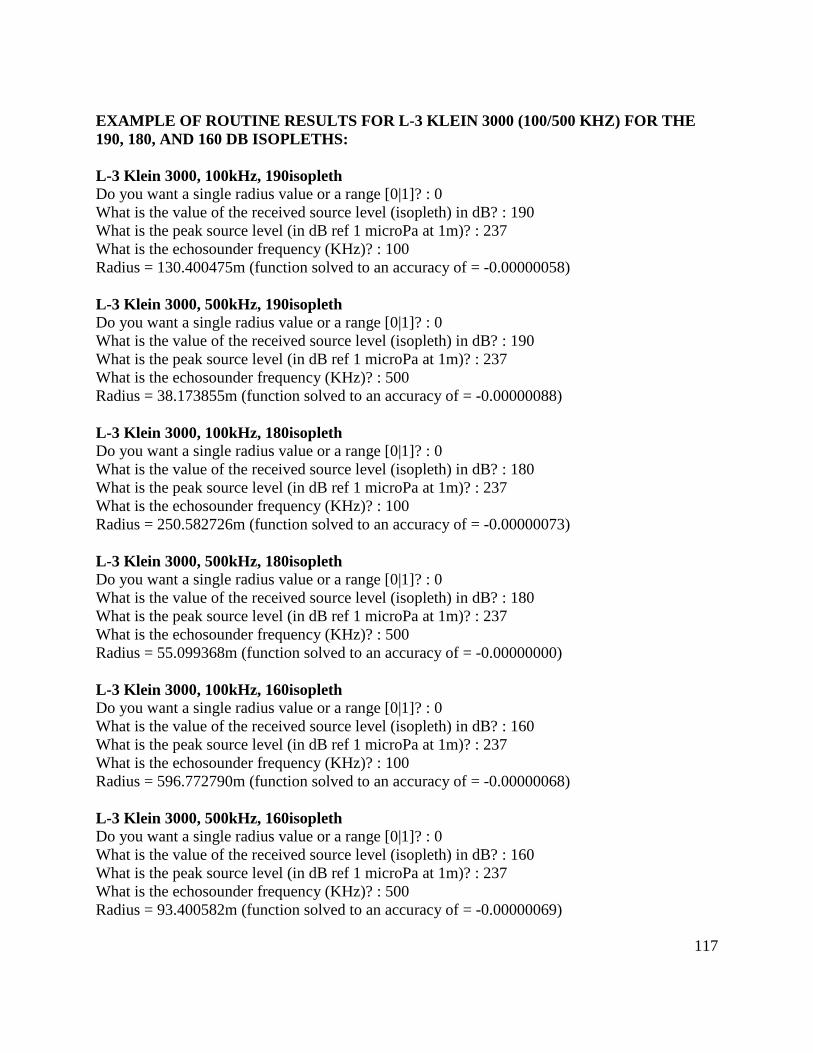
EXAMPLE OF ROUTINE RESULTS FOR L-3 KLEIN 3000 (100/500 KHZ) FOR THE 190, 180, AND 160 DB ISOPLETHS: L-3 Klein 3000, 100kHz, 190isopleth Do you want a single radius value or a range [0|1]? : 0 What is the value of the received source level (isopleth) in dB? : 190 What is the peak source level (in dB ref 1 microPa at 1m)? : 237 What is the echosounder frequency (KHz)? : 100 Radius = 130.400475m (function solved to an accuracy of = -0.00000058) L-3 Klein 3000, 500kHz, 190isopleth Do you want a single radius value or a range [0|1]? : 0 What is the value of the received source level (isopleth) in dB? : 190 What is the peak source level (in dB ref 1 microPa at 1m)? : 237 What is the echosounder frequency (KHz)? : 500 Radius = 38.173855m (function solved to an accuracy of = -0.00000088) L-3 Klein 3000, 100kHz, 180isopleth Do you want a single radius value or a range [0|1]? : 0 What is the value of the received source level (isopleth) in dB? : 180 What is the peak source level (in dB ref 1 microPa at 1m)? : 237 What is the echosounder frequency (KHz)? : 100 Radius = 250.582726m (function solved to an accuracy of = -0.00000073) L-3 Klein 3000, 500kHz, 180isopleth Do you want a single radius value or a range [0|1]? : 0 What is the value of the received source level (isopleth) in dB? : 180 What is the peak source level (in dB ref 1 microPa at 1m)? : 237 What is the echosounder frequency (KHz)? : 500 Radius = 55.099368m (function solved to an accuracy of = -0.00000000) L-3 Klein 3000, 100kHz, 160isopleth Do you want a single radius value or a range [0|1]? : 0 What is the value of the received source level (isopleth) in dB? : 160 What is the peak source level (in dB ref 1 microPa at 1m)? : 237 What is the echosounder frequency (KHz)? : 100 Radius = 596.772790m (function solved to an accuracy of = -0.00000068) L-3 Klein 3000, 500kHz, 160isopleth Do you want a single radius value or a range [0|1]? : 0 What is the value of the received source level (isopleth) in dB? : 160 What is the peak source level (in dB ref 1 microPa at 1m)? : 237 What is the echosounder frequency (KHz)? : 500 Radius = 93.400582m (function solved to an accuracy of = -0.00000069)
117
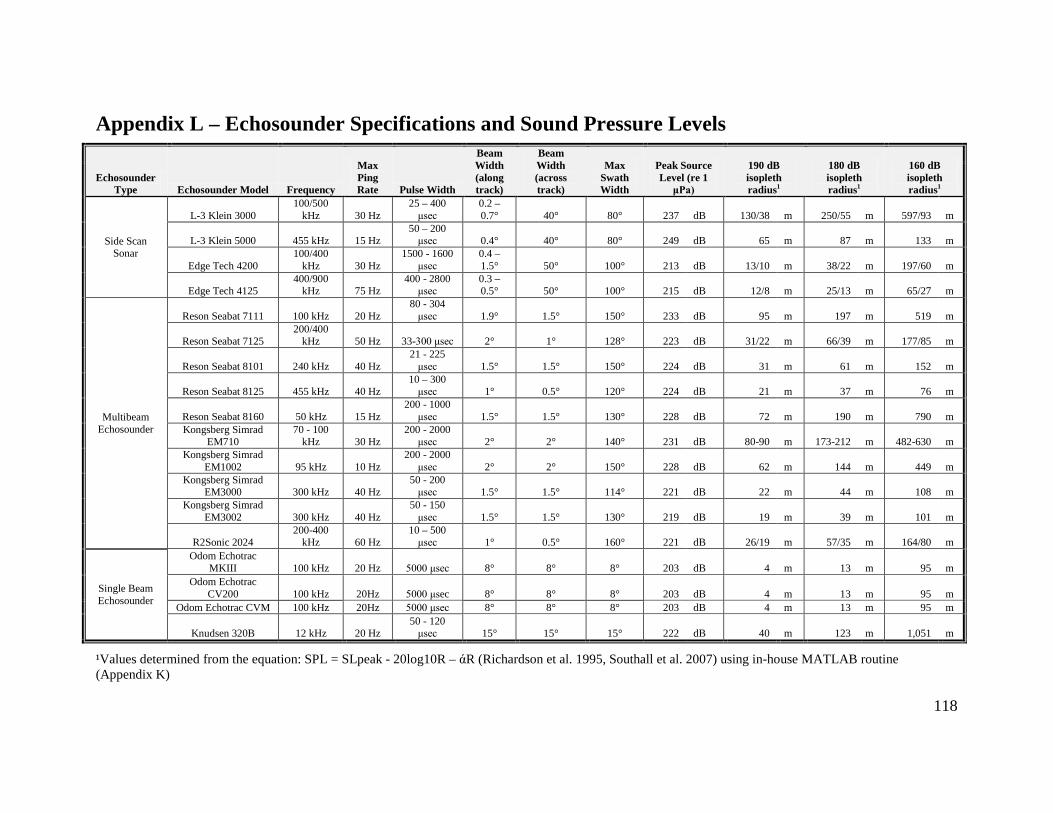
Appendix L – Echosounder Specifications and Sound Pressure Levels
Echosounder Type Echosounder Model Frequency
Max Ping Rate Pulse Width
Beam Width (along track)
Beam Width (across track)
Max Swath Width
Peak Source Level (re 1
μPa)
190 dB isopleth radius1
180 dB isopleth radius1
160 dB isopleth radius1
Side Scan Sonar
L-3 Klein 3000 100/500
kHz 30 Hz 25 – 400
μsec 0.2 – 0.7° 40° 80° 237 dB 130/38 m 250/55 m 597/93 m
L-3 Klein 5000 455 kHz 15 Hz 50 – 200
μsec 0.4° 40° 80° 249 dB 65 m 87 m 133 m
Edge Tech 4200 100/400
kHz 30 Hz 1500 - 1600
μsec 0.4 – 1.5° 50° 100° 213 dB 13/10 m 38/22 m 197/60 m
Edge Tech 4125 400/900
kHz 75 Hz 400 - 2800
μsec 0.3 – 0.5° 50° 100° 215 dB 12/8 m 25/13 m 65/27 m
Multibeam Echosounder
Reson Seabat 7111 100 kHz 20 Hz 80 - 304
μsec 1.9° 1.5° 150° 233 dB 95 m 197 m 519 m
Reson Seabat 7125 200/400
kHz 50 Hz 33-300 μsec 2° 1° 128° 223 dB 31/22 m 66/39 m 177/85 m
Reson Seabat 8101 240 kHz 40 Hz 21 - 225
μsec 1.5° 1.5° 150° 224 dB 31 m 61 m 152 m
Reson Seabat 8125 455 kHz 40 Hz 10 – 300
μsec 1° 0.5° 120° 224 dB 21 m 37 m 76 m
Reson Seabat 8160 50 kHz 15 Hz 200 - 1000
μsec 1.5° 1.5° 130° 228 dB 72 m 190 m 790 m Kongsberg Simrad
EM710 70 - 100
kHz 30 Hz 200 - 2000
μsec 2° 2° 140° 231 dB 80-90 m 173-212 m 482-630 m Kongsberg Simrad
EM1002 95 kHz 10 Hz 200 - 2000
μsec 2° 2° 150° 228 dB 62 m 144 m 449 m Kongsberg Simrad
EM3000 300 kHz 40 Hz 50 - 200
μsec 1.5° 1.5° 114° 221 dB 22 m 44 m 108 m Kongsberg Simrad
EM3002 300 kHz 40 Hz 50 - 150
μsec 1.5° 1.5° 130° 219 dB 19 m 39 m 101 m
R2Sonic 2024 200-400
kHz 60 Hz 10 – 500
μsec 1° 0.5° 160° 221 dB 26/19 m 57/35 m 164/80 m
Single Beam Echosounder
Odom Echotrac MKIII 100 kHz 20 Hz 5000 μsec 8° 8° 8° 203 dB 4 m 13 m 95 m
Odom Echotrac CV200 100 kHz 20Hz 5000 μsec 8° 8° 8° 203 dB 4 m 13 m 95 m
Odom Echotrac CVM 100 kHz 20Hz 5000 μsec 8° 8° 8° 203 dB 4 m 13 m 95 m
Knudsen 320B 12 kHz 20 Hz 50 - 120
μsec 15° 15° 15° 222 dB 40 m 123 m 1,051 m
¹Values determined from the equation: SPL = SLpeak - 20log10R – άR (Richardson et al. 1995, Southall et al. 2007) using in-house MATLAB routine (Appendix K)
118
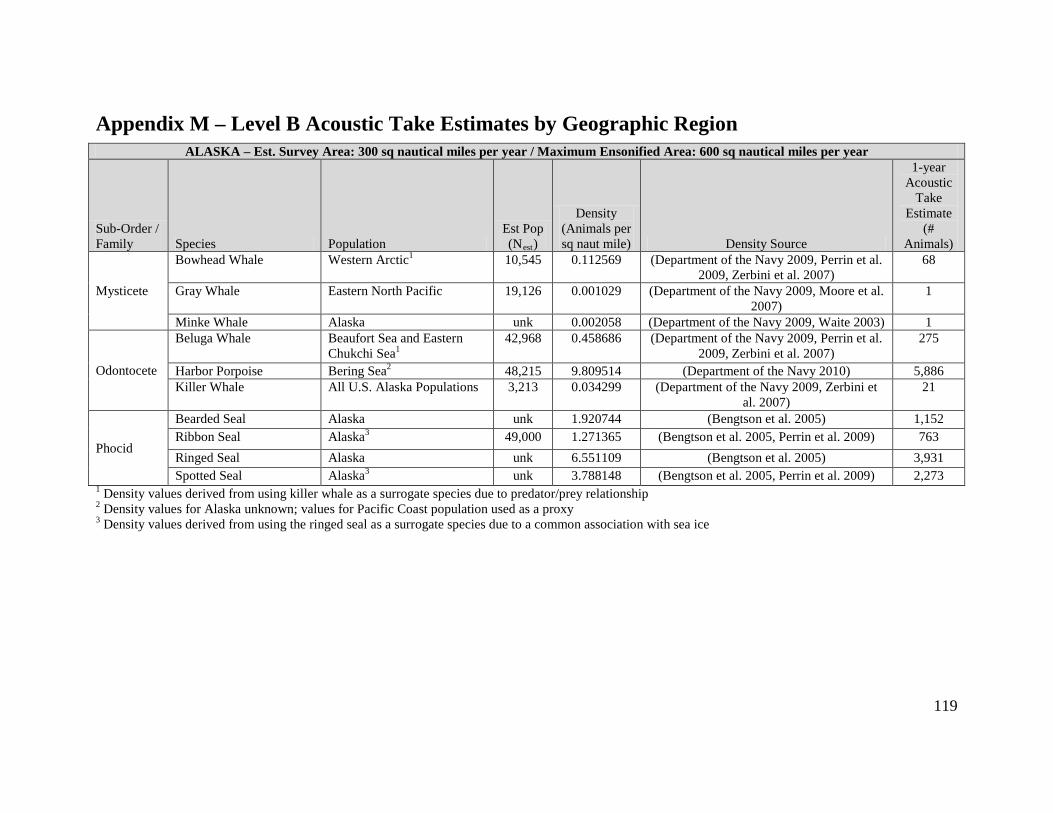
Appendix M – Level B Acoustic Take Estimates by Geographic Region ALASKA – Est. Survey Area: 300 sq nautical miles per year / Maximum Ensonified Area: 600 sq nautical miles per year
Sub-Order / Family Species Population
Est Pop (Nest)
Density (Animals per sq naut mile) Density Source
1-year Acoustic
Take Estimate
(# Animals)
Mysticete
Bowhead Whale Western Arctic1 10,545 0.112569 (Department of the Navy 2009, Perrin et al. 2009, Zerbini et al. 2007)
68
Gray Whale Eastern North Pacific 19,126 0.001029 (Department of the Navy 2009, Moore et al. 2007)
1
Minke Whale Alaska unk 0.002058 (Department of the Navy 2009, Waite 2003) 1
Odontocete
Beluga Whale Beaufort Sea and Eastern Chukchi Sea1
42,968 0.458686 (Department of the Navy 2009, Perrin et al. 2009, Zerbini et al. 2007)
275
Harbor Porpoise Bering Sea2 48,215 9.809514 (Department of the Navy 2010) 5,886 Killer Whale
All U.S. Alaska Populations
3,213
0.034299 (Department of the Navy 2009, Zerbini et al. 2007)
21
Phocid
Bearded Seal Alaska unk 1.920744 (Bengtson et al. 2005) 1,152 Ribbon Seal Alaska3 49,000 1.271365 (Bengtson et al. 2005, Perrin et al. 2009) 763 Ringed Seal Alaska unk 6.551109 (Bengtson et al. 2005) 3,931 Spotted Seal Alaska3 unk 3.788148 (Bengtson et al. 2005, Perrin et al. 2009) 2,273
1 Density values derived from using killer whale as a surrogate species due to predator/prey relationship 2 Density values for Alaska unknown; values for Pacific Coast population used as a proxy 3 Density values derived from using the ringed seal as a surrogate species due to a common association with sea ice
119
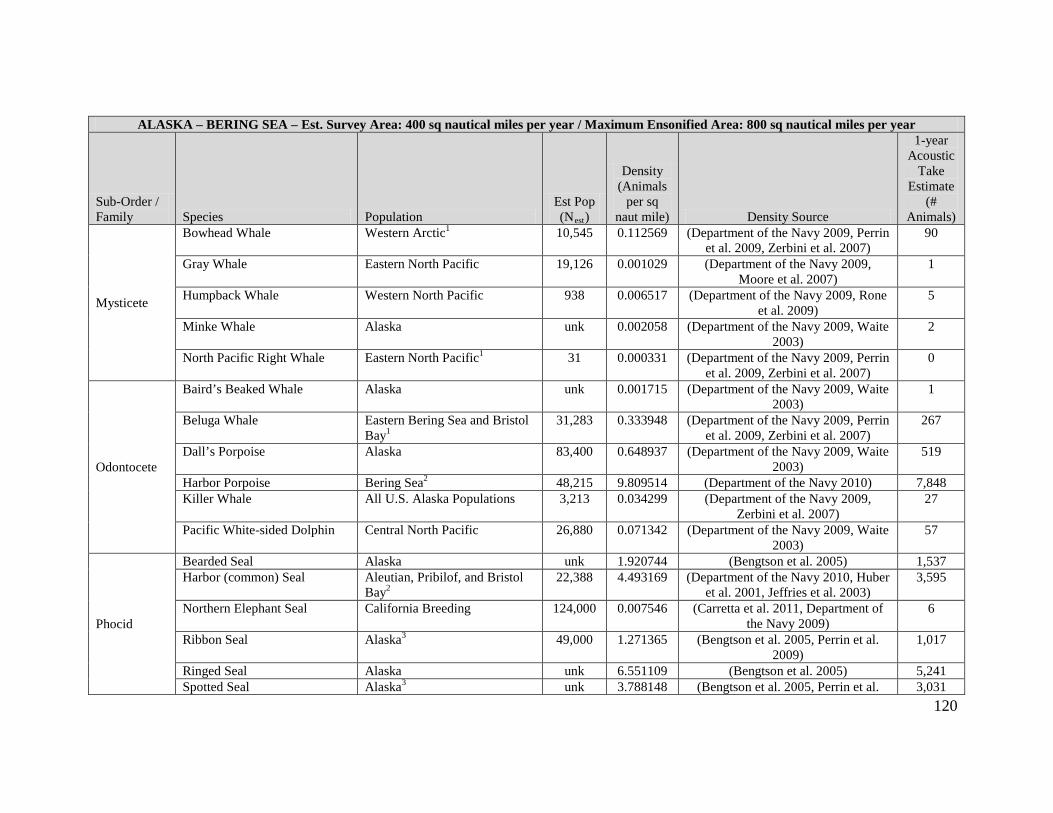
ALASKA – BERING SEA – Est. Survey Area: 400 sq nautical miles per year / Maximum Ensonified Area: 800 sq nautical miles per year
Sub-Order / Family Species Population
Est Pop (Nest)
Density (Animals
per sq naut mile) Density Source
1-year Acoustic
Take Estimate
(# Animals)
Mysticete
Bowhead Whale Western Arctic1 10,545 0.112569 (Department of the Navy 2009, Perrin et al. 2009, Zerbini et al. 2007)
90
Gray Whale Eastern North Pacific 19,126 0.001029 (Department of the Navy 2009, Moore et al. 2007)
1
Humpback Whale Western North Pacific 938 0.006517 (Department of the Navy 2009, Rone et al. 2009)
5
Minke Whale Alaska unk 0.002058 (Department of the Navy 2009, Waite 2003)
2
North Pacific Right Whale Eastern North Pacific1 31 0.000331 (Department of the Navy 2009, Perrin et al. 2009, Zerbini et al. 2007)
0
Odontocete
Baird’s Beaked Whale Alaska unk 0.001715 (Department of the Navy 2009, Waite 2003)
1
Beluga Whale Eastern Bering Sea and Bristol Bay1
31,283 0.333948 (Department of the Navy 2009, Perrin et al. 2009, Zerbini et al. 2007)
267
Dall’s Porpoise Alaska 83,400 0.648937 (Department of the Navy 2009, Waite 2003)
519
Harbor Porpoise Bering Sea2 48,215 9.809514 (Department of the Navy 2010) 7,848 Killer Whale All U.S. Alaska Populations 3,213 0.034299 (Department of the Navy 2009,
Zerbini et al. 2007) 27
Pacific White-sided Dolphin Central North Pacific 26,880 0.071342 (Department of the Navy 2009, Waite 2003)
57
Phocid
Bearded Seal Alaska unk 1.920744 (Bengtson et al. 2005) 1,537 Harbor (common) Seal Aleutian, Pribilof, and Bristol
Bay2 22,388 4.493169 (Department of the Navy 2010, Huber
et al. 2001, Jeffries et al. 2003) 3,595
Northern Elephant Seal California Breeding 124,000 0.007546 (Carretta et al. 2011, Department of the Navy 2009)
6
Ribbon Seal Alaska3 49,000 1.271365 (Bengtson et al. 2005, Perrin et al. 2009)
1,017
Ringed Seal Alaska unk 6.551109 (Bengtson et al. 2005) 5,241 Spotted Seal Alaska3 unk 3.788148 (Bengtson et al. 2005, Perrin et al. 3,031
120
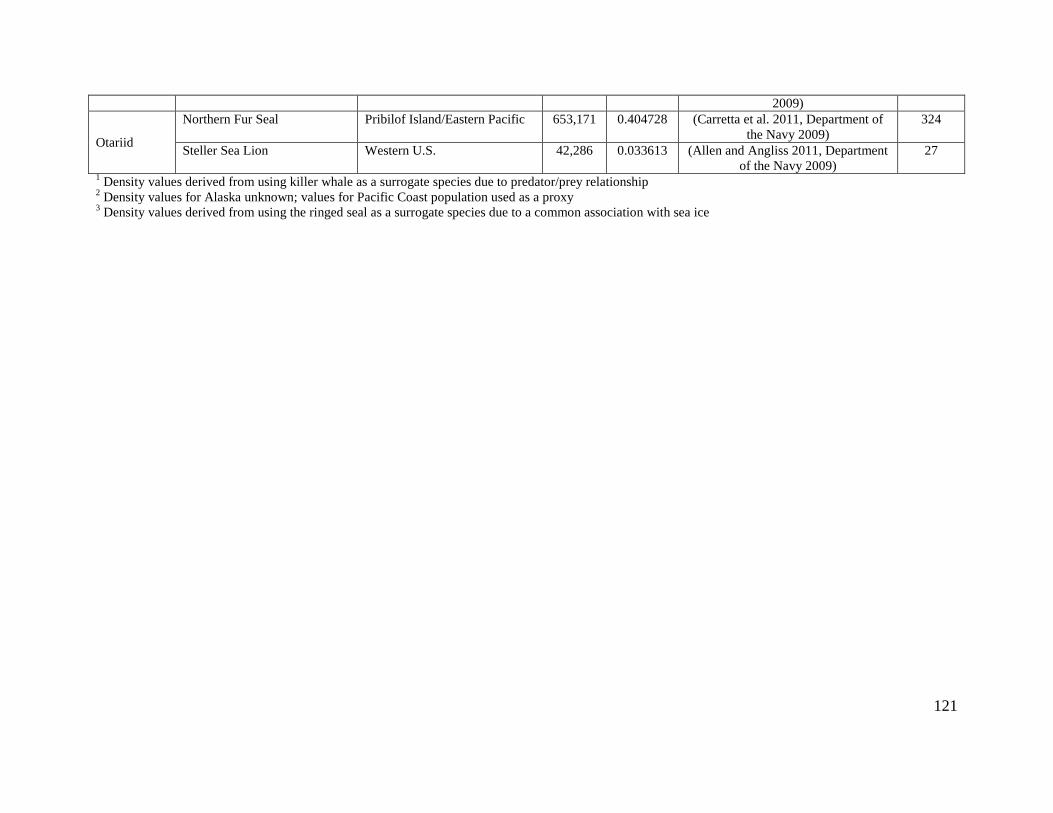
2009)
Otariid
Northern Fur Seal Pribilof Island/Eastern Pacific 653,171 0.404728 (Carretta et al. 2011, Department of the Navy 2009)
324
Steller Sea Lion Western U.S. 42,286 0.033613 (Allen and Angliss 2011, Department of the Navy 2009)
27
1 Density values derived from using killer whale as a surrogate species due to predator/prey relationship 2 Density values for Alaska unknown; values for Pacific Coast population used as a proxy 3 Density values derived from using the ringed seal as a surrogate species due to a common association with sea ice
121
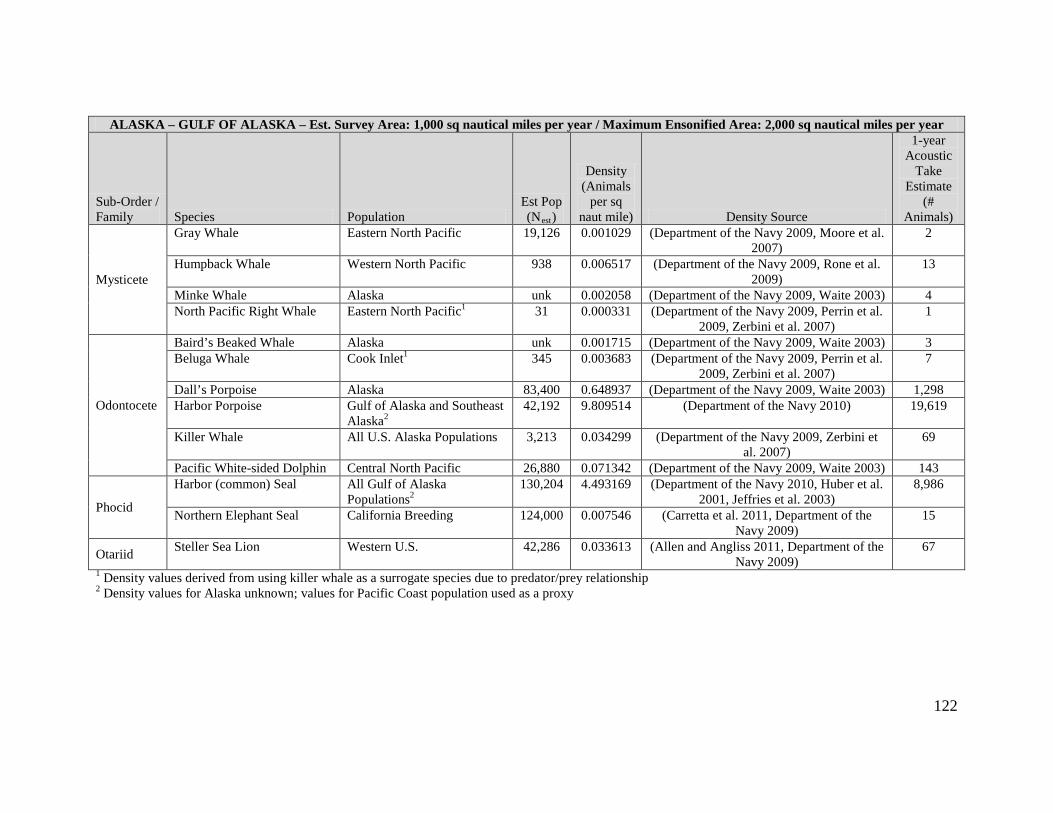
ALASKA – GULF OF ALASKA – Est. Survey Area: 1,000 sq nautical miles per year / Maximum Ensonified Area: 2,000 sq nautical miles per year
Sub-Order / Family Species Population
Est Pop (Nest)
Density (Animals
per sq naut mile) Density Source
1-year Acoustic
Take Estimate
(# Animals)
Mysticete
Gray Whale Eastern North Pacific 19,126 0.001029 (Department of the Navy 2009, Moore et al. 2007)
2
Humpback Whale Western North Pacific 938 0.006517 (Department of the Navy 2009, Rone et al. 2009)
13
Minke Whale Alaska unk 0.002058 (Department of the Navy 2009, Waite 2003) 4 North Pacific Right Whale Eastern North Pacific1 31 0.000331 (Department of the Navy 2009, Perrin et al.
2009, Zerbini et al. 2007) 1
Odontocete
Baird’s Beaked Whale Alaska unk 0.001715 (Department of the Navy 2009, Waite 2003) 3 Beluga Whale Cook Inlet1 345 0.003683 (Department of the Navy 2009, Perrin et al.
2009, Zerbini et al. 2007) 7
Dall’s Porpoise Alaska 83,400 0.648937 (Department of the Navy 2009, Waite 2003) 1,298 Harbor Porpoise Gulf of Alaska and Southeast
Alaska2 42,192 9.809514 (Department of the Navy 2010) 19,619
Killer Whale All U.S. Alaska Populations 3,213 0.034299 (Department of the Navy 2009, Zerbini et al. 2007)
69
Pacific White-sided Dolphin Central North Pacific 26,880 0.071342 (Department of the Navy 2009, Waite 2003) 143
Phocid
Harbor (common) Seal All Gulf of Alaska Populations2
130,204 4.493169 (Department of the Navy 2010, Huber et al. 2001, Jeffries et al. 2003)
8,986
Northern Elephant Seal California Breeding 124,000 0.007546 (Carretta et al. 2011, Department of the Navy 2009)
15
Otariid Steller Sea Lion Western U.S. 42,286 0.033613 (Allen and Angliss 2011, Department of the Navy 2009)
67
1 Density values derived from using killer whale as a surrogate species due to predator/prey relationship 2 Density values for Alaska unknown; values for Pacific Coast population used as a proxy
122
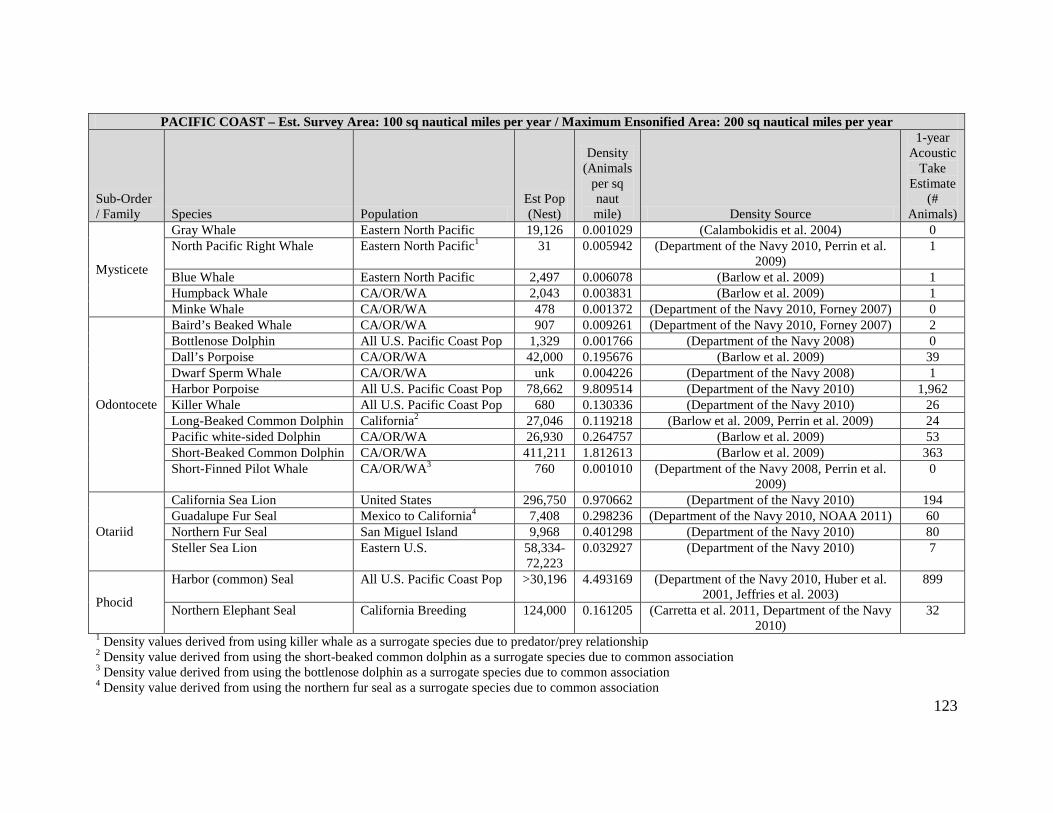
PACIFIC COAST – Est. Survey Area: 100 sq nautical miles per year / Maximum Ensonified Area: 200 sq nautical miles per year
Sub-Order / Family Species Population
Est Pop (Nest)
Density (Animals
per sq naut mile) Density Source
1-year Acoustic
Take Estimate
(# Animals)
Mysticete
Gray Whale Eastern North Pacific 19,126 0.001029 (Calambokidis et al. 2004) 0 North Pacific Right Whale Eastern North Pacific1 31 0.005942 (Department of the Navy 2010, Perrin et al.
2009) 1
Blue Whale Eastern North Pacific 2,497 0.006078 (Barlow et al. 2009) 1 Humpback Whale CA/OR/WA 2,043 0.003831 (Barlow et al. 2009) 1 Minke Whale CA/OR/WA 478 0.001372 (Department of the Navy 2010, Forney 2007) 0
Odontocete
Baird’s Beaked Whale CA/OR/WA 907 0.009261 (Department of the Navy 2010, Forney 2007) 2 Bottlenose Dolphin All U.S. Pacific Coast Pop 1,329 0.001766 (Department of the Navy 2008) 0 Dall’s Porpoise CA/OR/WA 42,000 0.195676 (Barlow et al. 2009) 39 Dwarf Sperm Whale CA/OR/WA unk 0.004226 (Department of the Navy 2008) 1 Harbor Porpoise All U.S. Pacific Coast Pop 78,662 9.809514 (Department of the Navy 2010) 1,962 Killer Whale All U.S. Pacific Coast Pop 680 0.130336 (Department of the Navy 2010) 26 Long-Beaked Common Dolphin California2 27,046 0.119218 (Barlow et al. 2009, Perrin et al. 2009) 24 Pacific white-sided Dolphin CA/OR/WA 26,930 0.264757 (Barlow et al. 2009) 53 Short-Beaked Common Dolphin CA/OR/WA 411,211 1.812613 (Barlow et al. 2009) 363 Short-Finned Pilot Whale CA/OR/WA3 760 0.001010 (Department of the Navy 2008, Perrin et al.
2009) 0
Otariid
California Sea Lion United States 296,750 0.970662 (Department of the Navy 2010) 194 Guadalupe Fur Seal Mexico to California4 7,408 0.298236 (Department of the Navy 2010, NOAA 2011) 60 Northern Fur Seal San Miguel Island 9,968 0.401298 (Department of the Navy 2010) 80 Steller Sea Lion Eastern U.S. 58,334-
72,223 0.032927 (Department of the Navy 2010) 7
Phocid
Harbor (common) Seal All U.S. Pacific Coast Pop >30,196 4.493169 (Department of the Navy 2010, Huber et al. 2001, Jeffries et al. 2003)
899
Northern Elephant Seal California Breeding 124,000 0.161205 (Carretta et al. 2011, Department of the Navy 2010)
32
1 Density values derived from using killer whale as a surrogate species due to predator/prey relationship 2 Density value derived from using the short-beaked common dolphin as a surrogate species due to common association 3 Density value derived from using the bottlenose dolphin as a surrogate species due to common association 4 Density value derived from using the northern fur seal as a surrogate species due to common association
123
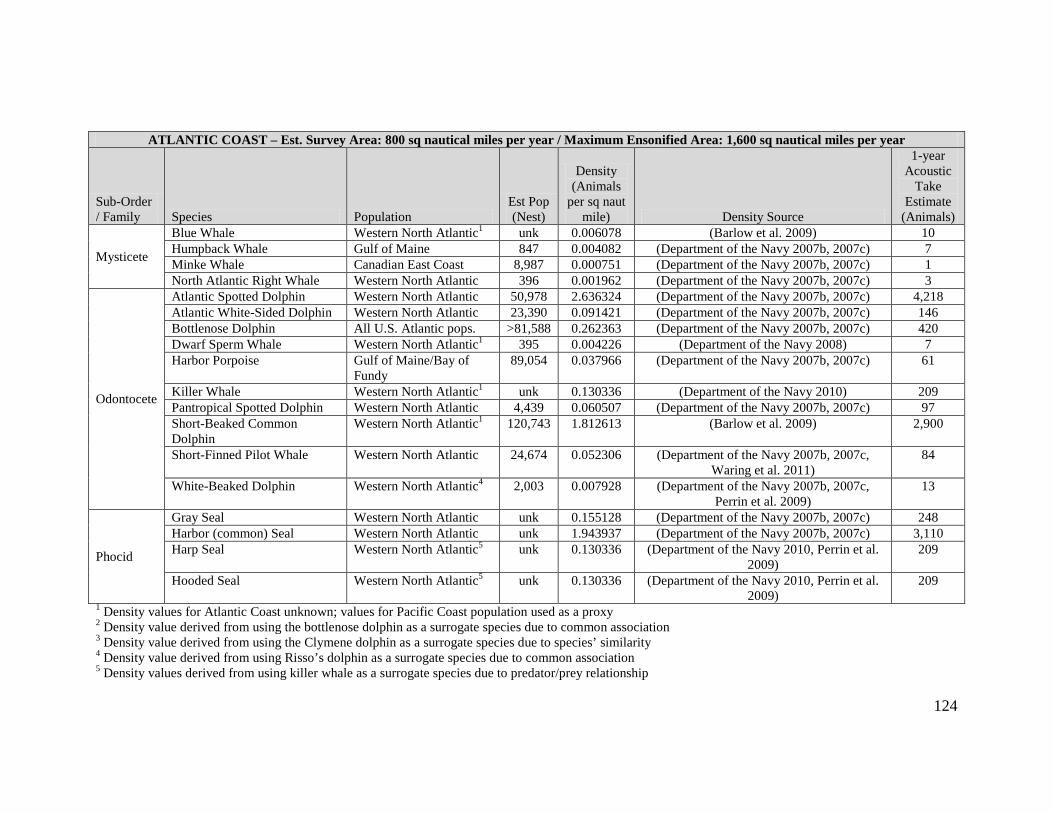
ATLANTIC COAST – Est. Survey Area: 800 sq nautical miles per year / Maximum Ensonified Area: 1,600 sq nautical miles per year
Sub-Order / Family Species Population
Est Pop (Nest)
Density (Animals
per sq naut mile) Density Source
1-year Acoustic
Take Estimate
(Animals)
Mysticete
Blue Whale Western North Atlantic1 unk 0.006078 (Barlow et al. 2009) 10 Humpback Whale Gulf of Maine 847 0.004082 (Department of the Navy 2007b, 2007c) 7 Minke Whale Canadian East Coast 8,987 0.000751 (Department of the Navy 2007b, 2007c) 1 North Atlantic Right Whale Western North Atlantic 396 0.001962 (Department of the Navy 2007b, 2007c) 3
Odontocete
Atlantic Spotted Dolphin Western North Atlantic 50,978 2.636324 (Department of the Navy 2007b, 2007c) 4,218 Atlantic White-Sided Dolphin Western North Atlantic 23,390 0.091421 (Department of the Navy 2007b, 2007c) 146 Bottlenose Dolphin All U.S. Atlantic pops. >81,588 0.262363 (Department of the Navy 2007b, 2007c) 420 Dwarf Sperm Whale Western North Atlantic1 395 0.004226 (Department of the Navy 2008) 7 Harbor Porpoise Gulf of Maine/Bay of
Fundy 89,054 0.037966 (Department of the Navy 2007b, 2007c) 61
Killer Whale Western North Atlantic1 unk 0.130336 (Department of the Navy 2010) 209 Pantropical Spotted Dolphin Western North Atlantic 4,439 0.060507 (Department of the Navy 2007b, 2007c) 97 Short-Beaked Common Dolphin
Western North Atlantic1 120,743 1.812613 (Barlow et al. 2009) 2,900
Short-Finned Pilot Whale Western North Atlantic 24,674 0.052306 (Department of the Navy 2007b, 2007c, Waring et al. 2011)
84
White-Beaked Dolphin Western North Atlantic4 2,003 0.007928 (Department of the Navy 2007b, 2007c, Perrin et al. 2009)
13
Phocid
Gray Seal Western North Atlantic unk 0.155128 (Department of the Navy 2007b, 2007c) 248 Harbor (common) Seal Western North Atlantic unk 1.943937 (Department of the Navy 2007b, 2007c) 3,110 Harp Seal Western North Atlantic5 unk 0.130336 (Department of the Navy 2010, Perrin et al.
2009) 209
Hooded Seal Western North Atlantic5 unk 0.130336 (Department of the Navy 2010, Perrin et al. 2009)
209
1 Density values for Atlantic Coast unknown; values for Pacific Coast population used as a proxy 2 Density value derived from using the bottlenose dolphin as a surrogate species due to common association 3 Density value derived from using the Clymene dolphin as a surrogate species due to species’ similarity 4 Density value derived from using Risso’s dolphin as a surrogate species due to common association 5 Density values derived from using killer whale as a surrogate species due to predator/prey relationship
124
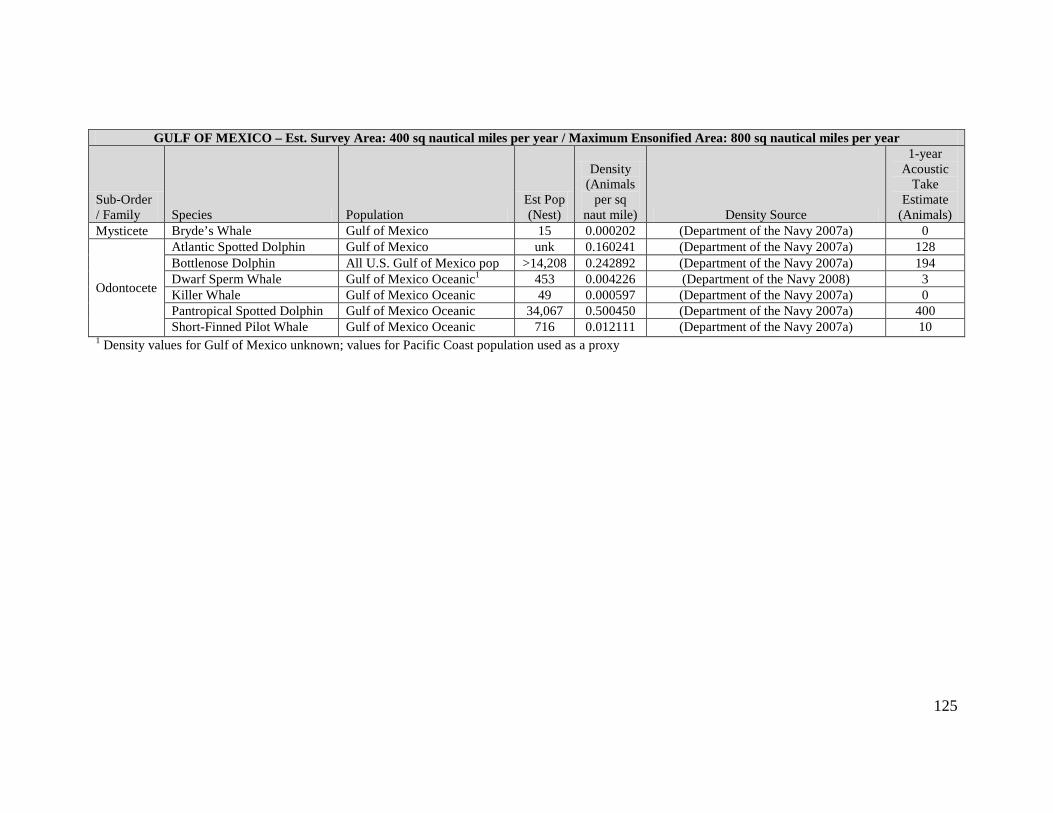
GULF OF MEXICO – Est. Survey Area: 400 sq nautical miles per year / Maximum Ensonified Area: 800 sq nautical miles per year
Sub-Order / Family Species Population
Est Pop (Nest)
Density (Animals
per sq naut mile) Density Source
1-year Acoustic
Take Estimate
(Animals) Mysticete Bryde’s Whale Gulf of Mexico 15 0.000202 (Department of the Navy 2007a) 0
Odontocete
Atlantic Spotted Dolphin Gulf of Mexico unk 0.160241 (Department of the Navy 2007a) 128 Bottlenose Dolphin All U.S. Gulf of Mexico pop >14,208 0.242892 (Department of the Navy 2007a) 194 Dwarf Sperm Whale Gulf of Mexico Oceanic1 453 0.004226 (Department of the Navy 2008) 3 Killer Whale Gulf of Mexico Oceanic 49 0.000597 (Department of the Navy 2007a) 0 Pantropical Spotted Dolphin Gulf of Mexico Oceanic 34,067 0.500450 (Department of the Navy 2007a) 400 Short-Finned Pilot Whale Gulf of Mexico Oceanic 716 0.012111 (Department of the Navy 2007a) 10
1 Density values for Gulf of Mexico unknown; values for Pacific Coast population used as a proxy
125
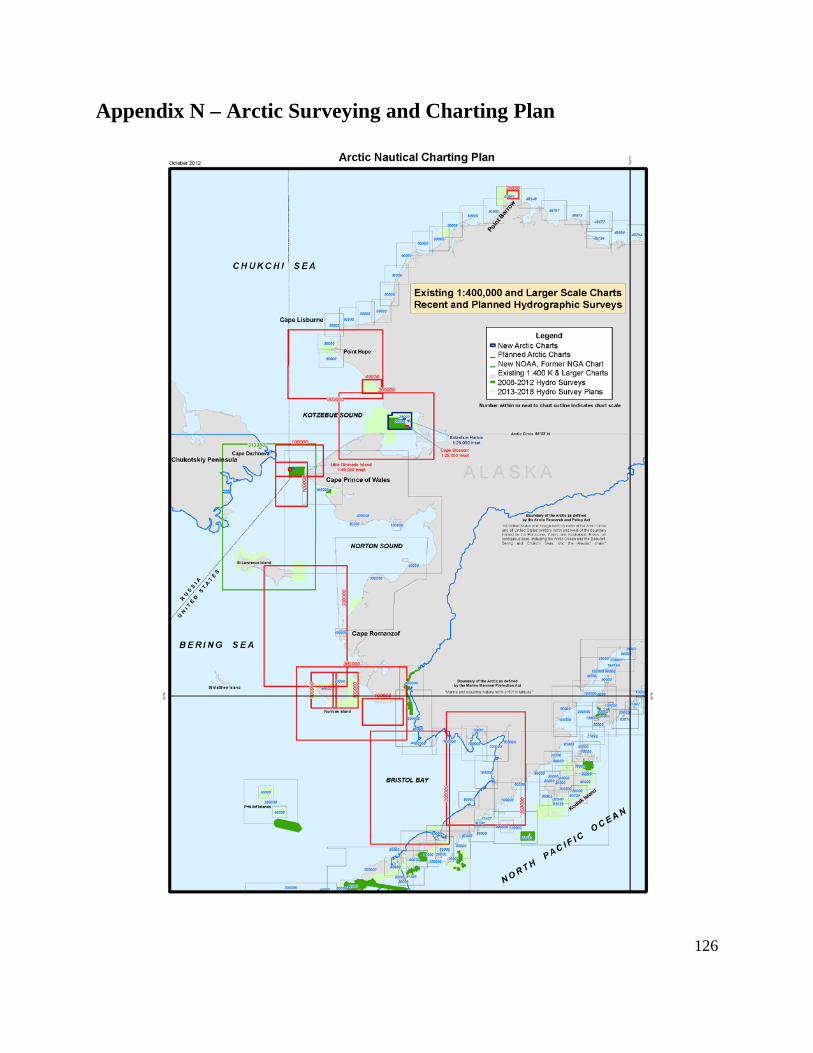
Appendix N – Arctic Surveying and Charting Plan
126
Appendix O – Sample Letter to State Historic Preservation Officer
30 April 2010
MEMORANDUM FOR: Dr. Charles McGimsey State Archaeologist, Director and Bruce Terrell Marine Historian with NOAA’s National Marine Sanctuary Program FROM: Kathleen Jamison
Hydrographic Surveys Division SUBJECT: Request for Comments on Historic Properties off Louisiana Coast Dear Bruce and Chip, The National Oceanic and Atmospheric Administration’s Office of Coast Survey (OCS) is planning on conducting hydrographic surveys (multibeam and side scan sonar data acquisition) off the Louisiana Coast from June – December, 2010. The purpose of this notice is to request comments regarding historic properties in the area before survey operations begin. The information produced by survey operations will be used to provide navigational information and products, including nautical charts, to the public. Except for dangers to navigation, which are made known to the public immediately, it is OCS policy to make information regarding possible historic resources available for SHPO review before public dissemination. If the upcoming survey finds information on features that may be historic, OCS will contact your office when this information is available for your review. I have attached a map showing the area where we plan to survey. Please do not hesitate to contact me with any questions. Respectfully,
Kathleen
127
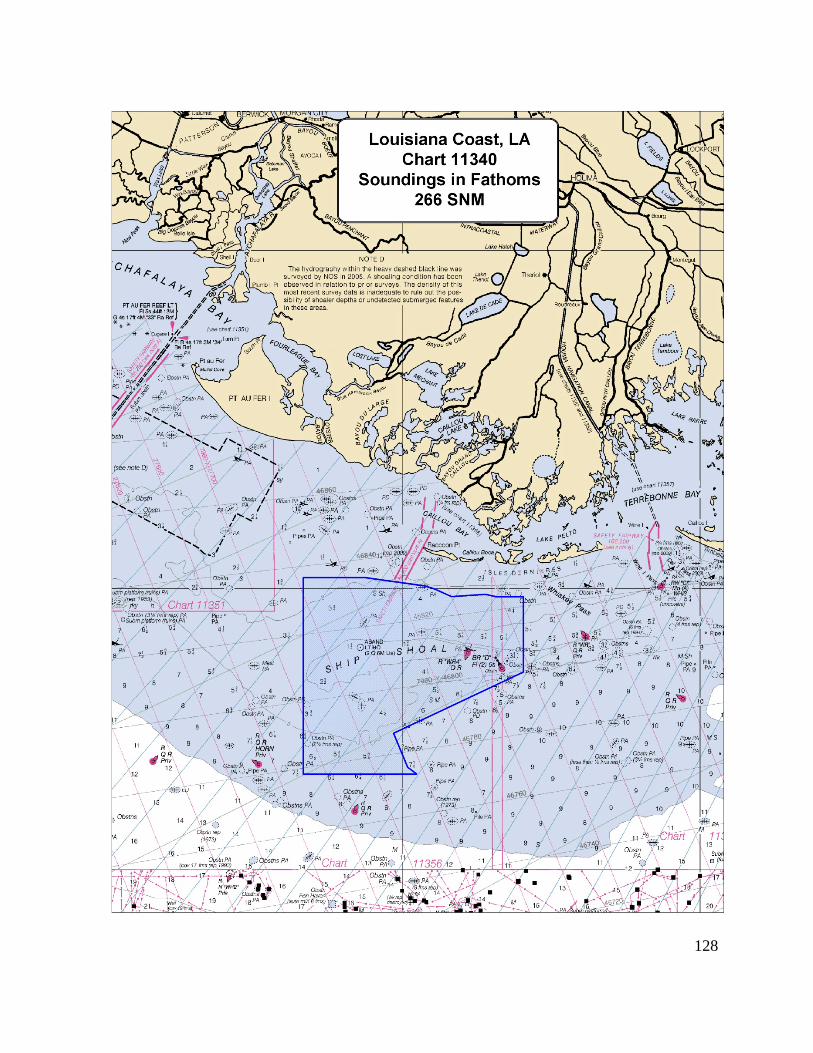
128