Embed Size (px)
Citation preview

Final Progress Report
Project Title: Energy Saving Separations Technologies for the Petroleum Industry:
An Industry-University-National Laboratory Research Partnership
Covering Period: 11/1/00-10/31/02
Date of Report: March 27, 2003
Contract ID Number: DE-FC07-01ID13998
Subcontractors: N/A
Other Partners: Dr. Paul Bryan, ChevronTexaco, Richmond, CA; Dr. George Huff, BP
Aromatics Group, Naperville, IL; Dr. Fred Stewart, INEEL, Idaho Falls,
ID
Contact: Profs. John R. Dorgan and J. Douglas Way
Chemical Engineering and Petroleum Refining Dept.Colorado School of Mines
1500 Illinois Street
Golden, CO 80401-1887Phone: 303-273-3720, Fax: 303-273-3730
Project Team: James Quinn, HQ Program Manager, [email protected]
Project Objective: This project works to develop technologies capable of replacing traditional
energy-intensive distillations so that a 20% improvement in energy efficiency can be realized.
Consistent with the DOE sponsored report, Technology Roadmap for the Petroleum Industry,the approach undertaken is to develop and implement entirely new technology to replace
existing energy intensive practices. The project directly addresses the top priority issue of
developing membranes for hydrocarbon separations.
The project is organized to rapidly and effectively advance the state-of-the-art in membranes for
hydrocarbon separations. The project team includes ChevronTexaco and BP, major industrial
petroleum refiners, who will lead the effort by providing matching resources and real worldmanagement perspective. Academic expertise in separation sciences and polymer materials
found in the Chemical Engineering and Petroleum Refining Department of the Colorado School
of Mines is used to invent, develop, and test new membrane materials. Additional expertise andspecial facilities available at the Idaho National Engineering and Environmental Laboratory
(INEEL) are also exploited in order to effectively meet the goals of the project. The proposed
project is truly unique in terms of the strength of the team it brings to bear on the development
and commercialization of the proposed technologies.
Background: Petroleum refining is the nation's most energy intensive industry. Estimates for
1994 indicate that the Petroleum industry used 6.3 quads (quadrillion BTU) [1]. Of this,atmospheric and vacuum distillation accounted for 35-40 percent of the total. Crude oils vary in
content based on the place of origin and must be refined and separated into useful components.
Currently this is primarily done by distillation, a process in which the fluids must be heated untilboiling. This is the primary reason for the high energy costs associated with the refining
process.

Final Progress Report March 27, 2003
DE-FC07-01ID13998
2
Membranes do offer an alternative means of separating chemical components without the needto heat and boil the fluids. Correspondingly, the energy savings associated with using a
membrane separation process rather than distillation are enormous. Membrane separations
rely on differences in the rate at which components pass through the membrane material. If onecomponent passes through (or permeates) faster than another, the fast permeating species can
be separated form the slower permeating species. There are several variations of this
phenomena ranging from reverse osmosis, to ultrafiltration, or electrodiaysis. However, thisproposal is concerned with improvements in pervaporation and in gas separations. Accordingly
only these technologies in reference to refinery separations are reviewed here. The use of
membrane separations in refinery operations has increased in recent years.
Pervaporation is a membrane process in which a liquid phase is in contact with one side of the
membrane and the permeant side contacts a reduced pressure gas phase. Pervaporation has
enjoyed great success in removing low amounts of water from organics, particularly in thedehydration of ethanol . Many commercial systems for this important application are available.
In addition, these systems may be used to dehydrate a variety of organic materials including but
not limited to methanol, butanol, xylenes, methylethylketone, tetrahydrofuran, and methylenechloride. Pervaporation is also used commercially to remove organics from aqueous streams.
A colorful success story being the GFT process for the removal of ethanol from beer and wine in
order to produce alcohol free beverages [2]. Technologies associated with organic/organic
separations using pervaporation are much less developed with a significant shortfall being thatknown membrane materials have difficulty withstanding the needed operating conditions
(prolonged high temperature exposure to organic solvents). Correspondingly, pervaporation has
had less of an impact in refinery operations but holds tremendous potential for energy andassociated costs savings if membranes can be constructed that are both effective and robust. It
is because of this potential that the development of membranes for hydrocarbon separations
ranks as one of the top two priorities in the Technology Roadmap for the Petroleum Industry
document. A previous DOE sponsored research needs assessment specifically identified thedevelopment of pervaporation membranes for organic separations as the highest priority [3].
Presently, the biggest technical obstacle associated with pervaporation membranes is theirinability to hold up under the conditions required for refinery relevant chemical separations.
That is, known materials suffer from physical and chemical changes as a result of exposure to
organic liquids and elevated temperatures. The proposed project addresses the relevantmaterials science issues for membrane materials so that effective and robust membranes
capable of performing hydrocarbon separations can be manufactured and deployed.
In the context of refinery operations, gas separation membranes saw their first widespreadcommercial use in hydrogen recovery [4, 5]. Hydrogen is increasingly needed to process heavy
and sour crudes making this an increasingly important area for innovation. Existing commercial
systems (which are or have been available from several companies including Air Products,Union Carbide, and DuPont) are relatively easy to operate and require only modest capital
investment. Several polymeric materials have been used in this context including aromatic
polyamides, polyimides, and even cellulose acetate. Membrane separations have also beenapplied to the removal of carbon dioxide (CO2) from various streams. For example, membranes

Final Progress Report March 27, 2003
DE-FC07-01ID13998
3
have been used to remove CO2 from reformer offgas [6]. Several commercial systems are also
available to separate CO2 and methane (CH4) an operation of immense importance in naturalgas processing.
Status:
Rubbery Blend Membranes for Hydrocarbon Separations by Pervaporation: Utilization of
membranes offers the promise of extraordinary energy savings if successfully applied tohydrocarbon-hydrocarbon and other organic separations. Membranes are bound to enter into
refining and petrochemical operations involving liquid separations once appropriate materials
and modules are developed. Hybrid processes such as utilizing membrane modules to break
azeotropes formed during distillation are particularly attractive because they offer less processcomplexity and reduced capital investment [7, 8]. Such an approach is now accepted in the
case of dehydration of ethanol as evidenced by the successful GFT process. Additionally,
membranes are now available that can be used to reduce sulfur content in gasoline asevidenced by the introduction of the SbraneTM process by the W.R. Grace company [9]. While
presently limited in commercial application, these emerging success stories present an
optimistic view for the future of membrane-based separations of organic liquids in demandingenvironments.
A common difficulty in utilizing membranes to separate organic liquids is that many common
polymeric materials cannot withstand long-term exposure to organic liquids at the moderately
high temperatures that are desirable. Excessive swelling of the polymers by organic liquids can
produce selectivity losses. In extreme conditions, the membrane material may simply dissolve.If glassy polymers are used for separating liquids, a finite solubility of the organic will plasticize
the polymer and lead to both selectivity and mechanical property losses. The need for robust
membrane materials that are capable of withstanding exposure to the organic liquids has beenidentified as one of the primary obstacles in achieving organic separations utilizing membrane
materials [3].
The approach taken in the present research and development project is to use physical blendsof rubbery materials that are crosslinked. Blending allows for control of the solubility selectivity
of the membrane while chemical crosslinking provides sufficient robustness to meet technical
requirements. It must be appreciated that the use of rubbery polymers inherently implies thatseparation selectivity will be primarily based on differences in solubility as opposed to
differences in diffusivity. This premise is based on the fact that for the rubbery systems under
consideration, the swelling is very large so that molecular mobility is very high. The conceptassociated with the present novel membranes is that by blending together different components
considerable control over the solubility selectivity may be achieved. Furthermore, semi-
quantitative thermodynamic modelling may be used as a guide for formulating blends for
specific separations. In this paper, these ideas are applied to the benzene-cyclohexane system.

Final Progress Report March 27, 2003
DE-FC07-01ID13998
4
Table I. Physical properties of benzene and cyclohexane
Benzene Cyclohexane
Freezing point(oC) 5.5 6.6
Boiling point(oC) 80.1 80.7
Density (g/cm3) 0.8737 0.7786
Refractive Index, n25D 1.498 1.426
Viscosity (cP) 0.65 0.98
Surface Tension (dyn/cm) 28.2 25.3
Molar volume (cm3/mol) 89.4 108.7
Collision diameter 0.526 0.606
dt 18.5 16.8
dD 18.4 16.8
dp 0.0 0.0
Solubility
Parameters(MPa)1/2
dh 2.0 0.2
Benzene-cyclohexane separation is of interest for many reasons. Cyclohexane is physicallyvery similar to benzene as demonstrated by the property comparison shown in Table I. As a
result of the very close boiling points (0.6 °C) and similar physical properties benzene and
cyclohexane form an azeotrope and thus provide a good model for azeotrope breaking bypervaporation. In addition, the pair may be used to represent the separation of aromatics
(benzene) from aliphatics (cyclohexane); a class of separations of technological importance.
Materials: Conceptually, many choices are available for rubbery blends. In this work,
the membrane system chosen consisted of the ternary blend of styrene butadiene rubber (SBR)
copolymer, acrylonitrile butadiene rubber (NBR) copolymer, and polyvinylchloride (PVC). This
blend is known to have a wide range of miscibility; NBR and PVC are miscible in all proportions.Additionally, this blend system possesses excellent solvent and good heat resiliance.[10] NBRs
and SBR were provided by Nippon Zeon and have 41.5, 28, 18% acrylonitrile content and
23.5% styrene content, respectively. PVC homopolymer was purchased from Aldrich ChemicalCompany.
NBR, SBR and PVC were dissolved in cyclohexanone to prepare a polymer blend solution of
known composition. Prepared blend samples are designated numerically as parts NBR, SBR,PVC. For example, 712 represents the blend containing 70 wt% NBR, 10 wt% SBR and 20 wt%
PVC. Crosslinking agents and when necessary, activator and accelerator, were added into the
solution. The solution was cast onto glass plate and dried in a fume hood for apporximately 1day (16-24 hours). This cast membrane film was crosslinked under vacuum in an oven at 130
°C for 80 minutes.
Methods: Screening of blend formulations was accomplished by simple swelling tests.
Prepared membrane samples were massed and subsequently submerged into solvent in sealed
Erlenmeyer flasks with agitation provided by a shaker table for 1 day at 25 °C. Upon removal,

Final Progress Report March 27, 2003
DE-FC07-01ID13998
5
the samples were blotted dry using a Kimwipe paper towel and immediately massed. The
swelling ratio (SR) of was calculated with following equation,
Swelling Ratio =Wd -Ws
Wd
¥100(1)
where Wd and Ws are the weight of dry and swollen samples, respectively.
Pervaporation experiments were carried out with laboratory scale equipment consisting of aMillipore membrane holder having an effective membrane area in contact with the feed liquid of
13,8 cm2. The feed liquid was continuously circulated from and returned to a 3 L reservoir.
Downstream pressure was maintained below 5 torr, typically at about 2 torr. After anequilibration period of at least 6 hours, permeate was collected at constant time intervals by
means of freezing in a liquid nitrogen cooled cold finger. Analysis of feed and permeation
stream compositions was performed by Gas Chromatography – Mass Spectrometry (AgilentGC-MASS G2570A) and checked by simple refractive index measurements.
The separation factor(a) and permeation rate are defined in the usual manner as follows in
Equations 1 and 2.
a =
wP ,BenzenewP ,cyclohexane
wF ,Benzene
wF ,cyclohexane (2)
Permeation Rate = Q =q ¥ L
A¥ t (3)
Here wP,i is the weight fraction of component i in permeate and wF,i is that in the feed. Q is thenormalized flux or permeation rate where q, L, A and t represent the mass of collected permeate
(g), membrane thickness (mm), membrane area (m2) and operating time (in hours), respectively.
Theory: The theoretical approach taken rests on the transport mechanism of
pervaporation following the solution-diffusion mechanism [11]. The relevant quantitative
relationship is given by Equation (4).
Ji =Di
L(ci0,m - ciL,m ) =
DiKi
gas
L( pi0 - piL) =
Pi
L(pi 0 - piL)
(4)
In Equation (4), Ji represents the flux of species i, D is diffusivity, L is the thickness of the
membrane, and ci0,m represents the concentration of the species internal to the membrane at
position 0 whereas ciL,m represents the concentration internal to the membrane at position L.The Ki
gas is a gas phase sorption coefficient that allows reference to the concentrations external
to the membrane via the partial pressures on either side of the membrane, pi0 and piL. Finally in
Equation (4), the gas permeability coefficient, Pi, is defined as the product of Di and Kigas.
For complete thermodynamic generality, it should be remembered that the concentrationinternal to the membrane is related to the concentration external to the membrane by the quality
of chemical potentials (m),

Final Progress Report March 27, 2003
DE-FC07-01ID13998
6
mi,m= m
i (5)Equation (5) is the rigorous basis for the form presented in Equation (4). Equation (4) reveals
the basic physics exploited by the present approach. Namely, blending is performed in order tomaximize the difference in the product of DiKi or in the case of solubility selectivity being
dominant, directly in the values for ci0,m. A fuller discussion of the quantitative methodology
used to accomplish this goal is described below.
Results: Swelling kinetics are of interest for many reasons; a simple experiment is used
to both determine the time needed to equilibrate the rubber and to determine diffusion
coefficients for the pure solvents. Kinetics of mass uptake for benzene, cyclohexane, and a50:50 weight mixture of the two are presented in Figure 1 for a 712 blend. Equilibrium swelling
is achieved within 4 hours. Diffusion coefficients for benzene and cyclohexane in the blend are
1.12 X 10⁻¹² m2/sec and 1.92 X 10⁻¹³ m2/sec, respectively. Published diffusion coefficient data forbenzene in natural rubber is 1 X 10-11 m2/sec while the value for benzene in PVC is 3 X 10-17
m2/sec [12]. Accordingly, the values determined are within reasonable bounds.
Figure 1. Mass update of components in blend 712.
Knowing that the blends are equilibrated, a systematic investigation of the relationship between
swelling and blend composition can be undertaken. Figure 2 shows the results of swelling tests
performed as the NBR content and, separately, the PVC content were changed in two series ofblends. When the content of NBR is increased, the swelling of both benzene and cyclohexane
are decreased. However, the ratio of benzene swelling to swelling by cyclohexane (the swelling
selectivity) increases. The same is true for blends in which the PVC content is increased.These results are easily rationalized by realizing that NBR and PVC are polar in nature and thus
preferentially solubilize benzene to cyclohexane.

Final Progress Report March 27, 2003
DE-FC07-01ID13998
7
Figure 2. Effects of blend composition on equilibrium swelling.
The results of Figure 2 may be empirically described by utilizing the concept of the solubility
parameter. This physical quantity is described for a low molecular weight compound according
to Equation 6.
d =Ecoh
V
ÊË
ˆ¯
1/2
=DH
VAP- RT
V
ÊË
ˆ¯
1/2
(6)
Here, d is the solubility parameter, Ecoh is the cohesive energy, V is volume, DHVAP is the
enthalpy of evaporation, R is the gas constant, and T is temperature. For polymers, the
solubility parameter can be defined as equal to the value of the solvent that produces the
maximum degree of swelling in a crosslinked version.
Solubility parameter values for the polymers used in this study are readily available and are
often split into dispersion (dd), polar (dp) and hydrogen bonding (dh) components [13]. In the
present study, it is convenient to define a parameter, da, according to Equation 7.
da2
= d p
2
+ dh2
(7)
In addition, a simple blending rule for solubility parameters of the blends in the form of Equation
8 is also utilized,
da,Blend = j ii da,i
(8)
where ji represents the volume fraction of species i. Figure 3 presents the measured swelling
selectivities as a function of the calculated polar component solubility parameter for several
different blends. From this figure, it can be seen that a reasonably quantitative relationship
between solubility selectivity and the polarity of the polymer blend does exist. This establishesa design heuristic for the separation of benzene and cyclohexane, namely, the blend should be
made as polar as possible.

Final Progress Report March 27, 2003
DE-FC07-01ID13998
8
Figure 3. Selectivity versus polar components of the solubility parameter.
Careful inspection of Figure 3 reveals that the solubility parameter approach is limited in utility.
Several blends have da values around 8.6 MPa1/2 but significantly different swelling selectivities.
Accordingly, while solubility parameters are an easy way to screen blend materials they do not
provide a rigorous, quantitative predictive capability.
Pervaporation results for a 50:50 by weight mixture of benzene and cyclohexane are exhibited
in Figure 4. In this figure, the selectivity factor, a, defined by Equation 2 is plotted against the
permeation rate defined by Equation 3. A typical tradeoff curve is found with fluxes increasingas selectivity decreases. It should be remembered that in this plot each point represents a
different blend composition having a distinct performance. Attention should also be focused on
the high permeation rates. In principle, a 10 mm permselective layer could produce between 0,5
and 5,0 kg/m2hr at 25°C.
Final Progress Report March 27, 2003
DE-FC07-01ID13998
9
Figure 4. Pervaporation selectivities for a series of rubbery blend membranes.
The material with the highest selectivity in Figure 4 is blend 316. Therefore this blendedmaterial was investigated across different compositions of the benzene cyclohexane feed
mixture; results are presented in Figure 5. Figure 5 also presents one data set for the 316 blend
separating a 50:50 mixture at a temperature of 60 °C. Increasing the temperature from 25 to 60
°C results in a relatively small decrease in permeate concentration (from 93.9 to 88.3 wt.%) but
to an enormous increase in permeation rate of nearly a factor of twenty (from 5.0 to 98.9 kg mm /
m2 hr). From a practical perspective this means that the azeotropic composition in the benzene-
cyclohexane system can be enriched to greater than 85 wt.% at a productivity of nearly 10
(kg/m2 hr) utilizing a 10 mm permselective layer of the optimised blend. To the authors’
knowledge, this is the highest fluxing material able to achieve this level of separation reported to
date.

Final Progress Report March 27, 2003
DE-FC07-01ID13998
10
Figure 5. Pervaporation results for optimised (316) formulation.
A predictive approach to the formulation of blended membranes may be pursued through the
utilization of group contribution methods. In particular, the UNIFAQ-FV model of Oishi andPrausnitz has been adopted to describe solubility of benzene and cyclohexane in the present
blends [14]. This procedure is only briefly described here but a more exhaustive description is
forthcoming [15].
The UNIFAQ model was initially established for liquid-vapor equilibrium calculations and then
extended to predict phase behavior for polymer mixtures and solutions. In this model, the
activity of a solution consists of three contributions.
lnaTotal
= lnaC+ lna
R+ lna
FV
(9)
Here, aTotal is the activity of a component, aC represents the combinatorial contribution, aR is a
residual contribution and aFV is the free-volume contribution to the total activity. The
combinatorial contribution is an entropic mixing factor based on differences in the size and
shape of dissimilar molecules.
lnajC= lnj +1- j j
j=1
q
Â(10)
where jj represents the volume fraction of species j. The residual factor represents the
enthalpy exchange between two groups.
lnajR= vk
jlnGk - lnGk
j[ ]k
Â(11)
where n jk is the number of groups of type k in molecule j, Gk is the group residual activity, and
G jk is the group residual activity in a reference solution containing only molecules of type j.
Finally, the free volume factor is given by Equation 12.

Final Progress Report March 27, 2003
DE-FC07-01ID13998
11
lnaFV = 3c
1ln
v1
1
3 -1
v1
3 -1
È
ÎÍÍ
˘
˚˙˙- c
1
v1
v-1
È
Î͢
˚1-
1
v1
1
3
È
ÎÍÍ
˘
˚˙˙
-1ÏÌÔ
ÓÔ
¸˝Ô
Ô(12)
where v is reduced volume fraction, 3c1 is the number of external degree of freedom per
solvent molecule (for hydrocarbons this value is 1,1). The grand advantage of a groupcontribution methodology is that predictions about the relative solubilities of various compounds
in a polymer blend can be made without the need for any data. Utilizing this approach allows for
the formulation an optimal blend composition for arbitrary mixtures based on a solubility
selectivity approach. The benefit of the group contribution methodology is apparent whenexamining the present pervaporation data.
Figure 6. Pervaporation selectivity versus polar solubility parameter.
Figure 6 presents the pervaporation selectivity results plotted versus the polar components of
the solubility parameter for the blends. In this figure individual blends are labeled. It is easilyseen that the description of performance utilizing solubility parameters is inadequate. A non-
monotonic relationship is found.
A much more satisfactory description is possible utilizing the UNIFAQ-FV model as evidenced in
Figure 7. In this case, the equilibrium solubilities of benzene and cyclohexane were calculatedusing the UNIFAQ-FV model. That is, the rigorous phase equilibrium problem specified in
Equation 5 has been solved for ci,o for both benzene and cyclohexane. This is an iterative
calculation as the equilibrium concentration of benzene is affected by the concentration of
cyclohexane and vice versa. From the equilibrium concentrations, solubility selectivity may becalculated. The correlation between measured membrane performance and calculated
selectivity is very good.

Final Progress Report March 27, 2003
DE-FC07-01ID13998
12
Figure 7. Pervaporation selectivity versus a priori calculated solubility selectivity.
A few comments on the significance of Figure 7 are warranted. First, it should be considered a
great success in the sense that the calculation does provide a rigorous means of screeningblend formulations in an a priori fashion. There exists a well-posed optimization problem for any
separation of organic liquids in which it is desired to maximize solubility differences. Utilizing a
group contribution method, solubility selectivities may be calculated as the blend formulation is
changed. Figure 7 demonstrates that such a calculation does in fact reveal the optimalformulation of the blend. At a minimum, the approach can distinguish, in an a priori fashion,
promising blend formulations in a quantitative way and thus reduce the number of needed
experiments during membrane development.
The lack of better quantitative agreement in Figure 7 is also of interest. A shortcoming of the
group contribution method used here is that no distinction is made between a CH2 group in acyclic (cyclohexane) versus linear (hexane or other aliphatic linear chain) structure. Previous
reports have found that the UNIFAQ model overestimates the solubility of cyclohexane and this
has led some researchers to change the parameter values for the CH2 group in cyclic
structures. In this work, the temptation to adjust parameters to better fit the data has beenresisted in favor of a less quantitative but more predictive model. It should also be remembered
that differences in diffusivity between benzene and cyclohexane may play a role in the actual
pervaporation performance. The results of Figure 1 show that the pure component diffusivitiesdiffer by a factor of 5 in blend 712. On the downstream side of the membrane where penetrant
concentrations are low, diffusion selectivity may become dominant. However, Figure 1 also
shows that the 50:50 mixture of benzene and cyclohexane diffuses into the membrane at a ratenearly equal to that of benzene. It is anticipated that the present system is a case of coupled
diffusion in which the rapidly diffusing species benzene swells the membrane material and
facilitates the diffusion of cyclohexane. The role of diffusion selectivity in these blended

Final Progress Report March 27, 2003
DE-FC07-01ID13998
13
materials is under investigation. To date, a predictive approach to coupled diffusion in highly
swollen rubber membranes remains elusive.
Conclusions: Membranes are entering into the demanding field of hydrocarbon
separations as evidenced by the recent commercialization of pervaporation systems. The widescale deployment of such systems holds the promise of tremendous energy savings and
considerable associated environmental benefits. A limitation associated with greater usage is
the lack of sufficiently robust membranes with acceptable mechanical and chemical properties.Additionally, the design of membrane materials from an a priori perspective for arbitrary
separations remains an elusive goal of the membrane technical community.
In this project, a novel approach was undertaken that consisted of using blends of rubberpolymers that are crosslinked in order to obtain sufficient mechanical and chemical robustness.
The utilization of blended materials allows for a wide range of chemical functionality within the
blend that can be exploited in order to produce the best possible solubility selectivity. Adoptionof a group contribution thermodynamic model provides an a priori methodology for seeking the
best blend formulation. While quantitative agreement with experiment is not achieved, the
modeling does predict the best blend formulation and as such serves the needed role ofproviding a rational methodology for designing blend membranes for specific purposes.
The ideas put forth in this ongoing work have been demonstrated on the model system of
benzene and cyclohexane. This system is of industrial interest in itself and also serves as agood model for both azeotrope breaking and aliphatic-aromatic separations. The optimized
blend is capable of enriching a 50 wt.% mixture to 88.3 wt.% at a permeation rate of nearly 10
(kg / m2 hr) utilizing a 10 mm permselective layer when operated at 60 °C. This performance is
among the best ever reported for the benzene-cyclohexane system.
Gas Separations Using Polyphosphazene Membranes: Removal of CO2 and H2S from CH4
containing gas streams are primary goals of this research. The separation materials consist ofasymmetric thin dense polymer film-ceramic composite membranes that have been studied for
pure gas permeability and mixed gas separation performance. Ceramic substrates used in
these studies are a commercially available controlled pore size alumina disk. Thin dense filmsare formed from a bulk polyphosphazene material that was applied using solution-casting
techniques to form defect-free films. Typical film thicknesses range from 5 mm to 200 mm.
Polyphosphazenes are a unique class of hybrid organic-inorganic material that enjoys a high
level of thermal and chemical stability required for use in the petrochemical industry. This
inherent stability is due to the hybrid nature of the polymer where the inorganic backbone
consists of alternating phosphorus and nitrogen atoms, see Figure 8. Bonding in the backboneconsists of alternating double and single bonds and each phosphorus is pentavalent leaving two
possible attachment points for pendant groups. Pendant groups provide the most evident
chemical and physical properties. By varying the pendant groups, the chemical and physicalproperties are also varied.
The backbone is formed through the ring opening polymerization of commercially availablehexachlorocyclotriphosphazene (1) yielding poly[(dichloro)phosphazene] (2). At each

Final Progress Report March 27, 2003
DE-FC07-01ID13998
14
phosphorus, there are two chlorines that displace readily through exposure to a nucleophile,
such as water. Thus, the chloro polymer is hydrolytically unstable. Substitution of the chlorinesfor organic oxygen or nitrogen containing pendant groups yields durable stable materials (3)
suitable for many applications. The transport properties have been known to be different with
respect to pendant group. The goal of this work is to develop new materials for the removal ofCO2 and H2S from CH4 gas streams, and to fundamentally understand the mechanism of
transport such that new systems can be envisioned, designed, and synthesized.
Figure 8. Synthesis of Polyphosphazenes.
Gas Permeability Experiments for MEE Substituted Phosphazenes. Pure GasExperiments. Pure gas permeability determinations were conducted using the time-lag method
[16, 17]. Measurements were made on thin dense films (200 mm thickness) installed into an
apparatus as shown in Figure 9. The instrument is housed in a constant temperature enclosure
and the temperature for all experiments was 30°C.

Final Progress Report March 27, 2003
DE-FC07-01ID13998
15
Figure 9. Schematic diagram of the pure gas permeability measurement instrument.
A series of related MEE substituted phosphazene polymers were studied for permeability and
selectivity using both pure and mixed gas systems. Characterization of the polymer was
accomplished through integration of their proton Nuclear Magnetic Resonance (NMR) spectra(Table 1). These polymers have three differing pendant groups attached each with a specific
function. 2-(2-methoxyethoxy)ethanol (MEE) is a polar aprotic organic pendant group that has
been correlated to CO2 permeability in previous work [18]. 4-Methoxyphenol is hydrophobic andassures good film forming performance. 2-Allylphenol provides functionality for facile cross-
linking. In general, the polymer series consists of an increasing polar MEE percentage while
decreasing the non-polar 4-methoxyphenol, thus increasing the polarity of the polymer.
Table 1. Composition of Substituted Polyphosphazenes.
Polymer MEE (%) 4-Methoxyphenol (%) 2-Allylphenol (%)
M2A 6 75 19
M010 21 72 7
M2B 38 46 16
M2D 48 48 4
M2E 74 24 2
Pure gas permeabilities were measured for these polymers where increasing permeability forCO2 was noted with increasing MEE in the polymer. In fact, increases in permeability for all
gases tested was observed with increasing MEE, although the other gases have an overall
lower permeability than CO2 (Table 2). Additionally, CO2/Ar and CO2/CH4 ideal gas selectivitiesremained approximately constant.

Final Progress Report March 27, 2003
DE-FC07-01ID13998
16
Table 2. Pure Gas Permeabilities (in Barrers) and Ideal Selectivities.
Polymer O2 Ar CH4 CO2 a CO2/Ar a CO2/CH4
M2A 1.6 1.3 1.2 13.5 10.4 11.3
M010 12.3 9.2 4.5 47.6 5.2 10.6
M2D 18.1 16.0 24.8 241.5 15.1 9.7
M2E 17.3 17.5 24.3 237.9 13.6 9.8
Mixed Gas Experiments. Mixed gas tests have been carried out to directly measure
selectivity. As illustrated in Figure 10, a feed gas is flowed across one side of a membrane at a
rate of 4 ml/min. Adjustment between the feed gas regulator and the mass flow controllerdetermine the pressure and feed flow on the membrane. The feed gas pressure for these
experiments was 30 psi. Gases that permeate through the membrane are swept away in a
helium gas stream. The permeate sweep gas flow is also controlled by a mass flow controller,and is set at 2 ml/ min. The total permeate flow during testing is measured directly using an
electronic soap bubble meter. Both the permeate and feed flows are directed by a series of
automated valves through two different gas chromatographs (GC) equipped with differentdetectors for analysis. GC A is equipped with flame ionization detectors (FID) for the analysis
volatile organics, while GC B has thermal conductivity detectors (TCD) for analyzing permanent
gases. The test valves and membrane were housed in an oven to maintain a constant
temperature of 30 °C.
Figure 10. Schematic diagram of the mixed gas membrane test apparatus.
Final Progress Report March 27, 2003
DE-FC07-01ID13998
17
Note: The flow for channel A was plumbed to allow the exit flow from the injection valve to go
into the entry port for the injection valve for channel B. This allows both the perm and feed to gothrough each column in GC B at the same time.
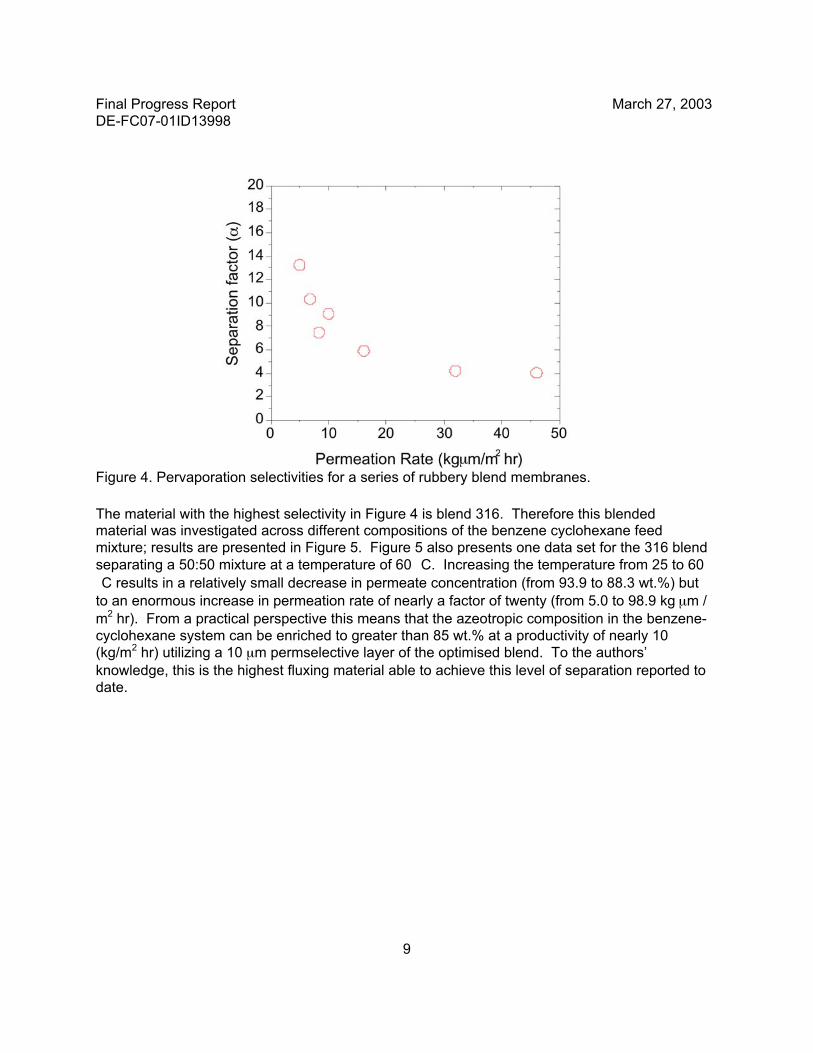
Permeabilities were calculated using eq. 1, where: DV/Dt is the total flow per unit time through
the membrane, Texp Pstp / Tstp Pexp corrects to standard temperature and pressure, l is membrane
thickness, A is membrane area, and Dp1 is the pressure differential taken from the feed pressure
and concentration determined from the GC analysis. In this study, a gas mixture consisting of3% of each of the following gases: argon, oxygen, nitrogen, methane, and carbon dioxide, with
the balance consisting of helium, was used for all measurements.
p =DV
Dt
T expPstp
P expTstp
l
ADp1 (13)
Trends between structure and gas permeability are not as clear as seen for the pure gas
experiments (Table 3). This was not unexpected due the intermolecular interactions betweenthe gases. However, the CO2/Ar selectivities remained roughly consistent with the ideal
selectivities. Nitrogen data was omitted from this study due to poor correlation to the rest of the
data set. It is proposed that nitrogen contamination from the atmosphere skewed the data.Permeabilities of oxygen may also be somewhat questionable, especially the data for polymer
M2E. A permeability of 120 Barrers compares poorly with the corresponding pure gas data
point.
Table 3. Mixed Gas Permeabilities (in Barrers) and Selectivities.
Polymer O2 Ar CH4 CO2 a CO2/Ar a CO2/CH4
M2A 26.8 2.8 4.8 8.4 3.0 1.8
M010 9.6 1.2 3.6 10.8 9.0 3.0
M2B 7.8 1.9 3.9 24.5 12.9 6.3
M2D 12.4 3.8 7.3 54.0 14.2 7.4
M2E 120 18.1 57.2 214 11.8 3.7
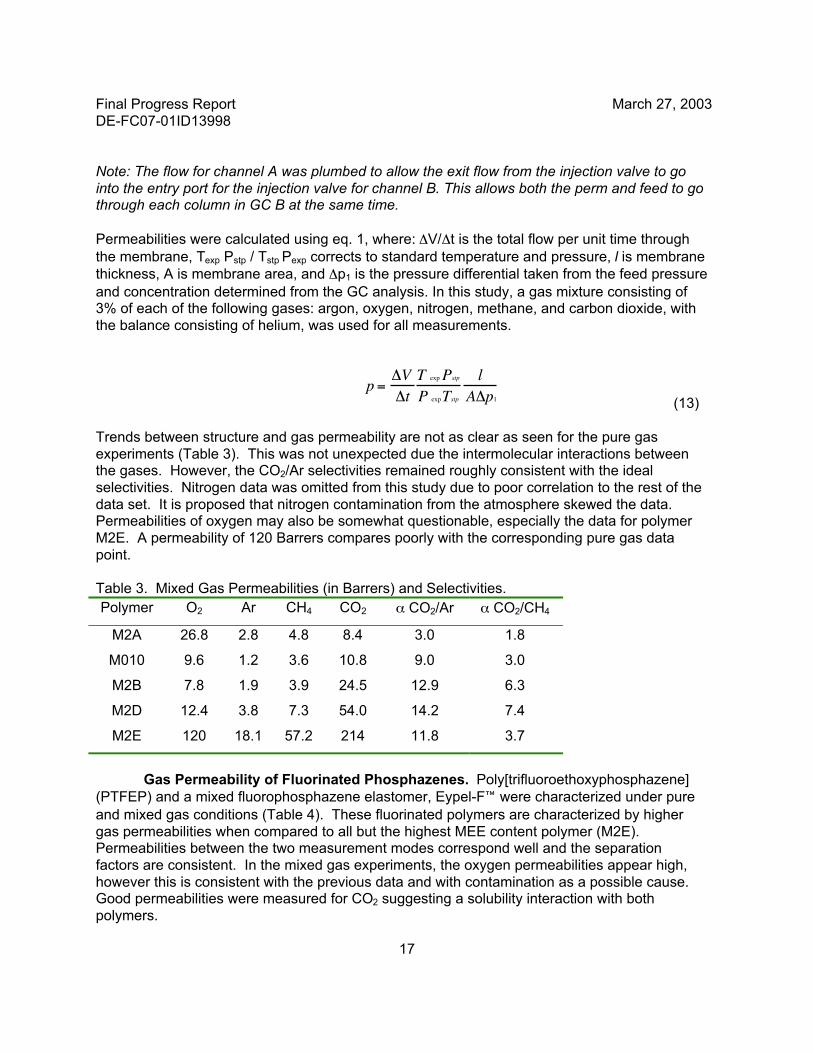
Gas Permeability of Fluorinated Phosphazenes. Poly[trifluoroethoxyphosphazene]
(PTFEP) and a mixed fluorophosphazene elastomer, Eypel-F‰ were characterized under pure
and mixed gas conditions (Table 4). These fluorinated polymers are characterized by higher
gas permeabilities when compared to all but the highest MEE content polymer (M2E).Permeabilities between the two measurement modes correspond well and the separation
factors are consistent. In the mixed gas experiments, the oxygen permeabilities appear high,
however this is consistent with the previous data and with contamination as a possible cause.Good permeabilities were measured for CO2 suggesting a solubility interaction with both
polymers.
Final Progress Report March 27, 2003
DE-FC07-01ID13998
18
Table 4. Pure and Mixed Gas Data for PTFEP and Eypel-F.
Polymer Method O2 Ar CH4 CO2 a CO2/Ar a CO2/CH4
PTFEP Pure 81.3 67.6 46.9 420 6.2 9.0
PTFEP Mixed 120 58 54 351 6.1 6.5
Eypel-F‰ Pure 65.1 37.2 40.6 376 10.1 9.3
Eypel-F‰ Mixed 153 65 78 403 6.2 5.2
Chemically Modified Ceramic Membranes for Xylene Separations: Effective separation of
positional isomers has been an important problem in the petroleum industry. The xyleneisomers are separated in industry using distillation methods, adsorption processes or
crystallization methods. However, since they are complex and energy consuming, membrane
separation techniques have been widely investigated as possible replacements. Zeolitemembranes[19-21], polymeric membranes[22-28] and liquid membranes[29, 30] have been
reported for the separation of hydrocarbon mixtures or mixtures of aromatic hydrocarbons.
A promising new class of complexation agents for the separation of positional isomers arecyclodextrins (CD) that have the structure of doughnut-shaped rings consisting of 6-8 glucose
units. The CD cavity can accommodate various aromatic carbon molecules [31]. Because of
their higher selectivity, CD modified materials have been commercialized as column packingmaterials for high performance liquid chromatography (HPLC) and capillary gas
chromatography[32, 33]. However, their use in the industrial scale process for the separation of
isomers has not been accomplished because of the difficulty of handling inclusioncomplexes[34, 35]. Therefore, we have investigated a continuous separation process using CD
modified membranes.
Krieg et al.[27] described a porous, ceramic, tubular membrane impregnated with a b-CD
polymer for the separation of the racemic pharmaceutical chlorthalidone. They impregnated b-
CD into the pores of Al2O3 and Zr2O3 composite membranes and polymerized the impregnated
CDs using epichlorohydrin. They obtained an average separation factor of 1.24 and theselectivity was consistent with the elution order observed in chiral HPLC. They speculated that
the separation occurred based on selective inclusion of penetrants within the CD cavity, where
the strongly interacting component might be captured, which would make its diffusivity in themembrane slower than that of the less interacting component. They also mentioned that the
less interacting component might diffuse through the center of the channel without inclusion into
the CD. Their suggested separation mechanism means that the selectivity was determined
based on the difference of diffusivity between the permeating components.
Polymer and b-CD composite membranes have been reported. Miyata et al. [26] reported
poly(vinyl alcohol) (PVA) membranes containing b-CD for the separation of o-/p-xylene binary
mixtures. Evapomeation tests using this membrane showed that a mixture of 10 wt% p-xylene
was concentrated to about 30 wt%. The selectivity of p-xylene increased as the p-xylene
concentration in feed decreased from 100 wt% to 10 wt%. They concluded that the selectivity ofp-xylene permeation was high at low concentration because the contribution of the flux through
the PVA matrix becomes small as the p-xylene concentration decreased in the feed.

Final Progress Report March 27, 2003
DE-FC07-01ID13998
19
Yamasaki et al.[24] also reported similar membranes for the separation of ethanol/watermixtures using pervaporation. They observed a significant dependence of the flux on the
ethanol concentration in feed. It was concluded that this dependency was due to the change of
diffusivity of both components based on theoretical analyses with a solution-diffusion modelusing the sorption data.
Chen et al.[25] has reported the separation of xylene isomers using b-CD filled PVA
membranes. They investigated the selectivity and flux for feed streams containing 5 % - 35 %
p-xylene concentration during pervaporation of p-/m-xylene binary mixtures. The selectivity
showed a maximum at 10 wt% feed p-xylene and the flux increased as the concentration of p-
xylene in the feed increased. From the similarity of the change of flux with the solubility changeof p-xylene, they concluded that pervaporation was mainly influenced by the formation of xylene
inclusion complexes in the CD cavity.
Although a comparison of the reported results on inorganic and polymeric CD modified
membranes is not straightforward because the influence of swelling in polymeric membranes
would significantly influence their performance, the detailed separation mechanism of CDmodified membranes is still obscure and a mathematical model has not been developed yet. In
this paper, we describe b-CD modified ceramic membranes for the separation of xylene
mixtures including pervaporation data using this membrane and a mathematical model to
predict its performance using transport theory and molecular simulation techniques. Amathematical model was formulized based on Stefan-Maxwell theory assuming a surface-
diffusion model. Model parameters including sorption isotherms were obtained from
experiments, and the intrinsic thermal diffusion coefficients based on Stefan-Maxwell theorywere obtained from molecular dynamics simulations. We will describe how this model can
reproduce the experimental observations including the selectivity and fluxes.
Theory: The selectivity of a CD modified membrane is hypothesized to depend on the
inclusion dynamics in the CD cavity whose size is close to the xylene molecule. The molecules
permeating through the membrane would be captured in a CD cavity first, and then would move
to a neighboring CD cavity according the driving force of the concentration gradient. Finally,xylene could permeate though the membrane from feed side to vacuum side. A surface
diffusion model fundamentally describes transport model in such dynamics. The theoretical
model of a surface diffusion through microporous inorganic membranes was developed byKrishna et al.[36] based on Stefan-Maxwell theory. The model has been successfully used to
predict the selectivity of hydrocarbon mixtures permeating through zeolite membranes using
known properties of zeolites19. In this paper, we try to examine the fit of the surface diffusion
model to the experimental binary and ternary mixture pervaporation data to gain a betterunderstanding of the transport mechanism that occurs in cyclodextrin modified ceramic
membranes.
For the estimation of flux using this mathematical model, the following assumption are made to
compare with the pervaporation experiments:

Final Progress Report March 27, 2003
DE-FC07-01ID13998
20
1. The rate-determining process is the transport through the membrane. Mass transfer
resistances in the liquid feed stream adjacent to the membrane and from the membraneto the vacuum region on the permeate side are neglected. The resistance of the flow
through the support layer is also assumed to be small compared with that through the
CD modified layer.2. The adsorption of penetrants at both the feed and permeate sides of the membrane are
assumed to be at equilibrium. The pressure on the permeate side in this study is zero.
3. Adsorption of xylenes in the CD modified membrane can be assumed to obey theLangmuir model.
First, the relationship of multicomponent permeation can be written in a generalized Fick’s law
form:
Ji= -r D
ik
∂qk
∂z,i =1,2,.....s
k=1
s
Â(14)
where Ji is the flux of penetrant i [m/s], r [kg/m3] is the density of membrane, qi is the occupancy
of penetrant i in the system, z is the distance into the membrane from the feed side, and Dik is
the multi component diffusion coefficient which has q 2 components including the cross
coefficients, Dik, can be described using Stefan-Maxwell theory[37].
Binary mixtures: For binary mixtures, the solution of Eq. (14) for the multicomponent
diffusion coefficient can be described by Stefan-Maxwell theory[37]. In the permeation of
xylenes through CD modified membranes considered here, the saturation loading for xyleneisomers are the same, then the fluxes for species 1 and 2 can be transformed to the form of a
deviation of occupancy to be solved numerically:
dq1
dz= -
J11+ q
2
D11
D12
+ q1
D22
D12
Ê
ËÁ
ˆ
¯˜
rqmD11 G11+ q
1
D22
D12
G11+ G
21( )ÏÌÓ
¸˝˛+ G
12+q
1
D22
D12
G12+ G
22( )ÏÌÓ
¸˝˛X -1
È
ÎÍÍ
˘
˚˙˙
(15)

Final Progress Report March 27, 2003
DE-FC07-01ID13998
21
( ) ( ) ˙˚
˘ÍÎ
È
˛˝¸
ÓÌÏ
G+G+G+˛˝¸
ÓÌÏ
G+G+G
˜¯
ˆÁÁË
Ê++
-=
XD
D
D
DDq
D
D
D
DJ
dz
d
m 1121
12
11
2211222
12
11
22222
12
22
1
12
11
22
2
1
qqr
qqq
(16)where X is given as follows:
( ) ( )
( ) ( ) ˜˜˜˜˜
¯
ˆ
ÁÁÁÁÁ
Ë
Ê
˛˝¸
ÓÌÏ
G+G+G-˛˝¸
ÓÌÏ
G+G+G
˛˝¸
ÓÌÏ
G+G+G-˛˝¸
ÓÌÏ
G+G+G
=
1121
12
11
2212212
12
22
112
122
211
2111
12
22
111
122
211
1222
12
11
222
D
D
D
D
JD
JD
D
D
JD
JD
D
D
X
(17)
and the elements of [G] are given by the following equation:
.,1,, sjiq
p
p
q
q
q
j
i
i
i
im
jm
ij=
∂
∂˜¯
ˆÁÁË
Ê=G (18)
where Dij and Dii are the Stefan-Maxwell diffusion coefficients, qim is the saturation adsorption ofthe species i, qi is the amount of adsorption of species i, s is the number of components and pi
is the pressure of species i. Occupancy, qi, is equal to qi / qim.
If adsorption equilibrium in the membrane is assumed to follow a Langmuir-type adsorptionisotherm, equations (15) and (16) can be used to estimate the fluxes using only the sorption
equilibrium on the feed side and the thermal intrinsic diffusivities in the membrane. The
diffusivities are obtained from experiment and molecular simulation techniques, respectively.
If we use the adsorption isotherm of CD powder for the estimation of Eq. (18), the membrane
density, r, can be written as:
r = rCDm*
(19)
where rCD is the bulk density of b-CD and m* is the geometric factor related to the porosity and
the condition of the polymerized CD layer.
Ternary mixtures: For a ternary mixture, Eq. (14) can be simplified by assuming that the
Stefan-Maxwell coefficient, Dij, is infinity. This assumption means that there are no interactions
between the permeating species. Such condition is sometimes observed in the permeation of
hydrocarbon molecules through MFI-type silicalite membranes[19, 38] where the interaction
Final Progress Report March 27, 2003
DE-FC07-01ID13998
22
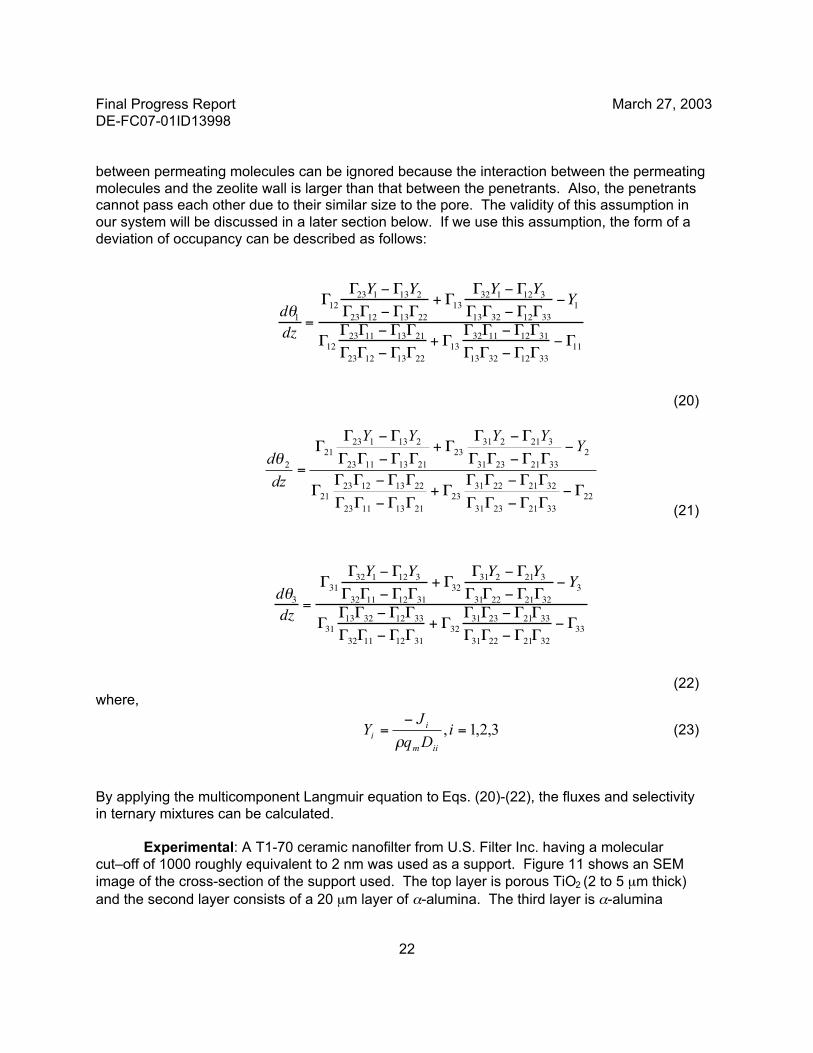
between permeating molecules can be ignored because the interaction between the permeating
molecules and the zeolite wall is larger than that between the penetrants. Also, the penetrantscannot pass each other due to their similar size to the pore. The validity of this assumption in
our system will be discussed in a later section below. If we use this assumption, the form of a
deviation of occupancy can be described as follows:
dq1
dz=
G12
G23Y1- G
13Y2
G23G12- G
13G22
+ G13
G32Y1- G
12Y3
G13G32- G
12G33
-Y1
G12
G23G11- G
13G21
G23G12- G
13G22
+ G13
G32G11- G
12G31
G13G32- G
12G33
- G11
(20)
22
33212331
32212231
23
21131123
22131223
21
2
33212331
321231
23
21131123
213123
21
2
G-GG-GG
GG-GGG+
GG-GG
GG-GGG
-GG-GG
G-GG+
GG-GG
G-GG
=
YYYYY
dz
dq
(21)
dq3
dz=
G31
G32Y1- G
12Y3
G32G11- G
12G31
+ G32
G31Y2- G
21Y3
G31G22- G
21G32
- Y3
G31
G13G32- G
12G33
G32G11- G
12G31
+ G32
G31G23- G
21G33
G31G22- G
21G32
- G33
(22)where,
3,2,1, =-
= iDq
JY
iim
i
ir
(23)
By applying the multicomponent Langmuir equation to Eqs. (20)-(22), the fluxes and selectivity
in ternary mixtures can be calculated.
Experimental: A T1-70 ceramic nanofilter from U.S. Filter Inc. having a molecular
cut–off of 1000 roughly equivalent to 2 nm was used as a support. Figure 11 shows an SEM
image of the cross-section of the support used. The top layer is porous TiO2 (2 to 5 mm thick)
and the second layer consists of a 20 mm layer of a-alumina. The third layer is a-alumina

Final Progress Report March 27, 2003
DE-FC07-01ID13998
23
consisting of the large particles compared to the particle size of the upper layers. A smooth and
uniform surface is observed.
Figure 11. Cross-sectional view of the unmodified membrane used as support.
The ends of support were glazed to prevent axial flow in the support and were fired at 880 °C for
20 minutes. Then the supports were cleaned by boiling them in aqueous hydrogen peroxidesolution for 30 minutes. The tubes were also boiled in distilled water for 30 minutes to remove
any residual hydrogen peroxide. After cleaning, the tubes were dried at 80 °C for at least 5
hours in a vacuum oven.
A two step modification of the support by b-CD was carried out using the sodium type b-CD salt,
the direct bonding method and the cross-linking method. The b-CD salt was prepared as
follows. b-CD (11.5 g) was dried at 80 °C overnight in a vacuum oven, and was dissolved in
175 mL of dimethylformamide (DMF) at room temperature with stirring. The solution was
heated to 120 °C and then 2 g NaH powder was added with stirring. After 5 minutes of heating,
the solution was cooled down to 90 °C, and then the sodium type b-CD salt solution was
obtained. In the direct bonding method, a pre-treated ceramic tube was put into 100 mL of b-
CD salt solution and was heated with stirring. The temperature and the reaction time in this
procedure were subject to optimization. In order to cross-link the directly bonded b-CD
modified alumina tube, the membrane was placed in 100 mL of dried toluene in a three-neck
flask. The temperature was kept at 90 °C and 2 g of Bis(trimethyl)octyl silane was added to the
toluene solution and stirred for 15 minutes. Then, 60 mL of b-CD salt solution was added to the
mixture and maintained at 90 °C with stirring for 50 minutes. The membrane was washed with
100 mL of toluene and methanol, and then dried.
TiO2
a-Al2O3
a-Al2O3
Final Progress Report March 27, 2003
DE-FC07-01ID13998
24
Bis(trimethyl)octyl silane was obtained from Petrarch Systems, HPLC grade DMF and NaH from
Aldrich, toluene and methanol from Aldrich, de-ionized water and 30% hydrogen peroxide from
Fisher Scientific were used in the synthesis.
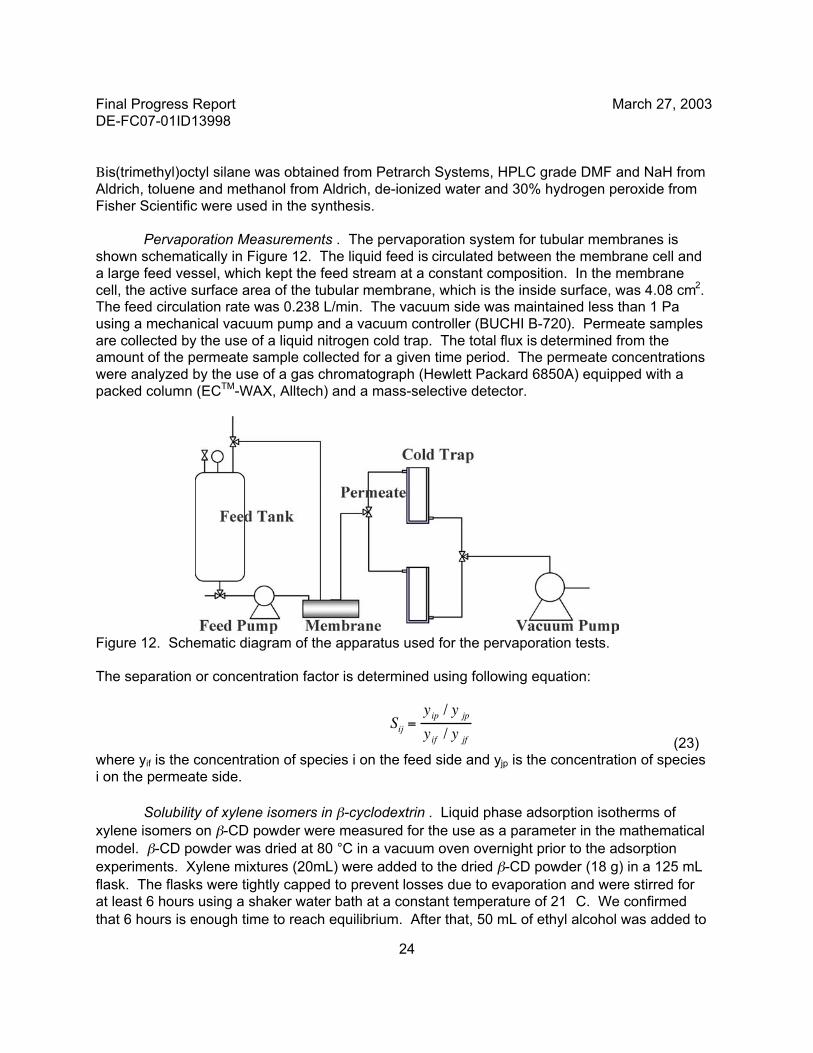
Pervaporation Measurements . The pervaporation system for tubular membranes is
shown schematically in Figure 12. The liquid feed is circulated between the membrane cell and
a large feed vessel, which kept the feed stream at a constant composition. In the membrane
cell, the active surface area of the tubular membrane, which is the inside surface, was 4.08 cm2.The feed circulation rate was 0.238 L/min. The vacuum side was maintained less than 1 Pa
using a mechanical vacuum pump and a vacuum controller (BUCHI B-720). Permeate samples
are collected by the use of a liquid nitrogen cold trap. The total flux is determined from theamount of the permeate sample collected for a given time period. The permeate concentrations
were analyzed by the use of a gas chromatograph (Hewlett Packard 6850A) equipped with a
packed column (ECTM-WAX, Alltech) and a mass-selective detector.
Figure 12. Schematic diagram of the apparatus used for the pervaporation tests.
The separation or concentration factor is determined using following equation:
Sij =yip / y jp
yif / y jf (23)where yif is the concentration of species i on the feed side and yjp is the concentration of species
i on the permeate side.
Solubility of xylene isomers in b-cyclodextrin . Liquid phase adsorption isotherms of
xylene isomers on b-CD powder were measured for the use as a parameter in the mathematical
model. b-CD powder was dried at 80 °C in a vacuum oven overnight prior to the adsorption
experiments. Xylene mixtures (20mL) were added to the dried b-CD powder (18 g) in a 125 mL
flask. The flasks were tightly capped to prevent losses due to evaporation and were stirred for
at least 6 hours using a shaker water bath at a constant temperature of 21 °C. We confirmed
that 6 hours is enough time to reach equilibrium. After that, 50 mL of ethyl alcohol was added to

Final Progress Report March 27, 2003
DE-FC07-01ID13998
25
extract the remaining xylenes that had not adsorbed in the CD cavity, then the flask was shaken
for 1 hour. After waiting 30 minutes to settle the CD powder to the bottom of the flask, the liquidphase concentration is measured using a gas chromatograph. The amount of adsorption was
estimated from the change of concentration of xylene in liquid phase by comparing with that of
the blank.
Molecular Simulations: NVE ensemble (the number of atoms, volume and total energy
are constant) molecular dynamics (MD) simulations were carried out to obtain the correcteddiffusivity of xylenes through the CD modified membrane. Cerius2 version 4.0 code, purchased
from Accelerys Inc, was used to perform the MD simulations. We chose the pcff 3.01 force field
set for representing the inter and intra atomic interactions[39]. Interactions considered in this
forcefield include bonding, angle, torsion, inversion, van der Waals, and electrostatic forces.The Ewald method was used for the summation of the electrostatic interactions. The interaction
cutoff length for the van der Waals interactions was 9 Å. All atoms were allowed to move during
the simulations. A velocity corresponding to the Boltzmann distribution at 260 K-294 K wasgiven to all atoms in an MD unit cell before performing the MD calculations. The average
temperature after 100 ps for all simulations was confirmed to be 294 K ± 7 K. 500ps MD runs
were performed with the time step 1 fs and the last 400 ps trajectories of atoms were used forestimating the self-diffusion coefficients, which were calculated by the mean square
displacement of each atom of the xylene molecules with an average over 2 ps of time using the
Einstein relationship.
Results and Discussion:
Optimization of Membrane Synthesis Conditions and Characterization: In order to
achieve a high selectivity and flux, our objectives were to synthesize a CD modified membranehaving a smooth, defect-free surface with the minimum membrane thickness. Hence, we
examined the effect of the reaction time and temperature of the direct bonding method on the
surface morphology using scanning electron microscopy (SEM, JEOL JXA-840). The
temperatures investigated were 110 °C and 120 °C and the reaction times investigated were 40
minutes, 80 minutes and 110 minutes. We have confirmed that temperature higher than 120 °C
causes the rapid formation of polymerized CDs in the solution and makes the membranesurface rough. In these experiments, we used small pieces of the ceramic membrane in the
reaction that is carefully broken into small species. The modified pieces are dried in the oven at
50 °C before SEM observation. SEM images of the membranes are presented in Figures 13
and 14. In Figure 13, the reaction temperature was 110 °C, and cracks are observed on the
membrane surface for the 40 minute and 80 minute reaction times. As the reaction time was
increased, the surface was covered with the CD phase, and finally, CD particles were deposited
after 110 minutes of reaction time. On the other hand, in Figure 14, the support surfaces werecompletely covered with the CD phase in 40 minutes reaction time, although the cracks in the
CD layer were observed. As the reaction temperature was increased to 120 °C, a sticky
crystalline layer of CD particles appeared on the surface. From these images, it seems that the
optimal reaction temperature and reaction time are 120 °C and around 40 minutes, respectively.
However, it was difficult to obtain a crack-free membrane using the direct bonding method.

Final Progress Report March 27, 2003
DE-FC07-01ID13998
26
Figure 13. SEM images showing the influence of reaction time on the membrane surface
structure using the direct bonding method at 110 °C. The reaction times are (a) 40 minutes, (b)
80 minutes, and (c) 110 minutes. Magnification levels are 70000, 50000 and 27000 times,respectively.
Figure 14 (a)-(c) SEM images showing the influence of reaction time on the membrane surface
structure using the direct bonding method at 120 °C. The reaction times are (a) 40 minutes, (b)
80 minutes, and (c) 110 minutes. (d) SEM image of the surface of a cross-linked b-CD modified
membrane. Magnification levels are 9500, 8500, 9500 and 2000 times, respectively.

Final Progress Report March 27, 2003
DE-FC07-01ID13998
27
Better results were obtained by cross linking the CD layer after the direct bonding synthesis
method. Figure 14(d) shows the surface of a cross-linked membrane. There were no cracksobserved on the surface. The reaction conditions for the direct bonding method were a
temperature of 120 °C and a reaction time of 40 minutes. It is noted that the cross-linking
method should be carried out immediately after the direct bonding method, otherwise the CDlayer will crack. Figure 15 is an image of a cross-section of a cross linked membrane. From
Figure 15, the thickness of the CD layer could not identified on the top layer of the membrane,
suggesting that the CD layer penetrated into the ceramic support. Comparing Figure 15 withthe SEM image of an unmodified membrane shown in Figure 11, the impregnated CD layer
seems to reach at the second layer of a-Al2O3 and that thickness can be estimated to be about
24 mm.
Figure 15. SEM images of the surface and cross-section of a cross-linked b-CD modified
membrane. Magnification levels are (right) 200 and (left) 2000 times.
The pore size of the top layer is approximately 2 nm and that is close to the molecular size of a
CD molecule, but there might be room for the cross linker molecules to diffuse through the CDlayer because of the presence of a pore size distribution in the top layer. Furthermore, the CD
and cross linker can also diffuse from the backside of asymmetric membranes. Hence, the
cross-linked CD would be structured to fill the pore or coat on the pore wall in the larger pore
layer.
Pervaporation Results: Pervaporation of ternary mixtures using non-modified membrane
is carried out to examine the intrinsic selectivity of support. The unmodified membrane showedmuch higher flux of about 146 kg/m2/hr than the CD modified membrane and no selectivity
beyond that from vapor liquid equilibrium was observed for any of the xylene isomers.
The pervaporation experiment for the ternary mixtures of xylene isomers was then carried out
using the CD-modified ceramic membranes. The feed was an equivolume xylene ternary
mixture. The selectivities measured were: m-/p-xylene of 1.39, o-/p-xylene of 1.33, and m-/o-
xylene of 1.05, with a flux of 0.03 kg/m2/hr. The order of flux is m- > o- > p-xylene.

Final Progress Report March 27, 2003
DE-FC07-01ID13998
28
The pervaporation results for p-/m-xylene binary mixtures are presented in Figure 16 as a
function of the feed p-xylene concentration. The flux increases with an increase in the feedconcentration of p-xylene. The dependency of the flux on the feed concentration also has been
observed in CD containing polymeric membranes[24, 25]. The measured selectivity is a strong
function of the p-xylene feed concentration. The selectivity decreased from 1.5 to 0.7 as the p-xylene concentration in the feed increases. A more detailed discussion about this will be
presented in the section 5.4. The fastest penetrant at low p-xylene concentrations in the feed is
p-xylene, and the selectivity gradually changes to the meta-selectivity as the p-xyleneconcentration in the feed increases.
Figure 16. Pervaporation results for p-xylene/m-xylene binary mixtures as a function of p-xylene
concentration in the feed.
Similar trends for the selectivity have been reported with polymeric membranes[24-26], although
the penetrants were different with those investigated here. A PVA/b-CD membrane for the
water/ethanol binary mixture separation has been reported to have a maximum selectivity at a
feed ethanol concentration 50 wt%6, while a PVA/b-CD membrane for the separation of p-/m-
xylene binary mixtures has exhibited a maximum in selectivity when the p-xylene feed
concentration was 10 wt%[26]. However, our membrane has no maximum in the selectivity likethose polymeric membranes. The reported decline of the selectivity in polymeric membranes
may be due to the contribution of a swelling effect. In our membrane, the CD was confined
inside the pore and the swelling effect would be suppressed.
Molecular Simulation Results: To perform an MD simulation one needs information
regarding the molecular configuration of CD in the membrane. The SEM image of a cross-
sectional view of the CD modified membrane in Figure 15 shows that the CD phase filled thepores of the ceramic membrane. Since the pore size of top layer of the support membrane is
close to the diameter of a CD molecule, CD molecules inside the pore were assumed to be
densely packed so that their density will be close to the bulk density of pure CD. CD moleculesin the pore might be connected each other by polymerization. However, in the molecular
simulations, in order to simplify the unknown structure, the effect of a polymer network of cross-

Final Progress Report March 27, 2003
DE-FC07-01ID13998
29
Figure 17. Snapshots from the MDsimulations of the diffusion of two p-
xylene molecules within the CD cavities.
Th k f h id i f
linked CD molecules is assumed to be small and ignored. This assumption would be
reasonable because the cross-linking procedure is performed after the impregnation procedureof CD. Therefore, we use the densely packed CD structure as the model for representing a CD
layer of the membrane.
The unit cell for the MD simulation contained 4
b-CD molecules and 2 xylene molecules, which
are the same isomers, with the cell dimensions;
a = 33.0 Å, b = 19.0 Å, and c = 20.0 Å. The
density of CD is 0.6 g/cm3, which corresponds to
the density of the bulk CD; 0.4~0.7 g/cm3. Theconfiguration of molecules in the unit cell was
energetically optimized using a molecular
mechanics calculations before performing the
MD simulations. Figure 17 shows snap shots ofthe unit cell during the MD simulations. As
shown in this figure, four CD molecules in the
unit cell are arranged so that their cavityopenings are essentially the same direction,
although after minimization two of the CDs are
slightly inclined. Xylene molecules can diffusethorough the cavity of two stacked CDs and it
would be extremely difficult for them to jump to
another path of a neighboring CD pair because
there is not enough space for the xylene to fitbetween two stacked CDs. In this Figure, the
diffusion of p-xylene molecules between two
neighboring CDs is shown. This transportdynamic occurred 4~6 times during the MD
simulation runs; xylene molecules remained
almost the entire simulation period inside thecavity. This means that the movement of xylene
molecules is likely to be diffusion by a hopping
mechanism. Similar dynamics were also
observed during the MD results with both m-xylene and o-xylene.
The Stefan-Maxwell diffusion coefficients we need for the mathematical model correspond to
the self-diffusion coefficients that were obtained from the MD simulations only when theconcentration of diffusing species is zero[40, 41]. In our MD simulations, the unit cell contains
two diffusing molecules; the occupancy studied is not zero precisely. However, two xylene
molecules in the unit cell are located separately with their own diffusional paths, and theinteractions with the CD molecules were so large so that the interaction between the diffusing
xylene molecules was neglected. Under such a condition, it would be a reasonable
approximation that the calculated self-diffusion coefficients are the Stefan-Maxwell diffusioncoefficients we need.
Final Progress Report March 27, 2003
DE-FC07-01ID13998
30
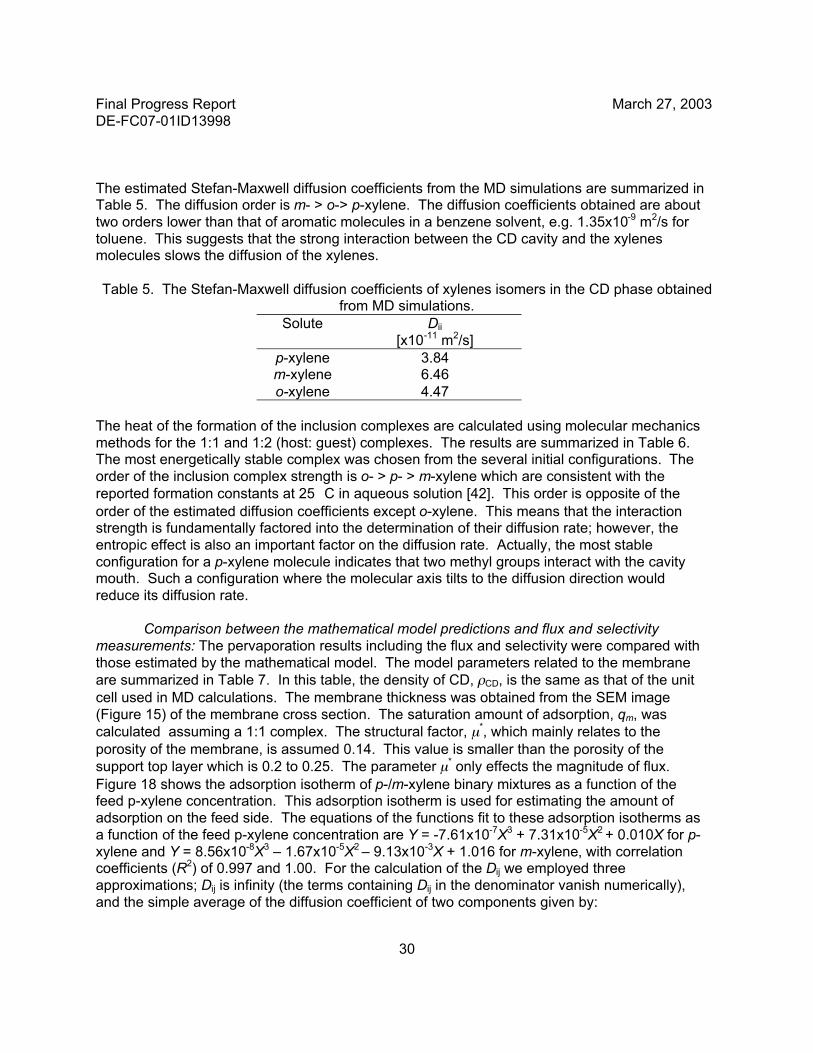
The estimated Stefan-Maxwell diffusion coefficients from the MD simulations are summarized inTable 5. The diffusion order is m- > o-> p-xylene. The diffusion coefficients obtained are about
two orders lower than that of aromatic molecules in a benzene solvent, e.g. 1.35x10⁻⁹ m2/s for
toluene. This suggests that the strong interaction between the CD cavity and the xylenesmolecules slows the diffusion of the xylenes.
Table 5. The Stefan-Maxwell diffusion coefficients of xylenes isomers in the CD phase obtainedfrom MD simulations.
Solute Dii
[x10-11 m2/s]
p-xylene 3.84m-xylene 6.46
o-xylene 4.47
The heat of the formation of the inclusion complexes are calculated using molecular mechanics
methods for the 1:1 and 1:2 (host: guest) complexes. The results are summarized in Table 6.The most energetically stable complex was chosen from the several initial configurations. The
order of the inclusion complex strength is o- > p- > m-xylene which are consistent with the
reported formation constants at 25 °C in aqueous solution [42]. This order is opposite of the
order of the estimated diffusion coefficients except o-xylene. This means that the interactionstrength is fundamentally factored into the determination of their diffusion rate; however, the
entropic effect is also an important factor on the diffusion rate. Actually, the most stable
configuration for a p-xylene molecule indicates that two methyl groups interact with the cavitymouth. Such a configuration where the molecular axis tilts to the diffusion direction would
reduce its diffusion rate.
Comparison between the mathematical model predictions and flux and selectivity
measurements: The pervaporation results including the flux and selectivity were compared with
those estimated by the mathematical model. The model parameters related to the membrane
are summarized in Table 7. In this table, the density of CD, rCD, is the same as that of the unit
cell used in MD calculations. The membrane thickness was obtained from the SEM image
(Figure 15) of the membrane cross section. The saturation amount of adsorption, qm, was
calculated assuming a 1:1 complex. The structural factor, m*, which mainly relates to the
porosity of the membrane, is assumed 0.14. This value is smaller than the porosity of the
support top layer which is 0.2 to 0.25. The parameter m* only effects the magnitude of flux.
Figure 18 shows the adsorption isotherm of p-/m-xylene binary mixtures as a function of thefeed p-xylene concentration. This adsorption isotherm is used for estimating the amount of
adsorption on the feed side. The equations of the functions fit to these adsorption isotherms as
a function of the feed p-xylene concentration are Y = -7.61x10-7X3 + 7.31x10-5X2 + 0.010X for p-
xylene and Y = 8.56x10-8X3 – 1.67x10-5X2 – 9.13x10⁻³X + 1.016 for m-xylene, with correlationcoefficients (R2) of 0.997 and 1.00. For the calculation of the Dij we employed three
approximations; Dij is infinity (the terms containing Dij in the denominator vanish numerically),
and the simple average of the diffusion coefficient of two components given by:
Final Progress Report March 27, 2003
DE-FC07-01ID13998
31
Dij = 0.5(D11+D22) (25)
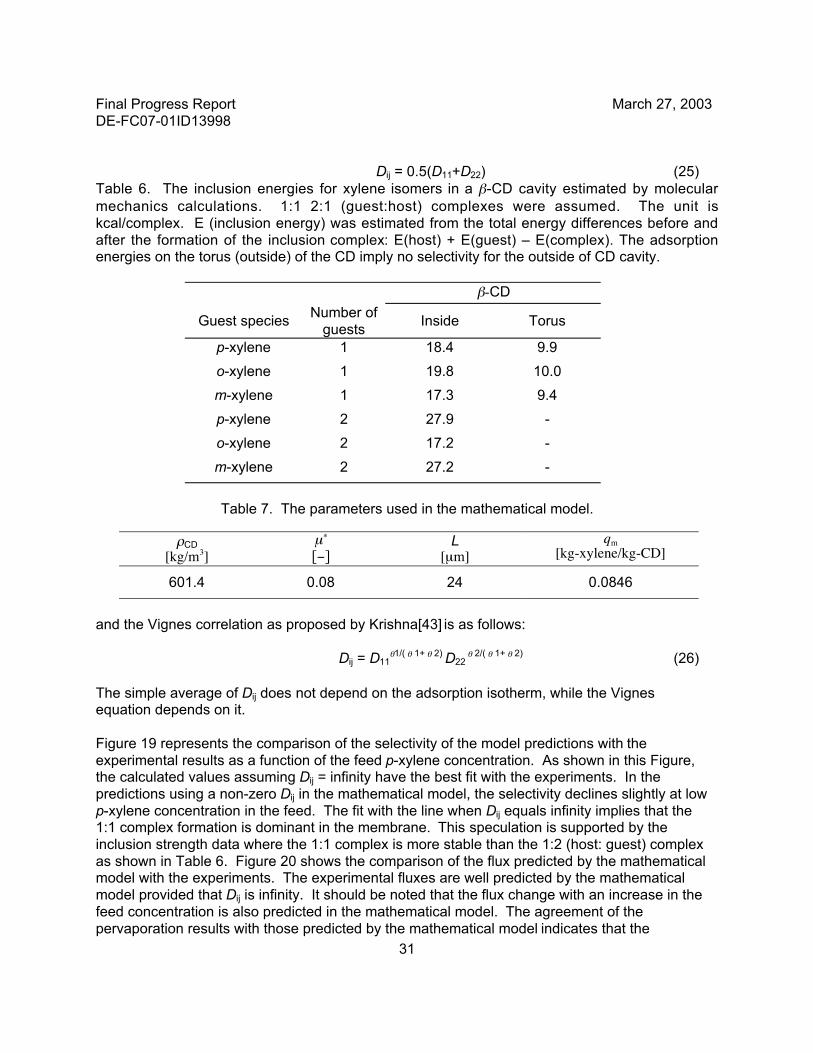
Table 6. The inclusion energies for xylene isomers in a b-CD cavity estimated by molecular
mechanics calculations. 1:1 2:1 (guest:host) complexes were assumed. The unit is
kcal/complex. E (inclusion energy) was estimated from the total energy differences before and
after the formation of the inclusion complex: E(host) + E(guest) – E(complex). The adsorptionenergies on the torus (outside) of the CD imply no selectivity for the outside of CD cavity.
b-CD
Guest speciesNumber of
guestsInside Torus
p-xylene 1 18.4 9.9
o-xylene 1 19.8 10.0
m-xylene 1 17.3 9.4
p-xylene 2 27.9 -
o-xylene 2 17.2 -
m-xylene 2 27.2 -
Table 7. The parameters used in the mathematical model.
rCD
[kg/m3]
m*
[-]L
[mm]
qm[kg-xylene/kg-CD]
601.4 0.08 24 0.0846
and the Vignes correlation as proposed by Krishna[43] is as follows:
Dij = D11q1/( q 1+ q 2) D22
q 2/( q 1+ q 2) (26)
The simple average of Dij does not depend on the adsorption isotherm, while the Vignesequation depends on it.
Figure 19 represents the comparison of the selectivity of the model predictions with the
experimental results as a function of the feed p-xylene concentration. As shown in this Figure,the calculated values assuming Dij = infinity have the best fit with the experiments. In the
predictions using a non-zero Dij in the mathematical model, the selectivity declines slightly at low
p-xylene concentration in the feed. The fit with the line when Dij equals infinity implies that the1:1 complex formation is dominant in the membrane. This speculation is supported by the
inclusion strength data where the 1:1 complex is more stable than the 1:2 (host: guest) complex
as shown in Table 6. Figure 20 shows the comparison of the flux predicted by the mathematicalmodel with the experiments. The experimental fluxes are well predicted by the mathematical
model provided that Dij is infinity. It should be noted that the flux change with an increase in the
feed concentration is also predicted in the mathematical model. The agreement of the
pervaporation results with those predicted by the mathematical model indicates that the

Final Progress Report March 27, 2003
DE-FC07-01ID13998
32
transport mechanism in this membrane is likely controlled by a surface diffusion mechanism,
and that the terms containing Dij could be neglected in our system.
The selectivity of the pervaporation process is basically a function of the sorption equilibrium
and the diffusion rates in the membrane. To provide a better understanding of the factors thatcontrol the transport, two sets of model calculations were carried out. In the first calculation,
Model 1, the individual diffusivities for two isomers are assumed to be equal to examine the
effect of the solubility difference. In another calculation, Model 2, it is assumed that theindividual solubility ratio of the isomers on the feed side is equal to the ratio of the feed
concentrations while the diffusivity differences are considered independently. Predicted flux and
selectivity for these models are presented in Figures 21 and 22, respectively. As shown in
these figures, the trends of flex and selectivity between two models are similar, and the best fitwith the change of the selectivity of the experimental data is that of Model 2. This suggests that
the strong dependency of the selectivity on the feed concentration is mainly due to the
contributions from the differences in the diffusion rates.
Figure 18. Sorption isotherms for the p-/m-
xylene binary system.
Figure 19. Comparison of the predicted fluxes
and the experimental results for the p-/m-
xylene binary mixtures. Predictions using
three approximations for Dij are shown.

Final Progress Report March 27, 2003
DE-FC07-01ID13998
33
Figure 20. Comparison of the predicted
selectivities and the experimental results
for the p-/m-xylene binary mixtures.Predictions using three approximations
of Dij are shown.
The selectivity of the pervaporation process is
basically a function of the sorption equilibriumand the diffusion rates in the membrane. To
provide a better understanding of the factors that
control the transport, two sets of modelcalculations were carried out. In the first
calculation, Model 1, the individual diffusivities
for two isomers are assumed to be equal toexamine the effect of the solubility difference. In
another calculation, Model 2, it is assumed that
the individual solubility ratio of the isomers on
the feed side is equal to the ratio of the feedconcentrations while the diffusivity differences
are considered independently. Predicted flux
and selectivity for these models are presented inFigures 21 and 22, respectively. As shown in
these figures, the trends of flex and selectivity
between two models are similar, and the best fitwith the change of the selectivity of the
experimental data is that of Model 2. This
suggests that the strong dependency of the
selectivity on the feed concentration is mainly due to the contributions from the differences inthe diffusion rates.
Figure 21. Predicted changes of the fluxes in
the two models as a function of the feed p-xylene concentration. Model 1 assumed that
the diffusion coefficients for two components
are equal while the sorption parameters are
correctly considered. Model 2 assumed thatthe sorption occupancy on the feed side is the
same as the ratio of the feed concentrations,
while the diffusivities are correctly considered.
Figure 22. Predicted changes of the selectivity
in the two models as a function of the feed p-xylene concentration. See Figure 21 for the
explanation of the assumptions in Models 1
and 2.
Final Progress Report March 27, 2003
DE-FC07-01ID13998
34
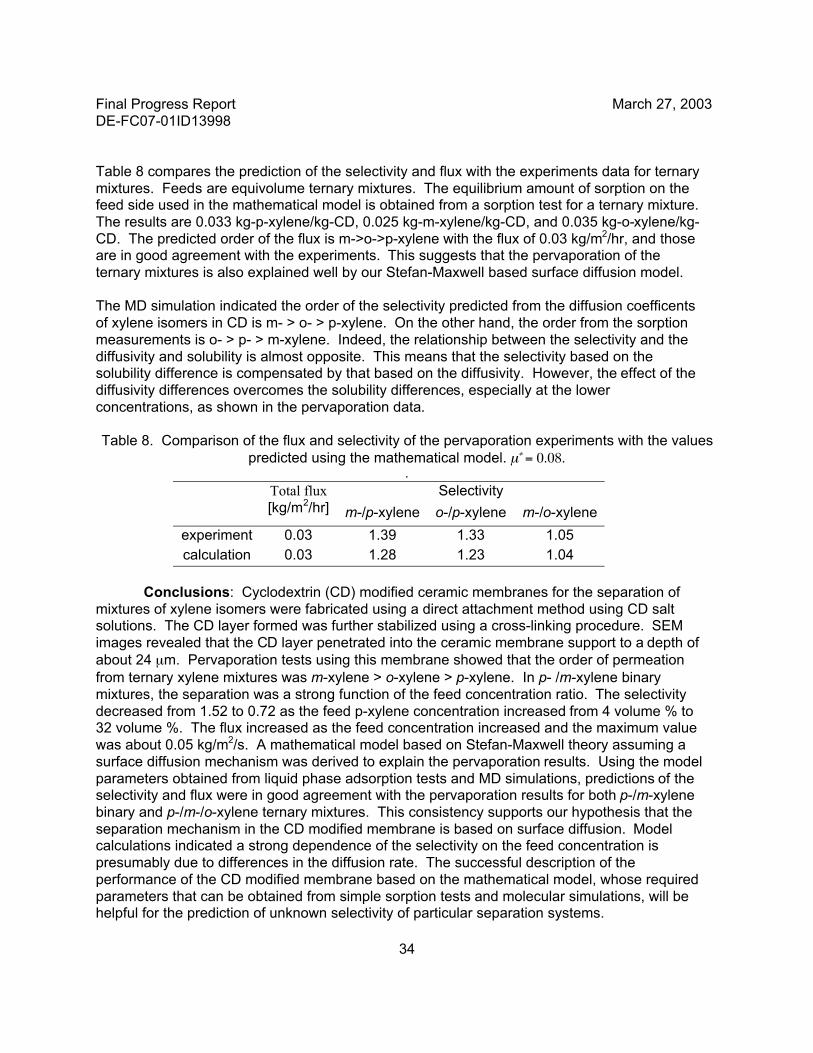
Table 8 compares the prediction of the selectivity and flux with the experiments data for ternary
mixtures. Feeds are equivolume ternary mixtures. The equilibrium amount of sorption on thefeed side used in the mathematical model is obtained from a sorption test for a ternary mixture.
The results are 0.033 kg-p-xylene/kg-CD, 0.025 kg-m-xylene/kg-CD, and 0.035 kg-o-xylene/kg-
CD. The predicted order of the flux is m->o->p-xylene with the flux of 0.03 kg/m2/hr, and thoseare in good agreement with the experiments. This suggests that the pervaporation of the
ternary mixtures is also explained well by our Stefan-Maxwell based surface diffusion model.
The MD simulation indicated the order of the selectivity predicted from the diffusion coefficents
of xylene isomers in CD is m- > o- > p-xylene. On the other hand, the order from the sorption
measurements is o- > p- > m-xylene. Indeed, the relationship between the selectivity and the
diffusivity and solubility is almost opposite. This means that the selectivity based on thesolubility difference is compensated by that based on the diffusivity. However, the effect of the
diffusivity differences overcomes the solubility differences, especially at the lower
concentrations, as shown in the pervaporation data.
Table 8. Comparison of the flux and selectivity of the pervaporation experiments with the values
predicted using the mathematical model. m* = 0.08..
SelectivityTotal flux
[kg/m2/hr] m-/p-xylene o-/p-xylene m-/o-xylene
experiment 0.03 1.39 1.33 1.05
calculation 0.03 1.28 1.23 1.04
Conclusions: Cyclodextrin (CD) modified ceramic membranes for the separation of
mixtures of xylene isomers were fabricated using a direct attachment method using CD saltsolutions. The CD layer formed was further stabilized using a cross-linking procedure. SEM
images revealed that the CD layer penetrated into the ceramic membrane support to a depth of
about 24 mm. Pervaporation tests using this membrane showed that the order of permeation
from ternary xylene mixtures was m-xylene > o-xylene > p-xylene. In p- /m-xylene binary
mixtures, the separation was a strong function of the feed concentration ratio. The selectivity
decreased from 1.52 to 0.72 as the feed p-xylene concentration increased from 4 volume % to32 volume %. The flux increased as the feed concentration increased and the maximum value
was about 0.05 kg/m2/s. A mathematical model based on Stefan-Maxwell theory assuming a
surface diffusion mechanism was derived to explain the pervaporation results. Using the model
parameters obtained from liquid phase adsorption tests and MD simulations, predictions of theselectivity and flux were in good agreement with the pervaporation results for both p-/m-xylene
binary and p-/m-/o-xylene ternary mixtures. This consistency supports our hypothesis that the
separation mechanism in the CD modified membrane is based on surface diffusion. Modelcalculations indicated a strong dependence of the selectivity on the feed concentration is
presumably due to differences in the diffusion rate. The successful description of the
performance of the CD modified membrane based on the mathematical model, whose required
parameters that can be obtained from simple sorption tests and molecular simulations, will behelpful for the prediction of unknown selectivity of particular separation systems.

Final Progress Report March 27, 2003
DE-FC07-01ID13998
35
Nomenclature:
A [m2] membrane area
a [P] activity
ci0,m [kg/m3] concentration of i at position 0
ciL,m [kg/m3] concentration of species i at position L.Di [m2/s] diffusion coefficient of species i
Ecoh [MJ] cohesive energy
Ji [kg/m2 s] flux of species iKi
gas [kg/m3 Pa] gas phase sorption coefficient
L [mm] membrane thickness
pi0 [Pa] partial pressures of species i in equilibrium with ci0,m
piL [Pa] partial pressures of species i in equilibrium with ci0,L
Pi [(m2/s)(kg/m3 Pa) permeability of species i; the product of Di and Kigas.
q [kg] mass of permeate
Q [kg mm/m2 hr.] permeation rate / normalized flux
t [hr. / s] time
T [°C] temperature
V [m3] volume
wP,i [P] weight fraction of component i in permeate
wF,i [P] weight fraction of component i in feed.
Wd / Ws [g] weight of dry sample / weight of swollen sample
a [P] separation factor
Gk [P] group residual activity
G jk [P] group residual activity in a reference solution of pure j.
d [MPa1/2] solubility parameter
ji [P] volume fraction of species i
m [J/kg mol] chemical potentialv [P] reduced volume fraction
n jk [P] number of groups of type k in molecule j
DHVAP [MJ] enthalpy of evaporation
3c1 [P] number of external degrees of freedom per molecule
Patents:
• A patent was filed on 1/25/03 describing the rubbery blend membranes and applicationsusing them to separate aromatic hydrocarbons from aliphatic hydrocarbons as well as
the separation of acid gases and nitrogen from methane. The title of the patent is:
POLYMER BLENDS AND METHODS OF SEPARATION USING THE SAME.

Final Progress Report March 27, 2003
DE-FC07-01ID13998
36
Publications/Presentations:
• Nam, S.Y. and J.R. Dorgan, 2002 North American Membrane Society Annual Meeting,
Los Angeles, CA, 5/02, Tuning Pervaporation Membrane Performance through Rubbery
Blends: Application to Benzene-Cyclohexane Separation.• Takaba, H. and J. D. Way, 2002 North American Membrane Society Annual Meeting,
Los Angeles, CA, 5/02, Separation of Isomeric Xylenes using Cyclodextrin Modified
Membranes• Takaba, H. and J. D. Way, "Separation of Isomeric Xylenes Using Cyclodextrin Modified
Ceramic Membranes," I&EC Res., I&EC Res., 42(6), 1243–1252(2003).
• Stone, M.L., Orme, C.J., Stewart, F.F., Benson, M.T. and Peterson, E.S., “Gas
Permeation Characteristics of Four Fluorinated Polymers”, Amer. Chem. Soc. PolymerPreprints 2002, 43(2), 1374
• Orme, C., Stewart, F. and Stone, M. “Gas Transport Properties of Designer
Phosphazene Polymers”, 2002 North American Membrane Society Annual Meeting, LosAngeles, CA, 5/02.
• Christopher J. Orme, John R. Klaehn, and Frederick F. Stewart, “Gas Permeability of
Polyphosphazenes Bearing Substituted Aromatic Pendant Groups” Manuscript inPreparation for Submission to J. Membr. Sci.
• Nam, S.Y. and J.R. Dorgan, A priori design of solubility selective membranes. J. Memb.
Sci., 2002. In Preparation.
References:
1. U. S. DOE, 1994 Manufacturing Energy Consumption Survey. 1997.2. Fleming, H.L., Dehydration of organic / aqueous mixtures by membrane pervaporation.
Proc. Int. Conf. on Fuel Alcohols and Chemicals, 1989.
3. Baker, R.W., E.L. Cussler, W. Eykamp, W.J. Koros, R.L. Riley, and H. Strathmann,
Membrane Separations Systems - A R&D Needs Assessment. 1990.4. Ho, W.S.W. and K.K. Sirkar, eds. Membrane Handbook. 1992, VanNostrand Reinhold:
New York.
5. Ho, W.S.W. and K.K. Sirkar, Membrane Handbook. 1992, New York: VanNostrandReinhold.
6. Schell, W.J., C.D. Houston, and W.L. Hopper, Membranes can efficiently separate
carbon dioxide from mixtures. Oil Gas Journal, 1983. 81(33): p. 52-56.7. Stephan, W., R.D. Noble, and C.A. Koval, Design Methodology for a Membrane /
Distillation Hybrid Process. Journal of Membrane Science, 1995. 99: p. 259.
8. Rautenbach, R. and R. Albrecht, The Separation Potential of Pervaporation Part 2.
Process Design and Economics. Journal of Membrane Science, 1985. 25: p. 25-54.9. White, L.S., Transport Properties of a polyimide solvent resistant nanofiltration
membrane. J. Memb. Sci., 2002. 205: p. 191-202.
10. Hofmann, W., Rubber Technology Handbook. 1980, Munich: Hanser.11. Wijmans, J.G. and R.W. Baker, The Solution-Diffusion Model: A Review,. Journal of
Membrane Science, 1995. 107: p. 1.
12. Sperling, L.H., Introduction to Physical Polymer Science. 3rd ed. 2001, New York: JohnWiley and Sons.

Final Progress Report March 27, 2003
DE-FC07-01ID13998
37
13. Hansen, C.M., Hansen Solubility Parameters: A User's Handbook. 2000, Boca Raton,
FL: CRC Press.14. Oishi, T. and J. Prausnitz, Estimation of Solvent Activities in Polymer Solutions Using a
Group-Contribution Method. Ind. Eng. Chem. Process Des. Dev., 1978. 17(3): p. 333-
339.15. Nam, S.Y. and J.R. Dorgan, A priori design of solubility selective membranes. J. Memb.
Sci., 2002. In Preparation.
16. Amerongen, G.J.v., The Permeability Of Different Rubbers To Gases And ItsRelationship To Diffusivity And Solubility. Journal of Applied Physics, 1946. 17: p. 972.
17. Barrer, R.M., Permeation, Diffusion, And Solution Of Gases In Organic Polymers.
Transactions of the Faraday Society, 1939. 35: p. 628.
18. Orme, C.J., M.K. Harrup, T.A. Luther, R.P. Lash, K.S. Houston, D.H. Weinkauf, and F.F.Stewart, Characterization of gas transport in selected rubbery amorphous
polyphosphazene membranes. Journal of Membrane Science, 2001. 186(2): p. 249-256.
19. Baertsch, C.D.F., H. H.; Falconer, J. L .; Noble R., Permeation of AromaticsHydrocarbon Vapors through Silicalite-Zeolite Membranes. J. Phys. Chem., 1996. 100:
p. 7676.
20. Xomeritakis, G.L., Z.; Tsapatis, M., Separation of Xylene isomers Vapors with OrientedMFI Membranes Made by Seeded Growth. Ind. Eng. Chem. Res., 2001. 40: p. 544.
21. Wegner, K.D., J.; Lin, Y. S., Polycrystalline MFI Zeolite Membranes: Xylene
Pervaporation and its Implication on Membrane Microstructure. J. Membr. Sci., 1999.
158: p. 17.22. Wytcherley, R.W.M., F. P., The Separation of meta- and para-Xylene by Pervaporation
in the Presence of CBr4 a Selective Feed-Complexing Agent. . J. Membr. Sci., 1992. 67:
p. 67.23. Mulder, M.H.V., Separation of Isomeric Xylenes by Permeation in Cellulose Ester
Membranes. J. Membr. Sci., 1982. 11: p. 349.
24. Yamasaki, A.I., T.; Masuoka, T.; Mizoguchi, K., Pervaporation of Ethanol/Water through
a Poly(Vinyl Alcohol)/Cyclodextrin (PVA/CD) Membrane. J. Membr. Sci., 1994. 89: p.111.
25. Chen, H.L.W., L. G.; Tan, J.; Zhu, C. L., PVA Membrane Filled b-Cyclodextrin for
Separation of Isomeric Xylenes by Pervaporation. Chem. Eng. J., 2000. 78: p. 159.26. Miyata, T.I., T.; Uragami, T., Characteristics of Permeation and Separation of Xylene
Isomers through Poly (Vinyl Alcohol) Membranes Containing Cyclodextrin. Macromol.
Chem. Phys., 1996. 197: p. 2909.27. Krieg, H.M.B., J. C.; Keizer, K., Chiral Resolution by b-Cyclodextrin Polymer-
impregnated Ceramic Membranes. . J. Membr. Sci., 2000. 164: p. 177.
28. Sikonia, J.G.M., F. P., Separation of Isomeric Xylenes by Permeation through Modified
Plastic Films. J. Membr. Sci., 1978. 4: p. 229.29. Krieg, H.M.L., J.; Keizer, K.; Breytenbach, J. C., Enrichment of Chlorthalodone
Enantiomers by Aqueous Bulk Liquid Membrane Containing b-Cyclodextrin. J. Membr.
Sci., 2000. 167: p. 33.30. Lue, S.J.J., H. J.; Hou, S. Y., Permeation of Xylene isomers through Supported Liquid
Membranes Containing Cyclodextrins. Sep. Sci. Technol., 2002. 37: p. 463.
31. Rekharsky, M.V.I., Y., Complexation Thermodynamics of Cyclodextrins. Chem. Rev.,1998. 98: p. 1875.

Final Progress Report March 27, 2003
DE-FC07-01ID13998
38
32. Armstrong, D.W.D., W.; Alak, A.; Hinze, T. E.; Bui, K.H., Liquid Chromatography
Separation of Diastereomers and Structural Isomers on Cyclodextrin-Bonded Phases.Anal. Chem., 1985. 57: p. 234.
33. Ching, C.B.H., K.; Liu, X., Sorption and Diffusion of Cresols on Bonded b-Cyclodextrin-
Silica Stationary Phase. Ind. Eng. Chem. Res., 1993. 32: p. 2789.34. Davies, J.E.D.K., W.; Powell, H. M.; Smith, N. O., J. Incl. Phenom., 1983. 1: p. 3.
35. Uematsu, I.J., Selective Liquid-Liquid Extraction of Xylene Isomers and Ethylbenzene
though Inclusion by Branched a-Cyclodextrin. Incl. Phenom. Mol. Recog. Chem., 1992.13: p. 1.
36. Krishna, R., Multicomponent Surface Diffusion of Adsorbed Species. A Description
Based in the Generalized Maxwell-Stefan Diffusion Equations. Chem. Eng. Sci., 1990.
45: p. 1779.37. Kapteijn, F.M., J. A.; Krishna, R., The Generalized Maxwell-Stefan Model for Diffusion in
Zeolites: Sorbate Molecules with Different Saturation Loadings. Chem. Eng. Sci., 2000.
55: p. 2923.38. van den Broeck, L.J.P.B., W. J. W.; Kapteijn, F.; Moulijin, J. A., Binary Permeation
through a Silicalite-1 Membrane. AIChE J., 1999. 45: p. 976.
39. Molecular Simulations, I., Cerius2 Software Manual. 1997, Molecular Simulations, Inc.:San Diego.
40. Karger, J.R., D. M., Diffusion in Zeolite and Microporous Solids. 1992, New York: Wiley-
Interscience.
41. Suzuki, S.T., H.; Yamaguchi, T.; Nakao, S., Estimation of Gas Permeability of a ZeoliteMembrane Based on a Molecular Simulation Technique and Permeation Model. J. Phys.
Chem. B., 2000. 104: p. 1971.
42. Sanemasa, I.A., Y., Association of Benzene and Alkylbenzenes with Cyclodextrins inAqueous Medium. Bull. Chem. Soc. Jpn., 1987. 60: p. 2059.
43. Krishna, R., A United Approach to the Modeling of Intraparticle Diffusion in Adsorption
Processes. Gas Sep. Purif., 1993. 7: p. 91.


![Recent Progress Towards Light Hydrocarbon Separations ...alchemy.cchem.berkeley.edu/static/pdf/papers/paper310.pdffor challenging hydrocarbon separations [5–10]. Comprising inorganic](https://img.pdfslide.net/doc/110x75/5f9a48eae799d435d81d07cc/recent-progress-towards-light-hydrocarbon-separations-for-challenging-hydrocarbon.jpg)