Embed Size (px)
Citation preview
www.CalSolarResearch.ca.gov
Final Project Report:
West Village Energy Initiative
APPENDIX A:
Task 1 Demo 1 Battery Buffered
Electric Vehicle Charging Station
Demonstrations
Grantee:
University of California, Davis
Energy Institute
July, 2015
California Solar Initiative
Research, Development, Demonstration
and Deployment Program RD&D:

PREPARED BY
University of California, Davis Energy Institute
University of California, Davis Office of Environmental Stewardship and Sustainability
UC Davis Energy Institute 1 Shields Avenue Davis, CA 95616 530-752-4909 436 Mrak Hall University of California, Davis
Principal Investigator: A. Sidney England asengland @ ucdavis.edu
Project Partners: E3 DEG General Electric
PREPARED FOR
California Public Utilities Commission California Solar Initiative: Research, Development, Demonstration, and Deployment Program
CSI RD&D PROGRAM MANAGER
Program Manager: Smita Gupta [email protected]
Project Manager: Smita Gupta [email protected]
Additional information and links to project related documents can be found at
http://www.calsolarresearch.ca.gov/Funded-Projects/
DISCLAIMER
“Any opinions, findings, and conclusions or recommendations expressed in this material are those of the author(s) and do not necessarily reflect the views of the CPUC, Itron, Inc. or the CSI RD&D Program.”

Preface
The goal of the California Solar Initiative (CSI) Research, Development, Demonstration, and Deployment (RD&D) Program is to foster a sustainable and self-supporting customer-sited solar market. To achieve this, the California Legislature authorized the California Public Utilities Commission (CPUC) to allocate $50 million of the CSI budget to an RD&D program. Strategically, the RD&D program seeks to leverage cost-sharing funds from other state, federal and private research entities, and targets activities across these four stages:
Grid integration, storage, and metering: 50-65%
Production technologies: 10-25%
Business development and deployment: 10-20%
Integration of energy efficiency, demand response, and storage with photovoltaics (PV)
There are seven key principles that guide the CSI RD&D Program:
1. Improve the economics of solar technologies by reducing technology costs and increasing system performance;
2. Focus on issues that directly benefit California, and that may not be funded by others;
3. Fill knowledge gaps to enable successful, wide-scale deployment of solar distributed generation technologies;
4. Overcome significant barriers to technology adoption;
5. Take advantage of California’s wealth of data from past, current, and future installations to fulfill the above;
6. Provide bridge funding to help promising solar technologies transition from a pre-commercial state to full commercial viability; and
7. Support efforts to address the integration of distributed solar power into the grid in order to maximize its value to California ratepayers.
For more information about the CSI RD&D Program, please visit the program web site at www.calsolarresearch.ca.gov.
UC Davis West Village Energy Initiative: CSI RD&D Project Final Report
3
Abstract
A solar PV powered battery buffered electric vehicle charging station was designed, installed and in UC Davis West Village, the largest planed zero net energy community in the United States. The solar powered, battery buffered EV charging station system consists of a 5 kW solar PV panel, a 35 kWh Lithium-ion battery, a 10 kW demand response bi-directional inverter, and a level 2 electric vehicle charger. The battery buffered charging station permits the maximum use of solar energy for charging electric vehicles and minimizes the impact of the charging on the electric utility grid.
Acknowledgements
We would like to give our special gratitude and thanks to California Solar Initiative for their financial support, the UC Davis Energy Institute for their help in developing and managing the project and Itron for their ongoing management of support of the CSI RD&D program.
UC Davis West Village Energy Initiative: CSI RD&D Project Final Report
4
Executive Summary
Solar PV Powered Battery Buffered Electric Vehicle Charging Station
Introduction
This task is concerned with the design, installation, checkout and demonstration of a battery buffered electric vehicle charging station in West Village. The electric energy for this station is provided from a nearby panel of photovoltaic solar cells or from the grid. The battery buffered charging station will permit the maximum use of solar energy for charging electric vehicles and will minimize the impact of the charging on the electric utility grid. The control of the electric energy to and from the battery and to the charging station is done through a bi-directional inverter which can function either as a DC/DC or DC/AC inverter as needed. West Village at UC Davis is the largest planned zero net energy community in the United States. It has an on-site over 2 megawatt PV generation, and is expected to be an area with high EV adoption. Hence it is an ideal site for demonstrating the battery buffered EV charging technology.
Project Objectives
Design, install, checkout and demonstrate a solar PV powered battery buffered electric vehicle charging station in West Village
Project Summary
The solar powered, battery buffered EV charging station system consists of a 5 kW solar PV panel, a 35 kWh Lithium ion battery, a 10 kW demand response bi-directional inverter, and a level 2 electric vehicle charger as shown in Figure 1. The bi-directional inverter controls power flow between the different units. It has two DC ports which are connected to the PV panel and battery storage and two AC ports tied to the utility grid and EV charger, respectively. PV power can be used to charge the EV, be stored in the battery, and/or be fed to the grid. The PV panels, battery storage, and the grid can provide power for charging the EV.
The control strategy for the system is to maximize PV energy used for EV charging and to reduce grid power demand from EV charging. There are two operating modes: grid-tied and standalone. Most of time, the charging station operates in the grid-tied mode. In the grid-tied mode, the EV can be charged from PV, the battery, and/or the grid. In the case of a power outage, the system will automatically switch to standalone mode and be isolated from the grid. In the standalone mode, the EV is charged from PV and the battery. When the grid power is restored, the system will automatically switch to grid-tied operation.
UC Davis West Village Energy Initiative: CSI RD&D Project Final Report
5
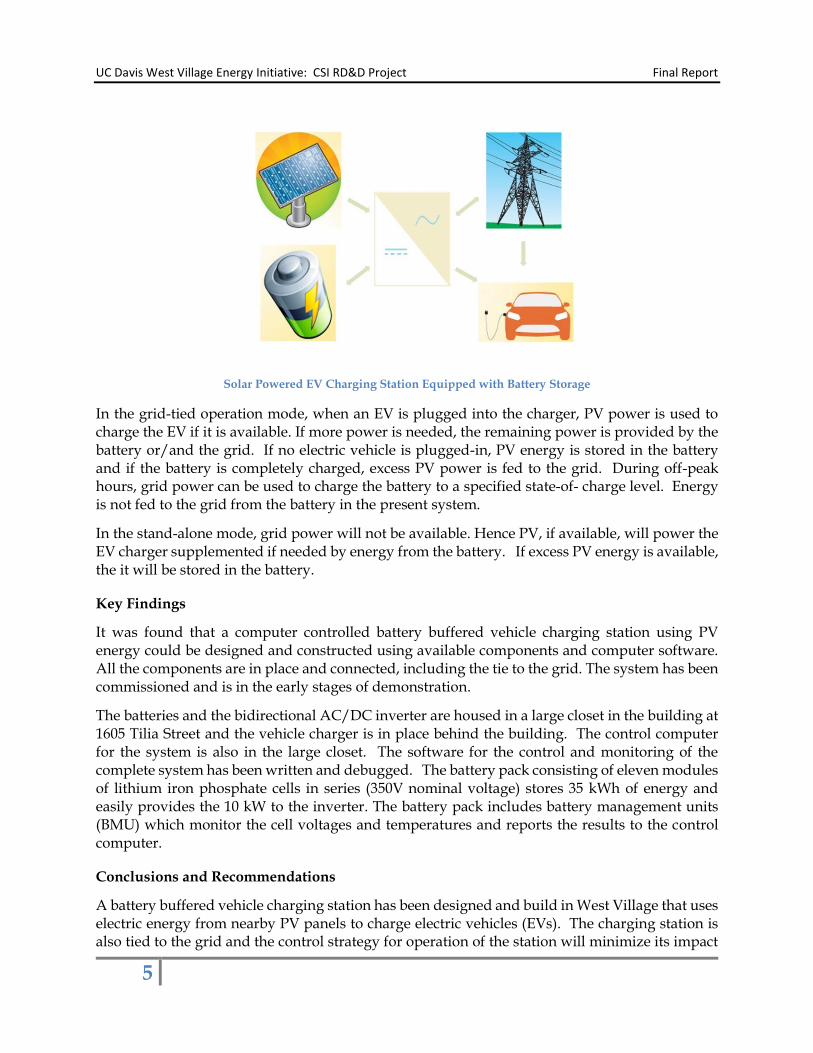
Solar Powered EV Charging Station Equipped with Battery Storage
In the grid-tied operation mode, when an EV is plugged into the charger, PV power is used to charge the EV if it is available. If more power is needed, the remaining power is provided by the battery or/and the grid. If no electric vehicle is plugged-in, PV energy is stored in the battery and if the battery is completely charged, excess PV power is fed to the grid. During off-peak hours, grid power can be used to charge the battery to a specified state-of- charge level. Energy is not fed to the grid from the battery in the present system.
In the stand-alone mode, grid power will not be available. Hence PV, if available, will power the EV charger supplemented if needed by energy from the battery. If excess PV energy is available, the it will be stored in the battery.
Key Findings
It was found that a computer controlled battery buffered vehicle charging station using PV energy could be designed and constructed using available components and computer software. All the components are in place and connected, including the tie to the grid. The system has been commissioned and is in the early stages of demonstration.
The batteries and the bidirectional AC/DC inverter are housed in a large closet in the building at 1605 Tilia Street and the vehicle charger is in place behind the building. The control computer for the system is also in the large closet. The software for the control and monitoring of the complete system has been written and debugged. The battery pack consisting of eleven modules of lithium iron phosphate cells in series (350V nominal voltage) stores 35 kWh of energy and easily provides the 10 kW to the inverter. The battery pack includes battery management units (BMU) which monitor the cell voltages and temperatures and reports the results to the control computer.
Conclusions and Recommendations
A battery buffered vehicle charging station has been designed and build in West Village that uses electric energy from nearby PV panels to charge electric vehicles (EVs). The charging station is also tied to the grid and the control strategy for operation of the station will minimize its impact
UC Davis West Village Energy Initiative: CSI RD&D Project Final Report
6
on the grid. The lithium-ion battery and bi-directional inverter which controls the energy to/from the battery and to the charging station are in place and connected into the system. The completed charging station has been commissioned and detailed data are being taken of its operation both as a means of storing PV electrical energy and charging vehicles on demand independent of the availability of PV energy or the grid.
The PV array (34 m2) for the West Village project is mounted vertically on the tower attached to the building at 1605 Tilia Street. The resultant PV energy is 7-14 kWh/day of electric energy in the summer and 14-28 kWh/day in the winter season. The PV energy should be sufficient to charge EVs that have traveled 75 and 40 miles per day in the winter and summer, respectively. This should permit a meaningful demonstration of the vehicle charging station using the present PV array and provide an opportunity for expanded vehicle charging if more PV energy is made available.
After this project is completed, research using the vehicle charging station will continue supported by a recent EISG grant, Intelligent Energy Management for the Solar Powered EV Charging Station. This research will include in the control of the charging station information on weather forecasts (solar intensity) and projections of the daily use patterns of the station. It is recommended that during this demonstration more PV energy than is currently available from the tower alone be made available for use at the vehicle charging station.
Public Benefit to California
The public benefits to California of this project are the demonstration of the use of PV energy to charge electric vehicles and the use of battery storage to maximize the fraction of the PV energy that can be used for charging and to minimize the impact of electric vehicle charging on the utility grid. Both of these benefits will become increasingly important as the number of electric vehicles in California continues to increase and the need for storage by the utilities becomes greater as the contribution of PV power generation becomes larger.
UC Davis West Village Energy Initiative: CSI RD&D Project Final Report
7
Table of Contents
Contents
WEST VILLAGE SOLAR PV POWERED BATTERY BUFFERED ELECTRIC VEHICLE CHARGING
STATION ....................................................................................................................................................... 2
Abstract.................................................................................................................................................... 3
Acknowledgements ............................................................................................................................... 3
Executive Summary ............................................................................................................................... 4
Table of Contents ............................................................................................................................... 7
List of Tables ....................................................................................................................................... 9
List of Figures ..................................................................................................................................... 9
Nomenclature ................................................................................................................................... 11
1. Introduction .......................................................................................................................................... 12
2. Technical Approach ............................................................................................................................. 12
2.1 Electrical Energy Storage Technologies for Charging Stations ........................................... 12
2.1.1 Selection Factors .................................................................................................................. 12
2.1.2 System Design Factors ........................................................................................................ 14
2.1.3 Characteristics of Batteries of Various Chemistries ....................................................... 15
2.1.4 Characteristics of the Batteries Used in the Vehicle Charging Station Project ........... 17
2.2 Integrated System Design ......................................................................................................... 18
2.2.1 System Overview ................................................................................................................ 18
2.2.2 System Design ..................................................................................................................... 19
2.2.3 System communication ...................................................................................................... 20
2.3 Control Strategy and Programming ........................................................................................ 21
2.3.1 Control Strategy .................................................................................................................. 21
2.3.2 Control Flowchart ............................................................................................................... 22
2.3.3 Supervisory Control............................................................................................................ 24
2.4 Construction of the system ....................................................................................................... 26
2.4.1 Energy Storage System ....................................................................................................... 26
2.4.2 Power Control System ........................................................................................................ 28

UC Davis West Village Energy Initiative: CSI RD&D Project Final Report
8
2.4.3 Vehicle charging Station .................................................................................................... 29
3. Test Data ................................................................................................................................................ 29
4. Results and discussion ........................................................................................................................ 32
5. Public Benefits and Recommendations ............................................................................................. 33
References ................................................................................................................................................. 33
UC Davis West Village Energy Initiative: CSI RD&D Project Final Report
9
List of Tables
Table 1: The Performance of Various Types of Batteries .................................................................... 16
Table 2: Characteristics of Lithium-Ion Batteries Using Various Chemistries ................................ 16
Table 3: Test Data for the LF Cells Used in the West Village Charging Station .............................. 18
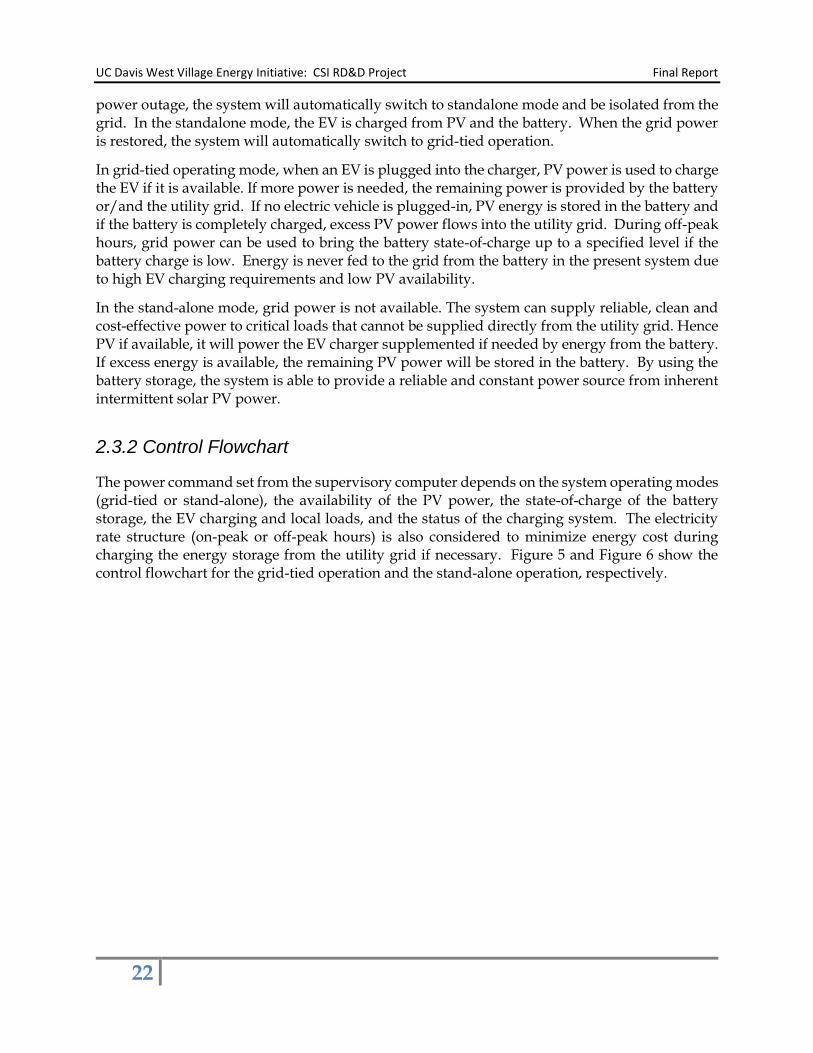
Table 4: Overview of CANBUS and MODBUS information ............................................................ 21
List of Figures
Figure 1: Block Diagram of the Battery Buffered Vehicle Charging Station ................................... 14
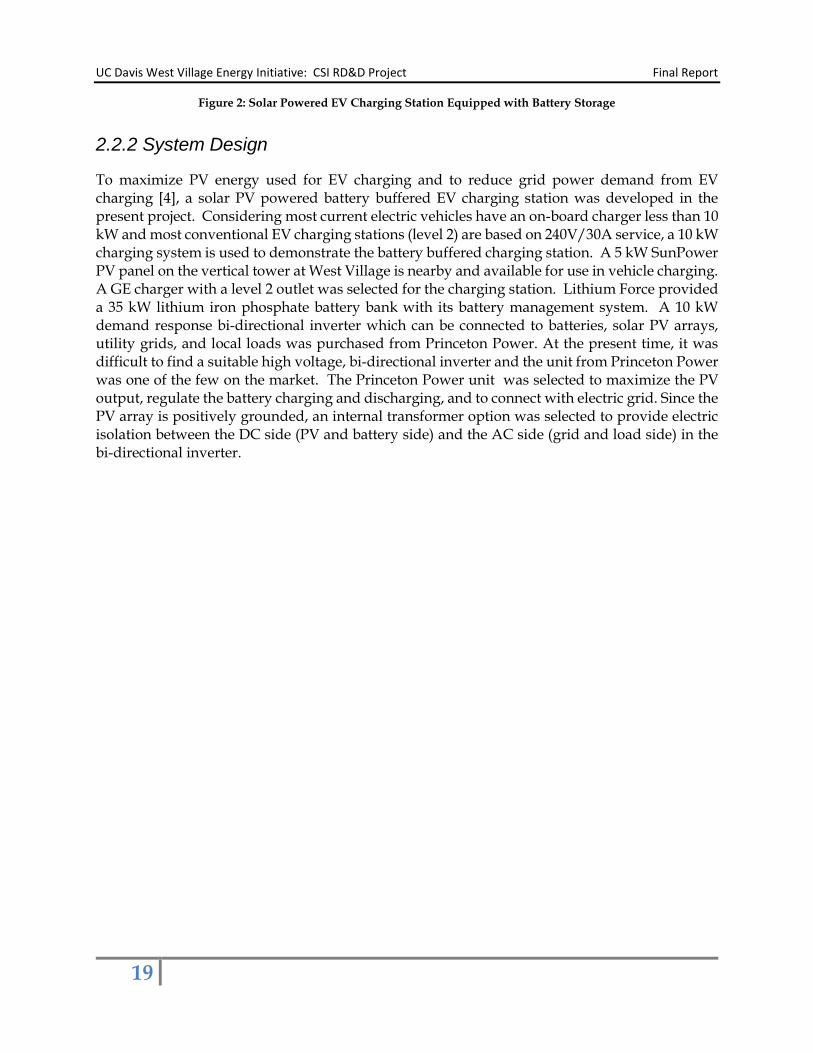
Figure 2: Solar Powered EV Charging Station Equipped with Battery Storage.............................. 19
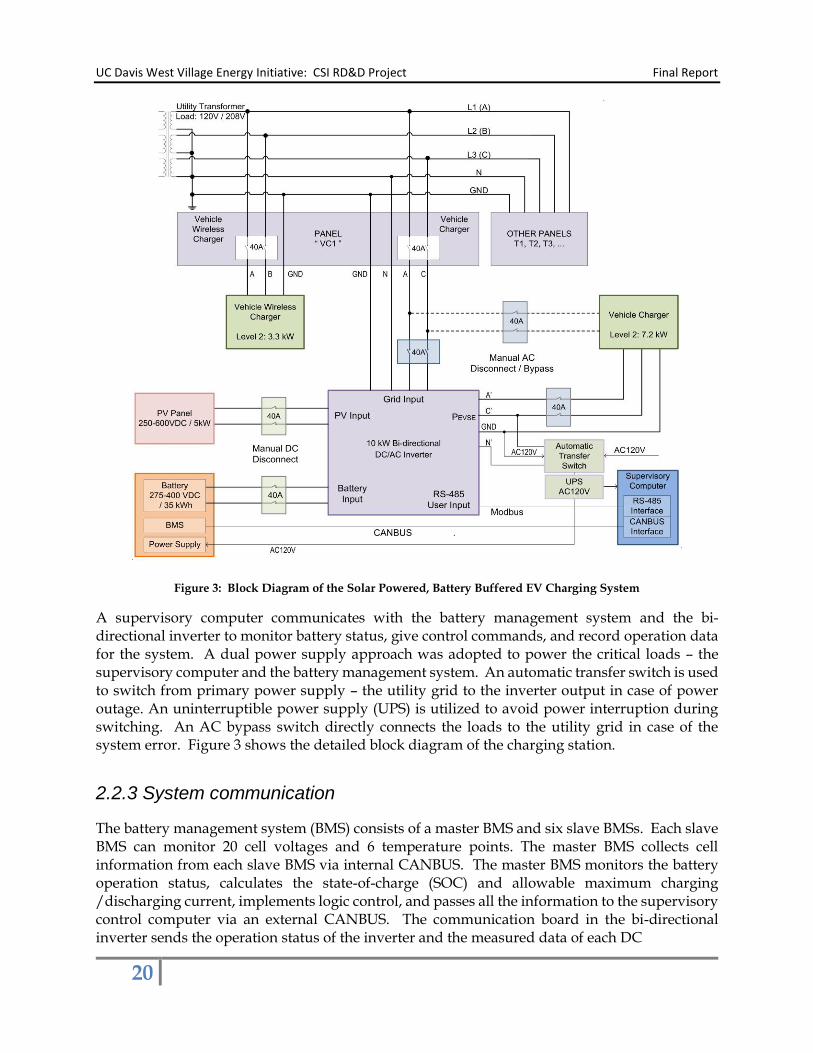
Figure 3: Block Diagram of the Solar Powered, Battery Buffered EV Charging System .............. 20
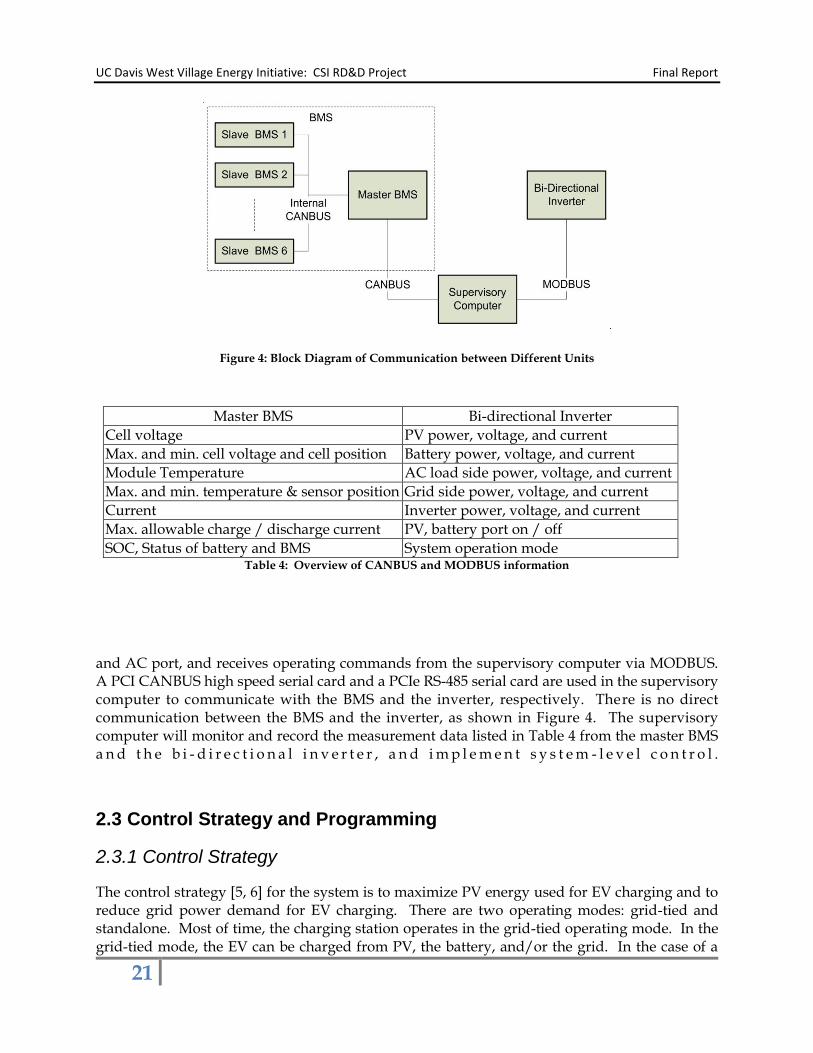
Figure 4: Block Diagram of Communication between Different Units ............................................ 21
Figure 5: Control Flowchart - Grid-Connected Operation ................................................................ 23
Figure 6: Control Flowchart – Standalone Operation ......................................................................... 23
Figure 7: System Overview Screen ....................................................................................................... 24
Figure 8: Energy Storage Screen ........................................................................................................... 25
Figure 9: System Control Interface ........................................................................................................ 25
Figure 10: Closet Floor Arrangement ................................................................................................... 26
Figure 11: 50 Ah Lithium Ion Phosphate Battery Cell ....................................................................... 27
Figure 12: Assembled Battery Module with Voltage and Temperature Probes ............................ 27
Figure 13: Battery Bank and Battery Management System ................................................................ 27
Figure 14: Bi-directional Inverter and Disconnect & Bypass Switches ............................................ 28
Figure 15: Electric Vehicle Charging Post ............................................................................................ 29
Figure 16: Profiles of battery power, PV power, EV charging load, grid power, and battery SOC .................................................................................................................................................................... 30
Figure 17: Profiles of PV power and EV charging load ..................................................................... 30
UC Davis West Village Energy Initiative: CSI RD&D Project Final Report
10
Figure 18: Grid power fluctuation caused by EV charging and solar PV electricity generation of a solar powered EV charging station without energy buffer ............................................................ 31
Figure 19: Reduced grid power spikes from EV charging and solar PV electricity by using a buffer battery ............................................................................................................................................ 31
Figure 20: Profiles of battery power and SOC .................................................................................... 32
UC Davis West Village Energy Initiative: CSI RD&D Project Final Report
11
Nomenclature
AC Alternative Current
CANBUS Controller Area Network Bus
BMS Battery Management System
BMU Battery Management Unit
DC Direct Current
EV Electric Vehicle
MODBUS A Serial Communication Protocol
PCI Peripheral Component Interconnect
PCIe Peripheral Component Interconnect Express
PV Photovoltaic
SOC State of Charge
VRLA Valve Regulated
UC Davis West Village Energy Initiative: CSI RD&D Project Final Report
12
1. Introduction
UC Davis West Village is the largest planned zero net energy community in the United States. It has an on-site 5 megawatt PV generation capacity and also is an area with high interest and expected high adoption of EVs. This makes it an ideal site for demonstrating the charging of EVs using PV generated electricity. Since when PV energy is available is not likely to match when it is needed for vehicle charging, it will be necessary to store some of the PV energy in batteries or transfer it to the grid as is done in most distributed residential PV systems. Storing the excess PV energy will make it possible to minimize the effect of EV charging on the grid and hence is encouraged by the utilities.
With rapid adoption of electric vehicles and mass installation of solar PV systems, especially in high PV and EV penetration areas, electric vehicle charging, especially fast charging poses a challenge for conventional utility grids, which lack the capacity to deliver high power and to store surplus solar electricity. One approach is to upgrade the electricity distribution networks and to employ smart grid technologies. This will require utility-wide integration of traditional IT solutions with operational energy storage technologies required to manage an increasingly complex and data-driven utility grids. It may not be economical to upgrade distribution infrastructures, including energy storage, in the early stage to handle this higher power demand and surplus solar PV energy. Another lower-cost and more reliable approach is to handle the solar PV energy and electric vehicle charging mismatch from the customers’ side, which is to store the excess PV energy in a battery for later use in the vehicle charging stations. The battery storage system helps buffer the electric grid from the spike power demands of electric vehicle charging when the charging station is grid-connected.
This task is concerned with the design, installation, checkout and demonstration of a battery buffered electric vehicle charging station in West Village. The electric energy for this station is provided from a nearby panel of photovoltaic solar cells or from the grid. The battery buffered charging station will permit the maximum use of solar energy for charging electric vehicles and minimize the impact of the charging on the electric utility grid. The control of the electric energy to and from the battery and to the charging station is done through a bi-directional inverter which can function either as a DC/DC or DC/AC inverter as needed. This report discusses in detail the design of the battery buffered charging station and how it will be operated in conjunction with the utility grid. This will include consideration of various aspects of the selection of the batteries for the electrical energy storage and the characteristics of the batteries selected for this system.
2. Technical Approach
2.1 Electrical Energy Storage Technologies for Charging Stations
2.1.1 Selection Factors
There are a number of factors involved in the selection of a battery for use in a battery-buffered vehicle charge station. These factors include the following:
(a) initial cost (b) maintenance requirements
UC Davis West Village Energy Initiative: CSI RD&D Project Final Report
13
(c) cycle life (d) safety (e) energy density (f) thermal management (g) charge/discharge efficiency
The first four factors are the most important and a large deficiency in one of these factors could preclude a battery technology from being considered for use in charge station energy storage. Energy density (Wh/kg, Wh/L) is much less important in stationary applications than for vehicle applications like in an EV. Power density (W/kg, W/L) is also much less important in the stationary applications because the power (kW) for charging is relatively low being in the range of 5-50 kW even for fast charging and the storage battery packs are relativity large (25-100 kWh). For example, charging at 6.6 kW and storage of 50 kWh results in a charge/discharge of 7.5 hours. Hence the charge/discharge times for the batteries for stationary applications are measured in hours or fraction of days.
For stationary storage, economics (initial cost and cycle life) and safety are the most important factors. In the case of economics, the most important consideration is cost of each kWh stored in $/kWh stored, which is given by
$/kWh stored = battery cost/ energy input over the life of the battery
= initial cost ($/kWh) x kWh capacity/cycle life x kWh stored
For example, consider a 100 kWh battery costing $200/kWh having a cycle life of 4000 cycles and a storage capability of 80% of its capacity.
$/kWh stored = 200 x 100 /(4000 x 80) = 0.0625 or 6.25 cents/kWh stored
In many stationary applications, the battery is charged and discharged once a day. In this example, the battery life would be slightly less than 11 years and the $/kWh stored over the life of the battery would be 6.25 cents /kWh. To greatly reduce the cost of energy storage, one needs to reduce the initial cost ($/kWh) and increase the cycle life. Fortunately there are batteries becoming available with long cycle life in excess of 10,000 cycles.
Battery safety is a critical issue for all battery applications. The main concerns for safety are the production of hydrogen during charging for aqueous electrolyte batteries, such as lead-acid and nickel metal hydride, and thermal runaway and electrolyte leakage for lithium batteries using organic electrolytes. In both cases, the primary approach to insuring safe operation of the batteries is monitoring their operation by measuring the cell voltages and temperatures and utilizing detectors for hydrogen or smoke. In addition, careful attention is given to limiting charge and discharge voltages and currents to preclude battery damage during cycling of the batteries. As noted previously, in most stationary applications like the vehicle charging station, the batteries do not experience high power conditions in either charge or discharge so they should operate at relatively low temperatures and electrical stress. Especially in the case of lithium batteries,
UC Davis West Village Energy Initiative: CSI RD&D Project Final Report
14
battery management units (BMU) have been developed for all the cells and modules commercially available. The BMUs, which are linked to the battery system control computer, will stop battery operation in the event of problems with any cell and will notify key personnel, including those concerned with fire, of problems with the batteries.
2.1.2 System Design Factors
The battery pack (voltage and kWh) and cell size (Ah) will be sized by the PV energy available on a daily basis and the needs of the charging station in terms of the voltage and power required to charge the EVs. The PV energy available is proportional to the size m2 of the PV panels and is dependent on their orientation to the sun. The electric energy required by the charging station is proportional to the number of EVs charged per day and the average energy required to charge their battery. The vehicle energy requirement follows from the energy usage Wh/mi of the EV and the miles traveled between battery charges. The maximum energy requirement for a given EV will be the size kWh of the battery pack which is between 20-30 kWh for most EVs. For example, if a charging station serviced 10 EVs which had an energy usage of 250 Wh/mi, charging efficiency of 87%, and average daily travel of 40 miles per day, the daily energy requirement of the charging station would be
Erequired = 10x 0.250x40/0.87 = 115 kWh/day
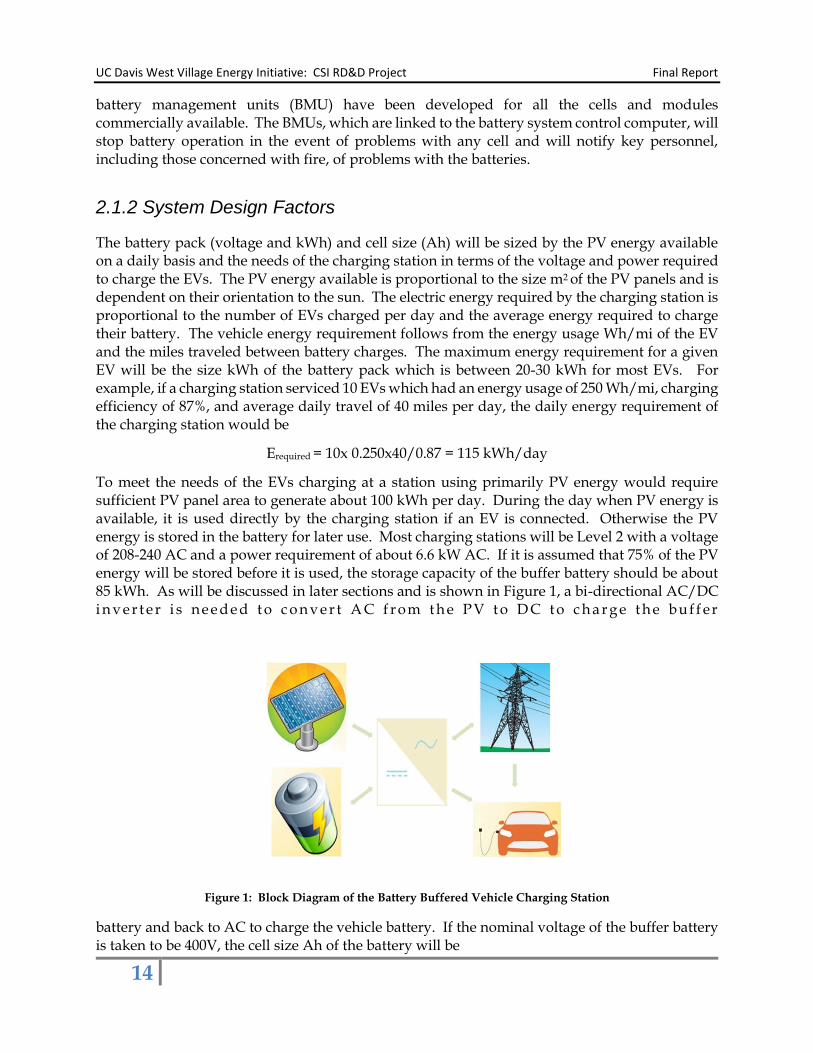
To meet the needs of the EVs charging at a station using primarily PV energy would require sufficient PV panel area to generate about 100 kWh per day. During the day when PV energy is available, it is used directly by the charging station if an EV is connected. Otherwise the PV energy is stored in the battery for later use. Most charging stations will be Level 2 with a voltage of 208-240 AC and a power requirement of about 6.6 kW AC. If it is assumed that 75% of the PV energy will be stored before it is used, the storage capacity of the buffer battery should be about 85 kWh. As will be discussed in later sections and is shown in Figure 1, a bi-directional AC/DC i n v e r t e r i s ne e d e d t o c o n v e r t A C f r om t h e P V t o D C t o c h a r g e t h e b uf f er
Figure 1: Block Diagram of the Battery Buffered Vehicle Charging Station
battery and back to AC to charge the vehicle battery. If the nominal voltage of the buffer battery is taken to be 400V, the cell size Ah of the battery will be
UC Davis West Village Energy Initiative: CSI RD&D Project Final Report
15
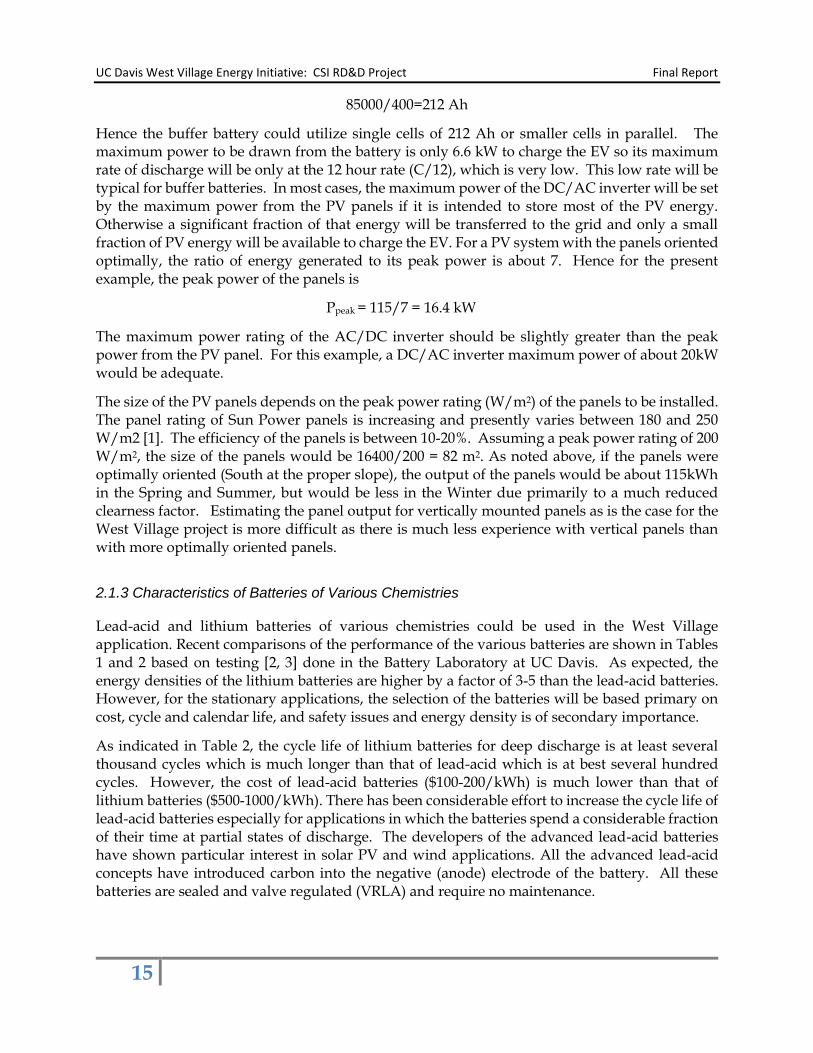
85000/400=212 Ah
Hence the buffer battery could utilize single cells of 212 Ah or smaller cells in parallel. The maximum power to be drawn from the battery is only 6.6 kW to charge the EV so its maximum rate of discharge will be only at the 12 hour rate (C/12), which is very low. This low rate will be typical for buffer batteries. In most cases, the maximum power of the DC/AC inverter will be set by the maximum power from the PV panels if it is intended to store most of the PV energy. Otherwise a significant fraction of that energy will be transferred to the grid and only a small fraction of PV energy will be available to charge the EV. For a PV system with the panels oriented optimally, the ratio of energy generated to its peak power is about 7. Hence for the present example, the peak power of the panels is
Ppeak = 115/7 = 16.4 kW
The maximum power rating of the AC/DC inverter should be slightly greater than the peak power from the PV panel. For this example, a DC/AC inverter maximum power of about 20kW would be adequate.
The size of the PV panels depends on the peak power rating (W/m2) of the panels to be installed. The panel rating of Sun Power panels is increasing and presently varies between 180 and 250 W/m2 [1]. The efficiency of the panels is between 10-20%. Assuming a peak power rating of 200 W/m2, the size of the panels would be 16400/200 = 82 m2. As noted above, if the panels were optimally oriented (South at the proper slope), the output of the panels would be about 115kWh in the Spring and Summer, but would be less in the Winter due primarily to a much reduced clearness factor. Estimating the panel output for vertically mounted panels as is the case for the West Village project is more difficult as there is much less experience with vertical panels than with more optimally oriented panels.
2.1.3 Characteristics of Batteries of Various Chemistries
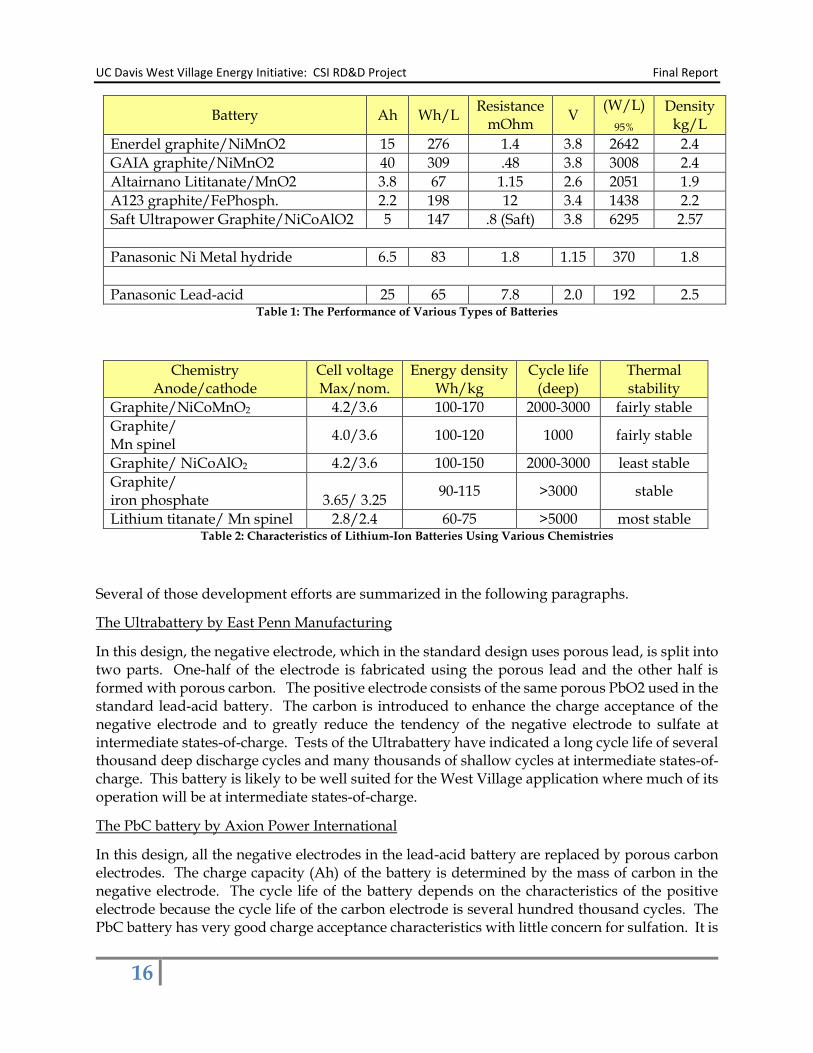
Lead-acid and lithium batteries of various chemistries could be used in the West Village application. Recent comparisons of the performance of the various batteries are shown in Tables 1 and 2 based on testing [2, 3] done in the Battery Laboratory at UC Davis. As expected, the energy densities of the lithium batteries are higher by a factor of 3-5 than the lead-acid batteries. However, for the stationary applications, the selection of the batteries will be based primary on cost, cycle and calendar life, and safety issues and energy density is of secondary importance.
As indicated in Table 2, the cycle life of lithium batteries for deep discharge is at least several thousand cycles which is much longer than that of lead-acid which is at best several hundred cycles. However, the cost of lead-acid batteries ($100-200/kWh) is much lower than that of lithium batteries ($500-1000/kWh). There has been considerable effort to increase the cycle life of lead-acid batteries especially for applications in which the batteries spend a considerable fraction of their time at partial states of discharge. The developers of the advanced lead-acid batteries have shown particular interest in solar PV and wind applications. All the advanced lead-acid concepts have introduced carbon into the negative (anode) electrode of the battery. All these batteries are sealed and valve regulated (VRLA) and require no maintenance.
UC Davis West Village Energy Initiative: CSI RD&D Project Final Report
16
Battery Ah Wh/L Resistance
mOhm V
(W/L)
95%
Density kg/L
Enerdel graphite/NiMnO2 15 276 1.4 3.8 2642 2.4
GAIA graphite/NiMnO2 40 309 .48 3.8 3008 2.4
Altairnano Lititanate/MnO2 3.8 67 1.15 2.6 2051 1.9
A123 graphite/FePhosph. 2.2 198 12 3.4 1438 2.2
Saft Ultrapower Graphite/NiCoAlO2 5 147 .8 (Saft) 3.8 6295 2.57
Panasonic Ni Metal hydride 6.5 83 1.8 1.15 370 1.8
Panasonic Lead-acid 25 65 7.8 2.0 192 2.5 Table 1: The Performance of Various Types of Batteries
Chemistry Anode/cathode
Cell voltage Max/nom.
Energy density Wh/kg
Cycle life (deep)
Thermal stability
Graphite/NiCoMnO2 4.2/3.6 100-170 2000-3000 fairly stable
Graphite/ Mn spinel
4.0/3.6 100-120 1000 fairly stable
Graphite/ NiCoAlO2 4.2/3.6 100-150 2000-3000 least stable
Graphite/ iron phosphate
3.65/ 3.25
90-115 >3000 stable
Lithium titanate/ Mn spinel 2.8/2.4 60-75 >5000 most stable Table 2: Characteristics of Lithium-Ion Batteries Using Various Chemistries
Several of those development efforts are summarized in the following paragraphs.
The Ultrabattery by East Penn Manufacturing
In this design, the negative electrode, which in the standard design uses porous lead, is split into two parts. One-half of the electrode is fabricated using the porous lead and the other half is formed with porous carbon. The positive electrode consists of the same porous PbO2 used in the standard lead-acid battery. The carbon is introduced to enhance the charge acceptance of the negative electrode and to greatly reduce the tendency of the negative electrode to sulfate at intermediate states-of-charge. Tests of the Ultrabattery have indicated a long cycle life of several thousand deep discharge cycles and many thousands of shallow cycles at intermediate states-of- charge. This battery is likely to be well suited for the West Village application where much of its operation will be at intermediate states-of-charge.
The PbC battery by Axion Power International
In this design, all the negative electrodes in the lead-acid battery are replaced by porous carbon electrodes. The charge capacity (Ah) of the battery is determined by the mass of carbon in the negative electrode. The cycle life of the battery depends on the characteristics of the positive electrode because the cycle life of the carbon electrode is several hundred thousand cycles. The PbC battery has very good charge acceptance characteristics with little concern for sulfation. It is
UC Davis West Village Energy Initiative: CSI RD&D Project Final Report
17
especially well suited for applications in which partial states-of-charge are experienced on a regular basis.
Lead-Carbon Battery by C&D Technologies
This battery is designed and fabricated much like the standard lead-acid battery except that a few percent by weight of carbon is added to the paste used in the negative electrode which then consists of a mixture of porous carbon and lead. The addition of the carbon is intended to enhance the charge acceptance of the negative and to reduce or eliminate sulfation at partial states-of-charge. C&D has developed this battery under contract to the US Army and is ready to commercialize it especially for standby, stationary applications like West Village.
Contact was made with the three companies listed, but it was not possible at this time to get either sample batteries to test or a commitment for batteries for use in the West Village vehicle charging station project.
2.1.4 Characteristics of the Batteries Used in the Vehicle Charging Station Project
It was decided to use lithium batteries in the vehicle charging station project for two reasons. First, space was limited in the place (large closet) in which the batteries had to be placed and second, cycle life was important as we did not want to have to replace the batteries in a couple of years. Standard deep-discharge lead-acid batteries would have been much too large to fit in the closet space and their cycle would have been less than one year assuming one cycle per day. It was decided to use lithium batteries of the iron phosphate chemistry because as shown in Table 2, they had reasonably high energy density (200-250 Wh/L) and long cycle life (2000-3000 cycles). In addition, the lithium iron phosphate chemistry is considered to be one of the most stable, safest of the lithium battery chemistries. It was decided to purchase the lithium batteries from Lithium Force (LF), located in Guangzhou, China. Dr. Burke had tested a number of cells from Lithium Force in 2011 and found them to have good performance and high quality. In addition, Dr. Burke had a good contact at Lithium Force and was able to get a good price and fast delivery of the batteries.
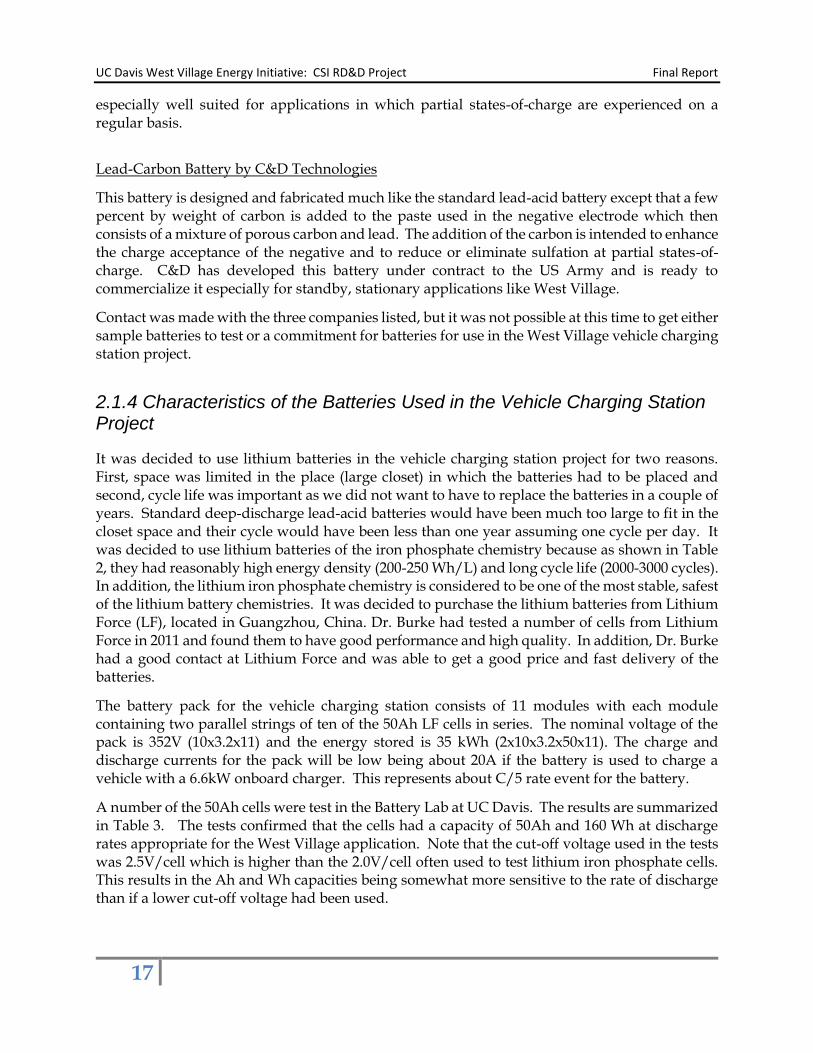
The battery pack for the vehicle charging station consists of 11 modules with each module containing two parallel strings of ten of the 50Ah LF cells in series. The nominal voltage of the pack is 352V (10x3.2x11) and the energy stored is 35 kWh (2x10x3.2x50x11). The charge and discharge currents for the pack will be low being about 20A if the battery is used to charge a vehicle with a 6.6kW onboard charger. This represents about C/5 rate event for the battery.
A number of the 50Ah cells were test in the Battery Lab at UC Davis. The results are summarized in Table 3. The tests confirmed that the cells had a capacity of 50Ah and 160 Wh at discharge rates appropriate for the West Village application. Note that the cut-off voltage used in the tests was 2.5V/cell which is higher than the 2.0V/cell often used to test lithium iron phosphate cells. This results in the Ah and Wh capacities being somewhat more sensitive to the rate of discharge than if a lower cut-off voltage had been used.
UC Davis West Village Energy Initiative: CSI RD&D Project Final Report
18
LF cell Iron Phosphate
FO 11A Weight 1.85kg 3.65-2.5V
Power (W) W/kg Time (sec) Wh Wh/kg
60 33 9340 156 84
109 60 4900 149 81
260 142 1900 137 75
Current (A) Time (sec) Ah C Rate
15 11950 49.8 .30
50 3428 47.6 1.05
100 1660 46.1 2.2
Resistance 2 sec Pulses
mOhm
Voc 50A 100A
3.27 1.7 1.6 Table 3: Test Data for the LF Cells Used in the West Village Charging Station
2.2 Integrated System Design
2.2.1 System Overview
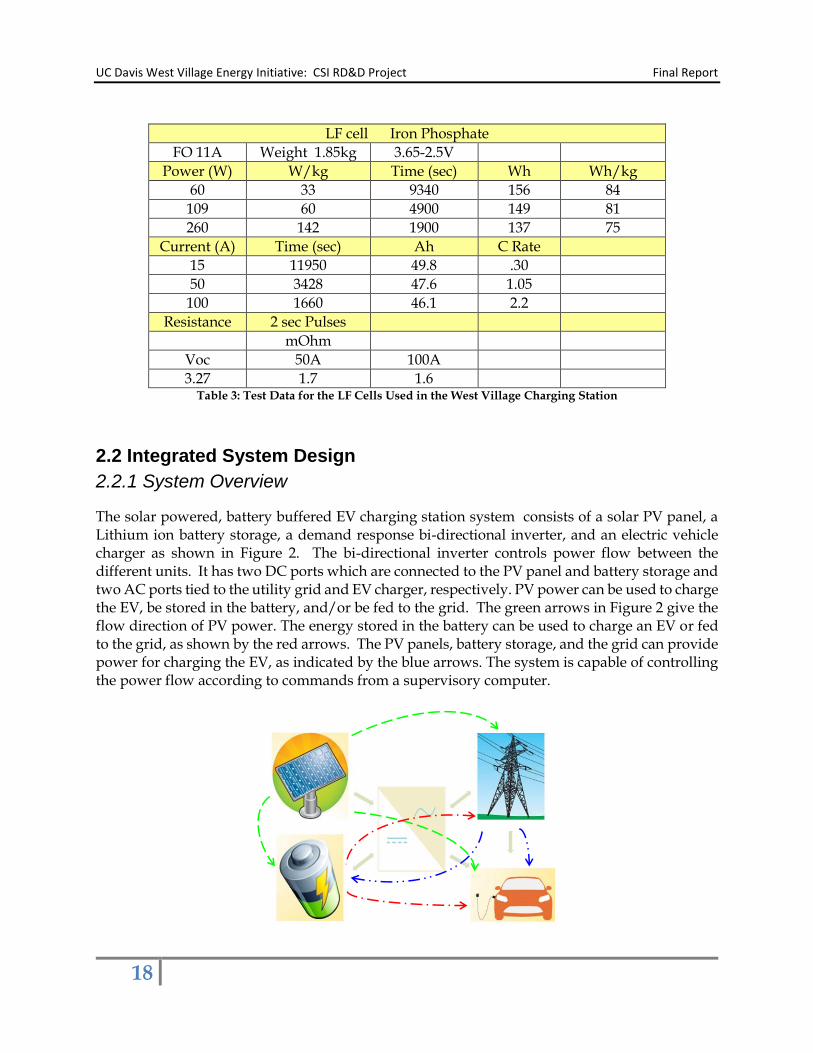
The solar powered, battery buffered EV charging station system consists of a solar PV panel, a Lithium ion battery storage, a demand response bi-directional inverter, and an electric vehicle charger as shown in Figure 2. The bi-directional inverter controls power flow between the different units. It has two DC ports which are connected to the PV panel and battery storage and two AC ports tied to the utility grid and EV charger, respectively. PV power can be used to charge the EV, be stored in the battery, and/or be fed to the grid. The green arrows in Figure 2 give the flow direction of PV power. The energy stored in the battery can be used to charge an EV or fed to the grid, as shown by the red arrows. The PV panels, battery storage, and the grid can provide power for charging the EV, as indicated by the blue arrows. The system is capable of controlling the power flow according to commands from a supervisory computer.
UC Davis West Village Energy Initiative: CSI RD&D Project Final Report
19
Figure 2: Solar Powered EV Charging Station Equipped with Battery Storage
2.2.2 System Design
To maximize PV energy used for EV charging and to reduce grid power demand from EV charging [4], a solar PV powered battery buffered EV charging station was developed in the present project. Considering most current electric vehicles have an on-board charger less than 10 kW and most conventional EV charging stations (level 2) are based on 240V/30A service, a 10 kW charging system is used to demonstrate the battery buffered charging station. A 5 kW SunPower PV panel on the vertical tower at West Village is nearby and available for use in vehicle charging. A GE charger with a level 2 outlet was selected for the charging station. Lithium Force provided a 35 kW lithium iron phosphate battery bank with its battery management system. A 10 kW demand response bi-directional inverter which can be connected to batteries, solar PV arrays, utility grids, and local loads was purchased from Princeton Power. At the present time, it was difficult to find a suitable high voltage, bi-directional inverter and the unit from Princeton Power was one of the few on the market. The Princeton Power unit was selected to maximize the PV output, regulate the battery charging and discharging, and to connect with electric grid. Since the PV array is positively grounded, an internal transformer option was selected to provide electric isolation between the DC side (PV and battery side) and the AC side (grid and load side) in the bi-directional inverter.
UC Davis West Village Energy Initiative: CSI RD&D Project Final Report
20
Figure 3: Block Diagram of the Solar Powered, Battery Buffered EV Charging System
A supervisory computer communicates with the battery management system and the bi-directional inverter to monitor battery status, give control commands, and record operation data for the system. A dual power supply approach was adopted to power the critical loads – the supervisory computer and the battery management system. An automatic transfer switch is used to switch from primary power supply – the utility grid to the inverter output in case of power outage. An uninterruptible power supply (UPS) is utilized to avoid power interruption during switching. An AC bypass switch directly connects the loads to the utility grid in case of the system error. Figure 3 shows the detailed block diagram of the charging station.
2.2.3 System communication
The battery management system (BMS) consists of a master BMS and six slave BMSs. Each slave BMS can monitor 20 cell voltages and 6 temperature points. The master BMS collects cell information from each slave BMS via internal CANBUS. The master BMS monitors the battery operation status, calculates the state-of-charge (SOC) and allowable maximum charging /discharging current, implements logic control, and passes all the information to the supervisory control computer via an external CANBUS. The communication board in the bi-directional inverter sends the operation status of the inverter and the measured data of each DC
UC Davis West Village Energy Initiative: CSI RD&D Project Final Report
21
Figure 4: Block Diagram of Communication between Different Units
Master BMS Bi-directional Inverter
Cell voltage PV power, voltage, and current
Max. and min. cell voltage and cell position Battery power, voltage, and current
Module Temperature AC load side power, voltage, and current
Max. and min. temperature & sensor position Grid side power, voltage, and current
Current Inverter power, voltage, and current
Max. allowable charge / discharge current PV, battery port on / off
SOC, Status of battery and BMS System operation mode Table 4: Overview of CANBUS and MODBUS information
and AC port, and receives operating commands from the supervisory computer via MODBUS. A PCI CANBUS high speed serial card and a PCIe RS-485 serial card are used in the supervisory computer to communicate with the BMS and the inverter, respectively. There is no direct communication between the BMS and the inverter, as shown in Figure 4. The supervisory computer will monitor and record the measurement data listed in Table 4 from the master BMS a n d t h e b i - d i r e c t i o n a l i n v e r t e r , a n d i m p l e m e n t s y s t e m - l e v e l c o n t r o l .
2.3 Control Strategy and Programming
2.3.1 Control Strategy
The control strategy [5, 6] for the system is to maximize PV energy used for EV charging and to reduce grid power demand for EV charging. There are two operating modes: grid-tied and standalone. Most of time, the charging station operates in the grid-tied operating mode. In the grid-tied mode, the EV can be charged from PV, the battery, and/or the grid. In the case of a
UC Davis West Village Energy Initiative: CSI RD&D Project Final Report
22
power outage, the system will automatically switch to standalone mode and be isolated from the grid. In the standalone mode, the EV is charged from PV and the battery. When the grid power is restored, the system will automatically switch to grid-tied operation.
In grid-tied operating mode, when an EV is plugged into the charger, PV power is used to charge the EV if it is available. If more power is needed, the remaining power is provided by the battery or/and the utility grid. If no electric vehicle is plugged-in, PV energy is stored in the battery and if the battery is completely charged, excess PV power flows into the utility grid. During off-peak hours, grid power can be used to bring the battery state-of-charge up to a specified level if the battery charge is low. Energy is never fed to the grid from the battery in the present system due to high EV charging requirements and low PV availability.
In the stand-alone mode, grid power is not available. The system can supply reliable, clean and cost-effective power to critical loads that cannot be supplied directly from the utility grid. Hence PV if available, it will power the EV charger supplemented if needed by energy from the battery. If excess energy is available, the remaining PV power will be stored in the battery. By using the battery storage, the system is able to provide a reliable and constant power source from inherent intermittent solar PV power.
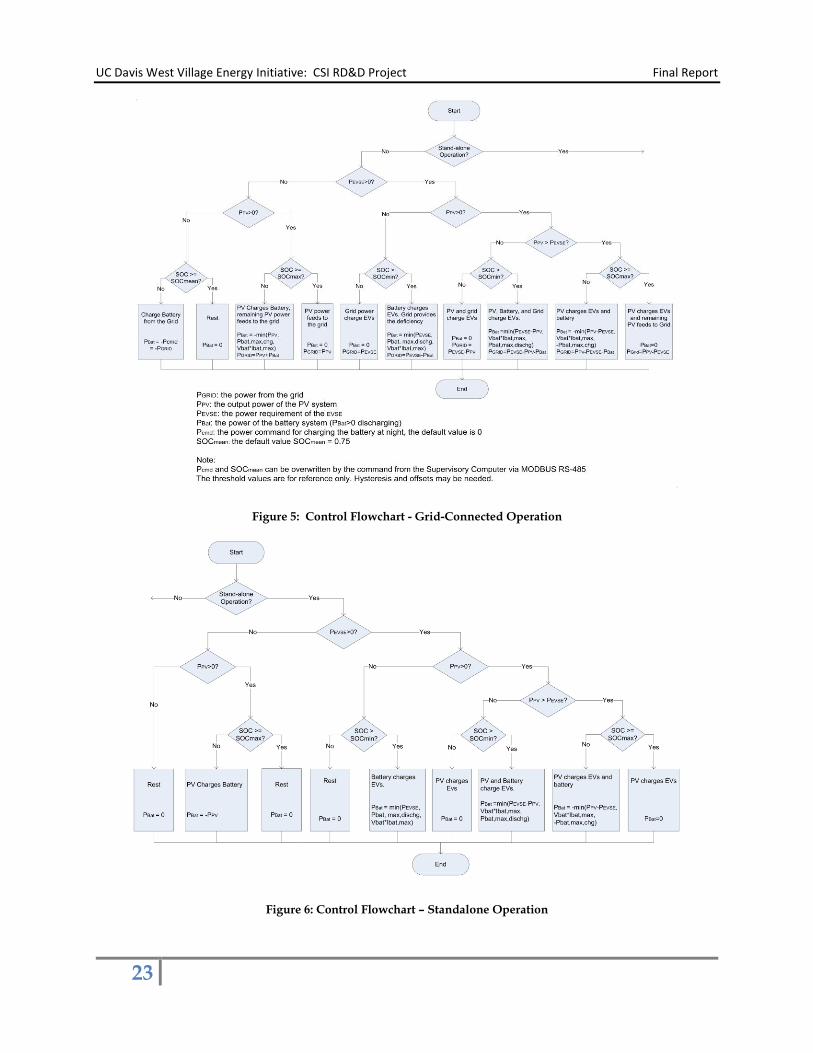
2.3.2 Control Flowchart
The power command set from the supervisory computer depends on the system operating modes (grid-tied or stand-alone), the availability of the PV power, the state-of-charge of the battery storage, the EV charging and local loads, and the status of the charging system. The electricity rate structure (on-peak or off-peak hours) is also considered to minimize energy cost during charging the energy storage from the utility grid if necessary. Figure 5 and Figure 6 show the control flowchart for the grid-tied operation and the stand-alone operation, respectively.
UC Davis West Village Energy Initiative: CSI RD&D Project Final Report
23
Figure 5: Control Flowchart - Grid-Connected Operation
Figure 6: Control Flowchart – Standalone Operation
UC Davis West Village Energy Initiative: CSI RD&D Project Final Report
24
2.3.3 Supervisory Control
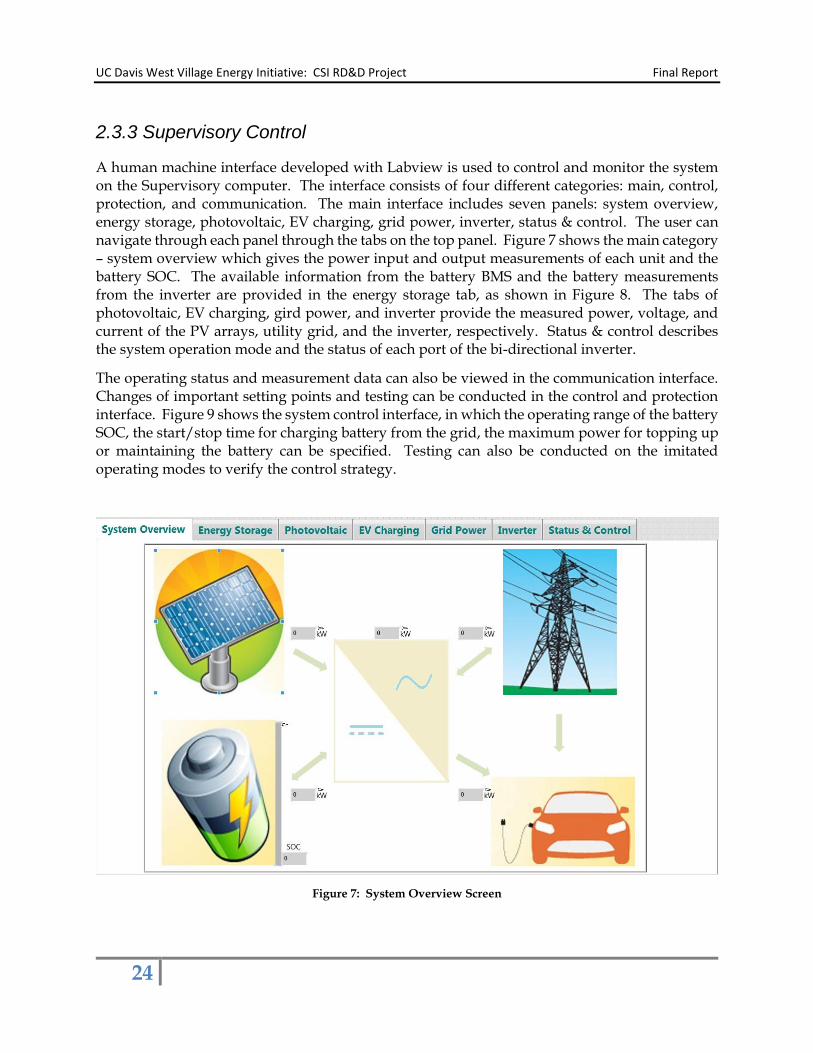
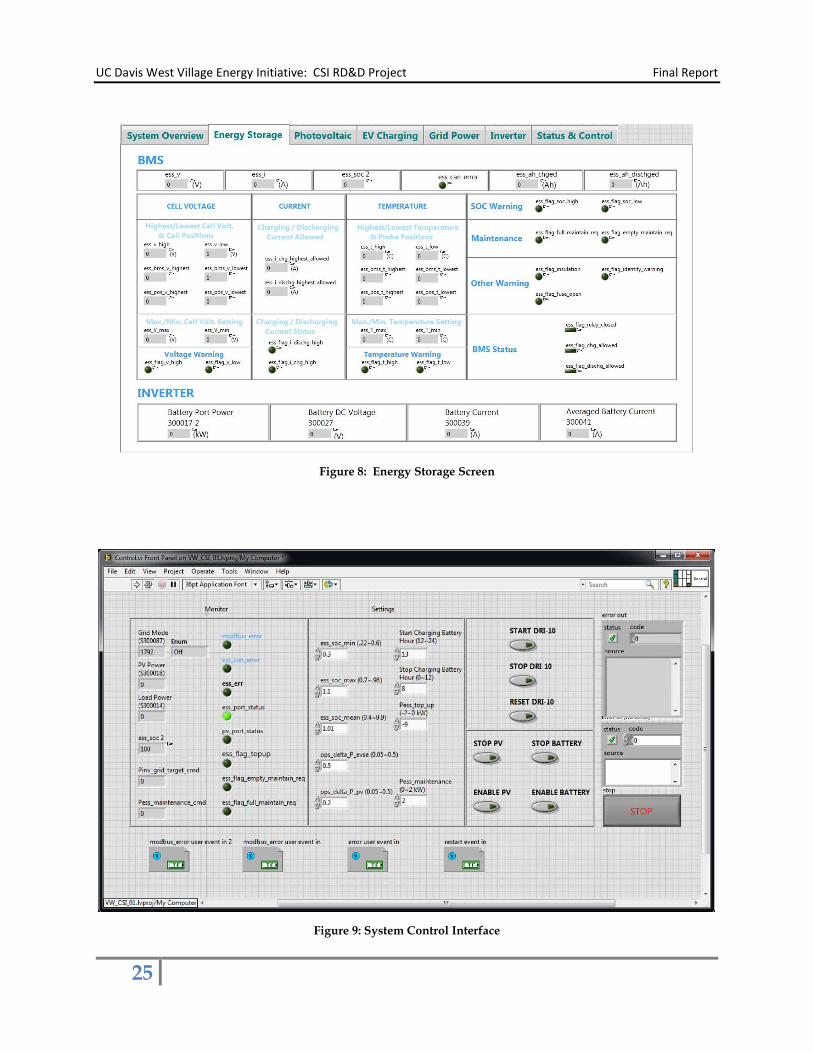
A human machine interface developed with Labview is used to control and monitor the system on the Supervisory computer. The interface consists of four different categories: main, control, protection, and communication. The main interface includes seven panels: system overview, energy storage, photovoltaic, EV charging, grid power, inverter, status & control. The user can navigate through each panel through the tabs on the top panel. Figure 7 shows the main category – system overview which gives the power input and output measurements of each unit and the battery SOC. The available information from the battery BMS and the battery measurements from the inverter are provided in the energy storage tab, as shown in Figure 8. The tabs of photovoltaic, EV charging, gird power, and inverter provide the measured power, voltage, and current of the PV arrays, utility grid, and the inverter, respectively. Status & control describes the system operation mode and the status of each port of the bi-directional inverter.
The operating status and measurement data can also be viewed in the communication interface. Changes of important setting points and testing can be conducted in the control and protection interface. Figure 9 shows the system control interface, in which the operating range of the battery SOC, the start/stop time for charging battery from the grid, the maximum power for topping up or maintaining the battery can be specified. Testing can also be conducted on the imitated operating modes to verify the control strategy.
Figure 7: System Overview Screen
UC Davis West Village Energy Initiative: CSI RD&D Project Final Report
25
Figure 8: Energy Storage Screen
Figure 9: System Control Interface
UC Davis West Village Energy Initiative: CSI RD&D Project Final Report
26
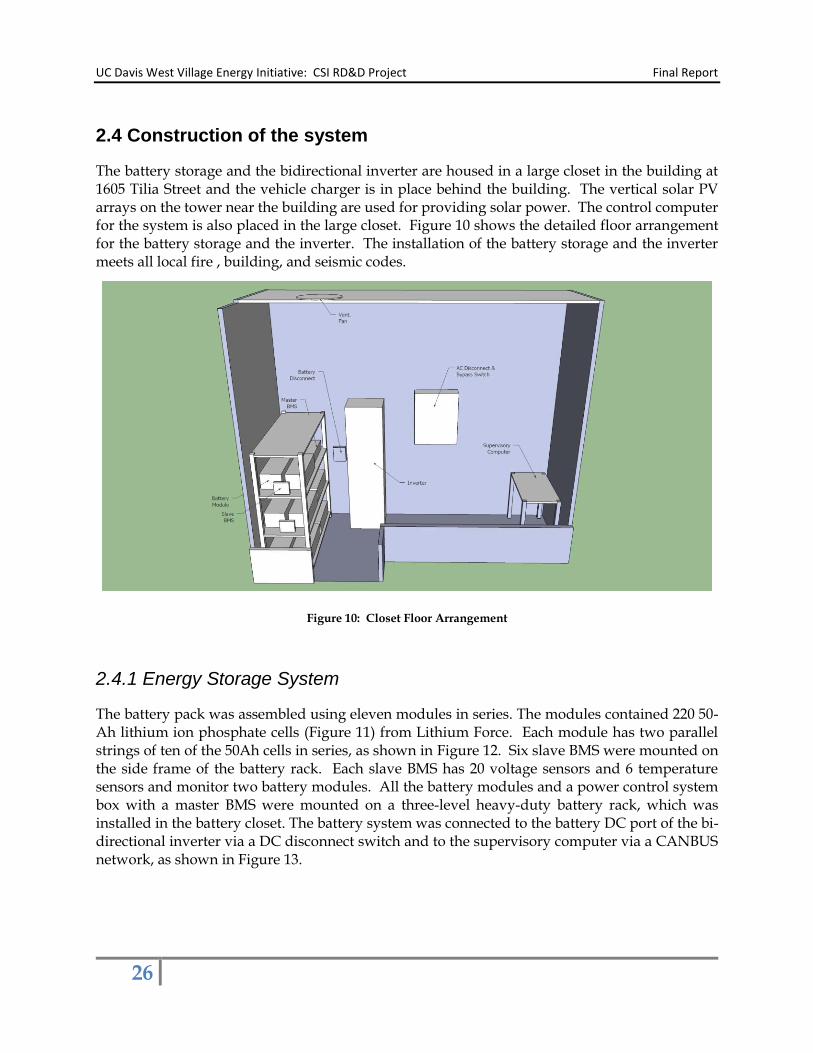
2.4 Construction of the system
The battery storage and the bidirectional inverter are housed in a large closet in the building at 1605 Tilia Street and the vehicle charger is in place behind the building. The vertical solar PV arrays on the tower near the building are used for providing solar power. The control computer for the system is also placed in the large closet. Figure 10 shows the detailed floor arrangement for the battery storage and the inverter. The installation of the battery storage and the inverter meets all local fire , building, and seismic codes.
Figure 10: Closet Floor Arrangement
2.4.1 Energy Storage System
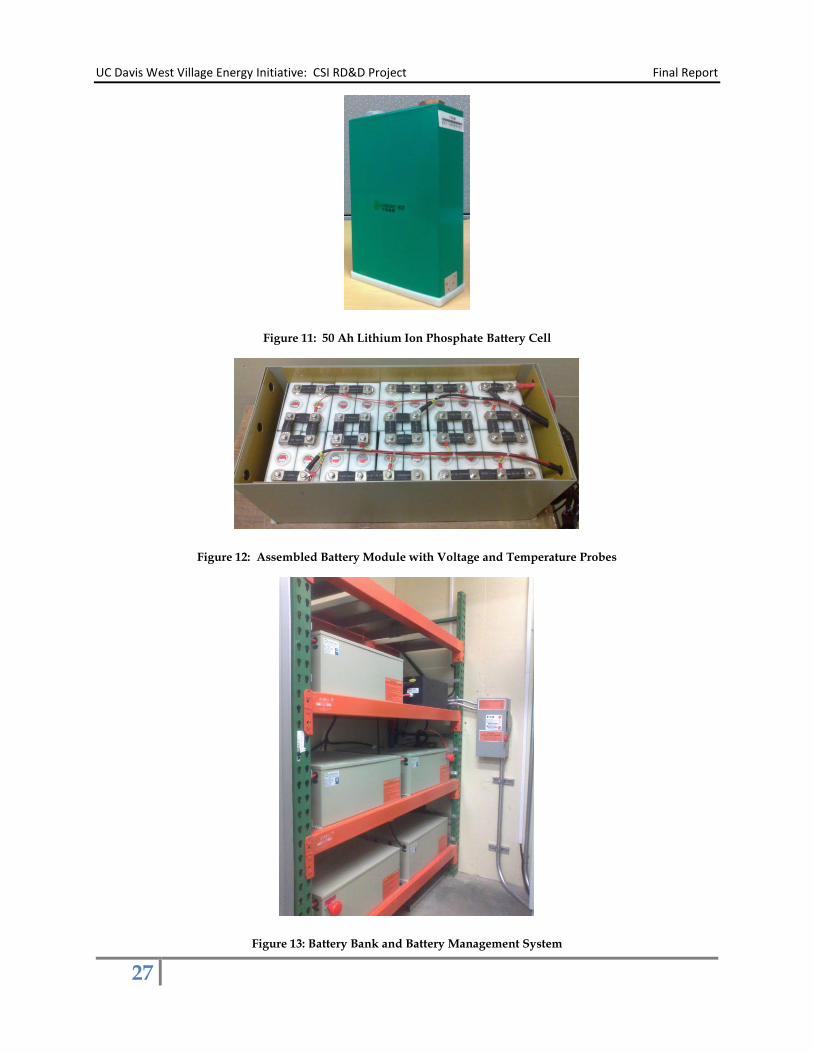
The battery pack was assembled using eleven modules in series. The modules contained 220 50-Ah lithium ion phosphate cells (Figure 11) from Lithium Force. Each module has two parallel strings of ten of the 50Ah cells in series, as shown in Figure 12. Six slave BMS were mounted on the side frame of the battery rack. Each slave BMS has 20 voltage sensors and 6 temperature sensors and monitor two battery modules. All the battery modules and a power control system box with a master BMS were mounted on a three-level heavy-duty battery rack, which was installed in the battery closet. The battery system was connected to the battery DC port of the bi-directional inverter via a DC disconnect switch and to the supervisory computer via a CANBUS network, as shown in Figure 13.
UC Davis West Village Energy Initiative: CSI RD&D Project Final Report
27
Figure 11: 50 Ah Lithium Ion Phosphate Battery Cell
Figure 12: Assembled Battery Module with Voltage and Temperature Probes
Figure 13: Battery Bank and Battery Management System
UC Davis West Village Energy Initiative: CSI RD&D Project Final Report
28
2.4.2 Power Control System
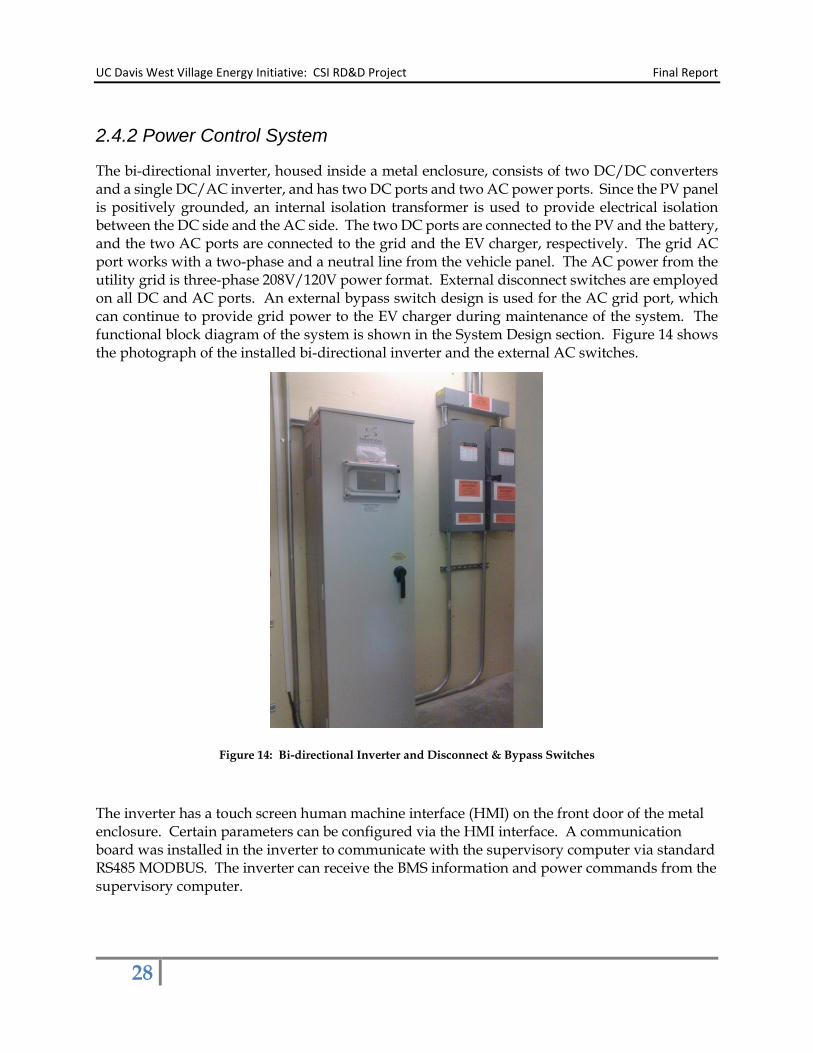
The bi-directional inverter, housed inside a metal enclosure, consists of two DC/DC converters and a single DC/AC inverter, and has two DC ports and two AC power ports. Since the PV panel is positively grounded, an internal isolation transformer is used to provide electrical isolation between the DC side and the AC side. The two DC ports are connected to the PV and the battery, and the two AC ports are connected to the grid and the EV charger, respectively. The grid AC port works with a two-phase and a neutral line from the vehicle panel. The AC power from the utility grid is three-phase 208V/120V power format. External disconnect switches are employed on all DC and AC ports. An external bypass switch design is used for the AC grid port, which can continue to provide grid power to the EV charger during maintenance of the system. The functional block diagram of the system is shown in the System Design section. Figure 14 shows the photograph of the installed bi-directional inverter and the external AC switches.
Figure 14: Bi-directional Inverter and Disconnect & Bypass Switches
The inverter has a touch screen human machine interface (HMI) on the front door of the metal enclosure. Certain parameters can be configured via the HMI interface. A communication board was installed in the inverter to communicate with the supervisory computer via standard RS485 MODBUS. The inverter can receive the BMS information and power commands from the supervisory computer.
UC Davis West Village Energy Initiative: CSI RD&D Project Final Report
29
2.4.3 Vehicle charging Station
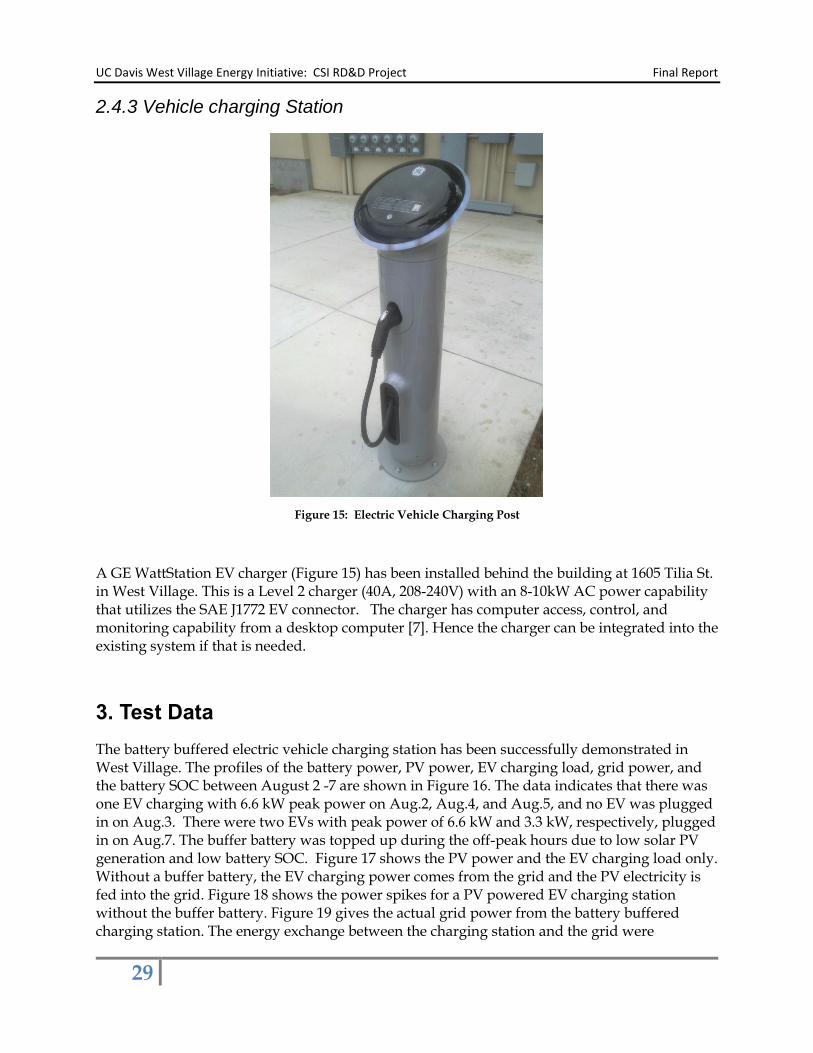
Figure 15: Electric Vehicle Charging Post
A GE WattStation EV charger (Figure 15) has been installed behind the building at 1605 Tilia St. in West Village. This is a Level 2 charger (40A, 208-240V) with an 8-10kW AC power capability that utilizes the SAE J1772 EV connector. The charger has computer access, control, and monitoring capability from a desktop computer [7]. Hence the charger can be integrated into the existing system if that is needed.
3. Test Data
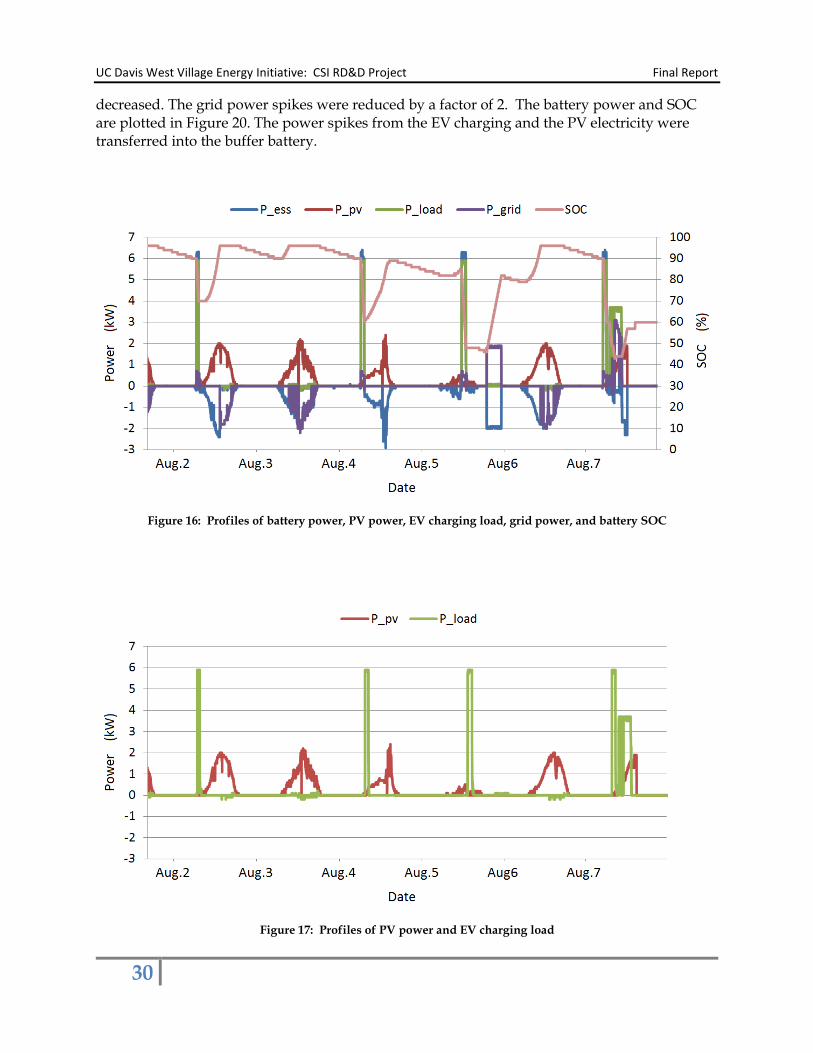
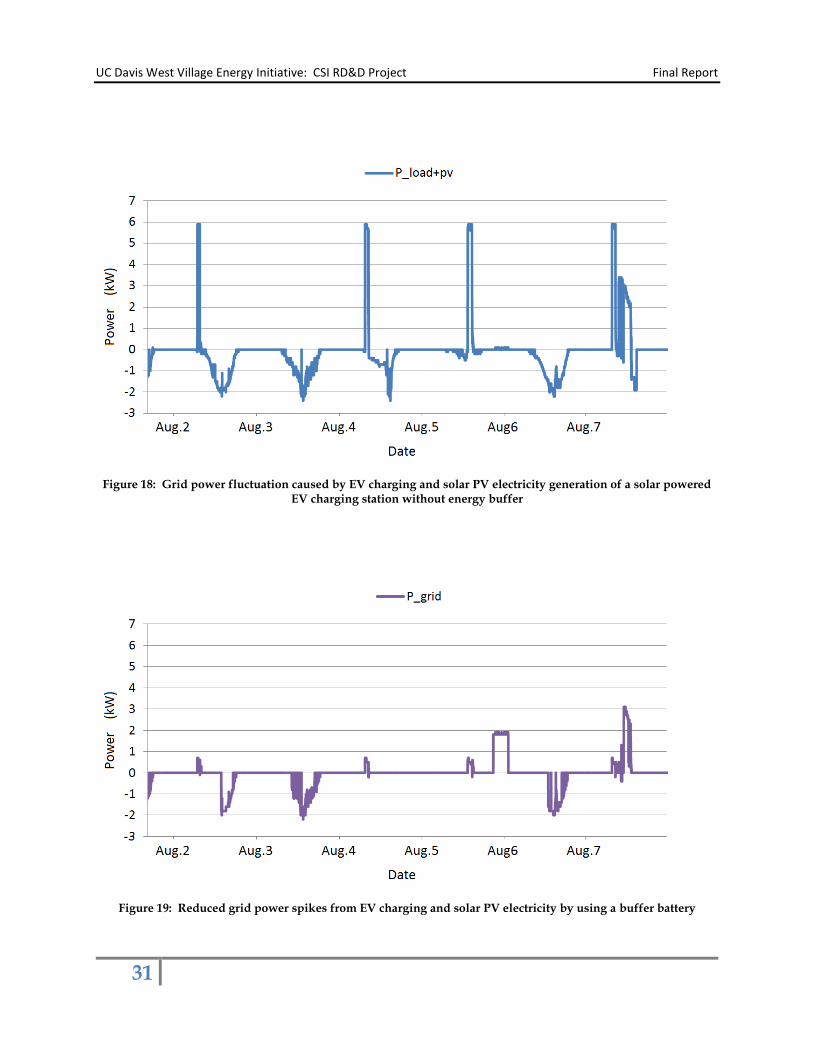
The battery buffered electric vehicle charging station has been successfully demonstrated in West Village. The profiles of the battery power, PV power, EV charging load, grid power, and the battery SOC between August 2 -7 are shown in Figure 16. The data indicates that there was one EV charging with 6.6 kW peak power on Aug.2, Aug.4, and Aug.5, and no EV was plugged in on Aug.3. There were two EVs with peak power of 6.6 kW and 3.3 kW, respectively, plugged in on Aug.7. The buffer battery was topped up during the off-peak hours due to low solar PV generation and low battery SOC. Figure 17 shows the PV power and the EV charging load only. Without a buffer battery, the EV charging power comes from the grid and the PV electricity is fed into the grid. Figure 18 shows the power spikes for a PV powered EV charging station without the buffer battery. Figure 19 gives the actual grid power from the battery buffered charging station. The energy exchange between the charging station and the grid were
UC Davis West Village Energy Initiative: CSI RD&D Project Final Report
30
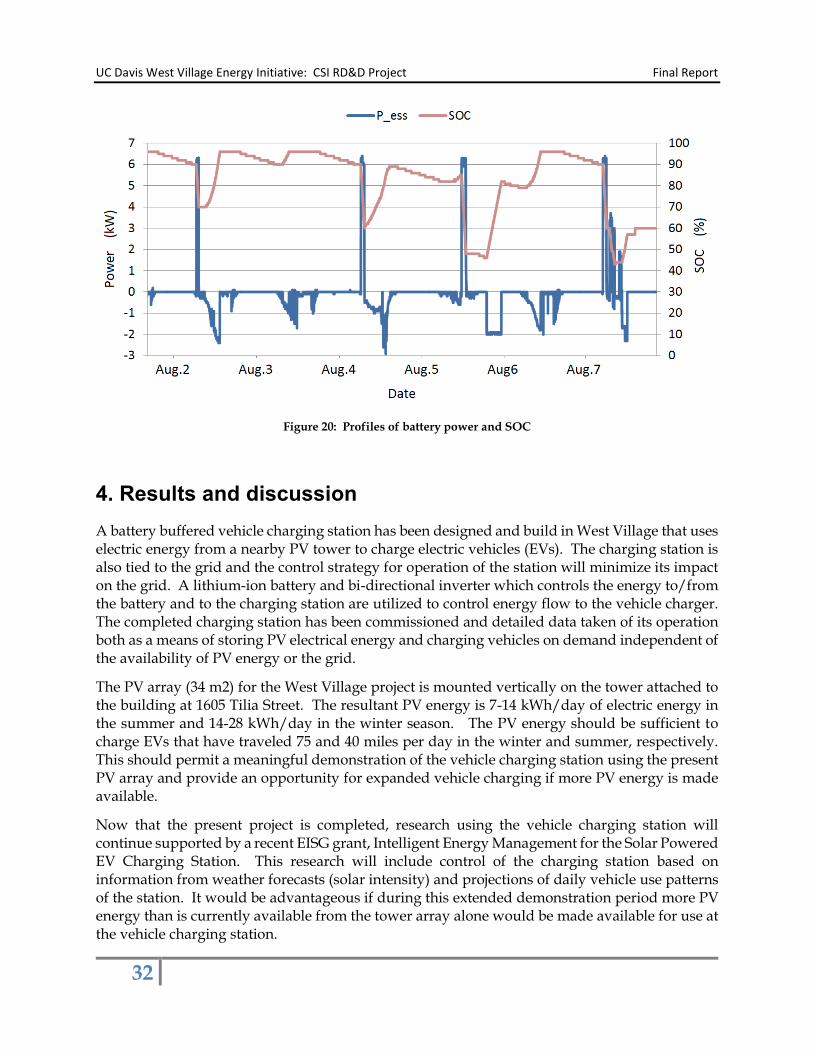
decreased. The grid power spikes were reduced by a factor of 2. The battery power and SOC are plotted in Figure 20. The power spikes from the EV charging and the PV electricity were transferred into the buffer battery.
Figure 16: Profiles of battery power, PV power, EV charging load, grid power, and battery SOC
Figure 17: Profiles of PV power and EV charging load
UC Davis West Village Energy Initiative: CSI RD&D Project Final Report
31
Figure 18: Grid power fluctuation caused by EV charging and solar PV electricity generation of a solar powered EV charging station without energy buffer
Figure 19: Reduced grid power spikes from EV charging and solar PV electricity by using a buffer battery
UC Davis West Village Energy Initiative: CSI RD&D Project Final Report
32
Figure 20: Profiles of battery power and SOC
4. Results and discussion
A battery buffered vehicle charging station has been designed and build in West Village that uses electric energy from a nearby PV tower to charge electric vehicles (EVs). The charging station is also tied to the grid and the control strategy for operation of the station will minimize its impact on the grid. A lithium-ion battery and bi-directional inverter which controls the energy to/from the battery and to the charging station are utilized to control energy flow to the vehicle charger. The completed charging station has been commissioned and detailed data taken of its operation both as a means of storing PV electrical energy and charging vehicles on demand independent of the availability of PV energy or the grid.
The PV array (34 m2) for the West Village project is mounted vertically on the tower attached to the building at 1605 Tilia Street. The resultant PV energy is 7-14 kWh/day of electric energy in the summer and 14-28 kWh/day in the winter season. The PV energy should be sufficient to charge EVs that have traveled 75 and 40 miles per day in the winter and summer, respectively. This should permit a meaningful demonstration of the vehicle charging station using the present PV array and provide an opportunity for expanded vehicle charging if more PV energy is made available.
Now that the present project is completed, research using the vehicle charging station will continue supported by a recent EISG grant, Intelligent Energy Management for the Solar Powered EV Charging Station. This research will include control of the charging station based on information from weather forecasts (solar intensity) and projections of daily vehicle use patterns of the station. It would be advantageous if during this extended demonstration period more PV energy than is currently available from the tower array alone would be made available for use at the vehicle charging station.
UC Davis West Village Energy Initiative: CSI RD&D Project Final Report
33
5. Public Benefits and Recommendations
The public benefits to California of this project are the demonstration of the use of PV energy to charge electric vehicles and the use of battery storage to maximize the fraction of the PV energy that can be used for charging and to minimize the impact of electric vehicle charging on the utility grid. Both of these benefits will become increasingly important as the number of electric vehicles in California continues to increase and the need for storage by the utilities becomes greater as the contribution of PV power generation becomes larger. As experience is gained with the use of the vehicle charging station in West Village, we will be in a position to recommend to other groups in California how they can best utilize PV energy for EV charging and the value of battery buffering as part of their systems.
References
1. Specification sheets for the SunPower E18 and E19 AC Solar Panels available on the SunPower website (sunpowercorp.com)
2. Burke, A.F. and Miller, M., Performance Characteristics of Lithium-ion Batteries of Various Chemistries for Plug-in Hybrid Vehicles, EVS-24, Stavanger, Norway, May 2009 (paper on the CD of the meeting)
3. Burke, A.F., Performance, Charging, and Second-use Considerations for Lithium Batteries for Plug-in Electric Vehicles, ITS-Davis Report UCD-ITS-RR-09-17, July 2009
4. Whitaker, C. Newmiller, J., Ropp, M., and Norris, B., Distributed Photovoltaic Systems Design and Technology Requirements, Sandia Report SAND 2008-0946P, February 2008
5. Halliwell, J., Tennessee Valley Authority Smart Modal Area Recharge Terminal (SMART) Station Project – Volume 1-Basic Design Report, Electric Power Research Institute, June 2010
6. Rathman, H., Nakamura,K., and Yamashiro, S., A Study on the Performance of Grid-connected PV-ECS System Considering Meteorological Variation, 15th PSCC, Leige, Belgium, August 2005
7. Specifications for the GE WattStation EV charger available on the GE website