Embed Size (px)
Citation preview


Contents
Company Information 03
Directors’ Report 04
Direcrtors’ Report Urdu 05
UNCONSOLIDATED FINANCIAL STATEMENT Balance Sheet 06
Pr Loss Account 07
Statement of Comprehensive Income 08
Cash Flow Statement 09
Statement of Changes in Equity 10
Notes to the Financial Statement 11
CONSOLIDATED FINANCIAL STATEMENT Balance Sheet 16
Pr Loss Account 17
Statement of Comprehensive Income 18
Cash Flow Statement 19
Statement of Changes in Equity 20
Notes to the Financial Statement 21


FIRST QUARTER REPORT 2017/18 03
Company Information
Board of Directors
Akhtar Hussain MalikChairman
Amir AbbassciyDirector & Chief Executive O cer
Muhammad Mahmood HussainDirector
Syed Arshad RazaDirector
Omar Khan LodhiDirector
Chaudhary Khaqan Saadullah KhanDirector
Murtaza HussainDirector
Audit Committee
Muhammad Mahmood Hussain, Chairman
Syed Arshad RazaMember
Chaudhary Khaqan Saadullah KhanMember
Human Resource and Remuneration Committee
Muhammad Mahmood Hussain, Chairman
Amir AbbassciyMember
Syed Arshad RazaMember
Chaudhary Khaqan Saadullah KhanMember
Services & StakeholdersCommittee
Akhtar Hussain MalikMember
Syed Arshad RazaMember
Chaudhary Khaqan Saadullah KhanMember
Chief Financial O cer
Naeem Asghar Malik
Company Secretary
Majid Muqtadir
Auditors
EY Ford RhodesChartered Accountants
Bankers
Allied Bank LimitedAl Baraka Bank (Pakistan) LimitedAskari Bank LimitedBank Alfalah LimitedBank Islami Pakistan LimitedFaysal Bank LimitedFirst Women Bank LimitedHabib Bank LimitedHabib Metropolitan Bank LimitedIndustrial and Commercial Bank of China LimitedJS Bank LimitedMCB Bank LimitedMeezan Bank LimitedNational Bank of PakistanPak Oman Investment Company LimitedSaudi Pak Industrial and Agricultural Investment Company Limited
Standard Chartered Bank (Pakistan) LimitedSoneri Bank LimitedSummit Bank LimitedSilkbank LimitedSindh Bank LimitedThe Bank of PunjabUnited Bank LimitedThe Bank of Khyber
Shares Registrar
FAMCO Associates (Pvt) Limited8-F, Next to Hotel FaranNursery, Block -6, P.E.C.H.S,Shahrah-e-Faisal,Karachi
Tel: (92 21) 3438 01013438 0102
Fax: (92 21) 3438 0106
Registered O ce
9th Floor, The Harbour Front,Dolmen City, HC-3, Block-4,Marine Drive, Clifton,Karachi 75600, Pakistan
Tel: (92 21) 111 222 081Fax: (92 21) 111 888 081
Website
www.byco.com.pk

FIRST QUARTER REPORT 2017/18 04
Director’s Report
In the name of Allah the Most Merciful and the Most Benevolent. The Directors of your Company are pleased to present a brief review of the nancial results and operations of your Company for the quarter ended 30th September, 2017.
As intimated earlier, the Company started operating its larger re nery from August 2017 with thenewly inducted Crude Charge Heater / Furnace. As a result of increased volume from re ning operations, gross revenue for the period increased by 87% to Rs. 41.4 billion. With stable Gross Re nery Margins (GRM), the Company earned Gross Pro t of Rs. 2.3 billion compared to Rs. 0.4 billion last year. Pro t after tax for the period under review amounted to Rs. 1.2 billion corresponding to earnings per share of Rs. 0.23 compared to Rs. 0.04 last year.
The Company is now subject to lower pricing of HSD products till the time it gets its HSD products Euro II compliant for which e orts are being made to have this on priority. Further, subsequent to the end of the period, the Company had to revise the re nery throughput owing to the furnace oil crisis that the industry faced. However, before the reporting date the reduced throughput was brought back. The Company continues to maintain highest standards of Health, Safety, Environment and Quality successfully. Focus remained on e cient and safe operations including safety of employees, customers and contractors along with compliance with national standards for production of quality products. The Board wishes to place on record its gratitude for the co-operation extended by Government of Pakistan and strategic partners including its customers, nancial institutions, suppliers, vendors and shareholders.
For and on behalf of the Board of Directors Chief Executive O cerKarachiJanuary 29th 2018
Director

FIRST QUARTER REPORT 2017/18 05

FIRST QUARTER REPORT 2017/18 06
Unconsolidated Condensed Interim Balance SheetAs at 30 September 2017
NON CURRENT ASSETSProperty, plant and equipmentLong term Investment Long term Loans and AdvancesLong-term depositsDeferred taxation
CURRENT ASSETSStores and sparesStock-in-tradeTrade debtsLoans and advances Trade deposits and short-term prepayments Accrued interestOther receivablesCash and bank balances
Total assets
EQUITY AND LIABILITIES
SHARE CAPITAL AND RESERVESAuthorized share capital6,000,000,000 (June 2017:6,000,000,000) Ordinary shares of Rs.10/- each
Share capitalMerger ReservesAccumulated losses
Contribution against future issue of shares
Surplus on revaluation of Property, plant and equipment
NON CURRENT LIABILITIESLong term nancing Loans from related partiesAccrued and deferred markupLong-term depositsDeferred liabilities
CURRENT LIABILITIESTrade and other payablesAdvance from customersAccrued mark-upShort term borrowings - securedCurrent portion of non-current liabilitiesTaxation - net
Contingencies and Commitments
Total equity and liabilities
The annexed notes form an integral part of these unconsolidated condensed interim nancial information.
Gap (CL - CA) 33,299,925 34,935,751
Notes Sep 30, 2017 Jun 30, 2017Unaudited Audited
6 73,549,472 73,046,950 16,931,504 16,931,504
987,936 947,936 16,956 16,956
1,282,932 1,282,932 92,768,800 92,226,278
516,829 483,884 7 13,239,123 12,582,849 8 5,186,837 4,858,318
1,050,169 1,056,064 18,858 13,173
213,985 237,951 9 2,050,889 2,147,976
360,289 249,577 22,636,979 21,629,792
115,405,779 113,856,070
60,000,000 60,000,000
53,298,847 53,298,847 (21,303,418) (21,303,418) (10,478,211) (11,820,649)
21,517,218 20,174,780 761,129 761,129
22,278,347 20,935,909
4,874,410 4,999,836
16,727,237 16,288,749 6,136,605 6,110,417 8,913,224 8,429,727
172,375 172,375 366,677 353,514
32,316,118 31,354,782
44,140,442 41,875,189 762,291 2,472,871 562,312 564,213
4,371,110 3,371,784 5,729,001 7,932,303
371,748 349,182 55,936,904 56,565,543
10
115,405,779 113,856,070
--------(Rupees in '000)--------
DirectorChief Executive

FIRST QUARTER REPORT 2017/18 07
Unconsolidated Condensed InterimFor the period ended 30 September 2017
DirectorChief Executive
Gross turnover
Sales tax, discount and others
Turnover - net
Cost of Sales
Gross pro t
Administrative expensesSelling and distribution expensesOther expensesOther income
Operating pro t
Finance costsExchange loss
Pro t before taxation
TaxationCurrentDeferred
Pro t after taxation
Earning per share - (Rupees)- Basic / Diluted
The annexed notes form an integral part of these unconsolidated condensed interim nancial information.
Sep Sep2017 2016
(Restated)
41,351,933 22,073,696
(9,910,459) (5,472,162)
31,441,474 16,601,534
(29,084,497) (16,238,619)
2,356,977 362,915
(226,549) (208,454) (81,521) (68,078)
(251,612) (169,364) 143,121 932,976
(416,561) 487,080
1,940,416 849,995
(493,909) (570,104) (102,183) (32,533)
(596,092) (602,637)
1,344,324 247,358
(127,314) (87,038) - 55,595
(127,314) (31,443)
1,217,010 215,915
0.23 0.04
------------Rupees in '000-------------

FIRST QUARTER REPORT 2017/18 08
DirectorChief Executive
Unconsolidated Condensed Interim Statement ofOther Comprehensive IncomeFor the period ended 30 September 2017
Sep Sep2017 2016
(Restated)
Pro t after taxation 1,217,010 215,915
Other comprehensive income - -
Total comprehensive Income for the period 1,217,010 215,915
-------Rupees in '000------
The annexed notes form an integral part of these unconsolidated condensed interim nancial information.

FIRST QUARTER REPORT 2017/18 09
DirectorChief Executive
Unconsolidated Condensed Interim Cash Flow StatementFor the period ended 30 September 2017
Interest incomeProvision for gratuity
Net cash ow before working capital changes
Movement in working capital(Increase) / decrease in current assets
Stores and sparesStock in tradeTrade debtsLoans and advances Trade deposits and short term prepayments Other receivables
Increase / (Decrease) in current liabilitiesTrade and other payables
Cash generated from operations
Financial costs paidIncome Taxes paidGratuity paidInterest income received
Net cash from operating activities
CASH FLOWS FROM INVESTING ACTIVITIESFixed capital expenditureAdvance against investment in Shares
(138,245) (129,462)
13,163 9,217 30,076 2,704,705 1,532,324
(32,945) (37,955) (656,274) (967,951) (383,757) 2,182,434
5,895 (2,726) (5,686) `97,087 (12,189)
554,673 2,138,805 8,227,133 (421,006) 3,300,418
8,257,209 2,283,699 4,832,742
(184,498) (200,384) (104,748) (92,681)
-- -- 33,333 30,130
7,216,332 2,027,786 4,569,807
(1,198,410) (477,490) (40,000) (15,000)
CASH FLOWS FROM OPERATING ACTIVITIESPro t before taxationAdjustments for:
Depreciation Finance costsProvision for impairment against doubtful debts
30 Sep 30 Sep
2017 2016
(Restated)
1,344,324 247,358
695,887 694,049 596,092 602,637 193,483 108,525
-----(Rupees in '000)-----
Net cash used in investing activities
CASH FLOW FROM FINANCING ACTIVITIESRepayment of long term loanShort term borrowings netLiabilities against assets subject to nance lease - net
Net cash generated from / used in nancing activities
Net increase / (decrease) in cash and cash equivalentsCash and cash equivalents - opening
Cash and cash equivalents - closing
The annexed notes form an integral part of these unconsolidated condensed interim nancial information.
(94,737) (1,238,410) (492,490)
(1,677,991) (2,158,455) 1,846,326 (1,168,307)
-- (4,362) (7,641,558) 168,335 (3,331,125)
(519,963) 957,712 746,193 560,465 (1,350,423) (593,141)
40,502 (392,711) 153,051

FIRST QUARTER REPORT 2017/18 10
DirectorChief Executive
Unconsolidated Condensed Interim Statement ofChanges In EquityFor the period ended 30 September 2017
Balance as at 1 July 2016
Cancellation of shares held by BOPL
Issuance of shares persuant to merger
Transfer upon merger
Merger Reserve
Total comprehensive income for the period
Pro t for the period
Incremental depreciation relating to surplus on revaluation ofProperty, plant and equipment - net of tax
Balance as at September 30, 2016
Balance as at 1 July 2017
Total comprehensive income for the period
Pro t for the period
Incremental depreciation relating to surplus on revaluation of property, plant andequipment - net of tax
Balance as at September 30, 2017
The annexed notes form an integral part of these unconsolidated condensed interim ancial information.
9,778,587 (7,944,149) 1,834,438 - 1,834,438
(7,905,101) -- -- (7,905,101) -- (7,905,101)
51,425,361 -- -- 51,425,361 -- 51,425,361
-- -- (3,757,751) (3,757,751) 761,129 (2,996,622)
-- (21,303,418) -- (21,303,418) -- (21,303,418)
-- 215,915 215,915 -- 215,915 `
-- 496,485 496,485 -- 496,485
53,298,847 (21,303,418) (10,989,500) 21,005,929 761,129 21,767,058
53,298,847 (21,303,418) (11,820,649) 20,174,780 761,129 20,935,909
-- -- 1,217,010 1,217,010 -- 1,217,010
-- -- 125,427 125,427 -- 125,427
53,298,847 (21,303,418) (10,478,212) 21,517,217 761,129 22,278,346
--------------------------------------(Rupees in ‘000) -------------------------------------------
Issued,
subscribed and
paid up capital
Accumulated Loss TotalContribution against
future issue of shares
TotalMerger Reserves
FIRST QUARTER REPORT 2017/18 11
Notes to the Unconsolidated Condensed InterimFinancial StatementsFor the period ended 30 September 2017
1. LEGAL STATUS AND NATURE OF BUSINESS
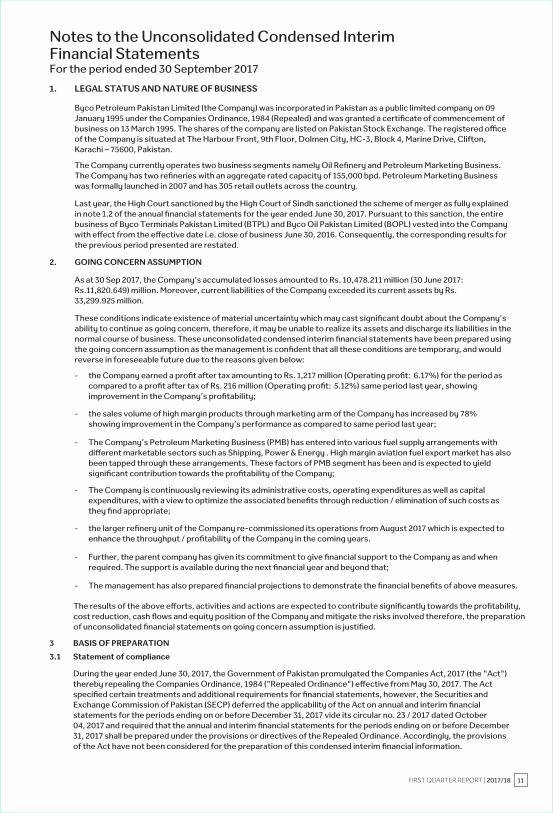
Byco Petroleum Pakistan Limited (the Company) was incorporated in Pakistan as a public limited company on 09January 1995 under the Companies Ordinance, 1984 (Repealed) and was granted a certi cate of commencement ofbusiness on 13 March 1995. The shares of the company are listed on Pakistan Stock Exchange. The registered o ceof the Company is situated at The Harbour Front, 9th Floor, Dolmen City, HC-3, Block 4, Marine Drive, Clifton,Karachi – 75600, Pakistan.
The Company currently operates two business segments namely Oil Re nery and Petroleum Marketing Business.The Company has two re neries with an aggregate rated capacity of 155,000 bpd. Petroleum Marketing Businesswas formally launched in 2007 and has 305 retail outlets across the country.
Last year, the High Court sanctioned by the High Court of Sindh sanctioned the scheme of merger as fully explainedin note 1.2 of the annual nancial statements for the year ended June 30, 2017. Pursuant to this sanction, the entirebusiness of Byco Terminals Pakistan Limited (BTPL) and Byco Oil Pakistan Limited (BOPL) vested into the Companywith e ect from the e ective date i.e. close of business June 30, 2016. Consequently, the corresponding results forthe previous period presented are restated.
2. GOING CONCERN ASSUMPTION
As at 30 Sep 2017, the Company’s accumulated losses amounted to Rs. 10,478.211 million (30 June 2017: Rs.11,820.649) million. Moreover, current liabilities of the Company exceeded its current assets by Rs.33,299.925 million. `
These conditions indicate existence of material uncertainty which may cast signi cant doubt about the Company'sability to continue as going concern, therefore, it may be unable to realize its assets and discharge its liabilities in thenormal course of business. These unconsolidated condensed interim nancial statements have been prepared usingthe going concern assumption as the management is con dent that all these conditions are temporary, and wouldreverse in foreseeable future due to the reasons given below:
- the Company earned a pro t after tax amounting to Rs. 1,217 million (Operating pro t: 6.17%) for the period ascompared to a pro t after tax of Rs. 216 million (Operating pro t: 5.12%) same period last year, showingimprovement in the Company’s pro tability;
- the sales volume of high margin products through marketing arm of the Company has increased by 78%showing improvement in the Company’s performance as compared to same period last year;
- The Company’s Petroleum Marketing Business (PMB) has entered into various fuel supply arrangements withdi erent marketable sectors such as Shipping, Power & Energy . High margin aviation fuel export market has alsobeen tapped through these arrangements. These factors of PMB segment has been and is expected to yieldsigni cant contribution towards the pro tability of the Company;
- The Company is continuously reviewing its administrative costs, operating expenditures as well as capitalexpenditures, with a view to optimize the associated bene ts through reduction / elimination of such costs asthey nd appropriate;
- the larger re nery unit of the Company re-commissioned its operations from August 2017 which is expected toenhance the throughput / pro tability of the Company in the coming years.
- Further, the parent company has given its commitment to give nancial support to the Company as and whenrequired. The support is available during the next nancial year and beyond that;
- The management has also prepared nancial projections to demonstrate the nancial bene ts of above measures.
The results of the above e orts, activities and actions are expected to contribute signi antly towards the pro tability,cost reduction, cash ows and equity position of the Company and mitigate the risks involved therefore, the preparationof unconsolidated nancial statements on going concern assumption is justi ed.
3 BASIS OF PREPARATION
3.1 Statement of compliance
During the year ended June 30, 2017, the Government of Pakistan promulgated the Companies Act, 2017 (the "Act")thereby repealing the Companies Ordinance, 1984 ("Repealed Ordinance") e ective from May 30, 2017. The Actspeci ed certain treatments and additional requirements for nancial statements, however, the Securities andExchange Commission of Pakistan (SECP) deferred the applicability of the Act on annual and interim nancialstatements for the periods ending on or before December 31, 2017 vide its circular no. 23 / 2017 dated October04, 2017 and required that the annual and interim nancial statements for the periods ending on or before December31, 2017 shall be prepared under the provisions or directives of the Repealed Ordinance. Accordingly, the provisionsof the Act have not been considered for the preparation of this condensed interim nancial information.

FIRST QUARTER REPORT 2017/18 12
Notes to the Unconsolidated Condensed InterimFinancial StatementsFor the period ended 30 September 2017
This unconsolidated condensed interim nancial information of the Company for the period ended 30 Sep 2017 hasbeen prepared in accordance with the requirements of the International Accounting Standard (IAS) 34 "InterimFinancial Reporting" and provision of and directives issued under the Companies Ordinance, 1984 (Repealed) . In casewhere requirements di er, the provisions of or directive issued under the Companies Ordinance, 1984 (Repealed)have been followed.
3.2 This unconsolidated condensed interim nancial information does not include all of the information required for fullannual nancial statements and should be read in conjunction with the annual nancial statements as at and for theyear ended 30 June 2017.
3.3 This unconsolidated condensed interim nancial information is un-audited and is being submitted to the shareholdersas required by listing regulations of Pakistan Stock Exchange vide section 245 of the Companies Ordinance, 1984 (Repealed).
3.4 This unconsolidated condensed interim nancial information is presented in Pakistan Rupees which is also theCompany's functional currency and all nancial information presented has been rounded o to the nearest thousand.
3.5 The comparative balance sheet presented in these unconsolidated condensed interim nancial information as at30 June 2017 has been extracted from the unconsolidated audited nancial statements of the Company for theyear ended 30 June 2017.
4 ACCOUNTING POLICIES
The accounting policies and the method of computation adopted in the preparation of these unconsolidated condensedinterim nancial information are the same as those applied in the preparation of the nancial statements of the Companyfor the year ended 30 June 2017.
Amendments to certain existing standards and new interpretations on approved accounting standards e ective duringthe period either were not relevant to the Company's operations or did not have any signi ant impact on the accountingpolicies of the Company.
5 ACCOUNTING ESTIMATES, JUDGEMENTS AND FINANCIAL RISK MANAGEMENT
The preparation of this unconsolidated condensed interim nancial information in conformity with approved accountingstandards requires management to make estimates, assumptions and use judgements that a ect the application of policiesand reported amounts of assets and liabilities and income and expenses. Estimates, assumptions and judgements arecontinually evaluated and are based on historical experience and other factors, including reasonable expectations of futureevents. Revisions to accounting estimates are recognised prospectively commencing from the period of revision.
Judgments and estimates made by the management in the preparation of this unconsolidated condensed interim nancialinformation are the same as those that were applied to the unconsolidated nancial statements as at and for the yearended 30 June 2017. The Company's nancial risk management objectives and policies are consistent with those disclosedin the nancial statements as at and for the year ended 30 June 2017.
6 PROPERTY, PLANT AND EQUIPMENT
Operating xed assets Capital work in progress - at cost
6.1 During the period, the additions in property, plant and equipment amounted to Rs. 1.2 billion.
7 STOCK IN TRADE
Raw material Finished products
Sep 30, 2017 Jun 30, 2017Unaudited Audited
39,792,991 39,002,978 33,756,481 34,043,972 73,549,472 73,046,950
Sep 30, 2017 Jun 30, 2017Unaudited Audited
7.1 8,371,887 6,784,377 7.2 & 7.3 4,867,236 5,798,472
13,239,123 12,582,849
Amount in Rs. '000
6.1
Amount in Rs. '000
7.1 This includes raw material in transit amouting to Rs. 4,525.869 million (30 June 2017: Rs. 4,032.88 million) as at thebalance sheet date.
7.2 Finished products having cost of 2,439.858 million (June 2017: 3,589.267 million) have been written down byRs. 95.659 million (June 2017: 303.694 million) to net realizable value.
7.3 Stock of nished products includes stock held by third parties and related party amounting to Rs. 1,922.662 million(June 2017: Rs. 1,033.413 million) and Rs. 221.088 million (June 2017: Rs. 103.839 million) respectively.
8 TRADE DEBTS - unsecured
8.1 This mainly includes Rs. 7,294.205 million (30 June 2017: Rs. 7,553.041 million) due from an OMC and Rs. 247.537million (30 June 2017: Rs. 224.068 million) due from related party against supplies of products.

FIRST QUARTER REPORT 2017/18 13
Notes to the Unconsolidated Condensed InterimFinancial StatementsFor the period ended 30 September 2017
8.2
9 OTHER RECEIVABLES - considered good
9.1 This includes Rs. 696 million and Rs. 985 million (30 June 2017: Rs. 706 million and Rs. 994) receivable from relatedparty and Coastal Re nery Limited respectively.
10 CONTINGENCIES AND COMMITMENTS
10.1 Contingencies
The status for contingencies is same as disclosed in unconsolidated nancial statements for the year ended 30 June 2017.
11 TRANSACTIONS AND BALANCES WITH RELATED PARTIES
The related parties comprise of ultimate parent company, parent company, subsidiary company, associated companies,directors, key management personnel, sta provident fund and sta gratuity fund. All transactions involving relatedparties arising in the normal course of business are conducted at agreed terms and conditions. Details of transactions andbalances with related parties during the period are as follows:
11.1 Transactions with related parties
During the period provision was made against doubtful debts amounting to Rs. 193.483 million.
Parent company:
Markup charged
Subsidiary Company:
Other expenses incurred
Associated companies:
Sales of goods and services
Purchase of operating xed assets and services
Sta provident fund
Payment of employees and Company's contribution
Key Management Personnel
Salaries and bene ts payment
11.2 Balances with related parties
Parent Company
Other receivables
Contribution against future issue of shares
Accrued markup
Loan payable
Jul - Sep Jul - Sep
2017 2016
(Restated)
33,309
11,786
--
--
10,412
38,881
15,986
1,070,590
402
43,242
177,543 174,715
(Un-audited)
30 September
2017(Audited)
30 June
2017
- 761,129 315,612
6,136,605
25,138 761,129 301,869
6,110,417
----(Rupees in ‘000)----
------------Unaudited----------
Amount in Rs. '000
Subsidiary Company
Receivable against expenses incurred 680,534 Associated Companies
Trade debts 224,068 Accrued interest 108,192 Long Term deposit receivable 95
Payable against purchases 8,147
Others
Payable to key management person 68,508 Payable to sta provident fund
696,520
247,537
74,858
95
8,147
68,508
29,119 46,019

FIRST QUARTER REPORT 2017/18 14
DirectorChief Executive
Notes to the Unconsolidated Condensed InterimFinancial StatementsFor the period ended 30 September 2017
12 OPERATING SEGMENTS
For management purposes, the Company has determined following reportable operating segments on the basis ofbusiness activities i.e. oil re ning and petroleum marketing. Oil re ning business is engaged in crude oil re ning and sellingof re ned petroleum products to oil marketing companies. Petroleum marketing business is engaged in trading of petroleumproducts, procuring products from oil re ning business as well as from other sources. The quantitative data forsegments is given below:
13 Reclassi cation
Following corresponding ures have been reclassi ed for better presentation:
From To
Long term Loans and Advances Loans and advances
Long term nancing Accrued and deferred markup
Selling and distribution expenses Cost of Sales
Selling and distribution expenses Gross turnover
Rs. '000
830,000
8,429,727
99,400
268,120
14 DATE OF AUTHORIZATION FOR ISSUE
This unconsolidated condensed interim nancial information was authorised for issue on 29 January, 2018by the Board of Directors of the Company.
Result
Finance costs
Other expenses
Interest income
Taxation
Pro t for the period
Other Information
Depreciation
Segment results - pro t
Sales to ext. customers
Inter-segment sales
Eliminations
Total revenue
2017 2016 2017 2016 2017 2016
19,466,575 9,501,392 11,974,899 7,100,142 31,441,474 16,601,534
11,117,579 6,669,484 -- 39,369 11,117,579 6,708,853
(11,117,579) (6,669,484) -- (39,369) (11,117,579) (6,708,853)
19,466,575 9,501,392 11,974,899 7,100,142 31,441,474 16,601,534
------------------------------------- (Rupees in '000) ------------------------------------
Oil Re ning Petroleum Marketing Total
1,699,935 688,751 353,848 201,145 2,053,783 889,896
(596,092) (602,637)
(251,612) (169,364)
138,245 129,462
(127,314) (31,443)
1,217,010 215,915
686,101 684,472 9,786 9,577 695,887 694,049

Consolidated Condensed Interim Financial StatementFor the Period Ended September 30, 2017

Consolidated Condensed Interim Balance SheetAs at 30 September 2017
Notes Sep 30, 2017 Jun 30, 2017Unaudited Audited
NON CURRENT ASSETSProperty, plant and equipment 6 88,764,051 88,479,753 Long term Loans and Advances 987,936 947,936 Long-term deposits 16,956 16,956
89,768,943 89,444,645
CURRENT ASSETSStores and spares 516,829 483,884 Stock in trade 7 13,239,123 12,582,849 Trade debts 8 5,186,837 4,858,318 Loans and advances 1,050,169 1,056,064 Trade deposits and short-term prepayments 18,858 13,173 Accrued interest 213,985 237,951 Other receivables 9 1,354,369 1,467,442 Cash and bank balances 360,289 249,577
21,940,459 20,949,258
Total assets 111,709,402 110,393,903
EQUITY AND LIABILITIES
SHARE CAPITAL AND RESERVESAuthorized share capital6,000,000,000 (June 2017:6,000,000,000) Ordinary 60,000,000 60,000,000 shares of Rs.10/- each
Share capital 53,298,847 53,298,847 Merger Reserves (21,303,418) (21,303,418) Accumulated losses (25,633,611) (26,866,160)
6,361,818 5,129,269 Contribution against future issue of shares 761,129 761,129
7,122,947 5,890,398
Surplus on revaluation of Property, plant and equipment 13,201,980 13,254,699
NON CURRENT LIABILITIESLong term financing 16,727,237 16,288,749 Loans from related parties 6,136,605 6,110,417 Accrued and deferred markup 8,913,224 8,429,727 Long-term deposits 172,375 172,375 Deferred liabilities 3,500,397 3,678,939
35,449,838 34,680,207
CURRENT LIABILITIESTrade and other payables 44,138,175 41,878,245 Advance from customer 762,291 2,472,871 Accrued mark-up 562,312 564,213 Short term borrowings - secured 4,371,110 3,371,784 Current portion of non-current liabilities 5,729,001 7,932,304 Taxation - net 371,748 349,182
55,934,637 56,568,599 Contingencies and Commitments 10
Total equity and liabilities 111,709,402 110,393,903
The annexed notes form an integral part of these consolidated condensed interim financial information.
--------(Rupees in '000)-------
DirectorChief Executive Chief Financial Officer
FIRST QUARTER REPORT 2017/18 16
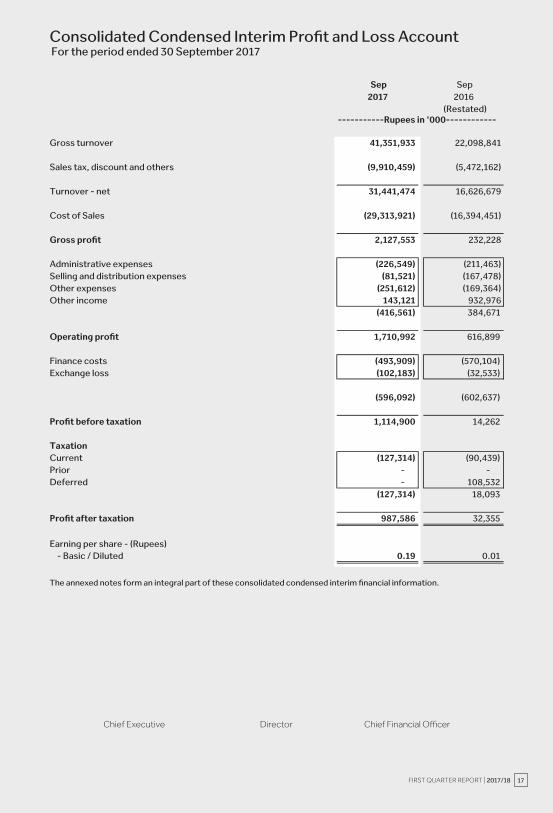
Consolidated Condensed Interim Profit and Loss AccountFor the period ended 30 September 2017
Gross turnover
Sales tax, discount and others
Turnover - net
Cost of Sales
Gross profit
Administrative expensesSelling and distribution expensesOther expensesOther income
Operating profit
Finance costsExchange loss
Profit before taxation
TaxationCurrentPriorDeferred
Profit after taxation
Earning per share - (Rupees)- Basic / Diluted
The annexed notes form an integral part of these consolidated condensed interim financial information.
Sep Sep2017 2016
(Restated)
41,351,933 22,098,841
(9,910,459) (5,472,162)
31,441,474 16,626,679
(29,313,921) (16,394,451)
2,127,553 232,228
(226,549) (211,463) (81,521) (167,478)
(251,612) (169,364) 143,121 932,976
(416,561) 384,671
1,710,992 616,899
(493,909) (570,104) (102,183) (32,533)
(596,092) (602,637)
1,114,900 14,262
(127,314) (90,439) - - - 108,532
(127,314) 18,093
987,586 32,355
0.19 0.01
-----------Rupees in '000------------
DirectorChief Executive Chief Financial Officer
FIRST QUARTER REPORT 2017/18 17

Consolidated Condensed Interim Statementof Other Comprehensive IncomeFor the period ended 30 September 2017
Sep Sep2017 2016
(Restated)
Pro t after taxation 987,586 32,355
Other comprehensive income - -
Total comprehensive Income for the period 987,586 32,355
---------Rupees in '000--------
The annexed notes form an integral part of these consolidated condensed interimnancial information.
DirectorChief Executive
FIRST QUARTER REPORT 2017/18 18

Consolidated Condensed Interim Cash Flow StatementFor the period ended 30 September 2017
CASH FLOWS FROM OPERATING ACTIVITIESPro t before taxationAdjustments for:
Depreciation Finance costsProvision for impairment against doubtful debtsInterest incomeProvision for gratuity
Net cash ow before working capital changes
Movement in working capital(Increase) / decrease in current assets
Stores and sparesStock in tradeTrade debtsLoans and advances Trade deposits and short term prepayments Other receivables
Increase / (Decrease) in current liabilitiesTrade and other payables
Cash generated from operations
Financial costs paidIncome Taxes paidInterest income received
Net cash from operating activities
CASH FLOWS FROM INVESTING ACTIVITIESFixed capital expenditureAdvance against investment in Shares
Net cash used in investing activities
CASH FLOW FROM FINANCING ACTIVITIESRepayment of long term loanShort term borrowings netLiabilities against assets subject to nance lease - net
Net cash generated from / used in nancing activities
Net increase / (decrease) in cash and cash equivalentsCash and cash equivalents - opening
Cash and cash equivalents - closing
The annexed notes form an integral part of these consolidated condensed interim nancial information.
30 Sep 30 Sep
2017 2016
(Restated)
1,114,900 14,262
914,111 912,273 596,092 602,637 193,483 108,525
(138,245) (129,462) 13,163 9,217
2,693,505 1,517,452
(32,945) (37,955) (656,274) (967,951) (383,757) 2,182,434
5,895 (2,726) (5,686) (110,556)
113,073 (12,189)
549,887 2,133,868 (409,806) 3,184,925
2,283,699 4,702,377
(184,498) (180,575) (104,748) (92,681)
33,333 30,130 2,027,786 4,459,251
(1,198,410) (477,490) (40,000) (15,000)
(1,238,410) (492,490)
(1,677,991) (2,158,455) 1,846,326 (1,168,307)
-- (4,362) 168,335 (3,331,125)
957,711 635,637 (1,350,422) (593,141)
(392,711) 42,495
(Rupees in '000)
DirectorChief Executive
FIRST QUARTER REPORT 2017/18 19

Consolidated Condensed Interim Statement of Changes In EquityFor the period ended 30 September 2017
Balance as at 1 July 2016
Cancellation of shares held by BOPL
Issuance of shares persuant to merger
Transfer upon merger
Merger Reserve
Total comprehensive income for the period
Pro t for the period
Incremental depreciation relating to surplus on revaluation ofProperty, plant and equipment - net of tax
Balance as at September 30, 2016
Balance as at 1 July 2017
Total comprehensive income for the period
Pro t for the period
Incremental depreciation relating to surplus on revaluation of property, plant andequipment - net of tax
Balance as at September 30, 2017
The annexed notes form an integral part of these consolidated condensed interim ancial information.
9,778,587 - (25,469,576) (15,690,989) - (15,690,989)
(7,905,101) -- -- (7,905,101) -- (7,905,101)
51,425,361 -- -- 51,425,361 -- 51,425,361
-- -- (3,757,751) (3,757,751) 761,129 (2,996,622)
-- (21,303,418) -- (21,303,418) -- (21,303,418)
-- 32,355 32,355 -- 32,355
-- 241,570 241,570 -- 241,570
53,298,847 (21,303,418) (28,953,402) 3,042,027 761,129 3,803,156
53,298,847 (21,303,418) (26,866,160) 5,129,269 761,129 5,890,398
-- -- 987,586 987,586 -- 987,586
-- -- 244,962 244,962 -- 244,962
53,298,847 (21,303,418) (25,633,612) 6,361,817 761,129 7,122,946
--------------------------------------(Rupees in ‘000) ------------------------------------------
Issued,
subscribed and
paid up capital
Accumulated Loss TotalContribution against
future issue of shares
TotalMerger Reserves
DirectorChief Executive
FIRST QUARTER REPORT 2017/18 20

Notes to the Consolidated Condensed InterimFinancial StatementsFor the period ended 30 September 2017
1. LEGAL STATUS AND NATURE OF BUSINESS
The "Group" consists of:
i) Byco Petroleum Pakistan Limited (the Holding Company)
The Holding Company was incorporated in Pakistan as a public limited company on 09 January 1995 under theCompanies Ordinance, 1984 (Repealed) and was granted a certi cate of commencement of business on 13March 1995. The shares of the company are listed on Pakistan Stock Exchange. The registered o ce of theCompany is situated at The Harbour Front, 9th Floor, Dolmen City, HC-3, Block 4, Marine Drive, Clifton, Karachi –75600, Pakistan.
The Holding Company currently operates two business segments namely Oil Re nery and Petroleum MarketingBusiness. The Holding Company has two re neries with an aggregate rated capacity of 155,000 bpd. PetroleumMarketing Business was formally launched in 2007 and has 305 retail outlets across the country.
Last year, the High Court sanctioned by the High Court of Sindh sanctioned the scheme of merger as fullyexplained in note 1.2 of the annual nancial statements for the year ended June 30, 2017. Pursuant to thissanction, the entire business of Byco Terminals Pakistan Limited (BTPL) and Byco Oil Pakistan Limited (BOPL)vested into the Holding Company with e ect from the e ective date i.e. close of business June 30, 2016.Consequently, the corresponding results for the previous period presented are restated.
ii) Byco Isomerization Pakistan (Private) Limited (BIPL) (Subsidiary Company)
BIPL was incorporated in Pakistan as a private limited company on 14 May 2014 under the repealed Ordinanceand it is a wholly owned subsidiary of the Holding Company. The registered o ce of BIPL is situated at Rooms406 and 407, 4th Floor, Islamabad Stock Exchange Towers, 55-B, Jinnah Avenue, Islamabad. BIPL is principallyengaged in blending, re ning and processing of petroleum naphtha to produce petroleum products such aspremium motor gasoline.
2. GOING CONCERN ASSUMPTION
As at 30 Sep 2017, the Group’s accumulated losses amounted to Rs. 25,633.611 million (30 June 2017: Rs.26,866.160) million. Moreover, current liabilities of the Group exceeded its current assets by Rs. 33,994.178million.
These conditions indicate existence of material uncertainty which may cast signi cant doubt about the Group'sability to continue as going concern, therefore, it may be unable to realize its assets and discharge its liabilitiesin the normal course of business. These consolidated condensed interim nancial statements have beenprepared using the going concern assumption as the management is con dent that all these conditions aretemporary, and would reverse in foreseeable future due to the reasons given below:
- the Group earned a pro t after tax amounting to Rs. 987 million (Operating pro t: 5.44%) for the period ascompared to a pro t after tax of Rs. 32 million (Operating pro t: 3.71%) same period last year, showingimprovement in the Group’s pro tability;
- the sales volume of high margin products through marketing arm of the Group has increased by 78%showing improvement in the Group’s performance as compared to same period last year;
- The Group’s Petroleum Marketing Business (PMB) has entered into various fuel supply arrangements withdi erent marketable sectors such as Shipping, Power & Energy . High margin aviation fuel export market hasalso been tapped through these arrangements. These factors of PMB segment has been and is expected toyield signi cant contribution towards the pro tability of the Group;
- The Group is continuously reviewing its administrative costs, operating expenditures as well as capitalexpenditures, with a view to optimize the associated bene ts through reduction / elimination of such costsas they nd appropriate;
- the larger re nery unit of the Group re-commissioned its operations from August 2017 which is expected toenhance the throughput / pro tability of the Group in the coming years.
- Further, the parent company of the Holding Company has given its commitment to give nancial support tothe Group as and when required. The support is available during the next nancial year and beyond that;
- The management has also prepared nancial projections to demonstrate the nancial bene ts of abovemeasures.
The results of the above e orts, activities and actions are expected to contribute signi cantly towards thepro tability, cost reduction, cash ows and equity position of the Group and mitigate the risks involved therefore,the preparation of consolidated nancial statements on going concern assumption is justi ed.
FIRST QUARTER REPORT 2017/18 21

Notes to the Consolidated Condensed InterimFinancial StatementsFor the period ended 30 September 2017
3.1 Statement of compliance
During the year ended June 30, 2017, the Government of Pakistan promulgated the Companies Act, 2017 (the "Act")thereby repealing the Companies Ordinance, 1984 ("Repealed Ordinance") e ective from May 30, 2017. The Act speci edcertain treatments and additional requirements for nancial statements, however, the Securities and Exchange Commissionof Pakistan (SECP) deferred the applicability of the Act on annual and interim nancial statements for the periods ending onor before December 31, 2017 vide its circular no. 23 / 2017 dated October 04, 2017 and required that the annual and interim
nancial statements for the periods ending on or before December 31, 2017 shall be prepared under the provisions ordirectives of the Repealed Ordinance. Accordingly, the provisions of the Act have not been considered for the preparationof this condensed interim nancial information.
This consolidated condensed interim nancial information of the Group for the period ended 30 Sep 2017 has beenprepared in accordance with the requirements of the International Accounting Standard (IAS) 34 "Interim FinancialReporting" and provision of and directives issued under the Companies Ordinance, 1984 (Repealed) . In case where
3.2 This consolidated condensed interim nancial information does not include all of the information required for fullannual nancial statements and should be read in conjunction with the annual nancial statements as at and for theyear ended 30 June 2017.
3.3 This consolidated condensed interim nancial information is un-audited and is being submitted to the shareholdersas required by listing regulations of Pakistan Stock Exchange vide section 245 of the Companies Ordinance, 1984 (Repealed).
3.4 This consolidated condensed interim nancial information is presented in Pakistan Rupees which is also the Group'sfunctional currency and all nancial information presented has been rounded o to the nearest thousand.
3.5 The comparative balance sheet presented in these consolidated condensed interim nancial information as at 30June 2017 has been extracted from the consolidated audited nancial statements of the Group for the yearended 30 June 2017.
4 ACCOUNTING POLICIES
The accounting policies and the method of computation adopted in the preparation of these consolidated condensedinterim nancial information are the same as those applied in the preparation of the nancial statements of the Groupfor the year ended 30 June 2017. Amendments to certain existing standards and new interpretations on approvedaccounting standards e ective during the period either were not relevant to the Group's operations or did not have anysigni cant impact on the accounting policies of the Group.
5 ACCOUNTING ESTIMATES, JUDGEMENTS AND FINANCIAL RISK MANAGEMENT
The preparation of this consolidated condensed interim nancial information in conformity with approved accountingstandards requires management to make estimates, assumptions and use judgements that a ect the application of policiesand reported amounts of assets and liabilities and income and expenses. Estimates, assumptions and judgements arecontinually evaluated and are based on historical experience and other factors, including reasonable expectations of futureevents. Revisions to accounting estimates are recognised prospectively commencing from the period of revision.
Judgments and estimates made by the management in the preparation of this consolidated condensed interim nancialinformation are the same as those that were applied to the consolidated nancial statements as at and for the yearended 30 June 2017. The Group's nancial risk management objectives and policies are consistent with those disclosedin the nancial statements as at and for the year ended 30 June 2017.
6 PROPERTY, PLANT AND EQUIPMENT
Operating xed assets Capital work in progress - at cost
6.1 During the period, the additions in property, plant and equipment amounted to Rs. 1.2 billion.
Sep 30, 2017 Jun 30, 2017Unaudited Audited
55,007,570 54,435,781 33,756,481 34,043,972 88,764,051 88,479,753
Amount in Rs. '000
6.1
7 STOCK IN TRADE
Raw material Finished products
Sep 30, 2017 Jun 30, 2017Unaudited Audited
7.1 8,371,887 6,784,377 7.2 & 7.3 4,867,236 5,798,472
13,239,123 12,582,849
Amount in Rs. '000Note
Note
FIRST QUARTER REPORT 2017/18 22
3 BASIS OF PREPARATION

Notes to the Consolidated Condensed InterimFinancial StatementsFor the period ended 30 September 2017
7.1 This includes raw material in transit amouting to Rs. 4,525.869 million (30 June 2017: Rs. 4,032.88 million) as at thebalance sheet date.
7.2 Finished products having cost of 2,439.858 million (June 2017: 3,589.267 million) have been written down byRs. 95.659 million (Jun 2017: 303.694 million) to net realizable value.
7.3 Stock of nished products includes stock held by third parties and related party amounting to Rs. 1,922.662 million(June 2017: Rs. 1,033.413 million) and Rs. 221.088 million (June 2017: Rs. 103.839 million) respectively.
8 TRADE DEBTS - unsecured
8.1 This mainly includes Rs. 7,294.205 million (30 June 2017: Rs. 7,553.041 million) due from an OMC and Rs. 247.537million (30 June 2017: Rs. 224.068 million) due from related party against supplies of products.
8.2
9 OTHER RECEIVABLES - considered good
9.1 This includes Rs. 985 million (30 June 2017: Rs. 994) receivable from Coastal Re nery Limited.
10 CONTINGENCIES AND COMMITMENTS
10.1 Contingencies
The status for contingencies is same as disclosed in consolidated nancial statements for the year ended 30 June 2017.
11 TRANSACTIONS AND BALANCES WITH RELATED PARTIES
The related parties comprise of ultimate parent company, parent company, associated companies, directors, keymanagement personnel, sta provident fund and sta gratuity fund. All transactions involving related parties arisingin the normal course of business are conducted at agreed terms and conditions. Details of transactions and balanceswith related parties during the period are as follows:
During the period provision was made against doubtful debts amounting to Rs. 193.483 million.
11.1 Transactions with related parties
Parent company:
Markup charged
Associated companies:
Sales of goods and services
Purchase of operating xed assets and services
Sta provident fund
Payment of employees and Company's contribution
Key Management Personnel
Salaries and bene ts payment
Jul - Sep Jul - Sep
2017 2016
(Restated)
38,881
33,309
1,070,590
--
402
--
43,242 20,813
177,543
174,715
------------Unaudited----------
Amount in Rs. '000
11.2 Balances with related parties
Parent Company
Other receivables
Contribution against future issue of shares
Accrued markup
Loan payable
Associated Companies
Trade debts
Accrued interest
Long Term deposit receivable
Payable against purchases
Others
Payable to key management person
Payable to sta provident fund
(Un-audited) (Audited)
30 September 30 June
2017 2017
- 25,138
761,129 761,129
315,612 301,869
6,136,605 6,110,417
247,537 224,068
74,858 108,192
95 95
8,147 8,147
68,508 68,508
29,119 46,019
(Rupees in ‘000)
FIRST QUARTER REPORT 2017/18 23

Notes to the Consolidated Condensed InterimFinancial StatementsFor the period ended 30 September 2017
12 OPERATING SEGMENTS
For management purposes, the Company has determined following reportable operating segments on the basis ofbusiness activities i.e. oil re ning and petroleum marketing. Oil re ning business is engaged in crude oil re ning andselling of re ned petroleum products to oil marketing companies. Petroleum marketing business is engaged in tradingof petroleum products, procuring products from oil re ning business as well as from other sources. The quantitative datafor segments is given below:
13 Reclassi ation
Following corresponding ures have been reclassi ed for better presentation:
From To Rs. '000
Long term Loans and Advances Loans and advances 830,000 Long term nancing Accrued and deferred markup 8,429,727 Selling and distribution expenses Cost of Sales 99,400Selling and distribution expenses Gross turnover 268,120
14 DATE OF AUTHORIZATION FOR ISSUE
This consolidated condensed interim nancial information was authorised for issue on 29 January, 2018by the Board of Directors of the Company.
Sales to ext. customersInter-segment sales Eliminations
Total revenue
Result
Finance costsOther expensesInterest incomeTaxation
Pro t for the period
Other InformationDepreciation
Segment results - pro t
2017 2016 2017 2016 2017 2016
19,466,575 9,501,392 11,974,899 7,100,142 31,441,474 16,626,679 11,117,579 6,669,484 -- 39,369 11,117,579 6,708,853
(11,117,579) (6,669,484) -- (39,369) (11,117,579) (6,708,853)
19,466,575 9,501,392 11,974,899 7,100,142 31,441,474 16,626,679
1,470,512 455,655 353,848 201,145 1,824,360 656,800
(596,092) (602,637) (251,612) (169,364)
138,245 129,462 (127,314) 18,093
987,586 32,355
904,325 902,696 9,786 9,577 914,111 912,273
---------------------------------- (Rupees in '000) ----------------------------------
Oil Re ning Petroleum Marketing Total
DirectorChief Executive
FIRST QUARTER REPORT 2017/18 24