Embed Size (px)
Citation preview

THE STUDY
ON
MASTER PLAN
FOR
URBAN TRANSPORT
IN
THE NAIROBI METROPOLITAN AREA
IN
THE REPUBLIC OF KENYA
FINAL REPORT
MARCH 2006
KATAHIRA & ENGINEERS INTERNATIONAL
RECS INTERNATIONAL INC.
JAPAN INTERNATIONAL COOPERATION AGENCY (JICA)
MINISTRY OF ROADS AND PUBLIC WORKSMINISTRY OF LOCAL GOVERNMENTTHE REPUBLIC OF KENYA
APPENDIX(VOLUME I)
JR
06-041
SD

i
TABLE OF CONTENTS
APPENDIX 2 NATIONAL DEVELOPMENT POLICY AND PLAN
2.1 National Development Policy and Plan A2-1
2.2 Synopsis of Recommendation on Integrated National Transport Policy A2-5
2.3 Outlines of Road Development Studies and Plans A2-8
APPENDIX 4 ROAD NETWORK
4.1 Available Data and Base Map A4-1
4.2 Number of Lanes of Road Network A4-5
4.3 Road Inventory Results A4-8
APPENDIX 5 PUBLIC TRANSPORT
5.1 Public Transport Modes A5-1
5.2 Mode Interchange Area A5-8
APPENDIX 6 TRAFFIC MANAGEMENT
6.1 Traffic Management Administration A6-1
6.2 Traffic Safety Analysis Regulation A6-2
APPENDIX 7 ORGANIZATION
7.1 Institutional Structure and Functions A7-1
7.2 Road Sector Administration A7-1
7.3 Public Transport Administration A7-14
APPENDIX 8 FINANCIAL STRUCTURE AND BUDGETING
8.1 Financial Structure and Budgeting A8-1
8.2 Main Financial Sources A8-7
8.3 Private Sector Participation: Case of Northern Corridor Project A8-12
ii
APPENDIX 10 TRAFFIC SURVEY AND ANALYSIS
10.1 Traffic Survey Location and Zoning System A10-1
10.2 Person Trip Survey A10-8
10.3 Cordon Line Survey A10-17
10.4 Screen Line Survey A10-21
10.5 Traffic Count Survey A10-24
10.6 Public Transport Users Survey A10-28
10.7 Travel Speed Survey A10-35
10.8 Stated Preference Survey A10-39
APPENDIX 11 FUTURE SOCIO-ECONOMIC FRAMEWORK
11.1 Development Potential and Constraint A11-1
11.2 Urban Land Use Types and Distributing Principles A11-4
APPENDIX 12 TRANSPORT DEMAND FORECAST
12.1 Verification of Trip Generation and Attraction Models A12-1
12.2 Verification of Modal Split Model A12-6
APPENDIX 13 ENVIRONMENTAL IMPACT ASSESSMENT (EIA) AND STRATEGIC ENVIRONMENTAL ASSESSMENT (SEA)
13.1 Environmental Impact Assessment (EIA) of GOK A13-1
13.2 Strategic Environmental Assessment (SEA) of GOK A13-2
13.3 Environmental Management System of GOK A13-3
13.4 Environmental Laws and Regulations of GOK Related to the Master Plan A13-6
13.5 New JICA Guidelines for Environmental and Social Considerations A13-9
13.6 Strategic Scheduling of Stakeholders Meeting A13-11
APPENDIX 14 NATURAL ENVIRONMENT OF THE STUDY AREA
14.1 Natural Environment of the Study Area A14-1
14.2 Social Environment of the Study Area A14-29
14.3 List of Invitation A14-40
14.4 Programme of the Stakeholders Meetings A14-45
14.5 Minutes of Meeting of the First Stakeholders Meeting A14-52
14.6 Views of the People in Nairobi on the Traffic Issues A14-90
14.7 Global Warning A14-93

iii
APPENDIX 15 EXPECTED ENVIRONMENTAL IMPACTS OF THE MASTER PLAN
15.1 Photographs of the Missing Links A15-1
15.2 Environmental Impacts of Missing Link Construction Works, Intersection
Improvement, Road Improvement and Non-Motorized Transportation
Traffic Corridors A15-20
15.3 IEE for the Proposed Projects of Alternative 3 A15-26
15.4 Major Environmental Impacts of High Priority Projects A15-32
15.5 Contents of Resettlement Action Plan A15-43
APPENDIX 21 INSTITUTIONAL PLAN
21.1 Introduction A21-1
21.2 Status of Implementation of Reforms A21-2
21.3 Efforts Made to Complete Road Sector Reforms A21-3
APPENDIX 28 FLOW OF NAIROBI RIVER
28.1 Flow Data of Nairobi River A28-1
28.2 Rainfall of Nairobi Area A28-21
28.3 Records of the Stakeholders Meeting A28-43
28.4 Environmental Impact Assessment for Pre-Feasibility Study on the
Missing Links, No.3, No.6 and No.7 A28-75

APPENDIX 2
NATIONAL DEVELOPMENT POLICY AND PLAN
Page 2.1 NATIONAL DEVELOPMENT POLICY AND PLAN A2-1 2.2 SYNOPSIS OF RECOMMENDATION ON INTEGRATED NATIONAL TRANSPORT POLICY A2-5 2.3 OUTLINES OF ROAD DEVELOPMENT STUDIES AND PLANS A2-8

NNUUTTRRAANNSS TThhee SSttuuddyy oonn MMaasstteerr PPllaann ffoorr UUrrbbaann TTrraannssppoorrtt iinn tthhee NNaaiirroobbii MMeettrrooppoolliittaann AArreeaa
FFiinnaall RReeppoorrtt AAppppeennddiixx A2-1
APPENDIX 2 NATIONAL DEVELOPMENT POLICY AND PLAN
2.1 EXTRACT OF NAIROBI METROPOLITAN GROWTH STRATEGY, 1973
(1) Nairobi Metropolitan Growth Strategy, 1973
Direction of Urbanization
• The regional strategy involves the expansion of Nairobi to the west and to north-east along the axis of the Thika Road and, at the same time, the encouragement of growth
of Thika, Athi River and Machakos.
• It is reasonable to anticipate that, given a continuation of growth, Nairobi and Thika may eventually fall within the same metropolitan area, and it is necessary to
formulate a strategy which could accommodate such an eventuality.
Corridor Development
• Expansion of the city along a corridor of development does give flexibility to react to changing growth rates and other pressures, and ensures a measure of adaptability
which is not inherent in a more concentric form of development.
Formation of District Cores
• Other than Thika, Athi River, and Machakos, three other towns in the region (Kiambu, Kikuyu and Limuru), although relatively small, will probably become increasingly
important as service centres for their rural areas, and also likely to develop local
industries.
Distribution of Industrial Functions
• Apart from central Industrial Area, industrial lands would be made available at Wilson Airport, Dagorettie, Karen-Langata, Dandora, Kasarani, and both north and
south of Ruiru.
• Many of the low- and middle-income housing districts would be served by small local industrial areas.
• Service centres would be located in relation to their potential catchments areas, but sitting on main roads and bus routes would also allow for the attraction of passing
trade.
• For the present study, the Central Area was defined as the land bounded by the railway, Uhuru Highway and Nairobi River.
Distribution of Housing Areas
• There is a considerable amount of space in and around the existing built-up area

NNUUTTRRAANNSS TThhee SSttuuddyy oonn MMaasstteerr PPllaann ffoorr UUrrbbaann TTrraannssppoorrtt iinn tthhee NNaaiirroobbii MMeettrrooppoolliittaann AArreeaa
FFiinnaall RReeppoorrtt AAppppeennddiixx A2-2
which will be developed.
• Care should be taken in the future not to allow low income housing developments to become too concentrated, to have them interspersed with higher income districts and
provide some high income areas to be located in the trade area of each secondary
shopping centre.
• Associated with each of the main areas of new housing would be one or more industrial areas and a large commercial centre.
• The major areas for development would be Dagorettie, Karen-Langata, the Eastern Area and the areas outside the north-eastern city boundary around Ruiru.
• There will be a substantial growth of population within the western shamba areas outside the city limits, which is likely to be of a more informal nature.
Distribution of Population
• It was concluded that the recommended strategy should not seek to impose higher residential densities merely in order to decrease the cost of the transport infrastructure.
Instead, the city should have the option over the long term to create housing areas that
answered the environmental demands and financial capability of the inhabitants. The
distribution of population is given in Table 2.1-1.
TABLE 2.1-1 DISTRIBUTION OF POPULATION
Area Population (2000) Remarks
Old City 556,000 125 ha of Eastleigh Airport were excluded from possible usable land. Employment in Central Area is estimated at 100,000 in 2000.
Ruaraka 387,000 Housing areas for low- and middle-income households Spring Valley 127,000 Housing area development for high-income households
Retaining of coffee plantation with large capacity for employment Karen-Langata 383,000 Retaining housing area for high-income households despite the population
density increase Dagorettie 500,000 - ditto - Eastern Sector 240,000 Housing areas for low- and middle-income households Western Shamba Area
250,000 Outside of Nairobi City Conserving agricultural land to the north Ribbon type new housing area development from existing settlement
Ruiru 557,000 Outside of Nairobi City Containing low- to high-density housing areas
(2) Land Use Plan of Nairobi City
The Study Area comprises Nairobi City and parts of adjoining Thika, Kiambu, Machakos, and
Kajiado Districts.
Thika District contains 6 administrative areas (Divisions). Out of those administrative areas,
total area or a part of Thika Municipality, Kakuzi, and Ruiru are included in the Study Area.

NNUUTTRRAANNSS TThhee SSttuuddyy oonn MMaasstteerr PPllaann ffoorr UUrrbbaann TTrraannssppoorrtt iinn tthhee NNaaiirroobbii MMeettrrooppoolliittaann AArreeaa
FFiinnaall RReeppoorrtt AAppppeennddiixx A2-3
Thika County Council, Thika Municipal Council, and Ruiru Municipal Council are the local
authorities within the Study Area.
Kiambu District contains 7 administrative areas (Divisions). Out of those administrative areas,
total area or a part of Kiambu, Kiambaa, Limuru, Githunguri, and Kikuyu are included in the
Study Area. Kiambu County Council, Kiambu Municipal Council, Kikuyu Town Council, and
Limuru Municipal Council are the local authorities within the Study Area.
Machakos District contains 11 administrative areas (Divisions). Out of those administrative
areas, Athi River, Kangundo and Matungulu are included in the Study Area. Mavoko
Municipal Council and Kangundo Town Council are the local authorities within the Study
Area.
Kajiado District contains 6 administrative areas (Divisions). Out of those administrative areas,
a part of Ngong and Central are included in the Study Area. Ngong Town Council and
Kajiado County Council are the local authorities within the Study Area.
Since the target year of “Nairobi Metropolitan Growth Strategy” prepared in 1973 is year
2000, currently no authorized comprehensive master plan to rely on. Lack of the
comprehensive master plan that will give clear directions for development aggravates the
abuse of land.
Land use regulation concerning land use zoning, plot ratios/ coverages and plot size was
prepared in 1979, which, in reality, is a constraint for private sector development. Table 2.1-2
shows plot ratio / coverages and the lowering of the permitted minimum plot sizes by zone.
Figure 2.1-1 shows the zoning for land use and plot ratio / coverage in Nairobi city.

NNUUTTRRAANNSS TThhee SSttuuddyy oonn MMaasstteerr PPllaann ffoorr UUrrbbaann TTrraannssppoorrtt iinn tthhee NNaaiirroobbii MMeettrrooppoolliittaann AArreeaa
FFiinnaall RReeppoorrtt AAppppeennddiixx A2-4
TABLE 2.1-2 RATIONALISATION OF PLOT RATIOS / COVERAGES AND THE
LOWERING OF THE PERMITTED MINIMUM PLOT SIZES
Zones current Proposed lanExisting min Proposed minProp. Max. permissioNotesland use use plot size plot size PR. Cov.
(ha) (ha)1A Commercial Commercial 0.05 0.04 2.00-6.00 0.80 High-rise flats:PR=1.0, GC=0.35
Residential Residential 0.1 2.00Light industry Light industr 0.4 2.00
1E Offices Commercial 0.1 0.04 2.00 0.80 High-rise flats:PR=1.0, GC=0.35Residential Offices 0.2
Residential2 Commercial Commercial 0.05 0.04 2.00 0.80 Flats not allowed.
Residential Residential 0.04 0.75 0.353 Residential Residential 0.1 0.1 0.75 0.35 Flats and maisonettes allowed; where
there is no sewer PR=GC=25% (septic tank)or 20%(conserv. tank)
4 ditto ditto 0.1 0.1 0.75 0.35 ditto but no advertising5 ditto ditto 0.3 0.2 0.75 0.35 ditto as No.3 no flats but maisonettes allowed.6 ditto ditto 0.4 0.2 0.75 0.50 ditto
0.37 ditto ditto 0.4 0.04 0.75 0.50 Special scheduled area (Mathare)
0.08 (on sewer)8 ditto ditto 0.04 0.04 0.75 0.50 Special scheduled area (Eastlands)9 Industrial Industrial 0.04 0.04 3.00 0.80 Ancillary use to occupy a max. of 20% of the
total permitted plinth.10 Residential Residential 0.04 0.04 0.75 0.35 Comprehesive scheme will be allowed with
(on sewer) a max.density of 35 units per ha.11 ditto ditto 0.04 0.04 0.75 Special scheduled area (Kibera)
(on sewer)12 ditto ditto 1.0 1.0 - - One unit per plot permitted; flats and Maisonettes
2.0 not allowed; adequate wholesome water to besupplied (Karen/Langata) adequate wholesomewater required.
13 ditto ditto 2.0 0.2 - - Where there is no sewer PR=GC=25% (septik 1.0 tank) or 20% (conserv. tank), one unit per plot 0.2 permitted.
14 ditto ditto 2.0 0.2 0.75 0.35 One unit per plot permitted; adequate water1.0 supply required.0.2
15 Agricultural Residential 0.1ha Township 0.1 Township 0.75 0.50 PR=GC=0.25(Septik tank) PR=GC=0.20 (Conser.Residential 0.04 (on sewer) tank) Terrace houses allowed. Adequate water
supply necessary (Dogaretti) (Special density area)16 Agricultural Residential 1.0 0.2 0.75 0.35 Adequate water supply required (Ruaraka).
Residential Industrial 2.00 0.80Industrial
17 Agricultural Residential 0.04 0.75 0.50 Where there is o sewer, min. plotsize=0.1ha(on sewer) Special sceduld area (Kahawa/Kasarani)
18 ditto ditto 0.75 0.50 Where there is o sewer, min. plot size=0.1ha(on sewer) Special sceduld area (East of Embakasi Airport)
Where there is no sewer, min. plot size=0.1ha19 Agricultural Agricultural 2.0 0.75 0.50 Special densty area (Eastern extension)
Reidential 0.1 35 units per plot allowed.0.05(on sewer)
20 Public Public - - - - Forest, Game forest, Defence areas, etc.
Source:Nairobi City CouncilSource: Nairobi City Council, 1979

NNUUTTRRAANNSS TThhee SSttuuddyy oonn MMaasstteerr PPllaann ffoorr UUrrbbaann TTrraannssppoorrtt iinn tthhee NNaaiirroobbii MMeettrrooppoolliittaann AArreeaa
FFiinnaall RReeppoorrtt AAppppeennddiixx A2-5
FIGURE 2.1-1 LAND USE AND PLOT RATIOS/COVERAGES ZONING IN NAIROBI CITY
2.2 SYNOPSIS OF RECOMMENDATION ON INTEGRATED NATIONAL TRANSPORT
POLICY
2.2.1 Kenya Transportation Policy and Roads Sub-sector Policy and Strategy
This study was carried out by KRB and EDF for preparation of coordinating policy papers of
road subsector for GOK and donor communities in March 2004. These identified issues of
NMT, urban planning and urbanisation, and transport management and congestion established
the principal polices and strategies of overall road-subsector, which of environment are,
however, lacked. The JICA Study will review and adopt the policies and strategies to meet the
Study objectives.
The policy and strategy for the road subsector will produce realistic and achievable work
through the following programming, design standards, and implementation.

NNUUTTRRAANNSS TThhee SSttuuddyy oonn MMaasstteerr PPllaann ffoorr UUrrbbaann TTrraannssppoorrtt iinn tthhee NNaaiirroobbii MMeettrrooppoolliittaann AArreeaa
FFiinnaall RReeppoorrtt AAppppeennddiixx A2-6
a. Programming
Priority Objectives:
• To reduce the overall combined maintenance cost of infrastructure and vehicle operating costs by: (i) giving first funding priority to roads in maintainable condition, and; (ii) reducing backlog maintenance and rehabilitation needs;
• Road agencies will produce realistic and achievable annual work programmes, with work prioritised against agreed criteria;
• All programmes will ensure that routine and periodic maintenance is planned for all maintainable roads; and
• Road users will be informed of the condition of roads so as to raise awareness of the importance of road maintenance.
Strategies: • Road agencies will produce realistic and achievable work annual programme, prioritised
according to agreed criteria. All programmes will provide for the routine maintenance of maintainable roads.
• KRB will only finance road works programme against agreed criteria that are submitted by road agencies in accordance with schedules that reflect cash-flow constrains;
• KRB will audit programmes produced by agencies to ensure programmes are met and criteria adhered to;
• KRB will launch a public information campaign on road maintenance; and • KRB will prepare a 5-year rolling investment plan for road maintenance and rehabilitation.
b. Design Standard
Policy Objectives:
• Ensure road user needs are satisfied through application of appropriate levels of service; • Ensure that roads are designed to reduce accidents, improve operational efficiency,
minimizes social degradation, mitigate environmental impacts, through the application of appropriate design standards;
• Ensure design standards are harmonised with those in the region (especially for international corridors);
• Ensure standards allow benefits from technical advances to be realised; and • Ensure that design standards adequately cater NMT and pedestrians.
Strategies:
• Revise standard and specifications for all road classes to incorporate technological advances, execution of using both equipment and labour-based methods, where appropriate, and ensuring coherence with regional standards for international routes;
• Trial new technique and materials to establish potential benefits, and review standards regularly;
• Ensure standards comply with environmental requirement; • Ensure compliance with standards (especially with safety requirements) before projects
commence; • Develop more appropriate ( and safe) traffic calming and other safety standards; • Ensure roads reserve widths are well defined and documented; and • Raise awareness of highway design engineers to the needs of road users.
NNUUTTRRAANNSS TThhee SSttuuddyy oonn MMaasstteerr PPllaann ffoorr UUrrbbaann TTrraannssppoorrtt iinn tthhee NNaaiirroobbii MMeettrrooppoolliittaann AArreeaa
FFiinnaall RReeppoorrtt AAppppeennddiixx A2-7
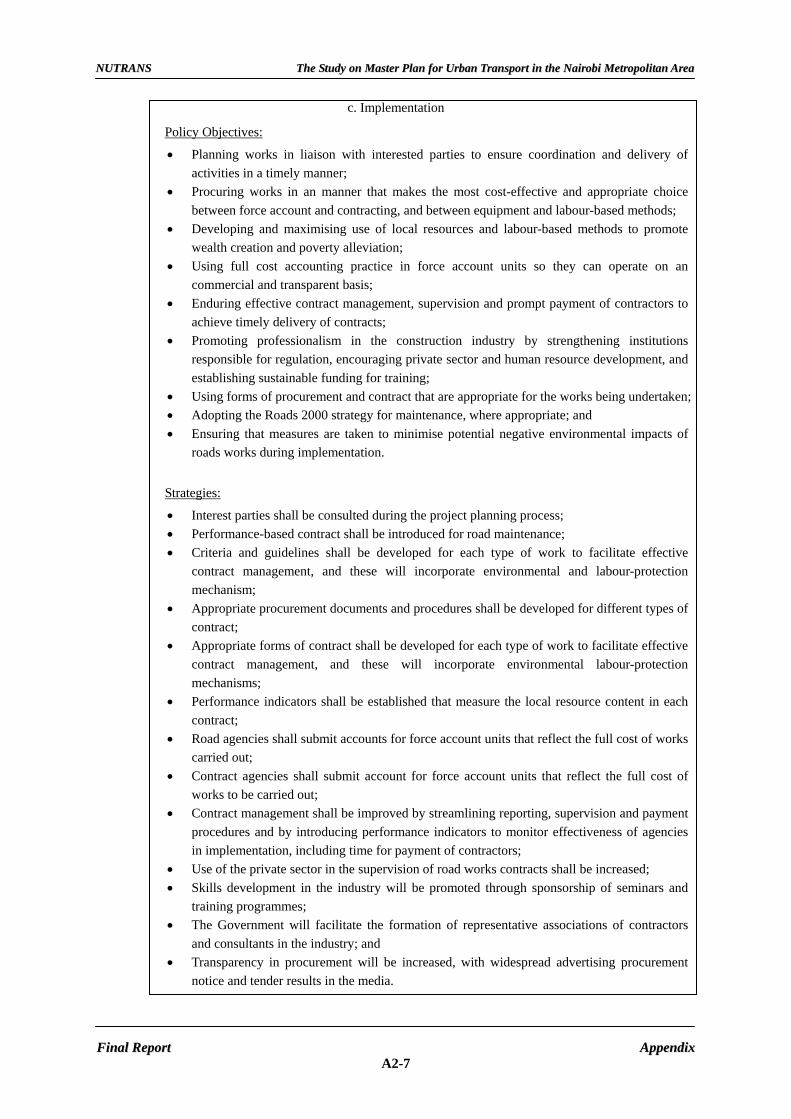
c. Implementation
Policy Objectives:
• Planning works in liaison with interested parties to ensure coordination and delivery of activities in a timely manner;
• Procuring works in an manner that makes the most cost-effective and appropriate choice between force account and contracting, and between equipment and labour-based methods;
• Developing and maximising use of local resources and labour-based methods to promote wealth creation and poverty alleviation;
• Using full cost accounting practice in force account units so they can operate on an commercial and transparent basis;
• Enduring effective contract management, supervision and prompt payment of contractors to achieve timely delivery of contracts;
• Promoting professionalism in the construction industry by strengthening institutions responsible for regulation, encouraging private sector and human resource development, and establishing sustainable funding for training;
• Using forms of procurement and contract that are appropriate for the works being undertaken; • Adopting the Roads 2000 strategy for maintenance, where appropriate; and • Ensuring that measures are taken to minimise potential negative environmental impacts of
roads works during implementation.
Strategies:
• Interest parties shall be consulted during the project planning process; • Performance-based contract shall be introduced for road maintenance; • Criteria and guidelines shall be developed for each type of work to facilitate effective
contract management, and these will incorporate environmental and labour-protection mechanism;
• Appropriate procurement documents and procedures shall be developed for different types of contract;
• Appropriate forms of contract shall be developed for each type of work to facilitate effective contract management, and these will incorporate environmental labour-protection mechanisms;
• Performance indicators shall be established that measure the local resource content in each contract;
• Road agencies shall submit accounts for force account units that reflect the full cost of works carried out;
• Contract agencies shall submit account for force account units that reflect the full cost of works to be carried out;
• Contract management shall be improved by streamlining reporting, supervision and payment procedures and by introducing performance indicators to monitor effectiveness of agencies in implementation, including time for payment of contractors;
• Use of the private sector in the supervision of road works contracts shall be increased; • Skills development in the industry will be promoted through sponsorship of seminars and
training programmes; • The Government will facilitate the formation of representative associations of contractors
and consultants in the industry; and • Transparency in procurement will be increased, with widespread advertising procurement
notice and tender results in the media.

NNUUTTRRAANNSS TThhee SSttuuddyy oonn MMaasstteerr PPllaann ffoorr UUrrbbaann TTrraannssppoorrtt iinn tthhee NNaaiirroobbii MMeettrrooppoolliittaann AArreeaa
FFiinnaall RReeppoorrtt AAppppeennddiixx A2-8
2.3 OUTLINES OF ROAD DEVELOPMENT STUDIES AND PLANS
2.3.1 A Part of Nairobi Metropolitan Growth Strategy (1973)
The City Council of Nairobi and United Nation prepared Nairobi Metropolitan Growth
Strategy in 1973. The general outline of the report was presented in Section 2.2. The proposed
road network are as follows.
Design Objectives
• To provide a system capable of meeting maximum demands for trips by all modes at the end of the century at reasonable level of services;
• To design the system to embody maximum flexibility, so that it may easily be extended or adopted to carter for alternative or subsequent development;
• To design and operate a system such that maximum efficiency is achieved by providing for maximum trip making at minimum cost, while minimising damage to
the environment.
Design Criteria
• Maximise the use of existing transportation infrastructure.
• In adding to the existing road network, attempt to create a directional grid system rather than a ring and radial system.
• Promote lineal growth, rather than radial growth, to maximise the use of new facilities provided and make the most efficient use of possible mass transportation
system.
• Minimise walk distance from residential and industrial areas to major transit routes, by careful land use planning, so limiting the need for feeder bus services.
The recommendations for road network improvement are summarized in Figurer 2.3-1.
a. 1979 b. 1985
FIGURE 2.3-1 RECOMMENDED TRANSPORTATION NETWORK

NNUUTTRRAANNSS TThhee SSttuuddyy oonn MMaasstteerr PPllaann ffoorr UUrrbbaann TTrraannssppoorrtt iinn tthhee NNaaiirroobbii MMeettrrooppoolliittaann AArreeaa
FFiinnaall RReeppoorrtt AAppppeennddiixx A2-9
2.3.2 The Nairobi Bypass Construction Project, Feasibility Study and its Detailed Design
Study (1988/1992)
The Feasibility study was carried out by MOTC and JICA in 1988 and the detailed design
study for the route of Southern Bypass was carried out in September 1992. The purpose of the
feasibility study is to divert through traffic on A104 and traffic on the other roads to the
Bypass and to solve the traffic congestion in the main streets of Nairobi. Proposed route is a
corridor from Mombasa Road to Naivasha Road passing the area between and Kenya Nairobi
National Park and a part of Ngong Road Forest, in the southern part of Nairobi. But
implementation of the project has been suspended due to environmental problem and land
acquisition. In 2003, the Southern Bypass construction is planned in the scope of the Northern
Corridor Transport Improvement Project. However, this study did not include Environmental
Impact Analysis (EIA), and mitigation measures of negative environmental impact, therefore
comprehensive EIA is recommended.
2.3.3 Actions Towards a Better Nairobi, Report And Recommendations of the Nairobi City
Convention (1993): Road
Nairobi City Convention prepared this report in cooperation with the Friedrich Naumann
Foundation in 1993. The plan became the basic plan for KUTIP’s long-term study, and
followed by the proposal of MRPWH, MOLG and NCC.
This study Identified transport and road problems in the City; (a) Potholes on all major roads;
(b) Moonscape-like crates in the Industrial area; (c) Broken pavements; (d) Gaping manholes;
(e) Monumental traffic jams at peak hours; (f) Increasing air pollution; (g) Broken down
sewers and inadequate storm water drainage; (h) Non-functioning traffic signals; (i) Broken
down street lighting; and (j) Hooliganism of the matatu drivers
The above situations has come about largely as a result of: (i) Neglect or ineffective
preventive maintenance of the city road network by the City Commission; (ii) Inadequate
investment and lack of improvements to the capacity of the road transportation infrastructure
despite the rapid rate of population growth and increased vehicle population in the city; (iii)
Failures in the management of the traffic system; (iv) Encroachment on public facilities,
mainly parking plots which have been illegally allocated for private development with
disregard for the pubic demand for such spaces; (v) Breakdown in the discipline of all road
users arising from the cynicism engendered by the collapse on the planning and law
enforcement agencies; (vi) Failure to implement various planning recommendations dating
back 20 years – over politicization of the City government has resulted in little or no
maintenance of professional standards in the city management; (vii) Lack of long-term vision

NNUUTTRRAANNSS TThhee SSttuuddyy oonn MMaasstteerr PPllaann ffoorr UUrrbbaann TTrraannssppoorrtt iinn tthhee NNaaiirroobbii MMeettrrooppoolliittaann AArreeaa
FFiinnaall RReeppoorrtt AAppppeennddiixx A2-10
about the growth needs for enlarged Nairobi Metropolitan Area to service the needs of
Nairobians beyond the year 2000; and (viii) Inadequacies of the rail system and the
inappropriately located aviation facilities in the city. These problems and the causes are still
take place to date.
The Study recommended the approaches to solve the above problems; (a) The need to create a
friendly and safe transportation system; (b) The need to provide an efficient transportation
system; (c) The need to ensure a transportation system that is attractive, accessible and
affordable for all Nairobians; (d) Special attention are the needs of the disabled and other
vulnerable group such as school children and the urban poor who have to walk to work.
Following the approaches the study proposed an Action Plan such as (A) Immediate (B)
Medium and (C) Long-Terms action plans. A. Immediate Action Plan
A-1 Action to increase the efficiency of the existing transport network through improved traffic management
• Traffic Management • Public transport • Taxis • Pedestrian traffic • Other non-motorized transport: Bicycle • Traffic-free pedestrian shopping/Tourist malls • Other actions to enhance safety and reduce traffic congestion • Maintenance of the transport network • Car parks
A-2 Action to increase the capacity of the transport system • Widening existing road arteries. • Improving critical junctions / interchanges • Converting all major roads to dual carriageway • Building key missing links in the network.
B. Medium Term Actions
B-1 Take action to review/update/reappraise existing plans/proposals for major improvements to the existing network with a view to implementing whatever is economically feasible. Most important is filling the gaps in the links in the present system and taking steps to increase capacity use while undertaking those capital works which could enhance the efficiency of the present network.
B-2 Take action to create /build key CBD bypass, especially the north/south bypasses. B-3 Initiate cost benefit analyses for the medium-term proposals for capital developments. B-4 Start work on a master plan of the city beyond the year 2000, taking into account the need
to lay out the growth pattern of the transportation system, and its proper integration with the planning and zoning requirements for a truly metropolitan city of the 21st Century.
NNUUTTRRAANNSS TThhee SSttuuddyy oonn MMaasstteerr PPllaann ffoorr UUrrbbaann TTrraannssppoorrtt iinn tthhee NNaaiirroobbii MMeettrrooppoolliittaann AArreeaa
FFiinnaall RReeppoorrtt AAppppeennddiixx A2-11
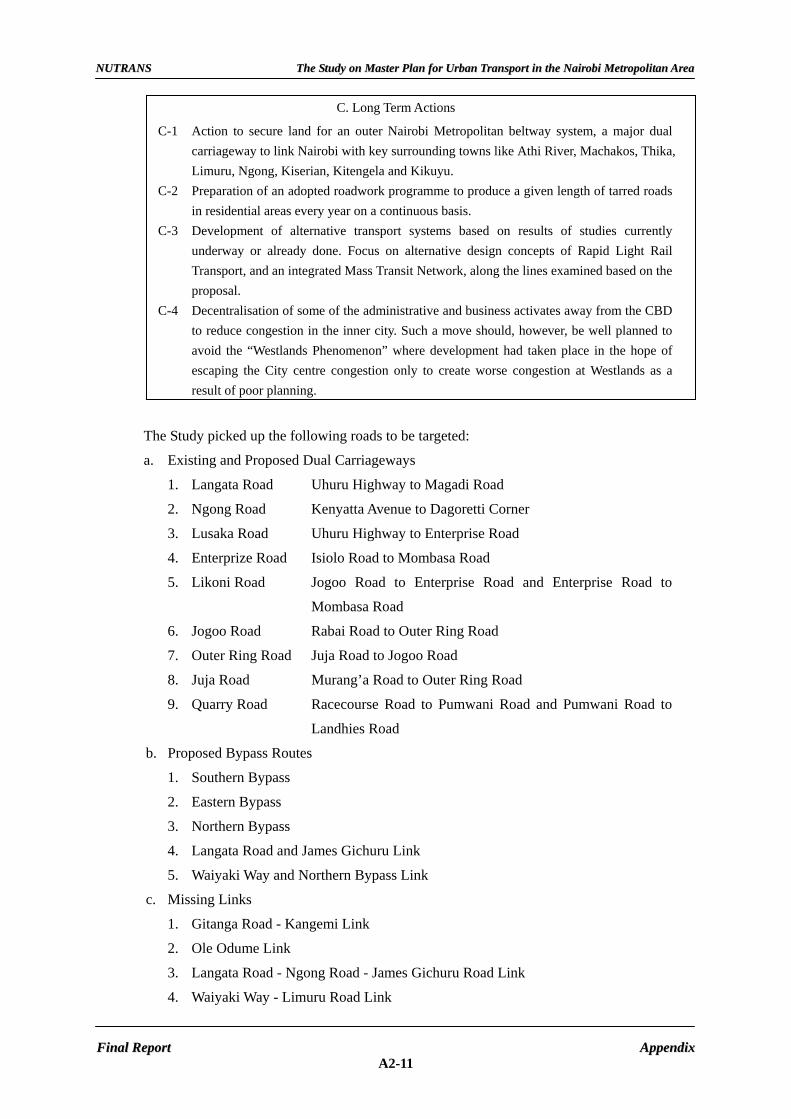
C. Long Term Actions
C-1 Action to secure land for an outer Nairobi Metropolitan beltway system, a major dual carriageway to link Nairobi with key surrounding towns like Athi River, Machakos, Thika, Limuru, Ngong, Kiserian, Kitengela and Kikuyu.
C-2 Preparation of an adopted roadwork programme to produce a given length of tarred roads in residential areas every year on a continuous basis.
C-3 Development of alternative transport systems based on results of studies currently underway or already done. Focus on alternative design concepts of Rapid Light Rail Transport, and an integrated Mass Transit Network, along the lines examined based on the proposal.
C-4 Decentralisation of some of the administrative and business activates away from the CBD to reduce congestion in the inner city. Such a move should, however, be well planned to avoid the “Westlands Phenomenon” where development had taken place in the hope of escaping the City centre congestion only to create worse congestion at Westlands as a result of poor planning.
The Study picked up the following roads to be targeted:
a. Existing and Proposed Dual Carriageways
1. Langata Road Uhuru Highway to Magadi Road
2. Ngong Road Kenyatta Avenue to Dagoretti Corner
3. Lusaka Road Uhuru Highway to Enterprise Road
4. Enterprize Road Isiolo Road to Mombasa Road
5. Likoni Road Jogoo Road to Enterprise Road and Enterprise Road to
Mombasa Road
6. Jogoo Road Rabai Road to Outer Ring Road
7. Outer Ring Road Juja Road to Jogoo Road
8. Juja Road Murang’a Road to Outer Ring Road
9. Quarry Road Racecourse Road to Pumwani Road and Pumwani Road to
Landhies Road
b. Proposed Bypass Routes
1. Southern Bypass
2. Eastern Bypass
3. Northern Bypass
4. Langata Road and James Gichuru Link
5. Waiyaki Way and Northern Bypass Link
c. Missing Links
1. Gitanga Road - Kangemi Link
2. Ole Odume Link
3. Langata Road - Ngong Road - James Gichuru Road Link
4. Waiyaki Way - Limuru Road Link
NNUUTTRRAANNSS TThhee SSttuuddyy oonn MMaasstteerr PPllaann ffoorr UUrrbbaann TTrraannssppoorrtt iinn tthhee NNaaiirroobbii MMeettrrooppoolliittaann AArreeaa
FFiinnaall RReeppoorrtt AAppppeennddiixx A2-12
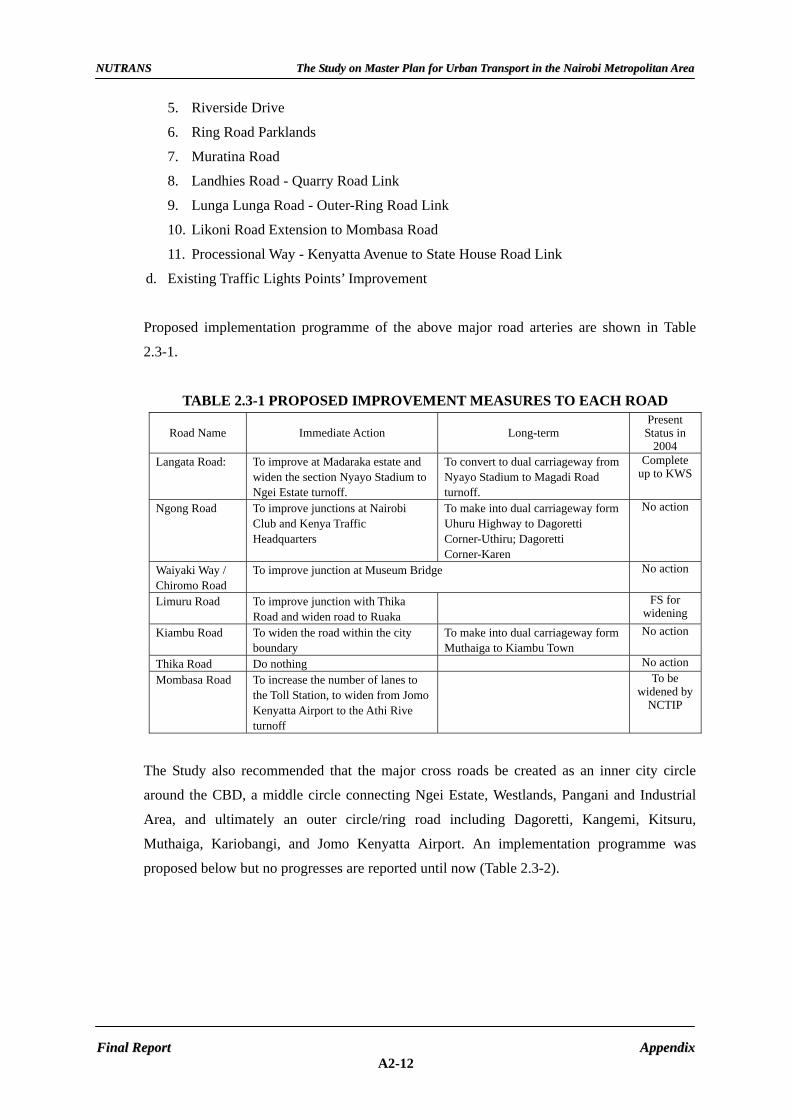
5. Riverside Drive
6. Ring Road Parklands
7. Muratina Road
8. Landhies Road - Quarry Road Link
9. Lunga Lunga Road - Outer-Ring Road Link
10. Likoni Road Extension to Mombasa Road
11. Processional Way - Kenyatta Avenue to State House Road Link
d. Existing Traffic Lights Points’ Improvement
Proposed implementation programme of the above major road arteries are shown in Table
2.3-1.
TABLE 2.3-1 PROPOSED IMPROVEMENT MEASURES TO EACH ROAD
Road Name Immediate Action Long-term Present
Status in 2004
Langata Road: To improve at Madaraka estate and widen the section Nyayo Stadium to Ngei Estate turnoff.
To convert to dual carriageway from Nyayo Stadium to Magadi Road turnoff.
Complete up to KWS
Ngong Road To improve junctions at Nairobi Club and Kenya Traffic Headquarters
To make into dual carriageway form Uhuru Highway to Dagoretti Corner-Uthiru; Dagoretti Corner-Karen
No action
Waiyaki Way / Chiromo Road
To improve junction at Museum Bridge No action
Limuru Road To improve junction with Thika Road and widen road to Ruaka
FS for widening
Kiambu Road To widen the road within the city boundary
To make into dual carriageway form Muthaiga to Kiambu Town
No action
Thika Road Do nothing No action Mombasa Road To increase the number of lanes to
the Toll Station, to widen from Jomo Kenyatta Airport to the Athi Rive turnoff
To be widened by
NCTIP
The Study also recommended that the major cross roads be created as an inner city circle
around the CBD, a middle circle connecting Ngei Estate, Westlands, Pangani and Industrial
Area, and ultimately an outer circle/ring road including Dagoretti, Kangemi, Kitsuru,
Muthaiga, Kariobangi, and Jomo Kenyatta Airport. An implementation programme was
proposed below but no progresses are reported until now (Table 2.3-2).

NNUUTTRRAANNSS TThhee SSttuuddyy oonn MMaasstteerr PPllaann ffoorr UUrrbbaann TTrraannssppoorrtt iinn tthhee NNaaiirroobbii MMeettrrooppoolliittaann AArreeaa
FFiinnaall RReeppoorrtt AAppppeennddiixx A2-13
TABLE 2.3-2 PROPOSED IMPLEMENTATION PROGRAMME
Road Name Immediate Action Medium-term Present
Status in 2004
Magadi Road To widen the road and cut trees in road reserve to improve visibility (sight distance)
Ngei Estate - Woodley To build this link (Missing Link 12)
Naivasha Road To improve junction with Waiyaki Way James Gichuru Road To improve junctions at Gitanga Road and Strathmore College Woodley Estate - Westlands
To build this missing link (Missing Link 6/7)
Msongari - Red Hill To build this link Ridgeways - Moi Sports Complex Kassarani
To establish this link by completing gaps in the system
Kariokor - Kijabe Road To build this link to dual carriageway standard
(Ring Road)
Pangani - Eastleigh - Jogoo Road
To establish this link by improving existing road sections
Note: ( ) means NCC proposed plans and projects in 2004.
2.3.4 A Road Network Development Master Plan Study (1995)
This study was carried out by JICA and Ministry of Public Works in 1995. The report
recommended a Superhighway by upgrading Uhuru highway and Nairobi Bypass. The
concept of superhighway and the Nairobi southern bypass are being considered in the scope
of the Northern Corridor Transport Improvement Project in 2003.
2.3.5 Kenya Urban Transport Improvement Project (KUTIP) : Nairobi: Long Term
Transport Study, Stage I
The Government of Kenya and World Bank launched KUTIP and the transport study of
Nairobi prepared a report of Nairobi Long Term Transport Study, Stage I in 1999. This study
was the first comprehensive study for the land use and transport in the Nairobi Metropolitan
since the 1973 Nairobi Metropolitan Strategy. However, KUTIP was suspended in the mid
stage and this report was not authorised by GOK. Therefore the JICA Study reviewed the data
and plans of the study.
2.3.6 Kenya Road Concession Framework
This study was carried out for the private sector involvement in the road construction and
management in the scope of the Northern Corridor Transport Improvement Project. The study
covers all stretch of northern corridor and concluded the private concession would be viable.
However, the study of the Kenya Transportation Policy and Roads Sub-Sector Policy and
Strategy concluded this viability would be uncertain. Out of all stretches, the section of the
route of Southern Bypass is taken a candidate of concession. As mentioned, above however,
this route shall require a comprehensive EIA.

NNUUTTRRAANNSS TThhee SSttuuddyy oonn MMaasstteerr PPllaann ffoorr UUrrbbaann TTrraannssppoorrtt iinn tthhee NNaaiirroobbii MMeettrrooppoolliittaann AArreeaa
FFiinnaall RReeppoorrtt AAppppeennddiixx A2-14
2.3.7 Northern Corridor Transport Improvement Project (On-going)
Lender: World Bank
Loan/Credit Amount: US$ 207 million
Total Project Cost: US$ 276.25 million
Effective Date: Expected 27 September 2004
Closing Date: 31 December 2009
Borrower: The Republic of Kenya
Implementation Agencies:
Ministry of Roads, Public Works and Housing (US$ 160 million);
Ministry of Transport and Communications (US$ 2.2 million); Kenya
Airports Authority (US$ 34.8 million), and
Kenya Civil Aviation Authority (US$ 10 million)
Project Background
One of the main objectives of the Government in the transport sector is to stimulate private
sector led economic growth through reducing the cost of doing business in Kenya and
increasing its competitiveness in the domestic, regional and international markets. However,
the sector is constrained by lack of adequate funds; institutional inefficiencies; weakness in
the policy, legal and regulatory environment; poor safety and security standards at the airports
and Mombasa port; and inadequate institutional capacity and human resource skills. As a
result, the transport costs and travel times are high and reliability is low. The project is to
assist the Government in its efforts to address these challenges, through the improvement of
priority transport infrastructure along the Northern Corridor.
Northern Transport Corridor connects port of Mombasa with Nairobi, Uganda, Rwanda,
Burundi and Democratic Republic of Congo. The project is expected to enhance domestic and
regional trade and create job opportunities in the construction industry.
Project Objectives
The Project Development Objectives are: (a) increase efficiency of road transport along
Northern Corridor to facilitate trade and regional integration; (b) enhance aviation safety and
security to meet international standards; and (c) promote private sector participation in the
management, financing and maintenance of road assets. This project is ongoing.

APPENDIX 4
ROAD NETWORK
Page 4.1 AVAILABLE DATA AND BASE MAP A4-1 4.2 NUMBER OF LANES OF ROAD NETWORK A4-5 4.3 ROAD INVENTORY RESULTS A4-8

NNUUTTRRAANNSS TThhee SSttuuddyy oonn MMaasstteerr PPllaann ffoorr UUrrbbaann TTrraannssppoorrtt iinn tthhee NNaaiirroobbii MMeettrrooppoolliittaann AArreeaa
Final Report Appendix A4-1
APPENDIX 4 ROAD NETWORK
4.1 AVAILABLE DATA AND BASE MAP
(1) Available Data for Base Map The following data were available for preparing a base map of the Study Area. Since only the topographic maps cover all the Study Area, so far the topographic maps were utilized as the base map (Table 4.1-1).
TABLE 4.1-1 AVAILABLE DATA FOR BASE MAP
Data Description Remarks Topographic map (1/50,000) Maps cover the study area ・ Maps was produced in 1972/3
・ Some contours in feet ・ No new road and present land use
JICA GIS Data in CBD Data covers 15km2 of CBD in Nairobi
・ Data was produced in 2000
JICA Aerial Photo in Nairobi Photo was taken in 2003 Covering Nairobi City only.
・ No full orthophoto product
Satellite Photo Photo was taken in 2004 Covering area is urban area in the Study Area
・ Lack of eastern part but covers most urban area.
(2) Road Inventory Data The list of available inventory data of roads is given in Table 4.1-2.
TABLE 4.1-2 PRESENT ROAD INVENTORY DATA
Item Data/Information Organization Data Form Inventory Date Remarks
Classified road MORPW GIS ArcGIS June 2003 No coordination with road name and width
Unclassified road KRB/MORPW Not Available
Not Available No road list Road List
Nairobi city road CCN Excel Sheet 2001 No GIS Data Topographic map Survey of Kenya 1/50,000 1972/1973 Old, no new roads Classified road map
MORPW GIS ArcGIS June 2003 No CCN area Road
Network Map
City road map Survey of Kenya Print 1995 Only the Centre
Classified Road under MOPWH The latest road inventory of classified road under MORPW was made in June 2003, and compiled in Geological Information System (GIS) by the Section of Road Inventory of MORPW in 2004. The data covered all classified roads including major roads classified as A, B, C that are network components for the master plan, and the secondary and minor roads classified as D, E , and Special Purpose roads such as government access (G) and rural access roads (R). The road inventory format is shown in Table 4.1-3 for major roads and Table 4.1-4 for minor roads.

NNUUTTRRAANNSS TThhee SSttuuddyy oonn MMaasstteerr PPllaann ffoorr UUrrbbaann TTrraannssppoorrtt iinn tthhee NNaaiirroobbii MMeettrrooppoolliittaann AArreeaa
Final Report Appendix A4-2
Use for Road ( A / B /C & Major Roads of NCC)
Road No. ; Road Name; Road Class; Survey by;Road Length; km (From Sta. To Sta. ) Province; Date;
Road Data
Median
From - To Type Width (m) Condition Type Width (m) Width (m) Type Width (m)
Bridge Data
LinkNo.
Sub-section
No.
Bridge Length(m)
Bridge Name
Row(m)
CarriagewayLinkNo.
Sub-section
No.
Sub sectionLength(km)
Station (km)
Remarks
TrafficCharacteristics
RemarksRoadsideLand Use
RoadStructure
SubstandardAlignment
Condition(Sub str.)
Condition (Super str.)
TerrainDrainage
Carriageway Width(m)
Shoulder/Sidewalk
Sidewalk Width(m)
Span Length(m)
Station(km)
Bridge Type
Type; AC (Asphalt Pavement) ST (Surface Treatment) CC (Cement Concrete) G (Gravel) E (Earth)
Terrain; F (Flat) R (Rolling) M (Mountainous)
Roadside Environment・R (Resident)・C (Commercial)・I (Industry)・A (Agriculture)・F (Forest)
Road Structure ・Em (Embankment H ≧ 2.0m ) ・Cu (Cut H ≧ 2.0m ) ・Le (Level H < 2.0m )
Traffic Characteristics ・Few ・Medium ・Heavy ・Very Heavy
( V ≦1,000 )( 1,000 ≦LV ≦ 5,000 )( 5,000 < V ≦10,000 )(Over 10,000)
The data compiled in GIS data included road number, road name, road class (A, B, C, D, E, Special Purpose), District, survey date and time, link name and subsection name, GPS reading, section/subsection length, carriageway width, the type of pavement such as, AC (Asphalt Concrete), BT (Bituminous Surface Treatment), G (Gravel), (Earth), with the condition of the pavement/road surface, etc. The data covered classified roads under MORPW in Nairobi City, but not cover all the roads under CCN. CCN Classified Road The roads in Nairobi City under CCN are all classified roads and have a total of 1,852. CCN had a list of all city roads in a form of spread sheet that was prepared by Kenya Urban Transport Infrastructure Project (KUTIP) in 2001. The data however are not compiled in GIS data. Contents of the data however included road name, road class (H, P, D, L, A, C), area, zone (sub-district name), section or link length, road width, pavement type etc. but conditions are not included. This pavement condition were investigated by the field survey under the Study.
TABLE 4.1-3 ROAD INVENTORY FORMAT FOR MAJOR ROAD

NNUUTTRRAANNSS TThhee SSttuuddyy oonn MMaasstteerr PPllaann ffoorr UUrrbbaann TTrraannssppoorrtt iinn tthhee NNaaiirroobbii MMeettrrooppoolliittaann AArreeaa
Final Report Appendix A4-3
Use for Road ( Minor Road )
Road No. ; Road Name; Road Class; Survey by;Road Length; km (From Sta. To Sta. ) Province; Date;
Road Data
From - To Type Width (m) Condition Type Width (m)
Bridge Data
Bridge NameStation(km)
Bridge Type RemarksSidewalk Width
(m)
CarriagewayWidth(m)
Condition(Sub str.)
Condition (Super str.)
Span Length(m)
Bridge Length(m)
LinkNo.
Sub-section
No.
TrafficCharacteristics
RemarksRoadside
EnvironmentRoad
StructureSubstandardAlignment
Row(m)
Carriageway Shoulder/SidewalkTerrain
LinkNo.
Sub-section
No.
Sub sectionLength(km)
Station (km)
Type; AC (Asphalt Pavement) ST (Surface Treatment) CC (Cement Concrete) G (Gravel) E (Earth)
Terrain; F (Flat) R (Rolling) M (Mountainous)
Roadside Environment・R (Resident)・C (Commercial)・I (Industry)・A (Agriculture)・F (Forest)U (U d)
Road Structure ・Em (Embankment H ≧ 2.0m ) ・Cu (Cut H ≧ 2.0m ) ・Le (Level H < 2.0m )
Traffic Characteristics ・Few ・Medium ・Heavy ・Very Heavy
( V ≦1,000 )( 1,000 ≦LV ≦ 5,000 )( 5,000 < V ≦10,000 )(Over 10,000)
TABLE 4.1-4 ROAD INVENTORY FORMAT FOR MINOR ROAD
(3) Field Survey The items listed below were surveyed and recorded. Road Road name (road No.), section name (section No.), Chainage (distance from the start point), section length, widths of carriageway and shoulders, type of pavement, pavement condition, existence / nonexistence of side walk, terrain, and land use.
Bridge Bridge name, location (chainage), bridge type, length, span length, widths of carriageway and sidewalk, and conditions of deck slab/ superstructure/ substructure/ approaches. A field survey used either the form of detailed field survey or simple field survey due to importance of the road network. The detailed field survey was carried out for important components of road network of the master plan such as the major roads of class A, B, C, and some D under MORPW and class H, P, D under CCN. On the other hand the simple field survey collects only items of road management and maintenance, mainly road width, pavement type and conditions, etc. and adopted for the minor roads that included D, E, Special Purpose Roads under MORPW, and the minor road of CCN.

NNUUTTRRAANNSS TThhee SSttuuddyy oonn MMaasstteerr PPllaann ffoorr UUrrbbaann TTrraannssppoorrtt iinn tthhee NNaaiirroobbii MMeettrrooppoolliittaann AArreeaa
Final Report Appendix A4-4
At the same time the bridge inventory survey was conducted for major bridges using the bridge inventory data of MORPW and a report prepared by former JICA bridge expert of MOPWH, and updated by the present conditions.
(4) Data Recording All data collected above are compiled in GIS data, because KRB intends to integrate road inventory data of Road Department of MORPW, CCN, MOLG by GIS Data Base. Thus CCN road inventory data were converted into GIS data by merging CCN inventory data with GIS positioning data that were collected separately by the Study. Some road alignments of the GIS data were different from the topographic maps of the Study Area, due to different coordination system. Table 4.1-5 shows the list of international roads while the list of national traffic roads is available in Table 4.1-6.
TABLE 4.1-5 INTERNATIONAL TRUNK ROADS (CLASS A)
Road No.
Length (Km) From Through To Remark
Study Area A109 499.3 Mombasa - Athi River Connecting A104A104 650.1 Namanga
(Tanzania Border)Athi River/ Nairobi
Malaba (Uganda Border) Tanzania/Uganda
A2 846.4 Nairobi Thika Moyale (Ethiopia Border) Ethiopia A3 570.6 Thika Garissa Liboi (Somalia Border) Somalia Outside of Study Area A1 896.9 Migori
(Tanzania Border)Kitale Lokichogio
(Sudan Border) Tanzania/Sudan
A14 113.6 Mombasa - Lunga Lunga (Tanzania Border)
Tanzania
A23 114.0 Voi (A104) - Taveta (Tanzania Border) Tanzania
TABLE 4.1-6 NATIONAL TRUNK ROADS (CLASS B)
Road No.
Length(Km)
From Through To Remark
Study Area B10 8.3 A104 (Mombasa
Road) - Jomo Kenyatta
Airport -
B3 299.5 Rioni(A104) Narok Kisii (A1) - Outside of Study Area B1 237.5 Londiani (A104) Kisumu(A1) Busia Uganda Border B2 65.8 Eldoret (A104) - Kitale (A1) - B4 292.5 Nakuru (A104) Marigat Sigor (A1) - B5 181.7 Nyeri(A2) Nyahururu Nakuru(A104) - B6 166.6 Wamumu (A2) Embu (B7) Meru (A2) - B7 272.5 Kibwezi A109) Kangonde (A3) Embu (B6) - B8 439.8 Mombasa(A109) Malindi Garissa (A3) - B9 783.9 Isiolo (A2) Wajir Mandera Ethiopia/Somalia
Border Note: B3 passes through only the north-west edge of the Study Area.
Cities on the road numbers are major cities near junctions.

NNUUTTRRAANNSS TThhee SSttuuddyy oonn MMaasstteerr PPllaann ffoorr UUrrbbaann TTrraannssppoorrtt iinn tthhee NNaaiirroobbii MMeettrrooppoolliittaann AArreeaa
Final Report Appendix A4-5
4.2 BRIDGE AND STRUCTURE CONDITIONS
TABLE 4.2-1 MAJOR BRIDGES IN THE STUDY AREA (OUTSIDE NAIROBI)
Road Name Length (m) PreStrs Concrete Steel Bailey Masonry Grand Total
A104 ~5 8 - - - 8 5~10 - - - - - 10~20 - - - - - 20~30 8 - - 1 9 30~40 2 - - - 2 40~ 1 - - - 1 A104 Total 19 - - 1 20 A2 ~5 1 - - - 1 5~10 1 - - - 1 10~20 4 1 - - 5 20~30 1 1 - - 2 30~40 2 - - - 2 40~ 1 - - - 1 A2 Total 10 2 - - 12 A3 53.0 1 - - - 1 A3 Total 1 1 C ~5 - - - 0 5~10 2 3 - 1 6 10~20 1 - - 1 20~30 2 - - - 2 30~40 1 - - - 1 40~ 2 - - - 2 C Total 7 4 0 1 12 D ~5 0 - - - 0 5~10 3 8 - 1 12 10~20 4 - - - 4 20~30 1 - - - 1 30~40 1 1 - - 2 40~ 1 1 - - 2 D Total 10 10 0 1 21 E ~5 1 - - - 1 5~10 1 - - - 1 10~20 2 1 1 - 4 20~30 - - 2 - 2 30~40 1 - - - 1 40~ - - - - 0 E Total 5 1 3 0 9 Grand Total 52 17 3 3 75 Source: MORPW

NNUUTTRRAANNSS TThhee SSttuuddyy oonn MMaasstteerr PPllaann ffoorr UUrrbbaann TTrraannssppoorrtt iinn tthhee NNaaiirroobbii MMeettrrooppoolliittaann AArreeaa
Final Report Appendix A4-6
TABLE 4.2-2 MAJOR BRIDGE CONDITIONS IN NAIROBI CITY
No. Name of Road Bridge name Type Length Superstructure Substructure
A104 MombasaRd/Uhuru Highway Footbridge Concrete 32.05 good good
A104 Uhuru Highway/Msa Rd Footbridge Concrete 22.4 fair fair
A104 Waiyaki Way Overpass Concrete 14.05 fair fair
A3 Muranga/Thika Rd Nairobi Rvr RHS Concrete 18.7 fair fair
A3 Muranga/Thika Rd Nairobi river bridge Concrete 15.0 fair fair
A3 Thika Rd Nairobi Rvr Concrete 18.4 fair fair
A3 Thika Rd Conc. deck/steel beam Steel 15.0 fair fair
C58 Langata Rd Box culvert Box Culvert 15.5 bad bad
C58 Langata Rd Ngong River FtBrdge Concrete 11.5 fair fair
C58 Langata Rd Ngong River(LHS) Concrete 12.0 fair fair
C58 Langata Rd Ngong River(RHS) Concrete 12.0 fair fair
C58 Langata Rd Footbridge (Pedestrian) Concrete 27.1 good good
C59 Outer ring Railway Concrete 30.4 fair fair
C59 Outer ring Ngong River Bridge Concrete 39.5 bad bad
C59 Outer ring Mathare river Concrete 29.4 very bad very bad
C59 Outer ring Nairobi Rvr Concrete 30.4 bad bad
C60 Ngong Rd box culvert Box Culvert 8.0 bad bad
C62 Limuru Road River Box Culvert 17.8 fair fair
C62 Limuru Road Gitathuru River Concrete 12.0 fair fair
C62 Limuru Road Mathare river Box Culvert 10.0 fair fair
C98 Komarock Stream nr Swamp Box Culvert 10.5 fair fair
C98 Komarock Nairobi Rvr Concrete 20.7 fair fair
N-L First Ave. Eastleigh Nairobi Rvr Concrete 14.6 bad fair
N-A Lamu Rd Nairobi Rvr Concrete 9.0 bad fair
N-A Mbagathi Footbridge Concrete 34.8 fair fair
N-A Mbagathi Nairobi Rvr Concrete 24.8 bad bad
N-C Ring Road Pumwani Nairobi Rvr Concrete 13.3 bad bad
N-D Lower Kabete Rd Mathare river Concrete 9.0 fair fair
N-P Juja Road Sch. Ft brd Steel 27.2 fair fair
N-Uc Museum Hill Rd Sch. Ft brd Concrete 14.05 Fair Fair
N-Uc Jogoo Railway Steel 21.4 fair fair
N-Uc Jogoo Footbridge Steel 34.5 fair fair
N-Uc Jogoo Footbridge Steel 26.8 fair fair
N-Uc Mtudadu Ave. Nairobi Rvr Concrete 17.5 fair fair
N-Uc Peponi Mathare Concrete 6.0 fair fair
N-Uc Pumwani Rd Nairobi Rvr Concrete 8.3 bad bad
N-Uc Race course rd Nairobi Rvr Concrete 19.2 bad bad
Note: The width of the foot bridges were given as carriageway width. Source: MORPW and JICA Study

NNUUTTRRAANNSS TThhee SSttuuddyy oonn MMaasstteerr PPllaann ffoorr UUrrbbaann TTrraannssppoorrtt iinn tthhee NNaaiirroobbii MMeettrrooppoolliittaann AArreeaa
Final Report Appendix A4-7
TABLE 4.2-3 NON-MOTORISED TRANSPORT CONDITIONS
Road Condtions
Bicycle Push/PullCart Walker Total NMT
(%)Carriageway
(m)Sidewalk
(m)1 Ngoong Road Nairobi Baptism Church 25,112 557 538 18 6,959 33,184 22.6% 9.3 Not all stretch
2 Kikuyu Road Dagoretti 1,921 47 167 50 978 3,163 37.8% 5.9 No(Waithaka Shopping to Naivasha Rd)
3 Naivahsa Road Riruta 4,116 51 755 40 4,523 9,485 56.1% 6.3 No(Kawangware to Ngong Rd)
4 James Gichuru Road ST. Austins Academy 14,252 50 1025 0 3,684 19,011 24.8% 9.5 2.0(Gitanga Rd to Waiyaki Way)
5 Arging Kodhek Road Yaya center 19,561 142 484 10 5,512 25,709 23.4% 7.8 1.9(Kingara Rd to Valley Rd)
6 Mbagathi Way Corridor Armed Forces Hospital 33,015 178 359 16 4,675 38,243 13.2% 14.0 1.5(Ngong Rd to Uhuru Highway) Both sides
7 Waiyaki Way Corridor ABC Place 31,509 434 672 154 2,968 35,737 10.6% 4-lane divided Not all stretch(Uthiru to Limuru Rd) Parkroad Nursing Home 15,428 77 288 132 8,029 23,954 35.3% 6.6 No
8 Kiambu Road Muthaiga police Station 8,242 53 155 0 1,994 10,444 20.6% 8.0 1.0(Thika Rd to City Boundary)
9 Jogoo Road Makongeni Police St. 55,629 532 1544 201 6,515 64,421 12.8% 16.6 2.0(Outerring Rd to Lusaka Rd)
10 Denis Pritt Road Corridor St. Georges Primary Scho 7,980 137 646 1 6,458 15,222 46.7% 7.0 1.9(Oloitokitok Rd to Keniyatta Av.) Both sides
11 Outer ring, Lunga Lunga & Mutindwa linBuruburu (Railway bridge 16,916 61 2,843 128 6,330 26,278 35.4% 7.3 NoMakadara 8,426 104 2,603 30 5,791 16,954 49.7%
12 Mombasa Road Jokim Estate 31,715 71 742 6 3,775 36,309 12.5% 23.7 NoNairobi South Pry. Schoo 48,082 704 155 11 2,530 51,482 5.2% 4-lane divided No
13 Limuru Road Canadian Embassy 16,837 221 624 0 1,528 19,210 11.2% 6.7 No(Murunga Rd to City Boundary) (Partial)
14 Thika Road Safari Park 32,361 132 667 27 3,513 36,700 11.5% 14.8 No(Murunga Rd to Keniyatta University) Kenyatta University 20,694 23 732 5 3,834 25,288 18.1% 4-lane divided No
MT Motorbike/Tricycle
NMTNo. Road Name Survey Location

APPENDIX 4.3
ROAD INVENTORY RESULTS

TAB
LE 4
.3-1
RO
AD
LE
NG
TH D
ATA
No.
DIS
TRIC
TC
LASS
NU
MFR
OM
TOLA
NES
SUR
FTYP
ESU
RFC
ON
DLE
NG
(KM
)SE
C T
OTA
L(K
M)
1K
ajia
do R
oad
Kaj
iado
AA
104
E148
0D
B (A
109)
2S
urfa
ce D
ress
ing
Fair
13.9
02M
acha
kos
AA
104
DB
A10
92
Pre
mix
Goo
d4.
416
Mac
hako
sA
A10
4D
BA
109
2S
urfa
ce D
ress
ing
Goo
d1.
540
Mac
hako
sA
A10
4E1
480
DB
2P
rem
ixG
ood
0.05
219
.909
Mom
bsa
Roa
dM
acha
kos
AA
104
A10
9D
B2
Pre
mix
Goo
d10
.033
Nai
robi
AA
104
DB
Mac
hako
sSt
art o
f Dua
l C2
Pre
mix
Goo
d1.
166
11.1
99U
huru
Hig
hway
/Wai
yaki
Way
Nai
robi
AA
104N
A10
4B
104
Pre
mix
Goo
d1.
184
Nai
robi
City
Nai
robi
AA
104N
B10
C89
4P
rem
ixG
ood
2.18
8N
airo
biA
A10
4NC
58C
61 c
entr
al4
Pre
mix
Goo
d8.
190
Nai
robi
AA
104N
C58
C61
cen
tral
6P
rem
ixG
ood
0.02
1N
airo
biA
A10
4NC
58C
61 c
entr
al6
Pre
mix
Fair
0.16
9N
airo
biA
A10
4NC
58C
61 c
entr
al6
Pre
mix
Fair
0.21
2N
airo
biA
A10
4NC
58C
61 c
entr
al6
Pre
mix
Fair
1.15
9N
airo
biA
A10
4NC
61 c
entr
alC
61 n
orth
4P
rem
ixFa
ir13
.820
Nai
robi
AA
104N
C61
nor
thD
B K
iam
bu4
Pre
mix
Fair
1.21
328
.156
Nai
vash
a R
oad
Kia
mbu
AA
104
DB
C63
2P
rem
ixG
ood
5.93
3K
iam
buA
A10
4C
63E4
222
Pre
mix
Goo
d2.
540
Kia
mbu
AA
104
E422
B3
2P
rem
ixG
ood
9.54
5K
iam
buA
A10
4B
3C
652
Pre
mix
Goo
d3.
500
21.5
182
Mom
bsa
Roa
dM
acha
kos
AA
109
C97
A10
42
Pre
mix
Fair
20.4
90M
acha
kos
AA
109
C97
A10
42
Pre
mix
Goo
d1.
591
22.0
813
Thik
a R
oad
Nai
robi
AA
2SA
2 M
utha
iga
C59
4P
rem
ixG
ood
3.51
6N
airo
bi c
ItyN
airo
biA
A2S
C59
C59
4P
rem
ixG
ood
0.09
5N
airo
biA
A2S
C59
DB
Thi
ka4
Pre
mix
Goo
d7.
391
Nai
robi
AA
2SP
anga
niD
B T
hika
4P
rem
ixFa
ir0.
004
11.0
06Th
ika
AA
2SB
DB
D4
Pre
mix
Goo
d1.
990
Thik
aA
A2S
DB
DB
4P
rem
ixFa
ir3.
246
Thik
aA
A2S
DB
DB
4P
rem
ixFa
ir0.
539
Thik
aA
A2S
DB
DB
4P
rem
ixFa
ir1.
230
Thik
aA
A2S
DB
DB
4P
rem
ixFa
ir0.
173
Thik
aA
A2S
DB
DB
4P
rem
ixFa
ir8.
635
Thik
aA
A2S
DB
DB
4P
rem
ixG
ood
0.30
5Th
ika
AA
2SD
BD
B4
Pre
mix
Goo
d1.
853
Thik
aA
A2S
DB
DB
4P
rem
ixFa
ir11
.815
29.7
87
1/17

TAB
LE 4
.3-1
RO
AD
LE
NG
TH D
ATA
No.
DIS
TRIC
TC
LASS
NU
MFR
OM
TOLA
NES
SUR
FTYP
ESU
RFC
ON
DLE
NG
(KM
)SE
C T
OTA
L(K
M)
4G
aris
sa R
oad
Thik
aA
A3
A2S
BD
2P
rem
ixG
ood
5.33
8Th
ika
AA
3A
2SB
D2
Pre
mix
Fair
3.64
1Th
ika
AA
3A
2SB
D2
Pre
mix
Goo
d24
.602
Thik
aA
A3
A2S
BD
2P
rem
ixG
ood
0.40
533
.987
Tota
l A17
7.64
3
5A
irpot
Roa
dN
airo
biB
B10
EA
104S
C59
2P
rem
ixG
ood
1.63
2N
airo
biB
B10
EC
59JK
IA2
Pre
mix
Goo
d0.
286
Nai
robi
BB
10W
A10
4NA
104S
2P
rem
ixG
ood
0.44
2N
airo
biB
B10
WA
104S
C59
2P
rem
ixG
ood
1.27
0N
airo
biB
B10
WC
59JK
IA2
Pre
mix
Goo
d0.
332
3.96
2To
tal B
3.96
2
2/17

TAB
LE 4
.3-1
RO
AD
LE
NG
TH D
ATA
No.
DIS
TRIC
TC
LASS
NU
MFR
OM
TOLA
NES
SUR
FTYP
ESU
RFC
ON
DLE
NG
(KM
)SE
C T
OTA
L(K
M)
6M
agad
i Roa
dK
ajia
doC
C58
E149
7D
523
2S
urfa
ce D
ress
ing
Goo
d4.
365
Kaj
iado
CC
58D
523
DB
2P
rem
ixFa
ir11
.324
Nai
robi
CC
58D
B K
ajia
doC
632
Pre
mix
Fair
3.30
3N
airo
biC
C58
DB
Kaj
iado
C63
2P
rem
ixG
ood
1.41
5N
airo
biC
C58
C63
C58
N2
Pre
mix
Goo
d1.
833
22.2
407
Lang
atta
Roa
dN
airo
biC
C58
SC
58M
b R
dN2
Pre
mix
Goo
d4.
751
Nai
robi
CC
58S
Mb
Rd
A10
4N2
Pre
mix
Goo
d1.
539
Nai
robi
CC
58S
A10
4NA
104S
2P
rem
ixG
ood
0.04
96.
339
Nai
robi
CM
b R
dNC
58C
612
Pre
mix
Goo
d2.
951
Nai
robi
CM
b R
dNC
58C
612
Pre
mix
Fair
0.08
4N
airo
biC
Mb
RdS
C58
C61
2P
rem
ixFa
ir2.
931
5.96
68
Out
er R
ing
Roa
dN
airo
biC
C59
B10
EC
892
Pre
mix
Fair
2.73
8N
airo
biC
C59
B10
EC
892
Pre
mix
Goo
d0.
130
Nai
robi
CC
59C
89C
982
Pre
mix
Goo
d5.
958
Nai
robi
CC
59C
89C
982
Pre
mix
Poo
r1.
324
Nai
robi
CC
59B
10A
22
Pre
mix
Poo
r0.
053
Nai
robi
CC
59C
98A
2N2
Pre
mix
Poo
r2.
861
Nai
robi
CC
59A
2SA
2N2
Pre
mix
Poo
r0.
104
Nai
robi
CC
59C
59C
592
Pre
mix
Poo
r0.
135
Nai
robi
CC
59A
2NA
2S2
Pre
mix
Poo
r0.
096
13.3
999
Ngo
ng R
oad
Kaj
iado
CC
60D
523
DB
2S
urfa
ce D
ress
ing
Fair
4.81
7N
airo
biC
C60
A10
4D
523
2P
rem
ixFa
ir3.
458
Nai
robi
CC
60A
104
DB
Kaj
iado
2P
rem
ixFa
ir5.
656
Nai
robi
CC
60A
104
DB
Kaj
iado
2P
rem
ixFa
ir0.
028
Nai
robi
CC
60A
104
DB
Kaj
iado
2P
rem
ixFa
ir1.
408
15.3
6710
Nai
vash
a R
oad/
Ngo
ng R
oad
Nai
robi
CC
61A
104
C60
3P
rem
ixFa
ir3.
606
Nai
robi
CC
61M
baga
thi R
dC
602
Pre
mix
Fair
0.76
3N
airo
biC
C61
A10
4M
baga
thi R
d2
Pre
mix
Fair
2.17
6N
airo
biC
C61
C60
A10
42
Pre
mix
Poo
r7.
211
Nai
robi
CC
61C
60A
104
2P
rem
ixP
oor
13.7
5611
Lim
uru
Roa
dK
iam
buC
C62
C63
DB
2P
rem
ixG
ood
5.58
5N
airo
biC
C62
FOR
ES
T R
OA
DD
B K
IAM
BU
2P
rem
ixG
ood
10.1
85K
iam
buC
C62
A10
4D
B2
Pre
mix
Goo
d14
.605
Kia
mbu
CC
62A
104
DB
2P
rem
ixG
ood
30.3
75
3/17

TAB
LE 4
.3-1
RO
AD
LE
NG
TH D
ATA
No.
DIS
TRIC
TC
LASS
NU
MFR
OM
TOLA
NES
SUR
FTYP
ESU
RFC
ON
DLE
NG
(KM
)SE
C T
OTA
L(K
M)
12N
airo
biC
C63
C68
D41
22
Pre
mix
Goo
d7.
384
Kia
mbu
CC
63D
BA
104
2S
urfa
ce D
ress
ing
Fair
6.21
2N
airo
biC
C63
C60
D41
22
Pre
mix
Goo
d6.
458
Kia
mbu
CC
63D
BA
104
2S
urfa
ce D
ress
ing
Poo
r0.
220
Kia
mbu
CC
63D
BA
104
2S
urfa
ce D
ress
ing
Fair
0.81
3K
iam
buC
C63
DB
A10
42
Sur
face
Dre
ssin
gP
oor
0.22
0K
iam
buC
C63
A10
4C
622
Sur
face
Dre
ssin
gFa
ir11
.316
Kia
mbu
CC
63C
62C
642
Sur
face
Dre
ssin
gFa
ir3.
440
Kia
mbu
CC
63C
6264
2S
urfa
ce D
ress
ing
Poo
r1.
554
Kia
mbu
CC
63C
62C
642
Sur
face
Dre
ssin
gG
ood
13.6
52K
iam
buC
C63
C64
DB
2S
urfa
ce D
ress
ing
Poo
r5.
587
Thik
aC
C63
A2S
BD
2S
urfa
ce D
ress
ing
Poo
r1.
457
Thik
aC
C63
A2S
BD
2S
urfa
ce D
ress
ing
Ver
y P
oor
3.98
8Th
ika
CC
63A
2SB
D2
Pre
mix
Goo
d4.
710
67.0
1113
Kia
mbu
Roa
dN
airo
biC
C64
A2
MU
THA
IGA
DB
Kia
mbu
2P
rem
ixG
ood
5.53
3K
iam
buC
C64
DB
D40
92
Pre
mix
Fair
4.41
9K
iam
buC
C64
D40
9C
632
Sur
face
Dre
ssin
gP
oor
1.02
1K
iam
buC
C64
E432
E433
2S
urfa
ce D
ress
ing
Ver
y P
oor
0.64
1K
iam
buC
C64
C63
E432
2S
urfa
ce D
ress
ing
Poo
r3.
285
Kia
mbu
CC
64E4
32E4
332
Sur
face
Dre
ssin
gP
oor
4.67
9K
iam
buC
C64
E433
E431
2S
urfa
ce D
ress
ing
Fair
1.21
0K
iam
buC
C64
E433
E431
2S
urfa
ce D
ress
ing
Ver
y P
oor
0.92
521
.715
14R
uiru
Kia
mbu
Roa
dTh
ika
CC
65C
63B
D2
Sur
face
Dre
ssin
gG
ood
11.7
9811
.798
15Th
ika
- Nai
vash
aTh
ika
CC
66A
104
A2S
2S
urfa
ce D
ress
ing
Goo
d1.
219
Thik
aC
C66
A10
4A
2S2
Sur
face
Dre
ssin
gG
ood
2.24
2Th
ika
CC
66A
104
A2S
2S
urfa
ce D
ress
ing
Fair
7.17
710
.638
116
Thik
aC
C67
A2N
BD
2S
urfa
ce D
ress
ing
Ver
y P
oor
7.53
0Th
ika
CC
67A
2NB
D2
Gra
vel
Poo
r2.
862
10.3
9217
Thik
aC
C70
A2
DB
2P
rem
ixFa
ir1.
538
Thik
aC
C70
A2
DB
2S
urfa
ce D
ress
ing
Fair
6.45
77.
995
18A
irpor
t Nor
th R
oad
Nai
robi
CC
89A
104
DB
2P
rem
ixFa
ir1.
560
Nai
robi
CC
89A
104
AP
TC2
Pre
mix
Poo
r0.
921
Nai
robi
CC
89A
104
AP
TC2
Sur
face
Dre
ssin
gFa
ir7.
032
9.51
30
4/17

TAB
LE 4
.3-1
RO
AD
LE
NG
TH D
ATA
No.
DIS
TRIC
TC
LASS
NU
MFR
OM
TOLA
NES
SUR
FTYP
ESU
RFC
ON
DLE
NG
(KM
)SE
C T
OTA
L(K
M)
19K
oma
Roa
ck R
oad
Mac
hako
sC
C98
C99
C10
02
Gra
vel
Goo
d5.
463
Mac
hako
sC
C98
C99
C10
02
Gra
vel
Fair
1.45
2M
acha
kos
CC
98C
99C
100
2E
arth
Fair
1.58
9M
acha
kos
CC
98C
99C
100
2E
arth
Poo
r3.
640
Mac
hako
sC
C98
C99
C10
02
Ear
thFa
ir0.
593
Mac
hako
sC
C98
C99
C10
02
Pre
mix
Fair
1.78
9M
acha
kos
CC
98D
BC
992
Pre
mix
Fair
0.01
6M
acha
kos
CC
98D
BC
992
Pre
mix
Goo
d14
.817
Mac
hako
sC
C98
DB
C99
2P
rem
ixG
ood
17.4
11N
airo
biC
C98
C59
DB
2P
rem
ixFa
ir2.
758
Nai
robi
CC
98C
59D
B2
Gra
vel
Fair
1.69
4N
airo
biC
C98
C59
DB
2P
rem
ixFa
ir20
.280
71.5
02
Nai
robi
CJU
JAC
59P
AN
GA
NI
2P
rem
ixFa
irN
airo
biC
JUJA
C59
PA
NG
AN
I2
Pre
mix
Fair
3.57
13.
571
20M
acha
kos-
Kan
gund
o R
oad
Mac
hako
sC
C99
C97
C98
2G
rave
lFa
ir3.
244
Mac
hako
sC
C99
C97
C98
2G
rave
lP
oor
4.95
28.
195
Nai
robi
to C
63 to
A10
4 (R
ironi
)To
tal C
329.
773
5/17

TAB
LE 4
.3-1
RO
AD
LE
NG
TH D
ATA
No.
DIS
TRIC
TC
LASS
NU
MFR
OM
TOLA
NES
SUR
FTYP
ESU
RFC
ON
DLE
NG
(KM
)SE
C T
OTA
L(K
M)
21C
63 (K
abet
e) to
E42
3 (N
gech
a)K
iam
buD
D37
8C
63D
B2
Sur
face
Dre
ssin
gFa
ir0.
318
Kia
mbu
DD
378
C63
DB
2S
urfa
ce D
ress
ing
Fair
4.13
5K
iam
buD
D37
8E
423
C63
2G
rave
lP
oor
3.28
5K
iam
buD
D37
8E
423
C63
2G
rave
lV
ery
Poo
r1.
338
Kia
mbu
DD
378
E42
3C
632
Gra
vel
Fair
2.96
6K
iam
buD
D37
8E
423
C63
2G
rave
lFa
ir0.
299
Kia
mbu
DD
378
E42
3 (N
. End
)E
423
(S. E
nd)
2S
urfa
ce D
ress
ing
Fair
0.07
5K
iam
buD
D37
8A
104
E42
32
Gra
vel
Goo
d0.
020
Kia
mbu
DD
378
A10
4E
423
2P
rem
ixFa
ir0.
081
Kia
mbu
DD
378
A10
4E
423
2P
rem
ixFa
ir0.
027
Kia
mbu
DD
378
A10
4C
632
Gra
vel
Fair
0.14
6K
iam
buD
D37
8A
104
E42
32
Gra
vel
Fair
1.51
6K
iam
buD
D37
8A
104
E42
32
Gra
vel
Goo
d0.
131
Kia
mbu
DD
378
A10
4E
423
2G
rave
lG
ood
1.48
215
.819
22A
2 (J
uja)
to S
tudy
Bor
der :
C64
(Nge
nda)
Thik
aD
D39
7A
2NC
642
Sur
face
Dre
ssin
gG
ood
10.0
0010
.000
23A
2 (R
uiru
) to
Stud
y B
orde
r : C
64 (K
iam
wan
gi)
Thik
aD
D39
8A
2NFO
RE
ST
2S
urfa
ce D
ress
ing
Goo
d12
.031
12.0
3124
C63
( K
ahaw
a ) t
o St
udy
Bor
der :
C64
(Nge
nda)
Th
ika
DD
399
C63
D39
82
Ear
thG
ood
1.39
3Th
ika
DD
399
C63
D39
82
Gra
vel
Fair
1.18
4Th
ika
DD
399
C63
D39
82
Gra
vel
Goo
d1.
152
Thik
aD
D39
9C
63D
398
2S
urfa
ce D
ress
ing
Fair
6.42
010
.150
25C
98 (N
jiru)
A2
( Gith
urai
) to
C63
(Kah
awa)
N
airo
biD
D40
0C
98A
22
Gra
vel
Fair
5.51
3N
airo
biD
D40
0C
98A
22
Sur
face
Dre
ssin
gG
ood
2.46
5N
airo
biD
D40
0C
98D
B K
iam
bu2
Sur
face
Dre
ssin
gG
ood
0.14
9N
airo
biD
D40
0A
2D
B K
iam
bu2
Sur
face
Dre
ssin
gG
ood
4.67
1K
iam
buD
D40
0D
BC
632
Pre
mix
Fair
3.21
016
.008
26D
409
(Chi
anda
) to
Stu
dy B
orde
r : C
65 (G
ithun
guri)
Kia
mbu
DD
403
D40
9C
652
Sur
face
Dre
ssin
gFa
ir1.
071
1.07
127
D40
9 (N
dunb
eri)
to S
tudy
Bor
der :
C65
(Gith
ungu
ri)K
iam
buD
D40
4D
409
C65
2S
urfa
ce D
ress
ing
Goo
d10
.300
28C
63 (K
iam
baa)
to D
409
(Cia
ndai
)K
iam
buD
D40
6C
63 (S
. End
)C
63 (N
. End
)2
Sur
face
Dre
ssin
gV
ery
Poo
r1.
261
Kia
mbu
DD
406
C63
D40
92
Sur
face
Dre
ssin
gV
ery
Poo
r0.
164
Kia
mbu
DD
406
C63
D40
92
Sur
face
Dre
ssin
gP
oor
0.75
7K
iam
buD
D40
6C
63D
409
2S
urfa
ce D
ress
ing
Fair
3.80
95.
990
29C
62 (H
ighr
idge
) to
C63
(Kia
mba
a) to
D40
9 (L
imur
u)
Kia
mbu
DD
407
C63
C62
2P
rem
ixFa
ir5.
005
Kia
mbu
DD
407
C62
C63
2P
rem
ixG
ood
14.4
8119
.486
6/17

TAB
LE 4
.3-1
RO
AD
LE
NG
TH D
ATA
No.
DIS
TRIC
TC
LASS
NU
MFR
OM
TOLA
NES
SUR
FTYP
ESU
RFC
ON
DLE
NG
(KM
)SE
C T
OTA
L(K
M)
30C
62 (H
ighr
idge
) to
C63
(Rua
ka)
Kia
mbu
DD
408
C62
DB
2S
urfa
ce D
ress
ing
Goo
d3.
943
Nai
robi
DD
408
C62
DB
KIA
MB
U2
Sur
face
Dre
ssin
gFa
ir3.
054
6.99
731
D40
0 (G
ithur
ai) C
64 (K
amba
a S/
Are
a)) C
63 (R
iaba
i) to
Stu
dy B
orde
r (K
aran
bain
i) D
407
to A
104(
Lim
uru)
N
airo
biD
D40
9D
400
C64
2S
urfa
ce D
ress
ing
Fair
7.38
7K
iam
buD
D40
9C
63C
642
Sur
face
Dre
ssin
gG
ood
0.57
9K
iam
buD
D40
9D
404
C63
2S
urfa
ce D
ress
ing
Goo
d3.
958
Kia
mbu
DD
409
D40
6D
404
2S
urfa
ce D
ress
ing
Poo
r3.
661
Kia
mbu
DD
409
D40
6D
404
2G
rave
lG
ood
1.46
1K
iam
buD
D40
9D
403
D40
62
Gra
vel
Goo
d3.
636
Kia
mbu
DD
409
A10
4D
403
2S
urfa
ce D
ress
ing
Poo
r0.
314
Kia
mbu
DD
409
A10
4D
403
2S
urfa
ce D
ress
ing
Goo
d2.
067
Kia
mbu
DD
409
A10
4D
403
2S
urfa
ce D
ress
ing
Poo
r0.
278
Kia
mbu
DD
409
A10
4D
403
2G
rave
lG
ood
11.2
37K
iam
buD
D40
9A
104
D40
32
Sur
face
Dre
ssin
gFa
ir3.
499
Kia
mbu
DD
409
A10
4D
403
2S
urfa
ce D
ress
ing
Poo
r0.
467
38.5
4632
A10
4 (P
arkl
and)
to C
63 (K
abite
)K
iam
buD
D41
0A
104
DB
2S
urfa
ce D
ress
ing
Poo
r3.
360
Kia
mbu
DD
410
A10
4D
B2
Gra
vel
Fair
0.39
6K
iam
buD
D41
0A
104
DB
2G
rave
lP
oor
2.63
5N
airo
biD
D41
0A
104
DB
Kia
mbu
2P
rem
ixFa
ir8.
991
Kia
mbu
DD
410
A10
4D
B2
Sur
face
Dre
ssin
gFa
ir0.
569
15.9
5133
C63
(Kin
oo) t
o St
udy
Bor
der
Kia
mbu
DD
411
C63
B3
2E
arth
Fair
1.36
4K
iam
buD
D41
1C
63B
32
Gra
vel
Poo
r1.
871
Kia
mbu
DD
411
C63
B3
2S
urfa
ce D
ress
ing
Ver
y P
oor
2.07
35.
309
34C
61 (W
aita
ka) t
o C
63 (K
inoo
)N
airo
biD
D41
2C
61D
B K
iam
bu2
Pre
mix
Fair
5.59
7N
airo
biD
D41
2C
61D
B K
iam
bu2
Pre
mix
Fair
1.07
96.
676
A3
(Gat
uany
aga)
to D
521(
Kye
lei)
35Th
ika
DD
49D
521
A3
2G
rave
lG
ood
0.53
5Th
ika
DD
49D
521
A3
2E
arth
Fair
1.36
5Th
ika
DD
49D
521
A3
2G
rave
lFa
ir2.
776
4.67
536
C98
(kiv
anii)
to S
tudy
Bor
der :
C97
(Vyu
lya)
Mac
hako
sD
D51
8C
97C
982
Gra
vel
Fair
0.02
7M
acha
kos
DD
518
C97
C98
2G
rave
lFa
ir4.
268
Mac
hako
sD
D51
8C
97C
982
Gra
vel
Fair
1.44
15.
736
37A
109
(Luk
eya)
to C
99(M
itabo
ni)
Mac
hako
sD
D51
9A
109
C99
2E
arth
Poo
r5.
695
Mac
hako
sD
D51
9A
109
C99
2G
rave
lFa
ir15
.747
21.4
42
7/17

TAB
LE 4
.3-1
RO
AD
LE
NG
TH D
ATA
No.
DIS
TRIC
TC
LASS
NU
MFR
OM
TOLA
NES
SUR
FTYP
ESU
RFC
ON
DLE
NG
(KM
)SE
C T
OTA
L(K
M)
38C
98 (T
ala)
to E
489
(Mat
ungu
lu)
Mac
hako
sD
D52
0D
521
E48
72
Gra
vel
Ver
y P
oor
0.95
6M
acha
kos
DD
520
D52
1E
487
2G
rave
lP
oor
2.41
4M
acha
kos
DD
520
D52
1E
487
2G
rave
lV
ery
Poo
r2.
792
Mac
hako
sD
D52
0D
521
E48
72
Ear
thV
ery
Poo
r0.
014
Mac
hako
sD
D52
0D
521
E48
72
Ear
thP
oor
0.01
3M
acha
kos
DD
520
D52
1E
487
2E
arth
Poo
r1.
902
Mac
hako
sD
D52
0D
521
E48
72
Gra
vel
Fair
5.56
9M
acha
kos
DD
520
D52
1E
487
2E
arth
Ver
y P
oor
6.37
920
.038
39C
98 (T
ala)
to A
3 (G
atua
nyag
a)M
acha
kos
DD
521
C98
DB
2G
rave
lV
ery
Poo
r0.
408
Mac
hako
sD
D52
1C
98D
B2
Gra
vel
Fair
4.86
1M
acha
kos
DD
521
C98
DB
2G
rave
lV
ery
Poo
r1.
326
Mac
hako
sD
D52
1C
98D
B2
Gra
vel
Fair
2.93
9M
acha
kos
DD
521
C98
DB
2G
rave
lP
oor
0.86
8M
acha
kos
DD
521
C98
DB
2G
rave
lFa
ir1.
064
Mac
hako
sD
D52
1C
98D
B2
Gra
vel
Poo
r3.
210
Mac
hako
sD
D52
1C
98D
B2
Gra
vel
Fair
2.14
5M
acha
kos
DD
521
C98
DB
2G
rave
lP
oor
1.12
0M
acha
kos
DD
521
C98
DB
2G
rave
lP
oor
0.06
0M
acha
kos
DD
521
C98
DB
2G
rave
lFa
ir0.
080
Mac
hako
sD
D52
1C
98D
B2
Gra
vel
Fair
5.09
3M
acha
kos
DD
521
C98
DB
2G
rave
lP
oor
5.73
7M
acha
kos
DD
521
C98
DB
2G
rave
lP
oor
0.00
7M
acha
kos
DD
521
C98
DB
2G
rave
lP
oor
1.10
8Th
ika
DD
521
A3
BD
2G
rave
lFa
ir2.
668
32.6
9340
A10
4: S
tudy
BD
C58
(Kis
eria
n) C
60 to
stu
dy B
D :
D52
6K
ajia
doD
D52
3A
104
C58
2S
urfa
ce D
ress
ing
Poo
r22
.000
Kaj
iado
DD
523
C58
C60
2S
urfa
ce D
ress
ing
Poo
r9.
806
Kaj
iado
DD
523
C60
E41
82
Sur
face
Dre
ssin
gP
oor
0.15
0K
ajia
doD
D52
3E1
491
D52
62
Gra
vel
Fair
5.75
037
.706
41A
109
(Luk
enya
sou
th) t
o E
1809
: C99
Mac
hako
sD
D52
7A
109
C99
2G
rave
lFa
ir0.
012
Mac
hako
sD
D52
7A
109
C99
2G
rave
lFa
ir3.
631
Mac
hako
sD
D52
7A
109
C99
2G
rave
lG
ood
10.5
1014
.154
Tota
l D30
0.48
0
8/17
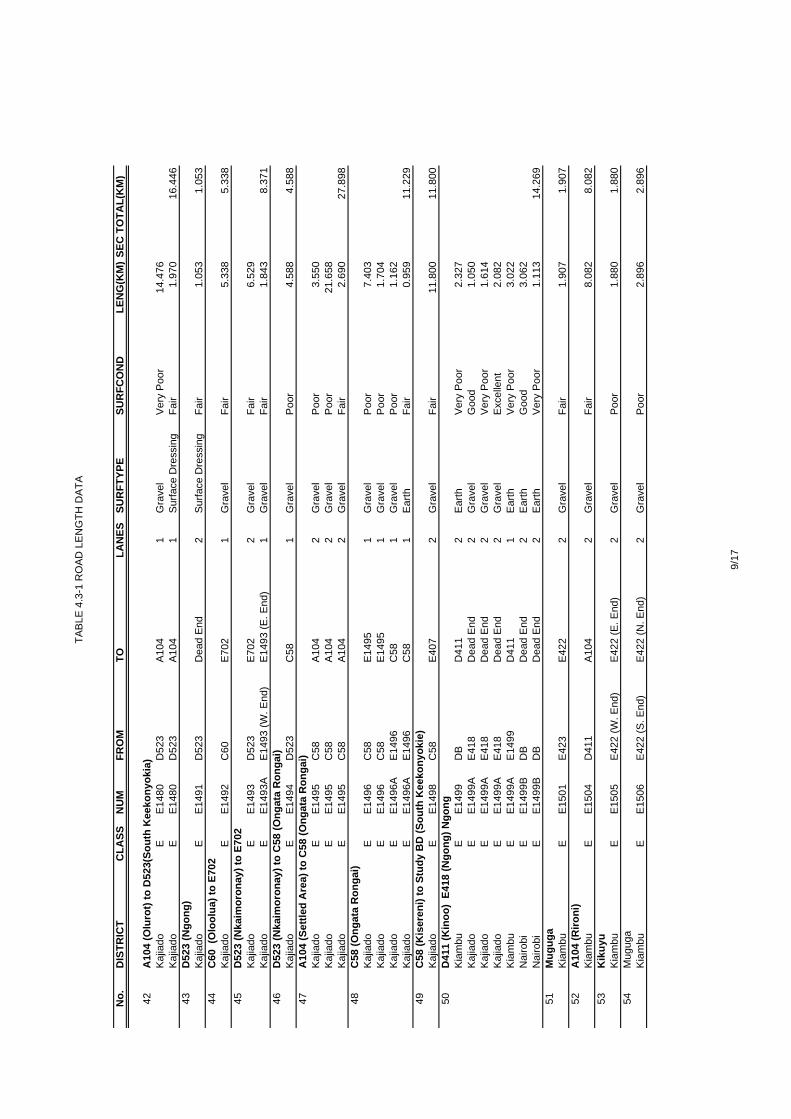
TAB
LE 4
.3-1
RO
AD
LE
NG
TH D
ATA
No.
DIS
TRIC
TC
LASS
NU
MFR
OM
TOLA
NES
SUR
FTYP
ESU
RFC
ON
DLE
NG
(KM
)SE
C T
OTA
L(K
M)
42A
104
(Olu
rot)
to D
523(
Sout
h K
eeko
nyok
ia)
Kaj
iado
EE
1480
D52
3A
104
1G
rave
lV
ery
Poo
r14
.476
Kaj
iado
EE
1480
D52
3A
104
1S
urfa
ce D
ress
ing
Fair
1.97
016
.446
43D
523
(Ngo
ng)
Kaj
iado
EE
1491
D52
3D
ead
End
2S
urfa
ce D
ress
ing
Fair
1.05
31.
053
44C
60 (
Olo
olua
) to
E702
Kaj
iado
EE
1492
C60
E70
21
Gra
vel
Fair
5.33
85.
338
45D
523
(Nka
imor
onay
) to
E702
Kaj
iado
EE
1493
D52
3E
702
2G
rave
lFa
ir6.
529
Kaj
iado
EE
1493
AE
1493
(W. E
nd)
E14
93 (E
. End
)1
Gra
vel
Fair
1.84
38.
371
46D
523
(Nka
imor
onay
) to
C58
(Ong
ata
Ron
gai)
Kaj
iado
EE
1494
D52
3C
581
Gra
vel
Poo
r4.
588
4.58
847
A10
4 (S
ettle
d A
rea)
to C
58 (O
ngat
a R
onga
i)K
ajia
doE
E14
95C
58A
104
2G
rave
lP
oor
3.55
0K
ajia
doE
E14
95C
58A
104
2G
rave
lP
oor
21.6
58K
ajia
doE
E14
95C
58A
104
2G
rave
lFa
ir2.
690
27.8
9848
C58
(Ong
ata
Ron
gai)
Kaj
iado
EE
1496
C58
E14
951
Gra
vel
Poo
r7.
403
Kaj
iado
EE
1496
C58
E14
951
Gra
vel
Poo
r1.
704
Kaj
iado
EE
1496
AE
1496
C58
1G
rave
lP
oor
1.16
2K
ajia
doE
E14
96A
E14
96C
581
Ear
thFa
ir0.
959
11.2
2949
C58
(Kis
eren
i) to
Stu
dy B
D (S
outh
Kee
kony
okie
) K
ajia
doE
E14
98C
58E
407
2G
rave
lFa
ir11
.800
11.8
0050
D41
1 (K
inoo
) E4
18 (N
gong
) Ngo
ngK
iam
buE
E14
99D
BD
411
2E
arth
Ver
y P
oor
2.32
7K
ajia
doE
E14
99A
E41
8D
ead
End
2G
rave
lG
ood
1.05
0K
ajia
doE
E14
99A
E41
8D
ead
End
2G
rave
lV
ery
Poo
r1.
614
Kaj
iado
EE
1499
AE
418
Dea
d E
nd2
Gra
vel
Exc
elle
nt2.
082
Kia
mbu
EE
1499
AE
1499
D41
11
Ear
thV
ery
Poo
r3.
022
Nai
robi
EE
1499
BD
BD
ead
End
2E
arth
Goo
d3.
062
Nai
robi
EE
1499
BD
BD
ead
End
2E
arth
Ver
y P
oor
1.11
314
.269
51M
ugug
aK
iam
buE
E15
01E
423
E42
22
Gra
vel
Fair
1.90
71.
907
52A
104
(Riro
ni)
Kia
mbu
EE
1504
D41
1A
104
2G
rave
lFa
ir8.
082
8.08
253
Kik
uyu
Kia
mbu
EE
1505
E42
2 (W
. End
)E
422
(E. E
nd)
2G
rave
lP
oor
1.88
01.
880
54M
ugug
aK
iam
buE
E15
06E
422
(S. E
nd)
E42
2 (N
. End
)2
Gra
vel
Poo
r2.
896
2.89
6
9/17

TAB
LE 4
.3-1
RO
AD
LE
NG
TH D
ATA
No.
DIS
TRIC
TC
LASS
NU
MFR
OM
TOLA
NES
SUR
FTYP
ESU
RFC
ON
DLE
NG
(KM
)SE
C T
OTA
L(K
M)
55C
63 (M
ugug
a)K
iam
buE
E15
07C
63 (S
. End
)C
63 (N
. End
)2
Sur
face
Dre
ssin
gP
oor
2.37
9K
iam
buE
E15
07C
63 (S
. End
)C
63 (N
. End
)2
Sur
face
Dre
ssin
gFa
ir0.
131
Kia
mbu
EE
1507
C63
(S. E
nd)
C63
(N. E
nd)
2G
rave
lP
oor
0.97
43.
484
56C
63 (K
inoo
) to
Stud
y B
orde
rK
iam
buE
E15
08D
411
C63
2S
urfa
ce D
ress
ing
Ver
y P
oor
3.42
63.
426
57A
104
(Oth
iru R
uthi
mitu
) to
C63
(Kab
ete)
Kia
mbu
EE
1509
A10
4D
410
2S
urfa
ce D
ress
ing
Poo
r1.
244
Kia
mbu
EE
1509
A10
4D
410
2G
rave
lP
oor
1.50
6K
iam
buE
E15
09D
410
C63
2G
rave
lP
oor
1.20
2K
iam
buE
E15
09D
410
C63
2G
rave
lFa
ir0.
439
4.39
158
Oth
iru R
uthi
mitu
Sou
thK
iam
buE
E15
10E
1509
D41
02
Sur
face
Dre
ssin
gV
ery
Poo
r0.
673
Kia
mbu
EE
1510
E15
09D
410
2S
urfa
ce D
ress
ing
Poo
r1.
601
2.27
459
Kab
ete
Kia
mbu
EE
1511
D41
0E
422
1E
arth
Poo
r1.
300
Kia
mbu
EE
1511
D41
0E
422
2S
urfa
ce D
ress
ing
Poo
r1.
160
2.46
060
Kiti
suru
Kia
mbu
EE
1512
E42
1D
B2
Gra
vel
Goo
d3.
990
3.99
061
A10
4(N
gech
a)K
iam
buE
E15
13A
104
E42
31
Gra
vel
Fair
0.99
2K
iam
buE
E15
13A
104
E42
31
Gra
vel
Fair
2.46
73.
460
62N
gech
aK
iam
buE
E15
14D
378
E42
52
Gra
vel
Poo
r4.
466
4.46
663
Nya
thun
aK
iam
buE
E15
15D
378
E42
12
Gra
vel
Ver
y P
oor
0.27
2K
iam
buE
E15
15D
378
E42
12
Sur
face
Dre
ssin
gV
ery
Poo
r0.
536
Kia
mbu
EE
1515
D37
8E
421
2G
rave
lP
oor
1.74
82.
556
64C
62 (N
yath
una)
Kia
mbu
EE
1516
E42
5C
622
Sur
face
Dre
ssin
gP
oor
1.66
21.
662
65C
62 (R
uaka
)K
iam
buE
E15
17D
408
C62
2E
arth
Poo
r0.
525
Kia
mbu
EE
1517
C63
D40
82
Ear
thP
oor
0.29
3K
iam
buE
E15
17D
408
C62
2E
arth
Fair
0.77
4K
iam
buE
E15
17C
63D
408
2E
arth
Fair
1.55
3K
iam
buE
E15
17C
63D
408
2E
arth
Poo
r2.
097
Kia
mbu
EE
1517
C63
D40
82
Ear
thFa
ir0.
373
Kia
mbu
EE
1517
AC
62D
ead
End
2E
arth
Poo
r2.
279
Kia
mbu
EE
1517
AC
62D
ead
End
1E
arth
Poo
r0.
185
8.07
9
10/1
7

TAB
LE 4
.3-1
RO
AD
LE
NG
TH D
ATA
No.
DIS
TRIC
TC
LASS
NU
MFR
OM
TOLA
NES
SUR
FTYP
ESU
RFC
ON
DLE
NG
(KM
)SE
C T
OTA
L(K
M)
66K
iam
baa
East
Kia
mbu
EE
1518
D40
7E
1519
1G
rave
lP
oor
3.59
5K
iam
buE
E15
18E
1519
E15
201
Gra
vel
Poo
r2.
244
Kia
mbu
EE
1518
E15
20D
406
1G
rave
lP
oor
0.36
4K
iam
buE
E15
18E
1520
D40
61
Gra
vel
Fair
1.61
27.
816
67C
63 (W
agut
hu)
Kia
mbu
EE
1519
D40
7E
1518
1G
rave
lV
ery
Poo
r1.
605
Kia
mbu
EE
1519
D40
7E
1518
1G
rave
lP
oor
0.49
0K
iam
buE
E15
19E
1518
C63
1G
rave
lP
oor
2.18
24.
277
68C
63 (N
dum
beri)
Kia
mbu
EE
1520
C63
D40
92
Sur
face
Dre
ssin
gFa
ir2.
545
Kia
mbu
EE
1520
C63
D40
92
Sur
face
Dre
ssin
gP
oor
1.62
3K
iam
buE
E15
20A
C63
(W. E
nd)
C63
(E. E
nd)
2S
urfa
ce D
ress
ing
Poo
r3.
080
7.24
769
Tigo
niK
iam
buE
E15
21E
423
E42
61
Ear
thFa
ir1.
336
Kia
mbu
EE
1521
E42
3E
426
1E
arth
Poo
r2.
860
Kia
mbu
EE
1521
E42
3E
426
2E
arth
Fair
3.17
67.
372
70K
arab
ain
Sout
hK
iam
buE
E15
22D
407
Dea
d E
nd1
Sur
face
Dre
ssin
gP
oor
1.92
4K
iam
buE
E15
22A
E42
3E
1522
1S
urfa
ce D
ress
ing
Poo
r1.
222
3.14
671
D39
9 to
Stu
dy B
DTh
ika
EE
1530
D39
9E
499
2G
rave
lG
ood
1.40
01.
400
72C
66 (T
hika
Mun
icip
ality
)Th
ika
EE
1534
E49
5C
662
Ear
thV
ery
Poo
r4.
101
4.10
173
A3
(Gat
uany
aga)
to A
2 E4
96 (J
uja)
Thik
aE
E15
35E
496
A3
1G
rave
lFa
ir2.
256
Thik
aE
E15
35E
496
A3
1G
rave
lP
oor
1.35
3Th
ika
EE
1535
E49
6A
32
Gra
vel
Fair
16.8
03Th
ika
EE
1535
E49
6A
32
Gra
vel
Fair
3.60
3Th
ika
EE
1535
E49
6A
32
Gra
vel
Goo
d7.
173
Thik
aE
E15
35E
496
A3
2G
rave
lFa
ir3.
233
34.4
2174
A 3
(Gat
uany
ga)
Thik
aE
E15
36E
1535
A3
2G
rave
lP
oor
1.87
1Th
ika
EE
1536
E15
35A
32
Gra
vel
Fair
1.33
3Th
ika
EE
1536
E15
35A
32
Gra
vel
Fair
3.99
67.
200
75C
67 (S
amur
u) to
Stu
dy B
D
Thik
aE
E15
51C
67C
672
Gra
vel
Goo
d9.
600
9.60
076
A3
(Stu
dy B
D)
Thik
aE
E15
97E
491
A3
2E
arth
Fair
2.90
02.
900
77A
3 (T
hika
Mun
icip
ality
) to
Stud
y B
DTh
ika
EE
1598
A3
E49
32
Sur
face
Dre
ssin
gP
oor
0.80
00.
800
11/1
7

TAB
LE 4
.3-1
RO
AD
LE
NG
TH D
ATA
No.
DIS
TRIC
TC
LASS
NU
MFR
OM
TOLA
NES
SUR
FTYP
ESU
RFC
ON
DLE
NG
(KM
)SE
C T
OTA
L(K
M)
78K
akuy
uni
Mac
hako
sE
E18
05D
518
E48
42
Ear
thP
oor
3.23
6M
acha
kos
EE
1805
D51
8E
484
2E
arth
Fair
0.01
7M
acha
kos
EE
1805
D51
8E
484
2E
arth
Fair
1.56
04.
813
79Lu
keny
a N
orth
Mac
hako
sE
E18
06E
434
D51
92
Ear
thV
ery
Poo
r0.
022
Mac
hako
sE
E18
06E
434
D51
92
Ear
thV
ery
Poo
r16
.624
16.6
4680
Kaw
athe
iM
acha
kos
EE
1818
E48
3 (S
. End
)E
483
(N. E
nd)
2E
arth
Fair
0.02
1M
acha
kos
EE
1818
E48
3 (S
. End
)E
483
(N. E
nd)
2E
arth
Fair
4.40
4M
acha
kos
EE
1818
E48
3 (S
. End
)E
483
(N. E
nd)
2E
arth
Fair
1.55
45.
979
81A
104
(Kat
ani)
to C
98 (R
uai)
Mac
hako
sE
E18
90A
104
KA
TAN
I2
Gra
vel
Goo
d10
.597
Mac
hako
sE
E18
90A
104
KA
TAN
I2
Ear
thG
ood
10.7
7121
.368
82C
58 (K
iser
eni)
Kaj
iado
EE
418
C58
E14
99A
2G
rave
lFa
ir13
.178
Kaj
iado
EE
418
E14
99A
D52
32
Sur
face
Dre
ssin
gG
ood
0.79
313
.971
83K
ikuy
uK
iam
buE
E42
0D
411
E42
22
Gra
vel
Fair
3.86
9K
iam
buE
E42
0D
411
E42
22
Gra
vel
Poo
r0.
446
Kia
mbu
EE
420
D41
1E
422
2G
rave
lFa
ir0.
178
4.49
384
Kab
ete
Kia
mbu
EE
421
C63
D37
82
Gra
vel
Fair
1.39
0K
iam
buE
E42
1C
63D
378
2G
rave
lP
oor
3.69
5K
iam
buE
E42
1E
425
C63
2S
urfa
ce D
ress
ing
Ver
y P
oor
2.08
5K
iam
buE
E42
1E
425
C63
2G
rave
lP
oor
0.27
57.
445
85M
ugug
aK
iam
buE
E42
2D
BC
632
Sur
face
Dre
ssin
gFa
ir0.
560
Kia
mbu
EE
422
DB
C63
2S
urfa
ce D
ress
ing
Poo
r1.
634
Kia
mbu
EE
422
E42
0E
422A
2G
rave
lP
oor
3.71
4K
iam
buE
E42
2C
63D
B2
Sur
face
Dre
ssin
gP
oor
1.13
1K
iam
buE
E42
2AE
422
(W. E
nd)
E42
2 (E
. End
)2
Sur
face
Dre
ssin
gFa
ir2.
209
9.24
886
C62
(Noe
cha)
to C
63 (M
ugug
a)K
iam
buE
E42
3C
63D
378
2G
rave
lFa
ir0.
153
Kia
mbu
EE
423
C63
D37
82
Gra
vel
Fair
1.26
6K
iam
buE
E42
3C
63D
378
2G
rave
lP
oor
0.48
8K
iam
buE
E42
3C
63D
378
2G
rave
lP
oor
6.65
9K
iam
buE
E42
3C
63D
378
1G
rave
lFa
ir0.
075
Kia
mbu
EE
423
C63
D37
82
Sur
face
Dre
ssin
gFa
ir0.
020
Kia
mbu
EE
423
D37
8C
622
Sur
face
Dre
ssin
gFa
ir1.
817
Kia
mbu
EE
423
C62
D40
72
Sur
face
Dre
ssin
gP
oor
3.57
2K
iam
buE
E42
3D
378
C62
2S
urfa
ce D
ress
ing
Poo
r0.
186
14.2
36
12/1
7

TAB
LE 4
.3-1
RO
AD
LE
NG
TH D
ATA
No.
DIS
TRIC
TC
LASS
NU
MFR
OM
TOLA
NES
SUR
FTYP
ESU
RFC
ON
DLE
NG
(KM
)SE
C T
OTA
L(K
M)
87A
104
(Oth
iru R
uthi
mitu
) To
C63
(Kin
oo)
Kia
mbu
EE
423A
C63
A10
42
Sur
face
Dre
ssin
gP
oor
3.23
5K
iam
buE
E42
3AC
63A
104
2E
arth
Fair
2.74
8K
iam
buE
E42
3AC
63A
104
2S
urfa
ce D
ress
ing
Poo
r0.
535
Kia
mbu
EE
423A
C63
A10
42
Ear
thP
oor
0.08
26.
600
88K
ihar
a to
Nge
cha
Kia
mbu
EE
425
C63
D40
82
Sur
face
Dre
ssin
gFa
ir6.
579
Kia
mbu
EE
425
D37
8C
632
Gra
vel
Poo
r5.
938
Kia
mbu
EE
425
D37
8C
632
Gra
vel
Fair
0.65
713
.174
89Ti
goni
Kia
mbu
EE
426
C62
D40
71
Sur
face
Dre
ssin
gP
oor
1.71
7K
iam
buE
E42
6C
62D
407
1S
urfa
ce D
ress
ing
Fair
2.99
34.
710
90C
iand
a to
Kar
abai
nK
iam
buE
E42
7D
409
D40
62
Sur
face
Dre
ssin
gP
oor
13.9
5213
.952
91K
arab
ain
Kia
mbu
EE
428
E42
7D
409
2G
rave
lFa
ir2.
032
Kia
mbu
EE
428
D40
7E
427
1S
urfa
ce D
ress
ing
Poo
r5.
085
7.11
792
Ikin
u (S
tudy
Are
a on
ly)
Kia
mbu
EE
431
D40
4C
642
Gra
vel
Fair
4.47
34.
473
93Th
inga
ng'a
Kia
mbu
EE
432
D40
4C
642
Sur
face
Dre
ssin
gFa
ir3.
816
Kia
mbu
EE
432
D40
4C
642
Sur
face
Dre
ssin
gP
oor
0.72
54.
540
94K
amiti
Kia
mbu
EE
433
C64
C63
2S
urfa
ce D
ress
ing
Poo
r1.
105
Kia
mbu
EE
433
C64
C63
2S
urfa
ce D
ress
ing
Ver
y P
oor
5.55
16.
656
95A
109
(Ath
i Riv
er) t
o C
98 (R
uai)
Mac
hako
sE
E43
4A
109
C98
2G
rave
lG
ood
10.5
75M
acha
kos
EE
434
A10
9C
982
Ear
thV
ery
Poo
r7.
104
Mac
hako
sE
E43
4A
109
C98
2E
arth
Ver
y P
oor
4.64
6M
acha
kos
EE
434
A10
9C
982
Ear
thV
ery
Poo
r0.
012
22.3
3796
A10
2 (R
uiru
) Th
ika
EE
435
D39
9A
2N1
Sur
face
Dre
ssin
gFa
ir0.
096
Thik
aE
E43
5D
399
A2N
1G
rave
lFa
ir3.
353
Thik
aE
E43
5D
399
A2N
1E
arth
Fair
0.95
0Th
ika
EE
435
D39
9A
2N1
Ear
thP
oor
0.75
8Th
ika
EE
435
D39
9A
2N2
Ear
thFa
ir1.
494
Thik
aE
E43
5D
399
A2N
2G
rave
lG
ood
1.80
18.
452
13/1
7

TAB
LE 4
.3-1
RO
AD
LE
NG
TH D
ATA
No.
DIS
TRIC
TC
LASS
NU
MFR
OM
TOLA
NES
SUR
FTYP
ESU
RFC
ON
DLE
NG
(KM
)SE
C T
OTA
L(K
M)
97C
98 (N
gulu
ni)
Mac
hako
sE
E47
4C
99C
982
Gra
vel
Fair
0.01
5M
acha
kos
EE
474
C99
C98
2G
rave
lFa
ir0.
554
Mac
hako
sE
E47
4C
99C
982
Gra
vel
Poo
r1.
239
Mac
hako
sE
E47
4C
99C
982
Gra
vel
Fair
1.27
8M
acha
kos
EE
474
C99
C98
2G
rave
lV
ery
Poo
r1.
217
Mac
hako
sE
E47
4C
99C
982
Gra
vel
Ver
y P
oor
5.13
6M
acha
kos
EE
474
C99
C98
2G
rave
lV
ery
Poo
r0.
010
9.44
998
C99
(Kaw
athe
i)M
acha
kos
EE
483
C99
D51
82
Gra
vel
Goo
d5.
228
Mac
hako
sE
E48
3C
99D
518
2G
rave
lP
oor
1.36
6M
acha
kos
EE
483
C99
D51
82
Gra
vel
Goo
d2.
984
Mac
hako
sE
E48
3C
99D
518
2E
arth
Fair
0.15
0M
acha
kos
EE
483
C99
D51
82
Ear
thG
ood
5.04
9M
acha
kos
EE
483
C99
D51
82
Ear
thG
ood
0.02
014
.798
99K
akuy
uni
Mac
hako
sE
E48
4D
519
E48
32
Sur
face
Dre
ssin
gP
oor
5.69
15.
691
100
C98
(Tal
a) to
Kan
zaru
Mac
hako
sE
E48
5C
98 (W
. End
)C
98 (E
. End
)2
Ear
thFa
ir1.
473
Mac
hako
sE
E48
5C
98 (W
. End
)C
98 (E
. End
)2
Ear
thV
ery
Poo
r0.
010
Mac
hako
sE
E48
5C
98 (W
. End
)C
98 (E
. End
)2
Ear
thP
oor
4.30
8M
acha
kos
EE
485
C98
(W. E
nd)
C98
(E. E
nd)
2E
arth
Ver
y P
oor
0.24
5M
acha
kos
EE
485
C98
(W. E
nd)
C98
(E. E
nd)
2E
arth
Fair
0.82
5M
acha
kos
EE
485
C98
(W. E
nd)
C98
(E. E
nd)
2E
arth
Ver
y P
oor
1.35
5M
acha
kos
EE
485
D52
1C
982
Ear
thP
oor
2.22
4M
acha
kos
EE
485
D52
1C
982
Ear
thV
ery
Poo
r0.
015
Mac
hako
sE
E48
5D
521
C98
2E
arth
Fair
0.88
6M
acha
kos
EE
485
D52
1C
982
Ear
thV
ery
Poo
r9.
862
Mac
hako
sE
E48
5AD
521
E48
52
Ear
thP
oor
2.79
423
.997
101
Kan
zavi
Mac
hako
sE
E48
9D
521
D52
02
Ear
thV
ery
Poo
r5.
526
Mac
hako
sE
E48
9D
521
D52
02
Ear
thP
oor
0.73
0M
acha
kos
EE
489
D52
1D
520
2E
arth
Ver
y P
oor
0.22
3M
acha
kos
EE
489
D52
1D
520
2E
arth
Poo
r1.
573
Mac
hako
sE
E48
9D
521
D52
02
Ear
thFa
ir0.
021
Mac
hako
sE
E48
9D
521
D52
02
Ear
thFa
ir2.
130
Mac
hako
sE
E48
9D
521
D52
02
Ear
thP
oor
0.53
7M
acha
kos
EE
489
D52
1D
520
2E
arth
Poo
r0.
017
Mac
hako
sE
E48
9D
521
D52
02
Ear
thFa
ir0.
012
Mac
hako
sE
E48
9D
521
D52
02
Ear
thFa
ir0.
512
Mac
hako
sE
E48
9D
521
D52
02
Ear
thFa
ir0.
021
Mac
hako
sE
E48
9D
521
D52
02
Ear
thP
oor
6.13
317
.433
14/1
7

TAB
LE 4
.3-1
RO
AD
LE
NG
TH D
ATA
No.
DIS
TRIC
TC
LASS
NU
MFR
OM
TOLA
NES
SUR
FTYP
ESU
RFC
ON
DLE
NG
(KM
)SE
C T
OTA
L(K
M)
102
A2
(Juj
a) T
o St
udy
BD
Thik
aE
E49
5A
2SC
662
Gra
vel
Fair
11.2
0011
.200
103
A2
(Juj
a E1
535)
To
Stud
y B
DTh
ika
EE
496
A2N
C64
1P
rem
ixG
ood
0.64
80.
648
104
C60
(Olo
olua
) To
C58
(Nka
imor
onya
)K
ajia
doE
E70
2C
60C
581
Gra
vel
Poo
r7.
353
Kaj
iado
EE
702
C60
C58
1G
rave
lFa
ir2.
817
Kaj
iado
EE
702
C60
C58
1G
rave
lP
oor
2.70
512
.875
Tota
l E53
2.58
6
15/1
7

TAB
LE 4
.3-1
RO
AD
LE
NG
TH D
ATA
No.
DIS
TRIC
TC
LASS
NU
MFR
OM
TOLA
NES
SUR
FTYP
ESU
RFC
ON
DLE
NG
(KM
)SE
C T
OTA
L(K
M)
105
Cia
nda
Kia
mbu
GG
11D
409
Dea
d E
nd2
Ear
thP
oor
0.53
8K
iam
buG
G11
AG
11B
C63
2E
arth
Fair
0.46
8K
iam
buG
G11
BG
6D
ead
End
2G
rave
lFa
ir0.
295
1.30
110
6Ti
goni
Kia
mbu
GG
13E
426
Dea
d E
nd2
Ear
thFa
ir1.
246
Kia
mbu
GG
13A
G13
Dea
d E
nd2
Ear
thP
oor
0.65
61.
902
107
Kah
awa
Kia
mbu
GG
2D
400
LOO
P2
Sur
face
Dre
ssin
gFa
ir0.
097
Kia
mbu
GG
2D
400
LOO
P2
Gra
vel
Fair
0.10
8K
iam
buG
G2
D40
0LO
OP
2G
rave
lFa
ir0.
349
Kia
mbu
GG
2D
400
LOO
P2
Gra
vel
Fair
2.28
6K
iam
buG
G2A
G2
Dea
d E
nd2
Gra
vel
Fair
0.77
1K
iam
buG
G2B
G2A
G2
2G
rave
lFa
ir0.
591
Kia
mbu
GG
2CG
2 (S
. End
)G
2 (N
. End
)2
Gra
vel
Fair
0.82
8K
iam
buG
G2D
G2
Dea
d E
nd2
Ear
thFa
ir0.
204
Kia
mbu
GG
2EG
2D
ead
End
2E
arth
Fair
1.14
66.
380
108
Thik
a M
unic
ipal
ityTh
ika
GG
3203
A3
THIK
A-H
IGH
-SC
H2
Sur
face
Dre
ssin
gP
oor
1.32
54Th
ika
GG
3203
A3
THIK
A-H
IGH
-SC
H2
Ear
thP
oor
0.15
66Th
ika
GG
3204
G32
03TH
IKA
-TE
CH
2S
urfa
ce D
ress
ing
Poo
r0.
9771
Thik
aG
G32
05G
3204
HO
SP
ITA
L2
Sur
face
Dre
ssin
gFa
ir0.
2403
Thik
aG
G32
05G
3204
HO
SP
ITA
L2
Gra
vel
Fair
0.39
713.
097
109
Kia
mba
a S/
Are
aK
iam
buG
G6
D40
9H
OS
PIT
AL
2S
urfa
ce D
ress
ing
Fair
0.21
5K
iam
buG
G6
D40
9H
OS
PIT
AL
2G
rave
lFa
ir0.
261
0.47
611
0Li
mur
uK
iam
buG
G7
D40
9D
. OFF
ICE
2S
urfa
ce D
ress
ing
Goo
d0.
465
0.46
511
1K
iam
baa
Kia
mbu
GG
9C
63 (W
. End
)C
63 (E
. End
)2
Sur
face
Dre
ssin
gFa
ir0.
915
0.91
5To
tal G
14.5
35
16/1
7

TAB
LE 4
.3-1
RO
AD
LE
NG
TH D
ATA
No.
DIS
TRIC
TC
LASS
NU
MFR
OM
TOLA
NES
SUR
FTYP
ESU
RFC
ON
DLE
NG
(KM
)SE
C T
OTA
L(K
M)
112
Kiv
aani
Mac
hako
sR
R10
C98
C10
02
Gra
vel
Fair
6.20
06.
200
113
Kik
uyu
Kia
mbu
RR
21E
422
R21
A2
Gra
vel
Poo
r3.
349
Kia
mbu
RR
21A
E42
2E
1506
1G
rave
lP
oor
1.18
64.
534
114
Riro
niK
iam
buR
R22
E15
04R
242
Gra
vel
Fair
1.95
61.
956
115
Riro
niK
iam
buR
R24
R22
A10
42
Gra
vel
Poo
r2.
755
2.75
511
6K
ikuy
uK
iam
buR
R25
E42
2R
281
Ear
thP
oor
2.35
0K
iam
buR
R25
E42
2R
282
Ear
thP
oor
0.58
7K
iam
buR
R25
E42
2R
281
Ear
thP
oor
2.63
5K
iam
buR
R25
R28
E15
041
Ear
thP
oor
0.83
2K
iam
buR
R25
E15
04R
222
Ear
thFa
ir0.
891
7.29
511
7K
yele
niM
acha
kos
RR
27D
521
D52
12
Gra
vel
Fair
12.0
37M
acha
kos
RR
27D
521
D52
12
Gra
vel
Fair
0.01
0M
acha
kos
RR
27D
521
D52
12
Gra
vel
Ver
y P
oor
14.0
39M
acha
kos
RR
27D
521
D52
12
Gra
vel
Ver
y P
oor
0.00
726
.092
118
Kik
uyu
Kia
mbu
RR
28R
20A
E15
041
Ear
thP
oor
0.51
2K
iam
buR
R28
R20
R20
A1
Ear
thP
oor
0.76
7K
iam
buR
R28
R20
AE
1504
2G
rave
lFa
ir1.
328
Kia
mbu
RR
28E
1504
A10
41
Gra
vel
Fair
0.83
5K
iam
buR
R28
R20
AE
1504
2E
arth
Poo
r1.
685
5.12
711
9R
uaka
Kia
mbu
RR
42C
63D
ead
End
1G
rave
lFa
ir1.
780
Kia
mbu
RR
42C
63D
ead
End
1G
rave
lP
oor
1.55
83.
338
Tota
l R57
.297
110
Ngo
ngK
ajia
doU
Unk
-1C
60D
ead
End
2E
arth
Goo
d4.
767
Kia
mbu
UU
nk-1
D40
1D
ead
End
2E
arth
Ver
y P
oor
1.09
55.
862
Tota
l Unk
5.86
2S
peci
al P
urpo
ses
77.6
94To
tal
1,42
2.13
8
17/1
7
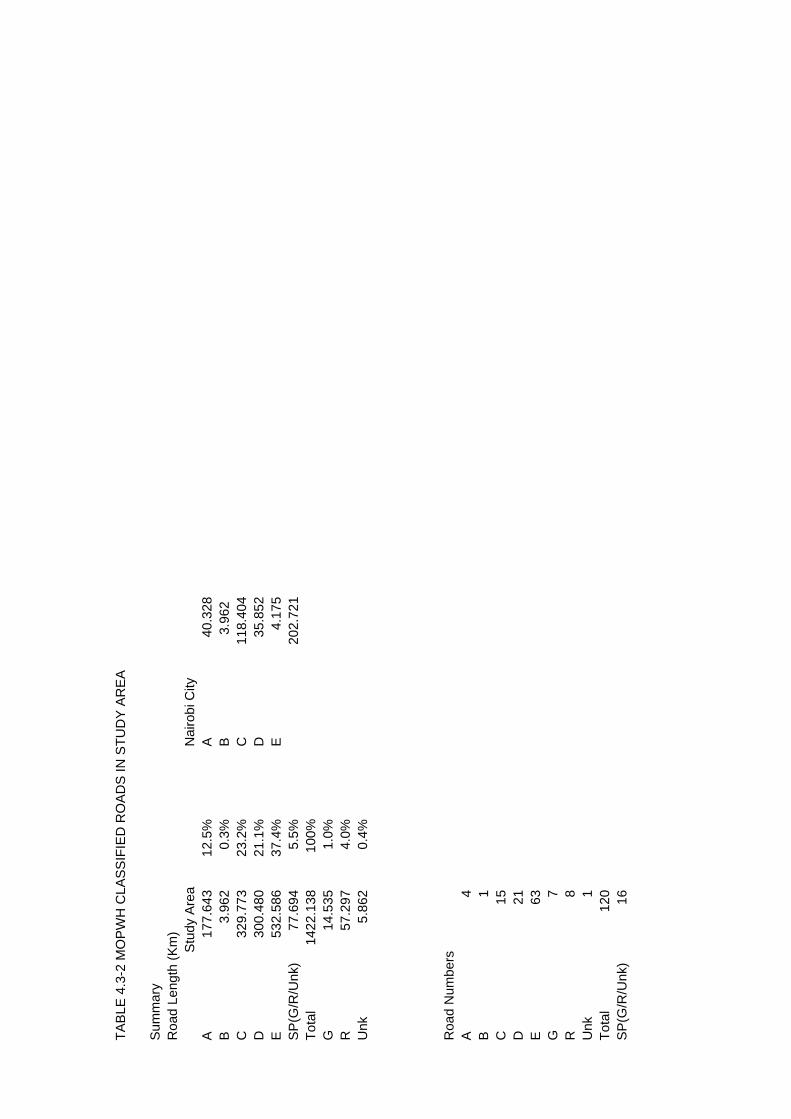
TAB
LE 4
.3-2
MO
PW
H C
LAS
SIF
IED
RO
AD
S IN
STU
DY
AR
EA
Sum
mar
yR
oad
Leng
th (K
m)
Stu
dy A
rea
Nai
robi
City
A17
7.64
312
.5%
A40
.328
B3.
962
0.3%
B3.
962
C32
9.77
323
.2%
C11
8.40
4D
300.
480
21.1
%D
35.8
52E
532.
586
37.4
%E
4.17
5S
P(G
/R/U
nk)
77.6
945.
5%20
2.72
1To
tal
1422
.138
100%
G14
.535
1.0%
R57
.297
4.0%
Unk
5.86
20.
4%
Roa
d N
umbe
rsA
4B
1C
15D
21E
63G
7R
8U
nk1
Tota
l12
0S
P(G
/R/U
nk)
16

TABLE 4.3-3 MPWH CLASSIFIED ROADS IN STUDY AREA
Mombasa RoadNairobi A A104 DB Machakos Start of Dual C 1.166 1.166Uhuru Highway/Waiyaki WayNairobi A A104N A104 B10 1.184 Nairobi CityNairobi A A104N B10 C89 2.188Nairobi A A104N C58 C61 central 8.190Nairobi A A104N C58 C61 central 0.021Nairobi A A104N C58 C61 central 0.169Nairobi A A104N C58 C61 central 0.212Nairobi A A104N C58 C61 central 1.159Nairobi A A104N C61 central C61 north 13.820Nairobi A A104N C61 north DB Kiambu 1.213 28.156
29.322Thika RoadNairobi A A2S A2 Muthaiga C59 3.516 Nairobi cItyNairobi A A2S C59 C59 0.095Nairobi A A2S C59 DB Thika 7.391Nairobi A A2S Pangani DB Thika 0.004 11.006
Airport RoadNairobi B B10E A104S C59 1.632Nairobi B B10E C59 JKIA 0.286Nairobi B B10W A104N A104S 0.442Nairobi B B10W A104S C59 1.270Nairobi B B10W C59 JKIA 0.332 3.962
Total B 3.962Magadi RoadNairobi C C58 DB Kajiado C63 3.303Nairobi C C58 DB Kajiado C63 1.415Nairobi C C58 C63 C58N 1.833 6.551Langata RoadNairobi C C58S C58 Mb RdN 4.751Nairobi C C58S Mb Rd A104N 1.539Nairobi C C58S A104N A104S 0.049 6.339
Nairobi C Mb RdN C58 C61 2.951Nairobi C Mb RdN C58 C61 0.084Nairobi C Mb RdS C58 C61 2.931 5.966Outer Ring RoadNairobi C C59 B10E C89 2.738Nairobi C C59 B10E C89 0.130Nairobi C C59 C89 C98 5.958Nairobi C C59 C89 C98 1.324Nairobi C C59 B10 A2 0.053Nairobi C C59 C98 A2N 2.861Nairobi C C59 A2S A2N 0.104Nairobi C C59 C59 C59 0.135Nairobi C C59 A2N A2S 0.096 13.399Ngong RoadNairobi C C60 A104 D523 3.458Nairobi C C60 A104 DB Kajiado 5.656Nairobi C C60 A104 DB Kajiado 0.028Nairobi C C60 A104 DB Kajiado 1.408 10.550Naivasha Road/Ngong RoadNairobi C C61 A104 C60 3.606Nairobi C C61 Mbagathi Rd C60 0.763Nairobi C C61 A104 Mbagathi Rd 2.176Nairobi C C61 C60 A104 7.211Nairobi C C61 C60 A104 13.756
1/2

TABLE 4.3-3 MPWH CLASSIFIED ROADS IN STUDY AREA
Limuru RoadNairobi C C62 FOREST ROAD DB KIAMBU 10.185 10.185
Nairobi C C63 C68 D412 7.384Nairobi C C63 C60 D412 6.458 13.842
Airport North RoadNairobi C C89 A104 DB 1.560Nairobi C C89 A104 APTC 0.921Nairobi C C89 A104 APTC 7.032 9.5130
Koma Rock RoadNairobi C C98 C59 DB 2.758Nairobi C C98 C59 DB 1.694Nairobi C C98 C59 DB 20.280 24.732
Nairobi C JUJA C59 PANGANINairobi C JUJA C59 PANGANI 3.571 3.571
C98 (Njiru) A2 ( Githurai) to C63 (Kahawa) Nairobi D D400 C98 A2 5.513Nairobi D D400 C98 A2 2.465Nairobi D D400 C98 DB Kiambu 0.149Nairobi D D400 A2 DB Kiambu 4.671 12.798
D400 (Githurai) C64 (Kambaa S/Area)) C63 (Riabai) to Study Border (Karanbaini) D407 to A104(Limuru) Nairobi D D409 D400 C64 7.387
A104 (Parkland) to C63 (Kabete)Nairobi D D410 A104 DB Kiambu 8.991
C61 (Waitaka) to C63 (Kinoo)Nairobi D D412 C61 DB Kiambu 5.597Nairobi D D412 C61 DB Kiambu 1.079 6.676
D411 (Kinoo) E418 (Ngong) NgongNairobi E E1499B DB Dead End 3.062Nairobi E E1499B DB Dead End 1.113 4.175
2/2

TAB
LE 4
.3-4
(1) R
OA
D IN
VEN
TOR
Y IN
DA
GO
RET
TI
RO
AD
INVE
NTO
RY
AR
EA:
Nai
robi
ZON
E: D
agor
etti
GIB
B A
FRIC
A
Uni
que
RO
AD
CO
DE
Sec
tion
Ave
.R
oad
type
Roa
d C
lass
urba
n or
rura
lP
ublic
Tran
spor
tR
oute
Car
riage
way
cond
ition
She
et N
o.
or li
nkW
idth
(pav
ed/
(H/P
/D/L
/A/
CR
oad
nam
e or
num
ber
AB
C {a
bcd}
leng
thun
pave
d)(U
/R)
(B/M
/T)
B/F
/G01
. Dag
oret
ti R
d. R
2N
CC
000
1K
ar. R
dW
an. R
d0.
000.
210.
213.
30U
(E)
AU
B00
0102
. Kan
gem
i Rd
AN
CC
000
2W
ai. W
ayK
an. R
d0.
001.
151.
153.
30P
AU
MB
0002
03. K
ange
mi R
d. B
NC
C 0
003
Kan
. Rd
AE
nd0.
000.
880.
885.
30P
CU
MB
0003
04. K
ange
mi R
d. C
NC
C 0
004
Kan
. Rd
BE
nd0.
000.
080.
083.
30U
(G)
CU
F00
0405
. Kan
gem
i Rd.
DN
CC
000
5K
an. R
d B
End
0.00
0.47
0.47
4.30
U(E
)C
UB
0005
06. K
ange
mi R
d. E
NC
C 0
006
Kan
. Rd
BE
nd0.
000.
100.
103.
30U
(G)
CU
B00
06
K
ange
mi R
d. E
NC
C 0
006
Kan
. Rd
BE
nd0.
100.
210.
113.
30U
(E)
CU
B00
0607
. Kan
gem
i Rd.
FN
CC
000
7K
an. R
d B
End
0.00
0.31
0.31
3.30
U(E
)C
UB
0007
08. K
ange
mi R
d. G
NC
C 0
008
Kan
. Rd
AM
t. V
. Est
0.00
0.83
0.83
6.30
PA
UM
F00
0809
. Kan
gem
i Rd.
HN
CC
000
9K
an. R
d G
End
0.00
0.05
0.05
3.50
U(G
)C
UB
0009
Kan
gem
i Rd.
HN
CC
000
9K
an. R
d G
End
0.05
0.10
0.05
3.50
U(E
)C
UB
0009
10. K
ange
mi R
d. J
NC
C 0
010
Kan
. Rd
AK
an. R
d. A
0.00
0.48
0.48
3.30
U(E
)A
UB
0010
11. K
ange
mi R
d. K
NC
C 0
011
Rd
ME
nd0.
000.
620.
623.
30U
(E)
CU
B00
1112
. Kan
gem
i Rd.
MN
CC
001
2K
an. R
d A
End
0.00
1.60
1.60
4.30
U(E
)C
UB
0012
13. K
awan
gwar
e R
d. A
NC
C 0
013
S.C
. End
S.C
End
0.00
0.32
0.32
4.00
U(E
)A
UB
0013
14. K
awan
gwar
e R
d. B
NC
C 0
014
Git.
Rd
End
0.00
0.11
0.11
4.00
U(E
)C
UB
0014
15. K
awan
gwar
e R
d. C
NC
C 0
015
Git.
Rd
Kaw
. Rd
B0.
000.
590.
595.
80P
AU
B00
1516
. Kaw
angw
are
Rd.
DN
CC
001
6K
aw. R
d. C
End
0.00
0.24
0.24
4.00
U(E
)C
UB
0016
17. K
awan
gwar
e R
d. E
NC
C 0
017
Git.
Rd
Kaw
. Rd
G0.
001.
261.
267.
10P
AU
B00
1718
. Kaw
angw
are
Rd.
GN
CC
001
8M
M.
Brg
.N
aiv.
Rd
0.00
3.18
3.18
4.00
U(E
)A
UM
B00
1819
. Kaw
angw
are
Rd.
HN
CC
001
9K
aw. R
d. J
Kaw
. Rd
G0.
000.
220.
224.
00U
(E)
UB
0019
20. K
awan
gwar
e R
d. I
NC
C 0
020
Kaw
. Rd.
GG
it. R
d0.
000.
440.
444.
00U
(E)
AU
B00
2021
. Kaw
angw
are
Rd.
JN
CC
002
1K
aw. R
d G
End
0.00
2.65
2.65
4.00
U(E
)C
UB
0021
22. M
t. V
iew
Est
. Rd.
1N
CC
002
2M
M.
Brg
.W
ai. W
ay0.
002.
942.
944.
00U
(E)
AU
BB
0022
23. M
t. V
iew
Est
. Rd.
10
NC
C 0
023
End
Rd.
8R
ds.
L/R
0.00
0.54
0.54
5.30
PA
UF
0023
24. M
t. V
iew
Est
. Rd.
11
NC
C 0
024
M.V
.E. R
d 2
M.V
.E. R
d12
0.00
0.09
0.09
5.60
PA
UM
F00
2425
. Mt.
Vie
w E
st. R
d. 1
2N
CC
002
5S
t. J.
Hos
p.M
.V.E
. Rd
20.
001.
101.
105.
25P
LU
MF
0025
26. M
t. V
iew
Est
. Rd.
13
NC
C 0
026
M.V
.E. R
d 2
M.V
.E. R
d14
0.00
0.19
0.19
6.10
PA
UF
0026
27. M
t. V
iew
Est
. Rd.
14
NC
C 0
027
M.V
.E. R
d 13
End
0.00
0.15
0.15
5.50
PC
UF
0027
28. M
t. V
iew
Est
. Rd.
2N
CC
002
8W
ai. W
ayM
.V.E
. Rd
20.
001.
741.
745.
30P
LU
BF
0028
29. M
t. V
iew
Est
. Rd.
3N
CC
002
9M
.V.E
. Rd
2M
.V.E
. Rd
40.
000.
170.
175.
20P
AU
F00
2930
. Mt.
Vie
w E
st. R
d. 4
NC
C 0
030
M.V
.E. R
d 3
End
0.00
0.08
0.08
6.10
PC
UF
0030
31. M
t. V
iew
Est
. Rd.
5N
CC
003
1M
.V.E
. Rd
2E
nd0.
000.
260.
265.
20P
CU
F00
31
Sec
tion
or li
nkS
ectio
n or
link
desc
riptio
nch
aina
ge(k
m)
(x.x
x)
Pag
e 1
of 2

TAB
LE 4
.3-4
(1) R
OA
D IN
VEN
TOR
Y IN
DA
GO
RET
TI
RO
AD
INVE
NTO
RY
AR
EA:
Nai
robi
ZON
E: D
agor
etti
GIB
B A
FRIC
A
Uni
que
RO
AD
Sec
tion
Ave
.R
oad
type
Roa
d ur
ban
orru
ral
Pub
licTr
ansp
ort
Car
riage
way
S
heet
no.
or li
nkW
idth
(pav
ed/
Cla
ssC
ondi
tion
Roa
d na
me
or n
umbe
rA
BC
{abc
d}le
ngth
unpa
ved)
(H/P
/D/
(U/R
)(B
/M/T
)S
tart
End
Sta
rtE
nd(k
m)
(x.x
)(m
) (x
.x)
L/A
/C)
B/F
/G(fr
om)
(to)
(from
)(to
)(P
/U)
32. M
t. V
iew
Est
. Rd
6N
CC
003
2M
.V.E
. Rd
2E
nd0.
000.
300.
305.
80P
CU
MF
0032
33. M
t. V
iew
Est
. Rd
7N
CC
003
3M
.V.E
. Rd
6M
.V.E
. Rd
50.
000.
630.
635.
90P
AU
MF
0033
34. M
t. V
iew
Est
. Rd
8N
CC
003
4M
.V.E
. Rd
2M
.V.E
. Rd1
00.
000.
160.
165.
50P
LU
F00
3435
. Mt.
Vie
w E
st. R
d 9
NC
C 0
035
M.V
.E. R
d 8
End
0.00
0.07
0.07
5.30
PC
UF
0035
36. R
. Sat
ellit
e R
d A
NC
C 0
036
Kin
. Rd.
Kin
. Rd
0.00
0.44
0.44
5.00
PA
UF
0036
37. R
. Sat
ellit
e R
d B
NC
C 0
037
Kab
. Rd
Nai
v. R
d0.
000.
400.
404.
40P
UF
0037
R. S
atel
lite
Rd.
BN
CC
003
7K
ab. R
dN
aiv.
Rd
0.40
1.02
0.62
4.40
U(G
)U
B00
3738
. R. S
atel
lite
Rd
CN
CC
003
8K
in. R
d.R
.S.
Rd
D0.
000.
130.
135.
00P
AU
F00
3839
. R. S
atel
lite
Rd
DN
CC
003
9N
aiv.
Rd
R.S
. R
d C
0.00
0.12
0.12
4.80
U(G
)U
B00
3940
. Dag
oret
ti H
s. R
dN
CC
004
0K
ik. R
dK
ar. R
d0.
000.
360.
365.
30P
AU
F00
4041
. Gith
iora
Roa
dN
CC
004
1N
aiv.
Rd
MM
. Brg
.0.
000.
440.
444.
00U
(E)
UB
0041
42. K
abiri
a R
oad
NC
C 0
042
Dag
. Rd
Kin
. Rd
0.00
1.44
1.44
5.00
PA
UB
F00
42
K
abiri
a R
oad
NC
C 0
042
Dag
. Rd
Kin
. Rd
1.44
6.82
5.38
5.00
U(G
)A
UB
B00
4243
. Kan
gem
i Byp
ass
NC
C 0
043
Wai
. Way
Wai
. Way
0.00
0.59
0.59
4.30
PA
UB
F00
4344
. Kar
iudi
ni R
oad
NC
C 0
044
Nai
v. R
dK
ar. R
d0.
000.
600.
605.
00P
UF
0044
45. K
arug
u R
oad
NC
C 0
045
Dag
Hs.
Rd
Rut
. P
S0.
000.
540.
543.
20P
AU
F00
45
K
arug
u R
oad
NC
C 0
045
Dag
Hs.
Rd
Rut
. P
S0.
541.
711.
173.
20U
(E)
AU
F00
4546
. Kaw
angw
are
Roa
dN
CC
004
6N
aiv.
Rd
Git.
Rd
0.00
0.39
0.39
4.00
U(E
)A
UM
B00
4647
. Kih
umbu
ini S
ch. R
d.N
CC
004
7K
an. R
d G
Kih
. Sch
.0.
000.
050.
056.
40P
AU
F00
4748
. Kik
uyu
Roa
dN
CC
004
8D
ag. M
kt.
Nai
v. R
d0.
005.
705.
706.
40P
LU
BF
0048
49. K
inya
njui
Roa
dN
CC
004
9N
aiv.
Rd
Nai
v. R
d0.
001.
871.
874.
00P
AU
MF
0049
50. N
aiva
sha
Roa
dN
CC
005
0N
go. R
dC
ity B
0.00
6.05
6.05
6.80
PP
UB
F00
5051
. Ndw
aru
Roa
dN
CC
005
1K
ik. R
dN
aiv.
Rd
0.00
2.20
2.20
3.30
PA
UF
0051
52. N
gong
Roa
dN
CC
005
2Fo
r. S
tN
aiv.
Rd
0.00
3.42
3.42
6.30
PU
BF
0052
53. N
goth
o R
oad
NC
C 0
053
Kin
. Rd.
Kab
. Rd
0.00
1.34
1.34
5.00
PA
UM
F00
5354
. Wai
thak
a C
rese
ntN
CC
005
4K
ik. R
dK
ik. R
d0.
001.
001.
003.
30P
AU
F00
5455
. Wan
gai R
oad
NC
C 0
055
Kag
. PS
Dag
. HS
0.00
1.00
1.00
3.50
U(E
)A
UB
0055
56. W
anye
e R
oad
NC
C 0
056
Ngo
t. R
d.N
aiv.
Rd
0.00
1.60
1.60
5.00
PA
UB
F00
56
(km
) (x
.xx)
Sec
tion
or li
nkS
ectio
n or
link
desc
riptio
nch
aina
ge
Pag
e 2
of 2

TAB
LE 4
.3-4
(2) R
OA
D IN
VEN
TOR
Y IN
EM
BA
KA
SIR
OA
D IN
VEN
TOR
YA
REA
: N
airo
biZO
NE:
Em
baka
siG
IBB
AFR
ICA
Uni
que
Sec
tion
Ave
.R
oad
type
Roa
d U
rban
or
Pub
licC
arria
gew
ay
She
et n
o.ro
ad c
ode
or li
nkW
idth
(pav
ed/
Cla
ssR
ural
Tran
spor
tC
ondi
tion
Roa
d na
me
or n
umbe
rle
ngth
unpa
ved)
(H/P
/D/
Rou
teA
BC
Sta
rtE
ndS
tart
End
(km
) (x
.x)
(m)
(x.x
)L/
A/C
)(U
/R)
(B/M
/T)
B/F
/G(a
bcd)
(from
)(to
)(fr
om)
(to)
(P/U
)57
. Em
baka
si V
il. R
d. A
NC
C 0
057
Em
b. R
dE
mb.
Rd
0.00
0.23
0.23
4.00
PA
UM
F00
5758
. Em
baka
si V
il. R
d. B
NC
C 0
058
Em
b. R
dE
mb.
Rd
0.00
0.31
0.31
4.00
PA
UM
F00
5859
. Em
baka
si V
il. R
d. C
NC
C 0
059
Em
b. R
dE
nd0.
000.
330.
333.
50P
CU
F00
5960
. Em
baka
si V
il. R
d D
NC
C 0
060
E.V
il. R
d C
Em
b. R
d0.
000.
220.
224.
00P
UF
0060
61. V
illa
Fran
ca R
d. 1
NC
C 0
061
Ent
. Rd
Msa
. Rd
0.00
0.75
0.75
6.70
PD
UM
F00
61
V
illa
Fran
ca R
d. 1
NC
C 0
061
Ent
. Rd
Msa
. Rd
0.75
2.08
1.33
6.70
U(E
)D
UM
B00
6162
. Vill
a Fr
anca
Rd.
1a
NC
C 0
062
V/F
r. R
d 1
End
0.00
0.83
0.83
4.00
U(E
)C
UM
B00
6263
. Vill
a Fr
anca
Rd.
1b
NC
C 0
063
V/F
r. R
d 1
Ent
. Rd.
0.00
1.07
1.07
4.00
U(E
)A
UM
B00
6364
. Vill
a Fr
anca
Rd.
1c
NC
C 0
064
Ent
. Rd
V/F
r Rd.
1b
0.00
0.27
0.27
4.00
U(E
)A
UM
B00
6465
. Vill
a Fr
anca
Rd.
1d
NC
C 0
065
V/F
r. R
d 1
End
0.00
0.28
0.28
7.60
U(E
)C
UB
0065
66. V
illa
Fran
ca R
d. 1
eN
CC
006
6V
/Fr.
Rd
1E
nd0.
000.
160.
167.
00P
CU
F00
6667
. Vill
a Fr
anca
Rd.
1f
NC
C 0
067
V/F
r. R
d 1
End
0.00
0.25
0.25
7.00
PC
UF
0067
68. V
illa
Fran
ca R
d. 1
gN
CC
006
8V
/Fr.
Rd
1E
nd0.
000.
190.
194.
00U
(E)
CU
B00
6869
. Vill
a Fr
anca
Rd.
BN
CC
006
9E
nt. R
dD
ia. T
. Qu
0.00
1.38
1.38
4.00
U(E
)U
B00
6970
. Vill
a Fr
anca
Rd.
B1
NC
C 0
070
V/F
r. R
d 1
End
0.00
0.69
0.69
4.00
U(E
)C
UB
0070
71. V
illa
Fran
ca R
d. B
2N
CC
007
1V
/Fr.
Rd
1E
nd0.
000.
200.
204.
00U
(E)
CU
B00
7172
. Airp
ort N
orth
Roa
dN
CC
007
2A
pt. G
ate
Msa
. Rd
0.00
4.38
4.38
6.90
PD
UB
F00
7273
. Airp
ort S
outh
Roa
dN
CC
007
3M
sa. R
dA
pt. N
. Rd
0.00
4.35
4.35
8.20
PD
UB
B00
7374
. Em
baka
si G
SU
Rd
NC
C 0
074
City
BE
mb.
V0.
005.
325.
326.
40P
DU
MF
0074
75. E
mba
kasi
Roa
dN
CC
007
5E
mb.
Rd
Apt
. N. R
d0.
003.
033.
037.
00P
DU
BF
0075
76. E
nter
pris
e R
oad
NC
C 0
076
Msa
. Rd
Ngo
. Rd
0.00
1.86
1.86
7.00
PP
UB
F00
7677
. Mom
basa
Roa
dN
CC
007
7C
ity B
B. V
. Brg
.0.
0010
.34
10.3
415
.00
PH
UB
F00
7778
. Out
er R
ing
Roa
dN
CC
007
8A
pt. N
. Rd
Jog.
Rd
0.00
3.22
3.22
7.40
PD
UB
B00
78
(km
) (x
.xx)
desc
riptio
nch
aina
geS
ectio
n or
link
Sec
tion
or li
nk

TAB
LE 4
.3-4
(3) R
OA
D IN
VEN
TOR
Y IN
KA
MU
KU
NJI
RO
AD
INVE
NTO
RY
AR
EA:
Nai
robi
ZON
E: K
amuk
unji
GIB
B A
FRIC
A
Uni
que
Sec
tion
Ave
.R
oad
type
Roa
d U
rban
or
Pub
licC
arria
gew
ayS
heet
No.
road
cod
eor
link
Wid
th(p
aved
/C
lass
Rur
alTr
ansp
ort
Con
ditio
nR
oad
nam
e or
num
ber
leng
thun
pave
d)(H
/P/D
/R
oute
AB
CS
tart
End
Sta
rtE
nd(k
m)
(x.x
)(m
) (x
.x)
L/A
/C)
(U/R
)(B
/M/T
)B
/F/G
(abc
d)(fr
om)
(to)
(from
)(to
)(P
/U)
79. 2
nd S
t.-Ju
ja R
oad
P.O
NC
C 0
079
2 S
t. E
st.
Ju. R
d. P
O0.
000.
060.
064.
00P
UF
0079
"
NC
C 0
079
2 S
t. E
st.
Ju. R
d. P
O0.
060.
230.
174.
00U
(E)
UF
0079
80. A
di-M
afud
udu
Rd.
NC
C 0
080
Adi
Rd.
Muf
. Rd
0.00
0.29
0.29
5.50
PU
MF
0080
81. A
di-W
angu
Rd.
NC
C 0
081
Adi
Rd.
Wan
. Rd
0.00
0.44
0.44
5.10
PA
UM
F00
8182
. Bah
ati R
d. 1
0N
CC
008
2R
am. R
dR
d. 9
0.00
0.13
0.13
4.60
PU
F00
8283
. Bah
ati R
d. 9
NC
C 0
083
Ram
. Rd
Bah
. Cre
.0.
000.
200.
206.
90P
UB
0083
84. D
igo-
K/K
unji
Rd.
NC
C 0
084
Dig
. Rd
Kam
. Rd.
0.00
0.28
0.28
4.80
PU
B00
8485
. Eas
tleig
h R
d. 7
NC
C 0
085
1 A
v. E
as.
Ol.
S. S
t.0.
000.
780.
784.
00U
(E)
AU
MB
0085
86. E
astle
igh
Rd.
8N
CC
008
617
St.
Eas
.R
d. 7
0.00
0.28
0.28
5.80
PA
UM
F00
8687
. Jog
oo-S
akw
a R
d.N
CC
008
7Jo
g. R
dS
ak. R
d0.
000.
300.
308.
00P
UM
B00
8788
. K/K
unji-
Sak
wa
Rd.
NC
C 0
088
Kam
. Rd
Sak
. Rd
0.00
0.22
0.22
6.00
PU
MF
0088
"N
CC
008
8K
am. R
dS
ak. R
d0.
220.
530.
316.
00U
(E)
UF
0088
89. F
r. B
uru
Bur
u R
d.N
CC
008
9N
ile R
dR
ab. R
d0.
000.
190.
194.
90P
UB
0089
90. F
r. H
eshi
ma
Rd.
13
NC
C 0
090
Hes
. Av.
Wan
. Rd
0.00
0.52
0.52
5.40
PU
MB
0090
91. F
r. A
/For
ce F
ence
NC
C 0
091
A/F
Fen
.2
Av.
Eas
0.00
0.33
0.33
4.00
U(E
)A
UM
B00
9192
. Fr.
Bah
ati C
rc. 1
1N
CC
009
2B
ah. C
r.K
aj. L
ane
0.00
0.24
0.24
4.30
PU
MB
0092
93. F
r. B
ahat
i Rd.
12
NC
C 0
093
Bah
. Cr.
Mba
. Rd.
0.00
0.35
0.35
4.40
PU
MB
0093
94. F
r. M
arim
bi S
t. R
d. 1
NC
C 0
094
Mar
. St.
End
0.00
0.08
0.08
4.80
PC
UB
0094
95. F
r. M
arim
bi S
t. R
d. 2
NC
C 0
095
Mar
. St.
End
0.00
0.11
0.11
4.70
PC
UB
0095
96. F
r. M
arim
bi S
t. R
d. 3
NC
C 0
096
Mar
. St.
End
0.00
0.14
0.14
4.70
PC
UB
0096
97. F
r. M
arim
bi S
t. R
d. 4
NC
C 0
097
Mar
. St.
End
0.00
0.16
0.16
4.70
PC
UB
0097
98. F
r. M
arim
bi S
t. R
d. 5
NC
C 0
098
Mar
. St.
End
0.00
0.15
0.15
4.70
PC
UB
0098
99. F
r. M
umia
s S
t. R
d. 2
8N
CC
009
9M
um. S
t.E
nd0.
000.
610.
615.
20P
CU
MB
0099
100.
11t
h S
treet
NC
C 0
100
1 A
v. E
as.
End
0.00
0.33
0.33
6.40
PC
UM
B01
0010
1. 1
2th
Stre
etN
CC
010
11
Av.
Eas
.E
nd0.
000.
320.
325.
40P
CU
MF
0101
102.
13t
h S
treet
NC
C 0
102
2 A
v. E
as.
End
Mow
0.00
0.14
0.14
9.20
PA
UB
F01
0210
3. 1
4th
Stre
etN
CC
010
31
Av.
Eas
.2
Av.
Eas
0.00
0.25
0.25
10.9
0U
(E)
AU
B01
0310
4. 1
7th
Stre
etN
CC
010
4R
d. 8
18th
St.
0.00
0.30
0.30
6.70
PA
UF
0104
"
NC
C 0
104
Rd.
818
th S
t.0.
300.
550.
256.
70U
(E)
AU
B01
0410
5. 1
8th
Stre
etN
CC
010
51
Av.
Eas
.M
uf. S
t.0.
000.
800.
806.
70P
AU
F01
0510
6. 1
st A
ve. E
/Lei
gh (1
)N
CC
010
6R
ua. R
d97
2 G
. Rd
0.00
0.97
0.97
8.30
PL
UB
B01
0610
7. 1
st A
ve. E
/Lei
gh (2
)N
CC
010
797
221
03 U
C0.
001.
131.
138.
30P
LU
BB
0106
108.
1st
Ave
. E/L
eigh
(3)
NC
C 0
108
2103
Juja
. Rd.
0.00
1.00
1.00
8.30
PL
UB
B01
06
(km
) (x
.xx)
Sec
tion
or li
nkS
ectio
n or
link
desc
riptio
nch
aina
ge
Pag
e 1
of 5

TAB
LE 4
.3-4
(3) R
OA
D IN
VEN
TOR
Y IN
KA
MU
KU
NJI
RO
AD
INVE
NTO
RY
AR
EA:
Nai
robi
ZON
E: K
amuk
unji
GIB
B A
FRIC
A
Uni
que
Sec
tion
Ave
.R
oad
type
Roa
d U
rban
or
Pub
licC
arria
gew
ay
She
et n
o.ro
ad c
ode
or li
nkW
idth
(pav
ed/
Cla
ssR
ural
Tran
spor
tC
ondi
tion
Roa
d na
me
or n
umbe
rle
ngth
unpa
ved)
(H/P
/D/
Rou
teA
BC
Sta
rtE
ndS
tart
End
(km
) (x
.x)
(m)
(x.x
)L/
A/C
)(U
/R)
(B/M
/T)
B/F
/G(a
bcd)
(from
)(to
)(fr
om)
(to)
(P/U
)10
9. 2
nd A
ve. E
/Lei
gh (1
)N
CC
010
9Ju
ja R
d.E
nd0.
001.
451.
459.
20P
CU
BB
0107
110.
2nd
Ave
. E/L
eigh
(2)
NC
C 0
110
0.00
0.40
0.40
9.20
PL
UB
B01
0811
1. 2
nd S
t. E
/Lei
ghN
CC
011
11
Av.
Eas
.E
nd0.
000.
250.
257.
10P
CU
F01
09
"N
CC
011
11
Av.
Eas
.E
nd0.
250.
790.
547.
10U
(E)
CU
F01
0911
2. 3
rd A
ve. E
/Lei
ghN
CC
011
2Ju
ja R
d.13
th S
t.0.
000.
160.
165.
30P
AU
MF
0110
"N
CC
011
2Ju
ja R
d.13
th S
t.0.
161.
251.
095.
30U
(E)
AU
MF
0110
113.
4th
Stre
etN
CC
011
31
Av.
Eas
.M
. W. S
ch.
0.00
0.24
0.24
5.70
PA
UF
0111
"N
CC
011
31
Av.
Eas
.M
. W. S
ch.
0.24
0.44
0.20
5.70
U(E
)A
UF
0111
114.
5th
Stre
etN
CC
011
41
Av.
Eas
.C
of C
.0.
000.
450.
455.
60P
AU
MF
0112
115.
6th
Stre
etN
CC
011
51
Av.
Eas
.E
nd0.
000.
160.
165.
60P
CU
F01
13
"
NC
C 0
115
1 A
v. E
as.
End
0.16
0.41
0.25
5.60
U(E
)C
UF
0113
116.
7th
Stre
et E
/Lei
ghN
CC
011
61
Av.
Eas
.3
Av.
Eas
.0.
000.
400.
405.
30P
AU
MB
0114
117.
8th
St.
E/L
eigh
NC
C 0
117
1 A
v. E
as.
3 A
v. E
as.
0.00
0.40
0.40
5.30
PA
UM
F01
1511
8. 9
th S
t. E
/Lei
ghN
CC
011
81
Av.
Eas
.3
Av.
Eas
.0.
000.
300.
305.
50P
AU
MF
0116
"N
CC
011
81
Av.
Eas
.3
Av.
Eas
.0.
300.
390.
095.
50U
(E)
AU
F01
1611
9. A
di R
oad
NC
C 0
119
Wan
. Av
Maf
. Rd
0.00
0.54
0.54
5.40
PA
UM
B01
1712
0. A
hero
Roa
dN
CC
012
0B
on. S
t.Lo
r. R
d0.
000.
480.
486.
00P
AU
MB
0118
121.
Aju
oga
Lane
NC
C 0
121
Aj.
Rd.
Adi
. Rd
0.00
0.09
0.09
4.80
PA
UB
0119
122.
Aju
oga
Roa
dN
CC
012
2N
ile R
d.E
nd0.
000.
320.
324.
80P
CU
B01
2012
3. A
lego
Lan
eN
CC
012
3K
tl. R
d.V
oi R
d0.
000.
110.
114.
40P
AU
B01
2112
4. A
mbi
ra R
oad
NC
C 0
124
Bon
. St.
Rua
. Rd
0.00
0.75
0.75
8.00
PA
UM
B01
2212
5. A
sem
bo L
ane
NC
C 0
125
Ktl.
Rd.
Voi
Rd
0.00
0.11
0.11
4.40
PA
UB
0123
126.
Bur
ubur
u R
d. (p
t.1)
NC
C 0
126
Wan
. Av
Rab
. Rd
0.00
0.72
0.72
6.60
PA
UB
B01
2412
7. B
urub
uru
Rd.
(pt.2
)N
CC
012
7R
ab. R
d.R
ab. R
d0.
000.
530.
536.
60P
AU
BB
0125
128.
Bah
ati C
resc
ent
NC
C 0
128
Hes
. Av.
Hes
. Rd
0.00
0.89
0.89
4.30
PA
UM
B01
2612
9. B
aric
uba
Stre
etN
CC
012
9M
ar. S
t1
Av.
Eas
.0.
000.
060.
065.
40P
AU
F01
27
"
NC
C 0
129
Mar
. St
1 A
v. E
as.
0.06
0.37
0.31
5.40
U(E
)A
UB
0127
130.
Bon
do S
treet
NC
C 0
130
Jog.
Rd.
But
. Sq.
0.00
0.36
0.36
6.00
PA
UB
0128
131.
Bur
ubur
u C
re.
NC
C 0
131
B/B
Rd
B/B
Rd
0.00
0.33
0.33
4.50
PA
UB
0129
132.
Bus
agw
a La
neN
CC
013
21
Av.
Eas
.2
Av.
Eas
.0.
000.
160.
164.
00P
AU
B01
3013
3. B
utec
ho R
oad
NC
C 0
133
Lam
. Rd.
Bon
. St.
0.00
0.24
0.24
5.00
PA
UB
0131
134.
But
echo
Squ
are
NC
C 0
134
Sak
. Rd
Bon
. St.
0.00
0.26
0.26
6.00
PA
UB
0132
135.
Cap
tain
Mun
gai S
t.N
CC
013
5Ju
ja R
d.E
nd0.
001.
071.
074.
00U
(E)
CU
B01
33
Sec
tion
or li
nkS
ectio
n or
link
desc
riptio
nch
aina
ge(k
m)
(x.x
x)
Pag
e 2
of 5

TAB
LE 4
.3-4
(3) R
OA
D IN
VEN
TOR
Y IN
KA
MU
KU
NJI
RO
AD
INVE
NTO
RY
AR
EA:
Nai
robi
ZON
E: K
amuk
unji
GIB
B A
FRIC
A
Uni
que
Sec
tion
Ave
.R
oad
type
Roa
d U
rban
or
Pub
licC
arria
gew
ay
She
et n
o.ro
ad c
ode
or li
nkW
idth
(pav
ed/
Cla
ssR
ural
Tran
spor
tC
ondi
tion
Roa
d na
me
or n
umbe
rle
ngth
unpa
ved)
(H/P
/D/
Rou
teA
BC
Sta
rtE
ndS
tart
End
(km
) (x
.x)
(m)
(x.x
)L/
A/C
)(U
/R)
(B/M
/T)
B/F
/G(a
bcd)
(from
)(to
)(fr
om)
(to)
(P/U
)13
6. C
hara
ngan
i Av
NC
C 0
136
18th
St.
MW
. S
t.0.
000.
140.
144.
00U
(E)
UB
0134
137.
Dig
o R
oad
NC
C 0
137
Mui
. St.
Pum
. St.
0.00
1.02
1.02
6.40
PA
UM
B01
3513
8. E
astla
nds
Cre
.N
CC
013
8Jo
g. R
d.N
ya. R
d.0.
000.
300.
306.
90U
(G)
AU
B01
36
"N
CC
013
8Jo
g. R
d.N
ya. R
d.0.
300.
610.
316.
90U
(E)
AU
B13
3613
9. E
ldor
et R
oad
NC
C 0
139
18th
St.
Wan
. A
v.0.
000.
890.
896.
80P
UM
B01
3714
0. E
mba
kasi
Cre
.N
CC
014
0V
oi. L
ane
Ruv
. R
d0.
000.
270.
275.
30P
AU
B01
3814
1. G
alol
e R
oad
NC
C 0
141
1 A
v. E
as.
A/F
. Fe
n.0.
000.
410.
415.
40U
(E)
AU
B01
3914
2. H
eshi
ma
Ave
nue
NC
C 0
142
Wa/
N R
d.R
am. R
d0.
000.
820.
827.
60P
LU
B01
4014
3. J
ogoo
Roa
dN
CC
014
3La
n. R
dD
/R.
Rd
0.00
1.60
1.60
20.0
0P
UB
B01
4114
4. J
uja
Roa
d (p
t.1)
NC
C 0
144
Rin
. Rd
3 A
v. E
as.
0.00
2.01
2.01
7.80
PP
UB
B01
4214
5. J
uja
Roa
d (p
t.2)
NC
C 0
145
3 A
v. E
as.
O/R
. R
d0.
002.
922.
927.
80P
PU
BB
0143
146.
Kah
ado
Roa
dN
CC
014
6B
ah. C
r.B
ah. C
rc.
0.00
0.35
0.35
3.90
PU
B01
4414
7. K
ahaw
a La
neN
CC
014
7B
ah. C
r.B
ah. C
rc.
0.00
0.32
0.32
4.30
PA
UB
0145
148.
Kam
ukun
ji R
oad
NC
C 0
148
Kam
. Rd
Dig
o R
d.0.
000.
850.
856.
00U
(E)
AU
B01
4614
9. K
arak
uta
Roa
dN
CC
014
9V
oi R
d.K
tl. R
d.0.
000.
110.
114.
40P
AU
B01
4715
0. K
eric
ho R
oad
NC
C 0
150
Ah.
St
But
. S
q.0.
000.
180.
186.
00P
AU
B01
48
"
NC
C 0
150
Ah.
St
But
. S
q.0.
180.
310.
136.
00U
(E)
AU
B01
4815
1. K
iroe
Stre
etN
CC
015
1G
.W. S
tM
ar.
St.
0.00
0.06
0.06
5.80
PA
UB
0149
"N
CC
015
1G
.W. S
tM
ar.
St.
0.06
0.37
0.31
5.80
U(E
)A
UB
0149
152.
Kiro
ngot
hi S
treet
NC
C 0
152
Juja
Rd
End
0.00
0.95
0.95
4.00
U(E
)C
UB
0150
153.
Kis
ii S
treet
NC
C 0
153
Lam
u. R
dD
igo
Rd.
0.00
0.50
0.50
10.0
0U
(E)
AU
B01
5115
4. K
isiw
a La
neN
CC
015
4K
tl. R
dV
oi. R
d0.
000.
110.
114.
30P
AU
F01
5215
5. K
itale
Lan
eN
CC
015
5K
tl. R
dK
tl. R
d.0.
000.
100.
104.
40P
AU
F01
5315
6. K
itale
Roa
dN
CC
015
6R
at. C
re.
Ktl.
Rd.
0.00
0.79
0.79
4.80
PA
UB
0154
157.
Kun
guru
Stre
etN
CC
015
7I.A
.V. E
as.
Mur
. R
d0.
000.
450.
454.
00U
(E)
UB
0155
158.
Kw
amu
Lane
NC
C 0
158
I.A.V
. Eas
.2
Av.
Es.
0.00
0.16
0.16
5.10
PU
B01
5615
9. K
yoga
Cre
scen
tN
CC
015
9R
ui. C
re.
Rui
. C
re.
0.00
0.34
0.34
4.60
PA
UF
0157
160.
Lam
u R
oad
NC
C 0
160
But
. Sq.
Dig
o R
d.0.
000.
440.
448.
00P
AU
MB
0158
161.
Lam
u R
oad
NC
C 0
161
Mun
. Rd
But
. Rd
0.00
0.24
0.24
5.50
PA
UM
B01
5916
2. L
andh
ies
Roa
dN
CC
016
2H
/S. A
v.Jo
g. R
d0.
001.
251.
2524
.00
PA
UB
F01
6016
3. L
oria
n R
oad
NC
C 0
163
Sak
. Rd
Ahe
. R
d0.
000.
260.
264.
00P
AU
F01
6116
4. M
ajor
Kin
yanj
ui S
t.N
CC
016
4M
ur. S
t.1
Av.
Eas
.0.
000.
450.
455.
50P
AU
F01
6216
5. M
ajor
Mur
iithi
St.
NC
C 0
165
Juja
Rd
End
0.00
1.05
1.05
5.60
U(E
)C
UB
0163
Sec
tion
or li
nkS
ectio
n or
link
desc
riptio
nch
aina
ge(k
m)
(x.x
x)
Pag
e 3
of 5

TAB
LE 4
.3-4
(3) R
OA
D IN
VEN
TOR
Y IN
KA
MU
KU
NJI
RO
AD
INVE
NTO
RY
AR
EA:
Nai
robi
ZON
E: K
amuk
unji
GIB
B A
FRIC
A
Uni
que
Sec
tion
Ave
.R
oad
type
Roa
d U
rban
or
Pub
licC
arria
gew
ay
She
et n
o.ro
ad c
ode
or li
nkW
idth
(pav
ed/
Cla
ssR
ural
Tran
spor
tC
ondi
tion
Roa
d na
me
or n
umbe
rle
ngth
unpa
ved)
(H/P
/D/
Rou
teA
BC
Sta
rtE
ndS
tart
End
(km
) (x
.x)
(m)
(x.x
)L/
A/C
)(U
/R)
(B/M
/T)
B/F
/G(a
bcd)
(from
)(to
)(fr
om)
(to)
(P/U
)16
6. M
alew
a R
oad
NC
C 0
166
1 A
v. E
as.
A/F
. Fe
n0.
000.
830.
834.
00U
(E)
AU
B01
6416
7. M
arim
bi S
treet
NC
C 0
167
1 A
v. E
as.
Mui
. S
t.0.
000.
390.
396.
70P
AU
F01
6516
8. M
bale
Roa
dN
CC
016
8B
ah. C
r.H
es.
Rd
0.00
0.37
0.37
4.40
PA
UF
0166
169.
Mer
u R
oad
NC
C 0
169
G/W
. St.
Dig
o R
d0.
000.
550.
557.
30P
AU
MF
0167
170.
Moy
ale
Roa
dN
CC
017
0La
m.
Rd
Bon
. S
t0.
000.
680.
685.
00P
AU
F01
6817
1. M
uina
mi S
treet
NC
C 0
171
G/W
. St.
Dig
o R
d0.
000.
600.
606.
50P
AU
F01
6917
2. M
umia
s R
oad
NC
C 0
172
O/R
. R
dR
ab. R
d0.
001.
051.
057.
00P
AU
BB
0170
173.
Mun
yem
a R
oad
NC
C 0
173
Mer
. R
dLa
m.
Rd
0.00
0.12
0.12
5.50
PA
UB
0171
174.
Mut
ura
Roa
dN
CC
017
41
Av.
Eas
.2
Av.
Es.
0.00
0.16
0.16
4.00
PA
UB
0172
175.
Muy
uyu
Roa
dN
CC
017
51
Av.
Eas
.3
Av.
Eas
0.00
0.44
0.44
4.00
PA
UB
0173
176.
Mvi
ma
Nyu
ki A
veN
CC
017
6R
d. 7
17th
St.
0.00
0.14
0.14
5.40
PA
UB
0174
"N
CC
017
6R
d. 7
17th
St.
0.14
0.26
0.12
5.40
U(E
)A
UB
0174
177.
Mw
ende
Stre
etN
CC
017
71
Av.
Eas
.E
nd0.
000.
730.
734.
00U
(E)
CU
B01
7517
8. N
giya
Roa
dN
CC
017
81
Av.
Eas
.B
on.
St
0.00
0.74
0.74
5.00
U(E
)A
UB
0176
179.
Nya
sa R
oad
NC
C 0
179
W/H
. A
v.Jo
g. R
d0.
000.
840.
846.
90P
AU
MF
0177
180.
Ol D
ebbi
Roa
dN
CC
018
0M
um. R
dE
nd0.
000.
260.
265.
00P
CU
B01
7818
1. O
l. D
iani
Roa
dN
CC
018
1O
l/P.
Rd
End
0.00
0.34
0.34
4.80
PC
UF
0179
182.
Ol.
Lele
shw
a R
d.N
CC
018
2M
um R
dM
um. R
d0.
000.
400.
405.
30P
AU
B01
8018
3. O
l Mus
alal
a R
d.N
CC
018
3O
l/P.
Rd
End
0.00
0.20
0.20
4.90
PC
UF
0181
184.
Ol.
Orie
ni R
oad
NC
C 0
184
Mum
Rd
End
0.00
0.21
0.21
5.00
PC
UF
0182
185.
Ol P
ogon
i Rd.
NC
C 0
185
Mum
Rd
Mum
. Rd
0.00
0.79
0.79
6.70
PA
UM
F01
8318
6. O
le S
inon
i St.
NC
C 0
186
Rd.
8R
d. 7
0.00
0.57
0.57
4.00
U(E
)A
UB
0184
187.
Out
er R
ing
Roa
dN
CC
018
7Jo
g. R
dJu
ja. R
d.0.
003.
903.
906.
90P
PU
BB
0185
188.
Pum
wan
i Roa
dN
CC
018
8D
igo
Rd.
R/R
d. P
0.00
0.71
0.71
8.90
PA
UB
B01
8618
9. R
abai
Roa
dN
CC
018
9M
um R
dJo
g. R
d0.
001.
151.
157.
10P
DU
BF
0187
190.
Ram
ogi R
oad
NC
C 0
190
Hes
. R
dR
ua. R
d0.
000.
370.
376.
70P
AU
MF
0188
191.
Rat
honi
Cre
scen
tN
CC
019
1V
oi.
Rd
Ruv
. C
re.
0.00
0.29
0.29
4.40
PA
UF
0189
192.
Rua
ha R
oad
NC
C 0
192
Ram
. R
dJo
g. R
d0.
000.
120.
1213
.70
PA
UM
B01
9019
3. R
uiru
Lan
eN
CC
019
3V
oi.
Rd
Ktl.
Rd
0.00
0.11
0.11
4.40
PA
UF
0191
194.
Ruv
uma
Roa
dN
CC
019
4H
es.
Rd
Voi
Rd
0.00
0.18
0.18
5.30
PU
B01
9219
5. S
akw
a R
oad
NC
C 0
195
Sak
. R
dLa
n. R
d0.
000.
420.
426.
40P
AU
MB
0193
196.
Seb
atai
yet R
oad
NC
C 0
196
1 A
v. E
as.
2 A
v. E
s.0.
000.
140.
144.
00P
AU
B01
94
"
NC
C 0
196
1 A
v. E
as.
2 A
v. E
s.0.
140.
400.
264.
00U
(E)
AU
B01
94
(km
) (x
.xx)
Sec
tion
or li
nkS
ectio
n or
link
desc
riptio
nch
aina
ge
Pag
e 4
of 5

TAB
LE 4
.3-4
(3) R
OA
D IN
VEN
TOR
Y IN
KA
MU
KU
NJI
RO
AD
INVE
NTO
RY
AR
EA:
Nai
robi
ZON
E: K
amuk
unji
GIB
B A
FRIC
A
Uni
que
Sec
tion
Ave
.R
oad
type
Roa
d U
rban
or
Pub
licC
arria
gew
ay
She
et n
o.ro
ad c
ode
or li
nkW
idth
(pav
ed/
Cla
ssR
ural
Tran
spor
tC
ondi
tion
Roa
d na
me
or n
umbe
rle
ngth
unpa
ved)
(H/P
/D/
Rou
teA
BC
Sta
rtE
ndS
tart
End
(km
) (x
.x)
(m)
(x.x
)L/
A/C
)(U
/R)
(B/M
/T)
B/F
/G(a
bcd)
(from
)(to
)(fr
om)
(to)
(P/U
)19
7. S
gt. M
jr. K
amuc
hobe
NC
C 0
197
1 A
v. E
as.
Mur
. R
d0.
000.
450.
454.
00U
(E)
LU
B01
9519
8. S
hiny
anga
Rd.
NC
C 0
198
Hes
. Rd
Nya
. R
d0.
000.
330.
335.
20P
UB
0196
199.
Ten
th S
treet
NC
C 0
199
1 A
v. E
as.
End
0.00
0.37
0.37
5.20
PC
UB
0197
200.
Thi
ka L
ane
NC
C 0
200
Hes
. Rd
Ram
. R
d0.
000.
660.
663.
70P
AU
B01
9820
1. T
hird
Stre
etN
CC
020
11
Av.
Eas
.A
/F.
Fen.
0.00
0.16
0.16
7.60
PL
UM
F01
9920
2. T
imbo
roa
Stre
etN
CC
020
2M
ar.
St.
G/W
. S
t.0.
000.
370.
375.
30P
AU
B02
0020
3. U
aso
Roa
dN
CC
020
3N
ya.
Rd
Shu
. R
d0.
000.
640.
645.
90P
AU
B02
0120
4. V
oi L
ane
NC
C 0
204
Voi
. Rd
Hes
. R
d0.
000.
290.
294.
50P
AU
B02
0220
5. V
oi R
oad
NC
C 0
205
Eld
. R
dK
tl. R
d0.
000.
420.
424.
50P
LU
B02
0320
6. W
ango
mbe
Wai
hora
Rd.
NC
C 0
206
Mum
. R
dM
um.
Rd
0.00
0.56
0.56
7.00
PU
MB
0204
207.
Wan
gu A
venu
eN
CC
020
7H
es. R
dN
il. R
d0.
000.
630.
636.
70P
AU
MB
0205
208.
Wan
gu C
resc
ent
NC
C 0
208
Wan
. R
dW
an.
Av
0.00
0.19
0.19
4.70
PA
UB
0206
209.
Wau
do S
treet
NC
C 0
209
Mui
. S
t.1
Av.
Eas
0.00
0.45
0.45
5.30
PA
UB
0207
210.
Woo
d S
treet
NC
C 0
210
Mur
. S
t.1
Av.
Eas
0.00
0.44
0.44
6.70
PL
UM
B02
08
(km
) (x
.xx)
Sec
tion
or li
nkS
ectio
n or
link
desc
riptio
nch
aina
ge
Pag
e 5
of 5

TAB
LE 4
.3-4
(4)
RO
AD
INVE
NTO
RY
AR
EA:
Nai
robi
ZON
E: K
aren
GIB
B A
FRIC
A
Uni
que
Sec
tion
orlin
k le
ngth
Ave
. Wid
thR
oad
type
(pav
ed/u
npav
ed)
Roa
d C
lass
urba
n or
rura
lP
ublic
Tran
spor
tR
oute
Car
riage
way
cond
ition
She
et N
o.
road
cod
eR
oad
nam
e or
num
ber
(km
) (x
.x)
(m)
(x.x
)(P
/U)
(H/P
/D/
(U/R
)(B
/M/T
)B
/F/G
AB
CS
tart
End
Sta
rtE
ndL/
A/C
)(a
bcd)
(from
)(to
)(fr
om)
(to)
211.
Aca
cia
Ave
nue
NC
C 0
211
Ac.
Dr.
End
0.00
0.43
0.43
4.00
U(E
)C
UB
0211
212.
Aca
cia
Driv
eN
CC
021
2M
ar. L
n.E
nd0.
001.
051.
054.
00U
(E)
CU
B02
1121
3. C
ut L
ine
NC
C 0
213
W/S
. R
dW
/N.
Rd
0.00
0.29
0.29
2.10
U(E
)A
UB
0212
214.
Dag
oret
ti R
oad
NC
C 0
214
City
BK
aren
/ S
0.00
4.06
4.06
5.80
PA
UB
F02
1321
5. F
ores
t Lan
eN
CC
021
5K
ar. R
dM
ba.
RI
0.00
0.88
0.88
3.25
PA
UF
0214
216.
For
est V
iew
Rd.
NC
C 0
216
R/P
. R
dD
ag.
Rd
0.00
0.21
0.21
4.00
PA
UF
0215
"N
CC
021
6R
/P.
Rd
Dag
. R
d0.
210.
940.
734.
00U
(E)
AU
B02
1521
7. K
aren
Roa
d (1
)N
CC
021
7M
ba. R
1N
go.
Rd
0.00
3.03
3.03
5.10
PL
UB
F02
1621
8. K
aren
Roa
d (2
)N
CC
021
8M
ba. R
1N
go.
Rd
0.00
1.92
1.92
5.10
PL
UB
F02
1621
9. K
erar
apon
Roa
dN
CC
021
9N
go. R
dM
W.
J0.
000.
440.
444.
30P
AU
F02
17
"N
CC
021
9N
go. R
dM
W.
J0.
441.
611.
174.
30U
(E)
AU
F02
1722
0. M
arul
a La
neN
CC
022
0K
ar. R
dE
nd0.
001.
181.
184.
00P
CU
F02
18
"N
CC
022
0K
ar. R
dE
nd1.
181.
860.
684.
00U
(E)
CU
F02
1822
1. M
baga
thi R
idge
NC
C 0
221
Mar
. Ln.
For.
Ln.
0.00
2.39
2.39
4.10
PL
UM
F02
1922
2. M
ioto
ni L
ane
NC
C 0
222
Nan
. R
dM
io.
Rd
0.00
0.84
0.84
4.45
PA
UF
0220
223.
Mio
toni
Rd.
(pt.1
)N
CC
022
3W
/N.
Rd
Ngo
. R
d0.
001.
741.
744.
55P
LU
MF
0221
224.
Mio
toni
Rd.
(pt.2
)N
CC
022
4W
/N.
Rd
Ngo
. R
d0.
001.
241.
245.
00P
LU
MF
0221
225.
Mio
toni
Wes
t Rd.
NC
C 0
225
Mio
. R
dN
go.
Rd
0.00
0.89
0.89
3.75
PA
UF
0222
226.
Mw
itu R
oad
NC
C 0
226
Ker
a. R
dM
wi.
Dr
0.00
2.50
2.50
5.00
PA
UM
F02
2322
7. N
andi
Roa
dN
CC
022
7N
go. R
dM
io.
Rd
0.00
1.79
1.79
3.70
PA
UF
0224
228.
Ngo
ng R
oad
NC
C 0
228
Len.
Sch
.C
ity B
0.00
7.05
7.05
6.30
PP
UB
F02
2522
9. O
lolu
a R
idge
NC
C 0
229
Ngo
. Rd
Mba
. R
I0.
000.
560.
564.
20P
AU
F02
26
"N
CC
022
9N
go. R
dM
ba.
RI
0.56
2.78
2.22
4.20
U(G
)A
UB
0226
230.
Pep
o La
neN
CC
023
0D
ag. R
dE
nd0.
001.
401.
403.
40U
(E)
CU
F02
2723
1. R
hino
Par
k R
oad
NC
C 0
231
Dag
. Rd
End
0.00
2.52
2.52
3.80
PC
UF
0228
232.
The
Lin
k R
oad
NC
C 0
232
Dag
. Rd
Win
. R
I0.
000.
560.
565.
00P
DU
F02
2923
3. T
hree
Des
ai L
ane
NC
C 0
233
Dag
. Rd
End
0.00
1.80
1.80
3.60
PC
UF
0230
234.
Tre
e La
neN
CC
023
4N
go. R
dE
nd0.
001.
241.
244.
00U
(E)
CU
B02
3123
5. W
arai
Nor
th R
oad
NC
C 0
235
W/S
. R
dD
ag.
Rd
0.00
0.86
0.86
3.50
PA
UF
0232
236.
War
ai S
outh
Roa
dN
CC
023
6D
ag. R
dW
/S. R
d0.
001.
621.
623.
40P
AU
F02
3323
7. W
estw
ood
Par
k R
dN
CC
023
7N
go. R
dE
nd0.
000.
580.
584.
30P
CU
F02
3423
8. W
indy
Rid
geN
CC
023
8N
go. R
dP
epo
Ln.
0.00
1.26
1.26
4.40
PD
UF
0235
(km
) (x
.xx)
Sec
tion
or li
nkS
ectio
n or
link
cha
inag
e
desc
riptio
n

TAB
LE 4
.3-4
(5) R
OA
D IN
VEN
TOR
Y IN
KIB
ERA
RO
AD
INVE
NTO
RY
AR
EA:
Nai
robi
ZON
E: K
iber
aG
IBB
AFR
ICA
Uni
que
Sec
tion
Ave
.R
oad
type
Roa
d U
rban
or
Pub
licC
arria
gew
ay
She
et n
o.ro
ad c
ode
or li
nkW
idth
(pav
ed/
Cla
ssR
ural
Tran
spor
tC
ondi
tion
Roa
d na
me
or n
umbe
rle
ngth
unpa
ved)
(H/P
/D/
Rou
teA
BC
Sta
rtE
ndS
tart
End
(km
) (x
.x)
(m)
(x.x
)L/
A/C
)(U
/R)
(B/M
/T)
B/F
/G(a
bcd)
(from
)(to
)(fr
om)
(to)
(P/U
)23
9. (F
rndc
rt. E
st. R
d. F
1)N
CC
023
9R
d. F
End
0.00
0.80
0.80
6.50
U(E
)C
UM
B23
624
0. In
sura
nce
Col
lN
CC
024
0R
d. E
Col
l0.
000.
610.
616.
40U
(E)
LU
B23
724
1. M
adar
aka
Pr.
Sch
.N
CC
024
1O
/S.
Rd.
Sch
.0.
000.
310.
314.
30P
UF
238
242.
Toi
Pr.
Sch
.N
CC
024
2M
ba. R
d.M
ba. S
ch.
0.00
0.27
0.27
4.80
PU
F23
924
3. A
kiba
Est
. Rd.
DN
CC
024
3K
ite.
Rd.
End
0.00
0.49
0.49
6.00
PC
UM
F24
024
4. A
kiba
Est
. Rd.
EN
CC
024
4R
d. D
End
0.00
0.12
0.12
5.00
PC
UB
241
245.
Aki
ba E
st. R
d. F
NC
C 0
245
Rd.
DE
nd0.
000.
110.
115.
00P
CU
F24
224
6. A
kiba
Est
. Rd.
GN
CC
024
6R
d. D
End
0.00
0.11
0.11
5.00
PC
UF
243
247.
Aki
ba E
st. R
d. H
NC
C 0
247
Rd.
DE
nd0.
000.
090.
095.
00P
CU
F24
424
8. A
kiba
Est
. Rd.
QN
CC
024
8D
ot.
GE
nd C
rc.
0.00
0.47
0.47
5.30
PC
UF
245
249.
Am
bose
li E
st. R
d. D
NC
C 0
249
Dot
. G
End
0.00
0.19
0.19
5.30
PC
UF
246
250.
Civ
il S
erva
nts,
Rd.
A1
NC
C 0
250
Kite
. R
d.C
/Rd.
A3
0.00
0.08
0.08
3.30
PA
UF
247
251.
Civ
il S
erva
nts,
Rd.
A2
NC
C 0
251
LHS
RH
S0.
000.
310.
313.
30P
AU
F24
825
2. C
ivil
Ser
vant
s, R
d. A
3N
CC
025
2LH
SR
HS
0.00
0.32
0.32
3.30
PA
UF
249
253.
Civ
il S
erva
nts,
Rd.
A4
NC
C 0
253
C/R
d A
3C
/Rd.
A5
0.00
0.19
0.19
3.30
PA
UF
250
254.
Civ
il S
erva
nts,
Rd.
A5
NC
C 0
254
C/R
d A
3E
nd0.
000.
100.
103.
30P
CU
F25
125
5. C
usto
ms
Est
. Rd.
1N
CC
025
5K
ite.
Rd.
End
0.00
0.19
0.19
7.00
PC
UM
F25
225
6. C
usto
ms
Est
. Rd.
JN
CC
025
6K
ite.
Rd.
End
0.00
0.25
0.25
6.00
PC
UM
F25
325
7. D
am E
st. R
d. A
NC
C 0
257
Lan.
Rd.
Rd.
D0.
000.
100.
105.
30P
UM
F25
425
8. D
am E
st. R
d. B
NC
C 0
258
Rd.
AR
d. C
0.00
0.18
0.18
5.20
PU
MF
255
259.
Dam
Est
. Rd.
CN
CC
025
9R
d. B
End
0.00
0.17
0.17
5.20
PC
UF
256
260.
Dam
Est
. Rd.
DN
CC
026
0R
d. C
Rd.
K0.
000.
450.
455.
30P
UM
F25
726
1. D
am E
st. R
d. E
NC
C 0
261
Rd.
DE
nd0.
000.
110.
116.
00P
CU
F25
826
2. D
am E
st. R
d. F
NC
C 0
262
Rd.
GR
d. E
0.00
0.14
0.14
4.80
PU
F25
926
3. D
am E
st. R
d. G
NC
C 0
263
Rd.
DE
nd0.
000.
120.
125.
10P
CU
F26
026
4. D
am E
st. R
d. H
NC
C 0
264
Rd.
DE
nd0.
000.
130.
135.
40P
CU
F26
126
5. D
am E
st. R
d. K
NC
C 0
265
Lan.
Rd.
End
(S
/C)
0.00
0.17
0.17
7.10
PC
UF
262
"N
CC
026
5La
n. R
d.E
nd0.
170.
260.
097.
10U
(E)
CU
B26
226
6. H
ighl
and
Est
. Rd.
NC
C 0
266
Dot
. G
End
Crc
.0.
000.
500.
505.
30P
CU
F26
326
7. J
ambo
Est
. Rd.
CN
CC
026
7R
d. B
End
0.00
0.31
0.31
4.80
PC
UF
264
268.
Jam
huri
Est
. Rd.
BN
CC
026
8S
t. R
d.E
nd0.
000.
200.
205.
20P
CU
MF
265
269.
Jam
huri
Est
. Rd.
AN
CC
026
9R
d. B
End
0.00
0.13
0.13
4.80
PC
UF
266
270.
Jam
huri
Est
. Rd.
DN
CC
027
0S
t. R
d.E
nd0.
000.
170.
175.
00P
CU
F26
7
Sec
tion
or li
nkS
ectio
n or
link
desc
riptio
nch
aina
ge(k
m)
(x.x
x) Pag
e 1
of 1
0

TAB
LE 4
.3-4
(5) R
OA
D IN
VEN
TOR
Y IN
KIB
ERA
RO
AD
INVE
NTO
RY
AR
EA:
Nai
robi
ZON
E: K
iber
aG
IBB
AFR
ICA
Uni
que
Sec
tion
Ave
.R
oad
type
Roa
d U
rban
or
Pub
licC
arria
gew
ay
She
et n
o.ro
ad c
ode
or li
nkW
idth
(pav
ed/
Cla
ssR
ural
Tran
spor
tC
ondi
tion
Roa
d na
me
or n
umbe
rle
ngth
unpa
ved)
(H/P
/D/
Rou
teA
BC
Sta
rtE
ndS
tart
End
(km
) (x
.x)
(m)
(x.x
)L/
A/C
)(U
/R)
(B/M
/T)
B/F
/G(a
bcd)
(from
)(to
)(fr
om)
(to)
(P/U
)27
1. J
amhu
ri E
st.
Rd.
EN
CC
027
1S
t. R
d.E
nd0.
000.
260.
264.
80P
CU
F26
827
2. K
MA
. Est
. Rd.
GN
CC
027
2M
uh.
Av.
Rd.
G1
0.00
0.16
0.16
5.30
PU
MF
269
273.
KM
A. E
st. R
d. G
1N
CC
027
3R
d. G
End
0.00
0.15
0.15
5.30
PC
UM
F27
027
4. K
MA
. Est
. Rd.
G2
NC
C 0
274
Rd.
G1
End
0.00
0.05
0.05
5.30
PC
UF
271
275.
KM
A. E
st. R
d. G
3N
CC
027
5R
d. G
1E
nd0.
000.
110.
115.
30P
CU
F27
227
6. K
PA
Est
. Rd.
AN
CC
027
6R
d. E
End
0.00
0.29
0.29
5.30
PC
UF
273
277.
Kib
era
Std
. Rd.
CN
CC
027
7N
go.
Rd.
Jam
. E
st.
0.00
0.14
0.14
4.60
PU
F27
427
8. K
iber
a R
oad
AN
CC
027
8K
ir. L
n.E
nd0.
000.
160.
166.
00P
CU
F27
527
9. K
tnge
la -
Lang
ata
Rd.
NC
C 0
279
Kite
. R
d.La
ng.
Rd.
0.00
0.67
0.67
7.00
PA
UM
F27
628
0. L
anga
ta -
Mah
iu R
d. X
NC
C 0
280
Lan.
Rd.
M/M
. R
d.0.
000.
590.
595.
30U
(E)
UF
277
281.
Lon
giri
- Kan
geth
eN
CC
028
1K
ang.
Rd.
End
0.00
0.08
0.08
4.00
PC
UF
278
282.
Mas
ai E
st. R
d. C
1N
CC
028
2K
ite.
Rd.
Rd.
C2
0.00
0.08
0.08
5.30
PU
F27
928
3. M
asai
Est
. Rd.
C10
NC
C 0
283
Rd.
C3
Rd.
C11
0.00
0.12
0.12
4.30
PU
F28
028
4. M
asai
Est
. Rd.
C11
NC
C 0
284
Kite
. R
d.R
d. C
120.
000.
190.
194.
30P
AU
F28
128
5. M
asai
Est
. Rd.
C12
NC
C 0
285
Kite
. R
d.E
nd0.
000.
270.
274.
30P
CU
F28
228
6. M
asai
Est
. Rd.
C13
NC
C 0
286
Rd.
C12
End
0.00
0.11
0.11
4.30
PC
UF
283
287.
Mas
ai E
st. R
d. C
14N
CC
028
7R
d. C
12E
nd0.
000.
120.
124.
30P
CU
F28
428
8. M
asai
Est
. Rd.
C15
NC
C 0
288
Rd.
C10
End
0.00
0.12
0.12
4.30
PC
UF
285
289.
Mas
ai E
st. R
d. C
2N
CC
028
9R
d. P
1R
d. P
20.
000.
040.
045.
30P
UF
286
290.
Mas
ai E
st. R
d. C
3N
CC
029
0R
d. C
1R
d. C
40.
000.
390.
395.
30P
UF
287
291.
Mas
ai E
st. R
d. C
4N
CC
029
1R
d. P
1R
d. P
20.
000.
140.
144.
30P
UF
288
292.
Mas
ai E
st. R
d. C
5N
CC
029
2R
d. P
1R
d. P
20.
000.
060.
064.
30P
UF
289
293.
Mas
ai E
st. R
d. C
6N
CC
029
3R
d. C
5R
d. C
30.
000.
060.
064.
30P
UF
290
294.
Mas
ai E
st. R
d. C
7N
CC
029
4R
d. C
3E
nd0.
000.
120.
124.
30P
CU
F29
129
5. M
asai
Est
. Rd.
C8
NC
C 0
295
Rd.
C3
End
0.00
0.12
0.12
4.30
PC
UF
292
296.
Mas
ai E
st. R
d. C
9N
CC
029
6R
d. C
3E
nd0.
000.
120.
124.
30P
CU
F29
329
7. M
atum
bato
/K-M
bere
NC
C 0
297
Mat
u. R
dK
/Ber
e R
d0.
000.
150.
153.
50U
(E)
AU
F29
429
8. M
baga
thi R
d. K
emri
NC
C 0
298
Mba
. R
d.K
em.
X0.
000.
420.
426.
00P
UM
F29
529
9. M
ugoy
a E
st. R
d. R
NC
C 0
299
Rd.
ER
d. R
0.00
1.05
1.05
5.30
PU
MF
296
300.
Mug
oya
Est
. Rd.
R1
NC
C 0
300
Rd.
RE
nd0.
000.
070.
075.
30P
CU
F29
730
1. M
ugoy
a E
st. R
d. R
2N
CC
030
1R
d. R
End
0.00
0.07
0.07
5.30
PC
UF
298
302.
Mug
oya
Est
. Rd.
R3
NC
C 0
302
Rd.
R4
Rd.
R0.
000.
050.
055.
30P
UF
299
303.
Mug
oya
Est
. Rd.
R4
NC
C 0
303
Rd.
RE
nd0.
000.
240.
245.
30P
CU
F30
0
Sec
tion
or li
nkS
ectio
n or
link
desc
riptio
nch
aina
ge(k
m)
(x.x
x) Pag
e 2
of 1
0

TAB
LE 4
.3-4
(5) R
OA
D IN
VEN
TOR
Y IN
KIB
ERA
RO
AD
INVE
NTO
RY
AR
EA:
Nai
robi
ZON
E: K
iber
aG
IBB
AFR
ICA
Uni
que
Sec
tion
Ave
.R
oad
type
Roa
d U
rban
or
Pub
licC
arria
gew
ay
She
et n
o.ro
ad c
ode
or li
nkW
idth
(pav
ed/
Cla
ssR
ural
Tran
spor
tC
ondi
tion
Roa
d na
me
or n
umbe
rle
ngth
unpa
ved)
(H/P
/D/
Rou
teA
BC
Sta
rtE
ndS
tart
End
(km
) (x
.x)
(m)
(x.x
)L/
A/C
)(U
/R)
(B/M
/T)
B/F
/G(a
bcd)
(from
)(to
)(fr
om)
(to)
(P/U
)30
4. M
ugoy
a R
d. X
(pt.1
)N
CC
030
4O
/S.
Av.
Muh
. A
v.0.
000.
540.
545.
30P
UM
F30
130
5. M
ugoy
a R
d. X
(pt.2
)N
CC
030
5M
uh.
Av.
Muh
. A
v.0.
000.
600.
605.
30P
UM
F30
230
6. M
uhoh
o - M
bsa.
Rd.
EN
CC
030
6M
uh.
Av.
Msa
. R
d.0.
001.
181.
185.
30P
DU
MF
303
307.
Mut
hong
o E
st. R
d. B
NC
C 0
307
Dot
. G
End
Crc
.0.
000.
530.
535.
30P
CU
F30
430
8. N
CC
Wes
t, R
d. X
NC
C 0
308
Mus
. R
d.M
ut.
Rd.
0.00
0.41
0.41
5.30
PA
UF
305
309.
New
Est
. Rd.
CN
CC
030
9K
ib.
Dr.
End
0.00
0.58
0.58
5.50
PC
UF
306
310.
New
Est
. Rd.
DN
CC
031
0R
d. C
Rd.
E0.
000.
220.
225.
40P
UF
307
311.
New
Est
. Rd.
EN
CC
031
1R
d. C
End
0.00
0.15
0.15
5.50
PC
UF
308
312.
New
Est
. Rd.
FN
CC
031
2K
ino
Rd.
End
0.00
0.13
0.13
2.90
PC
UF
309
313.
Ngu
mo
Est
. Rd.
AN
CC
031
3M
ba.
Rd.
End
0.00
0.15
0.15
4.90
PC
UF
310
314.
Ngu
mo
Est
. Rd.
BN
CC
031
4R
d. A
Rd.
C0.
000.
080.
085.
60P
AU
F31
131
5. N
gum
o E
st. R
d. C
NC
C 0
315
Rd.
BE
nd0.
000.
180.
185.
40P
CU
F31
131
6. N
gum
o E
st. R
d. D
NC
C 0
316
Mba
. R
d.E
nd0.
000.
220.
225.
50P
CU
F31
231
7. N
gum
o E
st. R
d. E
NC
C 0
317
Rd.
DR
d. F
0.00
0.09
0.09
5.50
PA
UF
313
318.
Ngu
mo
Est
. Rd.
FN
CC
031
8R
d. E
End
0.00
0.17
0.17
5.50
PC
UF
314
319.
Ngu
mo
Est
. Rd.
GN
CC
031
9M
ba.
Rd.
End
0.00
0.24
0.24
5.40
PC
UF
315
320.
Ngu
mo
Est
. Rd.
HN
CC
032
0R
d. G
0.00
0.32
0.32
6.00
PA
UF
316
321.
Ngu
mo
Est
. Rd.
IN
CC
032
1M
ba.
Rd.
Rd.
H0.
000.
370.
376.
00P
AU
F31
732
2. N
gum
o E
st. R
d. J
NC
C 0
322
Mba
. R
d.R
d. L
0.00
0.11
0.11
6.00
PA
UF
318
323.
Ngu
mo
Est
. Rd.
KN
CC
032
3R
d. L
L/R
0.00
0.18
0.18
5.00
PA
UF
319
324.
Ngu
mo
Est
. Rd.
LN
CC
032
4R
d. K
Rd.
M0.
000.
130.
136.
00P
AU
F32
032
5. N
gum
o E
st. R
d. M
NC
C 0
325
Rd.
LL/
R0.
000.
140.
146.
00P
AU
F32
132
6. N
gum
o E
st. R
d. N
NC
C 0
326
Rd.
LR
D.
Y0.
000.
070.
075.
00P
AU
F32
232
7. N
gum
o E
st. R
d. P
NC
C 0
327
Mba
. R
d.R
d. V
0.00
0.34
0.34
6.00
PA
UF
323
328.
Ngu
mo
Est
. Rd.
QN
CC
032
8R
d. P
End
0.00
0.19
0.19
6.00
PC
UF
324
329.
Ngu
mo
Est
. Rd.
RN
CC
032
9R
d. P
End
0.00
0.11
0.11
5.00
PC
UF
325
330.
Ngu
mo
Est
. Rd.
SN
CC
033
0R
d. P
End
0.00
0.15
0.15
5.00
PC
UF
326
331.
Ngu
mo
Est
. Rd.
TN
CC
033
1R
d. P
End
0.00
0.08
0.08
5.00
PC
UF
327
332.
Ngu
mo
Est
. Rd.
UN
CC
033
2M
ba.
Rd.
Rd.
V0.
000.
100.
106.
00P
AU
F32
833
3. N
gum
o E
st. R
d. V
NC
C 0
333
Rd.
P/L
L/R
0.00
0.40
0.40
5.00
PU
F32
933
4. N
gum
o E
st. R
d. W
NC
C 0
334
Bag
. R
d.0.
000.
440.
445.
00P
AU
F33
033
5. N
gum
o E
st. R
d. Y
NC
C 0
335
Rd.
NE
nd0.
000.
100.
106.
00P
CU
F33
133
6. R
ubia
Est
. Rd.
D1
NC
C 0
336
Kite
. R
d.R
d. D
20.
000.
240.
246.
40P
AU
MF
332
Sec
tion
or li
nkS
ectio
n or
link
desc
riptio
nch
aina
ge(k
m)
(x.x
x) Pag
e 3
of 1
0

TAB
LE 4
.3-4
(5) R
OA
D IN
VEN
TOR
Y IN
KIB
ERA
RO
AD
INVE
NTO
RY
AR
EA:
Nai
robi
ZON
E: K
iber
aG
IBB
AFR
ICA
Uni
que
Sec
tion
Ave
.R
oad
type
Roa
d U
rban
or
Pub
licC
arria
gew
ay
She
et n
o.ro
ad c
ode
or li
nkW
idth
(pav
ed/
Cla
ssR
ural
Tran
spor
tC
ondi
tion
Roa
d na
me
or n
umbe
rle
ngth
unpa
ved)
(H/P
/D/
Rou
teA
BC
Sta
rtE
ndS
tart
End
(km
) (x
.x)
(m)
(x.x
)L/
A/C
)(U
/R)
(B/M
/T)
B/F
/G(a
bcd)
(from
)(to
)(fr
om)
(to)
(P/U
)33
7. R
ubia
Est
. Rd.
D2
NC
C 0
337
K.
Rd.
D3
End
0.00
0.27
0.27
5.30
PC
UM
F33
333
8. R
ubia
Est
. Rd.
D5
NC
C 0
338
K.
Rd.
D3
End
0.00
0.09
0.09
5.30
PC
UF
334
339.
Rub
ia E
st. R
d. D
6N
CC
033
9G
/O.
Rd
End
0.00
0.07
0.07
5.30
PC
UF
335
340.
Rub
ia E
st. R
d. D
7N
CC
034
0G
/O.
Rd
End
0.00
0.09
0.09
5.30
PC
UF
336
341.
Rub
y E
st. R
d. A
1N
CC
034
1R
d. A
Rd.
B0.
000.
120.
125.
30P
UF
337
342.
Rub
y E
st. R
d. A
2N
CC
034
2R
d. B
Rd.
A0.
000.
120.
125.
30P
UF
338
343.
Rub
y E
st. R
d. A
3N
CC
034
3R
d. B
Rd.
A0.
000.
120.
125.
30P
UF
339
344.
Rub
y E
st. R
d. B
NC
C 0
344
Muh
. A
v.E
nd0.
000.
460.
465.
30P
CU
MF
340
345.
Rub
y E
st. R
d. C
NC
C 0
345
Muh
. A
v.E
nd0.
000.
220.
225.
30P
CU
F34
134
6. R
uby
Est
. Rd.
C1
NC
C 0
346
Rd.
CE
nd0.
000.
080.
085.
30P
CU
F34
234
7. R
uby
Est
. Rd.
C2
NC
C 0
347
Rd.
CE
nd0.
000.
080.
085.
30P
CU
F34
334
8. R
uby
Est
. Rd.
C3
NC
C 0
348
Rd.
C1
End
0.00
0.08
0.08
5.30
PC
UF
344
349.
Rub
y E
st.
Rd.
A (1
)N
CC
034
9M
uh.
Av.
End
0.00
0.24
0.24
5.30
PC
UM
F34
535
0. R
uby
Est
. Rd.
A (2
)N
CC
035
0M
uh.
Av.
End
0.00
0.22
0.22
5.30
U(E
)C
UM
F34
635
1. S
. C. S
ch. C
entre
NC
C 0
351
Muh
. A
v.M
uh.
Av.
0.00
0.22
0.22
5.30
PU
F34
735
2. S
. Lan
ds E
st. R
d. B
1N
CC
035
2K
it. R
dS
. Rd.
B2
0.00
0.25
0.25
5.30
PA
UM
F34
835
3. S
. Lan
ds E
st. R
d. B
2N
CC
035
3R
d. B
10R
d. B
30.
000.
710.
715.
30P
AU
MF
349
354.
S. L
ands
Est
. Rd.
B3
NC
C 0
354
Rd.
B2
End
0.00
0.06
0.06
5.30
PC
UF
350
355.
S. L
ands
Est
. Rd.
B4
NC
C 0
355
Rd.
B2
End
0.00
0.08
0.08
5.30
PC
UF
351
356.
S. L
ands
Est
. Rd.
B5
NC
C 0
356
Rd.
B2
Rd.
B6
0.00
0.08
0.08
5.30
PA
UF
352
357.
S. L
ands
Est
. Rd.
B6
NC
C 0
357
Rd.
X1
Rd.
X2
0.00
0.15
0.15
5.30
PA
UF
353
358.
S. L
ands
Est
. Rd.
B7
NC
C 0
358
Rd.
B2
End
0.00
0.11
0.11
5.30
PC
UF
354
359.
S. L
ands
Est
. Rd.
B8
NC
C 0
359
Rd.
B2
End
0.00
0.10
0.10
5.30
PC
UF
355
360.
S. L
ands
Est
. Rd.
B9
NC
C 0
360
Rd.
B8
Rd.
B1
0.00
0.10
0.10
5.30
PA
UF
356
361.
S. L
ands
Est
. Rd.
B10
NC
C 0
361
Rd.
B2
Rd.
B11
0.00
0.21
0.21
5.30
PA
UM
F35
736
2. S
. Lan
ds E
st. R
d. B
11N
CC
036
2R
d. X
1R
d. X
20.
000.
060.
065.
30P
AU
F35
836
3. S
. Lan
ds E
st. R
d. B
12N
CC
036
3R
d. B
1R
d. B
100.
000.
080.
085.
30P
AU
MF
359
364.
Sav
anna
Est
. Rd.
D1
NC
C 0
364
Rd.
DE
nd0.
000.
230.
235.
30P
CU
MF
360
365.
Sav
anna
Est
. Rd.
D2
NC
C 0
365
Rd.
D1
End
0.00
0.14
0.14
5.30
PC
UF
361
366.
Sav
anna
Est
. Rd.
D3
NC
C 0
366
Rd.
D2
End
0.00
0.14
0.14
5.30
PC
UF
362
367.
Sav
anna
Est
. Rd.
D(1
)N
CC
036
7M
uh.
Av.
Rd.
D1
0.00
0.08
0.08
5.30
PL
UF
363
368.
Sav
anna
Est
. Rd.
D(2
)N
CC
036
8M
uh.
Av.
Rd.
D1
0.00
0.13
0.13
5.30
U(E
)L
UF
364
369.
Sou
th 'C
' Rd.
BN
CC
036
9M
uf.
Av.
End
0.00
0.27
0.27
5.30
PC
UF
365
Sec
tion
or li
nkS
ectio
n or
link
desc
riptio
nch
aina
ge(k
m)
(x.x
x) Pag
e 4
of 1
0

TAB
LE 4
.3-4
(5) R
OA
D IN
VEN
TOR
Y IN
KIB
ERA
RO
AD
INVE
NTO
RY
AR
EA:
Nai
robi
ZON
E: K
iber
aG
IBB
AFR
ICA
Uni
que
Sec
tion
Ave
.R
oad
type
Roa
d U
rban
or
Pub
licC
arria
gew
ay
She
et n
o.ro
ad c
ode
or li
nkW
idth
(pav
ed/
Cla
ssR
ural
Tran
spor
tC
ondi
tion
Roa
d na
me
or n
umbe
rle
ngth
unpa
ved)
(H/P
/D/
Rou
teA
BC
Sta
rtE
ndS
tart
End
(km
) (x
.x)
(m)
(x.x
)L/
A/C
)(U
/R)
(B/M
/T)
B/F
/G(a
bcd)
(from
)(to
)(fr
om)
(to)
(P/U
)37
0. S
outh
'C'
Rd.
CN
CC
037
0R
d. D
Rd.
B0.
000.
100.
105.
30P
AU
F36
737
1. S
outh
'C'
Rd.
C1
NC
C 0
371
Rd.
CE
nd0.
000.
090.
095.
30P
CU
F36
837
2. S
outh
'C'
Rd.
DN
CC
037
2M
uh.
Av.
End
0.00
0.27
0.27
5.30
PC
UF
369
373.
Sou
th 'C
' R
d. D
1N
CC
037
3R
d. D
End
0.00
0.14
0.14
5.30
PC
UF
370
374.
Sou
th 'C
' R
d. E
NC
C 0
374
End
End
0.00
0.25
0.25
4.30
PC
UF
371
375.
Sou
th 'C
' R
d. F
NC
C 0
375
End
End
0.00
0.22
0.22
5.30
PC
UF
372
376.
Sou
th 'C
' R
d. G
NC
C 0
376
Rd.
ER
d. F
0.00
0.05
0.05
4.30
PU
F37
337
7. S
outh
'C'
Rd.
HN
CC
037
7R
d. E
Rd.
F0.
000.
050.
054.
30P
UF
374A
378.
Sou
th 'C
' R
d. I
NC
C 0
378
Rd.
YE
nd0.
000.
270.
275.
30P
CU
F37
4B37
9. S
outh
'C'
Rd.
JN
CC
037
9R
d. E
End
0.00
0.22
0.22
5.30
PC
UF
375
380.
Sou
th 'C
' R
d. K
NC
C 0
380
Rd.
JE
nd0.
000.
200.
205.
30P
CU
F37
638
1. S
outh
'C'
Rd.
MN
CC
038
1R
d. J
End
0.00
0.20
0.20
5.30
PC
UF
377
382.
Sou
th 'C
' R
d. N
1N
CC
038
2R
d. J
End
0.00
0.11
0.11
5.30
PC
UF
378
383.
Sou
th 'C
' R
d. N
2N
CC
038
3R
d. J
End
0.00
0.11
0.11
5.30
PC
UF
379
384.
Sou
th 'C
' R
d. O
NC
C 0
384
Rd.
X1
End
0.00
0.13
0.13
5.30
PC
UF
380
385.
Sou
th 'C
' R
d. P
NC
C 0
385
O/S
. A
v.R
d. T
10.
000.
660.
666.
40P
AU
F38
138
6. S
outh
'C'
Rd.
QN
CC
038
6R
d. P
P.
Crc
.0.
000.
370.
375.
30P
AU
MF
382
387.
Sou
th 'C
' R
d. R
NC
C 0
387
Rd.
PE
nd0.
000.
220.
225.
30P
CU
F38
338
8. S
outh
'C'
Rd.
SN
CC
038
8R
d. P
O/S
. A
v.0.
000.
150.
155.
30P
AU
F38
438
9. S
outh
'C'
Rd.
TN
CC
038
9E
ndE
nd0.
000.
370.
374.
30P
CU
F38
539
0. S
outh
'C'
Rd.
T2
NC
C 0
390
Kig
. A
v.M
sa.
Rd.
0.00
0.15
0.15
5.30
PU
MF
386
391.
Sou
th 'C
' R
d. T
3N
CC
039
1R
d. Y
End
0.00
0.14
0.14
5.30
PC
UF
387
392.
Sou
th 'C
' R
d. T
4N
CC
039
2R
d. T
6E
nd0.
000.
060.
065.
30P
CU
F38
839
3. S
outh
'C'
Rd.
T5
NC
C 0
393
Rd.
T7
Rd.
T6
0.00
0.06
0.06
5.30
PU
F38
939
4. S
outh
'C'
Rd.
T6
NC
C 0
394
Rd.
T5
End
0.00
0.25
0.25
5.30
PC
UF
390
395.
Sou
th 'C
' R
d. T
7N
CC
039
5M
uh.
Av.
End
0.00
0.25
0.25
5.30
PC
UF
391
396.
Sou
th 'C
' R
d. U
NC
C 0
396
Rd.
X1
End
(c )
0.00
0.25
0.25
5.30
PC
UM
F39
239
7. S
outh
'C'
Rd.
VN
CC
039
7R
d. U
Rd.
W0.
000.
210.
215.
30P
UM
F39
339
8. S
outh
'C'
Rd.
WN
CC
039
8R
d. T
3E
nd0.
000.
270.
275.
30P
CU
MF
394
399.
Sou
th 'C
' R
d. X
1N
CC
039
9R
d. P
End
0.00
0.15
0.15
5.30
PC
UF
395
400.
Sou
th 'C
' R
d. X
2N
CC
040
0M
ihu.
Av.
Mih
u. A
v.0.
000.
090.
094.
30P
UF
396
401.
Sou
th 'C
' R
d. Y
NC
C 0
401
Rd.
UR
d. X
10.
000.
240.
245.
30P
UF
397
402.
Sou
th 'C
' R
d. Z
NC
C 0
402
Muf
. A
v.R
d. X
10.
000.
380.
386.
40P
AU
MF
398
Sec
tion
or li
nkS
ectio
n or
link
desc
riptio
nch
aina
ge(k
m)
(x.x
x) Pag
e 5
of 1
0
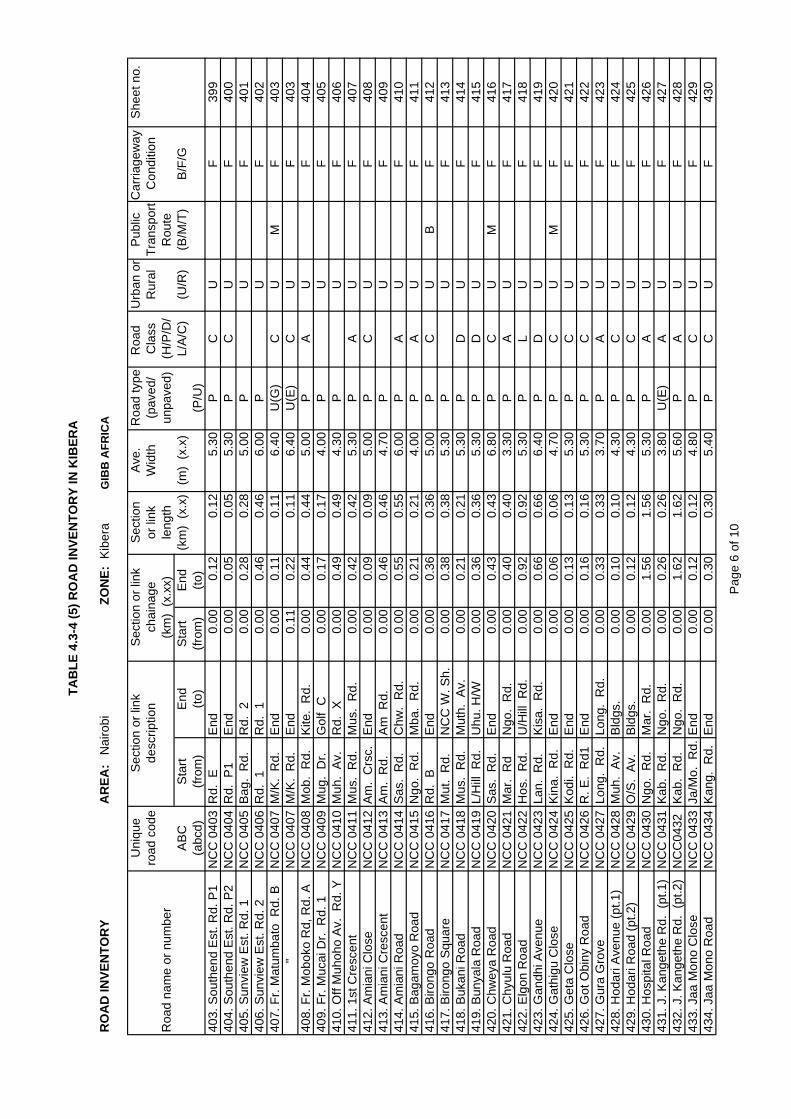
TAB
LE 4
.3-4
(5) R
OA
D IN
VEN
TOR
Y IN
KIB
ERA
RO
AD
INVE
NTO
RY
AR
EA:
Nai
robi
ZON
E: K
iber
aG
IBB
AFR
ICA
Uni
que
Sec
tion
Ave
.R
oad
type
Roa
d U
rban
or
Pub
licC
arria
gew
ay
She
et n
o.ro
ad c
ode
or li
nkW
idth
(pav
ed/
Cla
ssR
ural
Tran
spor
tC
ondi
tion
Roa
d na
me
or n
umbe
rle
ngth
unpa
ved)
(H/P
/D/
Rou
teA
BC
Sta
rtE
ndS
tart
End
(km
) (x
.x)
(m)
(x.x
)L/
A/C
)(U
/R)
(B/M
/T)
B/F
/G(a
bcd)
(from
)(to
)(fr
om)
(to)
(P/U
)40
3. S
outh
end
Est
. Rd.
P1
NC
C 0
403
Rd.
EE
nd0.
000.
120.
125.
30P
CU
F39
940
4. S
outh
end
Est
. Rd.
P2
NC
C 0
404
Rd.
P1
End
0.00
0.05
0.05
5.30
PC
UF
400
405.
Sun
view
Est
. Rd.
1N
CC
040
5B
ag.
Rd.
Rd.
20.
000.
280.
285.
00P
UF
401
406.
Sun
view
Est
. Rd.
2N
CC
040
6R
d. 1
Rd.
10.
000.
460.
466.
00P
UF
402
407.
Fr.
Mat
umba
to R
d. B
NC
C 0
407
M/K
. R
d.E
nd0.
000.
110.
116.
40U
(G)
CU
MF
403
"N
CC
040
7M
/K.
Rd.
End
0.11
0.22
0.11
6.40
U(E
)C
UF
403
408.
Fr.
Mob
oko
Rd,
Rd.
AN
CC
040
8M
ob.
Rd.
Kite
. R
d.0.
000.
440.
445.
00P
AU
F40
440
9. F
r. M
ucai
Dr.
Rd.
1N
CC
040
9M
ug.
Dr.
Gol
f C
0.00
0.17
0.17
4.00
PU
F40
541
0. O
ff M
uhoh
o A
v. R
d. Y
NC
C 0
410
Muh
. A
v.R
d. X
0.00
0.49
0.49
4.30
PU
F40
641
1. 1
st C
resc
ent
NC
C 0
411
Mus
. R
d.M
us.
Rd.
0.00
0.42
0.42
5.30
PA
UF
407
412.
Am
iani
Clo
seN
CC
041
2A
m.
Crs
c.E
nd0.
000.
090.
095.
00P
CU
F40
841
3. A
mia
ni C
resc
ent
NC
C 0
413
Am
. R
d.A
m R
d.0.
000.
460.
464.
70P
UF
409
414.
Am
iani
Roa
dN
CC
041
4S
as.
Rd.
Chw
. R
d.0.
000.
550.
556.
00P
AU
F41
041
5. B
agam
oyo
Roa
dN
CC
041
5N
go.
Rd.
Mba
. R
d.0.
000.
210.
214.
00P
AU
F41
141
6. B
irong
o R
oad
NC
C 0
416
Rd.
BE
nd0.
000.
360.
365.
00P
CU
BF
412
417.
Biro
ngo
Squ
are
NC
C 0
417
Mut
. R
d.N
CC
W. S
h.0.
000.
380.
385.
30P
UF
413
418.
Buk
ani R
oad
NC
C 0
418
Mus
. R
d.M
uth.
Av.
0.00
0.21
0.21
5.30
PD
UF
414
419.
Bun
yala
Roa
dN
CC
041
9L/
Hill
Rd.
Uhu
. H/W
0.00
0.36
0.36
5.30
PD
UF
415
420.
Chw
eya
Roa
dN
CC
042
0S
as.
Rd.
End
0.00
0.43
0.43
6.80
PC
UM
F41
642
1. C
hyul
u R
oad
NC
C 0
421
Mar
. R
dN
go.
Rd.
0.00
0.40
0.40
3.30
PA
UF
417
422.
Elg
on R
oad
NC
C 0
422
Hos
. R
d.U
/Hill
Rd.
0.00
0.92
0.92
5.30
PL
UF
418
423.
Gan
dhi A
venu
eN
CC
042
3La
n. R
d.K
isa.
Rd.
0.00
0.66
0.66
6.40
PD
UF
419
424.
Gat
higu
Clo
seN
CC
042
4K
ina.
Rd.
End
0.00
0.06
0.06
4.70
PC
UM
F42
042
5. G
eta
Clo
seN
CC
042
5K
odi.
Rd.
End
0.00
0.13
0.13
5.30
PC
UF
421
426.
Got
Obi
ny R
oad
NC
C 0
426
R. E
. R
d1E
nd0.
000.
160.
165.
30P
CU
F42
242
7. G
ura
Gro
veN
CC
042
7Lo
ng.
Rd.
Long
. R
d.0.
000.
330.
333.
70P
AU
F42
342
8. H
odar
i Ave
nue
(pt.1
)N
CC
042
8M
uh.
Av.
Bld
gs.
0.00
0.10
0.10
4.30
PC
UF
424
429.
Hod
ari R
oad
(pt.2
)N
CC
042
9O
/S.
Av.
Bld
gs.
0.00
0.12
0.12
4.30
PC
UF
425
430.
Hos
pita
l Roa
dN
CC
043
0N
go.
Rd.
Mar
. R
d.0.
001.
561.
565.
30P
AU
F42
643
1. J
. Kan
geth
e R
d. (
pt.1
)N
CC
043
1K
ab.
Rd.
Ngo
. R
d.0.
000.
260.
263.
80U
(E)
AU
F42
743
2. J
. Kan
geth
e R
d. (
pt.2
)N
CC
0432
Kab
. R
d.N
go.
Rd.
0.00
1.62
1.62
5.60
PA
UF
428
433.
Jaa
Mon
o C
lose
NC
C 0
433
Ja/M
o. R
d.E
nd0.
000.
120.
124.
80P
CU
F42
943
4. J
aa M
ono
Roa
dN
CC
043
4K
ang.
Rd.
End
0.00
0.30
0.30
5.40
PC
UF
430
Sec
tion
or li
nkS
ectio
n or
link
desc
riptio
nch
aina
ge(k
m)
(x.x
x) Pag
e 6
of 1
0

TAB
LE 4
.3-4
(5) R
OA
D IN
VEN
TOR
Y IN
KIB
ERA
RO
AD
INVE
NTO
RY
AR
EA:
Nai
robi
ZON
E: K
iber
aG
IBB
AFR
ICA
Uni
que
Sec
tion
Ave
.R
oad
type
Roa
d U
rban
or
Pub
licC
arria
gew
ay
She
et n
o.ro
ad c
ode
or li
nkW
idth
(pav
ed/
Cla
ssR
ural
Tran
spor
tC
ondi
tion
Roa
d na
me
or n
umbe
rle
ngth
unpa
ved)
(H/P
/D/
Rou
teA
BC
Sta
rtE
ndS
tart
End
(km
) (x
.x)
(m)
(x.x
)L/
A/C
)(U
/R)
(B/M
/T)
B/F
/G(a
bcd)
(from
)(to
)(fr
om)
(to)
(P/U
)43
5. J
amhu
ri C
resc
ent
NC
C 0
435
Kab
a. R
d.K
aba
Rd.
0.00
0.38
0.38
5.00
PL
UF
431
436.
Jam
huri
Roa
dN
CC
043
6N
go.
Rd.
Kib
e. R
d.0.
001.
601.
606.
30P
AU
F43
243
7. K
abiy
et R
oad
NC
C 0
437
Muh
. A
v.Th
o. R
d.0.
000.
200.
205.
30P
UF
433
438.
Kai
sung
ur R
oad
NC
C 0
438
Muh
. A
v.O
/S.
Av.
0.00
0.26
0.26
4.30
PU
F43
443
9. K
alas
a R
oad
NC
C 0
439
Mab
. R
d.M
ab.
Crs
.0.
000.
110.
115.
00P
UF
435
440.
Kam
bere
Roa
dN
CC
044
0L/
H.
Rd.
Rai
l/L0.
000.
760.
765.
30P
AU
F43
644
1. K
amur
ana
Clo
se (D
4)N
CC
044
1E
ndE
nd0.
000.
060.
065.
30P
CU
F43
744
2. K
amur
ana
Roa
d (D
3)N
CC
044
2K
amu.
Cl.
R. E
. Rd.
20.
000.
520.
525.
30P
UF
438
443.
Kan
ga R
oad
NC
C 0
443
Mak
. R
d.S
asu
Rd.
0.00
0.37
0.37
6.10
PU
F43
944
4. K
ange
the
Gre
enN
CC
044
4La
ng.
Rd.
Lang
. Rd.
0.00
0.29
0.29
4.00
PA
UF
440
445.
Kan
jaro
Roa
dN
CC
044
5M
bar.
Rd
End
0.00
0.09
0.09
5.00
PC
UF
441
446.
Kab
arne
t Gar
dens
NC
C 0
446
Kab
. R
d.H
/S. H
ome
0.00
0.27
0.27
5.40
PA
UF
442
447.
Kab
arne
t Lan
eN
CC
044
7K
ab.
Rd.
End
0.00
0.24
0.24
3.20
PC
UF
443
448.
Kab
arne
t Roa
dN
CC
044
8J/
K.
Rd.
Kib
. R
d.0.
000.
800.
805.
00P
AU
MF
444
449.
Kar
uri G
akur
e R
oad
NC
C 0
449
O/S
a. R
d.O
/Sa.
Rd.
0.00
0.70
0.70
5.30
PA
UF
445
450.
Ken
ya R
oad
NC
C 0
450
Kili
Rd.
Hos
p. R
d.0.
000.
400.
403.
30P
LU
F44
645
1. K
iber
a C
lose
NC
C 0
451
Kab
. R
d.E
nd0.
000.
210.
215.
00P
CU
F44
745
2. K
iber
a D
rive
NC
C 0
452
Jam
. R
d.J/
K.
Rd.
0.00
4.07
4.07
5.40
PA
UM
F44
845
3. K
iber
a R
oad
NC
C 0
453
Kab
. R
d.N
go.
Rd.
0.00
0.49
0.49
4.00
U(E
)A
UB
449
454.
Kib
era
Stn
. Roa
dN
CC
045
4S
ta.
Rd.
Kib
. S
tn.
0.00
0.38
0.38
5.00
PA
UM
F45
045
5. K
iber
a S
tn. R
oad
NC
C 0
455
Ngo
. R
d.Ja
m.
Est
.0.
000.
800.
807.
10P
DU
MF
451
456.
Kib
uye
Roa
dN
CC
045
6N
gob.
Rd.
End
0.00
0.07
0.07
5.00
PC
UF
452
457.
Kifa
ru C
resc
ent
NC
C 0
457
Mus
. R
d.M
us.
Rd.
0.00
0.42
0.42
5.30
PA
UF
453A
458.
Kili
man
jaro
Ave
nue
NC
C 0
458
Elg
. R
d.M
ara
Rd.
0.00
0.50
0.50
5.30
PL
UF
453B
459.
Kin
ango
p R
oad
NC
C 0
459
Sun
Rd.
Muv
. G
r.0.
000.
780.
785.
00P
AU
F45
446
0. K
inar
i Roa
dN
CC
046
0B
/R.
Rd.
Rd.
B0.
000.
280.
285.
00P
UF
455
461.
Kin
oo R
oad
(1)
NC
C 0
461
J/K
. R
d.E
nd0.
000.
100.
106.
70P
CU
F45
646
2. K
inoo
Roa
d (2
)N
CC
046
2J/
K.
Rd.
End
0.00
0.30
0.30
6.70
U(E
)C
UF
457
463.
Kiri
chw
a La
neN
CC
046
3S
una.
Rd.
End
0.00
0.12
0.12
6.10
PC
UF
458
464.
Kiri
nga
Roa
dN
CC
046
4B
/R.
Rd.
End
0.00
0.11
0.11
4.00
PC
UF
459
465.
Kis
auni
Roa
dN
CC
046
5G
an.
Rd.
Gan
. R
d.0.
000.
840.
845.
30P
DU
MF
460
466.
Kite
ngel
a R
d. (
pt.1
)N
CC
046
6K
ite.
Rd.
BS
/L. R
d. B
10.
001.
061.
067.
00P
LU
BF
461
467.
Kite
ngel
a R
d. (
pt.2
)N
CC
046
7K
/K.
Rd.
S/L
. E
st.
0.00
0.53
0.53
6.00
PL
UB
F46
2
Sec
tion
or li
nkS
ectio
n or
link
desc
riptio
nch
aina
ge(k
m)
(x.x
x) Pag
e 7
of 1
0

TAB
LE 4
.3-4
(5) R
OA
D IN
VEN
TOR
Y IN
KIB
ERA
RO
AD
INVE
NTO
RY
AR
EA:
Nai
robi
ZON
E: K
iber
aG
IBB
AFR
ICA
Uni
que
Sec
tion
Ave
.R
oad
type
Roa
d U
rban
or
Pub
licC
arria
gew
ay
She
et n
o.ro
ad c
ode
or li
nkW
idth
(pav
ed/
Cla
ssR
ural
Tran
spor
tC
ondi
tion
Roa
d na
me
or n
umbe
rle
ngth
unpa
ved)
(H/P
/D/
Rou
teA
BC
Sta
rtE
ndS
tart
End
(km
) (x
.x)
(m)
(x.x
)L/
A/C
)(U
/R)
(B/M
/T)
B/F
/G(a
bcd)
(from
)(to
)(fr
om)
(to)
(P/U
)46
8. K
odi R
oad
NC
C 0
468
Gan
. A
v.G
an.
Av.
0.00
0.61
0.61
5.30
PA
UF
463
469.
Kol
obot
Cre
scen
tN
CC
046
9K
olo.
Rd.
Kol
o. R
d0.
000.
310.
314.
80P
AU
F46
447
0. K
olob
ot R
oad
NC
C 0
470
Kol
o. R
d.E
nd0.
000.
840.
845.
20P
CU
F46
547
1. K
ungu
Kar
umba
Rd.
NC
C 0
471
Lan.
Rd.
Sas
. R
d.0.
000.
800.
806.
70P
AU
MF
466
472.
Lan
gata
Rd.
(pt.1
)N
CC
047
2K
aren
Lan.
Bar
0.00
2.69
2.69
6.50
PD
UB
F46
747
3. L
anga
ta R
d. (p
t.2)
NC
C 0
473
Msa
. R
d.La
n. R
d.0.
003.
313.
317.
50P
DU
BF
468
474.
Lin
di C
lose
NC
C 0
474
Lin.
Lan
eE
nd0.
000.
080.
084.
60P
CU
F46
947
5. L
indi
Lan
eN
CC
047
5K
an. R
d.E
nd0.
000.
120.
125.
60P
CU
F47
047
6. L
ongi
nye
Roa
dN
CC
047
6M
ba. R
d.G
olf /
C0.
000.
080.
084.
00P
AU
F47
147
7. L
ongi
ri C
lose
NC
C 0
477
Kan
. Gr.
End
0.00
0.12
0.12
4.00
PC
UF
472
478.
Lon
giri
Roa
dN
CC
047
8S
una
Rd.
M/K
. R
d.0.
001.
171.
174.
20P
AU
F47
347
9. L
ongo
not R
oad
NC
C 0
479
Ken
. R
d.K
ili.
Rd.
0.00
0.32
0.32
5.30
PL
UF
474
480.
Low
er H
ill R
oad
NC
C 0
480
H/S
. A
v.K
amb.
Rd.
0.00
1.37
1.37
4.30
PU
F47
548
1. M
abok
o C
lose
NC
C 0
481
Mab
. R
d.E
nd0.
000.
100.
105.
00P
CU
F47
648
2. M
abok
o C
resc
ent
NC
C 0
482
Mab
. R
d.M
ab.
Rd.
0.00
0.53
0.53
5.00
PA
UF
477
483.
Mab
oko
Roa
dN
CC
048
3K
ite.
Rd.
Mab
. C
rc.
0.00
0.79
0.79
5.00
PA
UF
478
484.
Mai
Mah
iu R
oad
NC
C 0
484
Muh
. A
v.E
nd0.
000.
390.
395.
30P
CU
F47
948
5. M
akar
ati R
oad
NC
C 0
485
P/M
. C
rc.
P/H
. C
rc.
0.00
0.10
0.10
4.30
PU
F48
048
6. M
akin
a C
resc
ent
NC
C 0
486
Mak
. R
d.M
ak.
Rd.
0.00
0.17
0.17
4.90
PU
F48
048
7. M
akin
a R
oad
NC
C 0
487
K/S
a. J
unc.
End
0.00
0.13
0.13
5.50
PC
UF
482
488.
Mal
ibet
Roa
dN
CC
048
8M
ab.
Crs
c.M
ab.
Rd.
0.00
0.15
0.15
6.00
PU
F48
348
9. M
ara
Roa
d (1
)N
CC
048
9U
/H.
Rd.
Hos
. R
d.0.
000.
500.
504.
30P
LU
F48
449
0. M
ara
Roa
d (2
)N
CC
049
0U
/H.
Rd.
Hos
. R
d.0.
000.
500.
504.
30P
LU
F48
549
1. M
asab
a R
oad
NC
C 0
491
Bun
. R
d.K
is.
R/L
0.00
0.92
0.92
4.30
PA
UF
486
"N
CC
049
1B
un.
Rd.
Kis
. R
/L0.
921.
030.
114.
30U
(E)
AU
B48
649
2. M
atum
bato
Clo
seN
CC
049
2M
at.
Rd.
End
0.00
0.20
0.20
3.30
PC
UF
487
493.
Mat
umba
to R
oad
NC
C 0
493
L/H
. R
d.E
lg.
Rd.
0.00
0.94
0.94
5.80
PL
UF
488
494.
Mba
gath
i Roa
dN
CC
049
4M
bag.
WB
aga.
Rd.
0.00
1.44
1.44
7.00
PA
UB
F48
949
5. M
baga
thi W
ayN
CC
049
5LA
N. R
d.N
go.
Rd.
0.00
2.95
2.95
6.40
PD
UF
490
496.
Mba
ruk
Roa
dN
CC
049
6M
uc.
Dr.
Bag
a. R
d.0.
000.
750.
755.
00P
AU
F49
149
7. M
buni
Clo
seN
CC
049
7K
ang.
Rd.
End
0.00
0.11
0.11
4.70
PC
UF
492
498.
Mel
ili R
oad
NC
C 0
498
Kig
. A
v.M
sa.
Rd.
0.00
0.51
0.51
7.40
PU
F49
349
9. M
ihut
i Ave
nue
NC
C 0
499
Muh
. A
v.O
/S.
Av.
0.00
0.30
0.30
6.40
PA
UF
494
(km
) (x
.xx)
Sec
tion
or li
nkS
ectio
n or
link
desc
riptio
nch
aina
ge Pag
e 8
of 1
0

TAB
LE 4
.3-4
(5) R
OA
D IN
VEN
TOR
Y IN
KIB
ERA
RO
AD
INVE
NTO
RY
AR
EA:
Nai
robi
ZON
E: K
iber
aG
IBB
AFR
ICA
Uni
que
Sec
tion
Ave
.R
oad
type
Roa
d U
rban
or
Pub
licC
arria
gew
ay
She
et n
o.ro
ad c
ode
or li
nkW
idth
(pav
ed/
Cla
ssR
ural
Tran
spor
tC
ondi
tion
Roa
d na
me
or n
umbe
rle
ngth
unpa
ved)
(H/P
/D/
Rou
teA
BC
Sta
rtE
ndS
tart
End
(km
) (x
.x)
(m)
(x.x
)L/
A/C
)(U
/R)
(B/M
/T)
B/F
/G(a
bcd)
(from
)(to
)(fr
om)
(to)
(P/U
)50
0. M
ihut
i Clo
seN
CC
050
0M
ih.
Av.
Mih
. A
v.0.
000.
100.
104.
30P
UF
495
501.
Mih
uti C
resc
ent
NC
C 0
501
Mih
. A
v.M
ih.
Av.
0.00
0.09
0.09
4.30
PA
UF
496
502.
Mite
lo R
oad
NC
C 0
502
Mih
. A
v.M
ih.
Av.
0.00
0.27
0.27
4.30
PA
UF
497
503.
Mor
ara
Lane
NC
C 0
503
Kol
. R
d.E
nd0.
000.
090.
094.
60P
CU
F49
850
4. M
osiro
Roa
dN
CC
050
4M
bar.
Rd.
End
0.00
0.09
0.09
5.00
PC
UF
499
505.
Msu
fi R
oad
NC
C 0
505
Gan
. A
v.E
nd0.
000.
400.
406.
40U
(E)
CU
MF
500
506.
Mto
ngw
e R
oad
NC
C 0
506
Bag
. Rd.
Bag
. R
d.0.
000.
450.
457.
00P
AU
F50
150
7. M
ucai
Driv
eN
CC
050
7N
go. R
d.M
bar.
Rd.
0.00
0.53
0.53
5.00
PA
UF
502
508.
Muc
ai R
oad
NC
C 0
508
Muc
. D
r.M
bar.
Rd.
0.00
0.28
0.28
5.00
PU
F50
350
9. M
uful
u A
ve.
NC
C 0
509
O/S
. A
v.C
lub
0.00
0.27
0.27
6.40
PL
UM
F50
451
0. M
ugo
Kib
iru R
oad
NC
C 0
510
J/K
. R
d.N
go.
Rd.
0.00
0.40
0.40
7.00
PA
UB
F50
551
1. M
uhoh
o A
ve. (
pt.1
)N
CC
051
1G
an.
Av.
Pt.
20.
000.
480.
487.
40P
AU
MF
506
512.
Muh
oho
Ave
. (pt
.3)
NC
C 0
512
Muh
. A
v.E
nd0.
000.
400.
406.
40U
(G)
CU
MF
507
"
NC
C 0
512
Muh
. A
v.E
nd0.
400.
700.
306.
40U
(E)
CU
MF
507
513.
Muh
oho
Roa
d (p
t.2)
NC
C 0
513
Muh
. A
v.E
nd0.
001.
831.
836.
40P
CU
MF
508
514.
Mut
haiti
Ave
. (1)
NC
C 0
514
Lan.
Rd.
Sum
. R
d.0.
000.
270.
275.
30P
DU
MF
509
515.
Mut
haiti
Ave
. (2)
NC
C 0
515
Lan.
Rd.
Sum
. R
d.0.
000.
240.
245.
30P
DU
MF
510
516.
Mut
omo
Roa
dN
CC
051
6M
bar.
Rd.
End
0.00
0.09
0.09
5.00
PC
UF
511
517.
Muv
aa G
rove
NC
C 0
517
Kin
. R
d.M
uv.
Lan.
0.00
0.32
0.32
4.00
PU
F51
251
8. M
uvaa
Lan
eN
CC
051
8K
in.
Rd.
Muv
. G
r.0.
000.
130.
133.
80P
UF
513
519.
Mw
achu
i Roa
dN
CC
051
9B
ir. R
d.E
nd0.
000.
260.
265.
00P
UF
514
520.
Mw
enes
i Cre
scen
tN
CC
052
0M
atu.
Rd.
Mat
u. R
d0.
000.
270.
275.
30P
UF
515
521.
Mw
enes
i Gar
dens
Rd.
NC
C 0
521
Mat
u. R
d.E
nd0.
000.
450.
455.
30P
CU
F51
652
2. N
dekw
a R
oad
(pt.1
)N
CC
052
2M
uh.
Av.
Bld
gs.
0.00
0.10
0.10
4.30
PA
UF
517
523.
Nde
kwa
Roa
d (p
t.2)
NC
C 0
523
O/S
. A
v.B
ldgs
.0.
000.
110.
114.
30P
AU
F51
852
4. N
dem
i Lan
eN
CC
052
4N
go. R
d.E
nd0.
000.
160.
164.
00U
(E)
CU
F51
952
5. N
dovu
Clo
seN
CC
052
5K
ang.
Rd.
End
0.00
0.10
0.10
4.60
PC
UF
520
526.
Ngo
bit R
oad
NC
C 0
526
Bag
a. R
d.E
nd0.
000.
290.
295.
00P
CU
F52
152
7. N
gong
Lan
eN
CC
052
7N
go. R
d.La
ngi.
Rd.
0.00
0.15
0.15
4.00
U(E
)A
UF
522
528.
Nia
mey
Roa
dN
CC
052
8M
us.
Rd.
Mut
h. R
d.0.
000.
230.
235.
30P
AU
MF
523
529.
Ole
San
gale
Roa
dN
CC
052
9La
n. R
d.E
nd0.
000.
960.
967.
40P
CU
F52
453
0. O
le S
hapa
ra A
venu
eN
CC
053
0M
uh.
Av.
Muh
. A
v.0.
001.
081.
085.
30P
AU
MF
525
531.
Ole
dean
i Cre
scen
tN
CC
053
1M
at.
Rd.
Mat
. R
d.0.
000.
370.
376.
40P
AU
F52
6
(km
) (x
.xx)
Sec
tion
or li
nkS
ectio
n or
link
desc
riptio
nch
aina
ge Pag
e 9
of 1
0

TAB
LE 4
.3-4
(5) R
OA
D IN
VEN
TOR
Y IN
KIB
ERA
RO
AD
INVE
NTO
RY
AR
EA:
Nai
robi
ZON
E: K
iber
aG
IBB
AFR
ICA
Uni
que
Sec
tion
Ave
.R
oad
type
Roa
d U
rban
or
Pub
licC
arria
gew
ay
She
et n
o.ro
ad c
ode
or li
nkW
idth
(pav
ed/
Cla
ssR
ural
Tran
spor
tC
ondi
tion
Roa
d na
me
or n
umbe
rle
ngth
unpa
ved)
(H/P
/D/
Rou
teA
BC
Sta
rtE
ndS
tart
End
(km
) (x
.x)
(m)
(x.x
)L/
A/C
)(U
/R)
(B/M
/T)
B/F
/G(a
bcd)
(from
)(to
)(fr
om)
(to)
(P/U
)53
2. O
luvi
mu
Roa
dN
CC
053
2M
uh.
Av.
Sun
gu R
d0.
000.
160.
164.
30P
AU
F52
753
3. P
aa C
resc
ent
NC
C 0
533
Mus
. R
d.M
us.
Rd.
0.00
0.42
0.42
5.30
PA
UF
528
534.
Pad
hola
Clo
seN
CC
053
4B
ir. R
d.E
nd0.
000.
110.
114.
00P
CU
F52
953
5. P
ika
Ave
nue
NC
C 0
535
J/S
. A
v.E
nd0.
000.
170.
174.
00P
CU
F53
053
6. P
odo
Roa
dN
CC
053
6V
/T.
Cl.
Kin
a. R
d.0.
000.
110.
115.
00P
UF
531
537.
Poj
o C
lose
NC
C 0
537
Kam
. Rd.
D3
End
0.00
0.08
0.08
5.30
PC
UF
532
538.
Poj
o R
oad
NC
C 0
538
R/E
. R
d.D
1K
am. R
d.D
30.
000.
120.
125.
30P
UF
533
539.
Pun
da M
lia C
resc
ent
NC
C 0
539
Muh
. A
v.M
uh.
Av.
0.00
0.30
0.30
4.30
PA
UF
534
540.
Rag
ati R
oad
NC
C 0
540
Mar
a. R
d.H
/S.
Av.
0.00
0.35
0.35
3.30
PA
UF
535
541.
Rd.
AN
CC
054
1C
hw. R
d.K
olo.
Rd.
0.00
0.07
0.07
5.50
PA
UF
536
542.
Rd.
XN
CC
054
2K
an.
Rd.
End
0.00
0.09
0.09
4.60
PC
UF
537
543.
Rum
bi C
lose
NC
C 0
543
Am
i. C
l.E
nd0.
000.
150.
154.
10P
CU
F53
854
4. R
umi R
oad
NC
C 0
544
O/S
. A
v.O
/S.
Av.
0.00
0.28
0.28
4.30
PA
UF
539
545.
Sas
umua
Cre
scen
tN
CC
054
5S
as.
Rd.
Sas
. R
d.0.
000.
360.
365.
60P
AU
F54
054
6. S
asum
ua L
ane
NC
C 0
546
Sas
. R
d.E
nd0.
000.
250.
254.
80P
CU
F54
154
7. S
asum
ua R
oad
NC
C 0
547
K/K
. R
d.C
hw.
Rd.
0.00
0.75
0.75
7.00
PA
UF
542
548.
Seg
a C
lose
NC
C 0
548
Kin
. R
d.E
nd0.
000.
060.
064.
80P
CU
F54
354
9. S
udek
Gro
veN
CC
054
9Lo
n. R
d.Lo
n. R
d.0.
000.
330.
333.
50P
AU
F54
455
0. S
umba
Roa
dN
CC
055
0M
uth.
Av.
Mus
. R
d.0.
000.
290.
295.
30P
LU
F54
555
1. S
una
Roa
dN
CC
055
1A
dam
sJ/
K.
Rd.
0.00
0.38
0.38
5.60
PA
UF
546
552.
Sun
gura
Roa
dN
CC
055
2M
uh.
Av.
Kai
. R
d.0.
000.
220.
224.
30P
AU
F54
755
3. T
hogo
to R
oad
NC
C 0
553
Kab
. R
d.M
/M.
Rd.
0.00
0.15
0.15
5.30
PU
F54
855
4. T
huci
Clo
seN
CC
055
4Th
u. R
d.E
nd0.
000.
060.
064.
00P
CU
F54
955
5. T
huci
Roa
dN
CC
055
5K
ite.
Rd.
Mw
a. R
d.0.
000.
110.
115.
00P
UF
550
556.
Upp
er H
ill R
oad
NC
C 0
556
L/H
. R
d.M
atu.
Rd.
0.00
1.06
1.06
5.30
PA
UF
551
557.
Via
zu T
amu
Clo
seN
CC
055
7V
/T.
Rd.
End
0.00
0.11
0.11
4.00
PC
UF
552
558.
Via
zu T
amu
Roa
dN
CC
055
8R
d. B
Pod
o. R
d.0.
000.
130.
134.
50P
UF
553
559.
Wam
agat
a R
oad
NC
C 0
559
Kin
o R
d.R
d. G
0.00
0.27
0.27
3.50
PU
F55
456
0. W
imbi
Clo
seN
CC
056
0B
iro R
d.E
nd0.
000.
110.
114.
10P
CU
F55
5
(km
) (x
.xx)
Sec
tion
or li
nkS
ectio
n or
link
desc
riptio
nch
aina
ge Pag
e 10
of 1
0

TAB
LE 4
.3-4
(6) R
OA
D IN
VEN
TOR
Y IN
KIL
IMA
NI
RO
AD
INVE
NTO
RY
AR
EA:
Nai
robi
ZON
E: K
ilim
ani
GIB
B A
FRIC
A
Uni
que
Sec
tion
Ave
.R
oad
type
Roa
d U
rban
or
Pub
licC
arria
gew
ay
She
et n
o.ro
ad c
ode
or li
nkW
idth
(pav
ed/
Cla
ssR
ural
Tran
spor
tC
ondi
tion
Roa
d na
me
or n
umbe
rle
ngth
unpa
ved)
(H/P
/D/
Rou
teA
BC
Sta
rtE
ndS
tart
End
(km
) (x
.x)
(m)
(x.x
)L/
A/C
)(U
/R)
(B/M
/T)
B/F
/G(a
bcd)
(from
)(to
)(fr
om)
(to)
(P/U
)56
1. S
t. G
eorg
e S
. Sch
.N
CC
056
1D
/Prit
tE
nd0.
000.
110.
114.
00U
(E)
CU
B55
656
2. K
ikam
bala
-Kie
ni R
dN
CC
056
2K
IE R
d.E
nd0.
000.
720.
724.
00U
(G)
CU
F55
7
Kik
amba
la-K
ieni
Rd.
NC
C 0
562
KIE
Rd.
End
0.72
1.23
0.51
4.00
U(E
)C
UB
557
563.
Kod
hek
Clo
seN
CC
056
3A
/K R
d.E
nd0.
000.
100.
104.
00P
CU
F55
856
4. O
ff M
uthi
ora
Rd.
NC
C 0
564
H/M
/ Rd.
Git.
Rd.
0.00
1.42
1.42
5.40
PU
F55
956
5. O
pp. S
t. G
eorg
e S
ch.
NC
C 0
565
D/P
Rd.
End
0.00
0.11
0.11
4.00
PC
UF
560
566.
1st
Ngo
ng A
venu
eN
CC
056
6B
ish
Rd.
Ngo
. Rd
0.00
0.34
0.34
6.00
PA
UF
561
567.
2nd
Ngo
ng A
venu
eN
CC
056
7B
ish
Rd.
Ngo
. Rd
0.00
0.37
0.37
3.54
PA
UF
562
568.
3rd
Ngo
ng A
venu
eN
CC
056
8V
al. R
d.N
go. R
d0.
000.
520.
524.
80P
AU
F56
356
9. 4
th N
gong
Ave
nue
NC
C 0
569
Bis
h R
d.N
go. R
d0.
000.
240.
245.
54P
AU
F56
457
0. 4
th N
gong
Ave
. (R
sv.)
NC
C 0
570
Bis
h R
d.N
go. R
d0.
000.
150.
155.
57P
AU
F56
557
1. 5
th N
gong
Ave
nue
NC
C 0
571
Val
. Rd.
Ngo
. Rd
0.00
0.53
0.53
5.40
PA
UF
566
572.
Am
bose
li R
d. (p
t.1)
NC
C 0
572
Con
. Dr.
Am
b R
d.0.
000.
350.
355.
13P
DU
F56
757
3. A
mbo
seli
Rd.
(pt.2
)N
CC
057
3A
mb
Rd.
Hat
h R
d.0.
000.
550.
554.
40U
(E)
LU
B56
857
4. A
rbor
etum
Driv
eN
CC
057
4R
/R K
ileS
/H R
d.0.
001.
021.
025.
80P
LU
F56
957
5. A
rbor
etum
Rd.
NC
C 0
575
S/H
Rd.
End
0.00
0.43
0.43
4.90
PC
UF
570
576.
Arg
. Kod
hek
Rd.
1N
CC
057
6R
/R K
ileG
it. R
d.0.
000.
430.
435.
36P
DU
BF
571
577.
Arg
. Kod
hek
Rd.
2N
CC
057
7R
/R K
ileR
/B R
d.0.
002.
182.
188.
10P
DU
BF
572
578.
Arg
. Kod
hek
Rd.
3N
CC
057
8R
/B R
d.K
oro.
Rd
0.00
1.68
1.68
6.53
PD
UF
573
579.
Bis
hops
Rd.
NC
C 0
579
R/B
Rd.
Ngo
. Rd
0.00
0.97
0.97
5.80
PA
UF
574
580.
Bam
boo
Lane
NC
C 0
580
Ria
r Rd.
End
0.00
0.12
0.12
4.00
U(E
)C
UF
575
581.
Cat
hedr
al R
oad
NC
C 0
581
Ngo
. Rd.
H/S
Ave
.0.
000.
460.
467.
40P
AU
MF
576
582.
Cha
ka R
d.N
CC
058
2Le
n. R
d.A
/K R
d.0.
000.
440.
445.
63P
DU
F57
758
3. C
halb
i Driv
eN
CC
058
3C
on. D
r.C
on. R
d.0.
001.
331.
334.
30P
AU
F57
858
4. C
hani
a A
venu
eN
CC
058
4M
en. R
d.M
/G R
d.0.
000.
610.
615.
46P
AU
F57
958
5. C
hurc
h R
oad
NC
C 0
585
Wai
. Rd.
End
0.00
0.47
0.47
5.50
PC
UF
580
C
hurc
h R
oad
NC
C 0
585
Wai
. Rd.
End
0.47
0.69
0.22
5.50
U(G
)C
UG
580
586.
Cly
de G
arde
nsN
CC
058
6K
ing
Rd.
End
0.00
0.11
0.11
4.00
U(E
)C
UF
581
587.
Cov
n. D
rv. (
pt.2
)N
CC
058
7E
/M D
r.J/
G R
d.0.
001.
331.
335.
90P
DU
F58
258
8. C
ovn.
Drv
. (pt
.1)
NC
C 0
588
E/M
Dr.
End
0.00
0.52
0.52
6.80
U(G
)C
UF
583
589.
Dag
oret
ti G
arde
nsN
CC
058
9R
iar R
d.E
nd0.
000.
190.
194.
69P
CU
F58
459
0. D
avid
Osi
eli R
d.N
CC
059
0W
ai. W
y.E
nd0.
000.
800.
805.
01P
CU
F58
559
1. D
enis
Prit
t Rd.
NC
C 0
591
S/H
Rd.
Gal
. Rd.
0.00
1.72
1.72
5.80
PD
UF
586
Sec
tion
or li
nkde
scrip
tion
Sec
tion
or li
nkch
aina
ge(k
m)
(x.x
x)
Pag
e 1
of 7

TAB
LE 4
.3-4
(6) R
OA
D IN
VEN
TOR
Y IN
KIL
IMA
NI
RO
AD
INVE
NTO
RY
AR
EA:
Nai
robi
ZON
E: K
ilim
ani
GIB
B A
FRIC
A
Uni
que
Sec
tion
Ave
.R
oad
type
Roa
d U
rban
or
Pub
licC
arria
gew
ayS
heet
No.
road
cod
eor
link
Wid
th(p
aved
/C
lass
Rur
alTr
ansp
ort
cond
ition
Roa
d na
me
or n
umbe
rle
ngth
unpa
ved)
(H/P
/D/
Rou
teB
/F/G
AB
CS
tart
End
Sta
rtE
nd(k
m)
(x.x
)(m
) (x
.x)
L/A
/C)
(U/R
)(B
/M/T
)(a
bcd)
(from
)(to
)(fr
om)
(to)
(P/U
)59
2. D
iani
Roa
dN
CC
059
2O
/O R
d.E
nd0.
000.
300.
304.
00U
(E)
CU
B58
759
3. D
orob
o R
oad
NC
C 0
593
Mam
. Rd
Kiv
e. R
d0.
000.
500.
505.
60P
AU
F58
859
4. E
ast C
hurc
h R
d.N
CC
059
4R
ha. R
dLa
nt. R
d0.
000.
570.
575.
70P
UF
589
595.
Elg
eyo
Mar
akw
et R
d.N
CC
059
5N
go. R
d.E
nd0.
000.
860.
865.
58P
CU
F59
059
6. E
lmol
o D
rive
NC
C 0
596
J/G
Rd.
Con
. Dr.
0.00
0.60
0.60
6.40
PL
UF
591
597.
Ew
ason
giro
Par
kN
CC
059
7M
/R W
End
0.00
0.60
0.60
4.60
PC
UF
592
598.
Fox
Clo
seN
CC
059
8R
ha. R
dE
nd0.
000.
250.
254.
70P
CU
F59
359
9. G
alan
a R
oad
NC
C 0
599
D/P
Rd.
A/K
Rd
0.00
0.49
0.49
6.80
PL
UF
594
600.
Gar
den
Roa
dN
CC
060
0R
/S D
r.E
nd0.
000.
330.
334.
80P
CU
F59
560
1. G
atun
du C
lose
NC
C 0
601
Gat
. Rd.
End
0.00
0.19
0.19
4.60
PC
UF
596
602.
Gat
undu
Cre
sent
NC
C 0
602
Gat
. Rd.
End
0.00
0.28
0.28
4.70
PC
UF
597
603.
Gat
undu
Roa
dN
CC
060
3M
an. R
dN
ye R
d.0.
000.
840.
845.
90P
AU
F59
860
4. G
edi R
oad
NC
C 0
604
J/G
Rd.
End
0.00
0.11
0.11
5.30
PC
UF
599
605.
Gem
Lan
eN
CC
060
5M
an. R
dE
nd0.
000.
490.
495.
40P
CU
F60
060
6. G
eorg
e P
adm
ore
LnN
CC
060
6K
ind
Rd.
Ngo
. Rd
0.00
0.18
0.18
5.58
U(E
)U
B60
160
7. G
eorg
e P
adm
ore
Rd
NC
C 0
607
Ros
e A
vR
/R K
il0.
000.
770.
774.
00U
(E)
AU
F60
260
8. G
ichu
ru R
d. (p
t.1)
NC
C 0
608
Man
. Rd
Gic
h. R
d0.
000.
410.
414.
20P
UF
603
609.
Gic
huru
Rd.
(pt.2
)N
CC
060
9G
ich.
Rd
End
0.00
0.05
0.05
5.20
PC
UF
604
610.
Gita
nga
Clo
seN
CC
061
0G
it. R
d.E
nd0.
000.
160.
164.
00U
(E)
CU
B60
561
1. G
itang
a R
oad
NC
C 0
611
A/K
Rd.
Mac
h R
d0.
003.
753.
756.
95P
LU
BF
606
612.
Gith
ungu
ri R
oad
NC
C 0
612
Kil.
Rd.
Tab.
Rd
0.00
0.65
0.65
3.90
PL
UF
607
613.
Gus
ii R
oad
NC
C 0
613
Sya
. Rd
End
0.00
0.15
0.15
4.00
PC
UF
608
614.
Ham
isi R
oad
NC
C 0
614
Mug
. Rd
Sug
. Rd
0.00
0.24
0.24
3.40
PA
UF
609
615.
Hen
dred
Ave
nue
NC
C 0
615
Mba
. Av.
Kor
o. R
d0.
000.
090.
095.
50P
LU
F61
061
6. H
endr
ed A
venu
eN
CC
061
7M
ba. A
v.K
oro.
Rd
0.00
0.48
0.48
5.50
PU
F61
161
7. H
endr
ed C
lose
NC
C 0
618
Hen
. Rd
End
0.00
0.07
0.07
4.40
PC
UF
612
618.
Hur
i Clo
seN
CC
061
9Te
n. D
r.E
nd0.
000.
120.
124.
00P
CU
F61
361
9. In
verg
ara
Gro
veN
CC
062
0V
an R
d.E
nd0.
000.
110.
114.
00U
(E)
CU
B61
462
0. Is
aac
Gat
hanj
u C
ls.
NC
C 0
621
I/G R
d.E
nd0.
000.
230.
233.
88P
CU
F61
562
1. Is
aac
Gat
hanj
u R
d.N
CC
062
2J/
G R
d.C
on. D
r.0.
000.
620.
625.
75P
DU
F61
662
2. It
huru
Gar
dens
NC
C 0
623
Mak
i Rd
End
0.00
0.14
0.14
4.00
U(E
)C
UF
617
623.
Jab
avu
Roa
dN
CC
062
4C
ha. R
dW
/ld. R
d0.
001.
011.
016.
34P
AU
F61
862
4. J
acar
anda
Ave
nue
NC
C 0
625
Mut
h. R
dG
it. R
d.0.
001.
151.
155.
55P
LU
F61
9
Sec
tion
or li
nkS
ectio
n or
link
desc
riptio
nch
aina
ge(k
m)
(x.x
x)
Pag
e 2
of 7

TAB
LE 4
.3-4
(6) R
OA
D IN
VEN
TOR
Y IN
KIL
IMA
NI
RO
AD
INVE
NTO
RY
AR
EA:
Nai
robi
ZON
E: K
ilim
ani
GIB
B A
FRIC
A
Uni
que
Sec
tion
Ave
.R
oad
type
Roa
d U
rban
or
Pub
licC
arria
gew
ay
She
et n
o.ro
ad c
ode
or li
nkW
idth
(pav
ed/
Cla
ssR
ural
Tran
spor
tC
ondi
tion
Roa
d na
me
or n
umbe
rle
ngth
unpa
ved)
(H/P
/D/
Rou
teA
BC
Sta
rtE
ndS
tart
End
(km
) (x
.x)
(m)
(x.x
)L/
A/C
)(U
/R)
(B/M
/T)
B/F
/G(a
bcd)
(from
)(to
)(fr
om)
(to)
(P/U
)62
5. J
ames
Gic
huru
Rd.
NC
C 0
625
Git.
Rd.
Wai
Wy.
0.00
4.22
4.22
9.20
PD
UM
F62
062
6. K
abar
sira
n A
v.N
CC
062
6W
ai. W
y.E
nd0.
001.
311.
315.
70P
CU
F62
162
7. K
ambu
ru D
rive
NC
C 0
627
Ngo
. Rd.
G/P
. Rd.
0.00
0.34
0.34
4.00
U(E
)A
UB
622
628.
Kan
dara
Roa
d.N
CC
062
8G
at. R
d.G
ich.
Rd
0.00
0.87
0.87
5.40
PL
UF
623
629.
Kan
jata
Cre
sent
N
CC
062
9K
an. R
d.K
an. R
d.0.
000.
460.
465.
30P
AU
F62
463
0. K
anja
ta R
oad
NC
C 0
630
J/G
Rd.
W
ai W
y.0.
001.
441.
445.
20P
DU
F62
563
1. K
aput
ei G
arde
ns R
dN
CC
063
1K
ap. R
d.K
ap. R
d.0.
000.
990.
995.
55P
LU
F62
663
2. K
aput
ei R
oad
NC
C 0
632
Oth
a. R
dK
/G. R
d.0.
000.
090.
095.
30P
UF
627
633.
Kas
uku
Roa
dN
CC
063
3Le
n. R
d.Ja
b. R
d.0.
000.
350.
355.
62P
AU
F62
863
4. K
ayah
we
Roa
dN
CC
063
4D
enis
/PG
al. R
d.0.
000.
630.
635.
60P
AU
F62
963
5. K
enya
tta A
venu
eN
CC
063
5U
H/H
'Way
V/M
' Rd.
0.00
0.90
0.90
12.8
0P
LU
BF
630
636.
Kie
ni R
oad
NC
C 0
636
Kan
. Rd.
End
0.00
0.17
0.17
5.40
PC
UF
631
637.
Kik
amba
la R
oad
NC
C 0
637
Mak
. Rd.
Mw
i. R
d.0.
000.
370.
374.
50P
AU
F63
263
8. K
ilim
ani R
d. (p
t.1)
NC
C 0
638
Men
. Rd.
Kiri
. Rd.
0.00
0.27
0.27
5.22
PL
UF
633
639.
Kili
man
i Rd.
(pt.2
)N
CC
063
9K
iri. R
d.E
/M. R
d.0.
000.
280.
285.
15U
(E)
LU
B63
464
0. K
ilim
ani R
d. (p
t.3)
NC
C 0
640
E/M
Rd.
N
de. R
d.0.
000.
190.
195.
15P
LU
F63
564
1. K
ilim
ani R
d. (p
t.4)
NC
C 0
641
Nde
. Rd.
O/O
. R
d.0.
000.
370.
375.
15U
(E)
LU
B63
664
2. K
ilung
u R
d.
NC
C 0
642
Nde
. Rd.
E/M
. Rd.
0.00
0.28
0.28
5.37
PA
UF
637
643.
Kin
daru
ma
Lane
NC
C 0
643
Kin
. Rd.
Ngo
. Rd
0.00
0.18
0.18
4.00
U(E
)A
UB
638
644.
Kin
daru
ma
Rd.
(pt.1
)N
CC
064
4M
en. R
d.K
in. L
n.0.
001.
121.
124.
81U
(E)
AU
B63
964
5. K
inda
rum
a R
d. (p
t.2)
NC
C 0
645
Men
. Rd.
Kiri
. Rd.
0.00
0.41
0.41
5.48
PA
UF
640
646.
Kin
gara
Clo
seN
CC
064
6K
ing
Rd.
End
0.00
0.19
0.19
4.00
U(E
)C
UB
641
647.
Kin
gara
Roa
dN
CC
064
7N
go. R
d.G
ita. R
d.0.
001.
011.
016.
78P
AU
F64
264
8. K
irich
wa
Gra
dens
NC
C 0
648
Kiri
. Rd.
End
0.00
0.16
0.16
4.00
PC
UF
643
649.
Kiri
chw
a G
rove
NC
C 0
649
Riv
. Dr.
End
0.00
0.07
0.07
3.30
PC
UF
644
650.
Kiri
chw
a R
d. (p
t.1)
NC
C 0
650
Ngo
. Rd.
End
0.00
0.82
0.82
5.64
PC
UF
645
651.
Kiri
chw
a R
d. (p
t.2)
NC
C 0
651
A/K
. R
d.E
nd0.
000.
370.
375.
00U
(E)
CU
B64
665
2. K
ivem
ia R
oad
NC
C 0
652
S/H
. Rd.
Mam
l0.
000.
300.
305.
60P
AU
F64
765
3. K
'lesh
wa
Rin
g R
d. W
NC
C 0
653
R/S
. Dr.
K'l
R/R
0.00
0.93
0.93
4.92
PD
UF
648
654.
Kol
loh
Roa
dN
CC
065
4J/
G R
d.
Mut
h. R
d0.
000.
190.
195.
50P
AU
F64
965
5. K
omo
Lane
NC
C 0
655
W/A
v.K
il. P
/S0.
000.
130.
134.
86P
UF
650
656.
Kom
o La
neN
CC
065
6W
/Av.
End
0.00
0.12
0.12
5.74
PC
UF
651
657.
Kor
osho
Roa
dN
CC
065
7K
un. R
d.G
it. R
d.0.
000.
490.
495.
93P
LU
MF
652
Sec
tion
or li
nkS
ectio
n or
link
desc
riptio
nch
aina
ge(k
m)
(x.x
x)
Pag
e 3
of 7

TAB
LE 4
.3-4
(6) R
OA
D IN
VEN
TOR
Y IN
KIL
IMA
NI
RO
AD
INVE
NTO
RY
AR
EA:
Nai
robi
ZON
E: K
ilim
ani
GIB
B A
FRIC
A
Uni
que
Sec
tion
Ave
.R
oad
type
Roa
d U
rban
or
Pub
licC
arria
gew
ay
She
et n
o.ro
ad c
ode
or li
nkW
idth
(pav
ed/
Cla
ssR
ural
Tran
spor
tC
ondi
tion
Roa
d na
me
or n
umbe
rle
ngth
unpa
ved)
(H/P
/D/
Rou
teA
BC
Sta
rtE
ndS
tart
End
(km
) (x
.x)
(m)
(x.x
)L/
A/C
)(U
/R)
(B/M
/T)
B/F
/G(a
bcd)
(from
)(to
)(fr
om)
(to)
(P/U
)65
8. K
unde
Clo
seN
CC
065
8K
un R
d.E
nd0.
000.
170.
175.
10P
CU
F65
365
9. K
unde
Roa
dN
CC
065
9M
ba. R
d.H
en. A
v0.
000.
770.
775.
42P
UF
654
660.
Lai
kipi
a C
lose
NC
C 0
660
Lai.
Rd.
End
0.00
0.10
0.10
3.70
PC
UF
655
661.
Lai
kipi
a R
oad
NC
C 0
661
Kile
. Rd.
End
0.00
0.76
0.76
4.00
PC
UF
656
662.
Lan
gata
Lan
eN
CC
066
2La
n. R
d.E
nd0.
000.
290.
296.
40P
CU
F65
766
3. L
anta
na L
ane
NC
C 0
663
E/C
Rd.
Wai
Wy
0.00
1.20
1.20
5.50
PA
UF
658
664.
Len
ana
Roa
dN
CC
066
4G
al. R
d.R
/B.
Rd.
0.00
2.51
2.51
5.60
PD
UB
F65
966
5. L
erog
hi G
arde
nsN
CC
066
5M
ba. A
v.E
nd0.
000.
210.
214.
00U
(E)
CU
B66
066
6. L
oiya
ngal
ani D
r. N
CC
066
6C
ha. D
r.O
wa.
Rd
0.00
0.60
0.60
3.50
PA
UF
661
667.
Lor
eto
Mus
onga
ri D
rN
CC
066
7L/
M L
n.K
anj.
Rd
0.00
0.32
0.32
5.60
PU
F66
266
8. L
oret
o M
uson
gari
LnN
CC
066
8J/
G.
Rd.
End
0.00
0.09
0.09
5.40
PC
UF
663
669.
Maa
lim J
uma
Rd.
NC
C 0
669
D/P
ritt
Lena
na0.
000.
280.
284.
00U
(E)
AU
B66
467
0. M
aget
a R
oad
NC
C 0
670
Ole
n. R
dM
uth.
Rd
0.00
1.12
1.12
5.43
PL
UF
665
671.
Mah
igu
Mai
ru A
v.N
CC
067
1M
uth.
Dr
ST.
M R
d0.
000.
310.
315.
20U
(G)
LU
B66
667
2. M
aji-M
azur
i Dr.
NC
C 0
672
J/G
. R
d.M
/M R
d0.
000.
120.
125.
75P
UF
667
673.
Maj
i-Maz
uri R
d.N
CC
067
3M
bab.
Rd.
E/M
Dr.
0.00
1.09
1.09
5.25
PL
UF
668
674.
Mak
eni R
oad
NC
C 0
674
Nye
Ri
Kik
a R
d.0.
000.
310.
314.
90P
AU
F66
967
5. M
akin
di R
oad
NC
C 0
675
Ngo
. Rd.
End
0.00
0.48
0.48
4.00
U(G
)C
UB
670
676.
Mak
uyu
Ln. (
lena
na)
NC
C 0
676
Lena
naE
nd0.
000.
080.
085.
69P
CU
F67
167
7. M
amla
ka R
oad
NC
C 0
677
S/H
Rd.
Nye
. Rd
0.00
1.16
1.16
6.80
PL
UF
672
678.
Man
dera
road
NC
C 0
378
Kile
. Rd.
Gat
. Rd.
0.00
1.57
1.57
6.00
PD
UF
673
679.
Man
yani
Lan
e E
ast
NC
C 0
679
Ma.
E. R
d.E
nd0.
000.
540.
544.
70P
CU
F67
468
0. M
anya
ni R
oad
Eas
tN
CC
068
0J/
G.
Rd.
M/W
Rd
0.00
0.92
0.92
4.70
PD
UF
675
681.
Man
yani
Roa
d W
est
NC
C 0
681
Wai
. Wy.
Kab
. Av.
0.00
0.63
0.63
5.40
PD
UF
676
682.
Mar
aro
Ave
nue
NC
C 0
682
A/K
. R
d.G
ita. R
d.0.
000.
290.
294.
00U
(E)
AU
B67
768
3. M
arcu
s G
arve
y R
d. 1
NC
C 0
683
A/K
. R
d.K
ind
Rd.
0.00
0.40
0.40
5.40
U(E
)A
UB
678
684.
Mar
cus
Gar
vey
Rd.
2N
CC
068
4A
/K.
Rd.
Kin
d R
d.0.
000.
140.
145.
42P
AU
F67
968
5. M
azer
a R
oad
NC
C 0
685
Sug
. Rd.
Loi R
d.0.
000.
250.
254.
90P
UF
680
686.
Mba
azi
Roa
d (p
t.1)
NC
C 0
686
Kin
. Rd.
H/K
. Jc
0.00
0.69
0.69
4.00
U(E
)L
UB
681
687.
Mba
azi R
oad
(pt.2
)N
CC
068
7K
in. R
d.H
/K. J
c0.
000.
070.
075.
37P
UF
682
688.
Mba
bane
Roa
dN
CC
068
8J/
G.
Rd.
Muh
. Av.
0.00
0.58
0.58
5.30
PA
UF
683
689.
Mbo
oni R
oad
NC
C 0
689
Sug
. Rd.
Maz
. R
d.0.
000.
290.
294.
20P
AU
F68
469
0. M
enel
ik R
oad
NC
C 0
690
Ngo
. Rd.
A/K
. R
d.0.
000.
670.
674.
94P
LU
F68
5
Sec
tion
or li
nkS
ectio
n or
link
desc
riptio
nch
aina
ge(k
m)
(x.x
x)
Pag
e 4
of 7

TAB
LE 4
.3-4
(6) R
OA
D IN
VEN
TOR
Y IN
KIL
IMA
NI
RO
AD
INVE
NTO
RY
AR
EA:
Nai
robi
ZON
E: K
ilim
ani
GIB
B A
FRIC
A
Uni
que
Sec
tion
Ave
.R
oad
type
Roa
d U
rban
or
Pub
licC
arria
gew
ay
She
et n
o.ro
ad c
ode
or li
nkW
idth
(pav
ed/
Cla
ssR
ural
Tran
spor
tC
ondi
tion
Roa
d na
me
or n
umbe
rle
ngth
unpa
ved)
(H/P
/D/
Rou
teA
BC
Sta
rtE
ndS
tart
End
(km
) (x
.x)
(m)
(x.x
)L/
A/C
)(U
/R)
(B/M
/T)
B/F
/G(a
bcd)
(from
)(to
)(fr
om)
(to)
(P/U
)69
1. M
ilim
ani R
oad
NC
C 0
691
D/P
Rd.
K
eny.
Av
0.00
0.86
0.86
6.50
PU
F68
6
M
ilim
ani R
oad
NC
C 0
691
D/P
Rd.
K
eny.
Av
0.86
1.24
0.38
6.50
U(E
)U
B68
669
2. M
imos
a R
oad
NC
C 0
692
Chu
. Rd.
Mvu
. Rd
0.00
0.49
0.49
2.20
U(E
)A
UG
687
693.
Miji
Ken
da R
d. (p
t.1)
NC
C 0
693
Ole
. Av.
Mji
K. R
d0.
000.
290.
293.
00P
AU
F68
869
4. M
iji K
enda
Rd.
(pt.2
)N
CC
069
4M
ji K
. Rd
End
0.00
0.05
0.05
2.70
U(E
)C
UB
689
695.
Mog
oiri
Roa
dN
CC
069
5S
ug. R
dO
th. R
d0.
000.
360.
365.
00P
DU
F69
069
6. M
oudi
ri R
oad
NC
C 0
966
Man
. Rd.
Lai R
d0.
000.
260.
265.
70P
UF
691
697.
Mtit
o A
ndei
Roa
dN
CC
069
7Ja
b. R
dLe
n. R
d0.
000.
320.
324.
00U
(E)
UB
692
698.
Mug
umo
Roa
dN
CC
069
8O
le. A
v.J/
G R
d.0.
000.
990.
995.
50P
DU
F69
369
9. M
uhoy
a A
venu
eN
CC
069
9M
ba. R
dM
/M R
d0.
001.
451.
454.
65P
AU
F69
470
0. M
uhoy
a C
lose
NC
C 0
700
Muh
. Av.
End
0.00
0.20
0.20
3.30
PC
UF
695
701.
Muk
oko
Clo
seN
CC
070
11R
ha. R
dE
nd0.
000.
180.
184.
00U
(G)
CU
B69
670
2. M
urin
ga R
d. (p
t.1)
NC
C 0
702
Nde
. Rd
Men
. R
d0.
000.
290.
294.
00U
(E)
AU
B69
770
3. M
urin
ga R
d. (p
t.2)
NC
C 0
703
Nde
. Rd
Men
. R
d0.
000.
290.
295.
68P
LU
F69
870
4. M
usa
Gita
u R
oad
NC
C 0
704
Wai
. Wy.
End
0.00
0.55
0.55
5.60
PC
UF
699
705.
Mut
hang
ari C
lose
NC
C 0
705
Mut
h. R
dE
nd0.
000.
110.
114.
60P
CU
F70
070
6. M
utha
ngar
i Gar
dens
NC
C 0
706
Mut
h. R
dG
it. R
d0.
000.
520.
524.
90U
(G)
LU
B70
170
7. M
utha
ngar
i Roa
dN
CC
070
7M
ug. R
dG
it. R
d0.
001.
101.
105.
50P
DU
F70
270
8. M
vuli
Roa
dN
CC
070
8W
ai. W
y.E
/C.
Rd
0.00
0.50
0.50
5.30
PA
UF
703
709.
Mw
ingi
Roa
dN
CC
070
9K
ika.
Rd
Nye
. Rd
0.00
0.43
0.43
4.50
PA
UF
704
710.
Mzi
ma
Spr
ing
Lane
NC
C 0
710
M/s
Ln.
R/S
Rd
0.00
0.45
0.45
5.20
PA
UF
705
711.
Mzi
ma
Spr
ing
Roa
dN
CC
071
1J/
G. R
d.O
le. A
v.0.
001.
471.
475.
30P
DU
F70
671
2. N
dem
i C
lose
NC
C 0
712
Nde
. Rd
End
0.00
0.08
0.08
4.00
U(E
)C
UB
707
713.
Nde
mi R
oad
NC
C 0
713
Kil.
Rd.
Ngo
. R
d0.
000.
680.
685.
66P
AU
F70
871
4. N
doto
Roa
dN
CC
071
4J/
G. R
d.M
ug. R
d0.
000.
530.
535.
30P
LU
F70
971
5. N
gong
Roa
dN
CC
071
5K
en. A
v.N
go.
B0.
006.
896.
898.
10P
PU
BF
710
716.
Nju
mbi
Roa
dN
CC
071
6C
ha. D
r.C
ha. D
r.0.
001.
081.
083.
73P
AU
F71
171
7. N
yang
umi A
venu
eN
CC
071
7Le
n. R
dD
/Prit
t0.
000.
430.
435.
72P
DU
F71
271
8. N
yere
re R
oad
NC
C 0
718
Ken
. Av.
S/H
Rd
0.00
0.83
0.83
6.30
PA
UF
713
719.
Nye
ri C
lose
NC
C 0
719
Nye
. Rd
End
0.00
0.07
0.07
3.60
PC
UF
714
720.
Nye
ri R
oad
NC
C 0
720
Gat
. Rd.
Oth
. Rd
0.00
0.54
0.54
5.30
PA
UF
715
721.
O'w
ashi
ka R
oad
NC
C 0
721
Loi.
Dr.
I/G R
d0.
000.
880.
884.
70P
LU
F71
672
2. O
leng
uruo
ne A
v.N
CC
072
2J/
G. R
d.M
ug. R
d0.
000.
910.
916.
20P
DU
F71
7
Sec
tion
or li
nkS
ectio
n or
link
desc
riptio
nch
aina
ge(k
m)
(x.x
x)
Pag
e 5
of 7

TAB
LE 4
.3-4
(6) R
OA
D IN
VEN
TOR
Y IN
KIL
IMA
NI
RO
AD
INVE
NTO
RY
AR
EA:
Nai
robi
ZON
E: K
ilim
ani
GIB
B A
FRIC
A
Uni
que
Sec
tion
Ave
.R
oad
type
Roa
d U
rban
or
Pub
licC
arria
gew
ay
She
et n
o.ro
ad c
ode
or li
nkW
idth
(pav
ed/
Cla
ssR
ural
Tran
spor
tC
ondi
tion
Roa
d na
me
or n
umbe
rle
ngth
unpa
ved)
(H/P
/D/
Rou
teA
BC
Sta
rtE
ndS
tart
End
(km
) (x
.x)
(m)
(x.x
)L/
A/C
)(U
/R)
(B/M
/T)
B/F
/G(a
bcd)
(from
)(to
)(fr
om)
(to)
(P/U
)72
3. O
le O
dum
e R
oad
NC
C 0
723
Ngo
. Rd.
M/M
Rd.
0.00
0.67
0.67
5.60
PA
UF
718
724.
Ole
keju
ado
Roa
dN
CC
072
4G
ich.
Rd
Kan
. Rd
0.00
0.34
0.34
5.00
PU
F71
972
5. O
loito
kito
k R
oad
NC
C 0
725
Maz
. R
dO
led.
Rd
0.00
0.36
0.36
5.40
PD
UF
720
726.
Oth
aya
Roa
dN
CC
072
6G
it. R
dN
ye. R
d0.
001.
081.
086.
60P
LU
F72
172
7. P
ilidi
li w
ayN
CC
072
7R
ha. R
dE
nd0.
000.
240.
244.
40P
CU
F72
272
8. P
roce
ssio
nal W
ayN
CC
072
8K
en. A
v.H
/S A
ve.
0.00
0.80
0.80
13.0
0P
AU
F72
372
9. R
alph
Bun
che
Rd.
NC
C 0
729
S/H
Rd.
Ngo
. Rd
0.00
1.35
1.35
6.10
PL
UF
724
730.
Ram
isi R
oad
NC
C 0
730
Jac.
Rd
J/G
Rd.
0.00
0.14
0.14
5.60
PU
F72
573
1. R
hapt
a R
oad
NC
C 0
731
M/M
Rd
Lant
. Rd
0.00
2.05
2.05
5.50
PA
UF
726
732.
Ria
ra C
lose
NC
C 0
732
Ria
. R
dE
nd0.
000.
180.
184.
00U
(E)
CU
F72
773
3. R
iara
Gar
dens
N
CC
073
3R
ia.
Rd
End
0.00
0.33
0.33
4.00
U(E
)C
UF
728
734.
Ria
ra L
ane
NC
C 0
734
Ria
. R
dE
nd0.
000.
240.
244.
00U
(E)
CU
B72
973
5. R
iara
Rd.
(Kin
gara
)N
CC
073
5D
ago
Rd
Kin
g. R
d0.
000.
630.
635.
53P
LU
F73
073
6. R
iara
Roa
dN
CC
073
6K
ing
Rd.
O/O
Rd
0.00
1.47
1.47
6.61
PL
UF
731
737.
Rin
g R
oad
Kili
man
iN
CC
073
7N
go. R
d.A
/K R
d.0.
000.
820.
826.
77P
DU
BF
732
738.
Riv
ersi
de D
rive
NC
C 0
738
J/G
. R
dC
hi. R
d0.
003.
213.
216.
60P
AU
F73
373
9. R
iver
side
Gar
dens
NC
C 0
739
R/D
rE
nd0.
000.
250.
255.
40P
CU
F73
474
0. R
iver
side
Gro
veN
CC
074
0R
/Dr
End
0.00
0.24
0.24
6.30
PC
UF
735
741.
Riv
ersi
de L
ane
NC
C 0
741
R/D
rE
nd0.
000.
570.
574.
20P
CU
F73
674
2. R
iver
side
Pad
dock
sN
CC
074
2R
/Dr
R/D
r0.
000.
600.
605.
70P
UF
737
743.
Riv
ersi
de W
/Lan
eN
CC
074
3R
/Dr
End
0.00
0.15
0.15
4.00
PC
UF
738
744.
Ros
e A
venu
e (p
t.1)
NC
C 0
744
Ngo
. Rd.
A/K
Rd.
0.00
0.99
0.99
5.40
U(E
)U
B73
974
5. R
ose
Ave
nue
(pt.2
)N
CC
074
5D
/Prit
tA
/K R
d.0.
000.
350.
354.
00U
(E)
AU
F73
974
6. S
ervi
ce R
oad
NC
C 0
746
SF/
HC
Ros
e A
v.0.
000.
460.
465.
39P
AU
F74
074
7. S
iaya
Roa
dN
CC
074
7G
atu.
Rd
Gus
i Av.
0.00
0.49
0.49
4.90
PA
UF
741
748.
Spo
rts R
oad
NC
C 0
748
Mvu
Rd
Lant
. Rd
0.00
1.00
1.00
5.70
PD
UF
742
749.
St.
Mic
hael
's R
d.N
CC
074
9C
hu. R
dR
ha.
Rd
0.00
0.69
0.69
5.20
PA
UF
743
750.
Sta
te H
se. A
venu
eN
CC
075
0S
/H R
d.K
eny.
Av.
0.00
0.89
0.89
7.90
PL
UF
744
751.
Sta
te H
se. R
oad
NC
C 0
751
Nye
. Rd
D/P
ritt
0.00
3.04
3.04
7.30
PU
F74
575
2. S
tate
Hse
. Cre
sent
NC
C 0
752
S/H
Rd.
S/H
Rd.
0.00
0.51
0.51
5.60
PL
UF
746
753.
Sug
uta
Roa
dN
CC
075
3K
a G
d's
Mak
u R
d0.
000.
660.
665.
10P
AU
F74
775
4. T
aber
e C
rese
ntN
CC
075
4G
ith. R
dK
ang
Rd
0.00
0.97
0.97
4.93
PL
UF
748
755.
Tan
gund
o R
oad
NC
C 0
755
Tab.
Crs
R/R
Kile
0.00
0.29
0.29
3.90
PL
UF
749
Sec
tion
or li
nkch
aina
geS
ectio
n or
link
desc
riptio
n(k
m)
(x.x
x)
Pag
e 6
of 7

TAB
LE 4
.3-4
(6) R
OA
D IN
VEN
TOR
Y IN
KIL
IMA
NI
RO
AD
INVE
NTO
RY
AR
EA:
Nai
robi
ZON
E: K
ilim
ani
GIB
B A
FRIC
A
Uni
que
Sec
tion
Ave
.R
oad
type
Roa
d U
rban
or
Pub
licC
arria
gew
ay
She
et n
o.ro
ad c
ode
or li
nkW
idth
(pav
ed/
Cla
ssR
ural
Tran
spor
tC
ondi
tion
Roa
d na
me
or n
umbe
rle
ngth
unpa
ved)
(H/P
/D/
Rou
teA
BC
Sta
rtE
ndS
tart
End
(km
) (x
.x)
(m)
(x.x
)L/
A/C
)(U
/R)
(B/M
/T)
B/F
/G(a
bcd)
(from
)(to
)(fr
om)
(to)
(P/U
)75
6. T
ende
Driv
eN
CC
075
6M
/S R
dM
/S D
r.0.
000.
910.
915.
30P
L/A
/C)
UF
750
757.
Ter
race
Clo
seN
CC
075
7R
ha. R
d.E
nd0.
000.
270.
275.
30P
CU
F75
175
8. T
heta
Lan
eN
CC
075
8Le
n. R
dW
'L R
d0.
001.
871.
874.
00U
(E)
UF
752
759.
Tig
oni R
oad
NC
C 0
759
A/K
Rd.
C
ha R
d0.
000.
490.
495.
62P
LU
F75
376
0. T
imau
Roa
dN
CC
076
0Ti
go R
d.A
/K R
d0.
000.
220.
225.
69P
AU
F75
476
1. T
inde
ret A
venu
eN
CC
076
1G
at. R
dK
an R
d0.
000.
340.
344.
60P
UB
755
762.
Tur
bo R
oad
NC
C 0
762
Len.
Rd
Nya
Rd
0.00
0.46
0.46
4.00
U(E
)A
UF
756
763.
Val
ley
Roa
dN
CC
076
3N
go. R
dK
en. A
v0.
001.
361.
3613
.00
PD
UB
B75
776
4. V
anga
Roa
dN
CC
076
4M
ba. A
v.G
it. R
d0.
000.
420.
424.
00U
(E)
AU
F75
876
5. V
ihig
a R
oad
NC
C 0
765
Mw
i. R
dM
ak.
Rd
0.00
0.37
0.37
5.15
PA
UF
759
766.
Wes
tland
Ave
nue
NC
C 0
766
Spo
r. R
dD
/O R
d0.
000.
460.
465.
50P
AU
F76
076
7. W
ood
Ave
nue
NC
C 0
767
Len.
Rd
Kin
Rd
0.00
0.97
0.97
5.27
PL
UF
761
768.
Woo
d G
arde
nN
CC
076
8W
ood
Av
End
0.00
0.13
0.13
4.77
PC
UF
762
769.
Woo
dlan
ds R
oad
NC
C 0
769
A/K
Rd.
D
/Prit
t0.
001.
001.
005.
74P
AU
B76
377
0. Y
arro
w G
rove
NC
C 0
770
Ria
. R
d.E
nd0.
000.
130.
134.
00U
(E)
AU
F76
4
(km
) (x
.xx)
desc
riptio
nS
ectio
n or
link
Sec
tion
or li
nkch
aina
ge
Pag
e 7
of 7

TAB
LE 4
.3-4
(7) R
OA
D IN
VEN
TOR
Y IN
LA
NG
ATA
RO
AD
INVE
NTO
RY
AR
EA:
Nai
robi
ZON
E: L
anga
taG
IBB
AFR
ICA
Uni
que
Sec
tion
Ave
.R
oad
type
Roa
d U
rban
or
Pub
licC
arria
gew
ay
She
et n
o.ro
ad c
ode
or li
nkW
idth
(pav
ed/
Cla
ssR
ural
Tran
spor
tC
ondi
tion
Roa
d na
me
or n
umbe
rle
ngth
unpa
ved)
(H/P
/D/
Rou
teA
BC
Sta
rtE
ndS
tart
End
(km
) (x
.x)
(m)
(x.x
)L/
A/C
)(U
/R)
(B/M
/T)
B/F
/G(a
bcd)
(from
)(to
)(fr
om)
(to)
(P/U
)77
1. W
ater
T. W
orks
NC
C 0
771
Coo
p. C
olW
/T. W
rk0.
000.
490.
494.
00U
(E)
AU
MB
765
772.
Fr.
Lang
ata
Rd.
Rda
NC
C 0
772
Lan.
Rd
End
0.00
1.26
1.26
4.00
PC
UF
766
773.
Avo
cado
Lan
eN
CC
077
3M
ag. R
dK
ipe.
Rd
0.00
0.53
0.53
3.50
U(E
)U
B76
777
4. B
anda
Lan
eN
CC
077
4K
ib. R
dM
uk. R
d0.
001.
261.
264.
90U
(G)
LU
B76
877
5. B
ogan
i Eas
t Roa
dN
CC
077
5B
og. R
d.M
ag. R
d0.
001.
781.
784.
50U
(E)
AU
F76
977
6. B
ogan
i Roa
dN
CC
077
6K
ar. R
dLa
n. S
. Rd
0.00
3.82
3.82
4.50
PA
UM
B77
077
7. C
hui L
ane
NC
C 0
777
Koi
Rd
End
0.00
0.42
0.42
2.70
PC
UB
771
778.
Cra
mti
Roa
dN
CC
077
8P
on. R
dK
ulu.
Rd
0.00
0.30
0.30
4.00
U(G
)U
F77
277
9. D
ik D
ik L
ane
NC
C 0
779
Lam
. Rd
End
0.00
0.22
0.22
3.10
PC
UB
773
780.
Dor
obo
Roa
dN
CC
078
0M
uk. R
dE
nd0.
000.
750.
754.
55U
(E)
CU
F77
478
1. D
uma
Roa
dN
CC
078
1N
yu. R
dE
nd0.
000.
220.
225.
25P
CU
B77
578
2. F
ores
t Edg
e R
oad
NC
C 0
782
Lan.
Rd
End
0.00
1.58
1.58
3.70
PC
UF
776
For
est E
dge
Roa
dN
CC
078
2La
n. R
dE
nd1.
582.
000.
423.
70U
(E)
CU
B77
678
3. G
ogo
Falls
Lan
eN
CC
078
3G
/F R
dE
nd0.
000.
280.
284.
00P
CU
B77
778
4. G
ogo
Falls
Roa
dN
CC
078
4K
oit.
Rd
Dum
a R
d0.
000.
380.
384.
00U
(E)
LU
B77
878
5. K
asul
u D
rive
NC
C 0
785
Bog
. Rd.
End
0.00
0.78
0.78
4.10
U(G
)C
UF
779
786.
Kaw
imbi
Roa
dN
CC
078
6La
n. R
dE
nd0.
001.
301.
304.
00U
(E)
CU
B78
078
7. K
ibem
be L
ane
NC
C 0
787
Kib
. Rd
Mag
a. R
d0.
000.
580.
583.
73U
(E)
AU
B78
178
8. K
ibem
be R
oad
NC
C 0
788
Kib
o. R
dB
an L
n0.
000.
900.
903.
90U
(E)
LU
B78
278
9. K
ibo
Lane
NC
C 0
789
M/W
. Rd
End
0.00
0.69
0.69
4.70
U(G
)C
UB
783
790.
Kib
oko
Roa
dN
CC
079
0K
ipe.
Rd
Muk
o. R
d0.
001.
181.
183.
75U
(E)
UB
784
791.
Kik
enni
Driv
e N
CC
079
1K
ike.
Rd
End
0.00
0.45
0.45
4.90
PC
UB
785
792.
Kik
enni
Lan
e (p
t.1)
NC
C 0
792
Tum
. Rd
Kik
e. L
n0.
000.
370.
373.
00U
(G)
UB
786
793.
Kik
enni
Lan
e (p
t.2)
NC
C 0
793
Kik
e. R
dTu
m. R
d0.
000.
460.
463.
00U
(E)
UF
787
794.
Kik
enni
Roa
dN
CC
079
4M
uk. R
dD
oro.
Rd
0.00
0.90
0.90
4.70
PA
UF
788
795.
Kim
a R
oad
NC
C 0
795
Tum
. Rd
End
0.00
0.70
0.70
5.30
PC
UF
789
796.
Kip
evu
Roa
dN
CC
079
6M
ag. R
dU
sh. R
d0.
001.
551.
554.
30P
LU
B79
079
7. K
oito
bos
Roa
dN
CC
079
7M
il. R
dU
sh. R
d0.
002.
162.
165.
20P
LU
F79
179
8. K
ongo
ni R
oad
NC
C 0
798
Kul
o. R
dU
sh. R
d0.
000.
410.
414.
00U
(G)
UB
792
799.
Kos
oim
o R
oad
NC
C 0
799
Nde
. Rd
End
0.00
1.05
1.05
3.80
PC
UB
793
800.
Kul
o R
oad
NC
C 0
800
Cra
. Rd
End
0.00
1.14
1.14
4.00
U(G
)C
UB
794
801.
Kum
be R
oad
NC
C 0
801
Bog
. Rd.
End
0.00
0.52
0.52
4.00
U(E
)C
UB
795
802.
Kw
arar
a R
oad
NC
C 0
802
Mba
. Rd
Nde
. Rd
0.00
0.61
0.61
4.00
U(E
)A
UB
796
Sec
tion
or li
nkS
ectio
n or
link
desc
riptio
nch
aina
ge(k
m)
(x.x
x)
Pag
e 1
of 3

TAB
LE 4
.3-4
(7) R
OA
D IN
VEN
TOR
Y IN
LA
NG
ATA
RO
AD
INVE
NTO
RY
AR
EA:
Nai
robi
ZON
E: L
anga
taG
IBB
AFR
ICA
Uni
que
Sec
tion
Ave
.R
oad
type
Roa
d U
rban
or
Pub
licC
arria
gew
ay
She
et n
o.ro
ad c
ode
or li
nkW
idth
(pav
ed/
Cla
ssR
ural
Tran
spor
tC
ondi
tion
Roa
d na
me
or n
umbe
rle
ngth
unpa
ved)
(H/P
/D/
Rou
teA
BC
Sta
rtE
ndS
tart
End
(km
) (x
.x)
(m)
(x.x
)L/
A/C
)(U
/R)
(B/M
/T)
B/F
/G(a
bcd)
(from
)(to
)(fr
om)
(to)
(P/U
)80
3. L
amw
ia R
oad
NC
C 0
803
Mili
. Rd
Koi
t. R
d0.
001.
961.
964.
20P
AU
B79
780
4. L
anga
ta N
orth
Lan
eN
CC
080
4La
n R
dK
if. R
d0.
001.
351.
353.
80U
(E)
UB
798
805.
Lan
gata
Roa
d (1
)N
CC
080
5N
go/K
are
Uh/
Ms'
r0.
004.
824.
825.
50P
DU
BF
799
806.
Lan
gata
Roa
d (2
)N
CC
080
6N
go/K
are
Uh/
Ms'
r0.
004.
674.
675.
50P
DU
BF
800
807.
Lan
gata
Sou
thN
CC
080
7La
n. R
dK
if. R
d0.
002.
682.
685.
20P
L/A
/C)
UF
801
808.
Mas
ai L
ane
NC
C 0
808
M/W
. Rd
Bog
. Rd
0.00
0.64
0.64
5.00
PA
UF
802
809.
Mas
ai R
oad
NC
C 0
809
Ush
. Rd
M/W
Rd.
0.00
0.61
0.61
5.00
U(E
)A
UB
803
810.
Mas
ai W
est R
oad
NC
C 0
810
Ush
. Rd
Mas
ai L
n.0.
001.
691.
694.
50P
AU
MF
804
811.
Mba
gath
i Lan
eN
CC
081
1M
ili. R
dE
nd0.
000.
280.
283.
35P
CU
F80
581
2. M
bani
Roa
dN
CC
081
2B
og. R
d.K
wa.
Rd
0.00
0.76
0.76
4.00
U(E
)U
B80
681
3. M
dodo
Lan
eN
CC
081
3La
n. R
dE
nd0.
000.
370.
373.
65P
CU
F80
7
M
dodo
Lan
eN
CC
081
3La
n. R
dE
nd0.
370.
690.
323.
65U
(E)
CU
B80
781
4. M
ilim
a R
oad
NC
C 0
814
Kim
a. R
dE
nd0.
002.
012.
014.
00P
CU
F80
881
5. M
okoy
eti E
ast R
oad
NC
C 0
815
Lan.
Rd
Mok
'w/R
d0.
001.
251.
254.
00U
(E)
UB
809
816.
Mok
oyet
i Wes
t Roa
dN
CC
081
6La
n. R
dM
ok'w
/Rd
0.00
1.48
1.48
3.80
U(E
)U
B81
081
7. M
uhut
i Roa
dN
CC
081
7M
un. R
dE
nd0.
000.
690.
694.
90P
CU
F81
181
8. M
uiri
Lane
NC
C 0
818
Lan.
Rd
Mui
. Rd
0.00
0.49
0.49
4.60
PA
UF
812
819.
Mui
ri R
oad
NC
C 0
819
F/E
Rd
End
0.00
0.46
0.46
4.14
PC
UF
813
M
uiri
Roa
dN
CC
081
9F/
E R
dE
nd0.
461.
040.
584.
14U
(E)
CU
B81
382
0. M
ukin
duri
Roa
dN
CC
082
0F/
E R
dE
nd0.
000.
480.
483.
80P
CU
F81
4
Muk
indu
ri R
oad
NC
C 0
820
F/E
Rd
End
0.48
1.10
0.62
3.80
U(G
)C
UB
814
M
ukin
duri
Roa
dN
CC
082
0F/
E R
dE
nd1.
101.
360.
263.
80U
(E)
CU
B81
482
1. M
ukom
a R
oad
NC
C 0
821
F/E
Rd
End
0.00
1.50
1.50
4.30
PC
UB
815
M
ukom
a R
oad
NC
C 0
821
F/E
Rd
End
1.50
2.15
0.65
4.30
U(E
)C
UF
815
822.
Mun
dere
ndu
Roa
dN
CC
082
2D
oro.
Rd
End
0.00
0.43
0.43
3.55
PC
UF
816
M
unde
rend
u R
oad
NC
C 0
822
Dor
o. R
dE
nd0.
430.
590.
163.
55U
(E)
CU
F81
682
3. M
uris
hu R
oad
NC
C 0
823
F/E
Rd
End
0.00
0.52
0.52
3.50
PC
UF
817
824.
Mut
amai
yu R
oad
NC
C 0
824
Dor
o. R
dE
nd0.
000.
390.
395.
00P
CU
F81
8
Mut
amai
yiu
Roa
dN
CC
082
4D
oro.
Rd
End
0.39
0.48
0.09
5.00
U(G
)C
UB
818
825.
Nde
ge R
oad
NC
C 0
825
Lan.
Rd
Bog
. Rd
0.00
2.28
2.28
4.32
PL
UB
819
826.
Ndo
vu R
oad
NC
C 0
826
Kip
e. R
dE
nd0.
000.
730.
734.
00P
CU
F82
082
7. N
yum
bu R
oad
NC
C 0
827
Dum
a R
dK
ima.
Rd
0.00
0.42
0.42
5.40
PU
F82
182
8. N
zohe
Roa
dN
CC
082
8B
og. R
d.K
alu.
Rd
0.00
0.67
0.67
4.00
U(E
)U
B82
2
Sec
tion
or li
nkS
ectio
n or
link
desc
riptio
nch
aina
ge(k
m)
(x.x
x)
Pag
e 2
of 3

TAB
LE 4
.3-4
(7) R
OA
D IN
VEN
TOR
Y IN
LA
NG
ATA
RO
AD
INVE
NTO
RY
AR
EA:
Nai
robi
ZON
E: L
anga
taG
IBB
AFR
ICA
Uni
que
Sec
tion
Ave
.R
oad
type
Roa
d U
rban
or
Pub
licC
arria
gew
ay
She
et n
o.ro
ad c
ode
or li
nkW
idth
(pav
ed/
Cla
ssR
ural
Tran
spor
tC
ondi
tion
Roa
d na
me
or n
umbe
rle
ngth
unpa
ved)
(H/P
/D/
Rou
teA
BC
Sta
rtE
ndS
tart
End
(km
) (x
.x)
(m)
(x.x
)L/
A/C
)(U
/R)
(B/M
/T)
B/F
/G(a
bcd)
(from
)(to
)(fr
om)
(to)
(P/U
)82
9. P
ongu
Roa
dN
CC
082
9Ta
n. R
dE
nd0.
000.
290.
294.
00U
(G)
CU
F82
383
0. Q
uarr
y La
neN
CC
083
0B
og. R
d.E
nd0.
000.
710.
713.
20P
CU
F82
4
Qua
rry
Lane
NC
C 0
830
Bog
. Rd.
End
0.71
1.30
0.59
3.20
U(G
)C
UF
824
831.
Sim
ba H
ill R
oad
NC
C 0
831
Koi
t. R
dM
/K R
d0.
000.
520.
523.
85P
LU
B82
583
2. T
anda
la R
oad
NC
C 0
832
Bog
. Rd.
Pon
. Rd
0.00
0.46
0.46
4.00
U(G
)U
B82
683
3. T
embo
Roa
dN
CC
083
3U
sh. R
dK
oi.
Rd
0.00
0.32
0.32
6.10
PA
UF
827
834.
Tom
ilane
Roa
dN
CC
083
4K
ong.
Rd
End
0.00
0.17
0.17
4.00
U(G
)C
UB
828
835.
Tum
bili
Roa
dN
CC
083
5K
ike
Rd
End
0.00
0.73
0.73
5.30
PC
UF
829
836.
Tw
iga
Hill
Roa
dN
CC
083
6U
sh. R
dK
oit.
Rd
0.00
0.90
0.90
4.20
PL
UF
830
837.
Ush
irika
Roa
dN
CC
083
7K
ip.
Rd
Mas
a. R
d0.
002.
582.
584.
80P
LU
MF
831
(km
) (x
.xx)
Sec
tion
or li
nkS
ectio
n or
link
desc
riptio
nch
aina
ge
Pag
e 3
of 3

TAB
LE 4
.3-4
(8) R
OA
D IN
VEN
TOR
Y IN
MA
KA
DA
RA
RO
AD
INVE
NTO
RY
AR
EA:
Nai
robi
ZON
E: M
akad
ara
GIB
B A
FRIC
A
Uni
que
Sec
tion
Ave
.R
oad
type
Roa
d U
rban
or
Pub
licC
arria
gew
ay
She
et n
o.ro
ad c
ode
or li
nkW
idth
(pav
ed/
Cla
ssR
ural
Tran
spor
tC
ondi
tion
Roa
d na
me
or n
umbe
rle
ngth
unpa
ved)
(H/P
/D/
Rou
teA
BC
Sta
rtE
ndS
tart
End
(km
) (x
.x)
(m)
(x.x
)L/
A/C
)(U
/R)
(B/M
/T)
B/F
/G(a
bcd)
(from
)(to
)(fr
om)
(to)
(P/U
)83
8. G
olde
n G
ate
Dr.
NC
C 0
838
Mw
a. R
d.E
nd0.
000.
420.
425.
30P
CU
F83
083
9. G
olde
n G
ate,
Rd.
AN
CC
083
9K
ap.
Rd.
End
0.00
0.73
0.73
5.40
PC
UF
831
840.
Indu
stria
l, R
d. A
NC
C 0
840
0.00
0.19
0.19
6.80
PU
F83
284
1. In
dust
rial,
Rd.
CN
CC
084
1E
nt.
Rd.
Rd.
C4
0.00
0.63
0.63
7.50
PA
UF
833
842.
Indu
stria
l, R
d. C
2N
CC
084
2R
d. C
1E
nd0.
000.
300.
307.
50P
CU
F83
484
3. In
dust
rial,
Rd.
C3
NC
C 0
843
Rd.
C6
Rd.
C4
0.00
0.56
0.56
7.80
PL
UF
835
844.
Indu
stria
l, R
d. C
4N
CC
084
4R
d. C
Rd.
C3
0.00
0.48
0.48
8.10
PA
UF
836
845.
Indu
stria
l, R
d. C
5N
CC
084
5R
d. C
3E
nd0.
000.
500.
507.
40P
CU
F83
784
6. In
dust
rial,
Rd.
C6
NC
C 0
846
Rd.
C2
Rd.
C3
0.00
0.31
0.31
7.50
PL
UF
838
847.
Indu
stria
l, R
d. C
7N
CC
084
7R
d. C
1R
d. C
40.
000.
180.
187.
80P
LU
F83
984
8. In
dust
rial,
Rd.
DN
CC
084
8R
d. C
4V
et/S
ta.
0.00
0.40
0.40
4.00
U(E
)U
F84
084
9. In
dust
rial,
Rd.
D1
NC
C 0
849
Rd.
DK
en. V
et0.
000.
290.
294.
00U
(E)
UF
841
850.
Indu
stria
l, R
d. E
NC
C 0
850
Ent
. R
d.E
nd0.
000.
270.
276.
50P
CU
F84
285
1. K
alol
eni E
st.
Rd.
AN
CC
085
1S
ta.
Rd.
S.
Bin
. S0.
000.
320.
324.
00P
AU
F84
385
2. K
alol
eni E
st.
Rd.
BN
CC
085
2S
ta.
Rd.
Njia
Kuu
0.00
0.27
0.27
4.30
PA
UF
844
853.
Kal
olen
i Est
. R
d. C
NC
C 0
853
S. B
in. S
Mas
a. L
n.0.
000.
110.
114.
30P
AU
F84
585
4. K
alol
eni E
st.
Rd.
DN
CC
085
4Jo
g. R
d.N
jia K
uu0.
000.
300.
304.
80P
AU
F84
685
5. K
alol
eni E
st.
Rd.
EN
CC
085
5Jo
g. R
d.N
jia K
uu0.
000.
160.
165.
70P
AU
F84
785
6. L
unga
Lun
ga R
d. B
NC
C 0
856
L/L.
Rd.
L/L.
Rd.
0.00
0.34
0.34
9.00
PA
UF
848
857.
Lus
aka
Rd,
Rd.
DN
CC
085
7W
/S.
Rd.
W/S
. R
d.0.
000.
490.
497.
00P
DU
BF
849
858.
Lus
aka
Rd,
Rd.
FN
CC
085
8S
/L.
Rd.
Dun
. R
d.0.
000.
270.
277.
00P
UB
F85
085
9. M
akon
geni
Est
. R
d. A
NC
C 0
859
J/R
. Fe
nR
d. B
0.00
0.77
0.77
4.00
PA
UF
851
860.
Mak
onge
ni E
st.
Rd.
BN
CC
086
0Fe
n. K
al.
Fen.
R/W
0.00
0.54
0.54
6.00
PA
UF
852
861.
Mak
onge
ni E
st.
Rd.
CN
CC
086
1M
ain
Gat
eE
nd0.
000.
750.
756.
00P
CU
F85
386
2. M
akon
geni
Est
. R
d. D
NC
C 0
862
Rd.
CE
nd0.
000.
320.
326.
00P
CU
F85
486
3. M
akon
geni
Est
. R
d. E
NC
C 0
863
Rd.
CE
nd0.
000.
310.
314.
00P
CU
F85
586
4. M
akon
geni
Est
. R
d. F
NC
C 0
864
Rd.
CE
nd0.
000.
320.
324.
00P
CU
F85
686
5. M
akon
geni
Est
. R
d. G
NC
C 0
865
Rd.
CE
nd0.
000.
320.
325.
00P
CU
F85
786
6. M
akon
geni
Est
. R
d. H
NC
C 0
866
Rd.
CR
d. C
0.00
0.96
0.96
6.00
PA
UF
858
867.
Mak
onge
ni E
st.
Rd.
JN
CC
086
7R
d. H
Rd.
H0.
000.
150.
156.
00P
UF
859
868.
Mak
onge
ni E
st.
Rd.
KN
CC
086
8R
d. C
Rd.
H0.
000.
420.
426.
00P
UF
860
869.
Mak
onge
ni E
st.
Rd.
LN
CC
086
9R
d. H
Rd.
K0.
000.
310.
316.
00P
UF
861
870.
Mak
onge
ni E
st.
Rd.
MN
CC
087
0K
al.
Fen.
Rd.
C0.
000.
490.
495.
00P
UF
862
(km
) (x
.xx)
Sec
tion
or li
nkS
ectio
n or
link
desc
riptio
nch
aina
ge Pag
e 1
of 7

TAB
LE 4
.3-4
(8) R
OA
D IN
VEN
TOR
Y IN
MA
KA
DA
RA
RO
AD
INVE
NTO
RY
AR
EA:
Nai
robi
ZON
E: M
akad
ara
GIB
B A
FRIC
A
Uni
que
Sec
tion
Ave
.R
oad
type
Roa
d U
rban
or
Pub
licC
arria
gew
ay
She
et n
o.ro
ad c
ode
or li
nkW
idth
(pav
ed/
Cla
ssR
ural
Tran
spor
tC
ondi
tion
Roa
d na
me
or n
umbe
rle
ngth
unpa
ved)
(H/P
/D/
Rou
teA
BC
Sta
rtE
ndS
tart
End
(km
) (x
.x)
(m)
(x.x
)L/
A/C
)(U
/R)
(B/M
/T)
B/F
/G(a
bcd)
(from
)(to
)(fr
om)
(to)
(P/U
)87
1. M
akon
geni
Est
. R
d. N
NC
C 0
871
Kal
. Fe
n.R
d. C
0.00
0.42
0.42
5.00
PA
UF
863
872.
Mak
onge
ni E
st.
Rd.
QN
CC
087
2K
al.
Fen.
Rd.
C0.
000.
420.
426.
00P
AU
F86
487
3. M
akon
geni
Est
. R
d. R
NC
C 0
873
Kal
. Fe
n.R
d. C
0.00
0.42
0.42
6.00
PA
UF
865
874.
Mak
onge
ni E
st.
Rd.
SN
CC
087
4K
al.
Fen.
Rd.
C0.
000.
420.
426.
00P
AU
F86
687
5. M
akon
geni
Est
. R
d. T
NC
C 0
875
Kal
. Fe
n.R
d. C
0.00
0.42
0.42
6.00
PA
UF
867
876.
Mak
onge
ni E
st.
Rd.
UN
CC
087
6Jo
g. F
en.
I/A.
Fen
0.00
0.70
0.70
6.00
PA
UF
868
877.
Riv
erba
nk E
st.
Rd.
AN
CC
087
7A
ok. R
d.R
d. B
0.00
0.22
0.22
5.00
PU
F86
987
8. R
iver
bank
Est
. R
d. B
NC
C 0
878
Rd.
AR
d. D
0.00
0.38
0.38
5.00
PU
F87
087
9. R
iver
bank
Est
. R
d. C
NC
C 0
879
Rd.
BE
nd0.
000.
320.
325.
00P
CU
F87
188
0. R
iver
bank
Est
. R
d. D
NC
C 0
880
Rd.
CE
nd0.
000.
270.
275.
00P
CU
F87
288
1. F
r. S
hule
Rd,
Rd.
19
NC
C 0
881
Shu
l. R
d.E
nd0.
000.
110.
114.
60P
CU
F87
388
2. F
r. S
hule
Rd,
Rd.
20
NC
C 0
882
Shu
l. R
d.E
nd0.
000.
080.
084.
60P
CU
F87
488
3. F
r. U
aso
Rd,
Rd.
14
NC
C 0
883
Uas
o R
d.M
ut.
Rd.
0.00
0.10
0.10
5.40
PU
F87
588
4. A
ddis
Aba
ba R
oad
NC
C 0
884
Ent
. R
d.E
nd0.
000.
480.
486.
00P
CU
F87
688
5. A
mas
ya C
resc
ent
NC
C 0
885
M/S
. R
d.M
/S.
Rd.
0.00
0.82
0.82
7.70
PU
F87
788
6. A
oko
Roa
dN
CC
088
6M
wa.
Rd.
Mch
. R
d.0.
000.
480.
486.
70P
AU
F87
888
7. A
thi R
iver
Roa
dN
CC
088
7A
/B.
Rd.
End
0.00
0.42
0.42
6.00
PC
UF
879
888.
Bam
buri
Roa
dN
CC
088
8E
nt.
Rd.
End
0.00
0.52
0.52
6.50
PC
UF
880
889.
Ban
dari
Roa
dN
CC
088
9D
un.
Rd.
End
0.00
0.26
0.26
6.00
PC
UF
881
890.
Bar
aza
Roa
dN
CC
089
0H
am.
Rd.
Ham
. R
d.0.
000.
610.
614.
40P
AU
F88
289
1. B
aric
ho ro
adN
CC
089
1B
un.
Rd.
Lus.
Rd.
0.00
0.58
0.58
8.00
PD
UF
883
892.
Bar
ingo
Roa
dN
CC
089
2N
gi.
Rd.
Jin.
Rd.
0.00
0.13
0.13
4.30
PA
UF
884
893.
Bon
do R
oad
NC
C 0
893
Dun
. R
d.E
nd0.
000.
150.
155.
00P
CU
F88
589
4. B
umba
ni R
oad
NC
C 0
894
M/S
. R
d.E
nd0.
000.
580.
586.
00P
CU
F88
689
5. B
ungo
ma
Roa
dN
CC
089
5B
ar.
Rd.
End
0.00
0.20
0.20
7.00
PC
UF
887
896.
Bun
yala
Roa
dN
CC
089
6C
om.
Rd.
UH
. H
/W0.
000.
540.
549.
00P
DU
MF
888
897.
Bus
ama
Clo
seN
CC
089
7S
hu.
Rd.
B/B
. R
d.0.
000.
090.
094.
70P
UF
889
898.
Bus
ia R
oad
NC
C 0
898
Ent
. R
d.E
nt.
Rd.
0.00
0.64
0.64
9.00
PA
UF
890
899.
But
ere
Roa
dN
CC
089
9C
hu.
Rd.
Ban
. R
d.0.
000.
530.
538.
00P
LU
F89
190
0. C
hang
amw
e R
oad
NC
C 0
900
Ent
. R
d.E
nd0.
000.
660.
666.
40P
LU
F89
290
1. C
harle
s N
ew R
oad
NC
C 0
901
Nile
Rd.
Rab
a. R
d.0.
000.
890.
896.
60P
AU
F89
390
2. C
hege
Kab
iru R
oad
NC
C 0
902
Lai.
Rd.
Mum
. R
d.0.
000.
440.
446.
30P
AU
F89
490
3. C
hepk
erio
Roa
dN
CC
090
3H
ol.
Rd.
Lus.
Rd.
0.00
0.32
0.32
7.00
PL
UF
895
(km
) (x
.xx)
Sec
tion
or li
nkS
ectio
n or
link
desc
riptio
nch
aina
ge Pag
e 2
of 7

TAB
LE 4
.3-4
(8) R
OA
D IN
VEN
TOR
Y IN
MA
KA
DA
RA
RO
AD
INVE
NTO
RY
AR
EA:
Nai
robi
ZON
E: M
akad
ara
GIB
B A
FRIC
A
Uni
que
Sec
tion
Ave
.R
oad
type
Roa
d U
rban
or
Pub
licC
arria
gew
ay
She
et n
o.ro
ad c
ode
or li
nkW
idth
(pav
ed/
Cla
ssR
ural
Tran
spor
tC
ondi
tion
Roa
d na
me
or n
umbe
rle
ngth
unpa
ved)
(H/P
/D/
Rou
teA
BC
Sta
rtE
ndS
tart
End
(km
) (x
.x)
(m)
(x.x
)L/
A/C
)(U
/R)
(B/M
/T)
B/F
/G(a
bcd)
(from
)(to
)(fr
om)
(to)
(P/U
)90
4. C
hogo
ria R
oad
NC
C 0
904
Dun
. R
d.E
nd0.
000.
260.
266.
00P
CU
F89
690
5. C
huka
Roa
dN
CC
090
5D
ar.
Rd.
But
e. R
d.0.
000.
110.
117.
00P
UF
897
906.
Cle
soi C
lose
NC
C 0
906
Cle
. R
d.E
nd0.
000.
210.
217.
50P
CU
F89
890
7. C
leso
i Roa
dN
CC
090
7L/
L. R
d.C
le.
Cl
0.00
0.55
0.55
7.50
PU
F89
990
8. C
omm
erci
al S
treet
NC
C 0
908
Bun
y. R
d.E
nd0.
001.
021.
029.
00P
CU
F90
090
9. D
ai D
ai R
oad
NC
C 0
909
Zan.
Rd.
Mko
. R
d.0.
000.
570.
576.
60P
LU
F90
191
0. D
akar
Roa
dN
CC
091
0E
nt.
Rd.
End
0.00
0.67
0.67
5.00
PC
UF
902
911.
Dar
-Es-
Sal
aam
Roa
dN
CC
091
1D
un.
Rd.
Ent
. R
d.0.
000.
730.
7310
.00
PD
UF
903
912.
Don
dori
Roa
dN
CC
091
2D
un.
Rd.
S/L
. R
d.0.
000.
280.
287.
00P
AU
F90
491
3. D
unga
Roa
dN
CC
091
3M
/D.
Rd.
W/S
. R
d.0.
000.
630.
639.
00P
DU
F90
591
4. E
na R
oad
NC
C 0
914
Nzu
i. R
d.E
nd0.
000.
040.
045.
60P
CU
F90
691
5. E
nter
pris
e R
oad
(pt.1
)N
CC
091
5M
sa.
Rd.
Lagu
t0.
000.
780.
789.
80P
PU
MF
907
916.
Ent
erpr
ise
Roa
d (p
t.2)
NC
C 0
916
Lagu
tIs
io.
Rd.
0.78
2.12
1.34
7.00
PP
UM
F90
891
7. E
nter
pris
e R
oad
(pt.3
)N
CC
091
7Fa
c. S
t.Is
io.
Rd.
2.12
4.15
2.03
18.0
0P
PU
MF
909
918.
Fac
tory
Stre
etN
CC
091
8B
un.
Rd.
Ent
. R
d.0.
001.
301.
307.
00P
AU
F91
091
9. F
unzi
Roa
dN
CC
091
9E
nt.
Rd.
End
0.00
0.91
0.91
6.00
PC
UF
911
920.
Gak
oe R
oad
NC
C 0
920
Cle
. R
d.E
nd0.
000.
390.
397.
00U
(G)
CU
F91
292
1. G
aris
sa R
oad
NC
C 0
921
Ngi
. R
d.N
ji. R
d.0.
000.
170.
173.
50P
AU
F91
392
2. G
ilgil
Roa
dN
CC
092
2E
nt.
Rd.
End
0.00
0.81
0.81
6.40
PC
UF
914
923.
Gur
a C
lose
NC
C 0
923
C/N
. R
d.E
nd0.
000.
070.
074.
70P
CU
F91
592
4. G
uthe
ra C
resc
ent
NC
C 0
924
Sor
e. R
d.G
/G.
Dr.
0.00
0.29
0.29
4.00
PA
UF
916
925.
Gut
hera
Lan
eN
CC
092
5S
ore.
Ln.
Gut
h. C
rc.
0.00
0.07
0.07
5.00
PA
UF
917
926.
Had
esa
Clo
seN
CC
092
6S
ore.
Rd.
End
0.00
0.20
0.20
5.00
U(G
)C
UF
918
927.
Ham
za R
oad
NC
C 0
927
Jog.
Rd.
Jog.
Rd.
0.00
1.12
1.12
5.50
PL
UM
F91
992
8. H
ola
Roa
dN
CC
092
8B
ar.
Rd.
Che
p. R
d.0.
000.
200.
207.
00P
AU
F92
092
9. H
oma
Bay
Roa
dN
CC
092
9E
nt.
Rd.
End
0.00
0.64
0.64
6.30
PC
UF
921
930.
Hom
be R
oad
NC
C 0
930
Bar
. R
d.E
nd0.
000.
140.
146.
70P
CU
F92
293
1. H
ono
Clo
seN
CC
093
1H
ono.
Crc
.E
nd0.
000.
220.
224.
70P
CU
F92
393
2. H
ono
Cre
scen
tN
CC
093
2S
hu.
Rd.
Hon
o. C
rs.
0.00
0.76
0.76
5.30
PA
UF
924
933.
Hon
o R
oad
NC
C 0
933
Shu
. R
d.H
ono.
Crs
.0.
000.
170.
175.
40P
AU
F92
593
4. Is
iolo
Roa
dN
CC
093
4E
nt.
Rd.
End
0.00
0.49
0.49
6.00
PC
UF
926
935.
Jiro
re R
oad
NC
C 0
935
Ent
. R
d.E
nd0.
000.
290.
297.
10P
CU
F92
793
6. J
ogoo
Roa
dN
CC
093
6La
ndhi
esO
/R.
Rd.
0.00
3.65
3.65
13.6
0P
PU
BF
928
(km
) (x
.xx)
Sec
tion
or li
nkS
ectio
n or
link
desc
riptio
nch
aina
ge Pag
e 3
of 7

TAB
LE 4
.3-4
(8) R
OA
D IN
VEN
TOR
Y IN
MA
KA
DA
RA
RO
AD
INVE
NTO
RY
AR
EA:
Nai
robi
ZON
E: M
akad
ara
GIB
B A
FRIC
A
Uni
que
Sec
tion
Ave
.R
oad
type
Roa
d U
rban
or
Pub
licC
arria
gew
ay
She
et n
o.ro
ad c
ode
or li
nkW
idth
(pav
ed/
Cla
ssR
ural
Tran
spor
tC
ondi
tion
Roa
d na
me
or n
umbe
rle
ngth
unpa
ved)
(H/P
/D/
Rou
teA
BC
Sta
rtE
ndS
tart
End
(km
) (x
.x)
(m)
(x.x
)L/
A/C
)(U
/R)
(B/M
/T)
B/F
/G(a
bcd)
(from
)(to
)(fr
om)
(to)
(P/U
)93
7. K
abiru
Roa
dN
CC
093
7D
ai D
ai R
dD
ai D
ai R
d0.
000.
290.
296.
00P
AU
F92
993
8. K
abra
s R
oad
NC
C 0
938
Muk
. R
d.E
nd0.
000.
200.
205.
00P
CU
F93
093
9. K
ampa
la R
d. (p
t.1)
NC
C 0
939
Ent
. R
d.E
nd0.
000.
580.
586.
90P
CU
F93
194
0. K
ampa
la R
d. (p
t.2)
NC
C 0
940
Ent
. R
d.E
nd0.
581.
360.
786.
30P
CU
F93
294
1. K
apiti
Cre
scen
tN
CC
094
1K
api.
Rd.
Kap
i. R
d.0.
000.
300.
304.
70P
AU
F93
394
2. K
apiti
Roa
dN
CC
094
2M
ko.
Rd.
M/A
. R
d.0.
000.
710.
716.
50P
AU
F93
494
3. K
atul
o R
oad
NC
C 0
943
M/S
. R
d.R
abai
. Rd.
0.00
0.51
0.51
5.30
PA
UF
935
944.
Ken
dong
Roa
dN
CC
094
4D
ai D
ai R
dD
ai D
ai R
d0.
000.
300.
304.
60P
AU
F93
694
5. K
hang
a R
oad
NC
C 0
945
Nzu
i R
d.E
nd0.
000.
100.
105.
70P
CU
F93
794
6. K
ilifi
Clo
seN
CC
094
6K
ili.
Rd.
Sor
e. R
d.0.
000.
220.
224.
80P
AU
F93
894
7. K
ilim
ambo
go R
oad
NC
C 0
947
Jog.
Rd.
Njia
Rd.
0.00
0.44
0.44
6.00
PL
UF
939
948.
Kitu
i Roa
dN
CC
094
8K
am.
Rd.
End
0.00
0.94
0.94
6.40
PC
UF
940
949.
Kiv
u R
oad
NC
C 0
949
Uas
o. R
d.R
ui.
Crs
.0.
000.
600.
604.
70P
AU
F94
195
0. K
rapf
Roa
dN
CC
095
0N
ji. R
d.Ji
n. R
d.0.
000.
250.
257.
00P
AU
F94
295
1. L
aibo
n R
oad
NC
C 0
951
C/K
. R
d.E
nd0.
000.
520.
524.
70P
CU
F94
395
2. L
ambw
e C
lose
NC
C 0
952
C/N
. R
d.E
nd0.
000.
130.
134.
70P
CU
F94
495
3. L
anet
Roa
dN
CC
095
3C
hep.
Rd.
Bar
i. R
d.0.
000.
200.
207.
00P
DU
F94
595
4. L
aset
Roa
dN
CC
095
4M
uta.
Rd.
End
0.00
0.24
0.24
4.50
PC
UF
946
955.
Lik
oni R
oad
NC
C 0
955
Ent
. R
d.Jo
g. R
d.0.
002.
172.
179.
00P
DU
MF
947
956.
Lok
itaun
g R
oad
NC
C 0
956
Lik.
Rd.
Lusi
. R
d.0.
000.
620.
626.
70P
UF
948
957.
Lon
dian
i Rd.
(pt.1
)N
CC
095
7Li
k. R
d.Li
k. R
d.0.
000.
090.
096.
70P
AU
F94
995
8. L
ondi
ani R
d. (p
t.2)
NC
C 0
958
Lik.
Rd.
Lik.
Rd.
0.09
0.43
0.34
6.70
U(E
)A
UF
950
959.
Luk
a R
oad
NC
C 0
959
Mak
. A
v.M
ak.
Av.
0.00
0.41
0.41
3.90
PA
UF
951
960.
Luk
ose
Driv
eN
CC
096
0In
si.
Rd.
Msa
. R
d.0.
000.
140.
145.
50P
UF
952
961.
Lun
ga L
unga
Roa
dN
CC
096
1Jo
g. R
d.Li
ko.
Rd.
0.00
3.97
3.97
9.00
PP
UM
F95
396
2. L
unga
Lun
ga R
oad
AN
CC
096
2L/
L. R
d.E
nd0.
000.
190.
196.
80P
CU
F95
496
3. L
unga
Lun
ga R
oad
CN
CC
096
3R
d. D
End
0.00
0.28
0.28
7.00
PC
UF
955
"
NC
C 0
963
Rd.
DE
nd0.
280.
630.
357.
00U
(E)
CU
B95
596
4. L
unga
Lun
ga R
oad
EN
CC
096
4S
asa
Rd.
Rd.
D0.
000.
580.
587.
50P
UF
956
965.
Lun
ga L
unga
Roa
d F
NC
C 0
965
Loki
. R
d.Lo
ki.
Rd
0.00
0.59
0.59
6.50
PU
F95
796
6. L
usak
a C
lose
NC
C 0
966
Pem
. S
t.E
nd0.
000.
210.
215.
00P
CU
F95
896
7. L
usak
a R
oad
(pt.1
)N
CC
096
7M
sa. R
d.E
nt.
Rd.
0.00
1.23
1.23
12.5
0P
DU
MF
959
968.
Lus
aka
Roa
d (p
t.2)
NC
C 0
968
Ent
. R
d.Jo
g. R
d.1.
232.
150.
9213
.40
PD
UM
F96
0
(km
) (x
.xx)
Sec
tion
or li
nkS
ectio
n or
link
desc
riptio
nch
aina
ge Pag
e 4
of 7

TAB
LE 4
.3-4
(8) R
OA
D IN
VEN
TOR
Y IN
MA
KA
DA
RA
RO
AD
INVE
NTO
RY
AR
EA:
Nai
robi
ZON
E: M
akad
ara
GIB
B A
FRIC
A
Uni
que
Sec
tion
Ave
.R
oad
type
Roa
d U
rban
or
Pub
licC
arria
gew
ay
She
et n
o.ro
ad c
ode
or li
nkW
idth
(pav
ed/
Cla
ssR
ural
Tran
spor
tC
ondi
tion
Roa
d na
me
or n
umbe
rle
ngth
unpa
ved)
(H/P
/D/
Rou
teA
BC
Sta
rtE
ndS
tart
End
(km
) (x
.x)
(m)
(x.x
)L/
A/C
)(U
/R)
(B/M
/T)
B/F
/G(a
bcd)
(from
)(to
)(fr
om)
(to)
(P/U
)96
9. L
usak
a R
oad
CN
CC
096
9Lu
s. R
d.E
nd0.
000.
810.
817.
00P
CU
F96
197
0. L
usin
geti
Roa
dN
CC
097
0Li
k. R
d.Lo
ki.
Rd
0.00
0.14
0.14
6.70
PU
F96
297
1. M
acha
kos
Roa
dN
CC
097
1E
nt.
Rd.
W/S
. R
d.0.
000.
680.
686.
00P
DU
F96
397
2. M
aend
eleo
Roa
dN
CC
097
2H
am.
Rd.
Ham
. R
d.0.
001.
061.
064.
30P
AU
F96
497
3. M
akad
ara
Ave
nue
NC
C 0
973
Ham
. R
d.H
am.
Rd.
0.00
0.48
0.48
4.80
PU
F96
597
4. M
aria
kani
Gar
dens
NC
C 0
974
Mar
. R
d.E
nd0.
000.
270.
275.
60P
CU
F96
697
5. M
aria
kani
road
NC
C 0
975
Muk
. R
d.G
ar.
Rd.
0.00
0.05
0.05
5.60
PA
UF
967
976.
Maz
inga
Roa
dN
CC
097
6S
ore.
Rd.
End
0.00
0.36
0.36
4.60
PC
UF
968
977.
Mch
umbi
Roa
dN
CC
097
7A
oko.
Rd.
Muk
. R
d.0.
000.
510.
514.
50P
LU
F96
997
8. M
fum
biri
Roa
dN
CC
097
8M
wa.
Rd.
P/V
. R
d.0.
000.
190.
194.
00P
UF
970
979.
Mig
wan
i Roa
dN
CC
097
9E
nt.
Rd.
Nya
h. R
d.0.
000.
630.
637.
50P
UF
971
980.
Mko
ma
Roa
dN
CC
098
0M
uke.
Rd.
Kap
i. R
d.0.
000.
420.
426.
60P
DU
F97
298
1. M
ogad
ishu
Roa
dN
CC
098
1L/
L. R
d.E
nd0.
000.
610.
617.
00P
CU
F97
398
2. M
omba
sa R
oad
(pt.2
)N
CC
098
2M
sa. R
d.N
yayo
Sta
.0.
002.
102.
1016
.00
PH
UB
F97
498
3. M
ukan
du R
oad
NC
C 0
983
Shi
. R
d.M
uk.
Rd.
0.00
0.33
0.33
5.00
PA
UF
975
984.
Muk
enia
Roa
dN
CC
098
4D
ung.
Rd.
Mch
. R
d.0.
000.
750.
7510
.00
PD
UF
976
985.
Muk
iranj
a R
oad
NC
C 0
985
Mak
o. F
e.N
jia K
uu0.
000.
180.
184.
20P
AU
F97
798
6. M
ulun
ga C
lose
NC
C 0
986
Sor
e. R
d.E
nd0.
000.
110.
114.
00P
CU
F97
898
7. M
umbi
Clo
seN
CC
098
7M
um.
Rd.
End
0.00
0.10
0.10
4.80
PC
UF
979
988.
Mum
bi C
resc
ent
NC
C 0
988
Mum
. R
d.La
i. R
d.0.
000.
150.
155.
00P
AU
F98
098
9. M
umbi
Lan
eN
CC
098
9M
um.
Rd.
End
0.00
0.10
0.10
5.00
PC
UF
981
990.
Mum
bi R
oad
NC
C 0
990
Rab
ai R
d.La
ibon
Rd.
0.00
0.35
0.35
6.50
PA
UF
982
991.
Mum
ias
Sou
th R
oad
NC
C 0
991
Mum
. R
d.R
aba.
Rd.
0.00
2.56
2.56
7.20
PA
UF
983
992.
Mus
ingu
Clo
seN
CC
099
2C
/N.
Rd.
End
0.00
0.22
0.22
4.50
PC
UF
983
993.
Mut
anda
Roa
dN
CC
099
3R
abai
Rd.
Lase
. R
d.0.
000.
280.
285.
30P
UF
984
994.
Mut
oini
Roa
dN
CC
099
4K
ivu.
Rd.
Rui
. C
rs.
0.00
0.27
0.27
5.00
PA
UF
985
995.
Mw
ange
ka R
oad
NC
C 0
995
Sor
e. R
d.S
ore.
Rd.
0.00
0.56
0.56
6.40
PA
UF
986
996.
Mw
embe
re R
oad
NC
C 0
996
Uho
. R
d.M
uk.
Rd.
0.00
0.32
0.32
6.00
PA
UF
987
997.
Nan
yuki
road
NC
C 0
997
L/L.
Rd.
Mog
a. R
d.0.
002.
312.
316.
50P
DU
F98
899
8. N
dum
be R
oad
NC
C 0
998
D R
d.E
nd0.
000.
360.
366.
50P
CU
F98
999
9. N
giri
Roa
dN
CC
099
9Ji
n. R
d.N
jiw.
Rd.
0.00
1.18
1.18
4.25
PL
UF
990
"
NC
C 0
999
Jin.
Rd.
Njiw
. R
d.1.
181.
340.
164.
25U
(E)
LU
BB
990
1000
. Nile
Roa
dN
CC
100
0Jo
g. R
d.B
/B.
Rd.
0.00
1.32
1.32
7.20
PP
UF
991
(km
) (x
.xx)
Sec
tion
or li
nkS
ectio
n or
link
desc
riptio
nch
aina
ge Pag
e 5
of 7

TAB
LE 4
.3-4
(8) R
OA
D IN
VEN
TOR
Y IN
MA
KA
DA
RA
RO
AD
INVE
NTO
RY
AR
EA:
Nai
robi
ZON
E: M
akad
ara
GIB
B A
FRIC
A
Uni
que
Sec
tion
Ave
.R
oad
type
Roa
d U
rban
or
Pub
licC
arria
gew
ay
She
et n
o.ro
ad c
ode
or li
nkW
idth
(pav
ed/
Cla
ssR
ural
Tran
spor
tC
ondi
tion
Roa
d na
me
or n
umbe
rle
ngth
unpa
ved)
(H/P
/D/
Rou
teA
BC
Sta
rtE
ndS
tart
End
(km
) (x
.x)
(m)
(x.x
)L/
A/C
)(U
/R)
(B/M
/T)
B/F
/G(a
bcd)
(from
)(to
)(fr
om)
(to)
(P/U
)10
01. N
jia K
uu R
oad
NC
C 1
001
Kal
. R
d.Lo
op.
Rd.
0.00
0.65
0.65
4.30
PA
UF
992
1002
. Njiw
a R
oad
NC
C 1
002
Lik.
Fen
.N
gi.
Rd.
0.00
0.83
0.83
4.70
PL
UF
993
"
NC
C 1
002
Lik.
Fen
.N
gi.
Rd.
0.83
1.12
0.29
4.70
U(E
)L
UB
F99
310
03. N
yahe
ra R
oad
NC
C 1
003
L/L.
Rd.
End
0.00
0.29
0.29
7.00
PC
UF
994
1004
. Nzi
u R
oad
NC
C 1
004
Mum
. R
d.M
/S.
Rd.
0.00
0.50
0.50
5.30
PU
F99
510
05. O
l Don
yo L
enga
i Rd.
NC
C 1
005
M/S
. R
d.M
/S.
Rd.
0.00
0.60
0.60
6.80
PA
UF
996
1006
. Ol D
onyo
Sab
uk R
d.N
CC
100
6M
/S.
Rd.
M/S
. R
d.0.
000.
670.
676.
90P
AU
F99
710
07. O
l Kal
ou R
oad
NC
C 1
007
Nan
. R
d.E
nd0.
000.
470.
477.
50P
CU
F99
810
08. P
ate
Roa
dN
CC
100
8L/
L. R
d.E
nd0.
000.
490.
497.
00P
CU
F99
910
09. P
lain
s V
iew
Roa
dN
CC
100
9S
ore.
Rd.
Uw
a. R
d.0.
000.
670.
676.
00P
LU
F10
0010
10. R
abai
Roa
dN
CC
101
0Jo
g. R
d.M
/S.
Rd.
0.00
1.70
1.70
7.10
PD
UF
1001
1011
. Ran
gwe
Clo
seN
CC
101
1S
er.
Rd.
End
0.00
0.13
0.13
7.50
PC
UF
1002
1012
. Ran
gwe
Roa
dN
CC
101
2L/
L. R
d.S
er.
Rd.
0.00
0.15
0.15
7.50
PU
F10
0310
13. R
ev. S
ymek
ha R
oad
NC
C 1
013
Kat
u. R
d.E
nd0.
000.
470.
475.
30P
CU
F10
0410
14. R
uiru
aka
Cre
scen
tN
CC
101
4U
aso
Rd.
Uas
o. R
d.0.
001.
691.
694.
80P
AU
F10
0510
15. R
ukw
a R
oad
NC
C 1
015
Rui
Crs
.R
ui.
Crs
.0.
000.
620.
626.
50P
UF
1006
1016
. Sad
i Roa
dN
CC
101
6K
api R
d.K
api.
Rd.
0.00
0.30
0.30
4.50
PA
UF
1007
1017
. Sal
im A
li B
in S
alim
Rd.
NC
C 1
017
Sta
. R
d.N
jia K
uu0.
000.
270.
274.
00P
AU
F10
0810
18. S
asio
Roa
d (p
t.1)
NC
C 1
018
Ser
. R
d.L/
L. R
d.0.
000.
260.
267.
00P
DU
F10
0910
19. S
asio
Roa
d (p
t.2)
NC
C 1
019
P/L
. D
ep.
L/L.
Rd.
0.26
1.08
0.82
7.50
PD
UF
1010
1020
. Sem
e R
oad
NC
C 1
020
Ham
. Rd.
Ham
. R
d.0.
000.
630.
634.
70P
AU
F10
1110
21. S
erem
Clo
seN
CC
102
1L/
L. R
d.S
as.
Rd.
0.00
0.19
0.19
7.50
PL
UF
1012
1022
. Ser
em R
oad
NC
C 1
022
L/L.
Rd.
Sas
. R
d.0.
000.
880.
887.
50P
LU
F10
1310
23. S
hiku
nga
Roa
dN
CC
102
3M
uk. R
d.M
ak.
Rd.
0.00
0.32
0.32
5.00
PA
UF
1014
1024
. Shu
le C
lose
NC
C 1
024
C/N
Rd.
End
0.00
0.22
0.22
4.70
PC
UF
1015
1025
. Shu
le R
oad
NC
C 1
025
Rab
a. R
d.N
ya.
Rd.
0.00
0.76
0.76
6.80
PA
UF
1016
1026
. Sor
e D
rive
NC
C 1
026
Sor
e. L
n.M
azi.
Rd.
0.00
0.38
0.38
5.00
PU
F10
1710
27. S
ore
Lane
NC
C 1
027
Maz
. R
d.M
sa.
Rd.
0.00
0.06
0.06
5.00
PU
F10
1810
28. S
ore
Roa
dN
CC
102
8M
sa. R
d.K
api.
Rd.
0.00
0.71
0.71
6.65
PD
UF
1019
1029
. Sot
ik R
oad
NC
C 1
029
Bun
. R
d.H
ola.
Rd.
0.00
0.17
0.17
6.00
U(G
)U
BF
1020
1030
. Sta
dium
Roa
dN
CC
103
0Jo
g. R
d.E
nd0.
000.
900.
906.
00P
CU
F10
2110
31. T
ana
Cre
scen
tN
CC
103
1B
/B.
Rd.
B/B
. R
d.0.
000.
400.
405.
30P
AU
F10
2210
32. T
inda
Clo
seN
CC
103
2C
/New
Rd
End
0.00
0.15
0.15
4.80
PC
UF
1023
(km
) (x
.xx)
Sec
tion
or li
nkS
ectio
n or
link
desc
riptio
nch
aina
ge Pag
e 6
of 7

TAB
LE 4
.3-4
(8) R
OA
D IN
VEN
TOR
Y IN
MA
KA
DA
RA
RO
AD
INVE
NTO
RY
AR
EA:
Nai
robi
ZON
E: M
akad
ara
GIB
B A
FRIC
A
Uni
que
Sec
tion
Ave
.R
oad
type
Roa
d U
rban
or
Pub
licC
arria
gew
ay
She
et n
o.ro
ad c
ode
or li
nkW
idth
(pav
ed/
Cla
ssR
ural
Tran
spor
tC
ondi
tion
Roa
d na
me
or n
umbe
rle
ngth
unpa
ved)
(H/P
/D/
Rou
teA
BC
Sta
rtE
ndS
tart
End
(km
) (x
.x)
(m)
(x.x
)L/
A/C
)(U
/R)
(B/M
/T)
B/F
/G(a
bcd)
(from
)(to
)(fr
om)
(to)
(P/U
)10
33. U
holo
Roa
dN
CC
103
3M
wa.
Rd.
Msa
. R
d.0.
000.
610.
616.
00P
AU
F10
2410
34. U
kwal
a R
oad
NC
C 1
034
P/V
iew
Rd.
P/V
iew
Rd.
0.00
0.43
0.43
5.00
PA
UF
1025
1035
. Vija
na R
oad
NC
C 1
035
Jog.
Rd.
Mak
. Fen
0.00
0.07
0.07
6.00
PL
UF
1026
1036
. Voi
Clo
seN
CC
103
6S
hu.
Rd.
End
0.00
0.13
0.13
5.00
PC
UF
1027
1037
. Wai
ga C
lose
NC
C 1
037
C/N
ew. R
dE
nd0.
000.
110.
114.
70P
CU
F10
2810
38. W
ajir
Roa
dN
CC
103
8B
and.
Rd.
Cho
g. R
d.0.
000.
130.
136.
00P
AU
F10
2910
39. W
itu R
oad
NC
C 1
039
Lus.
Rd.
End
0.00
0.15
0.15
6.70
U(G
)C
UB
F10
3010
40. W
orks
hops
Roa
dN
CC
104
0D
un.
Rd.
Bun
y. R
d.0.
000.
280.
288.
00P
AU
F10
3110
41. W
unda
nyi R
oad
NC
C 1
041
Nan
. R
d.E
nd0.
000.
530.
539.
00P
CU
F10
3210
42. Y
anga
Roa
dN
CC
104
2M
wa.
Rd.
End
0.00
0.06
0.06
7.00
PC
UF
1033
1043
. Zan
ziba
r Roa
dN
CC
104
3S
ore.
Rd.
Dai
Dai
Rd.
0.00
0.34
0.34
6.60
PA
UF
1034
(km
) (x
.xx)
Sec
tion
or li
nkS
ectio
n or
link
desc
riptio
nch
aina
ge Pag
e 7
of 7

TAB
LE 4
.3-4
(9) R
OA
D IN
VEN
TOR
Y IN
MA
THA
RE
RO
AD
INVE
NTO
RY
AR
EA:
Nai
robi
ZON
E: M
atha
reG
IBB
AFR
ICA
Uni
que
Sec
tion
Ave
.R
oad
type
Roa
d U
rban
or
Pub
licC
arria
gew
ay
She
et
road
cod
eor
link
Wid
th(p
aved
/C
lass
Rur
alTr
ansp
ort
Con
ditio
nN
o.R
oad
nam
e or
num
ber
leng
thun
pave
d)(H
/P/D
/R
oute
AB
CS
tart
End
Sta
rtE
nd(k
m)
(x.x
)(m
) (x
.x)
L/A
/C)
(U/R
)(B
/M/T
)B
/F/G
(abc
d)(fr
om)
(to)
(from
)(to
)(P
/U)
1044
. Bre
wer
y R
d. A
NC
C 1
044
O/R
Rd.
Rd.
B0.
000.
250.
256.
00P
AU
B10
3510
45. B
rew
ery
Rd.
BN
CC
104
5Th
ika
Rd
Hen
kel
0.00
0.47
0.47
6.80
PA
UB
1036
1046
. Bre
wer
y R
d. D
NC
C 1
046
Rd.
CB
/G.
Rd.
0.00
0.61
0.61
4.00
U(E
)A
UB
1037
1047
. Bre
wer
y R
d. C
NC
C 1
047
Rd.
BE
nd0.
000.
140.
146.
40P
CU
B10
3810
48. D
rive-
In R
d. 1
NC
C 1
048
Rd.
3R
d. 2
0.00
0.20
0.20
5.10
PA
UF
1039
1049
. Driv
e-In
Rd.
10
NC
C 1
049
Rd.
7R
d. 6
0.00
0.11
0.11
5.10
PA
UB
1040
1050
. Driv
e-In
Rd.
11
NC
C 1
050
Rd.
8R
d. 2
0.00
0.47
0.47
5.10
PL
UF
1041
1051
. Driv
e-In
Rd.
1B
NC
C 1
051
Rd.
BE
nd0.
000.
260.
265.
10P
CU
B10
4210
52. D
rive-
In R
d. 2
NC
C 1
052
Rd.
1R
d. 1
10.
000.
120.
125.
10P
AU
B10
4310
53. D
rive-
In R
d. 3
NC
C 1
053
Rd.
2R
d. 1
10.
000.
120.
125.
10P
AU
F10
4410
54. D
rive-
In R
d. 4
NC
C 1
054
Rd.
11
Rd.
50.
000.
100.
105.
10P
AU
F10
4510
55. D
rive-
In R
d. 5
NC
C 1
055
Rd.
4E
nd0.
000.
080.
085.
10P
CU
B10
4610
56. D
rive-
In R
d. 6
NC
C 1
056
Rd.
11
Rd.
10
0.00
0.07
0.07
5.10
PA
UF
1047
1057
. Driv
e-In
Rd.
7N
CC
105
7R
d. 2
Rd.
11
0.00
0.13
0.13
5.10
PA
UF
1048
1058
. Driv
e-In
Rd.
8N
CC
105
8R
d. 9
Rd.
11
0.00
0.10
0.10
5.10
PA
UB
1049
1059
. Driv
e-In
Rd.
9N
CC
105
9R
d. 7
Rd.
80.
000.
080.
085.
10P
AU
F10
5010
60. D
rive-
In R
d. A
NC
C 1
060
Rd.
1E
nd0.
000.
510.
515.
10U
(E)
CU
F10
5110
61. D
rive-
In R
d. B
NC
C 1
061
Rd.
AR
d. C
0.00
1.00
1.00
6.35
PL
UF
1052
1062
. Driv
e-In
Rd.
CN
CC
106
2R
d. B
Rd.
D0.
000.
220.
226.
00P
AU
B10
5310
63. D
rive-
In R
d. D
NC
C 1
063
Rd.
CE
nd0.
000.
250.
256.
10P
CU
BB
1054
1064
. Driv
e-In
Rd.
4A
NC
C 1
064
Rd.
4B
End
0.00
0.11
0.11
5.10
PC
UB
B10
5510
65. D
rive-
In R
d. 4
BN
CC
106
5R
d. 4
AR
d. 4
E0.
000.
150.
155.
10P
AU
B10
5610
66. D
rive-
In R
d. 4
CN
CC
106
6R
d. 4
BR
d. 4
D0.
000.
080.
085.
10P
AU
B10
5710
67. D
rive-
In R
d. 4
DN
CC
106
7R
d. 4
CR
d. 4
E0.
000.
140.
145.
10P
AU
B10
5810
68. D
rive-
In R
d. 4
EN
CC
106
8R
d. 4
DR
d. 4
B0.
000.
120.
125.
10P
AU
B10
5910
69. D
rive-
In R
d. 5
BN
CC
106
9R
d. 4
End
0.00
0.12
0.12
5.10
PC
UB
1060
1070
. Driv
e-In
Rd.
ZN
CC
107
0R
d. 4
Rd.
4A
0.00
0.05
0.05
5.10
PA
UB
1061
1071
. Gar
den
Est
. R
d. C
NC
C 1
071
Rd.
CE
nd0.
001.
221.
225.
00U
(E)
CU
B10
6210
72. G
arde
n E
st.
Rd.
DN
CC
107
2G
/E.
Rd.
End
0.00
0.25
0.25
4.90
PC
UB
1063
1073
. Gar
den
Est
. R
d. E
NC
C 1
073
G/E
. R
d.E
nd0.
000.
290.
295.
00U
(G)
CU
B10
6410
74. G
arde
n E
st.
Rd.
FN
CC
107
4G
/E.
Rd.
End
0.00
0.18
0.18
5.00
PC
UB
1065
1075
. Gar
den
Est
. R
d. G
NC
C 1
075
G/E
. R
d.R
/W.
Rd.
0.00
1.35
1.35
5.00
U(E
)U
B10
6610
76. G
arde
n E
st.
Rd.
HN
CC
107
6G
/E.
Rd.
Mar
u. R
d0.
000.
250.
255.
00U
(E)
UB
1067
Sec
tion
or li
nkS
ectio
n or
link
desc
riptio
nch
aina
ge(k
m)
(x.x
x)
Pag
e 1
of 6

TAB
LE 4
.3-4
(9) R
OA
D IN
VEN
TOR
Y IN
MA
THA
RE
RO
AD
INVE
NTO
RY
AR
EA:
Nai
robi
ZON
E: M
atha
reG
IBB
AFR
ICA
Uni
que
Sec
tion
Ave
.R
oad
type
Roa
d U
rban
or
Pub
licC
arria
gew
ay
She
et n
o.ro
ad c
ode
or li
nkW
idth
(pav
ed/
Cla
ssR
ural
Tran
spor
tC
ondi
tion
Roa
d na
me
or n
umbe
rle
ngth
unpa
ved)
(H/P
/D/
Rou
teA
BC
Sta
rtE
ndS
tart
End
(km
) (x
.x)
(m)
(x.x
)L/
A/C
)(U
/R)
(B/M
/T)
B/F
/G(a
bcd)
(from
)(to
)(fr
om)
(to)
(P/U
)10
77. G
ithur
ai E
. R
d. G
NC
C 1
077
N/T
Rd.
Kam
. R
d0.
000.
100.
106.
40P
AU
B10
68
"N
CC
107
7N
/T R
d.K
am.
Rd
0.10
0.73
0.63
6.40
U(G
)A
UB
1068
"
NC
C 1
077
N/T
Rd.
Kam
. R
d0.
731.
640.
916.
40U
(E)
AU
B10
6810
78. G
ithur
ai E
. R
d. H
NC
C 1
078
G.
Rd
End
0.00
0.21
0.21
3.50
U(E
)C
UB
1069
1079
. Gith
urai
E.
Rd.
IN
CC
107
9G
. R
dE
nd0.
000.
330.
333.
30U
(E)
CU
B10
7010
80. G
ithur
ai E
. R
d. J
NC
C 1
080
G.
Rd
End
0.00
0.45
0.45
3.50
U(E
)C
UB
1071
1081
. Gith
urai
E.
Rd.
KN
CC
108
1G
. R
dE
nd0.
000.
510.
513.
50U
(E)
CU
B10
7210
82. G
ithur
ai W
. R
d. A
1N
CC
108
2K
am.
Rd
Gith
. S
ch.
0.00
1.14
1.14
4.90
U(E
)U
B10
7310
83. G
ithur
ai W
. R
d. A
2N
CC
108
3G
ith.
Sch
.K
am.
Rd
0.00
1.14
1.14
4.90
U(E
)U
B10
7410
84. G
ithur
ai W
. R
d. A
3N
CC
108
4K
am.
Rd
Gith
. S
ch.
0.00
1.14
1.14
4.90
U(E
)U
B10
7510
85. G
ithur
ai W
. R
d. A
4N
CC
108
5G
ith.
Sch
.K
am.
Rd
0.00
1.14
1.14
4.90
U(E
)U
B10
7610
86. G
ithur
ai W
. R
d. A
5N
CC
108
6K
am.
Rd
Gith
. S
ch.
0.00
1.14
1.14
4.90
U(E
)U
B10
7710
87. G
ithur
ai W
. R
d. A
6N
CC
108
7K
am.
Rd
Gith
. S
ch.
0.00
1.14
1.14
4.90
U(E
)U
B10
7810
88. G
ithur
ai W
. R
d. A
7N
CC
108
8G
ith. M
rkt.
Kam
. R
d0.
001.
141.
144.
90U
(E)
CU
B10
7910
89. G
ithur
ai W
. R
d. B
1N
CC
108
9K
am.
Rd
Gith
. Shp
s0.
000.
230.
233.
30P
AU
B10
80
"N
CC
108
9K
am.
Rd
Gith
. Shp
s0.
231.
871.
643.
30U
(E)
AU
B10
8010
90. G
ithur
ai W
. R
d. B
2N
CC
109
0K
am.
Rd
F. R
d0.
001.
321.
323.
50U
(E)
AU
B10
8110
91. G
ithur
ai W
. R
d. C
NC
C 1
091
B2
Rd
C.
Rd
0.00
0.33
0.33
3.50
U(E
)U
B10
8210
92. G
ithur
ai W
. R
d. D
NC
C 1
092
D.
Rd
B1.
Rd
0.00
0.28
0.28
3.60
U(E
)U
B10
8310
93. G
ithur
ai W
. R
d. E
NC
C 1
093
B1.
Rd
End
0.00
0.29
0.29
4.00
U(E
)C
UB
1084
1094
. Gith
urai
W. R
d. F
NC
C 1
094
B1.
Rd
End
0.00
0.28
0.28
4.30
U(E
)C
UB
1085
1095
. Grd
n. E
st, R
d.A
(pt.2
)N
CC
109
5R
/W.
Rd
End
0.00
0.65
0.65
4.00
PC
UB
1086
A10
96. G
rdn.
Est
, Rd.
B (p
t.2)
NC
C 1
096
R/W
. R
dE
nd0.
000.
230.
235.
40P
CU
B10
86B
1097
. Grd
n. E
st, R
d.A
(pt.1
)N
CC
109
7R
/W.
Rd
End
0.00
0.26
0.26
4.00
PC
UB
1087
1098
. Grd
n. E
st, R
d.B
(pt.1
)N
CC
109
8R
/W.
Rd
End
0.00
0.16
0.16
3.30
PC
UM
B10
8810
99. H
urum
a E
st. R
d. A
NC
C 1
099
N/R
. R
dO
/M.
Rd
0.00
0.53
0.53
3.50
PA
UB
1089
1100
. Hur
uma
Est
. Rd.
BN
CC
110
0M
ath.
Rd
Juja
Rd
0.00
0.94
0.94
9.00
PA
UB
1090
1101
. Hur
uma
Est
. Rd.
CN
CC
110
1R
d. B
End
0.00
0.23
0.23
5.30
PC
UB
1091
1102
. Hur
uma
Est
. Rd.
DN
CC
110
2R
d. B
End
0.00
0.16
0.16
5.40
PC
UB
1092
1103
. Hur
uma
Est
. Rd.
D1
NC
C 1
103
Rd.
CR
d. D
0.00
0.13
0.13
6.10
PA
UB
1093
1104
. Hur
uma
Est
. Rd.
EN
CC
110
4R
d. B
End
0.00
0.10
0.10
5.50
PC
UB
1094
1105
. Hur
uma
Est
. Rd.
FN
CC
110
5R
d. B
Rd.
X0.
000.
300.
305.
20P
LU
B10
95
desc
riptio
nch
aina
ge(k
m)
(x.x
x)
Sec
tion
or li
nkS
ectio
n or
link
Pag
e 2
of 6

TAB
LE 4
.3-4
(9) R
OA
D IN
VEN
TOR
Y IN
MA
THA
RE
RO
AD
INVE
NTO
RY
AR
EA:
Nai
robi
ZON
E: M
atha
reG
IBB
AFR
ICA
Uni
que
Sec
tion
Ave
.R
oad
type
Roa
d U
rban
or
Pub
licC
arria
gew
ay
She
et n
o.ro
ad c
ode
or li
nkW
idth
(pav
ed/
Cla
ssR
ural
Tran
spor
tC
ondi
tion
Roa
d na
me
or n
umbe
rle
ngth
unpa
ved)
(H/P
/D/
Rou
teA
BC
Sta
rtE
ndS
tart
End
(km
) (x
.x)
(m)
(x.x
)L/
A/C
)(U
/R)
(B/M
/T)
B/F
/G(a
bcd)
(from
)(to
)(fr
om)
(to)
(P/U
)11
06. H
urum
a E
st. R
d. F
1N
CC
110
6R
d. F
Mat
h. R
d0.
000.
630.
635.
60P
AU
B10
9611
07. H
urum
a E
st. R
d. G
NC
C 1
107
Rd.
BE
nd0.
000.
090.
095.
70P
CU
B10
9711
08. H
urum
a E
st. R
d. K
NC
C 1
108
Rd.
BE
nd0.
000.
100.
105.
70P
CU
B10
9811
09. H
urum
a R
d. 2
NC
C 1
109
Mat
h. R
dR
d. 3
0.00
0.12
0.12
5.80
PA
UB
1099
1110
. Hur
uma
Rd.
3N
CC
111
0R
d. 2
Rd.
Y0.
001.
001.
005.
80P
LU
B11
0011
11. H
urum
a R
d. A
1N
CC
111
1H
ur.
Rd
End
0.00
0.33
0.33
5.80
PC
UB
1101
1112
. Hur
uma
Rd.
A2
NC
C 1
112
Rd.
A1
End
0.00
0.25
0.25
5.80
PC
UB
1102
"
NC
C 1
112
Rd.
A1
End
0.25
0.34
0.09
5.80
U(E
)C
UB
1102
1113
. Hur
uma
Rd.
A3
NC
C 1
113
Rd.
A1
End
0.00
0.50
0.50
5.80
PC
UB
1103
1114
. Hur
uma
Rd.
A4
NC
C 1
114
Rd.
AN
/R.
Rd
0.00
0.23
0.23
5.80
PA
UB
1104
"
NC
C 1
114
Rd.
AN
/R.
Rd
0.23
0.33
0.10
5.80
U(E
)A
UB
1104
1115
. Hur
uma
Rd.
A5
NC
C 1
115
Rd.
A4
End
0.00
0.19
0.19
5.80
PC
UM
B11
0511
16. H
urum
a R
d. A
6N
CC
111
6R
d. A
4E
nd0.
175.
80P
CU
MB
1106
1117
. Hur
uma
Rd.
XN
CC
111
7R
d. Y
O/R
. R
d0.
000.
990.
995.
90P
AU
MB
1107
"
NC
C 1
117
Rd.
YO
/R.
Rd
0.99
1.14
0.15
5.90
U(E
)A
UB
1107
1118
. Hur
uma
Rd.
ZN
CC
111
8H
ur.
Rd
Rd.
X0.
000.
210.
215.
90P
AU
B11
0811
19. H
urum
a R
d. Z
1N
CC
111
9H
ur.
Rd
Rd.
X0.
000.
210.
215.
90P
AU
B11
0911
20. J
ua K
ali E
st. R
d D
NC
C 1
120
Rd.
AE
nd0.
000.
150.
153.
00U
(G)
CU
B11
1011
21. K
ahaw
a W
. Rd.
BN
CC
112
1K
ah/W
. Rd
D.
Est
.0.
000.
230.
236.
10P
AU
B11
1111
22. K
ahaw
a W
. Rd.
B1
NC
C 1
122
Rd.
B1
End
0.00
0.36
0.36
5.60
PC
UB
1112
1123
. Kah
awa
W. R
d. B
2N
CC
112
3R
d. B
1E
nd0.
000.
140.
145.
10P
CU
B11
1311
24. K
ahaw
a W
. Rd.
CN
CC
112
4K
ah/W
. Rd
End
0.00
0.60
0.60
5.10
U(E
)C
UB
1114
1125
. Kah
awa
W. R
d. D
NC
C 1
125
Rd.
AR
d. B
0.00
0.80
0.80
5.10
PA
UB
1115
1126
. Kah
awa
W. R
d. A
NC
C 1
126
Kah
/W. R
dR
d. D
0.00
0.27
0.27
6.10
PA
UM
B11
1611
27. K
ario
bang
i N. R
d.A
NC
C 1
127
Kam
. R
dR
d. P
0.00
0.16
0.16
PA
UB
1117
1128
. Kar
ioba
ngi N
. Rd.
BN
CC
112
8K
am.
Rd
Rd.
E0.
000.
150.
152.
20P
AU
B11
1811
29. K
ario
bang
i N. R
d.C
NC
C 1
129
Kam
. R
dR
d. E
0.00
0.15
0.15
2.80
PA
UB
1119
1130
. Kar
ioba
ngi N
. Rd.
DN
CC
113
0R
d. A
Rd.
F0.
000.
120.
123.
50P
AU
B11
2011
31. K
ario
bang
i N. R
d.E
NC
C 1
131
Rd.
AR
d. F
0.00
0.13
0.13
3.20
PA
UB
1121
1132
. Kar
ioba
ngi N
. Rd.
FN
CC
113
2R
d. E
Rd.
A0.
000.
470.
473.
90P
AU
B11
2211
33. K
ario
bang
i N. R
d.G
NC
C 1
133
Rd.
FR
d. L
0.00
0.12
0.12
3.70
PA
UB
1123
1134
. Kar
ioba
ngi N
. Rd.
HN
CC
113
4R
d. F
Rd.
L0.
000.
120.
123.
20P
AU
B11
2411
35. K
ario
bang
i N. R
d.K
NC
C 1
135
Rd.
AR
d. F
0.00
0.12
0.12
3.60
PA
UB
B11
25
Sec
tion
or li
nkS
ectio
n or
link
desc
riptio
nch
aina
ge(k
m)
(x.x
x)
Pag
e 3
of 6
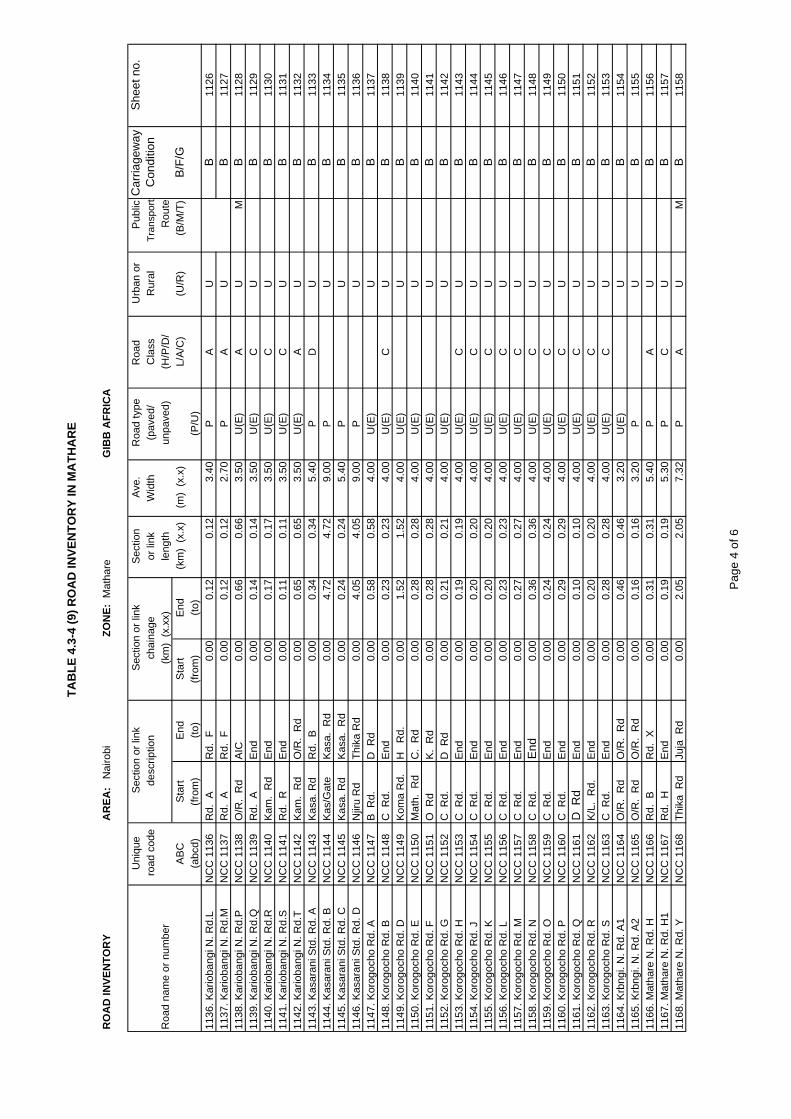
TAB
LE 4
.3-4
(9) R
OA
D IN
VEN
TOR
Y IN
MA
THA
RE
RO
AD
INVE
NTO
RY
AR
EA:
Nai
robi
ZON
E: M
atha
reG
IBB
AFR
ICA
Uni
que
Sec
tion
Ave
.R
oad
type
Roa
d U
rban
or
Pub
licC
arria
gew
ay
She
et n
o.ro
ad c
ode
or li
nkW
idth
(pav
ed/
Cla
ssR
ural
Tran
spor
tC
ondi
tion
Roa
d na
me
or n
umbe
rle
ngth
unpa
ved)
(H/P
/D/
Rou
teA
BC
Sta
rtE
ndS
tart
End
(km
) (x
.x)
(m)
(x.x
)L/
A/C
)(U
/R)
(B/M
/T)
B/F
/G(a
bcd)
(from
)(to
)(fr
om)
(to)
(P/U
)11
36. K
ario
bang
i N. R
d.L
NC
C 1
136
Rd.
AR
d. F
0.00
0.12
0.12
3.40
PA
UB
1126
1137
. Kar
ioba
ngi N
. Rd.
MN
CC
113
7R
d. A
Rd.
F0.
000.
120.
122.
70P
AU
B11
2711
38. K
ario
bang
i N. R
d.P
NC
C 1
138
O/R
. R
dA
IC0.
000.
660.
663.
50U
(E)
AU
MB
1128
1139
. Kar
ioba
ngi N
. Rd.
QN
CC
113
9R
d. A
End
0.00
0.14
0.14
3.50
U(E
)C
UB
1129
1140
. Kar
ioba
ngi N
. Rd.
RN
CC
114
0K
am.
Rd
End
0.00
0.17
0.17
3.50
U(E
)C
UB
1130
1141
. Kar
ioba
ngi N
. Rd.
SN
CC
114
1R
d. R
End
0.00
0.11
0.11
3.50
U(E
)C
UB
1131
1142
. Kar
ioba
ngi N
. Rd.
TN
CC
114
2K
am.
Rd
O/R
. R
d0.
000.
650.
653.
50U
(E)
AU
B11
3211
43. K
asar
ani S
td. R
d. A
NC
C 1
143
Kas
a. R
dR
d. B
0.00
0.34
0.34
5.40
PD
UB
1133
1144
. Kas
aran
i Std
. Rd.
BN
CC
114
4K
as/G
ate
Kas
a. R
d0.
004.
724.
729.
00P
UB
1134
1145
. Kas
aran
i Std
. Rd.
CN
CC
114
5K
asa.
Rd
Kas
a. R
d0.
000.
240.
245.
40P
UB
1135
1146
. Kas
aran
i Std
. Rd.
DN
CC
114
6N
jiru
Rd
Thik
a R
d0.
004.
054.
059.
00P
UB
1136
1147
. Kor
ogoc
ho R
d. A
NC
C 1
147
B R
d.D
Rd
0.00
0.58
0.58
4.00
U(E
)U
B11
3711
48. K
orog
ocho
Rd.
BN
CC
114
8C
Rd.
End
0.00
0.23
0.23
4.00
U(E
)C
UB
1138
1149
. Kor
ogoc
ho R
d. D
NC
C 1
149
Kom
a R
d.H
R
d.0.
001.
521.
524.
00U
(E)
UB
1139
1150
. Kor
ogoc
ho R
d. E
NC
C 1
150
Mat
h. R
dC
. R
d0.
000.
280.
284.
00U
(E)
UB
1140
1151
. Kor
ogoc
ho R
d. F
NC
C 1
151
O R
dK
. R
d0.
000.
280.
284.
00U
(E)
UB
1141
1152
. Kor
ogoc
ho R
d. G
NC
C 1
152
C R
d.D
Rd
0.00
0.21
0.21
4.00
U(E
)U
B11
4211
53. K
orog
ocho
Rd.
HN
CC
115
3C
Rd.
End
0.00
0.19
0.19
4.00
U(E
)C
UB
1143
1154
. Kor
ogoc
ho R
d. J
NC
C 1
154
C R
d.E
nd0.
000.
200.
204.
00U
(E)
CU
B11
4411
55. K
orog
ocho
Rd.
KN
CC
115
5C
Rd.
End
0.00
0.20
0.20
4.00
U(E
)C
UB
1145
1156
. Kor
ogoc
ho R
d. L
NC
C 1
156
C R
d.E
nd0.
000.
230.
234.
00U
(E)
CU
B11
4611
57. K
orog
ocho
Rd.
MN
CC
115
7C
Rd.
End
0.00
0.27
0.27
4.00
U(E
)C
UB
1147
1158
. Kor
ogoc
ho R
d. N
NC
C 1
158
C R
d.E
nd0.
000.
360.
364.
00U
(E)
CU
B11
4811
59. K
orog
ocho
Rd.
ON
CC
115
9C
Rd.
End
0.00
0.24
0.24
4.00
U(E
)C
UB
1149
1160
. Kor
ogoc
ho R
d. P
NC
C 1
160
C R
d.E
nd0.
000.
290.
294.
00U
(E)
CU
B11
5011
61. K
orog
ocho
Rd.
QN
CC
116
1D
Rd
End
0.00
0.10
0.10
4.00
U(E
)C
UB
1151
1162
. Kor
ogoc
ho R
d. R
NC
C 1
162
K/L
. R
d.E
nd0.
000.
200.
204.
00U
(E)
CU
B11
5211
63. K
orog
ocho
Rd.
SN
CC
116
3C
Rd.
End
0.00
0.28
0.28
4.00
U(E
)C
UB
1153
1164
. Krb
ngi.
N. R
d. A
1N
CC
116
4O
/R.
Rd
O/R
. R
d0.
000.
460.
463.
20U
(E)
UB
1154
1165
. Krb
ngi.
N. R
d. A
2N
CC
116
5O
/R.
Rd
O/R
. R
d0.
000.
160.
163.
20P
UB
1155
1166
. Mat
hare
N. R
d. H
NC
C 1
166
Rd.
BR
d. X
0.00
0.31
0.31
5.40
PA
UB
1156
1167
. Mat
hare
N. R
d. H
1N
CC
116
7R
d. H
End
0.00
0.19
0.19
5.30
PC
UB
1157
1168
. Mat
hare
N. R
d. Y
NC
C 1
168
Thik
a R
dJu
ja R
d0.
002.
052.
057.
32P
AU
MB
1158
desc
riptio
nch
aina
ge(k
m)
(x.x
x)
Sec
tion
or li
nkS
ectio
n or
link
Pag
e 4
of 6
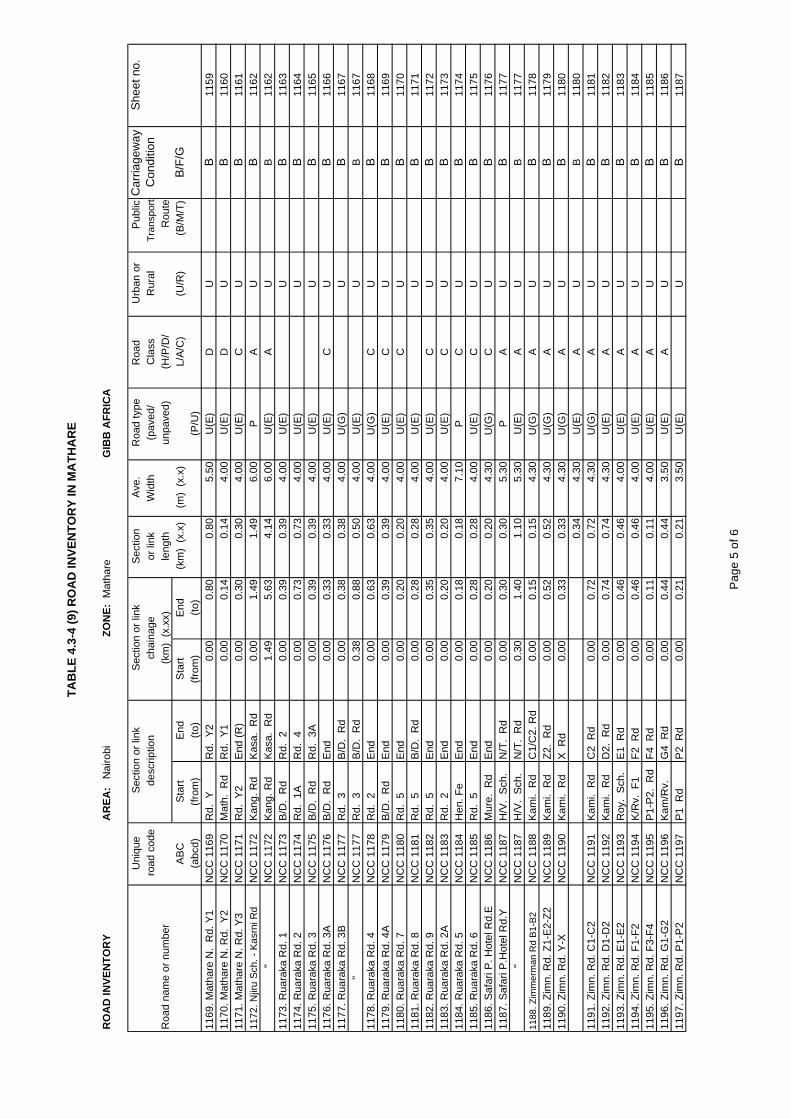
TAB
LE 4
.3-4
(9) R
OA
D IN
VEN
TOR
Y IN
MA
THA
RE
RO
AD
INVE
NTO
RY
AR
EA:
Nai
robi
ZON
E: M
atha
reG
IBB
AFR
ICA
Uni
que
Sec
tion
Ave
.R
oad
type
Roa
d U
rban
or
Pub
licC
arria
gew
ay
She
et n
o.ro
ad c
ode
or li
nkW
idth
(pav
ed/
Cla
ssR
ural
Tran
spor
tC
ondi
tion
Roa
d na
me
or n
umbe
rle
ngth
unpa
ved)
(H/P
/D/
Rou
teA
BC
Sta
rtE
ndS
tart
End
(km
) (x
.x)
(m)
(x.x
)L/
A/C
)(U
/R)
(B/M
/T)
B/F
/G(a
bcd)
(from
)(to
)(fr
om)
(to)
(P/U
)11
69. M
atha
re N
. R
d. Y
1N
CC
116
9R
d. Y
Rd.
Y2
0.00
0.80
0.80
5.50
U(E
)D
UB
1159
1170
. Mat
hare
N. R
d. Y
2N
CC
117
0M
ath.
Rd
Rd.
Y1
0.00
0.14
0.14
4.00
U(E
)D
UB
1160
1171
. Mat
hare
N. R
d. Y
3N
CC
117
1R
d. Y
2E
nd (R
)0.
000.
300.
304.
00U
(E)
CU
B11
6111
72. N
jiru
Sch
. - K
asrn
i Rd
NC
C 1
172
Kan
g. R
dK
asa.
Rd
0.00
1.49
1.49
6.00
PA
UB
1162
"
NC
C 1
172
Kan
g. R
dK
asa.
Rd
1.49
5.63
4.14
6.00
U(E
)A
UB
1162
1173
. Rua
raka
Rd.
1N
CC
117
3B
/D.
Rd
Rd.
20.
000.
390.
394.
00U
(E)
UB
1163
1174
. Rua
raka
Rd.
2N
CC
117
4R
d. 1
AR
d. 4
0.00
0.73
0.73
4.00
U(E
)U
B11
6411
75. R
uara
ka R
d. 3
NC
C 1
175
B/D
. R
dR
d. 3
A0.
000.
390.
394.
00U
(E)
UB
1165
1176
. Rua
raka
Rd.
3A
NC
C 1
176
B/D
. R
dE
nd0.
000.
330.
334.
00U
(E)
CU
B11
6611
77. R
uara
ka R
d. 3
BN
CC
117
7R
d. 3
B/D
. R
d0.
000.
380.
384.
00U
(G)
UB
1167
"
NC
C 1
177
Rd.
3B
/D.
Rd
0.38
0.88
0.50
4.00
U(E
)U
B11
6711
78. R
uara
ka R
d. 4
NC
C 1
178
Rd.
2E
nd0.
000.
630.
634.
00U
(G)
CU
B11
6811
79. R
uara
ka R
d. 4
AN
CC
117
9B
/D.
Rd
End
0.00
0.39
0.39
4.00
U(E
)C
UB
1169
1180
. Rua
raka
Rd.
7N
CC
118
0R
d. 5
End
0.00
0.20
0.20
4.00
U(E
)C
UB
1170
1181
. Rua
raka
Rd.
8N
CC
118
1R
d. 5
B/D
. R
d0.
000.
280.
284.
00U
(E)
UB
1171
1182
. Rua
raka
Rd.
9N
CC
118
2R
d. 5
End
0.00
0.35
0.35
4.00
U(E
)C
UB
1172
1183
. Rua
raka
Rd.
2A
NC
C 1
183
Rd.
2E
nd0.
000.
200.
204.
00U
(E)
CU
B11
7311
84. R
uara
ka R
d. 5
NC
C 1
184
Hen
. Fe
End
0.00
0.18
0.18
7.10
PC
UB
1174
1185
. Rua
raka
Rd.
6N
CC
118
5R
d. 5
End
0.00
0.28
0.28
4.00
U(E
)C
UB
1175
1186
. Saf
ari P
. Hot
el R
d.E
NC
C 1
186
Mur
e. R
dE
nd0.
000.
200.
204.
30U
(G)
CU
B11
7611
87. S
afar
i P.H
otel
Rd.
YN
CC
118
7H
/V.
Sch
.N
/T.
Rd
0.00
0.30
0.30
5.30
PA
UB
1177
"
NC
C 1
187
H/V
. S
ch.
N/T
. R
d0.
301.
401.
105.
30U
(E)
AU
B11
7711
88. Z
imm
erm
an R
d B
1-B
2N
CC
118
8K
ami.
Rd
C1/
C2.
Rd
0.00
0.15
0.15
4.30
U(G
)A
UB
1178
1189
. Zim
n. R
d. Z
1-E
2-Z2
NC
C 1
189
Kam
i. R
dZ2
. R
d0.
000.
520.
524.
30U
(G)
AU
B11
7911
90. Z
imn.
Rd.
Y-X
NC
C 1
190
Kam
i. R
dX
Rd
0.00
0.33
0.33
4.30
U(G
)A
UB
1180
0.34
4.30
U(E
)A
UB
1180
1191
. Zim
n. R
d. C
1-C
2N
CC
119
1K
ami.
Rd
C2
Rd
0.00
0.72
0.72
4.30
U(G
)A
UB
1181
1192
. Zim
n. R
d. D
1-D
2N
CC
119
2K
ami.
Rd
D2.
Rd
0.00
0.74
0.74
4.30
U(E
)A
UB
1182
1193
. Zim
n. R
d. E
1-E
2N
CC
119
3R
oy.
Sch
.E
1 R
d0.
000.
460.
464.
00U
(E)
AU
B11
8311
94. Z
imn.
Rd.
F1-
F2N
CC
119
4K
/Rv.
F1
F2 R
d0.
000.
460.
464.
00U
(E)
AU
B11
8411
95. Z
imn.
Rd.
F3-
F4N
CC
119
5P
1-P
2. R
dF4
Rd
0.00
0.11
0.11
4.00
U(E
)A
UB
1185
1196
. Zim
n. R
d. G
1-G
2N
CC
119
6K
am/R
v.G
4 R
d0.
000.
440.
443.
50U
(E)
AU
B11
8611
97. Z
imn.
Rd.
P1-
P2
NC
C 1
197
P1
Rd
P2
Rd
0.00
0.21
0.21
3.50
U(E
)U
B11
87
desc
riptio
nch
aina
ge(k
m)
(x.x
x)
Sec
tion
or li
nkS
ectio
n or
link
Pag
e 5
of 6

TAB
LE 4
.3-4
(9) R
OA
D IN
VEN
TOR
Y IN
MA
THA
RE
RO
AD
INVE
NTO
RY
AR
EA:
Nai
robi
ZON
E: M
atha
reG
IBB
AFR
ICA
Uni
que
Sec
tion
Ave
.R
oad
type
Roa
d U
rban
or
Pub
licC
arria
gew
ay
She
et n
o.ro
ad c
ode
or li
nkW
idth
(pav
ed/
Cla
ssR
ural
Tran
spor
tC
ondi
tion
Roa
d na
me
or n
umbe
rle
ngth
unpa
ved)
(H/P
/D/
Rou
teA
BC
Sta
rtE
ndS
tart
End
(km
) (x
.x)
(m)
(x.x
)L/
A/C
)(U
/R)
(B/M
/T)
B/F
/G(a
bcd)
(from
)(to
)(fr
om)
(to)
(P/U
)11
98. Z
imrm
n. R
d. P
1-Q
1N
CC
119
8Q
1. R
dP
1. R
d0.
000.
130.
134.
00U
(E)
AU
B11
8811
99. Z
imrm
n. R
d. Q
1-Q
2N
CC
119
9Q
1. R
dQ
2. R
d0.
000.
270.
274.
30U
(E)
AU
B11
8912
00. Z
imrm
n. R
d. W
1-W
2N
CC
120
0K
ami.
Rd
W2.
Rd
0.00
0.32
0.32
3.00
U(E
)A
UB
1190
1201
. Bab
a D
ogo
Rd.
pt.1
NC
C 1
201
O/R
. R
dE
nd0.
000.
320.
326.
00U
(G)
CU
B11
91
"
NC
C 1
201
O/R
. R
dE
nd0.
321.
020.
706.
00U
(E)
CU
B11
9112
02. B
aba
Dog
o R
d. p
t.2N
CC
120
2E
ndK
asa.
Rd
0.00
1.70
1.70
6.00
PA
UB
1192
"N
CC
120
2E
ndK
asa.
Rd
1.70
2.01
0.31
6.00
U(E
)A
UB
1192
1203
. Gar
den
Est
. Rd
NC
C 1
203
Kiri
. R
dTh
ika
Rd
0.00
4.06
4.06
5.40
PD
UM
B11
9312
04. H
alai
Est
. Lan
eN
CC
120
4R
/Way
. Rd
End
0.00
0.35
0.35
5.50
PC
UB
1194
1205
. Hur
uma
Roa
dN
CC
120
5M
ath.
Rd
O/R
. R
d0.
000.
550.
557.
05P
AU
B11
9512
06. K
ahaw
a W
. Roa
dN
CC
120
6K
ami.
Rd
R/S
ta.
0.00
1.87
1.87
6.80
PL
UB
B11
96
"
NC
C 1
206
Kam
i. R
dR
/Sta
.1.
871.
960.
096.
80U
(E)
LU
BB
1196
1207
. Kam
iti R
oad
NC
C 1
207
Thik
a R
dN
bi/K
bu B
0.00
6.03
6.03
6.20
PL
UB
B11
9712
08. K
amun
de R
oad
NC
C 1
208
O/R
. R
dO
/R.
Rd
0.00
1.72
1.72
7.20
PA
UB
B11
9812
09. K
asar
ani R
oad
NC
C 1
209
Nji.
Rd
Thik
a R
d0.
002.
252.
2510
.10
PL
UM
B11
9912
10. K
irigw
a C
lose
NC
C 1
210
Kiri
. R
dE
nd0.
000.
310.
314.
00U
(E)
CU
B12
0012
11. K
irigw
a La
neN
CC
121
1R
/Way
. Rd
Kiri
. R
d0.
000.
380.
385.
80P
AU
B12
0112
12. K
irigw
a R
d. (p
t.1)
NC
C 1
212
R/W
ay. R
dB
/B S
ch.
0.00
1.25
1.25
5.00
PL
UB
1202
1213
. Kiri
gwa
Rd.
(pt.2
)N
CC
121
3B
/B S
ch.
W. H
otel
0.00
1.25
1.25
6.33
PA
UB
1203
1214
. Lum
umba
Driv
eN
CC
121
4K
ami.
Rd
Mur
e. R
d0.
001.
101.
105.
30P
AU
B12
0412
15. M
arur
ui R
oad
NC
C 1
215
G/E
. R
dE
nd0.
001.
651.
654.
10P
CU
B12
0512
16. M
atha
re R
oad
NC
C 1
216
Juja
Rd
End
0.00
1.28
1.28
7.30
PC
UM
B12
0612
17. M
urem
a D
r. (p
t.1)
NC
C 1
217
Kam
i. R
dM
ure.
Rd
0.00
1.10
1.10
6.00
PU
B12
0712
18. M
urem
a D
r. (p
t.2)
NC
C 1
218
Mur
e. R
dJu
aKal
i Rd
0.00
0.99
0.99
6.00
U(E
)A
UB
1208
1219
. Mur
ema
Roa
dN
CC
121
9R
d. A
Rd.
Y0.
001.
231.
235.
30P
AU
B12
0912
20. N
jath
aini
Roa
dN
CC
122
0K
bu. B
or.
Kam
i. R
d0.
003.
023.
028.
40U
(G)
DU
B12
1012
21. O
ut. R
ing
Rd.
(pt.1
)N
CC
122
1Th
ika
Rd
Kam
u. R
d0.
001.
711.
717.
10P
PU
BB
1211
1222
. Out
. Rin
g R
d. (p
t.2)
NC
C 1
222
Kam
u. R
dJ/
K R
/A0.
001.
101.
107.
00P
PU
BB
1212
1223
. Rid
gew
ay L
ane
NC
C 1
223
R/W
ay. R
dE
nd0.
000.
330.
334.
00U
(E)
CU
B12
1312
24. R
idge
way
Roa
dN
CC
122
4K
bu. R
dK
iri.
Rd
0.00
2.23
2.23
5.00
PL
UM
B12
1412
25. T
hika
Roa
dN
CC
122
5M
/R-a
bout
Rua
ra0.
0015
.30
15.3
07.
30P
HU
B12
15
desc
riptio
nch
aina
ge(k
m)
(x.x
x)
Sec
tion
or li
nkS
ectio
n or
link
Pag
e 6
of 6

TAB
LE 4
.3-4
(10)
RO
AD
INVE
NTO
RY
IN N
JIR
UR
OA
D IN
VEN
TOR
YA
REA
: N
airo
biZO
NE:
Njir
uG
IBB
AFR
ICA
Uni
que
Sec
tion
Ave
.R
oad
type
Roa
d U
rban
or
Pub
licC
arria
gew
ay
She
et n
o.ro
ad c
ode
or li
nkW
idth
(pav
ed/
Cla
ssR
ural
Tran
spor
tC
ondi
tion
Roa
d na
me
or n
umbe
rle
ngth
unpa
ved)
(H/P
/D/
Rou
teA
BC
Sta
rtE
ndS
tart
End
(km
) (x
.x)
(m)
(x.x
)L/
A/C
)(U
/R)
(B/M
/T)
B/F
/G(a
bcd)
(from
)(to
)(fr
om)
(to)
(P/U
)12
26. D
ando
ra E
st. R
d 31
NC
C 1
226
Rd.
31
Roc
k R
d0.
000.
170.
174.
80P
AU
F12
2712
27. D
ando
ra E
st. R
d 32
NC
C 1
227
Roc
k R
dE
nd0.
000.
280.
285.
00P
CU
B12
2812
28. D
ando
ra E
st. R
d 33
NC
C 1
228
Rd.
31
End
0.00
0.56
0.56
5.00
PC
UB
1229
1229
. Dan
dora
Est
. Rd
34N
CC
122
9R
ock
Rd
End
0.00
0.24
0.24
5.00
PC
UF
1230
1230
. Dan
dora
Est
. Rd
35N
CC
123
0R
ock
Rd
End
0.00
0.27
0.27
5.00
PC
UB
1231
1231
. Dan
dora
Est
. Rd
36N
CC
123
1R
ock
Rd
End
0.00
0.33
0.33
5.00
PC
UF
1232
1232
. Dan
dora
Est
. Rd
37N
CC
123
2R
ock
Rd
End
0.00
0.33
0.33
4.90
PC
UB
1233
1233
. Dan
dora
Est
. Rd
38N
CC
123
3R
ock
Rd
End
0.00
0.28
0.28
4.90
PC
UB
1234
1234
. Dan
dora
Est
. Rd
39N
CC
123
4R
ock
Rd
End
0.00
0.32
0.32
4.90
PC
UF
1235
1235
. Dan
dora
Est
. Rd
40N
CC
123
5R
ock
Rd
Roc
k R
d0.
000.
240.
245.
00P
AU
B12
3612
36. D
ando
ra P
h1. R
d A
NC
C 1
236
J/M
. R
dK
oma
Rd
0.00
0.39
0.39
4.50
PA
UF
1237
"N
CC
123
6J/
M.
Rd
Kom
a R
d0.
390.
490.
104.
50U
(E)
AU
B12
3712
37. D
ando
ra P
h1. R
d B
NC
C 1
237
J/M
. R
dK
oma
Rd
0.00
0.26
0.26
5.00
PA
UF
1238
1238
. Dan
dora
Ph1
. Rd
CN
CC
123
8J/
M.
Rd
End
0.00
0.21
0.21
5.00
PC
UF
1239
1239
. Dan
dora
Ph1
. Rd
DN
CC
123
9R
d. B
End
0.00
0.38
0.38
4.00
PC
UF
1240
1240
. Dan
dora
Ph1
. Rd
EN
CC
124
0R
d. B
End
0.00
0.22
0.22
5.00
PC
UF
1241
1241
. Dan
dora
Ph1
. Rd
FN
CC
124
1J/
M.
Rd
Rd.
J0.
000.
190.
195.
00P
UF
1242
1242
. Dan
dora
Ph1
. Rd
GN
CC
124
2R
d. N
Rd.
F0.
000.
150.
155.
00P
AU
B12
4312
43. D
ando
ra P
h1. R
d I
NC
C 1
243
Rd.
HE
nd0.
000.
210.
215.
00P
CU
B12
4412
44. D
ando
ra P
h1. R
d J
NC
C 1
244
Rd.
FE
nd0.
000.
170.
174.
00P
CU
F12
4512
45. D
ando
ra P
h1. R
d K
NC
C 1
245
Rd.
FE
nd0.
000.
150.
155.
00P
CU
F12
4612
46. D
ando
ra P
h1. R
d L
NC
C 1
246
Rd.
FE
nd0.
000.
200.
205.
00P
CU
F12
4712
47. D
ando
ra P
h1. R
d M
NC
C 1
247
Rd.
HE
nd0.
000.
300.
305.
00P
CU
F12
4812
48. D
ando
ra P
h1. R
d N
NC
C 1
248
J/M
. R
dR
d. G
0.00
0.36
0.36
5.00
PA
UB
1249
1249
. Dan
dora
Ph5
. Rd
AN
CC
124
9J/
O.
Rd
End
0.00
0.12
0.12
5.00
U(E
)C
UB
1250
1250
. Dan
dora
Ph5
. Rd
BN
CC
125
0J/
O.
Rd
End
0.00
0.66
0.66
5.00
PC
UF
1251
1251
. Dan
dora
Ph5
. Rd
CN
CC
125
1J/
O.
Rd
End
0.00
0.36
0.36
5.00
PC
UF
1252
1252
. Dan
dora
Ph5
. Rd
DN
CC
125
2J/
O.
Rd
End
0.00
0.24
0.24
5.00
PC
UF
1253
1253
. Doo
nhol
m E
s. R
d A
NC
C 1
253
Rd.
PE
nd0.
000.
840.
844.
50P
CU
F12
5412
54. D
oonh
olm
Es.
RdB
NC
C 1
254
Rd.
AE
nd0.
000.
120.
124.
50P
CU
F12
5512
55. D
oonh
olm
Es.
RdC
NC
C 1
255
Rd.
AE
nd0.
000.
120.
124.
40P
CU
F12
5612
56. D
oonh
olm
Es.
RdD
NC
C 1
256
Rd.
AE
nd0.
000.
120.
124.
80P
CU
B12
5712
57. D
oonh
olm
Es.
RdE
NC
C 1
257
Rd.
AE
nd0.
000.
240.
244.
50P
CU
F12
58
(km
) (x
.xx)
Sec
tion
or li
nkS
ectio
n or
link
desc
riptio
nch
aina
ge
Pag
e 1
of 6

TAB
LE 4
.3-4
(10)
RO
AD
INVE
NTO
RY
IN N
JIR
UR
OA
D IN
VEN
TOR
YA
REA
: N
airo
biZO
NE:
Njir
uG
IBB
AFR
ICA
Uni
que
Sec
tion
Ave
.R
oad
type
Roa
d U
rban
or
Pub
licC
arria
gew
ay
She
et n
o.ro
ad c
ode
or li
nkW
idth
(pav
ed/
Cla
ssR
ural
Tran
spor
tC
ondi
tion
Roa
d na
me
or n
umbe
rle
ngth
unpa
ved)
(H/P
/D/
Rou
teA
BC
Sta
rtE
ndS
tart
End
(km
) (x
.x)
(m)
(x.x
)L/
A/C
)(U
/R)
(B/M
/T)
B/F
/G(a
bcd)
(from
)(to
)(fr
om)
(to)
(P/U
)12
58. D
oonh
olm
Es.
Rd
FN
CC
125
8R
d. A
End
0.00
0.16
0.16
5.00
PC
UF
1259
1259
. Doo
nhol
m E
s. R
dGN
CC
125
9R
d. A
Rd.
R0.
000.
190.
194.
50P
AU
B12
6012
60. D
oonh
olm
Es.
RdH
NC
C 1
260
Rd.
AE
nd0.
000.
200.
204.
70P
CU
B12
6112
61. D
oonh
olm
Es.
Rd
IN
CC
126
1R
d. A
Rd.
R0.
000.
190.
195.
50P
AU
F12
6212
62. D
oonh
olm
Es.
RdJ
NC
C 1
262
Rd.
AE
nd0.
000.
250.
254.
50P
CU
F12
6312
63. D
oonh
olm
Es.
RdK
NC
C 1
263
Rd.
RE
nd0.
000.
560.
564.
50P
CU
B12
6412
64. D
oonh
olm
Es.
RdL
NC
C 1
264
Rd.
RE
nd0.
000.
560.
564.
50U
(E)
CU
F12
6512
65. D
oonh
olm
Es.
RdM
NC
C 1
265
Rd.
RE
nd0.
000.
150.
154.
50P
CU
B12
6612
66. D
oonh
olm
Es.
RdN
NC
C 1
266
Rd.
RE
nd0.
000.
160.
164.
20P
CU
B12
6712
67. D
oonh
olm
Es.
RdO
NC
C 1
267
Rd.
RE
nd0.
000.
160.
165.
00P
CU
F12
6812
68. D
oonh
olm
Es.
RdP
NC
C 1
268
O/R
Rd.
End
0.00
1.81
1.81
7.50
PC
UF
1269
1269
. Gre
enfie
ld R
d. G
NC
C 1
269
Rd.
1R
d. 1
0.00
0.38
0.38
6.00
PU
F12
7012
70. G
reen
field
Rd.
HN
CC
127
0R
d. G
Rd.
I0.
000.
100.
104.
00U
(E)
UB
1271
1271
. Gre
enfie
ld R
d. I
NC
C 1
271
Rd.
GR
d. U
0.00
0.13
0.13
4.00
PU
F12
7212
72. G
reen
field
Rd.
JN
CC
127
2R
d. I
Rd.
K0.
000.
090.
095.
00P
UB
1273
1273
. Gre
enfie
ld R
d. K
NC
C 1
273
Rd.
JR
d. L
/R0.
000.
120.
125.
00P
UB
1274
1274
. Kay
ole
Est
. Rd.
AN
CC
127
4K
oma.
Rd
Rd.
B0.
000.
880.
886.
50P
UB
1275
"N
CC
127
4K
oma.
Rd
Rd.
B0.
881.
020.
146.
50U
(E)
UB
1275
1275
. Kay
ole
Est
. Rd.
BN
CC
127
5R
d. A
Rd.
D0.
002.
812.
815.
50P
UB
1276
1276
. Kay
ole
Est
. Rd.
CN
CC
127
6R
d. D
Rd.
D0.
000.
640.
645.
50P
UB
1277
1277
. Kay
ole
Est
. Rd.
DN
CC
127
7K
oma.
Rd
Kom
a. R
d0.
000.
570.
576.
00P
UB
1278
1278
. Kay
ole
Est
. Rd.
EN
CC
127
8R
d. D
Rd.
F0.
000.
190.
195.
00P
UB
1279
1279
. Kay
ole
Est
. Rd.
FN
CC
127
9R
d. D
End
0.00
0.65
0.65
5.00
PC
UF
1280
1280
. Kay
ole
Est
. Rd.
GN
CC
128
0K
ay.
Br.
Kan
. R
d0.
000.
880.
886.
00U
(E)
UB
1281
1281
. Kay
ole
Est
. Rd.
HN
CC
128
1R
d. D
Rd.
D0.
000.
580.
585.
00P
UF
1282
1282
. Kay
ole
Est
. Rd.
IN
CC
128
2R
d. D
Rd.
G0.
000.
270.
275.
00P
UB
1283
"
NC
C 1
282
Rd.
DR
d. G
0.27
0.34
0.07
5.00
U(E
)U
B12
8312
83. K
ayol
e E
st. R
d. J
NC
C 1
283
Rd.
DE
nd0.
000.
250.
254.
50P
CU
F12
8412
84. K
ayol
e E
st. R
d. K
NC
C 1
284
Rd.
DR
v/B
r0.
000.
330.
335.
00U
(E)
UF
1285
1285
. Kay
ole
Est
. Rd.
LN
CC
128
5R
d. D
Rd.
K0.
000.
330.
335.
00P
UF
1286
1286
. Kay
ole
Est
. Rd.
MN
CC
128
6R
d. B
Rd.
D0.
000.
570.
575.
00P
UF
1287
N
CC
128
7R
d. D
Rd.
F0.
000.
210.
215.
00P
UF
1288
1288
. Kay
ole
Est
. Rd.
ON
CC
128
8R
d. B
0.00
0.19
0.19
5.00
PU
F12
89
(km
) (x
.xx)
Sec
tion
or li
nkS
ectio
n or
link
desc
riptio
nch
aina
ge
Pag
e 2
of 6

TAB
LE 4
.3-4
(10)
RO
AD
INVE
NTO
RY
IN N
JIR
UR
OA
D IN
VEN
TOR
YA
REA
: N
airo
biZO
NE:
Njir
uG
IBB
AFR
ICA
Uni
que
Sec
tion
Ave
.R
oad
type
Roa
d U
rban
or
Pub
licC
arria
gew
ay
She
et n
o.ro
ad c
ode
or li
nkW
idth
(pav
ed/
Cla
ssR
ural
Tran
spor
tC
ondi
tion
Roa
d na
me
or n
umbe
rle
ngth
unpa
ved)
(H/P
/D/
Rou
teA
BC
Sta
rtE
ndS
tart
End
(km
) (x
.x)
(m)
(x.x
)L/
A/C
)(U
/R)
(B/M
/T)
B/F
/G(a
bcd)
(from
)(to
)(fr
om)
(to)
(P/U
)12
89. K
ayol
e E
st. R
d. P
NC
C 1
289
Rd.
B0.
000.
270.
275.
00P
UF
1290
1290
. Kay
ole
Est
. Rd.
QN
CC
129
0R
d. B
Kom
a R
d0.
000.
680.
686.
00P
UF
1291
1291
. Kay
ole
Est
. Rd.
RN
CC
129
1R
d. A
Rd.
O0.
000.
540.
545.
50P
UB
1292
1292
. Kay
ole
Est
. Rd.
SN
CC
129
2R
d. B
Rd.
B0.
000.
650.
656.
00P
UB
1293
1293
. Kay
ole
Est
. Rd.
TN
CC
129
3K
oma.
Rd
Rd.
B0.
000.
650.
655.
00P
UF
1294
1294
. Kay
ole
Est
. Rd.
Z1
NC
C 1
294
Rd.
TE
nd0.
000.
300.
305.
00P
CU
F12
9512
95. K
ayol
e E
st. R
d. Z
2N
CC
129
5R
d. T
Rd.
L/R
0.00
0.40
0.40
5.00
PU
B12
9612
96. K
omar
ock
Est
. Rd1
NC
C 1
296
Kom
a. R
dK
oma
Rd
0.00
0.85
0.85
7.00
PU
F12
9712
97. K
omar
ock
Est
. Rd2
NC
C 1
297
Rd.
2K
oma
Rd
0.00
1.14
1.14
7.00
PU
F12
9812
98. K
omar
ock
Est
. RdA
NC
C 1
298
Kom
a. R
dK
ang.
Rd
0.00
0.12
0.12
7.00
PU
F12
99
"N
CC
129
8K
oma.
Rd
Kan
g. R
d0.
120.
600.
487.
00U
(G)
UB
1299
1299
. Kom
aroc
k E
st. R
d1N
CC
129
9R
d. 2
0R
d. L
/R0.
000.
240.
245.
00P
UF
1300
1300
. Kom
aroc
k E
st. R
d10
NC
C 1
300
Rd.
2E
nd0.
000.
160.
165.
00P
CU
B13
0113
01. K
omar
ock
Est
. Rd1
1N
CC
130
1R
d. 2
End
0.00
0.13
0.13
5.00
PC
UB
1302
1302
. Kom
aroc
k E
st. R
d12
NC
C 1
302
Rd.
2E
nd0.
000.
110.
115.
00P
CU
B13
0313
03. K
omar
ock
Est
. Rd1
3N
CC
130
3R
d. 2
End
0.00
0.08
0.08
5.00
PC
UF
1304
1304
. Kom
aroc
k E
st. R
d14
NC
C 1
304
Rd.
2E
nd0.
000.
140.
145.
00P
CU
B13
0513
05. K
omar
ock
Est
. Rd1
5N
CC
130
5R
d. 2
0E
nd0.
000.
220.
226.
00P
CU
B13
0613
06. K
omar
ock
Est
. Rd1
6N
CC
130
6R
d. 2
0E
nd0.
000.
290.
295.
50P
CU
B13
0713
07. K
omar
ock
Est
. Rd2
NC
C 1
307
Kom
a. R
dK
oma
Rd
0.00
0.11
0.11
5.00
PU
F13
0813
08. K
omar
ock
Est
. Rd3
NC
C 1
308
Rd.
2R
d. 4
0.00
0.24
0.24
6.00
PU
F13
0913
09. K
omar
ock
Est
. Rd4
NC
C 1
309
Rd.
30.
000.
170.
175.
00P
UF
1310
1310
. Kom
aroc
k E
st. R
d5N
CC
131
0R
d. 3
Rd.
20.
000.
210.
215.
00P
UF
1311
1311
. Kom
aroc
k E
st. R
d6N
CC
131
1R
d. 2
Rd.
70.
000.
110.
116.
00P
UB
1312
1312
. Kom
aroc
k E
st. R
d7N
CC
131
2R
d. 6
0.00
0.21
0.21
6.00
PU
B13
1313
13. K
omar
ock
Est
. Rd8
NC
C 1
313
Rd.
2E
nd0.
000.
130.
135.
00P
CU
F13
1413
14. K
omar
ock
Est
. Rd9
NC
C 1
314
Rd.
2E
nd0.
000.
140.
145.
00P
CU
F13
1513
15. S
avan
nah
Est
. RdL
NC
C 1
315
Rd.
PR
d. M
0.00
0.16
0.16
6.00
PU
F13
1613
16. S
avan
nah
Est
. RdM
NC
C 1
316
Rd.
LR
d. L
0.00
0.76
0.76
5.50
PU
F13
1713
17. S
avan
nah
Est
. RdN
NC
C 1
317
Rd.
MR
d. M
0.00
0.09
0.09
6.00
PU
F13
1813
18. S
avan
nah
Est
. RdO
NC
C 1
318
Rd.
LR
d. L
0.00
0.35
0.35
5.00
PU
B13
1913
19. S
unris
e E
st. R
d. 1
NC
C 1
319
Rd.
PR
d. P
0.00
1.10
1.10
7.00
PA
UF
1320
1320
. Sun
rise
Est
. Rd.
5N
CC
132
0R
d. P
Rd.
P0.
000.
130.
135.
20U
(G)
UF
1321
(km
) (x
.xx)
Sec
tion
or li
nkS
ectio
n or
link
desc
riptio
nch
aina
ge
Pag
e 3
of 6

TAB
LE 4
.3-4
(10)
RO
AD
INVE
NTO
RY
IN N
JIR
UR
OA
D IN
VEN
TOR
YA
REA
: N
airo
biZO
NE:
Njir
uG
IBB
AFR
ICA
Uni
que
Sec
tion
Ave
.R
oad
type
Roa
d U
rban
or
Pub
licC
arria
gew
ay
She
et n
o.ro
ad c
ode
or li
nkW
idth
(pav
ed/
Cla
ssR
ural
Tran
spor
tC
ondi
tion
Roa
d na
me
or n
umbe
rle
ngth
unpa
ved)
(H/P
/D/
Rou
teA
BC
Sta
rtE
ndS
tart
End
(km
) (x
.x)
(m)
(x.x
)L/
A/C
)(U
/R)
(B/M
/T)
B/F
/G(a
bcd)
(from
)(to
)(fr
om)
(to)
(P/U
)13
21. S
unris
e E
st. R
d. A
NC
C 1
321
End
(z)
Rd.
L/R
0.00
0.10
0.10
5.00
U(G
)U
1322
1322
. Sun
rise
Est
. Rd.
BN
CC
132
2E
nd (
v-c)
Rd.
L/R
0.00
0.45
0.45
5.00
PU
F13
23
"
NC
C 1
322
End
(v-
c)R
d. L
/R0.
450.
570.
125.
00U
(G)
UB
1323
1323
. Sun
rise
Est
. Rd.
CN
CC
132
3R
d. B
End
0.00
0.20
0.20
5.00
PC
UB
1324
1324
. Sun
rise
Est
. Rd.
DN
CC
132
4R
d. B
End
0.00
0.07
0.07
5.00
PC
UF
1325
1325
. Sun
rise
Est
. Rd.
EN
CC
132
5R
d. B
End
0.00
0.17
0.17
6.00
PC
UB
1326
1326
. Sun
rise
Est
. Rd.
FN
CC
132
6R
d. B
End
0.00
0.14
0.14
5.00
PC
UF
1327
1327
. Sun
rise
Est
. Rd.
QN
CC
132
7R
d. I
Rd.
R0.
000.
130.
135.
60P
UB
1328
1328
. Sun
rise
Est
. Rd.
RN
CC
132
8R
d. Q
Rd.
S0.
000.
280.
285.
50P
UB
1329
1329
. Sun
rise
Est
. Rd.
SN
CC
132
9R
d. Q
Rd.
Q0.
000.
080.
085.
00P
UB
1330
1330
. Sun
rise
Est
. Rd.
TN
CC
133
0R
d. L
/R0.
000.
080.
085.
00U
(G)
UB
1331
1331
. Sun
rise
Est
. Rd.
UN
CC
133
1R
d. 1
Rd.
L/R
0.00
0.10
0.10
4.00
U(G
)U
B13
3213
32. S
unris
e E
st. R
d. V
NC
C 1
332
Rd.
1R
d. B
0.00
0.17
0.17
6.00
PU
F13
3313
33. S
unris
e E
st. R
d. W
NC
C 1
333
Rd.
BE
nd0.
000.
140.
146.
00P
CU
B13
3413
34. S
unris
e E
st. R
d. X
NC
C 1
334
Rd.
WE
nd0.
000.
130.
135.
00U
(G)
CU
F13
3513
35. S
unris
e E
st. R
d. Z
NC
C 1
335
Rd.
AR
d. X
0.00
0.09
0.09
5.00
U(G
)U
B13
3613
36. U
moj
a 1,
Rd.
B1
NC
C 1
336
B R
d.E
nd0.
000.
180.
185.
00P
CU
B13
3713
37. U
moj
a 1,
Rd.
B2
NC
C 1
337
Rd.
B1
R S
-C0.
000.
210.
214.
20P
AU
F13
3813
38. U
moj
a 1,
Rd.
B3
NC
C 1
338
Rd.
B1
R S
-C0.
000.
280.
285.
00P
AU
F13
3913
39. U
moj
a 1,
Rd.
B4
NC
C 1
339
Rd.
CR
S-C
0.00
0.24
0.24
5.00
PA
UF
1340
1340
. Um
oja
1, R
d. O
NC
C 1
340
Rd.
BR
d. B
0.00
0.15
0.15
6.00
PA
UB
1341
1341
. Um
oja
1, R
d. P
NC
C 1
341
Ngo
b. R
d.N
gob.
Rd.
0.00
0.27
0.27
5.00
PA
UF
1342
1342
. Um
oja
1, R
d. P
NC
C 1
342
Rd.
BR
d. R
0.00
0.40
0.40
4.70
PU
B13
4313
43. U
moj
a 1,
Rd.
QN
CC
134
3N
gob.
Rd.
Ngo
b. R
d0.
000.
270.
275.
00P
AU
F13
4413
44. U
moj
a 1,
Rd.
Q1
NC
C 1
344
Olu
m.
Rd
End
0.00
0.27
0.27
5.20
PC
UB
1345
1345
. Um
oja
1, R
d. R
NC
C 1
345
Rd.
BO
/R R
d0.
000.
380.
385.
00U
(E)
AU
B13
4613
46. U
moj
a 1,
Rd.
SN
CC
134
6M
uto.
Rd.
Mut
o. R
d0.
000.
270.
275.
00P
AU
F13
4713
47. U
moj
a 1,
Rd.
TN
CC
134
7M
uto.
Rd.
Mut
o. R
d0.
000.
280.
285.
00P
AU
F13
4813
48. U
moj
a 1,
Rd.
UN
CC
134
8M
uto.
Rd.
Mut
o. R
d0.
000.
110.
114.
00P
AU
B13
4913
49. U
moj
a 1,
Rd.
VN
CC
134
9R
d. B
End
0.00
0.14
0.14
3.80
PC
UB
1350
1350
. Um
oja
1, R
d. W
NC
C 1
350
Rd.
BR
d. B
0.00
0.24
0.24
5.00
PA
UF
1351
1351
. Um
oja
1, R
d. X
NC
C 1
351
Rd.
BK
ang.
Rd
0.00
0.38
0.38
7.00
PA
UF
1352
1352
. Um
oja
1, R
d. Z
NC
C 1
352
Ese
. R
d.E
nd0.
001.
341.
346.
40P
CU
F13
53
(km
) (x
.xx)
Sec
tion
or li
nkS
ectio
n or
link
desc
riptio
nch
aina
ge
Pag
e 4
of 6

TAB
LE 4
.3-4
(10)
RO
AD
INVE
NTO
RY
IN N
JIR
UR
OA
D IN
VEN
TOR
YA
REA
: N
airo
biZO
NE:
Njir
uG
IBB
AFR
ICA
Uni
que
Sec
tion
Ave
.R
oad
type
Roa
d U
rban
or
Pub
licC
arria
gew
ay
She
et n
o.ro
ad c
ode
or li
nkW
idth
(pav
ed/
Cla
ssR
ural
Tran
spor
tC
ondi
tion
Roa
d na
me
or n
umbe
rle
ngth
unpa
ved)
(H/P
/D/
Rou
teA
BC
Sta
rtE
ndS
tart
End
(km
) (x
.x)
(m)
(x.x
)L/
A/C
)(U
/R)
(B/M
/T)
B/F
/G(a
bcd)
(from
)(to
)(fr
om)
(to)
(P/U
)13
53. U
moj
a 1,
Rd.
X1
NC
C 1
353
Rd.
Z1
End
0.00
0.28
0.28
5.00
PC
UF
1354
1354
. Um
oja
1, R
d. Y
1N
CC
135
4R
d. Z
1E
nd0.
000.
210.
214.
20P
CU
F13
5513
55. U
moj
a 1,
Rd.
Z1
NC
C 1
355
Rd.
BR
d. X
10.
000.
180.
185.
00P
AU
B13
5613
56. U
moj
a 1,
Cre
. AN
CC
135
6R
d. B
Rd.
B0.
000.
240.
245.
30P
UF
1357
1357
. Um
oja
2, R
d. A
NC
C 1
357
Kom
a. R
dR
d. B
0.00
0.50
0.50
7.00
PA
UM
B13
5813
58. U
moj
a 2,
Rd.
BN
CC
135
8R
d. A
Rd.
A0.
003.
833.
837.
00P
LU
MF
1359
1359
. Um
oja
2, R
d. R
NC
C 1
359
Rd.
PR
d. A
0.00
0.63
0.63
4.20
PA
UF
1360
1360
. Um
oja
2, R
d. S
NC
C 1
360
Rd.
AR
d. T
0.00
0.59
0.59
3.20
PA
UB
1361
1361
. Um
oja
2, R
d. T
NC
C 1
361
Rd.
SR
d. U
0.00
0.53
0.53
5.00
PA
UF
1362
1362
. Um
oja
2, R
d. U
NC
C 1
362
Rd.
BTa
rmac
0.00
0.45
0.45
6.90
PU
F13
6313
63. F
r. K
omar
ock
Rd.
30N
CC
136
3K
oma.
Rd
Mut
a. R
d0.
000.
670.
675.
80U
(G)
UF
1364
1364
. Fr.
Mut
arak
wa
Rd.
29N
CC
136
4M
uta.
Rd
End
0.00
0.54
0.54
5.00
PC
UF
1365
1365
. Che
bony
o La
neN
CC
136
5R
d. B
End
0.00
0.27
0.27
5.50
PC
UF
1366
1366
. Ens
enya
Roa
dN
CC
136
6C
rst.
AE
nd0.
000.
200.
204.
10P
CU
F13
6713
67. G
aiku
yu C
resc
ent
NC
C 1
367
Gai
. R
dG
ai.
Rd.
0.00
0.28
0.28
4.90
PA
UF
1368
1368
. Gai
kuyu
Roa
dN
CC
136
8R
d. B
Gai
. R
d.0.
000.
320.
324.
60P
AU
B13
6913
69. J
ohn
Oso
go R
oad
NC
C 1
369
Roc
k R
d.R
ock
Rd.
0.00
3.41
3.41
6.30
PL
UM
F13
7013
70. K
angu
ndo
Rd.
(pt.1
)N
CC
137
0O
/R.
Rd
Kom
a. R
d0.
001.
801.
807.
00P
DU
BF
1371
1371
. Kan
gund
o R
d.(p
t.2)
NC
C 1
371
Kan
g. R
dK
oma.
Rd
0.00
2.51
2.51
8.00
PD
UB
F13
7213
72. K
apso
it C
resc
ent
NC
C 1
372
Kap
s. R
dK
aps.
Rd.
0.00
0.28
0.28
4.20
PA
UB
1373
1373
. Kap
soit
Roa
dN
CC
137
3R
d. B
End
0.00
0.33
0.33
4.40
PC
UB
1374
1374
. Kom
aroc
k R
d.(p
t.1)
NC
C 1
374
Juja
Rd.
Kom
a. R
d0.
0020
.15
20.1
56.
70P
DU
BB
1375
1375
. Kom
aroc
k R
d.(p
t.2)
NC
C 1
375
Kom
a. R
dK
oma.
Rd
0.00
1.15
1.15
7.40
PD
UB
F13
7613
76. K
omar
ock
Rd.
(pt.3
)N
CC
137
6K
oma.
Rd
NC
C C
ity0.
001.
341.
347.
40P
DU
BF
1377
1377
. Kom
aroc
k R
d.(p
t.4)
NC
C 1
377
Kom
a. R
dN
CC
City
0.00
3.83
3.83
6.30
PD
UB
F13
7813
78. L
imut
et L
ane
NC
C 1
378
Nya
n. R
dE
nd0.
000.
120.
125.
00P
CU
F13
7913
79. M
u. K
enya
tta R
d. 1
NC
C 1
379
Roc
k R
d.J/
O.
Rd
0.00
2.07
2.07
6.70
PL
UM
F13
8013
80. M
u. K
enya
tta R
d. 2
NC
C 1
380
Kom
a. R
dJ/
O.
Rd
0.00
1.00
1.00
7.50
PL
UM
F13
8113
81. M
utar
akw
a R
oad
NC
C 1
381
O/R
. R
dK
oma.
Rd
0.00
1.50
1.50
7.10
PL
UB
F13
8213
82. M
uton
guni
Crs
t.N
CC
138
2M
uto.
Rd
Mut
o. R
d.0.
000.
270.
275.
00P
AU
B13
8313
83. M
uton
guni
Rd.
NC
C 1
383
Rd.
BR
d. U
0.00
0.33
0.33
4.00
PA
UB
1384
1384
. Ngo
bini
Roa
dN
CC
138
4R
d. B
End
0.00
0.28
0.28
6.00
PC
UB
1385
1385
. Ngo
bini
Cre
scen
tN
CC
138
5N
go.
Rd
Ngo
. R
d.0.
000.
270.
275.
00P
AU
F13
86
(km
) (x
.xx)
Sec
tion
or li
nkS
ectio
n or
link
desc
riptio
nch
aina
ge
Pag
e 5
of 6

TAB
LE 4
.3-4
(10)
RO
AD
INVE
NTO
RY
IN N
JIR
UR
OA
D IN
VEN
TOR
YA
REA
: N
airo
biZO
NE:
Njir
uG
IBB
AFR
ICA
Uni
que
Sec
tion
Ave
.R
oad
type
Roa
d U
rban
or
Pub
licC
arria
gew
ay
She
et n
o.ro
ad c
ode
or li
nkW
idth
(pav
ed/
Cla
ssR
ural
Tran
spor
tC
ondi
tion
Roa
d na
me
or n
umbe
rle
ngth
unpa
ved)
(H/P
/D/
Rou
teA
BC
Sta
rtE
ndS
tart
End
(km
) (x
.x)
(m)
(x.x
)L/
A/C
)(U
/R)
(B/M
/T)
B/F
/G(a
bcd)
(from
)(to
)(fr
om)
(to)
(P/U
)13
86. N
yang
usu
Clo
seN
CC
138
6N
ya.
Rd
End
0.00
0.09
0.09
4.30
PC
UF
1387
1387
. Nya
ngus
u C
rst.
NC
C 1
387
Nya
. R
dN
ya.
Rd
0.00
0.14
0.14
4.30
PU
F13
8813
88. N
yang
usu
Roa
dN
CC
138
8W
. Crs
t.E
nd0.
000.
650.
654.
60P
CU
F13
8913
89. O
lum
bori
Clo
se
NC
C 1
389
Olu
. R
dE
nd0.
000.
870.
876.
60P
CU
F13
9013
90. O
lum
bori
Lane
NC
C 1
390
Olu
. R
dE
nd0.
000.
260.
266.
00P
CU
F13
9113
91. O
lum
bori
Roa
dN
CC
139
1R
d. B
Rd.
B0.
000.
190.
195.
20P
AU
F13
9213
92. O
supu
ko C
rst.
NC
C 1
392
Osu
p. R
dO
sup.
Rd
0.00
0.28
0.28
5.10
PA
UF
1393
1393
. Osu
puko
Roa
dN
CC
139
3R
d. B
Gai
. Ln
0.00
0.25
0.25
5.50
PA
UF
1394
1394
. Roc
k R
oad
NC
C 1
394
Kom
a. R
dJ/
O.
Rd
0.00
2.48
2.48
7.00
PA
UB
F13
9513
95. T
hugi
Cre
scen
tN
CC
139
5Th
ugi
Rd
End
0.00
0.27
0.27
5.00
PC
UB
1396
1396
. Thu
gi G
rove
NC
C 1
396
Thug
i R
dE
nd0.
000.
460.
465.
00P
CU
B13
9713
97. T
hugi
Roa
dN
CC
139
7W
. Crs
t.E
nd0.
000.
200.
203.
50P
CU
F13
98
(km
) (x
.xx)
Sec
tion
or li
nkS
ectio
n or
link
desc
riptio
nch
aina
ge
Pag
e 6
of 6

TAB
LE 4
.3-4
(11)
RO
AD
INVE
NTO
RY
IN S
TAR
EHE
RO
AD
INVE
NTO
RY
AR
EA:
Nai
robi
ZON
E: S
tare
heG
IBB
AFR
ICA
Uni
que
Sec
tion
Ave
.R
oad
type
Roa
d U
rban
or
Pub
licC
arria
gew
ay
She
et n
o.ro
ad c
ode
or li
nkW
idth
(pav
ed/
Cla
ssR
ural
Tran
spor
tC
ondi
tion
Roa
d na
me
or n
umbe
rle
ngth
unpa
ved)
(H/P
/D/
Rou
teA
BC
Sta
rtE
ndS
tart
End
(km
) (x
.x)
(m)
(x.x
)L/
A/C
)(U
/R)
(B/M
/T)
B/F
/G(a
bcd)
(from
)(to
)(fr
om)
(to)
(P/U
)13
98. R
ing
Rd.
Nga
raN
CC
139
8R
/R.
Rd.
End
0.00
0.66
0.66
6.80
PC
UB
1399
1399
. Kee
koro
k Ln
. Rd.
YN
CC
139
9K
/K.
Rd.
Kiri
. R
d0.
000.
180.
185.
00P
AU
B14
0014
00. K
olob
ot S
t. A
nn S
chN
CC
140
0K
olo
Rd.
St.
Ann
0.00
0.30
0.30
4.80
PU
F14
0114
01. L
ome
Rd.
-City
H. S
.N
CC
140
1Lo
me
Rd.
C. H
. S.
0.00
1.39
1.39
4.00
U(E
)A
UB
1402
1402
. Lom
e-E
.Day
N. S
chN
CC
140
2Lo
me
Rd.
Des
ai R
d.0.
000.
180.
184.
80U
(E)
UB
1403
1403
. Mik
onge
Ln-
Ago
i Cr.
NC
C 1
403
Ago
i. R
d.A
goi
Rd.
0.00
0.16
0.16
4.00
PA
UF
1404
1404
. Mur
anga
-Msh
ale
Rd
NC
C 1
404
Mur
a. R
d.M
sha.
Rd.
0.00
0.12
0.12
11.0
0U
(E)
UB
1405
1405
. Mur
anga
R.A
bt-E
ndN
CC
140
5R
/Abo
utM
uth.
R/A
0.00
0.15
0.15
5.20
PU
F14
0614
06. N
CC
Riv
er, R
d. A
NC
C 1
406
NC
C R
v.K
iri.
Rd
0.00
2.19
2.19
7.00
PA
UM
F14
0714
07. S
oitu
lol R
d.-N
dege
Ln.
NC
C 1
407
Soi
. R
dN
de.
Ln.
0.00
0.08
0.08
5.00
U(E
)U
B14
0814
08. F
r. S
heik
h R
oad
NC
C 1
408
She
. R
d.N
/Vie
w R
d0.
000.
280.
284.
00U
(E)
UB
1409
1409
. Joi
ns N
dege
Lan
eN
CC
140
9D
esa
Rd.
Nde
. Ln
.0.
000.
060.
066.
00U
(E)
AU
B14
1014
10. A
bidj
an R
oad
NC
C 1
410
Lom
e R
d.P
ark
Rd.
0.00
0.17
0.17
6.00
PA
UF
1411
1411
. Acc
ra R
oad
NC
C 1
411
Rv.
Rd.
T/M
. S
t.0.
000.
250.
256.
50P
AU
MB
1412
1412
. Ago
i Roa
dN
CC
141
2F/
V.
Rd.
End
0.00
0.81
0.81
5.65
PC
UB
1413
1413
. Baj
uni R
oad
NC
C 1
413
I/R.
Rd.
Des
ai R
d.0.
000.
210.
214.
00U
(E)
AU
B14
1414
14. B
anda
Stre
etN
CC
141
4Lo
it. S
t.K
ima
St.
0.00
0.46
0.46
8.70
PA
UF
1415
1415
. Bar
idi L
ane
NC
C 1
415
Bar
i. R
d.Ju
ja. R
d.0.
000.
160.
165.
90P
AU
F14
1614
16. B
arid
i Roa
dN
CC
141
6F/
V.
Rd.
N/V
. R
d.0.
000.
240.
246.
15P
LU
F14
1714
17. B
iash
ara
Stre
etN
CC
141
7K
oin.
St.
Moi
Av.
0.00
0.37
0.37
10.0
0P
AU
F14
1814
18. B
ilesh
a R
d. (p
t.1)
NC
C 1
418
Des
. R
d.Lo
me.
Rd.
0.00
0.30
0.30
4.50
PA
UF
1419
1419
. Bile
sha
Rd.
(pt.2
)N
CC
141
9D
es.
Rd.
Lom
e. R
d.0.
000.
110.
114.
00P
AU
F14
2014
20. B
onde
Lan
eN
CC
142
0Ju
ja R
dB
ari.
Rd.
0.00
0.15
0.15
6.70
PA
UF
1421
1421
. Bun
i Lan
eN
CC
142
1Ju
ja R
dB
ari.
Rd.
0.00
0.17
0.17
4.00
U(E
)U
F14
2214
22. B
usta
ni L
ane
NC
C 1
422
Ago
i. R
d.Za
mb.
Ln.
0.00
0.21
0.21
4.50
PA
UF
1423
1423
. Cha
i Roa
dN
CC
142
3Ju
ja R
dP
am.
Rd.
0.00
0.24
0.24
4.00
U(E
)U
B14
2414
24. C
ham
bers
Roa
dN
CC
142
4N
ga.
Rd.
Mur
a. R
d.0.
000.
500.
505.
40P
AU
F14
2514
25. C
hana
l Sin
gh R
d.N
CC
142
5K
ins.
Rd.
Des
ai R
d.0.
000.
340.
344.
00P
AU
B14
2614
26. C
ity H
all W
ayN
CC
142
6M
oi.
Av
Uhu
. H/W
0.00
0.86
0.86
13.3
0P
DU
BF
1427
1427
. Cro
ss L
ane
NC
C 1
427
Ndu
. R
d.C
ross
Rd.
0.00
0.37
0.37
7.00
PA
UF
1428
1428
. Cro
ss R
oad
NC
C 1
428
Nga
. R
d.R
/C.
Rd.
0.00
0.84
0.84
6.70
PA
UF
1429
1429
. Des
ai R
oad.
(pt.1
)N
CC
142
9M
ura.
Rd.
Fore
. R
d.0.
000.
710.
717.
50P
DU
MF
1430
1430
. Des
ai R
oad
(pt.2
)N
CC
143
0Fo
re.
Rd.
Mur
a. R
d.0.
000.
420.
426.
35P
UM
F14
31
(km
) (x
.xx)
Sec
tion
or li
nkS
ectio
n or
link
desc
riptio
nch
aina
ge
Pag
e 1
of 6

TAB
LE 4
.3-4
(11)
RO
AD
INVE
NTO
RY
IN S
TAR
EHE
RO
AD
INVE
NTO
RY
AR
EA:
Nai
robi
ZON
E: S
tare
heG
IBB
AFR
ICA
Uni
que
Sec
tion
Ave
.R
oad
type
Roa
d U
rban
or
Pub
licC
arria
gew
ay
She
et n
o.ro
ad c
ode
or li
nkW
idth
(pav
ed/
Cla
ssR
ural
Tran
spor
tC
ondi
tion
Roa
d na
me
or n
umbe
rle
ngth
unpa
ved)
(H/P
/D/
Rou
teA
BC
Sta
rtE
ndS
tart
End
(km
) (x
.x)
(m)
(x.x
)L/
A/C
)(U
/R)
(B/M
/T)
B/F
/G(a
bcd)
(from
)(to
)(fr
om)
(to)
(P/U
)14
31. D
ubai
Roa
dN
CC
143
1A
ccra
Rd.
Late
Rd.
0.00
0.18
0.18
7.00
PA
UF
1432
1432
. Dub
ois
Lane
NC
C 1
432
Acc
ra R
d.La
te R
d.0.
000.
170.
175.
50P
UF
1433
1433
. Dur
uma
Roa
dN
CC
143
3R
v. R
d.R
/C.
Rd.
0.00
0.77
0.77
6.00
PA
UB
1434
1434
. Elw
ak L
ane
NC
C 1
434
R/C
. R
d.E
nd0.
000.
170.
172.
60P
CU
F14
3514
35. F
airv
iew
Roa
dN
CC
143
5M
ura.
Rd.
Juja
. Rd.
0.00
0.80
0.80
11.4
3P
AU
B14
3614
36. F
ire S
tone
Lan
eN
CC
143
6La
te R
d.R
v. R
d.0.
000.
270.
275.
60P
AU
F14
3714
37. F
ores
t Lan
eN
CC
143
7Li
mu.
Rd.
Fore
. R
d.0.
000.
720.
724.
00U
(E)
AU
B14
3814
38. F
ores
t Rd.
(Nbi
)N
CC
143
8Li
mu.
Rd.
Fore
. R
d.0.
001.
491.
497.
00P
UM
F14
3914
39. F
ores
t Rd.
(Thi
ka)
NC
C 1
439
Mus
e. H
illP
anga
R/A
0.00
1.52
1.52
7.00
PU
F14
4014
40. G
aber
one
Roa
dN
CC
144
0Lu
th.
Av.
Rv.
Rd.
0.00
0.25
0.25
8.30
PA
UF
1441
1441
. Gal
be R
obe
Roa
dN
CC
144
1La
sa.
Rd.
Par
k R
d.0.
000.
290.
295.
40P
AU
F14
4214
42. G
alla
Roa
dN
CC
144
2M
una.
Rd
Kip
k. R
d.0.
000.
190.
195.
50P
AU
F14
4314
43. G
en. K
ago
Stre
etN
CC
144
3M
/N.
St.
Kau
. S
t.0.
000.
050.
057.
00P
UB
1444
1444
. Gen
. Wai
rung
i St.
NC
C 1
444
2nd
Av.
Kar
i. M
kt.
0.00
1.70
1.70
10.3
0P
LU
B14
4514
45. G
was
i Roa
dN
CC
144
5R
.Nga
laR
/R.
Pum
.0.
000.
140.
146.
50P
AU
B14
4614
46. H
aile
Sel
assi
e A
v.N
CC
144
6N
go.
Rd
Land
Rd.
0.00
2.55
2.55
18.6
0P
DU
BF
1447
1447
. Haj
i Roa
dN
CC
144
7C
hai
Rd.
F/V
. R
d.0.
000.
240.
245.
30P
LU
F14
4814
48. H
akat
i Roa
dN
CC
144
8T/
M.
St.
Tem
. R
d.0.
000.
240.
245.
30P
AU
F14
4914
49. H
aram
bee
Av.
NC
C 1
449
Uhu
. H
/WM
oi A
v.0.
000.
870.
8713
.40
PA
UF
1450
1450
. Har
ry T
huku
Rd.
NC
C 1
450
Uhu
. H
/WU
ni.
Way
0.00
0.71
0.71
6.80
PA
UF
1451
1451
. Hom
be S
treet
NC
C 1
451
R/R
. N
ga.
Mur
a. R
d.0.
001.
001.
006.
90P
LU
F14
5214
52. I
rung
u R
iika
Rd.
NC
C 1
452
Nga
. R
d.D
esai
Rd.
0.00
0.26
0.26
12.0
0P
UB
1453
1453
. Ite
syo
Lane
NC
C 1
453
Kip
a. R
d.N
ga.
Rd.
0.00
0.15
0.15
5.30
PD
UB
1454
1454
. Jai
nsal
a La
neN
CC
145
4K
eek.
Rd.
Kiri
. R
d.0.
000.
270.
276.
50P
AU
F14
5514
55. J
odon
go L
ane
NC
C 1
455
Jodo
. R
d.E
nd0.
000.
250.
256.
00P
CU
B14
5614
56. J
odon
go R
oad
NC
C 1
456
Kih
u. R
d.N
g. S
. Sch
0.00
0.14
0.14
6.40
PA
UF
1457
1457
. Kal
ongo
Roa
dN
CC
145
7N
gwe.
Rd
Mur
a. R
d.0.
000.
210.
216.
00P
UF
1458
1458
. Kam
ae L
ane
NC
C 1
458
Gab
e. R
d.Lu
th.
Av.
0.00
0.07
0.07
5.20
PA
UF
1459
1459
. Kau
nda
Stre
etN
CC
145
9K
eny.
Av.
M/B
. S
t.0.
000.
750.
759.
00P
AU
F14
6014
60. K
eeko
rok
Roa
dN
CC
146
0N
gar.
Rd.
Kilo
. R
d0.
000.
330.
337.
00P
AU
B14
6114
61. K
enya
tta A
venu
eN
CC
146
1V
al.
Rd.
Moi
. A
v.0.
000.
790.
7912
.80
PH
UB
F14
6214
62. K
ianj
eku
Roa
dN
CC
146
2N
ga.
Rd.
Kol
o. R
d.0.
000.
190.
195.
20P
AU
B14
6314
63. K
iarie
Kih
u R
oad
NC
C 1
463
Mur
a. R
d.B
ari.
Rd.
0.00
0.60
0.60
5.40
PA
UB
1464
(km
) (x
.xx)
Sec
tion
or li
nkS
ectio
n or
link
desc
riptio
nch
aina
ge
Pag
e 2
of 6
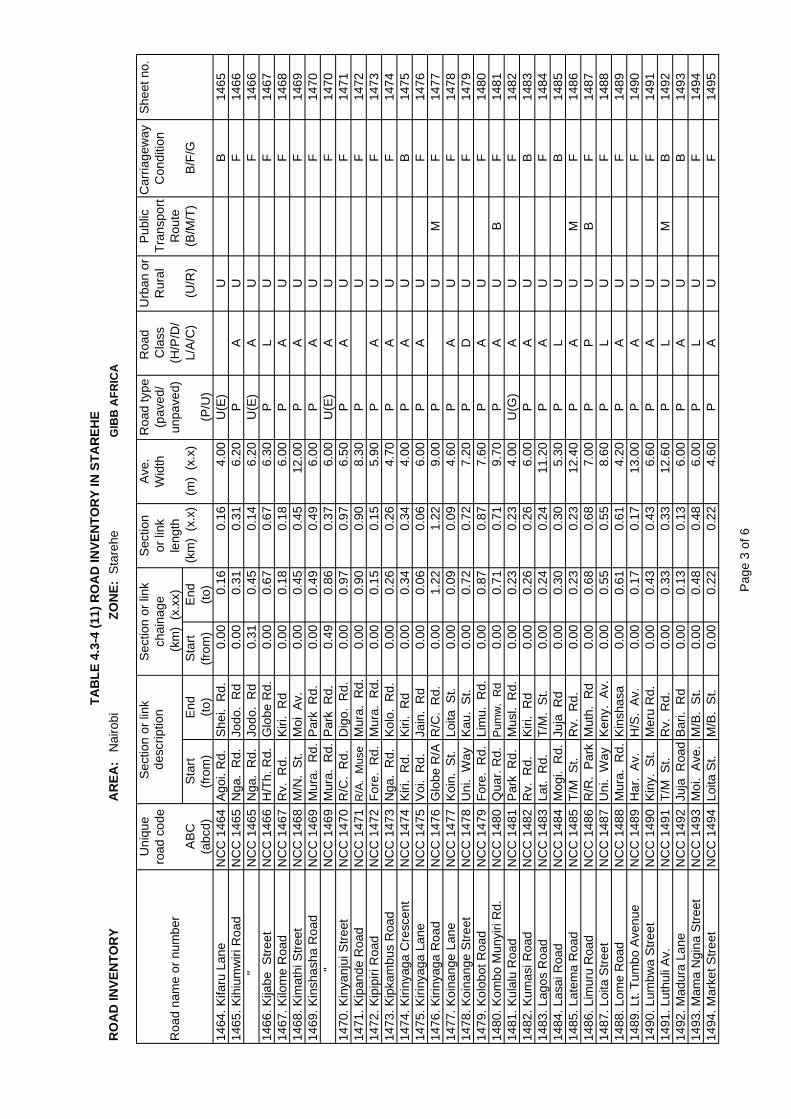
TAB
LE 4
.3-4
(11)
RO
AD
INVE
NTO
RY
IN S
TAR
EHE
RO
AD
INVE
NTO
RY
AR
EA:
Nai
robi
ZON
E: S
tare
heG
IBB
AFR
ICA
Uni
que
Sec
tion
Ave
.R
oad
type
Roa
d U
rban
or
Pub
licC
arria
gew
ay
She
et n
o.ro
ad c
ode
or li
nkW
idth
(pav
ed/
Cla
ssR
ural
Tran
spor
tC
ondi
tion
Roa
d na
me
or n
umbe
rle
ngth
unpa
ved)
(H/P
/D/
Rou
teA
BC
Sta
rtE
ndS
tart
End
(km
) (x
.x)
(m)
(x.x
)L/
A/C
)(U
/R)
(B/M
/T)
B/F
/G(a
bcd)
(from
)(to
)(fr
om)
(to)
(P/U
)14
64. K
ifaru
Lan
eN
CC
146
4A
goi.
Rd.
She
i. R
d.0.
000.
160.
164.
00U
(E)
UB
1465
1465
. Kih
ium
wiri
Roa
dN
CC
146
5N
ga.
Rd.
Jodo
. R
d0.
000.
310.
316.
20P
AU
F14
66
"
NC
C 1
465
Nga
. R
d.Jo
do.
Rd
0.31
0.45
0.14
6.20
U(E
)A
UF
1466
1466
. Kija
be S
treet
NC
C 1
466
H/T
h. R
d.G
lobe
Rd.
0.00
0.67
0.67
6.30
PL
UF
1467
1467
. Kilo
me
Roa
dN
CC
146
7R
v. R
d.K
iri.
Rd
0.00
0.18
0.18
6.00
PA
UF
1468
1468
. Kim
athi
Stre
etN
CC
146
8M
/N.
St.
Moi
Av.
0.00
0.45
0.45
12.0
0P
AU
F14
6914
69. K
insh
asha
Roa
dN
CC
146
9M
ura.
Rd.
Par
k R
d.0.
000.
490.
496.
00P
AU
F14
70
"
NC
C 1
469
Mur
a. R
d.P
ark
Rd.
0.49
0.86
0.37
6.00
U(E
)A
UF
1470
1470
. Kin
yanj
ui S
treet
NC
C 1
470
R/C
. R
d.D
igo.
Rd.
0.00
0.97
0.97
6.50
PA
UF
1471
1471
. Kip
ande
Roa
dN
CC
147
1R
/A.
Mus
eM
ura.
Rd.
0.00
0.90
0.90
8.30
PU
F14
7214
72. K
ipip
iri R
oad
NC
C 1
472
Fore
. R
d.M
ura.
Rd.
0.00
0.15
0.15
5.90
PA
UF
1473
1473
. Kip
kam
bus
Roa
dN
CC
147
3N
ga.
Rd.
Kol
o. R
d.0.
000.
260.
264.
70P
AU
F14
7414
74. K
iriny
aga
Cre
scen
tN
CC
147
4K
iri.
Rd.
Kiri
. R
d0.
000.
340.
344.
00P
AU
B14
7514
75. K
iriny
aga
Lane
NC
C 1
475
Voi
. R
d.Ja
in.
Rd
0.00
0.06
0.06
6.00
PA
UF
1476
1476
. Kiri
nyag
a R
oad
NC
C 1
476
Glo
be R
/AR
/C.
Rd.
0.00
1.22
1.22
9.00
PU
MF
1477
1477
. Koi
nang
e La
neN
CC
147
7K
oin.
St.
Loita
St.
0.00
0.09
0.09
4.60
PA
UF
1478
1478
. Koi
nang
e S
treet
NC
C 1
478
Uni
. W
ayK
au.
St.
0.00
0.72
0.72
7.20
PD
UF
1479
1479
. Kol
obot
Roa
dN
CC
147
9Fo
re.
Rd.
Lim
u. R
d.0.
000.
870.
877.
60P
AU
F14
8014
80. K
ombo
Mun
yiri
Rd.
NC
C 1
480
Qua
r. R
d.P
umw
. R
d0.
000.
710.
719.
70P
AU
BF
1481
1481
. Kul
alu
Roa
dN
CC
148
1P
ark
Rd.
Mus
l. R
d.0.
000.
230.
234.
00U
(G)
AU
F14
8214
82. K
umas
i Roa
dN
CC
148
2R
v. R
d.K
iri.
Rd
0.00
0.26
0.26
6.00
PA
UB
1483
1483
. Lag
os R
oad
NC
C 1
483
Lat.
Rd.
T/M
. S
t.0.
000.
240.
2411
.20
PA
UF
1484
1484
. Las
ai R
oad
NC
C 1
484
Mog
i. R
d.Ju
ja R
d0.
000.
300.
305.
30P
LU
B14
8514
85. L
atem
a R
oad
NC
C 1
485
T/M
St.
Rv.
Rd.
0.00
0.23
0.23
12.4
0P
AU
MF
1486
1486
. Lim
uru
Roa
dN
CC
148
6R
/R.
Par
kM
uth.
Rd
0.00
0.68
0.68
7.00
PP
UB
F14
8714
87. L
oita
Stre
etN
CC
148
7U
ni.
Way
Ken
y. A
v.0.
000.
550.
558.
60P
LU
F14
8814
88. L
ome
Roa
dN
CC
148
8M
ura.
Rd.
Kin
shas
a0.
000.
610.
614.
20P
AU
F14
8914
89. L
t. Tu
mbo
Ave
nue
NC
C 1
489
Har
. A
v.H
/S.
Av.
0.00
0.17
0.17
13.0
0P
AU
F14
9014
90. L
umbw
a S
treet
NC
C 1
490
Kin
y. S
t.M
eru
Rd.
0.00
0.43
0.43
6.60
PA
UF
1491
1491
. Lut
huli
Av.
NC
C 1
491
T/M
St.
Rv.
Rd.
0.00
0.33
0.33
12.6
0P
LU
MB
1492
1492
. Mad
ura
Lane
NC
C 1
492
Juja
Roa
dB
ari.
Rd
0.00
0.13
0.13
6.00
PA
UB
1493
1493
. Mam
a N
gina
Stre
etN
CC
149
3M
oi.
Ave
.M
/B.
St.
0.00
0.48
0.48
6.00
PL
UF
1494
1494
. Mar
ket S
treet
NC
C 1
494
Loita
St.
M/B
. S
t.0.
000.
220.
224.
60P
AU
F14
95
(km
) (x
.xx)
Sec
tion
or li
nkS
ectio
n or
link
desc
riptio
nch
aina
ge
Pag
e 3
of 6

TAB
LE 4
.3-4
(11)
RO
AD
INVE
NTO
RY
IN S
TAR
EHE
RO
AD
INVE
NTO
RY
AR
EA:
Nai
robi
ZON
E: S
tare
heG
IBB
AFR
ICA
Uni
que
Sec
tion
Ave
.R
oad
type
Roa
d U
rban
or
Pub
licC
arria
gew
ay
She
et n
o.ro
ad c
ode
or li
nkW
idth
(pav
ed/
Cla
ssR
ural
Tran
spor
tC
ondi
tion
Roa
d na
me
or n
umbe
rle
ngth
unpa
ved)
(H/P
/D/
Rou
teA
BC
Sta
rtE
ndS
tart
End
(km
) (x
.x)
(m)
(x.x
)L/
A/C
)(U
/R)
(B/M
/T)
B/F
/G(a
bcd)
(from
)(to
)(fr
om)
(to)
(P/U
)14
95. M
bono
Cre
scen
tN
CC
149
5M
bono
Rd
F/V
. R
d.0.
000.
210.
215.
50P
AU
B14
9614
96. M
bono
Lan
eN
CC
149
6M
bono
Rd
Pam
b. R
d0.
000.
130.
135.
50P
AU
F14
9714
97. M
bono
Roa
dN
CC
149
7R
/R N
gar
F/V
. R
d.0.
000.
220.
227.
40P
LU
F14
9814
98. M
fang
ano
Lane
NC
C 1
498
H/S
. A
v.R
/Nga
la0.
000.
450.
455.
60P
AU
F14
9914
99. M
fang
ano
Stre
etN
CC
149
9H
/S.
Av.
Luth
. A
v.0.
000.
480.
488.
30P
LU
BF
1500
1500
. Mik
onge
Lan
eN
CC
150
0N
/V.
Rd.
Ago
i R
d.0.
000.
230.
235.
80P
AU
F15
0115
01. M
iwa
Lane
NC
C 1
501
Ago
i R
d.B
ari.
Rd
0.00
0.63
0.63
4.00
PA
UF
1502
1502
. Mog
ira R
oad
NC
C 1
502
Par
k R
d.R
/R.
Nga
.0.
000.
400.
405.
60P
AU
F15
0315
03. M
oi A
venu
eN
CC
150
3U
ni. W
ayH
/S.
Av.
0.00
1.43
1.43
14.0
0P
DU
BF
1504
1504
. Mok
tar D
adda
h S
t.N
CC
150
4M
oi.
Ave
.K
oin.
St.
0.00
0.34
0.34
10.0
0P
AU
F15
0515
05. M
onro
via
Stre
etN
CC
150
5U
hu.
H/W
Moi
Av.
0.00
0.30
0.30
6.00
PA
UF
1506
1506
. Msh
ale
Lane
NC
C 1
506
Des
ai R
dO
/A.
Rd.
0.00
0.52
0.52
6.00
U(E
)A
UB
1507
1507
. Mta
ragw
a La
neN
CC
150
7S
he.
LnM
we.
Ln.
0.00
0.33
0.33
4.00
PA
UB
1508
1508
. Muh
oron
i Clo
seN
CC
150
8N
ga.
Rd.
End
0.00
0.13
0.13
4.00
U(E
)C
UB
1509
1509
. Mui
ndi M
bing
u S
treet
NC
C 1
509
M/N
. S
t.M
oi A
v.0.
000.
770.
779.
00P
LU
F15
1015
10. M
unyu
Roa
d (p
t.1)
NC
C 1
510
R/N
. S
t.G
abe.
Rd.
0.00
0.30
0.30
10.7
0P
AU
MF
1511
1511
. Mun
yu R
oad
(pt.2
)N
CC
151
1G
abe.
Rd.
Acc
r. R
d.0.
000.
150.
156.
40P
AU
MF
1512
1512
. Mur
anga
Rd.
(Thi
ka)
NC
C 1
512
Thik
a R
d.N
ga.
Rd.
0.00
1.01
1.01
20.2
0P
UB
F15
1315
13. M
uran
ga R
d. (p
t.1)
NC
C 1
513
Glo
beM
oi A
v.0.
000.
180.
189.
00P
UB
F15
1415
14. M
uran
ga R
d. (p
t.2)
NC
C 1
514
Fore
. R
d.M
ur.
Rd.
0.00
1.38
1.38
12.0
0P
DU
BF
1515
1515
. Mur
anga
Rd.
(pt.3
)N
CC
151
5Th
ika
Rd.
Fore
. R
d.0.
000.
490.
4914
.00
PU
BF
1516
1516
. Mur
atin
a S
treet
NC
C 1
516
Juja
Roa
dG
en. W
. St
0.00
1.43
1.43
4.00
U(E
)D
UB
1517
1517
. Mus
hem
bi R
oad
NC
C 1
517
Nga
. R
d.Li
mu.
Rd.
0.00
0.39
0.39
5.40
PA
UF
1518
1518
. Mus
indi
Lan
eN
CC
151
8K
ihu.
Rd.
Mis
h R
d.0.
000.
450.
454.
00P
AU
B15
1915
19. M
usin
di R
oad
NC
C 1
519
Kih
u. R
d.0.
000.
400.
406.
20P
AU
B15
2015
20. M
uslim
Roa
dN
CC
152
0P
ark
Rd.
Kul
a R
d.0.
000.
100.
105.
20P
AU
F15
21
"
NC
C 1
520
Par
k R
d.K
ula
Rd.
0.10
0.39
0.29
5.20
U(E
)A
UF
1521
1521
. Mw
atat
e La
neN
CC
152
1R
/C.
Rd.
End
0.00
0.16
0.16
3.60
PC
UF
1522
1522
. Mw
eni
Roa
dN
CC
152
2K
alo.
Rd.
Juja
Rd.
0.00
0.76
0.76
6.70
PA
UF
1523
1523
. Mw
ezi L
ane
NC
C 1
523
N/V
. R
d.S
he.
Rd.
0.00
0.23
0.23
4.00
PA
UF
1524
1524
. Nah
ar S
ingh
Roa
dN
CC
152
4M
ura.
Rd.
Thin
g R
d.0.
000.
380.
386.
00U
(E)
AU
F15
2515
25. N
dege
Lan
eN
CC
152
5F/
D.
JcFo
re.
Rd.
0.00
0.54
0.54
4.00
U(E
)A
UF
1526
1526
. Ndo
vu L
ane
NC
C 1
526
F/V
. R
d.N
/V.
Rd.
0.00
0.51
0.51
4.00
U(E
)A
UF
1527
(km
) (x
.xx)
Sec
tion
or li
nkS
ectio
n or
link
desc
riptio
nch
aina
ge
Pag
e 4
of 6
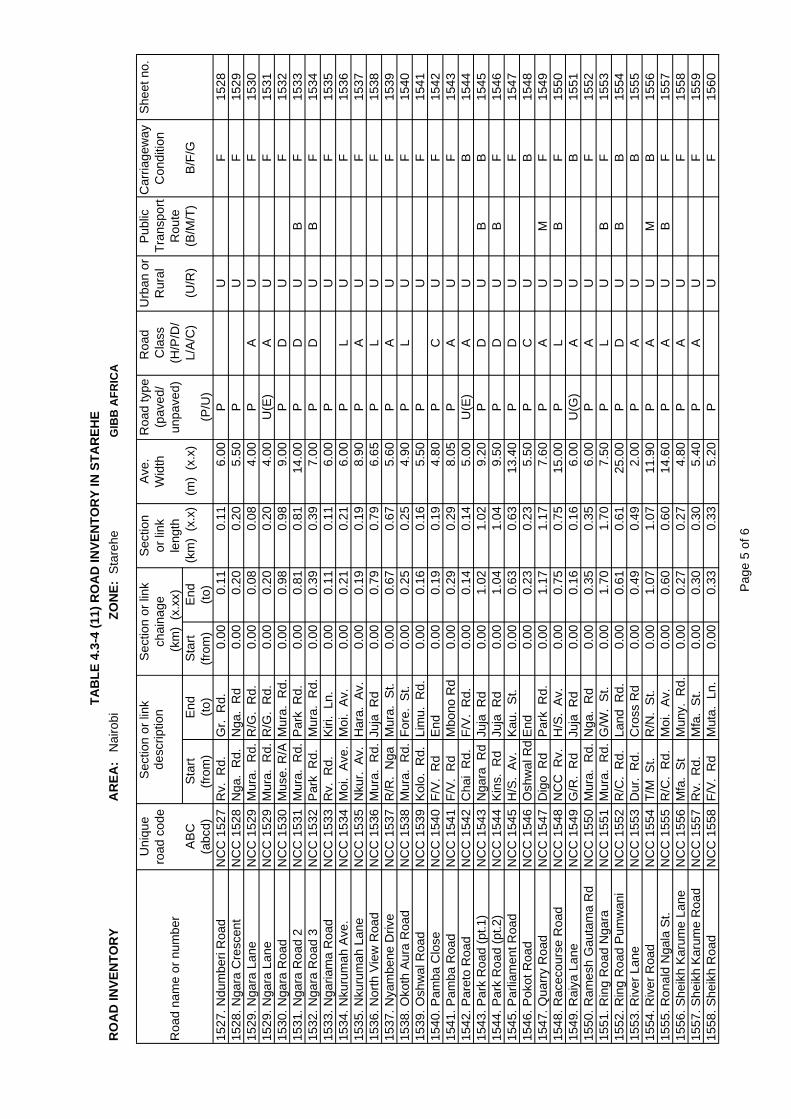
TAB
LE 4
.3-4
(11)
RO
AD
INVE
NTO
RY
IN S
TAR
EHE
RO
AD
INVE
NTO
RY
AR
EA:
Nai
robi
ZON
E: S
tare
heG
IBB
AFR
ICA
Uni
que
Sec
tion
Ave
.R
oad
type
Roa
d U
rban
or
Pub
licC
arria
gew
ay
She
et n
o.ro
ad c
ode
or li
nkW
idth
(pav
ed/
Cla
ssR
ural
Tran
spor
tC
ondi
tion
Roa
d na
me
or n
umbe
rle
ngth
unpa
ved)
(H/P
/D/
Rou
teA
BC
Sta
rtE
ndS
tart
End
(km
) (x
.x)
(m)
(x.x
)L/
A/C
)(U
/R)
(B/M
/T)
B/F
/G(a
bcd)
(from
)(to
)(fr
om)
(to)
(P/U
)15
27. N
dum
beri
Roa
dN
CC
152
7R
v. R
d.G
r. R
d.0.
000.
110.
116.
00P
UF
1528
1528
. Nga
ra C
resc
ent
NC
C 1
528
Nga
. R
d.N
ga.
Rd
0.00
0.20
0.20
5.50
PU
F15
2915
29. N
gara
Lan
eN
CC
152
9M
ura.
Rd.
R/G
. R
d.0.
000.
080.
084.
00P
AU
F15
3015
29. N
gara
Lan
eN
CC
152
9M
ura.
Rd.
R/G
. R
d.0.
000.
200.
204.
00U
(E)
AU
F15
3115
30. N
gara
Roa
dN
CC
153
0M
use.
R/A
Mur
a. R
d.0.
000.
980.
989.
00P
DU
F15
3215
31. N
gara
Roa
d 2
NC
C 1
531
Mur
a. R
d.P
ark
Rd.
0.00
0.81
0.81
14.0
0P
DU
BF
1533
1532
. Nga
ra R
oad
3N
CC
153
2P
ark
Rd.
Mur
a. R
d.0.
000.
390.
397.
00P
DU
BF
1534
1533
. Nga
riam
a R
oad
NC
C 1
533
Rv.
Rd.
Kiri
. Ln
.0.
000.
110.
116.
00P
UF
1535
1534
. Nku
rum
ah A
ve.
NC
C 1
534
Moi
. A
ve.
Moi
. A
v.0.
000.
210.
216.
00P
LU
F15
3615
35. N
kuru
mah
Lan
eN
CC
153
5N
kur.
Av.
Har
a. A
v.0.
000.
190.
198.
90P
AU
F15
3715
36. N
orth
Vie
w R
oad
NC
C 1
536
Mur
a. R
d.Ju
ja R
d0.
000.
790.
796.
65P
LU
F15
3815
37. N
yam
bene
Driv
eN
CC
153
7R
/R.
Nga
Mur
a. S
t.0.
000.
670.
675.
60P
AU
F15
3915
38. O
koth
Aur
a R
oad
NC
C 1
538
Mur
a. R
d.Fo
re.
St.
0.00
0.25
0.25
4.90
PL
UF
1540
1539
. Osh
wal
Roa
dN
CC
153
9K
olo.
Rd.
Lim
u. R
d.0.
000.
160.
165.
50P
UF
1541
1540
. Pam
ba C
lose
NC
C 1
540
F/V
. R
dE
nd0.
000.
190.
194.
80P
CU
F15
4215
41. P
amba
Roa
dN
CC
154
1F/
V.
Rd
Mbo
no R
d0.
000.
290.
298.
05P
AU
F15
4315
42. P
aret
o R
oad
NC
C 1
542
Cha
i R
d.F/
V.
Rd.
0.00
0.14
0.14
5.00
U(E
)A
UB
1544
1543
. Par
k R
oad
(pt.1
)N
CC
154
3N
gara
Rd
Juja
Rd
0.00
1.02
1.02
9.20
PD
UB
B15
4515
44. P
ark
Roa
d (p
t.2)
NC
C 1
544
Kin
s. R
dJu
ja R
d0.
001.
041.
049.
50P
DU
BF
1546
1545
. Par
liam
ent R
oad
NC
C 1
545
H/S
. A
v.K
au.
St.
0.00
0.63
0.63
13.4
0P
DU
F15
4715
46. P
okot
Roa
dN
CC
154
6O
shw
al R
dE
nd0.
000.
230.
235.
50P
CU
B15
4815
47. Q
uarr
y R
oad
NC
C 1
547
Dig
o R
dP
ark
Rd.
0.00
1.17
1.17
7.60
PA
UM
F15
4915
48. R
acec
ours
e R
oad
NC
C 1
548
NC
C R
v.H
/S.
Av.
0.00
0.75
0.75
15.0
0P
LU
BF
1550
1549
. Rai
ya L
ane
NC
C 1
549
G/R
. R
dJu
ja R
d0.
000.
160.
166.
00U
(G)
AU
B15
5115
50. R
ames
h G
auta
ma
Rd
NC
C 1
550
Mur
a. R
d.N
ga.
Rd
0.00
0.35
0.35
6.00
PA
UF
1552
1551
. Rin
g R
oad
Nga
raN
CC
155
1M
ura.
Rd.
G/W
. S
t.0.
001.
701.
707.
50P
LU
BF
1553
1552
. Rin
g R
oad
Pum
wan
iN
CC
155
2R
/C.
Rd.
Land
Rd.
0.00
0.61
0.61
25.0
0P
DU
BB
1554
1553
. Riv
er L
ane
NC
C 1
553
Dur
. R
d.C
ross
Rd
0.00
0.49
0.49
2.00
PA
UB
1555
1554
. Riv
er R
oad
NC
C 1
554
T/M
St.
R/N
. S
t.0.
001.
071.
0711
.90
PA
UM
B15
5615
55. R
onal
d N
gala
St.
NC
C 1
555
R/C
. R
d.M
oi.
Av.
0.00
0.60
0.60
14.6
0P
AU
BF
1557
1556
. She
ikh
Kar
ume
Lane
NC
C 1
556
Mfa
. S
tM
uny.
Rd.
0.00
0.27
0.27
4.80
PA
UF
1558
1557
. She
ikh
Kar
ume
Roa
dN
CC
155
7R
v. R
d.M
fa.
St.
0.00
0.30
0.30
5.40
PA
UF
1559
1558
. She
ikh
Roa
dN
CC
155
8F/
V.
Rd
Mut
a. L
n.0.
000.
330.
335.
20P
UF
1560
(km
) (x
.xx)
Sec
tion
or li
nkS
ectio
n or
link
desc
riptio
nch
aina
ge
Pag
e 5
of 6

TAB
LE 4
.3-4
(11)
RO
AD
INVE
NTO
RY
IN S
TAR
EHE
RO
AD
INVE
NTO
RY
AR
EA:
Nai
robi
ZON
E: S
tare
heG
IBB
AFR
ICA
Uni
que
Sec
tion
Ave
.R
oad
type
Roa
d U
rban
or
Pub
licC
arria
gew
ay
She
et n
o.ro
ad c
ode
or li
nkW
idth
(pav
ed/
Cla
ssR
ural
Tran
spor
tC
ondi
tion
Roa
d na
me
or n
umbe
rle
ngth
unpa
ved)
(H/P
/D/
Rou
teA
BC
Sta
rtE
ndS
tart
End
(km
) (x
.x)
(m)
(x.x
)L/
A/C
)(U
/R)
(B/M
/T)
B/F
/G(a
bcd)
(from
)(to
)(fr
om)
(to)
(P/U
)15
59. S
hilli
ngi R
oad
NC
C 1
559
Mus
h. R
dK
ian.
Rd.
0.00
0.18
0.18
4.50
PA
UB
1561
1560
. Sim
ba S
treet
NC
C 1
560
M/N
. S
t.C
/H.
Way
0.00
0.09
0.09
13.0
0P
AU
F15
6215
61. S
imbi
Roa
dN
CC
156
1D
esai
Rd
Kin
s. R
d.0.
000.
400.
405.
00P
AU
B15
6315
62. S
oit O
lolo
l Roa
dN
CC
156
2D
esai
Rd
O/A
. R
d.0.
000.
290.
295.
20P
LU
B15
6415
63. S
ongo
t Wal
kN
CC
156
3G
/R.
Rd
Mog
i. R
d.0.
000.
370.
375.
10P
LU
F15
6515
64. S
tand
ard
Stre
etN
CC
156
4K
oin.
St.
Kim
a. R
d.0.
000.
440.
449.
00P
AU
F15
6615
65. T
aifa
Roa
dN
CC
156
5C
/H.
Way
Har
a. A
v.0.
000.
290.
2913
.20
PL
UF
1567
1566
. Tai
fa L
ane
NC
C 1
566
Nga
. R
d.Ta
it. R
d.0.
000.
150.
153.
70P
UF
1568
1567
. Tav
eta
Roa
dN
CC
156
7A
ccr.
Rd.
Late
Rd.
0.00
0.18
0.18
8.30
PA
UF
1569
1568
. Tem
ple
Roa
dN
CC
156
8R
/C.
Rd.
T/M
. S
t.0.
000.
390.
399.
40P
LU
F15
7015
69. T
hing
ira R
oad
NC
C 1
569
Des
ai R
dK
ins.
Rd.
0.00
0.37
0.37
4.00
PA
UF
1571
1570
. Tim
boro
a La
neN
CC
157
0La
t. R
d.A
cc.
Rd.
0.00
0.18
0.18
5.70
PA
UF
1572
1571
. Tim
boro
a R
oad
NC
C 1
571
Lat.
Rd.
Lag.
Rd.
0.00
0.14
0.14
6.50
PU
F15
7315
72. T
om M
boya
Stre
etN
CC
157
2H
/S.
Av.
Rv.
Rd.
0.00
1.06
1.06
6.70
PL
UF
1574
1573
. Tsa
vo L
ane
NC
C 1
573
Acc
r. R
d.La
t. R
d.0.
000.
170.
175.
60P
AU
F15
7515
74. T
savo
Roa
dN
CC
157
4La
t. R
d.A
cc.
Rd.
0.00
0.18
0.18
7.00
PA
UF
1576
1575
. Tub
man
Stre
etN
CC
157
5M
oi A
v.K
oin.
St.
0.00
0.39
0.39
4.80
PA
UF
1577
1576
. Uhu
ru H
ighw
ayN
CC
157
6N
yayo
St.
Chi
ro.
Rd.
0.00
3.66
3.66
18.8
0P
HU
F15
7815
77. U
kwal
a R
oad
NC
C 1
577
Jogo
. R
d.B
aha
Rd.
0.00
0.42
0.42
6.00
PL
UB
1579
1578
. Uni
vers
ity W
ayN
CC
157
8U
hu. H
/WM
oi.
Av.
0.00
0.46
0.46
15.2
0P
PU
F15
8015
79. U
talii
Stre
etN
CC
157
9Lo
ita S
t.U
/H'w
ay0.
000.
160.
164.
80P
UF
1581
1580
. Uyo
ma
Stre
etN
CC
158
0R
/C.
Rd.
R/N
. S
t.0.
000.
260.
2612
.00
PA
UF
1582
1581
. Voi
Roa
dN
CC
158
1R
v. R
d.K
iri R
d.0.
001.
001.
0012
.50
PU
F15
8315
82. W
aber
a S
treet
NC
C 1
582
Ban
d. S
t.C
/H.
Way
0.00
0.36
0.36
5.90
PU
F15
8415
83. W
atal
ii S
treet
NC
C 1
583
M/N
. S
t.C
/H.
Way
0.00
0.08
0.08
9.00
PA
UF
1585
1584
. Web
uye
Roa
dN
CC
158
4D
esai
Rd
N/S
. R
d.0.
000.
120.
126.
00P
UB
1586
"
NC
C 1
584
Des
ai R
dN
/S.
Rd.
0.12
0.27
0.15
6.00
U(E
)U
B15
8615
85. Y
atta
Roa
dN
CC
158
5R
/C.
Rd.
R/R
. P
um0.
000.
080.
084.
00P
AU
F15
8715
86. Z
amba
rau
Lane
NC
C 1
586
Mik
o. L
n.M
w. L
n0.
000.
260.
266.
40P
AU
F15
88
"
NC
C 1
586
Mik
o. L
n.M
w. L
n0.
260.
320.
066.
40U
(E)
AU
B15
88
(km
) (x
.xx)
Sec
tion
or li
nkS
ectio
n or
link
desc
riptio
nch
aina
ge
Pag
e 6
of 6

TAB
LE 4
.3-4
(12)
RO
AD
INVE
NTO
RY
IN W
ESTL
AN
D
RO
AD
INVE
NTO
RY
AR
EA:
Nai
robi
ZON
E: W
estla
ndG
IBB
AFR
ICA
Uni
que
Sec
tion
Ave
.R
oad
type
Roa
d U
rban
or
Pub
licC
arria
gew
ay
She
et n
o.ro
ad c
ode
or li
nkW
idth
(pav
ed/
Cla
ssR
ural
Tran
spor
tC
ondi
tion
Roa
d na
me
or n
umbe
rle
ngth
unpa
ved)
(H/P
/D/
Rou
teA
BC
Sta
rtE
ndS
tart
End
(km
) (x
.x)
(m)
(x.x
)L/
A/C
)(U
/R)
(B/M
/T)
B/F
/G(a
bcd)
(from
)(to
)(fr
om)
(to)
(P/U
)15
87. L
w. K
abet
e-K
yuna
Rd
NC
C 1
587
L/K
. R
dK
yuni
Rd
0.00
0.13
0.13
4.00
U(E
)A
UB
1587
1588
. G. E
st. I
CR
AF
Rd.
NC
C 1
588
U/N
. A
v.Ic
raf
0.00
0.15
0.15
5.60
PU
F15
88
"
NC
C 1
588
U/N
. A
v.Ic
raf
0.15
0.76
0.61
5.60
U(G
)U
F15
8815
89. G
igiri
Est
. Rd.
NN
CC
158
9R
d. P
1R
d. P
20.
000.
540.
545.
30P
UB
1589
1590
. Gig
iri E
st. R
d. P
NC
C 1
590
Rd.
P1-
P2
End
0.00
0.25
0.25
5.30
PC
UB
1590
1591
. Gig
iri E
st. R
d. S
NC
C 1
591
Uni
cef
End
0.00
0.52
0.52
5.30
PC
UF
1591
1592
. Gig
iri E
st. R
d. P
2-P
1N
CC
159
2R
d. P
2R
d. P
10.
002.
412.
416.
40P
UF
1592
1593
. Gig
iri E
st. R
d. Q
-IN
CC
159
3U
/N.
Av.
Rd.
P2-
P1
0.00
0.32
0.32
5.30
PU
B15
9315
94. G
igiri
Est
. Rd.
Q-2
NC
C 1
594
U/N
. A
v.R
d. P
2-P
10.
000.
080.
085.
30U
(E)
UB
1594
1595
. Gig
iri, K
TTC
Rd.
ZN
CC
159
5U
/N.
Av.
KTT
C0.
000.
180.
185.
30P
AU
B15
9515
96. K
. I. S
ch. -
Pep
oni
NC
C 1
596
K. I
nt. S
ch.
Pep
o R
d.0.
001.
221.
225.
30P
AU
B15
9615
97. L
w. K
abet
e-W
aiya
ki W
.N
CC
159
7L/
W.
Rd.
Wai
. Way
0.00
3.68
3.68
6.40
PD
UF
1597
1598
. Lw
. Pep
oni R
d. J
CN
CC
159
8P
epon
i Rd
End
0.00
0.22
0.22
3.00
PC
UF
1598
1599
. Ny.
Est
. E1,
E2,
E3
NC
C 1
599
Rd.
D2-
C3
Rd.
E3
0.00
0.41
0.41
5.30
PU
B15
9916
00. N
y. E
st. C
1, C
2-A
2N
CC
160
0C
1 (c
3 d2
)N
ge.
Rd.
0.00
1.39
1.39
5.30
PU
F16
0016
01. N
yari
Es.
B1-
A2-
1N
CC
160
1R
/H.
Rd.
Nge
. R
d.0.
000.
330.
335.
30P
UB
1601
1602
. Nya
ri E
s. B
1-A
2-2
NC
C 1
602
R/H
. R
d.N
ge.
Rd.
0.00
0.22
0.22
5.30
U(E
)U
B16
0216
03. N
yari
Es.
C3-
D2
NC
C 1
603
Rd.
C3
R/H
. R
d.0.
001.
751.
756.
40P
UF
1603
1604
. Nya
ri E
s. D
1-D
2N
CC
160
4R
d. C
3-D
2E
nd0.
000.
150.
155.
30P
CU
F16
0416
05. N
yari
Est
. F1-
F2N
CC
160
5C
1/C
2/A
2E
nd0.
000.
550.
555.
30P
CU
F16
0516
06. N
yari
Est
. G1-
G2
NC
C 1
606
R/H
. R
d.E
nd0.
000.
210.
212.
27U
(E)
CU
B16
0616
07. N
yari
Est
. H1-
H2
NC
C 1
607
E1-
D2-
Rd
End
0.00
0.44
0.44
5.42
PC
UF
1607
1608
. Nya
ri E
st. K
1-K
2N
CC
160
8C
1/C
2 R
dC
2/C
3 R
d.0.
000.
150.
155.
30P
UF
1608
1609
. Opp
. Wam
bugu
Clo
seN
CC
160
9P
ark
Rd.
Pa-
D-N
s0.
000.
400.
404.
70P
UF
1609
1610
. Run
da E
st. R
d. D
NC
C 1
610
Run
. G
r.E
nd0.
000.
300.
305.
30P
CU
F16
1016
11. R
unda
Est
. Rd.
EN
CC
161
1R
un.
Gr.
End
0.00
0.03
0.03
5.30
PC
UF
1611
1612
. Run
da E
st. R
d. F
NC
C 1
612
Run
. G
r.E
nd0.
000.
480.
485.
30P
CU
F16
1216
13. R
unda
Est
. Rd.
GN
CC
161
3R
d. H
Rd.
P0.
000.
230.
235.
30P
AU
F16
1316
14. R
unda
Est
. Rd.
HN
CC
161
4R
uak.
Rd.
End
0.00
1.24
1.24
5.30
PC
UB
1614
1615
. Run
da E
st. R
d. J
NC
C 1
615
Rd.
HE
nd0.
000.
290.
295.
30P
CU
F16
15
"N
CC
161
5R
d. H
End
0.29
0.91
0.62
5.30
U(G
)C
UB
1615
1616
. Run
da E
st. R
d. K
NC
C 1
616
Rd.
JR
d. H
0.00
0.75
0.75
5.30
PU
F16
1616
17. R
unda
Est
. Rd.
LN
CC
161
7R
d. H
End
0.00
0.25
0.25
5.30
PC
UB
1617
Sec
tion
or li
nkS
ectio
n or
link
desc
riptio
nch
aina
ge(k
m)
(x.x
x)
Pag
e 1
of 8

TAB
LE 4
.3-4
(12)
RO
AD
INVE
NTO
RY
IN W
ESTL
AN
D
RO
AD
INVE
NTO
RY
AR
EA:
Nai
robi
ZON
E: W
estla
ndG
IBB
AFR
ICA
Uni
que
Sec
tion
Ave
.R
oad
type
Roa
d U
rban
or
Pub
licC
arria
gew
ay
She
et n
o.ro
ad c
ode
or li
nkW
idth
(pav
ed/
Cla
ssR
ural
Tran
spor
tC
ondi
tion
Roa
d na
me
or n
umbe
rle
ngth
unpa
ved)
(H/P
/D/
Rou
teA
BC
Sta
rtE
ndS
tart
End
(km
) (x
.x)
(m)
(x.x
)L/
A/C
)(U
/R)
(B/M
/T)
B/F
/G(a
bcd)
(from
)(to
)(fr
om)
(to)
(P/U
)16
18. R
unda
Est
. Rd.
MN
CC
161
8R
d. K
Rd.
J0.
000.
190.
195.
30P
UB
1618
1619
. Run
da E
st. R
d. N
NC
C 1
619
Rd.
HE
nd0.
000.
560.
565.
30P
CU
B16
1916
20. R
unda
Est
. Rd.
PN
CC
162
0R
d. N
End
0.00
0.31
0.31
5.30
PC
UB
1620
1621
. Sha
nzu-
Gre
vilu
a G
r.N
CC
162
1S
ha.
Rd.
Gre
-Gr.
0.00
0.30
0.30
5.75
U(E
)U
B16
2116
22. S
pr. V
alle
y - E
ndN
CC
162
2S
/V.
Rd.
End
0.00
0.15
0.15
5.30
PC
UF
1622
1623
. Spr
. Val
ley
- End
NC
C 1
623
S/V
. R
d.E
nd0.
000.
150.
155.
00P
CU
F16
2316
24. S
pr. V
alle
y - E
ndN
CC
162
4S
/V.
Rd.
End
0.00
0.10
0.10
4.50
PC
UF
1624
1625
. Wis
pers
Est
. Rd.
BN
CC
162
5U
/N.
Av.
End
0.00
0.33
0.33
5.10
PC
UF
1625
1626
. Wis
pers
Est
. Rd.
CN
CC
162
6R
d. B
End
0.00
0.22
0.22
5.30
PC
UF
1626
1627
. Wis
pers
Est
. Rd.
DN
CC
162
7U
/N.
Av.
Ros
. A
ca0.
000.
300.
305.
30P
UB
1627
1628
. Wis
pers
Est
. Rd.
EN
CC
162
8R
d. D
End
0.00
0.31
0.31
5.30
PC
UF
1628
1629
. Wis
pers
Est
. Rd.
FN
CC
162
9R
d. E
End
0.00
0.20
0.20
5.30
PC
UF
1629
1630
. Wis
pers
Est
. Rd.
GN
CC
163
0R
d. D
End
0.00
0.39
0.39
5.30
PC
UF
1630
1631
. Wis
pers
Est
. Rd.
HN
CC
163
1U
/N.
Av.
End
0.00
0.66
0.66
5.30
PC
UB
1631
1632
. Wis
pers
Est
. Rd.
JN
CC
163
2U
/N.
Av.
End
0.00
0.95
0.95
6.30
PC
UF
1632
1633
. Wis
pers
Est
. Rd.
KN
CC
163
3R
d. J
End
0.00
0.18
0.18
5.30
PC
UF
1633
1634
. Wis
pers
Est
. Rd.
MN
CC
163
4U
/N.
Av.
End
0.00
0.27
0.27
5.30
PC
UB
1634
1635
. At T
higi
ri +
Pep
oni
NC
C 1
635
Thig
i. R
d.P
epo
Rd.
0.00
0.18
0.18
4.30
PU
F16
3516
36. C
rc O
n Th
igiri
Rd.
NC
C 1
636
Thig
i. R
d.Th
igi.
Rd.
0.00
0.49
0.49
5.30
PU
F16
3616
37. F
r. Ja
cara
nda
Hot
elN
CC
163
7Ja
ca. H
'tel
0.00
0.19
0.19
6.20
PU
B16
3716
38. F
r. M
agum
u C
rsc.
NC
C 1
638
Ma.
Crs
c.E
nd0.
000.
070.
074.
80P
CU
B16
3816
39. F
r. Ta
arifa
Lan
eN
CC
163
9Ta
a. L
n.E
nd0.
000.
220.
224.
00U
(E)
CU
B16
3916
40. F
r. W
ood
Val
e G
r.N
CC
164
0W
/V.
Gr.
End
0.00
0.11
0.11
5.40
PC
UF
1640
1641
. Off
Mut
haig
a R
d. 1
NC
C 1
641
Mut
h. R
d.E
nd0.
000.
160.
164.
00U
(E)
CU
B16
4116
42. O
ff M
utha
iga
Rd.
2N
CC
164
2M
uth.
Rd.
End
0.00
0.18
0.18
4.00
U(E
)C
UB
1642
1643
. Off
Thig
iri R
idge
Rd.
NC
C 1
643
Th/R
. R
d.E
nd0.
000.
170.
175.
60P
CU
B16
4316
44. 1
st P
arkl
ands
Av.
NC
C 1
644
Lim
u. R
d.M
pa.
Rd.
0.00
1.78
1.78
5.97
PL
UB
1644
1645
. 2nd
Par
klan
ds A
v.N
CC
164
5Li
mu.
Rd.
Mpa
. R
d.0.
001.
761.
765.
92P
LU
F16
4516
46. 3
rd P
arkl
ands
Av.
NC
C 1
646
Lim
u. R
d.M
pa.
Rd.
0.00
1.75
1.75
7.00
PL
UF
1646
1647
. 4th
Par
klan
ds A
v.N
CC
164
7Li
mu.
Rd.
Nga
o. R
d.0.
001.
361.
366.
87P
LU
F16
4716
48. 5
th P
arkl
ands
Av.
NC
C 1
648
Lim
u. R
d.M
asa.
Rd.
0.00
0.83
0.83
7.00
PL
UF
1648
1649
. 6th
Par
klan
ds A
v.N
CC
164
9Li
mu.
Rd.
Mw
a. R
d.0.
000.
510.
516.
20P
LU
B16
4916
50. B
ende
ra L
ane
NC
C 1
650
S/V
. R
d.E
nd0.
001.
351.
354.
50P
CU
B16
50
Sec
tion
or li
nkS
ectio
n or
link
desc
riptio
nch
aina
ge(k
m)
(x.x
x)
Pag
e 2
of 8

TAB
LE 4
.3-4
(12)
RO
AD
INVE
NTO
RY
IN W
ESTL
AN
D
RO
AD
INVE
NTO
RY
AR
EA:
Nai
robi
ZON
E: W
estla
ndG
IBB
AFR
ICA
Uni
que
Sec
tion
Ave
.R
oad
type
Roa
d U
rban
or
Pub
licC
arria
gew
ay
She
et n
o.ro
ad c
ode
or li
nkW
idth
(pav
ed/
Cla
ssR
ural
Tran
spor
tC
ondi
tion
Roa
d na
me
or n
umbe
rle
ngth
unpa
ved)
(H/P
/D/
Rou
teA
BC
Sta
rtE
ndS
tart
End
(km
) (x
.x)
(m)
(x.x
)L/
A/C
)(U
/R)
(B/M
/T)
B/F
/G(a
bcd)
(from
)(to
)(fr
om)
(to)
(P/U
)16
51. B
hand
eri R
oad
NC
C 1
651
Mar
a. R
d.M
asa.
Rd.
0.00
0.40
0.40
5.11
PL
UF
1651
1652
. Bou
ndar
y R
oad
NC
C 1
652
S/V
. R
d.E
nd0.
000.
270.
273.
00U
(G)
CU
F16
5216
53. B
rook
side
Clo
seN
CC
165
3B
r. G
r.S
ch.
Ln.
0.00
0.11
0.11
4.90
PA
UF
1653
1654
. Bro
oksi
de D
rive
NC
C 1
654
Mug
. G
r.L/
K.
Rd.
0.00
1.33
1.33
6.70
PL
UB
1654
1655
. Bro
oksi
de G
arde
nN
CC
165
5M
ug.
Gr.
Br.
Dr.
0.00
0.41
0.41
6.70
PL
UB
1655
"N
CC
165
5M
ug.
Gr.
Br.
Dr.
0.41
0.50
0.09
6.70
U(G
)L
UB
1655
1656
. Bro
oksi
de G
rove
NC
C 1
656
Wai
. W
ayS
ch.
Ln.
0.00
0.49
0.49
5.60
PL
UB
1656
1657
. Chi
rom
o La
neN
CC
165
7C
hi.
Rd.
Ojij
o R
d.0.
000.
600.
605.
30P
AU
B16
5716
58. C
ork
Cre
scen
tN
CC
165
8Ta
a R
d.Ta
a. R
d.0.
000.
210.
215.
00P
AU
B16
5816
59. C
ross
Roa
dN
CC
165
9L/
V.
Rd.
End
0.00
0.50
0.50
5.40
PC
UF
1659
1660
. Cro
ss W
ay L
ane
NC
C 1
660
Wes
t C
l.M
uth.
Rd.
0.00
0.30
0.30
5.00
PA
UF
1660
1661
. Don
yo S
abuk
Av.
NC
C 1
661
Pep
oni R
dG
/M.
Dr.
0.00
0.77
0.77
3.80
U(E
)D
UB
1661
1662
. Don
yo S
abuk
Ln.
NC
C 1
662
G/M
. D
r.D
/S.
Av.
0.00
0.31
0.31
4.00
U(E
)A
UB
1662
1663
. El.
Rav
ine
Grd
ns.
NC
C 1
663
E/R
. R
d.E
nd0.
000.
200.
203.
70P
CU
B16
6316
64. E
l. R
avin
e G
r.N
CC
166
4E
/R.
Rd.
End
0.00
0.11
0.11
3.71
PC
UB
1664
1665
. El.
Rav
ine
Rd.
NC
C 1
665
Pep
oni R
dR
/R.
PK
L0.
000.
680.
685.
50P
DU
F16
6516
66. F
aras
i Lan
eN
CC
166
6N
ge.
Rd.
L/K
. R
d.0.
000.
900.
903.
50U
(G)
UB
1666
1667
. Far
asi W
ayN
CC
166
7L/
K.
Rd.
Far.
Ln.
0.00
0.60
0.60
3.10
U(G
)U
B16
6716
68. F
orce
s La
neN
CC
166
8R
/R.
PK
LM
pa.
Rd.
0.00
0.40
0.40
5.70
PA
UB
1668
1669
. For
est R
oad
NC
C 1
669
Lim
u. R
d.M
ura.
Rd.
0.00
1.28
1.28
8.00
PD
UM
F16
6916
70. F
orw
ard
Clo
seN
CC
167
0C
ity/B
Kiti
. R
d.0.
000.
810.
814.
00P
LU
B16
7016
71. G
. Mat
heng
e G
rdns
.N
CC
167
1G
en. M
. Dr.
L/K
. R
d.0.
000.
170.
174.
70P
AU
B16
71
"
NC
C 1
671
Gen
. M. D
r.L/
K.
Rd.
0.17
0.33
0.16
4.70
U(G
)A
UB
1671
1672
. Gen
. Mat
heng
e D
r.N
CC
167
2R
/R.
PK
LL/
K.
Rd.
0.00
2.17
2.17
6.10
PD
UF
1672
1673
. Gen
. Mat
heng
e C
l.N
CC
167
3G
en. M
. Dr.
End
0.00
0.10
0.10
2.50
U(G
)C
UB
1673
1674
. Gen
. Mat
heng
e D
r.N
CC
167
4K
ab.
Rd.
Mpa
ka R
d.0.
000.
410.
415.
50P
UB
1674
1675
. Gen
. Mat
heng
e Ln
.N
CC
167
5G
. M. D
r. D
/S.
Av.
0.00
0.26
0.26
4.00
U(E
)A
UB
1675
1676
. Get
athu
ru R
oad
NC
C 1
676
City
/BN
ge.
Rd.
0.00
2.38
2.38
6.10
PA
UM
B16
7616
77. G
igiri
Roa
dN
CC
167
7P
/H.
Rd.
Lim
. R
d.0.
001.
171.
174.
00P
LU
B16
7716
78. G
ithur
i Roa
dN
CC
167
8W
an.
Rd.
Tree
Rd.
0.00
0.43
0.43
5.55
PA
UB
1678
1679
. Gitu
amba
Roa
dN
CC
167
9G
re.
Gr.
Kyu
na R
d0.
000.
700.
705.
30P
LU
B16
7916
80. G
revi
llia
Gro
veN
CC
168
0M
ug.
Gr.
Gitu
. R
d.0.
000.
610.
614.
10P
LU
B16
8016
81. H
appy
Val
ley
NC
C 1
681
S/V
. R
d.E
nd0.
000.
170.
174.
50P
CU
B16
81
(km
) (x
.xx)
Sec
tion
or li
nkS
ectio
n or
link
desc
riptio
nch
aina
ge Pag
e 3
of 8

TAB
LE 4
.3-4
(12)
RO
AD
INVE
NTO
RY
IN W
ESTL
AN
D
RO
AD
INVE
NTO
RY
AR
EA:
Nai
robi
ZON
E: W
estla
ndG
IBB
AFR
ICA
Uni
que
Sec
tion
Ave
.R
oad
type
Roa
d U
rban
or
Pub
licC
arria
gew
ay
She
et n
o.ro
ad c
ode
or li
nkW
idth
(pav
ed/
Cla
ssR
ural
Tran
spor
tC
ondi
tion
Roa
d na
me
or n
umbe
rle
ngth
unpa
ved)
(H/P
/D/
Rou
teA
BC
Sta
rtE
ndS
tart
End
(km
) (x
.x)
(m)
(x.x
)L/
A/C
)(U
/R)
(B/M
/T)
B/F
/G(a
bcd)
(from
)(to
)(fr
om)
(to)
(P/U
)16
82. H
ill V
iew
Clo
seN
CC
168
2L/
K.
Rd
End
0.00
0.32
0.32
5.30
PC
UB
1682
1683
. Hill
Vie
w C
rsc.
NC
C 1
683
S/V
. R
d.E
nd0.
000.
540.
545.
30P
CU
B16
8316
84. H
ill V
iew
Ris
eN
CC
168
4H
/V.
Crs
c.C
ross
Rd
0.00
0.31
0.31
4.95
PU
B16
8416
85. I
regi
Roa
dN
CC
168
55t
h P
kls
Wan
g. R
d.0.
000.
480.
486.
60P
AU
B16
8516
86. I
ta R
oad
NC
C 1
686
1st P
kls
2nd
Pkl
s0.
000.
290.
295.
43P
AU
B16
8616
87. K
abet
e La
neN
CC
168
7G
/M D
r. L/
W.
Rd.
0.00
0.30
0.30
4.00
U(G
)U
B16
8716
88. K
arun
a C
lose
NC
C 1
688
Sch
. Ln
.E
nd0.
000.
340.
345.
50P
CU
B16
8816
89. K
arun
a R
oad
NC
C 1
689
Wai
. W
ayL/
W.
Rd.
0.00
0.43
0.43
5.50
PD
UB
1689
1690
. Kaz
kazi
Lan
eN
CC
169
0M
uth.
Rd.
Mug
o. R
d.0.
000.
080.
084.
00U
(E)
AU
B16
9016
91. K
edai
Clo
seN
CC
169
1Lo
re.
Crs
.E
nd0.
000.
110.
114.
36P
CU
B16
9116
92. K
iam
bu C
lose
NC
C 1
692
O/K
. R
d.E
nd0.
000.
110.
112.
90P
CU
B16
9216
93. K
iam
bu R
oad
NC
C 1
693
Mut
h. R
/A.
Kbu
/B0.
005.
435.
436.
70P
LU
B16
9316
94. K
ibag
are
Val
ley
NC
C 1
694
Lore
. RG
.E
nd0.
000.
920.
923.
30P
CU
B16
9416
95. K
itisu
ru R
oad
NC
C 1
695
For
CL
Pep
o. R
d.0.
003.
683.
684.
70P
DU
B16
9516
96. K
usi L
ane
NC
C 1
696
3rd
Pkl
s4t
h P
kl.
0.00
0.51
0.51
4.00
U(E
)A
UB
1696
1697
. Kyu
na C
lose
NC
C 1
697
Kyu
na R
dE
nd0.
000.
270.
274.
60P
CU
B16
9716
98. K
yuna
Cre
scen
tN
CC
169
8G
it. R
d.E
nd0.
001.
411.
415.
50P
CU
B16
9816
99. K
yuna
Lan
eN
CC
169
9K
yuna
Rd
End
0.00
0.13
0.13
4.00
U(G
)C
UB
1699
1700
. Kyu
na R
ise
NC
C 1
700
Kab
a Ln
.G
itu.
Rd
0.00
0.16
0.16
5.70
PU
B17
0017
01. K
yuna
Roa
d (1
)N
CC
170
1L/
K.
Rd
Lore
. R
g0.
001.
591.
594.
50P
DU
B17
0117
02. K
yuna
Roa
d (2
)N
CC
170
2L/
K.
Rd
Lore
. R
g1.
592.
130.
544.
50P
DU
B17
0217
03. L
ake
Vie
w R
d. (p
t.1)
NC
C 1
703
Cro
ss R
d.E
nd0.
000.
710.
715.
60P
CU
B17
0317
04. L
ake
Vie
w R
d. (p
t.2)
NC
C 1
704
L/V
. R
d. 1
Nge
. R
d.0.
000.
460.
465.
30P
UB
1704
1705
. Lim
uru
Rd
(pt.1
)N
CC
170
5E
mba
ssy
Rua
ka R
d.0.
001.
701.
705.
30P
PU
BB
1705
1706
. Lim
uru
Rd.
(pt.2
)N
CC
170
6R
uak.
Rd.
Mut
h. R
d.1.
706.
534.
836.
30P
PU
BB
1706
1707
. Lim
uru
Rd.
(pt.3
)N
CC
170
76.
539.
773.
248.
02P
PU
BB
1707
1708
. Lor
esho
Clo
seN
CC
170
8Lo
re. C
rs.
End
0.00
0.24
0.24
3.95
PC
UB
1708
1709
. Lor
esho
Cre
scen
tN
CC
170
9Lo
re.
Rg.
Lore
. R
g0.
001.
431.
435.
15P
DU
B17
0917
10. L
ores
ho G
rove
NC
C 1
710
Lore
. C
rs.
End
0.00
0.50
0.50
4.90
PC
UB
1710
1711
. Lor
esho
Rid
geN
CC
171
1K
abe.
Uni
.L/
K.
Rd.
0.00
4.02
4.02
5.63
PL
UB
1711
1712
. Lor
esho
Ris
eN
CC
171
2Lo
re.
Crs
.E
nd0.
000.
290.
294.
70P
CU
F17
1217
13. L
ores
ho V
ale
NC
C 1
713
Lore
. C
rs.
End
0.00
0.17
0.17
3.95
PC
UF
1713
1714
. Low
er K
abet
e R
d. 1
NC
C 1
714
R/R
. P
kl.
Lore
. R
g0.
003.
303.
306.
00P
DU
BB
1714
(km
) (x
.xx)
Sec
tion
or li
nkS
ectio
n or
link
desc
riptio
nch
aina
ge Pag
e 4
of 8

TAB
LE 4
.3-4
(12)
RO
AD
INVE
NTO
RY
IN W
ESTL
AN
D
RO
AD
INVE
NTO
RY
AR
EA:
Nai
robi
ZON
E: W
estla
ndG
IBB
AFR
ICA
Uni
que
Sec
tion
Ave
.R
oad
type
Roa
d U
rban
or
Pub
licC
arria
gew
ay
She
et n
o.ro
ad c
ode
or li
nkW
idth
(pav
ed/
Cla
ssR
ural
Tran
spor
tC
ondi
tion
Roa
d na
me
or n
umbe
rle
ngth
unpa
ved)
(H/P
/D/
Rou
teA
BC
Sta
rtE
ndS
tart
End
(km
) (x
.x)
(m)
(x.x
)L/
A/C
)(U
/R)
(B/M
/T)
B/F
/G(a
bcd)
(from
)(to
)(fr
om)
(to)
(P/U
)17
15. L
ower
Kab
ete
Rd.
2N
CC
171
5R
/R.
Pkl
Lore
. R
g.3.
308.
995.
695.
89P
DU
BB
1715
1716
. Mag
umo
Clo
seN
CC
171
6M
agu.
Crs
.E
nd0.
000.
060.
065.
00P
CU
B17
1617
17. M
agum
o C
resc
ent
NC
C 1
717
Kyu
na R
d.K
yuna
Rd.
0.00
0.79
0.79
5.00
PL
UB
1717
1718
. Mak
uba
Lane
NC
C 1
718
Lore
. C
rc.
End
0.00
0.22
0.22
4.20
PC
UB
1718
1719
. Mar
atha
Clo
seN
CC
171
9M
ara.
Rd.
1st
Pkl
s0.
000.
140.
145.
00P
AU
F17
1917
20. M
atun
du L
ane
NC
C 1
720
Bro
. G
r.S
ch.
Ln.
0.00
0.39
0.39
5.60
PA
UB
1720
1721
. Maz
ari R
oad
NC
C 1
721
Wai
. W
ayTr
ee R
d.0.
001.
291.
296.
75P
AU
B17
2117
22. M
bweh
a La
neN
CC
172
2M
uth.
Rd.
Ojij
o R
d.0.
000.
140.
144.
00U
(E)
AU
B17
2217
23. M
ogot
io R
oad
NC
C 1
723
Wai
. W
ayC
hi.
Ln.
0.00
0.40
0.40
4.40
PA
UB
1723
"
NC
C 1
723
Wai
. W
ayC
hi.
Ln.
0.40
0.66
0.26
4.40
U(E
)A
UB
1723
1724
. Mor
an R
oad
NC
C 1
724
1st P
kls
2nd
Pkl
s0.
000.
100.
104.
00P
AU
B17
2417
25. M
paka
Roa
d (p
t.1)
NC
C 1
725
1st P
kls
Nga
o R
d.0.
000.
220.
227.
00P
LU
F17
2517
26. M
paka
Roa
d (p
t.2)
NC
C 1
726
Wai
. W
ayV
/O.
Sch
.0.
000.
500.
507.
37P
LU
B17
26
"N
CC
172
6W
ai.
Way
V/O
. S
ch.
0.50
0.77
0.27
7.37
U(E
)L
UB
1726
1727
. Mpa
ka R
oad
(pt.3
)N
CC
172
7C
hi.
Rd.
Wai
. W
ay0.
000.
450.
455.
20P
UB
1727
1728
. Mpe
nzi L
ane
NC
C 1
728
Mut
h. R
d.M
ogo.
Rd.
0.00
0.19
0.19
4.00
U(E
)A
UB
1728
1729
. Mpe
nzi L
ane
NC
C 1
729
Mut
h. R
d.M
ogo.
Rd.
0.00
0.05
0.05
4.00
U(E
)U
B17
2917
30. M
sapo
Clo
seN
CC
173
0W
ai.
Way
End
0.00
0.18
0.18
4.00
U(E
)C
UB
1730
1731
. Msa
po L
ane
NC
C 1
731
Wai
. W
ayE
nd0.
000.
150.
154.
00U
(E)
CU
B17
3117
32. M
tam
a R
oad
NC
C 1
732
3rd
Pkl
s6t
h. P
kl0.
000.
620.
624.
00P
UB
1732
1733
. Mua
Par
k C
lose
NC
C 1
733
M/P
. R
d.E
nd0.
000.
110.
115.
30U
(E)
CU
B17
3317
34. M
ua P
ark
Lane
NC
C 1
734
M/P
. R
d.E
nd0.
001.
001.
004.
36P
CU
B17
3417
35. M
ua P
ark
Roa
dN
CC
173
5S
ere.
Av.
O/K
. R
d.0.
000.
640.
645.
30P
AU
B17
3517
36. M
ugug
a G
reen
NC
C 1
736
Bro
ok G
r.B
rook
Gds
.0.
000.
750.
755.
60P
AU
B17
36
"
NC
C 1
736
Bro
ok G
r.B
rook
Gds
.0.
750.
920.
175.
60U
(G)
AU
B17
3617
37. M
ugug
a G
rove
N
CC
173
7B
rook
Dr.
Mug
u. G
r.0.
000.
190.
196.
90P
AU
B17
3717
38. M
uhug
u R
oad
NC
C 1
738
Pkl
. R
d.Fo
re.
Rd.
0.00
0.26
0.26
10.6
0P
LU
B17
3817
39. M
ukin
duri
Clo
seN
CC
173
9M
uth.
Rd.
End
0.00
0.09
0.09
4.80
PC
UB
1739
1740
. Muk
indu
ri R
oad
NC
C 1
740
Wes
t R
d.M
ogo.
Rd.
0.00
0.30
0.30
4.70
PL
UB
1740
1741
. Muk
ui R
oad
NC
C 1
741
M/C
. R
d.M
uhu.
Rd.
0.00
0.16
0.16
5.60
PA
UF
1741
1742
. Mut
ati R
oad
NC
C 1
742
Kus
i. R
d.M
asa.
Rd.
0.00
0.10
0.10
4.00
PA
UB
1742
"
NC
C 1
742
Kus
i. R
d.M
asa.
Rd.
0.10
0.38
0.28
4.00
U(E
)A
UB
1742
1743
. Mut
haig
a C
lose
NC
C 1
743
Mut
h. R
d.E
nd0.
000.
240.
244.
00P
CU
B17
43
(km
) (x
.xx)
Sec
tion
or li
nkS
ectio
n or
link
desc
riptio
nch
aina
ge Pag
e 5
of 8

TAB
LE 4
.3-4
(12)
RO
AD
INVE
NTO
RY
IN W
ESTL
AN
D
RO
AD
INVE
NTO
RY
AR
EA:
Nai
robi
ZON
E: W
estla
ndG
IBB
AFR
ICA
Uni
que
Sec
tion
Ave
.R
oad
type
Roa
d U
rban
or
Pub
licC
arria
gew
ay
She
et n
o.ro
ad c
ode
or li
nkW
idth
(pav
ed/
Cla
ssR
ural
Tran
spor
tC
ondi
tion
Roa
d na
me
or n
umbe
rle
ngth
unpa
ved)
(H/P
/D/
Rou
teA
BC
Sta
rtE
ndS
tart
End
(km
) (x
.x)
(m)
(x.x
)L/
A/C
)(U
/R)
(B/M
/T)
B/F
/G(a
bcd)
(from
)(to
)(fr
om)
(to)
(P/U
)17
44. M
utha
iga
Cre
scen
tN
CC
174
4M
uth.
Rd.
End
0.00
0.28
0.28
4.70
PC
UB
1744
1745
. Mut
haig
a La
neN
CC
174
5M
uth.
Rd.
End
0.00
0.14
0.14
4.90
PC
UB
1745
1746
. Mut
haig
a R
ise
NC
C 1
746
Mut
h. R
d.E
nd0.
000.
130.
134.
00U
(E)
CU
B17
4617
47. M
utha
iga
Roa
dN
CC
174
7Li
mu.
Rd.
Thik
a R
d.0.
001.
741.
746.
65P
DU
BF
1747
1748
. Mut
hith
i Roa
dN
CC
174
8M
paka
Rd.
Mus
e. H
ill0.
001.
551.
555.
40P
LU
MF
1748
1749
. Mut
undu
Clo
seN
CC
174
9M
utu.
Rd.
End
0.00
0.09
0.09
4.00
U(E
)C
UB
1749
1750
. Mut
undu
Roa
dN
CC
175
0N
aiva
. R
d.S
ere.
Av.
0.00
0.62
0.62
4.90
PD
UB
1750
1751
. Mw
amba
o R
oad
NC
C 1
751
6th
Pkl
s.Li
mu.
Rd.
0.00
0.30
0.30
5.66
PA
UF
1751
1752
. Mw
anzi
Roa
d (p
t.1)
NC
C 1
752
R/R
. P
klP
epon
i Rd.
0.00
0.41
0.41
4.95
PA
UF
1752
1753
. Mw
anzi
Roa
d (p
t.2)
NC
C 1
753
R/R
. P
klP
epon
i Rd.
0.41
0.81
0.40
4.95
U(E
)A
UB
1753
1754
. Mw
eiga
Roa
dN
CC
175
4Lo
re.
Crs
.E
nd0.
000.
450.
454.
57P
CU
B17
5417
55. N
aiva
sha
Ave
nue
NC
C 1
755
Mut
h. R
d.M
utu.
Rd.
0.00
0.65
0.65
4.90
PA
UB
1755
1756
. Nga
o R
oad
NC
C 1
756
Mpa
ka R
d.K
usi.
Rd.
0.00
0.44
0.44
5.44
PA
UB
1756
1757
. Nge
cha
Roa
d (p
t.1)
NC
C 1
757
L/K
. R
d.P
epon
i Rd.
0.00
3.19
3.19
5.68
PA
UF
1757
1758
. Nge
cha
Roa
d (p
t.2)
NC
C 1
758
Pep
oni R
dR
/H.
Rd.
0.00
2.04
2.04
3.30
PA
UB
1758
1759
. Ojij
o La
neN
CC
175
9M
uth.
Rd.
Ojij
o R
d.0.
000.
250.
255.
70P
AU
B17
5917
60. O
jijo
Roa
dN
CC
176
0M
use.
Hill
Wai
. W
ay0.
000.
860.
867.
50P
AU
B17
6017
61. O
ld K
iam
bu R
oad
NC
C 1
761
M/P
. R
d.Fo
rest
Dr.
0.00
0.32
0.32
5.30
PU
F17
61
"
NC
C 1
761
M/P
. R
d.Fo
rest
Dr.
0.32
0.80
0.48
5.30
U(E
)U
B17
6117
62. O
rcha
rd C
lose
NC
C 1
762
Mut
h. R
d.E
nd0.
000.
240.
244.
00P
CU
F17
62
"
NC
C 1
762
Mut
h. R
d.E
nd0.
240.
350.
114.
00U
(E)
CU
B17
6217
63. O
thel
o La
neN
CC
176
3M
uth.
Rd.
End
0.00
0.25
0.25
6.15
PC
UF
1763
1764
. Par
klan
ds R
oad
NC
C 1
764
Mus
e. H
illLi
mu.
Rd.
0.00
2.58
2.58
9.10
PD
UF
1764
1765
. Pep
oni C
lose
NC
C 1
765
Pep
oni R
dE
nd0.
000.
120.
123.
00P
CU
F17
6517
66. P
epon
i Gro
veN
CC
176
6P
epon
i Rd
End
0.00
0.13
0.13
5.50
PC
UF
1766
1767
. Pep
oni R
oad
NC
C 1
767
Nge
. R
d.L/
K.
Rd.
0.00
4.66
4.66
5.75
PA
UF
1767
1768
. Plu
ms
Lane
NC
C 1
768
Mut
h. R
d.O
jijo
Rd.
0.00
0.14
0.14
4.30
PA
UF
1768
1769
. Red
Hill
Roa
d (1
)N
CC
176
9Li
mu.
Rd.
Kar
u. M
kt.
0.00
1.56
1.56
8.35
PL
UB
F17
6917
70. R
ed H
ill R
oad
(2)
NC
C 1
770
Lim
u. R
d.K
aru.
Mkt
.1.
563.
151.
598.
35P
UB
F17
7017
71. R
ing
Roa
d P
arkl
ands
NC
C 1
771
Kab
e. R
d.M
/N.
Rd.
0.00
1.26
1.26
5.30
PP
UF
1771
"N
CC
177
1K
abe.
Rd.
M/N
. R
d.1.
261.
360.
105.
30U
(E)
PU
B17
7117
72. R
ossl
yn C
lose
NC
C 1
772
R/H
. R
d.E
nd0.
000.
250.
253.
50P
CU
F17
7217
73. R
ossl
yn T
ree
Hom
esN
CC
177
3Li
mu.
Rd.
End
0.00
1.91
1.91
4.30
PC
UF
1773
(km
) (x
.xx)
Sec
tion
or li
nkS
ectio
n or
link
desc
riptio
nch
aina
ge Pag
e 6
of 8

TAB
LE 4
.3-4
(12)
RO
AD
INVE
NTO
RY
IN W
ESTL
AN
D
RO
AD
INVE
NTO
RY
AR
EA:
Nai
robi
ZON
E: W
estla
ndG
IBB
AFR
ICA
Uni
que
Sec
tion
Ave
.R
oad
type
Roa
d U
rban
or
Pub
licC
arria
gew
ay
She
et n
o.ro
ad c
ode
or li
nkW
idth
(pav
ed/
Cla
ssR
ural
Tran
spor
tC
ondi
tion
Roa
d na
me
or n
umbe
rle
ngth
unpa
ved)
(H/P
/D/
Rou
teA
BC
Sta
rtE
ndS
tart
End
(km
) (x
.x)
(m)
(x.x
)L/
A/C
)(U
/R)
(B/M
/T)
B/F
/G(a
bcd)
(from
)(to
)(fr
om)
(to)
(P/U
)17
74. R
uaka
Lan
eN
CC
177
4R
ua.
Rd.
Cof
. Fa
c.0.
000.
250.
255.
30P
UF
1774
1775
. Rua
ka D
rive
NC
C 1
775
Rua
. R
d.E
nd0.
000.
530.
535.
30P
CU
F17
7517
76. R
uaka
Gro
veN
CC
177
6R
ua.
Rd.
Run
da D
r.0.
000.
490.
495.
30P
AU
F17
7617
77. R
uaka
Roa
dN
CC
177
7Li
mu.
Rd.
End
(T)
0.00
2.07
2.07
8.20
PC
UB
F17
7717
78. R
unda
Clo
se 'B
'N
CC
177
8R
un.
Rd.
End
0.00
0.54
0.54
5.80
PC
UF
1778
1779
. Run
da D
rive
NC
C 1
779
Rua
. D
r.R
d. N
0.00
1.63
1.63
5.30
PA
UF
1779
1780
. Run
da E
st. R
d. Q
NC
C 1
780
Run
. D
r.E
nd0.
000.
200.
205.
30P
CU
F17
8017
81. R
unda
Gro
ve 'C
'N
CC
178
1R
un.
Rd.
End
0.00
1.80
1.80
7.40
PC
UF
1781
1782
. Run
da R
oad
'A'
NC
C 1
782
Rua
. R
d.E
nd0.
000.
870.
877.
40P
CU
F17
8217
83. S
choo
l Lan
eN
CC
178
3B
rook
. D
r.K
aru.
Rd.
0.00
1.05
1.05
5.40
PA
UF
1783
1784
. Ser
enge
ti A
venu
eN
CC
178
4M
uth.
Rd.
Mut
u. R
d.0.
000.
620.
624.
27P
AU
F17
8417
85. S
ergo
it La
neN
CC
178
5M
uth.
Rd.
End
0.00
0.18
0.18
4.10
PC
UF
1785
1786
. Sha
nzu
Roa
dN
CC
178
6L/
K.
Rd.
End
0.00
0.21
0.21
5.50
PC
UF
1786
"N
CC
178
6L/
K.
Rd.
End
0.21
0.88
0.67
5.50
U(G
)C
UB
1786
1787
. Shi
vach
i Roa
dN
CC
178
7W
ai.
Way
1st
Pkl
s.0.
000.
340.
345.
60P
AU
F17
8717
88. S
ports
Ave
nue
NC
C 1
788
Ojij
o R
d.Ta
ari.
Rd.
0.00
0.37
0.37
4.00
U(E
)A
UB
1788
1789
. Spr
ing
Val
ley
Rid
geN
CC
178
9S
/V.
Rd.
End
0.00
0.20
0.20
5.00
U(G
)C
UB
1789
1790
. Spr
ing
Val
ley
Clo
seN
CC
179
0S
/V.
Rd.
End
0.00
0.12
0.12
4.00
U(G
)C
UB
1790
1791
. Spr
ing
Val
ley
Crs
c.N
CC
179
1S
/V.
Rd
End
0.00
0.32
0.32
5.50
U(E
)C
UB
1791
1792
. Spr
ing
Val
ley
Rd.
NC
C 1
792
Pep
oni R
dL/
K.
Rd.
0.00
2.64
2.64
5.10
PA
UM
B17
9217
93. S
usw
a R
oad
NC
C 1
793
Mpa
ka R
d.K
usi
Ln.
0.00
0.46
0.46
4.00
U(E
)L
UB
1793
1794
. Taa
rifa
Lane
NC
C 1
794
Taar
. R
d.E
nd0.
000.
240.
244.
00U
(E)
CU
B17
9417
95. T
aarif
a R
oad
NC
C 1
795
Wai
. W
ayFo
re.
Rd.
0.00
0.57
0.57
5.50
PU
F17
9517
96. T
ate
Clo
seN
CC
179
6C
ity /
BK
iti.
Rd.
0.00
0.80
0.80
3.00
PD
UF
1796
1797
. Tch
ui C
lose
NC
C 1
797
Tchu
i R
d.E
nd0.
000.
160.
163.
73P
CU
F17
9717
98. T
chui
Roa
dN
CC
179
8S
ere.
Av.
End
0.00
1.03
1.03
5.75
PC
UF
1798
1799
. The
Cre
scen
tN
CC
179
9P
kls.
Rd.
Pkl
s. R
d.0.
000.
520.
524.
40P
AU
F17
9918
00. T
higi
ri C
lose
NC
C 1
800
T/R
. R
d.E
nd0.
000.
470.
474.
45P
CU
F18
0018
01. T
higi
ri G
arde
nN
CC
180
1T/
R.
Rd.
End
0.00
0.46
0.46
4.35
PC
UF
1801
1802
. Thi
giri
Gro
veN
CC
180
2T/
R.
Rd.
End
0.00
0.46
0.46
4.80
PC
UF
1802
1803
. Thi
giri
Lane
NC
C 1
803
T/R
. R
d.K
aru.
For
.0.
000.
460.
464.
80P
AU
F18
0318
04. T
higi
ri R
idge
NC
C 1
804
R/H
. R
d.P
epo.
Rd.
0.00
2.18
2.18
5.35
PD
UF
1804
1805
. Thi
giri
Ris
eN
CC
180
5T/
R.
Rd.
R/H
. R
d.0.
000.
230.
234.
20P
AU
F18
05
Sec
tion
or li
nkS
ectio
n or
link
desc
riptio
nch
aina
ge(k
m)
(x.x
x)
Pag
e 7
of 8

TAB
LE 4
.3-4
(12)
RO
AD
INVE
NTO
RY
IN W
ESTL
AN
D
RO
AD
INVE
NTO
RY
AR
EA:
Nai
robi
ZON
E: W
estla
ndG
IBB
AFR
ICA
Uni
que
Sec
tion
Ave
.R
oad
type
Roa
d U
rban
or
Pub
licC
arria
gew
ay
She
et n
o.ro
ad c
ode
or li
nkW
idth
(pav
ed/
Cla
ssR
ural
Tran
spor
tC
ondi
tion
Roa
d na
me
or n
umbe
rle
ngth
unpa
ved)
(H/P
/D/
Rou
teA
BC
Sta
rtE
ndS
tart
End
(km
) (x
.x)
(m)
(x.x
)L/
A/C
)(U
/R)
(B/M
/T)
B/F
/G(a
bcd)
(from
)(to
)(fr
om)
(to)
(P/U
)18
06. T
higi
ri R
oad
NC
C 1
806
T/R
. R
d.P
epon
i Rd.
0.00
0.20
0.20
4.05
PU
F18
06
"N
CC
180
6T/
R.
Rd.
Pep
oni R
d.0.
201.
020.
824.
05U
(E)
UB
1806
1807
. U.N
. A
ve. (
1)N
CC
180
7Li
mu.
Rd.
End
0.00
1.59
1.59
7.20
PC
UF
1807
1808
. U.N
. A
ve. (
2)N
CC
180
8Li
mu.
Rd.
End
1.59
1.87
0.28
7.20
U(E
)C
UB
1808
1809
. Val
e C
lose
NC
C 1
809
R/R
. P
klE
nd0.
000.
070.
074.
00U
(E)
CU
B18
0918
10. W
aiya
ki W
ayN
CC
181
0L/
K.
Rd.
Fore
. R
d.0.
009.
289.
2813
.00
PH
UB
F18
1018
11. W
ambu
gu C
lose
NC
C 1
811
Wam
. R
d.W
am.
Rd.
0.00
0.14
0.14
5.00
PU
F18
1118
12. W
ambu
gu G
rove
NC
C 1
812
Wam
. R
d.E
nd0.
000.
160.
164.
00U
(E)
CU
B18
1218
13. W
ambu
gu L
ane
NC
C 1
813
Pkl
s. R
d.W
am.
Rd.
0.00
0.15
0.15
6.66
PA
UB
1813
1814
. Wam
bugu
Roa
dN
CC
181
4Li
mu.
Rd.
End
0.00
0.73
0.73
5.53
PC
UF
1814
1815
. Wan
gapa
la R
oad
NC
C 1
815
4th
Pkl
s.T/
G.
Rd.
0.
000.
640.
647.
40P
AU
F18
1518
16. W
estla
nds
Clo
seN
CC
181
6W
est.
Rd.
Cr/W
ays
0.00
0.17
0.17
5.00
PA
UF
1816
1817
. Wes
tland
s R
oad
NC
C 1
817
Mpa
ka R
d.M
use.
Hill
0.00
1.36
1.36
4.00
PD
UM
F18
1718
18. W
oodv
ale
Gro
veN
CC
181
8C
hiro
. R
d.M
paka
Rd.
0.00
0.51
0.51
6.40
PL
UF
1818
1819
. Woo
dval
e La
neN
CC
181
9M
paka
Rd.
R/R
. P
kls.
0.00
0.30
0.30
5.00
PU
F18
19
(km
) (x
.xx)
Sec
tion
or li
nkS
ectio
n or
link
desc
riptio
nch
aina
ge Pag
e 8
of 8

TAB
LE 4
.3-4
(13)
RO
AD
INVE
NTO
RY
IN N
AIR
OB
I
RO
AD
INVE
NTO
RY
AR
EA:
Nai
robi
ZON
E:N
airo
biG
IBB
AFR
ICA
Uni
que
RO
AD
CO
DE
Sec
tion
Ave
.R
oad
type
Roa
d
urba
n or
rura
lP
ublic
Tran
spor
tR
oute
Car
riage
way
S
heet
no.
or li
nkW
idth
(pav
ed/
Cla
ssC
ondi
tion
Roa
d na
me
or n
umbe
rA
BC
{abc
d}le
ngth
unpa
ved)
(H/P
/D/
(U/R
)(B
/M/T
)S
tart
End
Sta
rtE
nd(k
m)
(x.x
)(m
) (x
.x)
L/A
/C)
B/F
/G(fr
om)
(to)
(from
)(to
)(P
/U)
1820
. Shi
mo
la T
ewa
Rd.
NC
C 1
820
Lusa
ka R
d.E
nd0.
000.
310.
313.
30P
CU
F18
2018
21. M
wea
Rd.
NC
C 1
821
Ngi
ri R
d.N
jiwa
Rd.
0.00
0.18
0.18
6.00
PL
UF
1821
1822
. Mas
eno
Rd.
NC
C 1
822
Ngi
ri R
d.N
jiwa
Rd.
0.00
0.17
0.17
5.00
PA
UB
1822
1823
. Ebu
rru
Rd.
NC
C 1
823
Ngi
ri R
d.N
jiwa
Rd.
0.00
0.12
0.12
4.00
PL
UB
1823
1824
. Men
enga
i Rd.
NC
C 1
824
Hos
p R
d.H
osp
Rd.
0.00
0.40
0.40
5.00
PL
UB
1824
1825
. Jab
avu
Lane
NC
C 1
825
Jaba
vu R
d.A
rg. K
od R
d.0.
000.
180.
184.
00P
AU
F18
2518
26. M
fudu
du S
treet
NC
C 1
826
Ole
Sin
Rd.
Eld
o R
d.0.
000.
370.
376.
30P
LU
F18
2618
27. K
ajia
do L
ane
NC
C 1
827
Bah
ati C
RC
Mba
le R
d.0.
000.
320.
324.
30A
UF
1827
1828
. Dam
i Lan
eN
CC
182
8B
ahat
i CR
CM
bale
Rd.
0.00
0.28
0.28
6.30
AU
F18
2818
29. K
iu L
ane
NC
C 1
829
Kaj
iado
Ln.
Kitu
i Ln
0.00
0.11
0.11
6.00
AU
F18
2918
30. U
lu R
oad
NC
C 1
830
Uas
o R
d.R
ukw
a R
d.0.
000.
210.
214.
00A
UF
1830
1831
. Gita
nga
Gro
veN
CC
183
1G
itang
a R
d.E
nd0.
000.
360.
364.
80C
UF
1831
1832
. Mac
haria
Roa
d.N
CC
183
2N
aiv.
Rd.
KA
W R
d. G
0.00
1.65
1.65
6.50
DU
F18
3218
33. J
airo
Ow
ino
Stre
etN
CC
183
3Q
uarr
y R
d.K
iny
St.
0.00
0.28
0.28
6.30
PA
UM
F18
3318
34. M
umia
s S
treet
NC
C 1
834
Kin
y S
t.E
nd0.
000.
180.
186.
30C
UT
B18
3418
35. M
uga
Stre
etN
CC
183
5K
iny
St.
R. C
ours
e R
d.0.
000.
140.
145.
50A
UB
1835
1836
. Hat
heru
Roa
dN
CC
183
6G
itang
a R
d.E
nd0.
000.
850.
853.
80C
UM
B18
3618
37. K
oron
go R
oad
1N
CC
183
7K
or L
n.E
nd0.
000.
170.
173.
20C
UB
1837
1838
. Kor
ongo
CR
CN
CC
183
8K
or R
d.K
or R
d.0.
000.
240.
246.
00A
UB
1838
1839
. Kor
ongo
Clo
seN
CC
183
9K
or R
d.K
or R
d.0.
000.
260.
266.
00P
AU
B18
3918
40. S
lip R
oad
NC
C 1
840
Uni
v. W
ayR
/Abo
ut0.
000.
180.
186.
00P
CU
F18
4018
41. N
gend
a R
oad
NC
C 1
841
Kil
Rd.
Ngi
ri R
d.0.
000.
310.
316.
00P
AU
F18
4118
42. M
uhor
i Roa
dN
CC
184
2K
ikuy
u R
d.N
amai
Rd.
0.00
4.88
4.88
6.00
PA
UF
1842
1843
. San
aka
Roa
dN
CC
184
32n
d P
kld
Av.
1st P
kld
Av.
0.00
0.25
0.25
6.80
PA
UB
1843
1844
. Sio
na R
oad
NC
C 1
844
Oko
th A
. Rd.
Mur
a R
d.0.
000.
120.
126.
00P
AU
F18
4418
45. A
shok
Lan
eN
CC
184
52n
d P
kld
Av.
San
aka
Rd.
0.00
0.22
0.22
5.80
PC
UF
1845
1846
. Tw
iga
Roa
dN
CC
184
6K
arur
a A
v.E
nd0.
000.
260.
266.
50P
AU
F18
4618
47. K
arur
a A
venu
eN
CC
184
7Li
mur
u R
d.E
nd0.
000.
710.
716.
00U
(E)
CU
F18
4718
48. A
rwin
Clo
seN
CC
184
8M
wan
gi R
d.E
nd0.
000.
840.
846.
20P
CU
F18
4818
49. A
rwin
CR
CN
CC
184
9A
rwin
Cls
.A
rwin
Cls
.0.
000.
520.
524.
00U
(G)
CU
F18
4918
50. M
tum
biri
Clo
seN
CC
185
0S
ore
Rd.
End
0.00
0.18
0.18
3.50
PC
UF
1850
1851
. Mag
adi R
oad
NC
C 1
851
0.00
4.50
U(E
)U
B18
5118
52. A
mbo
seli
Lane
NC
C 1
852
Am
bo. R
d.E
nd0.
000.
380.
386.
50U
(E)
UB
1852
(km
) (x
.xx)
Sec
tion
or li
nkde
scrip
tion
chai
nage
Sec
tion
or li
nk

Nairobi CBD1 Chiromo road Museum hill Waiyaki Way 2 3 62 City Hall way Moi Avenue Uhuru Highway 2 2 43 Haile Selasie Landhies Road Uhuru Highway 2 3 64 Haile Selasie Uhuru Highway Ngong road 2 2 45 Harambee Avenue Moi Avenue Uhuru Highway 2 2 46 Kenyatta Avenue Moi Avenue Posta Road 2 2 47 Kenyatta Avenue Posta Road Uhuru Highway 2 3 68 Kimathi Street Mama Ngina street Tubman road 2 2 49 Koinange street University Way Kenyatta Avenue 2 2 4
10 Landhies Rd Jogoo Road Haile Selasie 2 3 611 Loita Street Kenyatta Avenue Monrovia street 2 2 412 Moi Avenue University Way Haile Selasie 2 2 413 Parliament road Haile Selasie Kenyatta Avenue 2 2 414 Ronald Ngala Moi Avenue River road 2 2 415 Taifa Road City Hall Way Harambee Avenue 2 2 416 Uhuru Highway Museum hill Lusaka road 2 3 617 University Way Uhuru Highway Junction Slip road Junction 2 3 618 University Way Slip road Junction Miundi Mbingu 2 2 419 Racecourse Road Haile Selasie Waruingi street 2 2 4
Surrounding Areas including Urbanised Area20 Enterprise road Lusaka road Funzi road 2 2 421 Forest Road Limuru road Muranga road 2 3 622 Jogoo Road Landhies Road Likoni Road Junction 2 3 623 Jogoo Road Likoni Road Junction Outer Ring road 2 2 424 Juja road Ring road Ngara Muratina street 2 2 425 Langata Road Uhuru Highway Junction Kungu Karumba Junction 2 2 426 Lusaka Road Jogoo Road Enterprise road 2 3 627 Mbagathi way Langata road Ngong road 2 3 628 Mombasa Road Lusaka road JKIA 2 2 429 Muranga road Moi Avenue Ring road Ngara 2 2 430 Muranga road Ring road Ngara Thika road 2 3 631 Ngara road Museum hill Racecourse Road 2 2 432 Ngong road(town bound) Third Ngong Avenue Fifth Ngong Avenue 1 3 333 Ring Road Pumwani Racecourse Road Landhies Road 2 3 634 Thika road Muranga road Metro Boundary 2 2 435 Valley Road Milimani Road Argwings Kodhek 2 2 436 Waiyaki Way Ring Road Westlands Metro Boundary 2 3 6
TABLE 4.3-5 INVENTORY OF MULTIPLE LANE ROAD IN NAIROBI
Road NameTotal No. of
LanesStart point End pointNo. of
CarriagewaysNo. of Lanes/carriageway

TABLE 4.3-6 BRIDGE INVENTORY IN STUDY AREA
STR
UC
NU
M
DIS
TRIC
T
RO
AD
NU
M
SEC
TNU
M
MA
TER
IAL
CR
OSS
TYPE
LEN
GTH
WID
TH
NU
MSP
AN
S
HO
RIZ
CLE
AR VE
RTC
LEA
R
APP
RO
AC
HSU
RFT
YPE
APP
RO
AC
HSU
RFC
ON
D
REM
AR
KS
519 Kajiado A104 1 Masonry Waterway 24.2 8.3 5 8.3 0 Surface Dressing Fair523 Kajiado D523 1 PreStrs Concrete Waterway 16.0 7.8 1 7.2 5 Surface Dressing Poor524 Kajiado D523 1 PreStrs Concrete Waterway 30.8 7.8 2 7.2 4.7 Surface Dressing Poor525 Kajiado D523 1 PreStrs Concrete Waterway 11.0 8.0 1 7.1 3.9 Surface Dressing Poor526 Kajiado D523 1 PreStrs Concrete Waterway 13.4 7.8 1 7.1 4.4 Surface Dressing Poor515 Kajiado E1493 1 PreStrs Concrete Waterway 10.0 4.0 2 4.05 3 Gravel Fair516 Kajiado E1495 1 PreStrs Concrete Waterway 12.9 7.8 1 7.8 2.9 Gravel Fair517 Kajiado E1495 1 Bailey Waterway 21.8 3.4 1 3.7 4.6 Gravel Poor440 Kiambu A104 1 PreStrs Concrete Pedestrian 4.0 20.0 1 7.5 2.7 Premix 435 Kiambu A104 1 PreStrs Concrete Railway 35.3 20.0 1 7.5 5.8 Premix 436 Kiambu A104 1 PreStrs Concrete Road 5.0 20.0 1 7.5 5.5 Premix 437 Kiambu A104 1 PreStrs Concrete Road 34.3 20.0 1 7.5 5.5 Premix 439 Kiambu A104 1 PreStrs Concrete Pedestrian 4.0 20.0 1 7.5 2.7 Premix 441 Kiambu A104 1 PreStrs Concrete Road 34.3 20.0 1 7.5 5.5 Premix 442 Kiambu A104 1 PreStrs Concrete Pedestrian 25.0 3.0 1 8.5 5.8 Premix 438 Kiambu A104 1 PreStrs Concrete Pedestrian 4.0 20.0 1 7.5 3.7 Premix 432 Kiambu A104 2 PreStrs Concrete Road 40.0 11.6 1 11.1 4.5 Premix 424 Kiambu A104 2 PreStrs Concrete Road 25.0 4.8 1 12 2.7 Premix 425 Kiambu A104 2 PreStrs Concrete Pedestrian 25.0 2.5 1 10 5.5 Premix 426 Kiambu A104 2 PreStrs Concrete Road 34.3 16.6 1 7.5 3.4 Premix 427 Kiambu A104 2 PreStrs Concrete Pedestrian 4.0 20.0 1 9.7 2.7 Premix 428 Kiambu A104 2 PreStrs Concrete Railway 46.0 20.0 1 7.6 5.1 Premix 429 Kiambu A104 2 PreStrs Concrete Road 33.9 20.0 1 14 5.5 Premix 431 Kiambu A104 2 PreStrs Concrete Road 4.0 20.0 1 7.5 5.5 Premix 430 Kiambu A104 2 PreStrs Concrete Road 34.3 20.0 1 7.5 5.5 Premix 450 Kiambu A104 3 PreStrs Concrete Road 4.0 7.0 1 11.5 2.7 Premix 451 Kiambu A104 3 PreStrs Concrete Road 4.0 12.0 1 11.5 2.7 Premix 392 Kiambu C63 1 Steel Railway 13.6 5.0 1 7.1 5.7 Surface Dressing 390 Kiambu C63 1 Steel Railway 8.2 10.2 1 9.2 5.4 Surface Dressing 391 Kiambu C63 1 PreStrs Concrete Road 20.5 4.0 4 14.1 5.8 Surface Dressing 457 Kiambu C63 2 PreStrs Concrete Road 34.3 20.0 1 7.5 5.5 Surface Dressing 456 Kiambu C63 3 Masonry Waterway 9.3 6.2 1 6.2 5.7 Surface Dressing 458 Kiambu C63 4 PreStrs Concrete Waterway 9.3 8.5 1 7.9 2 Surface Dressing 394 Kiambu C64 1 Steel Waterway 8.5 7.9 1 7.2 3.5 Premix 405 Kiambu D403 1 PreStrs Concrete Waterway 7.3 6.7 1 6.1 2 Surface Dressing 399 Kiambu D404 1 Steel Waterway 8.1 8.1 1 8.1 2 Surface Dressing 406 Kiambu D407 1 Steel Railway 9.3 4.1 1 8.8 4 Premix 407 Kiambu D407 1 Steel Waterway 9.0 8.2 1 7.8 4 Premix 408 Kiambu D407 2 Steel Waterway 7.6 7.6 1 7.1 2.5 Premix 414 Kiambu D408 1 Steel Waterway 5.5 6.8 1 6.2 2.8 Surface Dressing 393 Kiambu D409 2 PreStrs Concrete Pedestrian 28.5 4.5 2 14 5.7 Surface Dressing 460 Kiambu D409 2 PreStrs Concrete Road 41.2 9.2 3 8.1 5.6 Surface Dressing 409 Kiambu D410 1 Masonry Railway 9.6 5.6 1 7.3 3 Gravel 434 Kiambu D410 1 PreStrs Concrete Road 5.0 20.0 1 7.5 5.5 Surface Dressing 411 Kiambu E426 1 PreStrs Concrete Waterway 4.7 3.6 1 3.1 1.1 Surface Dressing 314 Machakos A104 1 0.0 0.0 5 0 0 Premix Good313 Machakos A104 1 0.0 0.0 3 0 0 Premix Good284 Machakos A109 1 0.0 0.0 0 0 0 Premix Good286 Machakos A109 1 0.0 0.0 0 0 0 Premix Good285 Machakos A109 1 0.0 0.0 0 0 0 Premix Good272 Machakos A109 2 0.0 0.0 7 0 0 Premix Fair271 Machakos A109 2 0.0 0.0 3 0 0 Premix Fair275 Machakos A109 2 0.0 0.0 0 0 0 Premix Fair274 Machakos A109 2 0.0 0.0 0 0 0 Premix Fair273 Machakos A109 2 0.0 0.0 0 0 0 Premix Fair287 Machakos C98 1 0.0 0.0 0 0 0 Premix Good288 Machakos C98 1 0.0 0.0 0 0 0 Premix Good292 Machakos D520 1 0.0 0.0 0 0 0 Gravel Poor295 Machakos D521 1 0.0 0.0 0 0 0 Gravel Poor293 Machakos D521 1 0.0 0.0 9 0 0 Gravel Poor294 Machakos D521 1 0.0 0.0 0 0 0 Gravel Poor
1 of 2

TABLE 4.3-6 BRIDGE INVENTORY IN STUDY AREA
STR
UC
NU
M
DIS
TRIC
T
RO
AD
NU
M
SEC
TNU
M
MA
TER
IAL
CR
OSS
TYPE
LEN
GTH
WID
TH
NU
MSP
AN
S
HO
RIZ
CLE
AR VE
RTC
LEA
R
APP
RO
AC
HSU
RFT
YPE
APP
RO
AC
HSU
RFC
ON
D
REM
AR
KS
297 Machakos D521 1 0.0 0.0 0 0 0 Gravel Poor296 Machakos D521 1 0.0 0.0 0 0 0 Gravel Fair291 Machakos E483 1 0.0 0.0 2 0 0 Gravel Good
1877 Thika A2 1 PreStrs Concrete Railway 19.6 10.2 3 9.6 5.5 Premix Fair1844 Thika A2 1 PreStrs Concrete Pedestrian 45.6 2.4 2 2.2 6.2 Premix Fair1837 Thika A2 1 PreStrs Concrete Railway 29.0 9.9 3 9.9 5.3 Premix Good1876 Thika A2 1 Steel Waterway 11.6 10.3 2 10 5.3 Premix Fair1889 Thika A2 2 PreStrs Concrete Road 4.0 19.8 1 9 2.1 Premix Fair1886 Thika A2 2 PreStrs Concrete Waterway 10.3 8.0 1 8 4 Premix Fair1888 Thika A2 2 Steel Waterway 23.4 20.0 1 9.6 3.5 Premix Fair1890 Thika A2 2 PreStrs Concrete Railway 30.9 19.2 1 8.9 6.6 Premix Fair1891 Thika A2 2 PreStrs Concrete Railway 19.2 19.0 1 8.8 6.2 Premix Fair1887 Thika A2 2 PreStrs Concrete Railway 9.5 18.4 1 8.6 6.8 Premix Fair1846 Thika A2 3 PreStrs Concrete Waterway 31.7 19.4 1 9.5 5.1 Premix Excellent1893 Thika A2 3 PreStrs Concrete Waterway 17.5 18.4 1 8.9 4.5 Premix Fair1894 Thika A3 2 PreStrs Concrete Road 53.0 9.2 4 8.2 5.7 Premix Good1828 Thika C63 1 PreStrs Concrete Waterway 8.4 7.5 1 7.5 3.5 Surface Dressing Poor1879 Thika C63 3 PreStrs Concrete Waterway 40.7 9.1 2 8.3 4.7 Premix Good1878 Thika C63 3 PreStrs Concrete Road 104.0 9.2 4 8.4 5.7 Premix Good1861 Thika C65 1 Steel Waterway 9.2 8.5 1 8.5 2 Surface Dressing Good1892 Thika C67 3 PreStrs Concrete Road 29.5 9.7 1 9 5.5 Premix Fair1830 Thika D398 2 PreStrs Concrete Waterway 7.8 7.4 1 7.4 3.2 Surface Dressing Fair1829 Thika D399 1 Steel Waterway 9.6 4.5 1 4.5 5 Gravel Fair1859 Thika D399 2 PreStrs Concrete Waterway 15.9 7.6 1 7.6 3 Surface Dressing Fair1880 Thika D424 1 Steel Waterway 30.0 5.4 3 5.4 3.9 Gravel Fair1883 Thika D521 1 Steel Waterway 92.7 4.9 9 4.9 4 Gravel Fair1882 Thika D521 1 Steel Waterway 8.0 4.9 1 4.9 3.9 Gravel Fair1884 Thika D521 2 Steel Waterway 8.1 5.3 1 5.3 1.8 Gravel Fair1847 Thika E1535 1 PreStrs Concrete Road 32.5 12.2 2 11 5.8 Premix Good1838 Thika E1535 1 Bailey Waterway 18.4 3.9 1 3.85 3.8 Gravel Poor1868 Thika E1591 1 Bailey Waterway 30.0 3.2 2 3.2 2.9 Earth Fair1848 Thika E1598 1 PreStrs Concrete Waterway 37.5 8.8 3 8.8 5.3 Surface Dressing Poor1840 Thika E503 1 Steel Waterway 18.0 4.3 2 4.3 3.7 Gravel Fair
2 of 2

TAB
LE 4
.3-7
SU
MM
AR
Y O
F B
RID
GE
INV
EN
TOR
Y IN
NA
IRO
BI C
ITY
Shee
tN
o.x
yLH
SR
HS
1P
epon
iM
atha
re98
6169
225
5363
Con
cret
e6.
01
10.4
fair
fair
poor
poor
2Jo
goo
Rai
lway
9856
626
2644
82S
teel
21.4
124
.6fa
irfa
irgo
odgo
od3
Jogo
oFo
otbr
idge
9857
039
2600
40S
teel
34.5
21.
85fa
irfa
irN
/AN
/A4
Jogo
oFo
otbr
idge
9856
604
2620
88S
teel
26.8
21.
85fa
irfa
irN
/AN
/A5
Out
er ri
ng
Rai
lway
9859
058
2643
12C
oncr
ete
30.4
38.
9fa
irfa
irfa
irfa
ir6
Out
er ri
ng
Ngo
ng R
iver
Brid
ge98
5552
326
5141
Con
cret
e39
.54
9.4
bad
bad
poor
/nar
row
poor
/nar
row
7O
uter
ring
M
atha
re ri
ver
9861
795
2639
04C
oncr
ete
29.4
39.
3ve
ry b
adve
ry b
adba
dba
d8
Out
er ri
ng
Nai
robi
Rvr
9860
161
2640
38C
oncr
ete
30.4
39.
3ba
dba
dse
ttlin
gse
ttlin
g9
Kom
aroc
kS
tream
nr S
wam
p98
6101
226
6313
Box
Cul
vert
10.5
1-ce
ll7
fair
fair
good
good
10K
omar
ock
Nai
robi
Rvr
9860
419
2643
84C
oncr
ete
20.7
111
.5fa
irfa
irgo
odgo
od11
Juja
Roa
dS
ch. F
t brd
9859
515
2593
64S
teel
27.2
227
.2fa
irfa
irN
/AN
/A12
Lim
uru
Roa
dR
iver
9859
799
2576
56B
ox C
ulve
rt17
.82-
cell
9.3
fair
fair
bad
bad
13Th
ika
Rd
Nai
robi
Rvr
9860
268
2595
20C
oncr
ete
18.4
126
.5fa
irfa
irfa
irfa
ir14
Rac
e co
urse
rdN
airo
bi R
vr98
5827
525
8783
Con
cret
e19
.21
24.3
bad
bad
fair
fair
15P
umw
ani R
dN
airo
bi R
vr98
5782
625
9217
Con
cret
e8.
31
14.5
bad
bad
bad
bad
16La
mu
Rd
Nai
robi
Rvr
9851
642
2601
51C
oncr
ete
9.0
112
bad
fair
bad
bad
17Fi
rst A
ve. E
astle
igh
Nai
robi
Rvr
9857
383
2610
04C
oncr
ete
14.6
311
.5ba
dfa
irba
dba
d18
Mtu
dadu
Ave
.N
airo
bi R
vr98
5794
726
2023
Con
cret
e17
.51
10fa
irfa
irba
dba
d19
Mba
gath
iFo
otbr
idge
9854
943
2558
71C
oncr
ete
34.8
32.
6fa
irfa
irN
/AN
/A20
Mba
gath
iN
airo
bi R
vr98
5456
125
6270
Con
cret
e24
.82
8.5
bad
bad
bad
bad
21R
ing
road
Pum
wan
iN
airo
bi R
vr98
5815
325
8903
Con
cret
e13
.31
22.4
bad
bad
good
good
22La
ngat
a R
dB
ox c
ulve
rt98
5203
325
2328
Box
Cul
vert
15.5
110
.8ba
dba
dP
oor
Poo
r23
Mom
basa
Rd/
Uhu
ru H
ighw
ayFo
otbr
idge
9855
594
2581
80C
oncr
ete
32.0
52
3go
odgo
odN
/AN
/A24
Uhu
ru H
ighw
ay/M
sa R
dFo
otbr
idge
9856
733
2576
43C
oncr
ete
22.4
23
fair
fair
N/A
N/A
25W
aiya
ki W
ayO
verp
ass
9859
030
2565
47C
oncr
ete
14.0
51
18.5
fair
fair
good
good
26M
uran
ga/T
hika
Rd
Nai
robi
Rvr
RH
S98
5854
025
7619
Con
cret
e18
.73
17.7
fair
fair
good
good
27M
useu
m H
ill R
dN
airo
bi R
vr R
HS
9859
028
2566
05C
oncr
ete
14.0
51
10.9
Fair
Fair
good
good
28La
ngat
a R
dN
gong
Riv
er F
tBrd
ge98
5493
925
7088
Con
cret
e11
.51
4fa
irfa
irgo
odgo
od29
Lang
ata
Rd
Ngo
ng R
iver
(LH
S)
9854
940
9570
81C
oncr
ete
12.0
210
.9fa
irfa
irgo
odgo
od30
Lang
ata
Rd
Ngo
ng R
iver
(RH
S)
9854
948
2570
70C
oncr
ete
12.0
210
fair
fair
good
good
31La
ngat
a R
dFo
otbr
idge
(Ped
estri
ann)
9855
359
2573
53C
oncr
ete
27.1
23
good
good
N/A
N/A
32Li
mur
u R
oad
Gita
thur
u R
iver
9862
057
2569
11C
oncr
ete
12.0
17
fair
fair
poor
poor
33Li
mur
u R
oad
Mat
hare
rive
r98
6133
725
7581
Box
Cul
vert
10.0
arch
7fa
irfa
irfa
irfa
ir34
Ngo
ng R
dbo
x cu
lver
t98
5338
2432
59B
ox C
ulve
rt8.
01
5ba
dba
dba
dba
d35
Thik
a R
dco
nc. d
eck/
stee
l bea
m98
6081
926
0884
Con
cret
e15
.01
7fa
irfa
irgo
odgo
od36
Mur
anga
/Thi
ka R
dN
airo
bi ri
ver b
ridge
9858
629
2575
15C
oncr
ete
15.0
111
fair
fair
pave
dpa
ved
37Lo
wer
Kab
ete
Rd
Mat
hare
rive
r98
6202
525
2800
Con
cret
e9.
01
5fa
irfa
irTo
o N
arro
wTo
o N
arro
w
Brid
ew
idth
Supe
rst
ruct
Con
ditio
n of
App
roac
hG
PS R
eadi
ngTy
peSu
bst
ruct
Nam
e of
Roa
dB
ridge
nam
eLe
ngth
No.
of
Span
s
Nai
robi
Are
a

TAB
LE 4
.3-8
MA
JOR
CU
LVE
RT
INV
EN
TOR
Y IN
NA
IRO
BI C
ITY
Nam
e of
Roa
dB
ridge
nam
eN
o.N
EH
LHS
1P
epon
iC
utat
huru
Rvr
9861
692
2553
6317
12P
ipe
14.0
--
fair
fair
-2
Pep
oni
Mut
undu
Rvr
9862
785
2543
4117
12P
ipe
10.8
--
fair
fair
-3
Pep
oni
Can
uliz
ed R
vr98
6096
125
5419
1710
Mul
ti-pi
pe10
.2-
-fa
irfa
ir-
4N
gech
aTh
igiri
Rvr
9863
887
2530
0717
30P
ipe
16.6
--
fair
fair
-5
Thig
iri ri
dge
Thig
iri R
vr98
6353
525
4552
1727
Pip
e7.
0-
-fa
irfa
ir-
6Th
igiri
ridg
e M
utun
du R
vr98
6246
825
4361
1700
Pip
e6.
7-
-fa
irfa
ir-
7Lo
wer
Kab
ete
Can
alis
ed R
vr98
6112
425
4908
1718
Pip
e20
.8-
-fa
irfa
ir-
8K
yuna
Cre
sent
Can
alis
ed R
vr98
6140
025
1789
1755
Box
Cul
vert
17.0
--
fair
fair
-9
Nge
cha
Cut
athu
ru R
vr98
6301
025
0840
1759
Pip
e14
.7-
-fa
irfa
ir-
10N
gech
aM
utun
du R
vr98
6335
825
1998
1756
Box
Cul
vert
22.0
--
fair
fair
-
C/w
ayw
idth
Supe
rst
ruct
Sub
stru
ctC
ondi
tioTy
peLe
ngth
No.
of
Span
sG
PS R
eadi
ngN
airo
bi A
rea
Shee
t

APPENDIX 5
PUBLIC TRANSPORT
Page 5.1 PUBLIC TRANSPORT MODES A5-1 5.2 MODE INTERCHANGE AREA A5-8

NNUUTTRRAANNSS TThhee SSttuuddyy oonn MMaasstteerr PPllaann ffoorr UUrrbbaann TTrraannssppoorrtt iinn tthhee NNaaiirroobbii MMeettrrooppoolliittaann AArreeaa
FFiinnaall RReeppoorrtt AAppppeennddiixx A5-1
APPENDIX 5 PUBLIC TRANSPORT
5.1 PUBLIC TRANSPORT MODES
5.1.1 Bus and Matatu
(1) History Kenya Bus Service (KBS) started operations in 1934 as a subsidiary of Overseas Motor Transport Company Ltd. of London (OMT). Thirteen buses on 12 routes served the Nairobi population, which then amounted to 50,000 and carried 660,000 passengers during the first year. In 1951 the company was taken over by United Transport Overseas Ltd. (UTO) and in 1966 the Nairobi City Council acquired 25% of the company’s shares. In the late 1980s the policy decision of UTO to discontinue operations created a crisis. This was solved when Stagecoach Ltd. of Scotland took over UTO’s shares in 1992 and the company was renamed Stagecoach Kenya Bus. The latest change was in 1998, when Stagecoach sold the company to a group of Kenyan investors, who changed the company’s name back to Kenya Bus Service (KBS). Matatu was originally started in 1960s as illegal public transport by private undertaking. When the matatu system was legalized in 1973, the establishment of new routes was in principle freely done. Government policy was that it would assist small, hard-working enterprise to make a living beside the big business represented by a dominant bus company. Soon, however, syndicates emerged, not to operate matatu but to profit from those who did. Today, most matatu routes are controlled by loosely composed “associations” who act as self-appointed “owners” of the route. The vehicles themselves are owned by individual investors, normally not drivers. Table 5.1-1 shows brief history of public transport in Nairobi.
TABLE 5.1-1 BRIEF HISTORY OF PUBLIC TRANSPORT IN NAIROBI
Year Description 1934
Kenya Bus Service (KBS) initiated as a subsidiary of Overseas Motor Transport Company Ltd. Of London (OMT).
1951 KBS taken over by United Transport Overseas Ltd. Of London (UTO). 1960s Matatus operated illegally as pirates. 1966 25% of KBS shares acquired by Nairobi City Council. 1973 Matatus legalized. Market share insignificant. 1982 Matatus Vehicle Owners Association formed. 1986 Limited commuter rail service started. 1988 National Youth Service (NYS) starts bus operations 1989 Matatus Vehicle Owners Association dissolved. 1992
Establishment of Nyayo Bus Service Corporation (NBSC). UTO shares in KBS taken over by Stagecoach of Scotland.
1995 Stagecoach Kenya Bus formed. 1997 Liquidation of Nyayo Bus Service Corporation 1998 Stagecoach KBS market share down to 50%. Stagecoach KBS fare increase and staff reduction.
Stagecoach KBS sold the company to a group of Kenyan investors. Company’s name changed back to Kenya Bus Service (KBS)

NNUUTTRRAANNSS TThhee SSttuuddyy oonn MMaasstteerr PPllaann ffoorr UUrrbbaann TTrraannssppoorrtt iinn tthhee NNaaiirroobbii MMeettrrooppoolliittaann AArreeaa
FFiinnaall RReeppoorrtt AAppppeennddiixx A5-2
Source: Nairobi Long Term Transport Study
(2) Operational Characteristics (and Fares) There are 175 routes (50 bus routes and 125 matatu routes) and a fleet of 12,376 buses and matatus. Of this fleet number, approximately 12,000 are matatus and 78% of them are small, 14-seater matatus, which are main contributors of the traffic congestion in Nairobi. Total daily passengers of bus and matatu are approximately 830,000. KBS is a private company that had some 266 large buses (61 seated passengers) on fixed routes and time tables in 2003. Most routes they operate on are radial, passing through the city center. This reduces the need for passenger transfers and provides a competitive advantage over the matatus, which are permitted only to enter the city center along main peripheral roads. KBS split the companies into two: KBS and Bus Truck Company. KBS now offers two services: Express service (new buses) which is for inter city transport, mainly to Western Kenya; and the Metro Shuttle minibus that serves the high/medium income levels in Nairobi. The Bus Truck Company offers city transport, and is now the main competitor with matatus. (See Photo 5.1-1) Matatu mostly operates on the same routes as Kenya Bus Service, but without timetables. They are of two main types: the 14- and 25-seater vehicles. On some routes such as north-south routes, they compete among themselves. (See Photo 5.1-2) There is no fixed fare system for the matatu. Matatu fares depend on the time of the day and the weather conditions. The fares were higher during peak hours, late at night and during bad weathers until a few years ago. Nowadays, the fare sometimes is lower during peak hours due to the many competitors to the matatu business. But fares are still high late at night and during bad weathers. Matatu largely ignores official bus stops especially in peak hours. They depart from the terminal only when fully occupied and generally drive non-stop to the final destination. In off-peak periods, drivers try to pick up as many passengers as possible on the way, which leads to erratic driving and stopping behavior. During congested periods, traffic rules are often ignored (e.g. they use the road shoulders or lanes for opposing traffic to by-pass traffic jams).

NNUUTTRRAANNSS TThhee SSttuuddyy oonn MMaasstteerr PPllaann ffoorr UUrrbbaann TTrraannssppoorrtt iinn tthhee NNaaiirroobbii MMeettrrooppoolliittaann AArreeaa
FFiinnaall RReeppoorrtt AAppppeennddiixx A5-3
PHOTO 5.1-1 BUS TRACK AND METRO SHUTTLE AT CITY HALL WAY BUS STOP
PHOTO 5.1-2 BIG AND SMALL MATATUS ALONG HAILE SELASSIE AVE.

NNUUTTRRAANNSS TThhee SSttuuddyy oonn MMaasstteerr PPllaann ffoorr UUrrbbaann TTrraannssppoorrtt iinn tthhee NNaaiirroobbii MMeettrrooppoolliittaann AArreeaa
FFiinnaall RReeppoorrtt AAppppeennddiixx A5-4
PHOTO 5.1-3 TUK TUK WAITING PASSENGERS AT KENYATTA AVE./KIMATHI LANE
PHOTO 5.1-4 CYCLE TAXI IN THIKA

NNUUTTRRAANNSS TThhee SSttuuddyy oonn MMaasstteerr PPllaann ffoorr UUrrbbaann TTrraannssppoorrtt iinn tthhee NNaaiirroobbii MMeettrrooppoolliittaann AArreeaa
FFiinnaall RReeppoorrtt AAppppeennddiixx A5-5
PHOTO 5.1-5 FIVE-THIRTY COMMUTER TRAIN BOUND FOR THIKA
PHOTO 5.1-6 DANDORA STATION

NNUUTTRRAANNSS TThhee SSttuuddyy oonn MMaasstteerr PPllaann ffoorr UUrrbbaann TTrraannssppoorrtt iinn tthhee NNaaiirroobbii MMeettrrooppoolliittaann AArreeaa
FFiinnaall RReeppoorrtt AAppppeennddiixx A5-6
FIGURE 5.1-7 COMMUTER PASSENGER TREND
FIGURE 5.1-8 COMMUTER PASSENGER BY LINE
0
100000
200000
300000
400000
500000
600000
700000
800000
900000
1000000
Jul Aug sep oct nov dec jan feb mar apr may june
month
no. o
f pa
ssen
gers
2002/032003/04
NRB-KIKUYU(60,686) 12%
NRB-EMBAKASI(67,535), 14%
NRB-THIKA(204,484), 41%
NRB-KAHAWA(167,250), 33%

NNUUTTRRAANNSS TThhee SSttuuddyy oonn MMaasstteerr PPllaann ffoorr UUrrbbaann TTrraannssppoorrtt iinn tthhee NNaaiirroobbii MMeettrrooppoolliittaann AArreeaa
FFiinnaall RReeppoorrtt AAppppeennddiixx A5-7
5.1.2 Air Transport
The trends of annual air passengers and air freight of Nairobi International Airport from 1997 to 2002 are shown in Figures 5.1-9 and Table 5.1-2. Air passengers and air freight in 2002 reached approximately 3 million and 170 tons, respectively. Annual growth rates of air passengers and air freight are 3.7% and 17.0%, respectively. The trend of air freight is more remarkable than that of air passenger.
FIGURE 5.1-9 AIR PASSENGER TREND
TABLE 5.1-2 TREND OF AIR PASSENGER AND AIR FREIGHT
(Unit: passengers - 000 No.)
1997 1998 1999 2000 2001 2002Arrivals 1275 1087 1248 1376 1383 1458Departures 1022 1051 1205 1358 1399 1472In transit 254 211 215 211 187 127Total 2551 2350 2668 2945 2968 3057
(Unit: 000 tonnes)
1997 1998 1999 2000 2001 2002Cargo: Unloaded 28521 39538 31183 37918 40161 45419 Loaded 47169 76747 94369 101702 98986 123385Mail: Unloaded 1108 911 734 728 292 96 Loaded 435 479 335 296 173 109Total 77232 117674 126621 140643 139612 169009
0
500
1000
1500
2000
2500
3000
3500
1997 1998 1999 2000 2001 2002Year
No.
of
pass
ange
rs (
000)
DeparturesArrivals
`

NNUUTTRRAANNSS TThhee SSttuuddyy oonn MMaasstteerr PPllaann ffoorr UUrrbbaann TTrraannssppoorrtt iinn tthhee NNaaiirroobbii MMeettrrooppoolliittaann AArreeaa
FFiinnaall RReeppoorrtt AAppppeennddiixx A5-8
5.2 MODE INTERCHANGE AREA
One of the disadvantages of public transport modes is the transfer to other modes. The transfer, which generates at mode interchange areas such as railway stations and bus terminals, force such inconvenience as waiting time and walking between modes; therefore, one of the most important issues to improve the public transport system is the development of smooth transfer at mode interchange areas.
Nairobi Railway Station and Bus Truck terminal in the city center are the typical mode interchange areas in the Nairobi Metropolitan Area (See Photo 5.2-1).
The Nairobi Railway Station is the central railway station in the capital of Kenya and there is enough space for the station plaza. However, the station plaza is occupied only as matatus terminal. It is not effectively used as a mode interchange area.
The Bus Truck terminal in the city center is well developed as a mode interchange area; however, heavy traffic congestion is observed at the terminal’s narrow entrance and exit points. There are also many matatu terminals around this terminal (See Photo 5.2-1). The location of the five studied town is shown in Photo 5.2-2.
PHOTO 5.2-1 NAIROBI RAILWAY STATION

NNUUTTRRAANNSS TThhee SSttuuddyy oonn MMaasstteerr PPllaann ffoorr UUrrbbaann TTrraannssppoorrtt iinn tthhee NNaaiirroobbii MMeettrrooppoolliittaann AArreeaa
FFiinnaall RReeppoorrtt AAppppeennddiixx A5-9
PHOTO 5.2-2 LOCATION OF STUDIED FIVE TOWNS
Limuru
Ngong Kangundo
Athi River

APPENDIX 6
TRAFFIC MANAGEMENT
Page 6.1 TRAFFIC MANAGEMENT ADMINISTRATION A6-1 6.2 TRAFFIC SAFETY ANALYSIS REGULATION A6-2

NNUUTTRRAANNSS TThhee SSttuuddyy oonn MMaasstteerr PPllaann ffoorr UUrrbbaann TTrraannssppoorrtt iinn tthhee NNaaiirroobbii MMeettrrooppoolliittaann AArreeaa
FFiinnaall RReeppoorrtt AAppppeennddiixx A6-1
APPENDIX 6 TRAFFIC MANAGEMENT
6.1 TRAFFIC MANAGEMENT ADMINISTRATION
It is important to maintain the urban environment by improving urban transport. However, to keep the smooth traffic flow by optimizing the use of the road infrastructure in the city centre of Nairobi is difficult due to the increasing volume of traffic and limited expansion of transport infrastructure. The most effective measures to cope with this situation are traffic management, such as traffic signal control and car parking policies. Table 6.1-1 shows the matrix between the types of traffic management and related administrations. For example, the traffic safety education involves many agencies and organizations. However, the actual activities such as traffic safety campaign are being done individually. If these campaigns are conducted based on the comprehensive programme, it will create a much greater impact to the public. And it is obvious that the role of the local governments is wide in terms of the traffic management.
TABLE 6.1-1 TRAFFIC MANAGEMENT ADMINISTRATION
Nairobi City Other Towns Nairobi City Other Towns
Note
1. Private Stakeholders: Public Transport Operators, Business Associations and Private Sectors, etc.
2. △: Contribute to the process but not responsible in regulation and implementation
3. Road Traffic Safety includes Traffic Accident Data Collection & Processing and Traffic Safety Campaign & Education
4. KERSA: Kenya Private Sector Advocacy Group
Traffic Police
○ ○ ○
Ministry ofEducation,Science &
Technology
○
○
○ ○
○ ○
○ ○ ○ ○
○ △
△
○
○
PrivateStakeholders
(KERSA)
△
△
△
Road Traffic Safety
○
○
○
○ ○ ○
○
○
Items
Traffic Signals
Traffic ManagementSystem such as One-
way System
Car Parking Control
Traffic ManagementPolicy
Traffic Signage
Road Marking
Traffic Laws andRegulations ○
Ministry ofRoads &
Public Works
○
○
○
Ministry ofTransport
CouncilMinistry of
Health
○
Traffic Signal

NNUUTTRRAANNSS TThhee SSttuuddyy oonn MMaasstteerr PPllaann ffoorr UUrrbbaann TTrraannssppoorrtt iinn tthhee NNaaiirroobbii MMeettrrooppoolliittaann AArreeaa
FFiinnaall RReeppoorrtt AAppppeennddiixx A6-2
6.2 TRAFFIC SAFETY ANALYSIS REGULATION
Figure 6.2-7 shows the comparison of number of accidents before (2003) and after (2004) matatu regulation started in February 2004. The comparison period is five months from February to June in 2003 and 2004; the graph on the left shows the nationwide figures and the one on the right shows the figures for Nairobi. These graphs show that traffic accidents in whole of Kenya drastically decreased; on the other hand, traffic accidents in Nairobi did not much changed. This could mean that the maximum driving speed regulation of 80 km/hr has more effect to the intercity routes. Figure 6.2-3 shows the vehicle involvement before and after matatu regulation in Nairobi. The number of matatu-involving accidents decreased because of the matatu regulation; however, the number of accidents involving private cars increased. This shows that it is necessary to introduce more drastic traffic safety measures into Nairobi.
PHOTO 6.2-1 MUINDI MBINGU ST.

NNUUTTRRAANNSS TThhee SSttuuddyy oonn MMaasstteerr PPllaann ffoorr UUrrbbaann TTrraannssppoorrtt iinn tthhee NNaaiirroobbii MMeettrrooppoolliittaann AArreeaa
FFiinnaall RReeppoorrtt AAppppeennddiixx A6-3
FIGURE 6.2-2 COMPARISON OF NUMBER OF ACCIDENTS BEFORE (2003) AND AFTER (2004) MATATU REGULATION
FIGURE 6.2-3 COMPARISON OF VEHICLE TYPES INVOLVED IN ACCIDENTS BEFORE (2003) AND AFTER (2004) MATATU REGULATION IN NAIROBI
KENYA
1,481
5,586
0
1,000
2,000
3,000
4,000
5,000
6,000
FEB to June 2003 FEB to June 2004
Period
No
. of
acci
dent
sNAIROBI
1,799 1,712
0
1,000
2,000
3,000
4,000
5,000
6,000
FEB to June 2003 FEB to June 2004
Period
No
. of
acci
dent
s
0
100
200
300
400
500
600
700
Cars Lorries Buses Taxis Matatu M/cycle Persons Others
Vehicle type
No. o
f ac
ciden
ts
2003
2004

APPENDIX 7
ORGANIZATION
Page 7.1 INSTITUTIONAL STRUCTURE AND FUNCTIONS A7-1 7.2 ROAD SECTOR ADMINISTRATION A7-1 7.3 PUBLIC TRANSPORT ADMINISTRATION A7-14

NNUUTTRRAANNSS TThhee SSttuuddyy oonn MMaasstteerr PPllaann ffoorr UUrrbbaann TTrraannssppoorrtt iinn tthhee NNaaiirroobbii MMeettrrooppoolliittaann AArreeaa
FFiinnaall RReeppoorrtt AAppppeennddiixx A7-1
APPENDIX 7 ORGANIZATION
7.1 INSTITUTIONAL STRUCTURE AND FUNCTIONS
FIGURE 7.1-1 RELATIONSHIP OF MAIN PLAYERS AND FLOWS OF MAJOR FUNDS IN ROAD SECTOR
7.2 ROAD SECTOR ADMINISTRATION
7.2.1 The Ministry of Road and Public Works (MRPW) and the Roads Department (RD)
(1) MRPW In March 2004, MRPW succeeded the road sector responsibilities as the key central government agency for road maintenance, rehabilitation and construction of national trunk roads after the governmental restructuring. MRPW is in nature a governmental road engineering implementing agency. Currently, MRPW consists of two systems: one is the service supporting system under the Central Services Departments and the other is road business system mainly under RD with the Mechanical and Transport Department (MTD).
The Minister
UDD(KRB Sub-Agency)
Class A, B, CDevelopment MaintenancePlan Impl. Plan Impl.
Class D, EDevelopment MaintenancePlan Impl. Plan Impl.
Class G,L,R,S,T,WDevelopment MaintenancePlan Impl. Plan Impl.
Adopted Urban RoadsDevelopment MaintenancePlan Impl. Plan Impl.
Unclassified Rural RoadsDevelopment MaintenancePlan Impl. Plan Impl.
Unclassified NetworksDevelopment MaintenancePlan Impl. Plan Impl.
RD(KRB Agency)
71 DRCs(KRB Agency)
NCC/ 4 Large Municipalities(KRB Sub-Agency/Agency )
No-Adopted Urban Roads Development MaintenancePlan Impl. Plan Impl.
KWS(KRB Agency)
FD
KRB
MOLG
MRPW
MENR
Coordination/ Advisory
Planning/ Resource Allocation KRB Sub-Agency Relation
RMLF Fund FlowLATF & Other Fund FlowMRPW Development Fund Flow
Service Provision of Unclassified Networks Administrative Lines
Roads
35 Municipalities &67 Town Councils
(KRB Agency)
71 DREs underRD

NNUUTTRRAANNSS TThhee SSttuuddyy oonn MMaasstteerr PPllaann ffoorr UUrrbbaann TTrraannssppoorrtt iinn tthhee NNaaiirroobbii MMeettrrooppoolliittaann AArreeaa
FFiinnaall RReeppoorrtt AAppppeennddiixx A7-2
RD is the largest department in MRPW which accounts for approximately 80% of the total turnover of the Ministry. MTD, with 294 staff, mainly provides maintenance plant and equipment through its organizational system in provinces and districts: the Provincial Mechanical Engineer and District Mechanical Engineer are in charge of workshop and of maintenance of all the plant and equipment at the provincial and district levels. The level of services seems very poor in terms of both the availability and utilization of equipment. Currently the MRPW is carrying out an institutional reform programme including the reform of MTD.
The main responsibilities and core businesses of the road business system are as following: • Ensure cost effective designs for roads, bridge, airports, aerodromes and other civil
engineering structures; • Ensure quality control during construction, maintenance and rehabilitation of all
works • Avail reliable vehicle, plant and equipment; • Develop and improve mechanical workshops to serve as plant pools and inspection
centres for vehicle road worthiness; • Maintain existing main road network in the country; • Develop and effectively manage sufficiently robust road system that will require
minimum maintenance; and • Use of machinery and labor intensive techniques to promote employment and income
earnings. (2) RD
RD is headed by Chief Engineer who reports to the Permanent Secretary (PS) through an Engineer-in-Chief (EIC). RD is responsible for planning, design, construction, improvement, operation and maintenance of the classified road in Kenya. RD has four branches namely Planning, Development, Maintenance and Technical Administration. All of them are headed by Principal Superintending Engineers (PSE) who report to the Chief Engineer. Within the branches, there are 7 units which are headed by a Chief Superintending Engineers (CSE). Following the establishment of the KRB, functions of RD mainly cover the management of classes A, B and C of road network. These functions include the development (planning, design and construction), operation and maintenance of the classified road network. The functions of RD including its units are described briefly in Table 7.2-1.

NNUUTTRRAANNSS TThhee SSttuuddyy oonn MMaasstteerr PPllaann ffoorr UUrrbbaann TTrraannssppoorrtt iinn tthhee NNaaiirroobbii MMeettrrooppoolliittaann AArreeaa
FFiinnaall RReeppoorrtt AAppppeennddiixx A7-3
TABLE 7.2-1 THE FUNCTIONS OF RD AND ITS UNITS
No Units Functions 01 Planning 01 Overall planning and programming of long and short term road projects. 02 Monitoring on-going projects/ programs and preparing appropriate reports. 03 Review and analysis of national road policy for efficient utilization of existing
infrastructure. 04 Liaison with government ministries, organisations and development partners on
planning and implementation of road projects. 05 Providing policy and planning guidance on roads. 06 Ensuring that environmental and social concerns are integrated in road works. 07 Ensuring routine maintenance of roads is carried out in a manner benign to road
development. 08 Formulation and preparation of environmental manuals, standards and guidelines
for the road sector. 09 Providing policy and planning guidelines for road programs. 10 Co-ordination of extra-ordinary activities such as emergency road repairs and
disaster responses, and liaison with other GOK departments, NGO’s and other agencies on environmental and social programmes.
02 Design 01 Survey, design and tender documentation for road projects. 02 Formulation and preparation of standards and design manuals. 03 Dealing with matters related to road reserves and control of access to all classified
roads. 04 Management of drawing office and survey unit. 05 Maintaining the register of road engineering consultants and contractors. 06 Liaison with the road design consultants, materials branch and other organizations
and agencies on matters related to road design. 03 Bridge 01 The design of bridges, updating of bridge design manuals and specifications,
preparation and sustenance of bridge inventory and condition survey. 02 Supervision of construction and maintenance of bridges. 03 Preparation of bridge programs, budget and progress reports. 04 Construction 01 Administration of road works contracts both major improvements and
rehabilitation of roads. 02 Preparation of estimates and contract documents for resealing and recarpeting of
classified bitumen roads. 03 Preparation of monthly and quarterly reports. 04 Liaison with donors on all donor funded construction projects. 05 Liaison with government departments for smooth running of projects. 06 Processing of contractor’s and consultant’s payments. 05 Maintenance 01 Maintenance of all class A, B and C classified roads (paved and unpaved). 02 Overall planning, budgeting and co-ordination of the activities of the maintenance
(A, B and C roads). 03 Setting objectives and monitoring the performance on the maintenance of A, B and
C roads. 04 Preparation of estimates and contract documents for small scale maintenance
contracts. 05 Coordinating Donor/ GOK funding allocation for Road 2000 Program. 06 Promoting strategic objectives of Road 2000 Program. 07 Liaison with GOK ministries and departments, other organizations and agencies on
feeder roads. 06 Technical
Administration 01 General administration and supervision of cleanliness in the department.
02 Coordination of accident reports and briefs. 03 Liaison with relevant government ministries, departments, organizations agencies
(including donors) for professional and technical training for officers in the department.

NNUUTTRRAANNSS TThhee SSttuuddyy oonn MMaasstteerr PPllaann ffoorr UUrrbbaann TTrraannssppoorrtt iinn tthhee NNaaiirroobbii MMeettrrooppoolliittaann AArreeaa
FFiinnaall RReeppoorrtt AAppppeennddiixx A7-4
04 Overall coordination of Parliamentary questions. 05 Coordination of axle load enforcement. 06 Coordination of personnel (including staff disciplinary) and supplier matters in the
department. 07 Coordination of the management information system. 08 Attending ministerial advisory. 07 Technical
Compliance 01 Ensure that all projects are being implemented as per signed contracts.
02 Check evaluation of claims by Chief Project Engineers before they are forwarded to Principal Supt. Engineer (Development).
03 Check tender documents to ensure they are complete in all aspects. 04 Check quality and quantity of work done by direct labor units to ensure there is
value for money. 05 Ensure that programmes approved by District Roads Committees are followed and
that there is value for money for the works that are executed by District Roads Engineers.
RD’s Provincial road maintenance organization operates through a number of in-house “resealing” or “strategic maintenance units” based either at PWOs or in road camps around the country. These units were initially set up to look after all aspects of paved road maintenance but now are so run down they do little more than basic patching or “emergency” maintenance. Much of the work done by these units is of poor quality. RD has about 3,152 staff, of which 187 are in engineer posts, either in HQ, provinces or districts. This is translated allocation of one engineer for about every 340 km of classified network in the country, which is close to the optimum recommended by the World Bank (one engineer per 400 km). Despite the good skill levels of many RD staff, it seems that the current institutional environment which is characterized by lack of accountability and poor management structures prevents their potential from full realization. Senior staff at HQ and in the provinces are well trained and highly experienced. In the districts many engineers are degree or diploma holders trying to build up experience for eventual registration with IEK, and most of them have been benefited from training delivered under programs such as MRP and now increasing Roads 2000.
7.2.2 Kenya Roads Board (KRB)
(1) Overview The establishment of the KRB in 1999 is a significant event in the Kenya’s road sector. It is not only to prove a progress in institutional reform in the sector and to try to create an efficient and accountable organization for managing the RMLF, but also to build an institute to coordinate all the relating central and local governmental organizations in road infrastructure maintenance and development. The mandate of coordination given to KRB,

NNUUTTRRAANNSS TThhee SSttuuddyy oonn MMaasstteerr PPllaann ffoorr UUrrbbaann TTrraannssppoorrtt iinn tthhee NNaaiirroobbii MMeettrrooppoolliittaann AArreeaa
FFiinnaall RReeppoorrtt AAppppeennddiixx A7-5
despite this function has not been effectively utilized for some reasons, created a new relationship structure in history of the Kenya’s road sector development. Figure 7.2-2 shows institutional structure of road sector. KRB is responsible to the Minister of the MRPW, not to the MRPW itself. KRB is completely distinct organization from RD and is an autonomous organization administered by its Board of directors. Under KRB there are three road agencies of RD, DRCs and KWS, and RD’s sub-agencies consist of UDD with 42 Municipal Councils and 58 Town Councils, Nairobi City Council (CCN) and 4 large Municipal Councils. Through these agencies KRB keeps relationships with almost all the central and local governmental organizations relating to the road sector, e.g. relations with the MRPW through RD, relations with the MOLG through UDD, relations with the MENR through KWS, and relations with local authorities through DRCs. The Board members of KRB include five permanent secretaries from the MRPW, MOLG, MOT, MOF (Ministry of Finance), and MOFA (Ministry of Foreign Affairs). Other members of the Board are described in (3) of this Section. KRB has built up and been keeping a close relationship with similar organizations in the Southern Saharan African countries through the Southern Saharan African Transport Program (SSATP) of the World Bank and the African Road Maintenance Fund Association.
(2) KRB’s Establishment: the Result of Road Sector Reform
Figure 7.2-1 shows that the historical flow of the establishment of KRB originated from SSATP which took almost 10 years from birth of original idea of building a road fund to the establishment and operation of the fund management organization, KRB. KRB is a product of the road sector reform in Kenya. This reform has been facilitated by the international donors, particularly by the World Bank.
89 90 91 92 93 94 95 96 97 98 99 00 01 02
SSATP: road maintenance initiative, and policy reform (the DNA of KRB)
Seminar: milestone of institutional reform (original idea of KRB creating)
RMLF indirect cause for KRB
Road Sec Institution Study direct cause of KRB setting
KRB Act legal procedure KRB creation
Recruitment of Executive Director KRB
Fully operation KRB
FIGURE 7.2-1 ROAD OF KRB ESTABLISHMENT

NNUUTTRRAANNSS TThhee SSttuuddyy oonn MMaasstteerr PPllaann ffoorr UUrrbbaann TTrraannssppoorrtt iinn tthhee NNaaiirroobbii MMeettrrooppoolliittaann AArreeaa
FFiinnaall RReeppoorrtt AAppppeennddiixx A7-6
Legal & Administratio
Public Affairs Manager
Human Human
Resources Resources
Procurement
Accountant
Internal
Financial Accountant
Private G. Manager Controller Agency
Organization Finance &
Administrat Financial
Auditor
Manager TC Engineer TC
G. Manager Eastern Eastern
Minister Directors Exe Director Technical
Compliance Manager TC EngineerTC
Western Western
G. Manager Manager Engineer
Government Planning & Contracts Contracts
Representative Programme
Manager Engineer
Planning & Programme
Programme
Corporate
Planning &
IS & IT
Internal Auditor
FIGURE 7.2-2 ORGANISATION STRUCTURE OF KRB

NNUUTTRRAANNSS TThhee SSttuuddyy oonn MMaasstteerr PPllaann ffoorr UUrrbbaann TTrraannssppoorrtt iinn tthhee NNaaiirroobbii MMeettrrooppoolliittaann AArreeaa
FFiinnaall RReeppoorrtt AAppppeennddiixx A7-7
(3) Organizational Structure (See Figure 7.2-2)
KRB is not an executing agency which has direct responsibility for RMLF. This is potentially the strongest arrangement for fund management. In addition to the five members of the permanent secretaries of the Ministries, user side has five representatives on the Board from Automobile Association of Kenya (AAK), Association of Tour Operations, Kenyan Association of Manufacturers, Kenya Transport Association, and League of Women Voters. Furthermore, there are three other private sector representatives: Institution of Engineers of Kenya, and Institute of Surveyors of Kenya, and Institute of Certified Public Accountants of Kenya. A bigger representation from the private sector is materialized by deliberation to secure autonomy of KRB from the central Government, to reflect stake-holders’ voice in the management of the road network, and to facilitate introduction of a businesslike manner in management of road. The business like management is indeed one of the most valuable recommendations from the Road Sector Institutional Study in the 1995-1998. The Board is also required to advise a wide range of road-related policies to the Minister of MRPW. The Minister has a power to change the organization which has the representation in the Board of KRB by the gazetted order, and has recently replaced the Chamber of Commerce and the National Farmers Union by the Kenya Association of Manufacturers and the League of Women Voters. Appointments of the Board members from the representing private sector organizations are made by the Minister. Service period of the members is a fixed three-year term which is extendable for one further term. The current Board was inaugurated in September 2003. The chairperson is appointed by the President from the private sector Board members. The Executive Director is appointed by the Board in consultation with the Minister. KRB is the best-resourced organization, in terms of both financial and human resources, in the road sector and has been fully operational with complementing secretariat staffs only for just over two years. The professional staffs are well motivated, qualified and experienced.
(4) Functions and Business Process
Based on the KRB Act, the core functions undertaken by KRB are four which are summarized as followings: Management Functions of the Funds • Manage the funds derived from the fuel levy and any other funds that may accrue to
it. • Determine the allocation of the funds required by road agencies for the maintenance,
rehabilitation and development of the road network.

NNUUTTRRAANNSS TThhee SSttuuddyy oonn MMaasstteerr PPllaann ffoorr UUrrbbaann TTrraannssppoorrtt iinn tthhee NNaaiirroobbii MMeettrrooppoolliittaann AArreeaa
FFiinnaall RReeppoorrtt AAppppeennddiixx A7-8
Coordination Functions of Policy • Coordinate the implementation of all policies relating to the projects of the road
network. Monitoring Functions of Road Agencies Activities • Monitor and evaluate the operations or activities undertaken by road agencies in the
development, rehabilitation and maintenance of roads by means of technical, financial and performance audit with a view to achieving efficiency, cost effectiveness and safe.
• Monitor all procurements for road works or other associated works in accordance with the guidelines and criteria set out by KRB.
Recommendations Functions to the Government • Recommend to the Government appropriate levels of road user charges, fines,
penalties, levies or any sums required to be collected under the RMLF; • Advise the Minister on studies necessary for road development and improvement, on
specifications, design standards and classification of roads, on types, sizes and usage of vehicles on roads and the laden and axle load limits for protecting roads from damage, and on how to implement efficiently and effectively road maintenance; and on training of human resources.
One of the most important functions in KRB is to prepare, review and approve the Annual Public Road Programmes (APRP). The APRP is a key step for KRB towards a scientific management of the funds, which is internationally a fundamental document for a fund organization to manage its funds. The process of the APRP preparation is shown in Figure 7.2-3. The APRP is the basis for disbursement of the funds to local agencies, and is also the basis on which the activities of road agencies are evaluated. KRB requires its road agencies to prepare their annual road works programme for submission to the Board at least 6 months before the commencement of every fiscal year. These annual road works programs are analysed by the Board, and once acceptable all the work programs are consolidated to form the final APRP. KRB has prepared and circulated draft guidelines among road agencies for better program preparation in line with the direction of fund utilization. The guidelines include following 5 criteria:
- Road maintenance selection prioritization criteria for road classes A, B, C, and for urban roads,
- Limitations for overheads, material purchase, equipment repair and maintenance, office operations and training,
- Preparation of annual work plan for routine maintenance activities, - Preparation of an activity list of routine and periodic maintenance, and - Compliance with the procedures regulated by the Board.

NNUUTTRRAANNSS TThhee SSttuuddyy oonn MMaasstteerr PPllaann ffoorr UUrrbbaann TTrraannssppoorrtt iinn tthhee NNaaiirroobbii MMeettrrooppoolliittaann AArreeaa
FFiinnaall RReeppoorrtt AAppppeennddiixx A7-9
July Aug Sep Oct Nov Dec Jan Feb Mar Apr May Jun KRB advised RAs of funding ceilings for following FY
RAs forward draft ARWP to KRB
KRB and RAs agree on ARWP
KRB prepares a draft APRP to Board for approval
RAs: Road Agencies Board approves and to Minister
ARWP: Annual Road Works Programme Approved APRP to Treasury
FIGURE 7.2-3 APRP PROCESS
The APRP for the fiscal year 2003 - 2004 had been approved by the Board and covers projections for the fiscal years 2004 - 2005 and 2005 - 2006 in the time of February 2004.
7.2.3 Other Players
(1) MOLG and UDD The MOLG was established in 1963 to oversee the operations of Local Authorities, under the Local Government Act, CAP 265 of the Laws of Kenya and over 30 other statutes. The MOLG facilitates the operations of all 175 local authorities through the creation of an appropriate legal framework. The other statutes that guide the operation of the Ministry and local authorities are summed up into Table 7.2-2.

NNUUTTRRAANNSS TThhee SSttuuddyy oonn MMaasstteerr PPllaann ffoorr UUrrbbaann TTrraannssppoorrtt iinn tthhee NNaaiirroobbii MMeettrrooppoolliittaann AArreeaa
FFiinnaall RReeppoorrtt AAppppeennddiixx A7-10
TABLE 7.2-2 MAIN STATUTES GUIDING THE MOLG OPERATIONS
Area Contents CAP No. Administrative 01 Limitation of Action Act
02 Public Authorities Limitation Act 03 Local Government Act 04 Registration of Titles Act 05 Registration of Documents Act
CAP 022 CAP 039 CAP 265 CAP 281 CAP 285
Social 01 Housing Act 02 Education Act 03 Public Health Act 04 Land Group Representatives Act 05 Registered Land Act 06 Land Control Act 07 Wildlife Conservation and Management Act 08 Environmental Management and Coordination Act of 2000 09 Children Act of 2001 10 Water Act of 2002 11 Community Service Orders Act of 1998
CAP 117 CAP 211 CAP 242 CAP 287 CAP 300 CAP 302 CAP 376
- - - -
Economic 01 Valuation of Rating Act 02 Rating Act 03 Local Government Loans Act 04 Local Authorities Provident Fund Act 05 Local Authorities Recovery of Possessions of Property Act 06 Land Adjudication Act 07 Physical Planning Act 08 Trust Land Act 09 Land Acquisition Act 10 Agriculture Act 11 Exchequer and Audit Act 12 Trade Licensing Act 13 Local Authorities Transfer Fund Act of 1998
CAP 266 CAP 267 CAP 270 CAP 272
- CAP 284 CAP 286 CAP 288 CAP 295 CAP 368 CAP412
- -
Transport 01 Roads and Roads of Access Act 02 Traffic Act 03 Transport Licensing Act 04 Streets Adoption Act 05 Kenya Roads board Act of 1999
CAP 399 CAP 403 CAP 404 CAP 406
-
MOLG has two core departments and is supported by various sections under the administration department. The two core departments are UDD and Department of Local Authorities Inspectorate (DLAI). UDD is the sub-agency of KRB under RD as the KRB’s road agency. Table 7.2-3 shows organisation of MOLG. The Presidential Circular No. 3 of July 2003 spells out the following responsibilities of MOLG: • Local government sector policies, • By-laws for local authorities,

NNUUTTRRAANNSS TThhee SSttuuddyy oonn MMaasstteerr PPllaann ffoorr UUrrbbaann TTrraannssppoorrtt iinn tthhee NNaaiirroobbii MMeettrrooppoolliittaann AArreeaa
FFiinnaall RReeppoorrtt AAppppeennddiixx A7-11
• Support for capacity building for local authorities, • Local authorities loan authority, • Local authorities provident fund, • Local authorities superannuation fund, and • Local authorities transfer fund. Based on this mandate the following functions are performed by the MOLG: • Formulation, harmonisation and implementation of policies in the local government
sector; • Provision of physical and financial management and the regulatory framework for
local authorities; • Guiding and supporting local authorities in service delivery; • Guiding local authorities on issues of planning and development through formulation
and support in the implementation of development policies, strategies and programmes;
• Development and implementation of effective institutional, administrative and legal framework for operation of local authorities; and
• Spearheading local government sector reforms.
TABLE 7.2-3 ORGANIZATION OF MOLG
No. Name of Department or Section TechnicalStaff
Support Staff
Total
01 City Engineer Department Staff working in Department itself
2 25 27
02 Deputy City Engineer Staff working for City Engineer
1 5 6
03 Assistant City Engineer Staff working for Design
1 - 1
04 Assistant City Engineer Staff working for operation and services
5 5 10
05 Chief Assistance Engineer Operation and Services
1 - 1
06 Chief Assistance Engineer Implementation
135 343 478
07 Chief Assistance Engineer Roads
8 7 15
08 Chief Assistance Engineer Transport Unit
38 67 105
09 Chief Assistance Engineer Estate and Development
6 4 10
10 Principal Land Surveyor Engineering survey
9 21 30
Sub-total 206 477 683 11 Other sections - - 969 Total 1652
One of the core functions of MOLG is to carry out public infrastructure development and maintenance projects. In 1990s MOLG commissioned two major projects to solve urban transportation issues in the country. The first was the Kenya Urban Transport Infrastructure

NNUUTTRRAANNSS TThhee SSttuuddyy oonn MMaasstteerr PPllaann ffoorr UUrrbbaann TTrraannssppoorrtt iinn tthhee NNaaiirroobbii MMeettrrooppoolliittaann AArreeaa
FFiinnaall RReeppoorrtt AAppppeennddiixx A7-12
Project (KUTIP) of which objectives were four folds: to expand the capacity of congested main traffic arteries, improve travel conditions for pedestrians and cyclists, reduce road accidents, and encourage a more efficient NMT system in major urban areas. The second was the Nairobi Long-Term Transport Study (1999) of which objectives were to establish a long-term strategic plan for the development of urban transport in Nairobi and prepare short-term and medium term programmes for the implementation of related projects. Under KUTIP several sub-studies were carried out to provide guidelines for investment decisions in various major urban areas.
(2) CCN and CED Nairobi is the capital city of Kenya accommodating its Central Government entity. Nairobi is also one of Africa’s most important centers for commerce, industry, and tourism. Nairobi’s transport and communication networks have been developed to link the cities of the nearby countries. Inter-continental and international air links have been established through Nairobi’s airport and in coordination with east African regional roads and rail routes they have made Nairobi the region’s most important transport center for all modes. Presently the key powers relating to the road sector management, including access to an adequate revenue base, setting priorities and authorizing expenditure on transport infrastructure, as well as regulatory measures and their enforcement, are largely controlled by national institutions, mainly the MOLG, KRB and MRPW. This is in part a reflection of the political structure of government in Kenya. Although the national strategy envisions a shift of responsibility for urban transport to the City, CCN is not ready to receive it considering that it has been suffering from overstaffing which hinders proper allocation of budget for their services. For example, about 90% of the road maintenance funds in Nairobi were disbursed for wages and only 10% were spent on works directly. CCN has 10 departments, each with several sections, and with broader bases of skills than many national institutions. CCN has a City Engineer’s Department (CED), which could be a trustworthy organization delivering sufficient services, if it was vested adequate authority and resources. Since the members of the City Council are elected, the Council is accountable to the urban constituency. The residents expect better service and tend to complain the City Council, and specifically the CED. Based on the survey by the Team, CED has 1,652 staff in total, and 10 main units.
CCN has a road network of approximately 1,500 km including non-adopted and private roads. The road network is divided into four categories for purposes of administration as detailed in the Table 7.2-4.

NNUUTTRRAANNSS TThhee SSttuuddyy oonn MMaasstteerr PPllaann ffoorr UUrrbbaann TTrraannssppoorrtt iinn tthhee NNaaiirroobbii MMeettrrooppoolliittaann AArreeaa
FFiinnaall RReeppoorrtt AAppppeennddiixx A7-13
TABLE 7.2-4 ROAD NETWORK IN CCN1)
Description Paved (km) unpaved (km) Total (km)
Classified 2) 265 Nil 265
Adopted 3) 665 85 750
Non-adopted 4) Nil 465 465
Private 20 Nil 20
950 550 1,500 Note: 1) Length of Road Network is different from city road list of CCN because non-adopted and private
roads are included. 2) Classified: public roads that are part of national road network and are administrated by MRPW. 3) Adopted: public roads that conform to CAP 406 (Street Adoptions Act) and are administrated by
CCN. 4) Non-adopted: public roads but they are not conform to CAP 406 and are administrated by CCN. Source: CCN Report to KRB, Roads Sector Liaison meeting, Feb, 2004, Annex III-2, P1.
Currently only 60% is in a good condition while the remainder is at various stages of deterioration. The mandate of CCN regarding the road sector includes, but is not limited to, the development, rehabilitation and maintenance (both routine and periodic) adopted and non-adopted roads. Past inadequate allocation of funds by CCN for road maintenance has led to inadequate, delayed and sometimes no maintenance of the city roads which has resulted in the current unsatisfactory road conditions.
(3) Kenya Wildlife Service (KWS) and Forest Department (FD)
Both KWS and FD have extensive road networks that they maintain using their own resources. In addition there are some classified roads that provide access to parks and reserves, some of which are through routes, that are the responsibility of MRPW, but which are maintained by KWS on behalf of MRPW. KWS is specified as a road agency under the KRB Act, but FD is left un-specified. There are a total of 59 parks and reserves in Kenya. Among them, however, only the 25 parks are directly managed by KWS. The remaining 34 game reserves are managed by county councils. Most of the parks and the reserves are accessed from the classified road network, but some roads within the parks are also classified and a small number of them are through routes used by non-park traffic. To deal with the situation KWS has in-house capability of road maintenance. Most of these classified roads mentioned above are maintained by KWS under agreement with MRPW, at least within the park boundaries and some cases where the roads form the principal access route to park gates. Only the access road to Nairobi National Park is paved, all the other access roads are gravel or earth. The roads in the parks are maintained in reasonable condition with about 60% being in good to fair condition and the remainder needing some form of rehabilitation. The classified roads serving parks and reserves account for about 10% of the total length of the classified road network.

NNUUTTRRAANNSS TThhee SSttuuddyy oonn MMaasstteerr PPllaann ffoorr UUrrbbaann TTrraannssppoorrtt iinn tthhee NNaaiirroobbii MMeettrrooppoolliittaann AArreeaa
FFiinnaall RReeppoorrtt AAppppeennddiixx A7-14
KWS has its own road maintenance organization which is relatively well resourced having benefited from investments under various projects supported by international aid agencies such as the Protected Areas and Wildlife Service (PAWS) project, which was financed by WB and other financing from JICA. And being as a statutory corporation relatively unfettered from government procurement and accounting procedures, KWS is able to operate more flexibly and efficiently hiring professional staffs on reasonable salaries and applying business management principles. FD has a network of access, feeder and plantation roads used for the management of forest resources that extends 6,800 km which is maintained using its own force account units. The Forest Act, CAP 385, is the principal legislation for the conservation, management, and utilization of forests and forest products. FD is in charge of conservation, management, and utilization of forests and forest products. Besides FD, the other major institution in this field is the Kenya Forestry Research Institute.
7.3 PUBLIC TRANSPORT ADMINISTRATION
7.3.1 The Ministry of Transport (MOT)
MOT is in charge of the following organizations: • Kenya Meteorological Department which provides free public weather information, • Motor Vehicle Inspection Unit which ensures road worthiness of vehicles on Kenya’s
roads, and • Transport Licensing Board (TLB) which allocates public service routes to operate on. MOT is also responsible for overseeing smoother operations of the following transport service related state corporations: • Kenya Civil Aviation Authority (KCAA), • Kenya Airport Authority (KAA), • Kenya Ports Authority (KPA), • Kenya Ferry Services, • Kenya Railway Corporation (KR), and • Kenya National Shipping Line. In terms of transport policy making and transport management, a major department is the Transport Division. This division consists of three officers with support staff like secretaries and office assistants. The division oversees the functions of TLB and Motor Vehicle Inspection Unit. It interfaces MOT with these technical organizations in addition to advising the Permanent Secretary on policy issues affecting the two organizations. The Transport Division also liaises the Registrar of the Motor Vehicle which administratively falls under

NNUUTTRRAANNSS TThhee SSttuuddyy oonn MMaasstteerr PPllaann ffoorr UUrrbbaann TTrraannssppoorrtt iinn tthhee NNaaiirroobbii MMeettrrooppoolliittaann AArreeaa
FFiinnaall RReeppoorrtt AAppppeennddiixx A7-15
Kenya Revenue Authority currently. The core business in this division is road safety matters including legislation, inspection and licensing of motor vehicles, and is policy formulation and coordination.
7.3.2 Traffic Management Administration
(1) Overview Urban transport management generally represents a combination of policies, practices and measures which are specially deliberated and implemented for a particular urban area in a coherent, comprehensive and consistent manner. In general, the following are the purpose and objectives of traffic management efforts: • To maximize the efficient utilization of the existing transport system through various
low- and medium-cost capital improvement coupled with focused operational practices, and
• To apply the above to ensure normal transport operations in the event.
As stated before, in the traffic management and services (management is actually a sort of service field) sector, unfortunately, there is no core institution like the KRB to play a coordinative role. Therefore, the structure in this field could not take on a close relationship model, and it is actually just a fragmented structure model.
(2) CCN-Transport Unit (TU) under CED
TU, which is a large section under the CED with 105 staff in 2004, is mainly in charge of Nairobi traffic management. Based on the survey and other studies, roles of the TU have not been played efficiently and effectively, because of its insufficient capabilities, financial shortage and other miscellaneous reasons. TU could represent CCN’s interest and provide technical support concerning traffic forecasting, demand management, transport corridor planning, road reserve usage, and safety issues.
7.3.3 Road Safety Administration
Kenya has a fine legal framework for road safety with an updated Traffic Law, a simple but to basically reliable accident data recording system, and Traffic Police. Also the licensing systems and insurance systems have solid bases but they indeed have to be streamlined and improved. The underlying reason for the gradually deteriorating road safety is lack of political priority, which hampers proper funding and consequently impedes development of technical competencies and capabilities with the end result of improper implementation of specifically targeted and focused road safety countermeasures. This results in an in-cohesive road safety
NNUUTTRRAANNSS TThhee SSttuuddyy oonn MMaasstteerr PPllaann ffoorr UUrrbbaann TTrraannssppoorrtt iinn tthhee NNaaiirroobbii MMeettrrooppoolliittaann AArreeaa
FFiinnaall RReeppoorrtt AAppppeennddiixx A7-16
operational environment, where the main stakeholders act based on individual knowledge and personal experience, and drive – rather than on sound technical and systematic approaches and coherent policies. As mentioned above there are a lot of organizations to be in charge of road safety management. In policy-wide road safety is under MOT, and engineering implementation is under MRPW. Data collection, vehicle inspection and enforcement are in the hands of the Traffic Police, which is under the Ministry of Interior Security. The licensing is under TLB, and emergency services are under the Ministry of Health. When so many different ministries and agencies are involved in one area, coordination and especially cooperation are essential. During the latest road safety program in the 1980s the National Road Safety Council (NRSC) was established to ensure these and to prepare annual action plans, but NRSC is inactive. As a result no annual action plan is prepared. Existing cooperation among the agencies and ministries is inadequate. As a consequence the road safety works are scattered and in-cohesive. In order to improve this situation the MOT has introduced a Bill of Act to Parliament to amend the traffic act by establishing a Kenya Road Safety Agency (KRSA) operating under the autonomous scope with a board consisting of members both from the public and the private sectors which is similar to KRB. The Traffic Police collects all accident data for the purpose of legal prosecution and/ or insurance claims. The accident data is processed through a P41 form to the Traffic Police headquarters on a regular basis enabling the Police to have good accident data. The accident statistics are forwarded also to MRPW. Kenya vehicle inspection operates under the Kenya Police Department. They inspect a total of about 120,000 vehicles annually. They have 17 inspection centers. Among them the Nairobi center is the largest and best equipped. As poor vehicle conditions especially among commercial vehicles and matatus resulted in larger number of accidents, the vehicle inspection needs to be upgraded in terms of technical competencies and capabilities, and most importantly to be connected to enforcement. Vehicle inspection has been suggested privatised by several stakeholders in order to upgrade the facilities, to minimize financial leakage, to ensure autonomy from corruption, and to create a better reputation through higher integrity.
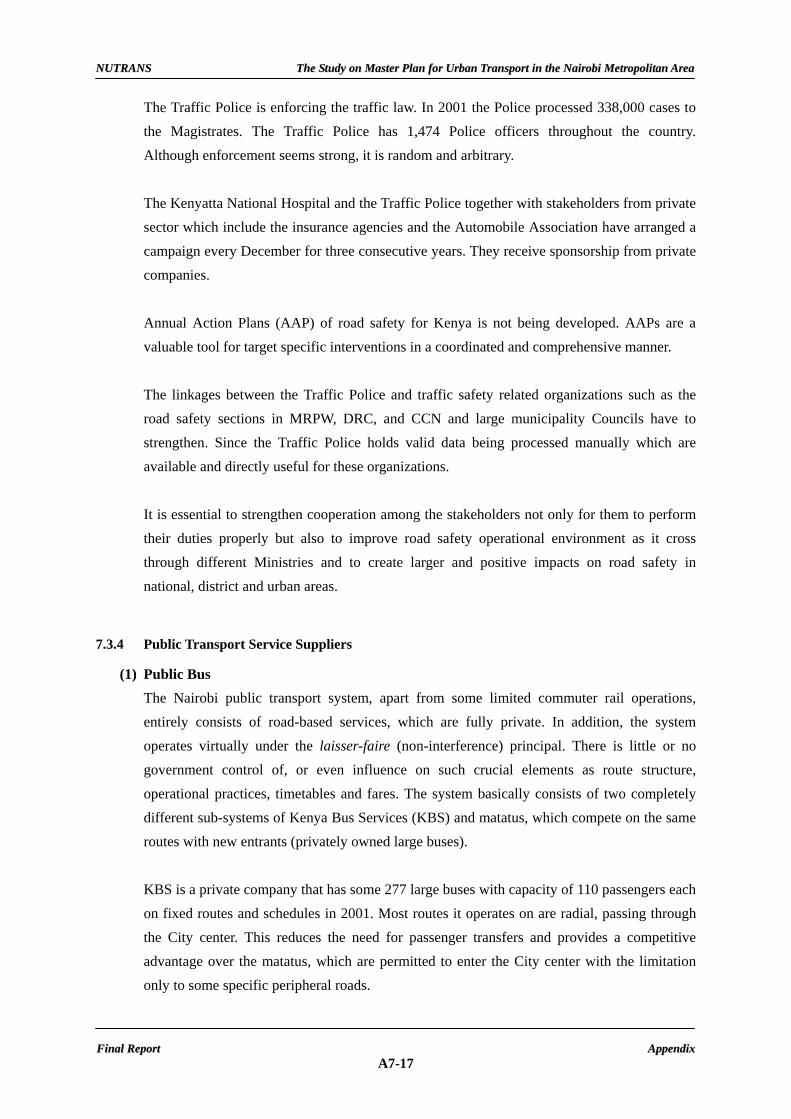
NNUUTTRRAANNSS TThhee SSttuuddyy oonn MMaasstteerr PPllaann ffoorr UUrrbbaann TTrraannssppoorrtt iinn tthhee NNaaiirroobbii MMeettrrooppoolliittaann AArreeaa
FFiinnaall RReeppoorrtt AAppppeennddiixx A7-17
The Traffic Police is enforcing the traffic law. In 2001 the Police processed 338,000 cases to the Magistrates. The Traffic Police has 1,474 Police officers throughout the country. Although enforcement seems strong, it is random and arbitrary. The Kenyatta National Hospital and the Traffic Police together with stakeholders from private sector which include the insurance agencies and the Automobile Association have arranged a campaign every December for three consecutive years. They receive sponsorship from private companies. Annual Action Plans (AAP) of road safety for Kenya is not being developed. AAPs are a valuable tool for target specific interventions in a coordinated and comprehensive manner. The linkages between the Traffic Police and traffic safety related organizations such as the road safety sections in MRPW, DRC, and CCN and large municipality Councils have to strengthen. Since the Traffic Police holds valid data being processed manually which are available and directly useful for these organizations. It is essential to strengthen cooperation among the stakeholders not only for them to perform their duties properly but also to improve road safety operational environment as it cross through different Ministries and to create larger and positive impacts on road safety in national, district and urban areas.
7.3.4 Public Transport Service Suppliers
(1) Public Bus The Nairobi public transport system, apart from some limited commuter rail operations, entirely consists of road-based services, which are fully private. In addition, the system operates virtually under the laisser-faire (non-interference) principal. There is little or no government control of, or even influence on such crucial elements as route structure, operational practices, timetables and fares. The system basically consists of two completely different sub-systems of Kenya Bus Services (KBS) and matatus, which compete on the same routes with new entrants (privately owned large buses). KBS is a private company that has some 277 large buses with capacity of 110 passengers each on fixed routes and schedules in 2001. Most routes it operates on are radial, passing through the City center. This reduces the need for passenger transfers and provides a competitive advantage over the matatus, which are permitted to enter the City center with the limitation only to some specific peripheral roads.

NNUUTTRRAANNSS TThhee SSttuuddyy oonn MMaasstteerr PPllaann ffoorr UUrrbbaann TTrraannssppoorrtt iinn tthhee NNaaiirroobbii MMeettrrooppoolliittaann AArreeaa
FFiinnaall RReeppoorrtt AAppppeennddiixx A7-18
KBS started operations in 1934 as a subsidiary of Overseas Motor Transport Company, Ltd. of London (OMT). The company was taken over by United Transport Overseas Ltd. (UTO) in 1951. The policy decision of UTO in the late 1980s to discontinue operation created a crisis which was solved when Stagecoach Ltd. of Scotland took over UTO’s shares in 1992 and the company was renamed Stagecoach Kenya Bus. The ownership of the KBS Company has changed hands many times. In 1988 Stagecoach sold the company to a group of Kenyan investors, who changed the company’s name back to Kenya Bus Services. At present KBS offers four services. Among them the Bus Track service offering ordinary city transport and the Metro Shuttle minibus serving the high/ medium income areas in Nairobi are subject to the Study. According to a study carried out by KBS in August and September 2000, KBS’s market share stood at some 17% for all routes, and 29% on KBS operated routes in the City. At that time KBS had about 240 buses operating daily, competing against 9,894 matatus and 15 country buses. The share has declined continuously. In 1994, KBS had 36% of the market. The small matatus were estimated to grow at about 31% per year in 2000. KBS transported some 300,000 passengers per day in 1990, while the number of passengers transported per bus per day has been steadily declining over the past years, from a high of 1,500 passengers/bus/day in the mid-80’s to less than 1,000 in 1997. The network has been gradually reduced over time, as routes have been abandoned and taken over by matatus. There are 30 Metro Shuttle minibuses, each with a capacity of carrying 33-seated passengers. They were newly bought and are well maintained, clean, carrying no standing passengers, and operated accordingly to the timetables. However, they are about 50% more expensive than the matatu. Their marketing targets are the middle- and high-income urban residents who value their comfort, safety, and time at higher bus fares, and are ready to pay the fares. KBS hopes to increase the fleet, as initial indicators demonstrate that the operation can expect better profits than the Bus Track service. Bus Track vehicles are refurbished old buses that have been plying city routes. Approximately 240 buses ply the city routes daily. The Bus Track service has been operated by former employees (former KBS supervisors) in some sort of lease from the company since 2001. The buses are operated on a profit sharing basis between the company and individual operators. Each operator manages about 10 buses. The leasing out the buses and licensing of private bus operators also affected the matatu operators who had dominated some of the routes previously not served by KBS due to poor road conditions.
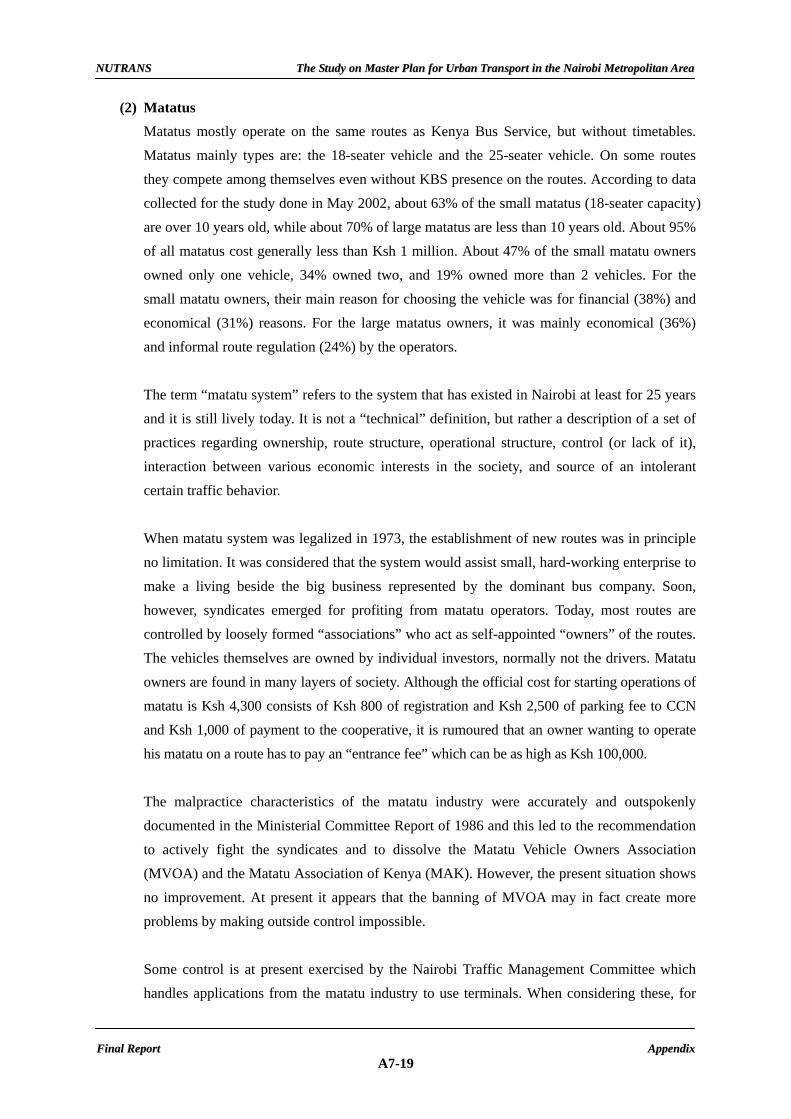
NNUUTTRRAANNSS TThhee SSttuuddyy oonn MMaasstteerr PPllaann ffoorr UUrrbbaann TTrraannssppoorrtt iinn tthhee NNaaiirroobbii MMeettrrooppoolliittaann AArreeaa
FFiinnaall RReeppoorrtt AAppppeennddiixx A7-19
(2) Matatus Matatus mostly operate on the same routes as Kenya Bus Service, but without timetables. Matatus mainly types are: the 18-seater vehicle and the 25-seater vehicle. On some routes they compete among themselves even without KBS presence on the routes. According to data collected for the study done in May 2002, about 63% of the small matatus (18-seater capacity) are over 10 years old, while about 70% of large matatus are less than 10 years old. About 95% of all matatus cost generally less than Ksh 1 million. About 47% of the small matatu owners owned only one vehicle, 34% owned two, and 19% owned more than 2 vehicles. For the small matatu owners, their main reason for choosing the vehicle was for financial (38%) and economical (31%) reasons. For the large matatus owners, it was mainly economical (36%) and informal route regulation (24%) by the operators. The term “matatu system” refers to the system that has existed in Nairobi at least for 25 years and it is still lively today. It is not a “technical” definition, but rather a description of a set of practices regarding ownership, route structure, operational structure, control (or lack of it), interaction between various economic interests in the society, and source of an intolerant certain traffic behavior. When matatu system was legalized in 1973, the establishment of new routes was in principle no limitation. It was considered that the system would assist small, hard-working enterprise to make a living beside the big business represented by the dominant bus company. Soon, however, syndicates emerged for profiting from matatu operators. Today, most routes are controlled by loosely formed “associations” who act as self-appointed “owners” of the routes. The vehicles themselves are owned by individual investors, normally not the drivers. Matatu owners are found in many layers of society. Although the official cost for starting operations of matatu is Ksh 4,300 consists of Ksh 800 of registration and Ksh 2,500 of parking fee to CCN and Ksh 1,000 of payment to the cooperative, it is rumoured that an owner wanting to operate his matatu on a route has to pay an “entrance fee” which can be as high as Ksh 100,000. The malpractice characteristics of the matatu industry were accurately and outspokenly documented in the Ministerial Committee Report of 1986 and this led to the recommendation to actively fight the syndicates and to dissolve the Matatu Vehicle Owners Association (MVOA) and the Matatu Association of Kenya (MAK). However, the present situation shows no improvement. At present it appears that the banning of MVOA may in fact create more problems by making outside control impossible. Some control is at present exercised by the Nairobi Traffic Management Committee which handles applications from the matatu industry to use terminals. When considering these, for

NNUUTTRRAANNSS TThhee SSttuuddyy oonn MMaasstteerr PPllaann ffoorr UUrrbbaann TTrraannssppoorrtt iinn tthhee NNaaiirroobbii MMeettrrooppoolliittaann AArreeaa
FFiinnaall RReeppoorrtt AAppppeennddiixx A7-20
approving the applications the Committee may take into account factors such as availability of land in the city center and entry routes there, but also whether the proposed route is likely to interfere with existing ones. In this way, some establishment control can be said exist. The matatu have been banned from the western part of the city center on the grounds that they disturbed traffic and this was actually observed. Also the rule against operating larger vehicles than 25-seaters followed. These seem to indicate that matatu sector are subject to some regulation.
(3) Rail Transport: Kenya Railways Company (KR) Rail transport provides the closest alternative to road for the movement of freight and passengers, thus the review of rail is more important than perhaps the other modes of transport. The financial and regulation requirements of rail transport are quite different to roads and make rail difficult to compete with roads on the same ground. Differing from road transport, KR also has to finance railway police and security, amortisation of all assets including fixed assets and un-remunerative services required by Government. Through various social services, KR employs 6,000 more personnel than the required personnel for core operations. It is also worth noting that KR has cross-subsidized to the turn of over Ksh 1.7 billion for the maintenance of roads through the fuel levy. Any future transport policy must address these issues. KR comprises 2,778 km of lines of which 1,083 km are main lines, 346 km principle lines, 490 km minor and branch lines and 859 km private lines and sidings. There has been no expansion of the network over the last ten years. The main line from Mombasa to Malaba constructed over 100 years ago provides the backbone of the network. The condition of the infrastructure has inevitably deteriorated due to lack of finance. Approximately 506 km of the main line suffers with speed restrictions resulting in average technical speeds of 40 kph for freight and 60 kph for passenger. Like roads, backlog rehabilitation is urgently needed, though there is no backlog maintenance program for rail that is contrary to roads which are currently being financed. Freight volume (tons) has fluctuated during the last decade from a high of over 3.5 million tons in 1993 to a low of 1.5 million tons in 1997. Since 1997 freight traffic volumes have increased to 2.6 million tons in 2002. Overall numbers of passenger traffic had varied between 300-400 million passenger-km between 1993 and 2000, but since then they have sharply declined to below 180 million passenger-km. Passenger service routes comprise

NNUUTTRRAANNSS TThhee SSttuuddyy oonn MMaasstteerr PPllaann ffoorr UUrrbbaann TTrraannssppoorrtt iinn tthhee NNaaiirroobbii MMeettrrooppoolliittaann AArreeaa
FFiinnaall RReeppoorrtt AAppppeennddiixx A7-21
Nairobi to Mombasa and Nairobi to Nanyuki. Typical passenger volumes on the Nairobi to Mombasa service are 32,000 per month and daily volumes of 12,000 are normal for the commuter services. Nairobi suburban services started in 2001. Clearly with increasing urbanization the demand for suburban services will increase but competition for intercity passengers with fast bus services travelling on good roads will be significant. KR is predominantly a freight railway with 95% of its income being generated from freight. The current fleet comprises 150 diesel locomotives, 500 passenger coaches and 5,000 wagons, most of which will need to be replaced over the next ten years. Operational efficiency is reduced by about 25% due to the prevalence of speed restrictions. However, surplus capacity exists that mitigates the costs of sub-optimal performance. Nevertheless, output of 560 tons per wagon per year or 1.4 tons per day indicates a very poor level of utilization that is mostly explained by the fact that a larger proportion of the wagon fleet is either set aside waiting or surplus to needs. With restoration of infrastructure, rationalization of rolling stock, and judicious and efficient train planning, traffic costs can be reduced and demand can be increased. KR employed 22,000 personnel at its peak. Currently the establishment stands at 9,500 with plans after concession that will reduce the establishment by a further 6,000 to 3,600. The employment reduction strategy envisaged after concession is sensible in commercial terms and partly explains the dismissal financial performance posted by KR for some time. It is estimated that the rail sector currently employs about 6,000 personnel that are not necessarily for its core services but are rather for provision of social services. Shortly following the dissolution of East Africa Railways, the 1978 Kenya Railways Act set up KR as a state-owned company. The Act required the enterprise to balance its accounts and operate commercially. But the Act also ties KR management to the MOT for control of traffic, fares, investment, and budget. KR is also bound to employ a large cadre of personnel for social reasons, to provide entirely for its infrastructure and even to engage its own police force. Thus the 1978 Railways Act, like other contemporary legislation, provides a conflicting and ambiguous set of objectives for the undertaking. This Act remains in force and must be replaced by new legislation that establishes railways as an independent commercial entity that permits the private sector participation that has been enjoyed by the road sector for a generation.

APPENDIX 8
FINANCIAL STRUCTURE AND BUDGETING
Page 8.1 FINANCIAL STRUCTURE AND BUDGETING A8-1 8.2 MAIN FINANCIAL SOURCES A8-7 8.3 PRIVATE SECTOR PARTICIPATION: CASE OF NORTHERN CORRIDOR PROJECT A8-12
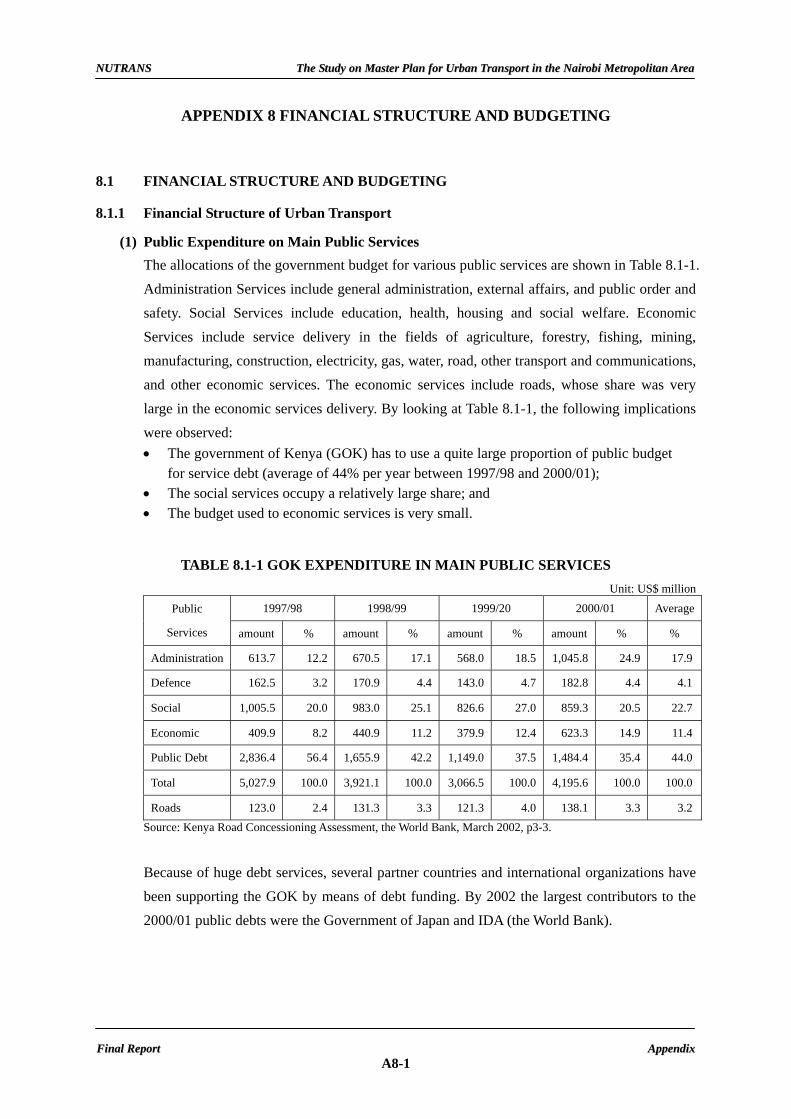
NNUUTTRRAANNSS TThhee SSttuuddyy oonn MMaasstteerr PPllaann ffoorr UUrrbbaann TTrraannssppoorrtt iinn tthhee NNaaiirroobbii MMeettrrooppoolliittaann AArreeaa
FFiinnaall RReeppoorrtt AAppppeennddiixx A8-1
APPENDIX 8 FINANCIAL STRUCTURE AND BUDGETING
8.1 FINANCIAL STRUCTURE AND BUDGETING
8.1.1 Financial Structure of Urban Transport
(1) Public Expenditure on Main Public Services The allocations of the government budget for various public services are shown in Table 8.1-1. Administration Services include general administration, external affairs, and public order and safety. Social Services include education, health, housing and social welfare. Economic Services include service delivery in the fields of agriculture, forestry, fishing, mining, manufacturing, construction, electricity, gas, water, road, other transport and communications, and other economic services. The economic services include roads, whose share was very large in the economic services delivery. By looking at Table 8.1-1, the following implications were observed: • The government of Kenya (GOK) has to use a quite large proportion of public budget
for service debt (average of 44% per year between 1997/98 and 2000/01); • The social services occupy a relatively large share; and • The budget used to economic services is very small.
TABLE 8.1-1 GOK EXPENDITURE IN MAIN PUBLIC SERVICES Unit: US$ million
1997/98 1998/99 1999/20 2000/01 AveragePublic
Services amount % amount % amount % amount % %
Administration 613.7 12.2 670.5 17.1 568.0 18.5 1,045.8 24.9 17.9
Defence 162.5 3.2 170.9 4.4 143.0 4.7 182.8 4.4 4.1
Social 1,005.5 20.0 983.0 25.1 826.6 27.0 859.3 20.5 22.7
Economic 409.9 8.2 440.9 11.2 379.9 12.4 623.3 14.9 11.4
Public Debt 2,836.4 56.4 1,655.9 42.2 1,149.0 37.5 1,484.4 35.4 44.0
Total 5,027.9 100.0 3,921.1 100.0 3,066.5 100.0 4,195.6 100.0 100.0
Roads 123.0 2.4 131.3 3.3 121.3 4.0 138.1 3.3 3.2Source: Kenya Road Concessioning Assessment, the World Bank, March 2002, p3-3.
Because of huge debt services, several partner countries and international organizations have been supporting the GOK by means of debt funding. By 2002 the largest contributors to the 2000/01 public debts were the Government of Japan and IDA (the World Bank).

NNUUTTRRAANNSS TThhee SSttuuddyy oonn MMaasstteerr PPllaann ffoorr UUrrbbaann TTrraannssppoorrtt iinn tthhee NNaaiirroobbii MMeettrrooppoolliittaann AArreeaa
FFiinnaall RReeppoorrtt AAppppeennddiixx A8-2
8.1.2 Budget Allocations for the Road Sector
(1) Overview Kenya has made quite remarkable progress during 1990s in allocation of domestic resources for the road sector, especially for road maintenance. Even though the Government has been experiencing major financial problems, the recurrent budget (the Road Maintenance Fuel Levy) has not been affected by either diversion or borrowing. The governmental budgets in 1990s on the road sector is shown in Table 8.1-2.
TABLE 8.1-2 BUDGETS IN THE ROAD SECTOR IN THE 1989-2001 Unit: US$ million (2001 price)
FY Recurrent Development Budget Toll Sub-total
Total Funding
1989/90 37.3 9.9 47.2 152.9 200.2 1990/91 28.8 13.5 42.2 131.8 174.0 1991/92 26.5 14.8 41.3 115.5 156.8 1992/93 24.6 14.3 38.9 104.1 143.0 1993/94 19.3 9.8 29.1 68.3 97.4 1994/95 34.2 0.0 34.2 29.5 63.6 1995/96 60.2 0.0 60.2 65.5 125.7 1996/97 81.0 0.0 81.0 100.3 181.3 1997/98 96.5 0.0 96.5 58.1 154.6 1998/99 85.8 0.0 85.8 51.3 137.1 1999/00 89.2 0.0 89.2 46.7 135.9 2000/01 87.7 0.0 87.7 37.3 125.0 2001/02 89.9 0.0 89.9 47.7 137.6 FY89-95 33.0 9.0 42.0 95.0 137.0 FY96-01 88.0 88.0 57.0 145.0
Note: The funding allocations are for the classified road network. Source: Strategic Review: the Kenya Road Sector, the World Bank, Mary, 2002, p7.
The comparison of the annual average funding of fiscal year 1996-2001 with the fiscal year 1989-1995 in the table shows that the recurrent funding increased in more than double from US$ 42 million during fiscal year 1996-2001 to US$ 88 million during fiscal year 1989-1995 in terms of year 2001 price. This significant increase solely owes to the creation of the Road Maintenance Levy Fund (RMLF) in 1993 and its execution since 1994. But development funding has fallen substantially, and the net increase in overall funding had been marginal. Development funds come mainly from the donor aids, and the flow of development funds has been seriously affected by the reduction of aids to Kenya in the 1990s.
Since the establishment of the new Government, financial budget for the road sector has increased steadily, due to growth of the fuel levy and recovering trend of foreign development assistances. The latest data regarding total road sector budget amounting to US$276.28 million for the fiscal year 2004/05 shown in Table 8.1-3 indicates a substantial growth comparing to the average total budget for the road sector during fiscal year 1996-2001 amounting to US$145.0.

NNUUTTRRAANNSS TThhee SSttuuddyy oonn MMaasstteerr PPllaann ffoorr UUrrbbaann TTrraannssppoorrtt iinn tthhee NNaaiirroobbii MMeettrrooppoolliittaann AArreeaa
FFiinnaall RReeppoorrtt AAppppeennddiixx A8-3
TABLE 8.1-3 TOTAL FUNDING FOR THE ROAD SECTOR IN FY 2004/05 Financial Sources Projected Funding (US$ million) 1 RMLF 108.75 2 Transit Toll Collection 2.5 3 Development Budget for MRPW 145.36 4 Urban roads development 9.49 5 LATF 10.18 Total Road sector funding 276.28
Note: The RMLF is a dedicated tax levied on petrol and diesel for the maintenance of roads, and its rate is currently US$ 7.25 cents = Ksh 5.90 per liter. Development budget, urban roads budget and LATF are all derived from Government’s general revenue budget. Development budget comes mainly from the foreign development partners.
Source: The KRB Operation, KRB, Nov 2004, p8.
Total amounts for the road sector in fiscal year 2004/05 is US$ 276.28 million which is more than the double amount of fiscal year 2001/02 (US$ 137.60 million). It should be emphasized, however, that the required cost for carrying out full maintenance on the roads currently in good condition, plus “holding” maintenance on roads in fair condition would be over Ksh 8 billion which is approximately equals to US$ 100 million, against the road network as of 2003. The amount is just about equal to the revenue presently available from the RMLF. Details of the costs are shown in Table 8.1-4.
TABLE 8.1-4 ANNUAL MAINTENANCE COST REQUIREMENT OF THE ROAD NETWORK
Unit: Ksh million Class Total Normal Mt 2003 Holding Mt 2003 Total Mt 2003Network Km km Per yr km Per yr km Per yr<50vpd 2,594 361 86 2,234 142 2,594 228>50vpd 6,343 1,177 642 5,166 458 6,343 1,099
Paved
Sub-total 8,937 1,538 728 7,399 600 8,937 1,328<50vpd 15,930 7,965 597 7,965 299 15,930 896>50vpd 11,250 6,102 1,204 5,148 193 11,250 1,397
Gravel
Sub-total 27,180 14,067 1,801 13,113 492 27,180 2,293<50vpd 20,958 10,479 382 10,479 191 20,958 573>50vpd 6,213 3,371 193 2,842 52 6,213 245
Earth
Sub-total 27,171 13,850 575 13,321 243 27,171 818
Classified
Total 63,288 29,455 3,104 33,833 1,334 63,288 4,438Primary 1.001 250 286 751 261 1,001 547
Secondary 1,489 372 211 1,116 265 1,489 476Paved
Sub-total 2,490 623 497 1,868 526 2,490 1,023Gravel Secondary 12,040 6,020 2,235 6,020 361 12,040 2,596
Urban
Total 14,530 6,643 2,732 7,888 887 14,530 3,619Paved 11,427 2,160 1,225 9,267 1,126 11,427 2,351Gravel 39,220 20,087 4,036 19,133 853 39,220 4,889Earth 27,171 13,850 575 13,321 243 27,171 818
All Roads
Network Total 77,818 36,097 5,836 41,721 2,221 77,818 8,057Source: Kenya Transport Sector Policy and Roads Sub-sector Strategy Study, Scott Wilson, December, 2003,
Vol.1, p34.
The said table shows that urban road maintenance requires Ksh 3,619 million which is about 44% of the total cost amounting to Ksh 8,057 million. The analysis on required maintenance

NNUUTTRRAANNSS TThhee SSttuuddyy oonn MMaasstteerr PPllaann ffoorr UUrrbbaann TTrraannssppoorrtt iinn tthhee NNaaiirroobbii MMeettrrooppoolliittaann AArreeaa
FFiinnaall RReeppoorrtt AAppppeennddiixx A8-4
costs contrasts with the current allocation of resources for maintenance which allot only 7.5% of RMLF to urban roads i.e. about Ksh 600 million which corresponds only one sixth of urban roads maintenance needs. Another estimate from KRB at the 2004 Liaison Meeting shows that annual maintenance needs for the entire network are about Ksh 15 billion. Another point to emphasize is that, a lot of monies are needed not only for routine maintenance with good and fair conditions, but also for urgently required restoration works of the network. The estimated cost for restoration of the entire network to a maintainable condition is shown in Table 8.1-5.
TABLE 8.1-5 COST OF RESTORING THE ROAD NETWORK Unit: Ksh million
Class Periodic Backlog Rehabilitation Reconstruction Total
Network Km Cost Km Cost Km Cost Km Cost
<50vpd 1,179 4,048 521 5,208 533 10,503 2,234 19,759
>50vpd 2,339 7,954 1,937 23,012 890 17,102 5,166 48,068
Paved
Sub-total 3,519 12,002 2,458 28,220 1,423 27,605 7,399 67,827
<50vpd 0 0 7,965 11,470 0 0 7,965 11,470
>50vpd 0 0 5,148 8,481 0 0 5,148 8,481
Gravel
Sub-total 0 0 13,113 19,951 0 0 13,113 19,951
<50vpd 0 0 10,479 6,707 0 0 10,479 6,707
>50vpd 0 0 2,842 1,819 0 0 2,842 1,819
Earth
Sub-total 0 0 13,321 8,525 0 0 13,321 8,525
Classified
Total 3,519 12,002 28,892 56,697 1,423 27,605 33,833 96,303
Primary 277 2,220 474 7,577 0 0 751 9,797
Secondary 435 1,742 681 5,448 0 0 1,116 7,190
Paved
Sub-total 713 3,962 1,155 13,025 0 0 1,868 16,987
Gravel Secondary 0 0 6,020 14,448 0 0 6,020 14,448
Urban
Total 713 3,962 7,175 24,473 0 0 7,888 31,435
Paved 4,232 15,963 3,612 41,245 1,423 27,605 9,267 84,813
Gravel 0 0 19,133 34,399 0 0 19,133 34,399
Earth 0 0 13,321 8,525 0 0 13,321 8,525
All
Roads
Network Total 4,232 15,963 36,066 84,170 1,423 27,605 41,721 127,738Source: Kenya Transport Sector Policy and Roads Sub-sector Strategy Study, Scott Wilson, December, 2003,
Vol.1, p35.
The cost for clearing backlog maintenance and carrying out rehabilitation and reconstruction of the entire network, which consists of the classified and urban roads including both paved and unpaved roads, is approximately Ksh128 billion (around US$ 1.6 billions). This is a big amount of money as compared to the one year budget of the RMLF for the network maintenance which is only Ksh 8 billion. Total amount of Ksh 128 billion is divided by Ksh 96 billion or US$ 1.2 billion for classified roads and Ksh 31 billion for urban roads. No estimate has been made for the unclassified network.

NNUUTTRRAANNSS TThhee SSttuuddyy oonn MMaasstteerr PPllaann ffoorr UUrrbbaann TTrraannssppoorrtt iinn tthhee NNaaiirroobbii MMeettrrooppoolliittaann AArreeaa
FFiinnaall RReeppoorrtt AAppppeennddiixx A8-5
A current big issue is the clearance of backlog periodic maintenance on the paved roads. The clearance has to be conducted within the immediate short term to prevent these roads from exceeding the degree of deterioration at the turning point to substantial increase in rehabilitation unit cost. Unfortunately, RMLF is currently fully committed (or even over-committed) on on-going contracts, most of which are for rehabilitation and/ or reconstruction of unpaved roads. Thus, without external funding assistance backlog periodic maintenance is going to be left deferred although much more rehabilitation costs shall inevitably be born. The rehabilitation and reconstruction cost of the paved network is estimated at about Ksh 85 billions or almost US$ 1.1 billions of which about 20% are ones for the urban road network. Rehabilitation of unpaved road network is estimated at about Ksh43 billions or US$ 500 millions of which about 33% are one for urban gravel roads. From the foregoing, there is a huge funding gap of more than Ksh 100 billion or over US$ 1.25 billion for backlog maintenance execution. Furthermore additional annual fund of about Ksh 3 billion is also required for routine and periodic maintenance. This annual shortfall causes supplementary fund requirement for backlog maintenance to the aforementioned sum of the funding gap.
(2) MRPW According to an internal document, MRPW’s budgets for FY 2003/04 and 2004/05 have large growth. Compared with Ksh 3.86 billion in FY 2002/03, the budget for FY 2003/04 increased to 19.5 billion, and further increase to 25 billion is observed in this fiscal year. The increase comes from growth of both the RMLF (recurrent budget) and the development budget (See Table 8.1-6).
TABLE 8.1-6 MRPW BUDGET BETWEEN THE FY 2002-03 AND 2004/05 Unit: Ksh million
Fiscal Year 2002/03 Net Approved
2003/04 Gross Expenditure
2004/05 Gross Estimate
Recurrent Budget 2,230 10,865 11,618
Development Budget 1,627 8,663 13,360
Total Budget 3,857 19,528 24,978
Source: The Project for Construction of Rural Bridges in Central and Eastern Kenya, Feb, 2004. p4. (3) CCN
The roads within the jurisdiction of Nairobi City are divided into classified roads and unclassified urban roads. These roads can further be divided into pave and unpaved. In terms of the urban paved road, CCN has about 2,490 km, almost 66% of the entire Kenya’s paved

NNUUTTRRAANNSS TThhee SSttuuddyy oonn MMaasstteerr PPllaann ffoorr UUrrbbaann TTrraannssppoorrtt iinn tthhee NNaaiirroobbii MMeettrrooppoolliittaann AArreeaa
FFiinnaall RReeppoorrtt AAppppeennddiixx A8-6
urban roads. In terms of the unpaved urban road, CCN has 12,000 km, about 12% of all unpaved urban roads. But CCN, for a long time, has received only a little of funds for its road maintenance. In FY 2003/04 the received funds are highest, US$ 4.32 million, however, in the year before 2002/03 CCN only received US$ 1.75 million. Since KRB in operation, KRB already allocated two times of road budgets for CCN (in the 2002/03 and 2003/04). The annual average of such allocation is US$ 2.23 million, which is less than 3% of the RMLF as a total.
For the last three years, the following roads were improved through the funds for Nairobi: - 10 km over-laid under periodic maintenance programme, - 65 km of roads had their streetlights rehabilitated, - 160 km of roads were repaired under routine maintenance programme both in-house and
contracted, and - 64 km of roads were gravelled. The study done by the World Bank team shows that the estimated amount of the possible maintenance needs for the national urban paved networks is about US$ 13.7 million per year, of which, 65.6% (US$ 9 million) has to be used in Nairobi City. The length of pave urban roads outside Nairobi is extremely small. Among US$ 9 million, the World Bank team considers that US$ 3.3 million of fund should be allocated for routine maintenance and US$ 5.8 million for periodic maintenance. Based on this study, the funds used currently by CCN are just one third of its needs.
(4) MOLG Between 1997 and 2001, the MOLG received 20% of the total RMLF for the maintenance of Local Authorities roads. KRB Act 1999 excluded local authorities from accessing the RMLF funds. In 2002 the Urban Development Department (UDD) of MOLG was appointed as a sub-agency. The road funds received by UDD between 2000/02 and 2002/03 are summarized in Table 8.1-7. TABLE 8.1-7 ROAD FUNDS UDD RECEIVED IN THE FY 2000/01-2002/03
Unit: Ksh Source of Funding 2000/01 2001/02 2002/03
RMLF LATF 156,269,930 226,069,215 Development GOK Account
115,249,740 54,358,166 20,000,000
Development Aids Account 807,006,025 101,271,499 1,200,000,000 Total 1,078,525,695 381,698,880 1,220,000,000 Total in US$ million 13.48 4.77 15.25
Source: The Report submitted by UDD for KRB, Feb, 2004

NNUUTTRRAANNSS TThhee SSttuuddyy oonn MMaasstteerr PPllaann ffoorr UUrrbbaann TTrraannssppoorrtt iinn tthhee NNaaiirroobbii MMeettrrooppoolliittaann AArreeaa
FFiinnaall RReeppoorrtt AAppppeennddiixx A8-7
For this period, the total US$ 33.5 million road funds were used in these projects: - 528 km of roads were rehabilitated under IDA and GOK financing; - 7500 m2 of bus/matatu parks and roadside parking were rehabilitated; - 16 km of footpaths and cycle tracks were built; - 5 footbridges were constructed.
(5) KWS
KWS is in charge of planning and executing the routine and periodic maintenance of the unclassified roads within the national parks and 5 national reserves. KWS also carries out maintenance of selected classified access roads and all internal classified roads under an MOU agreement with the Chief Engineer (Roads) of the MRPW. The classified access roads leading to parks and reserves are 4,422 km. For the last two financial years KWS has received from the Government Ksh 27 million annually in budgets for the maintenance of unclassified roads and airstrips. This is far below the estimated Ksh 180 million required annually for all parks and reserves. The funding is distributed to 12 projects. In the 2002/03 financial year KWS as its road agency presented to KRB a budget of Ksh 60 million that was approved. In this year KWS actually received a total of Ksh 51 million from KRB. This funding is mainly used for maintaining the roads in Tsavo National Parks, Amboseli National Parks and other national parks.
8.2 MAIN FINANCIAL SOURCES
8.2.1 Overview
Financial resource for the road sector in Kenya has been, up to now, coming from governmental public funds. Private sector participation has been studied and discussed, but there has been currently not into practice. Public sources for the road sector can be broadly divided into two categories: internal (domestic) and external (foreign development donor aids). In terms of the domestic funding, the largest source is the Road Maintenance Levy Fund (RMLF) created in 1993, and managed by the Kenya Roads Board (KRB), and the second the Local Authorities Transfer Fund (LATF), set up in 1999, now managed by the Ministry of Local Government (MOLG). These are the most important public financial sources for road maintenance, rehabilitation and even development in Kenya. Before RMLF and LATF, funding for road sector mainly approved and allocated by the governmental institutions, i.e. by the MRPW for the classified roads and by the MOLG for the unclassified and urban roads.

NNUUTTRRAANNSS TThhee SSttuuddyy oonn MMaasstteerr PPllaann ffoorr UUrrbbaann TTrraannssppoorrtt iinn tthhee NNaaiirroobbii MMeettrrooppoolliittaann AArreeaa
FFiinnaall RReeppoorrtt AAppppeennddiixx A8-8
Currently, except the RMLF and the LATF, which focus mainly on national road maintenance and rehabilitation, GOK almost has no other sources for road maintenance, but still arranges some relatively smaller and non-routine budgets for road development and for supporting to the new road construction projects financed by foreign donor aids. In addition, cess (a classic word means tax) is also a money source for the road maintenance. Main financial sources including the foreign development aids are described in the following sections.
8.2.2 RMLF
In response to the serious lack of sustainable sources of funding for road maintenance and repair and to the recommendations of the 1992 Seminar, a Road Maintenance Levy Fund (RMLF) Act was passed by Parliament in 1993. The Fund receives the proceeds from a fuel levy on any petroleum fuels consumed in Kenya, and from the transit tolls levied under the Public Roads Toll Act. The government responsible for administrating the RMLF up to year 2000 was the MRPW (the Permanent Secretary). However, with the Kenya Roads board Act of 1999, the responsibility for operating the Fund was transferred to KRB. In the first fiscal year of introduction of RMLF, the amount levied was about US$ 34 million, and up to FY 2001/02, it had grown to US$ 90 million with gradual increase in the levy rate. And in fiscal year 2003/04, it is over US$ 100 million. The collection and disbursement of RMLF for the last two and half years (FY2001/02, 2002/03 and 2003/04 (Jul-Dec)) are shown in Table 8.2-1. This table indicates that MRPW receives about 54% - 60% of the Fund in the latest two and half years and CCN received about 1.2% - 1.3%. Another data shows that in the fiscal 2003/04 over 31% of the RMLF is allocated for works on the classified D and E roads and below in the districts, about 7.5% for urban (of which 20% is for Nairobi), and the remaining 57% for classified A, B and C roads. KWS has a very small portion of the Fund for the maintenance of some classified roads in the parks.

NNUUTTRRAANNSS TThhee SSttuuddyy oonn MMaasstteerr PPllaann ffoorr UUrrbbaann TTrraannssppoorrtt iinn tthhee NNaaiirroobbii MMeettrrooppoolliittaann AArreeaa
FFiinnaall RReeppoorrtt AAppppeennddiixx A8-9
TABLE 8.2-1 COLLECTION AND DISTRIBUTION OF RMLF Unit: Ksh
2003/04 (Jul-Dec) 2002/03 FY2001/02
Fuel Levy Receipts 4,081,423,000 7,739,101,836 7,836,411,000
Disbursement 3,716,420,000 6,920,940,822 7,858,043,000
Balance 365,003,000 818,161,014 -21,632,000
Breakdown of Disbursements
KRB 120,714,916 228,984,144 235,291,736
MRPW/RD: Class ABC Roads 2,293,583,387 4,003,017,283 4,208,874,750 District Roads-RD: Class DE & others
239,513,720 807,249,457 1,344,459,625
Urban Roads: Sub-total 198,063,400 675,689,939 894,222,358
MOLG/UDD 142,482,796 446,129,331 894,222,358
Nairobi City Council 45,614,645 93,247,222
Mombasa Municipal Council 31,162,504
Nakuru Municipal Council 5,971,153
Eldoret Municipal Council 3,994,806
LAs: 46 Towns & Municipalities 105,150,882
KWS: Park Roads 24,544,700 51,000,000
DRCs: Constituency Roads 840,000,000 1,155,000,000 1,175,194,479
Total 3,716,420,123 6,920,940,822 7,858,042,949
Rate of Disbursement (%)
MRPW/RD: Class ABC Roads 61.71 57.84 53.56
Nairobi City Council 1.23 1.35 0
KRB 3.25 3.31 2.99 Source: Progress Report by KRB, Annex II, Feb 2004, p13.
24% of the total RMLF were distributed to the 71 districts accordingly to a formula that accounts for differing needs in terms of land area, population, network length, traffic levels and economic activity. Current funding allocations obviously favour the rural network in disproportional manner. The urban roads receive only a small fraction of the RMLF, despite the fact that these roads carry most of the traffic and require the most expensive maintenance unit cost per km basis. Based on the KRB Act, RMLF is required to be allocated according to the breakdown: - At least 24% equitable to DRCs, - At least 16% equally to all constituencies, - At most 3% for KRM operation, and - The balance RMLF for other roads, i.e. for MRPW (about 57%).

NNUUTTRRAANNSS TThhee SSttuuddyy oonn MMaasstteerr PPllaann ffoorr UUrrbbaann TTrraannssppoorrtt iinn tthhee NNaaiirroobbii MMeettrrooppoolliittaann AArreeaa
FFiinnaall RReeppoorrtt AAppppeennddiixx A8-10
Because of a big gap between road maintenance needs and actual limited funding sources managed by KRB, KRB is doing a study to increase fuel levy rate, applying Birmingham model to establish optimal fuel levy rate in order to enlarge fund amounts. The study is carried out under the Northern Corridor Transport Improvement Project under WB fund. In addition, KRB is considering a possibility of collection of other road related funds (LATF, cess etc), as well as land rate to be managed by KRB. For this, KRB has established the amount of cess collection at Ksh 373 million for FY 2002/2003, because the Agriculture Act (Cap 318) amended in 2002 stipulates that 80% of cess shall be used for road works.
8.2.3 LAFT and Cess
Financial reforms started by addressing the inter-governmental fiscal relations which resulted to the establishment of Local Authorities Transfer Fund (LATF), under the Local Authorities Transfer Act No.8 of 1998. Under the fund, the government allocated 5% of the total annual national income tax revenues for distribution to all local authorities in the country as a grant, based on transparent criteria. The fund is supporting good financial management, debt resolution, and service delivery and strengthening participatory development by involving stakeholder participation in Local Authority programs and activities. LATF is now operated and managed by MOLG. Cess is a sort of tax levied on the transactions of agricultural products. Cess is usually collected by the officials at the transaction centres of the independent authorities, agencies and/or boards in charge of the respective agricultural products. The management of Cess money however is not standardized. Some boards hand money over to local authorities, while others send it directly to MOLG. Recently part of Cess is controlled by KRB with its authority to administer 80% of cess. KRB is administering the Cess money maintaining the linkage with its disbursement to the programs for the collected locals. LATF and Cess are not fixed, and fluctuate from year to year. However, two principles under the LATF are clear: one is certain amounts (averagely about 20%) have to use in road maintenance; and another the amounts allocated for road maintenance should not be used for other ways, just for work projects. All money from the LATF needs to break-down in the program known as Local Authority Service Delivery Action plan (LASDAP). During FY 2002/03, a total of Ksh 199 million was disbursed for directly to designated projects. A total of 30 projects were undertaken dealing with improvement of roads, storm water drains and street lighting. The component of roads, storm water drains and street lighting makes up 33% of the total LASDAP projects at an estimated cost of Ksh 66.4 million.

NNUUTTRRAANNSS TThhee SSttuuddyy oonn MMaasstteerr PPllaann ffoorr UUrrbbaann TTrraannssppoorrtt iinn tthhee NNaaiirroobbii MMeettrrooppoolliittaann AArreeaa
FFiinnaall RReeppoorrtt AAppppeennddiixx A8-11
Nairobi, in FY 2002/03, received Ksh 347 million, and 2003/04 Ksh 647 million from MOLG. Based on the regulation of CCN, there is approximately Ksh 60 million to be used for road maintenance and street lighting. Now KRB is administering part of Cess according to its vested authority to administer 80% of Cess fund. Cess funds are utilized for projects/ programs particularly to the respective fund collected areas.
8.2.4 Foreign Donor Aids
A number of foreign development partners including some international financial organizations have been financing the transport sector in Kenya for a long time. Recently some foreign development partners are active on road improvement, for example, on the Northern Corridor road EU is financing the reconstruction of the Mtito Andei – Sultan Hamud section (135 km) for which the construction works began in April 2003. It is planning to finance the Mai Mahiu – Naivasha – Lanet (85 km) section. EU is also engaged actively in the Roads 2000 program along with DANIDA (Denmark), SIDA (Sweden), KfW (Germany), AfD (France) and AfDB for rehabilitation and periodic maintenance of rural roads in about 26 districts. USA and UK are also assisting the government to improve the aviation safety and security and in this regard, the WB is working closely with the US Department of Transportation (Safe Skies Initiative for Africa) and DfID (Department for International Development) of UK to ensure coordination and harmonization of the World Bank’s involvement and avoidance of any duplication. The Nordic Development Fund (NDF) will co-finance (under parallel financing arrangements) one of the road sections under the project and part of the road sector institutional strengthening component (support to KRB). The different sector ministries hold regular roundtable discussions with the major development partners to coordinate their activities in the infrastructure sector. A joint appraisal mission was conducted with NDF (February 2004) to agree on the components to be funded by NDF and respective implementation arrangement. It had been the implicit agreement, in the early 1990s, that if GOK increased maintenance funding to the levels required for a sustainable road network, the donors would help to clear the back-log of reconstruction, rehabilitation and delayed periodic maintenance. Maintenance funding has increased substantiality, but donor assistance has been limited to the below anticipated level. Some World Bank funding had not been materialized due to the slow preparation of the Strategic Plan. The general reduction in donor assistance to Kenya had affected negatively. However, the donor aids are recovering since the establishment of new

NNUUTTRRAANNSS TThhee SSttuuddyy oonn MMaasstteerr PPllaann ffoorr UUrrbbaann TTrraannssppoorrtt iinn tthhee NNaaiirroobbii MMeettrrooppoolliittaann AArreeaa
FFiinnaall RReeppoorrtt AAppppeennddiixx A8-12
government in the late 2002. A good example for this recovery is the quickened progress of the Northern Corridor Transport Improvement Project by IDA/ World Bank. From a new data, in FY 2003/04, development partners’ contribution was Ksh 3.7 billion, occupying 64% of the total development budget, while the GOK contribution was Ksh 2 billion, which was 36% of the total development budget. In FY 2004/05, donor aids has a big leap arriving to Ksh 7.8 billion, 78% of the total development budget because of the Northern Corridor project, and the GOK had a slight growth in development funding arriving to Ksh 2.2 billion. As a result the ratio of GOK fund for development decreased to 22%. From the past through the present and toward a visible future, donors aids have been and shall be an important source of fund for Kenyan road development and improvement.
8.3 PRIVATE SECTOR PARTICIPATION: CASE OF NORTHERN CORRIDOR PROJECT
8.3.1 Overview
Until recently, the almost universal model was that the road sector was owned, managed and financed by governments with the public sector for implementing much of the works. The role of the private sector was restricted to implementing contractor under the governments (central and local, in case of Kenya, MRPW and MOLG and local authorities) with the designs and standards established by the government. This model required large public works departments (such as the Roads Department of MRPW), large numbers of government engineers (such as engineers in RD) and usually extensive works organizations (such as the provincial works offices and district works offices belonging to RD), and equipment and plant holdings (such as the Department of Mechanical and Transport in MRPW). This was the model inherited by Kenya, and it provided good services for many years. Overtime there have been many modifications. Kenya road sector has been facing the declining effectiveness of the public sector model, and a huge and increasing financial gap in road maintenance and reconstruction. If the government does not have enough funds and donor funding is limited, it shall be necessary to increase the level of financing from the private sector in a number of ways. One of possible ways is the shadow road concession. In the case of the shadow toll, the private sector would be bearing the construction and maintenance cost risk, as well as a risk regarding the level of traffic. The private sector would have to evaluate the likely risks probability KRB defaulting on the payment of either the shadow toll or fixed payment schedule. On the other hand, KRB would need to evaluate the probability of the concessionaire failing to meet performance standards.

NNUUTTRRAANNSS TThhee SSttuuddyy oonn MMaasstteerr PPllaann ffoorr UUrrbbaann TTrraannssppoorrtt iinn tthhee NNaaiirroobbii MMeettrrooppoolliittaann AArreeaa
FFiinnaall RReeppoorrtt AAppppeennddiixx A8-13
Another possible way is the toll road concession. This would be a much more controversial change to the current system of financing and managing roads in Kenya. In this case the concessionaire would be bearing the construction, maintenance and traffic risks and there would be a direct link of the road investment, the road use and the road charge. The private sector is neither a charity nor a donor partner and will not invest in Kenyan roads without the prospect of substantial profit. The private sector will be very selective, looking for the roads with high traffic volume which indicates substantial revenue earning potential. Because Kenya needs the private sector finance to rehabilitate its road network and because the Kenya road concession is strongly recommended by development partners, particularly by the World Bank, the private sector participation, the form of road concession, was discussed and studied several years ago. The most important study in this aspect is the Kenya Road Concession Assessment implemented by BKS and financed by the World Bank. The recent BKS report put forward the concept of a toll concession for the Northern Corridor and maintenance concessions on all the other main roads with a traffic flow of 500 vehicles per day and more. If Kenyan government adopts the proposal, the entire main road network shall be effectively placed under the private sector management and maintenance. The public sector’s role shall be to monitor that whether the service standards specified in the concession agreements being satisfied. This is a very radical departure from the traditional model, but may well be an attractive way forward, if efficient road services are to be guaranteed. Therefore, the road concession of the Northern Corridor project needs to be described in details from the perspective of road financial sources.
8.3.2 Road Concession Possibility
(1) Project Background The BKS Group was awarded the study “Road Concessions in Kenya” by the World Bank in May 2001. This study consists of two phases, namely, the phase one: Assessment of concession potential, and the phase two: Design of concession framework. By November 2004, the two phases have been completed and the final reports have been submitted to the Kenyan government. In the same line with the BKS study, the World Bank has been reviewing and preparing to implement the Northern Corridor Transport Improvement Project (NCTIP). The NCTIP is planned to consist of eight components, and the third component is the private sector participation in road management and maintenance. This component comprises: (a) technical assistance for facilitating concession of selected sections of the Northern Corridor road link;

NNUUTTRRAANNSS TThhee SSttuuddyy oonn MMaasstteerr PPllaann ffoorr UUrrbbaann TTrraannssppoorrtt iinn tthhee NNaaiirroobbii MMeettrrooppoolliittaann AArreeaa
FFiinnaall RReeppoorrtt AAppppeennddiixx A8-14
and (b) initiating a pilot program of long-term performance based on maintenance and management of a selected sub-network (about 300 km) of lower traffic volume roads.
(2) Economic Considerations and Economic Impact Based on the BKS report, the investment on the Northern Corridor roads has very large economic impact. The proposed road construction and upgrading of the Northern Corridor are expected to increase the economic growth by 1% during the 3-year construction period. This investment is also expected to increase the gross domestic investment by 22%, the total domestic savings by 44%, and the gross domestic investment/ GDP by 4%. Applying economic internal rate of return 22%, which is average transport projects calculated by the World Bank, the project could earn an annual return of about US$ 77 million based on direct benefits compared to costs. If fund is borrowed domestically, upward pressure on domestic interest rates will occur due to the increased demand for fund. If fund is borrowed from abroad, the borrowing is expected to increase the domestic supply of money by 1.7% and may have consequent decreasing effect on the domestic interest rates. Considering the current balance of payment of Kenya which is net capital outflow and the Kenyan balance of the current account which is in a deficit (more than US$ 230 million in 2000), too much overall foreign debt may prevent new foreign aid loan to be materialized. In addition, foreign borrowing is expensive in terms of local currency considering the requirement of repayment, both interest and principal, by foreign currency. Furthermore, foreign borrowing by the GOK increases its debt service obligation which is already very high enough with its financial capacity. The use of road concession as a mechanism to finance for building road is considered appropriate for promoting equitable income distribution, since its income generation targets road users specifically who are generally regarded as more affluent members of society and in a better position to pay for roads. Concession therefore shifts the burden of paying for road development and maintenance from the general taxpayers to the road users. From the benefit-cost considerations, road construction by means of concession with tolling is economically viable if the construction can be materialized by some years earlier than the expected case of public funding since the economic benefits can be attained earlier. The additional tolling cost is thus offset by the additional economic returns accommodated by earlier construction. The number of years for that advantage depends on variables such as pavement conditions and traffic demand.
(3) Technical Considerations The extent of the potential shadow toll network – classified roads with ADTs of 500 vehicles

NNUUTTRRAANNSS TThhee SSttuuddyy oonn MMaasstteerr PPllaann ffoorr UUrrbbaann TTrraannssppoorrtt iinn tthhee NNaaiirroobbii MMeettrrooppoolliittaann AArreeaa
FFiinnaall RReeppoorrtt AAppppeennddiixx A8-15
per day and more excluding the roads under the Northern Corridor – is 3,792 km. The fuel levy income for the potential shadow toll network, which is US$ 22.5 million, is sufficient to cover the estimated maintenance expenses of this network, which amounts to US$ 22.1 million. However, the current estimated backlog of the potential shadow toll network is US$ 360.5 million. The extent of road length for the potential conventional concession – the Northern Corridor from Mombasa to Malaba – is 922 km (excluding planned bypass for Mombasa, Nairobi and Nakuru).
(4) Types of Concession Arrangements Basically there are three types of concession arrangements that were studied. BOT Concessions Using Conventional Tolls The most important advantage of BOT concessions based on conventional tolls is that a new source of revenue, which is toll collected from road users, is to be introduced instead of increase in extraction from existing sources. The most important disadvantages of this type are firstly that road users are affected more directly since actual tolls being levied and secondly that significant toll-related capital, operating and maintenance costs associate. Another very important disadvantage is that high return on investment is indispensable to attract private investors. BOT Concessions Using shadow Tolls: The most important advantage of BOT concessions based on shadow tolls is that road users are not affected directly by such tolls, and that the capital, operating and maintenance costs associated with the implementation are low. Further advantage of shadow tolling is that existing sources of funding are being stretched to achieve the implementation of more projects at an earlier date by effectively using private sector loan financing. The most important disadvantage is that no new funding source for additional support of shadow toll projects. Another very important disadvantage is that these projects require high return on capital investment which satisfies private investors. Construction Contract Combined with Maintenance Concession (MOT: Maintain, Operate and Transfer Concession): The most important advantage of this approach is that the funding of the initial project largely depends on traditional funding sources (foreign development partners, fuel levy income). This approach significantly reduces the fund preparation requirement of private investors comparing to a normal BOT project. Another very important advantage is that private sector expertise in funding, and in execution of road operation and maintenance is expected to be

NNUUTTRRAANNSS TThhee SSttuuddyy oonn MMaasstteerr PPllaann ffoorr UUrrbbaann TTrraannssppoorrtt iinn tthhee NNaaiirroobbii MMeettrrooppoolliittaann AArreeaa
FFiinnaall RReeppoorrtt AAppppeennddiixx A8-16
materialized in effective manner. Disadvantage of this approach is that the initial funding depends on traditional sources which are limited.
(5) Financial Considerations Financial evaluations were performed to determine the toll levels at which the most logical conventional road concession project, namely the Northern Corridor project, would be financially viable form the perspective of a private sector concessionaire. Financial evaluations were performed for the three scenarios:
S1: Northern Corridor (A109/A104 Mombasa - Malaba); S2: Northern Corridor East (A109 Mombasa - Nairobi); S3: Northern Corridor West (A104 Nairobi - Malaba);
The financial results obtained indicated acceptable DSCRs(Debt Service Cover Ratio)(>1.25) as well as high IRRs (>28% pa) for all scenarios. The affordability of toll tariffs is an essential prerequisite for the viability of a conventional concession. Affordability is assumed if the direct short-term benefits exceed the toll tariffs by a reasonable margin, which was the case for all conventional toll scenarios. Financial evaluations were further performed for all classified road with average daily traffic volumes above 500 vpd to determine the shadow toll levels at which the most logical roads i.e. higher traffic volume roads, would be financially viable from the perspective of a private sector concessionaire. Financial evaluations were performed for the following scenarios: S4: All classified roads with ADT volumes above 500 vpd; and S5: All classified roads with ADT volumes above 500 vpd excluding northern corridor (A109/A104 Mombasa-Nairobi-Malaba). The financial results obtained indicated acceptable DSCRs (>1.25) as well as high IRRs (>28% pa) for both scenarios. However, the revenue streams required by the Concessionaire from the GOK or its development partners for these shadow-tolling scenarios were significant.
APPENDIX 10
TRAFFIC SURVEY AND ANALYSIS
Page
10.1 TRAFFIC SURVEY LOCATION AND ZONING SYSTEM A10-1 10.2 PERSON TRIP SURVEY A10-8 10.3 CORDON LINE SURVEY A10-17 10.4 SCREEN LINE SURVEY A10-21 10.5 TRAFFIC COUNT SURVEY A10-24 10.6 PUBLIC TRANSPORT USERS SURVEY A10-28 10.7 TRAVEL SPEED SURVEY A10-35 10.8 STATED PREFERENCE SURVEY A10-39

NNUUTTRRAANNSS TThhee SSttuuddyy oonn MMaasstteerr PPllaann ffoorr UUrrbbaann TTrraannssppoorrtt iinn tthhee NNaaiirroobbii MMeettrrooppoolliittaann AArreeaa
FFiinnaall RReeppoorrtt AAppppeennddiixx A10-1
APPENDIX 10 TRAFFIC SURVEY AND ANALYSIS
10.1 TRAFFIC SURVEY LOCATION AND ZONING SYSTEM
FIGURE 10.1-1 TRAFFIC SURVEY LOCATIONS (TRAVEL SPEED SURVEY)
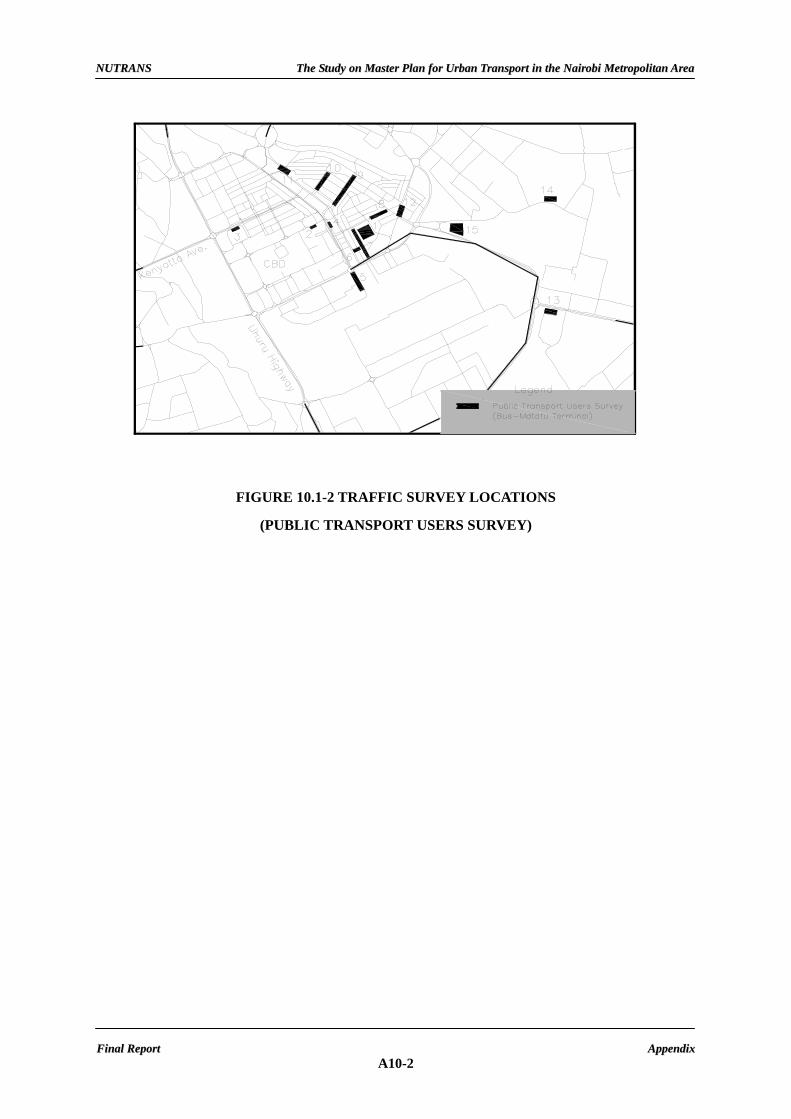
NNUUTTRRAANNSS TThhee SSttuuddyy oonn MMaasstteerr PPllaann ffoorr UUrrbbaann TTrraannssppoorrtt iinn tthhee NNaaiirroobbii MMeettrrooppoolliittaann AArreeaa
FFiinnaall RReeppoorrtt AAppppeennddiixx A10-2
FIGURE 10.1-2 TRAFFIC SURVEY LOCATIONS
(PUBLIC TRANSPORT USERS SURVEY)

NNUUTTRRAANNSS TThhee SSttuuddyy oonn MMaasstteerr PPllaann ffoorr UUrrbbaann TTrraannssppoorrtt iinn tthhee NNaaiirroobbii MMeettrrooppoolliittaann AArreeaa
FFiinnaall RReeppoorrtt AAppppeennddiixx A10-3
TABLE 10.1-1(1) ZONING SYSTEM (NAIROBI) 1/3
No. Zone Code Sub-location Zone Code Location(TAZ) Zone Code Division1 1 City center1 1 Starehe1 1 Central2 2 City center23 3 City center34 4 City square1 2 Starehe25 5 City square26 6 City square37 7 Pangani 3 Kariokor8 8 Ziwani/Kariokor9 9 Mathare 4 Mathare
10 10 Mabatini11 11 Mlango Kubwa12 12 Kia Maiko 5 Haruma13 13 Huruma14 14 Ngara East 6 Ngara15 15 Ngara West16 16 Makongeni/Kaloleni 7 Makongeni 2 Makadara17 17 Harambee 8 Makadara18 18 Hamza/Lumumba19 19 Mbotela 9 Maringo20 20 Ofafa Maringo21 21 Landi Mawe1 10 Viwandani22 22 Landi Mawe223 23 Viwandani24 24 Hazina 11 Mukuru Nyayo25 25 Nairobi South26 26 Kariobangi North 12 Kariobangi 3 Kasarani27 27 Baba dogo28 28 Gotathuru 13 Korogocho29 29 Nyayo30 30 Kiwanja 14 Kahama
31 31 Kahama West/Juak/Kongo Soweto
32 32 Githurai/Kamuthi 15 Githurai33 33 Mathare 4A 16 Ruaraka34 34 Utalii35 35 Mathare North36 36 Roysambu/Njathaini 17 Roysambu37 37 Garden38 38 Mwiki 18 Kasarani39 39 Kasarani
TAZ: Traffic Analysis Zone(refer to Chapter 12)
Small Zoning System Large Zoning SystemMidium Zoning System

NNUUTTRRAANNSS TThhee SSttuuddyy oonn MMaasstteerr PPllaann ffoorr UUrrbbaann TTrraannssppoorrtt iinn tthhee NNaaiirroobbii MMeettrrooppoolliittaann AArreeaa
FFiinnaall RReeppoorrtt AAppppeennddiixx A10-4
TABLE 10.1-1(2) ZONING SYSTEM (NAIROBI) 2/3
No. Zone Code Sub-location Zone Code Location(TAZ) Zone Code Division40 40 Embakasi 19 Embakasi 4 Embakasi41 41 Mihang'o42 42 Mukurukwa Njenga 20 Mukurukwa Njenga43 43 Imara Daima44 44 Umoja 21 Umoja45 45 Savannah46 46 Kayole 22 Kayole47 47 Komarock48 48 Njiru 23 Njiru49 49 Maili Saba50 50 Dandora 'A' 24 Dandora51 51 Dandora 'B'
52 52 Kariobangi South/Mowlem
25 Kariobangi S
53 53 Ruai 26 Ruai54 54 Ngundu55 55 Airbase 27 Eastleigh North 5 Pumwani56 56 Eastleigh North57 57 Eastleigh South 28 Eastleigh South58 58 California
59 59 Majengo/Gorofani/Bondeni/Gikomba 29 Punwani
60 60 Kimathi 30 Bahati61 61 Uhuru62 62 Shauri Moyo 31 Kamukunji63 63 Muthurwa/Kamukunji
64 64 Upper parklands/Spring Valley 32 Parklands 6 Westlands
65 65 Loresho/Kyuna 33 Kitisuru66 66 Kitisuru67 67 Muthaiga 34 Highridge68 68 Karura69 69 Highridge170 70 Highridge271 71 Gihagi 35 Kangemi72 72 Mountain View73 73 Kangemi74 74 Kilimani1 36 Kilimani75 75 Kilimani276 76 Kilimani377 77 Kilimani478 78 Kileleshwa79 79 Muthangari1 37 Lavington80 80 Muthangari281 81 Maziwa
TAZ: Traffic Analysis Zone(refer to Chapter 12)
Small Zoning System Midium Zoning System Large Zoning System
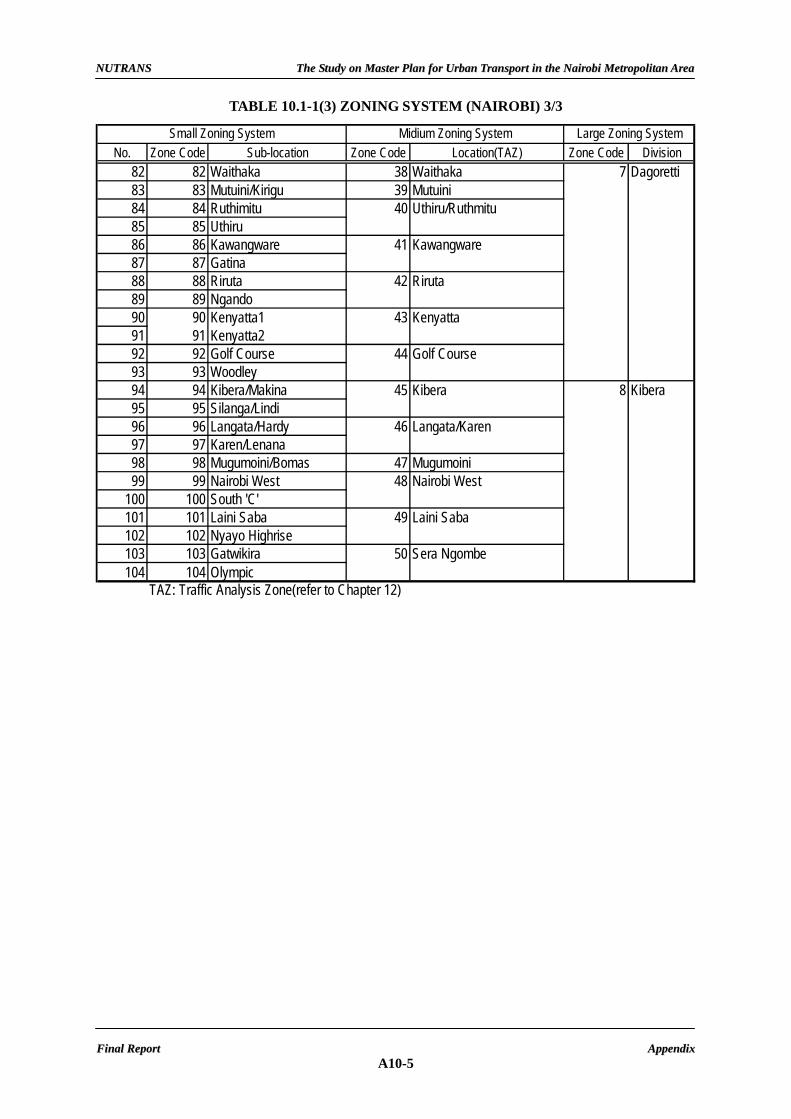
NNUUTTRRAANNSS TThhee SSttuuddyy oonn MMaasstteerr PPllaann ffoorr UUrrbbaann TTrraannssppoorrtt iinn tthhee NNaaiirroobbii MMeettrrooppoolliittaann AArreeaa
FFiinnaall RReeppoorrtt AAppppeennddiixx A10-5
TABLE 10.1-1(3) ZONING SYSTEM (NAIROBI) 3/3
No. Zone Code Sub-location Zone Code Location(TAZ) Zone Code Division82 82 Waithaka 38 Waithaka 7 Dagoretti83 83 Mutuini/Kirigu 39 Mutuini84 84 Ruthimitu 40 Uthiru/Ruthmitu85 85 Uthiru86 86 Kawangware 41 Kawangware87 87 Gatina88 88 Riruta 42 Riruta89 89 Ngando90 90 Kenyatta1 43 Kenyatta91 91 Kenyatta292 92 Golf Course 44 Golf Course93 93 Woodley94 94 Kibera/Makina 45 Kibera 8 Kibera95 95 Silanga/Lindi96 96 Langata/Hardy 46 Langata/Karen97 97 Karen/Lenana98 98 Mugumoini/Bomas 47 Mugumoini99 99 Nairobi West 48 Nairobi West
100 100 South 'C'101 101 Laini Saba 49 Laini Saba102 102 Nyayo Highrise103 103 Gatwikira 50 Sera Ngombe104 104 Olympic
TAZ: Traffic Analysis Zone(refer to Chapter 12)
Small Zoning System Midium Zoning System Large Zoning System

NNUUTTRRAANNSS TThhee SSttuuddyy oonn MMaasstteerr PPllaann ffoorr UUrrbbaann TTrraannssppoorrtt iinn tthhee NNaaiirroobbii MMeettrrooppoolliittaann AArreeaa
FFiinnaall RReeppoorrtt AAppppeennddiixx A10-6
TABLE 10.1-1(4) ZONING SYSTEM (THIKA, KIAMBU, KAJIADO, MACHAKOS)
No. Zone Code Location Zone Code Division Zone Code District105 1001 Thika Municipal
106 1002 Gatuanyaga107 1003 Samuru 52 Kakuzi108 1004 Juja109 1005 Riuru1110 1006 Riuru2111 2001 Kikuyu, Kinoo, Karai112 2002 Muguga,Kabete,
Nyathuna113 2003 55 Limuru114 2004 Ruaka, Kiambaa, Kihara115 2005 Kiambaa S/area,
Waguthu, Ting'ang'a,Riabai, Kamiti
116 2006 Ndumberi, Cianda117 2007 Ikinu 57 Githunguri118 3001 Ngong, Oloolua119 3002 S. Keekonyoike120 3003 Kiserian121 3004 Ongata Rongai,
Nkaimoronya122 3005 Kitenkela 59 Central123 4001 Kyeleni,Kyanzavi124 4002 Koma rock125 4003 Kalandini,Tala,Matungulu,
Nguluni126 4004 61 Kangundo127 4005 Katani128 4006 Lukenya1129 4007 Lukenya2130 4008 Settled area
11
12
Thika
Kiambu
Kajiado
MachakosMatunguru
Mavoko
51
53
53
56
58
60
62
Ruiru
Kiambaa
Ngong
Small Zoning System Midium Zoning System Large Zoning System
Municipality 9
Kikuyu 10

NNUUTTRRAANNSS TThhee SSttuuddyy oonn MMaasstteerr PPllaann ffoorr UUrrbbaann TTrraannssppoorrtt iinn tthhee NNaaiirroobbii MMeettrrooppoolliittaann AArreeaa
FFiinnaall RReeppoorrtt AAppppeennddiixx A10-7
TABLE 10.1-1(5) ZONING SYSTEM (OUT OF THE STUDY AREA)
No. Zone Code Location Zone Code Division Zone Code ProvinceKakuzi(excluded Sumuru) 63Ithanga, Mitumbir
132 5002 Gatanga, Gatundu, KamwangiGithwnguri(excluded Ikinu) 64Lari
134 5004 Central, Ndithini, Nwala, Kalama 65Kathian(ecluded Mitaboni)Yatla, Masinga, YathuiNgong(C. Keekoniyoike, Mosiro) 66Central(excluded Kitenkela)Magadi, Mashuru, Namanga,Loitokitok
No. Zone Code Division Zone Code Province Zone Code Country137 6001 Nyandarua138 6002 Kirinyaga, Murang'a, Nyeri,
Maragua139 6003 Makueni140 6004 Kitui, Mwingi141 6005 Embu, Mbeere, Meru Central,
Tharaka, Nithi(Meru S.)142 6006 Isiolo, Marsabit, Meru North, M143 6007 Kilifi, Kwake, Lamu, Monbasa,
Taita taveta, Tana river, Malindi69 COAST
144 6008 all 70 NORTH EASTERN145 6009 Narok,Trans mara146 6010 Nakuru147 6011 Bomet, Kericho,Keiyo, Koibatek,
Nandi, Trans nzoia, UasinGishu,Baringo, Marakwet,Turkana, WestPokot,Laikipia,Samburu
148 6012 all 72 NYANZA, WESTERN149 7001 TANZANIA150 7002 UGANDA151 7003 SUDAN152 7004 ETHIOPIA153 7005 SOMALI
135001
5003
5005
5006
Thika
Kiambu
Machakos
Kajiado
CENTRAL
EASTERN
R/VALLEY
Small Zoning System Midium Zoning System Large Zoning System
131
133
135
136
Small Zoning System Midium Zoning System Large Zoning System
CENTRAL KENYA14
15
67
68
71
73
EASTERN
R/VALLEY
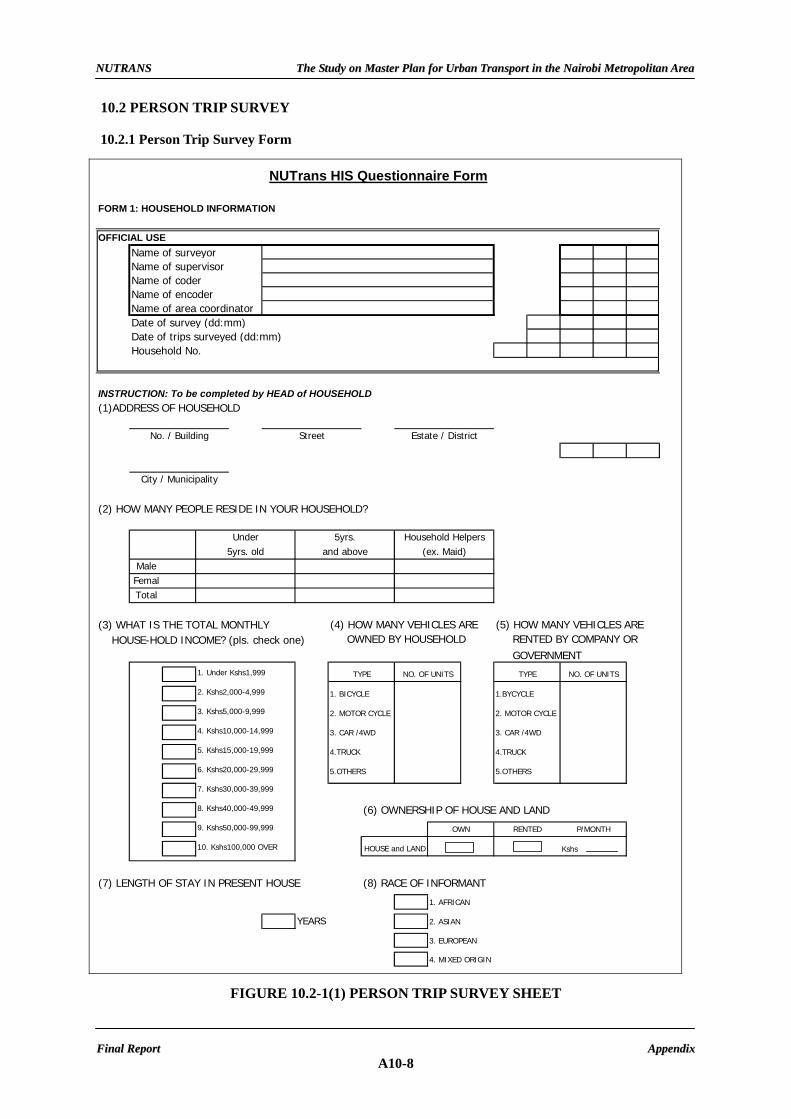
NNUUTTRRAANNSS TThhee SSttuuddyy oonn MMaasstteerr PPllaann ffoorr UUrrbbaann TTrraannssppoorrtt iinn tthhee NNaaiirroobbii MMeettrrooppoolliittaann AArreeaa
FFiinnaall RReeppoorrtt AAppppeennddiixx A10-8
10.2 PERSON TRIP SURVEY
10.2.1 Person Trip Survey Form
FORM 1: HOUSEHOLD INFORMATION
OFFICIAL USEName of surveyorName of supervisorName of coderName of encoderName of area coordinatorDate of survey (dd:mm)Date of trips surveyed (dd:mm)Household No.
INSTRUCTION: To be completed by HEAD of HOUSEHOLD(1)ADDRESS OF HOUSEHOLD
(2) HOW MANY PEOPLE RESIDE IN YOUR HOUSEHOLD?
Under 5yrs.
MaleFemalTotal
(3) WHAT IS THE TOTAL MONTHLY HOUSE-HOLD INCOME? (pls. check one)
GOVERNMENT
1. BICYCLE 1.BYCYCLE
2. MOTOR CYCLE 2. MOTOR CYCLE
3. CAR /4WD 3. CAR /4WD
4.TRUCK 4.TRUCK
5.OTHERS 5.OTHERS
Kshs
(7) LENGTH OF STAY IN PRESENT HOUSE (8) RACE OF INFORMANT
1. AFRICAN
YEARS 2. ASIAN
3. EUROPEAN
4. MIXED ORIGIN
HOUSE and LAND
(5) HOW MANY VEHICLES ARE RENTED BY COMPANY OR
TYPE NO. OF UNITS TYPE NO. OF UNITS
OWN
NUTrans HIS Questionnaire Form
City / Municipality
No. / Building Street Estate / District
(6) OWNERSHIP OF HOUSE AND LAND
P/MONTHRENTED
10. Kshs100,000 OVER
3. Kshs5,000-9,999
4. Kshs10,000-14,999
5. Kshs15,000-19,999
6. Kshs20,000-29,999
7. Kshs30,000-39,999
8. Kshs40,000-49,999
9. Kshs50,000-99,999
1. Under Kshs1,999
2. Kshs2,000-4,999
(4) HOW MANY VEHICLES ARE OWNED BY HOUSEHOLD
5yrs. oldHousehold Helpers
(ex. Maid)and above
FIGURE 10.2-1(1) PERSON TRIP SURVEY SHEET

NNUUTTRRAANNSS TThhee SSttuuddyy oonn MMaasstteerr PPllaann ffoorr UUrrbbaann TTrraannssppoorrtt iinn tthhee NNaaiirroobbii MMeettrrooppoolliittaann AArreeaa
FFiinnaall RReeppoorrtt AAppppeennddiixx A10-9
FORM 2: HOUSEHOLD MEMBER INFORMATION
OFFICIAL USE
INSTRUCTION: To be completed for every HOUSEHOLD MEMBER aged 5yrs, and above
(1) AGE (2) SEX:(pls check) Male Female
(3) WORK ADDRESS
(4) SCHOOL ADDRESS
(5) OCCUPATION (6) EMPLOYMENT SECTOR (7) MONTHLY INCOME(Pls Encircle) (Pls Encircle) (Pls Encircle)
1.Officials of Govt. & Special 1.Agriculture, Hunting & Forestry
Interest Org., Corporate Exec., 2. Fishing
Mangers, Managing 3.Mining & Quarrying
2.Professionals 4.Manufacturing
3.Technical & Assoc. Professionals 5.Electricity, Gas & Water Supply
4.Clerical Worker 6.Construction
5.Service Workers & Shop & Market Workers 7.Wholesales & Retail Trade; Repair
6.Farmers, Forestry Workers & of Motor Vehicles Motorcycles,
Fisherman Personal & Household Goods
7.Traders & Related Workers 8.Hotels & Restaurants
8.Plant & Machine Operators & Assemblers 9.Transport, Storage & Comm.
9.Laborers & Unskilled Workers 10.Financial Intermediation
10. Teacher & School Workers 11.Real Estate, Renting & Business Activities
11.Student (Elem.) 12.Public Adm. & Defense
12.Student (H.S. & Univ.) 13.Education
13.Housewife 14.Health & Social Work
14.Jobless 15.Other Community, Social & Personal Service
15.Others, specify 16.Private Households
17.Extra-territorial Organizations
1. Yes 2. No
City / Municipality
No. / Building Street
1. Under Kshs1,999
Estate / District
City / Municipality
HOUSEHOLD No. ID No.
No. / Building Street Estate / District
(8) DRIVER'S LICENSE HELD.
5. Kshs15,000-19,999
2. Kshs2,000-4,999
3. Kshs5,000-9,999
4. Kshs10,000-14,999
10. Kshs100,000 OVER
6. Kshs20,000-29,999
7. Kshs30,000-39,999
8. Kshs40,000-49,999
9. Kshs50,000-99,999
FIGURE 10.2-1(2) PERSON TRIP SURVEY SHEET

NNUUTTRRAANNSS TThhee SSttuuddyy oonn MMaasstteerr PPllaann ffoorr UUrrbbaann TTrraannssppoorrtt iinn tthhee NNaaiirroobbii MMeettrrooppoolliittaann AArreeaa
FFiinnaall RReeppoorrtt AAppppeennddiixx A10-10
TRIP INFORMATIONINSTRUCTION: To be completed for every HOUSEHOLD MEMBER aged 5yrs, and above
a.8. Religious and Social9. Wholesale and Retail Shop
10. Restaurant / Entertainment b. b.
11. Others
c. AM c. AM
PM PM
d. AM d. AM
PM PM
e. e.
f. f.
g. g.
12.Trailer
13. KR (Railway)
14.Others
If Driver write D
If Passenger write P h. h.
i. i.
4th Transfer4th Transfer
2nd Transfer
Next Mode
3rd Transfer 3rd Transfer
Next Mode
(Give address/land mark,famous bldg. nearby)
AS IN
:
Hours Minutes
1st TRIP
If Mode of TRAVEL is Private carwrite No. of passenger
No. /Building Street
Estate/District City
:
:
Hours Minutes
FORM 3:
TRIP PURPOSE
2nd TRIPTRIP INFORMATION
OF 1st TRIP
7. Shopping
INFORMATION IS
4. Factory / warehouses
5. School / Universities
Educational
3. Office / Bank
Hours Minutes
Where did this trip begin?
6. Recreational Place, Park
8. Others
7. Medical and Welfare
3. To School
4. Personal Business
5. Firm Business
6. Social
1. To Home
2. To Work Where did this trip end?
(6) DESTINATION
Hours Minutes
(2) INSTITUTION of
:
(10) DRIVER or
No. /Building StreetNo. /Building Street
(7) TRIP PURPOSE
Original Mode TRANSFER POINT
Next Mode
Next Mode
2. Bicycle
1. Walking
11.Truck
3. Motor Cycle (8) MODE of TRAVEL
(Give address/land mark,famous bldg. nearby)
If you transferred toanother vehicle / mode oftravel during the trip, statethe mode you changed toand the place. (Give streetintersection/ famous bldg.or land mark).
(9) TRANSFER
MODE of TRAVEL
10. School/ Co./Tourist Bus
8. Taxi
9. Private Car
Estate/District City Estate/District City
1st Transfer
Next Mode
Original Mode
1st Transfer
Next Mode
2nd Transfer
TRANSFER POINT
(11) No. of PASSENGER
DESTINATION
(1) ORIGIN
PASSENGER
4. Tricycle
5. Matatu
6. Metro Shuttle
7. Bus
ORIGIN
(3) TIME STARTED
(4) TIME of ARRIVAL
(5) INSTITUTION of
(only for Passenger Car)
(only for Passenger Car)
ORIGIN AND DESTINATION
1. Residence (Home)
2. Commercial Institution
FIGURE 10.2-1(3) PERSON TRIP SURVEY SHEET

NNUUTTRRAANNSS TThhee SSttuuddyy oonn MMaasstteerr PPllaann ffoorr UUrrbbaann TTrraannssppoorrtt iinn tthhee NNaaiirroobbii MMeettrrooppoolliittaann AArreeaa
FFiinnaall RReeppoorrtt AAppppeennddiixx A10-11
10.2.2 Survey Results
Modal Share by Trip Purpose The share of “walking” mode to trip “to work” is just 29% which is the lowest among all trip purposes. Figure 10.2-1 shows the mode composition of each trip purpose.
65.3%
58.0%
28.8%
47.3%
14.0%
14.4%
17.1%
22.6%
39.3%
29.6%
6.6%
21.5%
0% 20% 40% 60% 80% 100%
Others
To School
To Work
To Home
Walking Two-wheel Mode Private Car/Taxi/TruckMatatu Bus Scool/Co./ BusKR(Railway) Others
FIGURE 10.2-1 MODAL SHARE BY TRIP PURPOSE
TABLE10.2-1 MODAL SHARE BY TRIP PURPOSE
HOME WORK SCHOOL OTHERS TOTAL Walking 1,060,324 347,110 273,457 586,388 2,267,280 Two-wheel Mode 23,701 22,314 2,052 7,344 55,411 Private Car/Taxi/Truck 321,594 259,471 30,917 125,720 737,702 Matatu 662,547 473,796 106,656 153,406 1,396,405 Bus 87,232 60,085 14,068 17,684 179,068 School/Co./ Bus 72,094 29,241 43,545 5,415 150,296 KR(Railway) 9,998 10,158 759 617 21,533 Others 3,202 2,750 209 1,600 7,762 Total 2,240,692 1,204,926 471,665 898,174 4,815,457
Modal Share by Car Ownership As expected, the modal share of “private car/taxi/truck” is very high at 52% to “with car” household. “walking” is the main mode of “without car” household which stands at 54%.

NNUUTTRRAANNSS TThhee SSttuuddyy oonn MMaasstteerr PPllaann ffoorr UUrrbbaann TTrraannssppoorrtt iinn tthhee NNaaiirroobbii MMeettrrooppoolliittaann AArreeaa
FFiinnaall RReeppoorrtt AAppppeennddiixx A10-12
47.1%
24.9%
54.0%
15.3%
52.0%
29.0%
14.5%
33.5%
3.9%
0% 20% 40% 60% 80% 100%
Total
W/ Car
W/O Car
Walking Two-wheel Mode Private Car/Taxi/TruckMatatu Bus Scool/Co./ BusKR(Railway) Others
FIGURE 10.2-2 MODAL SHARE BY CAR OWNERSHIP
Modal Share by Zone Private mode (car and taxi) share in the west area is higher than the other areas. While the share of public mode in the east area is high.
FIGURE 10.2-3 MODAL SHARE BY ZONE (ORIGIN ZONE BASE)
Legend

NNUUTTRRAANNSS TThhee SSttuuddyy oonn MMaasstteerr PPllaann ffoorr UUrrbbaann TTrraannssppoorrtt iinn tthhee NNaaiirroobbii MMeettrrooppoolliittaann AArreeaa
FFiinnaall RReeppoorrtt AAppppeennddiixx A10-13
Trip Rate by Personal Attribute As for the trip rate by gender, the trip rate of male is higher than that of female. The former trip rate is 2.44 trips while the latter is 2.04 trips. As for the occupation, employee is the highest among them, and by household car ownership, with-car household is higher than those without-car. Comparing that by household income class, high income group is the largest among them.
Trip Rates by Gender
0.000.50
1.001.50
2.002.50
3.00
Others 0.41 0.43
To School 0.21 0.23
To Work 0.69 0.42
To Home 1.12 0.96
Male Female
Trip Rates by Occupation
0.000.501.001.50
2.002.50
3.00
Others 0.45 0.28 0.51
To School 0.02 0.82 0.02
To Work 0.92 0.05 0.19
To Home 1.17 1.08 0.64
Employee Student Un-Employee
Trip Rates by Car Ownership
0.00
0.50
1.001.50
2.00
2.50
3.00
Others 0.42 0.42
To School 0.21 0.24
To Work 0.55 0.61
To Home 1.04 1.06
W/O Car W/ Car
Trip Rates by HH Income Class
0.000.50
1.001.50
2.002.50
3.00
Others 0.46 0.39 0.40
To School 0.20 0.23 0.24
To Work 0.52 0.56 0.62
To Home 1.04 1.04 1.06
Low Middle High
FIGURE 10.2-4 TRIP RATE BY PERONAL ATTRIBUTE

NNUUTTRRAANNSS TThhee SSttuuddyy oonn MMaasstteerr PPllaann ffoorr UUrrbbaann TTrraannssppoorrtt iinn tthhee NNaaiirroobbii MMeettrrooppoolliittaann AArreeaa
FFiinnaall RReeppoorrtt AAppppeennddiixx A10-14
Trip Generation and Attraction Excluding home trips, which are generally generated and attracted based on zonal population, other trip purposes have different characteristics. Work trips are generating in large scale from residential areas since their occurrences correlate with the size of the population. The volume of attraction is high in employment areas, such as the central commercial and business area as well as in the industrial areas.
Trip
Generation
Trip
Attraction
FIGURE 10.2-5 TRIP GENERATION AND ATTRACTION BY TRIP PURPOSE
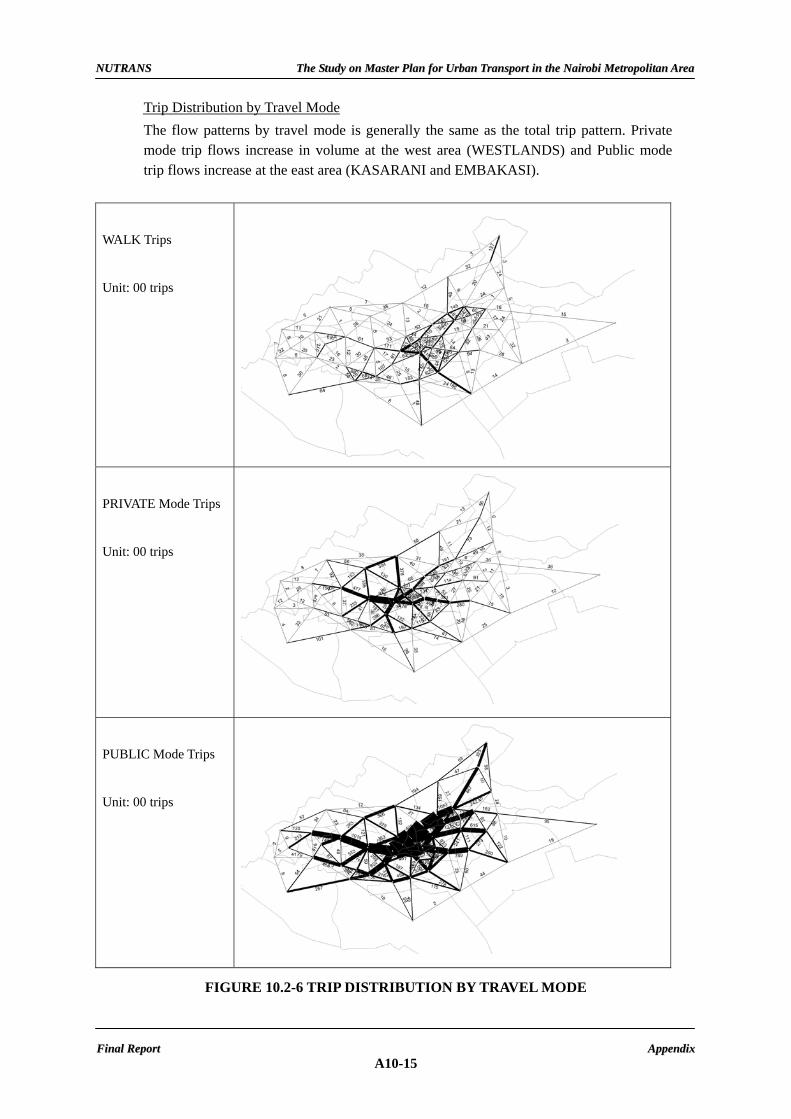
NNUUTTRRAANNSS TThhee SSttuuddyy oonn MMaasstteerr PPllaann ffoorr UUrrbbaann TTrraannssppoorrtt iinn tthhee NNaaiirroobbii MMeettrrooppoolliittaann AArreeaa
FFiinnaall RReeppoorrtt AAppppeennddiixx A10-15
Trip Distribution by Travel Mode The flow patterns by travel mode is generally the same as the total trip pattern. Private mode trip flows increase in volume at the west area (WESTLANDS) and Public mode trip flows increase at the east area (KASARANI and EMBAKASI).
WALK Trips
Unit: 00 trips
PRIVATE Mode Trips
Unit: 00 trips
PUBLIC Mode Trips
Unit: 00 trips
FIGURE 10.2-6 TRIP DISTRIBUTION BY TRAVEL MODE

NNUUTTRRAANNSS TThhee SSttuuddyy oonn MMaasstteerr PPllaann ffoorr UUrrbbaann TTrraannssppoorrtt iinn tthhee NNaaiirroobbii MMeettrrooppoolliittaann AArreeaa
FFiinnaall RReeppoorrtt AAppppeennddiixx A10-16
Departure and Arrival Time of Trips Most of WORK and SCHOOL trips start between 6:00 and 7:00 and arrive at 7:00 to 8:00. The morning peak ratio is 43% in WORK trip departure, and 51% in SCHOOL trip. The peak ratio of arrival time is 38% in WORK trip, and 54% in SCHOOL trip. In addition, the evening peak is considered between 16:00 to 18:00 and the ratio is lower than the morning peak.
0%
10%
20%
30%
40%
50%
60%
1 2 3 4 5 6 7 8 9 10 11 12 13 14 15 16 17 18 19 20 21 22 23 24
To Home To Work To School Others Total
(Starting Time of Trip Generation)
0%
10%
20%
30%
40%
50%
60%
1 2 3 4 5 6 7 8 9 10 11 12 13 14 15 16 17 18 19 20 21 22 23 24
To Home To Work To School Others Total
(Arriving Time of Trip Generation)
FIGURE 10.2-7 STARTING AND ARRIVING TIME OF TRIPS