Embed Size (px)
Citation preview
1
Final Report
CCEM Key Comparison CCEM. M.-K1
“ Magnetic Flux Density by means of Transfer Standard Coil“
March 2005
Kurt WeyandElectricity Division
Physikalisch-Technische BundesanstaltBundesallee 100, D-38116 Braunschweig, Germany
e-mail: [email protected]
2
Participants
K.Weyand, J.Lüdke, R.KetzlerPhysikalisch Technische Bundesanstalt - PTB, Braunschweig, Germany
P.G.ParkKorea Research Institute of Standards and Science - KRISS, Taejon, Republic of Korea
V.ShifrinD.I.Mendeleyev Institute for Metrology - VNIIM, St. Petersburg, Russian Federation
V.BalakrishnanNational Measurement Laboratory, - NML CSIRO (now National Measurement Institute Australia (NMIA)),Lindfield, Australia
L.DorosinskiTübitak Ulusal Metroloji Enstitüsü - UME, Gebze-Kocaeli, Turkey
M.Hall, J.BartholomewNational Physical Laboratory - NPL, Teddington, United Kingdom
G. Crotti, F. FiorilloIstituto Elettrotecnico Nazionale “Galileo Ferraris“ -IEN,Torino, Italy
Z.WeiNational Institute of Metrology - NIM, Beijing, China
J. KupecCzech Metrology Institute - CMI, Praha, Czech Republic
M.A.EscobarCentro Nacional de Metrologia - CENAM, Queretaro, Mexico
Comparison support group: M. Hall, NPL, UK (coordinator)G. Crotti, IEN, ITK. Weyand, PTB, DE

3
Introduction
The delegates of the CCEM discussion meeting on international comparisons in magnetism - 15th of May 2000 in
Sydney - recommended that a world-wide comparison of the magnetic flux density by means of a transfer stan-
dard coil should be proposed in addition to and in accordance with the EUROMET Project No. 446, which had
been finished in March 2000. This comparison did not follow the formal rules of a key comparison. At the meet-
ing of the CCEM Working Group on Low Frequency Quantities (WGLF, ex Working Group on Key Compari-
sons (WGKC)) in Paris, on 13 September 2000, it was decided that an international CIPM Key Comparison of
B/I according to Doc. WGKC Sep00-9 should be prepared with the Physikalisch-Technische Bundesanstalt
(PTB) as the pilot laboratory. The document mentioned was circulated to the CCEM members as a "call for par-
ticipation" in November 2000.
The transfer standard
A single layer solenoid of the Garret type [1],[2] with a winding length of about 350 mm and a diameter of
122 mm was prepared by PTB to serve as dc- and ac-transfer standard. The coil former is made of ceramics, the
winding of the solenoid is fixed by means of epoxy. The standard is capable of carrying a maximum permitted
current IC of 1 A, producing a field in its centre with a flux density B0 of about 2 mT. The field in the centre
region is as homogeneous as necessary to enable NMR measurements - protons in H2O - by the free precession
method even for fields larger than 1 mT. Four diametrically arranged current return leads along the coil, fixed at
the same distance from the coil axis and resistively equalised, ensure general compensation of field components
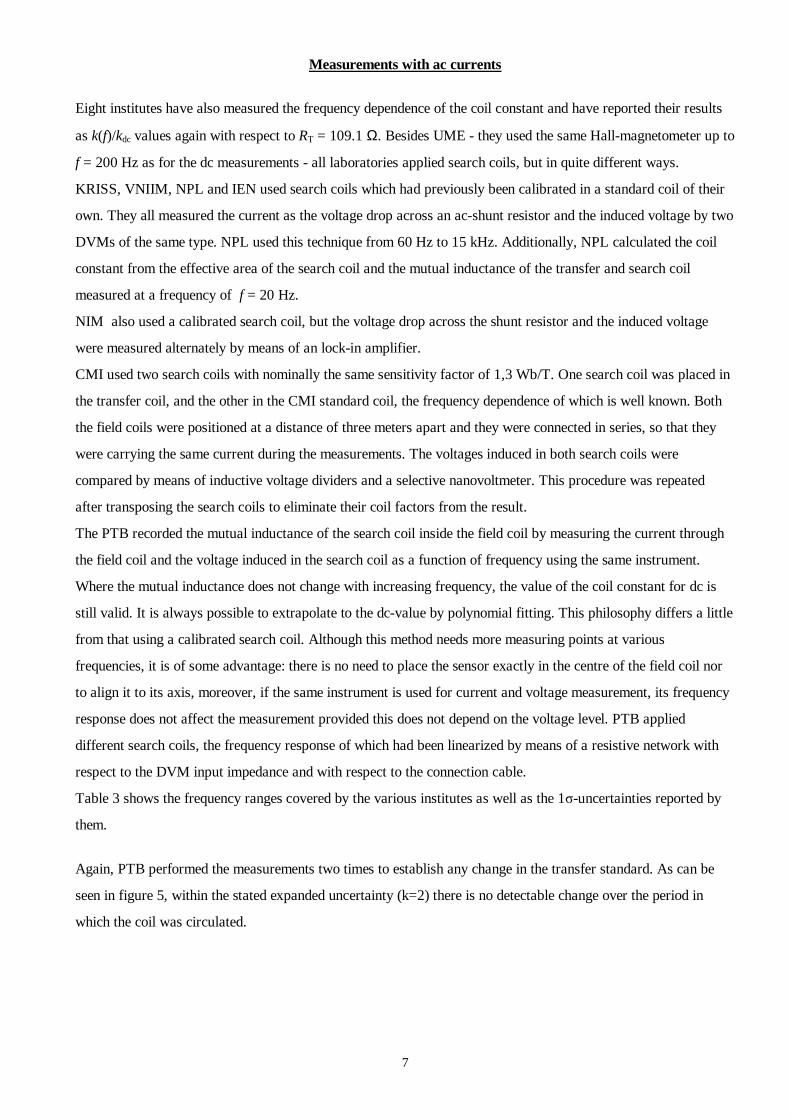
perpendicular to the coil axis and reproducible connection conditions for all participants. Figure 1 shows the field
profile on the coil axis related to the centre field of about 1 mT, whereby the flux density was measured using a
fluxgate magnetometer with 5 mm sensor length and the position by means of an optical length measuring system.
In addition, VNIIM checked the homogeneity applying ac currents with frequencies up to 20 kHz. The deviation
at ∆x = ± 20 mm from the centre value was over the whole frequency range less than 0.05 %, whereby the relative
uncertainty of these measurements was also estimated to be 0.05 %.
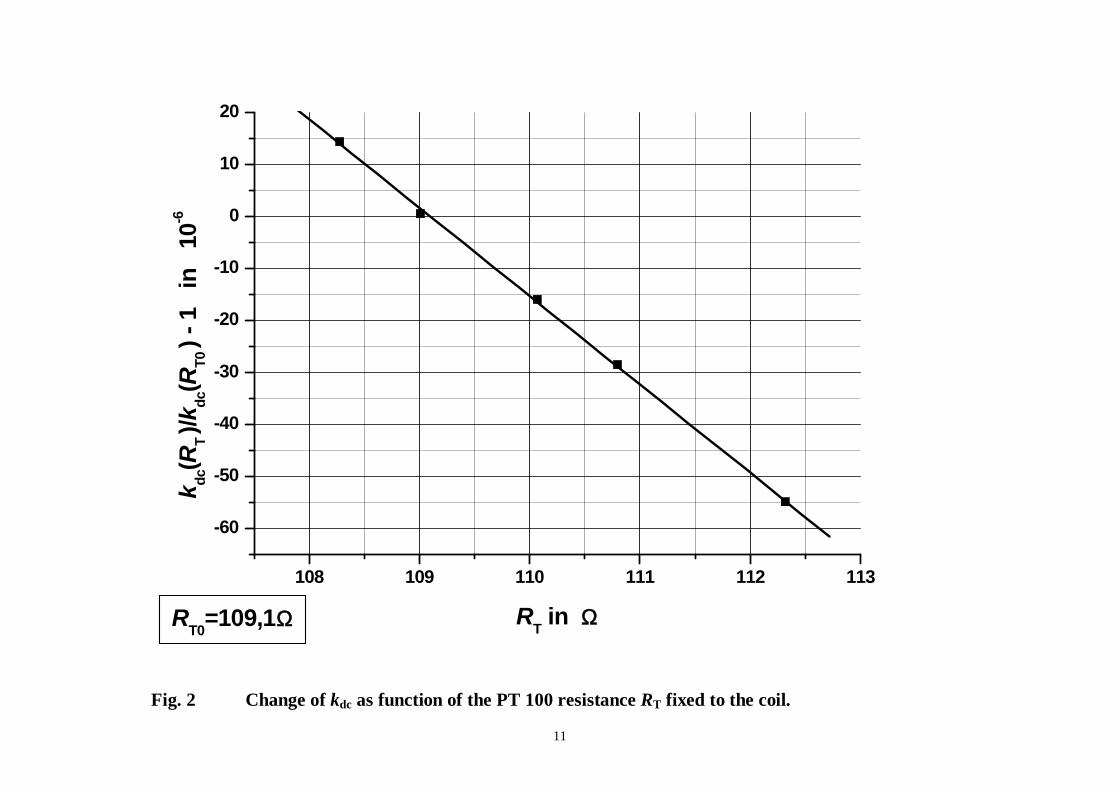
At the one end of the coil a Pt 100 resistor RT is fixed to the winding provided as a coil temperature reference. By
varying the room temperature, the temperature coefficient of the coil constant kdc = B0/IC with respect to the
change of RT was measured applying NMR according to figure 2. From the slope the temperature dependence
follows as
−
Ω⋅±−=−
Ω=− 1.10910)10.17(1
)1.109()( 6
0
T
Tdc
Tdc RRk
Rk , (1)
with RT0 corresponding to 23 °C.
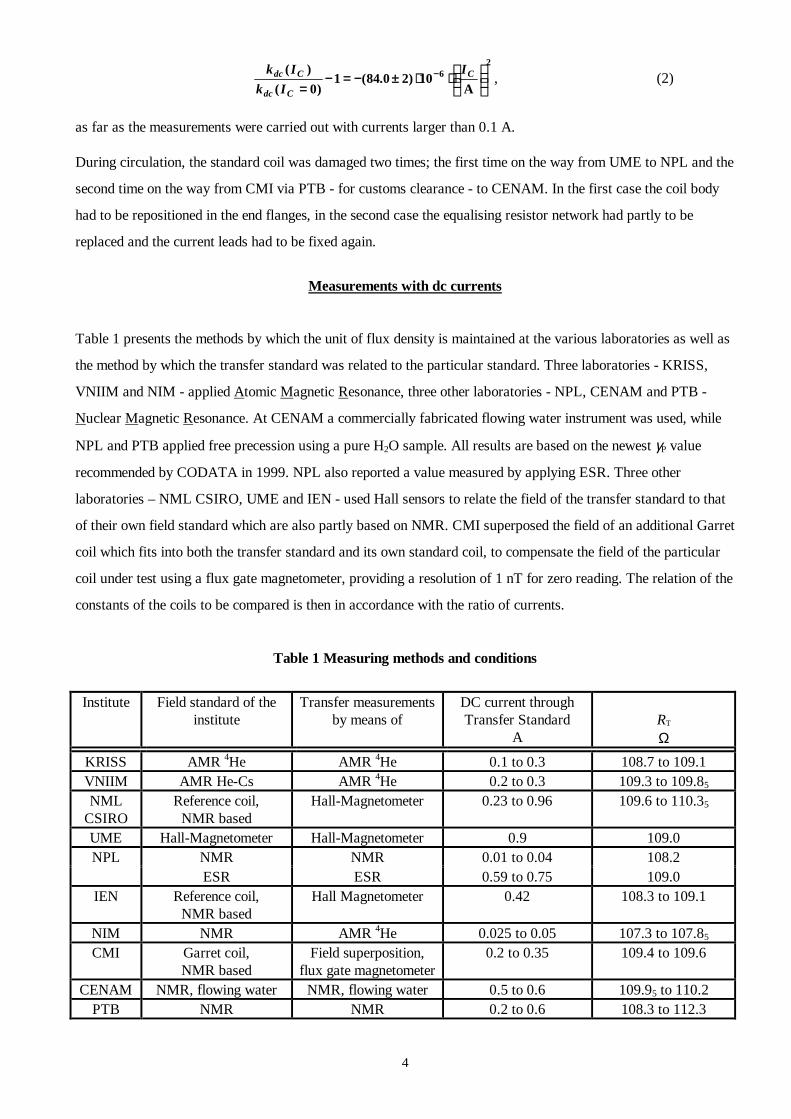
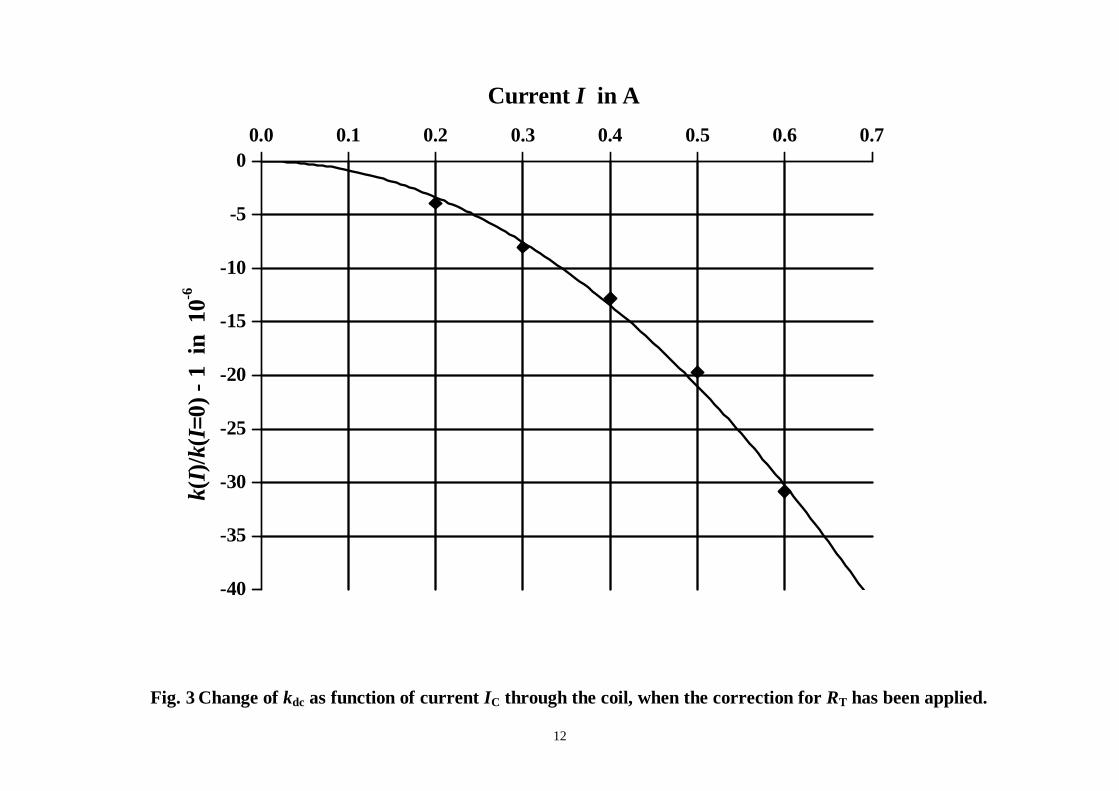
VNIIM gave a hint that, besides the correction according to equ. (1), the coil constant depends on current IC. This
was later investigated in PTB applying NMR at different currents with the result presented by figure 3. The
reported values have therefore been corrected according to
4
26
A10)20.84(1
)0()(
⋅⋅±−=−
=− C
Cdc
Cdc IIk
Ik , (2)
as far as the measurements were carried out with currents larger than 0.1 A.
During circulation, the standard coil was damaged two times; the first time on the way from UME to NPL and the
second time on the way from CMI via PTB - for customs clearance - to CENAM. In the first case the coil body
had to be repositioned in the end flanges, in the second case the equalising resistor network had partly to be
replaced and the current leads had to be fixed again.
Measurements with dc currents
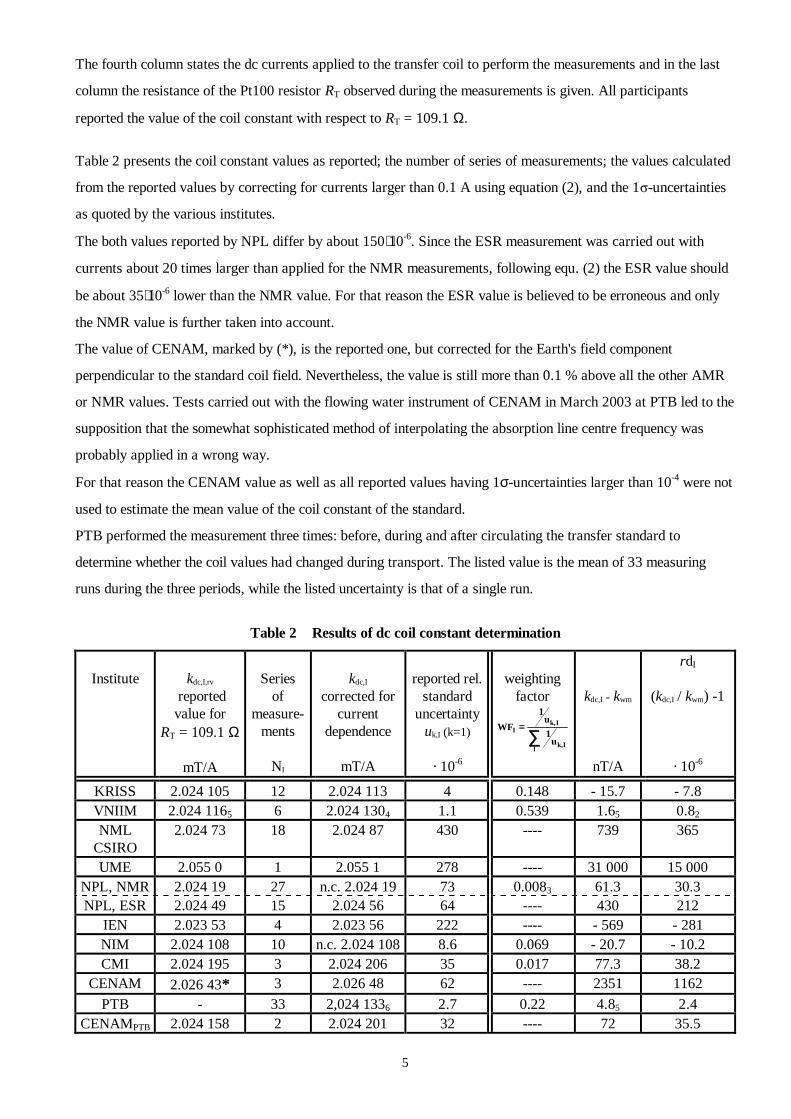
Table 1 presents the methods by which the unit of flux density is maintained at the various laboratories as well as
the method by which the transfer standard was related to the particular standard. Three laboratories - KRISS,
VNIIM and NIM - applied Atomic Magnetic Resonance, three other laboratories - NPL, CENAM and PTB -
Nuclear Magnetic Resonance. At CENAM a commercially fabricated flowing water instrument was used, while
NPL and PTB applied free precession using a pure H2O sample. All results are based on the newest γP value
recommended by CODATA in 1999. NPL also reported a value measured by applying ESR. Three other
laboratories – NML CSIRO, UME and IEN - used Hall sensors to relate the field of the transfer standard to that
of their own field standard which are also partly based on NMR. CMI superposed the field of an additional Garret
coil which fits into both the transfer standard and its own standard coil, to compensate the field of the particular
coil under test using a flux gate magnetometer, providing a resolution of 1 nT for zero reading. The relation of the
constants of the coils to be compared is then in accordance with the ratio of currents.
Table 1 Measuring methods and conditions
Institute Field standard of theinstitute
Transfer measurementsby means of
DC current throughTransfer Standard
ART
Ω
KRISS AMR 4He AMR 4He 0.1 to 0.3 108.7 to 109.1VNIIM AMR He-Cs AMR 4He 0.2 to 0.3 109.3 to 109.85
NMLCSIRO
Reference coil,NMR based
Hall-Magnetometer 0.23 to 0.96 109.6 to 110.35
UME Hall-Magnetometer Hall-Magnetometer 0.9 109.0NMR NMR 0.01 to 0.04 108.2NPLESR ESR 0.59 to 0.75 109.0
IEN Reference coil,NMR based
Hall Magnetometer 0.42 108.3 to 109.1
NIM NMR AMR 4He 0.025 to 0.05 107.3 to 107.85
CMI Garret coil,NMR based
Field superposition,flux gate magnetometer
0.2 to 0.35 109.4 to 109.6
CENAM NMR, flowing water NMR, flowing water 0.5 to 0.6 109.95 to 110.2PTB NMR NMR 0.2 to 0.6 108.3 to 112.3
5
The fourth column states the dc currents applied to the transfer coil to perform the measurements and in the last
column the resistance of the Pt100 resistor RT observed during the measurements is given. All participants
reported the value of the coil constant with respect to RT = 109.1 Ω.
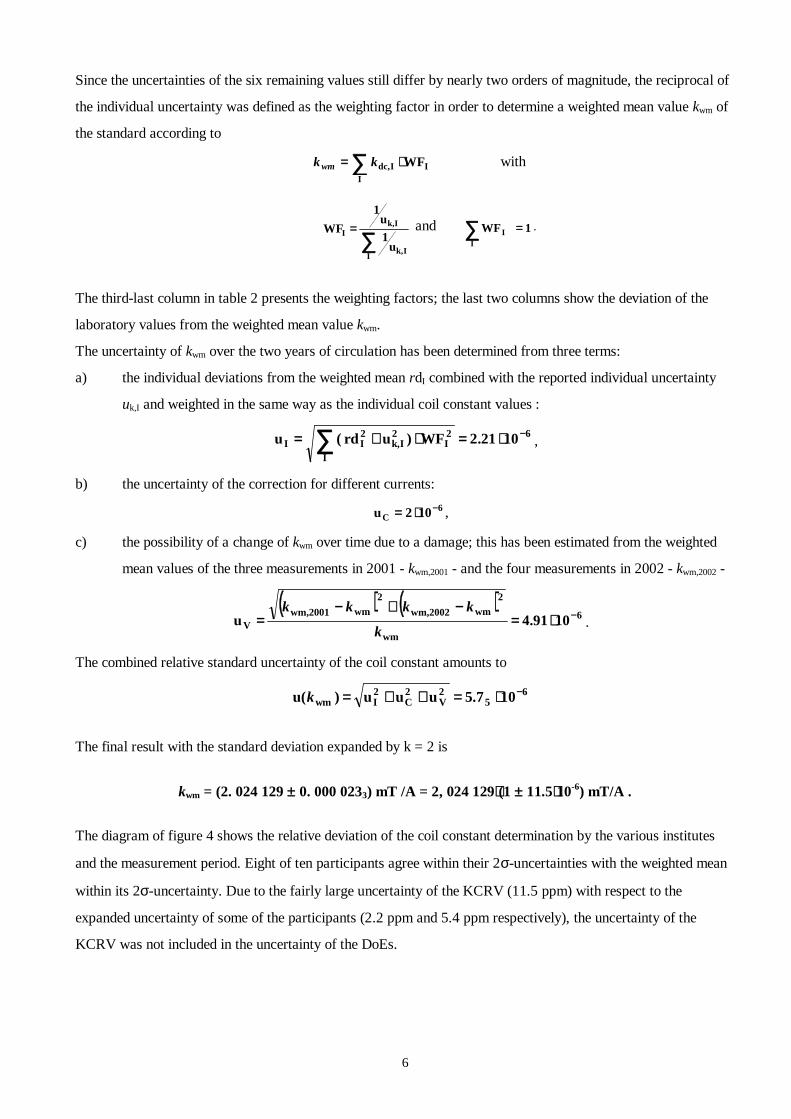
Table 2 presents the coil constant values as reported; the number of series of measurements; the values calculated
from the reported values by correcting for currents larger than 0.1 A using equation (2), and the 1 -uncertainties
as quoted by the various institutes.
The both values reported by NPL differ by about 150⋅10-6. Since the ESR measurement was carried out with
currents about 20 times larger than applied for the NMR measurements, following equ. (2) the ESR value should
be about 35⋅10-6 lower than the NMR value. For that reason the ESR value is believed to be erroneous and only
the NMR value is further taken into account.
The value of CENAM, marked by (*), is the reported one, but corrected for the Earth's field component
perpendicular to the standard coil field. Nevertheless, the value is still more than 0.1 % above all the other AMR
or NMR values. Tests carried out with the flowing water instrument of CENAM in March 2003 at PTB led to the
supposition that the somewhat sophisticated method of interpolating the absorption line centre frequency was
probably applied in a wrong way.
For that reason the CENAM value as well as all reported values having 1σ-uncertainties larger than 10-4 were not
used to estimate the mean value of the coil constant of the standard.
PTB performed the measurement three times: before, during and after circulating the transfer standard to
determine whether the coil values had changed during transport. The listed value is the mean of 33 measuring
runs during the three periods, while the listed uncertainty is that of a single run.
Table 2 Results of dc coil constant determination
Institute kdc,I,rv
reportedvalue for
RT = 109.1 Ω
mT/A
Seriesof
measure-ments
NI
kdc,I
corrected forcurrent
dependence
mT/A
reported rel.standard
uncertaintyuk,I (k=1)
· 10-6
weightingfactor
∑=
I Ik,
Ik,I
u1u
1WF
kdc,I - kwm
nT/A
rdI
(kdc,I / kwm) -1
· 10-6
KRISS 2.024 105 12 2.024 113 4 0.148 - 15.7 - 7.8VNIIM 2.024 1165 6 2.024 1304 1.1 0.539 1.65 0.82
NMLCSIRO
2.024 73 18 2.024 87 430 ---- 739 365
UME 2.055 0 1 2.055 1 278 ---- 31 000 15 000NPL, NMR 2.024 19 27 n.c. 2.024 19 73 0.0083 61.3 30.3NPL, ESR 2.024 49 15 2.024 56 64 ---- 430 212
IEN 2.023 53 4 2.023 56 222 ---- - 569 - 281NIM 2.024 108 10 n.c. 2.024 108 8.6 0.069 - 20.7 - 10.2CMI 2.024 195 3 2.024 206 35 0.017 77.3 38.2
CENAM 2.026 43* 3 2.026 48 62 ---- 2351 1162PTB - 33 2,024 1336 2.7 0.22 4.85 2.4
CENAMPTB 2.024 158 2 2.024 201 32 ---- 72 35.5
6
Since the uncertainties of the six remaining values still differ by nearly two orders of magnitude, the reciprocal of
the individual uncertainty was defined as the weighting factor in order to determine a weighted mean value kwm of
the standard according to
∑ ⋅=I
IIdc, WFkkwm with
∑=
I Ik,
Ik,I
u1u
1WF and 1WF
II =∑ .
The third-last column in table 2 presents the weighting factors; the last two columns show the deviation of the
laboratory values from the weighted mean value kwm.
The uncertainty of kwm over the two years of circulation has been determined from three terms:
a) the individual deviations from the weighted mean rdI combined with the reported individual uncertainty
uk,I and weighted in the same way as the individual coil constant values :
6
I
2I
2Ik,
2II 1021.2WF)urd(u −⋅=⋅+= ∑ ,
b) the uncertainty of the correction for different currents:6
C 102u −⋅= ,
c) the possibility of a change of kwm over time due to a damage; this has been estimated from the weighted
mean values of the three measurements in 2001 - kwm,2001 - and the four measurements in 2002 - kwm,2002 -
( ) ( )6
wm
2wmwm,2002
2wmwm,2001
V 1091.4u −⋅=−+−
=k
kkkk.
The combined relative standard uncertainty of the coil constant amounts to
65
2V
2C
2Iwm 107.5uuu)(u −⋅=++=k
The final result with the standard deviation expanded by k = 2 is
kwm = (2. 024 129 ± 0. 000 0233) mT /A = 2, 024 129⋅(1 ± 11.5⋅10-6) mT/A .
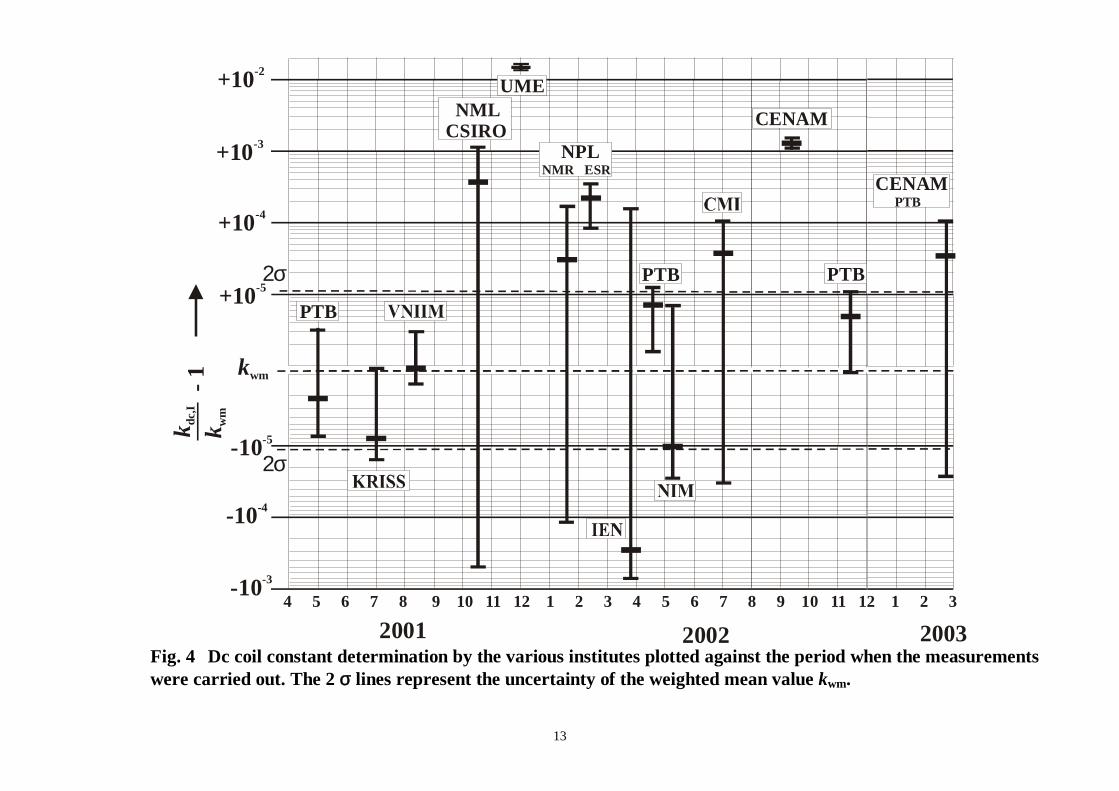
The diagram of figure 4 shows the relative deviation of the coil constant determination by the various institutes
and the measurement period. Eight of ten participants agree within their 2σ-uncertainties with the weighted mean
within its 2σ-uncertainty. Due to the fairly large uncertainty of the KCRV (11.5 ppm) with respect to the
expanded uncertainty of some of the participants (2.2 ppm and 5.4 ppm respectively), the uncertainty of the
KCRV was not included in the uncertainty of the DoEs.
7
Measurements with ac currents
Eight institutes have also measured the frequency dependence of the coil constant and have reported their results
as k(f)/kdc values again with respect to RT = 109.1 Ω. Besides UME - they used the same Hall-magnetometer up to
f = 200 Hz as for the dc measurements - all laboratories applied search coils, but in quite different ways.
KRISS, VNIIM, NPL and IEN used search coils which had previously been calibrated in a standard coil of their
own. They all measured the current as the voltage drop across an ac-shunt resistor and the induced voltage by two
DVMs of the same type. NPL used this technique from 60 Hz to 15 kHz. Additionally, NPL calculated the coil
constant from the effective area of the search coil and the mutual inductance of the transfer and search coil
measured at a frequency of f = 20 Hz.
NIM also used a calibrated search coil, but the voltage drop across the shunt resistor and the induced voltage
were measured alternately by means of an lock-in amplifier.
CMI used two search coils with nominally the same sensitivity factor of 1,3 Wb/T. One search coil was placed in
the transfer coil, and the other in the CMI standard coil, the frequency dependence of which is well known. Both
the field coils were positioned at a distance of three meters apart and they were connected in series, so that they
were carrying the same current during the measurements. The voltages induced in both search coils were
compared by means of inductive voltage dividers and a selective nanovoltmeter. This procedure was repeated
after transposing the search coils to eliminate their coil factors from the result.
The PTB recorded the mutual inductance of the search coil inside the field coil by measuring the current through
the field coil and the voltage induced in the search coil as a function of frequency using the same instrument.
Where the mutual inductance does not change with increasing frequency, the value of the coil constant for dc is
still valid. It is always possible to extrapolate to the dc-value by polynomial fitting. This philosophy differs a little
from that using a calibrated search coil. Although this method needs more measuring points at various
frequencies, it is of some advantage: there is no need to place the sensor exactly in the centre of the field coil nor
to align it to its axis, moreover, if the same instrument is used for current and voltage measurement, its frequency
response does not affect the measurement provided this does not depend on the voltage level. PTB applied
different search coils, the frequency response of which had been linearized by means of a resistive network with
respect to the DVM input impedance and with respect to the connection cable.
Table 3 shows the frequency ranges covered by the various institutes as well as the 1 -uncertainties reported by
them.
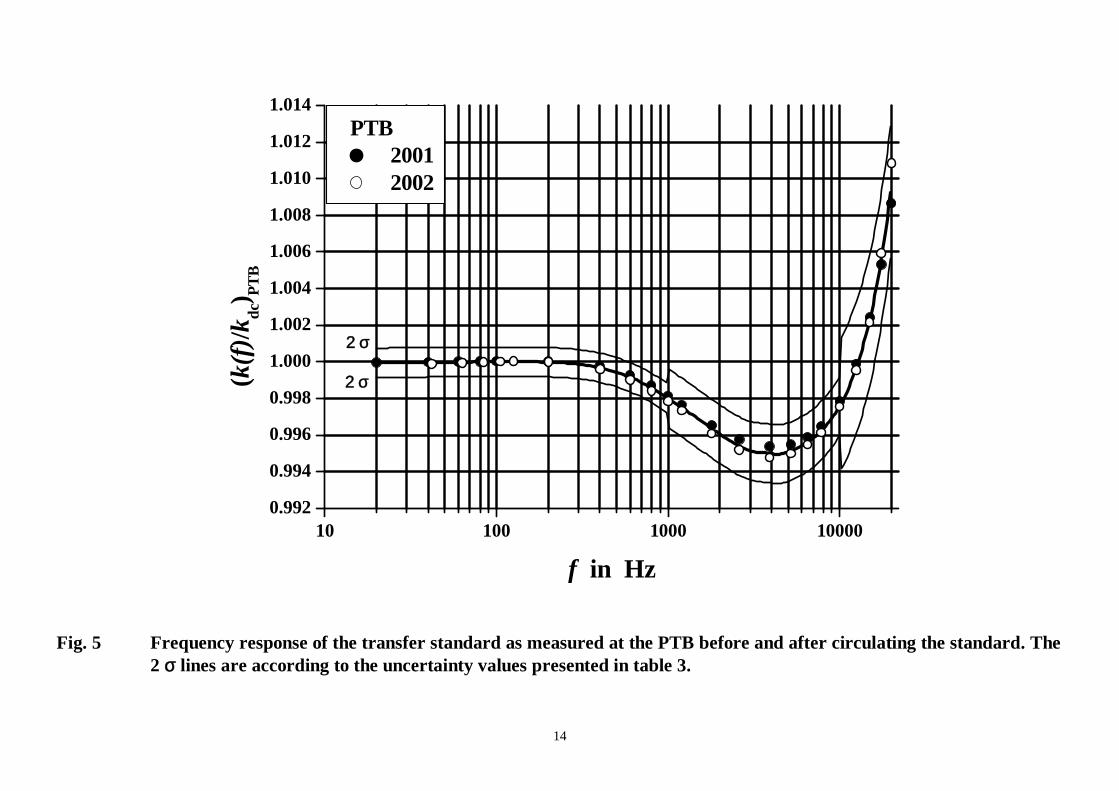
Again, PTB performed the measurements two times to establish any change in the transfer standard. As can be
seen in figure 5, within the stated expanded uncertainty (k=2) there is no detectable change over the period in
which the coil was circulated.
8
Table 3 Frequency ranges and reported uncertainties of the ac measurements
Institute Frequency f
kHz
reporteduncertainty
uQ(f),I (1 )
⋅ 10-2
Frequency f
kHz
reported uncertainty
uQ(f),I (1 )
⋅ 10-2
Frequency f
kHz
reporteduncertainty
uQ(f),I (1 )
⋅ 10-2
KRISS 0.1 to 1 0.08 1.1 to 5 0.13 5.1 to 20 0.22VNIIM 0.06 to 6.3 0.07 10 to 20 0.17UME 0.05 to 0.2 0.4NPL 0.02 0.039 0.06 to 20 0.2IEN 0.02 to 6 0.16 8 to 10 0.17 12 to 20 0.18 to 0.28NIM 0.03 to 20 0.22CMI 0.04 to 0.88 0.03 1.22 to 4.8 0.059 7.2 to 20 0.24PTB 0.02 to .99 0.04 1 to 9.9 0.08 10 to 20 0.17
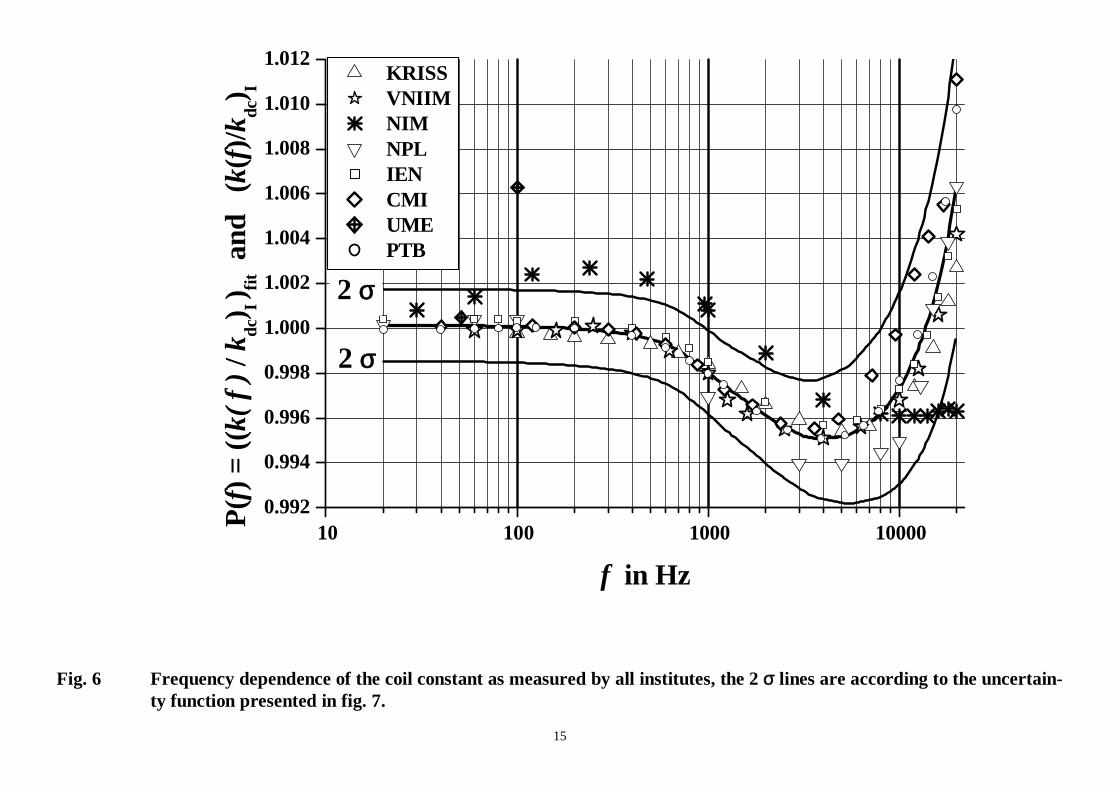
Due to the current distributing networks on both flanges of the standard coil, each including a short-circuiting
loop, the frequency dependence differs from the usually observed one; the function Q(f) = k(f)/kdc shows a
minimum at about 4 kHz. This was designed in order to provide a frequency dependence differing from that of the
standard coil used in the EUROMET project. As shown by figure 6, six of the eight institutes, which performed
ac-measurements, have in general fulfilled this function, one measured a quite different function and one failed
even at low frequencies - at f = 200Hz the value of UME deviates by more than 3 %.
For this reason, the values presented by UME and NIM have not been used to calculate the fit curve
P(f) = ((k(f)/kdc)I)fit by means of partial polynomial least squares adjustment of all values (k(f)/kdc)I presented by
the six remaining institutes.
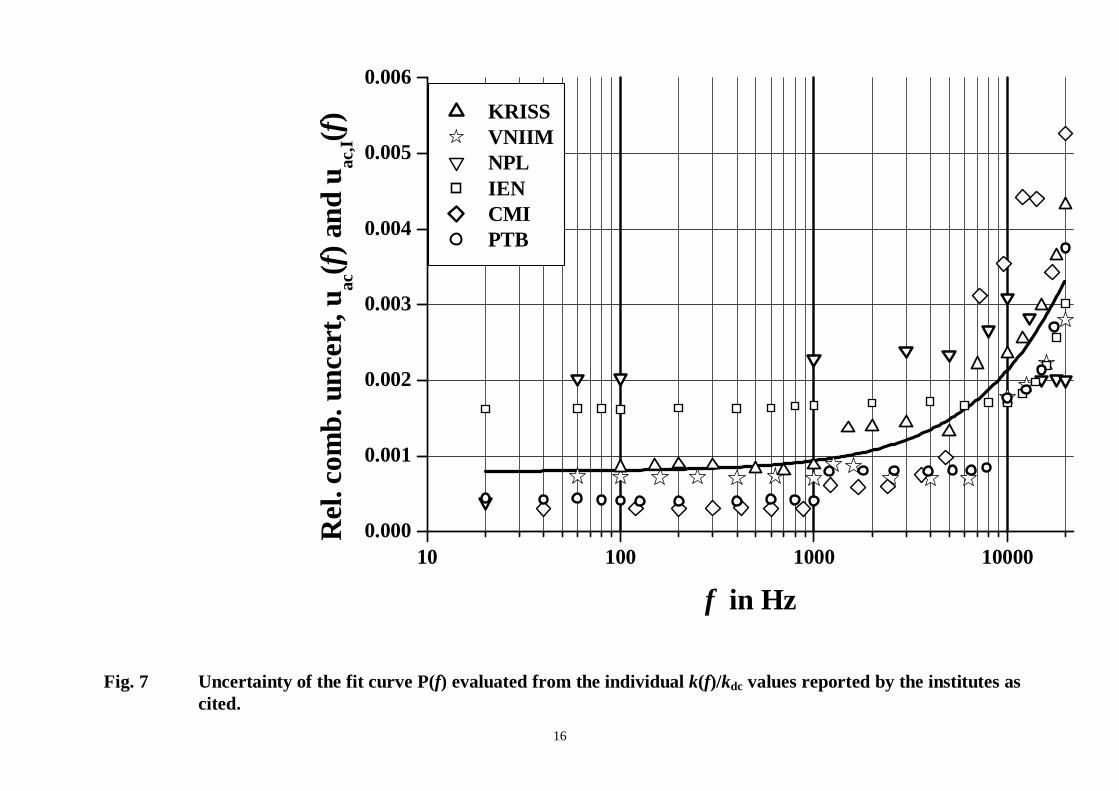
The individual uncertainties of the ac measurements do not differ in the manner of the measurements using dc,
therefore a weighting procedure has not been applied. Figure 7 presents the relative combined uncertainty uac(f) of
the curve P(f) as evaluated by polynomial fitting of the relative uncertainty of all individual measured values QI(f)
according to
[ ] 2IQ(f),
2IIac, u)(P)(Qu +−= ff .
The standard uncertainty of P(f) increases from 0.08 % at low frequencies to about 0.33 % at f = 20 kHz,
whereby the individual uac,I points above the fit line dominate the final uncertainty of P(f) at the particular
frequency.
As shown by figure 6, all values reported by the six institutes agree with P(f) within the expanded uncertainty
(k = 2).
Final remarks
The results presented in this first world-wide international comparison offer a good view of the capabilities of the
participants to disseminate the magnetic quantity “flux density” as maintained using an artefact as a transfer
standard. They agree well with the results obtained within the EUROMET Project No. 446 [3]. Compared with
this, the uncertainty of the dc measurements could be reduced by more than a factor of 2, the uncertainty of the ac
9
measurements is almost the same. A large contribution to the uncertainty had to be assigned because of possible
damages of the standard during transportation.
With respect to the measurements of the coil constant at dc, eight of ten participants’ results agree with the
weighted mean within a 2σ uncertainty. The reason for the deviation of another one could be cleared up after
finishing the comparison, thus they will also agree in future. Four of the participants show particularly good
agreement within 10-5. Besides, the dc measurements confirm the supposition that NMR- and AMR-methods
should be regarded as the most accurate, followed by the ESR-technique which again proves to be more accurate
than the measurements applying Hall-elements.
With respect to the measurements of the frequency dependence of the coil constant, six of eight participants’
results agree well up to a frequency of 20 kHz, though an unusual dependence on frequency has been established.
One participant did not meet the curve progression within 2σ and one failed it remarkably even at low
frequencies.
The overall good agreements of this comparison are particularly notable, as there are a number of different
measurement techniques being used. In case of a further intercomparison in future, a modified transfer standard
having a very low temperature coefficient based on recent developments could be provided and a more reliable
way of transportation must be found.
References
[1] M.W.Garrett: "Axially Symmetric Systems for Generating and Measuring Magnetic Fields", J.Appl.Phys., vol.22, pp 1091-1107, 1951.
[2] M.W.Garrett and S.Pissanetzky: "Polygonal Coil Systems for Magnetic Fields with Homogeneity of the Fourth to theEigth Order", Rev. of Sci. Instr., vol.42, pp 840-857, 1971.
[3] K.Weyand et al.: "Final Report on EUROMET Project No. 446", Metrologia, 38, pp 187-191, 2001
10Fig. 1 Field profile of the transfer standard. The measured values are fitted by a fourth-order polynomial.
-40 -30 -20 -10 0 10 20 30 40-2.0
-1.5
-1.0
-0.5
0.0
0.5
position x in mm
B(x
)/B(x
=0) -
1 in
10
-4
11
Fig. 2 Change of kdc as function of the PT 100 resistance RT fixed to the coil.
108 109 110 111 112 113
-60
-50
-40
-30
-20
-10
0
10
20
RT0=109,1Ω
k dc(R
T)/k
dc(R
T0) -
1
in
10-6
RT in Ω
12
Fig. 3 Change of kdc as function of current IC through the coil, when the correction for RT has been applied.
-40
-35
-30
-25
-20
-15
-10
-5
00.0 0.1 0.2 0.3 0.4 0.5 0.6 0.7
Current I in A
k(I)
/k(I
=0) -
1 i
n 1
0-6
13
Fig. 4 Dc coil constant determination by the various institutes plotted against the period when the measurementswere carried out. The 2 σ lines represent the uncertainty of the weighted mean value kwm.
+10-4
+10-3
+10-2
-10-3
+10-5
-10-5
-10-4
2001 2002 2003 4 5 6 7 8 9 10 11 12 1 2 3 4 5 6 7 8 9 10 11 12 1 2 3
PTB
PTB
CENAM
CENAMPTB
NMLCSIRO
PTB
NPLNMR ESR
UME
kwm-1k w
m
k dc,
I
2σ
2σ
14
Fig. 5 Frequency response of the transfer standard as measured at the PTB before and after circulating the standard. The2 σ lines are according to the uncertainty values presented in table 3.
10 100 1000 100000.992
0.994
0.996
0.998
1.000
1.002
1.004
1.006
1.008
1.010
1.012
1.014
2 σ
2 σ
PTB 2001 2002
(k(f)
/kdc
) PTB
f in Hz
15
Fig. 6 Frequency dependence of the coil constant as measured by all institutes, the 2 σ lines are according to the uncertain-ty function presented in fig. 7.
10 100 1000 100000.992
0.994
0.996
0.998
1.000
1.002
1.004
1.006
1.008
1.010
1.012
2 σ
2 σ
KRISS VNIIM NIM NPL IEN CMI UME PTB
P(f)
= ((k
( f )
/kdc
) I) fit a
nd
(k(f)
/kdc
) I
f in Hz
16
Fig. 7 Uncertainty of the fit curve P(f) evaluated from the individual k(f)/kdc values reported by the institutes ascited.
10 100 1000 100000.000
0.001
0.002
0.003
0.004
0.005
0.006 KRISS VNIIM NPL IEN CMI PTB
Rel
. com
b. u
ncer
t, u ac
(f) a
nd u
ac,I(f)
f in Hz
17
CCEM.M.-K1
Appendix 1
Individual uncertainty budgets
18
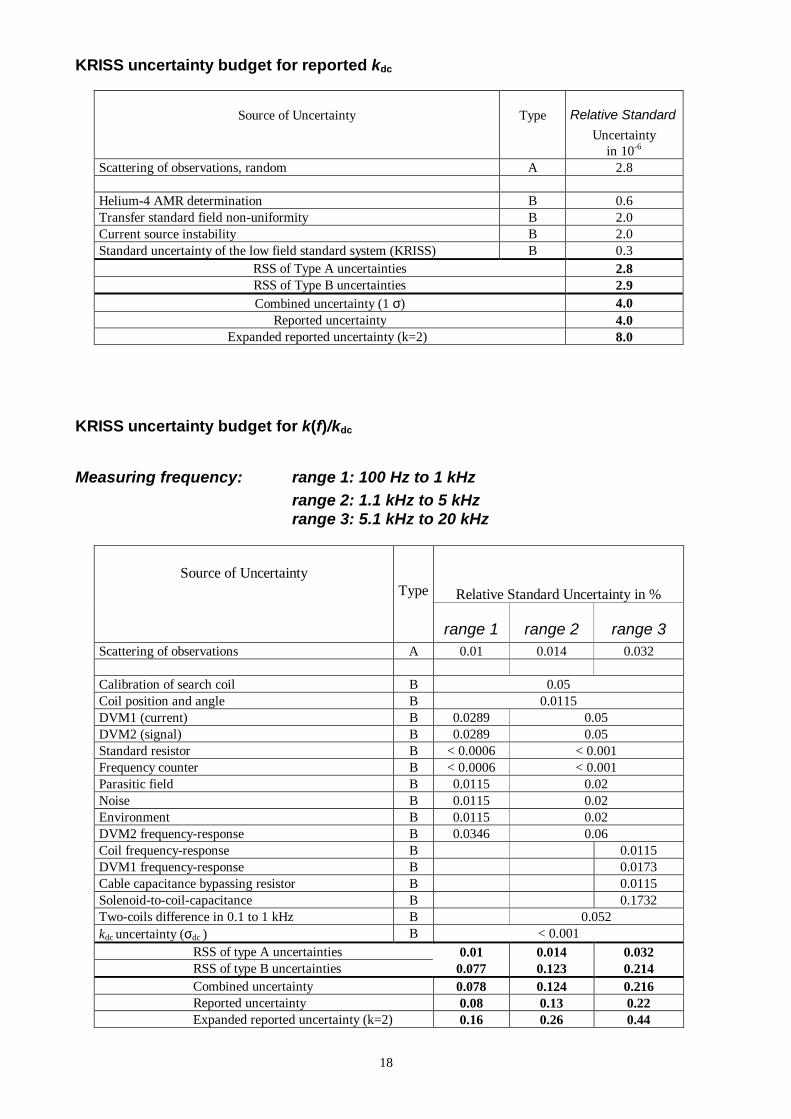
KRISS uncertainty budget for reported kdc
Source of Uncertainty Type Relative StandardUncertainty
in 10-6
Scattering of observations, random A 2.8
Helium-4 AMR determination B 0.6Transfer standard field non-uniformity B 2.0Current source instability B 2.0Standard uncertainty of the low field standard system (KRISS) B 0.3
RSS of Type A uncertainties 2.8RSS of Type B uncertainties 2.9Combined uncertainty (1 σ) 4.0
Reported uncertainty 4.0Expanded reported uncertainty (k=2) 8.0
KRISS uncertainty budget for k(f)/kdc
Measuring frequency: range 1: 100 Hz to 1 kHzrange 2: 1.1 kHz to 5 kHzrange 3: 5.1 kHz to 20 kHz
Relative Standard Uncertainty in %Source of Uncertainty
Type
range 1 range 2 range 3Scattering of observations A 0.01 0.014 0.032
Calibration of search coil B 0.05Coil position and angle B 0.0115DVM1 (current) B 0.0289 0.05DVM2 (signal) B 0.0289 0.05Standard resistor B < 0.0006 < 0.001Frequency counter B < 0.0006 < 0.001Parasitic field B 0.0115 0.02Noise B 0.0115 0.02Environment B 0.0115 0.02DVM2 frequency-response B 0.0346 0.06Coil frequency-response B 0.0115DVM1 frequency-response B 0.0173Cable capacitance bypassing resistor B 0.0115Solenoid-to-coil-capacitance B 0.1732Two-coils difference in 0.1 to 1 kHz B 0.052kdc uncertainty (σdc ) B < 0.001
RSS of type A uncertainties 0.01 0.014 0.032RSS of type B uncertainties 0.077 0.123 0.214Combined uncertainty 0.078 0.124 0.216Reported uncertainty 0.08 0.13 0.22Expanded reported uncertainty (k=2) 0.16 0.26 0.44
19
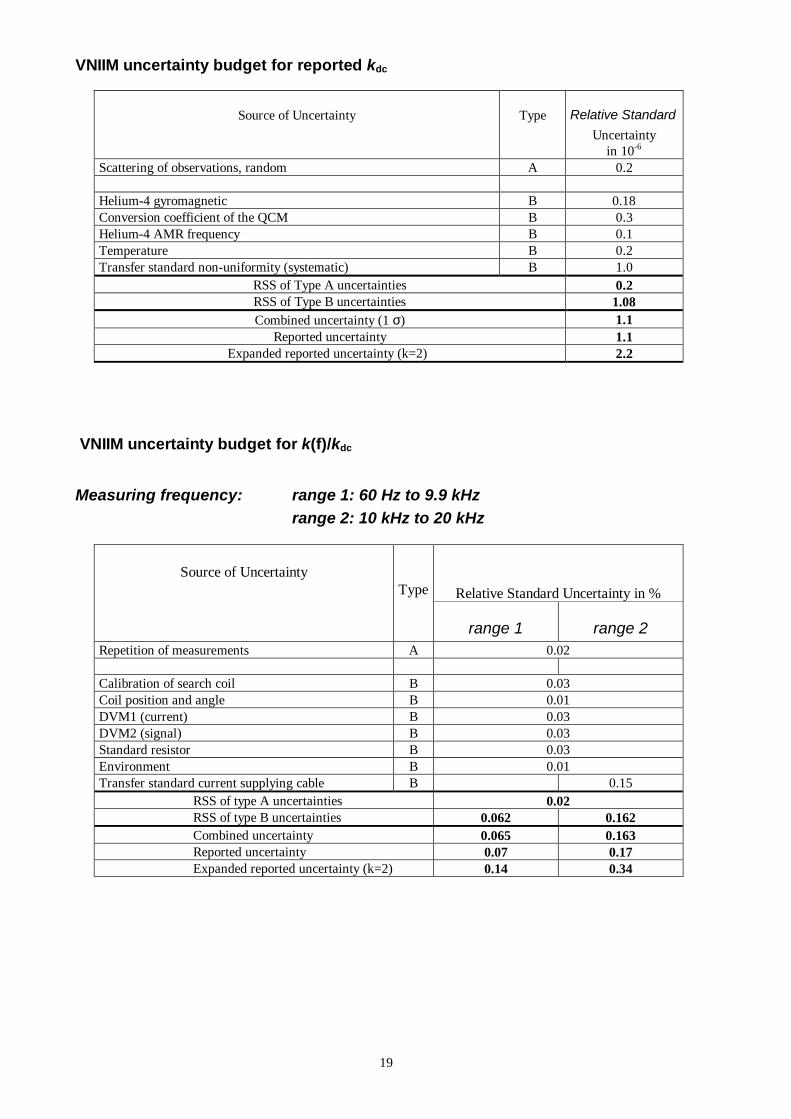
VNIIM uncertainty budget for reported kdc
Source of Uncertainty Type Relative StandardUncertainty
in 10-6
Scattering of observations, random A 0.2
Helium-4 gyromagnetic B 0.18Conversion coefficient of the QCM B 0.3Helium-4 AMR frequency B 0.1Temperature B 0.2Transfer standard non-uniformity (systematic) B 1.0
RSS of Type A uncertainties 0.2RSS of Type B uncertainties 1.08Combined uncertainty (1 σ) 1.1
Reported uncertainty 1.1Expanded reported uncertainty (k=2) 2.2
VNIIM uncertainty budget for k(f)/kdc
Measuring frequency: range 1: 60 Hz to 9.9 kHzrange 2: 10 kHz to 20 kHz
Relative Standard Uncertainty in %Source of Uncertainty
Type
range 1 range 2Repetition of measurements A 0.02
Calibration of search coil B 0.03Coil position and angle B 0.01DVM1 (current) B 0.03DVM2 (signal) B 0.03Standard resistor B 0.03Environment B 0.01Transfer standard current supplying cable B 0.15
RSS of type A uncertainties 0.02RSS of type B uncertainties 0.062 0.162Combined uncertainty 0.065 0.163Reported uncertainty 0.07 0.17Expanded reported uncertainty (k=2) 0.14 0.34
20
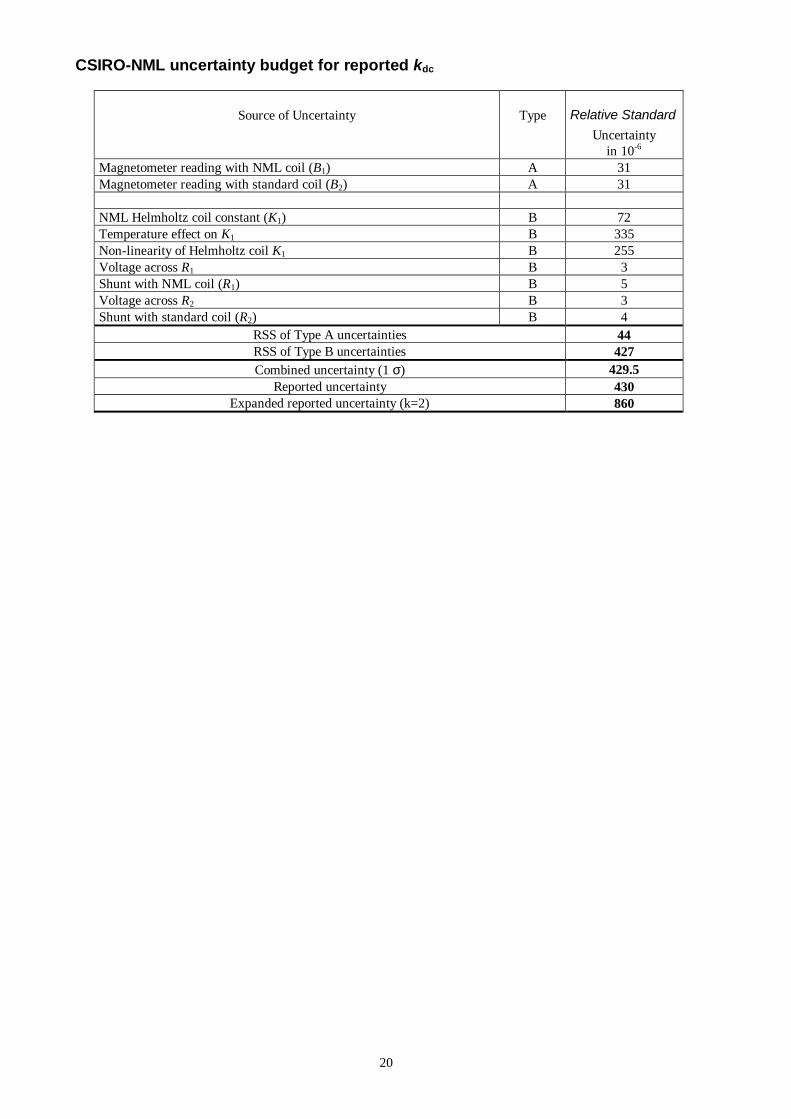
CSIRO-NML uncertainty budget for reported kdc
Source of Uncertainty Type Relative StandardUncertainty
in 10-6
Magnetometer reading with NML coil (B1) A 31Magnetometer reading with standard coil (B2) A 31
NML Helmholtz coil constant (K1) B 72Temperature effect on K1 B 335Non-linearity of Helmholtz coil K1 B 255Voltage across R1 B 3Shunt with NML coil (R1) B 5Voltage across R2 B 3Shunt with standard coil (R2) B 4
RSS of Type A uncertainties 44RSS of Type B uncertainties 427Combined uncertainty (1 σ) 429.5
Reported uncertainty 430Expanded reported uncertainty (k=2) 860
21
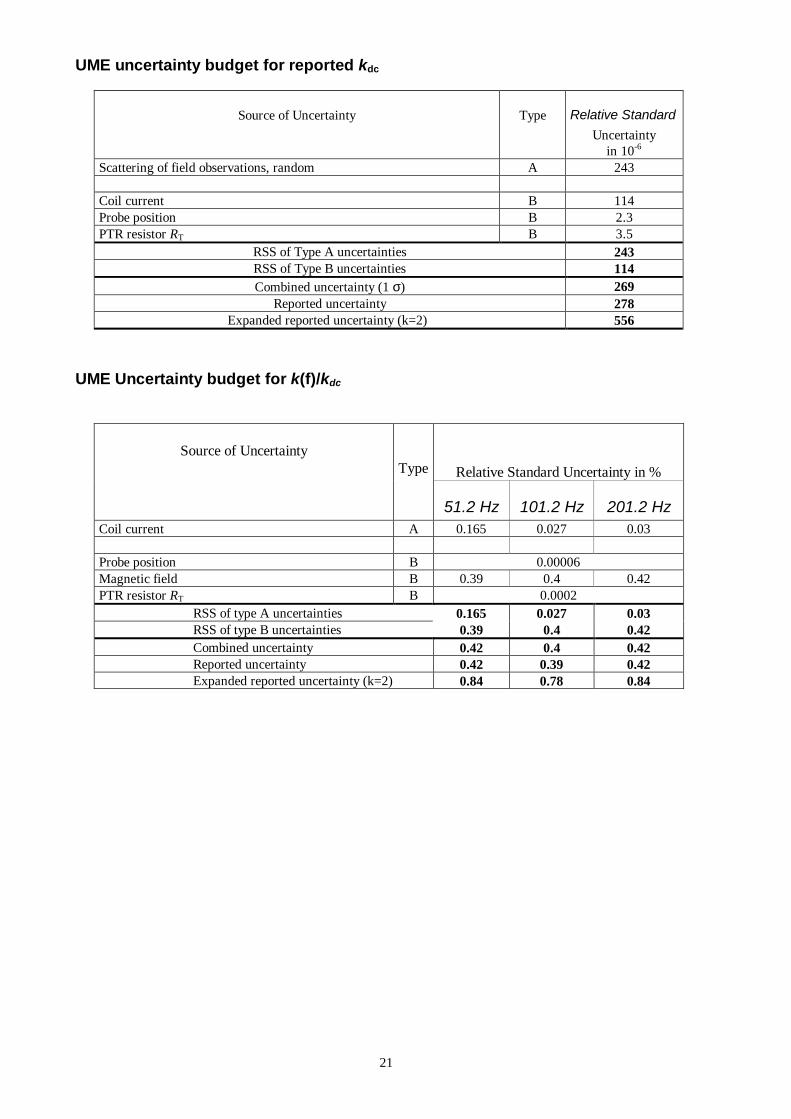
UME uncertainty budget for reported kdc
Source of Uncertainty Type Relative StandardUncertainty
in 10-6
Scattering of field observations, random A 243
Coil current B 114Probe position B 2.3PTR resistor RT B 3.5
RSS of Type A uncertainties 243RSS of Type B uncertainties 114Combined uncertainty (1 σ) 269
Reported uncertainty 278Expanded reported uncertainty (k=2) 556
UME Uncertainty budget for k(f)/kdc
Relative Standard Uncertainty in %Source of Uncertainty
Type
51.2 Hz 101.2 Hz 201.2 HzCoil current A 0.165 0.027 0.03
Probe position B 0.00006Magnetic field B 0.39 0.4 0.42PTR resistor RT B 0.0002
RSS of type A uncertainties 0.165 0.027 0.03RSS of type B uncertainties 0.39 0.4 0.42Combined uncertainty 0.42 0.4 0.42Reported uncertainty 0.42 0.39 0.42Expanded reported uncertainty (k=2) 0.84 0.78 0.84
22
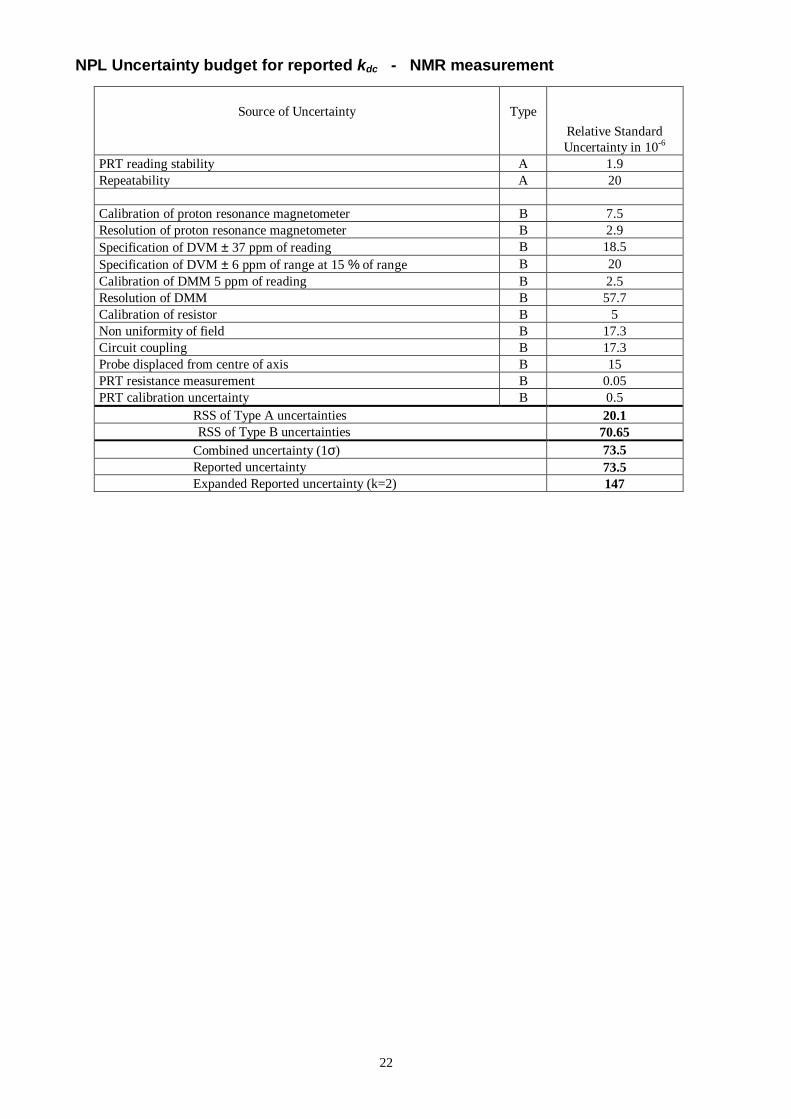
NPL Uncertainty budget for reported kdc - NMR measurement
Source of Uncertainty TypeRelative StandardUncertainty in 10-6
PRT reading stability A 1.9Repeatability A 20
Calibration of proton resonance magnetometer B 7.5Resolution of proton resonance magnetometer B 2.9Specification of DVM ± 37 ppm of reading B 18.5Specification of DVM ± 6 ppm of range at 15 % of range B 20Calibration of DMM 5 ppm of reading B 2.5Resolution of DMM B 57.7Calibration of resistor B 5Non uniformity of field B 17.3Circuit coupling B 17.3Probe displaced from centre of axis B 15PRT resistance measurement B 0.05PRT calibration uncertainty B 0.5
RSS of Type A uncertainties 20.1RSS of Type B uncertainties 70.65
Combined uncertainty (1σ) 73.5Reported uncertainty 73.5Expanded Reported uncertainty (k=2) 147

23
NPL Uncertainty budget for k(f)/kdc - frequency range: 60 Hz to 20 kHz
Source of Uncertainty TypeRelative StandardUncertainty in %
PRT reading stability A 0.00019Repeatability A 0.02
Calibration of search coil M134 B 0.08History of search coil M134 B 0.02Frequency response of search coil M134 B 0.1Specification of DVM measuring across shunt, ± 0.035 % of reading B 0.0175DVM specification, ± 0.015 % of range, at 15 % of range B 0.05Calibration of DVM worst case - current B 0.0375Value of current shunt B 0.0005Frequency response of current shunt B 0.015Drift of current shunt B 0.0866Specification of DVM measuring coil output, ± 0.035 % of reading B 0.0175DVM specification, ± 0.015 % of range, at 12 % of range B 0.0625Calibration of DVM worst case – induced voltage B 0.0375Loading of DVM on shunt B 0.0346Loading of DVM on coil B 0.0289Coil not aligned for maximum reading B 0.02Coils displaced from centre of axis B 0.0015Non uniformity of field B 0.00173Circuit coupling B 0.05774Uncorrected pickup where RSS of 3.3 mV with 325.3 mV B 0.003PRT resistance measurement B 0.0000048PRT calibration uncertainty B 0.00005
RSS of Type A uncertainties 0.02RSS of Type B uncertainties 0.2
Combined uncertainty (1σ) 0.2013Reported uncertainty 0.205Expanded reported uncertainty (k=2) 0.41
24
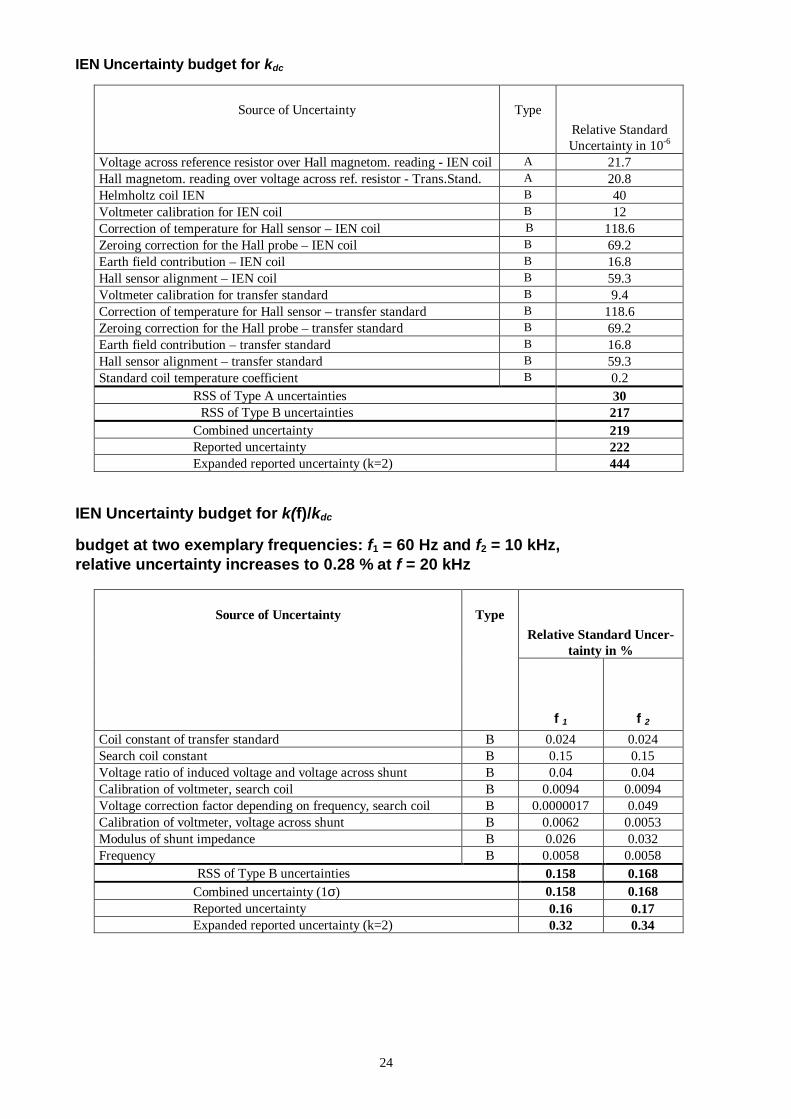
IEN Uncertainty budget for kdc
Source of Uncertainty TypeRelative StandardUncertainty in 10-6
Voltage across reference resistor over Hall magnetom. reading - IEN coil A 21.7Hall magnetom. reading over voltage across ref. resistor - Trans.Stand. A 20.8Helmholtz coil IEN B 40Voltmeter calibration for IEN coil B 12Correction of temperature for Hall sensor – IEN coil B 118.6Zeroing correction for the Hall probe – IEN coil B 69.2Earth field contribution – IEN coil B 16.8Hall sensor alignment – IEN coil B 59.3Voltmeter calibration for transfer standard B 9.4Correction of temperature for Hall sensor – transfer standard B 118.6Zeroing correction for the Hall probe – transfer standard B 69.2Earth field contribution – transfer standard B 16.8Hall sensor alignment – transfer standard B 59.3Standard coil temperature coefficient B 0.2
RSS of Type A uncertainties 30 RSS of Type B uncertainties 217
Combined uncertainty 219Reported uncertainty 222Expanded reported uncertainty (k=2) 444
IEN Uncertainty budget for k(f)/kdc
budget at two exemplary frequencies: f1 = 60 Hz and f2 = 10 kHz,relative uncertainty increases to 0.28 % at f = 20 kHz
Relative Standard Uncer-tainty in %
Source of Uncertainty Type
f 1 f 2
Coil constant of transfer standard B 0.024 0.024Search coil constant B 0.15 0.15Voltage ratio of induced voltage and voltage across shunt B 0.04 0.04Calibration of voltmeter, search coil B 0.0094 0.0094Voltage correction factor depending on frequency, search coil B 0.0000017 0.049Calibration of voltmeter, voltage across shunt B 0.0062 0.0053Modulus of shunt impedance B 0.026 0.032Frequency B 0.0058 0.0058 RSS of Type B uncertainties 0.158 0.168
Combined uncertainty (1σ) 0.158 0.168Reported uncertainty 0.16 0.17Expanded reported uncertainty (k=2) 0.32 0.34
25
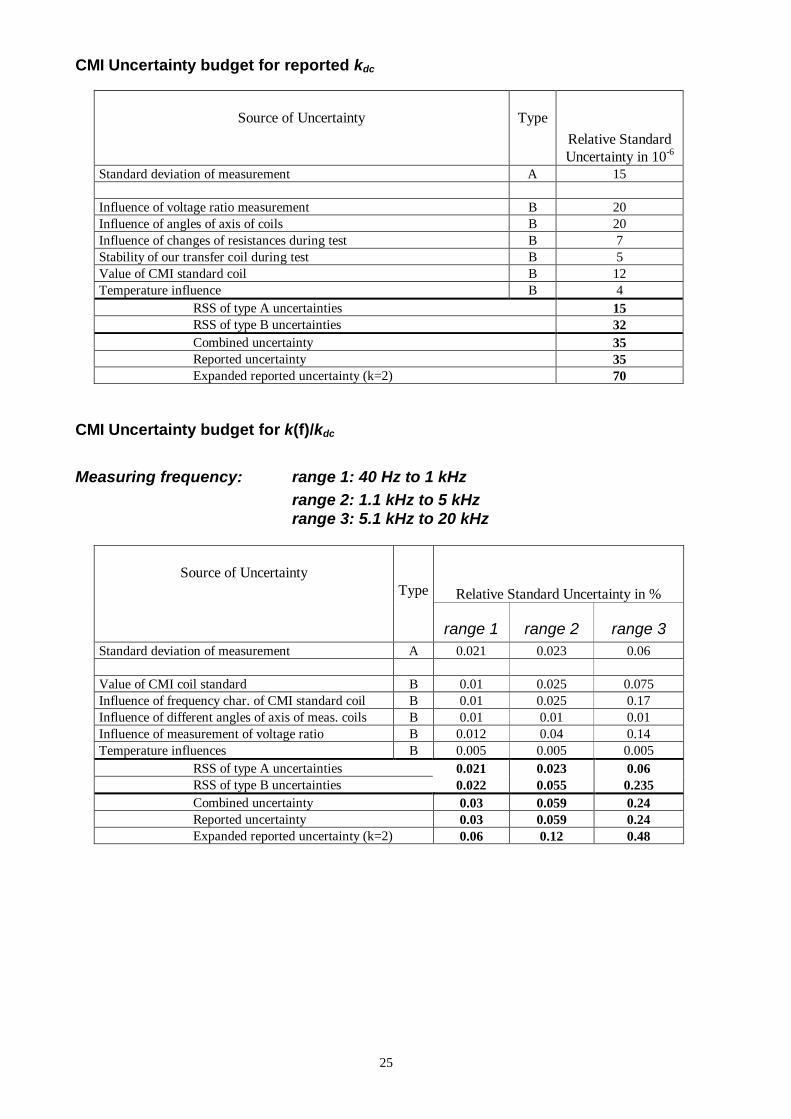
CMI Uncertainty budget for reported kdc
Source of Uncertainty TypeRelative StandardUncertainty in 10-6
Standard deviation of measurement A 15
Influence of voltage ratio measurement B 20Influence of angles of axis of coils B 20Influence of changes of resistances during test B 7Stability of our transfer coil during test B 5Value of CMI standard coil B 12Temperature influence B 4
RSS of type A uncertainties 15RSS of type B uncertainties 32Combined uncertainty 35Reported uncertainty 35Expanded reported uncertainty (k=2) 70
CMI Uncertainty budget for k(f)/kdc
Measuring frequency: range 1: 40 Hz to 1 kHzrange 2: 1.1 kHz to 5 kHzrange 3: 5.1 kHz to 20 kHz
Relative Standard Uncertainty in %Source of Uncertainty
Type
range 1 range 2 range 3Standard deviation of measurement A 0.021 0.023 0.06
Value of CMI coil standard B 0.01 0.025 0.075Influence of frequency char. of CMI standard coil B 0.01 0.025 0.17Influence of different angles of axis of meas. coils B 0.01 0.01 0.01Influence of measurement of voltage ratio B 0.012 0.04 0.14Temperature influences B 0.005 0.005 0.005
RSS of type A uncertainties 0.021 0.023 0.06RSS of type B uncertainties 0.022 0.055 0.235Combined uncertainty 0.03 0.059 0.24Reported uncertainty 0.03 0.059 0.24Expanded reported uncertainty (k=2) 0.06 0.12 0.48
26
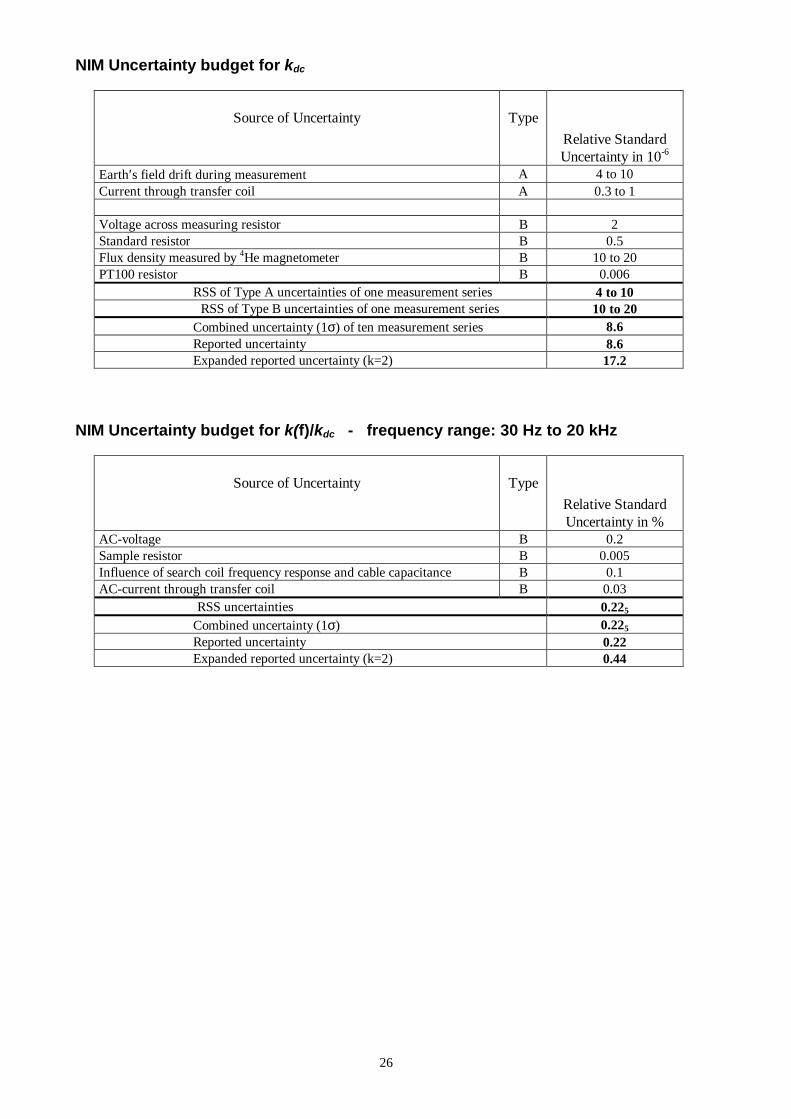
NIM Uncertainty budget for kdc
Source of Uncertainty TypeRelative StandardUncertainty in 10-6
Earth′s field drift during measurement A 4 to 10Current through transfer coil A 0.3 to 1
Voltage across measuring resistor B 2Standard resistor B 0.5Flux density measured by 4He magnetometer B 10 to 20PT100 resistor B 0.006
RSS of Type A uncertainties of one measurement series 4 to 10 RSS of Type B uncertainties of one measurement series 10 to 20
Combined uncertainty (1σ) of ten measurement series 8.6Reported uncertainty 8.6Expanded reported uncertainty (k=2) 17.2
NIM Uncertainty budget for k(f)/kdc - frequency range: 30 Hz to 20 kHz
Source of Uncertainty TypeRelative StandardUncertainty in %
AC-voltage B 0.2Sample resistor B 0.005Influence of search coil frequency response and cable capacitance B 0.1AC-current through transfer coil B 0.03 RSS uncertainties 0.225
Combined uncertainty (1σ) 0.225
Reported uncertainty 0.22Expanded reported uncertainty (k=2) 0.44
27
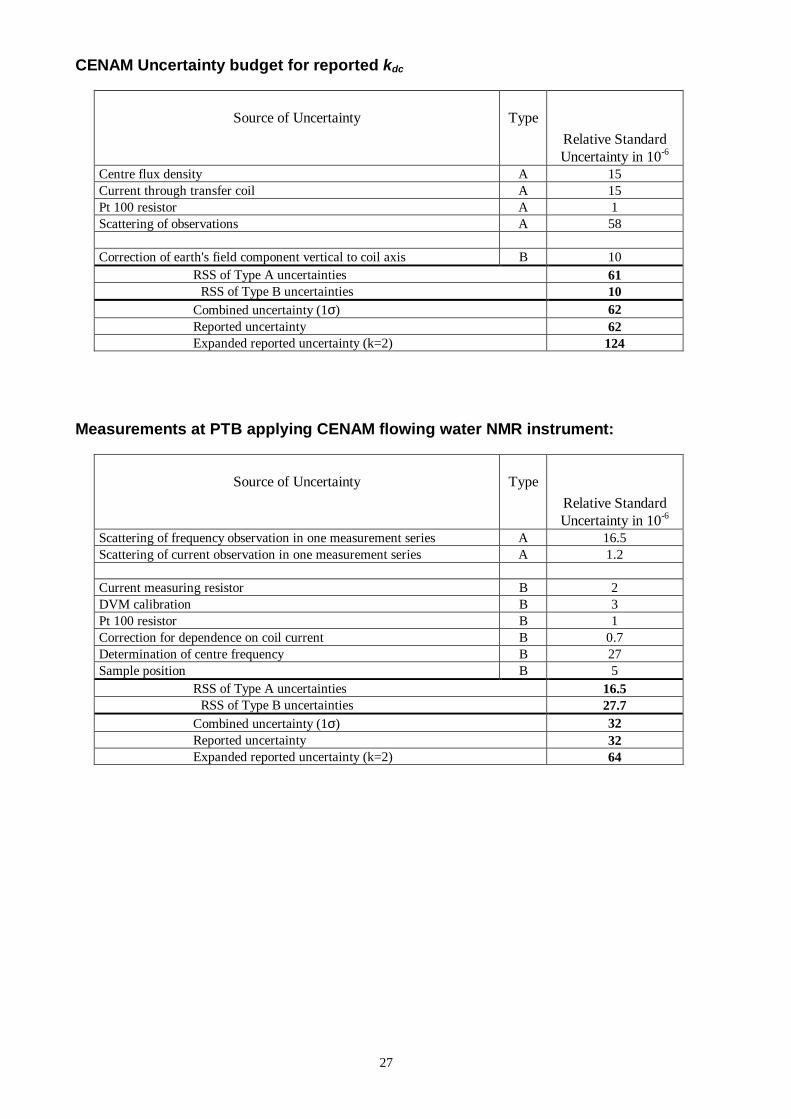
CENAM Uncertainty budget for reported kdc
Source of Uncertainty TypeRelative StandardUncertainty in 10-6
Centre flux density A 15Current through transfer coil A 15Pt 100 resistor A 1Scattering of observations A 58
Correction of earth's field component vertical to coil axis B 10RSS of Type A uncertainties 61
RSS of Type B uncertainties 10Combined uncertainty (1σ) 62Reported uncertainty 62Expanded reported uncertainty (k=2) 124
Measurements at PTB applying CENAM flowing water NMR instrument:
Source of Uncertainty TypeRelative StandardUncertainty in 10-6
Scattering of frequency observation in one measurement series A 16.5Scattering of current observation in one measurement series A 1.2
Current measuring resistor B 2DVM calibration B 3Pt 100 resistor B 1Correction for dependence on coil current B 0.7Determination of centre frequency B 27Sample position B 5
RSS of Type A uncertainties 16.5 RSS of Type B uncertainties 27.7
Combined uncertainty (1σ) 32Reported uncertainty 32Expanded reported uncertainty (k=2) 64
28
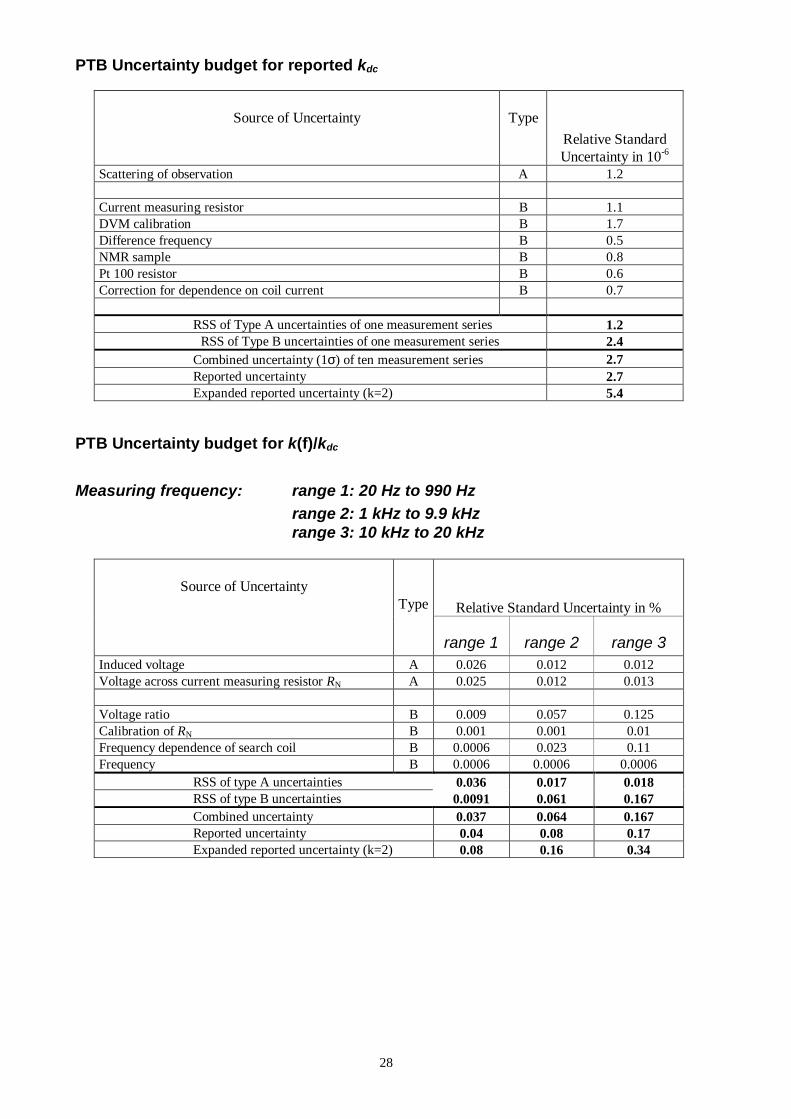
PTB Uncertainty budget for reported kdc
Source of Uncertainty TypeRelative StandardUncertainty in 10-6
Scattering of observation A 1.2
Current measuring resistor B 1.1DVM calibration B 1.7Difference frequency B 0.5NMR sample B 0.8Pt 100 resistor B 0.6Correction for dependence on coil current B 0.7
RSS of Type A uncertainties of one measurement series 1.2 RSS of Type B uncertainties of one measurement series 2.4
Combined uncertainty (1σ) of ten measurement series 2.7Reported uncertainty 2.7Expanded reported uncertainty (k=2) 5.4
PTB Uncertainty budget for k(f)/kdc
Measuring frequency: range 1: 20 Hz to 990 Hzrange 2: 1 kHz to 9.9 kHzrange 3: 10 kHz to 20 kHz
Relative Standard Uncertainty in %Source of Uncertainty
Type
range 1 range 2 range 3Induced voltage A 0.026 0.012 0.012Voltage across current measuring resistor RN A 0.025 0.012 0.013
Voltage ratio B 0.009 0.057 0.125Calibration of RN B 0.001 0.001 0.01Frequency dependence of search coil B 0.0006 0.023 0.11Frequency B 0.0006 0.0006 0.0006
RSS of type A uncertainties 0.036 0.017 0.018RSS of type B uncertainties 0.0091 0.061 0.167Combined uncertainty 0.037 0.064 0.167Reported uncertainty 0.04 0.08 0.17Expanded reported uncertainty (k=2) 0.08 0.16 0.34
29
CCEM.M.-K1
Appendix 2
Comparison Protocol
30
Proposal of an Intercomparison within the CCEM of Magnetic Flux Density by Means of a TransferStandard Coil.
Preliminary remarks:
The delegates of the CCEM discussion meeting on international comparisons in magnetism - 15th of May
2000 in Sydney - decided that a worldwide intercomparison of the magnetic flux density by means of a
transfer standard coil should be proposed in addition to and in accordance with the EUROMET project No.
446 which had been finished in March 2000. At the meeting, NPL (Dr. M. Hall) had agreed to overtake the
role of the pilot laboratory, whereas PTB should provide the standard coil. Meanwhile NPL cancelled its
agreement for budget reasons and PTB has agreed to pilot the intercomparison. At the time of the meeting
in Sydney, at least five Standard Laboratories were interested in participating in this intercomparison:
VNIIM, St.Petersburg, Russia,
NIM, Beijing, China.
KRISS, Taejong, Republic of Korea
ETL, Tsukuba, Japan, (?)
CSIRO-NML, Sydney, Australia,
NIST, Boulder or Gaithersburg, USA.
In the meantime, UME from Turkey has also shown its interest in participation.
In order to find out how the results obtained within the planned intercomparison are in relation with these of
the EUROMET project, two of the EUROMET partners, besides PTB, should also participate in the new
intercomparison. The NPL has already agreed, IEN, Dr. G. Crotti, has been asked to take part.
Transfer Standard:
A single layer solenoid of the Garret type is prepared to serve as dc- and ac-transfer standard. It provides
an inner diameter of about 100 mm and a winding length of 345 mm. The coil has a dc-resistance of 35 Ω
and is capable of carrying a maximum permitted current of 1 A, producing a field in its centre with a flux
density B0 of about 2 mT. The field in the centre region is as homogeneous as necessary to enable NMR
measurements by the free precession method even for fields larger than 1 mT. Four diametrically arranged
current return leads along the coil, fixed at the same distance from the coil axis and resistively
symmetrized, ensure general compensation of field components perpendicular to the coil axis and
reproducible connection conditions for all participants. The coil is connected by a twisted cable of about
30 cm length with banana plugs at the end. At one end of the coil a PT 100 resistor is fixed to the winding
provided as a coil temperature reference. The coefficients for calculating the coil temperature from the
resistance measurements, the temperature coefficient of the standard as well as a diagram of the measured
flux density profile will be circulated together with the standard.
31
Program of the intercomparison:
Each participant is asked to determine the dc coil constant kdc - which is the quotient of the centre flux
density B0 over the current Ic through the coil - and to determine its deviation over frequency up to f = 20
kHz. For this purpose the partners shall apply the measuring methods and use the current equipment
available to them to maintain and to disseminate the unit of magnetic dc- and ac flux density. All results
shall be related to a coil temperature of Tc = 23°C.
With respect to the dc measurements it would be a welcome development if NMR or atomic resonance
methods could be applied.
In case of ac measurements, care must be taken that loading the standard capacitively by the measuring
circuit should be avoided. Furthermore, the surroundings of the standard during the measurements should
be free from metallic materials to avoid loading due to induced eddy currents. (As a rule: no metals within a
distance of at least three times the length of the coil.)
Reporting the results
The participating institutes must report their results, i.e. the coil constant kdc and its frequency response
k(f)/kdc to the pilot institute as soon as possible, together with uncertainty budgets according to the "Guide
to the Expression of Uncertainty in Measurement". It is to expect that the 1σ uncertainty in case of the dc
measurement is not larger than 10-4, for measurements with frequencies f ≤ 2 kHz less than 0.2 % and with
frequencies above 2 kHz not more than 0.5 %.
Possible schedule:
If all participants are well prepared to start the measurements just after receiving the standard, a period of
three weeks should be enough to perform all measurements including additional checks for reproducibility
of the results. Three more weeks have been estimated for transportation of the standard to the next partner.
The PTB will arrange all required carnets as far as they can be managed in Germany. Nevertheless, each
participant should contact the relevant customs office in advance in order to check, whether special or
unusual requirements have to be fulfilled to send the standard to the country of the partner following him.
To avoid any delay he should also contact a transportation service company in time.
If all institutes mentioned above finally agree to participate, the standard could be circulated as follows.
Jan. to March 2001: Final tests on standard at PTB and preparation for its transport.
1st of April VNIIM, Russia receives standard
15th of May NIM, China "
1st of July KRISS, RoK "
15th of August ETL, Japan "
1st of Oct. CSIRO-NML, Australia "
32
15th of Nov. NIST, USA "
1st of January 2002 NPL, UK "
15th of Febr. IEN, Italy "
1st of April UME, Turkey "
15th to 31th. of May Re-measurements at PTB
1st of Aug. Final results
Final remark
Each participating institute will be bound to follow the "Guidelines for CIPM key comparisons" -appendix
F to the MRA.
![· B/C = [B1/K1+rP+B2/K1+rP2+…+Bn/K1+rPn] / [C1/K1+rP+C2/K1+rP2+…+Cn/K1+rPn] 5.3flf> IGKInternal Rate of Return, IRRP I¢{ÝF^!$I –7˚FG«ˆTu” $%7 ô( üI ·fiflf> I](https://img.pdfslide.net/doc/110x75/5cde29d788c9938b288c087b/-bc-b1k1rpb2k1rp2bnk1rpn-c1k1rpc2k1rp2cnk1rpn-53f.jpg)