Embed Size (px)
Citation preview

7
I
GLR-113
Final Reporton
A URINE VOLUME MEASUREMENT SYSTEM
For
National Aeronautical and Space AdministrationManned Spacecraft Center
R & D Contract BranchContract NAS 9-11612
(Contract Period, April 29, 1971 to December 31, 1972)
December 1972
H. F. PoppendiekG. MouritzenC. M. Sabin
GEOSCIENCE LTD410 South Cedros Avenue
Sol ana Beach, California 92075
https://ntrs.nasa.gov/search.jsp?R=19730007368 2020-03-23T07:59:24+00:00Z

GLR-113
Final Reporton
A URINE VOLUME MEASUREMENT SYSTEM
For
National Aeronautical and Space AdministrationManned Spacecraft Center
R & D Contract BranchContract NAS 9-11612
(Contract Period, April 29, 1971 to December 31, 1972)
December 1972
H. F. PoppendiekG. MouritzenC. H. Sabin
GEOSCIENCE LTD410 South Cedros Avenue
Sol ana Beach, California 92075

TABLE OF CONTENTS
I. INTRODUCTION . 1
II. DESCRIPTION OF SYSTEM 2
III. INVESTIGATION OF POTENTIAL PROBLEM AREAS 7
IV. FABRICATION OF THE PROTOTYPE MEASUREMENT SYSTEM 22
V. LABORATORY TESTING OF PROTOTYPE MEASUREMENT SYSTEM 35
VI. CONCLUSIONS 41
VII. BIBLIOGRAPHY 43

•I. INTRODUCTION
The NASA's medical and behavioral experiments program objectives
of future manned space flights require that the urine volume of
each individual void be determined. Presently, there are no
satisfactory methods for making such determination. Therefore,
NASA is seeking an improved urine volume measurement system for
use in the ynusual environment of manned space flight.
NASA's current urine transfer and collection system utilizes a
blower that draws cabin air and urine through a duct into the
urine collector in the zero-gravity environment. The volume
measurement is made at a subsequent time. The major difficulty in
making the measurement relates to the presence of air in the urine.
The system being studied by Geoscience utilizes a low time-constant
thermal flowmeter. The time integral of the transient response of
the flowmeter gives the urine volume during a void as it occurs. In
addition, the two phase flows through the flowmeter present no
problem. Developments of the thermal flowmeter and a verification
of the predicted performance characteristics during the contract
period are summarized in this report.

II. DESCRIPTION OF SYSTEM
The Geoscience "axial fluid temperature differential" flowmeter is
briefly described as follows. Heat from an electrical heater is
added to a thin wall tube through which a two-component mixture of
urine and air is flowing. A thermopile that measures the axial
temperature rise in the established flow region is positioned on the
tube wall (the temperature field for this system is shown in Figure 1).
The flow tube, heater, and thermopile are insulated from the sur-
roundings by a foam layer or a vacuum jacket. The heat balance on the*
flowmeter at steady state is
qH = {ml CP] + m2 V 4tm 0)
where
qH , electrical heat input between the thermopile junctions
m, , urine mass flow rate
cp-| , urine heat capacity
nip , air mass flow rate
c , air heat capacityP2
At , axial flu~'d temperature differential
The mass fraction of urine in the two-component mixture can be defined asml
Xl = + m
* The storage term is small under transient performance conditionsif the thermal capacity of the system is low.

LU
OCLU0.2UJ
ENTRANCEREGION
ESTABLISHEDFLOW RECION
DISTANCE •
UNIFORM HEAT ADDITION
H -U 1 4 TU I
Figure 1. Entrance and Established Flow Region Descriptions

From Equations (1) and (2), the urine mass flow rate can be expressed as,
qHmn = T—^ (3)r + /J-Vi i 4t[Pi p i j . P 2 J m
The thermopile voltage is given by,
ES = n e 4tm (4)
where
n , number of thermocouple junction sets
e , thermoelectric power of the two dissimilar metals that
comprise the thermopile
Substitution of Equation (4) into (3) yields,
qH n eml =
'' (^£-)K <•'s
where
jr- (5)
qHn eK = ( 6 )
r, ,/ ] - x i \ / % x
cPl
c
It is of importance to examine the flowmeter constant K for the present
application of two component urine-air flow. The mass flow rates in
Equation (2) can be expressed as volumetric flow rates,

V
"1ml
m, + nu
Q, 7,
Q, r, + Q2 y2
(7)
where
Q , volumetric flow rate
y , density
For the present application, the volumetric flow rates for the two
components are of the same order of magnitude (say Q-, = Q2). For this
case, X, becomes
or
- Xlv yXl 1
For urine, 7, = 62.4 lbs/ft3 and c ^1.0 Btu/lb °F and for airP-]
X, = 0.075 lbs/ft3 and cn - 0.24 Btu/lb °F, the bracket term in* P2Equation (6) becomes
i+i ^ V 2 1M /\ X, Ac /L \ 1 PI
- 1 + / 0 . 0 7 5 \1 I 6 2.4J
= 1.00029
/ 0.24
I 1 - 0
This result means that the presence of the gas component is unimportant
in the heat balance of the flowmeter system for the urine mass fraction
indicated. Note that even if the urine flow is reduced by a factor of

100, the effect of the gas component is still small.
The urine mass flow rate can be inversely related to the thermo-
electric output signal, ES (Equation (5), and the urine volume is
obtained by integrating the mass flow rate over time,
e~V f
1 J(8)
where
V-, , urine volume
6 , time

III. INVESTIGATION OF POTENTIAL PROBLEM AREAS
1. Significance of Variations of Specific Heat and Density of Urine
The question of the influence of variations in urine density and heat
capacity on the urine flow rate and volume determinations was identified
at the beginning of the program. The following analytical treatment
demonstrates that these property variations over wide ranges of void
volume per day are not serious.
Urine consists mainly of water and small amounts of organic and inorganic
constituents; namely, sodium and potassium chlorides and urea. From the
known constituents, the density can be calculated for the mixture using
the formula,
where
y , density of mixturej_ U
u , weight fraction of the n constituent
y . , density of the n constituent
This formula was used to predict the density of idealized urine mixtures
made from 8.90 gm NaCl, 3.45 gm KC1, and 15 and 30 gm urea mixed in
volumes of 600, and 2400 ml of water (the normal void range for an adult
* See Reference 5 in the Bibliography

in twenty-four hours). The results of these calculations are shown
in Table I and are found to be in good agreement with the experimental
range reported in the literature, namely, 1.003<y<1.03 gm/cc.
The heat capacity of idealized urine mixtures can be calculated from
*the following formula,
CP ' f «n \ (10)
where
c , heat capacity of mixture
c , heat capacity of the n constituentthw , weight fraction of the n constituent
n
The heat capacity calculations for the mixtures used in the previous
two examples are presented in Table II.
The property prediction methods used above have been found to be in good
agreement with experimental values, as the references cited indicate.
The density and heat capacity variations over the wide range of conditions
shown are only a few percent. Further, in the flowmeter equations them-
selves, these two properties enter as a product; the mean variation of
this product varies less than one percent. The effect of this result
is verified by examining a typical flowmeter calibration curve (Figure 2),
for both urine and water. These data indicate that no significant
differences occur for these two liquids.
* See Reference 4 in the Bibliography

TABLE I. DENSITY PREDICTIONS
Water Volume NaCl, gm K Cl, gm Urea, gm Calculated densityml gm/cc
2400 8.9 3.45 30 1.0063
600 8.9 3.45 30 1.0250
2400 8.9 - 3.45 15 1.0047
600 8.9 3.45 15 1.0185

"^Volumem] NaC], gm
24008.9
6008.9
24008.9
K Cl ' 9m Ureaur ca
3.4530
3-4530
3'45 ,5
gm caPacr;:at!d, a,
°C
0.988
0.950
600 -. 0.98Q
150.966

I I
lOQo.9.
iliiFTTrTTH
7.
6.
505.
.. . _ i I {" { I I ! ' i f~j ' ! ! I I ! i { 11! I'!
IBM 1 I±EH i±t
ss -rrrjTTr
48PmFirrn<'Mil•- • •*!t\-.
H-H- H-lr:....,, -.—•-
Bft
mo
EEE±03±!±I
oCr 3.
M
QJ 2.5.
fOQi
fif
MCtTf I_ j§Tili1-"!TX:
10.
3iFt1
C) -in -'
4,
Legend::
2.5
-ht--H-ri ffl
4Z":i!:Ei:f;L1.5. iif ffl
i i.
i .i j ;
JJ.1.Ir
iiHirlK irHiilfi - H i i l ! mit nr
nnMl;
rtinnrimiirr1
irrtirtimm tii
IjJ
I^Tith-
rtni-
1.5 2.5 3 4 5 6 7 8 9 105 10
1.5 2 2.5 3
204 5 6 7 8 9
50 10
Flowmeter signal, E,
Figure 2. Flow Calibration Curve for Water and Urine for HeaterVoltage of 2.9 Volts.

12
2. Significance of Electrical Resistance of Urine
An analysis was made of the tube wall electrical resistance as compared
to the electrical resistance of urine completely filling the inside
tube of the thermal flowmeter (worst case). Since the calculated
resistance of the urine is more than four orders of magnitude higher
than that of the tube wall, all the electric heat can be considered
dissipated in the tube wall and nothing in the urine. It will, therefore,
not be necessary to electrically insulate the urine from the tube wall.
3. Length to Inside Diameter (L/D) Ratio of the Tube
Because the flowmeter for this application is always in turbulent flow
(because of the relatively high velocity air flow that is always present),
the L/D ratio that defines the entrance region is about 10. The flow-
meter being used has an L/D of about 100 (the thermopile being in the
exit end of the tube). Thus, the thermopile is always in the established
flow region.
4. Single Phase Versus Two-Phase Flow Conditions
Flowmeter measurements under single phase liquid flow in the turbulent
flow regime were found to be in good agreement with two-phase flow data
under the limiting air flow conditions outlined in Section II.
5. Depositions or Percipitates
Wall deposits from percipitates will not influence the flowmeter readings
because any thermal resistance changes would only influence the radial
\

13
heat transfer but not the axial heat transfer (which is what the
flowmeter senses).
6. Cross Contamination Control
In Section II, it was demonstrated that the extreme variations in
urine density and heat capacity that are encountered are small enough
so that the flowmeter signal is not significantly influenced. Thus,
cross contamination does not present a problem.
7. Defining the Beginning and End Point of the Flow Measurement
A matter that needed a more detailed description was what happens to the
flowmeter signal when liquid flow through the meter has not yet started
or when it has ceased. As the liquid flow becomes very small, the
output signal becomes very large (Equation 5). However, if all flow
were stopped and the air flow component were small, all heat generated
by the electrical heater would be lost from the tube by conduction from
its ends. If the flowmeter is symmetrical in design, the temperature
profile in the tube would be symmetrical and the thermopile signal
would be zero (for these specific conditions). In order that the tube
temperature does not become excessive under zero flow conditions, a
temperature sensor located on the tube wall shuts off the heater at
that condition. As soon as the wall temperature drops to the limiting
value, the heater is again activated by the temperature controller.
This feature can be seen in Figure 3 where a typical flow trace is shown.
These "shut-off spikes" at zero flow (before or after a liquid flow

14
\
Oo:
O)
o.10
CO-ocooOlCO
oC\J
o
•z.o
-o
o
o>
CDc
3T3
c
co
3O
SO
<U O
CL O)E IM(OX -(->
LU to
CU
3CD

15
measurement) may or may not be present depending upon how low the
limiting tube wall temperature setting is for the temperature regulator.
In the case of Figure 4, for example, such spikes do not exist.
Although the starting and stopping features are easily identified on
these traces, possible interference with automatic flow integration
required the addition of a flow switch discussed in Section V.
8. Differences in Air Flow Rates
The theoretical description of air flow rate on a liquid or urine flow
rate measurement in the flowmeter has been described in Section II.
For equal volumetric flow rates of air and liquid, it was shown that the
presence of the air would cause a change in signal that is less than
0.03 percent. If the air flow rate were ten times as large as the
urine flow rate, the error would be less than 0.3 percent.
A number of experiments were performed in the laboratory to verify the
predicted air flow effect on the flowmeter output signal. Specifically,
liquid flow rates were held constant or nearly so while air flow rates
were varied from ten to one hundred fold above the liquid flow rates.
Both recording and indicating potentiometers were used to make the study.
The air flow effect on the signal was found to agree with predictions;
the deviations found were within the accuracy limits of the heater power
and recorder zero stability.

16
o
oJ-lCDN
T3
O>
«3
<a
O)oCO
S-QJ•oOO01
toM-O
0)
"a.
«a-OJ

17
The air flow in this flowmeter system plays a very important role;
namely, because of its magnitude, it keeps the liquid component in
the turbulent state even at low liquid velocities. As has been
pointed out previously, under laminar flow conditions, excessive
entrance lengths would be required.
9. Differences in Urine Flow Rates
The urine flow rate function was shown in Section II (the inverse
function of the axial fluid temperature differential between<the
thermopile junctions in the flowmeter). The wide range of liquid flow
measurements made for the system (15 fold variation), verifies the
predicted function (defined by the 45 percent line on log-log paper).
10. Range of Accuracy in Respect to Urine Flow Rate and Urine Volume
Volume measurements were made with urine in order to verify earlier
analytical predictions that urine and water would behave in the same
way as far as the flowmeter is concerned. Typical urine flow data were
shown in Figure 2. The urine flow data are seen to fall close to the
water flow data. A microvolt recorder, Honeywell Electronik 194, with
a 100 microvolt full span on a twelve inch chart was used to record the
flowmeter signals for various liquid flow experiments. Urine voids were
measured by performing an integration of the recorder trace. These
results were also compared with actual void measurements and were found
to agree within two percent of each other. This value is within the
desired accuracy.

18
11. Gravity Effects
A flowmeter (containing a straight flow tube) was tested in both
horizontal and vertical positions in order to verify that gravity
effects would not influence flowmeter performance. The tests were
made over the complete operating range (from very small flows to the
maximum flow capacity of the flowmeter). At constant flow rates, the
flowmeter readings were found to be identical for vertical and horizontal
orientations of the flow tube. A typical example is shown in Figure 5.
The thermal flowmeter will, therefore, yield the same readings in a zero
gravity environment as in the Earth's gravity field. Consequently, no
calibration will be necessary during space flights.
12. Comparison of Suction and Pressurized Flow
Tests were made to demonstrate that a suction pressure applied at the
outlet to the flowmeter with liquid and air flow would yield flowmeter
readings identical to those obtained when using pressurized inlet flow.
The results from this experiment are shown in Figure 6. Note that no
difference in flow performance was found between pressurized and suction
flow as expected.
13. AC vs DC Flowmeter Heater Power
A test was made to verify the fact that the flowmeter can operate either
on AC or DC electrical heating power. When a DC power source was
connected to the flowmeter heater circuit, the flowmeter volume integral
for constant flow rates was found to be identical to the AC calibration
curve (for a constant heater voltage); the results are noted in Figure 7.

03O
f-,o>
19
eN
• r-l
1-1
O
20 Seconds
o>
Full span equals 200 / /V
Figure 5. Recorder trace of output voltagewith flowmeter in alternate vertical andhorizontal positions at constant power input(24 watts) and a nearly constant flow rate(about 28 cc/sec).
O2oX.

DBS/DO pinbn

21
<r trUJ UJQ- Q_X XUJ UJ
s-cu
4->Ol
o
ca
atQ.
OS-a.T3C(O
S-
d)4->c
D-.C
O)
3O
o•r—•4->re
(OO
cutoS-
co
<D
3
"1Vd931NI QN003S 09

22
IV. FABRICATION OF THE PROTOTYPE MEASUREMENT SYSTEM
The potential problem area studies that were performed on this project
were outlined in Section III. The results indicated that the pre-
dicted performance chacteristies discussed in Chapter II for the
flowmeter were realistic. If the flowmeter is operated under the
conditions specified, urine flow rates and urine volumes can be
obtained in a zero gravity environment under two component flow
conditions (i.e., requiring no phase separation). It is also pointed
out that the system can be adapted to other spacecraft fluid flow rate
monitoring requirements.
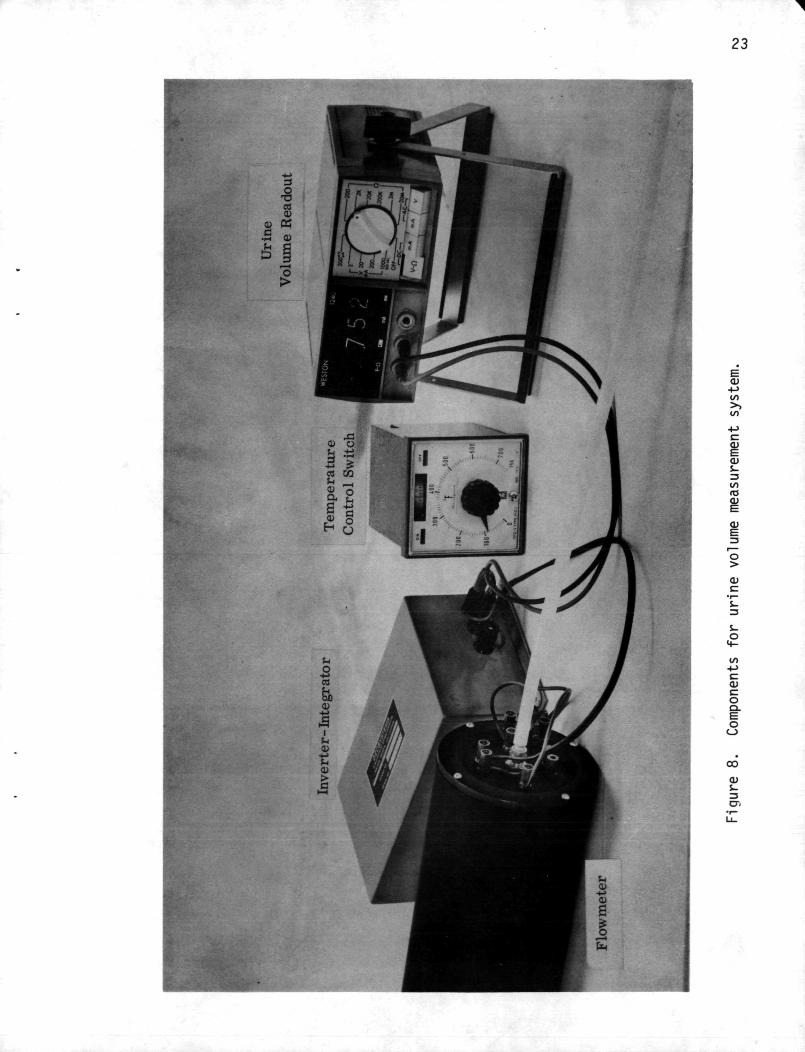
A view of the complete urine volume measurement system as envisioned
for a spacecraft application is shown in Figure 8. The system consists
of a flowmeter, an inverter-integrator, a urine volume readout (digital
voltmeter), a temperature control switch and a urine receptacle with a
flow switch (not shown). A typical installation is shown schematically
in Figure 9.
1. Thermal Flowmeter
The prototype thermal flowmeter is contained inside an insulated
enclosure. Therefore, essentially all of the electrical resistance
heating supplied to the flowmeter tube is transferred to the urine
flowing through the system.
23
01ro
o
S-o
C1J
oQ.
OCJ
00
O)i-

24
o-Mro
H3
O)->(/I
1)
•1)
5
D
*(—i-
O
Q.
UJ
o
CD<_l>
cn
O>S-
CT;
25
The unamplified electric output signal from the thermal flowmeter
varies from 10 microvolts for high urination rates to 500 micro-
volts for very low urination rates, for a power input of 25 watts.
The flowmeter signal can be increased further by increasing the
electrical power to the flowmeter.
A number of flowmeter configurations were built to test various
design features. One flowmeter consisted of a coiled tube (for
compactness) which was contained in a vacuum jacket. This design
was found to be difficult to manufacture without further application
work.
Four different flowmeters utilizing a straight flow tube were built
to test 1) different types of thermopile installations, 2) the effects
of variable tube lengths and tube diameters, 3) various flowmeter
heaters and 4) thermal insulation.
The best flowmeter had a 0.20 inch diameter flow tube, 16 inches long,
operating at 25 watts power input with a maximum urine flow rate of
25 cc/sec (at a 5 psig differential pressure) and an air flow rate of
0.35 cfm (1.00 cfm is the specified allowable flow rate for Skylab).
These limiting parameters can be changed in the following ways:
a. If the tube diameter is increased or the tube length is
decreased, the air flow rate would have to be increased
somewhat to maintain turbulent flow in the tube. However,
fully turbulent flow cannot be maintained at urine flow
rates less than about 2 cc/sec.
26
b. If the heating power is increased above 30 watts, the bulk
urine temperature rise becomes more than 10°F for a urine
flow rate of 1 cc/sec or less. The system is designed to
keep maximum urine heating as it flows through the flow-
meter to a few degrees Fahrenheit; an average temperature
rise for a void is a fraction of a degree Fahrenheit.
c. The maximum urine flow rate that the meter can receive can
be increased by using a larger diameter tube with greater
length.
An alternate method for increasing the maximum urine flow
rate that can be monitored is to have two flow tubes in
parallel inside the same housing as presently used for the
single tube. All other parameters would remain unchanged,
but the integrator would have to be modified to accomodate
the output from two flow tubes.
2. Signal Inverter and Integrator
In order to convert thermal flowmeter output signals to the desired
urine flow integral (urine volume), an analog signal processing circuit
has been designed and constructed. The functions involved are signal
amplification, inversion and integration (see Figure 10).
The unit which has been constructed utilizes solid state discrete-type
analog components, the performance of which is independent of ambient
temperature variations. This is accomplished by enclosing the entire
circuit in a controlled temperature oven.

27
o_I—IDO
COo>
a:oi—Qi
LUh-
t—t
1 OO
i ir1— Q OLU __J H~00 O i— <1 , 1 — 1— "^FL-LJ J_- _^»
Qi OO
o(— t
tl_l_
C_31—
1LU
ct CD O
CJ3 O i— •m — i- -55;L. _1 — OO
1 — 1
r— i
OO
10I—o
2CVJ
o
o;uui—o:
totoo>
oo.
1C
CT,•r*(/>
l»-o£S-CTi
•o
(O£TO
oc
Ol
CD
O 2
II
OJ~
Q- O
o:LUo
oo
a:

28
The amplifier section, which has an overall voltage gain of ten
thousand in two stages, has a differential input, and is designed
to provide an input of ten volts to the inverter (with an input of
one millivolt). The bandwidth has been limited to about ten kilo-
cycles in order to decrease the white noise generated by the input
transistors. It may be useful to decrease the bandwidth further since
the maximum frequency of the transducer signal is at least an order
of magnitude below this. The zero point drift of this amplifier is
less than 0.1 microvolts, referred to the input. The noise is in the
order of one microvolt rms, referred to the input.
The inverter is a transconductance type four quadrant multiplier-
divider, which performs the operation of dividing a constant voltage by
the amplified transducer signal to perform the inversion process. This
component has an input-output relationship which is accurate to one
percent over an input voltage range from 0.4 volts to 10 volts, which
represents a factor of 25 in flow rate.
The integrator unit consists of five functional blocks in a single
package. In addition to the integrator itself, there are: a solid state
switch on the input to perform the integrate-hold function; a bound
circuit on the input to limit the input signal voltage to 0.7 volts,
necessary in order to protect the integrating amplifier; a solid state
switch to perform the reset function; and an outlet bound to limit the
outlet voltage to the maximum capability of the integrating amplifier,

29
which is 10 volts. This processing unit is completely solid state,
and with the environmental oven requires no day-to-day adjustment.
All that is necessary to perform a flow totalization with this
instrument is to reset the integrator with one switch and start
urination. The power to the flowmeter and integrator are activated
automatically by the flow sensor and the control unit. Since the
output is at the level of a few volts, it can be read with any con-
venient panel instrument.
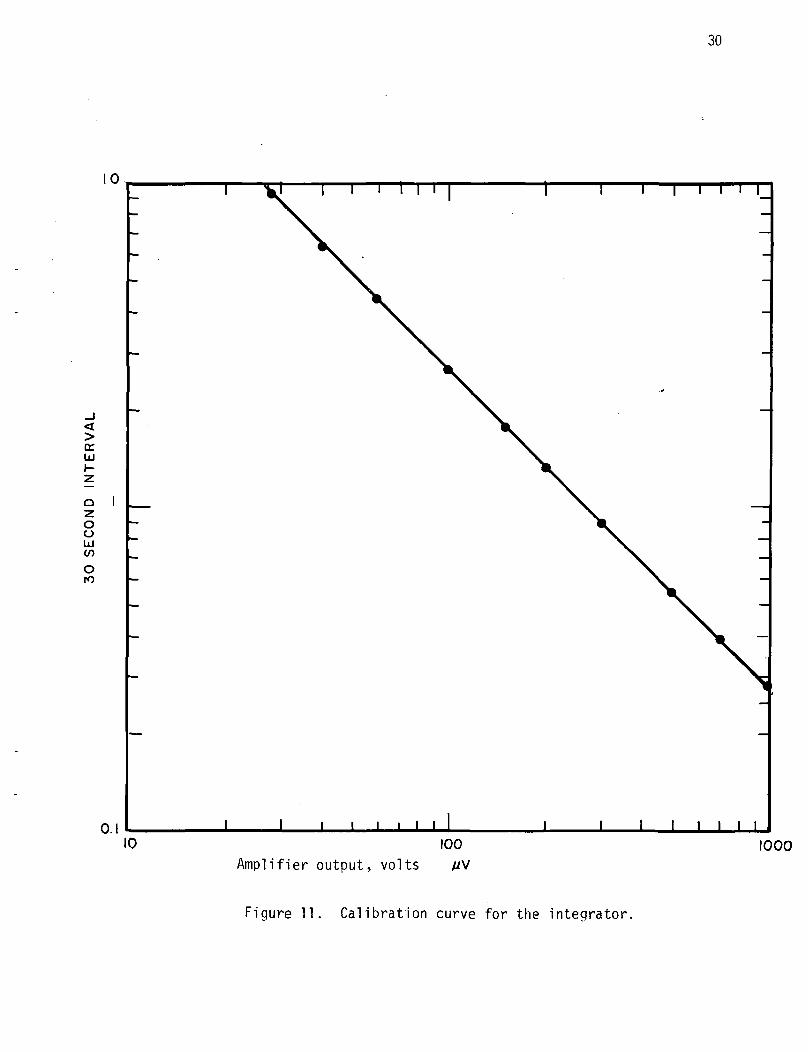
A calibration curve for the integrator based on a controlled input
voltage is shown in Figure 11. All units in the combined system
were found to operate satisfactorily and the computed volumes agreed
with the measured void volumes (within two percent under normal
operating conditions).
3. Flow Switch
A flow switch arrangement was developed which turns on the flowmeter
heater and integrator simultaneously as urine enters the sysem. This
flow switch (which is activated by a thermal sensor) also turns off
the power to the flowmeter heater and stops the integrator when
urination ceases. .This feature was added for the purpose of automatic
operation.
A number of different designs were tested in the laboratory. One flow
switch sensor consisted of a thermocouple attached to a stainless steel
funnel with perforations (see Figure 12). This unit was positioned at
DCUJ
0 IZooUJ<nOro
30
I I ' I I I | I i r
O.I10
I I I I I I I I100
Amplifier output, volts //V
i I i i i i i1000
Figure 11. Calibration curve for the integrator.

31
STAINLESSSTEELSHEATHED
THERMOCOUPLE
RINE RECEPTACLE
FLOW SWITCH
Figure 12. Sectional view of the funnel urine flow switch.

32
the bottom of the urine receptacle. The perforations allow urine to
pass through the funnel, but at the same time guarantee that small
drops of urine will contact the funnel and thus increase its temperature
sufficiently to activate a temperature controller switch (by the thermo-
couple sensor). This type of flow switch sensor was found to operate
satisfactorily at low to medium flow rates. However, even large
perforations were insufficient to allow large volume flow rates to pass
through the funnel. Also, the thermal time constant of the sensor was
not small enough.
The flow switch must be activated as soon as the first drop of urine
contacts the funnel. Thus, the flowmeter heater power is on before the
urine enters the downstream flowmeter. When urination ceases, the urine
flow switch sensor is cooled by the airflow as soon as the last drop
leaves the funnel. However, there must be some time lag in shutting
off the flowmeter until the temperature drops to some pre-set value of
the temperature controller (sufficient to allow passage of the last drop
of urine through the flowmeter).
The spiral flow switch sensor shown in Figure 13 is considered to be
an optimized design, having satisfactory time responses. By setting
the temperature control switch to on-off operation at 90°F (5°F above
the highest cabin temperature of 85°F) the urine flow switch sensor
will activate power to the flowmeter and the integrator automatically
when urination starts, regardless of cabin temperature. At the highest

33
•
\ \ \ \11MILlLI
1• ii* V
V>
1 .PROTECTIVE VINYL
V
^—^
**r~
.-*--
1 i/ /
tiI /
\ ^
-35TIB&2i
/
/;
A i
' /___ THERMOCOUPLE WIRES TO
CONTROL SWITCH
/^^ URINE RECEPTACLE AND TRA
/^^TYPICAL FLOW PATTERNS
"//
^FLOW SENSOR - SPIRAL TUBE CON"
-" THERMOCOUPLE (ST. ST. TUBING 0.(
0.008" WALL, 0.040"SPACING BE
COILS)
' ' — — TYPICAI 1 OCATIONS OF INTFRNAI
THERMOCOUPLES
[—O.40 "O.D.( SPIRAL)
Figure 13. Spiral urine flow switch.

34
cabin temperature of 85°F, the first drop of urine contacting the
sensor will increase its temperature above the 90°F setting in a
fraction of a second. At the lowest cabin temperature of 65°F, only
a few drops of urine need to contact the urine sensor to activate the
power in a fraction of a second; thus, system power is always on
before the first urine drop enters the flowmeter.
The airflow, passing through the flow switch after the last urine drop,
cools the sensor from urine temperature to the 90°F setting in a time
period of 10 to 20 seconds (for room temperatures between 65°F and 85°F)
This time lag is sufficient to guarantee passage of the last drop of
urine through the flowmeter and without excessive loss of cabin air.
A single spiral flow switch was used in the laboratory to automatically
turn on and off the urine volume measurement system (within the above
time limits) during the long term performance tests described in
Geoscience's memo, GLM-99.

35
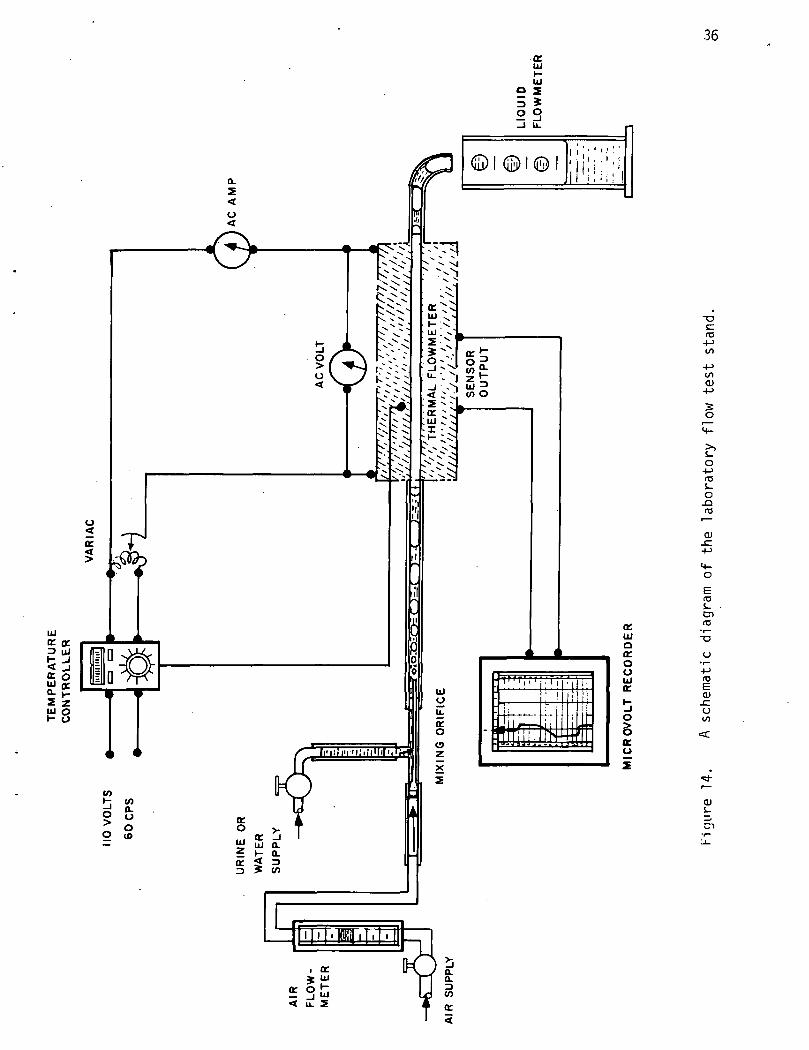
V. LABORATORY TESTING OF PROTOTYPE MEASUREMENT SYSTEM
The investigation of some of the potential problem areas (summarized
in Section III) required laboratory evaluations in a test stand,
illustrated in Figure 14. A water (or urine) reservoir and a
compressed air line were the fluid sources used. Liquid flow was
measured with a graduate and a stop watch. Air flow was measured
with a Rotameter. The output signals of the flowmeter were measured
with recording and indicating potentiometers. AC and DC power sources
were used to activate the flowmeter heater and the wall temperature
was monitored by a temperature controller. The power into the heater
was metered by an ammeter and a voltmeter.
The urine volume measurement system (UVMS) shown in Figure 14 was used to
calibrate the thermal flowmeter and measure its time constants.
Calibration results have been discussed previously. Response times
(time constants) for sudden flow changes were measured to be 1 to 1-1/2
seconds. It is felt that for urination periods of 20 to 60 seconds,
such time transients will not effect the overall volume measurements
significantly; also, the starting and ending transients are compensating
types.
Additional system tests and verifications are briefly outlined in the
following paragraphs.
36o:UJ
ui „:
sSuj oH O
CU
o«4^
S-o
O)(D
-oo
reE0)
-CoCO
^J-
Ol
37
1. Environmental Temperature Control
If there is a large difference in temperature between the urine and
the cabin environment, transient heat transfer can occur if the
thermal insulation is insufficient. Therefore, in order to make this
temperature difference small, super insulation or environmental
temperature control must be used; the latter method was employed.
An external electrical heater was installed on the outside of the
flowmeter. The external heater was then activated with a 28-volt AC
or DC circuit so that the flowmeter was maintained at normal urine
temperature. The system is therefore ready for urination measurements
at any time.
Experiments were performed with the flowmeter maintained at 100°F and
liquid flow temperatures of 95°F, 100°F, and 105°F. In all cases, the
zero deviation on the recorder (with no flowmeter heater power on) was
less than the two percent accuracy in flow rate being sought. The
external heater was therefore proven to control the flowmeter temperature
satisfactorily.
2. Suction Air Flow Arrangement
A suction air flow arrangement was assembled for the final flowmeter
test work. In this system, air and urine flows into a urine receptacle,
through the flowmeter and into a receiving tank. A vacuum pump then
removes the air from the tank.

38
When the flowmeter system was operated in this configuration, the
measured flow rates were identical to the ones reported earlier for
pressure flow. The measured urine voids were accurate within two
percent of the actual voids.
3. Long-Term Functionabil ity Tests
The flowmeter was used daily during urine voiding by two staff members
of Geoscience for a six-week period (see GLM-99 for details). The
UVMS functioned satisfactorily during the six-week test period with no
change in calibration. Calibration was checked weekly by adding 150 cc
of urine into the UVMS and comparing the integrals from the system
recordings. In addition, these tests demonstrated long-term reliability
of the electrical components. The flowmeter tube was inspected at the
end of the six-week test period. There was no deposit of any kind inside
the tube, which had its original shiny surface. Apparently, the high
velocity, turbulently flowing urine-air mixture does not allow the
deposition process to occur.
The flowmeter was operated as it would be in a spacecraft installation.
The external heater was on continuously; thus maintaining the flowmeter
between 98°F and 100°F at all times, so that it was ready for urination.
Before urination was initiated, the air suction pump for the system was
turned on. Urination into a receptacle containing a thermocouple
temperature sensor activated the power to the flowmeter and recorder as

39
soon as the first drop of urine entered the receptacle. One drop
of urine was sufficient to increase the temperature of the flow
switch sensor. When urine flow ceased, the sensor of the switch
cooled and then deactivated the flowmeter and recorder. Thus, the
urine volume measurement system was operated automatically during
each urination as it would in a spacecraft. Long-term function-
ability of the overall system in automatic spacecraft operation was
thereby demonstrated.
4. Void Measurement Using the Inverter-Integrator
Typical volume measurements were made in the laboratory using the
inverter-integrator and a prototype flowmeter. The integrated volume
output signal was shown earlier in Figure 11 as a function of constant
volume flow rate in 30 second runs. Note that the experimental
points deviate from the straight line by less than 1.5 percent. In a
second set of experiments, the volume flow rate was varied to simulate
typical urination flow voids. The void volume was again plotted as a
function of the integrated output signal in Figure 15, and the experi-
mental points deviated from a straight line relationship by less than
2 percent.

40
0.9
0.8
0.7
0.6
0.4
0.3
O.Z
O. I
0100 200
I
300cc
400 500 600
Figure 15. Typical urination voids, integrated vs. measured.

41
VI. CONCLUSIONS
A compact flowmeter was fabricated, "Prototype E," using a flow tube
16 inches long and 0.19 inches I.D. The urine flow range with this
flowmeter is 1 cc/sec to 24 cc/sec using an air flow of 0.35 cfm and
a maximum pressure drop of 5 psig across the flow tube (see Figure 16).
For an air flow rate of 0.25 cfm, this flowmeter will handle urine flow
rates from 3 cc/sec to 40 cc/sec. Thus, it is noted that this system
closely satisfies the typical requirements cited for space vehicle use.
Further refinements of the urine volume flowmeter are possible, but
were not within the scope of the present contract. The prototype
flowmeter can be modified to broaden its operating range as desired.
Also, a flowmeter consisting of two parallel flow tubes similar to
"Prototype E" flowmeter (16 inches long and 0.19 inches I.D.) would
satisfy excess urine void requirements.
A compact inverter/integrator unit was used in the program calibration
tests and was found to give void measurements within the specified two
percent accuracy. Also, a new urine flow switch is included which
successfully activates and deactivates system powers automatically
during urination.

oLL)CO.
Oo
10
42
100 i I i i I IT
I I I I i i I i I I 1
10 100
Figure 16. Calibration curve for "Prototype E" flowmeterusing 25 watt power.
1000

43
VII. BIBLIOGRAPHY
1. Petrack, P., "Chemical Method of Urine Volume Measurement,"
Final Report, 17 Dec. 1964 - June 1967, Contract NAS9-3904,
NASA-CR-65682; Report 8642-FR, CSCL06S, Acquisition No. N67-
34813.
2. Scott, R. Jr., "Modification of NASA Urine Collecting System,"
Final Report, 1 May 1966 - 1 April 1968, Contract NAS9-62061,
NASA-CR-92105, CFSTI; Acquisition No. N68-23714.
3. Petrack, P., W. J. Huffsteller and R. S. Serpas, "A System for
Measurement of Micturition Volume by Tracer Dilution Technique,"
Aerospace Medical Association, Annual Scientific Meeting, 37th
Las Vegas, Nev., April 18-21, 1966, preprints (A66-32134 17-04).
4. Poppendiek, H. F., N. D. Greene, R. Randall, H. G. Furgerson,
"Annual Report on Whole Organ Freezing and Thawing Heat Transfer
and Thermal Properties," ONR Contract No. 4095(00), Period
April 1, 1966 to March 31, 1967.
5. Poppendiek, H. F., R. Randall, J. A. Breeden, J. E. Chambers,
J. R. Murphy, "Thermal Conductivity Measurements and Predictions
for Biological Fluids and Tissues," Cryobiology Vol 3, No. 4, 1966.

44
6. G. Mouritzen and H. F. Poppendiek, "Flow Switch Development
For Geoscience's Urine Volume Measurement System," GLM-98,
September 1972.
7. H. F. Poppendiek and G. Mouritzen, "Demonstration Tests of Long
Term Functionability of the Urine Volume Measurement System,"
GLM-99, September 1972.