Embed Size (px)
Citation preview

Author
Harsha Sapdhare
PhD Candidate,
Natural and Built Environments Research Centre,
University of South Australia
Legatus Group Regional Community Wastewater Management Scheme
(CWMS) Survey and Sludge Processing Plant Viability Investigation
2019
Member Role Organisation
Harsha Sapdhare APR intern Natural and Built Environments Research Centre,
University of South Australia
Prof Simon Beecham Academic
Mentor
Deputy Vice Chancellor: Research and Innovation,
University of South Australia
Simon Millcock Industry Mentor Chief Executive Officer, Legatus Group, South Australia
Nick Swain Mentor Manager Environment, Land and Heritage Expertise, SA
Water
Paul Chapman Project Officer Legatus Group, South Australia
Acknowledgement
The author would like to acknowledge the support of SA Water, the Department of Health
and Ageing, and the South Australia Environment Protection Authority.
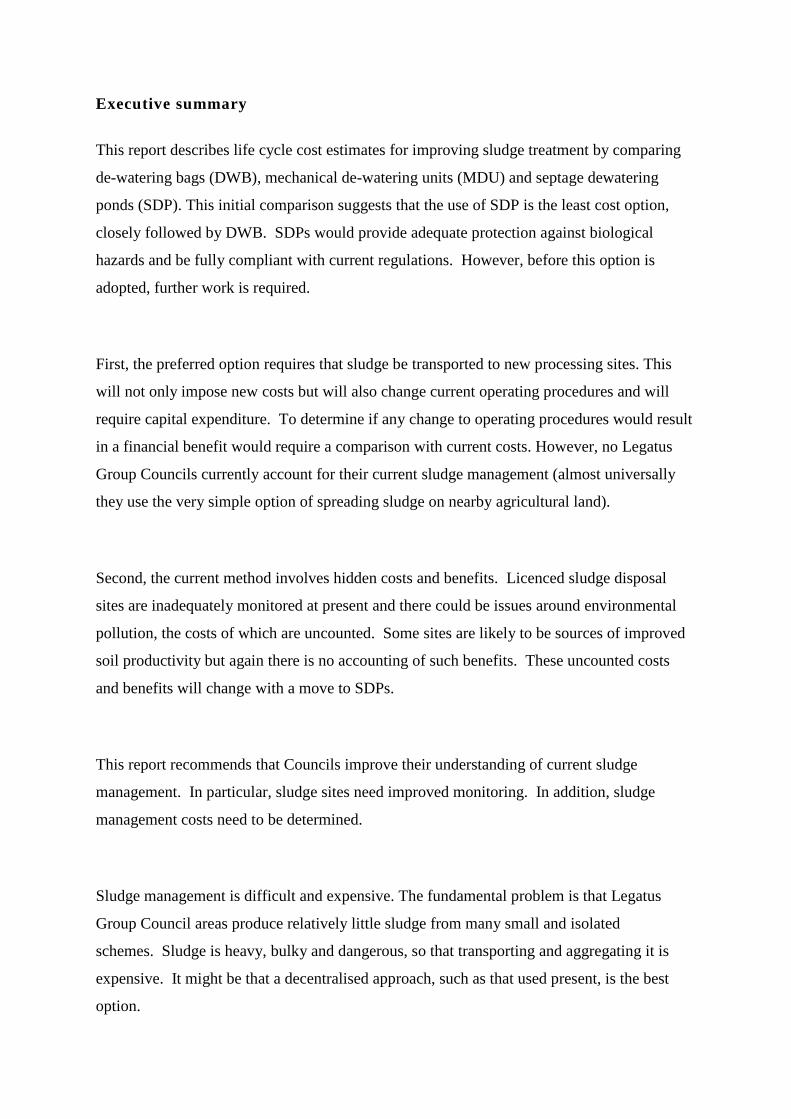
Executive summary
This report describes life cycle cost estimates for improving sludge treatment by comparing
de-watering bags (DWB), mechanical de-watering units (MDU) and septage dewatering
ponds (SDP). This initial comparison suggests that the use of SDP is the least cost option,
closely followed by DWB. SDPs would provide adequate protection against biological
hazards and be fully compliant with current regulations. However, before this option is
adopted, further work is required.
First, the preferred option requires that sludge be transported to new processing sites. This
will not only impose new costs but will also change current operating procedures and will
require capital expenditure. To determine if any change to operating procedures would result
in a financial benefit would require a comparison with current costs. However, no Legatus
Group Councils currently account for their current sludge management (almost universally
they use the very simple option of spreading sludge on nearby agricultural land).
Second, the current method involves hidden costs and benefits. Licenced sludge disposal
sites are inadequately monitored at present and there could be issues around environmental
pollution, the costs of which are uncounted. Some sites are likely to be sources of improved
soil productivity but again there is no accounting of such benefits. These uncounted costs
and benefits will change with a move to SDPs.
This report recommends that Councils improve their understanding of current sludge
management. In particular, sludge sites need improved monitoring. In addition, sludge
management costs need to be determined.
Sludge management is difficult and expensive. The fundamental problem is that Legatus
Group Council areas produce relatively little sludge from many small and isolated
schemes. Sludge is heavy, bulky and dangerous, so that transporting and aggregating it is
expensive. It might be that a decentralised approach, such as that used present, is the best
option.
Contents 1 Introduction ........................................................................................................................ 1
1.1 Background ................................................................................................................. 1
1.2 Aims and scope ........................................................................................................... 1
1.3 Report outline .............................................................................................................. 2
2 Current practices ................................................................................................................. 2
2.1 Existing CWMS sludge and septage management ...................................................... 3
2.2 Estimates of quantities ................................................................................................ 6
2.2.1 Quantity of sludge ................................................................................................ 6
2.2.2 Septage ................................................................................................................. 8
2.3 The quality of sludge and septage ............................................................................. 10
2.4 Projections for sludge and septage ............................................................................ 11
3 Technological options for a sludge processing plant........................................................ 15
3.1 Introduction ............................................................................................................... 15
3.2 Dewatering bags ........................................................................................................ 15
3.2.1 Mechanical dewatering units (mobile)............................................................... 16
3.2.2 Septage dewatering ponds.................................................................................. 17
4 The viability of sludge processing plant ........................................................................... 19
4.1 Introduction ............................................................................................................... 19
4.2 Cost estimates for the three technologies .................................................................. 19
4.3 Viability and the problem of scale ............................................................................ 24
5 Summary and recommendations ...................................................................................... 27
6 References ........................................................................................................................ 29
List of Figures
Figure 1 Map of 15 Constituent Councils .................................................................................. 1
Figure 2 CWMS Sludge Viability Project Framework .............................................................. 3
Figure 3 CWMS Schematic Including Collection Network and Treatment .............................. 4
Figure 4 Typical value chain of CWMS .................................................................................... 5
Figure 5 Geo dewatering bags at Port Lincoln WWTP (Faulkner, 2015) ............................... 15
Figure 6: Septage dewatering ponds schematic ....................................................................... 17
Figure 7 Dewatering sewage ponds, Loxton, South Australia................................................. 18
List of Tables
Table 1 Estimated sludge production per year in the Legatus Group Councils......................... 7
Table 2 Sludge production range ............................................................................................... 8
Table 3 Estimated septage and dry sludge produced per year in the Legatus Group Councils . 9
Table 4 Septage production range............................................................................................ 10
Table 5 Predicted population growth ....................................................................................... 12
Table 6 Estimated current and projected septage (kL/year) and sludge production (t/year) ... 13
Table 7 Predicted quantity of dry sludge (t/year) .................................................................... 14
Table 8 Comparative features of mechanical dewatering technologies (Day and Giles, 2002;
Young et al., 2006)................................................................................................................... 16
Table 9 Costs and benefits of various options ......................................................................... 21
Table 10 Cost estimation for septage and sludge management ............................................... 22
Table 11 Cost estimation for selected scenarios ...................................................................... 23
Table 12 Groups of Councils and biosolid hubs ...................................................................... 25

Glossary
Term Description
ABS Australian Bureau of Statistics
AHC Adelaide Hills Council
BOD Biological Oxygen Demand
CWMS Community Wastewater Management Scheme
DCMB District Council of Mount Barker
DoHA Department of Health and Ageing
ds Dry solids
DWB Dewatering bags
EP Equivalent population
EPA Environmental Protection Authority
ESCOSA Essential Services Commission of South Australia
HDPE High-density polyethylene
kL Kilolitres
LCC Life Cycle Costing
LGA Local Government Association
m3 Cubic Metre
MDU Mechanical Dewatering Units
NPV Net Present Value
PSS Pressure sewerage system
SA Water South Australian Water Corporation
SBR Sequential Batch Reactor
SDP Sludge Dewatering Ponds
SGW Sludge and green waste co-composting
SRMTMP Safety, Reliability, Maintenance, and Technical Management Plan
STED Septic Tank Effluent Disposal Scheme
STEP Septic Tank Effluent Pumping Scheme
STP Sewage Treatment Plant
T Time
t Tonnes
TP Total phosphorus
TSS Total suspended solids
TN Total nitrogen
WWTP Wastewater Treatment Plan
Definitions:
Aerobic digestion The biochemical decomposition of organic matter in biosolids into carbon
dioxide and water by micro-organisms in the presence of air (oxygen).
Anaerobic digestion The biochemical decomposition of organic matter in biosolids into carbon
dioxide, methane and water by micro-organisms in the absence of dissolved
oxygen.
Biosolids Stabilised organic solids derived totally or in part from wastewater treatment
processes which can be managed safely to utilise beneficially their nutrient,
soil conditioning, energy, or other value. The term biosolid does not include
untreated wastewater sludges, industrial sludges or the product produced
from the high-temperature incineration of sewage sludge. It should also be
noted that many other solid waste materials are not classified as biosolids,
e.g., animal manures; food processing or abattoir wastes; solid inorganic
wastes; and untreated sewage or untreated wastes from septic systems/sewage
wastes.
Community Wastewater
Management System
(CWMS)
A common drainage system designed to collect, treat, re-use and/or dispose
of primary treated effluent from septic tanks on individual properties. The
collection system is a network of pipes and pumping stations that transport
the effluent from the septic tanks to the treatment site. The treatment system
can either be by facultative (oxidation) lagoons where effluent is stored and
treated by the aerobic system or by mechanical treatment plants where
aerobic action is undertaken in a series of aerated tanks.
Contamination Grade A grading method used to describe the quality of a biosolids batch according
to the concentration of potentially toxic elements contained therein.
Grading Process of describing biosolids products based on their contaminants
(Contamination Grade) and degree of stabilisation (Stabilisation Grade).
Lagoon A storage facility for sludge
Legatus Group 15 Central local government Councils in South Australia
Septage Wet sludge was taken from a septic tank for disposal or reuse.
Septic Tank Effluent
Disposal (STED)
scheme
A common drainage system for the collection of effluent from septic tanks in
townships, now known as Community Wastewater Management Systems.
Sewage Sludge The residual, semi-solid material that is produced as a by-product
during sewage treatment of industrial or municipal wastewater.
1 Introduction
1.1 Background
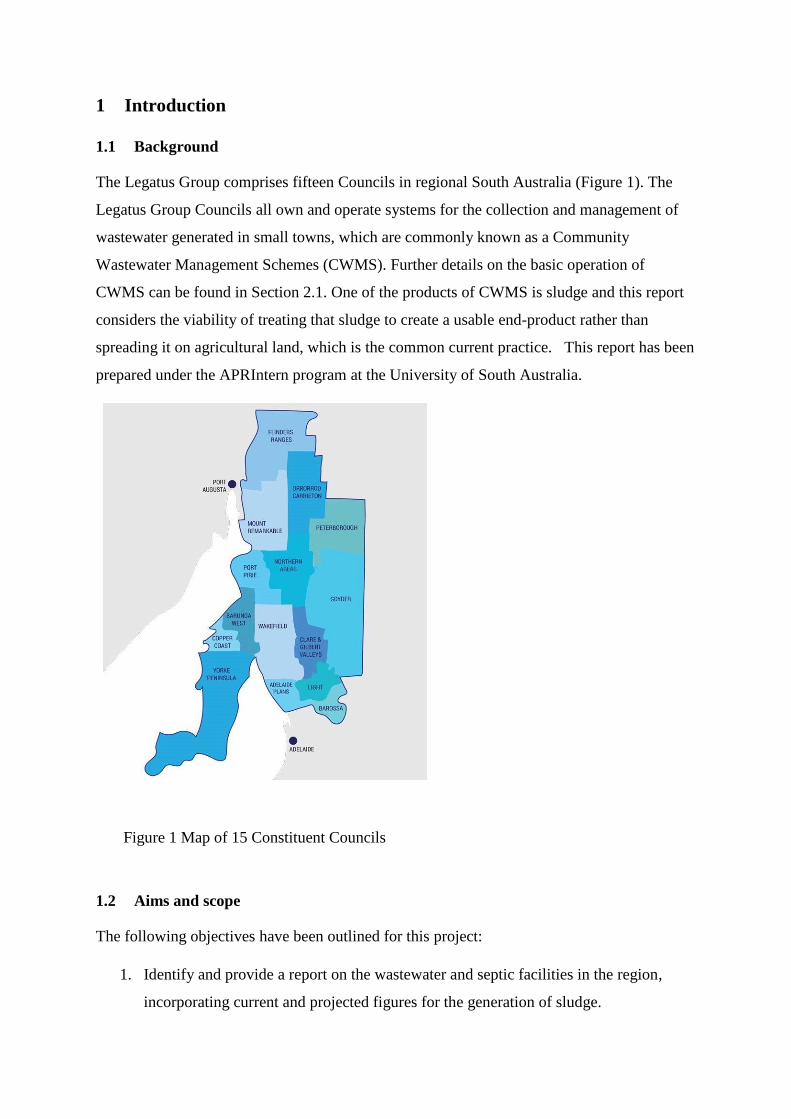
The Legatus Group comprises fifteen Councils in regional South Australia (Figure 1). The
Legatus Group Councils all own and operate systems for the collection and management of
wastewater generated in small towns, which are commonly known as a Community
Wastewater Management Schemes (CWMS). Further details on the basic operation of
CWMS can be found in Section 2.1. One of the products of CWMS is sludge and this report
considers the viability of treating that sludge to create a usable end-product rather than
spreading it on agricultural land, which is the common current practice. This report has been
prepared under the APRIntern program at the University of South Australia.
Figure 1 Map of 15 Constituent Councils
1.2 Aims and scope
The following objectives have been outlined for this project:
1. Identify and provide a report on the wastewater and septic facilities in the region,
incorporating current and projected figures for the generation of sludge.
2. Undertake a desktop study of current literature and data relevant to regional sludge
facilities.
3. Liaise with key industry representatives on the outcomes of the findings from the
research.
4. Provide a final report, including key recommendations regarding the viability of a
regional sludge facility.
While the report title refers to sludge alone, the scope has been interpreted to include septage
pumped from septic tanks attached to CWMS. The scope of this investigation therefore
extends to:
- sludge volumes
- current treatment, disposal and management of septage and sludge
- issues and gaps in the disposal of sludge.
The report also aims to estimate the costs for the alternative treatment and disposal of sludge
and to determine the most cost-effective option and its environmental impact.
1.3 Report outline
This report begins in Section 2 by considering current practices among Legatus Councils.
Section 2 also provides estimates of the quantity and quality of sludge. This work is based on
information obtained from Councils by surveys and follow-up telephone interviews.
Projections are also provided for future volumes based on extrapolations of Census data.
Section 3 employs a literature review to consider three technologies which can be used to
treat sludge in a regional, rural setting. Section 4 considers the issue of viability. It firstly
provides cost estimates of the three options. Secondly, it considers the importance of
economies of scale and the difficulties in aggregating sludge across Council Schemes.
Section 5 provides conclusions and recommendations.
2 Current practices
The first task is to describe these CWMS. Primary information concerning the number of
CWMS in each Council area was acquired from the Department of Health and Ageing. A
survey questionnaire was developed to collect information on the scale and operation of these
schemes, including sludge production and management (Appendix A). This was followed by
telephone correspondence. When it was available, additional information was collected from
the Safety, Reliability, Maintenance, and Technical Management Plan (SRMTMP), which is
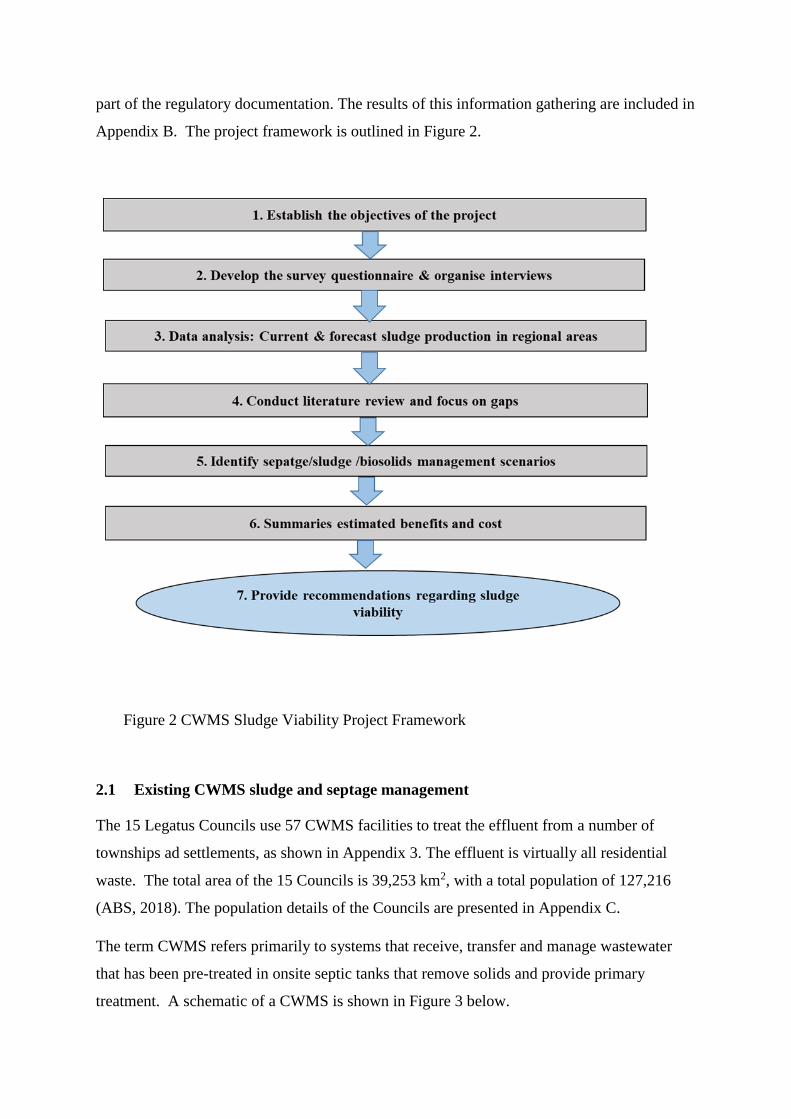
part of the regulatory documentation. The results of this information gathering are included in
Appendix B. The project framework is outlined in Figure 2.
Figure 2 CWMS Sludge Viability Project Framework
2.1 Existing CWMS sludge and septage management
The 15 Legatus Councils use 57 CWMS facilities to treat the effluent from a number of
townships ad settlements, as shown in Appendix 3. The effluent is virtually all residential
waste. The total area of the 15 Councils is 39,253 km2, with a total population of 127,216
(ABS, 2018). The population details of the Councils are presented in Appendix C.
The term CWMS refers primarily to systems that receive, transfer and manage wastewater
that has been pre-treated in onsite septic tanks that remove solids and provide primary
treatment. A schematic of a CWMS is shown in Figure 3 below.
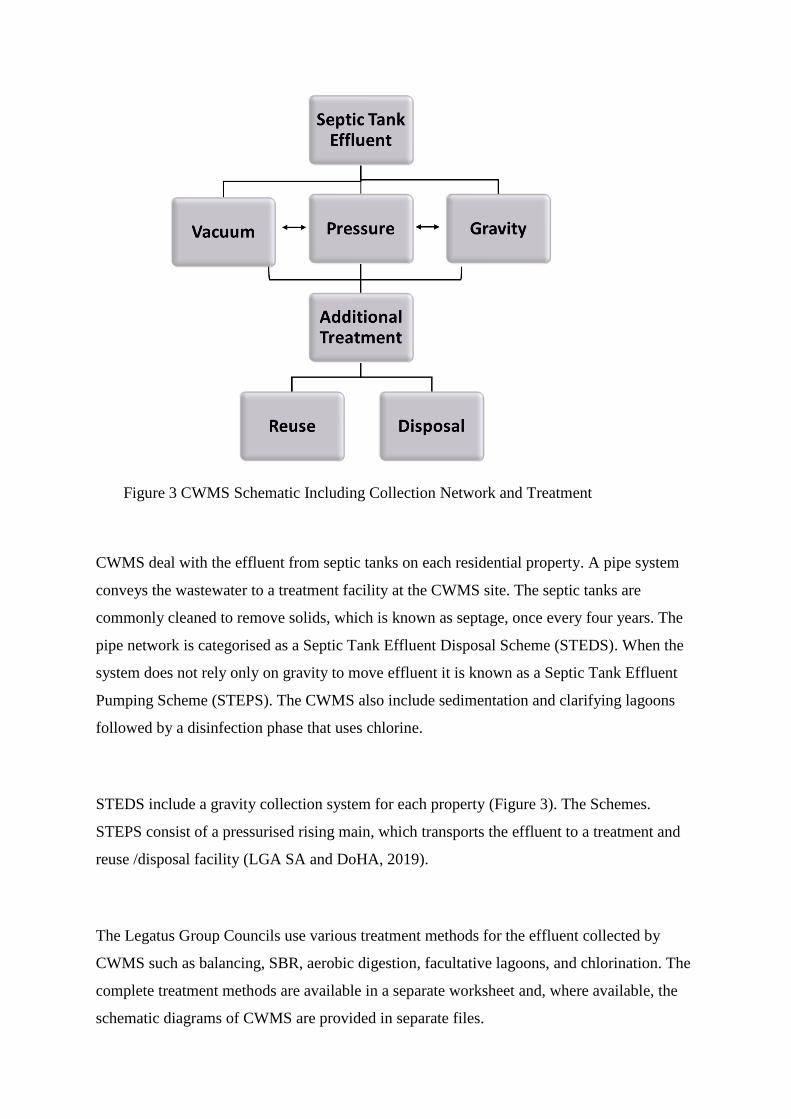
Figure 3 CWMS Schematic Including Collection Network and Treatment
CWMS deal with the effluent from septic tanks on each residential property. A pipe system
conveys the wastewater to a treatment facility at the CWMS site. The septic tanks are
commonly cleaned to remove solids, which is known as septage, once every four years. The
pipe network is categorised as a Septic Tank Effluent Disposal Scheme (STEDS). When the
system does not rely only on gravity to move effluent it is known as a Septic Tank Effluent
Pumping Scheme (STEPS). The CWMS also include sedimentation and clarifying lagoons
followed by a disinfection phase that uses chlorine.
STEDS include a gravity collection system for each property (Figure 3). The Schemes.
STEPS consist of a pressurised rising main, which transports the effluent to a treatment and
reuse /disposal facility (LGA SA and DoHA, 2019).
The Legatus Group Councils use various treatment methods for the effluent collected by
CWMS such as balancing, SBR, aerobic digestion, facultative lagoons, and chlorination. The
complete treatment methods are available in a separate worksheet and, where available, the
schematic diagrams of CWMS are provided in separate files.
One output of CWMS is recycled wastewater which can be used for local irrigation of golf
course, ovals, public gardens and farms. Wastewater safety is maintained by testing at NATA
accredited laboratories for heavy metal, pathogen, BOD and TSS analysis.
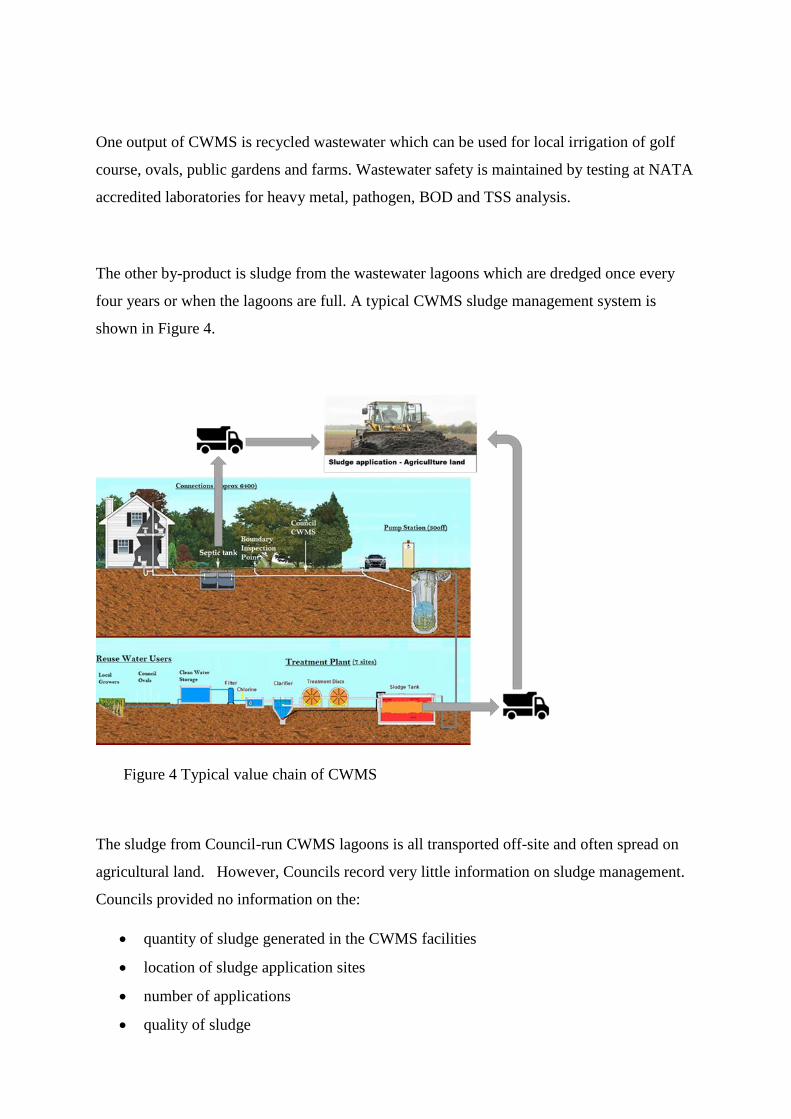
The other by-product is sludge from the wastewater lagoons which are dredged once every
four years or when the lagoons are full. A typical CWMS sludge management system is
shown in Figure 4.
Figure 4 Typical value chain of CWMS
The sludge from Council-run CWMS lagoons is all transported off-site and often spread on
agricultural land. However, Councils record very little information on sludge management.
Councils provided no information on the:
• quantity of sludge generated in the CWMS facilities
• location of sludge application sites
• number of applications
• quality of sludge
• post-application monitoring of soil or groundwater.
The septic tanks are installed in each property by the owners and are required to follow the
design and system criteria developed by the Local Government Association (LGA) of South
Australia and the Australian Government Department of Health and Ageing (DoHA) (LGA
SA and DoHA, 2019). Septic tanks provide primary treatment such as sedimentation
(sludge/solids), flotation (scum), clarification (effluent) and anaerobic digestion (breakdown
of organic material). The septage settles at the bottom of the tank and is typically removed
once every four years (Figure 4). The contractors pump out septage leaving about 10% in the
tank to maintain an appropriate bacterial population for ongoing treatment.
The SA EPA has provided a detailed guideline on septage waste management (EPA, 2017).
The SA EPA and DoHA guidelines are listed in Appendix E but the key points relevant here
are that:
- Septic tank effluent should only be spread on land with suitable soil properties
- Repeated application of septage to land may cause impacts to soil, groundwater and
surface water.
2.2 Estimates of quantities
Estimates of quantities are made firstly for sludge and secondly for septage. Then projections
are made for both through to the year 2039.
2.2.1 Quantity of sludge
Without data from the Councils, the quantity of sludge produced in CWMS lagoons was
estimated based on the equivalent population connected by CWMS for a year considering
0.04 kg of Biological Oxygen Demand (BOD) per 24 hours (1 day) (LGA SA and DoHA,
2019). A conversion factor of 0.6 is used to estimate sludge volumes based on the
combination of aerobic and anaerobic processes and 20 % dry solids (Gujer et al., 1995). The
following equation (1) was used:
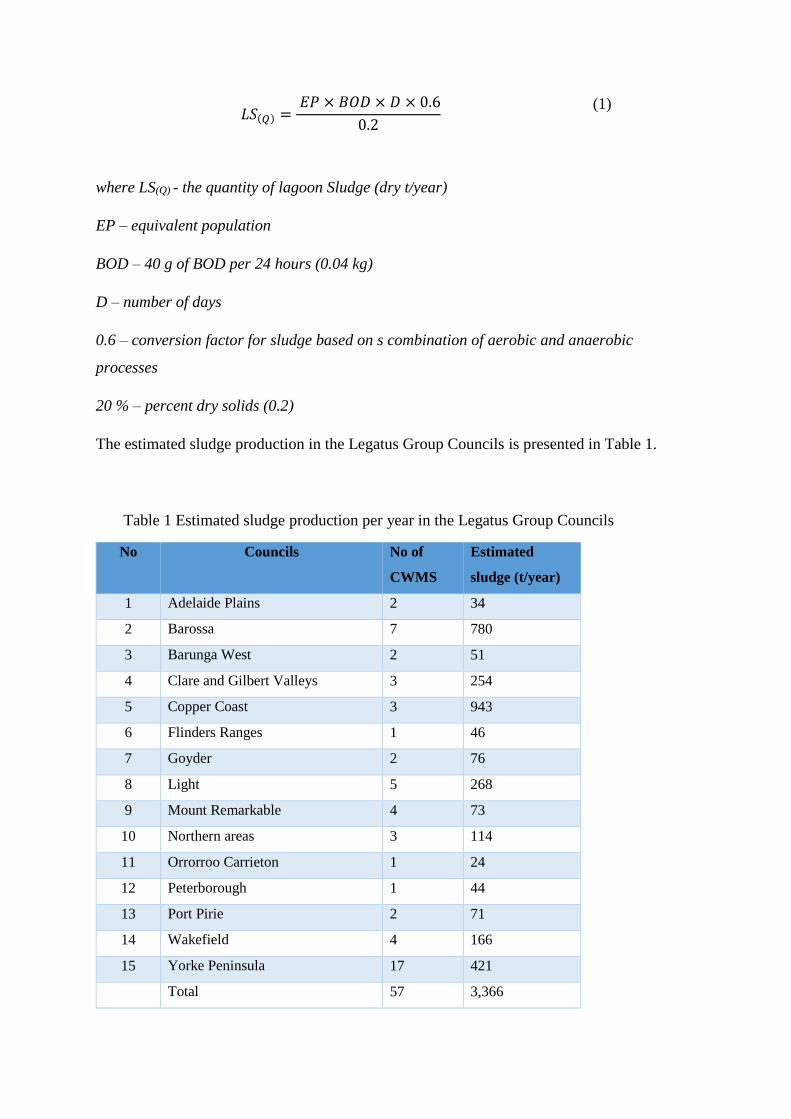
𝐿𝑆(𝑄) = 𝐸𝑃 × 𝐵𝑂𝐷 × 𝐷 × 0.6
0.2
(1)
where LS(Q) - the quantity of lagoon Sludge (dry t/year)
EP – equivalent population
BOD – 40 g of BOD per 24 hours (0.04 kg)
D – number of days
0.6 – conversion factor for sludge based on s combination of aerobic and anaerobic
processes
20 % – percent dry solids (0.2)
The estimated sludge production in the Legatus Group Councils is presented in Table 1.
Table 1 Estimated sludge production per year in the Legatus Group Councils
No Councils No of
CWMS
Estimated
sludge (t/year)
1 Adelaide Plains 2 34
2 Barossa 7 780
3 Barunga West 2 51
4 Clare and Gilbert Valleys 3 254
5 Copper Coast 3 943
6 Flinders Ranges 1 46
7 Goyder 2 76
8 Light 5 268
9 Mount Remarkable 4 73
10 Northern areas 3 114
11 Orrorroo Carrieton 1 24
12 Peterborough 1 44
13 Port Pirie 2 71
14 Wakefield 4 166
15 Yorke Peninsula 17 421
Total 57 3,366

The quantity of sludge was categorised into four groups to understand the range of production
in the Legatus Group Councils and details are presented in Table 2. This shows that most
Legatus CWMS produce quantities of sludge in the range of 10 to 50 t/year. Only 9
townships estimated sludge production that ranged from 100 to 500 t/year.
Table 2 Sludge production range
Sludge from lagoon
range (t/year)
No of CWMS % of total
CWMS
100 to 500 9 16
50 to 99 6 11
10 to 49 32 57
1 to 9 10 18
Total 57 100
2.2.2 Septage
Septic tanks are pumped out on the initiative of property owners by contractors who are
licenced by the EPA to transport and dispose of septage on approved land sites.
The lack of data regarding septage quantities has meant that an estimate had to be made based
on typical septic tank sizes (3000 L) and typical frequency of emptying (once after every 4
years) with a sensitivity analysis also conducted using larger tank sizes (5000 L). The
following equation (2) was used to estimate the quantity of sludge:
𝑆(𝑄) = 𝑃(𝑛) × 𝑇(𝑄) (2)
where S(Q) – quantity septage,
P(n) – number of properties,
T(Q) – tank size (L)
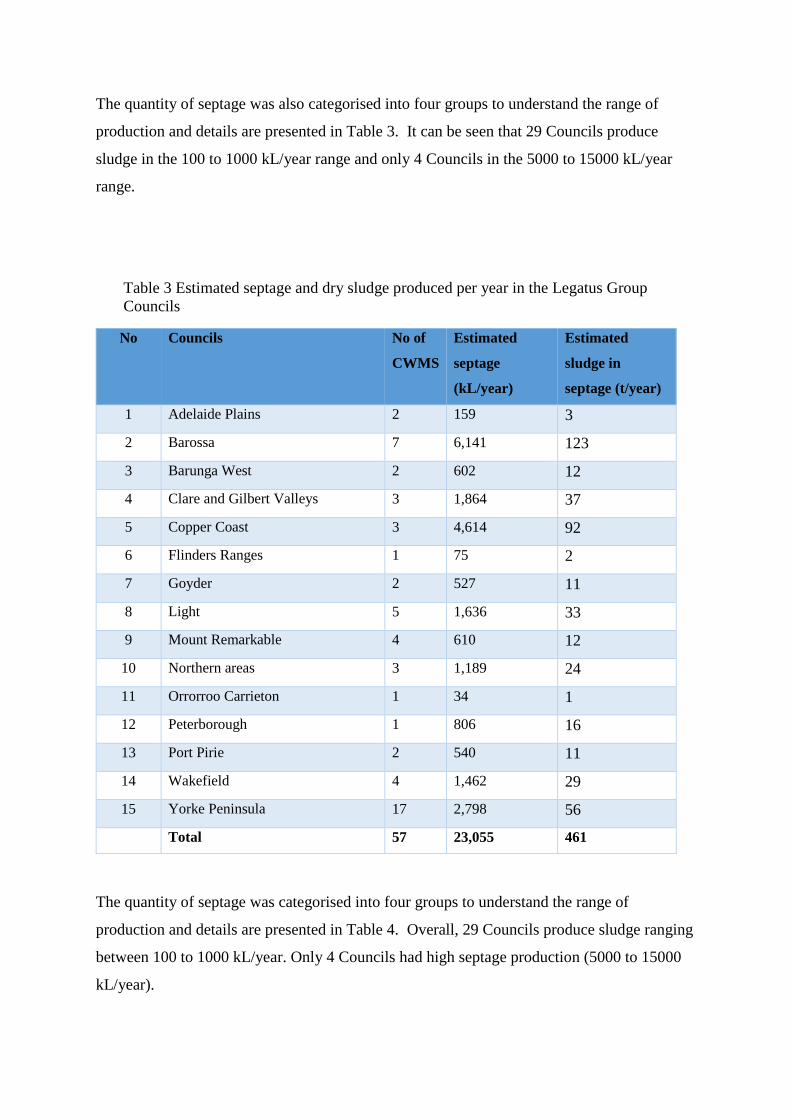
The quantity of septage was also categorised into four groups to understand the range of
production and details are presented in Table 3. It can be seen that 29 Councils produce
sludge in the 100 to 1000 kL/year range and only 4 Councils in the 5000 to 15000 kL/year
range.
Table 3 Estimated septage and dry sludge produced per year in the Legatus Group
Councils
No Councils No of
CWMS
Estimated
septage
(kL/year)
Estimated
sludge in
septage (t/year)
1 Adelaide Plains 2 159 3
2 Barossa 7 6,141 123
3 Barunga West 2 602 12
4 Clare and Gilbert Valleys 3 1,864 37
5 Copper Coast 3 4,614 92
6 Flinders Ranges 1 75 2
7 Goyder 2 527 11
8 Light 5 1,636 33
9 Mount Remarkable 4 610 12
10 Northern areas 3 1,189 24
11 Orrorroo Carrieton 1 34 1
12 Peterborough 1 806 16
13 Port Pirie 2 540 11
14 Wakefield 4 1,462 29
15 Yorke Peninsula 17 2,798 56
Total 57 23,055 461
The quantity of septage was categorised into four groups to understand the range of
production and details are presented in Table 4. Overall, 29 Councils produce sludge ranging
between 100 to 1000 kL/year. Only 4 Councils had high septage production (5000 to 15000
kL/year).
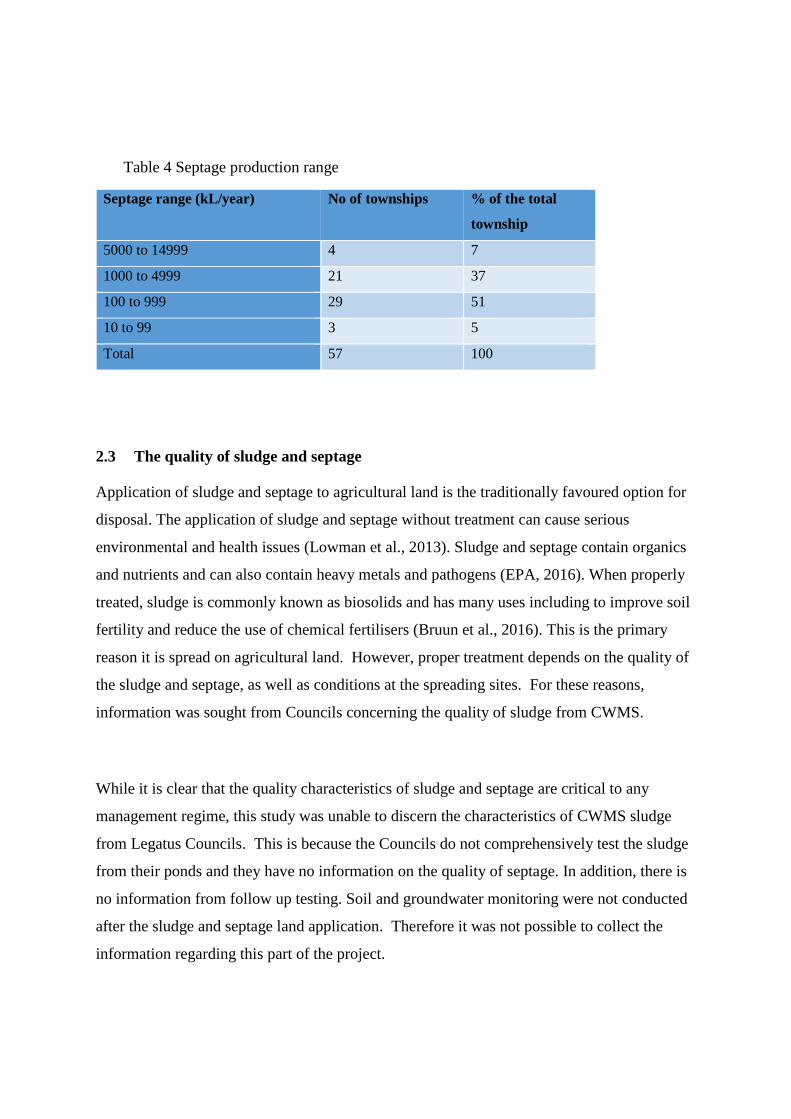
Table 4 Septage production range
Septage range (kL/year) No of townships % of the total
township
5000 to 14999 4 7
1000 to 4999 21 37
100 to 999 29 51
10 to 99 3 5
Total 57 100
2.3 The quality of sludge and septage
Application of sludge and septage to agricultural land is the traditionally favoured option for
disposal. The application of sludge and septage without treatment can cause serious
environmental and health issues (Lowman et al., 2013). Sludge and septage contain organics
and nutrients and can also contain heavy metals and pathogens (EPA, 2016). When properly
treated, sludge is commonly known as biosolids and has many uses including to improve soil
fertility and reduce the use of chemical fertilisers (Bruun et al., 2016). This is the primary
reason it is spread on agricultural land. However, proper treatment depends on the quality of
the sludge and septage, as well as conditions at the spreading sites. For these reasons,
information was sought from Councils concerning the quality of sludge from CWMS.
While it is clear that the quality characteristics of sludge and septage are critical to any
management regime, this study was unable to discern the characteristics of CWMS sludge
from Legatus Councils. This is because the Councils do not comprehensively test the sludge
from their ponds and they have no information on the quality of septage. In addition, there is
no information from follow up testing. Soil and groundwater monitoring were not conducted
after the sludge and septage land application. Therefore it was not possible to collect the
information regarding this part of the project.
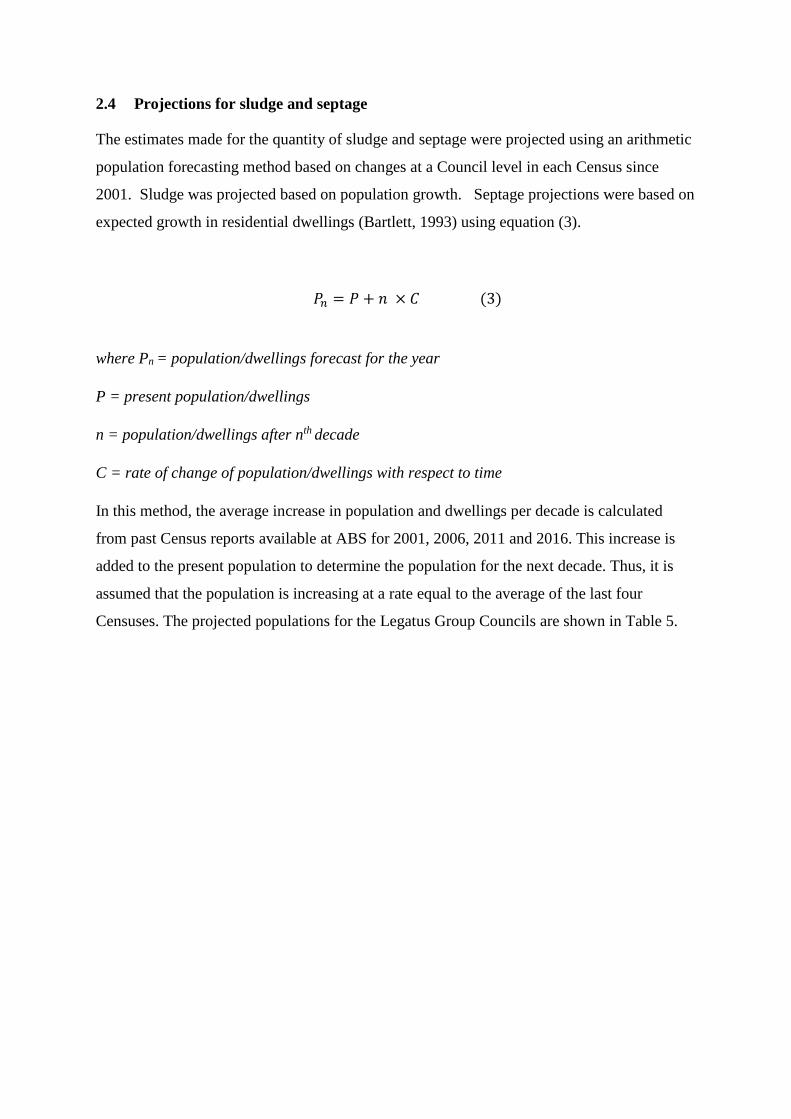
2.4 Projections for sludge and septage
The estimates made for the quantity of sludge and septage were projected using an arithmetic
population forecasting method based on changes at a Council level in each Census since
2001. Sludge was projected based on population growth. Septage projections were based on
expected growth in residential dwellings (Bartlett, 1993) using equation (3).
𝑃𝑛 = 𝑃 + 𝑛 × 𝐶 (3)
where Pn = population/dwellings forecast for the year
P = present population/dwellings
n = population/dwellings after nth decade
C = rate of change of population/dwellings with respect to time
In this method, the average increase in population and dwellings per decade is calculated
from past Census reports available at ABS for 2001, 2006, 2011 and 2016. This increase is
added to the present population to determine the population for the next decade. Thus, it is
assumed that the population is increasing at a rate equal to the average of the last four
Censuses. The projected populations for the Legatus Group Councils are shown in Table 5.
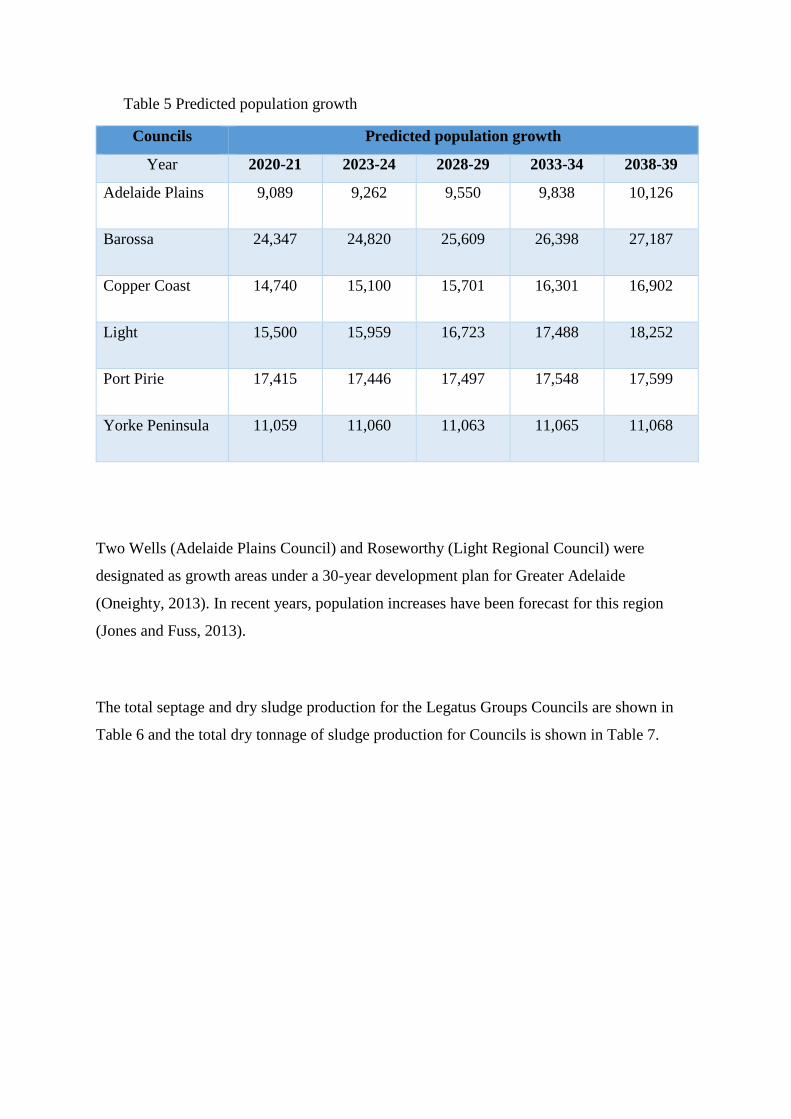
Table 5 Predicted population growth
Councils Predicted population growth
Year 2020-21 2023-24 2028-29 2033-34 2038-39
Adelaide Plains 9,089 9,262
9,550
9,838
10,126
Barossa 24,347 24,820
25,609
26,398
27,187
Copper Coast 14,740 15,100
15,701
16,301
16,902
Light 15,500
15,959
16,723
17,488
18,252
Port Pirie 17,415
17,446
17,497
17,548
17,599
Yorke Peninsula 11,059
11,060
11,063
11,065
11,068
Two Wells (Adelaide Plains Council) and Roseworthy (Light Regional Council) were
designated as growth areas under a 30-year development plan for Greater Adelaide
(Oneighty, 2013). In recent years, population increases have been forecast for this region
(Jones and Fuss, 2013).
The total septage and dry sludge production for the Legatus Groups Councils are shown in
Table 6 and the total dry tonnage of sludge production for Councils is shown in Table 7.

Table 6 Estimated current and projected septage (kL/year) and sludge production (t/year)
No. Councils Year 2018-19 Year 2023-24 Year 2028-29 Year 2033-34 Year 2038-39
Current 5 years 10 years 15 years 20 years
Septage Sludge Septage Sludge Septage Sludge Septage Sludge Septage Sludge
1 Adelaide Plains 159 34 2,857 406 2,951 423 3,045 431 3,138 444
2 Barossa 6,141 780 8,157 1,087 8,452 1,136 8,748 1,156 9,043 1,191
3 Barunga West 602 51 1,430 112 1,451 113 1,473 113 1,494 113
4 Clare and Gilbert Valleys 1,864 254 3,456 406 3,549 416 3,643 420 3,736 427
5 Copper Coast 4,614 943 7,027 661 7,356 698 7,686 714 8,015 740
6 Flinders Ranges 75 46 739 70 745 68 751 67 757 65
7 Goyder 527 392 1,677 180 1,693 179 1,708 179 1,724 178
8 Light 1,636 268 4,576 699 4,789 746 5,003 766 5,216 799
9 Mount Remarkable 610 73 1,286 125 1,306 125 1,326 125 1,346 125
10 Northern Areas 1,189 114 1,800 198 1,826 198 1,851 197 1,876 197
11 Orrorroo Carrieton 34 24 383 39 388 38 393 38 398 38
12 Peterborough 806 115 812 70 813 68 814 67 815 65
13 Port Pirie 540 71 6,471 764 6,570 767 6,669 769 6,768 771
14 Wakefield 1,462 166 2,480 304 2,528 310 2,576 312 2,624 316
15 Yorke Peninsula 2,798 421 7,560 484 7,728 485 7,895 485 8,063 485

Table 7 Predicted quantity of dry sludge (t/year)
No. Councils Estimated
current
Year
2023-24
(5 years)
Year
2028-29
(10
years)
Year
2033-34
(15
years)
Year
2038-39
(20
years)
t/year t/year t/year t/year t/year
1 Adelaide Plains 34 463 482 492 506
2 Barossa 780 1,250 1,305 1,331 1,372
3 Barunga West 51 141 142 142 143
4 Clare and Gilbert
Valleys
254 475 487 493 502
5 Copper Coast 943 802 845 868 901
6 Flinders Ranges 46 84 82 82 80
7 Goyder 392 214 213 213 213
8 Light 268 791 842 866 904
9 Mount Remarkable 73 151 151 151 151
10 Northern areas 114 234 234 235 235
11 Orrorroo Carrieton 24 46 46 46 46
12 Peterborough 115 87 84 83 81
13 Port Pirie 71 894 899 902 906
14 Wakefield 166 354 360 364 368
15 Yorke Peninsula 421 636 639 643 646
Total 3,752 6,620 6,811 6,910 7,054
This section has focused on the volume and quality of sludge because these are crucial
considerations in determining viability, and this is discussed in more detail in Section 4.
Viability also depends on the technological solutions that are available and this is the subject
for the next section.

3 Technological options for a sludge processing plant
3.1 Introduction
The current practice whereby septage and sludge is applied to agricultural land is conducted
in the absence of processing facilities. There are a number of alternative approaches and this
section uses a literature review to consider three of the options most likely to be relevant to
the scale of operation relevant to this study.
3.2 Dewatering bags
Dewatering bags have the potential to separate water from sludge (Ashworth, 2003) in order
to minimize handling costs. Dewatering bags are single-use commercial products that are
adopted in many countries, including Australia. Dewatering bags have been used for
wastewater treatment plants, aquaculture (Sharrer et al., 2009), paper mills and in mining for
ash fly slurry (Khachan et al., 2012). Polymer or alum is often used to enhance the
precipitation, coagulation and flocculation processes (Ebeling et al., 2004).
Previous research has reported a significant reduction in the total suspended solids (TSS)
(95%) and total phosphorous (TP) (67%) (Sharrer et al., 2009). Based on local experience, it
has been shown that dewatering bags have relatively low capital costs, are effective for low
flows, but have higher mobilisation costs throughout their life cycle. In South Australia,
dewatering bags have been used at Port Lincoln WWTP in an unsuccessful initial trial
(Figure 5) (Faulkner, 2015).
Figure 5 Geo dewatering bags at Port Lincoln WWTP (Faulkner, 2015)
Key conclusions
- Handling and transportation costs are high
- Suitable for small-scale decentralised WWTP
- Additional alum and polymer dosing required
- Low capital cost, single use, low environmental impact
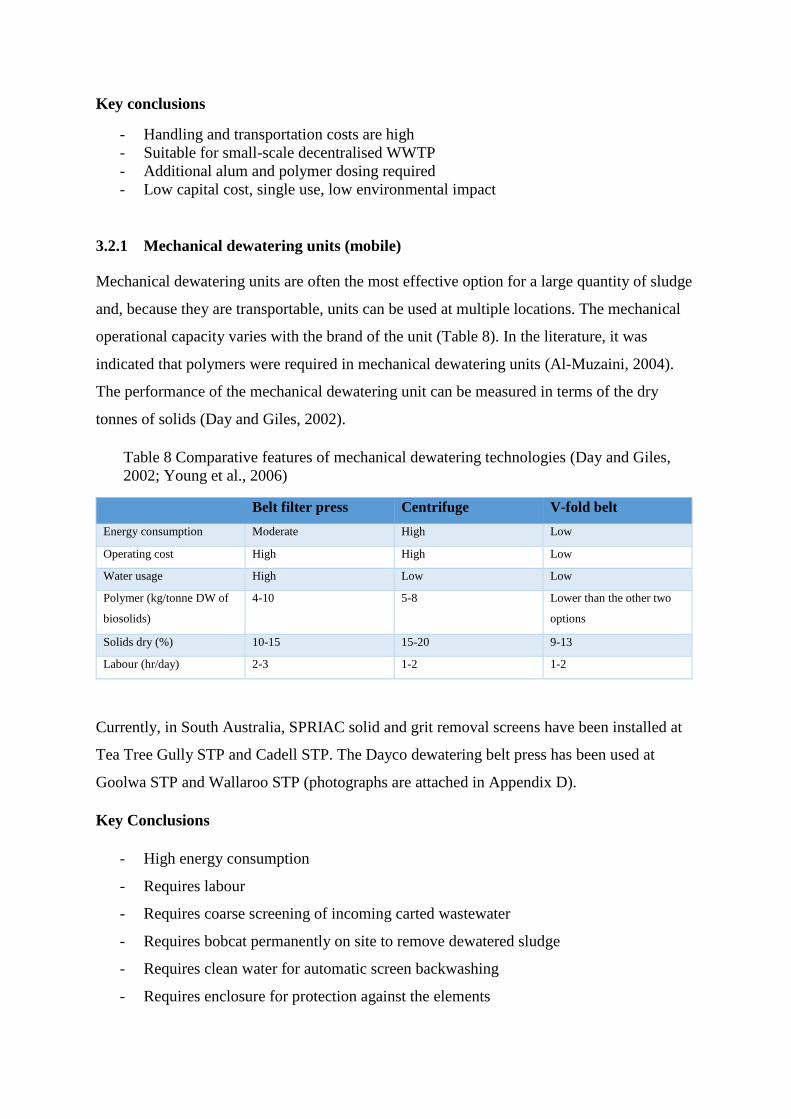
3.2.1 Mechanical dewatering units (mobile)
Mechanical dewatering units are often the most effective option for a large quantity of sludge
and, because they are transportable, units can be used at multiple locations. The mechanical
operational capacity varies with the brand of the unit (Table 8). In the literature, it was
indicated that polymers were required in mechanical dewatering units (Al-Muzaini, 2004).
The performance of the mechanical dewatering unit can be measured in terms of the dry
tonnes of solids (Day and Giles, 2002).
Table 8 Comparative features of mechanical dewatering technologies (Day and Giles,
2002; Young et al., 2006)
Belt filter press Centrifuge V-fold belt
Energy consumption Moderate High Low
Operating cost High High Low
Water usage High Low Low
Polymer (kg/tonne DW of
biosolids)
4-10 5-8 Lower than the other two
options
Solids dry (%) 10-15 15-20 9-13
Labour (hr/day) 2-3 1-2 1-2
Currently, in South Australia, SPRIAC solid and grit removal screens have been installed at
Tea Tree Gully STP and Cadell STP. The Dayco dewatering belt press has been used at
Goolwa STP and Wallaroo STP (photographs are attached in Appendix D).
Key Conclusions
- High energy consumption
- Requires labour
- Requires coarse screening of incoming carted wastewater
- Requires bobcat permanently on site to remove dewatered sludge
- Requires clean water for automatic screen backwashing
- Requires enclosure for protection against the elements
- Requires inflow balancing with lift pump to screen
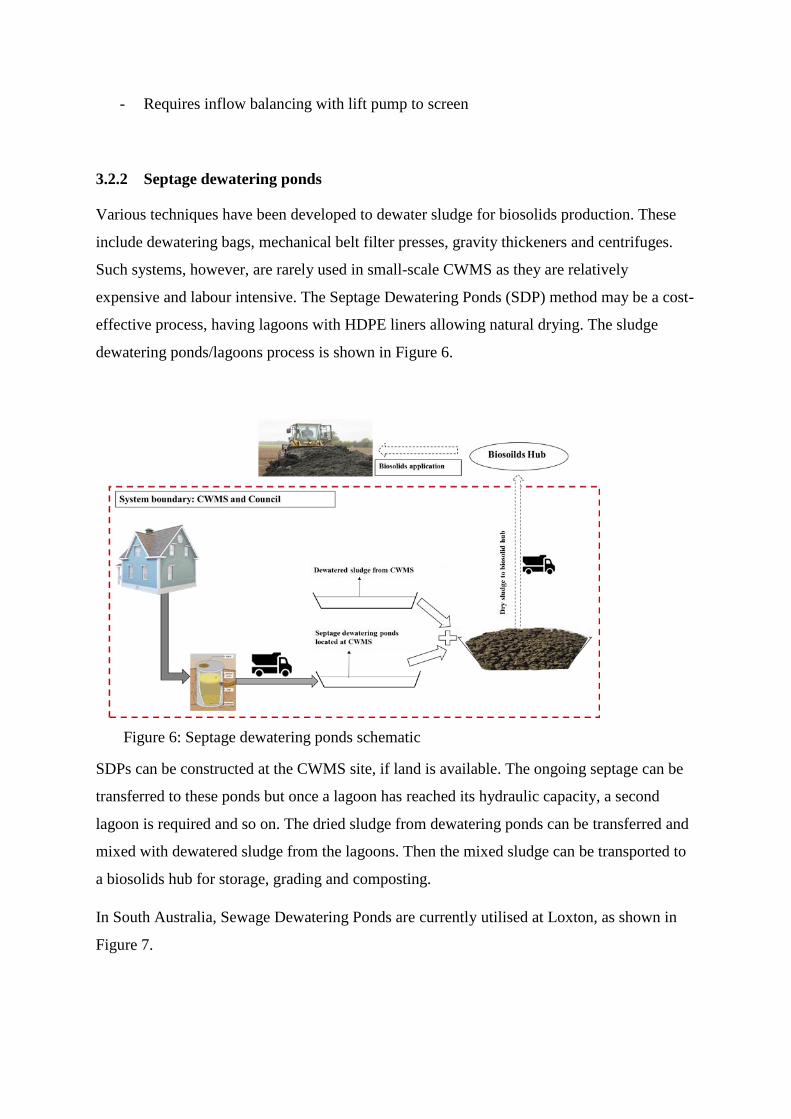
3.2.2 Septage dewatering ponds
Various techniques have been developed to dewater sludge for biosolids production. These
include dewatering bags, mechanical belt filter presses, gravity thickeners and centrifuges.
Such systems, however, are rarely used in small-scale CWMS as they are relatively
expensive and labour intensive. The Septage Dewatering Ponds (SDP) method may be a cost-
effective process, having lagoons with HDPE liners allowing natural drying. The sludge
dewatering ponds/lagoons process is shown in Figure 6.
Figure 6: Septage dewatering ponds schematic
SDPs can be constructed at the CWMS site, if land is available. The ongoing septage can be
transferred to these ponds but once a lagoon has reached its hydraulic capacity, a second
lagoon is required and so on. The dried sludge from dewatering ponds can be transferred and
mixed with dewatered sludge from the lagoons. Then the mixed sludge can be transported to
a biosolids hub for storage, grading and composting.
In South Australia, Sewage Dewatering Ponds are currently utilised at Loxton, as shown in
Figure 7.
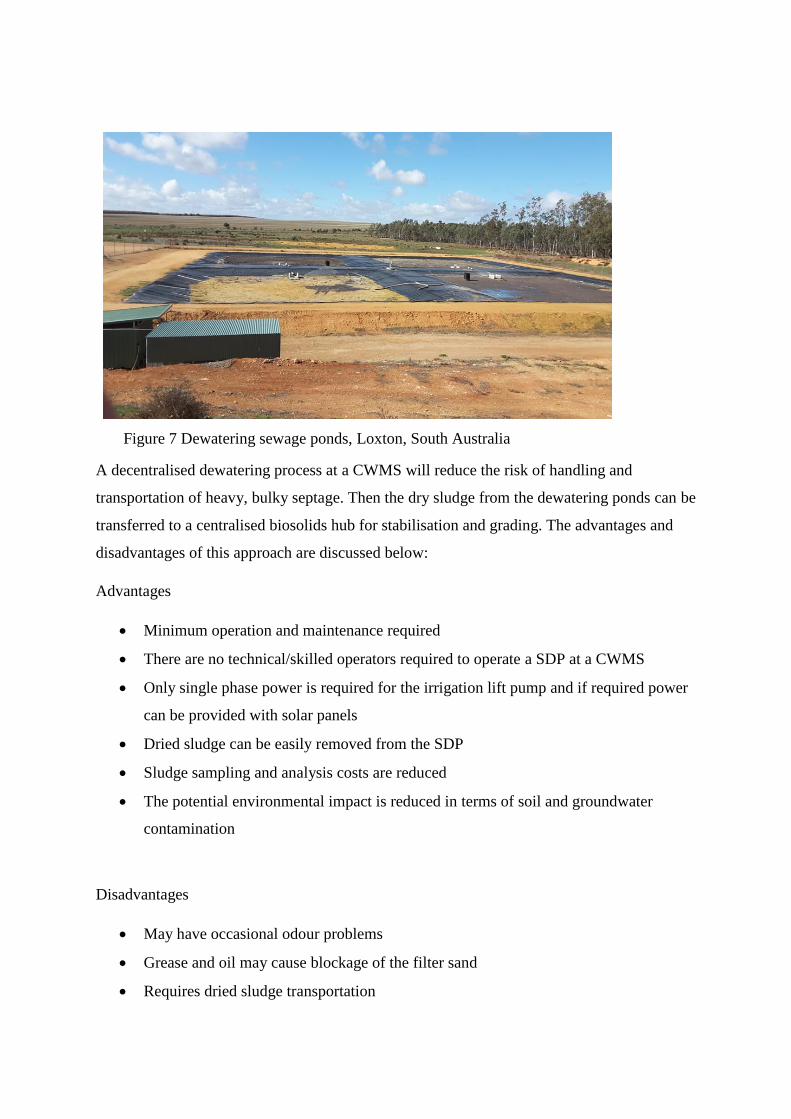
Figure 7 Dewatering sewage ponds, Loxton, South Australia
A decentralised dewatering process at a CWMS will reduce the risk of handling and
transportation of heavy, bulky septage. Then the dry sludge from the dewatering ponds can be
transferred to a centralised biosolids hub for stabilisation and grading. The advantages and
disadvantages of this approach are discussed below:
Advantages
• Minimum operation and maintenance required
• There are no technical/skilled operators required to operate a SDP at a CWMS
• Only single phase power is required for the irrigation lift pump and if required power
can be provided with solar panels
• Dried sludge can be easily removed from the SDP
• Sludge sampling and analysis costs are reduced
• The potential environmental impact is reduced in terms of soil and groundwater
contamination
Disadvantages
• May have occasional odour problems
• Grease and oil may cause blockage of the filter sand
• Requires dried sludge transportation
This section has reviewed three technologies which are suitable for better managing sludge in
the Legatus Council areas. By improving management with one of these techniques, the end
product can be a biosolid suitable for further processing into soil enhancers and other
purposes. The key question is which is the most cost effective option and this is discussed in
the next section.
4 The viability of sludge processing plant
4.1 Introduction
The fundamental characteristics of the Legatus Group Council CWMS is that they are small
and they are isolated. Also transporting sludge is very expensive and difficult to move safely.
In addition, it is bulky material with a very low value to volume ratio. This means that
Councils might need to aggregate sludge to achieve economies of scale but are unable to do
so cheaply because of the distances.
The viability assessment that follows is based on these facts. It begins with the basics by
making a cost comparison of the three technological options considered above. It does so by
considering the situation in just one Legatus Council and so looks only at that disaggregated
scale and limited transport needs. However, a more complete viability analysis requires
consideration of firstly some options for aggregating and secondly consideration of adding
other organic waste into the process.
4.2 Cost estimates for the three technologies
The cost of constructing SDPs within each CWMS site will depend on, among other things,
site conditions and transportation distances. To simplify matters, this section shows life cycle
cost estimates for the three options based on a single Northern Areas Council (covering the
towns of Jamestown, Laura and Gladstone, see Table 11; and the details are provided in a
separate document).
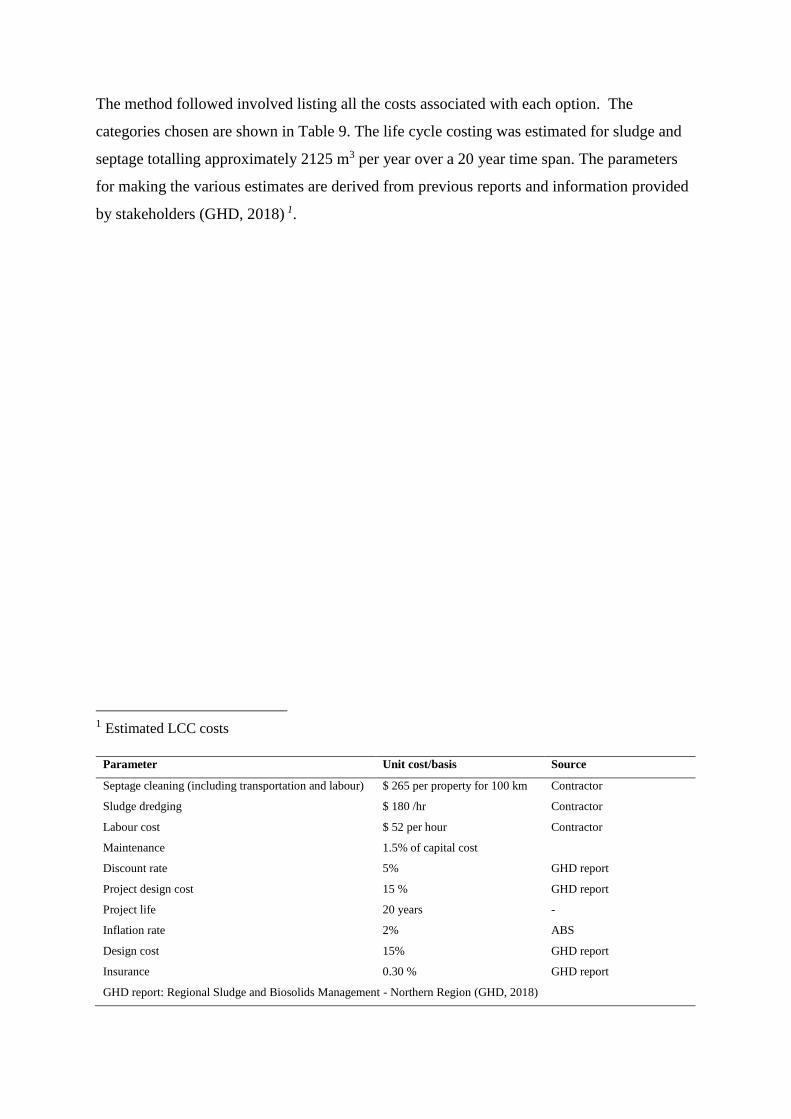
The method followed involved listing all the costs associated with each option. The
categories chosen are shown in Table 9. The life cycle costing was estimated for sludge and
septage totalling approximately 2125 m3 per year over a 20 year time span. The parameters
for making the various estimates are derived from previous reports and information provided
by stakeholders (GHD, 2018) 1.
1 Estimated LCC costs
Parameter Unit cost/basis Source
Septage cleaning (including transportation and labour) $ 265 per property for 100 km Contractor
Sludge dredging $ 180 /hr Contractor
Labour cost $ 52 per hour Contractor
Maintenance 1.5% of capital cost
Discount rate 5% GHD report
Project design cost 15 % GHD report
Project life 20 years -
Inflation rate 2% ABS
Design cost 15% GHD report
Insurance 0.30 % GHD report
GHD report: Regional Sludge and Biosolids Management - Northern Region (GHD, 2018)
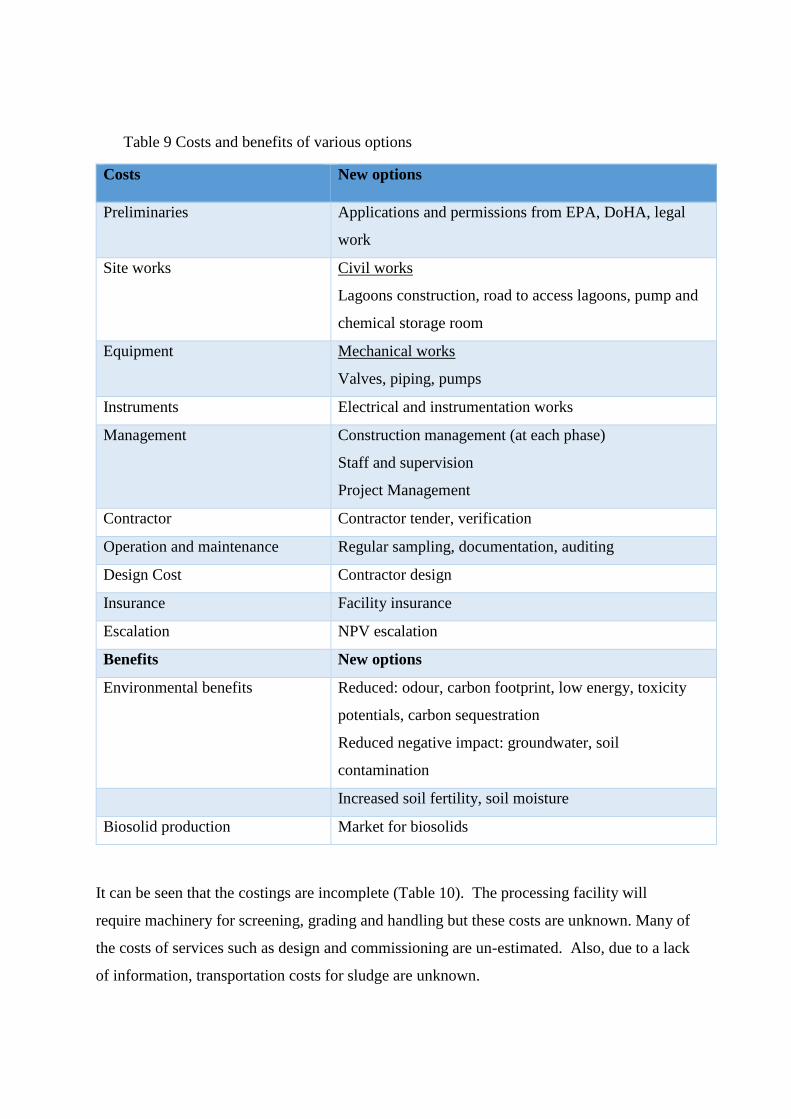
Table 9 Costs and benefits of various options
Costs New options
Preliminaries Applications and permissions from EPA, DoHA, legal
work
Site works Civil works
Lagoons construction, road to access lagoons, pump and
chemical storage room
Equipment Mechanical works
Valves, piping, pumps
Instruments Electrical and instrumentation works
Management Construction management (at each phase)
Staff and supervision
Project Management
Contractor Contractor tender, verification
Operation and maintenance Regular sampling, documentation, auditing
Design Cost Contractor design
Insurance Facility insurance
Escalation NPV escalation
Benefits New options
Environmental benefits Reduced: odour, carbon footprint, low energy, toxicity
potentials, carbon sequestration
Reduced negative impact: groundwater, soil
contamination
Increased soil fertility, soil moisture
Biosolid production Market for biosolids
It can be seen that the costings are incomplete (Table 10). The processing facility will
require machinery for screening, grading and handling but these costs are unknown. Many of
the costs of services such as design and commissioning are un-estimated. Also, due to a lack
of information, transportation costs for sludge are unknown.

Table 10 Cost estimation for septage and sludge management
Commodity Option 1 Option 2 Option 3
1 Construction cost ($) AUD ($) AUD ($) AUD ($)
Preliminaries Unknown Unknown Unknown
Civil works 1500 49,500 4,000
Mechanical works 7,400 7,400 7,400
Construction management Unknown Unknown Unknown
Testing and commissioning Unknown Unknown Unknown
Machinery (dewatering unit) - Unknown -
Contractor fees (10 % profit margin) 11,549 21,797 11,871
2 Fees and allowance 318 599 326
3 Project development cost Unknown Unknown Unknown
4 Project design cost (7 %) 8,893 16,783 9,141
5 Project delivery cost (15%) 19,057 35,964 19,587
6 Transportation Unknown Unknown Unknown
7 Opportunity and risk-based contingency (30%) 46,593 87,933 47,891
8 Septage supply* 105,006 105,006 105,006
9 Sludge supply 1,080 1,080 1,080
10 Insurance (0.30 %) 606 1,143 623
Total ($) 202,510 365,403 199,008
*customer paid (include septic tank cleaning, transportation and disposal)
This table provides a template for the costs associated with various options and all costs are subject to change

It has not been possible to undertake the detailed work required to make comprehensive
estimates within the timeframe of this project. The preliminary work suggests that the major
costs are in sourcing septage and sludge. Septage is especially costly to source but it must be
noted that these costs are currently incurred by householders and would not be a cost to
Councils. However, if the costings move beyond a single Council then the costs of sourcing
materials will rise.
Further work is clearly required to make a full assessment of costs. However, based on the
tentative LCC analysis, options 3 and 1 ranked 1st and 2nd, respectively (Table 11). The
proposed options involve the following considerations:
• Changes to sludge and septage transport
• Permission from SA EPA and DoHA to construct a SDP at CWMS
• Dredging and dewatering of ponds by third party contractor for each site
• Record and maintenance requirements
• Capital costs to build a biosolids hub.
Table 11 Cost estimation for selected scenarios
Options Capital cost
(AUD) $
Per m3 cost
(AUD) $
LCC (20 years) Rank
Option 1 201,984 6.13 243,040 II
Option 2 365,403 11.10 439,677 III
Option 3 199,008 6.04 239,459 I

4.3 Viability and the problem of scale
Economies of scale are a well-established concept in wastewater management (Fraquelli and
Giandrone, 2003). Small-scale wastewater treatment facilities are significantly influenced by
scale economics (Hernández-Chover et al., 2018). This is important because each Legatus
CWMS is small and isolated.
By means of comparison, SA Water has considered the processing of sludge from Adelaide
sewers and other SA Water facilities (GHD, 2018). The volumes involved are at least one
order of magnitude greater than in the Legatus Councils and yet processing of sludge is non-
viable. While the options available to SA Water would generate revenue from reuse, this
would only reduce the losses involved. SA Water considered various options for regional
processing but found that “none are considered to fit into the category of providing a cost
effective regional strategic solution. Transport of liquid unstabilised sludge to a centralised
digestion facility, is likely to be costly, and provide inherent risks of community odours /
spillages” (GHD, 2018).
These points are important for two reasons. First, sludge processing could be undertaken at a
central hub for all Legatus Group Councils. This will reduce the costs of processing but add
to the costs of transport and the alternative is to use multiple sites. Second, the viability of
processing could improve if other organic material were added to sludge.
The first option is to use SDPs which give a decentralised septage dewatering process,
followed by centralised biosolids management. While this would be the preferred
combination, it will require complete transformation and control of disposal sites as well as
transportation. It will require septage and lagoon sludge from CWMS to be combined and
transferred to multiple, small-scale biosolid hubs. The process of dewatering septage at the
CWMS site may reduce the transportation costs and reduce the risks associated with
transporting bulky and heavy liquid sludge.
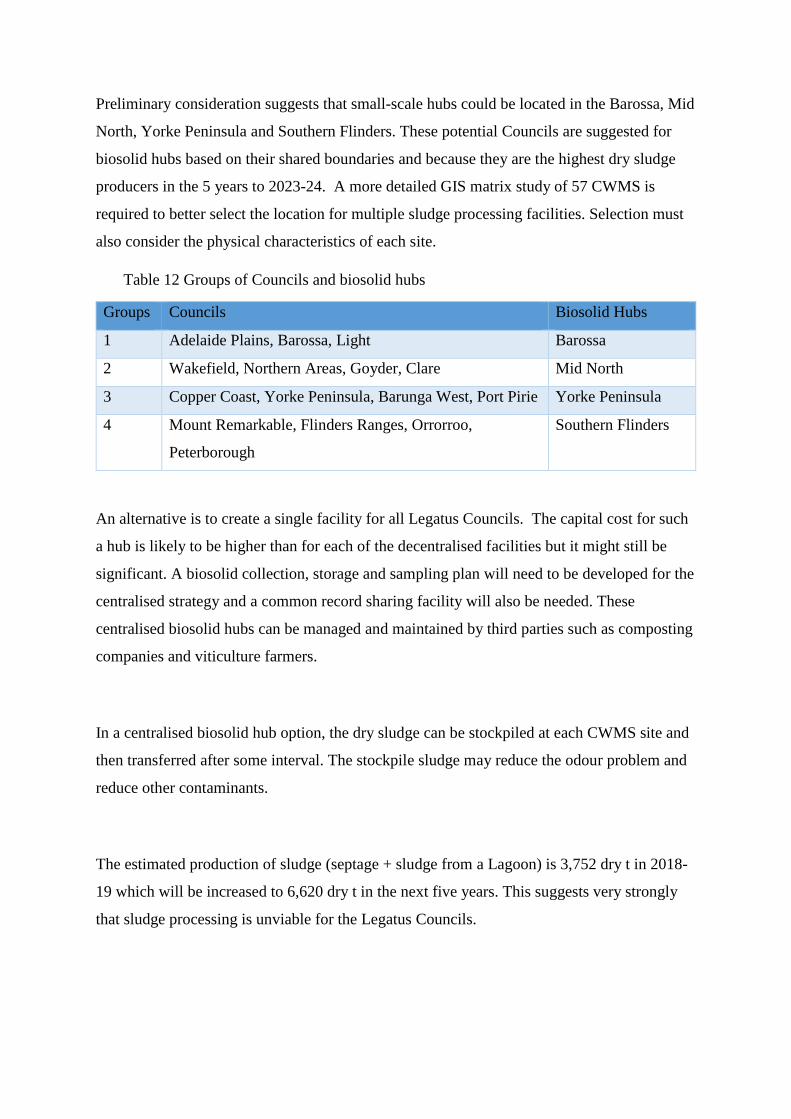
Preliminary consideration suggests that small-scale hubs could be located in the Barossa, Mid
North, Yorke Peninsula and Southern Flinders. These potential Councils are suggested for
biosolid hubs based on their shared boundaries and because they are the highest dry sludge
producers in the 5 years to 2023-24. A more detailed GIS matrix study of 57 CWMS is
required to better select the location for multiple sludge processing facilities. Selection must
also consider the physical characteristics of each site.
Table 12 Groups of Councils and biosolid hubs
Groups Councils Biosolid Hubs
1 Adelaide Plains, Barossa, Light Barossa
2 Wakefield, Northern Areas, Goyder, Clare Mid North
3 Copper Coast, Yorke Peninsula, Barunga West, Port Pirie Yorke Peninsula
4 Mount Remarkable, Flinders Ranges, Orrorroo,
Peterborough
Southern Flinders
An alternative is to create a single facility for all Legatus Councils. The capital cost for such
a hub is likely to be higher than for each of the decentralised facilities but it might still be
significant. A biosolid collection, storage and sampling plan will need to be developed for the
centralised strategy and a common record sharing facility will also be needed. These
centralised biosolid hubs can be managed and maintained by third parties such as composting
companies and viticulture farmers.
In a centralised biosolid hub option, the dry sludge can be stockpiled at each CWMS site and
then transferred after some interval. The stockpile sludge may reduce the odour problem and
reduce other contaminants.
The estimated production of sludge (septage + sludge from a Lagoon) is 3,752 dry t in 2018-
19 which will be increased to 6,620 dry t in the next five years. This suggests very strongly
that sludge processing is unviable for the Legatus Councils.
However, before it is concluded that sludge processing is unviable because of scale it is
possible to enhance scale by making use of other organic waste that exists in Legatus Council
areas. For example, residential organic waste is typically disposed of in non-compost waste
bins and this may be collected and added to the waste stream. The organic waste contains
nitrogen and phosphorous which may be useful for composting and can be mixed with the
septage or sludge (Jouraiphy et al., 2005)2. Combining these waste streams might offer other
benefits too as co-composting reduces the pollutant and bio-availability of heavy metals in
sewage sludge (Fourti et al., 2010).
Another potential source of organics is to make use of refuse from agriculture. For example,
Almondco producing 35,000 t/year of almond husk and shell which can be added to the
sludge to enhance the quality and quantity of the compost (Sánchez et al., 2017; Watteau and
Villemin, 2011). In addition, Tarac Technologies treats over 135,000 t of grape marc and this
may also be used for co-composting (Tarac Technologies, 2019). Livestock farming also
produces a considerable amount of manure which may also be available (Mishima et al.,
2017).
These options all involve composting biosolids. Composting is a microbial based aerobic
manure and humification process, producing a source of soil fertiliser in an environmentally
friendly way to minimise organic waste (Febrisiantosa et al., 2018). The co-composting of
sludge, organic waste and livestock waste can provide an optimal C:N ratio, particle density,
pH and moisture content (Huang et al., 2004).
In considering all these options, the composting site should be constructed and developed
based on EPA and DoHA guidelines and requirements. The ratio of sludge, livestock manure
and organic waste will also need to be further investigated.
2 The application of untreated sludge to agricultural land is limited as it contains pathogens, heavy metals and toxic pollutants (Dudka and Miller, 1999). To reduce these risks, composting is considered to be the best management practice (Ouatmane et al., 2000).
5 Summary and recommendations
The conclusions of this report are tentative. The scope of this project, the lack of pre-existing
information and the major role played by private contractors, mean that more resources are
required to make firm recommendations. The recommendations that follow are shaped by
these limitations.
The first conclusion is that the most cost-effective sludge treatment process that could replace
current practices for Legatus Councils, including the private sector management of septage, is
Sludge Dewatering Ponds. This conclusion is tentative firstly because full operational costs
have not been estimated. In particular, the cost of this treatment depends critically on the cost
of transporting sludge to the facility and selection of the environmentally optimal site, neither
of which have been considered here in sufficient detail.
Recommendation 1:
A site selection process for a sludge treatment facility be undertaken. The selection is to
optimise both transport costs and environmental impacts.
The second conclusion is that establishing sludge treatment facilities will not be viable in the
sense of being profitable and self-supporting. The price received for treated sludge will only
offset some of the costs of the operation. Of course, it is possible that this will represent a net
gain by reducing the current costs, but the next conclusion is pertinent.
The third conclusion is that Councils themselves cannot report their sludge operations in any
detail. The sludge quantities are unknown, costs breakdowns are unrecorded and monitoring
is not undertaken, at least not systematically with records kept. In addition, virtually all the
septage in these systems is managed by private contractors and Councils know almost
nothing about these operations.
It follows that it is impossible to determine if the SDP proposal would be an improvement in
financial terms. This situation leads to the following recommendation, aimed at generating
the information needed:
Recommendation 2:
An indicative costing be undertaken for a selected Council’s current sludge management
process. This should form a template and a base case for other Councils to then follow with
their own costing exercises.
The fourth conclusion is that current arrangements involve uncounted costs and benefits. In
particular, Councils are contracting to have sludge spread on agricultural land but are not
monitoring the subsequent processes and outcomes. It is not known if current arrangements
are imposing unacceptable costs that would justify a shift to the SDP option.
Recommendation 3:
That test monitoring be undertaken and processes identified at selected, current sludge
spreading sites to determine the environmental impacts of current arrangements.

6 References
ABS, 2017. Australian demographic statistics, Australian Bureau of Statistics, Catalogue
number 3101.0, 2017. Government of Australia, Canberra.
ABS 2018, Consumer price index, Australia, Australian Bureau of Statistics, Australia,
https://www.abs.gov.au/price-indexes-and-inflation.05/01/2019
Al-Muzaini, S., 2004. A comparative study of sludge dewatering units for sludge
management. Journal of Environmental Science and Health, Part A 39, 473-482.
Ashworth, B., 2003. Geobags - the South Gippsland Water experience, 66th Annual water
industry engineers and operators conference. Water Industry Engineers, Eastbank
Centre Victoria.
Bartlett, A.A., 1993. The arithmetic of growth: methods of calculation. Population and
Environment 14, 359-387.
Bruun, S., Yoshida, H., Nielsen, M.P., Jensen, L.S., Christensen, T.H., Scheutz, C., 2016.
Estimation of long-term environmental inventory factors associated with land
application of sewage sludge. J. Clean. Prod. 126, 440-450.
Day, P., Giles, P., 2002. Innovative belt filter press takes the hard work out of sludge
dewatering. Filtration & Separation 39, 18-20.
Dudka, S., Miller, W.P., 1999. Accumulation of potentially toxic elements in plants and their
transfer to human food chain. Journal of Environmental Science and Health, Part B
34, 681-708.
Ebeling, J.M., Ogden, S.R., Sibrell, P.L., Rishel, K.L., 2004. Application of chemical
coagulation aids for the removal of suspended solids (TSS) and phosphorus from the
microscreen effluent discharge of an intensive recirculating aquaculture system. 66,
198-207.
EPA, 2016. Septic tank sludge management, in: Authority, E.P. (Ed.). Environment
Protection Authority, South Australia.
EPA, 2017. South Australian biosolids guidlines for the safe handling and reuse of biosolids.
Environment Protection Authority, South Australia.
Faulkner, M., K., R., 2015. Strategies for manageing sludge handling capacity limitaions at
Port Lincoln WWTP, 78th Annual Water Industry Engineers and Operators
Conference, Bendigo, Australia.
Febrisiantosa, A., Ravindran, B., Choi, H.L., 2018. The Effect of co-additives (biochar and
FGD gypsum) on ammonia volatilization during the composting of livestock waste.
Sustainability 10.
Fourti, O., Jedidi, N., Hassen, A., 2010. Humic substances change during the co-composting
process of municipal solid wastes and sewage sludge. World Journal of Microbiology
26, 2117-2122.
Fraquelli, G., Giandrone, R., 2003. Reforming the wastewater treatment sector in Italy:
Implications of plant size, structure, and scale economies. 39.
GHD 2018, Regional sludge and biosolids management plans Northen Region concept design
report. Corporation, S.W., South Australia,
Gujer, W., Henze, M., Mino, T., Matsuo, T., Wentzel, M., Marais, G., 1995. The activated
sludge model No.2: biological phosphorus removal. Water Sci. Technol. 31, 1-11.
Hernández-Chover, V., Bellver-Domingo, Á., Hernández-Sancho, F., 2018. Efficiency of
wastewater treatment facilities: The influence of scale economies. J. Environ.
Manage. 228, 77-84.
Huang, G.F., Wong, J.W.C., Wu, Q.T., Nagar, B.B., 2004. Effect of C/N on composting of
pig manure with sawdust. Waste Management 24, 805-813.

Jones, A., Fuss, E., 2013. Two Wells prepares for population swell. Australian Broadcasting
Corporation, ABC North and West SA.
Jouraiphy, A., Amir, S., El Gharous, M., Revel, J.-C., Hafidi, M., 2005. Chemical and
spectroscopic analysis of organic matter transformation during composting of sewage
sludge and green plant waste. Int. Biodeterior. Biodegrad. 56, 101-108.
Kellogg Brown & Root Pty Ltd 2006, Mount Lofty Ranges septage and greenwaste co-
composting trial. South Australia,
Khachan, M., Bhatia, S., Maurer, B., Gustafson, A., 2012. Dewatering and utilization of fly
ash slurries using geotextile tubes. Indian Geotechnical Journal 42, 194-205.
LGA SA, DoHA, 2019. South Australian Community Wastewater Management System
(CWMS) design criteria. South Australian Local Government Association and South
Australian Department for Health & Ageing, South Australia.
Lowman, A., McDonald, M.A., Wing, S., Muhammad, N., 2013. Land application of treated
sewage sludge: community health and environmental justice. Environ. Health
Perspect. 121, 537-542.
Mishima, S.-i., Leon, A., Eguchi, S., Shirato, Y., 2017. Livestock waste, potential manure
production and its use in Japan in 1980 and 2010. Compost Sci. Util. 25, S43-S52.
Oneighty 2013, Barossa, Light and Lower North Region Open Space, recreation and public
realm strategy. South Australia,
https://www.apc.sa.gov.au/contentFile.aspx?filename=Barossa%20Open%20Space%
20Background%20Context%20Report.pdf
Ouatmane, A., Provenzano, M., Hafidi, M., Senesi, N., 2000. Compost maturity assessment
using calorimetry, spectroscopy and chemical analysis. Compost Sci. Util. 8, 124-134.
Sánchez, Ó.J., Ospina, D.A., Montoya, S., 2017. Compost supplementation with nutrients and
microorganisms in composting process. Waste Management 69, 136-153.
Sharrer, M.J., Rishel, K., Summerfelt, S., 2009. Evaluation of geotextile filtration applying
coagulant and flocculant amendments for aquaculture biosolids dewatering and
phosphorus removal. Aquacult. Eng. 40, 1-10.
Tarac Technologies 2019, Winery residual management, Tarac Technologies, South
Australia, https://www.tarac.com.au/services/winery-residual/.22/06/2019
Watteau, F., Villemin, G., 2011. Characterization of organic matter microstructure dynamics
during co-composting of sewage sludge, barks and green waste. Bioresource
Technology 102, 9313-9317.
Young, D., Ochre, P., Kuijvenhoven, K., 2006. V-fold belt dewatering technology, 31st
Annual Qld water industry workshop - oprations skills. Annual Qld water industry
workshop - oprations skills, Rockhampton.

Appendix A: The Survey questionnaire for CWMS and sludge viability investigation
Survey Questionnaire
Community Wastewater Treatment Scheme (CWMS) Sludge Processing
Plant Viability Investigation
Respondent information
Council:
Contact person name :
Position :
Email :
Phone number :
Introduction
The purpose of this questionnaire is to determine the potential to reduce disposal problems and
costs by finding a viable use for wastewater sludge across the Legatus Group region. We are
seeking the current and projected volumes and the current and future systems and costs. This
will allow comparison to other options, including reuse by major South Australian soil and
compost companies.
To minimise the time taken to collect the information, PhD Intern Harsha Sapdhare will be in
touch with the relevant contact person at each Council to assist. The Legatus Group already
holds information about regional CWMS, some of which we will check in this study, but the
major purpose is to focus on sludge.

Survey (please indicate ‘X’ where applicable in box)
Wastewater Treatment Plant (WWTP) general information
WWTP location :
WWTP Address :
Total wastewater inflow (m3/d) :
Design WWTP treatment capacity (m3/d)
No of properties connected :
Total population equivalent treated (EP) :
Expected annual population growth (%)
Wastewater treatment plant operating process flow diagram (please attached site plan if
available)
_________________________________________________________________________
___________________________________________________________________________
WWTP
Gravity sewage systems (raw sewage collection, no septic tanks)
Sewage system with pumped and gravity lines in the network
Pumped raw sewage from individual connections to common mains (pressure sewerage)
Septic tank effluent drainage – by gravity
Septic tank effluent drainage –pumped and gravity lines in the network (STEDS)
Vacuum sewerage systems

Types of wastewater treated
Domestic (m3/day)
Estimated percentage of inflow (trade
waste)
WWTP – process
a) Mechanical screen: ______________
b) Raked screen: ______________
c) Grit removal chamber: ______________
d) Screening handling system: ______________
e) Grit classification system: ______________
f) Odour fan and extraction systems: ______________
Attached growth system such as trickling filter, rotating bio-reactor:
________________________________________________________________________
________________________________________________________________________
Other biological treatment: _______________________________________________
_________________________________________________________________________
Filtration system (sand, micro filtration etc.)
__________________________________________________________________________
Lagoon based systems and capacity
a) Aerobic: ____________
b) Facultative: ____________
c) Anaerobic: ____________
d) Aerated lagoon ____________
e) Evaporative lagoons: ____________
Annual sludge production (tonnes of dry solids)
__________________________________________________________________________
Handling and storage
_______________________________________________________________________
________________________________________________________________________
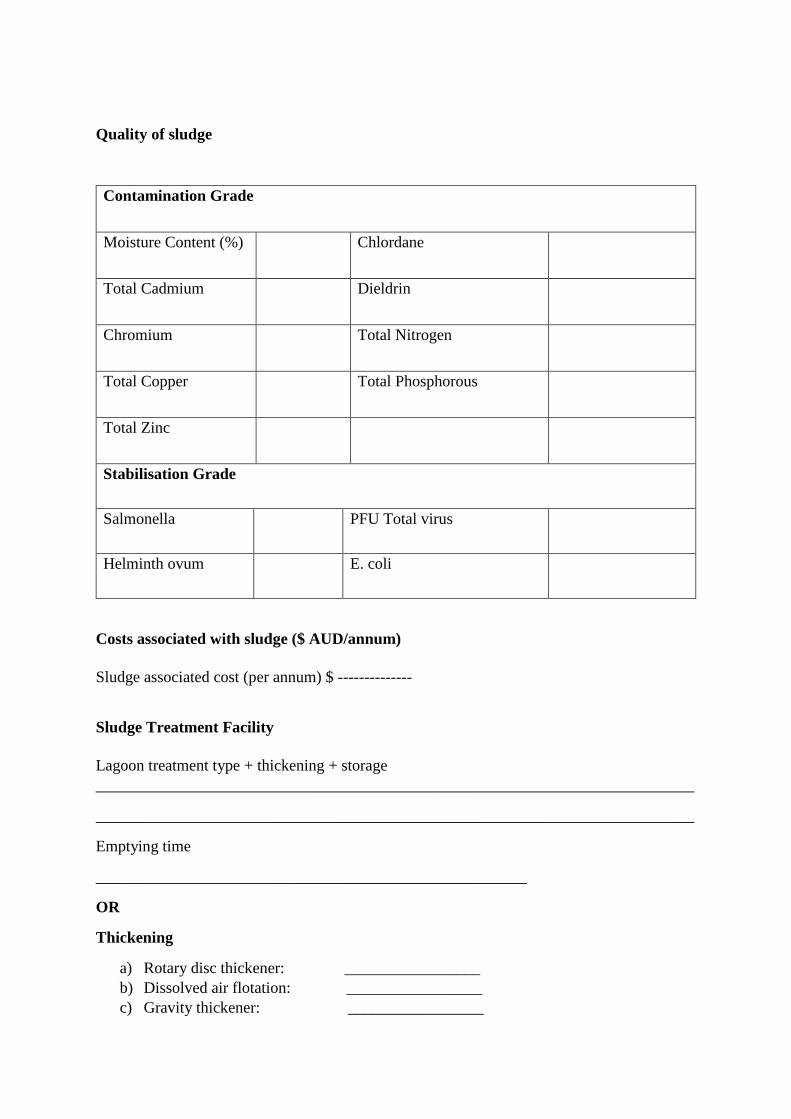
Quality of sludge
Contamination Grade
Moisture Content (%) Chlordane
Total Cadmium Dieldrin
Chromium Total Nitrogen
Total Copper Total Phosphorous
Total Zinc
Stabilisation Grade
Salmonella PFU Total virus
Helminth ovum E. coli
Costs associated with sludge ($ AUD/annum)
Sludge associated cost (per annum) $ --------------
Sludge Treatment Facility
Lagoon treatment type + thickening + storage
___________________________________________________________________________
___________________________________________________________________________
Emptying time
______________________________________________________
OR
Thickening
a) Rotary disc thickener: _________________
b) Dissolved air flotation: _________________
c) Gravity thickener: _________________

d) Belt thickener: _________________
Dewatering
a) Centrifuge:
i. Air agitated drying: _____________
ii. Composting: _____________
b) Sludge drying beds: ______________
c) Other _______________
Storage capacity (tonnes) (Wet/dry)
a) Stockpile: _______________ __________________% solids
b) Stabilisation lagoons: _______________ __________________ % solids
c) Sludge lagoons: _______________ ___________________ % solids
Bio solids: ______________ tonnes/year
% dry ______________
Biosolids forms:
Biosolids slurry: _____m3
Biosolids dewatered cake: ______tonnes
Biosolids pellets: ______
Lime amended biosolids: ______ tonnes
Composted biosolids: _______tonnes
_________________________________________________________________
_________________________________________________________________
a) Biosolids reuse (%) in:
Agriculture: ________%
Horticulture: ________%
Landscaping: ________%
Composting: ________%
Land rehabilitation: ________%
b) Transportation for stockpiling to: ______________distance: _________
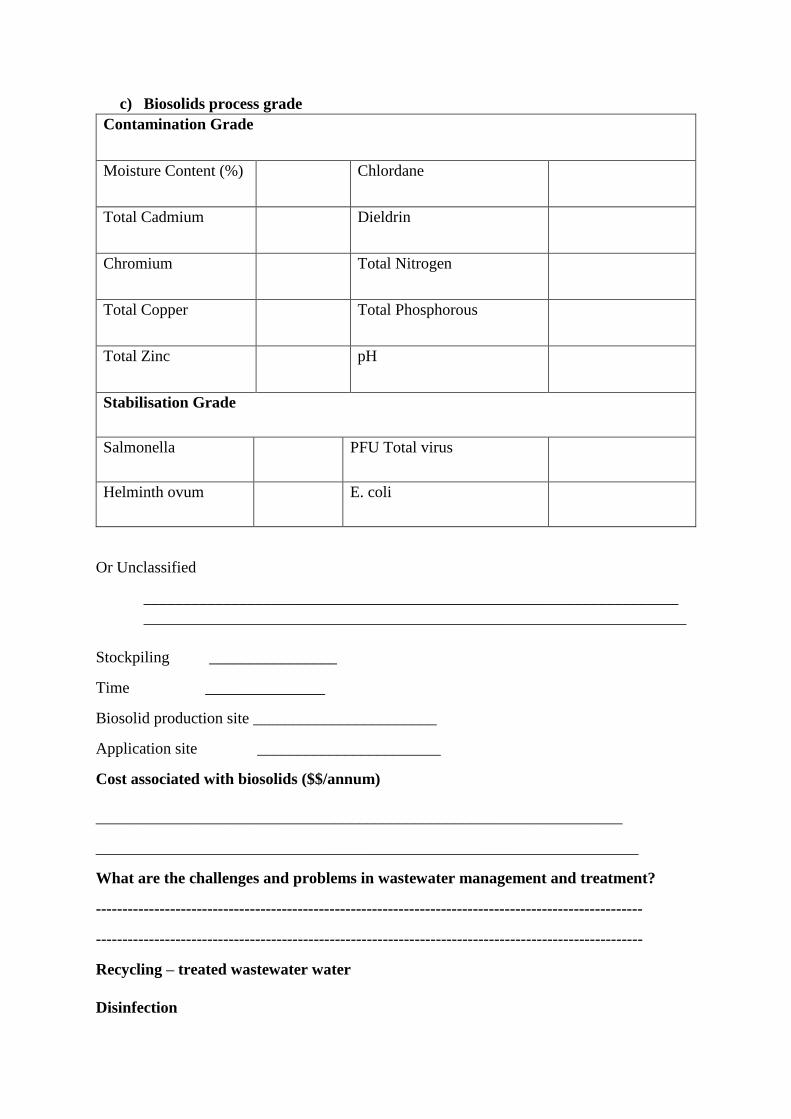
c) Biosolids process grade
Contamination Grade
Moisture Content (%) Chlordane
Total Cadmium Dieldrin
Chromium Total Nitrogen
Total Copper Total Phosphorous
Total Zinc pH
Stabilisation Grade
Salmonella PFU Total virus
Helminth ovum E. coli
Or Unclassified
___________________________________________________________________
____________________________________________________________________
Stockpiling ________________
Time _______________
Biosolid production site _______________________
Application site _______________________
Cost associated with biosolids ($$/annum)
__________________________________________________________________
____________________________________________________________________
What are the challenges and problems in wastewater management and treatment?
-------------------------------------------------------------------------------------------------------
-------------------------------------------------------------------------------------------------------
Recycling – treated wastewater water
Disinfection
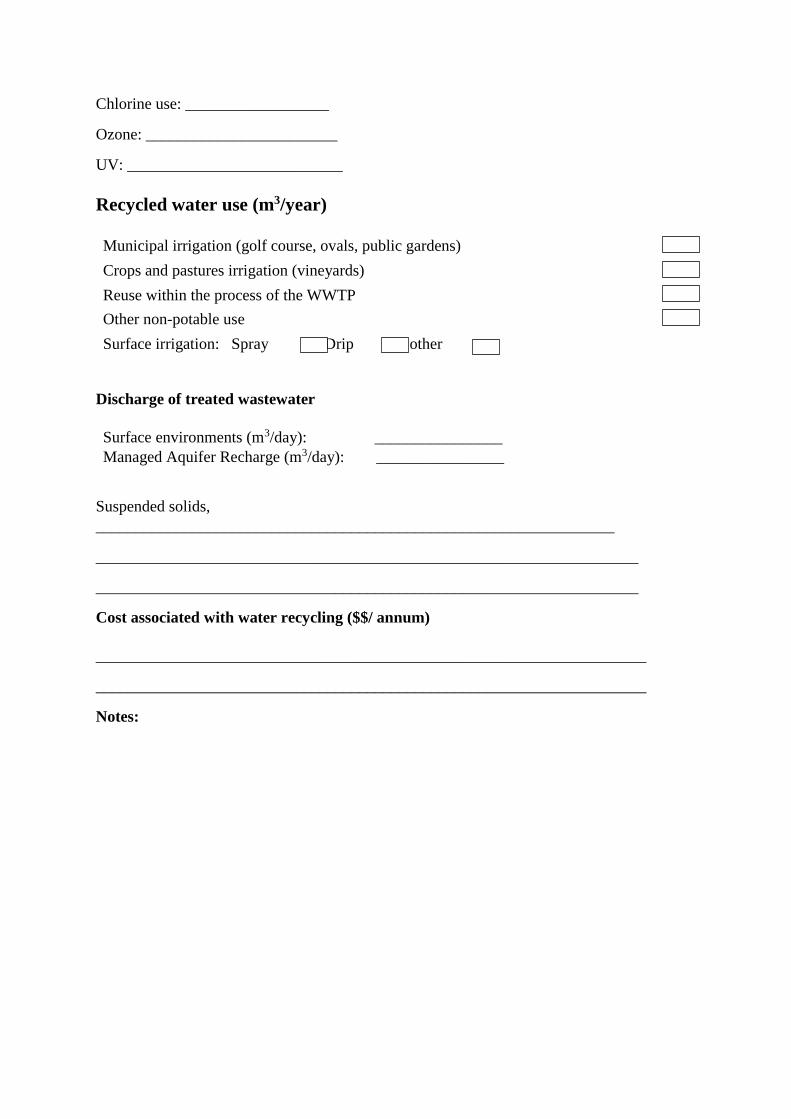
Chlorine use: __________________
Ozone: ________________________
UV: ___________________________
Recycled water use (m3/year)
Municipal irrigation (golf course, ovals, public gardens)
Crops and pastures irrigation (vineyards)
Reuse within the process of the WWTP
Other non-potable use
Surface irrigation: Spray Drip other
Discharge of treated wastewater
Surface environments (m3/day): ________________
Managed Aquifer Recharge (m3/day): ________________
Suspended solids,
_________________________________________________________________
____________________________________________________________________
____________________________________________________________________
Cost associated with water recycling ($$/ annum)
_____________________________________________________________________
_____________________________________________________________________
Notes:
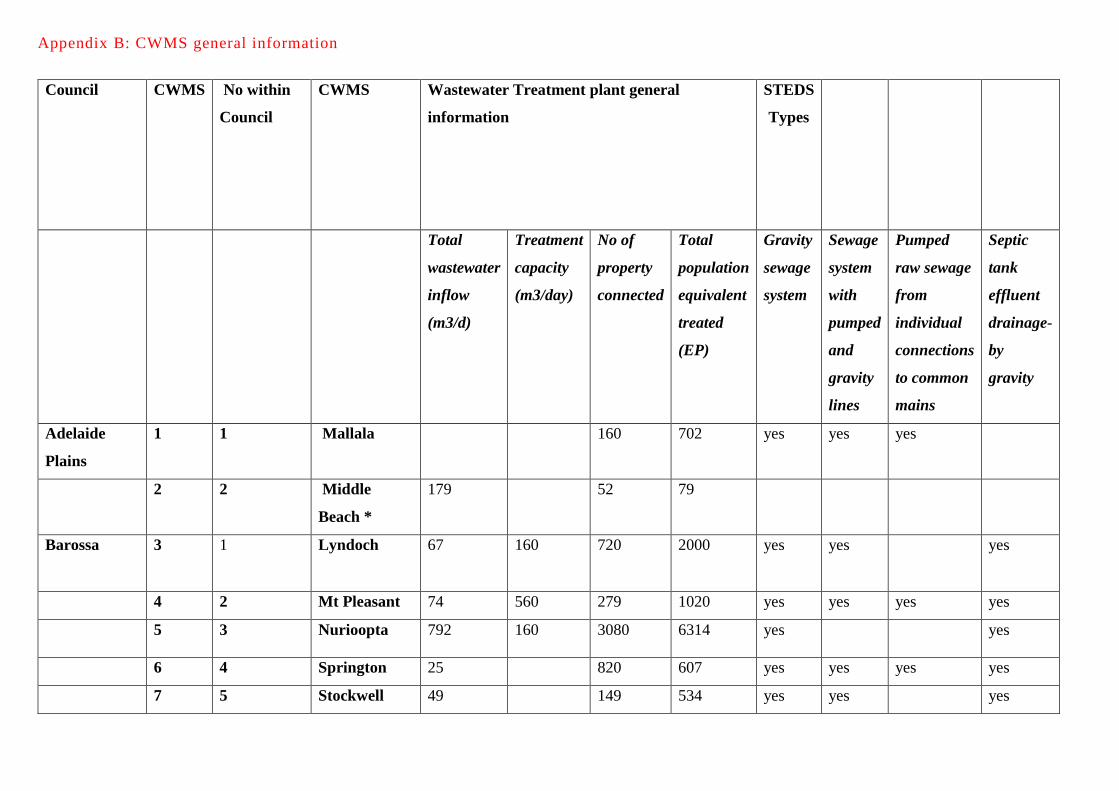
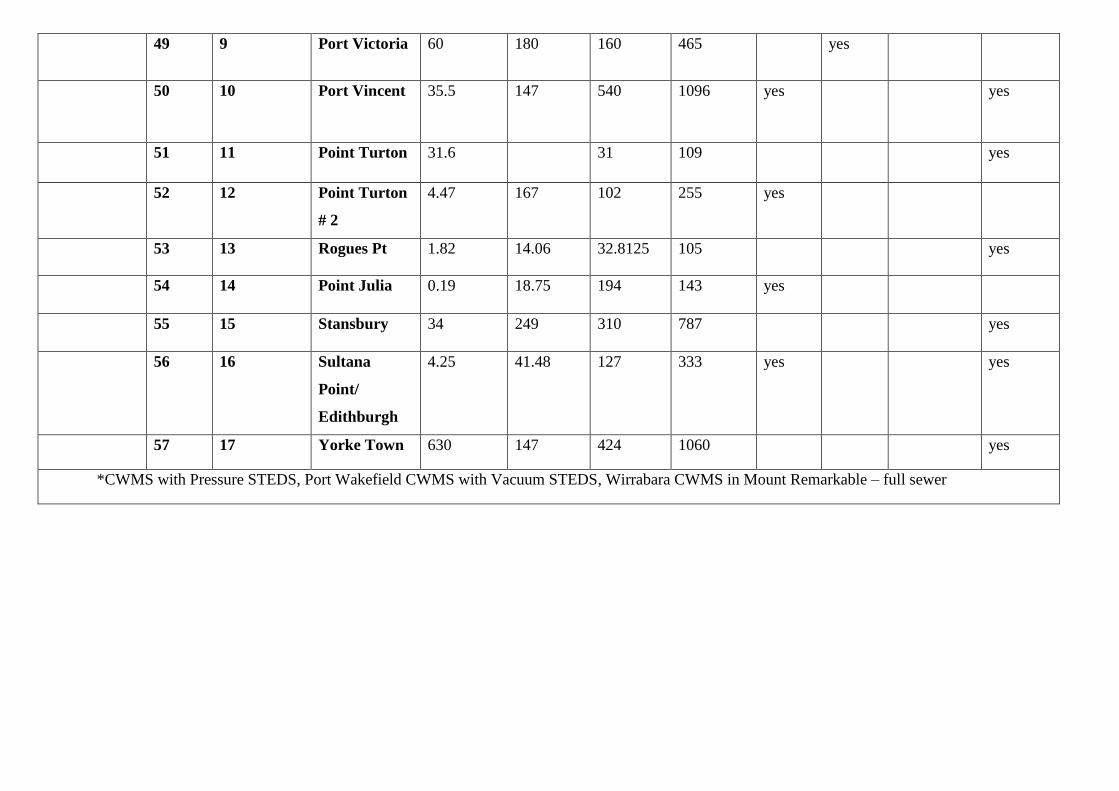
Appendix B: CWMS general information
Council CWMS No within
Council
CWMS Wastewater Treatment plant general
information
STEDS
Types
Total
wastewater
inflow
(m3/d)
Treatment
capacity
(m3/day)
No of
property
connected
Total
population
equivalent
treated
(EP)
Gravity
sewage
system
Sewage
system
with
pumped
and
gravity
lines
Pumped
raw sewage
from
individual
connections
to common
mains
Septic
tank
effluent
drainage-
by
gravity
Adelaide
Plains
1 1 Mallala
160 702 yes yes yes
2 2 Middle
Beach *
179
52 79
Barossa 3 1 Lyndoch 67 160 720 2000 yes yes
yes
4 2 Mt Pleasant 74 560 279 1020 yes yes yes yes
5 3 Nurioopta 792 160 3080 6314 yes
yes
6 4 Springton 25
820 607 yes yes yes yes
7 5 Stockwell 49
149 534 yes yes
yes

8 6 Tanunda 1000
2320 4588 yes
yes
9 7 Williamstown 278
820 2755 yes yes
yes
Barunga
West
10 1 Port
Broughton
145 159 610 752
yes
11 2 Bute 39
192 410
yes
Clare and
Gilbert
Valleys
12 1 Clare 630 680 1824 4500
yes
13 2 Riverton 150 170 422 800
14 3 Saddleworth 40 80 239 500
yes
Copper
Coast
Council
15 1 Kadina* 187.4 425.5 1571 5498 no yes no yes
16 2 Port Hughes* 587 1200 1556 5446 yes yes yes yes
17 3 Wallaroo* 862 1000 3025 10,587 yes yes No yes
Flinders
Ranges
18 1 Quorn 35 140 100 1050
yes
Goyder 19 1 Burra Unknown Unknown 320 1103 Yes
Yes
20 2 Eudunda 63 180 382 640
Yes

Light 21 1 Kapunda 400 680 1180 2917 Yes Yes
yes
22 2 Freeling 350 414 465 2214 Yes
yes yes
23 3 Roseworthy
156 994
24 4 Nuriootpa
28
25 5 Greenock
352 1087
Mount
Remarkable
26 1 Booleroo 58.9
185 331
Yes
27 2 Melrose 74
151 350
yes
28 3 Wirrabara 122.57
251 403
Full
sewer
29 4 Wilmington 110
226 587
yes
Northern
Areas
30 1 Jamestown 258 354 996 1500
yes
31 2 Laura 74
499
yes
32 3 Gladstone
166 389 600
yes
Orroroo
Carrieton
33 1 Orrorroo
557
Peterborough 34 1 Peterborough New 470 1075 1000
Pirie 35 1 Crystal
Brook
182
585 1185 yes yes
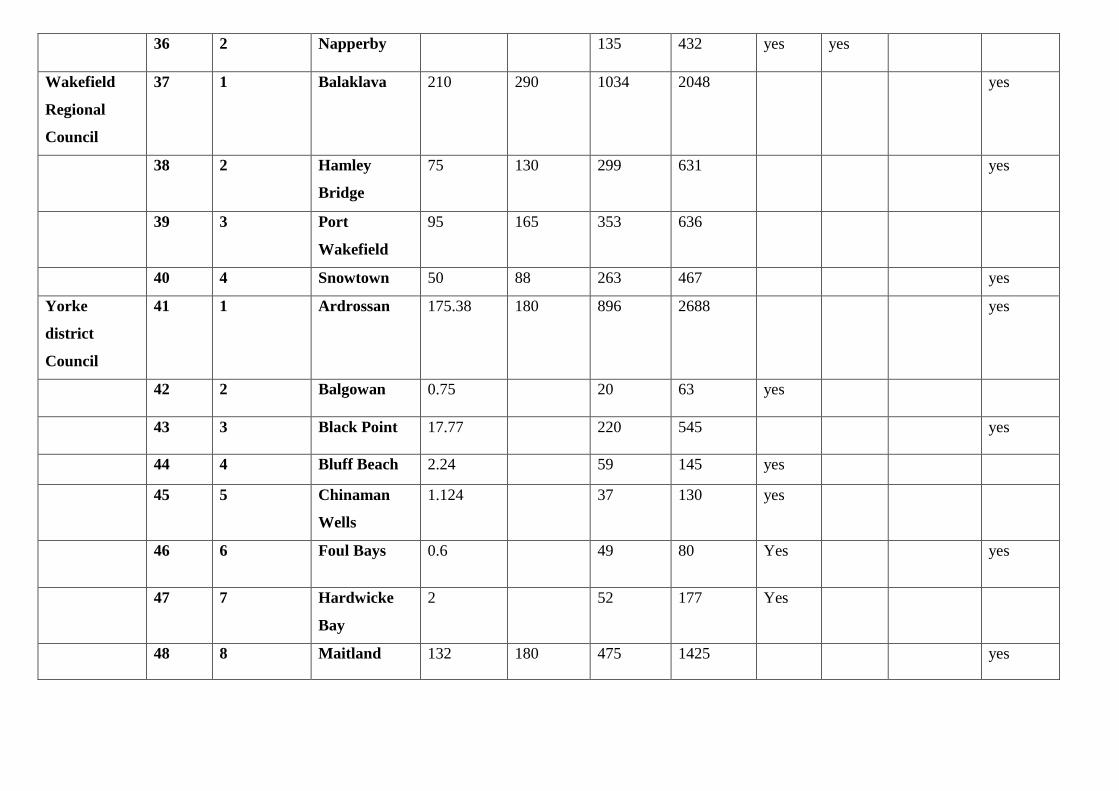
36 2 Napperby
135 432 yes yes
Wakefield
Regional
Council
37 1 Balaklava 210 290 1034 2048
yes
38 2 Hamley
Bridge
75 130 299 631
yes
39 3 Port
Wakefield
95 165 353 636
40 4 Snowtown 50 88 263 467
yes
Yorke
district
Council
41 1 Ardrossan 175.38 180 896 2688
yes
42 2 Balgowan 0.75
20 63 yes
43 3 Black Point 17.77
220 545
yes
44 4 Bluff Beach 2.24
59 145 yes
45 5 Chinaman
Wells
1.124
37 130 yes
46 6 Foul Bays 0.6
49 80 Yes
yes
47 7 Hardwicke
Bay
2
52 177 Yes
48 8 Maitland 132 180 475 1425
yes
49 9 Port Victoria 60 180 160 465
yes
50 10 Port Vincent 35.5 147 540 1096 yes
yes
51 11 Point Turton 31.6
31 109
yes
52 12 Point Turton
# 2
4.47 167 102 255 yes
53 13 Rogues Pt 1.82 14.06 32.8125 105
yes
54 14 Point Julia 0.19 18.75 194 143 yes
55 15 Stansbury 34 249 310 787
yes
56 16 Sultana
Point/
Edithburgh
4.25 41.48 127 333 yes
yes
57 17 Yorke Town 630 147 424 1060
yes
*CWMS with Pressure STEDS, Port Wakefield CWMS with Vacuum STEDS, Wirrabara CWMS in Mount Remarkable – full sewer
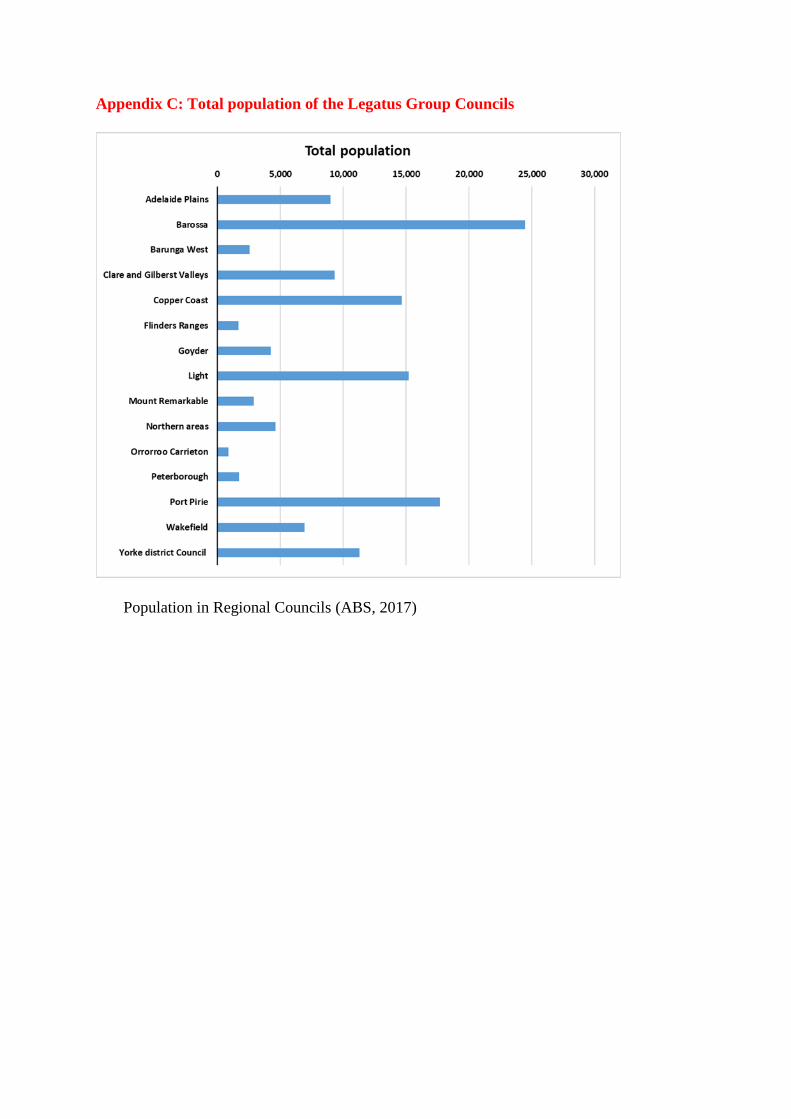
Appendix C: Total population of the Legatus Group Councils
Population in Regional Councils (ABS, 2017)
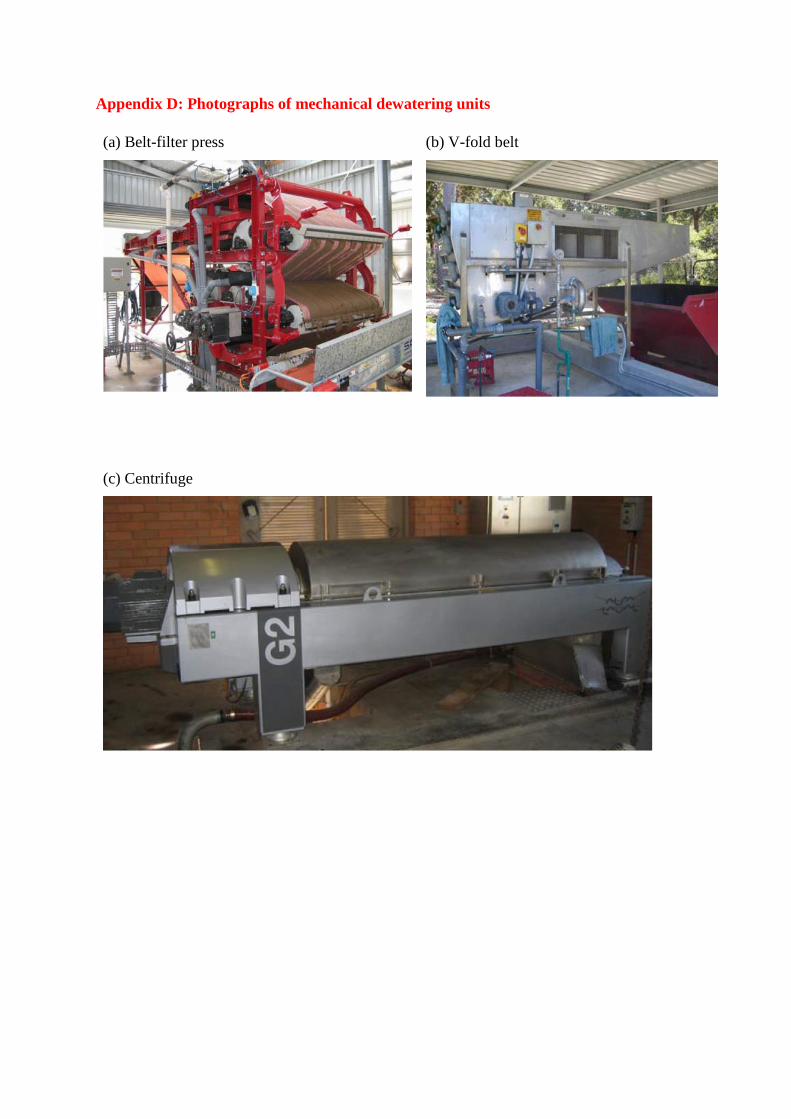
Appendix D: Photographs of mechanical dewatering units
(a) Belt-filter press
(b) V-fold belt
(c) Centrifuge
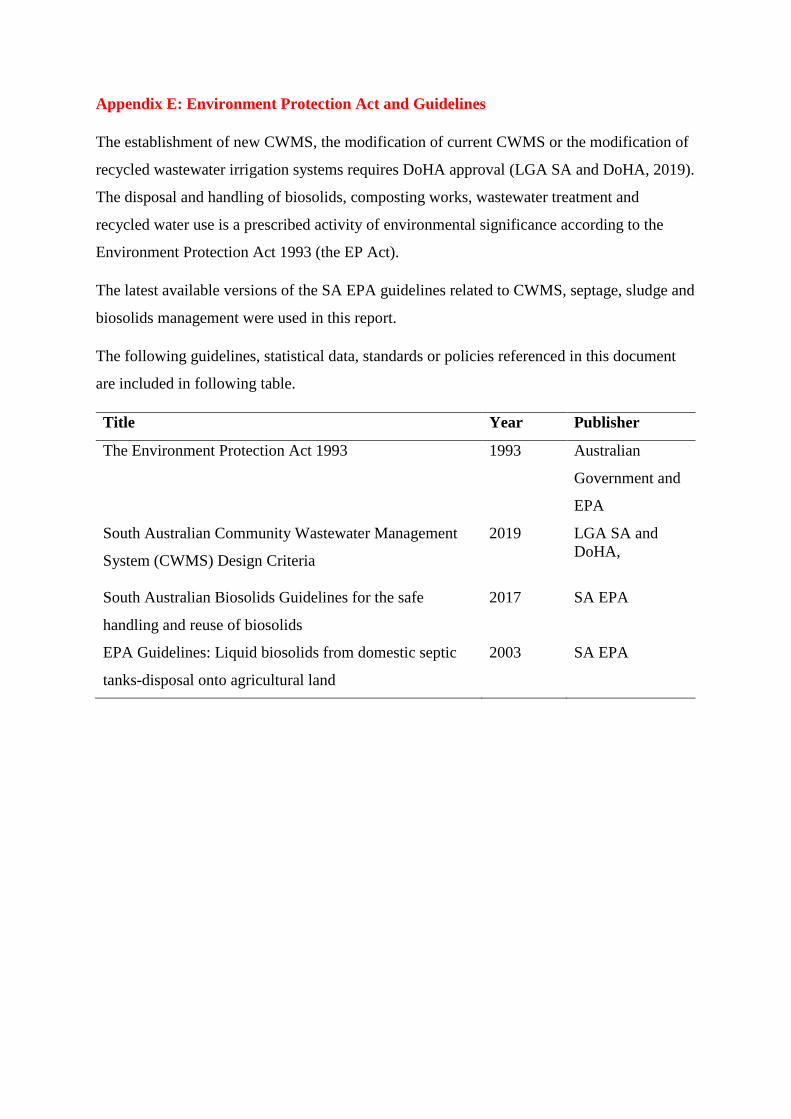
Appendix E: Environment Protection Act and Guidelines
The establishment of new CWMS, the modification of current CWMS or the modification of
recycled wastewater irrigation systems requires DoHA approval (LGA SA and DoHA, 2019).
The disposal and handling of biosolids, composting works, wastewater treatment and
recycled water use is a prescribed activity of environmental significance according to the
Environment Protection Act 1993 (the EP Act).
The latest available versions of the SA EPA guidelines related to CWMS, septage, sludge and
biosolids management were used in this report.
The following guidelines, statistical data, standards or policies referenced in this document
are included in following table.
Title Year Publisher
The Environment Protection Act 1993 1993 Australian
Government and
EPA
South Australian Community Wastewater Management
System (CWMS) Design Criteria
2019 LGA SA and
DoHA,
South Australian Biosolids Guidelines for the safe
handling and reuse of biosolids
2017 SA EPA
EPA Guidelines: Liquid biosolids from domestic septic
tanks-disposal onto agricultural land
2003 SA EPA