Embed Size (px)
Citation preview

Field Study on the Efficacy of the New Restart Provision for Hours of Service
January 2014

FOREWORD As part of the Hours-of-Service of Drivers Final Rule, published on December 27, 2011, with a compliance date of July 1, 2013, if commercial motor vehicle (CMV) drivers choose to use a provision allowing “restart” of the 60- or 70-hour duty-cycle limit, they are required to include at least two nighttime periods (from 1 a.m. until 5 a.m., based on the home terminal time zone if the restart takes place in a time zone that differs from the driver’s home terminal) in their restart breaks in order to have sufficient time for sleep recuperation. Drivers who end their duty cycle between 1 a.m. and 7 p.m. must extend their 34-hour restart break by 1 or more hours to be compliant with this new restart rule. Under the auspices of the Federal Motor Carrier Safety Administration (FMCSA), as mandated by Congress through the Moving Ahead for Progress in the 21st Century Act (MAP-21), a naturalistic field study was conducted between January and July 2013 to examine the efficacy of the new restart rule.
This technical report presents the design, methods, research findings, and conclusions of the field study. The most important and statistically significant finding was that when drivers had only one nighttime period in their restart break, they showed greater levels of objectively and subjectively measured fatigue than when they had two or more nighttime periods in their restart break. The finding provides evidence in support of the efficacy of the new restart rule in mitigating driver fatigue.
This technical report may be of interest to policy makers, regulators, and anyone else interested in fatigue and its management in commercial motor vehicle operations and other modes of transportation.
NOTICE
This document is disseminated under the sponsorship of the U.S. Department of Transportation (USDOT) in the interest of information exchange. The U.S. Government assumes no liability for its contents or the use of the information contained in this document. The contents of this report reflect the views of the contractor, who is responsible for the accuracy of the data presented herein. The contents do not necessarily reflect the official policy of the USDOT. This report does not constitute a standard, specification, or regulation.
The U.S. Government does not endorse products or manufacturers named herein. Trademarks or manufacturers’ names appear in this report only because they are considered essential to the objective of this report.
QUALITY ASSURANCE STATEMENT
The Federal Motor Carrier Safety Administration (FMCSA) provides high-quality information to serve Government, industry, and the public in a manner that promotes public understanding. Standards and policies are used to ensure and maximize the quality, objectivity, utility, and integrity of its information. FMCSA periodically reviews quality issues and adjusts its programs and processes to ensure continuous quality improvement.

Technical Report Documentation Page 1. Report No. RRR-13-058
2. Government Accession No.
3. Recipient's Catalog No.
4. Title and Subtitle Field Study on the Efficacy of the New Restart Provision for Hours of Service
5. Report Date September 2013 6. Performing Organization Code
7. Author(s) Van Dongen, Hans P.A., PhD, and Mollicone, Daniel J., PhD
8. Performing Organization Report No.
9. Performing Organization Name and Address Sleep and Performance Research Center Washington State University, Spokane, WA and Pulsar Informatics Inc., Philadelphia, PA
10. Work Unit No. (TRAIS) 11. Contract or Grant No.
12. Sponsoring Agency Name and Address U.S. Department of Transportation Federal Motor Carrier Safety Administration 1200 New Jersey Ave SE Washington, DC 20590
13. Type of Report Final Report, October 2012–September 2013 14. Sponsoring Agency Code
15. Supplementary Notes This program was sponsored by the Federal Motor Carrier Safety Administration. Dr. Martin R. Walker served as the Contracting Officer’s Representative. 16. Abstract The objective of this research project was to examine the efficacy of the new restart rule promulgated as part of the Hours of Service of Drivers Final Rule, published on December 27, 2011, with a compliance date of July 1, 2013. Under the new restart rule, if commercial motor vehicle (CMV) drivers choose to use a provision allowing “restart” of the 60- or 70-hour duty-cycle limit, they are required to include at least two nighttime periods (from 1 a.m. until 5 a.m.) in their restart breaks in order to have sufficient time for sleep recuperation before beginning another duty cycle. To investigate the efficacy of the new rule, a naturalistic field study was conducted (prior to the compliance date) to assess fatigue in drivers working their normal schedules and performing their normal duties. During this study, researchers performed a comparison of driver fatigue during duty cycles preceded by a restart break with only one nighttime period versus duty cycles preceded by a restart break with two or more nighttime periods. Findings included the following results, which constitute evidence in support of the efficacy of the new restart rule:
1. Drivers affected by the new rule were primarily nighttime drivers. The new rule thus targets those drivers who are at the greatest risk of fatigue.
2. Drivers affected by the new rule reverted to a predominantly nighttime sleep schedule during the restart break. Extending the restart break for drivers affected by the new rule to include an additional nighttime period thus provides them with greater opportunity for sleep recuperation.
3. Drivers who would have already been compliant with the new rule showed less fatigue than those affected by the new rule. This implies that having at least two nighttime periods (from 1 a.m. until 5 a.m.) in the restart break helps to mitigate fatigue.
17. Key Words biological nights, circadian rhythm, commercial motor vehicle, fatigue, HOS, hours of service, performance, recovery, restart, sleep
18. Distribution Statement No restrictions
19. Security Classif. (of this report) Unclassified
20. Security Classif. (of this page) Unclassified
21. No. of Pages 52
22. Price
Form DOT F 1700.7 (8-72) Reproduction of completed page authorized.

ii
SI* (MODERN METRIC) CONVERSION FACTORS TABLE OF APPROXIMATE CONVERSIONS TO SI UNITS
Symbol When You Know Multiply By To Find Symbol LENGTH in inches 25.4 millimeters mm ft feet 0.305 meters m yd yards 0.914 meters m mi miles 1.61 kilometers km AREA in² square inches 645.2 square millimeters mm² ft² square feet 0.093 square meters m² yd² square yards 0.836 square meters m² ac acres 0.405 hectares ha mi² square miles 2.59 square kilometers km² VOLUME Note: Volumes greater than
1000 L shall be shown in m³
fl oz fluid ounces 29.57 milliliters mL gal gallons 3.785 liters L ft³ cubic feet 0.028 cubic meters m³ yd³ cubic yards 0.765 cubic meters m³ MASS oz ounces 28.35 grams g lb pounds 0.454 kilograms kg T short tons (2000 lb) 0.907 megagrams (or “metric ton”) Mg (or “t”) TEMPERATURE Temperature is in exact degrees °F Fahrenheit 5 × (F-32) ÷ 9
or (F-32) ÷ 1.8 Celsius °C
ILLUMINATION fc foot-candles 10.76 lux lx fl foot-Lamberts 3.426 candela/m² cd/m² Force and Pressure or Stress lbf poundforce 4.45 newtons N lbf/in² poundforce per square inch 6.89 kilopascals kPa
TABLE OF APPROXIMATE CONVERSIONS FROM SI UNITS Symbol When You Know Multiply By To Find Symbol LENGTH mm millimeters 0.039 inches in m meters 3.28 feet ft m meters 1.09 yards yd km kilometers 0.621 miles mi AREA mm² square millimeters 0.0016 square inches in² m² square meters 10.764 square feet ft² m² square meters 1.195 square yards yd² ha hectares 2.47 acres ac km² square kilometers 0.386 square miles mi² VOLUME mL milliliters 0.034 fluid ounces fl oz L liters 0.264 gallons gal m³ cubic meters 35.314 cubic feet ft³ m³ cubic meters 1.307 cubic yards yd³ MASS g grams 0.035 ounces oz kg kilograms 2.202 pounds lb Mg (or “t”) megagrams (or “metric ton”) 1.103 short tons (2000 lb) T TEMPERATURE Temperature is in exact degrees °C Celsius 1.8C + 32 Fahrenheit °F ILLUMINATION lx lux 0.0929 foot-candles fc cd/m² candela/m² 0.2919 foot-Lamberts fl Force & Pressure or Stress N newtons 0.225 poundforce lbf kPa kilopascals 0.145 poundforce per square inch lbf/in²
*SI is the symbol for the International System of Units. Appropriate rounding should be made to comply with Section 4 of ASTM E380. (Revised March 2003, Section 508-accessible version September 2009)
iii
TABLE OF CONTENTS
LIST OF ACRONYMS AND ABBREVIATIONS .................................................................. vii
EXECUTIVE SUMMARY ......................................................................................................... ix
1. INTRODUCTION.................................................................................................................1
1.1 BACKGROUND ...........................................................................................................1
1.2 PROJECT TASKS .........................................................................................................2
1.3 LITERATURE REVIEW ..............................................................................................5
2. METHODS ..........................................................................................................................11
2.1 STUDY PROCEDURES .............................................................................................11
2.2 MEASUREMENTS .....................................................................................................13
2.3 STATISTICAL ANALYSES ......................................................................................14
2.4 DRIVERS ....................................................................................................................16
3. RESULTS ............................................................................................................................19
3.1 DUTY, DRIVING, AND SLEEP ................................................................................19
3.2 FATIGUE OUTCOMES .............................................................................................22
4. CONCLUSIONS .................................................................................................................27
4.1 NATURALISTIC FIELD STUDY ..............................................................................27
4.2 NEW RESTART RULE AND SLEEP ........................................................................28
4.3 NEW RESTART RULE AND FATIGUE ..................................................................29
ACKNOWLEDGMENTS ...........................................................................................................33
REFERENCES .............................................................................................................................35

iv
LIST OF FIGURES Figure 1. Graph. Primary result of the first laboratory study of the restart break.() The graph
shows lapses on a 10-minute Psychomotor Vigilance Test (PVT) as a function of time of day, collapsed over 5-day simulated duty cycles before and after a 34-hour restart break in a laboratory study. Volunteers were randomized either to a “best case” condition, which entailed daytime wakefulness (and nighttime sleep) throughout the study, or a “worst case” condition, which entailed nighttime wakefulness (and daytime sleep) during the two 5-day duty cycles, while transitioning back to a daytime schedule during the 34-hour restart break. Times of day in the graph are through the day (9:05 a.m.–6:55 p.m.) for the “best case” condition and through the night (9:05 p.m.–6:55 a.m.) for the “worst case” condition. Error bars indicate standard error of the mean. .....6
Figure 2. Graph. Primary result of the second laboratory study of the restart break,() plotted on top of that of the first laboratory study (cf. Figure 1). The graph shows lapses on a 10-minute PVT as a function of time of day, collapsed over 5-day simulated duty cycles before and after a restart break in a laboratory study. In the second laboratory study, volunteers were assigned to a “worst case” condition, which entailed nighttime wakefulness (and daytime sleep) during the two 5-day duty cycles, while transitioning back to a daytime schedule during restart break. In the second laboratory study, the restart break was extended from 34 hours to 58 hours to include a second biological night. This helped to mitigate performance impairment in the duty cycle after the restart break. Times of day in the graph are through the day (9:05 a.m.–6:55 p.m.) for the “best case” condition and through the night (9:05 p.m.–6:55 a.m.) for the “worst case” conditions. Error bars indicate standard error of the mean. ....................................7
Figure 3. Image. Illustration of an example display presented by the smartphone software to begin reaction time testing on the PVT or to log sleep. .................................................11
Figure 4. Image. Black-and-white image of a data acquisition system mounted into the engine compartment of a truck. .................................................................................................12
Figure 5. Graph. Distribution of drivers logged as on duty, as a percentage of total driver hours for each hour of the day, during duty cycles. Error bars indicate ± 1 standard error of the mean. ........................................................................................................................19
Figure 6. Graph. Distribution of drivers logged as driving, as a percentage of total driver hours for each hour of the day, during duty cycles. Error bars indicate ± 1 standard error of the mean. ........................................................................................................................20
Figure 7. Graph. Distribution of drivers sleeping, as a percentage of total driver hours for each hour of the day, during duty cycles. Error bars indicate ± 1 standard error of the mean.21
Figure 8. Graph. Distribution of drivers sleeping, as a percentage of total driver hours for each hour of the day, during the restart break. Error bars indicate ± 1 standard error of the mean. ..............................................................................................................................21
Figure 9. Graph. Mean lapses of attention on a 3-minute PVT, by 4-hour period of the day, during duty cycles. Error bars indicate ± 1 standard error of the mean. ........................22
Figure 10. Graph. Mean lapses of attention on a 3-minute PVT, by 4-hour period of the day, during the restart break. Error bars indicate ± 1 standard error of the mean. .................23
Figure 11. Graph. Mean lane deviation, by hour of the day, during duty cycles. Error bars indicate ± 1 standard error of the mean. .........................................................................24

v
Figure 12. Graph. Mean subjective sleepiness on the KSS, by 4-hour period of the day, during duty cycles. Error bars indicate ± 1 standard error of the mean. ....................................25
Figure 13. Graph. Mean subjective sleepiness on the KSS, by 4-hour period of the day, during the restart break. Error bars indicate ± 1 standard error of the mean. ............................25
Figure 14. Graph. A 24-hour profile of the propensity to sleep from a published study that allowed subjects to sleep at any time of the day. Upwards in the graph corresponds to greater sleep propensity. Figure adapted from Van Dongen et al.() ...............................29

vi
LIST OF TABLES Table 1. Key findings of the naturalistic field study. .......................................................................x Table 2. Demographic and study-related characteristics of the CMV drivers who participated in
the naturalistic field study. .............................................................................................17

vii
LIST OF ACRONYMS AND ABBREVIATIONS
Acronym Definition
ANOVA analysis of variance
ATRI American Transportation Research Institute
BMI body mass index
CAN controller area network
cm centimeter
CMV commercial motor vehicle
FMCSA Federal Motor Carrier Safety Administration
FRA Federal Railroad Administration
GPS Global Positioning System
HOS Hours of Service
Hz Hertz
IRB Institutional Review Board
KSS Karolinska Sleepiness Scale
MAP-21 Moving Ahead for Progress in the 21st Century Act
mph miles per hour
ms milliseconds
PERCLOS percentage of eyelid closure
PVT Psychomotor Vigilance Test
T&E train and engine
VTTI Virginia Tech Transportation Institute

viii
[This page intentionally left blank.]

ix
EXECUTIVE SUMMARY The objective of this research project was to examine the efficacy of the new restart rule promulgated as part of the Hours of Service of Drivers Final Rule, published on December 27, 2011, with a compliance date of July 1, 2013. Under the new restart rule, if commercial motor vehicle (CMV) drivers choose to use a provision allowing “restart” of the 60- or 70-hour duty-cycle limit, they are required to include at least two nighttime periods (from 1 a.m. until 5 a.m., based on the home terminal time zone if the restart takes place in a time zone that differs from the driver’s home terminal) in their restart breaks to allow sufficient opportunity for sleep recuperation before beginning another duty cycle. To investigate the efficacy of this new rule, a naturalistic field study was conducted (before the compliance date) to assess fatigue in drivers working their normal schedules and performing their normal duties. During this study, researchers performed a comparison of driver fatigue between duty cycles preceded by a restart break with only one nighttime period versus duty cycles preceded by a restart break with two or more nighttime periods.
Researchers conducted a naturalistic field study (from January until July 2013) with drivers whose duty schedules used the restart provisions of the previous hours-of-service (HOS) regulations. A total of 106 CMV drivers (100 men, 6 women; ages 24–69) completed the study. These drivers were studied during two duty cycles and during the intervening restart break. Their commercial driving experience ranged from less than a year to more than 39 years with a mean of 12.4 years. The drivers represented various types of trucking operations and included 44 local drivers, 26 regional drivers, and 36 over-the-road drivers.
Participating drivers provided a total of 1,260 days of data and drove a total of 414,937 miles during this field study. The drivers’ electronic duty logs were used to identify the periods when they were on duty and when they were driving and to define their duty cycles and restart breaks. Wrist activity monitors measured drivers’ sleep/wake patterns. Drivers’ fatigue levels were measured three times per day by means of a Psychomotor Vigilance Test (PVT) and by means of subjective sleepiness scores. A truck-mounted lane tracking system measured lane deviation (variability in lateral lane position).
Comparisons were made between the 24-hour profiles of duty, driving, sleep, PVT performance, subjective sleepiness scores, and lane deviation in duty cycles preceded by a restart break containing only one nighttime period versus duty cycles preceded by a restart break containing two or more nighttime periods. In duty cycles preceded by a restart break with only one nighttime period, drivers showed more nighttime-oriented duty and driving patterns and more daytime-oriented sleep patterns than in duty cycles preceded by a restart break with two or more nighttime periods. During duty cycles preceded by a restart break with only one nighttime period, drivers also exhibited more lapses of attention on the PVT and more variability in lateral lane position, and they reported greater subjective sleepiness. Key findings of the study are summarized in Table 1 below.
These results indicate that having at least two nighttime periods from 1 a.m. until 5 a.m. in the restart break helps to mitigate fatigue. These results are consistent with earlier, laboratory-based studies of the restart break, and constitute further evidence in support of the efficacy of the new

x
restart rule. Given that driver fatigue has been documented to be a risk factor for truck crashes, the new restart rule can thus be expected to help improve safety on U.S. roads.
Table 1. Key findings of the naturalistic field study.
Outcome Measure Summary of Differences between Study Conditions Lapses of attention (primary fatigue measure): significant difference between conditions (see Figure 9)
Drivers exhibited more lapses of attention, especially at night, during duty cycles preceded by a restart break with only one nighttime period, as compared to a restart break with two or more nighttime periods.
Subjective sleepiness: significant difference between conditions (see Figure 12)
Drivers reported greater sleepiness, especially towards the end of their duty periods, during duty cycles preceded by a restart break with only one nighttime period, as compared to a restart break with two or more nighttime periods.
Lane deviation: significant difference between conditions (see Figure 11)
Drivers showed increased lane deviation (i.e., more variability in lateral lane position) at night and in the morning and afternoon (but not in the evening) during duty cycles preceded by a restart break with only one nighttime period, as compared to a restart break with two or more nighttime periods.
Sleep: significant difference between conditions (see Figure 7)
Sleep occurred predominantly during the day in duty cycles preceded by a restart break with only one nighttime period, and predominantly at night in duty cycles preceded by a restart break with two or more nighttime periods.
On duty: significant difference between conditions (see Figure 5)
Time spent on duty occurred predominantly at night in duty cycles preceded by a restart break with only one nighttime period, whereas it was more evenly distributed across the hours of the day in duty cycles preceded by a restart break with two or more nighttime periods.
Driving: significant difference between conditions (see Figure 6)
Time spent driving was greater and occurred more typically at night in duty cycles preceded by a restart break with only one nighttime period, as compared to a restart break with two or more nighttime periods.

1
1. INTRODUCTION
1.1 BACKGROUND
The Hours-of-Service (HOS) regulations for property-carrying commercial motor vehicle (CMV) drivers that were in effect until June 30, 2013, prescribed the following:
• Drivers may drive 11 hours within a 14-hour non-extendable window after coming on duty following 10 consecutive hours off duty.
• Drivers may not drive after 60/70 hours on duty in the most recent 7/8 days.
• Drivers may restart a duty cycle after taking a restart break of 34 or more consecutive hours off duty (commonly referred to as the 34-hour restart rule).
Under the new restart rule that went into effect on July 1, 2013, if CMV drivers choose to use a provision allowing “restart” of the 60- or 70-hour duty-cycle limit, they are required to include at least two nighttime periods (from 1 a.m. until 5 a.m.) in their restart breaks. The previous, optional restart provision, which is known as the 34-hour restart rule, provided drivers with at least 34 hours to recuperate following a duty cycle, and thereby mitigated the build-up of fatigue across duty cycles. However, based on neurobiology,(1) fatigue would be expected to build up more rapidly across duty cycles in nighttime drivers than in daytime drivers. Furthermore, fatigue would be expected to dissipate less effectively during 34-hour restart breaks for nighttime drivers, which include only one biological night (versus two biological nights for daytime drivers).
These issues were the focus of two laboratory studies, conducted from 2008–2010, which set out to determine the efficacy of the 34-hour restart rule in nighttime versus daytime duty schedules.(2,3) The two studies provided evidence that relative to a daytime duty schedule, a nighttime duty schedule is associated with reduced amounts of sleep, degraded performance on a range of objective performance tasks, increased subjective sleepiness, and less efficacy of a 34-hour restart break to prevent build-up of impairment across duty cycles.(4,5) These effects were mitigated by extending the restart break to include a second biological night.(6) Thus, researchers concluded that a restart period containing two biological nights (as opposed to one biological night) could improve the efficacy of the restart period for nighttime driving operations, yielding increased opportunity for sleep recuperation and thereby greater potential for recovery from fatigue before another duty cycle begins.
The Federal Motor Carrier Safety Administration (FMCSA) published the Hours of Service of Drivers Final Rule on December 27, 2011.(7) The new regulations, which went into effect on July 1, 2013, require CMV drivers who wish to use the restart provision (i.e., who wish to exceed the 60/70 hours in 7/8 days limit) to take a break with at least two nighttime periods, defined as periods from 1 a.m. until 5 a.m. (based on the time zone for their home terminal). Drivers who end their duty cycle between 1 a.m. and 7 p.m. must extend their 34-hour restart break by 1 or more hours to be compliant with this new restart rule. For study purposes, any off-duty period of 34 or more consecutive hours was considered to be a restart period. A duty cycle was any period of on-duty time between restart periods.
2
To examine the real-world efficacy of the new restart rule, Congress charged FMCSA to conduct a field study, as mandated through the Moving Ahead for Progress in the 21st Century Act (MAP-21), which was signed into law on July 6, 2012.(8) MAP-21 specifically required the field study to be representative of drivers affected by the maximum driving time requirements and to be methodologically consistent with the above-mentioned laboratory studies and an ongoing field study called the “Scheduling and Fatigue Recovery Project.” FMCSA thus procured a contract to conduct a naturalistic field study meeting these criteria.
The current report describes the design, methods, research findings, and conclusions of this naturalistic study. The study measured sleep, reaction time performance, sleepiness, and driving performance across two duty cycles and the intervening restart break in a total of 106 CMV drivers. Data were collected over a total of 30,241 hours (25,185 hours during duty cycles and 5,056 hours during restart breaks), yielding 1,814,460 one-minute data points used for analysis. Researcher made a total of 3,169 assessments of reaction time performance and subjective sleepiness, and they recorded multiple driving measures across a total of 8,049 hours and 414,937 miles of driving.
The restart breaks of the 106 participating drivers broke down as follows:
• 20 drivers had a restart break with only 1 nighttime period preceding both recorded duty cycles.
• 5 drivers had a restart break with only 1 nighttime period preceding their first duty cycle and a restart break with two or more nighttime periods preceding their second duty cycle.
• 26 drivers had a restart break with 2 or more nighttime periods preceding their first duty cycle and a restart break with only 1 nighttime period preceding their second duty cycle.
• 55 drivers had a restart break with 2 or more nighttime periods preceding both duty cycles.
1.2 PROJECT TASKS
The following tasks were completed for this project:
Task 1: Kick-off meeting and development of draft detailed work plan. The research team wrote a draft work plan providing details for each of the project tasks. A peer review team consisting of independent experts in the area was constituted by FMCSA in cooperation with the researchers to review the scientific aspects of the study. A kick-off meeting was held on October 16, 2012 to review and address key elements of the draft work plan with FMCSA personnel, VTTI representation, and the peer review team. The researchers provided an overview of the project, the background literature, the planned strategies for driver recruitment and data collection, the timeline, and the peer review process. Based on feedback received during the kick-off meeting, the research team adjusted and resubmitted the plan. The draft detailed work plan was approved on November 1, 2012.

3
Task 2: Finalize project work plan. The research team worked with the FMCSA and the peer review team to develop the final work plan for each stage of the project. The plan included potential literature review sources, detailed data collection and statistical analysis plans, project milestones, and target completion dates. The final work plan was submitted to FMCSA on November 17, 2012.
Task 3: Obtain Institutional Review Board (IRB) approval. The research team was required to obtain approval from the IRB before starting the field research on human subjects. The research team submitted a study protocol to the IRB at Washington State University and received approval on November 20, 2012. Additionally, the research team applied for and received (on January 9, 2013) a certificate of confidentiality from the Department of Health and Human Services.
Task 4: Secure participation by recruited carriers. Per the contract agreement, the research team was required to recruit at least two carriers to participate in the field study. Three carriers agreed to participate in the study. Researchers held separate briefings with each of these carriers between December 2012 and February 2013.
Task 5: Literature review. The research team updated the literature reviews conducted for the earlier laboratory studies, with a particular emphasis on the following:
• New studies regarding the need for recovery from fatigue and the efficacy of the 34-hour restart.
• Significant findings from international research relating to commercial vehicle driver fatigue.
• Significant findings relating to driver fatigue and safety and the need for an adequate recovery period published in more general domestic and international sources.
The update is included in the present report.
Task 6: Conduct carrier focused field study. The research team conducted a naturalistic field study with drivers whose duty schedules used the restart provision of the HOS regulations. The research team was required to complete (at a minimum) the following tasks:
• Follow drivers through at least two duty cycles to document changes in performance pre-restart versus post-restart.
• Compare daytime and nighttime drivers to themselves and each other in a mixed within- and between-subjects design focused on the number of nighttime periods in the restart break.

4
• Measure sleep/wake patterns through continuous wrist activity monitoring, and measure performance on a Psychomotor Vigilance Test (PVT) at least twice daily using a portable PVT device.
• Record key driving performance metrics (such as lane deviation and speed) using on-board equipment installed in drivers’ trucks by the research team.
Four research assistants staffed the study onsite and communicated with the participating drivers daily. Researchers issued the following pieces of equipment during the study:
• 28 wrist activity monitors for sleep/wake recordings.
• 28 smartphones for administration of the PVT, fatigue and sleepiness scales, and sleep/wake/caffeine logs. Smartphone calling was disabled, and test administration was blocked while driving.
• 26 data acquisition systems. Researchers installed these systems in trucks dedicated by the carriers to the study and in independent contractors’ trucks. These systems recorded vehicle parameters and driving performance metrics continuously.
The current report describes the study design, methodology, analyses, results, and conclusions of the field study in detail.
Task 7: Progress monitoring and reporting. To ensure close oversight by stakeholders and timely completion of the study, the researchers provided study stakeholders with weekly e-mail reports on driver recruitment and biweekly e-mail reports on overall study progress. Additionally, the research team held monthly teleconference meetings with the study stakeholders, as well as quarterly in-person project meetings.
Task 8: Data reduction and analysis. Statistical testing involved a within- and between-subjects comparison of duty status, driving, sleep, and fatigue measures as a function of whether duty cycles were preceded by a restart break with only one nighttime period (1 a.m.–5 a.m.) or by a restart break with two or more nighttime periods. Statistical analyses employed state-of-the-art mixed-effects methodology(9) as used in the earlier laboratory studies and in the “Scheduling and Fatigue Recovery Project” referred to in MAP-21.
Task 9: Submit preliminary report. Preliminary reporting on the study findings occurred during two teleconferences with study stakeholders on August 28, 2013 and September 12, 2013. The research team submitted a preliminary technical report on the study to FMCSA on September 17, 2013.
Task 10: Submission and peer review of draft final report. The draft final report was sent to FMCSA representation and to the peer review team on September 21, 2013. In the subsequent days, the research team addressed comments and suggestions received from the peer review team.

5
Task 11: Submission of final report. The final, Section 508-compliant technical report was submitted to FMCSA representation on September 26, 2013. Additionally, researchers met with FMCSA on October 15, 2013, to present the study findings.
1.3 LITERATURE REVIEW
As part of this project, the researcher team was asked to update literature reviews previously conducted for the earlier laboratory studies on the restart break, with emphasis on recent studies regarding the need for recovery from fatigue and the efficacy of the 34-hour restart; significant findings from international research relating to commercial vehicle driver fatigue; and significant findings relating to driver fatigue and safety and the need for an adequate recovery period from more general domestic and international sources. This section contains the literature review update, focusing on research published in the last 5 years and starting with a summary of the findings of the earlier laboratory studies on the restart break.
In the first laboratory study on the restart break,(10) 27 healthy volunteers were studied in a “worst case/best case” within- and between-groups comparison of two 5-day (14-hours/day) simulated duty cycles separated by a 34-hour restart break. Half the sample was randomized to the “best case” condition, which entailed daytime wakefulness (and nighttime sleep) throughout the study. The other half was randomized to the “worst case” condition, which entailed nighttime wakefulness (and daytime sleep) during the two 5-day duty cycles, while transitioning back to a daytime schedule during the 34-hour restart break. Performance on a variety of neurobehavioral tasks and on a high-fidelity driving simulator was measured throughout the study.
The primary outcome measure of the study was the number of lapses of attention on a PVT. In the “best case” condition, average PVT performance in the 5-day duty cycle after the 34-hour restart break was the same as that in the 5-day duty cycle before the 34-hour restart, indicating that the restart break was efficacious at maintaining performance in the “best case” condition. In the “worst case” condition, however, average PVT performance in the 5-day duty cycle after the 34-hour restart was impaired relative to performance in the 5-day duty cycle before the 34-hour restart, indicating that the restart break was not efficacious at maintaining performance in the “worst case” condition (see Figure 1). The “worst case” condition also displayed a progressive increase in lane deviation on the high-fidelity driving simulator over the hours of the night. These objective observations of performance impairment were not reflected in subjective measures of sleepiness and mood, which inaccurately suggested that some adaptation to the “worst case” condition would occur.

6
0
1
2
3
4
5
09:0
5 pm
/am
09:5
5 pm
/am
12:0
5 am
/pm
12:5
5 am
/pm
03:0
5 am
/pm
03:5
5 am
/pm
06:0
5 am
/pm
06:5
5 am
/pm
09:0
5 pm
/am
09:5
5 pm
/am
12:0
5 am
/pm
12:5
5 am
/pm
03:0
5 am
/pm
03:5
5 am
/pm
06:0
5 am
/pm
06:5
5 am
/pm
Time Point within Days
PVT
Laps
es
Worst CaseBest Case
First 5-day work period
Second 5-day work period
Figure 1. Graph. Primary result of the first laboratory study of the restart break.(11) The graph shows lapses on a 10-minute Psychomotor Vigilance Test (PVT) as a function of time of day, collapsed over 5-day simulated duty cycles before and after a 34-hour restart break in a laboratory study. Volunteers were randomized either to a “best case” condition, which entailed daytime wakefulness (and nighttime sleep) throughout the study, or a “worst case” condition, which entailed nighttime wakefulness (and daytime sleep) during the two 5-day duty cycles, while transitioning back to a daytime schedule during the 34-hour restart break. Times of day in the graph are through the day (9:05 a.m.–6:55 p.m.) for the “best case” condition and through the night (9:05 p.m.–6:55 a.m.) for the “worst case” condition. Error bars indicate standard error of the mean.
Despite equal durations of sleep opportunity in the two study conditions, subjects in the “worst case” condition did not manage to get enough sleep because of the daytime placement of sleep periods. Perhaps due to transitioning back to a normal nighttime sleep schedule during the 34-hour restart break, the restart intervention was not efficacious at mitigating the sleep loss and consequent performance impairment in the “worst case” condition. The study findings highlighted the importance of considering circadian effects on sleep and performance in HOS regulations.(12)
The second laboratory study on the restart break(13) investigated whether extending the restart break so that it included two biological nights would increase its efficacy at mitigating impairment in the “worst case” condition. For operational purposes of the study, a 58-hour restart break was implemented because this allowed the opportunity for two full nights of sleep while transitioning back to a daytime schedule. The study design was otherwise the same as that of the “worst case” condition in the first laboratory study, and 12 healthy volunteers were studied.
The primary outcome measure of the study was again the number of lapses of attention on the PVT. Average PVT performance in the 5-day duty cycle after the restart break was not

7
significantly different from that in the 5-day duty cycle before the restart break, indicating that the restart break with two biological nights was efficacious at maintaining performance. The restart break with two biological nights was also efficacious with respect to other outcome measures, including lane deviation on the high-fidelity driving simulator, although some residual performance impairment remained for these measures after the restart break.
Secondary analyses comparing the results of the second laboratory study to those of the first laboratory study indicated that, in the context of nighttime duty schedules, the restart break with two biological nights constituted an improvement compared to the restart break with only one biological night (see Figure 2). The extra sleep opportunity offered by the second biological night appeared to be responsible for this improvement.
0
1
2
3
4
5
09:0
5 pm
/am
09:5
5 pm
/am
12:0
5 am
/pm
12:5
5 am
/pm
03:0
5 am
/pm
03:5
5 am
/pm
06:0
5 am
/pm
06:5
5 am
/pm
09:0
5 pm
/am
09:5
5 pm
/am
12:0
5 am
/pm
12:5
5 am
/pm
03:0
5 am
/pm
03:5
5 am
/pm
06:0
5 am
/pm
06:5
5 am
/pm
Time Point within Days
PVT
Laps
es
Worst CaseBest CaseSecond Study
First 5-day work period
Second 5-day work period
Figure 2. Graph. Primary result of the second laboratory study of the restart break,(14) plotted on top of that of the first laboratory study (cf. Figure 1). The graph shows lapses on a 10-minute PVT as a function of time of day, collapsed over 5-day simulated duty cycles before and after a restart break in a laboratory study. In the second laboratory study, volunteers were assigned to a “worst case” condition, which entailed nighttime wakefulness (and daytime sleep) during the two 5-day duty cycles, while transitioning back to a daytime schedule during restart break. In the second laboratory study, the restart break was extended from 34 hours to 58 hours to include a second biological night. This helped to mitigate performance impairment in the duty cycle after the restart break. Times of day in the graph are through the day (9:05 a.m.–6:55 p.m.) for the “best case” condition and through the night (9:05 p.m.–6:55 a.m.) for the “worst case” conditions. Error bars indicate standard error of the mean.
The findings of these two laboratory studies of the restart break(15,16) informed the rulemaking with regard to the new restart rule in the Hours of Service of Drivers Final Rule.(17) An important question that remained was whether the findings from the laboratory research would translate to

8
CMV operations in the field. A related question was whether nighttime drivers in the real world tend to transition back to a daytime waking and nighttime sleeping schedule during their restart break, as had been assumed in the “worst case” conditions of the two laboratory studies.
Other research relevant to fatigue and performance in CMV drivers during the last 5 years includes a naturalistic truck driving study conducted by the Virginia Tech Transportation Institute (VTTI).(18,19,20) In this study, 103 CMV drivers were followed during their regular revenue-producing runs, while driving a truck equipped with a data acquisition system, over a period of approximately 4 weeks. Average duty days included 66 percent driving, 23 percent non-driving duty (including 4 percent heavy work such as loading/unloading), and 11 percent resting. Driver performance was examined by the occurrence of safety-critical events, which included crashes, near-crashes, crash-relevant conflicts, and unintentional lane deviations. It was found that the risk of safety-critical events increased as a function of time driving in interaction with time on duty, with both factors contributing to increased risk. The risk of safety-critical events increased if most of the driving time was placed late rather than early in the duty period. A break from driving was found to result in a reduction in the risk of safety-critical events of up to 50 percent during the hour following the break, with this benefit increasing if the driver was off duty during the break.
Another naturalistic study involved 32 long-haul livestock transport truck drivers operating in remote regions of Australia.(21) For a period of 2 weeks, drivers wore wrist activity monitors to measure sleep, and they logged the timing of duty, driving and sleep, as well as the location of sleep bouts (at home, in a depot, or in their sleeper berth). Results indicated that drivers slept an average of 6.1 hours per 24 hours, with the majority of sleep occurring at night, although drivers occasionally took daytime naps as well. Consistent with their operational demands, drivers most often slept in their sleeper berths. Differences in sleep across locations appeared to be marginal, although sleeping at home was associated with earlier bedtimes and 52 minutes more sleep per day on average.
Several analyses of FMCSA’s Large Truck Crash Causation Study appeared recently.(22,23,24) Crash data were collected from 24 collection sites in 17 different States in the period from 2001–2003. Analyzed crashes included a truck with a weight rating of 10,000 pounds or more and a fatality or injury. In total, the database included 963 crashes, involving 1,123 large trucks, 959 non-truck motor vehicles, 251 fatalities, and 1,408 injuries. Fatigue was found to be a contributing factor in 13 percent of cases and more frequently in single-vehicle lane departure crashes. Fatigue-relevant factors such as early morning driving, extended time awake, and prior sleep deprivation were associated with single-vehicle crashes, more so than with multi-vehicle crashes. Fatigue was not independently a significant predictor of injury severity, but may have played a role indirectly through time of day, as crashes occurring between 7:30 p.m. and 5:30 a.m. were generally more severe.
Evidence is accumulating that obesity is associated with driver fatigue and safety-critical events. In the VTTI study described above, 53.4 percent of participating drivers were classified as obese based on their body mass index (BMI). Relative to non-obese drivers, obese drivers (with a BMI of 30 or more) were found to be 1.22 to 1.69 times more likely to be fatigued based on camera image-derived percentage of eyelid closure (PERCLOS) and ratings of drowsiness by trained observers. Furthermore, compared to non-obese drivers, obese drivers had a 1.37 times greater
9
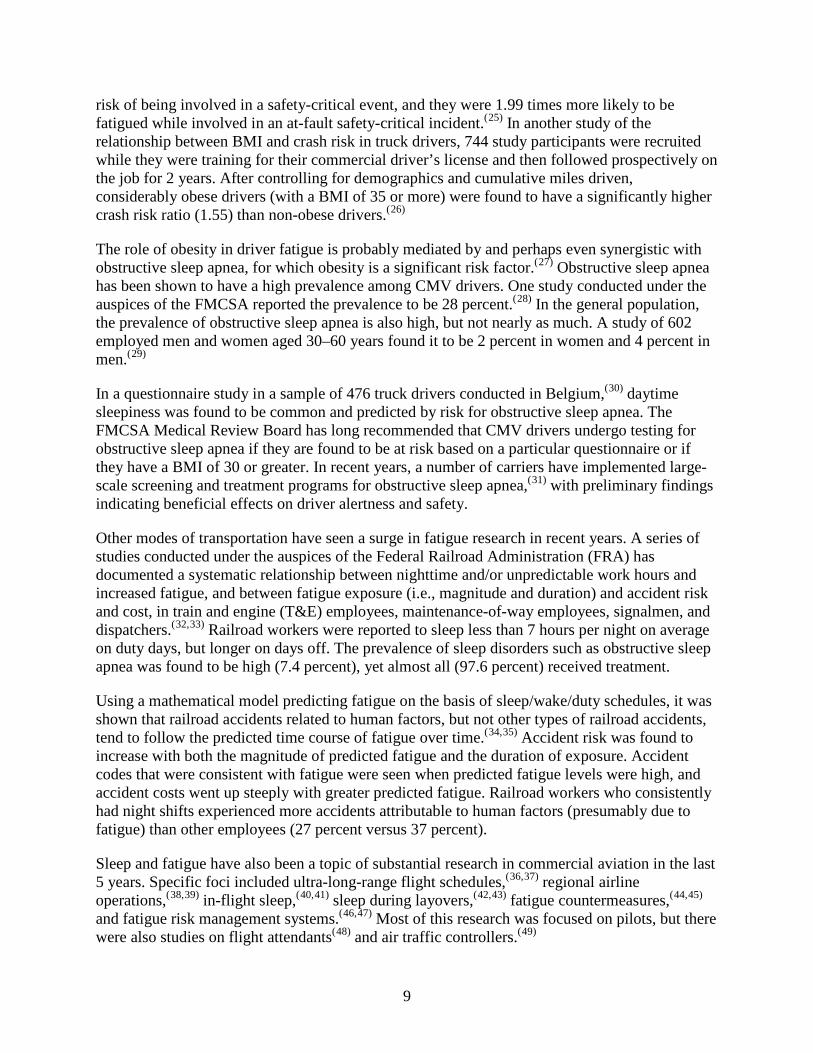
risk of being involved in a safety-critical event, and they were 1.99 times more likely to be fatigued while involved in an at-fault safety-critical incident.(25) In another study of the relationship between BMI and crash risk in truck drivers, 744 study participants were recruited while they were training for their commercial driver’s license and then followed prospectively on the job for 2 years. After controlling for demographics and cumulative miles driven, considerably obese drivers (with a BMI of 35 or more) were found to have a significantly higher crash risk ratio (1.55) than non-obese drivers.(26)
The role of obesity in driver fatigue is probably mediated by and perhaps even synergistic with obstructive sleep apnea, for which obesity is a significant risk factor.(27) Obstructive sleep apnea has been shown to have a high prevalence among CMV drivers. One study conducted under the auspices of the FMCSA reported the prevalence to be 28 percent.(28) In the general population, the prevalence of obstructive sleep apnea is also high, but not nearly as much. A study of 602 employed men and women aged 30–60 years found it to be 2 percent in women and 4 percent in men.(29)
In a questionnaire study in a sample of 476 truck drivers conducted in Belgium,(30) daytime sleepiness was found to be common and predicted by risk for obstructive sleep apnea. The FMCSA Medical Review Board has long recommended that CMV drivers undergo testing for obstructive sleep apnea if they are found to be at risk based on a particular questionnaire or if they have a BMI of 30 or greater. In recent years, a number of carriers have implemented large-scale screening and treatment programs for obstructive sleep apnea,(31) with preliminary findings indicating beneficial effects on driver alertness and safety.
Other modes of transportation have seen a surge in fatigue research in recent years. A series of studies conducted under the auspices of the Federal Railroad Administration (FRA) has documented a systematic relationship between nighttime and/or unpredictable work hours and increased fatigue, and between fatigue exposure (i.e., magnitude and duration) and accident risk and cost, in train and engine (T&E) employees, maintenance-of-way employees, signalmen, and dispatchers.(32,33) Railroad workers were reported to sleep less than 7 hours per night on average on duty days, but longer on days off. The prevalence of sleep disorders such as obstructive sleep apnea was found to be high (7.4 percent), yet almost all (97.6 percent) received treatment.
Using a mathematical model predicting fatigue on the basis of sleep/wake/duty schedules, it was shown that railroad accidents related to human factors, but not other types of railroad accidents, tend to follow the predicted time course of fatigue over time.(34,35) Accident risk was found to increase with both the magnitude of predicted fatigue and the duration of exposure. Accident codes that were consistent with fatigue were seen when predicted fatigue levels were high, and accident costs went up steeply with greater predicted fatigue. Railroad workers who consistently had night shifts experienced more accidents attributable to human factors (presumably due to fatigue) than other employees (27 percent versus 37 percent).
Sleep and fatigue have also been a topic of substantial research in commercial aviation in the last 5 years. Specific foci included ultra-long-range flight schedules,(36,37) regional airline operations,(38,39) in-flight sleep,(40,41) sleep during layovers,(42,43) fatigue countermeasures,(44,45) and fatigue risk management systems.(46,47) Most of this research was focused on pilots, but there were also studies on flight attendants(48) and air traffic controllers.(49)

10
A running theme in sleep and fatigue research across modes of transportation, in other industries, and in the military is that of duty schedules causing temporal conflict with the neurobiology of circadian (i.e., 24-hour) rhythms and sleep regulation, resulting in sleep curtailment and fatigue.(50) This highlights the criticality of both the timing and duration of off-duty periods for sleep recuperation such as restart breaks, as has also been shown in the laboratory.(51,52,53)

11
2. METHODS
2.1 STUDY PROCEDURES
A total of 106 CMV drivers completed the study between January 2013 and July 2013. The objective of the study was to compare fatigue between duty cycles preceded by a restart break with only one nighttime period (1 a.m.–5 a.m.) versus duty cycles preceded by a restart break with two or more nighttime periods. Every driver contributed data from two duty cycles, and since this was a naturalistic study, the number of nighttime periods in the restart break preceding each duty cycle varied and could be either the same or different for each driver.
At the end of the restart break preceding the first recorded duty cycle, each participating driver met with a research assistant. During those meetings, research assistants explained the study procedures, and each driver gave written, informed consent. Research assistants informed drivers that study participation would not affect their employment or their relationship with their carrier in any way. Additionally, research assistants informed participants that any personal data collected during the study would be kept strictly confidential and would not be shared outside of the research team.
Research assistants provided every driver with a smartphone to use for entering sleep/wake logs, recording caffeine use, testing reaction time performance on the PVT, and reporting subjective sleepiness during the study. Figure 3 shows a picture of one of the displays presented by the smartphone software, as seen by the drivers. The smartphone was set up with keypad and screen touch sounds off, display brightness at maximum, automatic screen rotation off, and power-saving mode disabled. Smartphone features such as calling and texting were disabled, and the PVT application was blocked while the truck was in motion. The research assistant made sure that drivers were familiar with the operation of the smartphone. Research assistants also supervised drivers as they practiced the PVT, instructing them to give their best effort on the task every time.
Figure 3. Image. Illustration of an example display presented by the smartphone software to begin reaction time testing on the PVT or to log sleep.

12
Research assistants also provided every driver with a wrist activity monitor. Drivers were asked to wear their wrist activity monitors continuously throughout the study. Finally, each driver was assigned a truck that was equipped with a data acquisition system. An example of how the data acquisition system was installed is shown in Figure 4.
Accelerometer
Cellular modem
Power supply
DAS computer
J1939 connection
Figure 4. Image. Black-and-white image of a data acquisition system mounted into the engine compartment of a truck.
Each driver participated in the study through two consecutive duty cycles and the intervening restart break. During the study, drivers performed their normal driving and duty tasks and managed their schedules and restart breaks naturalistically. While drivers were driving, the truck-based data acquisition systems continuously recorded a range of vehicle parameters and driving performance metrics; these data were encrypted and transmitted to a secure computer server via cellular network.
Three times per day, drivers took a 3-minute PVT on the smartphone: once immediately before starting a duty day, once during a break about halfway through the duty day, and once immediately after ending a duty day. On restart days, drivers took the PVT once within 2 hours of waking, once in the middle of the day, and once within 2 hours before going to bed. At the completion of each PVT bout, the smartphone prompted the driver to indicate whether there had been any distractions during performance testing.
Drivers also used their issued smartphones for the following:
• To provide scores for subjective sleepiness on the Karolinska Sleepiness Scale (KSS).(54)
• To enter responses on other self-report assessments.

13
• To update sleep/wake logs.
• To record times of caffeine intake.
Each driver’s typical daily time commitment for the study was less than 30 minutes. Smartphone data were transmitted to a secure computer server via cellular network and reviewed daily by a research assistant.
Drivers who participated in the study maintained daily contact with research assistants to review compliance with the smartphone assessments and to ask and/or answer any questions relating to distractions during PVT testing or other unusual events that might have impacted their schedules or data collection. At this time, research assistants also asked drivers to report any instances when they had removed the wrist activity monitor (e.g., to take a shower). Drivers were encouraged to contact a research assistant at any hour of the day if any questions or issues arose related to the study.
At the end of the second duty cycle of the study—when study participation ended—each driver met with a research assistant again. During these meetings, research assistants completed the following:
• Downloaded data from the wrist activity monitor and reviewed them with the driver.
• Discussed and resolved any inconsistencies, mistakes, or missing entries in the sleep/wake and caffeine logs.
• Discussed any apparent outliers in the PVT performance data and/or KSS subjective sleepiness scores.
• Solicited feedback on the study and on any potentially relevant issues.
Researchers also downloaded the drivers’ official (electronic) duty logs for the period of the study from their respective carriers’ duty log databases. Each driver received compensation for participating in the study.
The compliance date for the new restart rule was July 1, 2013. The field study was completed in July 2013, and none of the drivers’ schedules was impacted by the new rule during the study. No crashes were reported by any of the drivers during their study participation.
2.2 MEASUREMENTS
From each driver’s duty log, researchers extracted on-duty status and driving status in 1-minute intervals. Researchers also assessed the beginning and end dates/times of the restart periods preceding each of the two recorded duty cycles.
The wrist activity monitor worn by each driver recorded cumulative activity counts and average light exposure levels in 1-minute intervals. Research assistants marked periods of immobility as potential sleep periods and checked them against the driver’s smartphone-based sleep/wake log and against records of times when the driver had removed the wrist activity monitor. Periods of sleeping or napping were extracted with 1-minute resolution.

14
Researchers extracted the number of lapses of attention (i.e., reaction times greater than 355 ms)(55) from every 3-minute PVT bout performed on the smartphone. In addition, researchers counted the number of false starts to verify compliance on the task, but this variable was not used for data analysis. PVT assessments for which the driver indicated potential confounds due to distractions were not included in the data set.
All KSS subjective sleepiness scores entered by drivers on the smartphone after performing the PVT were recorded as values ranging from 1 (extremely alert) to 9 (extremely sleepy). KSS scores entered when the driver indicated being distracted were not included in the data set.
The trucks used in the study were equipped with data acquisition systems, which made continuous, passive recordings of the following: distance traveled, speed, acceleration, lateral lane position relative to left and right lane markers, steering wheel angle, headway distance, fuel use, and a range of other truck-based parameters and driving metrics. The system collected data from the following:
• The truck’s J1939 network through the controller area network (CAN) bus.
• Sensors measuring steering wheel angle, lateral and longitudinal acceleration, and yaw rate.
• A global positioning system (GPS) device.
• A lane tracking system.
The data acquisition system was imperceptible to drivers with the exception of the lane tracking system camera, which was mounted on the windshield facing forward in order to capture images of the road. The data acquisition system did not generate any feedback or alerts of any kind.
During the study, speed was sampled at 10 Hz and lateral lane position at approximately 13 Hz. From these data, researchers extracted average and standard deviation of speed in 1-minute intervals. Researchers also extracted lane deviation, computed as the standard deviation of the distance of the center of the truck to the left lane marker averaged with the distance of the center of the truck to the right lane marker, in 1-minute intervals. If the sum of the distance to the left and right lane markers varied with a standard deviation of 10 cm or more in a given 1-minute interval, this indicated that the lane was broadening, narrowing, shifting, or curving, or that the driver was changing lanes. The interpretation of lane deviation as a driving performance measure under those circumstances is not clear, and therefore researchers discarded the lane deviation data for such 1-minute intervals. Furthermore, the lane tracking system provided a four-point measure reflecting degree of confidence in detecting the lane markers. Researchers discarded lane position data that did not have the highest degree of confidence, and they only kept 1-minute intervals for which the number of discarded samples was less than 50 percent. Finally, researchers only retained 1-minute intervals in which the average speed was between 45 miles per hour (mph) and 65 mph and the standard deviation of speed was less than 1 mph.
2.3 STATISTICAL ANALYSES
Researchers distinguished two study conditions for this project:

15
• Restart break with only one nighttime period—when a driver’s restart break included only one complete period from 1 a.m. until 5 a.m. and the driver thus would not have been compliant with the new restart rule.
• Restart break with more than one nighttime period—when a driver’s restart break included two or more complete periods from 1 a.m. until 5 a.m. and the driver thus would have been compliant with the new restart rule.
The main objective of the statistical analyses was to examine whether there were differences in the observed levels of fatigue for duty cycles following a restart break with only one nighttime period (1 a.m. to 5 a.m.) versus duty cycles following a restart break with two or more nighttime periods. Note that each driver who participated in the study contributed data from two duty cycles, and since this was a naturalistic study, the number of complete nighttime periods in the restart break preceding each of their two duty cycles could be either the same or different. Thus, daytime and nighttime drivers were compared to themselves and each other in a mixed within- and between-subjects design focused on the number of nighttime periods in the restart break.
If it were to be found that fatigue levels in duty cycles following a restart break with only one nighttime period were significantly greater than fatigue levels in duty cycles following a restart break with two or more nighttime periods, then that would provide evidence in support of the efficacy of the new rule, as this would imply that compliance with the new rule would be associated with less fatigue. If, on the other hand, it were to be found that fatigue levels in duty cycles following a restart break with two or more nighttime periods were significantly greater than fatigue levels in duty cycles following a restart break with only one nighttime period, then that would provide evidence against the efficacy of the new rule, as this would imply that compliance with the new rule would be associated with greater fatigue. In the instance of no significant differences in fatigue levels between the two conditions, the results of the study would be considered inconclusive.
The within- and between-subjects nature of the study design made the data set well suited for analysis with statistically powerful mixed-effects regression-based techniques.(56) Nonetheless, a straightforward repeated-measures design could not be applied because of the variation among drivers in the duration of the duty cycles and restart breaks and in the timing of the PVT and KSS assessments. However, previous research focused on the restart break had revealed the importance of investigating systematic differences in 24-hour patterns.(57) Therefore, the primary statistical approach for the study involved mixed-effects analysis of variance (ANOVA) of 24-hour patterns of outcome measures between subjects as well as within subjects between duty cycles. Note that all data recorded for each driver were expressed in the driver’s home terminal time. This technique made it possible for the researcher to statistically compare repeated-measures data between duty cycles, both within and between drivers.
To implement the primary statistical approach, researchers averaged the data for on-duty status and driving status, which were in the data set at 1-minute intervals, over 1-hour bins for each hour of the day across days in each duty cycle for each driver. Researchers followed the same approach with the lane deviation data, which were also in the data set at 1-minute intervals (except that researchers calculated the root mean square rather than the average over 1-hour bins; that is, lane variance rather than lane deviation was averaged, as is the statistically correct

16
procedure). The primary analysis of these processed data involved mixed-effects ANOVA with fixed effects of condition (only one nighttime period or two or more nighttime periods during the restart break), hour of the day (0–23), duty cycle (1 or 2), and their two- and three-way interactions; and a random effect on the intercept over the 106 subjects. For each driver and each duty cycle, the data in each 1-hour bin were weighted by the number of contributing 1-minute intervals. The effects and interactions of duty cycle were included in the analysis primarily to account for repeated measures within subjects and were of passing interest only. The key statistical outcomes of the analysis were the effects and interactions of condition and hour of the day.
The same methodology was applied to the sleep/wake data collected by the wrist activity monitors used during the study. Because sleep/wake patterns were also recorded during the restart break preceding the second duty cycle, and those data were of interest in their own right, an additional mixed-effects ANOVA was performed for the restart break with fixed effects of condition, hour of the day, and their interaction. For each driver’s restart break, the 1-minute sleep/wake state data were first averaged over 1-hour bins for each hour of the day across restart days.
The primary fatigue outcome variable, as designated in advance during the design phase of the study, was the number of lapses of attention on the PVT, a simple reaction time task with high stimulus density. The PVT is considered a gold standard assay of fatigue,(58,59) and validation studies of the 3-minute version of the PVT used in the current study have been published.(60,61) The number of lapses of attention on the PVT has been shown to be among the most sensitive outcome metrics with the most favorable statistical properties for measuring fatigue.(62,63)
Given that the PVT measurements were performed less frequently than the other measurements discussed thus far, and at discrete time points rather than continuously, the data on lapses of attention were aggregated (but not averaged) in 4-hour bins spanning the 24 hours of the day, and collapsed (again, not averaged) across days in each duty cycle for each driver. Other than that, the same mixed-effects ANOVA was performed again (without any need for weighting the data). Additionally, since PVT measurements were also taken during the restart break preceding the second duty cycle, and those data were of interest in their own right, an additional mixed-effects ANOVA was performed again for the restart break data.
A secondary fatigue outcome variable—subjective sleepiness scores on the KSS—was analyzed the same way as lapses of attention on the PVT.
Graphs of the data were generated to represent the distributions of averages over drivers and duty days (or restart days) as a function of time of day in each condition. These graphs were derived from the statistical analyses using the predicted population marginal means and their standard errors.
2.4 DRIVERS
Because the study was a naturalistic field study, participation in the study required only that drivers had a valid CMV driver’s license; were fit for duty by regulatory standards (e.g., had passed their most recent mandatory physical examination); were representative of drivers

17
affected by the maximum driving time requirements; and planned to take a restart break immediately before as well as during the study participation period. A total of 119 drivers signed up for the study. The study run of the first driver to sign up was designated as a practice run, and this driver’s data were never analyzed or included in the study data set. Four drivers could not participate or withdrew from the study for medical or personal reasons. For eight drivers, there were critical gaps in the data because of missing duty logs or critical failure of the wrist activity monitor or truck-based data acquisition system. Thus, the final sample included 106 drivers. Their demographic and study-related characteristics are shown in Table 2.
Table 2. Demographic and study-related characteristics of the CMV drivers who participated in the naturalistic field study.
Characteristic Description Age Ranging from 24 to 69 years (mean ± standard
deviation: 45.4 ± 10.7 years) Sex 100 men, 6 women Experience as a CMV driver (self-reported) Ranging from less than 1 to 39 years (mean ± standard
deviation: 12.4 ± 8.7 years) Experience as a CMV driver with current carrier (self-reported)
Ranging from less than 1 to 25 years (mean ± standard deviation: 6.3 ± 6.4 years)
Type of operation Employed with carrier: 103 drivers • Intermodal: 48 drivers • Dedicated: 32 drivers • Flatbed: 13 drivers • Temperature control: 7 drivers • Van truckload: 3 drivers Owner-operator contracting with carrier: 3 drivers
Type of driving Local: 44 drivers Regional: 26 drivers Over-the-road: 36 drivers
Truck used during study Freightliner Cascadia: 82 drivers • Day cab: 23 drivers • Single sleeper berth: 41 drivers • Double sleeper berth: 18 drivers International ProStar: 24 drivers • Day cab: 21 drivers • Single sleeper berth: 3 drivers
Number of nighttime periods in restart break preceding first duty cycle
Only one nighttime period: 25 drivers Two or more nighttime periods: 81 drivers
Number of nighttime periods in restart break preceding second duty cycle
Only one nighttime period: 46 drivers Two or more nighttime periods: 60 drivers
Duration of restart break preceding first duty cycle (before study participation)
2.4 ± 1.1 days (i.e., 57.8 ± 25.8 hours) (mean ± standard deviation)
Duration of restart break preceding second duty cycle 2.0 ± 0.6 days (i.e., 47.7 ± 14.0 hours) (mean ± standard deviation)
Duration of first duty cycle 5.1 ± 1.2 days (mean ± standard deviation) Duration of second duty cycle 4.8 ± 1.0 days (mean ± standard deviation)

18
Characteristic Description Total duration of participation 11.9 ± 1.5 days (mean ± standard deviation) Cumulative time on duty per duty cycle 54.9 ± 7.1 hours (mean ± standard deviation) Cumulative time driving per duty cycle 40.5 ± 8.7 hours (mean ± standard deviation)
Each driver in the study sample contributed data from two duty cycles, and since this was a naturalistic study, the conditions associated with those two duty cycles could be the same or different. For the 106 drivers included in the study sample, the breakdown was as follows:
• Group A: 20 drivers had a restart break with only one nighttime period preceding both duty cycles.
• Group B: 5 drivers had a restart break with only one nighttime period preceding their first duty cycle and a restart break with two or more nighttime periods preceding their second duty cycle.
• Group C: 26 drivers had a restart break with two or more nighttime periods preceding their first duty cycle and a restart break with only one nighttime period preceding their second duty cycle.
• Group D: 55 drivers had a restart break with two or more nighttime periods preceding both duty cycles.
Thus, 25 drivers had one nighttime period in the restart break preceding their first duty cycle (Groups A and B), and 46 drivers had one nighttime period in the restart break preceding their second duty cycle (Groups A and C). In total, 51 drivers (48.1 percent of the sample) had a restart break with only one nighttime period preceding at least one of their duty cycles.
In the cases when the restart break had two or more nighttime periods, the number of nighttime periods was 2.3 ± 0.4 (mean ± standard deviation) both when the restart break preceded the first duty cycle or when it preceded the second duty cycle.
The total data set comprised 1,260 duty days. A grand total of 414,937 miles of driving were recorded by the truck-based data acquisition systems. After data reduction, this yielded a total of 235,575 usable 1-minute records of lane deviation. For 1 driver, the lane tracking system failed, so for statistical analysis of lane deviation, the effective sample size was 105 drivers. Between the beginning of their first duty cycle and the end of their second duty cycle, the 106 drivers performed 29.9 ± 6.2 PVT bouts (mean ± standard deviation). The total data set included 3,169 PVT data records.

19
3. RESULTS
3.1 DUTY, DRIVING, AND SLEEP
Each driver contributed data from two duty cycles, and since this was a naturalistic study, the number of complete nighttime periods in the restart preceding each of their two duty cycles could be either the same or different. Therefore, statistical analyses focused on differences in 24-hour patterns, both within and between subjects, for the condition of only one nighttime period in the restart break preceding a duty cycle versus the condition of two or more nighttime periods in the restart break preceding a duty cycle. The key statistical outcomes of these analyses were the effects and interactions of condition (only one nighttime period or two or more nighttime periods during the preceding restart break) and hour of the day.
Drivers were on duty 11.2 ± 0.3 hours per 24 hours during duty cycles following a restart break with only one nighttime period, and 11.1 ± 0.2 hours per 24 hours during duty cycles following a restart break with two or more nighttime periods (grand mean ± standard error). There was a significant main effect of hour of the day (F23,4887 = 5.78, p < 0.001), and a significant interaction of condition by hour of the day (F23,4887 = 10.66, p < 0.001). Figure 5 shows the distribution of on-duty status, as recorded in the duty logs, as a percentage of total driver hours in the data set for every hour of the day, in each of the two conditions.
0%
20%
40%
60%
80%
100%
0 4 8 12 16 20 24
Hour of the Day
Perc
ent o
f Driv
er H
ours
on D
uty
12am 4am 8am 12pm 4pm 8pm 12am
One nighttime period(1 a.m. to 5 a.m.) inprior restart
Two or more nighttime periods (1 a.m. to 5 a.m.)in prior restart
Figure 5. Graph. Distribution of drivers logged as on duty, as a percentage of total driver hours for each hour of the day, during duty cycles. Error bars indicate ± 1 standard error of the mean. As an example to help interpret this graph, the grey curve pertains to the condition when the restart break preceding the duty cycle had only one nighttime period. In the graph, the first shown value of the curve for that condition, in the midnight–1 a.m. bin, is 53.4 percent. This percentage means that on any duty day in any duty cycle preceded by a restart break with only one nighttime period, the chance of finding any of the 106 drivers in the study “on duty” for any given minute between midnight and 1 a.m. was 53.4 percent. In other words, the propensity to be “on duty” between midnight and 1 a.m. in that condition was 53.4 percent (and the propensity to be “off duty” between midnight and 1 a.m. in that condition was the remaining 46.6 percent).

20
Drivers were driving 8.5 ± 0.2 hours per 24 hours during duty cycles following a restart break with only one nighttime period, and 7.9 ± 0.2 hours per 24 hours during duty cycles following a restart break with two or more nighttime periods (grand mean ± standard error). There was a significant main effect of condition (F1,4887 = 4.09, p = 0.044), a significant main effect of hour of the day (F23,4887 = 5.06, p < 0.001), and a significant interaction of condition by hour of the day (F23,4887 = 12.55, p < 0.001). Figure 6 shows the distribution of time logged as driving, as a percentage of total driver hours in the data set for every hour of the day, in each of the two conditions.
0%
20%
40%
60%
80%
100%
0 4 8 12 16 20 24
Hour of the Day
Perc
ent o
f Driv
er H
ours
Lo
gged
as
Driv
ing
12am 4am 8am 12pm 4pm 8pm 12am
One nighttime period(1 a.m. to 5 a.m.) inprior restart
Two or more nighttime periods (1 a.m. to 5 a.m.)in prior restart
Figure 6. Graph. Distribution of drivers logged as driving, as a percentage of total driver hours for each hour of the day, during duty cycles. Error bars indicate ± 1 standard error of the mean.
These results show that time spent on duty and time spent driving were distributed more or less evenly across the hours of the day during duty cycles preceded by a restart break with two or more nighttime periods, whereas they were distinctly more oriented towards the night in duty cycles preceded by a restart break with only one nighttime period. In other words, a driver was likely to be driving primarily at night during a duty cycle following a restart break with only one nighttime period.
Throughout the study, researchers monitored drivers’ sleep via wrist activity monitors. During duty cycles, drivers were sleeping 6.0 ± 0.2 hours per 24 hours following a restart break with only one nighttime period, and 6.2 ± 0.1 hours per 24 hours following a restart break with two or more nighttime periods (grand mean ± standard error). There was a significant main effect of hour of the day (F23,4887 = 6.51, p < 0.001), and a significant interaction of condition by hour of the day (F23,4887 = 11.09, p < 0.001). Figure 7 shows the distribution of sleep during duty cycles, as a percentage of total driver hours in the data set for every hour of the day, in each of the two conditions.

21
0%
20%
40%
60%
80%
100%
0 4 8 12 16 20 24
Hour of the Day
Perc
ent o
f Driv
er H
ours
Slee
ping
dur
ing
Dut
y C
ycle
s
12am 4am 8am 12pm 4pm 8pm 12am
One nighttime period(1 a.m. to 5 a.m.) inprior restart
Two or more nighttime periods (1 a.m. to 5 a.m.)in prior restart
Figure 7. Graph. Distribution of drivers sleeping, as a percentage of total driver hours for each hour of the day, during duty cycles. Error bars indicate ± 1 standard error of the mean.
During the restart break between the two duty cycles of the study, drivers were sleeping 8.8 ± 0.3 hours per 24 hours when the restart break contained only one nighttime period and 8.9 ± 0.2 hours per 24 hours when the restart break contained two or more nighttime periods (grand mean ± standard error). There was a significant main effect of hour of the day (F23,2392 = 45.51, p < 0.001), and a significant interaction of condition by hour of the day (F23,2392 = 2.45, p < 0.001). Figure 8 shows the distribution of sleep during the restart break, as a percentage of total driver hours in the data set for every hour of the day, in each of the two conditions.
0%
20%
40%
60%
80%
100%
0 4 8 12 16 20 24
Hour of the Day
Perc
ent o
f Driv
er H
ours
Sl
eepi
ng d
urin
g R
esta
rt B
reak
12am 4am 8am 12pm 4pm 8pm 12am
One nighttime period(1 a.m. to 5 a.m.) inrestart break
Two or more nighttime periods (1 a.m. to 5 a.m.)in restart break
Figure 8. Graph. Distribution of drivers sleeping, as a percentage of total driver hours for each hour of the day, during the restart break. Error bars indicate ± 1 standard error of the mean.
These results show that sleep occurred primarily during the night during duty cycles preceded by a restart break with two or more nighttime periods, whereas it occurred primarily during the day during duty cycles preceded by a restart break with only one nighttime period (see Figure 7).

22
However, the 24-hour patterns of sleep in the two conditions were not simply the reverse of the 24-hour patterns of duty and driving (refer to Figure 5 and Figure 6). In both conditions, the propensity for sleep during duty cycles was relatively increased during the night and reduced during the early evening hours.
The 24-hour patterns of sleep during the restart break (see Figure 8) were considerably different than those observed during the two duty cycles (shown in Figure 7). Notwithstanding relatively small differences between restart breaks with one nighttime period as compared to restart breaks with two or more nighttime periods, sleep occurred predominantly at night, and almost no sleep was obtained in the early evening hours, in both study conditions.
3.2 FATIGUE OUTCOMES
The primary fatigue outcome for the study was the number of lapses of attention on the 3-minute PVT. The number of lapses of attention on the PVT has been shown to be among the most sensitive outcome metrics with the most favorable statistical properties for measuring fatigue.(64,65)
During duty cycles, overall drivers exhibited 2.0 ± 0.3 lapses of attention per test bout following a restart break with only one nighttime period, and 1.7 ± 0.3 lapses of attention per test bout following a restart break with two or more nighttime periods (grand mean ± standard error). There was a significant main effect of condition (F1,2526 = 5.93, p = 0.015), and a significant main effect of time of day (F5,2526 = 2.99, p = 0.011). Figure 9 shows the distribution of lapses of attention during duty cycles, over consecutive 4-hour periods of the day, in the two conditions. As shown in this figure, the difference between the two conditions was greatest at night (up to 0.8 lapses of attention per 3-minute test bout, or 51.5 percent). The magnitude of this difference is comparable to the daily increase in lapses of attention on the 3-minute PVT that has been observed in a study involving sleep restriction to 4 hours per day.(66)
0
1
2
3
4
5
0 4 8 12 16 20 24
Hour of the Day
Mea
n La
pses
of A
ttent
ion
onth
e PV
T du
ring
Dut
y C
ycle
s
12am 4am 8am 12pm 4pm 8pm 12am
One nighttime period(1 a.m. to 5 a.m.) inprior restart
Two or more nighttime periods (1 a.m. to 5 a.m.)in prior restart
Figure 9. Graph. Mean lapses of attention on a 3-minute PVT, by 4-hour period of the day, during duty cycles. Error bars indicate ± 1 standard error of the mean.

23
During the restart break between the two duty cycles of the study, drivers exhibited 2.7 ± 0.5 lapses of attention per test bout when the restart break contained only one nighttime period, and 1.5 ± 0.4 lapses of attention per test bout when the restart break contained two or more nighttime periods (grand mean ± standard error). There was a significant main effect of time of day (F5,400 = 2.75, p = 0.019); the main effect of condition just failed to reach significance (F1,400 = 3.78, p = 0.053). Figure 10 shows the distribution of lapses of attention on the PVT during the restart break, over consecutive 4-hour periods of the day, in the two conditions.
0
1
2
3
4
5
0 4 8 12 16 20 24
Hour of the Day
Mea
n La
pses
of A
ttent
ion
onth
e PV
T du
ring
Res
tart
Bre
ak
12am 4am 8am 12pm 4pm 8pm 12am12am 4am 8am 12pm 4pm 8pm 12am
One nighttime period(1 a.m. to 5 a.m.) inrestart break
Two or more nighttime periods (1 a.m. to 5 a.m.)in restart break
Figure 10. Graph. Mean lapses of attention on a 3-minute PVT, by 4-hour period of the day, during the restart break. Error bars indicate ± 1 standard error of the mean.
These results indicate that drivers showed greater fatigue, as measured objectively with the PVT, during duty cycles preceded by a restart break with only one nighttime period as compared to duty cycles preceded by a restart break with two or more nighttime periods. The effect was particularly pronounced during the night (i.e., when most of the driving occurred for the drivers whose restart break contained only one nighttime period). Drivers also showed greater fatigue on the PVT during the restart break itself if it contained only one nighttime period.
As a secondary fatigue outcome, driving performance was measured in terms of lane deviation during the two duty cycles of the study. Overall, lane deviation was 18.8 ± 0.4 cm during duty cycles following a restart break with only one nighttime period, and 18.7 ± 0.4 cm during duty cycles following a restart break with two or more nighttime periods (grand mean ± standard error). There was a significant main effect of time of day (F1,2706 = 11.05, p < 0.001), and a significant interaction of condition by time of day (F23,2706 = 2.17, p = 0.001). Post-hoc contrasts between conditions by hour of the day revealed that lane deviation was greater in the 4 a.m.–5 a.m., 8 a.m.–9 a.m., and 3 p.m.–4 p.m. bins, but it was smaller in the 7 p.m.–8 p.m. bin after a restart break with only one nighttime period. Lane deviation was at most 1.2 cm (or 7 percent) greater and no more than 1.1 cm (or 6 percent) smaller during duty cycles following a restart break with only one nighttime period as compared to a restart break with two or more nighttime periods. Figure 11 shows the distribution of lane deviation, over the hours of the day, in the two conditions.

24
16
17
18
19
20
21
0 4 8 12 16 20 24
Hour of the Day
Mea
n La
ne D
evia
tion
(cm
)
12am 4am 8am 12pm 4pm 8pm 12am12am 4am 8am 12pm 4pm 8pm 12am
One nighttime period(1 a.m. to 5 a.m.) inprior restart
Two or more nighttime periods (1 a.m. to 5 a.m.)in prior restart
Figure 11. Graph. Mean lane deviation, by hour of the day, during duty cycles. Error bars indicate ± 1 standard error of the mean.
These results indicate that the number of nighttime periods in the restart break had a moderate effect on lane deviation during the subsequent duty cycle, for which the pattern was consistent with the effect seen on lapses of attention on the PVT (refer to Figure 9). However, whether the effect on lane deviation has any real-world impact remains to be determined.
Subjective sleepiness was measured with the KSS, on which drivers rated themselves from 1 (extremely alert) to 9 (extremely sleepy). During duty cycles, drivers rated their sleepiness as 3.3 ± 0.1 following a restart break with only one nighttime period and as 3.1 ± 0.1 following a restart break with two or more nighttime periods (grand mean ± standard error). There was a significant main effect of condition (F1,2489 = 4.63, p = 0.032), a significant main effect of time of day (F5,2489 = 15.94, p < 0.001), and a significant interaction of condition by time of day (F5,2489 = 21.18, p < 0.001). Figure 12 shows the distribution of KSS scores during duty cycles, over consecutive 4-hour periods of the day, in the two conditions.

25
1
2
3
4
5
6
0 4 8 12 16 20 24
Hour of the Day
Mea
n Su
bjec
tive
Slee
pine
ss o
nth
e K
SS d
urin
g D
uty
Cyc
les
12am 4am 8am 12pm 4pm 8pm 12am
One nighttime period(1 a.m. to 5 a.m.) inprior restart
Two or more nighttime periods (1 a.m. to 5 a.m.)in prior restart
Figure 12. Graph. Mean subjective sleepiness on the KSS, by 4-hour period of the day, during duty cycles. Error bars indicate ± 1 standard error of the mean.
During the restart break between the two duty cycles of the study, drivers rated their sleepiness as 3.7 ± 0.2 when the restart break contained only one nighttime period, and 3.1 ± 0.2 when the restart break contained two or more nighttime periods (grand mean ± standard error). There was a significant main effect of condition (F1,394 = 6.90, p = 0.009), a significant main effect of time of day (F5,394 = 6.40, p < 0.001), and a significant interaction of condition by time of day (F5,394 = 3.62, p = 0.003). Figure 13 shows the distribution of KSS scores, over consecutive 4-hour periods of the day, in the two conditions.
1
2
3
4
5
6
0 4 8 12 16 20 24
Hour of the Day
Mea
n Su
bjec
tive
Slee
pine
ss o
n th
e K
SS d
urin
g R
esta
rt B
reak
12am 4am 8am 12pm 4pm 8pm 12am12am 4am 8am 12pm 4pm 8pm 12am
One nighttime period(1 a.m. to 5 a.m.) inrestart break
Two or more nighttime periods (1 a.m. to 5 a.m.)in restart break
Figure 13. Graph. Mean subjective sleepiness on the KSS, by 4-hour period of the day, during the restart break. Error bars indicate ± 1 standard error of the mean.
These results indicate that drivers showed greater subjective sleepiness during duty cycles preceded by a restart break with only one nighttime period as compared to duty cycles preceded by a restart break with two or more nighttime periods. The increased sleepiness during duty

26
cycles preceded by a restart break with only one nighttime period was most pronounced towards the late morning hours, that is, toward the end of most drivers’ driving periods in that condition. During the restart break itself, the 24-hour pattern of sleepiness was similar but overall higher and shifted in time (delayed by about one 4-hour bin) when the break contained only one nighttime period as compared to when it contained two or more nighttime periods.

27
4. CONCLUSIONS
4.1 NATURALISTIC FIELD STUDY
FMCSA sponsored a naturalistic field study that was conducted between January and July 2013 to examine the efficacy of the new restart provision under the updated Hours of Service of Drivers Final Rule. Under the new rule (published on December 27, 2011, with a compliance date of July 1, 2013), if CMV drivers choose to use a provision allowing “restart” of the 60- or 70-hour duty-cycle limit, they are required to include at least two nighttime periods (from 1 a.m. until 5 a.m.) in their restart breaks in order to have sufficient opportunity for sleep recuperation. This means that drivers who end their duty cycle between 1 a.m. and 7 p.m. must extend their 34-hour restart break by 1 or more hours to be compliant with the new rule.
In the field study conducted as part of this project, researchers measured sleep and fatigue through two consecutive duty cycles and the intervening restart break in a sample of CMV drivers. Participating drivers had a valid CMV driver’s license, were fit for duty by regulatory standards, were actively employed with a carrier or as an independent contractor, and were representative of drivers affected by the maximum driving time requirements. During the study, drivers managed their duty and driving schedules and performed their tasks as they would normally have done; there was no experimental intervention to change their schedules or their behavior. The study was completed in July 2013, and none of the drivers’ schedules was impacted by the new restart provision for HOS during the study.
In each of the two duty cycles measured during the study, a driver could be in one of two conditions relevant to the new restart rule:
• The driver’s restart break preceding the duty cycle contained only one nighttime period, and thus the driver would not have been compliant with the new restart rule.
• The driver’s restart break preceding the duty cycle contained two or more nighttime periods, and thus the driver would have been compliant with the new rule.
The study compared 24-hour patterns of duty, driving, sleep, and fatigue between these two conditions.
Researchers collected data for 106 CMV drivers, over a total of 30,241 hours, yielding 1,814,460 one-minute data points used for analysis. Of the total sample of drivers, 48.1 percent had a restart break with only one nighttime period preceding at least one of their duty cycles. During the study, a total of 3,169 assessments of reaction time performance and subjective sleepiness were made, and multiple driving measures were recorded across a total of 8,049 hours and 414,937 miles of driving. For comparison, the Federal Highway Administration’s “Driver Fatigue and Alertness Study” involved 80 CMV drivers and a total of about 4,000 hours of driving; VTTI’s “Naturalistic Truck Driving Study” yielded data on 97 CMV drivers and a total of approximately 735,000 miles of driving. By these standards, the field study described in the current report is among the largest of its kind.
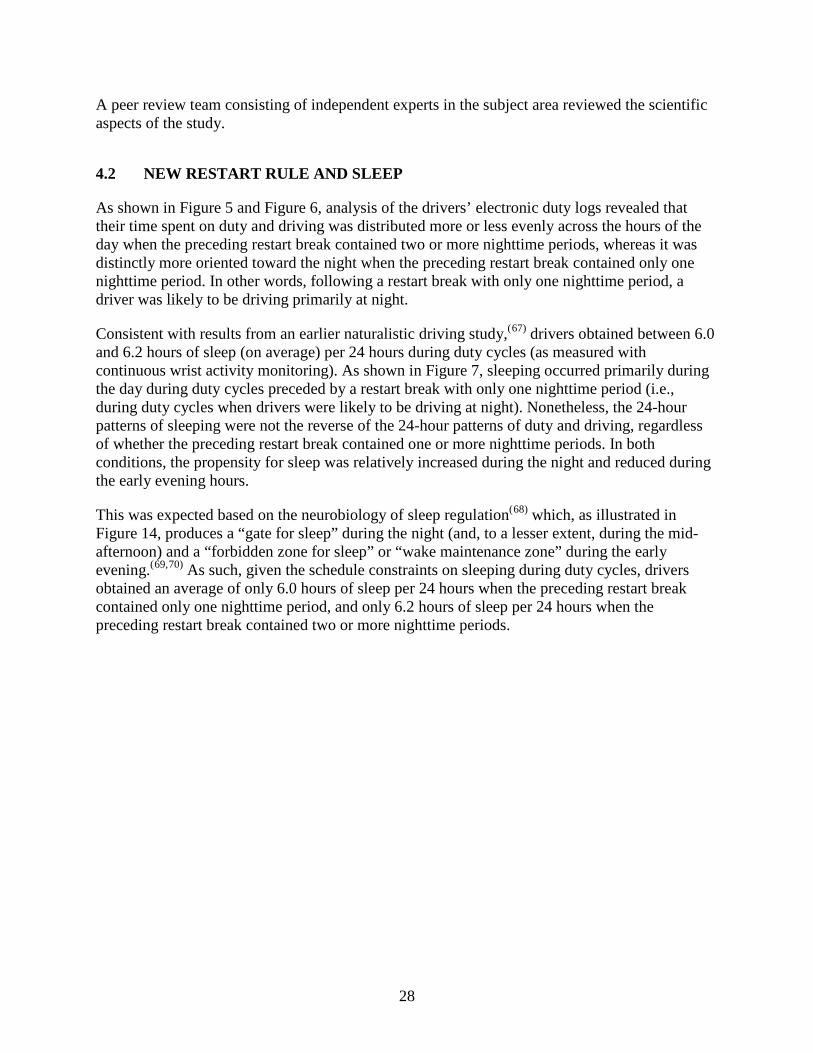
28
A peer review team consisting of independent experts in the subject area reviewed the scientific aspects of the study.
4.2 NEW RESTART RULE AND SLEEP
As shown in Figure 5 and Figure 6, analysis of the drivers’ electronic duty logs revealed that their time spent on duty and driving was distributed more or less evenly across the hours of the day when the preceding restart break contained two or more nighttime periods, whereas it was distinctly more oriented toward the night when the preceding restart break contained only one nighttime period. In other words, following a restart break with only one nighttime period, a driver was likely to be driving primarily at night.
Consistent with results from an earlier naturalistic driving study,(67) drivers obtained between 6.0 and 6.2 hours of sleep (on average) per 24 hours during duty cycles (as measured with continuous wrist activity monitoring). As shown in Figure 7, sleeping occurred primarily during the day during duty cycles preceded by a restart break with only one nighttime period (i.e., during duty cycles when drivers were likely to be driving at night). Nonetheless, the 24-hour patterns of sleeping were not the reverse of the 24-hour patterns of duty and driving, regardless of whether the preceding restart break contained one or more nighttime periods. In both conditions, the propensity for sleep was relatively increased during the night and reduced during the early evening hours.
This was expected based on the neurobiology of sleep regulation(68) which, as illustrated in Figure 14, produces a “gate for sleep” during the night (and, to a lesser extent, during the mid-afternoon) and a “forbidden zone for sleep” or “wake maintenance zone” during the early evening.(69,70) As such, given the schedule constraints on sleeping during duty cycles, drivers obtained an average of only 6.0 hours of sleep per 24 hours when the preceding restart break contained only one nighttime period, and only 6.2 hours of sleep per 24 hours when the preceding restart break contained two or more nighttime periods.

29
Slee
p Pr
open
sity
Time of Day15:00 21:00 03:00 09:00 15:00
wake maintenance
zone
primary gate for sleep
secondary gate for sleep
Figure 14. Graph. A 24-hour profile of the propensity to sleep from a published study that allowed subjects to sleep at any time of the day. Upwards in the graph corresponds to greater sleep propensity. Figure adapted from Van Dongen et al.(71)
Drivers’ 24-hour profiles of sleep, shown in Figure 8, were substantially different during restart breaks as compared to during duty cycles (refer to Figure 7). During restart breaks, drivers obtained an average of 8.8 hours of sleep per 24 hours when the break contained only one nighttime period, and 8.9 hours of sleep per 24 hours when the break contained two or more nighttime periods. In both conditions, drivers predominantly slept at night, and almost no sleep was obtained during the early-evening “wake maintenance zone” during the restart break. This finding – which in the absence of duty schedule constraints was again to be expected based on the neurobiology of sleep regulation (see Figure 14) – appears to refute anecdotal claims that nighttime drivers would generally maintain a schedule with nighttime wakefulness and daytime sleep during their restart breaks. In contrast, it confirms the validity of the assumption in the earlier laboratory studies of the restart break that nighttime drivers tend to transition back to a daytime waking and nighttime sleeping schedule during their restart break.
This naturalistic study did not include any experimental intervention to demonstrate that extending the duration of the restart break for drivers whose break contained only one nighttime period would compel them to have sleep/wake patterns more similar to those of drivers whose break contained two or more nighttime periods. However, as shown in Figure 8, drivers gravitated toward the same nighttime-oriented pattern of sleep during their restart breaks whether their restart break contained one or more nighttime periods. Thus, it is plausible that in the condition of the restart break containing only one nighttime period, extending the break to include two nighttime periods would substantively increase drivers’ opportunity to obtain recuperative sleep before beginning a new duty cycle. This suggests that the new rule increases the recuperative sleep potential during restart breaks, thereby helping to mitigate driver fatigue.
4.3 NEW RESTART RULE AND FATIGUE
The primary objective measure of fatigue, as designated in advance of the study, was the number of lapses of attention on a 3-minute PVT administered via a smartphone. The PVT, which was

30
performed three times per day, is a well-validated and widely-used standard measure of fatigue.(72,73,74) As shown in Figure 9, the number of lapses of attention (defined as reaction times greater than 355 ms)(75) on the PVT was significantly greater during duty cycles when the preceding restart break contained only one nighttime period than when it contained more than one nighttime period.
The overall difference in the frequency of lapses of attention during duty cycles between these two conditions was 0.4 lapses of attention per 3-minute test bout; at night the difference went up to 0.8 lapses per 3-minute test bout (see Figure 9). For comparison, sleep restriction to 4 hours of time in bed per day has been found to result in an average daily increase of about one lapse of attention on the 3-minute PVT.(76) Such an increase in the frequency of attentional lapses has implications for real-world driving performance, road safety threat detection, evasive maneuvering and braking response speed, and crash risk.(77)
To better understand the difference in PVT outcomes between the two conditions, consider the following: drivers with a restart containing only one nighttime period averaged nearly one additional lapse of attention in 3 minutes. These lapses of attention are reaction times of 355 ms or longer. At 60 mph, a truck would travel 30 feet or more during one of these lapses of attention. Research has shown that as a driver experiences more lapses of attention, the average duration of those lapses becomes longer.(78) Thus, the average distance traveled during one of these lapses of attention increases. Lapses of attention are periods when a CMV driver may be missing information (such as a road sign, a traffic signal, or a vehicle that is overtaking the driver) or experiences decreased ability to maintain a stable lane position. Crashes occur when hazardous circumstances align and the driver is not paying attention and cannot take the correct mitigating action. Thus, an increase in lapses of attention increases crash risk.
During the restart break, overall there were 1.3 more lapses of attention per 3-minute test bout when the break contained only one nighttime period versus two or more nighttime periods, as shown in Figure 10. The greatest difference between conditions was seen in the late morning, when a restart break with only one nighttime period was associated with 1.8 more lapses of attention than a restart break with two or more nighttime periods. This elevated fatigue during the restart break contributes to the evidence that drivers were unable to recuperate sufficiently during restart breaks that contained only one nighttime period.
These results are in line with the earlier laboratory studies of the 34-hour restart break.(79,80) Those studies demonstrated that nighttime duty schedules (i.e., schedules most likely to be associated with only one nighttime period in the restart break) are associated with reduced sleep and increased fatigue, which can be mitigated by extending the restart break to include a second biological night.(81,82,83) The results of the current field study thus support the conclusion that a restart break with two biological nights, relative to a restart break with only one biological night, improves the efficacy of the restart break for nighttime driving operations, yielding a greater potential for recovery from fatigue before recycling back to the work force. In other words, these results indicate that having at least two nighttime periods from 1 a.m. until 5 a.m. in the restart break helps to mitigate fatigue, providing evidence in support of the efficacy of the new restart rule.

31
While drivers were on the road, truck-based data acquisition systems tracked lateral lane position and a range of other vehicle parameters continuously. Lateral lane position was analyzed in terms of lane deviation (i.e., standard deviation of lane position) in 1-minute intervals. Only data captured with the highest degree of confidence in the detection of the lane markers, on straight roads with constant lane width, when the driver was not changing lanes, and when the driving speed was near-constant and between 45 mph and 65 mph, were used for statistical analysis. This reduced the lane deviation data to a set comparable to that analyzed in the earlier laboratory studies of the restart break,(84,85) where lane deviation was found to be sensitive to fatigue for personal automobiles.
As displayed in Figure 11, in the current field study, researchers observed significant effects of the number of nighttime periods in the restart break for lane deviation. These effects were similar (across the 24 hours of the day) to those observed for the PVT (refer to Figure 9), but they were moderate in magnitude. However, that does not mean that the lane deviation effects, or the PVT effects for that matter, have little practical relevance for driving performance. A recent driving simulator study of CMV drivers revealed that drowsiness degrades the ability of the drivers to keep their lane position and steering control.(86) The study indicated that crashes involving a drowsy driver are preceded by large-amplitude steering angle corrections and sporadic short intervals with no significant changes in steering angle. These phenomena may be related to lapses of attention such as those observed on the PVT. Even so, given the inertia of a heavy truck, lane excursions should perhaps be compared between conditions on the basis of a metric other than lane deviation over 1-minute intervals (as was done in the present study). This will be explored in follow-up research.
Figure 12 and Figure 13 show that the study results for subjective sleepiness scores on the KSS were similar to the study results for lapses of attention on the PVT, in that subjective sleepiness was higher overall when the restart break contained only one nighttime period than when it contained two or more nighttime periods (refer to Figure 9 and Figure 10). When drivers had only one nighttime period in the restart break, they reported greater subjective sleepiness both during duty cycles and during the restart break. During duty cycles, the increased sleepiness was most pronounced during the late morning hours (toward the end of the driving period for most drivers whose restart break contained only one nighttime period). Such a pattern is consistent with that observed in the earlier laboratory studies of the restart break.(87,88,89) Taken together, these findings suggest that the new rule requiring drivers to have at least two nighttime periods in their restart break helps to reduce driver sleepiness in the field.
In conclusion, the results of this naturalistic field study indicate that having at least two nighttime periods from 1 a.m. until 5 a.m. in the restart break mitigates fatigue, as measured both objectively and subjectively, by virtue of increasing the total amount of sleep obtained during that restart break. The results are in line with the earlier laboratory studies of the restart break and constitute further evidence in support of the efficacy of the new restart rule.

32
[This page intentionally left blank.]

33
ACKNOWLEDGMENTS We thank the volunteer drivers for their participation in the study. We are indebted to the three carriers for their support, for facilitating driver recruitment and study logistics, and for making trucks available for instrumentation and use during the study. We are grateful to the peer review team for their valuable comments and suggestions: Thomas Balkin, Ph.D. (Chair), Thomas Raslear, Ph.D., and Jerry Robin. Finally, this project would not have been possible without the tireless effort and outstanding work of the researchers in the field (in alphabetical order): Rachel Bartels, Kevin Kan, Samantha Riedy, Brieann Satterfield, Amy Sparrow, and Aaron Unice.

34
[This page intentionally left blank.]

35
REFERENCES 1 Van Dongen, H.P.A., Dinges, D.F. “Circadian rhythms in sleepiness, alertness, and
performance.” In M. Kryger, T. Roth, and W.C. Dement (Eds.) Principles and Practice of Sleep Medicine, 4th Edition, pp. 435-443, Philadelphia, PA: Elsevier, 2005.
2 Van Dongen, H.P.A., Belenky, G. “Investigation into motor carrier practices to achieve optimal commercial motor vehicle driver performance: Phase I.” Report No. FMCSA-RRR-09-057. U.S. Department of Transportation, Washington, D.C., 2010.
3 Van Dongen, H.P.A., Jackson, M.L., Belenky, G. “Duration of restart period needed to recycle with optimal performance: Phase II.” Report No. FMCSA-RRR-10-062. U.S. Department of Transportation, Washington, D.C., 2010.
4 Van Dongen & Belenky, 2010. 5 Van Dongen, H.P.A., Belenky, G., Vila, B.J. “The efficacy of a restart break for recycling
with optimal performance depends critically on circadian timing.” Sleep 34: 917-929, 2011. 6 Van Dongen et al., 2010. 7 U.S Department of Transportation. Hours of Service of Drivers Final Rule.
https://www.fmcsa.dot.gov/rules-regulations/administration/rulemakings/final/HOS-Final-Rule-12-27-11.pdf, accessed September 19, 2013.
8 U.S. Government Printing Office. Moving Ahead for Progress in the 21st Century Act. 112th Congress Public Law 141, 2012. http://www.gpo.gov/fdsys/pkg//PLAW-112publ141/html/PLAW-112publ141.htm (accessed September 17, 2013).
9 Van Dongen, H.P.A., Maislin G., Dinges, D.F. “Dealing with inter-individual differences in the temporal dynamics of fatigue and performance: Importance and techniques.” Aviation, Space, and Environmental Medicine 75: A147–A154, 2004.
10 Van Dongen & Belenky, 2010. 11 Van Dongen & Belenky, 2010. 12 Van Dongen et al., 2011. 13 Van Dongen et al., 2010. 14 Van Dongen & Belenky, 2010. 15 Van Dongen & Belenky, 2010. 16 Van Dongen et al., 2010. 17 U.S. Department of Transportation, 2010. 18 Hanowski, R.J., Hickman, J.S., Olson, R.L., Bocanegra, J. “Evaluating the 2003 revised
hours-of-service regulations for truck drivers: The impact of time-on-task on critical incident risk. Accident Analysis and Prevention 41: 268-275, 2009.

36
19 Blanco, M., Hanowski, R.J., Olson, R.L., Morgan, J.F., Soccolich, S.A., Wu, S., Guo, F.
“The impact of driving, non-driving work, and rest breaks on driving performance in commercial motor vehicle operations.” Report No. FMCSA-RRR-11-017. U.S. Department of Transportation, Washington, D.C., 2011.
20 Soccolich, S.A., Blanco, M., Hanowski, R.J., Olson, R.L., Morgan, J.F., Guo, F., Wu, S. “An analysis of driving and working hour on commercial motor vehicle driver safety using naturalistic data collection.” Accident Analysis and Prevention, in press.
21 Darwent, D., Roach, G., Dawson, D. “How well do truck drivers sleep in cabin sleeper berths?” Applied Ergonomics 43: 442-446, 2012.
22 Hallmark, S.L., Hsu, Y., Maze, T., McDonald, T., Fitzsimmons, E. “Investigating factors contributing to large truck lane departure crashes using the Federal Motor Carrier Safety Administration’s Large Truck Crash Causation Study (LTCCS) database.” Report No. DOT F-1700.7. U.S. Department of Transportation, Cambridge, MA, 2009.
23 Knipling, R.R. “The good, the bad, and the ugly: three large truck crash categories and what they tell us about driver fatigue.” Submitted to Docket FOMCSA-2004-19608, June 7, 2011.
24 Zhu, X., Srinivasan, S. “A comprehensive analysis of factors influencing the injury severity of large truck crashes.” Accident Analysis and Prevention 43: 49-57, 2011.
25 Wiegand, D.M., Hanowski, R.J., McDonald, S.E. “Commercial drivers’ health: A naturalistic study of body mass index, fatigue, and involvement in safety-critical events. Traffic Injury Prevention 10: 573-579, 2009.
26 Anderson, J.E., Govadab, M., Steffen, T.K., Thorne, C.P., Varvarigou, V., Kales, S.K., Burks, S.V. “Obesity is associated with the future risk of heavy truck crashes among newly recruited commercial drivers.” Accident Analysis and Prevention 49: 378-384, 2012.
27 Xie, W., Chakrabarty, S., Levine, R., Johnson, R., Talmage, J.B. “Factors associated with obstructive sleep apnea among commercial vehicle drivers.” Journal of Occupational and Environmental Medicine 53: 169-173, 2011.
28 Pack, A.I., Dinges, D., Maislin, G. “A study of prevalence of sleep apnea among commercial truck drivers.” Report No. DOT-RT-02-030. U.S. Department of Transportation, Washington, D.C., 2002.
29 Young, T., Palta, M., Dempsey, J., Skatrud, J., Weber, S., Badr, S. “The occurrence of sleep-disordered breathing among middle-aged adults.” New England Journal of Medicine 328: 1230-1235, 1993.
30 Braeckman, L., Verpraet, R., Van Risseghem, M., Pevernagie, D., DeBacquer, D. “Prevalence and correlates of poor sleep quality and daytime sleepiness in Belgian truck drivers.” Chronobiology International 28: 126-134, 2011.
31 Berger, M., Varvarigou, V., Rielly, A., Czeisler, C.A., Malhotra, A., Kales, S.N. “Employer-mandated sleep apnea screening and diagnosis in commercial drivers. Journal of Occupational and Environmental Medicine 54: 1017-1025, 2012.

37
32 Gertler, J., DiFiore, A., Raslear, T. “Fatigue status of the U.S. railroad industry.” Report No.
DOT/FRA/ORD-13/06. U.S. Department of Transportation, Washington, D.C., 2013. 33 Raslear, T.G., Gertler, J., DiFiore A. “Work schedules, sleep, fatigue, and accidents in the
U.S. railroad industry.” Fatigue: Biomedicine, Health and Behavior 1: 99-115, 2013. 34 Hursh, S.R., Raslear, T.G., Kaye, A.S., Fanzone, J.F. “Validation and calibration of a fatigue
assessment tool for railroad work schedules, final report.” Report No. DOT/FRA/ORD-08/04. U.S. Department of Transportation, Washington, D.C., 2008.
35 Raslear, T.G., Hursh, S.R., Van Dongen, H.P.A. “Predicting cognitive impairment and accident risk.” Progress in Brain Research, 190: 155-167, 2011.
36 Holmes, A., Al-Bayat, S., Hilditch, C., Bourgeois, Bougrine S. “Sleep and sleepiness during an ultra long-range flight operation between the Middle East and United States.” Accident Analysis and Prevention 45 (Supple.): 27-31, 2012.
37 Gander, P.H., Signal, T.L., Van den Berg, M.J., Mulrine, H.M., Jay, S.M., Mangie, J. “In-flight sleep, pilot fatigue and Psychomotor Vigilance Task performance on ultra-long-range versus long-range flights.” Journal of Sleep Research, in press.
38 Van Dongen, H.P.A., McCauley, P. Final report. “Regional Airline Association Fatigue and Performance Study phase 1.” Regional Airline Association, Washington, D.C., 2010.
39 Cabon, P., Deharvengt, S., Grau, J.Y., Maille, N., Berechet, I., Mollard R. “Research and guidelines for implementing Fatigue Risk Management Systems for the French regional airlines.” Accident Analysis and Prevention 45 (Suppl.): 41-44, 2012.
40 Roach, G.D., Darwent, D., Sletten, T.L., Dawson, D. “Long-haul pilots use in-flight napping as a countermeasure to fatigue.” Applied Ergonomics 42: 214-218, 2011.
41 Signal, T.L., Gander, P.H., Van den Berg, M.J., Graeber, R.C. “In-flight sleep of flight crew during a 7-hour rest break: Implications for research and flight safety.” Sleep 36: 109-115, 2013.
42 Darwent, D., Dawson, D., Roach, G.D. “Prediction of probabilistic sleep distributions following travel across multiple time zones.” Sleep 33: 185-195, 2010.
43 Dorrian, J., Darwent, D., Dawson, D., Roach, G.D. “Predicting pilots’ sleep during layovers using their own behavior or data from colleagues: Implications for biomathematical models.” Accident Analysis and Prevention 45 (Suppl.): 17-21, 2012.
44 Darwent et al., 2010. 45 Dorrian et al., 2012. 46 Gander, P., Hartley, L., Powell, D., Cabon, P., Hitchcock, E., Mills A., Popkin, S. “Fatigue
risk management: Organizational factors at the regulatory and industry/company level.” Accident Analysis and Prevention 43: 573-590, 2011.

38
47 Rangan, S., Bowman, J.L., Hauser, W.J., McDonald, W.W., Lewis, R.A., Van Dongen,
H.P.A. “Integrated fatigue modeling in crew rostering and operations.” Canadian Aeronautics and Space Journal 59: 1-6, 2013.
48 Avers, K., Nei, D., King, S.J., Thomas, S., Roberts, C., Banks, J.O., Nesthus, T.E. “Flight attendant fatigue: A quantitative review of flight attendant comments.” Report No. DOT/FAA/AM-11/16. U.S. Department of Transportation, Washington, D.C., 2011.
49 Signal, T.L., Gander, P.H., Anderson, H., Brash, S. “Scheduled napping as a countermeasure to sleepiness in air traffic controllers.” Journal of Sleep Research 18: 11-19, 2009.
50 Satterfield, B.C., Van Dongen, H.P.A. “Occupational fatigue, underlying sleep and circadian mechanisms, and approaches to fatigue risk management.” Fatigue: Biomedicine, Health and Behavior 1: 118-136, 2013.
51 Van Dongen et al., 2011. 52 Rupp, T.L., Wesensten, N.J., Bliese, P.D., Balkin, T.J. “Banking sleep: Realization of
benefits during subsequent sleep restriction and recovery.” Sleep 32: 311-321, 2009. 53 Banks, S., Van Dongen, H.P.A., Maislin,G., Dinges, D.F. “Neurobehavioral dynamics
following chronic sleep restriction: Dose-response effects of one night for recovery.” Sleep 33: 1013-1026, 2010.
54 Åkerstedt, T., Gillberg, M. “Subjective and objective sleepiness in the active individual.” International Journal of Neuroscience 52: 29-37, 1990.
55 Basner, M., Mollicone, D., Dinges, D.F. “Validity and sensitivity of a brief Psychomotor Vigilance Test (PVT-B) to total and partial sleep deprivation.” Acta Astronautica 69: 949–959, 2011.
56 Van Dongen et al., 2004. 57 Van Dongen et al., 2011. 58 Dorrian, J., Rogers, N.L., Dinges, D.F. “Psychomotor vigilance performance: neurocognitive
assay sensitive to sleep loss.” In CA Kushida (Ed.) Sleep Deprivation: Clinical Issues, Pharmacology, and Sleep Loss Effects, pp. 39-70, New York, NY: Marcel Dekker, 2005.
59 Lim, J., Dinges, D.F. “Sleep deprivation and vigilant attention.” Annals of the New York Academy of Sciences 1129: 305-322, 2008.
60 Basner, M., Dinges, D.F. “Maximizing sensitivity of the Psychomotor Vigilance Test (PVT) to sleep loss.” Sleep 34: 581–591, 2011.
61 Basner, M., Rubinstein, J. “A 3-minute version of the Psychomotor Vigilance Test predicts fatigue-related declines in luggage-screening performance.” Journal of Occupational and Environmental Medicine 53: 1146–1154, 2011.
62 Basner & Dinges, 2011.

39
63 Balkin, T.J., Bliese, P.D., Belenky, G., Sing, H., Thorne, D.R., Thomas, M., Redmond, D.P.,
Russo, M., Wesensten, N.J. “Comparative utility of instruments for monitoring sleepiness-related performance decrements in the operational environment.” Journal of Sleep Research 13: 219–227, 2004.
64 Basner & Dinges, 2011. 65 Balkin et al., 2004. 66 Basner & Rubenstein, 2011. 67 Hanowski, R.J., Hickman, J., Fumero, M.C., Olson, R.L., Dingus, T.A. “The sleep of
commercial vehicle drivers under the 2003 hours-of-service regulations.” Accident Analysis and Prevention 39: 1140–1145, 2007.
68 Van Dongen & Dinges, 2005. 69 Lavie, P. Ultrashort sleep-waking schedule. III. “‘Gates’ and ‘forbidden zones’ for sleep.”
Electroencephalography and Clinical Neurophysiology 63: 414–425, 1986. 70 Strogatz, SH., Kronauer, R.E., Czeisler, C.A. “Circadian pacemaker interferes with sleep
onset at specific times each day: Role in insomnia.” American Journal of Physiology 253: R172–R178, 1987.
71 Van Dongen, H.P.A., Kerkhof, G.A., Klöppel, H.B. “Seasonal covariation of the circadian phases of rectal temperature and slow wave sleep onset.” Journal of Sleep Research 6: 19–25, 1997.
72 Basner et al., 2011. 73 Dorrian et al., 2005. 74 Lim & Dinges, 2008. 75 Basner et al., 2011. 76 Basner & Rubenstein, 2011. 77 Philip, P., Åkerstedt, T. “Transport and industrial safety, how are they affected by sleepiness
and sleep restriction?” Sleep Medicine Reviews 10: 347-356, 2006. 78 Lim & Dinges, 2008. 79 Van Dongen & Belenky, 2010. 80 Van Dongen et al., 2010. 81 Van Dongen & Belenky, 2010. 82 Van Dongen et al., 2010. 83 Van Dongen et al., 2011. 84 Van Dongen et al., 2011.

40
85 Forsman, P.M., Vila, B.J., Short, R.A., Mott, C.G., Van Dongen, H.P.A. “Efficient driver
drowsiness detection at moderate levels of drowsiness.” Accident Analysis and Prevention 50: 341–350, 2013.
86 Mortazavi A, Eskandarian A, Sayed RA. “Effect of drowsiness on driving performance variables of commercial vehicle drivers.” International Journal of Automotive Technology 10: 391–404, 2009.
87 Van Dongen & Belenky, 2010. 88 Van Dongen et al., 2010. 89 Van Dongen et al., 2011.