Embed Size (px)
Citation preview
FINAL REPORT
FISH MERCURY LEVELS IN NORTHEASTERN
MASSACHUSETTS LAKES
December 2003
Office of Research and Standards Massachusetts Department of Environmental Protection
1 Winter Street Boston, MA 02108
USA
FISH MERCURY IN NE MASSACHUSETTS LAKES
MA DEP, Office of Research and Standards
ii
TABLE OF CONTENTS Title Page
LIST OF CONTRIBUTORS ..........................................................................................................V
ABSTRACT.................................................................................................................................. VI
EXECUTIVE SUMMARY ........................................................................................................VIII
INTRODUCTION .......................................................................................................................... 1
MATERIALS AND METHODS.................................................................................................... 4
Study Design ................................................................................................................................... 4 Category 1 – Public Health-Based Lake Survey for Mercury Advisory Consideration............. 5 Category 2 – Regional Geographic Comparisons....................................................................... 5
Sampling Protocol........................................................................................................................... 7 Category 1 – Public Health-Based Lake Survey for Mercury Advisory Consideration............ 7 Category 2 – Regional Geographic Comparisons....................................................................... 7
Field Methods ................................................................................................................................. 7
Laboratory Procedures .................................................................................................................... 8
Data Analysis Methods ................................................................................................................... 8 Category 1 - Public Health-Based Lake Survey for Mercury Advisory Consideration ............. 8 Category 2 - Regional Geographic Comparisons ....................................................................... 9
Preliminary Data Evaluation................................................................................................... 9 Verification of Assumptions for Use of Parametric Statistics .............................................. 10 Mercury Concentrations, Fish Condition, and Reproductive Condition ............................. 11 Spatial Variation in Mercury Concentrations in Northeast Massachusetts .......................... 11 Mercury in Northeast Massachusetts Lake Fish Versus Other State Fish............................ 12 Fish Mercury and Lake Water Quality ................................................................................. 13
RESULTS ..................................................................................................................................... 14
Category 1 - Public Health-Based Lake Survey for Mercury Advisory Consideration ............... 14
Category 2 - Regional Geographic Comparisons ......................................................................... 15 Preliminary Data Evaluation..................................................................................................... 15 Verification Of Assumptions .................................................................................................... 16 Mercury Concentrations, Fish Condition, And Reproductive Condition................................ 17
FISH MERCURY IN NE MASSACHUSETTS LAKES
MA DEP, Office of Research and Standards
iii
Spatial Variation In Mercury Concentrations In Northeast Massachusetts .............................. 18 Mercury In Northeast Massachusetts Lake Fish Versus Statewide Distributions ................... 19 Fish Mercury And Lake Water Quality .................................................................................... 19
DISCUSSION............................................................................................................................... 20
SUMMARY AND CONCLUSIONS ........................................................................................... 29
ACKNOWLEDGMENTS ............................................................................................................ 32
REFERENCES ............................................................................................................................. 50
APPENDIX A............................................................................................................................... 55
APPENDIX B............................................................................................................................... 61
FISH MERCURY IN NE MASSACHUSETTS LAKES
MA DEP, Office of Research and Standards
iv
LIST OF TABLES Table 1. Study Design Details ..................................................................................................... 33 Table 2. Predictive Equations for Mercury in Massachusetts Fish.............................................. 35 Table 3. Advisory Screening Tissue Mercury Concentrations in Northeast Massachusetts Lakes.
............................................................................................................................................... 36 Table 4. Factor Scores for Environmental and Fish Condition Variables. .................................. 37 Table 5. Results of Environmental Gradient Studies from Point Atmospheric Mercury Sources
............................................................................................................................................... 38
LIST OF FIGURES Figure 1. Mean Mercury Concentrations for Target-Sized LMB and All YP in Northeast
Massachusetts Study Lakes. Potential Mercury Depositional Areas Noted in Relation to Point Source Locations ......................................................................................................... 40
Figure 2. Fish Species Mercury Concentrations (±1 Standard Deviation) By Location. ............ 41 Figure 3. Fish Mercury Concentrations in Northeast Massachusetts. A) Based on Public Health
Risk Criteria; B) YP Values Compared to 1997 Study Values (Rose et al., 1999). ............. 43 Figure 4. Frequencies of Fish Consumption Advisories Based on Fish Tissue Mercury
Concentrations (>0.5 mg/kg). Northeast Massachusetts Versus Rural Areas. A) all YP; B) standard-sized LMB. * NE Massachusetts advisory frequency significantly greater than Rural Areas, p=0.05. ............................................................................................................. 44
Figure 5. Total Fish Mercury Concentrations Versus Total Fish Length.................................... 45 Figure 6. Study Variables Plotted by Study Area ....................................................................... 46 Figure 7. Fish Condition Index (weight/length3) Versus Fish Muscle Mercury Concentration.. 47 Figure 8. Mean Species Mercury Concentrations (means ± 1 std. dev.) Stratified by Sex and
Reproductive Condition Based on All YP and 27-38 cm Target Range LMB. D-developing, R-ripe, S-spent gonads. ......................................................................................................... 48
Figure 9. Comparative LMB and YP Muscle Mercury Concentrations. Means ±1 standard deviation, ranges. .................................................................................................................. 49
FISH MERCURY IN NE MASSACHUSETTS LAKES
MA DEP, Office of Research and Standards
v
LIST OF CONTRIBUTORS Office of Research and Standards
Michael S. Hutcheson, PhD, MPH Jane Rose, PhD C. Mark Smith, PhD, MS Carol Rowan West, MSPH
Wall Experiment Station
Kenneth Hulme Oscar Pancorbo, Ph.D. Barbara A. Eddy Chi-ying Hsieh
Division of Watershed Management
Gregory DeCesare Robert Maietta
Normandeau Associates
Richard Simmons Mark Mattson Joseph Strube
FISH MERCURY IN NE MASSACHUSETTS LAKES
MA DEP, Office of Research and Standards
vi
ABSTRACT Fish from 26 lakes in northeast Massachusetts were sampled in order to: 1) determine if human
health fish consumption advisories for mercury were necessary; 2) examine the relationships
between levels of fish tissue total mercury concentrations in the study area and other regions of
the State and country; and 3) examine the possible contribution of local sources of atmospheric
mercury to the local fish mercury concentrations. In a recent regional report on mercury in the
northeast states, this area of Massachusetts was predicted, on the basis of atmospheric dispersion
modeling of sources of mercury emissions in the U.S., to have the highest level of atmospheric
mercury deposition in the northeast U.S. This area of Massachusetts has had until recently three
municipal waste combustors and one medical waste incinerator and has a long history of
industrialization, with mercury releases occurring as early as the nineteenth century. The study
area was delineated into downwind, near- field upwind and far upwind areas based upon
prevailing wind patterns vis-à-vis the four incinerators. Concentrations of mercury in fish tissue
were compared with data from elsewhere in the State and between these sub-areas to determine
whether any differences could be potentially attributed to the incinerators.
Largemouth bass (LMB) (Micropterus salmoides) and yellow perch (YP) (Perca flavescens)
were the primary species sampled. Brown bullhead (BB) (Ameiurus nebulosus), chain pickerel
(CP) (Esox niger), and yellow bullhead (YB) (Ictalurus natalis) were also obtained for advisory
screening. Mercury concentrations in LMB (mean 0.89 ± 0.43 mg/kg [n=192] for all
individuals) in the study area were in the top quartile of LMB mercury values derived for more
rural, non- local-source- impacted Massachusetts lakes (the Green Mountains/Berkshire
Highlands, the Worcester/Monadnock Plateau, and the Narragansett/Bristol Lowlands
subecoregions in the west, central and eastern parts of the state respectively). Because of these
elevated mercury concentrations, all but one of the lakes in the study design in which LMB were
caught warranted fish consumption advisories for LMB (concentrations >0.5 mg/kg). This
particular lake was located far upwind of the incinerators. In those other parts of the state, fewer
than 50% of the waterbodies tested in a previous study required fish consumption advisories due
to mercury. YP mercury concentrations (mean 0.44 ± 0.21 mg/kg, n=152) were similar to, if not
FISH MERCURY IN NE MASSACHUSETTS LAKES
MA DEP, Office of Research and Standards
vii
slightly greater than those from more rural regions of the state. YP mercury concentrations from
65% of the lakes were below the threshold for issuing a fish consumption advisory.
There was no obvious relationship between LMB or YP fish tissue mercury concentrations and
their locations relative to prevailing wind patterns and the incinerators. LMB tissue
concentrations correlated with the mercury content of their prey, YP, and water temperature.
Tissue concentrations did not correlate with lake water pH, conductivity or dissolved oxygen
concentration. The study results therefore suggest that the tissue concentrations of mercury in
LMB in the study area reflect the predicted higher atmospheric mercury deposition rate for this
region which has urbanized and rural areas, and that these concentrations are greater than those
for more rural areas of the state having lower predicted atmospheric deposition rates of mercury.
Although no relationship could be discerned between the major point sources in the area and fish
mercury concentrations, the resolution of the approach used (prevailing wind analysis) is of
limited power to detect any such effects. Long-term monitoring of fish tissue and sediment
mercury concentrations which are underway will provide additional information on this issue.
FISH MERCURY IN NE MASSACHUSETTS LAKES
MA DEP, Office of Research and Standards
viii
EXECUTIVE SUMMARY
Massachusetts (MA) has sampled 189 fresh waterbodies since 1983 as part of a statewide
program to identify freshwater fish populations with concentrations of various chemicals,
including mercury, tha t could be harmful to humans. Fish taken from 85 of the lakes and rivers
have had sufficiently high, elevated levels of edible tissue mercury to warrant posting of mercury
fish consumption advisories for these water bodies.
The extent of mercury contamination of our freshwater fishery resources became apparent in the
early 1990s, and state agencies then began to address the mercury problem in its entirety. The
Massachusetts Department of Environmental Protection’s Office of Research and Standards
(ORS) initiated a study in 1995 (Rose et al., 1999) to determine the distribution of mercury in
freshwater fish tissue in lakes that are not impacted by known sources of mercury. The 1995
study lakes were located in three rural ecoregions of the west, central and southeastern parts of
the state (the Green Mountains/Berkshire Highlands, the Worcester/Monadnock Plateau, and the
Narragansett/Bristol Lowlands). The study sought to characterize a baseline for future
investigations and to identify possible environmental factors associated with mercury in fish.
One of the products of the regional focus on mercury issues was a 1998 examination of sources
of mercury in the state and regional rates of atmospheric deposition of mercury. The Northeast
States/Eastern Canadian Provinces Mercury Study (1998) used a computer model that combined
emission source information with wind and weather data to predict mercury deposition rates
across New England. Elevated mercury deposition was predicted in an area extending from the
northeast region of Massachusetts, including the Merrimack River Valley, into southern New
Hampshire and Maine. The model assessed mercury emissions from sources outside New
England (e.g. coal- fired utilities in the Midwest) and within the region (e.g., municipal waste
combustors, medical waste incinerators and other combustion facilities).
The predicted high mercury deposition rate in this urbanized area of the state, combined with
public requests for additional fish testing in the same area, gave rise to the present study. This
FISH MERCURY IN NE MASSACHUSETTS LAKES
MA DEP, Office of Research and Standards
ix
study addressed concerns about public health risks from human consumption of potentially
mercury-contaminated fish from the northeast region of Massachusetts. It also compared fish
tissue mercury concentrations in the study area to those of fish from other regions of the State, as
well as the geographical distribution of fish mercury with respect to identified local point sources
of atmospheric emissions of mercury. The study was designed to sample lakes located at
increasing distances from four mercury emissions point sources operating over the last
approximately 20 years (3 municipal waste combustors and 1 medical waste incinerator) in far
upwind, upwind and downwind directions (based on prevailing wind direction). This was the
first extensive fish testing effort around an urbanized area of Massachusetts and the first in New
England targeting an area of predicted maximal mercury deposition. Largemouth bass (LMB)
(Micropterus salmoides) and yellow perch (YP) (Perca flavescens) were the primary species
sampled. Brown bullhead (BB) (Ameiurus nebulosus), chain pickerel (CP) (Esox niger) and
yellow bullhead (YB) (Ictalurus natalis) were also obtained for advisory screening.
The study goals were to:
1. sample fish from lakes in northeast Massachusetts where the public has access to fishing to
determine the need for fish consumption advisories;
2. determine whether the frequency of advisories is greater in this area than across the state as a
whole;
3. establish a baseline for fish mercury concentrations in order to evaluate trends, thereby
providing an environmental results-based indicator of the success of mercury source control
efforts
4. compare mercury concentrations in fish from the region with those from other more rural
parts of the State;
FISH MERCURY IN NE MASSACHUSETTS LAKES
MA DEP, Office of Research and Standards
x
5. determine if there are geographic differences in fish mercury concentrations within the study
area related to the locations of the major point sources of mercury emissions vis-à-vis
prevailing wind direction;
6. determine whether predicted high atmospheric deposition rates of mercury for the area were
mirrored by fish tissue mercury concentrations.
7. evaluate the accuracy of a model, developed by MA DEP, to predict mercury levels in fish
based on measures of water quality.
Of the 26 lakes studied, LMB were caught successfully in 24. 23 of these warranted fish
consumption advisories on the basis of mercury levels in LMB. The one lake not meriting an
advisory was located far upwind of the area with the incinerators. Mercury levels in YP and BB
were generally lower than those in LMB in about 65% of the lakes, which did not warrant
advisories for those species. Two lakes lacked the target species for the study and thus were not
issued a fish consumption advisory. Only one lake did not receive a fish consumption advisory,
even though all target species were collected from the lake.
In other more rural parts of the state, fewer than 50% of the waterbodies tested in a previous
study required fish consumption advisories due to mercury levels in LMB. In contrast to LMB,
YP mercury concentrations from 65% of the present study lakes were below the threshold for
issuing a fish consumption advisory.
In this study, the overall mean mercury concentration over all fish caught was 0.89 ± 0.43 (1 std.
dev.) mg/kg for LMB, ranging from 0.18 - 2.5 mg/kg. In YP, mean mercury concentration was
0.44 ± 0.21 mg/kg, ranging from 0.12 - 1.1 mg/kg. In BB, mean mercury concentration was 0.28
mg/kg, ranging from 0.10 - 0.52 mg/kg.
The LMB mean mercury concentrations per lake in the study area were higher overall than those
observed elsewhere in the State, with values falling in the top 25% of those observed for the
three rural ecoregions of Massachusetts previously sampled. YP and BB mean mercury
FISH MERCURY IN NE MASSACHUSETTS LAKES
MA DEP, Office of Research and Standards
xi
concentrations were also greater in these northeast lakes compared to the lakes in the earlier
study. The values for these two species were lower than those for LMB, consistent with our
experience that these species do not tend to bioaccumulate mercury to the same degree as LMB.
These results are also consistent with those of other studies, which have found that LMB and
other predatory, long-lived fish species at or near the top of the food web have higher mercury
concentrations than fish from lower trophic levels.
Geographic differences in fish mercury levels were not related to the proximity or location of the
lakes, vis-à-vis prevailing winds, to the mercury point sources located in the area. However, the
only lake in this study area in which LMB were caught and which did not require a
consumption advisory for LMB was located far upwind from the point sources considered.
Seasonally and weather system-dependent shifts in wind directions associated with wet
deposition events may have complicated the atmospheric mercury dispersion pattern.
A model developed by MA DEP in the course of earlier fish studies, relating mercury in fish to
water quality parameters, did not accurately predict mercury levels in fish in the present study.
In conclusion, this study has documented that greater mercury concentrations exist in the muscle
of mercury-accumulating fish in a region of the state which has a long history of
industrialization, historic point sources of mercury emissions and a predicted high atmospheric
deposition rate of mercury. The study did not discern a relationship among the locations of lakes,
their observed fish mercury concentrations, and the locations of the point sources considered.
However, these results should be interpreted cautiously, as distances from the point sources vis-
à-vis prevailing wind patterns is a crude measure of the potential for atmospheric mercury
deposition which is also dependent on wet deposition events.
Additionally, the relationship between fish tissue mercury concentrations and mercury inputs to
the environment is complex and poorly understood, modulated by numerous biological, physical
and chemical factors (e.g., lake mercury methylation rates, lake wetland and watershed areas,
lake water chemistry, bedrock geology in the region, fish physiology, variations in wind patterns
and precipitation events).
FISH MERCURY IN NE MASSACHUSETTS LAKES
MA DEP, Office of Research and Standards
xii
The elevated mercury levels recorded in LMB in the study area may result from one or a
combination of the following factors: 1) higher rates of air deposition, attributable to multiple
sources, including distant and local point sources (e.g., the incinerators located in the area), a
possibility that is consistent with the air deposition modeling results discussed previously; 2) the
greater degree of overall urbanization and industrialization of lands within the airshed in this
study, compared to those evaluated previously (e.g., Green Mountains/Berkshire Highlands,
Worcester/Monadnock Plateau, Narragansett/Bristol Lowlands); 3) unique physical, chemical or
biological characteristics of the lakes in the area, which might increase the bioavailability of
mercury. Further research, some of which is underway, is needed to differentiate among these
possibilities. Of particular interest is the extent to which mercury deposition to these lakes, as
well as New England as a whole, has responded to the substantial reductions in mercury
emissions that have been achieved as a result of the New England Governors and Eastern
Canadian Premiers Mercury Action Plan and the MA Zero Mercury Strategy. Under these plans
mercury emissions have been reduced by >50% in New England and Eastern Canada and by
close to 70% in MA. Unfortunately, commensurate reductions in mercury emissions from out-of-
region sources have not occurred. Regional efforts are underway to assess the current
contributions of out-of-region sources to mercury deposition in New England and to assess
changes in mercury deposition and fish contamination. Because of the cycling of past emissions
and ongoing inputs, particularly from out-of-region sources (e.g. coal- fired utilities), it may take
many years to see reductions in fish tissue mercury concentrations.
FISH MERCURY IN NE MASSACHUSETTS LAKES
MA DEP, Office of Research and Standards
1
INTRODUCTION
Northeast Massachusetts (MA) has an important history of industrialization dating back into the
nineteenth century with the extensive burgeoning of mills along major rivers, including the
Merrimack River in northeast Massachusetts and southern New Hampshire. Most of this
industry is now gone and the infrastructure for the mills is slowly being converted to non-
manufacturing uses. Many of the older, larger towns are still densely populated areas, yet
surrounding lands are relatively undeveloped. Associated with urbanization have been
manufacturing activities, generation of domestic and industrial wastes, and generation of
combustion products to the atmosphere from heating, energy generation and waste destruction.
This region was recently identified through the use of an air deposition model as having the
highest predicted annual levels of recent wet and dry atmospheric deposition of mercury (>100
ug/m2) in the northeast United States (Northeast States/Eastern Canadian Provinces, 1998). This
mercury input has added to the historical input of mercury and other chemicals to the
environment.
Mercury deposited from the atmosphere is thought to come from longer-range transport and
near-field point sources (Mason et al., 1994). The atmospheric mercury can come from
anthropogenic or natural sources, such as volcanoes and earth crustal off gassing. Long-range
transport-derived deposition should be relatively uniform across the entire area of northeast
Massachusetts. The area which was the focus of the present study had the State’s highest
concentration of point sources of atmospheric mercury emissions in the last two decades of the
twentieth century: three municipal solid waste combustors (MSWC) and a medical waste
incinerator (MWI) (Figure 1). Prior to that period, most trash incineration was conducted on a
more dispersed municipal level. Only two facilities (MSWC) are still operational. These types of
facilities were subject to new, stricter limitations on their atmospheric emissions of mercury
starting in 2000. Zones downwind from major point sources (e.g., smelters, tailings piles and
power stations (Goodman and Roberts, 1971) may be subject to increased deposition of a variety
of contaminants. Past widespread burning of coal for domestic heat, for coal gas production, for
firing industrial boilers in the late nineteenth and first half of the twentieth centuries, and
FISH MERCURY IN NE MASSACHUSETTS LAKES
MA DEP, Office of Research and Standards
2
municipal level solid waste combustion probably all contributed to a relatively high background
mercury signature in the environment.
Fish reflect elevated mercury inputs to the environment. Approximately 44% of the rivers and
lakes in Massachusetts sampled since 1983 are subject to fish consumption advisories as a result
of mercury contamination of edible fish muscle.
When the extent of mercury contamination of Massachusetts’ freshwater fishery resources
became apparent in the early 1990s, Rose et al. (1999) conducted a study to determine the
distribution of mercury in freshwater fish tissue in non-source-impacted, largely rural
Massachusetts’ lakes. That study sought to define a baseline for future studies and to identify
possible environmental factors associated with mercury in largemouth bass (LMB) (Micropterus
salmoides), yellow perch (YP) (Perca flavescens), and brown bullhead (BB) (Ameiurus
nebulosus). The general order of mercury concentrations in the three species was
LMB>YP>BB. The study lakes were apportioned among more rural areas of three
subecoregions of the state: the western Green Mountains/Berkshire Highlands, the more
centrally located Worcester/Monadnock Plateau, and the eastern Narragansett/Bristol Lowlands.
Fish tissue mercury concentrations only varied significantly among areas in YP and were highest
in the Worcester/Monadnock Plateau lakes. The level of primary production in each lake was
not a strong predictor of fish tissue mercury concentrations. YP and BB tissue mercury
concentrations correlated inversely with the pH of the lake waters. LMB tissue mercury
concentrations correlated most highly with the weight of the fish, the size of the lakes, and the
areas of surrounding wetlands and watersheds. Predictive numerical models for each species’
tissue mercury concentrations were developed from the data set. The best predictors of tissue
mercury concentrations differed between species: lake water calcium concentration and water
temperature for YP; fish size and the mercury concentrations in YP for LMB; and dissolved
organic carbon concentration and lake water pH for BB.
In 1994, fish from a few of the lakes in the northeast part of the State were sampled as part of the
State’s routine fish toxics surveillance program. Some lakes were identified as having fish with
tissue mercury concentrations greater than 0.50 mg/kg; the concentration above which the
FISH MERCURY IN NE MASSACHUSETTS LAKES
MA DEP, Office of Research and Standards
3
Massachusetts Department of Public Health (MA DPH, 1995) issues fish consumption
advisories. More restrictive advisories are issued for concentrations greater than 1 mg/kg.
In 1998 MA DEP initiated new MWC rules that included stringent mercury emissions control
regulations to lower mercury emissions up to 95%. This study was initiated before the adoption
of the new controls, so that the results will serve as an environmental baseline for comparison
with fish tissue mercury monitoring results in the future after the emissions reductions. The
other reasons for the study were to determine the need for additional consumption advisories, to
examine possible spatial patterns in the occurrence of higher fish mercury concentrations, and to
compare the fish contamination situation in this localized, geographical region to more rural
areas and to regional New England data. The region predicted to have higher atmospheric
deposition rates of mercury may be considered an “urban airshed”, containing both urban and
rural land use types. The lakes sampled within this airshed were in primarily rural settings. The
objectives of the study were divided into two categories:
Category 1 – Public Health-Based Lake Survey for Mercury Advisory Consideration
1. Sample fish where fishing takes place from lakes in northeast Massachusetts to
determine the need for fish consumption advisories; and
2. determine whether the frequency of necessary advisories is greater in this area
than in other, more rural areas of the State.
Category 2 – Regional Geographic Comparisons
3. Establish a baseline for fish mercury concentrations in order to evaluate trends,
thereby providing an environmental results-based indicator of the success of
mercury source control efforts;
4. Determine if there are any spatial patterns in fish mercury concentrations within
the study area related to the locations of the major historic point sources of
mercury emissions;
FISH MERCURY IN NE MASSACHUSETTS LAKES
MA DEP, Office of Research and Standards
4
5. determine how well measured mercury concentrations match those predicted by a
fish tissue mercury prediction model developed by MA DEP; and
6. compare mercury concentrations in fish from the study area with those from other
parts of Massachusetts.
MATERIALS AND METHODS
STUDY DESIGN
The two broad categories of study objectives dictated the details of the study design. One set of
objectives consisted of a broader survey of additional species and some additional lakes to
determine whether fish consumption advisories for mercury were needed to protect public health.
The second set of objectives consisted of and was met by a more intensive sampling program on
a subset of the lakes sampled in the first category. For the latter category, more LMB and YP
fish were obtained and analyzed individually to support the statistically-based evaluation of the
relation between atmospheric mercury inputs and fish tissue mercury concentrations.
The study area was subdivided on the basis of the potential for atmospheric deposition of
mercury from potentially major, local emission sources (Figure 1). While the area delineated by
the regional deposition modeling project as the high deposition zone covered a large part of the
study area, it was defined, in part, by the minimum spatial resolution of the model used to predict
deposition. Actual patterns of mercury deposition within this artificially designated zone may not
be uniform because of local point source contributions and variations in local wind directions
and associated precipitation events.
The subdivision of the study area was made to improve the efficiency of the study design for the
second category of objectives. The (Northeast States/Eastern Canadian Provinces, 1998) air
deposition model used smaller grid areas within its study area to allow for more refined
FISH MERCURY IN NE MASSACHUSETTS LAKES
MA DEP, Office of Research and Standards
5
projection of deposition specific to the conditions of each grid area. We stratified the high
deposition area defined by the model’s grid cell into three areas (Figure 1): an area in the
predominant downwind direction (Gaylor and Swirsky Gold, 1998) from the major mercury
point sources (an arc from about 0-90o centered on the Lawrence MSWC; an area upwind of
these sources (within approximately about 7.3 km and in direction from 90-360o centered on the
Lawrence MSWC); and farther upwind (> 15.5 km from the western-most located incinerators)
of the modelling grid, influenced likely only by deposition of mercury transported longer
distances. The locations of lakes upwind and downwind of the point sources might reasonably
be expected to represent the potential for lesser and greater atmospheric deposition of mercury,
respectively, from the point sources. Upwind/downwind evaluations were made from a wind rose
compiled from meteorological data collected from Nov. 1989 – Nov. 1990 at Ward Hill,
Haverhill, MA (DiNardi et al., 1991).
The fish species analyzed were LMB, YP, BB, yellow bullhead (YB) (Ictalurus natalis) and
chain pickerel (CP) (Esox niger). The lakes sampled in this study (Table 1) were chosen on the
basis of: size of lake (4 hectares minimum size), availability of fish species, fishing pressure,
access, and proximity to other lakes.
Category 1 – Public Health-Based Lake Survey for Mercury Advisory Consideration
The objective of this part of the work was to provide fish tissue mercury concentration data for
lakes in the study area to permit evaluation of the need for fish consumption advisories to protect
public health. Twenty-six lakes were sampled (fourteen from the downwind area, six from the
upwind and six from the far upwind areas).
Category 2 – Regional Geographic Comparisons
The objectives of this section of the study were to: (1) quantitatively compare individual fish
edible muscle concentrations of mercury in LMB and YP from lakes downwind, upwind and far
upwind from potential major point sources of mercury emissions; (2) to examine spatial patterns
FISH MERCURY IN NE MASSACHUSETTS LAKES
MA DEP, Office of Research and Standards
6
in species mercury concentrations; and (3) compare data obtained in this study to previous
studies around the State and elsewhere. This work was limited to these 2 species because LMB
are known to be among the highest bioaccumulators and they are representative of an upper level
trophic group. YP are ubiquitous native omnivores. Our previous work in Massachusetts lakes
has shown that other species such as BB are less likely to accumulate mercury (Rose et al.,
1999).
Other possible determinants of the fish mercury concentrations beyond geographically-based
differences being investigated could act as data confounders. These include season, fish size/age,
reproductive condition, physiological condition, water temperature, pH and conductivity, amount
of available organic matter in the water, trophic status of the lakes and extent of watershed and
wetlands feeding into the lakes. Many of these variables are independent and their effects on
fish mercury concentrations may be difficult to differentiate.
In the design phase, the anticipated relationship between fish size and tissue mercury
concentrations was addressed by limiting field collections to those fish which might be kept and
consumed by anglers (i.e., minimum sizes to keep and upper cutoffs to restrict size-related
variability) (e.g., LMB between 30 and 36 cm in total length and YP between 20 and 25 cm in
total length). For budgetary reasons, the study was performed in the spring, unintentionally
coincident with spawning season. It was therefore not possible to design the study to control for
seasonally varying variables such as fish reproductive condition, fish condition index, and water
temperature in the experimental design. However, relationships among these variables and
tissue mercury concentrations were evaluated during data interpretation.
One determinant of lake water pH is the nature of the surrounding soils. Since the study area lies
within one subecoregion of the state (Griffith et al., 1993), we did not expect any large pH
differences between lakes as a result of surrounding soil differences between lakes, although
there may be other site-specific factors which could be responsible for differences in pH values
between lakes. The potential relationships among lake water pH, conductivity and fish mercury
concentrations are explored in the data interpretation phase.
FISH MERCURY IN NE MASSACHUSETTS LAKES
MA DEP, Office of Research and Standards
7
SAMPLING PROTOCOL
Category 1 – Public Health-Based Lake Survey for Mercury Advisory Consideration
The Commonwealth’s fish sampling protocol for its fish toxics testing program (Isaac et al.,
1992), which calls for fish composite analysis, was used on five of the 26 lakes because the
resultant data were to be used for advisory analysis only. Most of these fish were processed
identically to those for Category 2 objectives except for compositing of fillets for 2-3 fish. One
to six individuals each for the 5 species of fish were sought from each lake with a target of 3 fish
per species.
Category 2 – Regional Geographic Comparisons
A subset of 21 of the 26 lakes sampled in this study (Table 1) was subjected to more intensive
sampling for geographic difference evaluation than those lakes where fish were used for advisory
screening. Nine fish of each species were sought from each lake. We have previously determined
that this number would be adequate to address the sampling needs for these types of
comparisons, given the variability in fish tissue mercury concentrations in the state (Rose et al.,
1999). Ten, five and six lakes were sampled from each of the downwind, upwind and far upwind
sampling regions, respectively (Table 1). A greater number of lakes were sampled from the
downwind region in order to provide sufficient coverage to investigate spatial patterns in fish
mercury within that region.
FIELD METHODS
Fish were sampled with box nets, gill nets, trot lines, electroshocking, and rod and reel.
Electroshocking was the preferred method because of its efficiency and the lessened chance for
injury or tissue deterioration associated with some of the other methods. Fish were removed
from the water, rinsed with ambient water, wrapped individually in aluminum foil, placed in
FISH MERCURY IN NE MASSACHUSETTS LAKES
MA DEP, Office of Research and Standards
8
polyethylene Ziploc bags and placed on ice for delivery to the laboratory within 24 hours of
collection. During field collections at each lake, depth profiles of water temperature, dissolved
oxygen concentration, pH, and conductivity were made at one meter depth intervals throughout
the water column from one station in each lake located over the deepest portion of the lake. The
list of water quality parameters was a subset of that used in our previous work (Rose et al.,
1999), reflecting that study’s identification of the important environmental determinants of tissue
mercury concentrations. Field sampling took place between 14 April and 26 May 1999, except
for Hovey’s Pond (fished 17 June 1999).
LABORATORY PROCEDURES
Fish were processed for analysis of mercury in lateral muscle in accordance with U.S. EPA
procedures (U.S. Environmental Protection Agency, 1993). Total fish lengths and wet weights
were recorded. Scales were removed from LMB and YP for age analysis. Pectoral spines were
removed from BB for age analysis. Other details of handling and sample preparation are
described in Rose et al. (1999). A Perkin Elmer Flow Injection Mercury System was used for
total mercury analysis. Recovery for spiked fish samples and precisions of the analyses were 103.3
± 9.1% and 4.0 ± 3.8% (means ± 1 std. dev.). The reference standard for mercury in fish tissue was
freeze-dried tuna tissue (BCR ref. std #463). The accuracy of analyses of that standard was 102.5 ±
4.7%. Mercury in all laboratory reagent blanks was less than the method detection limit (MDL) of
0.02 mg/kg.
DATA ANALYSIS METHODS
Category 1- Public Health-Based Lake Survey for Mercury Advisory Consideration
Mean species tissue mercury concentrations based either on individual fish analyses or
composite sample analyses gathered in this study from each of the 26 lakes were used for
evaluating each lake’s fish consumption health risk status. The determination of the need for fish
FISH MERCURY IN NE MASSACHUSETTS LAKES
MA DEP, Office of Research and Standards
9
consumption advisories for various groups of consumers was performed by MA DPH according
to methods described in (MA DPH, 1995), consisting essentially of using a concentration of 0.50
mg/kg as the point at and above which advisories are required.
The frequency of advisories for LMB and YP for the lakes in northeast Massachusetts (not
including the three far upwind lakes in Harvard, Lancaster and Lunenburg) was compared to the
frequencies of advisories required for the two species from lakes sampled in our previous
Massachusetts study of more rural lakes (Rose et al., 1999). Fisher’s Exact Test was used for
comparison of frequencies (one-sided test, p = 0.05) (Sokal and Rohlf, 1995). The LMB tissue
mercury concentrations of theoretical standard-sized fish (see section below on Preliminary Data
Evaluation) were used to eliminate variation due to fish size in this analysis. Standardization for
size was not done for the Kenoza Lake sample, as it was a composite. While this adjustment is
justifiable for comparison of frequencies of advisories, it is not appropriate to adjust for size
when evaluating the acceptability of fish for human consumption from a particular lake. Each
lake’s standard-sized LMB tissue mercury concentrations, or the lake mean of all individual YP
mercury concentrations were compared to categories of health risk defined by the MA DPH
(1995): 1) concentrations below the MA DPH defined advisory cutoff concentration of 0.50
mg/kg; 2) concentrations between 0.50 – 1.0 mg/kg; and 3) concentrations >1.0 mg/kg. MA
DPH uses the higher value as another cutoff for more restrictive advisories.
Category 2 - Regional Geographic Comparisons
Preliminary Data Evaluation
Bivariate plots of individual fish mercury concentrations versus age, length or weight for all
lakes for each species and then for each lake individually were examined for relationships
between the variables. In order to determine if there was a differential effect of fish size (using
length as an indicator) on mercury concentrations for each species, tests of parallelism of
regression line slopes (Sokal and Rohlf, 1995) of log10-transformed tissue mercury concentration
versus length were performed on the data for separate lakes.
FISH MERCURY IN NE MASSACHUSETTS LAKES
MA DEP, Office of Research and Standards
10
Two procedures were applied to the LMB data to remove the confounding effect of size noted on
preliminary evaluation from other between groups comparisons of mercury concentrations. One
approach was to censor the data set. Although fish size objectives were predefined for field
sampling in an effort to minimize the anticipated size effect, in practice, fish over a larger size
range were obtained and included in the data set. Through visual examination of plots of mercury
concentrations versus length for all fish, and the frequency distribution of these values, a target
size range of 27-38 cm total length was identified. Use of fish within this range represents a
compromise between trying to retain as many fish as possible in the analysis for statistical power
reasons and narrowing of the size range to remove the effect of size. Only fish falling within this
target size range were used in subsequent analyses as noted where there was a possibility of size
being a confounder in the analysis.
The other approach used to adjust for the effect of LMB size was to derive a predicted mercury
concentration for a “standard-sized LMB”: defined as the arithmetic mean fish length over all
fish sampled. In subsequent analyses for comparing data between lakes, the predicted mercury
concentration of a standard-sized fish for a lake was used as a basis for comparison. It was
determined by regressing individual fish mercury concentrations on body lengths for fish from
the lake, and solving the regression equation for the predicted tissue mercury associated with the
length of the standard-sized fish. Prior to running the regression analysis, plots of these two
variables were examined for linearity. In those data sets which were nonlinear, both variables
were log10-transformed prior to running the regression analysis.
Verification of Assumptions for Use of Parametric Statistics
The fish tissue mercury concentration data for each species were examined with the following
techniques to determine if they were normally distributed: 1) generation of frequency histograms
of individual fish tissue mercury concentrations and application of Kolmogorov-Smirnov test for
goodness of fit to normal distribution at a = 0.05 (Sokal and Rohlf, 1995); 2) generation of
normal probability plots of these mercury concentrations for each lake; 3) examination of plots
of lake mean tissue mercury concentrations versus associated standard deviations to determine if
FISH MERCURY IN NE MASSACHUSETTS LAKES
MA DEP, Office of Research and Standards
11
means were correlated with errors; and 4) inspection of error variances between lake tissue
mercury concentrations for homogeneity (Bartlett’s test (Sokal and Rohlf, 1995)). Violations of
these assumptions of normality and errors for any species were addressed by applying log10
transformations to the individual fish tissue mercury concentration data prior to additional
testing. The justification for the use of this particular transformation was that frequency
distributions of tissue mercury concentrations were skewed to the right and means were
correlated with standard derivations. Transformations removed the dependence of the variance
on the mean and made the distributions more symmetrical, i.e., normal.
Mercury Concentrations, Fish Condition, and Reproductive Condition
The condition of fish was assessed with a condition factor calculated for individual fish as its
weight divided by its cubed length (W/L3) (Ricker, 1975). Data for all fish caught were included
in the analysis because there was no apparent relationship between fish condition and length or
age. W/L3 values were examined for normality prior to further statistical evaluation. Potential
differences in each species condition factor between areas and between lakes within areas were
examined with a nested analysis of variance (ANOVA) of this variable between upwind-
downwind areas nested in ponds with replicated measurements (p = 0.05) (Sokal and Rohlf,
1995). The relationship between condition index and mercury level in all fish was visually
examined in bivariate scatterplots of the data points for these two variables for each species and
generation of Pearson’s cross-correlation coefficients.
Possible relationships between the reproductive condition of fish and their respective tissue
mercury concentrations were examined with bivariate plots of each lake’s mean tissue mercury
concentrations for target-sized LMB and all YP versus reproductive condition for each species,
sex, and reproductive condition segregated by sex. Two-way ANOVAs were performed with
log-transformed mercury values for these fish to test for differences in each species mercury
concentrations between sex and reproductive condition.
Spatial Variation in Mercury Concentrations in Northeast Massachusetts
FISH MERCURY IN NE MASSACHUSETTS LAKES
MA DEP, Office of Research and Standards
12
A nested ANOVA with unequal sample sizes (Sokal and Rohlf, 1995) was used to test for
differences in each species’ mercury concentrations in lakes among downwind, upwind and far
upwind potential deposition areas. The first level of classification was deposition area. Lakes
were the subordinate classification category, and log10-transformed mercury concentrations were
the dependent variable. Individual fish within lakes represent replicated observations of mercury
concentration in fish for that lake. The analyses were run for the target-sized LMB, because there
were no replicate observations for the “standard sized” fish predicted mercury concentration, and
for all YP. In cases where there were less than three fish per lake, the lake’s data were omitted
from the analyses because of either the low number of replicate fish per lake or the absence of
enough fish (>1) to calculate within- lake variance estimates.
Mercury in Northeast Massachusetts Lake Fish Versus Other State Fish
The mercury concentrations for all YP and standard-sized LMB for lakes in northeast
Massachusetts were compared against the data for these species from our study of 24 rural, non-
source- impacted lakes throughout Massachusetts (Rose et al., 1999). Mean YP mercury
concentrations for each lake were calculated. The LMB Mercury concentration data for each of
the lakes in that study were standardized (as described above for northeastern Massachusetts
lakes) to the concentrations associated with the standard-sized fish identified for this study. The
24 lake mercury concentrations for each species were then used to identify the 25th and 75th
percentile concentrations from frequency distributions of these species fish tissue mercury
concentrations. These cutoff points defined three ranges of mercury concentrations which we
called “low” (<25th percentile), “medium” (25-75th percentile) and “high” (>75th percentile). For
each species, the numbers of lakes from this study falling into each of the three ranges based on
sampling from rural, non-source- impacted lakes were then tabulated using the mercury values
for each lake in this study. For YP, lake mean tissue mercury concentrations for the rural study
were compared against those of the northeast Massachusetts study area (using all lakes sampled)
using a one-sided t-test (Ho : µ NE MA ≤ µ rural vs. Ha: µ NE MA > µ rural). For LMB, the same test was
performed on log-transformed standard-sized fish mercury concentration values (using only data
from lakes where data on individual fish were available).
FISH MERCURY IN NE MASSACHUSETTS LAKES
MA DEP, Office of Research and Standards
13
Fish Mercury and Lake Water Quality
The relative importance of lake water quality parameters to the variability observed in tissue
mercury concentrations between lakes was assessed with a factor analysis (Sokal and Rohlf,
1995) using tissue mercury concentrations, fish condition index, and the physical variables. This
multivariate statistical procedure provides a means for identifying intervariable correlation
structures among numerous variables. A large, multivariate data set is reduced through this
procedure to one of fewer, new, abstract variables called factors. These factors are constructed
to be independent of each other, and to represent those groups of original variables in the data set
which are most highly intercorrelated in terms of their variance patterns. Similar variance
patterns may be inferred to represent one basis for commonality in the processes linking those
groups of variables. The upwind-downwind areas were numerically coded for this analysis with
downwind having the lowest numerical value and far upwind having the highest value.
Pearson’s product moment correlation matrices were calculated for each species mercury
concentration and environmental variables. A ‘varimax’ normalized rotation strategy was used to
improve the separation of variables on factors. Initially, the factor analysis was computed for
two factors. The number of factors was increased iteratively until mercury in the species being
analyzed scored highly on only one factor. Appendix A contains a more detailed general
description of the concepts behind factor analysis and the interpretation of the results of these
types of analyses.
Predictive numerical models (multiple regression equations) of fish muscle mercury
concentrations for each species based upon lake water characteristics such as pH, conductivity,
etc., had been developed from the data obtained with sampling in three subecoregions in the state
in and reported on in MA DEP (MA DEP, 1997) (Table 2). These equations were applied to the
present study to predict tissue mercury concentrations in the northeast Massachusetts lakes. The
predictive equation for YP employed lake calcium concentrations which were not measured in
the present study. A surrogate variable measured in this study was used: pH. The relationship
between pH and calcium in the subecoregion study was determined with a linear regression
analysis ( [Ca++] = -6.54+1.495*pH, r2=0.49, sig. at p=0.05). This relationship allowed lake pHs
measured in the present study to be used to predict calcium concentrations which then were used
FISH MERCURY IN NE MASSACHUSETTS LAKES
MA DEP, Office of Research and Standards
14
in the equation for mercury. These predicted concentrations are compared to the measured
concentrations for that species in the lakes of the present study. Data for Center Pond, Yokum
Pond and Ashfield Pond were not included because of anomalously high calcium values greater
than 10 mg/L. Those ponds also had high chloride and conductivity values. Prospect Hill Pond
data were also omitted because of an anomalously high pH value of 10.5.
All statistical evaluations in this study were performed with the Statistica/W, Version 5.0
software package (StatSoft, Tulsa, OK, USA)
RESULTS Twenty-six lakes were sampled in northeast MA. Collected fish included 203 LMB, 160 YP, 43
BB, 11 CP and 9 YB.
CATEGORY 1 - PUBLIC HEALTH-BASED LAKE SURVEY FOR MERCURY ADVISORY
CONSIDERATION
Mean mercury concentrations based on all YP caught (Table 3 and Appendix B Table B1) from
65% (11/17) of the study area lakes were below the threshold for issuing a fish consumption
advisory for mercury (Table 3, Figures 2 and 3A). The YP in the remaining six ponds had
mercury concentrations from 0.5 ppm - 1 ppm. None of the ponds contained YP with mean
mercury levels greater than 1 ppm. The frequency of advisories (35%) warranted for this species
in northeast Massachusetts where mercury concentrations were >0.50 mg/kg was greater than
those needed for fish from the three subecoregions sampled by Rose et al. (1999) (p=0.05, Figure
3B).
Five of the six ponds requiring mercury based fish consumption advisories are approximately 4 –
14 km northeast to east of the incinerators, and the sixth pond is about 9 km SSE of the
incinerators (Figure 3A). Four of the five are not directly in the predominant downwind
direction (Northeast States/Eastern Canadian Provinces, 1998) from the incinerators in this area.
FISH MERCURY IN NE MASSACHUSETTS LAKES
MA DEP, Office of Research and Standards
15
Four of the ponds sampled are 5.6 - 14 km in the predominant direction downwind from the
incinerators, yet did not require fish advisories based on mercury in YP. One pond
approximately 6 km upwind of the incinerators required a fish advisory based on mercury in YP.
For LMB, fish advisories were warranted for all but one of the ponds that were tested in the
upwind and downwind directions (Table 3, Figures 2 and 3A, Appendix B Table B1) where this
target species was present. The frequency with which advisories for LMB in the study area ponds
(Hg >0.50 mg/kg) were warranted is greater than that for the ponds in more rural subecoregions
sampled in our earlier study (p=0.05, Figure 4). As with YP populations, the distribution of
ponds and their associated mercury advisories for LMB bears no evident relationship to the
location of the incinerators (Figure 3A).
CP from all 4 lakes where they were caught would require fish consumption advisories for
mercury (3 downwind, 1 upwind). YB for Chadwicks Pond in the downwind area merited an
advisory, whereas those individuals of this species from two upwind ponds did not require
advisories. BB obtained in 15 lakes had not accumulated enough mercury to warrant fish
consumption advisories except in 2 lakes (1 downwind and 1 far upwind) (Table 3).
CATEGORY 2 - REGIONAL GEOGRAPHIC COMPARISONS
Summarized results are contained in Appendix B Table B1.
Preliminary Data Evaluation
The slopes of individual lake regression lines of YP mercury concentrations versus length were
unequal (p=0.05). Closer examination of the plots for individual lakes did not reveal any
consistent pattern in mercury – length relationships, with most having no relationship. YP
mercury concentrations over all lakes were not related to fish length (Figure 5). All YP data
FISH MERCURY IN NE MASSACHUSETTS LAKES
MA DEP, Office of Research and Standards
16
were therefore used in any subsequent between- lake comparison of tissue mercury
concentrations because of the absence of a size confounding effect.
Mercury concentrations in LMB were positively correlated with fish length (Figure 5). Slopes
of individual lake regression lines of mercury versus length were significantly different between
lakes (p = 0.05). This situation indicated that results from any further tests with the raw data set
would be confounded by the effect of the length of the fish in each sample. A target size range
of 27-38 cm was then chosen to narrow the size range of fish included in subsequent analyses
using individual fish data in order to minimize the confounding effect of size on the comparative
analyses between lakes. This range represented 77% (n=148) of all the individual LMB
analyzed.
The total length of the “standard-sized” LMB for this data set was 33.9 cm. Central tendency
estimates of tissue mercury concentrations generated for all fish caught, for fish in the “target
range” and for “standard-sized” fish were very similar for almost all ponds (Appendix B Table
B1). Variation about the central tendency estimates was usually greatest for the whole data set.
The mean percentage difference between estimated mean mercury concentrations using the
second and third methods of controlling for the differential effects of size on LMB tissue
mercury concentrations (limiting the size of fish included in the calculations and use of a
calculated mercury concentration for a standard-sized fish) over all lakes was 9 ± 13 % (mean ±
1 std. dev.) (Appendix B Table B1), ranging between 0 and 48%. This comparison indicates that
either method produces relatively similar estimates of mean LMB mercury concentrations in a
lake independent of fish size. The “target range” is perhaps more subjective since it relies upon
the analyst’s judgment to identify an appropriate size range of fish to include in the analysis.
The “standard-sized” fish approach uses all of the data obtained and employs a more objective
process for identifying a central estimate.
Verification Of Assumptions
FISH MERCURY IN NE MASSACHUSETTS LAKES
MA DEP, Office of Research and Standards
17
The raw mercury concentration values for both species (and the target size range concentrations
for LBM) did not meet the criteria outlined in the methods section for use in ANOVAs and other
types of parametric statistical procedures. Values were, therefore, log10-transformed before use
in subsequent procedures; the transformations rectifying the violations of assumptions that
existed with the untransformed data.
Mercury Concentrations, Fish Condition, And Reproductive Condition
YP caught in this study were 17.3 - 33.8 cm long (mean = 24.2 cm) and weighed from 52.3 to
378.3 g (mean = 176.0). These fish ranged in age from year-class 2 to 11, with the majority of
fish in the fifth to seventh year class. The condition indices of these fish did not vary
significantly between areas, but did vary significantly between lakes within areas (nested
ANOVA: F Areas= MS Area/MSPond = 0.067 with 2,14 df, NS; FPonds = MSPonds/MSError = 12.78
with 14, 135 df, p=0.05) (Figure 6B).
The mean (± 1 std. dev.) YP mercury concentration of all individual YP sampled in this study
was 0.44 ± 0.21 mg/kg. Concentration values ranged from 0.12 - 1.1 mg/kg. Condition index
was independent of the muscle mercury concentrations (r2=0.001) (Figure 7). Sixty seven and
eight tenths percent (103/152) of YP were female. However, 3% of the fish were not classified
as to sex. Ninety-six percent of the fish had spent gonads. Neither sex nor reproductive stage
had a significant relationship with YP tissue mercury concentrations nor was there a significant
interaction between the two variables (2-way ANOVA: Fsex = 2.71 with 1,131 df; Fcondition = 0.13
with 1,131 df respectively, Fsex x condition = 3.35 with 1,131 df; for each p>0.05) (Figure 8).
The LMB sampled were 24.2 - 53.2 cm long (mean = 33.9 cm) and weighed from 151.5 - 2392.3
g (mean = 584.6). The youngest fish caught was in the first year-class, the oldest in the 14th.
Most fish were in the third through fifth year-classes. There were no significant differences in
condition indices between the three areas, but differences between lakes within each area were
significant (nested ANOVA: F Areas= MSArea/MSPond = 2.299 with 2,18 df, p > 0.05; FPonds =
MSPonds/MSError = 3.24 with 18,171 df, p=0.05) (Figure 6A).
FISH MERCURY IN NE MASSACHUSETTS LAKES
MA DEP, Office of Research and Standards
18
The mean (±1 std. dev.) mercury concentration for all LMB caught (n=192) was 0.89 ±0.43
mg/kg. Concentrations ranged from 0.18 – 2.5 mg/kg. The condition of these fish was
independent of their muscle mercury concentrations (R2 = 0.025) (Figure 7). Forty-seven and
three tenths percent (70/148) of all target-sized LMB caught were identified as female. The
majority of these LMB were in a prespawning condition (40.5% developing and 49.3% ripe).
Only one fish of all fish sampled was in a spent condition. Mercury concentrations of fish did not
differ significantly between the two sexes, nor between those fish in different reproductive states
(conclusion limited to pre-spawning fish characterized as developing or ripe) (2-Way ANOVA:
Fsex = 0.74 with 1,127 df and Fcondition = 0.31 with 1,127 df, p>0.05)(Figure 8). There were too
few spent and immature fish to include in between-group testing.
Spatial Variation In Mercury Concentrations In Northeast Massachusetts
There was no obvious geographical pattern in tissue mercury concentrations between lakes for
either species (Figure 1). YP showed modest variation in mercury concentration values and no
spatial pattern. Differences between the mean YP mercury concentrations of lakes within each
of the three designated study areas (Figure 2) were not significant (nested ANOVA: F = MS
AREA/MSLAKES = 1.39 with 2,14 df, p>0.05). Differences between lakes were significant (F =
7.57 with 14,135 df, p>0.05). The single fish from Crystal Lake in Haverhill was not included in
this analysis.
The highest concentrations of LMB tissue mercury in the data set were in lakes which were both
upwind and to an easterly angle of 45o of the prevailing SW- NE wind direction in the area
(Figure 1). Differences between the target LMB mercury concentrations of lakes within each of
the three study areas (Figure 2) were not significant (nested ANOVA: F = MS AREAS/MSLAKES =
1.49 with 2,17 df, p>0.05). Differences between lakes were significant (F = 29.87 with 17,120
df, p=0.05). Lake Attatash in Amesbury was omitted from the nested ANOVA because it had
fewer than three fish within the target size range for interpretation.
FISH MERCURY IN NE MASSACHUSETTS LAKES
MA DEP, Office of Research and Standards
19
Mercury Concentrations In Northeast Massachusetts Lake Fish Versus Statewide Mercury Concentrations
The 25th percentile and 75th percentile concentrations defining the distribution of mercury
concentrations from more rural, non-source-impacted lakes were 0.20 and 0.38 mg/kg for YP
and 0.27 and 0.49 mg/kg for standard-sized LMB.
The YP mercury concentrations from eight of the northeast Massachusetts ponds (Figure 3B) fell
into the medium range of the rural lake values. The YP mercury concentrations of the remaining
nine study area ponds were in the high range of the rural lake values. None of the northeastern
Massachusetts lake values were in the low range of rural lake values. Northeast Massachusetts
YP mean lake mercury concentrations as a group were significantly greater than those of more
rural lakes (t=3.22, 40 df, p =0.05) (Figure 9).
Seventy-five percent of the LMB populations sampled in the 1997 study (Rose et al., 1999)
contained less than 0.49 mg/kg mercury. All of the standard-size LMB lake mean tissue mercury
concentrations from the northeast study area ponds, except Fort Pond, far upwind, were greater
than this value (the high range of the more rural pond values). The northeast study area lake fish
tissue mercury concentrations for standard-sized LMB as a group were significantly greater than
those of lakes from more rural areas (t=4.97, 32 df, p<0.05).
Although the data set for BB was not intended for detailed statistical analysis, there were
sufficient numbers of samples to enable a comparison of lake mean concentrations between the
northeast Massachusetts lakes and those of more rural areas of the rest of the state. Mean lake
mercury concentrations (log-transformed) of fish from the northeast study area were significantly
greater than those from more rural areas lakes (1 sided t-test: t=2.89, 35 df, p=0.05).
Fish Mercury And Lake Water Quality
FISH MERCURY IN NE MASSACHUSETTS LAKES
MA DEP, Office of Research and Standards
20
The only strong relationships between fish tissue mercury concentrations and the environmental
variables or the condition of the fish were for the LMB mercury concentrations, YP condition
and water temperature (Table 4, Factor 1). YP condition and water temperature had similar
variance patterns. The high factor loading scores of both YP and LMB tissue mercury
concentrations on the same Factor (3) indicated that they had similar variance patterns and were
positively correlated. The moderate, negative condition index factor score for LMB on this
factor can be interpreted as indicating that the mercury concentrations in the two principal fish
species studied were inversely related to the condition index of LMB. Fish mercury
concentrations and the probable depositional areas of mercury from the incinerators related to
up– and downwind directions are independent, as shown by their loadings on different
independent factors. None of the lake environmental variables were significantly different when
grouped and compared by upwind and downwind lakes, and by far upwind lakes to downwind
lakes (t-test, p>0.05). Other relationships between variables which were revealed by the factor
analysis are: similarities between water conductivity and the defined potential depositional areas
for mercury (i.e., Factor 2. higher conductivities associated with lakes in more upwind
directions) (Figures 3 and 6F); and between water pH and dissolved oxygen concentration
(Factor 4). The apparent relationship between conductivities and assigned depositional areas is
likely a data artifact because of the anomalously high conductivity value of 647 µS/cm for Ames
Pond. When lake conductivities are grouped by depositional area, there are no significant
differences between the groups, with or without the high value included (1-Way ANOVAs:
F2,18=2.28, p>0.05; F2,17 = 2.38, p>0.05 respectively).
Predicted mercury concentrations for YP and LMB tissues using the model from the rural lakes
study and values of physical variables measured in this study were substantially greater than
those actually measured (median of 5x for YP and median of 5.6x for LMB)(Results not
presented).
DISCUSSION The results from this study provide a valuable perspective on the ecological and human health
ramifications of mercury inputs to urban areas. Regionally elevated tissue mercury
FISH MERCURY IN NE MASSACHUSETTS LAKES
MA DEP, Office of Research and Standards
21
concentrations in some fish species were consistent with projections from limited prior fish
sampling and from modeling of atmospheric deposition inputs of mercury to the ecosystem, yet
there were no obvious relationships apparent between the concentrations of mercury in the
tissues of these species in lakes in northeast Massachusetts and the locations of those lakes with
respect to recognized point atmospheric emission sources of mercury (MSWC and MWI) (Figure
1). LMB contained more mercury than YP from the same water bodies, consistent with the
results of our earlier work in Massachusetts (Rose et al., 1999). The high LMB tissue mercury
concentrations translate into a public health risk when these fish are consumed by humans. The
concern is particularly focused upon pregnant women, infants and young children, who are all
susceptible to the toxicological effects of mercury. Using criteria employed by the MA DPH,
fish consumption advisories for mercury were warranted for LMB for all but one of the lakes in
the study area in which this species was caught . This lake, Fort Pond in Lancaster, was in the far
upwind area out of the region of high predicted atmospheric deposition of mercury. The
frequency of advisories for northeastern lakes is greater than that seen in more rural parts of the
state. A number of consumption advisories for mercury in YP were warranted. The frequency
of advisories was barely significantly greater than that required in more rural areas.
Atmospheric inputs of mercury to terrestrial and aquatic ecosystems are recognized to come
from long-range transport and local sources. The elemental (Hgo) and ionized (Hg (II)) oxidation
states of inorganic mercury are the primary forms of mercury in the atmosphere. The
predominantly elemental, gaseous Hgo is transported back to earth mainly through dry
deposition, whereas the more reactive, water soluble Hg (II) is removed from the atmosphere
much more quickly through wet and dry processes (Lin and Pehkonen, 1999). With current
levels of control technology in the United States on point sources of mercury such as combustion
facilities, most of the Hg(II) is believed to be captured, and the emitted mercury is in the Hgo
state, having a longer atmospheric residence time and therefore longer time and further distance
transport before deposition (Lin and Pehkonen, 1999). Some unknown, but probably large,
proportion of the mercury historically emitted by emission sources in northeast Massachusetts
would therefore be expected to have been transported out of the immediate downwind areas.
The local deposition component would reflect dry deposition and precipitation scavenging of
particulate mercury.
FISH MERCURY IN NE MASSACHUSETTS LAKES
MA DEP, Office of Research and Standards
22
A number of studies, but not all, have reported or suggested gradients of decreasing mercury in
various media with distance from point atmospheric sources (Table 5). The absence of a clear
relationship between fish mercury concentrations and locations of mercury emission point
sources in northeast Massachusetts suggests that the fate of mercury in the ecosystem from
introduction to sequestration in biological tissues is a complex one, modified by many
intervening processes, such as biological methylation and water and sediment geochemical
processes. The presence of multiple sources makes inferring relationships between inputs from
any one source and concentrations in fish in any particular lake difficult. The association of
precipitation events, which would wash mercury from the atmosphere, and wind directions at the
times of those events would also tend to “smear out” the pattern of dispersion of mercury if
precipitation was not primarily associated with predominant winds (SW → NE).
There were interspecific differences in the degree of fish tissue mercury contamination in the
study area. LMB had tissue mercury concentrations on average 2.2x higher than values from
more rural, non- local-source-impacted regions of the state, and had similarly elevated
concentrations comparable to LMB in a number of other studies (Figures 2 and 9). The general
level of mercury contamination of YP from northeast Massachusetts was similar to that of YP
from more rural regions of the state and from other areas of the country (Figure 9).
The urban-rural differences in fish tissue mercury concentrations for LMB, while intuitively
consistent with the expected situation from high predicted atmospheric mercury inputs from the
urban region, are counter to the results of several studies elsewhere. In a pilot, unpublished,
nationwide study of fish tissue mercury concentrations from 20 watershed basins throughout the
United States, mercury concentrations in predominantly bass species ranked as follows when
categorized by predominant land use of the lands surrounding lakes sampled: agriculture/forest
>> mine- impacted > agriculture > urban (Brumbaugh et al., 2001). In the urban watersheds, lake
sediment mercury concentrations (both total and methyl mercury) often ranked high, while fish
tissue concentrations ranked low. Mercury loading to urban Minnesota lakes was 35% greater
than in rural areas (Swain, 2000). The highest mercury concentrations in predacious fish
occurred however in more rural parts of the State (Jeremiason, 2000). This situation was
FISH MERCURY IN NE MASSACHUSETTS LAKES
MA DEP, Office of Research and Standards
23
attributed to greater production rates of methyl mercury in the more rural lakes than in the urban
lakes (Jeremiason, pers. comm.). LMB tissue mercury concentrations in fish from drainage lakes
in highly urbanized areas of Connecticut were less than those in fish from rural areas (Hanten et
al., 1998). Total mercury in atmospheric precipitation was higher in the Connecticut urban areas
than in more rural areas of the State (Carley and Perkins, 2000). Regional differences in LMB
tissue mercury concentrations were attributed to the influences of geology on lake water
chemistry, rather than urbanization and atmospheric deposition (Hanten et al., 1998). The
Connecticut urbanized lakes were in areas of either metamorphosed limestone forming a marble
valley, or sedimentary rock held together by carbonate materials. The lakes in northeastern
Massachusetts occur in glacial sediments over metamorphic and granitic bedrock and therefore
have less buffering capacity and a tendency for lower pHs than the Connecticut urban lakes.
Since fish tissue mercury concentrations have often been related to water pH in the literature
(Grieb et al., 1990); (Driscoll et al., 1994); (Watras et al., 1998)), the differences between
Connecticut urban and Massachusetts urban lakes and their respective rural counterparts may
reflect the geologic influences from underlying bedrock. The two state comparative studies
suggest that while inputs (atmospheric or otherwise) of mercury to waterbodies may play a role
in the final mercury concentrations seen in fish, in- lake or watershed and wetland
biogeochemical processes, including methylation, may play a more important role in the
production and availability of organic forms of mercury for absorption by invertebrates and fish.
Nationally, the ranking of fish tissue mercury concentrations by land use was paralleled by the
methyl mercury water concentrations (Brumbaugh et al., 2001), supporting the idea of the
importance of methylation. We have recently supported work which has documented that the
sediments in one lake in the downwind zone of our study area have had a greater mercury
deposition rate since shortly after 1910 ((Wallace et al., 2003)) than has occurred in a more rural
lake elsewhere in the state (Luce and Wallace, unpublished data). This information supports the
predictive modeling results for the region.
The results from other comparative studies on LMB (Figure 9) further support the conclusion
that LMB tissue mercury concentrations in northeast Massachusetts are high. The general level
of mercury in LMB tissues in Maryland lakes located as far as 15 km from a coal- fired power
plant was less than that seen in northeast Massachusetts (0.43 ppm maximum in LMB from the
FISH MERCURY IN NE MASSACHUSETTS LAKES
MA DEP, Office of Research and Standards
24
Maryland lakes vs. 2.5 ppm maximum in the northeastern Massachusetts lakes of this study)
(Pinkney et al., 1997). The Oregon reservoir data (Park and Curtis 1997) represent a water body
not influenced by point sources of mercury. However, fish in reservoir impoundments have high
tissue mercury concentrations as a result of mobilization of mercury sequestered in flooded
organic matter (Bodaly et al.,1984). This comparative value from a reservoir might therefore be
biased high relative to values for seepage lakes. In a preliminary analysis of nationwide tissue
mercury data for LMB (n=50), Brumbaugh et al. (2000) identified a mean tissue concentration
of 0.51 mg/kg in age 3 fish. The corresponding mean value for this study’s age 3 fish was 0.80
mg/kg. YP concentrations measured in this study were similar to those in other studies in
Minnesota, Wisconsin and New York.
A number of factors could potentially influence the levels of mercury in fish tissue in this and
other comparative studies beyond those discussed above (e.g., mercury inputs, geology, water
pH, dissolved organic carbon content, alkalinity, hardness). Potentially important among these
are fish size and age, food chain length, year-to-year variation, seasonal factors, fish condition
index, reproductive state and the sex of the fish.
Older, larger, predacious fish (LMB, CP) tend to accumulate more mercury as they age (Rose et
al., 1999). Data from the present study indicate that differences in mercury concentrations
between smallest and largest fish may be about one order of magnitude. This degree of
difference illustrates the importance of controlling for age or size as a confounder when
interpreting tissue mercury concentration in some species of fish. Failure to account for this
source of variability in the data can lead to incorrect conclusions derived from comparisons
between fish tissue mercury concentrations from different samples. We corrected for the
potential effect of fish size two different ways: by censoring data, and by standardizing for fish
size. Use of censored data on individual fish results in fewer numbers of fish tissue mercury
concentrations used in analysis. Use of a standard-size fish’s mercury concentration uses the
information on all fish gathered to generate a regression-derived single mercury concentration
for a standard-sized fish.
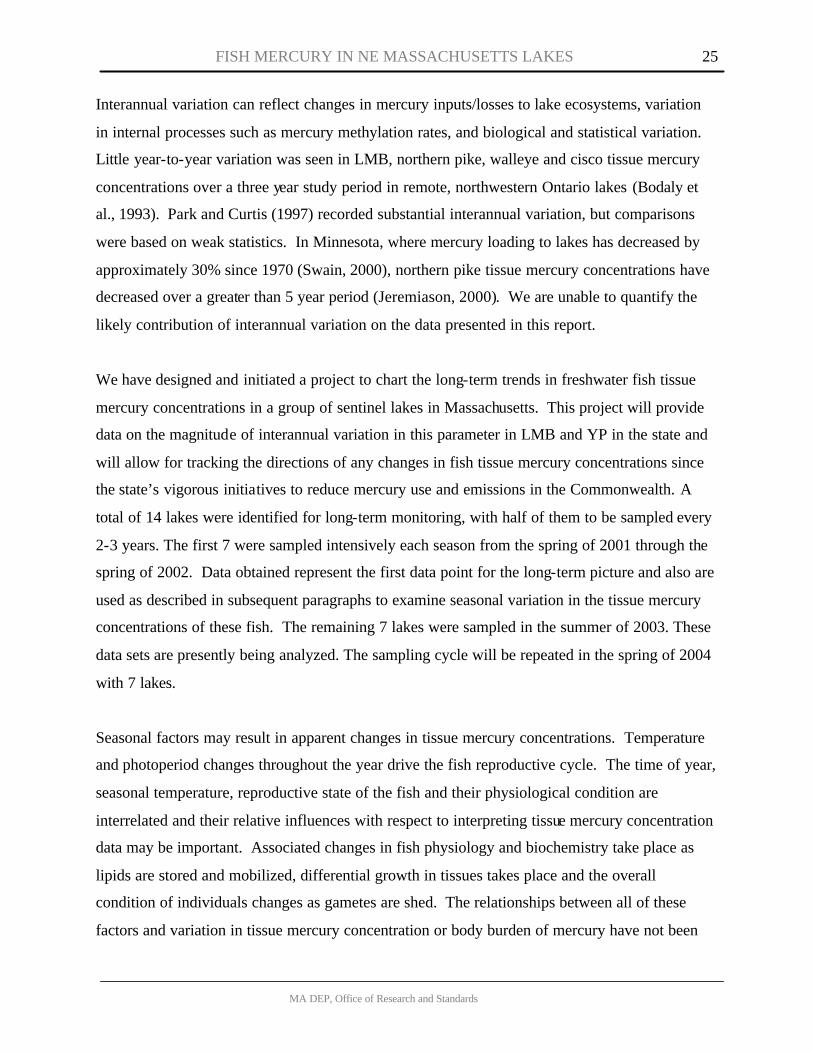
FISH MERCURY IN NE MASSACHUSETTS LAKES
MA DEP, Office of Research and Standards
25
Interannual variation can reflect changes in mercury inputs/losses to lake ecosystems, variation
in internal processes such as mercury methylation rates, and biological and statistical variation.
Little year-to-year variation was seen in LMB, northern pike, walleye and cisco tissue mercury
concentrations over a three year study period in remote, northwestern Ontario lakes (Bodaly et
al., 1993). Park and Curtis (1997) recorded substantial interannual variation, but comparisons
were based on weak statistics. In Minnesota, where mercury loading to lakes has decreased by
approximately 30% since 1970 (Swain, 2000), northern pike tissue mercury concentrations have
decreased over a greater than 5 year period (Jeremiason, 2000). We are unable to quantify the
likely contribution of interannual variation on the data presented in this report.
We have designed and initiated a project to chart the long-term trends in freshwater fish tissue
mercury concentrations in a group of sentinel lakes in Massachusetts. This project will provide
data on the magnitude of interannual variation in this parameter in LMB and YP in the state and
will allow for tracking the directions of any changes in fish tissue mercury concentrations since
the state’s vigorous initiatives to reduce mercury use and emissions in the Commonwealth. A
total of 14 lakes were identified for long-term monitoring, with half of them to be sampled every
2-3 years. The first 7 were sampled intensively each season from the spring of 2001 through the
spring of 2002. Data obtained represent the first data point for the long-term picture and also are
used as described in subsequent paragraphs to examine seasonal variation in the tissue mercury
concentrations of these fish. The remaining 7 lakes were sampled in the summer of 2003. These
data sets are presently being analyzed. The sampling cycle will be repeated in the spring of 2004
with 7 lakes.
Seasonal factors may result in apparent changes in tissue mercury concentrations. Temperature
and photoperiod changes throughout the year drive the fish reproductive cycle. The time of year,
seasonal temperature, reproductive state of the fish and their physiological condition are
interrelated and their relative influences with respect to interpreting tissue mercury concentration
data may be important. Associated changes in fish physiology and biochemistry take place as
lipids are stored and mobilized, differential growth in tissues takes place and the overall
condition of individuals changes as gametes are shed. The relationships between all of these
factors and variation in tissue mercury concentration or body burden of mercury have not been
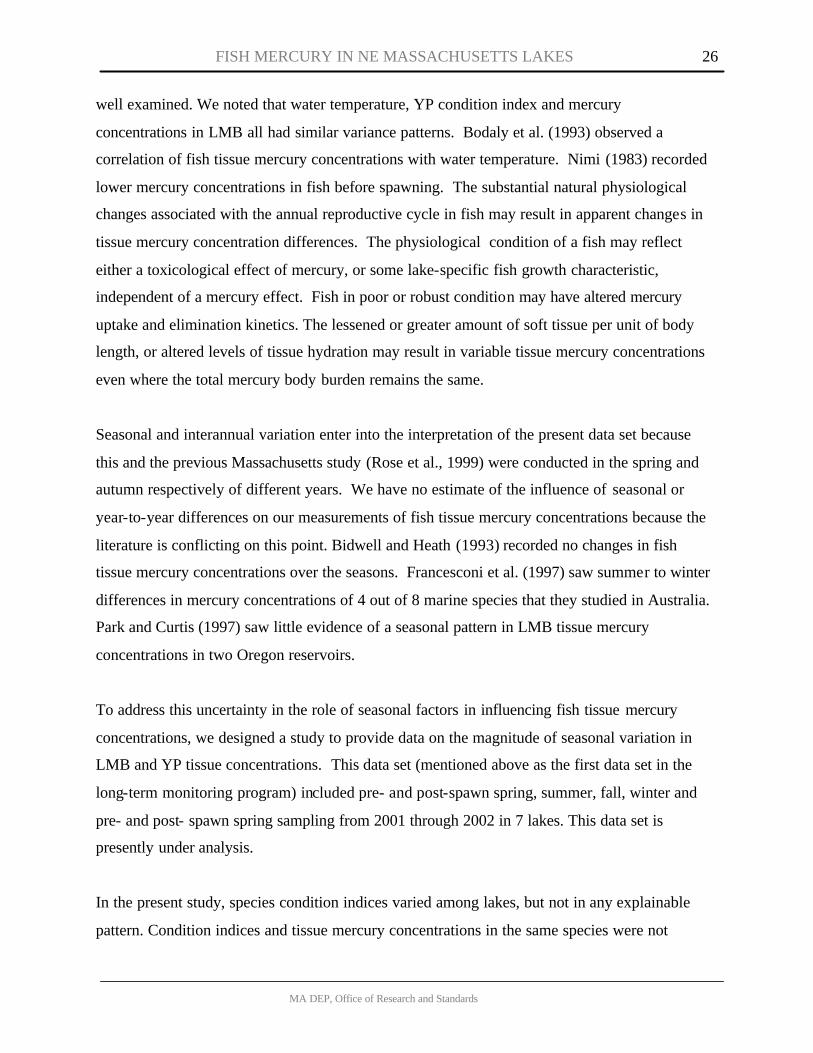
FISH MERCURY IN NE MASSACHUSETTS LAKES
MA DEP, Office of Research and Standards
26
well examined. We noted that water temperature, YP condition index and mercury
concentrations in LMB all had similar variance patterns. Bodaly et al. (1993) observed a
correlation of fish tissue mercury concentrations with water temperature. Nimi (1983) recorded
lower mercury concentrations in fish before spawning. The substantial natural physiological
changes associated with the annual reproductive cycle in fish may result in apparent changes in
tissue mercury concentration differences. The physiological condition of a fish may reflect
either a toxicological effect of mercury, or some lake-specific fish growth characteristic,
independent of a mercury effect. Fish in poor or robust condition may have altered mercury
uptake and elimination kinetics. The lessened or greater amount of soft tissue per unit of body
length, or altered levels of tissue hydration may result in variable tissue mercury concentrations
even where the total mercury body burden remains the same.
Seasonal and interannual variation enter into the interpretation of the present data set because
this and the previous Massachusetts study (Rose et al., 1999) were conducted in the spring and
autumn respectively of different years. We have no estimate of the influence of seasonal or
year-to-year differences on our measurements of fish tissue mercury concentrations because the
literature is conflicting on this point. Bidwell and Heath (1993) recorded no changes in fish
tissue mercury concentrations over the seasons. Francesconi et al. (1997) saw summer to winter
differences in mercury concentrations of 4 out of 8 marine species that they studied in Australia.
Park and Curtis (1997) saw little evidence of a seasonal pattern in LMB tissue mercury
concentrations in two Oregon reservoirs.
To address this uncertainty in the role of seasonal factors in influencing fish tissue mercury
concentrations, we designed a study to provide data on the magnitude of seasonal variation in
LMB and YP tissue concentrations. This data set (mentioned above as the first data set in the
long-term monitoring program) included pre- and post-spawn spring, summer, fall, winter and
pre- and post- spawn spring sampling from 2001 through 2002 in 7 lakes. This data set is
presently under analysis.
In the present study, species condition indices varied among lakes, but not in any explainable
pattern. Condition indices and tissue mercury concentrations in the same species were not
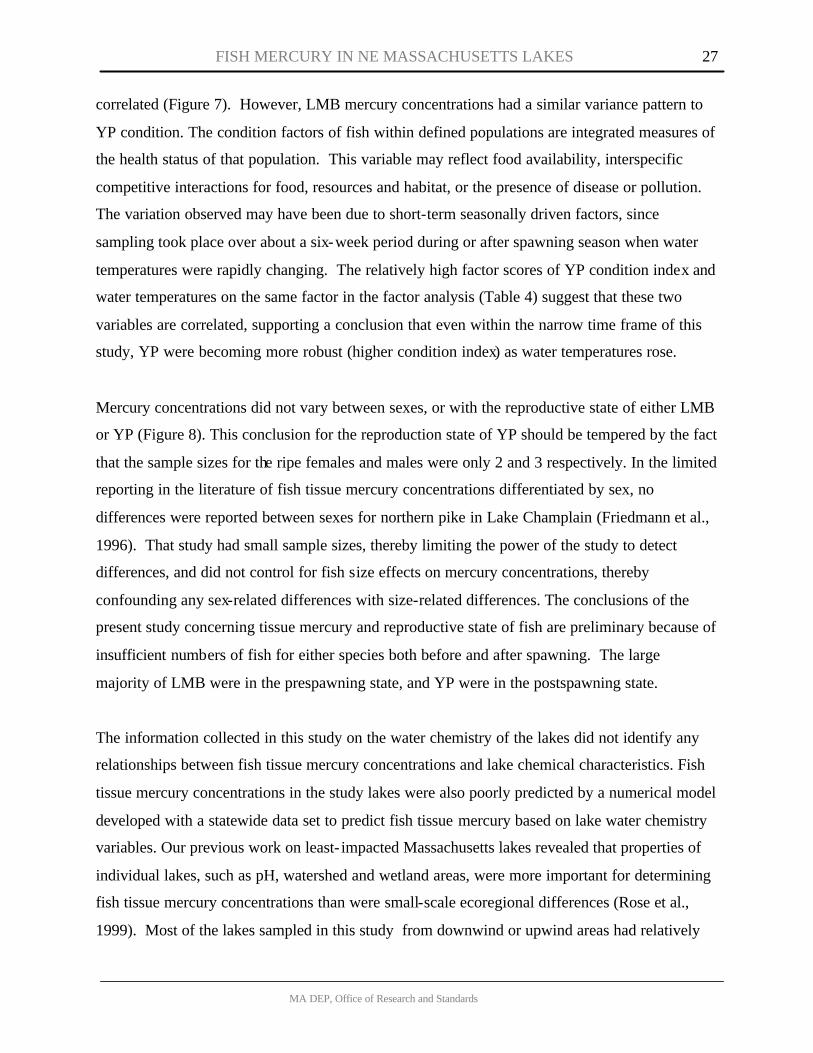
FISH MERCURY IN NE MASSACHUSETTS LAKES
MA DEP, Office of Research and Standards
27
correlated (Figure 7). However, LMB mercury concentrations had a similar variance pattern to
YP condition. The condition factors of fish within defined populations are integrated measures of
the health status of that population. This variable may reflect food availability, interspecific
competitive interactions for food, resources and habitat, or the presence of disease or pollution.
The variation observed may have been due to short-term seasonally driven factors, since
sampling took place over about a six-week period during or after spawning season when water
temperatures were rapidly changing. The relatively high factor scores of YP condition index and
water temperatures on the same factor in the factor analysis (Table 4) suggest that these two
variables are correlated, supporting a conclusion that even within the narrow time frame of this
study, YP were becoming more robust (higher condition index) as water temperatures rose.
Mercury concentrations did not vary between sexes, or with the reproductive state of either LMB
or YP (Figure 8). This conclusion for the reproduction state of YP should be tempered by the fact
that the sample sizes for the ripe females and males were only 2 and 3 respectively. In the limited
reporting in the literature of fish tissue mercury concentrations differentiated by sex, no
differences were reported between sexes for northern pike in Lake Champlain (Friedmann et al.,
1996). That study had small sample sizes, thereby limiting the power of the study to detect
differences, and did not control for fish size effects on mercury concentrations, thereby
confounding any sex-related differences with size-related differences. The conclusions of the
present study concerning tissue mercury and reproductive state of fish are preliminary because of
insufficient numbers of fish for either species both before and after spawning. The large
majority of LMB were in the prespawning state, and YP were in the postspawning state.
The information collected in this study on the water chemistry of the lakes did not identify any
relationships between fish tissue mercury concentrations and lake chemical characteristics. Fish
tissue mercury concentrations in the study lakes were also poorly predicted by a numerical model
developed with a statewide data set to predict fish tissue mercury based on lake water chemistry
variables. Our previous work on least- impacted Massachusetts lakes revealed that properties of
individual lakes, such as pH, watershed and wetland areas, were more important for determining
fish tissue mercury concentrations than were small-scale ecoregional differences (Rose et al.,
1999). Most of the lakes sampled in this study from downwind or upwind areas had relatively
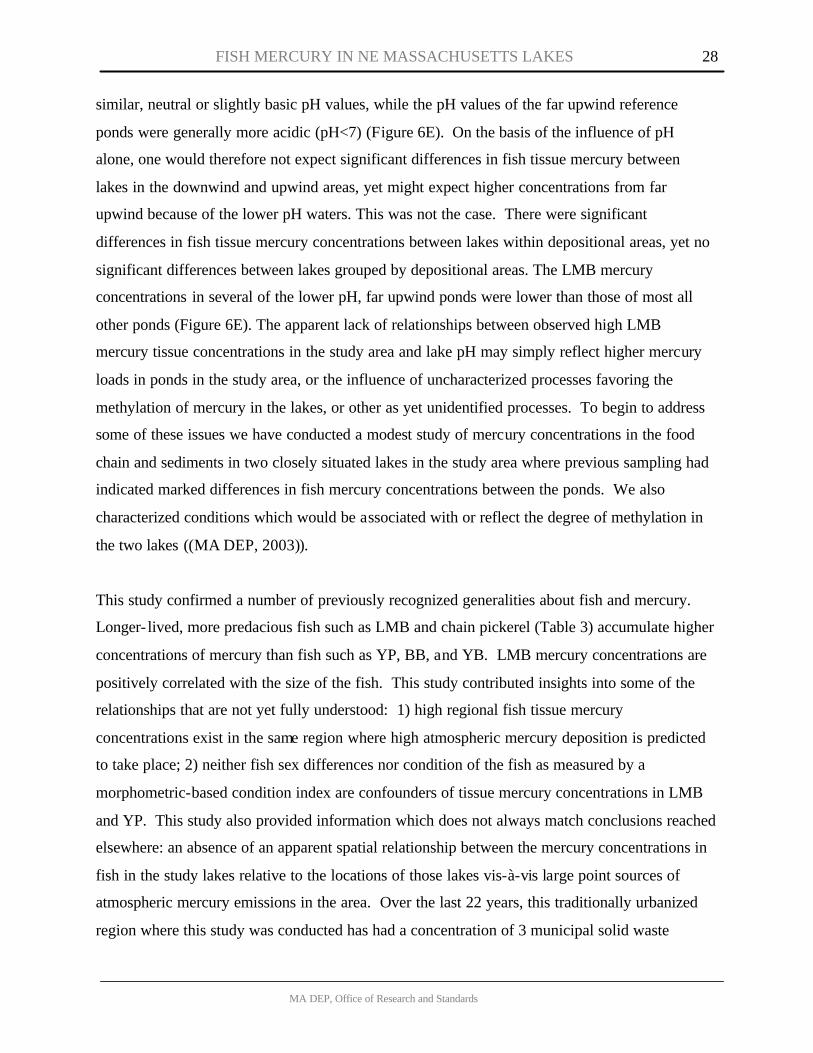
FISH MERCURY IN NE MASSACHUSETTS LAKES
MA DEP, Office of Research and Standards
28
similar, neutral or slightly basic pH values, while the pH values of the far upwind reference
ponds were generally more acidic (pH<7) (Figure 6E). On the basis of the influence of pH
alone, one would therefore not expect significant differences in fish tissue mercury between
lakes in the downwind and upwind areas, yet might expect higher concentrations from far
upwind because of the lower pH waters. This was not the case. There were significant
differences in fish tissue mercury concentrations between lakes within depositional areas, yet no
significant differences between lakes grouped by depositional areas. The LMB mercury
concentrations in several of the lower pH, far upwind ponds were lower than those of most all
other ponds (Figure 6E). The apparent lack of relationships between observed high LMB
mercury tissue concentrations in the study area and lake pH may simply reflect higher mercury
loads in ponds in the study area, or the influence of uncharacterized processes favoring the
methylation of mercury in the lakes, or other as yet unidentified processes. To begin to address
some of these issues we have conducted a modest study of mercury concentrations in the food
chain and sediments in two closely situated lakes in the study area where previous sampling had
indicated marked differences in fish mercury concentrations between the ponds. We also
characterized conditions which would be associated with or reflect the degree of methylation in
the two lakes ((MA DEP, 2003)).
This study confirmed a number of previously recognized generalities about fish and mercury.
Longer- lived, more predacious fish such as LMB and chain pickerel (Table 3) accumulate higher
concentrations of mercury than fish such as YP, BB, and YB. LMB mercury concentrations are
positively correlated with the size of the fish. This study contributed insights into some of the
relationships that are not yet fully understood: 1) high regional fish tissue mercury
concentrations exist in the same region where high atmospheric mercury deposition is predicted
to take place; 2) neither fish sex differences nor condition of the fish as measured by a
morphometric-based condition index are confounders of tissue mercury concentrations in LMB
and YP. This study also provided information which does not always match conclusions reached
elsewhere: an absence of an apparent spatial relationship between the mercury concentrations in
fish in the study lakes relative to the locations of those lakes vis-à-vis large point sources of
atmospheric mercury emissions in the area. Over the last 22 years, this traditionally urbanized
region where this study was conducted has had a concentration of 3 municipal solid waste
FISH MERCURY IN NE MASSACHUSETTS LAKES
MA DEP, Office of Research and Standards
29
combustors and 1 medical waste incinerator. These types of facilities are recognized as major
potential contributors to mercury emissions in the US (U.S. Environmental Protection Agency,
1997) and Massachusetts (Smith and Rowan-West, 1996). The study did not provide additional
insight about the potential for relationships between fish mercury concentrations and: 1)
interannual and seasonal variation; 2) fish spawning period; and 3) chemistry of lake water and
sediment (to the extent measured in this study for all three items). However, studies launched in
the last two years will provide this information.
The major findings of this study are that fish tissue mercury concentrations in our study area
appear to reflect model-predicted inputs of mercury within the regional airshed from atmospheric
deposition, but do not reflect more localized inputs from what were considered major mercury
emissions sources within the area. Better understanding of mercury bioaccumulation in fish in
Massachusetts could be facilitated in the future by the availability of modelled mercury
deposition estimates on a more refined areal grid, actual measurements of atmospheric mercury
deposition, chronological histories of mercury deposition rates in the sedimentary record of lake
sediment cores, direct measures of mercury methylation rates in the study lakes, measurement of
organic matter content and concentrations of organic and inorganic mercury in surface waters.
SUMMARY AND CONCLUSIONS
The study goals were to:
• sample fish from lakes in northeast Massachusetts where the public has access to fishing
to determine the need for fish consumption advisories;
• determine whether the frequency of advisories is greater in this area than across the state
as a whole;
• establish a baseline for fish mercury concentrations in order to evaluate trends, thereby
providing an environmental results-based indicator of the success of mercury source
control efforts;
• compare mercury concentrations in fish from the region with those from other more rural
parts of the State;
FISH MERCURY IN NE MASSACHUSETTS LAKES
MA DEP, Office of Research and Standards
30
• determine if there are geographic differences in fish mercury concentrations within the
study area related to the locations of the major point sources of mercury emissions vis-à-
vis prevailing wind direction;
• determine whether predicted high atmospheric deposition rates of mercury for the area
were mirrored by fish tissue mercury concentrations.
• evaluate the accuracy of a model, developed by MA DEP, to predict mercury levels in
fish based on measures of water quality.
LMB and YP were the primary target species and brown bullhead, yellow bullhead and chain
pickerel were secondary species. The study area in northeast Massachusetts was delineated into
three regions based upon their locations with respect to a cluster of four major mercury point
sources in the region (3 municipal waste combustors and 1 medical waste incinerator): far
upwind, upwind, and downwind as inferred from predominant wind directions.
Of the 26 lakes studied, 23 warranted fish consumption advisories on the basis of mercury levels
in LMB. Mercury levels in YP and BB were generally lower than those in LMB in about 65% of
the lakes, which did not warrant advisories for those species. Two lakes lacked the target species
for the study and thus were not issued a fish consumption advisory. Only one lake did not
receive a fish consumption advisory, even though all target species were collected from the lake.
In addition, we found that:
• Size-standardized LMB mercury concentrations in all lakes sampled in northeast
Massachusetts were in the top quartile of size-standardized LMB tissue mercury
concentrations from more rural lakes around the state (>0.49 mg/kg). The mean (± 1
standard deviation) LMB mercury muscle concentration was 0.89 ± 0.43 mg/kg (n=192).
• The LMB mercury concentrations in all ponds in the study area within the zone of
predicted high atmospheric deposition of mercury warranted fish consumption advisories
for mercury, a frequency greater than has been required after monitoring in more rural
parts of the state.
FISH MERCURY IN NE MASSACHUSETTS LAKES
MA DEP, Office of Research and Standards
31
• YP mercury concentrations were in the middle to high ranges (25th – 75th percentile and
> 75th percentile) of values for YP from more rural lakes in the state. The mean (±1 std.
dev.) YP muscle mercury concentration was 0.44 + 0.21 mg/kg (n=152).
• Mercury in YP from 35% of the predicted high atmospheric deposition area study area
lakes was above the threshold (>0.5 mg/kg) for issuing an advisory. This frequency of
required advisories was just barely greater than that required from monitoring of this
species from rural parts of the state.
• There was no obvious geographical pattern in the lake fish tissue mercury concentrations
with respect to the upwind-downwind study design, or to the locations of the major point
sources in relation to the lakes.
• LMB tissue mercury concentrations were correlated with water temperature and the
condition of YP. There was also a positive relationship between mercury in LMB, that in
YP and an inverse relationship of these two variables with LMB condition index
(weight/total length3).
• This study was designed to assess whether fish mercury concentrations were related to
local major atmospheric mercury emission sources. This study was not designed to
control for potentially confounding variables such as: seasonal and interannual
differences in fish tissue mercury concentrations; reproductive state of the fish; in- lake
mercury methylation rates; and mercury inputs to specific lakes. The influences of these
and other variables remain to be examined in future work.
FISH MERCURY IN NE MASSACHUSETTS LAKES
MA DEP, Office of Research and Standards
32
ACKNOWLEDGMENTS Dr. Russell Isaac of MA DEP’s Division of Watershed Management contributed to discussions
during the design of this study. MA DEP staff Mary Crain Penniman, Jane Colonna-Romano,
Mark Casella, and Mark Mattson all assisted with fish collections. Richard Keller of the MA
Department of Fisheries, Wildlife and Environmental Law Enforcement kindly aged fish scales
and spines and graciously provided assistance whenever requested. James H. Sullivan of WES
supervised the inorganics analyses. Tracey Daras and Marie Cotter-Brown of MA DEP’s GIS
Laboratory prepared figures containing maps in the report.
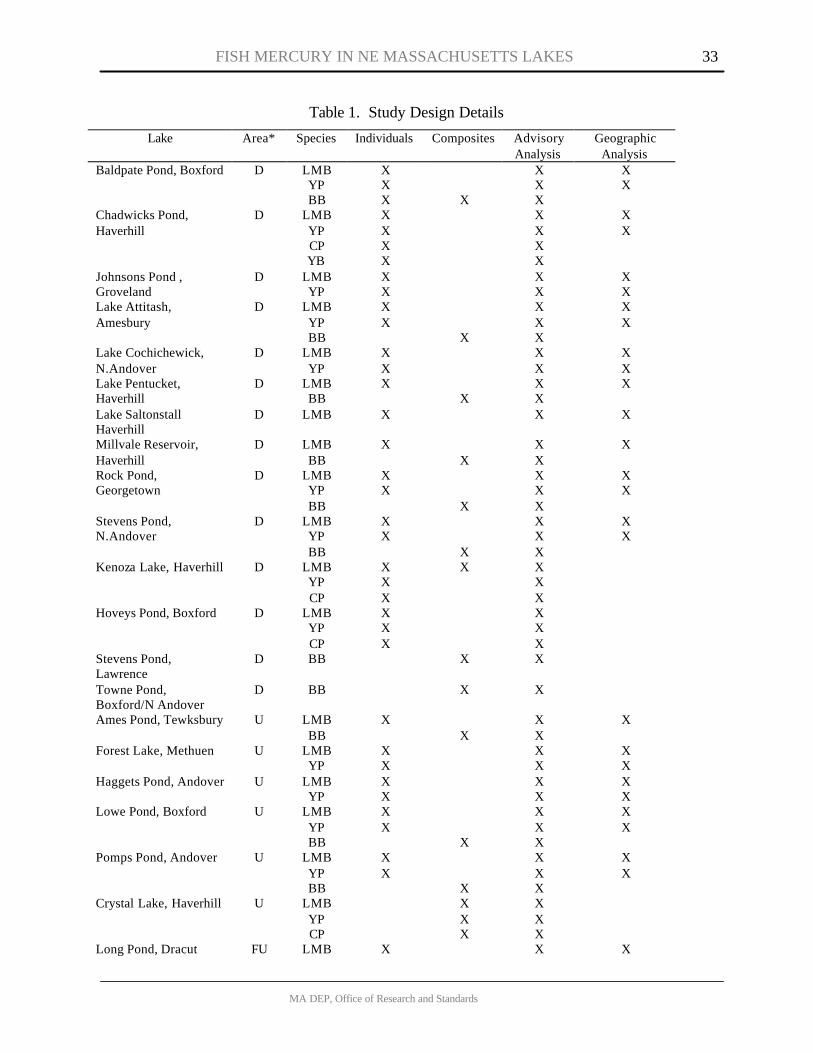
FISH MERCURY IN NE MASSACHUSETTS LAKES
MA DEP, Office of Research and Standards
33
Table 1. Study Design Details
Lake Area* Species Individuals Composites Advisory Analysis
Geographic Analysis
Baldpate Pond, Boxford D LMB YP BB
X X X
X
X X X
X X
Chadwicks Pond, Haverhill
D LMB YP CP YB
X X X X
X X X X
X X
Johnsons Pond , Groveland
D LMB YP
X X
X X
X X
Lake Attitash, Amesbury
D LMB YP BB
X X
X
X X X
X X
Lake Cochichewick, N.Andover
D LMB YP
X X
X X
X X
Lake Pentucket, Haverhill
D LMB BB
X X
X X
X
Lake Saltonstall Haverhill
D LMB X X X
Millvale Reservoir, Haverhill
D LMB BB
X X
X X
X
Rock Pond, Georgetown
D LMB YP BB
X X
X
X X X
X X
Stevens Pond, N.Andover
D LMB YP BB
X X
X
X X X
X X
Kenoza Lake, Haverhill D LMB YP CP
X X X
X
X X X
Hoveys Pond, Boxford D LMB YP CP
X X X
X X X
Stevens Pond, Lawrence
D BB X X
Towne Pond, Boxford/N Andover
D BB X X
Ames Pond, Tewksbury U LMB BB
X X
X X
X
Forest Lake, Methuen U LMB YP
X X
X X
X X
Haggets Pond, Andover U LMB YP
X X
X X
X X
Lowe Pond, Boxford U LMB YP BB
X X
X
X X X
X X
Pomps Pond, Andover U LMB YP BB
X X
X
X X X
X X
Crystal Lake, Haverhill U LMB YP CP
X X X
X X X
Long Pond, Dracut FU LMB X X X
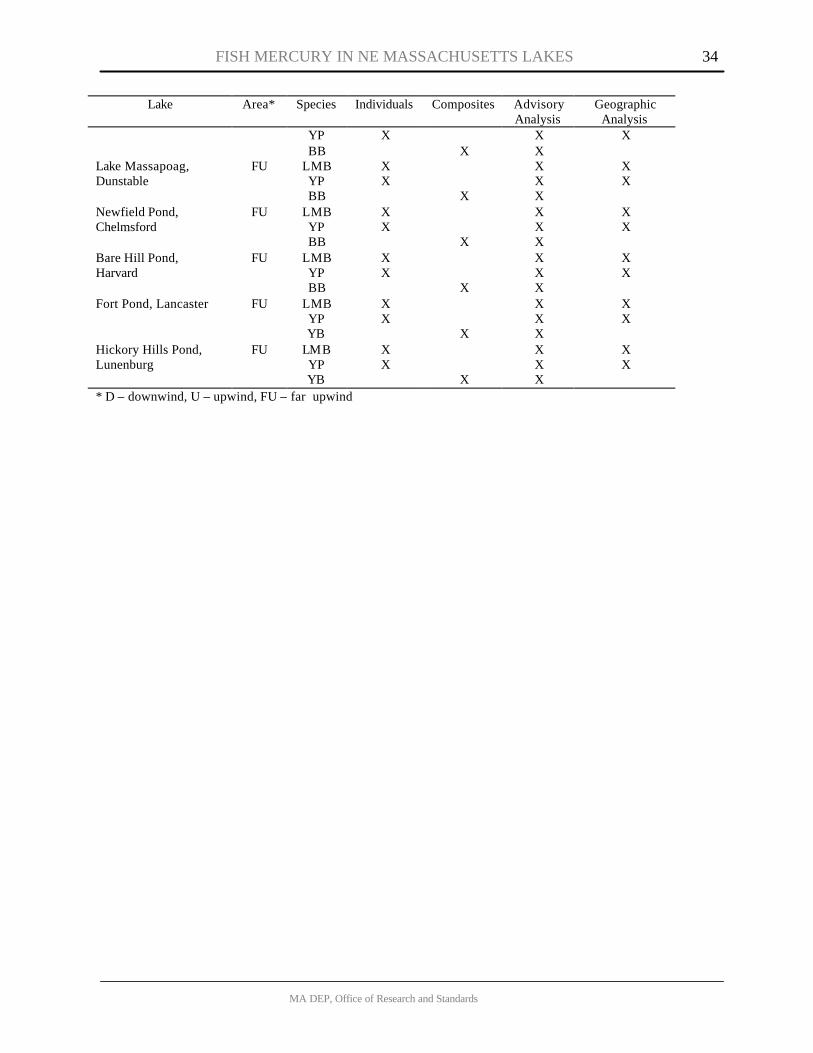
FISH MERCURY IN NE MASSACHUSETTS LAKES
MA DEP, Office of Research and Standards
34
Lake Area* Species Individuals Composites Advisory Analysis
Geographic Analysis
YP BB
X X
X X
X
Lake Massapoag, Dunstable
FU LMB YP BB
X X
X
X X X
X X
Newfield Pond, Chelmsford
FU LMB YP BB
X X
X
X X X
X X
Bare Hill Pond, Harvard
FU LMB YP BB
X X
X
X X X
X X
Fort Pond, Lancaster FU LMB YP YB
X X
X
X X X
X X
Hickory Hills Pond, Lunenburg
FU LMB YP YB
X X
X
X X X
X X
* D – downwind, U – upwind, FU – far upwind
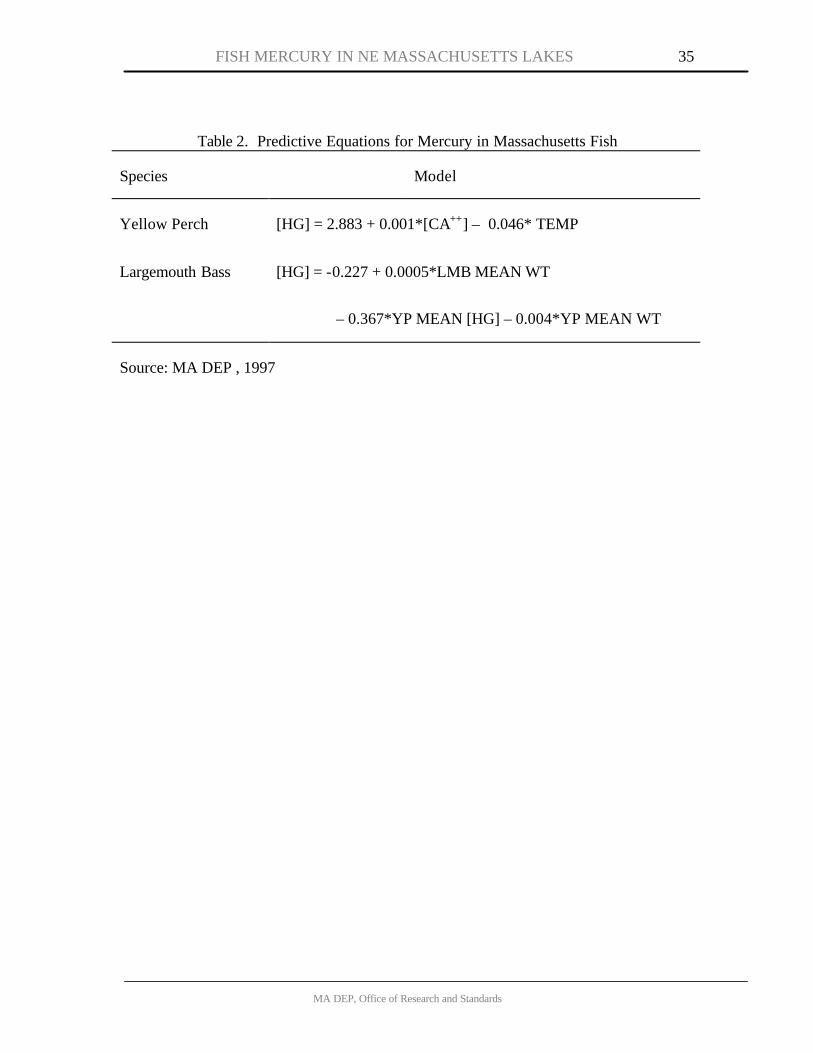
FISH MERCURY IN NE MASSACHUSETTS LAKES
MA DEP, Office of Research and Standards
35
Table 2. Predictive Equations for Mercury in Massachusetts Fish
Species Model
Yellow Perch [HG] = 2.883 + 0.001*[CA++] – 0.046* TEMP
Largemouth Bass [HG] = -0.227 + 0.0005*LMB MEAN WT
– 0.367*YP MEAN [HG] – 0.004*YP MEAN WT
Source: MA DEP , 1997
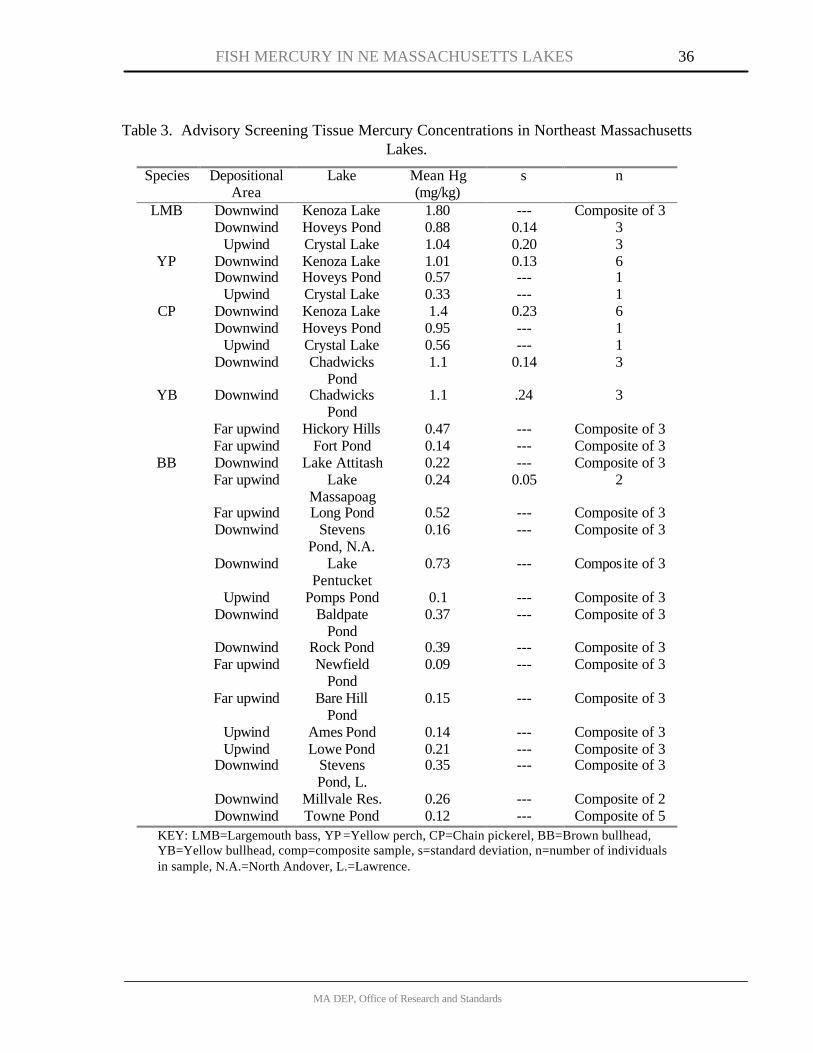
FISH MERCURY IN NE MASSACHUSETTS LAKES
MA DEP, Office of Research and Standards
36
Table 3. Advisory Screening Tissue Mercury Concentrations in Northeast Massachusetts Lakes.
Lake Mean Hg s n Species Depositional Area (mg/kg)
LMB Downwind Kenoza Lake 1.80 --- Composite of 3 Downwind Hoveys Pond 0.88 0.14 3 Upwind Crystal Lake 1.04 0.20 3
YP Downwind Kenoza Lake 1.01 0.13 6 Downwind Hoveys Pond 0.57 --- 1 Upwind Crystal Lake 0.33 --- 1
CP Downwind Kenoza Lake 1.4 0.23 6 Downwind Hoveys Pond 0.95 --- 1
Upwind Crystal Lake 0.56 --- 1 Downwind Chadwicks
Pond 1.1 0.14 3
YB Downwind Chadwicks Pond
1.1 .24 3
Far upwind Hickory Hills 0.47 --- Composite of 3 Far upwind Fort Pond 0.14 --- Composite of 3
BB Downwind Lake Attitash 0.22 --- Composite of 3 Far upwind Lake
Massapoag 0.24 0.05 2
Far upwind Long Pond 0.52 --- Composite of 3 Downwind Stevens
Pond, N.A. 0.16 --- Composite of 3
Downwind Lake Pentucket
0.73 --- Composite of 3
Upwind Pomps Pond 0.1 --- Composite of 3 Downwind Baldpate
Pond 0.37 --- Composite of 3
Downwind Rock Pond 0.39 --- Composite of 3 Far upwind Newfield
Pond 0.09 --- Composite of 3
Far upwind Bare Hill Pond
0.15 --- Composite of 3
Upwind Ames Pond 0.14 --- Composite of 3 Upwind Lowe Pond 0.21 --- Composite of 3 Downwind Stevens
Pond, L. 0.35 --- Composite of 3
Downwind Millvale Res. 0.26 --- Composite of 2 Downwind Towne Pond 0.12 --- Composite of 5
KEY: LMB=Largemouth bass, YP =Yellow perch, CP=Chain pickerel, BB=Brown bullhead, YB=Yellow bullhead, comp=composite sample, s=standard deviation, n=number of individuals in sample, N.A.=North Andover, L.=Lawrence.
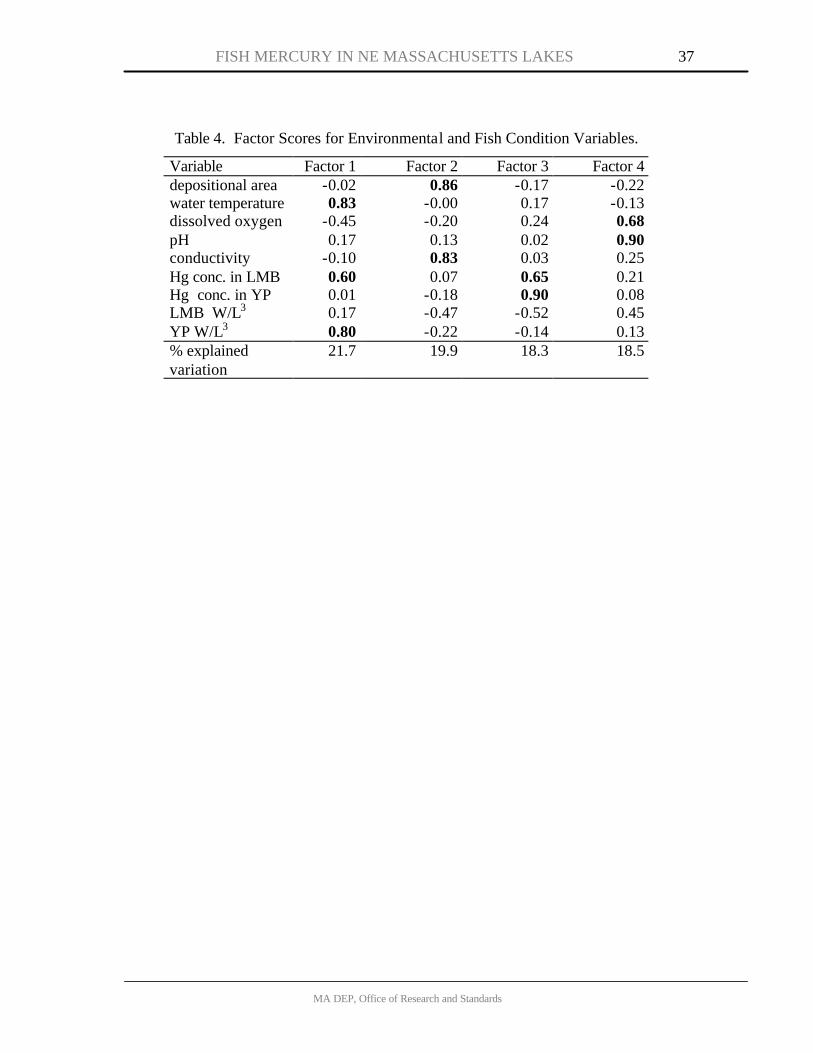
FISH MERCURY IN NE MASSACHUSETTS LAKES
MA DEP, Office of Research and Standards
37
Table 4. Factor Scores for Environmental and Fish Condition Variables.
Variable Factor 1 Factor 2 Factor 3 Factor 4 depositional area -0.02 0.86 -0.17 -0.22 water temperature 0.83 -0.00 0.17 -0.13 dissolved oxygen -0.45 -0.20 0.24 0.68 pH 0.17 0.13 0.02 0.90 conductivity -0.10 0.83 0.03 0.25 Hg conc. in LMB 0.60 0.07 0.65 0.21 Hg conc. in YP 0.01 -0.18 0.90 0.08 LMB W/L3 0.17 -0.47 -0.52 0.45 YP W/L3 0.80 -0.22 -0.14 0.13 % explained variation
21.7 19.9 18.3 18.5
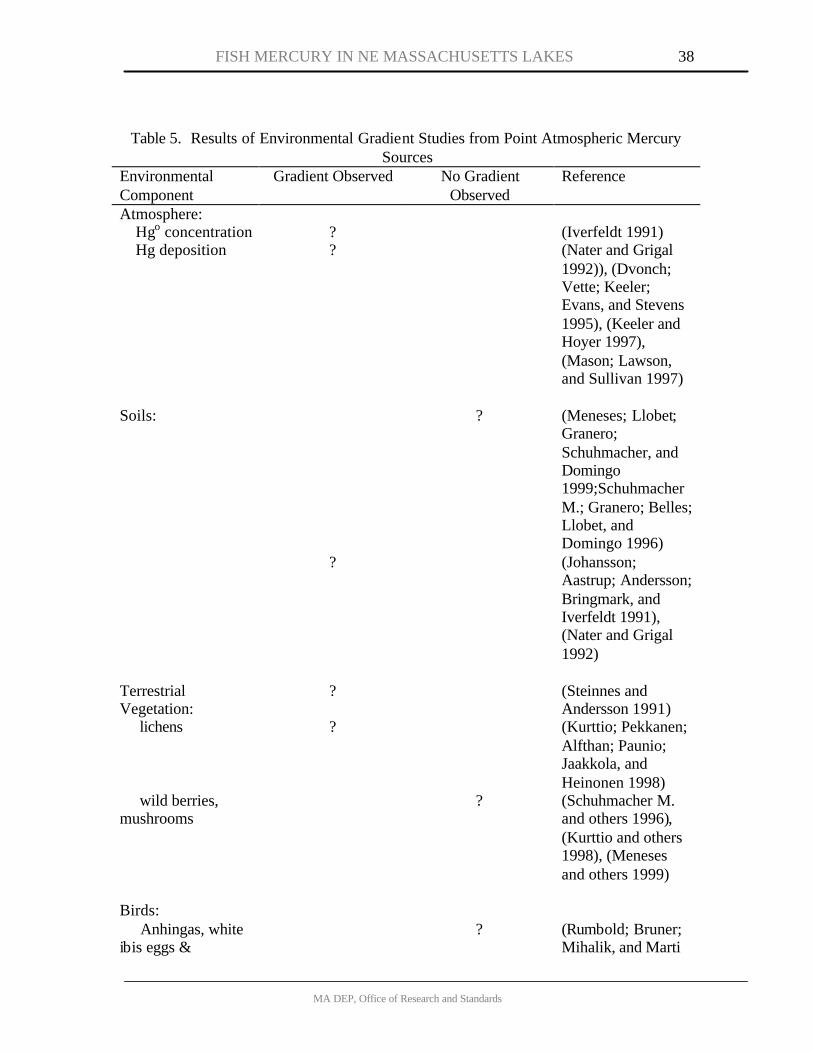
FISH MERCURY IN NE MASSACHUSETTS LAKES
MA DEP, Office of Research and Standards
38
Table 5. Results of Environmental Gradient Studies from Point Atmospheric Mercury Sources
Environmental Component
Gradient Observed No Gradient Observed
Reference
Atmosphere: Hgo concentration ? (Iverfeldt 1991) Hg deposition ? (Nater and Grigal
1992)), (Dvonch; Vette; Keeler; Evans, and Stevens 1995), (Keeler and Hoyer 1997), (Mason; Lawson, and Sullivan 1997)
Soils: ? (Meneses; Llobet; Granero; Schuhmacher, and Domingo 1999;Schuhmacher M.; Granero; Belles; Llobet, and Domingo 1996)
? (Johansson; Aastrup; Andersson; Bringmark, and Iverfeldt 1991), (Nater and Grigal 1992)
Terrestrial Vegetation:
? (Steinnes and Andersson 1991)
lichens ? (Kurttio; Pekkanen; Alfthan; Paunio; Jaakkola, and Heinonen 1998)
wild berries, mushrooms
? (Schuhmacher M. and others 1996), (Kurttio and others 1998), (Meneses and others 1999)
Birds: Anhingas, white ibis eggs &
? (Rumbold; Bruner; Mihalik, and Marti
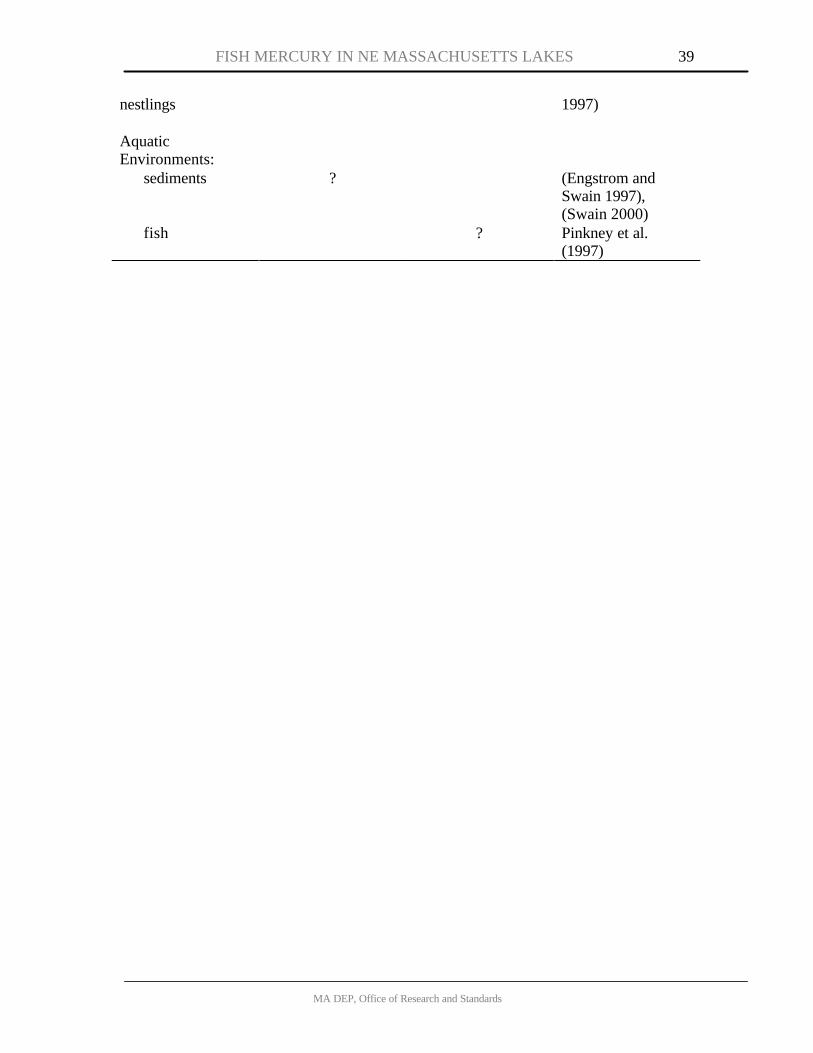
FISH MERCURY IN NE MASSACHUSETTS LAKES
MA DEP, Office of Research and Standards
39
nestlings
1997)
Aquatic Environments:
sediments ? (Engstrom and Swain 1997), (Swain 2000)
fish ? Pinkney et al. (1997)
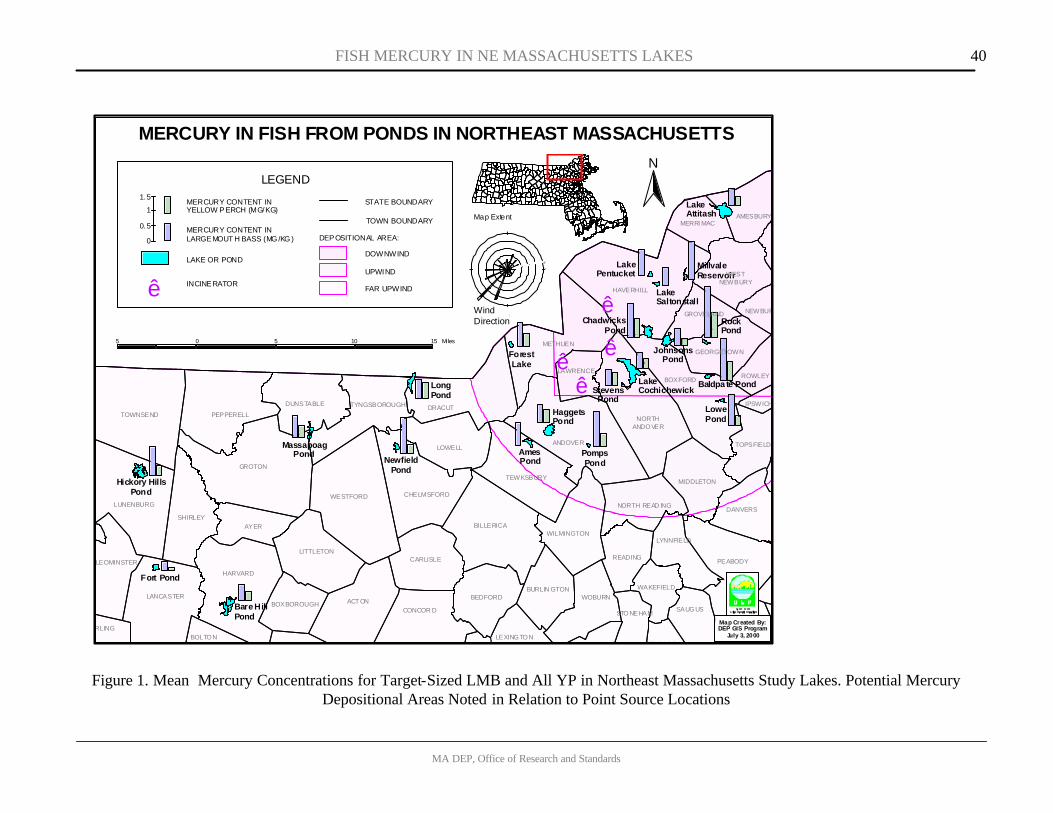
FISH MERCURY IN NE MASSACHUSETTS LAKES
MA DEP, Office of Research and Standards
40
ê
ê êê
ForestLake
RockPond
LakePentucket
LakeSaltonstall
Millvale Reservoir
LakeAttitash
LowePond
Baldpa te Pond
ChadwicksPond
JohnsonsPond
LakeCochichewickStevens
Pond
Haggets Pond
AmesPond
PompsPond
LongPond
MassapoagPond
NewfieldPond
Hickory HillsPond
Fort Pond
Bare HillPond
GROVELAND
GEORGETOWN
GROTON
ANDOVER
HAVERHILL
WESTFORD
HARVARD
BILLERICA
DRACUTTOWNSEND
BOXFORD
METHUEN
ACT ON
PEPPERELL
LUNENBURG
SHIRLEY
LOWELL
AYER
LYNN
TEWKSBURY
CHELMSFORD
LANCASTER
LITTLETONCARLISLE PEABODY
NORTHANDOVER
DUNSTABLE
BEDFORD
WILMINGTON
WOBURN
MIDDLETON
DANVERS
CONCOR D
READING
TYNGSBOROUGH
LYNNFIELD
LEOMINSTER
AMESBURY
BURLIN GTON
WESTNEWBURY
TOPSFIELD
MERRI MAC
NORTH READ ING
SAUGUSBOXBOROUGH
WAKEFIELD
LAWRENCEROWLEY
STONEHAM
NEWBUR
LEXINGTON
IPSWICH
RLINGBOLTON
MELROSE
MERCURY IN FISH FROM PONDS IN NORTHEAST MASSACHUSETTS
5 0 5 10 15 Mi les
Map Created By:DEP GIS Program
July 3, 2000
Map Extent
LAKE OR POND
INCINERATORê
1
1.5
0
0.5 MERCURY CONTENT INLARGEMOUT H BASS (MG /KG )
MERCURY CONTENT INYELLOW PERCH (MG/KG)
STATE BOUNDARY
TOWN BOUNDARY
DEPOSITIONAL AREA:
DOWNWIND
UPWIND
FAR UPWIND
LEGEND
E
%
N
W
SWind Direction
N
Figure 1. Mean Mercury Concentrations for Target-Sized LMB and All YP in Northeast Massachusetts Study Lakes. Potential Mercury
Depositional Areas Noted in Relation to Point Source Locations
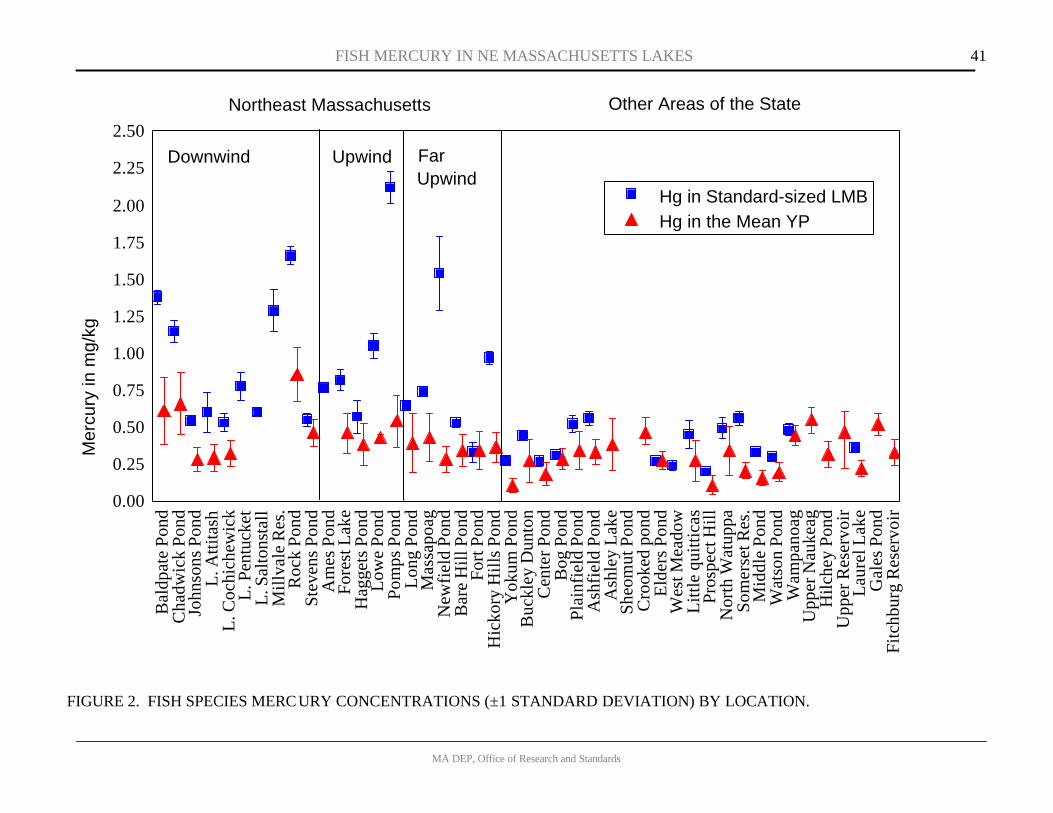
FISH MERCURY IN NE MASSACHUSETTS LAKES
MA DEP, Office of Research and Standards
41
FIGURE 2. FISH SPECIES MERCURY CONCENTRATIONS (±1 STANDARD DEVIATION) BY LOCATION.
AM
ercu
ry in
mg/
kg
0.00
0.25
0.50
0.75
1.00
1.25
1.50
1.75
2.00
2.25
2.50
Bal
dpat
e Po
ndC
hadw
ick
Pond
John
sons
Pon
dL
. Atti
tash
L. C
ochi
chew
ick
L. P
entu
cket
L. S
alto
nsta
llM
illva
le R
es.
Roc
k Po
ndSt
even
s Po
ndA
mes
Pon
dFo
rest
Lak
eH
agge
ts P
ond
Low
e Po
ndPo
mps
Pon
dL
ong
Pond
Mas
sapo
agN
ewfi
eld
Pond
Bar
e H
ill P
ond
Fort
Pon
dH
icko
ry H
ills
Pond
Yok
um P
ond
Buc
kley
Dun
ton
Cen
ter P
ond
Bog
Pon
dPl
ainf
ield
Pon
dA
shfi
eld
Pond
Ash
ley
Lak
eSh
eom
ut P
ond
Cro
oked
pon
dE
lder
s Po
ndW
est M
eado
wL
ittle
qui
ttica
sPr
ospe
ct H
illN
orth
Wat
uppa
Som
erse
t Res
.M
iddl
e Po
ndW
atso
n Po
ndW
ampa
noag
Upp
er N
auke
agH
ilche
y Po
ndU
pper
Res
ervo
irL
aure
l Lak
eG
ales
Pon
dFi
tchb
urg
Res
ervo
ir
Hg in Standard-sized LMBHg in the Mean YP
Northeast Massachusetts Other Areas of the State
Downwind Upwind FarUpwind

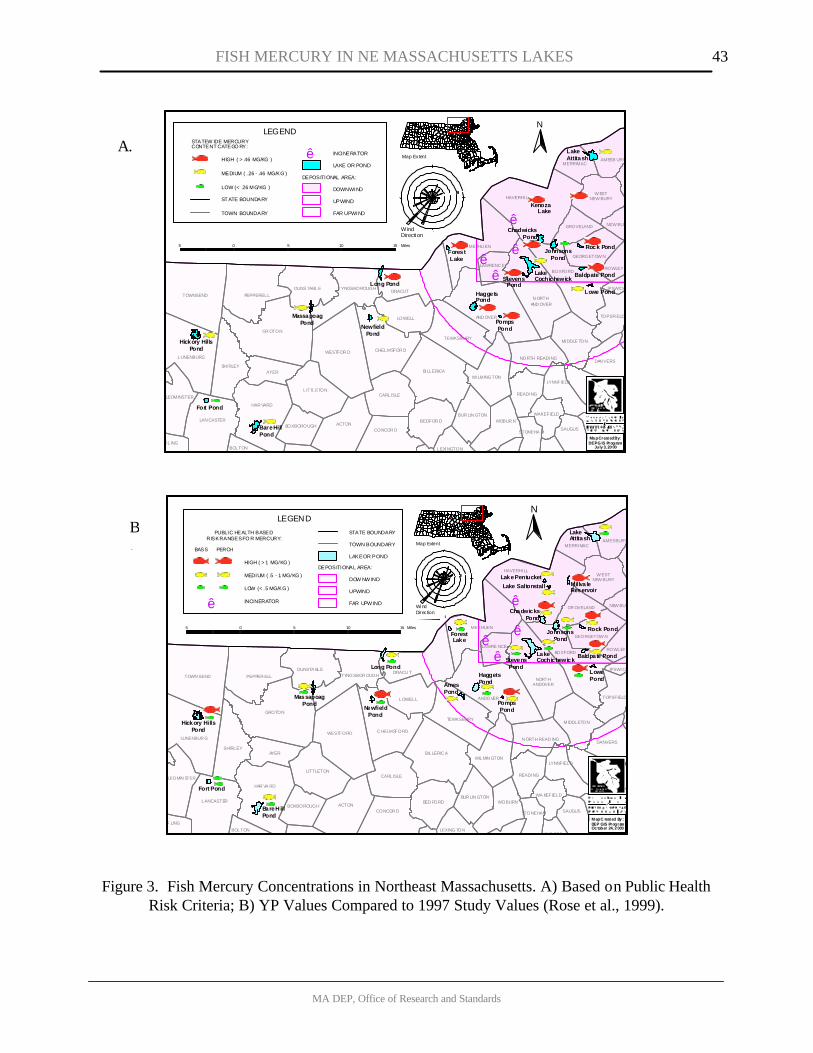
FISH MERCURY IN NE MASSACHUSETTS LAKES
MA DEP, Office of Research and Standards
43
ê
ê ê
ê
ForestLake
Rock Pond
KenozaLake
LakeAttitash
Lowe Pond
Baldpate Pond
ChadwicksPond
JohnsonsPond
LakeCochichewickStevens
Pond
Haggets Pond
PompsPond
Long Pond
MassapoagPond
NewfieldPond
Hickory HillsPond
Fort Pond
Bare HillPond
GROVELAND
GEORGETOW N
GR OTON
AND OVER
HAVERHI LL
WESTFOR D
HAR VARD
BI LLERICA
DRACUTTOWNSEND
BOXFORD
METHU EN
ACTON
PEPPERELL
LUNENBURG
SHI RLEY
LOWELL
AYER
LYN N
TEWKSBURY
CHELMSFOR D
LAN CASTER
LITTLETONCARLISLE PEABOD Y
N ORTHAND OVER
DUNS TABLE
BEDFOR D
WI LMINGTON
WOBUR N
MI DDLE TON
DAN VERS
CONCOR D
READI NG
TYNGSBOROUGH
LYNNFIELD
LEOMINSTER
AMESB URY
BUR LIN GTON
W ESTNEW BURY
TOPSFI ELD
MERRIMAC
NORTH READI NG
SAUGUSBOXBOROUGH
WAKEFIELD
LAWRENC EROWLEY
STONEHA M
NEW BUR
LEXI NGTON
IPSWICH
RLINGBOLTON
MELROSE
Ma p Creat ed By:DEP G IS Program
July 3, 20 00
N
Map Extent
5 0 5 10 15 Miles
E
%
N
W
SWind Directi on
STATEW IDE MERCURY CONTENT CATEGO RY:
MEDIUM ( .26 - .46 MG/KG )
HIGH ( > .46 MG/KG )
LOW (< .26 MG/KG )
LEGEND
FAR UPWIND
UPWIND
DOWNWIND
DEPOSITIONAL AREA:
TOWN BOUNDARY
ST ATE BOUNDARY
ê INCINERATOR
LAKE OR POND
ê
ê ê
ê
GR OVELAND
GEORGETOW NForestLake
Rock Pond
Lake PentucketMillva le Reservoir
LakeAttitash
LowePond
Baldpate Pond
ChadwicksPond
JohnsonsPond
LakeCochichewickStevens
PondHaggets Pond
PompsPond
Long Pond
MassapoagPond
NewfieldPond
Hickory HillsPond
Fort Pond
Bare H illPond
GROTON
ANDOVER
HAVERHI LL
WESTFORD
HAR VA RD
BILLERIC A
DRACU TTOWN SEND
BOXFORD
METHUEN
ACTON
PEPPER ELL
LUNENBUR G
SHIRLEY
LOWELL
AYER
LYN N
TEWKSBURY
C HELMSFORD
LANCASTER
LITTLETONCARLISLE PE ABODY
NORTHANDOVER
DUNSTA BLE
BED FORD
WILMIN GTON
WOBURN
MIDDLETON
DANVERS
CONCOR D
READI NG
TYNGSBOR OUGH
LYNNFIELD
LEOMIN STER
AMESBURY
BUR LIN GTON
W ESTNEW BURY
TOPSFIELD
MERRI MAC
N ORTH READ ING
SAUGUSBOXBOROUGH
WA KEFIELD
LAWRE NCEROWLEY
STONEHAM
NEW BUR
LEXINGTON
IPSWI CH
R LING
BOLTONMELR OSE
Lake Saltonstall
AmesPond
5 0 5 10 15 Miles
Map C reat ed By :DEP GIS ProgramOc tober 24, 2 000
Map Extent
LAKE OR POND
DEPOSITIONAL AREA:
DOW NW IND
UPWIND
FAR UPW IND
STATE BOUNDARY
TOWN BOUNDARY
LEGEND
LOW (< .5 MG/KG )
HIGH ( > 1 MG/KG )
MEDIUM ( .5 - 1 MG/KG )
BASS PERCH
PUBLIC HEALTH BASED RISK RANGES FO R MERCURY:
INCINERATORê
E
%
N
W
SWi nd Direc tion
N
Figure 3. Fish Mercury Concentrations in Northeast Massachusetts. A) Based on Public Health Risk Criteria; B) YP Values Compared to 1997 Study Values (Rose et al., 1999).
A.
B .
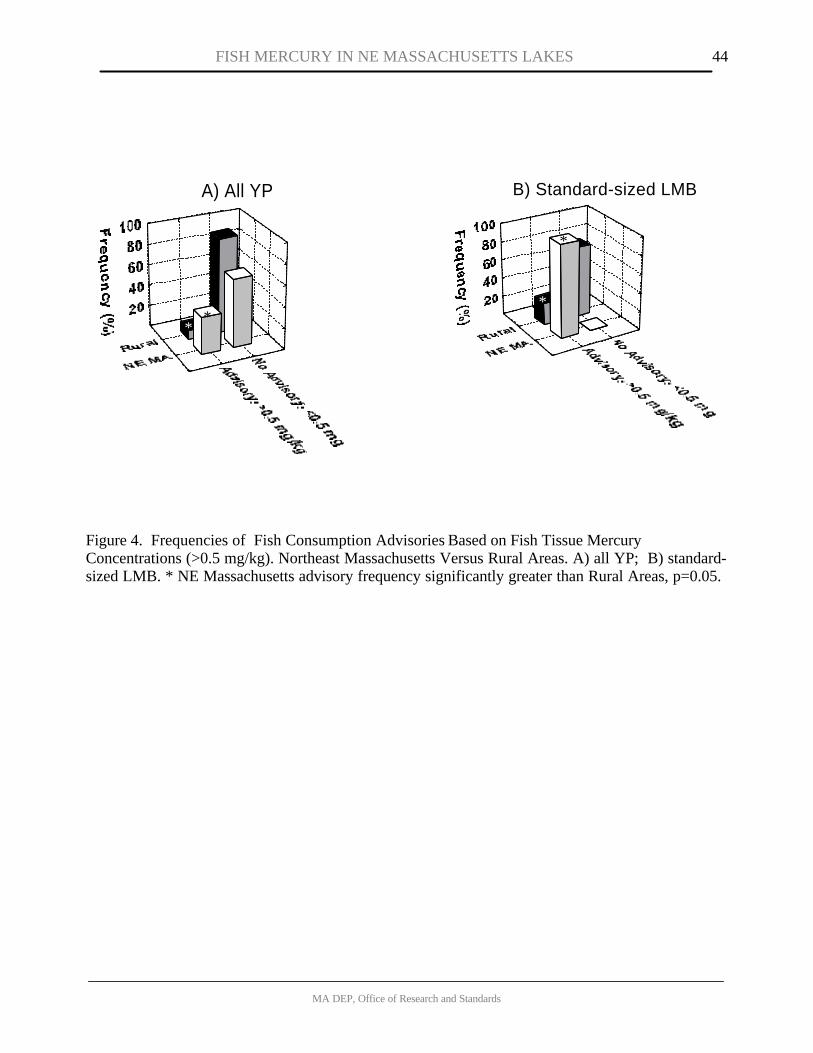
FISH MERCURY IN NE MASSACHUSETTS LAKES
MA DEP, Office of Research and Standards
44
A) All YP B) Standard-sized LMB
Figure 4. Frequencies of Fish Consumption Advisories Based on Fish Tissue Mercury Concentrations (>0.5 mg/kg). Northeast Massachusetts Versus Rural Areas. A) all YP; B) standard-sized LMB. * NE Massachusetts advisory frequency significantly greater than Rural Areas, p=0.05.
*
*
*
*
*
*
*
*
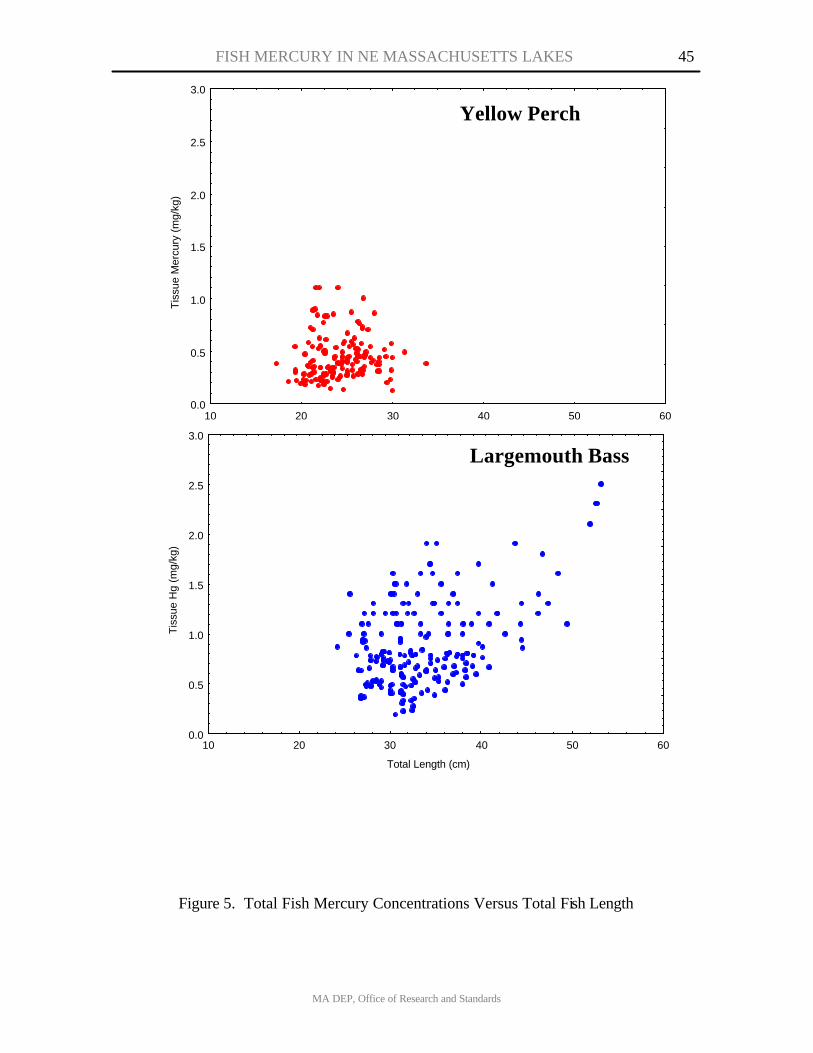
FISH MERCURY IN NE MASSACHUSETTS LAKES
MA DEP, Office of Research and Standards
45
Figure 5. Total Fish Mercury Concentrations Versus Total Fish Length
Tis
sue
Mer
cury
(m
g/kg
)
0.0
0.5
1.0
1.5
2.0
2.5
3.0
10 20 30 40 50 60
Total Length (cm)
Tis
sue
Hg
(mg/
kg)
0.0
0.5
1.0
1.5
2.0
2.5
3.0
10 20 30 40 50 60
Yellow Perch
Largemouth Bass
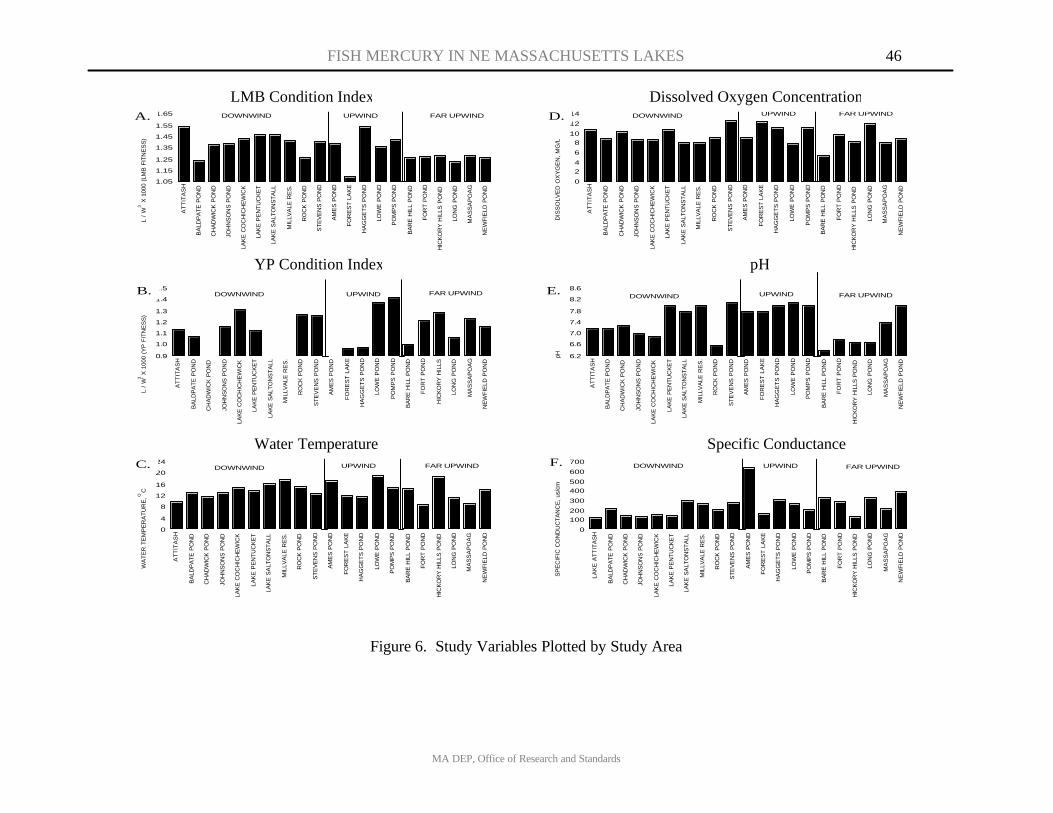
FISH MERCURY IN NE MASSACHUSETTS LAKES 46
MA DEP, Office of Research and Standards
L /
W 3 X
100
0 (L
MB
FIT
NE
SS
)
1.05
1.15
1.25
1.35
1.45
1.55
1.65
AT
TIT
AS
H
BA
LDP
ATE
PO
ND
CH
AD
WIC
K P
ON
D
JOH
NS
ON
S P
ON
D
LAK
E C
OC
HIC
HE
WIC
K
LAK
E P
EN
TUC
KE
T
LAK
E S
ALT
ON
STA
LL
MIL
LVA
LE R
ES
.
RO
CK
PO
ND
STE
VE
NS
PO
ND
AM
ES
PO
ND
FO
RE
ST
LA
KE
HA
GG
ET
S P
ON
D
LOW
E P
ON
D
PO
MP
S P
ON
D
BA
RE
HIL
L P
ON
D
FO
RT
PO
ND
HIC
KO
RY
HIL
LS P
ON
D
LON
G P
ON
D
MA
SS
AP
OA
G
NE
WFI
ELD
PO
ND
DOWNWIND UPWIND FAR UPWIND
L /
W3 X
100
0 (Y
P F
ITN
ES
S)
0.9
1.0
1.1
1.2
1.3
1.4
1.5
AT
TIT
AS
H
BA
LDP
ATE
PO
ND
CH
AD
WIC
K P
ON
D
JOH
NS
ON
S P
ON
D
LAK
E C
OC
HIC
HE
WIC
K
LAK
E P
EN
TUC
KE
T
LAK
E S
ALT
ON
STA
LL
MIL
LVA
LE R
ES
.
RO
CK
PO
ND
ST
EV
EN
S P
ON
D
AM
ES
PO
ND
FO
RE
ST
LA
KE
HA
GG
ET
S P
ON
D
LOW
E P
ON
D
PO
MP
S P
ON
D
BA
RE
HIL
L P
ON
D
FO
RT
PO
ND
HIC
KO
RY
HIL
LS
LON
G P
ON
D
MA
SS
AP
OA
G
NE
WF
IELD
PO
ND
DOWNWIND UPWIND FAR UPWIND
WA
TE
R T
EM
PE
RA
TU
RE
, OC
0
4
8
12
16
20
24
AT
TIT
AS
H
BA
LDP
ATE
PO
ND
CH
AD
WIC
K P
ON
D
JOH
NS
ON
S P
ON
D
LAK
E C
OC
HIC
HE
WIC
K
LAK
E P
EN
TUC
KE
T
LAK
E S
ALT
ON
STA
LL
MIL
LVA
LE R
ES
.
RO
CK
PO
ND
STE
VE
NS
PO
ND
AM
ES
PO
ND
FO
RE
ST
LA
KE
HA
GG
ET
S P
ON
D
LOW
E P
ON
D
PO
MP
S P
ON
D
BA
RE
HIL
L P
ON
D
FO
RT
PO
ND
HIC
KO
RY
HIL
LS P
ON
D
LON
G P
ON
D
MA
SS
AP
OA
G
NE
WFI
ELD
PO
ND
DOWNWIND UPWIND FAR UPWIND
DIS
SO
LVE
D O
XY
GE
N,
MG
/L
0
24
6
810
12
14
AT
TIT
AS
H
BA
LDP
ATE
PO
ND
CH
AD
WIC
K P
ON
D
JOH
NS
ON
S P
ON
D
LAK
E C
OC
HIC
HE
WIC
K
LAK
E P
EN
TUC
KE
T
LAK
E S
ALT
ON
STA
LL
MIL
LVA
LE R
ES
.
RO
CK
PO
ND
STE
VE
NS
PO
ND
AM
ES
PO
ND
FO
RE
ST
LA
KE
HA
GG
ET
S P
ON
D
LOW
E P
ON
D
PO
MP
S P
ON
D
BA
RE
HIL
L P
ON
D
FO
RT
PO
ND
HIC
KO
RY
HIL
LS P
ON
D
LON
G P
ON
D
MA
SS
AP
OA
G
NE
WFI
ELD
PO
ND
DOWNWIND UPWIND FAR UPWIND
pH 6.2
6.6
7.0
7.4
7.8
8.2
8.6
AT
TIT
AS
H
BA
LDP
ATE
PO
ND
CH
AD
WIC
K P
ON
D
JOH
NS
ON
S P
ON
D
LAK
E C
OC
HIC
HE
WIC
K
LAK
E P
EN
TUC
KE
T
LAK
E S
ALT
ON
STA
LL
MIL
LVA
LE R
ES
.
RO
CK
PO
ND
ST
EV
EN
S P
ON
D
AM
ES
PO
ND
FO
RE
ST
LA
KE
HA
GG
ET
S P
ON
D
LOW
E P
ON
D
PO
MP
S P
ON
D
BA
RE
HIL
L P
ON
D
FO
RT
PO
ND
HIC
KO
RY
HIL
LS P
ON
D
LON
G P
ON
D
MA
SS
AP
OA
G
NE
WF
IELD
PO
ND
DOWNWIND UPWIND FAR UPWIND
SP
EC
IFIC
CO
ND
UC
TAN
CE
, us/
cm
0
100200
300
400500
600
700
LAK
E A
TT
ITA
SH
BA
LDP
ATE
PO
ND
CH
AD
WIC
K P
ON
D
JOH
NS
ON
S P
ON
D
LAK
E C
OC
HIC
HE
WIC
K
LAK
E P
EN
TUC
KE
T
LAK
E S
ALT
ON
STA
LL
MIL
LVA
LE R
ES
.
RO
CK
PO
ND
STE
VE
NS
PO
ND
AM
ES
PO
ND
FO
RE
ST
LA
KE
HA
GG
ET
S P
ON
D
LOW
E P
ON
D
PO
MP
S P
ON
D
BA
RE
HIL
L P
ON
D
FO
RT
PO
ND
HIC
KO
RY
HIL
LS P
ON
D
LON
G P
ON
D
MA
SS
AP
OA
G
NE
WFI
ELD
PO
ND
DOWNWIND UPWIND FAR UPWIND
A.
B.
C.
D.
E.
F.
Figure 6. Study Variables Plotted by Study Area
LMB Condition Index
YP Condition Index
Dissolved Oxygen Concentration
Water Temperature Specific Conductance
pH
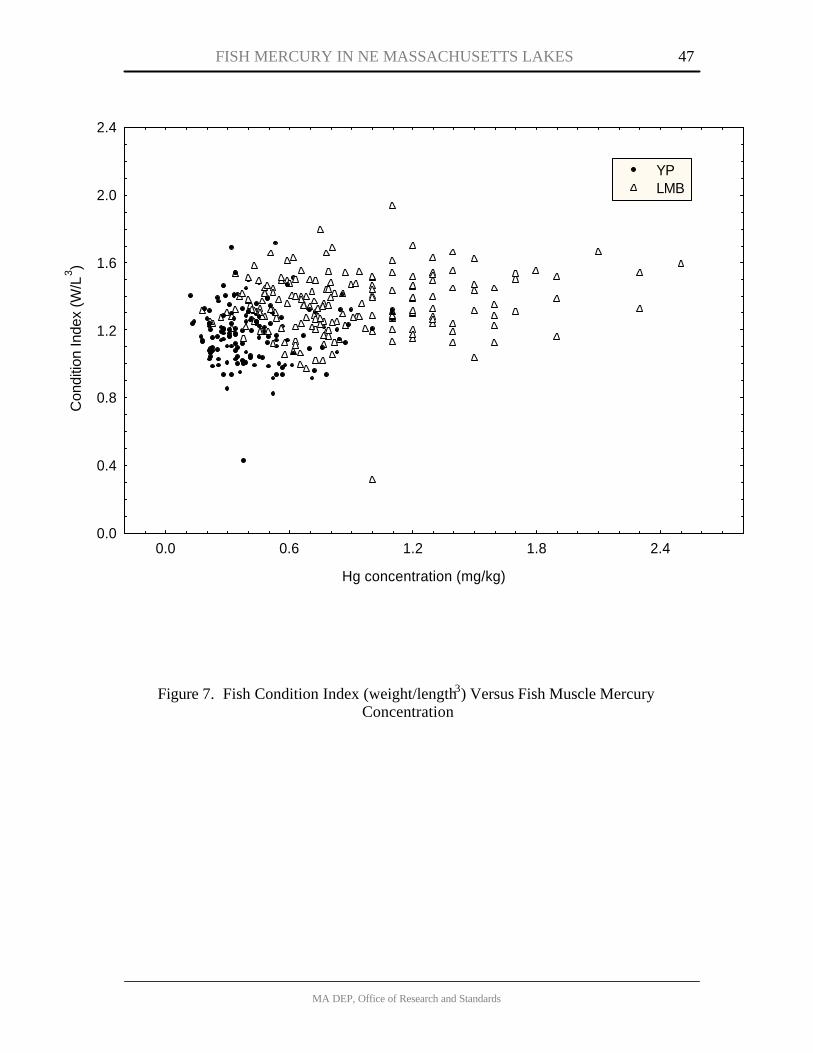
FISH MERCURY IN NE MASSACHUSETTS LAKES
MA DEP, Office of Research and Standards
47
Figure 7. Fish Condition Index (weight/length3) Versus Fish Muscle Mercury Concentration
Hg concentration (mg/kg)
Con
ditio
n In
dex
(W/L
3 )
0.0
0.4
0.8
1.2
1.6
2.0
2.4
0.0 0.6 1.2 1.8 2.4
YPLMB
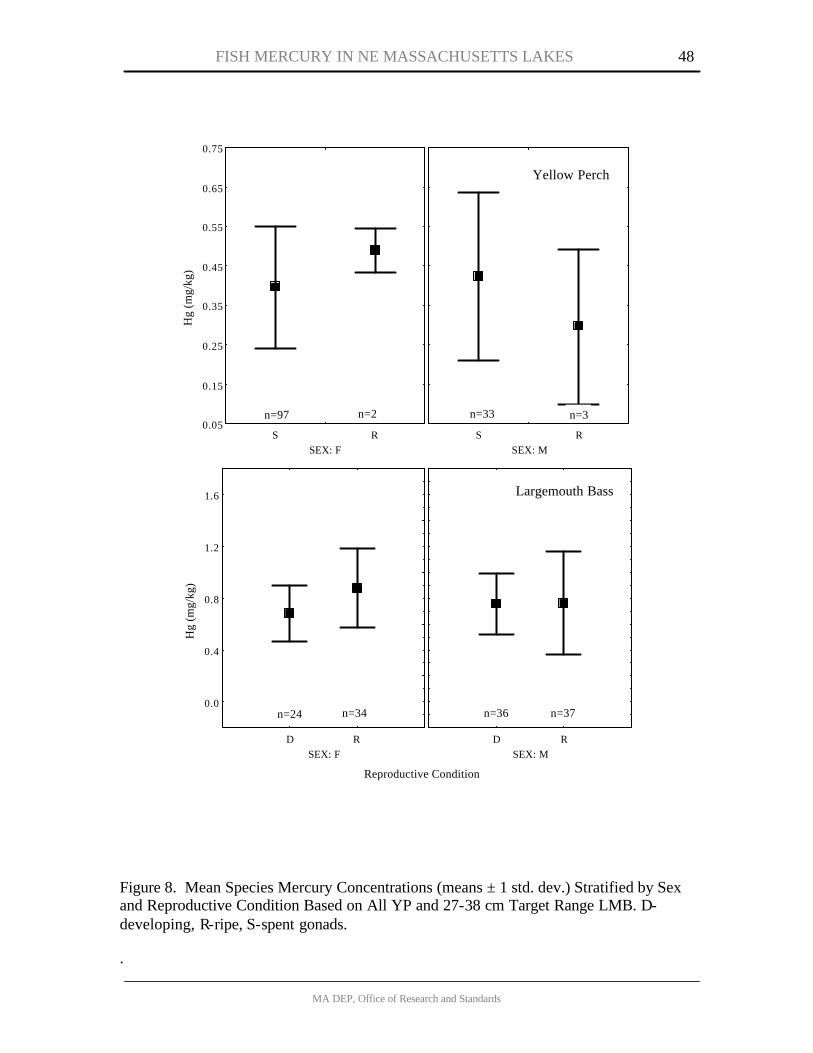
FISH MERCURY IN NE MASSACHUSETTS LAKES
MA DEP, Office of Research and Standards
48
Figure 8. Mean Species Mercury Concentrations (means ± 1 std. dev.) Stratified by Sex and Reproductive Condition Based on All YP and 27-38 cm Target Range LMB. D-developing, R-ripe, S-spent gonads.
.
Hg
(mg/
kg)
SEX: F
0.05
0.15
0.25
0.35
0.45
0.55
0.65
0.75
S RSEX: M
S R
Yellow Perch
n=97 n=2 n=33 n=3
Reproductive Condition
Hg
(mg/
kg)
SEX: F
0.0
0.4
0.8
1.2
1.6
D RSEX: M
D R
Largemouth Bass
n=24 n=34 n=36 n=37
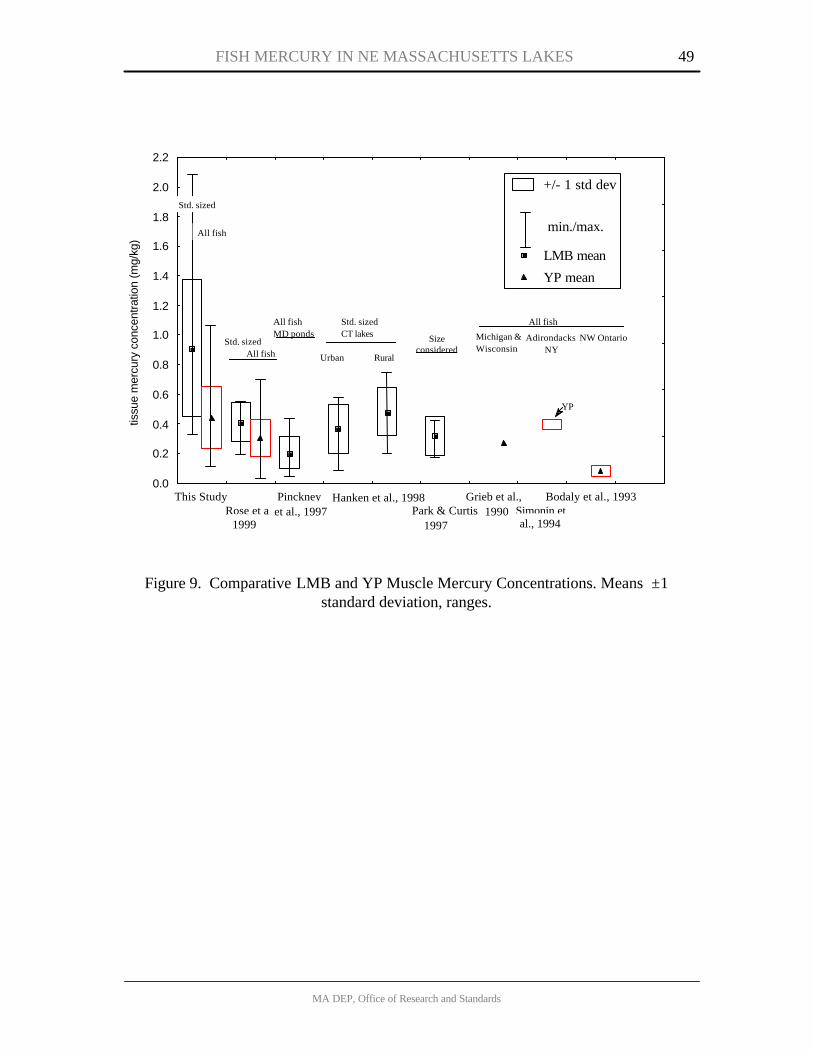
FISH MERCURY IN NE MASSACHUSETTS LAKES
MA DEP, Office of Research and Standards
49
Figure 9. Comparative LMB and YP Muscle Mercury Concentrations. Means ±1 standard deviation, ranges.
tissu
e m
ercu
ry c
once
ntra
tion
(mg/
kg)
0.0
0.2
0.4
0.6
0.8
1.0
1.2
1.4
1.6
1.8
2.0
2.2
This StudyRose et al.
PinckneyPark & Curtis
Grieb et al.,Simonin et
Bodaly et al., 1993
+/- 1 std dev
LMB mean
YP mean
Hanken et al., 1998
min./max.
Std. sized
Std. sized
Std. sizedCT lakes
All fish
All fish
All fishMD ponds
All fish
Urban Rural
1999et al., 1997
1997 al., 19941990
Michigan &Wisconsin
Adirondacks,NY
NW Ontario
YP
Sizeconsidered
FISH MERCURY IN NE MASSACHUSETTS LAKES 50
MA DEP, Office of Research and Standards
REFERENCES
Bidwell, J. R. and Heath, A. G. An in situ study of rock bass (Ambloplites rupestris)
physiology: effect of season and mercury contamination. Hydrobiologia. 1993; 264137-152.
Bodaly, R. A.; Hecky, R. E., and Fudge, R. J. P. Increases in fish mercury levels in lakes flooded by the Churchill River diversion, northern Manitoba. Canadian Journal Fisheries and Aquatic Sciences. 1984; 41:682-691.
Bodaly, R. A.; Rudd, J. W. M.; Fudge, R. J. P., and Kelly, C. A. Mercury Concentrations in Fish Related to Size of Remote Canadian Shield Lakes. Canadian Journal of Fisheries and Aquatic Sciences. 1993; 50(5):980-987.
Brumbaugh, W. G.; Krabbenhoft, D. P.; Helsel, D. R.; Wiener, J. G., and Echols, K. R. A national pilot study of mercury contamination of aquatic ecosystems along multiple gradients: bioaccumulation in fishes.: U.S. Department of the Interior, U.S. Geological Survey; September 2001(Biological Science Report USGS/BRD/BSR–2001-0009).
Carley, R. J. and Perkins, C. Interim Report. Connecticut Atmospheric Mercury Monitoring Network. November 1, 1996 – October 30, 1998. Environmental Research Institute, University of Connecticut..Storrs, CT; 2000 Jan 28.
Clayton, C. A.; Perritt, R. L.; Pellizzari, E. D.; Thomas, K. W.; Whitmore, R. W.; Wallace, L. A.; Ozkaynak, H., and Spengler, J. D. Particle Total Exposure Assessment Methodology (PTEAM) study: distributions of aerosol and elemental concentrations in personal, indoor, and outdoor air samples in a southern California community. J Expo Anal Environ Epidemiol. 1993; 3(2):227-50.
DiNardi, S. R.; Knapp, R. R., and Kitson, C. E. Review and Investigation to Address Specific Technical Issues Raised During the Site Assignment Evaluation for the Ogden Haverhill Facility in Haverhill, Massachusetts. 1991.
Driscoll, C. T.; Yan, C.; Schofield, C. L.; Munson, R., and Holsapple, J. The Mercury Cycle and Fish in the Adirondack Lakes. Environmental Science & Technology. 1994; 28(3):A136-A143.
Dvonch, J. T.; Vette, A. F.; Keeler, G. J.; Evans, G., and Stevens, R. An Intensive Multisite Pilot-Study Investigating Atmospheric Mercury in Broward County, Florida. Water Air and Soil Pollution. 1995; 80(1-4):169-178.
Engstrom, D. R. and Swain, E. B. Recent Declines in Atmospheric Mercury Deposition in the Upper Midwest. Environmental Science & Technology. 1997; 31(4):960-967.
FISH MERCURY IN NE MASSACHUSETTS LAKES 51
MA DEP, Office of Research and Standards
Francesconi, K. A.; Lenanton, R. C. J.; Caputi, N., and Jones, S. Long-Term Study of Mercury Concentrations in Fish Following Cessation of a Mercury-Containing Discharge. Marine Environmental Research. 1997; 43(1-2):27-40.
Friedmann, A. S.; Watzin, M. C.; Leiter, J. C., and Brinckjohnsen, T. Effects of Environmental Mercury on Gonadal Function in Lake Champlain Northern Pike (Esox Lucius). Bulletin of Environmental Contamination and Toxicology. 1996; 56(3):486-492.
Gaylor, D. W. and Swirsky Gold, L. Regulatory cancer risk assessment based on a quick estimate of a benchmark dose derived from the maximum tolerated dose. Regul Toxicol Pharmacol. 1998; 28(3):222-5.
Goodman, G. T. and Roberts, T. M. Plants and soils as indicators of metals in the air. Nature. 1971; 231(5301):287-292.
Grieb, T. M.; Driscoll, C. T.; Gloss, S. P.; Schofield, C. L.; Bowie, G. L, and Porcella, D. B. Factors affecting mercury accumulation in fish in the upper Michigan peninsula. Environ. Toxicol Chem. 1990; 9919-930.
Griffith, G. E.; Omernik, JM.; Pierson, S. M., and Kiilsgaard, C. W. Massachusetts Regionalization Project.Draft ed.. Corvallis, OR: U.S. Environmental Protection Agency, Environmental Research Laboratory; 1993.
Hanten, R. P.; Neumann, R. M., and Ward, S. M. Relationships Between Concentrations of Mercury in Largemouth Bass and Physical and Chemical Characteristics of Connecticut Lakes. Transactions Of The American Fisheries Society. 1998; 127(5):807-818.
Isaac, R. A.; Maietta, R. J., and Johnson, A. S. The role of fish tissue monitoring in evaluating and managing toxic substances: a summary of Massachusetts' program. Boston, MA: Massachusetts Department of Environmental Protection, Bureau of Resource Protection; 1992.
Iverfeldt, A. Occurrence and Turnover of Atmospheric Mercury Over the Nordic Countries. Water Air and Soil Pollution. 1991; 56251-265.
Jeremiason, J. Mercury Contamination Trends in Fish. Spring 2000 Federal State Toxicology and Risk Analysis Committee Meeting . Washington, DC: U.S. Environmental Protection Agency; 2000.
Johansson, K.; Aastrup, M.; Andersson, A.; Bringmark, L., and Iverfeldt, A. Mercury in Swedish Forest Soils and Waters - Assessment of Critical Load. Water Air and Soil Pollution. 1991; 56267-281.
Baker, J. E. Atmospheric Deposition of Contaminants to the Great Lakes and Coastal Waters. Pensacola, FL: SETAC Press; 1997.
FISH MERCURY IN NE MASSACHUSETTS LAKES 52
MA DEP, Office of Research and Standards
Kurttio, P.; Pekkanen, J.; Alfthan, G.; Paunio, M.; Jaakkola, J. J. K., and Heinonen, O. P. Increased Mercury Exposure in Inhabitants Living in the Vicinity of a Hazardous-Waste Incinerator - A 10-Year Follow-Up. ARCHIVES OF ENVIRONMENTAL HEALTH. 1998; 53(2):129-137.
Lin, C. J. and Pehkonen, S. O. The Chemistry Of Atmospheric Mercury - A Review. ATMOSPHERIC ENVIRONMENT. 1999; 33(13):2067-2079.
MA DEP. Fish Mercury Distribution in Massachusetts Lakes. 1997.
MA DEP. Mercury Bioaccumulation in the Food Webs of Two Northeastern Massachusetts Freshwater Ponds. Boston, MA: Office of Research and Standards, Massachusetts Department of Environmental Protection. 2003 Apr.
MA DPH. Fish Consumption Advisories for Mercury in Freshwater Fish. Massachusetts Department of Public Health. Boston, MA.1995 May.
Mason, R. P.; Fitzgerald, W. F., and Morel, F. M. M. The biogeochemical cycling of elemental mercury: Anthropogenic influences. . Geochimica Et Cosmochimica Acta. 1994; 58(15):3191-3198.
Mason, R. P.; Lawson, N. M., and Sullivan, K. A. Atmospheric Deposition to the Chesapeake Bay Watershed - Regional and Local-Sources. Atmospheric Environment. 1997; 31(21):3531-3540.
Meneses, M.; Llobet, J. M.; Granero, S.; Schuhmacher, M., and Domingo, J. L. Monitoring Metals in the Vicinity of a Municipal Waste Incinerator - Temporal Variation in Soils and Vegetation. Science Of The Total Environment. 1999. 226(2-3):157-164.
Nater, E. A. and Grigal, D. F. Regional Trends in Mercury Distribution Across the Great-Lakes States, North Central USA. Nature. 1992. 358(6382):139-141.
Nimi, A. J. Biological and toxicological effects of environmental contaminants in fish and their eggs. Can J Fish Aquat Sci. 1983;. 40306-312.
Northeast States/Eastern Canadian Provinces (Northeast States for Coordinated Air Use Management, Northeast Waste Management Officials Association, New England Interstate Water Pollution Control Commission, Canadian Ecological Monitoring and Assessment Network). Mercury Study. A Framework for Action. Boston, MA; 1998 Feb.
Park, J. G. and Curtis, L. R.. Mercury Distribution in Sediments and Bioaccumulation by Fish in 2 Oregon Reservoirs - Point-Source and Nonpoint-Source Impacted Systems. Archives Of Environmental Contamination And Toxicology. 1997; 33(4):423-429.
Pinkney, A. E.; Logan, D. T., and Wilson, H. T. Mercury Concentrations in Pond Fish in
FISH MERCURY IN NE MASSACHUSETTS LAKES 53
MA DEP, Office of Research and Standards
Relation to a Coal-Fired Power-Plant. Archives Of Environmental Contamination And Toxicology. 1997; 33(2):222-229.
Ricker, W. E. Computation and interpretation of biological statistics of fish populations. Bull. 191 ed. Ottawa, Ontario. 382.pp.: Fisheries Res. Bd. of Canada; 1975.
Rose, J.; Hutcheson, M. S.; West, C. R.; Pancorbo, O.; Hulme, K.; Cooperman, A.; Decesare, G.; Isaac, R., and Screpetis, A. Fish Mercury Distribution in Massachusetts, USA Lakes. Environmental Toxicology And Chemistry. 1999; 18(7):1370-1379.
Rumbold, D. G.; Bruner, M. C.; Mihalik, M. B., and Marti, E. A. Biomonitoring Environmental Contaminants Near a Municipal Solid-Waste Combustor. Environmental Pollution. 1997; 96(1):99-105.
Schuhmacher M.; Granero, S.; Belles, M.; Llobet, J. M., and Domingo, J. L. Levels of Metals in Soils and Vegetation in the Vicinity of a Municipal Solid Waste Incinerator. Toxicological and Environmental Chemistry. 1996; 56:119-132.
Smith, C. M. and Rowan-West, C., eds. Mercury in Massachusetts: An evaluation of sources, emissions, impacts and controls. Boston, MA: Massachusetts Department of Environmental Protection, Office of Research and Standards; 1996.
Sokal, Robert R and Rohlf, F. James. Biometry the principles and practice of statistics in biological research. 3rd ed ed. New York: Freeman; 1995. xix, 887 p .
Steinnes, E. and Andersson, E. M. Atmospheric Deposition of Mercury in Norway - Temporal and Spatial Trends. Water Air and Soil Pollution. 1991; 56:391-404.
Swain, E. Mercury Deposition and Control in Minnestota. Spring 2000 Federal State Toxicology and Risk Analysis Committee Meeting. St. Paul, MN. Washington, DC: U.S. Environmental Protection Agency; 2000.
U.S. Environmental Protection Agency. Methods for the determination of inorganic substances in environmental samples. Washington, D.C.: U.S. EPA, Office of Research and Development; 1993; EPA 600/R-93-100.
U.S. Environmental Protection Agency (Office of Air Quality Planning and Standards and Office of Research and Development). Mercury Study Report to Congress. V. II: An Inventory of Anthropogenic Mercury Emissions in the United States; 1997.
. Wallace, G. T.; Oktay, S.; Pala, F.; Ferraro, M.; Gnatek, M., and Luce, D. Determination of Recent Inputs of Mercury to Lakes/Ponds in the Merrimack Valley Using Sediment Cores - a Feasibility Study. 2003. University of Massachusetts Boston, Department of Coastal and Ocean Sciences. Report for Massachusetts Department of Environmental Protection.
Watras, C. J.; Back, R. C.; Halvorsen, S.; Hudson, R. J. M.; Morrison, K. A., and Wente,
FISH MERCURY IN NE MASSACHUSETTS LAKES 54
MA DEP, Office of Research and Standards
S. P. Bioaccumulation of Mercury in Pelagic Freshwater Food Webs. Science of the Total Environment. 1998; 219(2-3):183-208.
Zhou, T. and Weis, J. S. Swimming Behavior and Predator Avoidance in 3 Populations of Fundulus heteroclitus Larvae After Embryonic And/Or Larval Exposure To Methylmercury. Aquatic Toxicology. 1998; 43(2-3):131-148.
FISH MERCURY IN NE MASSACHUSETTS LAKES 55
MA DEP, Office of Research and Standards
APPENDIX A
Factor Analysis Description
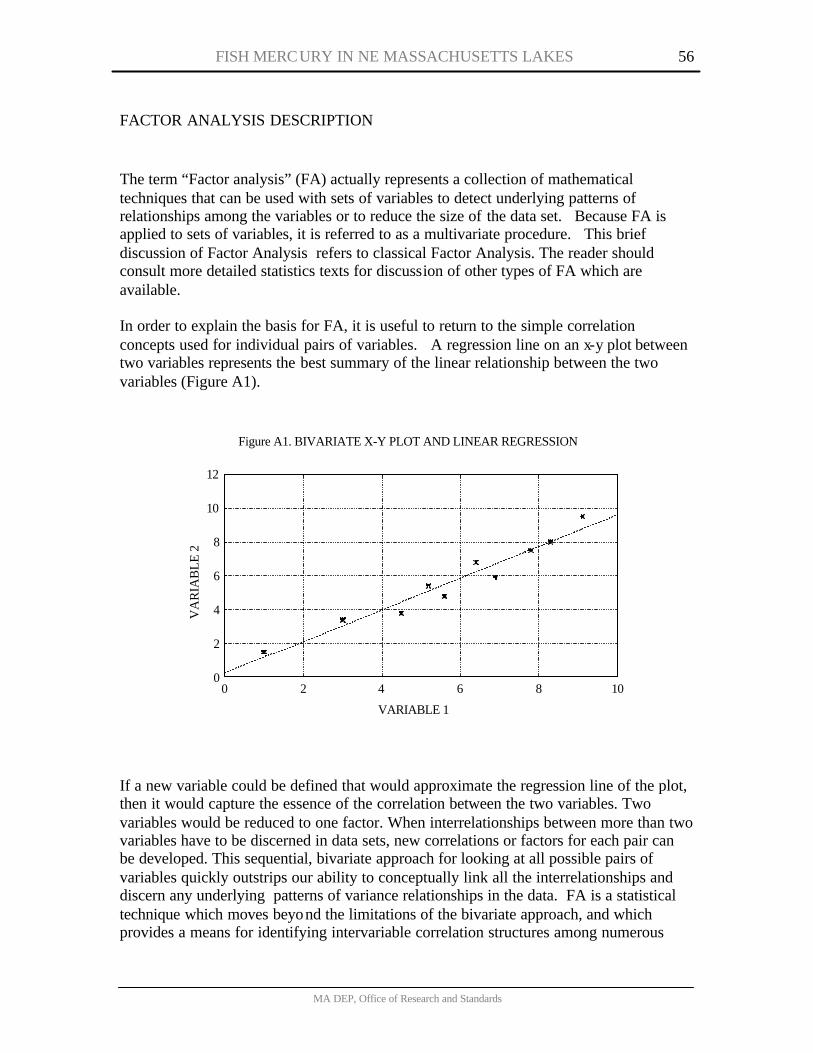
FISH MERCURY IN NE MASSACHUSETTS LAKES 56
MA DEP, Office of Research and Standards
FACTOR ANALYSIS DESCRIPTION
The term “Factor analysis” (FA) actually represents a collection of mathematical techniques that can be used with sets of variables to detect underlying patterns of relationships among the variables or to reduce the size of the data set. Because FA is applied to sets of variables, it is referred to as a multivariate procedure. This brief discussion of Factor Analysis refers to classical Factor Analysis. The reader should consult more detailed statistics texts for discussion of other types of FA which are available. In order to explain the basis for FA, it is useful to return to the simple correlation concepts used for individual pairs of variables. A regression line on an x-y plot between two variables represents the best summary of the linear relationship between the two variables (Figure A1).
Figure A1. BIVARIATE X-Y PLOT AND LINEAR REGRESSION
VARIABLE 1
VA
RIA
BLE
2
0
2
4
6
8
10
12
0 2 4 6 8 10
If a new variable could be defined that would approximate the regression line of the plot, then it would capture the essence of the correlation between the two variables. Two variables would be reduced to one factor. When interrelationships between more than two variables have to be discerned in data sets, new correlations or factors for each pair can be developed. This sequential, bivariate approach for looking at all possible pairs of variables quickly outstrips our ability to conceptually link all the interrelationships and discern any underlying patterns of variance relationships in the data. FA is a statistical technique which moves beyond the limitations of the bivariate approach, and which provides a means for identifying intervariable correlation structures among numerous
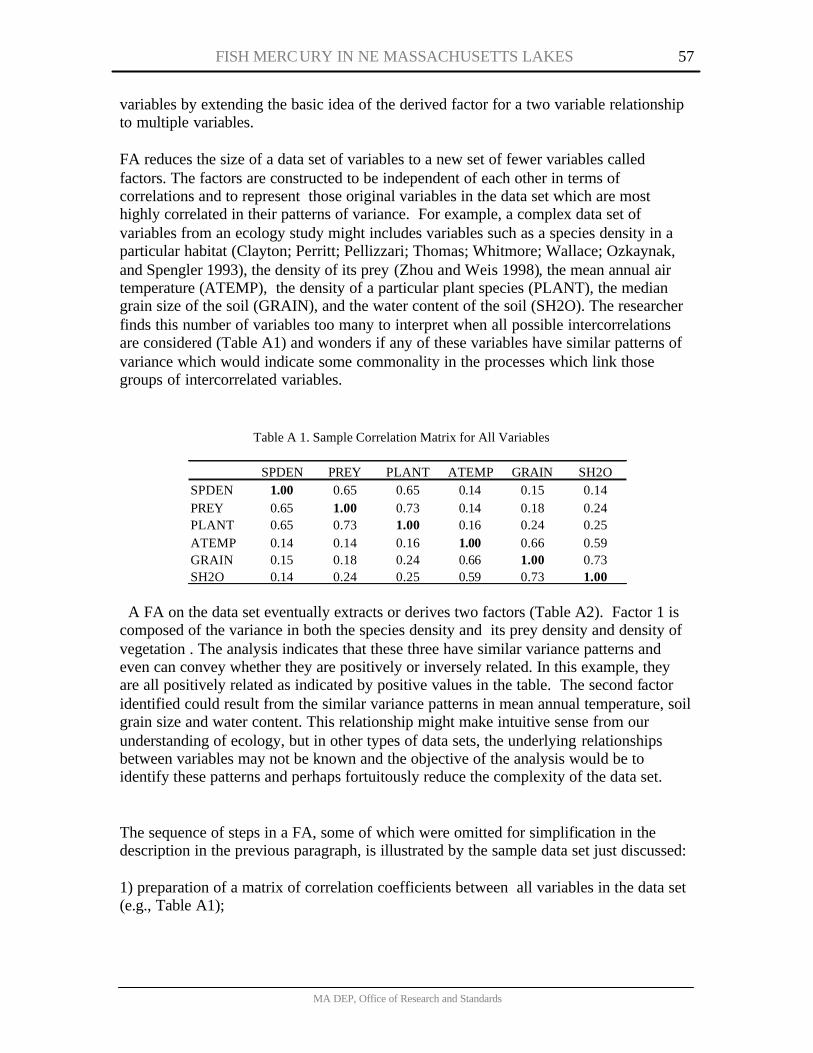
FISH MERCURY IN NE MASSACHUSETTS LAKES 57
MA DEP, Office of Research and Standards
variables by extending the basic idea of the derived factor for a two variable relationship to multiple variables. FA reduces the size of a data set of variables to a new set of fewer variables called factors. The factors are constructed to be independent of each other in terms of correlations and to represent those original variables in the data set which are most highly correlated in their patterns of variance. For example, a complex data set of variables from an ecology study might includes variables such as a species density in a particular habitat (Clayton; Perritt; Pellizzari; Thomas; Whitmore; Wallace; Ozkaynak, and Spengler 1993), the density of its prey (Zhou and Weis 1998), the mean annual air temperature (ATEMP), the density of a particular plant species (PLANT), the median grain size of the soil (GRAIN), and the water content of the soil (SH2O). The researcher finds this number of variables too many to interpret when all possible intercorrelations are considered (Table A1) and wonders if any of these variables have similar patterns of variance which would indicate some commonality in the processes which link those groups of intercorrelated variables.
Table A 1. Sample Correlation Matrix for All Variables
SPDEN PREY PLANT ATEMP GRAIN SH2OSPDEN 1.00 0.65 0.65 0.14 0.15 0.14PREY 0.65 1.00 0.73 0.14 0.18 0.24PLANT 0.65 0.73 1.00 0.16 0.24 0.25ATEMP 0.14 0.14 0.16 1.00 0.66 0.59GRAIN 0.15 0.18 0.24 0.66 1.00 0.73SH2O 0.14 0.24 0.25 0.59 0.73 1.00
A FA on the data set eventually extracts or derives two factors (Table A2). Factor 1 is composed of the variance in both the species density and its prey density and density of vegetation . The analysis indicates that these three have similar variance patterns and even can convey whether they are positively or inversely related. In this example, they are all positively related as indicated by positive values in the table. The second factor identified could result from the similar variance patterns in mean annual temperature, soil grain size and water content. This relationship might make intuitive sense from our understanding of ecology, but in other types of data sets, the underlying relationships between variables may not be known and the objective of the analysis would be to identify these patterns and perhaps fortuitously reduce the complexity of the data set. The sequence of steps in a FA, some of which were omitted for simplification in the description in the previous paragraph, is illustrated by the sample data set just discussed: 1) preparation of a matrix of correlation coefficients between all variables in the data set (e.g., Table A1);
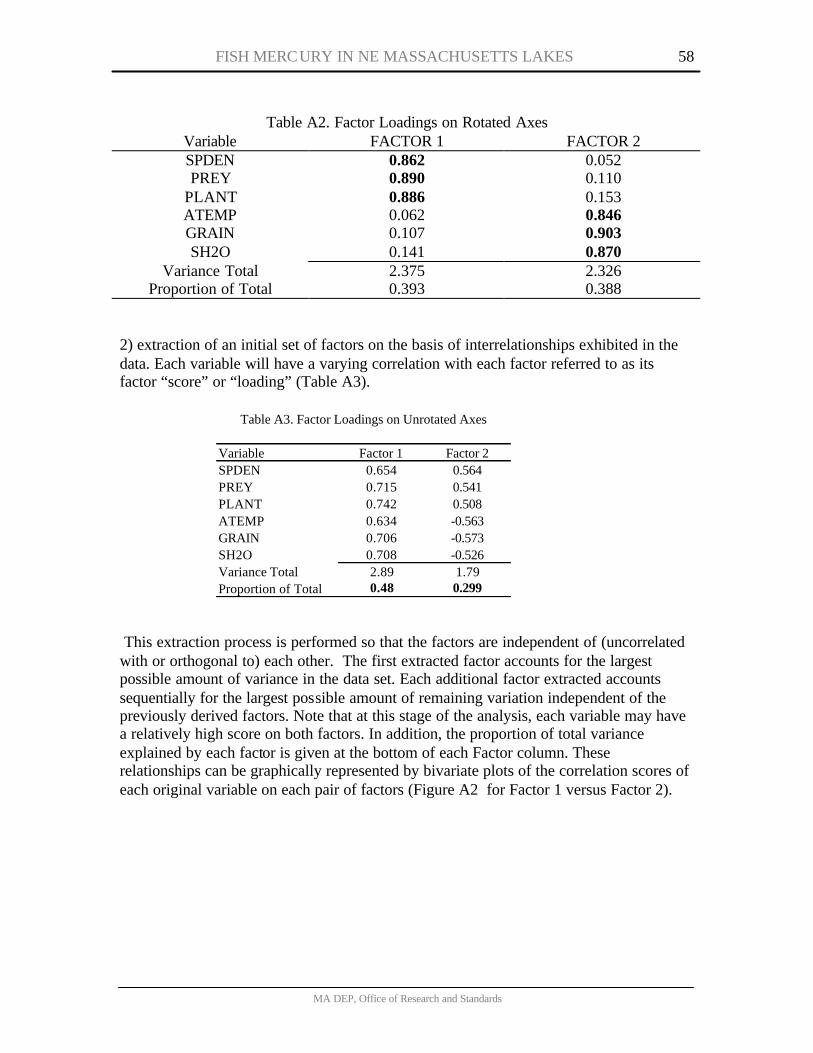
FISH MERCURY IN NE MASSACHUSETTS LAKES 58
MA DEP, Office of Research and Standards
Table A2. Factor Loadings on Rotated Axes
Variable FACTOR 1 FACTOR 2 SPDEN 0.862 0.052 PREY 0.890 0.110
PLANT 0.886 0.153 ATEMP 0.062 0.846 GRAIN 0.107 0.903 SH2O 0.141 0.870
Variance Total 2.375 2.326 Proportion of Total 0.393 0.388
2) extraction of an initial set of factors on the basis of interrelationships exhibited in the data. Each variable will have a varying correlation with each factor referred to as its factor “score” or “loading” (Table A3).
Table A3. Factor Loadings on Unrotated Axes
Variable Factor 1 Factor 2SPDEN 0.654 0.564PREY 0.715 0.541PLANT 0.742 0.508ATEMP 0.634 -0.563GRAIN 0.706 -0.573SH2O 0.708 -0.526Variance Total 2.89 1.79Proportion of Total 0.48 0.299
This extraction process is performed so that the factors are independent of (uncorrelated with or orthogonal to) each other. The first extracted factor accounts for the largest possible amount of variance in the data set. Each additional factor extracted accounts sequentially for the largest possible amount of remaining variation independent of the previously derived factors. Note that at this stage of the analysis, each variable may have a relatively high score on both factors. In addition, the proportion of total variance explained by each factor is given at the bottom of each Factor column. These relationships can be graphically represented by bivariate plots of the correlation scores of each original variable on each pair of factors (Figure A2 for Factor 1 versus Factor 2).
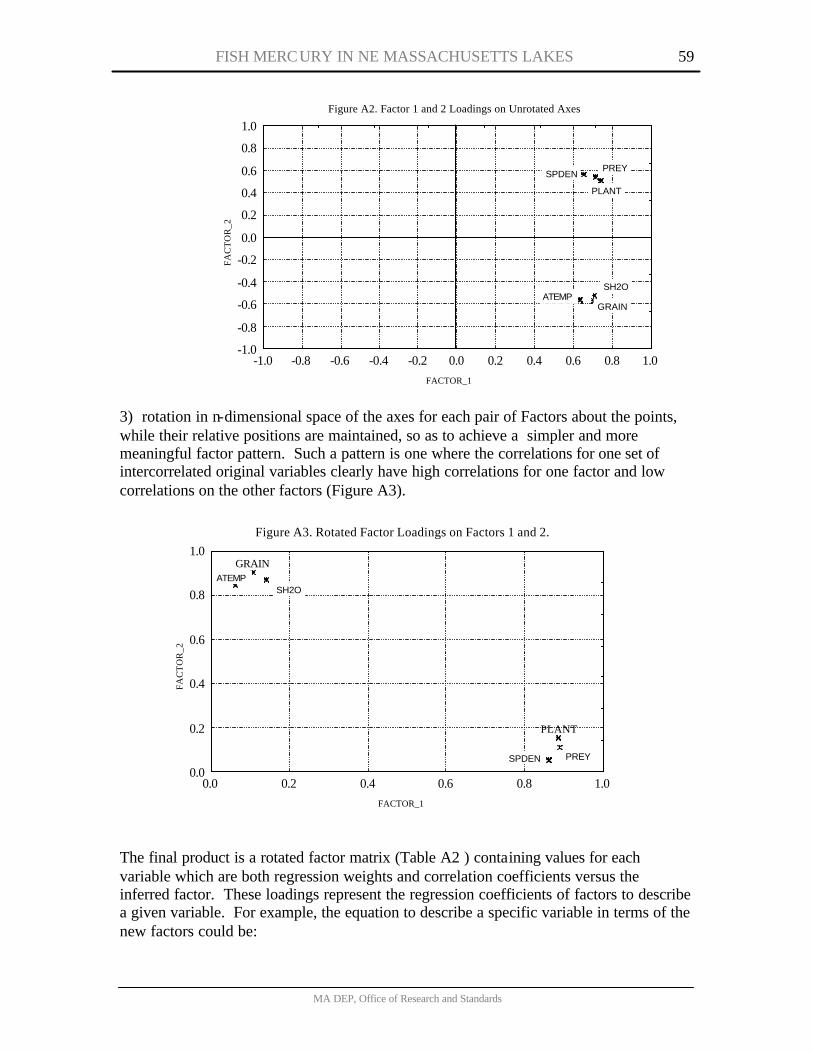
FISH MERCURY IN NE MASSACHUSETTS LAKES 59
MA DEP, Office of Research and Standards
Figure A2. Factor 1 and 2 Loadings on Unrotated Axes
FACTOR_1
FAC
TO
R_2
-1.0
-0.8
-0.6
-0.4
-0.2
0.0
0.2
0.4
0.6
0.8
1.0
-1.0 -0.8 -0.6 -0.4 -0.2 0.0 0.2 0.4 0.6 0.8 1.0
ATEMPGRAIN
SH2O
SPDENPREY
PLANT
3) rotation in n-dimensional space of the axes for each pair of Factors about the points, while their relative positions are maintained, so as to achieve a simpler and more meaningful factor pattern. Such a pattern is one where the correlations for one set of intercorrelated original variables clearly have high correlations for one factor and low correlations on the other factors (Figure A3).
Figure A3. Rotated Factor Loadings on Factors 1 and 2.
FACTOR_1
FAC
TO
R_2
PLANT
GRAIN
0.0
0.2
0.4
0.6
0.8
1.0
0.0 0.2 0.4 0.6 0.8 1.0
SPDEN PREY
SH2OATEMP
The final product is a rotated factor matrix (Table A2 ) containing values for each variable which are both regression weights and correlation coefficients versus the inferred factor. These loadings represent the regression coefficients of factors to describe a given variable. For example, the equation to describe a specific variable in terms of the new factors could be:
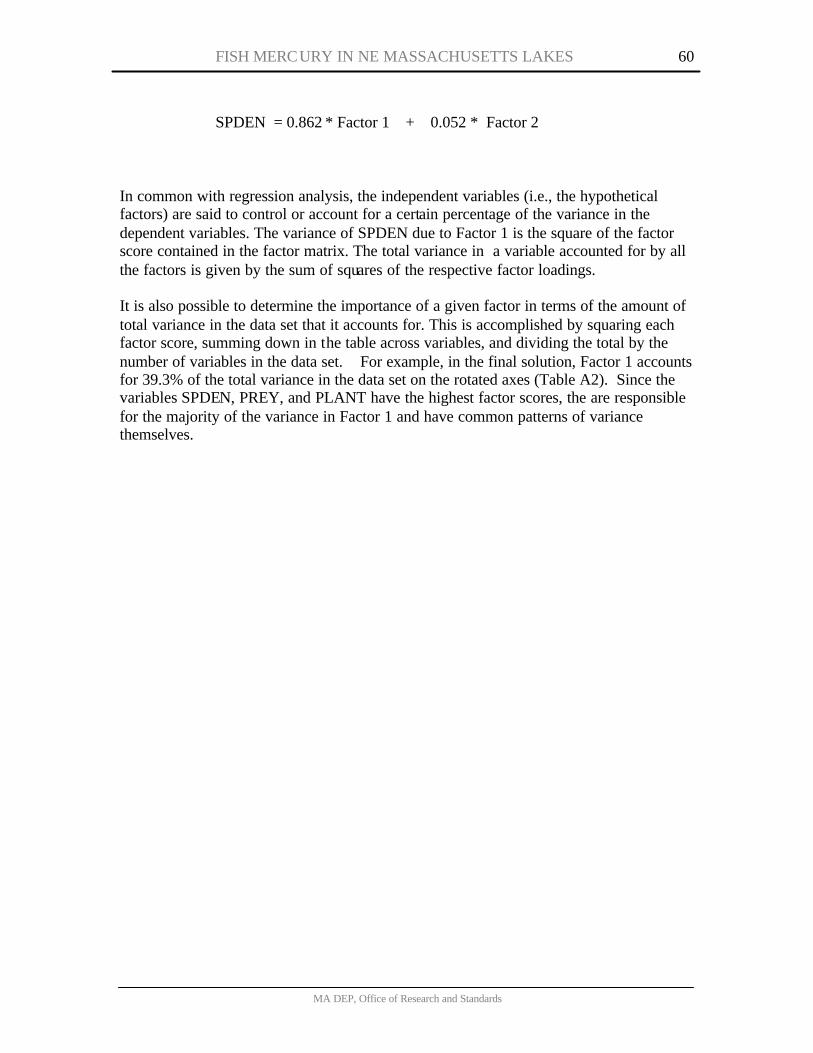
FISH MERCURY IN NE MASSACHUSETTS LAKES 60
MA DEP, Office of Research and Standards
SPDEN = 0.862 * Factor 1 + 0.052 * Factor 2
In common with regression analysis, the independent variables (i.e., the hypothetical factors) are said to control or account for a certain percentage of the variance in the dependent variables. The variance of SPDEN due to Factor 1 is the square of the factor score contained in the factor matrix. The total variance in a variable accounted for by all the factors is given by the sum of squares of the respective factor loadings. It is also possible to determine the importance of a given factor in terms of the amount of total variance in the data set that it accounts for. This is accomplished by squaring each factor score, summing down in the table across variables, and dividing the total by the number of variables in the data set. For example, in the final solution, Factor 1 accounts for 39.3% of the total variance in the data set on the rotated axes (Table A2). Since the variables SPDEN, PREY, and PLANT have the highest factor scores, the are responsible for the majority of the variance in Factor 1 and have common patterns of variance themselves.
FISH MERCURY IN NE MASSACHUSETTS LAKES 61
MA DEP, Office of Research and Standards
APPENDIX B
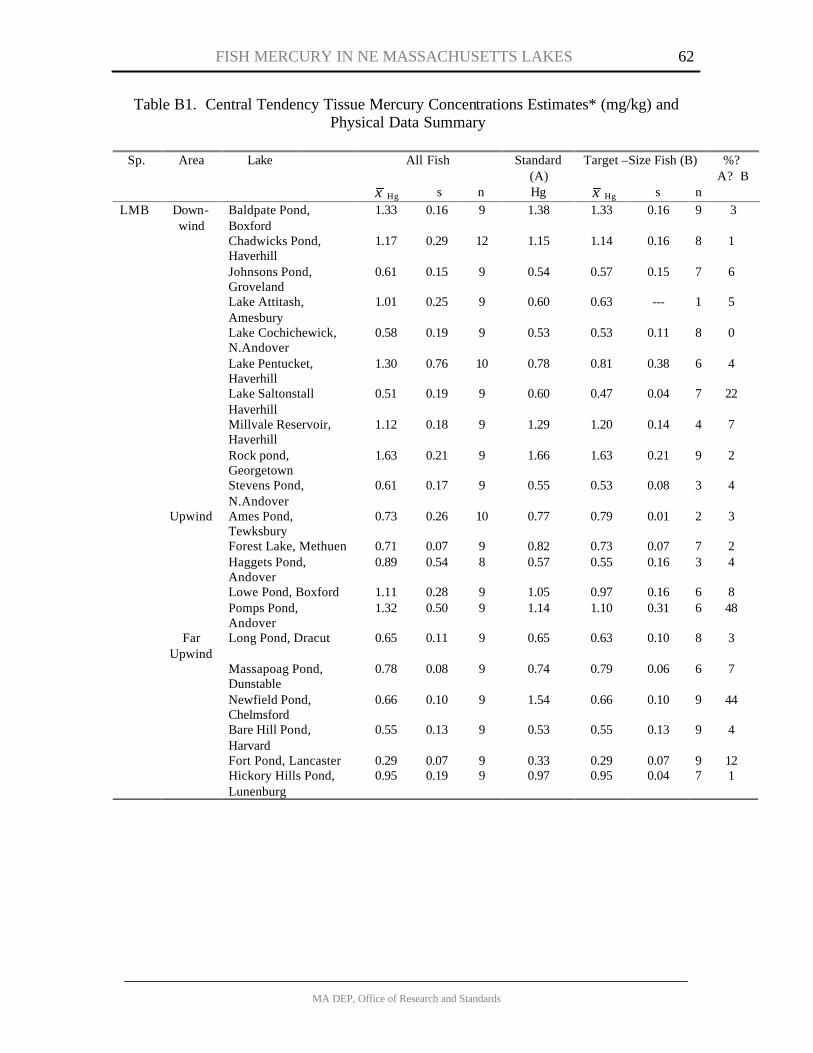
FISH MERCURY IN NE MASSACHUSETTS LAKES 62
MA DEP, Office of Research and Standards
Table B1. Central Tendency Tissue Mercury Concentrations Estimates* (mg/kg) and Physical Data Summary
All Fish Standard
(A) Target –Size Fish (B) %?
A? B Sp. Area Lake
x Hg s n Hg x Hg s n LMB Down-
wind Baldpate Pond, Boxford
1.33 0.16 9 1.38 1.33 0.16 9 3
Chadwicks Pond, Haverhill
1.17 0.29 12 1.15 1.14 0.16 8 1
Johnsons Pond, Groveland
0.61 0.15 9 0.54 0.57 0.15 7 6
Lake Attitash, Amesbury
1.01 0.25 9 0.60 0.63 --- 1 5
Lake Cochichewick, N.Andover
0.58 0.19 9 0.53 0.53 0.11 8 0
Lake Pentucket, Haverhill
1.30 0.76 10 0.78 0.81 0.38 6 4
Lake Saltonstall Haverhill
0.51 0.19 9 0.60 0.47 0.04 7 22
Millvale Reservoir, Haverhill
1.12 0.18 9 1.29 1.20 0.14 4 7
Rock pond, Georgetown
1.63 0.21 9 1.66 1.63 0.21 9 2
Stevens Pond, N.Andover
0.61 0.17 9 0.55 0.53 0.08 3 4
Upwind Ames Pond, Tewksbury
0.73 0.26 10 0.77 0.79 0.01 2 3
Forest Lake, Methuen 0.71 0.07 9 0.82 0.73 0.07 7 2 Haggets Pond,
Andover 0.89 0.54 8 0.57 0.55 0.16 3 4
Lowe Pond, Boxford 1.11 0.28 9 1.05 0.97 0.16 6 8 Pomps Pond,
Andover 1.32 0.50 9 1.14 1.10 0.31 6 48
Far Upwind
Long Pond, Dracut 0.65 0.11 9 0.65 0.63 0.10 8 3
Massapoag Pond, Dunstable
0.78 0.08 9 0.74 0.79 0.06 6 7
Newfield Pond, Chelmsford
0.66 0.10 9 1.54 0.66 0.10 9 44
Bare Hill Pond, Harvard
0.55 0.13 9 0.53 0.55 0.13 9 4
Fort Pond, Lancaster 0.29 0.07 9 0.33 0.29 0.07 9 12 Hickory Hills Pond,
Lunenburg 0.95 0.19 9 0.97 0.95 0.04 7 1
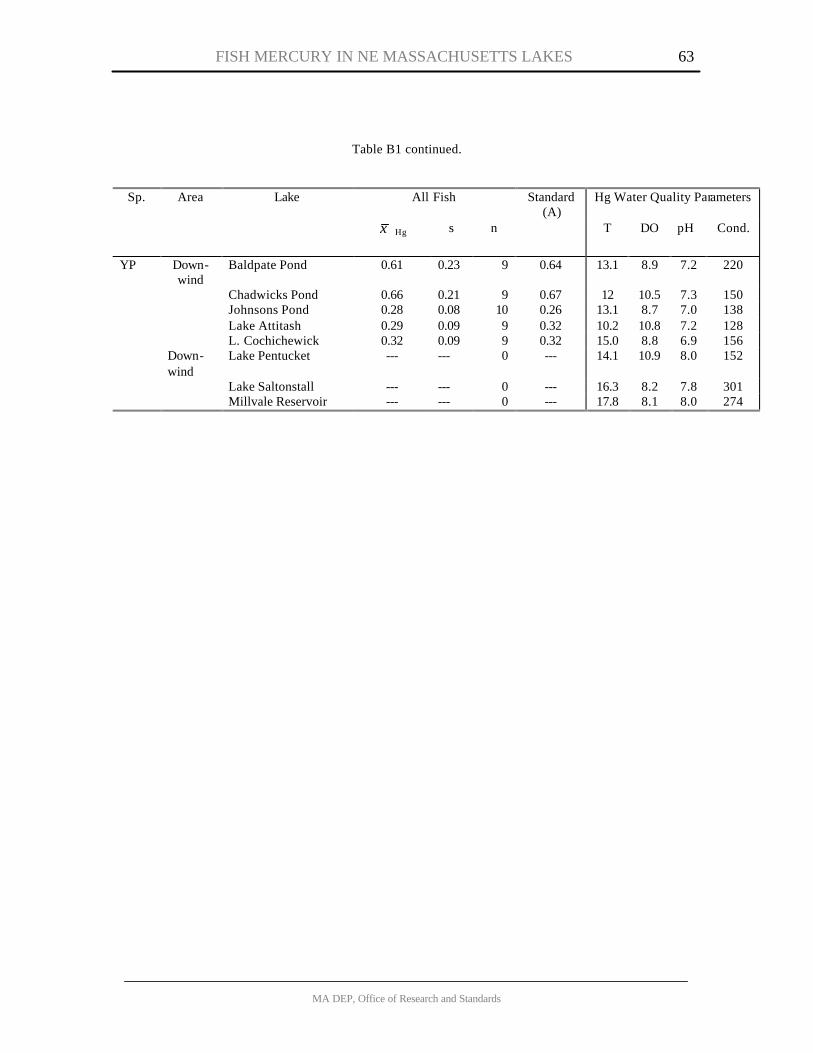
FISH MERCURY IN NE MASSACHUSETTS LAKES 63
MA DEP, Office of Research and Standards
Table B1 continued.
Sp. Area Lake All Fish Standard (A)
Hg Water Quality Parameters
x Hg s n
T DO pH Cond.
YP Down-wind
Baldpate Pond 0.61 0.23 9 0.64 13.1 8.9 7.2 220
Chadwicks Pond 0.66 0.21 9 0.67 12 10.5 7.3 150 Johnsons Pond 0.28 0.08 10 0.26 13.1 8.7 7.0 138 Lake Attitash 0.29 0.09 9 0.32 10.2 10.8 7.2 128 L. Cochichewick 0.32 0.09 9 0.32 15.0 8.8 6.9 156
Down-wind
Lake Pentucket --- --- 0 --- 14.1 10.9 8.0 152
Lake Saltonstall --- --- 0 --- 16.3 8.2 7.8 301 Millvale Reservoir --- --- 0 --- 17.8 8.1 8.0 274