Embed Size (px)
Citation preview

FINAL REPORT
FOR
POCHE BEACH URBAN RUNOFF ULTRAVIOLET LIGHT BACTERIA DISINFECTION PROJECT
CBI GRANT NO. 23 AGREEMENT NO. 01-236-550-1
PREPARED FOR:
STATE WATER RESOURCES CONTROL BOARD DIVISION OF FINANCIAL ASSISTANCE 1001 I STREET, SACRAMENTO, CA 95814
PREPARED BY:
JAMES R. VOLZ, P.E., SENIOR CIVIL ENGINEER WATERSHED AND COASTAL RESOURCES DIVISION
RESOURES AND DEVELOPMENT MANAGEMENT DEPARTMENT COUNTY OF ORANGE
300 N. FLOWER STREET, SANTA ANA, CA 92703
APRIL 13, 2005

TABLE OF CONTENTS
SECTION NUMBER DESCRIPTION PAGE 1. State Disclosure Requirement..................................................................................1 2. Introduction and Project Background ......................................................................1 3. Purpose and Goal of the Project ..............................................................................3 4. Contact Information ................................................................................................3 5. M01 Watershed Description ...................................................................................5 6. Project Description...................................................................................................8 7. Project Results ......................................................................................................13 8. Analysis and Effectiveness in Reaching Goals .....................................................17 9. Monitoring and Sampling Locations ....................................................................18 10. Project Difficulties ................................................................................................19 11. Recommendations for Future Project Enhancements ...........................................21 12. Conclusions and Recommendations ......................................................................22 FIGURES (PHOTOGRAPHS) Figure 1: Aerial photo of Poche Beach at the mouth of the Prima Deshecha Channel.......... 1Figure 2: Aerial photo of the M01 Watershed........................................................................ 5Figure 3: Photo of M01 at downstream end of landfill .......................................................... 6Figure 4: Photo of the scour pond .......................................................................................... 6Figure 5: Photo of M01 channel about one mile from beach ................................................. 7Figure 6: Photo of M01 channel about 3 miles from beach ................................................... 7Figure 7: Photo of Poche Beach ............................................................................................. 8Figure 8: Poho of operating UV System ............................................................................. 10Figure 9: Photo of treatment system location....................................................................... 11Figure 10: Photo of UV device at factory .............................................................................. 12Figure 11: Photo of minor leakage through sandbags ............................................................ 12Figure 12: Photo of Debris Net ............................................................................................. 13 TABLES Table 1: California Department of Health Services AB411 Limits Table 2: Number of exceedences of AB411 criteria from 1999 through 2004 Table 3: Results of bacteria testing Table 4: Levels of bacteria attached to algae Table 5: On-going sampling locations
Page 2 of 25

1. STATE DISCLOSURE REQUIREMENT Funding for this project has been provided in full or in part through a contract with the State Water Resources Control Board (SWRCB) pursuant to the Costa-Machado Water Act of 2000 (Proposition 13) and any amendments thereto for the implementation of California's Nonpoint Source Pollution Control Program. The contents of this document do not necessarily reflect the views and policies of the SWRCB, nor does mention of trade names or commercial products constitute endorsement or recommendation for use. (Gov. Code 7550, 40 CFR 31.20)
2. INTRODUCTION AND PROJECT BACKGROUND The Poche Beach Bacteria Disinfection System is a Clean Beaches Initiative (CBI) Project. The State Water Resources Control Board Agreement Number for this project is 01-236-550-1. The project consists of installing an ultraviolet-light (UV) bacteria disinfection system in the Prima Deshecha (M01) flood control channel to disinfect bacteria from dry weather urban runoff just before it reaches Poche Beach. Figure 1 is an aerial photo of Poche Beach at the mouth of the Prima Deshecha flood control channel outlet.
Figure 1
Page 3 of 25
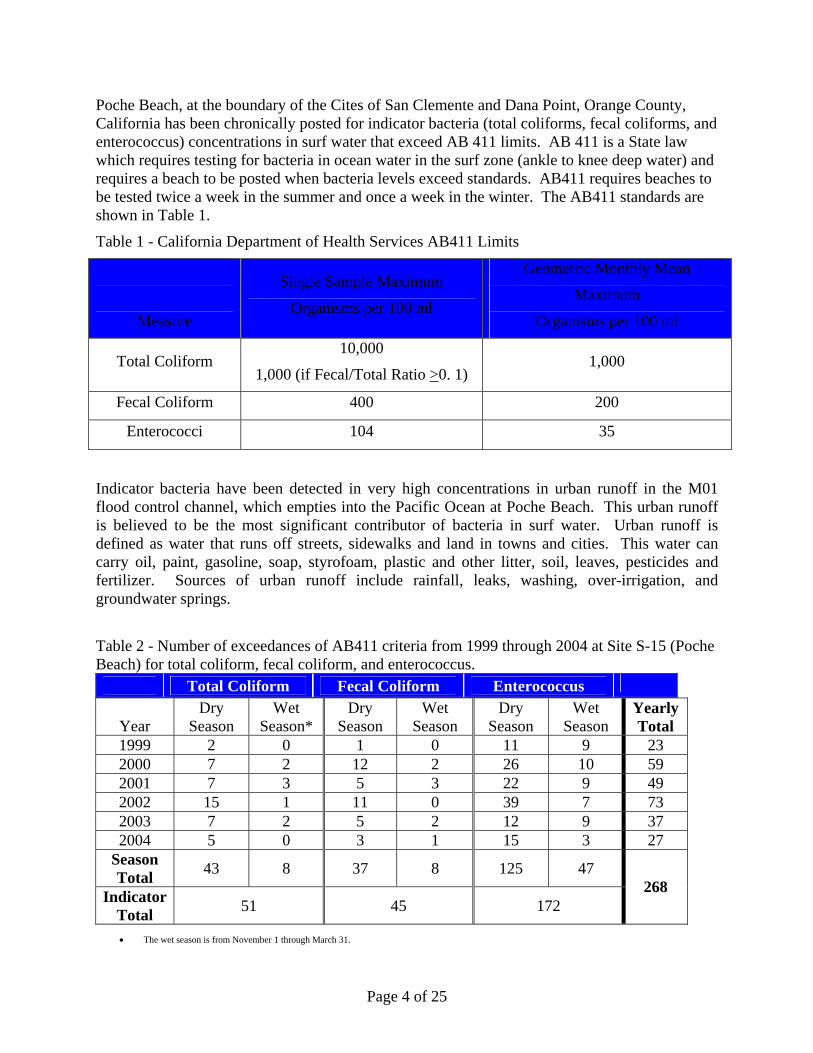
Poche Beach, at the boundary of the Cites of San Clemente and Dana Point, Orange County, California has been chronically posted for indicator bacteria (total coliforms, fecal coliforms, and enterococcus) concentrations in surf water that exceed AB 411 limits. AB 411 is a State law which requires testing for bacteria in ocean water in the surf zone (ankle to knee deep water) and requires a beach to be posted when bacteria levels exceed standards. AB411 requires beaches to be tested twice a week in the summer and once a week in the winter. The AB411 standards are shown in Table 1.
Table 1 - California Department of Health Services AB411 Limits
Measure
Single Sample Maximum
Organisms per 100 ml
Geometric Monthly Mean
Maximum
Organisms per 100 ml
Total Coliform 10,000
1,000 (if Fecal/Total Ratio >0. 1) 1,000
Fecal Coliform 400 200
Enterococci 104 35
Indicator bacteria have been detected in very high concentrations in urban runoff in the M01 flood control channel, which empties into the Pacific Ocean at Poche Beach. This urban runoff is believed to be the most significant contributor of bacteria in surf water. Urban runoff is defined as water that runs off streets, sidewalks and land in towns and cities. This water can carry oil, paint, gasoline, soap, styrofoam, plastic and other litter, soil, leaves, pesticides and fertilizer. Sources of urban runoff include rainfall, leaks, washing, over-irrigation, and groundwater springs.
Table 2 - Number of exceedances of AB411 criteria from 1999 through 2004 at Site S-15 (Poche Beach) for total coliform, fecal coliform, and enterococcus.
Total Coliform Fecal Coliform Enterococcus
Year Dry
Season Wet
Season* Dry
Season Wet
Season Dry
Season Wet
Season Yearly Total
1999 2 0 1 0 11 9 23 2000 7 2 12 2 26 10 59 2001 7 3 5 3 22 9 49 2002 15 1 11 0 39 7 73 2003 7 2 5 2 12 9 37 2004 5 0 3 1 15 3 27
Season Total 43 8 37 8 125 47
Indicator Total 51 45 172
268
• The wet season is from November 1 through March 31.
Page 4 of 25

Poche Beach is posted 500-ft upcoast and 500-ft downcoast of the M01 flood control channel outlet based strictly on monitoring at site S-15 by the Orange County Health Care Agency and the South Orange County Wastewater Authority. Site S-15 is located approximately 100 feet upcoast of the M01 flood control channel outlet into the surf zone. A map and table of the monitoring locations is shown later in this report. The exceedances in Table 2 are single sample exceedances and do not reflect the severity of the postings at Poche Beach. The postings at Poche Beach are a result predominately of AB411’s requirement for a 30-day running geometric mean. For example, for the year 2004, there were only 27 single sample events which required the beach to be posted; however, the beach 500-ft upcoast and 500-ft downcoast of the outlet was posted continuously from January 1, 2004 through March 2004 and June 2004 through December 2004 due mostly to the 30 day geometric mean.
In August 2001, the County of Orange was awarded this CBI Grant to install a UV Bacteria Disinfection Device at Poche Beach. On July 3, 2002, the San Diego Regional Water Quality Control Board issued a 13225 Directive to the County of Orange and the City of San Clemente regarding Poche Beach. The 13225 Directive ordered the County and the City of San Clemente to take the following actions:
1. Continue to identify and eliminate pollutant sources in the Poche Creek watershed.
2. Develop and implement a dry weather monitoring program in the watershed in accordance with the MS4 NPDES permit (Regional Board Order No. R9-2002-01)
3. Implement a monitoring program for influent and effluent of the UV bacteria disinfection facility that includes pre-project water quality data.
4. Verify that there is no reasonable potential for the treatment facility to add pollutants in the discharge to the receiving water.
3. PURPOSE AND GOAL OF THE PROJECT The purpose of the project is to disinfect approximately 500 gallons per minute (720,000 gallons per day) of bacteria laden dry-weather urban runoff from the M01 flood control channel. The goal of the project is to eliminate or drastically reduce the number of times the beach is posted in violation of the AB411 standards as listed above.
4. CONTACT INFORMATION The following personal at the County of Orange and the City of San Clemente may be contacted for additional information regarding this project:
Jim Volz, P.E., Senior Civil Engineer County of Orange RDMD Watershed and Coastal Resources Division 300 N. Flower Street, Santa Ana, CA 92703 Phone: 714-834-2037
Page 5 of 25

E-mail: [email protected] Brandi Outwin, P.E., Principal Engineer City of San Clemente Engineering Division 910 Calle Negocio, Suite 100 San Clemente, CA 92673 Phone: (949) 361-6187 E-mail: [email protected] Vincent Gin, P.E., Acting Chief County of Orange RDMD Watershed and Coastal Resources Division 300 N. Flower Street, Santa Ana, CA 92703 Phone: 714-834-5679 E-mail: [email protected] Larry McKenney, Manager County of Orange RDMD Watershed and Coastal Resources Division 300 N. Flower Street, Santa Ana, CA 92703 Phone: 714-834-5067 E-mail: [email protected]
5. M01 WATERSHED DESCRIPTION The watershed is called the Prima Deshecha Canada Watershed. This name dates back several hundred years and is translated as “First Rough Canyon” south of the San Juan Capistrano Mission. The watershed is numbered as Facility M01 by the Orange County Flood Control District. The creek is called Poche Creek by the Orange County Health Care Agency since it flows onto Poche Beach. The M01 flood control channel drains an area of approximately 4,400 acres in the City of San Clemente, California and a very small portion of the City of San Juan Capistrano in the extreme upper portion of the watershed. The entire watershed is of uniform slope and is relatively steep from the beach to the headwaters. A significant portion of the watershed area, about 20 percent, consists of the Shorecliffs Golf Course and grass greenbelts. About 50 percent of the watershed area consists of streets and large two-story single family residential homes on small lots. The Prima Deshecha Canada landfill and undeveloped native land take up about 30 percent of the watershed area. There is very little commercial land use and zero industrial land use in the watershed. The M01 flood control channel is located underground in the middle of the golf course in the lower half of the watershed. The M01 flood control channel is located underground in the middle of a wide grass beltway in the upper half of the watershed. There is no dry weather urban runoff from the landfill or from the undeveloped areas in the upper watershed. Ninety five (95) percent of the M01 channel is a covered reinforced concrete box (RCB) and the remaining five (5) percent is vertical-walled or trapezoidal concrete channel. The entire creek is fully-concrete-lined from the beach to the headwaters within the landfill, a distance of about 5 miles. The facility ranges in size from an 8-ft by 8-ft concrete box to a 20-ft wide by 11-ft high concrete box. The largest confluence into the M01 box, other than
Page 6 of 25

the Cascaditas Channel, is a 5-ft diameter pipe. The M01 flood control channel, as it empties onto Poche Beach, is a double-barreled covered reinforced concrete box and is 20-ft wide and 11-ft high. Figure 2 is an aerial photo of the watershed. The yellow line is the boundary of the watershed.
Figure 2
Page 7 of 25

Figure 3
Figure 3 is a photo of the M01 channel at the downstream end of the Prima landfill about five miles from the beach. The M01 is concrete lined from this point to the beach.
There is a natural forming scour pond on the beach at the outlet of the M01. The City of San Clemente has photos of this scour pond in the 1930s. This pond is formed from wave and tide action which deposits sand at the mouth of the creek. This scour pond is approximately the same size every year unless the shoal is mechanically breached allowing the pond to drain. Occasionally the outlet on the beach moves as much several hundred feet. The County has all required regulatory permits to shape the scour pond twice per year. Figure 4 is a photo of the scour pond.
Figure 4
Page 8 of 25

Figure 5
Figure 5 is a photo of the M01 channel about one mile from the beach.
Figure 6
Figure 6 is a photo of the M01 channel about 3 miles from the beach.
Page 9 of 25

Figure 7
Figure 7 is a photo of Poche Beach and the only trailer park in the watershed. The businesses on the left side of the photo are all the commercial properties in the watershed except for the golf course.
During an inspection of the underground M01 box in 2004, a significant volume of water was pouring through the weepholes in the concrete. It is possible that as much as 50 percent, or even greater, of the total dry weather flow of 500 gallons per minute is groundwater.
6. PROJECT DESCRIPTION The Poche Beach UV bacteria disinfection project is designed to alter the DNA, and render ineffective, bacteria in the dry-weather urban runoff in the M01 channel just before this runoff reaches the beach. This was accomplished by the installation of gravity flow ultraviolet (UV) bacteria disinfection equipment in the M01 fully concrete lined flood control channel. A 250 gallon per minute (GPM) gravity flow UV disinfection system is installed in each barrel at the location shown in Figure 9. The disinfection systems are installed approximately 200-ft upstream of the beach. Sandbags are placed to divert the flow into and through the UV disinfection system. The sand bags are placed to the height of the treatment system. The UV devices are about 2-ft wide, 4-ft tall and 10-ft long. A square weir inside the treatment system just downstream of the UV bulbs ensures that all of the UV bulbs are submerged even if there is no flow in the channel. The plan was to install the disinfection system on April 15 of each year and remove it on October 15 of each year. The system cannot remain in the channel during the storm season because of flooding risks and risks of damage to the disinfection equipment.
Page 10 of 25

Figures in the Appendix display a cross section and details of the treatment system in the channel.
Each UV device cost approximately $25,000 for a total of $50,000. The cost to bring in electrical service and run the electrical conduit between the controller and the UV units was approximately $80,000. Each UV bacteria disinfection system includes the following:
o Two racks of 4 lamps for a total of 8 lamps. The lamps are 150W low-pressure UV lamps that emit a single wavelength UV radiation of 253.7 nanometers.
o Quarts sleeves in which each lamp resides. o Submersible ballasts. o Lamp cleaning system consisting of sliding rings with stainless steel wires inside that
remove dirt, algae, and other attached substances from the outside of the lamp quartz sleeves.
o Stainless steel inlet grate to keep trash and debris out. o Locking lids o Downstream rectangular flow control weir. This weir is designed to keep the water level
within approximately 2 inches of the top surface of the top lamps at 250 gallons per minute and to prevent the water level from dropping below the top surface of the top lamp at zero flow.
o V-notched weir at the downstream end of the stainless steel box for flow measurement. o Adjustable casters on the bottom of the system to level the system during installation. o Wheels on the bottom of the system to allow movement of the system during installation
and extraction. o Differential pressure transmitter at the downstream end of the system to transmit the
elevation of the water at the v-notch weir. This is converted into a flow rate by a flow meter and totalizers at the power control center (PCC).
o Ultrasonic level sensor attached to the wall of the M01 barrel just upstream of the treatment system. This level sensor measures the elevation of water upstream of the treatment system and sends this signal to the PCC.
o Power distribution center, which is located outside of the channel on the south side of Pacific Coast Highway on railroad property. The power distribution center contains the control system for the ultraviolet disinfection system. The control system consists of shutoff relays that shut down the system when: the upstream water elevation is below the low set point or above the high set point. the flow measurement drops to zero. there is a ground fault detected in the system.
o Junction box located on the wall of the channel barrel to which the lamps and controls plug. This junction box contains terminal blocks and customized plugs for all power and control systems that feed each UV system. The interior components of the junction boxes are removed each winter and reinstalled each summer.
There is very little sedimentation upstream of the UV bacteria disinfection device during dry weather flow, although, even during the summer months the water through the system contained significant turbidity. The turbidity consisted of suspended solids which did not fall
Page 11 of 25

out upstream of the UV bacteria disinfection system. During sampling events it was noted that there was no sediment on the floor of the flood control channel upstream of the device. There is very little trash is this flood control channel during the dry season. Rainfall events can result in a large amount of trash in this system. There is a very large amount of green waste in this system during both dry weather and rainfall events. The green waste consists of both grass clippings and algae. Very thick (up to one foot), green algae grows on the invert of the concrete flood control channel for the bottom one mile of the watershed which is exposed to sunlight. There is no algal growth in the covered portions of the channel. Hence, an adequately designed upstream green waste capturing device is essential to proper system performance. Figure 8
Figure 8 is a photo of the operating UV system in the south barrel of the M01 flood control box about 200-ft upstream of the beach.
Page 12 of 25

El Camino Real
Avenida Vaquero
Pacific CoastHighway
In-line subsurface treatment system
In-line subsurface sediment basin
M01 SubsurfaceStorm Channel Cascaditas Storm Channel
Poche Beach
Debris Net
CaminoCapistrano
Power Control Center
Debris Net
Electric and Control Conduit
Figure 9
Page 13 of 25

Figure 10 Figure 10 is a photo of one of the UV devices at the factory in Vancouver, Canada
Figure 11 Figure 11 displays some minor leakage through the sandbag berm diverting water through the UV system.
Page 14 of 25

Figure 12 Figure 12 is a photo of a debris net installed on the M01 channel about one mile upstream of the beach where the trapezoidal concrete channel becomes a covered concrete box. Another net was installed on the Cascaditas Channel. The nets were ineffective in trapping any debris other than leaves and pine needles. The grass clippings passed through the nets and the algal growth occurs between the nets and the UV devices. There is surprisingly little quantity of litter in this system; however, the large amount of grass clippings, small branches, pine needles, leaves and algae more than make up for the little amount of litter. A more appropriate type of net would be the “sock” type with a permanently open mouth and ¼-inch openings. The two debris nets were funded by this CBI grant.
7. PROJECT RESULTS
On November 5, 2003 the system installation was completed in accordance with the plans and specifications. The system was pilot tested for one day prior to a storm event. The units were then stored at the County Operation and Maintenance yard in Anaheim for the winter. The units were reinstalled in the flood control channel on April 13, 2004. Several days after installation a storm event washed the sandbags from the system; however, there was no damage to the UV devices. The devices remained in the channel for the entire dry season until October 15, 2004.
Table 3 shows the results of the Poche UV bacteria disinfection system for the bacteria sampling events. The units are Colony Forming Units (CFU) per 100 ml of water. Bacteria samples were taken in triplicate. The numbers listed in Table 3 are an average of the triplicate samples taken. The result of each individual sample is located in the Appendix. The flow rate through each UV unit during each sample was approximately the same, 250 gallons per minute or greater (0.5 cfs to 0.75 cfs). All samples were tested by the County of Orange Public Health Laboratory, which is a State certified laboratory on Shellmaker Island in Newport Bay. The lead sampler for all sampling events was Karen Hauptly of the County RMDM/Environmental Resources.
Page 15 of 25

Table 3 – Results of Bacteria Testing November 5, 2003
North Barrel of M01 Flood Control Box Upstream of UV
Device Downstream of UV Device
Percent Bacteria Removal
Total Coliforms 76,670 6,300 91.8 Fecal Coliforms 37,330 2,267 93.9 Enterococcus 29,000 2,667 90.8 Note: Device was operating at full capacity South Barrel of M01 Flood Control Box Upstream of UV
Device Downstream of UV Device
Percent Bacteria Removal
Total Coliforms 68,330 4,800 93.0 Fecal Coliforms 14,700 1,193 91.9 Enterococcus 11,170 1,367 87.8 Note: Device was operating with one bulb out Scour Pond and Surf Zone at Outlet Total Coliforms Fecal Coliforms Enterococcus Scour Pond No data No data No data Surf zone at outlet No data No data No data
May 20, 2004 North Barrel of M01 Flood Control Box Upstream of UV
Device Downstream of UV Device
Percent Bacteria Removal
Total Coliforms 2,667 33 98.8 Fecal Coliforms 3,900 23 99.4 Enterococcus 4,733 27 99.4 Note: Device was operating at full capacity South Barrel of M01 Flood Control Box Upstream of UV
Device Downstream of UV Device
Percent Bacteria Removal
Total Coliforms 7,666 4,000 47.8 Fecal Coliforms 1,967 2,300 No Change Enterococcus 5,033 5,467 No Change Note: Device was partially operating Scour Pond and Surf Zone at Outlet Total Coliforms Fecal Coliforms Enterococcus Scour Pond 5,000 3,733 2,633 Surf zone at outlet 273 143 107
Page 16 of 25

June 16, 2004
North Barrel of M01 Flood Control Box Upstream of UV
Device Downstream of UV Device
Percent Bacteria Removal
Total Coliforms 40,333 42,333 Device not operating Fecal Coliforms 20,733 23,667 Device not operating Enterococcus 13,867 13,200 Device not operating Note: Device was not operating South Barrel of M01 Flood Control Box Upstream of UV
Device Downstream of UV Device
Percent Bacteria Removal
Total Coliforms 11,500 28,000 Device not operating Fecal Coliforms 10,540 8,133 Device not operating Enterococcus 6,667 5,973 Device not operating Note: Device was not operating Scour Pond and Surf Zone at Outlet Total Coliforms Fecal Coliforms Enterococcus Scour Pond No data No data No data Surf zone at outlet No data No data No data
July 21, 2004
North Barrel of M01 Flood Control Box Upstream of UV
Device Downstream of UV Device
Percent Bacteria Removal
Total Coliforms 56,666 20,333 64.1 Fecal Coliforms 44,333 17,667 60.2 Enterococcus 50,000 33,000 34.0 Note: Device was fully operational South Barrel of M01 Flood Control Box Upstream of UV
Device Downstream of UV Device
Percent Bacteria Removal
Total Coliforms 130,000 35,667 72.6 Fecal Coliforms 47,000 24,667 47.5 Enterococcus 104,000 57,667 44.6 Note: Device was fully operational Scour Pond and Surf Zone at Outlet Total Coliforms Fecal Coliforms Enterococcus Scour Pond 9,667 7,167 1,513 Surf zone at outlet 63 60 36
Page 17 of 25

August 19, 2004 North Barrel of M01 Flood Control Box Upstream of UV
Device Downstream of UV Device
Percent Bacteria Removal
Total Coliforms 276,667 41,667 84.9 Fecal Coliforms 80,000 38,000 52.5 Enterococcus 254,667 13,700 94.6 Note: Device was fully operational South Barrel of M01 Flood Control Box Upstream of UV
Device Downstream of UV Device
Percent Bacteria Removal
Total Coliforms 153,333 31,000 79.8 Fecal Coliforms 55,000 15,667 71.5 Enterococcus 55,333 11,067 80.0 Note: Device was fully operational Scour Pond and Surf Zone at Outlet Total Coliforms Fecal Coliforms Enterococcus Scour Pond 13,000 3,600 3,933 Surf zone at outlet 8,300 350 670
September 27, 2004
North Barrel of M01 Flood Control Box Upstream of UV
Device Downstream of UV Device
Percent Bacteria Removal
Total Coliforms 133,333 23,667 82.3 Fecal Coliforms 53,667 14,700 72.6 Enterococcus 42,667 11,100 74.0 Note: Device was fully operational South Barrel of M01 Flood Control Box Upstream of UV
Device Downstream of UV Device
Percent Bacteria Removal
Total Coliforms 120,000 39,333 67.2 Fecal Coliforms 36,667 23,000 37.3 Enterococcus 40,000 11,300 71.8 Note: Device was fully operational Scour Pond and Surf Zone at Outlet Total Coliforms Fecal Coliforms Enterococcus Scour Pond 10,533 3,200 2,900 Surf zone at outlet 1,633 510 277
Page 18 of 25

Samples of the algae were taken just upstream of the treatment system on July 21, 2004 for bacteria testing. The algae was sonified in sterile water and tested by the Orange County Health Care Agency laboratory. The bacteria levels attached to the algae are shown in Table 4.
Table 4 – Levels of bacteria attached to algae
Algae Total Coliforms Fecal Coliforms Enterococcus
Average Value 18,500,000 146,667 3,000,000
Additional testing of the scour pond and surf zone at the outlet were performed in compliance with the approved sampling plan dated September 2003. These tests included bacteria in the scour pond sediment, bacteria in the water overlying the sediment in the scour pond, bacteria in the sediment at the surf zone, and water overlying the sediment in the surf zone. The results of these bacteria tests are located in the Appendix.
Toxicity tests were taken of the water just upstream and just downstream of each of the two UV disinfection devices. The results of the toxicity tests indicate that the water is toxic. The result of the toxicity testing is located in the Appendix.
Grain size distribution analyses were performed at the scour pond and the ocean outlet for each of the sampling events. Particles in the surf zone were larger than in the scour pond. Scour pond particles tended toward silty sand. The results of the grain size distribution analyses are located in the Appendix.
8. ANALYSIS AND EFFECTIVENESS IN REACHING GOALS 1. The bacteria levels entering the Poche Beach UV bacteria disinfection system can be very
high. The month with the highest levels of bacteria was August 2004 with approximately 276,700 CFU per 100 ml of Total Coliform and 254,700 CFU per 100 ml of Enterococcus. This is approaching the bacteria levels found in water samples in sanitary sewer pipelines.
2. When the Poche Beach UV bacteria disinfection system was operating, the effectiveness was
approximately the following. Percent removal of Total Coliforms: 78% Percent removal of Fecal Coliforms: 63% Percent removal of Enterococcus: 68%
3. The effluent from the UV devices from both barrels, when fully operational, had higher
concentrations of Total Coliforms, Fecal Coliforms and Enterococcus than the scour pond. This could be from two sources; natural sunlight exposure (UV radiation) in the scour pond and dilution from high tides. The scour pond is exposed to sunlight while the flood control channel is dark. It is thought that the scour pond is a source of bacteria regrowth, which may very well be true; however, the most likely answer is that the bacteria levels exiting the UV
Page 19 of 25

device are still higher than ambient bacteria levels which can be supported naturally in the scour pond.
4. The scour pond had much higher concentrations of all indicator bacteria than the surf zone
which is expected due to increased dilution at the surf zone. 5. The bacteria levels upstream of the UV bacteria disinfection system differed greatly month to
month with May having the least amount of bacteria and August having the highest. This is consistent with the results of 16 years of bacteria sampling along the coast at this location by the County of Orange Health Care Agency.
6. The levels of bacteria attached to the algae and grass clippings are extremely high (300,000
cfu per 100 ml for enterococcus, 18,500,000 CFU per 100 ml for total coliforms, and 147,000 for fecal coliforms).
7. The bacteria removal rates appear to be reasonably good considering the interferences from
grass clippings and suspended solids due to the rudimentary filtration. However, the bacteria levels exiting the UV device are still very high even with the system fully operational.
8. The project resulted in superior quality water entering the scour pond during the summer of
2004. However, there was no reduction in the frequency of posting of the beach.
9. MONITORING AND SAMPLING LOCATIONS The monitoring and sampling locations were the same as those contained in the Sampling and Analysis Plan dated September 2003 with the following exception. The bacteria samples were not taken upstream of the upstream sandbag sediment dam. This was due to the inability to access this site which was about 40-ft upstream of the UV devices. The water depth on either side of the upstream dam was over 4-ft deep and dangerous to access. The sample taken upstream of the UV device was taken about 10-inches below the surface of the water about six inches upstream of the UV device. The sample taken downstream of the UV device was taken in the flow from the tail end of the UV device. The sample in the scour pond was taken along the south bank of the pond at approximately the middle. Each sample location was numbered 1 through 10 as shown in the Appendix. Poche Beach is posted about 80 percent of the year 500-ft upcoast and 500-ft downcoast of the mouth of the flood control channel. This posting is based on the sampling location located 100-ft upcoast of the outlet at the surf zone. This exact location has been sampled by the County of Orange Health Care Agency for 16 years. This data is on the web site www.ocbeachinfo.com. Starting in 2001, the County of Orange, Resources and Development Department (RDMD), Watershed and Coastal Resources Department has been sampling all the drains which enter onto
Page 20 of 25
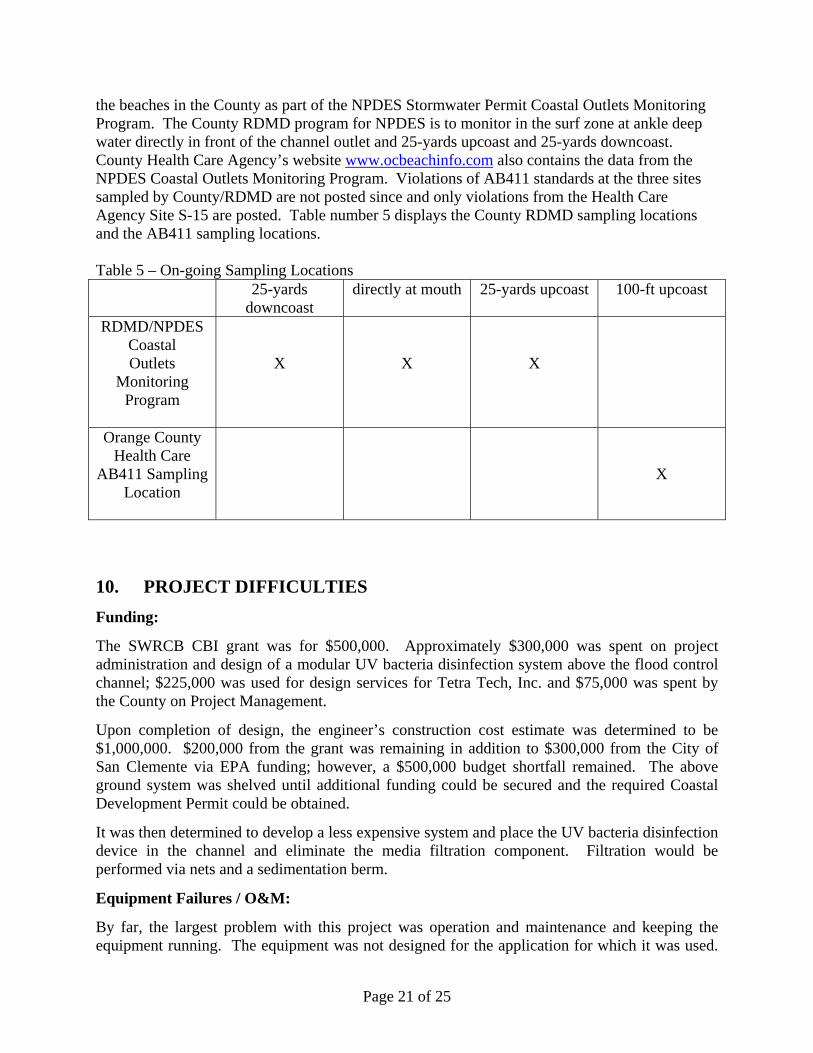
the beaches in the County as part of the NPDES Stormwater Permit Coastal Outlets Monitoring Program. The County RDMD program for NPDES is to monitor in the surf zone at ankle deep water directly in front of the channel outlet and 25-yards upcoast and 25-yards downcoast. County Health Care Agency’s website www.ocbeachinfo.com also contains the data from the NPDES Coastal Outlets Monitoring Program. Violations of AB411 standards at the three sites sampled by County/RDMD are not posted since and only violations from the Health Care Agency Site S-15 are posted. Table number 5 displays the County RDMD sampling locations and the AB411 sampling locations. Table 5 – On-going Sampling Locations
25-yards downcoast
directly at mouth 25-yards upcoast 100-ft upcoast
RDMD/NPDES Coastal Outlets
Monitoring Program
X
X
X
Orange County Health Care
AB411 Sampling Location
X
10. PROJECT DIFFICULTIES Funding:
The SWRCB CBI grant was for $500,000. Approximately $300,000 was spent on project administration and design of a modular UV bacteria disinfection system above the flood control channel; $225,000 was used for design services for Tetra Tech, Inc. and $75,000 was spent by the County on Project Management.
Upon completion of design, the engineer’s construction cost estimate was determined to be $1,000,000. $200,000 from the grant was remaining in addition to $300,000 from the City of San Clemente via EPA funding; however, a $500,000 budget shortfall remained. The above ground system was shelved until additional funding could be secured and the required Coastal Development Permit could be obtained.
It was then determined to develop a less expensive system and place the UV bacteria disinfection device in the channel and eliminate the media filtration component. Filtration would be performed via nets and a sedimentation berm.
Equipment Failures / O&M:
By far, the largest problem with this project was operation and maintenance and keeping the equipment running. The equipment was not designed for the application for which it was used.
Page 21 of 25

The equipment was designed to be used in the wastewater industry for final water quality polishing and was not made to be placed inside a flood control box. An extensive search of all manufacturers of ultraviolet light equipment indicates that no one produces equipment directly applicable to the intended use. Suntec Environmental Inc. is the only manufacturer of submersible UV ballasts and made the equipment most applicable to this installation. The equipment shorted out frequently. The equipment was under warranty and new supplies were mailed from the manufacturer at no cost; however, there were often several weeks of delays. There are many safety devices which protect the system from damage; however, these devices turn the system off with little provocation and must be manually restarted.
Green Waste:
It was observed that significant quantities of grass clippings and algae were accumulating at the inlet grate of the treatment systems. Operation and Maintenance crews used a garden rack to scrape the green waste from the front screen every two to three days to prevent the screen from plugging.
The two debris nets upstream on the M01 flood control channel and the Cascaditas channel are ineffective in capturing grass clippings and the algae is growing between the nets and the UV devices.
Coastal Development Permit:
The California Coastal Commission rejected the initial above ground treatment system for two reasons: (1) They called the scour pond an aquatic resource and did not want the scour pond filled; and, (2) they objected to the barrier in the flood control channel calling it a shoreline protective device which is now prohibited by the Coastal Act. These issues with the Coastal Commission together with the funding issue resulted in the decision to modify the project and install the bacteria disinfection device in the flood control channel.
Confined Space Requirement:
A confined space crew is required for all entry to the flood control box. The UV units were about 200-ft upstream of the intersection of the beach and concrete channel. This added three additional personnel to ensure the safety of the crews servicing the facility.
Summer rainfall events:
Within a week after the system was installed in the flood control channel in April 2004, a significant precipitation event occurred. This precipitation washed all the sandbags away; however, there was no damage to the UV devices.
Leakage through the sandbags:
A small amount of leakage through the sandbags occurred although it was a very minor amount.
Page 22 of 25

11. RECOMMENDATIONS FOR FUTURE PROJECT ENHANCEMENTS
The decision has been made to build appropriate infrastructure and place the UV bacteria disinfection system outside the flood control channel and include an extensive media filtration and backwash system. Construction of this system is anticipated to cost $1.2 to $1.9 million. The existing UV bacteria system on Aliso Creek (J01P28), which includes full media filtration, removes 99.9 percent of the bacteria so we know that UV disinfection will work with proper filtration. This project proved that it is required to remove the turbidity from the water prior to disinfection. Storm drain to sanitary sewer diversion is not possible at this location due to capacity issues in the sewer lines and at the sewage treatment plants.
Ninety (90) percent complete construction drawings for the above ground project were completed with this grant. The County of Orange has received a grant from the California Integrated Waste Management Board, with $424,000 remaining in the grant, to perform enhancements to the Poche UV device and move the units above ground. The City of San Clemente in January 2005 offered $500,000 ($300,000 from EPA and $200,000 in City water quality funds) to fund a portion of the project to move the system above ground and add filtration and backwash. The County will budget the remaining costs from its general fund. It is not known as this time if the existing UV devices will be utilized in the new project. In the event that the units are not used at Poche they will be utilized elsewhere in the County to improve water quality. The upgraded project consists of constructing a wet well adjacent to the flood control channel at the railroad bridge, install a rubber dam to keep out the tide and divert the urban runoff to the wetwell, install a pumping system in the wetwell, fabricate and install filtration, construct a backwash pipeline under the railroad tracks to the sewer, and construct a discharge system to the surf zone. The treatment system will be permanently installed on a new foundation beside the channel on railroad property. Shade fencing around treatment system will be required. Installation of a retaining wall will be required along Pacific Coast Highway. The following tasks will be necessary to install the system outside the channel (CEQA is complete and certified by the Orange County Board of Supervisors for the above ground system, California Regional Water Quality Control Board Region 9 (RWQCB-9) section 401 certification has been obtained, and Department of Fish and Game Section 1601 Streambed Alteration Agreement has been obtained): • Locate sufficient funding • Finalize the 90 percent complete plans, specifications, and contract documents for
construction • Obtain United States Army Corps of Engineers (USACOE) Section 404 Permit and possibly
Section 10 permit. A Section 10 permit may be needed because the rubber dam is in the intertidal zone.
Page 23 of 25

• Obtain California Coastal Commission Coastal Development Permit. • CEQA is complete and certified by the Orange County Board of Supervisors for the above
ground system. • California Regional Water Quality Control Board Region 9 (RWQCB-9) section 401
certification has been obtained for the above ground project. • Department of Fish and Game Section 1601 Streambed Alteration Agreement has been
obtained for the above ground project. • Approvals from the South Coast Water District for the backwash will be required. • Modify license agreement with railroad for extended footprint of system. • Solicit bids and hire a contractor.
12. CONCLUSIONS AND RECOMMENDATIONS Much was learned from this project. We learned that UV bacteria disinfection is not recommended deep inside a flood control box due to operation and maintenance issues. The indicator bacteria counts in this watershed are among the highest in all of Orange County most likely due to the fact that the upstream box is fully concrete lined from the beach to the headwaters and is mostly covered. The beach remained posted the entire summer even with 70 percent bacteria removal.
The most likely reason for the several occasions when the system removed 98 percent of the bacteria was that the intake into the system was largely plugged with algae resulting in a longer exposure to the UV light.
Education with regard to fertilizers and overwatering is highly recommended. Data indicates that the discharge rate varies greatly during the day which would appear that the culprit is overwatering. After education then strict enforcement should be implemented.
Removal of the greenbelt between the landfill and the golf course is recommended and replacement with native landscaping. This is a 300-ft wide strip of grass that is frequently irrigated and fertilized. The low flow water in the large concrete box under the greenbelt should be pumped to the proposed native landscaping above the flood control box.
Conversion of the golf course from grass which must be watered and mowed to artificial grass is recommended due to the irrigation runoff, mowed grass clippings, and fertilizers which can be eliminated. Construction of wetlands through the golf course is recommended. Politically it will not be possible to remove the concrete flood control box since it was installed recently (in the early 1990s) at the cost of several million dollars. Low flows should be diverted to a proposed natural swale through the golf course which was present until the early 90s.
One of the reasons the UV bacteria disinfection device did not show better results may be due to the 30 day geometric mean and the frequent times the devices were malfunctioning kept the beach posted.
Page 24 of 25

Installing the UV bacteria disinfection system outside the channel and providing full clay and sand media filtration and backwash and pumping the treated water directly to the ocean is recommended since it has proven to work in Orange County at the J01P28 facility.
Page 25 of 25