Embed Size (px)
Citation preview
1
Final Report for the Determining Patient Health Literacy during a Medicine Consultation Study
Paul Duell1; Allan Clark1; Neil Cooper1; David Wright1;
Jenny Hartt2; Tony Budd2; Debi Bhattacharya1
1 University of East Anglia, Norwich, NR4 7TJ, UK
2 Lay advisors, Norwich, UK
This report is independent research funded by Pharmacy Research UK. The views expressed in this publication are those of the author(s) and not necessarily those of Pharmacy Research UK.
2
Contents Main messages ..................................................................................................................................... 3
Background .......................................................................................................................................... 4
Methods................................................................................................................................................ 5
Design .............................................................................................................................................. 5
Study recruitment and activity ..................................................................................................... 6
Sample size .................................................................................................................................. 6
Quantitative data collection ............................................................................................................. 8
Quantitative data analysis ................................................................................................................ 8
Qualitative data collection and analysis ........................................................................................... 8
Study Management .......................................................................................................................... 8
Results .................................................................................................................................................. 9
Pharmacy characteristics .................................................................................................................. 9
Patient characteristics....................................................................................................................... 9
Health literacy levels of individuals using pharmacies .................................................................. 10
Accuracy of pharmacists’ ability to classify health literacy compared to the NVS ...................... 10
Use of the indicators by pharmacists during a medicine related consultation ............................... 11
Factors correlated to and predictors of health literacy ................................................................... 13
Patient demographic characteristics ........................................................................................... 13
Heuristic indicators .................................................................................................................... 13
Pharmacist accuracy of predicting health literacy with the indicators. ......................................... 14
Estimates of model parameters and precision ................................................................................ 15
Discussion ...................................................................................................................................... 16
Pharmacist accuracy................................................................................................................... 16
Effectiveness of the indicators ................................................................................................... 17
Why professionals over-estimate health literacy ....................................................................... 17
Limitations ................................................................................................................................. 18
Future directions ........................................................................................................................ 18
References ...................................................................................................................................... 19
3
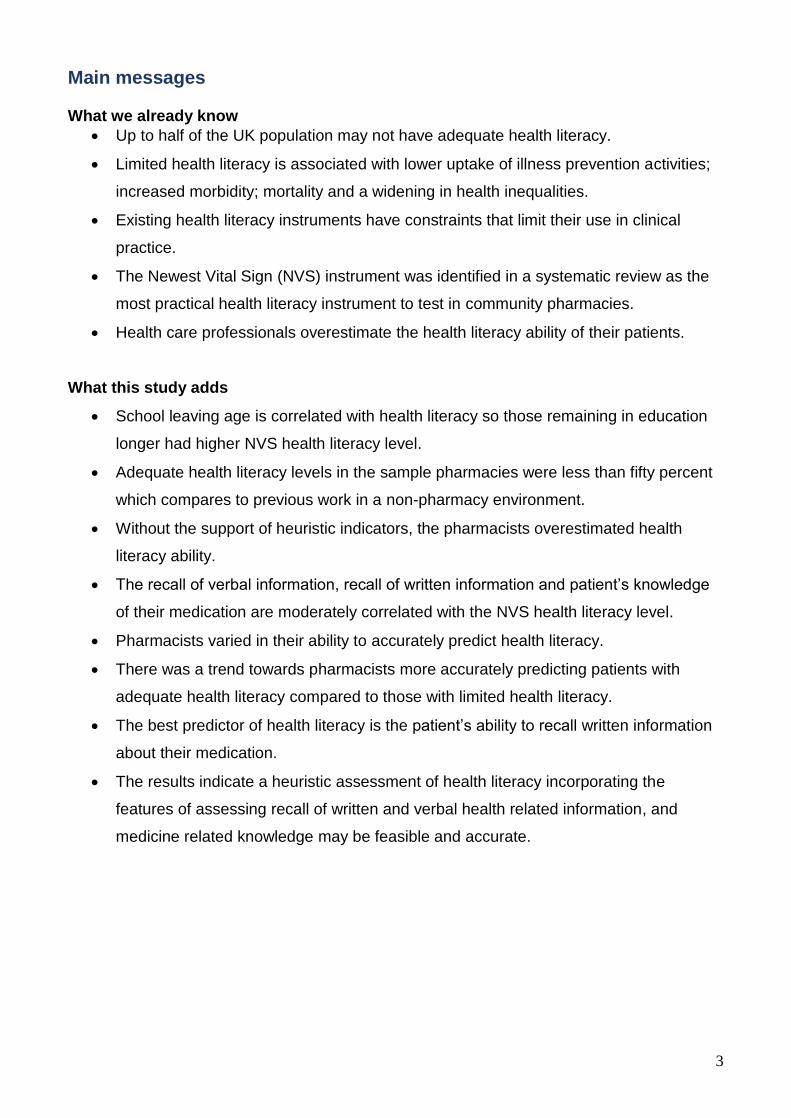
Main messages What we already know
Up to half of the UK population may not have adequate health literacy.
Limited health literacy is associated with lower uptake of illness prevention activities;
increased morbidity; mortality and a widening in health inequalities.
Existing health literacy instruments have constraints that limit their use in clinical
practice.
The Newest Vital Sign (NVS) instrument was identified in a systematic review as the
most practical health literacy instrument to test in community pharmacies.
Health care professionals overestimate the health literacy ability of their patients.
What this study adds
School leaving age is correlated with health literacy so those remaining in education
longer had higher NVS health literacy level.
Adequate health literacy levels in the sample pharmacies were less than fifty percent
which compares to previous work in a non-pharmacy environment.
Without the support of heuristic indicators, the pharmacists overestimated health
literacy ability.
The recall of verbal information, recall of written information and patient’s knowledge
of their medication are moderately correlated with the NVS health literacy level.
Pharmacists varied in their ability to accurately predict health literacy.
There was a trend towards pharmacists more accurately predicting patients with
adequate health literacy compared to those with limited health literacy.
The best predictor of health literacy is the patient’s ability to recall written information
about their medication.
The results indicate a heuristic assessment of health literacy incorporating the
features of assessing recall of written and verbal health related information, and
medicine related knowledge may be feasible and accurate.
4
Background Health literacy is ‘the degree to which individuals can obtain, process, and understand the
basic health information and services needed to make appropriate health decisions’ (1). Health
literacy ability is described as one of three categories: limited, marginal or adequate. Parts of
the UK have more than half of the population lacking adequate health literacy (2).
Limited health literacy prevents patients fully understanding their chronic diseases and
impacts on their ability to take their medicines as prescribed. Patients with limited health
literacy are ten to eighteen times more likely to be unable to recognise all of their medicines
compared to someone with adequate health literacy (3). Health literacy is not assessed in
routine healthcare practice. The approach adopted in the USA is a ‘universal precaution’ which
assumes that everyone has limited health literacy. However, this approach contradicts the
principle of patient-centred care and of tailoring communication to the individual’s
requirements. A simple, quick way to identify patients with limited health literacy, that is
acceptable to patients, would allow pharmacists to tailor their communication to best support
patients take their medicines correctly and manage their chronic diseases.
A systematic review of existing health literacy instruments (4) identified that the Newest Vital
Sign (NVS) may be a practical instrument to use in the research setting but there was little
evidence of its suitability for use in practice. The research team recently investigated the
acceptability and feasibility of using the NVS in a routine community pharmacy consultation.
This project established that whilst it was largely acceptable to patients, it would not be feasible
to incorporate into all routine consultations. There is therefore a need to investigate alternative
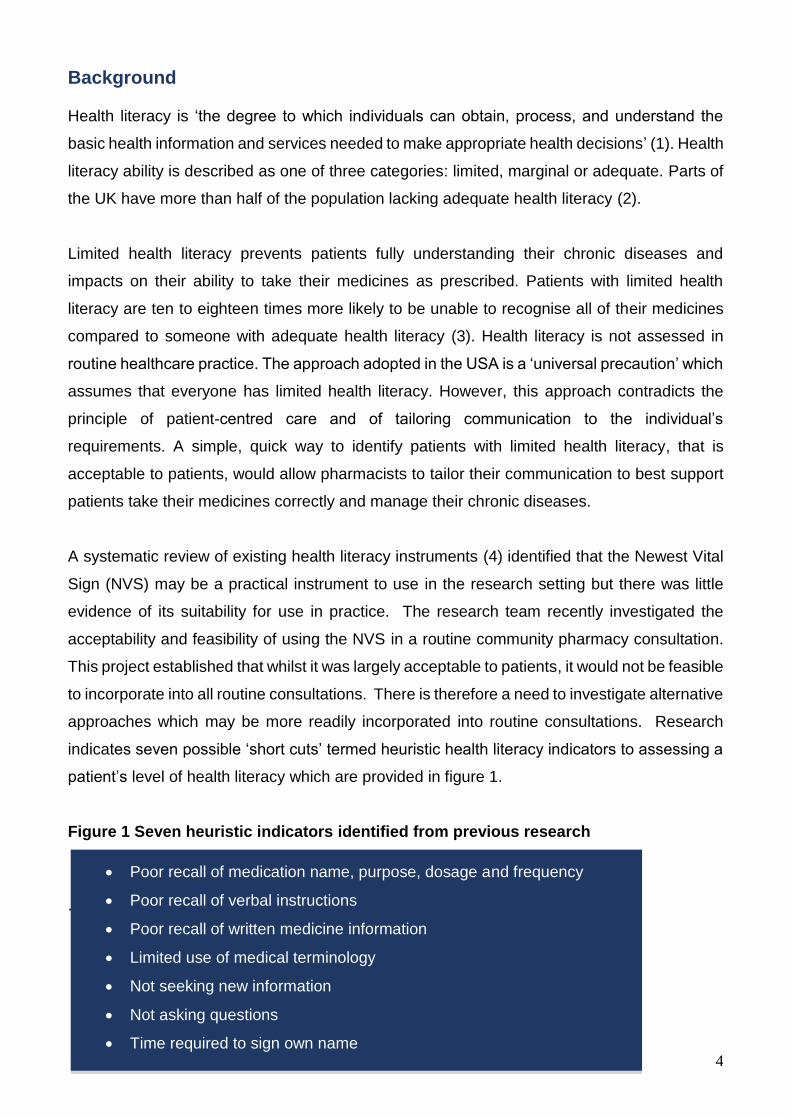
approaches which may be more readily incorporated into routine consultations. Research
indicates seven possible ‘short cuts’ termed heuristic health literacy indicators to assessing a
patient’s level of health literacy which are provided in figure 1.
Figure 1 Seven heuristic indicators identified from previous research
.
Poor recall of medication name, purpose, dosage and frequency
Poor recall of verbal instructions
Poor recall of written medicine information
Limited use of medical terminology
Not seeking new information
Not asking questions
Time required to sign own name
5
The present study investigates the use of these heuristics as a potential replacement for a
validated health literacy instrument such as the NVS. These heuristics were tested during a
pharmacist led medicine consultation to identify if they could be used to accurately assess a
patient’s health literacy level. The aims of the study were to:
estimate the health literacy levels of individuals using pharmacies
assess the accuracy of pharmacists’ ability to classify health literacy compared to the
NVS
characterise use of the heuristic indicators by pharmacists during a consultation
investigate factors correlated to and predictors of health literacy
assess the acceptability/appropriateness of approaches to health literacy assessment
in the community pharmacy
Methods Design
Mixed qualitative and quantitative methods were used to estimate the ability of the heuristic
indicators relative to the NVS, to accurately distinguish between patients with differing levels
of health literacy. Pharmacist interviews were used to assess the provisional acceptability to
community pharmacists of using the heuristic indicators in routine medicine consultations.
Pharmacy eligibility The study was open to all pharmacies in North East Essex CCG except online pharmacies.
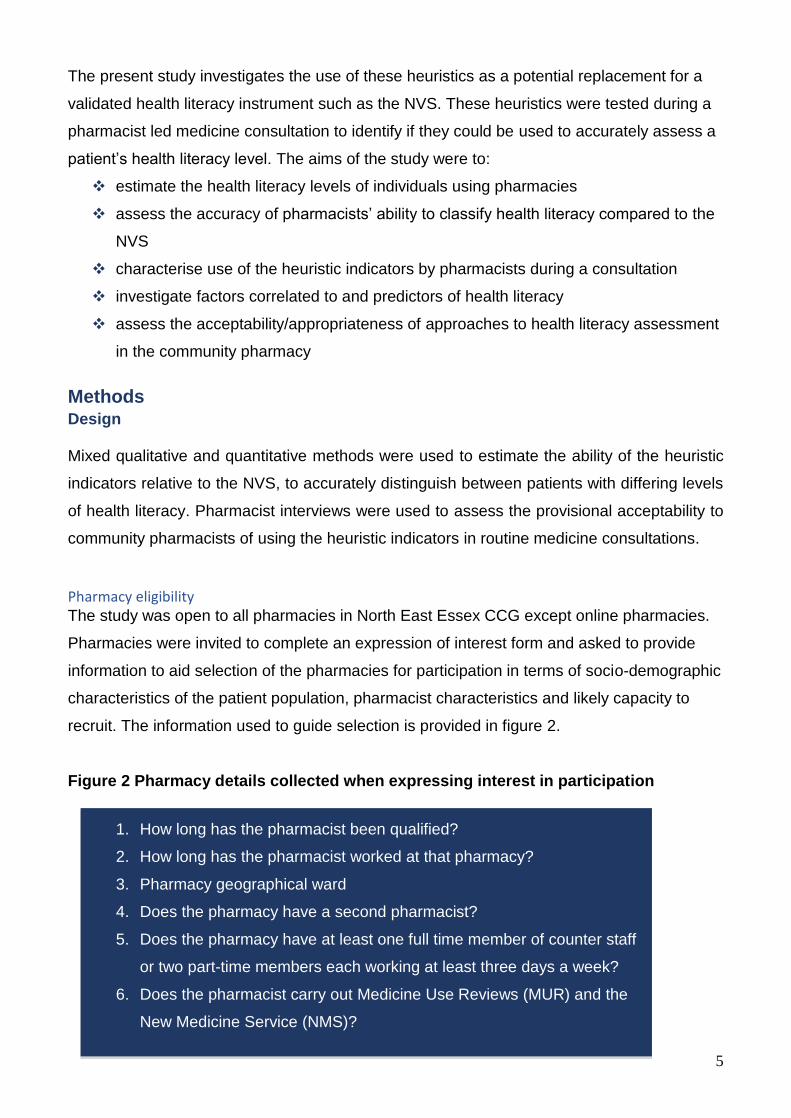
Pharmacies were invited to complete an expression of interest form and asked to provide
information to aid selection of the pharmacies for participation in terms of socio-demographic
characteristics of the patient population, pharmacist characteristics and likely capacity to
recruit. The information used to guide selection is provided in figure 2.
Figure 2 Pharmacy details collected when expressing interest in participation
1. How long has the pharmacist been qualified?
2. How long has the pharmacist worked at that pharmacy?
3. Pharmacy geographical ward
4. Does the pharmacy have a second pharmacist?
5. Does the pharmacy have at least one full time member of counter staff
or two part-time members each working at least three days a week?
6. Does the pharmacist carry out Medicine Use Reviews (MUR) and the
New Medicine Service (NMS)?
6
Study recruitment and activity
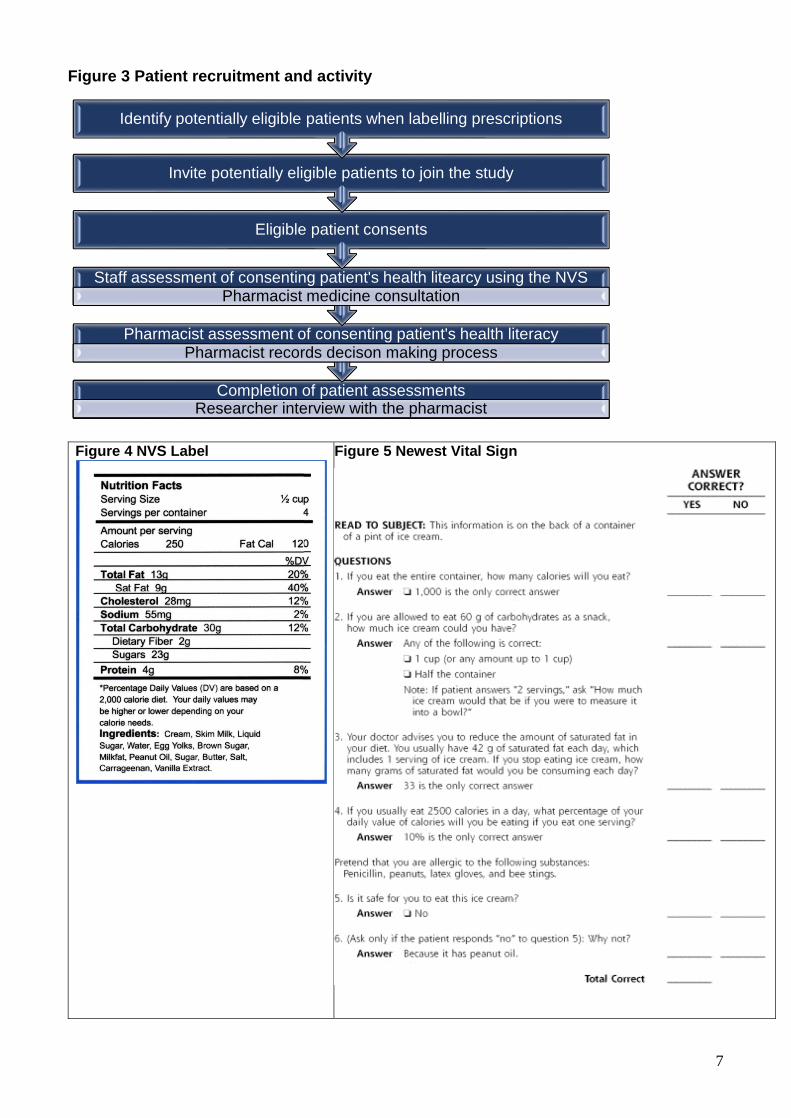
Figure 3 shows the process followed by the pharmacy teams to recruit and assess patients.
All adults prescribed at least one medication for treating high blood pressure were eligible for
study participation. The rationale for focussing on people with high blood pressure was that it
is a very common long term condition that requires prescription medication to regulate.
Patients providing written, informed consent were invited into the pharmacy consultation
room by a trained member of the pharmacy staff who further explained study procedures.
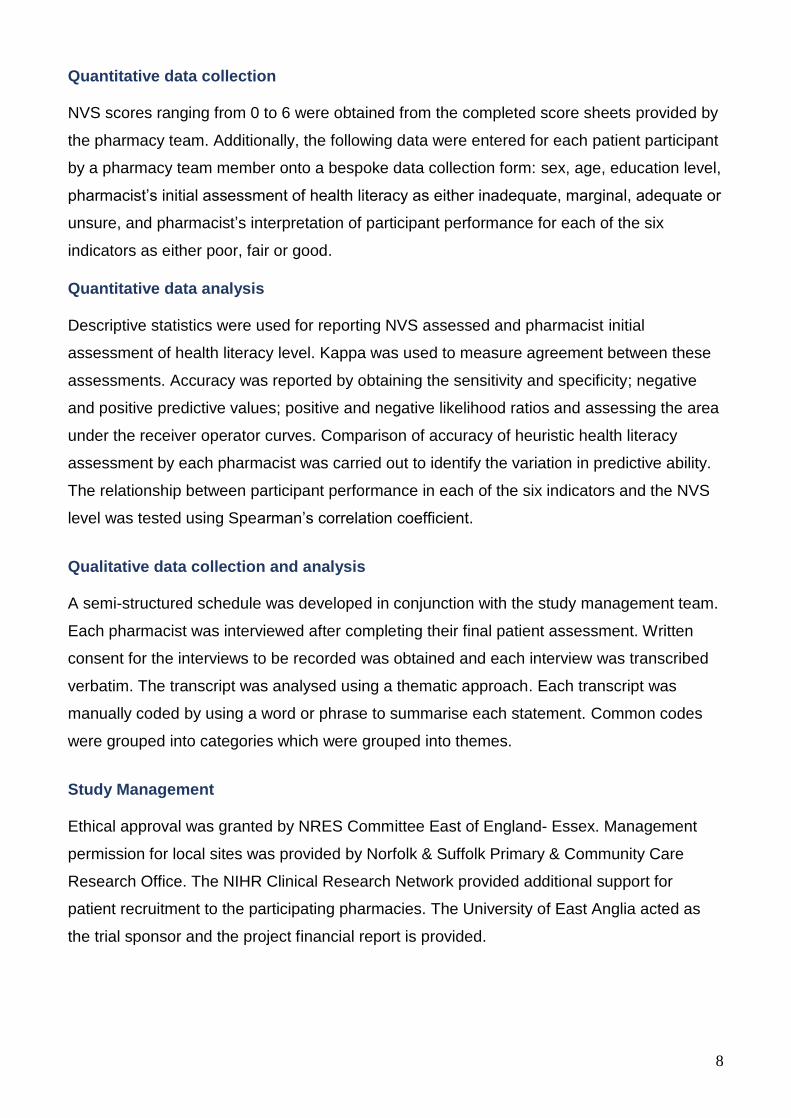
The NVS assessment was then undertaken as per figure 4 relating to the information
provided in figure 5. NVS scores of four or above indicate adequate health literacy, two to
three marginal and one or less indicate limited health literacy. On completing the NVS
assessment, the completed score sheet was sealed in a stamped addressed envelope for
return to the principal researcher. The patient was then directed to the pharmacist who was
given the patient’s unique reference number to add to subsequent documentation.
The pharmacist used their professional judgement to choose the topic of the medicine
consultation for the heuristic assessment. They were advised to structure the consultation to
trigger participants to demonstrate the heuristic indicators in figure 1. They then entered their
assessment for each indicator on a data collection form. After the participant left the
consultation room, the pharmacist entered a brief explanation of their decision making
process for determining the patient’s health literacy level. They also recorded on a scale of 0
to 10 how easy it was to incorporate each indicator into the consultation and indicated the
perceived value of each indicator in reaching their overall assessment of health literacy.
Sample size
With seven heuristic indicators, a sample size of 91 patients would provide sufficient power
to detect whether any of the heuristics are significantly associated with NVS assessed level
of health literacy.
7
Figure 3 Patient recruitment and activity
Figure 4 NVS Label
Figure 5 Newest Vital Sign
Completion of patient assessmentsResearcher interview with the pharmacist
Pharmacist assessment of consenting patient's health literacyPharmacist records decison making process
Staff assessment of consenting patient's health litearcy using the NVSPharmacist medicine consultation
Eligible patient consents
Invite potentially eligible patients to join the study
Identify potentially eligible patients when labelling prescriptions
8
Quantitative data collection
NVS scores ranging from 0 to 6 were obtained from the completed score sheets provided by
the pharmacy team. Additionally, the following data were entered for each patient participant
by a pharmacy team member onto a bespoke data collection form: sex, age, education level,
pharmacist’s initial assessment of health literacy as either inadequate, marginal, adequate or
unsure, and pharmacist’s interpretation of participant performance for each of the six
indicators as either poor, fair or good.
Quantitative data analysis
Descriptive statistics were used for reporting NVS assessed and pharmacist initial
assessment of health literacy level. Kappa was used to measure agreement between these
assessments. Accuracy was reported by obtaining the sensitivity and specificity; negative
and positive predictive values; positive and negative likelihood ratios and assessing the area
under the receiver operator curves. Comparison of accuracy of heuristic health literacy
assessment by each pharmacist was carried out to identify the variation in predictive ability.
The relationship between participant performance in each of the six indicators and the NVS
level was tested using Spearman’s correlation coefficient.
Qualitative data collection and analysis
A semi-structured schedule was developed in conjunction with the study management team.
Each pharmacist was interviewed after completing their final patient assessment. Written
consent for the interviews to be recorded was obtained and each interview was transcribed
verbatim. The transcript was analysed using a thematic approach. Each transcript was
manually coded by using a word or phrase to summarise each statement. Common codes
were grouped into categories which were grouped into themes.
Study Management
Ethical approval was granted by NRES Committee East of England- Essex. Management
permission for local sites was provided by Norfolk & Suffolk Primary & Community Care
Research Office. The NIHR Clinical Research Network provided additional support for
patient recruitment to the participating pharmacies. The University of East Anglia acted as
the trial sponsor and the project financial report is provided.
9
The study management committee consisted of all authors, including two patient members.
Meetings were held at all significant project time points, with a total of five meetings during
the study.
Results
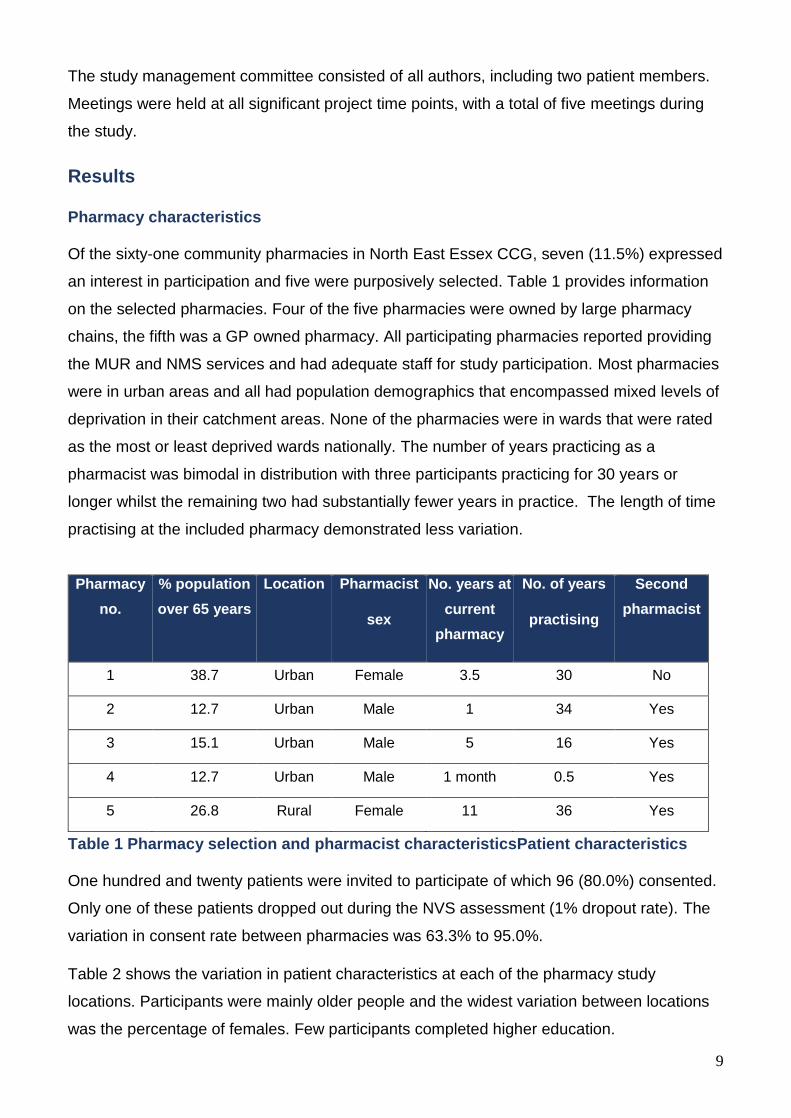
Pharmacy characteristics
Of the sixty-one community pharmacies in North East Essex CCG, seven (11.5%) expressed
an interest in participation and five were purposively selected. Table 1 provides information
on the selected pharmacies. Four of the five pharmacies were owned by large pharmacy
chains, the fifth was a GP owned pharmacy. All participating pharmacies reported providing
the MUR and NMS services and had adequate staff for study participation. Most pharmacies
were in urban areas and all had population demographics that encompassed mixed levels of
deprivation in their catchment areas. None of the pharmacies were in wards that were rated
as the most or least deprived wards nationally. The number of years practicing as a
pharmacist was bimodal in distribution with three participants practicing for 30 years or
longer whilst the remaining two had substantially fewer years in practice. The length of time
practising at the included pharmacy demonstrated less variation.
Pharmacy
no.
% population
over 65 years
Location Pharmacist
sex
No. years at
current
pharmacy
No. of years
practising
Second
pharmacist
1 38.7 Urban Female 3.5 30 No
2 12.7 Urban Male 1 34 Yes
3 15.1 Urban Male 5 16 Yes
4 12.7 Urban Male 1 month 0.5 Yes
5 26.8 Rural Female 11 36 Yes
Table 1 Pharmacy selection and pharmacist characteristicsPatient characteristics
One hundred and twenty patients were invited to participate of which 96 (80.0%) consented.
Only one of these patients dropped out during the NVS assessment (1% dropout rate). The
variation in consent rate between pharmacies was 63.3% to 95.0%.
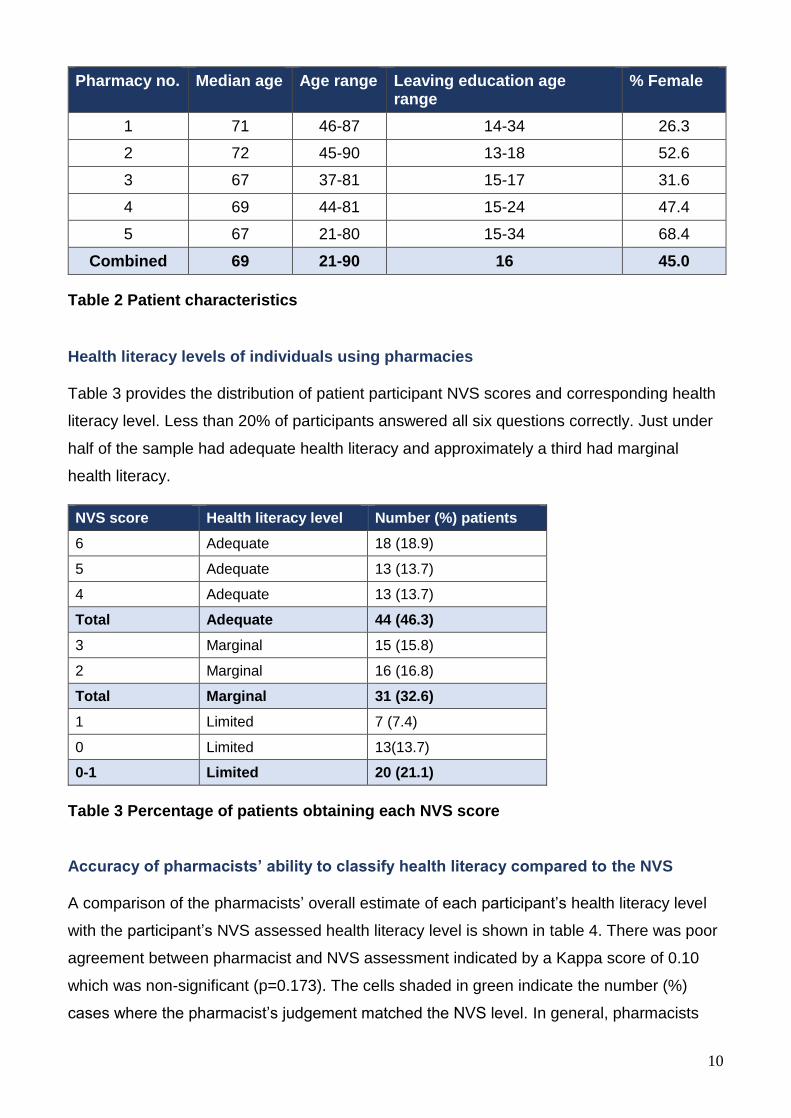
Table 2 shows the variation in patient characteristics at each of the pharmacy study
locations. Participants were mainly older people and the widest variation between locations
was the percentage of females. Few participants completed higher education.
10
Pharmacy no. Median age Age range Leaving education age range
% Female
1 71 46-87 14-34 26.3
2 72 45-90 13-18 52.6
3 67 37-81 15-17 31.6
4 69 44-81 15-24 47.4
5 67 21-80 15-34 68.4
Combined 69 21-90 16 45.0
Table 2 Patient characteristics
Health literacy levels of individuals using pharmacies
Table 3 provides the distribution of patient participant NVS scores and corresponding health
literacy level. Less than 20% of participants answered all six questions correctly. Just under
half of the sample had adequate health literacy and approximately a third had marginal
health literacy.
NVS score Health literacy level Number (%) patients
6 Adequate 18 (18.9)
5 Adequate 13 (13.7)
4 Adequate 13 (13.7)
Total Adequate 44 (46.3)
3 Marginal 15 (15.8)
2 Marginal 16 (16.8)
Total Marginal 31 (32.6)
1 Limited 7 (7.4)
0 Limited 13(13.7)
0-1 Limited 20 (21.1)
Table 3 Percentage of patients obtaining each NVS score
Accuracy of pharmacists’ ability to classify health literacy compared to the NVS
A comparison of the pharmacists’ overall estimate of each participant’s health literacy level
with the participant’s NVS assessed health literacy level is shown in table 4. There was poor
agreement between pharmacist and NVS assessment indicated by a Kappa score of 0.10
which was non-significant (p=0.173). The cells shaded in green indicate the number (%)
cases where the pharmacist’s judgement matched the NVS level. In general, pharmacists
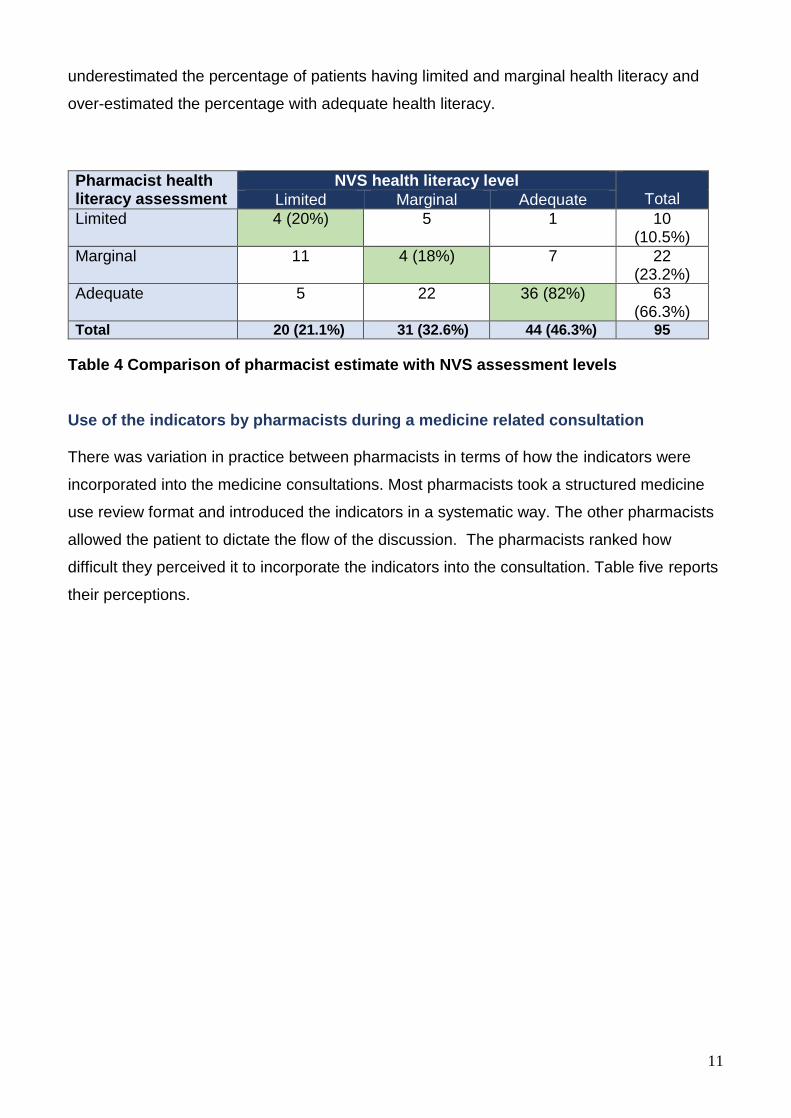
11
underestimated the percentage of patients having limited and marginal health literacy and
over-estimated the percentage with adequate health literacy.
Pharmacist health literacy assessment
NVS health literacy level Total Limited Marginal Adequate
Limited 4 (20%) 5 1 10 (10.5%)
Marginal 11 4 (18%) 7 22 (23.2%)
Adequate 5 22 36 (82%) 63 (66.3%)
Total 20 (21.1%) 31 (32.6%) 44 (46.3%) 95
Table 4 Comparison of pharmacist estimate with NVS assessment levels
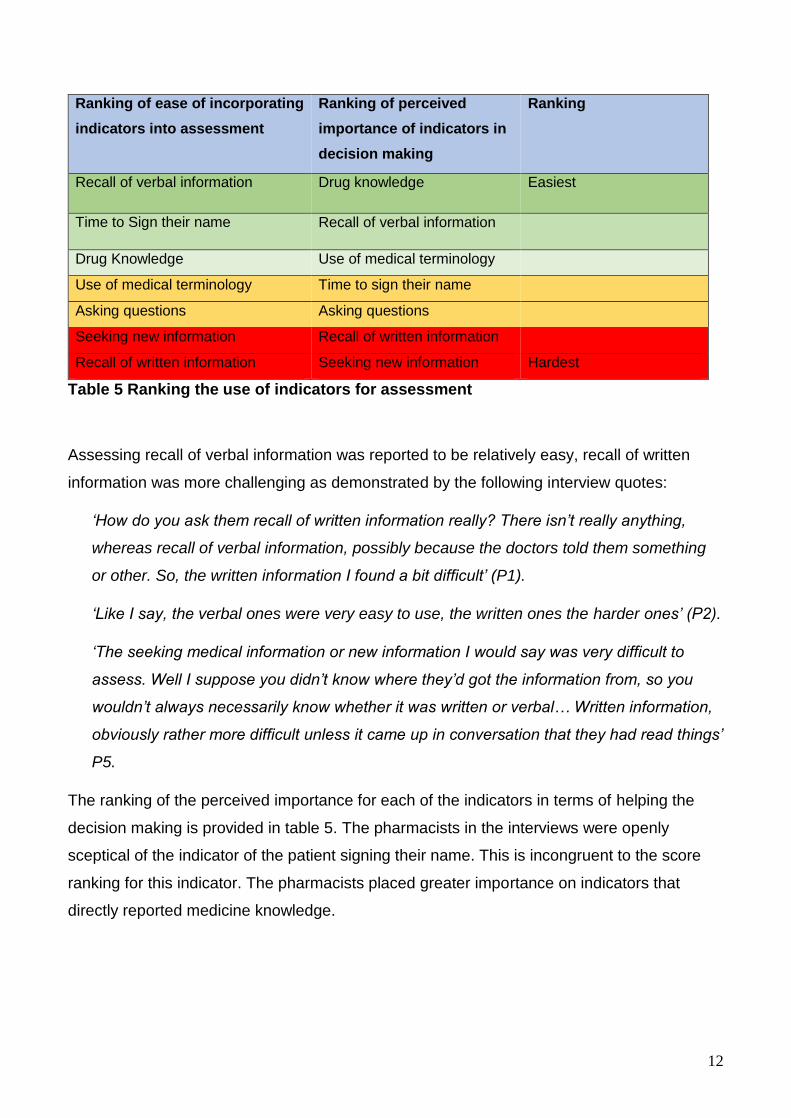
Use of the indicators by pharmacists during a medicine related consultation
There was variation in practice between pharmacists in terms of how the indicators were
incorporated into the medicine consultations. Most pharmacists took a structured medicine
use review format and introduced the indicators in a systematic way. The other pharmacists
allowed the patient to dictate the flow of the discussion. The pharmacists ranked how
difficult they perceived it to incorporate the indicators into the consultation. Table five reports
their perceptions.
12
Ranking of ease of incorporating
indicators into assessment
Ranking of perceived
importance of indicators in
decision making
Ranking
Recall of verbal information Drug knowledge Easiest
Time to Sign their name Recall of verbal information
Drug Knowledge Use of medical terminology
Use of medical terminology Time to sign their name
Asking questions Asking questions
Seeking new information Recall of written information
Recall of written information Seeking new information Hardest
Table 5 Ranking the use of indicators for assessment
Assessing recall of verbal information was reported to be relatively easy, recall of written
information was more challenging as demonstrated by the following interview quotes:
‘How do you ask them recall of written information really? There isn’t really anything,
whereas recall of verbal information, possibly because the doctors told them something
or other. So, the written information I found a bit difficult’ (P1).
‘Like I say, the verbal ones were very easy to use, the written ones the harder ones’ (P2).
‘The seeking medical information or new information I would say was very difficult to
assess. Well I suppose you didn’t know where they’d got the information from, so you
wouldn’t always necessarily know whether it was written or verbal… Written information,
obviously rather more difficult unless it came up in conversation that they had read things’
P5.
The ranking of the perceived importance for each of the indicators in terms of helping the
decision making is provided in table 5. The pharmacists in the interviews were openly
sceptical of the indicator of the patient signing their name. This is incongruent to the score
ranking for this indicator. The pharmacists placed greater importance on indicators that
directly reported medicine knowledge.
13
Factors correlated to and predictors of health literacy
Patient demographic characteristics
No significant relationships were observed between the level of health literacy and sex
(Spearman’s R=-0.14, p=0.18) or age (Spearman’s R=-0.16, p=0.13) however, older school
leaving age was significantly correlated with better health literacy (Spearman’s R=0.34,
p<0.0001).
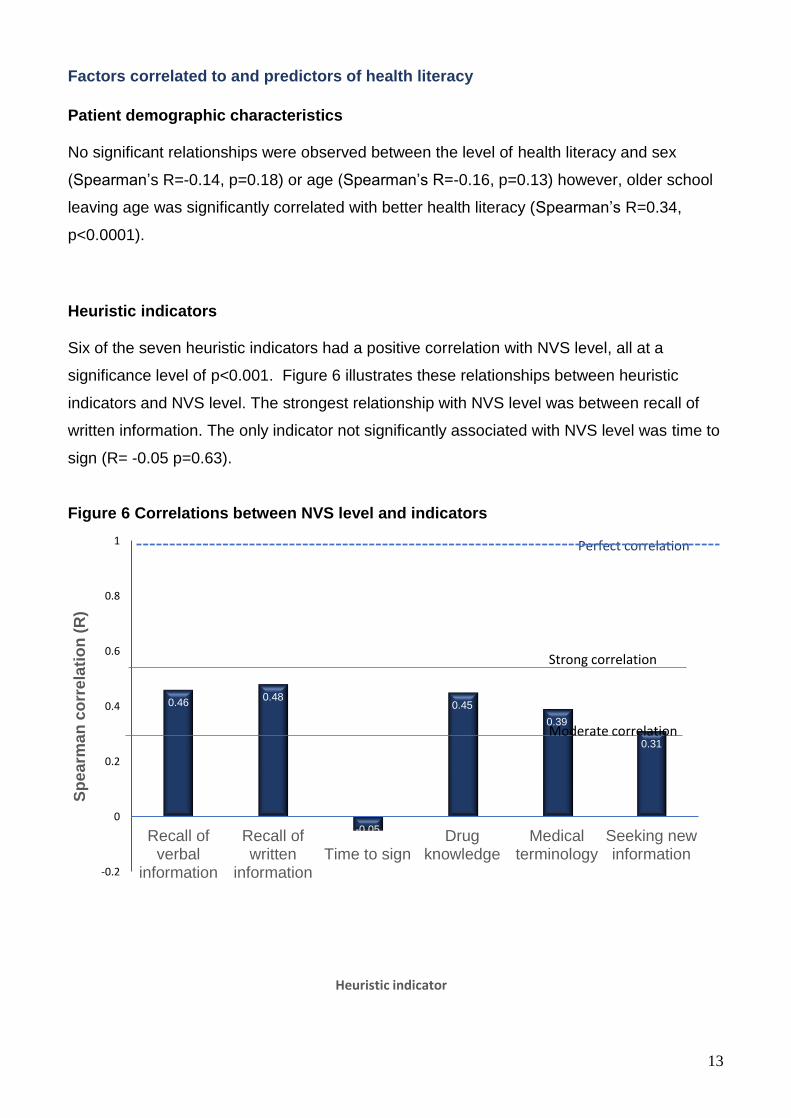
Heuristic indicators
Six of the seven heuristic indicators had a positive correlation with NVS level, all at a
significance level of p<0.001. Figure 6 illustrates these relationships between heuristic
indicators and NVS level. The strongest relationship with NVS level was between recall of
written information. The only indicator not significantly associated with NVS level was time to
sign (R= -0.05 p=0.63).
Figure 6 Correlations between NVS level and indicators
0.460.48
-0.05
0.45
0.39
0.31
-0.2
0
0.2
0.4
0.6
0.8
1
Recall ofverbal
information
Recall ofwritten
informationTime to sign
Drugknowledge
Medicalterminology
Seeking newinformation
Sp
ea
rma
n c
orr
ela
tio
n (
R)
Heuristic indicator
Strong correlation
Moderate correlation
Perfect correlation

14
Pharmacist accuracy of predicting health literacy with the indicators.
Combining limited and marginal health literacy levels improved the predictive ability of the
pharmacists to identify limited health literacy. Table 6 shows the positive predictive values for
each pharmacist and the 95% confidence intervals. The confidence intervals and the
predictive capability of the pharmacists varied considerably.
Table 6. Pharmacists’ predictive ability to identify limited health literacy
Combining marginal and adequate health literacy increased the predictive ability of all the
pharmacists to identify adequate health literacy. Table 7 shows the predictive capability of
pharmacists to identify patients with adequate health literacy. The positive predictive value
indicates the likelihood that an obtained limited health literacy result is correct. The three
most experienced pharmacists’ accuracy for all of the indicators for true negative cases
(adequate health literacy) was greater than 89%. The most experienced pharmacist only
missed one true negative case for the indicator use of medical terminology.
Table 7 Pharmacists predictive ability to identify adequate health literacy
The NPV indicates the likelihood that an adequate health literacy assessment obtained is
correct. The ranking of Negative Predictive Values (NPV) scores obtained by the
pharmacists matched their length of experience as practising pharmacists. That is, the
pharmacist with the longest experience had the highest NPV and second longest second
highest down to the least experienced who scored lowest. The 95% confidence interval
Limited and marginal combined
Pharmacist number Positive Predictive Value (PPV)
PPV 95%Cl
5 84.9 76.3-90.7
4 78.3 69.6-85.1
1 75.6 68.4-81.2
2 66.7 50.7-79.5
3 47.2 40.4-54.2
Pharmacy number Negative Predictive Value (NPV)
NPV 95%Cl
5 98.6 91.4-99.8
2 97.4 97.4-97.4
1 91.7 85.0-95.5
3 89.2 86.7-91.3
4 74.4 69.5-78.9
15
ranges indicate that there was a significant difference between the least experienced
pharmacist (practising for less than one year) and the other pharmacists. The Pearson
correlation between the length of time practising and the NPV was r= 0.97 p=0.01.
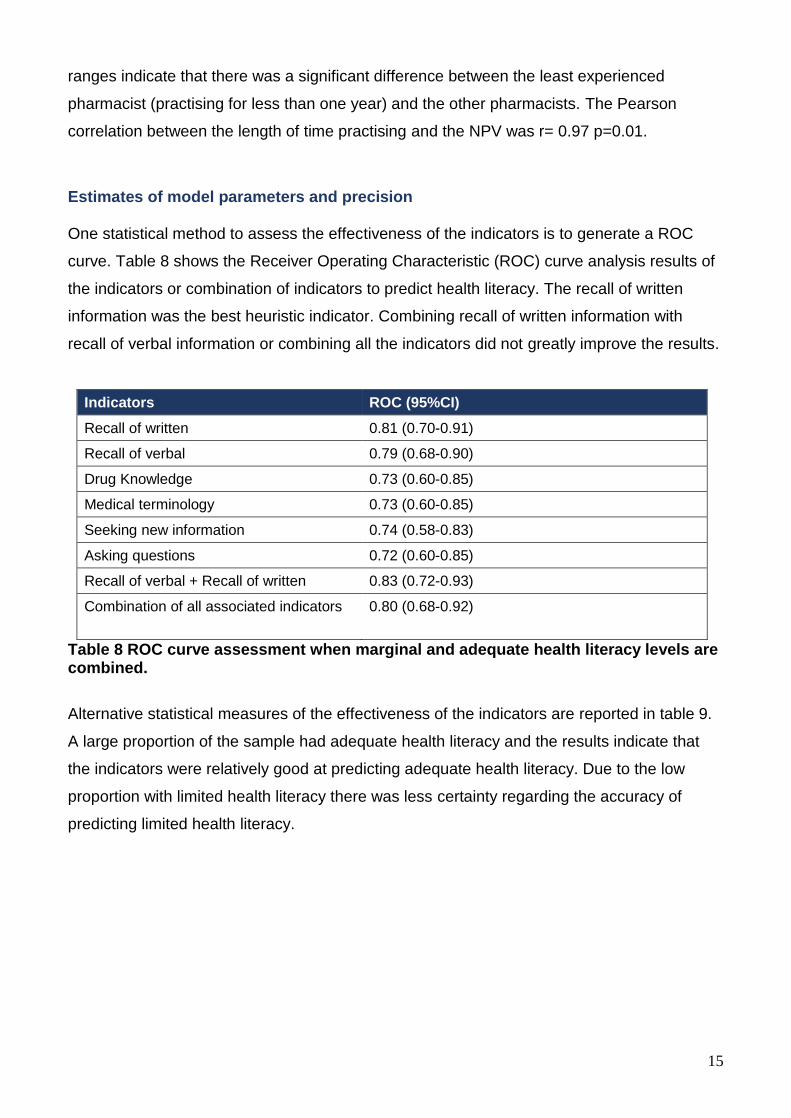
Estimates of model parameters and precision
One statistical method to assess the effectiveness of the indicators is to generate a ROC
curve. Table 8 shows the Receiver Operating Characteristic (ROC) curve analysis results of
the indicators or combination of indicators to predict health literacy. The recall of written
information was the best heuristic indicator. Combining recall of written information with
recall of verbal information or combining all the indicators did not greatly improve the results.
Indicators ROC (95%CI)
Recall of written 0.81 (0.70-0.91)
Recall of verbal 0.79 (0.68-0.90)
Drug Knowledge 0.73 (0.60-0.85)
Medical terminology 0.73 (0.60-0.85)
Seeking new information 0.74 (0.58-0.83)
Asking questions 0.72 (0.60-0.85)
Recall of verbal + Recall of written 0.83 (0.72-0.93)
Combination of all associated indicators
0.80 (0.68-0.92)
Table 8 ROC curve assessment when marginal and adequate health literacy levels are combined.
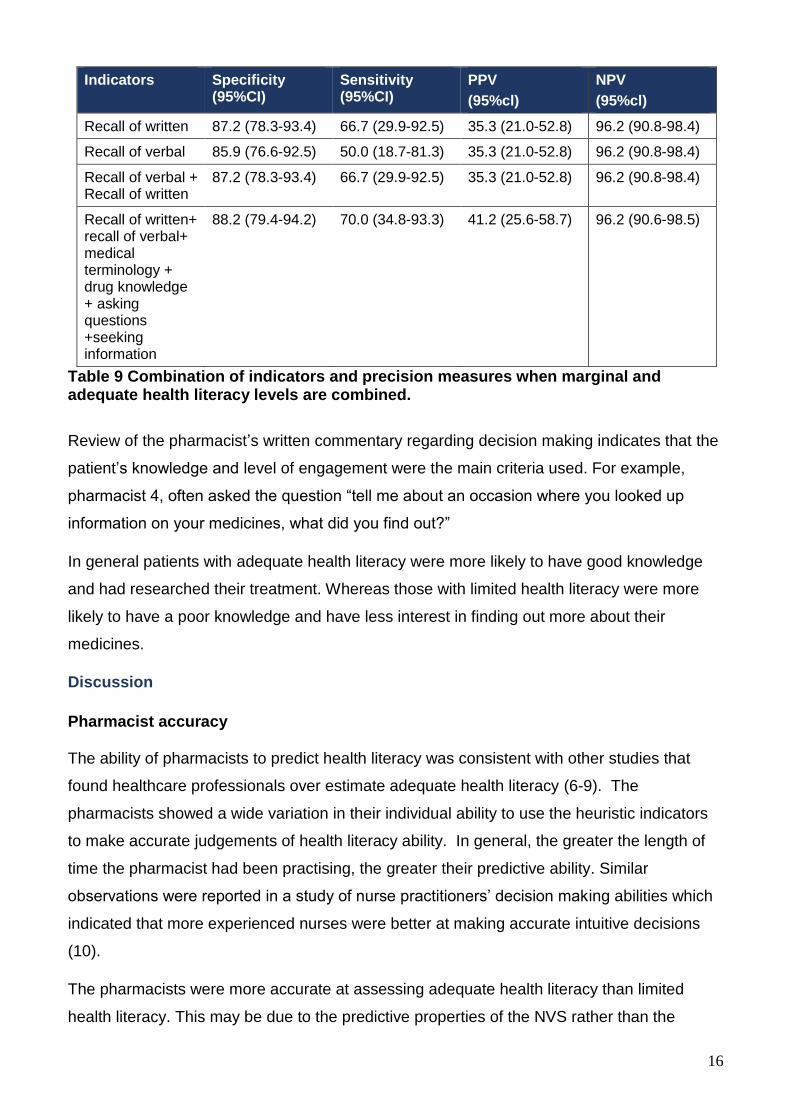
Alternative statistical measures of the effectiveness of the indicators are reported in table 9.
A large proportion of the sample had adequate health literacy and the results indicate that
the indicators were relatively good at predicting adequate health literacy. Due to the low
proportion with limited health literacy there was less certainty regarding the accuracy of
predicting limited health literacy.
16
Indicators Specificity (95%CI)
Sensitivity (95%CI)
PPV
(95%cl)
NPV
(95%cl)
Recall of written 87.2 (78.3-93.4) 66.7 (29.9-92.5) 35.3 (21.0-52.8) 96.2 (90.8-98.4)
Recall of verbal 85.9 (76.6-92.5) 50.0 (18.7-81.3) 35.3 (21.0-52.8) 96.2 (90.8-98.4)
Recall of verbal + Recall of written
87.2 (78.3-93.4) 66.7 (29.9-92.5) 35.3 (21.0-52.8) 96.2 (90.8-98.4)
Recall of written+ recall of verbal+ medical terminology + drug knowledge + asking questions +seeking information
88.2 (79.4-94.2) 70.0 (34.8-93.3) 41.2 (25.6-58.7) 96.2 (90.6-98.5)
Table 9 Combination of indicators and precision measures when marginal and adequate health literacy levels are combined.
Review of the pharmacist’s written commentary regarding decision making indicates that the
patient’s knowledge and level of engagement were the main criteria used. For example,
pharmacist 4, often asked the question “tell me about an occasion where you looked up
information on your medicines, what did you find out?”
In general patients with adequate health literacy were more likely to have good knowledge
and had researched their treatment. Whereas those with limited health literacy were more
likely to have a poor knowledge and have less interest in finding out more about their
medicines.
Discussion
Pharmacist accuracy
The ability of pharmacists to predict health literacy was consistent with other studies that
found healthcare professionals over estimate adequate health literacy (6-9). The
pharmacists showed a wide variation in their individual ability to use the heuristic indicators
to make accurate judgements of health literacy ability. In general, the greater the length of
time the pharmacist had been practising, the greater their predictive ability. Similar
observations were reported in a study of nurse practitioners’ decision making abilities which
indicated that more experienced nurses were better at making accurate intuitive decisions
(10).
The pharmacists were more accurate at assessing adequate health literacy than limited
health literacy. This may be due to the predictive properties of the NVS rather than the
17
heuristic indicators. Validation of the NVS (11) demonstrated that it had a high specificity for
detecting adequate health literacy.
Effectiveness of the indicators
The indicator ‘recall of written information’ was most effective of the six tested. It had similar
success in predicting health literacy as other validated tools. (12) (13) In contrast to
previously reported tools, we have demonstrated that this indicator is suitable for use within
a standard medicine related consultation. Combining all six indicators that had a significant
correlation with NVS score did not greatly improve the overall effectiveness as a health
literacy assessment. Based on the data obtained, the small increase is effectiveness is
insufficient to warrant further exploration of combining all six indicators.
The percentage of the sample that had adequate health literacy is comparable to a larger UK
NVS study carried out in Stoke (2). Consequently, the health literacy levels observed in this
study may be generaliseable to the wider community pharmacy environment.
The current thinking on health literacy assessment recommends the use of the ‘universal
precaution’ approach (14) The universal precaution approach is to treat all individuals as
potentially having limited health literacy. However, patient-centred care is based on treating
people as individuals and not treating them all the same regardless of their needs.
The level of limited health literacy observed, in this study, would suggest that 80% of the
sample would be inappropriately treated as having limited health literacy if a universal
approach was applied. The assessment of an individual’s recall of written information could
be used to identify those patients that have adequate health literacy thereby allowing all
patients to have information tailored to their personal needs.
Further work is required with a larger study sample size to reduce the uncertainty of the
predictive accuracy for identifying limited health literacy.
Why professionals over-estimate health literacy
This study is the first to collect information on why clinicians over estimate health literacy.
The pharmacists provided explanations of how they estimated individual’s health literacy
ability. When the comments were compared for individuals having the same health literacy
level themes were identified. The themes of patient knowledge and patient engagement
were clearly visible within each health literacy level. The variation in patient knowledge and
engagement between each health literacy level suggests a pattern of increasing knowledge
18
and engagement with higher health literacy levels. This pattern is concordant with previous
research indicating that those with limited health literacy are less likely to access information
and lack health knowledge (15)’. However, for each health literacy level, there were
exceptions to the expected pattern. Therefore, if the pattern was being used by pharmacists
to inform their health literacy assessment it is unsurprising that they occasionally reached the
wrong conclusion.
Pharmacist 5 who was the most accurate at using the indicators referred frequently to the
importance of the individual’s ability to correctly pronounce medical terms and conditions.
The pharmacist was therefore using a heuristic version of the REALM instrument (16) as part
of her decision making. It is unclear to what extent this heuristic version of REALM
influenced her final decisions. It does raise the possibility that future research could explore
the use of a heuristic use of REALM as an alternative mechanism to assess health literacy.
In contrast to the quantitative findings the pharmacists perceived using the recall of written
information the hardest indicator to incorporate into a consultation. However, any further
research which would have to include guidance on how to use the indicator in a consistent
way. This guidance could therefore address these initial concerns and lead to a fully
validated heuristic assessment observation or direct question.
Limitations
The variation in proportion of patients with limited health literacy at each pharmacy may
impact on the comparison between the samples. NPV values are susceptible to changes in
the underlying prevalence however other measures of accuracy used in this study are less
prone to be affected.
Future directions
The recall of written information potentially could be used to guide the tailoring of information
to patients in community pharmacies. However, due to a relatively small proportion of study
participants having limited health literacy, there is a high degree of uncertainty regarding the
accuracy of this indicator. A further study with a larger sample size is required to see if the
same level of accuracy in predicting health literacy for patients with adequate health literacy
can be replicated for those with limited health literacy.
Further work is also required to formulate more structured guidance on how to use the
heuristic in consistent way so that the predictive ability demonstrated by the experienced
pharmacists can be replicated by all.
19
References
1. Ratzan S, Parker M. Introduction: Health Literacy. 2000. National Library of Medicine. National Institute of Health.
2. Protheroe J, Whittle R, Bartlam B, et al. Health literacy, associated lifestyle and demographic factors in adult population of an English City: a cross-sectional survey. Health Expectations 2016; doi:10.1111/hex.12440
3. Kripalani S, Henderson L, Chiu E, et al. Predictors of mediaction self-management skill in a low-litearcy population. Journal of General Internal Medicine. 2006;21
4. Duell P, Wright D, Renzaho A, Bhattacharya D. Optimal health litearcy measurement for the clinical setting: a systematic review. Patient Education and Counseling 2015; 98(11):1295-307
5. Rowlands G, Khazaezadeh N, Oteng-Ntim E, et al. Development and vaildation of a measure of health litearcy in the UK: the newest vital sign. BMC Public Health 2013; 13:116
6. Lindau ST, Tomori C, Lyons T, Langseth L, Bennett CL, Garcia P. The association of health literacy with cervical cancer prevention knowledge and health behaviors in a multiethnic cohort of women. American Journal of Obstetrics and Gynecology. 2002;186(5):938-43.
7. Kelly P, Haidet P. Physician overestimation of patient literacy: a potential source ofvhealth care disparities. Patient Educationnand Counselling. 2007;66(1):119-22.
8. Bass P, Wilson J, Griffith C, Barnett D. Residents Ability to identify patients with poor literacy skills. Academic Medicine. 2002;77:1039-41.
9. Carpenter C, Kaphingst K, Goodman M, Lin M, Melson A, Griffey R. Feasibility and diagnostic accuracy of brief health literacy and numeracy screening instruments in an urban emergency department. Academic Emergency Medicine. 2014;21:137-46.
10. Chen AMH, Yehle KS, Albert NM, Ferraro KF, Mason HL, Murawski MM, et al. Original Research: Relationships between health literacy and heart failure knowledge, self-efficacy, and self-care adherence. Research in Social and Administrative Pharmacy. 2014;10:378-86.
11. Weiss BD, Mays MZ, Martz W, Castro KM, DeWalt DA, Pignone MP, et al. Quick Assessment of Literacy in Primary Care: The Newest Vital Sign. The Annals of Family Medicine. 2005;3(6):514-22.
12. Chew LD, Griffin JM, Partin MR, al. e. Validation of screening questions for limited health literacy in a large VA outpatient population. J Gen Intern Med. 2008;23(5).
13. Goodman M, Griffey R, Carpenter C, al. e. Do subjective measures improve the ability to identify limited health literacy in a clinical setting? Journal of the American Board of Family Medicine. 2015;28(5):584-94.
14. Paasche-Orlow M, Wolf M. Evidence does not support clinical screening of literacy. Journal of Internal Medicine. 2008;23:100-2.
15. Arnold CL, Rademaker A, Bailey SC, Esparza JM, Reynolds C, Liu D, et al. Literacy barriers to colorectal cancer screening in community clinics. J Health Commun. 2012;17 Suppl 3:252-64.
16. Davis TC, Long SW, Jackson RH, Mayeaux EJ, George RB, Murphy PW, et al. Rapid estimate of adult literacy in medicine: A shortened screening instrument. Family Medicine. 1993;25(6):391-5.