Embed Size (px)
Citation preview

Technical Memorandum 104815
Final Report for theUltralight Fabric Reflux Tube(UFRT) Thermal/Vacuum Test
K. M. HurlbertM. K. EwertJ. P. GrafJ. R. KellerK. A. PauleyR. J. GuentherZ. I. Antoniak
March 1996

Technical Memorandum 104815
Final Report for theUltralight Fabric Reflux Tube(UFRT) Thermal/Vacuum Test
K. M. Hurlbert and M. K. EwertLyndon B. Johnson Space CenterHouston, Texas 77058
J. P. Graf and J. R. KellerLockheed-Martin Engineering & SciencesHouston, Texas 77058
K. A. Pauley, R. J. Guenther, and Z. I. AntoniakBattelle, Pacific Northwest LaboratoriesRichland, Washington 99352
March 1996

ii
ACKNOWLEDGMENTS
The authors would like to express their gratitude to Cindy Cross of the NASAJohnson Space Center (JSC), Crew and Thermal Systems Division (CTSD), for actingas Project Manager during the summer of 1994. Her contributions in leading theteam and preparing for the thermal/vacuum testing directly supported the successof the fiscal year 1994 program.
The NASA test director, Eric Chan, and the entire test team of the CTSD SystemsTest Branch are recognized for their excellence in supporting the buildup andimplementation of the testing.
Cindy Dew and Leslie Haag of the GHG Corporation, supporting the CTSD, arerecognized for their support of the editing of this final report.
The authors would also like to thank D.V. Archer of Battelle, Pacific NorthwestLaboratories for perfecting the fabrication of the test articles. Also from Battelle,James M. Bates is recognized for his support to the testing at JSC.
Funding for the fiscal year 1994 program was provided by NASA HeadquartersOffice of Life and Microgravity Sciences and Applications, Code U.
This publication is available from the NASA Center for AeroSpace Information,800 Elkridge Landing Road, Linthicum Heights, MD 21090-2934, (301) 621-0390.
iii
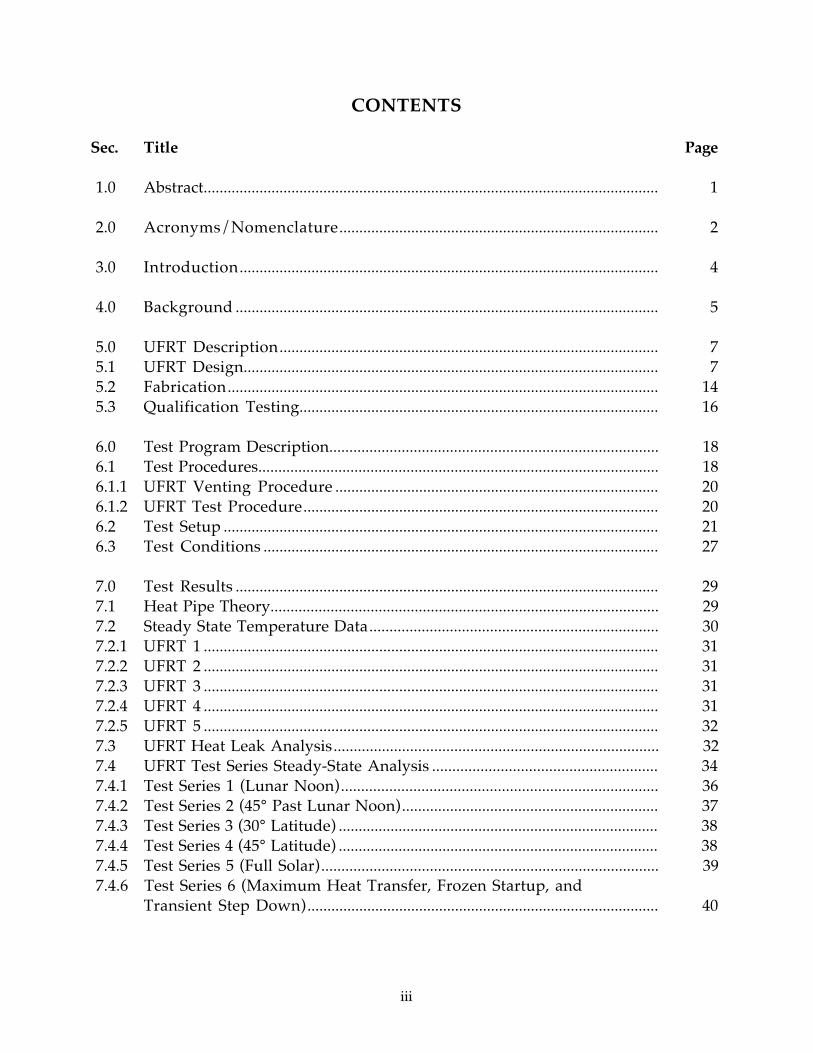
CONTENTS
Sec. Title Page
1.0 Abstract.................................................................................................................. 1
2.0 Acronyms/Nomenclature................................................................................ 2
3.0 Introduction......................................................................................................... 4
4.0 Background .......................................................................................................... 5
5.0 UFRT Description............................................................................................... 75.1 UFRT Design........................................................................................................ 75.2 Fabrication............................................................................................................ 145.3 Qualification Testing.......................................................................................... 16
6.0 Test Program Description.................................................................................. 186.1 Test Procedures.................................................................................................... 186.1.1 UFRT Venting Procedure ................................................................................. 206.1.2 UFRT Test Procedure......................................................................................... 206.2 Test Setup ............................................................................................................. 216.3 Test Conditions ................................................................................................... 27
7.0 Test Results .......................................................................................................... 297.1 Heat Pipe Theory................................................................................................. 297.2 Steady State Temperature Data........................................................................ 307.2.1 UFRT 1 .................................................................................................................. 317.2.2 UFRT 2 .................................................................................................................. 317.2.3 UFRT 3 .................................................................................................................. 317.2.4 UFRT 4 .................................................................................................................. 317.2.5 UFRT 5 .................................................................................................................. 327.3 UFRT Heat Leak Analysis................................................................................. 327.4 UFRT Test Series Steady-State Analysis ........................................................ 347.4.1 Test Series 1 (Lunar Noon)............................................................................... 367.4.2 Test Series 2 (45° Past Lunar Noon)................................................................ 377.4.3 Test Series 3 (30° Latitude) ................................................................................ 387.4.4 Test Series 4 (45° Latitude) ................................................................................ 387.4.5 Test Series 5 (Full Solar).................................................................................... 397.4.6 Test Series 6 (Maximum Heat Transfer, Frozen Startup, and
Transient Step Down)........................................................................................ 40

iv
CONTENTS(Continued)
Sec. Title Page
7.5 Steady State Results Summary ........................................................................ 427.5.1 UFRT Dryout Characteristics............................................................................ 427.5.2 Operating Characteristics With Ncgs.............................................................. 437.5.3 UFRT Normal Operations................................................................................ 447.5.4 UFRT Operations in Various Environments............................................... 45
8.0 Benefit of the UFRT in a Lunar Base Thermal Control System............... 468.1 Assumptions........................................................................................................ 468.2 Trade Study Results and Discussion............................................................... 48
9.0 Conclusions.......................................................................................................... 49
10.0 References............................................................................................................. 50
APPENDIXESA Battelle Design Drawings for UFRT With Titanium Liners..................... A-1B Qualification Test Plan for the FY94 UFRT Design..................................... B-1C Qualification Test Results for the FY94 UFRT Design................................ C-1D UFRT Venting Procedure Description........................................................... D-1E UFRT TSS/SINDA Thermal Model Description......................................... E-1F Analysis of UFRTs Using Heat Pipe Theory................................................. F-1G Test Series 1 - Raw Data..................................................................................... G-1H Test Series 2 - Raw Data..................................................................................... H-1I Test Series 3 - Raw Data..................................................................................... I-1J Test Series 4 - Raw Data..................................................................................... J-1K Test Series 5 - Raw Data..................................................................................... K-1L UFRT Detailed Steady State Analysis............................................................. L-1M Lessons Learned .................................................................................................. M-1

v
FIGURES
Fig. Title Page
5.1 Overall Design of UFRT With Titanium Liners for 1994 Tests................ 85.2 Preform Design Used for Making Titanium Liners.................................... 95.3 Liner Design for UFRT With Titanium Liners............................................ 95.4 Titanium End Caps Used for UFRTs With Titanium Liners. .................. 105.5 Crimping Ring Design Used for UFRTs With Titanium Line................. 115.6 Stages of Fabrication of a UFRT With Titanium Liner and
Nextel Overwrap................................................................................................. 12
6.1 UFRT Lunar Simulation Locations. ............................................................... 176.2 UFRT Chamber E Layout. ................................................................................. 196.3 UFRT Thermocouple Locations and Tube Numbering............................. 206.4 UFRT Test Configuration in Chamber E....................................................... 216.5 UFRT Array.......................................................................................................... 226.6 UFRT Array in Chamber E. .............................................................................. 236.7 UFRT Thermocouple Locations...................................................................... 246.8 UFRT Evaporator Clamp Heaters. .................................................................. 256.9 Test Environment Across UFRT Array......................................................... 276.10 Heat Flux Distribution Over Flat and Curved Surfaces. ............................ 27
7.1 Axial Temperature Distribution in the UFRT CondenserRegion for Test Point 1C.................................................................................... 30
7.2 Schematic of the UFRT System. ...................................................................... 337.3 NCG or Vapor Void Location Identification. ............................................... 357.4 UFRT 1 Transient Step Down Test ................................................................. 417.5 UFRT 3 Transient Step Down Test ................................................................. 417.6 UFRT 4 Transient Step Down Test ................................................................. 42
8.1 Radiator Surface Temperature......................................................................... 48
C.1 Thermocouple and Power Data From the UFRT Qualification Test. ..... C-2
E.1 UFRT Post-Test Thermal Model. .................................................................... E-2E.2 UFRT Model Chamber E Configuration........................................................ E-3E.3 UFRT Surface Temperatures, Series 1............................................................ E-5E.4 UFRT Surface Temperatures, Test Series 2................................................... E-6E.5 UFRT Surface Temperatures, Test Series 3................................................... E-7E.6 UFRT Surface Temperatures, Test Series 4................................................... E-8E.7 UFRT Surface Temperatures, Test Series 5................................................... E-9

vi
FIGURES(continued)
Fig. Title Page
E.8 UFRT Surface Temperatures, Test Series 6................................................... E-10E.9 UFRT Surface Sink Temperatures, Test Series 1. ........................................ E-11E.10 UFRT Surface Sink Temperatures, Test Series 2. ........................................ E-12E.11 UFRT Surface Sink Temperatures, Test Series 3. ........................................ E-13E.12 UFRT Surface Sink Temperatures, Test Series 4. ........................................ E-14E.13 UFRT Surface Sink Temperatures. Test Series 5. ........................................ E-15E.14 UFRT Surface Sink Temperatures, Test Series 6. ........................................ E-16
G.1 Test Series 1 - Tube 1 Raw Data........................................................................ G-1G.2 Test Series 1 - Tube 2 Raw Data........................................................................ G-2G.3 Test Series 1 - Tube 3 Raw Data........................................................................ G-3G.4 Test Series 1 - Tube 4 Raw Data........................................................................ G-4G.5 Test Series 1 - Tube 5 Raw Data........................................................................ G-5
H.1 Test Series 2 - Tube 1 Raw Data........................................................................ H-1H.2 Test Series 2 - Tube 2 Raw Data........................................................................ H-2H.3 Test Series 2 - Tube 3 Raw Data........................................................................ H-3H.4 Test Series 2 - Tube 4 Raw Data........................................................................ H-4H.5 Test Series 2 - Tube 5 Raw Data........................................................................ H-5
I.1 Test Series 3 - Tube 1 Raw Data........................................................................ I-1I.2 Test Series 3 - Tube 2 Raw Data........................................................................ I-2I.3 Test Series 3 - Tube 3 Raw Data........................................................................ I-3I.4 Test Series 3 - Tube 4 Raw Data........................................................................ I-4I.5 Test Series 3 - Tube 5 Raw Data........................................................................ I-5
J.1 Test Series 4 - Tube 1 Raw Data........................................................................ J-1J.2 Test Series 4 - Tube 2 Raw Data........................................................................ J-2J.3 Test Series 4 - Tube 3 Raw Data........................................................................ J-3J.4 Test Series 4 - Tube 4 Raw Data........................................................................ J-4J.5 Test Series 4 - Tube 5 Raw Data........................................................................ J-5
K.1 Test Series 5 - Tube 1 Raw Data........................................................................ K-1K.2 Test Series 5 - Tube 2 Raw Data........................................................................ K-2K.3 Test Series 5 - Tube 3 Raw Data........................................................................ K-3K.4 Test Series 5 - Tube 4 Raw Data........................................................................ K-4K.5 Test Series 5 - Tube 5 Raw Data........................................................................ K-5

vii
FIGURES(concluded)
Fig. Title Page
L.1 UFRT Surface Temperatures, Test Series 1................................................... L-1L.2 UFRT Internal Temperatures, Test Series 1.................................................. L-2L.3 UFRT Evaporator Temperatures, Test Series 1............................................ L-3L.4 UFRT Surface Temperatures, Test Series 2................................................... L-7L.5 UFRT Internal Temperatures, Test Series 2.................................................. L-8L.6 UFRT Evaporator Temperatures, Test Series 2............................................ L-9L.7 UFRT Surface Temperatures, Test Series 3................................................... L-12L.8 UFRT Internal Temperatures, Test Series 3.................................................. L-13L.9 UFRT Evaporator Temperatures, Test Series 3............................................ L-14L.10 UFRT Surface Temperatures, Test Series 4................................................... L-18L.11 UFRT Internal Temperatures, Test Series 4.................................................. L-19L.12 UFRT Evaporator Temperatures, Test Series 4............................................ L-20L.13 UFRT Surface Temperatures, Test Series 5................................................... L-24L.14 UFRT Internal Temperatures, Test Series 5.................................................. L-25L.15 UFRT Evaporator Temperatures, Test Series 5............................................ L-26

viii
TABLES
Table Title Page
5.1 Comparison of 1994 and 1992 UFRT Designs ............................................... 75.2 Weights of Components in As-Fabricated Titanium UFRTs, (g)............. 135.3 Accomplishment of Test Objectives for UFRT 0 ......................................... 15
6.1 UFRT Test Procedures Matrix.......................................................................... 186.2 UFRT Model Test Environments ................................................................... 266.3 UFRT Water Charge........................................................................................... 28
7.1 Thermodynamic Heat Transfer Limits From HTPIPE ............................... 297.2 Component Area, Emissivity, and Heat Loss Equation ............................. 337.3 UFRT Dryout Conditions.................................................................................. 43
8.1 Results of Trade Study....................................................................................... 48
B.1 FY94 UFRT Design.............................................................................................. B-2
D.1 Values of Henry's Constant at Different Temperatures............................. D-2
E.1 Material Optical Properties ............................................................................... E-1E.2 Chamber E IR Lamp and Solar Settings in Thermal Model...................... E-4
L.1 UFRT 1 Temperature Differences ................................................................... L-4L.2 UFRT 2 Temperature Differences ................................................................... L-4L.3 UFRT 3 Temperature Differences ................................................................... L-5L.4 UFRT 4 Temperature Differences ................................................................... L-5L.5 UFRT 5 Temperature Differences ................................................................... L-6L.6 UFRT 1 Temperature Differences ................................................................... L-10L.7 UFRT 3 Temperature Differences ................................................................... L-10L.8 UFRT 4 Temperature Differences ................................................................... L-11L.9 UFRT 5 Temperature Differences ................................................................... L-11L.10 UFRT 1 Temperature Differences ................................................................... L-15L.11 UFRT 2 Temperature Differences ................................................................... L-15L.12 UFRT 3 Temperature Differences ................................................................... L-16L.13 UFRT 4 Temperature Differences ................................................................... L-16L.14 UFRT 5 Temperature Differences ................................................................... L-17L.15 UFRT 1 Temperature Differences ................................................................... L-21L.16 UFRT 3 Temperature Differences ................................................................... L-22

ix
TABLES(concluded)
Table Title Page
L.17 UFRT 4 Temperature Differences ................................................................... L-22L.18 UFRT 5 Temperature Differences ................................................................... L-23L.19 UFRT 1 Temperature Differences ................................................................... L-27L.20 UFRT 3 Temperature Differences ................................................................... L-28L.21 UFRT 4 Temperature Differences ................................................................... L-28L.22 UFRT 5 Temperature Differences ................................................................... L-29

1
1.0 ABSTRACT
Spacecraft thermal control systems (TCSs) are essential to provide the necessarythermal environment for the crew and to ensure that the equipment functionsadequately on space missions. The Ultralight Fabric Reflux Tube (UFRT) wasdeveloped by Battelle, Pacific Northwest Laboratories (PNL), with partial fundingfrom the NASA Lewis Research Center, as a lightweight radiator concept to be usedon planetary surface-type missions (e.g., Moon, Mars). The UFRT consists of a thin-walled tube (acting as the fluid boundary), overwrapped with a low-mass ceramicfabric (acting as the primary pressure boundary). The tubes are placed in an array inthe vertical position with the evaporators at the lower end. Heat is added to theevaporators, which vaporizes the working fluid. The vapor travels to the condenserend above and cools as heat is radiated to the environment. The fluid condensed onthe tube wall is then returned to the evaporator by gravity. The primary objectivesfor the fiscal year (FY) 1994 program included the design and fabrication of prototypeUFRTs, and thermal/vacuum chamber testing of these test articles.
Six UFRTs with titanium liners were successfully manufactured and delivered tothe Johnson Space Center (JSC) in July 1994. Five tubes were tested in a thermal/vacuum chamber in September 1994. Data were obtained to characterize theperformance of the UFRTs under simulated lunar conditions and prove the designconcept. In addition, an in-house trade study showed that an optimized/improvedUFRT could achieve as much as a 25% mass savings in the heat rejection subsystemof future planetary-type TCSs.

2
2.0 ACRONYMS/NOMENCLATURE
As surface areaCTSD Crew and Thermal Systems DivisionD diameterF view factorH Henry’s ConstantIR infraredJSC Johnson Space CenterL lengthk thermal conductivityn number of moles of gasNASA National Aeronautics and Space AdministrationNCG non-condensable gasN W no wickP pressurePA projected areaPNL Pacific Northwest LaboratoryQ total heat transferq heat fluxR universal gas constantSINDA Systems Improved Numerical Differencing AnalyzerT temperatureTA true anomalyT/C thermocoupleTSS Thermal Synthesizer SystemTCS Thermal Control SystemUFRT Ultralight Fabric Reflux TubeV volumeW wickx concentration
Greek
α absorptivityε emissivityσ Stefan-Boltzman Constant

3
Subscripts
evap evaporatorenv environmentheater heaterloss loss to surroundingssink ambient sinksurf surfacetube tube surface

4
3.0 INTRODUCTION
The heat rejection radiator section of a human spacecraft TCS comprises typically30% to 45% of its overall system mass. As the power levels of these spacecraftincrease over time, this heat rejection section will grow proportionally. Therefore,the need for lightweight radiators to reduce the overall system mass for thesemissions is significant. Lightweight radiators for future planetary-type missions(e.g., Moon, Mars), which can also take advantage of partial gravity environments,are also needed and may provide mass savings for the entire TCS.
The UFRT was developed by PNL, operated by Battelle Memorial Institute for theDepartment of Energy. The UFRT design utilizes a thin-walled tube which acts asthe fluid boundary. A low-mass ceramic fabric is braided and placed over the linerto act as the primary pressure boundary to minimize the overall mass of the tubes.Concentric rings are compressed over the fabric at the ends of the UFRT to hold thefabric in place. End caps, which are electron beam welded to the thickened endlengths of the tube, comprise the remainder of the pressure boundary.
The UFRT radiator concept uses gravity as the main fluid transport mechanism.The tubes are oriented vertically with an evaporator at the lower end. Heat added tothe evaporator vaporizes the working fluid. The vapor travels to the coolercondenser end where the heat is conducted through the tube wall and radiated tothe environment. The fluid then returns to the evaporator by means of gravity andthe process is repeated.
The major objectives of the UFRT development program in FY94 includedfabricating prototype UFRTs with an improved titanium liner and evaluating thetubes under simulated lunar environmental conditions using a thermal/vacuumchamber. The project activities described in this report were funded through NASAHeadquarters Office of Life and Microgravity Sciences and Applications, Code U.

5
4.0 BACKGROUND
The National Aeronautics and Space Administration (NASA) JSC Crew andThermal Systems Division (CTSD) initiated work on the UFRT concept withBattelle during FY92 under an existing contract. Eight prototype UFRTs weredesigned and manufactured under the program during that year, and were sent toJSC to be tested under thermal/vacuum conditions.
These first-generation UFRTs were constructed using a thin copper liner with aNextel overwrap, held in place with compression rings. The tubes were 1.1 m(43.3 in.) in length and had a nominal diameter of 0.025 m (1 in.). Charge fittingswere soldered to the condenser end caps to allow the tubes to be filled with theworking fluid (water). Inside the evaporator section of the UFRTs was a wick (alsoNextel) to ensure that liquid was distributed over the entire heat transfer(evaporator) surface.
The 1992 thermal/vacuum chamber testing was conducted at JSC in August of thatyear. The test matrix included nominal startup and shutdown, frozen startup,transient loading, operation for simulated lunar day and night, and maximum heattransfer. The results from the testing were limited. All but three of the UFRTsfailed during installation into the chamber, due to their fragility. In addition,instrumentation failures prevented the tubes from being tested above 90 watts (W).However, the testing did indicate that the UFRTs operated isothermally along thecondenser sections and performed as expected in nominal operations. The tubesalso performed startup from a full frozen state without incident, and performed asexpected during transient loading. Results of this testing are documented inGuenther et al., 1992.
Several areas of improvement were identified from the 1992 testing, with theforemost being improvement of the liner material to withstand handlingoperations. Optimization studies conducted at Battelle showed that the UFRT masscould potentially be lowered to <2 kg/m2 without compromising performance by anumber of design changes, including potentially smaller tube diameters (i.e., greaterlength-to-diameter ratios), thinner or smaller attachment components, materialswith lower densities, and the use of fins.
Work on the program continued during FY93 to further optimize the design andfabricate an improved UFRT. A primary goal was to use a titanium liner. Titaniumwas selected due to its strength and low mass, which are attractive features for theUFRT design. Battelle began operations using a new cluster mill, and successfullyfabricated liners using copper. A titanium preform was also constructed to supportthe development of the improved UFRTs during FY94.

6
This report documents the major UFRT development activities for FY94, includingthe fabrication of improved UFRTs and thermal/vacuum chamber testingconducted at JSC, as well as related analyses. Six UFRTs were successfully fabricatedduring this year, however, limited funding and schedule constraints permitted theincorporation of only a few improvements identified during previous years. Themajor design changes for the new UFRTs included 1) substituting titanium linersfor the copper liners; 2) redesigning the end caps to minimize uncertainties incollecting temperature data and evaluating the test results; and 3) reducing thelength of the evaporator, and its end cap length, to reduce overall weight andincrease the heat flux. Also, wicks were included in only half of the UFRTs to allowevaluation of their performance. Five of these UFRTs were tested underthermal/vacuum conditions in September 1994. The following sections provideadditional detail on the UFRT design, fabrication, testing, and results from thiswork.

7
5.0 UFRT DESCRIPTION
Six UFRTs were built by Battelle and sent to JSC, including one pretest UFRT usedfor thermal testing at PNL. Only five of the UFRTs were scheduled for thermal/vacuum testing at JSC. Details are provided in the following sections on the design(Section 5.1), fabrication and assembly (Section 5.2), and qualification testing (Section5.3) conducted prior to shipment.
5.1 UFRT DESIGN
The UFRTs built and tested in FY94 consisted of a titanium liner with a ceramicfabric overwrap, stretched over the condenser region and held in place with coppercompression rings. The overall design is summarized in Table 5.1 and comparedwith the UFRTs built previously for testing in 1992. Schematics of the overalldesign, the preform used to make the liner, the titanium liner, the end caps, and thecrimping (or compression) rings for the UFRTs built in 1994 are shown in Figures5.1 through 5.5, respectively. The UFRTs built for testing in 1994 were similar tothose built and tested in 1992 (Pauley et al., 1993), although some dimensions andmaterials were changed. A titanium preform (Figure 5.2) was used to produce thetitanium liner (Figure 5.3) that consisted of a 2.5-cm (1-in.)-diameter tube with alength of 111.8 cm (44 in.), thick ends, and a thin central region. The 305-µm(0.012-in.)-thick ends facilitate welded end caps, while the thin central region(66 µm, 0.0026 in.) reduces the UFRT overall weight, while still acting as apermeation barrier for the water working fluid.
Table 5.1. Comparison of 1994 and 1992 UFRT Designs
Design Aspect 1994 Design 1992 Design
General Dimensions nominal 2.5-cm (1-in.) diameter,1.13 m (44.4 in.) long from endcap to end cap
nominal 2.5-cm ( 1-in.) diameter,1.00 m (39.6 in.) long from endcap to end cap
Materials
Liner Ti ASTM B338, Grade 2,unannealed after forming
Copper, annealed after forming
End caps Ti ASTM B338, Grade 2 Copper, annealed after forming
Crimping Rings Copper Copper
Fabric Nextel 312 Nextel 312
Spring Spring steel none
Wick SiO2 Nextel 312
Working fluid Water Water

8
Figure 5.1. Overall Design of UFRT With Titanium Liners for 1994 Tests.

9
Figure 5.2. Preform Design Used for Making Titanium Liners.
Figure 5.3. Liner Design for UFRT With Titanium Liners.

10
Figure 5.4. Titanium End Caps Used for UFRTs With Titanium Liners.

11
Figure 5.5. Crimping Ring Design Used for UFRTs With Titanium Liner.
Nextel 312 with a biaxial weave has been used as the overwrap for all of the UFRTsbuilt for JSC. Selection of this material was based primarily on its absorptance andemittance characteristics in the solar spectrum: Battelle tests indicate an emittancemeasured at approximately 0.93 at 425 K (306°F) and an absorptance of 0.1 in solarwavelengths. The as-woven fabric was heat-treated before assembling the UFRTs,which consisted of baking the fabric at 1173 K (1652°F) for 16 hours to remove thesizing on the woven material (here, sizing refers to the starch, wax, or other organicingredient applied to the fiber strands to protect them and aid in handling; thesizing of a fabric is normally removed before the final product is used).
The flat end cap design shown in Figure 5.4 was chosen to minimize machiningcosts and reduce uncertainties from water in the evaporator region below the heatedzone during testing. Stress analyses conducted at Battelle using the ALGOR finiteelement program indicated that the end cap design would withstand 1.86 MPa(270 psia) at 450K (350°F) without yielding.
Additional components used in the UFRTs included crimping (or compression)rings, fabric wicks, and retaining springs. The crimping rings (Figure 5.5) were usedto attached the fabric to the titanium liner. The rings were made of copper becausethey could be compressed easily onto the fabric, and this eliminated concerns of
12
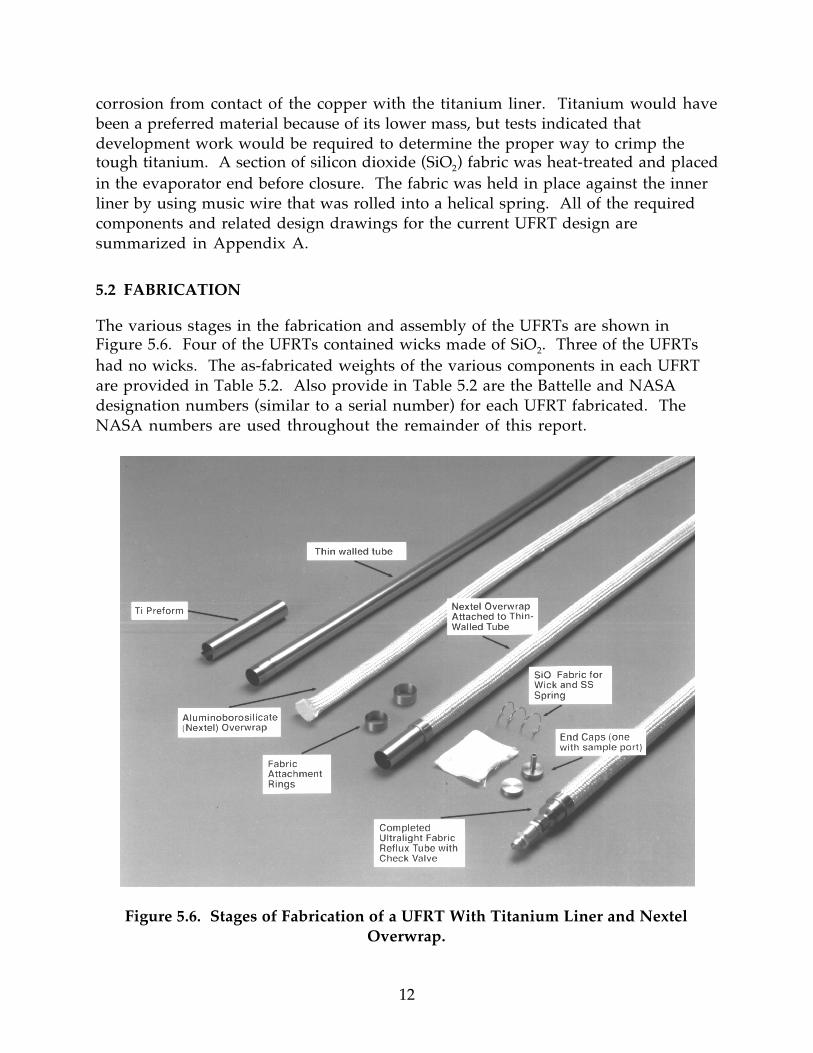
corrosion from contact of the copper with the titanium liner. Titanium would havebeen a preferred material because of its lower mass, but tests indicated thatdevelopment work would be required to determine the proper way to crimp thetough titanium. A section of silicon dioxide (SiO2) fabric was heat-treated and placedin the evaporator end before closure. The fabric was held in place against the innerliner by using music wire that was rolled into a helical spring. All of the requiredcomponents and related design drawings for the current UFRT design aresummarized in Appendix A.
5.2 FABRICATION
The various stages in the fabrication and assembly of the UFRTs are shown inFigure 5.6. Four of the UFRTs contained wicks made of SiO2. Three of the UFRTshad no wicks. The as-fabricated weights of the various components in each UFRTare provided in Table 5.2. Also provide in Table 5.2 are the Battelle and NASAdesignation numbers (similar to a serial number) for each UFRT fabricated. TheNASA numbers are used throughout the remainder of this report.
Figure 5.6. Stages of Fabrication of a UFRT With Titanium Liner and NextelOverwrap.

13
Table 5.2. Weights of Components in As-Fabricated Titanium UFRTs, (g)
NASA
UFRT
No.
Battelle
No.1Ti Liner
Weight
Ti End
Caps
(Top)
Ti End
Caps
(Bottom)
Copper
Sleeves
Nextel
Fabric2Overall Comments
0 1 30.7 6.3 5.0 14.8 71.8 133.5 w/wick3 (2.8 g) &retainer4 (2.1 g);
collapsed & ruinedduring end cap welding
1 2 33.2 6.4 5.0 15.0 71.5 131.1
6 3 31.5 6.5 5.0 14.0 76.1 136.8 w/wick3 (1.9 g) &retainer6 (1.8 g); uglyouter fabric, has 4"
section of loose weave
2 4 33.3 6.6 5.0 14.0 69.0 131.7 w/wick5 (2.0 g) &retainer6 (1.8 g)
3 5 31.1 6.5 5.0 14.3 69.4 130.2 w/wick5 (2.0 g) &retainer6 (1.9 g)
4 6 32.5 6.5 5.0 14.3 69.9 128.2
5 7 31.9 6.5 5.0 13.6 69.5 126.51 All of the UFRTs were marked at Battelle with an identifying number (1 through 7) on the end caps.2 Nextel 312 (P.O. 167687); Heat-treated at 1173K (1652°F) for 16 hrs.3 Silicon Dioxide fabric 7.62 cm wide x 11.4 cm long (3 in. x 4.5 in.); Heat cleaned at 823K (1022°F) for 4 hrs.4 Spring fabricated from 0.104-cm (0.041-in.)-dia. music wire 25.4 cm (10 in.) long.5 Silicon Dioxide fabric 7.62-cm wide x 8.9-cm long (3 in. x 3.5 in.); Heat Cleaned at 823K (1022°F) for 6 hrs.6 Spring fabricated from 0.104-cm (0.041-in.) dia. music wire 22.9-cm (9-in.) long.
Notes: Original units measured in grams, inches, °C, and psig. Units leak checked with argon at 0.62 MPa (89.7 psia)
for 1 hr. Units fitted with a check valve on condenser end and backfilled with argon at 0.31 MPa (44.7 psia) for
shipment.
A key element in the fabrication of the UFRT is the forming of a titanium tube, orliner, with thick ends and an intermediate region with very thin walls in onecontinuous piece. The proprietary process used to make the liners with thin centralregions and thick ends is conducted at room temperature without any lubricants. Apreform (see Figure 5.2) is placed over a long mandrel that is centered in a cluster ofrollers. The specially designed rollers are compressed onto the preform at acontrolled rate while the mandrel rotates. This spinning process extrudes out theformed material. The initial wall thickness of the preform is reduced by about 98%in a single pass to form the thin wall region, and by a smaller percentage to form thethick ends. No special heat treatment was used to condition the initial or final

14
titanium material. After cutting off the ends of the titanium liner to the properlength, a pressure test was conducted with air at 0.45 MPa (65 psia) for 1 hour orlonger to ensure the integrity of the finished liner.
A woven tube of Nextel 312 ceramic fabric with a biaxial weave was attached usingconcentric pairs of copper rings that were crimped over the fabric at both ends of theliner. The UFRT fabrication was completed by the electron beam welding of the endcaps.
5.3 QUALIFICATION TESTING
Two types of qualification tests were conducted at Battelle: a thermal test for UFRT 1and integrity tests on all of the liners and completed UFRTs. UFRTs 2 through 6were fabricated, filled with argon, and shipped to JSC without system level thermalor pressure testing.
The detail of the qualification testing is included in two appendices. Appendix Bdescribes the qualification test plan and procedures. Appendix C outlines the testresults and conclusions.
All test criteria for thermal testing of UFRT 1 were accomplished during thequalification test. Specifically, Table 5.3 describes the manner in which each testobjective was met. No deviations from the test plan were observed.
In summary, UFRT 1 was tested to 175 W without failure or loss of heat rejectioncapability. No problems were encountered with the Nextel/titanium heat pipeoperating in the vertical (reflux) mode other than some evaporator liquid dryout.Test data indicated that this heat pipe operating in a space (non-convective)environment would not be performance limited, but would reach radiative limitswell before reaching other thermodynamic limits. Therefore, based on the criteriapresented above, the prototype UFRT (UFRT 1) met all requirements, and generalproduction of the test article UFRTs was initiated.

15
Table 5.3. Accomplishment of Test Objectives for UFRT 0
Test Objective Test Result
Successful charging and startup Startup was accomplished with less than 1 g ofworking fluid loss.
Operation up to the minimum ambientatmospheric operating temperature(377 K)
The UFRT was tested to a condenser temperatureof 410 K.
General isothermicity over thecondenser length during steady stateoperation
Condenser isothermicity was verified using aninfrared (IR) camera during steady stateoperation.
Pressure containment throughout thetest
No breach of the pressure containment wasobserved during the test.
Successful shutdown without pressureanomalies at the conclusion of the test
Since pressure was not directly measured duringthe test, no pressure information can be reportedto verify this result. However, pressure wasindirectly calculated using the vapor temperatureof the working fluid. This calculation did notindicate anomalies during the shutdownprocedure.
The remaining qualification tests conducted on the UFRTs to be shipped to JSC(UFRTs 1 through 6) consisted of checking the integrity of the liners after they wereformed and after final assembly. The liners were leak-tested for 1 hour afterpressurizing with argon to 0.45 MPa (65 psia). In addition, the assembled UFRTswere leak checked with argon gas at 0.62 MPa (90 psia) for 1 hr, fitted with a checkvalve on the condenser end, and backfilled with argon at 0.3 MPa (45 psia) forshipment.
In addition to the qualification tests conducted on the test articles, several pressuretests were conducted on both thin-walled titanium tubes and fabricated UFRTs. Theresults of the tests on short thin-walled tubes indicated that the 51-µm (0.002-in.)-thick wall would not survive stresses caused by atmospheric pressure if the tubeswere evacuated. For this reason, the UFRTs were filled with the water workingfluid at JSC before thermal/vacuum testing. Furthermore, a titanium liner waspressure tested to 3.5 MPa (515 psia) at room temperature without failure, wellabove the expected limit of 1.9 MPa (280 psia) for this temperature.

16
6.0 TEST PROGRAM DESCRIPTION
The UFRT thermal/vacuum test was run to simulate the lunar environment.Environmental conditions were chosen to represent a combination of solar andinfrared (IR) intensities. Of the two possible space-related uses of the UFRT, Moonand Mars bases, the lunar environment provided a wider and more severe range,hot to cold, of temperature environments. The test simulated these environmentsat various times in the lunar day, as well as various lunar latitudes. A transient stepdown test was also run to determine whether ice crystals would form in thecondenser section of the UFRTs, thus decreasing their efficiency. Theseenvironments were simulated in Chamber E, Building 33, at JSC using thecombination of a solar lamp (simulated sun) and IR lamps (simulated lunar IR).The following sections provide additional detail on the test procedures (Section 6.1),test setup (Section 6.2), and test conditions (Section 6.3) for the thermal/vacuumtesting conducted in September 1994.
6.1 TEST PROCEDURES
The UFRTs were subjected to extreme warm and cold lunar environments, as wellas nominal, full sun, warm, and frozen startup tests. To achieve theseenvironments, one solar lamp and several IR lamps were used. IR lamps simulatedthe lunar surface while the solar lamp simulated the sun. The solar lamp wasadjusted according to equation 6.1:
Incident Solar Flux = Sun * sin(latitude) (6.1)
to account for the UFRTs' locations at various lunar latitudes. The amount of solarflux equal to one sun is 1370 W/m2, at nominal conditions.
The test setup in Chamber E simulated the UFRTs mounted perpendicular to thelunar surface as shown in Figure 6.1. The test also simulated the UFRT array'sorientation to the sun at lunar noon as shown in the figure.
The UFRT was tested at the extreme temperature environments found during thelunar day. The hot case environment simulated a UFRT array located on the lunarequator at lunar noon (Test Series 1). Also, the cold case environment simulated aUFRT array operating during lunar night (Test Series 6a). This case simulated theUFRT operation at any latitude or time during the lunar night, since the IR isnegligible during the lunar night. During the cold case test, the maximum heattransfer and frozen startup characteristics of the UFRT were evaluated. A summaryof the IR lamp power and solar lamp inputs for the hot and cold cases is shown inTable 6.1.

17
Two warm cases simulated the UFRT operations at the 30° and 45° latitudes (TestSeries 3 and 4, respectively) and lunar noon as shown in Figure 6.1. One test seriesinvestigated the UFRT operation at 1/8 of the lunar day or True Anomaly (TA) = 45°past lunar noon on the equator (Test Series 2) as shown in Figure 6.1. A test series(Test Series 5) was run to determine the UFRT response to a full solar environmentas if the UFRT array were located on the lunar poles (latitude = 90°), also shown inFigure 6.1. Again, a summary of the IR lamp power input and solar lamp input forthese cases is shown in Table 6.1.
Equator30°
15°
45°
Test Series 1 (0° Latitude)
Test Series 3(30° Latitude)
Test Series 4 (45° Latitude)
Test Series 5 (90° Latitude)
Incoming Solar Flux
Test Series 6 (Lunar Night)
Cold case
Moon(Lateral View)
Lunar NoonTest Series 1 (Lunar Noon)
Moon(Pole View)
45°
Test Series 2 (45° past Lunar Noon)
Figure 6.1. UFRT Lunar Simulation Locations.

18
Table 6.1. UFRT Test Procedures Matrix
Test Solar Main Side IR LunarSeries (suns) IR Lamps Lamps N/S Environment
(W) (W) Description1 0 200 75 Lunar noon2 0 160 150/250 1/8 Lunar day3 0.5 300 150 30° Latitude4 0.71 142 75 45° Latitude5 1 0 0 Full Solar
6a 0 0 0 Maximum Heat Transfer 6b 0 0 0 and Frozen Startup
6.1.1 UFRT Venting Procedure
Since the UFRTs were filled in atmospheric conditions, air was introduced insidethe tubes and dissolved in the water. If this non-condensable gas (NCG) had notbeen removed before testing, the heat rejection performance of the UFRTs couldhave been severely degraded. Therefore, a venting procedure was developed toremove these undesirable gases. This procedure, and the equations used to developthis procedure, are described in Appendix D.
6.1.2 UFRT Test Procedure
For the lunar noon, 1/8 lunar day, 30° latitude, and 45° latitude tests (Test series 1, 2,3, and 4, respectively), the Chamber E solar lamp and IR lamps were set to theparameters shown in Table 6.1. The UFRT heaters were set to 5 W. When the tubesreached steady-state conditions, the heater power was increased in 10 to 15 Wincrements, and again the UFRTs were allowed to reach steady-state. Steady-stateconditions were defined as when the UFRT fabric or titanium liner temperaturechanged less than 0.3°C per hour. The process was repeated until the test articletemperature (internal temperature probe) reached 155°C ± 5°C.
The full solar test (Test Series 5) began by setting Chamber E solar lamp and IRlamps to the parameters shown in Table 6.1, while the UFRT clamp heaters were setto the 20 W power setting. After the UFRTs reach steady-state conditions, the powerwas increased in 15 W increments. This process was repeated until the test articletemperature (internal temperature probe) reached 155°C ± 5°C.

19
The maximum heat transfer (Test Series 6a) and frozen startup (Test Series 6b) beganwith the solar lamp, IR lamps, and evaporator heaters turned off. When theevaporator end cap TC reached a temperature of -18°C (225.2 K), the water is in afrozen state and the evaporator heaters were increased to the 65 W power setting.The UFRTs were again allowed to reach steady-state conditions before the powerinput was increased in 10 W increments. This process was repeated until the testarticle temperature (internal temperature probe) reached 155°C ± 5°C. For thetransient step down test, the power was then decreased by 10 W increments. Thepower was decreased every 10 minutes until the UFRT evaporator heater power was0 W.
6.2 TEST SETUP
Testing was conducted in Chamber E, Building 33, at JSC. The UFRTs were placed inChamber E side by side in an array as shown in Figure 6.2.
Solar Lamp
Chamber EDoor
Chamber ECold Walls
UFRT Array
IR LampCage
Figure 6.2. UFRT Chamber E Layout.

20
As seen in Figure 6.3, the SiO2 wicked UFRTs (designated 2 and 3) were placed inpositions 2 and 3, while UFRTs 1, 4, and 5 were wickless. Because of the IR lamparrangement, the outer UFRTs experienced a colder environment than the middleUFRTs. The UFRTs were separated into groups as follows:
A. Middle UFRT - Tube 3B. UFRTs 2 and 4C. Outer UFRTs - Tubes 1 and 5
1 2 3 4 5
NW W W NW NW
Solar Lamp
- T/C Locations
NW - No Wick
W - Wick
UFRT tubes
UFRT tube numbers
Figure 6.3. UFRT Thermocouple Locations and Tube Numbering.
Figure 6.4 shows the layout of the chamber in more detail. The UFRT array waslocated approximately 0.58 m from the Chamber E door. The tubes were suspended0.05 m above the chamber floor and held in place by a mounting bracket attached tothe Chamber E I-beam on top, and by a test stand supplied by Battelle at the bottom.The UFRT array tubes were placed on 0.1-m centers perpendicular to the solar beam.To provide the IR heating, twelve IR lamps surrounded the test article. Four"20-inch" lamps, were mounted 0.29 m from the UFRT array, between the tubes andthe solar lamp. Four more "20-inch" IR lamps were mounted 0.29 m away from thearray, between the tubes and the Chamber E door. To add heat flux to the outerUFRTs, two "10-inch" IR lamps were mounted perpendicularly to each side of theUFRT array as shown in Figure 6.4. The pneumatic valves used in the ventingprocedure were mounted to the chamber I-beam between the UFRT array and thechamber door. The test stand, pneumatic valves, and associated tubing werecovered with aluminized Mylar to prevent heat leak to or from the UFRTs.

21
A rectangular heat flux coupon measuring 0.076 m x 0.076 m was instrumented withthree thermocouples. The flux coupon was installed in the test stand betweenUFRTs 2 and 3. The front (side facing the solar lamp) of the square was coveredwith the Nextel fabric, while the back of the square was covered with aluminumtape. The flux coupon was oriented perpendicular to the solar rays in the chamberas shown in Figure 6.4. A close-up of the UFRT array and a photo showing itsinstallation in the chamber are shown in Figures 6.5 and 6.6, respectively.
Eight type T thermocouples were used to monitor the performance of each UFRT asshown in Figure 6.7. Two thermocouples were attached to the UFRT evaporatorsection, one on the end cap and one between the UFRT clamp heaters. Onethermocouple was located at the UFRT condenser end cap and a probe thermo-couple was mounted inside the UFRT to monitor the internal temperature. Thetips of the probe thermocouples on UFRTs 1 and 2 were located 0.3 m from theUFRT condenser end cap, while the probe thermocouple tips on UFRTs 3 through 5were located 0.1 m from the UFRT condenser end cap. Four thermocouples weremounted on the Nextel fabric of the UFRT condenser section. Three thermocoupleswere epoxied to the fabric at 1/4 UFRT condenser section length intervals (approx-imately 25 cm) as shown in Figure 6.7. The fourth, a hypodermic thermocouple,was mounted 1/3 of the way down the length of the condenser section (approx-imately 0.3 m). The hypodermic probe was located just underneath the top layer ofthe Nextel fabric and was secured with epoxy. The thermocouples mounted to thecondenser section were in the solar beam on UFRTs 1 and 2, while the UFRTcondenser section thermocouples on UFRTs 3 through 5 were not mounted in thesolar beam as shown in Figure 6.3.
Figure 6.4. UFRT Test Configuration in Chamber E.

22
Figure 6.5. UFRT Array.

23
Figure 6.6. UFRT Array in Chamber E.

24
3/4 T/C - Condenser
1/2 T/C - Condenser
Evaporator T/C - Between Clamp Heaters
Evaporator T/C - End Cap
Probe T/C
1/4 T/C - Condenser
Clamp Heaters
Condenser End Cap
Hypodermic T/C
Figure 6.7. UFRT Thermocouple Locations.
As shown in Figure 6.8, heat was applied to the evaporator section by the use ofscrew-type clamp heaters. Metal shims were placed between the heaters and theouter surface of the evaporator section to reduce contact resistance, therebyincreasing heat transfer to the evaporator section. The heaters were powered byVARIAC power supplies.

25
MetalShims
ClampHeater
EvaporatorSection
ClampScrew
HeaterLead Wires
Bottom View
EvaporatorSection
ClampHeater
ClampHeater
Cut-Away View
MetalShims
MetalShims
Figure 6.8. UFRT Evaporator Clamp Heaters.
6.3 TEST CONDITIONS
Table 6.2 shows the IR lamp settings, solar lamp setting, and resultingenvironmental estimates for the UFRT tests. These estimates are a result of aTSS/SINDA model of the test setup in Chamber E, correlated with the test results.The TSS/SINDA model is described in Appendix E. Because each tube did notoperate under the same environmental conditions, the environmental settings(solar lamp and IR lamps) measured during the test were modified in the analysis toreflect the various environments across the UFRT array.

26
Table 6.2. UFRT Model Test Environments
Test Solar Forward and Side IR Simulated Environments EnvironmentalSeries (suns) Aft IR Lamps Lamps N/S 0 W on evaporator heaters (K) Coupon Temp
(W) (W) Middle Tube Tubes 2 and 4 Outer Tubes (K)1 0 200 75 308 303 293 3282 0 160 150/250 294 289 287 3113 0.5 300 150 348 342 333 3574 0.71 142 75 300 296 290 3345 1 0 0 232 232 228 2776 0 0 0 120 120 120 125
An example of the sink temperature variation across the tubes is shown in Figure6.9. Table 6.2 shows each UFRT environment at the 0 W power setting. As can beseen from the table, the curve in Figure 6.9 represents a 7° to 15 °C drop in theenvironmental temperature from the middle tube to the outer tubes. Thetemperature drop was most pronounced when the IR lamps were in use. Theenvironmental temperatures become greater at higher power settings due to theinteraction between the UFRTs, as shown in Figures E.3 through E.8 in Appendix E.The plots of the post test analysis depicting both the UFRT sink temperatures andsurface temperatures are shown in Figures E.9 through E.14. A portion of theenvironmental temperature drop at the outer tubes occurred because these tubeswere closer to the Chamber E cold walls. This was observed during the full solarand the maximum heat transfer cases.

27
54321
UFRT Tubes
Envi
ronm
ent-
Sink
Tem
pera
ture
Increasing Temperature
Figure 6.9. Test Environment Across UFRT Array.
In the post-test model correlation described in Appendix E, the environmentalcoupon showed a higher sink temperature with both IR and/or solar input, asshown in Figures E1 to E5. This occurred because the flux coupon presented lesssurface area to the incoming flux than the UFRT as shown in Figure 6.10. The flatsurface represents the flux coupon while the curved surface represents the UFRT.Therefore, less heat per unit of surface area was applied to the UFRT than to the fluxcoupon. However, when no heat flux, solar or IR was imposed on the UFRT array,as shown in Figure F.6, the flux coupon temperatures remained below theestimation of the UFRT sink temperatures.
Heat Flux = 1 W/m (Solar or IR)
Total Heat Q = P.A. * Heat Flux = 1 W = 1 W
Heat Distributed over surface
q/a = Heat/S.A.
= 1 W/m = 1/(π /2) W/m
= 0.64 W/m
1 m π/2 mSurface Area
1 m 1 mProjected Area
Figure 6.10. Heat Flux Distribution Over Flat and Curved Surfaces.

28
Each UFRT was charged with 21 grams of water, and was weighed before and afterthe charging procedure to ensure that the proper amount of water was placed intothe tubes. After the test, the tubes were re-weighed. Three of the tubes lost less than2 grams of water. However, tubes 2 and 5 lost approximately half of their originalcharge of water (> 10 grams). The amount of water that remained in each UFRTduring the test is shown in Table 6.3. Some loss of the water charge was expectedduring the procedure to vent the NCGs from the UFRTs; however, too much waterwas inadvertently vented from UFRTs 2 and 5. The Battelle recommendation forthe amount of water in each UFRT during operation was 20g. UFRTs 1, 3, and 4 hadthe required amount of water for the test within ±1g.
Table 6.3. UFRT Water Charge
UFRT Water Charge Weight (g)Number Before Test Loss
1 21 19.1 1.92 21.1 9.9 11.23 20.9 20.5 0.44 21 20.1 0.95 21 10.8 10.2

29
7.0 TEST RESULTS
Multiple analyses were conducted to determine the characteristics of the UFRTsunder simulated lunar conditions. The following sections describe the analyticalresults, including an assessment of the UFRTs using heat pipe theory (Section 7.1),an evaluation of steady-state temperature data from the thermal/vacuum chambertesting (Section 7.2), an analysis of heat leakage from the UFRTs during testing(Section 7.3), and overall results of the test series conducted in the chamber (Section7.4), including a theory on the potential presence of non-condensable gases (NCGs)or vapor void at the top of the tubes. The last section (Section 7.5) presents asummary of the overall characteristics of the UFRTs based on all of the analysescompleted.
7.1 HEAT PIPE THEORY
It is proposed that the operation of the UFRT may be described by modeling the heattransfer and fluid flow behavior using conventional heat pipe analysis. The“radiative heat transfer from a gray-body equations” used came from Wein, Stefan,and Boltzmann (Siegel, 1981). The mathematical description of the fluid andthermal behavior of heat pipes came from Dunn and B&K Engineering. A briefsummary of these equations and behaviors is presented in Appendix F.
The heat transfer limits, shown in Table 7.1, have been calculated with the HTPIPEcode using the methodology described in the appendix. It is obvious that the UFRTdesign is limited by the surface area available for radiative heat transfer.
Table 7.1. Thermodynamic Heat Transfer Limits From HTPIPEEvaporator Capillary Entrainment Sonic Limit Boiling Area LimitTemp. (K) Limit (W) Limit (W) (W) Limit (W) (W)
290 21000 5600 5600 28310 65000 9000 9000 36330 170000 13000 13000 47350 395000 19000 19000 59370 820000 25000 25000 74390 1555000 32000 32000 91410 2730000 40000 40000 111430 4499000 47000 47000 134450 7032000 55000 55000 84000 161470 10521000 62000 62000 69000 191490 15188000 68000 68000 55000 226

30
7.2 STEADY STATE TEMPERATURE DATA
Observations were made from the raw data, resulting in an evaluation ofthermocouple accuracy. Plots of the steady-state data are shown in Appendices Gthrough K for Test Series 1 through 5, respectively. The accuracy of thethermocouples determined whether or not the readings were included in thisanalysis. The nominal uncertainty of a thermocouple is approximately ±2°C. Forthe purposes of this analysis, if the thermocouples were within ±3°C, they wereconsidered to be similar. In some cases where 0 W is plotted, this refers toconditions when a UFRT evaporator heater was turned off and it was no longermonitored.
A principle indicator that the UFRTs are operating as a closed system heat pipe is theisothermicity along the condenser length. The temperature distribution,demonstrated in Figure 7.1, is relatively flat, which indicates adequate operation.
0.70.60.50.40.30.20.1290
300
310
320
330
340
350
360
370
380
UFRT1
UFRT2
UFRT3
UFRT4
UFRT5
Axial Height (Percent)TOP BOTTOM
Figure 7.1. Axial Temperature Distribution in the UFRT Condenser Regionfor Test Point 1C.
The error bands for this figure were derived from an analysis of the thermocoupleresponses after a steady state frozen condition was achieved before starting TestSeries 6. With no IR or solar radiation fields, and no fluid flow within the UFRTs,

31
the error bands were calculated from the deviation from the average condenserthermocouple responses.
7.2.1 UFRT 1
The surface temperature consisted of an average of the thermocouple readings atpositions of 1/4, 1/2, and 3/4 along the condenser section. The surfacethermocouple temperature readings consistently read within ±3°C of each other andfollowed a similar trend for the entire test. For this tube, the tip of the hypodermicthermocouple was inadvertently in contact with the titanium liner surface, andtherefore followed the internal temperature. Hence, the hypodermic thermocouplewas excluded from the surface temperature calculations. The internal probe wasused to measure the internal temperature, while the evaporator end capthermocouple was used to measure the evaporator temperature.
7.2.2 UFRT 2
UFRT 2 was only used during Test Series 1 and Test Series 3 because of its low watercharge after the venting procedure. UFRT 2 dried out in both test series when theevaporator end cap temperature increased above the calibration range of theevaporator thermocouple at approximately 15 W of heat rejection. The average ofthe condenser section thermocouple readings was used to determine the surfacetemperature of UFRT 2. Probe temperature represents internal temperature andevaporator end cap temperature was representative of evaporator temperatures.
7.2.3 UFRT 3
In UFRT 3, the condenser section thermocouple readings and the hypodermicthermocouple reading were similar, ±3°C, for all of the test series. Therefore, theaverage of the condenser surface thermocouples and the hypodermic thermocouplewas used as the UFRT condenser section surface temperature. Probe temperaturerepresents internal temperature and evaporator end cap temperature wasrepresentative of evaporator temperatures.
7.2.4 UFRT 4
In UFRT 4, condenser section surface thermocouple readings at 1/4, 1/2, and 3/4measured similar temperatures within (±3°C of each other). The hypodermicthermocouple read consistently halfway between the condenser surface temperatureand the internal probe temperature and, therefore, was not used for surfacetemperature analysis. The average of the condenser surface thermocouples

32
represents the UFRT condenser surface temperature. The internal temperatureprobe and evaporator end cap thermocouple reading represent the internal andevaporator temperatures of UFRT 4, respectively.
7.2.5 UFRT 5
In UFRT 5, condenser section surface thermocouple readings at 1/4, 1/2, and 3/4measured similar temperatures within ±3°C of each other. The hypodermicthermocouple read temperatures between the internal and surface temperatures.Therefore, the hypodermic thermocouple readings were not used to represent theUFRT 5 surface temperature. The average of the condenser section thermocoupleswas used to represent the UFRT condenser surface temperature. The probe andcondenser end cap thermocouples read the same temperatures throughout the test.However, only the internal probe was used to represent the internal temperature ofUFRT 5. The evaporator end cap thermocouple represents the evaporatortemperature of UFRT 5.
7.3 UFRT HEAT LEAK ANALYSIS
During the thermal/vacuum test, it was discovered that the amount of heat rejectedby the radiating surface was not equal to the heater input. Since an earlieruncertainty analysis showed that the error in heater power measurement is small(Paul, T. H., 1994) and thermocouple error for this test was minimized by applyingthe lessons learned from a previous test (Graf, J. P. and Keller, J. R., 1994), thedifference between heater input power and the heat rejected is assumed to be due toheat leaks. As will be shown in an upcoming section, the heat leak equationsdeveloped here are sufficient to correct the problem.
A schematic of a UFRT is shown in Figure 7.2. The main heat rejection surface isthe ceramic fabric; however, it is clear that heat may also be rejected from the othercomponents. The heaters have a relatively large surface area and also have thehighest temperature in the system. Heat is also lost from the exposed metal areas ofthe end cap, the holding rings and the evaporator section. An attempt was made tominimize the heat losses from these surfaces by covering them with Mylar;however, due to the high temperature associated with the heaters, the Mylarinsulation was degraded and physically changed during testing (possibly melting oroxidizing), thereby reducing its effectiveness. Finally, though not shown here, heatleak to the holding fixtures of the UFRT may also occur.

33
g
Heaters
Woven Fabric Surface End Cap
EvaporatorSection
Vent Line
Copper Crimping Ring
Figure 7.2. Schematic of the UFRT System.
Since the UFRT test was conducted in a vacuum, convective heat transfer did notexist and radiative heat transfer was the primary method of heat rejection. For anysurface, the heat loss by radiation is given by:
Q = εσAs(Tsurf4 - Tenv4) (7.1)
where Q, As, Tsurf, Tsink, ε, and σ are the heat loss, surface area, surfacetemperature, environmental temperature, emissivity and Stefan-Boltzmannconstant, respectively. The surface area, emissivity, and corresponding radiativeheat loss equation for each component are listed in Table 7.2. Since the Mylar wasdegraded during the test, the emissivity of the heaters was assumed to be double thestandard emissivity of a sheet of Mylar. The equation describing the heat loss fromthe holding rings may overestimate the actual heat leak, since the holding rings areinsulated from the condenser by the Nextel fabric. It should be noted, however, thatthe contribution to the overall heat leak equation by this term is small compared toall the other components. In addition, temperatures associated with thiscomponent are the lowest measured in the test (Ttube is the coldest componenttemperature).
Table 7.2. Component Area, Emissivity, and Heat Loss Equation
Component Emissivity Area (m2) Heat Loss Equation (W)
End Cap 0.30 0.00200 Q = 6.0*10-4σ(Ttube4 - Tenv4)
Heaters 0.10 0.00760 Q = 7.6*10-4σ(Theater4 - Tenv4)
Holding Rings 0.10 0.00106 Q = 1.0*10-4σ(Ttube4 - Tenv4)
Evaporator 0.30 0.00042 Q = 1.2*10-4σ(Tevap4 - Tenv4)

34
In addition to radiative heat losses, there were small conduction heat losses to theholding fixtures. The conduction heat losses can be calculated by:
Q = (kA/L)*(Tevap - Tenv) (7.2)
where k is the thermal conductivity of the insulation between the UFRT and theholding fixture, A is the conduction area, and L is the thickness of the insulation.For this test set-up, the thermal conductivity was estimated at 0.10 W/m-K(Incropera, F.P. and DeWitt, D.P., 1985), the contact area was estimated at0.0000806 m2, and the thickness of the insulation was estimated at 0.001778 m.Substituting these values into equation 7.2 yields the conduction heat loss (in W).
Q = 4.6*10-3(Tevap - Tenv) (7.3)
Summing the heat leak equations listed in Table 1 and equation 7.3 producesan overall heat loss equation given by:
Qloss = 7.6*10-4σ(Theater4 - Tenv4) + 1.2*10-4σ(Tevap4 - Tenv4) +
7.0*10-4σ(Ttube4 - Tenv4) + 4.6*10-3(Tevap - Tenv) (7.4)
As will be shown in a later section, this equation was able to correct the discrepancybetween the heat rejected and the heat input.
7.4 UFRT TEST SERIES STEADY-STATE ANALYSIS
The data collected during testing showed that a temperature front moved up thelength of the UFRTs during startup. Possible explanations for this phenomena aredescribed below, theorizing the presence of noncondensable gases (NCGs) or a vaporvoid at the top of the tubes.
UFRTs 1, 3, and 4 exhibited the presence of NCGs or vapor void in the region belowthe internal temperature probe at specific heat rejection values in each test series.NCG or vapor void presence in the UFRTs was determined by observing theinternal temperature, when the internal temperature made a sharp increase of up to25°C with respect to the surface and evaporator temperatures. At low powers, thetemperature front moved past the highest external thermocouple, but remainedbelow the tip of the internal probe thermocouple. As the evaporator heater powerwas increased, the NCGs or vapor void were believed to pass from below theinternal temperature probe to above, as shown in Figure 7.3.

35
WaterVapor
InternalTemperature
Probe
NCGs or cold water vapor
UFRT Condenser Section
UFRT End Cap
(a) (b)
Figure 7.3. NCG or Vapor Void Location Identification.
One explanation for this sheathing of the internal probe thermocouple is that NCGswere liberated from the working fluid. NCGs are initially trapped in the water afterit is added to the tubes. Although procedures were employed to attempt to releasethese NCGs from the water in the UFRTs before testing, as described in Section 6.1.1,there was no adequate method to determine the amount released or still remainingin the tubes. A post-test analysis based on the data in Figure J.1 of Appendix J didresult in an estimated concentration of 24 ppm, using the ideal gas law to calculatethe amount of air in the top quarter of the tube. This result supports theassumption that NCGs were present during the test.
Battelle personnel have also seen this phenomena in previous testing conducted intheir facilities. They described the phenomena at that time using a heat balancetheory. As certain heat inputs are provided to the evaporator, only discreet areas arerequired in the condenser region to radiate the heat from the UFRT, as described inequation F.1 of Appendix F. The remaining interior volume of the UFRT above theradiating area is believed to be filled with a low density vapor void. As thecondenser becomes coupled with the evaporator to radiate the input heat load, thetemperature front moves up the condenser. Finally, at a given heat load for eachtest series, the vapor void disappears as the entire condenser area is used.
With either theory, it is clear that there was a presence of NCGs or vapor void. Thisphenomena was considered in the post-test analyses described in the followingsections.

36
There are two possible methods to evaluate the temperature differences seen in theUFRT test. For the first method, the radiative power can be calculated usingequations F.4 and F.5 and thermocouple data collected during the thermal/vacuumtests. The environmental temperatures were determined from thermocouplemeasurements on an unheated coupon of Nextel fabric in the chamber and furtherrefined by employing a calculated distribution for both the infrared and solar lamps.The UFRT temperatures were averages of the epoxy-mounted thermocouplemeasurements over the length of the condenser region. The temperature drop wascalculated using equation F.6 and the appropriate thermocouple data. Theevaporator end cap thermocouple was used to measure the evaporator temperature.The condenser temperature was an averaged reading of the epoxy-mountedthermocouples along the condenser region.
The second method for evaluating the temperature differences used the steady-statetest points. The steady-state test points shown in Appendix L were found by takingthe steady-state raw data shown in Appendices G-K and subtracting the amount ofheat leak (described in Section 7.3) from the evaporator heater power settings todetermine for the heat rejected by the condenser section. The condensertemperatures were calculated using the average of the condenser T/Cs as specified inSection 7.2.
The second method's results are presented here because the data correlated wellwith the post test model (shown in Appendix E). Detailed descriptions of the resultsand their associated tables and plots are located in Appendix L. These descriptionsinclude a presentation of all of the test points. In the cases where dryout occurred,the highest power setting and internal temperature were noted for each test series.In the remaining UFRTs, the power setting and internal temperature prior to NCGor vapor void passage by the internal temperature probe are shown. The maximumpower setting and internal temperatures of each UFRT were also noted. Thiscombined to define the operating range of the UFRTs during this test.
The characteristics of UFRT dryout will be determined using UFRTs 2 and 5. Dryoutis characterized by a sharp increase in the evaporator end cap temperature. UFRTs 1,3, and 4 will be used to characterize the normal operation of the UFRT.
7.4.1 Test Series 1 (Lunar Noon)
UFRTs 1 and 3 followed the same surface and internal temperature trend as shownin Figures L.1 and L.2. However, UFRT 1 surface and internal temperatures wereapproximately 20°C less than UFRT 3. UFRT 4 had a shallower slope than bothUFRTs 1 and 3. All of the UFRTs followed the same trend in the evaporatortemperatures as shown in Figure L.3. While evaporator temperatures of UFRTs 3

37
and 4 were nearly the same, UFRT 1 environmental temperatures wereapproximately 15°C less than both UFRTs 3 and 4 at all of the power settings.
UFRTs 1 and 3 had approximately the same internal to surface temperaturedifferences, 17°C to 30°C. In nearly the same power range, UFRT 4 had smallerinternal to surface temperature differences, 12°C to 23°C, than UFRTs 1 or 2.However, the wicked UFRT (UFRT 3) had almost negligible temperature differencesbetween the evaporator and internal temperatures with a 2°C to 7°C temperaturedifference range. UFRT 1 was nearly the same as UFRT 3 in evaporator to internaltemperature differences with a range of 2.6°C to 9°C. UFRT 4 had much highertemperature differences between the evaporator and internal locations, 14°C to 40°C.The total temperature difference for UFRTs 1 and 3 were approximately 24°C to40°C. UFRT 4 had a total temperature difference that ranged from 27°C to 50°C.
While remaining within the internal pressure limits, the maximum heat rejectionoutput by UFRTs 1, 3, and 4 in Test Series 1 were 47.7 W, 38.9 W and 49.1 W,respectively. UFRT 2 dried out at the 12.1 W heat rejection with an internaltemperature of approximately 320 K. UFRT 5 dried out at 36.9 W heat rejection and367 K internal temperature.
7.4.2 Test Series 2 (45° Past Lunar Noon)
UFRTs 1 and 3 followed the same temperature trend for surface and internaltemperatures as shown in Figures L.4 and L.5. However, UFRT 1 surface andinternal temperatures were approximately 16°C less that UFRT 3. UFRT 4 had ashallower slope than both UFRTs 1 and 3. All of the UFRTs followed the sametrend in the evaporator temperatures as shown in Figure L.6. While UFRT 3 wasthe warmest, UFRT 4 was approximately 4°C to 15°C less than UFRT 3 and UFRT 1was approximately 15°C to 25°C less than UFRT 3.
UFRT 4 had the smallest internal to surface temperature differences of 8°C to 21°C.UFRT 1 had internal to surface temperature differences of approximately 17°C to26°C. UFRT 3 had the greatest internal to surface temperature differences of 18°C to38°C. UFRT 3 had almost negligible evaporator and internal temperaturedifferences (1°C to 4°C). UFRT 1 was slightly higher than UFRT 3 in evaporator tointernal temperature differences with a 4°C to 12°C range. UFRT 4 had the highesttemperature difference between the evaporator and internal locations (18°C to 29°C).The total temperature difference for UFRTs 1 and 3 were approximately 20°C to 40°Cwhile UFRT 4 had a total temperature difference that ranged from 27°C to 50°C.
The maximum heat rejection tested for UFRTs 1, 3, and 4 was 45.6 W, 43.5 W, and40.5 W, respectively, and maximum heat rejections were limited by the maximum

38
internal pressure limit. UFRT 2 was not tested. UFRT 5 dried out above the 18.7 Wheat rejection and 328K internal temperature.
7.4.3 Test Series 3 (30° Latitude)
UFRTs 1 and 3 followed similar surface temperature trends as shown in Figure L.7in Appendix L. UFRT 4 had a shallower surface temperature slope and wasapproximately 10°C less than UFRT 1. UFRTs 1 and 3 followed the sametemperature trend for internal temperatures as shown in Figure L.8. However,UFRT 1 internal temperatures were approximately 25°C less than UFRT 3. UFRT 4had a slightly shallower internal temperature slope than both UFRTs 1 and 3.UFRTs 1 and 3 followed the same trend in the evaporator temperatures as shown inFigure L.9. UFRT 1 was approximately 15°C to 25°C less than UFRT 3. UFRT 4 had ashallower evaporator temperature slope and was located between the evaporatorcurves for UFRTs 1 and 3.
UFRT 1 had the least internal to surface temperature differences of 11°C to 21°C.UFRT 4 had internal to surface temperature differences of approximately 25°C to35°C. UFRT 3 had the greatest internal to surface temperature differences rangingfrom 38°C to 49°C. UFRT 3 had almost negligible evaporator to internaltemperature differences of 3°C to 5°C. UFRT 1 was slightly higher than UFRT 3 inevaporator to internal temperature differences with a 7°C to 13°C range oftemperature differences. UFRT 4 had the highest temperature difference betweenthe evaporator and internal locations of 23°C to 28°C. The total temperaturedifference for UFRT 1 was approximately 19°C to 35°C. UFRT 3 had a totaltemperature difference that ranged from 42°C to 52°C. The total temperaturedifferences were largest for UFRT 4 and ranged from approximately 49°C to 63°C.
The maximum heat rejection for UFRTs 1, 3, and 4 was 43.3 W, 39.5 W, and 42.8 W,respectively, without exceeding the UFRT internal pressure limits. UFRTs 2 and 5dried out prior to 14.6 W and 18.4 W, respectively, while the internal temperatureswere 323K and 337K, respectively.
7.4.4 Test Series 4 (45° Latitude)
UFRTs 1, 3, and 4 followed the same temperature trend for surface and internaltemperatures as shown in Figures L.10 and L.11. UFRTs 1 and 4 had approximatelythe same surface and internal temperatures. However, these UFRTs surface andinternal temperatures were approximately 10°C and 20°C less, respectively, thanUFRT 3. UFRTs 1, 3, and 4 followed the same evaporator temperature trends asshown in Figure L.12. While UFRTs 1 and 3 were the warmest, UFRT 1 wasapproximately 12°C to 20°C less than UFRT 3 and UFRT 1.

39
UFRT 1 had an internal to surface temperature differences ranging from 17°C to23°C, respectively. UFRT 4 had internal to surface temperature differences ofapproximately 13°C to 28°C. UFRT 3 had the greatest internal to surface temperaturedifferences of 24°C to 43°C. UFRT 3, had almost negligible evaporator and internaltemperature differences, 1°C to 3°C. UFRT 1 was slightly higher than UFRT 3 inevaporator to internal temperature differences with a 2.4°C to 12°C range oftemperature differences. UFRT 4 had the highest temperature difference betweenthe evaporator and internal locations, 19°C to 38°C. The total temperaturedifference for UFRT 1 was approximately 19°C to 35°C. UFRT 3 had a totaltemperature difference that ranged from 25°C to 45°C. The total temperaturedifferences were largest for UFRT 4 and ranged from approximately 33°C to 65°C.
The maximum heat rejection for UFRTs 1, 3, and 4 was 38.2 W, 44.9 W, and 41.7 W,respectively, without exceeding the internal pressure limits. UFRT 5 dried out atthe 22.4 W heat rejection with an internal temperature of 357K.
7.4.5 Test Series 5 (Full Solar)
UFRTs 1 and 3 had nearly the same surface temperature trends as shown inFigure L.13. UFRT 4 had a similar surface temperature trend that was approximately12°C to 20°C less than UFRT 1. UFRTs 1, 3, and 4 followed the same temperaturetrend for internal temperatures as shown in Figure L.14. However, UFRT 1 internaltemperatures were approximately 8°C to 30°C less than UFRT 3. UFRT 4 internaltemperatures were approximately 20°C to 30°C less than UFRT 3. UFRTs 1, 3, and 4followed the same trend in the evaporator temperatures as shown in Figure L.12.UFRT 4 evaporator temperature was approximately 4°C less than UFRT 3 whileUFRT 1 was approximately 12°C to 20°C less than UFRT 3.
UFRT 1 had internal to surface temperature differences of 17°C to 25°C. UFRT 4 hadan internal to surface temperature differences of approximately 25°C to 33°C.UFRT 3 had the greatest internal to surface temperature differences of 32°C to 57°C.UFRT 3 had almost negligible evaporator and internal temperature differences, -5°Cto 10°C. UFRT 1 was slightly higher than UFRT 3 in evaporator to internaltemperature differences with a 5°C to 14°C range of temperature differences.UFRT 4 had the highest temperature difference between the evaporator and internallocations, 21°C to 35°C . The total temperature difference for UFRT 1 wasapproximately 22°C to 40°C. UFRT 3 had a total temperature difference that rangedfrom 41°C to 53°C. The total temperature differences were largest for UFRT 4 andranged from approximately 46°C to 69°C.
40
The maximum amount of heat rejection for UFRTs 1, 3, and 4 was 43.6 W, 58.0 W,and 32.3 W, respectively, without exceeding the internal pressure limits of theUFRT. UFRT 5 dried out when the heat rejection of 29.5 W was exceeded. Theinternal temperature of UFRT 5 was 328K at dryout.
7.4.6 Test Series 6 (Maximum Heat Transfer, Frozen Startup, and Transient Step Down)
All of the UFRTs reached a frozen state at an evaporator temperature of less than -20 °C. The heaters were turned on and set to a power setting near the expectedmaximum heater input power of 65 W. UFRTs 2 and 5 dried out at the high powersetting. UFRTs 1, 3, and 4 performance was not affected by the frozen condition,indicating that no damage occurred to the UFRTs during the frozen startup. UFRTs1 and 4 reached the maximum internal pressure at the 65 W input power setting.UFRT 3 approached the internal pressure limit at the 70 W power setting during themaximum heat transfer case.
UFRTs 1 and 4 started at the 50 W input power, while UFRT 3 began at the 70 Wpower setting. The input power was then decreased by 10 W every 10 minutes untilthe input power was 0 W. The purpose of this test was to determine whether icecrystals would form on the UFRT condenser section wall and result in evaporatordryout. This was not shown to occur because the internal temperatures remainedabove the freezing point of water as shown in Figures 7.4 through 7.6. In addition,the evaporator temperature did not rise sharply as seen in the other dryoutsituations in this test.

41
Time (hr)
-100
-50
0
50
100
150
0 0.5 1 1.5
Evaporator Temperature
Surface Temperature
Internal Temperature
Power Input
Pow
er I
nput
(W
) an
d T
empe
ratu
re (
°C)
Fig. 7.4. UFRT 1 Transient Step Down Test.
-50
0
50
100
150
200
0 0.5 1 1.5
Time (hr)
Evaporator Temperature
Surface Temperature
Internal Temperature
Power Input
Pow
er I
nput
(W
) an
d T
empe
ratu
re (
°C)
Fig 7.5. UFRT 3 Transient Step Down Test.
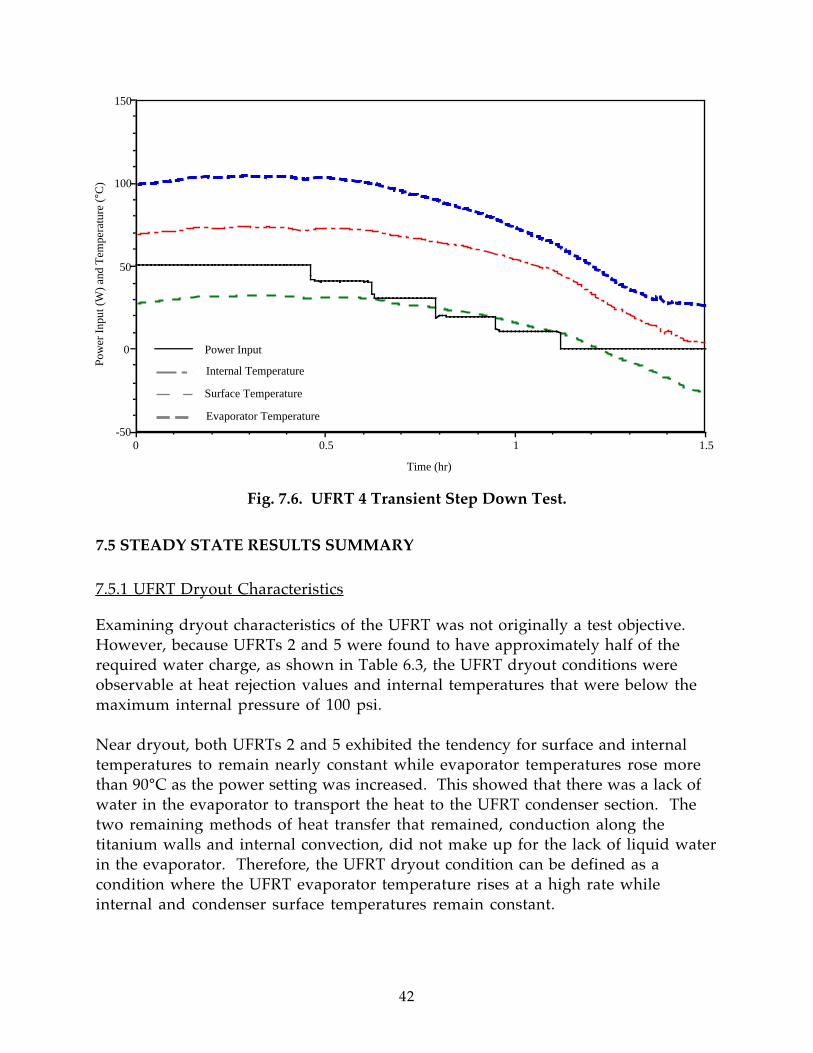
42
-50
0
50
100
150
0 0.5 1 1.5
Time (hr)
Evaporator Temperature
Surface Temperature
Internal Temperature
Power Input
Pow
er I
nput
(W
) an
d T
empe
ratu
re (
°C)
Fig. 7.6. UFRT 4 Transient Step Down Test.
7.5 STEADY STATE RESULTS SUMMARY
7.5.1 UFRT Dryout Characteristics
Examining dryout characteristics of the UFRT was not originally a test objective.However, because UFRTs 2 and 5 were found to have approximately half of therequired water charge, as shown in Table 6.3, the UFRT dryout conditions wereobservable at heat rejection values and internal temperatures that were below themaximum internal pressure of 100 psi.
Near dryout, both UFRTs 2 and 5 exhibited the tendency for surface and internaltemperatures to remain nearly constant while evaporator temperatures rose morethan 90°C as the power setting was increased. This showed that there was a lack ofwater in the evaporator to transport the heat to the UFRT condenser section. Thetwo remaining methods of heat transfer that remained, conduction along thetitanium walls and internal convection, did not make up for the lack of liquid waterin the evaporator. Therefore, the UFRT dryout condition can be defined as acondition where the UFRT evaporator temperature rises at a high rate whileinternal and condenser surface temperatures remain constant.

43
For the UFRTs used in this test, it is uncertain exactly at which power setting andinternal temperature that each UFRT experienced dryout. This was because the lastrecorded test point was always just below the heat rejection value that caused thedryout and environmental conditions were different for each test. Therefore, theheat rejection values recorded prior to dryout were noted. The maximum heatrejection value and internal temperature that UFRT 2 dried out at were 14.6 W and323 K, respectively, as shown in Table 7.3. UFRT 5 dried out at a maximum heatrejection of 37 W and 367K in Test Series 3. In all of the test series, UFRT 5 dried outat a higher heat rejection and internal temperature. UFRT 5 had approximately 1.0 gof water more than UFRT 2, which may increase the UFRT dryout temperatures.Also, UFRT 5 had no wick while UFRT 2 had a wick as shown in Figure 6.3. UFRT 5may have allowed fluid to traverse the entire evaporator while in UFRT 2, the wickwould tend to hold the fluid near the top of the evaporator, thereby hinderingremoval of the heat from the lower clamp heater.
Table 7.3. UFRT Dryout ConditionsUFRT2 UFRT5
Test Heat Internal Heat Internal Series Rejection Temperature Rejection Temperature
(W) (K) (W) (K)1 12.1 320 36.9 3672 N/A N/A 18.7 3283 14.6 323 18.4 3374 N/A N/A 22 3575 N/A N/A 29.5 328
7.5.2 Operating Characteristics With NCGs
UFRT 4 operated in what seemed to be an acceptable fashion during the test.However, UFRT 4 did not follow the same trends as UFRT 1 or UFRT 3 in any of thetest series. UFRT 4 had a shallower surface and internal temperatures with respectto heat rejection than UFRTs 1 and 3. For example, UFRT 4 typically had highersurface and internal temperatures than UFRT 3 at low heat rejection values andsurface and internal temperatures lower than UFRT 1 at higher heat rejectionvalues. UFRT 4 did not correspond to the post test math model calculations shownin Appendix F. UFRT 4 also showed abnormally high evaporator to internaltemperature differences, similar to UFRTs 1 and 3 when NCGs or vapor void waspresumed below the internal temperature probe. Therefore, it is suspected thatsignificant NCGs or vapor void was present in UFRT 4 during the test.

44
The result of NCGs or vapor void in the UFRT was a high evaporator to internaltemperature difference. The presence of the NCGs or vapor made the internal tosurface temperature difference falsely low. However, because the evaporator tointernal temperature difference was as high as 40°C, the total temperature differencefrom evaporator to surface exceeded 50°C for most of the test series.
7.5.3 UFRT Normal Operations
UFRTs 1 and 3 performed as expected as shown in post-test model correlation plotsin Appendix F. Except for Test Series 3, the model solutions were within ±5°C of thetest series results. Also, the test results had a slightly higher temperature differencethan the model from the middle to the outside tubes, as shown in Figures F1through F5. Both UFRTs 1 and 3 had the same trend as the post-test model.
UFRTs 1 and 3 had very small temperature differences from evaporator to internaltemperatures. At the low heat rejections, approximately 20 W, both UFRTs hadnegligible temperature differences that did not exceed 10°C. However, at the higherheat rejections, the wicked UFRT (UFRT 3) never exceeded 7.0°C temperaturedifference between the evaporator and internal temperatures while UFRT 1, thewickless UFRT, had maximum temperature differences of not more than 14.0°C.The advantage in evaporator to internal temperature differences is associated withthe wicked UFRT, UFRT 3.
UFRT 1 had the lower temperature difference from internal to surface betweenUFRT 3 and UFRT 1. UFRT 1 temperature difference ranged from 17°C to 30°C forall of the test series. The internal to surface temperature difference for UFRT 3 werewithin 3°C of UFRT 1 in the first test series. However, as the test series progressed,the internal to surface temperature difference increased from 18°C to 32°C at the18 W heat rejection values to 33°C to 56°C at the 58 W heat rejection values.
UFRT 1 had the smallest evaporator to surface temperature differences ofapproximately 20°C to 40°C at the 18 W and 48 W heat rejection values, respectively.UFRT 3 had evaporator to surface temperature differences of 20°C to 52°C at 18 Wand 58 W heat rejection values, respectively. If we assumed that the internal tosurface temperature differences should be approximately the same, then the internalto surface temperature differences of UFRT 1 and evaporator to internaltemperature differences of UFRT 3 can be combined to produce a small evaporatorto surface temperature difference savings of approximately 5°C. This would resultin a wicked UFRT evaporator to surface temperature difference range ofapproximately 20°C to 35°C.
45
7.5.4 UFRT Operations in Various Environments
As can be seen in Table 6.2, most of the simulated UFRT environments on the sunside of the moon varied little, less than 14 K, except for the full solar case, TestSeries 5. The difference in temperature environments from Test Series 1, 2, and 4for the middle tube, UFRT 3, was only 14 K while the environments for the outerUFRT, UFRT 1, was only 6 K. Similarly, during the test, the various environmentsdiffered by less than 12 K for both UFRTs 1 and 3. The sun side environments didnot vary enough to see a significant difference in the UFRTs operating temperaturesor in the heat rejection values. Furthermore, both UFRTs 1 and 3 acted nearly thesame in Test Series 1, 2, and 4 due to the similarity of the environments. The testconfirmed model results that the sun side environments were similar even withthe combination of solar and IR heat input.
The full solar case produced a much lower temperature environment of 232 K. Thisenvironment was approximately 70 K lower than any of the cases that used acombination of solar and IR fluxes (Test Series 1-4). This test series confirmed thatthe UFRTs ran at an acceptable sink temperature in a full solar environment. Thiscase also shows that the IR flux had a much greater influence on the environmentaltemperatures than did the solar flux, due to the UFRTs’ high value of emissivity.

46
8.0 BENEFIT OF THE UFRT IN A LUNAR BASE THERMAL CONTROLSYSTEM
To assess the potential benefit of the UFRT for future NASA missions, a simpletrade study was performed. Total heat rejection system masses were computed for aUFRT radiator and for a state-of-the-art aluminum radiator for the case of a 50 kWlunar base at the equator. This study was a variation on the trade study documentedin Ewert, 1993. Since the UFRT could be used alone or in conjunction with otheradvanced thermal control system (TCS) hardware, four different TCS configurationswere considered: heat pump, radiator shade, heat pump plus shade and neither(horizontal low alpha radiator by itself). For each case, the total heat rejectionsystem mass was computed including a "power mass penalty" for power consumedby the system.
8.1 ASSUMPTIONS
Key assumptions in the study were:
• Internal TCS set point is 275 K and there is a 3 K temperature drop at eachinterface heat exchanger. For example, in the heat pump system, the heat pumpevaporator operates at 272 K and lifts the temperature to 377 K in the condenser.Heat is then transferred to the rejection loop fluid at 374 K and to the metal inthe radiator at 371 K. The radiator surface temperature, or operatingtemperature, is the radiator metal temperature minus the "radiator DT" as seenin Figure 8.1. In the systems without heat pump, the rejection loop fluid is272 K and the metal in the radiator is 269 K.
• Evaporator-to-condenser temperature drop, or "radiator DT," for the currentUFRT is 20 K based on test data. Temperature drop for an improved UFRT wasassumed to be 3 K. The temperature drop for the state-of-the art flow-throughradiator is 1 K. These temperature drops reduce radiator operating temperatureand thus reduce heat rejection per unit area.
• 50 kW lunar base located at the equator (worst thermal environment).
• Radiator shade is parabolic and half as tall as the vertical radiator. It has a massof 1.7 kg/m2 of radiator area.
• Heat acquisition and transport system masses are not included; they areassumed to be equal for all cases.
• Maximum (and optimum) heat pump lift is 105 K. Heat pump efficiency is 45%of the Carnot efficiency and mass is 8 kg/kW of capacity.
• Effective heat sink temperatures for each case were computed using thermalmath models.
• Vertical radiators are two-sided and their mass is computed from theInternational Space Station Alpha central TCS radiators (9/93 estimates).

47
State-of-the-art radiator mass is equal to the space station radiator mass which is16 kg/m2 of projected (not radiating) area. A breakdown of this mass betweenpanels, manifold, and structure is shown below. It is assumed that the decreasedstructural requirements due to the availability of the lunar surface for bracingand the increased requirements due to increased gravity cancel each other out.The radiator is deployable; missions which allow an erectable radiator wouldprobably have a lower mass.
• Current UFRT radiator mass is equal to state-of-the-art radiator mass with theradiator panel mass replaced by the UFRT mass of 0.13 kg/tube or 3.11 kg/m2 ofprojected area. Improved UFRT mass is based on concepts by Battelle whichwould eliminate the ceramic fabric and decrease the tube size to reduce mass to1.12 kg/m2 of projected area. Mass breakdown is (kg/m2 ):
State-of-the-art Current UFRT Improved UFRTpanel without manifolds 5.08 3.11 1.12panel manifolds 1.19 1.19 1.19deployment structure & base 9.72 9.72 9.72 Total 16.00 14.00 12.00
No credit was given to the UFRT structure mass due to the lower panel masssince deployment structure mass is driven more by its own mass and stiffnessrequirements than it is by panel mass. Improved structures are not consideredhere as they are a separate development effort which could be applied to eitheran aluminum or UFRT radiator panel. There may be some additional structuralbenefit with the lighter UFRT panels, but that is beyond the scope of this study.
• The "neither" case uses a one-sided horizontal low alpha radiator withabsorptivity (α) = 0.1. Since this radiator is one-sided, it can be closer to theground and it should require less support structure than the vertical radiators.Therefore, its mass was arbitrarily assumed to be 3 kg/m2 less than the verticalradiators.
• Emissivity is 0.89 for the UFRT as measured at JSC in July 1994. Emissivity andfin efficiency are 0.90 and 0.92 respectively for the state-of-the-art radiator.
• UFRT view factor to space (no fins) for the tested spacing is 0.93 which takes theplace of the fin efficiency for the state-of-the-art radiator.
• The power mass penalty used for the heat pump is 22 kg/kW per LewisResearch Center for daytime power using an advanced solar photovoltaic powersystem.
Other assumptions can be found in Ewert, 1993.

48
T radiator
T metalT fluid
State-of-the-artFlow-through
Radiator
UFRTRadiator
T metalT fluid
Fin
T radiatorFabric
Radiator∆T
Radiator∆T
Figure 8.1. Radiator Surface Temperature.
8.2 TRADE STUDY RESULTS AND DISCUSSION
Table 8.1 shows the result of the trade study for the heat pump (H/P), radiator shade,heat pump plus shade (both) and radiator alone (neither) cases. The current UFRTincreases, rather than decreases, the heat rejection system mass compared to thestate-of-the-art radiator for all 4 cases considered. The primary reason for this is thelarge temperature drop through the UFRT which reduces radiator operatingtemperature. In a hot thermal environment such as the moon, this is a substantialpenalty. The mass savings due to the UFRT were not enough to outweigh theincreased radiator area required. While the reduction in radiator panel mass was39% due to the UFRT, the reduction in overall radiator mass (including structure)was only 13%, pointing out the need to work on improving the radiator structure aswell as the panels.
Table 8.1. Results of Trade Study
HEAT REJECTION SYSTEM 50 kW SYSTEM
MASS SUMMARY (KG) H / P SHADE BOTH NEITHER
STATE OF THE ART 3320 3490 2553 6468
CURRENT UFRT 4464 5963 2767 13965
IMPROVED UFRT 2904 2863 2306 4820
Assuming that the conductance between the titanium liner and the radiator surfacecan be reduced, an overall temperature drop through the UFRT of 3K would bereasonable. Using this assumption along with projections for lower mass tubes, thetrade study results for an improved UFRT do show a mass savings compared to thestate-of-the-art radiator for all 4 cases. The heat rejection mass savings range from10% for the "both" case to 25% for the "neither" case.

49
9.0 CONCLUSIONS
This report documents that the major objectives for the FY94 UFRT program havebeen successfully accomplished. Six UFRTs, with the titanium liners, weremanufactured and provided to JSC in July 1994. Five of the delivered tubes weretested successfully in a thermal/vacuum chamber under simulated lunar conditionsin September 1994.
The thermal/vacuum chamber testing explored three different operating character-istics of the UFRT: dryout, operations with NCGs or vapor void, and normaloperations. The UFRT dryout characteristic was defined as a rapid evaporatortemperature rise while the internal and surface temperatures remained constant. Inthe dryout comparison of UFRTs 2 and 5, it can be seen that the wicked UFRT(UFRT 2) dried out at a lower heat rejection and internal temperature than UFRT 5.The results of this test also showed that the wickless UFRT (UFRT 5), with a slightlyhigher water charge, had better dryout characteristics than the wicked UFRT.
When NCGs or vapor void were present in the UFRTs, a high temperaturedifference existed between the evaporator and internal temperatures. The UFRTsstill operated with the NCGs or vapor void present. However, the penalty for UFRToperation with NCGs or vapor void was a high temperature difference between theevaporator to surface temperature of approximately 70°C at the high power settings.
UFRTs 1 and 3 operated as expected and correlated well with the post-test model.The overall evaporator to condenser surface temperature difference was smallest forUFRT 1 (no wick), which was 20°C to 40°C at the 18 W and 48 W heat rejectionvalues, respectively. The wicked UFRT (UFRT 3) had evaporator to surfacetemperature differences of 20°C to 50°C at the 18 W and 58 W heat rejection values,respectively. Combining the best characteristics from both UFRTs (UFRT 1 -internal to surface; UFRT 3 - evaporator to internal), the best evaporator to surfacetemperature difference can be as low as 20°C to 35°C at the 18 W and 48 W heatrejection values, respectively.
In addition to characterizing the UFRTs, the thermal/vacuum chamber testingdemonstrated the successful buildup and operation of a test stand for this purpose.However, the test team did compile a list of "lessons learned," included inAppendix M, to be considered for future UFRT tests.
The test data obtained in this program also supported a trade study to compare aUFRT radiator to a state-of-the-art aluminum radiator (Section 8.0). The study didshow that the UFRT design could achieve as much as a 25% mass savings in theheat rejection subsystem of future planetary-type TCSs.

50
10.0 REFERENCES
Ewert, M. K., 1993, "Investigation of Lunar Base Thermal Control System Options,"23rd International Conference on Environmental Systems, Colorado Springs,Colorado, SAE Technical Paper #932112.
Graf, J.P., and Keller J.R., 1994, “UT Lunar Radiator Shade Concept Chamber EThermal Vacuum Test Final Report,” report submitted to NASA Johnson SpaceCenter, JSC-38083, ADV-122.
Guenther, R. J. et al., 1992, "Fiscal Year 1992 Annual Report for the BubbleMembrane Radiator Project," report submitted to NASA Johnson Space Centerunder Contract DE-AC06-76RLO 1830.
Incropera, F.P., and DeWitt, D.P., 1985, Fundamentals of Heat and Mass Transfer ,John Wiley and Sons, New York.
Paul, T.H., 1994, “Lunar Radiator Parabolic Shade Experimental Sink TemperatureUncertainty Analysis,” report submitted to NASA Johnson Space Center,LESC-31112, CTSD-1736.
Pauley, K. A. et al., 1993, “Design and Test of Ultralight Fabric Reflux Tubes,” Proceedings of the Tenth Symposium on Space Nuclear Power and Propulsion ,Institute for Space Nuclear Power Studies, University of New Mexico,Albuquerque, New Mexico.

A-1
APPENDIX ABATTELLE DESIGN DRAWINGS FOR UFRT WITH TITANIUM LINERS
Part Name Number Battelle Drawing No. andDescription
Material
UFRT OverallDesign
1 Titanium Ultralight RefluxTubes for August 1994 Testing atNASA Johnson Space Center,DV Archer, 7/2/94
See Below
Preform 1 Copper Preform for Heat Pipe,LL King, 11/7/91
Titanium,ASTM B338,Grade 2
Liner 1 Titanium Liner for UFRT, DVArcher, 6/25/94
Titanium asformed fromASTM B338,Grade 2
Inner CopperSleeve
2 SK No. 1044, Reflux TubeCrimping Rings, 1/21/92
Copper
Outer CopperSleeve
2 SK No. 1044, Reflux TubeCrimping Rings, 1/21/92
Copper
End Cap 1 Titanium UFRT End Caps, DVArcher, 7/3/94
Titanium
End Cap withPort
1 Titanium End Cap (With Hole),DV Archer, 3/14/94
Titanium
Ceramic Fabric 1 Titanium Ultra-light RefluxTubes for August 1994 Testing atNASA Johnson Space Center,DV Archer, 7/2/94
Nextel 312
Internal Wick 1 or 0 N A SiO2
Spring 1 or 0 N A Spring steel

B-1
APPENDIX BQUALIFICATION TEST PLAN FOR THE FY94 UFRT DESIGN
TEST PURPOSE
The qualification test will be conducted to:
• verify the FY94 UFRT design capabilities, including operating pressure,condenser and evaporator temperatures, and power through-put
• provide test experience which may improve the operability of thethermal/vacuum testing of the UFRT design
• quantify individual thermal phenomena during the operation of the UFRTdesign which may aid in the interpretation of data collected duringthermal/vacuum testing
A successful test would include the following elements:
• successful charging and startup
• operation of the URFT up to the minimum ambient atmospheric operatingtemperature 377K (104oC)
• general isothermicity over the condenser length during steady state operation
• pressure containment throughout the test
• successful shutdown without pressure anomalies at the conclusion of the test
TEST DESCRIPTION
The following procedures have been developed to conduct the qualification testingof a single UFRT prototype. This design does not incorporate a wick structure in theevaporator region. The current design specifications are summarized in Table B.1.

B-2
Table B.1. FY94 UFRT Design
Evaporator Condenser
Length 5.1 cm Length 101.92 cm
Inner Diameter 2.54 cm Inner Diameter 2.54 cm
Wall Thickness 304.8 µm Liner Wall Thickness 63.5 µm
Material Titanium Fabric Wall Thickness 560 µm
Evaporator Surface ///////////////////// Liner Material Titanium
Length 7.62 cm Fabric Material AIB2SiO2
Outer Diameter 2.54 cm Working Fluid /////////////////////
Surface Roughness Smooth Fluid Water
Material N/A Volume 20 cc
Test Equipment
The qualification test will require a single instrumented prototypic UFRT. Therequired instrumentation includes bare-wire thermocouples, a sheathedthermocouple, a pressure transducer, and two 100-watt clamp heaters. An infraredcamera with a liquid nitrogen feed will also be used to image the test article. Thedigital data will be collected using a personal computer-based data acquisitionsystem. A 1/3 psi check valve will be used to prevent UFRT collapse during the test.
Test Procedure
The test will map the performance of the UFRT test article between 104oC (220oF)and 166oC (330oF). An outline of the test procedures will consist of the followingactivities:
• Set up IR camera with liquid N2 feed.
• Install 5 thermocouples: 2 at evaporator, 1 at condenser tip (insulate),1 internal at condenser end, and 1 placed on the condenser fabric.
• Install heaters and insulate evaporator.
• Estimate/calculate amount of water required for fill.
• Obtain about 100 cc of distilled/deionized/degassed water.
• Set up reflux tube in vertical position using the Chamber E mounting bracket,with the evaporator region on the bottom.

B-3
• Use the following procedure to charge the tubes: (1) fill the UFRT will an argoncover gas; (2) place 25 cc of water in the UFRT; (3) add heat to the heater clampsuntil boiling occurs; (4) vent water vapor until solid vapor is sustained at theend port; and (5) close fitting on end port.
• Determine the final charge amount by weighing the UFRT (plusinstrumentation) both before and after the completion of the chargingprocedure.
• Test between 104oC (220oF) and 166oC (330oF), evaluating the temperatureprofile with both thermocouples and IR camera (use the latter for axial as wellas circumfrential temperature profile measurements, and record on VHS tape)to ensure isothermal performance. Also use the data acquisition system torecord power, pressure, and temperatures measured with thermocouples.
• After testing, turn off heater power and again crack condenser fitting to preventcollapse of tube as temperature/pressure drops below about 110oC (230oF).
• Drain water (options: check reflux tube internals with boroscope; remove allwater and pressurize with dry inert gas for shipment to JSC).
• The procedure will be repeated for the second UFRT design.
Data Collection
Data will be collected using a personal computer-based data acquisition system. Theparameters of interest include temperatures at various locations, internal pressure,and heater power. The temperatures will be measured at the evaporator endcap, theevaporator surface, the condenser internal, and the condenser surface.
The infrared camera will also be used to determine the temperature of varioussurfaces by inputting an assumed emittance for the material. This feature will beused to calibrate the condenser surface thermocouple.
TEST LOCATION
The test will be conducted in the 306W Building, 300 Area, Pacific NorthwestLaboratory. The room is a high bay, which creates difficulties in maintaining aconstant heat transfer coefficient during the operation of the UFRT prototype. Thisissue will be addressed by the use of shields to minimize the effects as much aspossible.
Other test locations were explored at the Pacific Northwest Laboratory. Severalvacuum chambers were visited with the intention of providing minormodifications to accommodate the UFRT test article. However, it was determinedthat the cost of modifications would exceed the budget allocated for this task.

C-1
APPENDIX CQUALIFICATION TEST RESULTS FOR THE FY94 UFRT DESIGN
The thermal qualification test was conducted on a prototypic UFRT (UFRT 1) inorder to insure both the integrity and functionality of design. The test wasconsidered successful if the following criteria were met:
• Successful charging and startup• Operation of the UFRT up to the minimum ambient atmospheric operating
temperature (104oC (220oF))• General isothermicity over the condenser length during steady-state operation• Pressure containment throughout the test• Successful shutdown without pressure anomalies at the conclusion of the test
UFRT 1 was tested at Battelle in air in a vertical position on June 17, 1994 using twoclamp-on heaters. The test sequence consisted of heating the UFRT in a vertical(thermosyphon) orientation to establish power capabilities and ensure pressurecontainment. Power was increased in 25 W increments, starting with 125 W andincreased to a maximum of 175 W. At the maximum power level of 175 W, theUFRT temperatures were close to 411 K (280oF) and the corresponding pressureshould have been about 0.3 MPa (50 psia). The pressure transducer did not functionproperly. Power was thereafter decreased to 50 W, and the pressure sensorconnection attachment fitting was cracked open to prevent reflux tube collapse fromambient atmospheric pressure. Power was then completely turned off and dataacquisition terminated. Throughout the test, an infrared (IR) camera was used todetermine whether the heat rejection was isothermal along the condenser region.Total testing time was about 80 minutes. Following a cool-down period, the waterwas removed, the UFRT was filled with argon gas to 0.3 MPa (45 psia), and it waspackaged for shipment to JSC. The thermocouple and power response for thequalification test is shown in Figure C.1.
• The non-condensable gas venting procedure during startup worked well (IRphotography showed uniform temperatures along entire condenser lengthduring operation). It is estimated that << 1 g of fluid was lost from the tubeduring the 1 to 2 minutes of "steaming" with the tube open to atmosphere.The UFRT was weighed before final assembly and addition of water, but wasnot reweighed after the test.

C-2
5000400030002000100000
50
100
150
200
Evaporator Thermocouple #1
Evaporator Thermocouple #2
Condenser Thermocouple
Power (W)
Time (s)
Te
mp
era
ture
(C
) o
r P
ow
er
(W)
Evaporator Thermocouple #1 - mounted on evaporator endcapEvaporator Thermocouple #2 - mounted on evaporator above the clamp heaters
Figure C.1. Thermocouple and Power Data From the UFRT Qualification Test.
• At the highest power lever (175 W) the fabric surface temperatures were about22 K (36oF) less than the condenser vapor temperatures. This temperature dropis based on an assumed emittance for the Nextel fabric of 0.93 (used by the IRcamera) that was well matched by thermocouple readings. For example, at150 W, the condenser thermocouple indicated 375.6 K (216.7oF), while the IRcamera showed 375.0 K. In tests conducted by Battelle on previous UFRTs withcopper liners, the temperature drop was less than 10K under similar condi-tions. This increase in temperature difference is ascribed to the increasedthermal resistance from the uneven quality of the Nextel sleeve, and poorercontact with the condenser from a looser fit of the fabric over the liner and/orthe expected lower yielding of the titanium into the fabric after pressurization.This is an area for further investigation and optimization.
The UFRT design was tested to 175 W without failure or loss of heat rejectioncapability. No problems were encountered with the Nextel/Ti heat pipe operatingin the vertical (reflux) mode other than some evaporator liquid dryout. Test dataindicate that this heat pipe, operating in a space (non-convective) environment willnot be performance-limited, but will reach radiative limits well before reachingother thermodynamic limits.

D-1
APPENDIX DUFRT VENTING PROCEDURE DESCRIPTION
Since the UFRTs were filled in atmospheric conditions, air may have been trappedinside the tubes. If this non-condensable gas (NCG) is not removed before testing isbegun, the heat rejection performance of the UFRTs may be severely degraded.Therefore, a venting procedure was developed and is shown below. The equationsused to determine venting time are listed in the second section of this Appendix.
1) Open UFRT vent valves to the chamber.
2) Heat the UFRT to 25°C, as indicated by the evaporator thermocoupletemperatures.
3) With the vent valves open to the chamber, begin pump down. Maintain theUFRT temperatures at 25°C.
4) When the chamber pressure reaches 10.4 kPa (1.5 psia), the UFRT vent valvesare shut while the pump down of the chamber continues. It is essential that thepressure in the UFRTs always be greater than the chamber pressure. While thesaturation temperature associated with 25°C is only 3.2 kPa, this higher pressurewill ensure that boiling does not occur allowing a substantial amount ofworking fluid to be lost.
Steps 1 through 4 are used to reduce the amount of air in each UFRT tube byremoving air and by reducing the pressure of the air above the liquid water. Byreducing the overall pressure of the tube, the amount of air in solution will bereduced.
5) Once the chamber pressure drops below 3.5 kPa (0.5 psia), turn the UFRT heatersoff and continue pump down to vacuum conditions.
6) Allow the water in the UFRTs to freeze. From Battelle calculations, freezingwill be completed when the end cap temperature drops below 255.2 K.
7) Once freezing has occurred, open each UFRT one at a time and vent for 20minutes.
Steps 5 through 7 are used to eliminate the air above the frozen solid. After thesesteps, the only air remaining is that air which is trapped in the solid matrix.
8) Turn of the heaters and melt the ice. The ice will be melted when the internaltemperature probe reaches 20 to 25°C.
9) Once the internal temperatures reaches 20 to 25°C, hold the water at thistemperature for one hour.

D-2
Step 8 and 9 are used to liberate the air remaining in the solid and liquid and ensureit is in the top portion of the condenser section. In other words, this vigorousboiling and condensation process pushes all the NCGs to the top of the condensersection.
10) Vent each UFRT for one second.
Since all the air in each UFRT is at the top of the condenser section, the ventingassociated with step 10 eliminates the final NCGs.
The concentration of the air in the water (in ppm) can be calculated by the followingequation (Paul, T. H., 1994):
x = P/H (D.1)
where P is the pressure of the gas above the liquid in atmospheres and H is Henry'sconstant. Henry's constant varies with temperature and the value of this constantfor various temperatures is listed in Table D.1. Equation D.1 indicates the lower thepressure of the gas above the liquid the lower the concentration of water in the gas.
Table D.1. Values of Henry's Constant at Different Temperatures
Temperature (°C) H
0 43200
50 94600
100 107000
Once freezing has been completed and the air above the solid vented, the only airremaining in the system is that which is trapped in the solid. After the solid ismelted and vigorous boiling is present, the NCGs will be pushed to the top of theUFRTs. The volume occupied by the NCGs can be calculated from the ideal gas law.
PV = nRT (D.2)
where P, V, n, R, and T are the pressure, volume, number of moles, ideal gasconstant, and temperature, respectively. The pressure and temperature willcorrespond to those of the saturation condition in the UFRT.

D-3
Once the volume of the tube occupied by the NCGs is determined, the final venttime can be determined. Since the UFRTs vent to a vacuum and the pressure in theUFRTs will be nearly constant due to the heater input, the flow process can bedescribed by the choked flow equation found in any standard thermodynamicstextbook [2] and the vent time is simply the volume divided by the volumetric flowrate. For the problem at hand the vent time is approximately 0.2 sec; however, sincethe pneumatic valves can only cycle in one second, this time was chosen as the venttime.

E-1
APPENDIX EUFRT TSS/SINDA THERMAL MODEL DESCRIPTION
Geometric modeling of the test was performed using the TSS. Chamber E wasmodeled as a closed cylinder. A parallel light source entered through a one-waytransparent surface at the end opposite from the chamber door as shown inFigure E.1. The UFRTs were placed side to side in an array as shown in the figure.The UFRTs were placed on 10.16-cm centers with the entire UFRT array being43.18 cm across. The UFRTs were placed near the chamber E door as shown. Themodel included the test stand that held the UFRTs in place. The mylar that coveredthe pneumatic valves was simulated using a flat plate located above the UFRTs andbetween the UFRT and the chamber door as shown in Figure E.2. The IR was inputfrom eight 40.6-cm x 1.6-cm plates arranged four between the UFRTs and the solarbeam and four between the UFRTs and the Chamber E door as shown in Figure E.2.The location of these lamps also simulated the solar shadowing that existed duringthe test. An additional four 12.7-cm x 1.6-cm IR plates were located at on both edgesof the UFRT array as shown. The optical properties of the materials used in the TSSsolid model are listed in Table E.1.
Table E.1. Material Optical Properties
Material Absorptivity EmissivityNextel fabric 0.20 0.89Titanium 0.50 0.14Copper 0.35 0.04Chamber walls 0.95 0.95IR surfaces 1.00 1.00Steel 0.50 0.15Aluminum 0.22 0.47
The UFRT model environment was adjusted to mirror the conditions and chamberE test environment as shown previously in Tables 6.1 and 6.2. To simulate thechamber E cold walls, the simulated cold walls were set to 120K. The IR panelsprovided IR to the UFRTs and were varied for each test series as shown in Table E.2.To simulate the planetary conditions, a diffuse IR was emitted from the flat platesthat simulated the IR lamps. The maximum IR applied to the main and side flatplates was 22.63 W/m2 and 56.58 W/m2, respectively. The parallel light sourcesimulated the solar heat impinging on the UFRTs and was set as shown in Table E.2.The maximum solar constant (solar = 1.0) used was 1,370 W/m2.

E-2
Parallel LightSource -Simulated Solarfrom Solar Lamp
Chamber ECold Walls
Chamber EDoor
IR LampSimulators
UFRTArray
IR LampSimulators
Figure E.1. UFRT Post-Test Thermal Model.

E-3 10 cm
centers
UFRTarray
Chamber ECold Walls
Chamber EI-beam
UFRTarray
Chamber EDoor
Chamber ESolar Lamp
Chamber E End View(view from Solar Lamp)
Chamber E Side View
Figure E.2. UFRT Model Chamber E Configuration
UFRT MylarCovered Lines
29 cm
34 cm 34 cm
Side IRLamp Sims
58 cm
SideIR Sims.
40.6cm IRLamp
Simulators
29 cm
Chamber E Floor Chamber E Floor
FluxCoupon
40.6cm IRLamp
Simulators

E-4
Table E.2. Chamber E IR Lamp and Solar Settings in Thermal Model
Test Sim. Solar Flat Plate IR Output (W/m2)Series (W/m2) Main Side
1 0.00 22,630 16,9722 0.00 18,135 33,944/56,5753 685.00 33,945 33,9454 973.00 16,120 16,9725 1370.00 0 06 0.00 0 0
Each UFRT condenser section was divided into 16 nodes, 4 lengthwise and 4circumfrentially. These 16 surface nodes were connected in the SINDA model toone center node. Because of the titanium's high conductivity and 2-mil thickness,no discernible temperature difference would be seen between the inner and outertitanium wall. Therefore, the heater node of each UFRT was attached to the Nextelfabric. The Nextel fabric conductivity of 0.015
W m-K
was used to connect the interiorof the Nextel fabric to the UFRT surface nodes. This conductivity represented thecontact conductance between the titanium and the Nextel fabric in addition to theNextel conductance.
Heat was applied to the central node until the assigned temperature of the node wasreached. Then, the steady state temperature condition of the tube was known. Thesink and surface temperatures of the Nextel fabric were extracted from the SINDAmodel. The sink temperature was obtained using the heat input into the heaternode, Q, and the Nextel surface temperature in the following equation:
Tsink = (T4surf - Q
σεA )0.25 (E.1)
The model containing a 7.6-cm x 7.6-cm flux coupon was placed between UFRTs 2and 3 as shown in Figure E.2 to give an indication of how the UFRT environmentscompared to the flux coupon temperatures. The flux coupon had a Nextel fabricfacing the solar lamp and an aluminum side facing the Chamber E door in the TSSmodel. In the SINDA model, a node was placed in between the two surface nodesand the temperature of that node was allowed to reach steady state without any heatinput. The conductivity of the Nextel fabric was used to connect the surface of theNextel to the central node, while a high conductivity was assigned to the aluminumside due to its negligible thermal resistance.
Only the condenser section was analyzed for the heat rejection paths. The exposedarea of the copper band and titanium end cap at the top represented only 3% of theentire exposed area. The evaporator section was also excluded because its portion ofthe UFRT was covered with heaters and MLI and was not exposed to the chamberduring the test.

E-5
6 05 55 04 54 03 53 02 52 01 51 050
Sur
face
Tem
pera
ture
(K)
Heat Rejection (W)
Thermal Model
Test Results
250
300
350
400
450
Middle TubeTubes 2 and 4Outer Tubes
Tube 1Tube 3Tube 4
Figure E.3. UFRT Surface Temperatures, Series 1.

E-6
6 05 55 04 54 03 53 02 52 01 51 050250
300
350
400
450
Middle TubeTubes 2 and 4Outer Tubes
Tube 1Tube 3Tube 4
Heat Rejection (W)
Su
rfac
e T
emp
erat
ure
(K
) Thermal Model
Test Results
Figure E.4. UFRT Surface Temperatures, Test Series 2.

E-7
6 05 55 04 54 03 53 02 52 01 51 050300
325
350
375
400
425
450
Middle TubeTubes 2 and 4Outer Tubes
Tube 1Tube 3Tube 4
Heat Rejection (W)
Su
rfac
e T
emp
erat
ure
(K
) Thermal Model
Test Results
Figure E.5. UFRT Surface Temperatures, Test Series 3.

E-8
6 05 55 04 54 03 53 02 52 01 51 050280
300
320
340
360
380
400
420
Middle TubeTubes 2 and 4Outer Tubes
Tube 1Tube 3Tube 4
Heat Rejection (W)
Su
rfac
e T
emp
erat
ure
(K
) Thermal Model
Test Results
Figure E.6. UFRT Surface Temperatures, Test Series 4.

E-9
7 06 56 05 55 04 54 03 53 02 52 01 51 0260
280
300
320
340
360
380
400
420
Middle TubeTubes 2 and 4Outer Tubes
Tube 1Tube 3Tube 4
Heat Rejection (W)
Su
rfac
e T
emp
erat
ure
(K
) Thermal Model
Test Results
Figure E.7. UFRT Surface Temperatures, Test Series 5.

E-10
7 06 56 05 55 04 54 03 53 02 52 01 51 050100125150
175200225
250275
300325350
375400
Middle TubeTubes 2 and 4Outer Tubes
Heat Rejection (W)
Su
rfa
ce
Te
mp
era
ture
s (
K)
Figure E.8. UFRT Surface Temperatures, Test Series 6.
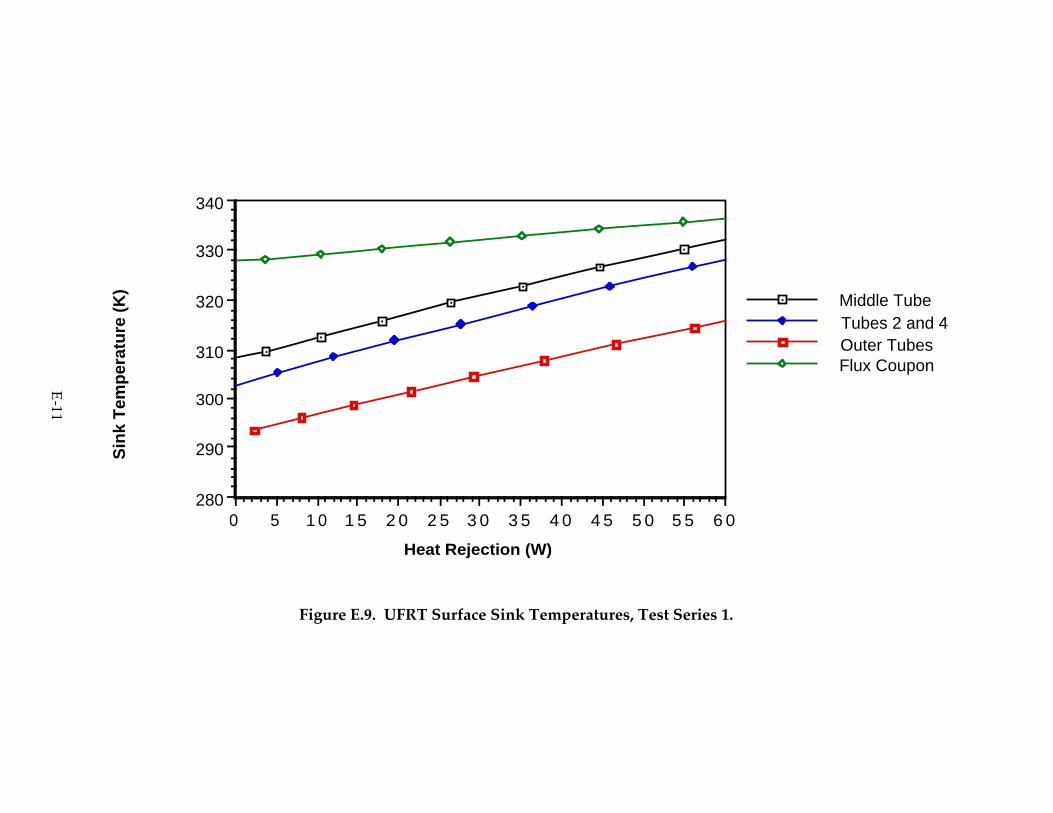
E-11
6 05 55 04 54 03 53 02 52 01 51 050280
290
300
310
320
330
340
Middle TubeTubes 2 and 4Outer TubesFlux Coupon
Heat Rejection (W)
Sin
k T
emp
erat
ure
(K
)
Figure E.9. UFRT Surface Sink Temperatures, Test Series 1.

E-12
6 05 55 04 54 03 53 02 52 01 51 050280
290
300
310
320
330
Middle TubeTubes 2 and 4Outer TubeFlux Coupon
Heat Rejection (W)
Sin
k T
emp
erat
ure
(K
)
Figure E.10. UFRT Surface Sink Temperatures, Test Series 2.

E-13
6 05 55 04 54 03 53 02 52 01 51 050330
340
350
360
370
380
390
Middle TubeTubes 2 and 4Outer TubesFlux Coupon
Heat Rejection (W)
Sin
k T
emp
ertu
re (
K)
Figure E.11. UFRT Surface Sink Temperatures, Test Series 3.

E-14
6 05 55 04 54 03 53 02 52 01 51 050280
290
300
310
320
330
340
350
Middle TubeTubes 2 and 4Outer TubesFlux Coupon
Heat Rejection (W)
Sin
k T
emp
erat
ure
s (K
)
Figure E.12. UFRT Surface Sink Temperatures, Test Series 4.
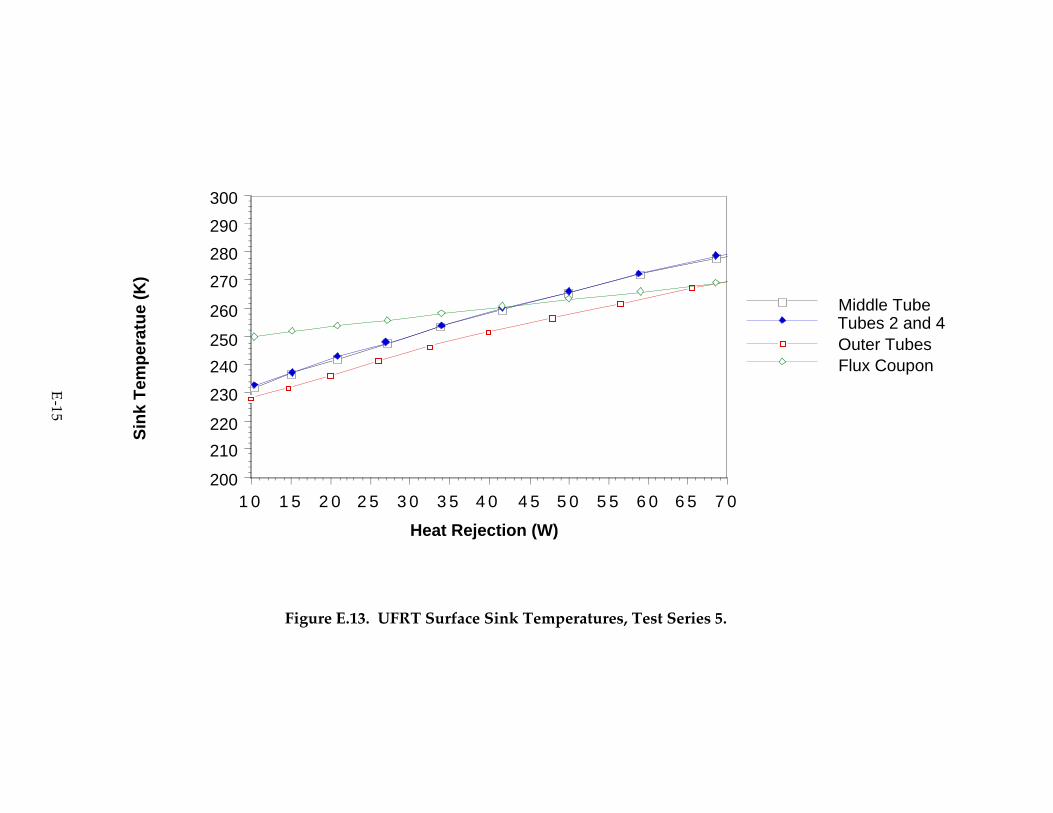
E-15
7 06 56 05 55 04 54 03 53 02 52 01 51 0200
210
220
230
240
250
260
270
280
290
300
Middle TubeTubes 2 and 4Outer TubesFlux Coupon
Heat Rejection (W)
Sin
k T
emp
erat
ue
(K)
Figure E.13. UFRT Surface Sink Temperatures, Test Series 5.

E-16
7 06 05 04 03 02 01 00100
125
150
175
200
225
250
Middle TubeTubes 2 and 4Outer TubesFlux Coupon
Heat Rejection (W)
Sin
k T
emp
erat
ure
(K
)
Figure E.14. UFRT Surface Sink Temperatures, Test Series 6.

F-1
APPENDIX FANALYSIS OF UFRTS USING HEAT PIPE THEORY
Two important performance parameters may be calculated to assess the performanceof UFRTs during the thermal/vacuum tests. These are the radiative heat transferand the overall temperature drop along each UFRT. These performance parametersmay be determined directly from the experimental data measured during the tests.These parameters will be explicitly defined below.
The actual power input into each UFRT may be compared with the calculatedradiated power from the UFRT condenser region. The calculated radiated power isdetermined by gray-body heat transfer to the environment and to the adjacentUFRTs. This heat transfer may be calculated, in its most basic form, usingEquation F.1.
Q = εσπLD(T4-Tenv4) (F.1)
where Q is the radiated power in Watts, ε is the dimensionless emissivity, σ is theStefan-Boltzmann constant ( 5.729 X 10⁻⁸ W/(m2-K4)), L is the length of thecondenser region of the UFRT, D is the outer diameter of the condenser region ofthe UFRT, T is the outer surface temperature of the condenser region of the UFRT,and the Tenv is the effective environmental sink temperature as viewed by theUFRT condenser.
However, equation F.1 does not include a separate formulation for the heat transferfrom the UFRT to the environment and the UFRT to any adjacent UFRTs. If all ofthe UFRTs are operating at the same temperature, the net heat transfer betweenUFRTs will be zero. However, since the UFRTs were often operated at differenttemperatures (including zero power input during some test points), this heattransfer must be accounted for. Therefore, a view factor must be included in theradiation heat transfer equation.
Assuming the UFRTs are infinitely long parallel cylinders, the view factor betweeneach UFRT can be found using Equations F.2 and F.3:
F1-2 = F2-1 = π-1 [ (X2-1)1/2+ sin-1 (1/X) - X] (F.2)
where
X = 1 + (s/2r) (F.3)
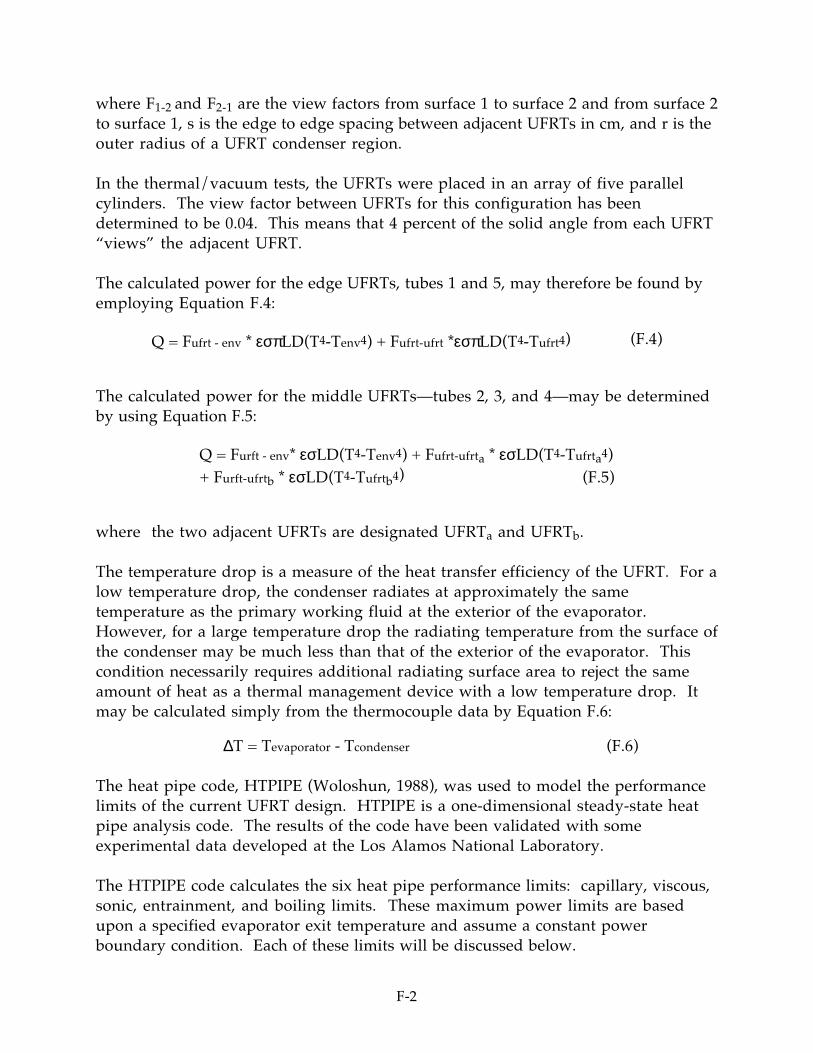
F-2
where F1-2 and F2-1 are the view factors from surface 1 to surface 2 and from surface 2to surface 1, s is the edge to edge spacing between adjacent UFRTs in cm, and r is theouter radius of a UFRT condenser region.
In the thermal/vacuum tests, the UFRTs were placed in an array of five parallelcylinders. The view factor between UFRTs for this configuration has beendetermined to be 0.04. This means that 4 percent of the solid angle from each UFRT“views” the adjacent UFRT.
The calculated power for the edge UFRTs, tubes 1 and 5, may therefore be found byemploying Equation F.4:
Q = Fufrt - env * εσπLD(T4-Tenv4) + Fufrt-ufrt *εσπLD(T4-Tufrt4) (F.4)
The calculated power for the middle UFRTs—tubes 2, 3, and 4—may be determinedby using Equation F.5:
Q = Furft - env* εσLD(T4-Tenv4) + Fufrt-ufrta * εσLD(T4-Tufrta4)+ Furft-ufrtb * εσLD(T4-Tufrtb4) (F.5)
where the two adjacent UFRTs are designated UFRTa and UFRTb.
The temperature drop is a measure of the heat transfer efficiency of the UFRT. For alow temperature drop, the condenser radiates at approximately the sametemperature as the primary working fluid at the exterior of the evaporator.However, for a large temperature drop the radiating temperature from the surface ofthe condenser may be much less than that of the exterior of the evaporator. Thiscondition necessarily requires additional radiating surface area to reject the sameamount of heat as a thermal management device with a low temperature drop. Itmay be calculated simply from the thermocouple data by Equation F.6:
∆T = Tevaporator - Tcondenser (F.6)
The heat pipe code, HTPIPE (Woloshun, 1988), was used to model the performancelimits of the current UFRT design. HTPIPE is a one-dimensional steady-state heatpipe analysis code. The results of the code have been validated with someexperimental data developed at the Los Alamos National Laboratory.
The HTPIPE code calculates the six heat pipe performance limits: capillary, viscous,sonic, entrainment, and boiling limits. These maximum power limits are basedupon a specified evaporator exit temperature and assume a constant powerboundary condition. Each of these limits will be discussed below.

F-3
The capillary limit of the UFRT is based on the pressure gradient limitations acrossthe vapor/liquid interface. If the pressure in the liquid is greater than the pressurein the vapor, an unstable condition would exist. However, this generally does notoccur and a wet point is generated at some axial location; i.e. other than at the end ofthe condenser. The capillary limiting condition is defined in Equation F.7:
∆Pcap = 2σ1cos θ/rc (F.7)
where ∆Pcap is the capillary pressure, σ1 is the liquid surface tension of the water,and rc is the capillary pore radius.
The viscous limit is defined by the condition that the vapor pressure cannot benegative. When the overall vapor pressure is very low, the total pressure dropalong the condenser may be essentially zero. Since this pressure drop drives theoverall fluid transport, a power limit can be derived based on the vapor pressure.Typically, however, this limit is only approached during initial startup. The viscouslimit is defined in Equation F.8:
Qvisc = (rv2 hfg ρv ∆Pv)/(1.6 µv leff) (F.8)
where rv is the radius of the vapor region, hfg is the latent heat of vaporization, ρv isthe density of the vapor, ∆Pv is the overall pressure drop, µv is the viscosity, and leffis the effective length of the condenser region.
The UFRT power transport capacity may also be limited by sonic vapor flow. Thechoked flow condition in the UFRT is defined in Equation F.9:
Qsonic = 0.474hfg (ρvPv) 0.5 (F.9)
where hfg is the latent heat of vaporization, ρv is the density of the vapor, and Pv isthe pressure of the vapor.
The entrainment limit in the UFRT is a result of the surface shear between thecounter-flowing vapor and liquid. The shear stress exerted by the vapor on theliquid prevents the liquid from returning to the evaporator, causing a dry-out in theevaporator. The entrainment limit is defined in Equations F.10 and F.11:
Qent = 2.99 ρv Av hfg 1.5 [σ/(ρv hfg δ)] 0.545 (F.10)
where
δ = [σ/(ρl - ρv)g] 0.5 (F.11)
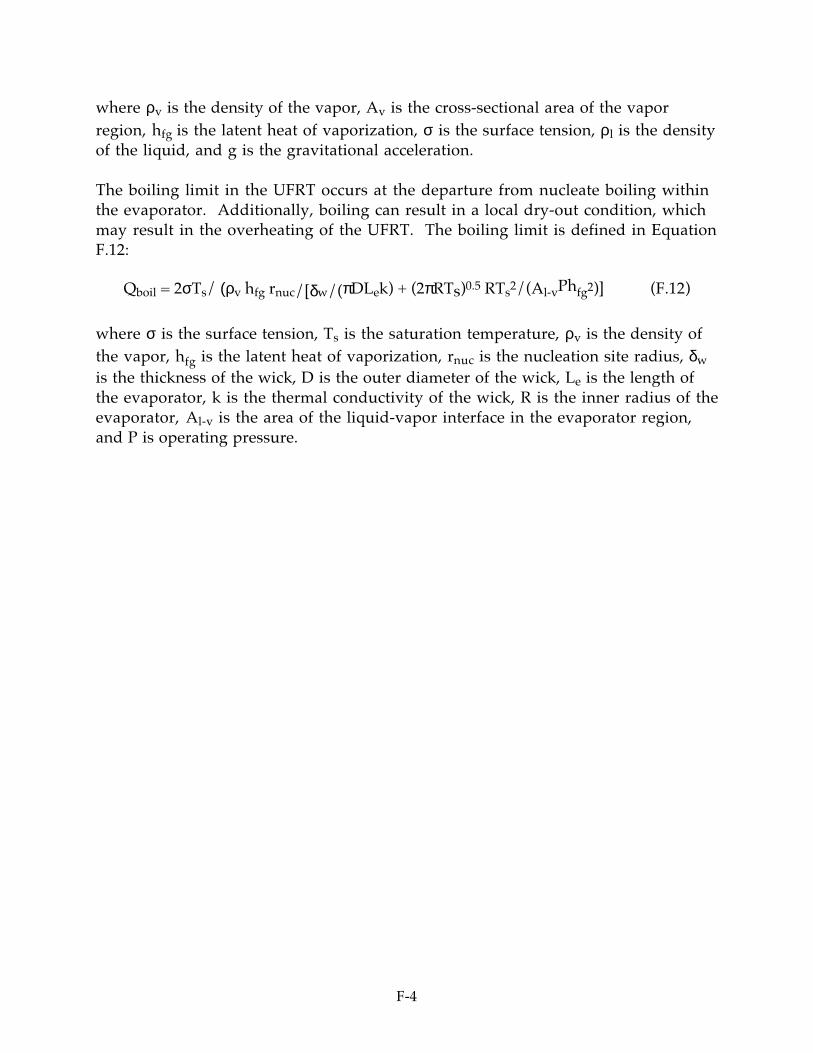
F-4
where ρv is the density of the vapor, Av is the cross-sectional area of the vaporregion, hfg is the latent heat of vaporization, σ is the surface tension, ρl is the densityof the liquid, and g is the gravitational acceleration.
The boiling limit in the UFRT occurs at the departure from nucleate boiling withinthe evaporator. Additionally, boiling can result in a local dry-out condition, whichmay result in the overheating of the UFRT. The boiling limit is defined in EquationF.12:
Qboil = 2σTs/ (ρv hfg rnuc/[δw/(πDLek) + (2πRTs)0.5 RTs2/(Al-vPhfg2)] (F.12)
where σ is the surface tension, Ts is the saturation temperature, ρv is the density ofthe vapor, hfg is the latent heat of vaporization, rnuc is the nucleation site radius, δw
is the thickness of the wick, D is the outer diameter of the wick, Le is the length ofthe evaporator, k is the thermal conductivity of the wick, R is the inner radius of theevaporator, Al-v is the area of the liquid-vapor interface in the evaporator region,and P is operating pressure.

AP
PE
ND
IX G
TE
ST
SE
RIE
S 1 -R
AW
DA
TA
G-1
6 05 55 04 54 03 53 02 52 01 51 0500
25
50
75
100
125
150
Condenser End Cap
Probe Temp
Hypodermic Temp
1/4 Temp
1/2 Temp
3/4 Temp
Evaporator End Cap
Heater Power (W)
Te
mp
era
ture
(°C
)
Figure G.1. Test Series 1 - Tube 1 Raw Data

G-2
6 05 55 04 54 03 53 02 52 01 51 0500
25
50
75
100
125
150
Condenser End Cap
Probe Temp
Hypodermic Temp
1/4 Temp
1/2 Temp
3/4 Temp
Evaporator End Cap
Heater Power (W)
Tem
per
atu
re (
°C)
Figure G.2. Test Series 1 - Tube 2 Raw Data.

G-3
6 05 55 04 54 03 53 02 52 01 51 0500
25
50
75
100
125
150
Condenser End Cap
Probe Temp
Hypodermic Temp
1/4 Temp
1/2 Temp
3/4 Temp
Evaporator End Cap
Heater Power (W)
Tem
per
atu
re (
°C)
Figure G.3. Test Series 1 - Tube 3 Raw Data.

G-4
6 05 55 04 54 03 53 02 52 01 51 0500
25
50
75
100
125
150
Condenser End Cap
Probe Temp
Hypodermic Temp
1/4 Temp
1/2 Temp
3/4 Temp
Evaporator End Cap
Heater Power (W)
Tem
per
atu
re (
°C)
Figure G.4. Test Series 1 - Tube 4 Raw Data.

G-5
6 05 55 04 54 03 53 02 52 01 51 0500
25
50
75
100
125
150
Condenser End Cap
Probe Temp
Hypodermic Temp
1/4 Temp
1/2 Temp
3/4 Temp
Evaporator End Cap
Heater Power (W)
Tem
per
atu
re (
°C)
Figure G.5. Test Series 1 - Tube 5 Raw Data.

AP
PE
ND
IX H
TE
ST
SE
RIE
S 2 - R
AW
DA
TA
H-1
6 05 55 04 54 03 53 02 52 01 51 0500
25
50
75
100
125
150
Condenser End Cap
Probe Temp
Hypodermic Temp
1/4 Temp
1/2 Temp
3/4 Temp
Evaporator End Cap
Heater Power (W)
Tem
per
atu
re (
°C)
Figure H.1. Test Series 2 - Tube 1 Raw Data.

H-2
6 05 55 04 54 03 53 02 52 01 51 0500
25
50
75
100
125
150
Condenser End Cap
Probe Temp
Hypodermic Temp
1/4 Temp
1/2 Temp
3/4 Temp
Evaporator End Cap
Heater Power (W)
Tem
per
atu
re (
°C)
Figure H.2. Test Series 2 - Tube 2 Raw Data.

H-3
6 05 55 04 54 03 53 02 52 01 51 0500
25
50
75
100
125
150
Condenser End Cap
Probe Temp
Hypodermic Temp
1/4 Temp
1/2 Temp
3/4 Temp
Evaporator End Cap
Heater Power (W)
Tem
per
atu
re (
°C)
Figure H.3. Test Series 2 - Tube 3 Raw Data.

H-4
6 05 55 04 54 03 53 02 52 01 51 0500
25
50
75
100
125
150
Condenser End Cap
Probe Temp
Hypodermic Temp
1/4 Temp
1/2 Temp
3/4 Temp
Evaporator End Cap
Heater Power (W)
Tem
per
atu
re (
°C)
Figure H.4. Test Series 2 - Tube 4 Raw Data.

H-5
6 05 55 04 54 03 53 02 52 01 51 0500
25
50
75
100
125
150
Condenser End Cap
Probe Temp
Hypodermic Temp
1/4 Temp
1/2 Temp
3/4 Temp
Evaporator End Cap
Heater Power (W)
Tem
per
atu
re (
°C)
Figure H.5. Test Series 2 - Tube 5 Raw Data.

AP
PE
ND
IX I
TE
ST
SE
RIE
S 3 - R
AW
DA
TA
I-1
6 05 55 04 54 03 53 02 52 01 51 0500
25
50
75
100
125
150
Condenser End Cap
Probe Temp
Hypodermic Temp
1/4 Temp
1/2 Temp
3/4 Temp
Evaporator End Cap
Heater Power (W)
Tem
per
atu
re (
°C)
Figure I.1. Test Series 3 - Tube 1 Raw Data.
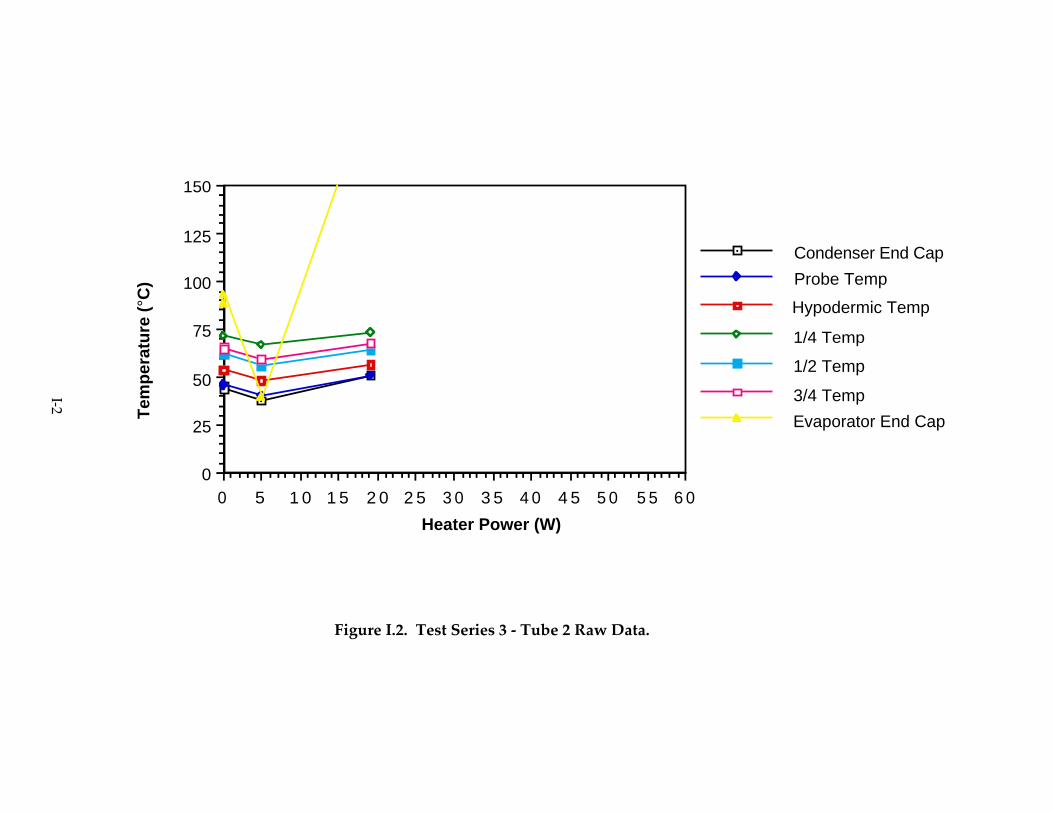
I-2
6 05 55 04 54 03 53 02 52 01 51 0500
25
50
75
100
125
150
Condenser End Cap
Probe Temp
Hypodermic Temp
1/4 Temp
1/2 Temp
3/4 Temp
Evaporator End Cap
Heater Power (W)
Tem
per
atu
re (
°C)
Figure I.2. Test Series 3 - Tube 2 Raw Data.
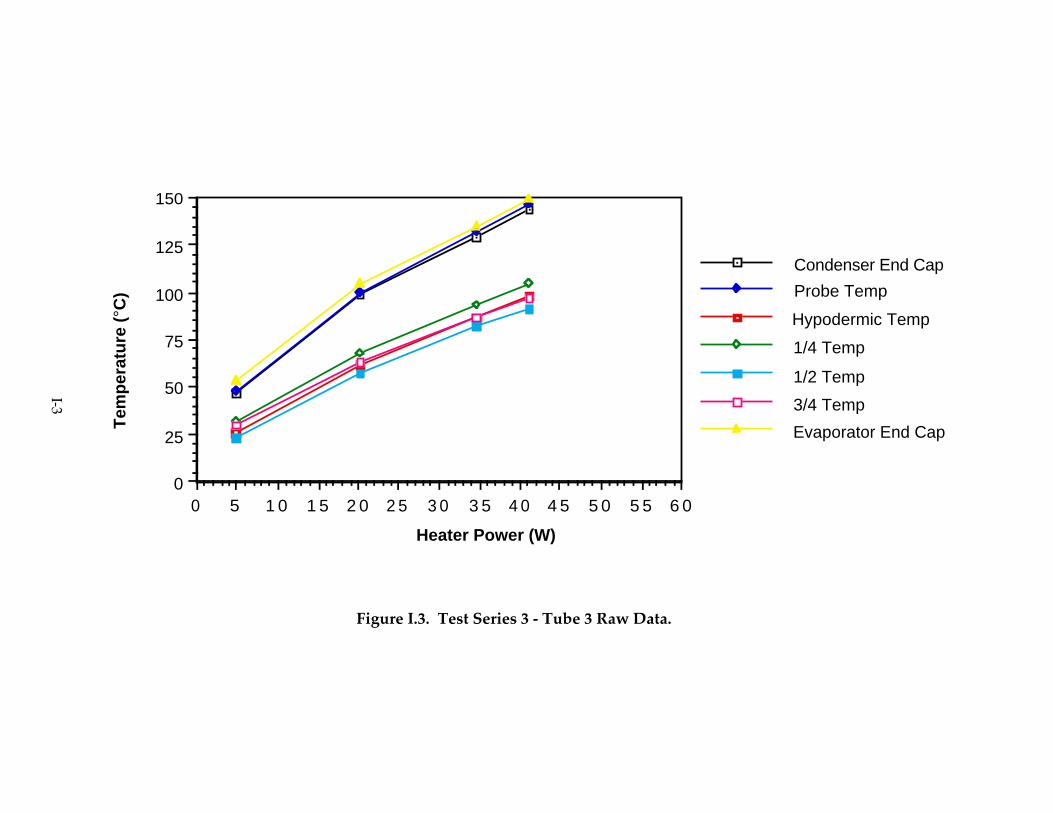
I-3
6 05 55 04 54 03 53 02 52 01 51 0500
25
50
75
100
125
150
Condenser End Cap
Probe Temp
Hypodermic Temp
1/4 Temp
1/2 Temp
3/4 Temp
Evaporator End Cap
Heater Power (W)
Tem
per
atu
re (
°C)
Figure I.3. Test Series 3 - Tube 3 Raw Data.
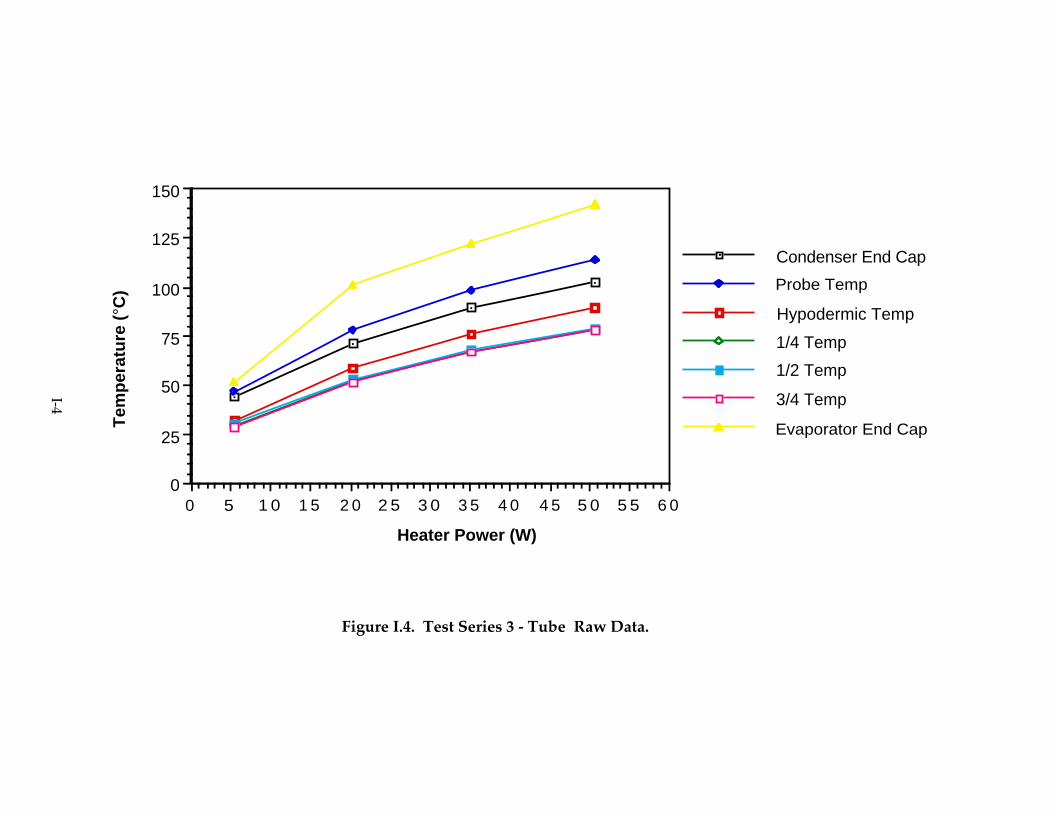
I-4
6 05 55 04 54 03 53 02 52 01 51 0500
25
50
75
100
125
150
Condenser End Cap
Probe Temp
Hypodermic Temp
1/4 Temp
1/2 Temp
3/4 Temp
Evaporator End Cap
Heater Power (W)
Tem
per
atu
re (
°C)
Figure I.4. Test Series 3 - Tube Raw Data.

I-5
6 05 55 04 54 03 53 02 52 01 51 0500
25
50
75
100
125
150
Condenser End Cap
Probe Temp
Hypodermic Temp
1/4 Temp
1/2 Temp
3/4 Temp
Evaporator End Cap
Heater Power (W)
Tem
per
atu
re (
°C)
Figure I.5. Test Series 3 - Tube 5 Raw Data.

AP
PE
ND
IX J
TE
ST
SE
RIE
S 4 - R
AW
DA
TA
J-1
6 05 55 04 54 03 53 02 52 01 51 0500
25
50
75
100
125
150
Condenser End Cap
Probe Temp
Hypodermic Temp
1/4 Temp
1/2 Temp
3/4 Temp
Evaporator End Cap
Heater Power (W)
Tem
per
atu
re (
°C)
Figure J.1. Test Series 4 - Tube 1 Raw Data.

J-2
6 05 55 04 54 03 53 02 52 01 51 0500
25
50
75
100
125
150
Condenser End Cap
Probe Temp
Hypodermic Temp
1/4 Temp
1/2 Temp
3/4 Temp
Evaporator End Cap
Heater Power (W)
Tem
per
atu
re (
°C)
Figure J.2. Test Series 4 - Tube 2 Raw Data.

J-3
6 05 55 04 54 03 53 02 52 01 51 0500
25
50
75
100
125
150
Condenser End Cap
Probe Temp
Hypodermic Temp
1/4 Temp
1/2 Temp
3/4 Temp
Evaporator End Cap
Heater Power (W)
Tem
per
atu
re (
°C)
Figure J.3. Test Series 4 - Tube 3 Raw Data.

J-4
6 05 55 04 54 03 53 02 52 01 51 0500
25
50
75
100
125
150
Condenser End Cap
Probe Temp
Hypodermic Temp
1/4 Temp
1/2 Temp
3/4 Temp
Evaporator End Cap
Heater Power (W)
Tem
per
atu
re (
°C)
Figure J.4. Test Series 4 - Tube 4 Raw Data.

J-5
6 05 55 04 54 03 53 02 52 01 51 0500
25
50
75
100
125
150
Condenser End Cap
Probe Temp
Hypodermic Temp
1/4 Temp
1/2 Temp
3/4 Temp
Evaporator End Cap
Heater Power (W)
Tem
per
atu
re (
°C)
Figure J.5. Test Series 4 - Tube 5 Raw Data.

AP
PE
ND
IX K
TE
ST
SE
RIE
S 5 - R
AW
DA
TA
K-1
7 06 56 05 55 04 54 03 53 02 52 01 51 050-75
-50
-25
0
25
50
75
100
125
150
175
200
Condenser End Cap
Probe Temp
Hypodermic Temp
1/4 Temp
1/2 Temp
3/4 Temp
Evaporator End Cap
Heater Power (W)
Tem
per
atu
re (
°C)
Figure K.1. Test Series 5 - Tube 1 Raw Data.

K-2
7 06 56 05 55 04 54 03 53 02 52 01 51 050-75
-50
-25
0
25
50
75
100
125
150
175
200
Condenser End Cap
Probe Temp
Hypodermic Temp
1/4 Temp
1/2 Temp
3/4 Temp
Evaporator End Cap
Heater Power (W)
Tem
per
atu
re (
°C)
Figure K.2. Test Series 5 - Tube 2 Raw Data.

K-3
7 06 56 05 55 04 54 03 53 02 52 01 51 050-75
-50
-25
0
25
50
75
100
125
150
175
200
Condenser End Cap
Probe Temp
Hypodermic Temp
1/4 Temp
1/2 Temp
3/4 Temp
Evaporator End Cap
Heater Power (W)
Tem
per
atu
re (
°C)
Figure K.3. Test Series 5 - Tube 3 Raw Data.

K-4
7 06 56 05 55 04 54 03 53 02 52 01 51 050-75
-50
-25
0
25
50
75
100
125
150
175
200
Condenser End Cap
Probe Temp
Hypodermic Temp
1/4 Temp
1/2 Temp
3/4 Temp
Evaporator End Cap
Heater Power (W)
Tem
per
atu
re (
°C)
Figure K.4. Test Series 5 - Tube 4 Raw Data.

K-5
7 06 56 05 55 04 54 03 53 02 52 01 51 050-75
-50
-25
0
25
50
75
100
125
150
175
200
Condenser End Cap
Probe Temp
Hypodermic Temp
1/4 Temp
1/2 Temp
3/4 Temp
Evaporator End Cap
Heater Power (W)
Tem
per
atu
re (
°C)
Figure K.5. Test Series 5 - Tube 5 Raw Data.

L-1
AP
PE
ND
IX L
UFR
T D
ET
AIL
ED
ST
EA
DY
ST
AT
E A
NA
LY
SIS
L.1 T
ES
T S
ER
IES
1 (LU
NA
R N
OO
N)
5 04 54 03 53 02 52 01 51 050280
300
320
340
360
380
400
UFRT1UFRT2UFRT3UFRT4UFRT5
Heat Rejection (W)
Tem
per
atu
re (
K)
Figure L.1. UFRT Surface Temperatures, Test Series 1.

L-2
5 04 54 03 53 02 52 01 51 050250
300
350
400
450
UFRT1UFRT2UFRT3UFRT4UFRT5
Heat Rejection (W)
Tem
per
atu
re (
K)
Figure L.2. UFRT Internal Temperatures, Test Series 1.

L-3
5 04 54 03 53 02 52 01 51 050300
320
340
360
380
400
420
440
460
UFRT1UFRT2UFRT3UFRT4UFRT5
Heat Rejection (W)
Tem
per
atu
re (
K)
Figure L.3. UFRT Evaporator Temperatures, Test Series 1.

L-4
L.1.1 UFRT 1
NCG passage occurred in UFRT 1 before the 14.2W heat rejection test point whilethe internal temperature was 337K. UFRT 1, an outer UFRT, experienced theinternal to external temperature difference of 17°C to 30°C for heat rejections of14.2W to 47.7W, respectively as shown in Table L.1. However, UFRT 1's evaporatorto internal temperature difference rose steadily from approximately 1°C to 9°C fromthe 14.2W to 47.7W of heat rejection, respectively. UFRT 1's maximum heatrejection was approximately 47.7W before the internal pressure limit was reached
Table L.1. UFRT 1 Temperature DifferencesHeat Temperature Differences
Rejection Surface Internal Evaporator Total(W) (°C) (°C) (°C)4.6 -1.50 24.50 23.0014.2 16.8 0.80 17.6023.5 21.53 2.80 24.3332.4 25.00 2.60 27.6039.3 28.10 6.20 34.3047.7 30.43 8.60 39.03
L.1.2 UFRT 2
UFRT 2 dried out at the approximately 12.1 W of heat rejection. The internaltemperature at dryout was approximately 320K. The dryout could be seen in FiguresL.1 through L.3 where the surface and internal temperatures (Figures L.1 and L.2,respectively) remain nearly the same while the UFRT 2 evaporator temperaturediverged up from the other UFRT evaporator temperatures. A summary of the testpoints run prior to dryout are shown in Table L.2.
Table L.2. UFRT 2 Temperature DifferencesHeat Temperature Differences
Rejection Surface Internal Evaporator Total(W) (°C) (°C) (°C)4.1 5,17 28.50 33.677.3 6.93 126.60 133.5312.1 7.37 187.80 195.17

L-5
Table L.3. UFRT 3 Temperature DifferencesHeat Temperature Differences
Rejection Surface Internal Evaporator Total(W) (°C) (°C) (°C)4.1 -10.48 18.60 8.1313.4 -4.08 16.40 12.3221.5 17.68 6.60 24.2829.7 26.50 2.20 28.7038.9 32.55 3.70 36.25
L.1.3 UFRT 3
In UFRT 3, NCG passage occurred before the 21.5W heat rejection value and 380Kinternal temperature. UFRT 3, the middle UFRT, had internal to externaltemperature differences ranging from 18°C to 33°C for the 21.5W and 38.9W heatrejection values, respectively, as shown in Table L.3. The internal to evaporatortemperature difference was almost isothermal with the temperature differencefluctuating from 2°C to 7°C at heat rejection values from 21.5W to 38.9W,respectively. UFRT 3 reached the internal pressure limit at 38.9W heat rejectionwhile the internal temperature was 418K.
L.1.4 UFRT 4
NCG passage in UFRT 4 occurred below the 20.3W heat rejection value and 365Kinternal temperature. UFRT 4's maximum heat rejection was approximately 49.1Wdue to the pressure limitation. UFRT 4 had internal to surface temperaturedifferences ranging from 13°C to 23°C at the 20.3W to 49.1W heat rejections,respectively. However, the temperature difference was 14°C to 27°C between theinternal and evaporator temperatures at the 20.3W to 49.1W heat rejections,respectively, as shown in Table L.4.
Table L.4. UFRT 4 Temperature DifferencesHeat Temperature Differences
Rejection Surface Internal Evaporator Total(W) (°C) (°C) (°C)4.2 0.17 2.10 2.2714.0 7.13 3.10 10.2320.3 12.77 14.10 26.8729.8 14.70 27.60 42.3040.1 20.60 33.50 54.1049.1 23.07 27.30 50.37

L-6
L.1.5 UFRT 5
UFRT 5 dried out at less than the 36.9 W heat rejection value and 367K internaltemperature. Dryout in UFRT 5 was preceded by little or no increase, less than 10°C,in internal or surface temperatures with increasing heat input while the evaporatortemperature increased by over 90°C as shown in Figures L.1 through L.3. Thetemperature difference between internal and external temperatures remainedapproximately the same for UFRT 5. Table L.5 shows the temperature differences inUFRT 5 up to dryout.
Table L.5. UFRT 5 Temperature DifferencesHeat Temperature Differences
Rejection Surface Internal Evaporator Total(W) (°C) (°C) (°C)4.5 2.97 11.80 14.7713.6 10.00 17.40 27.4022.5 15.37 24.80 40.1729.0 15.57 66.00 81.5736.9 15.53 106.10 121.63

L-7
L.2 T
ES
T S
ER
IES
2 (45° PA
ST
LU
NA
R N
OO
N)
5 04 54 03 53 02 52 01 51 050260
280
300
320
340
360
380
400
UFRT1UFRT3UFRT4UFRT5
Heat Rejection (W)
Tem
per
atu
re (
K)
Figure L.4. UFRT Surface Temperatures, Test Series 2.
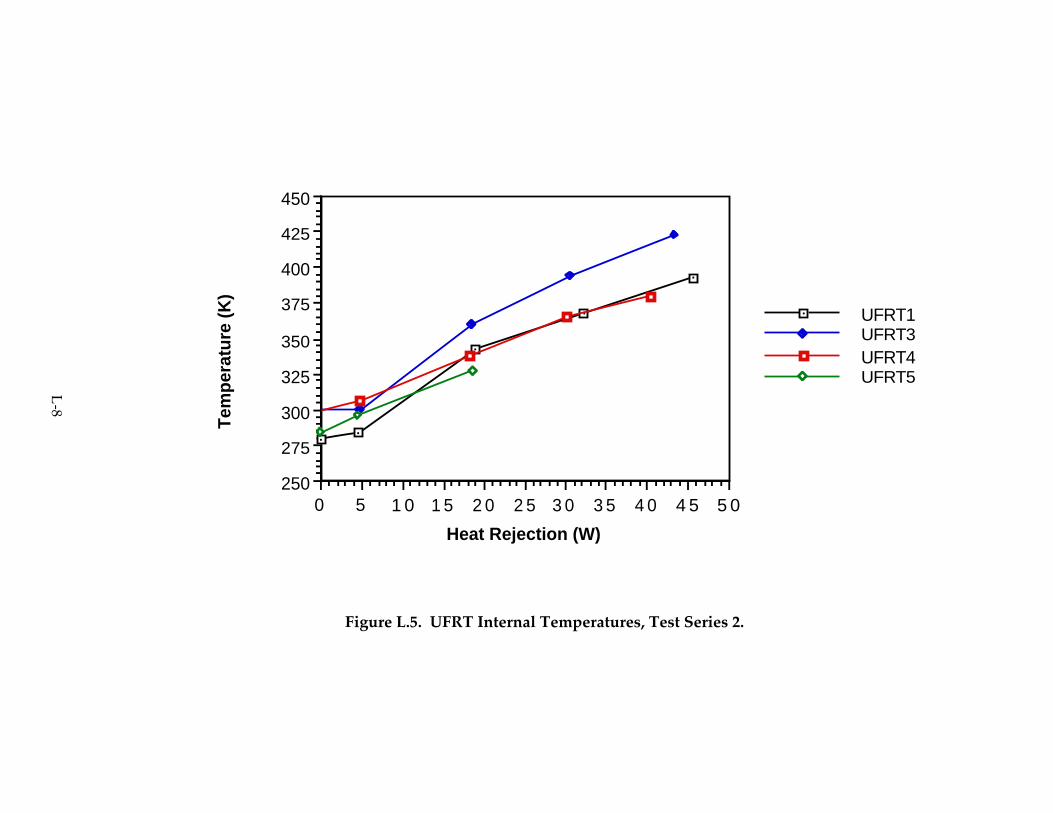
L-8
5 04 54 03 53 02 52 01 51 050250
275
300
325
350
375
400
425
450
UFRT1UFRT3UFRT4UFRT5
Heat Rejection (W)
Tem
per
atu
re (
K)
Figure L.5. UFRT Internal Temperatures, Test Series 2.

L-9
5 04 54 03 53 02 52 01 51 050250
275
300
325
350
375
400
425
450
UFRT1UFRT3UFRT4UFRT5
Heat Rejection (W)
Tem
per
atu
re (
K)
Figure L.6. UFRT Evaporator Temperatures, Test Series 2.

L-10
L.2.1 UFRT 1
NCGs existed below the temperature probe below the 18.8W heat rejection valueand 280K internal temperature for UFRT 1. UFRT 1 internal to externaltemperatures differences varied from 17°C to 26°C at 18.8W to 45.6W of heatrejection, respectively. The evaporator to internal temperature differences increasedfrom 4.7°C to 11.5°C over the heat rejection values from 18.8W to 45.6W,respectively, as shown in Table L.6. UFRT 1 reached maximum pressure at 45.6W ofevaporator heater power without exceeding the internal pressure limits.
Table L.6. UFRT 1 Temperature DifferencesHeat Temperature Differences
Rejection Surface Internal Evaporator Total(W) (°C) (°C) (°C)-0.1 9.40 9.70 19.104.5 -4.13 26.70 22.5718.8 17.53 4.70 22.2332.2 21.60 8.40 30.0045.6 26.27 11.50 37.77
L.2.2 UFRT 2
UFRT 2 was not operated during this test series.
L.2.3 UFRT 3
NCGs were present below the internal temperature probe below 18.4W of heatrejection and an internal temperature of 360K. UFRT 3 internal to externaltemperature differences range from 18°C to 38°C at the 18.4W to 43.5W evaporatorheater power settings, respectively. The evaporator temperature to internaltemperature differentials were small, 1°C to 4°C, for power settings of 18.4W to43.5W, respectively, as shown in Table L.7. UFRT 3 reached maximum pressure atthe evaporator heater power of 43.5W.
Table L.7. UFRT 3 Temperature DifferencesHeat Temperature Differences
Rejection Surface Internal Evaporator Total(W) (°C) (°C) (°C)-0.2 4.43 -14.60 -10.184.7 -10.00 15.50 5.5018.4 18.18 1.40 19.5730.6 28.95 2.50 31.4543.5 38.00 4.10 42.10

L-11
L.2.4 UFRT 4
NCGs were present below the internal temperature probe when the UFRT heatrejection was below 18.4W and the internal temperature was below 338K. UFRT 4internal to external temperature differences varied from 8°C to 21°C at 18.4W to40.5W evaporator power input as shown in Table L.8. The evaporator to internaltemperature differences increased from 18°C to 28°C over evaporator heater powersettings from 18.4W to 40.5W. UFRT 4 reached maximum heat rejection at 40Wbefore reaching the maximum UFRT internal pressure.
Table L.8. UFRT 4 Temperature DifferencesHeat Temperature Differences
Rejection Surface Internal Evaporator Total(W) (°C) (°C) (°C)-0.2 -0.40 -13.30 -13.704.8 -1.63 6.10 4.4718.4 8.10 18.40 26.5030.0 16.63 17.90 34.5340.4 21.13 28.50 49.63
L.2.5 UFRT 5 UFRT 5 dried out above the 18.7W heat rejection and 328K internal temperature.Dryout can be seen beginning in Figure L.6 where the evaporator temperaturediverged from the other UFRT evaporator temperatures. The constant surface andinternal temperatures preceding the dryout of UFRT 5 were not seen as well as intest series 1 because of the bigger steps in increasing the power of the evaporatorheater input. This reduced the number of temperature samples (test points)available to see the phenomenon. A summary of the temperature differences priorto dryout is shown in Table L.9.
Table L.9. UFRT 5 Temperature DifferencesHeat Temperature Differences
Rejection Surface Internal Evaporator Total(W) (°C) (°C) (°C)0.0 5.77 -5.10 0.674.5 1.83 19.30 21.1318.7 10.43 66.70 77.13
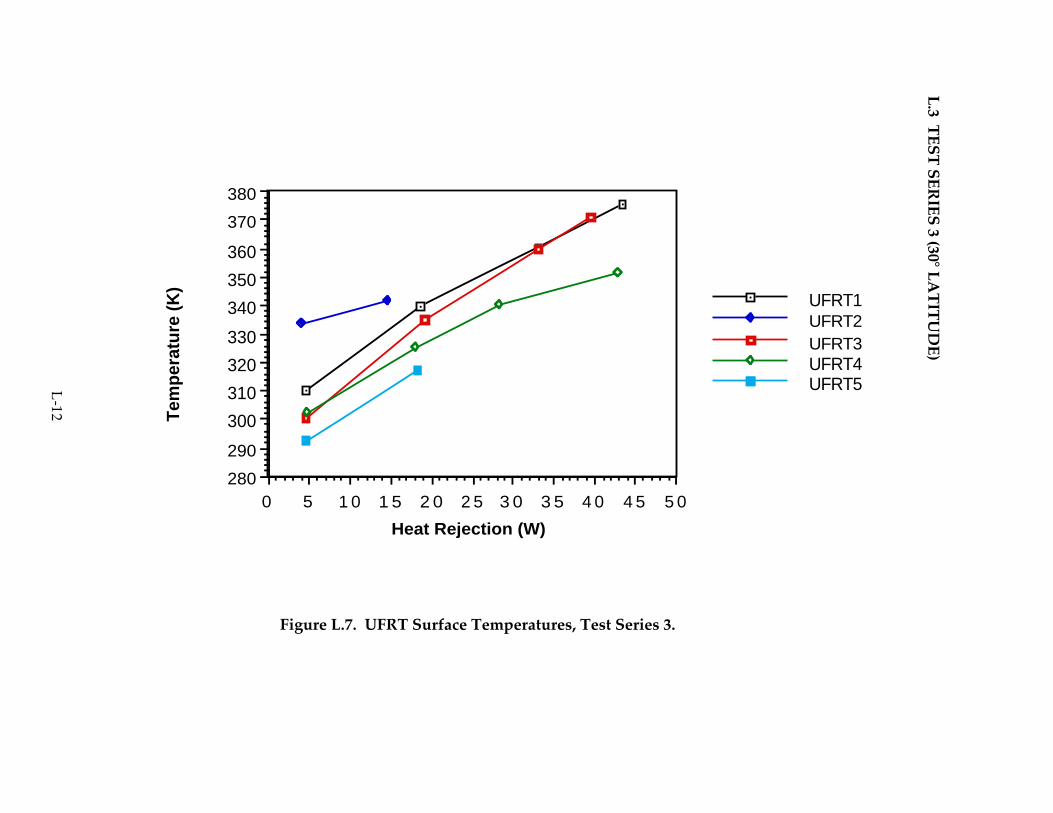
L-12
L.3 T
ES
T S
ER
IES
3 (30° LA
TIT
UD
E)
5 04 54 03 53 02 52 01 51 050280
290
300
310
320
330
340
350
360
370
380
UFRT1UFRT2UFRT3UFRT4UFRT5
Heat Rejection (W)
Tem
per
atu
re (
K)
Figure L.7. UFRT Surface Temperatures, Test Series 3.

L-13
5 04 54 03 53 02 52 01 51 050250
300
350
400
450
UFRT1UFRT2UFRT3UFRT4UFRT5
Heat Rejection (W)
Tem
per
atu
re (
K)
Figure L.8. UFRT Internal Temperatures, Test Series 3.

L-14
5 04 54 03 53 02 52 01 51 050300
325
350
375
400
425
450
UFRT1UFRT2UFRT3UFRT4UFRT5
Heat Rejection (W)
Tem
per
atu
re (
K)
Figure L.9. UFRT Evaporator Temperatures, Test Series 3.

L-15
L.3.1 UFRT 1
Internal temperatures indicate that NCGs were located below the temperature probeat evaporator heater power setting below 18.8W and 351K internal temperature forUFRT 1. UFRT 1 internal to surface temperature differences were 11.2°C to 21.4°Cfor heat rejection values of 18.8W and 43.3W, respectively, as shown in Table L.10.UFRT 1 internal to evaporator temperatures increased from 7.3°C to 13.2°C for heatrejection values from 18.8W to 43.3W, respectively. The UFRT maximum heatrejection was 43.3W at 397K internal temperature without exceeding the internalpressure limits.
Table L.10. UFRT 1 Temperature DifferencesHeat Temperature Differences
Rejection Surface Internal Evaporator Total(W) (°C) (°C) (°C)4.5 -10.67 15.90 5.2318.8 11.20 7.30 18.5033.0 16.97 9.90 26.8743.3 21.43 13.20 34.63
L.3.2 UFRT 2
UFRT 2 dried out above 14.6W of heat rejection and 323K internal temperature.Dryout can be seen by the sharp evaporator temperature increase as shown inFigure L.9 while the surface and interior temperatures remain nearly the same asshown in Figures L.7 and L.8. A summary of the temperature differences prior todryout is shown in Table L.11.
Table L.11. UFRT 2 Temperature DifferencesHeat Temperature Differences
Rejection Surface Internal Evaporator Total(W) (°C) (°C) (°C)4.2 -20.40 -0.30 -20.7014.6 -18.00 149.10 131.10

L-16
L.3.3 UFRT 3
For UFRT 3, internal temperatures show that NCGs were located below thetemperature probe at heat rejections was below 19.3W and the internal temperaturewas below 373K. For evaporator heater power settings from 19.3W to 39.5W,UFRT 3's internal to external temperature difference rose from 37.8°C to 48.7°C,respectively, as shown in Table L.12. However, the internal to evaporatortemperature differences for UFRT 3 decreased from 4.5°C to 2.9°C for the 19.3W to39.5W power settings, respectively. Maximum heat rejection in UFRT 3 was 39.5Wwithout exceeding the internal pressure limits of the UFRT.
Table L.12. UFRT 3 Temperature DifferencesHeat Temperature Differences
Rejection Surface Internal Evaporator Total(W) (°C) (°C) (°C)4.6 20.00 5.80 25.8019.3 37.78 4.50 42.2833.2 45.00 3.20 48.2039.5 48.68 2.90 51.57
L.3.4 UFRT 4
UFRT 4 showed no sharp rise in the internal temperatures as shown in Figure L.8.It appears that no NCGs passed by the tip of internal probe. UFRT 4 internal toexternal temperature difference increased from 25°C to 34.9°C for the 18.1W to42.8W heat rejection values, respectively, as shown in Table L.13. The evaporator toprobe temperature difference rose from 23.2°C to 28.4°C for the 18.1W to 42.8W heatrejection values, respectively. Maximum heat rejection for UFRT 4 was 42.8Wwithout exceeding the UFRT maximum internal pressure limits.
Table L.13. UFRT 4 Temperature DifferencesHeat Temperature Differences
Rejection Surface Internal Evaporator Total(W) (°C) (°C) (°C)4.7 17.57 4.30 21.8718.1 25.77 23.20 48.9728.2 30.93 23.70 54.6342.8 34.93 28.40 63.33

L-17
L.3.5 UFRT 5
UFRT 5 dried out before reaching 18W of heat rejection and the 337K internaltemperature. Dryout can be seen from sharp evaporator temperatures increases asshown in Figure L.9. Constant surface temperatures were not observed prior todryout of UFRT 5 as in test series 1 because of the lack of test points. A summary ofthe temperature differences prior to dryout is shown in Table L.14.
Table L.14. UFRT 5 Temperature DifferencesHeat Temperature Differences
Rejection Surface Internal Evaporator Total(W) (°C) (°C) (°C)4.6 13.97 19.50 33.4718.4 20.07 64.90 84.97

L-18
L.4 T
ES
T S
ER
IES
4 (45° LA
TIT
UD
E)
5 04 54 03 53 02 52 01 51 050280
300
320
340
360
380
400
UFRT1UFRT3UFRT4UFRT5
Heat Rejection (W)
Tem
per
atu
re (
K)
Figure L.10. UFRT Surface Temperatures, Test Series 4.

L-19
5 04 54 03 53 02 52 01 51 050250
300
350
400
450
UFRT1UFRT3UFRT4UFRT5
Heat Rejection (W)
Tem
per
atu
re (
K)
Figure L.11. UFRT Internal Temperatures, Test Series 4.

L-20
5 04 54 03 53 02 52 01 51 050300
325
350
375
400
425
450
UFRT1UFRT3UFRT4UFRT5
Heat Rejection (W)
Tem
per
atu
re (
K)
Figure L.12. UFRT Evaporator Temperatures, Test Series 4.

L-21
L.4.1 UFRT 1
In UFRT 1, the NCGs were located below the internal temperature probe below17.9W of heat rejection and an internal temperature of 347K. The internal toexternal temperature difference for UFRT 1 ranged from 17.0°C to 23.1°C for 17.9Wto 38.2W of heat rejection, respectively, as shown in Table L.15. UFRT 1 evaporatorto internal temperature difference ranged from 2.4°C to 12.5°C at the 18W to 38W ofheat rejection, respectively. UFRT 1 temperatures were jagged in part to hysteresis.The maximum heat rejection for UFRT 1 was 38.2W before reaching the internalpressure limit of the UFRT.
The 38W test point was performed prior to the 28W test point. Therefore, the UFRTmay still be trying to dissipate heat from dryout or over heat and pressurelimitations. That, coupled with the fact that the environment was being increasedby surrounding UFRTs, UFRT 3, meant that the temperatures were greater at thelower power setting. It could also be due to "bleed" over heat from adjoiningUFRTs that are at increased power setting and are imparting higher temperatures tothe UFRT 4 evaporator. This may show a high level of capacitance in the UFRTtubes.
Table L.15. UFRT 1 Temperature DifferencesHeat Temperature Differences
Rejection Surface Internal Evaporator Total(W) (°C) (°C) (°C)4.3 -11.30 28.00 16.7017.9 17.03 2.40 19.4338.2 22.63 12.50 35.1328.8 23.07 12.00 35.07
L.4.2 UFRT 2
UFRT 2 was not tested in this test series.
L.4.3 UFRT 3
In UFRT 3, the NCGs were below the internal probe between below 19.1W of heatrejection and 366K internal temperature. UFRT 3 internal to external temperaturedifferences increased from 24.2°C to 43.0°C from evaporator heater powers from19.1W to 44.9W, respectively, as shown in Table L.16. UFRT 3 internal to evaporatortemperatures increased from 1.0°C to 2.9°C over the range of evaporator heaterpowers from 19.1W to 44.9W. The maximum heat rejection for UFRT 3 was 44.9Wwithout exceeding the UFRT internal pressure limits.

L-22
Table L.16. UFRT 3 Temperature DifferencesHeat Temperature Differences
Rejection Surface Internal Evaporator Total(W) (°C) (°C) (°C)4.7 -7.43 13.60 6.1719.1 24.18 1.00 25.1840.5 39.88 2.20 42.0844.9 42.95 2.90 45.85
L.4.4 UFRT 4
No indication of NCGs below the internal temperature probe at the minimum heatrejection of 4.8W and an internal temperature of 276K. UFRT 4 internal to externaltemperature differences increased from 13.3°C to 27.5°C for evaporator heater inputsfrom 18.3W to 41.7W, respectively, as shown in Figure L.17. The internal toevaporator temperature differences for UFRT 4 ranged from 19.3°C to 37.7°C forevaporator heater inputs from 18.3W to 41.7W, respectively. UFRT 4's maximumheat rejection was 41.7W without exceeding the UFRT internal pressure limits.
Table L.17. UFRT 4 Temperature DifferencesHeat Temperature Differences
Rejection Surface Internal Evaporator Total(W) (°C) (°C) (°C)4.8 3.07 2.50 5.5718.3 13.27 19.30 32.5736.6 24.83 35.00 59.8341.7 27.47 37.70 65.17

L-23
L.4.5 UFRT 5
UFRT 5 dried above 22W of heat rejection and an internal temperature of 357K.Internal and external temperatures rose steadily along with the other UFRTtemperatures, while the evaporator temperature for UFRT 5 became hotter at afaster rate than other UFRT evaporator temperatures. A summary of thetemperature differences prior to dryout is shown in Table L.18.
Table L.18. UFRT 5 Temperature DifferencesHeat Temperature Differences
Rejection Surface Internal Evaporator Total(W) (°C) (°C) (°C)4.4 6.60 9.90 16.5015.6 13.13 51.60 64.7322.0 17.33 77.90 95.2322.4 17.60 79.80 97.40

L-24
L.5 T
ES
T S
ER
IES
5 (FUL
L S
OL
AR
)
6 05 55 04 54 03 53 02 52 01 51 0280
290
300
310
320
330
340
350
360
370
380
UFRT1UFRT3UFRT4UFRT5
Heat Rejection (W)
Tem
per
atu
re (
K)
Figure L.13. UFRT Surface Temperatures, Test Series 5.

L-25
6 05 55 04 54 03 53 02 52 01 51 0300
320
340
360
380
400
420
440
UFRT1UFRT3UFRT4UFRT5
Heat Rejection (W)
Tem
per
atu
re (
K)
Figure L.14. UFRT Internal Temperatures, Test Series 5.
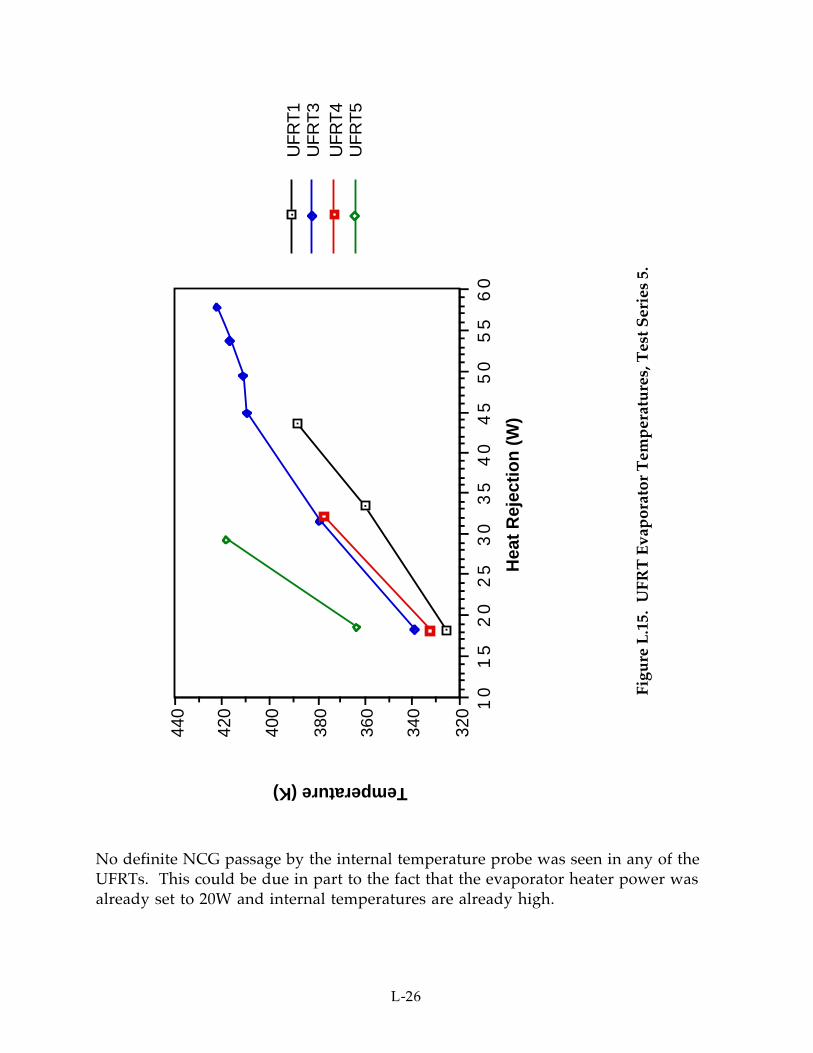
L-26
60
55
50
45
40
35
30
25
20
15
10
320
340
360
380
400
420
440
UFR
T1U
FR
T3
UFR
T4U
FR
T5
Hea
t R
ejec
tio
n (
W)
Temperature (K)
Figu
re L
.15.
UFR
T E
vap
orat
or T
emp
erat
ure
s, T
est S
erie
s 5.
No definite NCG passage by the internal temperature probe was seen in any of theUFRTs. This could be due in part to the fact that the evaporator heater power wasalready set to 20W and internal temperatures are already high.

L-27
L.5.1 UFRT 1
The internal temperature at the lowest heat rejection of 18.3W was 320K and thisindicated that no NCGs were identified below the internal temperature probe.UFRT 1 internal to surface temperature differences increased from 17.0°C to 25.8°Cat the heat rejection values ranging from 18.3W to 43.6W, respectively, as shown inTable L.19. The evaporator to internal temperature difference on UFRT 1 increasedfrom 5.2°C to 14.1°C for heat rejection values from 18.3W to 43.6W. The maximumamount of heat rejected by UFRT 1 was 43.6W without exceeding the UFRT internalpressure limits.
Table L.19. UFRT 1 Temperature DifferencesHeat Temperature Differences
Rejection Surface Internal Evaporator Total(W) (°C) (°C) (°C)18.3 17.00 5.20 22.2033.6 22.60 10.20 32.8043.6 25.83 14.10 39.93
L.5.2 UFRT 2
UFRT 2 was not tested in this test series.
L.5.3 UFRT 3
The minimum internal temperature of UFRT 3 was 330K at the lowest heatrejection value of 18.4W. There was no sign of NCGs present below the internaltemperature probe. Internal to surface temperature differences for UFRT 3 rangedfrom 31.7°C to 56.1°C for heat rejections 18.4W to 58.0W, respectively, as shown inTable L.20. The internal to evaporator temperature differences decreased from 9.5°Cto -3.8°C for the 18.4W to 58.0W power settings, respectively. The maximumamount of heat rejection from UFRT 3 was 58.0W without exceeding the maximuminternal pressure.
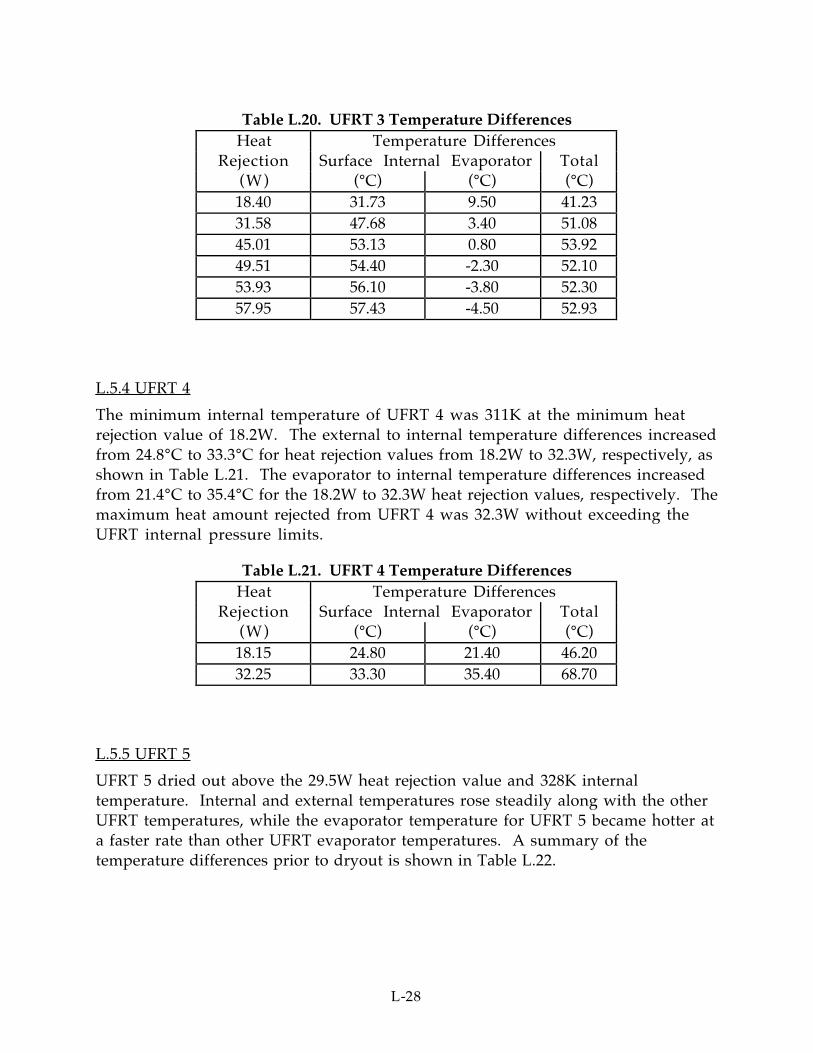
L-28
Table L.20. UFRT 3 Temperature DifferencesHeat Temperature Differences
Rejection Surface Internal Evaporator Total(W) (°C) (°C) (°C)18.40 31.73 9.50 41.2331.58 47.68 3.40 51.0845.01 53.13 0.80 53.9249.51 54.40 -2.30 52.1053.93 56.10 -3.80 52.3057.95 57.43 -4.50 52.93
L.5.4 UFRT 4
The minimum internal temperature of UFRT 4 was 311K at the minimum heatrejection value of 18.2W. The external to internal temperature differences increasedfrom 24.8°C to 33.3°C for heat rejection values from 18.2W to 32.3W, respectively, asshown in Table L.21. The evaporator to internal temperature differences increasedfrom 21.4°C to 35.4°C for the 18.2W to 32.3W heat rejection values, respectively. Themaximum heat amount rejected from UFRT 4 was 32.3W without exceeding theUFRT internal pressure limits.
Table L.21. UFRT 4 Temperature DifferencesHeat Temperature Differences
Rejection Surface Internal Evaporator Total(W) (°C) (°C) (°C)18.15 24.80 21.40 46.2032.25 33.30 35.40 68.70
L.5.5 UFRT 5
UFRT 5 dried out above the 29.5W heat rejection value and 328K internaltemperature. Internal and external temperatures rose steadily along with the otherUFRT temperatures, while the evaporator temperature for UFRT 5 became hotter ata faster rate than other UFRT evaporator temperatures. A summary of thetemperature differences prior to dryout is shown in Table L.22.

L-29
Table L.22. UFRT 5 Temperature DifferencesHeat Temperature Differences
Rejection Surface Internal Evaporator Total(W) (°C) (°C) (°C)18.66 22.33 54.30 76.6329.51 25.63 89.50 115.13

M-1
APPENDIX MLessons Learned
1) Overcharging with water is desirable to allow for losses due to venting.
2) Heat trace the vent line(s) completely, avoid any freezing in the lines.
3) Include watt meters on the IR and solar lamps.
4) Look at insulating the top and bottom of the tube array, consider includinginsulation on the fittings and a portion of the tubes.
5) Include Teflon blocks for the test stand to sit on to isolate it from the chamberfloor.
6) IR cage should minimize shadowing from the solar lamp.
7) Attempt to improve the venting procedure.
8) The epoxied thermocouples seemed to work well, the hypodermicthermocouples were difficult to install without touching the UFRT liner.
9) Include a pressure transducer for each UFRT (internal pressure).
10) Try to get IR camera capability.
11) Improve the measurement of the environmental temperature, reconsider usinga coupon.
12) Use small ID lines (1/16 instead of 1/4) for fill and venting.
13) Complete and distribute a Test Requirements Document at least one monthahead of the test.
14) Try for at least a full week of testing.
15) Try to minimize the amount of epoxy on the thermocouples.
16) Consider using a thinner fabric or a thicker tube with a coating instead of fabric.
17) Use Kapton or other high-temperature insulation.
18) Use thermal grease between heater and tube.
19) Attempt to get heaters with a better fit.
20) Consider making the tubes thicker, to handle 14.7 psi without crushing, andwhich can easily be filled before placement in the test stand.