Embed Size (px)
Citation preview

1
Submitted to: Government of Nepal
Nepal Dairy Development Board (NDDB)
Harihar Bhawan, Lalitpur
Post box: 5901
Tel : 977-1-525400 Fax: 977-1-532096
E-mail:[email protected]
Ministry of Irrigation Department of Irrigation
Irrigation and Water Resources Management Projects
Jaulakhel, Lalitpur, Phone: +977 1 5525585, 5530922 Email: [email protected]
Consulting Service for “Benchmark Survey on Quality of Raw and
Processed Milk in Nepal"
RFP No: NDDB/C/RFP/2072-73/01
Final Report
2073 Ashadh
Submitted by: Right to Access Nepal "RAN", Kathmandu, Nepal Contact: 01-4412240/9841584764 Email: [email protected] URL: www.righttoaccessnepal.org.np
2
Lainchour, Kathmandu
2073-Ashadh-15h
To:
The Executive Director
National Dairy Development Board (NDDB),
Hariharbhawan, Lalitpur,
Subject: Submission of Draft Report
Dear Sir,
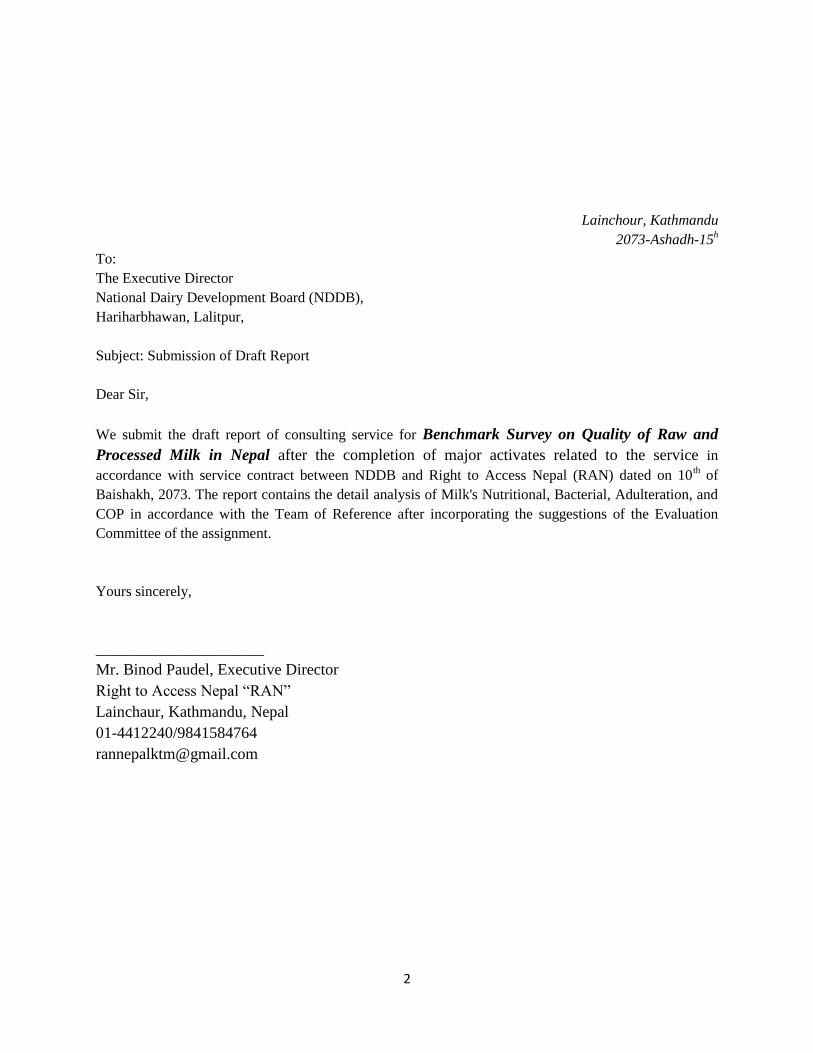
We submit the draft report of consulting service for Benchmark Survey on Quality of Raw and
Processed Milk in Nepal after the completion of major activates related to the service in
accordance with service contract between NDDB and Right to Access Nepal (RAN) dated on 10th of
Baishakh, 2073. The report contains the detail analysis of Milk's Nutritional, Bacterial, Adulteration, and
COP in accordance with the Team of Reference after incorporating the suggestions of the Evaluation
Committee of the assignment.
Yours sincerely,
_______________________
Mr. Binod Paudel, Executive Director
Right to Access Nepal ―RAN‖
Lainchaur, Kathmandu, Nepal
01-4412240/9841584764

3
Table of Content
Table of Content
List of Table
List of Figures Page No
Chapter I Introduction 7
1.1 Backgrounds 7
1.2 Problem Statement 8
1.3 Objectives of the current study 11
1.4 Scope of assignment 12
1.5 Significance of the Study 13
1.6 Organization of the Study 15
Chapter II Conceptual Review of Literatures 16
2.1 Physical Characteristics of Milk 16
2.2 Microbiology of Milk 17
2.3 Adulteration in Milk 20
2.4 Antibiotic Residues in Milk 21
2.5 Review Findings 21
2.5.1. Dairy Animal Population and Distribution in Nepal 21
2.5.2 Annual Milk Production 23
2.5.3 Per Capita Milk Availability 26
2.5.4 Existing Milk Production System in Nepa l27
2.5.5 Smallholder dairying 28
2.5.6 Periurban milk production 39
2.5.7 Dairying through co-operatives 30
2.5.8 Existing Milk and Milk Products Marketing System 31
2.5.8 Dairy Value Chain 34
2.6 Importance of milk hygiene 36
2.6.1 Clean Milk Production on the Farm 37
2.6.2 Sources of Milk contamination 37
2.6.3 Conditions for Clean Milk Production 37
2.6.4 Milk preservation on the farm 38
2.7 Good Milking Procedure 38
2.7.1 Quality Assurance during production of milk 39
2.7.2 Quality assurance at milk collection centres 41
2.7.3 Quality Assurance at Processing Industry 42
2.7.4 Good Husbandry Practices 42
Chapter III Research Methodology 47
3.1 Population 47
3.2 Sampling 48
3.3 Assignments 49
3.3.1 COP and GMP Assessment 49

4
3.3.2 Nutritional Quality Examination 49
3.3.3 Adulteration Examination 50
3.3.4 Microbiological Test 51
3.4 Study Approach 53
3.5 Sampling Guidelines 56
Chapter IV Analysis and Presentation 59
4.1 The nutrient content in Milk 59
4.2 The Adulteration Test in Milk 65
4.3 The CoP Test in Milk 68
4.3.1 Dairy animal farms and farmers 68
4.3.2 Collection Centre/ Chilling Centres and transportation 69
4.4 Micro-Biological Testing of the Milk 72
4.4.1 Total plate count 77
4.4.2 Coliform count 77
4.5 Discussion 77
4.5.1 The nutrient contents 77
4.5.2 Milk Adulteration 83
4.5.3 Microbiological quality of milk 85
Chapter V Conclusion and Recomendation 93
5.1 Conclusion 93
5.2 Recommendation 93
Annexes 95
Annex I: Field Questioners 95
Annex III: Descriptive Statistics of COP Test of Milk Value Chain 108

5
List of Table
Table 1: List of common Milk Adulterants and their harmful effects 20
Table 2: Effects of common antibiotics used for animals 21
Table 3:Cattle Population by Development and Ecological Region (2010/11)22
Table 4: Buffalo Population by Development and Ecological Region (2010/11)22
Table 5:Annual Milk Production by Ecological Region (2010/11) 23
Table 6:Annual Milk Production by Development Region (2010/11) 24
Table 7: Projection on Annual Growth rate required to meet milk consumption recommended by
FAO/WHO by 2020.26
Table 8: Milk marketing channel and number of intermediaries 31
Table 9: Advantages and disadvantages of various milking channels 33
Table 10: Tentative size of Milk and milk production 47
Table 12: Physiology and Nutritional testing list of Milk 50
Table 11: Sampling Frame of the Study 48
Table 13: Adulteration Test of Milk 50
Table:14 Descriptive Statistics of Milk's Physiological and Nutritional Quality (Sunsari District)
60
Table 15: Descriptive Statistics of Physiological and Nutritional Test of Milk (Ilam District)60
Table 16: Descriptive Statistics of Physiological and Nutritional Test of Milk (Chitwan District)
61
Table: 17 Descriptive Statistics of Milk's Physiological and Nutritional Quality (Kavre District)
61
Table 18: Descriptive Statistics of Physiological and Nutritional Test of Milk (Nawalparasi
District) 62
Table 19: Descriptive Statistics of Physiological and Nutritional Test of Milk (Kaski District)63
Table: 20: Descriptive Statistics of Milk's Physiological and Nutritional Quality (Dadeldhura
District) 63
Table 21: Descriptive Statistics of Physiological and Nutritional Test of Milk (Surkhet) 63
Table 22:Descriptive Statistics of Physiological and Nutritional Test of Milk (Kailali District)64
Table:23: Descriptive Statistics of Milk's Physiological and Nutritional Quality (Kathmandu
Valley) 64

6
Table:24 Descriptive Statistics of Milk's Physiological and Nutritional Quality (Banke District)
64
Table 25: Descriptive Statistics of Adulteration Test of Milk (Sunsari District) 65
Table 26:Descriptive Statistics of Adulteration Test of Milk (Ilam District) 65
Table 27:Descriptive Statistics of Adulteration Test of Milk (Chitwan District) 66
Table 28: Descriptive Statistics of Adulteration Test of Milk (Kavre District) 66
Table 29:Descriptive Statistics of Adulteration Test of Milk (Nawalparasi District) 67
Table 30: Descriptive Statistics of Adulteration Test of Milk (Kaski District) 67
Table 31: Descriptive Statistics of Adulteration Test of Milk (Banke District) 67
Table 32:Descriptive Statistics of Adulteration Test of Milk (Surkhet/Kailali/Dadeldhura
District) 68
Table 33: Descriptive Statistics of Adulteration Test of Milk (Kathmandu Valley) 68
Table 34 Composition of cow milk 78
List of Figures
Figure 1: Gross composition of milk, showing major constituents. 16
Figure 2: Milking cattle and cow milk production trend in Nepal 25
Figure 3: Milking buffalo and buffalo milk production trend in Nepal 25
Figure 4: Milk Marketing Channel in Nepal 32
Figure 5: Dairy Value Chain 34
Figure 6: Quality assurance during transportation of milk 41
Fig 7: Milk Production and Distribution channels in Nepal 47
Figure 8: Changes in the concentrations of fat, protein and lactose over a lactation of a cow 79
Figure 9: Fat globules in milk. 80
Figure 10: The four phases of bacterial growth. 86

7
Abbreviation
0C : Degree Celsius
AI : Artificial Insemination
Avg. : Average
BMSS : Biratnagar Milk Supply Scheme
CFU : Colony Forming Unit
COB : Clout on Boiling
COP : Code of Practice
CR/CDR : Central Development Region
DDC : Dairy Development Corporation
DENIDA : Danish International Development Agency
DLS : Department of Livestock
ER/EDR : Eastern Development Region
FAO : Food and Agriculture Organization
FWR/FWDR : Far-Western Development Region
GMP : Good Manufacturing Process/Practice
HKH : Hindu Kush Himalaya
HMSS : Hetaunda Milk Supply Scheme
HTST : High Temperature Short Time
KMSS : Kathmandu Milk Supply Scheme
LMSS : Lumbini Milk Supply Scheme
Max : Maximum
Med : Median
Min : Minimum
MOAD : Ministry of Agriculture Development
MPC : Multi-Purpose Cooperative
MT : Metric Ton
MWR/MWDR : Mid-Western Development Region
NBSM : Nepal Bureau of Standards and Metrology
NDDB : National Dairy Development Board
NS : Nepal Standard
Obs. : Observation
PBS : Phosphate Buffer Solution
PMSS : Pokhara Milk Supply Scheme
SD : Standard Deviation
SNF : Solid Not Fat
SPC : Standard Plate Count
TNTC : Too Numerous to Count
ToR : Term of Reference
TPC : Total Plate Count
UHT : Ultra High Temperature
UN : United Nation
US : United State
WHO : World Health Organization
WR/WDR : Western Development Region

8
Chapter I
Introduction
1.1 Backgrounds
Dairy is the most important sub sector in Nepalese livestock production, providing almost 2/3rd
of the livestock sector GDP and 9% to national GDP. The sub sector provides employment for
more than half million farm families in production and further more than 10000 in processing
and marketing. The dairy sub sector not only provides employment and income generation
opportunities but also ensures flow of money from urban (consumers sites) to rural sector
(production sites) that has tremendously helped in livelihood improvement of the rural people as
well as development of the rural sector. The dairy animal farming is gradually transforming into
commercial system from the subsistence and large dairy animal farms are emerging in the
country to meet the unmet demand for milk and milk products in the country. Young, educated
and foreign returnees are being attracted in this enterprise recently.
Milk is a rich source of minerals such as calcium, vitamin D and phosphorous which are very
important to develop human bones, but a glass of milk contains more other essential nutrients. It
contains protein, carbohydrates, vitamins, minerals and fat. Protein is important to fight diseases,
renew cells, build muscles and maintain healthy hair and nails. It has substantial amount of
carbohydrate in form of lactose which gives energy to the body. A moderated amount of milk fat
supplies essential fatty acids which help to keep body cells warm.
Being a nutritious food, milk serves as an ideal medium for the growth of various
microorganisms. It is a highly perishable commodity and poor handling can exert both a public
health and economic toll, thus requiring hygienic vigilance throughout the production to
consumer chain. Although freshly drawn milk from animals may possess temporary ‗germicidal‘
or ‗bacteriostatic‘ properties, growth of microorganisms is inevitable unless it is processed by
freezing, heat treatment or irradiation. Microorganism in raw milk can originate from different
sources such as air, milking equipment, feed, soil, faeces and grass. The microorganism load and
types found in milk shortly after milking are influenced by factors such as animal and equipment
cleanness, season, ambient temperature, storage, personnel health, cleanness and animal health.
On this basis the daily production and eventual marketing and sale of milk requires special
consideration to ensure its delivery to the market in hygienic and acceptable condition.

9
Antibiotics used on cattle medicine practices in local dairy farmers are unavoidable. These
practices allow the antibiotic residues still left on milk. Even the concentrations were low,
antibiotic residue consumed can cause health problems such as allergy, intoxication and
antibiotic-resistance. Besides that, milk with antibiotic residues cannot be treated with using
microorganisms‘ starter. Antibiotic residues-free milk would increase consumer safety.
Adulteration of milk reduces the quality of milk and can even make it hazardous. Adulterants
such as soap, acid, starch, table sugar and chemicals like formalin may be added to the
milk. Most of the chemicals used as adulterants are poisonous and cause health
hazards. Adulterants are mainly added to increase the shelf life of milk. Some of the
preservatives like acid and formalin are added to the milk as adulterants, thereby increasing the
storage period of milk. Generally, water is added to the milk to increase the volume content of
the milk. Such practices are illegal and should be prohibited, and thus, adulteration free milk is
today‘s deemed voice of government, consumer, and other stakeholders.
The quality is the key for success in today‘s market. Milk should be free from adulteration,
antibiotic residues, and harmful bacteria such as coliform. It should be fresh to drink with
incorporating a rich amount or necessary nutrients on it. Therefore, we (the consulting firms)
proposed method and strategy to carry out the study of ―Benchmark Survey of Raw and
Processed Milk in Nepal‖. The proposed methodology is expected to cover the scope required by
the client, thereby, is supposed to help for making a quality milk production and distribution
behaviour in Nepal.
1.2 Problem Statement
Food safety is universally recognized as a public health priority. It requires a holistic approach,
from production to consumption. All foods have the potential to cause food borne illness, and
milk and milk products are no exception. Milk is complete food in itself whereas it also harbors
many harmful microorganisms if handled and stored improperly that has human health
implication. Dairy animals may carry human pathogens. Such pathogens present in milk may
increase the risk of causing food borne illness. Moreover, the milking procedure, subsequent
pooling and the storage of milk carry the risks of further contamination from man or the
environment or growth of inherent pathogens. Further, the composition of many milk products
makes them good media for the outgrowth of pathogenic micro-organisms. Potential also exists

10
for the contamination of milk with residues of veterinary drugs, pesticides and other chemical
contaminants. Therefore, implementing the proper hygienic control of milk and milk products
throughout the food chain is essential to ensure the safety and suitability of these foods for their
intended use.
Milk and dairy products can be important in diversifying the diet. They are nutrient dense and
provide high quality protein and micronutrients in an easily absorbed form that can benefit both
nutritionally vulnerable people and healthy people when consumed in appropriate amounts.
Although dairy foods contribute to saturated fatty acid content of the diet, other components in
milk such as calcium and polyunsaturated fatty acids may reduce risk factors for coronary heart
disease. There is moderate evidence showing an association between milk and dairy product
consumption and lower incidence of Type 2 Diabetes in adults. Some components in milk and
dairy products such as calcium, vitamin D (fortified milk) and milk proteins may be protective
against cancer. Several studies suggest that milk may offer protection against colorectal cancer.
Raw milk and raw milk products can lead to food-borne illness in humans. Given that these
products are not pasteurized/ treated, alternative safety controls are required to ensure that they
do not pose a public health risk (Source: Food and Agriculture Organization of the United
Nations online). In this regard, it is important to recognise a combination of essential nutrients in
raw and processed milk necessary for human healthy life of Nepalese market, and thus an
important research question raised as: To what extent current nutritional values of raw and
pasteurized milk exist in Nepal, and do they fall within the permissible standard such as Nepal
Standard (NS), WHO, etc.?
In addition to being a nutritious food for humans, milk provides a favorable environment for the
growth of microorganisms. Yeasts, moulds and a broad spectrum of bacteria can grow in milk,
particularly at temperatures above 16°C. Raw milk from animal such as healthy cow contains
few bacteria, but contamination during handling can rapidly increase bacterial numbers. Milk is
an ideal food and many bacteria grow readily in it. Microbes can enter milk via the cow, air,
feedstuffs, milk handling equipments and persons, etc. Some bacteria are useful in milk
processing, causing milk to sour naturally. Natural souring of milk may be advantageous: for
example, in smallholder butter-making. Naturally soured milk is used to make many products,
e.g. irgo, yoghurt, sour cream, ripened buttermilk and cheese. These products provide ways of
preserving milk and are also pleasant to consume. They are produced by the action of

11
fermentative bacteria on lactose and are more readily digested than fresh milk. However, milk
can also carry pathogenic bacteria, such as Salmonella, Tuberculosis Bovis and Brucella, and can
thus transmit disease. Other bacteria can cause spoilage of the milk, and spoilage cause poor
yields of products. The coliform group of bacteria comprises all aerobic and anaerobic grams
which are capable of fermenting lactose with the production of acid and gas in higher
temperature in little time. Most coliforms do not cause disease, but a small percentage can cause
illness in people, especially young children, the elderly, and those with weakened immune
systems. Testing of coliform organisms is used to monitor the hygienic quality of food products.
However, pasteurisation is a heat treatment method to reduce bacteria in milk, but pasteurised
milk is not sterile. Concerning the specified context, the next important research question is
raised as: To what extent the bacterial quality exists in raw and pasteurized milk of Nepal, and
does it fall within the permissible standard such as Nepal Standard (NS), WHO, UN Food and
Agriculture, etc.?
Dairy cattle that have been treated with antibiotics produce milk containing antibiotic residues
for a period of time after treatment. Treated cows are therefore required to be excluded from the
milk supply for a specific time period to ensure that antibiotic residues no longer remain in their
milk. Antibiotic residues in milk may lead to severe allergic reactions in sensitive consumers,
and a change in consumer perception of milk being a pure, unadulterated, natural product. All of
these concerns may result in major economic losses to the dairy industry as well as in public
health. Meanwhile, the next important research question is raised as: To what extent the level of
antibiotic residues contamination exists in raw and pasteurized milk of Nepal?
Quality control tests for milk are very important to assure adulterant free milk for consumption.
Milk is most commonly diluted with water, this not only reduces its nutritional value, but
contaminated water can also cause additional health problems. Milk shall be injurious when
harmful preservative such as formalin is added on it, thereby, causes liver and kidney damage as
it is highly toxic. Urea can lead to vomiting, nausea and gastritis. Urea is particularly harmful
for the kidneys, and caustic soda can be dangerous for people suffering from hypertension and
heart ailments. The health impact of drinking milk adulterated with these chemicals is worse for
children. Caustic soda harms the mucosa of the food pipe, especially in kids. The moment
demand important research question that need to be addressed as: To what extent the level of
adulteration exists in raw and pasteurized milk of Nepal?

12
In Nepal, Nepal NDDB and Danida Support Project conducted a Benchmark Survey of Quality
of Milk and Milk Products, in 2001. The results from the survey showed that many of the
products did not meet the compositional standards laid out by the Food Act. The problem was
also seen in the microbiological quality of Milk. In order to reduce the contamination of milk and
increase the quality, governmental authority such as Nepal Bureau of Standards and Metrology
(NBSM) has made benchmarking standard for milk and milk products. But the standard was
made in 1977 and nether it is supposed to be reliable to the present contest nor is it consistent
with international standard such as WHO, UN Food and Agriculture, etc. In this regard, NBSM
must harmonize standards to facilitate provision of safe milk production and consumption
practice so that it could improve public health and increase the economic value to the producers.
These standards must be followed in each step of milk production chain such as milk at the farm,
collection at bulking centres, procurement at factory, market delivery, and purchase by the
consumer. Moreover, packaging should be labeled by quoting necessary composition and
information on proper handling by the consumer to reduce risks associated with improper
handling of milk. Government of Nepal approved Code of Practice (CoP) for Dairy Industries,
but the implementation part is still lacking. Furthermore, most of the dairies do not have
laboratory manual or company standards of milk and milk products. This has resulted the
deterioration of the quality of milk from source (farmer level) due to unhygienic milking
practices, adulteration, use of inappropriate and contaminated milk vessels, open transportation,
etc. Meanwhile, behaviour such as lack of cleanliness, use of contaminated water, absence of
strict quality control system and use of uncertain quality packing materials by the dairy
industries, and use of dirty milk crates, inappropriate transportation of processed milk and its
disorganized selling (such as in footpaths) by the retail distributor have further deteriorated the
milk quality of Nepal. In this regard, important research questions are raised as: What is the
benchmark quality of milk in current scenario? To what extent CoP for Dairy Industries has been
implemented in different level of milk production chain such as farmer level, collection centres,
freezing centres, dairy industries, and retail stores?
In order to solve above research questions, a Bench Mark Survey Study on quality of raw and
pasteurized milk across the dairy value chain in the country is necessary, so that, a prompt
recommend can be made for production and trading of quality milk and food safety can be made.
1.3 Objectives of the current study

13
As per the ToR, following are the specific objectives of the assignment:
Assess the current nutritional and bacterial quality of raw and pasteurized milk in Nepal
and benchmark against the Nepal Standard (NS)
Establish benchmark of raw and pasteurized milk available in the Nepali market
Recommend appropriate approach to maintain the established benchmark at different
level of production and market chain to maintain the NS.
Assess the adulteration status of raw milk and make doable recommendation to avoid
adulteration
1.4 Scope of assignment
As per the ToR, following are the specific Scopes of the assignment:
Review of the current chemical and bacterial quality of raw and pasteurized milk
available in Nepal market
Assess the implementation level of CoP administered by the government by all concern
stakeholders.
Assess whether the stakeholders in the production and market chain of raw and
pasteurized milk adopted the standard spell out by the Food Act of Nepal
Assess any GMP process of raw and pasteurized milk undertaken by the stakeholders in
market chain.
Assess the adulteration in the milk and recommend method and strategy to control and
monitor the type and level of adulteration in raw and pasteurized milk.
Formulation of New Methods and Strategies of gathering information about raw milk and
pasteurized milk and formulation of new, alternative strategies in to be adopted to tackle
the various challenges on maintaining minimum standard of raw and pasteurized milk.
Assess the current practice of dissemination of Knowledge and Learning Knowledge of
the new production, processing and marketing methods and practices of raw and
pasteurized milk.

14
Assess the evaluation of results and feedback information with respect to raw and
pasteurized milk quality and tie it up with minimum bench mark.
1.5 Significance of the Study
Milk is a nutritious food that provides a good media for growth of bacteria. Despite the
cleanliness of the milking process, freshly produced milk contains numerous bacteria. Most of
these bacteria come from the udder of the milk producing animals which are often contaminated
with faecal matter on the outer surface. Washing of the udder reduces the contamination load but
does not eliminate it. Good hygiene and sanitization methods are required to prevent spoilage of
milk; transmission of disease-causing organisms; and other health hazards associated with
consumption of unhygienic milk and products.
Various types of bacteria in raw milk cause different effects in milk and human health. Spoilage
bacteria only produce quality changes in milk (taste and cuddling); while pathogenic bacteria
from infected animals, a filthy udder and equipment may cause disease. Milk may also contain
substances that are hazardous to human health such as antibiotics and pesticides from exposed
animals for which withdrawal periods after treatment with veterinary drugs and pesticides are not
observed. Veterinary drugs may cause allergies and induce resistance to antibiotics; while
pesticides may trigger carcinogenic effects.
Often, at home, milk is boiled to destroy bacteria. However, in industry, heat treatment methods
such as pasteurization (75oC for 15 sec) and sterilization (130o-150o C for 3-5sec) are used to
make milk safe for consumption. Pasteurization reduces the number of spoilage bacteria and
destroys pathogens; while sterilization further destroys their spores. Proliferation of
microorganisms can be prevented by refrigerated transport and storage.
To reduce contamination of milk at any step of the value chain and ensure effective heat
treatments and good hygienic practices are required throughout the food chain (Farm to table). In
this regard, Nepal Bureau of Standards (NBSM) expresses its interest to harmonized standards to
facilitate provision of safe milk and reduce wastage through spoilage. These standards should be
used at every level of the food chain: production of milk at the farm, collection at bulking
centers, procurement at factory, market delivery, and purchase by the consumer. Milk packets
should be labeled to provide necessary information on proper handling by the consumer to
reduce risks associated with improper handling of milk.

15
Standards provide guidance on the principles for food hygiene and best practices in the dairy
industry (use of veterinary drugs, pesticides animal feeds, prevention of aflatoxins). Safe margins
are set for parameters on pathogens, aflatoxins, veterinary drugs and pesticide residues. Test
methods provide guidance for validating compliance to specified maximum limits in milk and
milk products. Food safety through standards development and regular reviews; product
certification (standardization mark); import inspection; testing; training and food safety
management system certification is essential to maintain quality of raw and pasteurized milk.
In 2001, NDDB and Danida Support Project conducted a Benchmark Survey of Quality of Milk
and Milk Products in Nepal. The survey has shown that many of the products did not meet the
minimum compositional standards laid out by the Food Act and the major problem was in the
microbiological quality. In this new millennium, quality philosophy is considered as password to
the market. Quality, as in other products, is considered as an indispensable attributes of the milk
and milk products too.
Most of the dairies have neither laboratory manual nor company standards of milk and milk
products. Although there is GoN approved Code of Practice (CoP) for Dairy Industries, it has
remained unimplemented. Had this CoP been implemented in true spirit, the dairy industries and
the quality of milk and milk products they produce would have been of higher quality standard.
But, unfortunately, neither the CoP is implemented by the dairy industries nor the Committee
constituted for monitoring the implementation status of the CoP is active and functioning. The
Committee meeting, which is to be held at least bi-monthly, has not been held since a long time
and neither the Committee members nor persons designated by it have regularly visited the
dairies to know their working system and supervise their working conditions.
Consequently, the quality of milk starts gradually deteriorating from source (farmer level) due to
unhygienic animal keeping and milking practices, adulteration of water and other substances, use
of inappropriate and contaminated milk vessels (e.g. black polythene tanks) and open
transportation. In addition, lack of cleanliness, use of contaminated water, absence of strict
quality control system and use of uncertain quality packing materials in the dairy industries, and
use of dirty milk crates, inappropriate transportation of processed milk and its disorganized
selling (such as in footpaths) further deteriorate milk quality. Ineffective system to take action
against the defaulters is another critical issue in maintaining the quality of milk. As such, quality

16
of milk and milk products is doubtful. Based on the objectives and functions, NDDB intends to
commission a Bench Mark Survey Study on quality of raw and pasteurized milk across the dairy
value chain in the country in order to recommend reforms needed for production and trading of
quality milk in relation to the food safety.
1.6 Organization of the Study
The study report is broadly categorized in five chapters. The first chapter describes about
problem statement, study objectives and significant of the study along with background of the
study. The second chapter reviews related documents, papers, research articles, past studies, etc.
related to the present study. Similarly, the third chapter discusses the methodological design of
the study. The results and findings of the study have been presented in chapter four. Finally, the
chapter five concludes the findings of the study.

17
Chapter II
Conceptual Review of Literatures
2.1 Physical Characteristics of Milk
Milk may be defined various ways. Chemically speaking, milk is a complex fluid in which more
than 100 separate chemical compounds have been found. Its major components are water, fat,
lactose, casein1, whey proteins, and minerals (or ash) in amounts varying with the milk of
various species of animals. However, for any given species, the range of values for the
constituents of milk is fairly constant. From a physiological standpoint, milk is the secretion of
the normally functioning mammary gland of the females of all mammals, which is produced for
some time following parturition for the diet of the young of the species during the initial period
of growth. In terms of physical chemistry, milk is an opaque, whitish fluid of multi disperse
phases. The true solution contains lactose, vitamins, acids, enzymes, and some inorganic salts.
Moreover, Milk is composed of water, milk fat, and SNF. The SNF consists of protein, lactose,
and minerals. These solids are also referred to as skim solids, or serum solids. The term total
solid refers to the serum solids plus the milk fat. The major components of raw milk are
illustrated in Figure 1.
The major constituents of milk vary more widely in individual cow‘s milk than in pooled market
milk. Factors affecting the milk such as breed of cow, intervals of milking, stages of milking,
different quarters of udder, lactation period, season, feed, nutritional level, environmental
temperature, health status, age, weather, oestrum, gestation period, and exercise are known to
cause variations in fat, protein, lactose, and mineral levels in milk derived from individual cows.
1 the major milk protein
Casein,
2.8% Whey
protein,
0.6%
Protein
3.4% Lactose
4.8% Minerals
0.7%
Fat,
3.7%
SNF,
8.9%
Milk
Milk
solids
12.6% Water
87.4%
Fig 1: Gross composition of milk, showing major constituents.

18
In general, these variations tend to average out but display an interesting seasonal pattern in
commercial milk used by food processors, which may have an important impact on properties of
the finished products.
2.2 Microbiology of Milk
Initial Micro-flora
Although milk produced from the mammary glands of healthy animals is initially sterile,
microorganisms are able to enter the udder through the teat duct opening. Where the mammary
tissue becomes infected and inflamed large numbers of microorganisms and somatic cells are
usually shed into the milk. Mastitis is a very common disease in dairy cows, and may be present
in a subclinical form, which can only be diagnosed by examining the milk for raised somatic cell
counts. Although the organisms involved in mastitis are not usually able to grow in refrigerated
milk, they are likely to survive, and their presence may be a cause of concern for health. Most
common microorganism found in fresh milk form healthy cow are Gram-Positive Cocci,
Streptococci, Staphylococci And Micro-Cocci; Lactic Acid Bacteria, Pseudomonas Spp., Yeast,
Coryne-Bacteria, etc., whereas most common microorganism found in milk form unhealthy cow
are Mycobacterium Bovis, Brucella Abortus, Coxiella Burnetii, Listeria Mono-Cytogenes,
Salmonellae, etc. which have a serious health concern for human. The outer surface of the udder
is also a major source of microbial contamination in milk. The surface is likely to be
contaminated with a variety of materials, including soil, bedding, faeces and residues of silage
and other feeds. Many different microorganisms can be introduced by this means, notably
Salmonellae, Campylobacter Spp., L. Mono-Cytogenesis, Psychotropic Spore-Formers,
Clostridia, and Entero-Bacteriaceae. Good animal husbandry and effective cleaning and
disinfection of udders prior to milking are important in minimising contamination.
Other sources of contamination
Milking equipment and storage tanks have been shown to make a significant contribution to the
psychrotrophic micro flora of milk if not adequately sanitised. Exposure to inadequately cleaned
equipment and contaminated air are also sources of contamination. Milk residues on surfaces and
in joints and rubber seals can support the growth of psychrotrophic Gram-negative organisms
such as Pseudomonas, Flavobacterium, Enterobacter, Cronobacter, Klebsiella, Acinetobacter,
Aeromonas, Achromobacter and Alcaligenes, and Gram-positive organisms such as

19
Corynebacterium, Microbacterium, Micrococcus and sporeforming Bacillus and Clostridium.
These organisms are readily removed by effective cleaning and disinfection, but they may build
up in poorly cleaned equipment. Milk-stone, a mineral deposit may also accumulate on
inadequately cleaned surfaces, especially in hard water areas. Gram-positive cocci, some
lactobacilli, and Bacillus spores can colonise this material and are then protected from cleaning
and disinfection. Some of these organisms may survive pasteurisation and eventually cause
spoilage. Other, less significant, sources of contamination include farm water supplies, farm
workers and airborne microorganisms.
Micro flora during the transportation and storage of milk
Bacterial numbers in the milk may increase during transport, either as a result of contamination
from inadequately cleaned tankers or from the growth of Psychrotrophic organisms, particularly
Pseudomonas spp. Milk temperature and duration of the transport stage are therefore important
factors. On arrival at the processing site, the milk is transferred to bulk storage tanks, or silos,
prior to processing. The milk may be stored in the silos for 2 – 3 days, and further growth of
Psychrotrophic bacteria is likely during this period. The degree of growth is dependent on the
initial microbial load, and the storage time and temperature. The growth of Psychrotrophic
bacteria may also be accompanied by the production of heat-stable, extracellular Proteolytic and
Lipolytic enzymes. These enzymes are often capable of surviving pasteurisation and, in some
cases, ultra high temperature (UHT) processing, and they may subsequently cause spoilage in the
processed milk.
Techniques to limit the growth of Psychrotrophs during raw milk storage
Thermisation: The most commonly used technique is to apply a mild heat treatment
(thermisation), by heating to around 57 – 68 °C for 15 – 20 seconds and then cooling rapidly to
<6 °C. This reduces the Psychrotrophic population significantly and can extend the storage life
of the raw milk by several days.
Deep cooling: As the storage temperature is a key factor for the rate of growth of Psychrotrophic
spoilage organisms, storing milk at as low temperature as possible can also extend the storage
life significantly.
Methods of Treating Milk

20
Separation: Milk can be separated into skimmed milk, cream and sediment fractions, using
centrifugal separators. The agitation involved may also break up clumps of bacteria, potentially
producing an apparent increase in the number of colony-forming units. This process also allows
the milk to be standardised to a specified fat content by adding back the correct quantity of
cream.
Homogenisation: Homogenisation reduces the size of the milk fat globules. The fat globules are
then small enough to remain in suspension. Homogenisers used for pasteurised milk may be
linked to the pasteuriser, and run at raised temperature in order to minimise possible microbial
contamination. UHT processed milks are homogenised in sterile conditions after heat treatment
and before aseptic filling.
Pasteurisation: Some form of heat process is commonly applied to milk to ensure
microbiological safety, and to extend shelf life; the most commonly used process is
pasteurisation. In the most of the case, both low-temperature, long time (63 – 65 °C for 30
minutes), and high-temperature, short time (HTST 71.7 – 75 °C for at least 15 seconds)
minimum processes are permitted. However, in practice, the HTST process is now generally
used. Higher processes (such as ultra-pasteurisation at 130 to150 °C for at least 2 seconds) may
also be applied to products with high fat and solids content. Pasteurisation processes are
designed to reduce the numbers of vegetative microbial pathogens to levels that are considered
acceptable, although bacterial spores are not destroyed. Most of the potential Psychrotrophic
spoilage bacteria are also eliminated. However, certain heat-resistant Mesophilic organisms are
able to survive pasteurisation.
UHT or sterilisation processes: Milk may also be subjected to more severe heat processes
sufficient to achieve "commercial sterility". This may be done by batch heating in closed
containers, or continuously with aseptic filling into sterile containers. Both conventional retort
sterilisation and UHT processes must achieve a minimum of 3 minutes to ensure product safety.
These processes destroy all vegetative cells in the milk, and the majority of spores, although
certain very heat-resistant spores may survive. This results in a long shelf life without the need
for refrigeration, but also causes Organoleptic changes in the milk, such as browning.
Conventional sterilisation processes involve heating the milk in thick-walled glass bottles, closed
with a crimped metal cap, at about 120 °C for approximately 30 minutes. However, modern

21
large-scale production methods often use an initial UHT treatment prior to filling the container,
followed by retorting for a reduced time (10 – 12 minutes), and then a rapid cooling process.
2.3 Adulteration in Milk
Table 1:
List of common Milk Adulterants and their harmful effects
Adulterants Added to Harmful effects in human health
Water Increases the volume Decreases the nutritional value of milk;
poses health risk due to addition of
contaminated water
Benzoic and
Salicylic acid
Increase shelf life for long distance
transportation
Increase asthma problem and the level of
hyperactivities in children
Detergents Increases the foaming to give
thickness and whiteness
Increases the gastro-intestine and kidney
problems
Urea Provides whiteness; increases the
constancy for improving SNF%,
imitates natural
Gives overburdens to kidney and may
cause kidney failure
Formalin Increase shelf life for long distance
transportation
Causes liver and kidney damage, it is
highly toxic
Sugar Increase the quality and SNF% Prove fatal for diabetic patient
Carbonates
and Bi-
Carbonates
Mask the pH and acidity values of
badly preserved milk to pass it as
fresh milk
Can cause disruption in hormone affecting
regular development and reproduction
Ammonium
Sulphate
Increases the lactometer reading
by increasing the density of milk
Can cause irritation in gastro-intestinal
track causing nausea, vomiting, diarrhea,
etc. It is neurotoxin and can cause
behavioural change
Milk is one of the products which can be adulterated in many ways affecting the quality of
further dairy products. Intention behind adding edible or inedible substance in milk is more for
economic concerns. But, the root causes can be illustrated as:- demand and supply gap: more
acute during some season due to low milk production and increased demand; physical nature of
milk: aqueous and opaque nature of milk can accommodate many adulterants in milk; degraded
moral society: wrecked moral status coupled with passion for profiteering; spoiled socio-
economic structure: persons engaged in the business to increase their income and raise socio-
economic status; perishable nature of milk: the unscrupulous producers/traders use preservatives,
neutralizers, etc. to prolong the shelf life of sub standard milk; unorganized condition of dairy

22
industry: most of the milk is procured and traded by unorganized dairies; which freely adulterate
the milk; low legal standards and their improper enforcement, lack of suitable, rapid and sure
tests etc. The table 1 shows the common milk adulterants and their harmful effects.
2.4 Antibiotic Residues in Milk
Antibiotic use plays a major role in the emerging public health crisis of antibiotic resistance.
Although the majority of antibiotic use occurs in dairy farms, relatively little attention has been
paid to how antibiotic use in dairy animals contributes to the overall problem of antibiotic
resistance. The potential threat to human health resulting from inappropriate antibiotic use in
dairy animals is significant, as pathogenic-resistant organisms propagated in these livestock are
poised to enter the dairy supply and could be widely disseminated in dairy products. Antibiotic
residues in milk may lead to severe allergic reactions in sensitive consumers, and cause antibiotic
resistance in human body. The table 2 shows the residues warning period of lactating animas.
Table 2:
Effects of common antibiotics used for animals
Antibiotic Treatment for Residues warning
for milk withdraw
Penicillin bacterial pneumonia (shipping fever) caused
by Pasteurella multocida
48 hours
Flunixin inflamed tissue, mainly used for pain, soiling,
fever, loss of function of certain internal organs,
etc.
36 hours
Sulfadimethozine respiratory, urinary tract, enteric, and soft tissue
infections
10 days
Oxytetracyclin Bacterial pneumonia, caused, inflamed tissue,
mainly used for pain, soiling, fever.
21 days
Tetracycline 5 days Source: US Food and Drug Administration Guideline
2.5 Review Findings
2.5.1. Dairy Animal Population and Distribution in Nepal
Cattle, buffaloes, yak and their crossbred are important dairy animals being reared in the country.
The estimated population of cattle, buffaloes and yak/crossbred are 7.2 million, 5.0 million and
63 thousand respectively during the year 2010/11. Of the total cattle population, the distribution
in hill agro ecological region was highest (48%) followed by Terai (40%) and least in the

23
mountain agro-ecological region. Similarly, the cattle population was found to be mostly
concentrated in the Eastern Development Region (28.8%) followed by Central Development
Region (23.6%), Mid Western Development Region (18.0%) and Western Development Region
(16.6%). The cattle population was least in the far western development region (13.0%)
Table 3:
Cattle Population by Development and Ecological Region (2010/11)
Ecological
Regions
Development Regions
EDR CDR WDR MWDR FWDR Total
Mountain 252,649 184,250 11,321 197,051 225,267 870,538
(12%)
Hills 744,597 825,357 773,751 735,714 386,146 3,465,565
(48%)
Terai 1,085,027 693,507 417,976 367,485 325,951 2,889,946
(40%)
Total 2,082,273
(28.8%)
1,703,114
(23.6%)
1,203,048
(16.6%)
1,300,250
(18.0%)
937,364
(13.0%) 7,226,049
Source: (MoAD, 2012)
The distribution of buffaloes was also highest in the hill agro ecological region (52.4%) followed
by in Terai (39.0%) and least in mountain region (8.6%). Likewise distribution of buffaloes in
CDR, WDR, EDR, MWDR and FWDR were 25.6%, 25.2%, 23.3%, 15.3% and 10.6%,
respectively.
Table 4:
Buffalo Population by Development and Ecological Region (2010/11)
Ecological
Regions
Development Regions
EDR CDR WDR MWDR FWDR Total
Mountain 146,682 148,047 88 34,273 99,185 428,275
(8.6%)
Hills 427,286 644,691 934,358 404,927 205,464 2,616,726
(52.4%)
Terai 587,724 486,383 325,513 324,924 224,104 1,948,648
(39%)
Total 1,161,692
(23.3%)
1,279,121
(25.6%)
1,259,959
(25.2%)
764,124
(15.3%
528,753
(10.6%) 4,993,649
Source: (MOAD, 2012)

24
The estimated population of yak and crossbred (Chauries) in the country was 63000 during FY
2010/11 and are found in the 28 Northern high hills and mountain district of the country.
Though statistics on population of cattle and buffaloes segregated by breed is not available, it is
estimated that around 10-12% of the cattle population and 25-36% of buffalo population are
considered to be exotic or crossbred (DLS, 2010).
2.5.2 Annual Milk Production
The estimated annual milk production in the country in the year 2010/11 was 1.56 million MT, a
3.95% higher than that in the year 2009/10 (DLS, 2012). The annual milk production was highest
from the hill region (52.5%) followed by Terai (40.5%) and least in the Himalayan region
(7.0%).
Table 5:
Annual Milk Production by Ecological Region (2010/11)
Ecologica
l Regions
Cattle Buffalo
Total
Milk
(MT)
Milking
animal
Milk
Prodn
(MT)
Productivit
y (kg/yr)
Milking
animal
Milk
Prodn
(MT)
Productivit
y (kg/yr)
Mountain 113,294 38,466 339.5 98,438 71,009 721.4 109,475
Hills 495,228 220,431 445.1 734,191 596,161 812.0 816,592
Terai 365,600 188,288 515.0 459,015 442,155 963.3 630,443
Total 974,122 447,185 459.1 1,291,644 1,109,325 858.8 1,556,510
Source: DLS (2012)
The average milk production per milking cow and buffalo stood at only 459 kg and 859kg
respectively. Again the productivity of animals in Terai and Hills were higher as compared to the
productivity of animals at Himalayan region mainly due to gradual replacement of indigenous
cattle and buffaloes with exotic or crossbred animals particularly in the region where milk
collection facilities from organized sector (DDC and private dairies) have been established.
Similarly, the annual milk production in CDR was highest (29.7%) followed by production in
EDR (25.5%), WDR (23.2%), MWDR (11.6%) and least in FWDR (10.1%) also coinciding with

25
the milk collection network established in the country. Only recently milk collection and
processing facilities have been established in the far western development region.
Table 6:
Annual Milk Production by Development Region (2010/11)
Development
Regions
Cattle Buffalo
Total
Milk
(MT) Milking
animal
Milk
Prodn
(MT)
Productivity
(kg/yr) Milking
animal
Milk Prodn
(MT)
Productivity
(kg/yr)
EDR 302,767 151,113 499.1 300,644 245,338 816.0 396,451
CDR 238,973 120,941 506.1 347,604 341,970 983.8 462,911
WDR 156,800 72,396 461.7 352,959 288,257 816.7 360,653
MWDR 147,788 53,021 358.8 151,443 126,997 838.6 180,018
FWDR 127,794 49,714 389.0 138,994 106,763 768.1 156,477
Total 974,122 447,185 459.1 1,291,644 1,109,325 858.8 1,556,510
The trend analysis of milk production from cattle and buffaloes shows gradual steady increase in
both total production and number of milking animals, but the productivity improvement has been
marginal both for cattle and buffaloes. Programme for increasing the productivity of dairy
animals rather than increasing the absolute number of animals would be quite essential to
minimize additional burden on already limited availability of livestock feeding resources.

26
0
200000
400000
600000
800000
1000000
1200000
2001 2002 2003 2004 2005 2006 2007 2008 2009 2010
Year
Nu
mb
er
of
mil
kin
g c
att
le a
nd
mil
k
pro
du
cti
on
(M
T)
370
380
390
400
410
420
430
440
450
460
Mil
k P
rod
ucti
vit
y (
kg
/an
imal/
yr)
Milking Cattle Number Cow Milk Production Cow milk productivity
Figure 2: Milking cattle and cow milk production trend in Nepal
Figure 3: Milking buffalo and buffalo milk production trend in Nepal
2.5.3 Per Capita Milk Availability
0
200000
400000
600000
800000
1000000
1200000
1400000
2001 2002 2003 2004 2005 2006 2007 2008 2009 2010
Years
Nu
mb
er
of
Mil
kin
g B
uff
alo
es a
nd
Bu
ffalo
mil
k p
rod
ucti
on
(M
T)
820
825
830
835
840
845
850
855
860
Pro
du
cti
vit
y (
kg
/yr/
an
imal)
Milking Buffalo Number Buffalo Milk Production Buffalo milk productivity
27
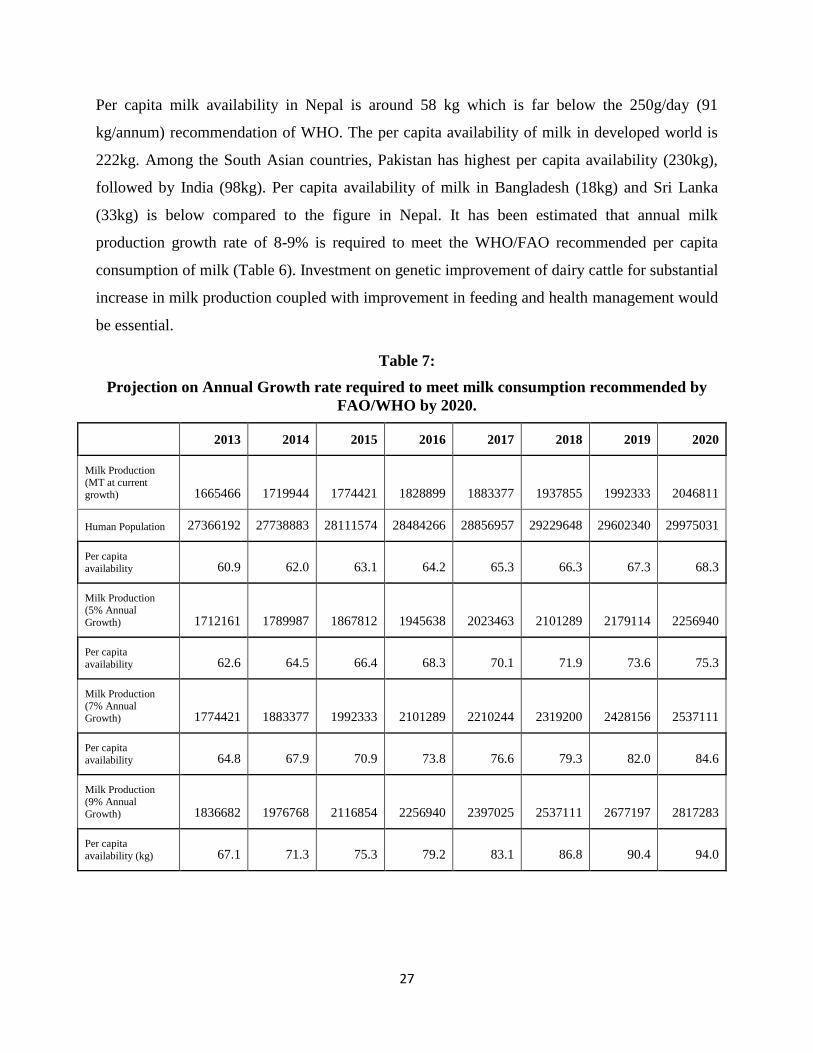
Per capita milk availability in Nepal is around 58 kg which is far below the 250g/day (91
kg/annum) recommendation of WHO. The per capita availability of milk in developed world is
222kg. Among the South Asian countries, Pakistan has highest per capita availability (230kg),
followed by India (98kg). Per capita availability of milk in Bangladesh (18kg) and Sri Lanka
(33kg) is below compared to the figure in Nepal. It has been estimated that annual milk
production growth rate of 8-9% is required to meet the WHO/FAO recommended per capita
consumption of milk (Table 6). Investment on genetic improvement of dairy cattle for substantial
increase in milk production coupled with improvement in feeding and health management would
be essential.
Table 7:
Projection on Annual Growth rate required to meet milk consumption recommended by
FAO/WHO by 2020.
2013 2014 2015 2016 2017 2018 2019 2020
Milk Production
(MT at current
growth) 1665466 1719944 1774421 1828899 1883377 1937855 1992333 2046811
Human Population 27366192 27738883 28111574 28484266 28856957 29229648 29602340 29975031
Per capita
availability 60.9 62.0 63.1 64.2 65.3 66.3 67.3 68.3
Milk Production (5% Annual
Growth) 1712161 1789987 1867812 1945638 2023463 2101289 2179114 2256940
Per capita
availability 62.6 64.5 66.4 68.3 70.1 71.9 73.6 75.3
Milk Production (7% Annual
Growth) 1774421 1883377 1992333 2101289 2210244 2319200 2428156 2537111
Per capita
availability 64.8 67.9 70.9 73.8 76.6 79.3 82.0 84.6
Milk Production (9% Annual
Growth) 1836682 1976768 2116854 2256940 2397025 2537111 2677197 2817283
Per capita
availability (kg) 67.1 71.3 75.3 79.2 83.1 86.8 90.4 94.0

28
2.5.4 Existing Milk Production System in Nepal
Milk production in Nepal broadly can be classified into two systems 1) traditional subsistence
milk production system and 2) market linked commercial/ semi commercial milk production
system. This market linked system can be further sub divided into
Smallholder peri-urban production
Urban Production
Large Scale commercial production
Cooperative animal farming and milk production
Rural subsistence production
Largely in the rural areas
Mostly animals are indigenous and utilizes natural resources- grazing
1-3 milking animals (cattle or buffaloes)
Predominantly for HH consumption
Minimal marketing opportunity
Minimal external inputs- direct cost minimum
Extra milk sold directly to consumers (if opportunity exists) or converted to ghee and sold in
the market
Small holder- peri urban milk production
Most prevalent in peri urban areas
2-10 milking animals (cattle, buffaloes or mixed generally crossbred)
Generally stall fed
Milk marketed to organized formal sector
Farmers mostly involved in MPCs for easy marketing
Some land holdings for green grass production
Purchase of compound feeds or ingredients
Urban Production
Represent small section
Farmers‘ keep crossbred animals 1-10
No green grass production due to high opportunity cost of land
Depends on purchased feed and dry roughages
If numbers are few- found roaming around roadside in search of feed
Opportunity to sell milk directly to consumers with higher price (>Rs 50/lt)
Large Scale Commercial Production
Gradually emerging in peri urban areas

29
More than 20 milking crossbred animals upto 100
Green forage production - important
Dairying – not mixed with other agricultural operation
In Terai and low hills
Cooperative animal farming and milk production
Emerging – young and educated population
Medium to large scale commercial production
2.5.5 Smallholder dairying
Smallholder dairy systems are common throughout the developing countries. Market-oriented
dairy farming by smallholders practicing a mixed crop-livestock form of farming can be a key to
economic development in many areas of the HKH including Nepal. Over the past 10 to 15 years,
considerable changes have taken place in the structure and management systems of smallholder
dairy farming within the mixed crop-livestock farming systems. In particular, there have been
notable changes in the species and breeds of the dairy population, infrastructure, and market
developments. Increasing urban markets and improved marketing systems have led to a slow but
steady move towards dairy farming as a means of supplementary income generation and even as
a commercial venture rather than as part of a subsistence system.
Devendra (2001) categorized smallholder dairy production into three systems:
1. Traditional, usually with ad hoc marketing arrangements such as many peri urban farms
2. Cooperative, formed from natural aggregation and concentration of farms
3. Intensive, where herd sizes become larger
Smallholders manage their herds in order to maintain a steady supply of milk. The number of
milch animals that can be reared in a smallholder system has a certain ceiling. The obvious
determining factors to this are the size of landholding, the availability of feed and human labour.
In the major dairy pocket areas of Nepal, majority of the dairy farmers are smallholders. Out of
880 farms under recording scheme for genetic improvement programme across 14 hill and Terai
districts of Nepal, the median herd size was found to be 5 with majority of households (56%)
having cattle herd size of 1-5. Very few households were having more than 10 cattle and
extremely low had herd size of more than 20 cattle. Some of the smallholder dairy farmers keep
the mixed herd of cattle and buffalo, some only buffaloes and rest only cattle with their unique
explanation for such practices. Although government programmes have promoted crossbred

30
cows for use as dairy animals, the use of buffalo is becoming popular among small farmers
because of their adaptability to local feed resources, high milk fat content, and salvage value in
the hills. The milk produced from these smallholder farmers come into formal milk market
through organized private and public dairy sector in the country. Some farmers are still opt to
supply milk directly to the consumers or to the intermediate processor (hotel and restaurants
producing sweets) as they get better price for milk compared to the price when they sell it to the
formal milk market.
In Nepal's hills and Terai, areas that are accessible via the road network have experienced
significant growth in smallholder dairy farming. The marketing of milk has been facilitated by
the establishment of milk collection centers that transport milk to the main chilling canters
established by DDC (government), as well as by private dairies in strategic milk collection
points.
Private sector involvement in processing milk from smallholdings is increasing. However, the
private sector's efforts are also uncoordinated, and quality enforcement is lacking. The private
sector also suffers from unfair competition with the subsidized public sector.
In the high hills and mountain areas, Chauries (crossbred between yak and hill cattle) are being
raised mainly for milk production. The milk is being utilized for Yak cheese production by DDC
owned and private cheese factories. Milk production from Chauries are seasonal (not milked
during winter feed scarce period) and thus the operation of these cheese factories located in the
remote high hills of the country are also seasonal.
2.5.6 Periurban milk production
Most of the smallholder dairy production development has been evolved around peri urban areas
as there is good road link and good market potential for the milk and products in adjoining city
centre. The state owned Dairy Development Corporation (DDC) initiated 5 different milk supply
scheme namely Kathmandu Milk Supply Scheme (KMSS), Biratnagar Milk Supply Scheme
(BMSS), Hetaunda Milk Supply Scheme (HMSS), Pokhara Milk Supply Scheme (PMSS) and
Lumbini Milk Supply Scheme (LMSS) in Kathmandu, Biratnagar, Hetauda, Pokhara and Butwal
respectively. Consequently, the smallholder as well as medium to large scale dairy farms
emerged in the vicinity of these city centres. The collection and chilling centres were established

31
around these dairy farm settlements. The private dairy sectors also focused their activities on
these established centres thus smallholder dairy grew faster in these peri urban areas. However,
in the present context of short supply of around 400000 lit of milk daily to the established
capacity of small to large dairy industries, the private sectors are expanding their coverage in
new peri urban areas as well as in the villages where there is good road linkage. The lower
opportunity costs of land and labor in peri urban areas compared to that within the cities have
greatly encouraged dairy development in peri urban areas. However, smallholder dairy farming
is not uncommon in the city centre itself. Small to medium sized dairy farms are found in major
cities like Kathmandu, Pokhara and Biratnagar. The feeding of these dairy animals kept in the
city itself however differs from that kept in the peri urban areas. In the city centres, the animals
greatly depends on straw and concentrates, whereas there is a practice of cultivating forage grass
depending on availability of land in peri urban areas. Green grasses from fallow land and
roadside and from fodder tree is also available in the peri urban areas.
2.5.7 Dairying through co-operatives
The fundamentals of the cooperatives is working together to build self reliant communities.
Cooperatives are often cited as one of the most effective way of grouping small dairy farmers to deal
with the challenges of producing and marketing milk. As a result of the perishable nature of milk
and the range of skills involved in its production and marketing, dairying requires a number of
services that can best be provided by cooperative action. It is not surprising therefore that the
cooperative movement has featured prominently in the development of the dairy industry
worldwide.
A dairy cooperative business is owned, operated, and controlled by the dairy farmers who benefit
from its services. Members finance the cooperative and share in profits it earns in proportion to
the volume of milk they market through the cooperative. Milk producers' cooperatives and
association were formed for the first time in 1980 in Nepal to cope with the challenges being
faced by smallholder farmers in milk production pockets. At present, there are 1748 Milk
Producer's Cooperative Societies (MPCs) functioning in 62 districts in the country (as of Ashad
2068). These primary cooperatives used to have at least 25 member farmers. In the district level,
District Milk Producers’ Cooperative Unions (DMPCUs) are in function in 38 districts which

32
coordinates and facilitates its member primary cooperatives within the district for dairy operation.
Central Dairy Cooperative Association of Nepal (CDCAN) is the national level umbrella for primary
cooperatives and union in the country.
The farmers’ are paid for milk on basis of fat and SNF content of the milk. However, the primary
cooperatives are additionally paid for total solid content of the bulk milk from DDC and dairy
industries. This amount helps to run cooperative for its day to day operation. The salary to the
personnel involved in the cooperative, transportation cost from collection to chilling centres or dairy
industries, and purchase of chemicals and glassware required are also paid from these earnings of the
cooperatives.
Farmer-owned dairy cooperatives engage in a variety of activities to provide members an assured
market for their milk. Dairy cooperatives range widely in size and function-some solely arrange
for the sale of members' milk and provide few services, while others manufacture range of
products and may market their products directly to consumers. Most MPCs are engaged in milk
collection, quality testing and distribution of milk payments. Some MPCs operate input supply,
veterinary services, and consumer goods outlets for members. Feed manufacturing by the
cooperatives and selling to the cooperative member is gaining popularity as there is greater
quality assurance and payment ease in the process.
2.5.8 Existing Milk and Milk Products Marketing System
The existing milk and milk products marketing channel operating in the country is summarized
in the following table and diagram
Table 8: Milk marketing channel and number of intermediaries
Milk Marketing Channels Number of
intermediaries
Producer-consumer 0
Producer-milk hawker-consumer 1
Producer-processor-consumer 1
Producer-processor- retailer-consumer 2
Producer-milk trader—consumer 2
Producer-dairy co-operative –processor- retailer - consumer 3

33
The number of intermediaries involved will have a bearing on both producer and consumer milk
prices. The shorter the channel the more likely that the consumer prices will be low and the
producer will get a higher return.
From the consumer point of view, the shorter the marketing chain, the more likely is the retail
price going to be low and affordable. But this is only the one side of the coin. Actually the price
paid to producer by consumers in direct channel (no middlemen) or short channel (through
Hawkers) might have to even pay higher than the processed milk, because of consumers‘
preference for whole milk rather than reconstituted processed milk. This explains why, following
the liberalization of the dairy industry, direct sales of raw milk from producers to consumers
(channel 1) or through hawkers (channel 2) has been on the increase despite the public health
risks associated with the consumption of untreated milk and milk products. Milk producers may
not necessarily benefit from a short marketing chain i.e. milk processors may be paying farmers
the same price as hawkers. However, farmers sometimes prefer selling milk to hawkers because
other factors such as prompt payments and inaccessibility to formal market outlets such as
producer co-operatives or lack of nearby milk processing factory. The biggest disadvantage of
direct milk sales to consumers by hawkers is the total lack of quality control and the frequent rate
of adulteration of milk with (dirty) water, which is illegal.
Figure 4: Milk Marketing Channel in Nepal

34
Table 9:
Advantages and disadvantages of various milking channels
Channel Strength Weakness
Cooperative Offer an assured permanent market
Offer Services- feed, vaccine etc
No limit to quantity farmers can supply
Quality control- fare trade
Ownership feeling
Investment opportunity-share
Bonus payment
Collection centre not far from producing
farm
Relatively lower price where competition
exists
Sometime there might be delay in
payment
Farmers end up bearing the cost of
mismanagement
Over politicization
Vendors/
Hawkers/
Middlemen
Pay somewhat higher price where
competition exists
Prompt payment
Collects milk from farmers doorstep
Provide market outlet in region not well
serviced by formal procurement system
Chance of disappearance without payment
Not a reliable market
No supply of input or services or no
credits on them
Arbitrary change of price without prior
knowledge
No quality control on milk
Hotel/
Resturants
Higher prices than cooperative
Payment can be negotiated
A reliable market
Can not disappear
No security- business can be closed at any
time
No Input and service support
Can‘t take all milk
Consumers/
neighbors
Collects from farm/ or delivered
Flexible time
Price is usually higher
Not a reliable source
Can delay payment
Dairy
Industries
Generally prompt payment
Give price for true weight and content
Relatively better price where competition
exists
Sometimes delayed payment can occur if
their products are stored for long time
Tries to control over price paid to
producer
The prevailing milk and products marketing channel can be further simplified as:
Farmers to Consumers- Fluid milk and products such as Curd, Paneer, Khowa, Chhurpi
Farmers to hotel/Restaurants (Fluid Milk) to consumers- Fluid milk (in tea coffee), kheer
Farmers to Sweet shop (Fluid milk and partially processed products: Chhena, Khowa) to
consumers- various sweets (Barfi, Penda, Rasbari, Lalmohan etc)
Farmers to cooperatives (fluid milk) to consumers- Fluid milk and products (Panner, Ghee, Curd,
Lassi)

35
Farmers to cooperative (fluid milk) to processor (fluid milk) to retailers/vendors (products such
as pasteurized milk, yoghurt, cheese, paneer, sweets, ghee etc.) to consumers (the same products)
In a nutshell, while the informal sector scores over the formal sector by virtue of the fact that in many
areas it is the only marketing channel open to the rural producer and other factors related to, paying
slightly higher prices, offering short term instant cash credit and providing milk collection service at
farmer doorstep, the formal sector provides an assured and permanent market as well as a number of
other livestock support services.
2.5.8 Dairy Value Chain
The dairy value chain starts with raw milk production at the farmer level and ends with consumers who
buy the processed milk and dairy products. There are several players between the start and end of the
chain, – namely the feed suppliers, artificial insemination (AI) and health services providers, milk
collectors and agents, processing units and distribution networks. At almost each level in the value chain,
there is some value added such that the cost of raw milk increases as it passes through the several stages
in as illustrated in the following figure:
Figure 5: Dairy Value Chain
Production and Collection of Milk
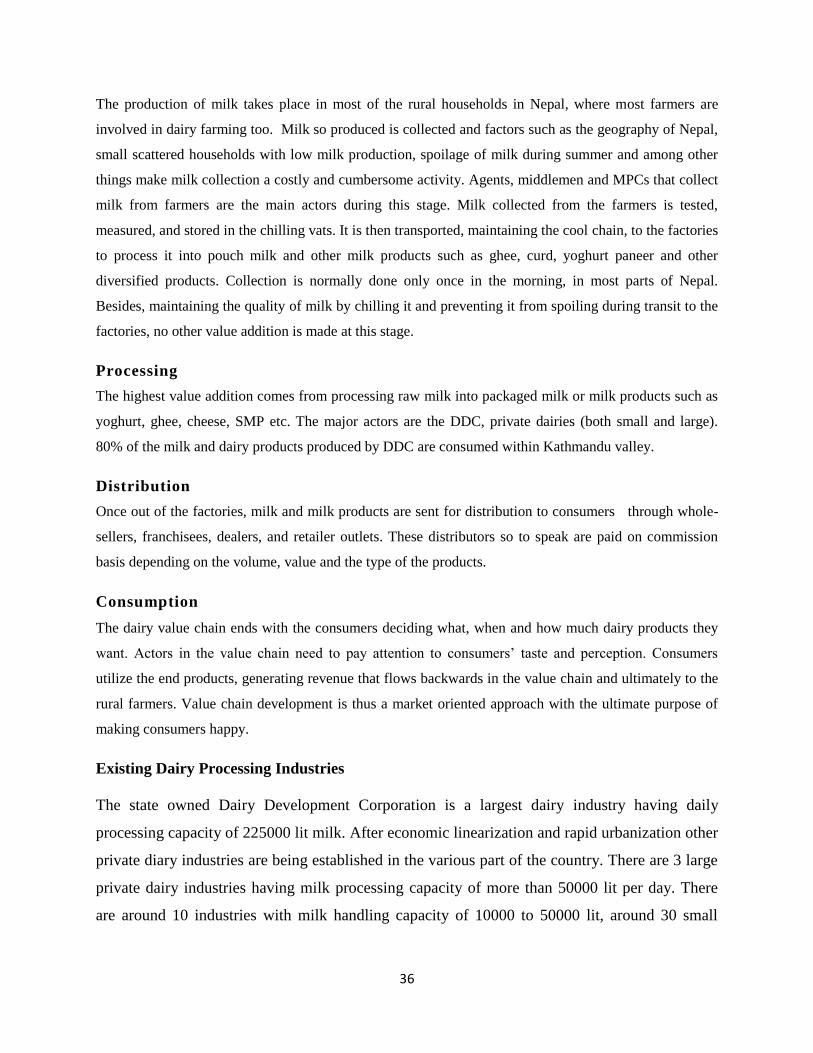
36
The production of milk takes place in most of the rural households in Nepal, where most farmers are
involved in dairy farming too. Milk so produced is collected and factors such as the geography of Nepal,
small scattered households with low milk production, spoilage of milk during summer and among other
things make milk collection a costly and cumbersome activity. Agents, middlemen and MPCs that collect
milk from farmers are the main actors during this stage. Milk collected from the farmers is tested,
measured, and stored in the chilling vats. It is then transported, maintaining the cool chain, to the factories
to process it into pouch milk and other milk products such as ghee, curd, yoghurt paneer and other
diversified products. Collection is normally done only once in the morning, in most parts of Nepal.
Besides, maintaining the quality of milk by chilling it and preventing it from spoiling during transit to the
factories, no other value addition is made at this stage.
Processing
The highest value addition comes from processing raw milk into packaged milk or milk products such as
yoghurt, ghee, cheese, SMP etc. The major actors are the DDC, private dairies (both small and large).
80% of the milk and dairy products produced by DDC are consumed within Kathmandu valley.
Distribution
Once out of the factories, milk and milk products are sent for distribution to consumers through whole-
sellers, franchisees, dealers, and retailer outlets. These distributors so to speak are paid on commission
basis depending on the volume, value and the type of the products.
Consumption
The dairy value chain ends with the consumers deciding what, when and how much dairy products they
want. Actors in the value chain need to pay attention to consumers‘ taste and perception. Consumers
utilize the end products, generating revenue that flows backwards in the value chain and ultimately to the
rural farmers. Value chain development is thus a market oriented approach with the ultimate purpose of
making consumers happy.
Existing Dairy Processing Industries
The state owned Dairy Development Corporation is a largest dairy industry having daily
processing capacity of 225000 lit milk. After economic linearization and rapid urbanization other
private diary industries are being established in the various part of the country. There are 3 large
private dairy industries having milk processing capacity of more than 50000 lit per day. There
are around 10 industries with milk handling capacity of 10000 to 50000 lit, around 30 small

37
industries handling 1000-10000 lit milk per day and around 700 small industries/ vendors
handling less than 1000 lit of milk daily.
2.6 Importance of milk hygiene
Milk becomes sour when stored for long periods at high ambient temperatures prevalent in
tropical and subtropical countries. This is because the inherent lactic acid bacteria and
contaminating microorganisms from storage vessels or the environment break down the lactose
in milk into lactic acid. When sufficient lactic acid has accumulated, the milk becomes sour and
coagulates. Raw milk that contains too much lactic acid, even if it does not appear to be curdled,
will coagulate when heated. This acidity is known as ―developed acidity‖ and such milk is not
acceptable for sale to consumers or milk processors.
The number of spoilage bacteria in raw milk depends on the level of hygiene during milking and
the cleanliness of the vessels used for storing and transporting the milk. During the first 2–3
hours after milking, raw milk is protected from spoilage by inherent natural antibacterial
substances that inhibit the growth of spoilage bacteria. However, if the milk is not cooled, these
antibacterial substances break down causing bacteria to multiply rapidly. Cooling milk to less
than 10°C may prevent spoilage for up to three days. High storage temperatures result in faster
microbial growth and hence faster milk spoilage.
Raw milk is also known to be associated with pathogenic bacteria which cause milk-borne
diseases such as tuberculosis, brucellosis or typhoid fever, among others. Hygienic milk
production, proper handling and storage of milk, and appropriate heat treatment can reduce or
eliminate pathogens in milk. In many countries, milk processing factories are required by law to
pasteurise milk before selling it to the public. Many consumers also routinely boil milk before
drinking it to protect themselves from milk-borne diseases. Processed milk must be handled
hygienically to avoid post-processing contamination.
So, whether one is selling milk directly to consumers or to a processing factory, it must be
handled hygienically so that it remains fresh and capable of being heated without curdling.
Hygienic milk handling includes using clean equipment, maintaining a clean milking

38
environment, observing good personal hygiene and preserving the quality of milk during storage
and transportation to the consumer or processing plant.
2.6.1 Clean Milk Production on the Farm
Good hygienic practice is very important in the production of clean milk. Clean milk has the
following characteristics:
● Low bacterial count
● Pleasant creamy smell and colour
● No obnoxious odors
● No dirt and extraneous matter
● No residues of antibiotics, sanitizers or pesticides
2.6.2 Sources of Milk contamination
Raw milk may be contaminated by bacteria from several sources. These include:
● Udder and udder flanks
● Milker
● Milking environment
● Milking equipment
● Vessels used for milk storage and transportation
2.6.3 Conditions for Clean Milk Production
Some important points to observe in order to produce clean milk:
● Milking should be carried out in a well-ventilated barn with adequate lighting.
● The floor of the milk barn must be durable and easy to clean, preferably made of concrete.
● After use, milking vessels and equipment must be cleaned with potable water, sanitized and
dried in the sun on a drying rack. Suitable disinfectants, such as hypochlorite solution, should be
used at the recommended concentrations.
● Milkers must be healthy and not suffering from contagious diseases or ulcers.
● Only healthy cows should be milked. Cows suffering from mastitis should be milked last and
their milk discarded. Milk from cows on antibiotic treatment should not be sold until the
specified withdrawal period (usually 72 hours or more) has elapsed.
● Colostrum (the milk produced in the first five days after calving) should not be mixed with
normal milk. Calves must be allowed to suckle their dams and excess colostrum may be given to
other calves.
● During milking, the first strips of milk (fore milk) should be milked into a separate, black-
coated cup (strip cup) to check for mastitis. The fore milk should then be discarded.
● Where possible, raw milk should be cooled using simple methods such as immersing milk cans
in a trough of running cool water or evaporative cooling

39
2.6.4 Milk preservation on the farm
While most smallholder farmers do not have cooling facilities, it is important to cool milk and
store it at as low a temperature as is practically possible if it cannot be delivered within 2–3
hours after milking. This is particularly important for evening milk or where morning milk
cannot be transported to the milk collection point within 2–3 hours. Simple means of cooling,
such as immersing milk cans in ice blocks or cold water in a trough, are better than leaving the
milk uncooled. Where available, domestic refrigerators may be used but avoid freezing milk as
this destabilizes the fat.
2.6.4 Good Milking Procedure
It is important to follow proper milking procedures in order to obtain milk of good and consistent
quality. A properly executed routine milking procedure is part and parcel of clean milk
production.
The following steps should be followed:
Milk at the same time every day ensures consistent butterfat content. Usually, the longer the
milking interval the higher the butterfat content and volume of milk. The reverse is true for
shorter intervals. There are no economic benefits of milking more than twice a day unless one
has very high yielding cows (>40 litres/day). For most smallholder producers, a twice-a-day
milking routine is adequate.
Wash the udder with a clean towel Stimulates milk let-down and release of the hormone
oxytocin which acts on the milk secretory (alveolar) cells, causing release of milk.
Remove the fore milk into a strip cup Helps to check for abnormal colour or presence of
blood clots. This may indicate infections like mastitis. The fore milk should be discarded.
Complete milking within 4–5 minutes After 5 minutes, the stimulation effect of release of
oxytocin wanes away.
Dip teats in a post teat dip disinfectant (iodophor or hypochlorite) Prevents infection of
the udder.
Test cows regularly using the California mastitis test (CMT) or the Whiteside test, both
of which are simple to use. Enables early detection and treatment of mastitis
Use of appropriate equipment: One of the major sources of contamination of milk is the
use of equipment and storage vessels which cannot be easily cleaned and sanitized. These

40
include jerry cans and buckets made of non-food grade plastic. Metal containers such as
aluminum and stainless steel cans are recommended under the code of hygienic practices.
2.7 Fundamentals of CoP
Dairy farmers are in the business of producing food. They aim to ensure that the safety and quality of
their raw milk will satisfy the highest expectations of the food industry and consumers. On-farm practices
should also ensure that milk is produced by healthy animals under acceptable conditions for the animals
and in balance with the local environment.
The overarching principles applying to the production, processing and handling of all milk and milk
products are:
From raw material production to the point of consumption, all dairy products should be subject to
a combination of control measures. Together, these measures (good agricultural practice - GAP
and good manufacturing practice - GMP) should meet the appropriate level of public health
protection.
Good hygienic practices should be applied throughout the production and processing chain so that
milk and milk products are safe and suitable for their intended use.
Wherever appropriate, hygienic practices for milk and milk products should be implemented.
GAP/GMP together should be effective.
All dairy farmers, suppliers to dairy farmers, milk carriers and haulers, dairy product and food
manufacturers, distributors and retailers should be part of an integrated food safety and quality assurance
management system. Good farming practices underpin the marketing of safe, quality-assured milk-based
products.
The role of dairy farmers is to ensure that good agricultural, hygienic and animal husbandry practices are
employed at the farm level. The focus should be on preventing a problem (including animal diseases)
rather than solving it after it has occurred.
Good dairy farming practices should contribute to ensuring milk and milk products are safe and suitable
for their intended use.
2.7.1 Quality Assurance during production of milk
The guiding objective for good dairy farming practice is that milk should be produced on-farm from
healthy animals under generally accepted conditions. To achieve this, dairy farmers need to apply GAP in
the following areas:
animal health;

41
milking hygiene;
animal feeding and water;
animal welfare; and
environment.
For some of these areas, there are control points that must be managed to achieve defined outcomes. The
guide contains guidelines specific to the five areas listed above but is not meant as a substitute for
national legislation.
GAP also means that dairy farmers should ensure that appropriate records are kept, especially those that
enable adequate traceability of:
the use of agricultural and veterinary chemicals;
the purchase and use of animal feed and
the unique identification of individual animals.
Records should also be kept of:
- milk storage temperatures (when available)
- veterinary or medication treatments of individual animals.
The owner of a dairy farm should also ensure that people undertaking and supervising the milking
operations and management of the dairy farm are skilled in:
animal husbandry;
the hygienic milking of animals;
the administration of veterinary drugs;
the activities undertaken on the dairy farm in relation to food safety and food hygiene; and
health and safety practices relating to dairy farm operators.

42
Figure 6: Quality assurance during transportation of milk
Vessels used to transport milk must meet the specifications in the code of hygienic practices. Vessels
made of copper or copper alloys should not be used for milk as copper oxidises butterfat, resulting in off-
flavours. Aluminium and stainless steel containers are ideal. Non-food grade plastic cans, buckets and
jerry cans must not be used1. In addition to milk vessels being made of the right material they should:
Have smooth finishes free from open seams, cracks and rust
Have wide openings such that every surface that comes into contact with milk can be accessed
easily for cleaning and sanitation. In this regard, both metal and plastic containers with dead ends
should not be used for handling and storage of milk.
Be used only for handling and storing milk
2.7.2 Quality assurance at milk collection centres
Farmer groups and operators of milk collection points and centres need systems of quality control for the
milk they receive from individual farmers. This enables segregation of poor quality milk at collection
centres. Several simple tests, if carried out judiciously and consistently, will enable the milk collection
centre to ensure that only good quality milk is accepted for onward transportation to milk processing
factories, milk bars or retailers of raw milk in urban centres.
It is necessary to provide a facility for cleaning of milk cans and other vessels used in bringing the milk to
the milk cooling centre. A wash trough with cold running water will enable milk cans to be rinsed free of
milk immediately they are emptied. Soap for cleaning milk cans should be made available by the farmer
group. Milk cans should be well rinsed after cleaning to avoid tainting the milk with soap residues.

43
Farmers should be advised to thoroughly clean their milk cans with soap and tepid water immediately
upon returning to the farm. A final rinse with hot water will kill most bacteria. The cans should then be
dried on a drying rack in the sun; sunlight helps
2.7.3 Quality Assurance at Processing Industry
The raw and chilled milk received at processing industry first need to be stored in the appropriate
tank maintaining the appropriate temperature. The milk is then pasteurized at appropriate Temp
for appropriate time to insure all harmful organisms are killed. Personal hygiene of factory
operator, cleanliness of working area, appropriate machinery installed, appropriate management
of effluent are basic requirements for assuring the quality of finished products from the factory to
be supplied to the consumers.
2.7.4 Good Husbandry Practices
Animal health
Animals that produce milk need to be healthy and an effective health care programme should be
in place.
Good agricultural
practice (GAP)
Examples of suggested measures to
achieve GAP
Objective/Control measure
1.1 Prevent entry of
disease onto the
farm
1.1.1 Only buy animals of known disease
status and control their introduction onto the
farm
1.1.2 Ensure cattle transport on and off the
farm does not introduce disease
1.1.3 Have secure boundaries/fencing
1.1.4 If possible, limit access of people and
wildlife to the farm
1.1.5 Have a vermin control programme in
place
1.1.6 Only use clean equipment from a
known source
- Keep animals healthy
- Comply with
national/regional animal
movement and disease
controls
1.2 Have an
effective herd health
management
programme in place
1.2.1 Use an identification system that
allows all animals to be identified
individually from birth to death
1.2.2 Develop an effective herd health
management programme focused on
prevention that meets the farm‘s needs as
well as regional and national requirements
1.2.3 Regularly check animals for signs of
- Detect animal diseases
early
- Prevent spread of disease
among animals
- Prevent transmission of
zoonoses
- Ensure traceability

44
disease
1.2.4 Sick animals should be attended to
quickly and in an appropriate way
1.2.5 Keep sick animals isolated and
separate milk from sick animals and animals
under treatment
1.2.6 Keep written records of all treatments
and identify treated animals appropriately
1.2.7 Manage animal diseases that can affect
public health (zoonoses)
1.3 Use all
chemicals and
veterinary
medicines as
prescribed
1.3.1 Use chemicals according to directions,
calculate dosages carefully and observe
appropriate withholding periods
1.3.2 Only use veterinary medicines as
prescribed by veterinarians and observe
specified withholding periods
1.3.3 Store chemicals and veterinary
medicines securely and dispose of them
responsibly
- Prevent occurrence of
chemical residues in milk
1.4 Train people
appropriately
1.4.1 Have procedures in place for detecting
and handling sick animals and veterinary
chemicals
1.4.2 Make sure all people are sufficiently
trained to carry out their tasks
1.4.3 Choose competent sources for advice
and interventions
- Follow correct procedures
Milking hygiene
Milk should be harvested and stored under hygienic conditions. Equipment used to harvest and
store milk should be suitable and well maintained.
Good agricultural
practice (GAP)
Examples of suggested measures to
achieve GAP
Objectives/Control
measures
2.1 Ensure milking
routines do not injure cows
or introduce contamination
to milk
2.1.1 Uniquely identify individual
animals
2.1.2 Ensure appropriate udder
preparation for milking
2.1.3 Ensure consistent milking
techniques
2.1.4 Separate milk from sick or
treated animals
2.1.5 Ensure milking equipment is
correctly installed and maintained
2.1.6 Ensure a sufficient supply of
clean water
- Use suitable and well
maintained equipment for
milking and milk storage

45
2.2 Ensure milking is
carried out under hygienic
conditions
2.2.1 Ensure housing environment is
clean at all times
2.2.2 Ensure milking area is kept
clean
2.2.3 Ensure the milkers follow basic
hygiene rules
- Harvest milk under
hygienic conditions
2.3 Ensure milk is handled
properly after milking
2.3.1 Ensure milk is cooled in the
specified time
2.3.2 Ensure milk storage area is
clean and tidy
2.3.3 Ensure milk storage equipment
is adequate to hold milk at the
specified temperature
2.3.4 Ensure unobstructed access for
bulk milk collection
- Refrigerate and store milk
under hygienic conditions
Animal feeding and water
Animals need to be fed and watered with products of suitable quality and safety.
Good agricultural
practice (GAP)
Examples of suggested measures to
achieve GAP
Objectives/Control
measures
3.1. Ensure animal feed
and water are of adequate
quality
3.1.1 Ensure the nutritional needs of
animals are met
3.1.2 Ensure good quality water
supplies are provided, regularly
checked and maintained
3.1.3 Use different equipment for
handling chemicals and feed stuffs
3.1.4 Ensure chemicals are used
appropriately on pastures and forage
crops
3.1.5 Only use approved chemicals for
treatment of animal feeds or
components of animal feeds and
observe withholding periods
- Keeping animals healthy
with good quality feed
- Preserve water supplies and
animal feed materials from
chemical contamination
- Avoid chemical
contamination due to
farming practices
3.2. Control storage
conditions of feed
3.2.1 Separate feeds intended for
different species
3.2.2 Ensure appropriate storage
conditions to avoid feed
contamination
3.2.3 Reject mouldy feed
- No microbiological or toxin
contamination or unintended
use of prohibited feed
ingredients or veterinary
preparations
- Keeping animals healthy
with good quality feed
3.3. Ensure the traceability
of feedstuffs bought off
3.3.1 All suppliers of animal feeds
should have an approved quality
- Quality assurance
programme of feed supplier

46
the farm assurance programme in place
3.3.2 Maintain records of all feed or
feed ingredients received on the farm
(specified bills or delivery notes on
order)
Animal welfare
Animals should be kept according to the following principles:
Freedom from thirst, hunger and malnutrition
Freedom from discomfort
Freedom from pain, injury and disease
Freedom from fear
Freedom to engage in relatively normal patterns of animal behaviour
Good agricultural
practice (GAP)
Examples of suggested measures to
achieve GAP
Objectives/Control
measures
4.1 Ensure animals are
free from thirst, hunger
and malnutrition
4.1.1 Provide sufficient feed (forage
and/or fodder) and water every day
4.1.2 Adjust stocking rates and/or
supplementary feeding to ensure
adequate water, feed and fodder supply
4.1.3 Protect animals from toxic plants
and other harmful substances
4.1.4 Provide water supplies of good
quality that are regularly checked and
maintained
- Healthy, productive
animals
- Appropriate feeding and
watering of animals
4.2 Ensure animals are
free from discomfort
4.2.1 Design and construct buildings to
be free of obstructions and hazards
4.2.2 Where relevant, provide adequate
space allowances and clean bedding
4.2.3 Protect animals from adverse
weather conditions and the consequences
thereof
4.2.4 Provide housed animals with
adequate ventilation
4.2.5 Provide non-slippery floors
- Protection of animals
against extreme climate
conditions
- Provide a safe environment
4.3 Ensure animals are
free from pain, injury
and disease
4.3.1 Have an effective herd health
management programme in place and
inspect animals regularly
4.3.2 Protect against lameness
4.3.3 Lactating animals should be milked
regularly
4.3.4 Do not use procedures and
- Justified and humane
actions
- Good sanitary conditions

47
practices that cause unnecessary pain
4.3.5 Follow appropriate calving and
weaning practices
4.3.6 Have appropriate procedures for
marketing calves
4.3.7 When animals have to be killed on-
farm, avoid unnecessary pain
4.3.8 Avoid poor milking routines as
they may injure cattle
4.4 Ensure animals are
free from fear
4.4.1 Provide competent animal
husbandry skills and appropriate training
- Absence of ill-treatment
- Security of animals and
farmer
4.5 Ensure animals can
engage in relatively
normal patterns of
animal behaviour
4.5.1 Have herd management and
husbandry procedures that do not
unnecessarily compromise social activity
- Freedom of movement
- Preserve gregarious
behaviour and other
behaviours, such as preferred
sleeping position
Environment
Milk production should be managed in balance with the local environment surrounding the farm.
Good agricultural
practice (GAP)
Examples of suggested measures to
achieve GAP
Objectives/Control
Measures
5.1 Have an appropriate
waste management
system.
5.1.1 Ensure wastes are stored to
minimize the risk of environmental
pollution
5.1.2 Manage pastures to avoid effluent
runoff by spreading farm manures in
accordance with local condition
- Limit the potential impact
of dairy farming practices on
the environment.
5.2 Ensure dairy
farming practices do
not have an adverse
impact on the local
environment
5.2.1 Contain dairy runoff on-farm
5.2.2 Use chemicals (fertilizers,
agricultural and veterinary chemicals,
pesticides, etc) appropriately to avoid
contamination of the local environment
5.2.3 Ensure overall appearance of the
dairying operation is appropriate for a
facility in which high quality food is
harvested
- Presenting a positive image
of milk production practices.
5.1 Have an appropriate
waste management
system.
5.1.1 Ensure wastes are stored to
minimize the risk of environmental
pollution
5.1.2 Manage pastures to avoid effluent
runoff by spreading farm manures in
accordance with local conditions
- Limit the potential impact
of dairy farming practices on
the environment.

48
Chapter III
Research Methodology
3.1 Population
Table 10: Tentative size of Milk and milk production
Particulars Unit 2008/9 2009/10 2010/11 2011/12
Animal Population
i) Cattles
ii) Buffalos
No
No
7090714
4680486
7175198
4836984
7226050
4993650
7244944
5133139
Milk Production
i) Cow
ii) Buffalos
Mt
Mt
413919
1031500
429030
1066867
447185
1109325
468913
1153838
Dairy Cooperatives No 1674 (i.e. of 2015/16 data from Coop. Division)
Source: Statistics of Agriculture Activities, Ministry of Agriculture
Nepalese milk production and distribution channels are comprised with multiple layers. We can
broadly categorize the channels in to five layers as in figure 7. Mainly, milks are collected in
local collection centers from either by local non-professional farmers or by commercial farm
Fig 7: Milk Production and Distribution channels in Nepal
Production in
Farmer level
Local Farmer Cow
& Buffalo Sheds,
Commercial Cow &
Buffalo Farms
Collection Centers
Local Points Dairy
Cooperatives
Freezing Centers
Distance
Transportation
Tank, Van, Milk
Can, Bottle, etc.
Processing
Factories
Small, medium
& large scales
industries, firms,
etc.
Final Markets
Factory outlets,
retail dairy shop,
grocery shop,
footpath, etc.
Final Consumer

49
houses. Sometime consumers visit local farm sheds or local collection centers to collect fresh
and raw milk directly. Collected milks from local collection centers and dairy cooperatives are
further collected to nearby freezing centers. After cooling the milk into the desired temperature, a
distance transport to processing industry is done by milk tanks, vans, etc. Those milks are
processed in processing centers, and thereby, distributed to final consumers through factory
outlets, dairy realtors, glossary shop, footpath, etc. The tentative size of milk and milk producing
animals of Nepal are given in the table 10.
3.2 Sampling
Sampling Point:
Number of Development Regions: 5 (1. Eastern, 2. Central, 3. Western, 4. Mid-Western, 5. Far-
Western)
Number of target Ecological Regions: 2 (Hill, Tarai)
Number of Production Channel: 5 (as per figure 1)
Total Number of Sampling Point = (Number of Development Region × Number of target
Ecological Regions × Number of Production Channel
= 5 × 2 × 5 = 50 Points
Sampling Frame and Actual Sample Size:
Sample collection districts and sites from each sampling point are finalized and presented in the
table below after the discussion with the technical team of NDDB.
Table 11: Sampling Frame of the Study
Devlmt.
Regions
Eastern Central Western Mid-Western Far-Western
Geography Hilly Tarai Hilly Tarai Hilly Tarai Hilly Tarai Hilly Tarai
District Ilam Sunsari Kavre Chitwan Kaski Nawal
parasi
Surkhet Banke Dadel
dhura
Kailali
Farmer
Level
15 15 15 15 15 15 5 5 5 5

50
Collection
Centers
3 3 3 3 3 3 1 1 1 2
Distance
Transportat
ion
3 3 3 3 3 3 1 1 1 1
Processing
Factories
- 2 3 2 3 3 3 2 - 3
Final
Consumer
5 5 5 5 5 5 5 5 5 5
Total 26 28 29 28 29 29 15 14 12 16
Farmer
Level
Collection
Centers
Distance
Transportation
Processing
Factories
Final
Consumer
Total
Kathmandu Valley
15 3 3 24 21 66
Total targeted sample size: 292 observations
3.5 Assignments:
3.5.1 COP and GMP Assessment
Government of Nepal approved Code of Practice (CoP) for Dairy Industries for good
manufacturing process/practice (GMP) in each level of milk value chain. The first assignment of
the project is to access the implementation status of the COP and GMP in dairy value chain of
Nepal. Using the structured checklist, the assessment of COP/GMP shall be taken out through
the field survey of each observation of the sampling frame. The structured questionnaire is
prepared in Nepali language and presented in Annex I.
3.5.2 Nutritional Quality Examination
It is important to recognize a combination of essential nutrients in raw and processed milk which
is necessary for human health. Therefore, the next assignment of the project is to examine the
nutritional quality of the raw and processed milk of Nepal. The milk sample will be first sensory
evaluated for presence or absence of visible dirt, acceptable or unacceptable odor and normal or
abnormal color. The nutritional quality or the nutrient content of milk will be analyzed by using
Lactoscan at the milk collection center brought by individual farmers. The table 12 shows the list

51
of the physical and nutritional components that shall be tested in existing milk value chain of
Nepal.
Table 12: Physiology and Nutritional testing list of Milk
Components Methodology Detail
Sensory
evaluation
Appearance, flavor Visible dirt- Present or absent
Odor- Acceptable or not acceptable
Color- normal or abnormal
COB - Milk sample will be boiled in test tube and any clot
observed
Fat content
SNF
Protein
Added Water
Conductivity
pH
Temperature
Lactoscan milk
analizer
If Lactoscan machine is not available, then fat will
be determined by Gerber‘s Centrifuge method, SNF
by Butyrometer, pH by pH meter and temperature by
thermometer.
3.5.3 Adulteration Examination
Milk is one of the products which can be adulterated in many ways affecting the quality of
further dairy products. The next assignment of the project is to examine the adulteration status of
the milk in the market. The adulteration examination is done using "kit for detection of
adulterations in milk" developed by National Dairy Development Board, Anand-388001,
Gujarat, India. The detail of the examination process is presented in the table 13.
Table 13: Adulteration Test of Milk
Components Methodological Steps
Urea Detection 1. Take 2 ml milk.
2. Add 2 ml Urea Reagent and mix well
3. Distinct Yellow Colour-Urea has been added to milk
Starch and Cereal
Flours Detection
1. Boil 5 ml milk and cool it.
2. Add a few drops of starch reagent.
3. Blue Color-Starch and Cereal Flours have been added to milk.
Sugar/Sucrose 1. Take 1 ml milk.
2. Add 1 ml. Sugar Reagent.
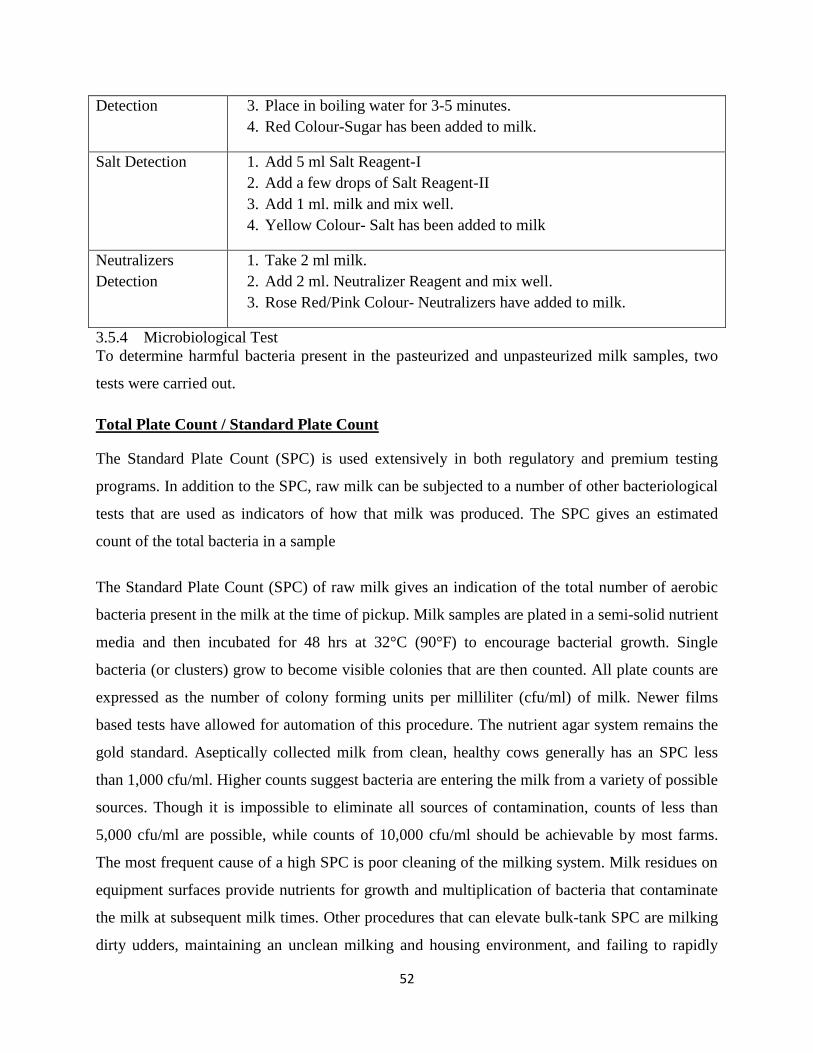
52
Detection 3. Place in boiling water for 3-5 minutes.
4. Red Colour-Sugar has been added to milk.
Salt Detection 1. Add 5 ml Salt Reagent-I
2. Add a few drops of Salt Reagent-II
3. Add 1 ml. milk and mix well.
4. Yellow Colour- Salt has been added to milk
Neutralizers
Detection
1. Take 2 ml milk.
2. Add 2 ml. Neutralizer Reagent and mix well.
3. Rose Red/Pink Colour- Neutralizers have added to milk.
3.5.4 Microbiological Test
To determine harmful bacteria present in the pasteurized and unpasteurized milk samples, two
tests were carried out.
Total Plate Count / Standard Plate Count
The Standard Plate Count (SPC) is used extensively in both regulatory and premium testing
programs. In addition to the SPC, raw milk can be subjected to a number of other bacteriological
tests that are used as indicators of how that milk was produced. The SPC gives an estimated
count of the total bacteria in a sample
The Standard Plate Count (SPC) of raw milk gives an indication of the total number of aerobic
bacteria present in the milk at the time of pickup. Milk samples are plated in a semi-solid nutrient
media and then incubated for 48 hrs at 32°C (90°F) to encourage bacterial growth. Single
bacteria (or clusters) grow to become visible colonies that are then counted. All plate counts are
expressed as the number of colony forming units per milliliter (cfu/ml) of milk. Newer films
based tests have allowed for automation of this procedure. The nutrient agar system remains the
gold standard. Aseptically collected milk from clean, healthy cows generally has an SPC less
than 1,000 cfu/ml. Higher counts suggest bacteria are entering the milk from a variety of possible
sources. Though it is impossible to eliminate all sources of contamination, counts of less than
5,000 cfu/ml are possible, while counts of 10,000 cfu/ml should be achievable by most farms.
The most frequent cause of a high SPC is poor cleaning of the milking system. Milk residues on
equipment surfaces provide nutrients for growth and multiplication of bacteria that contaminate
the milk at subsequent milk times. Other procedures that can elevate bulk-tank SPC are milking
dirty udders, maintaining an unclean milking and housing environment, and failing to rapidly

53
cool milk to less than 40°F. On rare occasions, cows with mastitis can shed infectious bacteria
into the milk can also cause a high SPC. In these circumstances, a concurrent elevation in SCC
should be evident.
The plate count method relies on bacteria growing a colony on a nutrient medium. The colony
becomes visible to the naked eye and the number of colonies on a plate can be counted. For
effective plate count method one should do serial dilution of the original sample. Our objective is
to grow on average between 30 and 300 colonies of the target. Fewer than 30 colonies makes the
interpretation statistically unstable and greater than 300 colonies often results in overlapping
colonies and imprecision in the count. To ensure that an appropriate number of colonies will be
generated several dilutions are normally cultured. Even though cell count method is more time
consuming, but provides statistically accurate and repeatable results.
Like stated earlier, for effective plate count, serial dilution must be done. Serial dilution is any
dilution where the concentration decreases by the same quantity in each successive step. Serial
dilutions are multiplicative. If a solution has a 1/10 dilution the number represents 1 part of the
patient sample added to 9 parts of diluents. So the volumes used would be 10-1= 9. This
represents 1 part patient sample added to 9 parts of diluents.
We have also used serial dilution method in our experiment. The original sample was serially
diluted, plated by swabbing and counting of live bacteria to determine the number of bacteria in

54
a given population. Swabbing the suspension allows us to evenly distribute samples on the plate.
To this end we will make serial dilutions of a solution containing an unknown number of bacteria,
plate these bacteria and determine the total number of bacteria in the original solution by
counting the number of colony forming units and comparing them to the dilution factor. Each
colony forming unit represents a bacterium that was present in the diluted sample. The numbers
of colony forming units (CFU‘s) are divided by the product of the dilution factor and the volume
of the plated diluted suspension to determine the number of bacteria per ml that were present in
the original solution.
For each dilution, the numbers of colony forming units on the plates were counted. If the
number of CFUs on the plate was greater than 1000, it was recorded as TNTC (too numerous to
count). Alternatively, if the numbers are greater than 1000 and if the diluted bacterial suspension
was evenly distributed the on the surface of the plate then the plate was divided into 4 sectors,
the number of bacteria in one sector was counted and multiplied by four. If the number of CFUs
on the plate was below 10, the number of CFUs was recorded, but it was not used in calculations.
Materials Required
Distilled Water
Phosphate Buffer Saline
MacConkey Agar
Nutrient Agar
Petri Dishes
Test tube
Micro Pippette and Tips
Procedure:
1. Firstly, the bacterial source was serially diluted. 10 small sterile test tubes were taken and
each tube was marked starting from 10-1
to 10-10
.
2. 4.5 ml of Phosphate Buffer Solution (PBS) was added to each tube.
3. 0.5 ml of milk sample was added in the first dilution tube. This bacterial suspension was
mixed thoroughly using the vortex shaker on each dilution before preceding the next
dilution.

55
4. 0.1 ml of each diluted suspension was added to respective Nutrient agar and Mc Conkey
agar plate. (Nutrient Agar is used for total bacterial count and Mc Conkey agar used for
Coliform count)
5. The bacterial suspension was evenly distributed by swabbing.
6. The plates were then placed in incubator at 37°C overnight.
7. After incubation, the plates were taken out and bacteria were counted under electric
colony counter.
Calculating the number of bacteria per ml of serially diluted bacteria:
To calculate the number of bacteria per ml of diluted sample one should use the following
equation:
For example, if for the 1x 10⁻⁸
dilution plate you plated 0.1 ml of the diluted cell suspension and
counted 200 bacteria, then the calculation would be: 200/0.1 ml x 10-8
or 200/10-9
or 2.0 x 10¹¹
bacteria per ml.
Coliform Count
Coliforms detected from pasteurized products can often suggest improper pasteurization or post
pasteurization contamination. Coliform tests are conducted following pasteurization primarily to
detect bacterial recontamination of the milk. Retail milk products must have a coliform count
less than 10/ml or gram
Number of CFU
Volume plated (ml) x total dilution used
Number of CFU
ml

56
The Coliform Count (Coli Count) procedure selects for bacteria that are most commonly
associated with manure or environmental contamination. Milk samples are plated on a selective
nutrient media that encourages the growth of coliform bacteria, while preventing the growth of
others. Although coliform are often used as indicators of fecal contamination, there are strains
that commonly exist in the environment. Coliform may enter the milk supply as a consequence
of milking dirty cows or the claw becoming soiled with manure during milking. Generally,
counts greater than 100 cfu/ml would indicate poor milking hygiene or other sources of
contamination. Higher coliform counts more often result from dirty equipment and in rare cases
result from milking cows with environmental coliform mastitis.
Enumeration of total coliform bacteria: Total coliform was determined by the same method
used in the enumeration of total viable bacteria. The medium used for coliform was MacConkey
agar. Inoculated plates were incubated at 37°C for 24 hours. After incubation, typical pinkish and
centrally red colonies were counted by using colony counter and total coliform was calculated.
3.6 Study Approach:
Desk Study
A review of literatures related to the assignments such as books, working papers, journal articles,
proceedings, research papers, university theses, related laws: food act, COP, etc.; standards, etc.
shall be done. The past study conducted by NDDB and other related stakeholders of Nepal has
reviewed rigorously.
Field Survey
During the field survey, samplers have done two tasks: filling up questionnaire/checklist for CoP
and Food Act implementation assessment and collection of Milk samples for field test.
Moreover, the collected from Kathmandu Valley and Kavre District have transfored to the lab in
Kathmandu. Field Samplers have done three tasks: collecting sample milk, field testing of them,
and filling up of questionnaire from each observation.
Field Test
The testings of the nutritional quality and food adulteration status of the milk have done in field
immediately during the sampling time point using reagents and milk analyzer. The methodology

57
and protocol of such reagents/analyzers given by the manufacturers are presented on preceeding
section i.e. section 3. For the validation purpose, witness signature: most probably the milk
sample owner; is made compulsory for the field testing results. Testing record form is presented
in annex 2.
Lab Test
The lab testing of bacterial quality –TPC and Coliform- has done using the appropriate lab
methodology as shown in the assignments. Due to the time requiring factor for distance
transportation that results spoilage of milk, only the samples from the Kathmandu Valley and
Kavre District have tested in lab.
Technical Analysis
The lab has provided the report of tested results. This includes the chemical, physical and
microbiological analysis of milk.
Data Analysis: Descriptive analysis such as mean, median, standard deviation and their t-scores
shall be generated for field survey and Lab results data. Moreover, frequency count, ratio,
percent, etc are also very important tools for qualitative analysis. District wise analysis of
descriptive statistics has done to seek the inferential and generalizing quality of the drawn
sampless.
3.5 Sampling Guidelines
Sampling equipment shall be clean and dry.
Samples for bacteriological examination shall be collected by a person trained in the
technique of sampling for bacteriological work. For bacteriological purposes, all
equipment including plungers, sample bottles, stoppers, shall be sterile and the samples
shall be collected under aseptic conditions.
Equipment shall be sterilized by one of the following methods:
a) Heating in a hot air oven for not less than 2 hours at 160°C, or
b) Autoclaving for not less than 15 minutes at 120°C.

58
NOTE - Under field conditions, equipment may be sterilized by immersion for at least 5 minutes
in boiling water. Equipment treated by this method shall be used immediately.
Sampling Bottles. - The sampling bottles shall be made of good quality glass, suitable for
sterilization. The sample bottle shall be wide mouthed, round with sloping sides on the
pattern of the milk bottles. Bottles used for collecting samples for chemical analysis shall
be provided with well-fitting caps, or bark corks. Bottles for collecting samples for
bacteriological examination shall be glass stoppered. The capacity of the sample bottle
shall be 100, 150 or 250 ml. The size of the sample bottle selected for taking a sample
shall be such that after containing the quantity of milk required for analysis; only a small
space would be left for efficient mixing of the sample as a larger space would allow the
rat to churn during transit. When samples are collected for bacteriological examination, it
shall be seen that air-space is avoided by filling the bottles to the top, leaving however,
and sufficient space to allow for expansion of the rubber stopper. Bark corks shall not be
used for closing milk sample bottles for bacteriological examination.
NOTE - Alternatively, for collecting samples for chemical analysis suitable plastic bottles of
above capacities may also be used.
Label of Samples: Each sample container shall be sealed air-tight after filling and
marked with particulars regarding the, purpose of sampling, the name of the supplier or
other particulars of the stock, the date and time of sampling, the nature of preservatives, if
any, added and any other relevant information. Samples for bacteriological examination
shall be marked distinctively.
Transport of Samples: Milk samples which are to be examined for flavor shall be
protected from light and shall not be exposed to odours, which may be absorbed during
transport.
a) Samples for Chemical Examination-s- It is desirable that samples of milk for chemical
examination are delivered for testing on the same day they are taken. The samples shall be stored
in a refrigerator at a temperature of 0 to 5°C. Where this is not possible, adequate precautions
shall be taken to prevent deterioration and exposure to high temperature and light during transit,

59
In some cases, formaldehyde may be added as a preservative to prevent deterioration, provided it
does not interfere with the subsequent analysis. When formaldehyde has been added, this fact
and the quantity added shall be indicated on the label,
NOTE - If any sample is to be used for cryoscopic examination, mercuric chloride shall be
permissible as a preservative, provided the bottle is properly labeled as ' POISON '.
b) If the tests are to determine the bacteriological quality of the milk, samples shall be chilled
immediately and maintained at a temperature not exceeding 4oC.

60
Chapter IV
Analysis and Presentation
4.1 The nutrient content in Milk
Milk is an important source of nutrient required for growth in infants and children and for
maintenance of health in adults. Milk is a perfect food, readily digested and absorbed. It is a sole
natural food for infants and children. It is chiefly a valuable source of good quality protein, fat,
carbohydrates, vitamins and minerals. Protein in diet supply the amino acids required for growth
of infants and children. It is also required for maintenance of tissues in adults.
Milk contains fat, protein, lactose, minerals and vitamins in addition to major component water
ranging from 83-87% depending on species and stages of lactation, season etc. The protein
content is more or less stable but the fat content varies greatly with species, breed, stage of
lactation, feeding management and health condition.
Table:14
Descriptive Statistics of Milk's Physiological and Nutritional Quality (Sunsari District) Level
Temp. FAT SNF Density Added Water Level Temp. FAT SNF Density Added Water
Overall Avg. 30.71 4.27 8.35 27.05 11.3 Farmer 30.87 4.84 8.52 27.19 9.164
Max. 34 8.4 10 35.5 62.3 32 8.4 9.2 32.5 16.1
Min. 25 1 3.6 10 0 29 1.5 7.8 23.6 1.37
Range 9 7.4 6.4 25.5 62.3 3 6.9 1.4 8.9 14.73
SD 1.46 1.8 1.13 4.57 11.49 0.74 1.85 0.42 2.75 4.24
CV 0.048 0.42 0.14 0.17 1.01 0.024 0.38 0.05 0.10 0.46
Med 31 4.05 8.4 27.25 10 31 4.3 8.4 27.1 10
No of Obs. 28 28 28 28 28 15 15 15 15 15
CC Avg. 31.67 3.93 8.47 28 9.36 Trans. 31.67 2.73 8.17 27.67 13.06
Max. 32 4.1 8.7 28.8 12.1 34 4.9 9.5 33.7 25
Min. 31 3.7 8.2 26.7 7.02 30 1 7 24.2 0
Range 1 0.4 0.5 2.1 5.08 4 3.9 2.5 9.5 25
SD 0.58 0.21 0.25 1.14 2.56 2.08 1.99 1.26 5.24 12.54
CV 0.018 0.05 0.03 0.04 0.27 0.066 0.73 0.15 0.19 0.96
Med 32 4 8.5 28.5 8.96 31 2.3 8 25.1 14.2
No of Obs. 3 3 3 3 3 3 3 3 3 3
Factory Avg. 28.67 4.6 8.17 26.07 12.43 Outlet 32.5 3.95 8.05 26.25 13.6
Max. 31 5.5 8.5 27.8 17.1 34 4.9 8.1 27.4 14.2
Min. 25 4.1 7.7 23.3 9.09 31 3 8 25.1 13
Range 6 1.4 0.8 4.5 8.01 3 1.9 0.1 2.3 1.2
SD 3.21 0.78 0.42 2.4 4.16 2.12 1.34 0.07 1.65 0.85
CV 0.11 0.17 0.05 0.01 0.33 0.065 0.34 0.01 0.069 0.06
Med 30 4.2 8.3 27.1 11.1 32.5 3.95 8.05 26.25 13.6
No of Obs. 2 2 2 2 2 5 5 5 5 5
COB=Clout on Boiling; Temp=Temperature; Sen=Sensory Evaluation; SNF=Solid Not Fat; 1=(+)ve; 2=(-)ve;
The Food Act of Nepal has defined Standard Pasteurized milk should have at least 3% fat
content and 8% Solid Not Fat (SNF). The act is silent about the protein content of milk. The Act

61
also emphasizes 0 level of coliform (harmful bacteria) in processed milk and less than 1000 total
plate count/ml.
The price of raw milk paid to the farmers in Nepal at present is determined by the fat and solid
not fat content. However, in developed countries, protein is also important criteria for fixing the
price of milk.
Table 15:
Descriptive Statistics of Physiological and Nutritional Test of Milk (Ilam District)
Temp. pH
FAT SNF Den. Added Water Temp.
pH FAT SNF Den. Added Water
Overall
Farmer
Avg. 21.77 7.15 2.35 7.11 24.14 23.77 21.8 7.14 2.27 7.04 23.7 24.47
Max. 22.5 7.31 5.4 8.59 29.9 43.5 22.5 7.31 5.4 8.32 28.9 42.1
Min. 21 7.01 0.89 5.37 17.7 8.43 21 7.01 0.89 5.43 17.7 10.6
Range 1.5 0.3 4.51 3.22 12.2 35.07 1.5 0.3 4.51 2.89 11.2 31.5
SD 0.45 0.09 0.99 0.89 3.45 9.78 0.46 0.11 1.03 0.92 3.4 10.08
CV 0.02 0.01 0.42 0.13 0.14 0.41 0.02 0.01 0.45 0.13 0.14 0.41
Med 22 7.13 2.16 7.2 24.1 22.55 22 7.12 2.1 7.1 23.9 23.7
No of Obs. 26 26 26 26 26 26 15 15 15 15 15 15
CC
Trans.
Avg. 21.67 7.16 2.08 7.14 26.27 23.27 21. 7 7.14 2.6 7.3 24.47 21.47
Max. 22 7.2 2.6 7.45 29.9 25.2 22 7.21 2.8 7.5 25.2 22.6
Min. 21 7.13 1.73 6.98 23.3 20 21 7.09 2.3 7.2 23.9 19.3
Range 1 0.07 0.87 0.47 6.6 5.2 1 0.13 0.5 0.3 1.3 3.3
SD 0.58 0.04 0.46 0.27 3.35 2.8 0.58 0.07 0.26 0.17 0.67 1.88
CV 0.03 0.01 0.22 0.04 0.13 0.12 0.03 0.01 0.1 0.02 0.03 0.09
Med 22 7.15 1.92 7 25.6 24.6 22 7.11 2.7 7.2 24.3 22.5
No of Obs. 3 3 3 3 3 3 3 3 3 3 3 3
Outlet
Avg. 21.8 7.2 2.56 7.17 24 23.366
Max. 22 7.3 4.94 8.59 27.7 43.5
Min. 21 7.09 1 5.37 18.1 8.43
Range 1 0.21 3.94 3.22 9.6 35.07
SD 0.45 0.1 1.45 1.39 4.65 15.18
CV 0.02 0.01 0.56 0.19 0.194 0.65
Med 22 7.24 2.3 7.91 27.2 15
No of Obs. 5 5 5 5 5 5
The collected samples were tested immediately after bringing them to the laboratory for fat
content, protein content, solid not fat (SNF) content and lactose content. Lactoscan machine was
used to determine these nutrients content. A 20 ml sample after shaking the content was used to
determine the nutrients content of pasteurized and raw milk. After each 5 sample, the machine
was washed with the distilled water and at the end of the test, this was washed by alkaline
detergent solution prescribed by the manufacturer.
The discriptive statistics of milk content of pasteurized milk sample is given in the tables
presented on this section.

62
Table 16:
Descriptive Statistics of Physiological and Nutritional Test of Milk (Chitwan District)
Temp. pH FAT SNF Den. Added Water Temp. pH FAT SNF Den. Added Water
Overall
Farmer
Avg. 31.25 7.13 3.8 7.9 24.35 11.92 31.2 7.1 4.31 8.4 23.43 10.31
Max. 32 7.31 8.78 9.01 32.1 70 32 7.31 8.78 9.01 28.9 17.3
Min. 30 7.01 1.5 2.5 17 0 30 7.01 2.62 7.68 17 6.91
Range 2 0.3 7.28 6.51 15.1 70 2 0.3 6.16 1.33 11.9 10.39
SD 0.59 0.11 1.51 1.4 3.97 14.9 0.68 0.11 1.72 0.31 3.8 2.82
CV 0.019 0.01 0.4 0.18 0.16 1.25 0.02 0.02 0.4 0.04 0.16 0.27
Med 31 7.12 3.77 8.34 24.2 8.835 31 7.03 3.94 8.39 23.9 10.2
No of Obs. 28 28 28 28 28 28 15 15 15 15 15 15
CC
Transp.
Avg. 31.3 7.17 4.13 8.29 26.27 11.21 31 7.13 3.06 7.96 24.47 4.34
Max. 32 7.31 4.38 8.44 29.9 12.4 31 7.15 3.1 8.79 25.2 5.81
Min. 31 7.01 3.98 8.17 23.3 9.64 31 7.11 3 7.4 23.9 1.6
Range 1 0.3 0.4 0.27 6.6 2.76 0 0.04 0.1 1.39 1.3 4.21
SD 0.58 0.15 0.22 0.14 3.35 1.42 0 0.11 1.71 1.97 3.8 28.8
CV 0.02 0.02 0.05 0.02 0.12 0.127 0 0.01 0.56 0.25 0.16 6.6
Med 31 7.2 4.04 8.25 25.6 11.6 31 7.13 3.08 7.7 24.3 5.6
No of Obs. 3 3 3 3 3 3 3 3 3 3 3 3
Factory
Outlet
Avg. 31.5 7.13 3.35 7.45 24.98 4.55 31.4 7.19 2.7 6.3 25.64 24.7
Max. 32 7.15 3.9 7.7 25.01 7 32 7.29 4.8 8.9 32.1 70
Min. 31 7.11 2.8 7.2 24.95 2.1 31 7.09 1.5 2.5 18.1 0
Range 1 0.04 1.1 0.5 0.06 4.9 1 0.2 3.3 6.4 14 70
SD 0.71 0.02 0.78 0.35 0.04 3.47 0.55 0.08 1.37 2.87 6.4 34.2
CV 0.02 0 0.23 0.05 0.0017 0.76 0.02 0.01 0.51 0.46 0.25 1.39
Med 31.5 7.13 3.35 7.45 24.98 4.55 31 7.21 2.6 7.6 27.2 0.3
No of
Obs. 2 2 2 2 2 2 5 5 5 5 5 5
Table: 17
Descriptive Statistics of Milk's Physiological and Nutritional Quality (Kavre District) Level
Temp. FAT SNF Density Added Water Level Temp. FAT SNF Density Added Water
Overall Avg. 19.57 4.74 8.40 25.94 9.51 Farmer 22.0 4.84 8.52 27.19 9.164
Max. 26.30 7.60 9.10 30.90 42.80 26.2 8.4 9.2 32.5 16.1
Min. 5.40 2.70 1.32 15.30 0.00 11.4 1.5 7.8 23.6 1.37
Range 20.90 4.90 7.78 15.60 42.80 14.8 6.9 1.4 8.9 14.73
SD 6.20 1.22 1.72 3.54 10.07 4.3 1.85 0.42 2.75 4.24
CV 0.32 0.26 0.23 0.14 1.06 0.2 0.38 0.05 0.10 0.46
Med 21.50 4.80 7.90 26.30 6.65 22.5 4.3 8.4 27.1 10
No of Obs. 29 29 29 29 29 15 15 15 15 15
CC Avg. 18.67 3.93 8.47 28 9.36 Trans. 17.67 2.73 8.17 27.67 13.06
Max. 32 4.1 8.7 28.8 12.1 34 4.9 9.5 33.7 25
Min. 31 3.7 8.2 26.7 7.02 30 1 7 24.2 0
Range 1 0.4 0.5 2.1 5.08 4 3.9 2.5 9.5 25
SD 0.58 0.21 0.25 1.14 2.56 2.08 1.99 1.26 5.24 12.54
CV 0.018 0.05 0.03 0.04 0.27 0.066 0.73 0.15 0.19 0.96
Med 32 4 8.5 28.5 8.96 31 2.3 8 25.1 14.2
No of Obs. 3 3 3 3 3 3 3 3 3 3
Factory Avg. 18.67 4.6 8.17 26.07 12.43 Outlet 22.5 3.95 8.05 26.25 13.6
Max. 31 5.5 8.5 27.8 17.1 34 4.9 8.1 27.4 14.2
Min. 25 4.1 7.7 23.3 9.09 31 3 8 25.1 13
Range 6 1.4 0.8 4.5 8.01 3 1.9 0.1 2.3 1.2
SD 3.21 0.78 0.42 2.4 4.16 2.12 1.34 0.07 1.65 0.85
CV 0.11 0.17 0.05 0.01 0.33 0.065 0.34 0.01 0.069 0.06
Med 30 4.2 8.3 27.1 11.1 32.5 3.95 8.05 26.25 13.6
No of Obs. 3 3 3 3 3 5 5 2 5 5
COB=Clout on Boiling; Temp=Temperature; Sen=Sensory Evaluation; SNF=Solid Not Fat; 1=(+)ve; 2=(-)ve;

63
Table 18:
Descriptive Statistics of Physiological and Nutritional Test of Milk (Nawalparasi District)
Temp.
pH
FAT SNF Den.
Added
Water Temp.
pH
FAT SNF Den.
Added
Water
Overall
Farmer
Avg. 31.49 6.94 3.88 8.07 28.01 23.77 21.8 7.14 2.27 7.04 23.7 24.47
Max. 41.00 7.3 7.20 8.90 35.50 43.5 22.5 7.31 5.4 8.32 28.9 42.1
Min. 25.00 6.5 1.00 7.14 23.30 8.43 21 7.01 0.89 5.43 17.7 10.6
Range 16.00 0.8 6.20 1.76 12.20 35.07 1.5 0.3 4.51 2.89 11.2 31.5
SD 4.68 0.21 1.37 0.45 3.38 9.78 0.46 0.11 1.03 0.92 3.49 10.08
CV 0.15 0.03 0.35 0.06 0.12 0.41 0.02 0.01 0.45 0.13 0.149 0.41
Med 30.00 6.95 3.97 8.20 27.80 22.55 22 7.12 2.1 7.1 23.9 23.7
No of
Obs. 29 29 29 29 29 29 15 15 15 15 15 15
CC
Trans.
Avg. 21.67 7.16 2.08 7.14 26.27 23.27 21. 7 7.14 2.6 7.3 24.47 21.47
Max. 22 7.2 2.6 7.45 29.9 25.2 22 7.21 2.8 7.5 25.2 22.6
Min. 21 7.13 1.73 6.98 23.3 20 21 7.09 2.3 7.2 23.9 19.3
Range 1 0.07 0.87 0.47 6.6 5.2 2 0.13 0.5 0.3 1.3 3.3
SD 0.58 0.04 0.46 0.27 3.35 2.8 0.58 0.07 0.26 0.17 0.67 1.88
CV 0.03 0.01 0.22 0.04 0.13 0.12 0.03 0.01 0.1 0.02 0.03 0.09
Med 22 7.15 1.92 7 25.6 24.6 22 7.11 2.7 7.2 24.3 22.5
No of
Obs. 3 3 3 3 3 3 3 3 3 3 3 3
Outlet
Factory
Avg. 21.8 7.2 2.56 7.17 24 23.36 21.8 7.16 2.6 7.04 23.7 23.77
Max. 22 7.3 4.94 8.59 27.7 43.5 22 7.2 2.8 8.32 28.9 43.5
Min. 21 7.09 1 5.37 18.1 8.43 21 7.13 2.3 5.43 17.7 8.43
Range 1 0.21 3.94 3.22 9.6 35.07 1 0.07 0.5 2.89 11.2 35.07
SD 0.45 0.1 1.45 1.39 4.65 15.18 0.45 0.04 0.26 0.92 3.49 9.78
CV 0.02 0.01 0.56 0.19 0.194 0.65 0.02 0.01 0.1 0.13 0.15 0.41
Med 22 7.24 2.3 7.91 27.2 15 22 7.15 2.7 7.1 23.9 22.5
No of
Obs. 5 5 5 5 5 5 3 3 3 3 3 3
The average fat content of the pasteurized milk is 4.72% in milk sample of Chitwan distric.
Though, the fat of the milk is varied by seasonal, and other feeding materials, the allmost sample
were in the range as prescribed by Food Act for standard pasteurized milk.
The solid not fat (SNF) content of milk comprises of lactose, protein and minerals. The SNF of
the standard milk according to food acts of Nepal should be not less than 8. In the most of the
milk sample from various level, the average SNF content was found to be nearto or equal to or
higher than ot that, which is acceptable as per the standard.
The other nutritional quality and physiological quality range or standard of the milk such as
protien, added water, tempreture at the time of collection of the sample, density, pH, etc are not
defined by the food act. The details of those are presented on the table in this scetion. Those
statistics are slidely varried in different district of Nepal. Therefore, it can be concluded that the
physiological and neutritional quality of milk are uniform in entire the country.

64
Table 19:
Descriptive Statistics of Physiological and Nutritional Test of Milk (Kaski District)
Temp. pH FAT SNF Den. Added Water Temp. pH FAT SNF Den. Added Water
Overall
Farmer
Avg. 31.25 7.13 4.03 7.33 23.10 17.01 31.2 7.1 4.31 8.4 23.43 10.31
Max. 32 7.31 5.74 9.00 28.50 33.00 32 7.31 8.78 9.01 28.9 17.3
Min. 30 7.01 3.00 4.50 5.00 14.00 30 7.01 2.62 7.68 17 6.91
Range 2 0.3 2.74 4.50 23.50 19.00 2 0.3 6.16 1.33 11.9 10.39
SD 0.59 0.11 0.67 1.05 5.13 5.84 0.68 0.11 1.72 0.31 3.8 2.82
CV 0.019 0.01 0.17 0.14 0.22 0.34 0.02 0.02 0.4 0.04 0.16 0.27
Med 31 7.12 4.10 7.50 23.00 23.00 31 7.03 3.94 8.39 23.9 10.2
No of
Obs. 29 29 29 29 29 29 15 15 15 15 15 15
CC
Transp.
Avg. 31.3 7.17 4.13 8.29 26.27 11.21 31 7.13 3.06 7.96 24.47 4.34
Max. 32 7.31 4.38 8.44 29.9 12.4 31 7.15 3.1 8.79 25.2 5.81
Min. 31 7.01 3.98 8.17 23.3 9.64 31 7.11 3 7.4 23.9 1.6
Range 1 0.3 0.4 0.27 6.6 2.76 0 0.04 0.1 1.39 1.3 4.21
SD 0.58 0.15 0.22 0.14 3.35 1.42 0 0.11 1.71 1.97 3.8 28.8
CV 0.02 0.02 0.05 0.02 0.12 0.127 0 0.01 0.56 0.25 0.16 6.6
Med 31 7.2 4.04 8.25 25.6 11.6 31 7.13 3.08 7.7 24.3 5.6
No of
Obs. 3 3 3 3 3 3 3 3 3 3 3 3
Factory
Market
Avg. 31.5 7.13 3.35 7.45 24.98 4.55 31.4 7.19 2.7 6.3 25.64 24.7
Max. 32 7.15 3.9 7.7 25.01 7 32 7.29 4.8 8.9 32.1 70
Min. 31 7.11 2.8 7.2 24.95 2.1 31 7.09 1.5 2.5 18.1 0
Range 1 0.04 1.1 0.5 0.06 4.9 1 0.2 3.3 6.4 14 70
SD 0.71 0.02 0.78 0.35 0.04 3.47 0.55 0.08 1.37 2.87 6.4 34.2
CV 0.02 0 0.23 0.05 0.0017 0.76 0.02 0.01 0.51 0.46 0.25 1.39
Med 31.5 7.13 3.35 7.45 24.98 4.55 31 7.21 2.6 7.6 27.2 0.3
No of
Obs. 3 3 3 3 3 2 5 5 5 5 5 5
Table: 20
Descriptive Statistics of Milk's Physiological and Nutritional Quality (Dadeldhura District) Overall Temp. FAT SNF Density Temp. FAT SNF Density Added Water
Avg. 30.19 4.25 6.96 15.8492 Farmer 30.66 3.34 6.75 5.91 13.23
Max. 39 7.2 8.4 27 35.3 3.99 7.5 19.8 33.65
Min. 19.8 2.57 4.5 2.3 29 2.57 5.63 2.3 7.52
Range 19.2 4.63 3.9 24.7 6.3 1.42 1.87 17.5 26.13
SD 4.705 1.46 1.09 10.2655 2.642 0.55 0.71 7.79 11.43
CV 0.156 0.34 0.16 0.6477 0.086 0.16 0.11 1.32 0.863
Med 29.1 3.56 7.03 21.22 30 3.5 6.99 2.4 8
No of Obs. 12 12 12 12 5 5 5 5 5
COB=Clout on Boiling; Temp=Temperature; Sen=Sensory Evaluation; SNF=Solid Not Fat; 1=(+)ve; 2=(-)ve;
Table 21:
Descriptive Statistics of Physiological and Nutritional Test of Milk (Surkhet)
Temp. FAT SNF Density Added Water Temp. FAT SNF Density Added Water
Overall
Outlet
Avg. 26.95 4.79 7.88 25.55 9.78 21.8 2.27 7.04 23.7 24.47
Max. 34.8 7.20 8.92 31.00 48.00 22.5 5.4 8.32 28.9 42.1
Min. 19.8 1.94 4.50 15.00 0.00 21 0.89 5.43 17.7 10.6
Range 15 5.26 4.42 16.00 48.00 1.5 4.51 2.89 11.2 31.5
SD 4.47 1.38 1.13 3.85 12.77 0.46 1.03 0.92 3.48671 10.08
CV 0.17 0.29 0.14 0.15 1.31 0.02 0.45 0.13 0.14712 0.41
Med 28.45 4.85 8.27 26.00 5.87 22 2.1 7.1 23.9 23.7
No of Obs. 14
14 14 14 14 5
5 5 5 5

65
Table 22:
Descriptive Statistics of Physiological and Nutritional Test of Milk (Kailali District)
Temp. FAT SNF Density Added Water Temp. FAT SNF Density Added Water
Overall
Farmer
Avg. 29.31 4.89 9.37 24.9 8.90 34 5.02 8.24 22.54 11.42
Max. 36 6.9 27.5 29.6 17.1 36 6.9 8.7 26.9 17.1
Min. 22 3 7.4 11.1 1.37 27 3.4 7.7 11.1 6.5
Range 14 3.9 20.1 18.5 15.73 9 3.5 1 15.8 10.6
SD 4.67 1.05 4.86 3.94 5.28 3.94 1.38 0.43 6.47 4.67
CV 0.16 0.22 0.52 0.16 0.59 0.12 0.27 0.05 0.29 0.41
Med 28.5 4.55 8.14 25.55 7.585 36 4.5 8.3 25.1 11.1
No of Obs. 16 16 16 16 16 5 5 5 5 5
Table:23
Descriptive Statistics of Milk's Physiological and Nutritional Quality (Kathmandu Valley)
Temp. pH FAT SNF Den. Added Water Temp. pH FAT SNF Density Added Water
Overall
Farmer
Avg. 18.29 6.773 4.37 7.61 25.96 4.45 16.5 6.66 4.17 8.01 26.82 2.72
Max. 30.3 7.52 8 10.1 35.7 23.6 27 7.13 7.4 10 35.4 13.8
Min. 10 5.3 1.8 5.05 3.4 0 10 6.1 1.8 6.87 3.4 0
Range 20.3 2.22 6.2 5.09 32.3 23.6 17 1.03 5.6 3.14 32 13.8
SD 6.58 0.39 1.43 1.18 5.32 6.763 6.752 0.319 1.48 0.94 7.14775 5.22
CV 0.36 0.058 0.33 0.16 0.20 1.52 0.41 0.048 0.36 0.12 0.27 1.92
Med 15.6 6.8 4.1 7.45 26.3 0 12.8 6.6 4 7.51 26.6 0
No of
Obs. 66 66 66 66 66 66 15 15 15 15 15 15
Factory
Outlet
Avg. 19.7 6.979 4.38 7.37 24.2 5.87 17.97 6.7 4.46 7.74 27.51 2.77
Max. 28 7.22 8 10.1 35.7 23.6 30.3 7.52 8 10.1 35.7 13
Min. 12 6.55 2.4 5.06 13.1 0 10.3 5.3 2.8 5.81 20.5 0
Range 16 0.67 5.6 5.08 22.6 23.6 20 2.22 5.2 4.33 15.2 13
SD 5.439 0.19 1.22 1.37 5.53 8.209 7.656 0.51 1.71 1 3.54 4.79
CV 0.276 0.03 0.28 0.19 0.23 1.41 0.426 0.076 0.38 0.13 0.128 1.73
Med 20 7.026 4.4 7.31 24 0.96 13 6.7 3.6 7.43 26.7 0
No of
Obs. 24 24 24 24 24 24 21 21 21 21 21 21
COB=Clout on Boiling; Temp=Temperature; Sen=Sensory Evaluation; SNF=Solid Not Fat; 1=(+)ve; 2=(-)ve;
Table:24
Descriptive Statistics of Milk's Physiological and Nutritional Quality (Banke District) Level
Temp. FAT SNF Density Added Water Level Temp. FAT SNF Density Added Water
Overall Avg. 25.2 3.8 8.1 24.1 9.3 Farmer 24.87 3.84 7.52 23.19 8.164
Max. 34 8.9 8.9 28.5 23.7 32 8.4 9.2 32.5 16.1
Min. 15.3 1.5 6.6 19.0 0.0 29 1.5 7.8 23.6 1.37
Range 18.7 2.7 2.3 9.5 23.7 3 6.9 1.4 8.9 14.73
SD 6.60 0.8 0.8 2.5 8.5 0.74 1.85 0.42 2.75 4.24
CV 0.26 0.2 0.1 0.1 0.9 0.024 0.38 0.05 0.10 0.46
Med 22 3.7 8.5 24.6 9.9 31 4.3 8.4 27.1 10
No of Obs. 15 15 15 15 15 5 5 5 5 5
Factory Avg. 27.67 4.6 8.17 26.07 12.43 Outlet 25.3 3.82 7.42 23.10 5.164
Max. 31 5.2 8.5 27.8 17.1 32 8.4 9.2 32.5 16.1
Min. 25 1.5 7.7 23.3 9.09 18 1.5 7.8 23.6 1.37
Range 6 1.4 0.8 4.5 8.01 3 6.9 1.4 8.9 14.73
SD 3.21 0.78 0.42 2.4 4.16 0.74 1.85 0.42 2.75 4.24
CV 0.11 0.17 0.05 0.01 0.33 0.024 0.38 0.05 0.10 0.46
Med 30 4.2 8.3 27.1 11.1 31 4.3 8.4 27.1 10
No of Obs. 3 3 3 3 3 5 5 5 5 5
COB=Clout on Boiling; Temp=Temperature; Sen=Sensory Evaluation; SNF=Solid Not Fat; 1=(+)ve; 2=(-)ve;
4.2 The Adulteration Test in Milk

66
Adulterants are the substances that are added in the product for making more profit or to extend
the shelf life of highly perishable goods. The adulterants are mostly harmful for the human health
and thus should be avoided such unethical practices by the actors in dairy value chain. The
sampled milk samples from farm level to consumer level were tested for adulteration of starch,
sugar, neutralizer, Urea, salt and starch as per the standard protocol described in the label of the
reagents used.
Table 25:
Descriptive Statistics of Adulteration Test of Milk (Sunsari District)
Sen Urea Neu Salt COB Starch Sugar Sen. Urea Neu Salt COB Starch Sugar
Overall
Farmer
Freq. 28 0 0 4 0 0 0 15 0 0 1 0 0 0
Percent 100 0 0 14.3 0 0 0 100 0 0 6.67 0 0 0
No of Obs. 28 28 28 28 28 28 28 15 15 15 15 15 15 15
CC
Trans.
Freq. 3 0 0 1 0 0 0 3 0 0 1 0 0 0
Percent 100 0 0 33.3 0 0 0 100 0 0 33.3 0 0 0
No of Obs. 3 3 3 3 3 3 3 3 3 3 3 3 3 3
Factory
Outlet
Freq. 3 0 0 1 0 0 0 2 0 0 1 0 0 0
Percent 100 0 0 33.3 0 0 0 100 0 0 50 0 0 0
No of Obs. 3 3 3 3 3 3 3 2 2 2 2 2 2 2
Freq.=No of +ve Count; No of Obs.=Number of Observation; CC=Collection Center; Trans.=Transportation; Sen= Sensory Evaluation;
Neu=Neutralizer
Table 26:
Descriptive Statistics of Adulteration Test of Milk (Ilam District)
Sen Urea Neut. Salt COB Starch Sugar Sen Urea Neut. Salt COB Starch Sugar
Overall
Farmer
Freq 26 0 0 26 0 0 0 15 0 0 15 0 0 0
% 100 0 0 100 0 0 0 100 0 0 100 0 0 0
No of Obs. 26 26 26 26 26 26 26 15 15 15 15 15 15 15
CC
Trans.
Freq 3 0 0 3 0 0 0 3 0 0 3 0 0 0
% 100 0 0 100 0 0 0 100 0 0 100 0 0 0
No of Obs. 3 3 3 3 3 3 3 3 3 3 3 3 3 3
Outlet
Freq 5 0 0 5 0 0 0
% 100 0 0 100 0 0 0
No of Obs. 5 5 5 5 5 5 5
Freq.=No of +ve Count; No of Obs.=Number of Observation; CC=Collection Center; Trans.=Transportation; Sen= Sensory Evaluation;
Neu=Neutralizer
Food adulteration is an act of intentionally debasing the quality of food offered for sale either by
the admixture or substitution of inferior substances or by the removal of some valuable
ingredients. Food adulteration takes into account not only the intentional addition or substitution
or abstraction which adversely affects nature, substances and quality of foods, but also their
incidental contamination during the period of growth , harvesting, storage, processing, transport
and distribution.

67
Table 27:
Descriptive Statistics of Adulteration Test of Milk (Chitwan District)
Sen Urea Neut Salt COB Starch Sugar Sen Urea Neut Salt COB Starch Sugar
Overall
Farmer
Freq. 28 0 0 28 0 0 0 15 0 0 15 0 0 0
Percent 100 0 0 100 0 0 0 100 0 0 100 0 0 0
No of Obs. 28 28 28 28 28 28 28 15 15 15 15 15 15 15
CC
Transp.
Freq. 3 0 0 3 0 0 0 3 0 0 3 0 0 0
Percent 100 0 0 100 0 0 0 100 0 0 100 0 0 0
No of Obs. 3 3 3 3 3 3 3 3 3 3 3 3 3 3
Factory
Market
Freq. 0 0 0 0 2 0 0 0 0 0 0 5 0 0
Percent 0 0 0 0 100 0 0 0 0 0 0 100 0 0
No of Obs. 2 2 2 2 2 2 2 5 5 5 5 5 5 5
Freq.=No of +ve Count; No of Obs.=Number of Observation; CC=Collection Center; Trans.=Transportation; Sen= Sensory Evaluation;
Neu=Neutralizer
Table 28:
Descriptive Statistics of Adulteration Test of Milk (Kavre District)
Sen Urea Neu Salt COB Starch Sugar Sunsari Sen. Urea Neu Salt COB Starch Sugar
Overall
Freq. 30 0 0 7 4 0 0 Farmer 15 0 0 1 0 0 0
Percent 100 0 0 23.3 13.3 0 0 100 0 0 6.67 0 0 0
No of Obs. 30 30 30 30 30 30 30 15 15 15 15 15 15 15
CC
Freq. 3 0 0 1 0 0 0 Trans. 3 0 0 1 0 0 0
Percent 100 0 0 33.3 0 0 0 100 0 0 25 0 0 0
No of Obs. 3 3 3 3 3 3 3 4 4 4 4 4 4 4
Factory
Freq. 3 0 0 1 0 0 0 Outlet 5 0 0 2 0 0 0
Percent 100 0 0 33.3 0 0 0 100 0 0 40 0 0 0
No of Obs. 3 3 3 3 3 3 3 5 5 5 5 5 5 5
Freq.=No of +ve Count; No of Obs.=Number of Observation; CC=Collection Center; Trans.=Transportation; Sen= Sensory Evaluation;
Neu=Neutralizer
Adulteration means any materials which is or could be employed for making the food unsafe or
sub standard or misbranded or containing extraneous matter. The adulterants/preservatives
assume the proportion of health hazards for end consumers, particularly infants (Tipu et al.,
2007). Suppliers of milk appear to have found three ways to increase their margin from the sale
of milk: (i) dilution (ii) extraction of valuable components, i.e. milk fat removed as cream, and
(iii) a combination of (i) and (ii) with the addition of cheap (and sometimes potentially harmful)
bulking additives, such as low quality flour, to bring the total solids to a level which is
acceptable to consumers. Some of the chemicals, adulterants and malpractices results in public
health concern and malnutrition. Normally, the adulteration in food is done either for financial
gain or lack of proper hygienic conditions of processing, storing, transportation and marketing.
This ultimately leads to the stage that the consumer is either cheated or often becomes victim of
diseases. Such types of adulteration are quite common in developing countries. It is equally

68
important for the consumer to know the common adulterants and their effects on health.
Table 29:
Descriptive Statistics of Adulteration Test of Milk (Nawalparasi District)
Sen Urea Neut. Salt COB Starch Sugar
Overall
Freq 26 0 0 0 0 0 0
% 100 0 0 0 0 0 0
No of Obs. 29 29 29 29 29 29 29
Freq.=No of +ve Count; No of Obs.=Number of Observation; CC=Collection Center; Trans.=Transportation; Sen= Sensory Evaluation;
Neu=Neutralizer
Quality control tests for milk are very important to assure adulterant free milk for consumption.
Adulteration of milk reduces the quality of milk and can even make it hazardous. Adulterants
such as salt, urea, starch, table sugar and chemicals such as costic soda may be added to the milk.
Most of the chemicals used as adulterants are poisonous and cause health hazards. Adulterants
are mainly added to increase the shelf life of milk. Some of the preservatives like acid and
formalin is added to the milk as adulterants, thereby increasing the storage period of milk.
Generally, water is added to the milk to increase the volume content of the milk. Some of the
common adulterants found in milk and their detection are presented on the tables of this section.
Table 30:
Descriptive Statistics of Adulteration Test of Milk (Kaski District)
Sen Urea Neut Salt COB Starch Sugar Overall
Freq. 28 0 0 0 0 0 0
Percent 100 0 0 0 0 0 0
No of Obs. 28 28 28 28 28 28 28 Freq.=No of +ve Count; No of Obs.=Number of Observation; CC=Collection Center; Trans.=Transportation; Sen= Sensory Evaluation;
Neu=Neutralizer
Table 31:
Descriptive Statistics of Adulteration Test of Milk (Banke District)
Sen Urea Neu Salt COB Starch Sugar Sen. Urea Neu Salt COB Starch Sugar
Overll
Freq. 15 0 0 3 0 0 0 Farmer 15 0 0 1 0 0 0
Percent 100 0 0 20 0 0 0 100 0 0 20 0 0 0
No of Obs. 15 15 15 15 15 15 15 5 5 5 5 5 5 5
Factory
Freq. 3 0 0 1 0 0 0 Outlet 2 0 0 1 0 0 0
Percent 100 0 0 20 0 0 0 100 0 0 20 0 0 0
No of Obs. 3 3 3 3 3 3 3 5 5 5 5 5 5 5
Freq.=No of +ve Count; No of Obs.=Number of Observation; CC=Collection Center; Trans.=Transportation; Sen= Sensory Evaluation;
Neu=Neutralizer
During our testing of the adulteration in milk, we found a significant amount of salt added to the
milk. In Kathmandu Valley, three samples were found to be Urea adulterated out of 66 samples.
Similerly, sixteen samples of milk were found to be Salt adulterated. Neither of the sample tested
for the COB, is found to be positive. For the detail result, the statistics are presented in the table.

69
Table 32:
Descriptive Statistics of Adulteration Test of Milk (Surkhet/Kailali/Dadeldhura District)
Sen Urea Neut. Salt COB Starch Sugar
Overall
Freq 14/16/15 0 0 0 0 0 0
% 100 0 0 0 0 0 0
No of Obs. 14/16/15 14/16/15 14/16/15 14/16/15 14/16/15 14/16/15 14/16/15 Freq.=No of +ve Count; No of Obs.=Number of Observation; CC=Collection Center; Trans.=Transportation; Sen= Sensory Evaluation;
Neu=Neutralizer
Table 33:
Descriptive Statistics of Adulteration Test of Milk (Kathmandu Valley)
Sen Urea Neu Salt COB Starch Sugar Sen. Urea Neu Salt COB Starch Sugar
Overall
Freq. 67 3 0 16 0 0 0 Farmer 15 0 0 1 0 0 0
Percent 100 4.5 0 23.9 0 0 0 100 0 0 6.7 0 0 0
No of Obs. 66 66 66 66 66 66 66 15 15 15 15 15 15 15
Factory
Freq. 24 3 0 14 0 0 0 Outlet 21 0 0 0 0 0 0
Percent 100 12.5 0 58.3 0 0 0 100 0 0 0 0 0 0
No of Obs. 24 24 24 24 24 24 24 21 21 21 21 21 21 21
Freq.=No of +ve Count; No of Obs.=Number of Observation; CC=Collection Center; Trans.=Transportation; Sen= Sensory Evaluation;
Neu=Neutralizer
4.3 The CoP Test in Milk The descriptive statistics of the CoP assessment of the milk are presented in the annex III. Here,
we have presented the some meaningful discussion ponitwise.
4.3.1 Dairy animal farms and farmers
Most of the farmers visited were found to be aware about the hygienic condition required for
production of clean milk, however, most of them were also found to be negligent in this aspect.
Some of them were lacking on the knowledge on Good Husbandry Practices (GHP). In general
following observations regarding the status of CoP/ GHP implementation in the observed farms:
The cleanliness of the dairy animal farms was not upto the level required from bird eye
observation. Some of the observed farms (25%) were in very bad condition, around 60%
were in the medium level and only 15% farms were found to be very neat and clean. The
lack of cleanliness in the farms was more due to ignorance rather than lack of resources.
Regular cleaning of the animal shed was lacking. Some of the farmers stated that
inadequate water availability was the major reason for poor cleanliness of the farm.

70
In 90% of the farms, the manure pit was just next to the shed. Appropriate disposal of
manure was lacking.
The outlooks of the farm workers were not very pleasing. There were no provision for
working dress and boots in most of the farms. The personnel hygiene of the farm workers
were also found to be grossly compromised. This again was the shear negligence rather
than lack of knowledge.
There was no provision of milking parlour except in one large farm. Animals were
milked in the same place where they are being kept.
Regular vaccinations against prevailing diseases were common in almost all farms.
Drenching against internal parasites is practiced when found infected after faecal
examination as well as a regular practice of twice drenching in a year.
Post milking teat dipping practices to control mastitis was minimal but most of the
farmers reported dry cow therapy for mastitis control.
There was lack of isolation shed for sick animals.
In most of the farms milking cans were either aluminum or stainless steel. None of the
farms were found to be using plastic can for milking animals
Some farmers were found to be using plastic buckets to carry milk to the collection
centre, which need to be discouraged.
The vessel used for milking and carrying milk seems to be cleaned regularly
Farm bio security seems to be grossly overlooked. Farmers were also unaware about the
importance and fundamental of farm bio security.
Though most of the farmers reported that they do not sell milk from the animals during
antibiotic medication period, but reliability of the statement is questionable.
Almost all farm visited were located near the milk collection centre, thus there was no
time lag between production and delivery of milk to the collection centre.
4.3.2 Collection Centre/ Chilling Centres and transportation
Implementation status of code of practices at collection centre/ chilling centre of both private
sector and DDC were not satisfactory. Partially, some of the setting and practices were found to
be complying with CoP while most of the others were not. Following observations were made in
collection centre/ chilling centre

71
Some of the collection centre/ chilling centre were found to be located side by the road.
The dust contamination arising from road and vehicle was prominent.
There was generally lack of proper cleanliness in the collection premises and
surroundings.
The floor in the collection centre/ chilling centre was not properly level (wear and tear)
making floor cleaning difficult.
The wash basins were not in the proper place in most of the collection centre.
In the collection centre run by cooperatives of private dairy industries, the primary lab to
test the milk quality was in the same milk receiving area which is not a good practice.
The wall and floor of some of the collection centre were found to be not properly cleaned
It was observed that there was no provision for refresher training to the staff working in
the collection centre that motivate them to comply with CoP and maintain personal
hygiene.
The collection centres were found to be accepting milk carried out in plastic can/ tank
even without proper closing the lid/cover exposing contamination during the transport.
Some milk carrying can were even found to be temporarily repaired with soap to close
the small opening,
In some of the collection centre, the personnel involved in handling of milk were found to
be even not wearing apron, gloves and boots.
In some of the collection centre, the cleanliness of milk receiving tank was not
acceptable.
The chilling cost of milk has been increasing due to increasing load shedding.
The proper effluent management systems were missing in most of the collection centre.
Spill over milk and milk containing utensil washing water was found to be let in front of
the collection centre.
4.3.3 Dairy industries
Dairy industries of different capacity were observed. In general, the dairy industries were found
to be struggling for adopting and fully complying with the CoP. The general conditions of the
factory premises, surroundings, equipments and workers are found to be improving gradually,

72
but still lots have to be done to fully comply with the CoP. The following observations were
made in the different dairy industries
Dairy industries were found to be gradually moving towards modernization, efficient
management and maintaining surrounding cleanliness, but still lot improvement in the
installed equipment and premises are required.
The existing pipelines and valve need to regularly checked, some of them were found to
be rusted, leaking and should be maintained properly.
The industries were accepting the unsold milk from the market and reusing in the next
batch which has been one of the reason for deteriorating quality of marketed milk.
Though most of the industrialists were aware of HACCP, GMP and FSMS, the
implementation is not to a full standard and thus need their appropriate implementation.
The old machinery used for several years, need tested for their efficiency and updated as
per required.
The processing cost is increasing due to increasing load shedding.
In some industries, trained dairy technicians were lacking.
Training and motivation of the factory workers for maintaining personal hygiene and
maintaining quality products through popper industry operating producers was found to
be necessary.
The basic amenities for the factory workers were available in most of the industries
Most of the factory lack effluent treatment plant and management of factory effluent
seems to a major problem.
Most of the factory had no laboratory or functional laboratory for micro biological test.
The microbiological quality of the products must be stringently monitored and consumers
should be assured of quality and hygienic milk and milk products particularly the absence
of coliform bacteria in the pasteurized milk.
Regular quality testing procedures should be adopted in the industries
The pset control system inside the factory premises was lacking which need to be in
place.
In most of the factory, water treatment plant/ facility was lacking.
In most of the industries, the process flow charts were not in place.

73
Regulation for visitors were not stringent in most of the factories
The storage of packing materials should also be managed properly to avoid post
processing contamination.
4.4 Micro-Biological Testing of the Milk
As milk is complete food for human it is also highly perishable and also a good source of
nutrient for microbial growth which has human health implication. Therefore the processed milk
supplied to the consumers should content the prescribed nutrients in it and should be free from
any visual dirt and free from harmful microbial contamination. For this careful and hygienic
handling of milk both in production and processing places as well as proper storage at outlets are
also mandatory. Milk quickly becomes sour when it is stored for long periods at high ambient
temperatures prevalent in tropical and subtropical countries. This is because the inherent lactic
acid bacteria and contaminating microorganisms from storage vessels or the environment break
down the lactose in milk into lactic acid. When sufficient lactic acid has accumulated, the milk
becomes sour and coagulates. Raw milk that contains too much lactic acid, even if it does not
appear to be curdled, will coagulate when heated. This acidity is known as ―developed acidity‖
and such milk is not acceptable for sale to consumers or milk processors.
The number of spoilage bacteria in raw milk depends on the level of hygiene during milking and
the cleanliness of the vessels used for storing and transporting the milk. During the first 2–3
hours after milking, raw milk is protected from spoilage by inherent natural antibacterial
substances that inhibit the growth of spoilage bacteria. However, if the milk is not cooled, these
antibacterial substances break down causing bacteria to multiply rapidly. Cooling milk to less
than 10°C may prevent spoilage for up to three days. High storage temperatures result in faster
microbial growth and hence faster milk spoilage.
Raw milk is also known to be associated with pathogenic bacteria which cause milk-borne
diseases such as tuberculosis, brucellosis or typhoid fever, among others. Hygienic milk
production, proper handling and storage of milk, and appropriate heat treatment can reduce or
eliminate pathogens in milk. In many countries, milk processing factories are required by law to
pasteurize milk before selling it to the public. Many consumers also routinely boil milk before
drinking it to protect themselves from milk-borne diseases. Processed milk must be handled
hygienically to avoid post-processing contamination. So whether one is selling milk directly to
consumers or to a processing factory, it must be handled hygienically so that it remains fresh and

74
capable of being heated without curdling. Hygienic milk handling includes using clean
equipment, maintaining a clean milking environment, observing good personal hygiene and
preserving the quality of milk during storage and transportation to the consumer or processing
plant.
Bacterial contamination of raw milk can generally occur from three main sources; within the
udder, outside the udder, and from the surface of equipment used for milk handling and storage.
The bacteriological tests used most often are the Standard Plate Count (SPC), the Preliminary
Incubation Count (PI), the Lab Pasteurization Count (LPC) and the Coliform Count. Ideally,
bacteria levels within the udder are low and additional bacterial contamination is minimized.
When bacteria counts are elevated above acceptable levels, both quantitative and qualitative
analyses can help pinpoint the causes.
Raw milk as it leaves the udder of healthy cows normally contains very low numbers of
microorganisms and generally will contain less than 1000 colony-forming units of total bacteria
per milliliter (cfu/ml). In healthy cows, bacterial colonization within the teat cistern, teat canal,
and on healthy teat skin does not significantly contribute total numbers of bacterial neither in
bulk milk, nor to the potential increase in bacterial numbers during refrigerated storage. This
natural flora of the cow generally will not influence the SPC, PI, LPC, or Coliform counts.
While the healthy udder should contribute very little to the total bacteria count of bulk milk, a
cow with mastitis has the potential to shed large numbers of microorganisms into her milk. The
influence of mastitis on the total bacteria count of bulk milk depends on type of bacteria, the
stage of infection and the percent of the herd infected. Quarters from infected cows have the
potential to shed in excess of 10,000,000 bacterial cfu/ml of milk produced. Mastitis organisms
found to most often influence the total bulk milk bacteria counts are Streptococci (primarily
Strep agalactiae and Strep uberis) although other mastitis pathogens have the potential to
influence the bulk tank count as well. Staphylococcus aureus is not thought to be a frequent
contributor to total bulk tank counts although counts as high as 60,000/ml have been
documented. While Staph aureus and Strep ag are rarely found outside of the mammary gland,
environmental mastitis pathogens (Strep uberis and coliforms) can occur in milk as a result of
other contributing factors such as dirty cows, poor equipment cleaning and/or poor cooling.
Increases in SCC can sometimes serve as supportive evidence that mastitis bacteria may have
caused increases in the bulk tank counts. This correlation seems to apply more for Streptococci

75
than for Staph aureus. Correlations between increases in somatic cell counts and other
environmental mastitis organisms, including coliform bacteria, and coagulase-negative
Staphylococci, were found to be poor as well. Staph aureus and Strep ag do not grow
significantly on soiled milking equipment or under conditions of marginal or poor milk cooling.
In general, mastitis organisms will not influence PI or LPC though in some cases of coliform
mastitis, Coli counts may be elevated.
The exterior of the cows' udder and teats can contribute microorganisms that are naturally
associated with the skin of the animal as well as microorganisms that are derived from the
environment in which the cow is housed and milked. In general, the direct influence of natural
inhabitants as contaminants in the total bulk milk count is considered to be small and most of
these organisms do not grow competitively in milk. Of more importance is the contribution of
microorganisms from teats soiled with manure, mud, feeds or bedding. Teats and udders of cows
inevitably become contaminated while they are lying in stalls or when allowed in dirty lots. Used
organic bedding has been shown to harbor large numbers of microorganisms often exceed
100,000,000 to 10,000,000,000 per gram of bedding. Organisms associated with bedding
materials that contaminate the surface of teats and udders include streptococci, staphylococci,
spore-formers, coliforms and other Gram-negative bacteria. Both thermoduric and
psychrotrophic strains of bacteria are commonly found on teat surfaces indicating that
contamination on the outside of the udder can influence PI, LPC, and Coli counts. The influence
of dirty cows on total bacteria counts depends on the extent of soiling of the teat surface and the
udder prep procedures employed. Milking heavily soiled cows could potentially result in bulk
milk counts exceeding 10,000 cfu/ml. Several studies have investigated pre-milking udder
hygiene techniques in relation to the bacteria count of milk. Generally, thorough cleaning of the
teat with a sanitizing solution (predip) followed by thorough drying with a clean towel is
effective in reducing the numbers of bacteria in milk contributed from soiled teats.
The degree of cleanliness of the milking system probably influences the total bulk milk bacteria
count as much, if not more, than any other factor. Milk residue left on equipment contact
surfaces supports the growth of a variety of microorganisms. Organisms considered to be natural
inhabitants of the teat canal and teat skin are not thought to grow significantly on soiled milk
contact surfaces or during refrigerated storage of milk. This generally holds true for organisms
associated with contagious mastitis (Staph aureus and Strep ag) though it is possible that certain

76
bacteria associated with environmental mastitis (coliforms) may be able to grow significantly. In
general, bacteria from environmental contamination (bedding or manure) are more likely to grow
on soiled equipment surfaces. Water used on the farm might also be a source of bacteria,
especially psychrotrophs, which could seed soiled equipment. Cleaning and sanitizing
procedures can influence the degree and type of bacterial growth on milk contact surfaces by
leaving behind milk residues that support growth, as well as by setting up conditions that might
select for specific microbial groups. Even though equipment surfaces may be considered
efficiently cleaned with hot water, more resistant bacteria (thermodurics) may endure in low
numbers. If milk residue is left behind (milk stone) growth of these types of organisms, although
slow, may persist. Old cracked rubber parts are also associated with higher levels of thermoduric
bacteria. Significant build-up of these organisms to a point where they influence the total bulk
tank count may take several days to weeks though increases would be detected in the LPC. Less
efficient cleaning, using lower temperatures and/or the absence of sanitizers tends to select for
the faster growing, less resistant organisms (psychrotrophs), principally Gram-negative rods
(coliforms and Pseudomonas) and some Streptococci. This will result in a high PI and in some
case an elevated LPC. Effective use of chlorine or iodine sanitizers has been associated with
reduced levels of psychrotrophic bacteria that cause high PI counts. Psychrotrophic bacteria tend
to be present in higher bacteria count milk and are often associated with neglect of proper
cleaning or sanitizing procedures and/or poorly cleaned refrigerated bulk tanks.
Refrigeration of raw milk, while preventing the growth of non-psychrotrophic bacteria, will
select for psychrotrophic microorganisms that enter the milk from soiled cows, dirty equipment
and the environment. Minimizing the level of contamination from these sources will help prevent
psychrotrophs from growing to significant levels in the bulk tank during the on-farm storage
period or at the processing plant. In general these organisms are not thermoduric and will not
survive pasteurization. The longer raw milk is held before processing (legally up to 5 days), the
greater the chance that psychrotrophs will increase in numbers. Holding milk near the PMO legal
limit of 45°F allows much quicker growth than milk held below 40°F. Although milk produced
under ideal conditions may have an initial psychrotrophic population of less than 10% of the
total bulk tank count, psychrotrophic bacteria can become the dominant bacteria after 2 to 3 days
at 40°F, resulting in a significant influence on PI counts. Colder temperatures 34-36°F will delay
this shift, though not indefinitely.

77
Under conditions of poor cooling with temperatures greater than 45°F, bacteria other than
psychrotrophs are able to grow rapidly and can become predominant in raw milk Streptococci
have historically been associated with poor cooling of milk. These bacteria will increase the
acidity of milk. Certain bacteria are also responsible for a "malty defect" that is easily detected
by its distinct odor. Storage temperatures greater than 60°F tend to select for these types of
contaminants. The types of bacteria that grow and become significant will depend on the initial
contamination of the milk. Once milk leaves the farm, raw milk handling as well as the sub-
sample collected by the milk hauler is beholden to the same sets of rules. If the raw milk or the
samples used to run the regulatory tests are maintained at the proper temperature, bacterial
counts can be significantly altered. Since most bulk tank milk is commingled in an over-the-road
milk truck, the only way to determine each producer‘s contribution to the commingled milk is
the sub-sample collected at pickup. Sample integrity must be maintained from the original bulk
tank of milk, through hauling to the milk processor, and eventually through the end of the
diagnostic procedures. As more milk processors are using bacteria counts within their premium
programs, competent subsample handling is essential. In addition, much like SCC, one or two
samples within a 30-day span are inadequate to provide a proper measure of a farm‘s
management practices.
Microbiological analysis of milk is carried out to determine the degree of bacterial contamination
in milk and to understand the chemical changes brought in milk as a result of microbial
action. Pasteurization is done to destroy such harmful bacteria. If pasteurization of milk is not
carried out properly there will be presence of larger count of bacteria in the milk. Methylene
blue Reduction test is used to detect the presence of bacteria in milk. This test works on the
principle that the methylene blue indicator is present in an oxidized form, but in the presence of
bacteria, leads to the reduction of this indicator in a comparatively short span of time. The blue
color developed on addition of the indicator to the milk will change to white color within a short
period indicates the presence of bacteria in the milk and thus denotes improper pasteurization.
4.4.1 Total plate count
The total number of bacterial count in pasteurized milk sample is presented in the Annex IV. The
average number of bacteria per ml of pasteurized milk was 16600 leaving two samples which

78
had too many numbers of bacteria to be counted. TPC ranged from 9000 to as high as 35000
with two samples innumerable, but not a single pasteurized milk sample were free from bacteria.
4.4.2 Coliform count
Coliform is a harmful bacteria mostly arising from faecal origin. Coliform were detected both in
pasteurized and loose milk marketed in Kathmandu valley which need to be addressed with
proper hygienic measures to be taken both at production and processing unit as well as post
processing handling. The coliform counts in sampled milk samples are presented in annex IV.
4.5 Discussion
4.5.1 The nutrient contents
The fat and solid not fat content of the milk (standard pasteurized) were within the range as
prescribed by Food Act of Nepal. The Food Act of Nepal states that the standard pasteurized
milk should contain at least 3% fat and 8% SNF. The average fat content of pasteurized milk
marketed in different brand name in Kathmandu valley was found to be 2.98% ranging from 2.7
to 3.2%. No consistently low or high fat content in pasteurized milk were obtained indicating
reliability of adjustment of fat content during the processing. Similarly the SNF content was
7.95% ranging from 7.7 to 8.13%.
In the loose milk marketed, the average fat content of cow milk and buffalo milk were 4.04 and
6.3% respectively while that of SNF content were 7.98 and 9.2% respectively for cow and
buffalo milk. The protein and lactose content were not considered independently for determining
price of milk in Nepal but is collectively appears in SNF content is determines the price of milk.
The nutrient content of milk is determined by the genetics and environment in which the animals
are raised. Milk composition varies considerably among breeds of dairy cattle: Jersey and
Guernsey breeds give milk of higher fat and protein content than Shorthorns and Friesians. Zebu
cows can give milk containing up to 7% fat. Similarly, there is difference in the milk constituents
between different species. The milk constituents in cow milk are given the Table. The cow milk
contains 85.5-89.5% water and rest 10.5 to 14.5 solids. The solid parts of milk constitute fat,
protein, lactose and minerals. The fat content varies from 2.5 to 6.0%; protein content varies
from 2.9-5.0%; lactose 3.6 to 5.5% and minerals from 0.6 to 0.9%.

79
Table 34 Composition of cow milk
Main constituent Range (%) Mean (%)
Water 85.5 – 89.5 87.0
Total solids 10.5 – 14.5 13.0
Fat 2.5 – 6.0 4.0
Proteins 2.9 – 5.0 3.4
Lactose 3.6 – 5.5 4.8
Minerals 0.6 – 0.9 0.8
The potential fat content of milk from an individual cow is determined genetically, as are protein
and lactose levels. Thus, selective breeding can be used to upgrade milk quality. Heredity also
determines the potential milk production of the animal. However, environment and various
physiological factors greatly influence the amount and composition of milk that is actually
produced. Herd recording of total milk yields and fat and SNF percentages will indicate the most
productive cows, and replacement stock should be bred from these.
The milk constituents are also influenced by the environment. The fat content of milk varies
considerably between the morning and evening milking because there is usually a much shorter
interval between the morning and evening milking than between the evening and morning
milking. If cows were milked at 12-hour intervals the variation in fat content between milkings
would be negligible, but this is not practicable on most farms. Normally, SNF content varies
little even if the intervals between milkings vary.
The fat, lactose and protein contents of milk vary according to stage of lactation. Solids-not-fat
content is usually highest during the first 2 to 3 weeks, after which it decreases slightly. Fat
content is high immediately after calving but soon begins to fall, and continues to do so for 10 to
12 weeks, after which it tends to rise again until the end of the lactation. The variation in milk
constituents throughout lactation is shown in the following Figure.

80
Figure 11. Changes in the concentrations of fat, protein and lactose over a lactation of a cow
As cows grow older, the fat content of their milk decreases by about 0.02 percentage units per
lactation. The fall in SNF content is much greater.
Underfeeding reduces both the fat and the SNF content of milk produced, although SNF content
is more sensitive to feeding level than fat content. Fat content and fat composition are influenced
more by roughage (fibre) intake.
The SNF content can fall if the cow is fed a low-energy diet, but is not greatly influenced by
protein deficiency, unless the deficiency is acute.
The first milk drawn from the udder is low in fat while the last milk (or strippings) is always
quite high in fat. Thus it is essential to mix thoroughly all the milk removed, before taking a
sample for analysis. The fat left in the udder at the end of a milking is usually picked up during
subsequent milkings, so there is no net loss of fat.
Both fat and SNF contents can be reduced by disease, particularly mastitis.
Milk fat
If milk is left to stand, a layer of cream forms on the surface. The cream differs considerably in
appearance from the lower layer of skim milk.
Under the microscope cream can be seen to consist of a large number of spheres of varying sizes
floating in the milk. Each sphere is surrounded by a thin skin—the fat globule membrane—
which acts as the emulsifying agent for the fat suspended in milk (Figure).The membrane
protects the fat from enzymes and prevents the globules coalescing into butter grains. The fat is
present as an oil-in-water emulsion: this emulsion can be broken by mechanical action such as
shaking.

81
Figure 12 Fat globules in milk.
Fats are partly solid at room temperature. The term oil is reserved for fats that are completely
liquid at room temperature. Fats and oils are soluble in non-polar solvents, e.g. ether.
About 98% of milk fat is a mixture of triacyl glycerides. There are also neutral lipids, fat-soluble
vitamins and pigments (e.g. carotene, which gives butter its yellow colour), sterols and waxes.
Fats supply the body with a concentrated source of energy: oxidation of fat in the body yields 9
calories/g. Milk fat acts as a solvent for the fat-soluble vitamins A, D, E and K and also supplies
essential fatty acids (linoleic, linolenic and arachidonic).
Milk proteins
Proteins are an extremely important class of naturally occurring compounds that are essential to
all life processes. They perform a variety of functions in living organisms ranging from
providing structure to reproduction. Milk proteins represent one of the greatest contributions of
milk to human nutrition. Proteins are polymers of amino acids. Only 20 different amino acids
occur, regularly in proteins. They have the general structure:
Some proteins contain substances other than amino acids, e.g. lipoproteins contain fat and
protein. Such proteins are called conjugated proteins:
One of the major milk protein is casein Casein was first separated from milk in 1830, by adding
acid to milk, thus establishing its existence as a distinct protein. In 1895 the whey proteins were

82
separated into globulin and albumin fractions. It was subsequently shown that casein is made up
of a number of fractions and is therefore heterogeneous. The whey proteins are also made up of a
number of distinct proteins.
Casein is easily separated from milk, either by acid precipitation or by adding rennin. In cheese-
making most of the casein is recovered with the milk fat. Casein can also be recovered from skim
milk as a separate product. Casein is dispersed in milk in the form of micelles. The micelles are
stabilised by the Κ-casein. Caseins are hydrophobic but Κ-casein contains a hydrophilic portion
known as the glycomacropeptide and it is this that stabilises the micelles.
After the fat and casein have been removed from milk, one is left with whey, which contains the
soluble milk salts, milk sugar and the remainder of the milk proteins (whey protein). Like the
proteins in eggs, whey proteins can be coagulated by heat. When coagulated, they can be
recovered with caseins in the manufacture of acid-type cheeses. The whey proteins are made up
of a number of distinct proteins, the most important of which are lactoglobulin and lactoglobulin.
Lactoglobulin accounts for about 50% of the whey proteins, and has a high content of essential
amino acids. It forms a complex with Κ-casein when milk is heated to more than 75°C, and this
complex affects the functional properties of milk. Denaturation of -lactoglobulin causes the
cooked flavor of heated milk.
In addition to the major protein fractions outlined, milk contains a number of enzymes. The main
enzymes present are lipases, which cause rancidity, particularly in homogenised milk, and
phosphatase enzymes, which catalyse the hydrolysis of organic phosphates. Measuring the
inactivation of alkaline phosphatase is a method of testing the effectiveness of pasteurisation of
milk.
Peroxidase enzymes, which catalyse the breakdown of hydrogen peroxide to water and oxygen,
are also present. Lactoperoxidase can be activated and use is made of this for milk preservation.
Milk also contains protease enzymes, which catalyse the hydrolysis of proteins, and lactalbumin,
bovine serum albumin, the immune globulins and lactoferrin, which protect the young calf
against infection.
Milk carbohydrates
Lactose is the major carbohydrate fraction in milk. It is made up of two sugars, glucose and
galactose. The average lactose content of milk varies between 4.7 and 4.9%, though milk from
individual cows may vary more. Mastitis reduces lactose secretion.

83
Lactose is a source of energy for the young calf, and provides 4 calories/g of lactose metabolised.
It is less soluble in water than sucrose and is also less sweet. It can be broken down to glucose
and galactose by bacteria that have the enzyme -galactosidase. The glucose and galactose can
then be fermented to lactic acid. This occurs when milk goes sour. Under controlled conditions
they can also be fermented to other acids to give a desired flavour, such as propionic acid
fermentation in Swiss-cheese manufacture.
Lactose is present in milk in molecular solution. In cheese-making lactose remains in the whey
fraction. It has been recovered from whey for use in the pharmaceutical industry, where its low
solubility in water makes it suitable for coating tablets. It is used to fortify baby-food formula.
Lactose can be sprayed on silage to increase the rate of acid development in silage fermentation.
It can be converted into ethanol using certain strains of yeast, and the yeast biomass recovered
and used as animal feed. However, these processes are expensive and a large throughput is
necessary for them to be profitable. For smallholders, whey is best used as a food without any
further processing.
Heating milk to above 100oC causes lactose to combine irreversibly with the milk proteins. This
reduces the nutritional value of the milk and also turns it brown.
Because lactose is not as soluble in water as sucrose, adding sucrose to milk forces lactose out of
solution and it crystallizes. This causes sandiness in such products as ice cream. Special
processing is required to crystallize lactose when manufacturing products such as instant skim
milk powders.
Some people are unable to metabolize lactose and suffer from an allergy as a result. Pre-
treatment of milk with lactase enzyme breaks down the lactose and helps overcome this
difficulty. In addition to lactose, milk contains traces of glucose and galactose. Carbohydrates are
also present in association with protein. Κ-casein, which stabilizes the casein system, is a
carbohydrate-containing protein.
Milk salts
Milk salts are mainly chlorides, phosphates and citrates of sodium, calcium and magnesium.
Although salts comprise less than 1 % of the milk they influence its rate of coagulation and other
functional properties. Some salts are present in true solution. The physical state of other salts is
not fully understood. Calcium, magnesium, phosphorous and citrate are distributed between the

84
soluble and colloidal phases (Table 16). Their equilibria are altered by heating, cooling and by a
change in pH.
Table 35. Distribution of milk salts between the soluble and colloidal phases.
Total Dissolved Colloidal
(mg/100 ml of milk)
Calcium 1320.1 51.8 80.3
Magnesium 10.8 7.9 2.9
Total phosphorus 95.8 36.3 59.6
Citrate 156.6 141.6 15.0
In addition to the major salts, milk also contains trace elements. Some elements come to the milk
from feeds, but milking utensils and equipment are important sources of such elements as
copper, iron, nickel and zinc.
Milk vitamins
Milk contains the fat-soluble vitamins A, D, E and K in association with the fat fraction and
water-soluble vitamins B complex and C in association with the water phase. Vitamins are
unstable and processing can therefore reduce the effective vitamin content of milk.
4.5.2 Milk Adulteration
Adulteration was not the major problem detected in pasteurized milk. None of the milk samples
were found to be adulterated with table sugar and formalin either to enrich SNF content or to
increase the shelf life. Since the pasteurized milk is the bulk of milk collected from different
collection centre for processing, the adulteration in processed milk might be attributable to
adulteration at production and collection level. However, some of the pasteurized milk samples
were found to be positive for adulteration with starch and caustic soda. However, the adulteration
was not consistent meaning that some branded pasteurized milk is not always found to be
adulterated with these substances.
However, the adulteration of starch and soda was more prominent with the milk sold loose in the
market. This has been mainly due to extend shelf life of milk and increasing SNF content of milk
as milk is paid on the basis of fat and SNF content by the milk vendors to the producers.

85
The removal of fat, addition of water to increase volume, addition of sugar, starch to increase
SNF content, addition of soda, formalin to increase shelf life, addition of urea, ammonium
sulphate are some forms of adulteration in milk.
In a study carried out in Pakistan to evaluate level of adulteration of milk vended at educational
canteen, results of adulterants showed that 97% and 93% of the milk samples collected from
canteens of educational institutes and public places showed water addition in them. Urea
adulteration was present in 63% and 87% samples; Formalin adulteration was present in 23%
and 27% samples while 87% and 97% samples showed cane sugar adulteration from various
canteens of educational institutes and public places, respectively. While hydrogen peroxide
adulteration was found in 3% milk samples from various canteens of public places. No sample
was found to be adulterated with starch, detergent and oil from canteens of both the places.
Similar results have been also reported by Haasnoot et al. (2001), Cataldi et al. (2003), Mabrook
and Petty (2003), Jha and Matsuoka (2004), Renny et al. (2005), Borin et al (2006), Luykx et al.
(2007), Sengar (2007) and Lateef et al. (2009). It is also concluded that milk sold at various
canteens of educational institutes and public places were extensively put to malpractices such as
skimming and adulteration with water (Khan et al. 1991, Mustafa et al. 1991, Khan et al. 1999
and Lateef et al. 2009). Different adulterants present in the milk like water, urea, formalin,
hydrogen peroxide and cane sugar threatened the wholesomeness of milk. It is very unfortunate
that the students in educational institutes and public at public places especially passengers are
enforced to consume that milky coloured fluid which is extensively put to adulteration. It did not
meet the legal standard and requirements.
Source: Faraz et al. (2013)

86
4.5.3 Microbiological quality of milk
Both pasteurized and loose milk sold in Kathmandu valley were found to be unsafe from
microbiological quality standard for human consumption. The total plate count as well as
coliform count per ml of milk in loose sold unpasteurized milk was significantly higher
compared to the pasteurized milk. However, even the pasteurized milk was unsafe. The milk
from DDC had somewhat lower coliform count (400-600 CFU/ml) compared to the pasteurized
milk of other brands. The coliform contamination of milk sold marketed loose are attributable to
lower hygienic standard at production level (animal farms) and handling during transportation
and selling, but the coliform count even in the pasteurized milk revealed that either the milk is
not properly pasteurized (problem in pasteurization unit- time and temperature combination) or
there is post pasteurization contamination such as the contaminated filling pouch, contaminated
water used for washing the unit, lack of cleanliness in the milk handler at processing etc.
Coliform are considered as indicator organisms because their presence in food indicates some
form of contamination. Poor hygiene, contaminated water, unsanitary milking practices, and
improperly washed and maintained equipment can lead to higher coliform counts in raw milk.
Pasteurized milk shouldn‘t contain any coliform bacteria as though coliform bacteria can‘t
survive the pasteurization temperature but the presence of TCC (Total coliform count)of the
pasteurized milk samples indicates either defect in pasteurization process or post pasteurization
contamination which includes contamination in packaging materials, defects in pipe lines.
Bacterial growth in milk
Bacterial growth refers to an increase in cell numbers rather than an increase in cell size. The
process by which bacterial cells divide to reproduce themselves is known as binary transverse
fission. The time taken from cell formation to cell division is called the generation time. The
generation time can therefore be defined as the time taken for the cell count to double.
The curve shown in the Figure below shows the phases of bacterial growth following inoculation
of bacteria into a new growth medium. The following phases can be identified:
1. Lag phase: There is usually some delay in growth following inoculation of bacteria into a
new medium, during which time the bacteria adapt to the medium and synthesise the
enzymes needed to break down the substances in the growth medium.

87
2. Log phase: Once the bacteria have adapted to the new medium they start to reproduce
quickly and their numbers multiply evenly for each increment of time. A plot of the log
number of cells against time gives a linear relationship: this is therefore called the log
phase. The cells are at their greatest activity in this phase. Transferring cultures to a fresh
medium at regular intervals can maintain the cells in an active state. An active culture can
rapidly dominate any new environment.
3. Stationary phase: As the bacteria dominate the growth medium, they deplete the
available nutrients or toxic waste products accumulate, slowing the rate of reproduction.
At the same time, cells are dying off: A state of equilibrium is reached between the death
of old cells and formation of new cells, resulting in no net change in cell numbers. This
phase is called the stationary phase.
4. Death phase: In the next phase the formation of new cells ceases and the existing cells
gradually die off: This is called the death phase.
5. The log phase can be prolonged by removing toxic waste, by adding more nutrients or
both.
The log phase can be prolonged by removing toxic waste, by adding more nutrients or both.
Figure 13 The four phases of bacterial growth.
Factors affecting bacterial growth
Bacterial growth is affected by (1) temperature, (2) nutrient availability, (3) water supply, (4)
oxygen supply, and (5) acidity of the medium.
Temperature: Theoretically, bacteria can grow at all temperatures between the freezing point of
water and the temperature at which protein or protoplasm coagulates. Somewhere between these
maximum and minimum points lies the optimum temperature at which the bacteria grow best.

88
Temperatures below the minimum stop bacterial growth but do not kill the organism. However,
if the temperature is raised above the maximum, bacteria are soon killed. Most cells die after
exposure to heat treatments in the order of 70°C for 15 seconds, although spore-forming
organisms require more severe heat treatment, e.g. live steam at 120°C for 30 minutes.
Bacteria can be classified according to temperature preference: Psycrophilic bacteria grow at
temperatures below 16°C, mesophilic bacteria grow best at temperatures between 16 and 40°C,
and thermophilic bacteria grow best at temperatures above 40°C.
Nutrients: Bacteria need nutrients for their growth and some need more nutrients than others.
Lactobacilli live in milk and have lost their ability to synthesise many compounds, while
Pseudomonas can synthesise nutrients from very basic ingredients.
Bacteria normally feed on organic matter; as well as material for cell formation organic matter
also contains the necessary energy. Such matter must be soluble in water and of low molecular
weight to be able to pass through the cell membrane. Bacteria therefore need water to transport
nutrients into the cell.
If the nutrient material is not sufficiently broken down, the micro-organism can produce exo-
enzymes which split the nutrients into smaller, simpler components so they can enter the cell.
Inside the cell the nutrients are broken down further by other enzymes, releasing energy which is
used by the cell.
Water: Bacteria cannot grow without water. Many bacteria are quickly killed by dry conditions
whereas others can tolerate dry conditions for months; bacterial spores can survive dry
conditions for years. Water activity (AW) is used as an indicator of the availability of water for
bacterial growth. Distilled water has an AW of 1. Addition of solute, e.g. salt, reduces the
availability of water to the cell and the AW drops; at AW less than 0.8 cell growth is reduced.
Cells that can grow at low AW are called osmophiles.
Oxygen: Animals require oxygen to survive but bacteria differ in their requirements for, and in
their ability to utilise, oxygen.

89
Bacteria that need oxygen for growth are called aerobic. Oxygen is toxic to some bacteria and
these are called anaerobic. Anaerobic organisms are responsible for both beneficial reactions,
such as methane production in biogas plants, and spoilage in canned foods and cheeses.
Some bacteria can live either with or without oxygen and are known as faculative anaerobic
bacteria.
Acidity: The acidity of a nutrient substrate is most simply expressed as its pH value. Sensitivity
to pH varies from one species of bacteria to another. The terms pH optimum and pH maximum
are used. Most bacteria prefer a growth environment with a pH of about 7, i.e. neutrality.
Bacteria that can tolerate low pH are called aciduric. Lactic acid bacteria in milk produce acid
and continue to do so until the pH of the milk falls to below 4.6, at which point they gradually
die off. In canning citrus fruits, mild heat treatments are sufficient because the low pH of the
fruit inhibits the growth of most bacteria.
Bacteria in milk
Milk fresh from a healthy cow contains few bacteria, but contamination during handling can
rapidly increase bacterial numbers. Milk is an ideal food and many bacteria grow readily in it.
Some bacteria are useful in milk processing, causing milk to sour naturally, leading to products
such as irgo. However, milk can also carry pathogenic bacteria, such as Salmonella,
Tuberculosis bovis and Brucella, and can thus transmit disease. Other bacteria can cause spoilage
of the milk, and spoilage and poor yields of products.
Bacterial contamination of raw milk can generally occur from three main sources; within the
udder, outside the udder, and from the surface of equipment used for milk handling and storage.
The bacteriological tests used most often are the Standard Plate Count (SPC), the Preliminary
Incubation Count (PI), the Lab Pasteurization Count (LPC) and the Coliform Count.
Sources of bacteria in raw milk

90
Milk is synthesized by cells within the mammary gland and is virtually sterile when secreted into
the alveoli of the udder. Beyond this stage of milk production, bacterial contamination can
generally occur from three main sources; within the udder, outside the udder, and from the
surface of equipment used for milk handling and storage. Cow health, environment, milking
procedures and equipment sanitation can influence the level of microbial contamination of raw
milk. Equally important is the milk holding temperature and length of time milk is stored before
testing and processing that allow bacterial contaminants to multiply. All these factors will
influence the total bacteria count (SPC) and the types of bacteria present in raw bulk tank milk.
Microbial contamination from within the udder: Raw milk as it leaves the udder of healthy cows
normally contains very low numbers of microorganisms and generally will contain less than
1000 colony-forming units of total bacteria per milliliter (cfu/ml). In healthy cows, bacterial
colonization within the teat cistern, teat canal, and on healthy teat skin does not significantly
contribute total numbers of bacterial neither in bulk milk, nor to the potential increase in
bacterial numbers during refrigerated storage. This natural flora of the cow generally will not
influence the SPC, PI, LPC, or Coliform counts. While the healthy udder should contribute very
little to the total bacteria count of bulk milk, a cow with mastitis has the potential to shed large
numbers of microorganisms into her milk. The influence of mastitis on the total bacteria count of
bulk milk depends on type of bacteria, the stage of infection and the percent of the herd infected.
Quarters from infected cows have the potential to shed in excess of 10,000,000 bacterial cfu/ml
of milk produced. Mastitis organisms found to most often influence the total bulk milk bacteria
counts are Streptococci (primarily Strep agalactiae and Strep uberis) although other mastitis
pathogens have the potential to influence the bulk tank count as well. Staphylococcus aureus is
not thought to be a frequent contributor to total bulk tank counts although counts as high as
60,000/ml have been documented. While Staph aureus and Strep ag are rarely found outside of
the mammary gland, environmental mastitis pathogens (Strep uberis and coliforms) can occur in
milk as a result of other contributing factors such as dirty cows, poor equipment cleaning and/or
poor cooling. Increases in SCC can sometimes serve as supportive evidence that mastitis bacteria
may have caused increases in the bulk tank counts. This correlation seems to apply more for
Streptococci than for Staph aureus. Correlations between increases in somatic cell counts and
other environmental mastitis organisms, including coliform bacteria, and coagulase-negative

91
Staphylococci, were found to be poor as well. Staph aureus and Strep ag do not grow
significantly on soiled milking equipment or under conditions of marginal or poor milk cooling.
In general, mastitis organisms will not influence PI or LPC though in some cases of coliform
mastitis, Coli counts may be elevated.
Microbial contamination from outside the udder: The exterior of the cows' udder and teats can
contribute microorganisms that are naturally associated with the skin of the animal as well as
microorganisms that are derived from the environment in which the cow is housed and milked.
In general, the direct influence of natural inhabitants as contaminants in the total bulk milk count
is considered to be small and most of these organisms do not grow competitively in milk. Of
more importance is the contribution of microorganisms from teats soiled with manure, mud,
feeds or bedding. Teats and udders of cows inevitably become contaminated while they are lying
in stalls or when allowed in dirty lots. Used organic bedding has been shown to harbor large
numbers of microorganisms often exceed 100,000,000 to 10,000,000,000 per gram of bedding.
Organisms associated with bedding materials that contaminate the surface of teats and udders
include streptococci, staphylococci, spore-formers, coliforms and other Gram-negative bacteria.
Both thermoduric and psychrotrophic strains of bacteria are commonly found on teat surfaces
indicating that contamination on the outside of the udder can influence PI, LPC, and Coli counts.
The influence of dirty cows on total bacteria counts depends on the extent of soiling of the teat
surface and the udder prep procedures employed. Milking heavily soiled cows could potentially
result in bulk milk counts exceeding 10,000 cfu/ml. Several studies have investigated premilking
udder hygiene techniques in relation to the bacteria count of milk. Generally, thorough cleaning
of the teat with a sanitizing solution (predip) followed by thorough drying with a clean towel is
effective in reducing the numbers of bacteria in milk.
Microbial contamination from equipment cleaning and sanitizing: The degree of cleanliness of
the milking system probably influences the total bulk milk bacteria count as much, if not more,
than any other factor. Milk residue left on equipment contact surfaces supports the growth of a
variety of microorganisms. Organisms considered to be natural inhabitants of the teat canal and
teat skin are not thought to grow significantly on soiled milk contact surfaces or during
refrigerated storage of milk. This generally holds true for organisms associated with contagious

92
mastitis (Staph aureus and Strep ag) though it is possible that certain bacteria associated with
environmental mastitis (coliforms) may be able to grow significantly. In general, bacteria from
environmental contamination (bedding or manure) are more likely to grow on soiled equipment
surfaces. Water used on the farm might also be a source of bacteria, especially psychrotrophs,
which could seed soiled equipment. Cleaning and sanitizing procedures can influence the degree
and type of bacterial growth on milk contact surfaces by leaving behind milk residues that
support growth, as well as by setting up conditions that might select for specific microbial
groups. Even though equipment surfaces may be considered efficiently cleaned with hot water,
more resistant bacteria (thermodurics) may endure in low numbers. If milk residue is left behind
(milk stone) growth of these types of organisms, although slow, may persist. Old cracked rubber
parts are also associated with higher levels of thermoduric bacteria. Significant build-up of these
organisms to a point where they influence the total bulk tank count may take several days to
weeks though increases would be detected in the LPC. Less efficient cleaning, using lower
temperatures and/or the absence of sanitizers tends to select for the faster growing, less resistant
organisms (psychrotrophs), principally Gram-negative rods (coliforms and Pseudomonas) and
some Streptococci. This will result in a high PI and in some case an elevated LPC. Effective use
of chlorine or iodine sanitizers has been associated with reduced levels of psychrotrophic
bacteria that cause high PI counts. Psychrotrophic bacteria tend to be present in higher bacteria
count milk and are often associated with neglect of proper cleaning or sanitizing procedures
and/or poorly cleaned refrigerated bulk tanks.
Milk storage temperature and time: Refrigeration of raw milk, while preventing the growth of
non-psychrotrophic bacteria, will select for psychrotrophic microorganisms that enter the milk
from soiled cows, dirty equipment and the environment. Minimizing the level of contamination
from these sources will help prevent psychrotrophs from growing to significant levels in the bulk
tank during the on-farm storage period or at the processing plant. In general these organisms are
not thermoduric and will not survive pasteurization. The longer raw milk is held before
processing (legally up to 5 days), the greater the chance that psychrotrophs will increase in
numbers. Although milk produced under ideal conditions may have an initial psychrotrophic
population of less than 10% of the total bulk tank count, psychrotrophic bacteria can become the
dominant bacteria after 2 to 3 days at 40°F, resulting in a significant influence on PI counts.

93
Colder temperatures 34-36°F will delay this shift, though not indefinitely. Under conditions of
poor cooling with temperatures greater than 45°F, bacteria other than psychrotrophs are able to
grow rapidly and can become predominant in raw milk. Streptococci have historically been
associated with poor cooling of milk. These bacteria will increase the acidity of milk. Certain
bacteria are also responsible for a "malty defect" that is easily detected by its distinct odor.
Storage temperatures greater than 60°F tend to select for these types of contaminants. The types
of bacteria that grow and become significant will depend on the initial contamination of the milk.
Once milk leaves the farm, raw milk handling as well as the sub-sample collected by the milk
hauler is beholden to the same sets of rules. If the raw milk or the sample used to run the
regulatory tests is maintained at the proper temperature, bacterial counts can be significantly
altered. Since most bulk tank milk is commingled in an over-the-road milk truck, the only way to
determine each producer‘s contribution to the commingled milk is the sub-sample collected at
pickup. Sample integrity must be maintained from the original bulk tank of milk, through hauling
to the milk processor, and eventually through the end of the diagnostic procedures. As more milk
processors are using bacteria counts within their premium programs, competent subsample
handling is essential. In addition, much like SCC, one or two samples within a 30-day span are
inadequate to provide a proper measure of a farm‘s management practices.

94
Chapter V
Conclusion and Recomendation
5.1 Conclusion
Both pasteurized and loose milk are sold in Nepal. There are various brand names of pasteurized
milk from different dairy industries sold from the various outlets located throughout the valley.
Similarly, loose milk collected by the vendor from various producer farmers in the city outskirt
or collected from middlemen is directly sold to the consumers in city without processing, but
with removal of certain level of fat content in the milk. Collected milk is kept in the deep freeze
before and are sold to the consumers. Farmers are either paid on the basis of fat content or based
both on fat and SNF content.
The quality of processed (pasteurized) milk sold in the various brand names in Nepal mostly
comply with the legal standard set forth by Nepal Food Act in terms of fat and SNF content. The
fat content and SNF content didn't vary significantly from the set standard of 3 and 8%
respectively. The detectable adulteration in pasteurized milk was also minimal. Whereas though
fat and SNF content of the loose milk sold are slightly higher than that of the pasteurized milk,
the adulteration level was more in loose sold milk. Starch and soda adulteration was more
common in loose sold milk while adulteration of sugar, formalin are nor prevalent.
The quality of milk sold in Kathmandu valley from the micro biological aspect was more critical
and do not comply at all with the set forth standard of nil coliform count in pasteurized milk.
The bacterial contamination (TPC and coliform) was more in the milk sold loose compared to
the pasteurized milk. Stringent hygienic measures both at production and processing unit thus is
warranted. Farmers need to be encouraged to comply with good husbandry practice an
processing industry should strictly follow the COP developed for dairy sector.
5.2 Recommendation
Based on the current study, the following recommendations have been made for availing the
wholesome and quality milk to the consumers of Kathmandu valley in general and throughout
the country in particular:

95
Milk producer farmers need to be motivated for production of hygienic milk following
good husbandry practices. The government should encourages through various means for
production of hygienic milk
Farmers should be trained for adopting GHP
The milk pricing system should also be based on the microbiological quality of the
supplied milk
The processing industries should strictly follow Code of Practice developed for dairy
sector. NDDB in collaboration of DLS should have authority to implement COP and
facilitate industries to comply with the COP.
The factory workers should be motivated in personal hygiene.
Loose vending of raw milk in the city should be discouraged, if still to be continued,
strict regulation on quality aspect should be emphasized.
Milk pricing system should also depend on the protein content of the milk.

96
Annexes
Annex I: Field Questioners
b'Uw pBf]u ;+alGw k|ZgfjnL
gd:sf/ Û d g]kfndf b'wsf] u'0f:t/ s:tf] 5 elg cWoogsf] nflu ;e]{Io0fdf cfPsf] x'F . of] cWoog /fli6«o b'Uw ljsf; af]8{sf] ;xof]udf clwsf/sf nflu kx'Fr g]kfn eGg] ;+:yfn] ug{ nflu /x]sf] 5 . o; cWoogaf6 xfn g]kfndf k|rlnt sRrf tyf k|zf]lwt b'wsf] k|of]u, k|;f/0f, u'0f:t/ cflbsf] cj:yf yfxf eO{ b'wsf] u'0f:t/ j[l4 ug{ ;xof]u k'Ub5 . ca d s]lx k|Zgx? tkfO{x?;Fu ;f]Wg uO{ /fv]sf] 5' . o;af6 k|fKt ;'rgf cWoogsf] glthf xfFl;n ug{ dfq k|of]u x'g]5 . tkfO{x?n] lbg'ePsf] ;'rgfsf] k|;f/0f xfdL ug]{ 5}gf}+ . t;y{, ;lx hjfkm lbP/ cWoognfO{ ;kmn kfl/lbg'xf]nf .
:yfg_______________ ;do____________gd"gf -sample_ sf]8 g+ ____________
;e]{If0fstf{sf] gfd____________________________
!= pBf]u tyf pBf]uLsf] gfdM________________________________________________
@= pBf]u /x]sf] :ynM_______________ #= pBf]u :yfkgf ;fnM _______________
$= pBf]usf] k|sf/M b"w k|;f]wg dfq b'Uw hGo kbfy{dfq b"w tyf b'Uw kbfy{ b'j}
%= b}lgs b'w k|zf]wg IfdtfM :yflkt ======== ;+rflnt ===========
^ sfo{/t hgzlQm ;+Vof M k|fljlws ======== k|zf;g ============
&. ISO Certification k|fKt u/]sf] gu/]sf]
*= pBf]u cGtu{t ;+rflng lr:ofg s]Gb| ;+VofM
cfkm' dftxtsf] ======
;xsf/Lsf] lr:ofg ;+Vof============
(= pBf]un] rr{]sf] hUufsf] If]qkmnM ========== k|zf]wg sIfsf] If]qkmn M==============
!)= pBf]u lgdf{0f:ynM j:tLsf] ljrdf j:tLjf6 jflx/
!!= pBf]u jl/kl/sf] jftfj/0fM :jR5, ;kmf kmf]xf]/d}nf tyf w'nf]o'Qm ufO{j:t' uf]7 glhs
!@= pBf]u:yn jfl9 klx/f]jf6 d'Qm M 5 5}g
!#= pBf]u:yn;Dd
jf6f]sf] Joj:yfM 5 5}g
ljh'nLsf] Joj:yfM 5 5}g

97
kfj/ JofsckM 5 5}g
9n lgsf;M 5 5}g
!$= pBf]u ejgsf] 5tM 9nfg h:tfkftf cGo
!%= ejgsf] e'O{ tftf]kfgL, Pl;8, cNsfnL cflbn]M ljlu|g] gljlu|g]
xfnsf] cj:yf s:tf] 5 =====================================================================================================
!^= ejgsf] e'O ;kmf ug{ M ;lhnf] c;lhnf]
!&= ejgleq ls/f, km6\of+u|f k|j]z ug{ M ;Sg] g;Sg]
!*= ejgleq 5'6\6f5'6\6}
k|;f]wgsIfM 5 5}g xfnsf] cj:yf=======================================
e08f/0fsIfM 5 5}g xfnsf] cj:yf=======================================
JjfO{n/sf]7fM 5 5}g xfnsf] cj:yf=======================================
k|of]uzfnfM 5 5}g xfnsf] cj:yf=======================================
8|]l;Ë ?dM 5 5}g xfnsf] cj:yf=======================================
;f}rfno tyf j]l;gM 5 5}g xfnsf] cj:yf=======================================
!(= sf/vfgsf] b'w eg{] . ljt/0f ug{] :ynsf] prfO{ M ======== lkm6
@)= ejgsf] lgoldt dd{t ;+ef/ ePsf] M 5 5}g
@!= k|zf]wg sIfsf] jgfj6 M kSsL sRrL
@@= k|zf]wg sIfdf k|fs[lts k|sfzsf] plrt Joj:yfM 5 5}g
@#= k|zf]wg sIfleq plrt :yfgdf cfjZostf cg'?k ljh'nLjQLsf] Joj:yf M 5 5}g
yk k|sfzsf] cfjZostf k5{ kb{}g ?===========================================================
@$= k|zf]wg sIfsf] e+'O{ Pl;8, cNsfnL cflbn] M ljlu|g] gljlu|g] xfnsf] cj:yf====================
@%= k|zf]wg sIfsf] e+'O{ M 6fon nufO{Psf] 6fon gnufO{Psf]
@^= k|zf]wg sIfsf] e+'O{df kfgL ghDg] Joj:yf M 5 5}g
E'fO{ xNsf le/fnf] 5 5}g
@&= k|zf]wgsIfsf] leQf sDtLdf !=% ld prfO{ ;Dd 6fO{n nufO{Psf] M 5 5}g
n n

98
@*= k|zf]wg sIfleq d]lzg tyf ;/;dfgsf\ h8fg, dd{t ;+ef/, lgl/If0f tyf :jR5 pTkfbgsf] nfuL pko'Qm
x'g] lsl;dn] /flvPsf] M 5 5}g
@(= k|zf]wg sIfdf plrt e]lG6n]zgsf] Joj:yf M 5 5}g
#)= k|zf]wg sIfleq ls/f km6\of+u|f gl5g{] Joj:yf ul/Psf] M 5 5}g
#!= sf/vfgfsf] e+'O{ tyf leQfx? lgoldt ;/;kmfO{ tyf lg;+s|d0f ug]{ ul/Psf] M 5 5}g
#@= k|zf]wg sIfsf] ;do ;dodf Sterility x]g{] Joj:yf M 5 5}g
##= b'w k|zf]wgsf] nfuL cfjZos dfqfdf vfg of]Uo kfgLsf] Joj:yf M 5 5}g
kfgLsf] >f]t M l8k jf]l/Ë vfg]kfgL sfof{no ljtl/t 6\o+fs/jf6 lsg]sf] cGo
kfgL k|zf]wgsf] Joj:yf M 5 5}g
kfgL k|zf]wg KnfG6sf] lgoldt ;/;kmfO{ M 5 5}g
#$= b'w k|zf]wg;+u k|ToIo ;Dks{df gcfpg] h:t} jfkm pTkfbg, cUgL lgoGq0f, /]lkm|h/]zg cflbsf] nfuL rflxg] kfgLsf] plrt k|jGw M 5 5}g
#%= sf/vfgf ;/;kmfO{ ug{ cfjZos tftf] lr;f] kfgLsf] Joj:yf M 5 5}g
#^= k|zf]wg tyf ;/;kmfO{sf] nfuL k|of]u x'g] kfgLsf] ;'Id h}ljs tyf /f;folgs kl/If0f ul/ /]s8{
/fVg] u/]sf] M 5 5}g
;'Id h}ljs -sf]lnkmd{ nufot_ kl/If0fsf] cGt/fnM =================
/f;folgs kl/If0fsf] cGt/fn M====================
#&= pBf]uaf6 lg:sg] kmf]xf]/ kfgL tyf cGo ;fdfu|Lsf] plrt Joj:yfkg ug{] ul/Psf] M 5 5}g
s;/L ug{] ul/Psf] 5 ?
Effluent Treatment Plant sf] Joj:yf M 5 5}g
#*= sfdbf/x? sf/vfgf k:g' cl3 ;/;kmfO{ ul/
Pk|f]g nufpg] ul/Psf] M 5 5}g
Jf'6 nufpg] ul/Psf] M 5 5}g
Sofk, nufpg] ul/Psf] M 5 5}g
n n

99
km]; df:s nufpg] ul/Psf] M 5 5}g
Unf]j nufpg] ul/Psf] M 5 5}g
#(= lo ;fdu|Lx?sf] lgoldt ;/;kmfO{ M u5{ ub{}g
$)= k|zf]wg sIf k:g cl3 km'6jfy tyf xftsf] Sanitization sf] Joj:yf ul/Psf] M 5 5}g
$!= sf/vfgf kl/;/leqsf ;f}rfnox?sf] ;/;kmfO{ Jojl:yt M 5 5}g
$@= sfdbf/n] ;f}rfno k|of]u ubf{ 5'6\6} rKknsf] k|of]u ug{] ul/Psf] M 5 5}g
$#= sfdbf/x?sf] nfuL sk8f km]g{sf\ nfuL 5'6\6} sf]7fsf] Joj:yf M 5 5}g
$$= b'w ;+sng, k|zf]wg, ljs|L ljt/0fdf ;+nUg JolQm JolQmut ;/;kmfO{df Wofg lbg] M u5{ ub{}g
$%= b'w ;+sng, k|zf]wg, ljs|L ljt/0fdf ;+nUg JolQmsf] lgoldt :jf:Yo kl/If0f ul/ /]s8{ /fVg] ul/Psf]
5 5}g
lgoldt kl/If0f cjlw============
$^= sf/vfgf kl/;/leq k|j]z ug{] jflx/sf JolQmx?nfO{ ;kmf sk8f, Pk|f]g cfjZostf cg';f/ j'6, k+hf, Sofk cflbsf] k|of]u ug{] ul/Psf] M 5 5}g
$&= k|zf]wg;+u k|ToIf ;+nUg JolQmn] x/]s k6s sfd z'? ug{‗' cl3, ;f}rfno k|of]u kl5 tyf ;8]un]sf sRrf b'w 5f]Pkl5 ;fj'g kfgLn] /fd|f] ;+u xft v'6\6f ;kmfug{] u/]sf] M 5 5}g
$*= k|zf]wg sIfdf hyfefjL y'Sg], vfg]s'/f vfg], r'/f]6 ;'lt{ vfg lgif]w ul.Psf] M 5 5}g
Solid Waste Management sf] Joj:yf M===================================================================================
$(= k|zf]wg;+u k|ToIf ;+nUg JolQmn] uxgf, 3l8, l6sf nufpg] tyf g+u kfNg] u/]sf] M 5 5}g
%)= k|of]uzfnfsf] Joj:yf
dfO{s|f]jfof]nf]lhsn NofjM 5 5}g
s]ldsn Nofj M 5 5}g
%!= lgoldt ?kdf sRrf b'wsf] kl/If0f ug{] ul/Psf] M 5 5}g
OlGb|ofg'e kl/If0f M b}lgs ;fKtflxs kflIfs dfl;s cGo
Sn6 cg jf]OlnË kl/If0fM b}lgs ;fKtflxs kflIfs dfl;s cGo
cNsf]xn kl/If0f M b}lgs ;fKtflxs kflIfs dfl;s cGo
n
n n
n n
n n
n n
n n n n n
n n n n n
n n n n n

100
km\of6 kl/If0f M b}lgs ;fKtflxs kflIfs dfl;s cGo
P;=Pg=Pkm= kl/If0f M b}lgs ;fKtflxs kflIfs dfl;s cGo
ld;fj6 kl/If0fM M b}lgs ;fKtflxs kflIfs dfl;s cGo
%@= Dffkb08 k'/f gePsf] b'wnfO{ M lkmtf{ k7fO{G5 d'No 36fP/ lnO{G5 Tolts} lnO{G5
%#= k|zf]lwt b'wsf] kl/If0f ug{] ul/Psf] M 5 5}g
OlGb|ofg'e kl/If0f M b}lgs ;fKtflxs kflIfs dfl;s cGo
km\of6 kl/If0f M b}lgs ;fKtflxs kflIfs dfl;s cGo
P;=Pkm=Pg kl/If0f M b}lgs ;fKtflxs kflIfs dfl;s cGo
ld;fj6 kl/If0fM b}lgs ;fKtflxs kflIfs dfl;s cGo
sf]lnkmd{ kl/If0f M b}lgs ;fKtflxs kflIfs dfl;s cGo
kmf]:km6]h kl/If0f M b}lgs ;fKtflxs kflIfs dfl;s cGo
;Dk'0f{ ;'IdhLjf0f' u0fgf M b}lgs ;fKtflxs kflIfs dfl;s cGo
%$= k|zf]wg ljlwM Jofr kfZr'/fO{h]zg HTST kfZr'/fO{h]zg cGo
%%= Jofr kfZr'/fO{h]zgsf] tfks|d tyf ;do M ===========, ============
%^= HTST kfZr'/fO{h]zgsf] tfks|d tyf ;do M ===========, ============
%&= b'Uw pBf]udf k|of]u x'g] / b'w / b'Uw kbfy{ ;+u ;+;u{ x'g] kfO{k, eNe, Sofg, :6f]/]h 6\of+s cflbsf] lgdf{0f
:6]gn]; l:6n (SS 304) kf]lnlyg cGo
%*= b'w k|zf]wg ug{' cl3 / kl5 pks/0f, :6f]/]h 6\of+s, 9'jfgLsf] ;fwg, kfO{k nfO{g, lkmlnË pks/0fx? /fd|f] ;+u ;kmf tyf lgd{nLs/0f ug{] ul/Psf] M 5 5}g
%(= k|zf]wg kZrft Commercial Food Grade sf] plrt :t/sf] (Proper Strength) sf] cNsfnL tyf
Pl;8 tyf tftf] kfgLn] ;kmf ug{] u/]sf] M 5 5}g
^)= k|zf]lwt b'w tyf sRrf b'w Ps} 7fp+df /fVg] ul/Psf] M 5 5}g
^!= d]lzg/L cf}hf/x?sf] lgoldt kl/If0f M ul/G5 ul/b}g
^@= k|zf]wg sIfsf] em\ofn 9f]sf v'nf /fVg] ul/Psf] M 5 5}g
n n n n n
n n n n n
n n n n n
n n n
n n
n n n n n
n n n n n
n n n n n
n n n n n
n n n n n
n n
n n n
n n n
n n
n n n
n n n
n n
n n
n n
n
n
n n
n

101
^#= k|zf]wg sIf cGo k|of]hgsf] nfuL k|of]u ug{] ul/Psf] M 5 5}g
^$= k|of]u ul/g] kfp8/ b'wsf] u'0f:t/ g]kfn ;/sf/n] tf]s]sf] dfkb08 cg';f/ M 5 5}g
Kffp8/ b'wsf] Dffkb08M
Kffp8/ b'wsf >f]t M
^%= s|]6, 6«nL tyf cGo ;fdfu|Lx?sf] ;/;kmfO{ M /fd|f] 5 /fd|f] 5}g
^^= kl/If0fdf k|of]u x'g] s]ldsnx?sf] e08f/0f M l7s 5 l7s 5}g
^&= s]ldsn;+u SMP tyf Kofs]lh ;fdfg ;+u} e08f/0f ul/Psf] M 5 5}g
e08f/0fsf] cj:yf s:tf] 5?=====================================================================================
^*= k|zf]lwt b'wsf] Kofs]6df P]g lgod cg';f/sf] n]jn nufO{Psf] M 5 5|}g
^(= k|zf]wg ljlw pNn]v ug{] ul/Psf] M 5 5|}g
&)= pTkfbg ldlt tyf Jofr g+, pkef]u ul/;Sg' kg{] ldlt pNn]v M 5 5|}g
&!= ljls| ljt/0fdf hfg' cl3 :6f]/]hdf /fvLPsf] tfks|d M=========== &@= ljs|L ljt/0fdf k|of]u ul/g] Eofgsf] cj:yf M /fd|f] g/fd|f]
&#= lkmtf{ cfPsf] b'w nfO{ M cGo tfhf b'wdf ld;fO{G5 b'Uw kbfy{ pTkfbg ul/G5 kmflnG5 &$= ljleGg txdf cfjZos kg{] ljleGg tflnd kfPsf] M 5 5}g Tflnd k|bfg ug{] ;+:yf . sfof{no M ================================================================== U'f0f:t/sf] b"w pTkfbg tkm{ pTk|]/0ff hufpg] ;+:yf M ================================================================== &$= :jR5 tyf :j:Yos/ b"w pTkfbg tyf ljt/0fsf] nfuL tflndsf] cfjZostf M 5 5}g
&%= cfGtl/s lgl/If0fsf] Joj:yfM 5 5}g
&^= HACCP. ISO k|dfl0fs/0f tkm{ Joj:yfkg nfu]sf] M 5 5}g
n n
n n
n n
n n
n n
n n
n n
n n
n
n n
n
n
n
n n
n
n
n
n
n
n
n
n
n
n
n
n
n
n
n
n
n

102
b"w ;+sng s]Gb| ;+alGw k|ZgfjnL
gd:sf/ Û d g]kfndf b'wsf] u'0f:t/ s:tf] 5 elg cWoogsf] nflu ;e]{Io0fdf cfPsf] x'F . of] cWoog /fli6«o b'Uw ljsf; af]8{sf] ;xof]udf clwsf/sf nflu kx'Fr g]kfn eGg] ;+:yfn] ug{ nflu /x]sf] 5 . o; cWoogaf6 xfn g]kfndf k|rlnt sRrf tyf k|zf]lwt b'wsf] k|of]u, k|;f/0f, u'0f:t/ cflbsf] cj:yf yfxf eO{ b'wsf] u'0f:t/ j[l4 ug{ ;xof]u k'Ub5 . ca d s]lx k|Zgx? tkfO{x?;Fu ;f]Wg uO{ /fv]sf] 5' . o;af6 k|fKt ;'rgf cWoogsf] glthf xfFl;n ug{ dfq k|of]u x'g]5 . tkfO{x?n] lbg'ePsf] ;'rgfsf] k|;f/0f xfdL ug]{ 5}gf}+ . t;y{, ;lx hjfkm lbP/ cWoognfO{ ;kmn kfl/lbg'xf]nf .
:yfg_______________ ;do____________gd"gf -sample_ sf]8 g+ ____________
;e]{If0fstf{sf] gfd________________
;+sng s]Gb|sf]] gfdM ______________________;+sng s]Gb|sf] 7]ufgfM ________________
s]Gb| O{Grfh{M ________________ ;fnfvfnf b}lgs b"w ;+sngM ============ ln
;+sng s]Gb|df lrlnËsf] ;'ljwf M 5 5}g
ePdf, lr:ofg IfdtfM ================ln e08f/0f Ifdtf M =================ln
;+sng s]Gb|sf] lsl;d M M l8=l8=;L= k|fO{e]6 8]/L ;xsf/L cGo
;+slnt b'w s+xf k7fO{G5 M l8=l8=;L= k|fO{e]6 8]/L cGo
kfj/ Backup sf] Joj:yf M 5 5}g
!= b'w ;+sng s]Gb| . lr:ofg s]Gb| sf] kl/z/sf] jftfj/0f M :jR5 5 kmf]xf]/ 5
@= b'w ;+sng s]Gb| . lr:ofg s]Gb| w]/} s[ifs . ;+:yfx?nfO{ M kfos kg{] ckfos kg{]
#= b"w ;+sng ljxfg j]n'sf b'j} k6s M x'G5 x'b}g
$= b'w ;+sng s]Gb|df cfjZos kfgLsf] cfk'tL{ M kof{Kt 5 ckfo{Kt 5
kfgLsf] >f]t M======================= kfgL lgd{nLs/0fsf] Joj:yfM =============================
%= ;+sng s]Gb|df ;/;kmfO{jf6 cfPsf kmf]xf]/ kfgLsf] Joj:yfkg M l7s 5 l7s 5}g
^= b'w ;+sng tyf :6f]/ ug{] ef+8f M :6]gn]; l:6n cfnd'lgod cGo
&= b'w 9'jfgL ul/g] ef+8f M :6]gn]; l:6n cfnd'lgod cGo
*= b'w 9'jfgL ul/g] ef+8fsf] d'v M leq ;kmf ug{ ;lsg] vfnsf] 5 ;fgf] ;kmfug{ uf/f] kg{]vfnsf] 5
(= b"w j'emfpg Nofpg]n] b"wsf] ef8f ;kmf ug{] u/]sf] M 5 5}g
!)= b"w ;+sngdf k|ToIf ;+nUg JolQmsf] JolQmut ;/;kmfO{ M /fd|f] 5 /fd|f] 5}g
!!= ;f}rfno k|of]u kl5 xft v'6\6f /fd|f] ;+u ;fj'g kfgLn] w'g] Joj:yf M 5 5}g
n
n
n
n
n
n
n
n
n
n
n
n
n
n
n
n n
n
n
n
n
n
n
n
n
n
n
n
n
n n
n
n
n
n
n
n
n
n
n
n
n
n
n
n
n
n
n
n
n
n n
n
n
n
n
n
n
n
n
n n
n n
n
n

103
!@= 6of+s/ Sofg ef8fx? ;kmfO{sf] ;'ljwf M 5 5}g
!#= 6\of+s/, :6f]/]h 6\of+s, ef8fjt{gx?sf] ;/;kmfO{sf] jt{dfg cj:yf M /fd|f] 5 /fd|f] 5}g
!$= lr:ofg s]Gb|df b'wnfO{ /flvg] tfks|d M=============
!%= ;+sng ePsf] ;j} b'wnfO{ lr:ofpg] Ifdtf M 5 5}g
!^= ;fdfGotof ;+sng sfo{sf] slt 306f kl5 k|zf]wg :yndf b'w k7fpg] ul/Psf] M ======================
!&= ;+sng . lr:ofg s]Gb|jf6 k|zf]wg :yn;Dd 9'jfgL ug{ k|of]u x'g] ef+8f . 6\of+s/M
:6]gn]; l:6n Pnd'lgod cGo
!*= b"w 9'jfgL ul/g] 6\of+s/ OG;'n]6]8 M 5 5}g
!(= ;+sng s]Gb|df k|of]uzfnfsf] Joj:yf M 5 5}g
@)= s]ldsnx? plrt 9+ujf6 e08f/0f ul/Psf] M 5 5}g
@!= lgoldt ?kdf sRrf b'wsf] kl/If0f ug{] ul/Psf] M 5 5}g
OlGb|ofg'e kl/If0f M b}lgs ;fKtflxs kflIfs dfl;s cGo
Sn6 cg jf]OlnË kl/If0fM b}lgs ;fKtflxs kflIfs dfl;s cGo
cNsf]xn kl/If0f M b}lgs ;fKtflxs kflIfs dfl;s cGo
km\of6 kl/If0f M b}lgs ;fKtflxs kflIfs dfl;s cGo
P;=Pg=Pkm= kl/If0f M b}lgs ;fKtflxs kflIfs dfl;s cGo
ld;fj6 kl/If0fM M b}lgs ;fKtflxs kflIfs dfl;s cGo
@@= u'0f:t/lxg b"w lng] ug{' ePsf] M 5 5}g
@#= /fd|f] u'0f:t/sf] b'wnfO{ lk|ldod d'Nosf] Joj:yf M 5 5}g
@$= s[ifsx?nfO{ ;kmf tyf :jR5 b"w pTkfbg tyf cfk"lt{ ug{ pTk|]/0ff lbg] ug{'ePsf] M 5 5}g
@%= s'g} k|sf/sf] tflndsf] cfjZostf M 5 5}g
ePdf, s:tf] tflndM=================================================================
slt ;dosf]M ===============================================================
@^= ;+sng s]Gb|sf] cfsl:ds . lgoldt lgl/If0f M x'g] u/]sf] x'g] gu/]sf]
@&= ;do ;dodf b'w pTkfbg:ygsf] lgl/If0f < ug{] u/]sf] ug{] gu/]sf]
n
n
n
n n
n
n n n n n
n n n n n
n n n n n
n n n n n
n n n n n
n n n n n
n
n
n
n
n n
n
n
n
n
n
n
n
n
n
n
n
n
n n
n
n
n n
n
n
n
n
n
n
n
n
n n
n n
n n

104
pTkfbg:yn -s[ifs:t/df_;+alGw k|ZgfjnL
gd:sf/ Û d g]kfndf b'wsf] u'0f:t/ s:tf] 5 elg cWoogsf] nflu ;e]{Io0fdf cfPsf] x'F . of] cWoog /fli6«o b'Uw ljsf; af]8{sf] ;xof]udf clwsf/sf nflu kx'Fr g]kfn eGg] ;+:yfn] ug{ nflu /x]sf] 5 . o; cWoogaf6 xfn g]kfndf k|rlnt sRrf tyf k|zf]lwt b'wsf] k|of]u, k|;f/0f, u'0f:t/ cflbsf] cj:yf yfxf eO{ b'wsf] u'0f:t/ j[l4 ug{ ;xof]u k'Ub5 . ca d s]lx k|Zgx? tkfO{x?;Fu ;f]Wg uO{ /fv]sf] 5' . o;af6 k|fKt ;'rgf cWoogsf] glthf xfFl;n ug{ dfq k|of]u x'g]5 . tkfO{x?n] lbg'ePsf] ;'rgfsf] k|;f/0f xfdL ug]{ 5}gf}+ . t;y{, ;lx hjfkm lbP/ cWoognfO{ ;kmn kfl/lbg'xf]nf .
:yfg_______________ ;do____________gd"gf -sample_ sf]8 g+ ____________
;e]{If0fstf{sf] gfd________________
s[ifssf] gfdM ________________ s[ifssf] 7]ufgfM________________
b"wfn ufO{sf] ;+VofM ========= bwfn' e};Lsf] ;+VofM ====== hDdf ufO{ e}+;L ;+VofM =========
kflnPsf ufO{sf hftx?M==============================================================================================================
kflnPsf e}+;Lsf hftx?M=============================================================================================================
cfxf/f Joj:yfkg M 3f+;df cfwfl/t k/fn, rf]s/ bfgfdf cfwfl/t cGo
;/b/ b}lgs b"wsf] pTkfbgM
jl9 x'g] l;hgdfM ========ln
sd x'g] l;hgdfM =========ln
b"w ljls| ul/g] ;+sng s]Gb|M ________________
;+sng s]Gb| ;Ddsf] b'/LM ________________
b"w ;+sng s]Gb|df nlug] M ljxfg dfq j]n'sf dfq ljxfg j]n'sf b}lgs b'O{ k6s
cf}ift k|fKt x'g] b"wsf] d"No M
ufO{sf] M ? ======== k|lt ln=
e}+;Lsf] M ? ======== k|lt ln=
!= ufO{ e}+;L kflnPsf] 7f+psf] jftfj/0fM /fd|f] g/fd|f]
@= uf]j/ tyf d'q Joj:yfkg M /fd|f] g/fd|f]
#= ufO{j:t' kfnLPsf] uf]7sf] ;/;kmfO{ M /fd|f] g/fd|f]
$= kfgL cfk"lt{sf] cj:yf M kof{Kt ckof{Kt
n
n
n
n
n
n
n
n
n
n
n
n
n
n
n
n
n
n
n
n
n
n
n
n
n
n
n
n

105
kfgLsf] >f]t M________________ kfgLsf] :jR5tf -jfx\o lgl/If0f_M________________
%= b'wfn' ufO{ e}+;Lsf] :jf:Yo cj:yf M :j:y c:j:y
^= c:j:Yo kz'j:t"sf] Joj:yfkgM======================================================================================
&= EofS;Lg];g ug{] ul/Psf]
Pkm=Pd=l8 lj?4M 5 5}g
HS tyf BQ lj?4M 5 5}g
cGo /f]u lj?4M 5 5}g
*= y'g]nf] /f]u /f]syfdsf] Joj:yf ul/Psf] M 5 5}g
(= b'w b'x'g] JolQmsf] :jf:Yo cj:yf M :j:y c:j:y
!)= b'w b'x'g] JolQmsf] JolQmut ;/;kmfO{M /fd|f] g/fd|f]
!!= ;f}rfno k|of]u kl5 ;fj'g kfgLn] xft v'6\6f /fd|f] ;+u w'g]M u/]sf] gu/]sf]
!@= b'w b'x'g' k"j{ ufO{e}+;Lsf] ;kmfO{ tyf y'g tyf sNrf}8f]sf] ;/;kmfO{ M /fd|f] g/fd|f]
!#= b'w b'x'g] ef+8f] M :6]gn]; l:6n Pnd'lgod cGo
!$= b'w b'x'g] ef+8fsf] ;/;kmfO{ M /fd|f];+u ug{] ul/Psf] emf/f 6fg{] lsl;djf6 ug{] ul/Psf]
!%= b"w 9'jfgL ul/g] ef+8fsf] ;/;kmfO{ M /fd|f] g/fd|f]
!^= b'w b'lx;s] kl5 lr:ofg s]Gb| . ;+sng s]Gb| ;Dd k'/fO{;Sg] ;do M ==========306f
!&= PlG6jfof]l6s tyf cGo cf}iflw k|of]u ul/Psf ufO{e}+;Ljf6 pTkflbt b'w ljs|L M ul/G5 ul/b}g
!*= :jR5 b'w pTkfbgsf] nfuL pTk|]/0ff M ldn]sf] 5 ldn]sf] 5}g
!(= :jR5 tyf u'0f:t/sf] b"w cfk'lt{ ubf{ lk|ldod d'No kfpg] u/]sf] M 5 5}g
@)= :jR5 b'w pTkfbgsf] nfuL tflnd lng' ePsf] M 5 5}g
@!= yk tflndsf] cfjZostf M 5 5}g
ePdf, s:tf] lsl;dsf] tyf slt lbgsf] ? ====================================================================================
@@= kz' Joj:yfkg Pj+ pkrf/ ;DjlGw k/fdz{ kfpg] ug{'ePsf] M 5 5}g
k/fdz{sf] >f]t M================================================
n
n
n
n
n
n
n
n
n
n
n
n
n
n
n
n
n
n
n
n
n
n
n
n
n
n
n
n
n
n
n
n
n
n
n
n
n
n
n
n n
n
n
n
n
n
n
n
n
n
n
n
n
n
n
n
n
n
n
n
n
n
n
n
n
n
n
n
n
n
n
n
n
n

106
k|zf]lwt b'w ljt/0f ;DalGw k|ZgfjnLx?
!= b'w /fVg] Knfl:6ssf] s|]6 ;kmf 5 5}g
@= 8]lne/L Eofg v'Nnf 5 5}g
#= 8]lne/L Eofg ;kmf 5 5}g
$= b'w las|L ug]{ :yfg÷k;n ;kmf 5 5}g
%= b'w lals| ug]{ :yfg÷k;n k|ToIf 3fd kg]{ vfnsf] 5 5}g
^= b'w a]Rg] :yfg km"6kfy÷km]fxf]/L jftfj/0f ÷hyfeflj 5 5}g
&= k|zf]lwt b'wsf] n]an 5 5}g
*= k|zf]lwt b'wsf] Kofs]6df tklzn dWo] s] n]lvPsf] 5
s= lg/f]ug k|lqmof -kfZr/fO8_ =======
v= lhjf0f' xgg -:6]/LnfO{h8_ ====
u= pRr tfkqmddf pkrf/ -UHT Treated_ ======
(=Kofs]6df kf]ifs tTjx?sf] ljj/0f 5 ====== 5}g =====
!)= Kofs]6df pBf]usf] k'/f gfd÷7]ufgf 5 ====== 5}g ======
!!= pkef]u ul/;Sg' kg]{ ldlt 5 ====== 5}g ====
!@= Koflsª Knfl:6s k|of]u ul/;s]kl5 k'g k|of]usf nflu hDdf u/L lalqm ug'{ kg]{ elg pkef]Qmfdf hgr]tgf hufpg] zAb 5 ======= 5}g =======
n
n
n
n
n
n
n
n
n
n
n
n
n
n
n
n
n
n
n
n
n
n
n
n
n
n
n
n
n
n
n
n
n
n
n
n
n
n
n
n
n
n
n
n
n
n
n
n
n
n
n
n

107
Annex II: Milk Testing Forms
Description of Sampling Point (Institution, Farmer etc.):
Name of Sampler:
Sample Code:
Date/Time: Place: District
S.N. Parameters Test Method Observed Value
Unit Value
1 Temperature Thermometer
Co
2 Sensory evaluation
Appearance: appearance-no
forgien matter, no cream layer
Flavor: salty, sour, rancid
Good or
Bad
3 pH pH meter
pH Scale
4 Urea Kit Reagent
+ive / -ive
5 Neutralizer Kit Reagent
+ive / -ive
6 Salt Kit Reagent
+ive / -ive
7 COB Boiling
+ive / -ive
8 Starch Kit Reagent
+ive / -ive
9 Sugar Kit Reagent
+ive / -ive
;
10 FAT Lacto-scan Milk Analyzer
%
11 SNF Lacto-scan Milk Analyzer
%
12 Density Lacto-scan Milk Analyzer
%
13 Addition Water Lacto-scan Milk Analyzer
%
14 Protein Lacto-scan Milk Analyzer
%
Name and Signature of Witness
Name Affiliation Position Signature
1
2

108
Annex III: Descriptive Statistics of COP Test of Milk Value Chain
Annex III.1: Descriptive Statistics of Questionnaire Survey for CoP of Milk Production in Farmer Level (Sunsari)
Q1 Q2 Q3 Q4 Q5 FMD HS/BQ Other Q8 Q9 Q10 Q11 Q12 Steel Q14 Q15 Q16 Q17 Q18 Q19 Q20 Q21 Q22
Freq. 15 15 14 15 15 12 10 0 4 15 15 15 15 6 14 15 1 0 10 0 1 15 6
% 100 100 93.3 100 100 80 66.7 0 26. 7 100 100 100 100 40 93.3 100 6. 7 0 66. 7 0 6.67 100 40
No of
Obs. 15 15 15 15 15 15 15 15 15 15 15 15 15 6 15 15 15 15 15 15 15 15 15
No of
Cow
No of
Buff Total Max Min Distance CC Cow Buff.
Avg. 1.99 1.75 2.27 14 6.7 13.3 51 61.25
Max. 2 1.5 2 10 4 5 50 62.5
Min. 4 3 6 40 28 45 55 65
Range 1 1 1 5 2 0.5 43 55
SD 3 2 5 35 26 44.5 12 10
CV 1 0.95 1.54 11.13 8.16 15.53 4.45 4.79
Med 0.52 0.55 0.68 0.87 1.28 1.17 0.09 0.087
No of
Obs. 14 4 15 15 15 15 13 4
Annex III.2: Descriptive Statistics of Questionnaire Survey for CoP of Milk Production in Collection Center (Sunsari District)
Avg Collection
( ltr)
Cooling
(ltr)
Storage
(ltr)
Q1a Q1a Q1d Q1c Q1d
QN
2
QN
3
QN
4
QN
5 QN8
QN
9
QN1
0
QN1
1
QN1
2
QN1
3
Freq
. 2 1 1 2 0 2 1 3 3 2 3 1 1 3 3
% 100 100 100 100 0
66.
7 33.3 100 100
66.6
7 100 100 100 100 100
No
of
Obs. 2 1 1 2 3 3 3 3 3 3 3 1 1 3 3
Avg. 130 250 250
Max. 200 500 500
Min. 50 50 50
Range 150 450 450 QN14
QN15
QN16
QN17
QN18
QN19
QN21
Alc.
Fat
SNF
QN22
QN23
QN24
QN25
QN26
QN27
Fre
q. 0 3 0 1 1 0 1 0 0 0 0 0 0 2 1 1
% 0 100 0 100 33.3 0 33.3 0 0 0 0 0 0
66.
67
33.
33
33.
33
No
of
Obs
. 2 3 1 1 3 3 3 1 1 1 3 3 3 3 3 3
SD 75.5 229.13 229.12
CV 0.58 0.92 0.92
Med 140 200 200
No of
Obs. 3 3 3

109
Annex III.3: Descriptive Statistics of Questionnaire Survey for CoP of Milk Production in Farmer Level (Ilam District)
Gras
s
Stra
and
Palate QN1
Q
N2
Q
N
3
Q
N
4
QN
5
F
M
D
HS
/BQ
Ot
her
QN
8
Q
N9
QN1
0
QN
11
QN
12
St
eel
Al
m.
QN
14
QN
15
QN
16
QN
17
QN
18
QN
19
QN
20
QN
21
QN
22
Freq. 15 6 15 13 12 6 15 6 3 9 9 15 15 15 15 6 10 15 15 0 13 4 12 1 15 0
% 100 40 100
86.
7 80 40 100 40 20 60 60
10
0 100 100 100 40
66.
7 100 100 0
86.
7
26.
7 80 6.7 100 0
No of
Obs. 15 6 15 15 15 15 15 15 15 15 15 15 15 15 15 6 10 15 15 15 15 15 15 15 15 15
No of
Cow No of Buff Total Max Min Dist. CC Cow
Avg. 2.6 0 2.4 11.7 3.07 55.2 37.87
Max. 5 0 5 18 6 500 48
Min. 1 0 1 7 2 1 30
Range 4 0 4 11 4 499 18
SD 1.64 0 1.64 3.26 1.39 132.7 5.42
CV 0.6 0 0.68 0.27 0.45 2.40 0.14
Med 2 0 2 11 2 10 35
No of Obs. 15 15 15 15 15 15 15
Annex III.4: Descriptive Statistics of Questionnaire Survey for CoP of Milk Production in Collection Center (Ilam District)
QN1 QN2 QN3 QN4 QN5 QN8 QN9 QN10 QN11 QN12 QN13 Other QN19 QN20 QN21 QN22 QN23 QN24 QN25 QN26 QN27
Freq. 3 3 0 2 3 3 3 3 3 3 3 3 3 3 3 0 3 3 3 3 3
% 100 100 0 66.67 100 100 100 100 100 100 100 100 100 100 100 0 100 100 100 100 100
No
of
Obs. 3 3 3 3 3 3 3 3 3 3 3 3 3 3 3 3 3 3 3 3 3
Annex III.5: Descriptive Statistics of Questionnaire Survey for CoP of Milk Production in Farmer Level (Chitwan District)
No of Cow No of Buff Total Grass
Stra and
Palate Both QN1 QN2 QN3 QN4 Water QN5 FMD HS/BQ Other QN8 QN9
Avg. 2.46 2 2.73 Freq. 10 15 15 15 12 11 15 1 14 15 15 5 11 15
Max. 4 2 4 Percent 66.67 100 100 100 80 73.33 100 6.7 93.33 100 100 33.33 73.33 100
Min. 1 2 1
No of
Obs. 10 15 15 15 14 14 15 8 14 15 15 15 15 15
Range 3 0 3
SD 0.88 0 0.80 Freq. QN10 QN11 QN12 Steel Alm QN14 QN15 QN16 QN17 QN18 QN19 QN20 QN21 QN22
CV 0.36 0 0.29 Percent 14 15 14 6 8 15 14 0 10 6 9 1 13 1
Med 3 2 3
No of
Obs. 93.33 100 93.33 40 53.33 100 93.33 0 66.66 40 60 6.67 86.67 6.67
No of Obs. 13 2 15 14 15 14 6 9 15 14 0 15 15 15 15 15 15

110
Annex III.6: Descriptive Statistics of Questionnaire Survey for CoP of Milk Production in Collection Center (Chitwan District)
Avg
Col(ltr)
Cooling
(ltr)
Storage(
ltr)
Ti
me
Pvt.
Dairy
Othe
rs
Back
up QN1 QN2 QN3
QN
4 PM
QN
5 QN8
QN
9 QN10 QN11 QN12
Avg. 1633.33 1333.3
1166.66
667 5.5 Freq. 3 1 0 3 2 1 3 0 3 2 3 1 1 3
Max. 2000 2000 2000 7 % 100 100 0 100
66.666
67
33.333
33 100 0 100
66.666
67 100 100 100 100
Min. 1400 1000 500 2.5
No of
Obs. 3 1 3 3 3 3 3 3 3 3 3 1 1 3
Range 600 1000 1500 4.5
SD 321.4 577.3
763.762
616
QN13
QN1
4
QN1
5
Othe
rs QN18 QN19
QN
20 QN21
QN
22 QN23
QN
24 QN25 QN26 QN27
CV 0.196 0.433 0.654
Freq. 3 0 3 1 1 0 0 1 0 0 0 2 1 1
Med 1500 1000 1000 7 % 100 0 100 100 33.333
33 0 0 33.333
33 0 0 0 66.66666
667 33.333
33 33.333
33
No of
Obs. 3 3 3 3
No of
Obs. 3 2 3 1 3 3 2 3 3 3 3 3 3 3
Annex III.7: Descriptive Statistics of Questionnaire Survey for CoP of Milk Production in Farmer Level (Kavre)
Q1 Q2 Q3 Q4 Q5
FM
D HS/BQ Other Q8 Q9
Q1
0
Q1
1
Q1
2
Stee
l
Q1
4
Q1
5
Q1
6
Q1
7 Q18
Q1
9
Q2
0
Q2
1
Q2
2
Freq. 15 15 14 14 15 12 5 0 10 15 15 15 15 6 14 15 1 0 10 0 1 15 6
% 10
0
10
0
93.
3
93.
3
10
0 80 33.3 0
66.6
7
10
0 100 100 100 40
93.
3 100 6. 7 0
66.
7 0
6.6
7 100 40
No of
Obs. 15 15 15 15 15 15 15 15 15 15 15 15 15 6 15 15 15 15 15 15 15 15 15
No of
Cow No of Buff Total Max Min Distance CC Cow Buff.
Avg. 3.1 1.75 2.27 14 6.7 13.3 51 61.25
Min. 2 2 2 10 4 5 50 62
Max. 4 3 6 40 28 45 55 65
Range 2 1 4 30 24 40 5 3
SD 3 2 5 35 26 44.5 12 10
CV 1 0.95 1.54 11.13 8.16 15.53 4.45 4.79
Med 3.52 0.55 0.68 0.87 1.28 1.17 0.09 0.087
No of
Obs. 14 4 15 15 15 15 13 4

111
Annex III.8: Descriptive Statistics of Questionnaire Survey for CoP of Milk Production in Collection Center (Kavre District)
Avg Collection
( ltr)
Cooling
(ltr)
Storage
(ltr)
Q1a Q1a Q1d Q1c Q1d
QN2
QN3
QN4
QN5 QN8
QN9
QN10
QN11
QN12
QN13
Freq
. 2 1 1 2 0 2 1 3 3 2 3 1 1 3 3
% 100 100 100 100 0
66. 7 33.3 100 100
66.67 100 100 100 100 100
No
of
Obs. 2 1 1 2 3 3 3 3 3 3 3 1 1 3 3
Avg. 130 250 250
Max. 200 500 500
Min. 50 50 50
Range 150 450 450 QN1
4
QN1
5
QN1
6
QN1
7
QN1
8
QN1
9
QN2
1
Al
c.
Fa
t
SN
F
QN2
2
QN2
3
QN2
4
QN2
5
QN2
6
QN2
7
Fre
q. 0 3 0 1 1 0 1 0 0 0 0 0 0 2 1 1
% 0 100 0 100 33.3 0 33.3 0 0 0 0 0 0
66. 67
33. 33
33. 33
No
of
Obs
. 2 3 1 1 3 3 3 1 1 1 3 3 3 3 3 3
SD 75.5 229.13 229.12
CV 0.58 0.92 0.92
Med 140 200 200
No of
Obs. 3 3 3
Annex III.9: Descriptive Statistics of Questionnaire Survey for CoP of Milk Production in Farmer Level (Nawalparsi District)
Gras
s
Stra
and
Palate QN1
Q
N2
Q
N
3
Q
N
4
QN
5
F
M
D
HS
/BQ
Ot
her
QN
8
Q
N9
QN1
0
QN
11
QN
12
St
eel
Al
m.
QN
14
QN
15
QN
16
QN
17
QN
18
QN
19
QN
20
QN
21
QN
22
Freq. 15 6 15 13 12 6 15 6 3 9 9 15 15 15 15 6 10 15 15 0 13 4 12 1 15 0
% 100 40 100
86.
7 80 40 100 40 20 60 60
10
0 100 100 100 40
66.
7 100 100 0
86.
7
26.
7 80 6.7 100 0
No of Obs. 15 6 15 15 15 15 15 15 15 15 15 15 15 15 15 6 10 15 15 15 15 15 15 15 15 15
No of
Cow No of Buff Total Max Min Dist. CC Cow
Avg. 5 3.45 8.13 46.93 30.4 12.87 48.13
Max. 13 10 17 170 164 45 55
Min. 2 1 2 9 3 1 44
Range 11 9 15 161 161 44 11
SD 3.32 2.88 5.49 44.94 43.55 12.13 4.09
CV 0.66 0.83 0.67 0.96 1.43 0.94 0.08
Med 4 2 5 30 15 10 46
No of
Obs. 15 11 15 15 15 15 15

112
Annex III.10: Descriptive Statistics of Questionnaire Survey for CoP of Milk Production in Collection Center (Nawalparasi District)
QN1 QN2 QN3 QN4 QN5 QN8 QN9 QN10 QN11 QN12 QN13 Other QN19 QN20 QN21 QN22 QN23 QN24 QN25 QN26 QN27
Freq. 2 2 2 3 3 2 3 1 1 3 3 0 3 0 3 0 0 0 2 1 1
% 66.7 66. 7 66. 7 100 100 66. 7 100 100 100 100 100 0 100 0 100 0 0 0 66.7 33. 3 33.3
No
of Obs. 3 3 3 3 3 3 3 1 1 3 3 3 3 1 3 3 3 3 3 3 3
Annex III.11: Descriptive Statistics of Questionnaire Survey for CoP of Milk Production in Farmer Level (Kaski District)
No of Cow No of Buff Total Grass Stra and Palate Both QN1 QN2 QN3 QN4 Water QN5 FMD HS/BQ Other QN8 QN9
Avg. 3.85 1.53 4.87 Freq. 10 15 15 15 12 11 15 1 14 15 15 5 11 15
Max. 28 19 28 Percent 66.67 100 100 100 80 73.33 100 6.7 93.33 100 100 33.33 73.33 100
Min. 0 0 1
No of
Obs. 10 15 15 15 14 14 15 8 14 15 15 15 15 15
Range 28 19 27
SD 7.46 4.87 9.01 QN10 QN11 QN12 Steel Alm QN14 QN15 QN16 QN17 QN18 QN19 QN20 QN21 QN22
CV 1.94 3.17 1.85 Freq. 14 15 14 6 8 15 14 0 10 6 9 1 13 1
Med 1 0 1 Percent 93.33 100 93.33 40 53.33 100 93.33 0 66.66 40 60 6.67 86.67 6.67
No of Obs. 13 15 15 No of Obs. 14 15 14 6 9 15 14 0 15 15 15 15 15 15
Annex III.12: Descriptive Statistics of Questionnaire Survey for CoP of Milk Production in Collection Center (Kaski District)
Avg
Col(ltr)
Cooling
(ltr)
Storage(ltr
)
Pvt.
Dairy
Other
s
Backu
p QN1 QN2 QN3 QN4 PM QN5 QN8 QN9
QN1
0
QN1
1
QN1
2
Avg. 533.33 633.33 633.33 Freq. 3 1 0 3 2 1 3 0 3 2 3 1 1 3
Max. 700 1000 1000 % 100 100 0 100 66. 7 33.3 100 0 100 66. 7 100 100 100 100
Min. 200 200 200
No of
Obs. 3 1 3 3 3 3 3 3 3 3 3 1 1 3
Range 500 800 800
SD 288.68 404.15 404.15
QN13 QN14 QN15
Other
s
QN1
8
QN1
9
QN2
0
QN2
1
QN2
2
QN2
3
QN2
4
QN2
5
QN2
6
QN2
7
CV 0.54 0.64 0.64 Freq. 3 0 3 1 1 0 0 1 0 3 3 3 3 3
Med 700 700 700 % 100 0 100 100 33.3 0 0 33.3 0 100 100 100 100 100
No of Obs. 3 3 3
No of Obs. 3 2 3 1 3 3 2 3 3 3 3 3 3 3

113
Annex III.13: Descriptive Statistics of Questionnaire Survey for CoP of Milk Production in Farmer Level
Q1 Q2 Q3 Q4 Q5 FMD HS/BQ Other Q8 Q9 Q10 Q11 Q12 Steel Q14 Q15 Q16 Q17 Q18 Q19 Q20 Q21 Q22
Freq. 5 5 4 5 5 2 3 0 4 5 5 5 5 6 4 5 1 0 1 0 1 5 3
% 100 100 80 100 100 40 60 0 26. 7 100 100 100 100 40 80 100 20 0 60 0 20 100 40
No of
Obs. 5
5 5 5 5 5 5 5 5 5 5 5 5 5 5 5 5 5 5 5 5 5 5
No of
Cow
No of
Buff Total Max Min Distance CC Cow Buff.
Avg. 2.4 2 3.6 21.8 12.6 22 52.5 63.33
Max. 4 3 6 40 28 40 55 65
Min. 1 1 2 9 2 10 50 60
Range 3 2 4 31 26 30 5 5
SD 1.1 1.0 1.8 16.6 12.78 12.55 2.89 2.89
CV 0.5 0.5 0.5 0.76 1.01 0.57 0.05 0.05
Med 2 2 3 10 5 15 52.5 65
No of Obs. 5 3 5 5 5 5 4 3
Annex III.14: Descriptive Statistics of Questionnaire Survey for CoP of Milk Production in Farmer Level (Surkhet District)
Grass
Stra
and Palate QN1
QN2
Q
N3
Q
N4
QN5
F
MD
HS /BQ
Other
QN8
QN9
QN10
QN11
QN12
Steel
Alm.
QN14
QN15
QN16
QN17
QN18
QN19
QN20
QN21
QN22
Freq. 5 3 5 3 2 6 5 6 3 9 9 5 5 5 5 6 2 5 5 0 3 4 2 1 5 0
% 100 60 100 60 80 40 100 40 20 60 60
10
0 100 100 100 40
66.
7 100 100 0 60 80 80 6.7 100 0
No of
Obs. 5 5 5 5 5 5 5 5 5 5 5 5 5 5 5 6 3 5 5 5 5 5 5 5 5 5
No of
Cow No of Buff Total Max Min
Avg. 2 5.75 4.71 22.1 10.3
Max. 7 19 26 100 50
Min. 0 1 1 4 2
Range 7 18 25 96 48
SD 2.83 8.85 9.39 34.84 17.58
CV 1.41 1.54 1.99 1.57 1.71
Med 1 1.5 1 8 4
No of Obs. 5 4 5 5 5

114
Annex III.15: Descriptive Statistics of Questionnaire Survey for CoP of Milk Production in Farmer Level (Kailali District)
No of Cow No of Buff Total Grass
Stra and
Palate Both QN1 QN2 QN3 QN4 Water QN5 FMD HS/BQ Other QN8 QN9
Avg. 1 1.5 1.57 Freq. 1 5 5 5 2 1 5 1 1 5 5 5 3 5
Max. 1 2 3 Percent 20 100 100 100 40 20 100 6.7 20 100 100 100 60 100
Min. 1 1 1 No of Obs. 5
5 5 5 5 5 5 5 5 5 5 5 5 5
Range 0 1 2
SD 0 0.57 0.78 Freq. QN10 QN11 QN12 Steel Alm QN14 QN15 QN16 QN17 QN18 QN19 QN20 QN21 QN22
CV 0 0.38 0.50 Percent 4 5 4 3 2 5 4 0 1 1 1 1 1 1
Med 1 1.5 1 No of Obs. 80 100 80 60 40 100 80 0 20 20 20 20 20 20
No of Obs. 5 4 5
5 5 5 5 5 5 5 5 5 5 5 5 5 5
Annex III.16:
Descriptive Statistics of Questionnaire Survey for CoP of Milk Production in Market (Dadeldhura District)
QN1 QN2 QN3 QN4 QN5 QN6 QN7
Yes Count 0 0 0 5 4 0 0
Percentage 0 0 0 100 80 0 0
Count 5 5 5 5 5 5 5
Annex III.17:
Descriptive Statistics of Questionnaire Survey for CoP of Milk in Outlet (Kailali District)
QN1 QN2 QN3 QN4 QN5 QN6 QN7 Pasteurized Sterilized UHT QN9 QN10 QN11 QN12
Freq. 5 0 5 5 2 3 3 5 0 0 5 5 5 0
Percent 100 0 100 100 40 60 60 100 0 0 100 100 100 0
No of obs. 5 5 5 5 5 5 5 5 5 5 5 5 5 5
Annex III.18:
Descriptive Statistics of Questionnaire Survey for CoP of Milk in Market (Surkhet District)
QN1 QN2 QN3 QN4 QN5 QN6 QN7
Yes Count 0 0 0 5 4 0 0
Percentage 0 0 0 100 80 0 0
Count 5 5 5 5 5 5 5

115
Annex III.19: Descriptive Statistics of Questionnaire Survey for CoP of Milk Production in
Market (Banke)
QN1 QN2 QN3 QN4 QN5 QN6 QN7
Yes Count 3 1 3 2 4 2 0
Percentage 60 20 60 40 80 40 0
Total Count 5 5 5 5 5 5 5
Annex III.20: Descriptive Statistics of Questionnaire Survey for CoP of Milk in Outlet (Kaski
District)
QN1 QN2 QN3 QN4 QN5 QN6 QN7
Yes Count 4 0 3 4 4 2 0
Percentage 80 0 60 80 80 40 0
Couunt 5 5 5 5 5 5 5
Annex III.21: Descriptive Statistics of Questionnaire Survey for CoP of Milk in Market
(Nawalparsdi District)
QN1 QN2 QN3 QN4 QN5 QN6 QN7
Yes Count 4 1 3 4 4 2 0
Percentage 80 20 60 80 80 40 0
Couunt 5 5 5 5 5 5 5
Annex III.22: Descriptive Statistics of Questionnaire Survey for CoP of Milk in Market (Kavre)
QN1 QN2 QN3 QN4 QN5 QN6 QN7
Yes Count 3 1 3 4 4 2 0
Percentage 60 20 60 80 80 40 0
Count 5 5 5 5 5 5 5
Annex III.23: Descriptive Statistics of Questionnaire Survey for CoP of Milk in Outlet (Chitwan
District)
QN1 QN2 QN3 QN4 QN5 QN6 QN7
Yes Count 3 2 2 3 4 1 2
Percentage 60 40 40 60 80 20 40
Couunt 5 5 5 5 5 5 5
Annex III.24: Descriptive Statistics of Questionnaire Survey for CoP of Milk in Market (Ilam
District)
QN1 QN2 QN3 QN4 QN5 QN6 QN7
Yes Count 5 2 5 5 3 0 0
Percentage 100 40 100 100 60 0 0
Couunt 5 5 5 5 5 5 4
Annex III.25: Descriptive Statistics of Questionnaire Survey for CoP of Milk Production in
Market (Sunsari District)
QN1 QN2 QN3 QN4 QN5 QN6 QN7
Yes Count 3 1 3 4 4 2 0
Percentage 60 20 60 80 80 40 0
Count 5 5 5 5 5 5 5

116
Annex IV: Lab Result for Microbiological Test
S.No. Lab Code Unit Observed values Sampling
point
Coliform /100ml TPC/100ml
1 M76 counts/100 ml >2400 TNTC
Kathmandu
District
2 M77 counts/100 ml >2400 TNTC
3 M78 counts/100 ml >2400 TNTC
4 M79 counts/100 ml >2400 28X106
5 M80 counts/100 ml >2400 TNTC
6 M81 counts/100 ml >2400 44X106
Bhaktapur 7 M82 counts/100 ml >2400 44X105
8 M83 counts/100 ml >2400 28X106
9 M84 counts/100 ml >2400 6X10⁶
Kathmandu 10 M85 counts/100 ml 240 TNTC
11 M86 counts/100 ml >2400 TNTC
12 M87 counts/100 ml 23 TNTC Bhaktapur
13 M88 counts/100 ml >2400 TNTC
14 M89 counts/100 ml >2400 TNTC Kathmandu
15 M90 counts/100 ml >2400 TNTC Lalitpur
16 M91 counts/100 ml >2400 256X106
17 M92 counts/100 ml >2400 TNTC Bhaktapur
18 M93 counts/100 ml >2400 TNTC
19 M94 counts/100 ml >2400 TNTC
Kathmandu 20 M95 counts/100 ml >2400 TNTC
21 M96 counts/100 ml >2400 TNTC
22 M61 counts/100 ml >2400 72X106
Kathmandu
District
23 M62 counts/100 ml >2400 37X106
24 M63 counts/100 ml >2400 88X106
25 M64 counts/100 ml 23 37X106
26 M65 counts/100 ml >2400 132X106
27 M66 counts/100 ml >2400 83X106
28 M67 counts/100 ml >2400 41X106
29 M68 counts/100 ml 23 16X106
30 M72 counts/100 ml >2400 12X106
Lalitpur 31 M73 counts/100 ml >2400 150X10
6
32 M74 counts/100 ml >2400 TNTC
33 M75 counts/100 ml >2400 87X106
34 M69 counts/100 ml >2400 TNTC
Bhaktapur 35 M70 counts/100 ml >2400 204X106
36 M71 counts/100 ml >2400 5X10⁶
37 M36 counts/100 ml >2400 TNTC
Bhaktapur
District
38 M40 counts/100 ml >2400 TNTC
39 M41 counts/100 ml >2400 TNTC
40 M42 counts/100 ml >2400 TNTC
41 M43 counts/100 ml >2400 TNTC
42 M44 counts/100 ml >2400 254X106
43 M35 counts/100 ml >2400 TNTC

117
44 M39 counts/100 ml >2400 TNTC
45 M49 counts/100 ml >2400 38X106
46 M50 counts/100 ml 240 7X10⁶
47 M56 counts/100 ml >2400 132X106
48 M57 counts/100 ml 23 53X106
49 M59 counts/100 ml >2400 TNTC
Lalitpur 50 M60 counts/100 ml >2400 TNTC
51 M58 counts/100 ml >2400 TNTC
52 M55 counts/100 ml >2400 TNTC Kathmandu
53 M45 counts/100 ml >2400 290X106
Kavre
54 M47 counts/100 ml >2400 108X106
55 M48 counts/100 ml >2400 6X10⁶
56 M37 counts/100 ml >2400 268X106
57 M38 counts/100 ml >2400 TNTC
58 M46 counts/100 ml >2400 290X105
59 M51 counts/100 ml 240 12X105
60 M53 counts/100 ml 23 8X10⁶
61 M54 counts/100 ml >2400 TNTC
62 M52 counts/100 ml >2400 70X106
63 M22 counts/100 ml >2400 68 X106
Kath
man
du
district
64 M23 counts/100 ml >2400 19X106
65 M24 counts/100 ml >2400 6X10⁶
66 M25 counts/100 ml >2400 14X106
67 M26 counts/100 ml >2400 36X106
68 M27 counts/100 ml >2400 204X106
69 M28 counts/100 ml >2400 134X106
Lalitp
ur D
istrict
70 M29 counts/100 ml >2400 64X106
71 M30 counts/100 ml >2400 43X106
72 M31 counts/100 ml >2400 TNTC
73 M32 counts/100 ml >2400 77X106
74 M33 counts/100 ml >2400 43X106
75 M34 counts/100 ml >2400 28X106
76 M3 counts/100 ml >2400 106 X106
Kathmandu
77 M4 counts/100 ml >2400 122X106
78 M6 counts/100 ml >2400 139X106
79 M1 counts/100 ml >2400 608X106
80 M11 counts/100 ml >2400 TNTC
81 M13 counts/100 ml >2400 380X106
82 M2 counts/100 ml >2400 130X106
83 M5 counts/100 ml >2400 176X106
84 M7 counts/100 ml >2400 12X106
85 M8 counts/100 ml >2400 144X106
86 M9 counts/100 ml >2400 328X106
87 M10 counts/100 ml >2400 330X106
88 M12 counts/100 ml >2400 208X106
89 M14 counts/100 ml >2400 316X106
90 M15 counts/100 ml >2400 340X106

118
91 M16 counts/100 ml >2400 TNTC
92 M17 counts/100 ml >2400 TNTC
93 M18 counts/100 ml >2400 85X106
94 M19 counts/100 ml >2400 TNTC
95 M20 counts/100 ml >2400 384X106
96 M21 counts/100 ml >2400 640X106