Embed Size (px)
Citation preview
i
FinalReportofRPSEAProject12122-91:4DIntegratedStudyUsingGeology,Geophysics,ReservoirModeling&RockMechanicstoDevelopAssessmentModelsforPotentialIn-
ducedSeismicityRisk
PrincipalInvestigator:JeremyBoak,OklahomaGeologicalSurvey,UniversityofOklahomaInvestigators: G.R.Keller,ret.,OklahomaGeologicalSurvey,UniversityofOklahoma
AustinHolland,UnitedStatesGeologicalSurvey,UniversityofOklahomaJeffersonChang,OklahomaGeologicalSurvey,UniversityofOklahomaStephenHolloway,OklahomaGeologicalSurvey,UniversityofOklahomaChenChen,OklahomaGeologicalSurvey,UniversityofOklahomaNoorulanGhouse,OklahomaGeologicalSurvey,UniversityofOklahomaFernandoFerrerVargas,OklahomaGeologicalSurvey,UniversityofOklahoma
AndrewThiel,OklahomaGeologicalSurvey,UniversityofOklahomaStevenMarsh,OklahomaGeologicalSurvey,UniversityofOklahomaDeepakDevegowda,MewbourneSchool,UniversityofOklahomaAhmadGhassemi,MewbourneSchool,UniversityofOklahoma
ii
TableofContents
ExecutiveSummary ES-1
1. PatternsofInducedSeismicityinCentralandNorthwestOklahoma 1
2. OklahomaEarthquakeSummaryReport2015-16 8
3. GravityDataCollection 22
4. SeismicTomographyofNorthCentralOklahoma 27
5. GravimetricDeterminationofBasementGeologicStructure 41
6. InterpretationofLowFrequencyPressureMeasurementsinInjectionandProductionWells 57
7. ModelingPorePressureVariationsandPotentialforInducedSeismicityAdjacenttoWaterDis-posalWells 67
8. IntegratedRockMechanicsStudies 85
9. TechnologyTransferActivities 95
ES-1
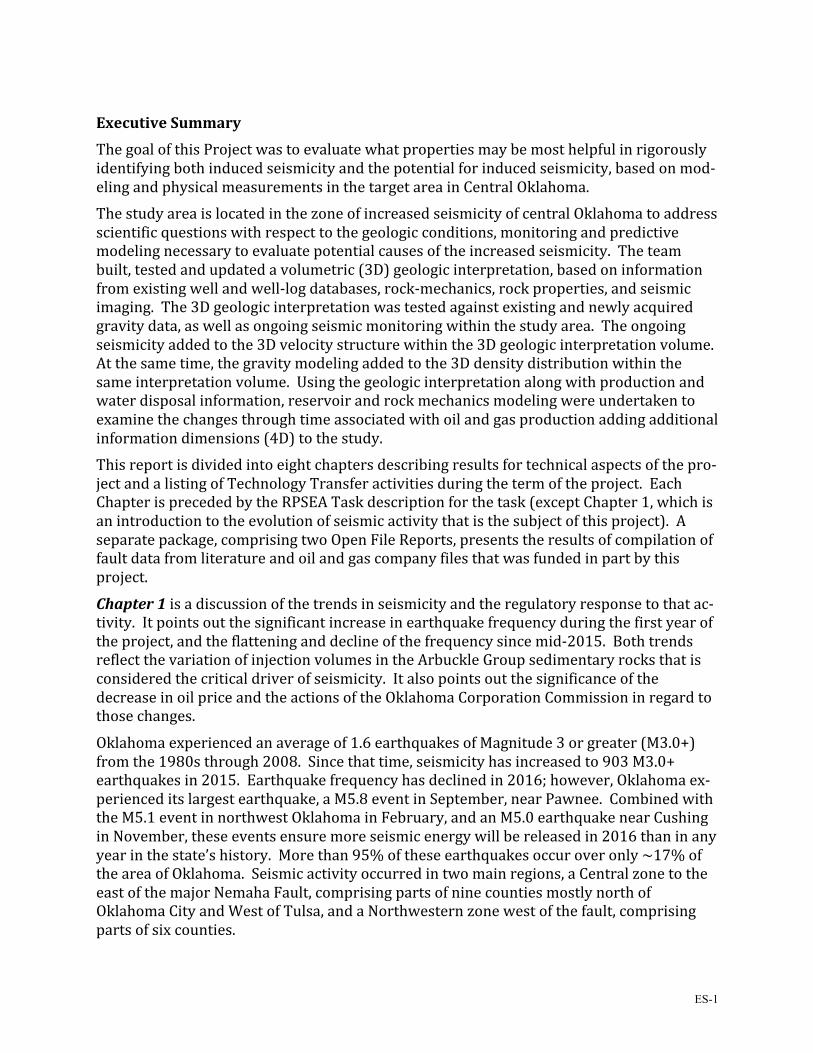
ExecutiveSummary
ThegoalofthisProjectwastoevaluatewhatpropertiesmaybemosthelpfulinrigorouslyidentifyingbothinducedseismicityandthepotentialforinducedseismicity,basedonmod-elingandphysicalmeasurementsinthetargetareainCentralOklahoma.ThestudyareaislocatedinthezoneofincreasedseismicityofcentralOklahomatoaddressscientificquestionswithrespecttothegeologicconditions,monitoringandpredictivemodelingnecessarytoevaluatepotentialcausesoftheincreasedseismicity.Theteambuilt,testedandupdatedavolumetric(3D)geologicinterpretation,basedoninformationfromexistingwellandwell-logdatabases,rock-mechanics,rockproperties,andseismicimaging.The3Dgeologicinterpretationwastestedagainstexistingandnewlyacquiredgravitydata,aswellasongoingseismicmonitoringwithinthestudyarea.Theongoingseismicityaddedtothe3Dvelocitystructurewithinthe3Dgeologicinterpretationvolume.Atthesametime,thegravitymodelingaddedtothe3Ddensitydistributionwithinthesameinterpretationvolume.Usingthegeologicinterpretationalongwithproductionandwaterdisposalinformation,reservoirandrockmechanicsmodelingwereundertakentoexaminethechangesthroughtimeassociatedwithoilandgasproductionaddingadditionalinformationdimensions(4D)tothestudy.Thisreportisdividedintoeightchaptersdescribingresultsfortechnicalaspectsofthepro-jectandalistingofTechnologyTransferactivitiesduringthetermoftheproject.EachChapterisprecededbytheRPSEATaskdescriptionforthetask(exceptChapter1,whichisanintroductiontotheevolutionofseismicactivitythatisthesubjectofthisproject).Aseparatepackage,comprisingtwoOpenFileReports,presentstheresultsofcompilationoffaultdatafromliteratureandoilandgascompanyfilesthatwasfundedinpartbythisproject.Chapter1isadiscussionofthetrendsinseismicityandtheregulatoryresponsetothatac-tivity.Itpointsoutthesignificantincreaseinearthquakefrequencyduringthefirstyearoftheproject,andtheflatteninganddeclineofthefrequencysincemid-2015.BothtrendsreflectthevariationofinjectionvolumesintheArbuckleGroupsedimentaryrocksthatisconsideredthecriticaldriverofseismicity.ItalsopointsoutthesignificanceofthedecreaseinoilpriceandtheactionsoftheOklahomaCorporationCommissioninregardtothosechanges.Oklahomaexperiencedanaverageof1.6earthquakesofMagnitude3orgreater(M3.0+)fromthe1980sthrough2008.Sincethattime,seismicityhasincreasedto903M3.0+earthquakesin2015.Earthquakefrequencyhasdeclinedin2016;however,Oklahomaex-perienceditslargestearthquake,aM5.8eventinSeptember,nearPawnee.CombinedwiththeM5.1eventinnorthwestOklahomainFebruary,andanM5.0earthquakenearCushinginNovember,theseeventsensuremoreseismicenergywillbereleasedin2016thaninanyyearinthestate’shistory.Morethan95%oftheseearthquakesoccuroveronly~17%oftheareaofOklahoma.Seismicactivityoccurredintwomainregions,aCentralzonetotheeastofthemajorNemahaFault,comprisingpartsofninecountiesmostlynorthofOklahomaCityandWestofTulsa,andaNorthwesternzonewestofthefault,comprisingpartsofsixcounties.
ES-2
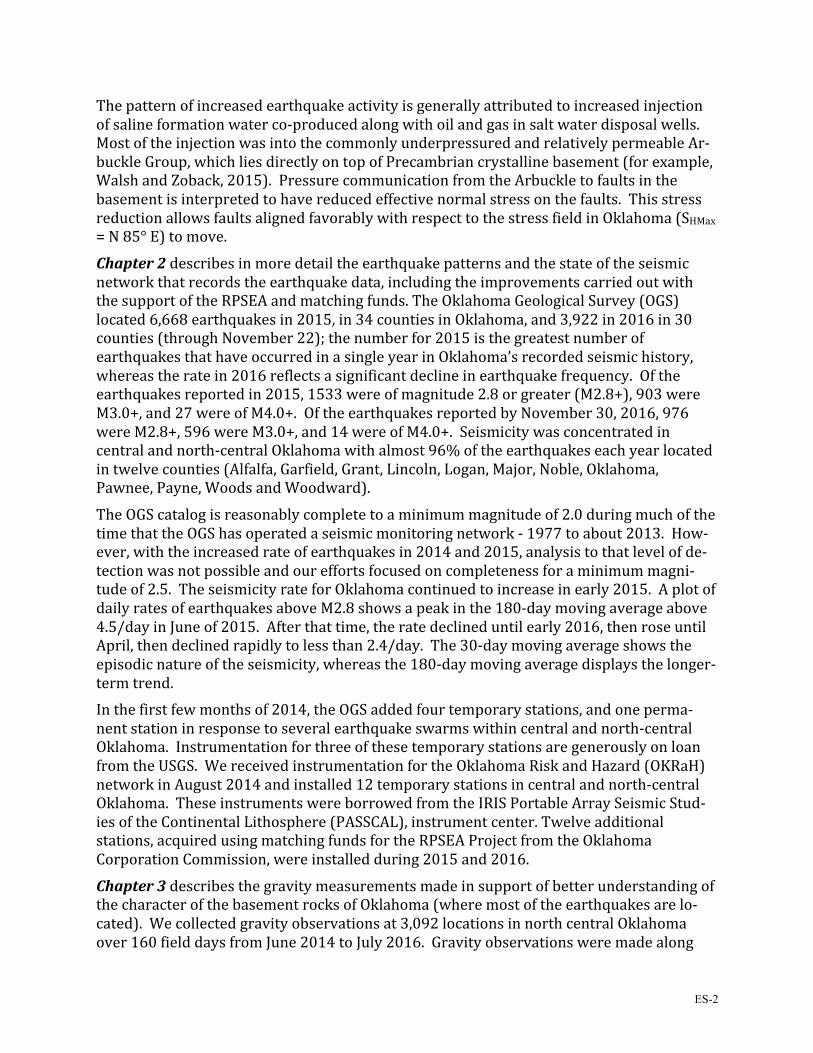
Thepatternofincreasedearthquakeactivityisgenerallyattributedtoincreasedinjectionofsalineformationwaterco-producedalongwithoilandgasinsaltwaterdisposalwells.MostoftheinjectionwasintothecommonlyunderpressuredandrelativelypermeableAr-buckleGroup,whichliesdirectlyontopofPrecambriancrystallinebasement(forexample,WalshandZoback,2015).PressurecommunicationfromtheArbuckletofaultsinthebasementisinterpretedtohavereducedeffectivenormalstressonthefaults.ThisstressreductionallowsfaultsalignedfavorablywithrespecttothestressfieldinOklahoma(SHMax=N85°E)tomove.Chapter2describesinmoredetailtheearthquakepatternsandthestateoftheseismicnetworkthatrecordstheearthquakedata,includingtheimprovementscarriedoutwiththesupportoftheRPSEAandmatchingfunds.TheOklahomaGeologicalSurvey(OGS)located6,668earthquakesin2015,in34countiesinOklahoma,and3,922in2016in30counties(throughNovember22);thenumberfor2015isthegreatestnumberofearthquakesthathaveoccurredinasingleyearinOklahoma’srecordedseismichistory,whereastheratein2016reflectsasignificantdeclineinearthquakefrequency.Oftheearthquakesreportedin2015,1533wereofmagnitude2.8orgreater(M2.8+),903wereM3.0+,and27wereofM4.0+.OftheearthquakesreportedbyNovember30,2016,976wereM2.8+,596wereM3.0+,and14wereofM4.0+.Seismicitywasconcentratedincentralandnorth-centralOklahomawithalmost96%oftheearthquakeseachyearlocatedintwelvecounties(Alfalfa,Garfield,Grant,Lincoln,Logan,Major,Noble,Oklahoma,Pawnee,Payne,WoodsandWoodward).TheOGScatalogisreasonablycompletetoaminimummagnitudeof2.0duringmuchofthetimethattheOGShasoperatedaseismicmonitoringnetwork-1977toabout2013.How-ever,withtheincreasedrateofearthquakesin2014and2015,analysistothatlevelofde-tectionwasnotpossibleandoureffortsfocusedoncompletenessforaminimummagni-tudeof2.5.TheseismicityrateforOklahomacontinuedtoincreaseinearly2015.AplotofdailyratesofearthquakesaboveM2.8showsapeakinthe180-daymovingaverageabove4.5/dayinJuneof2015.Afterthattime,theratedeclineduntilearly2016,thenroseuntilApril,thendeclinedrapidlytolessthan2.4/day.The30-daymovingaverageshowstheepisodicnatureoftheseismicity,whereasthe180-daymovingaveragedisplaysthelonger-termtrend.Inthefirstfewmonthsof2014,theOGSaddedfourtemporarystations,andoneperma-nentstationinresponsetoseveralearthquakeswarmswithincentralandnorth-centralOklahoma.InstrumentationforthreeofthesetemporarystationsaregenerouslyonloanfromtheUSGS.WereceivedinstrumentationfortheOklahomaRiskandHazard(OKRaH)networkinAugust2014andinstalled12temporarystationsincentralandnorth-centralOklahoma.TheseinstrumentswereborrowedfromtheIRISPortableArraySeismicStud-iesoftheContinentalLithosphere(PASSCAL),instrumentcenter.Twelveadditionalstations,acquiredusingmatchingfundsfortheRPSEAProjectfromtheOklahomaCorporationCommission,wereinstalledduring2015and2016.Chapter3describesthegravitymeasurementsmadeinsupportofbetterunderstandingofthecharacterofthebasementrocksofOklahoma(wheremostoftheearthquakesarelo-cated).Wecollectedgravityobservationsat3,092locationsinnorthcentralOklahomaover160fielddaysfromJune2014toJuly2016.Gravityobservationsweremadealong
ES-3
publicroadways,generallyalongsection-lineroads.Stationswerelocatedwith2-milespacingasacompromisebetweencoverageanddensitybothtofillexistinggravitycoveragegapsandtocollectagridofhigherspatialdensitystationspacing.Atotalof9,020uniquegravityreadingswerereduced,resultingin3,092gravitystationswithaccompanyingpost-processedGPScoordinates.Chapter4describesaseismictomographystudyconductedintheregionbyChenChenashisDoctoraldissertation.ItprovidesanupdatedseismicvelocitymodelforthedeepcrustanduppermantlebeneathOklahoma.Thisstudyresultsinenhancementstoourabilitytorelocateearthquakesmoreprecisely,whichisimportant,giventhatperhaps50%ofearthquakesinOklahomaoccuronfaultsthathavenotbeenpreviouslyidentified.Chenderivedtwovelocitymodelsusingnorth-centralOklahomaearthquakes.Hecreatedeachvelocitymodelwith>8000earthquakesofmagnitude2.0orgreater(M2+),and>100,000P-andS-wavepicksfromseismicrecords.Tobetterunderstandthestructuresinthecrystallinebasement,velocitymodels,gravity,andmagneticdatawereusedtoexaminethegeologicalcorrelation.Onalargescale,thevelocitymodelcorrelatestogravityanomaliesbecausedenserocksgenerallyhavehighvelocities,andviceversa.ThevelocitymodelsrevealstronglateralheterogeneitieswithinthePrecambriancrystallinebasement,whichindicatescomplexstructuresintheupperportionofthecrustinthestudyarea.MostoftheearthquakesincentralOklahomaareclusteredandpresentednortheast-south-west(NE-SW)ornorthwest-southeast(NW-SE)trendingorientationthatisconsistentwiththe~East-Westmaximumhorizontalstressstatewithintheregion.Withthe3Dvelocitymodel,thecatalogedearthquakeswererelocated.Thehigh-accuracyearthquakelocationsimprovedtheresolutionoffaultlocationsbyproducingsharperpatternsofseismicity.Furthermore,theimprovedtheearthquakelocationscanpotentiallybetterexplaintherelationshipbetweeninjectionwellsandinducedseismicity.Inaddition,theimprovementoftheearthquakelocationscanhelpidentifyprimaryfaultplanesfromfocalmechanisms,crustaldeformation,andothers.Asanexample,thestudypointstoasuiteofearthquakesintheCushingareain2014thathadpreviouslybeenrelocatedbytheU.S.GeologicalSurveyalongaWNW-ESEtrendingalignment,suggestingapreviouslyunidentifiedfaultoptimallyorientedforslip.Usingthenewvelocitymodel,theseearthquakeswerere-evaluated,andappeartolieonaNE-SWtrend.Resolutionofthisdifferencewillbecriticalifwearetounderstandpatternsofseismicityondeeplyburiedfaults.Chapter5describesagravimetricmodelforportionsofOklahomaandKansas(withsmallportionsofArkansasandMissouri)thatrepresentsintegrationofallthedatawehaveassembled.Thelargerregionalmodelisrequiredtoadequatelyrepresentthegravityfieldintheprojectarea.Thegeologiccharacteroftheuppercrystallinebasementcanbeestimatedandtestedusingageologicallyandstatisticallyconstraineddensityinversionofthreedimensional(3D)free-airgravitydataandageologicallyconsistent3Ddensitydistributionofknownandexpectedgeologicfeaturesaboveandbelowtheuppercrystallinebasement.Usingpublishedformationisopachmodels,a3Dgeologicmodelisbuiltthatisconsistentwithknownandexpectedgeologiccharacteristics.Asmoregeologic
ES-4
informationbecomesavailable,theexpectedgeologicformationmodelcanbeimprovedtoreflectthesedatawhilemaintainingconsistencywithboththeregionalandlocalgeologicmodel.TheResidualFreeAirGravityAnomalyresultingfromthemodelillustratesthecomplexityofthebasementgeologybetweentheMid-ContinentRift,(MCR)inKansas,andtheSouthernOklahomaAulacogen,(SOA).AssociatedwiththesetwomajortectonicfeaturesareparallelgeologicstructuresliketheNemahaUpliftandAmarilloUpliftandtheAnadarkobasin.Also,thereareadditionalassociatedstructuresthroughoutOklahomaliketheWilzettaFaultzoneandrelatedsmallerconjugatefaultzones.AlthoughOklahomasuffersfromverysparsesamplingforgravityandmagneticfields,therearerecognizableboundariesthatappeartocorrespondwelltofaults,bothmappedandblind.Therearealsofaultandseismicfeaturesthatdonotappeartoshowinthepotentialfieldmaps.Additionaldata,augmentedbyseismicreflectiondatafromoilandgascompanies,couldsignificantlyimproveourunderstandingofthebasementstructureandthepotentialconnectiontotheoverlyingArbuckleGroupsedimentaryrock.StudiesunderwaysupportedbytheGovernorofOklahomamayproducesuchintegration.Chapter 6presentsthemathematicalbasisforcharacterizationofreservoirsliketheAr-buckleGroupsedimentaryrock,andforpressureresponseanalysistoidentifyhighlycon-ductivefluidmigrationpathwaysinthesubsurfacefrominjectionwellpumpingtests.Inthiswork,wedocumentalowfrequencyasymptoticapproachtointerpretthesepumpingtests.Theworkflowdescribedheredependsonconstructinganappropriateinitialsubsurfacesimulationmodelandadjustingthevaluesoftheuncertainmodelvariablessothatthemodelperformanceisinreasonableagreementwithactualmeasurements.TheapproachalsocalculatessensitivitiesofresultstovariationsininputparametersbytwomethodsThefirstisasemi-analyticalapproach,fromthelowfrequencyasymptoticapproach.thesecondisanumericalsensitivitycalculationderivedbyperturbingeachgridcellpermeabilityvaluebyasmallvalueandsolvingthefullfieldsimulationtoobtainchangesinthepredictedbottomholepressureattheobservationwell.Theapproachdescribedinthischapterallowsforahigh-resolutionreconstructionofconductivepathwaysinthesubsurfaceforfluidmigration.Consequently,intheabsenceofothergeophysicalmeasurementsorgeologicinterpretation,itprovidesasoundapproachtoaddressingconcernsoverthemigrationofinjectedwateranditsroleininducedseismicity.Chapter 7providesanapplicationofthismethodtotheproblemofinducedseismicity.Theobjectiveofthisstudyistodeduceatemporalandspatialcorrelationbetweensalt-waterinjectionandearthquakefrequencyusingnumericalmodels.Itattemptstoaddresssomekeyconcerns,including:
• Isthereacriticalinjectionratebelowwhichseismicitymaybemanaged?• Whatistheoptimaldistanceforinjectionwellsfromafault?• Doesthefaulttransmissibilityplayaroleingoverninginducedseismicity?
ThemodelgridemployedtounderstandporepressurevariationsinresponsetofluidinjectionintheOklahomaCityFieldcoversavolume35by35by6km,withaninjectionwellinthecenterofthemodel,andcontainingfourfaultsatvaryingdistancesfromthewellbore.Faultproperties(suchastransmissibilitycontrastwiththecountryrock)andinjectionrates,arevariedindifferentsimulationsrunfortenyears.Resultingchangesin
ES-5
stressondifferentfaultsarecalculated,usingrockpropertiesforArbuckleGroupsedimentaryrocksandregionalstressesrepresentativeofcentralOklahoma.Thesimulationresultsindicatethatamaximumchangeinthepressureofcloseto12psiaisobservedatadepthof5.4kmfromthesurfaceadjacenttothefaultthatis500mawayfromtheinjectionwell.Suchapressureincreaseinafaultatthisdepthmaybesufficienttotrig-germovementoncriticallystressedfaultsappropriatelyorientedtotheregionalstressfield.Chapter 8presentsresultsofanintegratedrockmechanicsstudy.AlmostallstudiesontheincreasedseismicityincentralOklahomahavefocusedonporepressureeffectswithoutexplicitconsiderationoflarge-scalerockmassdeformation.Inthisstudy,wehavedevel-opedalarge-scalegeomechanicalconceptualmodelforafaultsystemandassessitsre-sponsetosaltwaterinjection.ThisportionoftheRPSEAProjectaimedtounderstandtheeffectofwaterinjectiononporepressureincreaseanditsconsequenceswithintheWilzettafaultzonenearPrague,Oklahoma.Thestudyareaselectedformodelingsaltwaterinjection,encompassedapproximately460squarekilometers(approximately22×23km).Themodelconsistedofsevenlayers;threeofthemarethetargetofinjection(theHuntongroup,theSimpsongroup,theArbucklegroup)andthebottomlayer(thebasement)isthelocationofmostearthquakes.Themodelincludedtwomajorfaults;theWilzettafault(WFZ)andtheMeeker-Praguefault(MPF).Zonessurroundingthefaultswererefinedtomoreaccuratelyreflectthefaultzone.Wesimulatedthehydraulicoverpressuresandpotentialforinducedseismicityduringhydraulicinjection.Afterlettingthesystemreachequilibrium,injectionwascommencedandcontinuedfor19years(1993to2011)usingreporteddata(injectionrateandwellpressure).Wemonitoredchangeofstressconditionandredistributionoftheporepressureinthedomain,anddisplacementalongthefaultstoevaluatethepossibilityofinducedseismicity.Modelresultssuggestthatinjectioncanchangetheinitialporepressurebyasignificantamount(6MPa)alongthefault(fortheassumedboundaryconditions),whichreducestheeffectivestress,andresultininduceddisplacementsintheXandYdirectionsafter14years.Theinduceddisplacementssuggestthepotentialforearthquakes.Thestudyalsocarriedouttestsofrelevantrocktypes,andconstructedfailureenvelopesfortheserocks.Althoughfullintegrationofthepropertieswasnotcompleted,theresultstodatesuggestthatreasonableparametervaluesinwell-constructedmodelscanprovidevaluableunderstandingoftheprocessofinjection-inducedseismicity.Chapter 9tabulatestheTechnologyTransferactivitiesconductedduringthelifeoftheproject.GiventhefeedbackfromtheWorkshop:SeismicityinOklahoma,heldSeptem-ber7-8,2016attheMoore-NormanTechnologyCenterinNormanOK,thiswasthemostproductiveoftheseactivities.ResearchersfromacrosstheU.S.withaninterestininducedseismicity,especiallyinOklahomaandadjacentstates,cametogetherfortwodaysanddis-cusseddiverseaspectsoftheissue.TheprojectreceivedfavorablecommentscomparingtheworkshoptoanearlieroneconductedbytheSocietyofExplorationGeophysicistsandtheSocietyofPetroleumEngineersinFortWorthinearly2016.ApreviousNationalSeismicHazardWorkshoponInducedSeismicityinNovember,2014,hostedjointly
ES-6
withtheUSGS,alsobroughtawidevarietyoftechnicalpersonneltogethertodiscussavarietyoftopicsonunderstandinginducedseismicitywithafocusongeneralriskfrominducedearthquakes.Theprojectresultin11publications,19professionalpresentationswithpublishedabstracts,40presentationsforawidevarietyoforganizationsmostlyinOklahoma.ProjectinvestigatorsattendednumerousmeetingsofaWorkingGroupoftheOklahomaIndependentPetroleumAssociation,andinteractedwithindustrygroupsonatleastfiveoccasions.StaffalsometwithStategovernmentstaffattheGovernor’sCoordinatingCouncilonSeismicity,theSecretaryofEnergyandEnvironmentDirector’smeetings,presentedattheGovernor’sEnergyConference,andpresentedtoInterimstudygroupsoftheOklahomalegislature.TheyalsometonseveraloccasionswithU.S.GeologicalSurveystaff,andvisitedtheNationalEarthquakeInformationCenter.ThePrincipalInvestigatoralsopresentedprojectresultsattwoRPSEAsponsoredmeetings.
1
1. PatternsofInducedSeismicityinCentralandNorthwestOklahoma
JeremyBoak,Director,OklahomaGeologicalSurvey,MewbourneCollegeofEarthandEnergy,UniversityofOklahoma,NormanOK73019
Summary
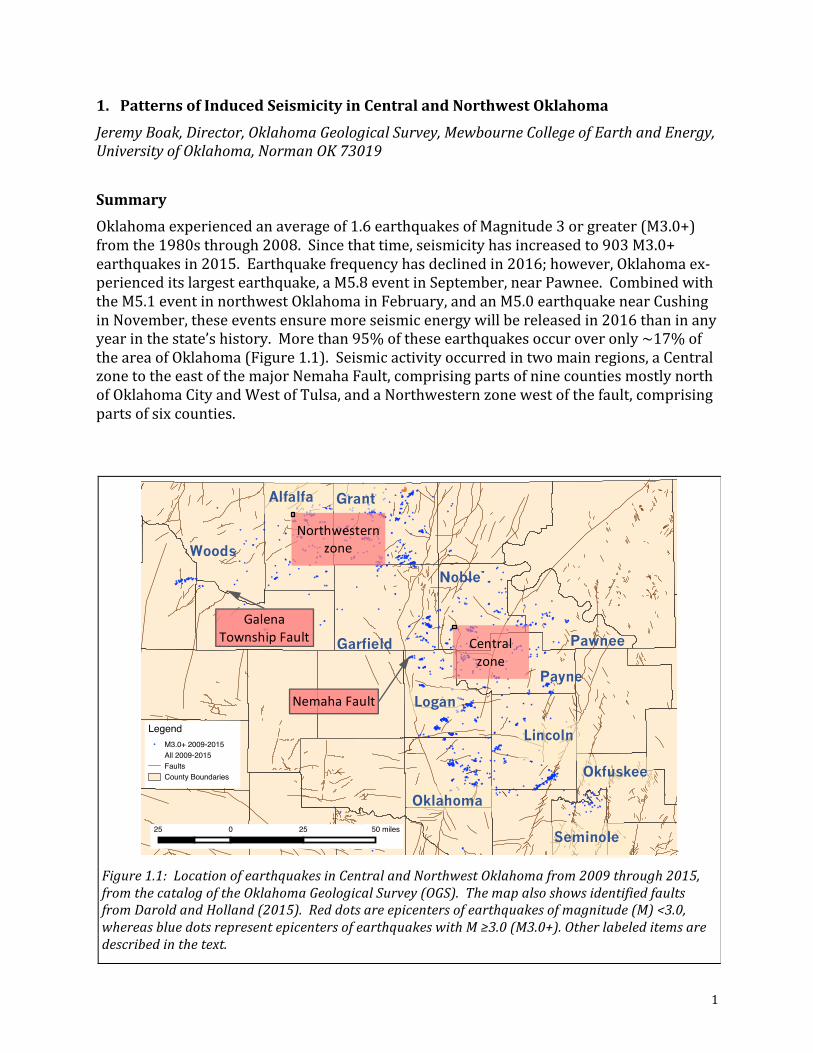
Oklahomaexperiencedanaverageof1.6earthquakesofMagnitude3orgreater(M3.0+)fromthe1980sthrough2008.Sincethattime,seismicityhasincreasedto903M3.0+earthquakesin2015.Earthquakefrequencyhasdeclinedin2016;however,Oklahomaex-perienceditslargestearthquake,aM5.8eventinSeptember,nearPawnee.CombinedwiththeM5.1eventinnorthwestOklahomainFebruary,andanM5.0earthquakenearCushinginNovember,theseeventsensuremoreseismicenergywillbereleasedin2016thaninanyyearinthestate’shistory.Morethan95%oftheseearthquakesoccuroveronly~17%oftheareaofOklahoma(Figure1.1).Seismicactivityoccurredintwomainregions,aCentralzonetotheeastofthemajorNemahaFault,comprisingpartsofninecountiesmostlynorthofOklahomaCityandWestofTulsa,andaNorthwesternzonewestofthefault,comprisingpartsofsixcounties.
Figure1.1:LocationofearthquakesinCentralandNorthwestOklahomafrom2009through2015,fromthecatalogoftheOklahomaGeologicalSurvey(OGS).ThemapalsoshowsidentifiedfaultsfromDaroldandHolland(2015).Reddotsareepicentersofearthquakesofmagnitude(M)<3.0,whereasbluedotsrepresentepicentersofearthquakeswithM≥3.0(M3.0+).Otherlabeleditemsaredescribedinthetext.
Alfalfa
Oklahoma
Payne
Woods
Lincoln
Grant
Garfield
Logan
Noble
Pawnee
Seminole
Okfuskee
Northwesternzone
Central zone
GalenaTownshipFault
NemahaFault
2
Thepatternofincreasedearthquakeactivityisgenerallyattributedtoincreasedinjectionofsalineformationwaterco-producedalongwithoilandgasinsaltwaterdisposalwells.MostoftheinjectionwasintothecommonlyunderpressuredandrelativelypermeableAr-buckleGroup,whichliesdirectlyontopofPrecambriancrystallinebasement(forexample,WalshandZoback,2015).PressurecommunicationfromtheArbuckletofaultsinthebasementisinterpretedtohavereducedeffectivenormalstressonthefaults.ThisstressreductionallowsfaultsalignedfavorablywithrespecttothestressfieldinOklahoma(SHMax=N85°E)tomove.Thispaperdiscussestheevolutionofthisseismicity,theregulatoryactionstakentoreduceseismicitybyreducingdeepinjection,andtheimportanceofde-cliningoilpriceinreducinginjectedvolumesinadvanceoffullimplementationoftheseregulatorydirectives.BriefHistoryofInducedSeismicityinOklahoma
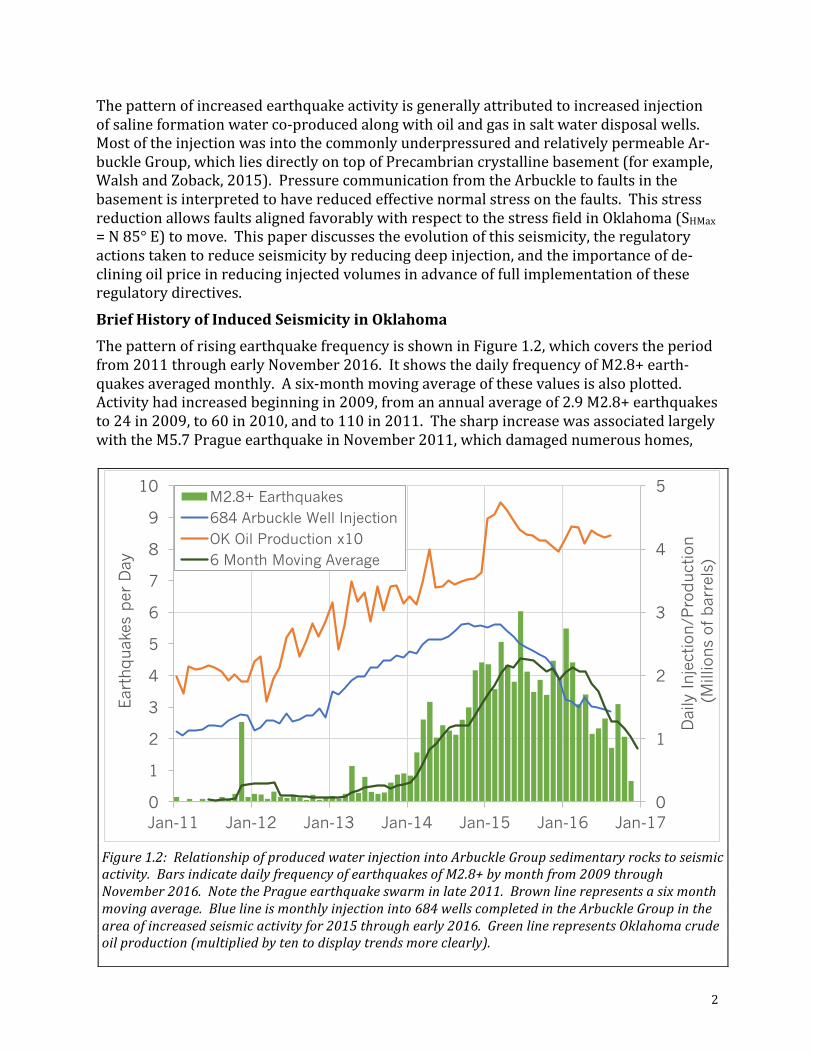
ThepatternofrisingearthquakefrequencyisshowninFigure1.2,whichcoverstheperiodfrom2011throughearlyNovember2016.ItshowsthedailyfrequencyofM2.8+earth-quakesaveragedmonthly.Asix-monthmovingaverageofthesevaluesisalsoplotted.Activityhadincreasedbeginningin2009,fromanannualaverageof2.9M2.8+earthquakesto24in2009,to60in2010,andto110in2011.ThesharpincreasewasassociatedlargelywiththeM5.7PragueearthquakeinNovember2011,whichdamagednumeroushomes,
Figure1.2:RelationshipofproducedwaterinjectionintoArbuckleGroupsedimentaryrockstoseismicactivity.BarsindicatedailyfrequencyofearthquakesofM2.8+bymonthfrom2009throughNovember2016.NotethePragueearthquakeswarminlate2011.Brownlinerepresentsasixmonthmovingaverage.Bluelineismonthlyinjectioninto684wellscompletedintheArbuckleGroupintheareaofincreasedseismicactivityfor2015throughearly2016.GreenlinerepresentsOklahomacrudeoilproduction(multipliedbytentodisplaytrendsmoreclearly).
0
1
2
3
4
5
6
7
8
9
10
Jan-11 Jan-12 Jan-13 Jan-14 Jan-15 Jan-16 Jan-170
1
2
3
4
5
Ear
thquak
es p
er D
ay
Dai
ly Inje
ctio
n/P
roduct
ion
(Mill
ions
of b
arre
ls)
M2.8+ Earthquakes684 Arbuckle Well InjectionOK Oil Production x106 Month Moving Average
3
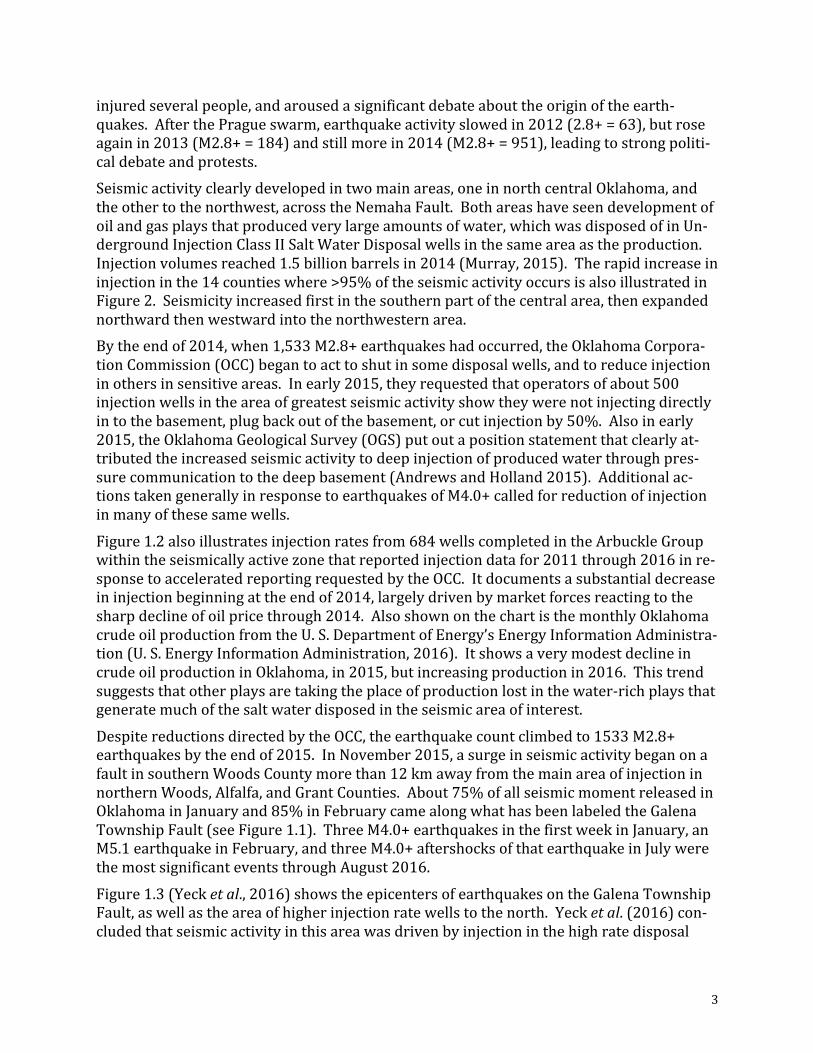
injuredseveralpeople,andarousedasignificantdebateabouttheoriginoftheearth-quakes.AfterthePragueswarm,earthquakeactivityslowedin2012(2.8+=63),butroseagainin2013(M2.8+=184)andstillmorein2014(M2.8+=951),leadingtostrongpoliti-caldebateandprotests.Seismicactivityclearlydevelopedintwomainareas,oneinnorthcentralOklahoma,andtheothertothenorthwest,acrosstheNemahaFault.Bothareashaveseendevelopmentofoilandgasplaysthatproducedverylargeamountsofwater,whichwasdisposedofinUn-dergroundInjectionClassIISaltWaterDisposalwellsinthesameareaastheproduction.Injectionvolumesreached1.5billionbarrelsin2014(Murray,2015).Therapidincreaseininjectioninthe14countieswhere>95%oftheseismicactivityoccursisalsoillustratedinFigure2.Seismicityincreasedfirstinthesouthernpartofthecentralarea,thenexpandednorthwardthenwestwardintothenorthwesternarea.Bytheendof2014,when1,533M2.8+earthquakeshadoccurred,theOklahomaCorpora-tionCommission(OCC)begantoacttoshutinsomedisposalwells,andtoreduceinjectioninothersinsensitiveareas.Inearly2015,theyrequestedthatoperatorsofabout500injectionwellsintheareaofgreatestseismicactivityshowtheywerenotinjectingdirectlyintothebasement,plugbackoutofthebasement,orcutinjectionby50%.Alsoinearly2015,theOklahomaGeologicalSurvey(OGS)putoutapositionstatementthatclearlyat-tributedtheincreasedseismicactivitytodeepinjectionofproducedwaterthroughpres-surecommunicationtothedeepbasement(AndrewsandHolland2015).Additionalac-tionstakengenerallyinresponsetoearthquakesofM4.0+calledforreductionofinjectioninmanyofthesesamewells.Figure1.2alsoillustratesinjectionratesfrom684wellscompletedintheArbuckleGroupwithintheseismicallyactivezonethatreportedinjectiondatafor2011through2016inre-sponsetoacceleratedreportingrequestedbytheOCC.Itdocumentsasubstantialdecreaseininjectionbeginningattheendof2014,largelydrivenbymarketforcesreactingtothesharpdeclineofoilpricethrough2014.AlsoshownonthechartisthemonthlyOklahomacrudeoilproductionfromtheU.S.DepartmentofEnergy’sEnergyInformationAdministra-tion(U.S.EnergyInformationAdministration,2016).ItshowsaverymodestdeclineincrudeoilproductioninOklahoma,in2015,butincreasingproductionin2016.Thistrendsuggeststhatotherplaysaretakingtheplaceofproductionlostinthewater-richplaysthatgeneratemuchofthesaltwaterdisposedintheseismicareaofinterest.DespitereductionsdirectedbytheOCC,theearthquakecountclimbedto1533M2.8+earthquakesbytheendof2015.InNovember2015,asurgeinseismicactivitybeganonafaultinsouthernWoodsCountymorethan12kmawayfromthemainareaofinjectioninnorthernWoods,Alfalfa,andGrantCounties.About75%ofallseismicmomentreleasedinOklahomainJanuaryand85%inFebruarycamealongwhathasbeenlabeledtheGalenaTownshipFault(seeFigure1.1).ThreeM4.0+earthquakesinthefirstweekinJanuary,anM5.1earthquakeinFebruary,andthreeM4.0+aftershocksofthatearthquakeinJulywerethemostsignificanteventsthroughAugust2016.Figure1.3(Yecketal.,2016)showstheepicentersofearthquakesontheGalenaTownshipFault,aswellastheareaofhigherinjectionratewellstothenorth.Yecketal.(2016)con-cludedthatseismicactivityinthisareawasdrivenbyinjectioninthehighratedisposal
4
wellsshowninthenorthernpartofthearea.Theyalsopointoutthat,whereasseismiceventsoccurrednearthehighinjectionratewells,noearthquakewasaslargeasthemainshockontheGalenaTownshipFault.Theyconcludethatthemagnitudeofinducedearth-quakesisdeterminedbythecharacteristicsofthefault,andnotthedegreeofporepres-sureenhancementfrominjection.Thisinferencesuggeststhatchangesininjectionratewillmostlikelyaffectthefrequencyofearthquakes,notthemagnitude.ElsewhereintheearthquakeAreaofInterest,earthquakefrequencydeclined.Thedeclinebeganinmid-2015inthecentralarea,andsomewhatlaterinthenorthwestarea.IntheCentralarea,whichexperienced14M4.0+earthquakesin2015,anM4.2earthquakeonNewYearsDay2016wasfollowedbyanintervalof88dayswithnoM4.0+earthquakes.Thenorthwestareaexperiencedapulseoflargerearthquakesinlate2015,amidatrendofgenerallydecreasingactivity.However,activityontheGalenaTownshipFaultledtoanoverallincreaseinM2.8+earthquakes.BeginninginMay2016,therateofM2.8+earth-quakesbeganarapiddecline.The180-dayrunningaverageofM2.8+earthquakesperdaypeakedinmid-2015atavaluenear4.5.Ithaddeclinedtoabout4.0bylateApril.Fromthere,itdeclinedtoabout2.3bytheendofSeptember,despiteburstsofactivityintheNorthwesternzoneinJulyandthePawneeearthquakeswarminSeptember.OvertheLaborDayweekend2016,aM5.8earthquakeoccurredinPawneeCounty,ontheeasternedgeoftheearthquakeAreaofInterest,inacountythathadexperiencedrelatively
Figure1.3:LocationofGalenaTownshipFaultandearthquakesoftheFairviewcluster(inWoodsandMajorCounties),aswellaszoneofhighrateinjectionwellsinGrantandAlfalfaCounties,~12kmaway.FromYeck,etal.,(2016)
5
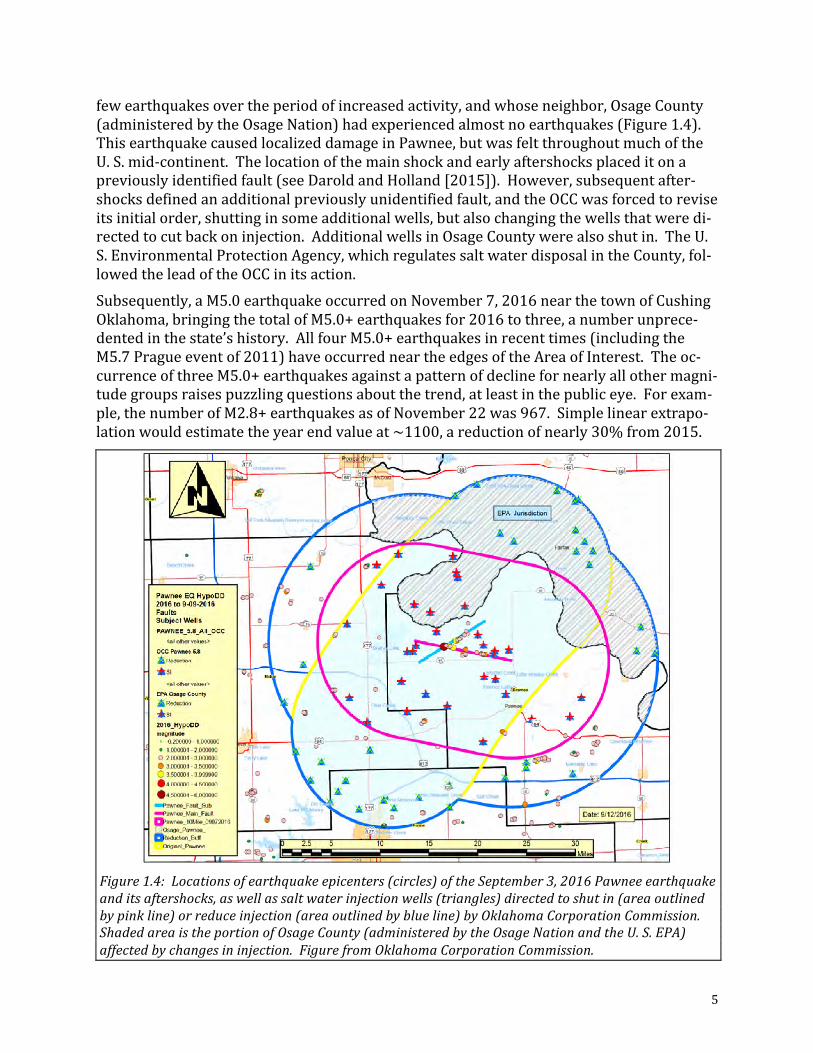
fewearthquakesovertheperiodofincreasedactivity,andwhoseneighbor,OsageCounty(administeredbytheOsageNation)hadexperiencedalmostnoearthquakes(Figure1.4).ThisearthquakecausedlocalizeddamageinPawnee,butwasfeltthroughoutmuchoftheU.S.mid-continent.Thelocationofthemainshockandearlyaftershocksplaceditonapreviouslyidentifiedfault(seeDaroldandHolland[2015]).However,subsequentafter-shocksdefinedanadditionalpreviouslyunidentifiedfault,andtheOCCwasforcedtoreviseitsinitialorder,shuttinginsomeadditionalwells,butalsochangingthewellsthatweredi-rectedtocutbackoninjection.AdditionalwellsinOsageCountywerealsoshutin.TheU.S. EnvironmentalProtectionAgency,whichregulatessaltwaterdisposalintheCounty,fol-lowedtheleadoftheOCCinitsaction.Subsequently,aM5.0earthquakeoccurredonNovember7,2016nearthetownofCushingOklahoma,bringingthetotalofM5.0+earthquakesfor2016tothree,anumberunprece-dentedinthestate’shistory.AllfourM5.0+earthquakesinrecenttimes(includingtheM5.7Pragueeventof2011)haveoccurredneartheedgesoftheAreaofInterest.Theoc-currenceofthreeM5.0+earthquakesagainstapatternofdeclinefornearlyallothermagni-tudegroupsraisespuzzlingquestionsaboutthetrend,atleastinthepubliceye.Forexam-ple,thenumberofM2.8+earthquakesasofNovember22was967.Simplelinearextrapo-lationwouldestimatetheyearendvalueat~1100,areductionofnearly30%from2015.
Figure1.4:Locationsofearthquakeepicenters(circles)oftheSeptember3,2016Pawneeearthquakeanditsaftershocks,aswellassaltwaterinjectionwells(triangles)directedtoshutin(areaoutlinedbypinkline)orreduceinjection(areaoutlinedbyblueline)byOklahomaCorporationCommission.ShadedareaistheportionofOsageCounty(administeredbytheOsageNationandtheU.S.EPA)affectedbychangesininjection.FigurefromOklahomaCorporationCommission.
6
ForMagnitude3.0earthquakes,thecurrentcountis591,whichwouldextrapolateto~660bytheendoftheyear–areductionofmorethan200fromthe2015valueof903.ActionsoftheCorporationCommission
TheOklahomaCorporationCommission(OCC)hastakennumerousstepstoreduceinjec-tionofproducedformationwateracrossmostoftheearthquake-pronearea.Theteamad-dressingtheearthquakeissuedefinedanearthquake-proneAreaofInterestthatencom-passedaverylargefractionoftheearthquakes.Thisareaincreasedinsizeastheearth-quakescontinued,althoughithasbeenstablesinceearly2016.TheOCChasissuedaseriesofdirectivescallingforchangesininjectionpracticesandquantitiesinresponsetotheevolvingseismicactivity(seeTable1.1).Averagedepthoftheearthquakeshasgenerallybeen5.4-5.5kilometers,indicatingthatmostoftheseismicityoccurswithinthecrystallinebasementofOklahoma(Daroldetal.,2015).InjectionintotheArbuckleGroup,thestratigraphicunitthatliesdirectlyonthecrystallinebasement,hasbeenidentifiedasthelikelycauseoftheearthquakes.Thelargestfractionofthevolumeofinjectionhasbeenintothishorizon,andincreasesofporepres-sureintheArbuckleareinterpretedtohavebeentransmittedtoblindfaultsinthecrystal-linebasement.Conclusions
TheelevatedseismicactivityresultingfromearthquakesinterpretedasinducedbyoilandgasoperationsinOklahomaishighlylikelytocontinueatleastthrough2017.Howmuchthenumberofearthquakeswilldecreasein2016islikelytodependupontheactivityontheGalenaTownshipFaultandonfaultsresponsibleforthePawneeandCushingearth-quakes.Asthelargestearthquakessince2011happenedinFebruary,SeptemberandNo-vemberof2016inthesezones,thereremainslargeuncertaintyaboutthefrequencyandmagnitudeofearthquakes,andtheirpotentialfordamage.EachoftheM5.0+eventshasresultedinsomedamage.However,theresultsofinitialdamagefromamoderate(sayM4.0+)earthquakethatisaggravatedbycumulativeshakingfromthenumeroussmallerearthquakeshasnotbeenevaluated,andremainsasignificantissueforthestate.Acknowledgements
TheauthoracknowledgesthesupportofmanymembersofthestaffoftheOklahomaGeo-logicalSurvey,particularlyhydrogeologistKyleMurrayandactingleadseismologistJeffer-sonChang.TheworkofAustinHollandandAmberleeDarold,whobuiltmuchofthepre-sentOGSseismicnetworkandestablishedtheframeworkforunderstandingOklahomaearthquakes,canhardlybeoverstated.ReferenceCited
Andrews,R.D.,andA.A.Holland2015,StatementonOklahomaSeismicity,April21,2015Darold,A.P.,A.A.Holland,J.K.Morris,A.R.Gibson,2015,OklahomaEarthquakeSummaryReport2014,OklahomaGeologicalSurveyOpen-FileReportOF1-2015,February2015Darold,A.P.,andA.A.Holland,2015,PreliminaryOptimalOklahomaFaultOrientationsOklahomaGeologicalSurveyOpenFileReportOF4-2015,July2015.
7
Murray,K.,2015,ClassIISaltwaterDisposalfor2009–2014attheAnnual-,State-,andCounty-ScalesbyGeologicZonesofCompletion,Oklahoma,OklahomaGeologicalSurveyOpen-FileReportOF5-2015,December2015.Walsh,F.R.andZoback,M.D.,2015,Oklahoma’srecentearthquakesandsaltwaterdis-posal,Sci.Adv.2015;1:e1500195Yeck,W.L.,M.Weingarten,H.M.Benz,D.E.McNamara,E.A.Bergman,R.B.Herrmann,J.L.Rubinstein,andP.S.Earle(2016),Far-fieldpressurizationlikelycausedoneofthelargestinjectioninducedearthquakesbyreactivatingalargepreexistingbasementfaultstructure,Geophys.Res.Lett.,43,doi:10.1002/2016GL070861.
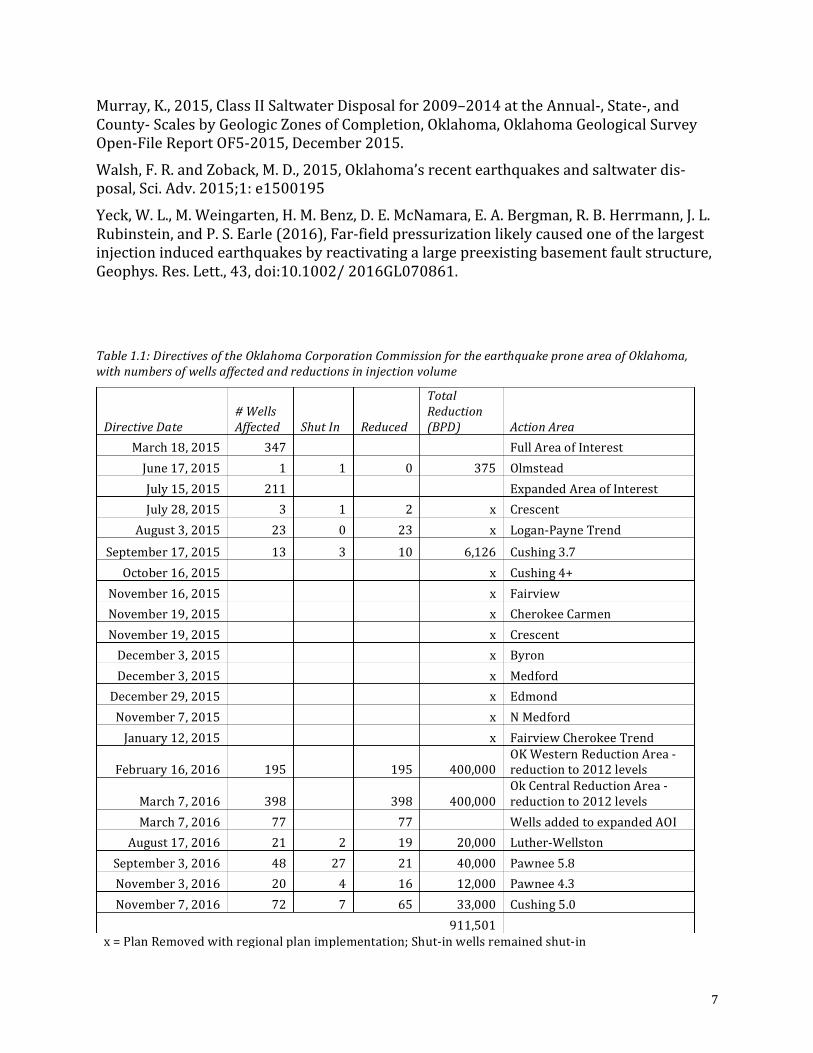
Table1.1:DirectivesoftheOklahomaCorporationCommissionfortheearthquakeproneareaofOklahoma,withnumbersofwellsaffectedandreductionsininjectionvolume
DirectiveDate#WellsAffected ShutIn Reduced
TotalReduction(BPD) ActionArea
March18,2015 347 FullAreaofInterestJune17,2015 1 1 0 375 OlmsteadJuly15,2015 211 ExpandedAreaofInterestJuly28,2015 3 1 2 x Crescent
August3,2015 23 0 23 x Logan-PayneTrendSeptember17,2015 13 3 10 6,126 Cushing3.7October16,2015 x Cushing4+
November16,2015 x FairviewNovember19,2015 x CherokeeCarmenNovember19,2015 x CrescentDecember3,2015 x ByronDecember3,2015 x MedfordDecember29,2015 x EdmondNovember7,2015 x NMedfordJanuary12,2015 x FairviewCherokeeTrend
February16,2016 195 195 400,000OKWesternReductionArea-reductionto2012levels
March7,2016 398 398 400,000OkCentralReductionArea-reductionto2012levels
March7,2016 77 77 WellsaddedtoexpandedAOIAugust17,2016 21 2 19 20,000 Luther-Wellston
September3,2016 48 27 21 40,000 Pawnee5.8November3,2016 20 4 16 12,000 Pawnee4.3November7,2016 72 7 65 33,000 Cushing5.0
911,501x=PlanRemovedwithregionalplanimplementation;Shut-inwellsremainedshut-in
8
DescriptionofRPSEATask6–SeismicMonitoring:TheSubcontractorshallinstallandoper-ate12seismicstationswithinstudyarea.DatashallbesentinrealtimetotheOklahomaGeologicalSurvey(OGS)seismicmonitoringsystemandprocessedforroutineproductssuchashypocentrallocationandfocalmechanism.Thestationsshallbelaidoutonaroughgridinculturallyquietlocations.These12stationsshallbeaugmentedbyfourportableseismicmonitoringsystemsfordetailedstudies,astheyareavailabledependingonseis-micitypatternsandparticularareasofinterest.Datafromthisseismicmonitoringeffortshallalsobeintegratedintothe3DEarthInterpretation(Task9.0)asseismictomography,hypocenterandstressorientations,andotherseismicimagingtechniques.ThereportappendedbelowsummarizesearthquakemonitoringactivitiesinOklahomadur-ing2015and2016,withreferencetoactivitiessupportedbytheRPSEAProject.
2. OklahomaEarthquakeSummaryReport2015-16
JeffersonChang,JeremyBoak,NoorulanGhouse,FernandoFerrerVargas,AndrewThielOklahomaGeologicalSurvey,SarkeysEnergyCenter,Rm.N-131100EastBoydSt.,Norman,Oklahoma73019-0628
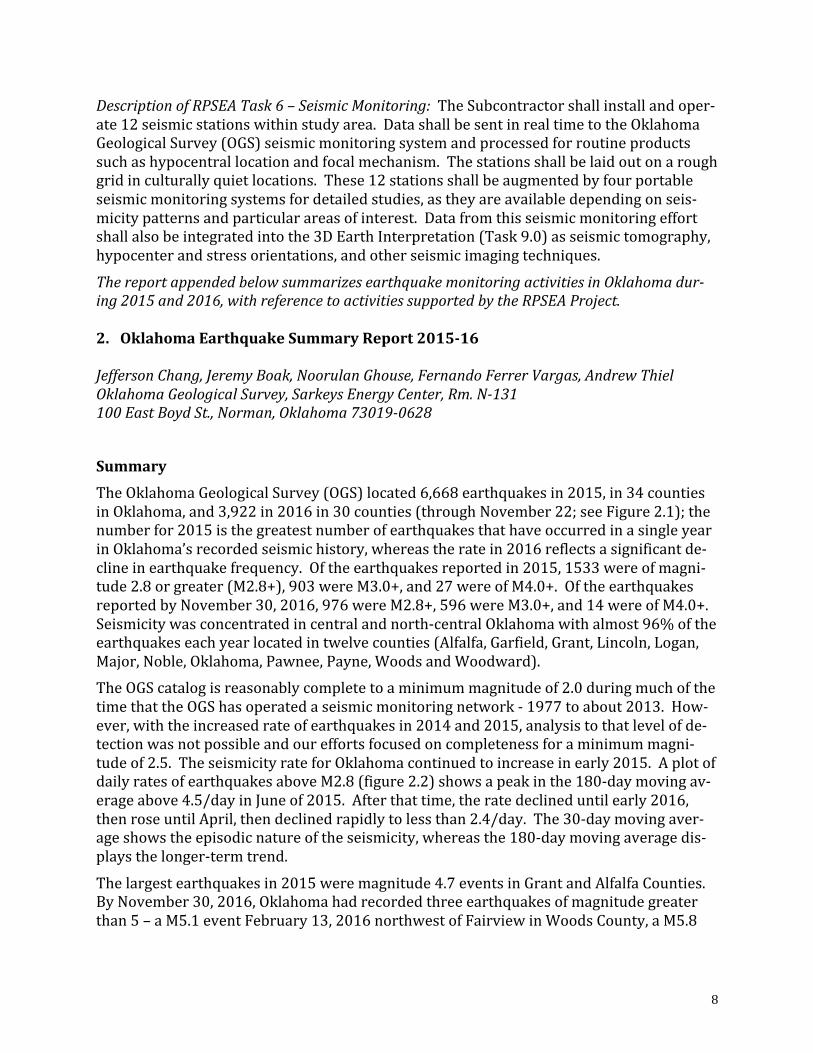
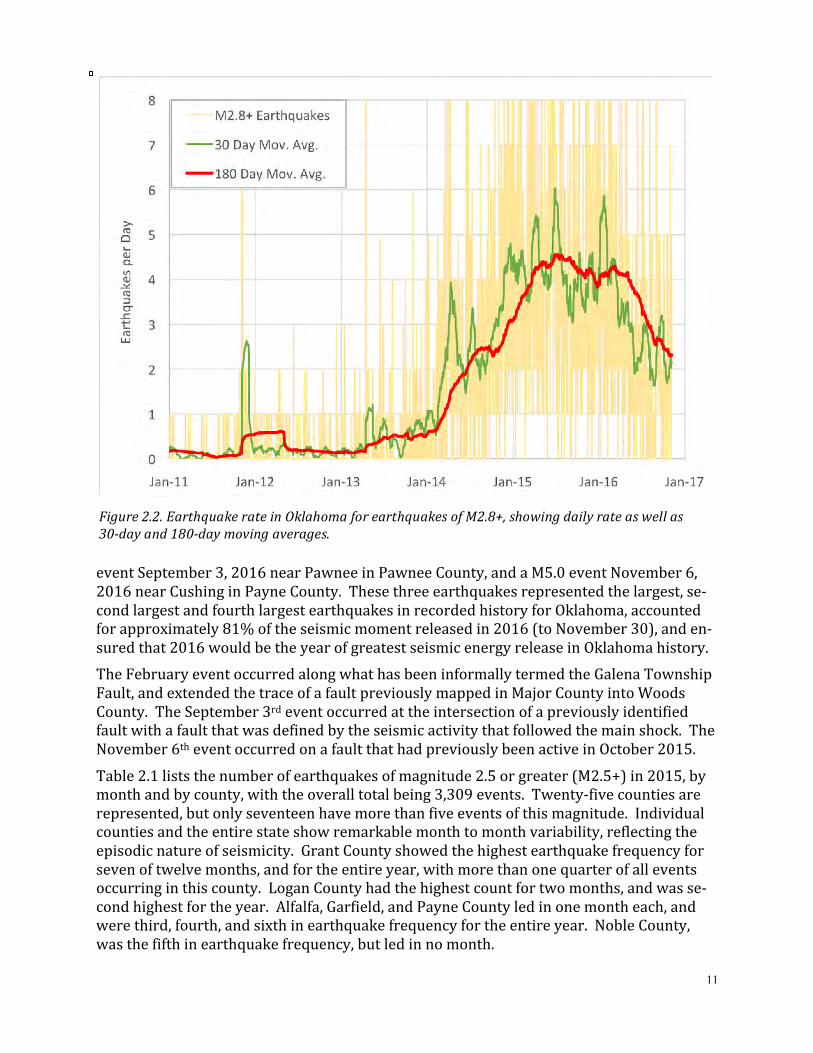
SummaryTheOklahomaGeologicalSurvey(OGS)located6,668earthquakesin2015,in34countiesinOklahoma,and3,922in2016in30counties(throughNovember22;seeFigure2.1);thenumberfor2015isthegreatestnumberofearthquakesthathaveoccurredinasingleyearinOklahoma’srecordedseismichistory,whereastheratein2016reflectsasignificantde-clineinearthquakefrequency.Oftheearthquakesreportedin2015,1533wereofmagni-tude2.8orgreater(M2.8+),903wereM3.0+,and27wereofM4.0+.OftheearthquakesreportedbyNovember30,2016,976wereM2.8+,596wereM3.0+,and14wereofM4.0+.Seismicitywasconcentratedincentralandnorth-centralOklahomawithalmost96%oftheearthquakeseachyearlocatedintwelvecounties(Alfalfa,Garfield,Grant,Lincoln,Logan,Major,Noble,Oklahoma,Pawnee,Payne,WoodsandWoodward).TheOGScatalogisreasonablycompletetoaminimummagnitudeof2.0duringmuchofthetimethattheOGShasoperatedaseismicmonitoringnetwork-1977toabout2013.How-ever,withtheincreasedrateofearthquakesin2014and2015,analysistothatlevelofde-tectionwasnotpossibleandoureffortsfocusedoncompletenessforaminimummagni-tudeof2.5.TheseismicityrateforOklahomacontinuedtoincreaseinearly2015.AplotofdailyratesofearthquakesaboveM2.8(figure2.2)showsapeakinthe180-daymovingav-erageabove4.5/dayinJuneof2015.Afterthattime,theratedeclineduntilearly2016,thenroseuntilApril,thendeclinedrapidlytolessthan2.4/day.The30-daymovingaver-ageshowstheepisodicnatureoftheseismicity,whereasthe180-daymovingaveragedis-playsthelonger-termtrend.Thelargestearthquakesin2015weremagnitude4.7eventsinGrantandAlfalfaCounties.ByNovember30,2016,Oklahomahadrecordedthreeearthquakesofmagnitudegreaterthan5–aM5.1eventFebruary13,2016northwestofFairviewinWoodsCounty,aM5.8
9
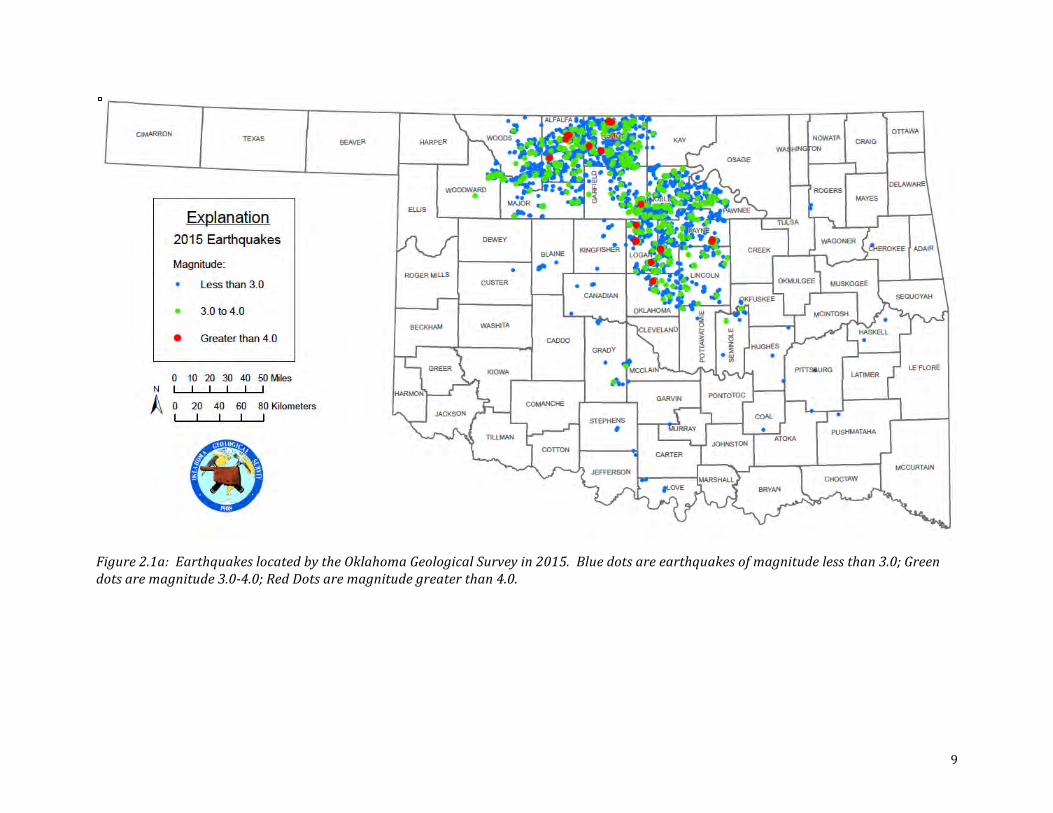
Figure2.1a:EarthquakeslocatedbytheOklahomaGeologicalSurveyin2015.Bluedotsareearthquakesofmagnitudelessthan3.0;Greendotsaremagnitude3.0-4.0;RedDotsaremagnitudegreaterthan4.0.
10
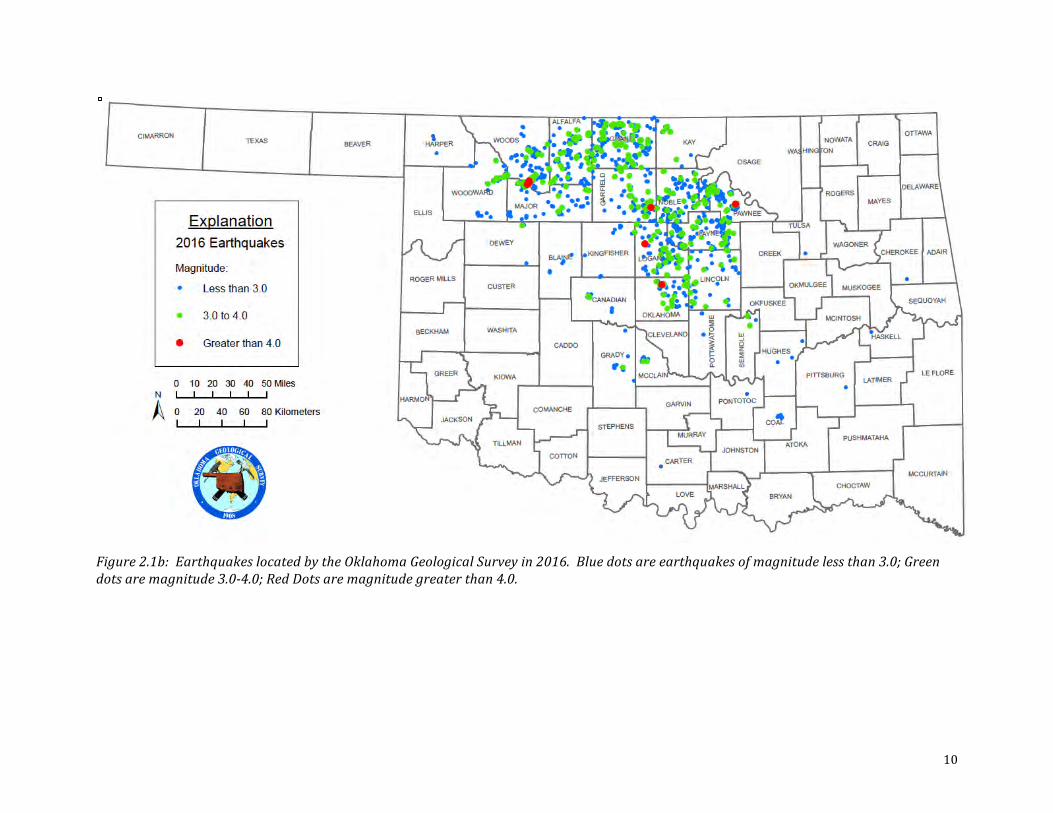
Figure2.1b:EarthquakeslocatedbytheOklahomaGeologicalSurveyin2016.Bluedotsareearthquakesofmagnitudelessthan3.0;Greendotsaremagnitude3.0-4.0;RedDotsaremagnitudegreaterthan4.0.
11
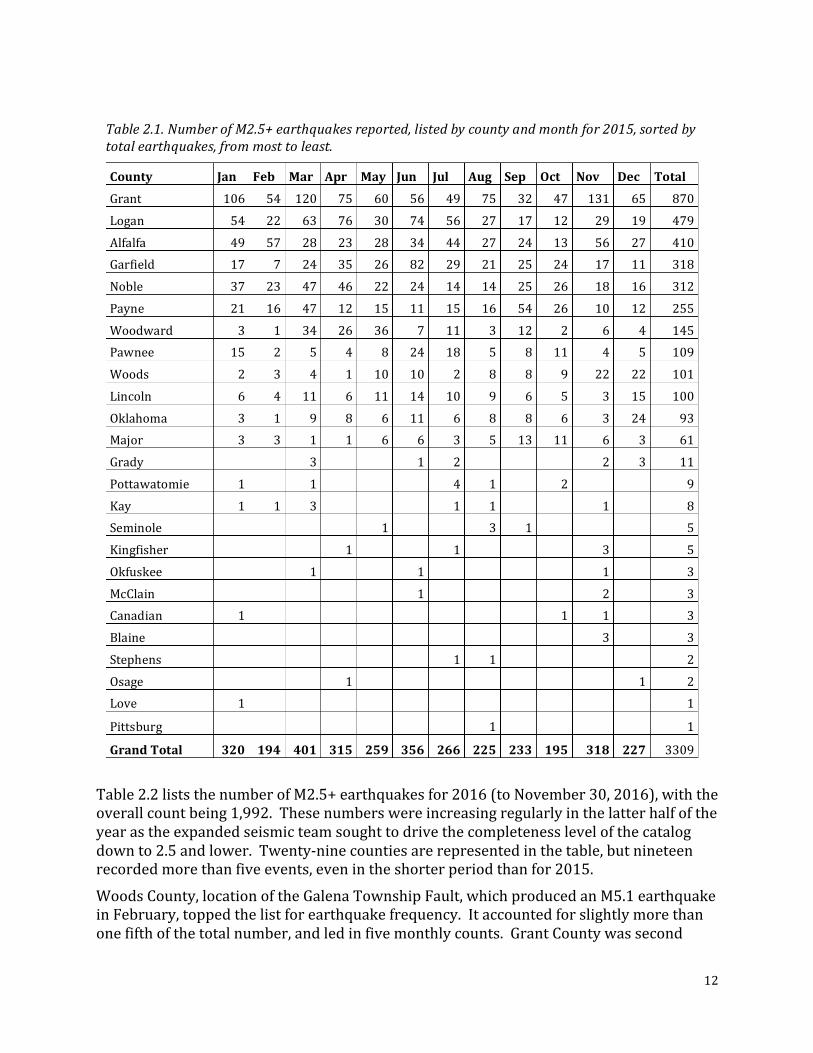
eventSeptember3,2016nearPawneeinPawneeCounty,andaM5.0eventNovember6,2016nearCushinginPayneCounty.Thesethreeearthquakesrepresentedthelargest,se-condlargestandfourthlargestearthquakesinrecordedhistoryforOklahoma,accountedforapproximately81%oftheseismicmomentreleasedin2016(toNovember30),anden-suredthat2016wouldbetheyearofgreatestseismicenergyreleaseinOklahomahistory.TheFebruaryeventoccurredalongwhathasbeeninformallytermedtheGalenaTownshipFault,andextendedthetraceofafaultpreviouslymappedinMajorCountyintoWoodsCounty.TheSeptember3rdeventoccurredattheintersectionofapreviouslyidentifiedfaultwithafaultthatwasdefinedbytheseismicactivitythatfollowedthemainshock.TheNovember6theventoccurredonafaultthathadpreviouslybeenactiveinOctober2015.Table2.1liststhenumberofearthquakesofmagnitude2.5orgreater(M2.5+)in2015,bymonthandbycounty,withtheoveralltotalbeing3,309events.Twenty-fivecountiesarerepresented,butonlyseventeenhavemorethanfiveeventsofthismagnitude.Individualcountiesandtheentirestateshowremarkablemonthtomonthvariability,reflectingtheepisodicnatureofseismicity.GrantCountyshowedthehighestearthquakefrequencyforsevenoftwelvemonths,andfortheentireyear,withmorethanonequarterofalleventsoccurringinthiscounty.LoganCountyhadthehighestcountfortwomonths,andwasse-condhighestfortheyear.Alfalfa,Garfield,andPayneCountyledinonemontheach,andwerethird,fourth,andsixthinearthquakefrequencyfortheentireyear.NobleCounty,wasthefifthinearthquakefrequency,butledinnomonth.
Figure2.2.EarthquakerateinOklahomaforearthquakesofM2.8+,showingdailyrateaswellas30-dayand180-daymovingaverages.
12
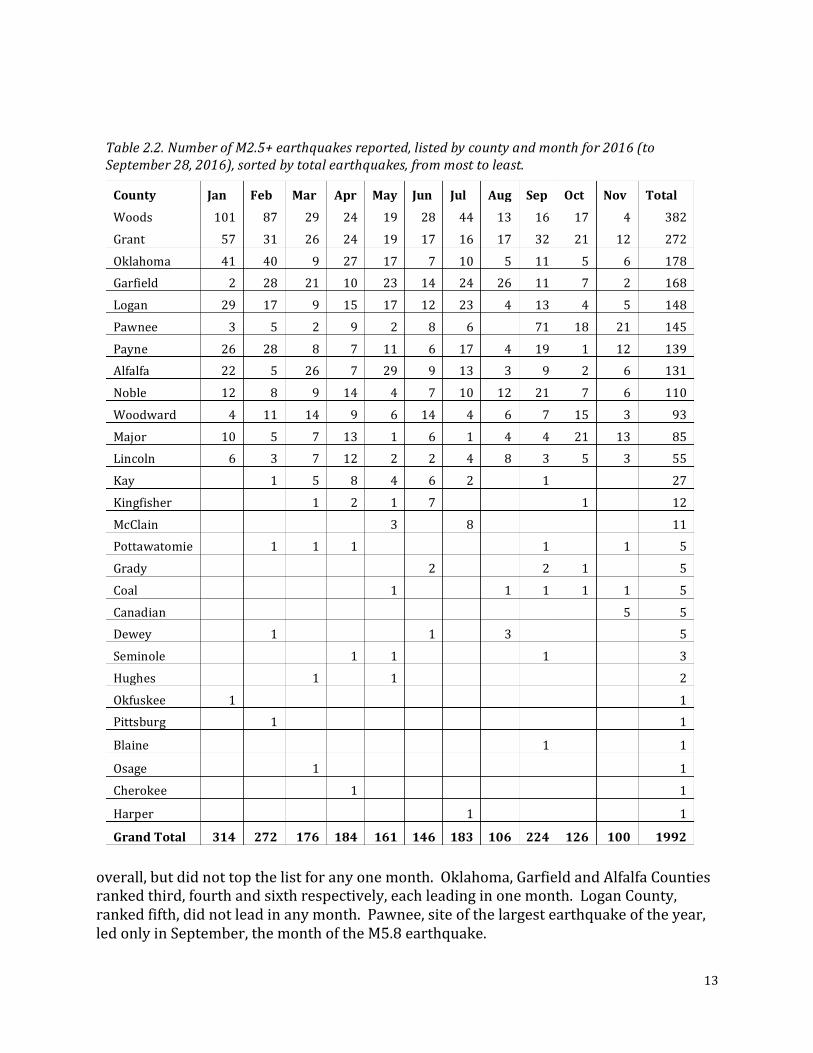
Table2.2liststhenumberofM2.5+earthquakesfor2016(toNovember30,2016),withtheoverallcountbeing1,992.Thesenumberswereincreasingregularlyinthelatterhalfoftheyearastheexpandedseismicteamsoughttodrivethecompletenesslevelofthecatalogdownto2.5andlower.Twenty-ninecountiesarerepresentedinthetable,butnineteenrecordedmorethanfiveevents,evenintheshorterperiodthanfor2015.WoodsCounty,locationoftheGalenaTownshipFault,whichproducedanM5.1earthquakeinFebruary,toppedthelistforearthquakefrequency.Itaccountedforslightlymorethanonefifthofthetotalnumber,andledinfivemonthlycounts.GrantCountywassecond
Table2.1.NumberofM2.5+earthquakesreported,listedbycountyandmonthfor2015,sortedbytotalearthquakes,frommosttoleast.
County Jan Feb Mar Apr May Jun Jul Aug Sep Oct Nov Dec Total
Grant 106 54 120 75 60 56 49 75 32 47 131 65 870Logan 54 22 63 76 30 74 56 27 17 12 29 19 479Alfalfa 49 57 28 23 28 34 44 27 24 13 56 27 410Garfield 17 7 24 35 26 82 29 21 25 24 17 11 318Noble 37 23 47 46 22 24 14 14 25 26 18 16 312Payne 21 16 47 12 15 11 15 16 54 26 10 12 255Woodward 3 1 34 26 36 7 11 3 12 2 6 4 145Pawnee 15 2 5 4 8 24 18 5 8 11 4 5 109Woods 2 3 4 1 10 10 2 8 8 9 22 22 101Lincoln 6 4 11 6 11 14 10 9 6 5 3 15 100Oklahoma 3 1 9 8 6 11 6 8 8 6 3 24 93Major 3 3 1 1 6 6 3 5 13 11 6 3 61Grady 3 1 2 2 3 11Pottawatomie 1 1 4 1 2 9Kay 1 1 3 1 1 1 8Seminole 1 3 1 5Kingfisher 1 1 3 5Okfuskee 1 1 1 3McClain 1 2 3Canadian 1 1 1 3Blaine 3 3Stephens 1 1 2Osage 1 1 2Love 1 1
Pittsburg 1 1
GrandTotal 320 194 401 315 259 356 266 225 233 195 318 227 3309
13
overall,butdidnottopthelistforanyonemonth.Oklahoma,GarfieldandAlfalfaCountiesrankedthird,fourthandsixthrespectively,eachleadinginonemonth.LoganCounty,rankedfifth,didnotleadinanymonth.Pawnee,siteofthelargestearthquakeoftheyear,ledonlyinSeptember,themonthoftheM5.8earthquake.
Table2.2.NumberofM2.5+earthquakesreported,listedbycountyandmonthfor2016(toSeptember28,2016),sortedbytotalearthquakes,frommosttoleast.
County Jan Feb Mar Apr May Jun Jul Aug Sep Oct Nov Total
Woods 101 87 29 24 19 28 44 13 16 17 4 382Grant 57 31 26 24 19 17 16 17 32 21 12 272Oklahoma 41 40 9 27 17 7 10 5 11 5 6 178Garfield 2 28 21 10 23 14 24 26 11 7 2 168Logan 29 17 9 15 17 12 23 4 13 4 5 148Pawnee 3 5 2 9 2 8 6 71 18 21 145Payne 26 28 8 7 11 6 17 4 19 1 12 139Alfalfa 22 5 26 7 29 9 13 3 9 2 6 131Noble 12 8 9 14 4 7 10 12 21 7 6 110Woodward 4 11 14 9 6 14 4 6 7 15 3 93Major 10 5 7 13 1 6 1 4 4 21 13 85Lincoln 6 3 7 12 2 2 4 8 3 5 3 55Kay 1 5 8 4 6 2 1 27Kingfisher 1 2 1 7 1 12McClain 3 8 11Pottawatomie 1 1 1 1 1 5Grady 2 2 1 5Coal 1 1 1 1 1 5Canadian 5 5Dewey 1 1 3 5Seminole 1 1 1 3Hughes 1 1 2Okfuskee 1 1Pittsburg 1 1
Blaine 1 1
Osage 1 1Cherokee 1 1
Harper 1 1
GrandTotal 314 272 176 184 161 146 183 106 224 126 100 1992
14
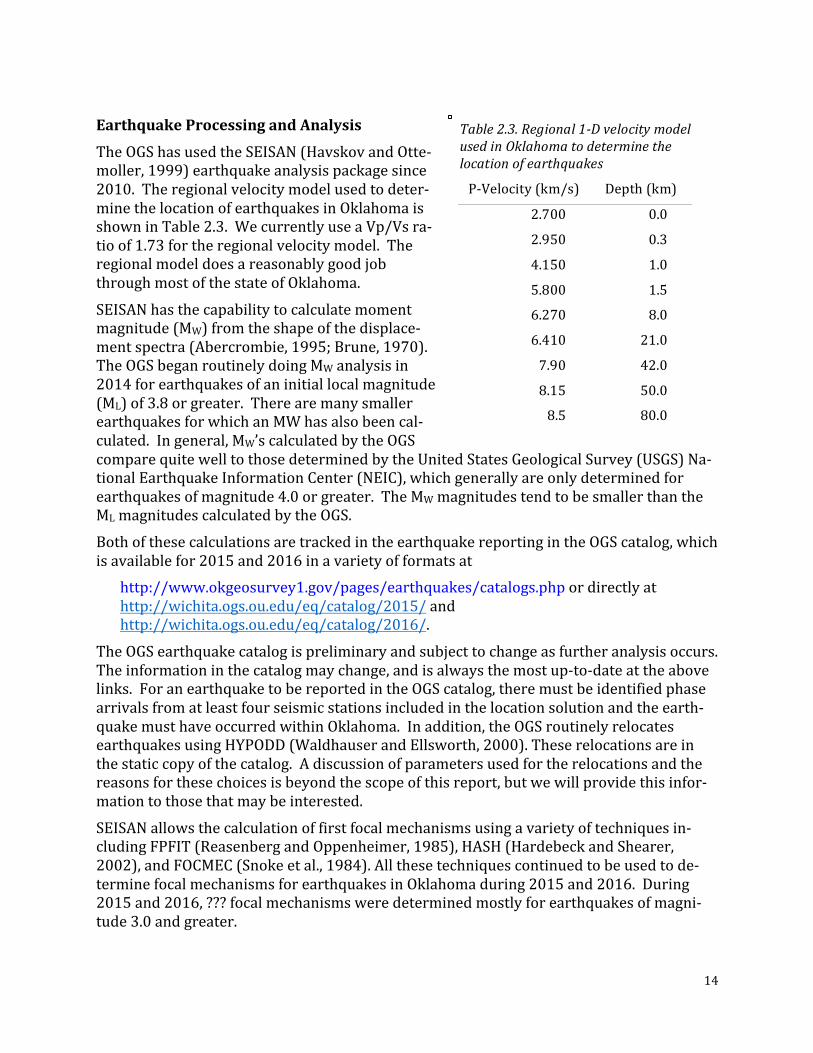
EarthquakeProcessingandAnalysisTheOGShasusedtheSEISAN(HavskovandOtte-moller,1999)earthquakeanalysispackagesince2010.Theregionalvelocitymodelusedtodeter-minethelocationofearthquakesinOklahomaisshowninTable2.3.WecurrentlyuseaVp/Vsra-tioof1.73fortheregionalvelocitymodel.TheregionalmodeldoesareasonablygoodjobthroughmostofthestateofOklahoma.SEISANhasthecapabilitytocalculatemomentmagnitude(MW)fromtheshapeofthedisplace-mentspectra(Abercrombie,1995;Brune,1970).TheOGSbeganroutinelydoingMWanalysisin2014forearthquakesofaninitiallocalmagnitude(ML)of3.8orgreater.TherearemanysmallerearthquakesforwhichanMWhasalsobeencal-culated.Ingeneral,MW’scalculatedbytheOGScomparequitewelltothosedeterminedbytheUnitedStatesGeologicalSurvey(USGS)Na-tionalEarthquakeInformationCenter(NEIC),whichgenerallyareonlydeterminedforearthquakesofmagnitude4.0orgreater.TheMWmagnitudestendtobesmallerthantheMLmagnitudescalculatedbytheOGS.BothofthesecalculationsaretrackedintheearthquakereportingintheOGScatalog,whichisavailablefor2015and2016inavarietyofformatsat
http://www.okgeosurvey1.gov/pages/earthquakes/catalogs.phpordirectlyathttp://wichita.ogs.ou.edu/eq/catalog/2015/andhttp://wichita.ogs.ou.edu/eq/catalog/2016/.
TheOGSearthquakecatalogispreliminaryandsubjecttochangeasfurtheranalysisoccurs.Theinformationinthecatalogmaychange,andisalwaysthemostup-to-dateattheabovelinks.ForanearthquaketobereportedintheOGScatalog,theremustbeidentifiedphasearrivalsfromatleastfourseismicstationsincludedinthelocationsolutionandtheearth-quakemusthaveoccurredwithinOklahoma.Inaddition,theOGSroutinelyrelocatesearthquakesusingHYPODD(WaldhauserandEllsworth,2000).Theserelocationsareinthestaticcopyofthecatalog.Adiscussionofparametersusedfortherelocationsandthereasonsforthesechoicesisbeyondthescopeofthisreport,butwewillprovidethisinfor-mationtothosethatmaybeinterested.SEISANallowsthecalculationoffirstfocalmechanismsusingavarietyoftechniquesin-cludingFPFIT(ReasenbergandOppenheimer,1985),HASH(HardebeckandShearer,2002),andFOCMEC(Snokeetal.,1984).Allthesetechniquescontinuedtobeusedtode-terminefocalmechanismsforearthquakesinOklahomaduring2015and2016.During2015and2016,???focalmechanismsweredeterminedmostlyforearthquakesofmagni-tude3.0andgreater.
Table2.3.Regional1-DvelocitymodelusedinOklahomatodeterminethelocationofearthquakes
P-Velocity(km/s) Depth(km)
2.700 0.0
2.950 0.3
4.150 1.0
5.800 1.5
6.270 8.0
6.410 21.0
7.90 42.0
8.15 50.0
8.5 80.0
15
TheOGSimplemented,withthesupportoftheUSGS,acontinuouswaveformbuffer(CWB)thatallowsforthereal-timeexchangeofdatafromourdataserverusingSEEDLINK,whichcontinuestobeusedtosenddatatotheIncorporatedResearchInstitutionsforSeismol-ogy’s(IRIS)datamanagementcenter(DMC).TheOGSCWBallowsforthecontinuousar-chivingofdataanddataretrievalforearthquakestudiesandanalysis.Inaddition,theOGSbeganoperatingaquasi-real-timeautomaticprocessingsystemcalledSeiProc.TheSeiProcsystemregularlyperformscoincidencetriggeringondifferentsub-netsinOklahoma.Onceeventsareidentified,thewaveformsareprocessedbyanauto-maticpickerandassociatoralgorithm(ChenandHolland,2014).AfteraneventhasbeenautomaticallylocatedusingtheSEISANearthquakelocationalgorithm,anMLisautomati-callydeterminedforeachearthquake.SeiProcallowsanalyststoprioritizetheireffortsbybeingabletoidentifyandbeginanaly-sisonearthquakeswithanautomaticallydeterminedmagnitudeof2.5orgreater.Fur-thermore,itreducestheeffortrequiredbyanalystsformanuallylocatingverysmallearth-quakes.Routinely,locationsandmagnitudescanchangesubstantiallyuponre-evaluationbyatrainedanalystcomparedtotheautomaticsystem.Becausethepotentialforproblem-aticeventsfromtheautomaticprocessingsystem,automaticearthquakesolutionsarenotreported.Thus,topreventconfusion,thesedataareonlyusedtoguideandprioritizetheanalysisofearthquakes.EarthquakeMagnitudesThestatehasseenanincreasednumberofmagnitude4.0orgreaterearthquakesin2015comparedtoyearsprior.However,afterfurtheranalysismanyhavemagnitudesbelow4.0;thisisoftenthecaseatboththeUSGSandtheOGS.Therearemanywaystocalculatemagnitudeandthemostreliablemethodsareusuallydoneaftertheinitialreportingofanearthquakeandfurtheranalysisoccurs.Themorereliablemethodsformagnitudedeterminationmostlyaffectthelargerearthquakesandtendtoreducetheirmagnitudeslightly.MostOklahomaearthquakesarelocatedandreportedwithaninitialMLandupdatedtoaMWiffurtheranalysisisdeemednecessary(i.e.theearthquakeisestimatedata3.8MLorgreater).ThemethodusedbytheOGStocalculateMLandtheMLattenuationrelationshipusedaredocumentedinDaroldetal.(2014).Localmagnitudesoftendisagreeslightlywithothermagnituderelationships,ascanbeseeninMiaoandLangston(2007),butarecommonlyusedbyregionalnetworks.Magnitudemeasurementsareestimatesbasedonrecordedgroundmotionsandhaveuncertaintythatcanbecharacterized(CEUS-SSC,2012).TheOGSusesthespectralshapeindisplacementofthePorSphasetodeterminetheMWforearthquakesusingfunctionalitywithinSEISAN(Abercrombie,1995;Brune,1970;Caprioetal.,2011;OttemollerandHavskov,2003).TheMWmoreaccuratelyrepresentstheareaofthefaultthatrupturedandthetotalenergyreleased(HanksandKanamori,1979;KanamoriandAnderson,1975),whereastheinitialMLusesmeasuredamplitudesandmaymoreaccuratelyrepresentthegroundshakingofanearthquakeexperiencedby
16
thosethatfeelit.TheOGSinitiallyreported60earthquakesatoraboveamagnitude4.0in2015and42in2016.However,aftercompletingMWanalysisandusingtheUSGSMWcal-culationsasthepreferredmagnitude,thenumberofreportedearthquakesatoraboveamagnitude4.0wasreducedto28for2015and14for2016(toNovember30,2016).ImprovementstoNetworkfromRPSEAProject
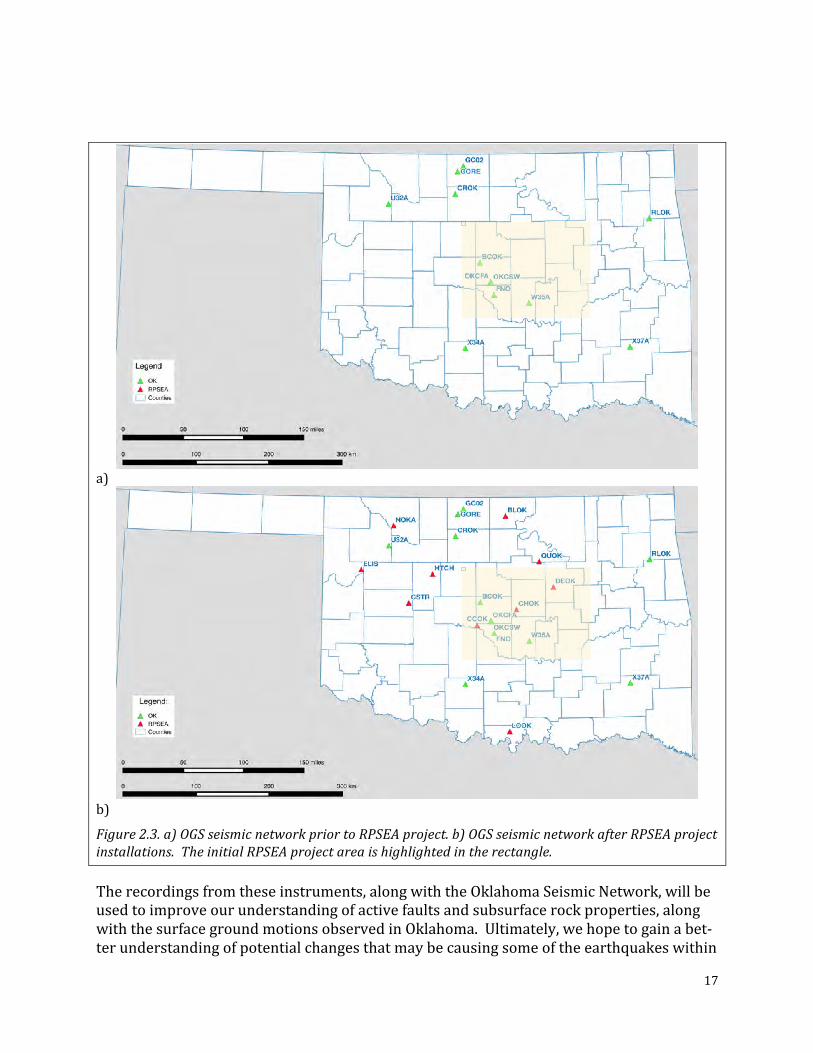
TohelpexpandandprioritizeanalysiseffortstheOGShaddevelopedandimplementedanautomaticprocessingandearthquakeevaluationsystemandupgradedtheexistingdataarchiving,retrieval,andexchangeprocesses.AdditionsandupgradestotheOGSseismicmonitoringnetworkduring2015and2016,continuedtodramaticallyimproveearthquakelocationaccuraciesandanalysis.TheconfigurationofOGSseismicstationsisshowninFigure2.3,bothbefore(2.3a)andafter(2.3b)implementationofthesystemupgradesaf-fordedbytheRPSEAProject.Inthefirstfewmonthsof2014,theOGSaddedfourtemporarystations,andoneperma-nentstationinresponsetoseveralearthquakeswarmswithincentralandnorth-centralOklahoma.InstrumentationforthreeofthesetemporarystationsaregenerouslyonloanfromtheUSGS.WereceivedinstrumentationfortheOklahomaRiskandHazard(OKRaH)networkinAugust2014andinstalled12temporarystationsincentralandnorth-centralOklahoma.TheseinstrumentswereborrowedfromtheIRISPortableArraySeismicStud-iesoftheContinentalLithosphere(PASSCAL),instrumentcenter.Twelveadditionalstations,acquiredusingmatchingfundsfortheRPSEAProjectfromtheOklahomaCorporationCommission,wereinstalledduring2015and2016.Tomeetwiththedemandsofanexpandingworkloadinallareasandtoimprovecommuni-cationwiththecommunity,theOGSaddedanactingleadseismologist,aleadseismicana-lyst,twoadditionalanalysts,andaseismictechnicianin2015and2016.However,theLeadSeismologist(AustinHolland)andResearchScientist(AmberleeDarold)bothlefttheOGSforpositionswiththeUnitedStatesGeologicalSurvey.JeffersonChangwaspromotedtoActingLeadSeismologistduringthesearchforaLeadSeismologist.InAugust2016,OGShiredJacobWaltertotheposition,withaNovember1,2016startdate.OklahomaRiskandHazard(OKRaH)NetworkOklahomaRiskandHazard(OKRaH)networkconsistsofasetoftemporaryseismicsta-tionsdeployedaspartofthisRPSEAProject,includingcostsharecontributionsfromthestateofOklahoma,theUniversityofOklahoma,andOklahomaoilandgasoperators.Forthisproject,12temporaryseismicstationsareoperatedincentralandnorth-centralOkla-homawithintheexistingseismicmonitoringnetworkoperatedbytheOGS.Eachstationconsistsofasensitiveseismometer,arecordingdevice,batteriesandasolarpanel.AlltwelveofthesestationsfeedimmediatelyintotheOGSseismicmonitoringsystem.ThedataareincorporatedintoroutineearthquakeanalysiswithinOklahomaorinsupportofotherresearchefforts.ThedataarealsoarchivedattheIRISDMC(www.iris.edu)andwillbemadeavailabletootherresearchersaftertheprojecthasbeencompleted.Onestation(KNG1)isbeingprovidedasopendataandisavailableattheIRISDMC.
17
a)
b)Figure2.3.a)OGSseismicnetworkpriortoRPSEAproject.b)OGSseismicnetworkafterRPSEAprojectinstallations.TheinitialRPSEAprojectareaishighlightedintherectangle.
Therecordingsfromtheseinstruments,alongwiththeOklahomaSeismicNetwork,willbeusedtoimproveourunderstandingofactivefaultsandsubsurfacerockproperties,alongwiththesurfacegroundmotionsobservedinOklahoma.Ultimately,wehopetogainabet-terunderstandingofpotentialchangesthatmaybecausingsomeoftheearthquakeswithin
18
Oklahoma.Further,current,informationontheOKRaHnetworkareavailableontheOGSseismicmonitoringwebsite.OGSOutreachandEducationEffortsTheincreasedrateofseismicityinOklahomain2014-15addedtothepotentialfuturerisktothepublic,thereforetheOGSsoughttoestablishamoreproactivestanceonearthquakeeducationandoutreachefforts.Thismultidimensionalapproachencompassedpresenta-tionstotheFederalEmergencyManagementAgency,localandstateemergencymanage-mentgroupsinadditiontoothercivicorganizations,astrongonlinepresence,activeen-gagementandopendialoguewithintheacademiccommunity,mediainterviews/state-ments,andtheproductionofhardcopypreparednessmaterials.Itisthroughtheseunder-takingsthattheOGSstayedconsistentlyvisibleandinformativetothepublic.WebsiteandSocialMediaOntheOGSwebsite(www.ou.edu/ogs/),asectionisdevotedtoinformationregardingOklahomaearthquakes.In2015and2016,theOGSwebsitepostedcurrentearthquakes,mapsoftheseismicmonitoringnetwork,earthquakecatalogues,currentandpastresearchpublications,andearthquakepreparedness/educationmaterial.Moreover,thewebsiteallowedfortheexternalreportingofearthquakesbythepublic(ReportFeelinganOklahomaEarthquake),askingseismologistsquestions(Askaseismologist)andthepostingoffrequentlyaskedquestionswithreplies(OKEarthquakeFAQ).ThehomepagedisplaysadirectlinktoourTwitterandFacebookaccounts.Twosocialmediaaccounts,Twitter’s@OKearthquakesandFacebook’sOklahomaGeologi-calSurvey–EarthquakeNotices,postthelatestinformationonOklahomaearthquakesastheyarelocatedandupdatedbyanalysts.Thecommunicationincludesthedate,time,mag-nitude,closesttown,latitude/longitude,anddepthofeachearthquake.Thenumberofsocialmediapostsgenerallycorrelateswiththenumberofearthquakesgreaterthanmagnitude2.4.Analysthoursoccurprimarilywithinworkdaysandworkinghours(8am-5pm);tweetsandFacebookpostsoccurmainlyduringthesetimes.Forearth-quakewithmagnitudesgreaterthan3.0,analystsareon-callandupdateearthquakeloca-tionsassoonaspossible,includingweekendsandholidays.TheTwitteraccount@OKearthquakescurrentlyhas3,191followers;thegeneralOGSac-count,@OKgeologyhas198additionalfollowers(total=3,389followers).TheFacebookaccountOklahomaGeologicalSurvey–EarthquakeNoticeshas2,168followers;theOkla-homaGeologicalSurveyaccounthas590additionalfollowers(total=2,758followers).AcademiaFromthemostbasictothemostadvancedlevelsofeducation,theOGSseismicgroupstrivestoextenditselfanditsknowledgetostudentsandscholarsinallareasconcerningOklahomaearthquakeeducationandon-goingresearch.TheOGSworkedwithmultipleprimary,secondary,andpost-secondaryinstitutionslastyearandheldatwodayWork-shoponOklahomaSeismicity,whichincludednumerouspresentationsandquestionandanswersessionsfortechnicalparticipantsfromFederalandstategovernment,academia,
19
nationallaboratories,andtheoilandgasindustry.Thefunctionwaswellattendedwithoveronehundredfortyparticipants.Attheprimaryandsecondarylevelsofeducation,theOGSacceptedseverallocalpublicschoolinvitationstoteachand/orgivepresentationsaboutearthquakes.Alongwiththeseinvitations,level-appropriatematerialswerecreatedtoscaffoldlearningforyoungstu-dentsandpreparednessbrochureswereprovidedtostudents,teachers,andparents.Addi-tionally,toursandpresentationswereheldforstudentsattheOGSfacilitiesbothinNor-man,OklahomaandLeonard,Oklahoma.BecausethemainofficesfortheOGSaresituatedattheUniversityofOklahomaandbe-causeeducationaloutreachishighlyvalued,theOGSemploysundergraduateandgraduatestudentstocreatemutuallybeneficialrelationshipsofinnovationanddevelopment.Thesestudent-employeeshelpwiththemaintenanceofcatalogs,databases,andevenemploytheirownoriginalresearchattimes.Inturn,theireducationandresearchreceivesinputfromprofessionalsandaddsacomponentofpracticalexperience.EmployeesoftheOGSseismicgrouppublishedseveralpapersin2015and2016andattendednumerousconferencestoshareandreceiveinputforrecentseismicfindingsinOklahoma.Theycollaboratedoftenwithinstitutionsandresearchersnation-wideandpar-ticipatedintheUSGSPowellCenterWorkingGrouponInducedSeismicity.Theirpublica-tionscanbefoundonthewebsiteorinthelistprovidedinChapter9:TechnologyTransferActivities.LocalCommunitiesRepresentativesfromtheOGSseismicmonitoringprogramgavenumerouspresentationstocommunityorganizationsalloverthestate.Thesepresentationsprovidedgeneral,fac-tualinformationontheincreaseofOklahomaearthquakesandvitalinformationaboutOk-lahomaearthquakehazardandpreparedness.Bysharingthisinformationwithcivic-mindedcommunityorganizations,itistheOGS’sexpectationthatcommunityleaders(membersoftheseorganizations)willfurtherdisseminateit,ultimatelyestablishingmorepublicawareness.MediaTheOGSseismicgroupofferedmanyinterviewandmediacoverageopportunitiestolocal,nationalandglobalmedia.Throughmediaexposure,theOGSgainedyetanothermethodofcommunicationandtransparencywiththepublic.Publications2015-2016Publicationsin2015and2016arelistedinChapter9:TechnologyTransferActivitiesConcludingRemarksEarthquakesarenotpredictableandwedonotknowwhatthefutureholds,therefore,itisnotpossibletoknowwhetherwearegoingtoseeanincreaseoradecreasein2017orbe-yond.The2016decreaseinearthquakesofamagnitude4.0andgreaterdecreasestheprobabilitythatwecouldhaveadamagingearthquakeinOklahoma.Ontheotherhand,theoccurrenceofthreeearthquakesofmagnitude5.0andgreatersuggestscontinuing
20
strongconcernaboutthepossibilityofdamagingearthquakes.BecauseitisimportantforOklahomanstounderstandhowtoprepareandwhattododuringanearthquake,ourweb-sitehasrelatedinformationandlinksaimedtoeducatethepublicaboutearthquakepreparedness.AcknowledgementsWewouldliketothankallthosethathelpedwiththemonumentaltaskofearthquakeanal-ysisin2015and2016,includingStephenMarsh,JenniferMorris,NoorulanGhouse,An-drewThiel,andJunjunHu.WewouldalsoliketothankIsaacWoelfel,ourseismologytech-nician,whomaintainstheseismographsandhasworkedtirelesslytoinstallnewandmoveexistingseismometersduringtheseverychallengingyears.WealsowishtoacknowledgeHarleyBenz,PaulEarle,DavidKetchum,JustinRubinstein,RobertWilliamsandmanyoth-ersattheUSGSfortheirhelp,supportandproductiveinteractions.ReferencesCitedAbercrombie,R.E.,1995,Earthquakesourcescalingrelationshipsfrom-1to5MLusingseismogramsrecordedat2.5kmdepth:J.Geophys.Res,v.100,no.B12,p.24,015-024,036.Aki,M.,1965,MaximumlikelihoodestimateofbintheformulalogN=a-bManditsconfi-dencelimits:Bull.EarthquakeRes.Inst.,TokyoUniv.,v.43,p.237-239.Brune,J.N.,1970,TectonicStressandtheSpectraofSeismicShearWavesfromEarth-quakes:J.Geophys.Res,v.75,no.26,p.4997-5009.Caprio,M.,Lancieri,M.,Cua,G.B.,Zollo,A.,andWiemer,S.,2011,Anevolutionaryapproachtoreal-timemomentmagnitudeestimationviainversionofdisplacementspectra:Geophys.Res.Let.,v.38,no.L02301,p.7.CEUS-SSC,2012,TechnicalReport:CentralandEasternUnitedStatesSeismicSourceChar-acterizationforNuclearFacilities,EPRI,PaloAlto,CA,U.S.DOE,andU.S.NRC,p.3176.Chen,C.,andHolland,A.A.,2014,APure-PythonPhasePickerandEventAssociator:Seis-mol.Res.Lett.,v.85,no.2,p.414.Darold,A.,Holland,A.A.,Chen,C.,andYoungblood,A.,2014,PreliminaryAnalysisofSeis-micityNearEagleton1-29,CarterCounty,July2014:Okla.Geol.Surv.Open-FileReport,v.OF2-2014,p.17.Gutenberg,B.,andRichter,C.F.,1944,FrequencyofEarthquakesinCalifornia:Bull.Seis-mol.Soc.Am.,v.34,no.4,p.185-188.Hainzl,S.,Scherbaum,F.,andBeauval,C.,2006,EstimatingBackgroundActivityBasedonInterevent-TimeDistribution:Bull.Seismol.Soc.Am.,v.96,no.1,p.313-320.Hanks,T.C.,andKanamori,H.,1979,AMomentMagnitudeScale:J.Geophys.Res.,v.84,no.5,p.2348-2350.Hardebeck,J.L.,andShearer,P.M.,2002,ANewMethodforDeterminingFirst-MotionFo-calMechanisms:Bull.Seismol.Soc.Amer.,v.92,no.6,p.2264-2276.
21
Havskov,J.,andOttemoller,L.,1999,SeisAnEarthquakeAnalysisSoftware:Seismol.Res.Lett.,v.70,p.532-534.Holland,A.A.,2013,OptimalFaultOrientationswithinOklahoma:Seismol.Res.Lett.,v.84,no.5,p.876-890.Kanamori,H.,andAnderson,D.L.,1975,Theoreticalbasisofsomeempiricalrelationsinseismology:Bull.Seismol.Soc.Amer.,v.65,p.1073-1095.Miao,Q.,andLangston,C.A.,2007,EmpiricalDistanceAttenuationandtheLocal-Magni-tudeScalefortheCentralUnitedStates:Bull.Seismol.Soc.Amer.,v.97,no.6,p.2137-2151.Ottemoller,L.,andHavskov,J.,2003,MomentMagnitudeDeterminationforLocalandRe-gionalEarthquakesBasedonSourceSpectra:Bull.Seismol.Soc.Am.,v.93,no.1,p.203-214.Reasenberg,P.,andOppenheimer,D.,1985,Fpfit,fpplot,andfppage:Fortrancomputerprogramsforcalculatinganddisplayingearthquakefaultplanesolutions.:U.S.Geol.SurveyOpen-FileReport,v.85-739,p.25.Snoke,J.A.,Munsey,J.W.,Teague,A.G.,andBollinger,G.A.,1984,AprogramforfocalmechanismdeterminationbycombineduseofpolarityandSV-Pamplituderatiodata:EarthquakeNotes,v.55,p.15.Waldhauser,F.,andEllsworth,W.L.,2000,Adouble-differenceearthquakelocationalgo-rithm:MethodandapplicationtothenorthernHaywardfault:Bull.Seismol.Soc.Amer.,v.90,p.1353-1368.Zoback,M.L.,1992,First-andSecond-OrderPatternsofStressintheLithosphere:TheWorldStressMapProject:J.Geophys.Res,v.97,no.B8,p.11,703-711,728.
22
DescriptionofRPSEATask6–CollectGravityInfillData:TheSubcontractorshallcollectadditionalgravitydatatoinfillexistinggravitydata.Thelocationoftheinfillgravitydatashallbedependentonthespatialresolutionoftheexistinggravitydataandthenecessitytovalidatethedensitydistributionwithinthe3Dgeologyinterpretationaspartoftherecursiveprocessaddressingthemisfitbetweentheobservedandestimatedgravitydata.
ThereportappendedbelowsummarizesgravitydatacollectionactivitiessupportedbytheRPSEAProject.
3. GravityDataCollectionStephenHolloway,KevinCrainOklahomaGeologicalSurvey,SarkeysEnergyCenter,Rm.N-131100EastBoydSt.,Norman,Oklahoma73019-0628
Introduction
ThegoalofthegravitycollectionportionoftheRPSEAprojectwassupplydatatomodelthesubsurfacestructuretobetterunderstandthestructureofthecrystallinebasementaspartofourefforttostudytheseismicityintheregion.TheobjectivesofthegravitycollectionfieldworkconductedfromJune2014toJuly2016wereseveral-fold:
• tocollectmoredenselyspacedgroundgravitymeasurementstoaddtoaregionalgravitydatabase,
• toidentifysignificantgravityanomaliestobeincorporatedintoageologicmodel,and
• toidentifyfaultsanddeeperstructuresespeciallyinareasofpossibleinducedseismicity.
ThisgravityfieldworkbuildsuponthePACESGravityDatabasedevelopedbytheUniver-sityofTexasatElPaso,whichcontainscontributionsfromtheU.S.GeologicalSurvey,theNationalGeospatial-IntelligenceAgency,NationalOceanicandAtmosphericAdministra-tion,industryandacademiccolleagues.DetailsofthePACESGravityDatabasecompilationeffortareavailableintheUSGSOpen-FileReport02-463(http://pubs.usgs.gov/of/2002/0463/).Ourworkfocusedonincreasingthespatialden-sityofthegravitymeasurementsinthedefinedRPSEAstudyarea,whichcenteredonthePragueearthquakesequence.Also,astheearthquakefrequencyincreasedandthelocationofseismicitychangedovertime,weshiftedourfocusnorthward,extendingbeyondouroriginalstudyarea.Gravitypotentialfieldanomaliesreflectvariationsinthephysicalpropertiesofrocksatdepth.Combinedwithindependentconstraintsfromgeologicfieldmapping,boreholeanalysis,geomagneticsurveyanomalies,andothergeophysicalobservations,gravitystud-iesprovideinsightintotheburiedgeologicalstructuresandthetectonicdevelopmentofthearea.
23
GlobalPositioningSystem(GPS)Data
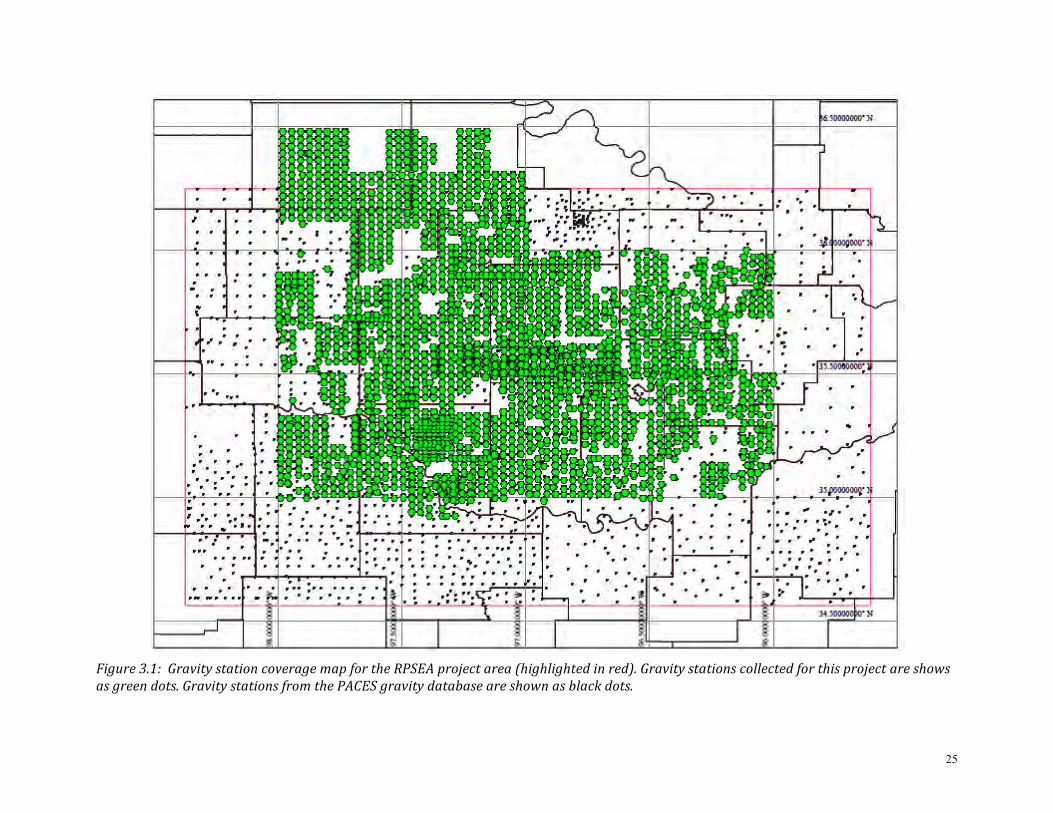
High-qualityGPSlocationdataarerequiredforaccurategravityanalysis.Sub-decimeterelevationaccuracyisneededtoobtaingravityreadingsthataremoreaccuratethan20mi-crogal(µGal,10-8m/sec2).Horizontalaccuracyisnotascrucialasverticalaccuracyinthegravitydatareductionprocess,althoughGPSsolutionstypicallyprovideahorizontalaccu-racythatisaboutthreetimesasfineastheverticalaccuracy.BoththeaccuracyandtheprecisionofaGPSsolutionareimportantforevaluatingthequalityofalocationdetermina-tion,butGPSprocessingsoftwarecommonlyreportsonlyprecisionestimates.WeemployedtwoGPSunits(abaseandarover)tomeasurehigh-qualitylocationsatgravitystations.Theseunitsutilizedual-frequencycarrier-phaseantennasandapplydif-ferentialcorrectionsrelativetolocalbasestationsaftertheGPStime-seriesarerecorded.TheGPSunitsusedwereTopconGB-1000receiverswithPG-A1withgroundplaneanten-nas.Topcondocumentationspecifiesahorizontalaccuracyof10mm+1.0ppm(xbaselinelength)andverticalaccuracyof15mm+1.0ppm(xbaselinelength).So,forexample,abaselineof10kmbetweenthebaseandroverGPSunitswouldyieldahorizontalaccuracyof20mmandverticalaccuracyof25mmunderidealconditions.Tofurtherincreaseouraccuracy,thebasestationmeasurementsaresubmittedtotheNa-tionalGeodeticSurvey's(NGS)OnlinePositioningUserService(OPUS),whichusesthethreenearestContinuouslyOperatingReferenceStations(CORS)intheregiontocalculatedifferentiallyahigh-precisionlocationofthebasestation.ThebaseandroverreceiversrecordedGPSdataevery5seconds.TheGPSroverdatawereacquiredatgravitystationsduring5-minuteoccupations.Onsomeoccasions,welostcar-rierphase-lockontheroverandhadtoreacquireit.Thisnecessitatesanew10-minutestaticwaittimebeforecontinuing.Wealsotestedreal-timekinematic(RTK)observationmodeinpriorfieldsessionsbutex-periencedproblemswithradioshadowing,outofrangeconditions,significantbatterydraw,plustheaddedcomplicationofneedingtomovethebasestationsmultipletimesperday.Weultimatelydecidedthatpost-processingwouldgiveussatisfactoryresultswhileutilizingourtimeefficientlyinthefield.GPSobservationsarerecordedasellipsoidalheightandmustbeconvertedtoorthometricheightbeforebeingusedforgeophysicalanalysis.WefirstconvertthestandardGPSout-putofWGS84datumtoNAD83(2011)toincorporatetheCORSstationcorrections.WethenconvertellipsoidalheighttoorthometricheightusingNAVD88(computedusingGE-OID12B).GravityDataWecollectedgravityobservationsat3,092locationsinnorthcentralOklahomaover160fielddaysfromJune2014toJuly2016(Figure3.1).Weusedtwogravitymeters,bothScin-trexCG-5Autogravsystems(serialnumbers080940457and080940101).Thesegravitymeterscomputeagravityreadingfromafilteredtimeseriesofrawreadingsoveraspeci-fiedintervaloftime.Weusedanoccupationtimeof1minute,whichwasrecommendedby
24
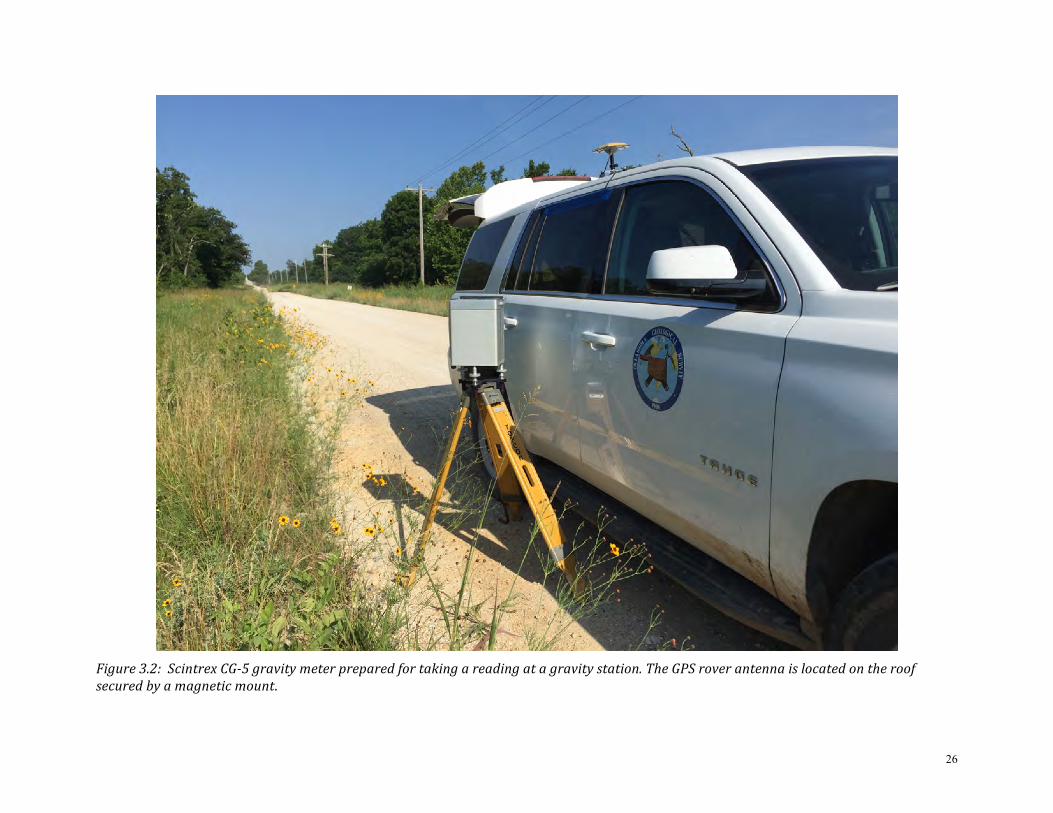
themanufacturer.Ateachgravitystation,wecollected3occupationsandwhensubse-quentgravityreadingswerewithin0.02µGal,weacceptedtheaverageofthethreeread-ingsasthevalueforthestation.WeutilizedtheabsolutegravitybasestationSEC1thatwasestablishedin2005.SEC1islocatedinthebasementoftheSarkeysEnergyCenteronTheUniversityofOklahomacam-pus.Itisasmallbrasscapembeddedinconcreteoppositethetowerelevatorsonlevel1.AbsoluteghasbeenestimatedatSEC1tobe979656.483±0.016mGals.WevisitedSEC1atthebeginningandendofeachgravityfieldday,takingthreesetsofthreereadingsandthentakingtheaveragetoestablishourstartingandendingabsolutevalues.Aftertakingourabsolutegravitybasestationreadings,wethenwoulddrivetoapredeter-minedareaandestablishalocalrelativegravityfieldbasestation.Thislocationofthefieldbasestationwaschosenbasedonseveralfactorsincludingaccessibility,security,andacentrallocationforthedesiredareatargetedforthatfieldday.Goodpracticeistorepeatreadingsatthesamefieldbasestationovermultipledaysandtiethosereadingstotheab-solutegravitybasestation.Thisservesasanaddedcheckontherepeatabilityofreadings.Gravityobservationsweremadeadjacenttothefieldvehicle(Figure3.2)alongpublicroadways,generallyalongsection-lineroads.Stationswerelocatedwith2-milespacingasacompromisebetweencoverageanddensitybothtofillexistinggravitycoveragegapsandtocollectagridofhigherspatialdensitystationspacing.Toprocessthegravitydata,wefirstcorrectforinstrumentdriftbycomparingthediffer-encebetweenthetide-correctedgravityreadingsatthegravitybasestationatthebegin-ningandendingofeachday.Thisisinadditiontothebuilt-intidalandinstrumentdriftcorrections.Wethenapplythestandardlatitudecorrectionandfree-aircorrectiontoeachreading.Atthispoint,theFreeAirgravityanomalyvaluescouldbeincorporatedintoourgravitymodelingeffort.Atotalof9,020uniquegravityreadingswerereduced,resultingin3,092gravitystationswithaccompanyingpost-processedGPScoordinates.
25
Figure3.1:GravitystationcoveragemapfortheRPSEAprojectarea(highlightedinred).Gravitystationscollectedforthisprojectareshowsasgreendots.GravitystationsfromthePACESgravitydatabaseareshownasblackdots.
26
Figure3.2:ScintrexCG-5gravitymeterpreparedfortakingareadingatagravitystation.TheGPSroverantennaislocatedontheroofsecuredbyamagneticmount.
27
DescriptionofRPSEATask9–ConstructionofIntegratedMulti-Variate3DGeologicInter-pretation
Thistaskprovidesthecrucialintegrativeplatformfortheintegratedanalysis.Amulti-vari-ate3-dimensional(3D)earthmodelbasedona3Dgeologicalinterpretationinitiallyem-ployingsubsurfacedata,digitalelevation,andresultsthatdefinestructuresbelowdrillingdepthsshallbedeveloped.The3Dinterpretationshallbebasedongravitydatathatcoversthestudyareauniformly,andshallbeiteratedbasedonresultssuchasseismictomogra-phy,seismicdataprovidedbyindustry,anddetailedwellloganalysis.
ThereportappendedbelowsummarizesaportionofTask9comprisingaseismictomographystudyinOklahoma,supportedbytheRPSEAProject.
4. SeismicTomographyofNorthCentralOklahomaChenChenOklahomaGeologicalSurvey,SarkeysEnergyCenter,Rm.N-131100EastBoydSt.,Norman,Oklahoma73019-0628
ThelargenumberofearthquakesthatoccurredinOklahomaandthesurroundingregionhavedrawnagreatdealofattentionsince2009.Manyseismometersweredeployedinthisregiontobetterrecordtheseismicity;thesenewinstrumentseasilyproducelargedatasetsthatarealmostimpossibletoprocessmanually.ChenandHolland[2016]developedaPy-thonpackageforautomaticallydetectingearthquakesandmakingphasepicks.ThesurgingseismicactivityinOklahomaprovidesanexcellentopportunitytostudydeepstructureswithinthecrystallinebasement,whicharehelpfultobetterunderstandtherelationshipbetweentheseismicityandgeologicalstructures.Priorto2009,earthquakesinOklahomaoccurredoverabroadregion,withoutshowingaclearrelationshipwithpreviouslyknownstructures.However,therecentprofoundseismicityincreasemayberelatedtoreactiva-tionoffaultsand/orfractureswithinthebasement,whichhavebeeninterpretedtobetrig-geredbywastewaterinjectionthatincreasesthepore-pressure,inturnpromotingfaultslip(forexample,Keranenetal.,2013).
Chenderivedtwovelocitymodelsusingnorth-centralOklahomaearthquakes.ByusingFMTOMO,hecreatedthefirstvelocitymodelwith>8000earthquakesofmagnitude2.0orgreater(M2+).Thismodelusedseveralcutoffs,suchasrequiringdepths>3.0km,numberofstationswithobservedarrivals>12,androotmeansquare(RMS)residualsoftravel-time<0.6seconds(s),thatwereselectedtocontrolthedataqualityandcomputationtime.Tobettercontrolthevelocitymodelfromthetomographicinversion,Chenfilteredthepickswithtravel-timeerrorsgreaterthan1.5scomparingtopredictedtravel-timebasedonaonedimensional(1D)velocitymodel.Afterfilteringthepicks,therewere153,119P-and145,949S-picksleft.TheVp/Vsratiousedwas1.73.
28
ThereliableregionofbothP-andS-wavetomographyresultswasestimatedwithchecker-boardtests.Thealternativelyperturbedvelocityanomalieswereimposedontotheinitial1Dvelocitymodeltocreateacheckerboardpattern.Positiveandnegativeanomaliesof0.6km/s,wereaddedtoP-wavevelocity,andsimilarly±0.3km/swereaddedtoS-waveveloc-ityalternatively.Themodelwasparameterizedwithanoptimizednodespacingofabout0.15°(Dx:~13km)´0.12°(Dy:~13km)´2.8km(Dz)afterseveraltestswithdifferentnodespacing.Thesolutionconvergedwell,andtheresidualswerereducedtoareasonablelevelafter4iterations.ThecheckerboardpatternsoftheP-wavevelocitymodelshallowerthan~15kmwererecoveredforcentralandnorthcentralOklahoma.
ThesecondvelocitymodelwascreatedbyusingtheSIMUL2000packagewiththecompo-siteeventmethod,whichreducesthevolumeofthedatatoimprovethecomputationtime.Althoughthetotalnumberofpicksisreduced,thecompositeeventmethodpreservesasmuchoftheoriginalphasepickinformationaspossible.Inaddition,thismethodmakesthecompositeeventdistributionmoreuniform.8,194M2+eventswereusedtostartthistom-ographicprocessing.
Thefirsttargetearthquakewasselectedthatcontainsthemostpicksfromthe1Dvelocity-relocateddata.Acloseeventsearchalgorithmidentifiedthenearbyearthquakeswithinacertainradius(2kminourcase)centeredatthetargetevent.Foracertainstation,themedianvalueofallthepicksfromtheeventswithinthe2-kmsearchingradius(includingthetargetevent)wasselectedinsteadoftakingthemeanvalue.Themedianvaluewasassignedtothetargeteventasthephaserecordfromthatcertainstation.Alargerradiussearching(5kminourcase)followedtoexcludetheeventsbetweentwospheres(withra-dius2kmand5kminthiscase,respectively)forcandidatetreatmentofthenexttargeteventinthefuture.Therewere493compositeeventswith13,447P-picksand11,293S-picksconstructedfrom8,194M2+events.Thefirst485compositeeventswereusedtoconductthesecondvelocitymodelingstudy,whichhasmorethan99.5%ofthepicksfromallthecompositeevents.
A30-kmhorizontalgridwaschosentoinvertforthethree-dimensional(3D)velocitymodel,whichisabouttwicethegridsizeoftheFMTOMOmodel,duetothecomputationcapabilityrestriction.Theverticalgridpointsarenotequallyspaced,whichpermitsbetterrepresentationinourinitialvelocitymodel.TheVp-andVp/Vs-ratio-dampingparameterswereoptimizedwithaseriesofsingle-iterationinversions,respectively.FortheVpdampingdetermination,thedampingparametersrangedfrom50to2000toplotthedatamisfitsversusmodelvariationtradeoffcurve,whileprohibitingtheVp/Vsratioinversion.FromtheVptradeoffcurve,300waschosenastheoptimizedvaluebecausethedatamis-fitscanbereducedsignificantlywithoutintroducingtoomuchmodelvariance.ByholdingtheVpdampingfixedat300,ChencoulduseaseriesofVp/Vsratiodampingparametersfrom10to1000todeterminetheoptimizedvalueas70.Thus,300and70werechosenasthevaluesforVpandVp/Vsratio,respectively,inthetomographicinversions.Althoughlowerdampingvaluescanreducethedatamisfits,theycanintroducesomesharpandstrongvelocityanomalyfeaturesthatprobablyareartifacts.
Tobetterunderstandthestructuresinthecrystallinebasement,velocitymodels,gravity,andmagneticdatawereusedtoexaminethegeologicalcorrelation.Onalargescale,thevelocitymodelcorrelatestogravityanomaliesbecausedenserocksgenerallyhavehigh
29
velocities,andviceversa.ThevelocitymodelsrevealstronglateralheterogeneitieswithinthePrecambriancrystallinebasement,whichindicatescomplexstructuresintheupperportionofthecrustinthestudyarea,suchasigneousintrusionsrelatedtotheOCM(OsageCountyMicrogranite),theSGG(SpavinawGraniteGroup),andthewidelydistributedCOGGCentralOklahomaGraniteGroup)unitinnorthcentralOklahoma(Reference).IestimatedalowVp/Vsratiozoneroughlyfromdepth~3–10km.Theaveragedbasementtopis~3kminOklahoma.Therefore,theVp/Vsratiocanbesimplifiedtothreelayers:<3km,~3to10km,and>10km,althoughthereisastrongvariationofVp/Vsratioinsomecross-sec-tions.Duetothecomplexfaultandfracturestructuresinthebasement,itisconsideredhighlypossiblethatwastewatercanpenetratetothedeepbasement,possiblyevendownto10kmormore.Water-filledfracturescanbeusedtoexplainthelowVp/VsratiozoneintheupperbasementofcentralOklahoma.
Earthquakelocationestimationisoneofthemostimportantinverseproblemsinseismol-ogy.Mostearthquakelocationmethodsarebasedonexploitingphasearrivalsfromtheseismicwaveformsandaselectedvelocitymodel.Accurateearthquakelocationisim-portantformanyapplications,suchasfaultstudies,hazardassessment,seismictomogra-phy,stressfielddetermination,identificationofinducedseismicity,andothers.
MostoftheearthquakesincentralOklahomaareclusteredandpresentednortheast-south-west(NE-SW)ornorthwest-southeast(NW-SE)trendingorientationthatisconsistentwiththe~East-Westmaximumhorizontalstressstatewithintheregion(Hollandetal.earth-quakesummary).Withthe3Dvelocitymodel,thecatalogedearthquakeswererelocated.Thehigh-accuracyearthquakelocationsimprovedtheresolutionoffaultlocationsbypro-ducingsharperpatternsofseismicity.Furthermore,theimprovedtheearthquakeloca-tionscanpotentiallybetterexplaintherelationshipbetweeninjectionwellsandinducedseismicity.Inaddition,theimprovementoftheearthquakelocationscanhelpidentifypri-maryfaultplanesfromfocalmechanisms,crustaldeformation,andothers.
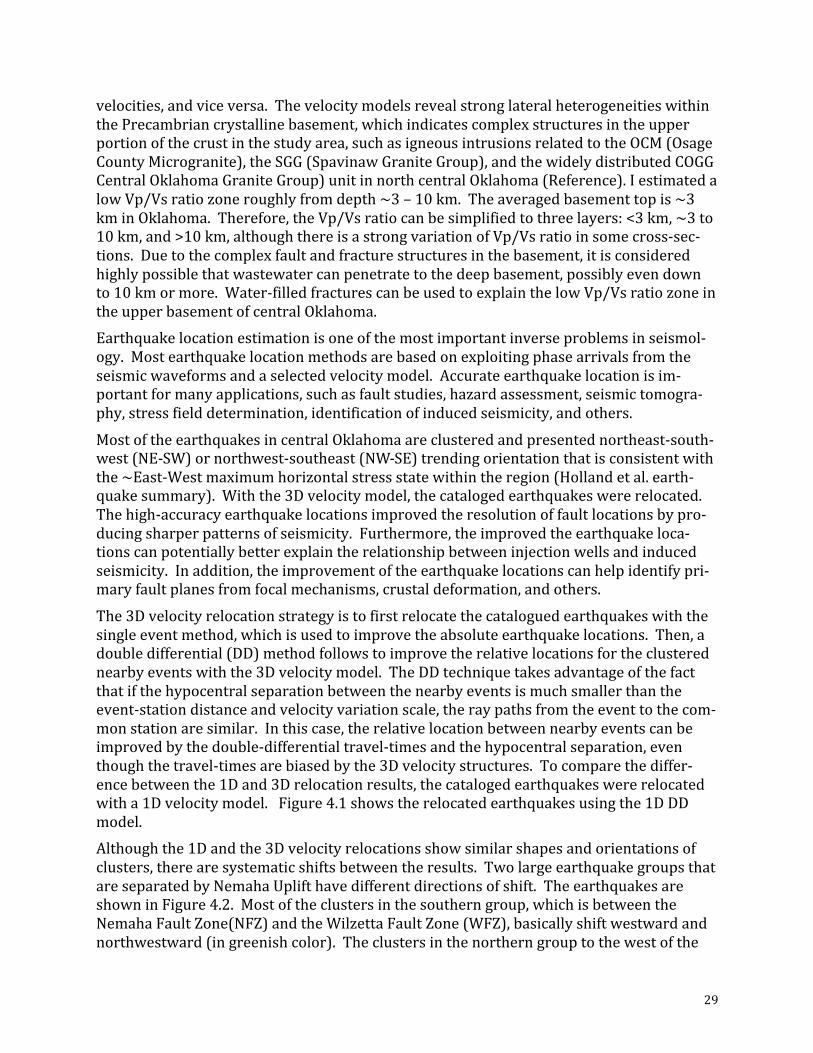
The3Dvelocityrelocationstrategyistofirstrelocatethecataloguedearthquakeswiththesingleeventmethod,whichisusedtoimprovetheabsoluteearthquakelocations.Then,adoubledifferential(DD)methodfollowstoimprovetherelativelocationsfortheclusterednearbyeventswiththe3Dvelocitymodel.TheDDtechniquetakesadvantageofthefactthatifthehypocentralseparationbetweenthenearbyeventsismuchsmallerthantheevent-stationdistanceandvelocityvariationscale,theraypathsfromtheeventtothecom-monstationaresimilar.Inthiscase,therelativelocationbetweennearbyeventscanbeimprovedbythedouble-differentialtravel-timesandthehypocentralseparation,eventhoughthetravel-timesarebiasedbythe3Dvelocitystructures.Tocomparethediffer-encebetweenthe1Dand3Drelocationresults,thecatalogedearthquakeswererelocatedwitha1Dvelocitymodel.Figure4.1showstherelocatedearthquakesusingthe1DDDmodel.
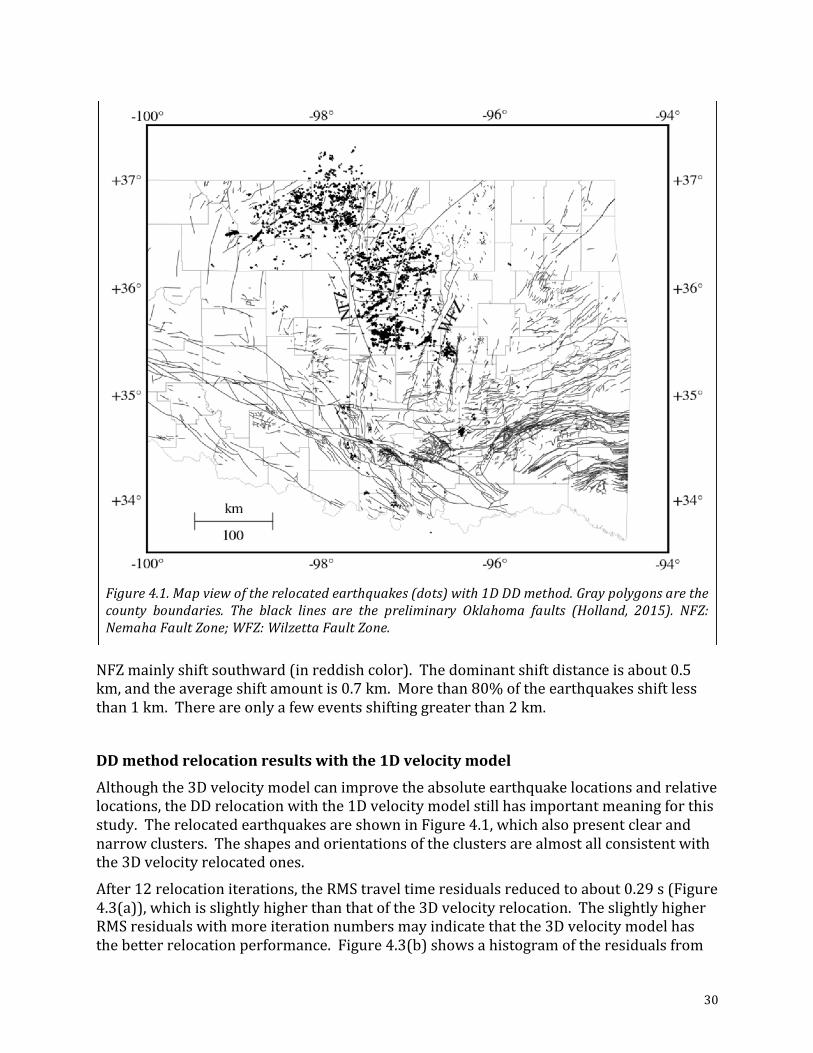
Althoughthe1Dandthe3Dvelocityrelocationsshowsimilarshapesandorientationsofclusters,therearesystematicshiftsbetweentheresults.TwolargeearthquakegroupsthatareseparatedbyNemahaUplifthavedifferentdirectionsofshift.TheearthquakesareshowninFigure4.2.Mostoftheclustersinthesoutherngroup,whichisbetweentheNemahaFaultZone(NFZ)andtheWilzettaFaultZone(WFZ),basicallyshiftwestwardandnorthwestward(ingreenishcolor).Theclustersinthenortherngrouptothewestofthe
30
NFZmainlyshiftsouthward(inreddishcolor).Thedominantshiftdistanceisabout0.5km,andtheaverageshiftamountis0.7km.Morethan80%oftheearthquakesshiftlessthan1km.Thereareonlyafeweventsshiftinggreaterthan2km.
DDmethodrelocationresultswiththe1DvelocitymodelAlthoughthe3Dvelocitymodelcanimprovetheabsoluteearthquakelocationsandrelativelocations,theDDrelocationwiththe1Dvelocitymodelstillhasimportantmeaningforthisstudy.TherelocatedearthquakesareshowninFigure4.1,whichalsopresentclearandnarrowclusters.Theshapesandorientationsoftheclustersarealmostallconsistentwiththe3Dvelocityrelocatedones.
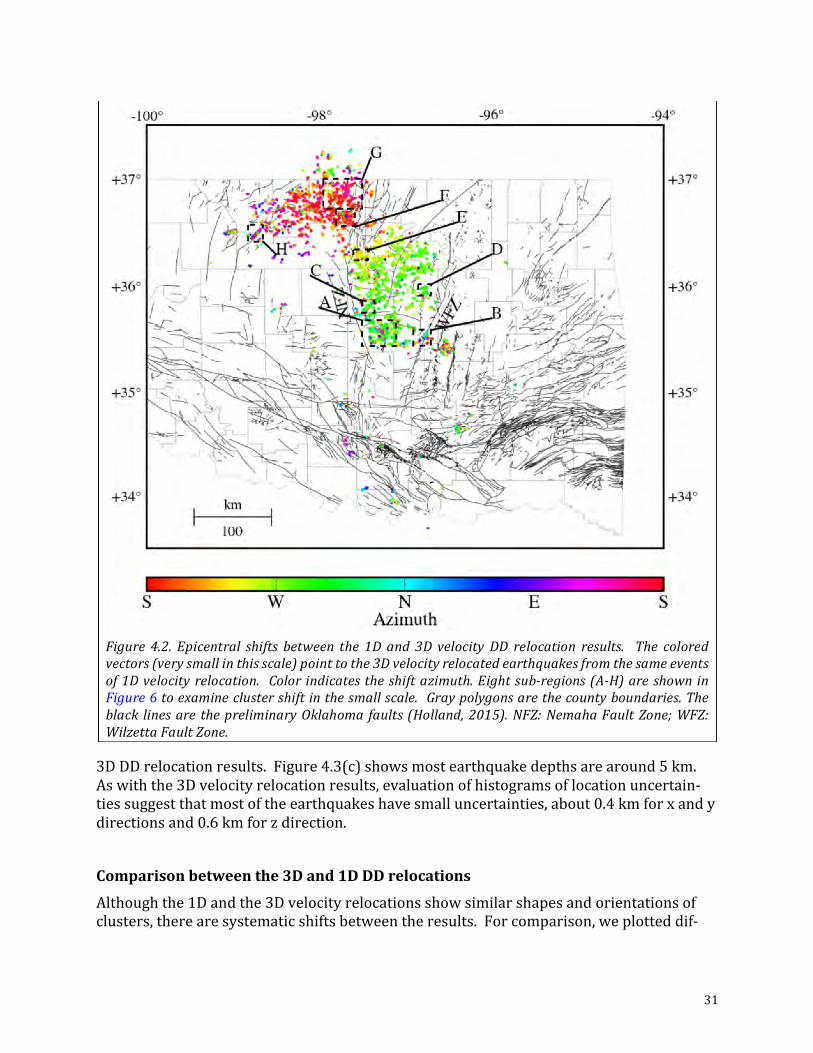
After12relocationiterations,theRMStraveltimeresidualsreducedtoabout0.29s(Figure4.3(a)),whichisslightlyhigherthanthatofthe3Dvelocityrelocation.TheslightlyhigherRMSresidualswithmoreiterationnumbersmayindicatethatthe3Dvelocitymodelhasthebetterrelocationperformance.Figure4.3(b)showsahistogramoftheresidualsfrom
Figure4.1.Mapviewoftherelocatedearthquakes(dots)with1DDDmethod.Graypolygonsarethecounty boundaries. The black lines are the preliminary Oklahoma faults (Holland, 2015). NFZ:NemahaFaultZone;WFZ:WilzettaFaultZone.
31
3DDDrelocationresults.Figure4.3(c)showsmostearthquakedepthsarearound5km.Aswiththe3Dvelocityrelocationresults,evaluationofhistogramsoflocationuncertain-tiessuggestthatmostoftheearthquakeshavesmalluncertainties,about0.4kmforxandydirectionsand0.6kmforzdirection.
Comparisonbetweenthe3Dand1DDDrelocationsAlthoughthe1Dandthe3Dvelocityrelocationsshowsimilarshapesandorientationsofclusters,therearesystematicshiftsbetweentheresults.Forcomparison,weplotteddif-
Figure 4.2. Epicentral shifts between the 1Dand 3D velocity DD relocation results. The coloredvectors(verysmallinthisscale)pointtothe3Dvelocityrelocatedearthquakesfromthesameeventsof1Dvelocity relocation. Color indicatesthe shiftazimuth.Eightsub-regions(A-H)are showninFigure6toexamineclustershiftinthesmallscale.Graypolygonsarethecountyboundaries.Theblack linesarethepreliminaryOklahomafaults(Holland,2015).NFZ:NemahaFaultZone;WFZ:WilzettaFaultZone.
32
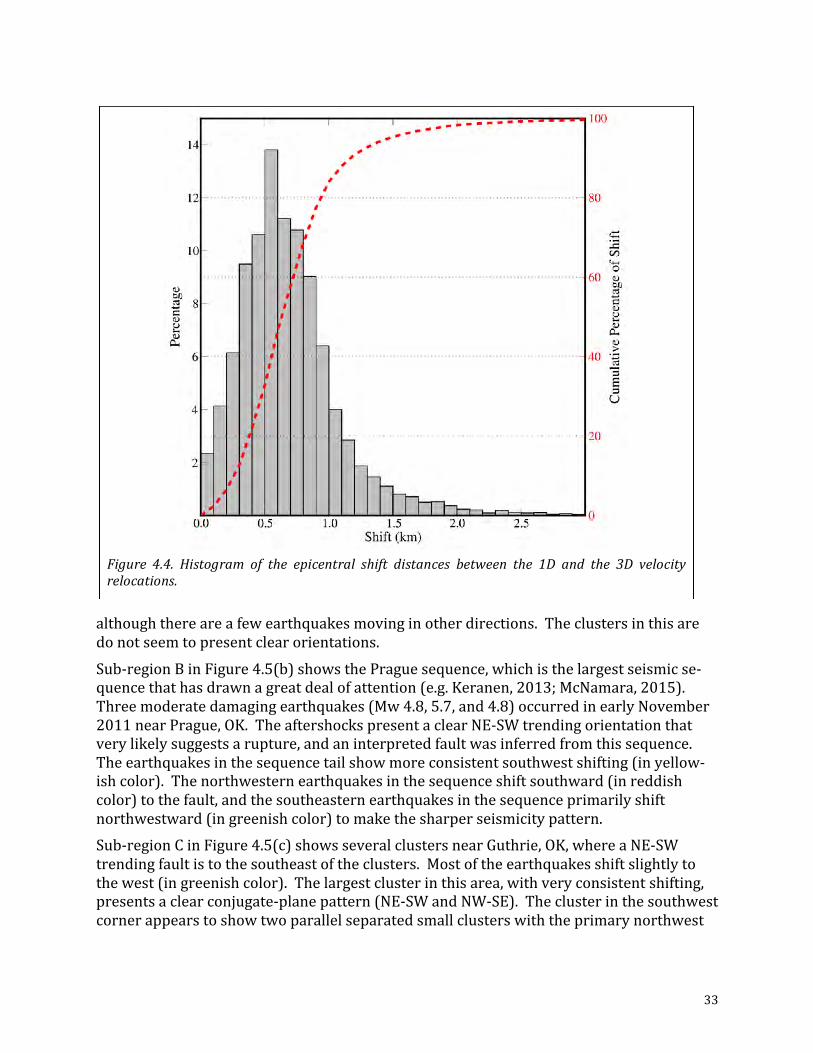
ferencesbetweenthe1Dandthe3DvelocityDDrelocationresultsinFigure4.2.Thevec-torspointtothe3DvelocityDDrelocationfromthe1DvelocityDDrelocationandarecolorcodedfordirectionsoftheshift.Twolargeearthquakegroupshavedifferentshiftingdirec-tions(Figure2).Asnotedabove,mostoftheclustersinthesoutherngroup,whichisbe-tweentheNFZandtheWFZ,basicallyshiftwestwardandnorthwestward(ingreenishcolor).TheclustersinthenortherngrouptothewestoftheNFZmainlyshiftsouthward(inreddishcolor).Figure4.4showsthehistogramoftheepicentralshiftdistancesbetweenthe1Dand3Dvelocityrelocationresults.Thedominantshiftdistanceisabout0.5km,andtheaverageshiftamountis0.7km.Morethan80%oftheearthquakesshiftlessthan1km.Thereareonlyafeweventswithshiftsgreaterthan2km.Figure4.5shows8sub-regions(blackdashedboxesinFig.4.2)toexamineclustershiftinginsmallscales.
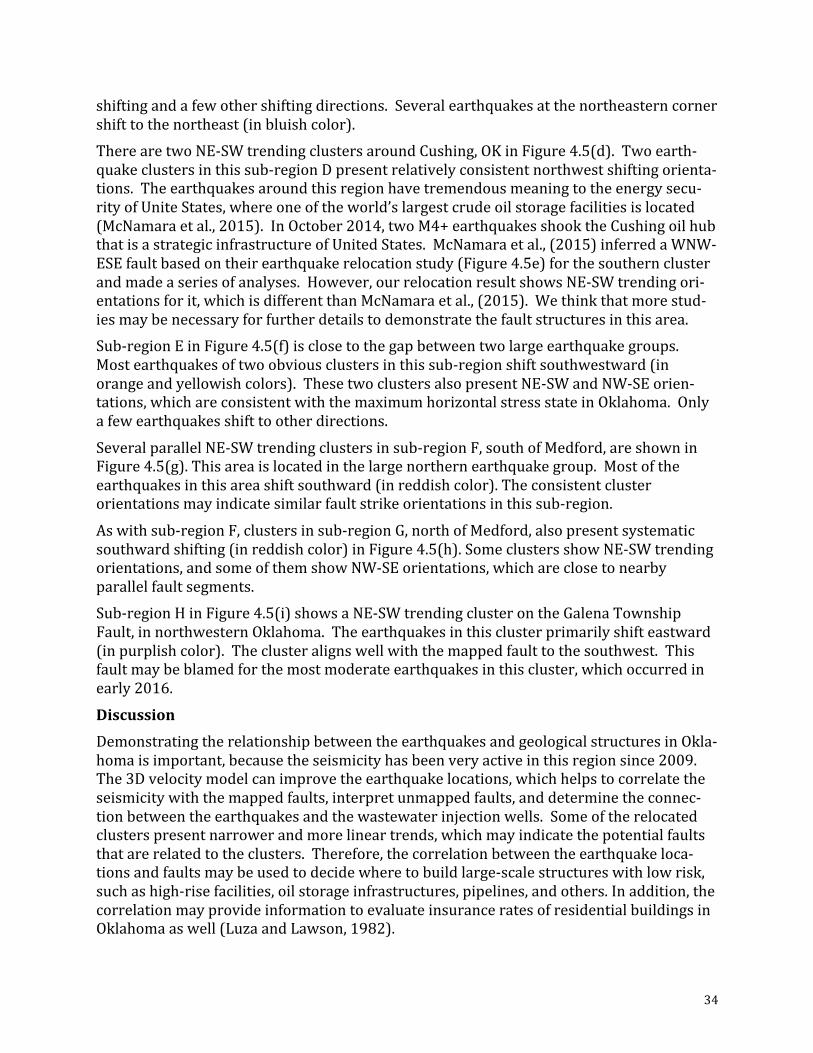
Sub-regionAinFigure4.5(a)showstherelocatedclustersnearthetownofJones,OK.The3Dvelocityrelocatedearthquakes(dots)generallypresentasystematicshiftinorientationcomparedtothe1Dvelocityrelocation(vectortails).(Thesymbolsarethesameforallthesub-regionsinFigure4.5a-i.Thevectorspointtothe3DDDrelocationfromthe1DDDre-location.)Theprominentshiftindirectionsfortheearthquakesinthisareaisnorthwest,
Figure4.3:(a)ReductionoftheRMStravel-timeresidualwithiterationsforthe1DDDmethod.(b)Histogramsofresidualdistributionforinitialcatalogueddata(shaded)andrelocationdata(white).(c)Histogramofthedepthaftertherelocation.
33
althoughthereareafewearthquakesmovinginotherdirections.Theclustersinthisaredonotseemtopresentclearorientations.
Sub-regionBinFigure4.5(b)showsthePraguesequence,whichisthelargestseismicse-quencethathasdrawnagreatdealofattention(e.g.Keranen,2013;McNamara,2015).Threemoderatedamagingearthquakes(Mw4.8,5.7,and4.8)occurredinearlyNovember2011nearPrague,OK.TheaftershockspresentaclearNE-SWtrendingorientationthatverylikelysuggestsarupture,andaninterpretedfaultwasinferredfromthissequence.Theearthquakesinthesequencetailshowmoreconsistentsouthwestshifting(inyellow-ishcolor).Thenorthwesternearthquakesinthesequenceshiftsouthward(inreddishcolor)tothefault,andthesoutheasternearthquakesinthesequenceprimarilyshiftnorthwestward(ingreenishcolor)tomakethesharperseismicitypattern.
Sub-regionCinFigure4.5(c)showsseveralclustersnearGuthrie,OK,whereaNE-SWtrendingfaultistothesoutheastoftheclusters.Mostoftheearthquakesshiftslightlytothewest(ingreenishcolor).Thelargestclusterinthisarea,withveryconsistentshifting,presentsaclearconjugate-planepattern(NE-SWandNW-SE).Theclusterinthesouthwestcornerappearstoshowtwoparallelseparatedsmallclusterswiththeprimarynorthwest
Figure 4.4. Histogram of the epicentral shift distances between the 1D and the 3D velocityrelocations.
34
shiftingandafewothershiftingdirections.Severalearthquakesatthenortheasterncornershifttothenortheast(inbluishcolor).
TherearetwoNE-SWtrendingclustersaroundCushing,OKinFigure4.5(d).Twoearth-quakeclustersinthissub-regionDpresentrelativelyconsistentnorthwestshiftingorienta-tions.Theearthquakesaroundthisregionhavetremendousmeaningtotheenergysecu-rityofUniteStates,whereoneoftheworld’slargestcrudeoilstoragefacilitiesislocated(McNamaraetal.,2015).InOctober2014,twoM4+earthquakesshooktheCushingoilhubthatisastrategicinfrastructureofUnitedStates.McNamaraetal.,(2015)inferredaWNW-ESEfaultbasedontheirearthquakerelocationstudy(Figure4.5e)forthesouthernclusterandmadeaseriesofanalyses.However,ourrelocationresultshowsNE-SWtrendingori-entationsforit,whichisdifferentthanMcNamaraetal.,(2015).Wethinkthatmorestud-iesmaybenecessaryforfurtherdetailstodemonstratethefaultstructuresinthisarea.
Sub-regionEinFigure4.5(f)isclosetothegapbetweentwolargeearthquakegroups.Mostearthquakesoftwoobviousclustersinthissub-regionshiftsouthwestward(inorangeandyellowishcolors).ThesetwoclustersalsopresentNE-SWandNW-SEorien-tations,whichareconsistentwiththemaximumhorizontalstressstateinOklahoma.Onlyafewearthquakesshifttootherdirections.
SeveralparallelNE-SWtrendingclustersinsub-regionF,southofMedford,areshowninFigure4.5(g).Thisareaislocatedinthelargenorthernearthquakegroup.Mostoftheearthquakesinthisareashiftsouthward(inreddishcolor).Theconsistentclusterorientationsmayindicatesimilarfaultstrikeorientationsinthissub-region.
Aswithsub-regionF,clustersinsub-regionG,northofMedford,alsopresentsystematicsouthwardshifting(inreddishcolor)inFigure4.5(h).SomeclustersshowNE-SWtrendingorientations,andsomeofthemshowNW-SEorientations,whichareclosetonearbyparallelfaultsegments.
Sub-regionHinFigure4.5(i)showsaNE-SWtrendingclusterontheGalenaTownshipFault,innorthwesternOklahoma.Theearthquakesinthisclusterprimarilyshifteastward(inpurplishcolor).Theclusteralignswellwiththemappedfaulttothesouthwest.Thisfaultmaybeblamedforthemostmoderateearthquakesinthiscluster,whichoccurredinearly2016.
DiscussionDemonstratingtherelationshipbetweentheearthquakesandgeologicalstructuresinOkla-homaisimportant,becausetheseismicityhasbeenveryactiveinthisregionsince2009.The3Dvelocitymodelcanimprovetheearthquakelocations,whichhelpstocorrelatetheseismicitywiththemappedfaults,interpretunmappedfaults,anddeterminetheconnec-tionbetweentheearthquakesandthewastewaterinjectionwells.Someoftherelocatedclusterspresentnarrowerandmorelineartrends,whichmayindicatethepotentialfaultsthatarerelatedtotheclusters.Therefore,thecorrelationbetweentheearthquakeloca-tionsandfaultsmaybeusedtodecidewheretobuildlarge-scalestructureswithlowrisk,suchashigh-risefacilities,oilstorageinfrastructures,pipelines,andothers.Inaddition,thecorrelationmayprovideinformationtoevaluateinsuranceratesofresidentialbuildingsinOklahomaaswell(LuzaandLawson,1982).
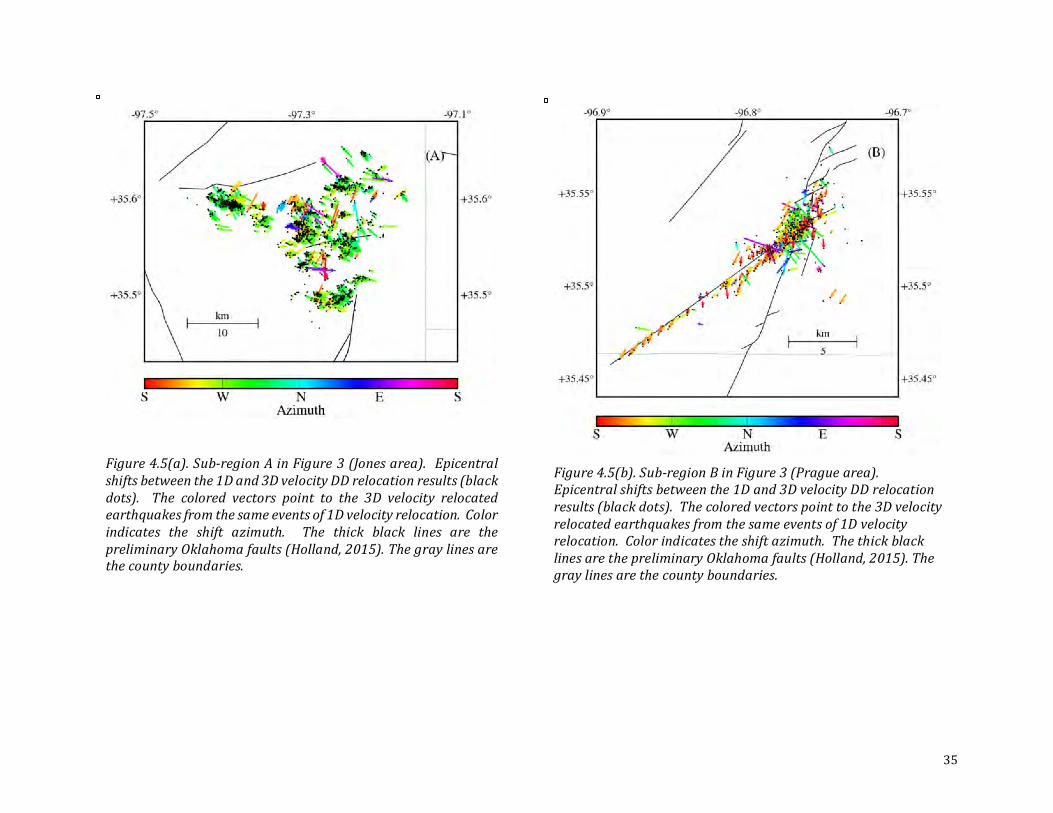
35
Figure4.5(b).Sub-regionBinFigure3(Praguearea).Epicentralshiftsbetweenthe1Dand3DvelocityDDrelocationresults(blackdots).Thecoloredvectorspointtothe3Dvelocityrelocatedearthquakesfromthesameeventsof1Dvelocityrelocation.Colorindicatestheshiftazimuth.ThethickblacklinesarethepreliminaryOklahomafaults(Holland,2015).Thegraylinesarethecountyboundaries.
Figure4.5(a).Sub-regionAinFigure3(Jonesarea). Epicentralshiftsbetweenthe1Dand3DvelocityDDrelocationresults(blackdots). The colored vectors point to the 3D velocity relocatedearthquakesfromthesameeventsof1Dvelocityrelocation.Colorindicates the shift azimuth. The thick black lines are thepreliminaryOklahomafaults(Holland,2015).Thegraylinesarethecountyboundaries.
36
Figure4.5(c).Sub-regionCinFigure3(Guthriearea).Epicentralshiftsbetweenthe1Dand3DvelocityDDrelocationresults(blackdots).Thecoloredvectorspointtothe3Dvelocityrelocatedearthquakesfromthesameeventsof1Dvelocityrelocation.Colorindicatestheshiftazimuth.ThethickblacklinesarethepreliminaryOklahomafaults(Holland,2015).
Figure4.5(d).Sub-regionDinFigure3(Cushingarea).Epicentralshiftsbetweenthe1Dand3DvelocityDDrelocationresults(blackdots).Thecoloredvectorspointtothe3Dvelocityrelocatedearthquakesfromthesameeventsof1Dvelocityrelocation.Colorindicatestheshiftazimuth.ThethickblacklinesarethepreliminaryOklahomafaults(Holland,2015).Thegraylinesarethecountyboundaries.
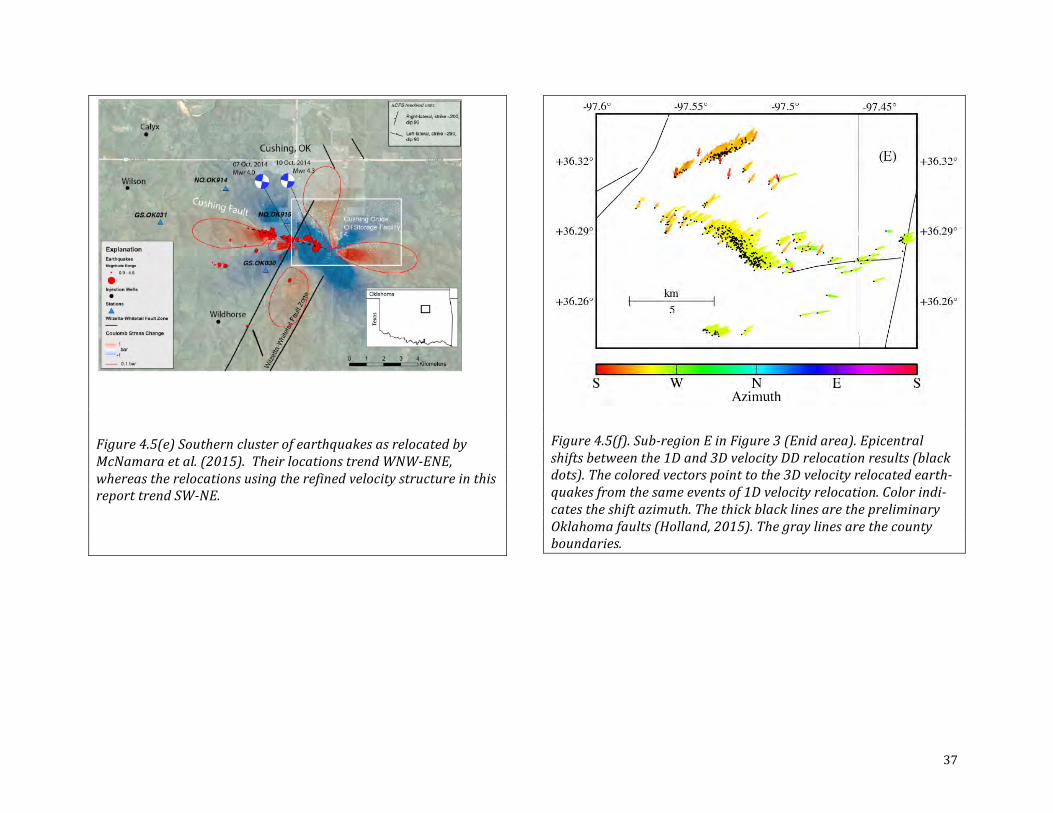
37
Figure4.5(e)SouthernclusterofearthquakesasrelocatedbyMcNamaraetal.(2015).TheirlocationstrendWNW-ENE,whereastherelocationsusingtherefinedvelocitystructureinthisreporttrendSW-NE.
Figure4.5(f).Sub-regionEinFigure3(Enidarea).Epicentralshiftsbetweenthe1Dand3DvelocityDDrelocationresults(blackdots).Thecoloredvectorspointtothe3Dvelocityrelocatedearth-quakesfromthesameeventsof1Dvelocityrelocation.Colorindi-catestheshiftazimuth.ThethickblacklinesarethepreliminaryOklahomafaults(Holland,2015).Thegraylinesarethecountyboundaries.
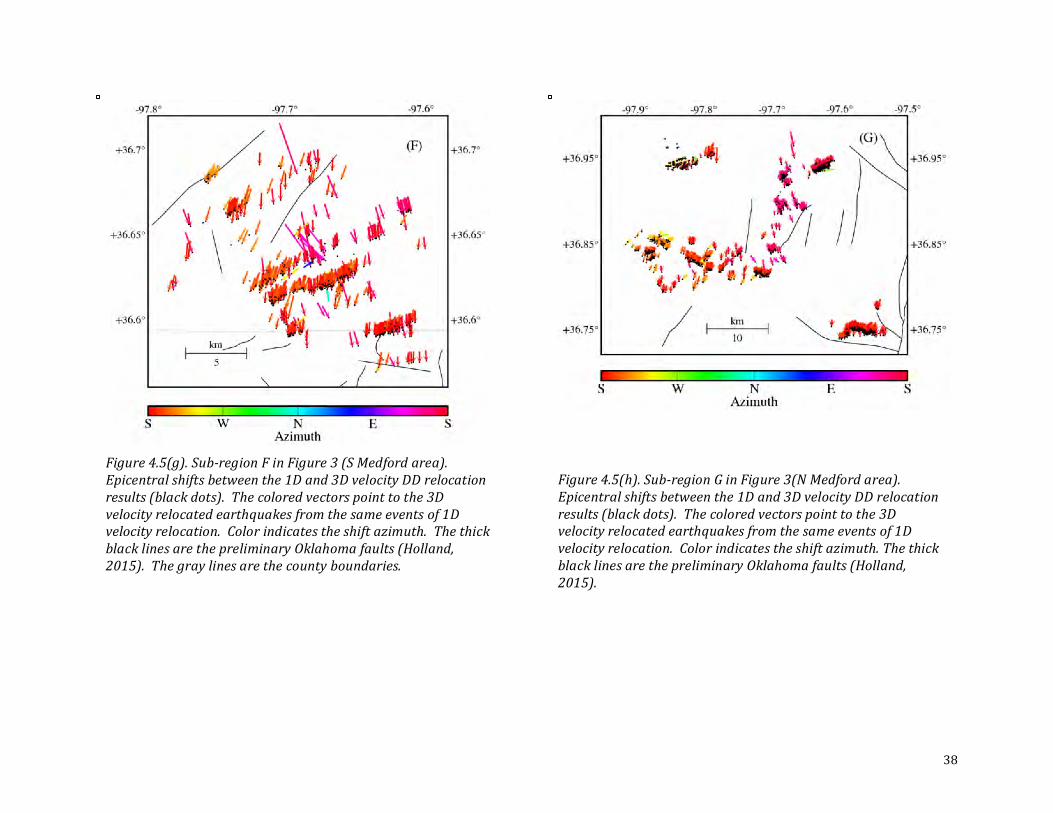
38
Figure4.5(g).Sub-regionFinFigure3(SMedfordarea).Epicentralshiftsbetweenthe1Dand3DvelocityDDrelocationresults(blackdots).Thecoloredvectorspointtothe3Dvelocityrelocatedearthquakesfromthesameeventsof1Dvelocityrelocation.Colorindicatestheshiftazimuth.ThethickblacklinesarethepreliminaryOklahomafaults(Holland,2015).Thegraylinesarethecountyboundaries.
Figure4.5(h).Sub-regionGinFigure3(NMedfordarea).Epicentralshiftsbetweenthe1Dand3DvelocityDDrelocationresults(blackdots).Thecoloredvectorspointtothe3Dvelocityrelocatedearthquakesfromthesameeventsof1Dvelocityrelocation.Colorindicatestheshiftazimuth.ThethickblacklinesarethepreliminaryOklahomafaults(Holland,2015).
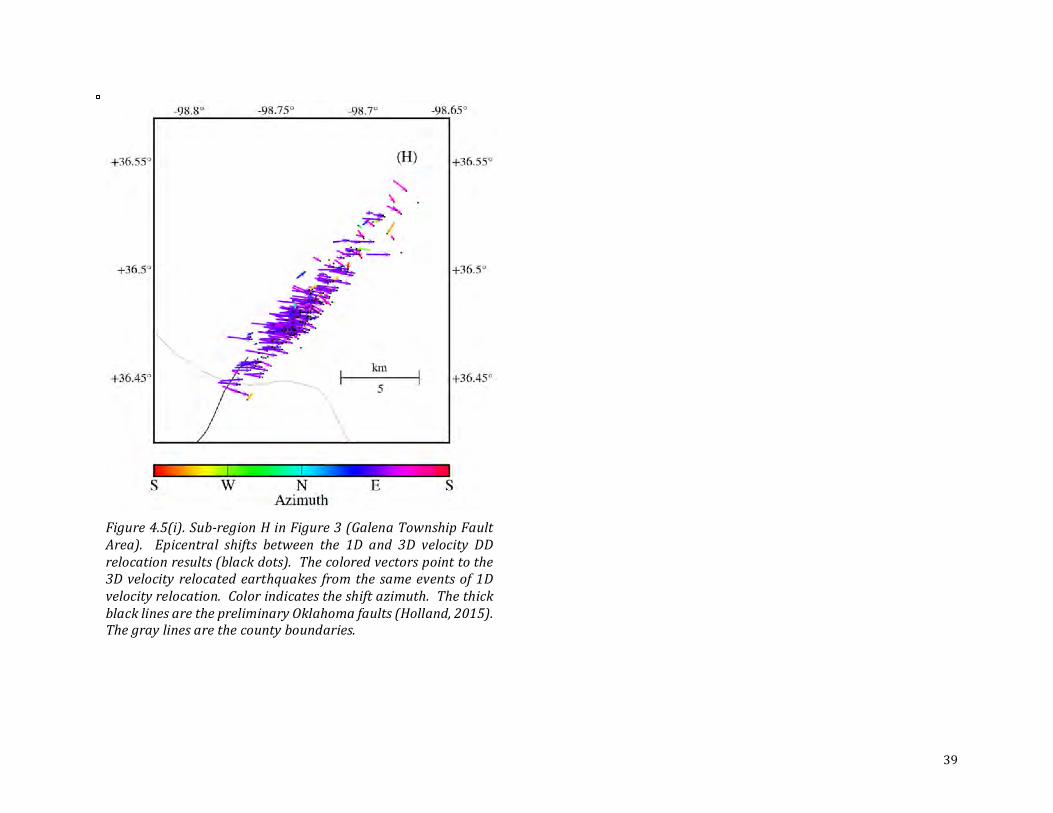
39
Figure4.5(i).Sub-regionHinFigure3(GalenaTownshipFaultArea). Epicentral shifts between the 1D and 3D velocity DDrelocationresults(blackdots).Thecoloredvectorspointtothe3Dvelocity relocatedearthquakes fromthe sameeventsof1Dvelocityrelocation.Colorindicatestheshiftazimuth.ThethickblacklinesarethepreliminaryOklahomafaults(Holland,2015).Thegraylinesarethecountyboundaries.
40
MostoftheclusterspresentnarrowerlineartrendswithNE-SWorNW-SEorientationafter
the3Dvelocityrelocation,whichareconsistentwiththefavorablefaultorientationsincen-
tralOklahoma(Holland,2013).SeveralstudiessuggestthatrecentearthquakesinOkla-
homawerecausedbyreactivationofancientfaultsthatcutthroughtheArbuckleGroup
andextendintotheupperbasement(e.g.Holland,2013;AltandZoback,2014;McNamara
etal.,2015).(Holland,2013;Sumyetal.,2014;McNamaraetal.,2015)studiedthePrague
sequencewithavarietyoffocalmechanismdatatoshowthatmostoftheearthquakesin
thePraguesequencedisplaystrike-slipmotion,whichisconsistentwiththeknowledge
thatWilzettaFaultisaverticalornearverticalfault,atleastintheshallowsedimentary
sectionandupperbasement.However,notalltheclustershavebeenwellstudiedinOkla-
homa.Formanyrelocatedclusters,thereisnoidentifiedfaultnearby,butsomeoftheclus-
tersmayassociatewithlargegeologicalstructuresincentralOklahoma,giventhatthey
alignwellwithmappedfaults.Duetothestrongheterogeneityinthebasement,basement
faultsmaybecomplicatedthataredifficulttoassociatewiththeseismicityincrease.
ReferencesAlt,R.,andM.Zoback,2014,DevelopmentofadetailedstressmapofOklahomaforavoid-
anceofpotentiallyactivefaultswhensitingwastewaterinjectionwells,AGUFallMeeting
2014,abstract.
Holland,A.A.,2013,OptimalfaultorientationswithinOklahoma,Seismol.Res.Lett.,84,
876–890.
Holland,A.A.,2015,PreliminaryfaultmapofOklahoma,OklahomaGeol.Surv.OpenFile
Rep.,OF3-2015
Keranen,K.M.,H.M.Savage,G.A.Abers,andE.S.Cochran,2013,Potentiallyinduced
earthquakesinOklahoma,USA:Linksbetweenwastewaterinjectionandthe2011MW5.7
earthquakesequence,Geology,41,699-702,doi:10.1130/G34045.1.
Luza,K.V.,andJ.E.Lawson,1982,SeismicityandtectonicrelationshipsoftheNemaha
UpliftinOklahoma,partIV,OklahomaGeologicalSurveySpecialPublication,82-1.
McNamara,D.E.,H.M.Benz,R.B.Herrmann,E.A.Bergman,P.Earle,A.Holland,R.Baldwin,
andA.Gassner,2015,EarthquakehypocentersandfocalmechanismsincentralOklahoma
revealacomplexsystemofreactivatedsubsurfacestrike-slipfaulting,Geophys.Res.Lett.,
42,2742–2749,doi:10.1002/2014GL062730.McNamara,D.E.,G.P.Hayes,H.M.Benz,R.A.Williams,N.D.McMahon,R.C.Aster,A.Hol-
land,T.Sickbert,R.Herrmann,R.Briggs,G.Smoczyk,E.Bergman,andP.Earle,2015,Reac-
tivatedfaultingnearCushing,Oklahoma:Increasedpotentialforatriggeredearthquakein
anareaofUnitedStatesstrategicinfrastructure,Geophys.Res.Lett.,42,8328–8332,doi:10.1002/2015GL064669.
Sumy,D.F.,E.S.Cochran,K.M.Keranen,M.Wei,andG.A.Abers,2014,Observationsof
staticCoulombstresstriggeringoftheNovember2011M5.7Oklahomaearthquakese-
quence,J.Geophys.Res.SolidEarth,119,1904–1923,doi:10.1002/2013JB010612.
41
Zoback,M.L.,1992,First-andsecond-orderpatternsofstressinthelithosphere:The
worldstressmapproject,J.Geophys.Res.,97,11703–11728,doi:10.1029/92JB00132.
42
DescriptionofRPSEATask9–ConstructionofIntegratedMulti-Variate3DGeologicInter-pretation
Thistaskprovidesthecrucialintegrativeplatformfortheintegratedanalysis.Amulti-vari-
ate3-dimensional(3D)earthmodelbasedona3Dgeologicalinterpretationinitiallyem-
ployingsubsurfacedata,digitalelevation,andresultsthatdefinestructuresbelowdrilling
depthsshallbedeveloped.The3Dinterpretationshallbebasedongravitydatathatcovers
thestudyareauniformly,andshallbeiteratedbasedonresultssuchasseismictomogra-
phy,seismicdataprovidedbyindustry,anddetailedwellloganalysis.
ThereportappendedbelowdescribesaportionofTask9comprisingdevelopmentofathree-dimensionalmodeloftheProjectareaanditssurroundingsderivedfromgravitymeasure-mentsandgeologicalinformation,supportedbytheRPSEAProject.
5. GravimetricDeterminationofBasementGeologicStructure
KevinCrainOklahomaGeologicalSurvey,MewbourneCollegeofEarthandEnergy,UniversityofOkla-homa,NormanOK73019
Abstract
MostOklahomaearthquakesoccurwithinthecrystallinebasement.Thisstudyinvestigates
whetherwecanidentifycrystallinebasementgeologicstructuresthatmayconcentrate
seismicity.Thepaperalsoseekstoidentifythedifferencesinbasementgeologiccharacter
thatdoanddonothostearthquakes.
Intheholisticview,gravitydatameasurethegravityfieldgeneratedbytheuniverse’s
uniquedensitydistributionatthetimeandlocationoftheobservation.Intherealworld
thisstudywillbeusingtheobservedfree-airgravitydata.Thestudyusesthefree-air
gravitybecauseitdoesnothaveanembeddedgeologicmodel,asisthecaseinthesimple
orcompleteBouguergravitymodel(Nettleton,1976).
Thegeologiccharacteroftheuppercrystallinebasementcanbeestimatedandtestedusing
ageologicallyandstatisticallyconstraineddensityinversionofthreedimensional(3D)
free-airgravitydataandageologicallyconsistent3Ddensitydistributionofknownandex-
pectedgeologicfeaturesaboveandbelowtheuppercrystallinebasement.Thegravitydata
arefourdimensional(4D)pointdatacollectedatuniquelocationsandtimesandreflectthe
Earth’suniquedensitydistributionatthetimeofobservation.Thegeologicmodelisacon-
tainerpopulatedwiththedensitydistributionofageologicallyconsistentexpectedmodel
Earth.Thedensityinversionestimatesthedensitydistributionthatminimizesthemisfit
betweentheobservedandestimatedfree-airgravitydata.Iftheresidualfree-airgravity
anomaly(RFAA),isconsistent,thentheestimateddensitydistributionmaybecorrectbutif
theRFAAisinconsistenttheresultsarenotcorrect.
Usingpublishedformationisopachmodels,a3Dgeologicmodelisbuiltthatisconsistent
withknownandexpectedgeologiccharacteristics.Asmoregeologicinformationbecomes
43
available,theexpectedgeologicformationmodelcanbeimprovedtoreflectthesedata
whilemaintainingconsistencywithboththeregionalandlocalgeologicmodel.
Thereforethe3Dgeologicmodelrepresentsthepublished3Dgeologicdataconstrainedby
observedandexpectedformationboundariesandrocktypes.Then,usingexpectedrock
typetodensityrelationships,ageologicallyconsistentexpected3Ddensitydistribution
modelcanbebuilt.Usingtheexpected3Ddensitydistributionmodel,theexpectedgravity
effectofthemodelateach3DgravitystationlocationiscalculatedwithSIGMA.SIGMAisa
newlydeveloped,efficient,andextremelyrapid3Dgravity,gravitygradiometrycalculation
algorithmatthe3Dgravitydatapointlocations(ChangandCrain,2015).
Thenwithageologicmodelandstatisticallyconstraineddensityinversion,theupdated
densitydistributionmodelestimatesadensitydistributionthatminimizesthemisfitbe-
tweentheobservedfree-airandestimatedfree-airgravitydata.Thedensityinversionisa
geologicallyandstatisticallyconstrainedlinearinversionwithgeologicandstatistical
constraints(Jackson,1979,TarantolaandValette,1982,Baker,1988,andCrain,2006).
TheresultingRFAAreflectsbasementgeologicmassdistributionsthatindicatecomplex
basementrocktypedistributionandgeologicstructuresthatareconsistentwiththe
availabledata,andshouldprovideinsightintothedistributionofearthquakes.
Introduction
Definitivelydeterminingthegeologicstructureofthebasementrequiresrockinhand.
Giventheexpenseofdrillingtothebasement,muchlesstothedepthsofearthquakes
withinthecrystallinebasement,andthelackofaccessibleseismicreflectionsurveys,
geophysicalmeasurementsremainthemostcosteffectivemethodstoinvestigatebasement
rockproperties.
Approximately25to30percentofthestateofOklahomahasexploration3Dseismicreflec-
tionsurveysandprobably90percentofOklahomahas2Dseismicsurveys.However,these
dataarenotavailablepublicly,andthisstudymustrelyonpublisheddatatobuildthe3D
geologicvolume.Therefore,thisstudymustrelyonpotentialfieldmethods,suchasmag-
neticandgravitymeasurementsavailablepublicly.
Ofthepotentialfieldmethods,themostcosteffectivegeophysicalmethodisaeromagnetic
dataandthatshouldbethefirstchoice.Butgiventhecosttoacquirenewhigh-resolution
aeromagneticsurveys,theOklahomaGeologicalSurveyhasusedlow-resolutionpublic
domainaeromagneticdata,(Bankey2002),andgravitydatafromthePanAmericanCenter
forEarth&EnvironmentalStudies[PACES],(Hinze2004),followedupwithnewlyacquired
gravitydata(Chapter3)toinvestigatetargetedanomalies.Fullyinvestigatingthegeologic
characterofthebasementusinggravimetricmethodsrequiresmorethanoneiterationof
expectedgeologicmodels.
Themodeleddomainmustbesubstantiallylargerthanthestudyareatoaccuratelyrepre-
sentthethree-dimensionaleffectsofrockmassesonthegravityfieldatagivenpoint.The
studyareaisshownasarectangleinthefiguresinthispaper.Themodeledareaincludes
muchofOklahoma,butalsopartsofadjacentKansas,Arkansas,andMissouri.TheProject
areanearthePragueearthquake,isshownasasmallerrectangle.Figure5.1showsamap
oftheobservedFreeAirAnomaly(FAA).
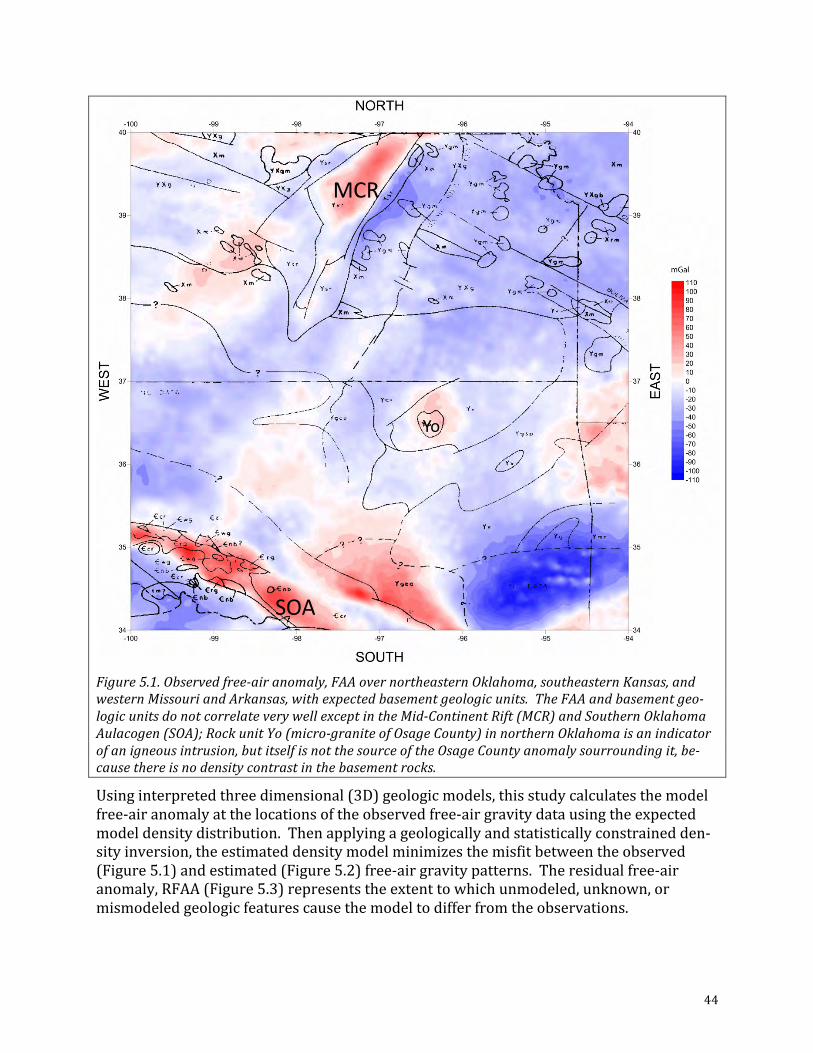
44
Figure5.1.Observedfree-airanomaly,FAAovernortheasternOklahoma,southeasternKansas,andwesternMissouriandArkansas,withexpectedbasementgeologicunits.TheFAAandbasementgeo-logicunitsdonotcorrelateverywellexceptintheMid-ContinentRift(MCR)andSouthernOklahomaAulacogen(SOA);RockunitYo(micro-graniteofOsageCounty)innorthernOklahomaisanindicatorofanigneousintrusion,butitselfisnotthesourceoftheOsageCountyanomalysourroundingit,be-causethereisnodensitycontrastinthebasementrocks.
Usinginterpretedthreedimensional(3D)geologicmodels,thisstudycalculatesthemodel
free-airanomalyatthelocationsoftheobservedfree-airgravitydatausingtheexpected
modeldensitydistribution.Thenapplyingageologicallyandstatisticallyconstrainedden-
sityinversion,theestimateddensitymodelminimizesthemisfitbetweentheobserved
(Figure5.1)andestimated(Figure5.2)free-airgravitypatterns.Theresidualfree-air
anomaly,RFAA(Figure5.3)representstheextenttowhichunmodeled,unknown,or
mismodeledgeologicfeaturescausethemodeltodifferfromtheobservations.
MCR
SOA
Yo
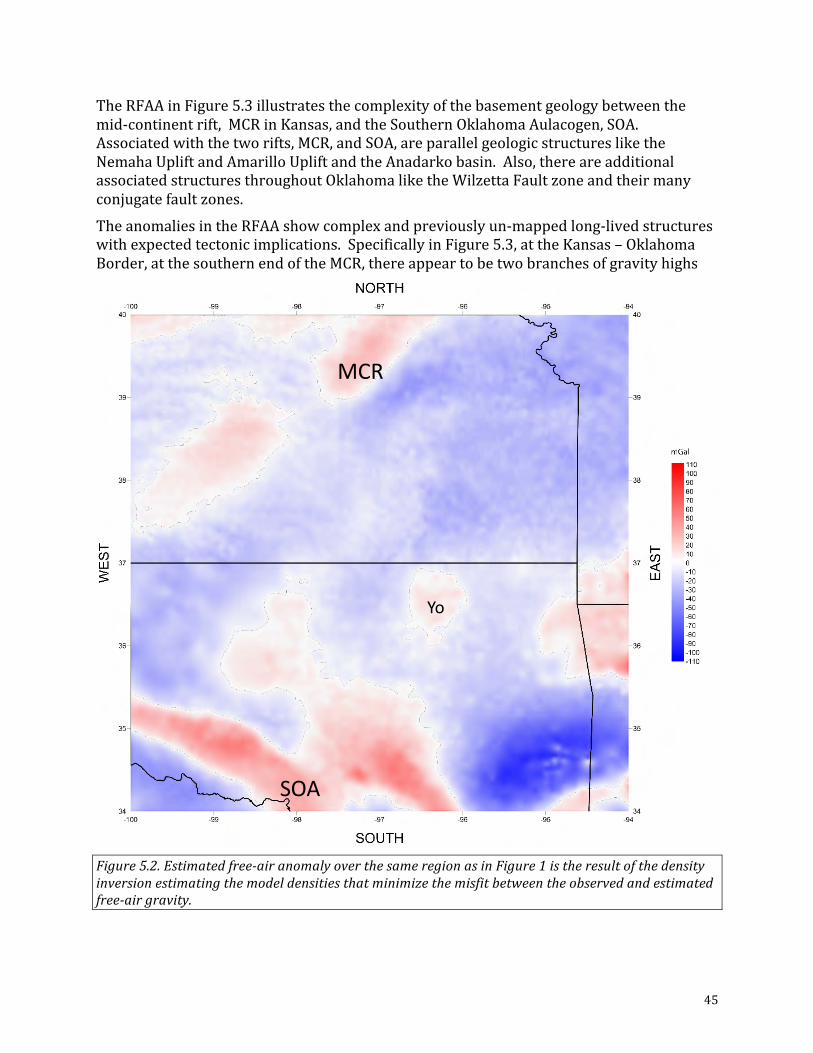
45
TheRFAAinFigure5.3illustratesthecomplexityofthebasementgeologybetweenthe
mid-continentrift,MCRinKansas,andtheSouthernOklahomaAulacogen,SOA.
Associatedwiththetworifts,MCR,andSOA,areparallelgeologicstructureslikethe
NemahaUpliftandAmarilloUpliftandtheAnadarkobasin.Also,thereareadditional
associatedstructuresthroughoutOklahomaliketheWilzettaFaultzoneandtheirmany
conjugatefaultzones.
TheanomaliesintheRFAAshowcomplexandpreviouslyun-mappedlong-livedstructures
withexpectedtectonicimplications.SpecificallyinFigure5.3,attheKansas–Oklahoma
Border,atthesouthernendoftheMCR,thereappeartobetwobranchesofgravityhighs
Figure5.2.Estimatedfree-airanomalyoverthesameregionasinFigure1istheresultofthedensityinversionestimatingthemodeldensitiesthatminimizethemisfitbetweentheobservedandestimatedfree-airgravity.
MCR
SOA
Yo
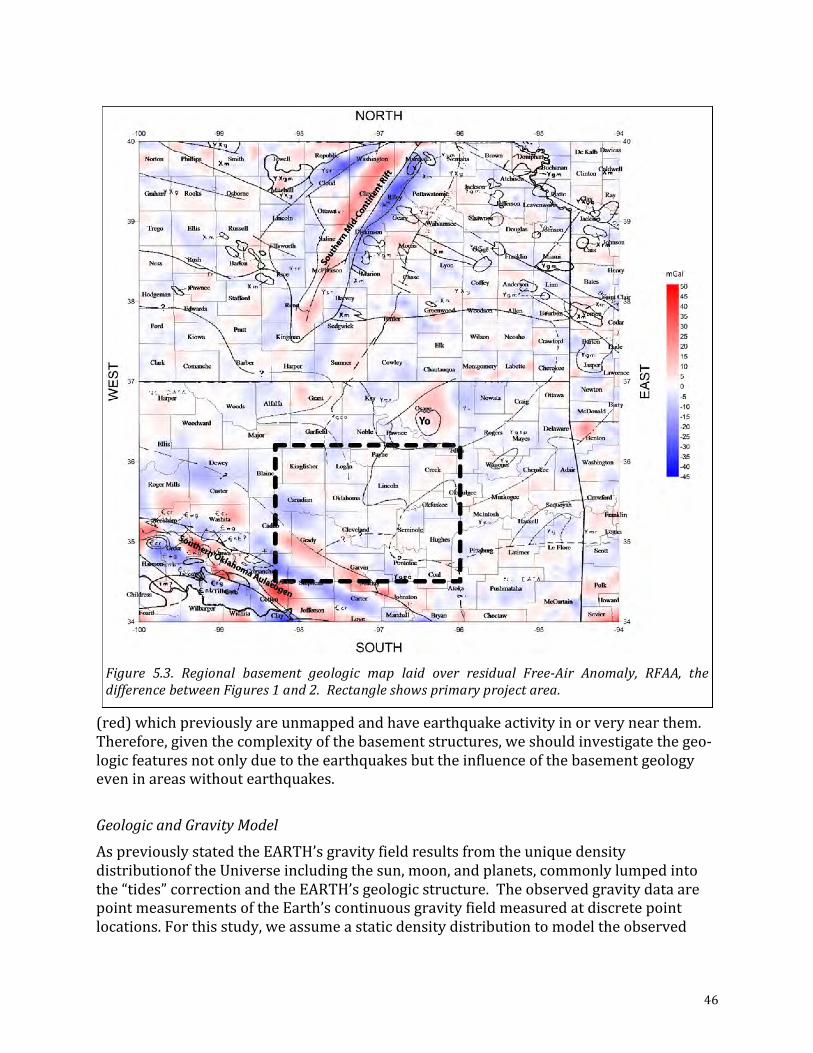
46
(red)whichpreviouslyareunmappedandhaveearthquakeactivityinorverynearthem.
Therefore,giventhecomplexityofthebasementstructures,weshouldinvestigatethegeo-
logicfeaturesnotonlyduetotheearthquakesbuttheinfluenceofthebasementgeology
eveninareaswithoutearthquakes.
GeologicandGravityModel
AspreviouslystatedtheEARTH’sgravityfieldresultsfromtheuniquedensity
distributionoftheUniverseincludingthesun,moon,andplanets,commonlylumpedinto
the“tides”correctionandtheEARTH’sgeologicstructure.Theobservedgravitydataare
pointmeasurementsoftheEarth’scontinuousgravityfieldmeasuredatdiscretepoint
locations.Forthisstudy,weassumeastaticdensitydistributiontomodeltheobserved
Figure 5.3. Regional basement geologic map laid over residual Free-Air Anomaly, RFAA, thedifferencebetweenFigures1and2.Rectangleshowsprimaryprojectarea.
47
gravityfieldattheirdiscretedatalocationsusingageologicallyconsistent3Dgeologic
model,withknownandexpectedrockdensitydistributionsandtheiruncertainties.
Theobservedfree-airgravityatanylocationmeasuresthegravityeffectofthedensitydis-
tributionofgeologicfeatures.Theinitialphaseofinterpretingtheobservedfree-airgravity
isremovingthegravityeffectsofknownandexpectedregional3Dgeologicunits.Thenthe
RFAArepresentsthegravityeffectoftheunmodeled,mismodeled,orunexpecteddensity
distributionswithintheuppercrustmodelthatiscurrentlyusingageologicallyconsistent
uniformsingledensity.
TheRFAAisthedifferencebetweentheobservedfree-airanomalyandtheestimatedfree-
airanomalycalculatedusingestimatedmodeldensitiesreturnedbyageologicallyandsta-
tisticallyconstraineddensityinversionthatminimizesthemisfitbetweentheobservedand
estimatedfree-airanomaly.
ModelingtheRFAArequiresdensitydistributionsconsistentwithexpectedandassumed
geologicfeaturestheyrepresent.Usingageologicandstatisticallyconstraineddensityin-
versiontominimizethemisfitbetweentheresidualgravityandtheestimatedresidual
gravityallowsprogressiverefinementofthedocumentablegeologicalmodel.Iftheresults
arestatisticallyconsistent,thentheresultingmodelmaybecorrect,butanyinconsistent
resultsaredefinitelyincorrect.
Theinitialphaseoftheinterpretationistoimagethegravityeffectoftheunknowndensity
distributionwithintheuppercrust.Theinitialmodeliscomposedoffourindividualgeo-
logicmodelsfromthesurfacetopographyto100kmbelowmeansealevel(BMSL),as
showninFigure5.4.Degreeofdetaildecreaseswithdepth,reflectingthelackofavailable
dataregardingthedeeperlevelsofthecrustandmantle.Eachelementofthegeologic
modelshasgeologicandstatisticalconstraintsusedbythedensityinversionwhen
estimatingthedensitiesthatminimizethemisfitbetweenthepriorandposteriormodeldensities.Thefirstmodelunitcomprisesthesedimentaryrocksabovethecrystalline
basement.Thesecondmodelunitistheuppercrust.Thethirdmodelunitisthelower
crust.Thefourthmodelunitisthemantle.
Figure5.5showsthenearsurfacesedimentaryrockabovethecrystallinebasement.The
currentsedimentaryrockmodelisauniformdensityvolumeattheaveragedensityofthe
sediment.Theexpectedvolumeisdefinedbytwosurfaces.Thetopsurfaceisthesurface
topographyatonearc-secondresolution(~30mgridspacing),andthebottomsurface,
thecrystallinebasement,isdefinedbya30arc-secondgridtopography(~1kmgrid).The
mostprominentfeaturesofthesedimentarysectionarethethicksectionsintheArkoma
andAnadarkoBasinsinthesouthernmarginoftheblock.Inaddition,theNemahaFault
showsupasaridgerunningroughlynorth-souththroughthemiddleoftheblock.
Theuppercrustbeneaththesedimentarysectionistherockvolumeofinterestbecauseit
ishostingmostOklahomaearthquakes.ThisunitisshowninFigure5.6.Theinitialmodel
assumestherockintheuppercrustisgranitic,withaconstantdensity,andanydensity
variationswithintheuppercrustshouldshowupasanomaliesintheRFAA.Theexpected
volumeisdefinedbytwosurfaces.Theuppersurfaceisthebasementsurfacebelowthe
sedimentarycolumn.Thebottomsurfaceisat25kilometersBMSL.
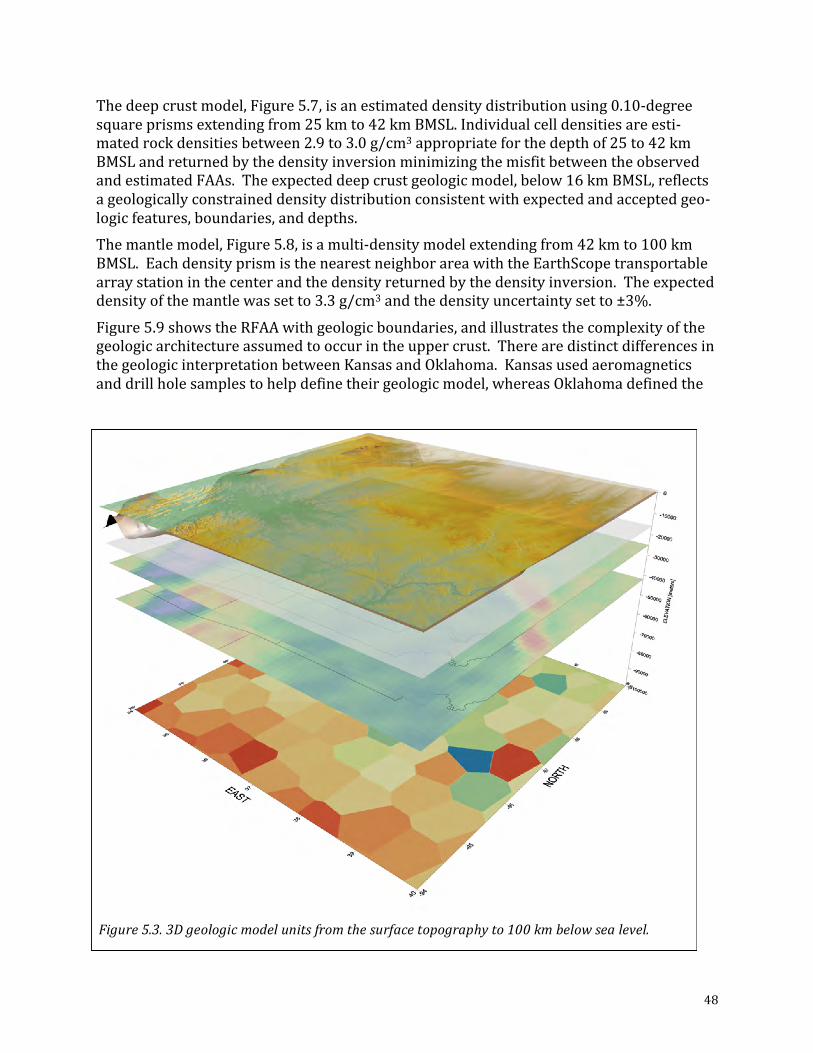
48
Thedeepcrustmodel,Figure5.7,isanestimateddensitydistributionusing0.10-degree
squareprismsextendingfrom25kmto42kmBMSL.Individualcelldensitiesareesti-
matedrockdensitiesbetween2.9to3.0g/cm3appropriateforthedepthof25to42km
BMSLandreturnedbythedensityinversionminimizingthemisfitbetweentheobserved
andestimatedFAAs.Theexpecteddeepcrustgeologicmodel,below16kmBMSL,reflects
ageologicallyconstraineddensitydistributionconsistentwithexpectedandacceptedgeo-
logicfeatures,boundaries,anddepths.
Themantlemodel,Figure5.8,isamulti-densitymodelextendingfrom42kmto100km
BMSL.EachdensityprismisthenearestneighborareawiththeEarthScopetransportable
arraystationinthecenterandthedensityreturnedbythedensityinversion.Theexpected
densityofthemantlewassetto3.3g/cm3andthedensityuncertaintysetto±3%.
Figure5.9showstheRFAAwithgeologicboundaries,andillustratesthecomplexityofthe
geologicarchitectureassumedtooccurintheuppercrust.Therearedistinctdifferencesin
thegeologicinterpretationbetweenKansasandOklahoma.Kansasusedaeromagnetics
anddrillholesamplestohelpdefinetheirgeologicmodel,whereasOklahomadefinedthe
Figure5.3.3Dgeologicmodelunitsfromthesurfacetopographyto100kmbelowsealevel.
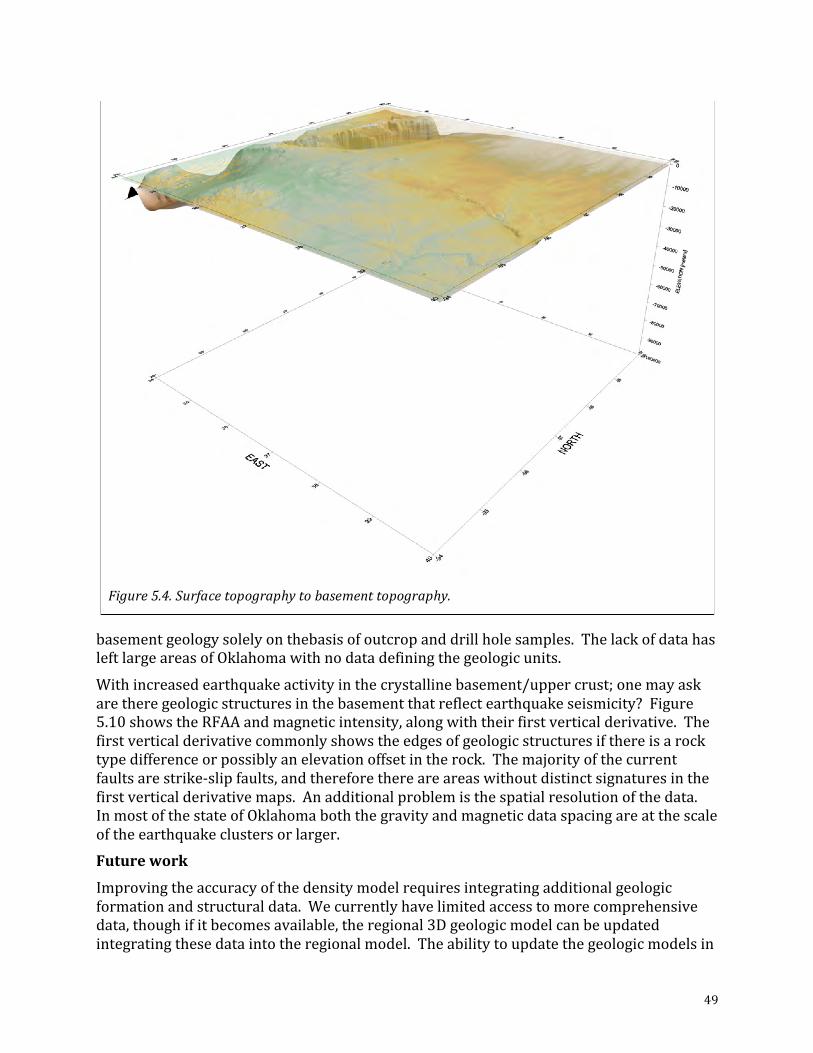
49
basementgeologysolelyonthebasisofoutcropanddrillholesamples.Thelackofdatahas
leftlargeareasofOklahomawithnodatadefiningthegeologicunits.
Withincreasedearthquakeactivityinthecrystallinebasement/uppercrust;onemayask
aretheregeologicstructuresinthebasementthatreflectearthquakeseismicity?Figure
5.10showstheRFAAandmagneticintensity,alongwiththeirfirstverticalderivative.The
firstverticalderivativecommonlyshowstheedgesofgeologicstructuresifthereisarock
typedifferenceorpossiblyanelevationoffsetintherock.Themajorityofthecurrent
faultsarestrike-slipfaults,andthereforethereareareaswithoutdistinctsignaturesinthe
firstverticalderivativemaps.Anadditionalproblemisthespatialresolutionofthedata.
InmostofthestateofOklahomaboththegravityandmagneticdataspacingareatthescale
oftheearthquakeclustersorlarger.
FutureworkImprovingtheaccuracyofthedensitymodelrequiresintegratingadditionalgeologic
formationandstructuraldata.Wecurrentlyhavelimitedaccesstomorecomprehensive
data,thoughifitbecomesavailable,theregional3Dgeologicmodelcanbeupdated
integratingthesedataintotheregionalmodel.Theabilitytoupdatethegeologicmodelsin
Figure5.4.Surfacetopographytobasementtopography.
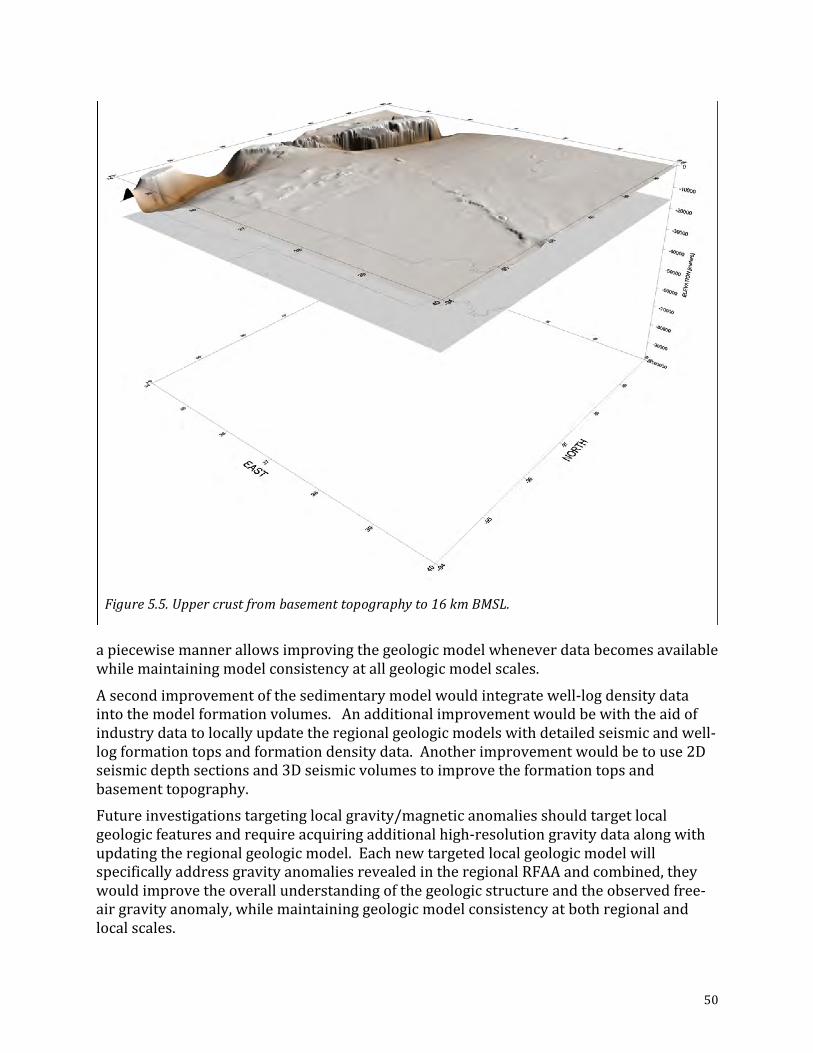
50
apiecewisemannerallowsimprovingthegeologicmodelwheneverdatabecomesavailable
whilemaintainingmodelconsistencyatallgeologicmodelscales.
Asecondimprovementofthesedimentarymodelwouldintegratewell-logdensitydata
intothemodelformationvolumes.Anadditionalimprovementwouldbewiththeaidof
industrydatatolocallyupdatetheregionalgeologicmodelswithdetailedseismicandwell-
logformationtopsandformationdensitydata.Anotherimprovementwouldbetouse2D
seismicdepthsectionsand3Dseismicvolumestoimprovetheformationtopsand
basementtopography.
Futureinvestigationstargetinglocalgravity/magneticanomaliesshouldtargetlocal
geologicfeaturesandrequireacquiringadditionalhigh-resolutiongravitydataalongwith
updatingtheregionalgeologicmodel.Eachnewtargetedlocalgeologicmodelwill
specificallyaddressgravityanomaliesrevealedintheregionalRFAAandcombined,they
wouldimprovetheoverallunderstandingofthegeologicstructureandtheobservedfree-
airgravityanomaly,whilemaintaininggeologicmodelconsistencyatbothregionaland
localscales.
Figure5.5.Uppercrustfrombasementtopographyto16kmBMSL.
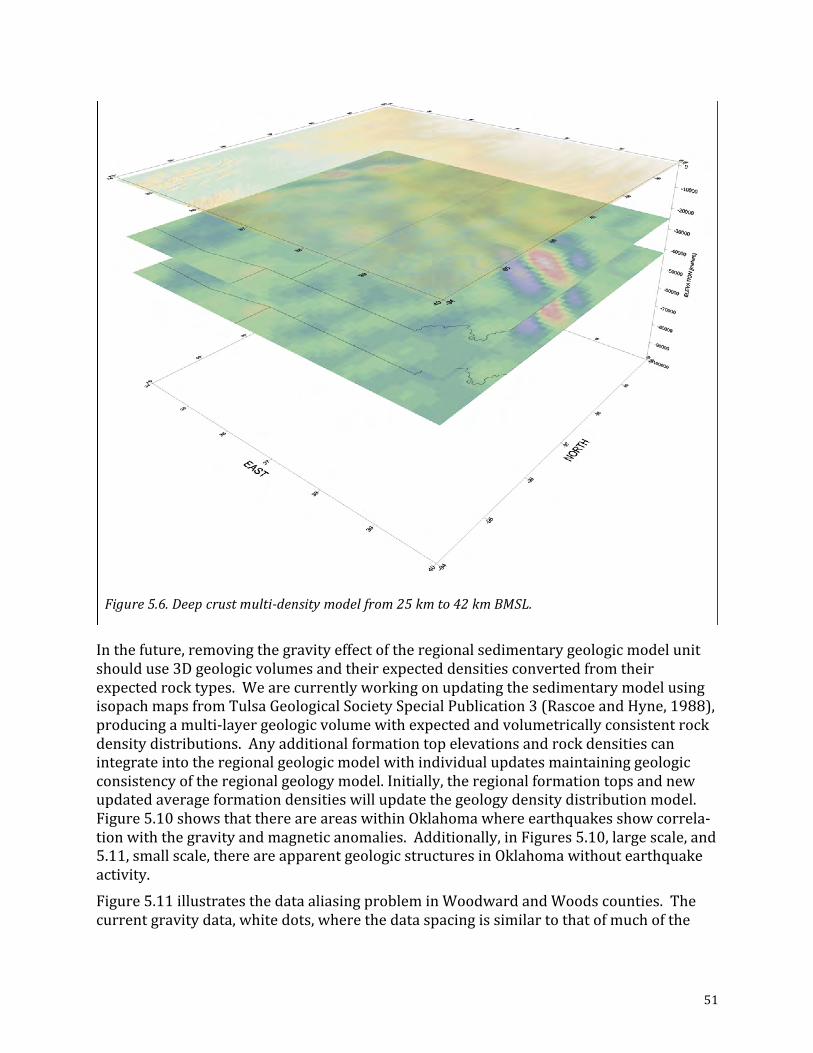
51
Inthefuture,removingthegravityeffectoftheregionalsedimentarygeologicmodelunit
shoulduse3Dgeologicvolumesandtheirexpecteddensitiesconvertedfromtheir
expectedrocktypes.Wearecurrentlyworkingonupdatingthesedimentarymodelusing
isopachmapsfromTulsaGeologicalSocietySpecialPublication3(RascoeandHyne,1988),
producingamulti-layergeologicvolumewithexpectedandvolumetricallyconsistentrock
densitydistributions.Anyadditionalformationtopelevationsandrockdensitiescan
integrateintotheregionalgeologicmodelwithindividualupdatesmaintaininggeologic
consistencyoftheregionalgeologymodel.Initially,theregionalformationtopsandnew
updatedaverageformationdensitieswillupdatethegeologydensitydistributionmodel.
Figure5.10showsthatthereareareaswithinOklahomawhereearthquakesshowcorrela-
tionwiththegravityandmagneticanomalies.Additionally,inFigures5.10,largescale,and
5.11,smallscale,thereareapparentgeologicstructuresinOklahomawithoutearthquake
activity.
Figure5.11illustratesthedataaliasingprobleminWoodwardandWoodscounties.The
currentgravitydata,whitedots,wherethedataspacingissimilartothatofmuchofthe
Figure5.6.Deepcrustmulti-densitymodelfrom25kmto42kmBMSL.
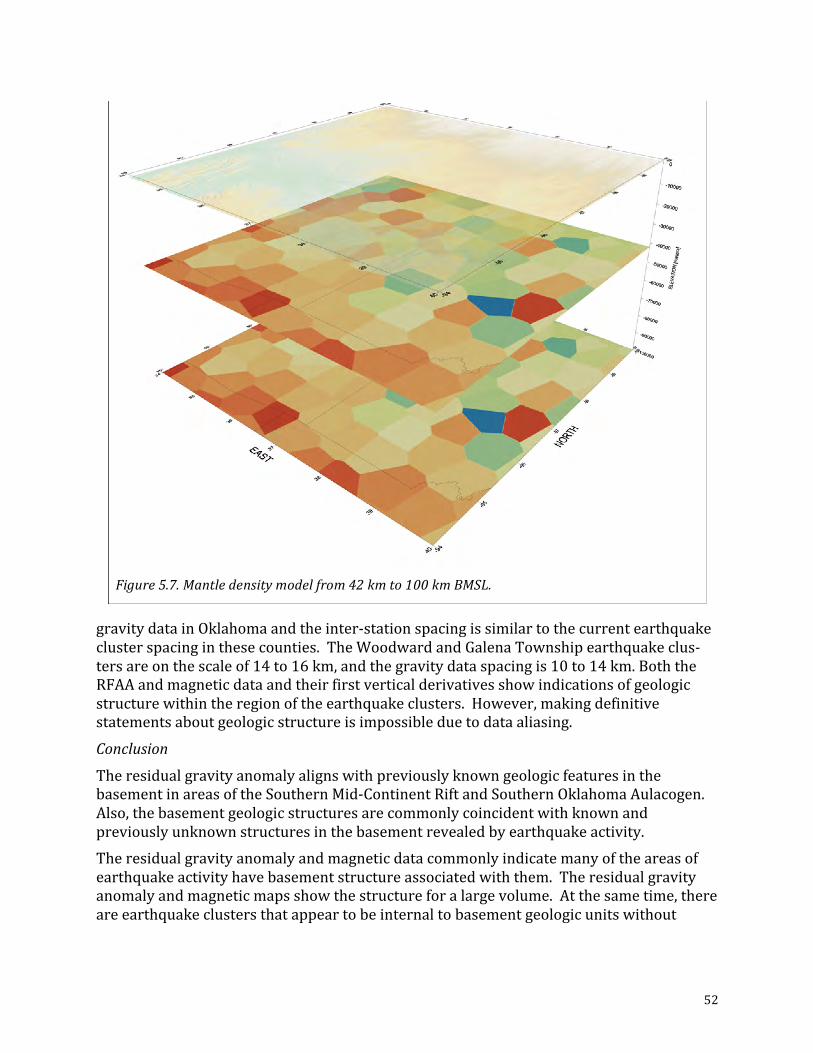
52
gravitydatainOklahomaandtheinter-stationspacingissimilartothecurrentearthquake
clusterspacinginthesecounties.TheWoodwardandGalenaTownshipearthquakeclus-
tersareonthescaleof14to16km,andthegravitydataspacingis10to14km.Boththe
RFAAandmagneticdataandtheirfirstverticalderivativesshowindicationsofgeologic
structurewithintheregionoftheearthquakeclusters.However,makingdefinitive
statementsaboutgeologicstructureisimpossibleduetodataaliasing.
Conclusion
Theresidualgravityanomalyalignswithpreviouslyknowngeologicfeaturesinthe
basementinareasoftheSouthernMid-ContinentRiftandSouthernOklahomaAulacogen.
Also,thebasementgeologicstructuresarecommonlycoincidentwithknownand
previouslyunknownstructuresinthebasementrevealedbyearthquakeactivity.
Theresidualgravityanomalyandmagneticdatacommonlyindicatemanyoftheareasof
earthquakeactivityhavebasementstructureassociatedwiththem.Theresidualgravity
anomalyandmagneticmapsshowthestructureforalargevolume.Atthesametime,there
areearthquakeclustersthatappeartobeinternaltobasementgeologicunitswithout
Figure5.7.Mantledensitymodelfrom42kmto100kmBMSL.
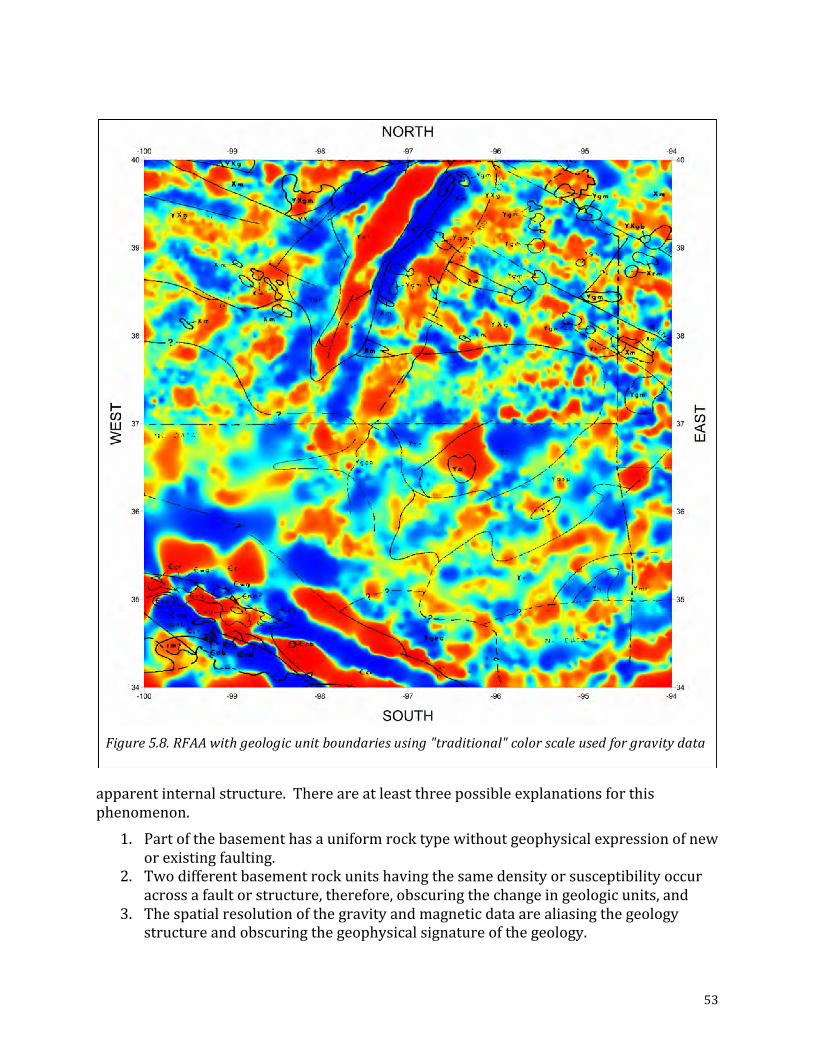
53
apparentinternalstructure.Thereareatleastthreepossibleexplanationsforthis
phenomenon.
1. Partofthebasementhasauniformrocktypewithoutgeophysicalexpressionofneworexistingfaulting.
2. Twodifferentbasementrockunitshavingthesamedensityorsusceptibilityoccuracrossafaultorstructure,therefore,obscuringthechangeingeologicunits,and
3. Thespatialresolutionofthegravityandmagneticdataarealiasingthegeologystructureandobscuringthegeophysicalsignatureofthegeology.
Figure5.8.RFAAwithgeologicunitboundariesusing"traditional"colorscaleusedforgravitydata
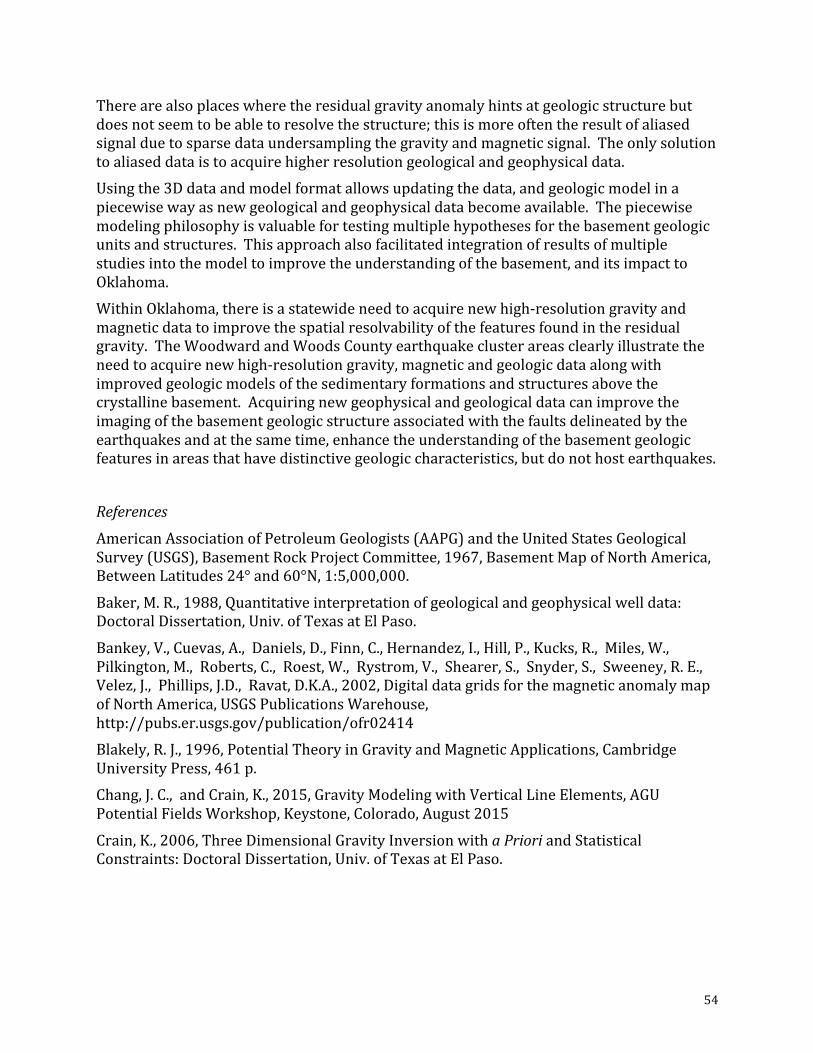
54
Therearealsoplaceswheretheresidualgravityanomalyhintsatgeologicstructurebut
doesnotseemtobeabletoresolvethestructure;thisismoreoftentheresultofaliased
signalduetosparsedataundersamplingthegravityandmagneticsignal.Theonlysolution
toaliaseddataistoacquirehigherresolutiongeologicalandgeophysicaldata.
Usingthe3Ddataandmodelformatallowsupdatingthedata,andgeologicmodelina
piecewisewayasnewgeologicalandgeophysicaldatabecomeavailable.Thepiecewise
modelingphilosophyisvaluablefortestingmultiplehypothesesforthebasementgeologic
unitsandstructures.Thisapproachalsofacilitatedintegrationofresultsofmultiple
studiesintothemodeltoimprovetheunderstandingofthebasement,anditsimpactto
Oklahoma.
WithinOklahoma,thereisastatewideneedtoacquirenewhigh-resolutiongravityand
magneticdatatoimprovethespatialresolvabilityofthefeaturesfoundintheresidual
gravity.TheWoodwardandWoodsCountyearthquakeclusterareasclearlyillustratethe
needtoacquirenewhigh-resolutiongravity,magneticandgeologicdataalongwith
improvedgeologicmodelsofthesedimentaryformationsandstructuresabovethe
crystallinebasement.Acquiringnewgeophysicalandgeologicaldatacanimprovethe
imagingofthebasementgeologicstructureassociatedwiththefaultsdelineatedbythe
earthquakesandatthesametime,enhancetheunderstandingofthebasementgeologic
featuresinareasthathavedistinctivegeologiccharacteristics,butdonothostearthquakes.
References
AmericanAssociationofPetroleumGeologists(AAPG)andtheUnitedStatesGeological
Survey(USGS),BasementRockProjectCommittee,1967,BasementMapofNorthAmerica,
BetweenLatitudes24°and60°N,1:5,000,000.
Baker,M.R.,1988,Quantitativeinterpretationofgeologicalandgeophysicalwelldata:
DoctoralDissertation,Univ.ofTexasatElPaso.
Bankey,V.,Cuevas,A.,Daniels,D.,Finn,C.,Hernandez,I.,Hill,P.,Kucks,R.,Miles,W.,
Pilkington,M.,Roberts,C.,Roest,W.,Rystrom,V.,Shearer,S.,Snyder,S.,Sweeney,R.E.,
Velez,J.,Phillips,J.D.,Ravat,D.K.A.,2002,Digitaldatagridsforthemagneticanomalymap
ofNorthAmerica,USGSPublicationsWarehouse,
http://pubs.er.usgs.gov/publication/ofr02414
Blakely,R.J.,1996,PotentialTheoryinGravityandMagneticApplications,Cambridge
UniversityPress,461p.
Chang,J.C.,andCrain,K.,2015,GravityModelingwithVerticalLineElements,AGU
PotentialFieldsWorkshop,Keystone,Colorado,August2015
Crain,K.,2006,ThreeDimensionalGravityInversionwithaPrioriandStatisticalConstraints:DoctoralDissertation,Univ.ofTexasatElPaso.
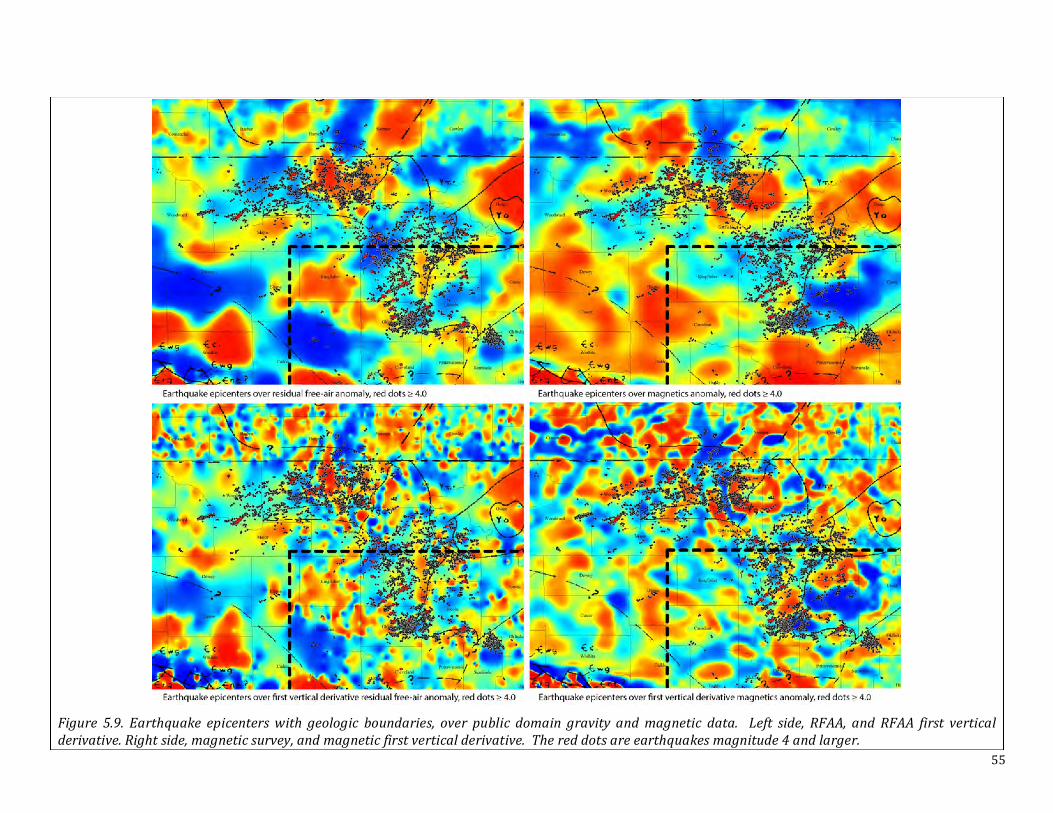
55
Figure 5.9. Earthquake epicenters with geologic boundaries, over public domain gravity andmagnetic data. Left side, RFAA, and RFAA first verticalderivative.Rightside,magneticsurvey,andmagneticfirstverticalderivative.Thereddotsareearthquakesmagnitude4andlarger.
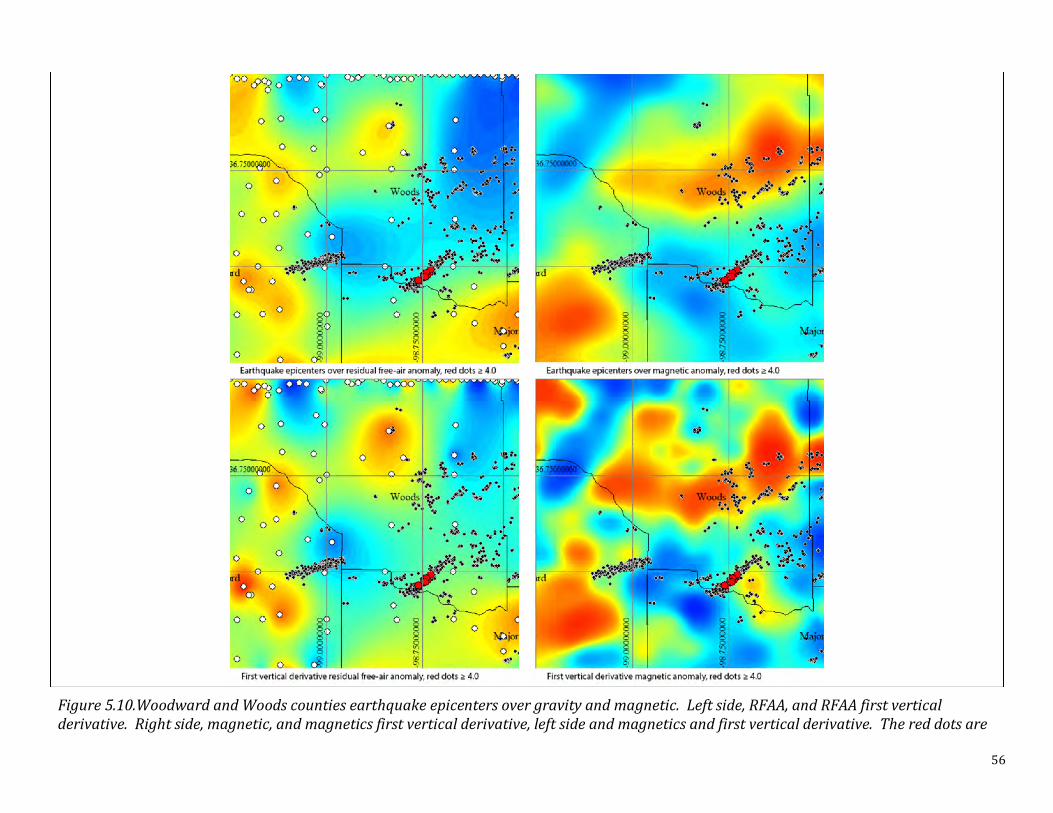
56
Figure5.10.WoodwardandWoodscountiesearthquakeepicentersovergravityandmagnetic.Leftside,RFAA,andRFAAfirstverticalderivative.Rightside,magnetic,andmagneticsfirstverticalderivative,leftsideandmagneticsandfirstverticalderivative.Thereddotsareearthquakesofmagnitude4andlarger.
57
Danes,Z.F.1960,OnaSuccessiveApproximationMethodforInterpretingGravity
Anomalies,Geophysics,25,1215-1228.doi:10.1190/1.1438809
Denison,R.E.,andMerritt,C.A.,1964,BasementRocksandStructuralEvolutionof
SouthernOklahoma,OklahomaGeologicalSurvey,Bull.95,302p.
Denison,R.E.,1981,BasementRocksinNortheasternOklahoma,OklahomaGeological
Survey,Circular84,88p.
Dicken,C.L.,Pimley,S.G.,Cannon,W.F.,2001,Precambrianbasementmapofthenorth
Mid-Continent,U.S.A.,Adigitalrepresentationofthe1990P.K.Simsmap,U.S.Geological
Survey;Open-FileReport2001-21,pubs.er.usgs.gov/publication/ofr0121
Hammer,S.,1974,ApproximationingravityInterpretationCalculations,Geophysics,v39,
205-222.doi:10.1190/1.1440422
Hinze,W.,etal.,2005,Newstandardforreducinggravitydata:TheNorthAmericangravity
database,Geophysics,Vol.70,No.4,p.J25–J32.
Jackson,D.D.,1979,Theuseofaprioridatatoresolvenon-uniquenessinlinearinversion:
Geophys.J.R.Astron.Soc.,57,137-157.
Nettleton,L.L.,1976,GravityandMagneticsinOilProspecting,McGraw-HillPress.
Rascoe,B.,andHyne,N.,eds.PetroleumGeologyoftheMid-Continent,TulsaGeologicalSociety,SpecialPublicationnumber3,1988.
Tarantola,A.,Valette,B.,1982,Generalizednon-linearinverseproblemssolvedusingleast
squarescriterion:Rev.ofGeophys.AndSpacePhysics,20,219-232.
58
DescriptionofRPSEAProjectTask10–4DIntegratedMultiscaleReservoirandGeologicalModeling:Afield-scalemodelrepresentativeoftheOsageCountygravityanomaly(theref-erencemodel)shallbedevelopedusinganensembleofmodelsthatareprogressivelyup-
dated.Asetofpredictionsshallbegeneratedthroughcouplednumericalsimulationofwa-
termovementinthesubsurfaceandthelocalizedstresschangesassociatedwithwaterin-
jection.Thesepredictionsshallbecomparedtoobservationsofseismicactivityinthere-
gionthathavepreviouslybeenattributedtowaterdisposalandbyreconcilingthesediffer-
encesinthemodeltocreateanimprovedrepresentationofthepreferentialflowpaths,ge-
omechanicalpropertiesandfaultcharacteristicsinthesubsurface.Theimprovedmodel
shallbetestedagainst4Dgeophysicalmonitoringanalysesandfurtherrefined.Thisshall
directlyaddressthekeychallengesrelatedtoimprovedquantification,sensitivityandres-
olutionofmonitoringtechnologies.Bysequentiallycalibratingreservoirperformance
modelstoallavailablemonitoringdata,improvedpredictionanddelineationofthein-
jectedwaterbecomespossible.
Thereportappendedbelowsummarizesthemathematicalbasisforevaluatingpressurere-sponseininjectionwells,aspartofthistasksupportedbytheRPSEAProject.
6. InterpretationofLowFrequencyPressureMeasurementsinInjectionand
ProductionWells
DeepakDevegowdaMewbourneCollegeofPetroleumandGeologicalEngineering,SarkeysEnergyCenter100EastBoydSt.,Norman,Oklahoma73019-0628
Theintentofthischapteristodelineateamathematicalprocedureforreservoircharac-
terizationandpressureresponseanalysistoidentifyhighlyconductivefluidmigration
pathwaysinthesubsurfacefrominjectionwellpumpingtests.Pumpingtestsonproduced
waterdisposalwellsareanecessaryfirststeptoidentifyfluidmigrationpathwaysinthe
vicinityoftheinjectionwell.Thesefluidmigrationpathwaysmayincludefractures,inter-
sectingfaultsorhighpermeabilityzones.Inthiswork,wedocumentalowfrequencyas-
ymptoticapproachbasedonVascoandKarasaki(2006)tointerpretthesepumpingtests.
6.1SubsurfaceCharacterizationfromDynamicData
Theeconomicimpactofinaccuratepredictionsoffuturepetroleumreservoirperformance
issubstantial.Thereforemakingpropercharacterizationofthereservoiranduncertainty
analysesinproductionforecastsarecrucialaspectsinanyreservoirdevelopmentstrategy.
Thisgoalisequallyapplicabletoproducedwaterdisposalwellsatvariousdisposalsites.
Accuratecharacterizationofthesubsurfaceiscriticaltopredictingtheultimatefateofthe
injectedwateranditspotentialtoinduceseismicity.Thisgoalisachievedthroughtheuse
ofhistorymatchingalgorithmswhichreconcilereservoir/subsurfacemodelstomeasure-
mentssuchaspressureorinjection/productiondataortimelapseseismicinformation.
Theworkflowdependsonconstructinganappropriateinitialsubsurfacesimulationmodel
andadjustingthevaluesoftheuncertainmodelvariablessothatthemodelperformanceis
inreasonableagreementwithactualmeasurements.Theseapproachescanbebroadly
59
classifiedintotwodistinctcategories:gradientbasedalgorithmsandstochasticap-
proaches.Regardlessoftheapproach,allpreviouslyrecordeddataissimultaneouslyused
toupdatethereservoirmodel.Thefirstclassofalgorithmsgenerallyutilizesparameter
sensitivitiesorgradientsofanappropriatelyconstructedobjectivefunctiontoarriveata
solutiontotheinverseproblem.Togeneratemultiplehistorymatchedmodelrealizations,
thesetechniquesinvolvetherepeatedapplicationoftheproceduretoeachrealizationof
thereservoir,aprocedurewhichcanbecomputationallydemanding.Furthermore,these
approachesrelyonthedevelopmentofcodethatmaynotbecapableofhandlingdiverse
typesofdynamicdata.
Ontheotherhand,stochasticalgorithmsliketheMarkovChainMonteCarlo(MCMC)ap-
proach,simulatedannealingandgeneticalgorithmsrelyonstatisticalapproachestoarrive
atsolutionstotheinverseproblem.However,theseapproachesareslowtoconvergeand
requireexcessiveturn-aroundtimesformodelcalibration.Theassociateddifficultieswith
bothcategoriesofhistorymatchingalgorithmsarefurthercompoundedwhenitisneces-
sarytoassimilatedatafrequently.
Becauseoftheincreaseddeploymentofpermanentsensorsordownholemonitors,itisin-
creasinglyimportanttomaintain‘livemodels’thatareprogressivelyupdatedassoonas
dataisobtained.Inanycase,thereisastrongneedtoseeksolutionsthatprovidereasona-
blyaccuratesolutionsinacomputationallyfeasibleframework.Inthiswork,wedescribe
anapproachdevelopedbyVascoandKarasaki(2006)thatreliesonalowfrequencyap-
proximationofthepressurediffusivityequationthatcanaddressthechallengesassociated
withnoisypressuremeasurementsacquiredduringapumpingtesttocharacterizehigh
conductivityfluidmigrationpathwaysinthesubsurface.
6.2Methodology
VascoandKarasaki(2006)haveinvestigatedanasymptoticsolutionoflowfrequencytran-
sientpressurevariationstoestimatehydraulicfractureconductivity.Theinversionofhy-
draulicfracturetomographycanbeusedtoestimatepermeability.In2000,Vascoandhis
colleaguesinvestigatedthehighfrequencyasymptoticsolutionforpressurevariationequa-
tions.Theseequationsproposesolutionsfortransientpressureamplitudeandarrivaltime
throughtheuseofdiffusivetraveltimetomography.Theuseofthisapproachisconducted
throughapplyingconstantrateteststhatarerunforspecificperiodsoftime.Theusesof
thesetestsaregovernedbyutilizingthetimederivativetoestimatearrivaltime.Compu-
tingthetimederivativeisusuallytroublesomeduetoregionalandwelleffectsthatcause
initialtimevariations.
Thismethodisusuallysurroundedbygreatnumberofdataandnoiseaccompanyingdata
acquisition.Therefore,thelowfrequencyasymptoticapproachusesthefrequencydomain
toreducetheamountofdataneededtofindsolutions.Usingboththeforwardandthein-
versesolutionsrequireonlytwoproblems,whichareexpressedbythesteadystatepres-
sureequations.
Thisstudyfocusesonusingthelowfrequencyapproximationtothediffusivityequation
becauseofthefollowingassumptions:
60
1. Thehighfrequencyvariationsaresensitivetonoiseinthemeasurements.2. Thelowfrequencyresponsescorrespondtolateralandverticalvariationsinthe
reservoirproperties.
3. Workinginthefrequencydomainreducesthenumberofobservationsneededsignificantly.
4. Themethodiseasilygeneralizedandcanbeappliedtomanydifferentreservoirandtestingscenarios.
6.3ThePressureDiffusivityEquation
Thefollowingequationdefinesthefinalformofpressurevariations" #, % :
∇ '() ∙ ∇" + '()∇ ∙ ∇" = - ./.) (1)
Wheretheterm(())denotesthetotalmobilitydefinedas
() =0123141
+ 0523545
(2)
Totalmobilitydoesnotvarysignificantlywithposition,x;thusitwillbetreatedasacon-
stant.ThetermC(x,t)orcoefficient(C)doesnotvarywithtime,t,duetothesaturation
constraint(67 + 68 = 1)mentionedabove.Thecoefficient,Cisgivenby:
- = :;:<+ =>767 + =>868 (3)
6.4TheLowFrequencyAsymptoticSolution
Inthisstudy,thelow-frequencyasymptoticsolutiontothediffusivityequationshownin
Equation1isemployedtoquantify,interpret,andinvertpressurevariationsinthelowfre-
quencydomain.Alow-frequencyapproachisadoptedinthisworkbecauseseveralofthe
high-frequencyvariationsinpressuremaybebecauseofchangesinwelloperatingcondi-
tionsorresponsestolocalizedchangesinreservoir/aquiferproperties.Lowfrequency
variationsontheotherhandarelikelytoberespondingtoalargerscalereservoir/injec-
tionvolumesurroundingtheinjectionwell.Transformingthepressurepressuretothe
frequencydomainalsoreducesthevolumeofobservationdatatoamuchsmallersetofob-
servationsandeliminatesnoiseinthemeasurementsofpressure.
Oneessentialpartoftheasymptoticinverseproblemtechniquearethesensitivitycalcula-
tions.Thesecalculationsarerequiredtostudyreservoirparametervariationsandtheir
consequenteffectondependentreservoirparameters.Fundamentally,implementingdif-
ferentmethodsofsensitivitycalculationsprovidesadditionalauthenticationofthepro-
posedapproachandverificationofitsvalidity.Sensitivitycalculationsarediscussedlater
inthechapter.
Themainpurposeoftheasymptoticapproachistofindasolutionforthediffusivepressure
componentthatemulatesthecharacteristicsofthewavepropagationmodel.Many,includ-
ingVirieuxetal.(1994),havestudiedtheasymptoticapproachinderivingthediffusivity
equationinthefrequencydomain.Thefollowingnotationdescribesthegeneralformof
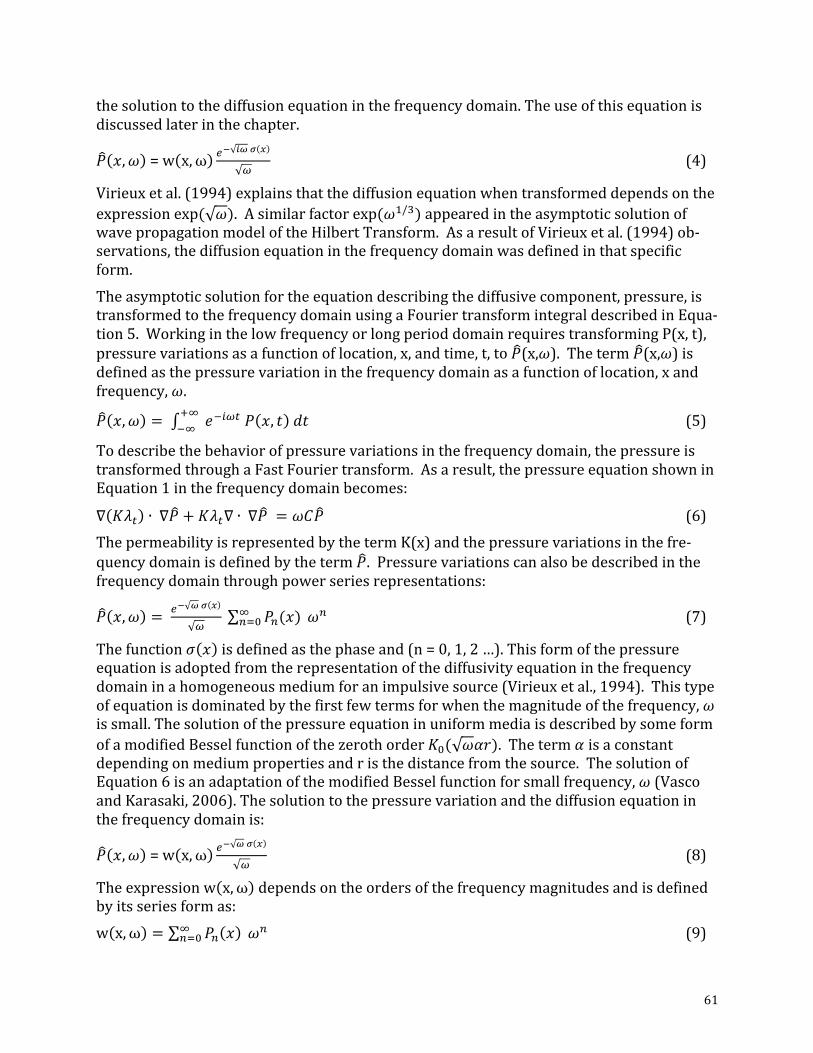
61
thesolutiontothediffusionequationinthefrequencydomain.Theuseofthisequationis
discussedlaterinthechapter.
" #,? =w x,ω CD EFG H
I (4)
Virieuxetal.(1994)explainsthatthediffusionequationwhentransformeddependsonthe
expressionexp( ?).Asimilarfactorexp(?N/P)appearedintheasymptoticsolutionofwavepropagationmodeloftheHilbertTransform.AsaresultofVirieuxetal.(1994)ob-
servations,thediffusionequationinthefrequencydomainwasdefinedinthatspecific
form.
Theasymptoticsolutionfortheequationdescribingthediffusivecomponent,pressure,is
transformedtothefrequencydomainusingaFouriertransformintegraldescribedinEqua-
tion5.WorkinginthelowfrequencyorlongperioddomainrequirestransformingP(x,t),
pressurevariationsasafunctionoflocation,x,andtime,t,to"(x,?).Theterm"(x,?)isdefinedasthepressurevariationinthefrequencydomainasafunctionoflocation,xand
frequency,?.
" #,? = QRSI)" #, % T%UVRV (5)
Todescribethebehaviorofpressurevariationsinthefrequencydomain,thepressureis
transformedthroughaFastFouriertransform.Asaresult,thepressureequationshownin
Equation1inthefrequencydomainbecomes:
∇ '() ∙ ∇" + '()∇ ∙ ∇" = ?-" (6)
ThepermeabilityisrepresentedbythetermK(x)andthepressurevariationsinthefre-
quencydomainisdefinedbytheterm".Pressurevariationscanalsobedescribedinthefrequencydomainthroughpowerseriesrepresentations:
" #,? = CD FG H
I "7(#)V
7WX ?7 (7)
ThefunctionY # isdefinedasthephaseand(n=0,1,2…).Thisformofthepressureequationisadoptedfromtherepresentationofthediffusivityequationinthefrequency
domaininahomogeneousmediumforanimpulsivesource(Virieuxetal.,1994).Thistype
ofequationisdominatedbythefirstfewtermsforwhenthemagnitudeofthefrequency,?issmall.Thesolutionofthepressureequationinuniformmediaisdescribedbysomeform
ofamodifiedBesselfunctionofthezerothorder'X( ?Z[).ThetermZisaconstantdependingonmediumpropertiesandristhedistancefromthesource.Thesolutionof
Equation6isanadaptationofthemodifiedBesselfunctionforsmallfrequency,?(VascoandKarasaki,2006).Thesolutiontothepressurevariationandthediffusionequationin
thefrequencydomainis:
" #,? =w x,ω CD FG H
I (8)
Theexpressionw x,ω dependsontheordersofthefrequencymagnitudesandisdefined
byitsseriesformas:
w x,ω = "7 #V7WX ?7 (9)
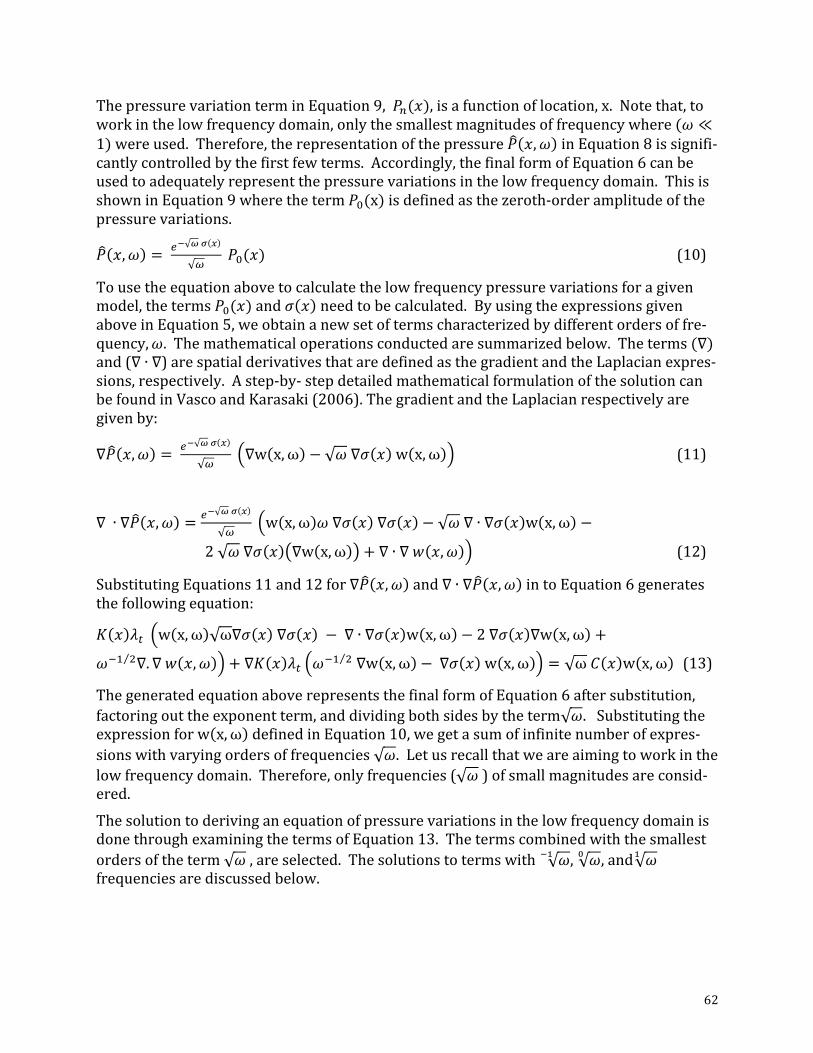
62
ThepressurevariationterminEquation9,"7(#),isafunctionoflocation,x.Notethat,toworkinthelowfrequencydomain,onlythesmallestmagnitudesoffrequencywhere(? ≪1)wereused.Therefore,therepresentationofthepressure" #,? inEquation8issignifi-
cantlycontrolledbythefirstfewterms.Accordingly,thefinalformofEquation6canbe
usedtoadequatelyrepresentthepressurevariationsinthelowfrequencydomain.Thisis
showninEquation9wheretheterm"X(x)isdefinedasthezeroth-orderamplitudeofthepressurevariations.
" #,? = CD FG H
I"X(#) (10)
Tousetheequationabovetocalculatethelowfrequencypressurevariationsforagiven
model,theterms"X(#)andY # needtobecalculated.ByusingtheexpressionsgivenaboveinEquation5,weobtainanewsetoftermscharacterizedbydifferentordersoffre-
quency, ?.Themathematicaloperationsconductedaresummarizedbelow.Theterms(∇)and(∇ ∙ ∇)arespatialderivativesthataredefinedasthegradientandtheLaplacianexpres-sions,respectively.Astep-by-stepdetailedmathematicalformulationofthesolutioncan
befoundinVascoandKarasaki(2006).ThegradientandtheLaplacianrespectivelyare
givenby:
∇" #,? = CD FG H
I ∇w x,ω − ?∇Y # w x,ω (11)
∇ ∙ ∇" #, ? = CD FG H
I w x,ω ?∇Y # ∇Y # − ?∇ ∙ ∇Y # w x,ω −
2 ?∇Y # ∇w x,ω + ∇ ∙ ∇_ #, ? (12)
SubstitutingEquations11and12for∇" #,? and∇ ∙ ∇" #, ? intoEquation6generates
thefollowingequation:
' # () w x, ω ω∇Y # ∇Y # −∇ ∙ ∇Y # w x,ω − 2∇Y # ∇w x,ω +
?RN `∇. ∇_ #, ? + ∇' # () ?RN `∇w x,ω −∇Y # w x,ω = ω- # w x,ω (13)
ThegeneratedequationaboverepresentsthefinalformofEquation6aftersubstitution,
factoringouttheexponentterm,anddividingbothsidesbytheterm ?.Substitutingtheexpressionforw x,ω definedinEquation10,wegetasumofinfinitenumberofexpres-
sionswithvaryingordersoffrequencies ?.Letusrecallthatweareaimingtoworkinthelowfrequencydomain.Therefore,onlyfrequencies( ?)ofsmallmagnitudesareconsid-ered.
Thesolutiontoderivinganequationofpressurevariationsinthelowfrequencydomainis
donethroughexaminingthetermsofEquation13.Thetermscombinedwiththesmallest
ordersoftheterm ?,areselected.Thesolutionstotermswith ?Db, ?c
,and ?b
frequenciesarediscussedbelow.
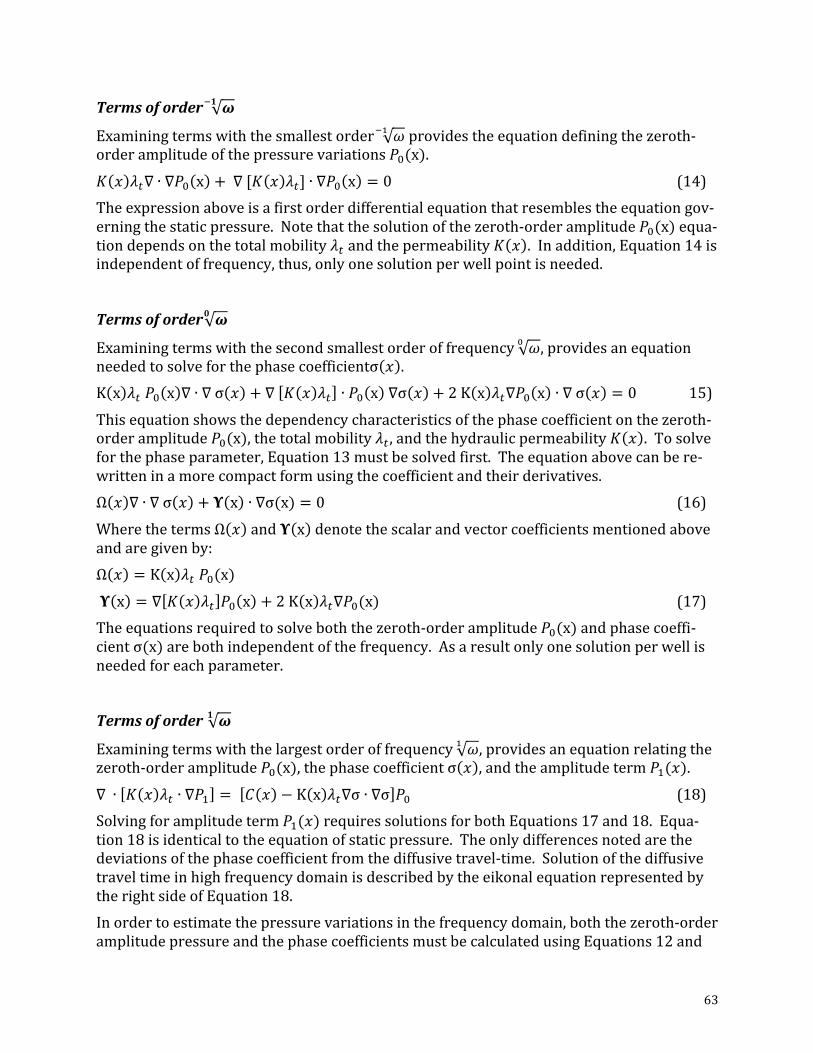
63
Termsoforder dDe
Examiningtermswiththesmallestorder ?Dbprovidestheequationdefiningthezeroth-
orderamplitudeofthepressurevariations"X(x).' # ()∇ ∙ ∇"X x +∇[' # ()] ∙ ∇"X x = 0 (14)
Theexpressionaboveisafirstorderdifferentialequationthatresemblestheequationgov-
erningthestaticpressure.Notethatthesolutionofthezeroth-orderamplitude"X(x)equa-tiondependsonthetotalmobility()andthepermeability' # .Inaddition,Equation14isindependentoffrequency,thus,onlyonesolutionperwellpointisneeded.
Termsoforder di
Examiningtermswiththesecondsmallestorderoffrequency ?c,providesanequation
neededtosolveforthephasecoefficientσ # .K x ()"X x ∇ ∙ ∇σ # + ∇ ' # () ∙ "X x ∇σ # + 2K x ()∇"X x ∙ ∇σ # = 0 15)
Thisequationshowsthedependencycharacteristicsofthephasecoefficientonthezeroth-
orderamplitude"X(x),thetotalmobility() ,andthehydraulicpermeability' # .Tosolveforthephaseparameter,Equation13mustbesolvedfirst.Theequationabovecanbere-
writteninamorecompactformusingthecoefficientandtheirderivatives.
Ω # ∇ ∙ ∇σ # + m x ∙ ∇σ(x) = 0 (16)
WherethetermsΩ # andm x denotethescalarandvectorcoefficientsmentionedaboveandaregivenby:
Ω # = K x ()"X(x)m x = ∇ ' # () "X x + 2K x ()∇"X(x) (17)
Theequationsrequiredtosolveboththezeroth-orderamplitude"X(x)andphasecoeffi-cientσ(x)arebothindependentofthefrequency.Asaresultonlyonesolutionperwellisneededforeachparameter.
Termsoforder de
Examiningtermswiththelargestorderoffrequency ?b,providesanequationrelatingthe
zeroth-orderamplitude"X(x),thephasecoefficientσ # ,andtheamplitudeterm"N(#).∇ ∙ ' # () ∙ ∇"N = - # − K x ()∇σ ∙ ∇σ "X (18)
Solvingforamplitudeterm"N(#)requiressolutionsforbothEquations17and18.Equa-tion18isidenticaltotheequationofstaticpressure.Theonlydifferencesnotedarethe
deviationsofthephasecoefficientfromthediffusivetravel-time.Solutionofthediffusive
traveltimeinhighfrequencydomainisdescribedbytheeikonalequationrepresentedby
therightsideofEquation18.
Inordertoestimatethepressurevariationsinthefrequencydomain,boththezeroth-order
amplitudepressureandthephasecoefficientsmustbecalculatedusingEquations12and
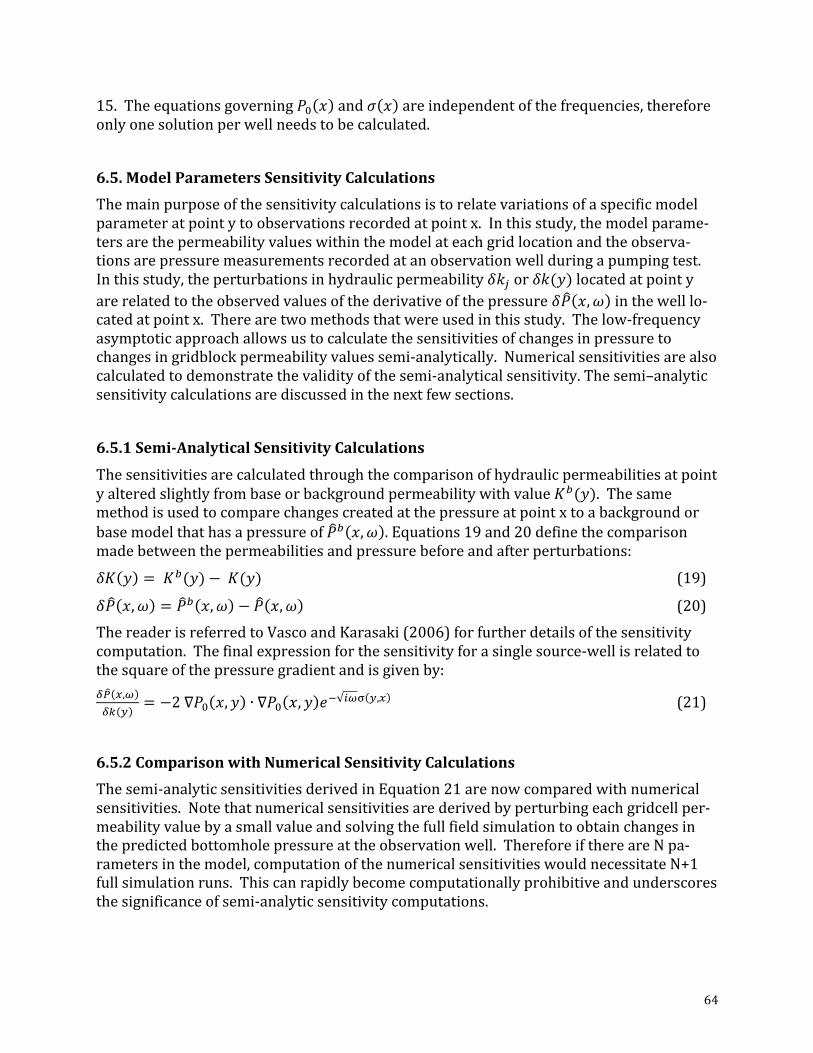
64
15.Theequationsgoverning"X # andY # areindependentofthefrequencies,thereforeonlyonesolutionperwellneedstobecalculated.
6.5.ModelParametersSensitivityCalculations
Themainpurposeofthesensitivitycalculationsistorelatevariationsofaspecificmodel
parameteratpointytoobservationsrecordedatpointx.Inthisstudy,themodelparame-
tersarethepermeabilityvalueswithinthemodelateachgridlocationandtheobserva-
tionsarepressuremeasurementsrecordedatanobservationwellduringapumpingtest.
Inthisstudy,theperturbationsinhydraulicpermeabilitynop orno(q)locatedatpointyarerelatedtotheobservedvaluesofthederivativeofthepressuren" #, ? inthewelllo-
catedatpointx.Therearetwomethodsthatwereusedinthisstudy.Thelow-frequency
asymptoticapproachallowsustocalculatethesensitivitiesofchangesinpressureto
changesingridblockpermeabilityvaluessemi-analytically.Numericalsensitivitiesarealso
calculatedtodemonstratethevalidityofthesemi-analyticalsensitivity.Thesemi–analytic
sensitivitycalculationsarediscussedinthenextfewsections.
6.5.1Semi-AnalyticalSensitivityCalculations
Thesensitivitiesarecalculatedthroughthecomparisonofhydraulicpermeabilitiesatpoint
yalteredslightlyfrombaseorbackgroundpermeabilitywithvalue'r(q).Thesamemethodisusedtocomparechangescreatedatthepressureatpointxtoabackgroundor
basemodelthathasapressureof"r #, ? .Equations19and20definethecomparison
madebetweenthepermeabilitiesandpressurebeforeandafterperturbations:
n' q = 'r(q) − '(q) (19)
n" #, ? = "r #, ? − " #,? (20)
ThereaderisreferredtoVascoandKarasaki(2006)forfurtherdetailsofthesensitivity
computation.Thefinalexpressionforthesensitivityforasinglesource-wellisrelatedto
thesquareofthepressuregradientandisgivenby:
s< t,Is2 u
= −2∇"X #, q ∙ ∇"X #, q QR SIv u,t (21)
6.5.2ComparisonwithNumericalSensitivityCalculations
Thesemi-analyticsensitivitiesderivedinEquation21arenowcomparedwithnumerical
sensitivities.Notethatnumericalsensitivitiesarederivedbyperturbingeachgridcellper-
meabilityvaluebyasmallvalueandsolvingthefullfieldsimulationtoobtainchangesin
thepredictedbottomholepressureattheobservationwell.ThereforeifthereareNpa-
rametersinthemodel,computationofthenumericalsensitivitieswouldnecessitateN+1
fullsimulationruns.Thiscanrapidlybecomecomputationallyprohibitiveandunderscores
thesignificanceofsemi-analyticsensitivitycomputations.
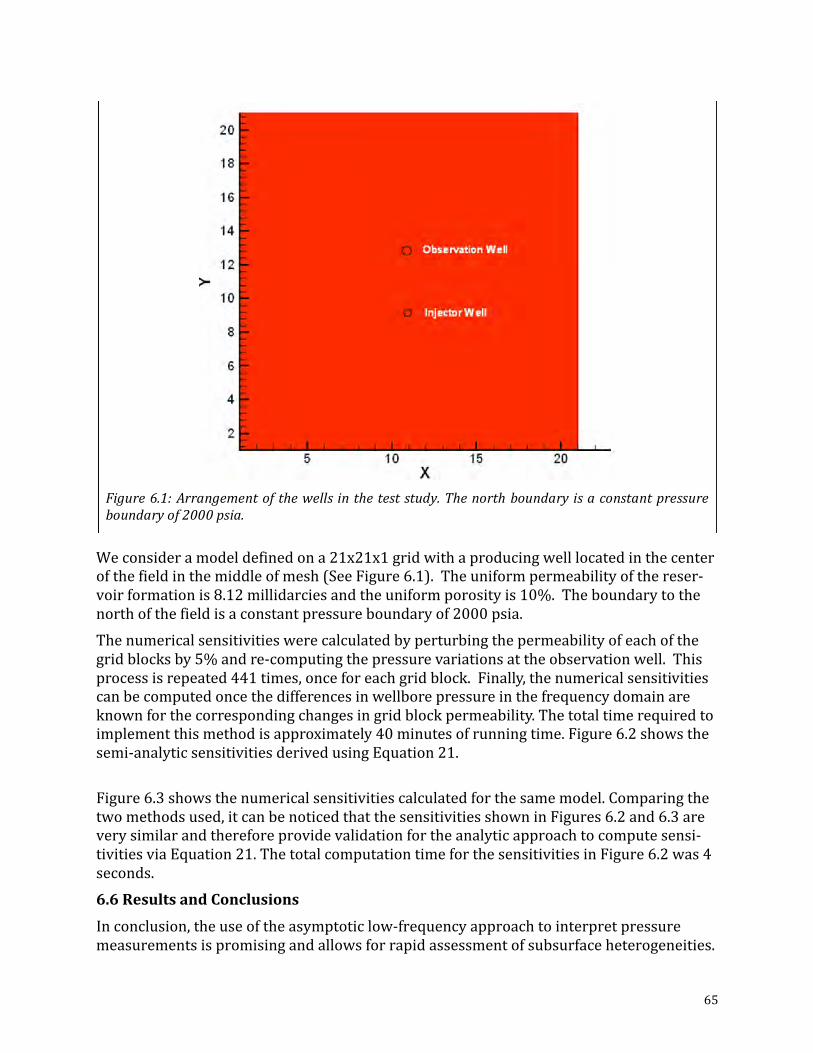
65
Weconsideramodeldefinedona21x21x1gridwithaproducingwelllocatedinthecenter
ofthefieldinthemiddleofmesh(SeeFigure6.1).Theuniformpermeabilityofthereser-
voirformationis8.12millidarciesandtheuniformporosityis10%.Theboundarytothe
northofthefieldisaconstantpressureboundaryof2000psia.
Thenumericalsensitivitieswerecalculatedbyperturbingthepermeabilityofeachofthe
gridblocksby5%andre-computingthepressurevariationsattheobservationwell.This
processisrepeated441times,onceforeachgridblock.Finally,thenumericalsensitivities
canbecomputedoncethedifferencesinwellborepressureinthefrequencydomainare
knownforthecorrespondingchangesingridblockpermeability.Thetotaltimerequiredto
implementthismethodisapproximately40minutesofrunningtime.Figure6.2showsthe
semi-analyticsensitivitiesderivedusingEquation21.
Figure6.3showsthenumericalsensitivitiescalculatedforthesamemodel.Comparingthe
twomethodsused,itcanbenoticedthatthesensitivitiesshowninFigures6.2and6.3are
verysimilarandthereforeprovidevalidationfortheanalyticapproachtocomputesensi-
tivitiesviaEquation21.ThetotalcomputationtimeforthesensitivitiesinFigure6.2was4
seconds.
6.6ResultsandConclusions
Inconclusion,theuseoftheasymptoticlow-frequencyapproachtointerpretpressure
measurementsispromisingandallowsforrapidassessmentofsubsurfaceheterogeneities.
Figure6.1:Arrangementofthewells intheteststudy.Thenorthboundaryisaconstantpressureboundaryof2000psia.
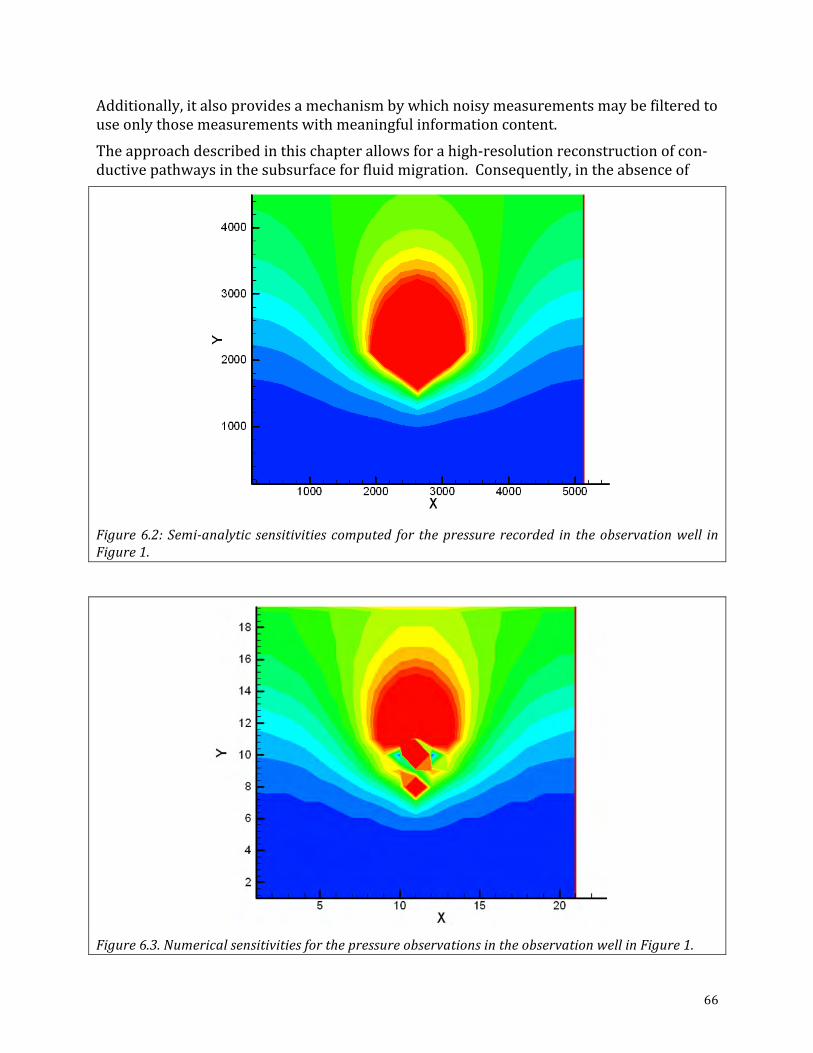
66
Additionally,italsoprovidesamechanismbywhichnoisymeasurementsmaybefilteredto
useonlythosemeasurementswithmeaningfulinformationcontent.
Theapproachdescribedinthischapterallowsforahigh-resolutionreconstructionofcon-
ductivepathwaysinthesubsurfaceforfluidmigration.Consequently,intheabsenceof
Figure6.2: Semi-analytic sensitivities computed for thepressure recorded in theobservationwell inFigure1.
Figure6.3.NumericalsensitivitiesforthepressureobservationsintheobservationwellinFigure1.

67
othergeophysicalmeasurementsorgeologicinterpretation,itprovidesasoundapproach
toaddressingconcernsoverthemigrationofinjectedwateranditsroleininducedseismic-
ity.ThemethodologydescribedhereborrowsheavilyfromVascoandKarasaki(2006)but
isverypromisingtodeterminethefateofinjectedwaterinsaltwaterdisposaloperations.
6.7References1. Gradshteyn,I.S.,andI.M.Ryzhik.1980,TableofIntegrals,Series,andProducts,Else-
vier,NewYork.
2. Oliver,D.S.1993.Theinfluenceofnon-uniformtransmissivityandstorativityondraw-down.WaterResourcesResearch29(1):169–178.
http://dx.doi.org/10.1029/92WR02061.
3. Vasco,D.W.2000.Analgebraicformulationofgeophysicalinverseproblems.Geophysi-calJournalInternational142(30):970–990.http://dx.doi.org
/10.1046/j.1365-246x.2000.00188.x.
4. Vasco,D.W.2004.Estimationofflowpropertiesusingsurfacedeformationandpres-suredata:Atrajectory-basedapproach.WaterResourcesResearch40(10):1-14.
W10104.http://dx.doi.org/10.1029/2004WR003272.
5. Vasco,D.W.,andK.Karasaki.2001.Inversionofpressureobservations:Anintegralformulation.JournalofHydrology253(1–4):27–40.DOI:
http://dx.doi.org/10.1016/S0022-1694(01)00482-6.
6. Vasco,D.W.,andK.Karasaki.2006.Interpretationandinversionoflow-frequencypres-sureobservations.WaterResourcesResearch42(5)W05408.
http://dx.doi.org/10.1029/2005WR004445.
7. Vasco,D.W.,H.Keers,andK.Karasaki.2000.Estimationofreservoirpropertiesusingtransientpressuredata:Anasymptoticapproach.WaterResourcesResearch
36(12),3447–3465.http://dx.doi.org/10.1029/2000WR900179.
8. Vera,F.andEconomides,C.2014.DescribingShaleWellPerformanceUsingTransientWellAnalysis.SPEJournal10(2):24-28.SPE-0214-024-
TWA.http://dx.doi.org/10.2118/0214-024-TWA.
9. Virieux,J.,Flores-Luna,C.,andGibert,D.1994.Asymptotictheoryfordiffusiveelectromagneticimaging.GeophysicalJournalInternational119(3):857-868.
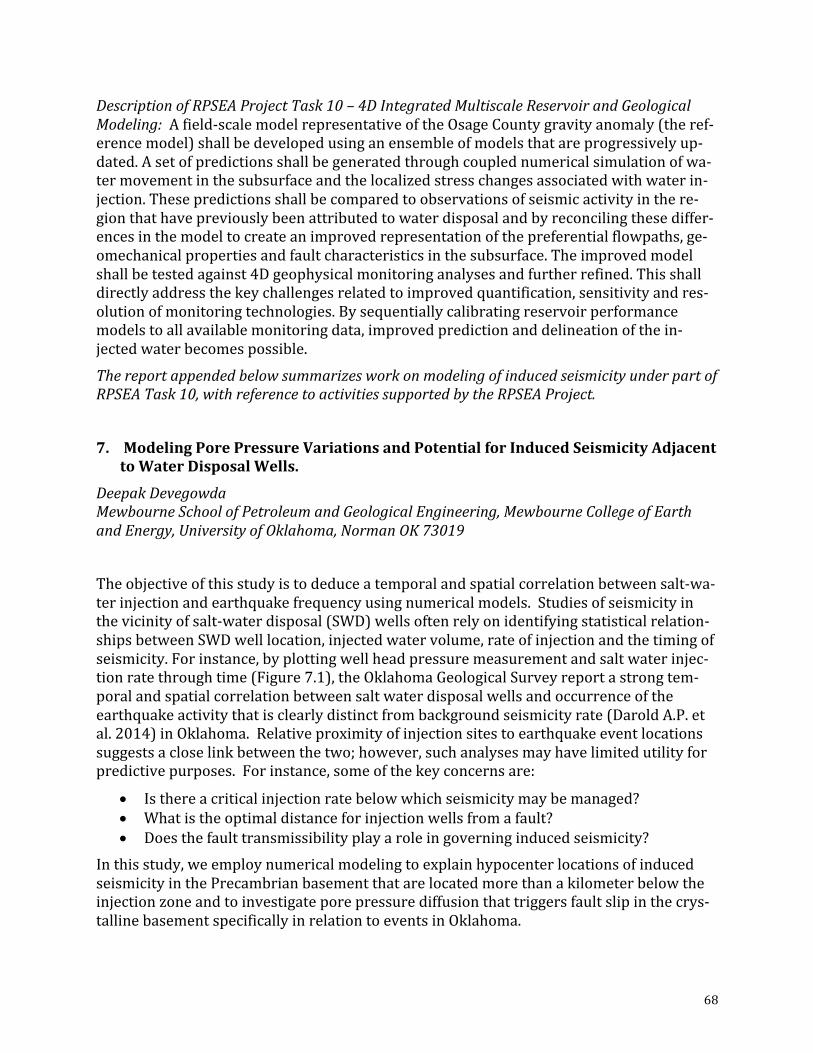
68
DescriptionofRPSEAProjectTask10–4DIntegratedMultiscaleReservoirandGeologicalModeling:Afield-scalemodelrepresentativeoftheOsageCountygravityanomaly(theref-erencemodel)shallbedevelopedusinganensembleofmodelsthatareprogressivelyup-
dated.Asetofpredictionsshallbegeneratedthroughcouplednumericalsimulationofwa-
termovementinthesubsurfaceandthelocalizedstresschangesassociatedwithwaterin-
jection.Thesepredictionsshallbecomparedtoobservationsofseismicactivityinthere-
gionthathavepreviouslybeenattributedtowaterdisposalandbyreconcilingthesediffer-
encesinthemodeltocreateanimprovedrepresentationofthepreferentialflowpaths,ge-
omechanicalpropertiesandfaultcharacteristicsinthesubsurface.Theimprovedmodel
shallbetestedagainst4Dgeophysicalmonitoringanalysesandfurtherrefined.Thisshall
directlyaddressthekeychallengesrelatedtoimprovedquantification,sensitivityandres-
olutionofmonitoringtechnologies.Bysequentiallycalibratingreservoirperformance
modelstoallavailablemonitoringdata,improvedpredictionanddelineationofthein-
jectedwaterbecomespossible.
ThereportappendedbelowsummarizesworkonmodelingofinducedseismicityunderpartofRPSEATask10,withreferencetoactivitiessupportedbytheRPSEAProject.
7. ModelingPorePressureVariationsandPotentialforInducedSeismicityAdjacent
toWaterDisposalWells.
DeepakDevegowdaMewbourneSchoolofPetroleumandGeologicalEngineering,MewbourneCollegeofEarthandEnergy,UniversityofOklahoma,NormanOK73019
Theobjectiveofthisstudyistodeduceatemporalandspatialcorrelationbetweensalt-wa-
terinjectionandearthquakefrequencyusingnumericalmodels.Studiesofseismicityin
thevicinityofsalt-waterdisposal(SWD)wellsoftenrelyonidentifyingstatisticalrelation-
shipsbetweenSWDwelllocation,injectedwatervolume,rateofinjectionandthetimingof
seismicity.Forinstance,byplottingwellheadpressuremeasurementandsaltwaterinjec-
tionratethroughtime(Figure7.1),theOklahomaGeologicalSurveyreportastrongtem-
poralandspatialcorrelationbetweensaltwaterdisposalwellsandoccurrenceofthe
earthquakeactivitythatisclearlydistinctfrombackgroundseismicityrate(DaroldA.P.et
al.2014)inOklahoma.Relativeproximityofinjectionsitestoearthquakeeventlocations
suggestsacloselinkbetweenthetwo;however,suchanalysesmayhavelimitedutilityfor
predictivepurposes.Forinstance,someofthekeyconcernsare:
• Isthereacriticalinjectionratebelowwhichseismicitymaybemanaged?
• Whatistheoptimaldistanceforinjectionwellsfromafault?
• Doesthefaulttransmissibilityplayaroleingoverninginducedseismicity?
Inthisstudy,weemploynumericalmodelingtoexplainhypocenterlocationsofinduced
seismicityinthePrecambrianbasementthatarelocatedmorethanakilometerbelowthe
injectionzoneandtoinvestigateporepressurediffusionthattriggersfaultslipinthecrys-
tallinebasementspecificallyinrelationtoeventsinOklahoma.
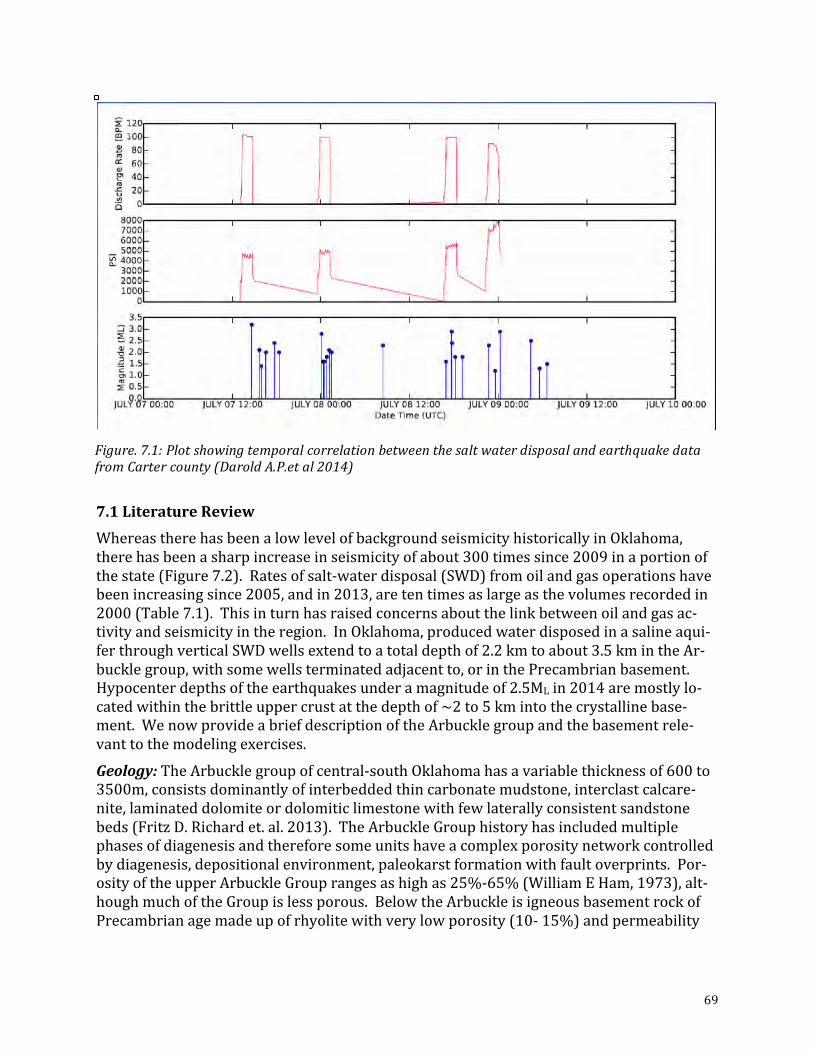
69
7.1LiteratureReview
WhereastherehasbeenalowlevelofbackgroundseismicityhistoricallyinOklahoma,
therehasbeenasharpincreaseinseismicityofabout300timessince2009inaportionof
thestate(Figure7.2).Ratesofsalt-waterdisposal(SWD)fromoilandgasoperationshave
beenincreasingsince2005,andin2013,aretentimesaslargeasthevolumesrecordedin
2000(Table7.1).Thisinturnhasraisedconcernsaboutthelinkbetweenoilandgasac-
tivityandseismicityintheregion.InOklahoma,producedwaterdisposedinasalineaqui-
ferthroughverticalSWDwellsextendtoatotaldepthof2.2kmtoabout3.5kmintheAr-
bucklegroup,withsomewellsterminatedadjacentto,orinthePrecambrianbasement.
Hypocenterdepthsoftheearthquakesunderamagnitudeof2.5MLin2014aremostlylo-
catedwithinthebrittleuppercrustatthedepthof~2to5kmintothecrystallinebase-
ment.WenowprovideabriefdescriptionoftheArbucklegroupandthebasementrele-
vanttothemodelingexercises.
Geology:TheArbucklegroupofcentral-southOklahomahasavariablethicknessof600to3500m,consistsdominantlyofinterbeddedthincarbonatemudstone,interclastcalcare-
nite,laminateddolomiteordolomiticlimestonewithfewlaterallyconsistentsandstone
beds(FritzD.Richardet.al.2013).TheArbuckleGrouphistoryhasincludedmultiple
phasesofdiagenesisandthereforesomeunitshaveacomplexporositynetworkcontrolled
bydiagenesis,depositionalenvironment,paleokarstformationwithfaultoverprints.Por-
osityoftheupperArbuckleGrouprangesashighas25%-65%(WilliamEHam,1973),alt-
houghmuchoftheGroupislessporous.BelowtheArbuckleisigneousbasementrockof
Precambrianagemadeupofrhyolitewithverylowporosity(10-15%)andpermeability
Figure.7.1:PlotshowingtemporalcorrelationbetweenthesaltwaterdisposalandearthquakedatafromCartercounty(DaroldA.P.etal2014)
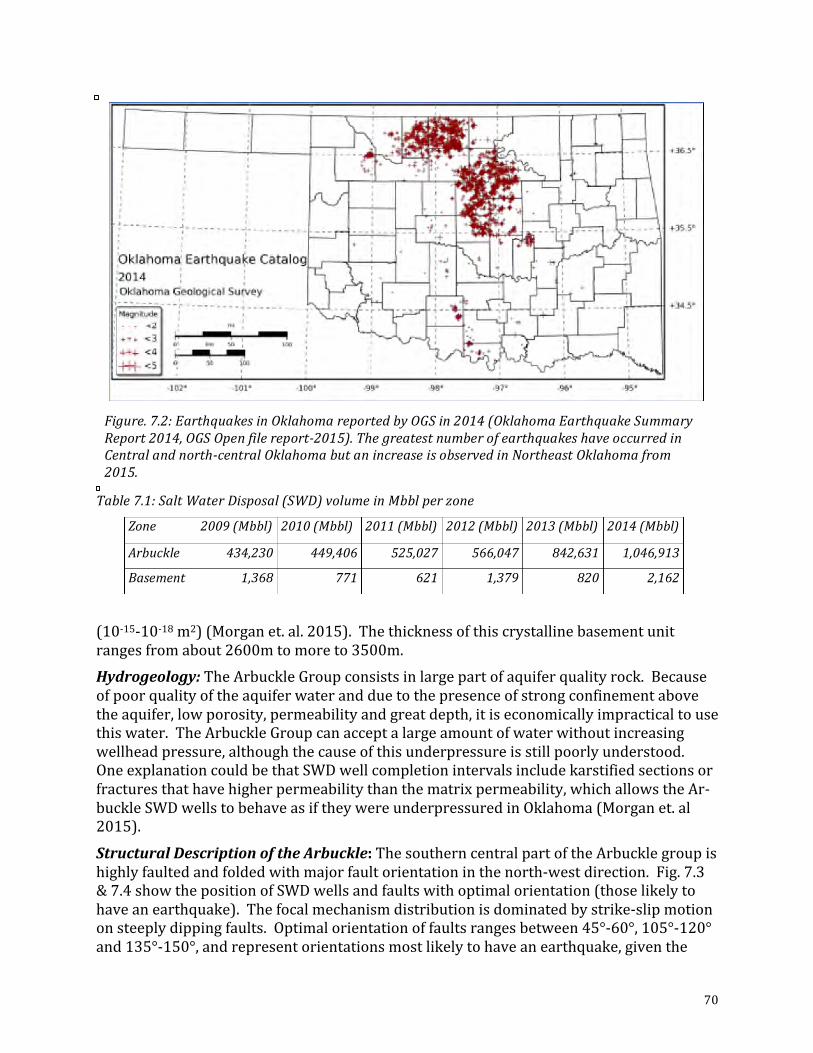
70
(10-15-10-18m2)(Morganet.al.2015).Thethicknessofthiscrystallinebasementunit
rangesfromabout2600mtomoreto3500m.
Hydrogeology:TheArbuckleGroupconsistsinlargepartofaquiferqualityrock.Becauseofpoorqualityoftheaquiferwaterandduetothepresenceofstrongconfinementabove
theaquifer,lowporosity,permeabilityandgreatdepth,itiseconomicallyimpracticaltouse
thiswater.TheArbuckleGroupcanacceptalargeamountofwaterwithoutincreasing
wellheadpressure,althoughthecauseofthisunderpressureisstillpoorlyunderstood.
OneexplanationcouldbethatSWDwellcompletionintervalsincludekarstifiedsectionsor
fracturesthathavehigherpermeabilitythanthematrixpermeability,whichallowstheAr-
buckleSWDwellstobehaveasiftheywereunderpressuredinOklahoma(Morganet.al
2015).
StructuralDescriptionoftheArbuckle:ThesoutherncentralpartoftheArbucklegroupishighlyfaultedandfoldedwithmajorfaultorientationinthenorth-westdirection.Fig.7.3
&7.4showthepositionofSWDwellsandfaultswithoptimalorientation(thoselikelyto
haveanearthquake).Thefocalmechanismdistributionisdominatedbystrike-slipmotion
onsteeplydippingfaults.Optimalorientationoffaultsrangesbetween45°-60°,105°-120°
and135°-150°,andrepresentorientationsmostlikelytohaveanearthquake,giventhe
Figure.7.2:EarthquakesinOklahomareportedbyOGSin2014(OklahomaEarthquakeSummaryReport2014,OGSOpenfilereport-2015).ThegreatestnumberofearthquakeshaveoccurredinCentralandnorth-centralOklahomabutanincreaseisobservedinNortheastOklahomafrom2015.
Table7.1:SaltWaterDisposal(SWD)volumeinMbblperzoneZone 2009(Mbbl) 2010(Mbbl) 2011(Mbbl) 2012(Mbbl) 2013(Mbbl) 2014(Mbbl)
Arbuckle 434,230 449,406 525,027 566,047 842,631 1,046,913
Basement 1,368 771 621 1,379 820 2,162
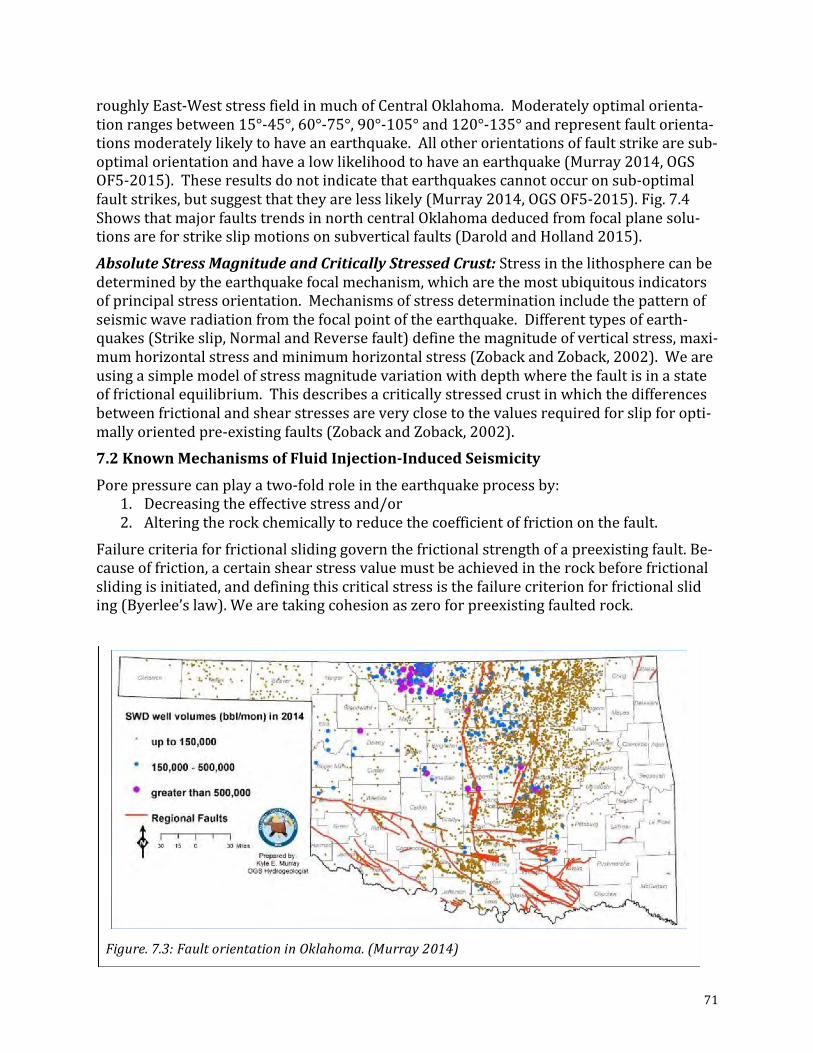
71
roughlyEast-WeststressfieldinmuchofCentralOklahoma.Moderatelyoptimalorienta-
tionrangesbetween15°-45°,60°-75°,90°-105°and120°-135°andrepresentfaultorienta-
tionsmoderatelylikelytohaveanearthquake.Allotherorientationsoffaultstrikearesub-
optimalorientationandhavealowlikelihoodtohaveanearthquake(Murray2014,OGS
OF5-2015).Theseresultsdonotindicatethatearthquakescannotoccuronsub-optimal
faultstrikes,butsuggestthattheyarelesslikely(Murray2014,OGSOF5-2015).Fig.7.4
ShowsthatmajorfaultstrendsinnorthcentralOklahomadeducedfromfocalplanesolu-
tionsareforstrikeslipmotionsonsubverticalfaults(DaroldandHolland2015).
AbsoluteStressMagnitudeandCriticallyStressedCrust:Stressinthelithospherecanbedeterminedbytheearthquakefocalmechanism,whicharethemostubiquitousindicators
ofprincipalstressorientation.Mechanismsofstressdeterminationincludethepatternof
seismicwaveradiationfromthefocalpointoftheearthquake.Differenttypesofearth-
quakes(Strikeslip,NormalandReversefault)definethemagnitudeofverticalstress,maxi-
mumhorizontalstressandminimumhorizontalstress(ZobackandZoback,2002).Weare
usingasimplemodelofstressmagnitudevariationwithdepthwherethefaultisinastate
offrictionalequilibrium.Thisdescribesacriticallystressedcrustinwhichthedifferences
betweenfrictionalandshearstressesareveryclosetothevaluesrequiredforslipforopti-
mallyorientedpre-existingfaults(ZobackandZoback,2002).
7.2KnownMechanismsofFluidInjection-InducedSeismicity
Porepressurecanplayatwo-foldroleintheearthquakeprocessby:
1. Decreasingtheeffectivestressand/or2. Alteringtherockchemicallytoreducethecoefficientoffrictiononthefault.
Failurecriteriaforfrictionalslidinggovernthefrictionalstrengthofapreexistingfault.Be-
causeoffriction,acertainshearstressvaluemustbeachievedintherockbeforefrictional
slidingisinitiated,anddefiningthiscriticalstressisthefailurecriterionforfrictionalslid
ing(Byerlee’slaw).Wearetakingcohesionaszeroforpreexistingfaultedrock.
Figure.7.3:FaultorientationinOklahoma.(Murray2014)
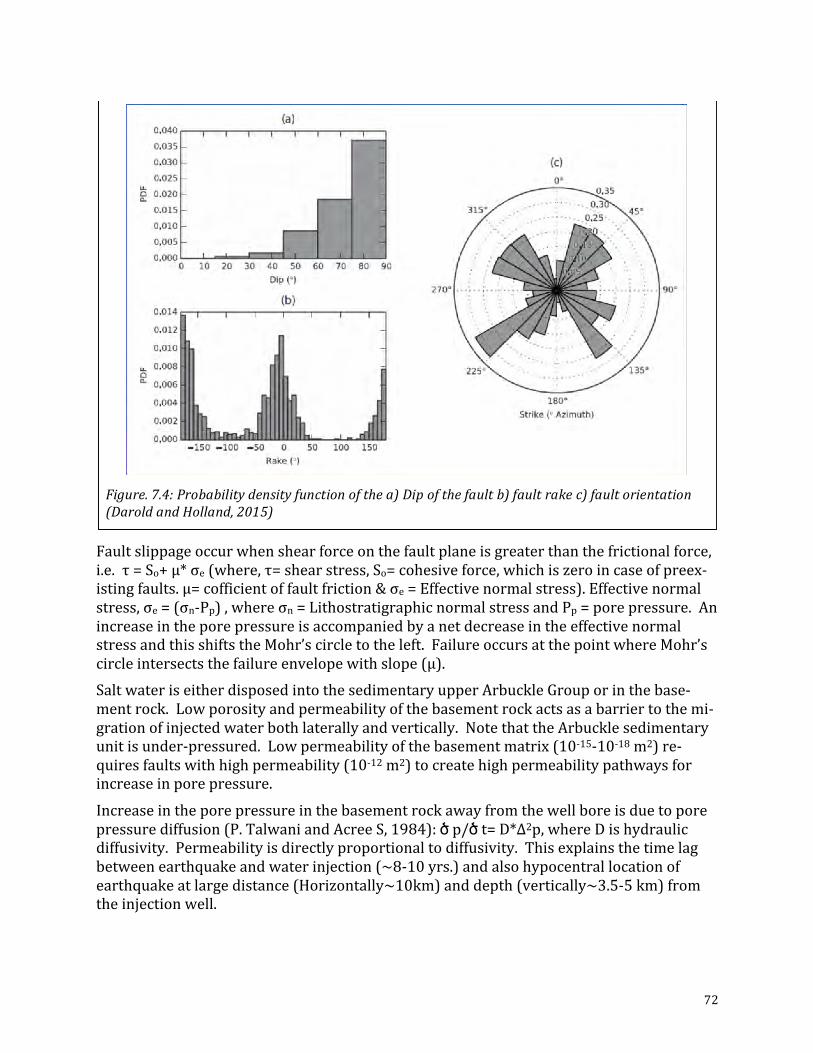
72
Faultslippageoccurwhenshearforceonthefaultplaneisgreaterthanthefrictionalforce,
i.e.τ=So+μ*σe(where,τ=shearstress,So=cohesiveforce,whichiszeroincaseofpreex-
istingfaults.μ=cofficientoffaultfriction&σe=Effectivenormalstress).Effectivenormal
stress,σe=(σn-Pp),whereσn=LithostratigraphicnormalstressandPp=porepressure.An
increaseintheporepressureisaccompaniedbyanetdecreaseintheeffectivenormal
stressandthisshiftstheMohr’scircletotheleft.FailureoccursatthepointwhereMohr’s
circleintersectsthefailureenvelopewithslope(μ).
SaltwateriseitherdisposedintothesedimentaryupperArbuckleGrouporinthebase-
mentrock.Lowporosityandpermeabilityofthebasementrockactsasabarriertothemi-
grationofinjectedwaterbothlaterallyandvertically.NotethattheArbucklesedimentary
unitisunder-pressured.Lowpermeabilityofthebasementmatrix(10-15-10-18m2)re-
quiresfaultswithhighpermeability(10-12m2)tocreatehighpermeabilitypathwaysfor
increaseinporepressure.
Increaseintheporepressureinthebasementrockawayfromthewellboreisduetopore
pressurediffusion(P.TalwaniandAcreeS,1984):ծ p/ծ t=D*Δ2p,whereDishydraulicdiffusivity.Permeabilityisdirectlyproportionaltodiffusivity.Thisexplainsthetimelag
betweenearthquakeandwaterinjection(~8-10yrs.)andalsohypocentrallocationof
earthquakeatlargedistance(Horizontally~10km)anddepth(vertically~3.5-5km)from
theinjectionwell.
Figure.7.4:Probabilitydensityfunctionofthea)Dipofthefaultb)faultrakec)faultorientation(DaroldandHolland,2015)
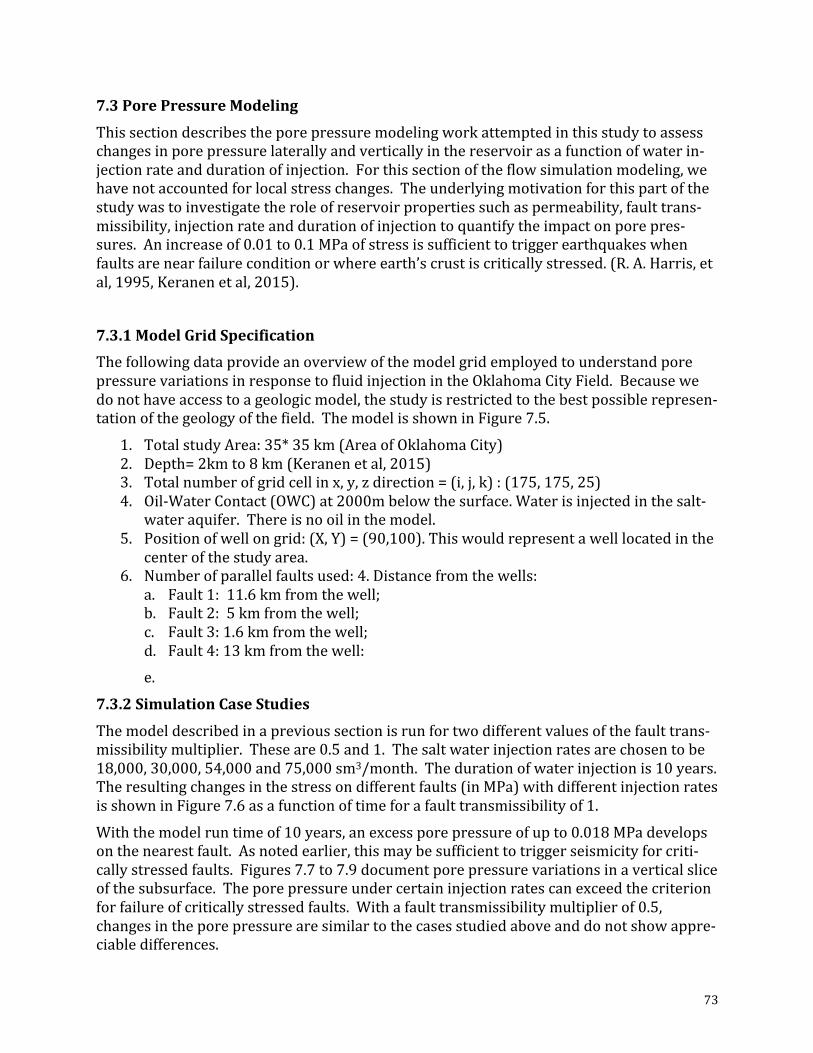
73
7.3PorePressureModeling
Thissectiondescribestheporepressuremodelingworkattemptedinthisstudytoassess
changesinporepressurelaterallyandverticallyinthereservoirasafunctionofwaterin-
jectionrateanddurationofinjection.Forthissectionoftheflowsimulationmodeling,we
havenotaccountedforlocalstresschanges.Theunderlyingmotivationforthispartofthe
studywastoinvestigatetheroleofreservoirpropertiessuchaspermeability,faulttrans-
missibility,injectionrateanddurationofinjectiontoquantifytheimpactonporepres-
sures.Anincreaseof0.01to0.1MPaofstressissufficienttotriggerearthquakeswhen
faultsarenearfailureconditionorwhereearth’scrustiscriticallystressed.(R.A.Harris,et
al,1995,Keranenetal,2015).
7.3.1ModelGridSpecification
Thefollowingdataprovideanoverviewofthemodelgridemployedtounderstandpore
pressurevariationsinresponsetofluidinjectionintheOklahomaCityField.Becausewe
donothaveaccesstoageologicmodel,thestudyisrestrictedtothebestpossiblerepresen-
tationofthegeologyofthefield.ThemodelisshowninFigure7.5.
1. TotalstudyArea:35*35km(AreaofOklahomaCity)2. Depth=2kmto8km(Keranenetal,2015)3. Totalnumberofgridcellinx,y,zdirection=(i,j,k):(175,175,25)4. Oil-WaterContact(OWC)at2000mbelowthesurface.Waterisinjectedinthesalt-
wateraquifer.Thereisnooilinthemodel.
5. Positionofwellongrid:(X,Y)=(90,100).Thiswouldrepresentawelllocatedinthecenterofthestudyarea.
6. Numberofparallelfaultsused:4.Distancefromthewells:a. Fault1:11.6kmfromthewell;b. Fault2:5kmfromthewell;c. Fault3:1.6kmfromthewell;d. Fault4:13kmfromthewell:e.
7.3.2SimulationCaseStudies
Themodeldescribedinaprevioussectionisrunfortwodifferentvaluesofthefaulttrans-
missibilitymultiplier.Theseare0.5and1.Thesaltwaterinjectionratesarechosentobe
18,000,30,000,54,000and75,000sm3/month.Thedurationofwaterinjectionis10years.
Theresultingchangesinthestressondifferentfaults(inMPa)withdifferentinjectionrates
isshowninFigure7.6asafunctionoftimeforafaulttransmissibilityof1.
Withthemodelruntimeof10years,anexcessporepressureofupto0.018MPadevelops
onthenearestfault.Asnotedearlier,thismaybesufficienttotriggerseismicityforcriti-
callystressedfaults.Figures7.7to7.9documentporepressurevariationsinaverticalslice
ofthesubsurface.Theporepressureundercertaininjectionratescanexceedthecriterion
forfailureofcriticallystressedfaults.Withafaulttransmissibilitymultiplierof0.5,
changesintheporepressurearesimilartothecasesstudiedaboveanddonotshowappre-
ciabledifferences.
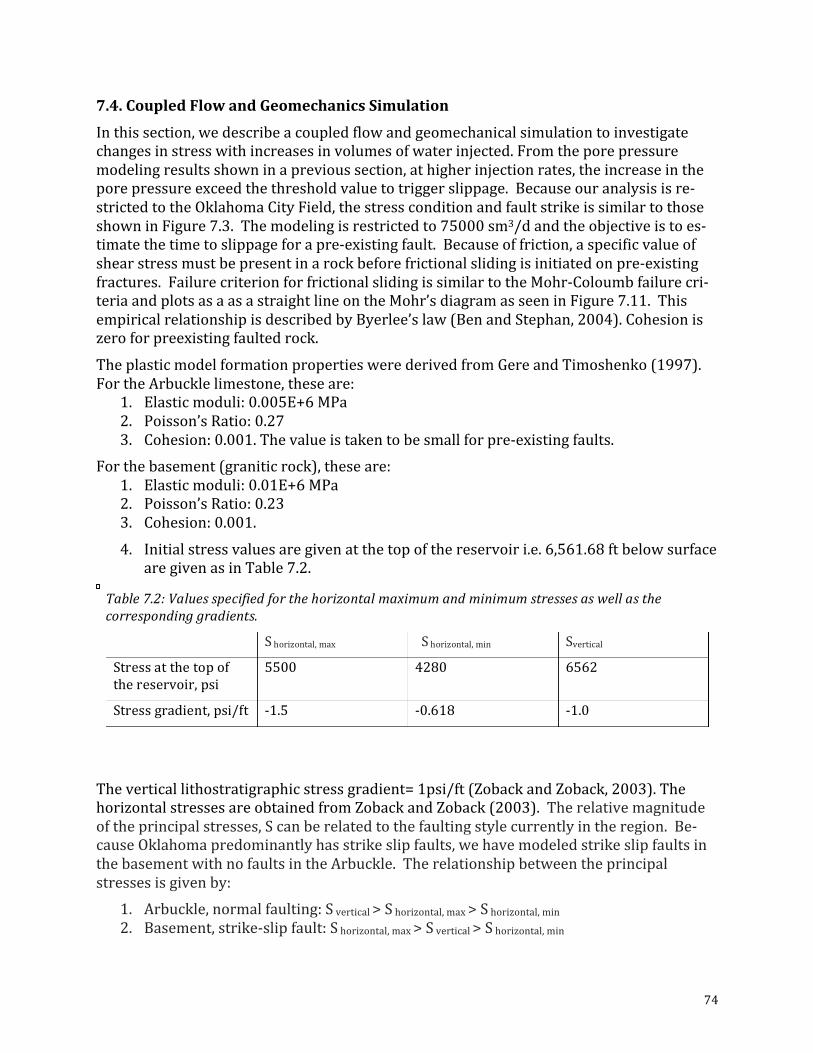
74
7.4.CoupledFlowandGeomechanicsSimulation
Inthissection,wedescribeacoupledflowandgeomechanicalsimulationtoinvestigate
changesinstresswithincreasesinvolumesofwaterinjected.Fromtheporepressure
modelingresultsshowninaprevioussection,athigherinjectionrates,theincreaseinthe
porepressureexceedthethresholdvaluetotriggerslippage.Becauseouranalysisisre-
strictedtotheOklahomaCityField,thestressconditionandfaultstrikeissimilartothose
showninFigure7.3.Themodelingisrestrictedto75000sm3/dandtheobjectiveistoes-
timatethetimetoslippageforapre-existingfault.Becauseoffriction,aspecificvalueof
shearstressmustbepresentinarockbeforefrictionalslidingisinitiatedonpre-existing
fractures.FailurecriterionforfrictionalslidingissimilartotheMohr-Coloumbfailurecri-
teriaandplotsasaasastraightlineontheMohr’sdiagramasseeninFigure7.11.This
empiricalrelationshipisdescribedbyByerlee’slaw(BenandStephan,2004).Cohesionis
zeroforpreexistingfaultedrock.
TheplasticmodelformationpropertieswerederivedfromGereandTimoshenko(1997).
FortheArbucklelimestone,theseare:
1. Elasticmoduli:0.005E+6MPa2. Poisson’sRatio:0.273. Cohesion:0.001.Thevalueistakentobesmallforpre-existingfaults.
Forthebasement(graniticrock),theseare:
1. Elasticmoduli:0.01E+6MPa2. Poisson’sRatio:0.233. Cohesion:0.001.4. Initialstressvaluesaregivenatthetopofthereservoiri.e.6,561.68ftbelowsurface
aregivenasinTable7.2.
Theverticallithostratigraphicstressgradient=1psi/ft(ZobackandZoback,2003).The
horizontalstressesareobtainedfromZobackandZoback(2003).Therelativemagnitude
oftheprincipalstresses,Scanberelatedtothefaultingstylecurrentlyintheregion.Be-
causeOklahomapredominantlyhasstrikeslipfaults,wehavemodeledstrikeslipfaultsin
thebasementwithnofaultsintheArbuckle.Therelationshipbetweentheprincipal
stressesisgivenby:
1. Arbuckle,normalfaulting:Svertical>Shorizontal,max>Shorizontal,min2. Basement,strike-slipfault:Shorizontal,max>Svertical>Shorizontal,min
Table7.2:Valuesspecifiedforthehorizontalmaximumandminimumstressesaswellasthecorrespondinggradients.
Shorizontal,max Shorizontal,min Svertical
Stressatthetopof
thereservoir,psi
5500 4280 6562
Stressgradient,psi/ft -1.5 -0.618 -1.0
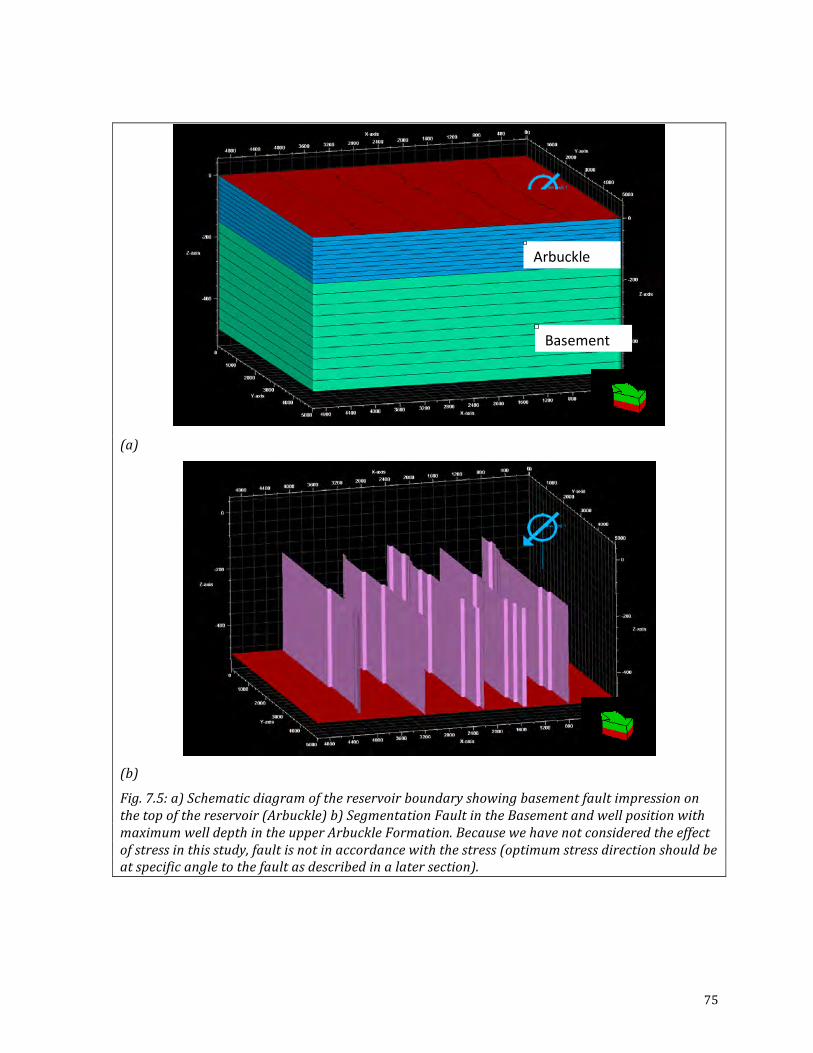
75
(a)
(b)
Fig.7.5:a)Schematicdiagramofthereservoirboundaryshowingbasementfaultimpressiononthetopofthereservoir(Arbuckle)b)SegmentationFaultintheBasementandwellpositionwithmaximumwelldepthintheupperArbuckleFormation.Becausewehavenotconsideredtheeffectofstressinthisstudy,faultisnotinaccordancewiththestress(optimumstressdirectionshouldbeatspecificangletothefaultasdescribedinalatersection).
Arbuckle
Basement
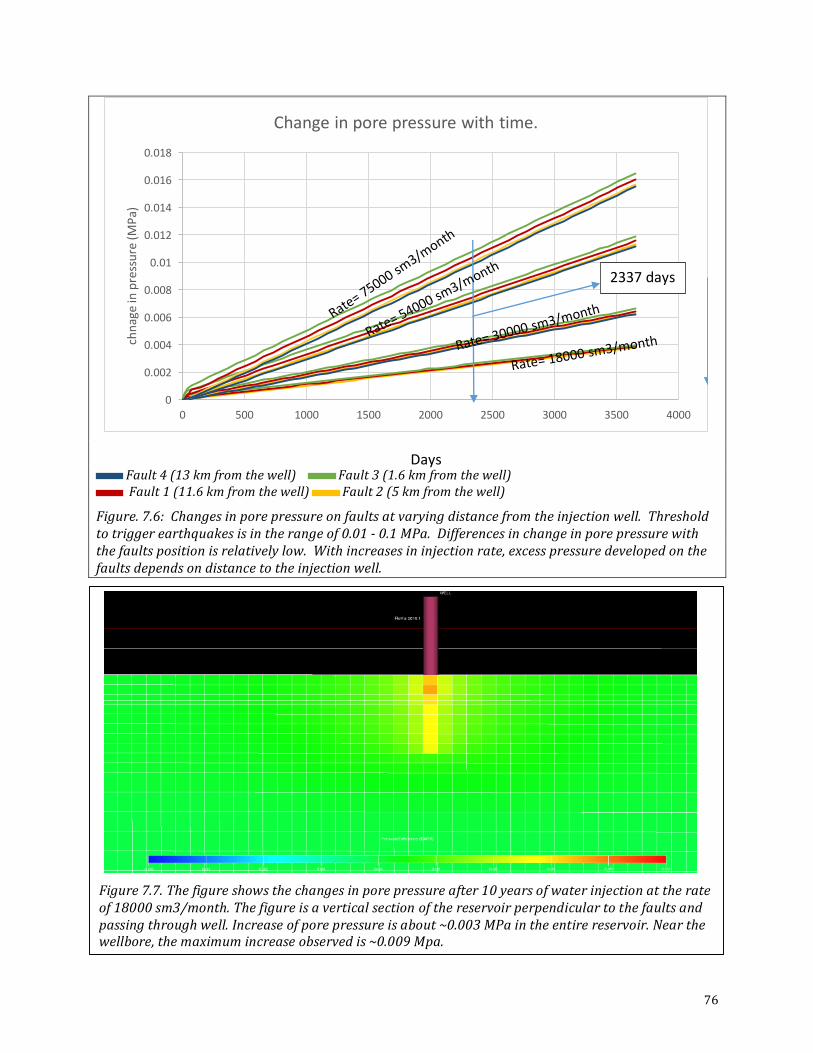
76
Fault4(13kmfromthewell) Fault3(1.6kmfromthewell)Fault1(11.6kmfromthewell) Fault2(5kmfromthewell)
Figure.7.6:Changesinporepressureonfaultsatvaryingdistancefromtheinjectionwell.Thresholdtotriggerearthquakesisintherangeof0.01-0.1MPa.Differencesinchangeinporepressurewiththefaultspositionisrelativelylow.Withincreasesininjectionrate,excesspressuredevelopedonthefaultsdependsondistancetotheinjectionwell.
0
0.002
0.004
0.006
0.008
0.01
0.012
0.014
0.016
0.018
0 500 1000 1500 2000 2500 3000 3500 4000
chnageinpressure(M
Pa)
Changeinporepressurewithtime.
2337days
Days
Figure7.7.Thefigureshowsthechangesinporepressureafter10yearsofwaterinjectionattherateof18000sm3/month.Thefigureisaverticalsectionofthereservoirperpendiculartothefaultsandpassingthroughwell.Increaseofporepressureisabout~0.003MPaintheentirereservoir.Nearthewellbore,themaximumincreaseobservedis~0.009Mpa.
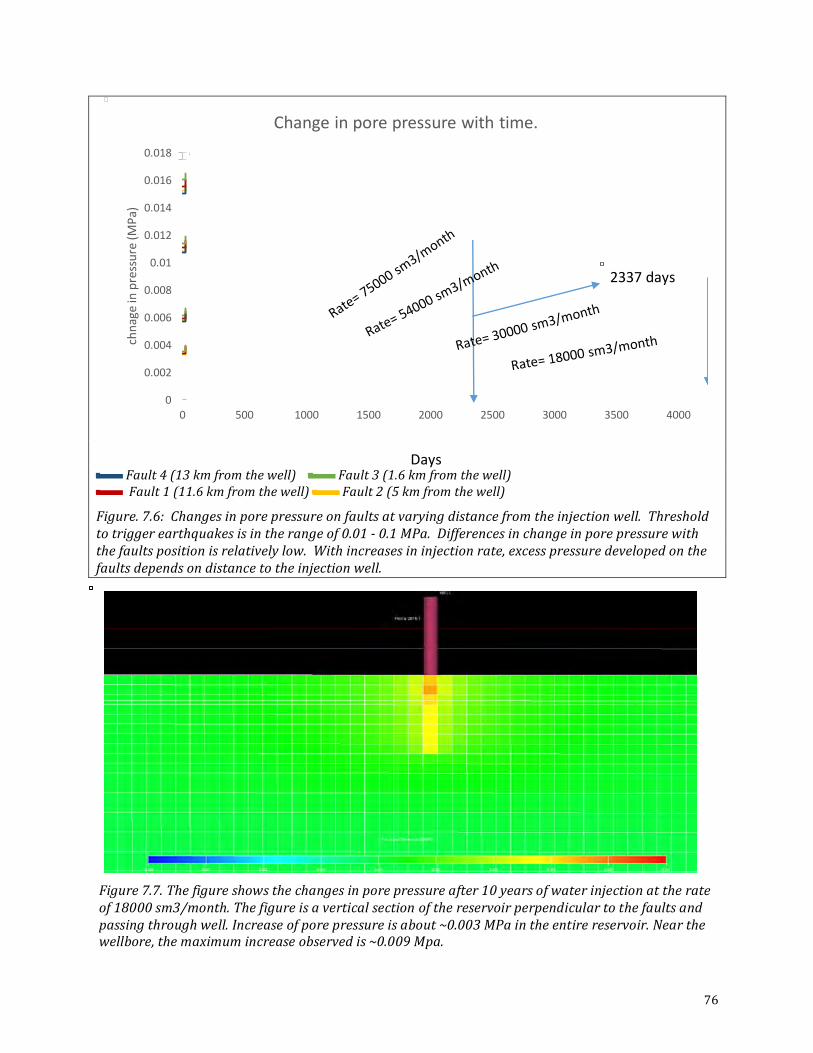
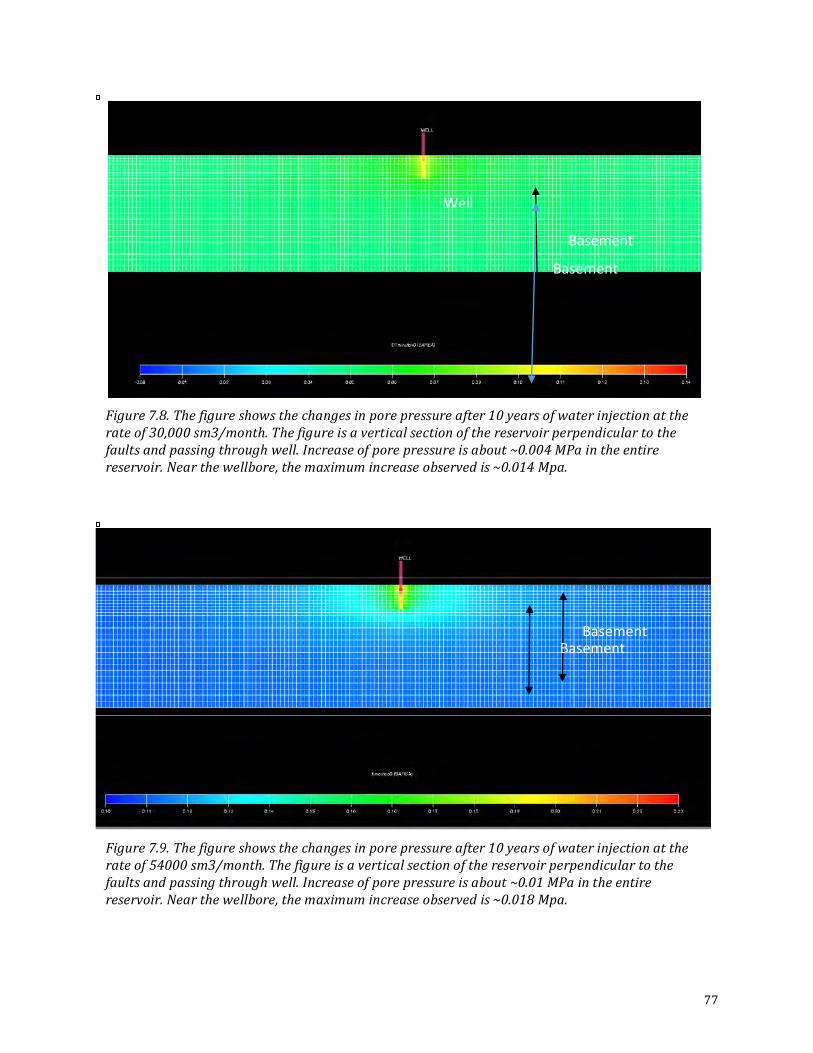
77
Figure7.8.Thefigureshowsthechangesinporepressureafter10yearsofwaterinjectionattherateof30,000sm3/month.Thefigureisaverticalsectionofthereservoirperpendiculartothefaultsandpassingthroughwell.Increaseofporepressureisabout~0.004MPaintheentirereservoir.Nearthewellbore,themaximumincreaseobservedis~0.014Mpa.
Basement
Well
Basement
Figure7.9.Thefigureshowsthechangesinporepressureafter10yearsofwaterinjectionattherateof54000sm3/month.Thefigureisaverticalsectionofthereservoirperpendiculartothefaultsandpassingthroughwell.Increaseofporepressureisabout~0.01MPaintheentirereservoir.Nearthewellbore,themaximumincreaseobservedis~0.018Mpa.
BasementBasement
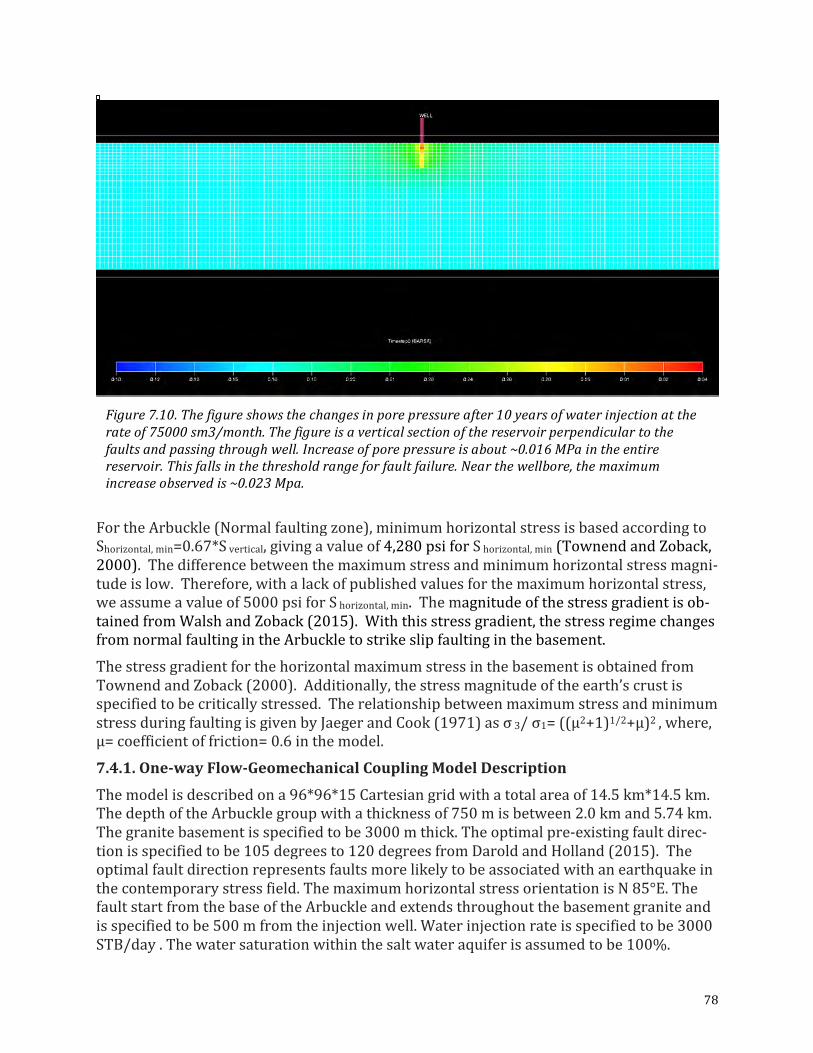
78
FortheArbuckle(Normalfaultingzone),minimumhorizontalstressisbasedaccordingto
Shorizontal,min=0.67*Svertical,givingavalueof4,280psiforShorizontal,min(TownendandZoback,
2000).Thedifferencebetweenthemaximumstressandminimumhorizontalstressmagni-
tudeislow.Therefore,withalackofpublishedvaluesforthemaximumhorizontalstress,
weassumeavalueof5000psiforShorizontal,min.Themagnitudeofthestressgradientisob-
tainedfromWalshandZoback(2015).Withthisstressgradient,thestressregimechanges
fromnormalfaultingintheArbuckletostrikeslipfaultinginthebasement.
Thestressgradientforthehorizontalmaximumstressinthebasementisobtainedfrom
TownendandZoback(2000).Additionally,thestressmagnitudeoftheearth’scrustis
specifiedtobecriticallystressed.Therelationshipbetweenmaximumstressandminimum
stressduringfaultingisgivenbyJaegerandCook(1971)asσ3/σ1=((µ2+1)1/2+µ)2,where,
µ=coefficientoffriction=0.6inthemodel.
7.4.1.One-wayFlow-GeomechanicalCouplingModelDescription
Themodelisdescribedona96*96*15Cartesiangridwithatotalareaof14.5km*14.5km.
ThedepthoftheArbucklegroupwithathicknessof750misbetween2.0kmand5.74km.
Thegranitebasementisspecifiedtobe3000mthick.Theoptimalpre-existingfaultdirec-
tionisspecifiedtobe105degreesto120degreesfromDaroldandHolland(2015).The
optimalfaultdirectionrepresentsfaultsmorelikelytobeassociatedwithanearthquakein
thecontemporarystressfield.ThemaximumhorizontalstressorientationisN85°E.The
faultstartfromthebaseoftheArbuckleandextendsthroughoutthebasementgraniteand
isspecifiedtobe500mfromtheinjectionwell.Waterinjectionrateisspecifiedtobe3000
STB/day.Thewatersaturationwithinthesaltwateraquiferisassumedtobe100%.
Figure7.10.Thefigureshowsthechangesinporepressureafter10yearsofwaterinjectionattherateof75000sm3/month.Thefigureisaverticalsectionofthereservoirperpendiculartothefaultsandpassingthroughwell.Increaseofporepressureisabout~0.016MPaintheentirereservoir.Thisfallsinthethresholdrangeforfaultfailure.Nearthewellbore,themaximumincreaseobservedis~0.023Mpa.
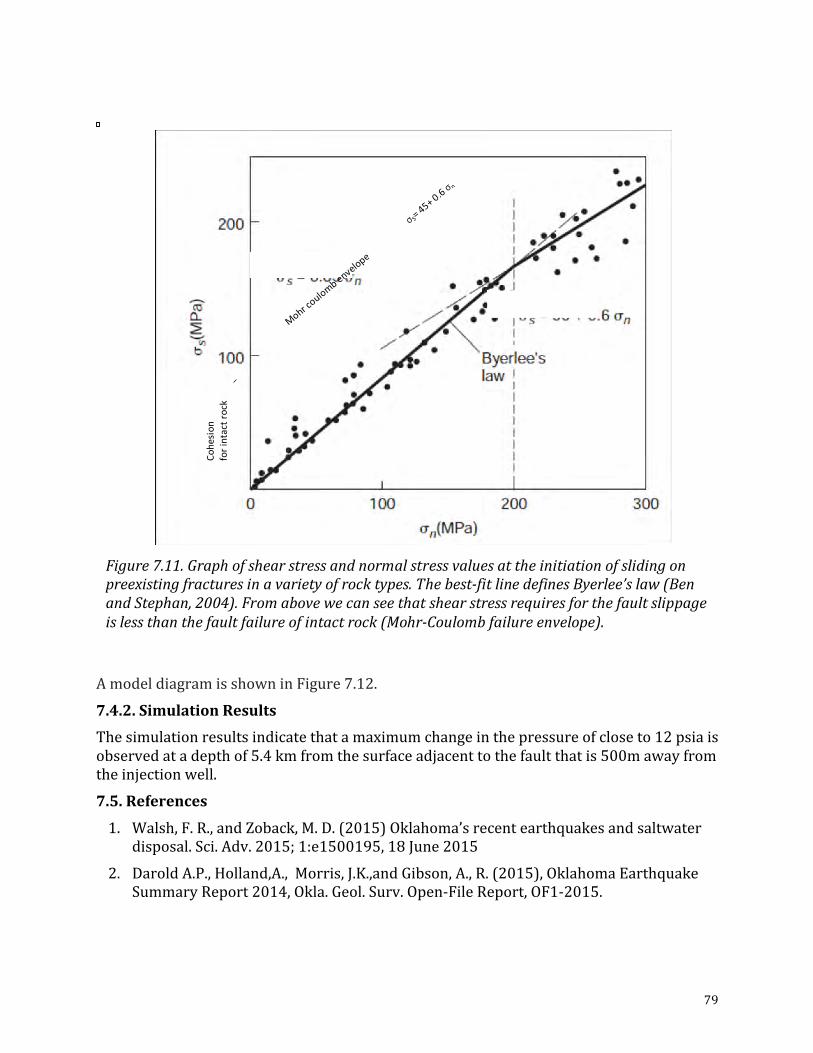
79
AmodeldiagramisshowninFigure7.12.
7.4.2.SimulationResults
Thesimulationresultsindicatethatamaximumchangeinthepressureofcloseto12psiais
observedatadepthof5.4kmfromthesurfaceadjacenttothefaultthatis500mawayfrom
theinjectionwell.
7.5.References
1. Walsh,F.R.,andZoback,M.D.(2015)Oklahoma’srecentearthquakesandsaltwaterdisposal.Sci.Adv.2015;1:e1500195,18June2015
2. DaroldA.P.,Holland,A.,Morris,J.K.,andGibson,A.,R.(2015),OklahomaEarthquakeSummaryReport2014,Okla.Geol.Surv.Open-FileReport,OF1-2015.
Figure7.11.Graphofshearstressandnormalstressvaluesattheinitiationofslidingonpreexistingfracturesinavarietyofrocktypes.Thebest-fitlinedefinesByerlee’slaw(BenandStephan,2004).Fromabovewecanseethatshearstressrequiresforthefaultslippageislessthanthefaultfailureofintactrock(Mohr-Coulombfailureenvelope).
Cohesion
forintactrock
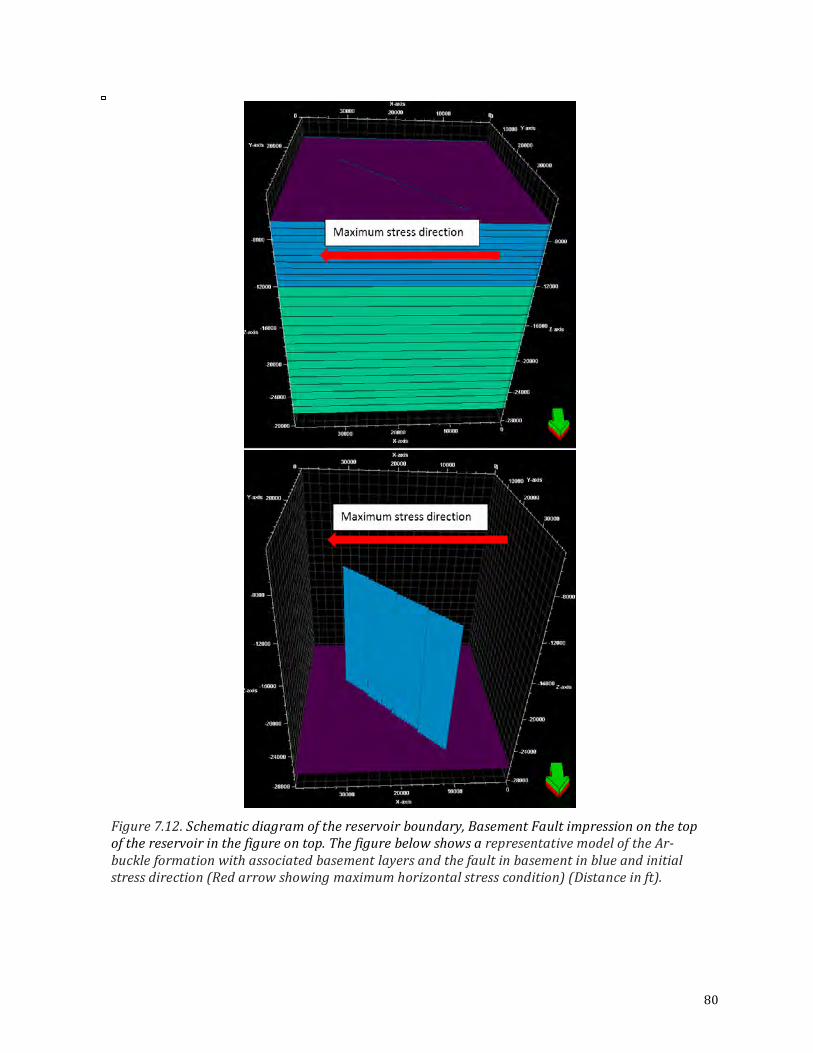
80
Figure7.12.Schematicdiagramofthereservoirboundary,BasementFaultimpressiononthetopofthereservoirinthefigureontop.ThefigurebelowshowsarepresentativemodeloftheAr-buckleformationwithassociatedbasementlayersandthefaultinbasementinblueandinitialstressdirection(Redarrowshowingmaximumhorizontalstresscondition)(Distanceinft).
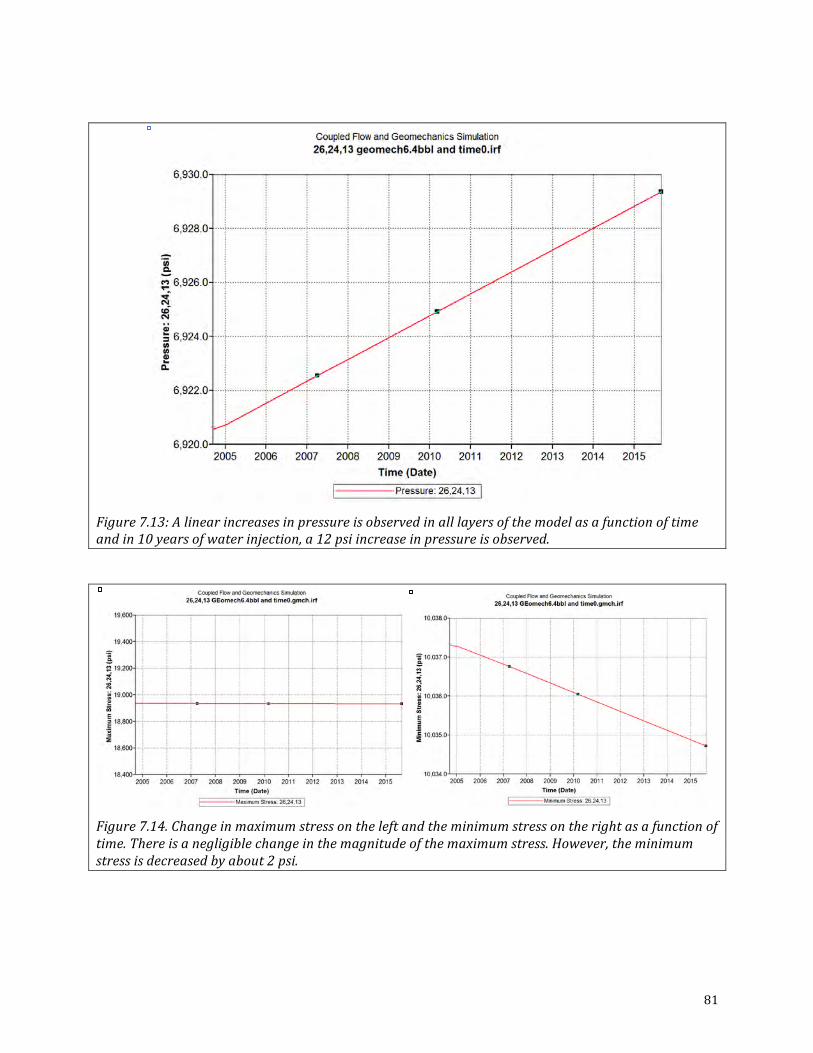
81
Figure7.13:Alinearincreasesinpressureisobservedinalllayersofthemodelasafunctionoftimeandin10yearsofwaterinjection,a12psiincreaseinpressureisobserved.
Figure7.14.Changeinmaximumstressontheleftandtheminimumstressontherightasafunctionoftime.Thereisanegligiblechangeinthemagnitudeofthemaximumstress.However,theminimumstressisdecreasedbyabout2psi.
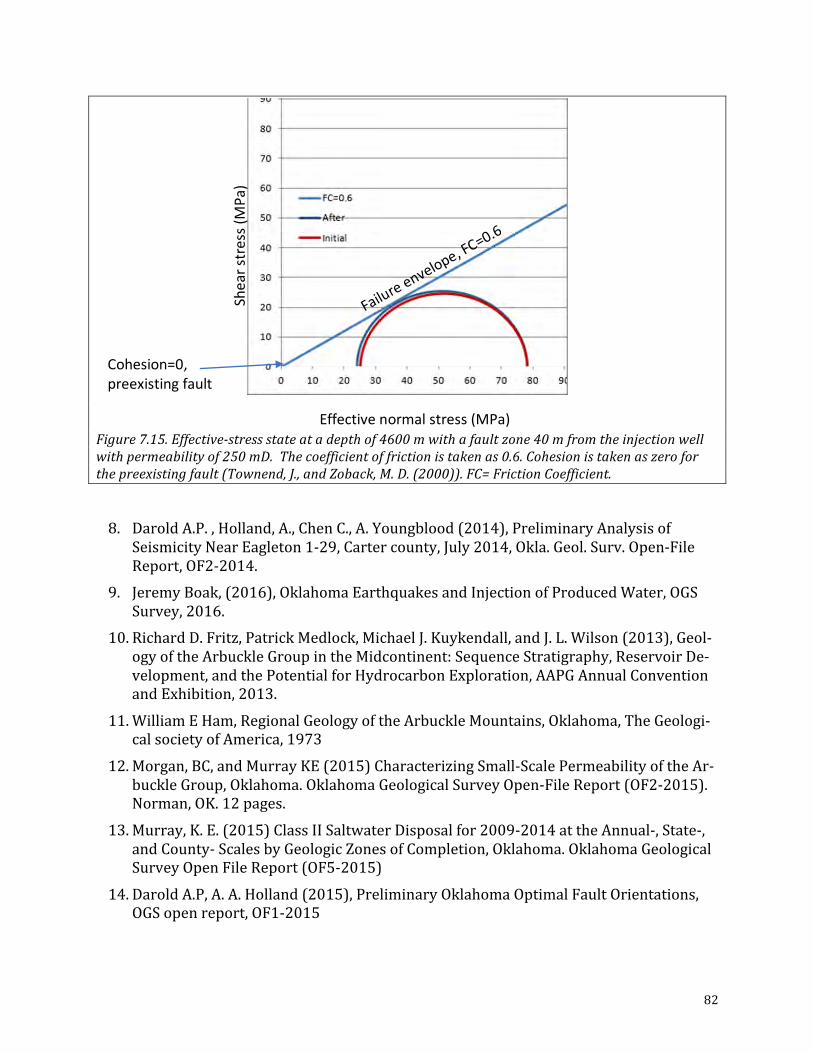
82
Figure7.15.Effective-stressstateatadepthof4600mwithafaultzone40mfromtheinjectionwellwithpermeabilityof250mD.Thecoefficientoffrictionistakenas0.6.Cohesionistakenaszeroforthepreexistingfault(Townend,J.,andZoback,M.D.(2000)).FC=FrictionCoefficient.
8. DaroldA.P.,Holland,A.,ChenC.,A.Youngblood(2014),PreliminaryAnalysisofSeismicityNearEagleton1-29,Cartercounty,July2014,Okla.Geol.Surv.Open-File
Report,OF2-2014.
9. JeremyBoak,(2016),OklahomaEarthquakesandInjectionofProducedWater,OGSSurvey,2016.
10. RichardD.Fritz,PatrickMedlock,MichaelJ.Kuykendall,andJ.L.Wilson(2013),Geol-ogyoftheArbuckleGroupintheMidcontinent:SequenceStratigraphy,ReservoirDe-
velopment,andthePotentialforHydrocarbonExploration,AAPGAnnualConvention
andExhibition,2013.
11. WilliamEHam,RegionalGeologyoftheArbuckleMountains,Oklahoma,TheGeologi-calsocietyofAmerica,1973
12. Morgan,BC,andMurrayKE(2015)CharacterizingSmall-ScalePermeabilityoftheAr-buckleGroup,Oklahoma.OklahomaGeologicalSurveyOpen-FileReport(OF2-2015).
Norman,OK.12pages.
13. Murray,K.E.(2015)ClassIISaltwaterDisposalfor2009-2014attheAnnual-,State-,andCounty-ScalesbyGeologicZonesofCompletion,Oklahoma.OklahomaGeological
SurveyOpenFileReport(OF5-2015)
14. DaroldA.P,A.A.Holland(2015),PreliminaryOklahomaOptimalFaultOrientations,OGSopenreport,OF1-2015
Effectivenormalstress(MPa)
Shearstress(M
Pa)
Cohesion=0,preexistingfault
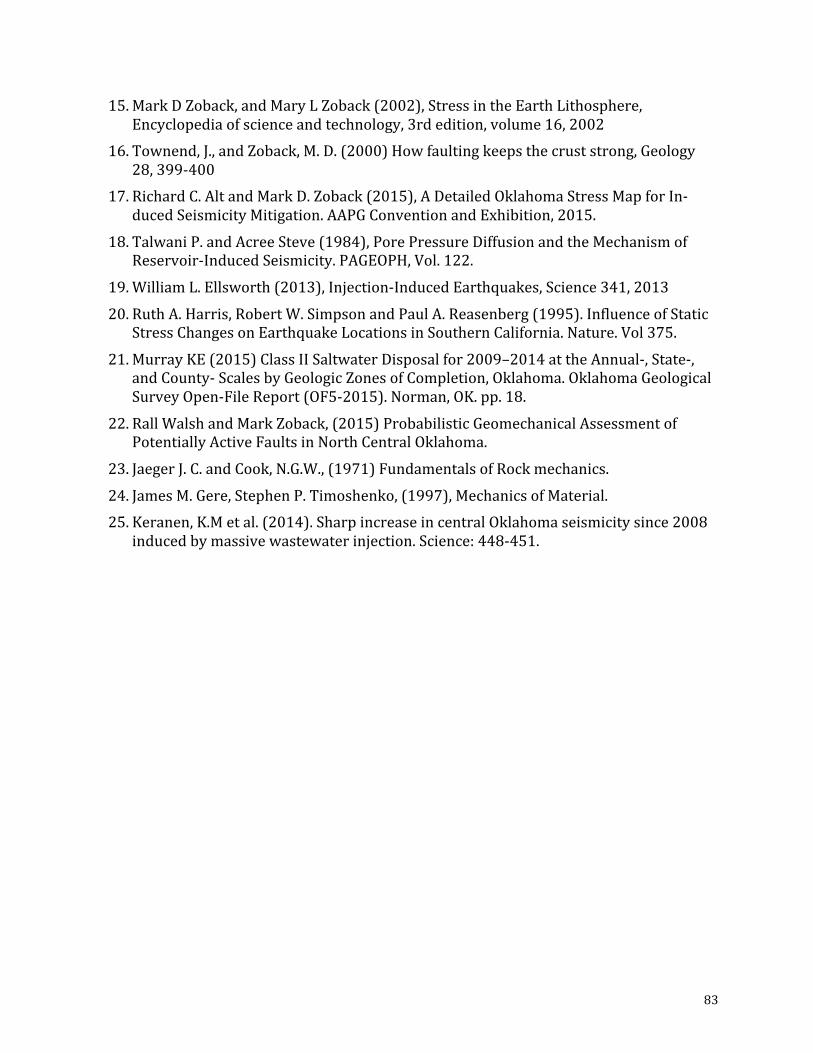
83
15. MarkDZoback,andMaryLZoback(2002),StressintheEarthLithosphere,Encyclopediaofscienceandtechnology,3rdedition,volume16,2002
16. Townend,J.,andZoback,M.D.(2000)Howfaultingkeepsthecruststrong,Geology28,399-400
17. RichardC.AltandMarkD.Zoback(2015),ADetailedOklahomaStressMapforIn-ducedSeismicityMitigation.AAPGConventionandExhibition,2015.
18. TalwaniP.andAcreeSteve(1984),PorePressureDiffusionandtheMechanismofReservoir-InducedSeismicity.PAGEOPH,Vol.122.
19. WilliamL.Ellsworth(2013),Injection-InducedEarthquakes,Science341,201320. RuthA.Harris,RobertW.SimpsonandPaulA.Reasenberg(1995).InfluenceofStatic
StressChangesonEarthquakeLocationsinSouthernCalifornia.Nature.Vol375.
21. MurrayKE(2015)ClassIISaltwaterDisposalfor2009–2014attheAnnual-,State-,andCounty-ScalesbyGeologicZonesofCompletion,Oklahoma.OklahomaGeological
SurveyOpen-FileReport(OF5-2015).Norman,OK.pp.18.
22. RallWalshandMarkZoback,(2015)ProbabilisticGeomechanicalAssessmentofPotentiallyActiveFaultsinNorthCentralOklahoma.
23. JaegerJ.C.andCook,N.G.W.,(1971)FundamentalsofRockmechanics.24. JamesM.Gere,StephenP.Timoshenko,(1997),MechanicsofMaterial.25. Keranen,K.Metal.(2014).SharpincreaseincentralOklahomaseismicitysince2008
inducedbymassivewastewaterinjection.Science:448-451.
84
DescriptionofRPSEAProjectTask11–IntegratedRockMechanicsStudies
Availablerockproperties,in-situstressestimates,observedseismicdata,andnaturalfrac-turedistributions,shallbeusedtocomputetheporepressureandthestressconditions
neededtobringtherockmassintocriticalstate.
Availableseismicdataandknowledgeofthetectonicframeworkoftheregionshallbeused
toestimatethein-situstresses,anddeterminediscontinuityorientationsandtheirme-chanicalproperties.Resultsfromanalysisofseismicwaveformsshallprovidethedistribu-
tionandorientationsofshearandpossibletensileevents,thefractureorientationsob-
tainedfromeventclusters,andestimatesoftheamountofslipfromwaveformanalysis.
Thenanalysisofhowthereservoirrockshouldfailinresponsetoinjectionshallbedone.A
3Dconceptualmodeloftheresponseofthereservoirtothestimulationsshallbeused.
A3Dmodelthatconsidersporepressureandstresseffectsshallbeusedtomodelmorede-
tailsofthemicroseismicevents.Thespatio-temporalpressuredistributionswithinthe
modelshallbeobtainedontheirregularlyspacednodesofthegridandcriticalityorrock
failurecriterion(triggeringcriterion)shallbedefinedthroughthereservoir.Oncethe
criticalityconditionissatisfied,asyntheticcloudofseismiceventscanbecreatedbycom-
paringitwiththethresholdvalueforeachcellintherockandateachtimestep.Themodel
parametersshallbeadjustedbymodifyingdiffusivity,stress,andcriticallyparametersto
matchthecharacteristicsoftheobservedmicroseismicity.
Thereportappendedbelowsummarizesintegratedrockmechanicalstudies,supportedbytheRPSEAProject.
5. IntegratedRockMechanicsStudiesAhmadGhassemiMewbourneCollegeofPetroleumandGeologicalEngineering,SarkeysEnergyCenter100EastBoydSt.,Norman,Oklahoma73019-0628
EarthquakesinthecontinentalinterioroftheUnitedStateshavehistoricallybeenrare,but
startingin2009therewasasignificantincreaseinthenumberoffeltevents.Aprominent
examplearethefourearthquakeswithmagnitudesof4.0orgreater,includingoneM5.7
earthquake,nearPrague,OklahomainNovember2011.Theseearthquakesledtowide-
spreadconcernaboutpotentialdamagefrominducedseismicity.
TheearthquakesoccurredclosetoClassIIUndergroundInjectionControlwellsforsaltwa-
terdisposal(SWD)fromoilandgasoperations.Theinjectedwaterincreasesporepres-
surewithinthetargetlayerandcanpressurizedeepercrystallinebasementrocksvianatu-
ralfracturesystemsandfaults.Ithasbeensuggestedthatthishasledtopressurization
andstressredistributionwithinthebasement,causingfaultreactivationandincreased
seismicity.
AlmostallstudiesontheincreasedseismicityincentralOklahomahavefocusedonpore
pressureeffectswithoutexplicitconsiderationoflarge-scalerockmassdeformation.In
thisstudy,wedevelopalarge-scalegeomechanicalconceptualmodelforthefaultssystem
andassessitsresponsetosaltwaterinjection.ThisportionoftheRPSEAProjectaimsto
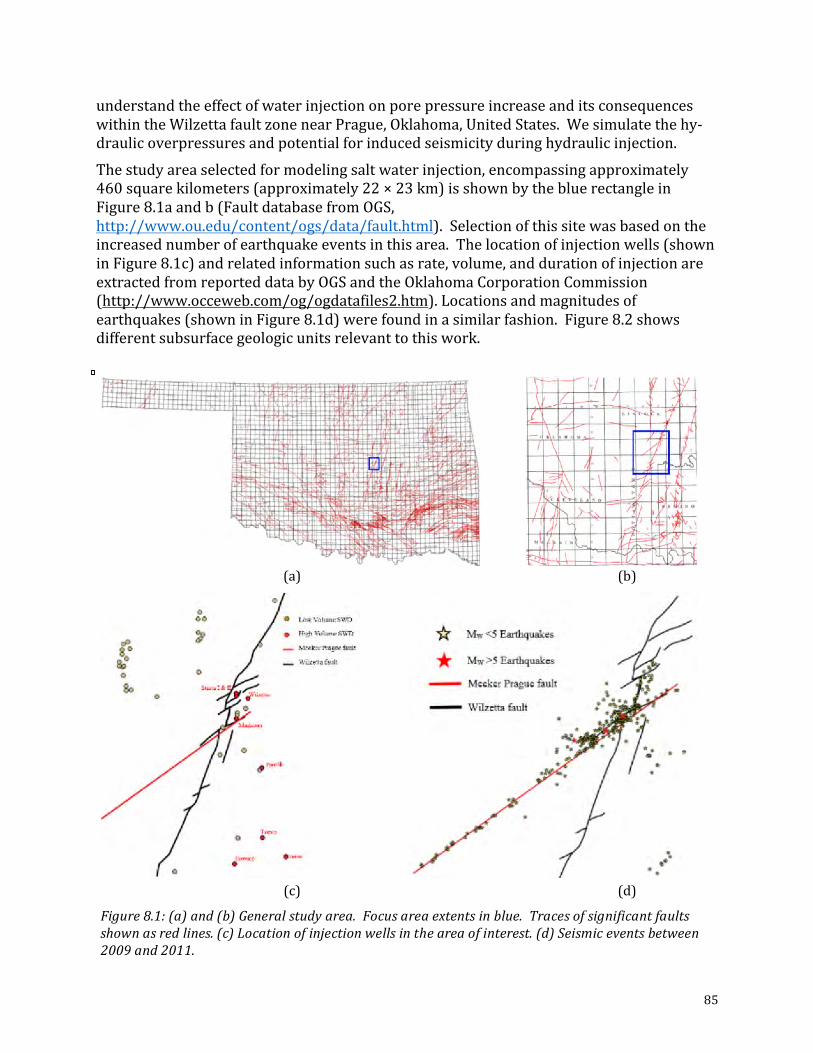
85
understandtheeffectofwaterinjectiononporepressureincreaseanditsconsequences
withintheWilzettafaultzonenearPrague,Oklahoma,UnitedStates.Wesimulatethehy-
draulicoverpressuresandpotentialforinducedseismicityduringhydraulicinjection.
Thestudyareaselectedformodelingsaltwaterinjection,encompassingapproximately
460squarekilometers(approximately22×23km)isshownbythebluerectanglein
Figure8.1aandb(FaultdatabasefromOGS,
http://www.ou.edu/content/ogs/data/fault.html).Selectionofthissitewasbasedonthe
increasednumberofearthquakeeventsinthisarea.Thelocationofinjectionwells(shown
inFigure8.1c)andrelatedinformationsuchasrate,volume,anddurationofinjectionare
extractedfromreporteddatabyOGSandtheOklahomaCorporationCommission
(http://www.occeweb.com/og/ogdatafiles2.htm).Locationsandmagnitudesof
earthquakes(showninFigure8.1d)werefoundinasimilarfashion.Figure8.2shows
differentsubsurfacegeologicunitsrelevanttothiswork.
(a) (b)
(c) (d)
Figure8.1:(a)and(b)Generalstudyarea.Focusareaextentsinblue.Tracesofsignificantfaultsshownasredlines.(c)Locationofinjectionwellsintheareaofinterest.(d)Seismiceventsbetween2009and2011.
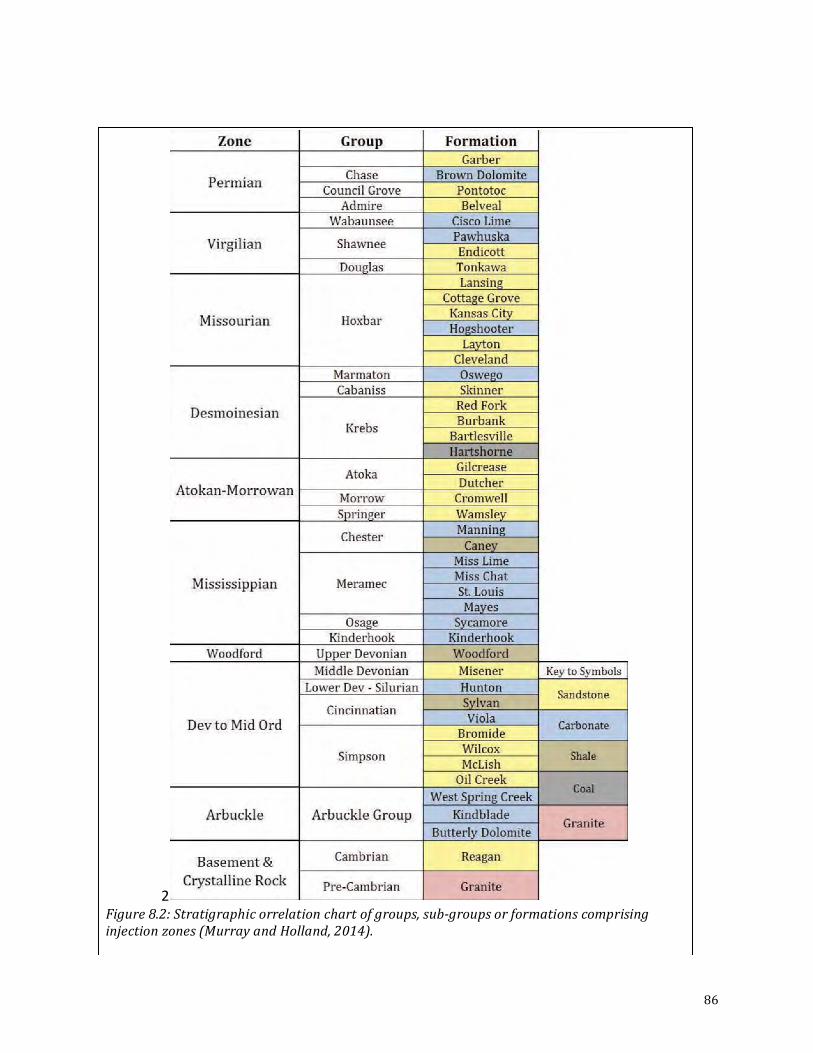
86
2 Figure8.2:Stratigraphicorrelationchartofgroups,sub-groupsorformationscomprisinginjectionzones(MurrayandHolland,2014).
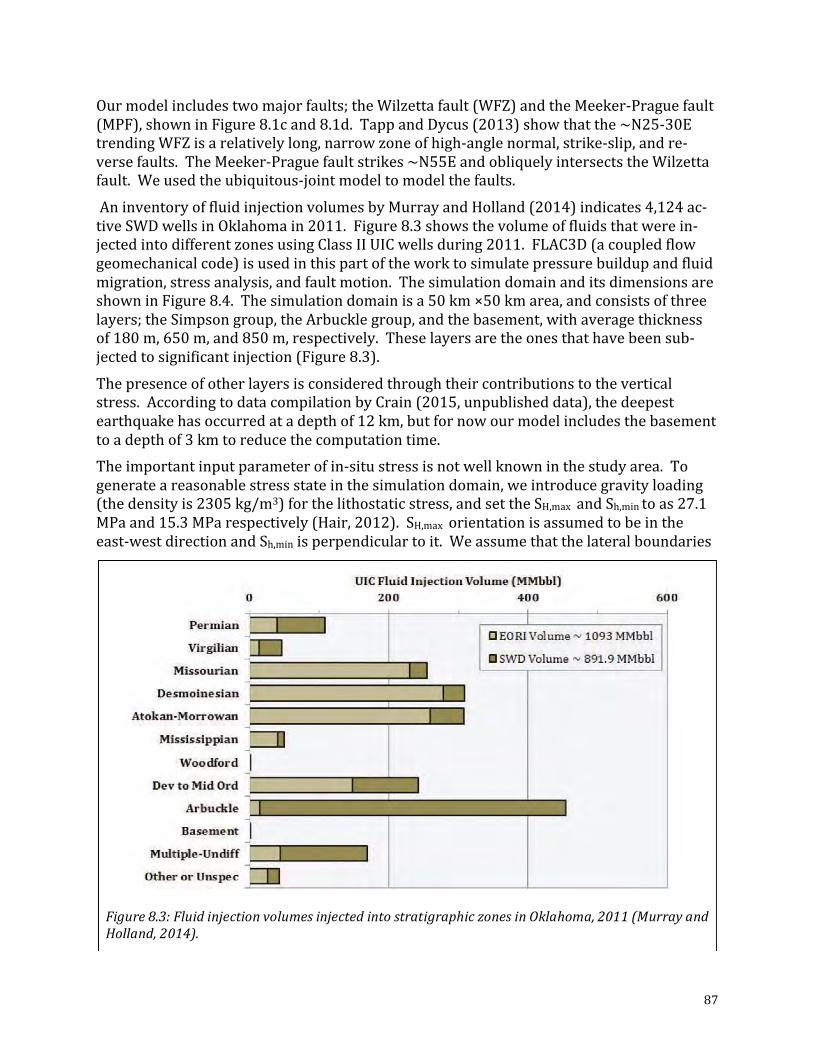
87
Ourmodelincludestwomajorfaults;theWilzettafault(WFZ)andtheMeeker-Praguefault
(MPF),showninFigure8.1cand8.1d.TappandDycus(2013)showthatthe~N25-30E
trendingWFZisarelativelylong,narrowzoneofhigh-anglenormal,strike-slip,andre-
versefaults.TheMeeker-Praguefaultstrikes~N55EandobliquelyintersectstheWilzetta
fault.Weusedtheubiquitous-jointmodeltomodelthefaults.
AninventoryoffluidinjectionvolumesbyMurrayandHolland(2014)indicates4,124ac-
tiveSWDwellsinOklahomain2011.Figure8.3showsthevolumeoffluidsthatwerein-
jectedintodifferentzonesusingClassIIUICwellsduring2011.FLAC3D(acoupledflow
geomechanicalcode)isusedinthispartoftheworktosimulatepressurebuildupandfluid
migration,stressanalysis,andfaultmotion.Thesimulationdomainanditsdimensionsare
showninFigure8.4.Thesimulationdomainisa50km×50kmarea,andconsistsofthree
layers;theSimpsongroup,theArbucklegroup,andthebasement,withaveragethickness
of180m,650m,and850m,respectively.Theselayersaretheonesthathavebeensub-
jectedtosignificantinjection(Figure8.3).
Thepresenceofotherlayersisconsideredthroughtheircontributionstothevertical
stress.AccordingtodatacompilationbyCrain(2015,unpublisheddata),thedeepest
earthquakehasoccurredatadepthof12km,butfornowourmodelincludesthebasement
toadepthof3kmtoreducethecomputationtime.
Theimportantinputparameterofin-situstressisnotwellknowninthestudyarea.To
generateareasonablestressstateinthesimulationdomain,weintroducegravityloading
(thedensityis2305kg/m3)forthelithostaticstress,andsettheSH,maxandSh,mintoas27.1
MPaand15.3MParespectively(Hair,2012).SH,maxorientationisassumedtobeinthe
east-westdirectionandSh,minisperpendiculartoit.Weassumethatthelateralboundaries
Figure8.3:FluidinjectionvolumesinjectedintostratigraphiczonesinOklahoma,2011(MurrayandHolland,2014).
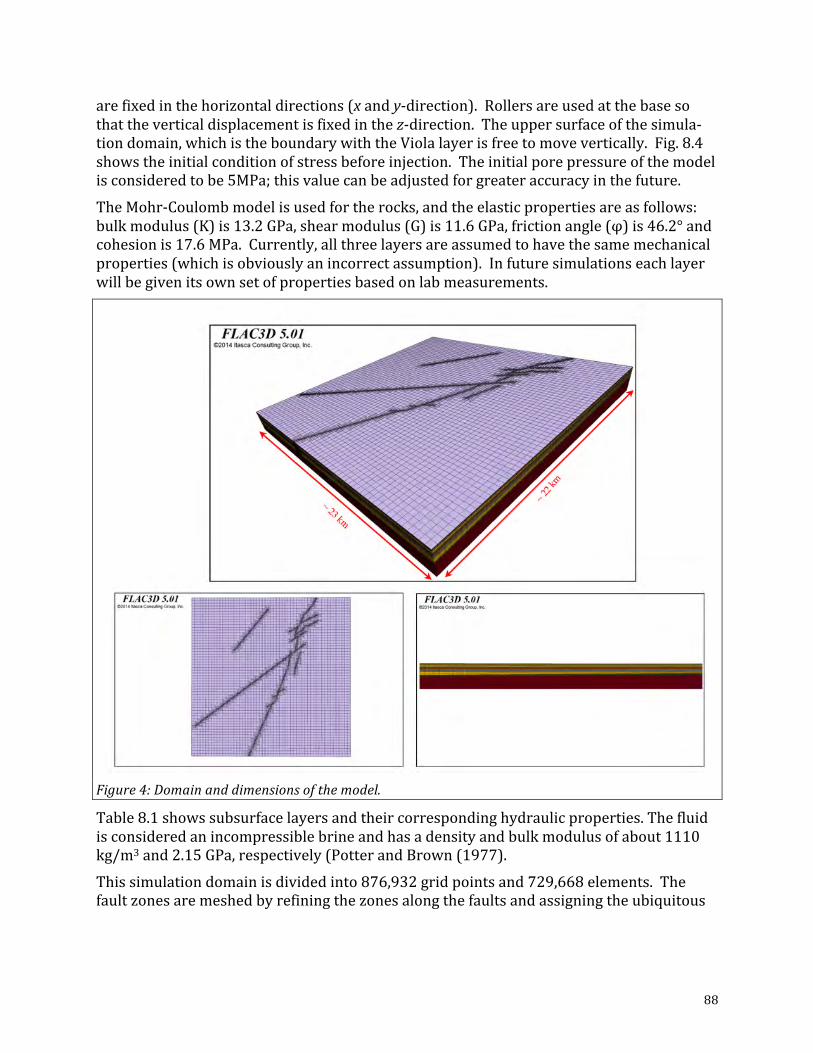
88
arefixedinthehorizontaldirections(xandy-direction).Rollersareusedatthebasesothattheverticaldisplacementisfixedinthez-direction.Theuppersurfaceofthesimula-tiondomain,whichistheboundarywiththeViolalayerisfreetomovevertically.Fig.8.4
showstheinitialconditionofstressbeforeinjection.Theinitialporepressureofthemodel
isconsideredtobe5MPa;thisvaluecanbeadjustedforgreateraccuracyinthefuture.
TheMohr-Coulombmodelisusedfortherocks,andtheelasticpropertiesareasfollows:
bulkmodulus(K)is13.2GPa,shearmodulus(G)is11.6GPa,frictionangle(φ)is46.2°and
cohesionis17.6MPa.Currently,allthreelayersareassumedtohavethesamemechanical
properties(whichisobviouslyanincorrectassumption).Infuturesimulationseachlayer
willbegivenitsownsetofpropertiesbasedonlabmeasurements.
Figure4:Domainanddimensionsofthemodel.
Table8.1showssubsurfacelayersandtheircorrespondinghydraulicproperties.Thefluid
isconsideredanincompressiblebrineandhasadensityandbulkmodulusofabout1110
kg/m3and2.15GPa,respectively(PotterandBrown(1977).
Thissimulationdomainisdividedinto876,932gridpointsand729,668elements.The
faultzonesaremeshedbyrefiningthezonesalongthefaultsandassigningtheubiquitous
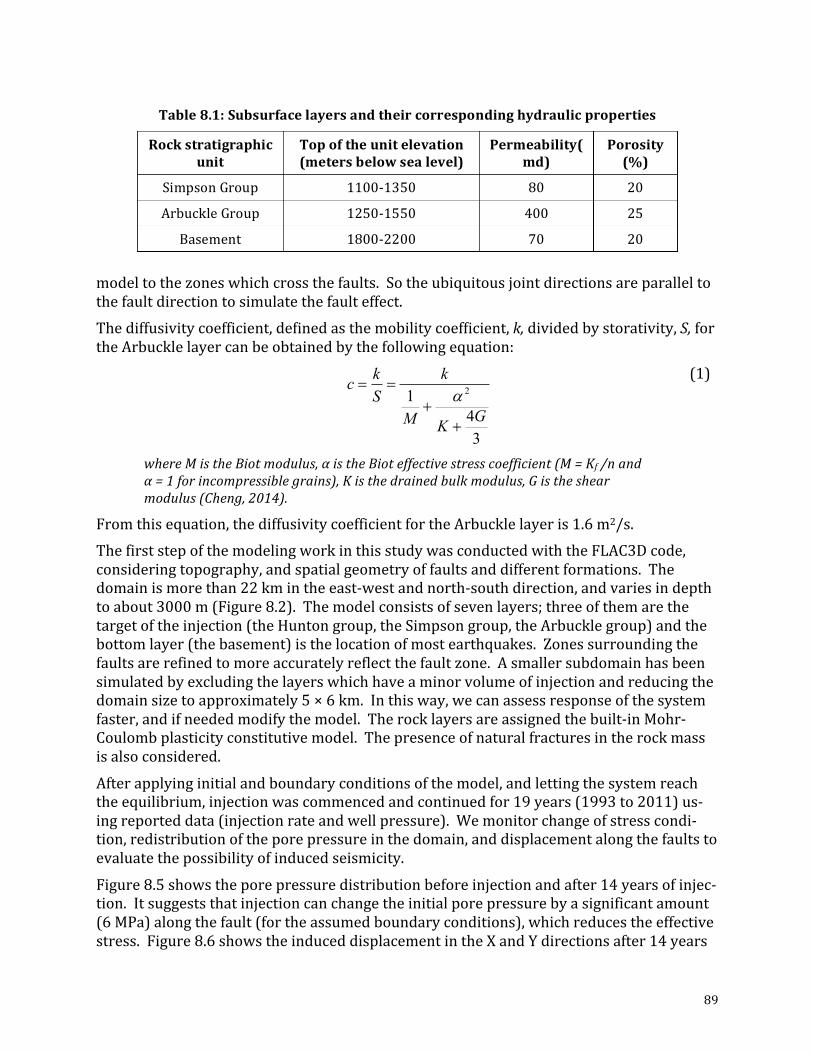
89
modeltothezoneswhichcrossthefaults.Sotheubiquitousjointdirectionsareparallelto
thefaultdirectiontosimulatethefaulteffect.
Thediffusivitycoefficient,definedasthemobilitycoefficient,k,dividedbystorativity,S,fortheArbucklelayercanbeobtainedbythefollowingequation:
34
1 2
GKM
kSkc
++
==a
(1)
whereMistheBiotmodulus,αistheBioteffectivestresscoefficient(M=Kf/nandα=1forincompressiblegrains),Kisthedrainedbulkmodulus,Gistheshearmodulus(Cheng,2014).
Fromthisequation,thediffusivitycoefficientfortheArbucklelayeris1.6m2/s.
ThefirststepofthemodelingworkinthisstudywasconductedwiththeFLAC3Dcode,
consideringtopography,andspatialgeometryoffaultsanddifferentformations.The
domainismorethan22kmintheeast-westandnorth-southdirection,andvariesindepth
toabout3000m(Figure8.2).Themodelconsistsofsevenlayers;threeofthemarethe
targetoftheinjection(theHuntongroup,theSimpsongroup,theArbucklegroup)andthe
bottomlayer(thebasement)isthelocationofmostearthquakes.Zonessurroundingthe
faultsarerefinedtomoreaccuratelyreflectthefaultzone.Asmallersubdomainhasbeen
simulatedbyexcludingthelayerswhichhaveaminorvolumeofinjectionandreducingthe
domainsizetoapproximately5×6km.Inthisway,wecanassessresponseofthesystem
faster,andifneededmodifythemodel.Therocklayersareassignedthebuilt-inMohr-
Coulombplasticityconstitutivemodel.Thepresenceofnaturalfracturesintherockmass
isalsoconsidered.
Afterapplyinginitialandboundaryconditionsofthemodel,andlettingthesystemreach
theequilibrium,injectionwascommencedandcontinuedfor19years(1993to2011)us-
ingreporteddata(injectionrateandwellpressure).Wemonitorchangeofstresscondi-
tion,redistributionoftheporepressureinthedomain,anddisplacementalongthefaultsto
evaluatethepossibilityofinducedseismicity.
Figure8.5showstheporepressuredistributionbeforeinjectionandafter14yearsofinjec-
tion.Itsuggeststhatinjectioncanchangetheinitialporepressurebyasignificantamount
(6MPa)alongthefault(fortheassumedboundaryconditions),whichreducestheeffective
stress.Figure8.6showstheinduceddisplacementintheXandYdirectionsafter14years
Table8.1:Subsurfacelayersandtheircorrespondinghydraulicproperties
Rockstratigraphic
unit
Topoftheunitelevation
(metersbelowsealevel)
Permeability(
md)
Porosity
(%)
SimpsonGroup 1100-1350 80 20
ArbuckleGroup 1250-1550 400 25
Basement 1800-2200 70 20
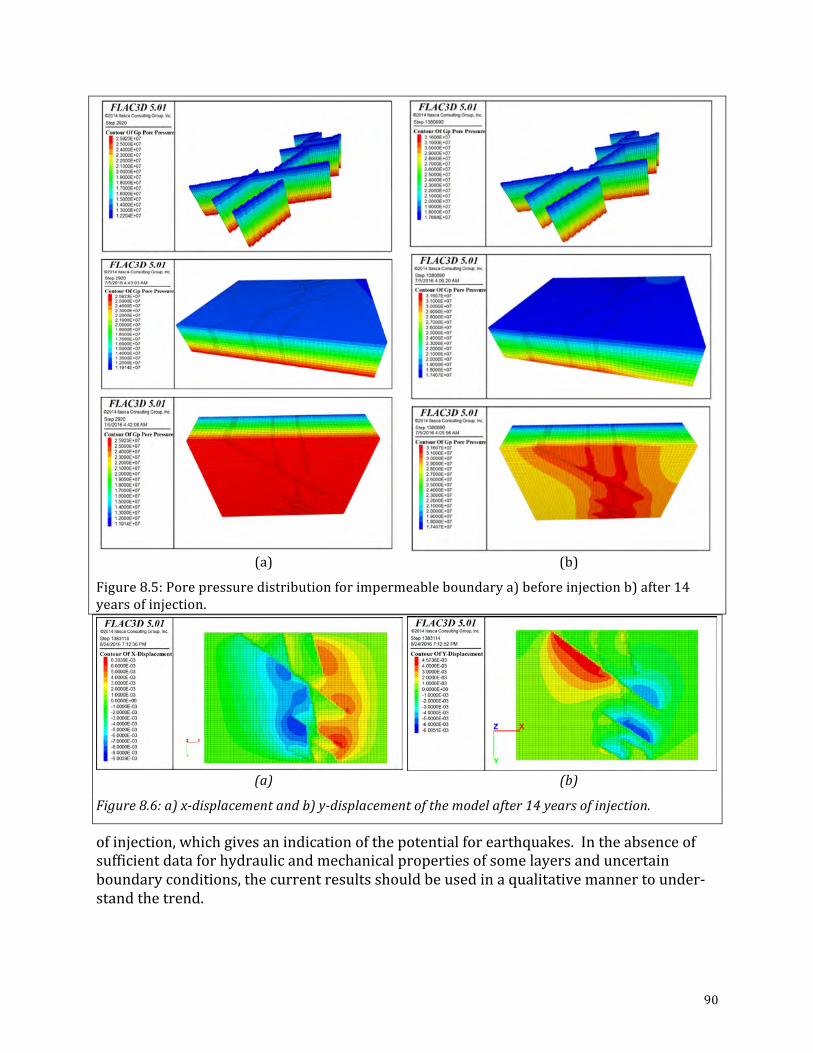
90
(a) (b)
Figure8.5:Porepressuredistributionforimpermeableboundarya)beforeinjectionb)after14
yearsofinjection.
(a) (b)
Figure8.6:a)x-displacementandb)y-displacementofthemodelafter14yearsofinjection.
ofinjection,whichgivesanindicationofthepotentialforearthquakes.Intheabsenceof
sufficientdataforhydraulicandmechanicalpropertiesofsomelayersanduncertain
boundaryconditions,thecurrentresultsshouldbeusedinaqualitativemannertounder-
standthetrend.
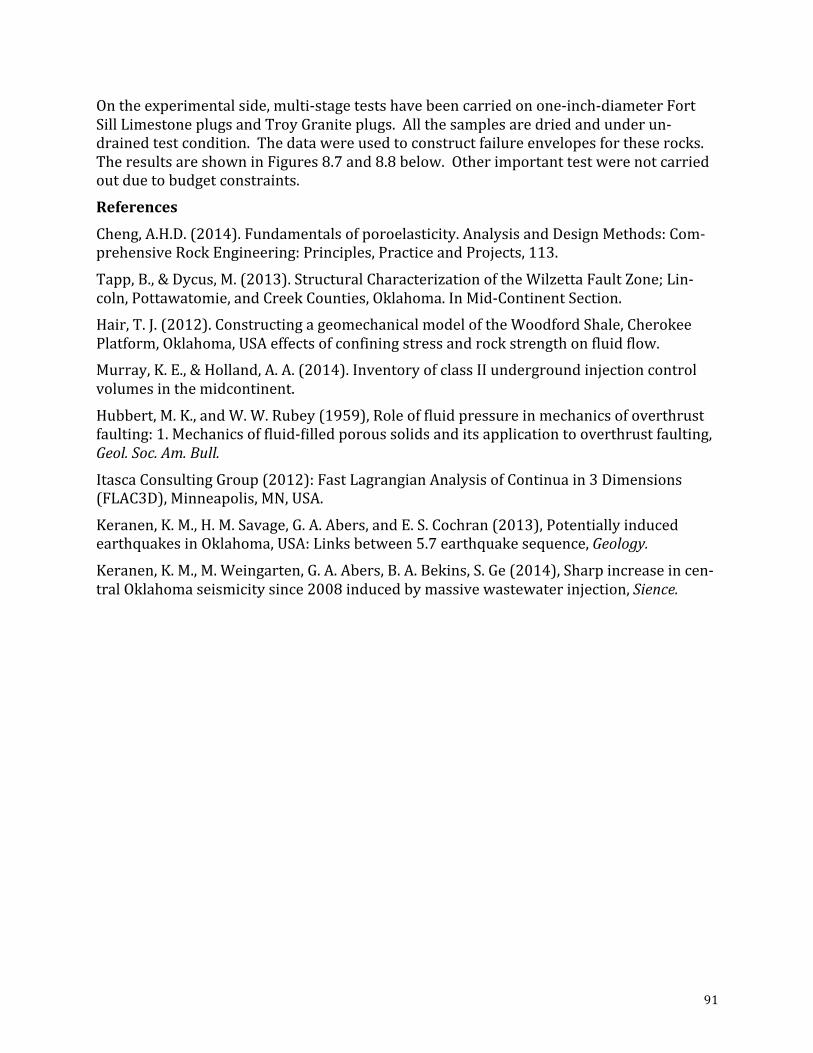
91
Ontheexperimentalside,multi-stagetestshavebeencarriedonone-inch-diameterFort
SillLimestoneplugsandTroyGraniteplugs.Allthesamplesaredriedandunderun-
drainedtestcondition.Thedatawereusedtoconstructfailureenvelopesfortheserocks.
TheresultsareshowninFigures8.7and8.8below.Otherimportanttestwerenotcarried
outduetobudgetconstraints.
References
Cheng,A.H.D.(2014).Fundamentalsofporoelasticity.AnalysisandDesignMethods:Com-
prehensiveRockEngineering:Principles,PracticeandProjects,113.
Tapp,B.,&Dycus,M.(2013).StructuralCharacterizationoftheWilzettaFaultZone;Lin-
coln,Pottawatomie,andCreekCounties,Oklahoma.InMid-ContinentSection.
Hair,T.J.(2012).ConstructingageomechanicalmodeloftheWoodfordShale,Cherokee
Platform,Oklahoma,USAeffectsofconfiningstressandrockstrengthonfluidflow.
Murray,K.E.,&Holland,A.A.(2014).InventoryofclassIIundergroundinjectioncontrol
volumesinthemidcontinent.
Hubbert,M.K.,andW.W.Rubey(1959),Roleoffluidpressureinmechanicsofoverthrust
faulting:1.Mechanicsoffluid-filledporoussolidsanditsapplicationtooverthrustfaulting,
Geol.Soc.Am.Bull.
ItascaConsultingGroup(2012):FastLagrangianAnalysisofContinuain3Dimensions
(FLAC3D),Minneapolis,MN,USA.
Keranen,K.M.,H.M.Savage,G.A.Abers,andE.S.Cochran(2013),Potentiallyinduced
earthquakesinOklahoma,USA:Linksbetween5.7earthquakesequence,Geology.
Keranen,K.M.,M.Weingarten,G.A.Abers,B.A.Bekins,S.Ge(2014),Sharpincreaseincen-
tralOklahomaseismicitysince2008inducedbymassivewastewaterinjection,Sience.
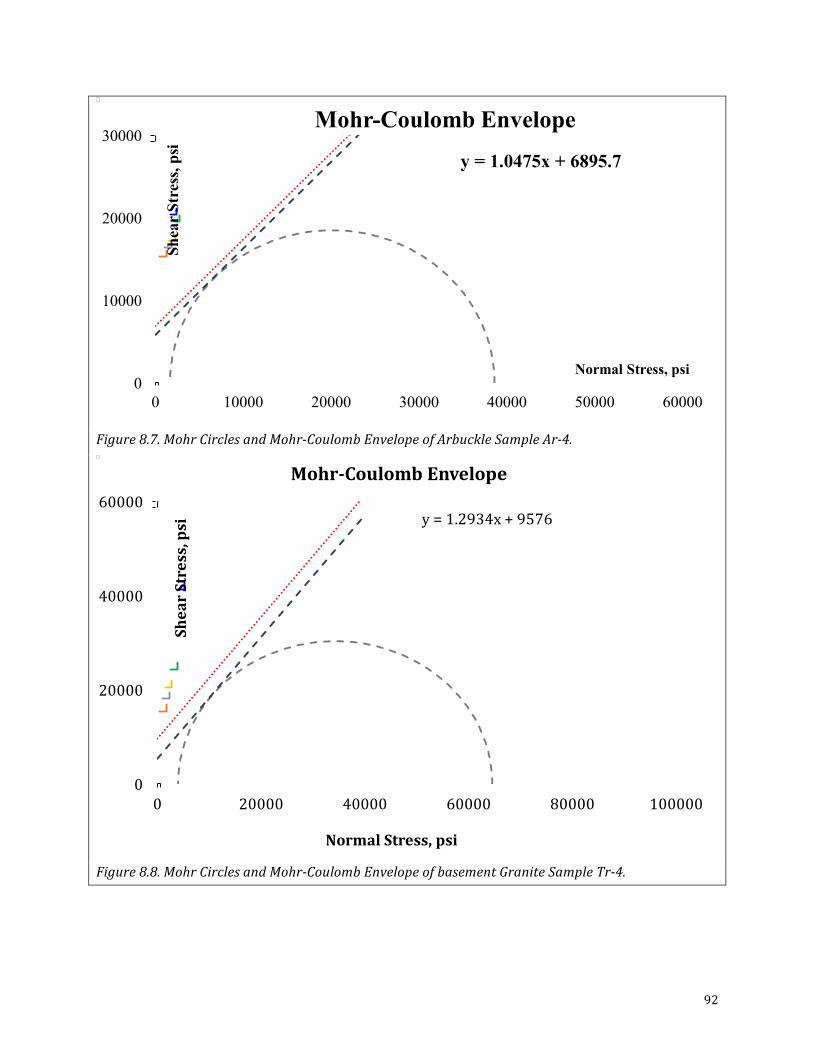
92
Figure8.7.MohrCirclesandMohr-CoulombEnvelopeofArbuckleSampleAr-4.
Figure8.8.MohrCirclesandMohr-CoulombEnvelopeofbasementGraniteSampleTr-4.
y = 1.0475x + 6895.7
0
10000
20000
30000
0 10000 20000 30000 40000 50000 60000
Shea
r St
ress
, psi
Normal Stress, psi
Mohr-Coulomb Envelope
y=1.2934x+9576
0
20000
40000
60000
0 20000 40000 60000 80000 100000
ShearStress,psi
NormalStress,psi
Mohr-CoulombEnvelope
93
DescriptionofRPSEAProjectTask3.0-TechnologyTransfer:SUBCONTRACTORshallworkwithRPSEAthroughouttheprojecttodevelopandimplementaneffectiveoverallTechnol-ogyTransferprogram.TheSUBCONTRACTORshallparticipateinallappropriateRPSEAworkshopsandshallregularlypresentresearchresultsatprofessionalmeetingssuchastheannualmeetingsoftheSocietyofExplorationGeophysicistsandAmericanAssociationofPetroleumGeologists.TheSUBCONTRACTORhasalonghistoryofhostingregionalworkshopsandshallannuallyhostworkshopsontopicssuchasitsrecentoneonFluidInjectionInducedSeismicity.Technologytransferactivitiesshallalsobedetailedinthe
ProjectManagementPlan.SUBCONTRACTORshallreportthecostassociatedwithprojectleveltechnologytransferactivitiesoneachmonthlyreportandinvoice.
ThereportappendedbelowsummarizestechnologytransferactivitiessupportedbytheRPSEAProject.
10. TechnologyTransferActivitiesPublications
ChenC.,andA.A.Holland(2016)PhasePApy:ARobustPurePythonPackageforAutomatic
IdentificationofSeismicPhases,SeismologicalResearchLetter.
Theauthorsprovidedtheprogrampackageofversion1.1tothepublicthroughGitHub
https://github.com/austinholland/PhasePApy.Version1.0hasbeenusedbyOklahoma
GeologicalSurvey(OGS)fornearrealtimeearthquakemonitoringsince2014.
Darold,A.P.,andA.A.Holland(2015)PreliminaryOklahomaOptimalFaultOrientations
OklahomaGeologicalSurveyOpen-FileReport,OF4-2015.
http://wichita.ogs.ou.edu/documents/OF4-2015/.
Darold,A.,A.A.Holland,C.Chen,andA.Youngblood(2014),PreliminaryAnalysisofSeis-
micityNearEagleton1-29,CarterCounty,July2014,Okla.Geol.Surv.Open-FileReport,OF2-2014,17.
Holland,A.A.(2014),ImagingtimedependentcrustaldeformationusingGPSgeodesyand
inducedseismicity,stressandoptimalfaultorientationsintheNorthAmericanmid-conti-
nent,UniversityofArizona,Tucson,Arizona,USA.
Holland,A.A.(2015),PreliminaryFaultMapofOklahoma,OklahomaGeologicalSurvey
OpenFileReport,OF3-2015..OF3-2015|Shape-file(GIS)|Supplemental
McNamara,D.E.,H.M.Benz,R.B.Herrmann,E.A.Bergman,P.Earle,A.Holland,R.Baldwin,
andA.Gassner(2015),EarthquakehypocentersandfocalmechanismsincentralOklahoma
revealacomplexsystemofreactivatedsubsurfacestrike-slipfaulting,GeophysicalResearchLetters,.
Murray,K.E.(2014),ClassIIUndergroundInjectionControlWellDatafor2010-2013by
GeologicZonesofCompletion,Oklahoma,Okla.Geol.Surv.Open-FileReport,OF1-2014,32.
Murray,K.E.,andA.A.Holland(2014),InventoryofClassIIUndergroundInjectionControl
VolumesintheMidcontinent,ShaleShaker,65(2),98-106.
OklahomaGeologicalSurvey,April21,2015OGSStatementonOklahomaEarthquakes
94
Toth,C.R.(2014),SeparationoftheEarthquakeTomographyInverseProblemtoRefine
HypocenterLocationsandTomographicModels:ACaseStudyfromCentralOklahoma,59
pp,UniversityofOklahoma,Norman,OK,USA.
U.S.GeologicalSurveyandOklahomaGeologicalSurvey,2014,USGSOGSJointPressRe-
leaseMay5,2014(PDF)
Workshops
InNovember2014,TheOGSco-hostedaworkshopwiththeUSGS.ThetitlewasWorkshop
onHazardfromInducedSeismicitywithabout140peopleinattendanceandanother42
participatedviaawebinar.Themeetingwastwodayslongwithonedayforthebroadsci-
entificcommunityandthepublic.Theseconddaywasamoretargetedmeetingwiththe
USGS,additionalresearchers,andthesteeringcommitteefortheNationalSeismicHazard
Maps.Moreinformationontheworkshopisavailableat
https://sslearthquake.usgs.gov/regional/ceus/workshop/.Theagendaforthismeetingis
providedonthefollowingpage.
TheUSGSisresponsibleforregularlyupdatingseismichazardmapsthatinformregulatory
bodiesandimpactupdatesofbuildingcodes.Themostrecentversionofthemapdidnot
includeseismiceventsthatwereinterpretedasbeinginduced.Asaresultofthiswork-
shop,thisstanceisbeenreversedandallseismicitywillbeconsideredinthenewmap.The
firstversionofthatmapwasissuedbytheUSGSinMarch2016,andshowstheoneyear
likelihoodofadamagingearthquakeintheUnitedStates.EarthquakeprobabilitiesforOk-
lahomaarederivedfromthecatalogofearthquakesinterpretedtobemainlyinduced.
Anotheroutcomeofthismeetingwastechnologytransfertoregulatorybodiesandduring
thismeetingtheOklahomaandKansasCorporationCommissionshadaveryproductive
discussionwithourresearchteam.Inabroadercontext,weareregularlyexchangingin-
formationbetweenourresearchgroup,regulatoryagencies,andindustry.
TheTechnologyTransferWorkshop:SeismicityinOklahomawasheldSeptember7-8,
2016attheMoore-NormanTechnologyCenterinNormanOKtogatherresearcherswork-
ingonvariousaspectsofseismicityinOklahoma,emphasizingthoseresearchersbasedin
Oklahoma(butincludingotherswithsignificantresearchprogramsinOklahomaandad-
joiningstates(Texas,Arkansas,andKansas).Theworkshopwasattendedbyabout140re-
searchersfromOklahomaandelsewhere,inGovernment(USGS,OGS,OklahomaCorpora-
tionCommission,KansasandArkansasGeologicalSurveys,TexasBureauofEconomicGe-
ology,DOE,NETL,EPA)Universities(UniversityofOklahoma,OklahomaStateUniversity,
UniversityofTexas,UniversityofColorado,StanfordUniversity,etc.)andindustry(Devon,
Chesapeake,ExxonMobil,Pioneer,WhiteStarPetroleum,Newfield,Cimarex,SandRidge,
XTO,Marathon,OklahomaOilandGasAssociation,OklahomaIndependentPetroleumAs-
sociation,GEGlobalResearch,CH2M).TheWorkshopAgendaisprovidedfollowingthe
previousworkshopagenda.
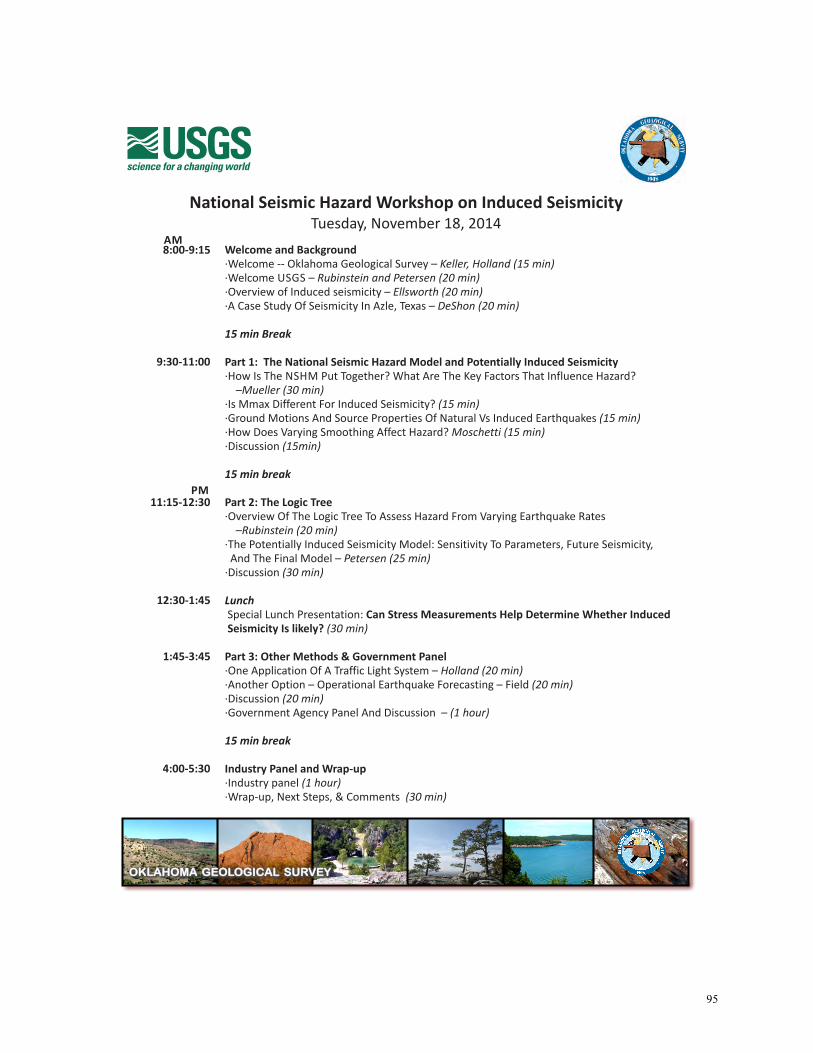
95
Welcome and Background· Welcome -- Oklahoma Geological Survey – Keller, Holland (15 min)
· Welcome USGS – Rubinstein and Petersen (20 min)
· Overview of Induced seismicity – Ellsworth (20 min)
· A Case Study Of Seismicity In Azle, Texas – DeShon (20 min)
15 min Break
Part 1: The National Seismic Hazard Model and Potentially Induced Seismicity · How Is The NSHM Put Together? What Are The Key Factors That Influence Hazard? –Mueller (30 min)
· Is Mmax Different For Induced Seismicity? (15 min)
· Ground Motions And Source Properties Of Natural Vs Induced Earthquakes (15 min)
· How Does Varying Smoothing Affect Hazard? Moschetti (15 min)
· Discussion (15min) 15 min break
Part 2: The Logic Tree · Overview Of The Logic Tree To Assess Hazard From Varying Earthquake Rates –Rubinstein (20 min)
· The Potentially Induced Seismicity Model: Sensitivity To Parameters, Future Seismicity, And The Final Model – Petersen (25 min)
· Discussion (30 min)
Lunch Special Lunch Presentation: Can Stress Measurements Help Determine Whether Induced Seismicity Is likely? (30 min)
Part 3: Other Methods & Government Panel · One Application Of A Traffic Light System – Holland (20 min)
· Another Option – Operational Earthquake Forecasting – Field (20 min)
· Discussion (20 min)
· Government Agency Panel And Discussion – (1 hour)
15 min break
Industry Panel and Wrap-up · Industry panel (1 hour)
· Wrap-up, Next Steps, & Comments (30 min)
8:00-9:15
9:30-11:00
11:15-12:30
12:30-1:45
1:45-3:45
4:00-5:30
National Seismic Hazard Workshop on Induced SeismicityTuesday, November 18, 2014
AM
PM
OKLAHOMA GEOLOGICAL SURVEY
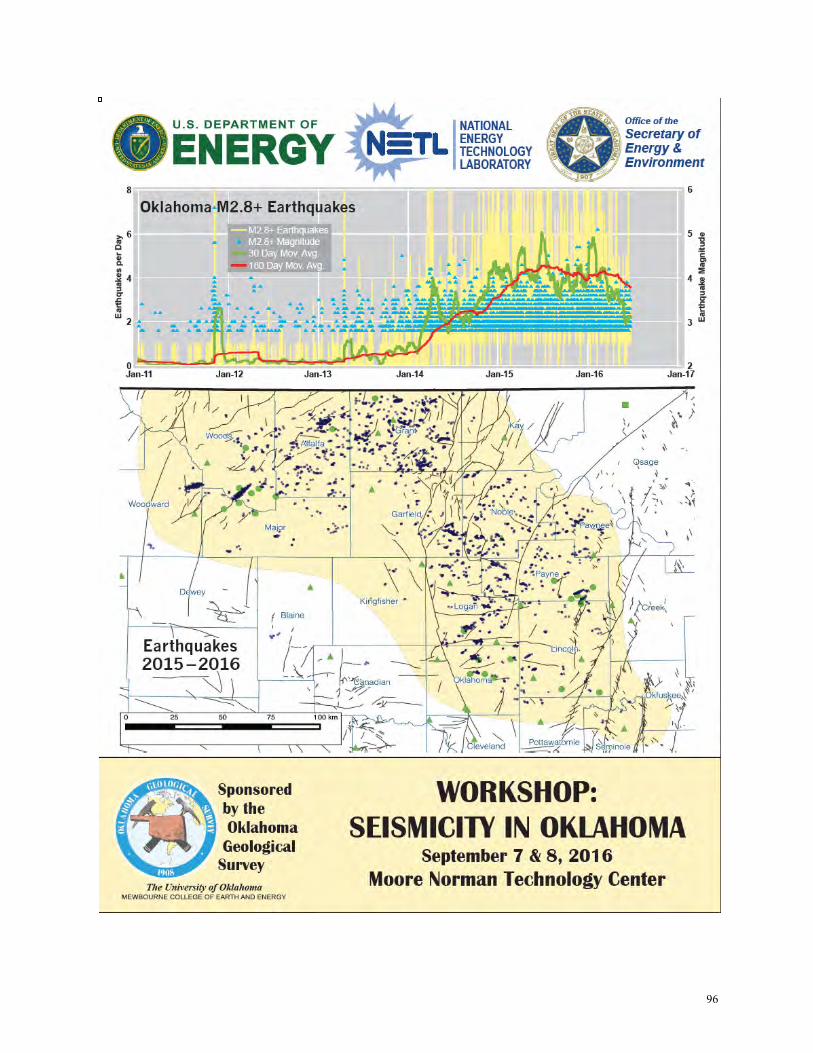
96
97
98
99
ProfessionalPresentationswithAbstracts
Chang,J.(2015)Semi-InfiniteGeologyModelingAlgorithm(SIGMA):AModularApproach
to3DGravity[Abstract86140],AmericanGeophysicalUnionFallMeeting,December17,
2015.
Darold,A.P.,Holland,A.,Gibson,A.(2014),AnalysisofSeismicityCoincidentwithHydrau-
licFracturingofaWellinSouthernOklahoma,inAmer.Geophys.UnionFallMeeting,Poster,SanFrancisco,CA.
Darold,A.P.andA.A.Holland(2015),AnalysisofSeismicityCoincidentwithHydraulicFrac-
turingofaWellinSouthwestOklahoma,SeismologicalSocietyofAmericaMeeting,Pasa-
denaCA,April20-23,2015.
Darold,A.P.andA.A.Holland(2015),AnalysisofSeismicityCoincidentwithHydraulicFrac-
turingofaWellinSouthwestOklahoma,GeologicalSocietyofAmericaSouth-CentralSec-
tionMeeting,StillwaterOK,March19-20,2015.PDFDownload
Holland,A.A.(2014,PotentialCaseofInducedSeismicityfromaWaterDisposalWellin
South-CentralOklahoma,Seismol.Res.Lett.,85(2),452.
Holland,A.A.(2014),InducedSeismicityfromFluidInjectionandDraftBestPractices,
GroundWaterProtectionCouncilUICConference,NewOrleans,LA,Jan.21-23,2014.
Holland,A.A.(2014),RecentEarthquakesinOklahomaandtheMid-continent:Significance
andPotentialforInducedSeismicity,21stIntegratedPetroleumEnvironmentalConsortium
Conference,Houston,TX,Oct.13-14,2014.
Holland,A.A.(2014),Inducedseismicity“UnknownKnowns”:theroleofstressandother
difficulttomeasureparametersofthesubsurface,NationalResearchCouncilJointMeeting
oftheCommitteeonEarthResourcesandCommitteeonGeologicalandGeotechnicalEngi-
neering,Oct.23,2014.
Holland,A.A.,andA.P.Darold(2014),PotentialCaseofInducedSeismicityfromaWater
DisposalWellinSouth-CentralOklahoma,inGSASouthCentralSection,edited,Geol.Soc.Amer.,Fayetteville,AR.
Holland,A.A,andA.P.Darold(2014),Considerationsindisposalwellsitingandopera-
tions:relativehazardandidentificationofinjection-inducedseismicityusingregionalor
localseismicmonitoring,SPE/SEG/ARMAInjectionInducedSeismicityWorkshop,Banff,
Canada,Sep.15-18,2014.
Holland,A.A.andA.P.Darold(2015),Areearthquakestriggeredbyhydraulicfracturing
morecommonthanpreviouslyrecognized?,GeologicalSocietyofAmericaSouthCentral
SectionMeeting,StillwaterOK,March19-20,2015.PDFDownload
Holland,A.A.andA.P.Darold(2015),Areearthquakestriggeredbyhydraulicfracturing
morecommonthanpreviouslyrecognized?,SeismologicalSocietyofAmericaMeeting,
PasedenaCA,April20-23,2015.
HollandA.A.,andG.R.Keller(2015)IndustryContributionstotheOklahomaFaultData-
baseAAPGMid-ContinentSectionMeeting,TulsaOKOct.6-8,2015
100
Holland,A.,G.R.Keller,A.Darold,K.Murray,andS.Holloway(2014),MultidisciplinaryAp-
proachtoIdentifyandMitigatetheHazardfromInducedSeismicityinOklahoma,inAmer.Geophys.UnionFallMeeting,SanFrancisco,CA.
Keller,G.R.,(2015)TheRoleofRiftingintheTectonicEvolutionoftheOklahomaRegion
(2015),GeologicalSocietyofAmericaSouth-CentralSectionMeeting,StillwaterOK,March
19-20,2015.
S.MarshandA.A.Holland,(2015)ComprehensiveFaultDatabaseandInterpretedFaultMapforOklahoma,AAPGMid-ContinentSectionMeeting,TulsaOKOct.6-8,2015
KevinCrainandJeffersonChangpresentedProjectworkonCrustalScaleTomography
(Task8)atanAGUpotentialfieldsworkshopinKeystone,ColoradoinAugust2015.Links
toabstractsforthepresentationsarelistedbelow.
J.C.ChangandK.D.Crain:
https://agu.confex.com/agu/seg15/webprogram/Paper38018.html
K.D.Crain:https://agu.confex.com/agu/seg15/webprogram/Paper38020.html
https://agu.confex.com/agu/seg15/webprogram/Paper38027.html
OnOctober19,2016,JeremyBoakpresentedatalkonInducedSeismicityandOklahoma
EarthquakestotheSocietyforExplorationGeophysicistsAnnualMeetinginDallasTX.
OtherPresentationsandInvitedTalks
AustinHollandwasaninvitedspeakerataNationalResearchCounciljointstandingcom-
mitteemeetingonOctober23,2014onthetopicof“CriticalIssuesintheSubsurface:Using
FieldObservatoriesandDatatoAdvanceUnderstandingofRockBehavior".
AustinHollandwasaninvitedspeakeratabriefingaboutinducedseismicityconvenedby
theU.S.DepartmentofEnergyinOctober2014.
TheprojectteamhadasignificantpresenceattheDecember2014AmericanGeophysical
UnionFallMeetinginSanFrancisco,California.Fourrelatedabstractsincludedinvestiga-
torsontheproject(Daroldetal.,2014,Hollandetal.,2014,Llenosetal.,2014,Majeretal.,2014).ThepresentationbyHollandetal.(2014)wasanintroductiontoboththisRPSEAprojectandotherrelatedeffortsunderwayinOklahoma.
RandyKellergaveatalkonOklahomaearthquakesandtheirpossiblerelationshipstooil
andgasactivitytoaprofessionalengineeringgroupwhoearnedContinuingEducation
Credits(CEUs)fortheirattendanceinSeptember2015
AustinHollandpresentedtheOklahomafaultdatadatabasetotheStanfordConsortiumon
InducedandTriggeredSeismicity(SCITS)inFebruary2015,includinglessonslearnedfrom
theindustrycontributionoffaultdataforthedatabaseassimilareffortsarebeingconsid-
eredelsewhere.
AustinHollandpresentedattheIEAGHGMonitoringNetworkMeetinginBerkeley,CAin
June2015withatalktitled“StrategyforMonitoringLargeRegionsofFluidInjectionand
InducedSeismicity:Oklahoma’sExperience”.
101
KyleMurraymadethefollowingpresentationsinAugust2015:
Aug14,2015Chicago,IL:NationalAssociationofInsuranceCommissioners(NAIC)Center
forInsuranceandPolicyResearch(CIPR)Event–OralPresentationtitledStateoftheScience:TriggeredSeismicityinOklahoma.
Aug15,2015Chicago,IL:NationalAssociationofInsuranceCommissioners(NAIC)
EarthquakeStudyGroupMeeting–OralPresentationtitledOverviewofEarthquakeActiv-ityintheContiguousStates.
Aug27,2015Woodward,OK:WaterTransfer,TreatmentandReuseWorkshopwith
SustainingOklahoma’sEnergyResources(SOER)–OralPresentationtitledWaterUseandPermittinginOklahomaProducedWater,UICandSWD.
OnSeptember10,2015,JeremyBoakpresentedadiscussionofthecurrentseismicactivity
totheHarvardClubofOklahomaCity
OnSeptember16,2015,JeremyBoakpresentedadiscussionofInducedSeismicityand
OklahomaEarthquakestotheOklahomaCityGeologicalSociety.
OnOctober7,2015,JeremyBoakpresentedadiscussionofInducedSeismicityandOkla-
homaEarthquakestotheSocietyofIndependentPetroleumEarthScientists.
OnOctober15,2015,JeremyBoakpresentedadiscussionofInducedSeismicityandOkla-
homaEarthquakestoaconferenceofNobleCountyAssessors.
OnJanuary20,2016,JeremyBoakpresentedadiscussionofinducedseismicityinOkla-
homatotheConsumerEnergyAllianceStateoftheEnergyIndustryRoundtableinOkla-
homaCity,
OnJanuary27,2016,JeremyBoakpresentedadiscussionofinducedseismicityinOkla-
homatotheOklahomaAggregatesAssociationannualmeetinginNorman.
OnFebruary11,2016,JeremyBoakpresenteddiscussionsofinducedseismicityinOkla-
homatotheOklahomaCityRotaryClub,TheTulsaGeophysicalSociety,andtheArdmore
GeologicalSociety.
OnFebruary16,2016,JeremyBoakpresentedadiscussionofinducedseismicityinOkla-
homatotheOklahomaStructuralEngineeringAssociationandtotheSac&FoxNation.
OnMarch3,2016,JeremyBoakpresentedatalkonInducedOklahomaSeismicitytothe
RockyMountainAssociationofGeologists/DenverGeophysicalSociety3-DSeismicSympo-
siuminDenver.
OnMarch7,2016,JeremyBoakpresentedatalkonInducedSeismicityinOklahomatothe
KiwanisClubofOklahomaCity.
OnMarch23,2016,JeremyBoakpresentedatalkonInducedSeismicityinOklahomato
theNormanBoardofRealtors.
OnMarch29,2016,JeremyBoakpresentedatalkonInducedSeismicityinOklahomato
theSEG/SPE(SocietyofExplorationGeophysicists/SocietyofPetroleumEngineers)Work-
shoponInducedSeismicityinFortWorth(March28-30)
OnApril5,2016,JeremyBoakpresentedatalkonOklahomaSeismicitytotheAssociation

102
ofEnergyServiceCompaniesinOklahomaCityandtotheSpringConferenceoftheOkla-
homaStructuralEngineeringAssociation.
OnApril13,2016,JeremyBoakpresentedatalkonOklahomaSeismicitytotheTulsa
AssociationofLeaseandTitleAnalystsofTulsa,Oklahoma.
OnMay2,2016,JeremyBoakpresentedatalkonInducedSeismicityandOklahomaEarth-
quakestotheNormanLionsClub,Norman,Oklahoma.
OnMay6,2016,JeremyBoakpresentedatalkonInducedSeismicityandOklahomaEarth-
quakestotheGeographicInformationCouncilofOklahoma,inOklahomaCity.
OnMay9,2016,JeremyBoakpresentedatalkonInducedSeismicityandOklahomaEarth-
quakestotheGeophysicalSocietyofOklahomaCity,inOklahomaCity.
OnMay10,2016,JeremyBoakpresentedatalkonInducedSeismicityandOklahoma
EarthquakestotheFortuneClub,inOklahomaCity.
OnMay19,2016,JeremyBoakpresentedatalkonInducedSeismicityandOklahoma
EarthquakestotheNorthTexasGeologicalSocietyinWichitaFallsTX.
OnJune21,2016,JeremyBoakpresentedatalkonInducedSeismicityandOklahoma
EarthquakestotheUnconventionalResourcesGroupoftheEnergyMineralsDivision,
AmericanAssociationofPetroleumGeologistsinCalgary,Alberta.
OnAugust26,2016,JeremyBoakparticipatedinapaneldiscussiononInducedSeismicity
andOklahomaEarthquakesattheOklahomaSchoolBoardsAssociationconferenceinOkla-
homaCity.
OnSeptember2,2016,JeremyBoakpresentedatalkonInducedSeismicityandOklahoma
EarthquakestotheDepartmentofGeologicalSciencesatOklahomaStateUniversityin
Stillwater,OK.
OnSeptember7,2016,JeremyBoakpresentedatalkonInducedSeismicityandOklahoma
EarthquakesatanAmericanChemicalSocietyChemistryCaféinTulsaOklahomaaspartof
apaneldiscussion.
OnSeptember14,2016,JeremyBoakparticipatedinapaneldiscussiononInducedSeis-
micityandOklahomaEarthquakestotheOklahomaMunicipalLeagueAnnualConference
inOklahomaCity,OK.
OnSeptember15,2016,JeremyBoakpresentedatalkonInducedSeismicityandOkla-
homaEarthquakestotheCouncilofPetroleumAccountantsSocietiesofOklahomainOkla-
homaCity.
OnSeptember20,2016,KyleMurraypresentedatalkonInducedSeismicityandOkla-
homaEarthquakestotheTulsaGeologicalSocietyinTulsaOK.
OnSeptember21,2016,JeremyBoakpresentedatalkonInducedSeismicityandOkla-
homaEarthquakestotheOklahomaCommercialRealEstateForumonEarthquakesin
OklahomaCity.
OnOctober11,2016,JeremyBoakpresentedatalkonInducedSeismicityandOklahoma
EarthquakestotheOklahomaIndependentPetroleumAssociationWildcatterWednesday

103
inOklahomaCity.
OnOctober26,2016,JeremyBoakpresentedatalkonInducedSeismicityandOklahoma
EarthquakestotheOklahomaCorporationCommissionOilandGasInstituteinTulsaOK.
OnOctober26,2016,JeremyBoakpresentedatalkonInducedSeismicityandOklahoma
EarthquakestotheU.S.AssociationofEnergyEconomistsAnnualMeetingWorkshopon
InducedSeismicityinTulsa.
OnOctober27,2016,JeremyBoakpresentedatalkonInducedSeismicityandOklahoma
Earthquakestothe5thAnnualProducedWaterQualityRecyclingandReuseCongressin
DenverCO.
OnNovember1,2016,JeremyBoakpresentedatalkonInducedSeismicityandOklahoma
EarthquakestotheNormanLionsClubinNorman.
IndustryInteractions
DuringFall2014,ProjectstaffinteractedwithNewDominion,whichprovidedasignificant
costshareforourproject.TheyaresharingideasaboutthecausesofOklahomaseismicity,
andwediscussedthedatathattheyplantoprovideaspartoftheircostsharecommitment.
OnAugust27,2015,andDecember2,2015,JeremyBoakattendedtheSeismicityWorking
GroupMeetingoftheOklahomaIndependentPetroleumAssociation,anddiscusseddata
needsfromtheindustryforevaluationofinducedseismicity.
OnNovember20,2015,JeremyBoaksatonapaneldiscussingseismicityandwastewater
injectionattheannualconferenceoftheOklahomaOilandGasAssociation
JeremyBoakmetwithJulieShemetaofMEQGeo,anindustryconsultantduringtheweek
beforeChristmas2015.
OnFebruary5,2016,JeremyBoakandKevinCrainmetwithChesapeakeEnergytore-
viewseismicdata.
OnMarch2,2016,RPSEAteammembersparticipatedinameetingwithExxonMobiland
XTOpersonnelregardingtheirassessmentofpotentiallyinducedseismicityinTexas,and
onariskassessmenttoolbeingdevelopedforinjectionwells.
GovernmentInteractions
JeremyBoakattendedmeetingsoftheGovernor’sCoordinatingCouncilonSeismicityin
OklahomaCityonSeptember8,2015,October7,2015,May23,2016,July18,2016,August
23,2016,andNovember2,2016.
JeremyBoak,andJeffersonChangattendedameetingoftheGovernor’sCoordinating
CouncilonSeismicityonApril19,2016,August23,2016.
OnJanuary19,2016,JeremyBoakandKyleMurrayattendedtheJanuarymeetingofthe
Governor’sCoordinatingCouncilonSeismicityinOklahomaCity.
104
OnFebruary16,2016,OGSstaffmembersattendedtheFebruarymeetingoftheGover-
nor’sCoordinatingCouncilonSeismicityinOklahomaCity
OnMarch21,2016,JeremyBoak,JeffersonChang,andKyleMurrayalsoattendedthe
MarchmeetingoftheGovernor’sCoordinatingCouncilonSeismicity.BothMurrayand
Boakwereinvitedspeakers.
OnMarch25,2016,OGSstaffmembersdiscussedtheupcomingreleaseoftheU.S.
GeologicalSurvey’sone-yearseismichazardassessmentoftheUnitedStates,which
showedbothnaturalandinducedseismichazardforthefirsttime,andhighlightednorth
centralOklahomaasanareawithsignificantriskofdamage.
JeremyBoakattendedtheSecretaryofEnergyandEnvironment’smonthlyDirector’s
meetingOnSeptember14,2015,October19,2015,November30,2015,February22,2016,
March21,2016,April25,2016,May31,2016,July25,2016,October10,2016.
TheOGSseismologyteammetwiththeOklahomaCorporationCommission’sOilandGas
DivisioninNormanonTuesday,October15,2015,onDecember15,2015,February1,
2016,April18,2016,June10,2016,September27,2016,October11,2016.
OnOctober30,2015,JeremyBoakpresentedatalkdiscussingseismicityandwastewater
injectiontoanInterimStudyGroupoftheOklahomalegislature.
OnNovember10,2015,JeremyBoakjoinedapaneldiscussingseismicityandwastewater
injectionattheOklahomaGovernor’sEnergyConference
JeremyBoakattendedmeetingsonseismichazardevaluationattheOklahomaDepart-
mentofTransportationonDecember8,2015,April4,2016,May16,2016.
JeremyBoakattendedthefallliaisonmeetingoftheAssociationofAmericanStateGeolo-
gistsinWashington,DC,September27-30,2015,andmetwithpersonnelfromUSGS,
GeologicalSocietyofAmerica,NationalMiningAssociation,TheNationalAcademies,anda
DOEundersecretary,aswellasstaffofseveralCongressionalCommittees.
USGS
JeremyBoakmetwithagroupattheUSGSNationalEarthquakeInformationCenterdur-
ingtheweekbeforeChristmas.
JeremyBoakmetwithRobertWilliamsoftheUSGSNationalEarthquakeInformationCen-
terJune7,2016.
TheOGSseismologyteammetwithagroupofU.S.GeologicalSurveyandCongressional
staffonJune28,2016.
JeremyBoak,JeffersonChang,andKyleMurraymetwithUSGSandOklahomaCorpora-
tionCommissionstafftodiscussseismicityinOklahomaonJune30,2016.
JeremyBoak,NoorulanGhouse,andJeffersionChangvisitedtheUSGSNationalEarth-
quakeInformationCenteronJuly22,2106todiscussanalysisofseismologicdata.
105
RPSEAMeetings
OnSeptember17,2015andMarch9,2016,JeremyBoakgaveaWebexupdateonthe
RPSEAProjecttoRPSEA,NETLandDOEpersonnel.
OnNovember4,2015,JeremyBoakpresentedadiscussionofthecurrentseismicactivity
toaRPSEATechnologyTransferworkshopinHouston,Texas,alongwithRandyKeller,
whodiscussedthelargertectonicpictureofOklahomaseismicity.
JeremyBoakpresentedatalkontheRPSEAProjectandInducedSeismicityinOklahomaat
theBestofRPSEAconferenceinGalvestonTX,August31,2016.