Embed Size (px)
Citation preview

PREPARED: March 2010
Acumen, LLC 500 Airport Blvd., Suite 365
Burlingame, CA 94010
Final Report on GPCI Malpractice RVUs for the CY 2010 Medicare Physician Fee Schedule Rule
Margaret O’Brien-Strain Sean McClellan Steve Frances Nick Theobald March 2010

This page is intentionally left blank.

TABLE OF CONTENTS
1 Introduction ............................................................................................................................. 1
2 Malpractice Premium Data Collection .................................................................................... 3
2.1 Premium Data Sought ....................................................................................................... 3 2.2 State Rate Filings Data Collection .................................................................................... 4 2.3 Additional Rate Information ............................................................................................. 7 2.4 Constructing the Malpractice Premium Data Set .............................................................. 9
3 Updating the Malpractice RVUs ........................................................................................... 11
3.1 Creating Raw Malpractice RVUs ................................................................................... 12 3.2 Defining Specialties ........................................................................................................ 17 3.3 Updating Technical Component Data ............................................................................. 20 3.4 MP RVU Floor ................................................................................................................ 24 3.5 Previously Updated CPTs without 2008 MTUS Values................................................. 24 3.6 New or Revised CPTs ..................................................................................................... 24
4 Impact of the Update ............................................................................................................. 26
4.1 Overall Impact and Impact by CPT Code Type .............................................................. 26 4.2 Impact by Specialty ......................................................................................................... 32
A. Appendix ............................................................................................................................... 34
A.1 Data Collection Gaps and Alternative Data Sources ...................................................... 34 A.2 Summary of 2008 MP RVU Data ................................................................................... 36 A.3 Analytic Crosswalk ......................................................................................................... 44
Final Report on Updated GPCI MP RVUs | December 2009
iii

Final Report on Updated GPCI MP RVUs | December 2009
iv
LIST OF TABLES
Table 2.1: Market Share and Number of Rate Filings Collected by State, 2006 and 2007 ............ 5
Table 2.2: States that Did Not Provide Rate Filing Data ................................................................ 7
Table 2.3: Patient Compensation Fund Overview .......................................................................... 8
Table 3.1: Data Sources Overview ............................................................................................... 11
Table 3.2: Number of State Rate Filings Collected for Each Specialty ........................................ 17
Table 3.3: Reassigned Specialties ................................................................................................. 18
Table 3.4: CPT Code Surgery Classes .......................................................................................... 20
Table 3.5: Professional, Technical and Global CPT Distinction .................................................. 21
Table 3.6: Example CPT Code with Modifiers ............................................................................ 22
Table 3.7: Specialty Mapping for New CPTs ............................................................................... 25
Table 4.1: Distribution of Updated BN MP RVU Values by Mod/Indicator ............................... 27
Table 4.2: Distribution of Updated BN MP RVU Values by Surgery Class ................................ 27
Table 4.3: Percent Change in MP RVU across CPT Codes Values by Mod/Indicator ................ 29
Table 4.4: Percent Change in MP RVU across CPT Codes by Surgery and Obstetrics Class ..... 29
Table 4.5: Percent Change Total RVU, 2008 to Updated BN Values by Mod/Indicator ............. 31
Table 4.6: Percent Change Total RVU, 2008 to Updated BN by Surgery Class .......................... 31
Table 4.7: Impact by Specialty ..................................................................................................... 32
Table A.1: Explanations for States with Low Collected Market Shares ...................................... 34
Table A.2: Summary of 2008 MP RVU Data, Base Run ............................................................. 37
Table A.3: Analytic Crosswalk ..................................................................................................... 44
1 INTRODUCTION
Since January 1, 1992, Medicare has paid for physicians' services under section 1848 of the Social Security Act (the Act), ``Payment for Physicians' Services.'' The Act requires that physician payments be based on national uniform relative value units based on the relative resources used in furnishing a service. As required by Section 1848(c), the Centers for Medicare and Medicaid Services (CMS) establish resource-based malpractice relative value units (MP RVUs) as part of the Resource-Based Relative Value Scale (RBRVS) method for reimbursing physicians. Section 1848(c)(2)(B)(i) of the Act requires that CMS review all RVUs no less often than every 5 years.
Like the geographic practice cost indices (GPCIs), which are designed to adjust reimbursements for differing regional work, practice and malpractice costs, RVUs are split into three components: the physician work RVUW, the practice expense RVUPE and the malpractice insurance RVUMP. While the GPCIs adjust payments for geographic variation, RVUs distinguish among services in the cost of providing services. The equation below demonstrates how these three RVU components combine with the GPCIs and a conversion factor (CF) translating between the adjusted RVUs and dollars to establish physician payments under Medicare for service K in locality L:
[ ] [ ] [ ]{ } CFRVUGPCIRVUGPCIRVUGPCIPayment KMPLMPKPELPEKWLWLK **** ,,,,,,, ++=
Physician Work Practice Expense Malpractice Insurance
Section 1848(c) of the Act requires that national RVUs be established for physician work, practice expense (PE), and malpractice expense. Initially, only the physician work RVUs were resource-based, and the PE and malpractice RVUs were based on average allowable charges. Section 4505(f) of the Balanced Budget Act of 1997 (BBA) amended section 1848(c) of the Act requiring CMS to implement resource-based malpractice (MP) RVUs for services furnished on or after 2000.
The resource-based MP RVUs were implemented in the Physician Fee Schedule (PFS) final rule published November 2, 1999 (64 FR 59380). The MP RVUs were based on malpractice insurance premium data collected from commercial and physician-owned insurers from all the States, the District of Columbia, and Puerto Rico. The first 5-Year Review of the physician work RVUs was published on November 22, 1996 (61 FR 59489) and was effective in 1997. The second 5-Year Review was published in the CY 2002 PFS final rule with comment period (66 FR 55246) and was effective in 2002. The third 5-Year Review of physician work
Final Report on Updated GPCI MP RVUs | December 2009
1

RVUs was published in the CY 2007 PFS final rule with comment period (71 FR 69624) and was effective on January 1, 2007.
In developing resource-based malpractice RVUs, CMS concluded that premium costs were driven primarily by physician specialty and the level of surgical involvement (2005 Proposed Rules, 70 FR 45784). Since malpractice insurance rates can dramatically shift over the course of several years, including both significant increases and decreases depending on the part of the country and specialty, it is critical to include updated premium costs in calculating the new malpractice RVUs.
Therefore, there are three substantial efforts that must be completed to update the malpractice RVUs. The first is the collection of malpractice (professional liability) insurance premium data by specialty. Using these premiums, the malpractice RVUs are based on the contribution of different physician specialties and surgical involvement to different Medicare procedures in order to determine the contribution of different risk factors based on the physician effort, captured in the physician work RVUs.
This report describes the data sources, methodologies and results for the current update of the malpractice RVUs, scheduled to be implemented in 2010. This report is organized into four main sections: Section 2 describes the collection of malpractice premium data for this update. Section 3 details the steps in calculating the malpractice RVUs, including the assumptions required at different steps. Finally, in Section 4, we explore the impact of the update.
Final Report on Updated GPCI MP RVUs | December 2009
2

Final Report on Updated GPCI MP RVUs | December 2009
3
2 MALPRACTICE PREMIUM DATA COLLECTION
This update relies on newly collected data on malpractice insurance premiums among leading insurance underwriters in each state. In this section, we describe the collection of the premium data, which is used in the calculation of MP RVUs. Our general approach to collecting the premium data was largely comparable to that for the last update of the Geographic Practice Cost Index (GPCI) in 2007, except that we sought to collect a broader range of specialties.
2.1 Premium Data Sought
The data collection focused on professional liability/medical malpractice insurance premiums for physicians and surgeons in all 50 states and Puerto Rico. In each state, Acumen attempted to collect data for at least 50 percent of the market share and from at least two operating medical malpractice insurers in each state. Acumen sought data effective for 2006, 2007 and, when available, 2008.1
Whenever possible, Acumen collected physician and surgeon medical malpractice premiums with the following characteristics:
• Claims-made: Acumen chose claims-made policies because they are the most commonly used malpractice insurance policies in the United States. Claims-made policy rates were used rather than occurrence policies. A claims-made policy covers physicians for the policy amount in effect when the claim is made, regardless of the date of event in question. An occurrence policy covers a physician for the policy amount in effect at the time of the event in question, even if the policy is expired.
• 1 million / 3 million liability (coverage) limits: Acumen chose one million and three million liability limits because they are the most commonly used liability limits for malpractice insurance policies in the United States. A 1M/3M liability limit policy means that the most that would be paid on any one claim is $1,000,000 and that the most that the policy would pay for several claims over the time frame of the policy is $3,000,000.
• Mature rates: Acumen collected mature year rates. Claims-made coverage involves a step process with premium increases over a set number of years of coverage in increments proportional to the claims reporting for that experience. At the mature year, premium adjustments are based only on annual rate changes.
1 Historically, premium data for the GPCIs has represented a three-year moving average (although in practice, firms do not always update their rates annually). Therefore, Acumen collected the most recent three years of rate filings, including rate filings for 2008.

Final Report on Updated GPCI MP RVUs | December 2009
4
The number of years that defines a mature claim differed across insurance companies.
• Regional Variations: While many rates applied statewide, premiums were adjusted by geography in some states. Each insurance company reported premium data based upon territories composed of one or more counties. The number of territories and territory definitions differed by insurance company and by year. Our dataset broke down company premium rates to the county level.
Acumen identified the top medical malpractice underwriters in each state before requesting medical malpractice premiums. Whenever possible, we identified the top medical malpractice underwriters through market share data published by state insurance departments, available online or by directly contacting the insurance departments. If market share information was not available from the state, Acumen relied upon an annual report published by the National Association of Insurance Commissioners (NAIC). We preferred market share data from state insurance departments because the NAIC reported data primarily at the group level, where a group can be comprised of several different insurance companies. In these cases, the market share value represented the entire group, not just the individual company of interest. Additionally, the NAIC included companies from which state departments did not collect rate filings as consistently, such as surplus lines and risk retention groups (RRGs). Therefore, Acumen could not obtain premium data for these organizations.2 In some states, the top underwriters primarily insured hospitals. These companies were ultimately excluded because this update, like previous updates, focuses on premiums for physicians and surgeons.
2.2 State Rate Filings Data Collection
The rate filings for malpractice insurance premiums were collected through state Departments of Insurance. We compiled contact information for current State insurance commissioners and staff relevant to this data collection (i.e. analysts in Medical Malpractice, Property and Casualty) by state. The first outreach was an email and accompanying telephone survey to identify the appropriate contact person and preferred method of communication (mail, fax, or email) for more detailed information, and to determine whether data are collected at the state level.
As with the previous malpractice premiums update, virtually all state insurance departments have established mechanisms to release rate filings to the public and required our
2 Data from risk retention groups and non-profits are typically exempt from state dictated rates and thus do not regularly file rates. Accordingly, Acumen could not request rates for these organizations from state insurance departments.

data collection to follow these established mechanisms. About half of the state insurance departments we contacted processed public records requests internally. For the others, the state insurance departments refer requests to third party vendors who pull rate filings in person. Therefore, in many states, we were required to hire third party vendors to pull rate filings, make copies, and ship the documents to Acumen.
To ensure that data was collected in a comparable manner from all states, Acumen developed a standard data collection protocol. This protocol was based on data collection from the previous GPCI update to maintain consistency, a standard data collection protocol based on the Office of Management and Budget (OMB) cleared data collection instrument. Most rate filings are only available in hard copy, each representing several hundred pages. Acumen staff conducted the data entry from documents received. For incomplete or inconsistent filings, research analysts consulted with state departments and vendors for clarification. The data collection period ran from October 2008 through February 2009.
Table 2.1 presents market share data sources by state and the final market shares collected for each state.
Table 2.1: Market Share and Number of Rate Filings Collected by State, 2006 and 2007
State 2006 2007
Market Share Source
# Company Rate Filings
Percent Market Share
Market Share Source
# Company Rate Filings
Percent Market Share
AK State 2 87% NAIC 2 71% AL State 2 76% State 2 75% AR NAIC 4 76% NAIC 4 76% AZ State 2 80% NAIC 2 63% CA State 3 56% State 4 62% CO State 3 69% State 4 70% CT State 2 49% State 4 49% DC NAIC 1 55% NAIC 1 48% DE NAIC 3 19% NAIC 4 59% FL State 5 59% State 5 58% GA NAIC 3 52% NAIC 3 55% HI NAIC 2 48% NAIC 2 49% IA NAIC 2 72% NAIC 3 71% ID NAIC 4 86% NAIC 4 85% IL NAIC 3 64% NAIC 3 98% IN NAIC 3 60% NAIC 3 59% KS NAIC 4 56% NAIC 5 66% KY NAIC 3 39% NAIC 4 51% LA NAIC 3 66% NAIC 3 64% MA State 2 88% State 2 88% MD State 3 82% State 4 62%
Final Report on Updated GPCI MP RVUs | December 2009
5

Final Report on Updated GPCI MP RVUs | December 2009
6
State 2006 2007
Market Share Source
# Company Rate Filings
Percent Market Share
Market Share Source
# Company Rate Filings
Percent Market Share
ME NAIC 2 78% NAIC 2 77% MI State 2 28% State 2 29% MN State 1 71% State 1 73% MO State 3 43% State 3 35% MS State 0 0% State 0 0% MT NAIC 2 52% NAIC 2 50% NC NAIC 3 52% NAIC 3 57% ND NAIC 2 37% NAIC 2 36% NE NAIC 2 41% NAIC 2 40% NH NAIC 2 58% NAIC 2 63% NJ NAIC 2 52% NAIC 3 55% NM NAIC 1 14% NAIC 3 63% NV State 4 36% State 4 34% NY State 2 86% State 2 81% OH NAIC 4 50% NAIC 5 61% OK NAIC 2 73% NAIC 2 76% OR NAIC 3 78% NAIC 4 85% PA NAIC 4 34% NAIC 4 34% PR NAIC 0 0% NAIC 0 0% RI NAIC 1 44% NAIC 1 34% SC NAIC 2 36% NAIC 2 53% SD NAIC 3 92% NAIC 3 91% TN NAIC 4 90% NAIC 4 59% TX NAIC 4 85% NAIC 4 85% UT NAIC 2 81% NAIC 2 73% VA NAIC 4 41% NAIC 4 41% VT NAIC 3 61% NAIC 3 82% WA NAIC 3 73% NAIC 3 72% WI NAIC 3 66% NAIC 3 63% WV NAIC 3 83% NAIC 3 70% WY NAIC 2 63% NAIC 2 64%
Acumen successfully collected medical malpractice insurance premium rates from 49 states and the District of Columbia, leaving only Mississippi and Puerto Rico outstanding. Table 2.2 compares states missing in the current data collection to those missing in the previous update. The malpractice data now reflects data for the District of Columbia, Nevada, New Mexico and Wyoming, previously absent in the last malpractice data update. As before, Acumen still lacks malpractice premium data for Mississippi and Puerto Rico. Additional information regarding data collection challenges for specific states is provided in the appendix.
Final Report on Updated GPCI MP RVUs | December 2009
7
3 Michelle M. Mello, “Understanding Medical Malpractice Insurance: a Primer,” The Robert Wood Johnson Foundation,” January 2006.
Table 2.2: States that Did Not Provide Rate Filing Data
2006/2007 GPCI Update
2008/2009 Data Collection
District of Columbia Mississippi
Nevada New Mexico Puerto Rico Wyoming
-- Mississippi
-- --
Puerto Rico --
2.3 Additional Rate Information
In addition to the core rate filings data described above, Acumen also collected additional information relevant to developing accurate cost information, including costs of patient compensation funds and professional liability insurance for technicians.
Patient Compensation Funds
PCFs are state funds that operate like an excess-layer insurer – that is, if a judgment exceeds the physician’s primary policy limit, the PCF pays the amount above the limit (or the amount between the limit and another statutorily-prescribed amount). They are funded by mandatory surcharges that physicians and hospitals pay on their primary-layer policies. These arrangements give primary insurers, physicians, and hospitals an extra cushion against large judgments.3 Seven states have Patient Compensation Funds (PCFs) that charge physicians a surcharge on top of their malpractice premium. In some states participation is voluntary, in others participation is mandatory.
The states that have patient compensation funds include Kansas, Indiana, Louisiana, Nebraska, New Mexico, Pennsylvania, and South Carolina. For these states, we requested both the rates for the insurance company premium and the PCF surcharge. Acumen also requested background information regarding the PCFs, including whether the state PCF was mandatory or optional, whether there were any requirements to utilize the PCF, the liability limits for the PCF, and the physician participation rate in the PCF. This information is summarized for all active Patient Compensation Funds in Table 2.3.

Table 2.3: Patient Compensation Fund Overview
State PCF Name Mandated Coverage Required Liability Limit
Physician Participation
Rate
IN Patient Compensation Fund Voluntary $250K/$750K $1.25M per occurrence 79%
KS Health Care Stabilization Fund Mandatory $200K/$600K
$100K/$300K, $300K/$900K, $800K/$2.4M
100%
LA Patient Compensation Fund Voluntary $100K/$300K $500K 72%
NE Excess Liability Fund Voluntary $200K/$600K $1.75M 72%
NM Patient Compensation Fund Voluntary $200K/$600K No Limit 50%
SC Patient Compensation Fund Voluntary $100K/$300K $200K/$600K 40%
PA Mcare (Medical Care Availability and Reduction of Error)
Mandatory $0.5M/$1.5M $0.5M/$1.5M 100%
WI Patient Compensation Fund Mandatory 1M/3M No Limit 100%
Technical Component Data
In 2008, the American Association of Physicists in Medicine (AAPM) requested that CMS include additional data into malpractice RVU calculations to reflect the liability insurance traditionally carried by technical medical subspecialties, such as therapeutic radiologists. AAPM explained that medical physicists, due to their key role in the design and quality assurance of high-risk radiation therapy procedures, have a significant liability exposure, and so liability insurance is normally carried by the medical physicist's employer or by the medical physicist if self employed.
In response to these requests, Acumen collected technical component data from Marsh Affinity Group Services, one of the largest association program insurance brokers and administrators in the United States providing malpractice insurance to medical physicists. These premiums, however, suggested a relatively low risk compared to physicians. Comments on the proposed rule suggested that liability risk incurred by practitioners providing technical services
Final Report on Updated GPCI MP RVUs | December 2009
8

Final Report on Updated GPCI MP RVUs | December 2009
9
was far greater than what was represented in the proposed rule. In response to these comments, Acumen utilized premium data provided by RBMA for “umbrella non-physician malpractice liability.” We further discuss the incorporation of these technical data in Section 3.
2.4 Constructing the Malpractice Premium Data Set
To structure the rate filing information into a data set for use in developing the malpractice RVUs, we needed to develop crosswalks for matching to CMS data sources. Two distinct crosswalks were required: specialty and territory.
The first crosswalk mapped the specialties listed in the rate fillings to specialty codes used in the CMS carrier files. Rather than select a subset of specialties, Acumen entered premium information for all physician and surgeon specialties available in the collected rate filings. Most insurance companies provided their own internal crosswalks from ISO codes to named specialties; Acumen matched these crosswalks to CMS carrier codes.
This crosswalk also preserved information regarding surgery classes, categorizations that impact premium rates. For example, many insurance companies distinguished general practice physicians into non-surgical, minor-surgical and major-surgical classes, each with different malpractice premiums. Some companies provided additional surgical sub-classes; for example, distinguishing general practice physicians that conducted obstetric procedures, which further impacted malpractice rates. Acumen recorded all of this information and standardized the data to CMS carrier codes. The use of these categories is described in Section 3.3 below.
Finally, many companies have different rates within states, representing different coverage territories. Acumen tracked this regional information within each rate filing by county and state FIPS codes. (Acumen also preserved the original territory code terminology specific to individual rate filings to allow easy crosschecking of collected rate filings.)

This page is intentionally left blank.

3 UPDATING THE MALPRACTICE RVUS
The Malpractice RVUs (Relative Value Units) represent the relative malpractice costs for medical procedures. The update of the malpractice RVUs involved five data sources, listed in Table 3.1 below. In particular, it requires information on malpractice premiums, linked to the physician work conducted by different specialties that provide Medicare services. Because malpractice costs vary by state and by specialty, the malpractice premium information must be weighted geographically and across specialties.
Table 3.1: Data Sources Overview
Dataset Name Source Last Update Observation Level Data Source Role
Malpractice Premiums (MP File)
State Departments of Insurance
Data effective in 2007 updated by Acumen in February 2009
County, specialty, surgery class, premium rate
Malpractice premiums for determining specialty risk factors.
Locality RVUs and Services (LRS File)
CMS 2008
Phys Zip, Carrier Number, Loc, Specialty
RVUs for creating geographic normalization factor
CPT RVUs and Services (CRS File)
CMS 2008
Carrier Number, Loc, Specialty, CPT/Mod
RVUs for weighting county-level malpractice premiums and national specialty risk factors
Geographic Practice Cost Index (GPCI File)
CMS 2008 Medicare Locality
Geographic Adjustments for Malpractice Premiums
National Physician Fee Schedule Relative Value File (NPFS File)
CMS 2008 CPT/Mod Physician Work RVUs and impact reference
In this section, we describe the conceptual process behind the recalculation of the
malpractice RVUs for each procedure using updated data from the sources listed in Table 3.1. Section 3.1 walks through the calculation of the “raw” malpractice RVUs, working from the basic concept back through the data elements required to calculate the MP RVUs. There are two major complications to this basic approach. First, as noted in Section 2 above, it is common for
Final Report on Updated GPCI MP RVUs | December 2009
11

insurance carriers to distinguish surgery or obstetrics categories within specialties. Our handling of this issue is discussed in Section 3.2. Second, a number of the procedures have billing split into a professional component and a technical component. Our handling of the technical and professional components is discussed in Section 3.3. CMS imposed a floor of 0.01 on all MP RVUs. This rule and its implementation is covered in Section 3.4. Finally, Sections 3.5 and 3.6 review processes for handling CPTs without observed services in the previous year as well as for calculating MTUS and RVUs for new and revised CPTs.
3.1 Creating Raw Malpractice RVUs
Conceptually, malpractice RVUs for each procedure (CPT/MOD) are calculated by multiplying a procedure level risk factor (RF) by the procedure’s physician work RVU, as shown in Equation (1). Physician Work RVUs (PW RVUs), last updated in 2007, reflect the physician time, technical skill and effort involved with a specific procedure. If it is higher, the clinical labor RVU for a procedure replaces the PW RVU in Equation (1). The RF then reflects the relative malpractice liability risk associated with that procedure, based on the specialties of the physicians who perform this service.
(1) MODCPTMODCPTMODCPT PWRVURFMPRVURaw /,2007// ×=
Where: Raw MP RVU = Updated Malpractice RVU, before budget neutralization CPT/MOD = Current Procedural Terminology / Modifier RF = Risk Factor PW RVU = Physician Work RVU from the 2007 National Physician
Fee Schedule Relative Value File
The resulting MP RVUs are considered “raw” in the sense that they are not yet adjusted to ensure budget neutrality, a topic we discuss below.
In Equation (1), the PW RVU values are drawn from the NPFS file. The calculation of the RF values is the chief task of the malpractice RVU update. In the rest of this discussion, we review the elements that go into calculating these RFCPT/MOD values.
Procedure Level Risk Factors
As shown in Equation (2), the procedure level risk factors are weighted averages of the risk factors associated with each specialty that performs the procedure.
Final Report on Updated GPCI MP RVUs | December 2009
12

(2) ∑∑ ×
=
SSMODCPT
SSMODCPTS
MODCPT MTUS
MTUSRFRF
,/
,/
/
Where:
RF = Risk Factor S = Specialty MTUS = Services Performed (Miles/Times/Units/Service)
The weights shown in Equation (2) are the sums of the number of services performed per specialty per procedure, as reported in the CRS file provided by CMS. The specialty level risk factors RFs are calculated from the malpractice premium data compiled by Acumen for this purpose. Equations (3) through (6) below outline the basic steps in developing these RFs values.
Raw Specialty Risk Factors
Specialty risk factors are calculated by dividing the national average premium for each specialty by the national average premium for the physician specialty with the lowest average rate, as shown in Equation (3).
(3) ⎟⎟⎠
⎞⎜⎜⎝
⎛=
LOWEST
SS PNorm
PNormRF
Where: RF = Risk Factor S = Specialty Norm P = Normalized National Average Premium
These national average premiums are normalized using the existing malpractice GPCIs to adjust for regional differences in the provision of services that might affect the calculation of these specialty risk factors. In the next several equations, we show the derivation of the national average premiums by specialty PS, and then we show the normalization.
National Average Premium for Each Specialty
The underlying malpractice premium data, as compiled in the MP file described in Section 2, are collected at the county level. Thus, the national average premiums used in
Final Report on Updated GPCI MP RVUs | December 2009
13

Equation (3) above are weighted averages of the county-level premiums for each specialty, weighted using the total RVUs for each specialty in each county (across all procedures).
(4) ∑ ×=
C S
SCSCS TRVU
TRVUPP
Where: P = Premium S = Specialty C = County TRVU = Total RVUs
As noted, the PSC values are derived from the malpractice premium data and calculated using Equation (5) below. The TRVU weights are drawn from specialty-zip code totals on the LRS file summed by county.
County Average Specialty Premiums
To calculate the national average specialty premiums in Equation (4), we first had to calculate an average specialty premium for each county from the county-level insurance carrier data gathered from state DOIs. We use market shares (MS) at the state level for firm F providing coverage in county C. MSC refers to the total market share for all firms providing coverage in that county. In creating these values, we averaged carrier-county-specialty-premiums, weighted by each carrier’s market share in each state (Equation (5)).
(5) ∑ ×=
F C
CFSCFSC MS
MSPP
Where: P = Premium S = Specialty C = County F = Insurance Carrier (Firm) MS = State-level company Market Share values
Normalized Premiums
Acumen also normalized premiums for geographic differences in malpractice premiums in order to complete Equation (4) (calculating Norm P). This normalization was necessary to
Final Report on Updated GPCI MP RVUs | December 2009
14

avoid inflated or deflated values due to potential differences in distribution of specialty-provided services across performed by geographic area. Normalization adjusts the national average premiums to account for these geographic differences in costs. (The geographic cost differences are handled through the GPCIs rather than in the RVUs themselves.)
Normalized premiums are calculated by dividing the unadjusted premiums for a given surgery class effective in a given year by the average malpractice geographic practice cost index (MP GPCI).
(6) S
SS GPCIMPAvg
PPNorm =
Where: Norm P = Normalized Premium S = Specialty Y = Year Avg MP GPCI = Average Malpractice GPCI P = Unadjusted Premium
Average Malpractice Geographic Cost Indices
In order to normalize the unadjusted premiums, we first need to calculate the average malpractice geographic cost indices (MP GPCI). The GPCI reduces geographic variation in Medicare payments by calculating an index distinctly adjusted from RVUs. The MP GPCI reflects geographic differences in premiums for mature claims made policies providing $1 million/$3 million limits of coverage.
National specialty MP GPCIs are calculated by averaging locality MP GPCIs for each specialty, weighted by locality MP RVUs (Equation (6)). The last CMS GPCI update was CY 2008 (phased in over two years).
Final Report on Updated GPCI MP RVUs | December 2009
15
(7)
( )
S
LLSL
S MPRVU
MPGPCIMPRVUGPCIMPAvg
∑ ×=
Where: MP GPCI = Average Malpractice GPCI S = Surgery L = Medicare Locality MP RVU = Malpractice RVU
GPCI = Geographic Practice Cost Index
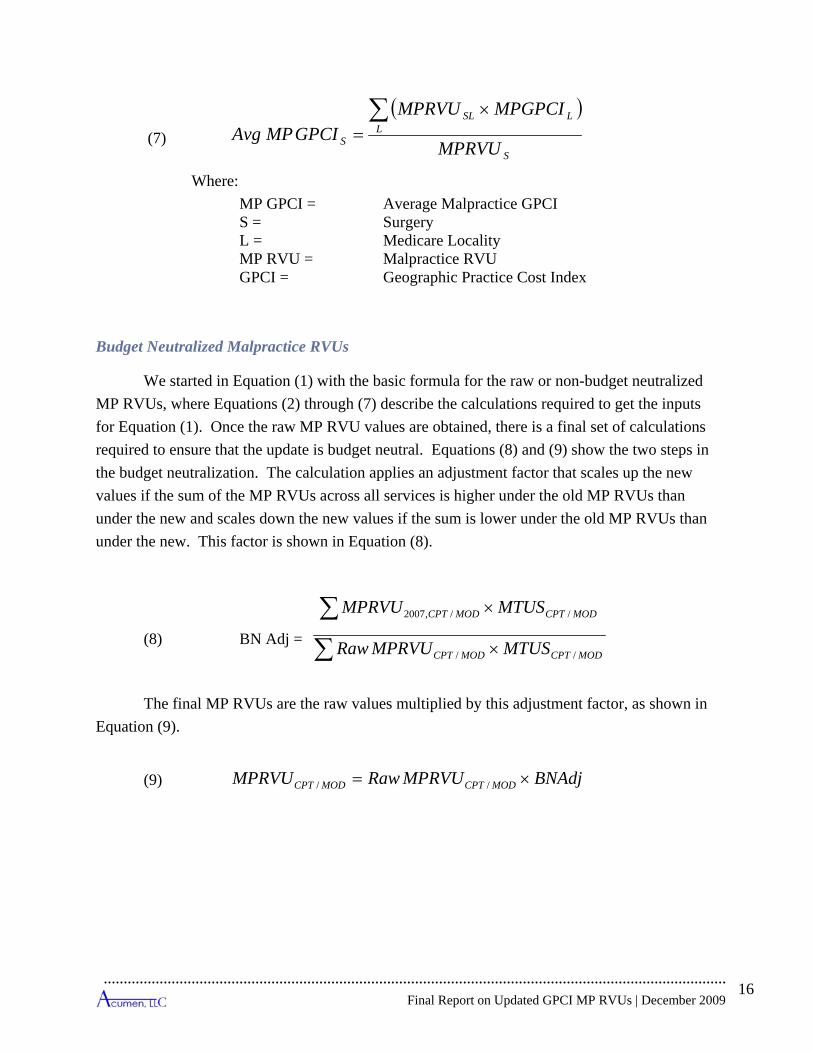
Budget Neutralized Malpractice RVUs
We started in Equation (1) with the basic formula for the raw or non-budget neutralized MP RVUs, where Equations (2) through (7) describe the calculations required to get the inputs for Equation (1). Once the raw MP RVU values are obtained, there is a final set of calculations required to ensure that the update is budget neutral. Equations (8) and (9) show the two steps in the budget neutralization. The calculation applies an adjustment factor that scales up the new values if the sum of the MP RVUs across all services is higher under the old MP RVUs than under the new and scales down the new values if the sum is lower under the old MP RVUs than under the new. This factor is shown in Equation (8).
(8) BN Adj = ∑
∑×
×
MODCPTMODCPT
MODCPTMODCPT
MTUSMPRVURaw
MTUSMPRVU
//
//,2007
The final MP RVUs are the raw values multiplied by this adjustment factor, as shown in Equation (9).
(9) BNAdjMPRVURawMPRVU MODCPTMODCPT ×= //
Final Report on Updated GPCI MP RVUs | December 2009
16

3.2 Defining Specialties
Equation (4) above assumes a straightforward definition of specialties, using the CMS carrier specialty codes listed in Table 3.2. In practice, there are two challenges to defining specialties for use in the MP RVUs based on the rate filings received by various carriers. First, there are only a few specialties that are only rarely distinguished from a general physician
Table 3.2: Number of State Rate Filings Collected for Each Specialty (Independent Risk Factors Not Calculated for Shaded Specialties)
Spec. Code Specialty Name
% of Total
MTUSStates Spec.
Code Specialty Name % of Total
MTUSStates
2 General Surgery 1.3% 50 66 Rheumatology 0.7% 48 7 Dermatology 3.9% 50 4 Otolaryngology 1.4% 47 8 Family Practice 7.3% 50 25 Physical Med and Rehab 1.3% 47
13 Neurology 1.6% 50 77 Vascular Surgery 0.4% 47 18 Ophthalmology 4.4% 50 92 Radiation Oncology 1.1% 47 20 Orthopedic Surgery 2.9% 50 84 Preventive Medicine 0.0% 45 22 Pathology 2.0% 50 38 Geriatric Medicine 0.2% 44 26 Psychiatry 1.4% 50 81 Critical Care (Intensivists) 0.2% 44 34 Urology 1.8% 50 90 Medical Oncology 0.7% 44 1 General Practice 1.0% 49 78 Cardiac Surgery 0.1% 41 3 Allergy Immunology 1.1% 49 48 Podiatry 3.1% 37 5 Anesthesiology 0.6% 49 71 Registered Diet/Nutr Prof 0.0% 35
10 Gastroenterology 1.4% 49 83 Hematology/Oncology 1.9% 35 11 Internal Medicine 13.3% 49 14 Neurosurgery 0.2% 49 16 Obstetrics Gynecology 0.6% 49 24 Plastic and Recon Surgery 0.2% 49 99 Unknown Physician Specialty 0.0% 35 28 Colorectal Surgery 0.1% 49 94 Interventional Radiology 0.3% 28 29 Pulmonary Disease 2.1% 49 85 Maxillofacial Surgery 0.0% 21 33 Thoracic Surgery 0.1% 49 35 Chiropractic 2.1% 18 36 Nuclear Medicine 0.1% 49 98 Gynecological/Oncology 0.1% 14 37 Pediatric Medicine 0.1% 49 79 Addiction Medicine 0.0% 12 39 Nephrology 1.5% 49 62 Psychologist 0.0% 6 40 Hand Surgery 0.1% 49 91 Surgical Oncology 0.0% 5 46 Endocrinology 0.4% 49 97 Physician Assistant 1.0% 5 72 Pain Management 0.1% 49 49 Ambulatory Surgical Center 0.0% 4 82 Hematology 0.1% 49 41 Optometry 1.1% 3 93 Emergency Medicine 2.2% 49 86 Neuropsychiatry 0.0% 2 6 Cardiology 9.4% 48 12 Osteopathic Manip Therapy 0.1% 1
30 Diagnostic Radiology 10.1% 48 45 Mamm Screening Center 0.0% 1 44 Infectious Disease 0.7% 48 67 Occupational Therapist 0.4% 1
Final Report on Updated GPCI MP RVUs | December 2009
17

Final Report on Updated GPCI MP RVUs | December 2009
18
category or are otherwise not included in the malpractice rate filings. Second, there are a number of specialties for which some insurance carriers distinguish classes within the specialty, typically major surgery, minor surgery, no surgery, and obstetrics/no obstetrics. Commonly, some carriers have class distinctions for a specialty while other carriers do not specify classes for the same specialty. In both of these cases, our goal is to keep as complete a list of specialties as possible, and yet ensure that the risk factors for the specialties were based on a robust set of data.4
Specialties with Insufficient State Coverage
Although we collected premium data from all states except Mississippi, some specialties do not have distinct risk categories in the rate filings from all states. As shown in Table 3.2, 14 specialties that are coded on the carrier claims were included in rate filings in 35 or fewer states. We did not develop separate risk factors from premium data for these 14 specialties and for specialty code 99, “Unknown Physician Specialty.” This leaves 44 specialties, representing 90 percent of the services reported in the CRS file, for which we use the malpractice premium data to develop risk factors.
Table 3.3: Reassigned Specialties
Spec Code Specialty Name New Spec
Code New Specialty
09 Interventional Pain Management 72 Pain Management 19 Oral Surgery 24 Plastic Reconstructive Surgery 30 Diagnostic Radiology 30 General Radiology 35 Chiropractic 03 Allergy Immunology 62 Psychologist 03 Allergy Immunology 65 Physical Therapist 03 Allergy Immunology 67 Occupational Therapist 03 Allergy Immunology 68 Clinical Psychologist 03 Allergy Immunology 79 Addiction Medicine 03 Allergy Immunology 85 Maxillofacial Surgery 24 Plastic Reconstructive Surgery 86 Neuropsychiatry 03 Allergy Immunology 91 Surgical Oncology 02 General Surgery 94 Interventional Radiology 30 General Radiology 98 Gynecological/Oncology 2 General Surgery 99 Unknown Physician Specialty 01 General Practice
4 Risks for audiologists and physician assistants are not used in calculating MP RVUs per CMS’s instructions.
For physician provided specialties with insufficient state coverage in the MP file, we initially matched the specialties to a similar specialty – conceptually or by reported premiums – for which we did have data. For example, some of the low cost specialties (addiction medicine, clinical psychology) are assigned the lowest (physician) cost risk factor. Consistent with the last MP RVU update, Acumen reassigned Chiropractic, Physical Therapist and Occupational Therapist to the lowest physician cost risk factor (Allergy Immunology). In response to comments to the proposed rule, we adjusted our mappings to better align risk for certain specialties. For instance, due to similarities identified in comments, both Oral Surgery and Maxillofacial Surgery now map to Plastic Reconstructive Surgery, and Gynecological/Oncology is assigned to General Surgery. Additionally, we blend Interventional Radiology premiums with Diagnostic Radiology to create a single General Radiology class. Table 3.3 lists the recoded specialties. The remaining categories are dropped, meaning they are not included in the weighted averages for calculating the malpractice RVUs in Equation (1).
Specialties with Surgery and Obstetrics Classes
A more complicated issue is the fact that over half of the listed specialties can have premium rates that differ for major surgery, minor surgery, no surgery and obstetrics. These classes are designed to reflect differences in risk of professional liability and the cost of malpractice claims if they occur. The same concept applies to procedures: some procedures carry greater liability risks. These liability risks are grouped by surgery, no-surgery, and obstetrics (Table 3.4). Surgery CPTs range from 10000-69999. Additionally, as per CMS instructions and consistent with current methodology, several other ranges of CPTs listed in Table 3.4 are grouped into the same risk category as surgical procedures. Codes ranging from 59000-59899 identify procedures grouped into the Obstetrics risk category. All remaining CPT codes are treated as no-surgery risk. With risk varying within specialty and procedures, the calculation of Equation (3) requires distinguishing between surgical, non-surgical and obstetrics premiums for the creation of specialty risk factors, which in turn are applied to surgical, non-surgical and obstetrics procedures in Equation (2).
We initially developed a set of rules differentiating between major and minor surgery classifications and their associated premiums to calculate specialty risk factors. In response to comments on the proposed rule, CMS chose not to distinguish risk between major and minor surgery premium categorizations. Instead, we only use major surgery premiums to calculate distinct surgery risk factors, and we only do so when there are sufficient major surgery premium filings. For specialties with distinct surgery and non-surgery risk factors, surgery risk factors are applied to CPT Codes in the 10000-69999 range, and non-surgery risk factors are applied to all other non-surgical and non-obstetrics codes. In instances of insufficient surgery premium data, we blend all available data into a single risk class applicable to both surgery and non-surgery
Final Report on Updated GPCI MP RVUs | December 2009
19

CPTs. For example, Urology has a single, blended risk factor calculated from both major surgery and non-surgery premiums, which is applied to both surgical and non-surgical procedures.
Table 3.4: CPT Code Surgery Classes
Surgery Class CPT Code Range
Surgery
10000-69999 92980-92998 93501-93536 92973-92974 93501-93533 93580-93581 93600-93613 93650-93652
92975 93617-93641
Obstetrics (OB) 59000-59899
No Surgery (NS) All other CPT Codes
In addition to surgical classifications, rate filings also distinguish separate obstetrics classifications for General Practice, Family Practice, and Obstetrics Gynecology specialties. Risk factors calculated from obstetrics-specific premiums for these three specialties are applied to the obstetrics CPTs identified by the CPT Codes in the 59000-59988 range.
3.3 Updating Technical Component Data
Procedural (CPT) data are distinguished as professional component (26), technical component (TC) or global data by modifiers (MOD) and PC/TC Indicators (PC/TC) according to the NPFS file. Professional and technical component modifiers were established for some services to distinguish the portions of services furnished by physicians. The professional component includes the physician work and associated overhead and malpractice insurance costs involved in technical services. The technical component includes the cost of equipment, supplies, technician salaries and malpractice insurance for procedures. Unmodified CPTs are called global data and refer to both components when billed together. Table 3.5 summarizes the differences among professional, technical and global CPT data.
Final Report on Updated GPCI MP RVUs | December 2009
20

Final Report on Updated GPCI MP RVUs | December 2009
21
Table 3.5: Professional, Technical and Global CPT Distinction
Professional Component
Technical Component Global
MOD Variable 26 TC None PC/TC Indicator 2 3 All Other
Description Physician work, overhead and professional liability
Equipment, supplies, technical salaries and liability
PC and TC billed together
The distinction between PC, TC and global data is important because each modifier has different associated risk factors. As discussed in Section 3.1, these risk factors distinguish relative malpractice liability risk associated with procedures, based on the specialties of the physicians who perform given services. The challenge is determining the associated risk factor for each modified CPT.
In the 2005 MP RVU update, BearingPoint assumed that their collected malpractice premium data represented PC data, yielding the PC risk factor (PC RFCPT). For the purpose of this update, CMS determined that collected malpractice premium data represented global data (Global RFCPT).
Basic Methodology to Determine Modifier Risk Factors
Our approach starts from the premise that the global MP RVUs equal the sum of the Professional and Technical Component MP RVUs, as shown in Equation (10) below5:
(10) Global MP RVUCPT = TC MP RVUCPT + PC MP RVUCPT
Our problem in calculating the MP RVUs for the PC and TC components is that there are two missing pieces of data: the PC risk factor – since we assume the risk factors calculated above correspond to the global risk factors – and any PW RVUs to associate with the technical component as required in Equation (1) in Section 3.1. We outline how we derive the missing components required to calculate these values below. Table 3.6 shows an example for CPT
5 This relationship does not hold for all PC and TC components. This is the case for PC/TC groups where the associated TC CPT is carrier-priced, in which case there is no associated Global due to the variability in TC pricing. Additionally, some TC CPTs do not have an associated PC component, as in the case of CPT 93005, Electrocardiogram; Tracing Only, without interpretation and report.

74175. The final column lists the final MP RVUs for this PC/TC group. The MP RVU for the TC MOD (0.02) and the MP RVU for the 26 MOD (0.09) add up to the global (unspecified) MP RVU (0.11). Note that there is no PW RVU for the TC component. Because the calculation of a MP RVU (Equation (1)) requires a PW RVU, the MP RVU cannot be directly calculated. Additionally, while the PW RVU can be applied for the calculation of the PC component, specialty risk cannot directly be derived from premiums, thus one of the terms on the right hand side of Equation (1) is missing. The lack of a PW RVU is addressed by the rule discussed in Section 3.1, where the greater of the PW RVU or clinical RVU is used to calculate CPT risk. In this case of TC CPTs, the clinical RVU is always used. The PC CPT risk factor, then, is derived from the TC and Global CPT risk factors.
Table 3.6: Example CPT Code with Modifiers
CPT MOD Description PW RVU
MP RVU
74175 Ct angio abdom w/o & w/dye 1.9 0.11
74175 26 Ct angio abdom w/o & w/dye 1.9 0.09
74175 TC Ct angio abdom w/o & w/dye 0.0 0.02
In calculating the PC risk factor, we must first assign risk for TC services. As discussed in Section 2.3, Acumen utilized mean premium data supplied by the RBMA for “umbrella non-physician malpractice liability.” We treat the premiums as identical for all TC components using a risk factor that accounts for minor differences by geographic area and is calculated using the equivalent of Equation (3):
(11) ⎟⎟⎠
⎞⎜⎜⎝
⎛=
LOWEST
TCTC PNorm
PNormRF
Where:
RF = Risk Factor TC = Technical Component Norm P = Normalized National Average Premium
The premium established by the RBMA data is set at $9,374. As the denominator in Equation (11) refers to the lowest physician premium (Allergy/Immunology), the TC group shows a risk factor below 1, at 0.859.
Final Report on Updated GPCI MP RVUs | December 2009
22

With the necessary components for calculating raw TC MP RVUs established, we can derive the remaining value required to calculate PC MP RVUs. Based on discussions with CMS, we define the global data as equivalent to the sum of the PC and TC data for any given CPT code. Accordingly, the risk factor for the global code is equal to the sum of the risk factors for the TC and PC. This means that the PC RF is equal to the difference between the global data and the TC data (Equation (10)).
(12) PC RFCPT =Global RFCPT – TC RFCPT
Where: Global RF = Global Component Risk Factor TC RF = Technical Component Risk Factor PC RF = Professional Component Risk Factor
Since the global RFCPT was derived using the basic approach described in Section 3.1, we can plug the RFTC into Equation (8) to get RFPC. We can then calculate the PC MP RVUs using the standard formula from Equation (1), repeated as Equation (13) below for the professional component. As discussed in Section 3.1, unadjusted MP RVUs are the products of specialty risk factors and physician work RVUs (PW RVUs).
(13) PCPCPC PWRVURFMPRVURaw ×= .
Final Report on Updated GPCI MP RVUs | December 2009
23

3.4 MP RVU Floor
Per CMS instructions, we impose a floor value of 0.01 all MP RVUs. Due to restrictions on the relationship between PC, TC and Global MP RVUs, the imposition can require a recalculation of Global MP RVUs. For example, after the raw MP RVUs are budget neutralized, imposing the floor equally across CPT 92587 along with TC and PC components leads to all showing a value of 0.01 because each individually show an actual value below 0.01. Equation (10) does not hold true in this example because the components no longer sum to the Global. To ensure that Equation (10) holds true, the floor is applied to just the PC and TC components. For cases where the imposition of the floor changes one of these values, the Global component is recalculated as the sum of the TC and PC component. Because the application of the floor and the restriction under Equation (10) affects budget neutrality, a second round of budget neutralization is applied.
3.5 Previously Updated CPTs without 2008 MTUS Values
For CPTs with non-zero values in previous MP RVU updates but lacking listed services in the CRS file, we assigned a MTUS value of one and assigned risk factors corresponding to appropriate CPT designations (TC risk factors for TC CPTs, the average risk factor for 26 and single CPTs, and the sum of relevant TC and 26 risk factors for global CPTs).
3.6 New or Revised CPTs
New or revised CPTs pose a problem as there are no MTUS associated with these procedures, nor are there any specialties associated with providing these services. CMS provided an analytical crosswalk for the revised CPTs which allow mapping of specialties, RVUs, and MTUS for these procedures (see Appendix for crosswalk). An analytical ration associated with these CPTs converts the RVUs and MTUS from the associated CPTs to the revised MTUS. An additional 45 new CPTs lacked crosswalks to other CPTs. CMS provided a mapping to specialties likely to be providing these services based on similarities to existing CPTs. Because there are no MTUS associated with these new CPTs, we treated them in the same manner as for CPTs that did not show MTUS for 2008, assigning 1 MTUS to each. Table 3.7 lists these codes along with the specialty mapping.
Final Report on Updated GPCI MP RVUs | December 2009
24

Final Report on Updated GPCI MP RVUs | December 2009
25
Table 3.7: Specialty Mapping for New CPTs
CPT MOD Assigned Specialty
21932 General Surgery 21933 General Surgery 22904 General Surgery 22905 General Surgery 31626 Pulmonary Disease 31627 Pulmonary Disease 32552 Thoracic Surgery 32553 Thoracic Surgery 33981 Cardiac Surgery 33982 Cardiac Surgery 33983 Cardiac Surgery 43775 General Surgery 46707 Colorectal Surgery (formerly Proctology) 53855 Urology 57426 Obstetrics Gynecology 74261 Diagnostic Radiology 74261 26 Diagnostic Radiology 74262 Diagnostic Radiology 74262 26 Diagnostic Radiology 74263 Diagnostic Radiology 74263 26 Diagnostic Radiology 75565 Cardiology 75565 26 Cardiology 75571 Cardiology 75571 26 Cardiology 75572 Cardiology 75572 26 Cardiology 75573 Cardiology 75573 26 Cardiology 75574 Cardiology 75574 26 Cardiology G0420 Nephrology G0421 Nephrology G0422 Cardiology G0423 Cardiology G0424 Pulmonary Disease

4 IMPACT OF THE UPDATE
In this section, we summarize the impact of the update to the MP RVUs for 8,768 procedures (defined by CPT/MOD codes) to be used in 2010. It is important to note that we did not apply the 5% threshold for inclusion of services or specialties as in previous MP RVU updates. Rather, we used the risk factor of the dominant specialty by services for each procedure with MTUS less than 100. This approach reflects the risk factors of the specialties that most frequently perform the procedure and avoids skewing from weighting specialties that rarely perform the procedure. Therefore, this updated threshold includes all specialties for which we have services and risk factors for each CPT code, even if the CPT provides fewer than 100 services or less than 5 percent of the services.
4.1 Overall Impact and Impact by CPT Code Type
To understand the impact of the changes overall and by CPT code type, we present three types of summary statistics. We start with average effects, then present the distribution of MP RVUs under the update compared to the pre-update, and finally report the percentage change.
Average MP RVUs and Distribution of MP RVUs
By construction, the MTUS weighted mean of the updated MP RVUs is the same as the pre-update MP RVUs. Table 4.1 presents the counts of the included procedures overall and by procedure type, associated with the calculations described in Sections 3.2 and 3.3.
The distribution for all updated MP RVUs is presented in the first column of Table 4.1, which the average MP RVUS is 1.01, with the MTUS-weighted average at 0.07. These values range from 0.01 (the imposed floor) to 16.58. Single CPTs show the highest MP RVU values, with a MTUS-weighted mean of 0.9. TC CPTs show the lowest values, with at least 75 percent at the floor of 0.01, with a maximum value of 0.14. The range for PC CPTs, with a maximum value of 1.67, exceeds that of Global CPTs, with a maximum value of 0.76. Even though Global CPTs are the sum of their PC and TC components, the highest PC component does not have an associated Global CPT, thus is above the highest Global value.
Table 4.2 presents the distribution of MP RVUs by Surgery, Surgery with Obstetrics, and Non-Surgery classifications. As expected, Surgery MP RVUs are much higher on average for the two surgery classifications when compared to Non-Surgery CPTs. The highest value, 16.58, occurs for a surgery CPT.
Final Report on Updated GPCI MP RVUs | December 2009
26
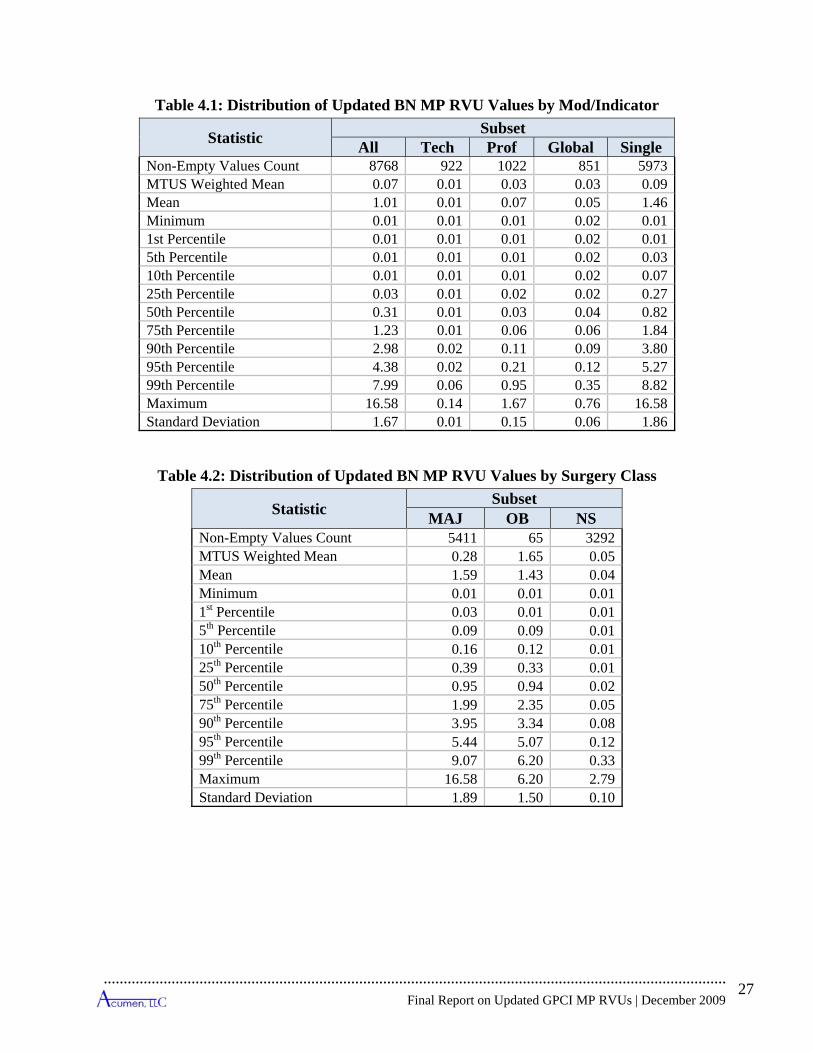
Table 4.1: Distribution of Updated BN MP RVU Values by Mod/Indicator
Statistic Subset All Tech Prof Global Single
Non-Empty Values Count 8768 922 1022 851 5973MTUS Weighted Mean 0.07 0.01 0.03 0.03 0.09Mean 1.01 0.01 0.07 0.05 1.46Minimum 0.01 0.01 0.01 0.02 0.011st Percentile 0.01 0.01 0.01 0.02 0.015th Percentile 0.01 0.01 0.01 0.02 0.0310th Percentile 0.01 0.01 0.01 0.02 0.0725th Percentile 0.03 0.01 0.02 0.02 0.2750th Percentile 0.31 0.01 0.03 0.04 0.8275th Percentile 1.23 0.01 0.06 0.06 1.8490th Percentile 2.98 0.02 0.11 0.09 3.8095th Percentile 4.38 0.02 0.21 0.12 5.2799th Percentile 7.99 0.06 0.95 0.35 8.82Maximum 16.58 0.14 1.67 0.76 16.58Standard Deviation 1.67 0.01 0.15 0.06 1.86
Table 4.2: Distribution of Updated BN MP RVU Values by Surgery Class
Statistic Subset MAJ OB NS
Non-Empty Values Count 5411 65 3292 MTUS Weighted Mean 0.28 1.65 0.05 Mean 1.59 1.43 0.04 Minimum 0.01 0.01 0.01 1st Percentile 0.03 0.01 0.01 5th Percentile 0.09 0.09 0.01 10th Percentile 0.16 0.12 0.01 25th Percentile 0.39 0.33 0.01 50th Percentile 0.95 0.94 0.02 75th Percentile 1.99 2.35 0.05 90th Percentile 3.95 3.34 0.08 95th Percentile 5.44 5.07 0.12 99th Percentile 9.07 6.20 0.33 Maximum 16.58 6.20 2.79 Standard Deviation 1.89 1.50 0.10
Final Report on Updated GPCI MP RVUs | December 2009
27

Final Report on Updated GPCI MP RVUs | December 2009
28
Percentage Change in MP RVUs
Tables 4.3 and 4.4 present the percent changes in MP RVUs, as well as the breakdown by type and the distributions of changes by CPT code type. Note that the total non-empty values count in Table 4.3 does not equal the total number of updated CPT values for the 2010 update. To avoid skewing the statistics, we excluded some CPT codes from the percent change statistics when the previous CPT value was zero, including those CPTs that were new for 2010. Examining the impact of the update on all CPTs, we see that MP RVUs drop by an average of 6 percent across 8,614 CPTs, but when change is weighted by MTUS, we see that the impact produces a 12 percent increase for all services included in this analysis. Among the different types of CPTs, TC codes show share of procedures dropping in value, with 75 percent of TC of updated MP RVUs holding no more than 25 percent of their original value. Less than 5 percent of these codes retain more than 35 percent of their earlier values. Most PC codes also experience a decline, though the MTUS-weighted average difference is just -3 percent. The drop in TC RVUs along with a general drop in PC RVUs also produces consistent a considerable drops for Global RVUs, with these RVUs experiencing a MTUS-weighted average drop of nearly 50 percent. Most Single CPTs, on the other hand, show increases in their values, with the average Single MP RVU increasing by 13 percent.
Table 4.4 compares 2010 and 2009 values by the different surgery classifications. While Surgery and Non-Surgery classifications experience average increases, the MTUS-average shows that MP RVUs for Obstetrics CPTs decline by 21 percent. However, there is substantial variation between the 2008 and updated values, with maximum changes between 6 and 10 times greater for the updated figures.

Table 4.3: Percent Change in MP RVU across CPT Codes Values by Mod/Indicator
Statistic Subset All Tech Prof Global Single
Non-Empty Values Count 8614 900 1000 829 5885MTUS Weighted Mean 12% -67% -3% -48% 26%Mean -6% -79% 0% -67% 13%Minimum -99% -99% -85% -97% -97%1st Percentile -98% -99% -68% -94% -72%5th Percentile -91% -98% -54% -92% -46%10th Percentile -82% -98% -50% -89% -29%25th Percentile -38% -94% -34% -85% -16%50th Percentile -4% -88% -1% -73% 2%75th Percentile 14% -75% -1% -58% 21%90th Percentile 49% -50% 68% -34% 69%95th Percentile 98% -50% 98% -23% 116%99th Percentile 197% -1% 197% -1% 207%Maximum 971% 98% 791% 98% 971%Standard Deviation 61% 24% 64% 25% 54%
Table 4.4: Percent Change in MP RVU across CPT Codes by Surgery and Obstetrics Class
Statistic Subset MAJ OB NS
Non-Empty Values Count 5328 65 3221 MTUS Weighted Mean 17% -21% 12% Mean 13% 12% -38% Minimum -99% -90% -99% 1st Percentile -68% -90% -98% 5th Percentile -43% -79% -97% 10th Percentile -28% -79% -92% 25th Percentile -16% -23% -83% 50th Percentile 3% -19% -50% 75th Percentile 22% -13% -1% 90th Percentile 72% -3% 18% 95th Percentile 117% 257% 49% 99th Percentile 206% 971% 126% Maximum 643% 971% 791% Standard Deviation 51% 181% 58%
Final Report on Updated GPCI MP RVUs | December 2009
29
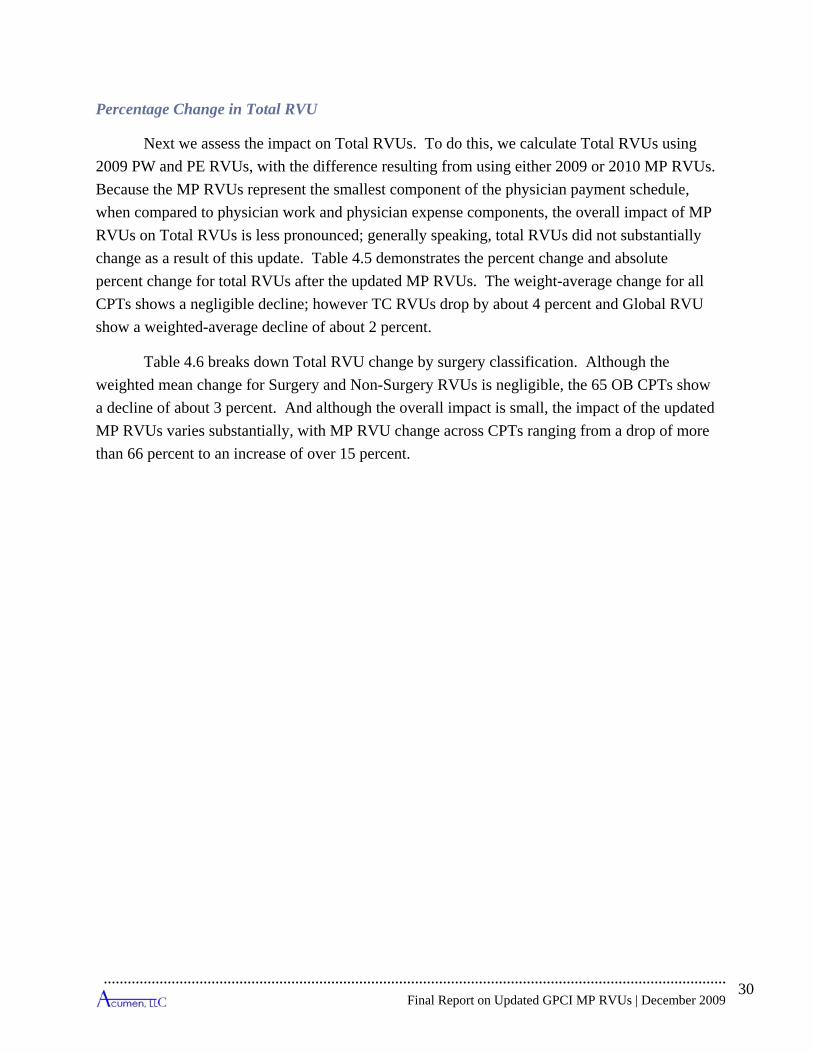
Percentage Change in Total RVU
Next we assess the impact on Total RVUs. To do this, we calculate Total RVUs using 2009 PW and PE RVUs, with the difference resulting from using either 2009 or 2010 MP RVUs. Because the MP RVUs represent the smallest component of the physician payment schedule, when compared to physician work and physician expense components, the overall impact of MP RVUs on Total RVUs is less pronounced; generally speaking, total RVUs did not substantially change as a result of this update. Table 4.5 demonstrates the percent change and absolute percent change for total RVUs after the updated MP RVUs. The weight-average change for all CPTs shows a negligible decline; however TC RVUs drop by about 4 percent and Global RVU show a weighted-average decline of about 2 percent.
Table 4.6 breaks down Total RVU change by surgery classification. Although the weighted mean change for Surgery and Non-Surgery RVUs is negligible, the 65 OB CPTs show a decline of about 3 percent. And although the overall impact is small, the impact of the updated MP RVUs varies substantially, with MP RVU change across CPTs ranging from a drop of more than 66 percent to an increase of over 15 percent.
Final Report on Updated GPCI MP RVUs | December 2009
30
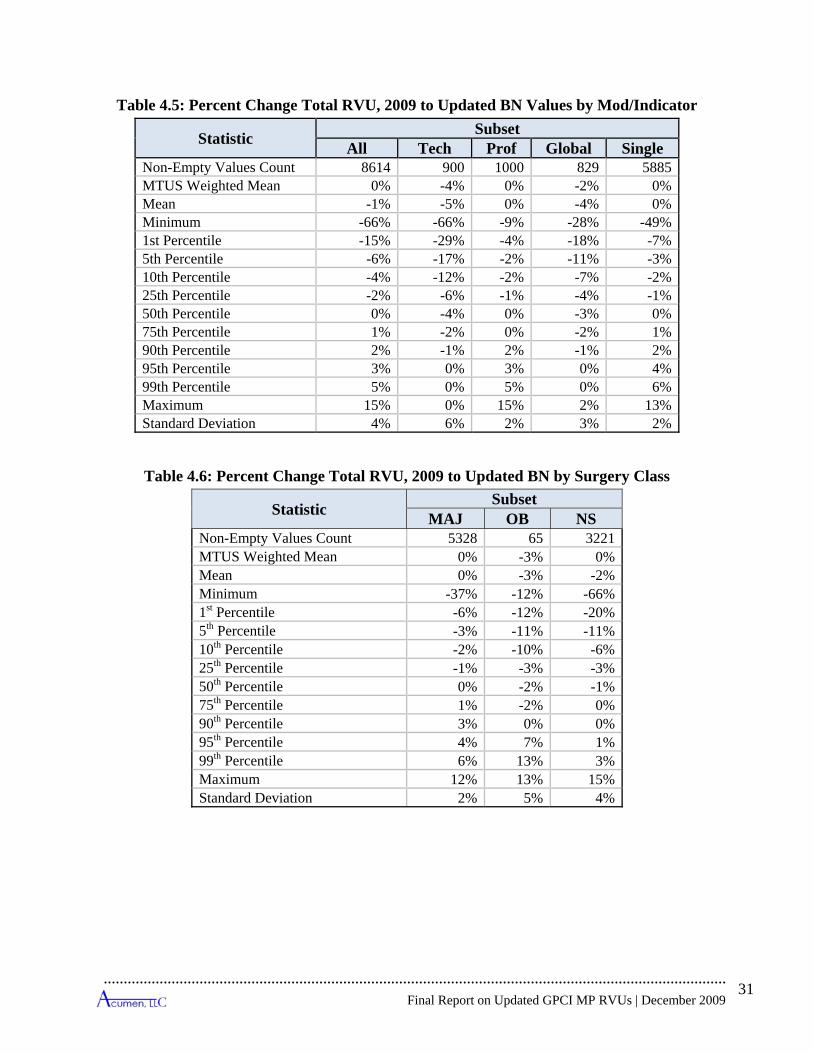
Table 4.5: Percent Change Total RVU, 2009 to Updated BN Values by Mod/Indicator
Statistic Subset All Tech Prof Global Single
Non-Empty Values Count 8614 900 1000 829 5885MTUS Weighted Mean 0% -4% 0% -2% 0%Mean -1% -5% 0% -4% 0%Minimum -66% -66% -9% -28% -49%1st Percentile -15% -29% -4% -18% -7%5th Percentile -6% -17% -2% -11% -3%10th Percentile -4% -12% -2% -7% -2%25th Percentile -2% -6% -1% -4% -1%50th Percentile 0% -4% 0% -3% 0%75th Percentile 1% -2% 0% -2% 1%90th Percentile 2% -1% 2% -1% 2%95th Percentile 3% 0% 3% 0% 4%99th Percentile 5% 0% 5% 0% 6%Maximum 15% 0% 15% 2% 13%Standard Deviation 4% 6% 2% 3% 2%
Table 4.6: Percent Change Total RVU, 2009 to Updated BN by Surgery Class
Statistic Subset MAJ OB NS
Non-Empty Values Count 5328 65 3221 MTUS Weighted Mean 0% -3% 0% Mean 0% -3% -2% Minimum -37% -12% -66% 1st Percentile -6% -12% -20% 5th Percentile -3% -11% -11% 10th Percentile -2% -10% -6% 25th Percentile -1% -3% -3% 50th Percentile 0% -2% -1% 75th Percentile 1% -2% 0% 90th Percentile 3% 0% 0% 95th Percentile 4% 7% 1% 99th Percentile 6% 13% 3% Maximum 12% 13% 15% Standard Deviation 2% 5% 4%
Final Report on Updated GPCI MP RVUs | December 2009
31
Final Report on Updated GPCI MP RVUs | December 2009
32
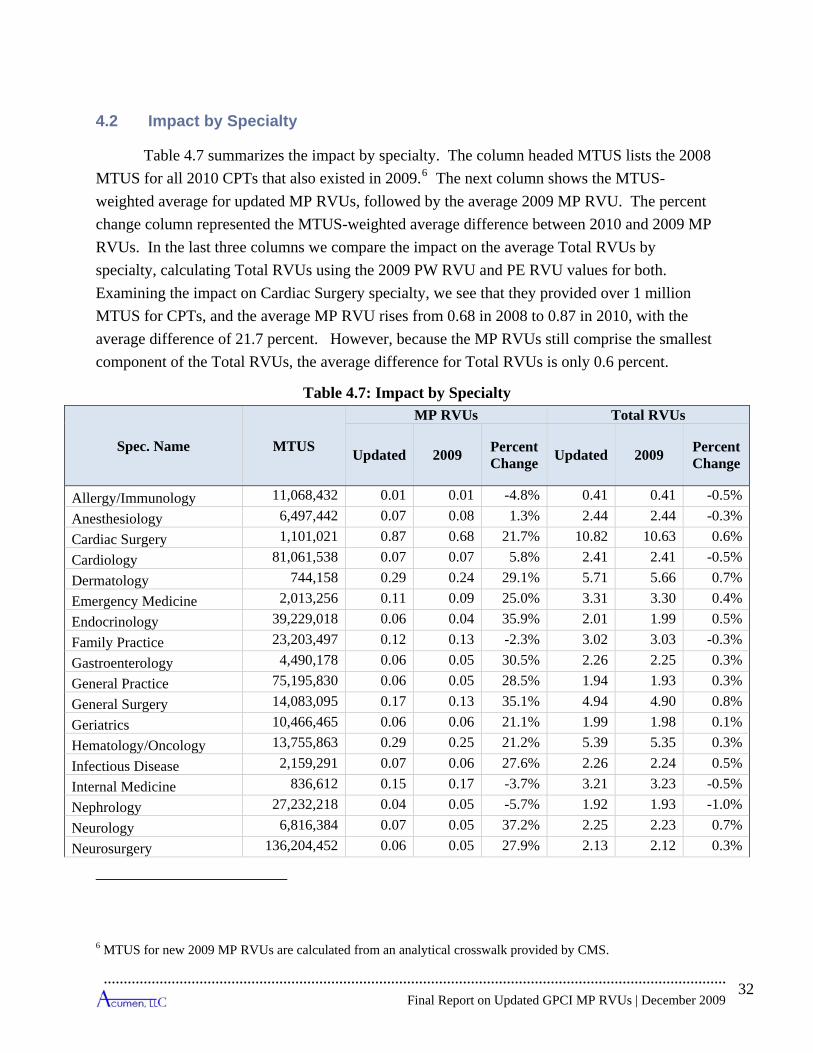
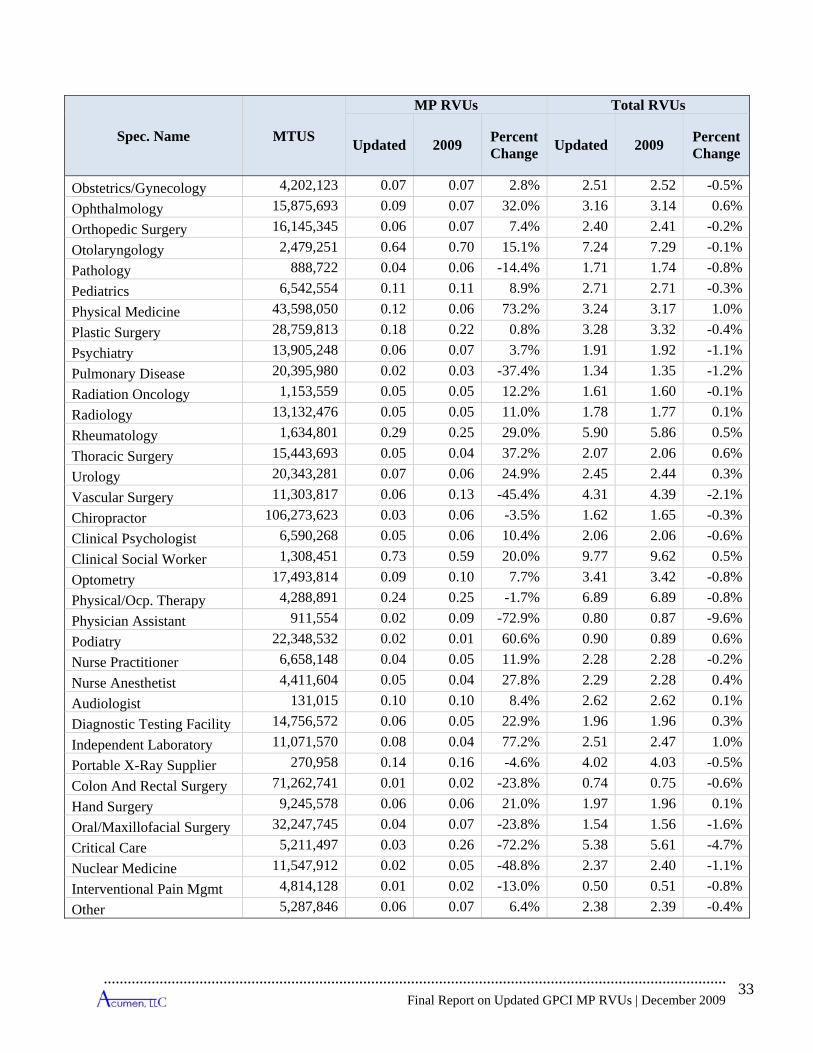
4.2 Impact by Specialty
Table 4.7 summarizes the impact by specialty. The column headed MTUS lists the 2008 MTUS for all 2010 CPTs that also existed in 2009.6 The next column shows the MTUS-weighted average for updated MP RVUs, followed by the average 2009 MP RVU. The percent change column represented the MTUS-weighted average difference between 2010 and 2009 MP RVUs. In the last three columns we compare the impact on the average Total RVUs by specialty, calculating Total RVUs using the 2009 PW RVU and PE RVU values for both. Examining the impact on Cardiac Surgery specialty, we see that they provided over 1 million MTUS for CPTs, and the average MP RVU rises from 0.68 in 2008 to 0.87 in 2010, with the average difference of 21.7 percent. However, because the MP RVUs still comprise the smallest component of the Total RVUs, the average difference for Total RVUs is only 0.6 percent.
Table 4.7: Impact by Specialty
Spec. Name MTUS
MP RVUs Total RVUs
Updated 2009 Percent Change Updated 2009 Percent
Change
Allergy/Immunology 11,068,432 0.01 0.01 -4.8% 0.41 0.41 -0.5%Anesthesiology 6,497,442 0.07 0.08 1.3% 2.44 2.44 -0.3%Cardiac Surgery 1,101,021 0.87 0.68 21.7% 10.82 10.63 0.6%Cardiology 81,061,538 0.07 0.07 5.8% 2.41 2.41 -0.5%Dermatology 744,158 0.29 0.24 29.1% 5.71 5.66 0.7%Emergency Medicine 2,013,256 0.11 0.09 25.0% 3.31 3.30 0.4%Endocrinology 39,229,018 0.06 0.04 35.9% 2.01 1.99 0.5%Family Practice 23,203,497 0.12 0.13 -2.3% 3.02 3.03 -0.3%Gastroenterology 4,490,178 0.06 0.05 30.5% 2.26 2.25 0.3%General Practice 75,195,830 0.06 0.05 28.5% 1.94 1.93 0.3%General Surgery 14,083,095 0.17 0.13 35.1% 4.94 4.90 0.8%Geriatrics 10,466,465 0.06 0.06 21.1% 1.99 1.98 0.1%Hematology/Oncology 13,755,863 0.29 0.25 21.2% 5.39 5.35 0.3%Infectious Disease 2,159,291 0.07 0.06 27.6% 2.26 2.24 0.5%Internal Medicine 836,612 0.15 0.17 -3.7% 3.21 3.23 -0.5%Nephrology 27,232,218 0.04 0.05 -5.7% 1.92 1.93 -1.0%Neurology 6,816,384 0.07 0.05 37.2% 2.25 2.23 0.7%Neurosurgery 136,204,452 0.06 0.05 27.9% 2.13 2.12 0.3%
6 MTUS for new 2009 MP RVUs are calculated from an analytical crosswalk provided by CMS.
Final Report on Updated GPCI MP RVUs | December 2009
33
Spec. Name MTUS
MP RVUs Total RVUs
Updated 2009 Percent Change Updated 2009 Percent
Change
Obstetrics/Gynecology 4,202,123 0.07 0.07 2.8% 2.51 2.52 -0.5%Ophthalmology 15,875,693 0.09 0.07 32.0% 3.16 3.14 0.6%Orthopedic Surgery 16,145,345 0.06 0.07 7.4% 2.40 2.41 -0.2%Otolaryngology 2,479,251 0.64 0.70 15.1% 7.24 7.29 -0.1%Pathology 888,722 0.04 0.06 -14.4% 1.71 1.74 -0.8%Pediatrics 6,542,554 0.11 0.11 8.9% 2.71 2.71 -0.3%Physical Medicine 43,598,050 0.12 0.06 73.2% 3.24 3.17 1.0%Plastic Surgery 28,759,813 0.18 0.22 0.8% 3.28 3.32 -0.4%Psychiatry 13,905,248 0.06 0.07 3.7% 1.91 1.92 -1.1%Pulmonary Disease 20,395,980 0.02 0.03 -37.4% 1.34 1.35 -1.2%Radiation Oncology 1,153,559 0.05 0.05 12.2% 1.61 1.60 -0.1%Radiology 13,132,476 0.05 0.05 11.0% 1.78 1.77 0.1%Rheumatology 1,634,801 0.29 0.25 29.0% 5.90 5.86 0.5%Thoracic Surgery 15,443,693 0.05 0.04 37.2% 2.07 2.06 0.6%Urology 20,343,281 0.07 0.06 24.9% 2.45 2.44 0.3%Vascular Surgery 11,303,817 0.06 0.13 -45.4% 4.31 4.39 -2.1%Chiropractor 106,273,623 0.03 0.06 -3.5% 1.62 1.65 -0.3%Clinical Psychologist 6,590,268 0.05 0.06 10.4% 2.06 2.06 -0.6%Clinical Social Worker 1,308,451 0.73 0.59 20.0% 9.77 9.62 0.5%Optometry 17,493,814 0.09 0.10 7.7% 3.41 3.42 -0.8%Physical/Ocp. Therapy 4,288,891 0.24 0.25 -1.7% 6.89 6.89 -0.8%Physician Assistant 911,554 0.02 0.09 -72.9% 0.80 0.87 -9.6%Podiatry 22,348,532 0.02 0.01 60.6% 0.90 0.89 0.6%Nurse Practitioner 6,658,148 0.04 0.05 11.9% 2.28 2.28 -0.2%Nurse Anesthetist 4,411,604 0.05 0.04 27.8% 2.29 2.28 0.4%Audiologist 131,015 0.10 0.10 8.4% 2.62 2.62 0.1%Diagnostic Testing Facility 14,756,572 0.06 0.05 22.9% 1.96 1.96 0.3%Independent Laboratory 11,071,570 0.08 0.04 77.2% 2.51 2.47 1.0%Portable X-Ray Supplier 270,958 0.14 0.16 -4.6% 4.02 4.03 -0.5%Colon And Rectal Surgery 71,262,741 0.01 0.02 -23.8% 0.74 0.75 -0.6%Hand Surgery 9,245,578 0.06 0.06 21.0% 1.97 1.96 0.1%Oral/Maxillofacial Surgery 32,247,745 0.04 0.07 -23.8% 1.54 1.56 -1.6%Critical Care 5,211,497 0.03 0.26 -72.2% 5.38 5.61 -4.7%Nuclear Medicine 11,547,912 0.02 0.05 -48.8% 2.37 2.40 -1.1%Interventional Pain Mgmt 4,814,128 0.01 0.02 -13.0% 0.50 0.51 -0.8%Other 5,287,846 0.06 0.07 6.4% 2.38 2.39 -0.4%
A. APPENDIX
Section A.1 provides additional details on the data collection process discussed in Section 2. Section A.2 provides additional summary tables showing the impact of the MP RVU update. Section A.3 shows the analytical crosswalk used for new CPTs.
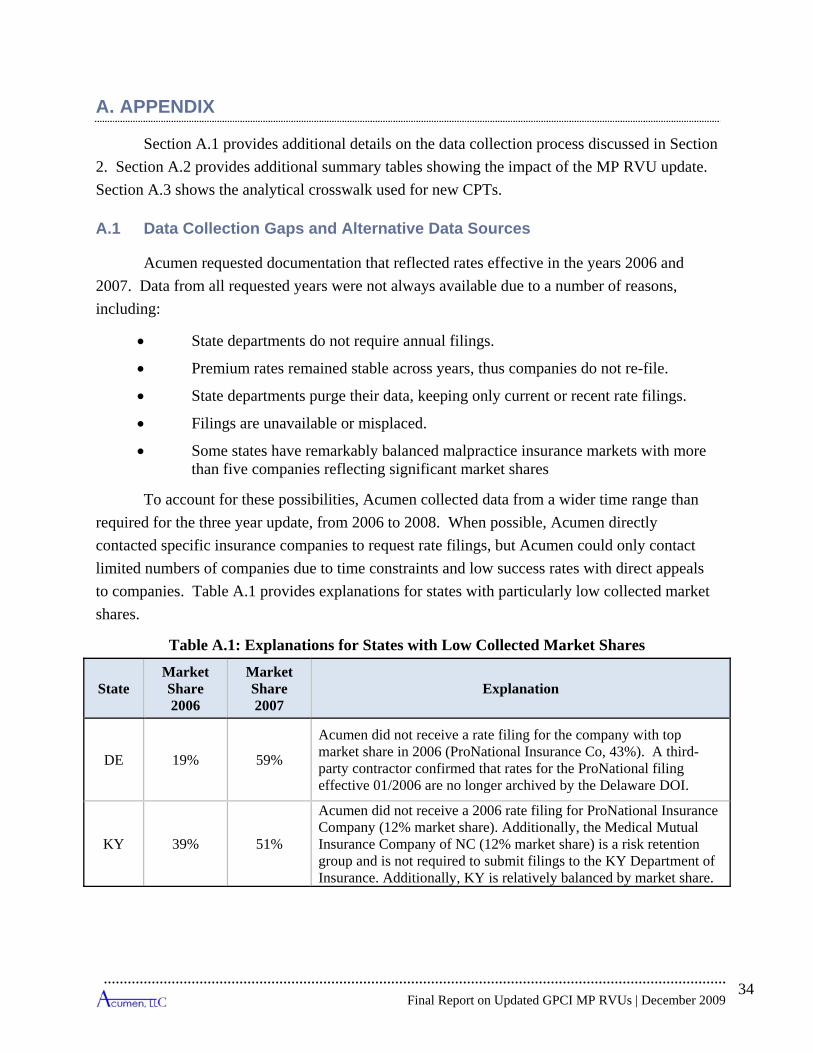
A.1 Data Collection Gaps and Alternative Data Sources
Acumen requested documentation that reflected rates effective in the years 2006 and 2007. Data from all requested years were not always available due to a number of reasons, including:
• State departments do not require annual filings.
• Premium rates remained stable across years, thus companies do not re-file.
• State departments purge their data, keeping only current or recent rate filings.
• Filings are unavailable or misplaced.
• Some states have remarkably balanced malpractice insurance markets with more than five companies reflecting significant market shares
To account for these possibilities, Acumen collected data from a wider time range than required for the three year update, from 2006 to 2008. When possible, Acumen directly contacted specific insurance companies to request rate filings, but Acumen could only contact limited numbers of companies due to time constraints and low success rates with direct appeals to companies. Table A.1 provides explanations for states with particularly low collected market shares.
Table A.1: Explanations for States with Low Collected Market Shares
State Market Share 2006
Market Share 2007
Explanation
DE 19% 59%
Acumen did not receive a rate filing for the company with top market share in 2006 (ProNational Insurance Co, 43%). A third-party contractor confirmed that rates for the ProNational filing effective 01/2006 are no longer archived by the Delaware DOI.
KY 39% 51%
Acumen did not receive a 2006 rate filing for ProNational Insurance Company (12% market share). Additionally, the Medical Mutual Insurance Company of NC (12% market share) is a risk retention group and is not required to submit filings to the KY Department of Insurance. Additionally, KY is relatively balanced by market share.
Final Report on Updated GPCI MP RVUs | December 2009
34

Final Report on Updated GPCI MP RVUs | December 2009
35
State Market Share 2006
Market Share 2007
Explanation
MI 28% 29%
Legislation PA 664 of 2002 effective 3-31-03 allows medical malpractice underwriters to operate without notifying MI DOI. Accordingly, most companies have not filed a new manual in several years.
MO 43% 35%
MO’s mandatory third party vendor did not locate Missouri Hospital Plan (15-20% market share). Additionally, market share in MO is remarkably balanced, with the top five insurance companies only holding 50-65% of the state market share.
MS 0% 0%
None of the top five companies in the state of Mississippi are required to file rates, rules or forms for approval because they are nonprofits and risk retention groups. Acumen contacted the company with greatest market share, the Medical Assurance Company of Mississippi, but was denied the requested information.
ND 37% 36% Acumen did not receive a rate filing for the top company in North Dakota (MHA Insurance Co, which has ~35% market share).
NE 41% 40%
The NE DOI requires rate filing requests to be conducted in-office. Acumen’s third party vendor could not locate current rate filings with adequate information for many of the companies with significant market shares. Upon request, Midwest Medical Insurance Group provided Acumen with their rates.
NM 14% 63% The NM DOI was only able to provide one rate filing effective in 2006.
NV 36% 34%
Despite following up with the NV DOI, Acumen did not receive rate filings for Nevada Mutual Insurance Co. (25% of the market share). Two of the other six rate filings received are effective in 2008, and are not included in the 06/07 market shares.
PA 34% 34%
Pennsylvania has a remarkably balanced medical malpractice market. Acumen collected four company rate filings effective in 2006 and 2007 after following up with the PA DOI for additional rate filings.
PR 0% 0% After multiple attempts, Acumen could not successfully contact Puerto Rico’s insurance department.
VA 41% 41%
Two of the top five companies in VA, which have at least 20% of market share, are RRGs (Risk Retention Groups) and are not required to file. Four of the top six companies were received for each year.

Final Report on Updated GPCI MP RVUs | December 2009
36
Medical Liability Monitor Data
Acumen supplemented the collected premium data with data from the Medical Liability Monitor rate survey, an independent study of malpractice premiums. These data are commonly used by researchers and government agencies, including the Government Accountability Office (GAO), to track changes in liability insurance costs. Because they cover only three specialties (internal medicine, general surgery and OB/GYN), these data are of limited use for the malpractice RVUs. However, they can be used to check trends in premiums over time, including projecting growth for states without recent filings available, so they may be used as a secondary resource in the development of the GPCIs in the future.
Physicians Insurance Association of America Data
Acumen investigated the use of data collected from the Physicians Insurance Association of America, a trade association of more than 60 professional liability (medical malpractice) insurance companies. Acumen examined a sample of the PIAA data and determined that PIAA collected the same data as Acumen: individual company rate filings. As of the time of this report, CMS is investigating the possibility of soliciting the PIAA for additional rate filings to supplement states with low collected market shares in the most recent MP RVU update.
A.2 Summary of 2008 MP RVU Data
Table A.2 shows summary data before and after MP RVU calculations for each surgery class – specialty combination using the final methodologies described in Section 3.2. The first two columns identify the specialty, and the third column identifies the classification of the premiums collected for the specialty. The next two columns show the PW RVUs for each specialty and their distribution with each specialty. The next column shows the normalized premiums for the unblended classifications followed by the risk factor for each of these specialty/surgery classifications. The column labeled Final Normalized Premium lists the premium used for the final risk factor calculation, which often is a blend of Non-Surgery and Unspecified premium classification. The Final National Risk Factor is calculated from the final premium, and identifies the specialty risk that is used for MP RVU calculations.

Table A.2: Summary of 2008 MP RVU Data, Base Run
Spec. Code Specialty Name
Surgery Class
Total PW RVUs
Percent PW
RVUs by Specialty
Normalized Premium
National Risk
Factor
# States with Spec.
Final Normalized Premium
Final National
Risk Factor
Final # States with Spec.
01 General Practice MAJ 777,717 3.2% $39,264.40 4.17 47 $39,264.40 3.60 47 01 General Practice MAJ w OB 751 0.0% $50,458.54 5.36 27 $50,458.54 4.63 27 01 General Practice NS 11,245,345 46.8% $16,552.68 1.76 47 $16,552.68 1.52 47 01 General Practice OB $30,235.54 3.21 6 01 General Practice UNSP 12,023,814 50.0% $21,491.69 2.28 8 02 General Surgery MAJ 23,090,435 54.7% $64,454.79 6.85 48 $64,454.79 5.91 48 02 General Surgery NS 19,156,666 45.3% $13,879.31 1.47 2 03 Allergy Immunology BLND $10,909.72 1.00 49 03 Allergy Immunology NS 1,608,013 49.6% $12,432.55 1.32 24 03 Allergy Immunology UNSP 1,634,891 50.4% $9,411.93 1.00 46 04 Otolaryngology MAJ 4,962,676 16.7% $38,817.50 4.12 43 $38,817.50 3.56 43 04 Otolaryngology NS 9,923,435 33.3% $15,772.04 1.68 34 $15,772.04 1.45 34 04 Otolaryngology UNSP 14,886,110 50.0% $44,039.05 4.68 14 05 Anesthesiology MAJ 4,866,930 27.2% $28,087.63 2.98 18 $24,041.75 2.20 44 05 Anesthesiology NS 4,088,450 22.8% $15,616.78 1.66 9 $24,041.75 2.20 44 05 Anesthesiology UNSP 8,955,581 50.0% $24,041.75 2.55 44 $24,041.75 2.20 44 06 Cardiology MAJ 16,973,587 7.6% $65,918.34 7.00 43 $65,918.34 6.04 43 06 Cardiology NS 94,893,725 42.4% $20,308.52 2.16 45 $20,308.52 1.86 45 06 Cardiology UNSP 111,867,373 50.0% $25,222.84 2.68 22 07 Dermatology MAJ 18,103,644 31.1% $42,705.29 4.54 31 $42,705.29 3.91 31 07 Dermatology NS 10,983,612 18.9% $12,314.66 1.31 47 $12,314.66 1.13 47 07 Dermatology UNSP 29,087,276 50.0% $12,545.66 1.33 27 08 Family Practice MAJ 2,471,442 1.5% $41,490.23 4.41 43 $41,490.23 3.80 43 08 Family Practice MAJ w OB 17,300 0.0% $51,950.00 5.52 31 $51,950.00 4.76 31 08 Family Practice NS 81,348,998 48.5% $17,105.01 1.82 49 $17,105.01 1.57 49
Final Report on Updated GPCI MP RVUs | December 2009
37

Final Report on Updated GPCI MP RVUs | December 2009
38
Spec. Code Specialty Name
Surgery Class
Total PW RVUs
Percent PW
RVUs by Specialty
Normalized Premium
National Risk
Factor
# States with Spec.
Final Normalized Premium
Final National
Risk Factor
Final # States with Spec.
08 Family Practice OB $33,127.72 3.52 11 08 Family Practice UNSP 83,837,741 50.0% $14,256.96 1.51 7 09 Interventional Pain Mgmt. UNSP 3,996,531 100.0% 2.19 10 Gastroenterology MAJ 15,174,052 18.7% $44,356.08 4.71 41 $44,356.08 4.07 41 10 Gastroenterology NS 25,333,821 31.3% $22,149.13 2.35 43 $22,149.13 2.03 43 10 Gastroenterology UNSP 40,507,873 50.0% $21,583.27 2.29 27 11 Internal Medicine MAJ 4,354,624 1.2% $29,410.00 3.12 8 11 Internal Medicine NS 181,175,795 48.8% $18,968.63 2.02 45 $18,968.63 1.74 45 11 Internal Medicine UNSP 185,531,015 50.0% $18,666.54 1.98 23 13 Neurology MAJ 663,132 1.1% $111,899.19 11.89 28 $111,899.19 10.26 28 13 Neurology NS 30,336,195 48.9% $24,000.19 2.55 45 $24,000.19 2.20 45 13 Neurology UNSP 30,999,356 50.0% $25,089.14 2.67 27 14 Neurosurgery MAJ 6,927,496 100.0% $108,487.45 11.53 46 $108,487.45 9.94 46 16 Obstetrics Gynecology MAJ 2,874,465 17.6% $51,026.54 5.42 48 $51,026.54 4.68 48 16 Obstetrics Gynecology MAJ w OB $89,805.73 9.54 43 $86,877.16 7.96 38 16 Obstetrics Gynecology NS 5,018,934 30.7% $18,458.14 1.96 40 $18,458.14 1.69 40 16 Obstetrics Gynecology NS w OB $18,641.79 1.98 13 16 Obstetrics Gynecology OB 291,362 1.8% $86,877.16 9.23 38 $86,877.16 7.96 38 16 Obstetrics Gynecology UNSP 8,184,762 50.0% $59,706.06 6.34 9 18 Ophthalmology MAJ 32,902,279 23.2% $20,679.04 2.20 50 $20,679.04 1.90 50 18 Ophthalmology NS 38,077,268 26.8% $11,619.30 1.23 49 $11,619.30 1.07 49 18 Ophthalmology UNSP 70,979,577 50.0% $16,594.60 1.76 22 19 Oral Surgery (dental only) MAJ 153,780 100.0% 5.46 20 Orthopedic Surgery MAJ 30,392,963 29.9% $59,580.98 6.33 48 $59,580.98 5.46 48 20 Orthopedic Surgery NS 20,363,809 20.1% $15,672.17 1.67 14 20 Orthopedic Surgery UNSP 50,756,777 50.0% $70,513.30 7.49 26

Final Report on Updated GPCI MP RVUs | December 2009
39
Spec. Code Specialty Name
Surgery Class
Total PW RVUs
Percent PW
RVUs by Specialty
Normalized Premium
National Risk
Factor
# States with Spec.
Final Normalized Premium
Final National
Risk Factor
Final # States with Spec.
22 Pathology NS 14,886,697 49.8% $18,818.82 2.00 41 $18,818.82 1.72 41 22 Pathology UNSP 15,000,973 50.2% $15,950.55 1.69 37 24 Plastic and Recon. Surgery MAJ 3,320,628 35.6% $59,541.47 6.33 41 $59,541.47 5.46 41 24 Plastic and Recon. Surgery NS 1,339,928 14.4% $14,454.38 1.54 5 24 Plastic and Recon. Surgery UNSP 4,660,556 50.0% $57,618.41 6.12 32 25 Phys. Med. and Rehab. BLND $12,809.15 1.17 47 25 Phys. Med. and Rehab. MAJ 1,358,908 4.0% $26,208.98 2.78 14 25 Phys. Med. and Rehab. NS 15,777,126 46.0% $13,288.97 1.41 28 25 Phys. Med. and Rehab. UNSP 17,136,056 50.0% $11,304.76 1.20 42 26 Psychiatry BLND $13,434.82 1.23 50 26 Psychiatry NS 23,531,533 50.0% $15,745.32 1.67 24 26 Psychiatry UNSP 23,559,403 50.0% $11,127.05 1.18 44 28 Colorectal Surgery MAJ 1,508,500 31.3% $43,169.72 4.59 31 $43,169.72 3.96 31 28 Colorectal Surgery NS 899,160 18.7% $4,264.29 0.45 4 28 Colorectal Surgery UNSP 2,407,660 50.0% $43,645.74 4.64 30 29 Pulmonary Disease BLND $22,784.03 2.09 47 29 Pulmonary Disease MAJ 1,143,834 1.4% $41,312.60 4.39 3 29 Pulmonary Disease NS 38,788,306 48.6% $23,945.01 2.54 35 29 Pulmonary Disease UNSP 39,932,140 50.0% $21,125.56 2.24 37 30 Diagnostic Radiology BLND $28,160.15 2.58 45 30 Diagnostic Radiology MAJ 7,251,730 5.3% $42,327.18 4.50 6 30 Diagnostic Radiology NS 61,279,826 44.7% $27,148.84 2.88 36 30 Diagnostic Radiology UNSP 68,531,574 50.0% $27,565.36 2.93 29 33 Thoracic Surgery MAJ 5,327,789 71.8% $70,772.61 7.52 48 $70,772.61 6.49 48 33 Thoracic Surgery NS 2,089,554 28.2% $17,996.51 1.91 6 34 Urology BLND $29,381.08 2.69 50

Final Report on Updated GPCI MP RVUs | December 2009
40
Spec. Code Specialty Name
Surgery Class
Total PW RVUs
Percent PW
RVUs by Specialty
Normalized Premium
National Risk
Factor
# States with Spec.
Final Normalized Premium
Final National
Risk Factor
Final # States with Spec.
34 Urology MAJ 12,434,250 21.4% $33,585.75 3.57 36 34 Urology NS 16,551,440 28.6% $21,101.13 2.24 13 34 Urology UNSP 28,985,912 50.0% $32,305.37 3.43 33 35 Chiropractic BLND 1.00 35 Chiropractic NS 13,719,867 50.0% $10,826.87 1.15 3 35 Chiropractic UNSP 13,719,867 50.0% $3,803.66 0.40 16 36 Nuclear Medicine BLND $17,927.36 1.64 42 36 Nuclear Medicine MAJ 10,583 0.6% $40,854.45 4.34 5 36 Nuclear Medicine NS 831,814 49.4% $19,428.23 2.06 20 36 Nuclear Medicine UNSP 842,470 50.0% $16,157.45 1.72 37 37 Pediatric Medicine MAJ 60,013 2.7% $42,176.08 4.48 17 37 Pediatric Medicine NS 1,047,747 47.3% $16,526.16 1.76 46 $16,526.16 1.51 46 37 Pediatric Medicine UNSP 1,108,081 50.0% $17,695.84 1.88 28 38 Geriatric Medicine MAJ 21,688 0.3% $45,580.20 4.84 35 $45,580.20 4.18 35 38 Geriatric Medicine NS 3,315,913 49.7% $15,542.83 1.65 40 $15,542.83 1.42 40 38 Geriatric Medicine UNSP 3,337,606 50.0% $15,187.25 1.61 15 39 Nephrology MAJ 754,181 1.0% $45,560.25 4.84 31 $45,560.25 4.18 31 39 Nephrology NS 36,316,731 49.0% $17,638.66 1.87 42 $17,638.66 1.62 42 39 Nephrology UNSP 37,070,911 50.0% $15,881.00 1.69 28 40 Hand Surgery BLND $37,703.19 3.46 48 40 Hand Surgery MAJ 732,660 28.0% $49,646.60 5.27 34 40 Hand Surgery NS 577,713 22.0% $4,741.32 0.50 4 40 Hand Surgery UNSP 1,310,373 50.0% $45,557.47 4.84 32 41 Optometry NS 10,685,179 47.9% $17,761.13 1.89 1 41 Optometry UNSP 11,643,967 52.1% $10,636.22 1.13 2 44 Infectious Disease MAJ 50,467 0.2% $37,925.51 4.03 1

Final Report on Updated GPCI MP RVUs | December 2009
41
Spec. Code Specialty Name
Surgery Class
Total PW RVUs
Percent PW
RVUs by Specialty
Normalized Premium
National Risk
Factor
# States with Spec.
Final Normalized Premium
Final National
Risk Factor
Final # States with Spec.
44 Infectious Disease NS 16,161,541 49.8% $22,526.08 2.39 40 $22,526.08 2.06 40 44 Infectious Disease UNSP 16,212,011 50.0% $17,306.36 1.84 31 45 Mammography Ctr. MAJ 463 1.2% $55,953.13 5.94 1 45 Mammography Ctr. NS 19,146 48.8% $14,155.48 1.50 1 45 Mammography Ctr. UNSP 19,610 50.0% $12,133.46 1.29 1 46 Endocrinology MAJ 55,420 0.4% $48,266.00 5.13 29 $48,266.00 4.42 29 46 Endocrinology NS 7,744,462 49.6% $16,358.68 1.74 40 $16,358.68 1.50 40 46 Endocrinology UNSP 7,800,035 50.0% $20,671.68 2.20 30 48 Podiatry BLND $23,166.19 2.12 32 48 Podiatry MAJ 12,887,595 27.0% $22,315.17 2.37 12 48 Podiatry NS 10,948,876 23.0% $16,398.14 1.74 16 48 Podiatry UNSP 23,836,471 50.0% $26,735.09 2.84 24 49 Ambulatory Surg. Ctr. NS 6,784 42.7% $23,075.59 2.45 2 49 Ambulatory Surg. Ctr. UNSP 9,085 57.3% $15,470.67 1.64 1 62 Psychologist BLND 1.00 62 Psychologist NS 180,371 50.0% $10,143.09 1.08 1 62 Psychologist UNSP 180,393 50.0% $4,597.33 0.49 2 65 Physical Therapist BLND 1.00 65 Physical Therapist NS 28,478,298 100.0% $4,448.47 0.47 1 66 Rheumatology BLND $16,669.21 1.53 47 66 Rheumatology NS 6,579,282 47.6% $17,696.97 1.88 34 66 Rheumatology UNSP 7,249,452 52.4% $15,736.46 1.67 32 67 Occupational Therapist BLND 1.00 67 Occupational Therapist NS 1,731,223 100.0% $4,126.33 0.44 1 68 Clinical Psychologist BLND 1.00 71 Reg. Dietitian/Nutr. Prof. BLND $17,300.44 1.59 29
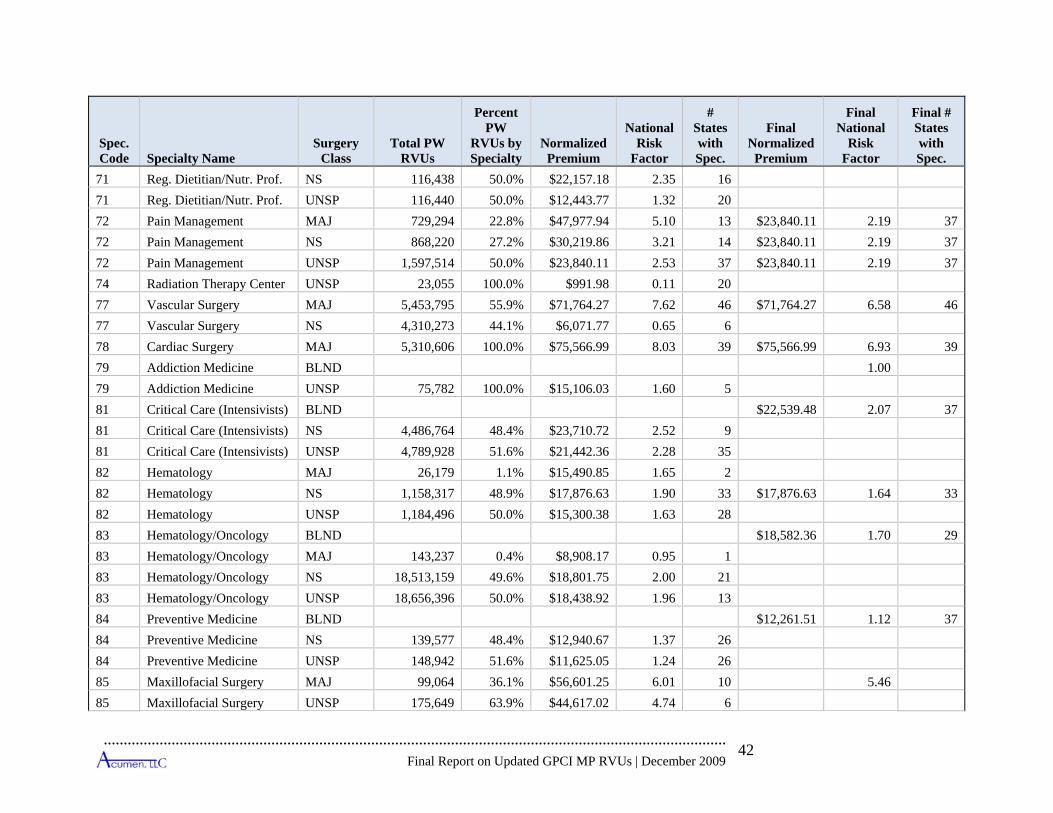
Final Report on Updated GPCI MP RVUs | December 2009
42
Spec. Code Specialty Name
Surgery Class
Total PW RVUs
Percent PW
RVUs by Specialty
Normalized Premium
National Risk
Factor
# States with Spec.
Final Normalized Premium
Final National
Risk Factor
Final # States with Spec.
71 Reg. Dietitian/Nutr. Prof. NS 116,438 50.0% $22,157.18 2.35 16 71 Reg. Dietitian/Nutr. Prof. UNSP 116,440 50.0% $12,443.77 1.32 20 72 Pain Management MAJ 729,294 22.8% $47,977.94 5.10 13 $23,840.11 2.19 37 72 Pain Management NS 868,220 27.2% $30,219.86 3.21 14 $23,840.11 2.19 37 72 Pain Management UNSP 1,597,514 50.0% $23,840.11 2.53 37 $23,840.11 2.19 37 74 Radiation Therapy Center UNSP 23,055 100.0% $991.98 0.11 20 77 Vascular Surgery MAJ 5,453,795 55.9% $71,764.27 7.62 46 $71,764.27 6.58 46 77 Vascular Surgery NS 4,310,273 44.1% $6,071.77 0.65 6 78 Cardiac Surgery MAJ 5,310,606 100.0% $75,566.99 8.03 39 $75,566.99 6.93 39 79 Addiction Medicine BLND 1.00 79 Addiction Medicine UNSP 75,782 100.0% $15,106.03 1.60 5 81 Critical Care (Intensivists) BLND $22,539.48 2.07 37 81 Critical Care (Intensivists) NS 4,486,764 48.4% $23,710.72 2.52 9 81 Critical Care (Intensivists) UNSP 4,789,928 51.6% $21,442.36 2.28 35 82 Hematology MAJ 26,179 1.1% $15,490.85 1.65 2 82 Hematology NS 1,158,317 48.9% $17,876.63 1.90 33 $17,876.63 1.64 33 82 Hematology UNSP 1,184,496 50.0% $15,300.38 1.63 28 83 Hematology/Oncology BLND $18,582.36 1.70 29 83 Hematology/Oncology MAJ 143,237 0.4% $8,908.17 0.95 1 83 Hematology/Oncology NS 18,513,159 49.6% $18,801.75 2.00 21 83 Hematology/Oncology UNSP 18,656,396 50.0% $18,438.92 1.96 13 84 Preventive Medicine BLND $12,261.51 1.12 37 84 Preventive Medicine NS 139,577 48.4% $12,940.67 1.37 26 84 Preventive Medicine UNSP 148,942 51.6% $11,625.05 1.24 26 85 Maxillofacial Surgery MAJ 99,064 36.1% $56,601.25 6.01 10 5.46 85 Maxillofacial Surgery UNSP 175,649 63.9% $44,617.02 4.74 6

Final Report on Updated GPCI MP RVUs | December 2009
43
Spec. Code Specialty Name
Surgery Class
Total PW RVUs
Percent PW
RVUs by Specialty
Normalized Premium
National Risk
Factor
# States with Spec.
Final Normalized Premium
Final National
Risk Factor
Final # States with Spec.
2.04 21 90 Medical Oncology NS 6,047,359 49.6% $19,234.90 Medical Oncology UNSP 6,092,434 50.0% $19,210.44 2.04 90 25
UNSP 77,694 50.0% $18,493.25 1.96 4 99 Unknown Physician Spec.
86 Neuropsychiatry BLND 1.23 90 Medical Oncology BLND $19,264.60 1.77 39 90 Medical Oncology MAJ 45,075 0.4% $30,570.24 3.25 4
91 Surgical Oncology MAJ 535,440 100.0% $41,968.05 4.46 1 5.91 92 Radiation Oncology BLND $24,853.46 2.28 42 92 Radiation Oncology MAJ 102,762 0.4% $17,526.25 1.86 1 92 Radiation Oncology NS 14,031,519 49.6% $27,603.89 2.93 7 92 Radiation Oncology UNSP 14,134,282 50.0% $22,176.30 2.36 40 93 Emergency Medicine MAJ 1,990,550 1.9% $53,247.12 5.66 40 $53,247.12 4.88 40 93 Emergency Medicine NS 50,244,741 48.1% $24,817.14 2.64 17 $24,817.14 2.27 17 93 Emergency Medicine UNSP 52,235,992 50.0% $35,784.79 3.80 34 98 Gynecological Oncology MAJ 579,235 24.9% $101,939.86 10.83 5 5.91 98 Gynecological/Oncology NS 582,475 25.1% $14,744.57 1.57 4 98 Gynecological/Oncology UNSP 1,163,209 50.0% $38,598.87 4.10 1 99 Unknown Physician Spec. MAJ 25,353 16.3% $41,999.83 4.46 5 3.60 99 Unknown Physician Spec. NS 52,334 33.7% $14,048.46 1.49 13 1.52

Final Report on Updated GPCI MP RVUs | December 2009
44
A.3 Analytic Crosswalk
Table A.3 presents the analytic crosswalk discussed in Section 3.6. The first two columns show the source CPTs with their modifiers. The source CPTs are mapped the destination CPT listed in the following columns. The final column lists the analytic ratio. This value is used for calculating RVUs and MTUS for the new codes by multiplying the RVUs and MTUS for the source CPTs with the analytical ratio to produce these values for the new CPTs.
Table A.3: Analytic Crosswalk Source CPT Destination CPT Analytic
Ratio CPT Code Modifier CPT Code Modifier 0064T 94799 1.000 0066T 74263 1.000 0066T TC 74263 TC 1.000 0066T 26 74263 26 1.000 0067T 74261 0.950 0067T TC 74261 TC 0.950 0067T 26 74261 26 0.950 0067T 74262 0.050 0067T TC 74262 TC 0.050 0067T 26 74262 26 0.050 0069T 93799 1.000 0084T 53855 1.000 0086T 93799 1.000 0087T 89398 1.000 0144T 75571 1.000 0144T TC 75571 TC 1.000 0144T 26 75571 26 1.000 0145T 75572 1.000 0145T TC 75572 TC 1.000 0145T 26 75572 26 1.000 0146T 75574 1.000 0146T TC 75574 TC 1.000 0146T 26 75574 26 1.000 0147T 75574 1.000 0147T TC 75574 TC 1.000 0147T 26 75574 26 1.000 0148T 75572 1.000 0148T TC 75572 TC 1.000

Final Report on Updated GPCI MP RVUs | December 2009
45
Source CPT Destination CPT Analytic Ratio CPT Code Modifier CPT Code Modifier
0148T 26 75572 26 1.000 0149T 75572 1.000 0149T TC 75572 TC 1.000 0149T 26 75572 26 1.000 0150T 75573 1.000 0150T TC 75573 TC 1.000 0150T 26 75573 26 1.000 0151T 75572 0.500 0151T TC 75572 TC 0.500 0151T 26 75572 26 0.500 0151T 75574 0.500 0151T TC 75574 TC 0.500 0151T 26 75574 26 0.500 0170T 46707 1.000 11402 22902 0.020 11402 11402 0.980 11406 22903 0.010 11406 11406 0.990 11422 21013 0.040 11422 21011 0.120 11422 11422 0.840 11443 21014 0.005 11443 21012 0.030 11443 11443 0.965 11444 21014 0.010 11444 11444 0.990 11602 22902 0.002 11602 11602 0.998 11606 22903 0.001 11606 11606 0.999 11622 21013 0.040 11622 21011 0.010 11622 11622 0.950 11643 21014 0.004 11643 21012 0.001 11643 11643 0.995 11644 21014 0.006 11644 11644 0.994 14300 14301 0.870

Final Report on Updated GPCI MP RVUs | December 2009
46
Source CPT Destination CPT Analytic Ratio CPT Code Modifier CPT Code Modifier
14300 14302 0.130 17999 21011 0.230 17999 21012 0.030 17999 22902 0.120 17999 22903 0.010 17999 17999 0.610 20999 21013 0.100 20999 21014 0.040 20999 21932 0.420 20999 21933 0.160 20999 22904 0.030 20999 22905 0.010 20999 20999 0.240 21015 21016 0.100 21015 21015 0.900 21499 21013 0.160 21499 21014 0.060 21499 21499 0.780 21555 21552 0.100 21555 21555 0.900 21556 21554 0.100 21556 21556 0.900 21557 21558 0.100 21557 21557 0.900 21899 21013 0.180 21899 21014 0.070 21899 21932 0.180 21899 21933 0.180 21899 21899 0.390 21930 21931 0.100 21930 21930 0.900 21935 21936 0.100 21935 21935 0.900 22899 21932 0.900 22899 21933 0.080 22899 22899 0.020 22900 22901 0.100 22900 22900 0.900 22999 22904 0.040

Final Report on Updated GPCI MP RVUs | December 2009
47
Source CPT Destination CPT Analytic Ratio CPT Code Modifier CPT Code Modifier
22999 22905 0.010 22999 22999 0.950 23075 23071 0.100 23075 23075 0.900 23076 23073 0.100 23076 23076 0.900 23077 23078 0.100 23077 23077 0.900 23221 23220 1.000 23222 23220 1.000 24075 24071 0.100 24075 24075 0.900 24076 24073 0.100 24076 24076 0.900 24077 24079 0.100 24077 24077 0.900 24151 24150 1.000 24153 24152 1.000 25075 25071 0.100 25075 25075 0.900 25076 25073 0.100 25076 25076 0.900 25077 25078 0.050 25077 25077 0.950 26115 26111 0.100 26115 26115 0.900 26116 26113 0.050 26116 26116 0.950 26117 26118 0.050 26117 26117 0.950 26255 26250 1.000 26261 26260 1.000 27047 27043 0.100 27047 27047 0.900 27048 27045 0.100 27048 27048 0.900 27049 27059 0.200 27049 27049 0.800 27079 27078 1.000
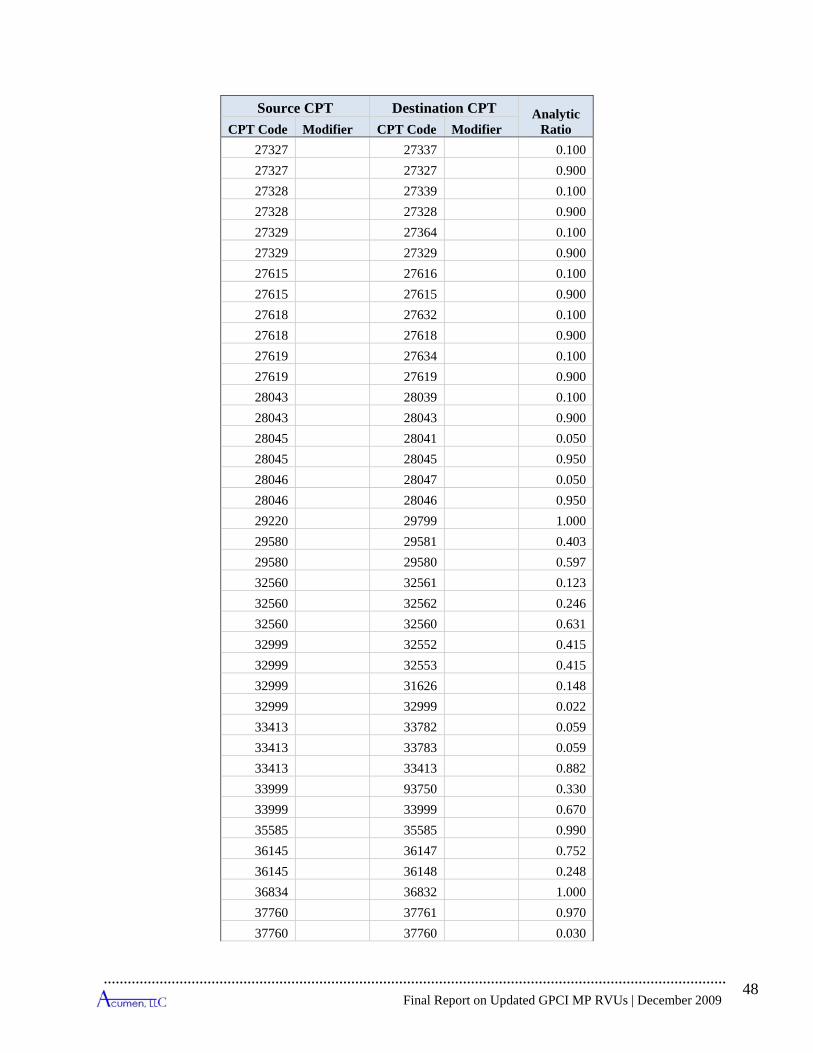
Final Report on Updated GPCI MP RVUs | December 2009
48
Source CPT Destination CPT Analytic Ratio CPT Code Modifier CPT Code Modifier
27327 27337 0.100 27327 27327 0.900 27328 27339 0.100 27328 27328 0.900 27329 27364 0.100 27329 27329 0.900 27615 27616 0.100 27615 27615 0.900 27618 27632 0.100 27618 27618 0.900 27619 27634 0.100 27619 27619 0.900 28043 28039 0.100 28043 28043 0.900 28045 28041 0.050 28045 28045 0.950 28046 28047 0.050 28046 28046 0.950 29220 29799 1.000 29580 29581 0.403 29580 29580 0.597 32560 32561 0.123 32560 32562 0.246 32560 32560 0.631 32999 32552 0.415 32999 32553 0.415 32999 31626 0.148 32999 32999 0.022 33413 33782 0.059 33413 33783 0.059 33413 33413 0.882 33999 93750 0.330 33999 33999 0.670 35585 35585 0.990 36145 36147 0.752 36145 36148 0.248 36834 36832 1.000 37760 37761 0.970 37760 37760 0.030

Final Report on Updated GPCI MP RVUs | December 2009
49
Source CPT Destination CPT Analytic Ratio CPT Code Modifier CPT Code Modifier
37799 37761 0.020 37799 37799 0.980 39599 21932 0.190 39599 21933 0.050 39599 29599 0.760 43280 43281 0.123 43280 43282 0.079 43280 43280 0.798 43289 43281 0.087 43289 43282 0.072 43289 43289 0.841 43659 43775 0.038 43659 43659 0.962 45170 45171 0.760 45170 45172 0.240 46210 46999 1.000 46211 46999 1.000 46937 45190 1.000 46938 45190 1.000 49999 49411 0.097 49999 49999 0.503 49999 22904 0.360 49999 22905 0.040 51726 51726 0.030 51726 26 51726 26 0.030 51726 TC 51726 TC 0.030 51772 51727 0.470 51772 TC 51727 TC 0.470 51772 26 51727 26 0.470 51772 51729 0.530 51772 TC 51729 TC 0.530 51772 26 51729 26 0.530 51795 51728 0.620 51795 TC 51728 TC 0.620 51795 26 51728 26 0.620 51795 51729 0.090 51795 TC 51729 TC 0.090 51795 26 51729 26 0.090 58999 57426 0.144

Final Report on Updated GPCI MP RVUs | December 2009
50
Source CPT Destination CPT Analytic Ratio CPT Code Modifier CPT Code Modifier
58999 58999 0.856 63660 63661 0.330 63660 63662 0.070 63660 63663 0.500 63660 63664 0.100 64470 64490 1.000 64472 64491 0.560 64472 64492 0.170 64475 64493 1.000 64476 64494 0.180 64476 64495 0.050 75558 75565 1.000 75558 TC 75565 TC 1.000 75558 26 75565 26 1.000 75560 75565 1.000 75560 TC 75565 TC 1.000 75560 26 75565 26 1.000 75562 75565 1.000 75562 TC 75565 TC 1.000 75562 26 75565 26 1.000 75564 75565 1.000 75564 TC 75565 TC 1.000 75564 26 75565 26 1.000 75790 75791 0.010 75790 TC 75791 TC 0.010 75790 26 75791 26 0.010 77012 TC 49411 0.106 77012 TC 77012 TC 0.894 77334 77338 0.053 77334 TC 77338 TC 0.052 77334 26 77338 26 0.052 77334 77334 0.947 77334 TC 77334 TC 0.948 77334 26 77334 26 0.948 78460 78453 1.000 78460 TC 78453 TC 1.000 78460 26 78453 26 1.000 78461 78454 1.000 78461 TC 78454 TC 1.000
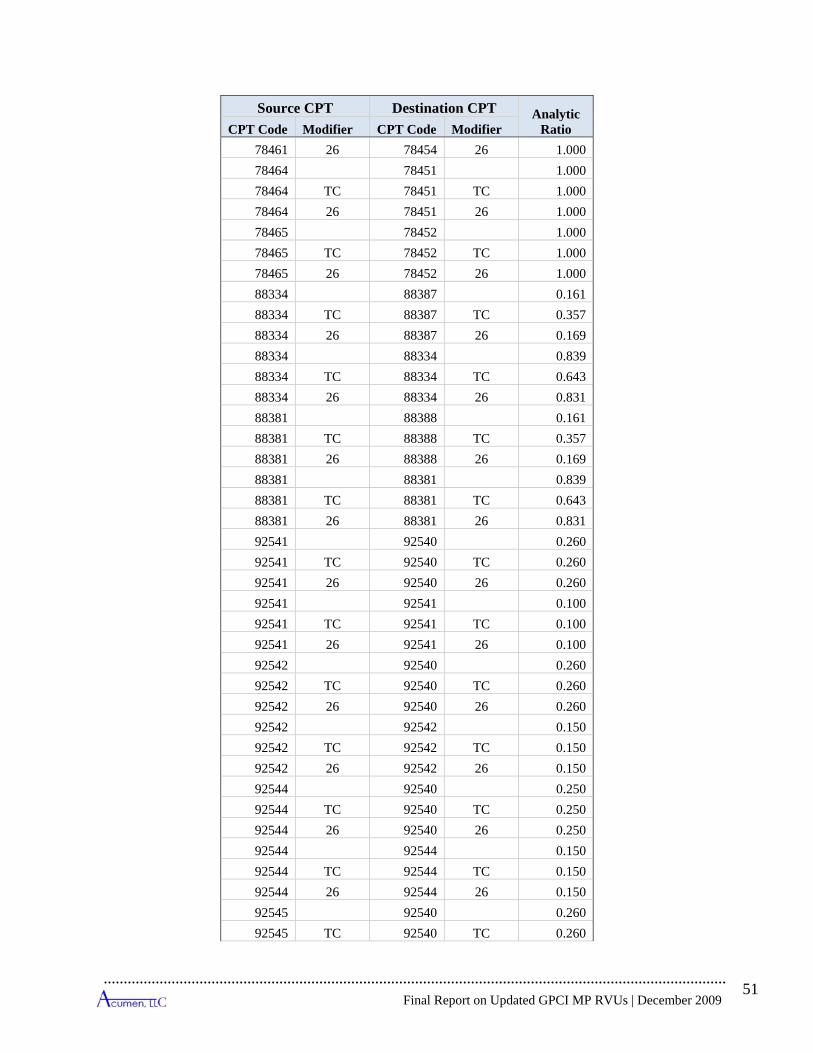
Final Report on Updated GPCI MP RVUs | December 2009
51
Source CPT Destination CPT Analytic Ratio CPT Code Modifier CPT Code Modifier
78461 26 78454 26 1.000 78464 78451 1.000 78464 TC 78451 TC 1.000 78464 26 78451 26 1.000 78465 78452 1.000 78465 TC 78452 TC 1.000 78465 26 78452 26 1.000 88334 88387 0.161 88334 TC 88387 TC 0.357 88334 26 88387 26 0.169 88334 88334 0.839 88334 TC 88334 TC 0.643 88334 26 88334 26 0.831 88381 88388 0.161 88381 TC 88388 TC 0.357 88381 26 88388 26 0.169 88381 88381 0.839 88381 TC 88381 TC 0.643 88381 26 88381 26 0.831 92541 92540 0.260 92541 TC 92540 TC 0.260 92541 26 92540 26 0.260 92541 92541 0.100 92541 TC 92541 TC 0.100 92541 26 92541 26 0.100 92542 92540 0.260 92542 TC 92540 TC 0.260 92542 26 92540 26 0.260 92542 92542 0.150 92542 TC 92542 TC 0.150 92542 26 92542 26 0.150 92544 92540 0.250 92544 TC 92540 TC 0.250 92544 26 92540 26 0.250 92544 92544 0.150 92544 TC 92544 TC 0.150 92544 26 92544 26 0.150 92545 92540 0.260 92545 TC 92540 TC 0.260

Final Report on Updated GPCI MP RVUs | December 2009
52
Source CPT Destination CPT Analytic Ratio CPT Code Modifier CPT Code Modifier
92545 26 92540 26 0.260 92545 92545 0.150 92545 TC 92545 TC 0.150 92545 26 92545 26 0.150 92567 92570 0.0165 92567 92550 0.1587 92567 92567 0.6329 92568 92570 0.0442 92568 92550 0.4237 92568 92568 0.02 92569 92570 0.3333 93701 TC 93701 1.000 94010 26 94011 0.001 94010 26 94010 26 0.999 94060 26 94012 0.001 94060 26 94060 26 0.999 94620 26 94013 0.001 94620 26 94620 26 0.999 95900 95905 0.240 95900 26 95905 26 0.240 95900 TC 95905 TC 0.240 95900 95900 0.760 95900 26 95900 26 0.760 95900 TC 95900 TC 0.760 95903 95905 0.160 95903 26 95905 26 0.160 95903 TC 95905 TC 0.160 95903 95903 0.840 95903 26 95903 26 0.840 95903 TC 95903 TC 0.840 95904 95905 0.100 95904 26 95905 26 0.100 95904 TC 95905 TC 0.100 95904 95904 0.900 95904 26 95904 26 0.900 95904 TC 95904 TC 0.900 99241 99201 0.500 99241 99211 0.500 99242 99202 0.500

Final Report on Updated GPCI MP RVUs | December 2009
53
Source CPT Destination CPT Analytic Ratio CPT Code Modifier CPT Code Modifier
99242 99212 0.500 99243 99203 0.500 99243 99213 0.500 99244 99204 0.500 99244 99214 0.500 99245 99205 0.500 99245 99215 0.500 99251 99221 0.700 99251 99304 0.300 99252 99221 0.350 99252 99222 0.350 99252 99304 0.150 99252 99305 0.150 99253 99222 0.700 99253 99305 0.300 99254 99222 0.350 99254 99223 0.350 99254 99305 0.150 99254 99306 0.150 99255 99223 0.700 99255 99306 0.300 G0392 35475 1.000 G0393 35476 1.000