Embed Size (px)
Citation preview

PROMOTION OF OIL AND GAS PRODUCING ISLAMIC TRANSITIONAL STATE OFAFGHANISTANAREAS TO THE PRIVATE SECTOR MINISTRY OF MINES AND INDUSTRYGRANT AGREEMENT NO. H007-AF EMERGENCY INFRASTRUCTURE RECONSTRUCTION PROJECT
EXECUTIVE SUMMARY
The purpose of the Final Report is to provide the Ministry of Mines and Industry with an account of the activities undertaken under the project, and with a general picture of the major achievement of the study. This Final Report also includes the market and economics study and the final training activities, which were delivered in early March in the offices of Gustavson Associates.
A number of significant findings were made during the work in the preparing of these sections. Those findings represent the primary achievements of the Study in addition tothe identification and preservation of essential documents needed for subsequentinvestigations. They include:
Identification and Preservation of Essential Documents Reserves Estimates under Western Standards Packages for Promotion of Investment in Afghanistan Creation of Blocks for Bidding Integration with Other Studies Concerning Emergency Aid Estimates of Realistic Production Rates Results of Market and Economic AnalysisExtensive Training of Afghani Officials
Identification and Preservation of Essential Documents
An adequate database now exists and can be accessed by the Ministry of Mines and Industry and by potential international investing oil companies. Gustavson Associatesbegan the study by cataloging and analyzing of the available data and information that was directly provided to Gustavson Associates by the Ministry of Mines and Industry or indirectly provided by the U.S. Geological Survey on a series of CD-ROMs. This data was gathered during several trips made to Kabul and Sheberghan by USGS and byGustavson personnel.
After an additional review of the data on file in Sheberghan, it became apparent that the vast majority of important information on the oil and gas reserves and resources were contained in technical reports prepared by Soviet Federal Corporations during the 1970s and 1980s.
These reports, while in poor paper condition were nevertheless very comprehensive and presented details of the activities that were conducted in the exploration, testing and mapping of the oil and gas fields in the Sheberghan area. The most important have been saved on DVD’s for preservation. These reports were carefully audited andprovided the basis for conducting probabilistic reserve estimates in known fields in the Sheberghan area. The methodology for performing this analysis is explained in detail in this Final Report.
7/6/2005 i Gustavson Associates

PROMOTION OF OIL AND GAS PRODUCING ISLAMIC TRANSITIONAL STATE OFAFGHANISTANAREAS TO THE PRIVATE SECTOR MINISTRY OF MINES AND INDUSTRYGRANT AGREEMENT NO. H007-AF EMERGENCY INFRASTRUCTURE RECONSTRUCTION PROJECT
Reserves Estimates under Western Standards
Reserves estimates were prepared for three currently producing gas fields and eight discovered, but non-producing fields, a total of eleven fields of which four are small oil fields. Of these some of the gas fields are of significance for potential rehabilitation and/or redevelopment. The table overleaf shows the name of the field, the Russian reserve estimates, Gustavson’s mean, probabilistic reserve estimates, the estimated ultimate recovery of gas, the cumulative production or estimated loss to date and the remaining gas reserves to be produced.
Other fields of minor significance were reviewed, but reserves could not be estimateddue to incomplete records or a lack of data. Therefore, the results of economicsignificance are, in summary:
Gas field reserves:
Gas FieldRemaining
GasReserves,
BCM
RemainingGas
Reserves,BCF
Jar Quduk 9.77 345Khoja Gogerdaq 16.77 592Yatimtaq 7.36 260Jangalikolon 13.38 473Bashikurd 6.37 225Juma 21.82 770TOTAL 75.47 2,665
Oil field reserves:
OIL FIELD Oil Reserves000 Tonnes
Oil ReservesMMBO
Kashkari 3731 27.04Zamarudsay 3754 26.39Aqdarya 2495 18.68Bazarkhami 490 3.58TOTAL 10470 75.70
7/6/2005 ii Gustavson Associates

PROMOTION OF OIL AND GAS PRODUCING ISLAMIC TRANSITAREAS TO THE PRIVATE SECTOR MINIGRANT AGREEMENT NO. H007-AF EMERGENCY INFRASTRUCTU
Russian Reserve Estimates Mean Probabilistic Reserve Estimates
Field
OilReservesM Tonnes
OilReserves
MMBO
GasReserves
BCM
GasReserves
BCFReserves,MMBOE
OilReservesM Tonnes
OilReserves
MMBO
GasReserves
BCM
GasReserves
BCFReserves,MMBOE
Jar Quduk 26.79 946.16 157.69 0 0.00 24.87 878.16 146.36Khoja Gogerdaq 58.57 2,068.40 344.73 0 0.00 58.30 2,059.01 343.17Yatimtaq 6.22 219.59 36.60 0 0.00 14.25 503.25 83.87Kashkari 5,980 44.49 44.49 3,731 27.04 0.10 3.64 27.65Jangalikolon 15.25 538.41 89.74 13.38 472.58 78.76Zamarudsay 3,400 25.30 25.30 3,754 26.39 0.06 2.14 26.74Bashikurd 10.41 367.77 61.30 6.37 224.83 37.47Aqdarya 2,205 16.41 16.41 2,495 18.68 0.01 0.42 18.75Juma 6.77 239.12 39.85 21.82 770.40 128.40Bazarkhami 650 4.84 4.84 489.6 3.58 0.01 0.30 3.63Khoja Bolan 2.54 89.70 14.95 1.95 69.03 11.50TOTALS 12,235 91.03 127 4,469.15 835.89 10468.90 75.70 141.12 4983.75 906.33
* Includes estimate of volumes lost during blow out.
7/6/2005 iii

PROMOTION OF OIL AND GAS PRODUCING ISLAMIC TRANSITIONAL STATE OF AFGHANISTANAREAS TO THE PRIVATE SECTOR MINISTRY OF MINES AND INDUSTRYGRANT AGREEMENT NO. H007-AF EMERGENCY INFRASTRUCTURE RECONSTRUCTION PROJECT
In addition, a methodology for assessing the undiscovered oil and gas potential in the Sheberghan area is presented in the Final Report. Based on historic production and regional geological trend maps presented in the USGS 1990 assessment, it isconcluded that the primary future potential of the basin rests with the Lower CretaceousHauterivian sandstones and the deeper Jurassic reefs.
Gustavson Associates concludes that the future resource potential will be heavilyweighted (i.e., estimated more than 90%) toward dry gas and/or gas-condensate.Hauterivian reservoirs will be mainly methane, while the Jurassic reef reservoirs may contain high concentrations of condensate and will also include both CO2 (carbon dioxide) and H2S (hydrogen sulfide).
Of the two plays, the Jurassic reefs appear to carry the highest future potential and could have huge associated gas resources. The USGS 1990 assessment concluded that the P50 (most likely) undiscovered resource base for the North Afghan basinconsists of an estimated 300 MMBO (millions of barrels of oil), 9.6 TCF (trillion cubicfeet), and 145 MMB of condensate. That old USGS estimate was prepared primarily on published information available at that time, since the USGS did not have access to information provided more recently by the MMI.
Gustavson’s review of data has revealed the presence of numerous undrilled prospective structures that have undergone various stages of geophysical exploration.If even a small number of these undrilled structures were to contain commercialhydrocarbon accumulations, then the estimated undiscovered oil and gas resources in the North Afghan Basin would dramatically exceed the USGS 1990 resource estimate. We have been advised that the USGS is currently contracted to update the estimate.
Packages for Promotion of Investment in Afghanistan
The activities conducted by Gustavson Associates related to the development of a draft promotional program for the offering of oil and gas producing areas to the private sector.Gustavson Associates created First Bid Round Blocks for each of the potential areas of northern Afghanistan that this Consultant believes can be promoted to the private sector for exploration and development of the country’s remaining oil and gas reserves and itsundeveloped resources.
Also included in the promotional material are a technical report to be used during the promotion and a draft digital database in DVD format that is intended for sale to interested and qualified companies for their use developing their strategies during theBid Round. These DVDs contain files for all of the technical materials that are recommended for inclusion in the Digital Data Package that will be available for purchase by interested and qualified bidders.
7/6/2005 iv Gustavson Associates

PROMOTION OF OIL AND GAS PRODUCING ISLAMIC TRANSITIONAL STATE OF AFGHANISTANAREAS TO THE PRIVATE SECTOR MINISTRY OF MINES AND INDUSTRYGRANT AGREEMENT NO. H007-AF EMERGENCY INFRASTRUCTURE RECONSTRUCTION PROJECT
Gustavson Associates created four promotional documents and they include:
Draft Invitation Letter from MinisterDraft Announcement of Bid Round Draft Color Promotional Brochure Draft Promotional Package Technical Report
The materials included in those four documents are to be used during the variousphases of the Promotional Round. Each of the elements contained in these documents has been designed to be used during the promotional efforts with only slightmodifications relating to dates and specifics of the Bid Round as prescribed in the Hydrocarbons Law and Regulations that are awaiting enactment in final form.
Creation of Blocks for Bidding
Gustavson Associates, as part of its contract with the Ministry of Mines and Industry (MMI) of the Islamic Transitional State of Afghanistan (Grant Agreement # H007-AF), developed a map that shows the locations of 11 proposed blocks to be offered during Afghanistan’s First Promotional Bid Round. The outlines of the blocks are shown on the map on the following page.
More detailed maps entitled, “North Afghanistan Basin with First Bid Round Blocks, Oil and Gas Fields, and Prospects” are included in the promotional package. It is entitled,“Northern Afghanistan Oil and Gas Investment Opportunities, First Promotional Round,Islamic Transitional State of Afghanistan, Ministry of Mines and Industry”, and isincluded in this Final Report.
Integration with Other Studies Concerning Emergency Aid
Several parties worked on the reconstruction of the oil and gas sector in Afghanistan.These include Gustavson Associates, working on the reserves in the known fields around Sheberghan and the investment promotion thereof to the international sector.
Hill International also had a contract; focusing on the downstream sector, including export potential, pipeline transportation of gas to Kabul, use of gas for powergeneration, expansion of fertilizer production and refining of oil for local consumption. In addition, the US Geological Survey is studying the undiscovered oil and gas potential outside the Sheberghan area and on a broader basis elsewhere in the country.
7/6/2005 v Gustavson Associates

PROMOTION OF OIL AND GAS PRODUCING ISLAMIC TRANSITIONAL STATE OF AFGHANISTANAREAS TO THE PRIVATE SECTOR MINISTRY OF MINES AND INDUSTRYGRANT AGREEMENT NO. H007-AF EMERGENCY INFRASTRUCTURE RECONSTRUCTION PROJECT
Map of North Afghanistan Basin with Proposed First PromotionalBid Round Blocks and Oil and Gas Fields
The interface between Gustavson and Hill is readily defined at the field level, where theGustavson forecast of produced oil and gas quantities (both short-term and ultimately recoverable) interface with the transportation to the markets listed above as being optimized by Hill. The results of the USGS study are by their nature not readily predictable.
Gustavson’s forecast of oil and gas quantities (reserves) were under study for the Afghanistan Ministry of Mines and Industry, but were not available until mid-May 2004 under Gustavson’s contract. Therefore, Hill contracted separately with Gustavson for a
7/6/2005 vi Gustavson Associates

PROMOTION OF OIL AND GAS PRODUCING ISLAMIC TRANSITIONAL STATE OF AFGHANISTANAREAS TO THE PRIVATE SECTOR MINISTRY OF MINES AND INDUSTRYGRANT AGREEMENT NO. H007-AF EMERGENCY INFRASTRUCTURE RECONSTRUCTION PROJECT
fast-track study leading to reasonable production rates, as might be expected in the near term.
Estimates of Realistic Production Rates
The basis for the fast-track production-rate study had to be the historic Soviet reserve estimates and Gustavson’s experience with the rehabilitation and development ofsimilar fields in Central Asia. Then later, when Gustavson’s own reserve estimates were completed, a careful comparison with the present fast-track results might lead to an adjustment in the production rate forecast.
It was predicted that an increase would occur, because the fast-track forecasts do notinclude a number of small fields, which, while already discovered, nevertheless were not treated with any confidence in the Soviet reserve categories.
The confidence level of the estimates is high for the 5-year term, thanks to a reasonablenumber of Soviet parametric wells and past production from three of the gas fields.After ten years the confidence level becomes reduced.
It is noted that it was assumed that aggressive, yet reasonable development activities can commence at typical Central Asia capital costs during the first half of 2005.
The gas delivery projections for Jar Quduk indicate that the risk-weighted gasproduction could reach 55 MMCF/D in the first few years by adding compression,stimulation of existing producers, conducting workovers and/or twinning non-producers,putting shut-in wells into production and deepening shut-in certain wells into deeperJurassic reservoirs. By the tenth year, the gas production would decrease to about 10MMCF/D.
The projections for Khoja Gogerdaq gas field indicate that the gas production couldreach 24 MMCF/D in the first few years by adding compression, conducting workovers, putting shut-in wells into production and drilling new wells. By the tenth year, the gas production would decrease to about 14 MMCF/D.
The gas projections for Yatimtaq indicate that the gas production could reach 20 MMCF/D in the first few years by producing the existing Well #21 unrestricted, and by conducting workovers to put shut-in wells into production. By the tenth year, the gas production would decrease to about 0.1 MMCF/D.
Several cases were considered for the Kashkari oilfield. Case 1 is an oil company’sstandard case, which assumes a readily available market, possibly by export. It showsthat the Kashkari oilfield can reach a peak production rate of 13,182 BOPD in 2007, butwould then decline rapidly afterwards. By 2013, after ten years of production, the oil production rate decreases to 6,177 BOPD. The cumulative oil production reaches 29.86 MMBO (4.09 million tons) at the end of 2013.
7/6/2005 vii Gustavson Associates

PROMOTION OF OIL AND GAS PRODUCING ISLAMIC TRANSITIONAL STATE OF AFGHANISTANAREAS TO THE PRIVATE SECTOR MINISTRY OF MINES AND INDUSTRYGRANT AGREEMENT NO. H007-AF EMERGENCY INFRASTRUCTURE RECONSTRUCTION PROJECT
In so-called Case 3, a level production rate of about 7,300 BOPD can be obtained for 7 years, and will decline thereafter. The cumulative oil production reaches 27.5 MMBO(3.77 million tons) at the end of 2015 and is followed by a long tail. Only additional oil from nearby small fields can fill the shortfall, but reserve data for these is not included under the present contract.
After belated discussions with Hill’s chemical engineer, Gustavson Associates pursueda roughly 6,000 BOPD field development plan based on a tighter well spacing with more costly oil because of the higher capital cost.
This plan optimized the delivery of oil over 15 years and left very little oil production thereafter. This approach provided the highest investment security for the refinery, but at a higher capital cost for the oil field development.
Results of Market and Economic Analyses
Summary of Market
The insignificant amounts of oil being produced from the small fields listed above are retorted locally for inferior transportation fuel and heating oil. The possibility for an oilrefinery development (6000 – 10,000 BOPD throughput range) has been mentioned above as having been studied by Hill International.
There is no true, current market for gas. Any produced gas is distributed at subsidized prices to domestic consumers and to the fertilizer plant at Mazar-e Sharif. Consequently, this Consultant had to make assumptions with regard to the future development of a gas market.
It has been assumed that the gas will be marketed with primary focus ona) the fertilizer plant,b) domestic consumption andc) a gas-fired power plant, the two latter aimed at serving the local energy market in
the "easy access corridor" of cities consisting of Sheberghan, Mazar-e Sharif, Baghlan, Pol-e Khomri and Kunduz.
Following these assumptions and using a base gas price at the outlet of a gas processing plant of $1.10 per MCF, the economics were run. This gas price is based on interviews with local consumers and the fertilizer plant management. This base pricehas been used in the following economic analyses and variations of gas price havebeen included for sensitivity purposes.
Description of Economic Model and Results.
This Consultant has, since the early 1990’s, conducted Continuing Education short-courses for the University of Tulsa entitled “International Petroleum Agreements”. These courses have continued until the present (May 2005), and have served
7/6/2005 viii Gustavson Associates

PROMOTION OF OIL AND GAS PRODUCING ISLAMIC TRANSITIONAL STATE OF AFGHANISTANAREAS TO THE PRIVATE SECTOR MINISTRY OF MINES AND INDUSTRYGRANT AGREEMENT NO. H007-AF EMERGENCY INFRASTRUCTURE RECONSTRUCTION PROJECT
international oil company investors (IOCs) towards comparing the net results from oil and gas discoveries in different countries.
Common for all has been the use of a basic model in spreadsheet format, which attempted to keep most technical aspects constant in order to evaluate the sensitivitiesto economic parameters. Therefore, this same format has been used in the present economic study of the Afghanistan contract. It is assumed that the Afghanistan Model Contract as presently drafted will eventually be approved and published. Minor changes can readily be entered into the spreadsheet in Excel format, provided on the enclosed CD-ROM.
The main assumptions are:
1. International investors (IOCs) will rehabilitate and drill new development wellsin known gas fields yielding the quantities estimated elsewhere in this Study for a Type Gas Field,
2. Medium-term exploration by the IOCs in the same concession areas will provide additional gas to allow delivery planning for a 20-year project life based on the geology and production statistics developed by this Consultant.
The royalty rate is assumed to be 5 percent in the base case scenario. Other rates can be entered and run in the model. The World Bank considers that a 3 percent royaltyrate may represent another possibility. This 3% rate is included in the alternate case presented below.
Income tax for hydrocarbon activities is yet to be established by the Parliament. In the meantime, this Consultant has followed the advice of The World Bank and uses 30 percent as an upper limit. Twenty percent has been used as another input for sensitivitycalculations, and is included in the alternate case.
The economic performance results of the “5 percent royalty with 30 percent tax” isshown here:
Achieved Internal Rate of Return 16.64%NPV10, $million 23.65NPV15, $million 4.80Cash-on-cash Return 1.06Discounted Cash-on-cash Return 0.26Years to Pay-out 5.5
As mentioned above, an alternate case was run to consider different royalty and incometax rates (3 and 20% respectively, instead of 5 and 30%). These are the onlydifferences between inputs for the base and the alternate case. The results of the alternate case “3 percent royalty with 20 percent tax” are summarized here:
7/6/2005 ix Gustavson Associates

PROMOTION OF OIL AND GAS PRODUCING ISLAMIC TRANSITIONAL STATE OF AFGHANISTANAREAS TO THE PRIVATE SECTOR MINISTRY OF MINES AND INDUSTRYGRANT AGREEMENT NO. H007-AF EMERGENCY INFRASTRUCTURE RECONSTRUCTION PROJECT
Economic Performance
Achieved Internal Rate of Return 17.96%NPV10, $million 28.80NPV15, $million 8.79Cash-on-cash Return 1.17Discounted Cash-on-cash Return 0.32Years to Pay-out 5.4
It is noted that there is practically no difference between the economic results of the two scenarios. The reason is that the Draft Model Contract allows 100% production share to the IOC Contractor. The model provides a 50% production share to the government only after the model has determined that a 15% Running Rate of Return has been reached by the IOC Contractor.
Extensive Training of Afghani Officials
The training was divided into courses presented in Afghanistan and in Colorado at the offices of Gustavson Associates.
Summary of Courses Offered in Afghanistan.
The following is a summary of training activities that took place in Afghanistan. Training consisted of both classroom time and on-the-job training time. The instructors participating include:
Edwin Moritz, Gustavson Associates, Boulder Colorado Hafizullah Nawabi, Gustavson Associates, Boulder Colorado David A Rasmussen, Gustavson Associates, Boulder Colorado Arman Sirazhev, Geostan Seismic Processing, Kazakhstan Geology of Petroleum Class-Conducted by Mr. Mirzad with minorcontribution by Gustavson personnel
At the MMI offices in Kabul Gustavson personnel trained the participants in numerousaspects of source rocks, and the dependence of sampling accuracy on tectonic style, i.e. the highest drilled structures may not sample source rocks, which may exist on the flanks or in the basins.
On-the-Job Training at Kabul, MMI offices also provided suggestions and helddiscussions with Ministry personnel on aspects for conducting promotion and handling negotiations with foreign oil companies. Gustavson teachers worked with computer
7/6/2005 x Gustavson Associates

PROMOTION OF OIL AND GAS PRODUCING ISLAMIC TRANSITIONAL STATE OF AFGHANISTANAREAS TO THE PRIVATE SECTOR MINISTRY OF MINES AND INDUSTRYGRANT AGREEMENT NO. H007-AF EMERGENCY INFRASTRUCTURE RECONSTRUCTION PROJECT
technicians, and showed them how to generate PowerPoint slide presentations (among others for President Karzai) with maps using instant digital pictures.
On-the-Job Training at Sheberghan with the MMI Exploration Group Gustavson’s main contacts were Engineer Talash and Geologist Wasai. Under the direction of these people Gustavson instructors trained MMI scientists in:
Scanning and document organization for reports and large maps. Review of seismic and geologic exploration concepts to explain numerous well results.Description of an exploration drilling strategy, which would use MMI’s ownpeople, who could use existing data, and existing seismic recording equipmentfor infill recording near well control.Identification of well workover candidates, where production could be improved using modern oilfield technology.Description of processing methods that could improve existing data when tapes were available.Instruction of MMI scientists on methods for data preservation such as scanning to preserve seismic prints.
Participation Time
Every day in Afghanistan was a 10-hour workday. The direct training is accounted forabove. The remaining time is participation time working with many individuals such as Ministry officials, Mr. Mandarkhail, and the many Exploration Department workers in Mazar-e-Sharif and Sheberghan, totaling 15 to 20 people at various times, often workings with groups of 4 to 6 people during data copying.
Activities included interviews to determine where data may exist, conditions of wells, well results and history, condition and inventory of seismic recording equipment, the histories of various data especially seismic data, direct participation in organizing and copying data, and passing on encouragement for the workers to do future work using the computers and software we have delivered.
Summary of Course Held in Colorado
Day 1: Promotional Activities- using examples, discuss standard offerings, documentsand promotional material made by State Oil Companies for successful promotion to attract foreign investment. Discuss and go through Second Interim Report prepared for Ministry.
Day 2: Petroleum Engineering- review basics of reservoir engineering including:volumetric analysis, material balance techniques, probabilistic reserve estimates, international standards and classification regarding reserve categorization.
Day 3: International Petroleum Contracts/ Economic Modeling- Gustavson presented and worked through various examples of international petroleum contracts in various
7/6/2005 xi Gustavson Associates
PROMOTION OF OIL AND GAS PRODUCING ISLAMIC TRANSITIONAL STATE OF AFGHANISTANAREAS TO THE PRIVATE SECTOR MINISTRY OF MINES AND INDUSTRYGRANT AGREEMENT NO. H007-AF EMERGENCY INFRASTRUCTURE RECONSTRUCTION PROJECT
places in the world. Using the fields in Afghanistan, work with economics model that was developed based in draft petroleum law. Run sensitivities based on various fiscal parameters and see impact on attracting foreign investment in the petroleum sector.
Organization of Report
In order to insure that the full scope of the project was covered in the Final Report, Gustavson Associates closely followed the outline given in the original contract. The primary sections included are:
I) Discovery and Analysis of Initial DataII) Market AnalysisIII) Preliminary Capital Cost AssessmentIV) Preliminary Economic AnalysisV) Field Status, Rehabilitation, and Development Program Plan VI) Phase Two – Promotion of First Bid Round Blocks VII) Training Program
The following report follows this outline from the original contract.
7/6/2005 xii Gustavson Associates

PROMOTION OF OIL AND GAS PRODUCING ISLAMIC TRANSITIONAL STATE OF AFGHANISTANAREAS TO THE PRIVATE SECTOR MINISTRY OF MINES AND INDUSTRYGRANT AGREEMENT NO. H007-AF EMERGENCY INFRASTRUCTURE RECONSTRUCTION PROJECT
TABLE OF CONTENTS
PAGE
EXECUTIVE SUMMARY ..................................................................................... i Identification of Preservation of Essential Documents............................... i
Reserve Estimates .................................................................................... ii Promotional Package for Investment in Afghanistan ................................. iv Creation of Blocks for Bidding ................................................................... iv Integration with Other Studies Concerning Emergency Aid....................... v Estimation of Reasonable Production Rates ............................................. vi
Extensive Training of Afghan Officials ....................................................... vii Summary of Course Offered in Afghanistan .............................................. vii On the Job Training .................................................................................. viii
Participation Time...................................................................................... viii Summary of Course Held in Colorado ....................................................... viii
I. DISCOVERY AND ANALYSIS OF INITIAL DATA ................................... I-1
1. Analysis of Available Information and Reports .......................................... I-1
2. Geological Data ......................................................................................... I-1
3. Reserve Estimates .................................................................................... I-3 3.1 Review of Well Data ....................................................................... I-3 3.1.1 Review of Production and Pressure Histories ..................... I-3 3.1.2 Review of Well Test Data..................................................... I-3 3.1.3 Well Long Analysis............................................................... I-4 3.1.4 Review of Core Data ............................................................ I-5 3.1.5 Review of Well Fluid Analyses ............................................. I-5
3.2 Review of Geological Maps ............................................................ I-6 3.3 Review of In-Place Hydrocarbons................................................... I-6 3.4 Estimation of Recovery Factors ...................................................... I-7
3.5 Categorization of Reserves............................................................. I-7 3.6 Probabilistic Reserve Analysis........................................................ I-8
4. Technical Findings (First Interim Report)................................................... I-9 4.1 Introduction ..................................................................................... I-9 4.1.1 Purpose................................................................................ I-9 4.1.2 Authority............................................................................... I-9 4.1.3 Travel to Afghanistan ........................................................... I-10 4.1.4 Organization of Report ......................................................... I-12
4.2 Work Program – Phase I (Technical Analysis)................................ I-12 4.2.1 Research and Data Collection ............................................. I-12
4.2.1.1 Summary of Gustavson Visit June 3 through June 15, 2004 ........................................... I-13
7/6/2005 xiii Gustavson Associates

PROMOTION OF OIL AND GAS PRODUCING ISLAMIC TRANSITIONAL STATE OF AFGHANISTANAREAS TO THE PRIVATE SECTOR MINISTRY OF MINES AND INDUSTRYGRANT AGREEMENT NO. H007-AF EMERGENCY INFRASTRUCTURE RECONSTRUCTION PROJECT
PAGE
4.2.2 Analysis of Available Information and Reports..................... I-14 4.2.3 Methodology ........................................................................ I-15 4.2.3.1 General ................................................................... I-15 4.2.3.2 Review of the Seismic Data .................................... I-15
Northern Fields with Seismic Index ......................... I-16 Zad Juma to Jangalikolon – Composite Seismic
Line 1....................................................................... I-16 Bashikurd to Jangalikolon – Composite Seismic
Line 2....................................................................... I-16Reprocessing of Lines 88337 and 88341 ................ I-17 Inventories of Seismic Lines.................................... I-17 Seismic Recording Parameters ............................... I-19
4.2.3.3 Calculation of In-Place Hydrocarbons ..................... I-19 4.2.3.4 Estimation of Recovery Factors .............................. I-20 4.2.3.5 Categorization of Reserves ..................................... I-20 4.2.3.6 Probabilistic Reserve Analysis ................................ I-21 4.2.3.7 Other Methods of Reserve Estimation .................... I-22 4.2.4 Analysis of Producing Fields ................................................ I-23 4.2.4.1 Introduction ............................................................. I-23 4.2.4.2 Jar Quduk Gas Field ............................................... I-24
Geology ................................................................... I-24 Cretaceous Hauterivian (XIV) Reservoir.................. I-24
Jurassic Kugitan Formation (XV and XVI)Reservoir ................................................................. I-25 Geophysics.............................................................. I-25 Reservoir Parameters.............................................. I-25 Volumetric Calculations ........................................... I-27 Production Data....................................................... I-28 Reserve Estimates .................................................. I-30 Production Forecast ................................................ I-31
4.2.4.3 Khoja Gogerdaq Gas Field...................................... I-32 Geology ................................................................... I-32 Cretaceous Albian (XI) Reservoir ............................ I-33 Cretaceous Aptian (XII) Reservoir ........................... I-33Cretaceous Hauterivian (XIV) Reservoir.................. I-33
Jurassic Kugitan Formation (XV and XVI) Reservoir ................................................................. I-34 Geophysics.............................................................. I-34 Reservoir Parameters.............................................. I-34 Volumetric Calculations ........................................... I-36 Production Data....................................................... I-38 Reserve Estimates .................................................. I-38 Production Forecast ................................................ I-40
4.2.4.4 Yatimtaq Gas Field.................................................. I-42
7/6/2005 xiv Gustavson Associates
PROMOTION OF OIL AND GAS PRODUCING ISLAMIC TRANSITIONAL STATE OF AFGHANISTANAREAS TO THE PRIVATE SECTOR MINISTRY OF MINES AND INDUSTRYGRANT AGREEMENT NO. H007-AF EMERGENCY INFRASTRUCTURE RECONSTRUCTION PROJECT
PAGE
Geology ................................................................... I-42 Cretaceous Aptian (XII) Reservoir ........................... I-43Cretaceous Hauterivian (XIV) Reservoir.................. I-43
Jurassic Kugitan Formation (XV and XVI) Reservoir ................................................................. I-44 Geophysics.............................................................. I-44 Reservoir Parameters.............................................. I-44 Volumetric Calculations ........................................... I-46 Production Data....................................................... I-48 Reserve Estimates .................................................. I-48 Production Forecast ................................................ I-49
4.2.4.5 Angut Oil Field......................................................... I-50 Geology ................................................................... I-50 Geophysics.............................................................. I-51 Reservoir Parameters.............................................. I-51 Volumetric Calculations ........................................... I-51 Production Data....................................................... I-51 Reserve Estimates .................................................. I-51 Production Forecast ................................................ I-51
4.2.5 Analysis of Discovered / Non-Producing Oil Fields .............. I-51 4.2.5.1 Introduction ............................................................. I-51 4.2.5.2 Kashkari Oil Field .................................................... I-52
Geology ................................................................... I-52 Cretaceous Albian (XI) Reservoir ............................ I-52 Cretaceous Aptian (XII) Reservoir ........................... I-53Cretaceous Hauterivian (XIV) Reservoir.................. I-53 Geophysics.............................................................. I-53 Reservoir Parameters.............................................. I-54 Volumetric Calculations ........................................... I-55
4.2.5.3 Bazarkhami Oil Field ............................................... I-58 Geology ................................................................... I-58 Geophysics.............................................................. I-58 Reservoir Parameters.............................................. I-58 Volumetric Calculations ........................................... I-59
4.2.5.4 Aqdarya Oil Field..................................................... I-62 Geology ................................................................... I-62 Cretaceous Albian (XI) Reservoir ............................ I-62 Cretaceous Hauterivian (XIV) Reservoir.................. I-63 Geophysics.............................................................. I-63 Reservoir Parameters.............................................. I-64 Volumetric Calculations ........................................... I-65
4.2.5.5 Zamarudsay Oil Field .............................................. I-68 Geology ................................................................... I-68 Cretaceous Hauterivian (XIV) Reservoir.................. I-68
7/6/2005 xv Gustavson Associates

PROMOTION OF OIL AND GAS PRODUCING ISLAMIC TRANSITIONAL STATE OF AFGHANISTANAREAS TO THE PRIVATE SECTOR MINISTRY OF MINES AND INDUSTRYGRANT AGREEMENT NO. H007-AF EMERGENCY INFRASTRUCTURE RECONSTRUCTION PROJECT
PAGE
Geophysics.............................................................. I-68 Reservoir Parameters.............................................. I-69 Volumetric Calculations ........................................... I-69
4.2.6 Analysis of Discovered / Non-Producing Gas Fields ............ I-72 4.2.6.1 Introduction ............................................................. I-72 4.2.6.2 Jangalikolon Gas Field ............................................ I-72
Geology ................................................................... I-72 Jurassic Kugitan Formation (XV and XVI)
Reservoir ................................................................. I-72 Geophysics.............................................................. I-73 Reservoir Parameters.............................................. I-73 Volumetric Calculations ........................................... I-75
4.2.6.3 Bashikurd Gas Field ................................................ I-76 Geology ................................................................... I-76 Jurassic Kugitan Formation (XV) Reservoir............. I-77Geophysics.............................................................. I-78 Reservoir Parameters.............................................. I-78 Volumetric Calculations ........................................... I-80
4.2.6.4 Juma Gas Field ....................................................... I-81 Geology ................................................................... I-81 Geophysics.............................................................. I-82 Reservoir Parameters.............................................. I-82 Volumetric Calculations ........................................... I-82
4.2.6.5 Khoja Bolan Gas Field ............................................ I-85 Geology ................................................................... I-85 Cretaceous Hauterivian (XIV) Reservoir.................. I-86 Jurassic Kugitan Formation (XV) Reservoir............. I-86Geophysics.............................................................. I-86 Reservoir Parameters.............................................. I-86 Volumetric Calculations ........................................... I-87
4.2.6.6 Shakarak ................................................................. I-88 Geology ................................................................... I-88 Geophysics.............................................................. I-88 Reservoir Parameters.............................................. I-88 Volumetric Calculations ........................................... I-88
4.3 Summary of Reserves for Discovered Oil and Gas Fields in The Sheberghan Area..................................................................... I-89
4.4 Bibliography .................................................................................... I-93
II. MARKET ANALYSIS ................................................................................ II-1
1. Petroleum Economic Spreadsheet ................................................. II-1 1.2 University of Tulsa Format ................................................... II-1
7/6/2005 xvi Gustavson Associates

PROMOTION OF OIL AND GAS PRODUCING ISLAMIC TRANSITIONAL STATE OF AFGHANISTANAREAS TO THE PRIVATE SECTOR MINISTRY OF MINES AND INDUSTRYGRANT AGREEMENT NO. H007-AF EMERGENCY INFRASTRUCTURE RECONSTRUCTION PROJECT
PAGE
1.3 Input Parameters.................................................................. II-1 1.4 Type Gas Field..................................................................... II-4 1.4.1 Royalty and Income Tax Rate ................................... II-5 1.5 Government Share of Production......................................... II-6 1.6 Economic Performance Output ............................................ II-6
III. PRELIMINARY CAPITAL COST ASSESSMENT..................................... III-1
IV. PRELIMINARY ECONOMIC ANALYSIS .................................................. IV-1
V. FIELD STATUS, REHABILITATION, AND DEVELOPMENT PROGRAM PLAN ..................................................................................... V-1
1. Review of Parallel Emergency Aid and Assistance......................... V-1 1.1 Integration of Findings.......................................................... V-3 1.1.1 Introduction................................................................ V-3 1.1.2 Data Sources............................................................. V-5 1.1.3 Geology Overview ..................................................... V-5 1.2 Producing Gas Fields........................................................... V-7 1.2.1 Jar Quduk.................................................................. V-7 1.2.1.1 Overview ...................................................... V-7 1.2.1.2 Producing Wells............................................ V-11 1.2.1.3 Non-Producing Wells.................................... V-11 1.2.1.4 Offset or Twin Wells ..................................... V-13 1.2.1.5 Jurassic Reservoirs ...................................... V-13
1.2.1.6 Recommended Work Program and Future Production Projections ................................. V-14
1.2.2 Khoja Gogerdaq ........................................................ V-19 1.2.2.1 Overview ...................................................... V-19 1.2.2.2 Producing Wells............................................ V-22 1.2.2.3 Non-Producing Wells.................................... V-24 1.2.2.4 Offset or Twin Wells ..................................... V-24
1.2.2.5 Recommended Work Program and Future Production Projections ................................. V-25
1.2.3 Yatimtaq .................................................................... V-31 1.2.3.1 Overview ...................................................... V-31 1.2.3.2 Proposed Workover Program ....................... V-31 1.3 Kashkari Oilfield ................................................................... V-41 1.3.1 Overview ................................................................... V-41 1.3.2 Recommended Drilling Program and Future Production Projections .............................................. V-41 1.3.2.1 Oil Production Tests ..................................... V-41 1.3.2.2 Recommended Drilling Program................... V-44 1.3.2.3 Oil Production Projection .............................. V-46
7/6/2005 xvii Gustavson Associates

PROMOTION OF OIL AND GAS PRODUCING ISLAMIC TRANSITIONAL STATE OF AFGHANISTANAREAS TO THE PRIVATE SECTOR MINISTRY OF MINES AND INDUSTRYGRANT AGREEMENT NO. H007-AF EMERGENCY INFRASTRUCTURE RECONSTRUCTION PROJECT
PAGE
1.3.3 Summary ................................................................... V-61 1.3.4 Analysis for Allocation of Hydrocarbon Resources into Concession Blocks ............................................. V-62
VI. PHASE TWO – PROMOTION OF FIRST BID ROUND BLOCKS ............ VI-1
1. Preparation of Promotional Material ............................................... VI-1 1.1 Introduction .......................................................................... VI-1 1.1.1 Purpose ..................................................................... VI-1 1.1.2 Authority .................................................................... VI-2 1.1.3 Organization of of Chapter VI .................................... VI-2
1.2 Work Program – Phase II (Promotional Program)................ VI-2 1.2.1 Methodology for Defining First Bid Round Blocks ..... VI-2
1.2.2 Geologic Basis for Block Designations...................... VI-4 1.2.2.1 Graticulation and Definition of Block
Boundaries................................................... VI-4 1.2.3 First Bid Round Block Descriptions ........................... VI-5 1.2.3.1 Yatimtaq-Khoja Gogerdaq Block .................. VI-5 1.2.3.2 Jar Quduk Block ........................................... VI-5 1.2.3.3 Juma-Bashikurd Block.................................. VI-6 1.2.3.4 Jangalikolon Block........................................ VI-7 1.2.3.5 Shirin Tagab Block ....................................... VI-7 1.2.3.6 Kashkari Block.............................................. VI-8 1.2.3.7 Bazarkhami Block......................................... VI-8 1.2.3.8 Zamarudsay Block........................................ VI-9 1.2.3.9 Saur-Kizbisay Block...................................... VI-10 1.2.3.10 North Basin West Block............................... VI-10 1.2.3.11 North Basin East Block................................ VI-11 1.2.4 Compilation of Plate 5 of the Promotional Technical Report ....................................................... VI-11
1.2.4.1 Russian Mapping Frame of Reference ......... VI-12 1.2.4.2 Graticule Display .......................................... VI-12 1.2.4.3 True Reference Map..................................... VI-12 1.2.5 Elements of Promotional Package ............................ VI-13 1.2.5.1 Draft Invitation Letter from Minister............... VI-13 1.2.5.2 Draft Announcement of Bid Round............... VI-13 1.2.5.3 Draft Color Promotional Brochure................. VI-14
1.2.5.4 Draft Promotional Package TechnicalReport .......................................................... VI-14
1.2.5.5 Digital Dataset on DVD................................. VI-14 1.2.5.6 Seismic Reprocessing Report ...................... VI-16 1.2.6 Implementation of Afghanistan Promotion................. VI-16
7/6/2005 xviii Gustavson Associates

PROMOTION OF OIL AND GAS PRODUCING ISLAMIC TRANSITIONAL STATE OF AFGHANISTANAREAS TO THE PRIVATE SECTOR MINISTRY OF MINES AND INDUSTRYGRANT AGREEMENT NO. H007-AF EMERGENCY INFRASTRUCTURE RECONSTRUCTION PROJECT
PAGE
VII. TRAINING PROGRAMS ........................................................................... VII-1
1. On the Job Training ........................................................................ VII-1
2. Participation Time ........................................................................... VII-2
LIST OF APPENDICES
A Description of Services
B USGS CD-Rom Data
C Well Inventory Database
D Seismic Inventory
E Translated Table of Contents
F Jar Quduk Afghanistan Documents
G Khoja Gogerdaq Afghanistan Documents
H Yatimtaq Afghanistan Documents
I Kashkari Afghanistan Documents
J Draft Invitation Letter from Minister
K Draft Announcement for Bid Round
L Draft Color Promotional Brochure
M Draft Promotional Package Technical Report
N Reserves for Oil and Gas Field in Sheberghan
O Oil and Gas Field Infrastructure and Rehabilitation
P Business Climate and Economic Overview
Q Hydrocarbons Law
R Hydrocarbons Regulations
S Model production Sharing Agreement
T Selected Bibliography
U Training Course Presentations
7/6/2005 xix Gustavson Associates

PROMOTION OF OIL AND GAS PRODUCING ISLAMIC TRANSITIONAL STATE OF AFGHANISTANAREAS TO THE PRIVATE SECTOR MINISTRY OF MINES AND INDUSTRYGRANT AGREEMENT NO. H007-AF EMERGENCY INFRASTRUCTURE RECONSTRUCTION PROJECT
LIST OF PLATES
1 Seismic Index Map for Sheberghan Area
2 Zad Juma to Jangalikolon Composite Seismic Line 1
3 Bashikord to Jangalikolon Composite Seismic Line 2
4 Regional Structure Map
5a North Afghanistan Basin
5b North Afghanistan Basin
6 1991 Tectonic Map
7/6/2005 xx Gustavson Associates

PROMOTION OF OIL AND GAS PRODUCING ISLAMIC TRANSITIONAL STATE OF AFGHANISTANAREAS TO THE PRIVATE SECTOR MINISTRY OF MINES AND INDUSTRYGRANT AGREEMENT NO. H007-AF EMERGENCY INFRASTRUCTURE RECONSTRUCTION PROJECT
LIST OF FIGURES
FIGURE PAGE
1-1 Oil and Gas Fields in the Area of Sheberghan, Afghanistan ........................ I-11
1-2 Example p/z Analysis ................................................................................ I-23
1-3 Distribution of Total Gas In Place, Jar Quduk Field ................................... I-27
1-4 Distribution of Total Gas Reserves, Jar Quduk Field................................. I-27
1-5 Jar Quduk Production History and Base Case Forecast ........................... I-29
1-6 Jar Quduk p/z Analysis.............................................................................. I-30
1-7 Jar Quduk Production Forecast ................................................................. I-32
1-8 Distribution of Total Gas In Place, Khoja Gogerdaq Field ......................... I-37
1-9 Distribution of Total Gas Reserves, Khoja Gogerdaq Field ....................... I-37
1-10 Khoja Gogerdaq Production History and Base Case Forecast .................. I-39
1-11 Khoja Gogerdaq p/z Analysis .................................................................... I-40
1-12 Khoja Gogerdaq Production Forecast ....................................................... I-42
1-13 Distribution of Total Gas In Place Before Blowout, Yatimtaq Field ............ I-46
1-14 Distribution of Total Gas Reserves Before Blowout, Yatimtaq Field .......... I-47
1-15 Distribution of Total Gas In Place After Blowout, Yatimtaq Field ............... I-47
1-16 Distribution of Total Gas Reserves After Blowout, Yatimtaq Field ............. I-48
1-17 Yatimtaq Production Forecast ................................................................... I-50
1-18 Distribution of Total Oil In Place, Kashkari Field........................................ I-56
1-19 Distribution of Total Oil Reserves, Kashkari Field...................................... I-56
1-20 Distribution of Total Gas In Place, Kashkari Field...................................... I-57
1-21 Distribution of Total Gas Reserves, Kashkari Field ................................... I-57
7/6/2005 xxi Gustavson Associates

PROMOTION OF OIL AND GAS PRODUCING ISLAMIC TRANSITIONAL STATE OF AFGHANISTANAREAS TO THE PRIVATE SECTOR MINISTRY OF MINES AND INDUSTRYGRANT AGREEMENT NO. H007-AF EMERGENCY INFRASTRUCTURE RECONSTRUCTION PROJECT
FIGURE PAGE
1-22 Distribution of Total Oil In Place, Bazarkhami Field................................... I-60
1-23 Distribution of Total Oil Reserves, Bazakhami Field.................................. I-60
1-24 Distribution of Total Gas In Place, Bazarkhami Field................................. I-61
1-25 Distribution of Total Gas Reserves, Bazarkhami Field .............................. I-61
1-26 Distribution of Total Oil In Place, Aqdarya Field ........................................ I-66
1-27 Distribution of Total Oil Reserves, Aqdarya Field ...................................... I-66
1-28 Distribution of Total Gas In Place, Aqdarya Field ...................................... I-67
1-29 Distribution of Total Gas Reserves, Aqdarya Field .................................... I-67
1-30 Distribution of Total Oil In Place, Zamarudsay Field.................................. I-70
1-31 Distribution of Total Oil Reserves, Zamarudsay Field................................ I-70
1-32 Distribution of Total Gas In Place, Zamarudsay Field................................ I-71
1-33 Distribution of Total Gas Reserves, Zamarudsay Field ............................. I-71
1-34 Distribution of Total Gas In Place, Jangalikolon Field................................ I-75
1-35 Distribution of Total Gas Reserves, Jangalikolon Field ............................. I-76
1-36 Distribution of Total Gas In Place, Bashikurd Field.................................... I-80
1-37 Distribution of Total Gas Reserves, Bashikurd Field ................................. I-81
1-38 Distribution of Total Gas In Place, Juma Field........................................... I-84
1-39 Distribution of Total Gas Reserves, Juma Field......................................... I-85
1-40 Distribution of Total Gas In Place, Khoja Bolan Field ................................ I-87
1-41 Distribution of Total Gas Reserves, Khoja Bolan Field .............................. I-87
1-42 Total in Place Distribution, Afghanistan Oil and Gas Fields....................... I-89
1-43 Total Oil Reserves Distribution, Afghanistan Oil and Gas Fields ............... I-90
7/6/2005 xxii Gustavson Associates
PROMOTION OF OIL AND GAS PRODUCING ISLAMIC TRANSITIONAL STATE OF AFGHANISTANAREAS TO THE PRIVATE SECTOR MINISTRY OF MINES AND INDUSTRYGRANT AGREEMENT NO. H007-AF EMERGENCY INFRASTRUCTURE RECONSTRUCTION PROJECT
FIGURE PAGE
1-44 Total Gas In Place Distribution, Afghanistan Oil and Gas Fields ............... I-90
1-45 Total Gas Reserves Distribution, Afghanistan Oil and Gas Fields............. 1-91
4-1 Graph of Production Rate Versus Time..................................................... IV-7
4-2 Afghanistan Typical Gas Discovery Economics Base Case – Present Value @10% ............................................................................................. IV-12
4-3 Afghanistan Typical Gas Discovery Economics Base Case – Internal Rate of Return, % ............................................................................................. IV-12
4-4 Afghanistan Typical Gas Discovery Economics Alternate Case – Present Value @10%, MM$.................................................................................... IV-13
4-5 Afghanistan Typical Gas Discovery Economics Alternate Case – InternalRate of Return, %...................................................................................... IV-14
5-1 Map Showing Location of Oil and Gas Fields............................................ V-4
5-2 Stratigraphic Chart of Northeastern Afghanistan ....................................... V-6
5-3 Jar Quduk Production History.................................................................... V-8
5-4a Jar Quduk Well #22 Wellhead ................................................................... V-9
5-4b Jar Quduk Well #22 Flowing Gas .............................................................. V-10
5-5 Structure Map of Jar Quduk Field with Well Categories ............................ V-12
5-6 Jar Quduk Annual Production Forecast..................................................... V-15
5-7 Jar Quduk Average Annual Production Rate Forecast .............................. V-16
5-8 Geologic Profile of the Khoja Gogerdaq Gas Field .................................... V-21
5-9 Khoja Gogerdaq Production History .......................................................... V-23
5-10 Khoja Gogerdaq Annual Production Forecast ........................................... V-26
5-11 Khoja Gogerdaq Average Annual Production Rate Forecast .................... V-27
5-12 Geologic Profile of the Yatimtaq Gas Field in Northern Afghanistan ......... V-32
7/6/2005 xxiii Gustavson Associates
PROMOTION OF OIL AND GAS PRODUCING ISLAMIC TRANSITIONAL STATE OF AFGHANISTANAREAS TO THE PRIVATE SECTOR MINISTRY OF MINES AND INDUSTRYGRANT AGREEMENT NO. H007-AF EMERGENCY INFRASTRUCTURE RECONSTRUCTION PROJECT
FIGURE PAGE
5-13 Yatimtaq Annual Production Forecast ....................................................... V-33
5-14 Yatimtaq Average Annual Production Rate Forecast ................................ V-34
5-15 Total 3 Fields Annual Production Forecast ................................................ V-37
5-16 Total 3 Fields Average Annual Production Rate Forecast ......................... V-38
5-17 Structure Map and Cross-Section of the Kashkari Oil field in Northern Afghanistan................................................................................................ V-42
5-18 Projection of Average Production Rate for Kashkari Oilfield – Case 1 ...... V-47
5-19 Projection of Annual Production for Kashkari Oilfield – Case 1 ................. V-47
5-20 Projection of Annual Production for Kashkari Oilfield(metric unit) Case 1 .................................................................................. V-48
5-21 Projection of Average Production Rate for Kashkari Oilfield – Case 2 ...... V-48
5-22 Projection of Annual Production for Kashkari Oilfield – Case 2 ................. V-49
5-23 Projection of Annual Production for Kashkari Oilfield (metric unit) Case 2 ....................................................................................................... V-49
5-24 Projection of Average Production for Kashkari Oilfield – Case 3............... V-50
5-25 Projection of Annual Production for Kashkari Oilfield – Case 3 ................. V-50
5-26 Projection of Annual Production for Kashkari Oilfield (metric unit) Case 3 ....................................................................................................... V-51
5-27 Projection of Average Production for Kashkari Oilfield – Case 4............... V-51
5-28 Projection of Annual Production for Kashkari Oilfield – Case 4 ................. V-52
5-29 Projection of Annual Production for Kashkari Oilfield (metric unit) Case 4 ....................................................................................................... V-52
6-1 Map of North Afghanistan Basin with Proposed First Promotional Bid Round Blocks and Oil and Gas Fields ....................................................... VI-3
7/6/2005 xxiv Gustavson Associates

PROMOTION OF OIL AND GAS PRODUCING ISLAMIC TRANSITIONAL STATE OF AFGHANISTANAREAS TO THE PRIVATE SECTOR MINISTRY OF MINES AND INDUSTRYGRANT AGREEMENT NO. H007-AF EMERGENCY INFRASTRUCTURE RECONSTRUCTION PROJECT
LIST OF TABLES
TABLE PAGE
1-1 Seismic Line Accounting ........................................................................... I-18
1-2 Jar Quduk Gas Field Input Parameters for Probabilistic Modeling ............ I-26
1-3 Jar Quduk Gas Field Probabilistic Reserves ............................................. I-28
1-4 Jar Quduk Annual Gas Production Forecast ............................................. I-31
1-5 Khoja Gogerdaq Gas Field Input Parameters for Probabilistic Modeling... I-35
1-6 Khoja Gogerdaq Gas Field Probabilistic Reserves.................................... I-38
1-7 Khoja Gogerdaq Annual Gas Production Forecast, MMSCF per year....... I-41
1-8 Yatimtaq Gas Field Input Parameters for Probabilistic Modeling............... I-45
1-9 Yatimtaq Annual Gas Production Forecast, MMCF per year ..................... I-49
1-10 Kashkari Oil Field Input Parameters for Probabilistic Modeling ................. I-54
1-11 Bazarkhami Oil Field Input Parameters for Probabilistic Modeling ............ I-59
1-12 Aqdarya Oil Field Input Parameters for Probabilistic Modeling.................. I-64
1-13 Zamarudsay Oil Field Input Parameters for Probabilistic Modeling ........... I-69
1-14 Jangalikolon Gas Field Input Parameters for Probabilistic Modeling ......... I-73
1-15 Bashikurd Gas Field Input Parameters for Probabilistic Modeling ............. I-79
1-16 Juma Gas Field Input Parameters for Probabilistic Modeling .................... I-83
1-17 North Afghan Basin – List of Oil and Gas Resources ................................ I-92
4-1 Base Case Input Parameters of Economic Spreadsheet........................... IV-4
4-2 Additional Base Case Input Parameters of Economic Spreadsheet .......... IV-5
4-3 Remaining Reserves in Six Gas Fields ..................................................... IV-6
7/6/2005 xxv Gustavson Associates

PROMOTION OF OIL AND GAS PRODUCING ISLAMIC TRANSITIONAL STATE OF AFGHANISTANAREAS TO THE PRIVATE SECTOR MINISTRY OF MINES AND INDUSTRYGRANT AGREEMENT NO. H007-AF EMERGENCY INFRASTRUCTURE RECONSTRUCTION PROJECT
TABLE PAGE
4-4 Royalty and Tax Input in Economic Spreadsheet ...................................... IV-7
4-5 Production Share to Government .............................................................. IV-8
4-6 Economic Performance ............................................................................. IV-8
4-7 Cash Flow Forecast, Base Case ............................................................... IV-10
4-8 Cash Flow Forecast, Alternate Case ......................................................... IV-11
4-9 Economic Performance, Alternate Case.................................................... IV-13
5-1 Summary of Wells Drilled at Jar Quduk Gas Field..................................... V-8
5-2 Current Status of Individual Wells at Jar Quduk Gas Field........................ V-11
5-3 Recommended Work Program, Jar Quduk Gas Field ............................... V-14
5-4 Jar Quduk Annual Production Forecasts ................................................... V-17
5-5 Jar Quduk Average Annual Production Rate Forecasts ............................ V-18
5-6 Summary of Wells Drilled in Khoja Gogerdaq Gas Field ........................... V-20
5-7 Status of Individual Wells, Khoja Gogerdaq Gas Field .............................. V-22
5-8 Recommended Work Program and Future Production Projections ........... V-25
5-9 Khoja Gogerdaq Annual Production Forecasts ......................................... V-28
5-10 Khoja Gogerdaq Average Annual Production Rate Forecasts................... V-30
5-11 Recommended Work Program, Yatimtaq Gas Field.................................. V-31
5-12 Yatimtaq Annual Production Forecasts ..................................................... V-35
5-13 Yatimtaq Average Annual Production Rate Forecasts............................... V-36
5-14 Total 3 Fields Annual Production Forecasts .............................................. V-39
5-15 Total 3 Fields Average Annual Production Rate Forecasts ....................... V-40
5-16 Data of Production Tests and Drillstem Tests – Horizon Xla, Kashkari Oilfield......................................................................................... V-43
7/6/2005 xxvi Gustavson Associates
PROMOTION OF OIL AND GAS PRODUCING ISLAMIC TRANSITIONAL STATE OF AFGHANISTANAREAS TO THE PRIVATE SECTOR MINISTRY OF MINES AND INDUSTRYGRANT AGREEMENT NO. H007-AF EMERGENCY INFRASTRUCTURE RECONSTRUCTION PROJECT
TABLE PAGE
5-17 Data of Production Tests and Drillstem Tests – Horizon Xlla, Kashkari Oilfield......................................................................................... V-43
5-18 Data of Production Tests and Drillstem Tests – Horizon Xllb, Kashkari Oilfield......................................................................................... V-44
5-19 Data of Production Tests and Drillstem Tests – Horizon XIV, Kashkari Oilfield......................................................................................... V-44
5-20 Average Initial Oil Flow Rate and Productivity Index ................................. V-45
5-21 Number of Wells Designed Under a Well Spacing of 80 Acres ................. V-45
5-22 Classification of Wells................................................................................ V-46
5-23 Production Projection for Kashkari Oilfield – Case 1 ................................. V-53
5-24 Production Projection for Kashkari Oilfield (Metric Unit) – Case 1............. V-54
5-25 Production Projection for Kashkari Oilfield – Case 2 ................................. V-55
5-26 Production Projection for Kashkari Oilfield (Metric Unit) – Case 2............. V-56
5-27 Production Projection for Kashkari Oilfield – Case 3 ................................. V-57
5-28 Production Projection for Kashkari Oilfield (Metric Unit) – Case 3............. V-58
5-29 Production Projection for Kashkari Oilfield – Case 4 ................................. V-59
5-30 Production Projection for Kashkari Oilfield (Metric Unit) – Case 4............. V-60
7-1 Training Program....................................................................................... VII-2
7/6/2005 xxvii Gustavson Associates
PROMOTION OF OIL AND GAS PRODUCING ISLAMIC TRANSITIONAL STATE OF AFGHANISTANAREAS TO THE PRIVATE SECTOR MINISTRY OF MINES AND INDUSTRYGRANT AGREEMENT NO. H007-AF EMERGENCY INFRASTRUCTURE RECONSTRUCTION PROJECT
I. DISCOVERY AND ANALYSIS OF INITIAL DATA
1. Analysis of Available Information and Reports
A broad spectrum of data was required to complete this project. After reviewing the U.S. Geological Survey-provided scanned data, there was a great deal of uncertaintyregarding the amount, quality, and condition of the data that was available for this project, particularly in the area of reservoir engineering. Appendix A of the contractmade the following assumptions:
1. well data will be available as raw (uninterpreted) logs and tests,2. seismic data will consist of field tapes with surveyor's and observer's notes,3. seismic data will need to be reprocessed,4. base maps will need to be constructed,5. cross-sections will need to be constructed,6. all seismic and well data will need to be interpreted,7. structure and isopach maps will need to be built,8. well drilling and completion data will be available and in need of analysis,9. well production data will be available and in need of analysis,10. inventory of production equipment and condition will be available,11. descriptions of field infrastructure will be available (layout, gathering, storage,
transport),12. descriptions of environmental status will be available (spills, remediation, clean-
up).
After preliminary review of the currently available data, it is apparent that not all of these assumptions were valid. Variances from these assumptions are discussed in the following subsections. The interpretation and analysis portion of this project was begun immediately; however full-scale, in-depth reservoir engineering analysis, in particular,was only achieved as newly requested engineering data was received. Reservoir characteristics included porosities, permeabilities, water saturations, clay content, and net pays wherever possible.
2. Geological Data
Even in the early stages of review and analysis, it was apparent that certain geologicaland geophysical data would not be available. We obtained some montage panels thatinclude Russian log suites for some of the wells. It was necessary to secure copies oflogs and geological reports for all wells, including wildcats that were drilled in the region.Data from wildcat wells was necessary in evaluating future upside exploration potentialin and around existing fields. It was unclear whether original copies of individual logsfrom each well could be obtained for digitizing or if the montage-type of log presentations are all that are available.
7/6/2005 I-1 Gustavson Associates

PROMOTION OF OIL AND GAS PRODUCING ISLAMIC TRANSITIONAL STATE OF AFGHANISTANAREAS TO THE PRIVATE SECTOR MINISTRY OF MINES AND INDUSTRYGRANT AGREEMENT NO. H007-AF EMERGENCY INFRASTRUCTURE RECONSTRUCTION PROJECT
The Soviet style well folios and field-specific technical reports contain a wide variety of data regarding individual wells. Some of these were available, individual data items were retrieved wherever possible. The key data elements were:
1. Well proposal report (including a well prognosis, description of the prospect, description of the target reservoirs, engineering design, drilling procedure, logging procedure, and testing procedure),
2. Daily drilling reports 3. Wellsite geologist's report (including cutting descriptions, hydrocarbon shows,
mud gas log, formation tops, reservoir descriptions, and log analysis)4. Core descriptions and analytical reports 5. Open hole logs (including resistivity, porosity, and other tools) 6. Drill stem test and production test results and analyses7. Completion report (summarizing the daily progress, as-installed casing strings,
completion techniques, testing results, as-installed equipment, and final status of the well)
Our preliminary review of the U.S. Geological Survey CD-ROMs indicated that copies ofthese well folios were not included but some technical reports were. Requests weremade for additional well-specific geological reports.
The U.S. Geological Survey dataset included scanned copies of 22 individual seismiclines, 12 of which are listed in Appendix B. A seismic base map included in the dataset indicates that many more lines were shot that would be useful for mapping the productive structures as well as the intervening areas between fields that may hold exploration potential. In addition, four of the lines are not shown on the seismic base map. The U.S. Geological Survey contacts indicated that all available seismic lines were scanned. A request was made to research the availability of the additional seismicdata.
Discussions with the U.S. Geological Survey as well as MMI officials indicated that the delicate and deteriorating condition of seismic field tapes may not permit their use for reprocessing of the existing seismic data. Reprocessing of the old data using modern state-of-the-art processing techniques would undoubtedly result in a dramatic increase in data quality and interpretability. Permission was finally obtained to use tapes from one line for a test reprocessing. This effort is discussed later in this Report.
Finally, it is extremely important to develop an accurate base map for geologic and geophysical mapping that shows the relative as well as absolute geographic locations ofoil and gas fields, wells, seismic lines, roads, pipelines, etc. There is a great deal of misunderstanding and uncertainty regarding Soviet "State Secret" geographiccoordinates for such entities. One of the first steps in gathering and utilizing data wasthe construction of base maps that located all of the critical infrastructure as well asseismic line positions as accurately as possible. This involved identifying key landmarkreferences coupled with the acquisition of modern GPS-derived coordinates for all of the
7/6/2005 I-2 Gustavson Associates

PROMOTION OF OIL AND GAS PRODUCING ISLAMIC TRANSITIONAL STATE OF AFGHANISTANAREAS TO THE PRIVATE SECTOR MINISTRY OF MINES AND INDUSTRYGRANT AGREEMENT NO. H007-AF EMERGENCY INFRASTRUCTURE RECONSTRUCTION PROJECT
wells. A series of Russian published Topographic maps with x-y coordinates was also a critical set of data. The base map was constructed in ArcView format.
3. Reserve Estimates
Estimating the reserves of Afghanistan’s oil and gas fields was among the most critical tasks of the entire project. The reserve estimates define the targets for development: what is the appropriate size for the development project, where should it focus, and what are the potential rewards? These estimates also guided the design and boundaries of potential concession blocks to be offered. As such, a significant workeffort and a significant amount of time was spent on this task. All reserve estimates as discussed below were made by type of hydrocarbon and by pay horizon and field.
3.1 Review of Well Data
3.1.1 Review of Production and Pressure Histories
For the three fields with production histories, review of production data was veryimportant in assessing remaining reserves and future production forecasts with time. As stated, the production records were poor and incomplete for some portions of the production history due to disruptions in normal field activities resulting from war. Gustavson used all available production and pressure data, along with other field data,to reconstruct any missing data as best as possible. Material balance calculations were made when possible, relating produced volumes and original size of the deposit to changes in reservoir pressure. This assisted in confirming estimates of oil or gas inplace and possibly in estimating uncertain cumulative production volumes.
Additionally, review of historical production rates assisted in prediction of potential ratesfrom undeveloped fields in similar reservoirs.
3.1.2 Review of Well Test Data
For undeveloped fields, well test data was highly important in estimating potential production rates under field development scenarios. Well test data was studied in detail, and compared to actual producing rates where available. The validity of testing methods and reasonableness of test results was ascertained. Adjustments were made to correct for less accurate testing methods when a comparison with more accurate methods could be made.
For example, as part of the reserve audit conducted by this Consultant on the Kamen/Tokarev-Teplov trend of fields in northwestern Kazakhstan, it was noted that the condensate/gas ratios (CGRs) reported from many of the available well tests were estimated based on analysis of small samples from the entire test. Comparison of CGRs estimated in this manner to CGRs measured through a Portatest unit on one well indicated that the CGRs determined from small sample analysis were consistently too high. Consequently, all these data were adjusted downward based on the average
7/6/2005 I-3 Gustavson Associates

PROMOTION OF OIL AND GAS PRODUCING ISLAMIC TRANSITIONAL STATE OF AFGHANISTANAREAS TO THE PRIVATE SECTOR MINISTRY OF MINES AND INDUSTRYGRANT AGREEMENT NO. H007-AF EMERGENCY INFRASTRUCTURE RECONSTRUCTION PROJECT
percentage difference found in the comparison. Similar methods were employed in this study, resulting in very high credibility in the final reserve estimates.
The well test data formed the basis for determining which portions of which undeveloped reservoirs were considered to contain Proved reserves. Minimum commercial producing rates were estimated, and tests of each reservoir in each wellwere judged against that standard.
When pressure transient data were available from well tests, these were analyzed to aidin our understanding of reservoir permeability, flow regimes, the presence or nature of fractures in the reservoir, and any well bore damage which might be present. Pressuretransient analysis provides the best method of obtaining effective formation permeability, since a much larger area of the reservoir is “sampled” during such a test than in a core. Therefore, this data is highly desirable, though not absolutely essential,to have for each reservoir at each field to aid in proper planning of such factors as well spacing.
3.1.3 Well Log Analysis
Several reservoir properties used in the volumetric calculation of reserves wereestimated, or previous estimates were audited and verified, based on calculations made from well log and core data. These include net pay thickness, porosity, hydrocarbon and water saturation, and depth to fluid contacts. Since, in a typical exploration ordelineation project, most if not all potential reservoirs in all wells have log data while fewer will have core data, the analysis of well log data is key. Gustavson hasconsiderable experience in working with Soviet well log data.
The well log analysis performed as part of this study was dependent on the amount and quantity of data available, as well as on the documentation available on previous loganalysis work. It was not possible to conduct a detailed independent log analysis for allwells and still meet the deadlines of the project and milestones along the way.Therefore, prior work was relied upon in some manner.
The first step was to generally review several logs at each field for quality of data. Then documentation and results of previous log analysis, when available, were studied in detail. If data quality was good, previously used methodologies were deemed appropriate, and quantified results were duplicated when spot-checked, no further workwas necessary and previous log calculations were relied upon. Based on theexperience of this Consultant in Kazakhstan, Soviet area logs are generally of sufficientquality to enable reasonable interpretation and quantification of pay zones, though Western logs may respond somewhat differently. The major adjustments expected are of the nature of net pay cutoff limits.
Gustavson’s staff includes geologists and engineers who have worked with Soviet well log data in the past and are familiar with interpretation and analysis of such data.
7/6/2005 I-4 Gustavson Associates

PROMOTION OF OIL AND GAS PRODUCING ISLAMIC TRANSITIONAL STATE OF AFGHANISTANAREAS TO THE PRIVATE SECTOR MINISTRY OF MINES AND INDUSTRYGRANT AGREEMENT NO. H007-AF EMERGENCY INFRASTRUCTURE RECONSTRUCTION PROJECT
3.1.4 Review of Core Data
No information was available to this Consultant regarding the number of cores taken or detailed core descriptions. It was our understanding from conversations with U.S. Geological Survey personnel that significant core data is available in Afghanistan. It is expected that at least one core per field is available. Core descriptions were reviewed by our geologist and considered with well log data to aid in characterization ofreservoirs. Routine porosity and permeability data was incorporated with our review of well log analyses. Core porosity was compared to calculated log porosity. Coreporosity/permeability relationships were established for each reservoir at each field. The permeability distribution is key to evaluating reservoir performance under flood processes.
Additional information such as descriptions and orientation of fractures, and vertical permeability as compared to horizontal permeability, were considered in evaluatingapplicability of thermal enhanced oil recovery methods. This Consultant has extensiveexperience incorporating core data appropriately into a reservoir study, and also in working with reservoirs with little or no good core data available.
3.1.5 Review of Well Fluid Analyses
Reservoir fluid Pressure-Volume-Temperature (PVT) data are important in understanding and predicting future behavior of a reservoir under various production scenarios. All available PVT data from fluid samples from the Afghanistan fields wasthoroughly reviewed. Sampling conditions were reviewed to aid in judging the validity of the data. The ideal situation is to have valid PVT data for each reservoir from both the oil-bearing and gas-bearing portion. With this data this Consultant can understand bubble points, dew points for gas reservoirs, and changes in reservoir fluids’ relativevolumes, gas content in oil, and oil and gas viscosity, at various pressures. This information was important in planning appropriate development schemes for eachreservoir. Initial formation volume factor is a key parameter in the volumetric calculationof reserves.
When such data were not available, or were judged to be invalid, the reservoirs may be assumed to contain fluids similar to other nearby reservoirs for which data are available.Alternatively, the fluids may be characterized by empirical correlations based on basicproperties such as API gravity, density of the gas, and initial gas content of the oil. The confidence in the use of such correlations is not as high as with accurately measuredPVT data; however, it is acceptable for all purposes, if better information is notavailable.
Another key aspect of fluid analyses is to determine the type and quantities ofcontaminants present in the reservoir fluids. Some fluids in the discovered fields of Afghanistan are known to contain sulfur or hydrogen sulfide (H2S). Accurate knowledge of these contaminants is necessary for proper planning of the equipment necessary for their removal.
7/6/2005 I-5 Gustavson Associates
PROMOTION OF OIL AND GAS PRODUCING ISLAMIC TRANSITIONAL STATE OF AFGHANISTANAREAS TO THE PRIVATE SECTOR MINISTRY OF MINES AND INDUSTRYGRANT AGREEMENT NO. H007-AF EMERGENCY INFRASTRUCTURE RECONSTRUCTION PROJECT
This Consultant requested a wide variety of detailed reservoir engineering data of thetypes described above in order to accurately perform the reserves and production forecast tasks. Through correspondence with Mr. Craig Wandrey of the U.S. GeologicalSurvey, we were aware that they have sampled gas from three wells in Jar Quduk field and oil samples from two wells in Angut field. The results of the geochemical analysisof these samples provided us with valuable data for use in our reservoir analysis.
3.2 Review of Geological Maps
Existing geologic maps, including structure maps of all pay horizons, and isopach mapsof net pay for all reservoirs, were reviewed in detail for quality control. Well datapostings were checked for accuracy and to ensure that the control points were properlyhonored in contouring. Reasonableness of contours, proper consideration of geologicsetting, and proper placement of fluid contacts were evaluated. When the maps were found to be acceptable based on this analysis, they were used in further calculations and planning. If not, they were adjusted, corrected, or redone as required.
3.3 Review of In-Place Hydrocarbons
Oil, gas, and condensate initially in place were calculated from the geologic maps and the data discussed previously, using the standard volumetric equations:
oi
wo
BshAOOIP )1(000,10
and
gi
w
BshAGIIP )1(000,10
whereOOIP = oil originally in place in the oil column (metric tons)GIIP = gas initially in place in the gas column (standard cubic meters)
o = oil density at standard conditions (g/cm3)A = reservoir area (hectares) h = average net pay thickness (meters) Ah = reservoir bulk volume (hectare-meters)
= average porosity (fraction) sw = average water saturation (fraction) Boi = initial oil formation volume factor, (reservoir cubic meters per stock tank cubic
meters)Bgi = initial gas formation volume factor, (reservoir cubic meters per standard cubic
meters)
The reservoir parameters in these equations would be for the portion of the reservoir in the appropriate column. The reservoir volume were determined by planimetering the isopach maps. When separate isopach maps were not available for oil and gas net pay, other methods were used. For example, a fraction of the reservoir volume found in the gas cap might be estimated from well data and applied to total reservoir volume. This
7/6/2005 I-6 Gustavson Associates

PROMOTION OF OIL AND GAS PRODUCING ISLAMIC TRANSITIONAL STATE OF AFGHANISTANAREAS TO THE PRIVATE SECTOR MINISTRY OF MINES AND INDUSTRYGRANT AGREEMENT NO. H007-AF EMERGENCY INFRASTRUCTURE RECONSTRUCTION PROJECT
was the approach used for the World Bank by this Consultant in the reserve audit of the Kamen/Tokarev-Teplov trend in Uralsk Oblast, Kazakhstan. Instead, gross height in the oil zone may be multiplied by average net to gross ratio and total area to determine oil reservoir volume, if this technique is appropriate. Any technique used was soundly based in reservoir engineering and geologic principles, and fully documented in the reserves report.
Secondary fluids in place include dissolved gas in the oil zone and condensate in thegas cap. These volumes were estimated by multiplying the factors determined from PVT analysis for initial gas content in the oil (Rsi) and for initial condensate yield of the gas by the oil and gas volumes determined as described above.
3.4 Estimation of Recovery Factors
The most reliable source of information to estimate recovery factors, or the percentage of hydrocarbons in place which is expected to be recoverable, was data from the produced Afghani fields and/or from other analogous fields in the nearby area ofTurkmenistan or Uzbekistan which have sufficient production history to enable prediction of reserves based on production performance. This Consultant reviewed all available information, both provided by the client and available in the literature, to find and evaluate field analogs. This Consultant applied the recovery factors determined in this manner to the hydrocarbon volumes in place already determined to estimate reserves.
When fields were located which were judged to be similar to the subject fields, butdifferent in important respects, the recovery factors from these similar fields wereadjusted as appropriate before application in our reserve calculations. Whenappropriate analogs were not found nearby, recovery factors were estimated based on general analytical solutions for the appropriate type of recovery mechanism for each reservoir. This Consultant is experienced in making such judgments and choosingappropriate recovery factors for all types of reservoirs around the world.
3.5 Categorization of Reserves
This Consultant used the Society of Petroleum Engineers (SPE) reserve definitions andSociety of Petroleum Evaluation Engineers (SPEE) guidelines to categorize thereserves as Proved, Probable, or Possible. These categories will generally depend upon proximity of the area in question to a producing well or a well in which the subjectreservoir was successfully tested. Additionally, different recovery factors may qualify in different categories.
Note that since no successful thermal recovery projects are known of in similar reservoirs in the area, incremental recovery associated with thermal or any other enhanced recovery method cannot be considered as Proved reserves. However, they may meet the definitions for Probable reserves. This Consultant is experienced in this type of reserve categorization, a full example of which can be reviewed in our SPE
7/6/2005 I-7 Gustavson Associates

PROMOTION OF OIL AND GAS PRODUCING ISLAMIC TRANSITIONAL STATE OF AFGHANISTANAREAS TO THE PRIVATE SECTOR MINISTRY OF MINES AND INDUSTRYGRANT AGREEMENT NO. H007-AF EMERGENCY INFRASTRUCTURE RECONSTRUCTION PROJECT
paper that describes our initial work on the Kamen/Tokarev-Teplov trend (Lencioni, Johnston, and Hagemann, SPE #36635, 1996).
3.6 Probabilistic Reserve Analysis
A probabilistic reserve analysis was performed for the purposes of appropriate planning, as well as for presenting in an internationally accepted and understood manner to international oil companies a quantification of the downside risk and upside potential of these development / redevelopment projects. Probabilistic analysis is highly applicable to a project such as this one where field development has not yet begun or whereuncertainties may exist in important field data. In early field development stages it is expected that estimates of Proved reserves will be considerable smaller than they will ultimately be as field development progresses. It would be inappropriate to attempt todesign field development or size field facilities based on these early Proved reserves.The recommended method for planning development and facilities is to utilize the Most Likely case, or 50% probability estimate, from a probabilistic analysis.
When considering investment in or lending for such a development project, major international companies and multilateral financial institutions such as the World Bank, consider a probabilistic analysis of great importance. Such entities desire to understand not only the expected development scenario, but also the possible downside risk and uncertainties associated with the project, as well as the possible upside potential. Worldwide, the most accepted method of presenting such considerations is viaprobabilistic analysis.
Therefore, this Consultant conducted a probabilistic analysis of the reserves of the Afghanistan fields as part of the proposed study. To do this, each parameterincorporated in our reserve calculations was evaluated for its expected probability distribution. Many reservoir parameters are appropriate to consider as occurring in a log normal distribution. If insufficient information is available to define such a log normal distribution, a triangular distribution is a simple and effective substitute. For a triangulardistribution, the appropriate specialists will estimate most likely, minimum, and maximum values of each reservoir parameter.
For fields where uncertain production histories may be a factor, reasonable variations in this data can be incorporated into a probabilistic analysis. Such variations could bebased on production decline analysis, material balance calculations, or both.
Dependent relationships can be established between reservoir parameters ifappropriate. For example, existing well log data may indicate that portions of the reservoir with the lowest effective porosity may have the highest connate watersaturation, whereas higher porosity sections have lower water saturation. In such a case, it would be appropriate to establish an inverse relationship between porosity and water saturation, such that if a high porosity is randomly estimated, a corresponding lowwater saturation is estimated. The degree of such a correlation can be controlled to be very strong or weak.
7/6/2005 I-8 Gustavson Associates

PROMOTION OF OIL AND GAS PRODUCING ISLAMIC TRANSITIONAL STATE OF AFGHANISTANAREAS TO THE PRIVATE SECTOR MINISTRY OF MINES AND INDUSTRYGRANT AGREEMENT NO. H007-AF EMERGENCY INFRASTRUCTURE RECONSTRUCTION PROJECT
After distributions and relationships between input parameters were defined, a series ofsimulations are run wherein points from the distributions will be randomly selected and used to calculate one iteration of estimated reserves. The iterations was repeated until stable statistics (mean and standard deviation) resulted from the resulting output distribution, usually several hundred iterations.
The output distribution was used to characterize the expected reserves. Graphs of cumulative probability versus reserves were constructed, and the most sensitive inputparameters were determined. Key points from the reserve distribution were pointed out,including the 50% point (most likely) the 90% point (downside case) and 10% point(upside potential). An example of such an analysis performed by this Consultant can be reviewed in our SPE paper on the Kamen/Tokarev-Teplov trend (Lencioni, Johnston,and Hagemann, SPE #36635, 1996).
4. Technical Findings (First Interim Report)
4.1 Introduction
4.1.1 Purpose
The purpose of the technical findings was to provide estimates of the remaining reserves of the gas fields in the Sheberghan area and also to provide an assessment of the hydrocarbon potential of certain portions of the North Afghan basin.
The technical findings provide a review of this Consultant’s cataloging and analysis ofthe available data and information that has been directly provided to Gustavson Associates by the Ministry of Mines and Industry or indirectly provided by the U.S. Geological Survey on a series of CD-ROMs. Receipt of this dataset provides the technical basis for the results presented in the technical findings, namely the reserve and resource estimates.
4.1.2 Authority
This Report has been generated under authority of the CONTRACT FORCONSULTANTS’SERVICES FOR PROMOTION OF OIL AND GAS PRODUCINGAREAS TO THE PRIVATE SECTOR between the Ministry of Mines and Industry,Islamic Transitional State of Afghanistan, and Gustavson Associates Inc. (USA), dated February 28, 2004 (Emergency Infrastructure Reconstruction Project Grant AgreementNo. H007-AF).
7/6/2005 I-9 Gustavson Associates

PROMOTION OF OIL AND GAS PRODUCING ISLAMIC TRANSITIONAL STATE OF AFGHANISTANAREAS TO THE PRIVATE SECTOR MINISTRY OF MINES AND INDUSTRYGRANT AGREEMENT NO. H007-AF EMERGENCY INFRASTRUCTURE RECONSTRUCTION PROJECT
4.1.3 Travel To Afghanistan
Gustavson Associates representatives made four trips to Afghanistan. In August 2003,Mr. Edwin Moritz, Vice President of Gustavson Associates Inc. (USA), was present for the opening of consultant proposals by the Ministry of Mines and Industry in Kabul. In December 2003, Mr. John Gustavson, President of Gustavson Associates Inc. (USA),and Mr. Moritz met with officials of the Ministry of Mines and Industry in Kabul to negotiate the terms of the present contract.
In February 2004, Mr. Moritz, appointed Deputy Project Manager for the project, and Mr. Hafizullah Nawabi, Engineering Advisor, met with officials of Afghan Gas and the Exploration Department in Sheberghan for the purpose of field inspection of a number of the gas fields and associated production facilities in order to ascertain the current gas production levels and capabilities. Figure 1-1 is an index map of the Sheberghan region showing the location of the major oil and gas fields that are the subjects of thispromotion project. For a more complete location map to all of the fields discussed in the report, the reader is referred to Plate 4. Mr. Moritz and Mr. Nawabi also obtainedadditional technical information for Kashkari oil field that will be required for reserves and production forecasting. Returning to Kabul, Mr. Moritz and Mr. Nawabi werepresent for the contract signing ceremony and Mr. Moritz signed the contract as representative for Gustavson Associates Inc. (USA).
Mr. Moritz returned (April, 2004) to Afghanistan for a data-gathering trip to both Sheberghan and Kabul. After review of the dataset that is currently available to Gustavson Associates in its office in Boulder, Colorado, USA, the technical staff requested additional geological, geophysical, and reservoir engineering data.
7/6/2005 I-10 Gustavson Associates

PROMOTION OF OIL AND GAS PRODUCING ISLAMIC TRANSITIONAL STATE OF AFGHANISTANAREAS TO THE PRIVATE SECTOR MINISTRY OF MINES AND INDUSTRYGRANT AGREEMENT NO. H007-AF EMERGENCY INFRASTRUCTURE RECONSTRUCTION PROJECT
Figure 1-1 Oil and Gas Fields in the Area of Sheberghan, Afghanistan
7/6/2005 I-11 Gustavson Associates

PROMOTION OF OIL AND GAS PRODUCING ISLAMIC TRANSITIONAL STATE OF AFGHANISTANAREAS TO THE PRIVATE SECTOR MINISTRY OF MINES AND INDUSTRYGRANT AGREEMENT NO. H007-AF EMERGENCY INFRASTRUCTURE RECONSTRUCTION PROJECT
In June 2004, a team of geophysicists traveled to Afghanistan to review and copyadditional geological and geophysical data needed to complete the reserve and resource estimates. This additional data was brought back to Gustavson’s offices in late June and was analyzed by staff engineers, geologists and geophysicists.
4.1.4 Organization Of Report
The subsequent parts of this section of this Final Report are organized into several main parts. The first part focuses on the Work Program, which includes all of the geologicaland reservoir engineering tasks as well as the development of a promotional package. The second part presents the conclusions from the Work Program. A Bibliography of references and materials used for the work is also included.
Also, Gustavson has prepared a section that discusses the regional structure, stratigraphy and petroleum systems as it relates to the hydrocarbon exploration potential in the immediate area of the producing fields and surrounding regions of the North Afghanistan basin. This is provided as Appendix E to this Report.
4.2 Work Program – Phase I (Technical Analysis)
Gustavson Associates worked diligently to complete the tasks that were included in Phase I. The majority of these tasks were completed with the remainder completed in Phase 2, with some tasks contingent upon passage of the petroleum law.
As of the writing of the Technical Finding, Gustavson completed the following tasks:
Compiled and analyzed all pertinent technical information on file in Sherberghan Evaluated the known oil and gas reserves that reside in fields, Forecasted future production for fields based on a hypothetical rehabilitation and development scenario.Reviewed and discussed the assessment for undiscovered oil and gas
For Phase II, Gustavson completed:
Preparation of preliminary concepts for concession blocks that will be offered tothe private sector for development
4.2.1 Research And Data Collection
7/6/2005 I-12 Gustavson Associates
The initial tasks of the work plan centered on gathering and review of all available dataand requesting any additional data that may be required to adequately complete thevarious Phase I tasks. Gustavson has received all of the data that was collected and provided by the U.S. Geological Survey on a series of CD-ROMs. In addition,Gustavson personnel have made three separate trips to Sheberghan to gatherinformation from the Afghan Gas Company and the Exploration Department. A listing ofall electronic data collected is included as Appendix B in this Report. Gustavson staff

PROMOTION OF OIL AND GAS PRODUCING ISLAMIC TRANSITIONAL STATE OF AFGHANISTANAREAS TO THE PRIVATE SECTOR MINISTRY OF MINES AND INDUSTRYGRANT AGREEMENT NO. H007-AF EMERGENCY INFRASTRUCTURE RECONSTRUCTION PROJECT
reviewed this dataset and determined that additional technical data was required.Requests were made for the additional data. More details of the additional data thatwere requested will be discussed in the following subsections by technical discipline.
As technical analysis was undertaken and the need for specific information wasidentified, it was necessary to make additional data requests to the Ministry of Minesand Industry.
During the visit in April, Edwin Moritz met with Mr. Abdul Salam, Manager of the Geophysical Department and the keeper of the available seismic data. As per our request, he provided a list of paper seismic sections that are available in the Geophysical Department and these are shown in Appendix D of this Report.
Mr. Salam advised that the Geophysical Department only has seismic lines for certain gas fields and discoveries in the Jouzjan Province. They do not have seismic for the other three provinces in the North Afghan Basin or seismic across the oilfields. It is not known if seismic was ever acquired for the oilfields since the reservoirs are shallow and they may have explored the oil by drilling.
Mr. Abdul Salam commented that when comparing the seismic index map (Plate 1) withthe list, there are more seismic lines on the list than are shown on the map. Mr. Abdul confirmed that there are more lines available than are shown on the map.
The data available appears to be interpreted seismic sections. They do not have detailed individual shot point maps for the known lines. Mr. Salam says the station interval is typically 50 meters with shots every 100 meters.
4.2.1.1 Summary of Gustavson Visit June 3 through June 15, 2004
Accompanied by Mr. Mandarkhail, Mr. David A. Rasmussen and Arman Sirazhev of Gustavson Associates met with officials in the Ministry of Mining and Industry, in Kabul where a brief progress report was presented and goals of the data-gathering trip to Sheberghan were explained. In Mazar-e-Sharif the group met briefly with the MMI Exploration Department, then drove to Sheberghan.
The group met with officials at the Afghan Gas Company and collected current data needed for the project. This included a summary of all producing wells, and test reports on useful wells. Officials pointed out that since 1998, no testing or geophysical loggingwork has been done on the producing fields. They said that it would be greatly appreciated if they could get some help with new logging and new petrophysical studies to help with their reserves determinations and to determine where the gas watercontacts are for the producing fields.
Most of the trip was spent with MMI Exploration Department in Sheberghan, gathering data from the significant fields and prospects. The fields and prospects of greatest interest were given priority in the data acquisition. Three digital scanners were used to
7/6/2005 I-13 Gustavson Associates

PROMOTION OF OIL AND GAS PRODUCING ISLAMIC TRANSITIONAL STATE OF AFGHANISTANAREAS TO THE PRIVATE SECTOR MINISTRY OF MINES AND INDUSTRYGRANT AGREEMENT NO. H007-AF EMERGENCY INFRASTRUCTURE RECONSTRUCTION PROJECT
copy report text and display panels of logs and maps, including a large documentscanner provided by the USGS, and an 11 by 18inch scanner provide by Gustavson Associates.
Of great value were well montages of significant wells for each field, which werescanned and copied to DVD discs, in the nine days of data collection and scanning. Engineer Abdul Wasay was very helpful during interviews in qualifying various wells foreach field and in gathering the most relevant reports and data. It was hoped that some well logs were on digital tape but apparently none of the geological data is in digital format at the Exploration Department’s offices in Sheberghan. The recordings weremade before the late 1980’s, and digital technology had not reached Afghanistan yet.
The visit to the Geophysical Department was useful and provided some interesting seismic lines across structures and through wells having significant test results. Tounderstand the extent of seismic recording, we checked carefully for additional seismicindex maps. The maps we have are the most complete. Some additional lines were recorded in the Ashraf area, southwest of Juma in 1991, the last of the Russian projects, but no index maps exist. No seismic index maps exist for the oil province in the south, and in discussions apparently no seismic data was ever recorded there.
Field tapes and support data were obtained during this trip for lines 88337 over the Chakhcha trend and 88341 across Bashikurd. This data was analyzed for data recovery from the possibly damaged tapes and for reprocessing if the tapes were readable. TheGustavson group inspected the seismic recording equipment, and found that it may be possible to refurbish the recorders, but there are no recording cables, and geophonesneed to be tested and refurbished. The shothole drilling trucks appear to be in goodorder as they are currently being used for water well drilling. The visit to Sheberghan was generally successful, resulting in data volume filling eight DVDs and a CD.
4.2.2 Analysis Of Available Information And Reports
After an extensive review of the data on file in Sheberghan, it became apparent that the vast majority of important information on the oil and gas reserves and resources were contained in technical reports prepared by Soviet Federal Corporations during the 1970s and 1980s. The corporations that prepared these reports are VO TEXHNOEXPORT1 and ZARUBEZHGEOLOGIA2. These reports are verycomprehensive and present details of the activities that were conducted in the exploration, testing and mapping of the oil and gas fields in the Sheberghan area. We
1 VO TEXHNOEXPORT, Federal Technology Export Corporation (literal translation: TECHHNO<logy>EXPORT FOREIGN TRADE ASSOCIATION), an agency of the Soviet Ministry of International Trade, founded in1932. This agency was in charge of a broad range of transactions related to technology and material export andimport, engineering, construction and other technical services provided by Soviet experts and companies abroad, etc.Texhnoexport had projects throughout Asia and Africa.
7/6/2005 I-14 Gustavson Associates
2 ZARUBEZHGEOLOGIA, International Geology Agency, an affiliate of the Ministry of Geology and NaturalResources is in charge of international exploration and production operations. It is our understanding that this is still active and has offices in Moscow.

PROMOTION OF OIL AND GAS PRODUCING ISLAMIC TRANSITIONAL STATE OF AFGHANISTANAREAS TO THE PRIVATE SECTOR MINISTRY OF MINES AND INDUSTRYGRANT AGREEMENT NO. H007-AF EMERGENCY INFRASTRUCTURE RECONSTRUCTION PROJECT
note that technical reports of this nature were not available for every field. For certain reports, the translated Table of Contents is provided in Appendix U.
The reports typically contain geologic maps, cross sections, well log montages, cross sections, core and test information, reservoir parameters and reserve estimates. Original source information such as geologist and engineering field notes, drillingreports and other data appeared to be lacking. Therefore, we have relied on thesereports for our analysis but these reports were carefully audited and checked foraccuracy and consistency. Our methodology for doing this is described below.
At the request of Gustavson, the Exploration Department has compiled a comprehensive well database that summarizes the exploration and development wells drilled in the North Afghan basin. This inventory is provided as Appendix C in thisReport.
In addition to the technical reports, information was also available from the Afghan GasCompany. This consisted of individual well information that included historicalproduction and pressure data and a record of perforated intervals.
4.2.3 Methodology
4.2.3.1 General
This section summarizes the methodology used by Gustavson for performing the technical tasks, principally focusing on the probabilistic analysis of known remaining oil and gas reserves from eleven of the most important producing and non-producing fields in the North Afghanistan basin. In addition, a brief discussion of two additional fields,Angut oil field and Shakarak gas field, for which probabilistic reserves were not assigned is also included for completeness.
4.2.3.2 Review of the Seismic Data
The available data at Gustavson all comes from scanning performed by the MMI Exploration Department in Sheberghan. The first set of data was collected by the USGS, and later visits by Gustavson scientists, brings the total lines to 23 that were obtained and reviewed. In addition to scanned data, two lines in the form of field tapes were taken for tape rehabilitation and reprocessing. Further discussions of the seismicdata are in the descriptions of the fields, which follow in subsections of this report, and in Appendix E, which discusses the regional exploration potential.
Synthetic seismograms were considered for generation, but no suitable sonic logs could be located. The library of seismic lines is also limited and it would be unlikely to find a sonic curve near a line we have. Some sonic logs were located near suitable lines but the curves only include a limited zone of interest and would not be able to model a seismic trace representing thousands of meters.
7/6/2005 I-15 Gustavson Associates
PROMOTION OF OIL AND GAS PRODUCING ISLAMIC TRANSITIONAL STATE OF AFGHANISTANAREAS TO THE PRIVATE SECTOR MINISTRY OF MINES AND INDUSTRYGRANT AGREEMENT NO. H007-AF EMERGENCY INFRASTRUCTURE RECONSTRUCTION PROJECT
A general guide for picking tops on the seismic data for that area is described asfollows. For Bashikurd well #4, at Bashikurd field, the one-way velocity for tying the Jurassic well tops to the seismic data is approximately 3544 meters /sec. The time pick of 2.5 seconds two way time was determined from the significant event at the Cretaceous-Jurassic boundary believed to be the anhydrite event, and depth valuescome from the reports and well displays.
Gustavson found that given the sparse coverage of available data, it was not possible to generate any new maps based on the seismic data. If all of the seismic data shown on the maps were available in useful form, then it may be possible to perform independent interpretations of this data.
Northern Fields with Seismic Index
Plate 1 shows the most complete index map available for seismic data in the context ofthe field outlines. Based on close questioning of Geophysical Department personnel, this is the most complete map available for seismic lines. Some additional data was recorded near Ashraf West and Ashraf South in 1991, but no maps are available from Afghanistan. It is likely that seismic data was recorded beyond the limits of the map butMMI has no copies or records of those surveys.
Zad Juma to Jangalikolon - Composite Seismic Line 1
This regional composite seismic profile was chosen because it crosses two main structural trends, namely the Juma-Bashikurd and Jangalikolon fields and prospects. Composite Seismic Line 1 (Plate 2) consists of several separate seismic lines that were connected graphically together in a single image to illustrate the main geologic features. Composite Seismic Line 1 starts at the southwest of the Zad Juma prospect, with line 87304, then crosses the Juma and Bashikurd trends connecting with Line 86204 nearJuma well #12.
The Juma-Bashikurd and Asskaya structures are apparent on the line as it passes intothe structural trough separating the Bashikurd structural high trend from Jangalikolon. Line 88329 connects in the trough and passes one kilometer to the north of Jangalikolon well #4 at the crest and center of Jangalikolon structure. Jangalikolon well#4 is significant because of its location at the crest of the structure and favorable testresults. The deepening basin north east of Jangalikolon is apparent on the north end of the composite line.
Bashikurd to Jangalikolon - Composite Seismic Line 2
This line is the best example of the Bashikurd structure and ties with Line 88334 crossing the eastern saddle of the Jangalikolon structure. Specifically Composite Seismic Line 2 (Plate 3) begins with line 85201 at the south end of the Juma structure, and passes through Bashikurd wells #4, #2 and #11, located in a broad structural plateau east of the main mapped structure. Line 88334 crosses a low saddle on the
7/6/2005 I-16 Gustavson Associates

PROMOTION OF OIL AND GAS PRODUCING ISLAMIC TRANSITIONAL STATE OF AFGHANISTANAREAS TO THE PRIVATE SECTOR MINISTRY OF MINES AND INDUSTRYGRANT AGREEMENT NO. H007-AF EMERGENCY INFRASTRUCTURE RECONSTRUCTION PROJECT
Jangalikolon-Chakhcha structural trend, where seismic frequencies and character of the seismic data on this line are particularly good, and may provide a preview of the potential of new processing.
Reprocessing of Lines 88337 and 88341
As described previously, field tapes from two lines were borrowed to determine if reprocessing is feasible. These lines are shown on Plate 1 where southwest-northeastLine 88337 crosses the major structural trend at the low saddle separating Jangalikolonand Chakhcha structures, and where Line 88341 crosses the south end of the Bashikurd structure, parallel to the main trend.
With new processing it is expected that dramatic improvement will result with theapplication of careful tape handling, precise geometry definition, and the best signalenhancement and noise reduction techniques. Prestack migration should provide dramatic enhancement and improved resolution of structural reservoir extents and faultdetail.
Inventories of Seismic Lines
While in Sheberghan, the Geophysical Department provided us with an inventory of paper seismic lines that are in their possession and as described previously, this list is presented in Appendix D of this report. This table lists all of the lines that the geophysical department has prints for. It is noted that the data is stored in large stacksin their offices. It is recommended that all seismic data be scanned for electronic archival to prevent further loss or disintegration of this valuable information.
Seismic data obtained by Gustavson Associates and the USGS is listed in the accompanying table, entitled Seismic Line Accounting (Table 1-1). The available data includes lines recorded in 1991, but no index maps showing the location of these lineshave been located. The index map used in this report (Plate 1) was created in 1988 orearly 1989.
7/6/2005 I-17 Gustavson Associates

PROMOTION OF OIL AND GAS PRODUCING ISLAMIC TRANSITIONAL STATE OF AFGHANISTANAREAS TO THE PRIVATE SECTOR MINISTRY OF MINES AND INDUSTRYGRANT AGREEMENT NO. H007-AF EMERGENCY INFRASTRUCTURE RECONSTRUCTION PROJECT
Table 1-1 Seismic Line Accounting
1988 Map Available DataComments80327 80327 Located84202 84202 Located85102 85102 Located85104 85104 Located85112 85112 Located85201 85201 Located85203 85203 Located86105 86105 Located86204 86204 Located86301 86301 Located87217 87217 Located87304 87304 Located
87308 bad file 88320 88320 Located88324 88324 Located88329 88329 Located88334 88334 Located
88335 no data in file 88337 88337 Located; NEW PROCESSING 88341 88341 Located; NEW PROCESSING
91103 location (Kuraishi) unknown 91104 location (Bughazkum) unknown 91105 location (Bughazkum) unknown
7/6/2005 I-18 Gustavson Associates

PROMOTION OF OIL AND GAS PRODUCING ISLAMIC TRANSITIONAL STATE OF AFGHANISTANAREAS TO THE PRIVATE SECTOR MINISTRY OF MINES AND INDUSTRYGRANT AGREEMENT NO. H007-AF EMERGENCY INFRASTRUCTURE RECONSTRUCTION PROJECT
Seismic Recording Parameters
The seismic surveys were recorded on 96-channel Russian built systems, which wereclose copies of Texas Instruments DFS V systems. A translation of a printed section line label is also presented in Appendix D in order to show the general recording parametersduring acquisition.
4.2.3.3 Calculation of In-Place Hydrocarbons
Oil, gas, and condensate initially in place were calculated from the geologic maps and the data discussed previously, using the standard volumetric equations:
oi
wo
BshAOOIP )1(000,10
and
gi
w
BshAGIIP )1(000,10
whereOOIP = oil originally in place in the oil column (metric tons)GIIP = gas initially in place in the gas column (standard cubic meters)
o = oil density at standard conditions (g/cm3)A = reservoir area (hectares) h = average net pay thickness (meters) Ah = reservoir bulk volume (hectare-meters)
= average porosity (fraction) sw = average water saturation (fraction) Boi = initial oil formation volume factor, (reservoir cubic meters per stock tank
cubic meters) Bgi = initial gas formation volume factor, (reservoir cubic meters per standard
cubic meters)
The reservoir parameters in these equations would be for the portion of the reservoir in the appropriate column; however, no oil reservoirs with gas caps were described in the available data for the discovered Northern Afghanistan oil fields. The area wasdetermined by planimetering structure maps to calculate the area. Net pay thickness was derived either from isopach maps or from the technical reports.
Secondary fluids in place include dissolved gas in the oil zone and condensate in thegas cap or gas reservoir. These volumes were estimated by multiplying the factors determined from PVT analysis or well testing for initial gas content in the oil (Rsi) and forinitial condensate yield of the gas by the oil and gas volumes determined as described above. For the gas fields in the Northern Afghanistan basin, the condensatecondensate content is very low, and these negligible volumes were not estimated.
7/6/2005 I-19 Gustavson Associates

PROMOTION OF OIL AND GAS PRODUCING ISLAMIC TRANSITIONAL STATE OF AFGHANISTANAREAS TO THE PRIVATE SECTOR MINISTRY OF MINES AND INDUSTRYGRANT AGREEMENT NO. H007-AF EMERGENCY INFRASTRUCTURE RECONSTRUCTION PROJECT
4.2.3.4 Estimation of Recovery Factors
The most reliable source of information to estimate recovery factors, or the percentage of hydrocarbons in place which is expected to be recoverable, was data from the produced Afghani fields and/or from other analogous fields in the nearby area ofTurkmenistan or Uzbekistan which have sufficient production history to enable prediction of reserves based on production performance. This Consultant has reviewedall available information, both provided by the client and available in the literature, to find and evaluate field analogs. Unfortunately, no such analogous fields could be found.The only producing oil field in Afghanistan, Angut, has no records available of its oil production data. No references in published literature were found on any nearby fieldsin Turkmenistan or Uzbekistan.
This Consultant has data available for numerous fields producing from generally similarCretaceous and Jurassic reservoirs in Western Siberia. We therefore estimated the range and the most likely recovery factors based on the range of data exhibited in theseWestern Siberian fields.
For gas fields, recovery factors were calculated assuming production from volumetricreservoirs, and a reasonable abandonment pressure. The lower limit for abandonment pressure was calculated using available data for operating manifold pressures in the producing fields and calculating associated flowing bottomhole pressures. In general,these values yielded very high gas recovery factors, and a slightly higher range of abandonment pressures were used with a most likely value estimated at about 10% ofthe initial reservoir pressure.
4.2.3.5 Categorization of Reserves
This Consultant uses the Society of Petroleum Engineers (SPE) reserve definitions andSociety of Petroleum Evaluation Engineers (SPEE) guidelines to categorize thereserves as Proved, Probable, or Possible. These definitions specify, for probabilistic analysis, that Proved reserves are those with at least a 90% probability of being presentand recoverable, with Proved plus Probable reserves requiring at least a 50% probability, and Proved plus Probable plus Possible reserves requiring at least a 10%probability.
It should be noted that the reserves presented in this Report do not yet fully comply withthe SPE definitions, because of the requirement that Proved reserves be commerciallyrecoverable. Economic analysis of development and production of oil and/or gas from each of these fields has not been conducted. Thus, these estimates are considered to be “technically recoverable” reserves, and this Consultant has no opinion at this time asto whether or not these are economically recoverable reserves. Economics will be evaluated pending finalization of Afghanistan’s Petroleum Law.
7/6/2005 I-20 Gustavson Associates

PROMOTION OF OIL AND GAS PRODUCING ISLAMIC TRANSITIONAL STATE OF AFGHANISTANAREAS TO THE PRIVATE SECTOR MINISTRY OF MINES AND INDUSTRYGRANT AGREEMENT NO. H007-AF EMERGENCY INFRASTRUCTURE RECONSTRUCTION PROJECT
4.2.3.6 Probabilistic Reserve Analysis
A probabilistic reserve analysis was performed for the purposes of appropriate planning, as well as for presenting in an internationally accepted and understood manner to international oil companies a quantification of the downside risk and upside potential of these development / redevelopment projects. Probabilistic analysis is highly applicable to projects such as most of these where field development has not yet begun or where uncertainties may exist in important field data. In early field development stages it is expected that estimates of proved reserves will be considerable smaller than they will ultimately be as field development progresses. It would be inappropriate to attempt todesign field development or size field facilities based on these early Proved reserves.The recommended method for planning development and facilities is to utilize the Most Likely case, or 50% probability estimate, from a probabilistic analysis.
When considering investment in or lending for such a development project, major international companies and multilateral financial institutions such as the World Bank, consider a probabilistic analysis of great importance. Such entities desire to understand not only the expected development scenario, but also the possible downside risk and uncertainties associated with the project, as well as the possible upside potential. Worldwide, the most accepted method of presenting such considerations is viaprobabilistic analysis.
Therefore, this Consultant conducted a probabilistic analysis of the reserves of the Afghanistan fields as part of the proposed study. To do this, each parameterincorporated in our reserve calculations was evaluated for its expected probability distribution. Many reservoir parameters are appropriate to consider as occurring in a log normal distribution. If insufficient information is available to define such a log normal distribution, a triangular distribution is a simple and effective substitute. For a triangulardistribution, the appropriate specialists will estimate most likely, minimum, and maximum values of each reservoir parameter.
Dependent relationships can be established between reservoir parameters ifappropriate. For example, existing well log data may indicate that portions of the reservoir with the lowest effective porosity may have the highest connate watersaturation, whereas higher porosity sections have lower water saturation. In such a case, it would be appropriate to establish an inverse relationship between porosity and water saturation, such that if a high porosity is randomly estimated, a corresponding lowwater saturation is estimated. The Khoja Bolon field was tested with such a correlation,and the resulting reserve distribution was compared to the distribution calculated without the correlation. Because very little difference was seen between the two, no correlations were used on other fields.
After distributions and relationships between input parameters are defined, a series of simulations are run wherein points from the distributions are randomly selected and used to calculate one iteration of estimated reserves. The iterations are repeated until
7/6/2005 I-21 Gustavson Associates

PROMOTION OF OIL AND GAS PRODUCING ISLAMIC TRANSITIONAL STATE OF AFGHANISTANAREAS TO THE PRIVATE SECTOR MINISTRY OF MINES AND INDUSTRYGRANT AGREEMENT NO. H007-AF EMERGENCY INFRASTRUCTURE RECONSTRUCTION PROJECT
stable statistics (mean and standard deviation) result from the resulting outputdistribution, usually several hundred iterations.
The output distribution is then used to characterize the expected reserves. Graphs of cumulative probability versus reserves will be constructed, and the most sensitive inputparameters will be determined. Key points from the reserve distribution will be pointed out, including the 50% point (most likely) the 90% point (downside case) and 10% point(upside potential).
4.2.3.7 Other Methods of Reserve Estimation
Where additional data were available, additional methods of reserve estimation were used. These included graphical gas material balance analysis (commonly referred to asthe p-over-z or p/z method) and production decline analysis. These methods are onlyapplicable for producing fields with production and reservoir pressure data available.
The p/z method consists of constructing a plot with cumulative gas production on the x axis and the quantity p/z, or reservoir pressure divided by the z factor (real gassupercompressibility factor), on the y axis. If the reservoir behaves as a volumetricreservoir, the points should fall on a straight line, with an x-intercept at the value oforiginal gas in place (OGIP) and ultimate gas reserves estimated by entering the graphon the y axis at the value of p/z associated with expected field abandonment pressure, and moving horizontally across the graph to the straight line, then moving down to the x axis to find the estimated value of cumulative gas production at abandonment. Figure 1-2 shows an example of this type of plot.
Production decline curve analysis consists of plotting gas production rates or volumesversus time on a semilog plot, and projecting the exhibited trends into the future.
7/6/2005 I-22 Gustavson Associates

PROMOTION OF OIL AND GAS PRODUCING ISLAMIC TRANSITIONAL STATE OF AFGHANISTANAREAS TO THE PRIVATE SECTOR MINISTRY OF MINES AND INDUSTRYGRANT AGREEMENT NO. H007-AF EMERGENCY INFRASTRUCTURE RECONSTRUCTION PROJECT
974 OGIP920 ULTIMATE RECOVERY208 p/z aband.
0
500
1,000
1,500
2,000
2,500
3,000
3,500
4,000
0 100 200 300 400 500 600 700 800 900 1,000 1,100
Cum Gas, BCF
p/z,
psi
Figure 1-2 Example p/z Analysis
4.2.4 Analysis Of Producing Fields
4.2.4.1 Introduction
This Section of the Report summarizes the technical work performed by Gustavson Associates staff for the purpose of gathering critical reservoir parameter data on severalproducing oil and gas fields in the North Afghanistan basin. The various reservoirparameters were used as basic input data for the probabilistic reserves modeling of the subject fields. The results of the modeling for each field are presented in the appropriate subsections that follow. The fields that are summarized in this section include three gas fields (Jar Quduk, Khoja Gogerdaq, and Yatimtaq) and one oil field (Angut). These fields were in various stages of development when the Soviets left Afghanistan in the early 1990’s. Some reservoirs were fairly well developed in some ofthe fields, particularly the shallower Cretaceous sandstone reservoirs (Albian Zone XI, Aptian Zone XII, and Hauterivian Zone XIV), while the deeper Jurassic carbonate reservoirs were, at best, only partially developed. The single producing oil field, Angut,is included in this section, however probabilistic reserves modeling and estimates ofremaining reserves were not performed because this field is depleted, or nearlydepleted, and it is unclear how much oil was produced from the original recoverable reserves base and how much remains to be produced.
7/6/2005 I-23 Gustavson Associates

PROMOTION OF OIL AND GAS PRODUCING ISLAMIC TRANSITIONAL STATE OF AFGHANISTANAREAS TO THE PRIVATE SECTOR MINISTRY OF MINES AND INDUSTRYGRANT AGREEMENT NO. H007-AF EMERGENCY INFRASTRUCTURE RECONSTRUCTION PROJECT
4.2.4.2 Jar Quduk Gas Field
Geology
Jar Quduk gas field is located 9 km. south-southwest of the city of Sheberghan (Figure 1-1, Plate 4). Geologically, the field is located on a broad, generally symmetrical domal structure that is cut by several parallel northwest-southeast faults on its northeastern flank as well as by an east-west fault along its crest. All of the faults are normal faults with down-to-the-north or to-the-northeast displacements ranging from 40-100 meters. Although none of the faults are critical to the trapping, the main NW-SE fault along the north flank appears to control the slightly different elevations of the gas-water contactsin the main and northern fault blocks at the main Lower Cretaceous Hauterivian productive horizon. The faults cut all of the Cretaceous formations well as the deeperJurassic reservoirs.
The two productive horizons at Jar Quduk gas field are the Lower Cretaceous (Hauterivian Zone XIV) sandstone reservoir and the Jurassic Kugitan reefal carbonate reservoirs (Zones XV, XVa, and XVI). The two horizons are separated by UpperJurassic evaporites. The Hauterivian reservoir has been the main producing horizon todate, having been developed with the most wells by the Russians. The Jurassic reservoirs have not yet been fully developed. Structural closure at the top of the Hauterivian horizon is approximately 210 meters and the height of the mapped gascolumn is 160 meters indicating that the structure is approximately 76% filled tospillpoint for the Hauterivian reservoir. At the deeper Jurassic reservoir, the gross gas column is also approximately 210 meters thick but includes three separate gasreservoirs with separate gas-water contacts as mapped. At the Hauterivian level, the field encompasses approximately 26.4 km2 as defined by the mapped position of the gas-water contact on the top of the zone.
For the Hauterivian and Jurassic (Kugitan) reservoirs in Jar Quduk field, the 1970s and 1980s vintage maps were quality-control checked, log picks were checked, and contours and well data were reviewed for consistency. The information to be used asinput parameters for probabilistic reserves calculation were tabulated and given to the engineering staff for use in reserves modeling.
Cretaceous Hauterivian (XIV) Reservoir
The following information sources were especially useful in assessing the CretaceousHauterivian reservoir at the Jar Quduk field:
Exhibit 8 from a 1982 report on the Hauterivian gas reserves at Jar Quduk, a structure map of the field at a scale of 1:25,000. The map on the sheet includes inner and outer original gas-water contact surfaces. To the left of the map, there is a table that includes gas and water flow rates over tested intervals and below the map is a table that gives some reservoir parameters (area, thickness,porosity, and gas saturation) for different Russian reserve categories.
7/6/2005 I-24 Gustavson Associates

PROMOTION OF OIL AND GAS PRODUCING ISLAMIC TRANSITIONAL STATE OF AFGHANISTANAREAS TO THE PRIVATE SECTOR MINISTRY OF MINES AND INDUSTRYGRANT AGREEMENT NO. H007-AF EMERGENCY INFRASTRUCTURE RECONSTRUCTION PROJECT
Structure map of the Hauterivian from 1986 at a scale of 1:25,000. This map includes many more wells than the 1982 Exhibit 8 map, which makes it useful forlocating wells. It is quite similar to the 1982 map.
Jurassic Kugitan Formation (XV and XVI) Reservoir
The following information sources were especially useful in assessing the JurassicKugitan formation at the Jar Quduk field:
Exhibit 5 from a 1986 report on the Jurassic gas reserves at Jar Quduk, a structure map and a cross section (scale of 1:10,000) of the XVa and the XVI horizons. The sheet includes several pieces of information. There are two structural maps (one for both the XVa and XVI horizons) with gas-water contact, and a cross section.Cross section geological profiles I-I through IV were useful for evaluating the placement of the gas-water contact based on tests in various wells.
Geophysics
Jar Quduk field has about 5 lines crossing it including a wide-line profile survey, (Plate 1). The closest line available is 84202, passing 4 km west through Golda and thenorthwesternmost edge of the field. This line is of poor quality in the important fault zones, due to structural complexity, old processing, and lack of data migration. Some deep events are discernable, but accurate well ties would be needed to interpret the data. The recording is probably adequate as shown by some good signal at 3.0 secondson parts of the line.
Reservoir Parameters
Table 1-2 below presents a summary of input parameters used in the probabilisticreserves modeling of Jar Quduk field. These parameters come from a variety of sources including maps, tables included on maps, information from the 1982 and 1986 Soviet-era Technoexport reports on the field, and data from other reports such as the 2003 Asian Development Bank Final Report on Gas Sector Rehabilitation and the 1970 Ministry of Geology of the USSR report on the Oil and Gas Potential of Northern Afghanistan (Bratash et al., 1970).
7/6/2005 I-25 Gustavson Associates

PROMOTION OF OIL AND GAS PRODUCING ISLAMIC TRANSITIONAL STATE OF AFGHANISTANAREAS TO THE PRIVATE SECTOR MINISTRY OF MINES AND INDUSTRYGRANT AGREEMENT NO. H007-AF EMERGENCY INFRASTRUCTURE RECONSTRUCTION PROJECT
Table 1-2 Jar Quduk Gas Field Input Parameters for Probabilistic Modeling
Gas Reservoir: Kugitan (XV)
Parameter MinimumMostLikely Maximum Remarks
Gas Gravity0.633 0.647 0.7ML and minima from Jar Quduk report, maxima from ADB
% N2 0.01 0.29 0.58From ADB % CO2 5.08 7.45 8.97From ADB % H2S 0.03 0.55 0.71From ADB, ML from Table 3.1, Khoja Gogerdaq report RES. TEMPERATURE °C 97 105 109From ADB INITIAL PRESSURE , atm 296 329 346From ADB ABANDONMENT PRES , atm 18 25Estimated from experience NET PAY , m 43.2 48 52.8ML from ADB (summation of zones), range ±10%AREA, ACRES 447 1127 1690ML is an equivalent area based on ADB
WATER SAT , % 14.0 19.0 24.0From ADB, ML is weighted average based on pore volume
POROSITY , % 9.0 9.6 11.0From ADB, ML is weighted average based on drainage volume
Gas Reservoir: Hautrivian (XIV)
Parameter MinimumMostLikely Maximum Remarks
Gas Gravity 0.6 0.61 0.619From Volume I, Jar Quduk report % N2 0.01 0.57 1.13From Volume I, Jar Quduk report % CO2 3.42 5.46 7.5From Volume I, Jar Quduk report % H2S 0 0.07 0.135From Volume I, Jar Quduk report
RES. TEMPERATURE °C 92 94 103Minima from ADB, maxima from Jar Quduk report, ML calculated based on temp. gradiant
INITIAL PRESSURE , atm 270 300 316From Jar Quduk report ABANDONMENT PRES , atm 18 25Estimated from experience
NET PAY , m 30 36.2 39.82ML from ADB, minima from Jar Quduk report, maxima±10% of ML
AREA, ACRES 5963 6511 6775Measured from Hautrivian map WATER SAT , % 23.7 25 34From Jar Quduk reportPOROSITY , % 13.4 14.9 17.3From Jar Quduk report
7/6/2005 I-26 Gustavson Associates

PROMOTION OF OIL AND GAS PRODUCING ISLAMIC TRANSITIONAL STATE OF AFGHANISTANAREAS TO THE PRIVATE SECTOR MINISTRY OF MINES AND INDUSTRYGRANT AGREEMENT NO. H007-AF EMERGENCY INFRASTRUCTURE RECONSTRUCTION PROJECT
Volumetric Calculations
Probabilistic reserve estimates were made based on the reservoir parameters described above. The resulting probability distributions for gas in place and ultimate gas reserves are shown in Figures 1-3 and 1-4.
P10 = 1,092.5 BCF
P50 = 982.6 BCF
P90 = 871.4 BCF
0%10%20%30%40%50%60%70%80%90%
100%
0 200 400 600 800 1,000 1,200 1,400Gas In Place, BCF
Percentof ValuesGreaterThanorEqualTo
Figure 1-3 Distribution of Total Gas In Place, Jar Quduk Field
P90 = 778.4 BCF
P50 = 879.7 BCF
P10 = 978.9 BCF0%
10%20%30%40%50%60%70%80%90%
100%
0.0 200.0 400.0 600.0 800.0 1,000.0 1,200.0Gas Reserves, BCF
Perc
ent o
f Valu
esGr
eate
r Tha
n or
Equ
al To
Figure 1-4 Distribution of Total Gas Reserves, Jar Quduk Field
7/6/2005 I-27 Gustavson Associates

PROMOTION OF OIL AND GAS PRODUCING ISLAMIC TRANSITIONAL STATE OF AFGHANISTANAREAS TO THE PRIVATE SECTOR MINISTRY OF MINES AND INDUSTRYGRANT AGREEMENT NO. H007-AF EMERGENCY INFRASTRUCTURE RECONSTRUCTION PROJECT
The following Table 1-3 presents the key results for the individual reservoirs:
Table 1-3 Jar Quduk Gas Field Probabilistic Reserves
OGIP, BCF Ultimate Gas Reserves, BCF Reservoir P90 P50 P10 P90 P50 P10Hauterivian 734.1 835.0 934.6 654.9 745.9 837.1Kugitan 96.4 146.2 192.1 86.8 131.8 172.6TOTAL 871.4 982.6 1092.5 778.4 879.7 978.9
Note that the sum of the individual reservoir distributions are not additive, except for the mean of the distribution. This is the nature of probabilistic distributions, because the parameters in each reservoir are allowed to vary independently from each other. The total distribution was evaluated on its own.
Production Data
Jar Quduk field began producing in 1980. Annual production data by well were provided to this Consultant by Afghan Gas, from 1987 forward. Additionally, total field production for the entire field history was included in the Asian Development Bankreport. Where these two data sets overlapped, agreement was good. Therefore the ADB report data was used for further analysis, since it provides a complete history. The data are shown in Figure 1-5 below.
7/6/2005 I-28 Gustavson Associates

PROMOTION OF OIL AND GAS PRODUCING ISLAMIC TRANSITIONAL STATE OF AFGHANISTANAREAS TO THE PRIVATE SECTOR MINISTRY OF MINES AND INDUSTRYGRANT AGREEMENT NO. H007-AF EMERGENCY INFRASTRUCTURE RECONSTRUCTION PROJECT
Production HistoryHauterivian
0
200
400
600
800
1000
1200
1400
1600
1800
2000
1975 1980 1985 1990 1995 2000 2005 2010 2015
Year
Gas V
olum
e, MM
CM
0
50
100
150
200
250
300
Pressure, atm
Total ProductionForecast GasHistorical PressureForecast Pressure
Figure 1-5 Jar Quduk Production History and Base Case Forecast
7/6/2005 I-29 Gustavson Associates
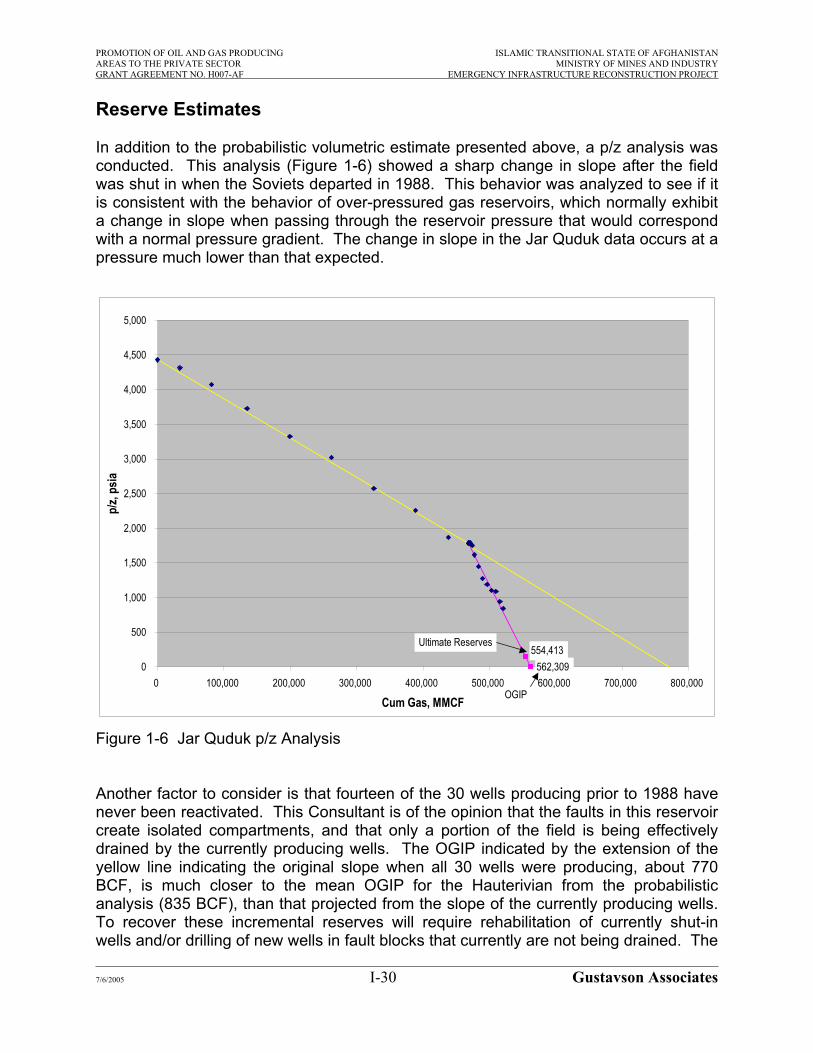
PROMOTION OF OIL AND GAS PRODUCING ISLAMIC TRANSITIONAL STATE OF AFGHANISTANAREAS TO THE PRIVATE SECTOR MINISTRY OF MINES AND INDUSTRYGRANT AGREEMENT NO. H007-AF EMERGENCY INFRASTRUCTURE RECONSTRUCTION PROJECT
Reserve Estimates
In addition to the probabilistic volumetric estimate presented above, a p/z analysis wasconducted. This analysis (Figure 1-6) showed a sharp change in slope after the field was shut in when the Soviets departed in 1988. This behavior was analyzed to see if it is consistent with the behavior of over-pressured gas reservoirs, which normally exhibita change in slope when passing through the reservoir pressure that would correspond with a normal pressure gradient. The change in slope in the Jar Quduk data occurs at a pressure much lower than that expected.
562,309554,413
0
500
1,000
1,500
2,000
2,500
3,000
3,500
4,000
4,500
5,000
0 100,000 200,000 300,000 400,000 500,000 600,000 700,000 800,000
Cum Gas, MMCF
p/z,
psia
Ultimate Reserves
OGIP
Figure 1-6 Jar Quduk p/z Analysis
Another factor to consider is that fourteen of the 30 wells producing prior to 1988 have never been reactivated. This Consultant is of the opinion that the faults in this reservoircreate isolated compartments, and that only a portion of the field is being effectivelydrained by the currently producing wells. The OGIP indicated by the extension of the yellow line indicating the original slope when all 30 wells were producing, about 770 BCF, is much closer to the mean OGIP for the Hauterivian from the probabilistic analysis (835 BCF), than that projected from the slope of the currently producing wells.To recover these incremental reserves will require rehabilitation of currently shut-in wells and/or drilling of new wells in fault blocks that currently are not being drained. The
7/6/2005 I-30 Gustavson Associates

PROMOTION OF OIL AND GAS PRODUCING ISLAMIC TRANSITIONAL STATE OF AFGHANISTANAREAS TO THE PRIVATE SECTOR MINISTRY OF MINES AND INDUSTRYGRANT AGREEMENT NO. H007-AF EMERGENCY INFRASTRUCTURE RECONSTRUCTION PROJECT
p/z reserve estimate is considered to represent the reserves for the currently producing group of wells, while the probabilistic volumetric reserve estimate is considered to be a better estimate of total field reserves.
Total cumulative production from Jar Quduk is reported to be 15.10 BCM (533.3 BCF).Therefore, remaining reserves for the current production scenario are estimated at 15.70 BCM (554.4 BCF) less 15.10 BCM (533.3 BCF), or 0.60 BCM (21.1 BCF). Mostlikely remaining reserves for the entire field, assuming redevelopment of fault blocks notcurrently producing from the Hauterivian, and development of the Kugitan, are 24.91 BCM (879.7 BCF) less 15.10 BCM (533.3 BCF), or 9.81 BCM (346.4 BCF).
Production Forecast
Production has been forecast for the next ten years from Jar Quduk field, for several different scenarios:
1. continuation as is,2. adding compression,3. stimulating current producers, 4. reactivation of six Hauterivian wells 5. produce one existing Kugitan well, and 6. deepen two additional wells to the Kugitan.
These forecasts are shown below in Table 1-4 and Figure 1-7
Table 1-4 Jar Quduk Annual Gas Production Forecast, millions standard cubic feet per year
Hauterivian KugitanChance of Achieving: 90% 50% 50% 80% 50%
YearHauterivian No
changes
Hauterivian –Add
CompressionHauterivian– Stimulate
Hauterivian– Workover
andReactivate
6 Wells
Kugitan – Produce 1
Well
Kugitan – Deepen 2
Wells TOTAL2004 4,749 146 1,286 898 5,473 (0) 12,5512005 4,483 258 2,122 1,129 8,983 8,733 25,7082006 4,232 231 1,748 831 8,008 6,389 21,4392007 3,993 212 1,437 604 7,172 3,877 17,2962008 3,768 199 1,177 432 6,445 2,214 14,2342009 3,554 190 959 299 5,808 1,099 11,9092010 3,353 185 775 197 5,247 357 10,1142011 3,162 183 621 120 4,749 (134) 8,7012012 2,982 184 490 61 4,308 (452) 7,5732013 2,812 186 381 14 3,913 (656) 6,648
10 yr Total 37,088.7 1,973.2 10,994.7 4,584.5 60,105.7 21,426.8 136,173.6
7/6/2005 I-31 Gustavson Associates

PROMOTION OF OIL AND GAS PRODUCING ISLAMIC TRANSITIONAL STATE OF AFGHANISTANAREAS TO THE PRIVATE SECTOR MINISTRY OF MINES AND INDUSTRYGRANT AGREEMENT NO. H007-AF EMERGENCY INFRASTRUCTURE RECONSTRUCTION PROJECT
Forecast Average Daily Rate
0.0
10.0
20.0
30.0
40.0
50.0
60.0
70.0
80.0
2004 2005 2006 2007 2008 2009 2010 2011 2012 2013
Year
Aver
age A
nnua
l Gas
Rat
e, m
illion
cubi
c fe
et p
er d
ay
Kogitan – Deepen 2 WellsKogitan – Produce 1 WellHauterivian – Workover and Reactivate 6 WellsHauterivian – StimulateHauterivian – Add CompressionHauterivian No changes
Figure 1-7 Jar Quduk Production Forecast
The deepening of two wells to the Kugitan has negative incremental production in later years due to interference among the three Kugitan well producing under that scenario.
4.2.4.3 Khoja Gogerdaq Gas Field
Geology
Khoja Gogerdaq field is located approximately 20 km. east of the city of Sheberghan(Figure 1-1, Plate 4). The field was discovered in 1960. Geologically, Khoja Gogerdaq field is located on a broad, generally symmetrical domal structure with no mapped faulting. The Khoja Gogerdaq structure is one of two structural domes that comprise a northwest-southeast oriented anticlinal ridge. The second dome is the site of Yatimtaq field, and its crest is located approximately 6 km. to the northwest of the KhojaGogerdaq crest. The two closely linked structures are separated by a saddle.
The productive horizons at Khoja Gogerdaq include the Lower Cretaceous Albian sands(Zone XI), Aptian sands (Zone XII), and Hauterivian sand (Zone XIV) and the JurassicKugitan formation carbonates (Zones XV and XVI). The Albian and Aptian reservoirsare relatively minor contributors with only small areal limits to the gas saturations at the crestal portion of the structure, covering about 3 km2 for the Albian reservoirs and 3.7
7/6/2005 I-32 Gustavson Associates

PROMOTION OF OIL AND GAS PRODUCING ISLAMIC TRANSITIONAL STATE OF AFGHANISTANAREAS TO THE PRIVATE SECTOR MINISTRY OF MINES AND INDUSTRYGRANT AGREEMENT NO. H007-AF EMERGENCY INFRASTRUCTURE RECONSTRUCTION PROJECT
km2 for the Aptian reservoirs. The main producer in the field is the Hauterivian reservoir, which was developed with the most wells by the Russians. The Hauterivian gas pool covers an estimated 36.4 km2 based on the projected mapped position of the gas-water contact at the top of the zone. Structural closure at the base of the Hauterivian exceeds 300 meters as mapped and the height of the gas column is about 240 meters, indicating that the structure is approximately 80% filled to spillpoint.
The deeper Jurassic Kugitan carbonate reef reservoir was only partly developed by theRussians with the drilling of 8 wells, one of which was below the gas-water contact. Another well (#9) drilled on the structure’s eastern flank not only missed the reef faciesbut penetrated the top of the Kugitan formation at a position below the projected gas-water contact. Structural closure at the top of the Kugitan formation exceeds 420 meters and the maximum height of the gas column based on the #3 well drilled at the crest of the structure is approximately 350 meters, indicating that the Jurassic gaspool(s) is approximately 83% filled to the spillpoint. Areal limits of the effective Jurassicgas pool are less well controlled by drilling than the limits for the shallower Hauterivian gas pool. Nevertheless, the Jurassic pool is estimated to cover some 29 km2.
For all of the reservoirs (Albian, Aptian, Hauterivian, and Kugitan), in Khoja Gogerdaq field, the 1970s and 1980s vintage maps were quality control checked, log picks werechecked, and contours and well data were reviewed for consistency. The information to be used as input parameters for probabilistic reserves calculation were tabulated and given to the engineering staff for use in reserves modeling.
Cretaceous Albian (XI) Reservoir
A structure map at a scale of 1:25,000 of the top of the Albian was reviewed. The map is from a 1979 report, but only some maps from the report were available. The map included depths of the formation surface and gas-water contact for the first and second Albian reservoir horizons. Well test data was not available for the Albian reservoir, so the gas-water contact could not be checked.
Cretaceous Aptian (XII) Reservoir
A structure map at a scale of 1:25,000 of the top of the Aptian was reviewed. The map is from a 1979 report, but only some maps from the report were available. The map included depths of the formation surface and gas-water contact for the 3-ty and 4-ty Aptian formations. Well test data was not available for the Aptian reservoir, so the gas-water contact could not be checked.
Cretaceous Hauterivian (XIV) Reservoir
A structure map at a scale of 1:25,000 of the base of the Hauterivian was reviewed.The map is from a 1979 report, but only some maps from the report were available. The map included depths of the formation surface and gas-water contact for the initialinternal boundary and the supposed current internal boundary of the gas pressure in the
7/6/2005 I-33 Gustavson Associates

PROMOTION OF OIL AND GAS PRODUCING ISLAMIC TRANSITIONAL STATE OF AFGHANISTANAREAS TO THE PRIVATE SECTOR MINISTRY OF MINES AND INDUSTRYGRANT AGREEMENT NO. H007-AF EMERGENCY INFRASTRUCTURE RECONSTRUCTION PROJECT
Hauterivian. The estimated outer gas boundary is also shown. Well test data was not available for the Hauterivian reservoir, so the gas-water contact could not be checked.
Jurassic Kugitan Formation (XV and XVI) Reservoir
The following information sources were especially useful in assessing the JurassicKugitan formation at the Khoja Gogerdaq field:
Report on the Jurassic from 1988. The available report information includes volumes I and II; volume III (the portion with maps and logs) was not available.Similarly, only parts of volume III of other earlier reports (1986, 1972, etc.) were available, as discussed below by exhibit number. Structure map of the Jurassic Kugitan formation at 1:25,000 scale from 1986.This sheet includes a cross section, sections of gamma logs from wells #41 and #3, and a table with information on well tests in the Jurassic. Exhibit 27 at 1:500 scale is from the 1972 Khoja Gogerdaq report, a well log of well #10. The last column on the right hand side includes some pressure, water flow rate, and density data. An exhibit (number unknown) from the 1972 Khoja Gogerdaq report, a cross section of well logs. This exhibit is composed of the entire length of logs for wells #10, #40, #33, #42,#41, #3, and #9. This is a stratigraphic cross section that is hung on the top ofthe Kugitan.Exhibit 19, Part 2 from the 1972 Khoja Gogerdaq report, a cross section of well logs. This exhibit is composed of the lower (from about 2000 m depth to total depth), predominantly Jurassic, portion of well logs for wells #41, #3, and #9.There are also information notes on the logs about well tests. This information includes water and gas flow rates. This information was used to check the location of the gas-water contact.
Geophysics
This important field shows only one line passing over it, line 86105, which is of very poor quality and of no value. The east end of the line has some continuous reflections in various fault blocks, with the best data coming from the upper Cretaceous section. Thepoor data is probably due to structural complexity, inadequate recording parameters, and old processing.
Reservoir Parameters
7/6/2005 I-34 Gustavson Associates
Table 1-5 below presents a summary of input parameters used in the probabilisticreserves modeling of Khoja Gogerdaq field. These parameters come from a variety of sources including maps, tables included on maps, information from the 1988 Soviet-era Zarubezhgeologia report on the field, and data from other reports such as the 2003 Asian Development Bank Final Report on Gas Sector Rehabilitation and the 1970 Ministry of Geology of the USSR report on the Oil and Gas Potential of Northern Afghanistan (Bratash et al., 1970).
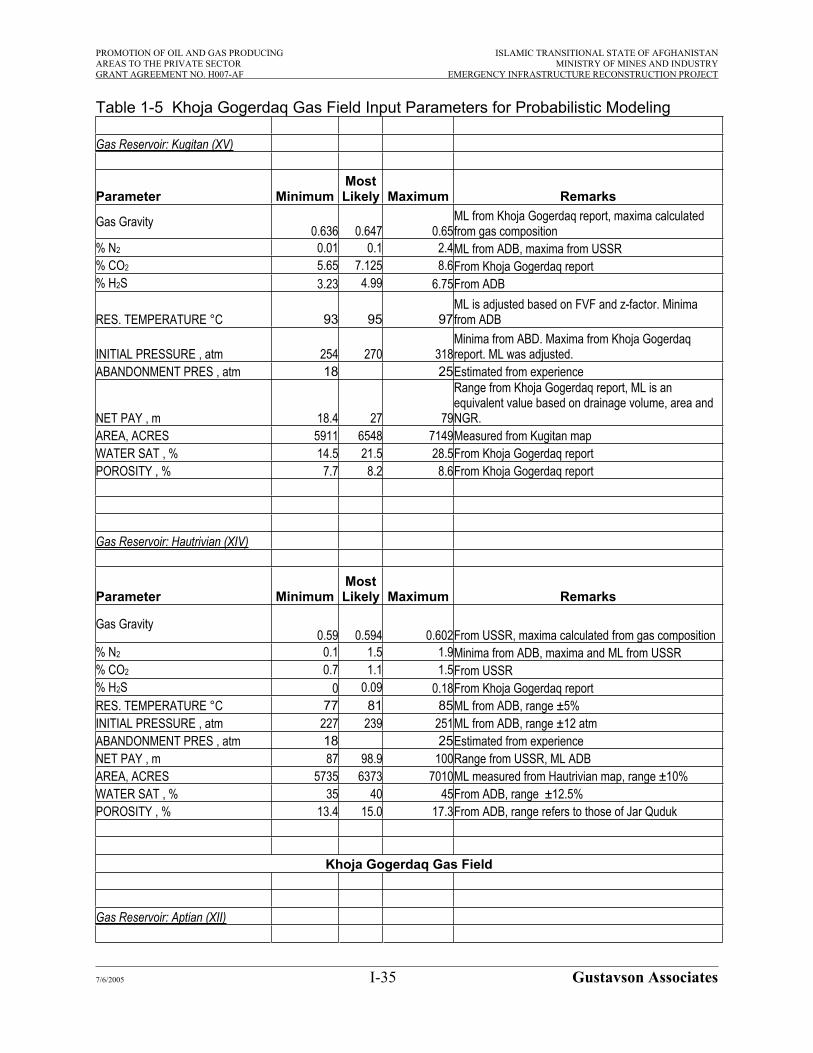
PROMOTION OF OIL AND GAS PRODUCING ISLAMIC TRANSITIONAL STATE OF AFGHANISTANAREAS TO THE PRIVATE SECTOR MINISTRY OF MINES AND INDUSTRYGRANT AGREEMENT NO. H007-AF EMERGENCY INFRASTRUCTURE RECONSTRUCTION PROJECT
Table 1-5 Khoja Gogerdaq Gas Field Input Parameters for Probabilistic Modeling
Gas Reservoir: Kugitan (XV)
Parameter MinimumMostLikely Maximum Remarks
Gas Gravity0.636 0.647 0.65
ML from Khoja Gogerdaq report, maxima calculatedfrom gas composition
% N2 0.01 0.1 2.4ML from ADB, maxima from USSR % CO2 5.65 7.125 8.6From Khoja Gogerdaq report % H2S 3.23 4.99 6.75From ADB
RES. TEMPERATURE °C 93 95 97ML is adjusted based on FVF and z-factor. Minima from ADB
INITIAL PRESSURE , atm 254 270 318Minima from ABD. Maxima from Khoja Gogerdaqreport. ML was adjusted.
ABANDONMENT PRES , atm 18 25Estimated from experience
NET PAY , m 18.4 27 79
Range from Khoja Gogerdaq report, ML is an equivalent value based on drainage volume, area and NGR.
AREA, ACRES 5911 6548 7149Measured from Kugitan map WATER SAT , % 14.5 21.5 28.5From Khoja Gogerdaq report POROSITY , % 7.7 8.2 8.6From Khoja Gogerdaq report
Gas Reservoir: Hautrivian (XIV)
Parameter MinimumMostLikely Maximum Remarks
Gas Gravity0.59 0.594 0.602From USSR, maxima calculated from gas composition
% N2 0.1 1.5 1.9Minima from ADB, maxima and ML from USSR % CO2 0.7 1.1 1.5From USSR % H2S 0 0.09 0.18From Khoja Gogerdaq report RES. TEMPERATURE °C 77 81 85ML from ADB, range ±5%INITIAL PRESSURE , atm 227 239 251ML from ADB, range ±12 atm ABANDONMENT PRES , atm 18 25Estimated from experience NET PAY , m 87 98.9 100Range from USSR, ML ADB AREA, ACRES 5735 6373 7010ML measured from Hautrivian map, range ±10%WATER SAT , % 35 40 45From ADB, range ±12.5%POROSITY , % 13.4 15.0 17.3From ADB, range refers to those of Jar Quduk
Khoja Gogerdaq Gas Field
Gas Reservoir: Aptian (XII)
7/6/2005 I-35 Gustavson Associates

PROMOTION OF OIL AND GAS PRODUCING ISLAMIC TRANSITIONAL STATE OF AFGHANISTANAREAS TO THE PRIVATE SECTOR MINISTRY OF MINES AND INDUSTRYGRANT AGREEMENT NO. H007-AF EMERGENCY INFRASTRUCTURE RECONSTRUCTION PROJECT
Parameter MinimumMostLikely Maximum Remarks
Gas Gravity 0.59 0.594 0.602Refer to Hautrivian of Khoja Gogerdaq % N2 0.1 1.5 1.9Refer to Hautrivian of Khoja Gogerdaq % CO2 0.7 1.1 1.5Refer to Hautrivian of Khoja Gogerdaq % H2S 0 0.09 0.18Refer to Hautrivian of Khoja Gogerdaq RES. TEMPERATURE °C 59 62 65ML from ADB, range ±5%INITIAL PRESSURE , atm 172 182 192ML from ADB, range ±10 atm ABANDONMENT PRES , atm 17 24Estimated from experience NET PAY , m 15.3 17 18.7ML from ADB, range ±10%
AREA, ACRES 827 919 1273ML and maxima measured from Aptian map, minima -10% of ML
WATER SAT , % 35 40 45From ADB, range ±12.5%POROSITY , % 12 14 16From ADB, range ±14%
Gas Reservoir: Albian (XI)
Parameter MinimumMostLikely Maximum Remarks
Gas Gravity 0.59 0.594 0.602Refer to Hautrivian of Khoja Gogerdaq % N2 0.1 1.5 1.9Refer to Hautrivian of Khoja Gogerdaq % CO2 0.7 1.1 1.5Refer to Hautrivian of Khoja Gogerdaq % H2S 0 0.09 0.18Refer to Hautrivian of Khoja Gogerdaq RES. TEMPERATURE °C 50 53 56ML from ADB, range ±5%INITIAL PRESSURE , atm 128 138 148ML from ADB, range ±10 atm ABANDONMENT PRES , atm 17 24Estimated from experience NET PAY , m 8.6 9.5 10.5ML from ADB, range ±10%
AREA, ACRES 658 731 793ML and maxima measured from Albian map, minima -10% of ML
WATER SAT , % 65 70 75From ADB, range ±7%POROSITY , % 8 10 12From ADB, range ±14%
Volumetric Calculations
Probabilistic reserve estimates were made based on the reservoir parameters described above. The resulting probability distributions for gas in place and ultimate gas reserves are shown in Figures 1-8 and 1-9.
7/6/2005 I-36 Gustavson Associates

PROMOTION OF OIL AND GAS PRODUCING ISLAMIC TRANSITIONAL STATE OF AFGHANISTANAREAS TO THE PRIVATE SECTOR MINISTRY OF MINES AND INDUSTRYGRANT AGREEMENT NO. H007-AF EMERGENCY INFRASTRUCTURE RECONSTRUCTION PROJECT
P90 = 1,988.7 BCF
P50 = 2,250.1 BCF
P10 = 2,614.9 BCF0%
20%
40%
60%
80%
100%
0 500 1,000 1,500 2,000 2,500 3,000 3,500
Gas In Place, BCF
Perc
ent o
f Valu
esGr
eate
r Tha
n or
Equ
al To
Figure 1-8 Distribution of Total Gas In Place, Khoja Gogerdaq Field
P10 = 2,360.5 BCF
P50 = 2,038.3 BCF
P90 = 1,802.6 BCF
0%
20%
40%
60%
80%
100%
0.0 500.0 1,000.0 1,500.0 2,000.0 2,500.0 3,000.0
Gas Reserves, BCF
Perc
ent o
f Valu
esGr
eate
r Tha
n or
Equ
al To
Figure 1-9 Distribution of Total Gas Reserves, Khoja Gogerdaq Field
7/6/2005 I-37 Gustavson Associates
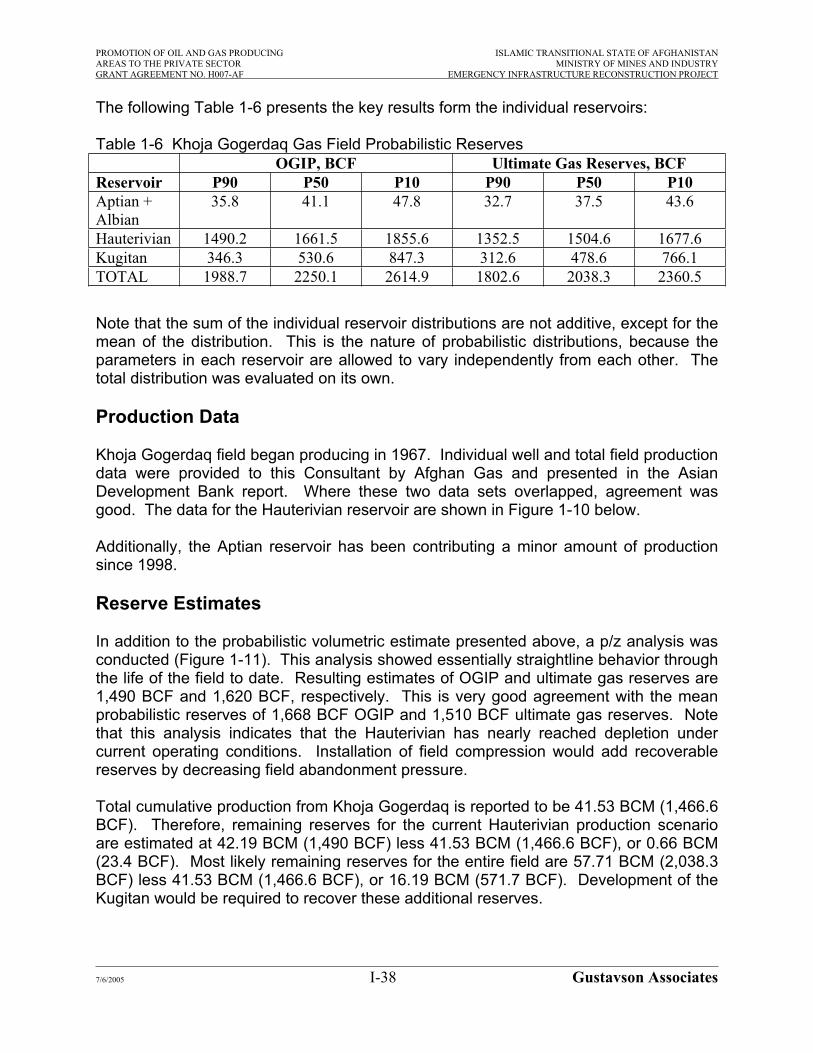
PROMOTION OF OIL AND GAS PRODUCING ISLAMIC TRANSITIONAL STATE OF AFGHANISTANAREAS TO THE PRIVATE SECTOR MINISTRY OF MINES AND INDUSTRYGRANT AGREEMENT NO. H007-AF EMERGENCY INFRASTRUCTURE RECONSTRUCTION PROJECT
The following Table 1-6 presents the key results form the individual reservoirs:
Table 1-6 Khoja Gogerdaq Gas Field Probabilistic ReservesOGIP, BCF Ultimate Gas Reserves, BCF
Reservoir P90 P50 P10 P90 P50 P10Aptian + Albian
35.8 41.1 47.8 32.7 37.5 43.6
Hauterivian 1490.2 1661.5 1855.6 1352.5 1504.6 1677.6Kugitan 346.3 530.6 847.3 312.6 478.6 766.1TOTAL 1988.7 2250.1 2614.9 1802.6 2038.3 2360.5
Note that the sum of the individual reservoir distributions are not additive, except for the mean of the distribution. This is the nature of probabilistic distributions, because the parameters in each reservoir are allowed to vary independently from each other. The total distribution was evaluated on its own.
Production Data
Khoja Gogerdaq field began producing in 1967. Individual well and total field production data were provided to this Consultant by Afghan Gas and presented in the Asian Development Bank report. Where these two data sets overlapped, agreement was good. The data for the Hauterivian reservoir are shown in Figure 1-10 below.
Additionally, the Aptian reservoir has been contributing a minor amount of production since 1998.
Reserve Estimates
In addition to the probabilistic volumetric estimate presented above, a p/z analysis wasconducted (Figure 1-11). This analysis showed essentially straightline behavior through the life of the field to date. Resulting estimates of OGIP and ultimate gas reserves are 1,490 BCF and 1,620 BCF, respectively. This is very good agreement with the mean probabilistic reserves of 1,668 BCF OGIP and 1,510 BCF ultimate gas reserves. Note that this analysis indicates that the Hauterivian has nearly reached depletion undercurrent operating conditions. Installation of field compression would add recoverablereserves by decreasing field abandonment pressure.
Total cumulative production from Khoja Gogerdaq is reported to be 41.53 BCM (1,466.6BCF). Therefore, remaining reserves for the current Hauterivian production scenario are estimated at 42.19 BCM (1,490 BCF) less 41.53 BCM (1,466.6 BCF), or 0.66 BCM (23.4 BCF). Most likely remaining reserves for the entire field are 57.71 BCM (2,038.3BCF) less 41.53 BCM (1,466.6 BCF), or 16.19 BCM (571.7 BCF). Development of the Kugitan would be required to recover these additional reserves.
7/6/2005 I-38 Gustavson Associates

PROMOTION OF OIL AND GAS PRODUCING ISLAMIC TRANSITIONAL STATE OF AFGHANISTANAREAS TO THE PRIVATE SECTOR MINISTRY OF MINES AND INDUSTRYGRANT AGREEMENT NO. H007-AF EMERGENCY INFRASTRUCTURE RECONSTRUCTION PROJECT
10
100
1000
10000
1960 1970 1980 1990 2000 2010 2020
Years
Gas
(MM
CM
)
0
50
100
150
200
250
300
Formation Pressure (atm
)
Volume MMCMforecastFormation Pressureforecast pressure
Figure 1-10 Khoja Gogerdaq Production History and Base Case Forecast
7/6/2005 I-39 Gustavson Associates

PROMOTION OF OIL AND GAS PRODUCING ISLAMIC TRANSITIONAL STATE OF AFGHANISTANAREAS TO THE PRIVATE SECTOR MINISTRY OF MINES AND INDUSTRYGRANT AGREEMENT NO. H007-AF EMERGENCY INFRASTRUCTURE RECONSTRUCTION PROJECT
Hautverian Reservoirp/z vs Cum Gas
1,670
1,490
0
500
1,000
1,500
2,000
2,500
3,000
3,500
4,000
4,500
0 200 400 600 800 1,000 1,200 1,400 1,600 1,800Cum Gas, BCF
p/z,
psi
Figure 1-11 Khoja Gogerdaq p/z Analysis
Production Forecast
Production has been forecast for the next ten years from Khoja Gogerdaq Field, for several different scenarios:
1. Hauterivian – no changes 2. Hauterivian – add compression 3. Hauterivian – stimulate 4. Aptian – no changes 5. Aptian – add compression 6. Aptian – stimulate 7. Aptian – new wells8. Albian – new wells9. Kugitan – reactivate 6 wells
These forecasts are shown below in Table 1-7 and Figure 1-12.
7/6/2005 I-40 Gustavson Associates

PROMOTION OF OIL AND GAS PRODUCING ISLAMIC TRANSITIONAL STATE OF AFGHANISTANAREAS TO THE PRIVATE SECTOR MINISTRY OF MINES AND INDUSTRYGRANT AGREEMENT NO. H007-AF EMERGENCY INFRASTRUCTURE RECONSTRUCTION PROJECT
Table 1-7 Khoja Gogerdaq Annual Gas Production Forecast, MMSCF per year
Hauterivian Aptian Albian KugitanChance ofAchieving: 90% 50% 90% 50% 50% 50% 50%
Kugitan Reactivat
6 Wells
Hauterivian – Add
CompressionAptian – No
changesAptian – AddCompression
Aptian – Stimulate
Aptian – NewWells
Albian – NewWells
Hauterivian –Stimulate
Hauterivian No changesYear
2004 3,829 944 1,642 507 131 226 102 13 1982005 3,672 1,836 2,924 482 251 386 1,179 154 2,1702006 3,521 1,787 2,604 458 239 328 1,353 177 2,3342007 3,376 1,741 2,319 436 229 279 778 102 2,3002008 3,238 1,697 2,065 414 219 236 427 56 2,2682009 3,106 1,657 1,837 394 211 200 206 27 2,2352010 2,979 1,618 1,633 374 203 168 63 8 2,2032011 2,857 1,582 1,451 355 195 140 (31) (4) 2,1722012 2,740 1,548 1,286 337 189 116 (93) (12) 2,1412013 2,628 1,516 1,139 320 182 95 (135) (18) 2,111
10 yr Total 31,944.9 15,926.9 18,898.3 4,076.9 2,049.5 2,173.7 3,849.5 502.9 20,134.0
7/6/2005 I-41 Gustavson Associates

PROMOTION OF OIL AND GAS PRODUCING ISLAMIC TRANSITIONAL STATE OF AFGHANISTANAREAS TO THE PRIVATE SECTOR MINISTRY OF MINES AND INDUSTRYGRANT AGREEMENT NO. H007-AF EMERGENCY INFRASTRUCTURE RECONSTRUCTION PROJECT
Forecast Average Daily Rate
0.0
5.0
10.0
15.0
20.0
25.0
30.0
35.0
40.0
2004 2005 2006 2007 2008 2009 2010 2011 2012 2013
Year
Aver
age A
nnua
l Gas
Rat
e, m
illion
cubi
c fe
et p
er d
ayKogitan – Reactivate 6 WellsAlbian – New WellsAptian – New WellsAptian – StimulateAptian – Add CompressionAptian – No changesHauterivian – StimulateHauterivian – Add CompressionHauterivian No changes
Figure 1-12 Khoja Gogerdaq Production Forecast
4.2.4.4 Yatimtaq Gas Field
Geology
Yatimtaq gas field was discovered in 1963. The initial discovery well found commercial gas in the Lower Cretaceous Hauterivian reservoir. In 1964, the Jurassic gas pool was discovered. As discussed in the previous Subsection, Yatimtaq field is situated on a separate domal structure that is located approximately 6 km. to the northwest of the Khoja Gogerdaq field. The two closely linked structures are separated by a saddle.The geological characterizations of the two adjacent fields are very similar (Plate 4). The main difference in the petroleum geology of the two fields is the apparent lack ofAlbian gas reservoirs at Yatimtaq. Like Khoja Gogerdaq, Yatimtaq is capable of producing gas from Lower Cretaceous Aptian (Zone XII) and Hauterivian (Zone XIV)sandstone reservoirs and from Middle-Upper Jurassic Kugitan formation carbonatereservoirs (Zones XV and XVI). As discussed below, no maps were available for eitherthe Aptian or the Jurassic Kugitan reservoirs so the remaining geological summary will focus on the Hauterivian zone, which was developed with the most wells by the Russians.
7/6/2005 I-42 Gustavson Associates

PROMOTION OF OIL AND GAS PRODUCING ISLAMIC TRANSITIONAL STATE OF AFGHANISTANAREAS TO THE PRIVATE SECTOR MINISTRY OF MINES AND INDUSTRYGRANT AGREEMENT NO. H007-AF EMERGENCY INFRASTRUCTURE RECONSTRUCTION PROJECT
At the Hauterivian horizon, the Yatimtaq structure is cut by a series of faults on itssouthern and western flanks. Throw on the faults ranges from about 30-160 meters with the greatest displacement occurring on a northwest-southeast arcuate fault located on the southwestern flank of the dome. These faults are not part of the overall critical trapping condition but they have resulted in differences in the elevation of the gas-watercontact in the various fault segments. The structural closure at the Hauterivian horizon exceeds 560 meters as mapped and the height of the gas column ranges from about 300 meters to 430 meters depending on fault block. This indicates that the Yatimtaq structure is about 54% to 77% filled to spillpoint within the various fault blocks. At the Hauterivian level, Yatimtaq gas field encompasses approximately 6.2 km2 based on the mapped position of the gas-water contact on the top of the zone.
For all of the reservoirs (Aptian, Hauterivian, and Kugitan), in Yatimtaq field, the 1970s and 1980s vintage maps were quality control checked, log picks were checked, andcontours and well data were reviewed for consistency. The information to be used asinput parameters for probabilistic reserves calculation were tabulated and given to the engineering staff for use in reserves modeling.
Cretaceous Aptian (XII) Reservoir
There were no maps available of the Aptian reservoir in Yatimtaq field, so the contours, well log data, and oil-water contact could not be quality control checked. Also, since there was no structure map of the Aptian available, volumetrics could not be calculated.
Cretaceous Hauterivian (XIV) Reservoir
The following information sources were especially useful in assessing the CretaceousHauterivian reservoir at the Yatimtaq field:
Reports on Yatimtaq from 1982. Only Volume II, appendix of tables, was available. Volume I, which contains the main text body of the report and volumeIII, which contains exhibits or plates of maps and logs were not available. Only exhibit 3 from volume III was available, which is discussed below.Exhibit 19 from a 1974 Yatimtaq report, a Hauterivian structural geology map at a scale of 1:10,000. The map of the Hauterivian showed that many of the wellswere directionally drilled. This map includes structure maps of both the upper and lower surfaces of the Hauterivian, as well as a net pay contour map. The outer and inner gas-water contacts are included on the maps. There are noteson the map of the top surface about gas flow rates and pressures over certain intervals. A table with Kelly bushing elevation, measured depth of drilling, and deviation depth corrections is also found on the map. There is also a table thatgives quantities of various Russian reserve categories. It is noted that both the bar and the number scale on this map are incorrect.Exhibit 3 from a 1982 Yatimtaq report, a well log cross section of the Hauterivian at a scale of 1:200. Partial logs for wells #22, #3, #21, and #5 are displayed on this sheet. This log section includes flow rate and pressure information for water
7/6/2005 I-43 Gustavson Associates

PROMOTION OF OIL AND GAS PRODUCING ISLAMIC TRANSITIONAL STATE OF AFGHANISTANAREAS TO THE PRIVATE SECTOR MINISTRY OF MINES AND INDUSTRYGRANT AGREEMENT NO. H007-AF EMERGENCY INFRASTRUCTURE RECONSTRUCTION PROJECT
and/or gas from certain intervals. This information was used to confirm the location of the gas-water contact. Exhibit 4, Part 2 from a 1973 Yatimtaq report, a well log cross section at a scale of 1:500. This section includes partial logs for wells #20, #3, #7, #4, #23, and #22 for mainly the Hauterivian. This section includes flow rate and pressure information for water and/or gas from certain intervals. This information was used to confirm the location of the gas-water contact. Part 1 of this exhibit has the same type of information, but the wells on Part 2 were more useful for locating the gas-water contact.Exhibit 3 from a 1973 Yatimtaq report, a well log cross section at a scale of 1:2000. This section includes complete logs for wells #24, #5, #19, #21, #3, #4,#23, and #22. The formations encountered throughout the wellbores are picked and delineated.
Jurassic Kugitan Formation (XV and XVI) Reservoir
There were no maps available of the Kugitan reservoir in Yatimtaq field, so the contours, well log data, and gas-water contact could not be quality control checked. Also, since there was no structure map of the Kugitan formation available, volumetricscould not be calculated.
Geophysics
This field is also significant, but shows only one line passing over it, line 86103 which isnot available.
Reservoir Parameters
In order to estimate the most likely values and the range of reservoir parameters atYatimtaq, significant amounts of data were reviewed. A large amount of data was obtained from Volume II of the 1982 Soviet-era Technoexport reserve report for the field. Additionally, the Asian Development Bank report was used for some data, particularly to derive the likely productive area of the Aptian reservoir, and to confirm average or most likely values of other parameters. For the Hauterivian and Kugitanreservoirs, reservoir pressure measurements from wells were found in the Russian reserve report from various dates before and after the major blowout that occurred in the early 1960s. These were used to estimate reserves both before and after theblowout. Selected reservoir parameters are shown in Table 1-8 below.
7/6/2005 I-44 Gustavson Associates

PROMOTION OF OIL AND GAS PRODUCING ISLAMIC TRANSITIONAL STATE OF AFGHANISTANAREAS TO THE PRIVATE SECTOR MINISTRY OF MINES AND INDUSTRYGRANT AGREEMENT NO. H007-AF EMERGENCY INFRASTRUCTURE RECONSTRUCTION PROJECT
Table 1-8 Yatimtaq Gas Field Input Parameters for Probabilistic Modeling Reservoir: Aptian (XII)
Parameter MinimumMostLikely Maximum Remarks
GAS GRAVITY 0.59 0.594 0.6 From Yatimtaq report % N2 0.8 1 1.2 From Yatimtaq report % CO2 3 3.7 4.4 From Yatimtaq report % H2S 0 0 0 From Yatimtaq report RES. TEMPERATURE, °C 60 64 68 Range from Yatimtaq report, ML from ADB reportINITIAL PRESSURE , atm 160.0 167.7 175.0 Range from Yatimtaq report, ML from ADB reportABANDONMENT PRES , atm 13.6 17.0 20.4 Estimated from experience NET PAY , m 6.3 7 12 Range from Yatimtaq report, ML from ADB report
AREA, ACRES 460 511 563ML derived from ADB report reserve data, range ±10%
WATER SAT , % 30 31.7 33 Range from Yatimtaq report, ML from ADB reportPOROSITY , % 14 16.4 18 Range from Yatimtaq report, ML from ADB report
Reservoir: Hauterivian (XIV)
Parameter MinimumMostLikely Maximum Remarks
GAS GRAVITY 0.58 0.62 0.68 From Yatimtaq report % N2 0.2 1.5 4 From Yatimtaq report % CO2 1.2 3.5 7.5 From Yatimtaq report % H2S 0 0.05 0.3 From Yatimtaq report RES. TEMPERATURE °C 72 75 78 Range from Yatimtaq report, ML from ADB reportINITIAL PRESSURE before blowout, atm 230 240 250 From Yatimtaq report INITIAL PRESSURE after blowout, atm 120 128 130 From Yatimtaq report ABANDONMENT PRES , atm 20 24 27 Estimated from experience NET PAY , m 50 57.1 75 Range from Yatimtaq report, ML from ADB report
AREA, ACRES - Gas-Filled 615 922 1,013ML measured from audited Russian map, range minimum based on well results, max = ML+10%
AREA, ACRES - Outer Wedge 551 613 672ML measured from audited Russian map, range ±10%
WATER SAT , % 16 21.5 35 Range from Yatimtaq report, ML from ADB reportPOROSITY , % 14 16.1 17.8 Range from Yatimtaq report, ML from ADB report
7/6/2005 I-45 Gustavson Associates

PROMOTION OF OIL AND GAS PRODUCING ISLAMIC TRANSITIONAL STATE OF AFGHANISTANAREAS TO THE PRIVATE SECTOR MINISTRY OF MINES AND INDUSTRYGRANT AGREEMENT NO. H007-AF EMERGENCY INFRASTRUCTURE RECONSTRUCTION PROJECT
Table 1-8 Yatimtaq Gas Field Input Parameters for Probabilistic Modeling (continued)
Reservoir: Kugitan (XV)
Parameter MinimumMostLikely Maximum Remarks
GAS GRAVITY 0.58 0.645 0.68 From Yatimtaq report % N2 0.5 1 3.4 From Yatimtaq report % CO2 3 4.5 7.6 From Yatimtaq report % H2S 0 2.7 5.7 From Yatimtaq report RES. TEMPERATURE °C 87 95 103 Range from Yatimtaq report, ML from ADB report
INITIAL PRESSURE before blowout, atm 282 286 305Calculated based on regional gradient from 1970 regional Russian ministry report
INITIAL PRESSURE after blowout, atm 193 240 278 From Yatimtaq report ABANDONMENT PRES, atm 20 24 27 Estimated from experience NET PAY , m 10.9 12.1 30 Range from Yatimtaq report, ML from ADB report
AREA, ACRES 150 300 500
Minimal data: no map; three wells tested, results unknown; much smaller numbers in ADB report than Hauterivian area and resvs
WATER SAT , % 29 40 50 Range from Yatimtaq report, ML from ADB reportPOROSITY , % 6 6.6 7.2 Range from Yatimtaq report, ML from ADB report
Volumetric Calculations
Probabilistic reserve estimates were made based on the reservoir parameters described above. The resulting probability distributions for gas in place and ultimate gas reserves, before and after the blowout, are shown in Figures 1-13 through 1-16.
TOTAL GAS IN PLACE
P10 = 648.5 BCF
P50 = 550.6 BCF
P90 = 469.9 BCF
0%
20%
40%
60%
80%
100%
0 100 200 300 400 500 600 700 800
Gas In Place, BCF
Perc
ent o
f Valu
esGr
eate
rTha
n or
Equ
al To
Figure 1-13 Distribution of Total Gas In Place Before Blowout, Yatimtaq Field
7/6/2005 I-46 Gustavson Associates

PROMOTION OF OIL AND GAS PRODUCING ISLAMIC TRANSITIONAL STATE OF AFGHANISTANAREAS TO THE PRIVATE SECTOR MINISTRY OF MINES AND INDUSTRYGRANT AGREEMENT NO. H007-AF EMERGENCY INFRASTRUCTURE RECONSTRUCTION PROJECT
TOTAL RECOVERABLE GAS
P90 = 425.3 BCF
P50 = 498.4 BCF
P10 = 588.0 BCF0%
10%20%30%40%50%60%70%80%90%
100%
0.0 100.0 200.0 300.0 400.0 500.0 600.0 700.0 800.0
Gas Reserves, BCF
Perc
ent o
f Valu
esGr
eate
r Tha
nor
Equ
alTo
Figure 1-14 Distribution of Total Gas Reserves Before Blowout, Yatimtaq Field
TOTAL GAS IN PLACE AFTER BLOWOUT
P90 = 267.3 BCF
P50 = 311.5 BCF
P10 = 364.1 BCF0%
10%20%30%40%50%60%70%80%90%
100%
0 100 200 300 400 500Gas In Place, BCF
Perc
ent o
f Valu
esGr
eate
r Tha
n or
Equ
al To
Figure 1-15 Distribution of Total Gas In Place After Blowout, Yatimtaq Field
7/6/2005 I-47 Gustavson Associates

PROMOTION OF OIL AND GAS PRODUCING ISLAMIC TRANSITIONAL STATE OF AFGHANISTANAREAS TO THE PRIVATE SECTOR MINISTRY OF MINES AND INDUSTRYGRANT AGREEMENT NO. H007-AF EMERGENCY INFRASTRUCTURE RECONSTRUCTION PROJECT
TOTAL RECOVERABLE GAS AFTER BLOWOUT
P10 = 303.6 BCF
P50 = 258.7 BCF
P90 = 222.5 BCF
0%10%20%30%40%50%60%70%80%90%
100%
0.0 50.0 100.0 150.0 200.0 250.0 300.0 350.0 400.0
Gas Reserves, BCF
Perc
ent o
f Valu
esGr
eate
r Tha
n or
Equa
l To
Figure 1-16 Distribution of Total Gas Reserves After Blowout, Yatimtaq Field
Of these volumes of gas, a little over half is expected to be in the Kugitan, with most of the rest in the Hauterivian and a small volume in the Aptian.
Production Data
The field was the site of a large blowout in 1963 when an appraisal well was drilled into a gas pool in the Jurassic. The well burned for three years before the drilling of reliefwells brought the field under control, resulting in a loss that has previously been estimated as much as 23 billion cubic meters of gas. This analysis indicates the most likely volume of lost gas to be 6.7 BCM.
After some delay, new development of the field began in 1985. Approximately sevenwells were drilled but only one was brought into production. Well #21 produces about55,000 standard cubic meters per day from the Kugitan in the Jurassic and was broughton stream in December 2001. No detailed production records are available for this well.
Reserve Estimates
No data were available for any method of reserve estimation other than the volumetricmethod described above. Cumulative production from the Yatimtaq field was reported in the Asian Development Bank report as 0.04 billion standard cubic meters (BCM) or1.4 BCF. Therefore, most likely remaining reserves for this field are 258.7 BCF (7.33 BCM) less 1.4 BCF (0.04 BCM), or 257.3 BCF (7.29 BCM) of gas.
7/6/2005 I-48 Gustavson Associates
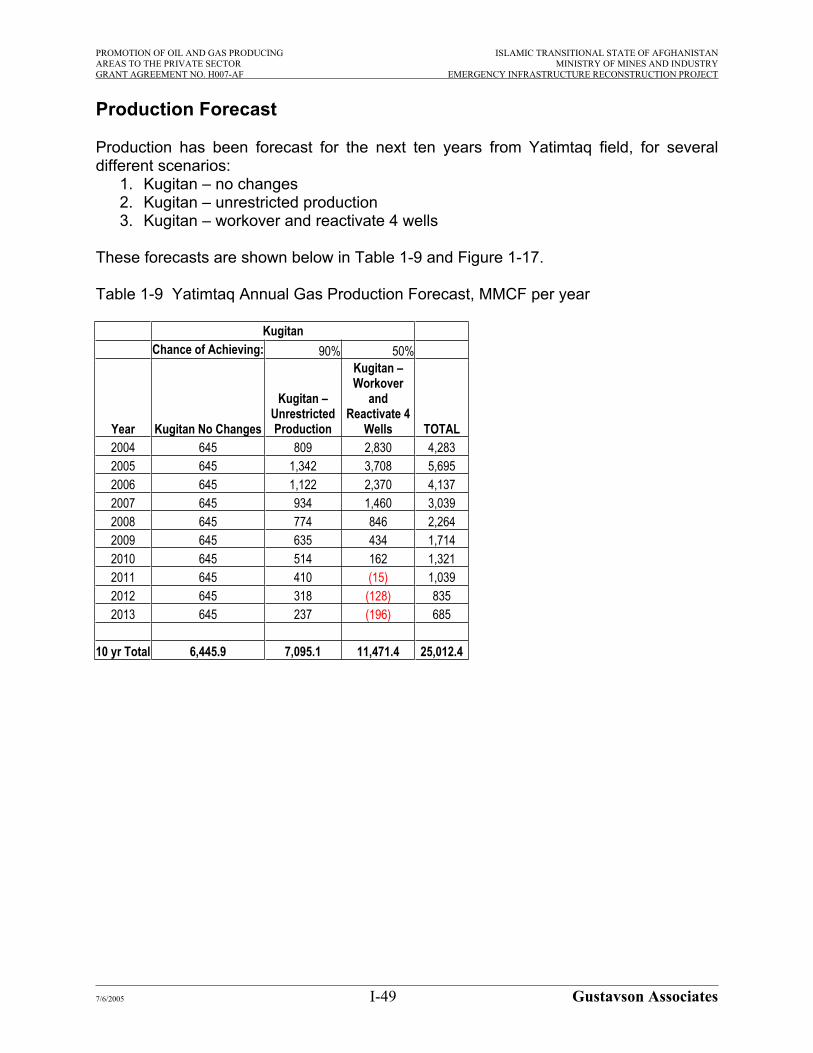
PROMOTION OF OIL AND GAS PRODUCING ISLAMIC TRANSITIONAL STATE OF AFGHANISTANAREAS TO THE PRIVATE SECTOR MINISTRY OF MINES AND INDUSTRYGRANT AGREEMENT NO. H007-AF EMERGENCY INFRASTRUCTURE RECONSTRUCTION PROJECT
Production Forecast
Production has been forecast for the next ten years from Yatimtaq field, for several different scenarios:
1. Kugitan – no changes2. Kugitan – unrestricted production 3. Kugitan – workover and reactivate 4 wells
These forecasts are shown below in Table 1-9 and Figure 1-17.
Table 1-9 Yatimtaq Annual Gas Production Forecast, MMCF per year
KugitanChance of Achieving: 90% 50%
Year Kugitan No Changes
Kugitan – UnrestrictedProduction
Kugitan – Workover
andReactivate 4
Wells TOTAL2004 645 809 2,830 4,2832005 645 1,342 3,708 5,6952006 645 1,122 2,370 4,1372007 645 934 1,460 3,0392008 645 774 846 2,2642009 645 635 434 1,7142010 645 514 162 1,3212011 645 410 (15) 1,0392012 645 318 (128) 8352013 645 237 (196) 685
10 yr Total 6,445.9 7,095.1 11,471.4 25,012.4
7/6/2005 I-49 Gustavson Associates
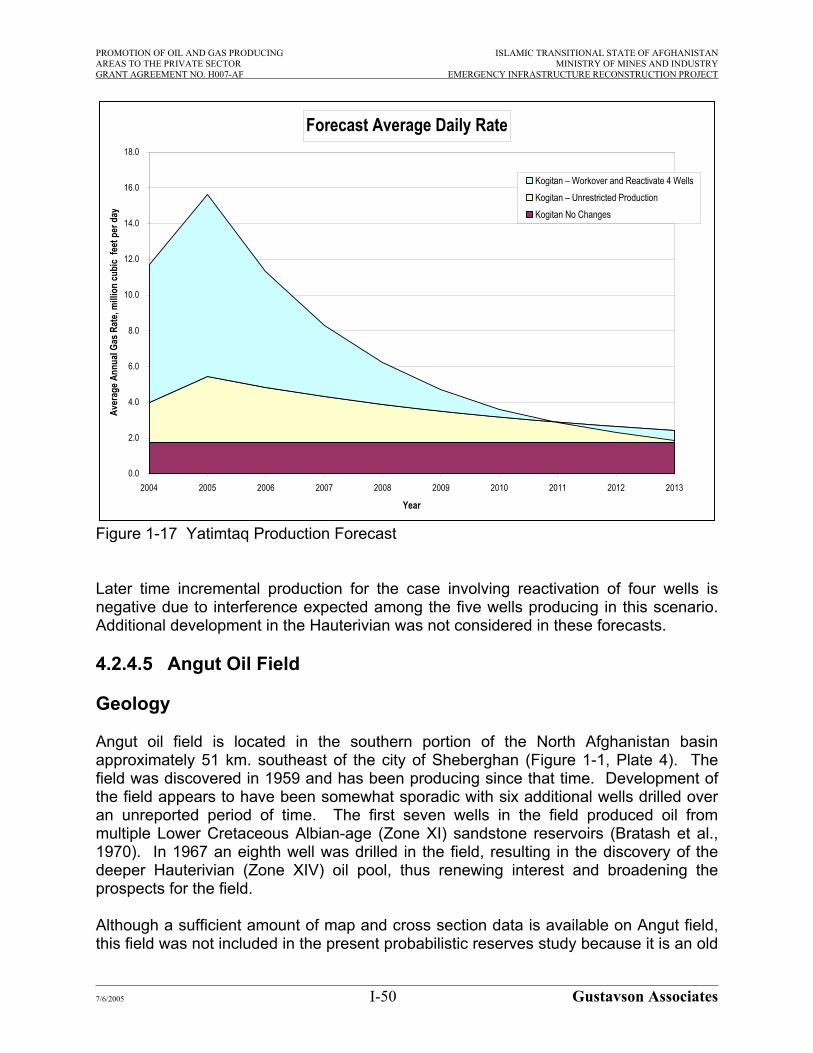
PROMOTION OF OIL AND GAS PRODUCING ISLAMIC TRANSITIONAL STATE OF AFGHANISTANAREAS TO THE PRIVATE SECTOR MINISTRY OF MINES AND INDUSTRYGRANT AGREEMENT NO. H007-AF EMERGENCY INFRASTRUCTURE RECONSTRUCTION PROJECT
Forecast Average Daily Rate
0.0
2.0
4.0
6.0
8.0
10.0
12.0
14.0
16.0
18.0
2004 2005 2006 2007 2008 2009 2010 2011 2012 2013
Year
Aver
age A
nnua
l Gas
Rat
e, m
illion
cubi
c fe
et p
er d
ay
Kogitan – Workover and Reactivate 4 WellsKogitan – Unrestricted ProductionKogitan No Changes
Figure 1-17 Yatimtaq Production Forecast
Later time incremental production for the case involving reactivation of four wells is negative due to interference expected among the five wells producing in this scenario.Additional development in the Hauterivian was not considered in these forecasts.
4.2.4.5 Angut Oil Field
Geology
Angut oil field is located in the southern portion of the North Afghanistan basin approximately 51 km. southeast of the city of Sheberghan (Figure 1-1, Plate 4). The field was discovered in 1959 and has been producing since that time. Development ofthe field appears to have been somewhat sporadic with six additional wells drilled overan unreported period of time. The first seven wells in the field produced oil from multiple Lower Cretaceous Albian-age (Zone XI) sandstone reservoirs (Bratash et al.,1970). In 1967 an eighth well was drilled in the field, resulting in the discovery of the deeper Hauterivian (Zone XIV) oil pool, thus renewing interest and broadening the prospects for the field.
Although a sufficient amount of map and cross section data is available on Angut field, this field was not included in the present probabilistic reserves study because it is an old
7/6/2005 I-50 Gustavson Associates

PROMOTION OF OIL AND GAS PRODUCING ISLAMIC TRANSITIONAL STATE OF AFGHANISTANAREAS TO THE PRIVATE SECTOR MINISTRY OF MINES AND INDUSTRYGRANT AGREEMENT NO. H007-AF EMERGENCY INFRASTRUCTURE RECONSTRUCTION PROJECT
field that is apparently depleted or nearly depleted. No data is available on how much oil was produced over the history of the field, and therefore it is not possible to estimate remaining recoverable oil reserves with any degree of confidence.
Geophysics
There are no maps available showing seismic data over the fields south of the map shown in Plate 1, including Angut field. In various discussions it seems that no data was ever recorded in areas outside of that seen on Plate 1.
Reservoir Parameters
A detailed study of the reservoir parameters at Angut has not been made due to the great uncertainty in the cumulative production volumes.
Volumetric Calculations
Volumetric reserve calculations at Angut have not been made due to the greatuncertainty in the cumulative production volumes.
Production Data
No production data are available for Angut field.
Reserve Estimates
Reserve estimates for Angut have not been made due to the great uncertainty in the cumulative production volumes.
Production Forecast
No production forecast for Angut Field has been made due to lack of data.
4.2.5 Analysis Of Discovered / Non-Producing Oil Fields
4.2.5.1 Introduction
This Section of the Report summarizes the technical work performed by Gustavson Associates staff for the purpose of gathering critical reservoir parameter data on severaldiscovered but, as yet, non-producing oil fields in the southern portions of the North Afghanistan basin. The various reservoir parameters were used as basic input data for the probabilistic reserves modeling of the subject fields. The results of the modeling for each field are presented in the appropriate subsections that follow. The four fields thatare summarized in Section 4.2.5 are Kashkari, Bazarkhami, Aqdarya, and Zamarudsay.
7/6/2005 I-51 Gustavson Associates
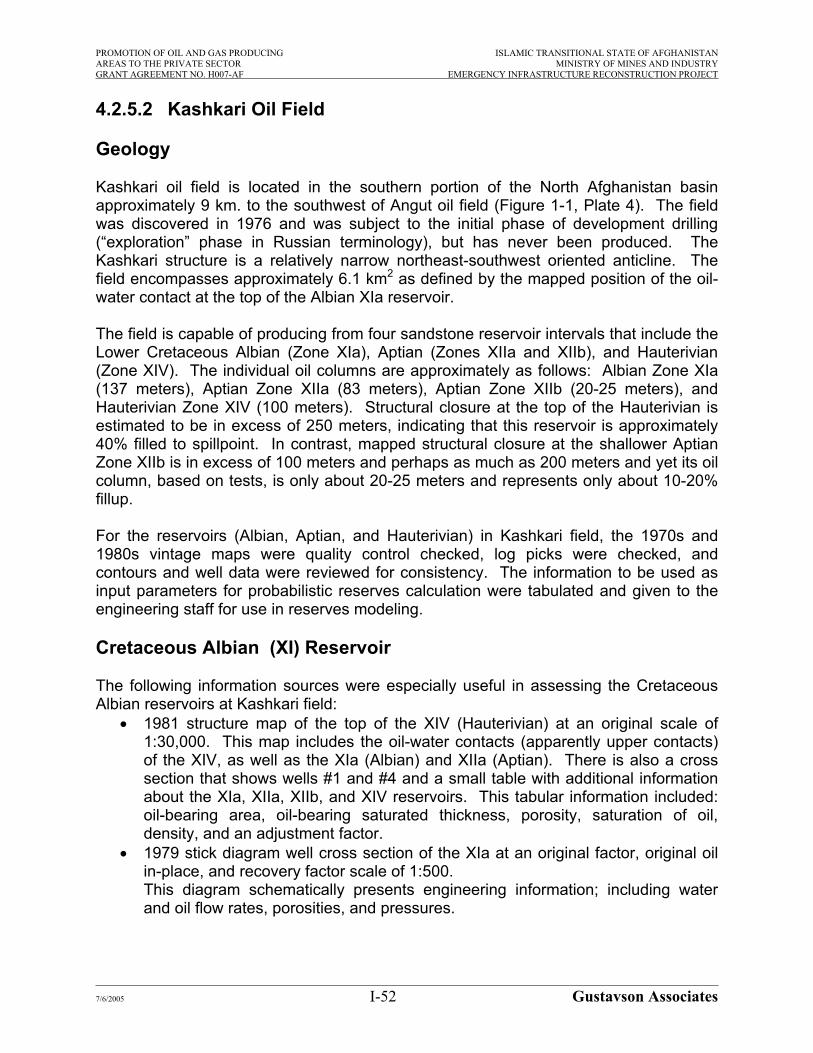
PROMOTION OF OIL AND GAS PRODUCING ISLAMIC TRANSITIONAL STATE OF AFGHANISTANAREAS TO THE PRIVATE SECTOR MINISTRY OF MINES AND INDUSTRYGRANT AGREEMENT NO. H007-AF EMERGENCY INFRASTRUCTURE RECONSTRUCTION PROJECT
4.2.5.2 Kashkari Oil Field
Geology
Kashkari oil field is located in the southern portion of the North Afghanistan basin approximately 9 km. to the southwest of Angut oil field (Figure 1-1, Plate 4). The field was discovered in 1976 and was subject to the initial phase of development drilling(“exploration” phase in Russian terminology), but has never been produced. The Kashkari structure is a relatively narrow northeast-southwest oriented anticline. The field encompasses approximately 6.1 km2 as defined by the mapped position of the oil-water contact at the top of the Albian XIa reservoir.
The field is capable of producing from four sandstone reservoir intervals that include the Lower Cretaceous Albian (Zone XIa), Aptian (Zones XIIa and XIIb), and Hauterivian(Zone XIV). The individual oil columns are approximately as follows: Albian Zone XIa (137 meters), Aptian Zone XIIa (83 meters), Aptian Zone XIIb (20-25 meters), and Hauterivian Zone XIV (100 meters). Structural closure at the top of the Hauterivian is estimated to be in excess of 250 meters, indicating that this reservoir is approximately40% filled to spillpoint. In contrast, mapped structural closure at the shallower Aptian Zone XIIb is in excess of 100 meters and perhaps as much as 200 meters and yet its oil column, based on tests, is only about 20-25 meters and represents only about 10-20% fillup.
For the reservoirs (Albian, Aptian, and Hauterivian) in Kashkari field, the 1970s and 1980s vintage maps were quality control checked, log picks were checked, andcontours and well data were reviewed for consistency. The information to be used asinput parameters for probabilistic reserves calculation were tabulated and given to the engineering staff for use in reserves modeling.
Cretaceous Albian (XI) Reservoir
The following information sources were especially useful in assessing the CretaceousAlbian reservoirs at Kashkari field:
1981 structure map of the top of the XIV (Hauterivian) at an original scale of 1:30,000. This map includes the oil-water contacts (apparently upper contacts) of the XIV, as well as the XIa (Albian) and XIIa (Aptian). There is also a crosssection that shows wells #1 and #4 and a small table with additional information about the XIa, XIIa, XIIb, and XIV reservoirs. This tabular information included:oil-bearing area, oil-bearing saturated thickness, porosity, saturation of oil,density, and an adjustment factor.1979 stick diagram well cross section of the XIa at an original factor, original oil in-place, and recovery factor scale of 1:500. This diagram schematically presents engineering information; including waterand oil flow rates, porosities, and pressures.
7/6/2005 I-52 Gustavson Associates

PROMOTION OF OIL AND GAS PRODUCING ISLAMIC TRANSITIONAL STATE OF AFGHANISTANAREAS TO THE PRIVATE SECTOR MINISTRY OF MINES AND INDUSTRYGRANT AGREEMENT NO. H007-AF EMERGENCY INFRASTRUCTURE RECONSTRUCTION PROJECT
Cretaceous Aptian (XII) Reservoir
The following information sources were especially useful in assessing the CretaceousAptian reservoirs at the Kashkari field:
1980 net pay map of the Aptian at an original scale of 1:10,000. This map included the outer and inner oil-water contacts for the XIIa (Aptian) reservoir in Kashkari field. 1980 map of the planned XIIb reservoir to be produced at an original scale of 1:10,000; Exhibit 23. This included a structure map of the XIIb reservoir with the outer and inner oil-water contacts. There is also a table on the sheet that gives information about wells and well tests including measured depth, depth in elevation, well test intervals, and water and oil flow rates. 1979 stick diagram well cross section of the XII at an original scale of 1:500. This diagram schematically presents engineering information; including waterand oil flow rates, porosities, and pressures.
Cretaceous Hauterivian (XIV) Reservoir
The following information sources were especially useful in assessing the CretaceousHauterivian reservoir at the Kashkari field:
1981 structure map of the top of the XIV (Hauterivian) at an original scale of 1:30,000. This map includes the oil-water contacts (apparently upper contacts) of the XIV, as well as the XIa (Albian) and XIIa (Aptian). There is also a crosssection that shows wells #1 and #4 and a small table with additional information about the XIa, XIIa, XIIb, and XIV reservoirs. This tabular information included oil-bearing area, oil-bearing saturated thickness, porosity, saturation of oil,density, adjustment factor, original oil in-place, and recovery factor. 1979 stick diagram well cross section of the XII at an original scale of 1:500. This diagram schematically presents engineering information; including waterand oil flow rates, porosities, and pressures.
There was also a part of a report from 1974 or later (the title page was missing so the date is uncertain) on Kashkari field that provided information about the XIa (Albian), XIIa (Aptian), and XIV (Hauterivian) reservoirs.
Geophysics
There are no maps available showing seismic data over the fields south of the map shown in Plate 1, including Kashkari field. In various discussions it seems that no data was ever recorded in areas outside of that seen on Plate 1.
7/6/2005 I-53 Gustavson Associates

PROMOTION OF OIL AND GAS PRODUCING ISLAMIC TRANSITIONAL STATE OF AFGHANISTANAREAS TO THE PRIVATE SECTOR MINISTRY OF MINES AND INDUSTRYGRANT AGREEMENT NO. H007-AF EMERGENCY INFRASTRUCTURE RECONSTRUCTION PROJECT
Reservoir Parameters
Table 1-10 below presents a summary of input parameters used in the probabilistic reserves modeling of Kashkari field. These parameters come from a variety of sources including maps, tables included on maps, and information from a Soviet-eraTechnoexport report on the field.
Table 1-10 Kashkari Oil Field Input Parameters for Probabilistic Modeling
Oil Reservoir: Albian (XIa)
Parameter MinimumMostLikely Maximum Remarks
Oil Gravity, °API 33 34 35.5From Kashkari report Gas-Oil Ratio, SCF/Bbl 76 76 76From Kashkari report Gas Gravity, relative to air 0.650 0.657 0.664From Kashkari report Reservoir Temperature, oC 46 49 52ML from Kashkari report, range from prod. Test Initial Reservoir Pressure, atm 113.7 120.9 128From prod. TestPorosity, % 16.7 17 19From Kashkari report Water Saturation, % 36 38 40From Kashkari report
Drainage Area, acre 1354 1505 1655Measured based on structure map of Albian, range±10%
Net Pay, meters 2 5 7Range from Kashkari report, ML weighted averagebased on drainage area
Oil Recovery Factor, % (Er) 18 26 35Estimated from experience Gas Recovery Factor, % Er 1.25*Er 1.5*ErEstimated from experience
Oil Reservoir: Aptian (XIIA)
Parameter MinimumMostLikely Maximum Remarks
Oil Gravity, °API 30.6 33.4 35From Kashkari report Gas-Oil Ratio, SCF/Bbl 62.6 62.6 62.6From Kashkari report Gas Gravity, relative to air 0.64 0.66 0.68From Kashkari report Reservoir Temperature, oC 47 49.5 52From Kashkari report Initial Reservoir Pressure, atm 129.5 134.8 140From Prod. TestPorosity, % 18.6 22 25.4From Kashkari report Water Saturation, % 22 30 38From Kashkari report
Drainage Area, acre 858 954 1049Measured based on structure map of Aptian (XIIA),range ±10%
Net Pay, meters 2.5 11.2 16.3Range from Kashkari report, ML weighted averagebased on drainage area
Oil Recovery Factor, % (Er) 18 26 35Estimated from experience Gas Recovery Factor, % Er 1.25*Er 1.5*ErEstimated from experience
Kashkari Oil Field
7/6/2005 I-54 Gustavson Associates

PROMOTION OF OIL AND GAS PRODUCING ISLAMIC TRANSITIONAL STATE OF AFGHANISTANAREAS TO THE PRIVATE SECTOR MINISTRY OF MINES AND INDUSTRYGRANT AGREEMENT NO. H007-AF EMERGENCY INFRASTRUCTURE RECONSTRUCTION PROJECT
Oil Reservoir: Aptian (XIIB)
Parameter MinimumMostLikely Maximum Remarks
Oil Gravity, °API 34 34.6 35.2From Kashkari report Gas-Oil Ratio, SCF/Bbl 62.6 62.6 62.6From Kashkari report Gas Gravity, relative to air 0.69 0.704 0.72From Kashkari report Reservoir Temperature, oC 47 49.5 52From Kashkari report Initial Reservoir Pressure, atm 129.5 134.8 140From Prod. TestPorosity, % 16.3 18.5 20.6From Kashkari report Water Saturation, % 26 33 35From Kashkari report
Drainage Area, acre 171 190 209Measured based on structure map of Aptian (XIIB),range ±10%
Net Pay, meters 2.5 4.5 7.1Range from Kashkari report, ML weighted averagebased on drainage area
Oil Recovery Factor, % (Er) 18 26 35Estimated from experience Gas Recovery Factor, % Er 1.25*Er 1.5*ErEstimated from experience
Oil Reservoir: Hauterivian (XIV)
Parameter MinimumMostLikely Maximum Remarks
Oil Gravity, °API 27 27.7 28.4From Kashkari report Gas-Oil Ratio, SCF/Bbl 159 159 159From Kashkari report Gas Gravity, relative to air 0.65 0.672 0.69From Kashkari report Reservoir Temperature, oC 52 58.5 68From prod. test Initial Reservoir Pressure, atm 128.0 147.5 167From prod. test Porosity, % 19.0 20.1 22.5From Kashkari report Water Saturation, % 26 29 40From Kashkari report
Drainage Area, acre 798 887 976Measured based on structure map of Hautrivian (XIV), range ±10%
Net Pay, meters 5 14.1 25From Kashkari report Oil Recovery Factor, % (Er) 18 26 35Estimated from experience Gas Recovery Factor, % Er 1.25*Er 1.5*ErEstimated from experience
Volumetric Calculations
Probabilistic reserve estimates were made based on the reservoir parameters described above. The resulting probability distributions for oil in place, ultimate oil reserves,associated gas in place, and ultimate gas reserves, are shown in Figures 1-18 through 1-21. As no data are available for other methods of reserve estimation, these representGustavson’s opinion of reserves for the field.
7/6/2005 I-55 Gustavson Associates

PROMOTION OF OIL AND GAS PRODUCING ISLAMIC TRANSITIONAL STATE OF AFGHANISTANAREAS TO THE PRIVATE SECTOR MINISTRY OF MINES AND INDUSTRYGRANT AGREEMENT NO. H007-AF EMERGENCY INFRASTRUCTURE RECONSTRUCTION PROJECT
P10 = 127 MMBO
P50 = 103 MMBO
P90 = 81 MMBO
0%10%20%30%40%50%60%70%80%90%
100%
0 50 100 150 200
Oil In Place, MMBO
Perc
ent o
f Valu
esGr
eate
r Tha
n or
Equ
al To
Figure 1-18 Distribution of Total Oil In Place, Kashkari Field
P90 = 20 MMBO
P50 = 27 MMBO
P10 = 34 MMBO0%
10%20%30%40%50%60%70%80%90%
100%
0 10 20 30 40 5
Oil Reserves, MMBO
Perc
ent o
f Valu
esGr
eate
r Tha
n or
Equ
al To
0
Figure 1-19 Distribution of Total Oil Reserves, Kashkari Field
7/6/2005 I-56 Gustavson Associates
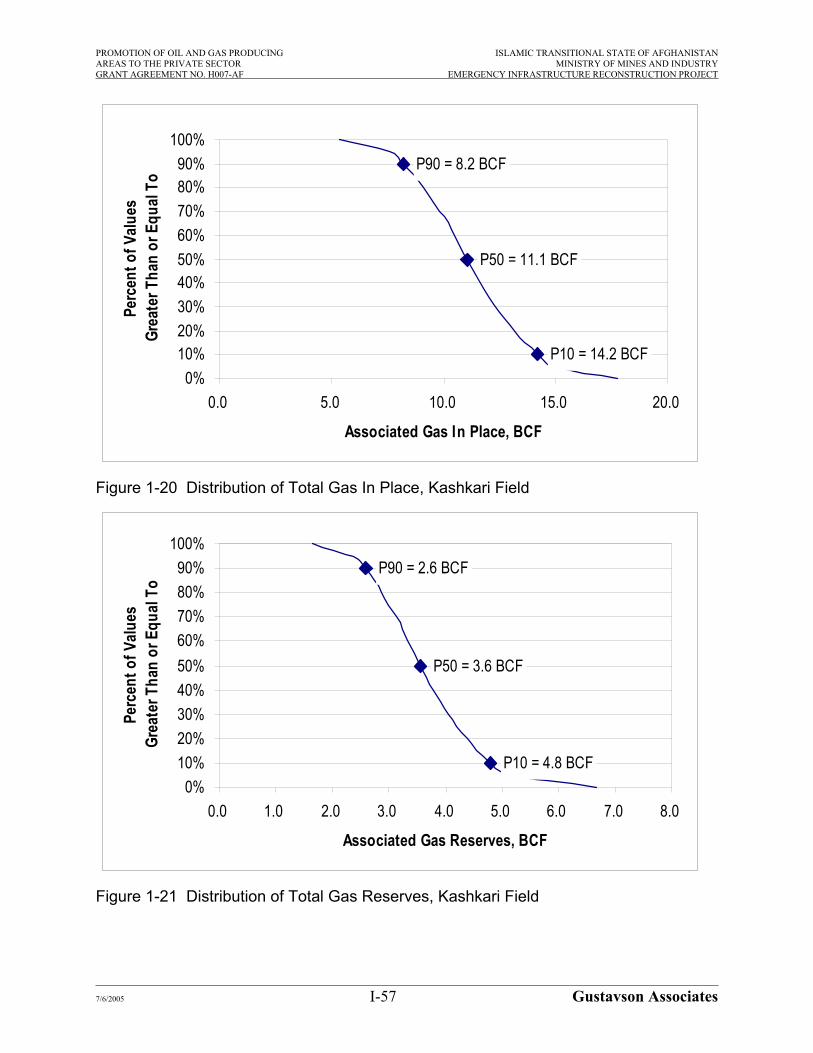
PROMOTION OF OIL AND GAS PRODUCING ISLAMIC TRANSITIONAL STATE OF AFGHANISTANAREAS TO THE PRIVATE SECTOR MINISTRY OF MINES AND INDUSTRYGRANT AGREEMENT NO. H007-AF EMERGENCY INFRASTRUCTURE RECONSTRUCTION PROJECT
P90 = 8.2 BCF
P50 = 11.1 BCF
P10 = 14.2 BCF0%
10%20%30%40%50%60%70%80%90%
100%
0.0 5.0 10.0 15.0 20.0
Associated Gas In Place, BCF
Perc
ent o
f Valu
esGr
eate
r Tha
n or
Equ
al To
Figure 1-20 Distribution of Total Gas In Place, Kashkari Field
P10 = 4.8 BCF
P50 = 3.6 BCF
P90 = 2.6 BCF
0%10%20%30%40%50%60%70%80%90%
100%
0.0 1.0 2.0 3.0 4.0 5.0 6.0 7.0 8.0
Associated Gas Reserves, BCF
Perc
ent o
f Valu
esGr
eate
r Tha
n or
Equ
al To
Figure 1-21 Distribution of Total Gas Reserves, Kashkari Field
7/6/2005 I-57 Gustavson Associates
PROMOTION OF OIL AND GAS PRODUCING ISLAMIC TRANSITIONAL STATE OF AFGHANISTANAREAS TO THE PRIVATE SECTOR MINISTRY OF MINES AND INDUSTRYGRANT AGREEMENT NO. H007-AF EMERGENCY INFRASTRUCTURE RECONSTRUCTION PROJECT
4.2.5.3 Bazarkhami Oil Field
Geology
Bazarkhami oil field is located in the southern portion of the North Afghanistan basin approximately 47 km. south of the city of Sheberghan and 28 km. west of Angut oil field (Figure 1-1, Plate 4). The structure is a NNE-SSW elongated anticline that is cut by two northwest-southeast trending faults that segment the anticline into three fault blockswhich are progressively downthrown to the north. The northern of the two faults marks the northern limit of the oil accumulation at the Lower Cretaceous Hauterivian reservoirhorizon. The oil field encompasses approximately 3.6 km2 based on the mapped position of the field’s oil-water contact and is located entirely within the central fault block. Overall independent structural closure at the top of the Hauterivian is in excessof 100 meters and may be as much as 260 meters. However, the oil column in the Hauterivian oil pool is only 25 meters, indicating that the structure is on the order of 10-25% filled to the estimated spillpoint. The only potentially productive horizon in this very small non-producing oil field is the Hauterivian sandstone.
For the Hauterivian reservoir in Bazarkhami field, there was little data available. Therewere two maps and an incomplete 1986 report on the field. A 1985 structure map of the top of the Hauterivian included the oil-water contact (apparently the outer oil-water contact). There was a cross section through wells #6, #7, #2, and #8 that also showed the oil-water contact. Also, there was a table that included information such as oil-bearing area, oil-bearing thickness, porosity, shrinkage factor, oil density, original oil in-place, recovery factor, and recoverable reserves for the XIV horizon in the field.
Geophysics
There are no maps available showing seismic data over the fields south of the map shown in Plate 1, including Bazarkhami field. In various discussions it seems that no data was ever recorded in areas outside of that shown on Plate 1.
Reservoir Parameters
Table 1-11 below presents a summary of input parameters used in the probabilistic reserves modeling of Bazarkhami field. These parameters come from a variety ofsources including maps, tables included on maps, and information from a 1986 Soviet-era Technoexport report on the field.
7/6/2005 I-58 Gustavson Associates

PROMOTION OF OIL AND GAS PRODUCING ISLAMIC TRANSITIONAL STATE OF AFGHANISTANAREAS TO THE PRIVATE SECTOR MINISTRY OF MINES AND INDUSTRYGRANT AGREEMENT NO. H007-AF EMERGENCY INFRASTRUCTURE RECONSTRUCTION PROJECT
Table 1-11 Bazarkhami Oil Field Input Parameters for Probabilistic Modeling
Oil Reservoir: Hauterivian (XIV)
Parameter MinimumMostLikely Maximum
Oil Gravity, °API 31 33 35Gas-Oil Ratio, SCF/Bbl 60 67 74Reservoir Temperature, oC 80 81 81Initial Reservoir Pressure, atm 229 234 239Porosity, % 18 20 22Water Saturation, % 31 36 40Drainage Area, acre 504 825 1087
Net Pay, meters 4.6 5.4 6.0Oil Recovery Factor, % (Er) 18 26 35Gas Recovery Factor, % Er 1.25*Er 1.5*Er
Volumetric Calculations
Probabilistic reserve estimates were made based on the reservoir parameters described above. The resulting probability distributions for oil in place, ultimate oil reserves,associated gas in place, and ultimate gas reserves, are shown in Figures 1-22 through 1-25. As no data are available for other methods of reserve estimation, these representGustavson’s opinion of reserves for the field.
7/6/2005 I-59 Gustavson Associates

PROMOTION OF OIL AND GAS PRODUCING ISLAMIC TRANSITIONAL STATE OF AFGHANISTANAREAS TO THE PRIVATE SECTOR MINISTRY OF MINES AND INDUSTRYGRANT AGREEMENT NO. H007-AF EMERGENCY INFRASTRUCTURE RECONSTRUCTION PROJECT
P10 = 17 MMBO
P50 = 14 MMBO
P90 = 11 MMBO
0%10%20%30%40%50%60%70%80%90%
100%
0 5 10 15 20 25
Oil In Place, MMBO
Perc
ent o
f Valu
esGr
eate
r Tha
n or
Equ
al To
Figure 1-22 Distribution of Total Oil In Place, Bazarkhami Field
P90 = 3 MMBO
P50 = 4 MMBO
P10 = 5 MMBO0%
10%20%30%40%50%60%70%80%90%
100%
0 1 2 3 4 5 6 7
Oil Reserves, MMBO
Perc
ent o
f Valu
esGr
eate
r Tha
n or
Equ
al To
Figure 1-23 Distribution of Total Oil Reserves, Bazarkhami Field
7/6/2005 I-60 Gustavson Associates

PROMOTION OF OIL AND GAS PRODUCING ISLAMIC TRANSITIONAL STATE OF AFGHANISTANAREAS TO THE PRIVATE SECTOR MINISTRY OF MINES AND INDUSTRYGRANT AGREEMENT NO. H007-AF EMERGENCY INFRASTRUCTURE RECONSTRUCTION PROJECT
P90 = 0.7 BCF
P50 = 0.9 BCF
P10 = 1.1 BCF0%
10%20%30%40%50%60%70%80%90%
100%
0.0 0.2 0.4 0.6 0.8 1.0 1.2 1.4 1.6
Associated Gas In Place, BCF
Perc
ent o
f Valu
esGr
eate
r Tha
n or
Equ
al To
Figure 1-24 Distribution of Total Gas In Place, Bazarkhami Field
P10 = 0.4 BCF
P50 = 0.3 BCF
P90 = 0.2 BCF
0%10%20%30%40%50%60%70%80%90%
100%
0.0 0.1 0.2 0.3 0.4 0.5 0.6 0.7
Associated Gas Reserves, BCF
Perc
ent o
f Valu
esGr
eate
r Tha
n or
Equ
al To
Figure 1-25 Distribution of Total Gas Reserves, Bazarkhami Field
7/6/2005 I-61 Gustavson Associates

PROMOTION OF OIL AND GAS PRODUCING ISLAMIC TRANSITIONAL STATE OF AFGHANISTANAREAS TO THE PRIVATE SECTOR MINISTRY OF MINES AND INDUSTRYGRANT AGREEMENT NO. H007-AF EMERGENCY INFRASTRUCTURE RECONSTRUCTION PROJECT
4.2.5.4 Aqdarya Oil Field
Geology
Aqdarya oil field is located in the southern portion of the North Afghanistan basin approximately 4 km. to the northeast of Kashkari oil field (Figure 1-1, Plate 4). The structure is essentially on-trend and en echelon with the Kashkari structure and exhibits and northeast-southwest elongation. The anticline is cut by northwest-southeast trending, near-vertical reverse fault that bisects the structure. The southwestern half of the structure is upthrown to the northeast half. Although this cross fault is not critical to the overall trapping of the oil pools, it does control the differing elevations of the oil-water contacts for the two halves of the structure for all three reservoirs (Albian ZonesXIa and XIb and the Hauterivian Zone XIV). The oil field encompasses 7.6 km2 asdefined by the mapped position of the oil-water contact for Zone XIb. The deeperHauterivian pool only encompasses 2 km2. The independent structural closure at theAlbian levels is in excess of greater than 110 meters. The maximum oil columns for the Albian XIa and XIb are slightly more than 100 meters, indicating that the Albian sandstone reservoirs are approximately 90% filled to spillpoint. However, the Hauterivian sandstone pool is only about 40-50% filled.
For the Albian and Hauterivian reservoirs in Aqdarya field, the 1970s and 1980s vintage maps were quality control checked, log picks were checked, and contours and well data were reviewed for consistency. The information to be used as input parameters forprobabilistic reserves calculation were tabulated and given to the engineering staff foruse in reserves modeling.
Cretaceous Albian (XI) Reservoir
The following information sources were especially useful in assessing the CretaceousAlbian reservoir at the Aqdarya field:
1975 structural map of the top and base of the XIa and net pay map of the XIa at an original scale of 1:10,000. The structure map of the top and base of the XIa include the outer and inner, respectively, oil-water contacts. There are also two tables on the sheet with data on wells #1 through #6. 1981 structure map of the top of the XIa. The structure map includes a deeperoil-water contact than the 1975 map (210 m depth rather than 170 m depth), but the oil-water contact is not completely shown in the lower left or apparentsoutheast end of the field. Because of this, an oil-water contact at the 210 mdepth on the 1975 map was used to calculate the area within the reservoir. Thismap also includes a cross section and two tables below the map. The cross section intersects wells #4, #7, #1, #8, and #9. This map has information on it about wells 7 and 8, which are not on the 1975 map. Well #9 is a proposed well, so there is no information about intercept depths for this well. The table on the right includes information about well tests, including test intervals, oil and water flow rates, and pressures. The table on the left includes information about oil-
7/6/2005 I-62 Gustavson Associates
PROMOTION OF OIL AND GAS PRODUCING ISLAMIC TRANSITIONAL STATE OF AFGHANISTANAREAS TO THE PRIVATE SECTOR MINISTRY OF MINES AND INDUSTRYGRANT AGREEMENT NO. H007-AF EMERGENCY INFRASTRUCTURE RECONSTRUCTION PROJECT
saturated area and thickness, porosity, oil saturation, oil density, shrinkage factor, original oil in- place, recovery factor, and recoverable reserves. Exhibit 11 1987 structure map of the top and base of the XIb and also a net paymap of the Xib. The structure maps of the top and base of the XIb include theouter and inner oil-water contacts, respectively. There are also three tables on the map. The upper left table includes oil and water flow rates, temperatures,and pressures for test intervals. The upper right table includes what is apparently data about the wellbores, such as depths and elevations. The table across the bottom of the map includes what seem to be reservoir parameters for the C1 category reserves in the XIb reservoir.Exhibit 4 1987 well correlation scheme for the XI reservoir. This cross section with well logs for wells #6, #4, #7, #3, #2, #1, #8, and #5 included water and oil flow rates for tested intervals.
Cretaceous Hauterivian (XIV) Reservoir
The following information sources were especially useful in assessing the CretaceousAlbian reservoir at the Aqdarya field:
Exhibit 12 1987 structure map of the top and base of the XIV reservoir. The structure maps of the top and base of the XIV includes only what is apparentlythe outer oil-water contact. There are also three tables on the map. The left table includes oil and water flow rates, temperatures, and pressures for test intervals. The upper right table includes what is apparently data about the wellbores, such as depths and elevations. The lower right table includes whatseem to be reservoir parameters for the C1 category reserves in the XIV.Exhibit 5 1987 well correlation scheme for the XIV reservoir. This cross section with well logs for wells #6, #4, #7, #3, #2, #1, and #5 included water and oil flow rates for tested intervals.
There is a 1987 well correlation scheme cross section (Exhibit 3), which shows entirewell logs for wells #6, #4, #7, #3, #2, #1, #8, #5. Stratigraphic correlations for zones XIa, XIb, and XIV are shown.
There is also a 1987 report that includes information about the XI, XII, and XIV reservoirs in Aqdarya field.
Geophysics
There are no maps available showing seismic data over the fields south of the map shown in Plate 1, including Aqdarya field. In various discussions it seems that no data was ever recorded in areas outside of that shown on Plate 1.
7/6/2005 I-63 Gustavson Associates

PROMOTION OF OIL AND GAS PRODUCING ISLAMIC TRANSITIONAL STATE OF AFGHANISTANAREAS TO THE PRIVATE SECTOR MINISTRY OF MINES AND INDUSTRYGRANT AGREEMENT NO. H007-AF EMERGENCY INFRASTRUCTURE RECONSTRUCTION PROJECT
Reservoir Parameters
Table 1-12 below presents a summary of input parameters used in the probabilistic reserves modeling of Aqdarya field. These parameters come from a variety of sources including maps, tables included on maps, and information from the 1987 Soviet-era Technoexport report on the field
Table 1-12 Aqdarya Oil Field Input Parameters for Probabilistic Modeling
Oil Reservoir: Albian (XIa)
Parameter MinimumMostLikely Maximum Remarks
Oil Gravity, °API 34.4 40 44.5ML from Table on structure map of XIa, range refer toXIb
Gas-Oil Ratio, SCF/Bbl 18 18 18Refer to XIbGas Gravity, relative to air 0.703 0.713 0.723Refer to XIbReservoir Temperature, oC 48 48.5 49Refer to XIbInitial Reservoir Pressure, atm 131.5 139.4 147.2Refer to XIb
Porosity, % 12.0 14.0 16.0ML from Table on structure map of XIa, range ±15%
Water Saturation, % 33 39 45ML from Table on structure map of XIa, range ±15%Drainage Area, acre 1483 1644 1806Range measured based on structure map of XIa
Net Pay, meters 9.2 11 13.8ML from Table on structure map of XIa, range from isopach map
Oil Recovery Factor, % (Er) 35 37 40Refer to XIbGas Recovery Factor, % Er Er ErEstimated from experience
Oil Reservoir: Albian (XIb)
Parameter MinimumMostLikely Maximum Remarks
Oil Gravity, °API 34.4 40 44.5From Aqdarya report Gas-Oil Ratio, SCF/Bbl 18 18 18From Aqdarya report Gas Gravity, relative to air 0.703 0.713 0.723From Aqdarya report Reservoir Temperature, oC 48 48.5 49From Aqdarya report Initial Reservoir Pressure, atm 131.5 139.4 147.2From Aqdarya report Porosity, % 14.0 16.0 17.4From Aqdarya report Water Saturation, % 29.7 33.0 45.0From Aqdarya report
Drainage Area, acre 1506 1673 1840ML is an equivalent area based on measured areas, range ±10%
Net Pay, meters 4.6 6.3 7From Aqdarya report Oil Recovery Factor, % (Er) 35 37 40ML from Aqdarya report Gas Recovery Factor, % Er Er ErEstimated from experience
7/6/2005 I-64 Gustavson Associates

PROMOTION OF OIL AND GAS PRODUCING ISLAMIC TRANSITIONAL STATE OF AFGHANISTANAREAS TO THE PRIVATE SECTOR MINISTRY OF MINES AND INDUSTRYGRANT AGREEMENT NO. H007-AF EMERGENCY INFRASTRUCTURE RECONSTRUCTION PROJECT
Oil Reservoir: Hauterivian (XIV)
Parameter MinimumMostLikely Maximum Remarks
Oil Gravity, °API 19.5 21.7 23.9From Aqdarya report Gas-Oil Ratio, SCF/Bbl 60 60 60From Aqdarya report Gas Gravity, relative to air 1.456 1.532 1.638From Aqdarya report Reservoir Temperature, oC 61 61.8 63From Aqdarya report Initial Reservoir Pressure, atm 172.7 176.1 179.4From Aqdarya report Porosity, % 16.5 16.9 18.3From Aqdarya report Water Saturation, % 31 39 40From Aqdarya report
Drainage Area, acre 447 497 546ML measured area on structure map of Hautrivian, range ±10%
Net Pay, meters 4.4 5.7 7From Aqdarya report Oil Recovery Factor, % (Er) 35 37 40ML from Aqdarya report Gas Recovery Factor, % Er 1.25*Er 1.5*ErEstimated from experience
Volumetric Calculations
Probabilistic reserve estimates were made based on the reservoir parameters described above. The resulting probability distributions for oil in place, ultimate oil reserves,associated gas in place, and ultimate gas reserves, are shown in Figures 1-26 through 1-29. As no data are available for other methods of reserve estimation, these representGustavson’s opinion of reserves for the field.
7/6/2005 I-65 Gustavson Associates

PROMOTION OF OIL AND GAS PRODUCING ISLAMIC TRANSITIONAL STATE OF AFGHANISTANAREAS TO THE PRIVATE SECTOR MINISTRY OF MINES AND INDUSTRYGRANT AGREEMENT NO. H007-AF EMERGENCY INFRASTRUCTURE RECONSTRUCTION PROJECT
P10 = 79 MMBO
P50 = 72 MMBO
P90 = 65 MMBO
0%10%20%30%40%50%60%70%80%90%
100%
0 20 40 60 80 100
Oil In Place, MMBO
Perc
ent o
f Valu
esGr
eate
r Tha
n or
Equ
al To
Figure 1-26 Distribution of Total Oil In Place, Aqdarya Field
P90 = 17 MMBO
P50 = 19 MMBO
P10 = 21 MMBO0%
10%20%30%40%50%60%70%80%90%
100%
0 5 10 15 20 25
Oil Reserves, MMBO
Perc
ent o
f Valu
esGr
eate
r Tha
n or
Equ
al To
Figure 1-27 Distribution of Total Oil Reserves, Aqdarya Field
7/6/2005 I-66 Gustavson Associates
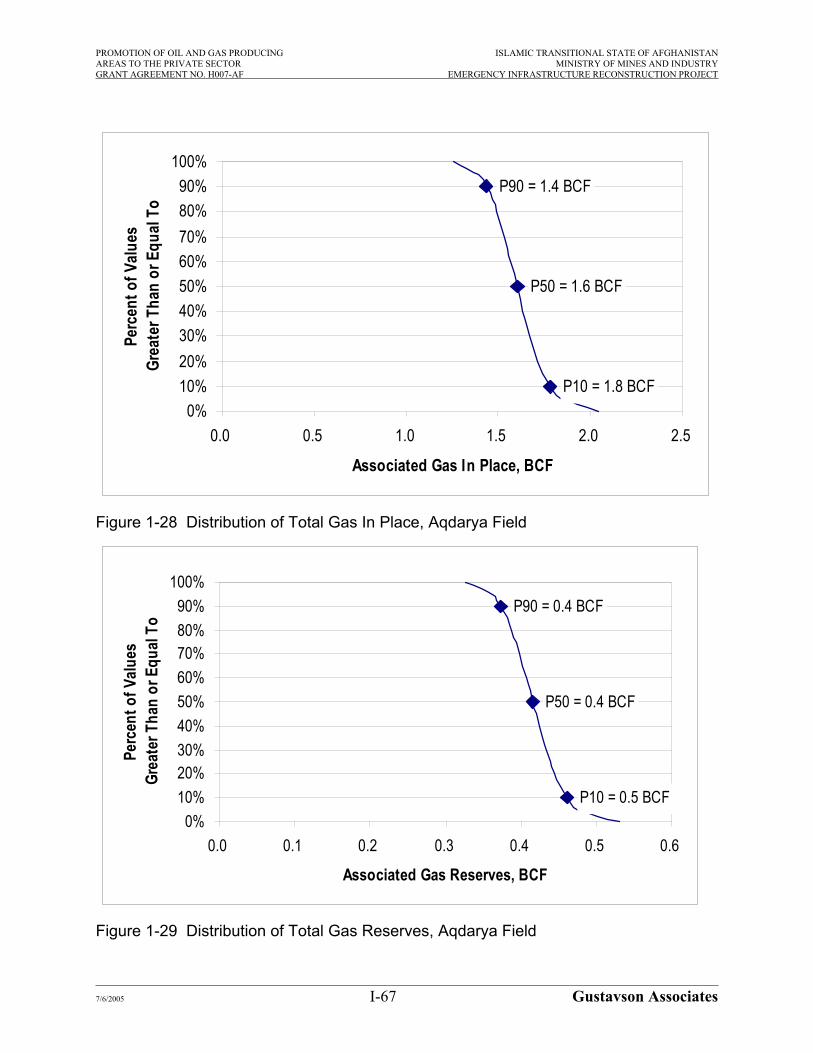
PROMOTION OF OIL AND GAS PRODUCING ISLAMIC TRANSITIONAL STATE OF AFGHANISTANAREAS TO THE PRIVATE SECTOR MINISTRY OF MINES AND INDUSTRYGRANT AGREEMENT NO. H007-AF EMERGENCY INFRASTRUCTURE RECONSTRUCTION PROJECT
P90 = 1.4 BCF
P50 = 1.6 BCF
P10 = 1.8 BCF0%
10%20%30%40%50%60%70%80%90%
100%
0.0 0.5 1.0 1.5 2.0 2.5
Associated Gas In Place, BCF
Perc
ent o
f Valu
esGr
eate
r Tha
n or
Equ
al To
Figure 1-28 Distribution of Total Gas In Place, Aqdarya Field
P10 = 0.5 BCF
P50 = 0.4 BCF
P90 = 0.4 BCF
0%10%20%30%40%50%60%70%80%90%
100%
0.0 0.1 0.2 0.3 0.4 0.5 0.6
Associated Gas Reserves, BCF
Perc
ent o
f Valu
esGr
eate
r Tha
n or
Equ
al To
Figure 1-29 Distribution of Total Gas Reserves, Aqdarya Field
7/6/2005 I-67 Gustavson Associates

PROMOTION OF OIL AND GAS PRODUCING ISLAMIC TRANSITIONAL STATE OF AFGHANISTANAREAS TO THE PRIVATE SECTOR MINISTRY OF MINES AND INDUSTRYGRANT AGREEMENT NO. H007-AF EMERGENCY INFRASTRUCTURE RECONSTRUCTION PROJECT
4.2.5.5 Zamarudsay Oil Field
Geology
Zamarudsay oil field is located in the southern portion of the North Afghanistan basinapproximately 60 km. to the southwest of the city of Sheberghan and about 37 km. westof Bazarkhami oil field (Figure 1-1, Plate 4). Zamarudsay is situated on an ENE-WSWtrending anticlinal closure. The anticline is cut on its southwest flank by a down-to-the-northeast normal fault with a little over 200 meters of throw. This fault bounds the field on the southwest and is a critical component of the trap. The field encompasses about 15.7 km2 as defined by the mapped position of the oil-water contact at the top of the Hauterivian Zone XIV reservoir. Fold closure into the fault at the top of the Hauterivian reservoir horizon is approximately 225 meters. The maximum height of the oil column isabout 50 meters, indicating that the structure is only a little over 20% filled to spillpoint. The Hauterivian Zone XIV is the only identified oil-productive reservoir interval in the field.
The maps and logs from the 1980s that relate to the Hauterivian Zone XIV reservoir inthis field were reviewed and the most current maps were quality control checked. Logs, map contours, and well data were also checked. The information to be used as input parameters for probabilistic reserves calculation were tabulated and given to the engineering staff for use in reserves modeling.
Cretaceous Hauterivian (XIV) Reservoir
The following information sources were especially useful in assessing the CretaceousAlbian reservoir at the Zamarudsay field:
Exhibit 5 1985 structure map of the top of the Hauterivian from a 1985 report on the field. This map includes the oil-water contact (apparently outer) on the map. Below the map is a cross section that includes wells #3, #5, #6, and proposed #7. There is also a small table that gives reservoir including oil-bearing area, oil-bearing thickness, porosity, oil saturation, shrinkage factor, oil density, original oil in-place, recovery factor, and recoverable reserves.1989 report on Zamarudsay field on the Hauterivian (XIV). Exhibit 18 from a 1989 report, which included resistivity and gamma ray logs.
Geophysics
There are no maps available showing seismic data over the fields south of the map shown in Plate 1, including Zamarudsay field. In various discussions it seems that no data was ever recorded in areas outside of that shown on Plate 1.
7/6/2005 I-68 Gustavson Associates
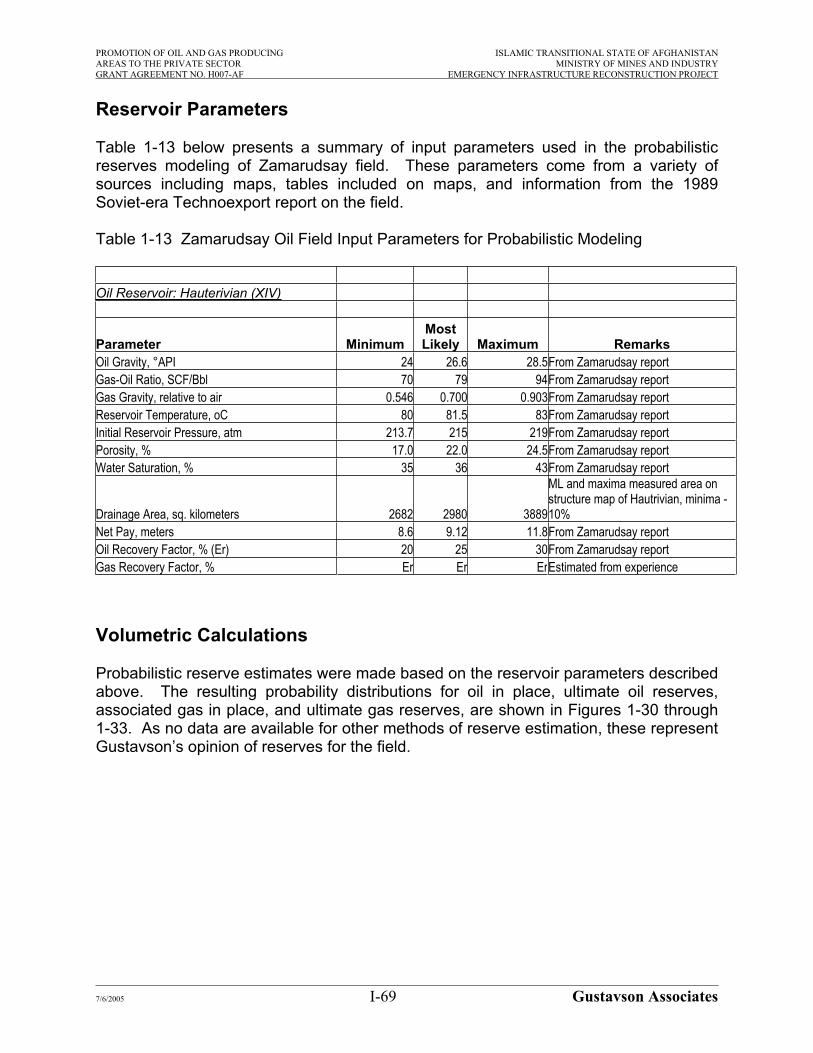
PROMOTION OF OIL AND GAS PRODUCING ISLAMIC TRANSITIONAL STATE OF AFGHANISTANAREAS TO THE PRIVATE SECTOR MINISTRY OF MINES AND INDUSTRYGRANT AGREEMENT NO. H007-AF EMERGENCY INFRASTRUCTURE RECONSTRUCTION PROJECT
Reservoir Parameters
Table 1-13 below presents a summary of input parameters used in the probabilistic reserves modeling of Zamarudsay field. These parameters come from a variety of sources including maps, tables included on maps, and information from the 1989 Soviet-era Technoexport report on the field.
Table 1-13 Zamarudsay Oil Field Input Parameters for Probabilistic Modeling
Oil Reservoir: Hauterivian (XIV)
Parameter MinimumMostLikely Maximum Remarks
Oil Gravity, °API 24 26.6 28.5From Zamarudsay report Gas-Oil Ratio, SCF/Bbl 70 79 94From Zamarudsay report Gas Gravity, relative to air 0.546 0.700 0.903From Zamarudsay report Reservoir Temperature, oC 80 81.5 83From Zamarudsay report Initial Reservoir Pressure, atm 213.7 215 219From Zamarudsay report Porosity, % 17.0 22.0 24.5From Zamarudsay reportWater Saturation, % 35 36 43From Zamarudsay report
Drainage Area, sq. kilometers 2682 2980 3889
ML and maxima measured area onstructure map of Hautrivian, minima -10%
Net Pay, meters 8.6 9.12 11.8From Zamarudsay report Oil Recovery Factor, % (Er) 20 25 30From Zamarudsay report Gas Recovery Factor, % Er Er ErEstimated from experience
Volumetric Calculations
Probabilistic reserve estimates were made based on the reservoir parameters described above. The resulting probability distributions for oil in place, ultimate oil reserves,associated gas in place, and ultimate gas reserves, are shown in Figures 1-30 through 1-33. As no data are available for other methods of reserve estimation, these representGustavson’s opinion of reserves for the field.
7/6/2005 I-69 Gustavson Associates

PROMOTION OF OIL AND GAS PRODUCING ISLAMIC TRANSITIONAL STATE OF AFGHANISTANAREAS TO THE PRIVATE SECTOR MINISTRY OF MINES AND INDUSTRYGRANT AGREEMENT NO. H007-AF EMERGENCY INFRASTRUCTURE RECONSTRUCTION PROJECT
P90 = 85 MMBO
P50 = 100 MMBO
P10 = 120 MMBO0%
10%20%30%40%50%60%70%80%90%
100%
0 50 100 150 200
Oil In Place, MMBO
Perc
ent o
f Valu
esGr
eate
r Tha
n or
Equ
al To
Figure 1-30 Distribution of Total Oil In Place, Zamarudsay Field
P90 = 20 MMBO
P50 = 26 MMBO
P10 = 33 MMBO0%
10%20%30%40%50%60%70%80%90%
100%
0 10 20 30 40 50 60
Oil Reserves, MMBO
Perc
ent o
f Valu
esGr
eate
r Tha
n or
Equ
al To
Figure 1-31 Distribution of Total Oil Reserves, Zamarudsay Field
7/6/2005 I-70 Gustavson Associates

PROMOTION OF OIL AND GAS PRODUCING ISLAMIC TRANSITIONAL STATE OF AFGHANISTANAREAS TO THE PRIVATE SECTOR MINISTRY OF MINES AND INDUSTRYGRANT AGREEMENT NO. H007-AF EMERGENCY INFRASTRUCTURE RECONSTRUCTION PROJECT
P90 = 6.8 BCF
P50 = 8.1 BCF
P10 = 9.8 BCF0%
10%20%30%40%50%60%70%80%90%
100%
0 2 4 6 8 10 12 14
Associated Gas In Place, BCF
Perc
ent o
f Valu
esGr
eate
r Tha
n or
Equ
al To
Figure 1-32 Distribution of Total Gas In Place, Zamarudsay Field
P10 = 2.7 BCF
P50 = 2.1 BCF
P90 = 1.6 BCF
0%10%20%30%40%50%60%70%80%90%
100%
0 1 2 3 4 5
Associated Gas Reserves, BCF
Perc
ent o
f Valu
esGr
eate
r Tha
n or
Equ
al To
Figure 1-33 Distribution of Total Gas Reserves, Zamarudsay Field
7/6/2005 I-71 Gustavson Associates

PROMOTION OF OIL AND GAS PRODUCING ISLAMIC TRANSITIONAL STATE OF AFGHANISTANAREAS TO THE PRIVATE SECTOR MINISTRY OF MINES AND INDUSTRYGRANT AGREEMENT NO. H007-AF EMERGENCY INFRASTRUCTURE RECONSTRUCTION PROJECT
4.2.6 ANALYSIS OF DISCOVERED / NON-PRODUCING GAS FIELDS
4.2.6.1 Introduction
This Section of the Report summarizes the technical work performed by Gustavson Associates staff for the purpose of gathering critical reservoir parameter data on severaldiscovered but, as yet, non-producing gas fields in the central and northern portions of the North Afghanistan basin. The various reservoir parameters were used as basic input data for the probabilistic reserves modeling of the subject fields. The results of the modeling for each field are presented in the appropriate subsections that follow. Thefive fields that are summarized in Section 4.2.6 are: Jangalikolon, Bashikurd, Juma, Khoja Bolan, and Shakarak.
4.2.6.2 Jangalikolon Gas Field
Geology
Jangalikolon gas field is located approximately 22 km. to the northwest of the city ofSheberghan (Figure 1-1, Plate 4). This large non-producing Jurassic reef discovery is situated on a broad domal structure that is part of a larger northwest-southeast oriented structural ridge. The reservoirs are developed within the Upper Jurassic Kugitan formation (Zone XV and possibly Zone XVI). The smaller Chakcha field is also located on this ridge to the southeast of Jangalikolon. The independent fold closure on theJangalikolon structure at the level of the Upper Jurassic IV Anhydrite is approximately150 meters. The gas accumulation encompasses 53 km2 as defined by the mapped position of the gas-water contact. Within that area, reservoir quality may vary greatly due to stratigraphic facies changes from porous reef to nonporous off-reef carbonates.Even within the relatively tighter non-reef facies carbonates, commercial production maybe established from fractured reservoirs. The Jangalikolon structure appears to be essentially filled to spillpoint.
Two maps were available for this field but only one well log was available. This data was checked for quality control and accuracy. The information to be used as inputparameters for probabilistic reserves calculation were tabulated and given to the engineering staff for use in reserves modeling.
Jurassic Kugitan Formation (XV and XVI) Reservoir
The available maps are 1985 and 1991vintage. There were only well logs available forwell #4 (neutron gamma, gamma, caliper, and a resistivity log curves at a scale of 1:200). When the depths on the log were compared to those on the cross section, itwas seen that the well was apparently deviated. Since there was no information about deviation corrections, the log and cross section information could not be checked witheach other. Well #4 enters the gas-bearing Kugitan unit at a subsea elevation of about3750 m and crosses through the unit to the gas-water contact at a subsea elevation of
7/6/2005 I-72 Gustavson Associates

PROMOTION OF OIL AND GAS PRODUCING ISLAMIC TRANSITIONAL STATE OF AFGHANISTANAREAS TO THE PRIVATE SECTOR MINISTRY OF MINES AND INDUSTRYGRANT AGREEMENT NO. H007-AF EMERGENCY INFRASTRUCTURE RECONSTRUCTION PROJECT
about 3840 m. This information was presented on a 1991 map of the Jungalkhulan and Chakcha fields (map scale: 1:100,000) that also included a cross section at a scale of 1:25,000, a well log interval from well #4 in Jungalkhulan, and a table with flow rates, pressures, and gas composition for Well 4. There was also an incomplete copy of a 1989 report on Well 4 that provided useful information.
Geophysics
This field has the best seismic coverage of all the fields and prospects and is shown onthe composite lines in Plates 2 and 3. The five lines available over the structure are indicated in Plate 1 and all are of good quality with good energy penetration to about the top of Jurassic. Deeper data only provides hints of the complexities within the Jurassic. The best line is 88329 plotted in correct orientation on the Composite Line 1 (Plate 2),showing a broad structure with a fault zone at station 150. Further discussion of this seismic data is included in Appendix E. The seismic data is not adequate for stratigraphic interpretation, and is useful for only general structural mapping and the faults are not well imaged.
Reservoir Parameters
Table 1-14 below presents a summary of input parameters used in the probabilistic reserves modeling of Jangalikolon field. These parameters come from a variety of sources including maps, tables included on maps, information from a Soviet-era report on well #4 in the field, and data from the 2003 Asian Development Bank Final Report on Gas Sector Rehabilitation.
Table 1-14 Jangalikolon Gas Field Input Parameters for Probabilistic Modeling
Gas Reservoir: Kugitan (XV 1)
Parameter MinimumMostLikely Maximum
Gas Gravity 0.641 0.694 0.767% N2 3.2 5.0 6.8% CO2 8.6 9.6 10.6% H2S 0.001 0.093 0.269RES. TEMPERATURE °C 136 141 145INITIAL PRESSURE , atm 532 572 610ABANDONMENT PRES , atm 34 51 68NET PAY , m 10 13 16AREA, ACRES 3835 10033 16061WATER SAT , % 13 21 30POROSITY , % 9 11 13
Gas Reservoir: Kugitan (XV 2)
7/6/2005 I-73 Gustavson Associates

PROMOTION OF OIL AND GAS PRODUCING ISLAMIC TRANSITIONAL STATE OF AFGHANISTANAREAS TO THE PRIVATE SECTOR MINISTRY OF MINES AND INDUSTRYGRANT AGREEMENT NO. H007-AF EMERGENCY INFRASTRUCTURE RECONSTRUCTION PROJECT
Parameter MinimumMostLikely Maximum
Gas Gravity 0.641 0.694 0.769% N2 3.2 4.9 6.8% CO2 8.6 9.6 10.6% H2S 0.002 0.096 0.273RES. TEMPERATURE °C 120 125 130INITIAL PRESSURE , atm 392 409 429ABANDONMENT PRES , atm 35 51 67NET PAY , m 3.0 3.6 4.2
AREA, ACRES 1933 2113 2295WATER SAT , % 13 22 30POROSITY , % 7.1 7.6 8.1
Gas Reservoir: Kugitan (XV 3)
Parameter MinimumMostLikely Maximum
Gas Gravity0.6408567 0.69594 0.7661716
% N2 3.18 4.93 6.77% CO2 8.62 9.61 10.56% H2S 0.002 0.098 0.277RES. TEMPERATURE °C 120 125 130INITIAL PRESSURE , atm 392 410 429ABANDONMENT PRES , atm 34 51 67NET PAY , m 9.1 11.0 12.9AREA, ACRES 990 1151 1304
WATER SAT , % 13.4 20.0 29.6POROSITY , % 7.1 8.4 9.6
7/6/2005 I-74 Gustavson Associates

PROMOTION OF OIL AND GAS PRODUCING ISLAMIC TRANSITIONAL STATE OF AFGHANISTANAREAS TO THE PRIVATE SECTOR MINISTRY OF MINES AND INDUSTRYGRANT AGREEMENT NO. H007-AF EMERGENCY INFRASTRUCTURE RECONSTRUCTION PROJECT
Volumetric Calculations
Probabilistic reserve estimates were made based on the reservoir parameters described above. The resulting probability distributions for gas in place and ultimate gas reserves are shown in Figures 1-34 and 1-35. As no data are available for other methods of reserve estimation, these represent Gustavson’s opinion of reserves for the field.
P10 = 788.8 BCF
P50 = 526.1 BCF
P90 = 293.5 BCF
0%10%20%30%40%50%60%70%80%90%
100%
0 200 400 600 800 1,000 1,200
Gas In Place, BCF
Perc
ent o
f Valu
es
Grea
ter T
han
or E
qual
To
Figure 1-34 Distribution of Total Gas In Place, Jangalikolon Field
7/6/2005 I-75 Gustavson Associates

PROMOTION OF OIL AND GAS PRODUCING ISLAMIC TRANSITIONAL STATE OF AFGHANISTANAREAS TO THE PRIVATE SECTOR MINISTRY OF MINES AND INDUSTRYGRANT AGREEMENT NO. H007-AF EMERGENCY INFRASTRUCTURE RECONSTRUCTION PROJECT
P90 = 257.8 BCF
P50 = 462.2 BCF
P10 = 694.0 BCF0%
10%20%30%40%50%60%70%80%90%
100%
0.0 200.0 400.0 600.0 800.0 1,000.0 1,200.0
Gas Reserves, BCF
Perc
ent o
f Valu
esGr
eate
r Tha
n or
Equ
al To
Figure 1-35 Distribution of Total Gas Reserves, Jangalikolon Field
4.2.6.3 Bashikurd Gas Field
Geology
Bashikurd gas field is located approximately 15 km. to the west of the city of Sheberghan (Figure 1-1, Plate 4). Bashikurd field is located at the eastern end of alarge, faulted anticlinal platform that also contains Juma field. The two fields areseparated by a prominent northwest-southeast trending fault zone that forms a criticalelement of the traps in both fields. The gas-bearing horizons in both fields includefractured, reefal carbonates with good matrix porosity that are developed within the Upper Jurassic Kugitan formation. Zone XV is productive at Bashikurd, whereas ZonesXV and XVa are gas-bearing at neighboring Juma. Multiple individual reservoirs are developed within this reef complex in both fields. Bashikurd gas field encompasses 43 km2 as defined by the mapped position of the gas-water contact and the adjacent Juma field encompasses 69 km2 on the western side of the bisecting fault zone. The maximum gross gas column at Bashikurd field is slightly less than 100 meters, whereasthe gross gas column in the adjacent Juma field is just under 175 meters. The elevations of the gas-water contact in the two fields differ by about 70 meters. The two fields have undergone development drilling (“exploration” in the Russian terminology)but neither field was produced prior to the departure of the Soviets in 1991.
Due to the close proximity of Bashikurd and Juma fields, the same information was used when checking the two fields because they are on the same maps. The Kugitan
7/6/2005 I-76 Gustavson Associates
PROMOTION OF OIL AND GAS PRODUCING ISLAMIC TRANSITIONAL STATE OF AFGHANISTANAREAS TO THE PRIVATE SECTOR MINISTRY OF MINES AND INDUSTRYGRANT AGREEMENT NO. H007-AF EMERGENCY INFRASTRUCTURE RECONSTRUCTION PROJECT
reservoir is present at both fields. Maps, logs, and cross sections of these fields fromthe 1980s were available. This data was checked for quality control and accuracy. The information to be used as input parameters for probabilistic reserves calculation weretabulated and given to the engineering staff for use in reserves modeling.
Jurassic Kugitan Formation (XV) Reservoir
The following information sources were especially useful in assessing the JurassicKugitan reservoir at the Bashikurd and Juma fields:
Exhibit 25 1989 structure maps of the top and base of the XV (Group I) and a structure map of the base of the XVa (Group I) all at an original scale of 1:50,000. The top and base structure maps included the outer and inner, respectively, gas-water contacts for the XV (Group I). The third structure map shows only the outer gas-water contact for the XVa (Group I). There are also three large tables of field and reservoir data. The mapping inputs table (uppertable on the left) includes KB elevation, wellbore curvature adjustments, interceptdepth and absolute elevations for the top of the XV and XVa, and the intercept depth and absolute elevations for the base of the XV for various wells. The summary table of reserves evaluation inputs (table in the lower left) includes gas bearing area, average gas net pay, volume of gas-saturated reservoir, portion of connected porosity, gas saturation, factor for conversion to dry gas, starting and ending formation pressure, temperature, initial and ending Boyle’s Law, wet and dry recognized reserves in-place, recoverable condensate, and sulfur componentof gas. The well test results table (table on the right side of the sheet) includesinformation about productive interval depth and absolute elevation, perforation interval, reservoir depth top and base depth and elevation for both Group I and Group II, fluid produced, formation pressure, choke diameter, and gas and water flow rates for the XV and XVa in various wells. Exhibit 26 1989 structure maps of the top and base of the XV Group II and a map of effective gas saturated thickness all at an original scale of 1:50,000. The top and base structure maps included the outer and inner, respectively, gas-watercontacts for the XV (Group II) reservoirs. There is also a table on the sheet that gives surface elevation, depth and elevation of the top of the XV (Group II), and the depth and elevation of the base of the XV (Group II). Exhibit 24 1989 net thickness map for the XV and XVa (Group I) reservoirs at an original scale of 1:50,000. This map provided information about thicknesses ofthe XV and XVa reservoirs. 1985 structure map of the top of the Kugitan at Bashikurd and Juma. The outer gas-water contact is included on the map. Below the map is a cross section below with wells #10-B, #6-B, proposed well #12-B, and proposed well #9-B. A portion of the gamma, neutron gamma, and resistivity logs for well #6 over the producing interval is included in the montage. Also, there are two tables. One includes water and gas flow rates and pressures for tested intervals in severalwells. The second table gives information about the wells drilled including bottom hole drilled depth and deviation correction.
7/6/2005 I-77 Gustavson Associates

PROMOTION OF OIL AND GAS PRODUCING ISLAMIC TRANSITIONAL STATE OF AFGHANISTANAREAS TO THE PRIVATE SECTOR MINISTRY OF MINES AND INDUSTRYGRANT AGREEMENT NO. H007-AF EMERGENCY INFRASTRUCTURE RECONSTRUCTION PROJECT
1989 geological production stick diagram cross section through wells #9-B, #6-B, #2-B, and #11-B. This diagram includes information on the location of the gas-water contact, gas flow rates over certain intervals, and pressures over certain intervals.Exhibit 21 1989 geological production stick diagram cross section through wells#9-B, #6-B, #2-B, and #11-B. This diagram includes information on the location of the gas-water contact, gas flow rates over certain intervals, and pressures over certain intervals in the XV and XVa. Exhibit 18 1989 geological production stick diagram cross section through wells#4-A, #8-B, #5-B, #1-B, #2-B, #3-B, and #7-B. This diagram includes information on the location of the gas-water contact, gas flow rates over certain intervals, and pressures over certain intervals in the XV and XVa. Exhibit 20 1989 geological production stick diagram cross section through wells#8-D, #6-D, #5-D, #10-B, #5-B (note that although the wells are labeled with a “D” (e.g., #8-D) for the Russian letter delta, the wells are Juma wells because“dzh” written letters are used to express the “j” sound). This diagram includesinformation on the location of the gas-water contact, gas flow rates over certain intervals, and pressures over certain intervals in the XV and XVa. Exhibit 23 1989 Juma production scheme stick diagram cross section through wells #8-D, #6-D, #7-D, #9-D, #1-D, #2-D, and #12-B. This diagram includesinformation on the gas-water contact, gas flow rates, water flow rates, and pressures in tested intervals in the XV and XVa.
There is also a 1989 report that includes information about the XV and XVa reservoirs in Bashikurd and Juma fields.
Geophysics
The Bashikurd structure is best seen in the Composite Line 2 (Plate 3) where line 85201 has some useful data in the Jurassic section at about 2 seconds. The faulted westmargin of the structure is apparent, but there are no useful details on the seismic data.Careful well interpretation could make the line more useful in determining the displacement and stratigraphy of the faulted blocks. A total of three lines are available across the structure. This structure is also discussed in Appendix E.
Reservoir Parameters
Table 1-15 below presents a summary of input parameters used in the probabilistic reserves modeling of Bashikurd field. These parameters come from a variety of sources including maps, tables included on maps, information from the 1989 Soviet-era Technoexport report on the field, and data from the 2003 Asian Development Bank Final Report on Gas Sector Rehabilitation.
7/6/2005 I-78 Gustavson Associates

PROMOTION OF OIL AND GAS PRODUCING ISLAMIC TRANSITIONAL STATE OF AFGHANISTANAREAS TO THE PRIVATE SECTOR MINISTRY OF MINES AND INDUSTRYGRANT AGREEMENT NO. H007-AF EMERGENCY INFRASTRUCTURE RECONSTRUCTION PROJECT
Table 1-15 Bashikurd Gas Field Input Parameters for Probabilistic Modeling
Gas Reservoir: Kugitan (XV-I)
Parameter MinimumMostLikely Maximum Remarks
Gas Gravity 0.555 0.65 0.67Range from Bashikurd report, ML from prod. Test
% N2 0.04 0.5 4.5Range from Bashikurd report, ML from prod. Test
% CO2 4.2 9.43 10Range from Bashikurd report, ML from prod. Test
% H2S 0.23 0.44 0.7Range from Bashikurd report, ML from prod. Test
RES. TEMPERATURE °C 124 134 143From prod. TestINITIAL PRESSURE , atm 406 422 449From prod. TestABANDONMENT PRES , atm 20 26Estimated from experience
NET PAY , m 2.4 7.51 15.2
Range from isopach map, ML weighted average based on drainage areas
AREA, ACRES 7125 7917 8709
ML is an equivalent area based on measurements,range ±10%
WATER SAT , % 17.0 20.0 23.0
Minima from Table on structure map, maxima from ADB, ML is weighted averagebased on pore volume
POROSITY , % 7.0 7.7 9.0
From ADB, ML is weighted average based on drainage volume
Gas Reservoir: Kugitan (XV-II)
Parameter MinimumMostLikely Maximum Remarks
Gas Gravity 0.555 0.65 0.67Range from Bashikurd report, ML from prod. Test
% N2 0.04 0.5 4.5Range from Bashikurd report, ML from prod. Test
% CO2 4.2 9.43 10Range from Bashikurd report, ML from prod. Test
% H2S 0.23 0.44 0.7Range from Bashikurd report, ML from prod. Test
RES. TEMPERATURE °C 124 134 143From prod. TestINITIAL PRESSURE , atm 406 422 449From prod. TestABANDONMENT PRES , atm 20 26Estimated from experience NET PAY , m 1.2 4 10.2From isopach map
AREA, ACRES 5724 6360 6996
ML is an equivalent area based on measurements,range ±10%
WATER SAT , % 17.0 20.0 23.0Refer to XV-I of BashikurdPOROSITY , % 7.0 7.7 9.0Refer to XV-I of Bashikurd
7/6/2005 I-79 Gustavson Associates

PROMOTION OF OIL AND GAS PRODUCING ISLAMIC TRANSITIONAL STATE OF AFGHANISTANAREAS TO THE PRIVATE SECTOR MINISTRY OF MINES AND INDUSTRYGRANT AGREEMENT NO. H007-AF EMERGENCY INFRASTRUCTURE RECONSTRUCTION PROJECT
Volumetric Calculations
Probabilistic reserve estimates were made based on the reservoir parameters described above. The resulting probability distributions for gas in place and ultimate gas reserves are shown in Figures 1-36 and 1-37. As no data are available for other methods of reserve estimation, these represent Gustavson’s opinion of reserves for the field.
P90 = 161.2 BCF
P50 = 234.8 BCF
P10 = 313.9 BCF0%
10%20%30%40%50%60%70%80%90%
100%
0 100 200 300 400 500Gas In Place, BCF
Perc
ent o
f Valu
esG r
eate
r Tha
n or
Equ
al To
Figure 1-36 Distribution of Total Gas In Place, Bashikurd Field
7/6/2005 I-80 Gustavson Associates

PROMOTION OF OIL AND GAS PRODUCING ISLAMIC TRANSITIONAL STATE OF AFGHANISTANAREAS TO THE PRIVATE SECTOR MINISTRY OF MINES AND INDUSTRYGRANT AGREEMENT NO. H007-AF EMERGENCY INFRASTRUCTURE RECONSTRUCTION PROJECT
P90 = 152.7 BCF
P50 = 222.4 BCF
P10 = 297.2 BCF0%
10%20%30%40%50%60%70%80%90%
100%
0.0 100.0 200.0 300.0 400.0 500.0
Gas Reserves, BCF
Perc
ent o
f Valu
esGr
eate
r Tha
n or
Equ
al To
Figure 1-37 Distribution of Total Gas Reserves, Bashikurd Field
4.2.6.4 Juma Gas Field
Geology
Juma gas field is located approximately 25 km. to the west of the city of Sheberghan (Figure 1-1, Plate 4). Juma field is located at the western end of a large, faulted anticlinal platform that also contains Bashikurd field. The two fields are separated by a prominent northwest-southeast trending fault zone that forms a critical element of the traps in both fields. In addition, Juma field is bounded by a separate fault on itssouthern flank. The gas-bearing horizons in both fields include fractured, reefal carbonates with good matrix porosity that are developed within the Upper Jurassic Kugitan formation. Zones XV and XVa are productive at Juma, whereas, only Zone XV is gas-bearing at neighboring Bashikurd. Multiple individual reservoirs are developed within this reef complex in both fields. Juma gas field encompasses 69 km2 as defined by the mapped position of the gas-water contact and the adjacent Bashikurd field encompasses 43 km2 on the eastern side of the bisecting fault zone. The maximum gross gas column at Juma field is slightly just under 175 meters, whereas the gross gascolumn in the adjacent Bashikurd field is slightly less than 100 meters. The elevationsof the gas-water contact in the two fields differ by about 70 meters. The two fields have undergone development drilling (“exploration” in the Russian terminology) but neitherfield was produced prior to the departure of the Soviets in 1991.
7/6/2005 I-81 Gustavson Associates
PROMOTION OF OIL AND GAS PRODUCING ISLAMIC TRANSITIONAL STATE OF AFGHANISTANAREAS TO THE PRIVATE SECTOR MINISTRY OF MINES AND INDUSTRYGRANT AGREEMENT NO. H007-AF EMERGENCY INFRASTRUCTURE RECONSTRUCTION PROJECT
Due to the close proximity of Bashikurd and Juma fields, the same information was used when checking the two fields because they are on the same maps. The reader is referred to Section 4.2.6 for a discussion of information jointly used for analysis of bothBashikurd and Juma fields.
Geophysics
This structure is seen on line 80327 and can be projected onto the Composite Line 1(Plate 2), where lines 87304 and 86204 connect at the northeast-bounding fault of the Juma structure. The data quality is poor, and at the end of line 86204, there is possible structural distortion due to low fold and incorrect processing. The critical fault zones are not imaged due to data skips and old processing, and perhaps inaccurate migration ofthe data.
Reservoir Parameters
Table 1-16 below presents a summary of input parameters used in the probabilistic reserves modeling of Juma field. These parameters come from a variety of sources including maps, tables included on maps, information from the 1989 Soviet-era Technoexport report on the field, and data from the 2003 Asian Development Bank Final Report on Gas Sector.
Volumetric Calculations
Probabilistic reserve estimates were made based on the reservoir parameters described above. The resulting probability distributions for gas in place and ultimate gas reserves are shown in Figures 1-38 and 1-39. As no data are available for other methods of reserve estimation, these represent Gustavson’s opinion of reserves for the field.
7/6/2005 I-82 Gustavson Associates

PROMOTION OF OIL AND GAS PRODUCING ISLAMIC TRANSITIONAL STATE OF AFGHANISTANAREAS TO THE PRIVATE SECTOR MINISTRY OF MINES AND INDUSTRYGRANT AGREEMENT NO. H007-AF EMERGENCY INFRASTRUCTURE RECONSTRUCTION PROJECT
Table 1-16 Juma Gas Field Input Parameters for Probabilistic Modeling
Gas Reservoir: Kugitan (XV-I)
Parameter MinimumMostLikely Maximum Remarks
Gas Gravity 0.559 0.63 0.675Range from Bashikurd report % N2 0.75 4.5 7.1Range from Bashikurd report % CO2 0.22 4.2 8.22Range from Bashikurd report % H2S 0.088 0.72 4.6Range from Bashikurd report RES. TEMPERATURE °C 125 131 136Range from Bashikurd report INITIAL PRESSURE , atm 413 421 429From prod. TestABANDONMENT PRES , atm 20 26Estimated from experience
NET PAY , m 3.2 15.24 41
Range from isopach map, ML weighted average based on drainage areas
AREA, ACRES 11237 12486 13735ML was measured based on structure map, range ±10%
WATER SAT , % 11.0 15.0 19.0Minima from ADB, maxima from Table on structure map
POROSITY , % 6.0 8.0 10.0ML from ADB, range ±25%
Gas Reservoir: Kugitan (XV-II)
Parameter MinimumMostLikely Maximum Remarks
Gas Gravity 0.559 0.63 0.675Refer to XV-I of Bashikurd% N2 0.75 4.5 7.1Refer to XV-I of Bashikurd% CO2 0.22 4.2 8.22Refer to XV-I of Bashikurd% H2S 0.088 0.72 4.6Refer to XV-I of BashikurdRES. TEMPERATURE °C 125 131 136Refer to XV-I of BashikurdINITIAL PRESSURE , atm 413 421 429Refer to XV-I of BashikurdABANDONMENT PRES , atm 20 26Refer to XV-I of BashikurdNET PAY , m 1 5 9.8From isopach map
AREA, ACRES 11355 12617 13879ML was measured based on structure map, range ±10%
WATER SAT , % 11.0 15.0 19.0Refer to XV-I of BashikurdPOROSITY , % 6.0 8.0 10.0Refer to XV-I of Bashikurd
Gas Reservoir: Kugitan (XVa)
Parameter MinimumMostLikely Maximum Remarks
Gas Gravity 0.559 0.63 0.675Refer to XV-I of Bashikurd% N2 0.75 4.5 7.1Refer to XV-I of Bashikurd% CO2 0.22 4.2 8.22Refer to XV-I of Bashikurd% H2S 0.088 0.72 4.6Refer to XV-I of Bashikurd
7/6/2005 I-83 Gustavson Associates

PROMOTION OF OIL AND GAS PRODUCING ISLAMIC TRANSITIONAL STATE OF AFGHANISTANAREAS TO THE PRIVATE SECTOR MINISTRY OF MINES AND INDUSTRYGRANT AGREEMENT NO. H007-AF EMERGENCY INFRASTRUCTURE RECONSTRUCTION PROJECT
RES. TEMPERATURE °C 125 131 136Refer to XV-I of BashikurdINITIAL PRESSURE , atm 413 421 429Refer to XV-I of BashikurdABANDONMENT PRES , atm 20 26Refer to XV-I of BashikurdNET PAY , m 4.7 7.71 10From isopach map
AREA, ACRES 2151 2389 2628ML was measured based on structure map, range ±10%
WATER SAT , % 11.0 15.0 19.0Refer to XV-I of BashikurdPOROSITY , % 6.0 8.0 10.0Refer to XV-I of Bashikurd
P10 = 1,252.6 BCF
P50 = 836.5 BCF
P90 = 530.3 BCF
0%10%20%30%40%50%60%70%80%90%
100%
0 500 1,000 1,500 2,000Gas In Place, BCF
Greaterto or Equal toPercentofValues
Figure 1-38 Distribution of Total Gas In Place, Juma Field
7/6/2005 I-84 Gustavson Associates

PROMOTION OF OIL AND GAS PRODUCING ISLAMIC TRANSITIONAL STATE OF AFGHANISTANAREAS TO THE PRIVATE SECTOR MINISTRY OF MINES AND INDUSTRYGRANT AGREEMENT NO. H007-AF EMERGENCY INFRASTRUCTURE RECONSTRUCTION PROJECT
P90 = 470.9 BCF
P50 = 741.1 BCF
P10 = 1,107.5BCF
0%10%20%30%40%50%60%70%80%90%
100%
0.0 200.0 400.0 600.0 800.0 1,000.0 1,200.0 1,400.0 1,600.0
Gas Reserves, BCF
Perc
ent o
f Valu
esGr
eate
r Tha
n or
Equ
al To
Figure 1-39 Distribution of Total Gas Reserves, Juma Field
4.2.6.5 Khoja Bolan Gas Field
Geology
Khoja Bolan gas field is located approximately 20 km. to the southeast of the city of Sheberghan and due south of the Yatimtaq-Khoja Gogerdaq complex. The Khoja Bolan structure is an east-west elongated, asymmetrical anticline with a gentle southern limband a steeper northern limb. The field is, at least in part, bounded by a down-to-the-north normal fault on its northern limb. Independent fold closure at the top of the productive Lower Cretaceous Hauterivian horizon is about 125 meters. The field encompasses an area just under 28 km2 as defined by the mapped position of the gas-water contact. The potentially productive reservoir at Khoja Bolan field is the Hauterivian sandstone. The maximum gas column at the field as defined by wells is 55 meters but may be as thick as 80 meters based on the highest structural contour as shown on the Hauterivian structure map. Based on this information, it appears that the Hauterivian pool is about 45-65% filled to spillpoint.
For the Hauterivian and Kugitan formation reservoirs in Khoja Bolan field, the 1970s and 1980s vintage maps were quality control checked, log picks were checked, and contours and well data were reviewed for consistency. The only maps available werefor the Hauterivian, so the Kugitan could not be checked. The information to be used as
7/6/2005 I-85 Gustavson Associates

PROMOTION OF OIL AND GAS PRODUCING ISLAMIC TRANSITIONAL STATE OF AFGHANISTANAREAS TO THE PRIVATE SECTOR MINISTRY OF MINES AND INDUSTRYGRANT AGREEMENT NO. H007-AF EMERGENCY INFRASTRUCTURE RECONSTRUCTION PROJECT
input parameters for probabilistic reserves calculation were tabulated and given to the engineering staff for use in reserves modeling.
Cretaceous Hauterivian (XIV) Reservoir
The following information sources were especially useful in assessing the CretaceousHauterivian reservoir at the Khoja Bolan field:
1981 structure map of the top of the Hauterivian. The map included a gas-water contact, apparently the outer contact. Below the map is a cross section throughwells #2 and #1 that also shows the gas-water contact. There are also two tables on the sheet. The upper table includes choke size and water and gas flow rates for given test intervals. The lower table includes the gas-saturated area,effective gas-saturated thickness, porosity, gas saturation, formation pressure, temperature correction, Boyle’s Law correction factor, and original oil in place calculation.1968 well log correlation cross section of wells #4, #3, #1, #6, #7, #8, and #9. This section shows a correlation of productive layers in the Hauterivian. 1968 well log correlation cross section of wells #2, #3, and #5. This sectionshows a correlation of productive layers in the Hauterivian.
Jurassic Kugitan Formation (XV) Reservoir
No map information available for this reservoir.
Geophysics
Plate 1 indicates that no seismic data was ever acquired across the Khoja Bolan structure, which is located to the south of Khoja Gogerdaq in the southeastern corner of the seismic index map.
Reservoir Parameters
The input parameters used in the probabilistic reserves modeling of Khoja Bolan field come from a variety of sources including maps, tables included on maps, information from the 1968 Soviet-era Technoexport report on the field, and data from the 2003 Asian Development Bank Final Report on Gas Sector Rehabilitation.
7/6/2005 I-86 Gustavson Associates

PROMOTION OF OIL AND GAS PRODUCING ISLAMIC TRANSITIONAL STATE OF AFGHANISTANAREAS TO THE PRIVATE SECTOR MINISTRY OF MINES AND INDUSTRYGRANT AGREEMENT NO. H007-AF EMERGENCY INFRASTRUCTURE RECONSTRUCTION PROJECT
Volumetric Calculations
GAS IN PLACE / Khoja Bolan
P10 = 88.9 BCF
P50 = 76.0 BCF
P90 = 64.3 BCF
0%10%20%30%40%50%60%70%80%90%
100%
0 20 40 60 80 100 120Gas
Gas In Place, BCF
Perc
ent o
f Valu
esGr
eate
r Tha
n or
Equ
al To
Figure 1-40 Distribution of Total Gas In Place, Khoja Bolan Field
RECOVERABLE GAS / Khoja Bolan
P90 = 57.8 BCF
P50 = 68.4 BCF
P10 = 79.8 BCF0%
10%20%30%40%50%60%70%80%90%
100%
0.0 20.0 40.0 60.0 80.0 100.0 120.0
Gas Reserves, BCF
Perc
ent o
f Valu
esGr
eate
r Tha
n or
Equ
al To
Figure 1-41 Distribution of Total Gas Reserves, Khoja Bolan Field
7/6/2005 I-87 Gustavson Associates

PROMOTION OF OIL AND GAS PRODUCING ISLAMIC TRANSITIONAL STATE OF AFGHANISTANAREAS TO THE PRIVATE SECTOR MINISTRY OF MINES AND INDUSTRYGRANT AGREEMENT NO. H007-AF EMERGENCY INFRASTRUCTURE RECONSTRUCTION PROJECT
4.2.6.6 Shakarak
Geology
Shakarak field is located approximately 5 km. to the south of the city of Sheberghan. It is a relatively small, symmetrical, northwest-southeast trending unfaulted anticline that is one of a group of small structures that form a northwest-southeast elongatedstructural ridge to the north of the large Jar Quduk structure. The gas-bearing reservoir at Shakarak is the Lower Cretaceous Hauterivian sandstone. Structural closure at the top of the Hauterivian reservoir is less than 60 meters based on the one structure map available for this field. Shakarak field encompasses an area of just under 5 km2 asdefined by the mapped position of the gas-water contact. A comparison of the mapped positions of the closing structural contour and the gas-water contact indicate that this gas pool represents essentially complete filling to the spillpoint of the structure.
For the Hauterivian reservoir in Shakarak field, there was little data available. The only available map is a 1985 structure map of the top of the Hauterivian with a cross section below. Since there were no logs, separate cross sections, or reports, this cross section provided the only information to quality control check the map. When the map was made, there was only one well, well #1, that had apparently been drilled. Well #3 hadbeen proposed and it was plotted on the map and cross section as its anticipatedlocation. There was also a gas-water contact included on the map at a contour of -2075m.
Geophysics
Four seismic lines were recorded over the field and none are available. The closest lineis 84202 discussed with Jar Quduk field.
Reservoir Parameters
There is insufficient data available for providing input parameters to a probabilisticreserves modeling analysis. Therefore, the only field characterization provided for Shakarak gas field in this Report is that described in the geological section above.
Volumetric Calculations
No probabilistic reserves analysis was performed for this undeveloped gas field.
7/6/2005 I-88 Gustavson Associates

PROMOTION OF OIL AND GAS PRODUCING ISLAMIC TRANSITIONAL STATE OF AFGHANISTANAREAS TO THE PRIVATE SECTOR MINISTRY OF MINES AND INDUSTRYGRANT AGREEMENT NO. H007-AF EMERGENCY INFRASTRUCTURE RECONSTRUCTION PROJECT
4.3 Summary Of Reserves For Discovered Oil And Gas Fields In The Sheberghan Area
Below are presented the probabilistic hydrocarbons in place and ultimate oil and gasreserves for the total of the eleven discovered oil and gas fields analyzed as part of thisstudy (Figures 1-42 through 1-45). The mean reserves from the probabilistic calculations are summarized in Table 1-17. Table 1-17 also includes the Russianreserve estimates for these fields for comparison purposes. Note that in general,Gustavson’s mean reserve estimates are reasonably close to the Russian estimates for gas; however, Gustavson’s estimates for oil reserves are considerably lower than the Russian estimates. This is primarily due to a difference of opinion regarding the oil recovery factor, which is consistently estimated consistently higher by the Russians.
P90 = 258 MMBO
P50 = 289 MMBO
P10 = 323 MMBO0%
10%20%30%40%50%60%70%80%90%
100%
0 100 200 300 400 500
Oil In Place, MMBO
Perc
ent o
f Valu
esGr
eate
r Tha
n or
Equ
alTo
Figure 1-42 Total Oil in Place Distribution, Afghanistan Oil and Gas Fields
7/6/2005 I-89 Gustavson Associates

PROMOTION OF OIL AND GAS PRODUCING ISLAMIC TRANSITIONAL STATE OF AFGHANISTANAREAS TO THE PRIVATE SECTOR MINISTRY OF MINES AND INDUSTRYGRANT AGREEMENT NO. H007-AF EMERGENCY INFRASTRUCTURE RECONSTRUCTION PROJECT
P90 = 66 MMBO
P50 = 75 MMBO
P10 = 87 MMBO0%
10%20%30%40%50%60%70%80%90%
100%
0 20 40 60 80 100 120
Oil Reserves, MMBO
Perc
ent o
f Valu
esGr
eate
r Tha
n or
Equ
alTo
Figure 1-43 Total Oil Reserves Distribution, Afghanistan Oil and Gas Fields
P90 = 5,026.7 BCF
P50 = 5,553.4 BCF
P10 = 6,143.2 BCF
0%10%20%30%40%50%60%70%80%90%
100%
0 1,000 2,000 3,000 4,000 5,000 6,000 7,000 8,000Gas In Place, BCF
Perc
ent o
f Valu
esGr
eate
r Tha
n or
Equ
alTo
Figure 1-44 Total Gas in Place Distribution, Afghanistan Oil and Gas Fields
7/6/2005 I-90 Gustavson Associates
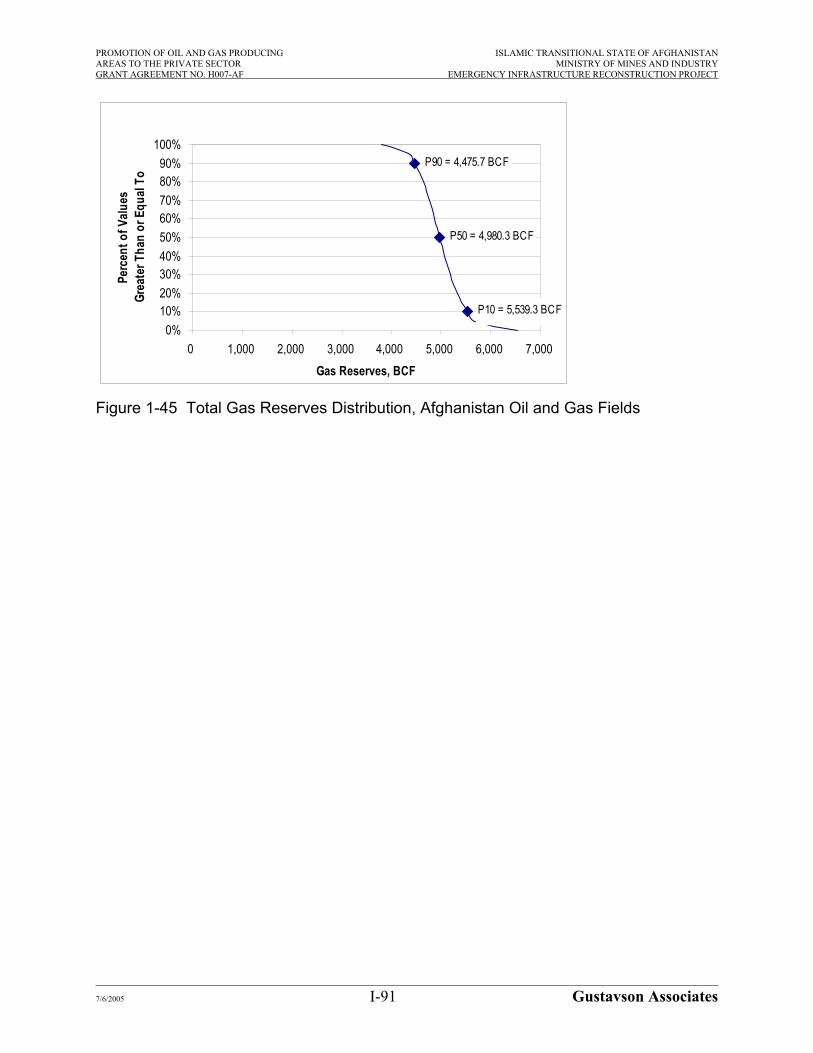
PROMOTION OF OIL AND GAS PRODUCING ISLAMIC TRANSITIONAL STATE OF AFGHANISTANAREAS TO THE PRIVATE SECTOR MINISTRY OF MINES AND INDUSTRYGRANT AGREEMENT NO. H007-AF EMERGENCY INFRASTRUCTURE RECONSTRUCTION PROJECT
P10 = 5,539.3 BCF
P50 = 4,980.3 BCF
P90 = 4,475.7 BCF
0%10%20%30%40%50%60%70%80%90%
100%
0 1,000 2,000 3,000 4,000 5,000 6,000 7,000Gas Reserves, BCF
Perc
ent o
f Valu
esGr
eate
r Tha
n or
Equ
alTo
Figure 1-45 Total Gas Reserves Distribution, Afghanistan Oil and Gas Fields
7/6/2005 I-91 Gustavson Associates
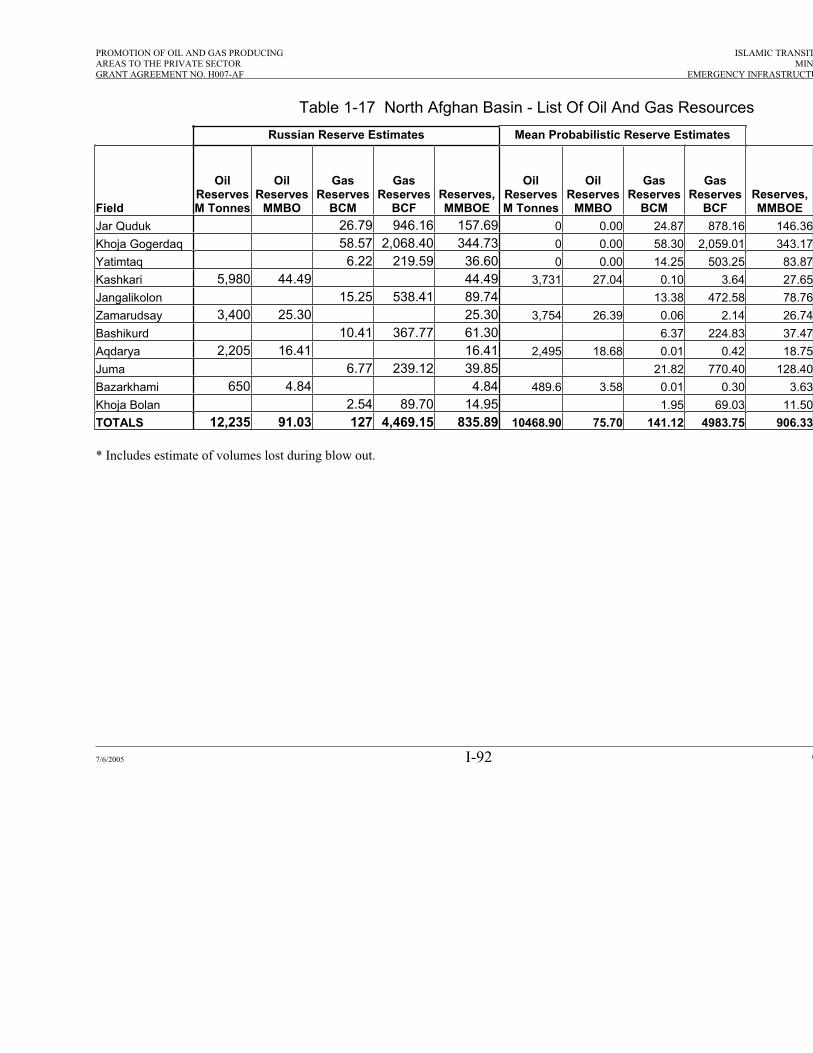
PROMOTION OF OIL AND GAS PRODUCING ISLAMIC TRANSITAREAS TO THE PRIVATE SECTOR MINIGRANT AGREEMENT NO. H007-AF EMERGENCY INFRASTRUCTU
Table 1-17 North Afghan Basin - List Of Oil And Gas ResourcesRussian Reserve Estimates Mean Probabilistic Reserve Estimates
Field
OilReservesM Tonnes
OilReserves
MMBO
GasReserves
BCM
GasReserves
BCFReserves,MMBOE
OilReservesM Tonnes
OilReserves
MMBO
GasReserves
BCM
GasReserves
BCFReserves,MMBOE
Jar Quduk 26.79 946.16 157.69 0 0.00 24.87 878.16 146.36Khoja Gogerdaq 58.57 2,068.40 344.73 0 0.00 58.30 2,059.01 343.17Yatimtaq 6.22 219.59 36.60 0 0.00 14.25 503.25 83.87Kashkari 5,980 44.49 44.49 3,731 27.04 0.10 3.64 27.65Jangalikolon 15.25 538.41 89.74 13.38 472.58 78.76Zamarudsay 3,400 25.30 25.30 3,754 26.39 0.06 2.14 26.74Bashikurd 10.41 367.77 61.30 6.37 224.83 37.47Aqdarya 2,205 16.41 16.41 2,495 18.68 0.01 0.42 18.75Juma 6.77 239.12 39.85 21.82 770.40 128.40Bazarkhami 650 4.84 4.84 489.6 3.58 0.01 0.30 3.63Khoja Bolan 2.54 89.70 14.95 1.95 69.03 11.50TOTALS 12,235 91.03 127 4,469.15 835.89 10468.90 75.70 141.12 4983.75 906.33
* Includes estimate of volumes lost during blow out.
7/6/2005 I-92 G

PROMOTION OF OIL AND GAS PRODUCING ISLAMIC TRANSITIONAL STATE OFAFGHANISTANAREAS TO THE PRIVATE SECTOR MINISTRY OF MINES AND INDUSTRYGRANT AGREEMENT NO. H007-AF EMERGENCY INFRASTRUCTURE RECONSTRUCTION PROJECT
II. MARKET ANALYSIS
Oil Market
Relative little crude oil is available from rehabilitation of existing wells or from new development. Gustavson Associates has estimated elsewhere in this Report thatreserves of 76 million barrels1 of crude oil may be developed from the three fields of Kashkari, Aqdarya and Zamarudsay including a minor contribution from Bazarkhami.
Liquid petroleum products (diesel fuel, kerosene, gasoline and liquefied petroleumgases), which could find a local market, can only be produced by refining of the crude oil.
Development of these fields could hypothetically provide feedstock for a small refinery at a relatively flat rate in the 6-8,000 barrels per day throughput. However, an independent study by Hill International, Inc.2 has shown such a refinery to be uneconomic.
Consequently, any crude oil production is in the short-to-medium term relegated to a market, which either inefficiently retorts the oil and condenses the vapors for automotive “fuel”, burns the crude oil for domestic heating, uses the oil as a road sealer or trucks it long-distance for sale.
This Consultant therefore concludes that there is currently no commercial market for oil in the quantities, which might be available from the abovementioned fields.
Gas Market
The market for gas in northern Afghanistan is also limited, but the reserve quantities arelarger than the equivalent oil. A summary is shown here for the significant fields:
Gas FieldRemaining
GasReserves,
BCM
RemainingGas
Reserves,BCF
Jar Quduk 9.77 345Khoja Gogerdaq 16.77 592Yatimtaq 7.36 260Jangalikolon 13.38 473Bashikurd 6.37 225Juma 21.82 770TOTAL 75.47 2,665
1 For comparison purposes, this amount is roughly equal to the DAILY oil consumption of the world.
7/6/2005 II-1 Gustavson Associates
2 Hill International, Inc.: Evaluation of Investment Options for the Development of Oil and GasInfrastructure in Afghanistan, March 28, 2005.

PROMOTION OF OIL AND GAS PRODUCING ISLAMIC TRANSITIONAL STATE OFAFGHANISTANAREAS TO THE PRIVATE SECTOR MINISTRY OF MINES AND INDUSTRYGRANT AGREEMENT NO. H007-AF EMERGENCY INFRASTRUCTURE RECONSTRUCTION PROJECT
There is an unsatisfied demand for gas for cooking, space heating and powergeneration by the local population. However, the currently low, subsidized gas priceshave discouraged any government redevelopment of wells. Most of these wells weretemporarily plugged in 1989 at the exit of Soviet troops.
At the same time, the low gas production levels and delivery through antiquated distribution systems have kept the consumers from becoming a reliable market. In other words, a “chicken-or-the-egg” syndrome exists, which only internationaldevelopment assistance may resolve. Therefore, any local gas market can only be considered a secondary augmentation of an international assistance-supported industrial market, not an end in itself.
The industrial projects and transportation opportunities, which were briefly scoped as part of this market study, included:
• Local domestic use • Kud Bergh fertilizer plant• Electric power plant • Transportation to Kabul • Export/import to the North• Effect of TAP mega-pipeline
Each of these will be discussed in the following sections.
Local Domestic Use
This market is currently represented by space heating and cooking for private consumers in the population centers of the provinces of Balkh and Jowzjan, represented by the provincial capitals of Mazar e-Sharif and Sheberghan, respectively.The population of Mazar e-Sharif is about 261,000, while Sheberghan is 51,000. The population in both provinces is thus strongly centered in the capitals, which ultimatelywill make the domestic-use market for gas and electricity less costly to develop and serve.
As mentioned earlier the gas price to consumers is subsidized by the government and only from 2 to 3 AFA per cubic meter is charged for delivery to a household, even aftermetering and transportation. This corresponds to a price range from $1.40 to $2.00 perMCF in either city under the exchange rate experienced in March 2005. If this pricerange were netted back to the wellhead following international standards, the wellheadprice to the operator would range from only $0.75 to $1.10 per MCF. Economics to the operator have therefore been run for a base case of $1.10 per MCF with sensitivities ranging from $0.50 to $2.50 per MCF.
7/6/2005 II-2 Gustavson Associates

PROMOTION OF OIL AND GAS PRODUCING ISLAMIC TRANSITIONAL STATE OFAFGHANISTANAREAS TO THE PRIVATE SECTOR MINISTRY OF MINES AND INDUSTRYGRANT AGREEMENT NO. H007-AF EMERGENCY INFRASTRUCTURE RECONSTRUCTION PROJECT
Kud Bergh Fertilizer Plant
A fertilizer plant was constructed in the outskirts of the city of Mazar e-Sharif around1970 with a rated capacity of 105,000 metric tons per year of urea. This Consultantvisited the plant manager and learned that only one of three lines was operative, so the annual production is about 40,000 metric tons of urea.
Still, this is an important industrial activity for the local area, which also provides socialbenefits for the population. Hill International in its previously described reportrecommends against rehabilitation of the plant, because of its antiquated chemical process design. This Consultant agrees, and also supports the concept of continuing production; subject, however, to institutional strengthening of the business processesincluding payment for the energy, which is consumed in form of gas from Sheberghan.
In spite of numerous requests, this Consultant has not received any details about the present capacity or economics of the fertilizer plant under various rehabilitationscenarios. Thus, no new price for natural gas as feedstock at the battery gate to the fertilizer plant has been made available for this Consultant to include in this Market and Economics section.
Instead, this Consultant has been limited to use the existing gas price at the plant gate, which is 0.90 AFA, corresponding to $0.60 per MCF. This low payment for gas already cleaned, metered and transported from the fields to the plant gate is indicative of the subsidized nature of the current (and only) industrial market for gas.
In accordance with the Contract this Consultant scoped out the market for a rehabilitated fertilizer plant producing at full nameplate capacity and ran market studiesaround the current gas price.
This section of the Report first establishes a model on basis of which a screening couldbe conducted of the various opportunities for fertilizer manufacture in Afghanistan. The model has been developed by Gustavson Associates on basis of both the available technology as well as the assumption of a 1,700 tpd urea plant to match Afghani conditions.
Over the last 25 years, most of the increase in world nitrogen consumption is accounted for by urea. The main factor influencing the share of the different nitrogen fertilizer products is the nutrient concentration of the product. The higher the concentration the lower the distribution, storage and handling costs per unit of nutrient. These are majoritems in the total cost structure. It is no coincidence that the most important product, urea has a high nutrient content.
The most important step in this brief urea market analysis was to compare the Kud Bergh fertilizer plant with the economics of using other sources for this world-classfertilizer. Possibilities for increasing or decreasing the capacity in order to improve the
7/6/2005 II-3 Gustavson Associates

PROMOTION OF OIL AND GAS PRODUCING ISLAMIC TRANSITIONAL STATE OFAFGHANISTANAREAS TO THE PRIVATE SECTOR MINISTRY OF MINES AND INDUSTRYGRANT AGREEMENT NO. H007-AF EMERGENCY INFRASTRUCTURE RECONSTRUCTION PROJECT
economics were briefly examined. Conclusions and recommendations are presented at the end of this section.
Up to the 1960s, the development of the nitrogen industry took place in the developedcountries of West Europe, North America and Japan. However, in the 1970's and early1980's, the construction of new plants shifted to the gas-rich countries of the Caribbean and Middle East and also to some large consuming countries such as China, India, Indonesia and Pakistan. At the same time, many plant closures occurred in West Europe and Japan. West Europe's share fell from 20% in 1980/81 to the 11% level at the present. Over a third of the world's production is in just two countries, China and India. That is the major competition for Afghanistan.
Next, the regional market for urea must be reviewed as well as the distribution pattern with emphasis on Asian countries. The most important Asian countries when considering nitrogen fertilizers are Russia, China and India. Less important from a quantity standpoint is Uzbekistan, although propinquity to Afghanistan makes that market worthy of local consideration as will be described below.
In 1999 the GDP of the CIS recorded zero growth, remaining at 53% of the 1989 level.Uzbekistan, which has adopted a cautious approach to reform, fared best with 3%growth, to reach 90% of the 1989 level.
In Uzbekistan, substantial state support and direction of agriculture are reflected in the maintenance of the former levels of fertilizer use in these two countries. Elsewhere in the region fertilizer demand is at a very low level. It is forecast that fertilizerconsumption in the countries of the FSU will increase at an annual average rate of 5%to 6% p.a. but consumption in the next five years will still be far below the 1980’s level.
It is on this basis that the local market in Afghanistan and the export potential to Russia and Uzbekistan must be viewed. In Russia the existing nitrogen fertilizer plants run at only half capacity. Also, large amounts of inexpensive natural gas are available.Consequently, Russia cannot be viewed as a potential for Afghani exports of urea.
Uzbekistan offers a slightly more optimistic candidate. The consumption is nearly up tothe level of the 1980’s and the fertilizer market is sensitive to transportation costs.Therefore, export opportunities may exist locally along the long Afghani-Uzbek border.However, it is concluded by this Consultant that there is no clear opportunity for expansion of the market for gas provided by the Kud Bergh fertilizer plant.
Electric Power Plant
A 160-MW power plant has been proposed for Northern Afghanistan, although thisConsultant has not been supplied with any details. However, Gustavson Associates has previously conducted feasibility studies of gas-fired, turbine-driven power plants in this capacity range and in developing countries. It is therefore assumed that the power
7/6/2005 II-4 Gustavson Associates

PROMOTION OF OIL AND GAS PRODUCING ISLAMIC TRANSITIONAL STATE OFAFGHANISTANAREAS TO THE PRIVATE SECTOR MINISTRY OF MINES AND INDUSTRYGRANT AGREEMENT NO. H007-AF EMERGENCY INFRASTRUCTURE RECONSTRUCTION PROJECT
plant is of the Frame 6 type (and not an aero-derivative type for maintenance reasons),and that a modular approach using a complex cycle is contemplated.
Under these assumptions a 160-MW power plant will consume about 40 million cubicfeet of gas per day (about 1.2 million cubic meters per day). This is a reasonableamount of gas considering the capacity of existing and rehabilitated wells in the Sheberghan area.
A key question is that of the location of the proposed power plant as well as the price ofthe natural gas feed. The location question has undoubtedly been studied by otherparties. The opinion of this Consultant is offered below. The price of the feed to the power plant should be as high as possible in order to incentivate investment in gas field rehabilitation, while not rendering power generation uneconomic.
The sensitivity graphs or “spider” diagrams in the economics section allow the reader to estimate the effect on the oil company performance as a function of varying gas prices.Transportation costs from a processing plant at Sheberghan to the power plant site must be included by the power plant economist.
In connection with gas transportation it is noteworthy that about two thirds of the distance to Kabul may be covered by transportation of energy in form of gas, while the remaining third may be relegated to energy-by-wire, in form of electric power. Consequently, the location of the power plant should be considered as far downstream as possible on the attached map in order to keep both forms of energy available. The availability of a pipeline along the northern basin will also incentivate additional gasexploration in that area.
7/6/2005 II-5 Gustavson Associates

PROMOTION OF OIL AND GAS PRODUCING ISLAMIC TRANSITIONAL STATE OFAFGHANISTANAREAS TO THE PRIVATE SECTOR MINISTRY OF MINES AND INDUSTRYGRANT AGREEMENT NO. H007-AF EMERGENCY INFRASTRUCTURE RECONSTRUCTION PROJECT
Export/import to the North
Finally, the market to the north may be considered. Other consultants have been tasked with pipeline routing studies. The results are unknown at this time to Gustavson Associates. However, we have determined that a new pipe was installed in 1989 just prior to the Soviet withdrawal from Afghanistan. This pipeline is reportedly unused, butmay be partially corroded. In any case it should be further investigated.
The pipeline runs North to Gaurdak (Turkmenistan) and Shirabad (Uzbekistan) and thereby also connects to the Russian grid. The map shows the routing. A further study of this access may be of importance, first to allow import of gas from the North to supplypossible infrastructure projects (such as a power plant), while the Afghani fields are being redeveloped. This would assist in securing the investments in gas-consuming infrastructure.
Later, this access may be back-flowed again to provide an export market (albeit a weak market in Uzbekistan) for excess Afghani gas, if any.
7/6/2005 II-6 Gustavson Associates

PROMOTION OF OIL AND GAS PRODUCING ISLAMIC TRANSITIONAL STATE OFAFGHANISTANAREAS TO THE PRIVATE SECTOR MINISTRY OF MINES AND INDUSTRYGRANT AGREEMENT NO. H007-AF EMERGENCY INFRASTRUCTURE RECONSTRUCTION PROJECT
III. PRELIMINARY CAPITAL COST ASSESSMENT
A preliminary estimate of development and operating costs associated with further development/re-development of Afghanistan’s reserves was required in order to perform the economic assessment mentioned previously.
Gustavson Associates generated such estimates independently, as we have done forother clients in numerous Feasibility Studies and reserve estimates for the developmentof Alibekmola, Kozhasay, and Urikhtau fields in Kazakhstan.
It is Gustavson’s understanding that some old Soviet drilling rigs are present in Afghanistan, which may be usable if refurbished. Alternatively, drilling rigs may bebrought in from Turkmenistan or other active oil and gas producing regions nearby. Gustavson Associates explored the costs of these options, and estimated costs for drilling new wells or working over existing wells, as appropriate.
The costs of any needed basic production facilities and gas processing plant infrastructure were also estimated, based largely on Gustavson’s familiarity with thecosts of such equipment in central Asia. These cost estimates were intended to be rough, preliminary estimates, appropriate for the purposes of demonstrating economic attractiveness of investment in concession blocks in Afghanistan, rather than detailed estimates such as required for construction purposes.
Finally, Gustavson Associates assessed the cost of production in its main elements: operating cost (direct - materials and labor, indirect - overheads and depreciation, contingencies and distribution costs), and general expenses (marketing or sales cost, and administrative expenses). These costs are based on the sale of dry, sweetened gas at the outlet of a gas processing plant, but prior to any compression for transportation purposes.
Again, these were scoping estimates based largely on Gustavson’s experience withother similar projects in Central Asia.
7/6/2005 III-1 Gustavson Associates
PROMOTION OF OIL AND GAS PRODUCING ISLAMIC TRANSITIONAL STATE OFAFGHANISTANAREAS TO THE PRIVATE SECTOR MINISTRY OF MINES AND INDUSTRYGRANT AGREEMENT NO. H007-AF EMERGENCY INFRASTRUCTURE RECONSTRUCTION PROJECT
IV. PRELIMINARY ECONOMIC ANALYSIS
As part of this project, Gustavson Associates performed an analysis of the economicparameters associated with investments in oil and gas concessions in Afghanistan.This is important to present to potential industry investors to gain their interest and demonstrate that projects in Afghanistan can compare favorably with similar projects in other parts of the world.
These economic calculations were also used for purposes of ranking and groupingfields and structures into marketable concession blocks. The calculations will be generally of a screening nature, as opposed to detailed economics for final feasibility or budgeting purposes.
Gustavson Associates constructed an economic model in the form of a cash flowforecast using an Excel spreadsheet. The economic model assessed gross income based on two main groups of variables: projected oil, gas, and condensate production and projected prices. While the assessment of price levels will use estimates provided by reliable outside sources, an attempt will be made to verify probabilities associatedwith certain price levels, or at least to provide a set of recommendations as to whyparticular price scenarios should be preferred.
Gross income will be adjusted by subtracting operating and capital expenditure, royalty, bonuses, and by accounting for production taxes as applicable in this case. In the process, net revenue will be calculated. Net income before taxes will be calculated and assessed separately for each year, and the appropriate tax rate applied to arrive at net profit figures. In its turn, net profit will be adjusted by depreciation, amortization andallowable depletion to arrive at net operating cash flow estimates.
Throughout the development of this portion of the model, Gustavson Associates was in close contact with World Bank personnel whom we understand are currently working with the Afghanis to draft a new Petroleum Law that will apply to agreements forproduction on the proposed new concession blocks. All applicable portions of the law were accurately incorporated into the model.
Finally, the economic model provided assessment and analyses of the main economicparameters of the project:
• accounting rate of return• benefit / cost ratio • payback period• net present value • internal rate of return
The emphasis was on the last two methods, generally believed to be more sophisticated and informative.
7/6/2005 IV-1 Gustavson Associates

PROMOTION OF OIL AND GAS PRODUCING ISLAMIC TRANSITIONAL STATE OFAFGHANISTANAREAS TO THE PRIVATE SECTOR MINISTRY OF MINES AND INDUSTRYGRANT AGREEMENT NO. H007-AF EMERGENCY INFRASTRUCTURE RECONSTRUCTION PROJECT
As part of completion of the report, Gustavson presented the model to the Client asfollows:
• provide for basic training of Client personnel for work with the model • deliver "know-how" and methodology to Client's personnel involved in
economic assessment • provide a copy of the economic model on a disk to Client's
representatives and carry out a one-day workshop on the use of economic and risk evaluation models in petroleum exploration and resource appraisal and development programs.
1. Petroleum Economics Spreadsheet
1.2 University of Tulsa Format
This Consultant has, since the early 1990’s, conducted Continuing Education short-courses for the University of Tulsa entitled “International Petroleum Agreements”. These courses have continued until the present (May 2005), and have served international oil company investors (IOCs) towards comparing the net results from oil and gas discoveries in different countries.
Over the last decade the classes have evaluated the sensitivities to loads like first-tranche oil, royalties, profit-oil splits and income taxes. Likewise, differences between licenses and production sharing contract have been studied. More recently,agreements such as Mexico’s Multiple Services Contract and Iran’s Buy-Back contracthave been included.
Common for all has been the use of a basic model in spreadsheet format, which attempted to keep most technical aspects constant in order to evaluate the sensitivitiesto economic parameters. The model has been widely accepted by industry participants in the Tulsa class, at least as a first cut at understanding the risks and rewards presented by a new entrant into the market of petroleum investment opportunities. Themodel has been applied in promotional efforts for various countries including Bangladesh, China, Kazakhstan, and Côte d’Ivoire.
Therefore, this same format has been used in the present economic study of the Afghanistan contract. It is assumed that the Afghanistan Model Contract as presentlydrafted will eventually be approved and published. Minor changes can readily beentered into the spreadsheet in Excel format, provided on the enclosed CD-ROM.
7/6/2005 IV-2 Gustavson Associates

PROMOTION OF OIL AND GAS PRODUCING ISLAMIC TRANSITIONAL STATE OFAFGHANISTANAREAS TO THE PRIVATE SECTOR MINISTRY OF MINES AND INDUSTRYGRANT AGREEMENT NO. H007-AF EMERGENCY INFRASTRUCTURE RECONSTRUCTION PROJECT
1.3 Input Parameters
The base case incorporates the most likely scenario, which is based on the following assumptions:
1. The hydrocarbon law will be passed with provisions for production sharing,income tax and royalties in general accordance with the Draft Model Contract,
2. International investors (IOCs) will rehabilitate and drill new development wellsin known gas fields yielding the quantities estimated elsewhere in this Study,
3. Medium-term exploration by the IOCs in the same concession areas will provide additional gas to allow delivery planning for a 20-year project life based on the geology and production statistics developed by this Consultant,
4. The gas will be marketed as described in the Market section of this Report with primary focus on a) the fertilizer plant, b) domestic consumption and c) a gas-fired power plant, the two latter aimed at serving the local energy market in the "easy access corridor" of cities consisting of Sheberghan, Mazar-e Sharif, Baghlan, Pol-e Khomri and Kunduz.
Following this approach an IOC would see a range of rates of return on the initial investment as well a variations of other performance parameters. The independent variables include gas price, capital investment (Capex), operating cost (Opex), andultimate production from a hypothetical type gas field. The type gas field is described below, following Table 4-1.
First, the portion of the spreadsheet shown in Table 4-1 allows for “hard input” into theExcel spreadsheet of the typical industry capital costs including Geology & Geophysics(G&G), which is reasonably assumed to be $20 million. This amount will be expended towards acquiring 3-D seismic data and cased-hole-logging of existing wells. Once additional development wells have been drilled and completed production facilitiesestimated at $10 million will be acquired as part of the capital cost.
7/6/2005 IV-3 Gustavson Associates

PROMOTION OF OIL AND GAS PRODUCING ISLAMIC TRANSITIONAL STATE OFAFGHANISTANAREAS TO THE PRIVATE SECTOR MINISTRY OF MINES AND INDUSTRYGRANT AGREEMENT NO. H007-AF EMERGENCY INFRASTRUCTURE RECONSTRUCTION PROJECT
Table 4-1 Base Case Input Parameters for Economic Spreadsheet
Capital Investment (US$ 000,000):
Acquisition Cost 0 Geological & Geophysical 20 Signature Bonus 0 First Oil Bonus 0 Production Facilities 10 Total Property Cost 30
Drilling & Completion Number of wells 20
US$ PerWell Total
Intangibles 2 40 Tangible 1 20
3 60
This scenario does not anticipate any Acquisition Cost from third parties. Likewise, the Draft Model Contract does not contemplate any Signature Bonus or First-Oil Bonus,which otherwise would have been entered at this point as hard input into the Excelspreadsheet.
The number of wells is estimated by the model from the likely number required to produce the total gas reserves, based on the average performance of existing fields in Afghanistan to date. The number of wells could also be entered independently. In the base case scenario thirteen wells are assumed.
The cost of new wells must also be entered. The costs used in the model are hard inputs based on this Consultant’s experience with development of oil and gas fields in Central Asia and discussions with drilling rig contractors and suppliers. An investor can accept these amounts or introduce his own numbers. The well cost has been further divided into tangible versus intangible costs for income tax purposes.
Additional base case input parameters are shown in Table 4-2. First, oil and gas pricesmay be entered. The base case contemplates $30/bbl of oil and $1.10 per MCF of gas.The oil price is low compared to current world oil prices, but the reader may enter any oil price and observe the sensitivity as long as an oil production forecast is entered into the model.
7/6/2005 IV-4 Gustavson Associates

PROMOTION OF OIL AND GAS PRODUCING ISLAMIC TRANSITIONAL STATE OFAFGHANISTANAREAS TO THE PRIVATE SECTOR MINISTRY OF MINES AND INDUSTRYGRANT AGREEMENT NO. H007-AF EMERGENCY INFRASTRUCTURE RECONSTRUCTION PROJECT
The base case shown does not include any oil production since the Afghanistan resources/reserves are heavily weighted toward gas. Still, oil (or more likely gascondensate) can be hard-entered as a production rate input under the “Million Bbls/year” column.
Gas prices have been discussed separately in the Market section of this Report. Sensitivity to gas prices can be read off of the sensitivity plots (spider diagrams) provided in the spreadsheet (see samples below).
The spreadsheet treats any oil or condensate for Opex purposes as “gas equivalent”and sums up the additional operating cost. The 50% production share to the government automatically applies to any oil or condensate in the income stream.
A uniform price escalation (applying to both oil and gas) is included, although the basecase assumes an escalation rate of zero. The sensitivity to price escalation would likelybe low as compared to other input parameters as long as the corresponding inflation rate of costs is at a similar percentage.
Table 4-2 Additional Base Case Input Parameters for Economic Spreadsheet
Oil Price (US$/BBL) $30.00Gas Price (US$/MCF) $1.10Price Escalation 0%
Production Rates BCF per year Million Bbls/year
Year 1 0 0Year 2 12 0Year 3 28 0Year 4 36 0Years 5 - 8 44 0Years 9 - 20 20% annual 10%
decline
Operating Costs (US$/MCF) 0.40 (Based on gas production equivalence)Inflation Rate 0.0%
U.S. Industrial Goods Wholesale Price Index 0.0%
7/6/2005 IV-5 Gustavson Associates

PROMOTION OF OIL AND GAS PRODUCING ISLAMIC TRANSITIONAL STATE OFAFGHANISTANAREAS TO THE PRIVATE SECTOR MINISTRY OF MINES AND INDUSTRYGRANT AGREEMENT NO. H007-AF EMERGENCY INFRASTRUCTURE RECONSTRUCTION PROJECT
1.4 Type Gas Field
As indicated above, this section on economic performance is kept as independent of detailed technical variables as possible. Therefore a hypothetical “type gas field” hasbeen developed. The Type Field is intended to represent an average of fields that have been discovered in Northern Afghanistan.
The fields, which have been studied by this Consultant and which most likely will be attractive to international investors, are summarized in Table 4-3 below. On basis of the amount of reserves and considering a reasonable development scenario this Consultant has designed a Type Field with about 420 BCF recoverable reserves over a twenty-yeareconomic life.
The production forecast for gas from this Type Field is shown in Figure 4-1. The production is assumed to be developed to reach a flat plateau and stay at that level through Year 8 after which the production rate will decline exponentially at 20% peryear.
Table 4-3 Remaining Reserves in Six Gas Fields
Gas FieldRemaining
GasReserves,
BCM
RemainingGas
Reserves,BCF
Jar Quduk 9.77 345Khoja Gogerdaq 16.77 592Yatimtaq 7.36 260Jangalikolon 13.38 473Bashikurd 6.37 225Juma 21.82 770TOTAL 75.47 2,665
7/6/2005 IV-6 Gustavson Associates

PROMOTION OF OIL AND GAS PRODUCING ISLAMIC TRANSITIONAL STATE OFAFGHANISTANAREAS TO THE PRIVATE SECTOR MINISTRY OF MINES AND INDUSTRYGRANT AGREEMENT NO. H007-AF EMERGENCY INFRASTRUCTURE RECONSTRUCTION PROJECT
7/6/2005 IV-7 Gustavson Associates
0.0
5.0
10.0
15.0
20.0
25.0
30.0
35.0
40.0
45.0
50.0
1 2 3 4 5 6 7 8 9 10 11 12 13 14 15 16 17 18 19 20
Project Year
Gas P
rodu
ctio
n, B
CF/yr
Figure 4-1 Graph of Production Rate versus Time, Afghan Type Gas Field
1.4.1 Royalty and Income Tax Rate
The royalty rate is assumed to be 5 percent in the base case scenario. Other rates can be entered and run in the model. The World Bank considers that a 3 percent royaltyrate may represent another possibility. This 3% rate is included in the alternate case resented below.
Income tax for hydrocarbon activities is yet to be established by the Parliament. In the meantime, this Consultant has followed the advice of The World Bank and uses 30 percent as an upper limit (Table 4-4). Twenty percent may be used as another input forsensitivity calculations, and is included in the alternate case.
Table 4-4 Royalty and Tax Input in Economic Spreadsheet
Royalty Rate 5.0%
Income Tax Rate 30%
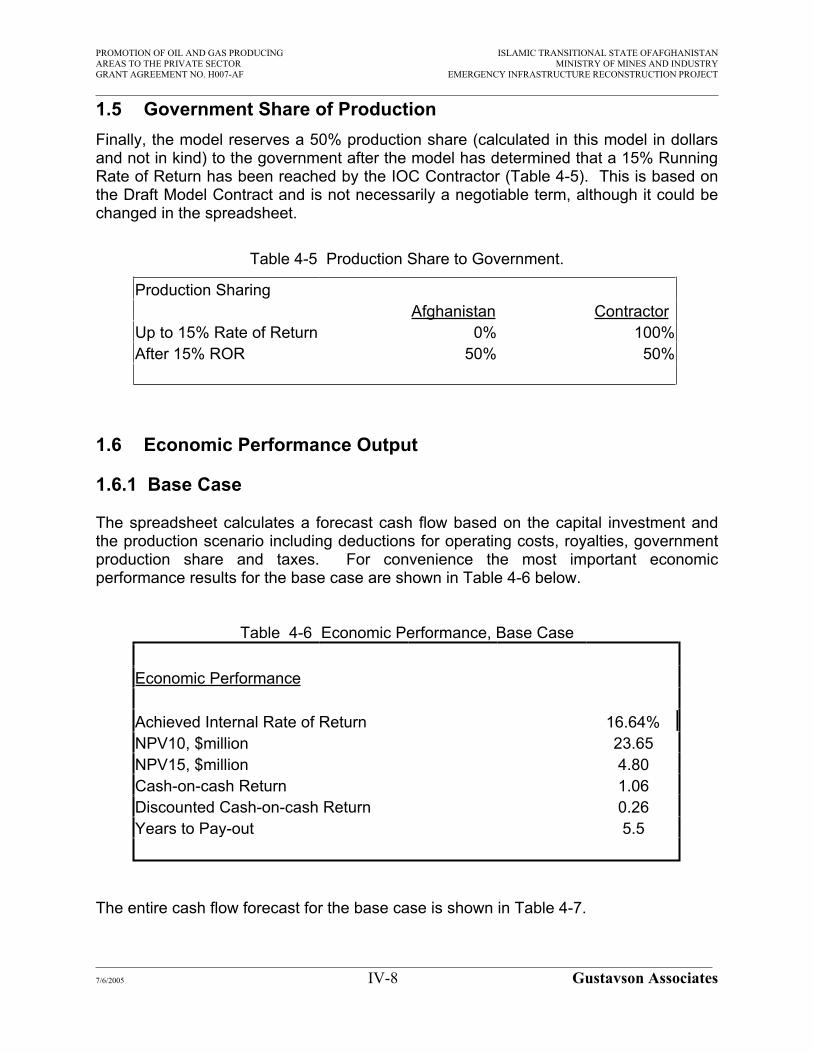
PROMOTION OF OIL AND GAS PRODUCING ISLAMIC TRANSITIONAL STATE OFAFGHANISTANAREAS TO THE PRIVATE SECTOR MINISTRY OF MINES AND INDUSTRYGRANT AGREEMENT NO. H007-AF EMERGENCY INFRASTRUCTURE RECONSTRUCTION PROJECT
1.5 Government Share of Production Finally, the model reserves a 50% production share (calculated in this model in dollarsand not in kind) to the government after the model has determined that a 15% RunningRate of Return has been reached by the IOC Contractor (Table 4-5). This is based on the Draft Model Contract and is not necessarily a negotiable term, although it could be changed in the spreadsheet.
Table 4-5 Production Share to Government.
Production Sharing Afghanistan Contractor
Up to 15% Rate of Return 0% 100%After 15% ROR 50% 50%
1.6 Economic Performance Output
1.6.1 Base Case
The spreadsheet calculates a forecast cash flow based on the capital investment and the production scenario including deductions for operating costs, royalties, government production share and taxes. For convenience the most important economicperformance results for the base case are shown in Table 4-6 below.
Table 4-6 Economic Performance, Base Case
Economic Performance
Achieved Internal Rate of Return 16.64%NPV10, $million 23.65NPV15, $million 4.80Cash-on-cash Return 1.06Discounted Cash-on-cash Return 0.26Years to Pay-out 5.5
The entire cash flow forecast for the base case is shown in Table 4-7.
7/6/2005 IV-8 Gustavson Associates

PROMOTION OF OIL AND GAS PRODUCING ISLAMIC TRANSITIONAL STATE OFAFGHANISTANAREAS TO THE PRIVATE SECTOR MINISTRY OF MINES AND INDUSTRYGRANT AGREEMENT NO. H007-AF EMERGENCY INFRASTRUCTURE RECONSTRUCTION PROJECT
A sensitivity analysis has been conducted for these economics. The parameters evaluated were gas rates and reserves, gas price, capital costs, operating costs, royaltyrate and income tax rate. These parameters were all varied both upward and downward by 15 and 30 percent.
These variations are considered to represent a reasonable expected range of maximumvariation in these parameters. Results are summarized on Figures 4-2 and 4-3 below.
1.6.2 Alternate Case
As mentioned above, an alternate case was run to consider different royalty and incometax rates (3 and 20% respectively, instead of 5 and 30%). These are the onlydifferences between inputs for the base and alternate cases. The results of the alternate case are summarized in Table 4-8 below, with the cash flow presented in Table 4-9. Spider diagrams are presented in Figures 4-4 and 4-5.
7/6/2005 IV-9 Gustavson Associates

PROMOTION OF OIL AND GAS PRODUCING ISLAMIC TRANSITAREAS TO THE PRIVATE SECTOR MINIGRANT AGREEMENT NO. H007-AF EMERGENCY INFRASTRUCTU
Table 4-7 Cash Flow Forecast, Base Case Cash Flow ModelAfghanistan Production Sharing Opportunity
Currency amounts expressed in (US$ 000,000)Production amounts (BBLS 000,000)Contract Year 0 1 2 3 4 5 6 7 8 9 10 11 12 13 14 15 16 17
Gross Production (mm BBLS) 0.0 0.0 0.0 0.0 0.0 0.0 0.0 0.0 0.0 0.0 0.0 0.0 0.0 0.0 0.0 0.0 0.0Gross Production (BCF) 0.0 12.0 28.0 36.0 44.0 44.0 44.0 44.0 35.2 28.2 22.5 18.0 14.4 11.5 9.2 7.4 5.9Total Gross (BCF equiv for Opex calc.) 0.0 12.0 28.0 36.0 44.0 44.0 44.0 44.0 35.2 28.2 22.5 18.0 14.4 11.5 9.2 7.4 5.9
Oil Price (BBL) 30.00 30.00 30.00 30.00 30.00 30.00 30.00 30.00 30.00 30.00 30.00 30.00 30.00 30.00 30.00 30.00 30.00Gas Price (MCF) 1.10 1.10 1.10 1.10 1.10 1.10 1.10 1.10 1.10 1.10 1.10 1.10 1.10 1.10 1.10 1.10 1.10
Oil Sales, $ 0.0 0.0 0.0 0.0 0.0 0.0 0.0 0.0 0.0 0.0 0.0 0.0 0.0 0.0 0.0 0.0 0.0Gas Sales, $ 0.0 13.2 30.8 39.6 48.4 48.4 48.4 48.4 38.7 31.0 24.8 19.8 15.9 12.7 10.2 8.1 6.5
Royalty 0.0 0.7 1.5 2.0 2.4 2.4 2.4 2.4 1.9 1.5 1.2 1.0 0.8 0.6 0.5 0.4 0.3Operating Costs 0.0 4.8 11.2 14.4 17.6 17.6 17.6 17.6 14.1 11.3 9.0 7.2 5.8 4.6 3.7 3.0 2.4Depreciation 10.8 18.0 18.0 18.0 18.0 7.2 0.0 0.0 0.0 0.0 0.0 0.0 0.0 0.0 0.0 0.0 0.0 Depreciation was calculated using 5-year straight line method.
Government Production Sharing 0.0 0.0 0.0 0.0 0.0 0.0 0.0 0.0 2.8 7.2 7.3 5.8 4.6 3.7 3.0 2.4 1.9
Taxable Income (10.8) (10.3) 0.1 5.2 10.4 21.2 28.4 28.4 19.9 10.9 7.3 5.8 4.6 3.7 3.0 2.4 1.9Income Tax 0.0 0.0 0.0 0.0 0.0 4.7 8.5 8.5 6.0 3.3 2.2 1.7 1.4 1.1 0.9 0.7 0.6Net Income (10.8) (10.3) 0.1 5.2 10.4 16.4 19.9 19.9 14.0 7.6 5.1 4.1 3.3 2.6 2.1 1.7 1.3
Add back Depreciation 10.8 18.0 18.0 18.0 18.0 7.2 0.0 0.0 0.0 0.0 0.0 0.0 0.0 0.0 0.0 0.0 0.0Capital Expenditures 54.0 36.0 0.0 0.0 0.0 0.0 0.0 0.0 0.0 0.0 0.0 0.0 0.0 0.0 0.0 0.0 0.0
Net Cash Flow (54.0) (28.3) 18.1 23.2 28.4 23.6 19.9 19.9 14.0 7.6 5.1 4.1 3.3 2.6 2.1 1.7 1.3Cumulative Cash Flow (54.0) (82.3) (64.2) (41.0) (12.6) 11.0 30.9 50.8 64.7 72.4 77.5 81.5 84.8 87.4 89.5 91.1 92.5Running IRR -62.7% -26.7% -5.7% 3.9% 9.2% 12.8% 14.6% 15.4% 15.8% 16.1% 16.3% 16.4% 16.5% 16.5% 16.6%PV disc @ 10% (51.5) (24.5) 14.2 16.6 18.5 14.0 10.7 9.7 6.2 3.1 1.9 1.4 1.0 0.7 0.5 0.4 0.3PV disc @ 15% (50.4) (22.9) 12.7 14.2 15.1 11.0 8.0 7.0 4.3 2.0 1.2 0.8 0.6 0.4 0.3 0.2 0.1
Government Share of RevenuesRoyalty 0.0 0.7 1.5 2.0 2.4 2.4 2.4 2.4 1.9 1.5 1.2 1.0 0.8 0.6 0.5 0.4 0.3Production Share 0.0 0.0 0.0 0.0 0.0 0.0 0.0 0.0 2.8 7.2 7.3 5.8 4.6 3.7 3.0 2.4 1.9Income Tax 0.0 0.0 0.0 0.0 0.0 4.7 8.5 8.5 6.0 3.3 2.2 1.7 1.4 1.1 0.9 0.7 0.6
Total 0.0 0.7 1.5 2.0 2.4 7.2 10.9 10.9 10.7 12.1 10.7 8.5 6.8 5.5 4.4 3.5 2.8
7/6/2005 IV-10 Gu

PROMOTION OF OIL AND GAS PRODUCING ISLAMIC TRANSITAREAS TO THE PRIVATE SECTOR MINIGRANT AGREEMENT NO. H007-AF EMERGENCY INFRASTRUCTU
Table 4-8 Cash Flow Forecast, Alternate Case Cash Flow ModelAfghanistan Production Sharing Opportunity
Currency amounts expressed in (US$ 000,000)Production amounts (BBLS 000,000)Contract Year 0 1 2 3 4 5 6 7 8 9 10 11 12 13 14 15 16 17
Gross Production (mm BBLS) 0.0 0.0 0.0 0.0 0.0 0.0 0.0 0.0 0.0 0.0 0.0 0.0 0.0 0.0 0.0 0.0 0.0Gross Production (BCF) 0.0 12.0 28.0 36.0 44.0 44.0 44.0 44.0 35.2 28.2 22.5 18.0 14.4 11.5 9.2 7.4 5.9Total Gross (BCF equiv for Opex calc.) 0.0 12.0 28.0 36.0 44.0 44.0 44.0 44.0 35.2 28.2 22.5 18.0 14.4 11.5 9.2 7.4 5.9
Oil Price (BBL) 30.00 30.00 30.00 30.00 30.00 30.00 30.00 30.00 30.00 30.00 30.00 30.00 30.00 30.00 30.00 30.00 30.00Gas Price (MCF) 1.10 1.10 1.10 1.10 1.10 1.10 1.10 1.10 1.10 1.10 1.10 1.10 1.10 1.10 1.10 1.10 1.10
Oil Sales, $ 0.0 0.0 0.0 0.0 0.0 0.0 0.0 0.0 0.0 0.0 0.0 0.0 0.0 0.0 0.0 0.0 0.0Gas Sales, $ 0.0 13.2 30.8 39.6 48.4 48.4 48.4 48.4 38.7 31.0 24.8 19.8 15.9 12.7 10.2 8.1 6.5
Royalty 0.0 0.4 0.9 1.2 1.5 1.5 1.5 1.5 1.2 0.9 0.7 0.6 0.5 0.4 0.3 0.2 0.2Operating Costs 0.0 4.8 11.2 14.4 17.6 17.6 17.6 17.6 14.1 11.3 9.0 7.2 5.8 4.6 3.7 3.0 2.4Depreciation 10.8 18.0 18.0 18.0 18.0 7.2 0.0 0.0 0.0 0.0 0.0 0.0 0.0 0.0 0.0 0.0 0.0 Depreciation was calculated using 5-year straight line method.
Government Production Sharing 0.0 0.0 0.0 0.0 0.0 0.0 0.0 2.9 10.4 9.4 7.5 6.0 4.8 3.8 3.1 2.5 2.0
Taxable Income (10.8) (10.0) 0.7 6.0 11.3 22.1 29.3 26.4 13.1 9.4 7.5 6.0 4.8 3.8 3.1 2.5 2.0Income Tax 0.0 0.0 0.0 0.0 0.0 3.9 5.9 5.3 2.6 1.9 1.5 1.2 1.0 0.8 0.6 0.5 0.4Net Income (10.8) (10.0) 0.7 6.0 11.3 18.3 23.5 21.1 10.5 7.5 6.0 4.8 3.8 3.1 2.5 2.0 1.6
Add back Depreciation 10.8 18.0 18.0 18.0 18.0 7.2 0.0 0.0 0.0 0.0 0.0 0.0 0.0 0.0 0.0 0.0 0.0Capital Expenditures 54.0 36.0 0.0 0.0 0.0 0.0 0.0 0.0 0.0 0.0 0.0 0.0 0.0 0.0 0.0 0.0 0.0
Net Cash Flow (54.0) (28.0) 18.7 24.0 29.3 25.5 23.5 21.1 10.5 7.5 6.0 4.8 3.8 3.1 2.5 2.0 1.6Cumulative Cash Flow (54.0) (82.0) (63.3) (39.3) (10.0) 15.5 39.0 60.1 70.6 78.1 84.1 88.9 92.8 95.9 98.3 100.3 101.9Running IRR -61.7% -25.4% -4.5% 5.4% 11.2% 14.7% 15.9% 16.6% 17.1% 17.4% 17.6% 17.7% 17.8% 17.9% 17.9%PV disc @ 10% (51.5) (24.3) 14.7 17.2 19.1 15.1 12.6 10.3 4.7 3.0 2.2 1.6 1.2 0.8 0.6 0.4 0.3PV disc @ 15% (50.4) (22.7) 13.2 14.7 15.6 11.8 9.5 7.4 3.2 2.0 1.4 1.0 0.7 0.5 0.3 0.2 0.2
Government Share of RevenuesRoyalty 0.0 0.4 0.9 1.2 1.5 1.5 1.5 1.5 1.2 0.9 0.7 0.6 0.5 0.4 0.3 0.2 0.2Production Share 0.0 0.0 0.0 0.0 0.0 0.0 0.0 2.9 10.4 9.4 7.5 6.0 4.8 3.8 3.1 2.5 2.0Income Tax 0.0 0.0 0.0 0.0 0.0 3.9 5.9 5.3 2.6 1.9 1.5 1.2 1.0 0.8 0.6 0.5 0.4
Total 0.0 0.4 0.9 1.2 1.5 5.3 7.3 9.7 14.2 12.2 9.8 7.8 6.2 5.0 4.0 3.2 2.6
7/6/2005 IV-11 Gu

PROMOTION OF OIL AND GAS PRODUCING ISLAMIC TRANSITIONAL STATE OFAFGHANISTANAREAS TO THE PRIVATE SECTOR MINISTRY OF MINES AND INDUSTRYGRANT AGREEMENT NO. H007-AF EMERGENCY INFRASTRUCTURE RECONSTRUCTION PROJECT
7/6/2005 IV-12 Gustavson Associates
Spider DiagramAfghanistan Typical Gas Discovery Economics
Base Case Royalty 5%, Income Tax 30%
(20.0)
(10.0)
0.0
10.0
20.0
30.0
40.0
50.0
0.7 0.8 0.9 1 1.1 1.2 1.3
Fraction of Base Case Value
Pres
ent V
alue @
10%
, MM$
Gas PriceOpexCapexProductionIncome TaxRoyalty
Figure 4-2 Afghanistan Typical Gas Discovery Economics Base Case – Present Value @10%, MM$
Spider DiagramAfghanistan Typical Gas Discovery Economics
Base Case Royalty 5%, Income Tax 30%
0.0%
5.0%
10.0%
15.0%
20.0%
25.0%
0.7 0.8 0.9 1 1.1 1.2 1.3
Fraction of Base Case Value
Inte
rnal
Rate
of R
etur
n, %
Gas PriceOpexCapexProductionIncome TaxRoyalty
Figure 4-3 Afghanistan Typical Gas Discovery Economics Base Case – Internal Rate of Return, %

PROMOTION OF OIL AND GAS PRODUCING ISLAMIC TRANSITIONAL STATE OFAFGHANISTANAREAS TO THE PRIVATE SECTOR MINISTRY OF MINES AND INDUSTRYGRANT AGREEMENT NO. H007-AF EMERGENCY INFRASTRUCTURE RECONSTRUCTION PROJECT
Table 4-9 Economic Performance, Alternate Case
Economic Performance
Achieved Internal Rate of Return 17.96%NPV10, $million 28.80NPV15, $million 8.79Cash-on-cash Return 1.17Discounted Cash-on-cash Return 0.32Years to Pay-out 5.4
Spider DiagramAfghanistan Typical Gas Discovery Economics
Base Case Royalty 3%, Income Tax 20%
(20.0)
(10.0)
0.0
10.0
20.0
30.0
40.0
50.0
60.0
0.7 0.8 0.9 1 1.1 1.2 1.3
Fraction of Base Case Value
Pres
ent V
alue @
10%
, MM$
Gas PriceOpexCapexProductionIncome TaxRoyalty
Figure 4-4 Afghanistan Typical Gas Discovery Economics Alternate Case – Present Value @10%, MM$
7/6/2005 IV-13 Gustavson Associates

PROMOTION OF OIL AND GAS PRODUCING ISLAMIC TRANSITIONAL STATE OFAFGHANISTANAREAS TO THE PRIVATE SECTOR MINISTRY OF MINES AND INDUSTRYGRANT AGREEMENT NO. H007-AF EMERGENCY INFRASTRUCTURE RECONSTRUCTION PROJECT
7/6/2005 IV-14 Gustavson Associates
Spider DiagramAfghanistan Typical Gas Discovery Economics
Base Case Royalty 3%, Income Tax 20%
0.0%
5.0%
10.0%
15.0%
20.0%
25.0%
30.0%
0.7 0.8 0.9 1 1.1 1.2 1.3
Fraction of Base Case Value
Inte
rnal
Rate
of R
etur
n, %
Gas PriceOpexCapexProductionIncome TaxRoyalty
Figure 4-5 Afghanistan Typical Gas Discovery Economics Alternate Case – Internal Rate of Return, %

PROMOTION OF OIL AND GAS PRODUCING ISLAMIC TRANSITIONAL STATE OFAFGHANISTANAREAS TO THE PRIVATE SECTOR MINISTRY OF MINES AND INDUSTRYGRANT AGREEMENT NO. H007-AF EMERGENCY INFRASTRUCTURE RECONSTRUCTION PROJECT
V. FIELD STATUS, REHABILITATION, AND DEVELOPMENT PROGRAM PLAN
Gustavson Associates integrated all components of the technical findings into a unified picture of the remaining hydrocarbon resources in the designated fields. This section of the final report comprises a substantial portion of the knowledge base that is required toform Concession Blocks and to produce a promotional packages. However, there arestrategic goals of the Afghan government that are as important, sometimes more important, than the technical findings.
1. Review of Parallel Emergency Aid and Assistance
Several parties worked on the reconstruction of the oil and gas sector in Afghanistan.These included Gustavson Associates, working on the reserves in the known fieldsaround Sheberghan and the investment promotion thereof to the international sector.
Hill International also had a contract; focusing on the downstream sector, includingexport potential, pipeline transportation of gas to Kabul, use of gas for powergeneration, expansion of fertilizer production and refining of oil for local consumption. In addition, the US Geological Survey studied the undiscovered oil and gas potential outside the Sheberghan area and on a broader basis elsewhere in the country.
The interface between Gustavson and Hill is readily defined at the oilfield level, wherethe Gustavson forecast of produced oil and gas quantities (both short-term and ultimately recoverable) interface with the transportation to the markets listed above as being optimized by Hill.
Gustavson’s forecasted oil and gas quantities (reserves and production rates) for the Afghanistan Ministry of Mines and Industry, which was completed in mid-May under Gustavson’s contract. Therefore, Hill contracted with Gustavson for a fast-track study leading to reasonable production rates, as might be expected in the near term.
The basis for this fast-track study was the historic Soviet reserve estimates and Gustavson’s experience with the rehabilitation and development of similar fields inCentral Asia. In May 2004, when Gustavson’s own reserve estimates were completed,a careful comparison with the present fast-track results showed an increase in the production rate forecast (due to the conservative nature of the fast track study).
The fast-track production rate estimates are presented in this Report. The confidencelevel of the estimates is high for the 5-year term, thanks to a reasonable number of Soviet parametric wells and past production from three of the gas fields. After ten yearsthe confidence level becomes reduced, but is expected to be regained after the new reserve estimates have been completed.
7/6/2005 V-1 Gustavson Associates

PROMOTION OF OIL AND GAS PRODUCING ISLAMIC TRANSITIONAL STATE OFAFGHANISTANAREAS TO THE PRIVATE SECTOR MINISTRY OF MINES AND INDUSTRYGRANT AGREEMENT NO. H007-AF EMERGENCY INFRASTRUCTURE RECONSTRUCTION PROJECT
It is noted that oilfield economics as seen from an international oil company standpoint were run as part of this fast-track estimate; instead, it was assumed that aggressive, yetreasonable development activities can commence at typical Central Asia capital costs during the second half of 2004.
The gas delivery projections for Jar Quduk indicate that the risk-weighted gas production could reach 55 MMCF/D in the first few years by adding compression,stimulation of existing producers, conducting workovers and/or twinning non-producers,putting shut-in wells into production and deepening shut-in certain wells into deeperJurassic reservoirs. By the tenth year, the gas production would decrease to about 10MMCF/D.
The projections for Kahoka Gogerdaq gas field indicate that the gas production could reach 24 MMCF/D in the first few years by adding compression, conducting workovers, putting shut-in wells into production and drilling new wells. By the tenth year, the gas production would decrease to about 14 MMCF/D.
The gas projections for Yatimtaq indicate that the gas production could reach 20 MMCF/D in the first few years by producing the existing Well #21 unrestricted, and by conducting workovers to put shut-in wells into production. By the tenth year, the gas production would decrease to about 0.1 MMCF/D.
Several cases were considered for the Kashkari oilfield. Case 1 is an oil company’sstandard case, which assumes a readily available market, possibly by export. It showsthat the Kashkari oilfield can reach a peak production rate of 13,182 BOPD in 2007, butthen decline rapidly afterwards. By 2013, after ten years of production, the oil production rate decreases to 6,177 BOPD. The cumulative oil production reaches 29.86 MMBO (4.09 million tons) at the end of 2013.
Case 2 is insignificant, but was based on an early attempt to feed a 10,000-BOPDrefinery. There are not enough reserves (Soviet numbers) to feed a refinery for 15 years at that level. The independent Gustavson reserves (now being studied) cannotbe expected to change that opinion with oil from the Kashkari field alone.
In Case 3, a level production rate of about 7,300 BOPD can be obtained for 7 years, and will decline thereafter. The cumulative oil production reaches 27.5 MMBO (3.77 million tons) at the end of 2015 and is followed by a long tail. Only additional oil from nearby small fields can fill the shortfall, but reserve data for these is not forthcoming until after May 2004.
After belated discussions with Hill’s chemical engineer, Gustavson Associates pursueda roughly 6,000 BOPD field development plan based on a tighter well spacing with more costly oil because of the higher capital cost. This plan will optimize the delivery of oilover 15 years and leave very little oil production thereafter. This approach may provide the highest investment security for the refinery at a higher capital cost for the oil field development.
7/6/2005 V-2 Gustavson Associates

PROMOTION OF OIL AND GAS PRODUCING ISLAMIC TRANSITIONAL STATE OFAFGHANISTANAREAS TO THE PRIVATE SECTOR MINISTRY OF MINES AND INDUSTRYGRANT AGREEMENT NO. H007-AF EMERGENCY INFRASTRUCTURE RECONSTRUCTION PROJECT
1.1 Integration of Findings
1.1.1 Introduction
This section was originally prepared for Hill International in order to support ongoingprojects that deal with the emergency reconstruction and rehabilitation of the oil and gas infrastructure in Afghanistan. This section provides short-term projections of future gasproduction from the three producing gas fields and one oil field in northwestern Afghanistan (Figure 5-1).
The short-term projections of gas production have been based on existing conditionsand also possible improvements. In this regard, we prepared projections based on no changes or improvements (status quo) to the present producing wells or supporting infrastructure. In addition, we also prepared projections based on various hypotheticalscenarios where incremental gas production could be obtained through variousmethods including the following:
Workovers and Maintenance RecompletionsActivation of shut-in wells Utilization of Compression
The projections of oil production have been based on reservoir parameters gleanedfrom various documents provided by the Afghan Gas Company Exploration Department, the United States Geological Survey, and others. The oil field has not undergone a sustained production phase and the condition of the existing wells is not known. Therefore, our projections are based on three possible development reservoirs whereoil production is obtained by drilling of new wells.
All of the various projections described above are included in this section of the finalreport. As part of work on this section, two persons from Gustavson Associatestraveled to Sheberghan in northwestern Afghanistan in order to meet with officials at the Afghan Gas Company and the Exploration Department and also to gather information.
7/6/2005 V-3 Gustavson Associates

PROMOTION OF OIL AND GAS PRODUCING ISLAMIC TRANSITIONAL STATE OFAFGHANISTANAREAS TO THE PRIVATE SECTOR MINISTRY OF MINES AND INDUSTRYGRANT AGREEMENT NO. H007-AF EMERGENCY INFRASTRUCTURE RECONSTRUCTION PROJECT
Figure 5-1 Map showing location of oil and gas fields
7/6/2005 V-4 Gustavson Associates

PROMOTION OF OIL AND GAS PRODUCING ISLAMIC TRANSITIONAL STATE OFAFGHANISTANAREAS TO THE PRIVATE SECTOR MINISTRY OF MINES AND INDUSTRYGRANT AGREEMENT NO. H007-AF EMERGENCY INFRASTRUCTURE RECONSTRUCTION PROJECT
1.1.2 Data Sources
The information and analyses presented in this section have been based on the following sources:
Interviews and information obtained from Afghan Gas Company and Exploration Department in Sheberghan Proprietary geologic and geophysical data obtained from the United StatesGeological Survey Asian Development Bank Report entitled “Afghanistan – Capacity Building for Reconstruction and Development, Gas Sector Rehabilitation” dated May 2003 Report entitled: “Petroleum Geology and Resources of Afghanistan” written byUSGS authors John Kingston and James Clarke, published 1995 Report entitled: “Geology and Oil and Gas Potential of Northern Afghanistan”prepared by Ministry of Geology of the USSR dated 1970
This section further describes the characteristics of the individual fields and presents the projections of short-term production rates along with the supporting assumptions and data.
1.1.3 Geology Overview
The general stratigraphy of North Afghanistan is discussed below and is presented in Figure 5-2. If additional detail information on the geological parameters of the field isavailable it is presented in the discussion of that field.
Triassic. Upper Triassic continental deposits are present locally in grabens, resting unconformably on eroded Paleozoic rocks. Theses rocks do not appear to play a role inpetroleum accumulation, either as source beds or as reservoirs.
Jurassic. The Lower Jurassic strata are continental clastics containing some coal bearing shale and some volcanics. The Middle Jurassic is made-up of clasticsbecoming finer-grained upward and may carry source beds. The Lower and Middle Jurassic section is about 1000 m thick at the northern border of Afghanistan and thins to the south.
7/6/2005 V-5 Gustavson Associates

PROMOTION OF OIL AND GAS PRODUCING ISLAMIC TRANSITIONAL STATE OFAFGHANISTANAREAS TO THE PRIVATE SECTOR MINISTRY OF MINES AND INDUSTRYGRANT AGREEMENT NO. H007-AF EMERGENCY INFRASTRUCTURE RECONSTRUCTION PROJECT
FIGURE 5-2 Stratigraphic Chart of Northeastern Afghanistan
Age Stage or (LocalName)
ZoneNumber
LithologyDescription
DepositionalEnvironment
Remarks
Min MaxRecent (Daura-Mauser) 150 370 Loose-sand Marl Continental Loss circulation
interval in thisformation
Miocene (Kashtan-Geen) 420 790 Sandstone and clay,clay dominant
Marine
Oligocene (Shafa) 245 320 Upper sandstone,Middle limestone,Lower clayUnconformity clay
Marine
Eocene (Sujak) 110 135Paleocene (Ghori) 200 250 Top marl, rest is
limestoneMarine Loss zone
Upper Cretaceous Turonian 730 780 Upper clay 80%,Middle sandstone,Lower marl withfossils
Marine
Cenomanian 160 240 Upper limestone,Middle clay andsandstone, Lower clay
Marine High pressure zone(in Jangalikoloand Chekchi areas)
Lower Cretaceous Albian XI 310 380 Clay 70%, sandstone30%
Marine Reservoir in Yatimtaq,Kashkari
Aptian XII 110 150 Top limestone, Middlelimestone, Bottomanhydrite
Marine Reservoir in Khoja Gogerdaq,Yatimtaq,Kashkari
Barremian 110 120 Clay, sandstone,anhydrite
Marine
Hauterivian XIV 125 135 Redbed siltstone,sandstone,conglomerates
Non Marine andMarine
Reservoir inJar Quduk,Khvajeh Gogerdaq,Yatimtaq,Kaskari
(Olian-Green) 75 90 Clay, sandstone, clay Marine
(Karabil) 90 330 Alteration of sandstone and clay
Marine
Upper Jurassic (Gawerdeck) 250 255 Salt (anhydrite) Marine Pipe sticking(Kugitan) XV 285 320 Dolomite limestone
85%Marine Reservoir in
Jar Quduk,Yatimtag
Total 3370 4665
Thickness(M)
Stratigraphic Chart of Northern Afghanistan Oil and Gas FieldsAge Stage or Zone Thickness Lithology Depositional Remarks
Local Name Number (m) Description Environment Min Max
7/6/2005 V-6 Gustavson Associates

PROMOTION OF OIL AND GAS PRODUCING ISLAMIC TRANSITIONAL STATE OFAFGHANISTANAREAS TO THE PRIVATE SECTOR MINISTRY OF MINES AND INDUSTRYGRANT AGREEMENT NO. H007-AF EMERGENCY INFRASTRUCTURE RECONSTRUCTION PROJECT
The Upper Jurassic section is an important petroleum producer of the region. The lowerUpper Jurassic Callovian and Oxfordian carbonates are some of the main reservoirs ofthe basin. The upper portion of the Upper Jurassic, Kimmeridgian and Tithonian saltand anhydrite provide effective seals.
Cretaceous. The Lower Cretaceous section consists of 1200 m of clastic and carbonate rocks of marine and lagoonal-continental origin. The Neocomian consists mainly ofcarbonates and shales, except for the Hauterivian, which are largely redbed siltstones,sandstones and conglomerates up to 140 m thick. Sandstones of the Hauterivian are principle reservoirs in the region. As much as 670 m of Aptian and Albian carbonate, shale and siltstone overlie the Neocomian.
The Upper Cretaceous consists of as much as 1500 m of carbonates, shales and siltstones, with some sandstones (80 to 110 m thick) in the Turning. The Lower Cretaceous section is relatively thick in the Afghan subbasin.
Paleogene. Deposition appears to have been continuous from the Mesozoic into the Cenozoic over most of the North Afghanistan basin. The lower Paleogene consistslargely of carbonates, evaporates and shales. The upper Paleogene consists of sandyclaystones and shales up to 610 m thick.
Neogene. Course Neogene clastic deposits lie unconformably above the upper Paleogene sandy claystones. The Neogene sediments play no role in petroleumaccumulation, (Kingston and Clarke, 1995).
1.2 Producing Gas Fields
1.2.1 Jar Quduk
1.2.1.1 Overview
The Jar Quduk gas field is located approximately 15 kilometers southwest of the city ofSheberghan. The field occupies an area of 50 square kilometers. Exploration activitieswere carried out during the 1970s and production commenced for Jar Quduk field in 1980.
The field achieved irregular plateau production of 5 million cubic meters per day from 1983 to 1987 and then declined. All of the gas has been produced from Hauterivian stage sandstone reservoirs of the Cretaceous. A total of 58 wells were drilled as part ofexploration and production of the field. The category of each of the wells drilled is summarized on Table 5-1.
7/6/2005 V-7 Gustavson Associates

PROMOTION OF OIL AND GAS PRODUCING ISLAMIC TRANSITIONAL STATE OFAFGHANISTANAREAS TO THE PRIVATE SECTOR MINISTRY OF MINES AND INDUSTRYGRANT AGREEMENT NO. H007-AF EMERGENCY INFRASTRUCTURE RECONSTRUCTION PROJECT
Table 5-1 Summary Of Wells Drilled At Jar Quduk Gas Field
Total explorationWells drilled
Result
gas -dry
Total AppraisalWells drilled
Result
gas - dry
TotaldevelopmentWells drilled
Grandtotal
2 - 2 23 23 - 33 58
In the late 1980s, the Soviet specialists stopped all of the production in the field byloading the producing wells with a mix of condensate and drilling mud. The field did not resume production until 1991. Since then, only fourteen wells have been reactivated for production. Attempts were made to activate more wells but these efforts were unsuccessful. The 14 active wells presently produce approximately 360,000 cubic meters per day and mainly supply residential gas to households in Sheberghan andMazar-e Sharif. Some of this gas is also used to supply the fertilizer plant. Theproduction history for the field is shown on Figure 5-3.
Jar Quduk Production HistoryHauterivian
0
200
400
600
800
1000
1200
1400
1600
1800
2000
1975 1980 1985 1990 1995 2000 2005 2010 2015
Year
Gas V
olum
e, MM
CM
0
50
100
150
200
250
300
Pressure, atm
TotalForecastHistoricalForecast
Figure 5-3 Jar Quduk Production History
7/6/2005 V-8 Gustavson Associates
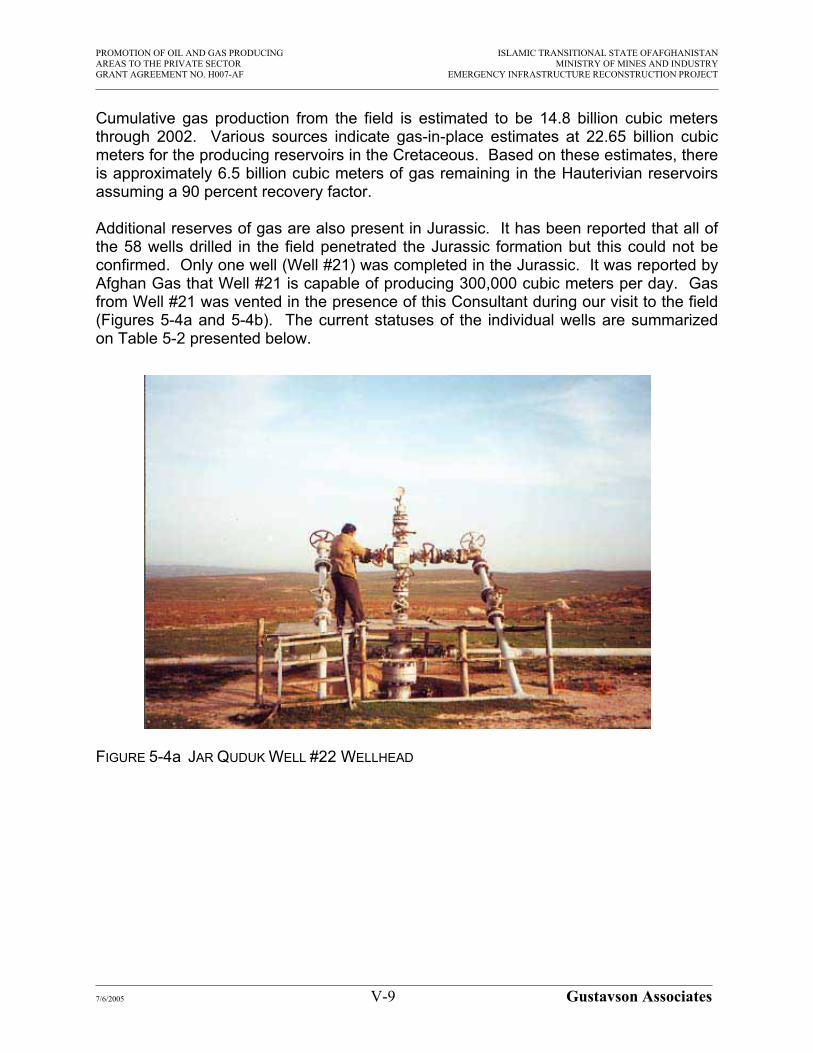
PROMOTION OF OIL AND GAS PRODUCING ISLAMIC TRANSITIONAL STATE OFAFGHANISTANAREAS TO THE PRIVATE SECTOR MINISTRY OF MINES AND INDUSTRYGRANT AGREEMENT NO. H007-AF EMERGENCY INFRASTRUCTURE RECONSTRUCTION PROJECT
Cumulative gas production from the field is estimated to be 14.8 billion cubic metersthrough 2002. Various sources indicate gas-in-place estimates at 22.65 billion cubicmeters for the producing reservoirs in the Cretaceous. Based on these estimates, there is approximately 6.5 billion cubic meters of gas remaining in the Hauterivian reservoirsassuming a 90 percent recovery factor.
Additional reserves of gas are also present in Jurassic. It has been reported that all ofthe 58 wells drilled in the field penetrated the Jurassic formation but this could not be confirmed. Only one well (Well #21) was completed in the Jurassic. It was reported by Afghan Gas that Well #21 is capable of producing 300,000 cubic meters per day. Gas from Well #21 was vented in the presence of this Consultant during our visit to the field (Figures 5-4a and 5-4b). The current statuses of the individual wells are summarized on Table 5-2 presented below.
FIGURE 5-4a JAR QUDUK WELL #22 WELLHEAD
7/6/2005 V-9 Gustavson Associates

PROMOTION OF OIL AND GAS PRODUCING ISLAMIC TRANSITIONAL STATE OFAFGHANISTANAREAS TO THE PRIVATE SECTOR MINISTRY OF MINES AND INDUSTRYGRANT AGREEMENT NO. H007-AF EMERGENCY INFRASTRUCTURE RECONSTRUCTION PROJECT
FIGURE 5-4b JAR QUDUK WELL #22 FLOWING GAS
7/6/2005 V-10 Gustavson Associates

PROMOTION OF OIL AND GAS PRODUCING ISLAMIC TRANSITIONAL STATE OFAFGHANISTANAREAS TO THE PRIVATE SECTOR MINISTRY OF MINES AND INDUSTRYGRANT AGREEMENT NO. H007-AF EMERGENCY INFRASTRUCTURE RECONSTRUCTION PROJECT
Table 5-2 Current Status Of Individual Wells At Jar Quduk Gas Field
Formation Wells no. in production Watered Out Wells
Completed wells not taken for production
Remarks
Albian - - - -Aptian - - - -
Hauterivian
51, 52, 54, 55, 59, 60, 61, 62, 68, 69, 70, 73, 78, 80, =14 wells
1, 2, 3, 4, 5, 6, 7, 8, 10, 11, 14, 15, 16, 18, 20, 22, 23, 24, 25, 26, 27, 28, 29, 30, 40, 100, 101 = 27 wells
19, 53, 56, 57, 58, 63, 64, 65, 66, 67, 71, 72, 74, 75, 76, 77, 79 = 17 wells
Well no-31 due to some problem is not given by expiration for production
Kugitan 21
A structure map of the field is presented in Figure 5-5. The individual wells are color coded according to various categories that describe current status and proposed workover.
1.2.1.2 Producing Wells
As described previously, fourteen wells produce approximately 300,000 cubic meters of gas per day. Individual well production histories were obtained from Afghan Gas butonly go back to 1987. All of the gas is produced from Hauterivian stage sandstone reservoirs of the Cretaceous.
1.2.1.3 Non-Producing Wells
There are approximately 19 non-producing wells that have remained shut-in since 1988, some perhaps even earlier. Afghan Gas has not been successful at bringing thesewells back into production. These wells have not produced because production wasstopped due to the following: 1) kill fluid column that prevented further gas from being produced, 2) excessive water production that hinders gas production, 3) hole has been junked with equipment.
While in Sheberghan, officials with Afghan Gas identified priority workover candidates that should be considered. The workover candidates include a program of reentry and workovers in order to bring these wells back into production. Officials with Afghan Gascautioned that the present level of the gas-water contact is unknown and theyrecommended starting with wells high on the structure. The priority candidates were selected with this in mind and summarized below:
7/6/2005 V-11 Gustavson Associates

PROMOTION OF OIL AND GAS PRODUCING ISLAMIC TRANSITIONAL STATE OFAFGHANISTANAREAS TO THE PRIVATE SECTOR MINISTRY OF MINES AND INDUSTRYGRANT AGREEMENT NO. H007-AF EMERGENCY INFRASTRUCTURE RECONSTRUCTION PROJECT
Producing Well
Shut-In Jurassic Well
Workover / Recompletion Candidate
Watered-Out Well
Figure 5-5 Structure Map of Jar Quduk Field
with Well Categories
7/6/2005 V-12 Gustavson Associates
PROMOTION OF OIL AND GAS PRODUCING ISLAMIC TRANSITIONAL STATE OFAFGHANISTANAREAS TO THE PRIVATE SECTOR MINISTRY OF MINES AND INDUSTRYGRANT AGREEMENT NO. H007-AF EMERGENCY INFRASTRUCTURE RECONSTRUCTION PROJECT
Well #56 – reportedly left with no down-hole completion during Soviet workover operations. Need to equip well with down-hole completion assembly, compatible with already installed equipment, circulate out kill fluid, and produce the well by flaring the initial gas
Well #58 – junk in hole, need to fish out
Well #64 – was producing 41,000 m3 prior to being killed, water production had increased
Well #67 – good candidate for workover, tested 114,000 m3 per day
Well #74 – never put on production, delivered from exploration department. Well issituated at top of structure but tested only 10,000 m3 per day.
Well #75 – was producing prior to being killed
1.2.1.4 Offset or Twin Wells
If any of the workovers proposed in the previous section are unsuccessful because ofreservoir damage due to invasion near the wellbore, then it may be prudent to drill atwin well directly offsetting the workover candidate. The anticipated production rate would be approximately the same in either case and is projected accordingly.
1.2.1.5 Jurassic Reservoirs
As described previously, Well #21 has been completed in the Jurassic and available forproduction. Well #21 is located at the crest of the structure but the level of the gaswater contact in the Jurassic is not known. However, we have assumed that two offsetting wells located slightly down on the structure could be deepened or drilled in order exploit the deeper gas reserves.
7/6/2005 V-13 Gustavson Associates

PROMOTION OF OIL AND GAS PRODUCING ISLAMIC TRANSITIONAL STATE OFAFGHANISTANAREAS TO THE PRIVATE SECTOR MINISTRY OF MINES AND INDUSTRYGRANT AGREEMENT NO. H007-AF EMERGENCY INFRASTRUCTURE RECONSTRUCTION PROJECT
1.2.1.6 Recommended Work Program and Future Production Projections
Table 5-3 Recommended Work Program, Jar Quduk Gas Field
Well No. FORECASTTITLE *
IMPROVEMENT EquipmentRequired
COMMENT
52, 54, 55, 60,61, 62, 68, 69,70, 73, 78, 80
Hautverian – AddCompression,
Compression Rehabilitationand/orinstallation of newcompressionequipment
Present gas production could be improved, with compression
52, 54, 55, 60, 61, 62, 68, 69,70, 73, 78, 80
Hautverian – Stimulate
Workover & stimulation of producing wells
Workover rig,acidizingequipment,Perforatingguns, cased hole logging equipment
Appears to be skin damage, may benefit from workover
56, 58, 64, 67, 74, 75
Hautverian – Workover & Reactivate 6 Wells
Workover & stimulation of non-producingwells
Workover rig,acidizingequipment,fishing tools, perforating guns, cased hole loggingequipment
Attempt to bring back into production those wells that were loaded with “kill fluid”
21 KugitanProduce 1 Well
Production of shut-in well completed in Jurassic
Gas sweetening plant
Assumes that sour gas can be economicallytreated to make pipeline quality gas
76, 77 KugitanDeepen 2 Wells
Deepening or drilling of Jurassicreservoirs
Drilling andworkover rig, cased hole tools and logging equipment,
Offsets to Well #21, requires detailed geologic mapping ofJurassic
* As labeled on Figure 5-6 and Table 5-4
Near-term gas production projections were made on the basis of continuation of existing production, and on the work program described in Table 5-4. The projections are for ten years and are shown graphically on Figures 5-6 and 5-7, and tabulated on Tables 5-
7/6/2005 V-14 Gustavson Associates

PROMOTION OF OIL AND GAS PRODUCING ISLAMIC TRANSITIONAL STATE OFAFGHANISTANAREAS TO THE PRIVATE SECTOR MINISTRY OF MINES AND INDUSTRYGRANT AGREEMENT NO. H007-AF EMERGENCY INFRASTRUCTURE RECONSTRUCTION PROJECT
4 and 5-5. Figure 5-6 shows the forecast on the basis of a total annual produced gasvolume in millions of normal cubic meters (MMCM), while Figure 5-7 shows the forecastaverage annual rate in millions of standard cubic feet per day (MMCF/D). Likewise, Table 5-4 shows annual forecast production volumes, while Table 5-5 shows average annual forecast rates.
The projections indicate that the risk-weighted annual incremental gas production couldreach 55 MMCFD in the first few years by adding compression, stimulation of existingproducers, conducting workovers and/or twinning non-producers, putting shut-in wellsinto production and deepening shut-in Hauterivian wells into deeper Jurassic reservoirs. By the tenth year, the annual incremental gas production would decrease to about 10 MMCF/D. The above projections do not consider the economics of implementing the above work program and assumes that all compression and stimulation work would be done immediately and not delayed or phased in.
The basis for these forecasts includes a review of average existing well production and reservoir pressures, a match of these conditions with the Darcy gas flow equations, and prediction of rates into the future based on the established Darcy flow equation and declining reservoir pressure as estimated by a simple material balance calculation.Water influx was ignored (current reservoir pressure was lower than would have been estimated based on reported gas initially in place and cumulative production assuming avolumetric reservoir, indicating that gas in place was over-estimated and/or water influxis not a significant impact on reservoir pressure). All potential additions to rate werechance weighted.
Jar Quduk ForecastAnnual Production
0.0
100.0
200.0
300.0
400.0
500.0
600.0
700.0
2004 2005 2006 2007 2008 2009 2010 2011 2012 2013
Year
Annu
al Ga
s, m
illion
nor
mal
cubi
c met
ers
Kugitan – Deepen 2 WellsKugitan – Produce 1 WellHauterivian – Workover and Reactivate 6 WellsHauterivian – StimulateHauterivian – Add CompressionHauterivian No changes
Figure 5-6 Jar Quduk Annual Production Forecast
7/6/2005 V-15 Gustavson Associates

PROMOTION OF OIL AND GAS PRODUCING ISLAMIC TRANSITIONAL STATE OFAFGHANISTANAREAS TO THE PRIVATE SECTOR MINISTRY OF MINES AND INDUSTRYGRANT AGREEMENT NO. H007-AF EMERGENCY INFRASTRUCTURE RECONSTRUCTION PROJECT
Jar Quduk ForecastAverage Daily Rate
0.0
10.0
20.0
30.0
40.0
50.0
60.0
70.0
80.0
2004 2005 2006 2007 2008 2009 2010 2011 2012 2013
Year
Aver
age A
nnua
l Gas
Rat
e, m
illion
cubi
c fe
et p
er d
ay
Kugitan – Deepen 2 WellsKugitan – Produce 1 WellHauterivian – Workover and Reactivate 6 WellsHauterivian – StimulateHauterivian – Add CompressionHauterivian No changes
Figure 5-7 Jar Quduk Average Annual Production Rate Forecast
7/6/2005 V-16 Gustavson Associates

PROMOTION OF OIL AND GAS PRODUCING ISLAMIC TRANSITIONAL STATE OFAFGHANISTANAREAS TO THE PRIVATE SECTOR MINISTRY OF MINES AND INDUSTRYGRANT AGREEMENT NO. H007-AF EMERGENCY INFRASTRUCTURE RECONSTRUCTION PROJECT
TABLE 5-4 JAR QUDUK ANNUAL PRODUCTION FORECASTS
Jar Quduk Annual Gas Production Forecast, millions normal cubic meters (MMCM) per yearHauterivian Kugitan
Chance of Achieving: 90% 50% 50% 80% 50%
YearHauterivian No
changes
Hauterivian –Add
CompressionHauterivian– Stimulate
Hauterivian– Workover
andReactivate
6 Wells
Kugitan–
Produce1 Well
Kugitan–
Deepen2 Wells TOTAL
2004 127.5 7.8 69.1 24.1 271.0 112.4 612.02005 120.3 6.9 57.0 30.3 227.6 218.2 660.42006 113.6 6.2 47.0 22.3 203.4 134.3 526.82007 107.2 5.7 38.7 16.2 182.5 79.6 429.82008 101.1 5.3 31.7 11.6 164.2 43.1 357.02009 95.4 5.1 25.8 8.0 148.2 18.6 301.22010 90.0 5.0 20.9 5.3 134.0 2.4 257.52011 84.9 4.9 16.7 3.2 121.5 (8.3) 222.82012 80.0 4.9 13.2 1.6 110.2 (15.1) 194.92013 75.5 5.0 10.3 0.4 100.2 (19.4) 171.9
10 yr Total 995.5 56.9 330.3 123.2 1,662.8 565.7 3,734.4
Jar Quduk Annual Gas Production Forecast, millions standard cubic feet (MMCF) per year Hauterivian Kugitan
Chance of Achieving: 90% 50% 50% 80% 50%
YearHauterivian No
changes
Hauterivian –Add
CompressionHauterivian– Stimulate
Hauterivian– Workover
andReactivate
6 Wells
Kugitan–
Produce1 Well
Kugitan–
Deepen2 Wells TOTAL
2004 4,749 292 2,576 899 10,097 4,187 22,7992005 4,483 258 2,125 1,130 8,478 8,128 24,6022006 4,232 231 1,751 831 7,576 5,004 19,6262007 3,993 212 1,440 605 6,798 2,966 16,0142008 3,768 199 1,179 432 6,119 1,604 13,3012009 3,554 190 961 299 5,521 694 11,2202010 3,353 185 777 197 4,994 88 9,5942011 3,162 183 623 120 4,525 (310) 8,3022012 2,982 184 491 61 4,107 (563) 7,2622013 2,812 186 382 14 3,735 (722) 6,406
10 yr Total 37,088.7 2,119.0 12,306.5 4,588.2 61,948.4 21,075.6 139,126.3
7/6/2005 V-17 Gustavson Associates
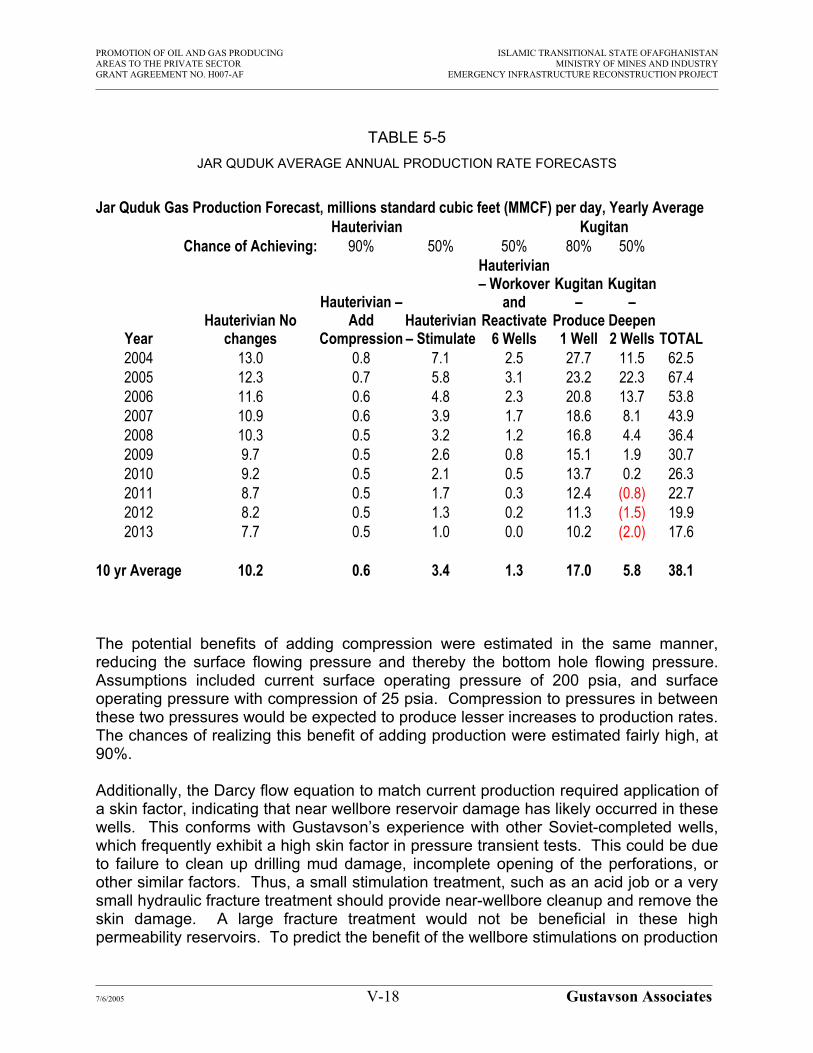
PROMOTION OF OIL AND GAS PRODUCING ISLAMIC TRANSITIONAL STATE OFAFGHANISTANAREAS TO THE PRIVATE SECTOR MINISTRY OF MINES AND INDUSTRYGRANT AGREEMENT NO. H007-AF EMERGENCY INFRASTRUCTURE RECONSTRUCTION PROJECT
TABLE 5-5 JAR QUDUK AVERAGE ANNUAL PRODUCTION RATE FORECASTS
Jar Quduk Gas Production Forecast, millions standard cubic feet (MMCF) per day, Yearly AverageHauterivian Kugitan
Chance of Achieving: 90% 50% 50% 80% 50%
YearHauterivian No
changes
Hauterivian –Add
CompressionHauterivian– Stimulate
Hauterivian– Workover
andReactivate
6 Wells
Kugitan–
Produce1 Well
Kugitan–
Deepen2 Wells TOTAL
2004 13.0 0.8 7.1 2.5 27.7 11.5 62.52005 12.3 0.7 5.8 3.1 23.2 22.3 67.42006 11.6 0.6 4.8 2.3 20.8 13.7 53.82007 10.9 0.6 3.9 1.7 18.6 8.1 43.92008 10.3 0.5 3.2 1.2 16.8 4.4 36.42009 9.7 0.5 2.6 0.8 15.1 1.9 30.72010 9.2 0.5 2.1 0.5 13.7 0.2 26.32011 8.7 0.5 1.7 0.3 12.4 (0.8) 22.72012 8.2 0.5 1.3 0.2 11.3 (1.5) 19.92013 7.7 0.5 1.0 0.0 10.2 (2.0) 17.6
10 yr Average 10.2 0.6 3.4 1.3 17.0 5.8 38.1
The potential benefits of adding compression were estimated in the same manner, reducing the surface flowing pressure and thereby the bottom hole flowing pressure. Assumptions included current surface operating pressure of 200 psia, and surface operating pressure with compression of 25 psia. Compression to pressures in betweenthese two pressures would be expected to produce lesser increases to production rates.The chances of realizing this benefit of adding production were estimated fairly high, at90%.
Additionally, the Darcy flow equation to match current production required application ofa skin factor, indicating that near wellbore reservoir damage has likely occurred in these wells. This conforms with Gustavson’s experience with other Soviet-completed wells, which frequently exhibit a high skin factor in pressure transient tests. This could be due to failure to clean up drilling mud damage, incomplete opening of the perforations, orother similar factors. Thus, a small stimulation treatment, such as an acid job or a very small hydraulic fracture treatment should provide near-wellbore cleanup and remove the skin damage. A large fracture treatment would not be beneficial in these high permeability reservoirs. To predict the benefit of the wellbore stimulations on production
7/6/2005 V-18 Gustavson Associates

PROMOTION OF OIL AND GAS PRODUCING ISLAMIC TRANSITIONAL STATE OFAFGHANISTANAREAS TO THE PRIVATE SECTOR MINISTRY OF MINES AND INDUSTRYGRANT AGREEMENT NO. H007-AF EMERGENCY INFRASTRUCTURE RECONSTRUCTION PROJECT
rate, the skin factor was reduced to zero in the Darcy flow equation, and the same procedure previously described was followed. Because of the considerable uncertaintyin the average well match, these projections were heavily risked with a 50% chance ofrealizing the benefit. Before such a work program is actually implemented, it is highlyrecommended that pressure buildup tests be conducted in all the wells considered fortreatment.
Projections were made for the six shut-in wells that are workover candidates based on a comparison of their average rates in 1986 and 1988 to the average rates of the currently producing wells in those same years. The six wells averaged 50 to 59% of the averagerate of the currently producing wells. A Darcy flow equation was then developed for the six wells by adjusting reservoir permeability until the rate under current pressure conditions was 55% of the current average rate of the currently producing wells, and the material balance calculations were made for the total of all producing wells and workover candidate wells. Again, because of the considerable uncertainty in these projections, they were heavily risked with a 50% chance of realizing the benefit. If the suggested workovers are not mechanically successful, it would be possible to drill twinwells instead.
Projections for Well 22, currently shut-in but capable of producing from the Jurassic, were based on matching available data regarding early well tests of the well.Productivity from two additional wells that are past Hauterivian producers offsetting Well 22 was assumed to be the same as from the tested well. Again, material balance calculations using the gas in place and initial reservoir pressure of the Jurassic were used to calculate future potential rates. Note that the three wells are predicted to interfere with one another; therefore, later rates predicted for the three wells are actuallylower than later rates for the single well, resulting in negative incremental production asshown on Tables 5-4 and 5-5 above. Production from Well 22 has a relatively high chance of being achieved, estimated at 80%, because the well has been demonstrated to be producible. Projections from the additional two wells are more uncertain, and estimated at a 50% chance of being achieved.
1.2.2. KHOJA GOGERDAQ
1.2.2.1 Overview
The Khoja Gogerdaq gas field is located approximately 23 kilometers east of the city of Sheberghan. The Khoja Gogerdaq structure was first explored in 1956 by a gravity survey conducted by Soviet scientists. In 1957, a 48 channel six-fold seismic survey was conducted with recording, processing and interpretation also conducted by Sovietspecialists. Exploratory drilling began in 1960. Well #1 was drilled in the crest of the structure and discovered gas in Cretaceous reservoirs. In all, five exploration and nine appraisal wells were drilled to delineate the field. The field was put on production in1967. Figure 5-8 is a geologic profile through the Khoja Gogerdaq gas field.
7/6/2005 V-19 Gustavson Associates

PROMOTION OF OIL AND GAS PRODUCING ISLAMIC TRANSITIONAL STATE OFAFGHANISTANAREAS TO THE PRIVATE SECTOR MINISTRY OF MINES AND INDUSTRYGRANT AGREEMENT NO. H007-AF EMERGENCY INFRASTRUCTURE RECONSTRUCTION PROJECT
The following table (Table 5-6) summarizes the wells drilled in the Khoja Gogerdaq field:
Table 5-6 Summary Of Wells Drilled In Khoja Gogerdaq Gas Field
Totalexplorationwells drilled
Result
gas -dry
Total Appraisalwells drilled
Result
gas -dry
Totaldevelopmentwells drilled
Grandtotal
5 4 1 9 9 - 38 52
Sandstone reservoirs deposited during the Hauterivian Stage of the Cretaceousaccounts for majority of the gas production from the field. The sandstone reservoirshave been described as silty and clayey-silt fine-grained sandstones. The sand fraction is reported to range from 74 percent in the lower section to 60 percent in the upper section. The remaining fractions are made up of silt and clay.
The Hauterivian reservoirs have a gross thickness that ranges from 140 to 160 meters, with an effective thickness in the range of 87 to 100 meters. Reservoir properties are asfollows:
Effective Porosity – 7 to 8 percent Permeability – 100 to 600 MD
During exploration, the absolute open flow potential for Well #2 was reported at 1,725 thousand m3 per day. The original gas-water interface was noted to be –1281 on thesouthwest side to –1247 on the northern side of the anticlinal structure.
There is a small percentage of gas production that comes from Aptian and Albian stage reservoirs. However, these reservoir rocks are thin, in the range of 5 to 15 meters. The initial potential reported from these zones were much lower at 120,000 m3 of gas perday.
An indeterminate number of wells penetrated the Jurassic and tested oil and gas in the middle of a 400 meter carbonate member of the Callovian-Oxfordian. Well #3 reportedly tested an absolute open flow of 1300 thousand m3 per day from a zone located at 2285 to 2309 meters in depth.
7/6/2005 V-20 Gustavson Associates

PROMOTION OF OIL AND GAS PRODUCING ISLAMIC TRANSITIONAREAS TO THE PRIVATE SECTOR MINISTRY OGRANT AGREEMENT NO. H007-AF EMERGENCY INFRASTRUCTURE
North S
Figure 5-8 Geologic profile of the Khoja Gogerdaq gas field in northern Afghanistan. Key: 1 - carbonate horizons with high permeability; 2 - carbonate horizons wpermeability; 3 - gas; 4 - formation water; 5 - dry horizon; 6 - gas-water interface absolute level; 7 - stratigraphic unconformity; 8 - angular unconformity.
7/6/2005 V-21 G
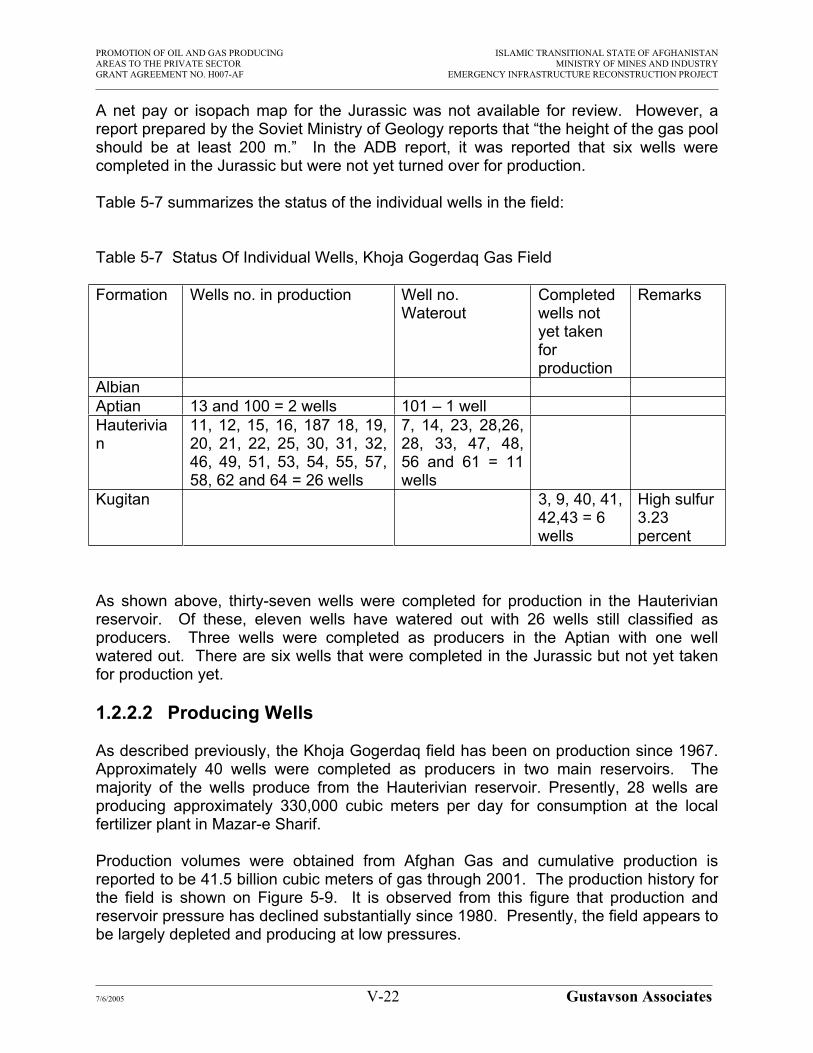
PROMOTION OF OIL AND GAS PRODUCING ISLAMIC TRANSITIONAL STATE OF AFGHANISTANAREAS TO THE PRIVATE SECTOR MINISTRY OF MINES AND INDUSTRYGRANT AGREEMENT NO. H007-AF EMERGENCY INFRASTRUCTURE RECONSTRUCTION PROJECT
A net pay or isopach map for the Jurassic was not available for review. However, a report prepared by the Soviet Ministry of Geology reports that “the height of the gas pool should be at least 200 m.” In the ADB report, it was reported that six wells were completed in the Jurassic but were not yet turned over for production.
Table 5-7 summarizes the status of the individual wells in the field:
Table 5-7 Status Of Individual Wells, Khoja Gogerdaq Gas Field
Formation Wells no. in production Well no. Waterout
Completedwells not yet taken forproduction
Remarks
AlbianAptian 13 and 100 = 2 wells 101 – 1 well Hauterivian
11, 12, 15, 16, 187 18, 19, 20, 21, 22, 25, 30, 31, 32, 46, 49, 51, 53, 54, 55, 57, 58, 62 and 64 = 26 wells
7, 14, 23, 28,26, 28, 33, 47, 48, 56 and 61 = 11 wells
Kugitan 3, 9, 40, 41, 42,43 = 6 wells
High sulfur3.23percent
As shown above, thirty-seven wells were completed for production in the Hauterivian reservoir. Of these, eleven wells have watered out with 26 wells still classified as producers. Three wells were completed as producers in the Aptian with one well watered out. There are six wells that were completed in the Jurassic but not yet takenfor production yet.
1.2.2.2 Producing Wells
As described previously, the Khoja Gogerdaq field has been on production since 1967. Approximately 40 wells were completed as producers in two main reservoirs. The majority of the wells produce from the Hauterivian reservoir. Presently, 28 wells are producing approximately 330,000 cubic meters per day for consumption at the local fertilizer plant in Mazar-e Sharif.
Production volumes were obtained from Afghan Gas and cumulative production is reported to be 41.5 billion cubic meters of gas through 2001. The production history for the field is shown on Figure 5-9. It is observed from this figure that production and reservoir pressure has declined substantially since 1980. Presently, the field appears to be largely depleted and producing at low pressures.
7/6/2005 V-22 Gustavson Associates

PROMOTION OF OIL AND GAS PRODUCING ISLAMIC TRANSITIONAL STATE OF AFGHANISTANAREAS TO THE PRIVATE SECTOR MINISTRY OF MINES AND INDUSTRYGRANT AGREEMENT NO. H007-AF EMERGENCY INFRASTRUCTURE RECONSTRUCTION PROJECT
Khoja Gogerdaq Production History
10
100
1000
10000
1960 1970 1980 1990 2000 2010 2020
Years
Gas
(MM
CM
)
0
50
100
150
200
250
300
Formation Pressure (atm
)
Volume MMCMforecastFormation Pressureforecast pressure
Figure 5-9 Khoja Gogerdaq Production History
Although compression was installed for the field in 1982, it is presently idle. Therefore, it is likely that present production rates can be improved through the activation ofcompression, or installation of new compression. In addition, certain wells producing from the Hauterivian reservoir have zones behind pipe in the Albian and Aptian that arepotential candidates for recompletion. However, because these shallower zones havebeen largely unproduced to date, their reservoir pressures are much higher than the Hauterivian reservoir pressure. Therefore, it is not recommended to commingle the three zones together, and the Hauterivian would need to be abandoned in a given well in order to recomplete that well in the Albian and/or Aptian. Because the Hauterivian still has significant rate and reserves to contribute at this time, such recompletions arenot likely to be favorable until a date in the future when the Hauterivian rates and reserves are further depleted. Alternatively, new wells could be drilled into the Albianand Aptian in order to exploit this potential.
7/6/2005 V-23 Gustavson Associates

PROMOTION OF OIL AND GAS PRODUCING ISLAMIC TRANSITIONAL STATE OF AFGHANISTANAREAS TO THE PRIVATE SECTOR MINISTRY OF MINES AND INDUSTRYGRANT AGREEMENT NO. H007-AF EMERGENCY INFRASTRUCTURE RECONSTRUCTION PROJECT
Considering the production performance in conjunction with the initial pressures and estimated gas in place for the Albian reservoir, it appears that one or some combination of the following may be true:
1. Gas-in-place is considerably smaller than reported 2. Cumulative production is higher than reported 3. Reservoir is severely damaged in the wells
We have assumed a combination of one and three as a basis for projections.
1.2.2.3 Non-Producing Wells
There are two main categories of non-producing wells at Khoja Gogerdaq:
1. Wells with high rates of water production – 11 in Hauterivian, 1 in Aptian 2. Wells completed in Jurassic but never produced
Regarding the “watered out” wells, specialized equipment and surveys are required in order to fully assess the problem and devise solutions if any. Given the high rate of depletion of the reservoir, recompletion in new or untapped zones is probably the bestchance for reestablishing gas production in these idle wells.
However, this potential can only be assessed through detailed formation evaluation andindividual well testing, something that has not yet been undertaken. Consequently, it is not possible to project any incremental gas production based on this hypothetical upsidepotential.
There appears to be good potential for increasing gas production by starting productionfrom six shut-in wells completed in the Jurassic reservoirs. It is likely that these wellswere just cased and not yet perforated but this is unknown.
The reserves in the Jurassic reservoirs were reported to be 10 billion cubic meters and Well #3 tested 1300 thousand cubic meters per day on an apparent absolute open flow test. However, the sulfur content is high in the range of three to six percent. The incremental gas production from tapping the Jurassic is projected and assumes that a sweetening and sulfur removal plant is installed to make pipeline quality gas.
1.2.2.4 Offset or Twin Wells
There appears to be good possibilities for increasing gas production through exploitation of the Albian and Aptian reservoirs. This could be accomplished via the drilling of new wells.
It will be necessary to conduct detailed geologic mapping of the individual Albian andAptian reservoirs in order to identify the best strategy (drilling or recompletion) forexploiting this potential.
7/6/2005 V-24 Gustavson Associates

PROMOTION OF OIL AND GAS PRODUCING ISLAMIC TRANSITIONAL STATE OF AFGHANISTANAREAS TO THE PRIVATE SECTOR MINISTRY OF MINES AND INDUSTRYGRANT AGREEMENT NO. H007-AF EMERGENCY INFRASTRUCTURE RECONSTRUCTION PROJECT
1.2.2.5 Recommended Work Program and Future Production Projections
The recommended work program for Khoja Gogerdaq is summarized on Table 5-8 below:
Table 5-8 - Recommended Work Program, Khoja Gogerdaq Gas Field Well No. FORECAST
TITLE *IMPROVEMENT Equipment
RequiredCOMMENT
11, 12, 15, 16, 187 18, 19, 20, 21, 22, 25, 30, 31, 32, 46, 49, 51, 53, 54, 55, 57, 58, 62, 64, 13, 100
Hautverian -- AddCompression,Aptian -- Add Compression
Compression Rehabilitationand/orinstallation of newcompressionequipment
Present gas production could be improved.
Various Hautverian – Stimulate,Aptian -- Stimulate
Workover & stimulation of Albian, Aptian and Hautrivianreservoirs
Workover rig,acidizingequipment,Perforatingguns, cased hole logging equipment
Based on calculations of skin damage, it appears that production can be possiblyimproved through workovers and stimulation
3, 9, 40, 41, 42,43
KugitanReactivate 6 Wells
Production of shut-in wells completed in Jurassic
Workover rig,cased hole tools and logging equipment, gas sweeteningplant
Assumes that sour gas can be economicallytreated to make pipeline quality gas
Five drillinglocations
Aptian -- New Wells,Albian -- New Wells
Drilling of Albian and/or Aptian reservoirs
Drilling andworkover rig, cased hole tools and logging equipment,
Assumes that Albian and Aptian production could be commingled into a single wellbore.Requires detailed geologic mappingof Albian and Aptian reservoirs to identify specific wells
* As labeled on Figure 5-10 and Table 5-9
7/6/2005 V-25 Gustavson Associates

PROMOTION OF OIL AND GAS PRODUCING ISLAMIC TRANSITIONAL STATE OF AFGHANISTANAREAS TO THE PRIVATE SECTOR MINISTRY OF MINES AND INDUSTRYGRANT AGREEMENT NO. H007-AF EMERGENCY INFRASTRUCTURE RECONSTRUCTION PROJECT
Near term gas production projections were made on the basis of the work program described in Table 5-8. The projections are for ten years and are shown graphically on Figures 5-10 and 5-11, and tabulated on Tables 5-9 and 5-10.
The projections indicate that the risk-weighted annual incremental gas production couldreach 24 MMCF/D in the first few years by adding compression, conducting workovers, putting shut-in wells into production and drilling new wells. By the tenth year, the annualincremental gas production would decrease to about 14 MMCF/D. The aboveprojections do not consider the economics of implementing the above work program and assumes that all compression and stimulation work would be done immediately and not delayed or phased in.
Khoja Gogerdaq ForecastAnnual Production
0.0
50.0
100.0
150.0
200.0
250.0
300.0
350.0
400.0
2004 2005 2006 2007 2008 2009 2010 2011 2012 2013
Year
Annu
al Ga
s, m
illion
nor
mal
cubi
c met
ers
Kugitan – Reactivate 6 WellsAlbian – New WellsAptian – New WellsAptian – StimulateAptian – Add CompressionAptian – No changesHauterivian – StimulateHauterivian – Add CompressionHauterivian No changes
Figure 5-10 Khoja Gogerdaq Annual Production Forecast
7/6/2005 V-26 Gustavson Associates

PROMOTION OF OIL AND GAS PRODUCING ISLAMIC TRANSITIONAL STATE OF AFGHANISTANAREAS TO THE PRIVATE SECTOR MINISTRY OF MINES AND INDUSTRYGRANT AGREEMENT NO. H007-AF EMERGENCY INFRASTRUCTURE RECONSTRUCTION PROJECT
Khoha Gogerdaq ForecastAverage Daily Rate
0.0
50.0
100.0
150.0
200.0
250.0
300.0
350.0
400.0
2004 2005 2006 2007 2008 2009 2010 2011 2012 2013
Year
Annu
al Ga
s, m
illion
nor
mal
cubi
c met
ers
Kugitan – Reactivate 6 WellsAlbian – New WellsAptian – New WellsAptian – StimulateAptian – Add CompressionAptian – No changesHauterivian – StimulateHauterivian – Add CompressionHauterivian No changes
Figure 5-11 Khoja Gogerdaq Average Annual Production Rate Forecast
7/6/2005 V-27 Gustavson Associates

PROMOTION OF OIL AND GAS PRODUCING ISLAMIC TRANSITAREAS TO THE PRIVATE SECTOR MINIGRANT AGREEMENT NO. H007-AF EMERGENCY INFRASTRUCTU
TABLE 5-9 KHOJA GOGERDAQ ANNUAL PRODUCTION FORECASTS
Khoja Gogerdaq Annual Gas Production Forecast, millions normal cubic meters (MMCM) per year Hauterivian Aptian Albian
Chance of Achieving: 90% 50% 90% 50% 50% 50%
YearHauterivian No
changes
Hauterivian –Add
CompressionHauterivian– Stimulate
Aptian – No
changesAptian – AddCompression
Aptian – Stimulate
Aptian – New
Wells
Albian – New
Wells
KR
2004 102.9 50.7 88.1 13.4 0.4 11.0 2.2 0.32005 98.6 49.3 78.5 13.0 0.4 9.9 26.2 3.42006 94.6 48.0 69.9 12.6 0.3 8.8 33.2 4.32007 90.7 46.8 62.2 12.2 0.3 7.8 22.1 2.92008 87.0 45.6 55.4 11.8 0.3 7.0 14.6 1.92009 83.4 44.5 49.3 11.5 0.3 6.2 9.4 1.22010 80.0 43.5 43.8 11.2 0.3 5.5 5.7 0.72011 76.7 42.5 38.9 10.8 0.3 4.9 3.2 0.42012 73.6 41.6 34.5 10.5 0.3 4.4 1.3 0.22013 70.6 40.7 30.6 10.2 0.3 3.9 0.0 0.0
10 yr Total 858.2 453.2 551.3 117.1 3.2 69.5 117.8 15.4
7/6/2005 V-28 G

PROMOTION OF OIL AND GAS PRODUCING ISLAMIC TRANSITAREAS TO THE PRIVATE SECTOR MINIGRANT AGREEMENT NO. H007-AF EMERGENCY INFRASTRUCTU
TABLE 5-9 (continued)
Khoja Gogerdaq Gas Production Forecast, millions standard cubic feet (MMCF) per day, Yearly AveraHauterivian Aptian Albian K
Chance of Achieving: 90% 50% 90% 50% 50% 50%
YearHauterivian No
changes
Hauterivian –Add
CompressionHauterivian– Stimulate
Aptian –No
changesAptian – AddCompression
Aptian – Stimulate
Aptian – New
Wells
Albian – New
Wells
KuRe
62004 3,832 1,890 3,283 498 14 411 81 112005 3,675 1,838 2,924 482 13 367 978 128 22006 3,524 1,788 2,604 468 13 328 1,236 162 22007 3,379 1,743 2,319 454 12 292 822 107 22008 3,241 1,699 2,065 441 12 261 542 71 22009 3,108 1,658 1,837 428 11 232 349 46 22010 2,981 1,619 1,633 416 11 207 214 28 22011 2,859 1,584 1,451 404 11 184 117 15 22012 2,742 1,549 1,286 392 10 163 49 6 22013 2,630 1,517 1,139 381 10 145 0 0 2
10 yr Total 31,970.7 16,884.5 20,540.0 4,364.3 117.5 2,589.5 4,389.1 573.4 20
7/6/2005 V-29 G

PROMOTION OF OIL AND GAS PRODUCING ISLAMIC TRANSITAREAS TO THE PRIVATE SECTOR MINIGRANT AGREEMENT NO. H007-AF EMERGENCY INFRASTRUCTU
TABLE 5-10 KHOJA GOGERDAQ AVERAGE ANNUAL PRODUCTION RATE FORECASTS
Khoja Gogerdaq Gas Production Forecast, millions standard cubic feet (MMCF) per day, Yearly AveraHauterivian Aptian Albian
Chance of Achieving: 90% 50% 90% 50% 50% 50%
YearHauterivian No
changes
Hauterivian –Add
CompressionHauterivian– Stimulate
Aptian –No
changesAptian – AddCompression
Aptian – Stimulate
Aptian –New
Wells
Albian –New
Wells
KR
2004 10.5 5.2 9.0 1.4 0.0 1.1 0.2 0.02005 10.1 5.0 8.0 1.3 0.0 1.0 2.7 0.32006 9.7 4.9 7.1 1.3 0.0 0.9 3.4 0.42007 9.3 4.8 6.4 1.2 0.0 0.8 2.3 0.32008 8.9 4.7 5.7 1.2 0.0 0.7 1.5 0.22009 8.5 4.5 5.0 1.2 0.0 0.6 1.0 0.12010 8.2 4.4 4.5 1.1 0.0 0.6 0.6 0.12011 7.8 4.3 4.0 1.1 0.0 0.5 0.3 0.02012 7.5 4.2 3.5 1.1 0.0 0.4 0.1 0.02013 7.2 4.2 3.1 1.0 0.0 0.4 0.0 0.0
10 yr Average 8.8 4.6 5.6 1.2 0.0 0.7 1.2 0.2
7/6/2005 V-30 G

PROMOTION OF OIL AND GAS PRODUCING ISLAMIC TRANSITIONAL STATE OF AFGHANISTANAREAS TO THE PRIVATE SECTOR MINISTRY OF MINES AND INDUSTRYGRANT AGREEMENT NO. H007-AF EMERGENCY INFRASTRUCTURE RECONSTRUCTION PROJECT
The forecasts were estimated using basically the same methodology as described above for Jar Quduk. Because the potential reserves for the Albian are so small, a separate calculation was not made for this calculation; rather, the new well forecast forthe Aptian was multiplied by the ratio of Albian to Aptian reserves to yield the Albian forecast.
1.2.3 Yatimtaq
1.2.3.1 Overview
The Yatimtaq Gas field is located 18 kilometers east of Sheberghan. A geologic profile of the Yatimtaq gas field is presented in Figure 5-12. The field was the site of a large blowout in 1963 when an appraisal well was drilled into a gas pool in the Jurassic. An estimated 23 billion cubic meters of gas was lost as the well burned for three years before the drilling of relief wells brought the field under control.
After some delay, new development of the field began in 1985. Approximately sevenwells were drilled but only one was brought into production. Well #21 produces about55,000 standard cubic meters per day from the Kugitan in the Jurassic and was broughton stream in December 2001. Based on various sources, there is an estimated 6 billion cubic meters of remaining reserves mainly in the Hauterivian.
1.2.3.2 Proposed Workover Program
Table 5-11 Recommended Work Program, Yatimtaq Gas Field
Well No. FORECASTTITLE *
IMPROVEMENT EquipmentRequired
COMMENT
21 Kugitan – UnrestrictedProduction
Well would be flowed full open choke and without any restriction
Uncertain – Sweetening plant, upgradedpipeline?
32, 38, 45, 47 Kugitan – Workover and Reactivate 4 Wells
Workover & stimulation of shut-in wells completed in Jurassic
Workover rig, cased hole tools and logging equipment
7/6/2005 V-31 Gustavson Associates

PROMOTION OF OIL AND GAS PRODUCING ISLAMIC TRANSITAREAS TO THE PRIVATE SECTOR MINIGRANT AGREEMENT NO. H007-AF EMERGENCY INFRASTRUCTU
North
Figure 5-12 Geologic profile of the Yatimtaq gas field in northern Afghanistan. Key: 1 - carbonate horizons with high permeability; 2 - carbonate horizons wpermeability; 3 - gas; 4 - formation water; 5 - dry horizon; 6 - gas-water interface absolute level; 7 - stratigraphic unconformity; 8 - angular unconformity.
7/6/2005 V-32 G

PROMOTION OF OIL AND GAS PRODUCING ISLAMIC TRANSITIONAL STATE OF AFGHANISTANAREAS TO THE PRIVATE SECTOR MINISTRY OF MINES AND INDUSTRYGRANT AGREEMENT NO. H007-AF EMERGENCY INFRASTRUCTURE RECONSTRUCTION PROJECT
There are four wells that are candidates for workover and completion. Two wells (Wells 32 and 45) were reportedly fully completed and perforated but were killed when the Soviet advisors left Afghanistan. The work required would be to circulate out the “kill fluid” and clean out the wellbore while flaring any initial gas.
The other two wells (Well #38 and #47) were reportedly abandoned without installation of a completion assembly. The work required would be install new down-hole equipment (tubing, packer, subs) and surface wellhead and valves then circulate out the “kill fluid” and clean-out the wellbore while flaring any initial gas.
Near term gas production projections were made on the basis of the work program described in Table 5-11 above. The projections are for ten years and are shown graphically on Figures 5-13 and 5-14, and tabulated on Tables 5-12 and 5-13.
The projections indicate that the risk-weighted annual incremental gas production couldreach 20 MMCF/D in the first few years by producing the existing Well 21 unrestricted, and conducting workovers to put shut-in wells into production. By the tenth year, the annual incremental gas production would decrease to about 0.1 MMCF/D. The above projections do not consider the economics of implementing the above work program and assumes that all work would be done immediately and not delayed or phased in.
Yatimtaq ForecastAnnual Production
0.0
50.0
100.0
150.0
200.0
250.0
2004 2005 2006 2007 2008 2009 2010 2011 2012 2013
Year
AnnualGas,millionnormalcubicme
Kugitan – Workover and Reactivate 4 WellsKugitan – Unrestricted ProductionKugitan No Changes
Figure 5-13 Yatimtaq Annual Production Forecast
7/6/2005 V-33 Gustavson Associates

PROMOTION OF OIL AND GAS PRODUCING ISLAMIC TRANSITIONAL STATE OF AFGHANISTANAREAS TO THE PRIVATE SECTOR MINISTRY OF MINES AND INDUSTRYGRANT AGREEMENT NO. H007-AF EMERGENCY INFRASTRUCTURE RECONSTRUCTION PROJECT
Yatimtaq ForecastAverage Daily Rate
0.0
5.0
10.0
15.0
20.0
25.0
2004 2005 2006 2007 2008 2009 2010 2011 2012 2013
Year
Aver
ageA
nnua
l Gas
Rate
, milli
on cu
bic
feet
per
day
Kugitan – Workover and Reactivate 4 WellsKugitan – Unrestricted ProductionKugitan No Changes
Figure 5-14 Yatimtaq Average Annual Production Rate Forecast
7/6/2005 V-34 Gustavson Associates
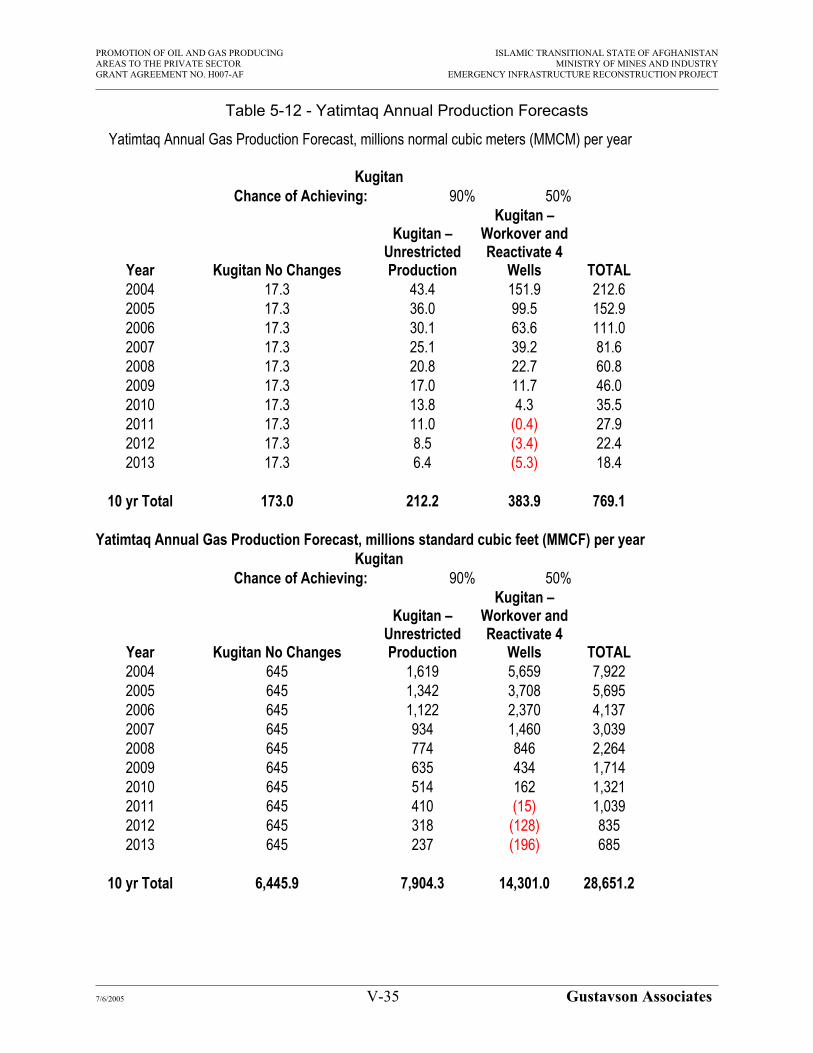
PROMOTION OF OIL AND GAS PRODUCING ISLAMIC TRANSITIONAL STATE OF AFGHANISTANAREAS TO THE PRIVATE SECTOR MINISTRY OF MINES AND INDUSTRYGRANT AGREEMENT NO. H007-AF EMERGENCY INFRASTRUCTURE RECONSTRUCTION PROJECT
Table 5-12 - Yatimtaq Annual Production Forecasts
Yatimtaq Annual Gas Production Forecast, millions normal cubic meters (MMCM) per year
KugitanChance of Achieving: 90% 50%
Year Kugitan No Changes
Kugitan – UnrestrictedProduction
Kugitan – Workover and Reactivate 4
Wells TOTAL2004 17.3 43.4 151.9 212.62005 17.3 36.0 99.5 152.92006 17.3 30.1 63.6 111.02007 17.3 25.1 39.2 81.62008 17.3 20.8 22.7 60.82009 17.3 17.0 11.7 46.02010 17.3 13.8 4.3 35.52011 17.3 11.0 (0.4) 27.92012 17.3 8.5 (3.4) 22.42013 17.3 6.4 (5.3) 18.4
10 yr Total 173.0 212.2 383.9 769.1
Yatimtaq Annual Gas Production Forecast, millions standard cubic feet (MMCF) per yearKugitan
Chance of Achieving: 90% 50%
Year Kugitan No Changes
Kugitan – UnrestrictedProduction
Kugitan – Workover and Reactivate 4
Wells TOTAL2004 645 1,619 5,659 7,9222005 645 1,342 3,708 5,6952006 645 1,122 2,370 4,1372007 645 934 1,460 3,0392008 645 774 846 2,2642009 645 635 434 1,7142010 645 514 162 1,3212011 645 410 (15) 1,0392012 645 318 (128) 8352013 645 237 (196) 685
10 yr Total 6,445.9 7,904.3 14,301.0 28,651.2
7/6/2005 V-35 Gustavson Associates

PROMOTION OF OIL AND GAS PRODUCING ISLAMIC TRANSITIONAL STATE OF AFGHANISTANAREAS TO THE PRIVATE SECTOR MINISTRY OF MINES AND INDUSTRYGRANT AGREEMENT NO. H007-AF EMERGENCY INFRASTRUCTURE RECONSTRUCTION PROJECT
TABLE 5-13
YATIMTAQ AVERAGE ANNUAL PRODUCTION RATE FORECASTS
Yatimtaq Gas Production Forecast, millions standard cubic feet (MMCF) per day, Yearly Average
KugitanChance of Achieving: 90% 50%
Year Kugitan No Changes
Kugitan – UnrestrictedProduction
Kugitan – Workover
andReactivate
4 Wells TOTAL2004 1.8 4.4 15.5 21.72005 1.8 3.7 10.2 15.62006 1.8 3.1 6.5 11.32007 1.8 2.6 4.0 8.32008 1.8 2.1 2.3 6.22009 1.8 1.7 1.2 4.72010 1.8 1.4 0.4 3.62011 1.8 1.1 (0.0) 2.82012 1.8 0.9 (0.3) 2.32013 1.8 0.6 (0.5) 1.9
10 yr Average 1.8 2.2 3.9 7.8
Again, the forecasts were estimated using the same basic concept as described abovefor Jar Quduk. These projections are considered less certain because so little data are available on the production from this field. The existing well appears to be choked backconsiderably, and could continue to produce at the current rate for the 10-year forecastperiod with no decline in rate. If this well could be produced unrestricted, considerable incremental rate could be achieved. Productivity of the four workover candidates wasassumed to be similar to that of Well 21.
7/6/2005 V-36 Gustavson Associates

PROMOTION OF OIL AND GAS PRODUCING ISLAMIC TRANSITIONAL STATE OF AFGHANISTANAREAS TO THE PRIVATE SECTOR MINISTRY OF MINES AND INDUSTRYGRANT AGREEMENT NO. H007-AF EMERGENCY INFRASTRUCTURE RECONSTRUCTION PROJECT
Total 3 Fields ForecastAnnual Production
0
200
400
600
800
1,000
1,200
1,400
2004 2005 2006 2007 2008 2009 2010 2011 2012 2013
Year
Annu
al Ga
s, m
illion
nor
mal
cubi
c met
ers
New WellsWorkoversStimulationsAdd Compression and Remove RestrictionsNo Changes
Figure 5-15 Total 3 Fields Annual Production Forecast
7/6/2005 V-37 Gustavson Associates

PROMOTION OF OIL AND GAS PRODUCING ISLAMIC TRANSITIONAL STATE OF AFGHANISTANAREAS TO THE PRIVATE SECTOR MINISTRY OF MINES AND INDUSTRYGRANT AGREEMENT NO. H007-AF EMERGENCY INFRASTRUCTURE RECONSTRUCTION PROJECT
Total 3 Fields ForecastAverage Daily Rate
0
20
40
60
80
100
120
140
2004 2005 2006 2007 2008 2009 2010 2011 2012 2013
Year
Aver
age A
nnua
l Gas
Rat
e, m
illion
cubi
c fe
et p
erda
y
WorkoversWorkoversStimulationsAdd Compression and Remove RestrictionsNo Changes
FIGURE 5-16 TOTAL 3 FIELDS AVERAGE ANNUAL PRODUCTION RATE FORECAST
7/6/2005 V-38 Gustavson Associates

PROMOTION OF OIL AND GAS PRODUCING ISLAMIC TRANSITIONAL STATE OF AFGHANISTANAREAS TO THE PRIVATE SECTOR MINISTRY OF MINES AND INDUSTRYGRANT AGREEMENT NO. H007-AF EMERGENCY INFRASTRUCTURE RECONSTRUCTION PROJECT
TABLE 5-14TOTAL 3 FIELDS ANNUAL PRODUCTION FORECASTS
Total 3 Fields Annual Gas Production Forecast, millions normal cubic meters (MMCM) peryear
YearNo
Changes
AddCompressionand Remove Restrictions Stimulations Workovers
NewWells TOTAL
2004 261.0 373.4 168.3 293.7 2.5 1,098.92005 249.2 320.2 145.4 406.3 29.7 1,150.82006 238.0 288.0 125.7 282.9 37.5 972.22007 227.4 260.4 108.7 196.8 24.9 818.22008 217.3 236.3 94.1 138.2 16.5 702.32009 207.6 215.2 81.3 98.3 10.6 613.02010 198.5 196.6 70.2 71.1 6.5 542.92011 189.8 180.1 60.6 52.8 3.6 486.82012 181.5 165.6 52.1 40.6 1.5 441.22013 173.6 152.6 44.7 32.4 0.0 403.3
10 yr Total 2,143.9 2,388.2 951.2 1,613.2 133.2 7,229.7
Total 3 Fields Annual Gas Production Forecast, millions standard cubic feet (MMCF) per year
YearNo
Changes
AddCompressionand Remove Restrictions Stimulations Workovers
NewWells TOTAL
2004 9,724 13,910 6,271 10,943 92 40,8472005 9,285 11,929 5,416 15,137 1,105 41,7672006 8,868 10,731 4,683 10,540 1,398 34,8222007 8,472 9,699 4,051 7,331 930 29,5532008 8,094 8,802 3,505 5,150 613 25,5502009 7,735 8,016 3,030 3,663 394 22,4442010 7,394 7,324 2,617 2,651 242 19,9852011 7,070 6,711 2,257 1,966 133 18,0052012 6,761 6,168 1,941 1,512 56 16,3822013 6,467 5,684 1,666 1,207 0 15,024
10 yr Total 79,869.5 88,973.6 35,435.9 60,099.7 4,962.5 264,378.8
7/6/2005 V-39 Gustavson Associates
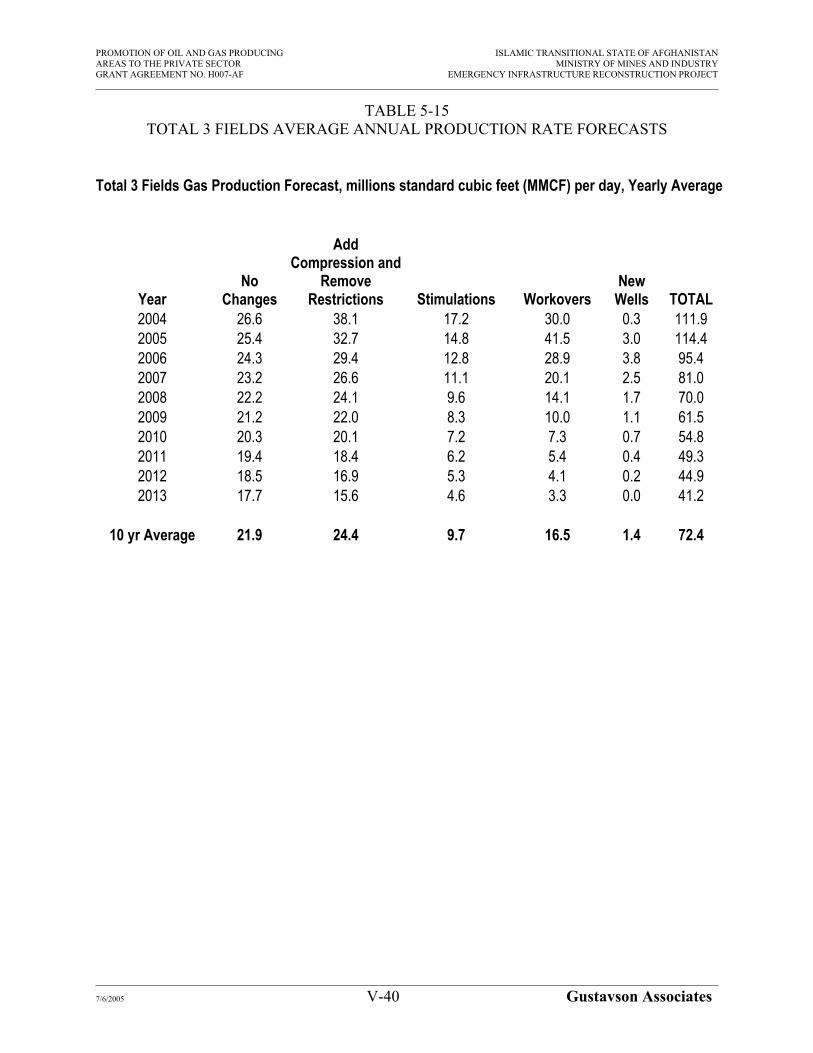
PROMOTION OF OIL AND GAS PRODUCING ISLAMIC TRANSITIONAL STATE OF AFGHANISTANAREAS TO THE PRIVATE SECTOR MINISTRY OF MINES AND INDUSTRYGRANT AGREEMENT NO. H007-AF EMERGENCY INFRASTRUCTURE RECONSTRUCTION PROJECT
TABLE 5-15TOTAL 3 FIELDS AVERAGE ANNUAL PRODUCTION RATE FORECASTS
Total 3 Fields Gas Production Forecast, millions standard cubic feet (MMCF) per day, Yearly Average
YearNo
Changes
AddCompression and
RemoveRestrictions Stimulations Workovers
NewWells TOTAL
2004 26.6 38.1 17.2 30.0 0.3 111.92005 25.4 32.7 14.8 41.5 3.0 114.42006 24.3 29.4 12.8 28.9 3.8 95.42007 23.2 26.6 11.1 20.1 2.5 81.02008 22.2 24.1 9.6 14.1 1.7 70.02009 21.2 22.0 8.3 10.0 1.1 61.52010 20.3 20.1 7.2 7.3 0.7 54.82011 19.4 18.4 6.2 5.4 0.4 49.32012 18.5 16.9 5.3 4.1 0.2 44.92013 17.7 15.6 4.6 3.3 0.0 41.2
10 yr Average 21.9 24.4 9.7 16.5 1.4 72.4
7/6/2005 V-40 Gustavson Associates

PROMOTION OF OIL AND GAS PRODUCING ISLAMIC TRANSITIONAL STATE OF AFGHANISTANAREAS TO THE PRIVATE SECTOR MINISTRY OF MINES AND INDUSTRYGRANT AGREEMENT NO. H007-AF EMERGENCY INFRASTRUCTURE RECONSTRUCTION PROJECT
1.3 Kashkari Oilfield
1.3.1 Overview
The Kashkari oil field is located south of the town of Sar-e Pul. The field is a relativelynarrow elongate anticline occupying an area of 12.5 square kilometers (Figure 5-17).Exploration activities were carried out during the 1970s, the field is reported to have been discovered in 1976.
The field has been estimated to have contained 19.6 million tons of oil in-place with 6.4million tons recoverable. The estimated quantities have been reported in several sources including a 1992 UN report and from documents provided by the Afghan Oil Company. Oil production from the field is believed to be limited, it is reported that oil production was interpreted in 1980 and thereafter only small quantities have been produced. At the time of this Report no production data was available.
Based on available documents it is believed that a total of 10 wells have been drilled onthe structure. All of these wells were drilled to the Hauterivian, six wells found oil saturated reservoir at the Albian, Hauterivian intervals, while four wells were wet.
The development scenarios presented in the following section assumes the existing wells will be abandoned and all production will come from newly drilled wells.
1.3.2 Recommended Drilling Program And Future Production Projections
1.3.2.1 Oil Production Tests
Ten total wells had been drilled at Kashkari Field as of the late 1970s. Oil production and drillstem tests were performed on these wells from the four productive horizons,Albian (Xia), Aptian (XIIa and XIIb), and Hauterivian (XIV). All these reservoirs are of Cretaceous age.
7/6/2005 V-41 Gustavson Associates

PROMOTION OF OIL AND GAS PRODUCING ISLAMIC TRANSITIONAL STATE OF AFGHANISTANAREAS TO THE PRIVATE SECTOR MINISTRY OF MINES AND INDUSTRYGRANT AGREEMENT NO. H007-AF EMERGENCY INFRASTRUCTURE RECONSTRUCTION PROJECT
Figure 5-17 Structure map and cross-section of the Kashkari oil field in northern Afghanistan
7/6/2005 V-42 Gustavson Associates

PROMOTION OF OIL AND GAS PRODUCING ISLAMIC TRANSITIONAL STATE OF AFGHANISTANAREAS TO THE PRIVATE SECTOR MINISTRY OF MINES AND INDUSTRYGRANT AGREEMENT NO. H007-AF EMERGENCY INFRASTRUCTURE RECONSTRUCTION PROJECT
The cross-sections of Kashkari Field indicate that the productive intervals at wells #5, #6 and # 7 are all below water/oil contact (WOC). Well #2 is also below WOC for most of the productive intervals except portions of horizon XIa. Production and drillstem tests demonstrated that Well #2 showed an uneconomic oil production rate of 0.35 m3/d fromhorizon XIa, while all other horizons in these four wells produced only water. The test results from various sources for six productive oil wells (#1, #3, #4, #8, #9 and #10) are summarized on Table 5-16 to Table 5-19 for each of four productive horizons. The average oil production rates for each horizon were 21.98, 66.68, 29.08 and 71.69 m3/d,respectively.
Table 5-16
Well #Test
interval Flow rateChoke
sizeInnitial
pressure Remarksm m3/d mm atm
1 1078-1094 48.2 6 121 Oil3 1063-1078 59 113.7 Oil4 N/A
1138-1176 4 ~ ~ Oil From Drillstem with p =65 atm1251-1276 27 128 Oil
9 956-971 11.3 4 119 Oil10 973-1024 4 ~ ~ Oil
8
Data of production tests and drillstem tests - horizon XIa, Kashkari Oilfield
Table 5-17
Well #Test
interval Flow rateChoke
sizeInnitial
pressure Remarksm m3/d mm atm
1 1140-1160 95.5 8 125.5 Oil3 1120-1144 59 6 128 Oil4 1046-1067 79.3 8 126.3 Oil8 1222-1247 14.4 8 124.9 Oil9 1010-1026 85.2 8 128.5 Oil10 N/A
Data of production tests and drillstem tests - horizon XIIa, Kashkari Oilfield
7/6/2005 V-43 Gustavson Associates

PROMOTION OF OIL AND GAS PRODUCING ISLAMIC TRANSITIONAL STATE OF AFGHANISTANAREAS TO THE PRIVATE SECTOR MINISTRY OF MINES AND INDUSTRYGRANT AGREEMENT NO. H007-AF EMERGENCY INFRASTRUCTURE RECONSTRUCTION PROJECT
Table 5-18
Well #Test
interval Flow rateChoke
sizeInnitial
pressure Remarksm m3/d mm atm
1 1172-1185 1.2 ~ 129.3 Oil3 1152-1168 1.4 ~ 125.5 Oil
1079-1100 74 8 129.5 Oil1079-1100 50.1 129.5 Oil
8 N/A9 N/A10 1104-1136 18.7 ~ ~ Oil From Drillstem with p =80 atm
4
Data of production tests and drillstem tests -horizon XIIb, Kashkari Oilfield
Table 5-19
Well #Test
interval Flow rateChoke
sizeInnitial
pressure Remarksm m3/d mm atm
1 1435.2-147 91.3 10 160 Oil1452-1493 34.2 8 163.4 Oil1452-1493 22.8 ~ 167.2 Oil
4 1330-1415 113.8 8 159.9 Oil8 1534-1574 62.4 ~ ~ Oil From Drillstem with p =60 atm
1292-1320 24.5 8 160.2 Oil1292-1320 124.5 128 Oil
10 1390-1439 100 6.7 164.6 Oil
Data of production tests and drillstem tests - horizon XIV, Kashkari Oilfield
3
9
1.3.2.2 Recommended Drilling Program
The four productive horizons (Xia, XIIa, XIIb, XIV) in Kashkari Field extend over a large vertical interval of about 400 meters. From an economic perspective, it may be unreasonable to produce oil from each horizon separately. The upper three horizonsare relatively close to each other and could likely be commingled. The deepest horizon,XIV, is farther from the other three reservoirs and would likely be most efficiently developed with wells completed in this horizon alone. Based on these assumptions and on well production capacity from each horizon, as shown on Table 5-20. Gustavson has categorized production wells into two types. One type of well produces oil from theupper three horizons (or as many of them as are present at a given location), that is,commingled production for three horizons. Another type of well produces oil just from the lowest horizon, XIV.
7/6/2005 V-44 Gustavson Associates

PROMOTION OF OIL AND GAS PRODUCING ISLAMIC TRANSITIONAL STATE OF AFGHANISTANAREAS TO THE PRIVATE SECTOR MINISTRY OF MINES AND INDUSTRYGRANT AGREEMENT NO. H007-AF EMERGENCY INFRASTRUCTURE RECONSTRUCTION PROJECT
Gustavson’s preliminary estimate of an efficient well spacing for development of this field is 80 acres per well, based on a general review of the available well production testand reservoir property data. Under a well spacing of 80 acres, 14 wells will produce from the single horizon XIV, while 24 wells will produce from the upper horizons, basedon their oil-bearing areas (see Table 5-21). The total number of production wells is 38. For a smaller well spacing of 40 acres, which may be desirable for rate acceleration purposes, twice as many wells would be required: 48 to produce the three upperhorizons, and 28 to produce the lower horizon, for a total well count of 76.
Table 5-20
XIa XIIa XIIb XIVAverage oil flow rate, m3/d 21.98 66.68 29.08 71.69Productivity index, m3/d/at 0.062 N/A 0.234 1.040
Average initial oil flow rate and productivity index
Table 5-21
XIa XIIa XIIb XIVDrainage area, km2 7.69 4.46 1.67 4.65
24 14 5 14Number of wells
Number of wells designed under a well spacing of 80 acres
On the other hand, XIIb has a smallest drainage area and only 5 wells will be drilled for this horizon with a well spacing of 80 acres. For XIa and XIIa, there are 14 and 24 wellsto be drilled, respectively. Hence, there are 5 wells to penetrate all three upper horizons, which are classified as type-1 wells. Subsequently, there are 9 wells to penetrate XIa and XIIa, classified as type-2 wells, and 10 wells to penetrate XIa, classified as type-3 wells. The wells penetrating XIV is classified as type-4. The classification of type ofwells is shown on Table 5-22.
7/6/2005 V-45 Gustavson Associates

PROMOTION OF OIL AND GAS PRODUCING ISLAMIC TRANSITIONAL STATE OF AFGHANISTANAREAS TO THE PRIVATE SECTOR MINISTRY OF MINES AND INDUSTRYGRANT AGREEMENT NO. H007-AF EMERGENCY INFRASTRUCTURE RECONSTRUCTION PROJECT
Table 5-22
Type 1 Type 2 Type 3 Type 4XIa, XIIa, XIIb XIa, XIIa XIa XIV
5 9 10 14Number of wells
Classification of wells
Penetrated horizons
Since the existing 6 oil producers were drilled twenty years ago, it is recommended todrill twin wells directly offsetting these wells if workovers on them are unsuccessful.
A basic drilling schedule is suggested as follows:1. First drill and complete 6 twin wells, in which 4 wells belong to type-1 and 2 wells
to type-4. 2. Drill and complete the rest wells belonging to type-1. 3. Drill and complete the wells belonging to type-2.
4. Drill and complete the rest wells belonging to type-4. 5. Drill and complete the wells belonging to type-3.
1.3.2.3 Oil Production Projection
Three cases were designed for drilling program, and oil production projection weremade on the basis of these cases. The details of drilling programs and projections for 25 years for each case are shown on Figures 5-18– 5-29, and tabulated on Tables 5-23 through 5-30.
Case 1 is planed to finish drilling and completing total 38 wells at the end of 2006; case2 in October, 2009; and case 3 in June, 2015. Figure 5-17 shows the forecast on average annual rate in standard barrels per day (STB/D) under drilling program of case1, while Figure 5-18 shows the forecast on a total annual produced oil volume in thousands of barrels (MSTB). Figure 5-19 shows the same forecast as Figure 5-18, butunder metric system in thousands of tons (MTON). Likewise, Table 5-23 provided the drilling program for this case and production forecast data, while Table 5-24 gave theresults under metric system. Similarly, Figures 5-21 – 5-23 and Tables 5-25 – 5-26 are for case 2, and Figures 5-24 – 5-26 and Tables 5-27 – 5-28 are for case 3, and Figures5-27 – 5-29 and Tables 5-29 – 5-30.
7/6/2005 V-46 Gustavson Associates
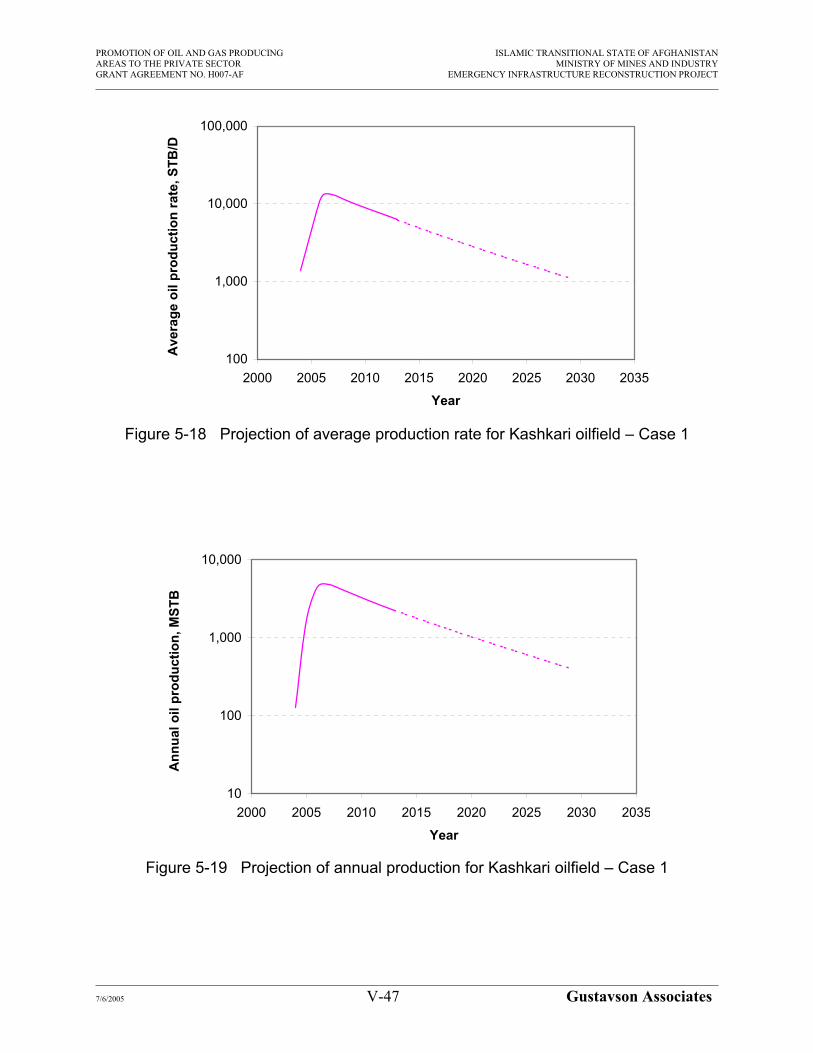
PROMOTION OF OIL AND GAS PRODUCING ISLAMIC TRANSITIONAL STATE OF AFGHANISTANAREAS TO THE PRIVATE SECTOR MINISTRY OF MINES AND INDUSTRYGRANT AGREEMENT NO. H007-AF EMERGENCY INFRASTRUCTURE RECONSTRUCTION PROJECT
100
1,000
10,000
100,000
2000 2005 2010 2015 2020 2025 2030 2035
Year
Ave
rage
oil
prod
uctio
n ra
te, S
TB/D
Figure 5-18 Projection of average production rate for Kashkari oilfield – Case 1
10
100
1,000
10,000
2000 2005 2010 2015 2020 2025 2030 2035
Year
Ann
ual o
il pr
oduc
tion,
MST
B
Figure 5-19 Projection of annual production for Kashkari oilfield – Case 1
7/6/2005 V-47 Gustavson Associates

PROMOTION OF OIL AND GAS PRODUCING ISLAMIC TRANSITIONAL STATE OF AFGHANISTANAREAS TO THE PRIVATE SECTOR MINISTRY OF MINES AND INDUSTRYGRANT AGREEMENT NO. H007-AF EMERGENCY INFRASTRUCTURE RECONSTRUCTION PROJECT
1
10
100
1,000
2000 2005 2010 2015 2020 2025 2030 2035
Year
Ann
ual o
il pr
oduc
tion,
MTO
N
Figure 5-20 Projection of annual production for Kashkari oilfield (metric unit) – Case 1
100
1,000
10,000
100,000
2000 2005 2010 2015 2020 2025 2030 2035
Year
Ave
rage
oil
prod
uctio
n ra
te, S
TB/D
Figure 5-21 Projection of average production rate for Kashkari oilfield – Case 2
7/6/2005 V-48 Gustavson Associates

PROMOTION OF OIL AND GAS PRODUCING ISLAMIC TRANSITIONAL STATE OF AFGHANISTANAREAS TO THE PRIVATE SECTOR MINISTRY OF MINES AND INDUSTRYGRANT AGREEMENT NO. H007-AF EMERGENCY INFRASTRUCTURE RECONSTRUCTION PROJECT
10
100
1,000
10,000
2000 2005 2010 2015 2020 2025 2030 2035
Year
Ann
ual o
il pr
oduc
tion,
MST
B
Figure 5-22 Projection of annual production for Kashkari oilfield – Case 2
1
10
100
1,000
2000 2005 2010 2015 2020 2025 2030 2035
Year
Ann
ual o
il pr
oduc
tion,
MTO
N
Figure 5-23 Projection of annual production for Kashkari oilfield (metric unit) – Case 2
7/6/2005 V-49 Gustavson Associates

PROMOTION OF OIL AND GAS PRODUCING ISLAMIC TRANSITIONAL STATE OF AFGHANISTANAREAS TO THE PRIVATE SECTOR MINISTRY OF MINES AND INDUSTRYGRANT AGREEMENT NO. H007-AF EMERGENCY INFRASTRUCTURE RECONSTRUCTION PROJECT
100
1,000
10,000
100,000
2000 2005 2010 2015 2020 2025 2030 2035
Year
Ave
rage
oil
prod
uctio
n ra
te, S
TB/D
Figure 5-24 Projection of average production rate for Kashkari oilfield – Case 3
10
100
1,000
10,000
2000 2005 2010 2015 2020 2025 2030 2035
Year
Ann
ual o
il pr
oduc
tion,
MST
B
Figure 5-25 Projection of annual production for Kashkari oilfield – Case 3
7/6/2005 V-50 Gustavson Associates

PROMOTION OF OIL AND GAS PRODUCING ISLAMIC TRANSITIONAL STATE OF AFGHANISTANAREAS TO THE PRIVATE SECTOR MINISTRY OF MINES AND INDUSTRYGRANT AGREEMENT NO. H007-AF EMERGENCY INFRASTRUCTURE RECONSTRUCTION PROJECT
1
10
100
1,000
2000 2005 2010 2015 2020 2025 2030 2035
Year
Ann
ual o
il pr
oduc
tion,
MTO
N
Figure 5-26 Projection of annual production for Kashkari oilfield (metric unit) – Case 3
100
1,000
10,000
100,000
2000 2005 2010 2015 2020 2025
Year
Ave
rage
oil
prod
uctio
n ra
te, S
TB/D
Figure 5-27 Projection of average production rate for Kashkari oilfield – Case 4
7/6/2005 V-51 Gustavson Associates

PROMOTION OF OIL AND GAS PRODUCING ISLAMIC TRANSITIONAL STATE OF AFGHANISTANAREAS TO THE PRIVATE SECTOR MINISTRY OF MINES AND INDUSTRYGRANT AGREEMENT NO. H007-AF EMERGENCY INFRASTRUCTURE RECONSTRUCTION PROJECT
10
100
1,000
10,000
2000 2005 2010 2015 2020 2025
Year
Ann
ual o
il pr
oduc
tion,
MST
B
Figure 5-28 Projection of annual production for Kashkari oilfield – Case 4
1
10
100
1,000
2000 2005 2010 2015 2020 2025
Year
Ann
ual o
il pr
oduc
tion,
MTO
N
Figure 5-29 Projection of annual production for Kashkari oilfield (metric unit) – Case 4
7/6/2005 V-52 Gustavson Associates

PROMOTION OF OIL AND GAS PRODUCING ISLAMIC TRANSITIONAL STATE OF AFGHANISTANAREAS TO THE PRIVATE SECTOR MINISTRY OF MINES AND INDUSTRYGRANT AGREEMENT NO. H007-AF EMERGENCY INFRASTRUCTURE RECONSTRUCTION PROJECT
TABLE 5-23 PRODUCTION PROJECTION FOR KASHKARI OILFIELD – CASE 1
YearNew wells
drilledTotal prod.
wellsTotal average
daily prod.Total averagemonthly prod.
Total annualprod. C
STB/D STB/MON MSTB
2004 3 3 1,366 41,892 1262005 11 14 4,377 133,211 15992006 24 38 12,293 374,160 44902007 0 38 13,182 401,230 48152008 0 38 11,528 350,863 42102009 0 38 10,116 307,897 36952010 0 38 8,906 271,059 32532011 0 38 7,863 239,324 28722012 0 38 6,961 211,863 25422013 0 38 6,177 188,001 22562014 0 38 5,493 167,185 20062015 0 38 4,894 148,963 17882016 0 38 4,368 132,958 15952017 0 38 3,905 118,859 14262018 0 38 3,496 106,406 12772019 0 38 3,134 95,379 11452020 0 38 2,812 85,593 10272021 0 38 2,526 76,892 9232022 0 38 2,272 69,141 8302023 0 38 2,044 62,225 7472024 0 38 1,841 56,045 6732025 0 38 1,660 50,515 6062026 0 38 1,497 45,562 5472027 0 38 1,351 41,119 4932028 0 38 1,220 37,131 4462029 0 38 1,102 33,547 403
7/6/2005 V-53 G
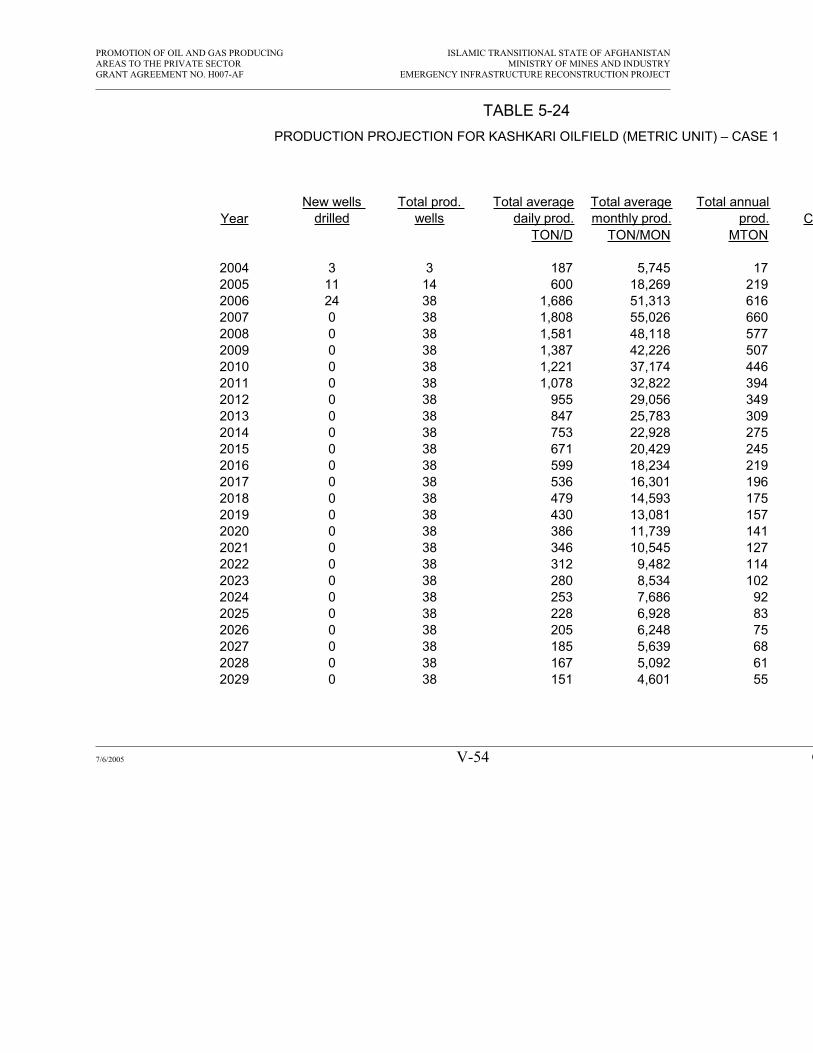
PROMOTION OF OIL AND GAS PRODUCING ISLAMIC TRANSITIONAL STATE OF AFGHANISTANAREAS TO THE PRIVATE SECTOR MINISTRY OF MINES AND INDUSTRYGRANT AGREEMENT NO. H007-AF EMERGENCY INFRASTRUCTURE RECONSTRUCTION PROJECT
TABLE 5-24 PRODUCTION PROJECTION FOR KASHKARI OILFIELD (METRIC UNIT) – CASE 1
YearNew wells
drilledTotal prod.
wellsTotal average
daily prod.Total averagemonthly prod.
Total annualprod. C
TON/D TON/MON MTON
2004 3 3 187 5,745 172005 11 14 600 18,269 2192006 24 38 1,686 51,313 6162007 0 38 1,808 55,026 6602008 0 38 1,581 48,118 5772009 0 38 1,387 42,226 5072010 0 38 1,221 37,174 4462011 0 38 1,078 32,822 3942012 0 38 955 29,056 3492013 0 38 847 25,783 3092014 0 38 753 22,928 2752015 0 38 671 20,429 2452016 0 38 599 18,234 2192017 0 38 536 16,301 1962018 0 38 479 14,593 1752019 0 38 430 13,081 1572020 0 38 386 11,739 1412021 0 38 346 10,545 1272022 0 38 312 9,482 1142023 0 38 280 8,534 1022024 0 38 253 7,686 922025 0 38 228 6,928 832026 0 38 205 6,248 752027 0 38 185 5,639 682028 0 38 167 5,092 612029 0 38 151 4,601 55
7/6/2005 V-54 G

PROMOTION OF OIL AND GAS PRODUCING ISLAMIC TRANSITIONAL STATE OF AFGHANISTANAREAS TO THE PRIVATE SECTOR MINISTRY OF MINES AND INDUSTRYGRANT AGREEMENT NO. H007-AF EMERGENCY INFRASTRUCTURE RECONSTRUCTION PROJECT
TABLE 5-25 PRODUCTION PROJECTION FOR KASHKARI OILFIELD – CASE 2
YearNew wells
drilledTotal prod.
wellsTotal average
daily prod.Total averagemonthly prod.
Total annualprod. Cum
STB/D STB/MON MSTB MM
2004 3 3 1,366 41,892 1262005 15 18 7,390 224,923 26992006 4 22 9,835 299,359 35922007 3 25 9,989 304,043 36492008 2 27 9,951 302,863 36342009 11 38 9,992 304,135 36502010 0 38 9,566 291,170 34942011 0 38 8,395 255,521 30662012 0 38 7,393 225,006 27002013 0 38 6,530 198,754 23852014 0 38 5,785 176,061 21132015 0 38 5,137 156,356 18762016 0 38 4,573 139,174 16702017 0 38 4,078 124,134 14902018 0 38 3,644 110,924 13312019 0 38 3,262 99,284 11912020 0 38 2,924 88,996 10682021 0 38 2,624 79,880 959 42022 0 38 2,358 71,784 861 42023 0 38 2,122 64,577 775 42024 0 38 1,911 58,151 698 42025 0 38 1,722 52,409 629 42026 0 38 1,553 47,272 567 42027 0 38 1,402 42,669 512 42028 0 38 1,266 38,540 462 42029 0 38 1,144 34,832 418 4
7/6/2005 V-55 G

PROMOTION OF OIL AND GAS PRODUCING ISLAMIC TRANSITIONAL STATE OF AFGHANISTANAREAS TO THE PRIVATE SECTOR MINISTRY OF MINES AND INDUSTRYGRANT AGREEMENT NO. H007-AF EMERGENCY INFRASTRUCTURE RECONSTRUCTION PROJECT
TABLE 5-26 PRODUCTION PROJECTION FOR KASHKARI OILFIELD (METRIC UNIT) – CASE 2
YearNew wells
drilledTotal prod.
wellsTotal average
daily prod.Total averagemonthly prod.
Total annual prod. Cum pr
TON/D TON/MON MTON MMT
2004 3 3 187 5,745 17 02005 15 18 1,013 30,847 370 02006 4 22 1,349 41,055 493 02007 3 25 1,370 41,697 500 12008 2 27 1,365 41,536 498 12009 11 38 1,370 41,710 501 22010 0 38 1,312 39,932 479 22011 0 38 1,151 35,043 421 32012 0 38 1,014 30,858 370 32013 0 38 896 27,258 327 32014 0 38 793 24,146 290 42015 0 38 705 21,443 257 42016 0 38 627 19,087 229 42017 0 38 559 17,024 204 42018 0 38 500 15,212 183 52019 0 38 447 13,616 163 52020 0 38 401 12,205 146 52021 0 38 360 10,955 131 52022 0 38 323 9,845 118 52023 0 38 291 8,856 106 52024 0 38 262 7,975 96 52025 0 38 236 7,188 86 52026 0 38 213 6,483 78 62027 0 38 192 5,852 70 62028 0 38 174 5,286 63 62029 0 38 157 4,777 57 6
7/6/2005 V-56 G

PROMOTION OF OIL AND GAS PRODUCING ISLAMIC TRANSITIONAL STATE OF AFGHANISTANAREAS TO THE PRIVATE SECTOR MINISTRY OF MINES AND INDUSTRYGRANT AGREEMENT NO. H007-AF EMERGENCY INFRASTRUCTURE RECONSTRUCTION PROJECT
TABLE 5-27 PRODUCTION PROJECTION FOR KASHKARI OILFIELD – CASE 3
YearNew wells
drilledTotal prod.
wellsTotal average
daily prod.Total averagemonthly prod.
Total annualprod. C
STB/D STB/MON MSTB
2004 3 3 1,366 41,892 1262005 6 9 4,077 124,083 14892006 4 13 5,705 173,655 20842007 4 17 6,997 212,965 25562008 2 19 7,372 224,378 26932009 2 21 7,272 221,348 26562010 2 23 7,239 220,338 26442011 2 25 7,256 220,840 26502012 2 27 7,309 222,459 26702013 2 29 7,363 224,100 26892014 6 35 7,255 220,813 26502015 3 38 7,090 215,799 25902016 0 38 6,332 192,738 23132017 0 38 5,583 169,942 20392018 0 38 4,940 150,353 18042019 0 38 4,384 133,430 16012020 0 38 3,901 118,738 14252021 0 38 3,480 105,924 12712022 0 38 3,111 94,700 11362023 0 38 2,787 84,831 10182024 0 38 2,501 76,123 9132025 0 38 2,248 68,414 8212026 0 38 2,023 61,570 7392027 0 38 1,823 55,479 6662028 0 38 1,644 50,044 6012029 0 38 1,485 45,185 542
7/6/2005 V-57 G
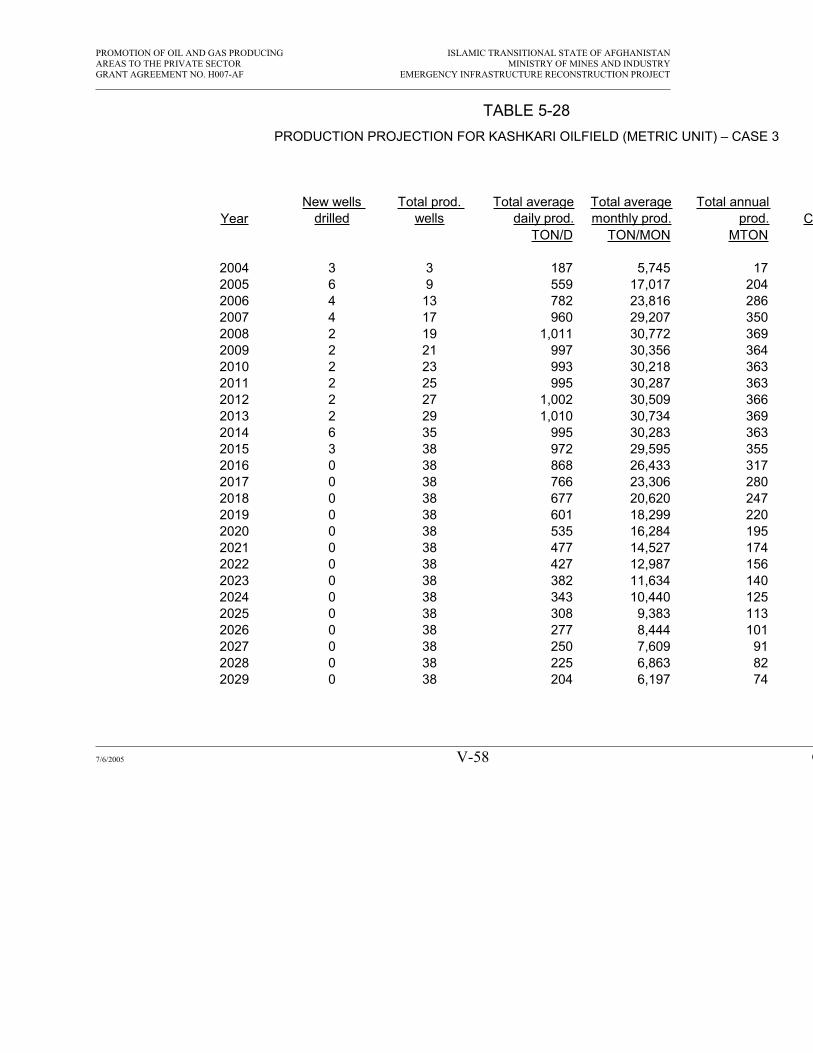
PROMOTION OF OIL AND GAS PRODUCING ISLAMIC TRANSITIONAL STATE OF AFGHANISTANAREAS TO THE PRIVATE SECTOR MINISTRY OF MINES AND INDUSTRYGRANT AGREEMENT NO. H007-AF EMERGENCY INFRASTRUCTURE RECONSTRUCTION PROJECT
TABLE 5-28 PRODUCTION PROJECTION FOR KASHKARI OILFIELD (METRIC UNIT) – CASE 3
YearNew wells
drilledTotal prod.
wellsTotal average
daily prod.Total averagemonthly prod.
Total annualprod. C
TON/D TON/MON MTON
2004 3 3 187 5,745 172005 6 9 559 17,017 2042006 4 13 782 23,816 2862007 4 17 960 29,207 3502008 2 19 1,011 30,772 3692009 2 21 997 30,356 3642010 2 23 993 30,218 3632011 2 25 995 30,287 3632012 2 27 1,002 30,509 3662013 2 29 1,010 30,734 3692014 6 35 995 30,283 3632015 3 38 972 29,595 3552016 0 38 868 26,433 3172017 0 38 766 23,306 2802018 0 38 677 20,620 2472019 0 38 601 18,299 2202020 0 38 535 16,284 1952021 0 38 477 14,527 1742022 0 38 427 12,987 1562023 0 38 382 11,634 1402024 0 38 343 10,440 1252025 0 38 308 9,383 1132026 0 38 277 8,444 1012027 0 38 250 7,609 912028 0 38 225 6,863 822029 0 38 204 6,197 74
7/6/2005 V-58 G

PROMOTION OF OIL AND GAS PRODUCING ISLAMIC TRANSITIONAL STATE OF AFGHANISTANAREAS TO THE PRIVATE SECTOR MINISTRY OF MINES AND INDUSTRYGRANT AGREEMENT NO. H007-AF EMERGENCY INFRASTRUCTURE RECONSTRUCTION PROJECT
TABLE 5-29 PRODUCTION PROJECTION FOR KASHKARI OILFIELD – CASE 4
YearNew wells
drilledTotal prod.
wellsTotal average
daily prod.Total averagemonthly prod.
Total annualprod.
STB/D STB/MON MSTB
2004 3 3 1,273 39,027 1172005 11 14 5,490 167,104 20052006 10 24 10,008 304,601 36552007 3 27 9,996 304,257 36512008 5 32 9,976 303,643 36442009 6 38 9,994 304,187 36502010 5 43 10,008 304,605 36552011 5 48 9,982 303,815 36462012 5 53 10,007 304,584 36552013 6 59 10,008 304,599 36552014 17 76 9,859 300,083 36012015 0 76 7,915 240,892 28912016 0 76 6,229 189,604 22752017 0 76 4,969 151,240 18152018 0 76 4,005 121,913 14632019 0 76 3,255 99,075 11892020 0 76 2,662 81,020 972
7/6/2005 V-59 G

PROMOTION OF OIL AND GAS PRODUCING ISLAMIC TRANSITIONAL STATE OF AFGHANISTANAREAS TO THE PRIVATE SECTOR MINISTRY OF MINES AND INDUSTRYGRANT AGREEMENT NO. H007-AF EMERGENCY INFRASTRUCTURE RECONSTRUCTION PROJECT
TABLE 5-30 PRODUCTION PROJECTION FOR KASHKARI OILFIELD (METRIC UNIT) – CASE
YearNew wells
drilledTotal prod.
wellsTotal average
daily prod.Total averagemonthly prod.
Total annuaprod
TON/D TON/MON MTON
2004 3 3 175 5,352 162005 11 14 753 22,917 2752006 10 24 1,372 41,774 5012007 3 27 1,371 41,727 5012008 5 32 1,368 41,642 5002009 6 38 1,371 41,717 5012010 5 43 1,373 41,774 5012011 5 48 1,369 41,666 5002012 5 53 1,372 41,771 5012013 6 59 1,372 41,774 5012014 17 76 1,352 41,154 4942015 0 76 1,085 33,037 3962016 0 76 854 26,003 3122017 0 76 681 20,742 2492018 0 76 549 16,719 2012019 0 76 446 13,587 1632020 0 76 365 11,111 133
7/6/2005 V-60 G

PROMOTION OF OIL AND GAS PRODUCING ISLAMIC TRANSITIONAL STATE OF AFGHANISTANAREAS TO THE PRIVATE SECTOR MINISTRY OF MINES AND INDUSTRYGRANT AGREEMENT NO. H007-AF EMERGENCY INFRASTRUCTURE RECONSTRUCTION PROJECT
The projection for case 1 indicates that Kashkari oilfield can reach a peak production rate of 13,182 STB/D in 2007 and then decline rapidly afterward. By 2013 — after ten year production, the oil production rate decreases to 6,177 STB/D. The cumulative oil production reaches 29.86 MMSTB (4.09 MMTON) at the end of 2013. For case 2, a peak production rate of around 10,000 STB/D can be reached in 2006 and maintained basically for 5 years for a stable production, up to 2011. The oil production rate decreases to 6,530 STB/D by 2013. The cumulative oil production reaches 28.99 MMSTB (3.98 MMTON) at the end of 2013. For case 3, a peak production rate of over 7,300 STB/D can be reached in 2008 and maintained 7 years so that a stable production can be lasted up to 2015. The cumulative oil production reaches 27.49 MMSTB (3.77 MMTON) at the end of 2015.
The basis for these forecasts is all the available data that we can acquire from various sources. As discussed before, the only production data acquired were the initialproduction test data, no production history data were available. Other important information acquired are the estimated original oil in place and recovery factors for each of the reservoirs. Based on theses information, well performance for each of thereservoirs were projected by assuming an exponential decline, which is considered to be a reasonable assumption by this consultant under current availability of data. With the average initial oil flow rates from tests of existing wells, the recoverable reserves under certain well spacing for each reservoir were matched by adjusting the declineparameter which describes production performance. After the decline parameters were estimated, predictions of production rate for various types of wells were made.
1.3.3 Summary
The three production scenarios presented earlier, a rapid exploitation (Case 1), a 10,000 BOPD refinery feed (Case 2), and 7,200 BOPD refinery feed (Case 3) are discussed and summarized below.
Case 1 is a production scenario which shows a strong peak and a relatively rapiddecline for natural reasons. Seen strictly from the standpoint of maximizing earlyincome to Afghanistan this case gets the oil out fast (good economics for the operatorand for the Treasury) and is tied to an export market, only. It is unsuitable as a refineryfeed source, because of the production variations.
Case 2 was prepared to provide refinery feedstock at a constant rate for 15 years (the standard term for refinery investments according to Carlos) and allowed addition of less credible reserves from other, smaller oil fields. The rate was around 10,000 BOPD,but could only be assured from Kashkari, alone for 7-8 year. Increasing amounts would need to be proved up and developed from the other, smaller fields thereafter.
Case 3 was studied in order to provide a high-confidence level estimate of Kashkariproduction capacity on a stand-alone basis, using oil field standards and aimed at providing refinery feed stock at constant levels. Under that case the oil field producedconstantly at 7,200 BOPD but would run out after 10 years."
7/6/2005 V-61 Gustavson Associates

PROMOTION OF OIL AND GAS PRODUCING ISLAMIC TRANSITIONAL STATE OF AFGHANISTANAREAS TO THE PRIVATE SECTOR MINISTRY OF MINES AND INDUSTRYGRANT AGREEMENT NO. H007-AF EMERGENCY INFRASTRUCTURE RECONSTRUCTION PROJECT
At the time this section was studied it was found to be of interest also to study a fourth approach, (Case 4), which would downplay oil field economics, but provide a constant-level, 15-year refinery feed from Kashkari. In other words, the refinery might accept ahigher cost of the produced oil in return for refinery investment protection.
Case 4 drills a larger number of wells (on reduced drainage spacing) than in the above three cases and continues at a plateau (to be more accurately determined) through Year 15. Thereafter, the field will rapidly decline. This causes an economic reduction to the operator who drills more wells than really needed, but the approach is not unknownto the oil industry and may still have an attractive return.
1.3.4 Analysis for Allocation of Hydrocarbon Resources into Concession Blocks
The contractual requirements of this section of the report are covered in their entirety in Ch. VI sections 1.2.1 through 2.1.4.3 of this report.
7/6/2005 V-62 Gustavson Associates

PROMOTION OF OIL AND GAS PRODUCING ISLAMIC TRANSITIONAL STATE OFAFGHANISTANAREAS TO THE PRIVATE SECTOR MINISTRY OF MINES AND INDUSTRYGRANT AGREEMENT NO. H007-AF EMERGENCY INFRASTRUCTURE RECONSTRUCTION PROJECT
VI. PHASE TWO- PROMOTION OF FIRST BID ROUND BLOCKS
1. Preparation Of Promotional Materials (Second Interim Report, 2-1 Through 2-19 And Appendix)
1.1 Introduction
1.1.1 Purpose
The purpose of this Section is to provide to the Ministry of Mines and Industry a draft promotional program for the promotion of oil and gas producing areas to the privatesector.
This section summarizes Gustavson Associates’ activities related to the development of a draft promotional program for the offering of oil and gas producing areas to the privatesector. Included in this section are the First Bid Round Block for each of the potential areas of northern Afghanistan that this Consultant believes can be promoted to the private sector for exploration and development of the country’s remaining oil and gas reserves and its undeveloped resources. Also included is a draft technical report to be used during the promotion and a draft digital database in DVD format that is intended for sale to interested and qualified companies for their use developing their strategiesduring the Bid Round.
The draft promotional program includes the Technical and Commercial conditionsassociated with the promotional effort as well as a methodology for the promotion. The specific Technical and Commercial conditions and promotion timetable are dependent on the timely enactment of a Hydrocarbons Law. At the present time, a Draft Hydrocarbons Law (2004), a Draft Hydrocarbons Regulations (2004) document and a Draft Model Production Sharing Agreement (2004) document have been under consideration but the final language has not yet been determined and the law has not yet been enacted.
The proposed timetable for the promotion is also a function of the time frame in whichthe Hydrocarbons Law is enacted. Specific dates for the First Bid Round have not been set at the present time. As a result, a detailed timetable for the promotional events cannot be developed, and is not included in this final report.
Therefore, this section of the final report focuses on the products that have beendeveloped by Gustavson Associates and which are recommended for inclusion in the technical promotional package as well as a draft version of a Letter from the Ministerand a draft Announcement of the Bid Round.
7/6/2005 VI-1 Gustavson Associates

PROMOTION OF OIL AND GAS PRODUCING ISLAMIC TRANSITIONAL STATE OFAFGHANISTANAREAS TO THE PRIVATE SECTOR MINISTRY OF MINES AND INDUSTRYGRANT AGREEMENT NO. H007-AF EMERGENCY INFRASTRUCTURE RECONSTRUCTION PROJECT
1.1.2 Authority
This Section has been generated under the authority of the CONTRACT FORCONSULTANTS’ SERVICES FOR PROMOTION OF OIL AND GAS PRODUCINGAREAS TO THE PRIVATE SECTOR between the Ministry of Mines and Industry,Islamic Transitional State of Afghanistan, and Gustavson Associates Inc. (USA), dated February 28, 2004 (Emergency Infrastructure Reconstruction Project Grant AgreementNo. H007-AF).
1.1.3 Organization Of Chapter VI
This Section is organized into 2 parts and a number of appendices. In addition, a set of DVD’s is included with the Section. These DVD’s contain files for all of the technicalmaterials that are recommended for inclusion in the Digital Data Package that will beavailable for purchase by interested and qualified bidders. Part 1 focuses on Phase II ofthe Work Program, which includes the development of the promotional package for the First Bid Round.
The appendices accompanying this section include the various elements of the promotional package and are as follows:
Appendix J: Draft Invitation Letter from MinisterAppendix K: Draft Announcement of Bid Round Appendix L: Draft Color Promotional Brochure Appendix M:Draft Promotional Package Technical Report
1.2 Work Program - Phase II (Promotional Program)
1.2.1 Methodology For Defining First Bid Round Blocks
Gustavson Associates, as part of its contract with the Ministry of Mines and Industry (MMI) of the Islamic Transitional State of Afghanistan (Grant Agreement # H007-AF), has developed a map that shows the locations of 11 proposed blocks to be offered during Afghanistan’s First Promotional Bid Round. The outlines of the blocks are shown in Figure 7-1 and on the accompanying maps entitled, “North Afghanistan Basin with First Bid Round Blocks, Oil and Gas Fields, and Prospects” which are included asPlates 5a and 5b in the promotional technical report entitled, “Northern Afghanistan Oiland Gas Investment Opportunities, First Promotional Round, Islamic Transitional Stateof Afghanistan, Ministry of Mines and Industry”.
7/6/2005 VI-2 Gustavson Associates

PROMOTION OF OIL AND GAS PRODUCING ISLAMIC TRANSITIONAL STATE OFAFGHANISTANAREAS TO THE PRIVATE SECTOR MINISTRY OF MINES AND INDUSTRYGRANT AGREEMENT NO. H007-AF EMERGENCY INFRASTRUCTURE RECONSTRUCTION PROJECT
Figure 6-1 Map of North Afghanistan Basin with proposed First Promotional Bid Round blocks and oil and gas fields
7/6/2005 VI-3 Gustavson Associates

PROMOTION OF OIL AND GAS PRODUCING ISLAMIC TRANSITIONAL STATE OFAFGHANISTANAREAS TO THE PRIVATE SECTOR MINISTRY OF MINES AND INDUSTRYGRANT AGREEMENT NO. H007-AF EMERGENCY INFRASTRUCTURE RECONSTRUCTION PROJECT
1.2.2 Geologic Basis for Block Designations
The 11 proposed blocks were defined on the basis of regional geology of the North Afghanistan basin as presented in the Soviet-era 1991 Tectonic Map (in Russian) that was obtained from the MMI. This map was a very detailed regional synthesis of their oil and gas exploration and development efforts over a span of more than thirty years. The 1991 tectonic map divides the western North Afghanistan basin into a series of tectonic provinces, each bounded by major fault systems. The map also shows the locations ofthe major discovered oil and gas fields, both those that were or are still being producedas well as fields which were discovered but never produced. In addition, prospectivestructures, either undrilled or only partially evaluated, are also shown within the variousstructural blocks.
Investment opportunities in the North Afghanistan basin include: (1) rehabilitation of oldproducing fields, (2) field development and production of as yet non-producing fields,and (3) both close-in and more regional exploration with varying risk profiles. Theseopportunities vary from block to block. Some blocks are more suited to developmentactivities at existing fields with only a few exploration opportunities. Other blocks havesomewhat more limited development opportunities but offer large potential forundiscovered resources. Four of the blocks are entirely exploratory in nature with no established production.
In defining the shapes and sizes of the 11 proposed blocks, Gustavson Associatesfollowed a methodology that incorporated three main criteria. Where possible, eachblock had to contain at least one development opportunity associated with a known oil or gas field. Such is the case for seven of the 11 blocks. Secondly, each block had to contain some degree of upside potential for new exploration for undiscovered resources, based largely on prospective structures shown on the 1991 Soviet tectonicmap. Thirdly, fields included in a given block had to be related by a combination of geological similarity and geographic proximity to each other. Finally, an attempt wasmade to equitably divide up the known oil and reserves in such a way that the blockswould offer economic incentives to a variety of potential industry contractors with varying interests and risk profiles. This mix includes the four blocks that have been identified exclusively for frontier exploration opportunities.
The accompanying block maps include a geo-referenced topographic base with a semi-transparent overlay of the geology from the 1991 Russian tectonic map. The methodologies and cartographic issues associated with geo-referencing this map are discussed in a following section of this report that accompanies the map. It isGustavson’s firm opinion that the map, including the geological features and wells, isaccurately geo-referenced with respect to latitude and longitude.
1.2.2.1 Graticulation and Definition of Block Boundaries
Plates 5a and 5b of this Final Report show the 5-minute by 5-minute graticular net that has been superimposed on the map for the purpose of locating features and defining
7/6/2005 VI-4 Gustavson Associates

PROMOTION OF OIL AND GAS PRODUCING ISLAMIC TRANSITIONAL STATE OFAFGHANISTANAREAS TO THE PRIVATE SECTOR MINISTRY OF MINES AND INDUSTRYGRANT AGREEMENT NO. H007-AF EMERGENCY INFRASTRUCTURE RECONSTRUCTION PROJECT
First Bid Round Block Boundaries. Following the definition of the eleven individualblocks on the basis of geologic boundaries, the proposed block outlines were drawn to the best fit of the geology using whole graticule divisions. The resulting block outlinesare shown on Plates 5a and 5b for comparison with the regional geologic boundaries. The eleven blocks are described briefly below as to their geologic and cartographiccriteria. The approximate areal extent of each block in square kilometers is listed using an average 5’x5’graticular area of 68.9262 km2.
1.2.3 First Bid Round Block Descriptions
1.2.3.1 Yatimtaq-Khoja Gogerdaq Block
The proposed Yatimtaq-Khoja Gogerdaq Block is centered on the Yatimtaq and KhojaGogerdaq gas fields that are closely related areally and geologically. A third, much smaller gas field, Khoja Bolan, is located in the southern part of the block. Thisproposed block covers the eastern portion of a major structural ridge that extends west-northwestward from the North Afghan High which underlies the southern portions of this proposed bid block and which extends to the east. This block has potential for bothHauterivian (Lower Cretaceous) sandstone reservoirs and the deeper Jurassic reefs.
The three gas fields together have P50 probabilistic remaining gas reserves of 921 billion cubic feet (BCF) or 26 billion cubic meters (BCM) of gas. The vast majority of those reserves are in Yatimtaq and Khoja Gogerdaq fields. This proposed block also contains a few small undrilled structures and may contain upside potential for deep Jurassic reef exploration along the northwestern boundary of the North Afghan High. Insummary, this block is primarily suited to the rehabilitation and development of remaining reserves in the two large fields with some additional delineation drilling in the Khoja Bolan gas field.
It is recommended that the drilling of one exploration well outside the limits of the existing fields be required in this block in addition to the field development. The proposed drilling schedule would include at least 3 new development wells (1 each inYatimtaq, Khoja Gogerdaq and Khoja Bolan), the first of which is to be drilled within thefirst 2 years, and the remaining two wells within the first 3 years of the contract. The required exploration well would have to be drilled within the first 4 years of the contract.
The proposed Yatimtaq-Khoja Gogerdaq Block encompasses approximately 1172 km2
and 17 full graticular sections.
1.2.3.2 Jar Quduk Block
The proposed Jar Quduk Block is centered on Jar Quduk gas field. It also includes Shakarak gas field, a small accumulation just to the north of Jar Quduk and south of the city of Sheberghan. Several undrilled small structures also fall within the boundaries ofthis proposed bid block. Two large structures are located to the west and south of JarQuduk field. This proposed block covers the central portion of the same major
7/6/2005 VI-5 Gustavson Associates

PROMOTION OF OIL AND GAS PRODUCING ISLAMIC TRANSITIONAL STATE OFAFGHANISTANAREAS TO THE PRIVATE SECTOR MINISTRY OF MINES AND INDUSTRYGRANT AGREEMENT NO. H007-AF EMERGENCY INFRASTRUCTURE RECONSTRUCTION PROJECT
structural ridge that underlies the Yatimtaq-Khoja Gogerdaq block and which extendswest-northwestward from the North Afghan High which is located to the east. The bid block boundary separating the two blocks follows a structural sag or syncline thatseparates the two producing trends. This block has potential for both Hauterivian(Lower Cretaceous) sandstone reservoirs and the deeper Jurassic reefs.
Jar Quduk gas field has P50 probabilistic remaining gas reserves of 345 BCF (10 BCM).In summary, this block is primarily suited to the rehabilitation and development ofremaining reserves in Jar Quduk field but may also have upside potential forundiscovered gas resources on undrilled structures within the block.
It is recommended that the drilling of a minimum of one exploration well outside thelimits of the existing fields be required in this block in addition to the field development.The proposed drilling schedule would include at least 2 new development wells (1 each in Jar Quduk and Shakarak), the first of which is to be drilled within the first 2 years, andthe second within the first 3 years of the contract. The required exploration well wouldhave to be drilled within the first 4 years of the contract. The proposed Jar Quduk Block encompasses approximately 896 km2 and 13 full graticular sections.
1.2.3.3 Juma-Bashikurd Block
The proposed Juma-Bashikurd Block includes the Juma-Bashikurd gas field complexlocated within the eastern regions of the block and extends westward to a north-northeast trending fault that separates it from the Shirin Tagab exploratory block to the west. This block straddles the central and western regions of the same west-northwestward trending structural ridge that includes the Yatimtaq-Khoja Gogerdaq and Jar Quduk blocks and is separated from the latter block by a NE-SW fault zone. The primary targets within this block are the deeper Jurassic reef reservoirs that produce atthe Juma-Bashikurd complex.
The Juma-Bashikurd gas field complex has P50 probabilistic remaining reserves of1015 BCF (28 BCM) from Jurassic reefal carbonates. The block also containsnumerous undrilled structures to the west that may be good targets for undiscovered gas resources in the Jurassic. In summary, this block carries both excellent field development opportunities as well as good to excellent upside exploration potential. It is recommended that the drilling of one exploration well outside the limits of the existing fields be required in this block in addition to the field development. The proposed drilling schedule would include at least 2 new development wells (1 each inJuma and Bashikurd), the first of which is to be drilled within the first 2 years and the second within the first 3 years of the contract. The required exploration well would have to be drilled within the first 4 years of the contract.
The proposed Juma-Bashikurd Block encompasses approximately 1861 km2 and 27 full graticular sections.
7/6/2005 VI-6 Gustavson Associates

PROMOTION OF OIL AND GAS PRODUCING ISLAMIC TRANSITIONAL STATE OFAFGHANISTANAREAS TO THE PRIVATE SECTOR MINISTRY OF MINES AND INDUSTRYGRANT AGREEMENT NO. H007-AF EMERGENCY INFRASTRUCTURE RECONSTRUCTION PROJECT
1.2.3.4 Jangalikolon Block
The proposed Jangalikolon Block is similar in many ways to the Juma-Bashikurd Block. Like the Juma-Bashikurd Block, it is primarily potential for the Jurassic reef reservoirs. To date, no shallower Hauterivian (Lower Cretaceous) production has been established on this block. The block contains the discovered but unproduced Jangalicolon gas field along with a number of other mapped but undrilled or lightly drilled structures. Jangalikolon field lies on a major northwest-southeast trending anticlinal ridge that parallels the major structural platform to the south and is separated from it by a major fault zone. To the north of the Jangalikolon trend, the North Afghanistan basin becomesextremely deep.
The Jangalikolon gas field is essentially undeveloped with only isolated drilling. However, it contains significant proved gas reserves in the Jurassic reefal carbonate reservoir with P50 probabilistic remaining gas reserves of 473 BCF (13.4 BCM).
It is recommended that the drilling of a minimum of one exploration well outside thelimits of Jangalikolon field be made a part of the commitment for this block in addition to the development of Jangalikolon gas field. The proposed drilling schedule wouldinclude at least 1 new development well in Jangalikolon field, to be drilled within the first 2 years of the contract. The required exploration well would have to be drilled within thefirst 4 years of the contract.
The proposed Jagalikolon Block encompasses approximately 1999 km2 and 29 full graticular sections.
1.2.3.5 Shirin Tagab Block
The proposed Shirin Tagab Block is located to the west of the Juma-Bashikurd Blockand extends to the Afghanistan-Turkmenistan border. It is separated from the Juma-Bashikurd Block on the basis of the same north-northeast trending fault that wasdescribed above. This block straddles the western regions of the same west-northwestward trending structural ridge that includes the Yatimtaq-Khoja Gogerdaq, JarQuduk and Juma-Bashikurd blocks. The primary targets within this block are the deeper Jurassic reef reservoirs that produce at the Juma-Bashikurd complex.
No drilling has taken place within the boundaries of this proposed bid round block.Therefore, it is one of the four proposed blocks that is entirely exploratory in nature.
It is recommended that the drilling of two exploration tests be made a part of the commitment on this block, the first of which is to be drilled within the first 2 years andthe second within the first 4 years of the contract.
The proposed Shirin Tagab Block encompasses approximately 1206 km2 and all or parts of 23 graticular sections (est. 17.5 net graticular sections).
7/6/2005 VI-7 Gustavson Associates

PROMOTION OF OIL AND GAS PRODUCING ISLAMIC TRANSITIONAL STATE OFAFGHANISTANAREAS TO THE PRIVATE SECTOR MINISTRY OF MINES AND INDUSTRYGRANT AGREEMENT NO. H007-AF EMERGENCY INFRASTRUCTURE RECONSTRUCTION PROJECT
1.2.3.6 Kashkari Block
The Kashkari Block is located in the southern portion of the North Afghanistan basinwhich to date has proven to be an oil province with some associated gas. The blockincludes three oil fields, one of which is nearly depleted (Angut oil field) and two which have been delineated to varying degrees but never produced (Kashkari and Aqdarya oil fields). All of these fields either produce or all capable of producing from Cretaceousreservoirs with the Lower Cretaceous Hauterivian sands being the major reservoirs. The deeper Jurassic reefal carbonate reservoirs that produce to the north in the basin are absent over much of the oil province, including all of the proposed Kashkari block.The Soviet-era mapping indicates that the ultimate southeastward pinchout of theJurassic section occurs just to the northwest of the Kashkari block.
The two unproduced oil fields located in the Kashkari Block have aggregate P50 probabilistic remaining reserves of 46 million barrels (MMBO) or 6.2 million tonnes of oiland small amounts of associated gas. A number of undrilled or lightly drilled structures are present throughout this block and may be targets for Cretaceous sandstone reservoirs. There is no Jurassic potential on any of these structures. In summary, the Kashkari Block has both development and exploration opportunities. The hydrocarbon product will most likely be oil with small amounts of associated gas but the percentage of gas could be higher in potential accumulations on structures in the northern part of the block.
It is recommend that the drilling of a minimum of one exploration well outside the limitsof the Kashkari and Aqdarya fields be made a part of the commitment for this block inaddition to the development of the two unproduced oil fields. The proposed drilling schedule would include at least 2 new development wells (1 each in Kashkari and Aqdarya), the first of which is to be drilled within the first 2 years and the second within the first 3 years of the contract. The required exploration well would have to be drilled within the first 4 years of the contract.
The proposed Kashkari Block encompasses 1723 km2 and 25 full graticular sections.
1.2.3.7 Bazarkhami Block
The proposed Bazarkhami Block is located in the southern portion of the North Afghanistan basin which to date has proven to be an oil province with some associated gas. It is immediately west of the Kashkari Block and shares a common boundary withthat block. The Bazarkhami Block includes one oil field, Bazarkhami, which has been delineated to some degree but never produced. Bazarkhami field is capable of producing from the Lower Cretaceous Hauterivian sands. The deeper Jurassic reefal carbonate reservoirs that produce to the north in the basin are absent over much of the oil province; however the Soviet-era mapping indicates that the ultimate southward and eastward pinchout of the Jurassic section occurs along an east-west to northeastwardtrending zone that runs through the northern portion of this proposed bid block. Some Jurassic exploratory potential could exist in the northern third of the block.
7/6/2005 VI-8 Gustavson Associates

PROMOTION OF OIL AND GAS PRODUCING ISLAMIC TRANSITIONAL STATE OFAFGHANISTANAREAS TO THE PRIVATE SECTOR MINISTRY OF MINES AND INDUSTRYGRANT AGREEMENT NO. H007-AF EMERGENCY INFRASTRUCTURE RECONSTRUCTION PROJECT
Bazarkhami oil field is a small field with P50 probabilistic remaining reserves of 3.6 MMBO or 0.5 million tones of oil and a small amount of associated gas. A number ofundrilled or lightly drilled structures are present throughout this block and may be targets for Cretaceous sandstone reservoirs. Some of the structures in the north may also have Jurassic potential. In summary, the Bazarkhami Block has a modest amount of development potential as well as close-in exploration opportunities. The hydrocarbonproduct will most likely be oil with small amounts of associated gas but may be oil and gas or gas-condensate in potential deeper Jurassic reservoirs.
It is recommend that the drilling of a minimum of one exploration well outside the limitsof the Bazarkhami field be made a part of the commitment for this block in addition to the development of the unproduced field. The proposed drilling schedule would includeat least 1 new development well in Bazarkhami field, to be drilled within the first 2 yearsof the contract. The required exploration well would have to be drilled within the first 4 years of the contract.
The proposed Bazarkhami Block encompasses 1103 km2 and 16 full graticular sections.
1.2.3.8 Zamarudsay Block
The Zamarudsay Block is located in the southwestern portion of the basin to the west of and adjacent to the Bazarkhami Block. This largely exploratory block extends westward nearly to the Afghanistan-Turkmenistan border. The geology of this extensive block isessentially the same as the southern half of the adjacent Bazarkhami Block with onlyCretaceous (mainly Hauterivian) potential. This conclusion is based on the Soviet-era mapping of the southward pinchout of Jurassic strata that occurs to the north of the block boundary.
The Zamarudsay Block includes the Zamarudsay oil field which is located in the eastern portion of the block. The field is capable of producing from Hauterivian sands and hasP50 probabilistic remaining reserves of 26 MMBO or 3.8 million tones of oil with small amounts of associated gas. The field has been partially delineated but has never been produced. In summary, this proposed block has some field development but is largely suited to exploration for Cretaceous reservoirs on closures developed along the east-west structural ridge that extends westward across the block from Zamarudsay oil field.No Jurassic potential exists within this block.
It is recommended that the drilling of one exploration well outside the limits of Zamarudsay field be made a part of the commitment on this block in addition to the development of the oil field. The proposed drilling schedule would include at least 1 new development well in Zamarudsay field, to be drilled within the first 2 years of the contract. The required exploration well would have to be drilled within the first 4 years ofthe contract.
The proposed Zamarudsay Block encompasses nearly 1723 km2 and 25 full graticularsections.
7/6/2005 VI-9 Gustavson Associates

PROMOTION OF OIL AND GAS PRODUCING ISLAMIC TRANSITIONAL STATE OFAFGHANISTANAREAS TO THE PRIVATE SECTOR MINISTRY OF MINES AND INDUSTRYGRANT AGREEMENT NO. H007-AF EMERGENCY INFRASTRUCTURE RECONSTRUCTION PROJECT
1.2.3.9 Saur-Kizbisay Block
The proposed Saur-Kizbisay Block is located immediately to the north of the Zamarudsay Block and immediately to the south of the Shirin Tagab and Juma-Bashikurd Blocks and extends to the Afghanistan-Turkmenistan border. It is separated from the Juma-Bashikurd and Shirin Tagab Blocks on the basis of a major west-northwest trending fault zone that cuts across the entire western portion of the North Afghanistan basin. Two main exploratory plays are present within this proposed bid round block. In the northern half of the block, the primary targets are the deeperJurassic reef reservoirs that are capable of producing at the Juma-Bashikurd complex and other gas fields in the north. Secondary targets could be lower CretaceousHauterivian sand reservoirs if the intervening Upper Jurassic salt is either absent or thinenough to allow for vertical migration of hydrocarbons. In the southern half of the block, the only potential reservoirs are Cretaceous in age based on the Soviet-era mapping ofthe southward pinchout of Jurassic strata that occurs along a west to northwest trending zone that crosses the central part of the block.
No drilling has taken place within the boundaries of this proposed bid round block.Therefore, it is one of the four proposed blocks that is entirely exploratory in nature.
It is recommended that the drilling of two exploration wells be made a part of the commitment on this block, the first of which is to be drilled within the first 2 years andthe second within the first 4 years of the contract.
The proposed Saur-Kizbisay Block encompasses approximately 1206 km2 and all or parts of 30 graticular sections (est. 28.9 net graticular sections).
1.2.3.10 North Basin West Block
The Proposed North Basin West Block is located in the western part of a large exploration area that extends northward from the north boundaries of the proposed Jangalikolon, Juma-Bashikurd and Shirin Tagab Blocks all the way to the Afghanistan-Turkmenistan border. He North Basin West Block includes the region north of latitude 37o 00’ 00” N and west of longitude 65o 35’ 00” E. This is an extremely deep part of the North Afghan basin and could contain large undiscovered gas or gas-condensateresources on some regionally mapped structures that are shown on various Russian and Afghani play maps. This proposed bid block is entirely exploratory in nature with no known field development opportunities and no known drilling. As such, it is best characterized as a high risk-high reward rank exploration block. The potential would most likely be for deeper Jurassic reservoirs and possibly shallower Tertiary-agedreservoirs that are not present to the south.
It is recommended that the drilling of two exploration wells be made a part of the commitment on this block, the first of which is to be drilled within the first 2 years andthe second within the first 4 years of the contract.
7/6/2005 VI-10 Gustavson Associates

PROMOTION OF OIL AND GAS PRODUCING ISLAMIC TRANSITIONAL STATE OFAFGHANISTANAREAS TO THE PRIVATE SECTOR MINISTRY OF MINES AND INDUSTRYGRANT AGREEMENT NO. H007-AF EMERGENCY INFRASTRUCTURE RECONSTRUCTION PROJECT
The proposed North Basin West Block encompasses approximately 1758 km2 and all orparts of 30 graticular sections (est. 25.5 net graticular sections).
1.2.3.11 North Basin East Block
The Proposed North Basin East Block is located in the eastern part of a large exploration area that extends northward from the north boundaries of the proposed Jangalikolon, Juma-Bashikurd and Shirin Tagab Blocks all the way to the Afghanistan-Turkmenistan border. The North Basin East Block includes the region north of latitude 37o 00’ 00” N. It stretches in an east-west direction from longitude 65o 35’ 00” E to longitude 66o 10’ 00” E. This is an extremely deep part of the North Afghan basin and could contain large undiscovered gas or gas-condensate resources on some regionallymapped structures that are shown on various Russian and Afghani play maps. The 1984 Russian-language map of structures and fields identified the Kelif, Kelif I and KelifII seismically defined structures. A Dari-language map of northern Afghanistan oil and gas fields identifies the Kelif structure and indicates that parametric (exploratory) drillingtook place or was scheduled to take place on this feature. The Well Database (includedhere as Appendix C) that was translated from Dari indicates that a well drilled on one ofthe Kelif structures in 1976 recovered oil. The North Basin East Block is entirelyexploratory in nature with no known field development opportunities and no known drilling with the exception of Kelif. As such, it is best characterized as a high risk-high reward rank exploration block. The potential would most likely be for deeper Jurassicreservoirs and possibly shallower Tertiary-aged reservoirs that are not present to the south.
It is recommended that the drilling of two exploration wells be made a part of the commitment on this block, the first of which is to be drilled within the first 2 years andthe second within the first 4 years of the contract. The identified Kelif structure could be one of the early opportunities for work on this proposed block.
The proposed North Basin East Block encompasses approximately 2654 km2 and all or parts of 44 graticular sections (est. 38.5 net graticular sections).
1.2.4 Compilation Of Plate 5 Of The Promotional Technical Report
Gustavson’s contract with the MMI required the following tasks to beaddressed when constructing the First Bid Round Maps:
a. Establish Map Formatb. Define Map Data Presentation c. Construction of Map Layers d. Quality Control of Maps e. Final Production of First Bid Round Maps
7/6/2005 VI-11 Gustavson Associates

PROMOTION OF OIL AND GAS PRODUCING ISLAMIC TRANSITIONAL STATE OFAFGHANISTANAREAS TO THE PRIVATE SECTOR MINISTRY OF MINES AND INDUSTRYGRANT AGREEMENT NO. H007-AF EMERGENCY INFRASTRUCTURE RECONSTRUCTION PROJECT
The resulting proposed First Bid Round Maps are presented as Plates 5a and 5b in the draft Promotional Report (Appendix M).
The basic framework for the Plates 5a and 5b Block Maps consists of detailed high quality scanned and geo-referenced versions of Russian topographic maps. These DRG (Digital Raster Graphic) images of topographic quadrangles date from 1984, and are at an original scale of 1:100,000. This base provides accurate x-y meter coordinates in the original Russian Transverse Mercator projection as well as accompanying GCS (Latitude and Longitude) coordinates. The maps were loaded into the ArcView 9 mapping program, projected, rectified, and the borders graphically trimmed. Map area isbeing added to the base map to cover the North Basin Block area. This extension isderived from the TPC (ONC) flight map series available from the National Imagery and Mapping Agency.
A valuable map obtained from the MMI is the 1991 Northwestern Afghanistan TectonicMap (in Russian) that was derived from original Russian prospect and structure maps. This map, described earlier, has an accurate meter grid along the border and x-y tickmarks within the map, making possible accurate geo-referencing in ArcView. It was further discovered that there is virtually no internal distortion of the map.
1.2.4.1 Russian Mapping Frame of Reference
The lack of distortion was confirmed by taking Russian well reports and locating wells in ArcView using the Russian x-y values on the geo-referenced Tectonic map. The Russian coordinates matched the ArcView computer coordinates exactly, where data existed, all across the map. Raw Russian x-y well data was tied to marked well locations on the map for the fields: Kashkari, Jar Quduk, Yatimtaq, Bazarkhami, Khoja Gogerdaq, Angut, and Juma, with very accurate results.
1.2.4.2 Graticule Display
In ArcView, a Latitude and Longitude graticule overlay of the map is easily displayed once the images have been geo-referenced and projected. The 5-minute by 5-minute graticule is shown on the maps and is the reference for the block boundaries. Blockcorners were noted from the map displays and will be included in the formal blockdescriptions once the block boundaries have been approved by the Ministry.
1.2.4.3 True Reference Map
Several known surface points including wells, gas plants and other features, were surveyed with GPS (Global Positioning System) instruments by representatives of the US Geological Survey and by Gustavson Associates. These Latitude and Longitudepoints tied very well with features on the topographic maps, particularly Yatimtaq, Khoja Gogerdaq and Jar Quduk fields. Significantly however, these points did not tie the labeled wells on the Tectonic map layer.
7/6/2005 VI-12 Gustavson Associates

PROMOTION OF OIL AND GAS PRODUCING ISLAMIC TRANSITIONAL STATE OFAFGHANISTANAREAS TO THE PRIVATE SECTOR MINISTRY OF MINES AND INDUSTRYGRANT AGREEMENT NO. H007-AF EMERGENCY INFRASTRUCTURE RECONSTRUCTION PROJECT
As we have discussed, we can accurately tie this map to the Russian x-y system and find well locations, but the true location of the structural features, and well locations areoffset when compared to the GPS-surveyed points. To register the Tectonic Map with known Latitude and Longitude points we shifted the Tectonic Map 214 meters east and 2073 meters north with respect to the True Latitude-Longitude Reference Grid. Thisshift is validated by additional surface reference points along the western Afghanistan border. The Tectonic Map layer shows inflection points along the western border of Afghanistan, which can be calibrated from ONC and TPC Series DRG digitized maps. We determined the Latitude and Longitude and x-y values for these inflection points,compared them to Tectonic Map locations and found the shift to be the same as the well shift across the structure map. Therefore with some confidence we can use this True Reference map to show the structures and prospects in their spatial relationship relativeto other surface features and within the topographic map Latitude and Longitude and x-y system. It is not clear why this shift in the Tectonic Map was employed, but indiscussions with the US Geological Survey, they have heard of this technique before, perhaps having been used as a security preservation measure by the Russian authors.
The Plates 5a and 5b Block Maps presented in the Promotional Technical Report(Appendix M of this Final Report) are jointly referred to as the True Reference version, and is the version just described. The Russian Reference version is also included asPlate 6 of the Report because, in its fully activated ArcView 9 format, it can be used asa “Rosetta Stone” which can translate original Russian x-y data from reports onto a useful work map for use in further exploration. The fully activated versions of Plates 5 and 6 would require the availability of the ArcView shape files and a licensed copy of the ArcView 9 mapping software. In addition, a license from East View Cartographic, Inc, of Minneapolis, Minnesota, USA would have to be obtained in order to use of the Russian topographic maps that were used to construct the base map and to cross-correlate x-y’s with Latitude and Longitude. These topographic maps comprise a digital mapping layer of Plates 5 and 6 and are a component of Gustavson’s ArcView shape files. Because of licensing restrictions, only non-manipulatable paper copy and digital.pdf versions of the maps are included with this Report and the accompanying DVD’s.
1.2.5 ELEMENTS OF PROMOTIONAL PACKAGE
The main elements of the proposed promotional package are included in the appendices to this Final Report and are discussed briefly below with some suggestionsfor their use and some thoughts on the rational for their inclusion. At the present time,these documents are only in “draft” form, pending review and comments by the Ministry. The fifth element of the promotional package is the 5-DVD set that contains the proposed digital dataset that would be available for purchase by interested parties. ThisDVD set is provided to the Ministry as a supplement to this Report.
1.2.5.1 Draft Invitation Letter from Minister
A draft version of the Letter of Invitation from the Minister is included as Appendix J to this Final Report for the Ministry’s consideration and comments. It is written with the
7/6/2005 VI-13 Gustavson Associates

PROMOTION OF OIL AND GAS PRODUCING ISLAMIC TRANSITIONAL STATE OFAFGHANISTANAREAS TO THE PRIVATE SECTOR MINISTRY OF MINES AND INDUSTRYGRANT AGREEMENT NO. H007-AF EMERGENCY INFRASTRUCTURE RECONSTRUCTION PROJECT
intention that it can used in conjunction with the Announcement of Bid Round flier and the Color Promotional Brochure in an initial mass-mailing effort to the international oiland gas industry. A copy of the letter will also be included in the front of the Promotional Technical Report that can be purchased by interested and qualified parties.
1.2.5.2 Draft Announcement of Bid Round
The draft “Announcement of Bid Round” flier is included as Appendix K to this Report. The announcement includes an invitation to a pre-Round promotional conference at a,as yet, undetermined date for the purpose of receiving information about the Bid Round.Included is a map of the offered blocks and a table listing the blocks by name and number and listing areas in square kilometers. The map can be easily modified byGustavson Associates should the Ministry decide to modify the block shapes and/orsizes. This Announcement can also be modified to appear in print in the Oil and GasJournal and the AAPG Explorer or other industry publications.
1.2.5.3 Draft Color Promotional Brochure
Appendix L contains a draft version of a Color Promotional Brochure which is designedto be included in an initial mailing packet to the international oil and gas industry. The brochure is designed to be a quick introduction to the oil and gas potential andopportunities in Afghanistan and includes text, a Bid Round Block map, a geologicalillustration or two, and one or two photographs. The sample brochure is just that, a sample document. Gustavson Associates would look forward to comments from the Ministry as to the contents of the brochure. If the Ministry has additional materials, photographs, or diagrams that it wishes to incorporate into the brochure, thosemodifications can be easily made.
1.2.5.4 Draft Promotional Package Technical Report
The draft version of the Promotional Technical Report is included as Appendix M to this Report. It is designed to be the first in-depth technical review of the oil and gaspotential of the North Afghanistan basin that will be available to interested and qualifiedinternational oil and gas companies following their receipt of the initial promotional packet described above. This Technical Report should be offered to interested partieson a purchase basis and could be made available through mail order, or copies could be available for onsite purchase at one of the pre-Round promotional conferences.
The Technical Report contains a regional synthesis of the hydrocarbon potential and petroleum systems of the North Afghanistan basin, detailed descriptions of each of the oil and gas fields, a summary of the remaining reserve potential of the basin and ofindividual fields, and a discussion of the existing infrastructure and rehabilitation requirements. Chapter 4 of the Technical Report focuses on the business, economic, and security climate of Afghanistan and includes draft copies of the proposed Hydrocarbons Law, the Hydrocarbons Regulations, and a Model Production Sharing Agreement. The accompanying introductory text in Chapter 4 is designed to be
7/6/2005 VI-14 Gustavson Associates

PROMOTION OF OIL AND GAS PRODUCING ISLAMIC TRANSITIONAL STATE OFAFGHANISTANAREAS TO THE PRIVATE SECTOR MINISTRY OF MINES AND INDUSTRYGRANT AGREEMENT NO. H007-AF EMERGENCY INFRASTRUCTURE RECONSTRUCTION PROJECT
compatible with a simple replacement of the draft versions of these three regulatorydocuments with final versions when written and enacted. Chapter 5 of the draftTechnical Report contains the methodology involved in the development of the First Bid Round Blocks and a description of each block. This can be modified easily if the Ministry chooses to modify the block outlines. Sections 5.5 through 5.8 deal with digitaldata package order forms, bid terms, bid procedures and bid forms. These Sections will require some additional text that is compatible with the final versions of the variousregulatory documents.
1.2.5.5 Digital Dataset on DVD
The final element of the proposed promotional package is a set of 5 DVD’s that contain the entire comprehensive digital dataset for the North Afghanistan basin. This package is intended for purchase by serious parties that are considering bidding in the First Bid Round. The purchase price should reflect the seriousness that companies will place in having access to this large dataset. The digital dataset consists of two types of data: (1)the regional and field-specific technical data (mainly in Russian language) that was provided to Gustavson Associates by the Ministry for the purposes of estimating remaining reserves in the nation’s main oil and gas fields and for developing the promotional package, and (2) excerpts from the Gustavson First Interim Report that contain the geological and geophysical descriptions and the detailed reserve calculations for 11 oil and gas fields for which remaining probabilistic reserves were estimated using the Ministry-supplied data.
It is recommended that this comprehensive basin-wide digital dataset be available forpurchase by qualified companies for the purpose of preparing their bidding strategies.Although this is a large amount of detailed information to release to the industry, it is this Consultant’s opinion that the industry will require access to such an expansive datasetin order to show serious interest in oil and gas development and exploration opportunities of Afghanistan. On a more positive note, many companies may be interested in the opportunities in northern Afghanistan precisely because this is a basin with oil and gas discoveries and production that has been essentially outside the sphere of knowledge and access of the Western oil and gas industry because it was explored and developed during the Soviet era. The opportunity to explore for and develop hydrocarbon reserves in such a basin using current oil industry technology could be very attractive to the industry.
7/6/2005 VI-15 Gustavson Associates

PROMOTION OF OIL AND GAS PRODUCING ISLAMIC TRANSITIONAL STATE OFAFGHANISTANAREAS TO THE PRIVATE SECTOR MINISTRY OF MINES AND INDUSTRYGRANT AGREEMENT NO. H007-AF EMERGENCY INFRASTRUCTURE RECONSTRUCTION PROJECT
1.2.5.6 Seismic Reprocessing Report
As a task in producing the Promotional Package, Gustavson Associates subcontracted with the Geostan JSC reprocessing center that is located in Almaty, Kazakhstan to reprocess two seismic lines using field tapes provided by the Ministry. There wasconcern both on the part of the Ministry and Gustavson Associates as to the tapes’physical condition and utility for reprocessing using modern processing techniques. This was a very instructional and a rewarding effort. The results indicated that the original tapes were not deteriorated to the point that they could not be read and,therefore, they could be used in the reprocessing program. The reprocessing effort is described in the Geostan Report that is a part of the draft Promotional Technical Reportthat is included as Appendix M to this Report.
1.2.6 Implementation of Afghanistan Promotion
Due to the lack of passage of both the Hydrocarbon Law/ Regulations, and the ModelContract, no implementation of the promotion was conducted. Upon passage of thoselaws, all the materials provided in the preceding section, and the appendices will be used to conduct several promotions assuming further contractual coverage in granted. They will likely take place in Houston, London, and Calgary. This consultant on multiple occasions conducted the necessary planning for these events, but no further updatescan be provided until both internal legislative problems in Afghanistan are worked out,and the decision is made at the World Bank to fund the promotion to its completion. It isthis consultants opinion that the promotion should move forward to its completion, but at the present time the contract ended with the completion of the promotional material.
7/6/2005 VI-16 Gustavson Associates
PROMOTION OF OIL AND GAS PRODUCING ISLAMIC TRANSITIONAL STATE OFAFGHANISTANAREAS TO THE PRIVATE SECTOR MINISTRY OF MINES AND INDUSTRYGRANT AGREEMENT NO. H007-AF EMERGENCY INFRASTRUCTURE RECONSTRUCTION PROJECT
VII. TRAINING PROGRAMS (IR 4-1, ALSO INCLUDE ENTIRE PETRO MANAGEMENT TRAINING)
The following is a summary of training activities that took place in Afghanistan. Training consisted of both classroom time and on-the-job training time. The instructors participating included:
Edwin Moritz, Gustavson Associates, Boulder Colorado Hafizullah Nawabi, Gustavson Associates, Boulder Colorado David A Rasmussen, Gustavson Associates, Boulder Colorado Arman Sirazhev, Geostan Seismic Processing, Kazakhstan
Geology of Petroleum Class-conducted by Mr. Mirzad with minor contribution by Gustavson personnel
At MMI offices in Kabul – Discussed aspects of source rocks and dependence ofsampling accuracy on tectonic style, i.e. highest drilled structures may not samplesource rocks which may exist on the flanks or in the basins.
On the Job Training
Kabul, MMI offices – Provided suggestions and held discussions with Ministry personnelon aspects for conducting promotion and handling negotiations with foreign oil companies. Worked with computer technicians, and showed them how to quicklyassemble a slide presentation for President Karzai with maps using instant digital pictures.
Sheberghan, MMI Exploration – Main contacts: Engineer Talash, Geologist Wasai. Showed MMI scientists scanning and document organization for reports and largemaps. Reviewed seismic and geologic exploration concepts to explain some well results. Described an exploration drilling strategy which would use of their own people,could use existing data, and existing seismic recording equipment for infill recording near well control. Identified well workover candidates where production could be improved using modern oilfield technology. Described processing methods that could improve existing data when tapes are available. Instructed MMI scientists on methodsfor data preservation such as scanning to preserve seismic prints.
7/6/2005 VII-1 Gustavson Associates

PROMOTION OF OIL AND GAS PRODUCING ISLAMIC TRANSITIONAL STATE OFAFGHANISTANAREAS TO THE PRIVATE SECTOR MINISTRY OF MINES AND INDUSTRYGRANT AGREEMENT NO. H007-AF EMERGENCY INFRASTRUCTURE RECONSTRUCTION PROJECT
Table 7-1 Training Program
No. of Persons
Type of Training Method of Training
Location of Training
Duration of Training
ExpectedResults of Training
6 Direct taskparticipation.Gain experiencein petroleumgeology,geophysics andreservoirengineering
Participation Afghanistan Over thecourse ofPhase I –estimated at2.5-3 months
Ownership in project andskills in analysis oftechnicaldata
4 Direct taskparticipation.Gain experiencein petroleumgeology,geophysics andreservoirengineering
Participation USA 3 to 4 weeks Ownership inproject andskills in analysis oftechnicaldata
15-25 Classroom Classroominstructionwith coursematerials,practicalapplicationsto expectedsituations
Sheberghan,Afghanistan
3 weeks
(three 1-weekclasses)
Gain practicalknowledge ofspecializedtopics inpetroleumexploration,reservoirengineering,andpetroleumeconomics
2-3 Industry shortcourses andseminars
Classroominstruction,lecture
To bedetermined
1 – 2 weeks Furtherknowledge inpetroleumexploration
Participation Time
Other than 1 day each way to and from Sheberghan, every day in Afghanistan was a 10 hour workday. The direct training is accounted for above. The remaining time wasparticipation time working with many individuals such as Ministry officials, Mr. Mandarkhail, and the many Exploration Department workers in Mazar-e-Sharif and Sheberghan, totaling 15 to 20 people at various times, often working with groups of 4 to 6 people during data copying. (Note see the slide show for examples)
Activities included interviews to determine where data may exist, conditions of wells, well results and history, condition and inventory of seismic recording equipment, the histories of various data especially seismic data, direct participation in organizing and copying data, and passing on encouragement for the workers to do future work using the computers and software we have delivered.
7/6/2005 VII-2 Gustavson Associates

PROMOTION OF OIL AND GAS PRODUCING ISLAMIC TRANSITIONAL STATE OFAFGHANISTANAREAS TO THE PRIVATE SECTOR MINISTRY OF MINES AND INDUSTRYGRANT AGREEMENT NO. H007-AF EMERGENCY INFRASTRUCTURE RECONSTRUCTION PROJECT
Gustavson Associates also assembled a large volume of training materials in conjunction with the training course that was held in Colorado. The materialsassociated with that course can be found in Appendix U.
7/6/2005 VII-3 Gustavson Associates