Embed Size (px)
Citation preview

Final Report: Water Use and Risks in Mining
G.M. Mudd, S.A. Northey, T.T. Werner RMIT University, December 2017 Page 1
Final Report: Water Use and Risks in Mining
Assoc. Prof. Gavin M. Mudd, Stephen A. Northey, Dr Tim Werner
Report to Columbia Water Center, Earth Institute, Columbia University
December 2017 Summary:

Final Report: Water Use and Risks in Mining
G.M. Mudd, S.A. Northey, T.T. Werner RMIT University, December 2017 Page 2
1. Overview
The mining industry can be a major consumer of water as well as presenting significant risks to water
resources – all of which can contribute to the financial (and social and environmental) costs or impacts of
mining. Water resource risks related to mining are often a key area of community concern. Whilst there is
widespread recognition of the need for the mining industry to be responsible in its approach to water
resources and mine site water management, there is very little academic literature which analyses in detail
the amount of water used by various mining projects, especially the links between water use and the local
climate regime and the financial costs of water management. Over recent years, however, there is a growing
wealth of water-related data being reported by mines and mining companies, often through regulatory
reporting but commonly through sustainability and related styles of corporate reporting and disclosures (e.g.
Global Reporting Initiative or GRI; CDP Water). In this report, we outline research work for the Columbia
Water Center which compiles an extensive database of water use in mining and land use mapping
information to address this weakness in the literature.
2. Methods
Our approach to compiling data is based on standard industry and academic practice and the wide
availability of data from public corporate reporting. The overall approach is based on life cycle assessment
methodology (i.e. input-output analysis).
Mine Production: all data is sourced from company annual or quarterly reporting (and sometimes
sustainability reporting). Data collected is on an annual basis and includes ore processed, ore grades,
concentrates produced, metals extracted and waste rock excavated. Data is only collected for the years of
relevant water data. For a range of mines, complete historical production statistics are compiled to
estimate cumulative production to the year of the imagery used for land use mapping (see below).
Land Use Area: all data is mapped using Google Earth, with key features of mining projects outlined in
polygons, including open pits, waste rock dumps (WRD’s), tailings storage facilities (TSF’s), infrastructure
(mill, workshops, roads, miscellaneous buildings), water ponds, heap leach piles (HLP’s). These areas are
then related to annual or cumulative production data, and allows an estimate of the areal footprint of a
mine, which can be used for water aspects (e.g. flood risk for TSFs, evaporation rates, groundwater sinks
from former pits, etc), or other aspects (e.g. biodiversity). All site features have been verified using
technical or corporate reports for each mine (e.g. distinguishing WRD’s from HLP’s). An example of
outlining is shown in Figure 1. Where satellite imagery in Google Earth is poor resolution, other sources
were used, such as site technical reports (e.g. Canadian-based NI43-101 reports), websites (especially
aerial imagery) or technical and academic literature (e.g. conference or journal papers).
Water Use: based on sustainability reporting by many mining companies, we add detailed water data to
each year of production for a given mine. Specifically, we account for water inputs and their source
(groundwater, surface water, marine or third party supplied), use (raw water, worked or recycled water)
and any discharges to the environment. The framework is based on a detailed analysis of a typical mine’s
imports and exports of water, effectively giving a water balance for a given mining project. This is outlined
in detail in Appendix 1, with the overall approach shown in Figure 2 below.
Mine Case Studies and Examples: where possible, specific case studies have been compiled to show the
impact of poor water management on mine production costs. These are intended to be indicative only, but
they do highlight the potential costs due to an accident (e.g. TSF failure), poor engineering design, major
storm event (e.g. open pit or underground mines flooding) or lack of water supplies – it must be
remembered that all mine sites are unique in their design, construction and operation with respect to water
risks, and this variability must be considered in assessing the financial implications of such water risks. In
addition, we compile a range of examples of costs to mines due to a variety of reasons (as noted above).
Overall, the case studies complement the detailed production, water use and mapping data.

Final Report: Water Use and Risks in Mining
G.M. Mudd, S.A. Northey, T.T. Werner RMIT University, December 2017 Page 3
Figure 1: Example delineation of a tailings dam area at the Padcal Cu mine, Philippines (Google Earth image
date 15 April 2017; co-ordinates approximately 16° 14’ 26.16” N, 120° 40’ 12.07” E)
Figure 2: Key data categories included in the mine water reporting database, which was largely based upon
the reporting categories outlined by MCA (2014) and ICMM (2017) (see Appendix 1 for further details)

Final Report: Water Use and Risks in Mining
G.M. Mudd, S.A. Northey, T.T. Werner RMIT University, December 2017 Page 4
3. Results
3.1 Water Use
The detailed database of water use reported by mining companies is provided as a Digital Appendix to this
report, with the key metrics shown in Table 1. As can be observed, there is considerable variability between
mine sites, even for some very close to each other. For example, the extent of worked (recycled) water use
varies from 0% (Porgera, Au), to 96% (Spence, Cu). For the adjacent mines of Radomiro Tomic and
Chuquicamata in northern Chile, the intensity of raw water use varies from 0.10 to 1.04 kL/t ore, respectively,
while worked (recycled) water use is also 0.29 to 0.59 kL/t ore, respectively. There are also somewhat
unexpected examples, such as the high fraction of worked water use (69.7%) at the Ok Tedi (Cu-Au-Ag)
mine in the tropical highlands of Papua New Guinea or the extent of discharged waters at the Antamina (Cu-
Zn-Ag-Mo) mine in Peru or El Teniente (Cu-Mo-Au-Ag) mine in Chile – despite the modest rainfall.
There are many factors which could explain this wide variability, such as ore type and hardness, process
configuration (mine-mill, mine-heap, the presence of a smelter and/or refinery), water quality, climate regime
(annual rainfall and evaporation rates), slurry densities during processing and tailings disposal, ore grades,
mine age, water infrastructure and design, costs, regulatory conditions, community concerns and issues
(especially adjacent communities which are reliant on water resources, especially agriculture) and policy
considerations. On the basis of the data compiled, it is difficult at present to discern any principal factors
which appear the most dominant in affecting water use. This will be the subject of further analyses as this
work is prepared for academic publications.
3.2 Land Use
Examples of the mapping of selected mines are shown below, including the Frontier Cu mine in Zambia in
Figure 3 before and after development and the Escondida and Zaldivar Cu mines in northern Chile mapped
in Figure 4.
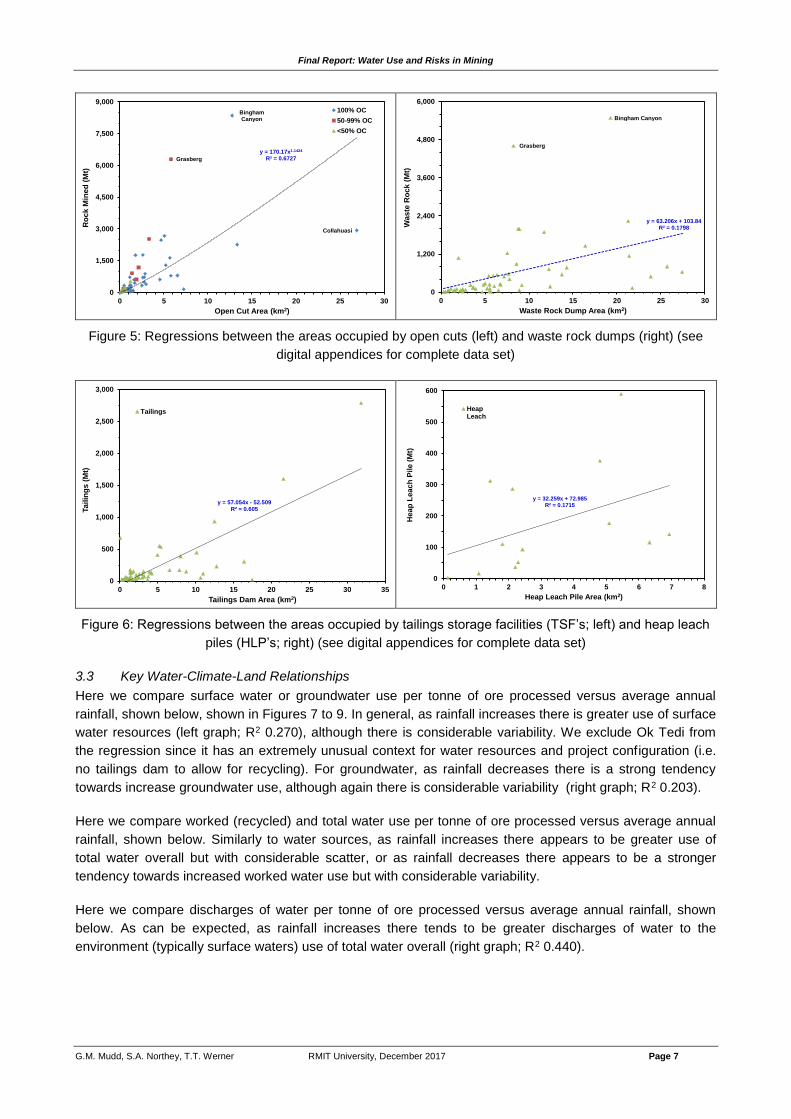
The results for land use versus cumulative mine production are given Figures 5 and 6 and in the digital
appendices, showing the expected result that as mines get larger in rock mined, the area of open cuts,
tailings storage facilities and waste rock dumps gets correspondingly bigger, albeit with some variability. For
some mines, this is due to pre-mine topography such as a mountain which has been excavated during
mining – meaning large tonnages but a more modest area (e.g. Bingham Canyon, Grasberg). Curiously,
Grasberg shows a very modest WRD area despite the high tonnage mined – which is simply due to the fact
that it allows considerable erosion of its WRD’s into the Ajkwa River system (along with direct disposal of
tailings into the Ajkwa River). For heap leach piles, however, there is considerable scatter and no obvious or
clear relationship between area and tonnage placed. This is likely to be related to the variations in design
and topography, as well as individual site economics, as this can lead to different HLP designs.

Final Report: Water Use and Risks in Mining
G.M. Mudd, S.A. Northey, T.T. Werner RMIT University, December 2017 Page 5
Table 1: Key water use metrics for various mines (full data in the Digital Appendices)
Notes: Mine Type: OC – open cut, UG – underground; Process Configuration: F – flotation plant, S – smelter, R – refinery, HL – heap leach, HM – hydrometallurgical plant; SD – Standard Deviation.
kL/t ore ±SD (No.) kL/t ore ±SD (No.) kL/t ore ±SD (No.) kL/t ore ±SD (No.) kL/t ore ±SD (No.) kL/t ore ±SD (No.) kL/t ore ±SD (No.) % ±SD (No.) kL/t ore ±SD (No.)
Alumbrera 2005-2012 OC F Cu-Au 0.56 0.05 6 2.00 0.50 7 0.57 0.03 7 1.44 0.45 8 73.5 1.5 7 0.026 0.008 4
Andina 2003-2016 OC-UG F Cu-Mo-Ag 0.33 0.09 5 0.79 0.21 8 1.49 0.50 12 1.05 0.11 9 0.89 0.08 12 45.3 3.3 7 0.73 0.51 13
Antamina 2012-2015 OC F Cu-Zn-Mo-Ag 0.065 0.004 4 0.46 0.08 2 0.89 0.05 4
Bald Mountain 2008-2014 OC C Au 0.47 0.71 7 0 0 6
Bingham Canyon 1997-2013 OC F-S-R Cu-Au-Mo-Ag 1.95 0.47 6 0.75 0.35 6 1.13 0.14 7 61.8 9.0 6 0.32 1
Black Mountain 2012-2013 UG F Pb-Zn-Ag-Cu 0.01 0.00 2 2.96 0.13 2 0.76 0.56 2 0.52 0.68 2 0.23 0.12 2 13.5 1.1 2 0 0 2
Bonikro 2011-2016 OC C Au 0.28 0.31 2 0.78 0.50 2 0.75 0.24 3 0.20 0.05 3 0.55 0.29 3 80.2 16.6 5 0.40 0.03 2
Cadia Group 2008-2015 OC-UG F Au-Cu-Ag 0.062 0.017 8 0.77 0.46 9 0.14 0.043 9 2.13 0.97 8 0.43 0.16 13 1.64 0.86 8 74.4 11.4 10 0.15 0.22 8
Cannington 2000-2010 UG F Pb-Zn-Ag 0.67 0.08 11 0.70 0.07 3 10.1 1
Chuquicamata 2011-2016 OC F-HL-S Cu-Mo-Ag-Au 0.91 1 1.19 0.03 3 7.83 0.49 5 1.01 0.13 5 6.82 0.45 5 87.1 1.4 5
Cobar-CSA 1999-2015 UG F Cu-Ag 1.06 0.19 15 1.06 0.19 15
Codelco Norte 2011-2016 OC F-HL-S Cu-Mo-Ag-Au 0.13 0.15 5 0.42 0.08 9 2.93 0.26 8 0.43 0.03 9 2.49 0.26 8 84.8 1.6 8 0.07 0.14 8
Collahuasi 2003-2015 OC F-HL Cu-Mo-Ag 0.74 0.05 7 0.004 0.002 5 3.15 0.32 10 0.69 0.04 10 2.46 0.34 10 77.4 1.5 10
Cortez 2008-2016 OC-UG HM-C-HL Au 0.30 0.21 8 1.30 0.24 3 89.8 2.5 4 0 0 6
Cowal 2008-2014 OC HM Au-Ag 0.28 0.08 5 0.16 0.13 6 0.006 1 0.45 0.09 6 98 1 0 0 2
Cracow 2005-2011 UG C Au 1.61 0.07 2 0.96 0.33 7 0.95 0.30 2 76.3 8.8 2
Darlot 2002-2003 UG C Au 5.04 1 3.26 1.61 2 0.63 1 12.6 1 0 0 2
El Teniente 2002-2016 UG F-S Cu-Mo-Ag-Au 0.14 0.10 5 1.07 0.32 8 2.91 0.59 12 1.25 0.29 12 1.67 0.36 12 57.5 3.9 12 1.07 0.42 13
Ernest Henry 2003-2012 OC-UG F Cu-Au 0.62 0.10 5 0.49 0.13 7 0.46 0.12 10
Escondida 2003-2008 OC F-HL Cu-Au-Ag 0.80 0.04 6 0.039 0.029 3 1.06 0.004 2 0.76 0.03 2 0.28 0.03 6 28.3 2.6 2
Eskay Creek 2002-2003 UG C Au 0.58 1 0.52 0.12 2 0.14 1 24.7 1 5.45 0.12 2
Gabriela Mistral 2012-2016 OC F Cu 0.11 0.03 6 0 0 4 0.43 0.57 4 0.10 0.06 4 0.33 0.56 4 51.7 44.2 4
Golden Grove 2005-2014 UG-OC F Zn-Cu-Pb-Au-Ag 0.48 0.73 4 3.61 0.84 3 1.51 0.19 5 2.37 0.80 5 0.53 1
Golden Sunlight 2008-2016 OC C Au 1.16 0.08 4 0.56 0.20 8 0.57 0.34 4 48.5 28.4 4 0 0 6
Goldstrike 2008-2016 OC-UG C Au 2.45 0.42 4 1.26 0.29 10 1.05 0.06 4 43.9 5.8 5 0 0 11
Greens Creek 1997-2000 UG F Au-Pb-Zn-Ag 7.97 2.02 4 2.14 0.24 4 5.84 1.87 4 72.2 6.0 4 3.35 1
Hemlo JV 2002-2016 OC-UG C Au 1.50 0.59 3 0.31 0.17 9 1.18 0.45 3 85.5 10.7 5 0.96 0.26 10
Hidden Valley 2010-2016 OC F-C Au-Ag 1.04 1.07 3 1.47 0.87 4 0.43 0.16 5 1.10 0.86 4 68.4 19.0 5 0.16 1
Holt-McDermott 2002-2003 UG C Au 2.05 1 0.92 0.15 2 1.23 1 60.2 1 5.39 0.09 2
Kinsevere 2012-2016 OC HM Cu 85 6 3
Konkola 2007-2016 UG F Cu 24.52 7.97 5 4.95 1.90 5 9.10 2.57 6 10.43 3.60 9 1.84 1.60 6 17.4 13.7 6 12.08 10.62 8
Lagunas Norte 2008-2016 OC HL-C Au 1.41 0.14 2 0.02 0.02 7 1.36 0.15 2 97.3 1.0 4 0.17 0.12 9
Lawlers 2002-2003 UG C Au 1.67 1 0.64 0.09 2 1.10 1 65.9 1 0.20 0.28 2
Lihir 1997-2016 OC HM-C Au-Ag 32.9 8.59 7 0 0 8 30.37 4.10 5
Lomas Bayas 2004-2011 OC HL Cu 0.018 0.01 6 0.10 0.01 6 0.14 0.01 2 0.12 0.02 4 0.03 0.002 4 24.4 0.2 2
Lumwana 2012-2016 OC F Cu 1.18 0.11 4 0.16 0.06 5 1.04 0.09 4 88.0 2.6 4 0.81 0.51 5
Marigold JV 2002-2003 OC C Au 0.08 0.01 2 0 1
McArthur River 2007-2009 OC F Pb-Zn-Ag 0.46 0.19 3 0.01 0.01 3 5.42 1.47 2 0.04 1
Ministro Hales 2011-2016 OC F Cu 0.58 0.39 2 0 0 2 0.46 0.09 2 0.37 0.08 2 0.09 0.01 2 13.5 11.7 3
Morro do Ouro 1997-2000 OC HL Au 2.43 0.18 4 0.62 0.15 4 1.80 0.20 4 74.2 6.2 4 0.04 1
Mount Isa (Cu) 2002-2012 UG F-S Cu-Ag 0.89 0.29 4 3.09 0.33 5 0.92 0.21 11 2.08 0.26 5 66.1 6.7 5
Mount Isa (PbZnAg) 2002-2012 UG-OC F-S Pb-Zn-Ag 1.22 1 2.52 0.30 2 0.96 0.31 6 1.81 0.08 2 70.1 8.3 2
Mount Lyell 2007-2014 UG F Cu-Au-Ag 1.40 0.36 2 2.20 0.21 4 2.38 0.95 4 2.51 0.92 3 0.22 0.21 3 6.8 7.2 3 8.79 4.12 7
Mount Rawdon 2009-2011 OC C Au 0.96 1 0.15 0.13 2 0.90 1 94 1 0.07 0.08 2
North Mara 2008-2013 OC C Au 0.25 0.22 6 100 1 0.01 0.02 5
Northparkes 2002-2016 UG-OC F Cu-Au 1.04 0.09 10 0.60 0.13 16 0.45 0.16 10 43.2 13.8 10
Ok Tedi 2003-2016 OC F Cu-Au-Ag 0.63 0.24 14 2.36 0.89 14 0.63 0.24 14 1.73 0.83 14 70.8 12.1 14
Olympic Dam 1988-2016 UG F-HL-S-R-HM Cu-U-Au-Ag 1.60 0.45 28 1.60 0.45 28
Oyu Tolgoi 2013-2016 OC F Cu-Au-Ag 0.56 1 2.86 0.54 4 0.44 0.10 4 2.43 0.44 4 85.0 1.2 4
Palabora 1994-2012 OC-UG F-S-R Cu 0.80 0.31 16 2.99 1.01 11 1.09 0.42 10 2.29 0.79 12 66.5 5.4 8 0.09 1
Patchway 1997-2000 OC C Au 2.79 0.66 4 2.30 0.88 4 0.50 0.33 4 19.7 16.4 4
Peak (NSW) 1997-2000 UG F Au-Pb-Zn-Ag 3.25 0.30 4 0.89 0.13 4 2.37 0.30 4 72.7 4.3 4
Pierina 2002-2016 OC HL Au 0.04 1 0.91 2.46 8 0.01 1 60.0 55.2 2 0.16 0.28 7
Plutonic 2002-2003 OC C Au 1.96 1 0.81 0.04 2 1.12 1 57.2 1 0 0 2
Porgera 2008-2015 OC-UG HM Au 0.92 0.09 2 5.24 0.64 3 5.64 0.54 8 0 0 3 0 3 8.20 2.90 7
Prominent Hill 2009-2016 OC-UG F Cu-Au-Ag 0.63 0.09 7 0 0 2 0.63 0.09 7
Pueblo Viejo 2012-2016 OC C Au 3.74 0.33 4 4.36 2.74 5 0.58 0.53 4 15.8 14.4 4 1.53 1.29 4
Radomiro Tomic 2011-2016 OC F Cu-Mo-Ag-Au 0.079 0.016 3 0.02 0.002 3 0.95 0.31 5 0.11 0.02 5 0.84 0.29 5 88.2 2.7 5
Rawhide 1997-2000 OC C Au-Ag 2.64 0.67 3 0.20 0.01 4 2.45 0.68 3 92.2 2.7 3
Renco 1997-2000 OC C Au 4.22 0.98 4 3.18 1.29 4 1.03 0.37 4 26.5 13.2 4
Ridgeway 1997-1999 OC C Au 0.25 0.12 2 0.05 0.05 3 0.19 0.07 2 78.9 11.7 2
Rosebery 2006-2016 UG F Zn-Pb-Ag-Cu-Au 19.08 12.27 3 1.61 1
Rossing 1995-2016 OC HM U 0.27 0.03 22 0.84 0.10 22 0.27 0.03 22 0.57 0.11 22 66.8 5.7 22
Round Mountain JV 2002-2003 OC C Au 0.22 0.01 2 0 0 2
Ruby Hill 2008-2016 OC HL-C Au 0.44 0.38 7 0 0 5
Salvador 2002-2016 OC F-HL Cu 0.30 0.14 7 1.22 0.33 10 2.76 0.71 10 1.56 0.33 10 1.01 0.45 11 37.9 8.5 12 0.29 0.45 13
Sepon 2009-2016 OC HM Cu 3.53 1.62 6 5.33 2.82 5 4.06 3.88 4
Skorpion 2012-2016 OC HM-R Zn 1.69 0.01 2 1.72 0.04 4 0.23 0.13 2 11.9 6.2 2 0 0 2
Spence 2007-2008 OC HL Cu 0.32 0.04 2 0.36 1 0.32 0.04 2 0.01 1 2.4 1
Telfer 2009-2016 OC-UG F-C Au-Cu-Ag 0.89 0.02 3 0 0 2 0.97 0.12 5 0.86 0.31 7 0.13 0.08 5 12.9 8.2 6
Tintaya-Antapaccay 2006-2012 OC F-HL Cu-Au-Ag 0.72 0.08 6 2.57 0.09 5 0.70 0.10 3 1.86 0.04 5 72.6 3.7 7
Togaruci-Gosowong 2004-2016 OC-UG C Au-Ag 4.99 2.35 2 2.17 0.46 2 5.99 1.05 3 4.02 1.42 10 0.73 0.67 3 8.4 11.2 5 5.45 1.97 3
Tulawaka 2008-2013 OC-UG C Au 0.61 0.31 6 0 0 5
Veladero 2008-2016 OC HL Au 0.049 0.013 8 47.8 55.1 4 0.006 0.006 8
Zaldivar 2008-2014 OC HL Cu 0.15 0.009 6 1.78 1 93 1.4 2 0 0 6
Mean 1.46 1.02 0.04 0.12 2.41 1.81 1.56 54.9 2.03
Median 0.52 0.78 0.04 0.07 2.05 0.63 1.07 65.9 0.16
Std. Dev. 4.45 1.12 0.15 1.96 4.61 1.84 30.8 5.05
DischargesGroundwater Surface Water Marine Water Third Party Water Total Raw Worked Worked
Use
Mine / Operation
Years of
Data
Coverage
Mine
Type
Process
ConfigurationMetals
Withdrawal

Final Report: Water Use and Risks in Mining
G.M. Mudd, S.A. Northey, T.T. Werner RMIT University, December 2017 Page 6
Figure 3: The Frontier Cu mine, Zambia, before (left) and after the development of mining (right)
Figure 4: Mine feature mapping of the Escondida and Zaldivar Cu mines, northern Chile, showing clean
image (left) and mapped features (right)
Final Report: Water Use and Risks in Mining
G.M. Mudd, S.A. Northey, T.T. Werner RMIT University, December 2017 Page 7
Figure 5: Regressions between the areas occupied by open cuts (left) and waste rock dumps (right) (see
digital appendices for complete data set)
Figure 6: Regressions between the areas occupied by tailings storage facilities (TSF’s; left) and heap leach
piles (HLP’s; right) (see digital appendices for complete data set)
3.3 Key Water-Climate-Land Relationships
Here we compare surface water or groundwater use per tonne of ore processed versus average annual
rainfall, shown below, shown in Figures 7 to 9. In general, as rainfall increases there is greater use of surface
water resources (left graph; R2 0.270), although there is considerable variability. We exclude Ok Tedi from
the regression since it has an extremely unusual context for water resources and project configuration (i.e.
no tailings dam to allow for recycling). For groundwater, as rainfall decreases there is a strong tendency
towards increase groundwater use, although again there is considerable variability (right graph; R2 0.203).
Here we compare worked (recycled) and total water use per tonne of ore processed versus average annual
rainfall, shown below. Similarly to water sources, as rainfall increases there appears to be greater use of
total water overall but with considerable scatter, or as rainfall decreases there appears to be a stronger
tendency towards increased worked water use but with considerable variability.
Here we compare discharges of water per tonne of ore processed versus average annual rainfall, shown
below. As can be expected, as rainfall increases there tends to be greater discharges of water to the
environment (typically surface waters) use of total water overall (right graph; R2 0.440).
y = 170.17x1.1424
R² = 0.6727
0
1,500
3,000
4,500
6,000
7,500
9,000
0 5 10 15 20 25 30
Ro
ck M
ined
(M
t)
Open Cut Area (km2)
100% OC
50-99% OC
<50% OC
BinghamCanyon
Collahuasi
Grasberg
y = 63.206x + 103.84R² = 0.1798
0
1,200
2,400
3,600
4,800
6,000
0 5 10 15 20 25 30
Wa
ste
Ro
ck
(M
t)
Waste Rock Dump Area (km2)
Bingham Canyon
Grasberg
y = 57.054x - 52.509R² = 0.605
0
500
1,000
1,500
2,000
2,500
3,000
0 5 10 15 20 25 30 35
Tailin
gs (
Mt)
Tailings Dam Area (km2)
Tailings
y = 32.259x + 72.985R² = 0.1715
0
100
200
300
400
500
600
0 1 2 3 4 5 6 7 8
Heap
Leach
Pile (
Mt)
Heap Leach Pile Area (km2)
HeapLeach

Final Report: Water Use and Risks in Mining
G.M. Mudd, S.A. Northey, T.T. Werner RMIT University, December 2017 Page 8
Figure 7: Regressions between the surface water (left) and groundwater (right) extracted and rainfall (see
digital appendices for complete data set)
Figure 8: Regressions between the worked (recycled) water (left) and total water use (right) and rainfall (see
digital appendices for complete data set)
y = 0.0007x + 0.4185R² = 0.2703
0
0.4
0.8
1.2
1.6
2
2.4
0 1,000 2,000 3,000 4,000 5,000 6,000
Su
rfa
ce
Wa
ter
Ex
tra
cte
d (
m3/t
ore
)
Annual Rainfall (mm/year)
Ok Tedi
(excludes Ok Tedi)
y = 0.2577e0.0012x
R² = 0.2031
0
0.4
0.8
1.2
1.6
2
2.4
0 500 1,000 1,500 2,000 2,500
Gro
un
dw
ate
r E
xtr
ac
ted
(m
3/t
ore
)
Annual Rainfall (mm/year)
Mount Lyell
(excludes Mount Lyell)
0
0.9
1.8
2.7
3.6
4.5
0 500 1,000 1,500 2,000 2,500
Wo
rke
d W
ate
r U
se
d (
m3/t
ore
)
Annual Rainfall (mm/year)
y = 0.0004x + 2.3931R² = 0.0516
0
4
8
12
16
20
0 500 1,000 1,500 2,000 2,500
To
tal
Wa
ter
Use
d (
m3/t
ore
)
Annual Rainfall (mm/year)

Final Report: Water Use and Risks in Mining
G.M. Mudd, S.A. Northey, T.T. Werner RMIT University, December 2017 Page 9
Figure 9: Regression between the discharged water and rainfall (see digital appendices for complete data
set)
y = 0.1432e0.0013x
R² = 0.4402
0
1
2
3
4
5
6
7
8
9
10
0 500 1,000 1,500 2,000 2,500 3,000
Dis
ch
arg
ed
Wa
ter
(m3/t
ore
)
Annual Rainfall (mm/year)

Final Report: Water Use and Risks in Mining
G.M. Mudd, S.A. Northey, T.T. Werner RMIT University, December 2017 Page 10
4. Case Studies & Examples
Here we present some selected case studies of the financial impacts of water risks on mines and companies,
as well as a range of specific examples on the cost implications being realised at various mines.
4.1 Tomingley Gold Mine, Alkane Resources Ltd, NSW Australia
March and June 2013 – significant rainfall affected construction, leading to major erosion and sediment
reaching off-site ponds at two adjacent farms and the Newell Highway; no subsequent reported budget
impacts (Annual Report 2013)
May 2015 – NSW Environment Protection Authority (EPA) successfully enforced a prosecution against
Tomingley gold mine for the March and June 2013 events, fine of Aus$95,000 (Quarterly Report, Sept.
2015)
April to June 2016 – excessive rainfalls during the quarter, no direct impacts (Quarterly Report, June
2016)
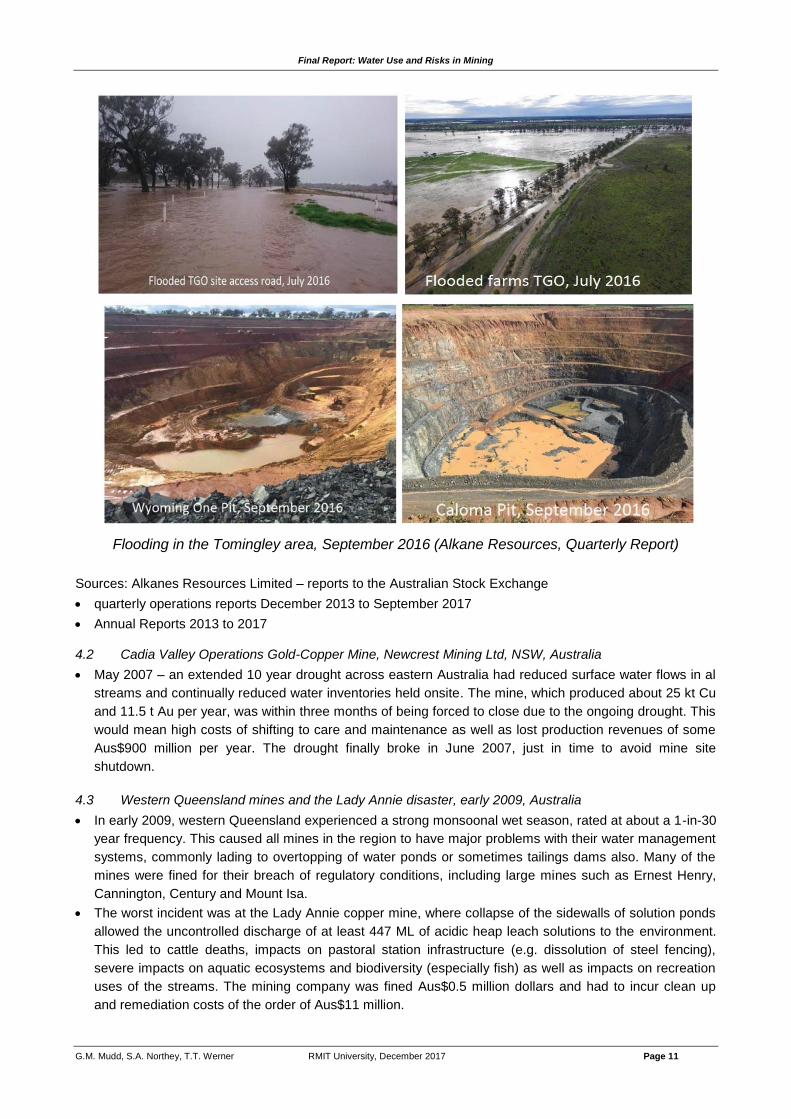
September and December 2016 quarters – persistent excessive rainfalls during the quarter, caused
flooding of the Wyoming One pit and delaying ore supply to the mill, leading to higher unit costs; mine site
water management systems held and no off-site impacts reported (Quarterly Report, Sept. 2016)
o assuming full mill capacity (~295 kt ore processed per quarter at a grade of 2 g/t Au), this means a
loss of production of ~7,227 oz Au (225 kg Au) in the Sept. 2016 quarter and ~5,906 oz Au (184 kg
Au) in the Dec. 2016 quarter
o market prices for gold in these quarters was Aus$1,760/oz Au and Aus$1,769/oz Au
o loss of revenue is Aus$12.7 million and Aus$10.4 million
o this represents a loss of revenue by about one third each quarter
o also means unit costs would be about one third lower – and mine operating at profit
instead of a loss
0
125
250
375
500
625
750
875
-500
0
500
1,000
1,500
2,000
2,500
3,000
20
13
D¼
20
14
M¼
20
14
J¼
20
14
S¼
20
14
D¼
20
15
M¼
20
15
J¼
20
15
S¼
20
15
D¼
20
16
M¼
20
16
J¼
20
16
S¼
20
16
D¼
20
17
M¼
20
17
J¼
20
17
S¼
Qu
art
erl
y G
old
Pro
du
cti
on
Rain
fall / A
ISC
All In Sustaining Costs (Aus$/oz)
Rainfall Deviation
Quarterly Gold Production (kg)
Abnormal rains,causing floodingand higherproduction costs
Abnormal rainfall & flooding
Sta
rt o
f p
rod
uc
tio
n
Final Report: Water Use and Risks in Mining
G.M. Mudd, S.A. Northey, T.T. Werner RMIT University, December 2017 Page 11
Flooding in the Tomingley area, September 2016 (Alkane Resources, Quarterly Report)
Sources: Alkanes Resources Limited – reports to the Australian Stock Exchange
quarterly operations reports December 2013 to September 2017
Annual Reports 2013 to 2017 4.2 Cadia Valley Operations Gold-Copper Mine, Newcrest Mining Ltd, NSW, Australia
May 2007 – an extended 10 year drought across eastern Australia had reduced surface water flows in al
streams and continually reduced water inventories held onsite. The mine, which produced about 25 kt Cu
and 11.5 t Au per year, was within three months of being forced to close due to the ongoing drought. This
would mean high costs of shifting to care and maintenance as well as lost production revenues of some
Aus$900 million per year. The drought finally broke in June 2007, just in time to avoid mine site
shutdown.
4.3 Western Queensland mines and the Lady Annie disaster, early 2009, Australia
In early 2009, western Queensland experienced a strong monsoonal wet season, rated at about a 1-in-30
year frequency. This caused all mines in the region to have major problems with their water management
systems, commonly lading to overtopping of water ponds or sometimes tailings dams also. Many of the
mines were fined for their breach of regulatory conditions, including large mines such as Ernest Henry,
Cannington, Century and Mount Isa.
The worst incident was at the Lady Annie copper mine, where collapse of the sidewalls of solution ponds
allowed the uncontrolled discharge of at least 447 ML of acidic heap leach solutions to the environment.
This led to cattle deaths, impacts on pastoral station infrastructure (e.g. dissolution of steel fencing),
severe impacts on aquatic ecosystems and biodiversity (especially fish) as well as impacts on recreation
uses of the streams. The mining company was fined Aus$0.5 million dollars and had to incur clean up
and remediation costs of the order of Aus$11 million.

Final Report: Water Use and Risks in Mining
G.M. Mudd, S.A. Northey, T.T. Werner RMIT University, December 2017 Page 12
4.4 Cerro Bayo Gold Mine, Mandalay Resources Ltd, Region IX, Chile
Management Discussion & Analysis (MDA) Reports June & September 2017
9 June 2017 – significant rainfall lead to flooding of the Delia NW mine, causing operations to be
indefinitely suspended.
Details remain unclear, but it appears that the major rainfall caused flooding of nearby Laguna Verde to
breach into and flood the Delia NW mine workings – but not the Delia SE or Coyita mines.
June 2017 quarter – loss of 3 weeks production amounts to ~US$4.04 million of lost revenue (based on
average production levels)
o “In addition to impacts on volumes, revenues, and cost of sales, the Company recorded $2.4 million of
additional expenses incurred for the search for the miners and crisis management following the event.
Other costs include a non-financial write-off of the remaining carrying value of the Delia NW mining
interests of $0.8 million and a loss of $0.5 million of property, plant and equipment which will not be
recovered from the flooded mine.” (page 3, June 2017)
September 2017 (and future) quarters – loss of entire production amounts to ~US$14.13 million of lost
revenue per quarter, excluding ongoing care & maintenance costs of US$5.5 million for the quarter (due
to mine being formally shut down), with future quarterly costs reducing to ~US$1.5 million/quarter – the
timing of re-opening remains unknown and unclear as it depends on when approval will be granted by the
Chilean regulator to re-start operations.
Lost revenue for 2017 alone can be estimated to be of the order of US$32.3 million plus care &
maintenance costs of ~US$8.5 million – with no clarity yet on the impact of any regulatory
decisions and associated costs (e.g. possible engineering works to reduce mine flooding risks).
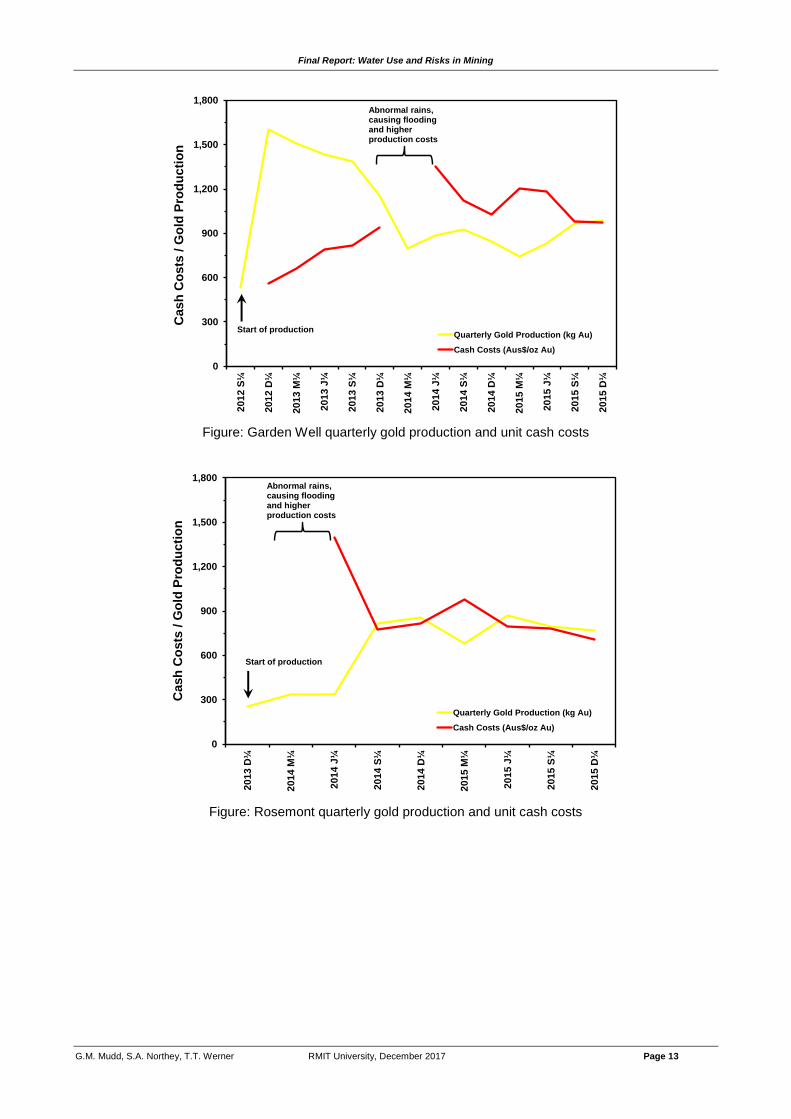
4.5 Duketon Group Gold Mines, Regis Resources Ltd, Western Australia, Australia
Relatively new gold mines, Moolart Well (start production ~August 2010), Garden Well (start production
~September 2012), Rosemont (start production ~October 2013)
o “Production was materially affected by a severe rainfall event and subsequent flooding of Garden Well
and Rosemont pits on 13th February 2014.” (ASX Quarterly Report, March 2014, page 1)
o “As previously reported, gold production during the quarter at Garden Well was hampered by lower
than expected head grades exacerbated by the commencement of a cut-back and significant rainfall
which impacted the ability to deliver higher than run of mine grade material to the mill.” (ASX Quarterly
Report, March 2015, page 2)
Based on expected mill production rates, lost revenue for the March and June 2014 quarters for
both Garden Well and Rosemont can be estimated to be ~Aus$83.9 million – reducing revenues by
~17.6%. Regis Resources was still able to deliver a maiden profit to shareholders, but this was
clearly reduced by the financial impact of the flooding event.
Final Report: Water Use and Risks in Mining
G.M. Mudd, S.A. Northey, T.T. Werner RMIT University, December 2017 Page 13
Figure: Garden Well quarterly gold production and unit cash costs
Figure: Rosemont quarterly gold production and unit cash costs
0
300
600
900
1,200
1,500
1,800
2012 S
¼
2012 D
¼
2013 M
¼
2013 J
¼
2013 S
¼
2013 D
¼
2014 M
¼
201
4 J
¼
2014 S
¼
2014 D
¼
2015 M
¼
201
5 J
¼
2015 S
¼
2015 D
¼
Cash
Co
sts
/ G
old
Pro
du
cti
on
Quarterly Gold Production (kg Au)
Cash Costs (Aus$/oz Au)
Abnormal rains,causing floodingand higherproduction costs
Start of production
0
300
600
900
1,200
1,500
1,800
2013 D
¼
2014
M¼
201
4 J
¼
2014
S¼
2014 D
¼
2015
M¼
201
5 J
¼
2015
S¼
2015 D
¼
Cash
Co
sts
/ G
old
Pro
du
cti
on
Quarterly Gold Production (kg Au)
Cash Costs (Aus$/oz Au)
Abnormal rains,causing floodingand higherproduction costs
Start of production

Final Report: Water Use and Risks in Mining
G.M. Mudd, S.A. Northey, T.T. Werner RMIT University, December 2017 Page 14
4.6 CDP Water Disclosures
The Carbon Disclosure Project (‘CDP’), originally designed to gather information about the financial risks
posed by exposure to climate change risks, developed a new approach for the reporting of water risks –
simply called CDP Water. Although disclosures through the CDP Water system are often not available on
mining company websites, they are available at CDP Water, and provide numerous examples of the financial
risks posed by various types of water risks and challenges for mining projects.
Some examples of disclosures to CDP Water (CDP Water 2013):
Company responses to the CDP Water questionnaire are available through the online CDP database and
these are occasionally also presented on company websites.
CDP Water 2016 Information Request - Anglo American – Period 1 Jan 2015 to 31 Dec 2015
Los Bronces, Salado River Basin, Chile
Financial Impact:
$90.5 million reduced revenue (18,000 tonnes lower copper production)
$180 million expenditure (investment in water recycling systems)
Impact Description:
“Los Bronces is Anglo American's largest operation in Chile and one of the largest copper deposits in the
world. Los Bronces is currently experiencing its 6th consecutive dry year. The water constraints have
resulted in production constraints. This has forced the team to develop and implement a series of water-
efficiency measures and seek alternative, non-competing sources of water to ensure the continuity of
adequate water supply for the operation.”
Response Description:
“The water constraints are part of our mining and processing plans for the year - which include actively
managing the use of our two processing plants - and we are progressing according to those plans. At Los
Bronces, the operation has continued to implement technical solutions to prevent further business impacts:
water is now transported via a 56-kilometre pipeline from the Las Tórtolas tailings dam to Los Bronces, using
a special water-recycling system. Other reduction initiatives include reducing the evaporation in tailing dams
as well as improving tailings deposition. The site will be adopting evaporation covers, expanding the use of
thickeners, and investigating other technology to recover water from tailings dams in 2016. In August the
installation of a new cyclone station was completed to increase the recovery of water in the dam. Los
Bronces is currently recycling more than 78% of available water. In the long-term, more stringent
environmental conditions, competing demand and continued dry conditions will continue to challenge
security. A project to support the operation to help it achieve Copper’s stated goal of “water resilience” by
2020 is underway.”

Final Report: Water Use and Risks in Mining
G.M. Mudd, S.A. Northey, T.T. Werner RMIT University, December 2017 Page 15
“Progress in implementing our water strategy is driven through our water management programme, which
has three areas of focus: driving operational excellence; investing in technology; and engaging and
partnering with our stakeholders. The programme is supported by a mandatory Group water standard and
delivered via operation-specific water-action plans. Los Bronces has continued to implement technical
solutions to prevent further business impacts: water is now transported via a 56-kilometre pipeline from the
Las Tórtolas tailings dam to Los Bronces, using a special water-recycling system. Other reduction initiatives
include reducing the evaporation in tailing dams as well as improving tailings deposition. The site will be
adopting evaporation covers, expanding the use of thickeners, and investigating other technology to recover
water from tailings dams in 2016. In August, the installation a new cyclone station was completed to increase
the recovery of water in the dam. Los Bronces is currently recycling more than 78% of available water. The
water recycling system at the Los Bronces operation was a significant investment of $180 million, which was
a direct capital expenditure cost derived from invoices.”
CDP Water 2016 Information Request - Anglo American – Period 1 Jan 2015 to 31 Dec 2015
Mogalakwena, Limpopo River Basin, South Africa
Financial Impact:
$250,000 increased operational costs (community water)
$5 million expenditure (municipal sewage works)
Impact Description:
“All of our operations within the Limpopo river basin are located in water stressed areas. In addition, there
are challenging socio-economic circumstances with high poverty levels and poor infrastructure. These
conditions are exacerbated by the drought conditions experienced in southern Africa as a result of the El
Nino effect. This means that access to secure water and community opposition is a risk. For example, in
August 2015 Mogalakwena mine experienced community protests and public violence. When consultations
between government and the mines and communities took place, one of the issues highlighted by
communities was the lack of potable water provision by the government.”
Response Description:
“While the delivery of services lies within the remit of local municipalities, as a temporary measure (until a
long-term solution is found) the mine offered to assist with water provision. This is especially important as the
province is undergoing a period of drought, which has impacted borehole water levels. The mine therefore is
extracting water from its deeper boreholes and distributing it to the community by bowser. It is also engaging
with the municipality in finding a permanent. Since November 2015, a total of 12 villages, with a population of
approximately 35,000 residents, have been supplied with water by the mine on a temporary basis. In
addition, the families that have not yet been relocated as part of the ongoing resettlement at Motlhotlo are
also being supplied with water until the process is completed. We also provide water to Podile Primary
School at Ga-Molekana and Seritarita High School as the water from their borehole is of poor quality. To
ensure the long-term security of water availability for our operations and surrounding communities, Anglo
American Platinum have also developed a bulk-water strategy and infrastructure plan, to protect, manage
and maintain the water supply.”

Final Report: Water Use and Risks in Mining
G.M. Mudd, S.A. Northey, T.T. Werner RMIT University, December 2017 Page 16
CDP Water 2016 Information Request - Anglo American – Period 1 Jan 2015 to 31 Dec 2015
De Beers Snap Lake underground mine, Mackenzie River Basin, Canada
Financial Impact:
$100 million per year (water management)
Impact Description:
“De Beers Snap Lake underground mine operation in Canada is located in an area of excessive water where
the host rock surrounding the ore body is fractured. This has resulted in the inflow of excess water including
ancient, naturally occurring “connate” groundwater that has been trapped in the rock deep underground for
thousands of years. This groundwater is high in mineral salts and requires special attention so that the mine
remains in compliance with water licence requirements. The major impacts include increased water
management costs linked to more stringent license conditions related to the volume and quality of
discharge.”
Response Description:
“Snap Lake mine was storing large volumes of water underground due to high concentrations of dissolved
solids including mineral salts, which required treatment before discharge to conform to prescribed limits. The
excess water also limited access to certain parts of the mine, which reduced the mineable ore level. As a
result of market conditions, the operation was placed into care and maintenance on December 4, 2015.
Water quality at the operation continues to be managed and monitored in line with its approved care and
maintenance plan. The mine is involved in technical studies, stakeholder engagement and legal processes to
evaluate options should it remain in extended care and maintenance.”
CDP Water 2015 Information Request – Anglo American – Period 1 Jan 2014 to 31 Dec 2014.
Mantos Blancos & Mantoverde, Copiapó and Lao River Basins, Chile
Financial Impact:
660 tonnes reduced copper production (Mantos Blancos – safety stoppages & water supply)
2,000 tonnes reduced copper production (Mantoverde – shutdown from damaged powerline)
$2 million (supporting reconstruction of Chanaral and El Salado)
Impact Description:
“The north of Chile was affected by abnormally heavy rainfall over the 24th and 25th of March, 2015. This
affected mainly Antofagasta, Copiapo and Chanaral with floods, landslides and avalanches causing a great
amount of damage to cities and small towns. This caused mudslides and rivers to breach their banks,
leaving residents stranded, flooding cities, and cutting power supply. Anglo American’s Mantoverde mine
was halted due to safety stoppages and restricted water supply. Mantos Blancos was halted after a power
failure. None of Anglo American’s employees or contractors were injured.”
Response Description:
“Our social team developed a plan to provide immediate support to the communities affected by this
catastrophe, providing food, water and other basic supplies, shelter in the company’s facilities and providing
support to the local authorities. Anglo American established a $2 million fund to support the reconstruction of
Chanaral and El Salado, with a focus on education, including the construction of two pre- school facilities
and supporting small and medium sized entrepreneurs to restart their businesses.”

Final Report: Water Use and Risks in Mining
G.M. Mudd, S.A. Northey, T.T. Werner RMIT University, December 2017 Page 17
CDP Water 2015 Information Request – Anglo American – Period 1 Jan 2014 to 31 Dec 2014.
Nickel, niobium and phosphate businesses, Sao Francisco River Basin, Brazil
Financial Impact:
US$560,000 capital expenditure (water savings project)
Impact/Risk Description:
“Water availability in the Catalão region is a risk to nickel, niobium and phosphates businesses in Brazil. The
risk has increased due to the dry season affecting the region and the increased water demand.”
Response Description:
“The risk is mitigated in the short term by an agreement signed with a peer company, which allows us to
abstract water from their tailings dam. To mitigate long term risk, a water use license was obtained for
abstraction from the São Marcos River. In 2014, Catalão experienced savings of 10 ML from WETT projects
and a total capital cost for projects of approximately US $ 560 000.”
CDP Water 2016 Information Request – African Rainbow Minerals – Period 1 Jul 2014 to 30 Jun 2015
Khumani Mine & Black Rock Mine, Orange (WMA) River Basin, South Africa
Financial Impact:
R15 million (augmentation to Sedibeng Water Supply
Impact/Risk Description:
“The risk is the potential loss of production or lost opportunity at Khumani mine and at Black Rock mine due
to the shortage of water and interruption in continuous water supply hampering the continuous running of the
plant resulting in a reduction in production and resultant lost revenue. Black Rock mine is at the end of the
Sedibeng water supply line and therefore ongoing expansion in water supply has to be planned closely with
availability in mind to manage water supply risk.”
Response Description:
“Investment in water infrastructure (e.g. Assmang assisted Sedibeng with the upgrade and expansion of the
Beeshoek pump station (debottlenecking); Khumani funded the upgrade of the Olifantshoek bulk water
infrastructure; and various investments in maintenance) Investment in on-site water storage, Collaboration
with the Sedibeng Water Board and the DWS (regional water study) Reduced consumption through
efficiencies (e.g. Reduced water consumption for mining activities through the use of "additives". The mine
uses a "paste" technology for tailings disposal to reduce consumption. Up to 85% of water is recovered.
Water balance and monitoring Implementing various efficiencies including Water conservation measures
implemented, such as storm water trenches and dams. Nkomati has a dewatering programme in place
managed by engineering services. There are various other measures to monitor and engineer pit stability.”
CDP Water 2016 Information Request – African Rainbow Minerals – Period 1 Jul 2014 to 30 Jun 2015
Nkomati, Inkomati-Usuthu (WMA) River Basin, South Africa
Financial Impact:
R1.75 million
Impact/Risk Description:
“There is a risk of non-compliance to the WUL condition. The mine has submitted a WUL amendment
application in order to store excess water in Pit 3. This will reduce the frequent discharges. The risk is the
potential failure of the pit slopes which may result in production losses, fatalities and equipment damage.
The risk is accentuated by the topography of the mine site and weather conditions.”
Response Description:
“Nkomati has a dewatering programme in place managed by engineering services. There are var ious other
measures to monitor and engineer pit stability.”

Final Report: Water Use and Risks in Mining
G.M. Mudd, S.A. Northey, T.T. Werner RMIT University, December 2017 Page 18
CDP Water 2016 Information Request – Newmont Mining Corporation – Period 1 Jan 2014 to 31 Dec
2015
Ghana Mines, Tano River Basin, Ghana
Financial Impact:
$37 million USD (plant disruption due to interrupted hydro-electricity supply)(25% reduction in gold
production)
Impact/Risk Description:
“Ghana generates 70% of its power from hydroelectric dams. Ghana is in the midst of a cyclical drought. The
drought is reducing the power output from Ghana's hydroelectric dams (now at about 50%). Reduced
national power output results in 1 day in each 3 days with no power during periods of load shedding.
Blackouts days impact both of our Ghana operating mines.”
Response Description:
“Use of technology for improving Ahafo water quality via a water treatment plant is now being developed.
Recycling of sewage treated effluent for gold processing. Further, additional opportunities have been
identified in Ahafo and Akyem Water Charters as part of implementing the Global Water Strategy. Installation
emergency backup power.”
Boddington, Hotham River Basin, Australia
Financial Impact:
$10 million USD
Impact/Risk Description:
“Our Boddington Western Australia operation requires abstraction of Hotham River water for processing
purposes. Lower than average rainfall limits the amount of water available for abstraction.”
Response Description:
“Site awareness programs, flocculation trials (increased tails density reducing water consumption),
infrastructure modifications - rerouting pipework (recycling of water) and optimization of plan process control
(increasing water efficiency).”
Final Report: Water Use and Risks in Mining
G.M. Mudd, S.A. Northey, T.T. Werner RMIT University, December 2017 Page 19
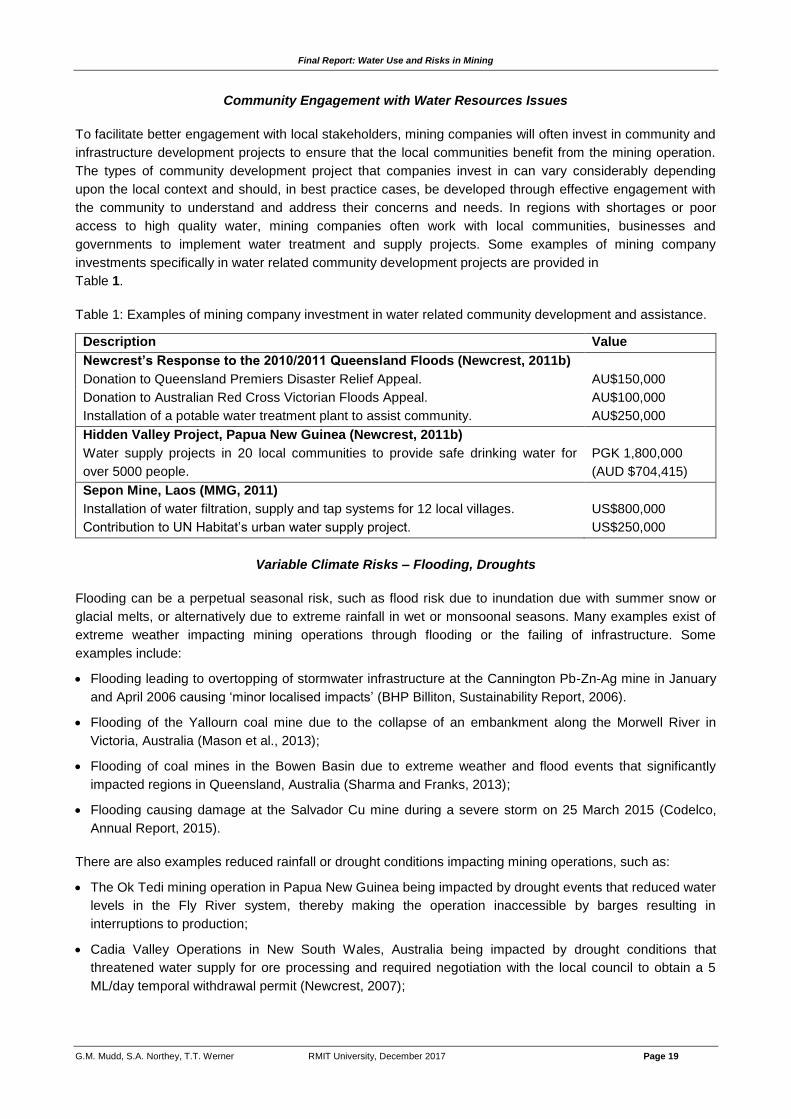
Community Engagement with Water Resources Issues
To facilitate better engagement with local stakeholders, mining companies will often invest in community and
infrastructure development projects to ensure that the local communities benefit from the mining operation.
The types of community development project that companies invest in can vary considerably depending
upon the local context and should, in best practice cases, be developed through effective engagement with
the community to understand and address their concerns and needs. In regions with shortages or poor
access to high quality water, mining companies often work with local communities, businesses and
governments to implement water treatment and supply projects. Some examples of mining company
investments specifically in water related community development projects are provided in
Table 1.
Table 1: Examples of mining company investment in water related community development and assistance.
Description Value
Newcrest’s Response to the 2010/2011 Queensland Floods (Newcrest, 2011b)
Donation to Queensland Premiers Disaster Relief Appeal. AU$150,000
Donation to Australian Red Cross Victorian Floods Appeal. AU$100,000
Installation of a potable water treatment plant to assist community. AU$250,000
Hidden Valley Project, Papua New Guinea (Newcrest, 2011b)
Water supply projects in 20 local communities to provide safe drinking water for
over 5000 people.
PGK 1,800,000
(AUD $704,415)
Sepon Mine, Laos (MMG, 2011)
Installation of water filtration, supply and tap systems for 12 local villages. US$800,000
Contribution to UN Habitat’s urban water supply project. US$250,000
Variable Climate Risks – Flooding, Droughts
Flooding can be a perpetual seasonal risk, such as flood risk due to inundation due with summer snow or
glacial melts, or alternatively due to extreme rainfall in wet or monsoonal seasons. Many examples exist of
extreme weather impacting mining operations through flooding or the failing of infrastructure. Some
examples include:
Flooding leading to overtopping of stormwater infrastructure at the Cannington Pb-Zn-Ag mine in January
and April 2006 causing ‘minor localised impacts’ (BHP Billiton, Sustainability Report, 2006).
Flooding of the Yallourn coal mine due to the collapse of an embankment along the Morwell River in
Victoria, Australia (Mason et al., 2013);
Flooding of coal mines in the Bowen Basin due to extreme weather and flood events that significantly
impacted regions in Queensland, Australia (Sharma and Franks, 2013);
Flooding causing damage at the Salvador Cu mine during a severe storm on 25 March 2015 (Codelco,
Annual Report, 2015).
There are also examples reduced rainfall or drought conditions impacting mining operations, such as:
The Ok Tedi mining operation in Papua New Guinea being impacted by drought events that reduced water
levels in the Fly River system, thereby making the operation inaccessible by barges resulting in
interruptions to production;
Cadia Valley Operations in New South Wales, Australia being impacted by drought conditions that
threatened water supply for ore processing and required negotiation with the local council to obtain a 5
ML/day temporal withdrawal permit (Newcrest, 2007);
Final Report: Water Use and Risks in Mining
G.M. Mudd, S.A. Northey, T.T. Werner RMIT University, December 2017 Page 20
Extremely low rainfall at the Lihir gold mine in Papua New Guinea that reduced the freshwater available
for the processing circuits, resulting in 40,000 oz Au lower production for the period (Newcrest, 2011a).
5. Publication Plan
At present, the rich data sets generated by this research are planned for multiple journal publications,
focussed on the water accounting framework, life cycle assessment as well as links between water balance
and water use. It is expected that all of these publications will be finalised in early 2018.
6. Discussion, Conclusions and Further Research
This study has generated extensive data sets on water use in mining as well as linking this to potential
financial risks related to water resources issues. Overall, there appears to be considerable variability in wate
use and risks, and this requires further complex statistical analysis which has been beyond the scope and
capacity of this project. There is clearly a need for further research, and the final publications will explore
these issues in greater detail. At present, however, it is clear that a mine or company’s exposure to the
financial costs of water resources risks are complex, highly variable and dependent on the mine’s design and
overall context. That is, all sites appear to be very site-specific and require individual analysis and
consideration. Some major gaps still remain, however, such as the ability to address water quality risks,
consistency of reporting, and the like. Despite considerable progress, there remains much to do to more fully
analyse and understand the relationship between mining, water resources and financial risks.
7. References
ICMM, 2017, A Practical Guide to Consistent Water Reporting. International Council on Mining & Metals
(ICMM), London, UK, March 2017, 72 p.
MCA. (2014). Water Accounting Framework for the Minerals Industry, User Guide, Version 1.3, January
2014. Prepared by the Sustainable Minerals Institute, University of Queensland for the Minerals
Council of Australia (MCA).
8. Digital Appendices
Water Metrics Database – detailed water intensity data related to production data and mine site areas.
Land Use Area Dataase – detailed areal mapping of major mines to assess key mine features.
Final Report: Water Use and Risks in Mining
G.M. Mudd, S.A. Northey, T.T. Werner RMIT University, December 2017 Page 21
9. Report Appendix 1
Justification of a Database for Water Use in Mining
Water Use Reporting Over the past two decades the mining industry has increasingly made disclosures of water use as part of
environmental management and corporate sustainability reporting (Perez and Sanchez, 2009). These
disclosures may include mandatory reporting, such as environmental compliance reporting to regulatory
authorities that may be made public in some jurisdictions. In other cases, mining companies are voluntarily
disclosing water use data through initiatives such as corporate sustainability reporting and market
disclosures (Leong et al., 2014). Most existing studies that have assessed these activities have focused
upon the degree of compliance with the various reporting standards that guide these disclosures, such as
the Global Reporting Initiative (Fonseca et al., 2014; Jenkins and Yakovleva, 2006). However, there has
been more limited analysis of the actual data being communicated within these reports and how this can be
used to develop a more rigorous understanding interactions of the mining industry with the environment and
society.
The Global Reporting Initiative (GRI) provides a framework for organisation's to regularly publish
‘Sustainability Reports’ that describe performance of the company on social, economic and environmental
grounds (GRI, 2013a) . Despite being voluntary, there has been strong uptake of GRI based sustainability
reporting by major mining companies (Perez and Sanchez, 2009; Fonseca et al., 2014). The GRI requires
organisations to report against a variety of societal, environmental and economic performance indicators.
The main indicators that could potentially provide useful data be reported under by the most recent reporting
standard GRI4 include (GRI, 2013a):
G4-EN8 – Total water withdrawal by source.
G4-EN9 – Water sources significantly affected by withdrawal of water.
G4-EN10 – Percentage and total volume of water recycled and reused.
G4-EN22 – Total water discharge by quality and destination.
G4-EN26 – Identity, size, protected status, and biodiversity value of water bodies and related habitats
significantly affected by the organisations discharges of water and runoff.
The GRI has evolved over time to meet the needs of stakeholders and to improve the meaningfulness or
requirements of reporting indicators. Additional reporting supplements specifically for the mining industry
have been made available to improve the quality of disclosures being made by the sector (GRI, 2013b).
The Carbon Disclosure Project (CDP) began as a scheme that was focused upon querying companies on
their exposure to climate change risks and the actions they were taking to mitigate or adapt to these risks
(CDP, 2017). Following the success of the CDP, a derivative scheme, CDP Water, was established to
assess how companies are exposed to water risks and the actions they are taking in manage or address
these. CDP Water is structured as a questionnaire that is sent to companies and the focus is on
understanding an individual company’s exposure to water related risks. Most major mining companies now
regularly report to the CDP and CDP Water schemes as part of their voluntary reporting practices. From this
considerable insights are able to be reached regarding the water related risks that the mining industry faces,
and their responses to these risks (CDP, 2013). CDP Water reports are accessible through an online
database and readers are encouraged to explore these, as they provide unique insights into how the mining
industry views water risks (GRI, 2017).
Analysis by CDP Water of the questionnaire responses of 36 mining companies showed that 92% of
respondents reported having identified water risks that could alter their business operation, revenue
generation or expenditure requirements within the next 5 years (CDP Water, 2013). Across these disclosures

Final Report: Water Use and Risks in Mining
G.M. Mudd, S.A. Northey, T.T. Werner RMIT University, December 2017 Page 22
a number of substantive risks were identified, although these differ depending upon where an individual
company’s operations are located. Many respondents cite increased water stress in the regions they operate
as a substantive risk. Risks associated with flooding are also commonly raised by respondents. Some mid-
to long-term regulatory risks related to tighter regulation of water discharges are also viewed as important
risks by some companies. Across shorter time horizons, changes to water withdrawal and allocation rights
are considered to be a more immediate regulatory risk by many companies.
Despite the widespread reporting of mining companies using schemes such as the GRI and CDP Water,
there has been substantial inconsistency in how mining companies have been reporting water use data to
these schemes (Cote et al., 2012; Mudd, 2008; Leong et al., 2014) developed its’ own water accounting
standards to facilitate the more consistent communication and reporting of water use information by mining
companies. As an example of this, the International Council on Mining & Metals recently released a water
reporting framework for the industry (ICMM, 2017) that was heavily developed based upon the Water
Accounting Framework for the Minerals Industry that was developed by the Sustainable Minerals Institute for
the Minerals Council of Australia (MCA, 2014).
The Water Accounting Framework for the Minerals Industry (WAFMI) was developed for by the Sustainable
Minerals Institute (University of Queensland) for the Minerals Council of Australia (MCA) (Cote et al., 2012;
MCA, 2014). The framework provides a consistent way of accounting for water flows through and within a
mine-site, to provide consistency in the accounting and reporting of this information. The WAFMI provides a
systematic way of recording the inputs, outputs, diversion and storage of water at a site level. Water quality
thresholds are used by the WAFMI to account for water inputs and outputs across three water quality
categories
The WAFMI provides data in two ways. An input-output table is the main outcome of adopting the WAF. This
provides a measure of all the inflows to the site, such as: rainfall, mine water infiltration, ground and surface
water withdrawals, and moisture entrainment in ores. Outputs include parameters such as: seepage,
evaporation, discharges and tailings entrainment. A statement of task usages is also included and contains
flows into individual processes, such as: concentrators, mine site equipment, etc. Analysis as shown that the
WAFMI is flexible enough to be broadly applicable to mining operations, regardless of the local climate or
hydrological context of the mining operation (Danoucaras et al., 2014).
The International Council on Mining & Metals has in recent years begun to provide guidance on water
management in the mining industry through the release of a range of publications listed below:
Water management in mining: a selection of case studies (ICMM, 2012)
Adapting to a changing climate: implications for the mining and metals industry’ (ICMM, 2013)
Water stewardship framework (ICMM, 2014)
A practical guide to catchment-based water management for the mining and metals industry (ICMM, 2015)
A practical guide to consistent water reporting (ICMM, 2017)
In March 2017, the ICMM released the ‘Practical Guide to Consistent Water Reporting’ (ICMM, 2017). The
ICMM’s water reporting guide was heavily modelled upon the WAFMI and so the two accounting standards
share the same basic underpinnings. However, a major improvement over the WAFMI is the greater
treatment given to providing guidance to describe the local water context surrounding mining operations and
more broadly the communication of water risk related information.

Final Report: Water Use and Risks in Mining
G.M. Mudd, S.A. Northey, T.T. Werner RMIT University, December 2017 Page 23
Water Use Reporting Several authors have previously compiled datasets of mine water use statistics, based most commonly on
the corporate sustainability reporting of mining companies. The early assessment of direct water use for
various metal production routes by Norgate and Lovel (2004; 2006) was based directly on data compiled
from the corporate sustainability reporting of mining, mineral processing and metal producing companies –
although this is not typically recognised. Considerable work was also undertaken by Mudd (2008) to compile
a dataset of mine water use intensity (e.g. m3/t product, m3/t ore) that, despite being the most comprehensive
assessment at the time, he considered to be a preliminary effort only. As he was aware of considerably more
reporting by companies that was not captured by his data compilation efforts. Prior to the present doctoral
studies, the author compiled a dataset of the water use intensity of copper mining operations (Northey et al.,
2013). Gunson (2013) also compiled a detailed dataset of mine water use intensity for 19 mined
commodities, which he used to estimate the global water withdrawals associated with non-fuel mining for the
years 2005-2008 (
Table 2). A range of limitations and shortcomings exist with these studies, including:
They have tended to focus compiling either water ‘use’, ‘consumption’ and ‘withdrawals’ data for mining
operations, with very limited definition or differentiation of these terms.
Water sources (e.g. surface, groundwater, rainfall, etc.) has not been specified.
Water discharge data has typically not been compiled.
The water quality of withdrawals and discharges has also not been specified.
Limited assessment how the data relates to local climate and water use contexts.
These short-comings are in large part due to the highly variable and inconsistent water use reporting
practices of individual companies, which would have prevented such analysis.
Table 2: Gunson’s (2013) estimate of global water withdrawals associated with non-fuel mining, based upon
his ore production method.
Withdrawals, Mm3 H2O
2006 2007 2008 2009
Total 6,870 7,766 7,489 7,518
Phosphate 3,046 3,258 3,187 3,052
Copper 1,337 1,233 1,301 1,363
Gold 657 942 997 1,141
Iron 589 737 555 883
Diamonds 546 713 206 305
Nickel 20 71 147 165
Zinc 195 243 82 95
Platinum 50 59 97 94
Potash 62 61 66 80
Bauxite 67 65 76 79
Molybdenum 129 102 86 58
Silver 22 21 28 40
Chromite 256 32
Lead 44 118 30 29
Tungsten 65 76 35 27
Uranium 9 12 18 25
Cobalt 3 16 26 19
Rhodium 21 31 45 16
Palladium 8 8 11 14
Final Report: Water Use and Risks in Mining
G.M. Mudd, S.A. Northey, T.T. Werner RMIT University, December 2017 Page 24
The development of industry water reporting guidance the such as those developed by the Minerals Council
of Australia (MCA, 2014) and the ICMM (2017) is expected to lead to increasing consistency and
sophistication of mine-site water use by companies. Therefore, there is an expectation of improved
availability and quality of water use data for the mining industry will improve going forward, and that this will
provide new sources of information that can be used to evaluate the water consumption and performance of
mining operations.
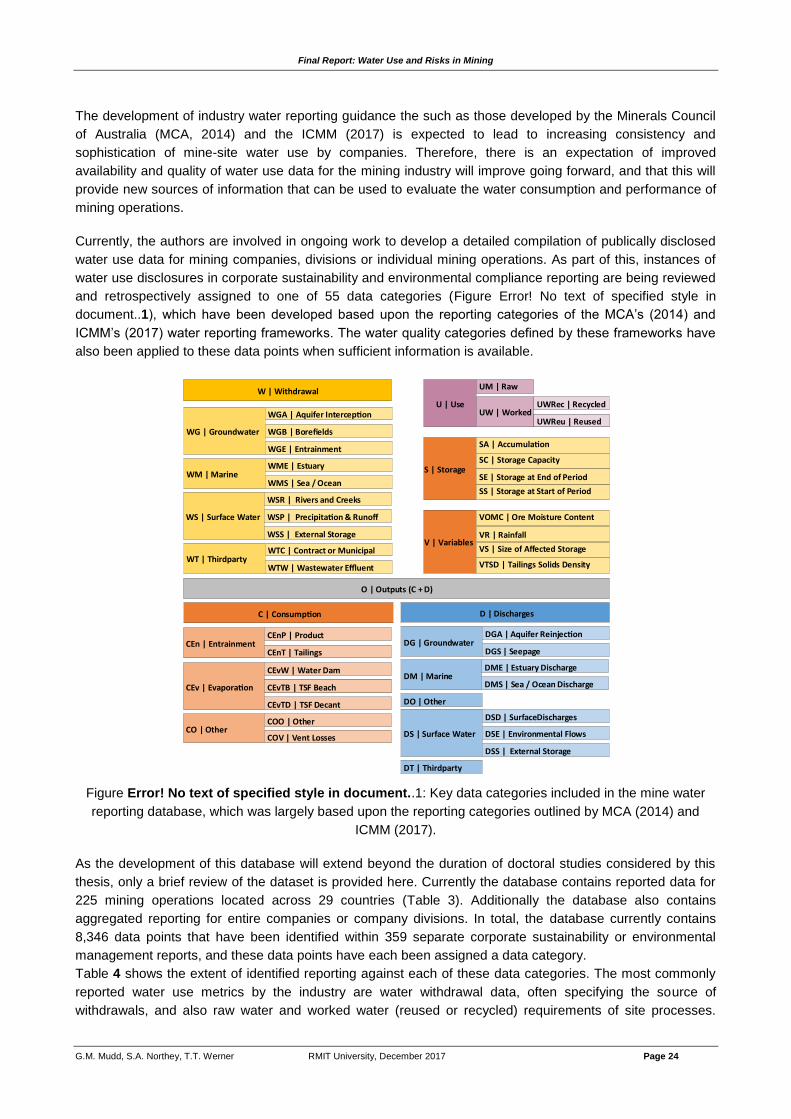
Currently, the authors are involved in ongoing work to develop a detailed compilation of publically disclosed
water use data for mining companies, divisions or individual mining operations. As part of this, instances of
water use disclosures in corporate sustainability and environmental compliance reporting are being reviewed
and retrospectively assigned to one of 55 data categories (Figure Error! No text of specified style in
document..1), which have been developed based upon the reporting categories of the MCA’s (2014) and
ICMM’s (2017) water reporting frameworks. The water quality categories defined by these frameworks have
also been applied to these data points when sufficient information is available.
Figure Error! No text of specified style in document..1: Key data categories included in the mine water
reporting database, which was largely based upon the reporting categories outlined by MCA (2014) and
ICMM (2017).
As the development of this database will extend beyond the duration of doctoral studies considered by this
thesis, only a brief review of the dataset is provided here. Currently the database contains reported data for
225 mining operations located across 29 countries (Table 3). Additionally the database also contains
aggregated reporting for entire companies or company divisions. In total, the database currently contains
8,346 data points that have been identified within 359 separate corporate sustainability or environmental
management reports, and these data points have each been assigned a data category.
Table 4 shows the extent of identified reporting against each of these data categories. The most commonly
reported water use metrics by the industry are water withdrawal data, often specifying the source of
withdrawals, and also raw water and worked water (reused or recycled) requirements of site processes.

Final Report: Water Use and Risks in Mining
G.M. Mudd, S.A. Northey, T.T. Werner RMIT University, December 2017 Page 25
Discharge data also exists for many mining operations. However, reporting is less common for data
categories related to the on-site storage of water and also specific modes of water consumption (e.g.
evaporation, tailings entrainment, etc.).
Table 3: List of countries containing a mining operation or division that reported data has been compiled for
Countries Containing a Mining Operation or Division with Reported Data
Argentina Fiji Mozambique Suriname
Australia France Namibia Tanzania
Brazil Germany Papua New Guinea United Kingdom
Canada India Peru United States
Chile Indonesia Philippine Zambia
Cote d'Ivoire Ireland Saudi Arabia
Dem. Rep. of Congo Laos South Africa
Dominican Republic Mongolia Spain
Table 4: Number of data points compiled for each data category
Code Description No. Code Description No.
W Withdrawals 552 C Consumption 43
WG Groundwater 333 CEn Entrainment 39
WGA Aquifer Interception 133 CEnP Product 4
WGB Borefields 486 CEnT Tailings Entrainment 4
WGE Ore Entrainment 24 CEv Evaporation 58
WM Marine 54 CEvTB Tailings Beach Evaporation 5
WMS Seawater 16 CEvTD Tailings Decant Evaporation 4
WS Surface Water 275 CEvW Water Dam Evaporation 10
WSP Precipitation and Runoff 109 CO Other 15
WSR Rivers and Creeks 79 COD Dust Suppression 11
WSS External Storage 33 COO Other 16
WT Third-party 151 COV Vent Losses 10
WTC Contract or Municipal 124 Sub-total 219
WTW Wastewater Effluent 40 D Discharges 610
Sub-total 2,409 DG Groundwater 48
U Use 151 DGS Seepage 27
UM Makeup/Raw 2,547 DM Marine 10
UW Worked 1,239 DME Estuary 11
UWRec Recycled (treated) 18 DMS Sea/Ocean 28
UWReu Reused (untreated) 20 DO Other 46
Sub-total 3,975 DS Surface Water 124
Div Diversions 7 DSD Surface Discharges 23
SA Accumulation 16 DSE Environmental Flows 16
SC Storage Capacity 9 DSS External Storage 10
SE Storage at End of Period 16 DT Third-party 61
SES Storage at Start of Period 16 Sub-total 1014
VOMC Ore Moisture Content 5 O Outputs (C+D) 150
VR Rainfall 411
VP Pan Evaporation 59
VS Size of Affected Water Source 10
VTSD Tailings Solids Density 30
Sub-total 579 Grand Total 8,346

Final Report: Water Use and Risks in Mining
G.M. Mudd, S.A. Northey, T.T. Werner RMIT University, December 2017 Page 26
Given the significant breadth of data currently being reported for the mining industry, it is possible to develop
detailed understanding of the overall water balance of many mining operations. For instance,

Final Report: Water Use and Risks in Mining
G.M. Mudd, S.A. Northey, T.T. Werner RMIT University, December 2017 Page 27
Table 5 presents a summary of key water use statistics for 35 copper mining operations currently included
within the database. From this data it is clear that there is substantial variability in how mining operations are
utilising and interacting with water. Some mines sites are heavily dependent upon withdrawing water from
groundwater, whereas others are more dependent upon surface water systems (including rainfall runoff) or
occasionally third-party sources (e.g. municipalities). There is also substantial variability in the intensity of
raw water use and also the contribution of worked water (reused or recycled) to total water use. The
discharge data is also highly variable and it is assumed that many of the mining operations are operated as
zero discharge sites.
Understanding the factors that drive the variability in the observed withdrawal, use and discharge data is not
a straightforward task. Copper mining operations are highly variable in terms of their processing
configurations, although from a water perspective this can roughly be generalised into two main processing
archetypes – heap leaching or flotation separation of sulphide ores – that could form the basis for further
assessment (see for instance Northey et al., 2013). There is also a temporal aspect to consider, as multiple
decades of data is available for some mines (e.g. Olympic Dam). Therefore, process and technology
improvements through time may also be a relevant consideration, as for instance there is some evidence
that Chilean copper mines are becoming more water efficient over (Lagos et al., 2017). Finally, the water
balance of a mining operation is heavily influenced by variability in weather and hydrological conditions and
so evaluating the dataset to identify the influence of these factors is also another potential avenue of future
research.

Final Report: Water Use and Risks in Mining
G.M. Mudd, S.A. Northey, T.T. Werner RMIT University, December 2017 Page 28
Table 5: Summary of water withdrawals, use and discharges for 25 copper mines. Absence of a data value does not imply that the flow does not exist, rather
only no public reporting was identified. Data key: Arithmetic average ± standard deviation (years of data). ‘Worked’ water is presented relative to total water
use (raw + worked water).
Mining Operation
Withdrawals Use Discharges
Groundwater Surface Marine Third-party Total Raw Worked
kL/t ore kL/t ore kL/t ore kL/t ore kL/t ore kL/t ore % kL/t Ore
Antamina 0.07±0.00(4) 0.43±0.06(4) - - 0.53±0.08(2) - - 0.90±0.06(4)
Alumbrera - - - - - 0.59±0.03(2) - -
Andina 0.20±0.14(7) 0.83±0.20(7) - 0.00±0.00(7) 1.01±0.07(10) 1.06±0.16(11) 44.8±6.9(13) 0.80±0.52(11)
Bingham Canyon - - - - - 1.13±0.18(6) 49.8±3.9(6) 0.32±0.00(1)
Cadia Valley
Operations 0.05±0.01(9) 0.51±0.44(9) - 0.14±0.04(9) 0.69±0.42(9) 0.40±0.14(11) 74.4±11.4(10) 0.17±0.22(8)
Chuquicamata 0.31±0.52(3) 0.89±0.59(4) - 0.00±0.00(4) 1.12±0.14(4) 1.04±0.12(4) 87.1±1.4(5) -
Cobar-CSA 0.29±0.00(2) 21.24±0.00(1) - - - 1.04±0.20(16) 45.5±8.7(3) -
Codelco Norte 0.10±0.16(3) 0.30±0.18(2) - 0.00±0.00(1) 0.45±0.02(7) 0.45±0.02(7) 84.8±1.6(8) 0.06±0.14(9)
Collahuasi 0.64±0.04(10) - - 0.05±0.00(1) 0.64±0.04(10) 0.61±0.04(13) 77.4±1.5(10) 0.02±0.00(5)
El Teniente 0.10±0.11(5) 1.07±0.28(6) - 0.00±0.00(3) 1.24±0.24(9) 1.24±0.26(11) 57.5±3.9(12) 1.03±0.40(11)
Ernest Henry 0.62±0.10(5) 0.49±0.13(7) - - - 0.48±0.13(10) - -
Escondida 0.58±0.10(6) - 0.02±0.02(3) 0.00±0.00(1) 0.53±0.06(2) 0.64±0.03(2) 28.3±2.6(2) 0.02±0.01(4)
Gabriela Mistral 0.11±0.03(6) 0.00±0.00(4) - 0.00±0.00(4) 0.12±0.02(4) 0.12±0.02(3) 51.7±44.2(4) -
Golden Grove 1.57±0.00(1) - - - 1.51±0.19(5) - 75.0±0.0(1) 0.37±0.23(3)
Kidd Mine - - - - - - 85.0±0.0(1) -
Kinsevere - - - - 4.27±4.10(4) - - -
Las Bambas - - - - 0.18±0.00(1) - 15.2±3.7(3) -
Lomas Bayas 0.06±0.04(8) 0.06±0.05(8) - - 0.11±0.02(8) 0.12±0.02(4) 24.4±0.2(2) -
Lumwana - - - - - 0.15±0.06(5) 88.0±2.6(4) 0.82±0.59(4)
Ministro Hales 0.58±0.39(2) 0.00±0.00(2) - 0.01±0.00(2) 0.58±0.40(2) 0.31±0.00(1) 20.2±1.7(2) -
Mount Isa (Copper) - 0.89±0.29(4) - - - 0.49±0.28(9) 66.1±6.7(5) -
Mount Lyell 1.60±0.00(1) 2.37±0.40(3) - - 2.61±1.22(4) 2.03±0.60(2) 14.3±0.0(1) 9.36±4.39(7)
Northparkes 0.43±0.17(9) 0.18±0.10(8) - - 0.64±0.17(8) 1.53±2.39(14) 49.7±21.6(10) -
Oyu Tolgoi 0.56±0.00(1) - - - - 0.48±0.06(4) 85.0±1.2(4) -
Ok Tedi - 0.57±0.21(12) - - - - - -
Olympic Dam 1.49±0.51(28) - - - - 1.15±0.10(10) - -
Palabora 0.34±0.16(5) 0.24±0.11(5) - 0.50±0.08(3) 1.00±0.35(3) 0.89±0.39(18) 72.1±10.1(12) 0.09±0.00(1)
Prominent Hill 0.65±0.08(6) 0.00±0.00(2) - 0.00±0.00(2) 0.64±0.14(3) - 19.5±3.5(2) -
Radomiro Tomic 0.08±0.02(3) 0.02±0.00(3) - - 0.10±0.02(3) 0.10±0.02(4) 88.2±2.7(5) -
Rosebery - - - - 19.08±12.27(3) - - 7.86±6.58(3)
Salvador 0.58±0.46(6) 1.20±0.54(7) - 0.00±0.00(6) 1.64±0.16(11) 1.59±0.19(12) 37.9±8.5(12) 0.31±0.45(12)
Sepon 0.05±0.02(2) 1.93±0.86(3) - - 3.34±1.52(8) - - 3.72±3.51(7)
Spence - - - 0.32±0.04(2) - 0.32±0.04(2) 96.0±0.0(1) -
Telfer 0.91±0.00(1) - - - - 0.87±0.34(7) 12.9±8.2(6) 0.04±0.01(2)
Zaldivar - - - - - 0.15±0.01(6) 93.0±1.4(2) 0.00±0.00(6)
Final Report: Water Use and Risks in Mining
G.M. Mudd, S.A. Northey, T.T. Werner RMIT University, December 2017 Page 29
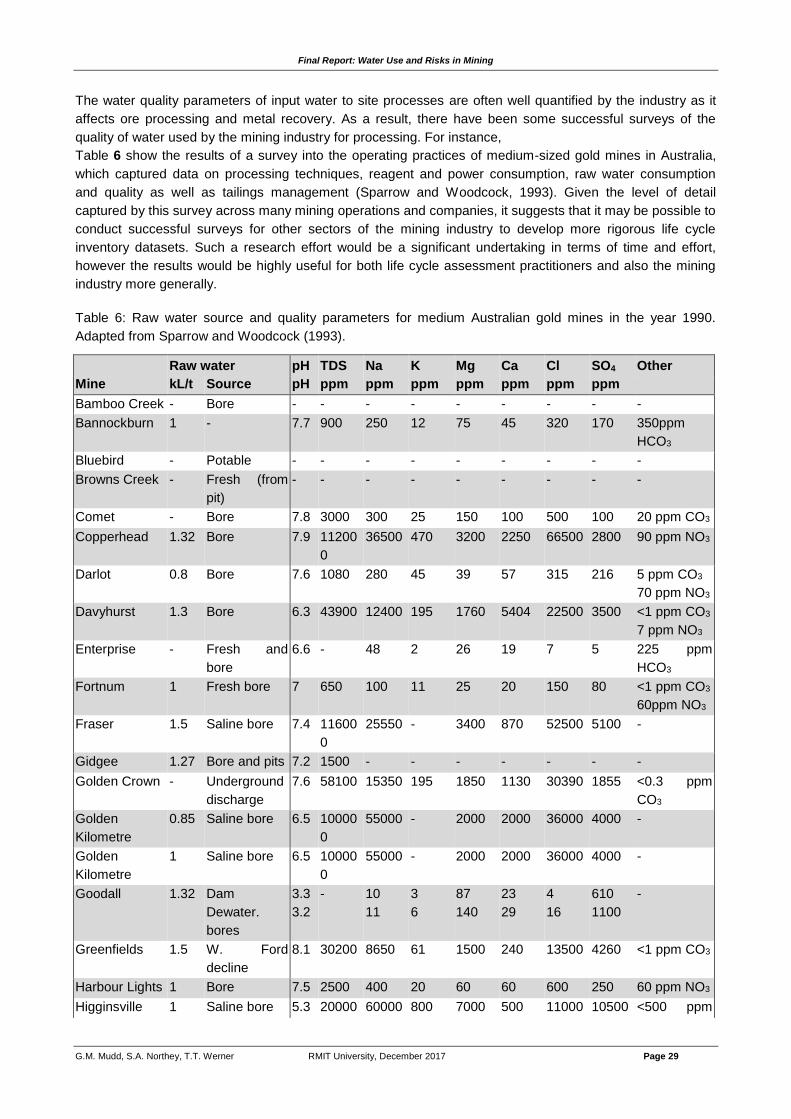
The water quality parameters of input water to site processes are often well quantified by the industry as it
affects ore processing and metal recovery. As a result, there have been some successful surveys of the
quality of water used by the mining industry for processing. For instance,
Table 6 show the results of a survey into the operating practices of medium-sized gold mines in Australia,
which captured data on processing techniques, reagent and power consumption, raw water consumption
and quality as well as tailings management (Sparrow and Woodcock, 1993). Given the level of detail
captured by this survey across many mining operations and companies, it suggests that it may be possible to
conduct successful surveys for other sectors of the mining industry to develop more rigorous life cycle
inventory datasets. Such a research effort would be a significant undertaking in terms of time and effort,
however the results would be highly useful for both life cycle assessment practitioners and also the mining
industry more generally.
Table 6: Raw water source and quality parameters for medium Australian gold mines in the year 1990.
Adapted from Sparrow and Woodcock (1993).
Raw water pH TDS Na K Mg Ca Cl SO4 Other
Mine kL/t Source pH ppm ppm ppm ppm ppm ppm ppm
Bamboo Creek - Bore - - - - - - - - -
Bannockburn 1 - 7.7 900 250 12 75 45 320 170 350ppm
HCO3
Bluebird - Potable - - - - - - - - -
Browns Creek - Fresh (from
pit)
- - - - - - - - -
Comet - Bore 7.8 3000 300 25 150 100 500 100 20 ppm CO3
Copperhead 1.32 Bore 7.9 11200
0
36500 470 3200 2250 66500 2800 90 ppm NO3
Darlot 0.8 Bore 7.6 1080 280 45 39 57 315 216 5 ppm CO3
70 ppm NO3
Davyhurst 1.3 Bore 6.3 43900 12400 195 1760 5404 22500 3500 <1 ppm CO3
7 ppm NO3
Enterprise - Fresh and
bore
6.6 - 48 2 26 19 7 5 225 ppm
HCO3
Fortnum 1 Fresh bore 7 650 100 11 25 20 150 80 <1 ppm CO3
60ppm NO3
Fraser 1.5 Saline bore 7.4 11600
0
25550 - 3400 870 52500 5100 -
Gidgee 1.27 Bore and pits 7.2 1500 - - - - - - -
Golden Crown - Underground
discharge
7.6 58100 15350 195 1850 1130 30390 1855 <0.3 ppm
CO3
Golden
Kilometre
0.85 Saline bore 6.5 10000
0
55000 - 2000 2000 36000 4000 -
Golden
Kilometre
1 Saline bore 6.5 10000
0
55000 - 2000 2000 36000 4000 -
Goodall 1.32 Dam
Dewater.
bores
3.3
3.2
- 10
11
3
6
87
140
23
29
4
16
610
1100
-
Greenfields 1.5 W. Ford
decline
8.1 30200 8650 61 1500 240 13500 4260 <1 ppm CO3
Harbour Lights 1 Bore 7.5 2500 400 20 60 60 600 250 60 ppm NO3
Higginsville 1 Saline bore 5.3 20000 60000 800 7000 500 11000 10500 <500 ppm

Final Report: Water Use and Risks in Mining
G.M. Mudd, S.A. Northey, T.T. Werner RMIT University, December 2017 Page 30
Raw water pH TDS Na K Mg Ca Cl SO4 Other
Mine kL/t Source pH ppm ppm ppm ppm ppm ppm ppm
0 0 CO3
Jubilee - Saline bore 3.3 50700 15400 320 2130 170 28200 4360 <2 ppm CO3
105 ppm
SiO2
Kaltails - Saline bore 3.9 15000
0
65000 230 8700 830 10900
0
11000 -
Kanowna - Bore 6.8 40000-
12000
0
8000 - 4000 - - - -
Karonie 0.5 Bore 5 18100
0
52700 295 6470 690 83400 11900 <1 ppm CO3
8 ppm Fe
Kundana 1 Saline bore 7 23800
0
85500 215 8000 2300 15000
0
5000 -
Labouchere - Bore 7.4 1200 200 11 55 75 300 200 <1 ppm CO3
<1 ppm NO3
1450 μS/cm
Lady Bountiful 1.3 - 6.8 64000 19400 29 2990 820 34000 6600 <1 ppm NO3
Laverton
operations
1.2 - 8.1 10000 2000 8550 1000 2000 70 450 -
Lawlers 1.6 Fresh bore
and saline pit
8.3 600 100 8 70 10 140 120 -
Lucky Draw - Fresh - - - - - - - - -
Magdala,
Wonga
0.35 Mine 7.9 7400 1850 42 340 350 2400 1000 -
Maldon 1.5 Mine 7.1 2000 500 15 200 40 1000 160 450 ppm
HCO3
Marvel Loch 1.79 Saline bore 6.5 23000 6400 160 1000 275 12100 1800 110 ppm
HCO3
Matilda 1.2 Bore 7.8 3500 - - - - - - -
Moline 0.95 Bore and
dam return
7 720 100 5 68 82 39 500 -
Mount Gibson 1.6 Bore
Pit
7.5
6.4
26000
20900
0
7450
64000
240
2000
1100
7500
250
750
13500
12000
0
2000
14300
<5 ppm CO3
90 ppm SiO2
Nevoria - Saline bore 6.8 68000 11000 200 2500 1000 25000 4000 80 ppm CO3
Nobles Nob,
White Devil
- Bore and
fresh
6.6 8300 1700 85 500 570 3700 1660 400 ppm
CO3
25 ppm NO3
Ora Banda - Saline bore 7.5 44000 11000 - 2600 245 20800 4350 68 ppm SiO2
Pajingo 1.5 Bore and pits 7 3500 800 13 150 100 1150 300 700 ppm
CO3
Parkes 0.75 Sewage plant
Old quarries
6.9
8.2
900
3600
160
600
18
6
19
288
36
159
216
1800
46
300
355 ppm
CO3
275 ppm
CO3
Peak Hill
Resources
- Bore 7.2 850 250 10 40 35 190 100 1 ppm CO3
550 ppm

Final Report: Water Use and Risks in Mining
G.M. Mudd, S.A. Northey, T.T. Werner RMIT University, December 2017 Page 31
Raw water pH TDS Na K Mg Ca Cl SO4 Other
Mine kL/t Source pH ppm ppm ppm ppm ppm ppm ppm
HCO3
Polaris 2 Bore and pits 7.3 70000 30000
0
300 4000 600 55000 6000 40 ppm CO3
Ravenswood - Open cut
rainwater
7.5 1000 47 9 57 250 7 730 -
Reedy 1.1 Bore, dam
return
9.2 2900 860 8 23 25 120 350 100 ppm
CO3
Sheahan-
Grants
1.3 Belubula R.
Dam return
8.5
8.5
- 32
1470
6
31
22
23
34
610
39
13550
15
2200
218 ppm
CO3
2000 ppm
SCN
Sons of Gwalia - Saline bore 7.5 54000 14500 300 1500 1100 24000 3800 -
Tanami 1.43 Bore and pits 7.8 1130 167 48 64 53 165 85 289 ppm
CO3
36 ppm NO3
Tarmoola 1.2 - 7 1200 340 50 38 70 750 240 1 ppm CO3
Temora 1.3 Fresh dam &
potable bore
6.6 - 10 5 3 2 10 2 30 ppm CO3
Three Mile Hill 1 Saline bore 6.5 57000 17060 100 2750 140 30400 6800 128 ppm
HCO3
Tower Hill 1.3 Saline bore 7.5-
8.0
80000 10000 4000 - - 20000 7200 120 ppm
HCO3
Transvaal 1.8 - 6.7 11320
0
25500 630 3400 870 72500 5100 50 ppm CO3
Tuckabianna 1.4 Fresh and
bore
7.8 675 110 7 20 28 150 90 60 ppm CO3
White Range - Bore - - - - - - - - -
Youanmi 1.22 Fresh bore
and saline pit
7.3 1100 275 10 47 54 400 120 -
Zoroastrian,
Davyhurst
1.5 Saline bore 6.9 89100 25000 190 5000 515 47600 5200 -
References:
CDP. (2013). Metals & Mining: a sector under water pressure. Analysis for institutional investors of critical
issues facing the industry. Carbon Disclosure Project, United Kingdom, July 2013, 20p.
CDP. (2017). Carbon Disclosure Project (CDP), United Kingdom. https://www.cdp.net (last accessed 8-11-
2017)
CDP Water, 2013. Metals & Mining: a sector under water pressure, Analysis for institutional investors of
critical issues facing the industry. July 2013.
CDP Water 2016 Information Request - Anglo American – Period 1 Jan 2015 to 31 Dec 2015.
https://www.cdp.net/sites/2016/72/772/Water%202016/Pages/DisclosureView.aspx
CDP Water 2015 Information Request – Anglo American – Period 1 Jan 2014 to 31 Dec 2014.
https://www.cdp.net/sites/2015/72/772/Water%202015/Pages/DisclosureView.aspx
CDP Water 2016 Information Request – African Rainbow Minerals – Period 1 Jul 2014 to 30 Jun 2015.
https://www.cdp.net/sites/2016/72/372/Water%202016/Pages/DisclosureView.aspx

Final Report: Water Use and Risks in Mining
G.M. Mudd, S.A. Northey, T.T. Werner RMIT University, December 2017 Page 32
CDP Water 2016 Information Request – Newmont Mining Corporation – Period 1 Jan 2014 to 31 Dec 2015.
https://www.cdp.net/sites/2016/17/13117/Water%202016/Pages/DisclosureView.aspx
Cote, C.M., Cummings, J., Moran, C.J., Ringwood, D. (2012). Water accounting in mining and minerals
processing. In: Godfrey, J.M., Chalmers, K. (Eds.). Water Accounting – International Approaches to
Policy and Decision-making. Edward Elgar, Cheltenham, UK, pp. 91-105.
Danoucaras, A.N., Woodley, A.P., Moran, C.J. (2014). The robustness of mine water accounting over a
range of operating contexts and commodities. Journal of Cleaner Production, 84, pp. 727-735.
http://dx.doi.org/10.1016/j.jclepro.2014.07.078
Fonseca, A., McAllister, M.L., Fitzpatrick, P. (2014). Sustainability reporting among mining corporations: a
constructive critique of the GRI approach. Journal of Cleaner Production, 84, pp. 70-83.
http://dx.doi.org/10.1016/j.jclepro.2012.11.050
GRI. (2013a). G4 Sustainability Reporting Guidelines: Reporting Principles and Standards Disclosures.
Global Reporting Initiative (GRI), Amsterdam, Netherlands.
GRI. (2013b). G4 Sector Disclosures - Mining and Metals Sector Disclosures. Global Reporting Initiative
(GRI), Amsterdam, Netherlands.
Gunson, A.J. (2013). Quantifying, reducing and improving mine water use. PhD Thesis, The University of
British Columbia, Canada, May 2013, 285p.
ICMM. (2012). Water management in mining: a selection of case studies. International Council on Mining &
Metals (ICMM), London, UK, May 2012, 32p.
ICMM. (2013). Adapting to a changing climate: implications for the mining and metals industry. International
Council on Mining & Metals, London, UK, March 2013.
ICMM. (2014). Water stewardship framework. International Council on Mining & Metals (ICMM), London, UK,
April 2014, 4p.
ICMM. (2015). A practical guide to catchment-based water management for the mining and metals industry.
International Council on Mining & Metals (ICMM), London, UK, 59p.
ICMM. (2017). A practical guide to consistent water reporting. International Council on Mining & Metals
(ICMM), London, UK, March 2017, 72p.
Jenkins, H., Yakovleva, N. (2006). Corporate social responsibility in the mining industry: Exploring trends in
social and environmental disclosure. Journal of Cleaner Production, 14, pp. 271-284.
http://dx.doi.org/10.1016/j.jclepro.2004.10.004
Lagos, G., Peters, D., Videla, A., Jara, J.J. (2017). The effect of mine aging on the evolution of
environmental footprint indicators in the Chilean copper mining industry 2001-2015. Journal of
Cleaner Production, in press. http://dx.doi.org/10.1016/j.jclepro.2017.10.290
Leong, S., Hazelton, J., Taplin, R., Timms, W., Laurence, D. (2014). Mine site-level water reporting in the
Macquarie and Lachlan catchments: a study of voluntary and mandatory disclosures and their value
for community decision-making. Journal of Cleaner Production, 84, pp. 94-106.
http://dx.doi.org/10.1016/j.jclepro.2014.01.021
Mason, L., Unger, C., Lederwasch, A., Razian, H., Wynne, L., Guirco, D. (2013). Adapting to climate risks
and extreme weather: A guide for mining and minerals industry professionals. National Climate
Change Adaptation Research Facility, Gold Coast, Australia, 77p.
MCA. (2014). Water Accounting Framework for the Minerals Industry, User Guide, Version 1.3, January
2014. Prepared by the Sustainable Minerals Institute, University of Queensland for the Minerals
Council of Australia (MCA).
Mudd, G.M. (2008). Sustainability Reporting and Water Resources: a Preliminary Assessment of Embodied
Water and Sustainable Mining. Mine Water and the Environment, 27, pp. 136-144.
http://dx.doi.org/10.1007/s10230-008-0037-5
Newcrest, 2007. Update on Cadia Water Supply. ASX market release, Newcrest Mining Limited, 15 May
2007, Melbourne, Australia.
Newcrest, (2011a). Quarterly Report for the Three Months Ending 31 March 2011. Newcrest Mining Ltd,
Melbourne, VIC, 10 p.

Final Report: Water Use and Risks in Mining
G.M. Mudd, S.A. Northey, T.T. Werner RMIT University, December 2017 Page 33
Newcrest. (2011b). Sustainability Report 2011. Newcrest Mining Limited, Melbourne, Australia.
MMG, 2011.
Norgate, T.E., Lovel, R.R. (2004). Water Use in Metal Production: a Life Cycle Perspective. Commonwealth
Scientific and Industrial Research Organisation (CSIRO), Australia. Report no. DMR2505.
Norgate, T.E., Lovel, R.R. (2006). Sustainable water use in minerals and metal production. Proceedings of
Water in Mining Conference 2006, Brisbane, QLD, Australia, pp. 331-339.
Northey, S., Haque, N., Mudd, G. (2013). Using sustainability reporting to assess the environmental footprint
of copper mining. Journal of Cleaner Production, 40, pp. 118-128.
http://dx.doi.org/10.1016/j.jclepro.2012.09.027
Perez, F., Sanchez, L.E. (2009). Assessing the Evolution of Sustainability Reporting in the Mining Sector.
Environmental Management, 43, pp. 949-961. https://doi.org/10.1007/s00267-008-9269-1
Sharma, V., Franks, D.M. (2013). In Situ Adaptation to Climatic Change: Mineral Industry Responses to
Extreme Flooding Events in Queensland, Australia. Society & Natural Resources 26(11), pp. 1252-
1267. http://dx.doi.org/10.1080/08941920.2013.797528
Sparrow, G.J., Woodcock, J.T. Gold ore treatment at medium-size Australian gold plants. In: Australasian
mining and metallurgy (Eds. Woodcock, J.T., Hamilton, J.K.), Volume 1 & 2, The Australian Institute
of Mining and Metallurgy, Victoria (1993). pp. 1035-1059.