Embed Size (px)
Citation preview

RHODE ISLAND
NONPOINT SOURCE MANAGEMENT
PROGRAM PLAN
September 2014
Rhode Island
Department of Environmental Management
Office of Water Resources

RI NPS Management Program Plan, September 2014 i
Rhode Island Nonpoint Source Management
Program Plan
Acknowledgements ................................................................................................................... iii
Acronyms Used .......................................................................................................................... iv
I. Introduction ............................................................................................................................. 1
A. Water Resource Goals ................................................................................................... 3
B. Water Quality Management Principles ........................................................................... 3
C. Rhode Island Nonpoint Source Program and the State Water Quality Management
Framework ........................................................................................................................... 4
II. RI Water Resources ................................................................................................................ 6
A. Description ...................................................................................................................... 6
B. Summary of NPS Pollution Problems ............................................................................. 8
III. NPS Management Program ................................................................................................. 19
A. Management Framework .............................................................................................. 19
A1. Water Quality Monitoring .................................................................................. 19
A2. Water Quality Assessment ................................................................................... 20
A3. Watershed-based Planning .................................................................................. 21
A4. Water Quality Restoration Planning (TMDLs) ................................................... 26
A5. Implementation of NPS Protection and Restoration Actions ............................. 27
B. Partners in NPS Management ....................................................................................... 29
B1. Overview .............................................................................................................. 29
B2. Examples of Program Collaboration .................................................................... 31
C. Setting Priorities............................................................................................................ 35
IV. Pollution Source Management ............................................................................................ 40
A. Onsite Wastewater Treatment Systems and Other Groundwater Discharges ............... 40
A1. OWTS ................................................................................................................. 40
A2. Other Groundwater Discharges ........................................................................... 44
B. Stormwater Runoff and Erosion Controls on Developed Lands .................................. 45
C. Road Salt and Sand Application ................................................................................... 48
D. Agriculture .................................................................................................................... 49
E. Lawn and Grounds Management .................................................................................. 51
F. Boating and Marinas ..................................................................................................... 53
F1. No Discharge Program/Pumpouts ....................................................................... 53
F2. Marinas ................................................................................................................ 54
G. Waterfowl ..................................................................................................................... 55
H. Minor Sources of Nonpoint Pollution ........................................................................... 56
H1. Dredging and Dredge Material Management ...................................................... 56
H2. Land Application Biosolids ...................................................................................... 57
H3. Surface Mining .................................................................................................... 58

RI NPS Management Program Plan, September 2014 ii
H4. Silviculture ........................................................................................................... 58
H5. Marine and Riverine Debris ................................................................................ 59
V. Other NPS Stressors ............................................................................................................ 60
A. Alteration of Wetlands (Freshwater and Coastal) ......................................................... 60
B. Aquatic Invasive Species .............................................................................................. 61
C. Barriers to Stream Connectivity.................................................................................... 62
D. Water Withdrawal ......................................................................................................... 63
VI. Implementation ................................................................................................................... 64
A. Resources for Implementation ..................................................................................... 64
A1. Sources of Funding to Support Implementation Projects .................................... 64
A2. The Challenge of Building Local Capacity ......................................................... 67
B. Implementation Tables .................................................................................................. 68
B1. Overarching Management Issues ......................................................................... 68
B2. Monitoring, Assessment, and Planning ............................................................... 70
B3. Pollution Source Management ............................................................................. 74
B4. Other NPS Stressors ............................................................................................. 87
VII. Evaluation .......................................................................................................................... 91
A. Measures of Progress .................................................................................................... 91
B. NPS Program Evaluation .............................................................................................. 95
References ................................................................................................................................. 97
Appendices:
A. EPA Required Components of NPS Management Plan and How This Plan Complies
B. Map of Ambient River Monitoring – Targeted Basins 2011-2014
C. Integration of Planning Activities to Support Watershed Management
D. EPA Required Minimum Elements of a Watershed-based Plan
E. Partners in Water Resource Protection and Restoration
F. Watershed Planning Areas Categorized for Protection and Restoration

RI NPS Management Program Plan, September 2014 iii
Acknowledgements
The updated Rhode Island Nonpoint Source Management Program Plan was compiled and
drafted by the Rhode Island Department of Environmental Management Office of Water
Resources. The plan was developed from materials generated by the Water Quality State Guide
Plan Technical Advisory Committee which has been meeting since the fall of 2013. See
http://www.planning.ri.gov/statewideplanning/land/water.php. In addition, DEM drew
inspiration from the updated plans recently produced in other New England states. The DEM
Office of Water Resources acknowledges and appreciates the information and input provided by
many individuals and programs both within DEM as well as outside the agency that contributed
to the update of the Rhode Island Nonpoint Source Management Program Plan.
DEM Office of Water Resources staff responsible for the production of the plan include: Betsy
Dake, Susan Kiernan, Lisa McGreavy, Ernie Panciera and John Zwarg.
DEM appreciates the support and guidance of US EPA Region 1, especially the thoughtful input
from Margherita Pryor, Regional Nonpoint Source Coordinator for Rhode Island.
Funding for the plan was provided in part by the Environmental Protection Agency through the
award of funds made available by Section 319 of the Clean Water Act.

RI NPS Management Program Plan, September 2014 iv
Acronyms Used
AIS Aquatic Invasive Species
BMP Best Management Practices
CWA Clean Water Act
CWFA Clean Water Finance Agency
CRMC RI Coastal Resources Management Council
CSSLP Community Septic System Loan Program
DEM RI Department of Environmental Management
DOH RI Department of Health
DOT RI Department of Transportation
EPA US Environmental Protection Agency
EQIP Environmental Quality Incentives Program
GRTS Grant Reporting and Tracking System
IC Impervious Cover
LID Low Impact Development
MS4 Municipal Separate Storm Sewer System
NWQI National Water Quality Initiative (NRCS)
NBEP Narragansett Bay Estuary Program
NGO Non-governmental Organization
NPS Nonpoint Source
NRCS US Department of Agriculture Natural Resources Conservation Service
OWR Office of Water Resources (DEM)
OWTS Onsite Wastewater Treatment Systems
PPA Performance Partnership Agreement
PPG Performance Partnership Grant
RIEMC RI Environmental Monitoring Collaborative
RINHS RI Natural History Survey
RIGIS RI Geographic Information System
RIPDES RI Pollution Discharge Elimination System
TMDL Total Maximum Daily Load
URI University of Rhode Island
USDA United States Department of Agriculture

RI NPS Management Program Plan, September 2014 1
Clean water is essential not only to our natural
environment, but also the way of life enjoyed in
Rhode Island. The State’s geography, with
Narragansett Bay at its center, means all Rhode
Islanders live near the water. We are closely
connected to both our freshwater and salt water
resources through the way we live, work and
play. Nonpoint source (NPS) pollution is a
major management concern in Rhode Island’s waters – both surface waters and groundwaters.
Unlike pollution from point sources that is discharged from a specific location (e.g., a pipe
outfall), NPS pollution comes from many diffuse sources.
Rhode Island state government has significant responsibility for managing water quality.
Through a combination of programs, it carries out responsibilities assigned by both federal and
state statutes. Rhode Island Department of Environmental Management (DEM) is designated in
state law as RI’s water pollution control agency. Within DEM, the Office of Water Resources
directly administers all delegated Clean Water Act programs in RI and is therefore well
positioned to coordinate actions among them to reinforce watershed–based approaches to water
quality protection and restoration. In RI, with respect to water quality management:
The State has the primary responsibility to coordinate monitoring of Rhode Island’s
natural environment, including its water resources, in order to generate information that
supports effective management of water quality;
The State, consistent with federal requirements, administers water quality standards and
conducts assessments of water quality conditions on a statewide basis;
The State, under delegated federal authority, has the primary responsibility for regulating
the discharge of pollutants from various sources into or onto water, air and land; and
The State, with public engagement, provides leadership in planning for the protection and
restoration of Rhode Island’s water resources.
For over twenty years, DEM has administered a NPS Management Program as one of several
key state water quality programs that work collectively toward clean water goals in Rhode
Island’s watersheds (see list of DEM Office of Water Resource Programs in the following Box).
DEM coordinates the State of Rhode Island Nonpoint Source Management Program in
collaboration with other state agencies and many other partners. The Program supports both
protection and restoration activities, including distribution of grant funding for local
implementation projects. The United States Environmental Protection Agency (EPA) provides
annual funding for the RI NPS Program as authorized by Section 319 of the federal Clean Water
Act. Funding is used to implement activities consistent with the state’s NPS management plan.
To continue to remain eligible for this funding, EPA requires states have an updated NPS
management plan. This plan represents a comprehensive update of the previous Rhode Island
Nonpoint Source Pollution Management Plan, generated in 1995. This plan incorporates the
eight key elements of an effective Nonpoint Source Management Plan as specified in 2013 EPA
guidance (EPA 2013) (see Appendix A).
I. Introduction

RI NPS Management Program Plan, September 2014 2
This Plan outlines a comprehensive approach for addressing NPS pollution across all levels of
government. It acknowledges that over time, management strategies will need to adapt in
response to climate change. The plan for the updated RI Nonpoint Source Management Program
describes:
The programs, strategies and resources state agencies and partners use to address priority
NPS water pollution problems;
A process for prioritizing watersheds for protection and restoration;
The priority NPS management actions to be undertaken during the next five years to
make progress toward water quality protection and restoration goals; and
Specific milestones to measure implementation of the plan for the next five years.
DEM Office of Water Resources Programs and Activities
Water Quality Standards – Surface Water and Groundwater
Water Quality Monitoring and Assessment
Nonpoint Source Pollution Management Program
Water Quality Restoration Planning (TMDLs)
Water Quality Certification Program
Rhode Island Pollutant Discharge Elimination System (RIPDES) including stormwater
management
Wastewater Planning and Design
Wastewater Facility Operation and Maintenance Program
Onsite Wastewater Management Program
Groundwater Discharge Program (includes Underground Injection Control Program)
Freshwater Wetlands Program
Shellfish Growing Area Management Program
Financial Assistance – State grants, certification for Clean Water State Revolving Fund
Technical Assistance – various topics including stormwater management, lake management etc.

RI NPS Management Program Plan, September 2014 3
The Rhode Island NPS Program is guided by the following long–term goals that apply to water
quality management in Rhode Island:
Protect the existing quality of RI’s waters and aquatic habitats and prevent further
degradation due to NPS pollution; and
Restore the quality of waters and aquatic habitats degraded by NPS pollution to
conditions that support the intended uses of these waters and habitats.
Within this plan, the concept of “water quality” encompasses both water quality and quantity as
well as the condition of aquatic habitats including, but not limited to, wetlands. Healthy aquatic
ecosystems have habitats that support the propagation of a diversity of fish and wildlife species.
Maintaining riparian buffers, restoring coastal wetlands, controlling invasive species and
providing fish access to upstream waters are some examples of the many efforts that will be
necessary to ensure healthy habitat for aquatic life.
The strategies and actions identified in the RI Nonpoint Source Management Plan target RI’s
most pressing NPS pollution challenges. The foundation for these actions is a set of
management principles utilized to develop this plan, as well as other state water related
management plans. They are:
State and local programs recognize watersheds are the appropriate unit for managing
water quality and water resources;
Protection and restoration are equally important to achieving RI’s goals for water quality;
Water pollution should be prevented whenever possible as it is a more cost–effective
strategy than source control and restoration;
Compliance with applicable federal, state and local regulatory programs is necessary for
water quality protection and restoration;
Water quality management is based on sound science and regularly integrates new
information, including improved scientific understanding, technological innovations and
knowledge of climate change;
Monitoring is an essential component of water quality management that yields
information necessary for effective management;
Indicators of environmental conditions and performance, as well as analytical tools, are
used to evaluate and report on progress toward water quality goals and objectives;
B. Water Quality Management Principles
A. Water Resources Goals

RI NPS Management Program Plan, September 2014 4
Integrated, well supported data management systems are essential for water resource
protection and restoration program management;
Limited resources at all levels of government require and justify efforts to prioritize
protection and restoration efforts;
Rhode Island citizens are informed and aware of water quality management priorities and
efforts to prevent and abate water pollution problems;
Interested stakeholders are involved in the planning and implementation of programs for
water resource protection and restoration through meaningful public engagement;
All levels of government (federal, state, local), non–governmental organizations (NGOs)
including watershed organizations, private entities and individuals share in the
responsibility and duty to protect and restore RI’s water resources; and
A collaborative effort is necessary across all governmental jurisdictions, agencies, and
programs to ensure success in protecting and restoring RI’s water resources.
The RI NPS Management Program Plan is
aligned within a larger, more comprehensive
water quality planning effort underway in
Rhode Island. It constitutes an important
component of a long–term state water quality
management plan that addresses planning for
a wider range of pollution sources – both point
and nonpoint – as well as other stressors
known to threaten or degrade water quality
and aquatic habitat in RI. Currently under
development, this long–range plan will be
articulated as a new element of the Rhode
Island State Guide Plan. In general, the state
guide plan has a twenty-year planning horizon, and in addition to water quality, it articulates
state policies across a range of topics including land use, transportation, water supply and others.
The new water quality element will describe the management framework and strategies for
ensuring that Rhode Island’s water resources are of a quality that supports healthy aquatic
ecosystems and meets the needs of future generations. The guide plan element will reflect a
growing recognition of the need for systems-based planning and management approaches that
apply more holistic approaches to water resource protection and restoration.
C. Rhode Island Nonpoint Source Program and the State Water
Management Framework

RI NPS Management Program Plan, September 2014 5
The actions in this NPS Management Program Plan are consistent with the content being
developed for the new water quality element of the state guide plan. They are presented in a
manner that reflects and reinforces Rhode Island’s general water quality management
framework. This framework, which consists of a five step process organized to facilitate the use
of sound science in management decision-making, has been incorporated into this updated NPS
Management Program Plan.
The framework steps are – Monitor, Assess, Plan, Protect/Restore, and Evaluate:
1) Monitor the quality and condition of water resources;
2) Based on an assessment of available data, characterize the condition of the water resource
and identify stressors or causes of degradation;
3) Develop a plan or strategies to restore and protect water resource conditions to achieve
specified goals;
4) Implement the strategies to protect and restore water quality and aquatic habitat; and
5) Evaluate results and cycle through the process again using information to adapt
management in light of new information.
The NPS Management Program Plan discusses actions related to each of the above steps with
respect to prevention and abatement of NPS pollution. Also see Appendices A and C for fuller
explanation of the alignment of these steps with the required elements of an effective state NPS
management program.
Figure 1. General Water Quality Management Framework in RI
Monitor
Plan for Protection and
Restoration
Assess
Evaluate Results
Implement Strategies for Protection and
Restoration

RI NPS Management Program Plan, September 2014 6
Rhode Island water resources consist of rivers and streams, lakes and ponds, groundwaters,
wetlands and estuarine and marine waters. Their form today was shaped by the region’s
geologic history including the advance and retreat of glaciers which carved bedrock and
deposited layers of sediments to shape Rhode Island’s landscape thousands of years ago. Our
water resource features are interconnected by the continuous movement of water through our
environment in a process known as the water cycle. This hydrologic connectivity reinforces the
need for integrated, holistic management approaches developed on a watershed scale. Rhode
Island waters include:
Freshwater Rivers and Streams: 1,420 miles of rivers and streams, 86% of
which are small headwater streams. (1:24,000, RIGIS)
Freshwater Lakes and Ponds: 20,749 acres of lakes, ponds and reservoirs
(1:24,000 RIGIS) and many other very small ponds. DEM estimates 75% of
lakes 20 acres and larger are manmade impoundments.
Groundwater Aquifers: 22 major stratified drift aquifers covering 190 square
miles; four federal sole source aquifer designations. (RIGIS)
Freshwater Wetlands: About 92,500 acres or approximately 13.4% of Rhode
Island’s land area is comprised of freshwater wetlands including swamps,
marshes, bogs and fens. Wooded swamp is the most abundant wetland type in
RI. (RIGIS)
Estuarine Waters: 159 square miles of estuarine waters including Narragansett
Bay and its sub–embayments, Little Narragansett Bay, eleven coastal lagoons
are located along the southern RI shore and salt ponds on Block Island.
(RIGIS)
Salt marshes: 3,630 acres of salt marsh located along RI’s coastal shorelines.
(RI Ecological Classification -2011, RIGIS)
Marine Waters: Rhode Island and Block Island Sounds.
II. Rhode Island Water Resources
A. Description

RI NPS Management Program Plan, September 2014 7
Figure 2. Rhode Island Freshwater Hydrology (excluding wetlands)

RI NPS Management Program Plan, September 2014 8
Nonpoint source pollution is recognized as a management concern in all RI watersheds. It
results primarily from human land use activities. While water pollution control programs,
including the Nonpoint Source Pollution Program, have clearly spurred improved water quality
over the last several decades, statewide assessment results continue to indicate that a significant
portion of Rhode Island’s surface waters are polluted. Distinguishing between point and
nonpoint pollution sources and determining their relative contribution to existing pollution
problems in urbanized watersheds can be challenging due to how these sources are defined (see
box). However, Rhode Island’s experience and the results of water quality studies pertaining to
TMDL development, indicate that NPS pollution sources are contributing to many of the
documented pollution problems in our watersheds. It is also recognized, however, that in some
watersheds, including our most urbanized landscapes, point sources constitute the dominant
pollution sources; e.g., wastewater discharges, combined sewer overflows, and urban stormwater
outfalls.
Major Water Pollution Concerns
The two most widespread causes of water pollution documented in Rhode Island are:
Pathogens – Waterborne pathogens include bacteria, viruses and other organisms that may cause
disease or health problems in humans. Nonpoint sources of pathogens include various
discharges from failed and substandard onsite wastewater treatment systems (OWTS), boat
discharges, pet wastes, and agricultural animal wastes as well as those from waterfowl and
wildlife. Surface runoff plays a major role in washing pathogens from many of these sources
into surface waters.
Nutrients – Nutrients are chemical elements that all living organisms need for growth. Problems
arise when too much of a nutrient is introduced into the environment through human activities.
In surface waters, excess nutrients fuel algal blooms that upset the ecological balance and can
lead to water quality degradation in a process known as eutrophication. Severe algal blooms can
result in the depletion of oxygen in the water that aquatic life needs for survival. Excess algae
When is stormwater runoff a nonpoint source of pollution?
For the purposes of this plan, stormwater runoff from developed land that travels in a
diffuse manner is categorized as a nonpoint source of pollution provided that it is not
collected in a conveyance system and discharged from a point location, such as a pipe
outfall. In contrast, urban stormwater runoff that is collected in infrastructure that leads
to a point discharge into a surface water is – in most cases – regulated as a point source
via the Rhode Island Pollutant Discharge Elimination System (RIPDES)-MS4 program.
This plan identifies actions pertaining to the management of diffuse sources of
stormwater runoff from developed lands.
B. Summary of NPS Pollution Problems

RI NPS Management Program Plan, September 2014 9
also reduce water clarity, preventing the growth of desirable plants (such as sea grasses) and
hamper the ability of aquatic life to find food. Certain types of blooms may result in the release
of natural toxins that can be harmful to humans, pets, marine mammals, fish and shellfish.
Freshwaters are primarily affected by excess phosphorus, while in coastal waters nitrogen is the
nutrient of highest concern. In some cases, both nutrients may interact and contribute to the
water pollution problem. In groundwater, excess nitrogen can cause nitrate concentrations to rise
to levels unsafe for drinking water consumption. The major human nonpoint sources of nutrients
in RI include onsite wastewater treatment systems discharges, fertilizer use, animal manure, pet
wastes and deposition from air pollution. Again, surface runoff often plays a significant role in
transporting excess nutrients into surface waters.
There are a variety of other pollutants associated with nonpoint sources of pollution in RI. These
include: sediment, salt, toxics (including metals, pesticides and synthetic organic compounds),
petroleum hydrocarbons, solid waste, compounds in pharmaceutical and personal care products,
and heat. To date, none of these have been found in concentrations of concern as frequently as
nutrients and pathogens; although caution is needed in drawing conclusions as monitoring for
these pollutants is also less extensive.
Water Quality Conditions in Rhode Island
The following section draws from the 2012 State’s Integrated Water Quality Monitoring and
Assessment Report, referred to as the Integrated Report, and other information to provide a
summary description of water quality conditions in Rhode Island. For purposes of assessment,
DEM assigned waterbody identification numbers to most of Rhode Island’s surface waters
resulting in 880 assessment units.
Overall statistics from the 2012 Integrated Report include:
Available data allowed full or partial assessment of 55%, or 486, of the assessment units.
Twenty-three percent (23%), or 206, of the assessed units were found to have acceptable
water quality.
About 32%, or 280, assessment units were found to have unacceptable conditions with
most (84%) exhibiting a water pollution problem caused by pollutants, including
pathogens, nutrients, metals and a few others.
Data was lacking in 45%, or 394, of the assessment units. These consisted primarily of
small streams as well as some lakes. Recent targeted monitoring in streams is expected
to narrow the gap in future assessment cycles.
When considering only those surface waters for which an assessment could be completed,
about 58% of the waterbody units were reported as having unacceptable water quality
conditions.

RI NPS Management Program Plan, September 2014 10
The 2012 assessment results are reflected on the maps in Figures 3 through 5. These maps do
not distinguish the nature of the impairment; e.g., pollutant, other causes including aquatic
invasive species. For more information on specific impairments, see 2012 Integrated Report at:
http://www.dem.ri.gov/programs/benviron/water/quality/pdf/iwqmon12.pdf
The nature and extent of water quality concerns varies by the type of water resource as briefly
described below.
Coastal Water Quality
Data exist to characterize water quality in all of Rhode Island’s estuarine waters. While a
majority of waters are of good quality, there are certain areas which continue to exhibit
persistently poor conditions. Elevated pathogens prevent shellfish harvesting and recreational
uses. Excess nutrients result in degraded habitat affecting the diversity of fish, invertebrates and
other marine life. Of particular concern for NPS management are RI’s southern coastal ponds
which remain vulnerable to pollution despite being located in less densely developed watersheds.
Sources of pollution to the coastal ponds include OWTS, fertilizer use and animal wastes
(including residential pets as well as wildlife). Stormwater runoff plays a significant role in
carrying pollutants into the ponds.
Overall –
Over a third of estuarine waters (35%) are impaired for one or more designated use due to
both point and nonpoint sources.
Pathogens –
23%, or 31.7 square miles of Rhode Island’s shellfishing waters are closed and
unavailable for harvest due to elevated levels of pathogens from both point and nonpoint
sources (excluding off-shore waters).
Over 87% of estuarine waters are categorized as acceptable for swimming and other
recreation; about 10% are not safe for recreational activities.
Nutrients –
All RI coastal ponds are considered vulnerable to nutrient enrichment.
Toxics –
Recently generated data on mercury in the tissue of marine finfish in Narragansett Bay
are prompting continued research in order to support assessement of public health risks.
Rivers and Streams
Rhode Island’s rivers and streams have been impacted by past use, historical growth along river
corridors and current development patterns. Data allowed the water quality in about 66%, or 917
of the total river miles tracked in Rhode Island to be fully or partially assessed for the 2012
Integrated Report. As seen in Figures 3 through 5, poor water quality affects both the
recreational use and ecological health of portions of the RI’s rivers and streams. Based on
available data, elevated pathogens are the most common problem and are widely distributed
through the state. Other pollution problems, including metals and nutrients, affect fewer streams
and occur most frequently within the urbanized portion of the state. Assessment of riverine

RI NPS Management Program Plan, September 2014 11
habitat as part of the biological monitoring protocol for streams has also provided evidence that
sedimentation in some streams is degrading aquatic habitat conditions.
Overall, for the 1,378 miles tracked by DEM–
Almost 40% of river and stream miles are impaired for one or more designated use.
Pathogens –
34% of river miles exhibit elevated levels of pathogens unsafe for recreational use;
data is lacking for 36%.
Biological condition –
20 % of river miles exhibit poor conditions for aquatic life; data is lacking for 36%.
44% or 605 miles met water quality criteria related to aquatic life uses.
Toxics –
About 17% of river miles have elevated levels of metals or other toxic compounds.
Lead was the metal most commonly detected at elevated levels.
Elevated mercury levels in fish tissue were found in about 44 miles, or 3%, of river
miles. A large data gap exists with data unavailable for 96% of river miles being
tracked by DEM.
Lakes and Ponds
DEM currently tracks 236 lakes, ponds and reservoirs covering 18,816 acres or 91% of the total
lake acreage in the state. Rhode Island lakes and ponds exhibit not only the impacts of
urbanization but also the degradation of native habitat by invasive aquatic plants. Unlike the
other types of waters, DEM has found the largest cause of impairment in lakes and ponds to be
invasive species. Widespread across the state, thirteen invasive species have been documented
in 88 lakes and ponds which equates to about 60% of the total number of lakes surveyed.
Nutrients are another priority concern with 36 lakes covering 2,251 acres or about 12% of the
total lake acreage exhibiting symptoms of nutrient enrichment (DEM, 2012). No direct
discharges of wastewater into lakes are authorized in RI, although some run-of-the-river
impoundments are located downstream and are influenced by wastewater treatment plants
discharges. In rural watersheds, nutrient management is focused on nonpoint sources including
OWTSs, diffuse stormwater runoff, waterfowl and wildlife waste and internal phosphorus
cycling among others. In urbanized areas, DEM has found eutrophic lakes and ponds are
affected by a combination of point (i.e., stormwater discharges regulated as point sources) and
nonpoint sources of pollution, e.g., waterfowl. Over the past several years, DEM has
documented cyanobacteria blooms in 23 lakes and ponds. In contrast to rivers, most lakes do not
exhibit elevated pathogens. Sedimentation is also a concern that has been raised by lakefront
property owners in certain lakes.
Overall –
41% of lake acres are impaired for one or more designated use.
Invasive Aquatic Plants –
About 25% of the total lakes and pond acreage is the state is categorized as impaired by
aquatic invasive species. However, invasives are in fact much more widespread and this
suggests the problems associated with invasives are likely to grow worse without
proactive management and intervention.

RI NPS Management Program Plan, September 2014 12
Pathogens –
Most lakes support recreational uses. Elevated levels of pathogens have been found in 8
lakes located in urbanized watersheds.
Nutrients –
36 lakes covering 2,251 acres exhibited elevated nutrients that can fuel algal blooms.
This represents about 12% of total lake acres in the state.
23 lakes and ponds were documented to have cyanobacteria blooms, also known as blue-
green algae.
Toxics –
Data availability is limited as toxics are not routinely monitored for in lakes and ponds.
Elevated mercury levels in fish tissues were found in 12.7 % of lakes acres. A large data
gap exists with data unavailable for 83% of lakes acres tracked by DEM.
Impervious Cover (IC) as an Indicator of Stream Condition
Research has established a relationship between water quality in streams and the amount
impervious cover within a watershed. Impervious cover generally refers to the hard surfaces
created by pavement, buildings or other structures which prevent the infiltration of precipitation
and as a result, generate additional stormwater runoff. Impervious cover associated with
urbanization causes water quality degradation in a variety of ways including changes in
hydrology and stream geometry, increased pollutant loadings and physical alteration to aquatic
habitats. (CWP 2003)
The Center for Watershed Protection (CWP) developed an impervious cover model based on
hundreds of studies that related increasing amounts of IC with declining stream quality. A
review of scientific literature confirmed the applicability of the commonly used threshold of 10%
IC for streams in our region (CWP 2003). In general, IC levels above 10% were associated with
negative changes in indicators of stream health and condition. However, the CWP further noted
“many studies also suggest that sensitive elements of the aquatic community are affected at even
lower levels of IC. Other impacts include loss of sensitive species and reduced abundance and
spawning success.”
As a general assessment in support of the NPS Program, DEM calculated the percent of
impervious cover for watershed lands in RI as grouped into watershed planning areas (see
discussion of planning areas on page 26). While several watersheds are shared with the
neighboring states of MA and CT, the figures here reflect the IC levels for the Rhode Island
portion of these watersheds. The results reveal that IC in just over half the state (51.1%) was
below the 10% threshold reflecting both the need and the opportunity to manage future growth to
prevent future degradation. In another 40.3% of the state land area, the IC % fell above 10% and
below 25%. Rhode Island’s most heavily developed watershed lands with IC levels greater than
25% constituted 8.6% of the state. These very urbanized watersheds had higher percentage of
stream miles with documented water quality impairments indicating a need for sustained
restoration efforts, although data gaps limit a full comparison among watersheds.

RI NPS Management Program Plan, September 2014 13
Figure 3. Northern RI Impaired Waters (Includes impairments due to pollutants and non-pollutants; e.g., aquatic invasive species.)

RI NPS Management Program Plan, September 2014 14
Figure 4. Southern RI Impaired Waters (Includes impairments due to pollutants and non-pollutants; e.g., aquatic invasive species.)

RI NPS Management Program Plan, September 2014 15
Figure 5. Eastern RI Impaired Waterbodies (Includes impairments due to pollutants and non-pollutants; e.g., aquatic invasive species.)

RI NPS Management Program Plan, September 2014 16
Figure 6. Impervious Cover and the Urban Services Boundary
The urban services boundary is designated in the state “Land Use 2025: State Land Use Policies and Plan.” This
Plan directs the State and communities to concentrate growth inside the Urban Services Boundary which has
existing infrastructure to support growth and within locally designated growth centers in rural areas.

RI NPS Management Program Plan, September 2014 17
Groundwater Conditions
Because of the generally localized nature of groundwater contamination, no groundwater
monitoring network has been established in RI. As noted in Section III.A1., the best source of
available information on ambient groundwater quality is the Department of Health’s data on
public drinking water wells that are regularly tested to ensure compliance with drinking water
standards.
Nitrate from OWTSs and fertilizer is used as an indicator of human impacts to groundwater.
Natural background concentrations of nitrate are less than 1 mg/l. Five mg/l of nitrate (one–half
the drinking water standard of 10 mg/l) has been established as the preventative action limit in RI
state groundwater quality standards and is often used as a threshold for determining acceptable
levels of impact from existing and proposed development. The data from public wells sampled
for nitrate over the past nine years (Table 1) reveal that the annual percentage of wells that
exceeded 5 mg/l averaged 5%. Elevated nitrates tend to occur in specific areas affected by local
pollution sources and are not documented to occur as widespread aquifer contamination.
Table 1. Nitrate in Public Wells.
Nitrate (mg/L) Number of Public Wells (State Fiscal Year: July 1- June 30)
2004/05 2005/06 2006/07 2007/08 2008/09 2009/10 2010/11 2011/12 2012/13
<=.2 177 197 184 166 183 183 165 166 140
.21-3 328 329 332 334 326 341 356 331 286
3.1-4.9 40 47 29 34 40 29 31 25 31
5.0-10.0 16 6 9 8 6 5 9 9 9
>=10.0 0 1 0 0 1 0 0 2 1
Total by Year 561 580 554 542 556 558 561 533 467
Freshwater and Coastal Wetlands
Wetlands are an important component of Rhode Island’s water resources. Historically, it is
estimated that Rhode Island has lost 25% or more of its freshwater wetlands (Hellyer, G. 1995)
and 53% of its coastal wetlands through historical filling and alteration. (Bromberg, K. 2005)
The functions and values associated with wetlands are degraded by NPS pollution including
physical stressors such as hydromodification.
With EPA support, monitoring of freshwater wetlands has been conducted by DEM in
partnership with the RI Natural History Survey (RINHS) in order to provide data to characterize
wetland condition. An analysis of data has documented both in–wetland stressors and landscape
stressors located in the area designated as buffer around the vegetated wetland. Despite
protective state regulations, the results revealed many wetlands are vulnerable to or suffer
degradation from nonpoint source pollution including physical alterations. Assessment of 281
vegetated wetlands indicated the most common wetland stressor was anthropogenic input of

RI NPS Management Program Plan, September 2014 18
stormwater and sediments followed by filling or dumping and invasive species. Within the
buffer areas around wetlands, raised roadbeds, unsewered residential development and footpaths
or trails were the most commonly found landscape stressor. (Peach, M., RINHS, 2013)

RI NPS Management Program Plan, September 2014 19
The following provides an overview of Rhode Island’s overall approach to managing and
controlling NPS pollution using the five step framework discussed in Section I.C. Although the
federal NPS funding and DEM NPS Program play an essential role, the Rhode Island program
also encompasses a broad set of its own tools and authorities exercised by DEM as well as
partner agencies. As reflected in this NPS Management Plan, Rhode Island recognizes a
combination of both regulatory and non–regulatory programs and activities are needed to
effectively manage NPS pollution. Included among these programs is the DEM–designated NPS
Program which has the lead responsibility for tracking and reporting to EPA on the coordinated
efforts of all the governmental programs incorporated into the Rhode Island NPS Management
Program Plan. The DEM NPS Program relies upon a foundation of technical information
concerning nonpoint source pollution problems that is generated by other programs in the DEM
Office of Water Resources including Water Quality Monitoring, Standards and Assessment
Programs and the TMDL Program, among others. Accordingly, the DEM NPS Program
collaborates with these programs to: produce information that allows for statewide tracking of
NPS pollution; target assessments of NPS impaired waters and set priorities; implement actions
for controlling NPS pollution; and to measure progress toward restoration and protection goals.
The DEM NPS Program is directed by a Supervising Environmental Scientist who reports to a
Deputy Chief in the DEM Office of Water Resources. The program is positioned to collaborate
across the entire DEM–OWR including its two major regulatory sections organized as Surface
Water Quality and Groundwater and Freshwater Wetlands.
A1. Water Quality Monitoring
Water quality monitoring is needed to generate information on the nature and extent of nonpoint
pollution. Rhode Island has an established strategy for the monitoring of surface waters. The
Rhode Island Water Monitoring Strategy (RIDEM 2005), prepared by DEM in coordination with
the RI Environmental Monitoring Collaborative (RIEMC), documents the surface water
monitoring activities that are needed for the state to achieve its goal of comprehensively
assessing its waters. The strategy is at: http://www.ci.uri.edu/Projects/RI-
Monitoring/Docs/DEM_WQ_Oct_14_05.pdf and is in the process of being updated. Annual
reports from the RIEMC document progress made in implementing the strategy as well as
important gaps in information that remain, given the current level of monitoring activity. (Full
reports available at: http://www.dem.ri.gov/bayteam/envirocollab.htm .
DEM has a leading role in implementing the water monitoring strategy by both conducting
monitoring programs and supporting monitoring by other entities. Collectively, the monitoring
programs are aimed at gathering ambient water quality to assess water quality conditions,
identifying waters and watersheds in good condition as well as water quality impairments,
III. NPS Management Program
A. Management Framework

RI NPS Management Program Plan, September 2014 20
supporting management decision–making and tracking progress toward clean water goals.
Programs important to characterizing NPS pollution include volunteer–based monitoring of
lakes, ponds, rivers and streams, the DEM ambient river monitoring program and shellfish
growing areas monitoring programs. DEM monitors rivers on a rotating schedule that supports
assessment of water quality across a watershed (see map in Appendix B). Ambient monitoring
programs are supplemented by more intensive targeted monitoring to characterize pollution
sources and develop water quality restoration plans (i.e., TMDLs). In addition, targeted
monitoring may be conducted to document changes in conditions associated with the
implementation of water quality restoration actions, including NPS pollution abatement actions.
Additional information on water monitoring is available on the DEM and partner websites.
Unlike the multi–faceted surface water quality monitoring efforts, Rhode Island lacks a
comprehensive and coordinated groundwater quality monitoring strategy. Groundwater
monitoring presents particular challenges associated with the manner in which pollutants move
in different aquifer settings. The best source of available information on ambient groundwater
quality is the Department of Health’s data on public drinking water wells that are regularly tested
to ensure compliance with drinking water standards. The Department of Health also maintains
data on private wells.
Collectively, the above programs provide data that is used to support Rhode Island’s water
quality assessment process and generate information needed in watershed plans.
A2. Water Quality Assessment Process
A primary source of information to characterize nonpoint source pollution in Rhode Island is the
statewide water quality assessment process which is described below.
Water Quality Standards
DEM has established water quality standards and classifications for both its surface and
groundwater resources that provide a basis for assessment of water quality conditions. For
surface waters, the water quality standards consist of three components: designated uses (denoted
by classification); criteria; and an anti–degradation statement that specifies the level of water
quality necessary to maintain designated uses. As part of the state Water Quality Regulations,
these standards are subject to approval by the EPA pursuant to the federal Clean Water Act and
may not be less stringent than federal requirements. All surface waters of the state are assigned
to a water quality classification. Specific designated uses are associated with each classification.
Every waterbody in the state is designated for swimming (primary and secondary recreational
contact), fish consumption, and aquatic life (fish and wildlife habitat) uses. Some waters are also
designated for shellfish consumption, shellfish controlled relay and depuration, or drinking water
supply uses. Associated with each designated use are water quality criteria which specify the
conditions that will support the designed use.
The DEM Groundwater Quality Rules classify all of the state's groundwater resources and
establish groundwater quality standards for each class. Protection of drinking water sources is a

RI NPS Management Program Plan, September 2014 21
primary objective of these rules. The four classes are designated GAA, GA, GB, and GC in
accordance with the RI Groundwater Protection Act of 1985 (RI General Laws 46-13.1).
Groundwater classified GAA and GA is to be protected to maintain drinking water quality,
whereas groundwater classified GB and GC is known or presumed to be unsuitable for drinking
water use without treatment. Greater than 90% of the state’s groundwater resources are
classified as suitable for drinking water use (i.e., class GAA and GA). Groundwater
classifications can be viewed at: http://www.dem.ri.gov/maps/gw.htm.
Assessment of Water Quality Conditions
To measure progress towards meeting the federal water quality goals, states are required to
assess and report on the quality of their state’s waters every two years pursuant to Section 305(b)
of the Clean Water Act. In Rhode Island, this responsibility falls to DEM which assesses
available data against established water quality standards and reports the results of this
assessment in the State’s Integrated Water Quality and Assessment Report (known as the
Integrated Report). The water quality assessment process for surface waters is reflected in
Figures 3 through 5 and results in a determination of whether or not the current water quality
conditions in a specific waterbody fully support its designated uses (swimming, shellfish
consumption, aquatic life, etc.). To evaluate the level of use support attainment, available water
quality data is compiled and compared to the appropriate criteria for each designated use. While
existing water quality monitoring programs provide a sizable amount of information, data gaps
exist and currently prevent a comprehensive assessment of all uses in all waters. The assessment
process leads to an assignment of individual waterbodies or portions of waterbodies (assessment
units) to one of five categories that reflect its attainment status. A significant outcome of the
assessment process is the identification of those surface waters not meeting water quality
standards and considered “impaired.” Category 5 of the Integrated Report is the state’s 303(d)
list, which identifies those waters impaired by a pollutant and in need of TMDL development.
See more information at:
http://www.dem.ri.gov/programs/benviron/water/quality/surfwq/index.htm
A3. Watershed-based Planning
As noted earlier, Rhode Island is placing renewed emphasis on a watershed–based approach to
managing water quality. Long recognized as being the most effective means to protect and
restore water resources, a watershed-based approach recognizes that watersheds transcend
political boundaries. To strengthen implementation of this approach, DEM is committing to
developing watershed plans for 26 planning areas designated across Rhode Island (see Figure 7).
The planning target for this 5 year plan is completion of 8 plans. A watershed plan serves as a
mechanism to integrate the full range of actions recommended for protecting and restoring water
quality and aquatic habitat within a given watershed. The plans will include but not be limited to
actions pertaining to nonpoint source pollution. The watershed plan provides an opportunity to
identify partners and to collaborate across all levels of the public and private sectors to determine
and implement actions that are supported by sound science. The plans provide an opportunity to
give emphasis to protection strategies as well as needed restoration actions. The aim is to

RI NPS Management Program Plan, September 2014 22
integrate management activities related to water quality and aquatic habitats within a given
watershed. This approach provides a process for government and other stakeholders to prioritize
NPS pollution and other water quality problems and work collaboratively on a watershed basis to
optimize results in terms of environmental outcomes and the other societal benefits associated
with improved water quality and habitat. As reflected in Figure 8, actions or initiatives from
other plans and reports can be compiled into one unifying vision and action plan for the
watershed. (See Appendix C for a description of these other planning activities.)
The goal for the watershed plan is to:
Describe the water resources and their water quality status;
Describe the current protection and restoration actions being carried out in the watershed;
Create an Action Plan with specific prioritized actions to protect and restore water quality
identified and the responsible entity and timeframe designated. Actions identified in
TMDLs and other plans will be compiled with additional actions added as necessary;
Establish coordinating mechanisms between towns and others for plan implementation;
and
Promote public understanding about the values of clean water and the actions necessary
to achieve clean water goals.
Watershed plans will cross reference other planning documents, such as any TMDLs, local
wastewater and stormwater plans that may exist, for those who want or need to delve deeper into
a particular topic or strategy. To the extent feasible, ambient monitoring of rivers and streams
will be aligned to support the schedule for watershed planning. The planning process is ongoing.
Once the watershed plan is adopted, success toward implementing the plan is regularly evaluated
and the plan must then be updated accordingly.
While intentionally broad in scope, the plans will adequately incorporate the required nine
elements of a watershed-based plan specified by EPA guidance. While these elements reflect a
federal emphasis on pollutant loading reductions, as envisioned by DEM, the watershed plans
developed in RI will also identify protection actions needed to prevent degradation of water
quality and aquatic habitats. Per EPA guidance, only those implementation projects within a
watershed having a nine–element watershed–based plan are eligible for Section 319 project
funds. A watershed plan must address the following minimum elements: (See Appendix D for
more detail)
a) Identification of causes of impairment and pollutant sources or groups of similar sources
that need to be controlled to achieve needed load reductions, and any other goals identified
in the watershed plan;
b) An estimate of the load reduction expected from the management measures;
c) A description of the NPS measures that will need to be implemented to achieve load
reductions in b), and a description of the critical areas in which those measures will be
needed to implement this plan;
d) Estimate of the amounts of technical and financial assistance needed, associated costs,
and/or the sources and authorities that will be relied upon to implement this plan;
e) An information and education component that identifies the education and outreach
activities or actions that will be used to implement the plan;

RI NPS Management Program Plan, September 2014 23
f) Schedule for implementing the NPS management measures identified in this plan that is
reasonably expeditious;
g) A description of interim measurable milestones for determining whether nonpoint source
management measures or other control actions are being implemented;
h) A set of criteria that can be used to determine whether loading reductions are being
achieved over time and substantial progress is being made toward attaining water quality
standards; and
i) A monitoring component to evaluate the effectiveness of the implementation efforts over
time. (EPA 2013)
Although watershed boundaries often extend beyond local or even state boundaries, many of the
actions called for in a watershed plan will necessarily be municipally based, as that is where the
authority lies for managing land use and for taking many other steps to protect and restore water
quality in Rhode Island. Therefore, it is necessary that the watershed plan be closely integrated
into the local comprehensive planning process. The watershed plan can take a holistic approach
by integrating water quality planning with land use planning and planning for activities such as
recreation and habitat preservation; e.g., greenway planning. For example, the watershed plan
may call for the creation of greenways in the watershed, which protect water quality, provide
recreational resources and vital habitat.
The “best” plans – ones that will be successfully implemented – are created with significant
input from the people living, working and playing in the watershed. Such plans provide added
value by coordinating among entities with vested interest in the watershed to share water quality
information, identify NPS pollution and other water quality priorities, and align resources to
drive forward the implementation of needed actions.

RI NPS Management Program Plan, September 2014 24
Figure 7. Watershed Planning Areas

RI NPS Management Program Plan, September 2014 25
Aquatic Habitat Protection and
Restoration Strategies
Coastal Habitat Restoration Strategy
State Wildlife Action Plan
SAMPs/CRMC regulations
Wetland Restoration Strategy
Stream connectivity planning
Invasive Species Management Plans
Water Quality Restoration Plans
TMDLs
Alternatives to TMDLs
State Water Quality Protection
Strategies
Nutrient Management Strategy
Project Priority List
Water pollution control regulations
BMP guidance
Source water Protection
SAMPs/CRMC regulations
Regional Plans
CCMP – Narragansett Bay
WATERSHED
PLANS
Prioritized
Protection
&
Restoration
Actions
Prioritized
Protection
&
Restoration
Actions
Facilitate
Implementation
Optimize
Results
Information on Resource Condition
Local Plans
Land use/Comprehensive Plan
On-site Wastewater
Wastewater Facility Plans
Local stormwater management plans
Water Supply Protection Plans
Flood Hazard Planning
Lake Management Plans
State Water Resource Assessments
Identify high quality waters
Identify pollution problems
Identify degraded aquatic habitats
State
Government
Input
R
E
C
O
M
M
E
N
D
E
D
A
C
T
I
O
N
S
Watershed
Council Input
Local
Government Input
Public
Input
Figure 8. Watershed Planning Process

RI NPS Management Program Plan, September 2014 26
A.4. Water Quality Restoration Planning (Total Maximum Daily Loads)
Once identified as "impaired," the state is required by the federal Clean Water Act to develop a
Total Maximum Daily Load (TMDL) or alternatively, implement water quality restoration
actions addressing each water body and each pollutant causing the impairment. A TMDL is a
water quality restoration plan that establishes the acceptable pollutant loads from both point and
nonpoint sources of pollution which allow the impaired waterbody to meet water quality
standards and support its’ designated uses. TMDLs are based on the relationship between
pollution sources in the watershed and instream water quality conditions. Through the TMDL
development process, water quality conditions are more thoroughly characterized and pollution
sources identified, providing the technical basis for the pollution abatement actions specified in
the water quality restoration plans. These actions are also incorporated into the watershed plans
described above.
There are several steps that are common to the development of most TMDLs:
• Identify the impaired waterbodies and pollutant(s) not meeting water quality standards;
• Assemble and review available data and information on the waterbody and its watershed;
• Identify stakeholders having an interest in the waterbody and/or watershed;
• Identify data gaps that need to be addressed to satisfactorily characterize water quality
conditions and pollution sources causing the identified impairment, and any factors affecting
the extent and severity of the impairment;
• If needed, develop and implement a monitoring plan (and Quality Assurance Project Plan)
to collect additional data to further characterize water quality and pollution sources. As part
of the assessment process, pollution sources are identified and their significance assessed
including point sources, such as wastewater treatment facility discharges and stormwater
outfalls, and nonpoint sources, such as septic systems and unchannelized runoff from
agricultural and urbanized areas;
• Estimate the current amount of point and nonpoint sources entering the waterbody;
• Establish the TMDL water quality target (typically the applicable water quality criteria)
and allowable load of the pollutant of concern that the waterbody can receive and still meet
water quality standards. For bacteria TMDLs, a concentration–based approach may be
applied whereby a percentage reduction in fecal coliform concentrations is determined to
represent necessary pollutant reductions;
• Allocate allowable loads between point and nonpoint sources, including providing a
margin of safety;
• Develop an implementation plan identifying the specific actions necessary to achieve the
waterbody’s water quality target(s);

RI NPS Management Program Plan, September 2014 27
• Conduct public meeting(s) and formally solicit and respond to public comments; and
• Submit the draft TMDL to EPA for formal approval.
The schedule for planned and future TMDL development is reflected in the 303(d) list. When
updating the list DEM holds a public hearing to solicit input on the schedule. When feasible,
DEM will be aligning TMDL development and watershed planning to reinforce focus within
targeted watersheds.
DEM provides information on TMDLs, including draft and completed TMDLs at:
http://www.dem.ri.gov/programs/benviron/water/quality/rest/index.htm.
A5. Implementation of NPS Protection and Restoration Actions
General Implementation Activities of the NPS Program
Implementation of the management approach for NPS pollution is the sum of activities carried
out by a number of programs. The DEM NPS Program works with many other water–related
programs both inside and outside of DEM to coordinate policy and achieve implementation of
nonpoint source pollution prevention and abatement actions. Three areas of DEM activities that
broadly support NPS management implementation include program coordination, public
outreach and data management. One of the roles of the DEM NPS Program is to facilitate
coordination among NPS–related activities and track progress towards the milestones in this
plan. A variety of coordination mechanisms are used to foster collaboration among programs
and alignment of work to optimize the efficient delivery of programs. Coordination mechanisms
operate at different levels within state government and include organized committees, ad hoc
committees and less formal arrangements among agency staff. These mechanisms help ensure
various programs are working with a shared understanding of NPS water quality problems and
toward common objectives regarding an issue, project or program.
Examples of State Level
Coordination Mechanisms:
State Planning Council &
Technical Advisory Committee
RI Bays, Rivers and Watersheds
Coordination Team
State Conservation Committee
CRMC Policy and Planning
Committee
NRCS State Technical Team

RI NPS Management Program Plan, September 2014 28
General public outreach reflects a range of communication activities carried out by DEM to
foster public understanding about water quality issues, NPS pollution and needed management
actions. DEM utilizes a variety of tools to support public outreach and education including
extensive collaboration with partners. In recent years DEM has begun to explore greater use of
social media as a means to share information. An informed public is necessary to build support
for needed management actions.
Data management, including the maintenance of the EPA Grant Reporting and Tracking System
and other federally required databases, is another key activity that supports implementation of
the NPS Program. As resources allow, over the next five years, DEM is also anticipating making
major changes to the current data management system that support both the OWTS and wetlands
permitting programs directly related to generating data for reporting on milestones in this plan.
Additional changes in the systems used to manage water quality data and report assessment
results to EPA are also underway. Staffing limitations have constrained the pace of
improvements. DEM is continuing to seek additional resources to address its information
technology needs.
Statewide Regulatory NPS Programs
One unique aspect of RI’s NPS program is the regulatory authority that DEM and CRMC
exercise over OWTS as well as land development in proximity to wetlands. In most other states,
these activities are largely regulated by county or local governmental agencies. Table 2. lists
state regulations germane to NPS management in RI. Regulations aimed at preventing pollution
generally apply statewide, although some more stringent rules have been imposed to give greater
protection to both surface and groundwater sources of public water supply and to prevent
degradation of other high quality special resource waters.
Table 2. State Regulations for NPS Management
DEM Water Quality Rules
DEM Groundwater Quality Rules
CRMC (Coastal Resources Management Council) Coastal Resources Management Program
DEM Rules Establishing Minimum Standards Relating to Location, Design, Construction and
Maintenance of Onsite Wastewater Management Systems
DEM Rules and Regulations Governing the Administration and Enforcement of the Fresh Water
Wetlands Act
CRMC Rules and Regulations Governing the Administration and Enforcement of the Fresh Water
Wetlands Act in the Vicinity of the Coast
DEM Rules for the Discharge of Non-Sanitary Wastewater and Other Fluids To or Below the Ground
Surface
DEM Rules and Regulations Relating to Pesticides
DEM Rules and Regulations for Dredging and the Management of Dredged Material
DEM Rules and Regulations for Sewage Sludge Management
Although the following are not stand alone Rules, the standards in these Manuals are referred to in other
regulatory programs:
- DEM and CRMC Stormwater Design and Installation Standards Manual
- DEM and CRMC Soil Erosion and Sediment Control Handbook

RI NPS Management Program Plan, September 2014 29
Statewide Non-Regulatory NPS Program Activities
As a complement to the regulatory oversight exercised by state and local officials, the RI NPS
Program was organized to coordinate a variety of non–regulatory activities aimed at encouraging
voluntary actions to strengthen NPS pollution prevention and facilitate water quality restoration.
Through its annual Performance Partnership Grant (PPG), DEM utilizes EPA funds to support
monitoring, assessment and watershed planning activities described above. In addition,
consistent with the overall water quality framework, the program carries out the following
activities to promote and implement effective NPS pollution management:
Interagency coordination via technical committees and other means;
Assessment of NPS problems and identification of targeted waters and watersheds;
Policy development to foster prevention and abatement of NPS pollution;
Technical assistance to municipalities, watershed organizations and others on
implementation of NPS best management practices (BMPs);
Financial assistance, in the form of grants of PPG (319) funds and state grants (as
funding allows) for NPS implementation projects;
Technical assistance (pre–application) to proponents of water quality and wetland
restoration projects through an interdisciplinary team (Water Quality and Wetlands
Restoration Team);
Outreach and educational activities, including training workshops; and
Participation in regional workgroups on NPS priority topics.
See also Sections IV. Pollution Source Management and Section V. Aquatic Habitat
Management for a detailed description of the regulatory and non-regulatory programs for
controlling NPS sources of pollution.
B1. Overview
As the lead state agency for water quality management and water pollution control, DEM has
responsibility for developing and implementing this Nonpoint Source Management Program Plan
consistent with its authorities. However, as noted earlier, there are many federal, state, quasi–
state, municipal, non–governmental, academic, and non–governmental entities that contribute in
significant ways to the management of NPS pollution in RI. (See also Appendix E which further
describes Partners in Water Resource Protection and Restoration.)
Given the strong relationship between land use and water quality, local governments have an
important role to play in water quality management through the exercise of their authorities to
govern land use. Local land use planning and zoning establishes the type and level of intensity
of development on the landscape, which determines to a major degree the potential impacts to
water quality. Municipalities have many tools available that can be applied to guide land use
development in a manner that is protective of water resources. In doing so, they comply with the
B. Partners in NPS Management

RI NPS Management Program Plan, September 2014 30
goals and policies for development specified in State Guide Plan – Land Use 2025 that will
reduce the impacts of development on water quality, such as:
Zoning to ensure the type and density of development is suitable for the resources that
may be impacted; may include overlay districts that restrict land uses that pose higher
pollution risks;
Conservation Development: This is a zoning technique in which the character–defining
features of a parcel are identified and protected before land is developed. It differs from
traditional development in that assessment of natural resources, not identifying building
sites, is the first step in the process;
Land acquisition of open space, to protect drinking water sources, protect surface water
quality and to conserve priority natural habitats ; and
Low impact development (LID) practices, which utilize site planning and design
techniques to mitigate the impacts of stormwater and site disturbance on our water
resources. In addition to conservation development, LID practices include (RIDEM and
CRMC 2011) (see also section on Stormwater):
o Requirements for vegetated riparian buffers
o Site clearing and grading standards
o Roadway and parking design guidelines
o Compact development
o Landscaping
In addition to their primary role in regulating land use, many municipalities implement local
onsite wastewater management programs, local stormwater management programs and may
operate other programs that support water quality management including acquisition and
management of open space.
Rhode Island law has also acknowledged and encouraged the role of regional organizations in
watershed management:
RI Rivers Council – RI state law (RIGL 46-28) established the RI Rivers Council to
coordinate and support activities of local watershed associations. Nine watershed
organizations have been designated by the Council in RI. State law bestows certain
rights to these designated organizations. The existing organizations vary in capacity from
those with paid professional staff to solely volunteer organizations. However, they all
fulfill a critical role in stewardship in their watersheds by raising awareness, coordinating
and implementing projects and advocating for protection and restoration actions.
State Conservation Committee and Conservation Districts – Rhode Island's Conservation
Districts, the Rhode Island State Conservation Committee, and the Natural Resources
Conservation Service are collectively known as the Conservation Partnership. DEM is a
member of the State Conservation Committee. Rhode Island’s three regional
conservation districts share a mission of promoting proper stewardship of natural
resources and have a long track record of carrying out initiatives involving education and
outreach, and various forms of technical assistance as well as project management
support on nonpoint source pollution topics.

RI NPS Management Program Plan, September 2014 31
Regional planning commissions – Two regional planning commissions, authorized by
state law, have been formed serving Aquidneck Island and the South County region.
While involved in a broader range of topics, these regional commissions have from time
to time taken on projects related to water quality and watershed management.
A variety of other organizations play meaningful roles in water quality management activities.
These include, but are not limited to academic institutions, other researchers, environmental or
conservation organizations, local land trusts, and various user groups (fishing, boating, etc.).
These are further described in the examples of collaboration below and in Appendix E.
Implementation of RI’s NPS Management Program Plan, including the continuing development
of watershed plans, requires active public engagement and stakeholder involvement. While the
state may have a lead role in monitoring and assessing water resources, the participation of all
entities most affected by management decisions is needed throughout the planning,
implementation and evaluation steps in the process. DEM envisions that broad stakeholder
engagement is a pre-requisite for success and will require the active involvement of all levels of
government (federal, state, local), quasi-governmental agencies, watershed councils, and other
non–governmental organizations, interested business and individuals. Effective public
engagement ensures environmental objectives are well integrated with related economic, social
and cultural goals, which in turn builds support for implementation of needed actions.
B2. Examples of Program Collaboration
Given resource limitations and the nature of nonpoint source pollution, future progress will
depend on the State building stronger partnerships and greater collaboration among the many
entities working to protect and improve water quality. In this regard Rhode Island’s small size is
an advantage in that the state agencies are often familiar with the local stakeholders actively
working within a given watershed. A significant amount of collaboration is taking place and it is
neither practical nor necessary to reflect all instances where this occurs. However, select
examples of existing collaboration by the DEM NPS Program and its partners are provided
below to illustrate how work is being coordinated and aligned to achieve NPS pollution
management goals.
Federal Government:
Environmental Protection Agency – In addition to routine program interactions associated
with Clean Water Act funding (including Section 319) provided to the State, the DEM OWR
and the regional EPA office have collaborated on special projects that advance
environmental protection by mitigating NPS pollution. Recent examples include the
development and implementation of a water quality restoration plan for Roger Williams
Park – a signature recreational resource in the City of Providence and improved treatment of
urban runoff through installation of BMPs in an industrial park also in Providence.
USDA, Natural Resources Conservation Service (NRCS) – The DEM NPS and TMDL
Programs, EPA and others interested in resource stewardship are members of the NRCS

RI NPS Management Program Plan, September 2014 32
State Technical Team. Opportunities are provided for water quality concerns to be part of
NRCS grant program scoring and in the development of conservation practice standards.
DEM and NRCS are also actively coordinating in the implementation of the National Water
Quality Initiative.
State Government:
Coastal Resources Management Council – DEM and CRMC staff routinely coordinate on a
number of topics. The agencies jointly developed and implement the RI Stormwater Design
and Installation Standards Manual, which reflects requirements for low impact development
and establishes treatment standards for stormwater discharges. The DEM NPS Program
continues to be involved in evaluating and refining policy related to implementation of the
manual and identifying potential revisions. Regulatory staff also routinely coordinate on
permitting projects in the coastal zone including the emergency repair of OWTS following
Super Storm Sandy. In addition, CRMC and DEM collaborate on programs related to
resource management including monitoring, protection and restoration of coastal wetlands
and management of aquatic invasive species.
Rhode Island Bays, Rivers and Watersheds Coordination Team – The “Coordination Team”
was established by state law (RIGL 46-31) to develop coordinated approaches to water
resource management and the sustainable development of Rhode Island’s water-reliant
economy. The Team includes DEM, CRMC, Department of Administration Planning
Program, RI Rivers Council, RI Water Resources Board, Narragansett Bay Commission and
the Commerce Department. See http://www.dem.ri.gov/bayteam/index.htm for more
information on the organization of the Team and its activities. DEM is collaborating with
the Coordination Team to support investigation into the feasibility of establishing
stormwater utility districts (SUDs) as a means of providing a sustainable source of funding
for stormwater management. Once established, the districts would generate funding that
could support the retrofitting of existing stormwater infrastructure with green infrastructure
practices and other BMPs.
Rhode Island Environmental Monitoring Collaborative (RIEMC) – RI Comprehensive
Environmental and Watershed Monitoring Act (R.I.G.L. § 46-31) in 2004 established the
Rhode Island Environmental Monitoring Collaborative to develop and, through its members,
implement comprehensive environmental monitoring to support management of Rhode
Island’s natural resources. The RIEMC advises and reports to the Coordination Team (see
above). DEM is collaborating with the RIEMC on an update of the RI Water Monitoring
Strategy. This update will review and make recommendations regarding monitoring needs
associated with evaluating nonpoint source pollution problems. The RIEMC provides a
forum for government agencies, university–based programs, non–governmental
organizations, and volunteers, to collaborate on monitoring activities, determine monitoring
priorities and identify critical gaps in data collection.
RI Department of Health – DEM NPS staff work closely with Department of Health
Programs on source water protection planning and responding to instances of public and
private drinking water contamination, investigation and abatement of water pollution

RI NPS Management Program Plan, September 2014 33
affecting public beaches and other water related public environmental health threats
including cyanobacteria blooms in surface waters and fish tissue contamination.
RI Clean Water Finance Agency – The Clean Water Finance Agency (CWFA) in
cooperation with DEM administers the Community Septic System Loan Program (CSSLP),
in which the towns that have a DEM–approved Onsite Wastewater Management Plan can
access funds from the Clean Water Revolving Loan Fund for low interest loans to
homeowners for OWTS repairs. (See also Section VI. A. Resources for Implementation.)
RI Water Resources Board – DEM is a member of the RI Water Resources Board. DEM
NPS staff routinely coordinate with Board staff on issues of water allocation and withdrawal
and their impact on water quality. DEM NPS staff also review the water supply system
management plans required by the Water Resources Board of the major water suppliers in
the state (see Appendix C).
Department of Administration – Rhode Island cities and towns must have a locally adopted
Community Comprehensive Plan that must be updated at least once every five years.
Municipal plans are required to be reviewed by the State for consistency with State goals
and policies. In turn, State agency projects and activities are to conform to local plans that
have received State approval. DEM NPS Program staff review draft and final local
comprehensive plans. The review process is coordinated across state government by the
Department of Administration Division of Planning.
Climate Change Commission – A recent state law formalized an executive agency level
climate change commission. The commission provides a forum for evaluating the effects on
NPS pollution associated with a changing climate in RI. DEM and CRMC are members of
the commission.
Regional Programs:
Narragansett Bay Estuary Program (NBEP) – Established in 1987 pursuant to Section 320 of
the Clean Water Act, the Narragansett Bay Estuary Program has been active for over two
decades. The program targets the bi-state watershed of Narragansett Bay and accordingly
constitutes a regional program with involvement from both Rhode Island and Massachusetts.
The Comprehensive Conservation and Management Plan for Narragansett Bay was updated
in 2013, reinforcing the regional and bi-state role of the program. It includes
recommendations pertaining to the major NPS problems in RI – pathogens and nutrients.
Among other areas, the DEM collaborates with the Narragansett Bay Estuary Program on
outreach to build support for effective management (e.g., Watershed Counts and Status and
Trends Report).
Academic Institutions:
University of Rhode Island – DEM works collaboratively with various individual researchers
as well as programs at URI. Collaboration ranges from projects of short duration to ongoing
efforts that have been in place for twenty years or more; e.g., Environmental Data Center

RI NPS Management Program Plan, September 2014 34
and GIS applications. Examples of ongoing collaboration with DEM on NPS related topics
include the following Cooperative Extension Programs:
New England Onsite Wastewater Training Program: A demonstration and field
training center for onsite wastewater treatment system technologies;
RI Nonpoint Education for Municipal Officials Program: Supports local decision
makers in the management of land use impacts on natural resources;
Home*A*Syst Program: Provides residential pollution prevention programs,
including drinking water well protection and landscaping for water resource
protection; and the
Watershed Watch Program: A scientist–led volunteer water quality monitoring
program.
URI Coastal Institute:
Watershed Counts: a collaborative initiative facilitated by the Coastal Institute’s role
as Chair of the RI Environmental Monitoring Collaborative and the Narragansett Bay
Estuary Program to provide information on indicators of water quality and watershed
conditions; and
Stormwater management forums and projects.
Non-governmental Organization (NGOs):
Environmental NGOs, which range in size and capability, are often collaborators with
governmental agencies on watershed protection and restoration projects and initiatives.
Such groups take on various roles in advocating for and carrying out NPS implementation
projects. Larger organizations including Save The Bay, Audubon Society of Rhode Island,
and The Nature Conservancy are broadly involved with environmental issues statewide and
operate ongoing programs in areas such as monitoring, education, land stewardship, and
habitat restoration that contribute to the implementation of this plan. Watershed
organizations (councils), which may employ staff or be solely volunteer-based
organizations, carry out a variety of programs, projects and activities within their geographic
area of focus. Additional organizations representing user groups or other specific interests,
such as Save The Lakes, Surfriders, Blueways Alliance, and RI Nursery Association also
carry out activities supportive of the goals in this plan.
Coastal Clean-ups – Coastal clean-ups have been coordinated in RI by NGOs, including but not
limited to RI Audubon Society, Save The Bay and Clean Ocean Access for many years, often as
part of national annual coastal clean-ups. Multiple sponsors, including DEM, have contributed
to this effort.

RI NPS Management Program Plan, September 2014 35
Setting Watershed Priorities
The long-term goal for all Rhode Island watersheds is to achieve clean and healthy waters. That
said, there is also a practical and strategic need to prioritize the work undertaken to protect and
restore water quality in order to optimize results. At the state scale, it is important to identify
which water quality stressors and which watersheds or waterbodies will be the focus of attention
within the limited resources of state water resource programs. At the watershed scale, it is
equally important to build consensus among a broad group of stakeholders on specific water
quality objectives and prioritize actions that address those objectives. A clearly articulated set of
priorities helps to facilitate the alignment of resources from various parties and move forward to
successfully implement needed actions. The following discusses the RIDEM priority setting
process in more detail.
State Level
Priorities within the state water resources programs are influenced by federal and state law,
federal funding guidance, state policy and information concerning environmental conditions.
The Environmental Protection Agency requires frameworks for prioritization within the
programs associated with administration of the federal Clean Water Act. Prioritization does not
mean changes to the level of protection afforded a given waterbody. Regulatory programs that
protect water quality and prevent pollution from a variety of sources are equitably administered
on a statewide basis across all watersheds as applicable. However, prioritization is an
acknowledgement that in order to be strategic in utilization of the limited resources currently
available to DEM, certain watersheds may be targeted for and receive greater focus and attention
than others within a given time period. Priorities are periodically re–visited based on new
information gained through updated water resource assessments and new scientific research.
Existing Prioritization Activities
The DEM Office of Water Resources programs include both protection and restoration activities.
For water resources in good condition, the State emphasizes preventing water pollution as well
as other forms of aquatic habitat degradation. For water resources known to be impaired or
degraded, the objectives are to both prevent further degradation and to restore conditions to
support designated uses or healthy habitat conditions.
With respect to focusing NPS management, DEM has identified the following:
As introduced in Section II, certain watershed planning areas with less than 10%
impervious cover and few surface water impairments may also support some of RI’s
cleanest waters and highest quality aquatic habitat. Protection and pollution prevention
are priorities in these areas although there may also be scattered waterbodies that may
also need targeted restoration;
C. Setting Priorities

RI NPS Management Program Plan, September 2014 36
Water quality impairments are more prevalent within watersheds/sub–basins that are
more urbanized. DEM has categorized a majority of designated watershed planning areas
as being in need of a mix of protection and restoration actions. These areas have existing
impervious cover ranging up to 25%; and
A smaller number of watershed planning areas have the highest extent of urbanization.
These lie largely within the urban services boundary designated in the document, “Land
Use 2025: State Land Use Policies and Plan” (RIDOA 2006). This boundary presents an
opportunity for evaluating its future use as a tool in prioritizing water quality protection
and restoration activities. The emphasis in these areas is on restoring water quality with
recognition these heavily developed watersheds will require sustained investment in
retrofitting the existing landscape and infrastructure over many years in order to achieve
water quality goals. (See Appendix F for the categorized list of watershed planning
areas.)
Existing DEM priorities can be described in relationship to water resource uses. Well-
established priorities related to the use of surface and groundwaters have been incorporated into
DEM statewide water programs including certain regulations. These priorities, which emphasize
protection of public health, are:
Protection and restoration of drinking water supply source waters – both surface waters
and groundwaters;
Protection and restoration of shellfish growing area waters;
Protection and restoration of public beach waters;
Restoration of waters degraded due to excess nutrients; and
Protection and restoration of water quality to support high quality aquatic habitats.
These priorities are primarily associated with the two major causes of water quality pollution in
RI – pathogens and nutrients. (See Section II.B. for additional detail.)
These priorities are reflected in:
Regulations that provide a higher level of protection by restricting pollution sources in
certain areas; e.g., drinking water source areas;
Scoring criteria used to rank and award both state and federal 319 implementation grants
for nonpoint source pollution abatement;
Priority Project List ranking process associated with projects that may receive financing
via the Clean Water State Revolving Loan Fund;
Schedule for TMDL development which gave initial emphasis to both impaired drinking
water sources and shellfish growing areas; and
DEM Annual Performance Partnership Agreement/Grant/Workplan.
Watershed Priorities for 2015 - 2019
The DEM Office of Water Resources is adapting its programs to give greater emphasis to
watershed management. This will allow DEM to invest additional effort in both watershed
planning and facilitating implementation of actions that are part of watershed–based protection
and restoration strategies. The DEM OWR directly administers several delegated Clean Water

RI NPS Management Program Plan, September 2014 37
Act programs in RI and is therefore well positioned to coordinate actions among these to
reinforce watershed-based approaches to water quality protection and restoration.
For the period from 2015 to 2019, the statewide priorities for management and abatement of
nonpoint source pollution will be:
Protection and restoration of drinking water supply sources;
Protection and restoration of waters utilized for public recreation;
Restoration of waters degraded due to excess nutrients;
Protection and restoration of shellfishing growing area waters; and
Protection and restoration of water quality to support high quality aquatic habitats.
To better support a watershed–based approach to implementation, DEM will progressively select
watersheds that will be the focus of DEM attention for watershed planning and promoting NPS
implementation activities. With respect to planning, DEM expects to be able to complete
watershed plans in a 1-2 year period as reflected in the schedule below. With respect to
protection and restoration actions, DEM expects varying levels of implementation will be
underway in all watersheds. DEM will focus attention in targeted watersheds by utilizing its
staffing resources to support an enhanced level of coordination and technical assistance. This
includes, but is not limited to, coordinating or participating in technical or other stakeholder
committees that work on a watershed basis. Given current resources, DEM will be able to target
only a few watersheds each year. The length of time a watershed is targeted will vary (2-5 years)
based on local needs and opportunities. Over time, DEM expects to complete watershed plans,
conduct monitoring and complete water quality restoration plans (TMDLs) as needed in all of
RI’s watersheds. This process will extend beyond the five year period targeted by this plan.
In addition to allocating its staffing resources, DEM administers programs that distribute grant
funding primarily for implementation of water quality and habitat restoration actions. To
reinforce the priorities reflected in this plan, DEM will be reviewing and revising the scoring
criteria applied in the grant programs as needed.
Based on an internal review of available information and consultation with state and local
partners, DEM has identified watersheds of focused attention for the next two years (2015–
2016). Factors that influenced the selection of watershed priorities included the following:
Priority beneficial uses of water resources being protected or restored consistent with the
priorities identified above;
Status of watershed planning;
Status of water quality restoration planning (TMDLs);
Potential for documenting water quality improvements;
Local engagement and other partnership opportunities; and
Potential to leverage resources to advance implementation; e.g., NRCS National Water
Quality Initiative (NWQI).
In certain watersheds, DEM expects that its involvement in coordinating and collaborating with
partners will extend beyond one year in order to sustain progress. Ideally, the DEM Office of
Water Resources would have sufficient resources to assign personnel to support planning and
coordination of water quality management activities in all areas of the state. Given this is not

RI NPS Management Program Plan, September 2014 38
possible at this time, DEM will instead select new targets for focused watershed activities,
including development of watershed-based plans, in 2016 taking into account availability of
resources.
DEM will continue to refine its approach to selecting watershed priorities and apply that to
identifying the next set of targets for 2017-2019. DEM–OWR will institute a process to review
priorities and select new targets as appropriate. The process as applied to 2017-2019 will
involve the following steps:
Review water quality assessment results – FY16 Integrated Report;
Solicit public input as part of required public meeting on 303(d) List of Impaired Waters;
Survey level of interest in watershed planning and management of local governments and
watershed councils;
Consider state strategic priorities and consult other agencies;
Internal discussion among DEM – OWR managers will be used to reach a consensus on
future watershed targets; and
Select new watershed targets in fall of 2016 and notify local officials of intended
activities; e.g., watershed planning. New targets will also be reflected in the annual
PPG/PPA.
Review and revise as needed the Request for Proposals for 319 Project Funds and the
associated scoring criteria in order to reflect priorities.
The prioritization process will be done in a manner consistent with DEM’s evolving approach to
the new vision of the TMDL program including prioritizing healthy watersheds for protection.
Selected watersheds will be reflected in future Performance Partnership Agreements.
Among these factors, DEM will give significant weight to the willingness of local partners to
work with DEM on both watershed planning and implementation initiatives and the opportunities
to leverage additional resources. DEM sees advantages to remaining flexible in scheduling and
aligning its work in order to continue to be responsive to opportunities that lead to strengthened
partnerships and enhanced local capacity. Such opportunities cannot always be forecast. For
example, the successful application by the Wood–Pawcatuck Watershed Association for federal
funds to support watershed planning presents a new opportunity for collaboration that is
mutually beneficial.

RI NPS Management Program Plan, September 2014 39
Table 3. Watersheds Targeted for Focused DEM NPS Program Activities
Watershed
Planning
Area
Targeted Waters
(Including, but not limited
to, the following)
NPS Management
Priority
Major Activities* Schedule
Aquidneck
Island
Bailey’s Brook
Maidford River
Paradise Brook
Drinking Water Reservoirs:
-Lawton Valley Reservoir
-St. Mary’s Pond
-Sisson Pond
-North Easton Pond
-South Easton Pond
-Nelson Pond
-Gardiner’s Pond
Drinking Water Supply -
restoration of source
water quality;
Public Recreation –
protection of marine
beaches.
Develop watershed
plan,
Develop TMDLs,
NWQI coordination,
Watershed project
implementation,
Nutrient
management,
Coastal habitat
restoration.
2015-2019
Bristol –
Kickemuit
and
Barrington-
Warren-
Palmer
Kickemuit River and
Reservoir
Mount Hope Bay
Bristol Harbor
Runnins River
Barrington River
Palmer River
Public recreation –
protection of marine
beaches;
Shellfish growing area –
restoration of water
quality.
Watershed project
Implementation.
2015-2016
Wood-
Pawcatuck
Watershed
Wood River
Pawcatuck River
Chipuxet River
Queen River
Beaver River
Meadow Brook
Worden Pond
Watchaug Pond
Chapman Pond
Drinking Water Supply –
protection of groundwater
quality;
Public Recreation –
protection and restoration
of water quality;
Aquatic Habitat –
protection and restoration
of high quality habitat.
Develop watershed
plan,
Riverine habitat
restoration.
2015-2018
Narrow
River
Narrow River
Mattatuxet River
Crooked Brook
Carr Pond
Shellfish growing area –
restoration of water
quality;
Public Recreation –
protection and restoration
of water quality.
Aquatic Habitat –
protection and restoration
of estuarine habitat.
Develop watershed
plan,
Watershed project
implementation,
Coastal habitat
restoration.
2015-2017
Scituate
Reservoir
Scituate Reservoir
Regulating Reservoir
Moswansicut Pond
Ponagansett River
Barden Reservoir
Westconnaug Reservoir
Drinking Water Supply –
protection of source water
quality.
Develop watershed
plan,
Watershed project
implementation,
Nutrient
management.
2015-2018
* Implementation activities within a targeted watershed planning area are expected to be on-going and will extend
beyond the schedule indicated. The schedule reflects allocation of DEM staffing resources to support
implementation.

RI NPS Management Program Plan, September 2014 40
The following sections discuss the management strategies for various categories of nonpoint
source pollution. This section provides the context for the corresponding actions and milestones
in Section VI.B.
A1. OWTS
Pollutants: pathogens, nutrients, pharmaceuticals and personal care products, household
hazardous materials
Key points:
Alternative OWTS provide opportunities for improved treatment, but they require greater
oversight, therefore strategies must be implemented to ensure their proper operation and
maintenance.
Local government must play a major role in ensuring OWTS maintenance.
Local planning for wastewater facility systems and OWTS should be integrated into one
local wastewater plan.
Cesspools are a substandard means of wastewater treatment and disposal that should be
eliminated statewide.
Wastewater from any structure not served by a sewer system is disposed of onsite using an onsite
wastewater treatment system (OWTS, also referred to as a septic system). This is a system of
pipes, tanks, and chambers used to treat and disperse sanitary wastewater into the soil. Sanitary
wastewater is water from toilets, sinks, showers and baths. Wastewater from commercial and
industrial processes (non–sanitary wastewater such as car washes, cooling waters, etc.) that is
disposed of onsite where there is no sewer system is regulated as a Groundwater Discharge (see
Section A2).
There are approximately 157,000 OWTS in Rhode Island, serving about 30% of the state’s
population and 80% of the state’s land area. In many areas of the state, it is not cost–effective or
desirable to extend public sewer service. In addition, Land Use 2025 (RIDOA 2006) discourages
the expansion of sewer service outside of the state’s designated urban services boundary.
Therefore, communities dependent on OWTS will continue to utilize them to treat their
wastewater into the foreseeable future. The exception to this are the limited areas identified and
targeted for future sewer service in facility plans prepared for public wastewater treatment
systems.
A. Onsite Wastewater Treatment Systems (OWTS) and
Other Groundwater Discharges
IV. Pollution Source Management

RI NPS Management Program Plan, September 2014 41
Wastewater from an OWTS moves downward through the soil into groundwater carrying with it
bacteria and viruses, nutrients (nitrogen and phosphorus), pharmaceuticals and personal care
products, and other contaminants improperly disposed of into the system. The level of treatment
provided to depends on many factors – system design and installation, system use and
maintenance and the local soil characteristics. A properly sited, designed, installed and
maintained OWTS will provide decades of use and provide treatment such that the system does
not adversely impact public health or the environment.
All OWTS are regulated and permitted by DEM through implementation of the DEM “Rules
Establishing Minimum Standards Relating to Location, Design, Construction and Maintenance
of Onsite Wastewater Treatment Systems.” These rules set prescriptive standards for the OWTS
components, size of systems based on intended use and soil conditions on each site, and the
location of systems based on maintaining minimum separation distances from drinking water
wells, wetlands and waterbodies, property lines, and other structures. Design flow from OWTS
range from 345 gallons per day for a 3 bedroom residence to greater than 20,000 gallons per day
for some schools and other institutions. Private sector professionals are licensed by DEM to
conduct an evaluation of the proposed site soil conditions, design and install the systems.
In addition to conventional system designs specified in the Rules, DEM has established a
procedure for approval of alternative or experimental OWTS technologies and drainfields. As of
January 2014, 19,047 alternative or experimental technologies and drainfields have been
installed in the state. These are more complex systems that require a greater level of oversight to
ensure that they operate as designed in order to achieve the desired level of treatment.
Alternative systems are used on difficult sites where a conventional system can not be installed
due to site limitations (e.g., high water table, small lots, nearby private wells). Alternative
systems can be installed with a smaller footprint or provide a higher level of treatment, resulting
in an equivalent or better environmental condition than a conventional system on an acceptable
lot with no site constraints. An acknowledged concern with this approach is the inevitable
development of sites formerly considered undevelopable due to new OWTS technologies. The
approval of an alternative OWTS allows the lot to be developed, creating impacts not related to
OWTS, such as stormwater runoff. Municipalities should be prepared for this and plan for
development accordingly. Alternative systems are also used in sensitive areas to meet water
quality objectives as demonstrated by the requirement for denitrification systems in the Salt Pond
and Narrow River watersheds for any new or repaired system.
OWTS can fail if they are improperly sited, designed, installed and/or maintained, causing health
and water quality concerns as wastewater backs up onto the land surface and flows directly into
surface waters, stormwater collection systems or moves untreated into groundwater. Lack of
maintenance is considered to be the primary cause of system failure.
Cesspools are an older, substandard method of disposal. They are essentially just a hole in the
ground which does not provide an acceptable level of treatment and is more likely to fail. As of
2014, there are approximately 20,000 cesspools still in use in RI. The RI Cesspool Act of 2007
(RIGL Chapter 23-19.15) requires cesspools within 200 feet of the coastal shoreline, public
drinking water wells and drinking water reservoir impoundments to be removed from service by
January 1, 2014. As of May 2014, 521 cesspools have been replaced and 482 have been

RI NPS Management Program Plan, September 2014 42
identified that need to be replaced. Removal of these primarily coastal cesspools is a major
priority, and DEM will continue to use tools to achieve compliance, including formal
enforcement actions. In addition, the use of large capacity cesspools (those serving any non-
residential facility that has the capacity to serve greater than 20 people per day or serves any
multi-family residence or apartment building) is prohibited by state and federal rules. Phasing
out the use of cesspools has been a major DEM initiative; however, the need remains for a
strategy to accelerate the removal of cesspools statewide.
Operation and maintenance of existing systems is the responsibility of the property owner. All
OWTS, both conventional systems and alternative treatment systems
with pumps and other electronic components, require periodic
maintenance to achieve expected levels of treatment performance.
Eighteen towns in RI have adopted onsite wastewater management
plans to encourage or require maintenance activities such as system
inspections or pumping of septic tanks (as enabled by RI General
Law Chapter 45-24.5) (see Figure 9). Once approved by DEM, these
plans make the towns eligible for the Community Septic System
Loan Program (CSSLP), through which the towns can access funds
from the Clean Water Revolving Loan Fund for low interest loans to
homeowners for OWTS repairs. As of July 1, 2014, 39 loans have
been issued to 14 towns over the past 15 years totaling $10,900,000.
The impacts of projected climate change through sea level rise and warmer soil temperatures
may decrease the effectiveness of OWTS in treating wastewater by means of:
Sea level rise will increase the vulnerability of systems in the coastal zone to storm
damages;
Rising water tables (due to sea level rise) in the coastal zone will decrease the
available aerated soil to treat wastewater beneath the system. Wet and saturated
conditions beneath the system favor pathogen survival and transport; and
Warmer soil temperatures statewide will potentially reduce available oxygen for
wastewater treatment in the soil.
Over the five year planning period, DEM will target focused effort toward the elimination of
cesspools, expansion of local wastewater programs and improved oversight of maintenance of
alternative and advanced onsite wastewater treatment systems.

RI NPS Management Program Plan, September 2014 43
Figure 9. Status of Local Onsite Wastewater Management Plans
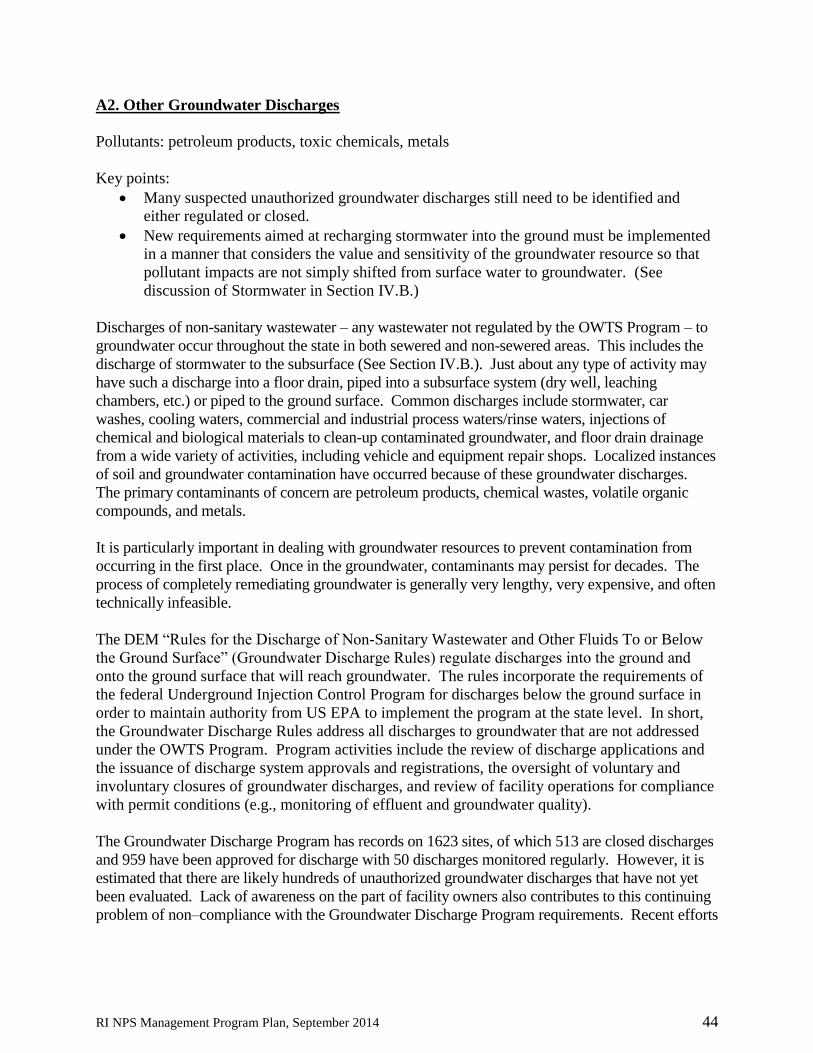
RI NPS Management Program Plan, September 2014 44
A2. Other Groundwater Discharges
Pollutants: petroleum products, toxic chemicals, metals
Key points:
Many suspected unauthorized groundwater discharges still need to be identified and
either regulated or closed.
New requirements aimed at recharging stormwater into the ground must be implemented
in a manner that considers the value and sensitivity of the groundwater resource so that
pollutant impacts are not simply shifted from surface water to groundwater. (See
discussion of Stormwater in Section IV.B.)
Discharges of non-sanitary wastewater – any wastewater not regulated by the OWTS Program – to
groundwater occur throughout the state in both sewered and non-sewered areas. This includes the
discharge of stormwater to the subsurface (See Section IV.B.). Just about any type of activity may
have such a discharge into a floor drain, piped into a subsurface system (dry well, leaching
chambers, etc.) or piped to the ground surface. Common discharges include stormwater, car
washes, cooling waters, commercial and industrial process waters/rinse waters, injections of
chemical and biological materials to clean-up contaminated groundwater, and floor drain drainage
from a wide variety of activities, including vehicle and equipment repair shops. Localized instances
of soil and groundwater contamination have occurred because of these groundwater discharges.
The primary contaminants of concern are petroleum products, chemical wastes, volatile organic
compounds, and metals.
It is particularly important in dealing with groundwater resources to prevent contamination from
occurring in the first place. Once in the groundwater, contaminants may persist for decades. The
process of completely remediating groundwater is generally very lengthy, very expensive, and often
technically infeasible.
The DEM “Rules for the Discharge of Non-Sanitary Wastewater and Other Fluids To or Below
the Ground Surface” (Groundwater Discharge Rules) regulate discharges into the ground and
onto the ground surface that will reach groundwater. The rules incorporate the requirements of
the federal Underground Injection Control Program for discharges below the ground surface in
order to maintain authority from US EPA to implement the program at the state level. In short,
the Groundwater Discharge Rules address all discharges to groundwater that are not addressed
under the OWTS Program. Program activities include the review of discharge applications and
the issuance of discharge system approvals and registrations, the oversight of voluntary and
involuntary closures of groundwater discharges, and review of facility operations for compliance
with permit conditions (e.g., monitoring of effluent and groundwater quality).
The Groundwater Discharge Program has records on 1623 sites, of which 513 are closed discharges
and 959 have been approved for discharge with 50 discharges monitored regularly. However, it is
estimated that there are likely hundreds of unauthorized groundwater discharges that have not yet
been evaluated. Lack of awareness on the part of facility owners also contributes to this continuing
problem of non–compliance with the Groundwater Discharge Program requirements. Recent efforts

RI NPS Management Program Plan, September 2014 45
have focused on identifying, permitting and closure of unauthorized discharges at higher risk
facilities such as floor drains at motor vehicle facilities.
Over the five year planning period, DEM will target the elimination of unauthorized groundwater
discharges giving emphasis to those located in areas dependent on groundwater for water supply.
(See also discussion of Road Salt and Sand Application in Section C below)
Pollutants: sediment, pathogens, nutrients, metals, petroleum products, salt, heat
Key points:
Low impact development strategies are the focus of long–term stormwater management;
Stormwater from existing impervious surface must be addressed in order to achieve
improvements in water quality;
Maintenance of stormwater management practices is often neglected and must be
improved; and
Among challenges to abating stormwater pollution, a major obstacle is the lack of a
reliable source of funding. (See Section VI.A. Resources for Implementation for
discussion of stormwater funding strategies)
Stormwater runoff is a major, widespread source of water quality degradation in RI and is known
or suspected to be associated with the majority of surface water quality impairments.
Stormwater impacts include: pathogen contamination resulting in beach closures and the closure
of shellfish growing areas; nutrient enrichment of waterbodies resulting in algal blooms
(including toxic cyanobacteria); elevated levels of other water pollutants (e.g., metals); stream
bank erosion; and aquatic habitat alterations from high flows. The degree to which stormwater
impacts water quality in any particular watershed is primarily a function of the amount of
impervious cover and how stormwater generated from the impervious cover is managed.
Diffuse stormwater runoff, such as overland sheet flow, is often categorized as a nonpoint source
of pollution. However, in highly urbanized areas prevalent in many portions of RI, stormwater is
collects in gutters and pipes and conveyed to a direct discharge into surface waters at the end of a
pipe. Pursuant to the federal Clean Water Act, this type of stormwater discharge is regulated as a
point source. In Rhode Island stormwater discharges from qualifying urban areas are subject to
the federally required Municipal Separate Storm Sewer System (MS4) Program, administered by
DEM under the Rhode Island Pollutant Discharge Elimination System Program. Activities
which directly implement an MS4 permit requirement are not eligible for Section 319 funding.
DEM has elected to present the following information that is generally applicable statewide with
the understanding that inclusion in this plan does not affect requirements in place on the use of
319 funding.
B. Stormwater Runoff and Erosion Controls on Developed
Lands

RI NPS Management Program Plan, September 2014 46
DEM and CRMC updated the RI Stormwater Design and Installation Standards Manual
“Stormwater Manual” (effective January 2011) to include the following stormwater management
requirements for new development permitted by state programs as specified in the Smart
Development for a Cleaner Bay Act of 2007 (RIGL 45-61.2-2):
Maintain pre–development groundwater recharge and infiltration on site to the
maximum extent practicable;
Demonstrate that post-construction stormwater runoff is controlled, and that post–
development peak discharge rates do not exceed pre–development peak discharge
rates; and
Use low impact design (LID) techniques as the primary method of stormwater
control to the maximum extent practicable.
The Stormwater Manual applies to both new development as well as certain redevelopment of
properties subject to state regulatory jurisdiction. This includes applications to the following
state regulatory programs: DEM and CRMC Freshwater
Wetlands Programs, DEM Water Quality Certification
Program, DEM Groundwater Discharge Program, DEM RI
Pollutant Discharge Elimination System Program, and
CRMC Coastal Management Program. Applications must
also comply with the Erosion and Sediment Control
Handbook that is referenced in the Stormwater Manual.
State policy emphasizing the adoption of LID practices is
intended to ensure future land development is done in a
manner that minimizes water pollution impacts due to
urban stormwater runoff. This includes using techniques
that preserve open spaces and riparian buffers as an
effective means to mitigate pollution as well as provide
other environmental benefits.
Local governments play an essential role in facilitating LID through implementation of their
local land use authorities. At present, many local land use ordinances are still in need of revision
in order to more fully implement innovative land use controls, including LID and the
conservation development planning process. To support local efforts, DEM and CRMC prepared
the “RI Low Impact Development Site Planning and Design Guidance Manual (2011),” which
provides information on different LID strategies from roadway design to conservation
development and provides examples of how to improve local ordinances.
The Stormwater Manual also sets requirements for stormwater treatment within watersheds via
recharge into the ground. Stormwater infiltration uses engineered BMPs and the natural
groundwater flow system to treat pollutants. Infiltrating more stormwater necessitates proper
management of these groundwater discharges to prevent impacts to groundwater used for
drinking water and other beneficial uses. The DEM Groundwater Discharge Rules discussed
above require registration of stormwater discharges that are placed below the ground surface
(eg., trenches or drywells) and those that infiltrate at the surface without an engineered filter

RI NPS Management Program Plan, September 2014 47
media (eg., infiltration basin). This stormwater infiltration is reviewed to ensure that it is done in
accordance with the standards in the Stormwater Manual, which specify approved BMPs and
design specifications for these BMPs in order to protect groundwater quality.
The RI State Conservation Committee, under the direction of the Director of DEM, adopted a
major comprehensive update of the RI Soil Erosion and Sediment Control Handbook
(“Handbook”) in the summer of 2014. The Handbook is intended to assist property owners,
developers, engineers, consultants, contractors, municipal staff and others in planning, designing
and implementing effective Soil Erosion and Sediment Control Plans for the development and
redevelopment of properties in Rhode Island. Contained within the Handbook are methods and
techniques for minimizing erosion and sedimentation based on the best currently available
technology representing the integration of the most recent technical information, expertise of the
soil and water resource managers involved in updating the manual and the guidelines and
preferred technologies of states with well–established soil erosion and sediment control
programs. Implementation of the practices in this Handbook, as required by the RI Stormwater
Design and Installation Standards Manual, is expected to significantly reduce sedimentation in
surface waters associated with construction activities.
Local stormwater management is an essential service that must be integrated into all relevant
aspects of local government, including planning, engineering and public works. Local
stormwater management practices currently vary widely with many municipalities who lack the
financial resources, staff or expertise to effectively manage stormwater from planning to
permitting to maintenance. State bond funds (2004 and 2012) have been and will be used to
distribute state grants to enhance local capacity to implement stormwater management. (See the
discussion of sustainable financing in Section VI.A., Resources for Implementation, including a
discussion of stormwater utilities) RIDEM is working with partners, including RIDOT, URI,
and others, to expand technical assistance as resources allow.
Proper design, siting and installation of BMPs as property is developed are not enough to achieve
state water quality goals for waters impaired by stormwater. Two challenges associated with
stormwater management include:
Proper maintenance of BMPs: Maintenance of the existing stormwater infrastructure
is a glaring weakness at the state, local and private sector levels. Stormwater
management BMPs for improving water quality must be maintained or the water
quality benefits of the BMP will largely be lost; and
Improving treatment of stormwater from existing developed lands: Accelerating the
pace at which performance of stormwater management on existing public and private
property is improved continues to be a significant challenge. Many of the completed
TMDL’s identify the need to improve stormwater management from existing
properties in the watershed to reduce pollutant loadings to impaired waters.
Significant responsibility for improved stormwater management rests with municipal
governments and the Rhode Island Department of Transportation. However, in
many watersheds it will also be necessary to reduce pollution from stormwater
runoff generated from private properties.

RI NPS Management Program Plan, September 2014 48
One of the most common sources of bacteria and other pathogens, as well as nutrients in
stormwater is pet waste, primarily dog waste, although other backyard pets (horses, goats, etc.,)
can cause localized problems. Dog waste in urban and suburban areas left on the sidewalk, or on
grass near the street, can be washed into stormwater drainage systems by runoff. It has been
estimated that for a small bay watershed (up to 20 square miles), 2 to 3 days of droppings from a
population of 100 dogs contribute enough bacteria to temporarily close a bay to swimming and
shellfishing (USEPA website). Dog waste can harbor a host of different bacteria, parasites and
viruses that can cause human illness and disease. One gram of dog waste contains 23 million
fecal coliform bacteria, almost twice as much as human waste (RIDEM 2010). In Rhode Island,
there are approximately 200,000 dogs and it is generally estimated that dogs produce one–half
pound of feces per dog per day (RIDEM 2011), which means that approximately 100,000 pounds
of dog waste is generated per day in RI. Management of pet waste is clearly the pet owner’s
responsibility, but only about 60% of dog owners pick up after their pets (Center for Watershed
Protection). Proper disposal of pet waste can be accomplished by flushing, burying, or sealing it
in bags and putting it in the trash.
Climate change is expected to result in wetter and more variable precipitation conditions in the
decades ahead with more frequent and more intense storms that have larger amounts of
precipitation falling over shorter time periods. Stormwater management systems are designed
based on the average precipitation rates in the recent past. Design standards were last changed in
2010. The capacity and performance of these systems will be an issue to closely evaluate as
precipitation patterns in RI change in response to climate change.
Over the five year planning period, DEM will target its work with an aim of documenting (1)
significant progress toward full implementation of LID to guide future development and
redevelopment; (2) reductions in impervious cover through the removal of pavement and other
hard surfaces and improved treatment of stormwater runoff in targeted watersheds and (3)
establishment of sustainable financing mechanisms in one or more communities.
Pollutants: salt, sediment
Key point:
Minimizing impacts to water resources from road salt and sand application while at the
same time maintaining public safety presents a unique challenge.
White stained pavement and layers of sand at the edge of the road are ample evidence of our
efforts to maintain the safety of our roadways in winter. But there is a water quality cost for the
application of salt and sand. Salt and sand can wash into surface waters impacting aquatic life,
and salt can enter groundwater and contaminate drinking water wells.
Salt and sand are applied to RI roads by RI Department of Transportation (DOT) staff, municipal
staff and private contractors, generally either as a mixture of 1:1 salt to sand ratio or as sand
alone. Weather conditions ultimately determine how much is applied. Municipal data is not
C. Road Salt and Sand Application

RI NPS Management Program Plan, September 2014 49
available, but DOT annual average number of pounds of salt per lane mile from 2005 to 2013
ranged from a high of 791 to a low of 382, averaging 516 pounds per lane mile per year (RIDOA
2014).
The technology and practices utilized by DOT is much more advanced than that used by municipal
governments and the private contractors. For example, no vehicles other than DOT use the
advanced spreader technology and only one other community is known to apply a brine solution.
Private contractors play a significant role in winter maintenance in support of state and local
governments on public roads and on private property. Up to 300 private contractor vehicles can be
used by DOT in any single storm, depending on the severity of the winter (RIDOA 2014).
The sand and sediment that remains on the roadway after the winter season is either washed into our
waters, dramatically affecting aquatic life and streambed habitat, or it becomes a major contributor
to stormwater BMP failure by clogging the systems. DOT estimates that only about five to 10
percent of the sand applied is recovered as street sweepings (RIDOA 2014).
The sand and salt must be stored in a manner to reduce impacts to water quality, primarily by
covering of the salt pile in a structure and containing runoff from the site. DEM Groundwater
Quality Rules require covering of all piles (public and private) with at minimum a durable cover in
areas where groundwater is classified GA and GAA. All but 5 of the 20 state salt piles are under
cover in a permanent structure (RIDOA 2014).
Over the five year planning period, DEM will target its efforts to support actions by state and local
governmental entities to reduce the amount of salt and sand applied to road surfaces through
modified and improved practices.
Pollutants: pathogens, nutrients, pesticides, sediment, petroleum wastes
Key point:
Farms should develop and implement a Farm Conservation Plan tailored to their specific
operations that identifies the best management practices needed to minimize adverse
impacts on water quality.
Rhode Island's farms contribute to the state's economic development and provide Rhode
Islanders with local food and farm vistas, as well as tourism opportunities and wildlife habitat.
But the nature of farming in RI has changed significantly over the past 20 years. There are fewer
large farms (particularly dairy) but more of the smaller specialized farms that are producing more
locally consumed farm products. Farming will continue in Rhode Island, and thus it is important
to ensure that these operations are conducted in a manner that avoids negative impacts to water
quality.
D. Agriculture

RI NPS Management Program Plan, September 2014 50
US Department of Agriculture 2012
Census of Agriculture (USDA 2014)
shows there are 1,243 farms in RI
using 69,589 acres. A farm is
defined by USDA as “Any place
from which $1,000 of agricultural
products were produced and sold, or
normally, would have been sold,
during the Census year.” These
latest numbers show essentially a
doubling of the number of farms and
acres in farmland from 1990 (580
farms, 33,000 acres) to today. The
average size of a farm is 56 acres
with the median 24 acres. Farms
with 9 acres or less increased from
the last census in 2007, and now
account for 35% of all farms.
The potential water quality contaminants associated with agricultural operations include nutrients
(from fertilizers and animal wastes), pathogens and organic materials (primarily from animal
wastes), sediment (from field erosion), pesticides, and petroleum products. In addition, water
withdrawals are a management issue of increasing concern in certain watersheds, e.g., the southern
portion of the State. The need for irrigation water can place high demands on local groundwater or
surface water supplies which, in turn, can cause a low flow condition in streams potentially resulting
in dramatic negative impacts on stream ecology. (See water withdrawals in Section V.D.)
The Rhode Island Division of Agriculture works closely with the federal United States
Department of Agriculture programs active in RI including the technical and financial assistance
programs administered through the USDA Natural Resources and Conservation Service (NRCS).
An important means to minimize the impact of agricultural operations is for a farm to develop
and implement a Conservation Plan that addresses water quality issues. Plans are usually
developed in consultation with DEM and NRCS. The plan describes the schedule of
implementation practices needed to solve natural resource concerns and may include multiple
components to address particular resource issues, such as nutrient management, erosion control,
irrigation management, integrated pest management, wildlife and habitat management, forest
management and others. In addition to conserving natural resources important to the farm, many
of the practices included in such plans offer additional benefits to the farmer including cost–
savings. Conservation Plans are not currently required in RI. However, a significant number of
farms (almost 900) have developed plans as a result of participation in the Farm, Forest Open
Space Program, which is a state program to allow eligible properties to be assessed at its current
use, rather than its value for development. Conservation Plans are a requirement in this program.
Some farms also follow recommended conservation practices voluntarily without the preparation
of a written plan.

RI NPS Management Program Plan, September 2014 51
There are no state regulations that establish standards for specific farm management practices to
control or prevent water pollution. However, the DEM Division of Agriculture has created
standards and specifications for agricultural BMPs which aim to prevent or minimize pollution
of surface waters and groundwater. These standards and specifications are guidelines only. The
guidelines are designed so that farmers may understand and identify on–farm sources of water
pollution and implement effective strategies to address them.
In those instances where farmers decide to take actions to prevent contamination or upgrade their
existing structural or management practices, DEM Agriculture and the USDA NRCS will work
with farmers to identify the appropriate corrective strategies. Funding to implement best
management practices may then be available through the NRCS Environmental Quality
Incentives Program (EQIP). This is a voluntary program that provides financial and technical
assistance to farmers to help plan and implement conservation practices that address natural
resource concerns. Farmers that apply through the EQIP may be eligible for 75% cost share on
projects built in accordance with the NRCS standards. Since the adoption of the 2008 USDA Farm
Bill, 284 EQIP contracts have been awarded in RI. In addition, NRCS has dedicated 5% of the
EQIP funds for projects in priority watersheds chosen jointly with DEM under the joint EPA/USDA
National Water Quality Initiative (NWQI) to work with farmers to implement approved strategies to
improve water quality. NRCS estimates that for each watershed, farmers representing only 2-10%
of the total farmland acreage in that watershed have participated in the EQIP Program (Personal
Communication from E. Boettger (NRCS) 3-11-14).
The DEM Division of Agriculture is responsible for enforcing pesticide state laws and
regulations developed to prevent environmental degradation that might result from improper use
of pesticides on farms, in yards, and inside homes. Through this program, commercial pesticide
applicators are trained, tested, and licensed to achieve a minimum level of competence in the
pesticide application industry. Anyone who applies pesticides on land not owned by themselves
or their employers must have a commercial pesticide applicator's license to apply general use
pesticides. Farmers and farm workers who apply restricted use and state limited use pesticides to
produce an agricultural commodity need to have a private applicator's license. Pesticides that are
applied by a licensed applicator on farms, yards and in homes in accordance with the EPA
approved label directions are considered protective of environmental quality, and such
application is not reviewed by DEM. (Note: However, applications to surface waters for control
of aquatic nuisance species are reviewed by DEM.)
For the five year planning period, the DEM NPS Program will work with NRCS and Division of
Agriculture to facilitate implementation of watershed projects and conservation practices on
Aquidneck Island.
Pollutants: Nutrients, pesticides
Key point:
Education of homeowners on proper turf management continues to be the primary strategy
to minimize water quality impacts.
E. Lawn and Grounds Management

RI NPS Management Program Plan, September 2014 52
The care and maintenance of residential lawns and gardens, and other landscaped areas such as golf
courses, cemeteries, athletic fields, and parks, can contribute to water quality degradation. Turf is a
major feature of all but the highest density urban landscapes, and how it is managed impacts water
quality. Excessive amounts and poor timing of applications of fertilizers and pesticides can result in
losses to the environment via leaching to groundwater or stormwater runoff.
Turf is often referred to as the largest "crop" in the United States. Over 22,070 tons of fertilizer
(including lime) was sold in RI from July 2012 to June 2013 (Personal Communication from Peter
Susi, DEM Agriculture, 3-10-14). This data is broken down by amount sold by bag, bulk and
liquid. Bag sales represented 18,516 tons of the total (84%). If one assumes that bags are generally
for the consumer market, whereas bulk and liquid shipments are for farmers, and that most of the
bagged materials are for lawns – we can see a picture forming of the relative potential impact of
residential turf grass management on our water resources.
Proper turf management depends on the use of the turf. Athletic fields, golf courses and other
heavily used grassed areas, are managed much differently than residential lawns. There is no single
maintenance approach that is applicable to all turf areas whether due to type of use or the site’s soil
characteristics. However, the area of turf in high–intensity uses is a small fraction of the residential
lawn area and these athletic fields, golf courses, etc. are usually professionally managed. In
contrast, most homeowners are not aware of the appropriate best management practices to reduce
the impacts to water quality in managing their lawns.
Many states, including five in the New England/New York region have enacted state laws to
minimize pollution from the overuse and misuse of fertilizer on turf grass. RI does not have a state
law to address fertilizer use. Furthermore, local government actions to address fertilizer use have
been limited to resolutions, ordinances requiring the use of sustainable vegetation and placing
conditions on permit approvals. Strategies for managing fertilizer and pesticide use on turf are
focused on education and training. The University of RI Cooperative Extension Program, including
the Master Gardener Program, and other associations have produced public information and
provided on–site training and education on proper lawn management. The intent has been for RI
residents, landscaping companies, turf managers for golf courses and athletic fields, and garden
centers to be aware of and to implement the appropriate strategies to reduce water quality impacts
from lawn care activities. The New England Interstate Water Pollution Control Commission
worked with the New England states and New York in producing a report with detailed guidelines
for turf management (“Regional Clean Water Guidelines for Fertilization of Urban Turf “(2014))
that will be a useful tool in promoting appropriate management strategies.
As noted above in the discussion of Agriculture, the DEM Division of Agriculture is responsible
for enforcing pesticide state laws and regulations to prevent environmental degradation that
might result from improper use of pesticides. Commercial pesticide applicators are trained,
tested, and licensed to achieve a minimum level of competence in the pesticide application
industry. Anyone who applies pesticides on other people's property must have a commercial
pesticide applicator's license. There is no review or oversight of the pesticide application itself.
Lawn watering is the primary use of our water resources in the summer – the time when water
levels in streams and groundwater are at their lowest. This water use stresses public supplies,

RI NPS Management Program Plan, September 2014 53
jeopardizing public safety (water for fire suppression) and the resulting low stream flows have
devastating effects on stream ecology (see Section V.D. Water Withdrawals). The most effective
way to minimize water quality impacts associated with lawn care is simply to minimize lawn area.
To the extent that some landscaping is desired, minimum maintenance/minimum disturbance and
xeriscaping strategies (the use of plant materials that require low moisture and/or nutrient
requirements) should be pursued.
With regard to both residential and non-residential turf management, problems can also originate
from storage and disposal practices. Chemicals can leak from hoses and containers, either
accidently or because of carelessness or negligence.
For the five year planning period, DEM is targeting the development and successful launching of
the green certification programs for turf management.
Pollutants: Pathogens, nutrients, petroleum waste, chemicals
Key points:
RI’s No Discharge Area designation must be enforced and adequately supported by well
maintained pumpout facilities.
RI’s Clean Marina Program provides a unique opportunity to minimize marina impacts
on water quality.
Boating is a major recreational activity and economic generator in RI. There were
approximately 37,889 boats registered in RI in 2013 (over the last 5 years, the highest number
was 41,584 in 2010).
F1. No Discharge Program/Pumpouts
The primary water quality concern from boating is the illegal
discharge of sanitary waste (pathogens and nutrients). Under
the federal Clean Water Act, it is illegal to discharge untreated
(raw) sewage from a vessel within 3 miles of shore, including
all of Narragansett Bay. In 1998, Rhode Island became the first
state in the country to receive the US Environmental Protection
Agency’s No Discharge Area designation for all of its marine
waters. A No Discharge Area is a designated body of water in
which the discharge of untreated and treated boat sewage is
prohibited (this does not include greywater or sink water).
To maintain the No Discharge Area designation for the state’s
marine waters, DEM must assure that there are pumpout
facilities available to RI boaters and that the pumpout facility
F. Boating and Marinas

RI NPS Management Program Plan, September 2014 54
infrastructure is in sound operating condition. As of 2013, 67 marine sanitation pumpout
facilities were operating in RI waters – 51 dockside pumpout facilities and 16 pumpout boats.
From 1994 to 2012 DEM has awarded 110 grants to towns and private marinas totaling
$1,668,138 in federal funds for the development and maintenance of pumpout facilities. The
grants averaged approximately $15,000 each with approximately 60% of the funds for new
facilities and 40% for facility maintenance. This public-private partnership has successfully
reduced a significant source of pathogen contamination to the state’s coastal waters. A survey in
2103 documented 708,717 gallons of wastewater was collected through pumpout facilities – the
highest volume recorded since the surveys began in 2000.
In 2007, the RI No Discharge Law (RIGL 46-12-39.1) went into effect requiring all boats with
permanently installed marine toilets to be inspected and certified that they have taken the steps
necessary to prevent overboard discharges of sewage when operating or moored in Rhode Island
waters. All boats subject to the program must obtain and display a no discharge certificate decal
valid for four years issued by a DEM–authorized certification agent (typically a harbor master or
marina/boatyard staff).
For the five year planning period, DEM efforts will be targeted to supporting the continued
operation of pumpout facilities in sufficient numbers to prevent the discharge of boat wastes into
RI coastal waters.
F2. Marinas
There are over 140 marinas located in the tidal waters of RI. Although marinas are not one of
the leading sources of water pollution, just their location on the water’s edge means that there is
always the potential to release pollutants directly into the water, causing a localized impact on
water quality. Water quality concerns from marinas include vessel maintenance, handling of
petroleum products, and sewage (see above regarding pumpouts) and stormwater management.
Boats require a great deal of maintenance over the course of a year: engines must be tuned and
lubricated; hulls must be washed, sanded and painted; and vessels must be prepped to withstand
the cold of winter. Each of these tasks—along with a myriad of other vessel maintenance
activities—has the potential to release pollutants onto land and into the water and air.
The RI Clean Marina Program was developed by CRMC, DEM, Rhode
Island Marine Trades Association, and Save the Bay in 2007 to support and
encourage the efforts of marina owners to better manage their facilities to
prevent water pollution. This is a voluntary, incentive–based program
designed to recognize and promote environmentally responsible marinas, boatyards, and yacht
clubs that employ water quality best management strategies to prevent pollution and conserve
resources. The State developed the RI Clean Marina Guidebook to aid marina operators in their
efforts to obtain a Clean Marina designation. While all marina facilities need to be at a minimum
compliant with any federal and state regulatory issues to receive a Clean Marina designation, it is
the implementation of BMPs for the issue areas present at a marina beyond the minimum
requirements that earns the designation.

RI NPS Management Program Plan, September 2014 55
The Program encourages cooperation between marinas, the boating public and the state’s
regulatory agencies. In fact, the final recommendation for a marina to receive the Clean Marina
designation comes from a review delegation consisting of CRMC, DEM and a representative of
the Rhode Island Marine Trades Association. As of January 2014, only 4 marinas in Rhode
Island have been designated as Clean Marinas. Marinas that participate in the Clean Marina
Program are recognized for their environmental stewardship and once certified as a Clean
Marina facility can expect positive publicity and will likely attract new, environmentally
responsible boaters.
Pollutants: pathogens and nutrients
Key point:
A sustainable statewide strategy is necessary for waterfowl management to mitigate
impacts to water quality.
Despite the public appeal of feeding the ducks, most people don’t realize that ducks and geese
can significantly contribute to water pollution. Feeding of waterfowl and suburban development
with large lawns and open land for waterfowl to land and congregate, especially near waterbodies,
can result in dramatic and unnaturally high concentrations of waterfowl in some locations.
Recent concern has focused on the large numbers of
resident Canada geese. As reported by the Southern
RI Conservation District, a single Canada goose can
eat up to 4 pounds of grass and produce up to 2
pounds of fecal waste a day. Whether by direct
deposition into the water or via transport by
stormwater, the bacteria and nutrients in their waste
can end up in our waterbodies. Although most
people find a few geese acceptable, problems
develop as local flocks grow and their droppings
become excessive.
Canada goose populations in Rhode Island can be broken into two broad groups: migratory and
resident. Migratory Canada goose populations are not considered to be a problem in Rhode
Island since they do not nest locally and experience significant hunting pressure across much of
their migratory routes. However, resident Canada goose populations have increased greatly over
the last 50 years in southern New England.
Efforts to control waterfowl to minimize water quality degradation that have been attempted in
RI include:
Stopping the public from feeding waterfowl;
G. Waterfowl

RI NPS Management Program Plan, September 2014 56
Modifying habitat. Waterfowl, especially grazers like geese, prefer easy access to water;
Maintaining an uncut vegetated buffer along the shore makes the habitat less desirable to
geese; and
Controlling goose populations with hunting and nest disruption.
During the five year planning period, DEM effort will be focused on development of statewide
strategy for waterfowl management.
H1. Dredging and Dredge Material Management
Pollutants: sediment, metals, toxic chemicals
Key point:
Dredged material must be properly managed at both the location of its removal and its
final use or disposal.
In a state with significant boating and shipping sectors, dredging of our waterways is vital to
maintain navigational access to harbors and marinas. Sediment from natural sedimentation
patterns and that which is carried off the landscape by stormwater is deposited in our waterways
and builds up to levels that impede ship and boat traffic. Due to RI’s long industrial history,
sediments from urbanized rivers and coastal waters targeted for removal may contain a variety of
pollutants, such as metals and hydrocarbons.
Permitting is required for dredging since it can impact water quality at both the point of material
removal and the subsequent location of its in-water disposal, if this option is chosen. The
impacts to the aquatic environment are similar at both steps:
Suspended sediment that is deposited can impact marine life, such as submerged aquatic
vegetation and fish larvae;
Loss of marine life from the location of dredging; and
Loss of bottom habitat in the area being dredged and at the place of disposal.
The upland disposal of dredged material also has potential impacts, primarily the infiltration to
groundwater of contaminants in the sediment, including chlorides.
DEM and CRMC administer the “Rules and Regulations for Dredging and the Management of
Dredged Material” to ensure that dredging in the marine environment and management of the
associated dredged material is conducted in a manner which is protective of groundwater and surface
water quality. The material to be dredged must be analyzed in order to ensure that the use or disposal
of the dredged material will not impact water quality. RI strongly encourages the beneficial use of
dredged material for brownfields redevelopment, beach nourishment, landscaping, habitat restoration
and/or creation, construction projects, landfill cover and other useful purposes.
H. Minor Sources of Nonpoint Pollution

RI NPS Management Program Plan, September 2014 57
Dredging projects in the northern half of the state mainly use the Confined Aquatic Disposal
cells located in the upper Providence River. These sediments are typically contaminated, but the
cells are required to be capped with clean material.
Dredging projects in the southern half of the state will typically dispose of sediments as beach
nourishment. Some marinas will reuse material on-site. Larger dredge projects where the
sediment does not meet beach nourishment criteria will opt to dispose of the material at an EPA
designated offshore regional disposal site in Rhode Island Sound known as 69B. Dredging also
occurs in the coastal ponds. Coastal storms wash away beaches and transport sediment into the
ponds, requiring dredging to increase flushing to the ponds and restore sand to the beaches.
H2. Land Application Biosolids
Pollutants: nutrient, pathogens, metals
Key point:
The threat to water quality from the land application of biosolids is equivalent to that from
any other fertilizer or soil amendment.
All aspects of sewage sludge management – generation, treatment, transport, disposal, land
application – must be in compliance with DEM’s “Rules and Regulations for Sewage Sludge
Management.” Most of the sludge generated at RI’s wastewater treatment facilities is disposed
of by incineration (~85%). Although the DEM Rules have standards for land disposal of sludge
(burial) and land application of minimally treated sludge, neither of these methods of sludge
management have recently been utilized in RI, and they are not likely to be used given siting and
permitting restrictions and economic considerations.
DEM allows for the beneficial use of sludge by means of applying biosolids to provide nutrients
and soil conditioning properties for growing crops, silviculture, and establishing vegetative cover
for reclamation sites. Currently in RI only Class A Biosolids are applied to land as fertilizer or
as a soil amendment. Class A Biosolids are those biosolids that have been treated by a method
such as composting to kill off pathogens. This renders the product safe for application to food
crops and those for animal grazing without any requirement for DEM permits. In addition to
biosolids generated in state (primarily at the Bristol wastewater facility), significant quantities of
Class A biosolids are brought into the state from the Massachusetts Water Resource Authority’s
Boston wastewater treatment facility and in bags of Milorganite generated by the Milwaukee
Metropolitan Sewage District.
The threat to water quality from the land application of sludge in RI as biosolids is going to be
similar to that posed by any other application of fertilizer or manure where inappropriate
application could cause water quality impairments. The DEM rules for sludge management have
standards for application of biosolids.

RI NPS Management Program Plan, September 2014 58
H3. Surface Mining
Pollutants: sediments
Key point:
Protecting water quality from material excavation operations requires diligent site
oversight both during removal operations and post removal through the period necessary
to successfully reclaim and stabilize the site.
Surface mining activities in Rhode Island are generally limited to sand and gravel operations and
stone quarrying/rock crushing operations, of which there are approximately 15-20 facilities
regularly operating in RI. The primary water quality concern from these operations is deposition of
sediments in nearby surface waters and wetlands from improperly managed sites and poorly
reclaimed former sites. Sedimentation is exacerbated by a failure to establish adequate buffers prior
to commencing operations, by not limiting the areas of disturbance or failing to maintain erosion
and sedimentation controls. Any washing or other type of processing conducted on-site adds to the
water quality concerns associated with mining operations. In addition, the process of removing
material decreases the depth to the water table from the surface, in some cases exposing the water
table, thus increasing the vulnerability of the groundwater resource to spills or leaks from machinery
operating in the excavation area.
Abandoned or improperly restored mining pits pose additional problems. Sand and gravel
operations are too often planned and carried out with little regard for post-production reclamation
needs, such as regrading, restoring topsoil, and re-vegetating. Exposed sites that are not properly
restored may continue to erode for many years. Abandoned mining pits have also tended to become
a convenient location for illegal dumping and disposal of wastes.
H4. Silviculture
Pollutants: sediment
Key point:
The utilization of BMPs and the generally small scale of activities limits the overall impacts
of timber harvesting on water quality in RI.
While harvesting forest products can contribute to water quality degradation due to increases in soil
erosion and sedimentation, the utilization of BMPs and the generally small scale of such activities
limit the overall impacts to water quality in RI. With the exception of clearing for development
(subject to stormwater permitting), the timber harvesting operations that take place in RI generally
involve selective cutting in localized areas. Commercial woodcutting operations are regulated by
DEM Division of Forest Environment, which requires that any harvester be registered with DEM,
file a Notification of Intent to Cut, implement required BMPs to prevent impacts to water quality,
and comply with the Freshwater Wetlands Program Rules.
RI NPS Management Program Plan, September 2014 59
H5. Marine and Riverine Debris
Pollutants: solid waste
Key point:
Debris in our waters is an often overlooked water quality issue best addressed through increased
public awareness.
Styrofoam cups, plastic drinking water bottles, fishing line, cigarette butts floating in our waters
and washed up on our beaches are not pleasant images of our "Ocean State." This debris is not
just a visual litter or waste issue – is a water quality issue. Trash in our waters can:
Injure swimmers and beach goers;
Kill and injure wildlife: many species accidentally ingest trash, mistaking it for food.
Abandoned fishing nets and gear, discarded fishing line and other forms of debris can
entangle marine wildlife – sea turtles, sea birds, and fish;
Threaten tourism and recreation, and the dollars they add to local economies by limiting
people's enjoyment of beach and water–related activities;
Complicate shipping and transportation by causing navigational hazards; and
Generate steep bills for retrieval and removal.
An estimated 90% of waterway debris comes from land-based sources (NOAA 1999) – blown
into the Bay or ocean or most commonly washed off our streets and into our waters via storm
drains. Debris also comes from recreational and commercial boaters. Organized primarily by
NGOs, annual coastal cleanups have been conducted in RI every year since 1986. In 2013,
11,921 pounds of debris were collected along 68.4 miles of shoreline in RI. The primary items
collected in descending order by number collected: cigarette butts, food wrappers, plastic bottle
caps, straws and stirrers, plastic bottles, beverage cans, non–grocery plastic bags, glass bottles,
plastic grocery bags, paper bags (Ocean Conservancy 2014).

RI NPS Management Program Plan, September 2014 60
As noted in the initial discussion of “water quality,” this plan is concerned with the protection
and restoration of aquatic habitats from not just pollution sources but also from other types of
stressors including hydromodification. EPA has included these stressors within the broad
interpretation of what constitutes nonpoint source pollution. This section will discuss these
stressors and identify actions needed to protect, enhance and restore habitat conditions in support
of aquatic life.
Stressor: Physical alteration
Key Points:
DEM and CRMC programs need to continue to emphasize the avoidance and
minimization of alterations to wetlands.
Many parties are interested in improving processes to facilitate voluntary restoration
actions.
Wetlands are generally those areas that are flooded or that have water at or near the surface of
the ground for part of the growing season. Freshwater swamps, marshes, and bogs are some of
the most commonly known wetland types. Coastal wetlands include salt marshes and contiguous
brackish marshes and areas of associated open water.
In Rhode Island, most wetlands are hydrologically linked with surface waters including
freshwater lakes, ponds, rivers, and streams or coastal waters. Wetlands function as a component
of the larger hydrologic system through which water moves within a watershed. Preventing
degradation of wetlands due to nonpoint source pollution is important to sustaining healthy
watersheds. While historically there has been a significant loss of wetlands resources due to
filling and other alterations, since the 1970s Rhode Island state law and policy has recognized the
importance of protecting wetlands. DEM and CRMC administer permitting programs that
regulate activities that may alter wetlands and require that any alterations be avoided and
minimized. The agencies have jurisdiction over vegetated wetlands and surface waterbodies as
well as certain lands that surround them. Additional information on the regulatory programs is
available on each agency’s website.
Wetland condition is vulnerable to degradation from a number of anthropogenic stressors. In
addition to the regulation of wetland alterations, effective management of wetland resources
requires a multi–faceted strategy that includes both protection and restoration activities. As
reflected in the RI Wetland Program Core Elements Plan, DEM is integrating wetland protection
and restoration into watershed-based planning efforts (DEM, 2013). In addition, Rhode Island is
working towards a statewide wetland restoration strategy that will facilitate voluntary restoration
activities. With respect to freshwater wetlands, areas of particular state interest include
enhancing or restoring the functions and values of riparian wetlands and buffers and identifying
A. Alteration of Wetlands (Freshwater and Coastal)
V. Other NPS Stressors

RI NPS Management Program Plan, September 2014 61
and protecting wetlands of high ecological value. To facilitate voluntary restoration of wetlands,
the DEM OWR formed the Water Quality and Wetland Restoration Team which provides
permitting pre–application assistance to restoration project proponents.
In the coastal zone, Rhode Island is focusing attention on the vulnerability of salt marshes to
climate change especially sea level rise. Coastal wetlands provide critical nursery habitat for
fisheries, play a role in absorbing nutrients to protect water quality and provide other benefits. A
collaborative effort is underway to simulate the coastal wetland migration under different sea
level rise scenarios. This information will support development of adaption strategies that may
improve the resiliency of salt marshes in light of climate change.
Wetland habitats are also valued within the Rhode Island State Wildlife Action Plan being
developed by the RIDEM Division of Fish and Wildlife in collaboration with a wide number of
partners. As part of the planning process, the threats affecting fish and wildlife species and
habitats are being analyzed. Among the threats are activities related to NPS pollution.
Additionally, the plan will recommend conservation actions to alleviate those threats, presenting
an opportunity to partner with the NPS program. To support the conservation objectives of the
Wildlife Action Plan, DEM has retained a contract employee who is tasked with conducting
outreach and providing technical assistance to municipalities and others regarding habitat and
wildlife issues. This initiative provides an opportunity to expand outreach efforts on certain
topics related to nonpoint source management, e.g., waterfowl management.
Over the five year planning period, DEM is targeting effort toward the integration of wetland
protection and restoration actions with other NPS management activities via watershed planning
and implementation of those plans.
Stressor: Physical alteration of aquatic habitat due to excessive plant growth by invasive species
Key Points:
Rhode Island lacks an organized lake management program.
Local entities lack capacity to carry out management, and current levels of available state
technical and financial assistance are inadequate to meet local needs.
Rhode Island waters have been degraded by the establishment of aquatic invasive species (AIS).
Several species of macrophyte aquatic invasive plants are known to have degraded habitat
conditions in many of RI’s freshwater lakes and ponds (DEM, 2012). Wetlands and brackish
water areas often exhibit invasive plants; e.g., phragmites. In freshwaters, effective management
of AIS often involves NPS pollution control activities.
To guide more effective management of aquatic invasive species, Rhode Island developed a
statewide management plan that outlines actions to prevent, control and mitigate the impacts of
AIS in Rhode Island waters. The plan is available at:
B. Aquatic Invasive Species

RI NPS Management Program Plan, September 2014 62
http://www.dem.ri.gov/programs/benviron/water/quality/pdf/aisplan.pdf. This plan notes the
need for establishment of a lake management program and an expanded level of technical and
financial assistance targeted at protecting and improving conditions in lakes and ponds. RIDEM
believes stewardship of lake resources should be achieved through lake management plans that
reflect actions needed to mitigate and manage existing AIS infestations and promote good water
quality through management of pollution sources. For lakes outside urbanized (i.e., sewered)
areas, these plans directly address nonpoint sources of pollution, in particular phosphorus, that
can promote plant growth in fresh water systems.
Stressor: Physical alterations in riverine ecosystems that limit access to aquatic habitat
Key Point:
Many barriers erected in streams no longer serve a useful purpose and pose an
impediment to the full functioning of riverine ecosystems.
Rhode Island’s development over the last two hundred years resulted in the alteration of rivers
and streams throughout the state. Dams of varying size were constructed on all larger rivers and
many of the smaller streams in RI. Not as dramatic as a dam, but as equally disruptive for some
riverine species, are sub–standard stream crossings that are characterized by constricted or
inadequate flow, perched culverts, blocked crossings or crossings in disrepair. These barriers to
stream connectivity prevent the free movement of aquatic life up and down a river system. The
result is fragmented aquatic habitat, potential impacts on water quality and an increase potential
for flooding. These hydromodications to river and streams are therefore considered a NPS
stressor on aquatic ecosystems.
There is growing recognition that restoration of stream
connectivity is important to enhance the functioning of RI’s
riverine ecosystems. The DEM Division of Fish and Wildlife
implements a program to restore access to anadromous fish
habitat through either the construction of fish passages or
removal of barriers. Major fish passage projects, including
dam removals, are planned or have been completed in the
Pawcatuck, Blackstone, Ten Mile, Pawtuxet and
Woonasquatucket Rivers. With implementation of certain
projects continuing, the DEM is partnering with the
Narragansett Bay Estuary Program to update the strategy on a
statewide basis.
Addressing barriers other than dams has also been the focus of
recent work. The RI Resource Conservation and Development
Council and the Natural Resources Conservation Service working with multiple partners, have
implemented the Stream Continuity Project between 2006 and 2013. Of the 4,374 identified
C. Barriers to Stream Connectivity

RI NPS Management Program Plan, September 2014 63
stream crossings in RI, over 1200 were assessed in different watersheds, and 69 of these were
found to have severe or significant barriers (RIRC&D 2013). Information from these
assessements will be integrated into watershed plans.
Stressor: Physical alteration associated with water withdrawals
Key Point:
Statewide groundwater demand doubles during the low flow period when there is less
water available; increase due in large part to agriculture and lawn watering.
Withdrawals of water from certain streams or adjacent aquifers can severely impact the quantity
and quality of stream water available during low flow periods. Impacts to the aquatic habitat
occur due to loss of riverbed area covered by water, receding wetlands, loss of vernal pools and
inadequate baseflow and in-stream water depth for a healthy, reproducing natural fish
population. Additionally, lower flows increase pollutant concentrations downstream of
dischargers and where discharge limits are based on certain flow assumptions, the limits may no
longer prove protective.
Rhode Island does not have a separate permitting system to regulate water withdrawals.
Conditions may be placed on new projects involving withdrawals subject to the state freshwater
wetlands or the water quality regulations. The RI Water Resources Board (WRB) has been
designated as the overall authority to devise a fair and equitable allocation of water resources
among users to ensure that long range considerations of water supply prevail over short term
considerations by prioritizing water withdrawals. To support this and other activities, the WRB
completed a strategic plan that reflects the continued efforts needed to develop water availability
estimates and improve water resource management.
DEM has developed a watershed-based approach for reviewing water withdrawal requests and
the Water Resources Board has incorporated this approach into their assessments of water
availability. The Stream Flow Depletion Methodology presumes a withdrawal done consistent
with the methodology will maintain stream flows that are protective of aquatic ecosystems
during varying hydroperiods including the low flow period. This approach identifies those
watersheds or portions of watersheds where adequate stream flows will support additional
withdrawals as well as those which have constraints to further withdrawals. Analysis of current
conditions indicates that the Chipuxet River, Hunt River, and Annaquatucket River watersheds
are the primary water supply basins where peak demand routinely exceeds the available supply
necessary to avoid adverse impacts to water quality.
D. Water Withdrawals

RI NPS Management Program Plan, September 2014 64
Many sources of funding are utilized to implement NPS management in Rhode Island. At the
state level, the DEM NPS Program is supported with federal Clean Water Act Section 319
program funding through a mechanism known as the Performance Partnership Agreement (PPA)
and associated Performance Partnership Grant (PPG) which is executed between DEM and EPA.
The program funds support several fulltime staff as well as water quality monitoring activities.
EPA’s grant to RI in FY14 was $510,522 for this purpose. EPA also provides other funds to
DEM to support the water quality assessment program, the TMDL program and additional water
quality activities relied upon by the NPS program.
As reflected in this plan, the NPS Program aims to strike an appropriate balance between
activities to proactively protect water resources from NPS threats and activities to abate NPS
pollution. Reflecting past guidance, over the past five years, the DEM NPS Program placed
greater emphasis on restoration activities including investment in the development and
implementation of TMDLs. With the changes in national guidance for FY14 and forward, DEM
is pursuing watershed planning in a manner that gives renewed attention to protection activities
including the integration of water quality and habitat protection activities within a watershed.
Given the extent of urbanization in RI, it has proven impractical to segregate watersheds based
on need for protection versus restoration at the scale at which watershed planning occurs.
Rather, DEM believes a mix of both types of activities will be necessary to achieve water quality
goals in all watersheds in RI. Accordingly, over time DEM is aiming for an equitable allocation
of resources to protection and restoration activities within the federally funded DEM NPS
Program. Past allocations reflect a significant focus on water quality restoration including
development of TMDLs. For example, the allocation of expenses for restoration versus
protection in FY14 was 70% to 30%.
Implementation of the NPS Management Plan involves the staff efforts of governmental agencies
as well as investments made through various grants, loan programs, NGO and private
contributions. On an annual basis, the total financial needs for NPS goals and objectives far
exceed the amount of funding available making prioritization a necessity. One objective of
strengthened watershed planning is to better align available resources from the federal, state and
local levels to accelerate implementation of needed actions.
A1. Sources of Funding to Support Implementation Projects
Clean Water Act (CWA) Section 319 Grants
DEM administers a competitive grant program that makes available federal EPA PPG (CWA
Section 319 project funds) for implementation of actions to prevent or abate NPS pollutions and
stressors. Consistent with federal guidance, DEM-OWR currently directs the project funds,
which constitute 50% of the total 319 allocation to Rhode Island, to implementation activities
A. Resources for Implementation
VI. Implementation

RI NPS Management Program Plan, September 2014 65
that are negotiated annually via the PPA-PPG process. Watershed project proposals are solicited
via a RFP process. Given the amount of funding available annually ($510,522 for FY2014),
DEM plans to issue an RFP every two years. The funds distributed as grants for watershed
projects generally require project match of 40% and project completion within a 1-3 year time
period. To incentivize local watershed projects, DEM has a policy that may allow a lower match
amount (25%) upon justification. This flexibility is allowed only when the overall match
available to the NPS program from all sources allows DEM to meet its EPA match requirements
per the PPG. A quality assurance program plan (RIDEM 2007) is in place that describes the
process used to manage NPS Management grants.
Clean Water State Revolving Fund
Direct Loans – In RI, the Clean Water State Revolving Fund loan program is available to
governmental entities for NPS watershed projects. Between 1990 and 2013, the program had
issued over $1 billion in loans with the majority allocated to wastewater projects including
upgrades to treatment works and abatement of combined sewer overflows. However, the SRF
loan program has also been used for NPS watershed projects including land acquisition for water
quality protection, landfill closures and green infrastructure practices to protect bathing beaches.
Community Septic System Loan Program (CSSLP) – As discussed in Section IV.A. under
OWTS, 18 towns in RI have adopted DEM approved onsite wastewater management plans to
encourage or require maintenance activities such as system inspections or pumping of septic
tanks. These plans make the towns eligible for a financial assistance program managed by the
CWFA referred to as the Community Septic System Loan Program. The program allows eligible
towns to access funds from the Clean Water Revolving Loan Fund for low interest loans to
homeowners for OWTS repairs. As of July 1, 2014, 39 loans have been issued to 14 towns over
the past 15 years totaling $10,900,000.
Sewer Tie-In Loan Fund Program – Modeled after the CSSLP, the CWFA also administers a
program that allows sewer system owners to access funds for low interest loans to homeowners
to connect their residences into the local sewer system and abandon their OWTS.
Narragansett Bay and Watershed Restoration Fund: DEM administers a competitive grant program that provides financial assistance to eligible
entities primarily for implementation of projects that restore water quality associated with NPS
pollution, including all types of stormwater discharges as well as aquatic habitat. Established in
2006, the fund is supported by state bond funds approved periodically by RI voters. In 2014,
DEM solicited for projects to restore water quality and enhance capacity for stormwater
management. An estimated $2.8 million was expected to be available for grants. Grantees are
required to provide matching contributions to projects (25-50%) and complete projects within a
1-3 year time period. Future grant rounds will be contingent on a renewal of funding for this
program. The rules governing the fund are available at:
http://www.dem.ri.gov/pubs/regs/regs/water/nbwsrbf3.pdf

RI NPS Management Program Plan, September 2014 66
NRCS Grant Programs: As discussed in Section IV. D., funding to implement best
management practices is available through the NRCS Environmental Quality Incentives Program
(EQIP). This is a voluntary program that provides financial and technical assistance to farmers
to help plan and implement conservation practices that address natural resource concerns.
Farmers that apply through the EQIP may be eligible for 75% cost share on projects built in
accordance with the NRCS standards. Since the adoption of the 2008 USDA Farm Bill, 284 EQIP
contracts have been awarded in RI. In addition, NRCS has dedicated 5% of the EQIP funds for
projects in priority watersheds chosen jointly with DEM under the joint EPA/USDA National Water
Quality Initiative to work with farmers to implement approved strategies to improve water quality.
NRCS estimates that for each of the watersheds in RI (defined using US Geological Survey
delineations), farmers representing only 2-10% of the total farmland acreage in that watershed have
participated in the EQIP Program. (E. Boettger 3-11-14)
RI Rivers Council: Administers a small legislative grants program that supports activities of
state designated watershed councils. Limited funding is made available via the state budget for
this purpose ($15,000 annually). http://www.ririvers.org
Marina Pumpout Grants: DEM administers an ongoing financial assistance program that
supports the installation, repair and upgrade of pump out facilities that service boats in Rhode
Island’s estuarine waters. Pursuant to the Clean Vessel Act, the program directs federal funds
from the Sport Fish Restoration and Boating Trust Fund, provide to DEM by the United States
Fish & Wildlife Service for this purpose. An average of $150,000-$200,000 has been made
available annually.
Rhode Island Bays, Rivers and Watersheds Coordination Team: Pursuant to state law, the
BRWCT oversees the expenditure of certain state funds generated by the collection of fees. A
portion of the funds (up to $250,000 per year) is currently directed to environmental monitoring
and supports state joint funding agreements with the United States Geological Survey. Other
funds are directed to priority projects developed by the BRWCT. Projects include financial
assistance to municipalities exploring sustainable funding mechanisms for stormwater
management. http://www.coordinationteam.ri.gov
Narragansett Bay Estuary Program: Purusant to its current workplans, the NBEP plans to
offer a small grants program that may offer opportunities for watershed projects that advance
implementation of this NPS Management Program Plan. http://www.nbep.org
Coastal Habitat Restoration Program: Pursuant to state law, CRMC administers a state grant
program capped at $250,000 per year that provides grants to support planning and
implementation of coastal habitat projects including the restoration of anadromous fish passage.
See: http://www.crmc.state.ri.us/habitatrestoration.html
State General Revenues: The DEM annual budget includes state funding that supports the two
positions that oversee the DEM NPS Program as well as the staff of the OWTS regulatory
program.

RI NPS Management Program Plan, September 2014 67
Municipal Funding: Local governments devote resources to implementation of this
Management Program Plan in a number of ways. Chief among them are staffing and operational
expenses to administer local programs, and matching funds for watershed projects that address
NPS pollution. The total expended annually varies considerably due to number and scale of
projects.
Watershed Organizations and Nongovernmental Organizations: While capacity varies,
NGOs often provide funding or in–kind services in support of monitoring, outreach and
education and the planning, design and execution of NPS watershed projects.
A2. The Challenge of Building Local Capacity
In addition to their primary role in regulating land use, many municipalities bear significant
responsibility for managing wastewater and stormwater infrastructure. This places a significant
burden on the local governments to have the necessary expertise and resources to manage these
tasks effectively. Among the legal, technical and fiscal obstacles to abating stormwater
pollution, a major constraint is the lack of a reliable funding source for this work. DEM has been
able to utilize certain state bond funds and limited federal funds to provide matching grants to
municipalities and other entities for projects that abate pollution associated with stormwater
runoff, but the funding availability has been variable rather than stable. In order to address local
funding shortfalls, DEM, working with partners such as the BRWCT, has supported the
exploration of establishing sustainable local and regional funding sources, through mechanisms
such as a stormwater enterprise fund or utility district. Under these models, a stormwater utility
fee is based on the demand placed on the municipal stormwater system by each user, not on a
property’s assessed value, with the fee usually determined by the amount of runoff the user
contributes to the system.. A stormwater utility provides a means for:
Consolidating or coordinating responsibilities that were previously dispersed among
several departments and divisions;
Generating funding that is adequate, stable, equitable and dedicated solely to managing
stormwater including needed retrofitting to improve treatment; and
Developing stormwater management programs that are comprehensive, cohesive and
consistent year-to-year.
In addition to municipalities, building capacity of non-governmental organizations (including
conservation districts and watershed organizations) has also been identified as a resource need.
These organizations vary in their capacity and are seeking access to greater technical and
financial assistance in order to carry out projects. Due to its own constraints, the state has
limited capacity to directly assist local organizations in the planning and management of
watershed projects. With partners, DEM is continuing to explore options for supporting the
strengthening of these organizations.

RI NPS Management Program Plan, September 2014 68
Note: Not all actions listed are supported by Clean Water Act Section 319 funds. The projects listed represent an integration of
programs with DEM and between DEM and other entities.
AN = As Necessary; TBD = To Be Determined
Table B.1. Overarching Management Strategies
Policies and Actions Milestones
2015
2016
2017
2018
2019
Data Management Lead Agency: DEM
Policy: From Management Principles: Integrated, well
supported data management systems are essential for
water resource protection and restoration program
management.
A. Design new data management systems to support
OWTS, Wetlands, and Groundwater Discharge/UIC
permitting. Document system requirements, evaluate
options and select approach. Develop and test
software application. (Subject to availability of
additional funding.)
a. Documentation of system
requirements.
b. New database application for OWTS,
Wetlands, Water Quality Certification,
and Groundwater Discharge/ UIC
permitting.
X
X
X
B. Transition from existing system to new data system
including migration of data. (Subject to availability of
additional funding.)
Data migration to new system complete. X X
C. Develop data systems to improve tracking of water
quality restoration projects, including installed BMPs.
Updated application to track water
quality restoration actions.
X
B. Implementation Tables

RI NPS Management Program Plan, September 2014 69
Policies and Actions Milestones
2015
2016
2017
2018
2019
Coordination Lead Agency: DEM
Policy: From Management Principles: A
collaborative effort is necessary across all
governmental jurisdictions, agencies, programs and
partners to ensure success in protecting and restoring
RI’s water resources.
A. Host, in collaboration with RI River Council, an
annual meeting of watershed groups to facilitate
program planning, coordinate activities and share
experiences in water quality protection and restoration.
Report on annual meeting. X X X X X
B. Support collaboration on state policy through
formal interagency coordination mechanisms.
Report on inter-agency state policy
initiatives or actions pertaining to NPS
pollution.
X X X X X
Outreach Lead Agency: DEM and Multiple Partners
Policy: From Management Principles: Rhode Island
citizens are informed and aware of water quality
management priorities and efforts to prevent and abate
water pollution problems.
A. Increase general public understanding of water
resources and watershed management issues using a
variety of outreach tools including social media.
Report on number of outreach activities
participated in by DEM.
X X X X X
B. Provide content on preventing and abating NPS
pollution and characterization of water quality
conditions as part of the re-design of the DEM website.
Report on status of new website
development.
X X

RI NPS Management Program Plan, September 2014 70
Table B.2. Monitoring, Assessment and Planning
Policies and Actions Milestones
2015
2016
2017
2018
2019
Water Quality Monitoring Lead Agency: DEM
Policy: Monitoring is an essential component of NPS
management to determine priorities and management
actions.
A. As resources allow, implement the DEM Water Quality
Monitoring Strategy to collect data needed to support
assessment of water quality and aquatic habitat conditions
and to identify NPS pollution sources.
a. Updated Water Quality Monitoring
Strategy.
b. Number of stations on wadeable rivers
and streams monitored as part of the
Ambient River Monitoring Program.
c. Coastal stream monitoring.
d. Wood-Pawcatuck River Basin monitoring
e. Pawtuxet River Basin monitoring
f. Blackstone River Basin monitoring
g. Urban rivers and East Bay monitoring
h. Annual agreement to support volunteer
based monitoring of freshwater lakes and
ponds.
i. Number of locations targeted monitoring
is conducted to document changes due to
NPS.
j. Report on number of shoreline surveys for
shellfishing areas conducted.
k. Report on number of waterbodies
sampled for cyanobacteria.
X
50
X
X
1-3
X
X
50
X
X
1-3
X
X
50
X
X
1-3
X
X
50
X
X
1-3
X
X
50
X
X
1-3
X
X

RI NPS Management Program Plan, September 2014 71
Policies and Actions Milestones
2015
2016
2017
2018
2019
B. Improve ease of access to water quality and other
monitoring data.
Data reports and spreadsheets posted on
DEM website.
X X X
X X
C. Document and refine strategies to monitor the condition
of wetlands – freshwater (DEM) and coastal
(NBNERR/CRMC). (Note: Implementation contingent on
future availability of funding.)
Updated monitoring strategies for wetlands.
X X
Water Quality Assessment Lead Agency: DEM
Policy: Periodically assess water quality data to identify
causes of impairments and provide information to help
characterize NPS pollution.
A. Contribute to preparation of the biennial Integrated
Water Quality Monitoring and Assessment Report.
a. Content on NPS Program and NPS
pollution developed for inclusion into the
Integrated Water Quality Monitoring and
Assessment Report.
b. Content on hydromodification and other
nonpoint stressors on wetland and aquatic
habitat developed for inclusion into the
Integrated Water Quality Monitoring and
Assessment Report.
X
X
X
X
X
B. Evaluate DOH public well data as an indicator of
ambient groundwater quality in RI.
Evaluation of DOH public well data. X X X
C. Utilize statewide water quality assessment results to
refine prioritization of watersheds/waters. Prioritization will
take into account evolving implementation of national
guidance regarding the TMDL Program Vision.
Updated list of targeted watersheds/waters. X X

RI NPS Management Program Plan, September 2014 72
Policies and Actions Milestones
2015
2016
2017
2018
2019
D. Continue to develop and apply assessment tools to
characterize the condition of wetlands. (Subject to
availability of additional funding.) Lead: DEM and CRMC
Report on characterization of wetland
resources.
X X
Water Quality Planning Lead Agency: DEM
Policy: Watershed plans articulate the priority actions
needed to protect and restore water quality and aquatic
habitats.
A. Continue development of watershed plans for 26
watershed planning areas.
a. Completed watershed web page with
general information about each of the 26
watershed planning areas.
b. Content of watershed webpage updated
and maintained.
c. Number of completed watershed plans for
DEM watershed planning areas per year.
X
1
X
1
X
2
X
2
X
2
B. Develop water quality restoration plans for waters known
or presumed to be impaired in whole or part by pollutants
from nonpoint sources. These plans provide the technical
basis for needed water quality restoration actions for
specific pollutants.
Completed TMDLs for waters impaired in
part or whole by NPS pollution.
4
0
9
TBD
TBD
C. Review and comment on local comprehensive plans,
water supply system management plans and other water
quality related plans in support of watershed planning.
Number of water related plans reviewed.
10
10
10
10
10
D. Encourage development of lake management plans. As
resources allow, provide technical or financial support for
plan development.
Report on number of lake management
plans completed.
X X X X X

RI NPS Management Program Plan, September 2014 73
Policies and Actions Milestones
2015
2016
2017
2018
2019
E. Integrate information and actions pertaining to wetland
protection and restoration into watershed plans.
a. Updated wetland watershed profiles for
26 watershed planning areas.
b. Content included in watershed plans.
X
X
X
X
X
X
X
F. Integrate actions need to enhance stream connectivity into
watershed plans.
Content included in watershed plans. X X X X X
Statewide NPS Program Implementation Activities
Lead Agency: DEM
Policy: From Management Principles: A collaborative
effort is necessary across all governmental jurisdictions,
agencies and programs to ensure success in protecting and
restoring RI’s water resources.
A. Administer 319 financial assistance program to support
implementation of actions identified in watershed plans.
a. RFP process administered to award new
grants for NPS protection and abatement
actions (319), including revising the scoring
chart to reflect revised priorities.
b. Report on funds allocated to new
projects.
c. Number of completed watershed projects.
X
2
X
X
2
X
2
X
X
2
X
2
B. Administer state financial assistance programs to assist
implementation of watershed restoration actions (as
resources allow).
Report on state grant awards for NPS
implementation.
X X X
C. Coordinate project teams, provide technical assistance to
partners and others implementing NPS prevention and
abatement actions. Integrate pollution prevention principles
and practices where feasible (DEM OCTA)
Number of watershed projects provided
technical assistance by NPS staff.
10 10 10 10 10

RI NPS Management Program Plan, September 2014 74
Table B.3. Pollution Source Management
Policies and Actions
Milestones 2015
2016
2017
2018
2019
Onsite Wastewater Treatment Systems (OWTS) and Other Groundwater Discharges Lead Agency: DEM unless otherwise stated.
Policy 1): Ensure proper siting, design, construction and
maintenance of onsite wastewater management systems to
protect groundwater and surface water quality and public
health.
A. Implement OWTS Rules. Periodically evaluate the
effectiveness of the OWTS Rules.
a. Number of new OWTS conformed by
DEM.
b. Number of OWTS repairs and
alterations.
c. Report on rule changes made.
400
1100
X
425
1100
X
450
1100
X
500
1100
X
550
1100
X
B. Participate in the RI Legislative Task Force on OWTS
and Wetlands standards – attend meetings, present at
meetings, assist in preparation of Task Force Report and
draft legislation.
a. Report on number of meetings attended.
b. Final Task Force Report.
X
X
C. Provide sufficient training opportunities to meet the
continuing education needs of OWTS design and
installation professionals. Lead: URI
Number of training opportunities. 40
40
40
40
40
D. Evaluate DEM licensed professionals through DEM
oversight, including field inspections.
Number of DEM field inspections. 2000 2000 2000 2000 2000
E. Review applications for approval of alternative treatment
systems. Coordinate meetings of the OWTS Technical
Review Committee (TRC).
a. Report on number of meetings of the
OWTS TRC.
b. Report on number of technology
reviews and number approved.
X
X
X
X
X
X
X
X
X
X
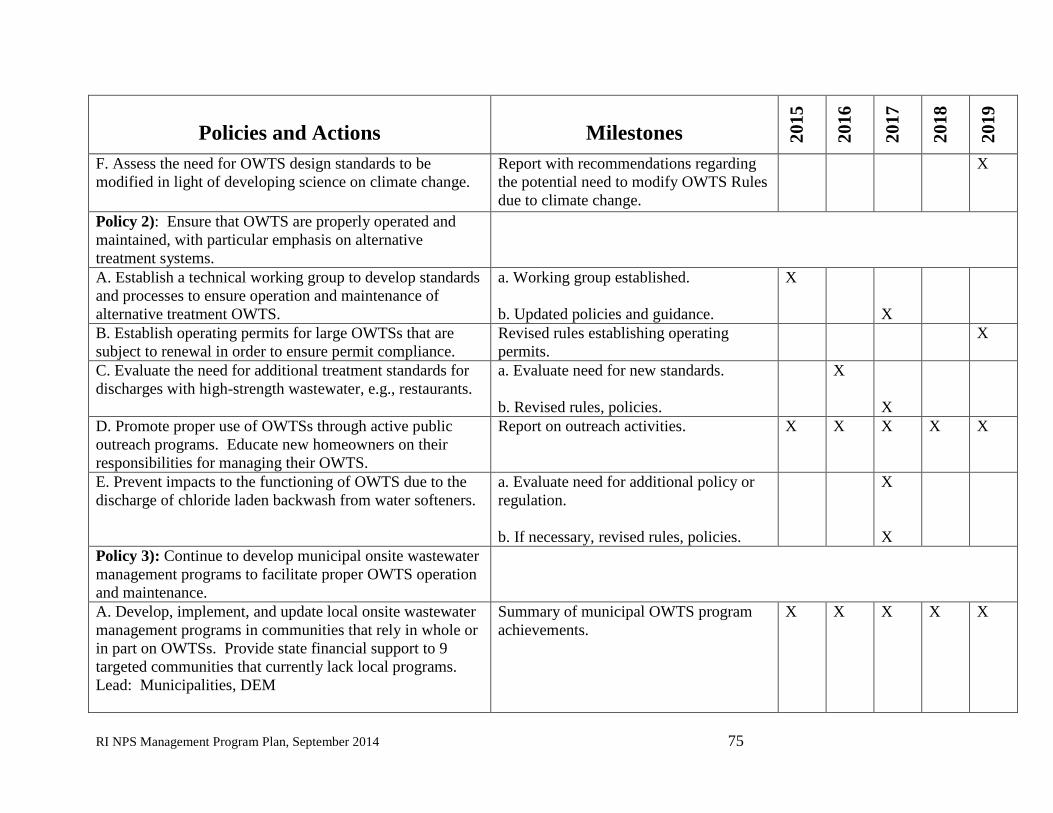
RI NPS Management Program Plan, September 2014 75
Policies and Actions
Milestones 2015
2016
2017
2018
2019
F. Assess the need for OWTS design standards to be
modified in light of developing science on climate change.
Report with recommendations regarding
the potential need to modify OWTS Rules
due to climate change.
X
Policy 2): Ensure that OWTS are properly operated and
maintained, with particular emphasis on alternative
treatment systems.
A. Establish a technical working group to develop standards
and processes to ensure operation and maintenance of
alternative treatment OWTS.
a. Working group established.
b. Updated policies and guidance.
X
X
B. Establish operating permits for large OWTSs that are
subject to renewal in order to ensure permit compliance.
Revised rules establishing operating
permits.
X
C. Evaluate the need for additional treatment standards for
discharges with high-strength wastewater, e.g., restaurants.
a. Evaluate need for new standards.
b. Revised rules, policies.
X
X
D. Promote proper use of OWTSs through active public
outreach programs. Educate new homeowners on their
responsibilities for managing their OWTS.
Report on outreach activities. X X X X X
E. Prevent impacts to the functioning of OWTS due to the
discharge of chloride laden backwash from water softeners.
a. Evaluate need for additional policy or
regulation.
b. If necessary, revised rules, policies.
X
X
Policy 3): Continue to develop municipal onsite wastewater
management programs to facilitate proper OWTS operation
and maintenance.
A. Develop, implement, and update local onsite wastewater
management programs in communities that rely in whole or
in part on OWTSs. Provide state financial support to 9
targeted communities that currently lack local programs.
Lead: Municipalities, DEM
Summary of municipal OWTS program
achievements.
X X X X X

RI NPS Management Program Plan, September 2014 76
Policies and Actions
Milestones 2015
2016
2017
2018
2019
B. Support increased participation by municipalities in the
Community Septic System Loan Program (CSSLP). Lead:
DEM and CWFA
a. Number of additional municipalities
participating in the CSSLP.
b. Report on activities to support
increased municipal participation
X
2
X
1
X
1
X
1
X
C. Provide funding for the CSSLP to enable municipal
onsite programs to provide financial assistance to
homeowners for repair and replacement of OWTSs. Lead:
CWFA
Total amount of annual CSSLP loan
disbursements.
$600,
000
$600,
000
$600,
000
$600,
000
$600,
000
Policy 4): Ensure that OWTSs are protective of public
health and the environment.
A. Continue implementation of denitrification requirements
in the Salt Pond and Narrow River critical resource areas.
Number of denitrification systems
installed.
125 125 125 125 125
B. Expand denitrification requirement to other poorly
flushed coastal embayments (beyond Salt Pond and Narrow
River) that are documented to have nutrient caused water
quality impairments due in part to OWTS.
a. Evaluation of need for denitrification
systems in additional areas.
b. If necessary, revised rules, policies.
X
X
C. Evaluate technologies/strategies for phosphorus
reduction in areas documented to have nutrient caused water
quality impairments due in part to OWTS.
a. Evaluation of need for phosphorus
reduction.
b. If necessary, revised rules, policies.
X
X
D. As necessary, due to deteriorating groundwater quality,
evaluate the need for more intensive OWTS management in:
1) densely developed areas that are dependent on private
drinking water wells and 2) wellhead protection areas where
nitrogen in the public well exceeds one–half the drinking
water standard.
Report on evaluations of specific
impacted areas. If necessary, revised
rules, policies.
X
X
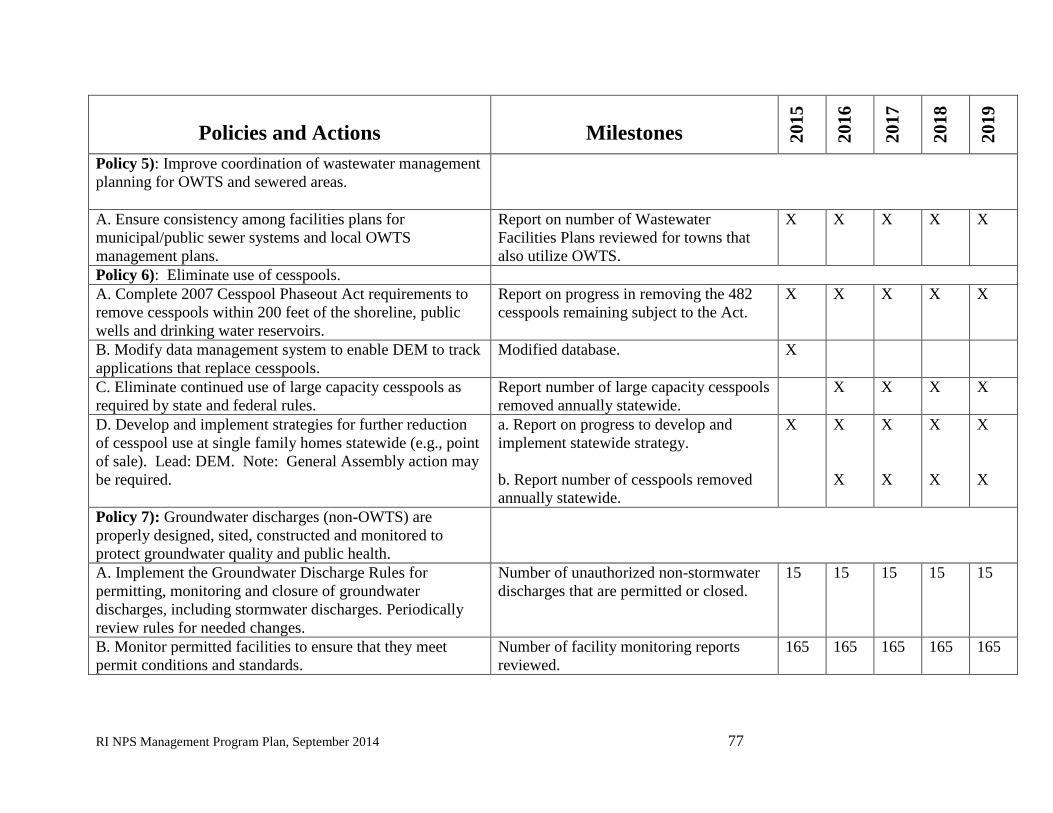
RI NPS Management Program Plan, September 2014 77
Policies and Actions
Milestones 2015
2016
2017
2018
2019
Policy 5): Improve coordination of wastewater management
planning for OWTS and sewered areas.
A. Ensure consistency among facilities plans for
municipal/public sewer systems and local OWTS
management plans.
Report on number of Wastewater
Facilities Plans reviewed for towns that
also utilize OWTS.
X X X X X
Policy 6): Eliminate use of cesspools.
A. Complete 2007 Cesspool Phaseout Act requirements to
remove cesspools within 200 feet of the shoreline, public
wells and drinking water reservoirs.
Report on progress in removing the 482
cesspools remaining subject to the Act.
X X X X X
B. Modify data management system to enable DEM to track
applications that replace cesspools.
Modified database. X
C. Eliminate continued use of large capacity cesspools as
required by state and federal rules.
Report number of large capacity cesspools
removed annually statewide.
X X X X
D. Develop and implement strategies for further reduction
of cesspool use at single family homes statewide (e.g., point
of sale). Lead: DEM. Note: General Assembly action may
be required.
a. Report on progress to develop and
implement statewide strategy.
b. Report number of cesspools removed
annually statewide.
X
X
X
X
X
X
X
X
X
Policy 7): Groundwater discharges (non-OWTS) are
properly designed, sited, constructed and monitored to
protect groundwater quality and public health.
A. Implement the Groundwater Discharge Rules for
permitting, monitoring and closure of groundwater
discharges, including stormwater discharges. Periodically
review rules for needed changes.
Number of unauthorized non-stormwater
discharges that are permitted or closed.
15 15 15 15 15
B. Monitor permitted facilities to ensure that they meet
permit conditions and standards.
Number of facility monitoring reports
reviewed.
165 165 165 165 165

RI NPS Management Program Plan, September 2014 78
Policies and Actions
Milestones 2015
2016
2017
2018
2019
C. Continue to maintain state primacy for the Underground
Injection Control Program (UIC) as delegated by EPA
pursuant to the Safe Drinking Water Act.
Respond to EPA request for information
to support primacy.
AN AN
Stormwater Runoff (Diffuse Sources) and Erosion Controls on Developed Lands Lead Agency: DEM unless otherwise stated.
Policy 1): Improve statewide management strategies to
protect RI’s water resources from impacts of stormwater
runoff from diffuse sources and associated erosion.
A. Implement, and update as necessary, the requirements of
the 2010 RI Stormwater Design and Installation Standards
Manual and the updated Soil Erosion and Sediment Control
Handbook (2014). Lead – DEM, CRMC, DOT, URI
a. Stormwater Manual Stakeholder group
established.
b. Updated Stormwater Manual.
c. Annual workshop on Stormwater
Manual updates and policies.
d. Number of training sessions on the Soil
Erosion and Sediment Control Handbook.
X
3
X
X
3
X
3
X
3
X
3
B. Review new technologies that have requested approval
for use in RI for stormwater management and approve new
technologies/BMPs for stormwater management that meet
the criteria in the Stormwater Manual.
a. Stormwater technology review
committee established.
b. Report on number of new stormwater
technologies reviewed and number
approved.
X
X
X
X
X
X
C. Investigate statewide strategies for source reduction (e.g.,
improve/increase street sweeping, prohibit coal tar based
pavement sealants, etc.).
Evaluate need for source reduction
strategies.
AN AN AN AN AN

RI NPS Management Program Plan, September 2014 79
Policies and Actions
Milestones 2015
2016
2017
2018
2019
Policy 2): Use low impact planning and design techniques
and associated BMPs as the primary method of stormwater
management to maintain and restore pre-development
hydrology.
A. Identify statewide strategies to facilitate LID
implementation in state permitting.
New guidance document for LID
implementation in state permitting.
X
B. Provide LID/green infrastructure training opportunities
for design professionals (engineers, landscape architects,
contractors) and municipal officials/staff.
Report on number of training sessions
provided.
X
X
X
X
X
C. Incorporate LID and RI Stormwater Standards in
municipal ordinances. Lead: Municipalities, URI, DEM
a. Develop model municipal ordinance
language.
b. Provide technical assistance on
ordinance updates in 6 communities.
c. Updated survey of municipal LID
ordinances.
X
X
X
X
X
X
Policy 3): Reduce and limit area of impervious cover.
A. Develop a statewide program/strategy to reduce
impervious cover other than by means of permitting
redevelopment.
a. Identification of program/strategy to
reduce impervious cover.
b. Implementation of programs/strategies
to reduce impervious cover.
X
X
B. Improve capacity at the state level to track areas of
impervious cover receiving various levels of treatment for
stormwater runoff.
Strategy for tracking impervious cover. X

RI NPS Management Program Plan, September 2014 80
Policies and Actions
Milestones 2015
2016
2017
2018
2019
Policy 4): Ensure that stormwater from significant areas of
existing impervious surface on public and private property
is properly managed on-site.
A. Evaluate tools to broadly incentivize stormwater
management retrofit on public and private property.
Evaluation of options for addressing
stormwater from existing public and
private property.
X
Policy 5): Support the development of dedicated and
sustainable funding mechanisms to manage local, regional
and state stormwater programs.
A. Provide financial and technical assistance to
municipalities to establish sustainable funding mechanisms,
such as stormwater utilities.
Provide technical assistance to
municipalities (number of municipalities).
7 TBD TBD TBD TBD
Policy 6): Reduce pollutants from pet waste in stormwater
runoff.
A Towns adopt and enforce local ordinances requiring
owners to pick up after their pets on public property or on
other people’s property.
Report on efforts to improve management
of pet waste in RI as part of updated
survey of municipal LID ordinances.
X
B. Improve public understanding of the impact of pet waste
on water quality.
C. State and town public facilities adopt strategies for
controlling pet waste, such as, specially designated dog
parks, provision of pet waste stations (plastic bags and
receptacles).
Policy 7): Ensure that statewide stormwater management
programs are adapted in response to new scientific findings
regarding climate change.
A Evaluate the potential impacts on existing BMPs
installed to manage NPS of stormwater runoff of
intensifying precipitation events, rising sea level and rising
water tables.
Report on adapting stormwater
management in RI to climate change.
X
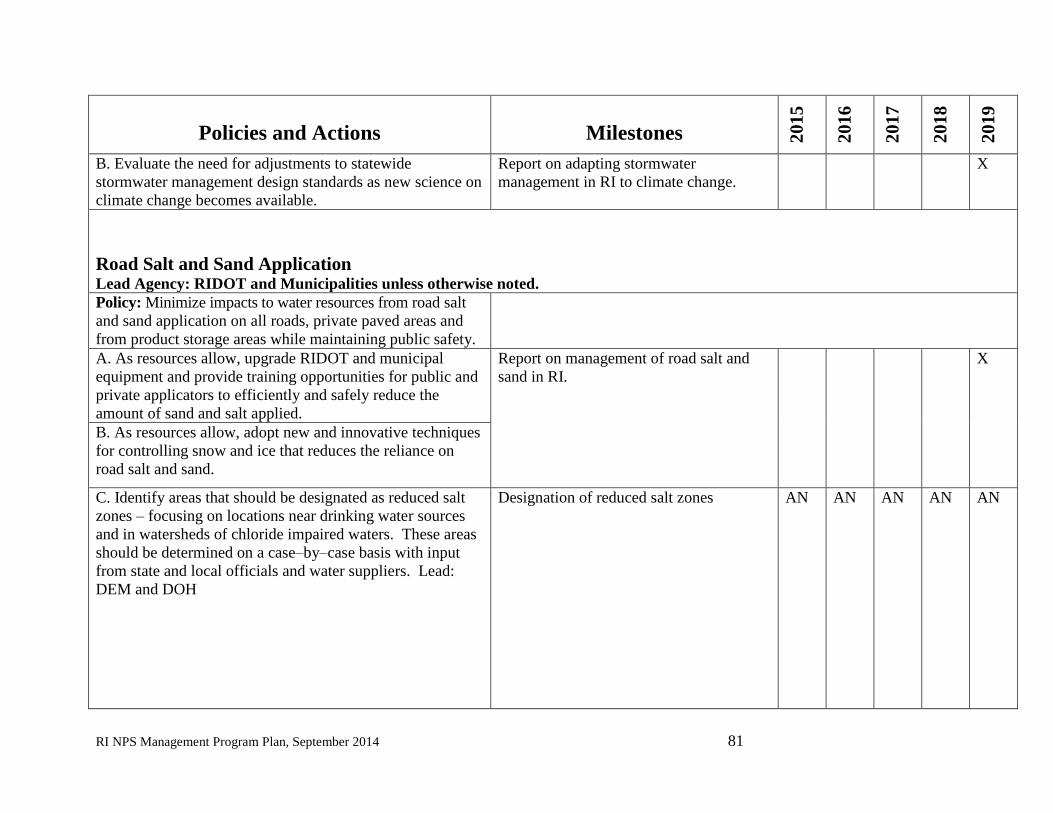
RI NPS Management Program Plan, September 2014 81
Policies and Actions
Milestones 2015
2016
2017
2018
2019
B. Evaluate the need for adjustments to statewide
stormwater management design standards as new science on
climate change becomes available.
Report on adapting stormwater
management in RI to climate change.
X
Road Salt and Sand Application Lead Agency: RIDOT and Municipalities unless otherwise noted.
Policy: Minimize impacts to water resources from road salt
and sand application on all roads, private paved areas and
from product storage areas while maintaining public safety.
A. As resources allow, upgrade RIDOT and municipal
equipment and provide training opportunities for public and
private applicators to efficiently and safely reduce the
amount of sand and salt applied.
Report on management of road salt and
sand in RI.
X
B. As resources allow, adopt new and innovative techniques
for controlling snow and ice that reduces the reliance on
road salt and sand.
C. Identify areas that should be designated as reduced salt
zones – focusing on locations near drinking water sources
and in watersheds of chloride impaired waters. These areas
should be determined on a case–by–case basis with input
from state and local officials and water suppliers. Lead:
DEM and DOH
Designation of reduced salt zones AN AN AN AN AN

RI NPS Management Program Plan, September 2014 82
Policies and Actions
Milestones 2015
2016
2017
2018
2019
Agriculture Lead Agency: DEM Agriculture and USDA Natural Resource Conservation Service
Policy: Manage agricultural operations to protect
groundwater and surface water quality and public health.
A. Investigate opportunities to encourage or require farmers to
prepare Conservation Plans.
a. State strategy for Water Quality
Protection in Agriculture.
b. Report on collaboration with NRCS on
implementation of the NWQI in targeted
watersheds.
c. Report on number of BMPs installed
with NRCS funds.
d. Participation in NRCS Technical Team
Meetings (meetings/yr).
e. Collaboration with the State
Conservation Committee on providing
assistance via conservation districts.
X
X
3
X
X
X
3
X
X
X
3
X
X
X
X
3
X
X
X
3
X
B. Regularly inspect farms with required Conservation Plans
(e.g., farms enrolled in Farm, Forest, and Open Space
Program) for compliance.
C. DEM and NRCS continue to collaborate on implementing
the National Water Quality Initiative. Lead: DEM and NRCS
D. Work with partners to encourage farmers to participate in
NRCS cost–sharing programs in designated watersheds;
Lead: NRCS
E. Number of agricultural BMP projects installed with NRCS
cost–sharing funds.
F. Selectively monitor groundwater and surface water quality
near agricultural operations as part of NWQI.
G. Encourage farmers to establish and maintain vegetated
riparian buffers.
H. Implement the Rules and Regulations Relating to
Pesticides.
I. Develop and implement green certification program for turf
farmers focusing on fertilizer and pesticide reduction. Lead:
DEM OCTA
Green certification program established
for turf farmers.
X

RI NPS Management Program Plan, September 2014 83
Policies and Actions
Milestones 2015
2016
2017
2018
2019
Lawn and Grounds Management Lead Agency: Multiple Partners
Policy: Prevent adverse water quality impacts from lawn care
and turf management.
A. Continue to develop and implement homeowner outreach
programs. Lead: DEM, URI, Municipalities.
Report on outreach efforts to
homeowners.
X X
B. Develop and implement green certification programs for
golf courses, landscaping companies, sports field managers,
and cemetery caretakers. Lead : DEM OCTA
a. Green certification program established
for landscaping companies.
b. Green certification program established
for sports field managers within
municipalities and higher education
facilities.
c. Green certification program established
for cemetery caretakers.
d. Number of golf courses that have
received the green certification.
10
10
X
X
X
15
15
20
C. Municipalities adopt ordinances to reduce areas of
disturbance that would become turf, encourage xeriscaping
and alternative landscaping strategies, and limit lawn
watering. Lead: Municipalities
Updated survey of municipal LID
ordinances.
X

RI NPS Management Program Plan, September 2014 84
Policies and Actions
Milestones 2015
2016
2017
2018
2019
Boating and Marinas Lead Agency: DEM and CRMC
Policy: Ensure boating activity and marinas do not
adversely impact water resources.
A. Provide and maintain an adequate number of pumpout
facilities in coastal waters.
a. Annual Report on the Pumpout
Program.
b. Ratio of registered boats to operating
pumpouts.
X
300:1
X
300:1
X
300:1
X
300:1
X
300:1
B. Oversee compliance with the No Discharge Area
designation.
C. Foster partnership with RI Marine Trades Association to
educate, inform and encourage additional marina
participation in the Clean Marina Program. Update Clean
Marina Handbook as necessary.
Report on status of the Clean Marina
Program.
X X X X X
Waterfowl Lead Agency: Multiple Partners
Policy: Manage waterfowl populations in RI, particularly
Canada geese, at appropriate numbers for the habitat to
minimize their water quality impacts.
A. Devise a sustainable statewide strategy for waterfowl
management.
Statewide strategy. X
B. Discourage the feeding of ducks and other waterfowl,
particularly in waters targeted as impacted by waterfowl in
TMDLs. Adopt local ordinances to prohibit feeding.
Report on municipal activities to control
waterfowl (part of effort to update survey
of municipal LID ordinances.)
X
C. Increase public understanding of proper waterfront
landscaping to deter geese.

RI NPS Management Program Plan, September 2014 85
Policies and Actions
Milestones 2015
2016
2017
2018
2019
D. Train volunteers to assist in controlling goose
populations, particularly in waters targeted as impacted by
waterfowl in TMDLs.
Report on number of volunteers trained to
control goose populations.
X X X X X
Minor Sources of NPS Pollution The sources below are described in Section IV.H., but they are not considered priority sources of NPS pollution by the DEM NPS Program.
Therefore, although actions are identified below to mitigate impact to water resources from these sources, no milestones are specified.
Dredging and Dredge Material Management
Lead Agency: CRMC and DEM
Policy: Reduce water quality impacts of dredging at both the location of material removal and the location of its use or disposal in water or on
land.
A. Continue to implement the “Rules and Regulations for Dredging and the Management of Dredged Material” and amend as necessary.
Land Application of Biosolids
Lead Agency: DEM
Policy: Manage land application of biosolids to prevent water quality impacts.
A. Ensure land application of biosolids is consistent with the DEM “Rules and Regulations for Sewage Sludge Management.”
Surface Mining
Lead Agency: Municipalities
Policy: Minimize adverse impacts to surface water and groundwaters from pollutants associated with resource extraction operations.
A. Municipalities adopt local earth removal ordinances that include requirements for water resources protection and site reclamation.
B. Research appropriate best management practices to reduce potential water quality problems associated with sand and gravel operations, with an
emphasis on reclamation strategies.

RI NPS Management Program Plan, September 2014 86
Policies and Actions
Milestones 2015
2016
2017
2018
2019
Silviculture
Lead Agency: DEM
Policy: Protect water quality during forest harvesting operations.
A. Continue to require the use of BMPs for all timber–harvesting operations.
B. Continue to provide training to foresters and loggers on the use of BMP’s.
C. Continue to provide a coordinated review of timber–harvesting operations involving wetlands.
D. Continue to work with other groups to educate landowners on proper land management practices.
Marine and Riverine Debris
Lead Agency: Multiple Partners
Policy: Decrease the amount of human generated debris in RI waters.
A. Increase public understanding of marine debris issues and change behaviors to reduce marine debris in RI.
B. Ensure human generated debris is properly contained on land and on boats to minimize release to the environment.
C. Increase coordination among the organizations involved in preventing and removing marine debris.
D. Participate in annual coastal cleanups.
E. Develop source reduction strategies for items most often found in the marine environment

RI NPS Management Program Plan, September 2014 87
Table B.4. Other NPS Stressors
Policies and Actions Milestones
2015
2016
2017
2018
2019
Alteration of Wetlands Lead Agency: DEM and CRMC
Policy 1): Avoid and minimize alterations and losses of
wetlands to protect the functions and values they provide.
A. Implement the Freshwater and Coastal wetland
regulatory programs. Periodically review and update rules to
reflect new scientific understanding and improve program
efficacy.
a. Report on acres of authorized loss of
wetlands.
b. Report on amended regulations.
X
X
X
X
X
X
X
X
X
X
B. Provide technical assistance and guidance to applicants to
promote project designs that avoid and minimize impacts on
wetlands.
Report on distribution of materials. X X X X X
C. Conduct training for design community to encourage
projects that make optimal use of conservation development
and LID principles.
Number of trainings. 1 1 1 1 1
D. Map vernal pools and share information with
municipalities and other interested stakeholders.
Vernal pools mapped for Wood Pawcatuck
watershed.
X
E. Develop and implement strategies to mitigate alteration
of salt marshes due to climate change, in particular sea level
rise.
Strategy developed.
X
Policy 2): Facilitate restoration of the quality and quantity
of wetlands.
A. Complete development of statewide freshwater wetland
restoration strategy that incorporates actions to mitigate
NPS pollution including hydromodification of wetlands.
Freshwater wetlands restoration strategy. X

RI NPS Management Program Plan, September 2014 88
Policies and Actions Milestones
2015
2016
2017
2018
2019
B. Complete development of statewide salt marsh
restoration strategy that incorporates actions to mitigate
NPS pollution including hydromodification of wetlands.
Lead: CRMC
Salt marsh restoration strategy. X
C. Improve tracking of wetland and aquatic habitat
restoration projects.
Updated inventory of restoration projects. X X X
D. Provide financial assistance for priority wetland
restoration projects; e.g., projects that deliver multiple
benefits for habitat, water quality and other functions and
values. Subject to availability of state bond funding.
Report on financial assistance provided. X X X X X
E. Provide technical assistance to proponents of voluntary
restoration projects via the Water Quality and Wetlands
Restoration Team.
Number of projects reviewed. 12 12 12 12 12
Aquatic Invasive Species (AIS) Lead Agency: Multiple Partners Policy 1): Prevent the introduction and establishment of
aquatic invasive species.
A. Expand targeted outreach to educate water users about
AIS and measures that should be taken to prevent their
spread; e.g., boat hygiene.
Report on outreach and education activities. X X X X X
B. Continue surveillance for AIS and refine rapid response
protocols.
a. Report on surveillance activities.
b. Refined rapid response protocols.
X X X X X
Policy 2): Control the spread of AIS and minimize their
harmful effects in RI waters.
A. Establish a lake management program in DEM. (Subject
to availability of funding.)
Report on status of establishing a DEM
Lake Management Program.
X X X X X

RI NPS Management Program Plan, September 2014 89
Policies and Actions Milestones
2015
2016
2017
2018
2019
B. Provide financial and technical assistance to local entities
carrying out lake management. (Subject to availability of
funding.)
Report on assistance provided. X X X X X
C. Implement regulatory program for aquatic herbicide
applications to control aquatic invasive species.
Applications reviewed for aquatic herbicide
permits.
50 50 50 50 50
Barriers to Stream Connectivity Lead Agency: Multiple Partners
Policy: Restore riverine ecosystem functioning through the
removal of barriers to stream connectivity.
A. Update the statewide strategy for anadromous fish
restoration.
Updated strategy. X
B. Provide financial assistance to projects that enhance
stream connectivity. (Subject to availability of funding.)
Report on financial assistance provided. TBD TBD TB
D
TBD
C. Encourage assessment of stream crossing and identify
those that are substandard and present barriers to movement
of aquatic life.
Report on efforts to assess stream crossings. X X X X X
Water Withdrawal Lead Agency: Water Resources Board and DEM
Policy: Manage water use and withdrawals based on water
availability that considers hydrologic capacity and aquatic
resources.
A. In watersheds where demand does not exceed or threaten
to exceed available water, ensure actions are taken to avoid
possible future exceedances.
Report on activities to manage water use in
such a manner to minimize impacts on
aquatic resources.
X
B. In watersheds where demand exceeds or threatens to
exceed available water, employ various strategies,
including:

RI NPS Management Program Plan, September 2014 90
Policies and Actions Milestones
2015
2016
2017
2018
2019
Increase efficiency of water use;
Increase infiltration of stormwater beyond the
minimum standards established in the RI Stormwater
Manual;
Identify other recharge opportunities such as aquifer
storage and recovery;
Identify the most cost effective management
approaches for reducing, coordinating, and/or
reconfiguring location and timing of water
withdrawals to support adequate stream flow during
low flow periods.
Report on activities to manage water use in
such a manner to minimize impacts on
aquatic resources.
X
C. Apply the DEM Streamflow Depletion Methodology in
agency water withdrawal decisions as applicable.
D. Evaluate water withdrawal impacts in the context of
climate change, which will result in an increased demand
for water for agriculture (increases in soil temperature and
longer growing seasons) and public water systems,
particularly during the dry periods.
Report on climate change impacts on water
withdrawal.
X

RI NPS Management Program Plan, September 2014 91
As noted earlier, the long-term goals of the RI NPS Management Program are to protect and
restore the condition of Rhode Island’s water resources affected by NPS pollution sources.
Evaluation of progress toward these goals is an essential step in RI’s overall water quality
management framework. Management effectiveness is primarily evaluated by the assessment of
water quality and aquatic habitat conditions over time. In addition, DEM and its partners
continue to work toward the development of commonly used environmental indicators that serve
to supplement water quality assessments results (see description of Watershed Counts
partnership Section III.B2). Information garnered through evaluation will provide a basis for
updating the Nonpoint Source Management Program Plan every five years to adapt to new
scientific understanding of emerging issues and changes in water quality. In addition, the plan
may be revised as needed to address changes resulting from legislation or budgetary actions that
affect the availability of resources.
Implementation of the RI Water Monitoring Strategy, described in Section III.A1., provides a
majority of the ambient water quality data necessary to evaluate success in preventing new
impairments and restoring existing impaired waters. This data may be supplemented by targeted
studies as needed and as resources allow. The periodic statewide assessment of water quality
conditions for surface waters and groundwaters produces information which can be used to track
progress toward water quality goals in individual waterbodies. For surface waters, if no new
waterbodies, particularly those previously assessed as in acceptable condition, are added to the
list of impaired waters, then Rhode Island has by one measure succeeded in meeting its
prevention goal. Additional tracking of trends in water quality will be performed to determine if
waterbodies of high quality conditions are experiencing degradation (decline in condition). A
return to condition that complies with surface water quality criteria marks a success. However,
as full restoration is often a very lengthy process, DEM is continuing to work toward indicators
that will allow reporting of partial progress. Success in protecting groundwater resources will be
evaluated in terms of the number of public wells that report exceedances of applicable drinking
water standards that are associated with source water conditions. In addition to water quality
assessment, DEM and its partners continue to work toward indicators of condition for freshwater
wetlands and salt marshes. These will provide an additional means of characterizing the
condition of this important component of a watershed once they are fully reviewed and adopted
into agency policy and practice.
In addition to direct measures of water quality, listed in the following table (Table 4) are other
indirect, but nonetheless valuable, environmental indicators that are being be used to describe
progress. These indicators can be used statewide and within particular watersheds as applicable.
Certain measures can be evaluated annually while others would be better determined periodically
(every two to five years).
A. Measures of Progress
VII. Evaluation

RI NPS Management Program Plan, September 2014 92
Table 4. Measures of Progress
Performance Measures
NPS Category Pollutant/Stressor Environmental Programmatic
Onsite wastewater
Stormwater runoff from
developed lands
Agriculture
Boating and Marinas
Waterfowl
Pathogens
Reduction in beach closure events
Reduction in shellfish closures
Reduction in surface waters impaired
for recreation uses
Number of cesspool removed
Progress in implementing local
OWTS programs
Progress toward implementing local
LID ordinances
Number of watershed projects
implemented to address nonpoint
sources of pathogens
Number of marine pumpout facilities
operating and volume of wastewater
collected
Number of manure management
BMPS installed with NRCS funds
Number of volunteers trained to
control goose population
Onsite wastewater
Stormwater runoff from
developed lands
Agriculture
Boating and Marinas
Waterfowl
Lawn and Grounds
Management
Nutrients
Reduced number of confirmed
cyanobacteria blooms
Full and partial progress toward
meeting water quality criteria
Improved water clarity (lakes)
Progress in implementing local
OWTS programs
Number of denitrification OWTS
installed
Progress toward implementing local
LID ordinances
Number of watershed projects
implemented to address nonpoint

RI NPS Management Program Plan, September 2014 93
Performance Measures
NPS Category Pollutant/Stressor Environmental Programmatic
sources of nutrients
Number of nutrient management
BMPs installed with NRCS funds.
Number of green certifications issued
for the turf management and golf
course industries.
Number of volunteers trained to
control goose populations
Stormwater runoff from
developed lands
Agriculture
Sediments
Reduction in aquatic life impairments
associated with sedimentation
Number of watershed projects
implemented to address nonpoint
sources of sediments
Progress toward implementing local
LID ordinances
Number of sediment management
BMPs installed with NRCS funds.
Groundwater discharges
Stormwater runoff from
developed lands
Agriculture
Metals, toxics, petroleum
hydrocarbons, synthetic organics,
pesticides
Reduction in number of public wells
reporting detection of VOCs
Number of unauthorized groundwater
discharges eliminated
Road Salt and Sand
Application
Salt and sand Reduction in volume of salt and sand
applied to RI state roads
Progress in reducing salt and sand
application volumes

RI NPS Management Program Plan, September 2014 94
Performance Measures
NPS Category Pollutant/Stressor Environmental Programmatic
Alteration of wetlands Physical alteration of habitat Total acreage of authorized wetland
loss
Total acreage of wetland restored
Number of watershed projects
implemented to improve wetland
buffers or abate NPS pollution
Aquatic Invasive Species Physical alteration of habitat Reduction in number of lakes
impaired by aquatic invasive species
Percent of public lakes managed
pursuant to lake management plan
Barriers to Stream Connectivity Physical alteration of habitat Total stream miles with improved
stream connectivity due to removal of
barriers
Number of watershed projects
implemented to improve stream
connectivity
Water Withdrawals Physical alteration of habitat Stream miles experiencing depleted
flows

RI NPS Management Program Plan, September 2014 95
In addition to tracking progress in protecting and restoring the condition of RI’s water resources,
DEM will evaluate progress of its NPS Program as required by EPA’s Section 319 NPS Program
Guidance. The following mechanisms will be used to report to EPA on Rhode Island’s progress
in meeting annual milestones and implementing the NPS Management Plan.
Annual NPS Report – Each year, DEM will prepare and submit to EPA an annual report that
summarizes NPS program activities, successes and completed projects. The report will reflect
the goals, actions and track progress on the milestones in this Plan.
Grant Reporting and Tracking System (GRTS) – DEM enters required data into the EPA
GRTS’s database to describe NPS program activities and projects. Pollutant load reduction
estimates are entered upon completion of implementation projects.
PPG Reporting – DEM will continue to comply with EPA requirements governing the
expenditure of Performance Partnership Grants including all applicable financial reports.
Satisfactory Progress Determination – DEM will provide information to EPA to conduct its
annual progress and performance review under Section 319 (h) (8). This will include
information on the expenditure of PPG funds on NPS projects.
B. NPS Program Evaluation

RI NPS Management Program Plan, September 2014 96
Table 5. NPS Programmatic Milestones
NPS Programmatic Milestones 2015
2016
2017
2018
2019
NPS Annual Report Submitted. X X X X X
Number of NPS Success Stories submitted to EPA for
partially restored waterbodies.
1 1
Number of NPS Success Stories submitted to EPA for
waterbodies where there has been a demonstration of
substantial improvement.
1 1 1 1 1
Number of new grant agreements for projects supported
with PPG funds (Section 319).
2 2 2 2 2
Number of BMPs installed as part of implementing
watershed-based projects with PPG funds (Section 319).
2 2 2 2 2
Data reported in the EPA GRTS database by February 15. X X X X X
Updated NPS Grant Program Programmatic Quality
Assurance Project Plan.
X
EPA approved NPS Management Program Plan update in
place by October 1, 2019 (with milestones for 2020-
2024).
X

RI NPS Management Program Plan, September 2014 97
Bromberg, K. and M. Bertness. 2005. Reconstructing New England Salt Marsh Losses Using
Historical Maps. Estuaries Vol. 28, No. 6, P. 823-932.
Center for Watershed Protection. 2003. Impacts of Impervious cover on Aquatic Systems.
Watershed Protection Research Monograph No. 1. Center for Watershed Protection. Ellicott
City. Maryland.
Center for Watershed Protection, Inc. Stormwater Manager’s Resource Center website.
Hellyer, Greg. 1995. Memorandum. Wetland Losses in Rhode Island 1780’s-1990’s. U.S.
Environmental Protection Agency 4 pp.
NOAA 1999. Turning to the Sea: America’s Ocean Future. U.S. Department of Commerce,
National Oceanic and Atmospheric Administration, Office of Public and Constituent Affairs.
Ocean Conservancy 2014. Turning the Tide on Trash; 2014 Report.
Peach, Michelle, April 2013. Powerpoint presentation. Rhode Island freshwater Wetlands
Monitoring and Assessment Plan (WMAP). Rhode Island Natural History Survey. Kingston, RI.
RIDEM 1995. RI Nonpoint Source Pollution Management Plan. RI Department of
Environmental Management. State of Rhode Island and Providence Plantations. Providence, RI.
RIDEM 2005. RI Water Monitoring Strategy. RI Department of Environmental Management.
State of Rhode Island and Providence Plantations. Providence, RI.
RIDEM 2007. Rhode Island Section 319 Nonpoint Source Grant Program Quality Assurance
Project Plan. RI Department of Environmental Management. State of Rhode Island and
Providence Plantations. Providence, RI.
RIDEM 2010. Total Maximum Daily Load Analysis for the Pawcatuck River and Little
Narragansett Bay Waters Bacteria Impairments. RI Department of Environmental Management.
State of Rhode Island and Providence Plantations. Providence, RI.
RIDEM 2011. Rhode Island Statewide Total Maximum Daily Load for Bacteria Impaired
Waters. RI Department of Environmental Management. State of Rhode Island and Providence
Plantations. Providence, RI.
RIDEM and CRMC 2010. RI Stormwater Design and Installation Standards Manual. State of
Rhode Island and Providence Plantations. Providence, RI.
RIDEM and CRMC 2011. RI Low Impact Development Site Planning and Design Guidance
Manual. State of Rhode Island and Providence Plantations. Providence, RI.
References

RI NPS Management Program Plan, September 2014 98
RIDEM 2012. Rhode Island Freshwater Lakes and Ponds: Aquatic Invasive Plants and Water
Quality Concerns. A Report to the Governor and Rhode Island General Assembly. RI
Department of Environmental Management. Providence. 130 pp.
RIDEM 2012. Integrated Water Quality Monitoring and Assessment Report. RI Department of
Environmental Management. State of Rhode Island and Providence Plantations. Providence, RI.
RIDOA 2006. Land Use 2025: State Land Use Policies and Plan; State Guide Plan Element 121.
RI Department of Administration, Division of Planning.
RIDOA 2014. Road Salt Application in Rhode Island (Draft), March 2014. Statewide Planning
Technical Paper #163. RI Department of Administration, Division of Planning. State of Rhode
Island and Providence Plantations. Providence, RI.
RIRC&D 2013. Road Crossings as Potential Barriers to Fish and Wildlife Movement: The RI
River and Stream Continuity Project. RI Resource Conservation and Development Council.
USDA 2014. National Agricultural Statistics Service 2012 Census of Agriculture Preliminary
Report. US Department of Agriculture.
USEPA 2013. EPA Nonpoint Source Program and Grants Guidelines for States and Territories;
issued April 12, 2013.
USEPA Website. Water: CZA, Pollution Prevention Management Measures. US Environmental
Protection Agency.

RI NPS Management Program Plan, September 2014 99
A. EPA Required Components of NPS Management Plan and How This Plan Complies
B. Map of Ambient River Monitoring – Targeted Basins 2011-2014
C. Integration of Planning Activities to Support Watershed Management
D. EPA Required Minimum Elements of a Watershed-based Plan
E. Partners in Water Resource Protection and Restoration
F. Watershed Planning Area Data on Impervious Cover and Impairments
Appendices

RI NPS Management Program Plan, September 2014 A1
EPA Required Components of NPS Management Plan and How This Plan
Complies
1. The state program contains explicit short and long-term goals, objectives and strategies
to restore and protect surface water and groundwater, as appropriate.
- I.A. Water Resource Goals
- VI.B. Implementation Tables.
2. The state strengthens its working partnerships and linkages to appropriate state,
interstate, tribal, regional, and local entities (including conservation districts), private
sector groups, citizens groups, and federal agencies.
- III. A. Management Framework
- Figure 8. Watershed Planning Process
- III.B. Partners in Water Quality Management
- Appendix E. Partners in Water Resource Protection and Restoration
3. The state uses a combination of statewide programs and on–the–ground projects to
achieve water quality benefits; efforts are well–integrated with other relevant state and
federal programs.
- III.A.5. Implementation of NPS Protection and Restoration Actions
- III.B. Partners in NPS Management
- IV. Pollution Source Management
- V. Other NPS Stressors
- VI.B. Implementation Tables.
4. The state program describes how resources will be allocated between (a) abating known
water quality impairments from NPS pollution and (b) protecting threatened and high
quality waters from significant threats caused by present and future NPS impacts.
- III. NPS Management Program
- III.C. Setting Priorities
- VI.A. Resources for Implementation
- Appendix F. Watershed Planning Areas Categorized for Protection and Restoration
APPENDIX A

RI NPS Management Program Plan, September 2014 A2
5. The state program identifies waters and watersheds impaired by NPS pollution as well as
priority unimpaired waters for protection. The state establishes a process to assign priority
and to progressively address identified watersheds by conducting more detailed watershed
assessments, developing watershed-based plans and implementing the plans.
- II.B. Summary of NPS Pollution Problems
- Figure 8. Watershed Planning Process
- III. NPS Management Program
- III.C. Setting Priorities
- Appendix F. Watershed Planning Areas Categorized for Protection and Restoration
6. The state implements all program components required by section 319(b) of the Clean
Water Act, and establishes strategic approaches and adaptive management to achieve and
maintain water quality standards as expeditiously as practicable. The state reviews and
upgrades program components as appropriate. The state program includes a mix of
regulatory, nonregulatory, financial and technical assistance, as needed.
- I.C. Rhode Island Nonpoint Source Program and the State Water Quality Management
Framework
- III.A.5. Implementation of NPS Protection and Restoration Actions
- Table 2. State Regulations for NPS Management
- IV. Pollution Source Management
- V. Other NPS Stressors
- VI.A. Resources for Implementation
- VI.B. Implementation Tables
7. The state manages and implements its NPS management program efficiently and
effectively, including necessary financial management.
- III. NPS Management Program
- VI.A. Resources for Implementation
- VII.B. NPS Program Evaluation
8. The state reviews and evaluates its NPS management program using environmental and
functional measures of success, and revises its NPS management program at least every
five years.
- VII.A. Measures of Progress
- VII.B. NPS Program Evaluation

RI NPS Management Program Plan, September 2014 B1
APPENDIX B
RI NPS Management Program Plan, September 2014 C1
Integration of Planning Activities to Support Watershed Management
As noted in Figure 8, water-related planning activities occur on different scales (federal,
regional, state, local) and for varying purposes. As previously described in Section III.B.
Partners in NPS Management, RI Bays, Rivers and Watersheds Coordination Team and the
Narragansett Bay Estuary Program represent ongoing efforts to integrate planning at a statewide
or regional scale. Accordingly, plans generated by these efforts provide direction to enhance the
development and coordination of statewide and watershed-wide programs and activities. Where
sufficiently specific, they may also reflect actions appropriate for inclusion in watershed-based
plans.
There are a variety of additional ongoing planning efforts relevant to watershed planning that
address both nonpoint and point sources of pollution. Described below, these plans, typically
prepared with a specific focus, can contribute content related to the protection and restoration of
water resources. These plans often serve as a source of watershed specific recommended actions
that should be reflected in a watershed plan.
1. Water Quality Management Planning
Water Quality Restoration Plans – Pursuant to federal Clean Water Act requirements, waters
impaired by pollutants become targets for Total Maximum Daily Load (TMDL) development or
the subject of other effective pollution control actions that are expected to restore water quality.
A TMDL is a calculation of the maximum amount of a pollutant that a waterbody can receive
and still meet water quality standards, and an allocation of that amount to the pollutant's sources.
TMDLs are based on the relationship between pollution sources in the watershed and instream
water quality conditions. A TMDL addresses a single pollutant or stressor for each waterbody or
waterbody segment. The water quality studies performed to support TMDL development often
yield additional information that helps characterize the nonpoint sources of pollution that may be
affecting a specific waterbody. The process results in a water quality restoration plan, or TMDL
plan, that identifies and provides the technical basis for the actions needed to restore water
quality. DEM provides information on TMDLs, including draft and completed TMDLS at:
http://www.dem.ri.gov/programs/benviron/water/quality/rest/index.htm
Special Area Management Plans (SAMPs) – The Coastal Resources Management Council
prepares these comprehensive plans that provide for natural resource protection and reasonable
coastal–dependent economic growth in policies and actions set forth for a specific coastal area of
the State. Protection of water quality is a key component of SAMPs. The CRMC coordinates
with local municipalities, as well as government agencies and community organizations, to
prepare the SAMPs and implement the management strategies. The following SAMPs have been
prepared: Metro Bay, Greenwich Bay, Aquidneck Island West Side, Narrow River, Salt Ponds
Region, Pawcatuck River, Ocean, and Shoreline Change (in development).
APPENDIX C

RI NPS Management Program Plan, September 2014 C2
Lake Management Plans – While lacking a formally organized lake management program within
state government, DEM has encouraged the development of lake management plans that
integrate topics related to water quality and management of aquatic invasive species taking into
account the larger watershed within which the lake is located. A lake management plan provides
the framework for fostering more effective management by identifying the threats to water
quality and habitat conditions, actions needed to prevent degradation and restore and manage
existing conditions. During the last decade, several lake associations have taken steps toward
developing plans.
Water Supply System Management Plans – Water Supply System Management Plans are
required by the Water Resources Board for the 29 large suppliers – those supplying greater than
50 million gallons of water per year. These comprehensive management plans have a water
quality protection component wherein the supplier is required to identify actions for protecting
water quality in its source water protection area (reservoir watershed and/or wellhead protection
area). Plans must be updated every 5 years.
Source Water Protection Assessments/Plans (Large supplier) – These plans were prepared by the
Department of Health for the 29 large water suppliers in RI in 2003 in response to federal Safe
Drinking Water Act requirements to conduct source water assessments. Plans included an
assessment of the vulnerability of the water supply based on water quality data and activities in
the source water protection area and recommendations to protect the water supply.
Source Water Protection Plans (Small supplier) – Source water protection/supply system plans
for the smaller suppliers (all those not subject to Water Supply System Management Plan
requirements) are not required, but are strongly recommended. A number of plans have been
prepared for willing suppliers using state and federal resources as they become available.
2.Water Related Infrastructure Planning
Urban Services Boundary – “Land Use 2025: State Land Use Policies and Plan” (State Guide
Plan Element 121) adopted in 2006 by the RI Department of Administration, identifies an Urban
Services Boundary, based upon a detailed land capability and suitability analysis that
demonstrates the capacity of this area to accommodate future growth. The Plan directs the State
and communities to concentrate growth inside the Urban Services Boundary and within locally
designated centers in rural areas, and to pursue significantly different land use and development
approaches for urban and rural areas. This boundary presents an opportunity for evaluating its
use as a tool in prioritizing water quality protection and restoration activities.
Wastewater Facility Planning – Facility plans are long-term (20 year) planning documents that
document the needs of wastewater treatment systems. Based on sound engineering principles,
they identify need related to enhanced treatment, system capacity and service areas; e.g., identify
areas that may require sewer service in the future. Facility plans are prepared by the operators of
wastewater treatment facilities and certain municipalities that have responsibility over portions
of a sewer collection systems but not treatment facilities. Consistency with a facility plan is a

RI NPS Management Program Plan, September 2014 C3
pre–requisite for decisions by DEM to authorize modifications to existing wastewater
infrastructure. It also is a factor in determining projects as qualifying for funding, such as the
state’s Clean Water State Revolving Fund.
Onsite Wastewater Management Plans – Local communities that rely on onsite wastewater
systems have been encouraged to develop local onsite wastewater plans and programs. The
plans identify specific actions a community expects to carry out to promote proper operation and
maintenance of OWTS. The plans also identify actions that would enhance local programs.
Stormwater Management Plans – Most RI municipalities have developed local stormwater
management plans which outline actions needed to prevent and abate impacts to water quality
from stormwater runoff. The plans may identify actions municipalities want to take to enhance
locally administered programs, such as pre– and post – construction oversight of stormwater
BMPs, as well as specific projects that are needed to retrofit existing infrastructure in support of
water quality restoration goals.
Water Supply System Management Plans – In addition to the water quality protection component
described above, Water Supply System Management Plans include information on the water
supply infrastructure and water use which is relevant to watershed hydrology and watershed
plans.
3. Land Use Planning for Water Quality
Comprehensive Community Plans – Rhode Island cities and towns must have a locally adopted
Community Comprehensive Plan that must be updated at least once every five years. Municipal
plans are required to be reviewed by the State for consistency with State goals and policies
including all elements of the State Guide Plan. In turn, State agency projects and activities are to
conform to local plans that have received State approval. The local comprehensive plan sets the
basis for the exercise of key local implementing powers for land use – zoning and development
review ordinances.
The Rhode Island Comprehensive Planning and Land Use Regulation Act (RIGL 45-22.2)
specified the requirements for municipal comprehensive plans, calling each “a statement (in text,
maps, illustrations, or other media of communication) that is designed to provide a basis
for rational decision–making regarding the long term physical development of the municipality.”
There are nine required elements with many opportunities to include provisions for the
protection and restoration of water quality.
Special Area Management Plans (SAMPs) – In addition to the strategies to protect water quality,
the SAMPs, in conjunction with the CRMC Coastal Management Program, direct allowable land
uses and activities in within the coastal zone jurisdictional area. The CRMC coordinates with
local municipalities, as well as government agencies and community organizations, to prepare
the SAMPs and implement the management strategies.

RI NPS Management Program Plan, September 2014 C4
4. Planning for Habitat Protection and Restoration
State Wildlife Action Plan – Rhode Island has prepared a State Wildlife Action Plan that is part
of a national program was created by Congress in 2000 to address the longstanding need to fund
actions to conserve declining fish and wildlife species before they become threatened or
endangered. The plan, subject to USFW approval, allows RI to remain eligible for matching
grants. DEM prepared the first plan in 2005 and is in the process of updating the plan for 2015.
Intended to be proactive, the plans assess the health of each state's wildlife and habitats, identify
the problems they face, and outline actions needed to conserve them over the long term. It
encompasses both marine and freshwater habitat types and provides recommended actions on
conservation that will be relevant to watershed plans.
Coastal Habitat Restoration Strategies – The growing interest in habitat restoration has
prompted a commitment by CRMC and DEM to update and further develop habitat restoration
strategies. DEM, in collaboration with NBEP, will produce an updated statewide plan for fish
passage to support anadromous fish restoration that includes site specific recommendations for
dam locations on coastal tributary rivers and streams. CRMC is leading an initiative to
developing a restoration plan targeting saltmarshes.

RI NPS Management Program Plan, September 2014 D1
EPA Required Minimum Nine Elements of a Watershed-based Plan (WRB)
(From: EPA Nonpoint Source Program and Grants Guidelines for States and Territories; issued
April 12, 2013.)
The nine elements, as well as short explanations of how each element fits in the context of the
broader WBP, are provided below. Although they are listed as a through i, they do not
necessarily take place sequentially. For example, element d asks for a description of the
technical and financial assistance that will be needed to implement the WBP, but this can be
done only after you have addressed elements e and i.
The level of detail needed to address the nine elements of WBPs will vary in proportion to the
homogeneity or similarity of land use types and variety and complexity of pollution sources. For
example, densely developed urban and suburban watersheds often have multiples sources of
pollution from historic and current activities (Superfund sites, point sources, solid waste
disposal, leakage from road salt storage, oil handling, stormwater caused erosion, road
maintenance, etc.) in addition to some agricultural activities. Plans will be more complex than in
predominantly rural settings in these cases. For this reason, plans for urban and suburban
watersheds may need to be developed and implemented at a smaller scale than watersheds with
agricultural lands of a similar character.
Element a. Identification of causes of impairment and pollutant sources or groups of similar
sources that need to be controlled to achieve needed load reductions, and any other goals
identified in the watershed plan. Sources that need to be controlled should be identified at the
significant subcategory level along with estimates of the extent to which they are present in the
watershed (e.g., X number of dairy cattle feedlots needing upgrading, including a rough
estimate of the number of cattle per facility; Y acres of row crops needing improved nutrient
management or sediment control; or Z linear miles of eroded streambank needing
remediation).
What does this mean?
Your WBP source assessment should encompass the watershed of the impaired waterbody (ies)
throughout the watershed, and include map(s) of the watershed that locates the major cause(s)
and source(s) of impairment in the planning area. To address these impairments, you will set
goals to meet (or exceed) the appropriate water quality standards for pollutant(s) that threaten or
impair the physical, chemical, or biological integrity of the watershed covered in the plan.
This element will usually include an accounting of the significant point and nonpoint sources in
addition to the natural background levels that make up the pollutant loads causing problems in
the watershed. If a TMDL or TMDLs exist for the waters under consideration, this element may
be adequately addressed in those documents. If not, you will need to conduct a similar analysis
(which may involve mapping, modeling, monitoring, and field assessments) to make the link
between the sources of pollution and the extent to which they cause the water to exceed relevant
water quality standards.
APPENDIX D

RI NPS Management Program Plan, September 2014 D2
Element b. An estimate of the load reductions expected from management measures.
What does this mean?
On the basis of the existing source loads estimated for element a, you will similarly determine
the reductions needed to meet water quality standards. After identifying the various management
measures that will help to reduce the pollutant loads (see element c below), you will estimate the
load reductions expected as a result of implementing these management measures, recognizing
the difficulty in precisely predicting the performance of management measures over time.
Estimates should be provided at the same level as that required in the scale and scope described
in element a (e.g., the total load reduction expected for dairy cattle feedlots, row crops, eroded
streambanks, or implementation of a specific stormwater management practice). For waters for
which TMDLs have been approved or are being developed, the plan should identify and
incorporate the TMDLs; the plan needs to be designed to achieve the applicable load reductions
in the TMDLs. Applicable loads for downstream waters should be included so that water
delivered to a downstream or adjacent segment does not exceed the water quality standards for
the pollutant of concern at the water segment boundary. The estimate should account for
reductions in pollutant loads from point and nonpoint sources identified in the TMDL as
necessary to attain the applicable water quality standards.
Element c. A description of the nonpoint source management measures that will need to be
implemented to achieve load reductions in element b, and a description of the critical areas in
which those measures will be needed to implement this plan.
What does this mean?
The plan should describe the management measures that need to be implemented to achieve the
load reductions estimated under element b, as well as to achieve any additional pollution
prevention goals outlined in the watershed plan (e.g., habitat conservation and protection).
Pollutant loads will vary even within land use types, so the plan should also identify the critical
areas17 in which those measures will be needed to implement the plan. This description should
be detailed enough to guide needed implementation activities throughout the watershed and can
be greatly enhanced by developing an accompanying map with priority areas and practices.
Thought should also be given to the possible use of measures that protect important habitats
(e.g., wetlands, vegetated buffers, and forest corridors) and other non–polluting areas of the
watershed. In this way, waterbodies would not continue to degrade in some areas of the
watershed while other parts are being restored.
Element d. Estimate of the amounts of technical and financial assistance needed, associated
costs, and/or the sources and authorities that will be relied upon to implement this plan.
What does this mean?
You should estimate the financial and technical assistance needed to implement the entire plan.
This includes implementation and long-term operation and maintenance of management
measures, information/education (I/E) activities, monitoring, and evaluation activities. You
should also document which relevant authorities might play a role in implementing the plan.
Plan sponsors should consider the use of federal, state, local, and private funds or resources that

RI NPS Management Program Plan, September 2014 D3
might be available to assist in implementing the plan. Shortfalls between needs and available
resources should be identified and addressed in the plan.
Element e. An information and education component used to enhance public understanding
of the plan and encourage their early and continued participation in selecting, designing, and
implementing the nonpoint source management measures that will be implemented.
What does this mean?
The plan should include an I/E component that identifies the education and outreach activities or
actions that will be used to implement the plan. These I/E activities may support the adoption
and long–term operation and maintenance of management practices and support stakeholder
involvement efforts.
Element f. A schedule for implementing the nonpoint source management measures identified
in this plan that is reasonably expeditious.
What does this mean?
You should include a schedule for implementing the management measures outlined in your
watershed plan. The schedule should reflect the milestones you develop in g and you should
begin implementation as soon as possible. Conducting baseline monitoring and outreach for
implementing water quality projects are examples of activities that can start right away. It is
important that schedules not be “shelved” for lack of funds or program authorities; instead they
should identify steps towards obtaining needed funds as feasible.
Element g. A description of interim measurable milestones for determining whether nonpoint
source management measures or other control actions are being implemented.
What does this mean?
The WBP should include interim, measurable implementation milestones to measure progress in
implementing the management measures. These milestones will be used to track implementation
of the management measures, such as whether they are being implemented according to the
schedule outlined in element f, whereas element h (see below) will develop criteria to measure
the effectiveness of the management measures by, for example, documenting improvements in
water quality. For example, a watershed plan may include milestones for a problem pesticide
found at high levels in a stream. An initial milestone may be a 30% reduction in measured
stream concentrations of that pesticide after 5 years and 50 percent of the users in the watershed
have implemented Integrated Pest Management (IPM). The next milestone could be a 40%
reduction after 7 years, when 80% of pesticide users are using IPM. The final goal, which
achieves the water quality standard for that stream, may require a 50% reduction in 10 years.
Having these waypoints lets the watershed managers know if they are on track to meet their
goals, or if they need to re–evaluate treatment levels or timelines.
Element h. A set of criteria that can be used to determine whether loading reductions are
being achieved over time and substantial progress is being made toward attaining water
quality standards.

RI NPS Management Program Plan, September 2014 D4
What does this mean?
As projects are implemented in the watershed, you will need water quality benchmarks to track
progress towards attaining water quality standards. The criteria in element h (not to be confused
with water quality criteria in state regulations) are the benchmarks or waypoints to measure
against through monitoring. These interim targets can be direct measurements (e.g., fecal
coliform concentrations, nutrient loads) or indirect indicators of load reduction (e.g., number of
beach closings). These criteria should reflect the time it takes to implement pollution control
measures, as well as the time needed for water quality indicators to respond, including lag times
(e.g., water quality response as it is influenced by ground water sources that move slowly or the
extra time it takes for sediment bound pollutants to break down, degrade or otherwise be isolated
from the water column). Appendix B of these guidelines, “Measures and Indicators of Progress
and Success,” although intended as measures for program success, may provide some examples
that may be useful. You should also indicate how you will determine whether the WBP needs to
be revised if interim targets are not met. These revisions could involve changing management
practices, updating the loading analyses, and reassessing the time it takes for pollution
concentrations to respond to treatment.
Element i. A monitoring component to evaluate the effectiveness of the implementation efforts
over time, measured against the criteria established under element h.
What does this mean?
The WBP should include a monitoring component to determine whether progress is being made
toward attaining or maintaining the applicable water quality standards for the waterbody(ies)
addressed in the plan. The monitoring program should be fully integrated with the established
schedule and interim milestone criteria identified above. The monitoring component should be
designed to assess progress in achieving loading reductions and meeting water quality standards.
Watershed-scale monitoring can be used to measure the effects of multiple programs, projects,
and trends over time. Instream monitoring does not have to be conducted for individual BMPs
unless that type of monitoring is particularly relevant to the project.
RI NPS Management Program Plan, September 2014 E1
Partners in Water Resource Protection and Restoration
State Agencies
RI Department of Environmental Management – lead agency for water pollution control;
regulates pollution sources, monitors water quality, establishes water quality standards.
Coastal Resources Management Council – lead agency for coastal zone management; manages
and plans for the preservation of the coastal resources, permits all activities within tidal waters.
RI Department of Health – regulates public water suppliers to ensure water provided to the
public meets drinking water standards; and monitors water quality at public bathing beaches.
RI Water Resources Board – oversees the management and use of drinking water resources:
identifies potential sources, allocates drinking water supplies and administers financial programs
to ensure adequate supplies of drinking water.
RI Department of Administration, Division of Planning – creates long-term plans for the state’s
development and management of its natural resources; ensures municipalities comply with local
planning requirements.
RI Clean Water Finance Agency – administers the state revolving fund to finance municipal
wastewater projects.
Narragansett Bay Commission – protects water quality in Narragansett Bay and its tributaries by
providing wastewater collection and treatment services in the Providence metropolitan area.
RI Department of Transportation – maintains state and federal roads, which includes stormwater
management and road salting and sanding.
Bay, Rivers, Watershed Coordination Team – conducts strategic, interagency planning, fosters
coordination of government programs and partnerships, and makes targeted investments in
science, monitoring, and policy analysis on water resource issues.
Narragansett Bay Estuary Program – protects Narragansett Bay through initiating and
coordinating projects with public and private partners with federal funds under the National
Estuary Program.
Narragansett Bay National Estuarine Research Reserve – preserves, protects and restores coastal
and estuarine ecosystems of Narragansett Bay through long-term research, education and
training.
APPENDIX E

RI NPS Management Program Plan, September 2014 E2
University of Rhode Island, Cooperative Extension – provides education, outreach, training and
technical assistance on water quality issues to citizens and public officials; manages volunteer
based program to collect and analyze water quality samples.
University of RI, Coastal Institute – advances knowledge and develops solutions to
environmental problems in coastal ecosystems.
University of RI, Coastal Resource Center – promotes stewardship and management in the
world's coastal ecosystems.
Federal Agencies
US Environmental Protection Agency – establishes national requirements for implementation of
federal laws for water quality management; provides funds to the state to implement water
quality programs under federal law, and conducts research on water quality issues.
US Geological Survey – conducts water quantity and quality studies of groundwater and surface
water resources, and monitors water quality and stream levels.
USDA, Natural Resources Conservation Services – provides funds and technical assistance to
farmers to implement best management practices for water quality management and habitat
improvement.
Local and Regional Entities
Municipalities – administer land use planning and specific local programs and plans for water
quality management, manage local wastewater treatment and stormwater systems.
Water Suppliers – provide drinking water to the public, and work to protect their source of
supply.
RI Rivers Council – coordinates and oversees activities of local watershed associations that have
been officially designated by the Council.
Non–profit Organizations (including Watershed Associations) – perform vital advocacy role in
managing watersheds.
Land Trusts – acquire important aquatic, riverine and upland habitat for protection of water
quality and aquatic life.
Individuals – Each of RI citizens can make a difference to improve water quality by being aware
of our water resources and taking steps (often simple) to protect and restore these resources.

RI NPS Management Program Plan, September 2014 F1
Watershed Categorization for Protection and Restoration
Watershed Planning Areas With Emphasis on Protection to Prevent Future
Impairments ( low levels of impervious cover and existing pollutant impairments)
% Impervious Cover
( RI Land Only)
Planning Areas Associated
with watersheds extending
outside of RI
Scituate Reservoir 4.1%
New Shoreham 6.3%
Prudence Island 3%
Sakonnet River East 8.5% X
Southeast Coastal 5.8% X
Watershed Planning Areas with Emphasis on Mix of Protection and Restoration
Strategies
Aquidneck Island 22.7%
Narrow River 13.8%
Bristol– Kickemuit River 21.9% X
Wood –Pawcatuck Rivers 4.9% X
Stafford Pond 9.7% X
Jamestown 12.5%
Branch River 6.1% X
Southwest Coastal 11.7%
Woonasquatucket River 21.4%
Quinebaug River 2.4% X
Saugatucket River 12.8%
Hunt River 14.1%
West Bay 18.1%
Blackstone River 19.6 % X
Pawtuxet River 18.6%
Watershed with Emphasis on Restoration ( highest levels of impervious cover)
Barrington –Palmer – Warren
Rivers
28.5% X
Greenwich Bay 30.6%
Moshassuck River 31.3%
Buckeye Brook 37.0%
Providence Seekonk 46.4%
Ten Mile River 44.3% X
APPENDIX F