Embed Size (px)
Citation preview

N O A A F I S H E R I E S S E R V I C E
Final RIR/4(b)(2) Preparatory Assessment/FRFA for the Critical Habitat Designation of Cook Inlet Beluga Whale
F I N A L
A U G U S T 1 1 , 2 0 1 0
Prepared by Prepared for
NOAA Fisheries Service Alaska Region
Division of Protection Resources ENTRIX, Inc.
12009 NE 99th St. #1410 Vancouver, WA 98682
T 360.883.0191 F 360.883.0292

NATIONAL MARINE FISHERIES SERVICE ii
Table of Contents
S E C T I O N 1 Purpose and Need .................................................................... 1-1
1.1 Background and Objectives ................................................................................ 1-1 1.2 Statutory Authority ............................................................................................. 1-2 1.3 Regulatory Requirements ................................................................................... 1-3
1.3.1 Requirements of Regulatory Impact Review ........................................ 1-3 1.3.2 Requirements of Section 4(b)(2) of the ESA ........................................ 1-4 1.3.3 Final Regulatory Flexibility Act Analysis Requirements ..................... 1-5
1.4 Structure of the Report ....................................................................................... 1-5
S E C T I O N 2 Proposed Action ....................................................................... 2-1
2.1 Proposed Critical Habitat Designation ............................................................... 2-1 2.1.1 Area 1 CH.............................................................................................. 2-1 2.1.2 Area 2 CH.............................................................................................. 2-2
2.2 Description of Alternatives ................................................................................ 2-2 2.3 Threats to the Species and Its Habitat ................................................................ 2-4 2.4 Primary Constituent Elements ............................................................................ 2-4
S E C T I O N 3 Methodology and Framework for Analysis ............................ 3-1
3.1 General Framework for the Analysis ................................................................. 3-1 3.2 Categories of Potential Economic Effects of Species Conservation .................. 3-1
3.2.1 Efficiency Effects .................................................................................. 3-2 3.2.2 Net Benefits ........................................................................................... 3-3 3.2.3 Distributional and Regional Economic Effects ..................................... 3-3
3.3 Baseline and Incremental Effects ....................................................................... 3-4 3.3.1 Baseline for the Analysis ....................................................................... 3-5 3.3.2 Types of Economic Costs and Benefits of Critical Habitat
Designation............................................................................................ 3-6 3.4 Analytic Time-Frame ......................................................................................... 3-8 3.5 Information Sources ........................................................................................... 3-8
S E C T I O N 4 Types of Economic Costs of Critical Habitat Designation .... 4-1
4.1 Direct Costs ........................................................................................................ 4-1 4.1.1 Administrative Section 7 Consultation Costs ........................................ 4-1 4.1.2 Section 7 Project Modification Costs .................................................... 4-3
4.2 Indirect Costs ...................................................................................................... 4-4 4.2.1 Other State and Local Laws (Trigger Effects) ...................................... 4-4 4.2.2 Stigma Effects ....................................................................................... 4-4 4.2.3 Time Delays .......................................................................................... 4-4 4.2.4 Regulatory Uncertainty ......................................................................... 4-4
S E C T I O N 5 Identifying Benefits .................................................................. 5-1
5.1 Framework for Estimating BeNefits .................................................................. 5-1
TABLE OF CONTENTS
NATIONAL MARINE FISHERIES SERVICE iii
5.2 Overview of Types of Economic Benefits .......................................................... 5-2 5.2.1 Use Benefits ........................................................................................... 5-4 5.2.2 Nonuse or Passive Use Benefits ............................................................ 5-6
5.3 Valuation Methods .............................................................................................. 5-7 5.4 Related Literature ............................................................................................... 5-8
5.4.1 Recreation Benefits ................................................................................ 5-9 5.4.2 Fishing ................................................................................................... 5-9 5.4.3 Whale Watching / Wildlife Viewing and Sightseeing ......................... 5-10 5.4.4 Subsistence Benefits ............................................................................ 5-11 5.4.5 Environmental Education and Volunteerism Benefits ......................... 5-12
5.5 Summary ........................................................................................................... 5-13
S E C T I O N 6 Contextual Information ............................................................. 6-1
6.1 Geographic Scope ............................................................................................... 6-1 6.2 Description of Affected Economies .................................................................... 6-1
6.2.1 Population Trends and Projections ........................................................ 6-2 6.2.2 Income-Related Measures of Social Well-Being ................................... 6-3 6.2.3 Race and Ethnicity ................................................................................. 6-4 6.2.4 Alaska Native Corporations and Communities ...................................... 6-5 6.2.5 Major Industrial Sectors....................................................................... 6-11
6.3 Regulatory Baseline .......................................................................................... 6-16 6.3.1 Federal ................................................................................................. 6-16 6.3.2 State Regulations ................................................................................. 6-20 6.3.3 International ......................................................................................... 6-21
6.4 Current and Projected Economic and Social Activity ...................................... 6-21 6.4.1 Oil and Gas Development .................................................................... 6-21 6.4.2 Mining.................................................................................................. 6-28 6.4.3 Transportation ...................................................................................... 6-38 6.4.4 Port Expansion and Development ........................................................ 6-48 6.4.5 Other Large-Scale Development/Infrastructure Projects ..................... 6-53 6.4.6 Water Quality ....................................................................................... 6-55 6.4.7 Power Projects/Development in Cook Inlet and Vicinity .................... 6-67 6.4.8 Commercial Fisheries .......................................................................... 6-71 6.4.9 Alaska Native Subsistence Use and Personal Use ............................... 6-79 6.4.10 Alaska Residents Personal Use Fishery ............................................... 6-84 6.4.11 Recreation and Tourism ....................................................................... 6-84 6.4.12 Military Activities ................................................................................ 6-90 6.4.13 Interactions between Cook Inlet Beluga Whale Habitats and other
Protected Species and their Habitats .................................................... 6-94 6.4.14 Educational, Scientific, Non-Consumptive Use of Cook Inlet Beluga
Whale and its Habitat ........................................................................... 6-97 6.5 Summary and Future Actions to Protect Cook Inlet beluga Whale Habitat ... 6-101
S E C T I O N 7 Costs and Benefits of Cook Inlet Beluga Whale Critical Habitat Designation .................................................................. 7-1
7.1 Oil and Gas Development ................................................................................... 7-1 7.1.1 Potential Costs to this Sector ................................................................. 7-1 7.1.2 Potential Benefits to this Sector ............................................................. 7-2
7.2 Mining ................................................................................................................. 7-2 7.2.1 Potential Costs to this Sector ................................................................. 7-2

FINAL RIR/4(B)(2)/FRFA OF CRITICAL HABITAT DESIGNATION OF COOK INLET BELUGA WHALE AUGUST 11, 2010
iv NATIONAL MARINE FISHERIES SERVICE
7.2.2 Potential Benefits to this Sector ............................................................ 7-3 7.3 Transportation .................................................................................................... 7-3
7.3.1 Potential Costs to the Sector .................................................................. 7-3 7.3.2 Potential Benefits to the Sector ............................................................. 7-3
7.4 Port Expansion and Development ...................................................................... 7-4 7.4.1 Potential Costs to the Sector .................................................................. 7-4 7.4.2 Potential Benefits to the Sector ............................................................. 7-4
7.5 Other Large-Scale Development / Infrastructure Projects ................................. 7-5 7.5.1 Potential Costs to Uplands Rock Quarry-Cotton Bay ........................... 7-5 7.5.2 Potential Benefits to these Developments ............................................. 7-5
7.6 Water Quality ..................................................................................................... 7-5 7.6.1 Potential Costs to the Sector .................................................................. 7-5 7.6.2 Potential Benefits to the Sector ............................................................. 7-6
7.7 Power Projects / Development in Cook Inlet and Vicinity ................................ 7-6 7.7.1 Potential Costs to Power Projects .......................................................... 7-6 7.7.2 Potential Benefits to Power Projects ..................................................... 7-6
7.8 Commercial Fisheries ......................................................................................... 7-7 7.8.1 Potential Costs to Commercial Fisheries ............................................... 7-7 7.8.2 Potential Benefits to Commercial Fisheries .......................................... 7-7
7.9 Native Alaskan and Subsistence Use ................................................................. 7-7 7.9.1 Potential Costs to Subsistence ............................................................... 7-8 7.9.2 Potential Benefits to Subsistence .......................................................... 7-8
7.10 Alaska Residents Personal Use Fishery ............................................................. 7-9 7.10.1 Potential Costs ....................................................................................... 7-9 7.10.2 Potential Benefits .................................................................................. 7-9
7.11 Recreation and Tourism ..................................................................................... 7-9 7.11.1 Potential Costs ....................................................................................... 7-9 7.11.2 Potential Benefits .................................................................................. 7-9
7.12 Military Activities ............................................................................................ 7-10 7.12.1 Potential Costs ..................................................................................... 7-10 7.12.2 Potential Benefits ................................................................................ 7-10
7.13 Interactions between Cook Inlet Beluga Whale Habitats and other Protected Species and their Habitats ................................................................................ 7-10 7.13.1 Potential Costs ..................................................................................... 7-11 7.13.2 Potential Benefits ................................................................................ 7-11
7.14 Educational, Scientific, Non-Consumptive Use of Cook Inlet Beluga Whale and its Habitat ................................................................................................... 7-11 7.14.1 Potential Costs ..................................................................................... 7-11 7.14.2 Potential Benefits ................................................................................ 7-11
7.15 Summary of Benefit-Cost Analysis of Critical Habitat Designation ............... 7-11
S E C T I O N 8 Expected Net Benefit to the Nation ......................................... 8-1
S E C T I O N 9 Area Exclusions Based upon Economic Impacts - A Section 4(b)(2) Preparatory Assessment of Cook Inlet Beluga Whale Critical Habitat Designation ............................ 9-1
9.1 Section 4(b)(2) Requirements ............................................................................ 9-1 9.1.1 The Statutory Language and Consideration of Potential Impacts of
Designation............................................................................................ 9-1 9.1.2 Key Legal Interpretations ...................................................................... 9-3

TABLE OF CONTENTS
NATIONAL MARINE FISHERIES SERVICE v
9.2 Synthesis: Impacts of Including Each of the Two Proposed Areas in the Critical Habitat Designation for the Cook Inlet Beluga Whale .......................... 9-4 9.2.1 Exclusions under Section 4(b)(2) .......................................................... 9-4 9.2.2 Areas Ineligible for Designation Under 4(a)(3)(B)(i) ............................ 9-6
S E C T I O N 1 0 Potential Impacts on Small Entities - A Regulatory Flexibility Act Analysis of Cook Inlet Beluga Whale Critical Habitat Designation ................................................................ 10-1
10.1 Contents of FRFA ............................................................................................. 10-2 10.1.1 Definition of a Small Entity ................................................................. 10-2 10.1.2 Reason for Considering the Action ...................................................... 10-4 10.1.3 Objectives of, and Legal Basis for, the Action .................................... 10-4 10.1.4 Significant Issues Raised by Public Comments ................................... 10-4 10.1.5 Description of Any Small Entities Directly Regulated Under the
Action .................................................................................................. 10-5 10.1.6 Reporting, Record-Keeping, and Other Compliance Requirements .... 10-7 10.1.7 Description of Steps Taken to Minimize Small Entity Impacts
Consistent with ESA ............................................................................ 10-9 10.1.8 Summary and Response to Public Comments Received on the IRFA10-10
10.2 Statements of Energy Effects .......................................................................... 10-10 10.2.1 Oil Supply and Natural Gas Production............................................. 10-11 10.2.2 Coal Production ................................................................................. 10-11 10.2.3 Electricity Production ........................................................................ 10-11
S E C T I O N 1 1 List of Preparers ..................................................................... 11-1
11.1 Agency Personnel ............................................................................................. 11-1 11.2 Final RIR/4(b)(2) Preparatory Assessment/FRFA Consultants ........................ 11-1
S E C T I O N 1 2 References .............................................................................. 12-1
Personal Communications .............................................................................. 12-15
Appendices Appendix A Nonuse Values of Critical Habitat for Cook Inlet Beluga Whale Appendix B Environmental Justice Impacts of Cook Inlet Beluga Whale Critical Habitat Designation
Tables Table 4-1 Example Range of Attributable Costs per Consultation (by Administrative Type in 2009
dollars) ................................................................................................................................... 4-3 Table 6-1 Population and Population Growth ........................................................................................ 6-3 Table 6-2 Population Projections (2000-2025) ...................................................................................... 6-3 Table 6-3 Income, Poverty Rates, and Unemployment Rates ................................................................ 6-4 Table 6-4 Historic Median Household Incomes (in 2009 dollars) ......................................................... 6-4 Table 6-5 Population by Ethnic and Racial Groups (2005-2007 Estimate) ........................................... 6-5 Table 6-6 Population and Population Growth in Communities with Significant AIAN Populations .... 6-6 Table 6-7 Income, Poverty Rates, and Unemployment Rates in Communities with Significant
AIAN Populations .................................................................................................................. 6-7

FINAL RIR/4(B)(2)/FRFA OF CRITICAL HABITAT DESIGNATION OF COOK INLET BELUGA WHALE AUGUST 11, 2010
vi NATIONAL MARINE FISHERIES SERVICE
Table 6-8 Population by Ethnic and Racial Groups (2000) in Communities with Significant AIAN Populations ............................................................................................................................. 6-8
Table 6-9 2006 County Business Patterns for Municipality of Anchorage and Non-Employer Statistics ............................................................................................................................... 6-13
Table 6-10 2006 County Business Patterns for Matanuska-Susitna Borough and Non-Employer Statistics ............................................................................................................................... 6-14
Table 6-11 2006 County Business Patterns for Kenai Peninsula Borough and Non-Employer Statistics ............................................................................................................................... 6-15
Table 6-12 Cook Inlet Oil Production and Projections ........................................................................... 6-23 Table 6-13 2006 Cook Inlet Oil and Gas Reserves ................................................................................. 6-24 Table 6-14 Cook Inlet Natural Gas Production and Projections ............................................................. 6-26 Table 6-15 Cook Inlet beluga whale Habitat Type/Area and Restrictions ............................................. 6-27 Table 6-16 Chuitna Coal Project Permit Application: Alaska Surface Coal Mining Control and
Reclamation Act Permits/Project Components .................................................................... 6-34 Table 6-17 Alaska Statewide Transportation Improvement Program (STIP) Projects near Cook Inlet . 6-39 Table 6-18 303(d) Impaired Water Bodies ............................................................................................. 6-56 Table 6-19 Category 4a and 4b Water Bodies ........................................................................................ 6-59 Table 6-20 Permits fished and annual commercial harvest of fish in Cook Inlet by Species and
Residency ............................................................................................................................. 6-72 Table 6-21 Upper Cook Inlet Catch Value by Species ........................................................................... 6-73 Table 6-22 Economic Significance of Commercial Salmon Fishing in Upper Cook Inlet ..................... 6-75 Table 6-23 Cook Inlet Herring Harvest 2003 to 2007 ............................................................................ 6-77 Table 6-24 Cook Inlet Commercial Razor Clam Harvest 2003 to 2007 ................................................. 6-77 Table 6-25 Cook Inlet Pacific Halibut Commercial Harvest Inlet 2002 to 2006 (IPHC statistical area
261 of Area 3A) .................................................................................................................... 6-78 Table 6-26 Subsistence Salmon Fishing from State Subsistence Program – 1998 – 2006 ..................... 6-83 Table 6-27 Angler Days in Saltwater and Freshwater by Cook Inlet Area ............................................ 6-87 Table 6-28 Economic Activities within Proposed Cook Inlet beluga whale Critical Habitat and
Vicinity ............................................................................................................................... 6-102 Table 7-1 Total Costs of Critical Habitat Designation, in $2009 (rounded to the nearest $1,000) ...... 7-12 Table 10-1 Small Business Size Standards matched to North American Industry Classification
System .................................................................................................................................. 10-3 Table 10-2 Description of Entities Potentially Affected by the CHD .................................................... 10-5 Table 10-3 Consultation Costs Related to Small Entities Potentially Affected by the CHD ................. 10-8 Table B-1 May 2008 Occupational Employment and Wage Estimates for the Anchorage MSA1 ............ 3 Table B-2 May 2008 Occupational Employment and Wage Estimates for Railbelt/Southwest Alaska
Nonmetropolitan Area1 ............................................................................................................. 4 Table B-3 2006 County Business Patterns and Non-Employer Statistics for NAICS Code 1141,
“Fishing” ................................................................................................................................... 6
Figures Figure 2-1 Cook Inlet Beluga Whale Critical Habitat Areas ................................................................... 2-3 Figure 3-1 Identifying Incremental Effects of Critical Habitat Designation ............................................ 3-7 Figure 3-2 Hypothetical Avoided Habitat Quality Deterioration due to Critical Habitat Designation .... 3-8 Figure 5-1 Benefits of Critical Habitat Designation ................................................................................ 5-3 Figure 6-1 Alaska Native Corporations and Villages in the Vicinity of Cook Inlet .............................. 6-10 Figure 6-2 Oil and Gas Operations within Cook Inlet and Vicinity ...................................................... 6-22 Figure 6-3 Mining Operations and Power Utilities in Cook Inlet and Vicinity ..................................... 6-30 Figure 6-3a Chuitna Coal Mine Project ................................................................................................... 6-31 Figure 6-4 Transportation and Port Expansion Projects within Cook Inlet and Vicinity ...................... 6-41
TABLE OF CONTENTS
NATIONAL MARINE FISHERIES SERVICE vii
Figure 6-5 Other Large-Scale Projects within Cook Inlet and Vicinity ................................................ 6-52 Figure 6-6 Locations of Selected Permitted Discharges in Cook Inlet and Rivers Feeding Cook Inlet 6-63 Figure 6-7 Commercial Fisheries Statistical Areas within Cook Inlet and Vicinity ............................. 6-74 Figure 6-8 Average Saltwater Angler Days by Location (2005-2007) within Cook Inlet .................... 6-88 Figure 6-9 Cook Inlet Saltwater Angler Days by Location from 2005 - 2007 ...................................... 6-89 Figure 6-10 Location of Military Bases in Upper Cook Inlet and Vicinity ............................................. 6-91
Abbreviations & Acronyms A ACMP Alaska Coastal Management Plan ACS Alaska Communications Systems ACWA Alaska Clean Water Actions ADEC Alaska Department of Environmental Conservation ADF&G Alaska Department of Fish and Game AHRS Alaska Heritage Resources Survey AIAN American Indian and Alaska Native AK Tidal Alaska Tidal Energy Company AMATS Anchorage Metropolitan Area Transportation Solutions ANC Ted Stevens Anchorage International Airport ANCSA Alaska Native Claims Settlement Act ANGDA Alaska Natural Gas Development Authority ANILCA Alaska National Interest Lands Conservation Act APPS Act to Prevent Pollution from Ships APU Alaska Pacific University AWWU Anchorage Water and Wastewater Utility
B B2F Beluga to Fairbanks BCA benefit-cost analysis Bcf billion cubic feet BLM Bureau of Land Management BOD5 Five day biochemical oxygen demand
C CERCLA Comprehensive Environmental Response, Compensation, and Liability Act CH critical habitat CHD critical habitat designation CITES Convention on International Trade in Endangered Species COD chemical oxygen demand CIRI Cook Inlet Region, Inc. CWA Clean Water Act
D DEC Alaska Department of Environmental Conservation DNR Alaska Department of Natural Resources
FINAL RIR/4(B)(2)/FRFA OF CRITICAL HABITAT DESIGNATION OF COOK INLET BELUGA WHALE AUGUST 11, 2010
viii NATIONAL MARINE FISHERIES SERVICE
DO&G Division of Oil and Gas DODI Department of Defense Instruction DOT&PF Alaska Department of Transportation and Public Facilities DOW Defenders of Wildlife DPLA Draft Pilot License Application DPS distinct population segment
E EA Environmental Assessment EAFB Elmendorf Air Force Base EEZ Exclusive Economic Zone EFH Essential Fish Habitat EIS Environmental Impact Statement EO executive order EO12866 Executive Order 12866 EPA Environmental Protection Agency ERFIA Eagle River Flats Impact Area ESA Endangered Species Act of 1973
F FAA Federal Aviation Administration FAR Friends of the Anchorage Coastal Wildlife Refuge FERC Federal Energy Regulatory Commission FHWA Federal Highway Administration Final listing 73 FR 62919 FONSI Finding of No Significant Impact FRFA Final Regulatory Flexibility Act FTA Federal Transit Administration
G GWh gigawatt hour
H HCP Habitat Conservation Plan
I ICRC Integrated Concepts and Research Coporation IHA Incidental Harrassment Authorization INRMP Integrated Natural Resource Management Plan IRFA Initial Regulatory Felxibility Act ITS incidental take statement
K KABATA Knik Amr Bridge and Toll Authority KPL Kenai Pipeline Company
L LCI Lower Cook Inlet

TABLE OF CONTENTS
NATIONAL MARINE FISHERIES SERVICE ix
LMU Land Management Unit LNG liquid natural gas LOA Letter of Authorization
M MARAD Maritime Administration mgd million gallons per day MHHW mean higher high water MLLW mean lower low water MMBO million barrels of oil MMcf/d million cubic feet per day MMPA Marine Mammal Protection Act of 1972 MOC Marathon Oil Company MP mile post MPOs metropolitan planning areas MPPRCA Marine Plastic Pollution Research and Control Act MSB RASP Matanusk-Susitna Borough Regional Aviation System Plan MS4 municipal separate storm sewer system
N NAICS North American Classification System NEPA National Environmental Policy Act NEV net economic value NMFS National Marine Fisheries Service NOAA Naitonal Oceanic and Atmospheric Administration NOI Notice of Intent NPDES National Pollutant Discharge Elimination System NPFMC North Pacific Fishery Management Council NPS National Park Service
O OCGENTM Cook Inlet Tidal Energy Project OHMP Office of Habitat Management and Planning OMB U.S. Office of Management and Budget OPI other Pacific Islander ORPC Ocean Renewable Power Company OSM Office of Surface Mining
P PCEs primary constituent elements POA Port of Anchorage PSC Prohibited Species Catch
R RASP Regional Aviation System Plan RFA Regulatory Flexibility Act
FINAL RIR/4(B)(2)/FRFA OF CRITICAL HABITAT DESIGNATION OF COOK INLET BELUGA WHALE AUGUST 11, 2010
x NATIONAL MARINE FISHERIES SERVICE
RIR Regulatory Impact Review ROD Record of Decision RPA reasonable and prudent alternatives RPMs reasonable and prudent measures
S SAFETEA-LU Safe, Accountable, Flexible, Effective Transportation Equity Act: A Legacy for Users Secretary Secretary of Commerce SEIS Supplementary Environmental Impact Statement SHARC Subsistence Halibut Registration Certificate SIC U.S. Standard Classification System SMCRA Surface Mining Control and Reclamation Act SPCC Spill Prevention, Control, and Countermeasure STIP Statewide Transportation Improvement Program
T TAH total aromatic hydrocarbons Tcf trillion cubic feet TEV total economic value TGU turbine-generator unit TIPs Transportation Improvement Programs TISEC Tidal Instream Energy Conversion TMDL Total Maximum Daily Load TSS total suspended solids
U UCI Upper Cook Inlet ULSD ultra low sulfur diesel UOCC Union Oil Company of California USACE U.S. Army Corps of Engineers USCG U.S. Coast Guard USDOT U.S. Department of Transportation USFWS U.S. Fish and Wildlife Service
W WMS Watershed Management Services WQS Water Quality Standards WTP willingness-to-pay WWTF Wastewater Treatment Facilities
Y Yd yard yd3 cubic yard

NATIONAL MARINE FISHERIES SERVICE 1-1
S E C T I O N 1 Purpose and Need
The action being addressed in this Final Regulatory Impact Review (Final RIR)/Section 4(b)(2) Preparatory Assessment/Final Regulatory Flexibility Act Analysis (FRFA) (hereinafter together, “Final RIR/4(b)(2) Preparatory Assessment/FRFA”) is the designation of critical habitat in waters of Cook Inlet, Alaska for the population of Delphinapterus leucas (hereinafter, “Cook Inlet beluga whale” or “species”), under authority of the Endangered Species Act of 1973 (ESA). The purpose of this Final RIR/4(b)(2) Preparatory Assessment/FRFA is to evaluate the economic, socioeconomic, and other costs and benefits of designating critical habitat for the Cook Inlet beluga whale (hereinafter, “CHD”), and assist the Secretary of Commerce (Secretary) in determining whether the benefits of excluding any particular area from the designation outweigh the benefits of including that area in the designation.1 This information allows the National Marine Fisheries Service (NMFS) to address the requirements of Executive Orders 12866 and 13211, and the Regulatory Flexibility Act (RFA), as amended by the Small Business Regulatory Enforcement Fairness Act.2
1.1 BACKGROUND AND OBJECTIVES
The population of Cook Inlet beluga whales has rapidly declined from an estimated stock of 1,300 animals in 1979. Abundance surveys, conducted between 1994 and 2008, have revealed the population estimates to range from a high of 653 animals in 1994 to a low of 278 animals in 2005; the most recent survey (from 2008) estimates the population at 375 animals. Aerial surveys document a 47 percent decline in the species population during the period between 1994 and 1998. Since 1999, the Cook Inlet beluga whale population has continued to decline at a rate of 1.5 percent per year. NMFS designated the Cook Inlet beluga whale stock as “depleted” under the Marine Mammal Protection Act of 1972 (MMPA) on May 31, 2000.3 Following this designation, on October 4, 2000, NMFS proposed regulations to limit the subsistence harvest and use of Cook Inlet beluga whales.4
A status review of the species, conducted in November 2006, predicted a 68-percent probability of the continued decline of the Cook Inlet beluga whales and their extinction in the next 300 years (26-percent probability of extinction in the next 100 years). A proposed rule to list the Cook Inlet beluga whale as an “endangered species” under the ESA was published by NMFS on April 20, 2007.5 An updated status review, released by NMFS in October 2008, upheld the conclusions of the 2006 status review and predicted a 70-percent probability of the continued decline of the Cook Inlet beluga whales and their extinction in the next 300 years (26-percent probability of extinction in the next 100 years) based on the model considered “most realistic” by NMFS.6 NMFS, which on April 22, 20087 had postponed the ESA determination decision until
1 16 U.S.C. §1533(B)(2) 2 Executive Order 12866, Regulatory Planning and Review, September 30, 1993; Executive Order 13211, Actions Concerning Regulations that
Significantly Affect Energy Supply, Distribution, or Use, May 18, 2001; 5.U.S.C. §601 et seq; and Pub Law No. 104-121. 3 65 FR 34590. 4 65 FR 59164. 5 72 FR 19854. 6 National Marine Fisheries Service, Alaska Fisheries Science Center, October 2008, “2008 Supplemental Status Review and Extinction
Assessment of Cook Inlet Belugas (Delphinapterus leucas).” 7 73 FR 21578.
FINAL RIR/4(B)(2)/FRFA OF CRITICAL HABITAT DESIGNATION OF COOK INLET BELUGA WHALE AUGUST 11, 2010
1-2 NATIONAL MARINE FISHERIES SERVICE
October 2008, published a final rule on October 22, 2008 (effective December 22, 2008) listing the Cook Inlet beluga whale as “endangered” (hereinafter, “final listing”).8
In the final listing, NMFS proposed to designate the critical habitat (CH) for the Cook Inlet beluga whale in a future listing, due to a lack of necessary data and information available at that time with which to “identify and describe PCEs (Primary Constituent Elements) of the habitat of the [Cook Inlet beluga whale], as well as the economic consequences of designating critical habitat.” The statutory timelines indicated that the final rule designating CH should be published within one year of the final listing, i.e. by October 22, 2009. To compile the necessary information for the process, as well as to identify and estimate economic effects of such a rule-making, NMFS has identified the objectives of this study as follows:
1. To identify, compile, characterize, and synthesize economic data, capital investment, regional impacts, and associated information as related to development activities in and around Cook Inlet, Alaska that have or may reasonably be assumed to have a Federal nexus to the Cook Inlet beluga whale critical habitat designation; and
2. To apply the information compiled through the first objective, to prepare a Final RIR/4(b)(2) Preparatory Assessment/FRFA of the proposed Cook Inlet beluga whale CHD and any alternative Cook Inlet beluga whale critical habitat designation(s).
1.2 STATUTORY AUTHORITY
Under the ESA, NMFS is responsible for designating CH for the endangered Cook Inlet beluga whale. Section 3 of the ESA defines critical habitat as:
(i) the specific areas within the geographical area occupied by the species, at the time it is listed, on which are found the physical and biological features (I) essential to the conservation of the species and (II) which may require special management considerations or protection: and (ii) specific areas outside the geographical area occupied by the species at the time it is listed that are determined by the Secretary to be essential for the conservation of the species.9
Section 3 of the ESA also defines the terms “conserve,” “conserving,” and “conservation” to mean “to use, and the use of, all methods and procedures which are necessary to bring any endangered species or threatened species to the point at which the measures provided pursuant to this chapter are no longer necessary.”10
Section 4 of the ESA requires that, before designating critical habitat, NMFS must consider the economic impacts, impacts on national security, and other relevant impacts of designating any particular area as critical habitat. Section 4 also provides that the Secretary may exclude any particular area from critical habitat if the benefits of exclusion outweigh the benefits of inclusion, unless excluding an area from critical habitat will result in the extinction of the species concerned.
8 73 FR 62919. 9 Endangered Species Act of 1973, Section 3(5)(A) (as amended by P.L. 94–325, June 30, 1976; P.L. 94–359, July 12, 1976; P.L. 95–212,
December 19, 1977; P.L. 95–632, November 10, 1978; P.L. 96–159, December 28, 1979; 97–304, October 13, 1982; P.L. 98–327, June 25, 1984; and P.L. 100–478, October 7, 1988; P.L. 100–653, November 14, 1988; and P.L. 100–707, November 23, 1988).
10 Endangered Species Act of 1973, Section 3(3) (as amended by P.L. 94–325, June 30, 1976; P.L. 94–359, July 12, 1976; P.L. 95–212, December 19, 1977; P.L. 95–632, November 10, 1978; P.L. 96–159, December 28, 1979; 97–304, October 13, 1982; P.L. 98–327, June 25, 1984; and P.L. 100–478, October 7, 1988; P.L. 100–653, November 14, 1988; and P.L. 100–707, November 23, 1988).
SECTION 1 PURPOSE AND NEED
NATIONAL MARINE FISHERIES SERVICE 1-3
1.3 REGULATORY REQUIREMENTS
As discussed previously, this document contains the Final RIR analysis, required under Executive Order 12866 (EO12866); Section 4(b)(2) Preparatory Assessment, required under ESA; and the FRFA, required by the RFA. The following summarize the requirements of each of the three components of this document.
1.3.1 Requirements of Regulatory Impact Review
The following statement from EO12866 summarizes the requirements of an RIR:
In deciding whether and how to regulate, agencies should assess all costs and benefits of available regulatory alternatives, including the alternative of not regulating. Costs and benefits shall be understood to include both quantifiable measures (to the fullest extent that these can be usefully estimated) and qualitative measures of costs and benefits that are difficult to quantify, but nevertheless essential to consider. Further, in choosing among alternative regulatory approaches, agencies should select those approaches that maximize net benefits (including potential economic, environment, public health and safety, and other advantages; distributive impacts; and equity), unless a statute requires another regulatory approach.11
EO12866 requires that the Office of Management and Budget (OMB) review proposed regulatory programs that are considered to be “significant.” A significant regulatory action is one that is likely to:
1. Have an annual effect on the economy of $100 million or more or adversely affect in a material way the economy, a sector of the economy, productivity, competition, jobs, the environment, public health or safety, or state, local, or tribal governments or communities.
2. Create a serious inconsistency or otherwise interfere with an action taken or planned by another agency.
3. Materially alter the budgetary impact of entitlements, grants, user fees, or loan programs or the rights and obligations of recipients thereof.
4. Raise novel legal or policy issues arising out of legal mandates, the President’s priorities, or the principles set forth in this EO.
The following are the minimum requirements for an RIR document:
1. A complete quantitative description (to the extent practicable) of the problem being addressed;
2. A clear description of the management objectives;
3. A comprehensive description of each alternative (including the No Action alternative);
4. A thorough description of the expected effects (both positive and negative) of each alternative, on each potentially impacted group; and
5. A qualitative analysis of the benefits and costs of each alterative, with a summary of the net National benefit (possibly negative). When adequate data are available, expected benefits and costs should be quantified to the fullest extent that these can be usefully estimated. [Emphasis added]
11 Executive Order 12866, Regulatory Planning and Review, Section 1(a), September 30, 1993.
FINAL RIR/4(B)(2)/FRFA OF CRITICAL HABITAT DESIGNATION OF COOK INLET BELUGA WHALE AUGUST 11, 2010
1-4 NATIONAL MARINE FISHERIES SERVICE
1.3.2 Requirements of Section 4(b)(2) of the ESA
Specific areas that satisfy the definition of critical habitat are not automatically designated as critical habitat. Section 4(b)(2)12 of the ESA requires NMFS to consider the economic impact, impact on national security, and any other relevant impact, of specifying any particular area as critical habitat. Section 4(b)(2) also provides NMFS, on behalf of the Secretary, with discretion to exclude any particular area from a designation, but only if the benefits of excluding that area outweigh the benefits of including it in the designation, and exclusion will not result in extinction of the species. Section 4(b)(2) of the ESA states:
The Secretary shall designate critical habitat, and make revisions thereto, under subsection (a)(3) of this section on the basis of the best scientific data available and after taking into consideration the economic impact, impact on national security, and any other relevant impact, of specifying any particular area as critical habitat. The Secretary may exclude any area from critical habitat if he determines that the benefits of such exclusion outweigh the benefits of specifying such area as part of the critical habitat, unless he determines, based on the best scientific and commercial data available, that the failure to designate such area as critical habitat will result in the extinction of the species concerned.13
A Section 4(b)(2) analysis consists of two components:
1. An initial mandatory requirement that the agency consider certain impacts of critical habitat designation; and
2. A discretionary component, wherein the agency, informed by those considerations, may propose excluding particular areas from the designation.
The ESA’s legislative history explains the broad latitude afforded NMFS in its consideration of impacts:
Economics and any other relevant impact shall be considered by the Secretary in setting the limits of critical habitat for such a species. The Secretary is not required to give economics or any other “relevant impact” predominant consideration in his specification of critical habitat…..The consideration and weight given to any particular impact is completely within the Secretary’s discretion.14,15
To this end, NMFS undertakes the following steps to implement Section 4(b)(2):
1. Identify particular areas for possible exclusion from critical habitat designation;
2. Determine the benefit of designation (e.g., biological, economic, or other benefits) of each particular area;
3. Determine the benefit of exclusion of each particular area;
4. Determine whether the benefits of exclusion outweigh the benefits of designation; and
5. Determine whether the exclusions (if any) will result in extinction of the species. 12 16 U.S.C. 1533(b)(1)(A) 13 16 U.S.C. §1533(b)(2) 14 H.R. Rep. No. 95-1625, at 16-17 (1978), 1978 U.S.C.A.N. 9453, 9466-67. 15 The provisions requiring consideration of impacts were originally discussed as applicable only to critical habitat designations for invertebrate
species. However, section 4(b)(2) as enacted is not limited to invertebrates, and NMFS and FWS have applied the provision to designations for vertebrate and invertebrate species.
SECTION 1 PURPOSE AND NEED
NATIONAL MARINE FISHERIES SERVICE 1-5
The Secretary may then choose to exclude from a designation of critical habitat a particular area that otherwise meets the definition of critical habitat, on a determination that the benefits of exclusion outweigh the benefits of including the area(s), and that the exclusion will not result in the species’ extinction. This step is discretionary with respect to exclusion (i.e., does not require exclusion, in any circumstance).
1.3.3 Final Regulatory Flexibility Act Analysis Requirements
The purpose of the RFA is to inform the agency, as well as the public, of the expected economic impacts of a proposed action, to ensure that the agency considers alternatives that minimize expected significant adverse economic impacts of the rule on substantial numbers of small entities, while meeting the goals and objectives of the final action. As such, the RFA does not contain decision criteria, per se. Major goals of the RFA are as follows:
1. To increase agency awareness and understanding of the impact of their regulations on small business;
2. To require that agencies communicate and explain their findings to the public; and
3. To encourage agencies to use flexibility and to provide regulatory relief to small entities.
The RFA emphasizes predicting impacts on small entities as a group, distinct from other entities, and on the consideration of alternatives that may minimize adverse economic impacts, while still achieving the stated objective of the action. Under 5 U.S.C., Section 603(b) and (c) of the RFA, each FRFA is required to contain the following elements:
1. A description of the reasons why action by the agency is being considered;
2. A succinct statement of the objectives of, and legal basis for, the final rule;
3. A description of and, where feasible, an estimate of the number of small entities to which the final rule will apply;
4. A description of the projected reporting, recordkeeping, and other compliance requirements of the final rule;
5. A description of the steps the agency has taken to minimize the significant economic impact on small entities consistent with the stated objectives of applicable statutes; and
6. A summary and response to public comments received on the Initial Regulatory Flexibility Analysis (IRFA).
1.4 STRUCTURE OF THE REPORT
The remainder of this report is organized as follows:
• Section 2: Proposed Action
• Section 3: Methodology and Framework for Analysis
• Section 4: Types of Economic Costs of Critical Habitat Designation
• Section 5: Identifying Benefits
• Section 6: Contextual Information
FINAL RIR/4(B)(2)/FRFA OF CRITICAL HABITAT DESIGNATION OF COOK INLET BELUGA WHALE AUGUST 11, 2010
1-6 NATIONAL MARINE FISHERIES SERVICE
• Section 7: Costs and Benefits of Cook Inlet beluga whale Critical Habitat Designation
• Section 8: Expected Net Benefit to the Nation
• Section 9: Area Exclusions Based upon Economic Impacts – A Section 4(b)(2) Preparatory Assessment of Cook Inlet beluga whale Critical Habitat Designation
• Section 10: Potential Impacts on Small Entities – A Regulatory Flexibility Act Analysis of Cook Inlet beluga whale Critical Habitat Designation
• Section 11: List of Preparers
• Section 12: References
In addition, the report includes two appendices: Appendix A presents an examination of both the theoretical and empirical underpinnings of Nonuse Valuation, with specific reference to Critical Habitat for Cook Inlet beluga whale, and Appendix B provides the Environmental Justice Impacts of Cook Inlet beluga whale Critical Habitat Designation.
NATIONAL MARINE FISHERIES SERVICE 2-1
S E C T I O N 2 Proposed Action
This section introduces the proposed CHD for Cook Inlet beluga whale and outlines the alternatives. It then presents the threats to the species. Finally, the Primary Constituent Elements for the species are identified.
2.1 PROPOSED CRITICAL HABITAT DESIGNATION
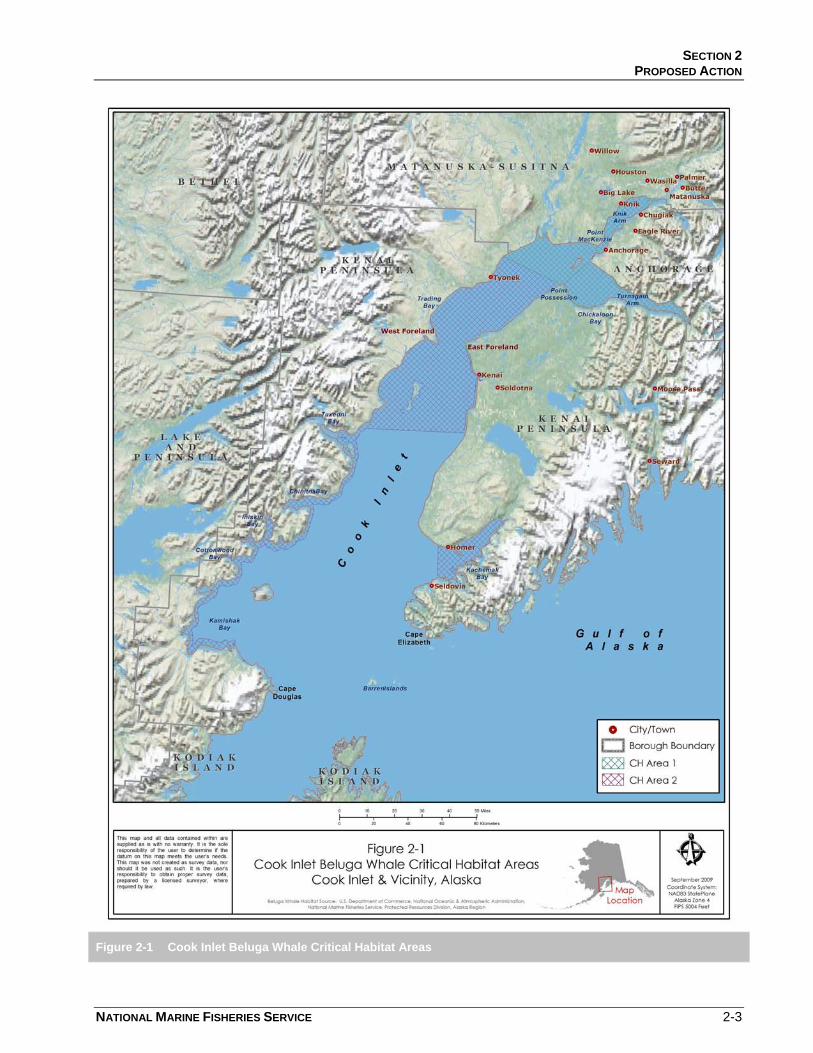
NMFS has proposed to designate as CH for Cook Inlet beluga whale two areas within the described range of the Cook Inlet beluga whale. Figure 2-1 shows the locations of both of these areas. Both the areas are within Cook Inlet, and are surrounded by two Alaska boroughs, Matanuska-Susitna and Kenai Peninsula, and by one consolidated city-borough, the Municipality of Anchorage.
2.1.1 Area 1 CH
Area 1 of the Cook Inlet beluga whale proposed CHD (Area 1 CH or Area 1) encompasses all marine waters of Cook Inlet north of a line connecting Point Possession (61.04N, 150.37W) and the mouth of Threemile Creek (61.08.55N, 151.04.40W), including waters of the Susitna River, Little Susitna River, and Chikaloon River below MHHW. This area provides important habitat during ice-free months, and is intensively used by Cook Inlet beluga whales between April and November. The area contains shallow tidal flats, river mouths, estuarine areas, and nearshore zones, important as Cook Inlet beluga whale foraging and calving habitats. The glacial fjords of Turnagain Arm and Knik Arm provide escape terrain from Orca whales, the only natural predator of the Cook Inlet beluga whale. Area 1 also has the highest concentrations of Cook Inlet beluga whales from spring through fall, as well as the greatest potential for adverse impacts from anthropogenic activities.
Many rivers in Area 1 have large eulachon and salmon runs, both significant food sources for Cook Inlet beluga whales. The Cook Inlet beluga whales visit Turnagain Arm in early spring, traveling to 20-Mile River and Placer Creeks, indicating the importance of eulachon runs for Cook Inlet beluga whale feeding. The Cook Inlet beluga whales’ use of upper Turnagain Arm decreases in the early summer, and then increases again, beginning in August and extending through the fall, coinciding with the area’s coho salmon runs. Intensive summer feeding by Cook Inlet beluga whales occurs in the Susitna delta area, Knik Arm, and Turnagain Arm.
Surveys by NMFS demonstrate intensive use of the Susitna delta area (from the Little Susitna River to Beluga River) and Chickaloon Bay (Turnagain Arm), with frequent large scale movements between the Susitna delta area, Knik Arm, and Turnagain Arm. The Chickaloon Bay area also appears to be used by Cook Inlet beluga whales throughout the year. The Cook Inlet beluga whales are particularly vulnerable to impacts in Area 1, due to their intensive use of relatively small areas (such as a stream mouth) and the biological importance of the area. Activities that restrict or deter access to Area 1 sites could reduce the species calving success, impair their ability to secure prey, and increase their susceptibility to predation by Orca whales. Projects that reduce anadromous fish runs could also negatively impact the foraging success of Cook Inlet beluga whales
FINAL RIR/4(B)(2)/FRFA OF CRITICAL HABITAT DESIGNATION OF COOK INLET BELUGA WHALE AUGUST 11, 2010
2-2 NATIONAL MARINE FISHERIES SERVICE
during this time. Furthermore, the tendency for the species to occur in high concentrations in Area 1 predisposes the Cook Inlet beluga whales to harm from such events as oil spills (a take issue).
The proposed CHD in Area 1 is bounded by the Mean Higher High Water (MHHW) datum, and includes tidally influenced reaches of the Beluga River, Susitna River, Little Susitna River, and Chikaloon Rivers.
2.1.2 Area 2 CH
Area 2 of the Cook Inlet beluga whale proposed CHD (Area 2 CH or Area 2) includes areas of known fall and winter Cook Inlet beluga whale use. This area encompasses all marine waters of Cook Inlet south of a line connecting Point Possession (61.04N, 150.37W) and the mouth of Threemile Creek (61.08.55N, 151.04.40W) and north of 60.25 north latitude, including waters within two nautical miles of MHHW along the western shoreline of Cook Inlet between 60.25 north latitude and the mouth of the Douglas River (59.01N, 153.75W); all waters of Kachemak Bay east of 40.00 west longitude; and waters of the Kenai River below the Warren Ames bridge at Kenai, Alaska.
Area 2 supports dispersed fall and winter feeding and transit areas, in waters where Cook Inlet beluga whales typically occur in smaller densities or deeper waters. It includes both near and offshore areas of Cook Inlet, north of a line connecting the village of Tyonek and Point Possession, and nearshore areas of the lower Cook Inlet. Area 2 includes fall feeding areas of Tuxedni, Chinitna, and Kamishak Bays on the west side, and a portion of Kachemak Bay on the east side of the Cook Inlet. Kachemak Bay has been included in Area 2, because Cook Inlet beluga whales commonly occur there; off the Homer Spit, in Mud Bay, and near the head of Kachemak Bay, at Fox River flats.
Dive behavior indicates Cook Inlet beluga whales make relatively deeper dives (e.g., to the bottom) and are at the surface less frequently in Area 2, and hence are less frequently observed. It is believed these deep dives are associated with feeding during the fall and winter months. The combination of deeper dives, consistent use of certain areas, and stomach content analyses indicate that Cook Inlet beluga whales are actively feeding in these areas. Pacific cod and saffron cod in this area constitute a significant part of the Cook Inlet beluga whale’s diet. Mid-Inlet winter habitat within Area 2 is important to the winter survival and recovery of the species.
2.2 DESCRIPTION OF ALTERNATIVES
The proposal to designate CH for the beluga whale in Cook Inlet, Alaska, is explained in detail in the preceding sections. The analysis of economic impacts of the proposed action contains two alternatives:
• Alternative 1. No action (status quo): NMFS would not designate CH in Cook Inlet, Alaska, for the Cook Inlet beluga whale. Conservation and recovery of the listed species would depend exclusively upon the protections provided under the “jeopardy” provisions of Section 7 of the ESA.
• Alternative 2. Designate Area 1 and Area 2: The areas proposed for CHD under this alternative are made up of Area 1 and Area 2, as described in Section 1.4. These two areas encompass all of upper-Cook Inlet, north of a line at 60˚ 25' north latitude, and portions of mid- and lower-Cook Inlet, extending south along the west side of the Cook Inlet, following the tidal flats into Kamishak Bay to Douglas Reef, between MHHW and waters within two nautical miles of shore. It further includes all waters of Kachemak Bay, eastward of 151˚ 30' west longitude and seaward of MHHW.
SECTION 2 PROPOSED ACTION
NATIONAL MARINE FISHERIES SERVICE 2-3
Figure 2-1 Cook Inlet Beluga Whale Critical Habitat Areas
FINAL RIR/4(B)(2)/FRFA OF CRITICAL HABITAT DESIGNATION OF COOK INLET BELUGA WHALE AUGUST 11, 2010
2-4 NATIONAL MARINE FISHERIES SERVICE
2.3 THREATS TO THE SPECIES AND ITS HABITAT
The final listing16 identifies the following activities that have the potential to pose conservation threats to the Cook Inlet beluga whale and its habitat:
• Development within and along upper Cook Inlet;
• Continued oil and gas exploration, development, and production;
• Industrial activities that discharge or accidentally spill pollutants (e.g., petroleum, seafood-processing waste, ship ballast, affluent from municipal wastewater treatment systems, and runoff from urban, mining, and agricultural areas);
• Tidal power development;
• Commercial, recreational, personal use, and subsistence fishing;
• Military activities;
• Indigenous peoples’ use;
• Recreation and tourism;
• Disease or predation;
• Inadequate existing regulatory mechanisms (at present, regulations cover the short-term subsistence harvest); and
• Stranding along mudflats in upper Cook Inlet, both individually and en masse.
The analysis examines most of the above activities to determine how they may be modified to mitigate, compensate for, or avoid threats to the Cook Inlet beluga whale and its habitat.
2.4 PRIMARY CONSTITUENT ELEMENTS
The following physical and biological features (in the context of CHD, described as Primary Constituent Elements or PCEs) have been initially identified by NMFS for the Cook Inlet beluga whale. These PCEs must occur within the area(s) to be designated as Cook Inlet beluga whale CH; they must require special management; and an action’s impact on these features will serve to determine destruction or adverse modification of CH. The six PCEs for the Cook Inlet beluga whale are as follows:
1. Intertidal and subtidal waters of Cook Inlet, with depths less than 30 feet at Mean Lower Low Water (MLLW) and within five miles of high and median flow anadromous fish streams. Such areas support important Cook Inlet beluga whale feeding habitat, because of their shallow depths and bottom structure, which act to concentrate prey and aid in the feeding efficiency of the Cook Inlet beluga whales. This physical/biological feature also provides important predator escape terrain and may be important for calving/nursery habitat, because of their predator protection, food availability, and thermal structure.
2. Primary prey species consisting of four species of Pacific salmon (Chinook, sockeye, chum, and coho), Pacific eulachon, Pacific cod, walleye pollock, saffron cod, and yellowfin sole. These biological features
16 73 FR 62919.
SECTION 2 PROPOSED ACTION
NATIONAL MARINE FISHERIES SERVICE 2-5
constitute the most important prey for Cook Inlet beluga whales, as identified through research, and as held by the traditional wisdom and knowledge of Alaska Native peoples, who have participated in the subsistence hunting of the species. Stomach analysis of Cook Inlet beluga whales has found that these fish species constitute the majority of consumed prey, by weight, during summer/ice free periods.
3. The absence of toxins or other agents of a type and/or amount harmful to Cook Inlet beluga whales. [It is not possible or practical to provide a comprehensive list of pollutants or substances known to be harmful, nor harmful concentration levels of such agents.]
4. Unrestricted passage between habitats.
5. Absence of in-water noise at levels resulting in abandonment of habitat. Empirical data exist on the reaction of Cook Inlet beluga whales to in-water noise (harassment and injury thresholds), but are lacking regarding levels that might elicit more subtle reactions, such as avoiding or abandoning certain areas.
6. Predator escape terrain within Knik Arm and Turnagain Arm. This feature may be due to the depth, currents, or turbidities of these waters.

NATIONAL MARINE FISHERIES SERVICE 3-1
S E C T I O N 3 Methodology and Framework for Analysis
This section describes the framework for the analysis. First, it describes the general framework for the analysis. It then describes, in economic terms, the general categories of economic effects that are the focus of regulatory impact analysis, including a discussion of both net benefit and distributional effects. Next, this section defines the baseline and incremental effects of the CHD. It concludes with a presentation of the time-frame for the analysis and information sources relied upon in the analysis.
3.1 GENERAL FRAMEWORK FOR THE ANALYSIS
A benefit-cost analysis (BCA) has been prepared to evaluate the alternatives under consideration in the designation of CH for the Cook Inlet beluga whale. This framework is preparatory to and supports the ESA’s Section 4(b)(2) decision-making process, by allowing NMFS, on behalf of the Secretary of Commerce, to compare an estimate of the “benefits of exclusion” of any particular area from the designation against an estimate of the “benefits of inclusion” of that particular area.17 In addition to having strong scientific support, this approach has support from the Whitehouse’s OMB, through its guidelines on regulatory analysis.18 A BCA is a well-established procedure for assessing the “best” course or scale of action, where “best” is that course which maximizes net benefits. Because an analysis of benefits and costs seeks to empirically measure the value of an activity in net benefit terms, it typically requires that a single metric, most commonly U.S. dollars, be used to gauge both benefits and costs. While all efforts are made to monetize the net benefits associated with the Cook Inlet beluga whale CHD, these benefits and costs are quantified and/or discussed qualitatively where sufficient data are not available. Executive Order 12866 explicitly provides for, and OMB guidance concurs in, use of a non-quantitative BCA that is consistent with economic theory and with the best available information when meaningful quantification is not possible.
3.2 CATEGORIES OF POTENTIAL ECONOMIC EFFECTS OF SPECIES CONSERVATION
This economic analysis considers the net benefit to the Nation, economic efficiency, and distributional effects that may result from efforts to protect the habitat determined to be “critical” to the conservation and recovery of the listed Cook Inlet beluga whale. Economic efficiency effects generally reflect “opportunity costs” associated with the commitment of resources required to accomplish, in this context, habitat conservation. For example, if the set of activities that may take place on a parcel of land in the vicinity of Cook Inlet is limited as a result of the CHD (or, for that matter, the presence of the species) in adjacent waters because that
17 NMFS, Northwest Fisheries Science Center, August 2005, “Final Economic Analysis of Critical Habitat Designation for 12 West Coast Salmon
and Steelhead ESUs.” Section 1.2.1 of this report is a reduced form discussion of the framework discussion provided in the West Coast salmon critical habitat analysis by the Northwest Fisheries Science Center.
18 OMB, “Circular A-4,” September 17, 2003.
FINAL RIR/4(B)(2)/FRFA OF CRITICAL HABITAT DESIGNATION OF COOK INLET BELUGA WHALE AUGUST 11, 2010
3-2 NATIONAL MARINE FISHERIES SERVICE
set of activities would be expected to destroy or adversely modify CH, and thus the market value of the land is reduced, this reduction in value represents one measure of opportunity cost or change in economic efficiency. The opportunity costs, attributable to the aforementioned limits, are in contrast to the welfare gains that accrue from not allowing unconstrained actions to destroy or adversely modify CH without considering alternatives and trade-offs. Similarly, the costs of a Federal action agency’s consultation with NMFS on actions that may destroy or adversely modify CH, under Section 7, represent opportunity costs of the designation. These consultation provisions were expressly established in law, recognizing their inherent costs, but were deemed of sufficient benefit to society’s interests (under ESA) to justify incurring this administrative commitment of resources. The BCA framework is intended to comprehensively identify and assess all such trade-offs.
This analysis also addresses the distribution of costs and benefits associated with the designation, including an assessment of any local or regional economic effects of habitat conservation, and the potential effects of conservation efforts on small entities and the energy industry. This information may be used by decision-makers to assess whether the costs and benefits of designation of CH for the Cook Inlet beluga whale inequitably burden or benefit a particular group or economic sector. For example, while conservation efforts may have a relatively small effect on the national economy, as whole, individuals employed in a particular sector of the regional or local economy may experience substantially greater economic effects. The differences between economic efficiency effects (i.e., consumers’ and producers’ surpluses), net benefits (i.e., net social welfare), and distributional effects (i.e., measures of change in economic activity), as well as their application in this analysis, are discussed in greater detail below.
3.2.1 Efficiency Effects
At the guidance of the OMB and in compliance with EO12866 “Regulatory Planning and Review,” Federal agencies measure changes in economic efficiency in order to understand how society, as a whole, will be affected by a regulatory action. Economic efficiency is typically measured against a “baseline” or status quo condition (i.e., the No Action alternative), with all attributable gains and losses compared for each alternative regulatory path. In the context of regulations that would designate CH for the Cook Inlet beluga whale, society seeks to accrue benefits from the conservation, recovery, and stewardship of this endangered species (reflected in the provisions of the ESA). At the same time, these welfare gains come at a cost to society. These costs reflect the opportunity cost of resources used or benefits foregone by society, as a result of the specific regulatory alternative considered. Economists generally characterize opportunity costs in terms of changes in producer and/or consumer surpluses in affected markets.19 Economic efficiency analyses seeks to measure, to the extent practicable, the relative trade-offs of each competing regulatory alternative (including the No Action alternative) to assure; 1) that a full accounting of all relevant costs and benefits is made, and 2) that the most economically efficient available alternative is identified.
It is, however, not always possible to measure each cost and each benefit in a common metric (e.g., U.S. dollars). When the regulatory action bears on welfare changes with both market and non-market characteristics, as is the case for endangered species management, conservation, and recovery efforts, markets (and, therefore, prices) do not exist for many important components of resource management. As will be demonstrated later in this analysis, the results of the analysis can be severely biased by excessive reliance on
19 For additional information on the definition of "surplus" and an explanation of consumer and producer surplus in the context of regulatory
analysis, see: Gramlich, Edward M., 1990, A Guide to Benefit-Cost Analysis (2nd Ed.), Prospect Heights, Illinois: Waveland Press, Inc.; and Environmental Protection Agency, 2000, Guidelines for Preparing Economic Analyses, EPA 240-R-00-003, September, available at http://yosemite.epa.gov/ee/epa/eed.nsf/webpages/Guidelines.html.

SECTION 3 METHODOLOGY AND FRAMEWORK FOR ANALYSIS
NATIONAL MARINE FISHERIES SERVICE 3-3
price signals from traditional markets and their interpretation in a BCA, especially within the context of environmental assets with complex and significant attributes not reflected in traditional market structures.
In some instances, compliance costs may provide a reasonable approximation of the economic burden associated with a regulatory action. For example, a Federal agency, such as the U.S. Army Corps of Engineers (USACE), may enter into a consultation with NMFS to ensure that a particular activity it plans to undertake, fund, or permit will not adversely modify CH. The effort required for the consultation (which, in practice, may be quite small), is an economic opportunity cost; because the manager's time and effort could have been spent on an alternative activity, had the area not been regulated as part of the CHD. However, this “burden” captures only one side of the equation. The investment of time and resources spent on consultation also “yields” social benefits, by assuring that inadvertent, unintentional, or inappropriate actions that destroy or adversely modify CH are not permitted, sanctioned, or undertaken by a Federal agency.
This analysis begins by measuring the costs and benefits associated with efforts undertaken to designate CH in Cook Inlet for the resident beluga whale. Compliance costs may, under certain limiting assumptions, provide a first approximation of the direct “cost” side of the change in economic efficiency. However, if the cost of conservation efforts is expected to significantly affect markets, the analysis will be expanded to consider potential changes in consumers’ and/or producers’ surpluses in affected markets.
3.2.2 Net Benefits
Having examined and assessed the size and scope of market-based effects of the CHD on economic efficiency, the analysis moves beyond this narrow characterization of “value,” to evaluate the comprehensive net benefits attributable to CHD. Net benefits are the benefits that remain after adjusting for the costs associated with CHD. As will become apparent, ESA CHD affects a complex suite of market and non-market, consumptive and non-consumptive, direct, indirect, and passive use values, inherent in conservation and recovery of endangered species and protection of associated CHs.
3.2.3 Distributional and Regional Economic Effects
Measurements of change in economic benefits and costs focus on the net welfare outcome attributable to a specific regulatory action, without consideration of how certain users, sectors, or other groups of people are affected. Thus, an analysis of net benefit effects, alone, may miss important distributional considerations. The OMB encourages Federal agencies to consider distributional effects, separately from benefits and costs.20 This analysis considers several types of distributional effects, including effects on small entities; effects on energy supply, distribution, and use; and regional economic effects. It is important to note that these measures are fundamentally different economic attributes from benefits and/or costs and, thus, cannot be added to or compared with estimates of net economic changes. Distributional effect estimators describe changes in “economic activity,” not economic benefits and costs.
20 U.S. Office of Management and Budget, 2003, "Circular A-4," http://www.whitehouse.gov/omb/circulars/a004/a-4.pdf, September 17.

FINAL RIR/4(B)(2)/FRFA OF CRITICAL HABITAT DESIGNATION OF COOK INLET BELUGA WHALE AUGUST 11, 2010
3-4 NATIONAL MARINE FISHERIES SERVICE
Effects on Small Entities and Energy Supply, Distribution, and Use
This analysis also considers how small entities, including small businesses, not-for-profit organizations, and governments, as defined by the RFA, might be affected by future species conservation efforts.21 In addition, in response to EO13211 “Actions Concerning Regulations that Significantly Affect Energy Supply, Distribution, or Use,” this analysis considers the future effects of CHD for the Cook Inlet beluga whale on the energy industry and its customers.22
Regional Economic Effects
Regional economic impact analysis can provide an assessment of the potential localized effects of CHD. Specifically, regional economic impact analysis produces a quantitative estimate of the potential magnitude of the initial change in regional economic “activity”, resulting from a regulatory action. Regional economic impacts are commonly measured using regional input/output models. These models rely on multipliers that represent the relationship between a change in one sector of the economy (e.g., expenditures by fishermen) and the effect of that change on economic output, income, or employment in other local sectors (e.g., suppliers of goods and services to fishermen). These economic data provide a numerical estimate of the magnitude of growth or contraction of jobs, income, and transactions in a specific local economy. These economic impacts reflect “activity” (i.e., they characterize “transfers” among local or regional components of the broader economy), not “net” changes in the economy, as a whole.
The use of regional input/output models in an analysis of the economic impacts of CHD can overstate the long-term effects of a regulatory change. Most importantly, these models provide a static view of the economy of a region or locality. That is, they attempt to measure the initial impact of a regulatory change on aspects of an economy, but do not consider long-term adjustments that the economy will make in response to this change. For example, these models provide estimates of the number of jobs lost in a given local or regional market, as a result of a regulatory change, but do not consider re-employment of these individuals over time or other adaptive responses by impacted businesses. In addition, the flow of goods and services across the regional boundaries defined in the model may change as a result of the regulation, compensating for a potential decrease in economic activity within the region.
Despite these and other limitations, in certain circumstances, the regional economic impact analysis may provide useful information about the scale and scope of localized changes in economic activity. It is important to remember that measures of regional economic activity generally reflect shifts in resource use, rather than net welfare losses or gains. Thus, these types of distributional impacts are reported separately from net benefit effects (i.e., not summed), and cannot be compared with estimates of net benefits.
3.3 BASELINE AND INCREMENTAL EFFECTS
This analysis examines the state of the world with and without the designation of CH for the Cook Inlet beluga whale. The "without CHD" scenario represents the baseline (i.e., the No Action alternative) for the analysis, considering habitat protections already extended to Cook Inlet beluga whales under its ESA Federal listing or under other Federal, State, and local regulations, including collateral protections resulting from
21 5 U.S.C. §§601 et seq. 22 Executive Order 13211, 2001,Actions Concerning Regulations that Significantly Affect Energy Supply, Distribution, or Use, May 18.
SECTION 3 METHODOLOGY AND FRAMEWORK FOR ANALYSIS
NATIONAL MARINE FISHERIES SERVICE 3-5
protection afforded other listed species, such as the Orca (killer) whale and Steller sea lion. The "with CHD" scenario attempts to describe the incremental effects associated specifically with and unique to the proposed CHD for the Cook Inlet beluga whale.23 This aspect of the analysis also provides an overview of costs and benefits that may be considered co-extensive with the listing of Cook Inlet beluga whales and other baseline protections. The focus of the analysis, however, is determining the increment of effects that can be uniquely attributed to CH, to the fullest extent practicable.
The first step in the economic analysis is to identify the baseline level of protection afforded the Cook Inlet beluga whales and their habitat (i.e., without CHD). This section provides a description of the methodology used to identify baseline conditions, against which incremental effects stemming from the proposed CHD for the Cook Inlet beluga whale (i.e., with CHD) will be contrasted. It also describes the incremental effects in more detail.
3.3.1 Baseline for the Analysis
The baseline for this analysis is the existing state of regulation that provides protection to the Cook Inlet beluga whales under the ESA, as well as under other Federal, state, and local laws and guidelines, without the CHD. The baseline includes the protections of Sections 7, 9, and 10 of the ESA, and economic effects resulting from these protections in the absence of CHD for the Cook Inlet beluga whales (i.e., the status quo or No Action alternative).
Absent a designation of CH, Section 7 of the ESA requires Federal agencies to consult with NMFS to ensure that any action authorized, funded, or carried out will not likely jeopardize the continued existence of any endangered or threatened species. The portion of the administrative costs of consultations under the jeopardy standard and the effects of any project modifications resulting from consideration of this standard are considered baseline effects.
Section 9 defines the actions that are prohibited by the ESA. In particular, it prohibits the “take” of endangered wildlife, where “take” means to “harass, harm, pursue, hunt, shoot, wound, kill, trap, capture, or collect, or to attempt to engage in any such conduct.”24 The economic effects associated with this section manifest themselves in Sections 7 and 10.
Under Section 10(a)(1)(B) of the ESA, an entity (e.g., a landowner or local government) may develop a Habitat Conservation Plan (HCP) for a listed animal species in order to meet the conditions for issuance of an incidental take permit in connection with the development and management of a property.25 The requirements posed by the HCP may have economic costs associated with the goal of ensuring that the effects of an incidental take are adequately avoided or minimized. The development and implementation of HCPs are considered a baseline protection for the species and habitat, unless the HCP is determined to be precipitated
23 We note that although the focus of this analysis is on the incremental effects of the rule, due to uncertainties with regard to future management
actions associated with Cook Inlet beluga whale critical habitat, it was difficult in some cases to exclude potential impacts that may already occur under the baseline. Thus, the analysis may include some costs which would have occurred under the baseline, regardless of this rule (i.e., co-extensive costs). An effort to explicitly identify the presence of co-extensive cost estimates and distinguish them from uniquely incremental CH costs, whenever possible, has been made herein.
24 16 U.S.C. 1532. 25 U.S. Fish and Wildlife Service, “Endangered Species and Habitat Conservation Planning,” http://endangered.fws.gov/hcp/, accessed November 8,
2007.

FINAL RIR/4(B)(2)/FRFA OF CRITICAL HABITAT DESIGNATION OF COOK INLET BELUGA WHALE AUGUST 11, 2010
3-6 NATIONAL MARINE FISHERIES SERVICE
by the designation of critical habitat, or CH designation influences stipulated conservation efforts under HCPs.
The protection of listed species and habitat is not limited to the ESA. Other Federal statues, as well as state and local laws, may also seek to protect the natural resources under their jurisdiction. If compliance with the Clean Water Act (CWA) or state environmental quality laws, for example, protects habitat for the species, such protective efforts are considered to be baseline protections and costs associated with these efforts are categorized accordingly. Many of the relevant existing regulations are discussed in Section 6.3.
3.3.2 Types of Economic Costs and Benefits of Critical Habitat Designation
This analysis separately monetizes, quantifies, or qualitatively assesses the “incremental” costs and benefits identified as deriving from this proposed CHD action, to the fullest extent practicable (a description of the types of benefits is provided later in Section 5). This incremental analysis is to determine the effects on human uses and activities uniquely attributable to the CHD that are above and beyond those effects due to existing or planned (required or voluntary) conservation efforts being conducted under other Federal, state, and local regulations or guidelines, including the ESA listing.
When critical habitat is designated, Section 7 requires Federal agencies to ensure that their actions will not result in the destruction or adverse modification of critical habitat (in addition to, and separate from, considering whether the actions are likely to jeopardize the continued existence of the species). The added administrative costs of including consideration of critical habitat in Section 7 consultations, and the additional costs of implementing project modifications, uniquely resulting from the protection of critical habitat, are the direct compliance costs of designating critical habitat. These costs are not in the baseline and are appropriately considered incremental costs of the CHD proposed action.
Figure 3-1 depicts the decision analysis regarding whether an effect should be considered incremental. The following sections describe this decision tree in detail.
Incremental costs may be the direct compliance costs associated with additional effort for forecast consultations, reinitiated consultations, new consultations occurring specifically because of the designation, and additional project modifications that would not otherwise have been required under the jeopardy standard. Additionally, incremental costs may accrue as a result of actions initiated in response to the potential designation of critical habitat (e.g., developing HCPs in an effort to avoid designation of critical habitat), triggering of additional requirements under state or local laws intended to protect sensitive habitat, and uncertainty and perceptional26 effects on markets. The nature of these costs is described in greater detail below.
26 While listed here under incremental costs, perceptional effects on the market need not be limited to adverse impacts. Generally, it is assumed that
property values for parcels adjacent to CH will fall upon designation, owing to perceived limits on use. However, it may be equally possible that proximity to designated CH may enhance the market value of a parcel (e.g., a home site abutting an estuary designated as CH may command a premium price, because CHD assures that no action with a Federal nexus will be allowed to destroy or adversely modify the estuary’s PCEs).
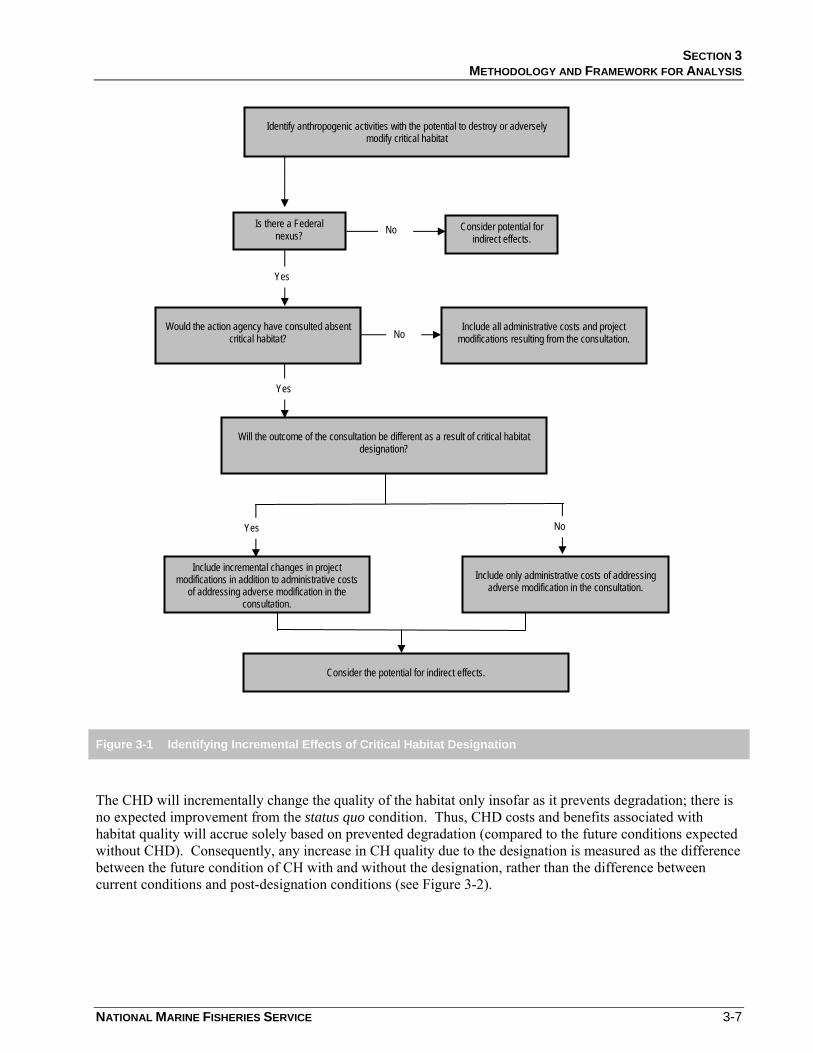
SECTION 3 METHODOLOGY AND FRAMEWORK FOR ANALYSIS
NATIONAL MARINE FISHERIES SERVICE 3-7
Figure 3-1 Identifying Incremental Effects of Critical Habitat Designation
The CHD will incrementally change the quality of the habitat only insofar as it prevents degradation; there is no expected improvement from the status quo condition. Thus, CHD costs and benefits associated with habitat quality will accrue solely based on prevented degradation (compared to the future conditions expected without CHD). Consequently, any increase in CH quality due to the designation is measured as the difference between the future condition of CH with and without the designation, rather than the difference between current conditions and post-designation conditions (see Figure 3-2).
Consider the potential for indirect effects.
Include incremental changes in project modifications in addition to administrative costs
of addressing adverse modification in the consultation.
Include only administrative costs of addressing adverse modification in the consultation.
Will the outcome of the consultation be different as a result of critical habitat designation?
Include all administrative costs and project modifications resulting from the consultation.
Would the action agency have consulted absent critical habitat?
Consider potential for indirect effects.
Is there a Federal nexus? No
Yes
No
Yes
Yes No
Identify anthropogenic activities with the potential to destroy or adversely modify critical habitat
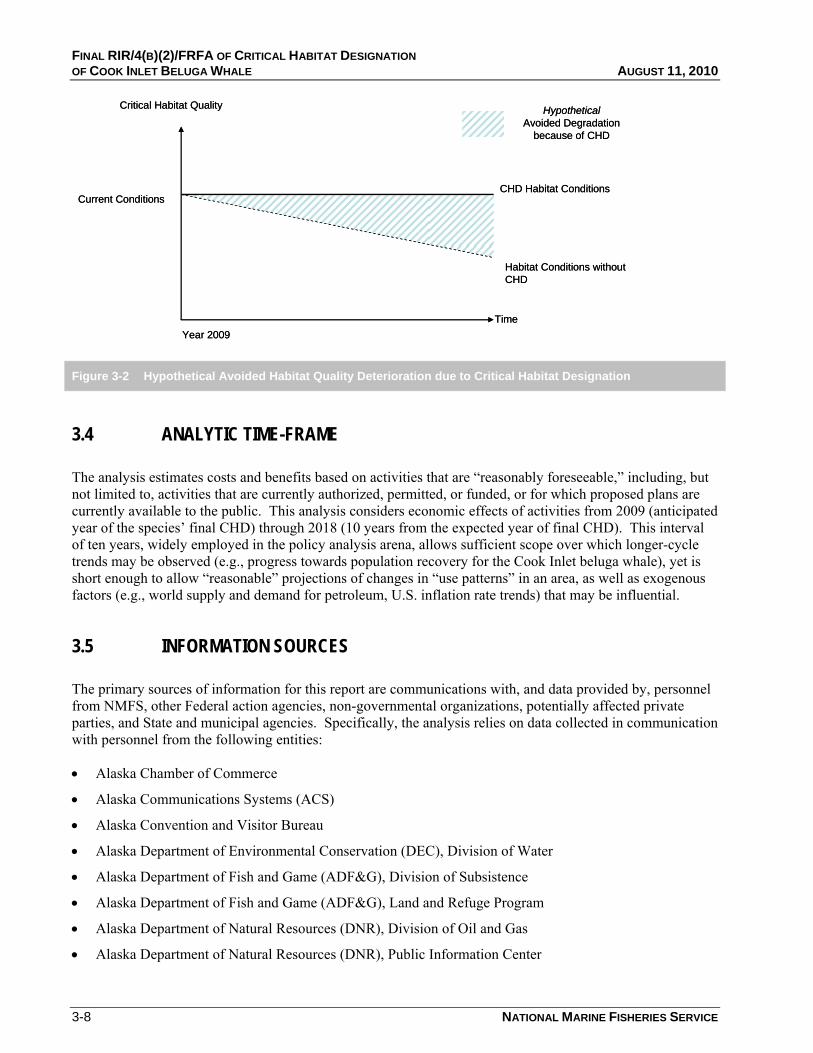
FINAL RIR/4(B)(2)/FRFA OF CRITICAL HABITAT DESIGNATION OF COOK INLET BELUGA WHALE AUGUST 11, 2010
3-8 NATIONAL MARINE FISHERIES SERVICE
Critical Habitat Quality
Current Conditions
Year 2009
CHD Habitat Conditions
Habitat Conditions without CHD
HypotheticalAvoided Degradation
because of CHD
Time
Critical Habitat Quality
Current Conditions
Year 2009
CHD Habitat Conditions
Habitat Conditions without CHD
HypotheticalAvoided Degradation
because of CHD
Time
Figure 3-2 Hypothetical Avoided Habitat Quality Deterioration due to Critical Habitat Designation
3.4 ANALYTIC TIME-FRAME
The analysis estimates costs and benefits based on activities that are “reasonably foreseeable,” including, but not limited to, activities that are currently authorized, permitted, or funded, or for which proposed plans are currently available to the public. This analysis considers economic effects of activities from 2009 (anticipated year of the species’ final CHD) through 2018 (10 years from the expected year of final CHD). This interval of ten years, widely employed in the policy analysis arena, allows sufficient scope over which longer-cycle trends may be observed (e.g., progress towards population recovery for the Cook Inlet beluga whale), yet is short enough to allow “reasonable” projections of changes in “use patterns” in an area, as well as exogenous factors (e.g., world supply and demand for petroleum, U.S. inflation rate trends) that may be influential.
3.5 INFORMATION SOURCES
The primary sources of information for this report are communications with, and data provided by, personnel from NMFS, other Federal action agencies, non-governmental organizations, potentially affected private parties, and State and municipal agencies. Specifically, the analysis relies on data collected in communication with personnel from the following entities:
• Alaska Chamber of Commerce
• Alaska Communications Systems (ACS)
• Alaska Convention and Visitor Bureau
• Alaska Department of Environmental Conservation (DEC), Division of Water
• Alaska Department of Fish and Game (ADF&G), Division of Subsistence
• Alaska Department of Fish and Game (ADF&G), Land and Refuge Program
• Alaska Department of Natural Resources (DNR), Division of Oil and Gas
• Alaska Department of Natural Resources (DNR), Public Information Center
SECTION 3 METHODOLOGY AND FRAMEWORK FOR ANALYSIS
NATIONAL MARINE FISHERIES SERVICE 3-9
• Alaska Department of Transportation and Public Facilities (DOT&PF)
• Alaska Wildland Adventures
• Anchorage Convention & Visitors Bureau
• Anchorage Water and Wastewater Utility (AWWU)
• Aurora Gas
• Chevron Technology Ventures
• Chugach Electric Association
• Escopeta Oil
• Explore Tours
• Henderson, Durham, and Richardson (HDR, Inc.)
• Homer Chamber of Commerce
• Knik Arm Bridge and Toll Authority (KABATA)
• Matanuska-Susitna Borough
• Michael D. Travis, Travis/Peterson Environmental Consulting, Inc. (consultant on the Knik-Willow Transmission Line)
• Municipality of Anchorage, Project Management & Engineering
• Municipality of Anchorage, Traffic Department
• Oceana Energy Company
• Ocean Renewable Power
• Ormat Technologies
• PacRim Coal LLP
• Port of Anchorage
• Renaissance Alaska, Ltd.
• State of Alaska (Alaska.gov)
• The Pebble Partnership
• Tom Mortensen Associates, LLC. (Upland Rock Quarry project)
• U.S. Army Corps of Engineers (USACE)
• U.S. Army, Fort Richardson, Natural Resources Branch
• U.S. Department of Commerce, National Oceanic and Atmospheric Administration (NOAA), NMFS, Alaska Region, Anchorage Field Office
• U.S. Environmental Protection Agency (EPA), Alaska Region 10
• U.S. Fish and Wildlife Service (USFWS), Kenai Wildlife Refuge
• U.S. Fish and Wildlife Service (USFWS), Marine Mammals Management
• U.S. Fish and Wildlife Service (USFWS), Subsistence Management Office
• U.S. Forest Service, Seward Ranger Station
FINAL RIR/4(B)(2)/FRFA OF CRITICAL HABITAT DESIGNATION OF COOK INLET BELUGA WHALE AUGUST 11, 2010
3-10 NATIONAL MARINE FISHERIES SERVICE
• U.S. National Oceanic and Atmospheric Administration Fisheries Service (NMFS)
• U.S. National Park Service (NPS), Lake Clark National Park
• URS Corporation
In addition, this analysis relies upon the MMPA consultation history of NMFS, as well as any ESA Section 7 consultation records, public comments, and published journal sources.

NATIONAL MARINE FISHERIES SERVICE 4-1
S E C T I O N 4 Types of Economic Costs of Critical Habitat Designation
This section presents the different types of economic costs that may stem from the CHD. These costs are categorized as direct and indirect costs.
4.1 DIRECT COSTS
The direct, incremental costs of critical habitat designation stem from the consideration, during Section 7 consultations, of the potential for destruction or adverse modification of critical habitat. The two categories of direct incremental costs of critical habitat designation are: 1) the administrative costs of conducting Section 7 consultation; and 2) implementation of any project modifications requested by NMFS through Section 7 consultations to avoid or minimize potential destruction or adverse modification of the critical habitat.
4.1.1 Administrative Section 7 Consultation Costs
Parties involved in Section 7 consultations for Cook Inlet beluga whales include NMFS,27 in its role as “consulting” agency, a Federal “action” agency (i.e., the Federal action, such as a permit or other authorization, provides the “Federal nexus” requiring consultation), and in some cases, a private (or non-Federal public) entity involved in the project or use activity. The Federal action agency serves as the liaison with NMFS. While consultations are required for activities that may adversely affect a listed species, regardless of whether critical habitat is designated, and involve a Federal nexus, the CHD may increase the cost and complexity of consultations, where the project or activity in question may adversely modify CH. Administrative expenditures associated with consultation may, therefore, result in both baseline and incremental costs.
For contextual purposes, Table 4-1 presents generalized per-event administrative costs of consultations. In general, three different scenarios associated with the designation of critical habitat may trigger incremental administrative consultation costs:
1. Additional effort to address adverse modification in a new consultation - New consultations taking place after critical habitat designation may require additional effort to address critical habitat issues, above and beyond the listing issues. In this case, only the additional administrative effort (i.e., expenditure of resources) required to address critical habitat is considered an incremental cost of the designation.
27 In cases where federal management actions governing fisheries are proposed that “may adversely modify” CH, NMFS may be both the “action”
agency and the “consulting” agency, although different Divisions within NMFS would perform these respective roles.
FINAL RIR/4(B)(2)/FRFA OF CRITICAL HABITAT DESIGNATION OF COOK INLET BELUGA WHALE AUGUST 11, 2010
4-2 NATIONAL MARINE FISHERIES SERVICE
2. Re-initiation of consultation to address adverse modification - Consultations that have already been completed on a project or activity may require re-initiation, specifically to address critical habitat considerations. In this case, the costs of re-initiating the consultation, including all associated administrative and project modification costs, are appropriately attributed to the designation.
3. Incremental consultation resulting entirely from critical habitat designation - Critical habitat designation may trigger consultations that would not have occurred, absent the designation (e.g., for an activity for which adverse modification may be an issue, while jeopardy is not). All associated administrative and project modification costs of incremental consultations are considered directly attributable to the designation.
The administrative costs of these consultations vary, depending on the specific details of the project. One way to address this variability is to show a range of possible costs of consultation. Table 4-1 provides estimated consultation costs representing effort required for all types of consultation, including those that consider both adverse modification and jeopardy. To estimate the fractions of the total administrative consultation costs that are baseline versus incremental, the following assumptions were applied:
• Costs associated with an incremental consultation (one occurring because of the designation of CH) would be attributed wholly to CHD;
• Incremental costs of a re-initiation of a consultation, because of the CHD, are assumed to be approximately half the cost of the original consultation that considered only jeopardy. This assumes that re-initiations are less time-consuming, as the groundwork for the project has already been considered in terms of its effect on the species;
• Efficiencies exist when considering both jeopardy and adverse modification at the same time (e.g., in staff time saved for project review, logistical expenses, data gathering and synthesis, and report writing) and, therefore, incremental administrative costs of considering adverse modification in consultations that will already be required to consider jeopardy, result in the smallest attributable incremental expenditure of these three consultation categories, roughly half that of a re-initiation.
• It is important to note that the estimated costs represent the mid-point of a potential range of costs to account for variability regarding levels of effort of specific consultations.
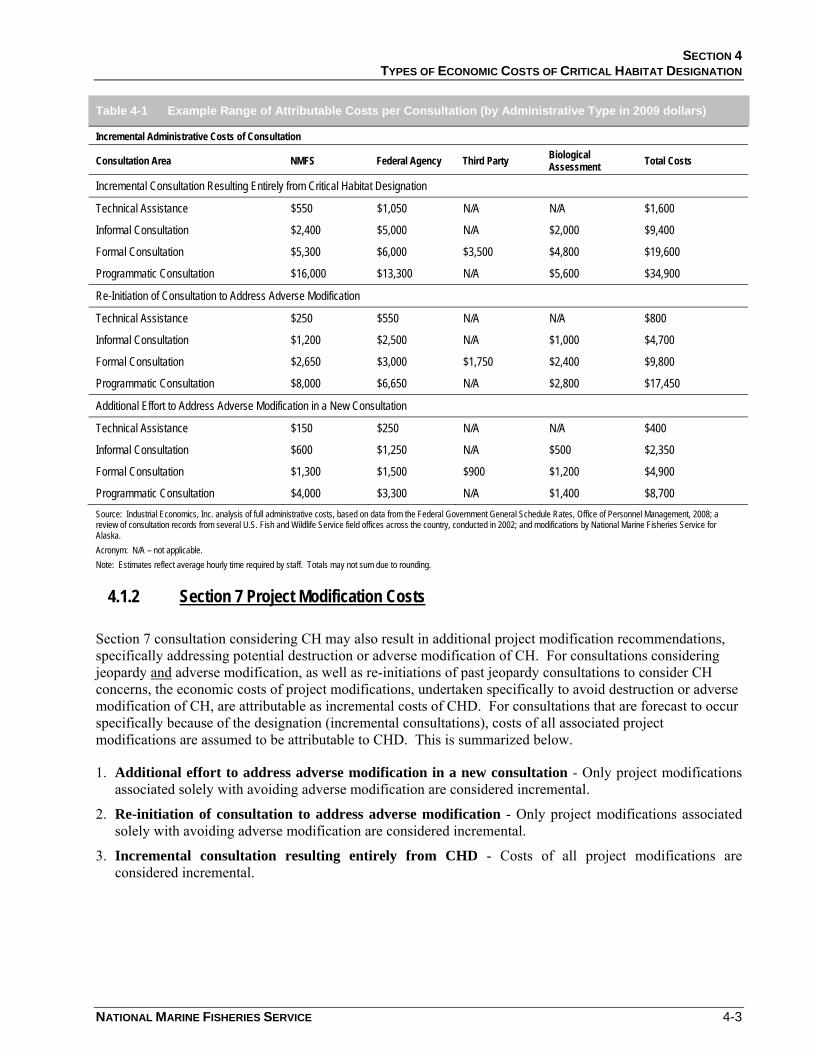
SECTION 4 TYPES OF ECONOMIC COSTS OF CRITICAL HABITAT DESIGNATION
NATIONAL MARINE FISHERIES SERVICE 4-3
Table 4-1 Example Range of Attributable Costs per Consultation (by Administrative Type in 2009 dollars)
Incremental Administrative Costs of Consultation
Consultation Area NMFS Federal Agency Third Party Biological Assessment Total Costs
Incremental Consultation Resulting Entirely from Critical Habitat Designation
Technical Assistance $550 $1,050 N/A N/A $1,600
Informal Consultation $2,400 $5,000 N/A $2,000 $9,400
Formal Consultation $5,300 $6,000 $3,500 $4,800 $19,600
Programmatic Consultation $16,000 $13,300 N/A $5,600 $34,900
Re-Initiation of Consultation to Address Adverse Modification
Technical Assistance $250 $550 N/A N/A $800
Informal Consultation $1,200 $2,500 N/A $1,000 $4,700
Formal Consultation $2,650 $3,000 $1,750 $2,400 $9,800
Programmatic Consultation $8,000 $6,650 N/A $2,800 $17,450
Additional Effort to Address Adverse Modification in a New Consultation
Technical Assistance $150 $250 N/A N/A $400
Informal Consultation $600 $1,250 N/A $500 $2,350
Formal Consultation $1,300 $1,500 $900 $1,200 $4,900
Programmatic Consultation $4,000 $3,300 N/A $1,400 $8,700 Source: Industrial Economics, Inc. analysis of full administrative costs, based on data from the Federal Government General Schedule Rates, Office of Personnel Management, 2008; a review of consultation records from several U.S. Fish and Wildlife Service field offices across the country, conducted in 2002; and modifications by National Marine Fisheries Service for Alaska. Acronym: N/A – not applicable. Note: Estimates reflect average hourly time required by staff. Totals may not sum due to rounding.
4.1.2 Section 7 Project Modification Costs
Section 7 consultation considering CH may also result in additional project modification recommendations, specifically addressing potential destruction or adverse modification of CH. For consultations considering jeopardy and adverse modification, as well as re-initiations of past jeopardy consultations to consider CH concerns, the economic costs of project modifications, undertaken specifically to avoid destruction or adverse modification of CH, are attributable as incremental costs of CHD. For consultations that are forecast to occur specifically because of the designation (incremental consultations), costs of all associated project modifications are assumed to be attributable to CHD. This is summarized below.
1. Additional effort to address adverse modification in a new consultation - Only project modifications associated solely with avoiding adverse modification are considered incremental.
2. Re-initiation of consultation to address adverse modification - Only project modifications associated solely with avoiding adverse modification are considered incremental.
3. Incremental consultation resulting entirely from CHD - Costs of all project modifications are considered incremental.
FINAL RIR/4(B)(2)/FRFA OF CRITICAL HABITAT DESIGNATION OF COOK INLET BELUGA WHALE AUGUST 11, 2010
4-4 NATIONAL MARINE FISHERIES SERVICE
4.2 INDIRECT COSTS
The designation of CH may, under certain circumstances, affect actions that do not have a Federal nexus and, thus, are not subject to the provisions of Section 7 under the ESA. Indirect costs are those changes in economic behavior that may occur outside of the ESA, through other Federal, state, or local actions that are motivated by the designation of CH. This section identifies common types of indirect costs that may be associated with the designation of CH. Importantly, these types of costs are not always considered incremental. In the case that these types of conservation efforts and economic effects are expected to occur regardless of CHD, they are appropriately considered baseline costs.
4.2.1 Other State and Local Laws (Trigger Effects)
Under certain circumstances, critical habitat designation may provide new information to a polity about the sensitive ecological nature of a geographic region, potentially triggering additional economic effects under state or local laws. In cases where these effects would not have been triggered in the absence of a critical habitat designation, they are appropriately considered indirect, incremental effects of the designation, for purposes of the RIR.28
4.2.2 Stigma Effects
In some cases, the public may perceive that critical habitat designation will result in limitations on private property uses, above and beyond those associated with anticipated project modifications and regulatory uncertainty described below. Public attitudes about the limits or restrictions that critical habitat designation may impose can be positive or negative, and can cause real economic effects to property owners, regardless of whether such limits are actually imposed. As the public becomes aware of the true regulatory burden imposed by critical habitat designation, the affect of the designation on property markets may equilibrate. To the extent that potential stigma effects on markets are probable and identifiable, these are considered indirect, incremental costs (and benefits)29 of the designation.
4.2.3 Time Delays
Both public and private entities may incur incremental delays associated with projects and other activities, due to requirements associated with the need to reinitiate the Section 7 consultation process and/or comply with other laws triggered by CHD. To the extent that delays result from the designation, they are appropriately attributable as incremental costs of the designation.
4.2.4 Regulatory Uncertainty
NMFS conducts Section 7 consultations on a case-by-case basis, and issues a biological opinion on formal consultations, based on species-specific and site-specific information. As a result, Federal government
28 Enhanced scientific information and understanding of sensitive ecological assets also yield benefits to society, facilitate sustainable management,
and reduce risks that uninformed actions will impose subsequent high mitigation costs, or result in irreparable damage. 29 Many forms of “use restrictions” result in enhanced property values for adjacent parcels. For example, the value of a property adjoining a
wilderness area, a National Park, or a scenic reservation will “benefit”, perhaps substantially, from such proximity.
SECTION 4 TYPES OF ECONOMIC COSTS OF CRITICAL HABITAT DESIGNATION
NATIONAL MARINE FISHERIES SERVICE 4-5
agencies, and private parties who seek permits or other authorization from those agencies, consult with NMFS under Section 7 and may face uncertainty concerning whether project modifications will be recommended by NMFS and, if so, what the nature of such modification recommendations may be. This uncertainty may diminish as consultations are completed and additional information becomes available on the effects of critical habitat designation on specific activities. Where information suggests that this type of regulatory uncertainty, stemming from CHD, may affect a project or allied economic behavior, associated costs are considered indirect, incremental results, attributable to the designation action.

NATIONAL MARINE FISHERIES SERVICE 5-1
S E C T I O N 5 Identifying Benefits
Under Executive Order 12866, OMB directs Federal agencies to provide an assessment of all costs and benefits of proposed regulatory actions (e.g., effects on health, safety, environment, economy, and well-being).30 This section focuses on the benefits of Cook Inlet beluga whale CHD. Benefits that may accrue due to the CHD include those related to recreation, aesthetics, environmental and political education, cultural and community identity, and subsistence use.
The close proximity of Cook Inlet beluga whale CH to Alaska’s largest population centers (Anchorage, Homer, Mat-Su Valley, and Kenai Peninsula), as well as Native Alaska communities, suggests potential for significant benefits to accrue to the local population and tourists. Furthermore, the fact that the CHD protects the habitat of a “charismatic megafauna” that people care about indicates that there are benefits to the wider United States population, as individuals throughout the nation are assured of the preservation of the Cook Inlet beluga whale’s natural habitat.31
In order to address benefits of the Cook Inlet beluga whale CHD, this section is divided into the following subsections. The first subsection provides a framework for understanding CHD benefits (i.e., the changes that may occur due to CHD) and the economic theory of how changes due to CHD can generate economic value. The next subsection describes in detail the different types of benefits that may accrue from CHD, while the third subsection provides a summary of the methods commonly used to estimate the value of such benefits. The values for these types of benefits from the peer-reviewed literature for Alaska and other areas of the United States are presented in the final subsection, followed by a brief summary. It is important to note that many of the values that are associated with CHD are non-market, meaning that they cannot be directly measured in the marketplace (as with typical economic goods and services that have a market price), but rather must be ascertained either indirectly through observing the behavior of people, or directly through simply asking people how much they value the resource.
5.1 FRAMEWORK FOR ESTIMATING BENEFITS
The primary driver for benefits from CHD is a potential change in the quality or condition of the CH that is an improvement over the expected condition of the habitat absent CHD. It is an incremental change in the condition of the CH, and not the entire resource, that is relevant to this evaluation (see Section 3 of this report for more information on the incremental approach). Furthermore, according to Section 3 of the ESA, the habitat is only designated as CH if it includes “those physical or biological features essential to the conservation of the species,” referred to as PCEs. In other words, the habitat in its current condition is suitable for the conservation and recovery of the species. Rather than improve the quality of the habitat or the PCEs, the CHD aims to sustain or preserve the quality of the habitat by preventing degradation. Along with the potential to sustain habitat quality above what it would otherwise be in the future, there is the potential
30 Executive Order 12866, 1993, Regulatory Planning and Review, September 30. 31 Reynolds, John E, Helene Marsh, and Timothy J. Regan, 2009, “Marine Mammal Conservation”, Endangered Species Research, 7: 23-28.
FINAL RIR/4(B)(2)/FRFA OF CRITICAL HABITAT DESIGNATION OF COOK INLET BELUGA WHALE AUGUST 11, 2010
5-2 NATIONAL MARINE FISHERIES SERVICE
that increased investment in public awareness, education, and scientific research associated with CHD will generate benefits.
In purpose and design, this analysis is focused on the benefits of CHD, but in practice, there is considerable overlap between the benefits of listing the Cook Inlet beluga whale and the benefits of CHD. Because the CHD is intended to support the goal of the listing, which is the conservation and recovery of Cook Inlet beluga whale population, there will be some co-extensive benefits as a result. That is, in certain scenarios, it is difficult to distinguish between benefits uniquely arising from CHD, and benefits arising in whole or in part from the listing. For example, if the designation of CH helps support an incremental increase in the number of Cook Inlet beluga whales, in situ, this will potentially benefit whale watchers, suppliers of whale watching excursions, and ancillary service suppliers (such as hotels, restaurants, marine fuel suppliers, etc.). However, this benefit arises from both the listing of the species and the designation of CH.
The benefits outlined above will generate economic benefits if they increase individual well-being, or “utility,” in the nation as compared with what would otherwise occur. In the following discussion, a brief conceptual overview is provided of how economists measure an increase in well-being from consumption of a good or service. This understanding is useful in that it explains; 1) how CHD might translate into a source of economic benefit or increased individual well-being, and 2) how this benefit could be empirically measured (i.e., quantified).
Economists measure the increase in well-being to consumers of a good or service as the difference between the price consumers pay for the good or service, and the benefit they derive from it (which is measured as the maximum price they would be willing to pay, and commonly referred to as willingness-to-pay or WTP). For example, if a tourist is willing to pay $100 for a fishing trip in Cook Inlet, but only has to pay $75, then the tourist has a net benefit, or increase in well-being, from the trip equal to $25. Assuming all other things equal, a change, or increase, in this well-being from the consumption of goods and services can thus occur either because the price falls, or because the quality of the good or service rises and results in increased value to (or WTP by) the consumer. In the case of the Cook Inlet beluga whale CHD, such improved well-being may arise if there is higher habitat quality in the future (than would otherwise occur in the absence of CHD). This may result in increased well-being (and WTP) if improved habitat quality increases the quality of goods and services provided by the habitat, such as fishing trips. If increased investment in public education and scientific knowledge occurs due to CHD, this too may cause increased well-being by causing personal preferences to change. If personal preferences change, such that public perception and enjoyment of CH or other environmental attributes increases for a given level of CH quality, CHD will also increase well-being and WTP for habitat services or environmental attributes even without changes in habitat quality.
5.2 OVERVIEW OF TYPES OF ECONOMIC BENEFITS
The benefits generated by a natural resource, such as Cook Inlet beluga whale CH, can be classified into several categories (see Figure 5-1). One important distinction is between use benefits that are generally associated with people’s present use of the CH resource, and nonuse (or passive use) benefits that do not require present use and, instead, are derived through simply the knowledge that the habitat exists and is protected. Within the use and nonuse benefit categories, there are further subcategories, which will be described below. Economists differ on the ways that these values are organized, in terms of use and nonuse classification, and sub-classifications. However, as the aim of this study is to account for all benefits, the specific categorical labels are less important than ensuring that all types of potential benefits accruing from CHD are identified and addressed.
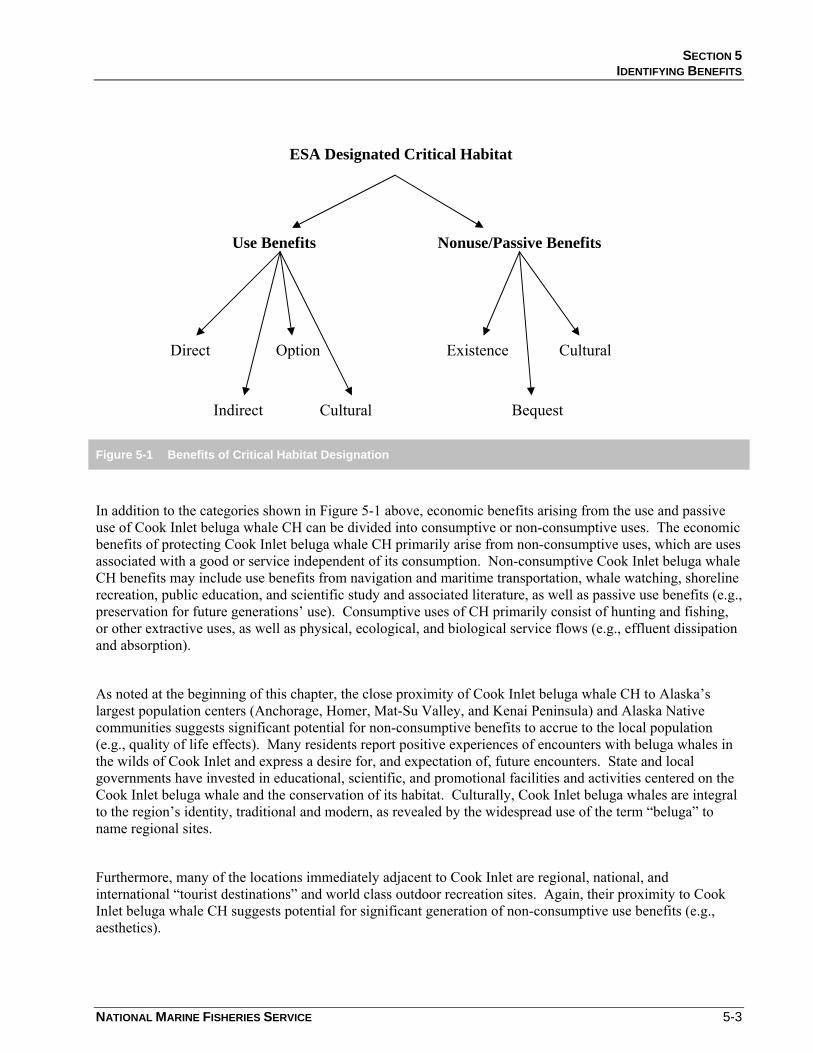
SECTION 5 IDENTIFYING BENEFITS
NATIONAL MARINE FISHERIES SERVICE 5-3
Figure 5-1 Benefits of Critical Habitat Designation
In addition to the categories shown in Figure 5-1 above, economic benefits arising from the use and passive use of Cook Inlet beluga whale CH can be divided into consumptive or non-consumptive uses. The economic benefits of protecting Cook Inlet beluga whale CH primarily arise from non-consumptive uses, which are uses associated with a good or service independent of its consumption. Non-consumptive Cook Inlet beluga whale CH benefits may include use benefits from navigation and maritime transportation, whale watching, shoreline recreation, public education, and scientific study and associated literature, as well as passive use benefits (e.g., preservation for future generations’ use). Consumptive uses of CH primarily consist of hunting and fishing, or other extractive uses, as well as physical, ecological, and biological service flows (e.g., effluent dissipation and absorption).
As noted at the beginning of this chapter, the close proximity of Cook Inlet beluga whale CH to Alaska’s largest population centers (Anchorage, Homer, Mat-Su Valley, and Kenai Peninsula) and Alaska Native communities suggests significant potential for non-consumptive benefits to accrue to the local population (e.g., quality of life effects). Many residents report positive experiences of encounters with beluga whales in the wilds of Cook Inlet and express a desire for, and expectation of, future encounters. State and local governments have invested in educational, scientific, and promotional facilities and activities centered on the Cook Inlet beluga whale and the conservation of its habitat. Culturally, Cook Inlet beluga whales are integral to the region’s identity, traditional and modern, as revealed by the widespread use of the term “beluga” to name regional sites.
Furthermore, many of the locations immediately adjacent to Cook Inlet are regional, national, and international “tourist destinations” and world class outdoor recreation sites. Again, their proximity to Cook Inlet beluga whale CH suggests potential for significant generation of non-consumptive use benefits (e.g., aesthetics).
Use Benefits Nonuse/Passive Benefits
Direct
Indirect
Option Existence
Bequest Cultural
Cultural
ESA Designated Critical Habitat

FINAL RIR/4(B)(2)/FRFA OF CRITICAL HABITAT DESIGNATION OF COOK INLET BELUGA WHALE AUGUST 11, 2010
5-4 NATIONAL MARINE FISHERIES SERVICE
5.2.1 Use Benefits
Use benefits of CH will be generated if the value of services derived from use of Cook Inlet beluga whale CH incrementally increases (above what it would be otherwise) due to the designation. The increase in marginal value associated with the change in use, due directly to the designation, makes up the use benefit portion of the total benefits of CHD. Use benefits are described below in four distinct (i.e., additive), but related, categories: direct, indirect, option, and cultural.
5.2.1.1 Direct Use Value
Direct use values include both consumptive and non-consumptive direct uses of the designated habitat. Any positive change in activities undertaken within the CH, compared to the no-designation condition, including changes in activity type, timing, or intensity, or any increase in the level of enjoyment of the current activities in the CH due to the designation, generates direct use benefits to society.
For example, compared to the “without CHD” conditions, the designation of CH could increase the value of the sport fishing experience in CH, as the Cook Inlet beluga whale CH overlaps substantially with popular recreational fishing locations. There are over 1.2 million recreational anglers fishing annually in the Cook Inlet and its tributaries.32 Prey fish for Cook Inlet beluga whales include popular sport fish target species, such as several species of Pacific salmon, eulachon, and groundfish. As PCEs for the Cook Inlet beluga whale, these species will be sustained as a necessary element of CH. If, compared to the no-CHD condition, the CHD enhances long-term stability and sustains healthy stocks of Cook Inlet beluga whale prey fish, then recreational anglers may experience an increased consumptive use value from fishing in and adjacent to Cook Inlet beluga whale CH.33
In addition to potential effects on fish stocks, CHD may also improve the non-consumptive value attributable to the aesthetic experience associated with fishing, as well as other related outdoor uses of adjacent areas, such as shorelines, view points, beaches, etc., within view of the CH. If the CHD preserves the aesthetic appeal of CH by decreasing adverse and objectionable anthropogenic changes, the CHD may increase personal well-being to those users who value one or more attributes (such as water quality, sighting of whales, and sighting of other wildlife) of the current state of areas to be designated as CH.
An example of a potential non-consumptive, direct34 use benefit of CHD is associated with increased value of wildlife viewing, including, but not limited to, whale watching. Cook Inlet beluga whale CH supports and sustains a myriad of other species, including other ESA-listed species. Many of these are highly valued as critical components of the aesthetic reward, cultural heritage, and non-pecuniary remuneration associated with
32 Alaska Department of Fish and Game, Sport Fish Division, Statewide Harvest Survey, Region II Southcentral Areas, downloaded on May 11,
2009 at http://www.sf.adfg.state.ak.us/statewide/participationandharvest/main/cfm. 33 Based on the purpose of CHD, sustaining prey stocks is intended to benefit the Cook Inlet beluga whale, and any increase in prey stock
population resulting from CHD may be entirely consumed by Cook Inlet beluga whales, creating no net gain or loss in direct benefits to subsistence, personal-use, or recreational fishermen in terms of retained fish. It is well established, however, that in the case of recreational fishing, many aspects of the experience contribute to the overall value attained, not simply the number of fish retained. Therefore, if CHD resulted in no net change in the number of retained sport caught fish, recreational anglers may still accrue increases in “value” from their experience. Presumably, this would be less the case for either subsistence or personal-use fishermen, who are, by-in-large, assumed to be fishing for “meat”.
34 Note that any increased value of wildlife viewing, including whale watching, could also be considered an indirect benefit of CHD, as the beluga is a resource that benefits directly from the critical habitat’s conservation. But, as noted above, this categorical distinction is less important than noting that this benefit exists.
SECTION 5 IDENTIFYING BENEFITS
NATIONAL MARINE FISHERIES SERVICE 5-5
living in Alaska, adjacent to Cook Inlet. The Cook Inlet beluga whale, itself, spends much of the spring and summer concentrated in the near-shore shallow waters adjacent to river mouths in upper Cook Inlet. If the CHD incrementally increases the Cook Inlet beluga whale population (compared to the without CHD condition), then people who value viewing the Cook Inlet beluga whales from either shoreline vantage points or from boats in the water, will experience increased well-being.
5.2.1.2 Indirect Use Value
Indirect use values are derived from the consumptive and/or non-consumptive indirect use of a natural resource. In this case, indirect use value is created from using a resource that is enhanced by an improvement (or an avoided deterioration) in the quality of the Cook Inlet beluga whale CH. For example, when beluga whale CH quality is sustained and preserved, nearby habitat, such as upland riparian zones and tidally-influenced segments of non-CHD streams, may benefit. An angler fishing in Cook Inlet or adjacent tributaries located outside of the CH may benefit from the maintenance of sport fish species spawning and rearing in CH (indirect consumptive use). Similarly, if the designation creates a more aesthetically appealing habitat in areas adjacent to CH, CHD could result in a more enjoyable boating or shoreline activity experience in these adjacent areas, and a higher value (or WTP) for these activities (indirect, non-consumptive use). Thus, in its use of habitat in the Cook Inlet area, society may benefit both directly from the sustained quality within CH itself, as well as indirectly from sustained quality in adjacent habitats.
Indirect use benefits also include scientific and educational gains attributable to the CHD. If CHD results in new and enhanced scientific understanding of the relationship between attributes of the CH and the Cook Inlet beluga whale, natural resource managers and scientists, as well as the population as a whole, benefit in a number of ways. CHD contributes to education, informing a wide range of individuals of the role habitat plays in maintenance of natural environmental service flows, the effects of human activity (both positive and negative) on those service flows, and ways in which human activity and natural functions interact. CHD may facilitate improved understanding of these interactions and tradeoffs at every level, from highly technical disciplines (e.g., microbiological analysis of demersal substrates), to K-12 classroom curricula, and to local civic decision-making.
5.2.1.3 Option Use Value
Option use values derive from the preservation of the option for future use of a resource. In the present context, the Cook Inlet beluga whale CHD will, it is anticipated, sustain the PCEs critical to the conservation and recovery of the Cook Inlet beluga whale. This action retains the option for individuals to use the preserved habitat in the future for any desired activities, based on prevailing conditions, needs, and preferences. Conceptually, option value reflects an individual’s WTP to avoid foreclosing future access to a resource or activity. Here, WTP reflects the current value to an individual of preserving the opportunity, at some unspecified point in the future, of using the designated CH. Some economists prefer to consider option value as simply another form of use value, because both current and future values should be considered and accounted for in all cases of value measurement. However, others consider this a unique classification, because it implies that people place distinct value on the “possibility” (i.e., option) of future use that is different from expected future use. This categorical distinction, while an interesting aside, has no immediate bearing on the evaluation of Cook Inlet beluga whale CHD.

FINAL RIR/4(B)(2)/FRFA OF CRITICAL HABITAT DESIGNATION OF COOK INLET BELUGA WHALE AUGUST 11, 2010
5-6 NATIONAL MARINE FISHERIES SERVICE
5.2.1.4 Cultural Use Value
Alaska Native groups have traditionally harvested the Cook Inlet beluga whale. Hunting of the species continues to be important for subsistence and cultural reasons in the Cook Inlet, with subsistence harvesting occurring as recently as 2006. Owing to the continued decline of the Cook Inlet beluga whale population, Alaska Native groups and the Federal Government have entered into joint management agreements that, in effect, have limited further hunting of the species until such time as the Cook Inlet beluga whale population can support controlled subsistence hunting.35
The CHD is intended to facilitate the conservation and recovery of the Cook Inlet beluga whale population. Achieving that objective would allow Alaska Native peoples to resume traditional subsistence Cook Inlet beluga whale hunting, yielding a culturally-based consumptive use benefit deriving from CHD protections. Beyond the direct association of the CHD and recovery and conservation of the Cook Inlet beluga whale population, Alaska Native peoples make subsistence and cultural use of other aspects of the CH. The protection and conservation of the CH and PCEs (in particular the prey species of Pacific salmon and eulachon) provided by the CHD may yield consumptive use benefits to Alaska Native people, who use these fish stocks and other CH resources for cultural, communal, and subsistence purposes.
Cultural values are different from other types of economic values, because they are specific to each group of people and, as such, do not readily lend themselves to monetary approximation. Economic monetization, in general, is typically based upon the premise that markets exist, or at least, can be approximated, within which trade can occur between two parties. This is not a valid assumption in the case of cultural values. Nevertheless, changes in individual well-being connected with enhanced cultural welfare of Alaska Native groups constitute real, potentially significant, economic benefits attributable to the proposed CHD.
5.2.2 Nonuse or Passive Use Benefits
Natural resources also have value to society independent of their use. Passive or nonuse values include, among others, existence, bequest, and cultural values. An increasing number of peer-reviewed, empirical studies have sought to estimate society’s value, or WTP, to protect rare species, unique habitats, or whole ecosystems. These nonuse or passive use values of habitat, as they may pertain to CHD, are identified and briefly discussed here. A more theoretically rigorous treatment of these concepts, and their application to, and potential implications for, Cook Inlet beluga whale CHD is presented in Appendix A.
Existence value is defined as individual utility or well-being derived from the knowledge of the existence of a natural resource, without the expectation of any form of use. For example, the mere knowledge of the existence of a relatively few California condors in the wild may elicit a large WTP (i.e., generate a large benefit) to assure the continued existence of that species in its natural ecological setting. This WTP, or benefit derived by an individual, may be substantial, even though the individual has no expectation of ever seeing the bird or visiting its habitat. The designation of CH for the listed Cook Inlet beluga whale could be expected to elicit a similar value.
35 Agreement between the National Marine Fisheries Service and the Cook Inlet Marine Mammal Council for the Co-Management of the Cook Inlet
Stock of Beluga Whale for the Years 2000, 2001, 2002, and 2006.
SECTION 5 IDENTIFYING BENEFITS
NATIONAL MARINE FISHERIES SERVICE 5-7
Passive use value to society of CHD reflects the increased well-being obtained from the knowledge that Cook Inlet beluga whales persist within their natural habitat in Cook Inlet. Society would not derive the same level of well-being (i.e., would not have an equivalent WTP) for a remnant population of Cook Inlet beluga whales being kept in an artificial environment, such as an aquarium tank at the Port of Anchorage. Thus, CH contributes directly (and very likely, significantly) to the nonuse benefit enjoyed by society due to the existence of the Cook Inlet beluga whale, in situ. As demonstrated in Appendix A, WTP for passive use welfare changes can be empirically estimated. Although no empirical estimation of these values for CHD has been completed to date, researchers at Alaska Fisheries Science Center at NMFS have initiated such a study that should be completed in several years.36
Passive use benefits are also generated by the preservation of natural resources, such as plant and animal species, habitat, and ecosystems, for future generations’ use. It has been empirically estimated that individuals derive utility from the knowledge that society preserves resources, so that they will be extant for the next generation, creating a bequest value. Again, economists disagree about whether bequest value is distinct from existence value, but, nonetheless, it represents an important conceptual element of passive use valuation. The potential change in the bequest value of habitat, following CHD, is one element of the total benefit society may derive from the CHD.
Increasingly, the cultural passive use value of the Cook Inlet beluga whale CH can be seen to extend beyond the traditions of Alaska Native peoples. Indeed, cultural passive use values are broadly reflected in the population at large, and include the passing down from generation to generation of life experiences and stories about the Cook Inlet beluga whale and their associated habitat attributes. Examples include books such as “Beluga Days” by Nancy Lord, the popular children’s song “Baby Beluga,” and a documentary film (in production by the Cousteau Society) on the Cook Inlet beluga whale and its status in the Cook Inlet’s ecological, social, economic, and cultural environs.
To some, the Cook Inlet beluga whale (and, by extension, Cook Inlet beluga whale CH) has become symbolic of the struggles of the modern world to preserve both financial prosperity and environmental integrity. The CHD for the Cook Inlet beluga whale may increase these passive use cultural and social values.
5.3 VALUATION METHODS
Economists typically rely on observed trades between willing buyers and willing sellers to identify the market-clearing price of a good or service. As described in the introduction to this section, environmental goods for which no market exists (non-market goods) are particularly challenging to value, because absent an observable market, no such “price” is revealed. The following excerpt from the more detailed discussion in Appendix A describes some of the techniques that have been developed to measure non-market values.
The value of non-market goods may be estimated using either revealed preference (RP) or stated preference (SP) valuation approaches. RP valuation methods use information on observed behavior to infer the value of the non-market good or service.37 As such, these methods require data on observable behavior to be linked to
36 The ongoing study is being conducted by Dr. Brian Garber-Yont and Dr. Dan Lew, Alaska Fisheries Science Center, National Marine Fisheries
Service, Alaska. 37 Bockstael, Nancy E., and Kenneth E. McConnell, 1983, “Welfare Measurement in the Household Production Function Framework,” American
Economic Review, 73(4): 806-814; and Boyle, Kevin J., 2003, “Introduction to Revealed Preference Methods,” in Patricia A. Champ, Kevin J. Boyle, and Thomas C. Brown (eds), A Primer on Nonmarket Valuation, Dordrecht, The Netherlands: Kluwer Academic Publishers.
FINAL RIR/4(B)(2)/FRFA OF CRITICAL HABITAT DESIGNATION OF COOK INLET BELUGA WHALE AUGUST 11, 2010
5-8 NATIONAL MARINE FISHERIES SERVICE
the non-market good in question.38 SP methods, on the other hand, involve asking individuals carefully worded hypothetical market questions to either directly or indirectly infer the value they place on a non-market good or service.39 Thus, the principal difference between RP and SP methods is the type of data used. Revealed preference methods use data on observed behavior to infer economic values, while stated preference methods use data on stated or intended behavior to infer economic values. Due to its reliance on observable behavior, revealed preference methods are generally not able to estimate nonuse values, which, by definition, are not tied directly to observable behavior.40 Thus, researchers generally utilize stated preference methods to estimate nonuse values.
The most commonly used and best known stated preference method is the contingent valuation method (CV), which in actuality is a class of methods. In CV, economic values for a non-market good or service are revealed through survey questions that set up hypothetical markets for a non-market good or service, and involve asking the respondent to indicate their WTP (or willingness-to-accept compensation) for (or to forgo) the good or service. In a typical CV survey, a public good is described, such as a program to protect one or more “Threatened or Endangered” species, or their CH, and respondents are asked questions to elicit their WTP for the public good through a payment vehicle, like taxes or contributions to a trust fund.41 42 (For a more detailed discussion of CV methods and valuation methods in general, see Appendix A.)
5.4 RELATED LITERATURE
Previous economic studies have estimated the economic value of the types of benefits that could accrue from CHD. A selection of these studies is reviewed below for each primary type of use value or activity associated with CHD, including wildlife viewing, whale watching, recreational fishing, subsistence activities, and education and volunteerism. An extensive body of literature related to passive use valuation is examined in Appendix A.
Using the Consumer Price Index, all values from the studies reviewed in this section were adjusted to 2009 dollars for comparison purposes.43 The literature and values cited in this section provide a general sense of the magnitude of the use benefit individuals and society derive from the attributes provided by resources such as Cook Inlet beluga whale CH. The benefits from these studies, however, are not directly associated with Cook Inlet beluga whale CHD, but instead demonstrate representative values. These cannot be directly 38 Included in the category of RP methods are travel cost methods (Parsons, 2003), hedonic methods (Taylor, 2003), and the avoidance expenditure
approach (Dickie, 2003). The appropriateness of each method depends upon how the non-market good enters individuals’ preferences, as discussed above and in Freeman (2003). In many of these methods, the economic value of the non-market good is measured through changes in the observable demand for a related good, such as a good that is consumed in conjunction with the non-market good (complement) or instead of the non-market good (substitute).
39 Mitchell, Robert C., and Richard T. Carson, 1989, Using Surveys to Value Public Goods: The Contingent Valuation Method, Washington, D.C.: Resources for the Future; and Carson, Richard T., Nicholas E. Flores, and Norman F. Meade. 2001, “Contingent Valuation: Controversies and Evidence,” Environmental and Resource Economics, 19: 173-210.
40 However, Larson (1992) has shown that under the assumption of what is termed Hicks-neutrality, the nonuse value is measurable from an analysis of market demand, though Flores (1996) has shown that the conditions for Hicks-neutrality to occur are unlikely to be met in practice. In addition, Carson, Flores, and Mitchell (1999) point out that any “technique capable of constructing the missing market for these types of goods is potentially capable of obtaining total-value estimates,” (page 109) and since total value is the sum of use and nonuse values, the TEV estimate would include nonuse value. Simulated markets where actual transactions occur (generally in experimental conditions) for the non-market good and actual referenda involving the non-market good are the other methods for estimating these values.
41 Cummings, R.G., D.S. Brookshire, and W.D. Schultz ed, 1986, Valuing Environmental Goods: An Assessment of the Contingent Valuation Method, Rowman & Allanheld Publishers; Mitchell, Robert C., and Richard T. Carson, 1989, “Using Surveys to Value Public Goods: The Contingent Valuation Method,” Washington, D.C.: Resources for the Future; Arrow, Kenneth, Robert Solow, Paul R. Portney, Edward E. Leamer, Roy Radner and Howard Schuman, 1993, “Report of the NOAA Panel on Contingent Valuation,” Federal Register, 58: 4601–4614.
42 While willingness-to-accept is sometimes the more relevant welfare measure, empirical and experimental evidence has pointed to the use of WTP welfare measures in stated preference surveys (e.g., Arrow, et al., [1993], Adamowicz, Bhardwaj, and McNab [1993], Mansfield [1999]).
43 CPI Inflation Calculator, Bureau of Labor Statistics, accessed at http://www.bls.gov/data/inflation_calculator.htm.

SECTION 5 IDENTIFYING BENEFITS
NATIONAL MARINE FISHERIES SERVICE 5-9
translated to CHD values, because it is not known with certainty how CHD will affect habitat quality (i.e., to what degree the CHD will reduce degradation, compared to the no-CHD condition), nor is it known with certainty the extent to which CHD will increase public education, awareness, or scientific research on the Cook Inlet beluga whale and its habitat. The values from these studies do, however, provide important context for understanding the possible magnitude of the use values that may result from CHD.
5.4.1 Recreation Benefits
The economic benefits of fishing and wildlife viewing have been studied extensively by economists, resulting in a wide range of values. In a 2001 study, Randall Rosenberger and John Loomis examined relevant literature to determine the value of outdoor recreation use in the United States.44 The final database includes 163 studies that provide over 750 benefit estimates of per day or per trip day recreation values. A trip day is defined as recreation occurring within a one-day period, and can last any length of time, from a half hour excursion to an all-day outing.
Included in the database are seven benefit estimates of wildlife viewing in Alaska, with an average value of $57.41 per trip day. The one study in the database of fishing in Alaska found a value of $53.46 per trip day. Through a technique called benefits transfer (see Appendix A), in which values from one study are applied in another context, values from the database were analyzed for the nation and for Alaska. Results showed that the national value of wildlife viewing was $39.40 per trip day, while Alaska wildlife viewing was valued slightly more at $39.61 per trip day. Again, using benefits transfer, the value to anglers of fishing in Alaska was estimated at $49.31 per trip day.
A 2005 study by John Loomis45 updates the Rosenberger and Loomis46 literature review through 2003, and provides over 1,200 benefit estimates in 30 outdoor recreation use categories. The updated database includes one additional study of wildlife viewing and three additional studies with values for fishing in Alaska. For fishing on pubic lands in Alaska, the study provides an average WTP value of $70.18 (with a WTP range of $51.62 and $92.77 per person per day), and an average WTP value of $55.85 per person per day for wildlife viewing in Alaska. Additional studies on the recreational value of fishing and wildlife viewing (measured in terms of WTP) are provided below.
5.4.2 Fishing
The economic benefits of fishing have been estimated in many studies, creating a wide range of values. In a 1995 study, Myrick Freeman examines previous literature to determine the value of Pacific salmon fishing in Alaska, British Columbia, Washington, Oregon, and California. The value of Pacific salmon fishing to anglers is estimated at $76.15 per trip in Deep Creek, Alaska,47 and $53.73 per trip in British Columbia, Canada.48
44 Rosenberger, Randall and John Loomis, 2001, “Benefit Transfer of Outdoor Recreation Use Values,” USDA forest Service General Technical
Report RMRS-GTR-72. 45 Loomis, John, 2005, “Updated Outdoor Recreation Use Values on National Forests and Other Public Lands,” USDA forest Service General
Technical Report PNW-GTR-658. 46 Rosenberger, Randall and John Loomis, 2001, “Benefit Transfer of Outdoor Recreation Use Values,” USDA forest Service General Technical
Report RMRS-GTR-72. 47 Wegge, T.C., R.T. Carson, and W.M. Hanemann, 1988, “Site Quality and the Demand for Sport fishing for Different Species in Alaska,” in
Proceedings of the Symposium Demand and Supply of Sport fishing, David S. Liao, ed., South Carolina Wildlife and Marine Service, Southwest
FINAL RIR/4(B)(2)/FRFA OF CRITICAL HABITAT DESIGNATION OF COOK INLET BELUGA WHALE AUGUST 11, 2010
5-10 NATIONAL MARINE FISHERIES SERVICE
A study by Mathew Berman, Sharman Haley, and Hongiin Kim49 examines the net benefits of reallocating 200,000 sockeye from commercial anglers to sport fishing anglers on the Kenai River in Alaska. The study estimates that less than one in four of these sockeye would be harvested by sport fishing anglers. At the time of the study, commercial salmon fisheries had a target of between 400,000 and 700,000 sockeye fish available to sport fishing anglers. The study relies on a 1993 telephone and mail survey of sport fishing households in south central Alaska. The results suggest that the increase of 200,000 sockeye for recreational fishing will increase benefits to angler households by $29, annually.
A paper by Charles Hamel, Mark Herrmann, Todd Lee, and Keith Criddle50 evaluates the economic benefits of halibut, coho, and Chinook sport fishing in Cook Inlet. The study is based on a 1997 mail survey of Alaska anglers. The survey was mailed to 4,000 randomly selected individuals who had Alaska sport fishing licenses in 1997.51 Of the 2,641 respondents, 352 had taken at least one sport fishing trip off the Kenai Peninsula for salmon or halibut in 1997. The study found an average (mean) annual benefit value of $108 for Alaska residents and $158 for non-residents. With a total of 197,556 angler days in 1997, the economic benefit of sport fishing in Cook Inlet was estimated to be $26 million, annually.
Anglers fishing along the Pacific coastline may also benefit from CHD, if fish stocks maintained and preserved due to CHD migrate and are caught outside the CHD area. Values for increased catch rates in this broader region are also substantial. For example, one study has estimated that an increase in salmon catch rate of one fish in British Columbia, Oregon, Washington, or California, yields an angler between $4.96 and $134.61 in economic benefits.52
5.4.3 Whale Watching / Wildlife Viewing and Sightseeing
The economic benefits from wildlife viewing, and particularly whale watching, can be substantial. For example, the benefit per person for whale watching in Alaska was estimated at $249 per trip, when whale
Region, as reported in Freeman III, A. Myrick, 1995, “The Benefits of Water Quality Improvements for Marine Recreation: A Review of the Empirical Evidence, Marine Resource Economics, Vol. 10, pp. 385-406.
48 Cameron, T.A., 1988, “A New Paradigm for Valuing Non-Market Goods Using Referendum Data: Maximum Likelihood Estimation by Censored Logistic Regression,” Journal of Environmental Economics and Management 15(3): 355-79. As reported in Freeman III, A. Myrick, 1995, “The Benefits of Water Quality Improvements for Marine Recreation: A Review of the Empirical Evidence, Marine Resource Economics, Vol. 10, pp. 385-406 and Pendleton, Linwood and Jamie Rookie, 2006 “Understanding the Potential Economic Impact of Marine Recreational Fishing: California,” Working Paper accessed at http://www.dfg.ca.gov/MLPA/pdfs/binder3di.pdf in July, 2099.
49 Berman, Matthew, Sharman Haley, and Hongjin Kim, 1997, “Estimating Net Benefits of Reallocation: Discrete Choice Models of Sport and Commercial Fishing,” Marine Resource Economics, Volume 12, p. 307-327.
50 As reported in three papers: Herrmann, M., S.T. Lee, C. Hamel, K.R. Criddle, H.T. Geier, J.A. Greenberg and C.E. Lewis, 2001, “An Economic Assessment of the Sport Fisheries for Halibut, Chinook and Coho Salmon in Lower and Central Cook Inlet,” Final Report, OCS Study MMS 2000-061, University of Alaska Coastal Marine Institute, University of Alaska Fairbanks and USDOI, MMS, Alaska OCS Region and Hamel et al., 2001, “An Economic Discussion of the Marine Sport Fisheries in Central and Lower Cook Inlet,” International Institute for Fisheries Economics and Trade, Corvallis, OR and Criddle et al., 2003, “Participation Decisions, Angler Welfare, and the Regional Economic Impact of Sport fishing,” Marine Resource Economics, Volume 18, pp. 291-312.
51 Herrmann, M., S.T. Lee, C. Hamel, K.R. Criddle, H.T. Geier, J.A. Greenberg and C.E. Lewis, 2001, “An Economic Assessment of the Sport Fisheries for Halibut, Chinook and Coho Salmon in Lower and Central Cook Inlet,” Final Report, OCS Study MMS 2000-061, University of Alaska Coastal Marine Institute, University of Alaska Fairbanks and USDOI, MMS, Alaska OCS Region.
52 Rowe, R.D., E.R. Morey, A.D. Ross, and W.D. Shaw, 1985, “Valuing Marine Recreation Fishing on the Pacific Coast,” Energy and Resource Consultants, Boulder CO.; and Cameron, T.A., and M.D. James, 1987, “Efficient Estimation Methods for ‘Close-Ended’ Contingent Valuation Surveys, Review of Economics and Statistics 69(2): 269-76; and Cameron, T.A., 1988, “A New Paradigm for Valuing Non-Market Goods Using Referendum Data: Maximum Likelihood Estimation by Censored Logistic Regression,” Journal of Environmental Economics and Management 15(3): 355-79; Loomis, J.D., 1988, “The Bioeconomic Effects of Timber Harvesting on Recreational and Commercial Salmon and Steel Head Fishing: A Case Study of the Siuslaw National Forest,” Marine Resource Economics 5:43-60. All as reported in Freeman III, A. Myrick, 1995, “The Benefits of Water Quality Improvements for Marine Recreation: A Review of the Empirical Evidence,” Marine Resource Economics, Vol. 10, pp. 385-406.
SECTION 5 IDENTIFYING BENEFITS
NATIONAL MARINE FISHERIES SERVICE 5-11
watching is the primary purpose of the trip, and $228 per trip, when it is the secondary purpose of the trip.53 In a 2006 review of whale watching studies, Linwood Pendleton presents a range of consumer surplus values between $35 and $46 per trip.54
Two studies by John Loomis, in 1994 and 2000,55 use the CV method to estimate the value of whale watching to California whale watchers. The studies were based on a 1991 to 1993 survey of whale watchers conducted at four locations along the California coast during times of the gray whale migration.56 Whale watching from shore was available at all four sites, while boat whale watching trips were common at two of the sites. It is important to note that at the time of the survey, gray whales had recently been removed from the ESA threatened species list. In the 1994 study, John Loomis and Douglas Larson examined whale watchers’ WTP for a 50 percent and 100 percent increase in the gray whale population, and a corresponding increase in sightings. The study finds the WTP for a 50 percent increase in gray whale sightings is $38, while a 100 percent increase in sightings elicits a WTP or benefit of $45.
A 2000 study by John Loomis, Shizuka Yorizane, and Douglas Larson57 estimated the consumer surplus associated with gray whale watching along the California coast, using the travel cost method. The study uses two estimation techniques, which provide the per person per day benefit values to whale watchers participating in several types of whale watching trips, including; (1) a whale watching trip to a single destination ($64 - $74), (2) single or multi-destination trip where whale watching is a main purpose of the trip ($77), and (3) a trip where whale watching is part of “a bundle of visits to related nearby sites” ($264). The higher values for multi-activity, multi-destination trips are consistent with the literature, since such trips are typically more valuable to participants due to the variety of experiences offered.
5.4.4 Subsistence Benefits
The economics of subsistence activities in Alaska have been studied with increasing intensity since the Exxon Valdez spill and resulting class action lawsuit by Alaska subsistence harvesters. Depending on the method of estimation, estimates of subsistence harvest range from $4 to $262 per pound. There are three methods applied for estimating the economic benefits of subsistence activities; 1) nutritional value, 2) replacement cost, and 3) non-market valuation.58 The replacement cost method was ultimately used to value Alaska Native subsistence losses in the case of the Exxon Valdez.59 It is important to note that replacement cost does
53 McCollum, D.W., and S.M. Miller, 1994, “Alaska Voters, Alaska Hunters, and Alaska Nonresident Hunters: Their Wildlife Related Trip
Characteristics and Economics,’ Anchorage: Alaska Department of Fish and Game, Division of Wildlife Conservation, as reported in Colt, Steve, 2001, “The Economic Importance of Healthy Alaska Ecosystems,” Institute of Social and Economic Research University of Alaska Anchorage, Alaska Conservation Foundation.
54 Pendleton, Linwood H., 2006, “Understanding the Potential Economic Impact of Marine Wildlife Viewing and Whale Watching in California: Using the Literature to Support Decision-Making for the Marine Life Protection Act.”
55 Loomis, John B. and Douglas M. Larson, 1994, "Total Economic Values of Increasing Gray Whale Populations: Results from a contingent valuation survey of visitors and households," Marine Resource Economics, 9: 275-286; and Loomis, John, Shizuka Yorizane, and Douglas Laron, 2000, “Testing Significance of Multi-Destination and Multi-Purpose Trip Effects in a Travel Cost Method Demand Model for Whale Watching Trips,” Agriculture and Resource Economics Review, 29/2, 183-191.
56 The Loomis and Larson 1994 study reports that surveys were conducted over the winter of 1991/1992. However, the Loomis et al., 2000 study reports that the surveys were conducted in 1993. Hence it is not clear exactly when the surveys were completed.
57 Loomis, John, Shizuka Yorizane, and Douglas Laron, 2000, “Testing Significance of Multi-Destination and Multi-Purpose Trip Effects in a Travel Cost Method Demand Model for Whale Watching Trips,” Agriculture and Resource Economics Review, 29/2, 183-191.
58 Colt, Steve, 2001, “The Economic Importance of Healthy Alaska Ecosystems,” Institute of Social and Economic Research University of Alaska Anchorage. Alaska Conservation Foundation.
59 Duffield, John, 1997, “Nonmarket Valuation and the Courts: the Case of the Exxon Valdez,” Contemporary Economic Policy, 15, 4.
FINAL RIR/4(B)(2)/FRFA OF CRITICAL HABITAT DESIGNATION OF COOK INLET BELUGA WHALE AUGUST 11, 2010
5-12 NATIONAL MARINE FISHERIES SERVICE
not take into account the cultural and/or social value of subsistence activity. Thus, replacement cost represents a lower bound estimate of the value of subsistence activity.60
In his 1997 publication, John Duffield reviews the research leading up to the valuation of Alaska Natives’ subsistence harvest following the Exxon Valdez spill. A 1987 pre-spill Alaska Subsistence study61 uses non-market valuation to determine the value of subsistence harvest at $262 per pound, based on the tradeoff between subsistence use and income. A 1993 study62 uses the same data as the 1987 study from the Alaska Subsistence Division on subsistence activities in 98 Alaska communities, and determines the value of economic subsistence harvest at $67 per pound.
For settlement purposes, the defendants presented the economic value of subsistence harvest at $15 per pound based on replacement cost. The plaintiffs provide a range of $18 to $20 per pound for the replacement cost of subsistence harvest. The damages awarded to the plaintiffs for subsistence harvest was in between the plaintiffs’ range of proposed replacement costs.63
A 2008 study64 on the value of Alaska subsistence harvest looks at the value of subsistence harvest in the Kenai Peninsula. The study relies on the per pound value of subsistence harvest, developed by Robert Wolfe65. This value ranges between $4 and $6 for hunting and fishing, though it relies on the author’s assumption and is unsubstantiated. Using this value, the 2008 study determines the total value of subsistence activities on the Kenai Peninsula to be between $2.6 and $4.3 million.
The economic benefits resulting from subsistence use of Copper River salmon are estimated in a 2000 study.66 The study is a travel cost study and relies on the ADF&G database on personal use and subsistence permit applications and reports. The study finds the benefit of subsistence and personal use fishing ranges from $83 to $93 per trip.
5.4.5 Environmental Education and Volunteerism Benefits
Environmental and political education and environmental volunteerism associated with habitat preservation are another potential source of individual and societal benefits of CHD. The relationship between CHD activities (e.g., the science, politics, economics, and public policy) and education and volunteerism is interdependent and, so, complicates the process of attempting to quantify the benefits. Nonetheless, studies show that environmental education and volunteering can provide substantial benefits to individuals and society as a whole. Many economic studies focus on the value of general education benefits, including wage, 60 Colt, Steve, 2001, “The Economic Importance of Healthy Alaska Ecosystems,” Institute of Social and Economic Research University of Alaska
Anchorage, Alaska Conservation Foundation. 61 Wolfe, Robert J. and Robert J. Walker, 1987, “Subsistence Economies in Alaska: Productivity, Geography, and Development Impacts,” Arctic
Anthropology, 24:2, 56-81 as reported in Duffield, John, 1997, “Nonmarket Valuation and the Courts: the Case of the Exxon Valdez,” Contemporary Economic Policy, 15, 4.
62 Hausman, Jerry A., 1993, “Report of Professor J. A. Hausma”, presented at the Exxon Valdez consolidated court case, as reported in Duffield, John, 1997, “Nonmarket Valuation and the Courts: the Case of the Exxon Valdez,” Contemporary Economic Policy, 15, 4.
63 Duffield, John, 1997, “Nonmarket Valuation and the Courts: the Case of the Exxon Valdez,” Contemporary Economic Policy, 15, 4. 64 Phillips, Spencer, Robert Silverman, and Anne Gore, 2008, “Greater than Zero: Toward the total economic value of Alaska’s national forest
wildlands,” The Wilderness Society. 65 Wolfe, Robert J., 2000, “Subsistence in Alaska: A Year 2000 Update,” Juneau Alaska: Division of Subsistence, Alaska Department of Fish and
Game, 4pp. 66 Henderson, Michelle M., Keith R. Criddle, and S. Todd Lee, 1999, “The Economic Value of Alaska’s Copper River Personal Use and
Subsistence Fisheries,” Alaska Fishery Research Bulletin, Vol. 6, No. 2.
SECTION 5 IDENTIFYING BENEFITS
NATIONAL MARINE FISHERIES SERVICE 5-13
health, and improved social relationship benefits from increased education levels.67 Studies specifically focusing on the benefits of environmental education and volunteering, such as those that may accrue from Cook Inlet beluga whale CHD, are few, but two studies conducted in the United Kingdom on environmental volunteering indicate the potential for significant benefits, both to society as well as to the individual volunteer.68 In these studies, British environmental volunteers, which likely have similar motivations and benefits as American environmental volunteers, have reported such varied individual benefits as increased personal well-being and positive emotional effects, gaining new skills and knowledge about environmental issues and policies, enjoyment of nature and the outdoors, increased physical exercise, and becoming more connected to other people in their community and their natural environment.
Community benefits reported in these studies include the value of environmental improvements, such as habitat restoration, as well as increased social capital and community cohesion that is generated from people connecting and working collaboratively. Social capital (often defined as the “social network and norms of reciprocity and trustworthiness that arise from them”)69 is, in turn, associated with broad societal benefits, including economic, psychological, health, social, and political benefits.70 To the extent that CHD increases environmental volunteering, it is expected that these individual and collective benefits will be generated.
In addition to the empirical studies, the fact that volunteer work for such purposes as the conservation of the Cook Inlet beluga whale and its CH is done without monetary compensation suggests that volunteering creates benefits for the volunteer. In economic theory, the time that individuals spend on volunteer work reduces the time they have available for paid work, and, therefore, “costs” them the equivalent of their foregone wages, or some portion thereof. Consequently, economists often estimate the minimum value of benefits to volunteers as the value to them of their foregone wages (adjusted downward for taxes and upward for fringe benefits), as well as any disutility of work (e.g., downward wage rate adjustment for work-induced stress). The theory suggests that for volunteers to be motivated to volunteer, the value of volunteering must exceed this foregone adjusted wage rate. Based on intrinsic enjoyment of the volunteer activity, the true hourly benefit derived from volunteering may actually exceed the labor rate.
5.5 SUMMARY
It is clear, based on the preceding discussion, that there are numerous types of economic benefits that may accrue to residents living near the Cook Inlet beluga whale proposed CH, and to citizens throughout the U.S. These include potential benefits associated with recreation, fishing, wildlife viewing, subsistence fishing, and environmental and volunteering benefits. The different types of expected benefits include direct use, indirect use, nonuse or passive use, consumptive, and non-consumptive benefits. While the magnitude of some of these types of benefits has been studied, none of these types of benefits has been studied in direct association with the CHD for Cook Inlet beluga whale. Further, in all cases, the types of economic benefits associated with CHD are largely co-extensive with listing the Cook Inlet beluga whale as endangered. As a result, it is very difficult to quantify the total value of economic benefit to be expected from the action of designating CH
67 Wolfe, Barbara, L. and Robert H. Haveman, 2002, “Social and Nonmarket Benefits from Education in an Advanced Economy,” Conference
Series 47, Education in the 21st Century: Meeting the Challenges of a Changing World. 68 O’Brien, Liz, Mardle Townsend, and Matthew Ebden, 2008, “Environmental Volunteering: Motivations, Barriers, and Benefits,” Report to the
Scottish Forestry Trust and Forestry Commission. Hine, Rachel, Jo Peacock, and Jules Pretty, 2008, “Evaluating the impact of environmental volunteering on behaviours and attitudes to the environment” for the British Trust of Conservation Volunteers.
69 Robert D. Putnam, 2000, Bowling Alone: The Collapse and Revival of American Community, New York: Simon & Schuster, p.19. 70 Saguaro Seminar on Civic Engagement in America, 2000, “Better Together: The Report of the Sagauro Seminar on Civic Engagement in
America,” Harvard University, Kennedy School of Government.

FINAL RIR/4(B)(2)/FRFA OF CRITICAL HABITAT DESIGNATION OF COOK INLET BELUGA WHALE AUGUST 11, 2010
5-14 NATIONAL MARINE FISHERIES SERVICE
at this time. However, it is clear that CHD will contribute to the types of economic benefits described in this section.
NATIONAL MARINE FISHERIES SERVICE 6-1
S E C T I O N 6 Contextual Information
This section presents the existing situation in the area of the Cook Inlet beluga whale proposed CHD and vicinity. First, the geographic area of analysis is introduced. Then, a socioeconomic profile of this area is presented. This is followed by the regulatory baseline. Finally, the present economic activities in the area and actions being taken to protect Cook Inlet beluga whales are discussed and synthesized.
6.1 GEOGRAPHIC SCOPE
The geographic scope of the analysis includes the areas proposed for Cook Inlet beluga whale CHD. Figure 2-1 in Section 2 presents the proposed Cook Inlet beluga whale CHD areas. The analysis focuses on activities within or affecting these areas, and presents costs and benefits at the lowest level of resolution feasible, given available data. Effects are reported for each area identified in the proposed rule. Note that economic activities affecting (or affected by) CH may be sited outside of the boundaries of the proposed CHD (e.g., development projects in the vicinity of Cook Inlet, but outside the water); these activities are considered relevant to this analysis.
In addition, the analysis acknowledges certain activities and projects that have the potential of affecting the PCEs, but are located outside the boundaries of the CH. Such actions may trigger Section 7 consultation(s) under ESA. One specific example of this is associated with the Prohibited Species Catch (PSC) of Chinook salmon, occurring in the Bering Sea pollock trawl fisheries. In recent years, thousands of Chinook salmon (e.g., 121,000 in 2007; 83,000 in 2006) have been intercepted in the prosecution of these pollock fisheries. Chinook are classified as “prohibited”, meaning they must be avoided, may not be targeted or retained, and all PSC must be returned to the sea, immediately. Despite this requirement, Chinook do not survive capture in trawl nets (i.e., there is 100% mortality).
It is virtually certain that salmon of Cook Inlet origin are among the PSC removals in the pollock fisheries. Because Cook Inlet Chinook salmon is one of the PCEs identified in the subject action, their loss in the pollock fisheries may have the potential to detrimentally affect CH. It is the case, however, that the source of origin of Chinook salmon PSCs are not well understood and scientifically verifiable. Research to genetically identify the natal source of salmon PSC is progressing, however, at present, it is not possible to scientifically confirm the presence of Cook Inlet Chinook salmon among the PSC losses. As source-of-origin data improve, the true potential for this removal to adversely modify CH for the Cook Inlet beluga whale will require periodic examination. While this analysis acknowledges the potentiality of such actions occurring far outside Cook Inlet to affect CH for the Cook Inlet beluga whales, the discussion, monetization, quantification, or qualification of the effects of these activities is presently beyond the scope of this analysis.
6.2 DESCRIPTION OF AFFECTED ECONOMIES
This section describes the existing socioeconomic environment in the Municipality of Anchorage, City and Borough; Matanuska-Susitna Borough; and Kenai Peninsula Borough; as well as, how those compare to the State of Alaska and the U.S. The section is organized into four main components: (1) population trends and
FINAL RIR/4(B)(2)/FRFA OF CRITICAL HABITAT DESIGNATION OF COOK INLET BELUGA WHALE AUGUST 11, 2010
6-2 NATIONAL MARINE FISHERIES SERVICE
projections; (2) income-related measures of social well being; (3) race and ethnicity; and (4) major industrial sectors. The focus of this section is on those socioeconomic parameters most likely to be affected by the proposed CHD. These key parameters include demographic characteristics of local residents, and employment and income levels in the boroughs. The data used for the economic and socioeconomic analyses are the most recent available or published data from reliable sources. All efforts are made to ensure that these data are updated to their latest release year.
6.2.1 Population Trends and Projections
The Municipality of Anchorage City-Borough, Matanuska-Susitna Borough, and Kenai Peninsula Borough together account for 62 percent of the total population of the State of Alaska. The Municipality of Anchorage is the most populous borough in the State, with a population of 284,994 in 2008.71 Communities within the Municipality of Anchorage include Girdwood, Bird, Indian, Eagle River, Birchwood, and Chugiak. The 2008 populations for Matanuska-Susitna and Kenai Peninsula were 82,515 and 52,990 individuals, respectively. Palmer, Houston, and Wasilla comprise the incorporated communities within Matanuska-Susitna, while other communities include Knik-Fairview, Butte, Meadow Lake, and Big Lake. Larger communities within the Kenai Peninsula include Homer, Kalifornsky, Kenai, Nikiski, and Soldotna.
As shown in Table 6-1, each borough experienced growth between 1990 and 2008. The largest rate of population growth in the boroughs analyzed was in Matanuska-Susitna, which grew at a rate of about 39 percent in the past eight years, and more than doubled its population between 1990 and 2009. The borough was ranked number 34 on the U.S. Census Bureau’s list of the 100 fastest growing U.S. counties with a population of 10,000 or more, between 2000 and 2008.72 According to the Matanuska-Susitna Borough government, population growth is driven, in part, by lower land and housing prices compared to the Municipality of Anchorage, where approximately one-third of this borough’s residents commute to work.73 The other two boroughs experienced slower, but still significant population growth, especially during the 1990s, when the population grew by 15 percent in the Municipality of Anchorage and almost 22 percent in Kenai Peninsula. Between 1990 and 2008, the population growth rates in the three boroughs exceeded those for the State of Alaska and the Nation.
71 The Municipality of Anchorage is a product of the merger of the City of Anchorage and Greater Anchorage Area Borough governments in 1975:
Municipality of Anchorage web site, “Anchorage Historical Highlights,” http://www.ci.anchorage.ak.us/History/index.html. 72 Census Bureau, Population Division, March 19, 2009, Table 8: Resident Population Estimates for the 100 Fastest Growing U.S. Counties with
10,000 or More Population in 2008: April 1, 2000 to July 1, 2008 (CO-EST2008-08). 73 Matanuska-Susitna Borough, “Mat-Su Economic Development Guide,” accessed April 1, 2009.
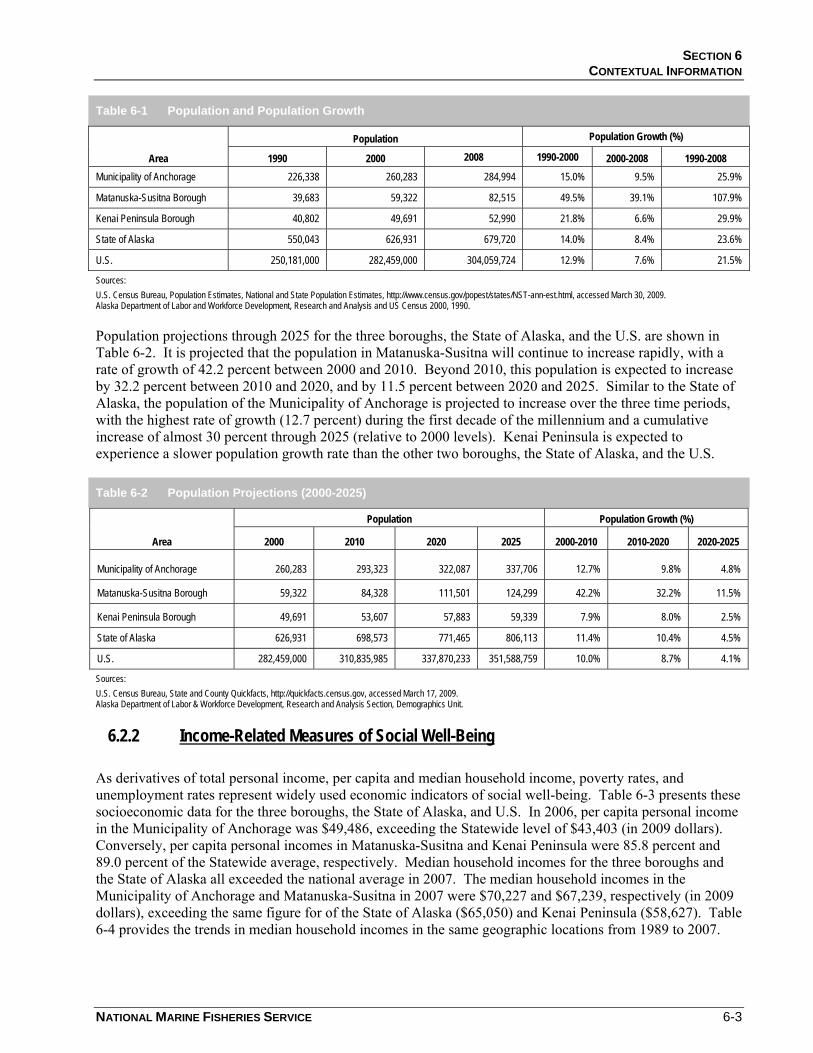
SECTION 6 CONTEXTUAL INFORMATION
NATIONAL MARINE FISHERIES SERVICE 6-3
Table 6-1 Population and Population Growth
Area
Population Population Growth (%)
1990 2000 2008 1990-2000 2000-2008 1990-2008 Municipality of Anchorage 226,338 260,283 284,994 15.0% 9.5% 25.9%
Matanuska-Susitna Borough 39,683 59,322 82,515 49.5% 39.1% 107.9%
Kenai Peninsula Borough 40,802 49,691 52,990 21.8% 6.6% 29.9%
State of Alaska 550,043 626,931 679,720 14.0% 8.4% 23.6%
U.S. 250,181,000 282,459,000 304,059,724 12.9% 7.6% 21.5%
Sources: U.S. Census Bureau, Population Estimates, National and State Population Estimates, http://www.census.gov/popest/states/NST-ann-est.html, accessed March 30, 2009. Alaska Department of Labor and Workforce Development, Research and Analysis and US Census 2000, 1990.
Population projections through 2025 for the three boroughs, the State of Alaska, and the U.S. are shown in Table 6-2. It is projected that the population in Matanuska-Susitna will continue to increase rapidly, with a rate of growth of 42.2 percent between 2000 and 2010. Beyond 2010, this population is expected to increase by 32.2 percent between 2010 and 2020, and by 11.5 percent between 2020 and 2025. Similar to the State of Alaska, the population of the Municipality of Anchorage is projected to increase over the three time periods, with the highest rate of growth (12.7 percent) during the first decade of the millennium and a cumulative increase of almost 30 percent through 2025 (relative to 2000 levels). Kenai Peninsula is expected to experience a slower population growth rate than the other two boroughs, the State of Alaska, and the U.S.
Table 6-2 Population Projections (2000-2025)
Area
Population Population Growth (%)
2000 2010 2020 2025 2000-2010 2010-2020 2020-2025
Municipality of Anchorage 260,283 293,323 322,087 337,706 12.7% 9.8% 4.8%
Matanuska-Susitna Borough 59,322 84,328 111,501 124,299 42.2% 32.2% 11.5%
Kenai Peninsula Borough 49,691 53,607 57,883 59,339 7.9% 8.0% 2.5%
State of Alaska 626,931 698,573 771,465 806,113 11.4% 10.4% 4.5%
U.S. 282,459,000 310,835,985 337,870,233 351,588,759 10.0% 8.7% 4.1%
Sources: U.S. Census Bureau, State and County Quickfacts, http://quickfacts.census.gov, accessed March 17, 2009. Alaska Department of Labor & Workforce Development, Research and Analysis Section, Demographics Unit.
6.2.2 Income-Related Measures of Social Well-Being
As derivatives of total personal income, per capita and median household income, poverty rates, and unemployment rates represent widely used economic indicators of social well-being. Table 6-3 presents these socioeconomic data for the three boroughs, the State of Alaska, and U.S. In 2006, per capita personal income in the Municipality of Anchorage was $49,486, exceeding the Statewide level of $43,403 (in 2009 dollars). Conversely, per capita personal incomes in Matanuska-Susitna and Kenai Peninsula were 85.8 percent and 89.0 percent of the Statewide average, respectively. Median household incomes for the three boroughs and the State of Alaska all exceeded the national average in 2007. The median household incomes in the Municipality of Anchorage and Matanuska-Susitna in 2007 were $70,227 and $67,239, respectively (in 2009 dollars), exceeding the same figure for of the State of Alaska ($65,050) and Kenai Peninsula ($58,627). Table 6-4 provides the trends in median household incomes in the same geographic locations from 1989 to 2007.
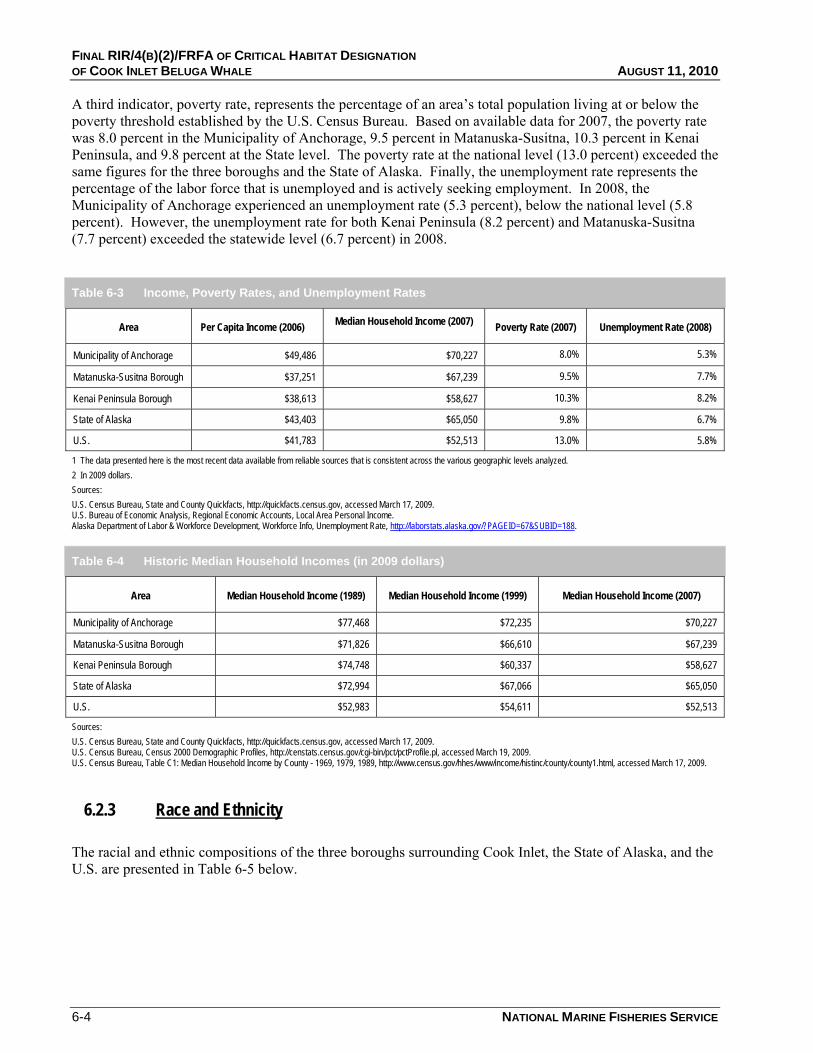
FINAL RIR/4(B)(2)/FRFA OF CRITICAL HABITAT DESIGNATION OF COOK INLET BELUGA WHALE AUGUST 11, 2010
6-4 NATIONAL MARINE FISHERIES SERVICE
A third indicator, poverty rate, represents the percentage of an area’s total population living at or below the poverty threshold established by the U.S. Census Bureau. Based on available data for 2007, the poverty rate was 8.0 percent in the Municipality of Anchorage, 9.5 percent in Matanuska-Susitna, 10.3 percent in Kenai Peninsula, and 9.8 percent at the State level. The poverty rate at the national level (13.0 percent) exceeded the same figures for the three boroughs and the State of Alaska. Finally, the unemployment rate represents the percentage of the labor force that is unemployed and is actively seeking employment. In 2008, the Municipality of Anchorage experienced an unemployment rate (5.3 percent), below the national level (5.8 percent). However, the unemployment rate for both Kenai Peninsula (8.2 percent) and Matanuska-Susitna (7.7 percent) exceeded the statewide level (6.7 percent) in 2008.
Table 6-3 Income, Poverty Rates, and Unemployment Rates
Area Per Capita Income (2006)�� Median Household Income (2007)�� Poverty Rate (2007) Unemployment Rate (2008)
Municipality of Anchorage $49,486 $70,227 8.0% 5.3%
Matanuska-Susitna Borough $37,251 $67,239 9.5% 7.7%
Kenai Peninsula Borough $38,613 $58,627 10.3% 8.2%
State of Alaska $43,403 $65,050 9.8% 6.7%
U.S. $41,783 $52,513 13.0% 5.8%
1 The data presented here is the most recent data available from reliable sources that is consistent across the various geographic levels analyzed. 2 In 2009 dollars. Sources: U.S. Census Bureau, State and County Quickfacts, http://quickfacts.census.gov, accessed March 17, 2009. U.S. Bureau of Economic Analysis, Regional Economic Accounts, Local Area Personal Income. Alaska Department of Labor & Workforce Development, Workforce Info, Unemployment Rate, http://laborstats.alaska.gov/?PAGEID=67&SUBID=188.
Table 6-4 Historic Median Household Incomes (in 2009 dollars)
Area Median Household Income (1989) Median Household Income (1999) Median Household Income (2007)
Municipality of Anchorage $77,468 $72,235 $70,227
Matanuska-Susitna Borough $71,826 $66,610 $67,239
Kenai Peninsula Borough $74,748 $60,337 $58,627
State of Alaska $72,994 $67,066 $65,050
U.S. $52,983 $54,611 $52,513
Sources: U.S. Census Bureau, State and County Quickfacts, http://quickfacts.census.gov, accessed March 17, 2009. U.S. Census Bureau, Census 2000 Demographic Profiles, http://censtats.census.gov/cgi-bin/pct/pctProfile.pl, accessed March 19, 2009. U.S. Census Bureau, Table C1: Median Household Income by County - 1969, 1979, 1989, http://www.census.gov/hhes/www/income/histinc/county/county1.html, accessed March 17, 2009.
6.2.3 Race and Ethnicity
The racial and ethnic compositions of the three boroughs surrounding Cook Inlet, the State of Alaska, and the U.S. are presented in Table 6-5 below.
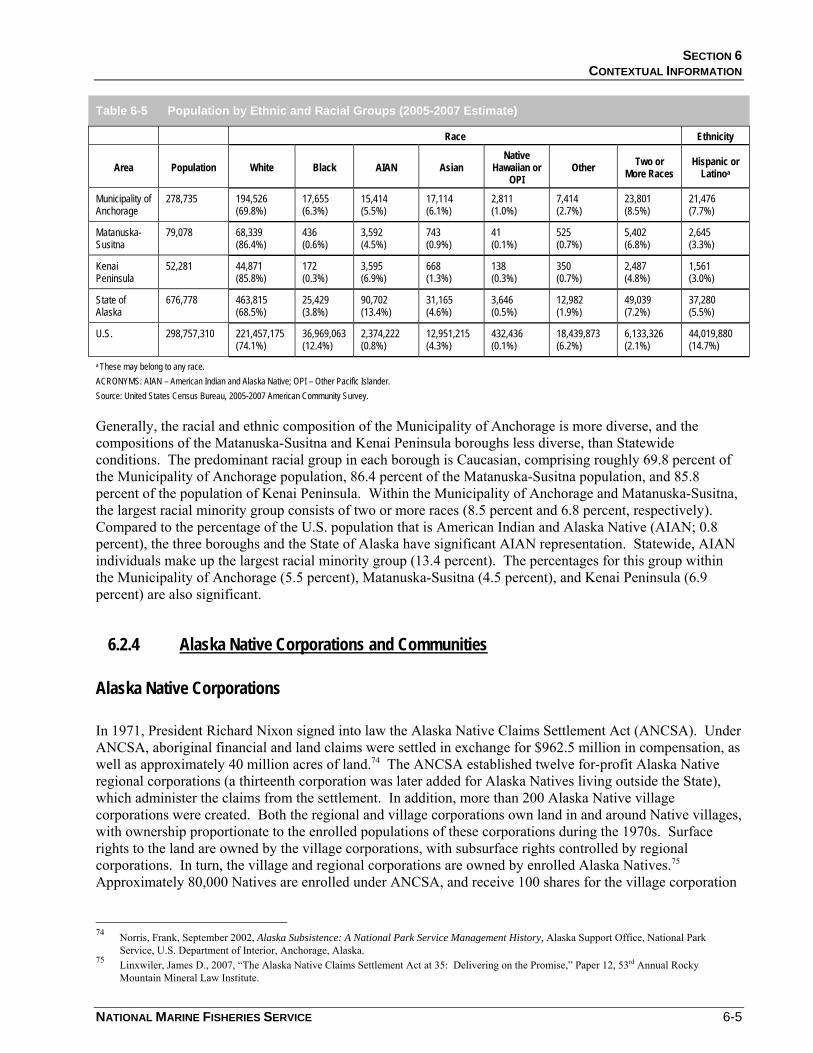
SECTION 6 CONTEXTUAL INFORMATION
NATIONAL MARINE FISHERIES SERVICE 6-5
Table 6-5 Population by Ethnic and Racial Groups (2005-2007 Estimate)
Race Ethnicity
Area Population White Black AIAN Asian Native
Hawaiian or OPI
Other Two or More Races
Hispanic or Latinoa
Municipality of Anchorage
278,735 194,526 (69.8%)
17,655 (6.3%)
15,414 (5.5%)
17,114 (6.1%)
2,811 (1.0%)
7,414 (2.7%)
23,801 (8.5%)
21,476 (7.7%)
Matanuska-Susitna
79,078 68,339 (86.4%)
436 (0.6%)
3,592 (4.5%)
743 (0.9%)
41 (0.1%)
525 (0.7%)
5,402 (6.8%)
2,645 (3.3%)
Kenai Peninsula
52,281 44,871 (85.8%)
172 (0.3%)
3,595 (6.9%)
668 (1.3%)
138 (0.3%)
350 (0.7%)
2,487 (4.8%)
1,561 (3.0%)
State of Alaska
676,778 463,815 (68.5%)
25,429 (3.8%)
90,702 (13.4%)
31,165 (4.6%)
3,646 (0.5%)
12,982 (1.9%)
49,039 (7.2%)
37,280 (5.5%)
U.S. 298,757,310 221,457,175 (74.1%)
36,969,063 (12.4%)
2,374,222 (0.8%)
12,951,215 (4.3%)
432,436 (0.1%)
18,439,873 (6.2%)
6,133,326 (2.1%)
44,019,880 (14.7%)
a These may belong to any race. ACRONYMS: AIAN – American Indian and Alaska Native; OPI – Other Pacific Islander. Source: United States Census Bureau, 2005-2007 American Community Survey.
Generally, the racial and ethnic composition of the Municipality of Anchorage is more diverse, and the compositions of the Matanuska-Susitna and Kenai Peninsula boroughs less diverse, than Statewide conditions. The predominant racial group in each borough is Caucasian, comprising roughly 69.8 percent of the Municipality of Anchorage population, 86.4 percent of the Matanuska-Susitna population, and 85.8 percent of the population of Kenai Peninsula. Within the Municipality of Anchorage and Matanuska-Susitna, the largest racial minority group consists of two or more races (8.5 percent and 6.8 percent, respectively). Compared to the percentage of the U.S. population that is American Indian and Alaska Native (AIAN; 0.8 percent), the three boroughs and the State of Alaska have significant AIAN representation. Statewide, AIAN individuals make up the largest racial minority group (13.4 percent). The percentages for this group within the Municipality of Anchorage (5.5 percent), Matanuska-Susitna (4.5 percent), and Kenai Peninsula (6.9 percent) are also significant.
6.2.4 Alaska Native Corporations and Communities
Alaska Native Corporations
In 1971, President Richard Nixon signed into law the Alaska Native Claims Settlement Act (ANCSA). Under ANCSA, aboriginal financial and land claims were settled in exchange for $962.5 million in compensation, as well as approximately 40 million acres of land.74 The ANCSA established twelve for-profit Alaska Native regional corporations (a thirteenth corporation was later added for Alaska Natives living outside the State), which administer the claims from the settlement. In addition, more than 200 Alaska Native village corporations were created. Both the regional and village corporations own land in and around Native villages, with ownership proportionate to the enrolled populations of these corporations during the 1970s. Surface rights to the land are owned by the village corporations, with subsurface rights controlled by regional corporations. In turn, the village and regional corporations are owned by enrolled Alaska Natives.75 Approximately 80,000 Natives are enrolled under ANCSA, and receive 100 shares for the village corporation
74 Norris, Frank, September 2002, Alaska Subsistence: A National Park Service Management History, Alaska Support Office, National Park
Service, U.S. Department of Interior, Anchorage, Alaska. 75 Linxwiler, James D., 2007, “The Alaska Native Claims Settlement Act at 35: Delivering on the Promise,” Paper 12, 53rd Annual Rocky
Mountain Mineral Law Institute.
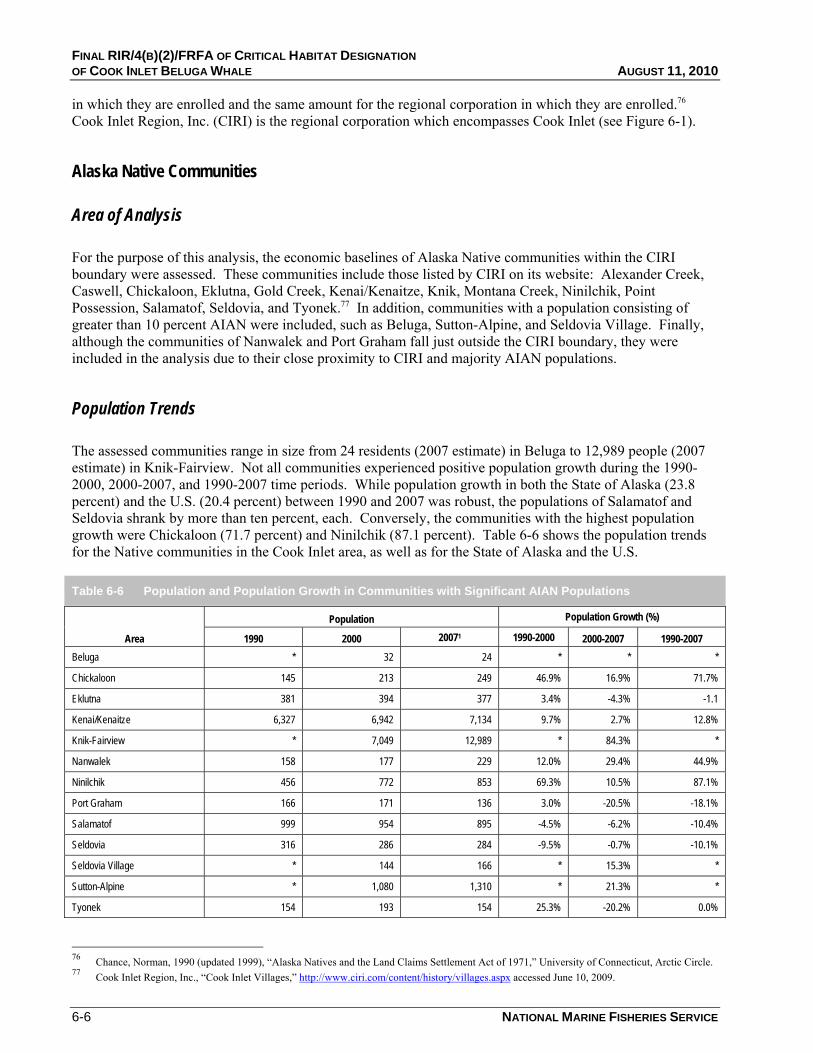
FINAL RIR/4(B)(2)/FRFA OF CRITICAL HABITAT DESIGNATION OF COOK INLET BELUGA WHALE AUGUST 11, 2010
6-6 NATIONAL MARINE FISHERIES SERVICE
in which they are enrolled and the same amount for the regional corporation in which they are enrolled.76 Cook Inlet Region, Inc. (CIRI) is the regional corporation which encompasses Cook Inlet (see Figure 6-1).
Alaska Native Communities
Area of Analysis
For the purpose of this analysis, the economic baselines of Alaska Native communities within the CIRI boundary were assessed. These communities include those listed by CIRI on its website: Alexander Creek, Caswell, Chickaloon, Eklutna, Gold Creek, Kenai/Kenaitze, Knik, Montana Creek, Ninilchik, Point Possession, Salamatof, Seldovia, and Tyonek.77 In addition, communities with a population consisting of greater than 10 percent AIAN were included, such as Beluga, Sutton-Alpine, and Seldovia Village. Finally, although the communities of Nanwalek and Port Graham fall just outside the CIRI boundary, they were included in the analysis due to their close proximity to CIRI and majority AIAN populations.
Population Trends
The assessed communities range in size from 24 residents (2007 estimate) in Beluga to 12,989 people (2007 estimate) in Knik-Fairview. Not all communities experienced positive population growth during the 1990-2000, 2000-2007, and 1990-2007 time periods. While population growth in both the State of Alaska (23.8 percent) and the U.S. (20.4 percent) between 1990 and 2007 was robust, the populations of Salamatof and Seldovia shrank by more than ten percent, each. Conversely, the communities with the highest population growth were Chickaloon (71.7 percent) and Ninilchik (87.1 percent). Table 6-6 shows the population trends for the Native communities in the Cook Inlet area, as well as for the State of Alaska and the U.S.
Table 6-6 Population and Population Growth in Communities with Significant AIAN Populations
Area
Population Population Growth (%)
1990 2000 20071 1990-2000 2000-2007 1990-2007 Beluga * 32 24 * * *
Chickaloon 145 213 249 46.9% 16.9% 71.7%
Eklutna 381 394 377 3.4% -4.3% -1.1
Kenai/Kenaitze 6,327 6,942 7,134 9.7% 2.7% 12.8%
Knik-Fairview * 7,049 12,989 * 84.3% *
Nanwalek 158 177 229 12.0% 29.4% 44.9%
Ninilchik 456 772 853 69.3% 10.5% 87.1%
Port Graham 166 171 136 3.0% -20.5% -18.1%
Salamatof 999 954 895 -4.5% -6.2% -10.4%
Seldovia 316 286 284 -9.5% -0.7% -10.1%
Seldovia Village * 144 166 * 15.3% *
Sutton-Alpine * 1,080 1,310 * 21.3% *
Tyonek 154 193 154 25.3% -20.2% 0.0%
76 Chance, Norman, 1990 (updated 1999), “Alaska Natives and the Land Claims Settlement Act of 1971,” University of Connecticut, Arctic Circle. 77 Cook Inlet Region, Inc., “Cook Inlet Villages,” http://www.ciri.com/content/history/villages.aspx accessed June 10, 2009.
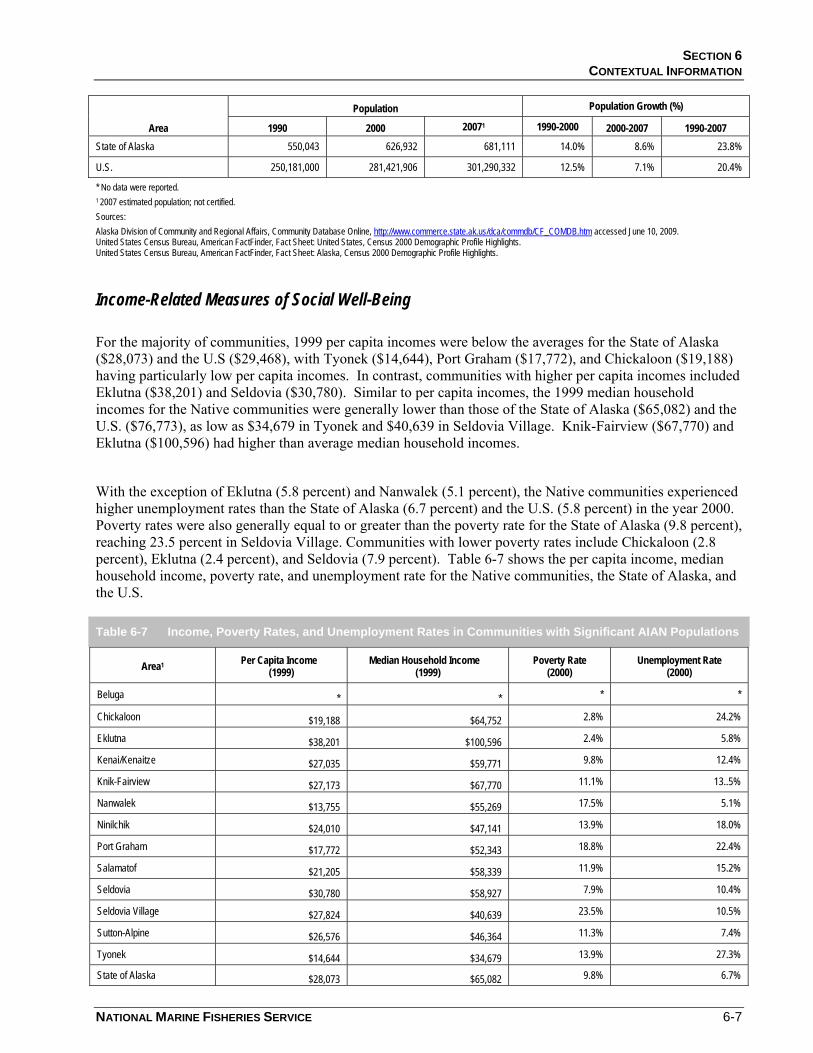
SECTION 6 CONTEXTUAL INFORMATION
NATIONAL MARINE FISHERIES SERVICE 6-7
Area
Population Population Growth (%)
1990 2000 20071 1990-2000 2000-2007 1990-2007 State of Alaska 550,043 626,932 681,111 14.0% 8.6% 23.8%
U.S. 250,181,000 281,421,906 301,290,332 12.5% 7.1% 20.4%
* No data were reported. 1 2007 estimated population; not certified. Sources: Alaska Division of Community and Regional Affairs, Community Database Online, http://www.commerce.state.ak.us/dca/commdb/CF_COMDB.htm accessed June 10, 2009. United States Census Bureau, American FactFinder, Fact Sheet: United States, Census 2000 Demographic Profile Highlights. United States Census Bureau, American FactFinder, Fact Sheet: Alaska, Census 2000 Demographic Profile Highlights.
Income-Related Measures of Social Well-Being
For the majority of communities, 1999 per capita incomes were below the averages for the State of Alaska ($28,073) and the U.S ($29,468), with Tyonek ($14,644), Port Graham ($17,772), and Chickaloon ($19,188) having particularly low per capita incomes. In contrast, communities with higher per capita incomes included Eklutna ($38,201) and Seldovia ($30,780). Similar to per capita incomes, the 1999 median household incomes for the Native communities were generally lower than those of the State of Alaska ($65,082) and the U.S. ($76,773), as low as $34,679 in Tyonek and $40,639 in Seldovia Village. Knik-Fairview ($67,770) and Eklutna ($100,596) had higher than average median household incomes.
With the exception of Eklutna (5.8 percent) and Nanwalek (5.1 percent), the Native communities experienced higher unemployment rates than the State of Alaska (6.7 percent) and the U.S. (5.8 percent) in the year 2000. Poverty rates were also generally equal to or greater than the poverty rate for the State of Alaska (9.8 percent), reaching 23.5 percent in Seldovia Village. Communities with lower poverty rates include Chickaloon (2.8 percent), Eklutna (2.4 percent), and Seldovia (7.9 percent). Table 6-7 shows the per capita income, median household income, poverty rate, and unemployment rate for the Native communities, the State of Alaska, and the U.S.
Table 6-7 Income, Poverty Rates, and Unemployment Rates in Communities with Significant AIAN Populations
Area1 Per Capita Income��
(1999) Median Household Income ��
(1999) Poverty Rate
(2000) Unemployment Rate
(2000)
Beluga * * * *
Chickaloon $19,188 $64,752 2.8% 24.2%
Eklutna $38,201 $100,596 2.4% 5.8%
Kenai/Kenaitze $27,035 $59,771 9.8% 12.4%
Knik-Fairview $27,173 $67,770 11.1% 13..5%
Nanwalek $13,755 $55,269 17.5% 5.1%
Ninilchik $24,010 $47,141 13.9% 18.0%
Port Graham $17,772 $52,343 18.8% 22.4%
Salamatof $21,205 $58,339 11.9% 15.2%
Seldovia $30,780 $58,927 7.9% 10.4%
Seldovia Village $27,824 $40,639 23.5% 10.5%
Sutton-Alpine $26,576 $46,364 11.3% 7.4%
Tyonek $14,644 $34,679 13.9% 27.3%
State of Alaska $28,073 $65,082 9.8% 6.7%

FINAL RIR/4(B)(2)/FRFA OF CRITICAL HABITAT DESIGNATION OF COOK INLET BELUGA WHALE AUGUST 11, 2010
6-8 NATIONAL MARINE FISHERIES SERVICE
Area1 Per Capita Income��
(1999) Median Household Income ��
(1999) Poverty Rate
(2000) Unemployment Rate
(2000)
U.S. $29,468 $76,773 13.0% 5.8%
* No data were reported. 1 The data presented here is the most recent data available from reliable sources that is consistent across the various geographic levels analyzed. 2 In 2009 dollars. Sources: Alaska Division of Community and Regional Affairs, Community Database Online, http://www.commerce.state.ak.us/dca/commdb/CF_COMDB.htm accessed June 10, 2009. United States Census Bureau, American FactFinder, Fact Sheet: United States, Census 2000 Demographic Profile Highlights. United States Census Bureau, American FactFinder, Fact Sheet: Alaska, Census 2000 Demographic Profile Highlights.
Race and Ethnicity
As discussed above, the populations of the Native communities selected for this analysis consisted of greater than 10 percent of residents who identified as AIAN in the year 2000, with the exceptions of Eklutna (8.4 percent), Kenai/Kenaitze (8.7 percent), and Knik-Fairview (5.7 percent). Compared to the composition of the U.S. population in the same year (0.9 percent AIAN), the State of Alaska had a greater proportion of AIAN residents (15.6 percent). The majority of the Native communities within CIRI had an even more significant percentage of AIAN residents, with Nanwalek (89.3 percent), Port Graham (84.8 percent), and Tyonek (95.3 percent) having particularly high percentages of AIAN residents within their respective populations. For all communities, with the exceptions of Nanwalek (6.8 percent), Port Graham (11.1 percent), and Tyonek (4.7 percent), Caucasian (white) residents comprised the majority of the populations. After AIAN, the largest racial groups within the Native communities were Black/African-American, and two or more races, although it should be noted that persons self-identifying with two or more races often reported AIAN affiliation. Table 6-8 below shows the populations by ethnic and racial groups for the Native communities, as well as for the State of Alaska and the U.S.
Table 6-8 Population by Ethnic and Racial Groups (2000) in Communities with Significant AIAN Populations
Race Ethnicity
Area Population (2000) White Black AIAN Asian
Native Hawaiian or
OPI Other Two or
More Races Hispanic or
Latino1
Beluga 32 24
(75.0%) 0
(0.0%) 8
(25.0%) 0
(0.0%) 0
(0.0%) 0
(0.0%) 0
(0.0%) 0
(0.0%)
Chickaloon 213 166
(77.9%) 3
(1.4%) 33
(15.5%) 2
(0.9%) 0
(0.0%) 4
(1.9%) 5
(2.4%) 3
(1.4%)
Eklutna 394 309
(78.4%) 9
(2.3%) 33
(8.4%) 8
(2.0%) 0
(0.0%) 5
(1.3%) 30
(7.6%) 52
(13.2%)
Kenai/Kenaitze 6,942 5,745
(82.8%) 34
(0.5%) 607
(8.7%) 115
(1.7%) 16
(0.2%) 78
(1.1%) 347
(5.0%) 265
(3.8%)
Knik-Fairview 7,049 6,198
(87.9%) 47
(0.7%) 403
(5.7%) 53
(0.8%) 6
(0.1%) 55
(0.8%) 287
(4.1%) 214
(3.0%)
Nanwelek 177 12
(6.8%) 0
(0.0%) 158
(89.3%) 0
(0.0%) 0
(0.0%) 0
(0.0%) 7
(4.0%) 2
(1.1%)
Ninilchik 772 635
(82.3%) 0
(0.0%) 108
(14.0%) 4
(0.5%) 0
(0.0%) 1
(0.1%) 24
(3.1%) 5
(0.6%)
Port Graham 171 19
(11.1%) 0
(0.0%) 145
(84.8%) 0
(0.0%) 0
(0.0%) 1
(0.6%) 6
(3.5%) 6
(3.5%)
Salamatof 954 685
(71.8%) 32
(3.4%) 190
(22.3%) 5
(0.5%) 1
(0.1%) 9
(0.9%) 32
(3.4%) 32
(3.4%)
Seldovia 286 210
(73.4%) 3
(1.0%) 50
(23.1%) 2
(0.7%) 1
(0.3%) 1
(0.3%) 19
(6.6%) 6
(2.1%)
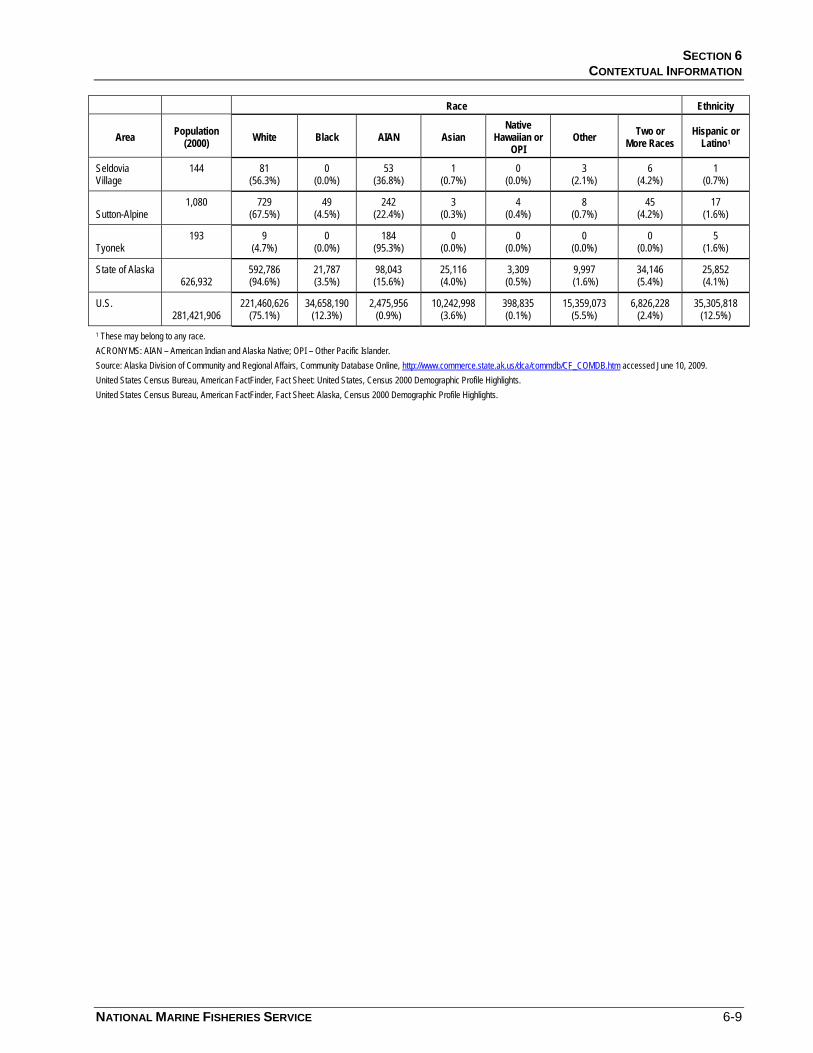
SECTION 6 CONTEXTUAL INFORMATION
NATIONAL MARINE FISHERIES SERVICE 6-9
Race Ethnicity
Area Population (2000) White Black AIAN Asian
Native Hawaiian or
OPI Other Two or
More Races Hispanic or
Latino1
Seldovia Village
144 81 (56.3%)
0 (0.0%)
53 (36.8%)
1 (0.7%)
0 (0.0%)
3 (2.1%)
6 (4.2%)
1 (0.7%)
Sutton-Alpine 1,080 729
(67.5%) 49
(4.5%) 242
(22.4%) 3
(0.3%) 4
(0.4%) 8
(0.7%) 45
(4.2%) 17
(1.6%)
Tyonek 193 9
(4.7%) 0
(0.0%) 184
(95.3%) 0
(0.0%) 0
(0.0%) 0
(0.0%) 0
(0.0%) 5
(1.6%)
State of Alaska 626,932
592,786 (94.6%)
21,787 (3.5%)
98,043 (15.6%)
25,116 (4.0%)
3,309 (0.5%)
9,997 (1.6%)
34,146 (5.4%)
25,852 (4.1%)
U.S. 281,421,906
221,460,626 (75.1%)
34,658,190 (12.3%)
2,475,956 (0.9%)
10,242,998 (3.6%)
398,835 (0.1%)
15,359,073 (5.5%)
6,826,228 (2.4%)
35,305,818 (12.5%)
1 These may belong to any race. ACRONYMS: AIAN – American Indian and Alaska Native; OPI – Other Pacific Islander. Source: Alaska Division of Community and Regional Affairs, Community Database Online, http://www.commerce.state.ak.us/dca/commdb/CF_COMDB.htm accessed June 10, 2009. United States Census Bureau, American FactFinder, Fact Sheet: United States, Census 2000 Demographic Profile Highlights. United States Census Bureau, American FactFinder, Fact Sheet: Alaska, Census 2000 Demographic Profile Highlights.

FINAL RIR/4(B)(2)/FRFA OF CRITICAL HABITAT DESIGNATION OF COOK INLET BELUGA WHALE AUGUST 11, 2010
6-10 NATIONAL MARINE FISHERIES SERVICE
Figure 6-1 Alaska Native Corporations and Villages in the Vicinity of Cook Inlet
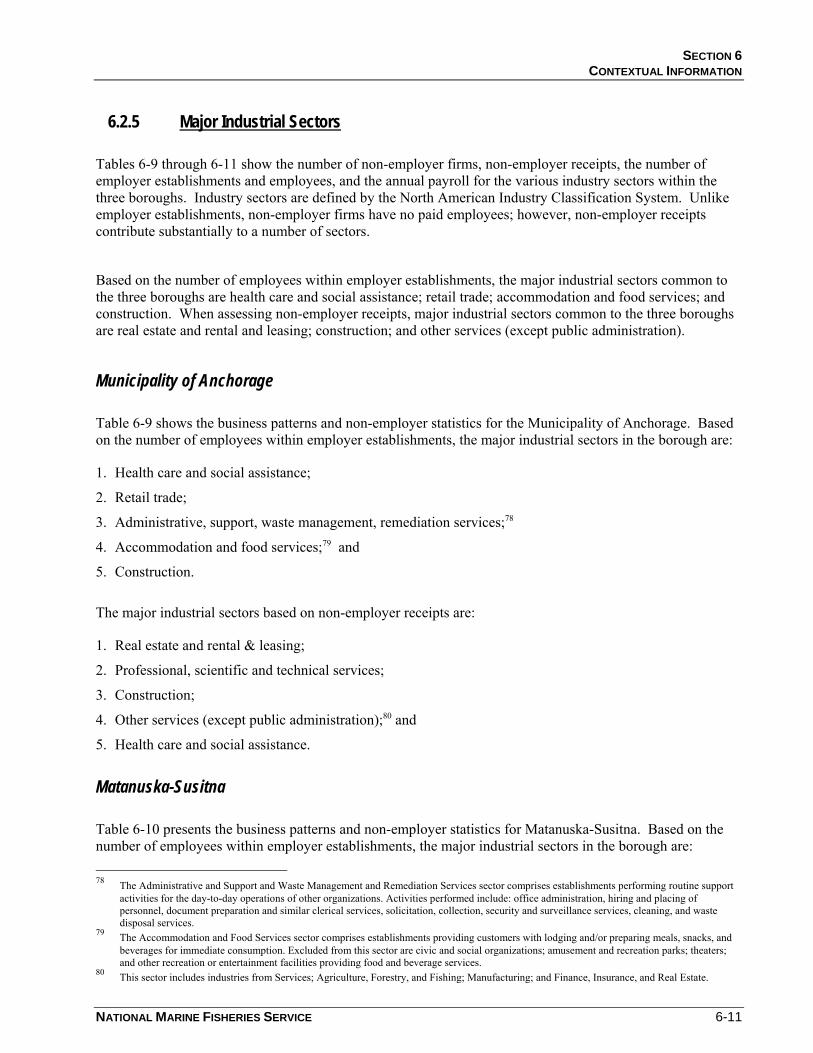
SECTION 6 CONTEXTUAL INFORMATION
NATIONAL MARINE FISHERIES SERVICE 6-11
6.2.5 Major Industrial Sectors
Tables 6-9 through 6-11 show the number of non-employer firms, non-employer receipts, the number of employer establishments and employees, and the annual payroll for the various industry sectors within the three boroughs. Industry sectors are defined by the North American Industry Classification System. Unlike employer establishments, non-employer firms have no paid employees; however, non-employer receipts contribute substantially to a number of sectors.
Based on the number of employees within employer establishments, the major industrial sectors common to the three boroughs are health care and social assistance; retail trade; accommodation and food services; and construction. When assessing non-employer receipts, major industrial sectors common to the three boroughs are real estate and rental and leasing; construction; and other services (except public administration).
Municipality of Anchorage
Table 6-9 shows the business patterns and non-employer statistics for the Municipality of Anchorage. Based on the number of employees within employer establishments, the major industrial sectors in the borough are:
1. Health care and social assistance;
2. Retail trade;
3. Administrative, support, waste management, remediation services;78
4. Accommodation and food services;79 and
5. Construction.
The major industrial sectors based on non-employer receipts are:
1. Real estate and rental & leasing;
2. Professional, scientific and technical services;
3. Construction;
4. Other services (except public administration);80 and
5. Health care and social assistance.
Matanuska-Susitna
Table 6-10 presents the business patterns and non-employer statistics for Matanuska-Susitna. Based on the number of employees within employer establishments, the major industrial sectors in the borough are: 78 The Administrative and Support and Waste Management and Remediation Services sector comprises establishments performing routine support
activities for the day-to-day operations of other organizations. Activities performed include: office administration, hiring and placing of personnel, document preparation and similar clerical services, solicitation, collection, security and surveillance services, cleaning, and waste disposal services.
79 The Accommodation and Food Services sector comprises establishments providing customers with lodging and/or preparing meals, snacks, and beverages for immediate consumption. Excluded from this sector are civic and social organizations; amusement and recreation parks; theaters; and other recreation or entertainment facilities providing food and beverage services.
80 This sector includes industries from Services; Agriculture, Forestry, and Fishing; Manufacturing; and Finance, Insurance, and Real Estate.

FINAL RIR/4(B)(2)/FRFA OF CRITICAL HABITAT DESIGNATION OF COOK INLET BELUGA WHALE AUGUST 11, 2010
6-12 NATIONAL MARINE FISHERIES SERVICE
1. Retail trade;
2. Health care and social assistance;
3. Construction;
4. Accommodation and food services; and
5. Other services (except public administration).
The major industrial sectors based on non-employer receipts are:
1. Construction;
2. Real estate and rental & leasing;
3. Retail trade;
4. Other services (except public administration); and
5. Professional, scientific, and technical services.
Kenai Peninsula
Table 6-11 shows the business patterns and non-employer statistics for the Kenai Peninsula. Based on the number of employees within employer establishments, the major industrial sectors in the borough are:
1. Health care and social assistance;
2. Retail trade;
3. Accommodation and food services;
4. Construction; and
5. Manufacturing.
The major industrial sectors based on non-employer receipts are:
1. Forestry, fishing, hunting, and agriculture support;
2. Construction;
3. Real estate and rental & leasing;
4. Retail trade;
5. Other services (except public administration).
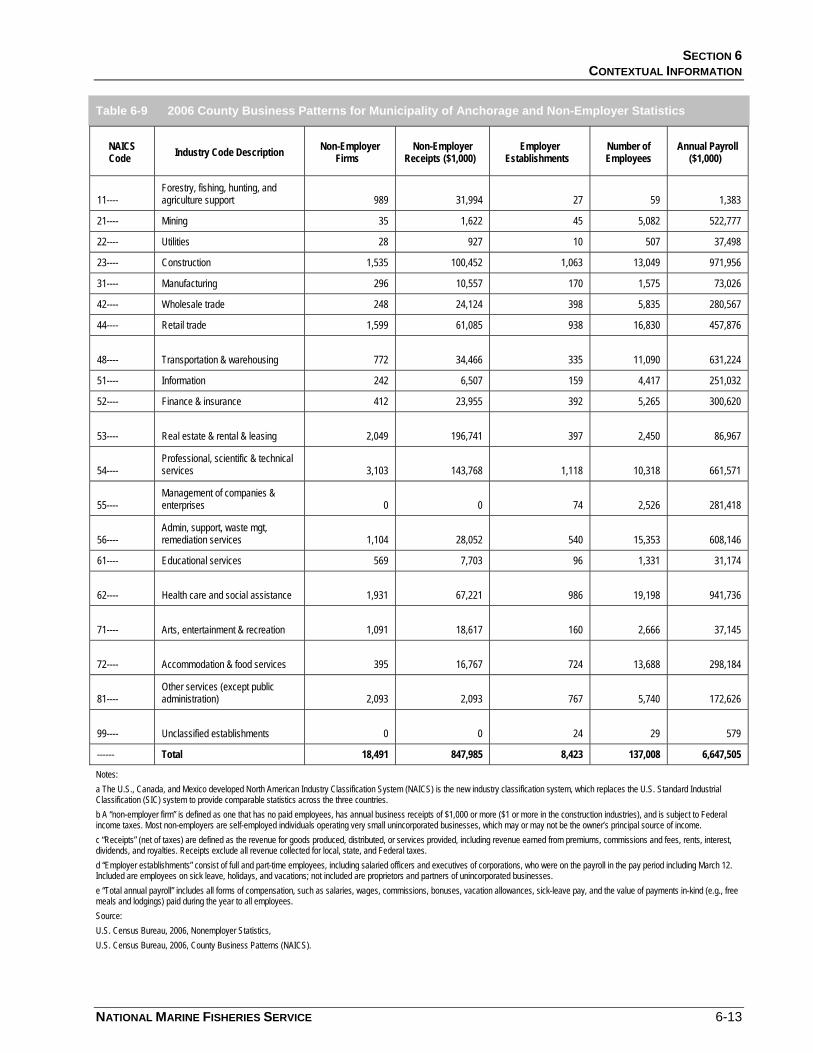
SECTION 6 CONTEXTUAL INFORMATION
NATIONAL MARINE FISHERIES SERVICE 6-13
Table 6-9 2006 County Business Patterns for Municipality of Anchorage and Non-Employer Statistics
NAICS Code� Industry Code Description Non-Employer
Firms� Non-Employer
Receipts ($1,000)� Employer
Establishments� Number of Employees
Annual Payroll ($1,000)�
11---- Forestry, fishing, hunting, and agriculture support 989 31,994 27 59 1,383
21---- Mining 35 1,622 45 5,082 522,777
22---- Utilities 28 927 10 507 37,498
23---- Construction 1,535 100,452 1,063 13,049 971,956
31---- Manufacturing 296 10,557 170 1,575 73,026
42---- Wholesale trade 248 24,124 398 5,835 280,567
44---- Retail trade 1,599 61,085 938 16,830 457,876
48---- Transportation & warehousing 772 34,466 335 11,090 631,224
51---- Information 242 6,507 159 4,417 251,032
52---- Finance & insurance 412 23,955 392 5,265 300,620
53---- Real estate & rental & leasing 2,049 196,741 397 2,450 86,967
54---- Professional, scientific & technical services 3,103 143,768 1,118 10,318 661,571
55---- Management of companies & enterprises 0 0 74 2,526 281,418
56---- Admin, support, waste mgt, remediation services 1,104 28,052 540 15,353 608,146
61---- Educational services 569 7,703 96 1,331 31,174
62---- Health care and social assistance 1,931 67,221 986 19,198 941,736
71---- Arts, entertainment & recreation 1,091 18,617 160 2,666 37,145
72---- Accommodation & food services 395 16,767 724 13,688 298,184
81---- Other services (except public administration) 2,093 2,093 767 5,740 172,626
99---- Unclassified establishments 0 0 24 29 579
------ Total 18,491 847,985 8,423 137,008 6,647,505
Notes: a The U.S., Canada, and Mexico developed North American Industry Classification System (NAICS) is the new industry classification system, which replaces the U.S. Standard Industrial Classification (SIC) system to provide comparable statistics across the three countries. b A “non-employer firm” is defined as one that has no paid employees, has annual business receipts of $1,000 or more ($1 or more in the construction industries), and is subject to Federal income taxes. Most non-employers are self-employed individuals operating very small unincorporated businesses, which may or may not be the owner’s principal source of income. c “Receipts” (net of taxes) are defined as the revenue for goods produced, distributed, or services provided, including revenue earned from premiums, commissions and fees, rents, interest, dividends, and royalties. Receipts exclude all revenue collected for local, state, and Federal taxes. d “Employer establishments” consist of full and part-time employees, including salaried officers and executives of corporations, who were on the payroll in the pay period including March 12. Included are employees on sick leave, holidays, and vacations; not included are proprietors and partners of unincorporated businesses. e “Total annual payroll” includes all forms of compensation, such as salaries, wages, commissions, bonuses, vacation allowances, sick-leave pay, and the value of payments in-kind (e.g., free meals and lodgings) paid during the year to all employees. Source: U.S. Census Bureau, 2006, Nonemployer Statistics, U.S. Census Bureau, 2006, County Business Patterns (NAICS).
FINAL RIR/4(B)(2)/FRFA OF CRITICAL HABITAT DESIGNATION OF COOK INLET BELUGA WHALE AUGUST 11, 2010
6-14 NATIONAL MARINE FISHERIES SERVICE
Table 6-10 2006 County Business Patterns for Matanuska-Susitna Borough and Non-Employer Statistics
NAICS Code� Industry Code Description Non-Employer
Firms� Non-Employer
Receipts ($1,000)�
Employer Establishments�
Number of Employees
Annual Payroll ($1,000)�
11---- Forestry, fishing, hunting, and agriculture support 416 12,970 17 0-19 0
21---- Mining 18 967 5 0-19 0
22---- Utilities 11 266 3 100-249 0
23---- Construction 1,086 71,177 463 1,712 86,874
31---- Manufacturing 141 4,272 45 127 3,655
42---- Wholesale trade 53 4,402 37 367 16,613
44---- Retail trade 662 20,616 231 3,200 85,233
48---- Transportation & warehousing 253 14,728 68 244 9,605
51---- Information 59 2,370 23 528 29,571
52---- Finance & insurance 80 4,049 63 423 17,268
53---- Real estate & rental & leasing 447 27,180 78 278 7,933
54---- Professional, scientific & technical services 601 18,721 139 572 24,827
55---- Management of companies & enterprises 0 0 7 100-249 0
56---- Admin, support, waste mgt, remediation services 302 5,454 92 365 10,926
61---- Educational services 153 1,484 19 196 3,290
62---- Health care and social assistance 418 9,290 198 2,471 92,760
71---- Arts, entertainment & recreation 280 4,556 49 243 4,600
72---- Accommodation & food services 131 5,487 179 1,472 27,615
81---- Other services (except public administration) 649 19,015 151 692 14,764
99---- Unclassified establishments 0 0 9 0 170
------ Total 5,760 227,004 1,876 13,282 472,485
Notes: a The U.S., Canada, and Mexico developed North American Industry Classification System (NAICS) is the new industry classification system, which replaces the U.S. Standard Industrial Classification (SIC) system to provide comparable statistics across the three countries. b A “non-employer firm” is defined as one that has no paid employees, has annual business receipts of $1,000 or more ($1 or more in the construction industries), and is subject to Federal income taxes. Most non-employers are self-employed individuals operating very small unincorporated businesses, which may or may not be the owner’s principal source of income. c “Receipts” (net of taxes) are defined as the revenue for goods produced, distributed, or services provided, including revenue earned from premiums, commissions and fees, rents, interest, dividends, and royalties. Receipts exclude all revenue collected for local, state, and Federal taxes. d “Employer establishments” consist of full and part-time employees, including salaried officers and executives of corporations, who were on the payroll in the pay period including March 12. Included are employees on sick leave, holidays, and vacations; not included are proprietors and partners of unincorporated businesses. e “Total annual payroll” includes all forms of compensation, such as salaries, wages, commissions, bonuses, vacation allowances, sick-leave pay, and the value of payments in-kind (e.g., free meals and lodgings) paid during the year to all employees. Source: U.S. Census Bureau, 2006, Nonemployer Statistics, U.S. Census Bureau, 2006, County Business Patterns (NAICS)
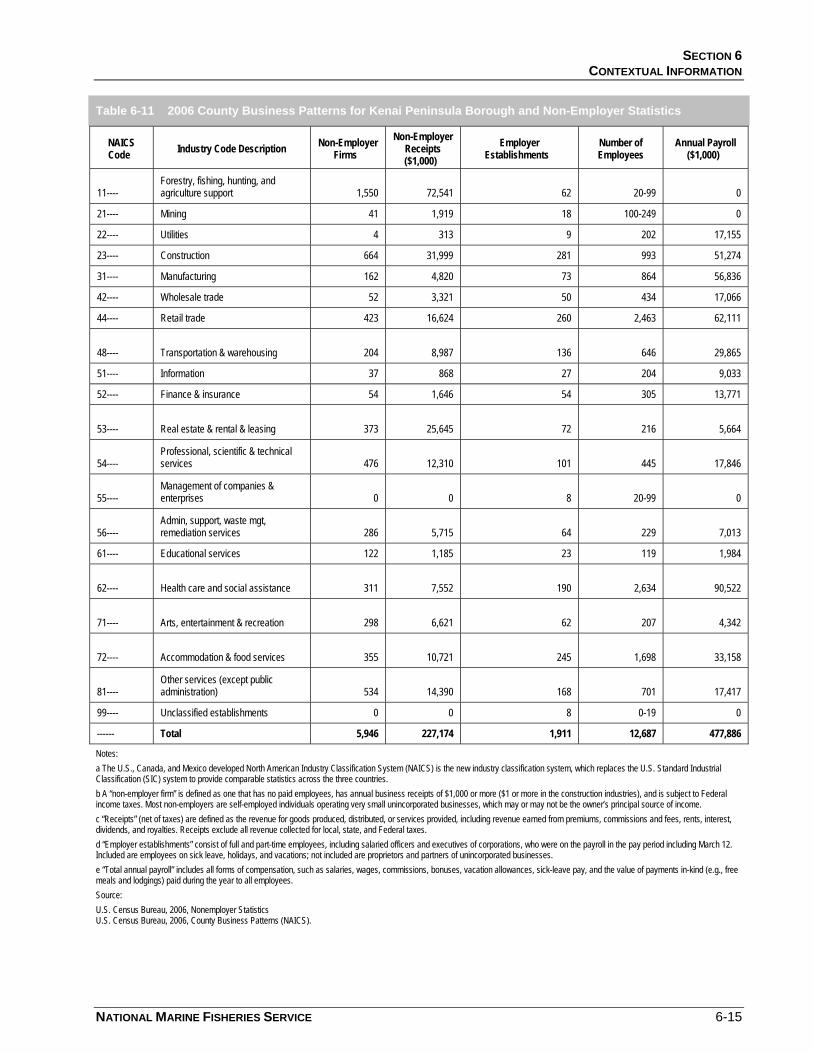
SECTION 6 CONTEXTUAL INFORMATION
NATIONAL MARINE FISHERIES SERVICE 6-15
Table 6-11 2006 County Business Patterns for Kenai Peninsula Borough and Non-Employer Statistics
NAICS Code� Industry Code Description Non-Employer
Firms� Non-Employer
Receipts ($1,000)�
Employer Establishments�
Number of Employees
Annual Payroll ($1,000)�
11---- Forestry, fishing, hunting, and agriculture support 1,550 72,541 62 20-99 0
21---- Mining 41 1,919 18 100-249 0
22---- Utilities 4 313 9 202 17,155
23---- Construction 664 31,999 281 993 51,274
31---- Manufacturing 162 4,820 73 864 56,836
42---- Wholesale trade 52 3,321 50 434 17,066
44---- Retail trade 423 16,624 260 2,463 62,111
48---- Transportation & warehousing 204 8,987 136 646 29,865
51---- Information 37 868 27 204 9,033
52---- Finance & insurance 54 1,646 54 305 13,771
53---- Real estate & rental & leasing 373 25,645 72 216 5,664
54---- Professional, scientific & technical services 476 12,310 101 445 17,846
55---- Management of companies & enterprises 0 0 8 20-99 0
56---- Admin, support, waste mgt, remediation services 286 5,715 64 229 7,013
61---- Educational services 122 1,185 23 119 1,984
62---- Health care and social assistance 311 7,552 190 2,634 90,522
71---- Arts, entertainment & recreation 298 6,621 62 207 4,342
72---- Accommodation & food services 355 10,721 245 1,698 33,158
81---- Other services (except public administration) 534 14,390 168 701 17,417
99---- Unclassified establishments 0 0 8 0-19 0
------ Total 5,946 227,174 1,911 12,687 477,886
Notes: a The U.S., Canada, and Mexico developed North American Industry Classification System (NAICS) is the new industry classification system, which replaces the U.S. Standard Industrial Classification (SIC) system to provide comparable statistics across the three countries. b A “non-employer firm” is defined as one that has no paid employees, has annual business receipts of $1,000 or more ($1 or more in the construction industries), and is subject to Federal income taxes. Most non-employers are self-employed individuals operating very small unincorporated businesses, which may or may not be the owner’s principal source of income. c “Receipts” (net of taxes) are defined as the revenue for goods produced, distributed, or services provided, including revenue earned from premiums, commissions and fees, rents, interest, dividends, and royalties. Receipts exclude all revenue collected for local, state, and Federal taxes. d “Employer establishments” consist of full and part-time employees, including salaried officers and executives of corporations, who were on the payroll in the pay period including March 12. Included are employees on sick leave, holidays, and vacations; not included are proprietors and partners of unincorporated businesses. e “Total annual payroll” includes all forms of compensation, such as salaries, wages, commissions, bonuses, vacation allowances, sick-leave pay, and the value of payments in-kind (e.g., free meals and lodgings) paid during the year to all employees. Source: U.S. Census Bureau, 2006, Nonemployer Statistics U.S. Census Bureau, 2006, County Business Patterns (NAICS).
FINAL RIR/4(B)(2)/FRFA OF CRITICAL HABITAT DESIGNATION OF COOK INLET BELUGA WHALE AUGUST 11, 2010
6-16 NATIONAL MARINE FISHERIES SERVICE
6.3 REGULATORY BASELINE
This section provides relevant information about the regulatory elements that exist in the absence of a CHD for the Cook Inlet beluga whale. Where proposed activities directly affect CH areas, these regulations may provide a level of protection to the species, even in the absence of Section 7 of the ESA. There are no HCPs associated with the Cook Inlet beluga whale.
6.3.1 Federal
Marine Mammal Protection Act
The Cook Inlet beluga whales benefit from protections afforded by the MMPA. The Cook Inlet beluga whales were designated as a depleted stock under the MMPA, in 2000, and a Draft Conservation Plan was published in 2005.81 A final Conservation Plan was made available in October 2008.82 The Conservation Plan is comprehensive, and provides recommendations to foster recovery of the species. While some recommendations are funded, many recommendations are unfunded. Therefore, it is uncertain whether these Cook Inlet beluga whale conservation measures will be implemented.
Subsistence harvest of marine mammals by Alaska Natives may be regulated when the population is designated as depleted under the MMPA, as is the case with Cook Inlet beluga whale. NMFS published a rule to provide for long-term subsistence harvest regulations for these Cook Inlet beluga whales in 2008.83
Endangered Species Act
Currently, the Cook Inlet beluga whale is listed as endangered under the ESA and is, therefore, protected under Section 7 of the ESA.84 Section 7 requires Federal agencies to ensure that actions they fund, authorize, or carry out will not jeopardize the continued existence of listed species, or destroy or adversely modify designated critical habitat. “Action,” in this case, is defined broadly to include Federal grants, permitting, licensing, or other regulatory actions.85 In general, if a listed species may be present in an action area, the Federal action agency must conduct a biological assessment to determine whether the proposed action may affect listed species. If the action agency’s assessment shows, and NMFS concurs, that the proposed action is not likely to result in jeopardizing any listed species or destruction or adverse modification of designated critical habitat, then the consultation is concluded.
If the Federal action agency’s biological assessment shows that a proposed action may result in jeopardizing any listed species or destruction or adverse modification of designated critical habitat, formal consultation and issuance of a biological opinion are required. During the formal consultation process, the action agency supplies NMFS with information that includes descriptions of the proposed action, action area, listed species that may be affected, and how the species may be affected by that action. NMFS has up to 135 days to complete consultation and prepare a biological opinion that contains the analysis of whether or not the proposed action would be likely to jeopardize the continued existence of the species or adversely modify or 81 70 FR 12853; March 16, 2005 82 NMFS, October 2008, “Conservation Plan for the Cook Inlet Beluga Whale.” 83 73 FR 60976; October 15, 2008. 84 71 FR 26852, October 22, 2008. 85 16 USC 1536(a)(2).
SECTION 6 CONTEXTUAL INFORMATION
NATIONAL MARINE FISHERIES SERVICE 6-17
destroy designated critical habitat. If a jeopardy or adverse modification determination is made, the biological opinion must identify reasonable and prudent alternatives (RPAs), if any, that would not jeopardize the continued existence of the listed species or destroy/adversely modify designated critical habitat and that are economically and technologically feasible. The action agency may choose to implement an RPA, modify the proposed action and consult with NMFS again, decide not to authorize, fund, or otherwise proceed with the action, or apply for an exception, a process rarely undertaken.
A biological opinion includes an incidental take statement (ITS) to authorize a take, resulting from the action. Incidental take is take that is incidental to, and not the purpose of, an otherwise lawful activity. The ITS also specifies reasonable and prudent measures (RPMs), considered necessary or appropriate to minimize the impact of the anticipated incidental take to the species.
Public Laws 106-31 (Section 3002) and 106-553 (Appendix B, Section 627); and 73 FR 60976 (October 15, 2008)
Public Law 106-31, Section 3002 prohibited, until October 1, 2000, the taking of Cook Inlet beluga whales, unless authorized through a cooperative agreement between the NMFS and Alaska Native organizations. In December 2000, Congress passed Public Law 106-553, Appendix B, Section 627, which extended the prohibition indefinitely. Each year, NMFS enters into a cooperative agreement with the Cook Inlet Marine Mammal Council to establish harvest limits and minimize waste and harassment.
In addition, regulations on subsistence harvest of Cook Inlet beluga whales, set forth in 73 FR 60976 (October 15, 2008), are considered by NMFS to be an effective conservation plan for managing subsistence harvest of the Cook Inlet population. The regulations set harvest limits for each five-year planning interval, beginning in 2008. Harvest limits are based on estimates of the population growth rate, estimated for the 10-year period prior to each five-year interval, and average abundance measured in the preceding five-year interval.
Magnuson-Stevens Fishery Management and Conservation Act: Essential Fish Habitat
The Magnuson-Stevens Fishery Conservation and Management Act (as amended through 1996) included provisions for the description of essential fish habitat (EFH) in fishery management plans, and consideration of actions to ensure the conservation and enhancement of habitat. In January 2007, the Act was amended to mandate the use of annual catch limits and accountability measures to end overfishing, provide for widespread market-based fishery management through limited access programs, and to call for increased international cooperation. This act may provide protection to Cook Inlet beluga whale PCEs by imposition of measures to prevent overfishing of Cook Inlet beluga whales’ primary prey species (Pacific salmon, Pacific eulachon, Pacific cod, walleye pollock, saffron cod, and yellowfin sole) and by improving conditions for these prey species by encouraging market based conservation strategies.
The EFH is defined as “those waters and substrate necessary to fish for spawning, breeding, feeding, or growth to maturity (16 USC § 1802(10)). NMFS has designated a number of areas within Cook Inlet as containing EFH. As such, the Magnuson-Stevens Act requires any Federal agency to consult with NMFS with respect to any action authorized, funded, or undertaken; or proposed to be authorized, funded, or undertaken, by such agency that may adversely affect the EFH. NMFS can provide recommendations to avoid or reduce the adverse impacts on EFH; however, Federal agencies are not required to follow those recommendations.
FINAL RIR/4(B)(2)/FRFA OF CRITICAL HABITAT DESIGNATION OF COOK INLET BELUGA WHALE AUGUST 11, 2010
6-18 NATIONAL MARINE FISHERIES SERVICE
Rivers and Harbors Act
The Rivers and Harbors Act (RHA; 33 USC §§ 401 et seq.) authorizes the USACE to issue permits for dams or dikes in intrastate waters of the U.S. (Section 9) and construction or other work, such as docks/piers and aquaculture structures, in or affecting navigable waters (Section 10). In issuing these permits, USACE conducts a “public interest balancing,” which can include evaluation of benefits and detriments of a project to fish and wildlife values, such as the Cook Inlet beluga whale. As a general matter, adverse impacts to Cook Inlet beluga whales are considered to be detrimental to the public interest, and the USACE findings for Section 10 permits must document how these impacts have been avoided. Through this evaluation, USACE requires applicants to avoid and minimize impacts to the Cook Inlet beluga whale, by altering the design of a project or by imposing mitigation actions.
The RHA also authorizes the U.S. Coast Guard (USCG) to protect U.S. navigable waters. Navigable waters are those waters that, at some time in the past, present, or future, are used to transport interstate or foreign commerce. Under 14 USC § 81, the USCG is charged with establishing, maintaining, and operating aids to navigation to serve the needs of U.S. armed forces and maritime commerce, and when those aids are electronic, air commerce as well, when requested by the Federal Aviation Administration. Protection of navigable waters also includes regulating bridge-related activities. In general, a bridge cannot be constructed across any navigable water(s) until the USCG has approved the location and construction plans.
Clean Water Act (CWA)
The purpose of the CWA is to restore the physical, biological, and chemical integrity of the waters of the United States, using two basic mechanisms: (1) direct regulation of discharges pursuant to permits issued under the National Pollution Discharge Elimination System (NPDES) and Section 404 (discharge of dredge or fill materials); and (2) the Title III water quality program.
Under the NPDES program, the U.S. Environmental Protection Agency (EPA) sets pollutant-specific limits on the point source discharges for major industries and provides permits to individual point sources that apply these limits. EPA has delegated responsibility for the NPDES permitting program to most states. State-issued NPDES permits are treated as non-Federal actions. As such, the issuance of NPDES permits by states is not subject to the consultation requirements of the ESA.
Under the water quality standards program, EPA has issued water quality criteria to establish limits on the ambient concentration of pollutants in surface waters that will still protect the health of the water body. States issue water quality standards that reflect the Federal water quality criteria and submit the standards to EPA for review. State water quality standards are subject to review every three years (triennial review). States apply the standards to NPDES discharge permits to ensure that discharges do not violate the water quality standards.
Under Section 401 of the CWA, all applicants for a Federal license or permit to conduct activity that may result in discharge to navigable waters of the United States are required to submit a State certification to the licensing or permitting agency. Section 404 of the CWA prescribes a permit program for the discharge of dredged or fill material into navigable waters. Specifically, pursuant to Section 404, permit applicants are required to show that they have “taken steps to avoid wetland impacts, where practicable, minimized potential impacts to wetlands, and provided compensation for any remaining, unavoidable impacts through activities to restore or recreate wetlands.”
SECTION 6 CONTEXTUAL INFORMATION
NATIONAL MARINE FISHERIES SERVICE 6-19
The CWA will influence activities occurring within the proposed Cook Inlet beluga whale CHD, because these activities (e.g., road/bridge construction) may require NPDES or Section 404 permits.
Clean Water Act; Comprehensive Environmental Response, Compensation, and Liability Act and Oil Pollution Act of 1990
The CWA, Comprehensive Environmental Response, Compensation, and Liability Act (42 USC §§ 9601 et seq.), and Oil Pollution Act of 1990 (33 USC §§ 2701 et seq.) mandate that parties that release hazardous materials or oil into the environment are responsible not only for the cost of cleaning up the release, but they are also responsible for restoring any injury to natural resources that results from the actual or threatened release, or from response actions. These provisions are applied to address impacts to Cook Inlet beluga whales from release incidents.
Water Resources Development Act
The Water Resources Development Act (33 USC §§ 2201 et seq.) authorizes the construction or study of USACE projects, and applies to all features of water resources development and planning, including environmental assessment and mitigation requirements.
Act to Prevent Pollution from Ships (APPS) as amended by the Marine Plastic Pollution Research and Control Act (MPPRCA)
The APPS, as amended by the MPPRCA, protects Cook Inlet beluga whales by requiring all U.S. ships and all ships in U.S. navigable waters or the exclusive economic zone (EEZ) to comply with the International Convention for the Prevention of Pollution from Ships (33 USC §§ 1901 et seq.). Under the regulations implementing APPS, as amended by MPPRCA, the discharge of plastics, including synthetic ropes, fishing nets, plastic bags, and a biodegradable plastic, into the water is prohibited. Discharge of floating dunnage, lining, and packing materials is prohibited in the navigable waters and in areas offshore less than 25 nautical miles from the nearest land. Food waste or paper, rags, glass, metal, bottles, crockery, and similar refuse cannot be discharged in the navigable waters or in waters offshore inside 12 nautical miles from the nearest land. Finally, food waste, paper, rags, glass, and similar refuse cannot be discharged in the navigable waters or in waters offshore inside three nautical miles from the nearest land. There are some exceptions for emergencies. USCG has the primary responsibility for enforcing regulations under the APPS, and the APPS applies to all vessels, including cruise ships, regardless of flag, operating in U.S. navigable waters and the EEZ.
The Lacey Act
The Lacey Act, as amended in 1981 (16 USC §§ 3372 et seq.), prohibits the trade of fish, wildlife, or plants taken in violation of any foreign, state, tribal or other U.S. law. For example, it is a violation of the Lacey Act for a retail store in New York to sell Cook Inlet beluga whale parts taken illegally from Alaska. However, Cook Inlet beluga whale parts taken by Alaska Natives through authorized subsistence hunting, pursuant to Public Law 106-31 (Section 3002), Public Law 106-553 (Appendix B, Section 627), and 73 FR 60976 (October 15, 2008), may be sold.
FINAL RIR/4(B)(2)/FRFA OF CRITICAL HABITAT DESIGNATION OF COOK INLET BELUGA WHALE AUGUST 11, 2010
6-20 NATIONAL MARINE FISHERIES SERVICE
Army Regulation 200-3 and the Sikes Act (16 USC 670a-670o, 74 Stat. 1052), as amended, Public Law 86-797
Army Regulation 200-3 and the Sikes Act are the guiding legislation for fish and wildlife management and the development of an Integrated Natural Resource Management Plan (INRMP) on Army installations.86 Similarly, INRMPs are required for Air Force installations by the Sikes Act, Department of Defense Instruction (DODI) 4715.3, DODI 4700.4, Air Force Instruction 32-7064, and Wing Instruction 32-7001.87 Both Elmendorf Air Force Base and Fort Richardson have developed INRMPs. The National Defense Authorization Act of 2004 provides for potential exclusions, provided that an INRMP is in place.
6.3.2 State Regulations
Alaska Statutes 16.05.841 and 16.05.871 provide a measure of protection to some of the identified Cook Inlet beluga whales’ PCEs, by requiring Fish Habitat Permits for activities that may impact the habitat of fish species, including the species upon which the Cook Inlet beluga whale preys. These statutes are discussed below. For activities that are low impact, practiced by several members of the public in a defined area, and traditional in use (such as boat launches and stream crossings along popular trail systems), General Permits may be issued in place of Fish Habitat Permits.88
Alaska Statute 16.05.841 (Fishway Act)
The Fishway Act prohibits activities that cross or occur within a stream that fish use and impair the efficient passage of fish without prior notification to and authorization from ADF&G, Division of Habitat. Examples of the types of uses or activities that require authorization from the Division of Habitat include water withdrawals; low-water crossings; stream realignment or diversion; dams; culvert installation; and construction, placement, deposition, or removal of any material or structure below ordinary high water.89
Alaska Statute 16.05.871 (Anadromous Fish Act)
Pursuant to the Anadromous Fish Act, private parties and government agencies must obtain approval from the ADF&G, Division of Habitat for all activities that occur within or across specified anadromous water bodies. Activities that “use, divert, obstruct, pollute, or change the natural flow or bed” of a specified anadromous water body (quoted portions from AS 16.05.871 (b)) may include construction; bank stabilization; blasting; road crossings; mining; water withdrawals; the use of vehicles or equipment in the waterway; gravel removal; stream realignment or diversion; and the placement, excavation, deposition, or removal of any material.90
86 U.S. Army Garrison Alaska, 2006, 2007-2011 Integrated Natural Resources Management Plan, Volume II, Annex D Fish and Wildlife
Management 87 Elmendorf AFB, Conservation and Planning Office, 2006, Integrated Natural Resources Management Plan Elmendorf Air Force Base, Alaska 88 Alaska Department of Fish and Game, Division of Habitat website, “Fish Habitat (Title 16) Permits,” accessed May 12, 2009. 89 Ibid. 90 Ibid.

SECTION 6 CONTEXTUAL INFORMATION
NATIONAL MARINE FISHERIES SERVICE 6-21
6.3.3 International
There are no known international or foreign regulations specifically developed to protect the Cook Inlet beluga whale.
6.4 CURRENT AND PROJECTED ECONOMIC AND SOCIAL ACTIVITY
This section discusses the economic and social activities within and in the vicinity of the Cook Inlet beluga whale proposed CHD.
6.4.1 Oil and Gas Development
Cook Inlet oil and natural gas (gas) production totaled 6.14 million barrels of oil (MMBO) and 196.6 billion cubic feet (Bcf) of gas, respectively, in 2006.91 The Kenai Peninsula Borough oil and gas development, located along the eastern shores of Cook Inlet, is in an advanced stage of production. Without new exploration and development, oil and gas production is projected to drop sharply over the next 20 years, with oil output expected to be 1.81 MMBO, while gas production is expected to be 17.0 Bcf in 2026.92 Despite this, it is projected that Cook Inlet has 30 trillion cubic feet of original-gas-in place, or more than twice the amount already discovered; additional production would require exploration.93
Cook Inlet natural gas production supplies the Phillips/Marathon Kenai liquid natural gas (LNG) plant, the Tesoro/Kenai refinery, Tesoro pipeline and power utilities in southcentral Alaska. There was also the Agrium urea-ammonia fertilizer plant in Kenai that used natural gas as its feedstock, but the facility closed at the end of 2007.94
Oil Production
There are currently 13 oil platforms (in nine production areas) operating in Cook Inlet, of which the majority is owned by Chevron (see Figure 6-2). Most of the activity shown on Figure 6-2 consists of individual well mains operating on existing platforms, and many of these platforms are depleted and use secondary recovery to extract the remaining oil.95 While there are some remaining untested areas where oil may occur, oil production in Cook Inlet is expected to decline to less than 2 MMBO per year by 2026. Oil production in the inlet began in 1960 and peaked at approximately 83 MMBO per year in 1970. As provided in Table 6-12, Cook Inlet oil production had declined to 6 MMBO by 2006.96
91 Alaska Oil and Gas Report, July 2007, Alaska Department of Natural Resources, Division of Oil and Gas, Anchorage, Alaska. 92 Alaska Department of Labor, Alaska Economic Trends: Alaska’s Oil Industry, 2008, Volume 28 (9). 93 U.S. Department of Energy, National Energy Technology Laboratory, 2006, Alaska Natural Gas Needs and Market Assessment. 94 Alaska Department of Labor, Alaska Economic Trends: Alaska’s Oil Industry, 2008, Volume 28 (9). 95 Havelock, Brian. 2009. Natural Resource Specialist, Alaska Department of Natural Resources, Division of Oil and Gas. Personal communication
with ENTRIX staff, April 8. 96 Alaska Department of Natural Resources, Division of Oil and Gas, 2007, Alaska Oil and Gas Report, July, Anchorage, Alaska.
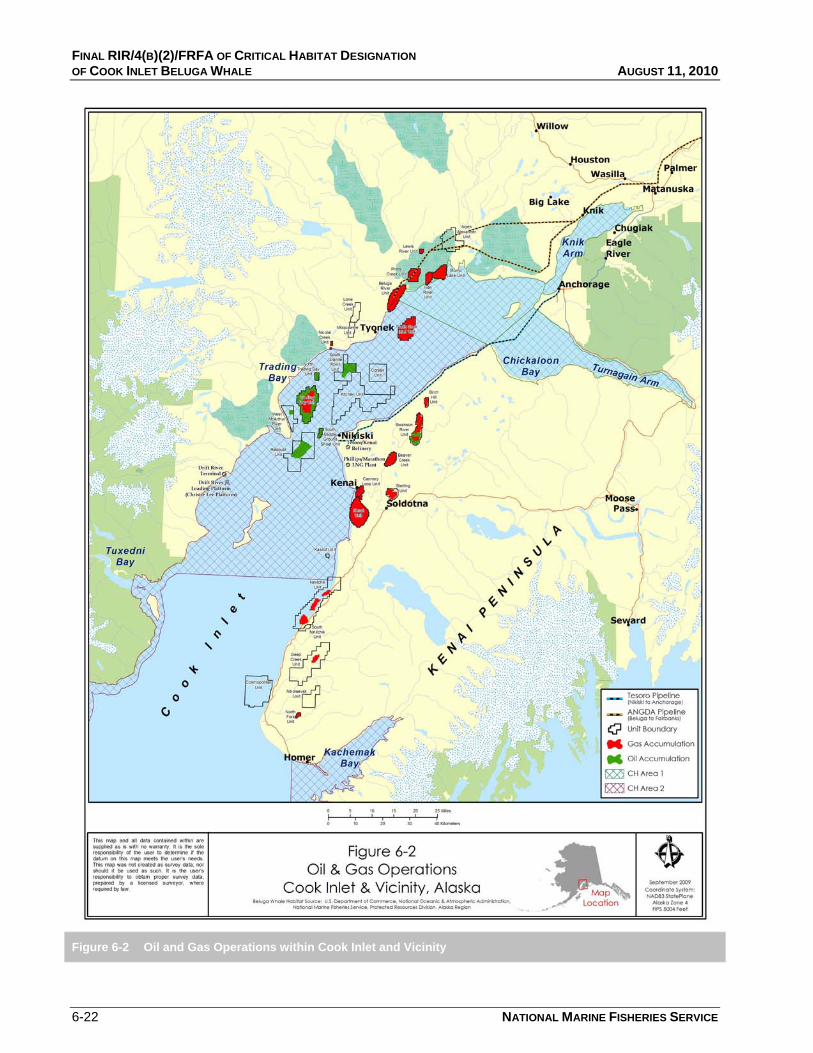
FINAL RIR/4(B)(2)/FRFA OF CRITICAL HABITAT DESIGNATION OF COOK INLET BELUGA WHALE AUGUST 11, 2010
6-22 NATIONAL MARINE FISHERIES SERVICE
Figure 6-2 Oil and Gas Operations within Cook Inlet and Vicinity
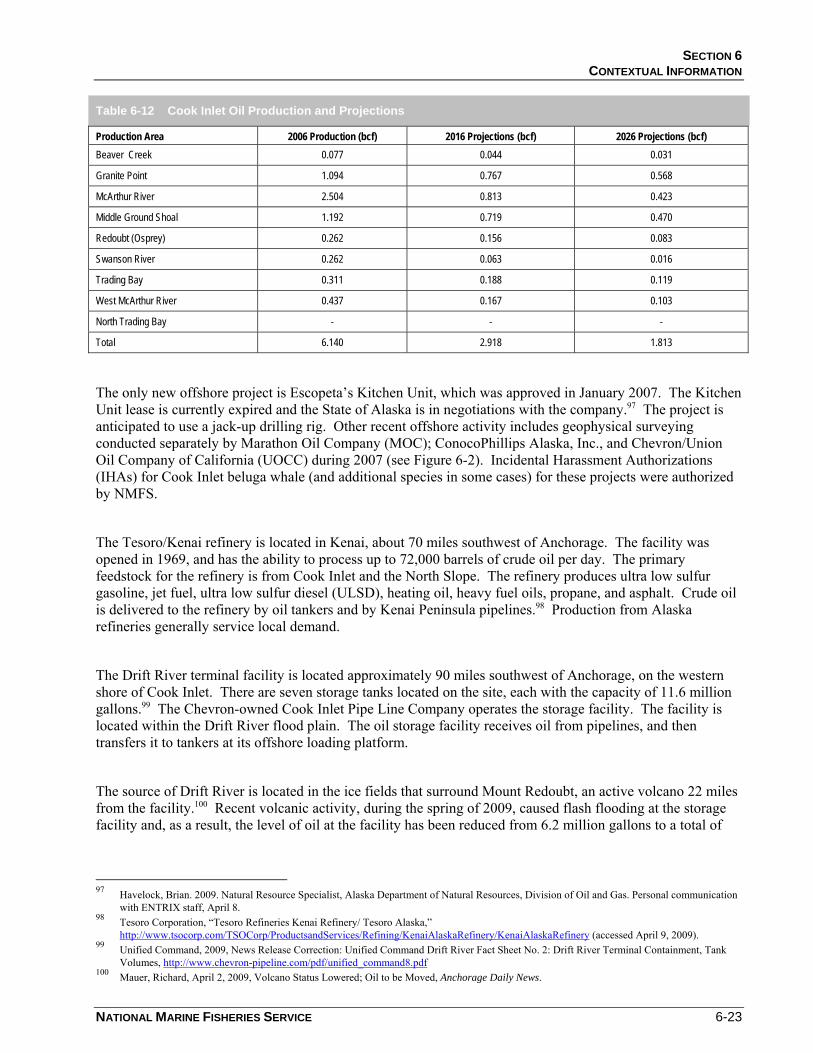
SECTION 6 CONTEXTUAL INFORMATION
NATIONAL MARINE FISHERIES SERVICE 6-23
Table 6-12 Cook Inlet Oil Production and Projections
Production Area 2006 Production (bcf) 2016 Projections (bcf) 2026 Projections (bcf) Beaver Creek 0.077 0.044 0.031
Granite Point 1.094 0.767 0.568
McArthur River 2.504 0.813 0.423
Middle Ground Shoal 1.192 0.719 0.470
Redoubt (Osprey) 0.262 0.156 0.083
Swanson River 0.262 0.063 0.016
Trading Bay 0.311 0.188 0.119
West McArthur River 0.437 0.167 0.103
North Trading Bay - - -
Total 6.140 2.918 1.813
The only new offshore project is Escopeta’s Kitchen Unit, which was approved in January 2007. The Kitchen Unit lease is currently expired and the State of Alaska is in negotiations with the company.97 The project is anticipated to use a jack-up drilling rig. Other recent offshore activity includes geophysical surveying conducted separately by Marathon Oil Company (MOC); ConocoPhillips Alaska, Inc., and Chevron/Union Oil Company of California (UOCC) during 2007 (see Figure 6-2). Incidental Harassment Authorizations (IHAs) for Cook Inlet beluga whale (and additional species in some cases) for these projects were authorized by NMFS.
The Tesoro/Kenai refinery is located in Kenai, about 70 miles southwest of Anchorage. The facility was opened in 1969, and has the ability to process up to 72,000 barrels of crude oil per day. The primary feedstock for the refinery is from Cook Inlet and the North Slope. The refinery produces ultra low sulfur gasoline, jet fuel, ultra low sulfur diesel (ULSD), heating oil, heavy fuel oils, propane, and asphalt. Crude oil is delivered to the refinery by oil tankers and by Kenai Peninsula pipelines.98 Production from Alaska refineries generally service local demand.
The Drift River terminal facility is located approximately 90 miles southwest of Anchorage, on the western shore of Cook Inlet. There are seven storage tanks located on the site, each with the capacity of 11.6 million gallons.99 The Chevron-owned Cook Inlet Pipe Line Company operates the storage facility. The facility is located within the Drift River flood plain. The oil storage facility receives oil from pipelines, and then transfers it to tankers at its offshore loading platform.
The source of Drift River is located in the ice fields that surround Mount Redoubt, an active volcano 22 miles from the facility.100 Recent volcanic activity, during the spring of 2009, caused flash flooding at the storage facility and, as a result, the level of oil at the facility has been reduced from 6.2 million gallons to a total of
97 Havelock, Brian. 2009. Natural Resource Specialist, Alaska Department of Natural Resources, Division of Oil and Gas. Personal communication
with ENTRIX staff, April 8. 98 Tesoro Corporation, “Tesoro Refineries Kenai Refinery/ Tesoro Alaska,”
http://www.tsocorp.com/TSOCorp/ProductsandServices/Refining/KenaiAlaskaRefinery/KenaiAlaskaRefinery (accessed April 9, 2009). 99 Unified Command, 2009, News Release Correction: Unified Command Drift River Fact Sheet No. 2: Drift River Terminal Containment, Tank
Volumes, http://www.chevron-pipeline.com/pdf/unified_command8.pdf 100 Mauer, Richard, April 2, 2009, Volcano Status Lowered; Oil to be Moved, Anchorage Daily News.
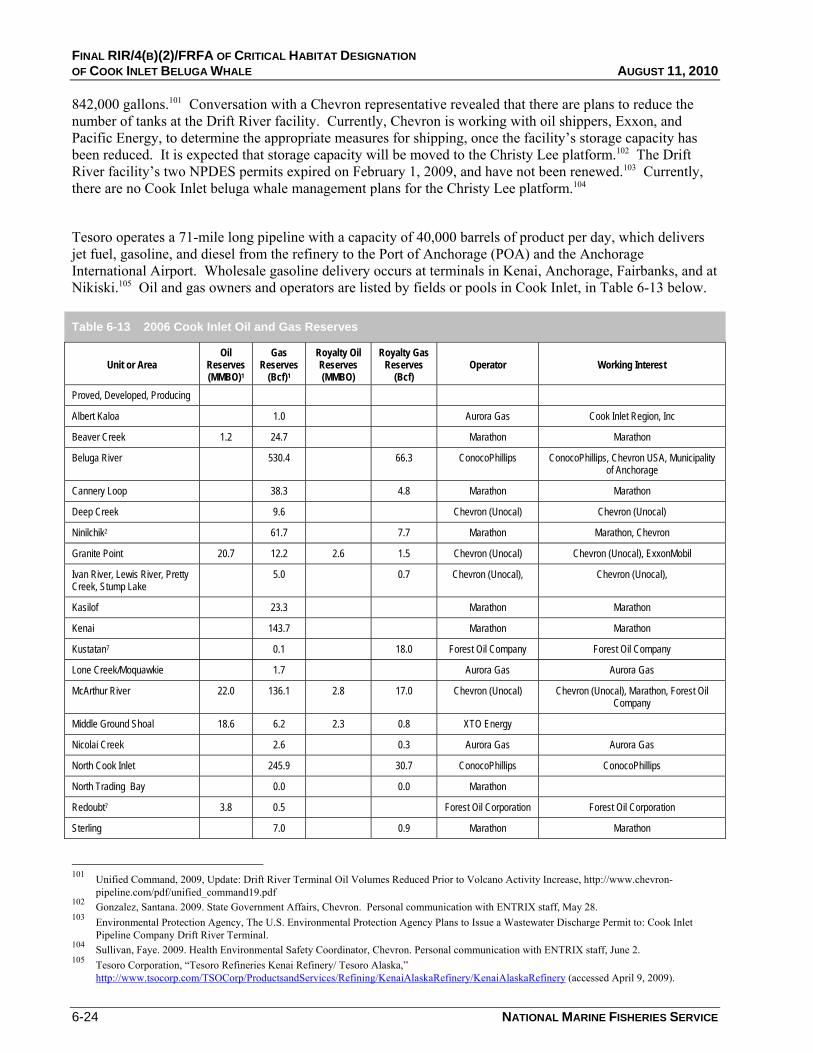
FINAL RIR/4(B)(2)/FRFA OF CRITICAL HABITAT DESIGNATION OF COOK INLET BELUGA WHALE AUGUST 11, 2010
6-24 NATIONAL MARINE FISHERIES SERVICE
842,000 gallons.101 Conversation with a Chevron representative revealed that there are plans to reduce the number of tanks at the Drift River facility. Currently, Chevron is working with oil shippers, Exxon, and Pacific Energy, to determine the appropriate measures for shipping, once the facility’s storage capacity has been reduced. It is expected that storage capacity will be moved to the Christy Lee platform.102 The Drift River facility’s two NPDES permits expired on February 1, 2009, and have not been renewed.103 Currently, there are no Cook Inlet beluga whale management plans for the Christy Lee platform.104
Tesoro operates a 71-mile long pipeline with a capacity of 40,000 barrels of product per day, which delivers jet fuel, gasoline, and diesel from the refinery to the Port of Anchorage (POA) and the Anchorage International Airport. Wholesale gasoline delivery occurs at terminals in Kenai, Anchorage, Fairbanks, and at Nikiski.105 Oil and gas owners and operators are listed by fields or pools in Cook Inlet, in Table 6-13 below.
Table 6-13 2006 Cook Inlet Oil and Gas Reserves
Unit or Area Oil
Reserves (MMBO)1
Gas Reserves
(Bcf)1
Royalty Oil Reserves (MMBO)
Royalty Gas Reserves
(Bcf) Operator Working Interest
Proved, Developed, Producing
Albert Kaloa 1.0 Aurora Gas Cook Inlet Region, Inc
Beaver Creek 1.2 24.7 Marathon Marathon
Beluga River 530.4 66.3 ConocoPhillips ConocoPhillips, Chevron USA, Municipality of Anchorage
Cannery Loop 38.3 4.8 Marathon Marathon
Deep Creek 9.6 Chevron (Unocal) Chevron (Unocal)
Ninilchik2 61.7 7.7 Marathon Marathon, Chevron
Granite Point 20.7 12.2 2.6 1.5 Chevron (Unocal) Chevron (Unocal), ExxonMobil
Ivan River, Lewis River, Pretty Creek, Stump Lake
5.0 0.7 Chevron (Unocal), Chevron (Unocal),
Kasilof 23.3 Marathon Marathon
Kenai 143.7 Marathon Marathon
Kustatan7 0.1 18.0 Forest Oil Company Forest Oil Company
Lone Creek/Moquawkie 1.7 Aurora Gas Aurora Gas
McArthur River 22.0 136.1 2.8 17.0 Chevron (Unocal) Chevron (Unocal), Marathon, Forest Oil Company
Middle Ground Shoal 18.6 6.2 2.3 0.8 XTO Energy
Nicolai Creek 2.6 0.3 Aurora Gas Aurora Gas
North Cook Inlet 245.9 30.7 ConocoPhillips ConocoPhillips
North Trading Bay 0.0 0.0 Marathon
Redoubt7 3.8 0.5 Forest Oil Corporation Forest Oil Corporation
Sterling 7.0 0.9 Marathon Marathon
101 Unified Command, 2009, Update: Drift River Terminal Oil Volumes Reduced Prior to Volcano Activity Increase, http://www.chevron-
pipeline.com/pdf/unified_command19.pdf 102 Gonzalez, Santana. 2009. State Government Affairs, Chevron. Personal communication with ENTRIX staff, May 28. 103 Environmental Protection Agency, The U.S. Environmental Protection Agency Plans to Issue a Wastewater Discharge Permit to: Cook Inlet
Pipeline Company Drift River Terminal. 104 Sullivan, Faye. 2009. Health Environmental Safety Coordinator, Chevron. Personal communication with ENTRIX staff, June 2. 105 Tesoro Corporation, “Tesoro Refineries Kenai Refinery/ Tesoro Alaska,”
http://www.tsocorp.com/TSOCorp/ProductsandServices/Refining/KenaiAlaskaRefinery/KenaiAlaskaRefinery (accessed April 9, 2009).

SECTION 6 CONTEXTUAL INFORMATION
NATIONAL MARINE FISHERIES SERVICE 6-25
Unit or Area Oil
Reserves (MMBO)1
Gas Reserves
(Bcf)1
Royalty Oil Reserves (MMBO)
Royalty Gas Reserves
(Bcf) Operator Working Interest
Swanson River 1.7 7.1 Chevron (Unocal) Chevron (Unocal)
Three Mile Creek 0.8 Aurora Gas Aurora Gas, Forest Oil Corporation
Trading Bay 5.0 2.9 0.6 0.4 Chevron (Unocal) Chevron (Unocal), Marathon, Forest Oil Corporation
West Foreland73 5.7 0.5 Forest Oil Corporation
West Fork 1.2 Marathon Cook Inlet Region, Inc.
West MacArthur River7 4.6 1.1 0.6 0.1 Forest Oil Corporation Forest Oil Corporation
Wolf Lake4 0.1 Marathon Cook Inlet Region, Inc
Probable, Undeveloped
Birch Hill Chevron (Unocal) Chevron (Unocal), CIRI, Marathon
Tyonek Deep5 25.0 30.0 3.1 3.8 Phillips Petroleum Company
Phillips Petroleum Company
Other Probable/Under-development6
385.6 48.2
Total Cook Inlet 102.5 1,684.6 12.0 201.7 1 Remaining recoverable reserves are based on the sum of Alaska Department Revenue forecasted production from 2007-2036. MMBO = Million Barrels of Oil; Bcf = Billion Cubic Feet. 2 Ninilchik Unit includes Falls Creek, Grassim Oskolkoff, Susan Dionne, and Paxton PAs. 3 West Foreland royalty is 5 percent on State acreage and 12.5 percent on Federal acreage. 4 Subsurface lands owned by Cook Inlet Region, Incorporated. 5 DNR Estimate. 6 Includes DNR estimates of non-producing, probable reserves based primarily gas prospectively in the Nikolaevsk and North Fork exploration areas. Also includes risked probable reserves estimates for the developed-producing fields based on a material balance, plans of development, historic well production rates, and field characteristics. 7 Forest Oil Corporation/Company sold their interest in all Cook Inlet holdings in 2007 to Pacific Energy Sources, Ltd., which has since filed for Chapter 11. Source: Alaska Department of Natural Resources Division of Oil and Gas, 2007, Alaska Oil and Gas Report, Anchorage, Alaska. Personal communication with Brian Havelock, Natural Resource Specialist, Alaska Department of Natural Resources, Division of Oil and Gas, April 9, 2009.
There is currently no oil or gas activity in Cook Inlet beluga whale Area 1 CHD, due to its lower geologic potential for oil deposits and the cost prohibitive nature of drilling there.106
Natural Gas Production
The LNG plant, located in Kenai, is the only LNG export facility in the United States, and has been in operation since 1969.107 Natural gas produced from the Tyonek platform provides the majority of ConocoPhillips’ source for the Kenai LNG facility. Once the natural gas is converted into a liquid form, it is loaded onto one of two ships and transported to Japan. Export authorizations have been obtained for Kenai LNG sales through March 2011. In 2007, ConocoPhillips sold 31.2 Bcf of LNG to customers in Japan.108
The majority of Anchorage Alaska’s energy needs are provided by the Beluga River natural gas field.109 The Beluga River gas field is located approximately 40 miles from Anchorage, on the western shore of Cook Inlet. 106 Tesoro Corporation, “Tesoro Refineries Kenai Refinery/ Tesoro Alaska,”
http://www.tsocorp.com/TSOCorp/ProductsandServices/Refining/KenaiAlaskaRefinery/KenaiAlaskaRefinery (accessed April 9, 2009). 107 Prevost, Jim, 2000, “On Track at Kenai’s LNG Plant,” Alaska Business Monthly. 108 ConocoPhillips Company. “United States – Alaska,” http://www.conocophillips.com/about/worldwide_ops/country/north_america/alaska.htm
(accessed April 10, 2009). 109 Stone, Norman, Robert G. Lindblom, 1987, Energy Insurance for Anchorage, Alaska – Beluga River Gas Field, Cook Inlet: Abstract. AAPG
Bulletin, Volume 71.
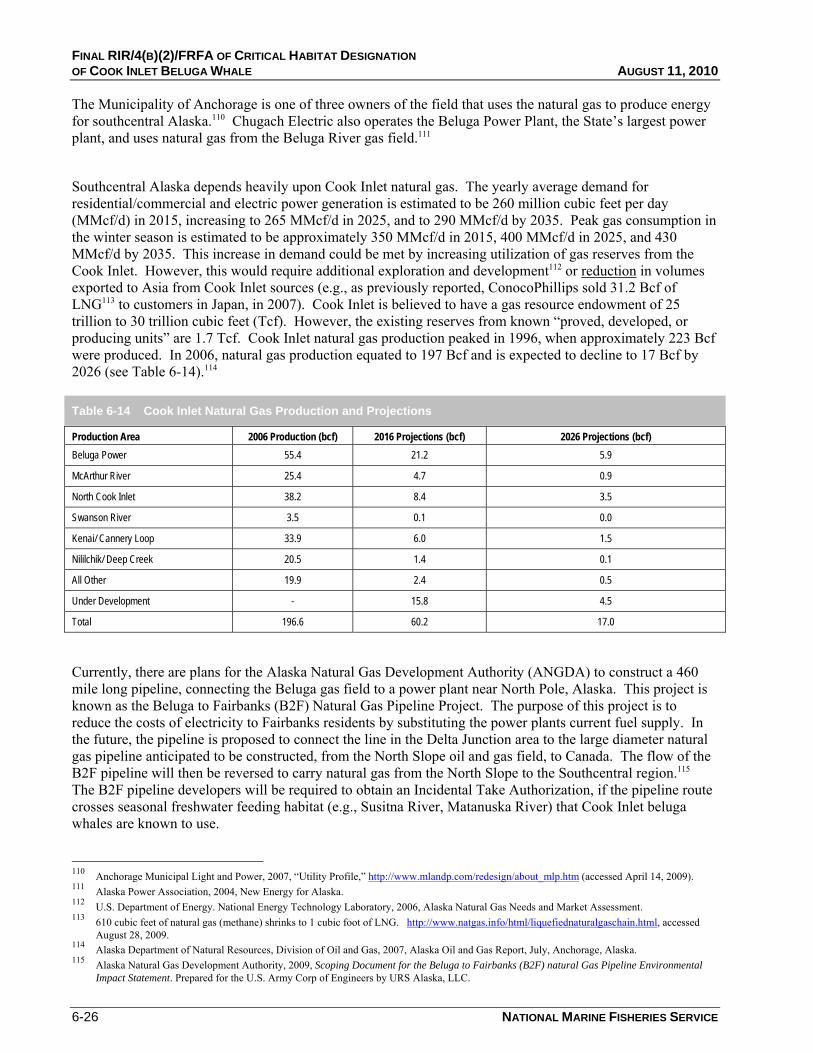
FINAL RIR/4(B)(2)/FRFA OF CRITICAL HABITAT DESIGNATION OF COOK INLET BELUGA WHALE AUGUST 11, 2010
6-26 NATIONAL MARINE FISHERIES SERVICE
The Municipality of Anchorage is one of three owners of the field that uses the natural gas to produce energy for southcentral Alaska.110 Chugach Electric also operates the Beluga Power Plant, the State’s largest power plant, and uses natural gas from the Beluga River gas field.111
Southcentral Alaska depends heavily upon Cook Inlet natural gas. The yearly average demand for residential/commercial and electric power generation is estimated to be 260 million cubic feet per day (MMcf/d) in 2015, increasing to 265 MMcf/d in 2025, and to 290 MMcf/d by 2035. Peak gas consumption in the winter season is estimated to be approximately 350 MMcf/d in 2015, 400 MMcf/d in 2025, and 430 MMcf/d by 2035. This increase in demand could be met by increasing utilization of gas reserves from the Cook Inlet. However, this would require additional exploration and development112 or reduction in volumes exported to Asia from Cook Inlet sources (e.g., as previously reported, ConocoPhillips sold 31.2 Bcf of LNG113 to customers in Japan, in 2007). Cook Inlet is believed to have a gas resource endowment of 25 trillion to 30 trillion cubic feet (Tcf). However, the existing reserves from known “proved, developed, or producing units” are 1.7 Tcf. Cook Inlet natural gas production peaked in 1996, when approximately 223 Bcf were produced. In 2006, natural gas production equated to 197 Bcf and is expected to decline to 17 Bcf by 2026 (see Table 6-14).114
Table 6-14 Cook Inlet Natural Gas Production and Projections
Production Area 2006 Production (bcf) 2016 Projections (bcf) 2026 Projections (bcf) Beluga Power 55.4 21.2 5.9
McArthur River 25.4 4.7 0.9
North Cook Inlet 38.2 8.4 3.5
Swanson River 3.5 0.1 0.0
Kenai/ Cannery Loop 33.9 6.0 1.5
Nililchik/ Deep Creek 20.5 1.4 0.1
All Other 19.9 2.4 0.5
Under Development - 15.8 4.5
Total 196.6 60.2 17.0
Currently, there are plans for the Alaska Natural Gas Development Authority (ANGDA) to construct a 460 mile long pipeline, connecting the Beluga gas field to a power plant near North Pole, Alaska. This project is known as the Beluga to Fairbanks (B2F) Natural Gas Pipeline Project. The purpose of this project is to reduce the costs of electricity to Fairbanks residents by substituting the power plants current fuel supply. In the future, the pipeline is proposed to connect the line in the Delta Junction area to the large diameter natural gas pipeline anticipated to be constructed, from the North Slope oil and gas field, to Canada. The flow of the B2F pipeline will then be reversed to carry natural gas from the North Slope to the Southcentral region.115 The B2F pipeline developers will be required to obtain an Incidental Take Authorization, if the pipeline route crosses seasonal freshwater feeding habitat (e.g., Susitna River, Matanuska River) that Cook Inlet beluga whales are known to use.
110 Anchorage Municipal Light and Power, 2007, “Utility Profile,” http://www.mlandp.com/redesign/about_mlp.htm (accessed April 14, 2009). 111 Alaska Power Association, 2004, New Energy for Alaska. 112 U.S. Department of Energy. National Energy Technology Laboratory, 2006, Alaska Natural Gas Needs and Market Assessment. 113 610 cubic feet of natural gas (methane) shrinks to 1 cubic foot of LNG. http://www.natgas.info/html/liquefiednaturalgaschain.html, accessed
August 28, 2009. 114 Alaska Department of Natural Resources, Division of Oil and Gas, 2007, Alaska Oil and Gas Report, July, Anchorage, Alaska. 115 Alaska Natural Gas Development Authority, 2009, Scoping Document for the Beluga to Fairbanks (B2F) natural Gas Pipeline Environmental
Impact Statement. Prepared for the U.S. Army Corp of Engineers by URS Alaska, LLC.
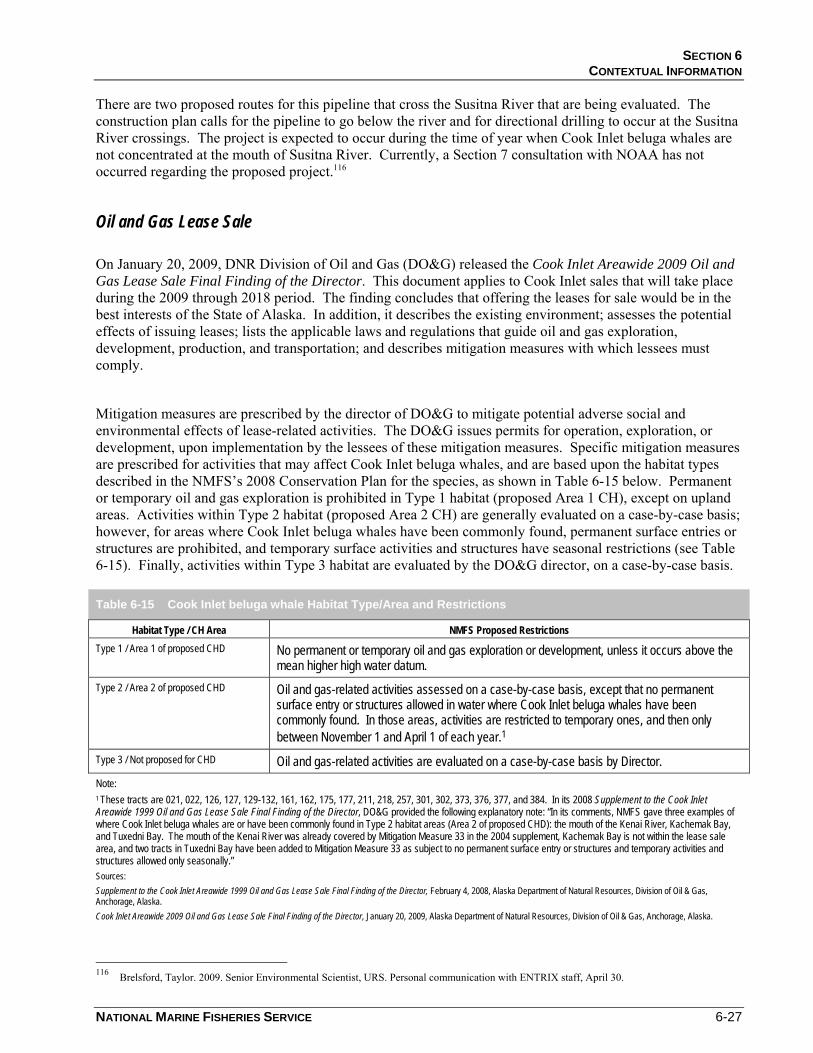
SECTION 6 CONTEXTUAL INFORMATION
NATIONAL MARINE FISHERIES SERVICE 6-27
There are two proposed routes for this pipeline that cross the Susitna River that are being evaluated. The construction plan calls for the pipeline to go below the river and for directional drilling to occur at the Susitna River crossings. The project is expected to occur during the time of year when Cook Inlet beluga whales are not concentrated at the mouth of Susitna River. Currently, a Section 7 consultation with NOAA has not occurred regarding the proposed project.116
Oil and Gas Lease Sale
On January 20, 2009, DNR Division of Oil and Gas (DO&G) released the Cook Inlet Areawide 2009 Oil and Gas Lease Sale Final Finding of the Director. This document applies to Cook Inlet sales that will take place during the 2009 through 2018 period. The finding concludes that offering the leases for sale would be in the best interests of the State of Alaska. In addition, it describes the existing environment; assesses the potential effects of issuing leases; lists the applicable laws and regulations that guide oil and gas exploration, development, production, and transportation; and describes mitigation measures with which lessees must comply.
Mitigation measures are prescribed by the director of DO&G to mitigate potential adverse social and environmental effects of lease-related activities. The DO&G issues permits for operation, exploration, or development, upon implementation by the lessees of these mitigation measures. Specific mitigation measures are prescribed for activities that may affect Cook Inlet beluga whales, and are based upon the habitat types described in the NMFS’s 2008 Conservation Plan for the species, as shown in Table 6-15 below. Permanent or temporary oil and gas exploration is prohibited in Type 1 habitat (proposed Area 1 CH), except on upland areas. Activities within Type 2 habitat (proposed Area 2 CH) are generally evaluated on a case-by-case basis; however, for areas where Cook Inlet beluga whales have been commonly found, permanent surface entries or structures are prohibited, and temporary surface activities and structures have seasonal restrictions (see Table 6-15). Finally, activities within Type 3 habitat are evaluated by the DO&G director, on a case-by-case basis.
Table 6-15 Cook Inlet beluga whale Habitat Type/Area and Restrictions
Habitat Type / CH Area NMFS Proposed Restrictions Type 1 / Area 1 of proposed CHD No permanent or temporary oil and gas exploration or development, unless it occurs above the
mean higher high water datum. Type 2 / Area 2 of proposed CHD Oil and gas-related activities assessed on a case-by-case basis, except that no permanent
surface entry or structures allowed in water where Cook Inlet beluga whales have been commonly found. In those areas, activities are restricted to temporary ones, and then only between November 1 and April 1 of each year.1
Type 3 / Not proposed for CHD Oil and gas-related activities are evaluated on a case-by-case basis by Director. Note: 1 These tracts are 021, 022, 126, 127, 129-132, 161, 162, 175, 177, 211, 218, 257, 301, 302, 373, 376, 377, and 384. In its 2008 Supplement to the Cook Inlet Areawide 1999 Oil and Gas Lease Sale Final Finding of the Director, DO&G provided the following explanatory note: “In its comments, NMFS gave three examples of where Cook Inlet beluga whales are or have been commonly found in Type 2 habitat areas (Area 2 of proposed CHD): the mouth of the Kenai River, Kachemak Bay, and Tuxedni Bay. The mouth of the Kenai River was already covered by Mitigation Measure 33 in the 2004 supplement, Kachemak Bay is not within the lease sale area, and two tracts in Tuxedni Bay have been added to Mitigation Measure 33 as subject to no permanent surface entry or structures and temporary activities and structures allowed only seasonally.” Sources: Supplement to the Cook Inlet Areawide 1999 Oil and Gas Lease Sale Final Finding of the Director, February 4, 2008, Alaska Department of Natural Resources, Division of Oil & Gas, Anchorage, Alaska. Cook Inlet Areawide 2009 Oil and Gas Lease Sale Final Finding of the Director, January 20, 2009, Alaska Department of Natural Resources, Division of Oil & Gas, Anchorage, Alaska.
116 Brelsford, Taylor. 2009. Senior Environmental Scientist, URS. Personal communication with ENTRIX staff, April 30.

FINAL RIR/4(B)(2)/FRFA OF CRITICAL HABITAT DESIGNATION OF COOK INLET BELUGA WHALE AUGUST 11, 2010
6-28 NATIONAL MARINE FISHERIES SERVICE
Lessees are further advised that the Cook Inlet beluga whale population is listed as a depleted stock under MMPA and as endangered under the ESA, with CH under ESA pending. Lessees should review the Federal Register and contact NMFS for more information. Furthermore, any geophysical survey activity may result in the taking of Cook Inlet beluga whales, and must, therefore, be consulted on with NMFS, in advance. Finally, NMFS, USFWS, and ADF&G perform annual monitoring efforts to further delineate the presence and distribution of the Cook Inlet beluga whale population, and lessees are advised to obtain annually updated information from these agencies.
A natural resource specialist was contacted at DO&G, who confirmed that the mitigation measures specified in the 2009 Final Finding are the standard measures required of lessees to protect Cook Inlet beluga whales. Mr. Havelock, a natural resource specialist with the State of Alaska, emphasized that geophysical survey activities must undergo a multi-agency review that includes ADF&G and NMFS, to determine whether the surveying would result in incidental take, by harassment, of Cook Inlet beluga whales. If so, NMFS may grant IHAs for the possible harassment of a small number of Cook Inlet beluga whales. The IHA includes stipulations to limit the possibility of take, which may include requiring aerial monitoring during surveying to ensure that Cook Inlet beluga whales are not in the vicinity of the project. If Cook Inlet beluga whales are spotted, the air gun is shut down until the Cook Inlet beluga whales have left the area.117
6.4.2 Mining
Chuitna Coal Project
The Chuitna Coal Project, proposed by PacRim Coal, is a planned surface coal mining project located 12 miles inland from the western shore of northern Cook Inlet (see Figures 6-3 and 6-3a).118 The project is approximately 45 miles west of Anchorage, in a largely undeveloped area. Land ownership in the area consists of the State of Alaska, Mental Health Trust, Kenai Peninsula Borough, Tyonek Native Corporation, Cook Inlet Region, Inc. and private parties.119 The project would develop one billion tons of a low sulfur coal resource and is expected to have a 25-year mine life based on the proven reserves.
In the early 1990s, a previous mine design for the Chuitna Coal Project was evaluated in an Environmental Impact Statement (EIS) and permitted.120 However, the project did not proceed to development. Given that there have been significant changes, both in regulations and in the original project design, a new Supplemental EIS (SEIS) will be required for the newly proposed project.
The project has three separate components; the Chuitna Coal Mine, associated mine infrastructure, and Ladd Landing.121 The Chuitna mine is the surface mining operation located within the 20,571-acre lease area. Associated infrastructure includes the access road, coal conveyor, employee housing, and an airstrip. The project’s control center and marine terminal will be located at Ladd Landing. The marine terminal will have a 10,000-foot trestle extending into Cook Inlet that will be used to load transport ships.
117 Havelock, Brian. 2009. Natural Resource Specialist, Alaska Department of Natural Resources, Division of Oil and Gas. Personal communication
with ENTRIX staff, April 8. 118 Environmental Protection Agency, 2006, Draft Scoping Document for the Chuitna Coal Project Supplemental Environmental Impact Statement. 119 U.S. Environmental Protection Agency, 2006, Draft Scoping Document for the Chuitna Coal Project Supplemental Environmental Impact
Statement. 120 Ibid. 121 Ibid.

SECTION 6 CONTEXTUAL INFORMATION
NATIONAL MARINE FISHERIES SERVICE 6-29
Cook Inlet is shallow along its western shoreline and, thus, would require regular dredging to allow ships to dock along the shore. Dredging would be an expensive operation, would permanently alter seafloor habitat, and could potentially affect wildlife. Therefore, PacRim determined that the development of a marine terminal extending from the shore into Cook Inlet would be the least-impact solution for transporting coal to market. The terminal is proposed in the area known as Ladd, approximately 1.5 miles north of the Village of Tyonek.122
122 Robert Rodrigues, Matt Nemeth, Tim Markowitz and Dale Funk, 2006, Review of literature on fish species and beluga whales in Cook Inlet,
Alaska. Final report prepared by LGL Alaska Research Associates, Inc., Anchorage, AK, for DRven Corporation, Anchorage, AK.
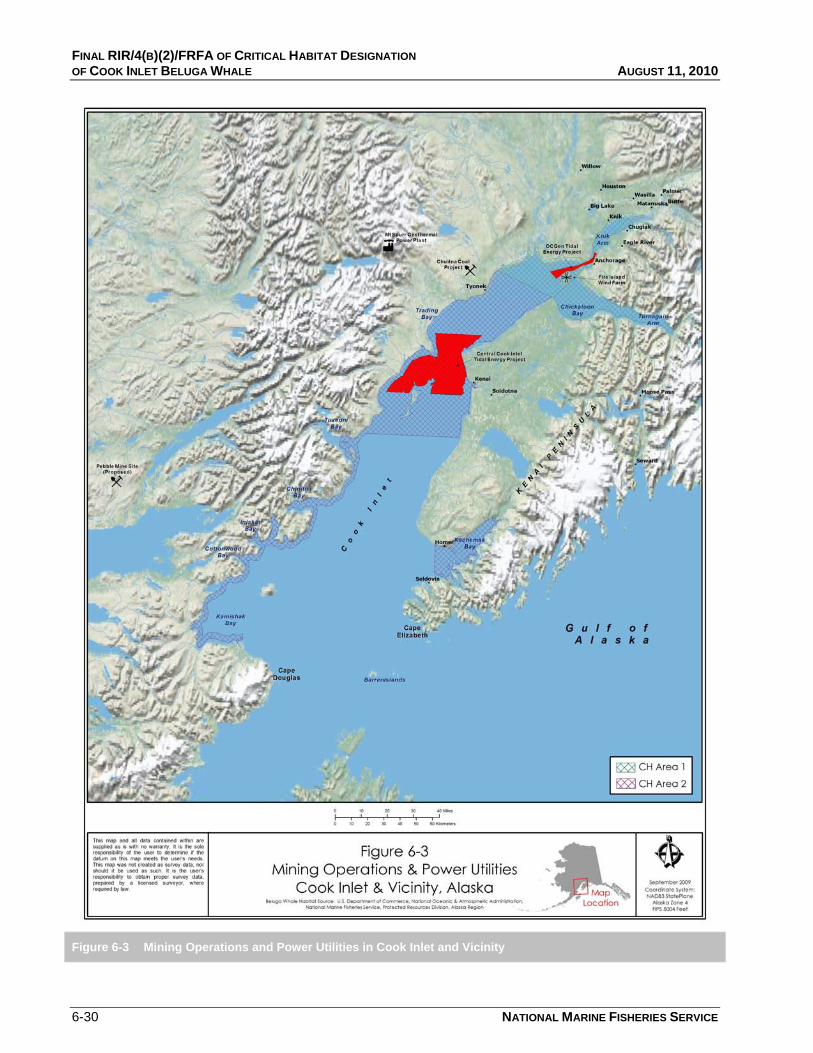
FINAL RIR/4(B)(2)/FRFA OF CRITICAL HABITAT DESIGNATION OF COOK INLET BELUGA WHALE AUGUST 11, 2010
6-30 NATIONAL MARINE FISHERIES SERVICE
Figure 6-3 Mining Operations and Power Utilities in Cook Inlet and Vicinity
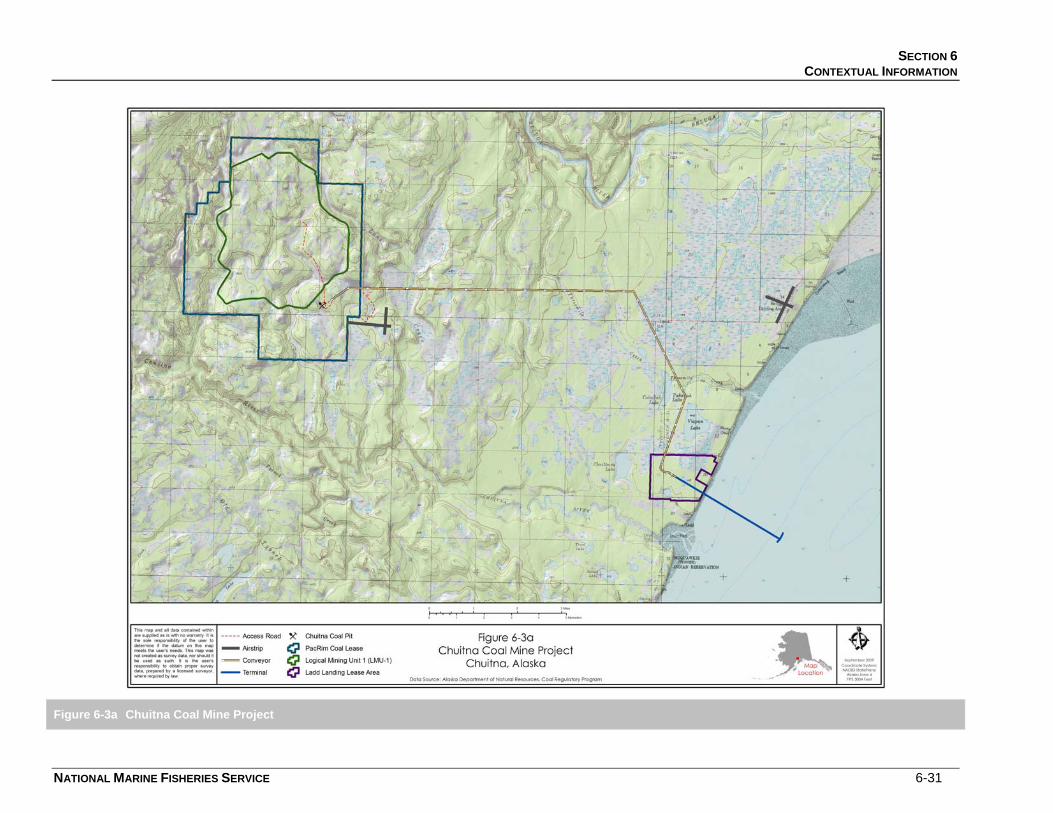
SECTION 6 CONTEXTUAL INFORMATION
NATIONAL MARINE FISHERIES SERVICE 6-31
Figure 6-3a Chuitna Coal Mine Project
FINAL RIR/4(B)(2)/FRFA OF CRITICAL HABITAT DESIGNATION OF COOK INLET BELUGA WHALE AUGUST 11, 2010
NATIONAL MARINE FISHERIES SERVICE 6-32
CHUITNA MINE PERMITTING REQUIREMENTS
In 1977, the U.S. Congress passed the Surface Mining Control and Reclamation Act (SMCRA). The Department of the Interior’s Office of Surface Mining (OSM) administers SMCRA. However, this Act allows for states to develop their own regulatory program that is consistent with Federal legislation and allows for states to have primacy over the Federal program. Therefore, the State of Alaska developed its own regulatory program, and enacted the Alaska Surface Coal Mining Control and Reclamation Act, on May 2, 1983.123
The Alaska Surface Coal Mining Control and Reclamation Act has three major objectives: to protect citizens and the environment during mining operations; to restore the land, following operations; and to reclaim the mines from previous mining operations, abandoned prior to the Act’s enactment. Essential elements of the Alaska Coal Regulatory Program include the following:
• Prior to mining activities, exploration and baseline studies of the site are required;
• A permitting system that makes expectations known and binding to the operator, (includes public participation);
• 65 separate performance standards for coal mining activities;
• Reclamation performance bonds;
• Monthly mine sites inspections; and
• Penalties for violation of the Act.124
The proposed project is subject to numerous Federal and State permitting requirements. The following list of necessary permits is taken from the Draft Scoping Document for the SEIS.125
FEDERAL AUTHORITIES EPA
CWA Section 402 NPDES permits for wastewater discharge
NPDES permits for stormwater discharges during construction and operation
Spill Prevention, Control, and Countermeasure (SPCC) plan
USACE
CWA Section 404 permit(s)
Rivers and Harbors Act Section 10 permit
NMFS
ITA
123 Bruce Buzby, 2007, How Coal Mine Projects are Permitted and Regulated in Alaska, Alaska Department of Natural Resources Division of
Mining, Land & Water. 124 Ibid. 125 U.S. Environmental Protection Agency, 2006, Draft Scoping Document for the Chuitna Coal Project Supplemental Environmental Impact
Statement.
SECTION 6 CONTEXTUAL INFORMATION
NATIONAL MARINE FISHERIES SERVICE 6-33
STATE AUTHORITIES DNR
Alaska Surface Coal Mining Control and Reclamation Act permit
Reclamation bond
Fish habitat permit
Water rights
Rights of way/access
Consistency determination with the Alaska Coastal Management Plan
Alaska Department of Environmental Conservation
CWA Section 401 certificate of reasonable assurance of EPA Section 402 NPDES and Corps Section 404 permits
Air quality permit
Water supply and sewage treatment system approval
Wastewater disposal permit
Stormwater Discharge Pollution Prevention Plan
Oil discharge prevention and contingency plan
Landfill permit and bonding
The Chuitna Coal Project is at an advanced permitting stage, expected to be completed by the spring or summer of 2010. As outlined in Table 6-16, PacRim has submitted many of the mining application documents. The company is currently collecting additional aquatic wildlife and cultural resource information and it is anticipated that the project will be in operation within three years.126 At this time, a complete permit application has not been submitted to the DNR/Division of Mining, Land, and Water. Once the entire permit application package has been submitted, an evaluation of the application and of the cumulative impacts of the project will be undertaken.
AGENCY INVOLVEMENT
PacRim submitted applications to the EPA for two new source NPDES permits, in March of 2006.127 These permits are for the discharge of treated wastewater from the mining area and for the wastewater discharge from Ladd Landing. Since these permits are for a new source, they are subject to compliance with National Environmental Policy Act (NEPA) prior to a final decision on the permits being made. The EPA decided that given that the project could have significant impacts on the environment, an SEIS would need to be prepared.
Once the Final SEIS is published, the EPA, as the lead Federal agency for the SEIS, will issue a Record of Decision (ROD) on potential project impacts to the environment, as well as a NPDES permit decision.
The ESA requires that the EPA coordinate with NMFS throughout development of the SEIS. In addition, USACE and DNR will be involved throughout the process. The NPDES permits are subject to review by 126 Lucas, Joe. 2009. Project Manager of Chuitna Coal Mine. Personal Communication with ENTRIX staff, April 17. 127 Environmental Protection Agency, 2006, Draft Scoping Document for the Chuitna Coal Project Supplemental Environmental Impact Statement.
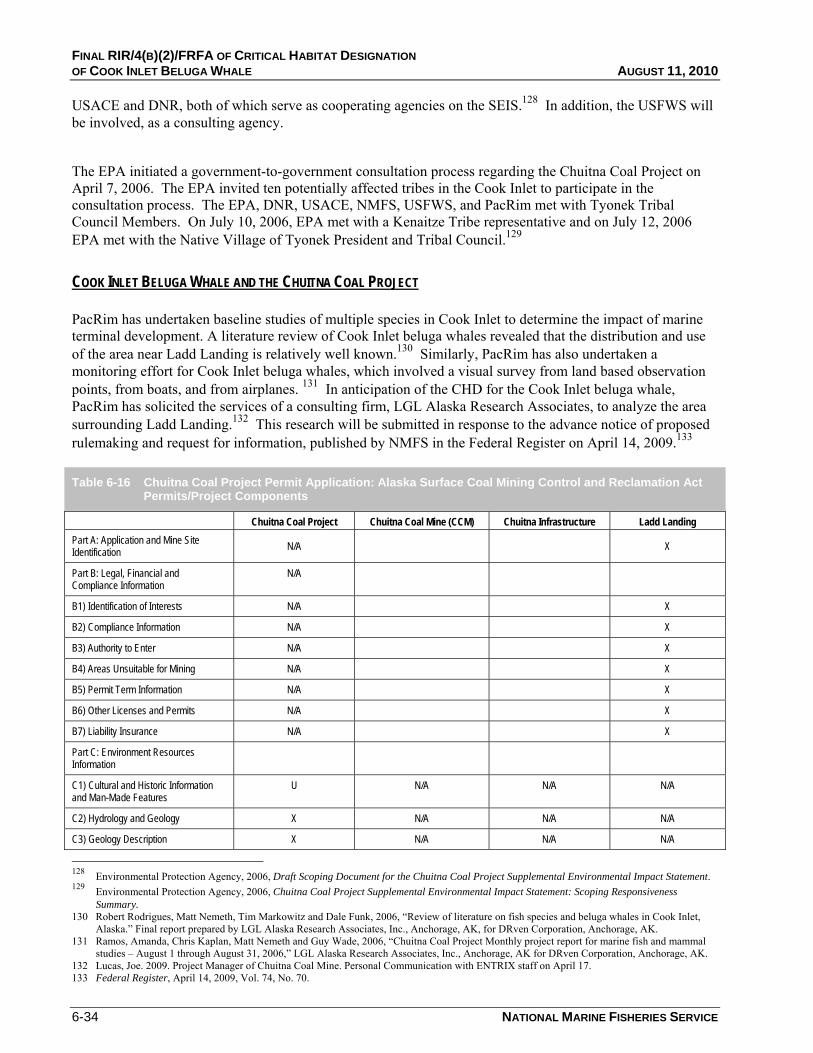
FINAL RIR/4(B)(2)/FRFA OF CRITICAL HABITAT DESIGNATION OF COOK INLET BELUGA WHALE AUGUST 11, 2010
6-34 NATIONAL MARINE FISHERIES SERVICE
USACE and DNR, both of which serve as cooperating agencies on the SEIS.128 In addition, the USFWS will be involved, as a consulting agency.
The EPA initiated a government-to-government consultation process regarding the Chuitna Coal Project on April 7, 2006. The EPA invited ten potentially affected tribes in the Cook Inlet to participate in the consultation process. The EPA, DNR, USACE, NMFS, USFWS, and PacRim met with Tyonek Tribal Council Members. On July 10, 2006, EPA met with a Kenaitze Tribe representative and on July 12, 2006 EPA met with the Native Village of Tyonek President and Tribal Council.129
COOK INLET BELUGA WHALE AND THE CHUITNA COAL PROJECT
PacRim has undertaken baseline studies of multiple species in Cook Inlet to determine the impact of marine terminal development. A literature review of Cook Inlet beluga whales revealed that the distribution and use of the area near Ladd Landing is relatively well known.130 Similarly, PacRim has also undertaken a monitoring effort for Cook Inlet beluga whales, which involved a visual survey from land based observation points, from boats, and from airplanes. 131 In anticipation of the CHD for the Cook Inlet beluga whale, PacRim has solicited the services of a consulting firm, LGL Alaska Research Associates, to analyze the area surrounding Ladd Landing.132 This research will be submitted in response to the advance notice of proposed rulemaking and request for information, published by NMFS in the Federal Register on April 14, 2009.133
Table 6-16 Chuitna Coal Project Permit Application: Alaska Surface Coal Mining Control and Reclamation Act Permits/Project Components
Chuitna Coal Project Chuitna Coal Mine (CCM) Chuitna Infrastructure Ladd Landing Part A: Application and Mine Site Identification N/A X
Part B: Legal, Financial and Compliance Information
N/A
B1) Identification of Interests N/A X
B2) Compliance Information N/A X
B3) Authority to Enter N/A X
B4) Areas Unsuitable for Mining N/A X
B5) Permit Term Information N/A X
B6) Other Licenses and Permits N/A X
B7) Liability Insurance N/A X
Part C: Environment Resources Information
C1) Cultural and Historic Information and Man-Made Features
U N/A N/A N/A
C2) Hydrology and Geology X N/A N/A N/A
C3) Geology Description X N/A N/A N/A
128 Environmental Protection Agency, 2006, Draft Scoping Document for the Chuitna Coal Project Supplemental Environmental Impact Statement. 129 Environmental Protection Agency, 2006, Chuitna Coal Project Supplemental Environmental Impact Statement: Scoping Responsiveness
Summary. 130 Robert Rodrigues, Matt Nemeth, Tim Markowitz and Dale Funk, 2006, “Review of literature on fish species and beluga whales in Cook Inlet,
Alaska.” Final report prepared by LGL Alaska Research Associates, Inc., Anchorage, AK, for DRven Corporation, Anchorage, AK. 131 Ramos, Amanda, Chris Kaplan, Matt Nemeth and Guy Wade, 2006, “Chuitna Coal Project Monthly project report for marine fish and mammal
studies – August 1 through August 31, 2006,” LGL Alaska Research Associates, Inc., Anchorage, AK for DRven Corporation, Anchorage, AK. 132 Lucas, Joe. 2009. Project Manager of Chuitna Coal Mine. Personal Communication with ENTRIX staff on April 17. 133 Federal Register, April 14, 2009, Vol. 74, No. 70.
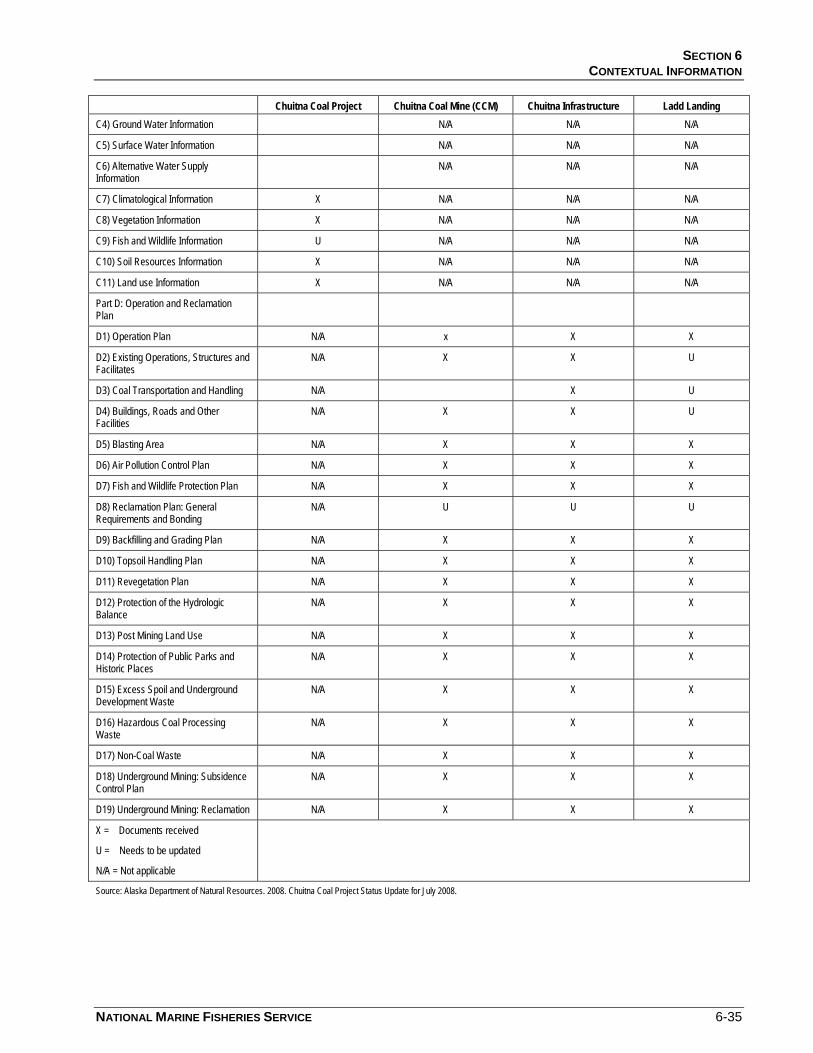
SECTION 6 CONTEXTUAL INFORMATION
NATIONAL MARINE FISHERIES SERVICE 6-35
Chuitna Coal Project Chuitna Coal Mine (CCM) Chuitna Infrastructure Ladd Landing C4) Ground Water Information N/A N/A N/A
C5) Surface Water Information N/A N/A N/A
C6) Alternative Water Supply Information
N/A N/A N/A
C7) Climatological Information X N/A N/A N/A
C8) Vegetation Information X N/A N/A N/A
C9) Fish and Wildlife Information U N/A N/A N/A
C10) Soil Resources Information X N/A N/A N/A
C11) Land use Information X N/A N/A N/A
Part D: Operation and Reclamation Plan
D1) Operation Plan N/A x X X
D2) Existing Operations, Structures and Facilitates
N/A X X U
D3) Coal Transportation and Handling N/A X U
D4) Buildings, Roads and Other Facilities
N/A X X U
D5) Blasting Area N/A X X X
D6) Air Pollution Control Plan N/A X X X
D7) Fish and Wildlife Protection Plan N/A X X X
D8) Reclamation Plan: General Requirements and Bonding
N/A U U U
D9) Backfilling and Grading Plan N/A X X X
D10) Topsoil Handling Plan N/A X X X
D11) Revegetation Plan N/A X X X
D12) Protection of the Hydrologic Balance
N/A X X X
D13) Post Mining Land Use N/A X X X
D14) Protection of Public Parks and Historic Places
N/A X X X
D15) Excess Spoil and Underground Development Waste
N/A X X X
D16) Hazardous Coal Processing Waste
N/A X X X
D17) Non-Coal Waste N/A X X X
D18) Underground Mining: Subsidence Control Plan
N/A X X X
D19) Underground Mining: Reclamation N/A X X X
X = Documents received
U = Needs to be updated
N/A = Not applicable
Source: Alaska Department of Natural Resources. 2008. Chuitna Coal Project Status Update for July 2008.
FINAL RIR/4(B)(2)/FRFA OF CRITICAL HABITAT DESIGNATION OF COOK INLET BELUGA WHALE AUGUST 11, 2010
6-36 NATIONAL MARINE FISHERIES SERVICE
Pebble Mine Power Source and Ore Transfer Facilities
All information concerning the proposed Pebble Mine facilities was obtained directly from the Pebble Partnership contacts and sources. The Pebble Partnership is composed of Northern Dynasty and Anglo American US, LLC. The proposed Pebble Mine is located about 200 miles southwest of Anchorage, in the Bristol Bay region of Alaska, on State lands designated for mineral exploration and development (see Figure 6-3). The Pebble mineral resource totals 5.1 billion tons measured and indicated, and 4.0 billion tons inferred, and contains an estimated 72 billion pounds of copper, 94 million ounces of gold, and 4.8 billion pounds of molybdenum, along with some silver, palladium, and rhenium.134 This is a very large deposit, although it is not high grade, and the Pebble Partnership is looking at different ways to use it.135 Under current preliminary plans, the mineralized ore would be fed to a metallurgical processing plant to separate copper, gold, and molybdenum from the non-mineralized portion of rock. Copper would be sent via pipeline to a port site and dewatered, with the water returned through a separate pipeline for re-use, and the non-mineralized portion of processed material would be stored in a tailings facility.136
As this project is still in the developmental stage, no project description has been developed yet that works economically or environmentally. A range of options for project planning are currently being examined, including a conventional open pit, high-volume underground mining (block caving) or a combination of both. The Pebble study team is looking at a range of tailings storage options, as well as milling and process alternatives, although it is expected that industry standard froth floatation will be the principal processing method selected. The Pebble Partnership is not expecting to have the details of the project until possibly the end of 2009.137 The environmental baseline document remains on schedule to be finalized in 2009. This document will be submitted with permit applications, targeted for 2010, once mine engineering and a proposed development plan is completed.138 Once the project description is available, there will be about six months of review and public involvement, including the pre-feasibility study, before the permitting process begins, which is currently scheduled for 2010 for both Federal and State agencies. The permitting process for the Pebble Project under the National Environmental Policy Act is expected to take three or more years.139
TRANSPORTATION COMPONENTS
Although no final decisions have been made, major components currently considered for transportation include an 86-mile restricted access industrial road between the mine and port site, over which materials used for mine construction, and freight and consumables used for operations, would be transported. Pipelines, which would follow the road corridor, would provide concentrate transport from the mine to the port site and the return of water to the mine-site. A multi-modal port on Iniskin Bay would be developed for loading mineral-bearing concentrates onto ocean-going vessels and receiving freight and operating consumables.
134 Northern Dynasty Minerals, Ltd., “The Pebble Project: The Future of U.S. Mining and Minerals, The Pebble Deposit”,
http://www.northerndynastyminerals.com/ndm/Pebble.asp (accessed May 1, 2009). 135 Smith, Mike. 2009. Pebble Partnership. Personal Communication with ENTRIX staff on April 20 and May 1. 136 Northern Dynasty Minerals, Ltd., “The Pebble Project: The Future of U.S. Mining and Minerals, The Pebble Deposit”,
http://www.northerndynastyminerals.com/ndm/Pebble.asp (accessed May 1, 2009). 137 Smith, Mike. 2009. Pebble Partnership. Personal Communication with ENTRIX staff on April 20; and
http://www.northerndynastyminerals.com/ndm/P_PD.asp 138 Northern Dynasty Minerals, Ltd., February 13, 2009, “Technical Report on the 2008 Program and Update on Mineral Resources and Metallurgy
Pebble Copper-Gold-Molybdenum Project Iliamna Lake Area Southwestern Alaska, U.S.A.”, http://www.northerndynastyminerals.com/i/pdf/ndm/2009-02-13_NI43-101.pdf .
139 Smith, Mike. 2009. Pebble Partnership. Personal Communication with ENTRIX staff on April 20; and Northern Dynasty Minerals, Ltd., “The Pebble Project: The Future of U.S. Mining and Minerals, The Pebble Deposit”, http://www.northerndynastyminerals.com/ndm/Pebble.asp (accessed May 1, 2009).
SECTION 6 CONTEXTUAL INFORMATION
NATIONAL MARINE FISHERIES SERVICE 6-37
Finally, electrical transmission lines would be constructed to carry power from a natural gas fired generating plant on the Kenai Peninsula.140
PROJECT IMPACTS ON THE REGIONAL ECONOMY
The actual impacts on the regional economies in the area of the Pebble project, of which there are several, cannot be predicted, a priori. There are far too many indeterminate variables and future decision-points, both private and public, for an objective characterization of such effects to be presented. That said, proponents of this development have identified a suite of economic and socioeconomic effects that they project will accrue based upon currently assumed parameters. They report that the proposed project includes a capital investment of $3 billion to $4 billion, approximately 1,000 jobs for 50 years to 80 years, 2,000 jobs during the project's 2-year to 3-year construction phase, hundreds of millions of dollars in annual operating expenditures, tens of millions of dollars in annual payments to State and local government, supply and service contracts, and other indirect and induced impacts to local communities, and new social and economic infrastructure for the Bristol Bay region. The proposed infrastructure for the Pebble Project could also provide low-cost power, improved road access, and other benefits to communities in the Bristol Bay region. Additionally, more than 50 consulting firms and 500 environmental scientists and technicians have worked on environmental studies and programs to support the preparation of a development plan for the Pebble Project. These studies were valued at $87 million, to the end of 2007,141 and as of the end of 2008, the Pebble Partnership has invested $360 million on a range of work programs and studies.142 The 2009 budget for completing a Pre-feasibility Study and preparing the Pebble Project for 2010 permitting is $59 million, with the potential for additional spending up to a total of $70 million.143
The direct development costs of the project are very high, and include a high cost of infrastructure for both the port development and road construction.144 Indirect and induced costs of the Pebble project’s development have not been evaluated as thoroughly.
PERMITS REQUIRED
The Pebble Mine Project will require the acquisition of many permits, though the project is not at the permitting stage yet. A large share of the permits known at this time to be required will encompass both shipping and road access, though not all permits required for the development process are yet known. A partial list is shown below.
Some examples of permits for ships known to be required include (but are not limited to):
• USACE: Section 404 Wetlands;
• Section 10 permits for navigation;
• USCG permits;
140 The Pebble Partnership, “Road, Port, and Power”, http://www.pebblepartnership.com/pages/project-information/road-port-power.php (accessed
May 1, 2009). 141 The Pebble Partnership, “Jobs & Business Opportunities, Overview”, http://www.pebblepartnership.com/pages/jobs-business-
opportunities/opportunities.php (accessed May 1, 2009); and The Pebble Partnership, “Road, Port, and Power”, http://www.pebblepartnership.com/pages/project-information/road-port-power.php (accessed May 1, 2009).
142 Northern Dynasty Minerals, Ltd., “The Pebble Project: The Future of U.S. Mining and Minerals, The Pebble Deposit”, http://www.northerndynastyminerals.com/ndm/Pebble.asp (accessed May 1, 2009).
143 http://www.northerndynastyminerals.com/ndm/NewsReleases.asp?ReportID=342004&_Area=News-Releases&_Title=US-59-Million-Work-Program-To-Prepare-Pebble-Project-For-Permitting.
144 Smith, Mike. 2009. Pebble Partnership. Personal Communication with ENTRIX staff on May 1.
FINAL RIR/4(B)(2)/FRFA OF CRITICAL HABITAT DESIGNATION OF COOK INLET BELUGA WHALE AUGUST 11, 2010
6-38 NATIONAL MARINE FISHERIES SERVICE
• Permits from Kenai Peninsula Borough (local government);
• State of Alaska Department of Environmental Conservation: Air quality permits; and
• Tidelands lease from State of Alaska DNR.
Some examples of road access permits known to be required include (but are not limited to):
• Tidelands permits; and
• State of Alaska Fish and Game permits.145
POTENTIAL EFFECTS TO CH
This project may have an effect on the CH for the Cook Inlet beluga whale. The development of Port Williamsport, which is the port most likely to be used for project transportation needs, could adversely modify or destroy Cook Inlet beluga whale CH, both directly, by physical alteration of the subtidal, tidal, and adjacent uplands areas, and indirectly, should the port development adversely impact salmon and/or other PCE fish species’ migration into and out of Cook Inlet spawning areas. The extent of the effect would depend on the Pebble project development scenarios to be evaluated, and cannot be estimated until those development scenarios are precisely defined.
6.4.3 Transportation
The Alaska Statewide Long-Range Transportation Policy Plan, titled “Let’s Get Moving 2030,” enables the State to comply with the Federal planning regulations of the 2005 “Safe, Accountable, Flexible, Effective Transportation Equity Act: A Legacy for Users” (SAFETEA-LU). Let’s Get Moving 2030 establishes development priorities for the statewide transportation system and establishes a framework for developing transportation planning documents, capital programs, and budgets.146
Implementation of the long-range plan is achieved through the 2006-2009 Statewide Transportation Improvement Program (STIP), which describes the schedules, costs, and funding sources for the major planned surface transportation projects throughout the State for the period 2006 through 2009. These projects include roads, trails, ferries, and transit, for which a reasonable certainty exists that full funding will be available through project completion. Projects included in the STIP were selected by DOT&PF from project nominations made by local governments, State and Federal agencies, and other entities, and are subject to approval by Federal Highway Administration (FHWA) and Federal Transit Administration (FTA). While DOT&PF is required by Federal regulations (23 CFR 450.216) to develop a STIP for all areas in the State, outside of metropolitan planning areas (MPOs), the projects listed in the respective Transportation Improvement Programs (TIPs) for the Anchorage and Fairbanks areas are incorporated into the Statewide STIP.147
Amendment 17 of the STIP shows the projects anticipated to receive Federal funding during the Federal fiscal years of 2008 and 2009, as well as projected funding beyond these years. A representative for STIP was contacted to determine which projects within the Municipality of Anchorage, Matanuska-Susitna, and Kenai
145 Smith, Mike. 2009. Pebble Partnership. Personal Communication with ENTRIX staff on April 20 and May 1. 146 Alaska Department of Transportation and Public Facilities, February 2008, “Let’s Get Moving 2030: Alaska Statewide Long-range
Transportation Policy Plan.” 147 Alaska Department of Transportation & Public Facilities, July 2, 2008, 2006-2009 STIP, Amendment #17.
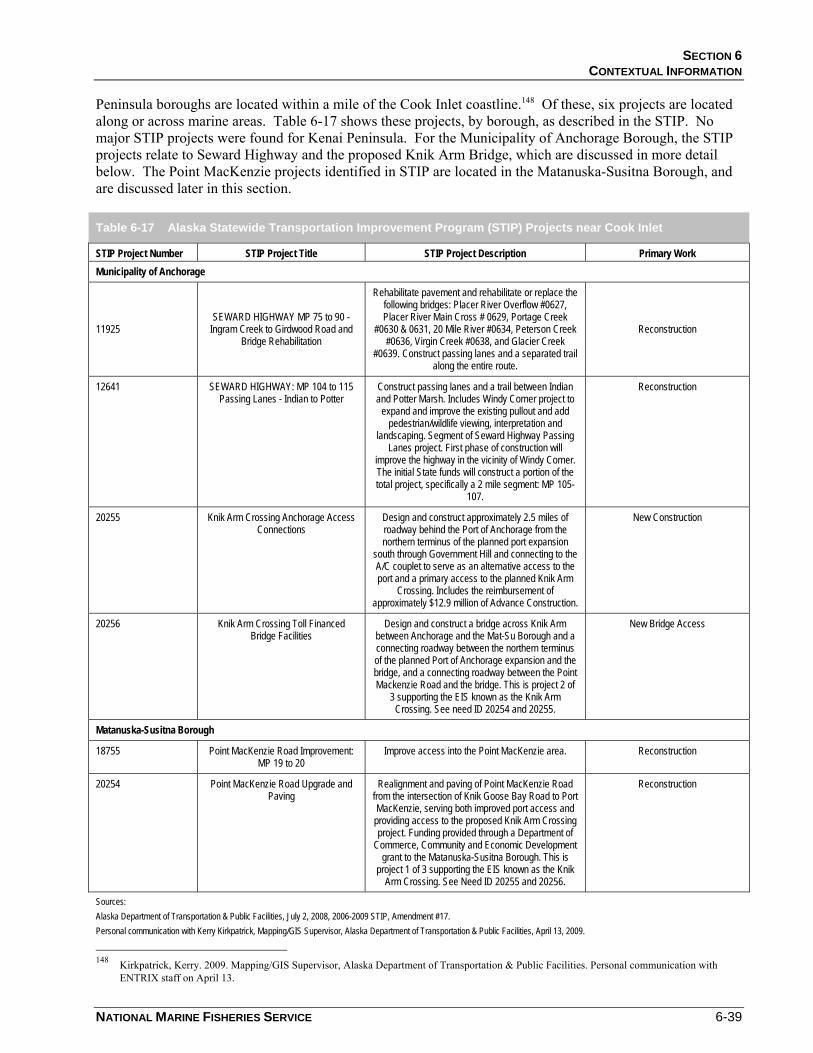
SECTION 6 CONTEXTUAL INFORMATION
NATIONAL MARINE FISHERIES SERVICE 6-39
Peninsula boroughs are located within a mile of the Cook Inlet coastline.148 Of these, six projects are located along or across marine areas. Table 6-17 shows these projects, by borough, as described in the STIP. No major STIP projects were found for Kenai Peninsula. For the Municipality of Anchorage Borough, the STIP projects relate to Seward Highway and the proposed Knik Arm Bridge, which are discussed in more detail below. The Point MacKenzie projects identified in STIP are located in the Matanuska-Susitna Borough, and are discussed later in this section.
Table 6-17 Alaska Statewide Transportation Improvement Program (STIP) Projects near Cook Inlet
STIP Project Number STIP Project Title STIP Project Description Primary Work Municipality of Anchorage
11925 SEWARD HIGHWAY MP 75 to 90 -
Ingram Creek to Girdwood Road and Bridge Rehabilitation
Rehabilitate pavement and rehabilitate or replace the following bridges: Placer River Overflow #0627, Placer River Main Cross # 0629, Portage Creek
#0630 & 0631, 20 Mile River #0634, Peterson Creek #0636, Virgin Creek #0638, and Glacier Creek
#0639. Construct passing lanes and a separated trail along the entire route.
Reconstruction
12641 SEWARD HIGHWAY: MP 104 to 115 Passing Lanes - Indian to Potter
Construct passing lanes and a trail between Indian and Potter Marsh. Includes Windy Corner project to
expand and improve the existing pullout and add pedestrian/wildlife viewing, interpretation and
landscaping. Segment of Seward Highway Passing Lanes project. First phase of construction will
improve the highway in the vicinity of Windy Corner. The initial State funds will construct a portion of the total project, specifically a 2 mile segment: MP 105-
107.
Reconstruction
20255 Knik Arm Crossing Anchorage Access Connections
Design and construct approximately 2.5 miles of roadway behind the Port of Anchorage from the northern terminus of the planned port expansion
south through Government Hill and connecting to the A/C couplet to serve as an alternative access to the port and a primary access to the planned Knik Arm
Crossing. Includes the reimbursement of approximately $12.9 million of Advance Construction.
New Construction
20256 Knik Arm Crossing Toll Financed Bridge Facilities
Design and construct a bridge across Knik Arm between Anchorage and the Mat-Su Borough and a connecting roadway between the northern terminus of the planned Port of Anchorage expansion and the bridge, and a connecting roadway between the Point Mackenzie Road and the bridge. This is project 2 of
3 supporting the EIS known as the Knik Arm Crossing. See need ID 20254 and 20255.
New Bridge Access
Matanuska-Susitna Borough
18755 Point MacKenzie Road Improvement: MP 19 to 20
Improve access into the Point MacKenzie area. Reconstruction
20254 Point MacKenzie Road Upgrade and Paving
Realignment and paving of Point MacKenzie Road from the intersection of Knik Goose Bay Road to Port MacKenzie, serving both improved port access and providing access to the proposed Knik Arm Crossing project. Funding provided through a Department of
Commerce, Community and Economic Development grant to the Matanuska-Susitna Borough. This is
project 1 of 3 supporting the EIS known as the Knik Arm Crossing. See Need ID 20255 and 20256.
Reconstruction
Sources: Alaska Department of Transportation & Public Facilities, July 2, 2008, 2006-2009 STIP, Amendment #17. Personal communication with Kerry Kirkpatrick, Mapping/GIS Supervisor, Alaska Department of Transportation & Public Facilities, April 13, 2009.
148 Kirkpatrick, Kerry. 2009. Mapping/GIS Supervisor, Alaska Department of Transportation & Public Facilities. Personal communication with
ENTRIX staff on April 13.
FINAL RIR/4(B)(2)/FRFA OF CRITICAL HABITAT DESIGNATION OF COOK INLET BELUGA WHALE AUGUST 11, 2010
6-40 NATIONAL MARINE FISHERIES SERVICE
In addition to the STIP representative, attempts were made to contact those persons involved with transportation planning in the Municipality of Anchorage, Matanuska-Susitna, and Kenai Peninsula boroughs. Of these contacts, only Mr. Lyon, the Transportation Planning Manager/Anchorage Metropolitan Area Transportation Solutions (AMATS) Coordinator for the Municipality of Anchorage, responded with information about transportation projects within the borough. Mr. Lyon stated that three transportation projects within the Municipality of Anchorage are planned to be located along or across marine waters: the Cook Inlet Ferry, Knik Arm Bridge, and the POA Expansion. These three projects are described in greater detail below.
Like the State of Alaska, the Municipality of Anchorage has a long-range transportation plan, entitled Anchorage Bowl 2025 Long-Range Transportation Plan with 2027 Revisions. This plan projects future transportation needs for the borough, based on current system shortcomings and forecasts of growth in population, the number of households, and employment. Funding sources for transportation projects are discussed, and priorities are set for policies, projects, and actions.149 The long-range transportation plan is implemented by the Municipality of Anchorage’s TIP, and the projects within the TIP are also incorporated into the State of Alaska’s STIP.150,151
This section discusses some of the key transportation projects identified through the above process and documents. Figure 6-4 presents the locations of these projects.
149 Municipality of Anchorage, Traffic Department, published December 2005 and revised April 2007, Anchorage Bowl 2025 Long-Range
Transportation Plan with 2027 Revisions, Anchorage, Alaska. 150 Municipality of Anchorage, Traffic Department, “Transportation Improvement Program,” accessed May 1, 2009. 151 Alaska Department of Transportation & Public Facilities, July 2, 2008, 2006-2009 STIP, Amendment #17.
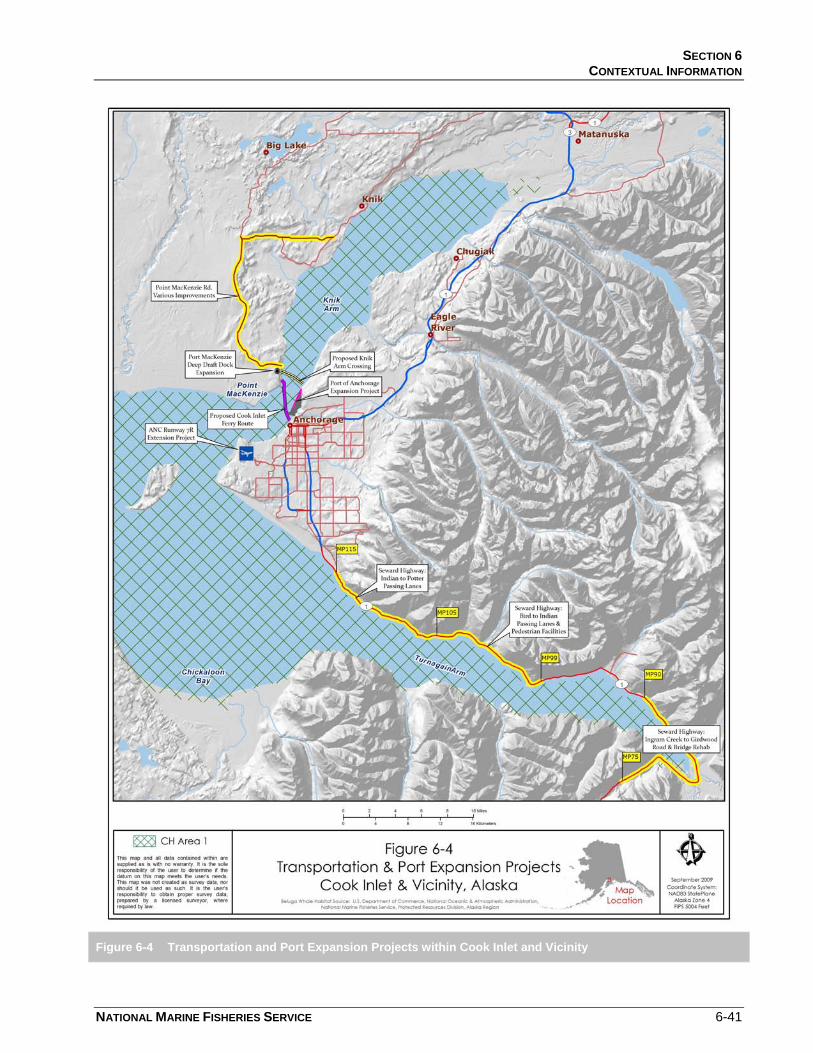
SECTION 6 CONTEXTUAL INFORMATION
NATIONAL MARINE FISHERIES SERVICE 6-41
Figure 6-4 Transportation and Port Expansion Projects within Cook Inlet and Vicinity
FINAL RIR/4(B)(2)/FRFA OF CRITICAL HABITAT DESIGNATION OF COOK INLET BELUGA WHALE AUGUST 11, 2010
6-42 NATIONAL MARINE FISHERIES SERVICE
Knik Arm Crossing152
The Knik Arm Crossing is a proposed 8,200-foot bridge crossing of the Knik Arm of the Upper Cook Inlet, located 1.25 miles north of Cairn Point, and would connect the Municipality of Anchorage to the Mat-Su Borough. The project is being headed up by the KABATA, an entity of the State of Alaska, with Federal oversight by U.S. Department of Transportation (USDOT) FHWA. The KABATA, established by an act of the Alaska State Legislature in 2003, is the project proponent and charged with the mission to “…develop, stimulate, and advance the economic welfare of the State and further the development of public transportation systems in the vicinity of the Upper Cook Inlet with construction of a bridge to span Knik Arm and connect the Municipality of Anchorage and the Matanuska-Susitna Borough [MSB]” (Alaska Statutes chapter 19.75).
The roadway connection on the Mat-Su side of Knik Arm would be Point MacKenzie Road, near the Port MacKenzie District. The roadway connections on the Anchorage side of Knik Arm would be generally in the POA/Government Hill/Ship Creek areas. The project would include a toll plaza, a rural principal artery, and be phase-constructed to meet anticipate future travel demand.153
On September 18, 2007, the FHWA issued the EIS and Final Section (4)f Evaluation Summary for the Knik Arm Crossing.154 A Record of Decision has not yet been issued. The preferred alternative in the Final EIS is the one with an 8,200-foot bridge, while the other alternative was a bridge length of 14,000 feet. The preferred alternative includes 33 piers, compared to the 66 to 76 piers required in the other option. The actual number and size of piles will be determined, once a contractor is hired.155 However, the marine fill area in the preferred alternative is double the marine fill area in the other option, 90 acres (eight acres of subtidal waters and 82 acres of estuarine shores and mud flats) versus 45 acres (zero acres of subtidal waters and 45 acres of estuarine shores and mud flats). If the preferred alternative is implemented, there will be about 220 hours of pile driving noise, and more fill in the Cook Inlet beluga whale habitat, while with the other alternative, the pile driving noise will be for 440 to 508 hours, but less fill in the Cook Inlet beluga whale habitat. Although the actual cost of the project and the final design will determined when the contractors are hired, according to the estimates provided in the Final EIS, the preferred alternative is the cheaper of the two options, with a total anticipated cost of $426.8 million in Phase 1 and $129.5 million dollars for Phase 2. The other option is estimated to cost $641.4 million in Phase 1 and $262.7 million dollars for Phase 2.156 At present, NMFS has not consulted on this proposed project.
KABATA had plans to commence construction in the spring of 2009, with operations scheduled for 2011.157 However, it was unclear whether funding for the project would be secured in time and if the required permits would be issued. The KABATA withdrew its application for regulations and subsequent Letters of Authorization (LOAs) from NMFS regarding the harassment of marine mammals, incidental to the
152 Most of the background information provided in this section is taken from information sources of the Knik Arm Crossing project, including the
KABATA website, documents, and discussion with key staff. 153 KABATA (Knik Arm Bridge and Toll Authority) and ADT&PF (Alaska Department of Transportation and Public Facilities), 2007, “Knik Arm
Crossing Final Environmental Impact Statement and Final Section (4)f Evaluation,” prepared for: Federal Highway Administration, December 18, 2007.
154 Ibid. 155 Mahoney, Barbara. 2009. National Marine Fisheries Management Biologist. Personal communication with ENTRIX staff, April 23. 156 KABATA (Knik Arm Bridge and Toll Authority) and ADT&PF (Alaska Department of Transportation and Public Facilities), 2007, “Knik Arm
Crossing Final Environmental Impact Statement and Final Section (4)f Evaluation,” prepared for: Federal Highway Administration, December 18, 2007.
157 KABATA (Knik Arm Bridge and Toll Authority), 2008, “Knik Arm Crossing Project Milestone and Schedule,” http://www.knikarmbridge.com/schedule.html, accessed April 10, 2009.

SECTION 6 CONTEXTUAL INFORMATION
NATIONAL MARINE FISHERIES SERVICE 6-43
construction of the bridge.158 The KABATA plans to submit a new application, after revising the number of Cook Inlet beluga whales for take through harassment to a lower number.159
On June 25, 2009, the AMATS Policy Committee approved a proposal to remove the Knik Arm Crossing project from the short-term part of Anchorage’s transportation plan, listing it instead as a long-term project. The effect of this decision was to delay the project until at least 2018.160
Based on a lawsuit filed by the cities of Houston and Wasilla (later joined by KABATA) against the AMATS Policy Committee, a state judge temporarily blocked the decision, pending a hearing on August 18, 2009.161 Prior to the hearing, the two parties reached a settlement (which has not been formally filed as of August 18, 2009), in which the AMATS Policy Committee agreed to rescind its June 25 decision. The AMATS Policy Committee is scheduled to meet on August 27, and has 60 days to rescind its earlier vote. The Committee has a September 30, 2009 deadline to approve the next stage of the city’s transportation plan, covering years 2010 to 2013.162
While the Knik Arm Crossing project is back on the books in the short-range part of Anchorage’s transportation plan, there is still uncertainty regarding the status, timeline, and funding for the project. When the analysis for the Final RIR/4(b)(2) Preparatory Assessment/FRFA was conducted, the project was anticipated to be delayed until at least 2018. Given that delay, final project design and engineering, completion of the myriad permit process, and initiation of construction was not reasonably likely to occur within the 10-year period of analysis and, therefore, the effects of this project on CHD are not analyzed in this report. However, as more information becomes available, either during the public comment period for this Final RIR/4(b)(2) Preparatory Assessment/FRFA, or through other sources, prior to the finalization of this document, the analysis of the economic impact of CHD on the Knik Arm crossing Project would be subject to revision.
Cook Inlet Ferry
The Matanuska-Susitna Borough is proposing a year-round commuter ferry system that would provide transportation across the two miles of Knik Arm that separates the Borough and Anchorage, Alaska. The ferry system will include terminal buildings, parking, and ferry landings at Port MacKenzie in MSB and Ship Creek in the Port of Anchorage. The ferry, an ice-breaking catamaran currently under construction and almost 80 percent complete, would hold about 20 vehicles and 115 passengers.163 The construction of the vessel, itself, is being funded by the Office of Naval Research, and will be given to the Mat-Su Borough for the purpose, and the borough will provide operational data over five years to the U.S. Navy.164 Ferry transit times are estimated to be about 25 minutes, including loading and unloading time.
158 74 FR 12840, March 25, 2009. 159 Paulson, Dale. 2009. Deputy Executive Director of Project Development, Knik Arm Bridge and Toll Authority. Personal communication with
ENTRIX staff, May 4. 160 Anchorage Daily News, June 25, 2009, “State-city panel approves delaying Knik Arm bridge,”
http://www.adn.com/news/alaska/knik/story/843700.html, accessed August 4, 2009. 161 Anchorage Daily News, July 15, 2009, “Knik bridge delay put on hold by judge,” http://www.adn.com/news/alaska/knik/story/865860.html,
accessed August 4, 2009. 162 Anchorage Daily News, August 19, 2009, “Knik bridge lawsuit settled; project is back,”
http://www.adn.com/news/alaska/matsu/story/902969.html, accessed August 20, 2009 163 MSB (Matanuska-Susitna Borough). 2009, Cook Inlet Ferry Project Facts, available online:
http://www.matsugov.us/administration/projects/pdf/CookInletFerry012607.pdf, accessed April 15, 2009. 164 Matanuska-Susitna Borough, the E-Craft Motor Vessel Susitna, Frequently Asked Questions,
http://ww1.matsugov.us/ferry/index.php?option=com_content&view=category&id=1&Itemid=5, accessed April 15, 2009.
FINAL RIR/4(B)(2)/FRFA OF CRITICAL HABITAT DESIGNATION OF COOK INLET BELUGA WHALE AUGUST 11, 2010
6-44 NATIONAL MARINE FISHERIES SERVICE
In 2003, an Environmental Assessment (EA) was completed for this project and the FTA signed a Finding of No Significant Impact (FONSI). The original EA considered alternative sites that could support ferry terminal infrastructure, including Port MacKenzie in the Mat-Su Borough and Ship Creek Point and the North Star terminal in Anchorage. The original EA and FONSI identified the North Star location as the preferred Knik Arm Ferry landing in Anchorage. The September 2006 Supplemental EA and FONSI identified Ship Creek Landing as the preferred alternative, located northwest of downtown Anchorage, south of the POA, and just west of the mouth of Ship Creek, on existing tideland fill.165 Mat-Su Borough is working with the USACE to further refine the proposed Anchorage site.166 The ferry landing at Mat-Su Borough would be located on the south side of the existing dock at Port MacKenzie. A terminal building and supporting water and sewage infrastructure are already in place.167
NMFS has provided mitigation measures to USACE to be added as conditions for issuing the permit.168 The Mat-Su Borough also plans to apply for an IHA permit from NMFS. The ferry is anticipated to be operational by fall of 2010 or spring of 2011. Construction on the landing on the Port MacKenzie side is about to commence (August 2009). During construction of the landings, a spotter will be available to look out for Cook Inlet beluga whales. In addition, an envelope will be put along piles to reduce noise. For the ferry vessel, itself, the borough has agreed to acoustic studies regarding Cook Inlet beluga whale, and is going to use jets for lesser noise from the vessel.169
Seward Highway
Seward Highway is the only road connection between the Kenai Peninsula and the rest of the State of Alaska. The portion of the highway between mile posts (MPs) 105 and 75 runs south of the Chugach Mountains and parallels the shoreline of Turnagain Arm, crossing numerous creeks and streams. Strong winds, heavy precipitation, winding roads, heavy traffic, and the lack of controlled access, all contribute to the highway containing one of the top ten highest corridors (Potter Marsh to Bird Point) for fatal/major injury crash rates among DOT&PF Central Region’s rural highways.170,171 Planned road and bridge improvements are expected to reduce the safety risks along this corridor.
Two major projects are planned for Seward Highway between mileposts 105 and 75. These projects are:
• Seward Highway MP 75-90: Ingram Creek to Girdwood Road and Bridge Rehabilitation Project
• Seward Highway MP 99-105: Bird to Indian
These projects are discussed in greater detail within the following sections.
165 Matanuska-Susitna Borough and Federal Transit Administration, 2006, Final Cook Inlet Ferry Supplemental Environmental Assessment.
Available online: 166 White, Rindj, 2008, “Mat-Su presses for ferry landing south of Ship Creek Mouth,” Anchorage Daily News. Published October 25, 2008.
Available online: http://www.adn.com/news/alaska/story/568005.html, accessed April 20, 2009. 167 Matanuska-Susitna Borough, 2008, Port Mackenzie Ferry Terminal Building Project Facts, Available online:
http://www.matsugov.us/administration/projects/pdf/FerrTerminal012307.pdf, accessed April 20, 2009. 168 National Marine Fisheries Service. 2007. Letter to U.S. Army Corps of Engineers. May 14. 169 Duffy, John. 2009. Manager, Matanuska-Susitna Borough. Personal communication with ENTRIX staff on May 6. 170 Alaska Department of Transportation & Public Facilities, March 14, 2008, Seward highway MP 75-90 Road and Bridge Rehabilitation Project,
Final Winter Wildlife Survey. 171 Alaska Department of Transportation & Public Facilities, July 2006, Scoping Summary Report, Seward Highway Milepost 99 to 105, prepared by
DOWL Engineers, Anchorage, Alaska.
SECTION 6 CONTEXTUAL INFORMATION
NATIONAL MARINE FISHERIES SERVICE 6-45
MP 75-90
The MP 75-90 project is incorporated into the STIP. Under the proposed project, passing lanes and a separated trail would be constructed along the entire route. In addition, road pavement would be rehabilitated, and the bridges crossing for the following water sources would be rehabilitated or replaced: Placer River Overflow, Placer River Main Cross, Portage Creek, 20 Mile River, Peterson Creek, Virgin Creek, and Glacier Creek.172 While bridge improvements are planned to occur within the tributaries of Turnagain Arm, improvements are not expected within CH for the Cook Inlet beluga whale.
The project would receive Federal funding via the Federal Highway Administration and, therefore, require an environmental document complying with NEPA; however, because the project is currently in an early planning stage, the level of environmental documentation required has not yet been determined.173 Numerous other studies have been conducted on the natural resources in the project area, including a report providing baseline data on use of the Turnagain Arm by the Cook Inlet beluga whale within MPs 75 to 80 and MPs 99 to 115. The report concluded that Cook Inlet beluga whales inhabit the near shore areas within Turnagain Arm in late summer and fall, with rare sightings occurring during the late spring to mid-summer. Consistent with previous research conducted by NMFS, Cook Inlet beluga whales were observed consistently around high tide in the Bird Point to Placer River portion of Upper Turnagain arm during late summer and fall. During mid-to-low tide, Cook Inlet beluga whales were observed moving into Lower Turnagain Arm.174 The Cook Inlet beluga whales use Turnagain Arm for feeding, as well as for refuge from Orcas.175
MP 99-105
The MP 99-105 corridor currently consists of two 12-foot wide travel lanes with 8-foot shoulders and a posted speed limit of 55 mph. The project proposes to address safety concerns along the corridor by adding passing lanes and pedestrian facilities along the entire route. In addition, 30 driveways currently intersect with the corridor, which creates hazardous turning movements. The proposed frontage road would be developed on the north side of the highway, reducing the number of driveways from 30 to four, and adding turn lanes on Seward Highway at frontage road access points.176 Minor wetlands impacts (approximately two acres) have been identified as potential effects of the proposed project.177
Federal Highway Administration provides funding to the project, which, therefore, requires an EA. The Draft EA is expected to be published in September 2009. Scoping was conducted for the project in 2006, with written comments received from the following agencies: FHWA, NMFS, DNR Office of Habitat Management and Permitting (OHMP), Anchorage School District Transportation Services, Municipality of Anchorage Planning Department, Alaska Railroad Corporation, USACE, DNR Division of Parks and Outdoor Recreation, and the Municipality of Anchorage Transportation Planning Division.178 Several comments were received which referenced the Cook Inlet beluga whale. The FHWA commented that data on the Cook Inlet beluga whale collected for the Knik Arm Bridge project, may provide baseline information regarding use of the MP 99-105 area by the Cook Inlet beluga whale. In addition, the DNR-OHMP stated that project alternatives, which involve fill into the tidelands, must address potential impacts to the Cook Inlet beluga 172 Alaska Department of Transportation & Public Facilities, July 2, 2008, 2006-2009 STIP, Amendment #17. 173 McCulloch, Miriam. 2009. Alaska Department of Transportation & Public Facilities. Personal communication with ENTRIX staff on May 4. 174 LGL Alaska Research Associates, Inc, April 2007, Monitoring Beluga Whale (Delphinapterus leucas) Distribution and Movements in Turnagain
Arm along the Seward Highway, prepared for HDR Alaska, Inc. on behalf of Alaska Department of Transportation & Public Facilities. 175 Lance, Brian. 2009. Fisheries Biologist, U.S. Department of Commerce, NOAA, NMFS. Personal communication with ENTRIX staff, May 4. 176 DOWL Engineers, September 10, 2007, “Seward Highway – Bird to Indian – MP 99-105,” PowerPoint presentation at Public Meeting No. 3. 177 Alaska Department of Transportation & Public Facilities, July 2006, Scoping Summary Report, Seward Highway Milepost 99 to 105, Appendix
K, prepared by DOWL Engineers, Anchorage, Alaska. 178 Ibid.

FINAL RIR/4(B)(2)/FRFA OF CRITICAL HABITAT DESIGNATION OF COOK INLET BELUGA WHALE AUGUST 11, 2010
6-46 NATIONAL MARINE FISHERIES SERVICE
whale migration, feeding, and calving. Finally, the NMFS provided recommendations on how to minimize impacts to its trust resources, specifically EFH. Fill operations within Turnagain Arm should be minimized to the extent practicable. To protect juvenile fish, fill operations should be restricted to periods when the mud is exposed by the tide, especially during the smolt outmigration, which occurs from mid-April through May. NMFS noted that the Cook Inlet beluga whales use salmon streams in the Turnagain Arm area for feeding, and recommended that fish studies be conducted.179
POTENTIAL EFFECTS OF SEWARD HIGHWAY PROJECTS ON CHD
The waters of Turnagain Arm contain Area 1 CH for the Cook Inlet beluga whale. Impacts to CH from development of the MP 75-90 and MP 99-105 transportation projects are not expected to be significant. Bridge improvements under the MP 75-90 project are not anticipated to occur within CH. While wetlands impacts may occur under the MP 99-105 project, these effects are expected to be minor (approximately two acres). Permits that may be required for the MP 99-105 include, USACE Section 404, ADEC Section 401 Water Quality Certification, ACMP Coastal Consistency Review, ADNR and OHMP Title 41 Fish Habitat, and Municipality of Anchorage Flood Hazard permits.180
Within the next 20 years, DOT&PF anticipates funding to upgrade Seward Highway into a four-lane highway. If the DOT&PF expands the highway into the tidelands of Turnagain Arm, the CHD may be adversely affected. A representative for DOT&PF indicates that, if the CH for Cook Inlet beluga whales is designated, the DOT&PF could be required to blast into the cliffs to the north of the highway in order to add the additional lanes.181 However, there is uncertainty regarding the likelihood that adequate funding will be received and that development of the project will begin within the ten-year period of analysis.
Ted Stevens Anchorage International Airport Runway 7R Extension Project
In fiscal year 2008, approximately 47,000 cargo flights and 55,000 passenger flights landed at the the Ted Stevens Anchorage International Airport (ANC), serving more than five million passengers.182 Concerns regarding airfield congestion, aircraft taxi delays around the passenger terminal area, and runway occupancy times of cargo planes landing on Runway 7R have prompted Alaska DOT&PF, in cooperation with FAA and the ANC, to propose a runway extension project, known as the “ANC Runway 7R Extension Project.” The proposed action would extend Runway 7R 1,500 feet to the west for landings, realign Taxiway G to create an acute angled exit taxiway, and extend Taxiway R to intersect with Runway 7R. In addition, easement actions, lighting, navigation, and weather equipment relocations would occur.
Currently, an EA is being compiled to analyze the potential effects of the project. A No Action Alternative is also assessed, under which these improvements would not occur. The Draft EA was expected to be released in July 2009, with the Final EA anticipated to be published in September of the same year. Pending selection of the proposed action, project construction is expected to occur during the summer months (June through August) of the years 2010 and 2011.
179 Alaska Department of Transportation & Public Facilities, July 2006, Scoping Summary Report, Seward Highway Milepost 99 to 105, Appendix
K, prepared by DOWL Engineers, Anchorage, Alaska. 180 DOWL Engineers, September 10, 2007, “Seward Highway – Bird to Indian – MP 99-105,” PowerPoint presentation at Public Meeting No. 3. 181 McCulloch, Miriam. 2009. Alaska Department of Transportation & Public Facilities. Personal communication with ENTRIX staff on May 4. 182 Ted Stevens Anchorage International Airport web site, “Airport Statistics,”
http://www.dot.state.ak.us/anc/business/airServiceDevelopment/statistics/index.shtml, accessed April 21, 2009.
SECTION 6 CONTEXTUAL INFORMATION
NATIONAL MARINE FISHERIES SERVICE 6-47
During the public involvement process, concerns were raised regarding possible impacts to the nearby recreational Sisson Loop Trail. Portions of the existing trail overlie and cross the proposed maintenance road that would be used to maintain the relocated runway approach lighting system under the proposed action. Conflicts between trail users and Federal Aviation Administration (FAA) or ANC maintenance vehicles would be avoided by the proposed Sisson Loop Trail Reroute, which would separate the trail from the existing road.
According to an environmental planner associated with the project, the runway extension and lighting system are far enough from the coast that no negative effects to Cook Inlet are anticipated. Additionally, no dredging or filling in waters of the U.S. would occur, nor would there by an increased use of de-icing fluids. Both the DOT&PF and NMFS were consulted regarding possible impacts to any threatened or endangered species. The agencies concluded that the project will not affect the Cook Inlet beluga whale, given that no work will be done within the water; there is a low probability that a significant amount of aircraft sound will penetrate the water; and it is unlikely that Cook Inlet beluga whales use the project area.183
Matanuska-Susitna Borough Regional Aviation System Plan
Private aircraft and air taxis are popular modes of transportation to reach recreational and remote locations with the Matanuska-Susitna Borough. In fact, the borough contains the highest concentration of public and private airport facilities in the nation, with more than 200 private airports and 10 public airports.184 Rapid population growth within the borough (see Section 6.2) ensures expanded commercial and residential development, as well as increased aircraft use. To avoid potential conflicts between aviation and other land uses, the FAA and Alaska DOT&PF provided funds to the borough to develop two relevant studies: the Matanuska-Susitna Borough Regional Aviation System Plan (MSB RASP), and the Public Airport/Floatplane Base Location Study. These two studies were completed in August 2008.
The MSB RASP was developed with the goals of increasing aviation safety, meeting the aviation needs of the borough, reducing conflicts between airports and other land uses, and supporting recreational flying, tourism, and economic development. To these ends, the RASP involved the public throughout the development of the plan, inventoried private and public airports, developed a forecast of aviation growth, examined the economic impact of aviation on the regional economy, assessed the potential methods of enhancing aviation safety, identified necessary improvements for public airports, and investigated the level of demand for new airports and where these might be located within the borough. The information gathered was used to develop recommendations for addressing airspace issues, enhancing communications and airport compatibility, and for improving public airports.185
The Public Airport/Floatplane Base Location Study synthesized information on population growth in the borough, the local demand for aviation services, and the location of roads in the borough to identify potential sites for new airport facilities. Out of a total of 33 sites evaluated, three sites were recommended for further evaluation in the South Matanuska-Susitna Borough area and two more for the Upper Susitna area.
The improvements recommended for further evaluation in the Matanuska-Susitna Borough are:
183 Brix, Kaja, Assistant Administrator for Protected Resources, Alaska Region, United States Department of Commerce, NOAA, NMFS, October 7,
2008, letter to Jerry O. Ruehle, Central Region Environmental Manager, Department of Transportation and Public Facilities, Anchorage, Alaska. 184 Matanuska-Susitna Borough, August 2008, Matanuska-Susitna Borough Regional Aviation Plan, prepared by DOWL Engineers. 185 Ibid.
FINAL RIR/4(B)(2)/FRFA OF CRITICAL HABITAT DESIGNATION OF COOK INLET BELUGA WHALE AUGUST 11, 2010
6-48 NATIONAL MARINE FISHERIES SERVICE
• Upgrade and add a floatplane pond at the existing Goose Bay Airport
• Upgrade and add a floatplane pond at the existing Big Lake Airport
• Construct facilities for wheeled aircraft and develop a floatplane base at Seven Mile Lake
• A site near Mile 121 of the Parks Highway
• A site near Mile 131 of the Parks Highway
Repeated attempts, without success, were made to contact the transportation planner for the Matanuska-Susitna Borough to ascertain the likelihood that development would occur within the next fifteen years at any of these sites. However, for all sites, except Goose Bay Airport, development would occur far from Cook Inlet and therefore, these projects likely would not negatively affect CHD for the Cook Inlet beluga whale. Furthermore, it appears that the potential development specified for the Goose Bay Airport, which is situated on land near the Knik Arm of Cook Inlet, is still only a “candidate” for further evaluation at this time, and would not likely occur in the foreseeable future.186
6.4.4 Port Expansion and Development
This section discusses the expansion projects associated with two ports in the vicinity of Cook Inlet beluga whale proposed CHD. Most of the background information provided in this section is taken from information sources of the two ports, including their websites, documents, and discussion with key staff.
Port of Anchorage (POA) Marine Terminal Redevelopment Project187
Established in fall of 1961, the POA is currently limited by its facilities, resulting in congestion at all five terminals. The POA Marine Terminal Redevelopment Project will expand, reorganize, and improve the POA over a seven-year period by adding an additional 135 acres of land (thereby almost doubling the present 156-acre size) and providing approximately 8,880 linear feet of waterfront structures west, northwest, and southwest of the existing POA. The POA anticipates that the project will stimulate local and regional economies, accommodate larger container and cruise ships, barges, and tankers, support new military requirements, enhance intermodal (rail, highway, and marine) transportation systems, and serve a wider range of users.
The POA expansion project is under the Federal oversight of the U.S. Department of Transportation Maritime Administration (MARAD). As such, MARAD is the lead Federal agency with responsibility to administer Federal, State, and local dollars, on behalf of the Municipality of Anchorage, to oversee the expansion. The POA is the project sponsor, financial partner, and owner.
According to POA public information, in order to continue to supply critical goods to Alaska, a phased construction schedule is being implemented so that operations at the port can continue without interruption. Construction began in 2005, and is expected to continue through 2014, primarily occurring in summer field
186 Matanuska-Susitna Borough, August 2008, “Airport Location Study,” Matanuska-Susitna Borough Regional Aviation Plan, prepared by DOWL
Engineers. 187 A formal consultation under the Endangered Species Act has been completed for this project, but may be re-initiated, as appropriate, after CH is
designated.
SECTION 6 CONTEXTUAL INFORMATION
NATIONAL MARINE FISHERIES SERVICE 6-49
seasons. An EA188 and a FONSI189 were issued by MARAD in early March 2005. The preferred alternative was chosen and the permitting has been phased. The design alternative selected for the final structure is an earthen filled sheet pile structure, or open cell sheet pile, with necessary fender piles and panels placed waterside of the bulkhead.
The project budget is planned around phased construction years, and covers: materials, labor, and equipment (about 91 percent); project management, geotechnical and seismic studies, and engineering design (about seven percent); and environmental studies, projects, and monitoring during construction (about two percent). Approximately 52 percent of the project's funding is from Federal sources (appropriations and grants from the DOD and Department of Transportation).190 The remaining 48 percent comes through State and local funding, which include State grants and POA profits. At a future time, POA plans to secure a revenue bond, through the Municipality of Anchorage. The POA does not rely on the tax base of Anchorage for operations or other support. In addition to ongoing operations and maintenance costs associated with day-to-day operations, the Port of Anchorage continues to have its own capital improvement program to include security updates, pile repair, and operations/maintenance expenses that are not included in the Federal expansion project, managed locally.
In 2004, MARAD estimated the project budget at $400 million for the least costly preferred alternative, and included the Federal Government's 50 percent contribution of funds. However, since then, other costs have been added, such as those associated with the addition of certain necessary structural components to the concept design, finalization of the regulatory review, and issuance of the final USACE permit that required continued whale and fish studies, an independent review of the geotechnical design, in-water pile driving restrictions, plus compensatory mitigation. Also, the permitting process has added at least one year onto the project schedule, resulting in additional costs.191 At present, the project budget is estimated at approximately $700 million.192
INCIDENTAL TAKE AUTHORIZATION AND LETTER OF AUTHORIZATION FROM NMFS
The POA and MARAD were granted an IHA by NMFS on July 14, 2008, for incidental take, by level B harassment only, of no more than 34 Cook Inlet beluga whales during the Phase 1 construction activities. This permit was valid from July 15, 2008 to July 14, 2009. The IHA contains mitigation measures and conditions for protecting the species. On February 20, 2008, POA and MARAD applied for an IHA, due to the possibility of an incidental take caused by noise or vibration during construction of the five year Phase 2 of the expansion. According to the FONSI issued by NMFS, in-water pile driving activities during the construction period may result in harassment to marine mammals, including Cook Inlet beluga whales. A Letter of Authorization (LOA) will replace the now expired IHA, for Phase 2. This is in process, and the public comment period on this LOA closed on May 26, 2009.193
188 Anchorage Port Expansion Team, 2005, "Port Intermodal Expansion Project. Marine Terminal Redevelopment Environmental Assessment -
Final.” 189 Anchorage Port Expansion Team, 2005, “Maritime Administration/Port of Anchorage Finding of No Significant Impact for the Marine Terminal
Redevelopment, Port Intermodal Expansion Project.” 190 Carroll, Leo. 2009. Special Projects, Port of Anchorage. Personal communication with ENTRIX staff, June 9. 191 Port of Anchorage Intermodal Expansion Project, http://www.portofanchorage.org/ov_project.html, accessed April 25, 2009. 192 Carroll, Leo. 2009. Special Projects, Port of Anchorage. Personal communication with ENTRIX staff, June 9. 193 Ibid.
FINAL RIR/4(B)(2)/FRFA OF CRITICAL HABITAT DESIGNATION OF COOK INLET BELUGA WHALE AUGUST 11, 2010
6-50 NATIONAL MARINE FISHERIES SERVICE
SECTION 404 PERMITS FROM USACE
The USACE issued the Phase I Permit (POA-2003-502-2) to discharge 1,075,500 cubic yards (yd3) of dredged and/or fill material within a 27-Acre Intertidal Area North of Existing Facilities. This permit expired on August 31, 2008. The Phase II Permit (POA-2003-502-N) was issued by the USACE on August 10, 2007, to discharge dredged and fill material in Waters of the U.S., including wetlands, necessary for the expansion of the POA. This permit, which expires on August 31, 2014, specifically authorizes the following work:
• “The discharge of fill material over 20.5 acres of wetlands associated with the development of the Cherry Hill and North End Runway borrow pits;
• The dredging of approximately 258,000 cubic yards of sediment over approximately 21 acres, necessary for the construction of the expanded dock and the discharge of the material at the existing Port of Anchorage maintenance dredging disposal site;
• The discharge of approximately 9,663,420 cubic yards of clean fill material over 111 acres of intertidal and nearshore subtidal water of Knik Arm, necessary for the construction of the expanded dock.”
This permit carries conditions to prevent and minimize adverse impacts to marine mammals and to ensure compliance with MMPA. These conditions are consistent with the IHA for Phase I construction period and will be re-evaluated upon receipt of the LOA for Phase II construction period.
As a condition of receiving the 404 permit from USACE, POA will set aside $8.9 million for Compensatory Mitigation, paid into an escrow account directly by the POA. The projects on which that money will be spent will be determined by an oversight committee led by the Municipality of Anchorage’s Office of Economic and Community Development.
CURRENT MEASURES TO PROTECT COOK INLET BELUGA WHALE
At present, the following measures are being undertaken to protect the species:194
• “Construction and operationally generated underwater noise is being evaluated to develop a baseline sound index.
• Sound levels and distance attenuation isopleths will be mapped.
• This baseline sound index will be collaborated with concurrent marine mammal monitoring efforts to statistically correlate construction and operational generated noise exposures with presence of Cook Inlet beluga whales with documentation of any altered behaviors observed (e.g. a dose-response analysis).
• A passive acoustic monitoring plan will be conducted to correlate unseen mammals detected by underwater hyrdrophone with visual observations.
• In collaboration with NMFS, a marine mammal monitoring program has been established to estimate the frequency at which Cook Inlet beluga whales are present in the project footprint, to characterize habitat use and behavior of Cook Inlet beluga whales near the port during ice free months, and to assess the impacts of noise on Cook Inlet beluga whale behavior and movements pre-construction, construction, post-construction.
• Enforcement of construction management practices to minimize impacts, such as front line observers on the construction team, direct radio communication with the Alaska Pacific University marine mammal
194 The Port of Anchorage Intermodal Expansion Project, http://www.portofanchorage.org/ov_project.html?15,22, accessed May 3, 2009.
SECTION 6 CONTEXTUAL INFORMATION
NATIONAL MARINE FISHERIES SERVICE 6-51
observation team, slow start of daily construction activities to allow Cook Inlet beluga whales to move out of the safety radii, in water impact pile driving not be allowed within two hours of either side of low tide, and monthly evaluation of these management practices to determine methods to improve construction techniques.”
Port MacKenzie Projects
Port MacKenzie consists of a 500-foot bulkhead and 8,000 acres of adjacent uplands, available for commercial lease. Matanuska-Susitna Borough, which owns Port MacKenzie, continues to explore commercial ventures for the Port. The borough is developing general informational materials that would highlight areas of the Port where development may be possible, and anticipates developing a more formal plan in the future. In addition to the projects listed here, the Port is considering other projects that, at this time, are considered speculative and are, therefore, not considered in this analysis.
PORT MACKENZIE DEEP DRAFT DOCK EXPANSION
In December 2004, a deep draft dock was substantially completed at Port Mackenzie and bulk commodities shipments followed soon after. This project increased the depth of the berth at Port MacKenzie to 60 feet, allowing vessels such as panamax and cape-sized vessels, State ferries, and cruise ships to dock. After the dock was completed, a private company constructed a conveyor system, road, and 18-acre pad to allow for import/export of commodities. The dock expansion is expected to allow for other new industrial and commercial activities at Port MacKenzie.
Currently, there are plans to extend the deep draft dock.195 The USACE permitted the expansion plans in July 2008, and the preliminary designs have been completed; however funding has not been obtained for the project to date. In a letter dated May 15, 2008, to USACE, NMFS provided mitigation measures for Cook Inlet beluga whale, and recommended that these be included as conditions in the USACE permit for the expansion project. NMFS also suggested that Port MacKenzie apply for a Small Take Authorization under MMPA.
PORT MACKENZIE BARGE DOCK EXPANSION
Port MacKenzie constructed a barge dock in 2000, capable of receiving vessels with a 20 foot draft. The dock began receiving shipments in July 2001, and an expansion was completed in fall of 2003.196 The port plans to further expand the barge dock by nearly eight acres and received a permit for the expansion in January 2007. Funding is yet to be secured for the expansion.
195 Port MacKenzie, 2007, “Port MacKenzie Deep Draft Dock: Matanuska-Susitna Borough Project Facts,” updated January 2007,
http://www.matsugov.us/administration/projects/pdf/DeepDraftDock012307.pdf, accessed May 1, 2009. 196 Port MacKenzie, 2008, “Long-Term Vision for Future of Commercial Transportation Users,” Presentation at Alaska Regional Ports Conference,
January 10-11, 2008, http://www.poa.usace.army.mil/en/cw/AK%20Regional%20Ports%20Study/Panel1_MarcVanDongen.pdf, accessed April 15, 2008.
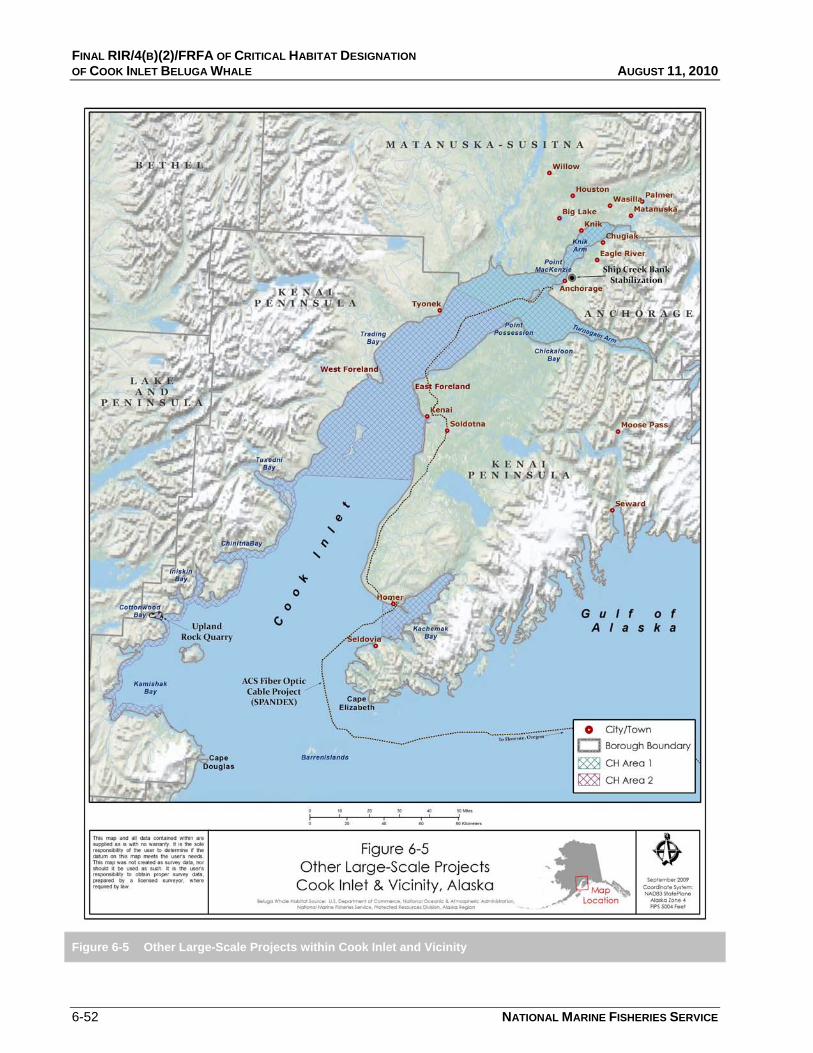
FINAL RIR/4(B)(2)/FRFA OF CRITICAL HABITAT DESIGNATION OF COOK INLET BELUGA WHALE AUGUST 11, 2010
6-52 NATIONAL MARINE FISHERIES SERVICE
Figure 6-5 Other Large-Scale Projects within Cook Inlet and Vicinity
SECTION 6 CONTEXTUAL INFORMATION
NATIONAL MARINE FISHERIES SERVICE 6-53
6.4.5 Other Large-Scale Development/Infrastructure Projects
This section describes other large-scale infrastructure projects within Cook Inlet and vicinity that may affect CH or be affected by the CHD. Figure 6-5 presents the locations of these projects.
ACS Fiber Optic Cable Project (SPANDEX Fiber Optic Cable)
Alaska Communications Systems Group (ACS) provides communications services to approximately three-fourths of the Alaskan State population. To increase communications capacity and network reliability, ACS proposed to develop SPANDEX, a submarine cable telecommunications system. In 2008, the submarine cable was installed between Florence, Oregon and Homer, Alaska. A terrestrial cable was developed to connect Homer to Nikiski, and a shorter marine segment was installed between Nikiski and Anchorage. The submarine cable from Nikiski passes through the Anchorage Coastal Wildlife Refuge and terminates onshore at Point Woronzof in Anchorage, at which point a terrestrial cable connects with an ACS facility.
The permitting process began in October 2007. The ACS consulted with NMFS; ADNR Division of Coastal and Ocean Management; USACE; USFWS; DNR Division of Mining, Lands, and Water; Kachemak Bay Wildlife Refuge; ADF&G, the State Historical Preservation Officer; ADNR Division of Parks and Outdoor Recreation, and pipeline owners for pipeline crossings. During the permitting process, the applicant (ACS) specified that the Nikiski-Point Woronzof cable would be double armored and buried at least 1.2 meters deep (in areas with a water depth of less than 1,500 meters) using a plow moving at no more than two knots in shallow waters and up to seven knots in very deep waters. The marine sections of the cable were anticipated to be installed from June to September 2008, with the terrestrial construction completed by August of that year.197
NMFS reviewed ACS’s proposal and determined that no adverse effects would occur to endangered or protected marine mammals, due to the slow speed of the ship and low level of noise generation. The applicant was advised that if marine mammals were observed in the immediate vicinity of project activities, the operators should slow vessel speed, change course, and reduce operational noise levels.198
Personal communication with the Director of Program Operations Management at ACS revealed that the company has finished laying the cable. Remaining activities include adding extra protection to the cable in three areas: where the cable crosses ConocoPhillips’s Tyonek pipeline, in an area south of Fire Island, and near Boulder Point. The same precautions will be used during application of additional cable protection and activities are, therefore, not anticipated to require additional consultation or mitigation.199
197 Gilbert, Stephen E. 2008. Director, Program Management Office, Alaska Communications System, February 1, 2008, letter to Brad Smith,
United States Department of Commerce, NOAA, NMFS, Protected Species Division, Anchorage, Alaska. 198 Mecum, Robert D. 2008. Acting Administrator, Alaska Region, United States Department of Commerce, NOAA, NMFS, April 18. Letter to
Stephen E. Gilbert, Director, Program Management Office, Alaska Communications System. 199 Gilbert, Stephen E. 2009. Director, Program Management Office, Alaska Communications System, Personal communication with ENTRIX staff,
April 16.
FINAL RIR/4(B)(2)/FRFA OF CRITICAL HABITAT DESIGNATION OF COOK INLET BELUGA WHALE AUGUST 11, 2010
6-54 NATIONAL MARINE FISHERIES SERVICE
Ship Creek Stabilization Project
Ice-scouring and a high siltation rate within Ship Creek in Anchorage cause erosion of the creek’s banks to occur. The high levels of erosion have caused Swan Bay Holdings, Inc. to propose a project that would stabilize a failing bulkhead, building foundation, and eroding stream bank on Ship Creek. As part of this project, 300 to 500 cubic yards of fill would be placed along the bank, and a timber dock would be removed by cutting pilings at the mudline or removing the pilings completely. Furthermore, large pieces of reinforced concrete would be keyed in to the gravel bed.
The company has attempted various erosion control measures in Ship Creek, since 1987. While NMFS does not anticipate significant direct adverse effects to living marine resources from the most recently proposed project, the agency has expressed concern that Swan Bay Holding’s erosion control activities may lead to cumulative impacts to living marine resources, by causing incremental loss of habitat. The Ship Creek estuary provides EFH for Chinook salmon, pink salmon, coho salmon, chum salmon, sculpins, Pacific cod, and walleye pollock. In addition, Area 1 habitat for the Cook Inlet beluga whale is located within the proposed project’s vicinity.
In order to reduce habitat loss for these marine resources, NMFS recommends that Swan Bay Holdings explore a longer-term erosion control solution, rather than the short-term erosion control measures it has practiced. For the proposed project, NMFS recommends that fill or dock removal activities occur outside of the hatchery salmon outmigration period, which occurs from May 15 through September 15. Fill materials should be clean, with no projecting metal, and be limited to 500 cubic yards. Finally, the reinforced concrete should be “a minimum diameter of 24 inches to 48 inches.”200
Upland Rock Quarry: Cottonwood Bay, Cook Inlet
The proposed project includes the placement of shot rock fill and armor rock into State-owned tidelands and marine waters to construct access routes, an airstrip, equipment work pads, waste rock and quarry rock sorting and storage areas, barge and tug docking areas, and breakwaters. Initial and maintenance dredging will be required for vessel docking. The dredging of sand and gravel will occur on State tidelands, and the proposed discharge of the dredged sands and gravels will be in-water to State tidelands. Quarry operations would only occur for a short period of time during the summer, and would likely occur only every other year.
Mr. Tom Mortensen, the agent for Diamond Point, LLC, the applicant, stated that two pre-application meetings have taken place. According to Mr. Mortensen, NMFS required four years of data on marine mammals present in the project vicinity. The Pebble Limited Partnership (consisting of Northern Dynasty Partnership and Anglo American US LLC) has collected this type of data for the Pebble Mine Project, and agreed to provide Diamond Point with the relevant portions of its studies. No Cook Inlet beluga whales were observed in Cottonwood Bay during the four year study period;201 however, according to a marine mammal expert at NMFS, aerial surveys and the data collected by the Pebble Limited Partnership have recorded Cook Inlet beluga whales nearby Cottonwood Bay.202
200 Taylor, Jonathan for Robert D. Mecum. 2007. Acting Administrator, Alaska Region, NMFS, NOAA, United States Department of Commerce.
January 25. letter to Colonel Kevin J. Wilson, District Engineer, Alaska District, United States Army Corps of Engineers. 201 Mortensen, Tom. 2009. Agent for Diamond Point, LLC. Personal communication with ENTRIX staff, April 16. 202 Migura, Mandy. 2009. Cook Inlet beluga whales, marine mammal strandings, United States Department of Commerce, NOAA, NMFS, Alaska
Region, Anchorage Field Office. Personal communication with ENTRIX staff, April 29, 2009.
SECTION 6 CONTEXTUAL INFORMATION
NATIONAL MARINE FISHERIES SERVICE 6-55
Currently, the docking and construction designs for the Diamond Point project are being modified to address concerns related to the potential impacts to commercial fisheries and otters. Once the modifications are complete, a permit application will be submitted to USACE. The USACE may issue a conditional permit that would include measures to protect marine mammals, such as temporarily ceasing operations if sensitive marine species are spotted in the project vicinity.203 Furthermore, if USACE determines that the project has the potential to impact species protected under MMPA or ESA, consultation with the agency which holds that species in trust would be required. In the case of the Cook Inlet beluga whale, consultation with NMFS under Section 7 of the ESA would be required. Additionally, if project operations have the potential to result in a take by harassment of the Cook Inlet beluga whale, the permit recipient would be required to obtain from NMFS an IHA under the MMPA, as well as an Incidental Take Statement under Section 7 of the ESA.
If CH for the Cook Inlet beluga whale were designated in the project vicinity, additional consultation with NMFS would be required. Since CH will be designated prior to project consultation with NMFS regarding impacts to the Cook Inlet beluga whales, Section 7 consultation on both the impacts to the species and to the habitat are anticipated to occur at the same time.204
6.4.6 Water Quality
Regulatory Background
The following section describes the Federal, State, and local regulations that apply to water quality in Cook Inlet.
FEDERAL CLEAN WATER ACT
The CWA (33 USC § 1251 et. seq) is a comprehensive set of statutes aimed at restoring and maintaining the chemical, physical, and biological integrity of the nation's waters. The CWA is the foundation of surface water quality protection in the United States. The CWA contains a variety of regulatory and non-regulatory tools to significantly reduce direct pollutant discharges into waters of the United States, and to manage polluted runoff. These tools are employed to achieve the broader goal of restoring and maintaining the chemical, physical, and biological integrity of the nation's waters, so that they can support the protection and propagation of fish, shellfish, and wildlife, and recreation in and on the water.
To protect the waters of the United States, water quality standards (WQS) consistent with the statutory goals of the CWA are established. Then, water bodies are monitored to determine whether the WQS are met. If all WQS are met, the anti-degradation policies and programs are employed to keep the water quality at acceptable levels. Ambient monitoring is also needed to ensure that this is the case. If the water body is not meeting WQS, it is listed as an impaired water body, as described in Section 303(d) of the CWA, and a strategy for meeting these standards must be developed or a waiver issued. The most common type of strategy is the development of a Total Maximum Daily Load (TMDL). TMDLs determine what level of pollutant load would be consistent with meeting WQS. TMDLs also allocate acceptable loads among sources of the relevant pollutants.
203 Mortensen, Tom. 2009. Agent for Diamond Point, LLC. Personal communication with ENTRIX staff, April 16. 204 Migura, Mandy. 2009. Cook Inlet beluga whales, marine mammal strandings, United States Department of Commerce, NOAA, NMFS, Alaska
Region, Anchorage Field Office. Personal communication with ENTRIX staff, April 29, 2009.
FINAL RIR/4(B)(2)/FRFA OF CRITICAL HABITAT DESIGNATION OF COOK INLET BELUGA WHALE AUGUST 11, 2010
6-56 NATIONAL MARINE FISHERIES SERVICE
Necessary reductions in pollutant loading are achieved by implementing strategies authorized by the CWA, along with any other tools available from Federal, State, and local governments, and nongovernmental organizations. Key CWA regulatory tools, pertinent to the Cook Inlet, include the following:
• Section 402, the NPDES permit program, covering point sources of pollution discharging into a surface waterbody.
• Section 401 of the CWA requires that before a Federal agency can issue a license or permit for construction or other activity, it must have received from the state in which the affected activity would take place a written certification that the activity will not cause or contribute to a violation of relevant state water quality standards. Downstream states whose WQS might be exceeded as a result of Federal approval of the activity can also play a role in the 401 process.
After implementation of these strategies, ambient conditions are again measured and compared to ambient water quality standards. If standards are now met, only occasional monitoring is needed. If standards are still not being met, then a revised strategy is developed and implemented, followed by more ambient monitoring. This iterative process must be repeated until standards are met. Table 6-18 provides information about the listed water bodies.
Initial authority for the implementation and enforcement of the CWA rests with the EPA. However, this authority can be exercised by states with approved regulatory programs. On October 31, 2008, the EPA approved the State of Alaska’s application to take over issuing and enforcing permits for wastewater discharges issued under the CWA.205
Table 6-18 303(d) Impaired Water Bodies
Region Category Alaska ID # Water Body Location Area of Concern
Water Quality
Standard Pollutant
Parameters Pollutant Sources
SC Category 5 Section 303(d) listed
20505-401 Big Lake Wasilla 1,250 acres Petroleum Hydro-carbons
Total Aromatic Hydrocarbons (TAH)
Motorized watercraft
SC Category 5 Section 303(d) listed
20505-001 Cottonwood Creek
Wasilla Entire 13 miles Residues Foam & Debris
Urban Runoff, Urban Development
SC Category 5 Section 303(d) listed
20401-412 Hood/
Spenard Lake
Anchorage 307 acres Dissolved Gas
Low Dissolved Oxygen
Urban Runoff, Industrial
SC Category 5 Section 303(d) listed
20402-001 Matanuska River
Palmer ½ mile Residues Debris Landfill
SC Category 5 Section 303(d) listed
20401-020 Ship Creek Glenn Hwy. Bridge. Down to Mouth
Anchorage 11 miles, Glenn Hwy. Bridge to Mouth
Petroleum Hydro-carbons, Oil & Grease
Petroleum Products
Urban Runoff
Source: Alaska Department of Environmental Conservation, 2008. Integrated Water Quality Monitoring and Assessment Report, April 1, 2008.
205 Alaska Department of Environmental Conservation, 2009a. Pollution Discharge Elimination system website, Accessed on May 5, 2009
http://www.dec.state.ak.us/water/npdes/background.htm.
SECTION 6 CONTEXTUAL INFORMATION
NATIONAL MARINE FISHERIES SERVICE 6-57
STATE OF ALASKA WATER QUALITY STANDARDS
The EPA approval of Alaska’s primacy of the NPDES program triggers a three-year transition from Federal to State control of the program.206 During the transition period, responsibility for developing and enforcing different types of permits is handed off from EPA to the Alaska Department of Environmental Conservation (ADEC). The transition will be complete by November 2011. The schedule for handing off the various facilities is as follows:207:
• Phase I Facilities - at program approval, October 31, 2008
− Domestic discharges
− Log storage and transfer facilities
− Seafood processing facilities
− Hatcheries
• Phase II Facilities - one year from program approval, October 31, 2009
− Federal facilities – Domestic plants at Department of Defense (DOD) and USCG facilities/cooling water
− Stormwater
− Pretreatment program
− Miscellaneous non domestic discharges
• Phase III Facilities - two years from program approval, October 31, 2010
− Mining
• Phase IV Facilities - three years from program approval, October 31, 2011
− Oil and gas industry
− Cooling water intakes
− Munitions
Prior to EPA’s approval to hand-off primacy of the NPDES program, the ADEC played a secondary role “certifying” that EPA permits meet State water quality standards under 18AAC 70.236(b)(4), and issuing State permits for very small discharges that EPA could not get to.208
The State of Alaska sets water quality standards for specific water bodies, based on their intended use.209 The water quality standards set by this chapter specify the degree of degradation that may not be exceeded in a water body as a result of human actions. The standards are set for concentrations of pollutant constituents including color, fecal coliform bacteria, dissolved gas, petroleum hydrocarbons, and others. The intended uses of the water bodies include water supply for drinking, culinary and food processing, growth and propagation of fish, shellfish, and other aquatic life. State water quality standards must be approved by the EPA for use in regulations triggered by the CWA. 206 The EPA will continue to consult on approval of State water quality standards. 207 Alaska Department of Environmental Conservation, 2009a. Pollution Discharge Elimination system website, Accessed on May 5, 2009
http://www.dec.state.ak.us/water/npdes/background.htm. 208 Alaska Department of Environmental Conservation, 2009b. Pollution Discharge Elimination system website, Accessed on May 5, 2009
http://www.dec.state.ak.us/water/npdes/APDESApproved.htm. 209 18 AAC 70.020.

FINAL RIR/4(B)(2)/FRFA OF CRITICAL HABITAT DESIGNATION OF COOK INLET BELUGA WHALE AUGUST 11, 2010
6-58 NATIONAL MARINE FISHERIES SERVICE
State water quality classifications protect Cook Inlet for marine use classifications (18 AAC 70.020.a.(2) A-D). The beneficial uses of Cook Inlet include aquaculture, seafood processing, industrial water supply, water contact and secondary recreation, growth and propagation of fish, shellfish, other aquatic life, and wildlife, and harvesting for consumption of raw mollusks or other raw aquatic life.
In addition to meeting the Federal CWA standards, the State of Alaska has instituted a Clean Water Actions (ACWA) initiative. The ACWA is much broader and more comprehensive assessment than the CWA that includes water quality, water quantity, and aquatic habitat.210 The Statewide water quality assessment describes whether the existing condition of Alaska’s water bodies is sufficient to maintain multiple designated uses of that water body.
The ADEC reports on water quality by providing a comprehensive evaluation of the status and health of each water body in the State of Alaska, and by describing the programs by which the State is maintaining or improving the quality of Alaska’s waters.211 In addition, this report describes the process by which water bodies are evaluated, in order to determine if they attain water quality standards or are impaired (polluted).
The categorization that Alaska uses to report on water quality is as follows:212
• Generally, water bodies are categorized by usage and the degree to which water quality goals are attained. There are five categories to which a water body can be assigned:
• Category 1. All the water quality standards for all designated uses are attained.
• Category 2. Some of the water quality standards for the designated uses are attained, but data and information to determine if the water quality standards for the remaining uses are attained are insufficient or absent.
• Category 3. Data or information is insufficient to determine that the water quality standards for any of the designated uses are attained.
• Category 4. The water body is determined to be impaired, but does not need a TMDL.
− Category 4a. Impaired waters with an established and EPA-approved TMDL.
− Category 4b. Impaired waters with established ―other pollution control requirements to meet water quality standards.
− Category 4c. Impaired waters that fail to meet a water quality standard which is not caused by a pollutant, but instead is caused by other types of pollution.
• Category 5. Water quality standards for one or more designated uses are not attained and the water body requires a TMDL or recovery plan. Category 5 waters are the Section 303(d) list of impaired waters.
Table 6-19 lists the water bodies that flow into Cook Inlet that are classified in Category 4 (Category 5 are the 303(d) listed water bodies shown in Table 6-18).
210 Alaska’s Department of Environmental Conservation, 2008, Integrated Water Quality Monitoring and Assessment Report April 1, 2008. 211 Ibid. 212 Ibid.
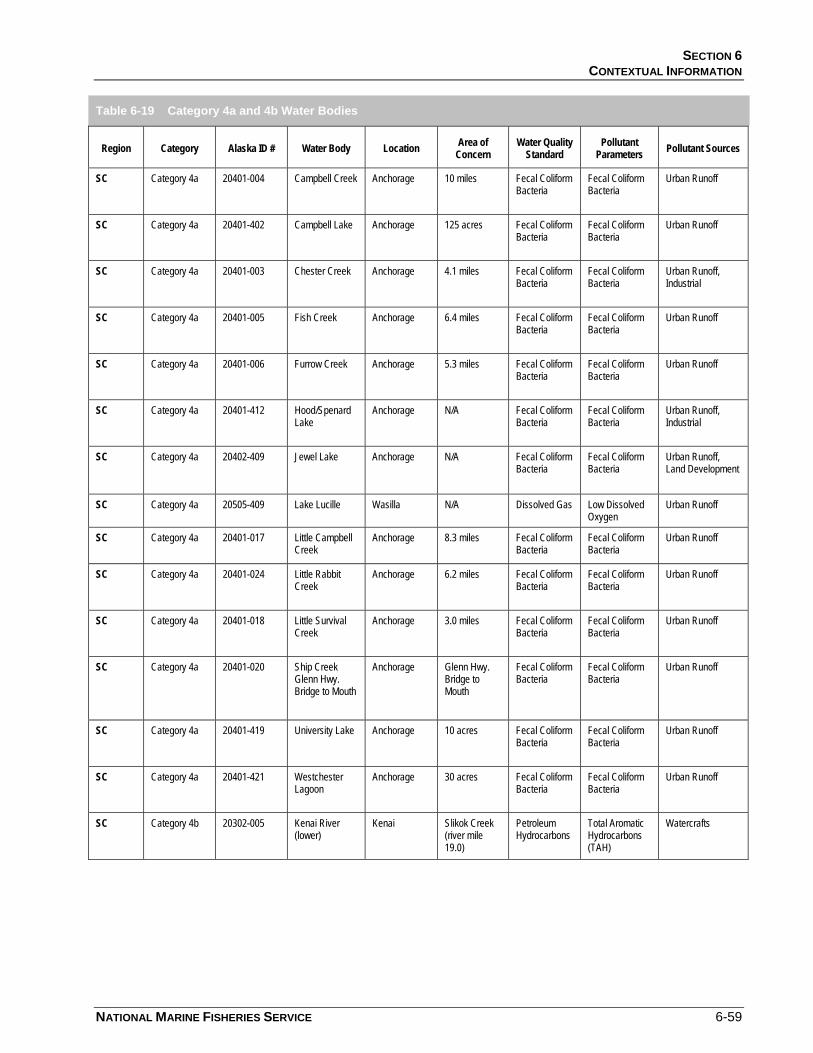
SECTION 6 CONTEXTUAL INFORMATION
NATIONAL MARINE FISHERIES SERVICE 6-59
Table 6-19 Category 4a and 4b Water Bodies
Region Category Alaska ID # Water Body Location Area of Concern
Water Quality Standard
Pollutant Parameters Pollutant Sources
SC Category 4a 20401-004 Campbell Creek Anchorage 10 miles Fecal Coliform Bacteria
Fecal Coliform Bacteria
Urban Runoff
SC Category 4a 20401-402 Campbell Lake Anchorage 125 acres Fecal Coliform Bacteria
Fecal Coliform Bacteria
Urban Runoff
SC Category 4a 20401-003 Chester Creek Anchorage 4.1 miles Fecal Coliform Bacteria
Fecal Coliform Bacteria
Urban Runoff, Industrial
SC Category 4a 20401-005 Fish Creek Anchorage 6.4 miles Fecal Coliform Bacteria
Fecal Coliform Bacteria
Urban Runoff
SC Category 4a 20401-006 Furrow Creek Anchorage 5.3 miles Fecal Coliform Bacteria
Fecal Coliform Bacteria
Urban Runoff
SC Category 4a 20401-412 Hood/Spenard Lake
Anchorage N/A Fecal Coliform Bacteria
Fecal Coliform Bacteria
Urban Runoff, Industrial
SC Category 4a 20402-409 Jewel Lake Anchorage N/A Fecal Coliform Bacteria
Fecal Coliform Bacteria
Urban Runoff, Land Development
SC Category 4a 20505-409 Lake Lucille Wasilla N/A Dissolved Gas Low Dissolved Oxygen
Urban Runoff
SC Category 4a 20401-017 Little Campbell Creek
Anchorage 8.3 miles Fecal Coliform Bacteria
Fecal Coliform Bacteria
Urban Runoff
SC Category 4a 20401-024 Little Rabbit Creek
Anchorage 6.2 miles Fecal Coliform Bacteria
Fecal Coliform Bacteria
Urban Runoff
SC Category 4a 20401-018 Little Survival Creek
Anchorage 3.0 miles Fecal Coliform Bacteria
Fecal Coliform Bacteria
Urban Runoff
SC Category 4a 20401-020 Ship Creek Glenn Hwy. Bridge to Mouth
Anchorage Glenn Hwy. Bridge to Mouth
Fecal Coliform Bacteria
Fecal Coliform Bacteria
Urban Runoff
SC Category 4a 20401-419 University Lake Anchorage 10 acres Fecal Coliform Bacteria
Fecal Coliform Bacteria
Urban Runoff
SC Category 4a 20401-421 Westchester Lagoon
Anchorage 30 acres Fecal Coliform Bacteria
Fecal Coliform Bacteria
Urban Runoff
SC Category 4b 20302-005 Kenai River (lower)
Kenai Slikok Creek (river mile 19.0)
Petroleum Hydrocarbons
Total Aromatic Hydrocarbons (TAH)
Watercrafts
FINAL RIR/4(B)(2)/FRFA OF CRITICAL HABITAT DESIGNATION OF COOK INLET BELUGA WHALE AUGUST 11, 2010
6-60 NATIONAL MARINE FISHERIES SERVICE
LOCAL
The Municipality of Anchorage regulates on-site wastewater disposal systems as per AO, § 15.65.005.213 The intent of this chapter is to maintain the public health and environmental quality through the regulation of on-site wastewater disposal. This chapter provides:
1. Minimum standards governing the design, installation, and operation of individual on-site wastewater disposal systems and authority to the municipality to administer and enforce these standards and regulations;
2. Prohibitions against wastewater discharges other than through approved means;
3. Authority to the municipality to create and empower limited local on-site sewer districts;
4. Authority to the municipality to require connection to public sewers and the conditions under which such connection must occur; and
5. Minimum standards for new subdivisions that are to be served by on-site wastewater disposal systems.
Categories of Permitted Discharges into Cook Inlet and Selected Waters
The following sections summarize categories of discharges into Cook Inlet and provide a description of specific discharges that are classified as ‘major dischargers’ by the EPA.214 These facilities, and other facilities selected by staff at the ADEC as being pertinent to this Final RIR/4(b)(2) Preparatory Assessment/FRFA,215 are shown in Figure 6-6. The types of facilities include municipal wastewater treatment facilities (WWTF), crude oil and natural gas, petroleum refining, cargo handling, seafood processing and hatcheries, and stormwater. There are many hundreds of other NPDES permits, besides those shown in Figure 6-6 and described below that discharge into Cook Inlet and the rivers feeding Cook Inlet. However, many of those are construction related or for very small volumes of discharge, such as small placer mines. For example, the EPA web-based database identifies 60 permits issued in the Matanuski-Susitna Borough, nearly all of which are construction-related, and none of these appear on EPA’s list of ‘major dischargers.’ For the purposes of this Final RIR/4(b)(2) Preparatory Assessment/FRFA, only those permits considered by EPA as ‘major dischargers,’ or of potential interest to ADEC, are included in the analysis.
MUNICIPAL WASTEWATER TREATMENT FACILITIES
Seven WWTFs, categorized as ‘major dischargers’ by EPA, have permits to discharge treated municipal wastewater into Cook Inlet or rivers that flow into Cook Inlet. Three of these WWTFs are managed by the Anchorage Water and Wastewater Utility (AWWU). AWWU provides sewage collection and treatment service to 280,000 people in the Municipality of Anchorage.216 It provides service to residential, commercial, and industrial, and septic pumping services via three WWTFs. The remaining four WWTFs serve the cities of Soldotna, Homer, Kenai, and Seward. What follows is a description of the seven WWTFs (the first three are managed by AWWU).
213 AO, § 15.65.005. 214 Environmental Protection Agency, Facility Registry System (FRS), www.epa.gov/enviro/index.html, accessed May 14, 2009. 215 Stambaugh, Sharman. 2009. Program Manager, Alaska Department of Environmental Protection, Division of Water, Wastewater Discharge
Authorization. Personal communication with ENTRIX staff, May 13; Alaska Department of Environmental Conservation, 2009a, Pollution Discharge Elimination system website, http://www.dec.state.ak.us/water/npdes/background.htm, accessed on May 5, 2009.
216 Anchorage Water and Wastewater Utility, 2006, Wastewater Master Plan, December.

SECTION 6 CONTEXTUAL INFORMATION
NATIONAL MARINE FISHERIES SERVICE 6-61
THE JOHN M. ASPLUND WATER POLLUTION CONTROL FACILITY (NPDES PERMIT NUMBER AK0022551) – MANAGED BY AWWU
Located on the tip of Point Woronzof, near Anchorage Airport, the facility treats domestic wastewater from the Anchorage bowl, south of Eagle River and north of Potter Marsh, including the military installations Fort Richardson and Elmendorf Air Force Base. Providing primary treatment, the facility uses skimming, screening, grit removal sedimentation, and chlorination techniques to treat an annual average outflow of 28 million gallons per day (mgd) of water.217 Chlorine treated primary effluent is then discharged through a diffuser into the Knik Arm of Cook Inlet from a 84 inch diameter pipe 804 feet off shore at a depth of 15 feet. In the past, regulations required summer water quality tests of the receiving waters for fecal coliform bacteria, enterococci bacteria, color, total residue chlorine, total hydrocarbons, total aromatic hydrocarbons, dissolved oxygen, turbitity, pH, temperature and salinity. The NPDES permit also included specific limits for the concentration and volume of the effluents biological oxygen demand and suspended solids.
The permit for this facility was originally issued in 1975. On June 15, 1979, EPA published the 301(h) regulations (40 CFR 125) establishing the criteria EPA would use for issuing an NPDES permit with a variance from secondary treatment requirements for the Asplund facility. The CWA was amended again in 1987. This amendment defined primary treatment, added restrictions on discharges to impaired estuarine waters, and added urban area pretreatment requirements. At the time, the State waived certification under Section 401 of the Act regarding compliance with State law and water quality standards, including a basis for the conclusions reached.218
The permit for the facility expired in 2005. The facility has been operating under an administrative extension since 2005. The EPA issued the original NPDES permit (permit number AK-002255-1) and despite Alaska’s approval for primacy of the NPDES permit program, the EPA will continue to be responsible for permitting the John Asplund WWTF. EPA is beginning to review the reissuance of the NPDES permit. At this time, the State has the authority to grant, deny, or waive its right to certify the permit.
GIRDWOOD WASTEWATER TREATMENT FACILITY (NPDES PERMIT NUMBER AK0047856) – MANAGED BY AWWU
The Girdwood WWTF produces activated sludge from the sewage collected from the area that includes the southern end of Girdwood Valley, lower Crow Creek Road, and the Alyeska and proposed Winner Creek ski resort areas. Wastewater from Girdwood WWTF, discharges into Glacier Creek, a tributary of Cook Inlet. The annual average flow between 1996 and 2000 was 0.46 mgd, ranging between 0.43 mgd and 0.49 mgd. The WWTF has sufficient capacity to treat inflows through 2026.219 The facility experienced a number of water quality exceedances from 2000 to 2005, including two pH violations, three daily fecal cloriform violations, two violations of monthly average flow220. According to the Girdwood Sewer Master Plan, 221 the floodplain location of the treatment plant presents a potential hazard. Although the WWTF is reportedly 217 Environmental Protection Agency, 2000, Fact Sheet on NPDES permit issuance for Municipality of Anchorage, John Asplund Water Pollution
Control Facility, Anchorage, AK, Accessed online 5/7/09 at: http://yosemite.epa.gov/r10/water.nsf/95537302e2c56cea8825688200708c9a/16dcdebf18bc8ee28825742b006cee6f/$FILE/ATTMP2OQ/AK0022551%20FS.pdf.
218 Anchorage Water and Wastewater Utility, 2006, Wastewater Master Plan, December. 219 Ibid. 220 EPA, 2000, Fact Sheet on NPDES permit issuance for Municipality of Anchorage, Girdwood Wastewater Treatment Facility, Girdwood, AK,
Accessed online at: http://yosemite.epa.gov/r10/water.nsf/95537302e2c56cea8825688200708c9a/16dcdebf18bc8ee28825742b006cee6f/$FILE/ATT7BRYI/girdwoodfact.PDF
221 Anchorage Water and Wastewater Utility, 2006, Wastewater Master Plan, December. Note: Alaska Water and Wastewater Utility manages the Girdwood Sewer Plant, and this information is in the Alaska Water and Wastewater Utility plan.

FINAL RIR/4(B)(2)/FRFA OF CRITICAL HABITAT DESIGNATION OF COOK INLET BELUGA WHALE AUGUST 11, 2010
6-62 NATIONAL MARINE FISHERIES SERVICE
located above the estimated 100-year flood level, there is some uncertainty about the topography and flood mapping used to evaluate flooding. In addition, the 1985 plan indicated that rapid and extreme shifts in the Glacier Creek channel alignment could cause embankment erosion adjacent to the treatment plant.
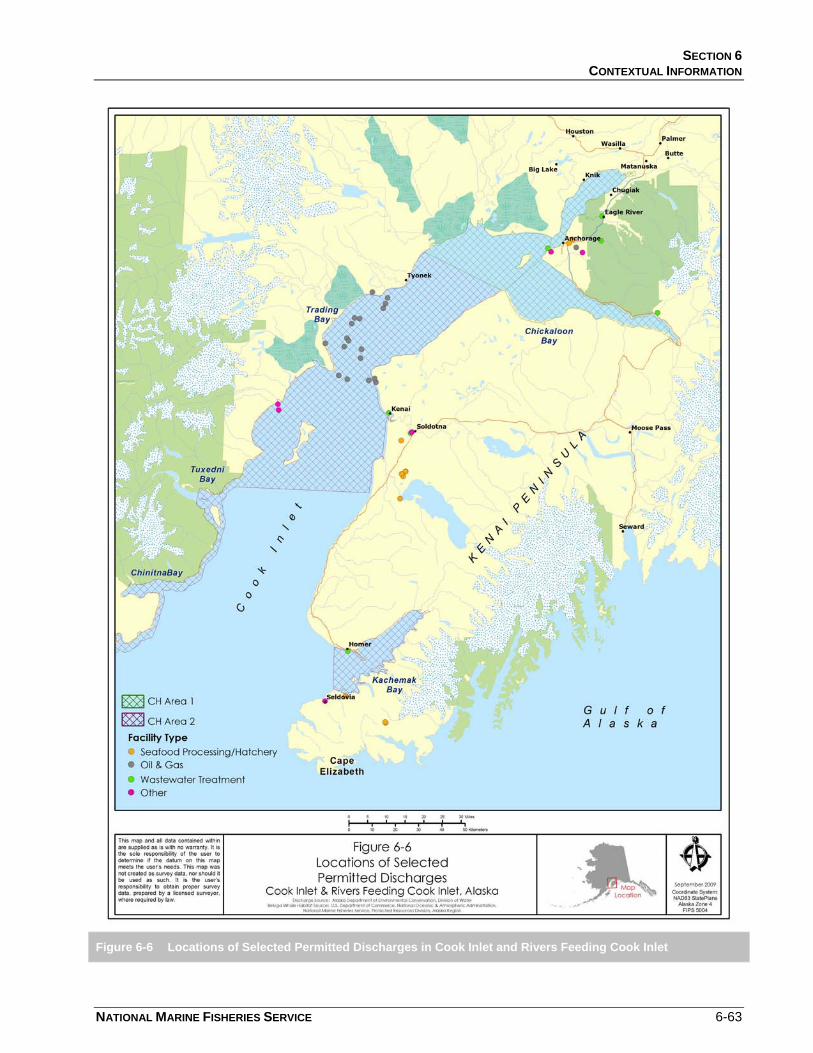
SECTION 6 CONTEXTUAL INFORMATION
NATIONAL MARINE FISHERIES SERVICE 6-63
Figure 6-6 Locations of Selected Permitted Discharges in Cook Inlet and Rivers Feeding Cook Inlet
FINAL RIR/4(B)(2)/FRFA OF CRITICAL HABITAT DESIGNATION OF COOK INLET BELUGA WHALE AUGUST 11, 2010
6-64 NATIONAL MARINE FISHERIES SERVICE
EAGLE RIVER WASTEWATER TREATMENT FACILITY (NPDES PERMIT NUMBER AK0022543) – MANAGED BY AWWU
Eagle River WWTF is located on a 27-acre lease parcel west of Glenn Highway, between Eagle River and Artillery Road. The WWTF receives domestic water from local residents and businesses then discharges into Eagle River, 1.5 river miles west of the Glenn Highway crossing. The facility is compliant with all effluent limitations from 2002 through 2005, and had it’s permit renewed in 2005222 The facility was upgraded in 1980, to include primary clarification, secondary treatment consisting of rotating biological contactors and clarification, and disinfection using chlorine (with a treatment capacity of 1.0 mgd ). The plant capacity is 2.5 mgd, with provision to double capacity in the future. The treatment system was converted to aeration basins, followed by clarifiers and effluent filters for tertiary treatment. This process is currently used in operating the facility. AWWU has published an updated facility plan for the Eagle River WWTF, Eagle River Wastewater Treatment Facility – Facility Plan Update.223 The plan evaluates the current plant condition and treatment process and indicates that the current facility has capacity, with some modifications, to treat expected wastewater flows through 2016.224
CITY OF SOLDOTNA WASTEWATER TREATMENT FACILITY (NPDES PERMIT NUMBER AK0020036)
The City of Soldotna owns, operates, and maintains a complete mix modification of activated sludge secondary treatment facility. The facility discharges treated municipal wastewater to the Kenai River and sludge to the Soldotna landfill. The facility receives no significant industrial discharge, and the system has no combined sewers. The facility serves a resident population of fewer than 4,000. Soldotna is a tourist destination area, so the actual population is higher during summer months. The current Soldotna permit expired on July 25, 2005. The facility is operating under an administrative extension. Design flow for the facility is 1.02 mgd. The City is currently considering expansion of capacity to 1.08 mgd, and installation of ultraviolet disinfection. A review of the facility’s discharge monitoring reports for the last three years shows that the facility’s average flow is about 0.54 mgd. Review of the discharge monitoring reports also reveal that the facility has generally reported compliance with its 1991 permit effluent limits.225
CITY OF HOMER WASTEWATER TREATMENT FACILITY (NPDES PERMIT NUMBER AK0021245)
This permit was not available from the same web-based search that produced the other permits. A request has been made to both ADEC and EPA for a copy of the permit. However, an online EPA database listed the facility’s receiving waters as Kachemak Bay in Cook Inlet, and listed the NPDES permitted discharge parameters for the facility as five-day biochemical oxygen demand, pH, total suspended solids, nitrogen (ammonia), fecal coliform, flow and total residual chlorine.226
KENAI WASTEWATER TREATMENT FACILITY (NPDES PERMIT NUMBER AK0021377)
The City of Kenai owns, operates, and maintains a complete mix modification of an activated sludge secondary treatment plant. The facility discharges treated municipal wastewater to Cook Inlet and sludge to the Soldotna landfill. The facility receives no significant industrial discharge, and the system has no combined
222 EPA, 2005, Fact Sheet on NPDES permit issuance for Municipality of Anchorage, Eagle River Wastewater Treatment Facility, Eagle River, AK,
Accessed online at: http://yosemite.epa.gov/R10/WATER.NSF/NPDES+Permits/CurrentAK822/$FILE/AK0022543%20FS.pdf 223 Anchorage Water and Wastewater Utility, Eagle River Wastewater Treatment Facility – Facility Plan Update, 2006 CDM and GV Jones and
Associates, Inc. 224 Anchorage Water and Wastewater Utility, 2006, Wastewater Master Plan, December. 225 Environmental Protection Agency, Facility Registry System (FRS), www.epa.gov/enviro/index.html, accessed May 14, 2009. 226 Ibid.
SECTION 6 CONTEXTUAL INFORMATION
NATIONAL MARINE FISHERIES SERVICE 6-65
sewers. The facility serves a resident population of 3,600. Kenai is a tourist destination area, so actual population is higher during summer months (EPA Fact Sheet).227 The permit became effective September 1, 2008, and expires August 31, 2013. Design flow for the facility is 1.330 mgd. The NPDES application shows that the facility’s annual average daily flow for the past three years was 0.573 mgd. Reviews of the discharge monitoring reports also reveal that the facility has generally reported compliance with its 1999 permit effluent limits. Discharge monitoring reports are forms the facility uses to report results of self-monitoring, including effluent testing results.
OTHER WWTFS, NOT CLASSIFIED AS ‘MAJOR DISCHARGERS’
THE CITY OF SELDOVIA
The community is on septic systems with a “common collector” with an ocean outfall. The outfall is not currently permitted.228 Sewage is piped to a community septic tank for primary treatment, and then discharges to an ocean outfall. Approximately 175 homes and facilities are served by the system; all homes are completely plumbed.
CRUDE PETROLEUM AND NATURAL GAS
XTO ENERGY INC, PLATFORM (NPDES PERMIT NUMBER AKG285003)
This permit was not available from the same web-based search that produced the other permits. A request has been made to both ADEC and EPA for a copy of the permit. However, an online EPA database stated that the facility discharges produced water into Cook Inlet and listed the NPDES permitted discharge parameters for the facility as flow rate, pH, and Oil and Grease.229
PETROLEUM REFINING
TESORO ALASKA (NPDES PERMIT NUMBER AK0000841)
Tesoro’s refining facility in Kenai, Alaska has the capacity to produce 72,000 barrels of oil a day. The facility discharges treated refining process wastewater into Cook Inlet, as well as some treated petroleum contaminated groundwater. The discharge occurs through an 8 inch diameter pipe, 700 feet offshore of Port Nikiski, in an area known as Forelands. The facility’s NPDES permit stipulates effluent limitations for five day biochemical oxygen demand (BOD5), total suspended solids (TSS), oil and grease, chemical oxygen demand (COD), ammonia, sulfide, phenolic compounds, total chromium, hexavalent chromium, pH, total aromatic hydrocarbons (TAH), and benzene. Tesoro also has a permit for an oil pipeline (NPDES permit number AK0001058) previously owned and operated as the Kenai Pipeline Company (KPL).
The pipeline moves oil in pipelines from oilfields to local refineries in Nikiski, 60 miles Southwest of Anchorage. The pipeline permit primarily covers treated ballast water discharging into Cook Inlet. The tanker ships served at the facility do not have separate compartments for oil and water so ballast water becomes contaminated with petroleum related compounds. This contaminated ballast water is treated at a facility onshore and discharged in batches into Cook Inlet. Annually, roughly five to nine batches of 100 thousand to 300 thousand gallons of treated wastewater are discharged into Cook Inlet from the Nikiski pier 227 Environmental Protection Agency, 2005, Fact Sheet on NPDES permit issuance for City of Kenai Wastewater Treatment Facility, Kenai, AK,
Accessed online 5/7/09 at: http://yosemite.epa.gov/r10/water.nsf/NPDES+Permits/CurrentAK822/$FILE/AK0021377+FS.pdf. 228 Stambaugh, Sharman. 2009. Program Manager, Alaska Department of Environmental Protection, Division of Water, Wastewater Discharge
Authorization. Personal communication with ENTRIX staff, May 13. 229 Environmental Protection Agency, Facility Registry System (FRS), www.epa.gov/enviro/index.html, accessed May 14, 2009.
FINAL RIR/4(B)(2)/FRFA OF CRITICAL HABITAT DESIGNATION OF COOK INLET BELUGA WHALE AUGUST 11, 2010
6-66 NATIONAL MARINE FISHERIES SERVICE
in 30-foot deep water. The facility’s NPDES permit established effluent limits for BOD5, TSS, COD, TAH, pH, Oil and Grease, residue, flow, total aqueous hydrocarbons, total organic carbon, chloride, and whole effluent toxicity.
STORMWATER
The NPDES Stormwater Program regulates stormwater discharges from three potential sources: municipal separate storm sewer systems (MS4s), construction activities, and industrial activities. Most stormwater discharges are considered point sources, and operators of these sources may be required to receive an NPDES permit before they can discharge. This permitting mechanism is designed to prevent stormwater runoff from washing harmful pollutants into local surface waters, such as streams, rivers, lakes, or coastal waters.
CITY OF ANCHORAGE (NPDES PERMIT NUMBER AKS052558)
The Municipality of Anchorage Watershed Management Services (WMS) is responsible for administration of the Municipality’s NPDES permit. The stormwater permit is a five-year term permit to discharge stormwater to U.S. receiving waters, issued jointly to the Municipality of Anchorage and the Alaska DOT. The Municipality of Anchorage and DOT are operating under an administrative extension of the first term permit, issued in 1997.230 This permit covers all areas within the corporate boundary of the Municipality of Anchorage, served by the MS4. The permit authorizes the discharge of stormwater to waters of the United States from: (1) all portions of the MS4 owned or operated by the Municipality of Anchorage; and (2) portions of the MS4 within State of Alaska highway rights-of-way located within the corporate boundaries of the Municipality of Anchorage that are owned or operated by the DOT & PF. This permit also authorizes the discharge of stormwater commingled with flows contributed by process wastewater, non-process wastewater, and stormwater associated with industrial activity, provided that the commingled flows fall within at least one of the categories of covered non-stormwater discharges.
OTHER DISCHARGES
Other discharges of potential relevance for this report were mentioned during consultation with the ADEC. These facilities have never received a permit from the EPA, but have received permits from either DEC or the USACE. Three facilities have been permitted by ADEC; the Anchorage International Airport, the Kenai Fire Training Facility, and the Eagle River Flats Fire Training Facility. The Airport uses deicing chemicals and the two fire training facilities use fire suppression chemicals. ADEC will be including these facilities in its NPDES program, as per the schedule. The POA has received several USACE certifications under Section 401 of the CWA.
ALASKA NITROGEN PRODUCTS
Alaska Nitrogen Products operates a nitrogen-producing fertilizer plant located about ten miles north of Kenai, Alaska. The facility includes two ammonia plants, as well as two urea plants, and employs roughly 300 workers. The facility is a major NPDES-permitted discharger, as it pipes discharge wastewater and sludge from the factory directly into Cook Inlet, roughly 1,600 feet offshore. The current NPDES permit was issued in November, 2000, and expired in 2005.231 Discharge constituents limited by the permit include
230 Municipality of Anchorage Watershed Management Services (WMS), 2009. http://wms.geonorth.com/permit_guidance/PermitGuidance.aspx
accessed on May 14, 2009. 231 Many NPDES permits are expired. When this occurs, they may be on administrative extension. However, there is no information available about
this particular permit. See the second permit listed at http://yosemite.epa.gov/r10/water.nsf/NPDES+Permits/CurrentAK822, accessed August 28, 2009.
SECTION 6 CONTEXTUAL INFORMATION
NATIONAL MARINE FISHERIES SERVICE 6-67
ammonia, nitrogen, oil and grease, and pH. From 1989 to 1999, facility monitoring revealed no nitrogen violations, one pH violation, and 12 ammonia violations.232
6.4.7 Power Projects/Development in Cook Inlet and Vicinity
Several proposed power projects were researched, with potential to affect the CHD of the Cook Inlet beluga whale. These include the four listed below [Fire Island Wind Farm, Central Cook Inlet Tidal Energy Project, Cook Inlet Tidal Energy Project (OCGenTM), and the Mt. Spurr Geothermal Power Plant], as well as three projects that have either been withdrawn from consideration (unlikely to occur) or have been found unlikely to impact such a designation. Chevron Technology Ventures, LLC has voluntarily surrendered the preliminary permit for the Chevron Alaska Renewable Energy project in the Cook Inlet, to focus its resources on other energy projects.233 The proposed project would have been located in the central part of the Cook Inlet in the Kenai Peninsula, Alaska, consisting of a field of axial free flow turbines with a capacity of 80 MW and an annual generation of 8.76 GWh.234 The Chakachamna Hydroelectric Project, a proposed project on Chakachamna Lake, was reviewed. No likely connection between the Project and the CHD was determined, due to its inland location and no physical connection to the Cook Inlet.235 The proposed Knik-Willow Transmission Line originally involved the construction of about 25 miles of new electrical transmission lines between the Teeland (Knik) and Douglas (Willow) substations for the Alaska intertie. However, the Alaska Energy Authority has requested that the project be revised in a way that would alter its path away from the Cook Inlet, to an inland location between the Lake Loraine area and Willow, so that the project is no longer likely to impact the CHD.236 Figure 6-3 presents the locations of power projects discussed in this section.
Fire Island Wind Farm (Wind Energy Alaska)
Wind Energy Alaska is currently planning construction and operation of the Fire Island wind farm, which would require the addition of a new power transmission line through the upper Cook Inlet. Fire Island is approximately three miles west of the Anchorage Bowl, and has over 4,000 acres of developable land. The Fire Island wind farm is expected to begin construction during the summer of 2009, and begin operations sometime during 2010. The plan calls for erecting 20 wind turbines, each capable of generating 1.5 megawatts of power.237 Chugach Electric Association, which will likely be a primary purchaser of the wind power, installed meteorological stations on the Island and discovered a land and wind resource capable of supporting up to 120 MW of wind turbines.
Wind Energy Alaska requested, and last year the Alaska Legislature appropriated, $25 million from Alaska Energy Authority to construct the seabed transmission line to connect the planned Fire Island wind farm into the electricity grid in Anchorage.238 This is a $150 million project, of which $125 million was raised from private sources.
232 Environmental Protection Agency, Facility Registry System (FRS), www.epa.gov/enviro/index.html, accessed May 14, 2009. 233 Sterling, John. 2009. Chevron Technology Ventures. Personal communication with ENTRIX staff on April 10. 234 Federal Energy Regulation Commission, June 11, 2007, Order issuing Preliminary Permit, Chevron Technology Ventures, Project No. 12744-
000. 235 TDX Power, “Chakachamna Hydroelectric Licensing Web Site”, http://www.chakachamna-hydro.com/about_the_project/geographic_setting.php
(accessed April 23, 2009). 236 Travis, Mike. 2009. Travis/Peterson Environmental Consulting, Inc. Personal communication with ENTRIX staff on April 23. 237 Anchorage Daily News, Jan. 25, 2009, “CIRI Optimistic Fire Island Wind Farm Will Take Off: POWER BY 2010: Many Hurdles Remain but
Officials Are Confident,” iStock Analysis, http://www.istockanalyst.com/article/viewiStockNews/articleid/2980123. 238 Ibid.
FINAL RIR/4(B)(2)/FRFA OF CRITICAL HABITAT DESIGNATION OF COOK INLET BELUGA WHALE AUGUST 11, 2010
6-68 NATIONAL MARINE FISHERIES SERVICE
The current plan includes the installation of two 34.5 kV submarine transmission cables that would extend from Fire Island to Point Campbell on the Anchorage mainland (approximately 3.1 miles) and into the existing power grid that runs from Homer to Fairbanks.239 The cables would be trenched or jetted into the tide flats from the North Point Transition Facility on Fire Island, east across Turnagain Arm in Upper Cook Inlet, to the landfall location approximately 0.7 miles north of Point Campbell, all within the utility corridor. The two lines will be made of solid dialectic cable, laid side by side and buried in mud, using a hydro plow. 240 A portion of the proposed route would be located within the utility corridor of the Anchorage Coastal Wildlife Refuge. Construction of the transmission lines is planned to be completed in 2010, with installation of the lines expected to take approximately two weeks. But, before the cable can be laid, the developers will need to get at least a few of the utilities involved to sign power-purchase agreements. The utilities are also waiting for Wind Energy Alaska to tell them exactly how much the electricity will cost per kilowatt, Chugach spokesman Phil Steyer said. Other hurdles that remain, according to a spokesman for CIRI, the Native corporation which owns the land, include the approval of all required permits.241
The USACE, meanwhile, will focus its own attention on the effects the project might have on the marine environment, including both the seabed transmission line and the impact that barge traffic carrying workers and materials may have on the intertidal zone.242 Wind Energy Alaska is currently in the process of writing the EA for the USACE, on which NMFS and all the other resource agencies have already commented. Further, all consultations have been completed and the Cook Inlet beluga whales were considered in the consultations with NMFS, with the proposal modified accordingly.243
Central Cook Inlet Tidal Energy Project (Alaska Tidal Energy Company)
The Federal Energy Regulatory Commission (FERC) issued a preliminary permit on June 7, 2007, to the Alaska Tidal Energy Company (AK Tidal), a wholly owned subsidiary of Oceana Energy Company, for its Central Cook Inlet Tidal Energy Project. The location of the proposed project is the central portion of Cook Inlet in Kenai Peninsula, Alaska. The purpose of the permit is “to maintain priority of application for a license during the term of the permit, while the Permittee conducts investigations and secures data necessary to determine the feasibility of the proposed project ...”244 The proposed project is estimated to produce 8.76 GWh per unit, annually, and would consist of:
• 50 to 500 Tidal In Stream Energy Conversion (TISEC) devices consisting of rotating propeller blades;
• integrated generators with a capacity of 0.5 to 2.0 MW each;
• anchoring systems;
• mooring lines;
• interconnection transmission lines;
• appurtenant facilities; and
239 Anchorage Daily News, Jan. 25, 2009, “CIRI Optimistic Fire Island Wind Farm Will Take Off: POWER BY 2010: Many Hurdles Remain but
Officials Are Confident,” iStock Analysis, http://www.istockanalyst.com/article/viewiStockNews/articleid/2980123. 240 Gilbert, Steve. 2009. Chugach Electric Association. Personal communication with ENTRIX staff, April 23. 241 Anchorage Daily News, Jan. 25, 2009, “CIRI Optimistic Fire Island Wind Farm Will Take Off: POWER BY 2010: Many Hurdles Remain but
Officials Are Confident,” iStock Analysis, http://www.istockanalyst.com/article/viewiStockNews/articleid/2980123. 242 Ibid. 243 Gilbert, Steve. 2009. Chugach Electric Association. Personal communication with ENTRIX staff, April 23. 244 Federal Energy Regulation Commission, June 7, 2007, Order issuing Preliminary Permit, Alaska Tidal Energy Company, Project No. 12705-000.
SECTION 6 CONTEXTUAL INFORMATION
NATIONAL MARINE FISHERIES SERVICE 6-69
• energy produced would be sold to a local utility.245
The preliminary permit requires that the permittee file a progress report with the FERC every six months. AK Tidal filed its first six-month progress report on November 30, 2007, the second six month progress report on May 20, 2008, and the third six-month progress report on November 30, 2008. No physical environmental studies were conducted during the first three six-month periods, but during the third six-month period, AK Tidal conducted in-depth reviews of tidal power infrastructure technologies. Consultation to date has included NMFS, among other Federal and State regulatory agencies and stakeholders. AK Tidal continues to reassess the project’s feasibility on an ongoing basis and, at this time, concludes that “the project warrants further expenditures of capital for the necessary consultations, studies and investigations, and is continually reassessed”.246
The status of the project is that the Notice of Intent (NOI) to file a license application and its draft application for a pilot project, under the pilot project license procedures for hydrokinetic projects, were due in June 2009.247 However, on April 20, 2009, AK Tidal filed a request for extension of time to September 7, 2009 to file their NOI and Draft License Application, due to recent nearby volcanic eruptions interrupting planned field work.248 This request is still pending before FERC.
Alaska DNR has the lead role in State permitting and coordinating Federal permitting.249 NMFS is an intervenor in the FERC process.250
Cook Inlet Tidal Energy Project (OCGen™)
Ocean Renewable Power Company (ORPC) Alaska has developed a proprietary ocean current electrical generation technology (OCGenTM) through its single member owner, Ocean Renewable Power Company, LLC. They believe this technology can be used to generate renewable electricity efficiently and cost-effectively from open ocean and tidal currents with minimal impact to the environment.251 ORPC was issued a preliminary permit from the FERC on April 17, 2007, to study the feasibility of its proposed Cook Inlet Tidal Energy Project, FERC No. 12679. The proposed project will be located in the Knik Arm of the Cook Inlet, in Matanuska-Susitna and Anchorage Boroughs, Alaska, and will consist of 70 to 100 OCGenTM modules having a capacity of 320 kW, a proposed underwater transmission line, and appurtenant facilities.
245 Federal Energy Regulation Commission, June 7, 2007, Order issuing Preliminary Permit, Alaska Tidal Energy Company, Project No. 12705-000. 246 Hoover, Mike, Alaska Tidal Energy Company. November 30, 2007. Letter to Ms. Kimberly D. Bose, Federal Energy Regulation Commission
re: Six-Month Progress Report #1 P-12705-000 (Central Cook Inlet tidal Energy Project); Hoover, Mike, Alaska Tidal Energy Company. May 30, 2008. Letter to Ms. Kimberly D. Bose, Federal Energy Regulation Commission re: Six-Month Progress Report #2 P-12705-000 (Central Cook Inlet tidal Energy Project); Hoover, Mike, Alaska Tidal Energy Company. November 30, 2008. Letter to Ms. Kimberly D. Bose, Federal Energy Regulation Commission re: Six-Month Progress Report #3 P-12705-000 (Central Cook Inlet tidal Energy Project).
247 Guey-Lee, William. 2008. Federal Energy Regulation Commission. June 30. Letter to Mr. Mike Hoover, Oceana Energy Company on behalf of Alaska Tidal Energy Company, re: Central Cook Inlet tidal Energy Project, Project No. 12705-000.
248 Hoover, Mike, Alaska Tidal Energy Company. April 20, 2009. Letter to Ms. Kimberly D. Bose, Federal Energy Regulation Commission re: Request for Extension of Time to File NOI and Draft License Application P-12705-000 (Central Cook Inlet tidal Energy Project).
249 Hoover, Mike, Alaska Tidal Energy Company. November 30, 2007. Letter to Ms. Kimberly D. Bose, Federal Energy Regulation Commission re: Six-Month Progress Report #1 P-12705-000 (Central Cook Inlet tidal Energy Project).
250 Federal Energy Regulation Commission, June 7, 2007, Order issuing Preliminary Permit, Alaska Tidal Energy Company, Project No. 12705-000. 251 ORPC (Ocean Renewable Power Company Alaska, LLC), May 2006, Application for Preliminary Permit, Before the United States Federal
Energy Regulatory Commission (FERC). Docket No. P-12679-000.
FINAL RIR/4(B)(2)/FRFA OF CRITICAL HABITAT DESIGNATION OF COOK INLET BELUGA WHALE AUGUST 11, 2010
6-70 NATIONAL MARINE FISHERIES SERVICE
The project’s estimated annual generation is between 51.8 gigawatt hour (GWh) and 74.1 GWh, which would be sold to a local utility.252
The preliminary permit requires that the permittee file a progress report with the FERC every six months. ORPC filed its fourth six-month progress report on March 31, 2009, the same date it filed its Draft Pilot License Application (DPLA). In its fourth progress report, ORPC indicates it has begun consultation with NMFS. It will be initiating the proposed pre-deployment study plans in May 2009 and during the field season, expected to continue through November 2009. Studies planned during this time specifically include Cook Inlet beluga whale observations.253 The DPLA is still pending before FERC.
The final tidal energy project is being developed and implemented in phases. The turbine-generator unit (TGU) demonstration project was developed in spring 2008. Then ORPC will engineer, build, install, and monitor (for a minimum period of 1 year) a commercial scale prototype tidal OCGen™ module at the site. ORPC hopes to install the prototype OCGen™ module in mid-2010 and operate it until at least mid-2011. ORPC then plans to begin installation of the first phase of the final tidal energy project in mid-2012. Port Mackenzie in the Matanuska-Susitna Borough has been selected for the center of operations.254 Full-scale commercial production is expected to create jobs in the area.255
The cost to test and monitor the prototype for a year is estimated at $8 million to $9 million. The estimated cost of a 20 megawatt commercial plant would be $36 million to $38 million. It would produce power at about $0.06 to $0.10 per kilowatt-hour.256
Mt. Spurr Geothermal Power Plant
The proposed site of the Mt. Spurr Geothermal Power Plant is located well inland, slightly west of the northern portion of Cook Inlet, and will only have the potential to impact Cook Inlet beluga whale CHD if new transmission lines are placed near or through Cook Inlet. Ormat Technologies won the bidding at $3.3 million for 35,000 acres.257 As with all alternative energy, the project consists mostly of capital costs.
The Alaska DNR Director’s decision that a geothermal lease sale best serves the State’s interest is contingent upon analysis of the potential effects of the sale, both adverse and beneficial. Under the terms of the lease with Ormat, the corporation has one year to file a proposed plan of exploration, and nine years to file a plan to develop the resource. A local engineer estimated that it could cost $100 million to $150 million to construct
252 Federal Energy Regulation Commission, April 17, 2007, Order issuing Preliminary Permit and Denying Competing Application, ORPC Alaska,
Project No. 12679-000. 253 Sauer, Christopher R., P.E., March 31, 2009. Letter to Ms. Kimberly D. Bose, Federal Energy Regulation Commission re: Cook Inlet Tidal
Energy Project (P-12679) Draft Pilot License Application; and Christopher R., Sauer, P.E. March 31, 2009. Letter to Ms. Kimberly D. Bose, Federal Energy Regulation Commission re: Cook Inlet Tidal Energy Project (P-12679) Progress Report No. 4.
254 Ocean Renewable Power Company, “OCGenTM Projects Alaska”, http:///www.oceanrenewablepower.com/ocgenproject_alaska.htm, accessed April 23, 2009.
255 Stigall, Russell, February 27, 2007, Mat-Su Valley Frontiersman, “Tidal Power Plan in Works,” http://www.frontiersman.com/articles/2007/02/25/news/news1.txt.
256 Ibid. 257 Ormat Technologies, Sept. 11, 2008, News Release, “Ormat Technologies, Inc. Secures Geothermal Rights in Alaska,” Ormat Technologies,
http://www.ormat.com/relation.php?did=84.
SECTION 6 CONTEXTUAL INFORMATION
NATIONAL MARINE FISHERIES SERVICE 6-71
100-megawatt geothermal power plant at Mount Spurr, and adding road, airstrip, and transmission line construction costs could, in their option, double that figure.258
Ormat Technologies is still in the early development/initial exploration stage of the project. They have stated that there will be a transmission line between the project and Anchorage, but they have not yet delineated its preferred path. Whether this proposed development will affect the Cook Inlet beluga whale CHD will depend on the dimensions of the CH, the interaction (if any) between development activities and the PCEs, and the attributes (e.g., location) of the transmission line project. No permits have been requested. Further, no cost estimates have been prepared. The timeline and schedule depend on the outcome of exploration activities, which are expected to be completed in 2009.259
6.4.8 Commercial Fisheries
This section describes commercial fisheries in Cook Inlet.
Identifying Federal Nexus
The State of Alaska has jurisdiction to manage commercial fisheries within three miles of shore, including all of the inland waters of Cook Inlet. Some exceptions to this management regime exist, including near shore ground fisheries, which are managed by NMFS in consultation with the North Pacific Fisheries Management Council (NPFMC), and Pacific halibut fisheries, which are jointly managed by the International Pacific Halibut Commission, NPFMC, and NMFS. For most fisheries within Cook Inlet, ADF&G is responsible for communicating and enforcing specific commercial fisheries regulations, developed by the Alaska Board of Fisheries.260, 261
Overview of Upper Cook Inlet Commercial Fishing
Commercial fishing in Cook Inlet is divided into upper and lower Inlet management districts. The Lower Cook Inlet (LCI) district, managed out of ADF&G’s Homer field office, is located south of Anchor Point, extending past Cape Douglass to the south. Of greater importance to the current analysis is the Upper Cook Inlet (UCI) management district, which encompasses all of the Inlet waters north of Anchor Point. The UCI management district is further divided into central and northern sub-districts. The northern district includes waters above Boulder Point (NE of East Foreland) and contains all of Area 1, as well as a portion of Area 2, of the Cook Inlet beluga whale proposed CH. The Central district includes Inlet waters north of Anchor Point and south of Boulder Point, and contains some of the Inlet’s most economically important fisheries. The central sub-district contains a roughly even split of Area 2 Cook Inlet beluga whale CHD and Type 3 Cook Inlet beluga whale habitat, as it is referred to in the Conservation Plan. Eight species dominate the commercial fishing industry in UCI. These include sockeye, Chinook, coho, chum, and pink salmon (the first four of which are PCEs under the proposed CHD), as well as Pacific herring, eulachon (smelt), and razor clams.
258 Alaska Department of Natural Resources Division of Oil and Gas, 2008, “Mount Spurr Geothermal Lease Sale No. 3,”
http://www.dog.dnr.state.ak.us/oil/products/publications/geothermal/spurr/Spurr%20final%202008.pdf. 259 Ormat Technologies. 2009. Personal communication with ENTRIX staff, April 27. 260 Sheilds, Pat, Alaska Department of Fish and Game, Division of Sport Fish and Commercial Fisheries, December 2007, “Upper Cook Inlet
Commercial Fisheries Annual Management Report, 2007,” Fishery Management Report No 07-64. 261 Clark, John H., Andrew McGregor, Robert D. Mecum, Paul Krasnowski and Amy M. Carroll, 2006, “The Commercial Salmon Fishery in
Alaska,” Alaska Fishery Research Bulletin, 12(1): 1-46.
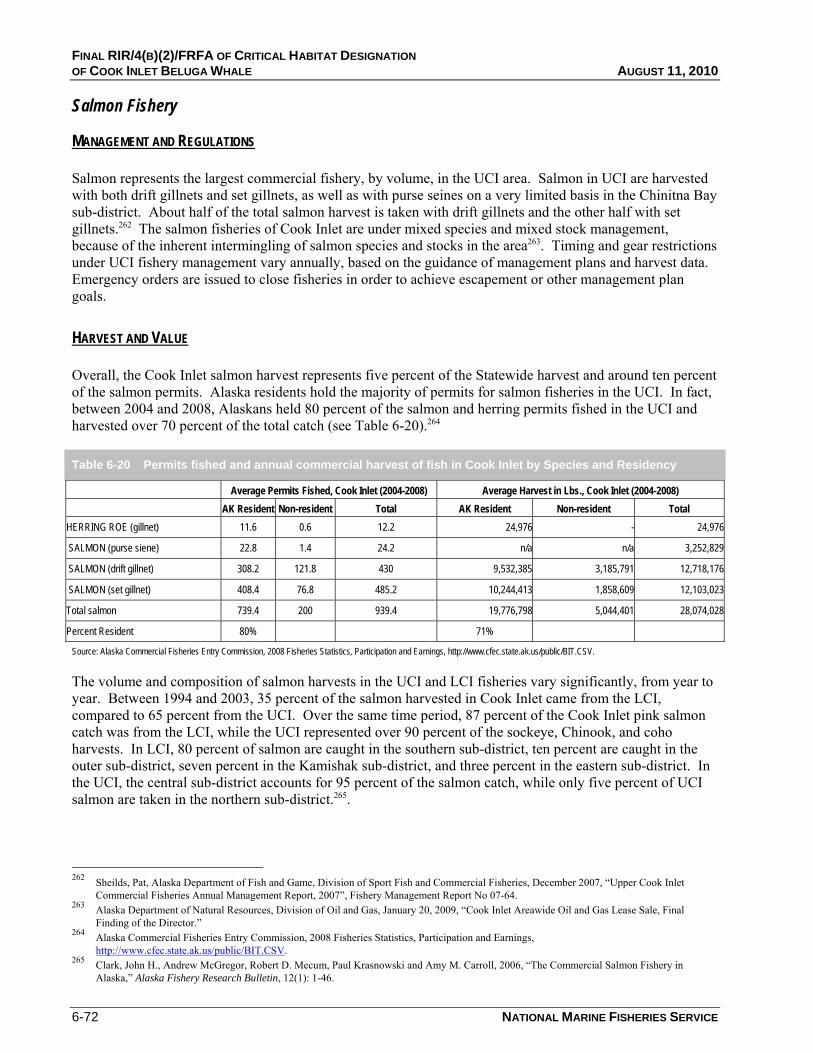
FINAL RIR/4(B)(2)/FRFA OF CRITICAL HABITAT DESIGNATION OF COOK INLET BELUGA WHALE AUGUST 11, 2010
6-72 NATIONAL MARINE FISHERIES SERVICE
Salmon Fishery
MANAGEMENT AND REGULATIONS
Salmon represents the largest commercial fishery, by volume, in the UCI area. Salmon in UCI are harvested with both drift gillnets and set gillnets, as well as with purse seines on a very limited basis in the Chinitna Bay sub-district. About half of the total salmon harvest is taken with drift gillnets and the other half with set gillnets.262 The salmon fisheries of Cook Inlet are under mixed species and mixed stock management, because of the inherent intermingling of salmon species and stocks in the area263. Timing and gear restrictions under UCI fishery management vary annually, based on the guidance of management plans and harvest data. Emergency orders are issued to close fisheries in order to achieve escapement or other management plan goals.
HARVEST AND VALUE
Overall, the Cook Inlet salmon harvest represents five percent of the Statewide harvest and around ten percent of the salmon permits. Alaska residents hold the majority of permits for salmon fisheries in the UCI. In fact, between 2004 and 2008, Alaskans held 80 percent of the salmon and herring permits fished in the UCI and harvested over 70 percent of the total catch (see Table 6-20).264
Table 6-20 Permits fished and annual commercial harvest of fish in Cook Inlet by Species and Residency
Average Permits Fished, Cook Inlet (2004-2008) Average Harvest in Lbs., Cook Inlet (2004-2008) AK Resident Non-resident Total AK Resident Non-resident Total
HERRING ROE (gillnet) 11.6 0.6 12.2 24,976 - 24,976
SALMON (purse siene) 22.8 1.4 24.2 n/a n/a 3,252,829
SALMON (drift gillnet) 308.2 121.8 430 9,532,385 3,185,791 12,718,176
SALMON (set gillnet) 408.4 76.8 485.2 10,244,413 1,858,609 12,103,023
Total salmon 739.4 200 939.4 19,776,798 5,044,401 28,074,028
Percent Resident 80% 71%
Source: Alaska Commercial Fisheries Entry Commission, 2008 Fisheries Statistics, Participation and Earnings, http://www.cfec.state.ak.us/public/BIT.CSV.
The volume and composition of salmon harvests in the UCI and LCI fisheries vary significantly, from year to year. Between 1994 and 2003, 35 percent of the salmon harvested in Cook Inlet came from the LCI, compared to 65 percent from the UCI. Over the same time period, 87 percent of the Cook Inlet pink salmon catch was from the LCI, while the UCI represented over 90 percent of the sockeye, Chinook, and coho harvests. In LCI, 80 percent of salmon are caught in the southern sub-district, ten percent are caught in the outer sub-district, seven percent in the Kamishak sub-district, and three percent in the eastern sub-district. In the UCI, the central sub-district accounts for 95 percent of the salmon catch, while only five percent of UCI salmon are taken in the northern sub-district.265.
262 Sheilds, Pat, Alaska Department of Fish and Game, Division of Sport Fish and Commercial Fisheries, December 2007, “Upper Cook Inlet
Commercial Fisheries Annual Management Report, 2007”, Fishery Management Report No 07-64. 263 Alaska Department of Natural Resources, Division of Oil and Gas, January 20, 2009, “Cook Inlet Areawide Oil and Gas Lease Sale, Final
Finding of the Director.” 264 Alaska Commercial Fisheries Entry Commission, 2008 Fisheries Statistics, Participation and Earnings,
http://www.cfec.state.ak.us/public/BIT.CSV. 265 Clark, John H., Andrew McGregor, Robert D. Mecum, Paul Krasnowski and Amy M. Carroll, 2006, “The Commercial Salmon Fishery in
Alaska,” Alaska Fishery Research Bulletin, 12(1): 1-46.
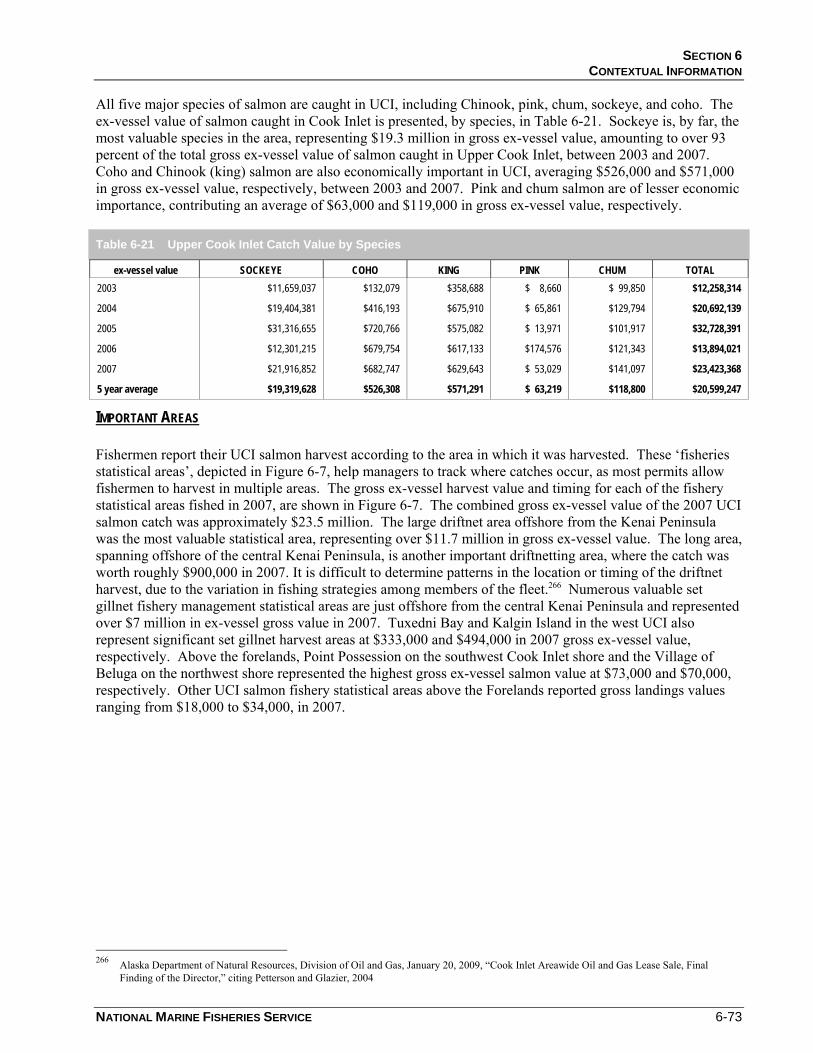
SECTION 6 CONTEXTUAL INFORMATION
NATIONAL MARINE FISHERIES SERVICE 6-73
All five major species of salmon are caught in UCI, including Chinook, pink, chum, sockeye, and coho. The ex-vessel value of salmon caught in Cook Inlet is presented, by species, in Table 6-21. Sockeye is, by far, the most valuable species in the area, representing $19.3 million in gross ex-vessel value, amounting to over 93 percent of the total gross ex-vessel value of salmon caught in Upper Cook Inlet, between 2003 and 2007. Coho and Chinook (king) salmon are also economically important in UCI, averaging $526,000 and $571,000 in gross ex-vessel value, respectively, between 2003 and 2007. Pink and chum salmon are of lesser economic importance, contributing an average of $63,000 and $119,000 in gross ex-vessel value, respectively.
Table 6-21 Upper Cook Inlet Catch Value by Species
ex-vessel value SOCKEYE COHO KING PINK CHUM TOTAL 2003 $11,659,037 $132,079 $358,688 $ 8,660 $ 99,850 $12,258,314
2004 $19,404,381 $416,193 $675,910 $ 65,861 $129,794 $20,692,139
2005 $31,316,655 $720,766 $575,082 $ 13,971 $101,917 $32,728,391
2006 $12,301,215 $679,754 $617,133 $174,576 $121,343 $13,894,021
2007 $21,916,852 $682,747 $629,643 $ 53,029 $141,097 $23,423,368
5 year average $19,319,628 $526,308 $571,291 $ 63,219 $118,800 $20,599,247
IMPORTANT AREAS
Fishermen report their UCI salmon harvest according to the area in which it was harvested. These ‘fisheries statistical areas’, depicted in Figure 6-7, help managers to track where catches occur, as most permits allow fishermen to harvest in multiple areas. The gross ex-vessel harvest value and timing for each of the fishery statistical areas fished in 2007, are shown in Figure 6-7. The combined gross ex-vessel value of the 2007 UCI salmon catch was approximately $23.5 million. The large driftnet area offshore from the Kenai Peninsula was the most valuable statistical area, representing over $11.7 million in gross ex-vessel value. The long area, spanning offshore of the central Kenai Peninsula, is another important driftnetting area, where the catch was worth roughly $900,000 in 2007. It is difficult to determine patterns in the location or timing of the driftnet harvest, due to the variation in fishing strategies among members of the fleet.266 Numerous valuable set gillnet fishery management statistical areas are just offshore from the central Kenai Peninsula and represented over $7 million in ex-vessel gross value in 2007. Tuxedni Bay and Kalgin Island in the west UCI also represent significant set gillnet harvest areas at $333,000 and $494,000 in 2007 gross ex-vessel value, respectively. Above the forelands, Point Possession on the southwest Cook Inlet shore and the Village of Beluga on the northwest shore represented the highest gross ex-vessel salmon value at $73,000 and $70,000, respectively. Other UCI salmon fishery statistical areas above the Forelands reported gross landings values ranging from $18,000 to $34,000, in 2007.
266 Alaska Department of Natural Resources, Division of Oil and Gas, January 20, 2009, “Cook Inlet Areawide Oil and Gas Lease Sale, Final
Finding of the Director,” citing Petterson and Glazier, 2004
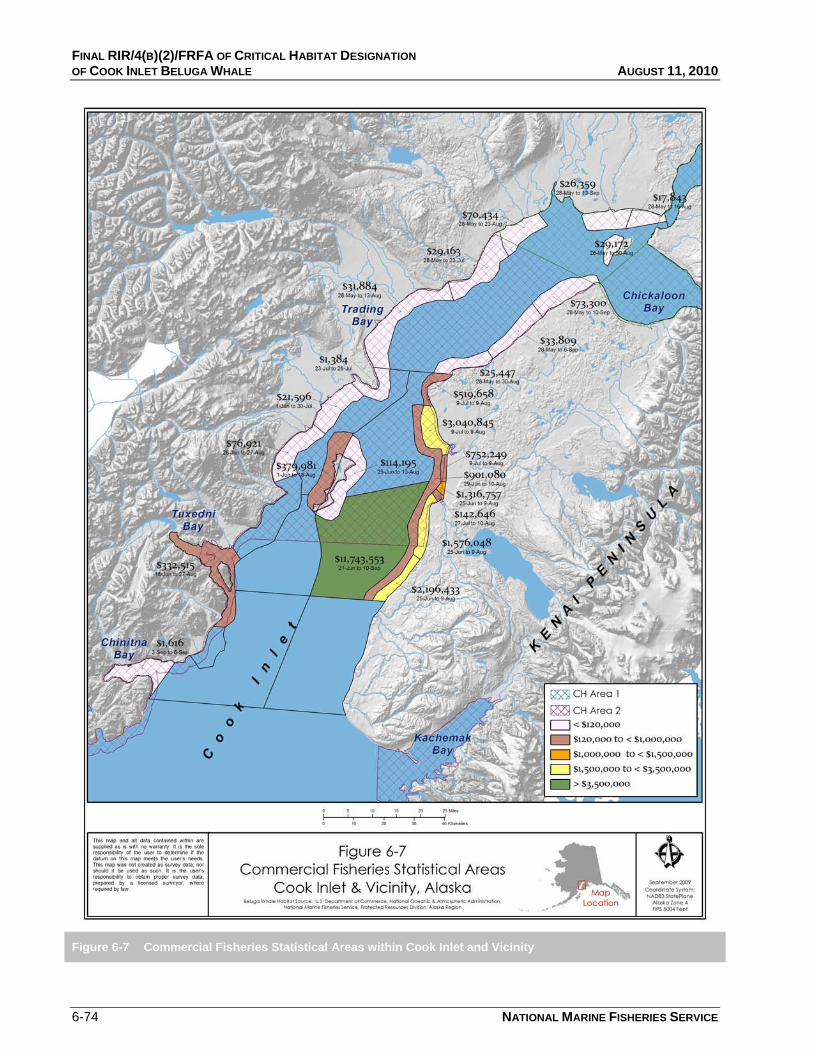
FINAL RIR/4(B)(2)/FRFA OF CRITICAL HABITAT DESIGNATION OF COOK INLET BELUGA WHALE AUGUST 11, 2010
6-74 NATIONAL MARINE FISHERIES SERVICE
Figure 6-7 Commercial Fisheries Statistical Areas within Cook Inlet and Vicinity
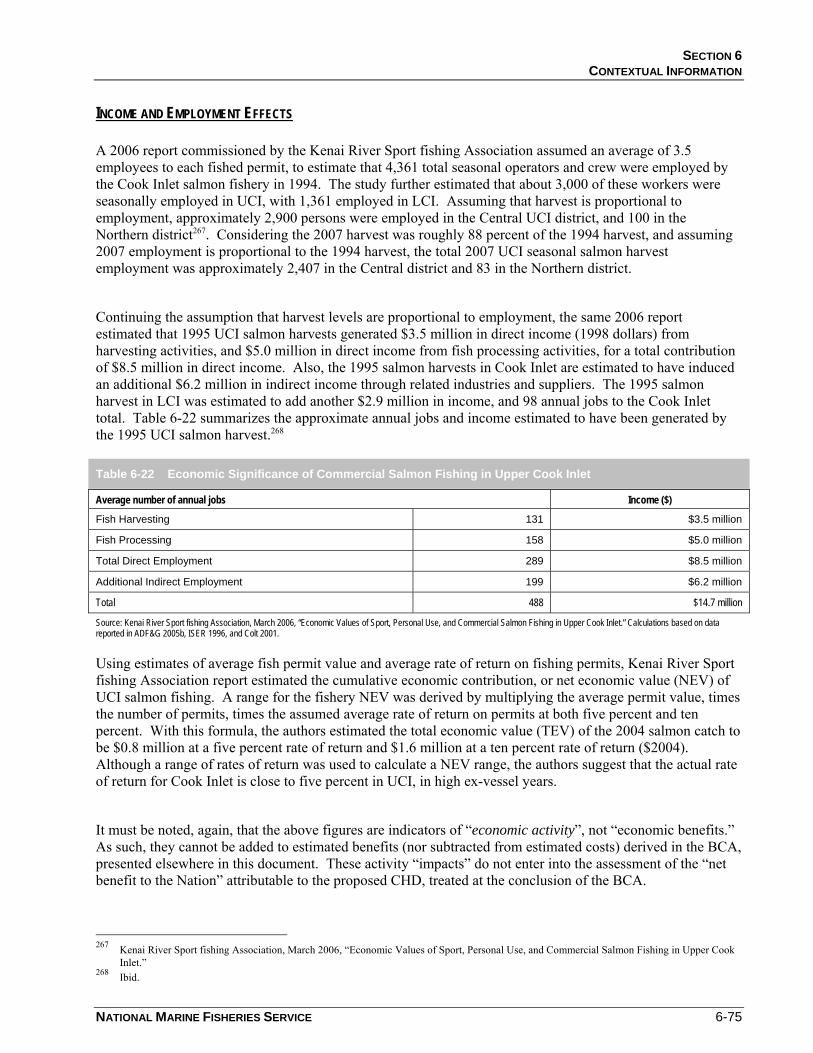
SECTION 6 CONTEXTUAL INFORMATION
NATIONAL MARINE FISHERIES SERVICE 6-75
INCOME AND EMPLOYMENT EFFECTS
A 2006 report commissioned by the Kenai River Sport fishing Association assumed an average of 3.5 employees to each fished permit, to estimate that 4,361 total seasonal operators and crew were employed by the Cook Inlet salmon fishery in 1994. The study further estimated that about 3,000 of these workers were seasonally employed in UCI, with 1,361 employed in LCI. Assuming that harvest is proportional to employment, approximately 2,900 persons were employed in the Central UCI district, and 100 in the Northern district267. Considering the 2007 harvest was roughly 88 percent of the 1994 harvest, and assuming 2007 employment is proportional to the 1994 harvest, the total 2007 UCI seasonal salmon harvest employment was approximately 2,407 in the Central district and 83 in the Northern district.
Continuing the assumption that harvest levels are proportional to employment, the same 2006 report estimated that 1995 UCI salmon harvests generated $3.5 million in direct income (1998 dollars) from harvesting activities, and $5.0 million in direct income from fish processing activities, for a total contribution of $8.5 million in direct income. Also, the 1995 salmon harvests in Cook Inlet are estimated to have induced an additional $6.2 million in indirect income through related industries and suppliers. The 1995 salmon harvest in LCI was estimated to add another $2.9 million in income, and 98 annual jobs to the Cook Inlet total. Table 6-22 summarizes the approximate annual jobs and income estimated to have been generated by the 1995 UCI salmon harvest.268
Table 6-22 Economic Significance of Commercial Salmon Fishing in Upper Cook Inlet
Average number of annual jobs Income ($)
Fish Harvesting 131 $3.5 million
Fish Processing 158 $5.0 million
Total Direct Employment 289 $8.5 million
Additional Indirect Employment 199 $6.2 million
Total 488 $14.7 million
Source: Kenai River Sport fishing Association, March 2006, “Economic Values of Sport, Personal Use, and Commercial Salmon Fishing in Upper Cook Inlet.” Calculations based on data reported in ADF&G 2005b, ISER 1996, and Colt 2001.
Using estimates of average fish permit value and average rate of return on fishing permits, Kenai River Sport fishing Association report estimated the cumulative economic contribution, or net economic value (NEV) of UCI salmon fishing. A range for the fishery NEV was derived by multiplying the average permit value, times the number of permits, times the assumed average rate of return on permits at both five percent and ten percent. With this formula, the authors estimated the total economic value (TEV) of the 2004 salmon catch to be $0.8 million at a five percent rate of return and $1.6 million at a ten percent rate of return ($2004). Although a range of rates of return was used to calculate a NEV range, the authors suggest that the actual rate of return for Cook Inlet is close to five percent in UCI, in high ex-vessel years.
It must be noted, again, that the above figures are indicators of “economic activity”, not “economic benefits.” As such, they cannot be added to estimated benefits (nor subtracted from estimated costs) derived in the BCA, presented elsewhere in this document. These activity “impacts” do not enter into the assessment of the “net benefit to the Nation” attributable to the proposed CHD, treated at the conclusion of the BCA.
267 Kenai River Sport fishing Association, March 2006, “Economic Values of Sport, Personal Use, and Commercial Salmon Fishing in Upper Cook
Inlet.” 268 Ibid.
FINAL RIR/4(B)(2)/FRFA OF CRITICAL HABITAT DESIGNATION OF COOK INLET BELUGA WHALE AUGUST 11, 2010
6-76 NATIONAL MARINE FISHERIES SERVICE
Smelt Fishery
REGULATIONS, MANAGEMENT, AND HARVEST
Prior to 1998, there was only sporadic harvest of smelt, due to unclear gear restrictions. The fishery was closed entirely after the 1999 season, as part of the Forage Fishery Management Plan, adopted by the Alaska Bureau of Fisheries. The fishery was opened in the northern UCI district in 2005, when the management plan was again updated. Currently, harvest is restricted to dip netting, from May 1 to June 30, in the northern district of UCI from the Chuit River to the Little Sustina River. The total harvest is managed as “not to exceed 100 tons of smelt.”269 Participation in the fishery requires a miscellaneous finfish permit, as well as a Commissioner’s permit (issued by ADF&G). In 2007, 11 permit holders harvested roughly 62.5 tons of smelt in UCI. Given an ex-vessel price of $0.50/lb, the fishery produced approximately $63,000 in gross ex-vessel revenue.
Herring Fishery
REGULATIONS AND MANAGEMENT
The herring fishery in Cook Inlet dates back over 100 years, with most of the early harvests centered in Kamishak Bay, on the west side of Lower Cook Inlet. Decreasing stocks and market conditions caused closure of the LCI herring fishery since 1999.270 The UCI herring fishery has existed since 1973, but stock depletions led to more restrictive regulations and management since the late 1980s. The herring management plan was modified in 2002 and 2005, to expand the harvest area to Tuxedni Bay, Chinitna Bay, and Kalgin Island. Despite the expansion, these new areas have not attracted participation. Almost all recent harvests have occurred in the northern sub-district, in the Clam Gulch area. The fishery is restricted to gillnetting, with a mesh restriction of 2.0 inches to 2.5 inches.271 Set gillnets are used almost exclusively.
HARVEST
From 2003 to 2007, the UCI herring harvest ranged from 3.7 tons in 2003, to 17.3 tons in 2005, with an average harvest of 11.1 tons over that period. Almost all of the harvest occurred in the Clam Gulch area of the UCI, with very limited harvests in Chinitna Bay in 2004 and 2005. In 2007, the average price paid for herring by commercial and sport halibut fishermen was $1,500/ton, resulting in an estimated gross ex-vessel value of $20,100.272 Table 6-23 shows the annual herring harvest, from 2003 to 2007, by area.
269 Sheilds, Pat, Alaska Department of Fish and Game, Division of Sport Fish and Commercial Fisheries, December 2007, “Upper Cook Inlet
Commercial Fisheries Annual Management Report, 2007”, Fishery Management Report No 07-64. 270 Alaska Department of Natural Resources, Division of Oil and Gas, January 20, 2009, “Cook Inlet Areawide Oil and Gas Lease Sale, Final
Finding of the Director.” 271 Sheilds, Pat, Alaska Department of Fish and Game, Division of Sport Fish and Commercial Fisheries, December 2007, “Upper Cook Inlet
Commercial Fisheries Annual Management Report, 2007”, Fishery Management Report No 07-64. 272 Ibid.

SECTION 6 CONTEXTUAL INFORMATION
NATIONAL MARINE FISHERIES SERVICE 6-77
Table 6-23 Cook Inlet Herring Harvest 2003 to 2007
HARVEST (tons) YEAR UPPER DISTRICT CHINITNA BAY TUXEDNI BAY KALGIN ISLAND TOTAL
2003 3.7 0 0 not open 3.7
2004 6.7 0.1 0 not open 6.8
2005 17.1 0.2 0 0 17.3
2006 14.4 0 0 0 14.4
2007 13.4 0 0 0 13.4
Average 11.06 0.06 0 0 11.12
Source: Sheilds, Pat, Alaska Department of Fish and Game, Division of Sport Fish and Commercial Fisheries, December 2007, “Upper Cook Inlet Commercial Fisheries Annual Management Report, 2007”, Fishery Management Report No 07-64.
Razor Clams
REGULATIONS, MANAGEMENT, HARVEST, AND VALUE
Commercial harvest of razor clams in UCI began in 1919, although the harvest has been highly variable, due to changing market conditions. Currently, the commercial fishery in UCI is limited to the west side of the Upper District, between Polly Creek and Crescent River. There is also some commercial shellfish harvest in Kachemak Bay, in Lower Cook Inlet. All commercial harvest of clams is done by hand digging and, although there are no harvest limits, the Alaska Department of Fish and Game manages the fishery based on a maximum harvest of 350,000 to 400,000 pounds, annually.273 Recent razor clam harvests have declined, as a result of competition with farmed alternatives.274 Table 6-24 shows the Cook Inlet razor clam harvest from 2003 to 2007. The annual harvest ranged between 369,000 pounds and 419,000 pounds, with an average harvest of 371,000 pounds. In 2007, fifteen diggers utilized permits for a total of 60 days from May 13 to August 3. The diggers were paid an average of $0.62 per pound for their harvested clams in 2007, resulting in a fishery gross ex-vessel value of approximately $175,000.275
Table 6-24 Cook Inlet Commercial Razor Clam Harvest 2003 to 2007
YEAR POUNDS 2003 411,403
2004 419,967
2005 371,395
2006 368,953
2007 283,085
Average 2003 - 2007 370,961
Halibut / Sablefish / Groundfish
Halibut (not managed as a “groundfish species), sablefish, and other groundfish have been commercially harvested in Cook Inlet for decades. Halibut are managed by a cooperative of State, Federal, and 273 Sheilds, Pat, Alaska Department of Fish and Game, Division of Sport Fish and Commercial Fisheries, December 2007, “Upper Cook Inlet
Commercial Fisheries Annual Management Report, 2007”, Fishery Management Report No 07-64. 274 Alaska Department of Natural Resources, Division of Oil and Gas, January 20, 2009, “Cook Inlet Areawide Oil and Gas Lease Sale, Final
Finding of the Director,” citing Trobridge and Goldman 2006 275 Sheilds, Pat, Alaska Department of Fish and Game, Division of Sport Fish and Commercial Fisheries, December 2007, “Upper Cook Inlet
Commercial Fisheries Annual Management Report, 2007”, Fishery Management Report No 07-64.
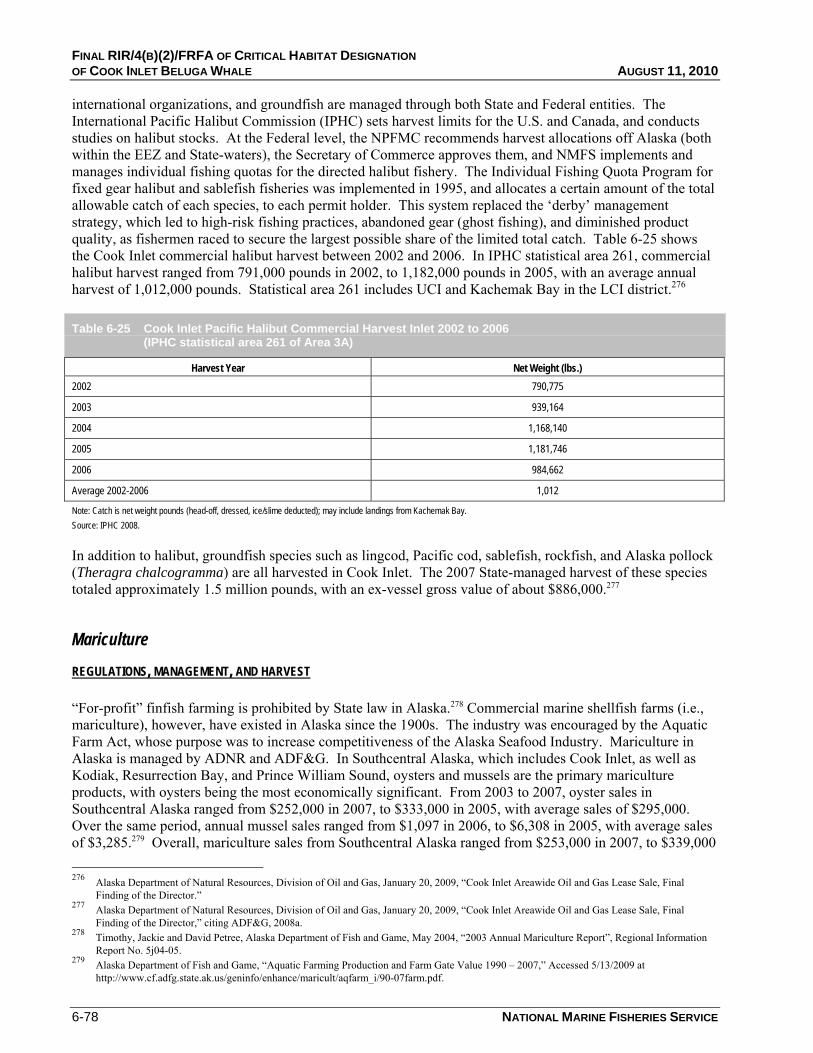
FINAL RIR/4(B)(2)/FRFA OF CRITICAL HABITAT DESIGNATION OF COOK INLET BELUGA WHALE AUGUST 11, 2010
6-78 NATIONAL MARINE FISHERIES SERVICE
international organizations, and groundfish are managed through both State and Federal entities. The International Pacific Halibut Commission (IPHC) sets harvest limits for the U.S. and Canada, and conducts studies on halibut stocks. At the Federal level, the NPFMC recommends harvest allocations off Alaska (both within the EEZ and State-waters), the Secretary of Commerce approves them, and NMFS implements and manages individual fishing quotas for the directed halibut fishery. The Individual Fishing Quota Program for fixed gear halibut and sablefish fisheries was implemented in 1995, and allocates a certain amount of the total allowable catch of each species, to each permit holder. This system replaced the ‘derby’ management strategy, which led to high-risk fishing practices, abandoned gear (ghost fishing), and diminished product quality, as fishermen raced to secure the largest possible share of the limited total catch. Table 6-25 shows the Cook Inlet commercial halibut harvest between 2002 and 2006. In IPHC statistical area 261, commercial halibut harvest ranged from 791,000 pounds in 2002, to 1,182,000 pounds in 2005, with an average annual harvest of 1,012,000 pounds. Statistical area 261 includes UCI and Kachemak Bay in the LCI district.276
Table 6-25 Cook Inlet Pacific Halibut Commercial Harvest Inlet 2002 to 2006 (IPHC statistical area 261 of Area 3A)
Harvest Year Net Weight (lbs.) 2002 790,775
2003 939,164
2004 1,168,140
2005 1,181,746
2006 984,662
Average 2002-2006 1,012
Note: Catch is net weight pounds (head-off, dressed, ice/slime deducted); may include landings from Kachemak Bay. Source: IPHC 2008.
In addition to halibut, groundfish species such as lingcod, Pacific cod, sablefish, rockfish, and Alaska pollock (Theragra chalcogramma) are all harvested in Cook Inlet. The 2007 State-managed harvest of these species totaled approximately 1.5 million pounds, with an ex-vessel gross value of about $886,000.277
Mariculture REGULATIONS, MANAGEMENT, AND HARVEST
“For-profit” finfish farming is prohibited by State law in Alaska.278 Commercial marine shellfish farms (i.e., mariculture), however, have existed in Alaska since the 1900s. The industry was encouraged by the Aquatic Farm Act, whose purpose was to increase competitiveness of the Alaska Seafood Industry. Mariculture in Alaska is managed by ADNR and ADF&G. In Southcentral Alaska, which includes Cook Inlet, as well as Kodiak, Resurrection Bay, and Prince William Sound, oysters and mussels are the primary mariculture products, with oysters being the most economically significant. From 2003 to 2007, oyster sales in Southcentral Alaska ranged from $252,000 in 2007, to $333,000 in 2005, with average sales of $295,000. Over the same period, annual mussel sales ranged from $1,097 in 2006, to $6,308 in 2005, with average sales of $3,285.279 Overall, mariculture sales from Southcentral Alaska ranged from $253,000 in 2007, to $339,000 276 Alaska Department of Natural Resources, Division of Oil and Gas, January 20, 2009, “Cook Inlet Areawide Oil and Gas Lease Sale, Final
Finding of the Director.” 277 Alaska Department of Natural Resources, Division of Oil and Gas, January 20, 2009, “Cook Inlet Areawide Oil and Gas Lease Sale, Final
Finding of the Director,” citing ADF&G, 2008a. 278 Timothy, Jackie and David Petree, Alaska Department of Fish and Game, May 2004, “2003 Annual Mariculture Report”, Regional Information
Report No. 5j04-05. 279 Alaska Department of Fish and Game, “Aquatic Farming Production and Farm Gate Value 1990 – 2007,” Accessed 5/13/2009 at
http://www.cf.adfg.state.ak.us/geninfo/enhance/maricult/aqfarm_i/90-07farm.pdf.

SECTION 6 CONTEXTUAL INFORMATION
NATIONAL MARINE FISHERIES SERVICE 6-79
in 2005, with average annual sales of $298,000. As of 2003, there were also two shellfish nurseries in Kachemak Bay that supply seed stock to mariculture growers.280
Processors and related industries
The University of Alaska Anchorage’s Institute for Social and Economic Research estimated that, of the salmon processed in Cook Inlet, 73 percent was processed in Kenai, 16 percent in Homer, and 11 percent in Anchorage.281
According to ADF&G, 32 firms purchased UCI fishery products during 2004, including 17 identified as ‘major buyers’. Save one, all of the major buyers are located in Cook Inlet, with three in the Anchorage area and 13 in the central district, along the outer Kenai Peninsula.282
Most of the seafood processing in the UCI occurs within the Kenai Peninsula Borough, and the Borough’s 2005 comprehensive plan summarized fish processing in the area. Over 38 million pounds of commercially harvested salmon were purchased by Cook Inlet processors in 2002. Salmon represented 62 percent of the volume of fish processed, but accounted for only 17 percent of the total value. Halibut purchases, on the other hand, accounted for 26 percent of total processing by volume and 62 percent of the value. The Kenai Peninsula Borough’s comprehensive plan also reported that approximately 1,350 workers in the Borough were seasonally employed by the seafood industry, down 60 percent from summer 2007.283
6.4.9 Alaska Native Subsistence Use and Personal Use
This section covers the current uses of the proposed Cook Inlet beluga whale CH area by indigenous people and others, for purposes of personal consumption and for customary and traditional purposes.
Identifying Federal Nexus
Cook Inlet area subsistence fisheries are managed by State and Federal entities. Both State and Federal subsistence fishing programs allow fishing by Alaska residents for personal consumption, and both programs are governed by a board that oversees the program’s management. In the Cook Inlet area, the Federal program provides permits to rural Alaskans in three communities that have each demonstrated a “customary and traditional” use of the fishery: Ninilchik, Cooper Landing, and Hope.284 The Federal jurisdiction over these programs stems from a legal interpretation of the Alaska National Interest Lands Conservation Act (ANILCA), which provided rural Alaskans access to traditional and customary uses of wild renewable resources. Although the State initiated the ANILCA subsistence program, it was found to be inconsistent with the Alaska Constitution, because the State was not allowed to discriminate against non-rural Alaskans. 280 Timothy, Jackie and David Petree, Alaska Department of Fish and Game, May 2004, “2003 Annual Mariculture Report,” Regional Information
Report No. 5j04-05. 281 Kenai River Sport fishing Association, March 2006, “Economic Values of Sport, Personal Use, and Commercial Salmon Fishing in Upper Cook
Inlet,” citing ISER, 1996. 282 Kenai River Sport fishing Association, March 2006, “Economic Values of Sport, Personal Use, and Commercial Salmon Fishing in Upper Cook
Inlet,” citing ADF&G, 2005. 283 Kenai Peninsula Borough, 2005, Kenai Peninsula Borough Comprehensive Plan Draft, Chapter 3: Economics,
http://www.borough.kenai.ak.us/planningdept/plan/2005/Chapter%203.pdf. 284 Buklis, Larry. 2009. Fisheries Division Supervisor, Office of Subsistence Management, USFWS, Anchorage, Alaska. Personal communication
with ENTRIX staff on May 12.
FINAL RIR/4(B)(2)/FRFA OF CRITICAL HABITAT DESIGNATION OF COOK INLET BELUGA WHALE AUGUST 11, 2010
6-80 NATIONAL MARINE FISHERIES SERVICE
Federal management of the ANILCA subsistence program then began in 1998, and the State began operating a separate fishery, offering personal use fishing permits to Alaska residents (including those living in the urban environs of Anchorage).285
The USFWS, with the Federal Subsistence Board, manages subsistence fisheries on waters in which the Federal government has a reserved water right. In the Cook Inlet, this includes waters of the Kenai and Kisilof Rivers, which are on or adjacent to Federal land, such as the Kenai National Wildlife Refuge, and the Chugach National Forest. There are no or very few marine waters in Cook Inlet that are under jurisdiction of the USFWS. In addition, a Federal subsistence fishery for halibut is operated by NMFS and the NPFMC for rural residents and members of the Alaska Native tribes. A Subsistence Halibut Registration Certificate (SHARC) is issued by the NMFS Restricted Access Management Program.286 Halibut, lingcod, and rockfish are harvested using these permits. In 2006, 317 SHARCS were fished in Cook Inlet.287
Both State and Federal programs recognize “traditional and cultural use” as a unique element of subsistence use, defined through a collection of criteria that need to be met to qualify the activity as traditional and cultural use. In subsistence fisheries still regulated by the State, Alaska law defines subsistence as “noncommercial, customary and traditional uses” of wild fish. Instead of defining subsistence areas, the State designates non-subsistence areas, based on the culture, economy, and way of life in a particular region. Although the majority of Cook Inlet is not designated as a subsistence area, there are four subsistence fisheries within the Cook Inlet area.288 Under both the State and Federal subsistence guidelines, subsistence uses are last to be restricted, after sport, commercial, or other types of fishery use. The Federal and State subsistence programs are operated in a coordinated fashion, following a Memorandum of Understanding between the Federal Subsistence Board and the State of Alaska.289
In addition to the subsistence program at the State level, a personal use fishery is also operated by ADF&G. The personal use fisheries comprise the Kasilof River set gillnet, Kasilof River dip net, Kenai River dip net, and Fish Creek dip net (which has been closed since 2002) fisheries.290
Finally, NMFS has been working cooperatively with the Cook Inlet Marine Mammal Council and other stakeholders to develop a Cook Inlet Subsistence Harvest Management Plan that will govern the annual harvest quota for traditional subsistence harvest of Cook Inlet beluga whales. The plan involves harvest quotas, based on abundance. As part of the agreement, there will be no subsistence harvest from 2008 to 2012, due to lack of a five-year minimum average number of Cook Inlet beluga whale, set at 350.291
285 Clark, J. H., A. McGregor, R. D. Mecum, P. Krasnowski and A. M. Carroll, 2006, “The commercial salmon fishery in Alaska. Alaska Fishery,”
Research Bulletin 12(1):1-146. Available at http://www.adfg.state.ak.us/pubs/afrb/vol12_n1/clarv12n1.pdf. 286 From Frequently Asked Questions, Alaska Subsistence Halibut Program, NMFS, Restricted Access Management Program, Revised, October,
2008. Available at: http://www.fakr.noaa.gov/ram/subsistence/faq1008.pdf. 287 Alaska Department of Natural Resources, Division of Oil and Gas, 2009, Cook Areawide Oil and Gas Lease Sale, Final Finding of the Director,
January 20. 288 Dunker, Kristine J., and Robert Lafferty, 2007, Upper Cook Inlet Personal Use Salmon Fisheries, 2004 – 2006, Fisher Data Series No. 07-88,
Alaska Department of Fish and Game, Divisions of Sport Fish and Commercial Fisheries. 289 Memorandum of Understanding for Coordinated Interagency Fish and Wildlife Management for Subsistence Uses on Federal Public Lands in
Alaska, Signed, December 18, 2008. 290 Alaska Department of Natural Resources, Division of Oil and Gas, 2009, Cook Areawide Oil and Gas Lease Sale, Final Finding of the Director,
January 20, page 5-19. 291 NMFS, and Cook Inlet Marine Mammal Council, 2008, Cook Inlet Beluga Whale Subsistence Harvest Management Plan Brochure, December
2008, available at: http://www.fakr.noaa.gov/protectedresources/whales/beluga/harvestplan/brochure1208.pdf.
SECTION 6 CONTEXTUAL INFORMATION
NATIONAL MARINE FISHERIES SERVICE 6-81
Cook Inlet Native Peoples Subsistence and Cultural Use
Historic and prehistoric cultural resources in the Cook Inlet are catalogued through the Alaska Heritage Resources Survey (AHRS), which is a database of all reported sites that are at least 50 years old. For the Cook Inlet area, hundreds of sites are reported in the AHRS, and demonstrate that human occupations date to as early as 8,000 years B.C.E. Since then, occupations include Dena’ina, Chugach, and Eskimo populations, as well as Russian and Euro-American occupations. Few formal archaeological surveys of the area have been completed, but sites around natural features, such as river mouths and along natural transportation routes are clustered. For example, along the Susitna River, there are sites on both sides. Other drainages, such as the Yentna, Theodore, Lewis, and other rivers have fewer sites. Sites are clustered around the communities of Tyonek, Knik, Eklutna, and Eagle River. Clustered sites are also found along the Kasilof and Kenai Rivers.
NATIVE PEOPLES AND VILLAGES
The Federally recognized tribes in and around Cook Inlet include, Chickaloon, Tyonek, Seldovia, Ninilchik, Kenaitze Indian Tribe, Eklutna, Knik, and Salamatof. 292 The community of Tyonek, on the west of Cook Inlet, is primarily made up of descendents of several Dena’ina Athabascan communities that historically lived in the area. In 2005, the population was surveyed extensively in a study of the use of wild resources.293 The study estimated a population of 202 at that time, with an average of 3 people per household, and approximately 66 households. The vast majority of the population (95 percent) identified themselves as Alaska Natives. The nearby town of Beluga was also studied for wild resource use and, in contrast, this community is estimated to number between 20 and 40 in population, with just 8 percent identified as Alaska Native.
The Ninilchik Village Tribe is a Federally recognized tribe, based in the village of Ninilchik. The Ninilchik Traditional Council website294 states that there are 600 members of this tribe. Results from 2000 Census state that 173 people identifying themselves as Alaska Natives mentioned the Ninilchik Traditional Council as their affiliated tribe. The Seldovia Village Tribe is another Federally-recognized tribe, located along the Kachemak Bay in the Lower Cook Inlet. Census results identify 147 members of this tribe. The Kenaitze Indian Tribe is made up of 1,236 members295 living throughout Alaska. In the Anchorage area, they have tribal offices located in Kenai, in the upper Cook Inlet. In 2000, 706 people in the U.S. identified the Kenaitze Tribe as their tribal affiliate. Eklunta, Knik, and Salamatof villages were identified in the 2000 U.S. Census by 64, 120, and 48 people, respectively, suggesting much larger tribal membership now, based on the trends in the other villages. Eklutna is located in Chugiak, near the Knik Arm, east of Anchorage. The Knik tribal council offices are located in Wasilla, near Anchorage.
TRADITIONAL AND CURRENT COOK INLET BELUGA WHALE HARVEST PRACTICES
The Alaska Native peoples living in the village of Tyonek, located in northwest Cook Inlet, have long harvested Cook Inlet beluga whales as a part of their cultural and dietary tradition. The subsistence harvest of Cook Inlet beluga whales went unregulated until 1999, and some blame excessive harvests for the nearly 50 percent reduction in the Cook Inlet beluga whale population between 1994 and 1999.296,297
292 From the website for the Cook Inlet Tribal Council: http://www.citci.com//index.aspx?pageID=12. 293 Stanek, Ronald T., David L. Holden, and Crystal Wassillie, 2007, Harvest and Uses of Wild Resources in Tyonek and Beluga Alaska: 2005-6,
Alaska Department of Fish and Game, Division of Subsistence, Technical Paper 321, November. 294 Ninilchik Traditional Council. Description. http://www.ninilchiktribe-nsn.gov/description.html. Accessed April 2009. 295 Kenaitze Indian Tribe. http://www.kenaitze.org/. Accessed April 2009. 296 While uncertainty exists as to the degree of responsibility subsistence harvesters have for this decline, the downward slide of Cook Inlet beluga
whale populations began well before 1994. Until the mid-1970’s, “sport shooting” of Cook Inlet beluga whales, from private recreational boats,

FINAL RIR/4(B)(2)/FRFA OF CRITICAL HABITAT DESIGNATION OF COOK INLET BELUGA WHALE AUGUST 11, 2010
6-82 NATIONAL MARINE FISHERIES SERVICE
Between 1999 and 2006, the Tyonek harvested a total of five Cook Inlet beluga whales, at a rate of zero to two Cook Inlet beluga whales per year. Despite management efforts, the Cook Inlet beluga whale population has continued to decline and, in 2007, the Tyonek agreed to forego their annual subsistence hunt. Legislation passed in 2008, calls for long term Cook Inlet beluga whale subsistence harvest limits to be determined at five year increments according to the estimated Cook Inlet beluga whale population size and growth rate.298
TRADITIONAL AND CURRENT MARINE MAMMAL HARVEST PRACTICES
Other marine mammal harvests for traditional and subsistence uses, by Native groups, are currently unregulated, and so little data are available for review.299 In a study of the Tyonek community over the 2005-2006 period, four harbor seals were taken by two Tyonek hunters.300 Other species that may be taken in the Cook Inlet include Steller sea lions, sea otters, and harbor seals. Between 1995 and 2007, there were reportedly four sea lions taken in Cook Inlet for subsistence purposes. Over that same time period there were between four and 111 harbor seals harvested on an annual basis for an average of 72 per annum.301 Between 2001 and 2008, the Cook Inlet sea otter subsistence harvest ranged between six and 109 animals per year, with an annual average of 38.302
SUBSISTENCE FISHERIES
The current subsistence activity of some Cook Inlet communities was recently studied by Stanek, et al.303 This study documents the extensive use of Cook Inlet fishery resources, including an average of 365 pounds of salmon, per capita, consumed per year for participating subsistence fishery households. The salmon harvests were from a variety of sources, including commercial setnets, subsistence setnets, and rod and reel fishing. The study indicated that about half the Tyonek residents relied on other wild sources, in addition to salmon, for over half the meat, fish, and birds they used. Some of the wild resources identified may also be prey of the Cook Inlet beluga whale, such as eulachon, Chinook salmon, coho salmon, sockeye salmon, chum salmon, herring, rainbow trout, and Dolly Varden.
As mentioned above, the Division of Subsistence at ADF&G operates a program for subsistence in certain areas of Cook Inlet, although much of Cook Inlet is designated as “non subsistence.” These areas are determined by the Alaska Joint Board of Fisheries and Game and, by law, must be consistent with the sustained yield principle. A system known as “Tier II” provides a way for the Board to prioritize among different subsistence users. The Tier II approach considers the following three criteria among the eight for determining subsistence priority:
1) the customary and direct dependence on the fish stock or game population by the subsistence user for human consumption as a mainstay of livelihood; 2) the proximity of the
fishing vessels, and from the shoreline was an unregulated and, reportedly, common practice among the general (i.e., non-subsistence) population of the region. As in the case of sea loins, harbor seals, Orcas, and other forms of marine life, beluga whales were regarded by many as “competitors” for fish resources and ubiquitous pests. Queirolo, Lewis Ph.D. August 17, 2009. National Marine Fisheries Service, Alaska Region. Personal communication with ENTRIX staff.
297 National Oceanic Atmospheric Administration. News Release Dated April 19, 2007. “NOAA Recommends Listing Cook Inlet Belugas Under Endangered Species Act.” http://www.publicaffairs.noaa.gov/releases2007/apr07/noaa07-r108.html. Accessed April 2009.
298 CFR Vol. 73 No. 200, October 15, 2008. 299 Smith, Brad. 2009. Management Biologist, National Marine Fisheries Service. Personal communication with ENTRIX staff, May 13. 300 Stanek, Ronald T., David L. Holden, and Crystal Wassillie, 2007, Harvest and Uses of Wild Resources in Tyonek and Beluga Alaska: 2005-6,
Alaska Department of Fish and Game, Division of Subsistence, Technical Paper 321, November. 301 Wolfe, Robert J., James A. Fall, Monica Riedel, 2009, The Subsistence Harvest of Harbor Seals and Sea Lions by Alaska Natives in 2007. Alaska
Department of Fish and Game, Division of Subsistence, Technical Paper 345, March. 302 Benter, Brad. 2009. U.S. Fish and Wildlife Service. Personal communication with ENTRIX staff, June 5. 303 Stanek, Ronald T., David L. Holden, and Crystal Wassillie, 2007, Harvest and Uses of Wild Resources in Tyonek and Beluga Alaska: 2005-6,
Alaska Department of Fish and Game, Division of Subsistence, Technical Paper 321, November.
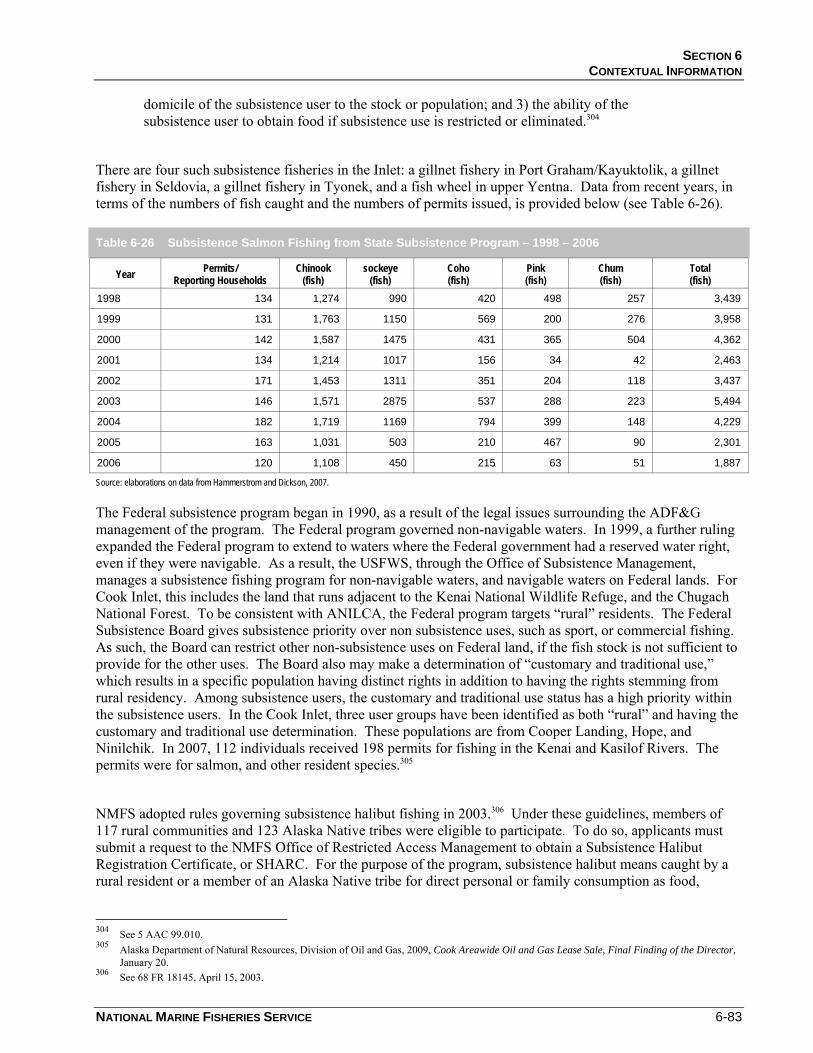
SECTION 6 CONTEXTUAL INFORMATION
NATIONAL MARINE FISHERIES SERVICE 6-83
domicile of the subsistence user to the stock or population; and 3) the ability of the subsistence user to obtain food if subsistence use is restricted or eliminated.304
There are four such subsistence fisheries in the Inlet: a gillnet fishery in Port Graham/Kayuktolik, a gillnet fishery in Seldovia, a gillnet fishery in Tyonek, and a fish wheel in upper Yentna. Data from recent years, in terms of the numbers of fish caught and the numbers of permits issued, is provided below (see Table 6-26).
Table 6-26 Subsistence Salmon Fishing from State Subsistence Program – 1998 – 2006
Year Permits/ Reporting Households
Chinook (fish)
sockeye (fish)
Coho (fish)
Pink (fish)
Chum (fish)
Total (fish)
1998 134 1,274 990 420 498 257 3,439
1999 131 1,763 1150 569 200 276 3,958
2000 142 1,587 1475 431 365 504 4,362
2001 134 1,214 1017 156 34 42 2,463
2002 171 1,453 1311 351 204 118 3,437
2003 146 1,571 2875 537 288 223 5,494
2004 182 1,719 1169 794 399 148 4,229
2005 163 1,031 503 210 467 90 2,301
2006 120 1,108 450 215 63 51 1,887
Source: elaborations on data from Hammerstrom and Dickson, 2007.
The Federal subsistence program began in 1990, as a result of the legal issues surrounding the ADF&G management of the program. The Federal program governed non-navigable waters. In 1999, a further ruling expanded the Federal program to extend to waters where the Federal government had a reserved water right, even if they were navigable. As a result, the USFWS, through the Office of Subsistence Management, manages a subsistence fishing program for non-navigable waters, and navigable waters on Federal lands. For Cook Inlet, this includes the land that runs adjacent to the Kenai National Wildlife Refuge, and the Chugach National Forest. To be consistent with ANILCA, the Federal program targets “rural” residents. The Federal Subsistence Board gives subsistence priority over non subsistence uses, such as sport, or commercial fishing. As such, the Board can restrict other non-subsistence uses on Federal land, if the fish stock is not sufficient to provide for the other uses. The Board also may make a determination of “customary and traditional use,” which results in a specific population having distinct rights in addition to having the rights stemming from rural residency. Among subsistence users, the customary and traditional use status has a high priority within the subsistence users. In the Cook Inlet, three user groups have been identified as both “rural” and having the customary and traditional use determination. These populations are from Cooper Landing, Hope, and Ninilchik. In 2007, 112 individuals received 198 permits for fishing in the Kenai and Kasilof Rivers. The permits were for salmon, and other resident species.305
NMFS adopted rules governing subsistence halibut fishing in 2003.306 Under these guidelines, members of 117 rural communities and 123 Alaska Native tribes were eligible to participate. To do so, applicants must submit a request to the NMFS Office of Restricted Access Management to obtain a Subsistence Halibut Registration Certificate, or SHARC. For the purpose of the program, subsistence halibut means caught by a rural resident or a member of an Alaska Native tribe for direct personal or family consumption as food,
304 See 5 AAC 99.010. 305 Alaska Department of Natural Resources, Division of Oil and Gas, 2009, Cook Areawide Oil and Gas Lease Sale, Final Finding of the Director,
January 20. 306 See 68 FR 18145, April 15, 2003.
FINAL RIR/4(B)(2)/FRFA OF CRITICAL HABITAT DESIGNATION OF COOK INLET BELUGA WHALE AUGUST 11, 2010
6-84 NATIONAL MARINE FISHERIES SERVICE
sharing for personal or family consumption as food, or customary trade.307 According to a recent study about the SHARC program,308 210 SHARCs were used in Cook Inlet in 2005, reportedly catching 3,194 halibut, as well as, 228 lingcod, and 330 rockfish as incidental catches. The total pounds of halibut caught in 2005, represents 6.7 percent of the total State subsistence catch, representing 70,024 pounds.
6.4.10 Alaska Residents Personal Use Fishery
The personal use fishery in Cook Inlet is operated by the ADF&G, Division of Sport Fish. The fishery was developed to allow residents to harvest fish for food, in areas where subsistence fishing is not allowed, such as Cook Inlet. The fishery is only allowed when harvesting these fish will not negatively impact an existing resource user.309 Only Alaska residents may participate in personal use fisheries. In Cook Inlet, there are five personal use fisheries that require permits, in addition to an Alaska resident sport fishing license. These are: Kenai River salmon dipnet; Kasilof River salmon dipnet; Kasilof River salmon set gillnet; Fish Creek sockeye salmon dipnet; and Kachemak Bay coho salmon gillnet. Other personal use fisheries that do not require special use permits are: China Poot Bay sockeye dipnet, hooligan dipnet and gillnet, and herring dipnet and gillnet. All Upper Cook Inlet Personal Use salmon fisheries are managed under the provisions of the Upper Cook Inlet Personal Use Salmon Fishery Management Plan.310
According to a recent study of the Upper Cook Inlet Personal Use salmon fishery, between 2004 and 2006, there was an average of 20,793 permits issued, with an average of 4,179 per year not actually fished.311 This leaves an average of over 16,500 permits per year used in the salmon fishery. The average number of fish taken in the three years is estimated at 323,273. The largest single harvest stemmed from the Kenai River dip net for sockeye, where an average of 228,652 salmon were taken, annually, between 2004 and 2006.
6.4.11 Recreation and Tourism
Recreation and tourism activities occur throughout Cook Inlet, but, with the exception of sport fishing, are primarily land-based activities. Sport fishing is concentrated in the fresh water rivers in the Kenai Peninsula, as well as dispersed throughout the salt waters of the Cook Inlet. Most sport fishing in the Anchorage area is located in the freshwater rivers flowing into Turnagain Arm and Knik Arm, with relatively little saltwater fishing in Cook Inlet.
Tourism in the Cook Inlet area is focused on the Kenai Peninsula and in Anchorage, which serves as a point of arrival or departure for many visitors. The vast majority of tourism is in the summer months from May through September. Data from the Alaska Visitors Statistics Program indicates that from May 2006 through April 2007, of the 1.1 million non-resident visitors to south central Alaska, 83 percent visited in the summer months between May and September.312 Of the estimated 907,000 summer visitors to south central Alaska in 2006, 814,000 visited Anchorage, followed by 439,000 to the Kenai Peninsula. Other popular communities to 307 NMFS, Alaska Division Restricted Access Management Program, 2008, Alaska Subsistence Halibut Program, Small Entity Compliance Guide,
October. 308 Fall, James A., David Koster, and Brian Davis, 2006, Subsistence Harvests of Pacific Halibut in Alaska, 2005, Technical Paper 320, Division of
Subsistence, Alaska Department of Fish and Game, December. 309 Alaska Department of Fish and Game, Sport Fishing Division, Cook Inlet Personal Use Fisheries Important Information, available at:
http://www.sf.adfg.state.ak.us/region2/personaluse/index.cfm. 310 See 5 AAC 77.540. 311 Dunker, Kristine J., and Robert Lafferty, 2007, Upper Cook Inlet Personal Use Salmon Fisheries, 2004 – 2006, Fisher Data Series No. 07-88,
Alaska Department of Fish and Game, Divisions of Sport Fish and Commercial Fisheries. 312 McDowell Group, DataPath Systems, and Davis, Hibbitts, & Midghall, Inc, 2007, “Alaska Visitors Statistics Program: Alaska Visitor Volume
and Profile, Summer 2006,” for the State of Alaska Department of Commerce, Community and Economic Development.
SECTION 6 CONTEXTUAL INFORMATION
NATIONAL MARINE FISHERIES SERVICE 6-85
visit were Whittier (232,000 visitors), Talkeetna (207,000 visitors), and Palmer/Wasilla (139,000 visitors) and Girdwood/Alyeska (135,000 visitors).
Description of Affected Economies
Recreation and tourism is a strong contributor to the Alaska economy. A study conducted for the Alaska Department of Commerce, Community, and Economic Development estimated that total travel and tourism spending in Alaska in 2002, supported nearly 40,000 jobs, or 13.7 percent of total employment in the State.313 Data from a report for the ADF&G indicates that in 2007, sport fishing in the south central region of Alaska supported approximately 11,500 jobs and generated $386.5 million in income.314 Over half of this economic contribution is from non-resident anglers. Recreation and tourism activities generate jobs and income primarily in the food service, lodging, guiding, and retail industries. As before, these are estimated measures of local and regional “economic activity”, not economic benefits and costs.
Current Recreation and Tourism Activities
Recreation and tourism activities in the Cook Inlet, near Anchorage, are primarily limited to small, personal use boats. According to the Anchorage Convention and Visitors Bureau, few, if any, private companies provide water-based recreation excursions in Cook Inlet waters near Anchorage.315 Representatives from the Alaska Chamber of Commerce, as well as a private tour operator, knew of no commercial boat tours offering whale watching or guided fishing in the Anchorage area.316 Due to the extreme tidal flows and shallow mudflats, boat tours do not travel the Turnagain Arm or Knik Arm. While many cruise passengers visit Anchorage as a point of arrival or departure, most cruise ships dock at Seward, and passengers travel overland to Anchorage, via tour bus, along Turnagain Arm. The opportunity to observe Cook Inlet beluga whales during this bus ride has been an integral component of the advertising for this activity. In support of this, the State of Alaska has invested significantly in the development of viewing and educational facilities (e.g., scenic turn-outs, sculptures and display panels of beluga whales) along the corridor between Anchorage and the head of Turnagain Arm.
Marinas and access to boat launch sites are very rare in the Anchorage area. According to the DNR, there is only one site for boat launching, a city-owned public access site located in Ship Creek. This site is used by boaters who navigate the saltwater areas near Anchorage. Most recreation activities in and along the Cook Inlet take place on the Kenai Peninsula.
In contrast to Anchorage, Homer and the Kachemak Bay attract many water-based recreationists. An estimated 150,000 people visit Homer, annually, with approximately half of these visits occurring between Memorial Day and Labor Day weekend. Sport fishing draws many visitors to Homer, and there are over 100 charter fishing vessels operating out of the Homer Harbor. The harbor, itself, has between 800 and 900 slips
313 Global Insight, 2004, “The Alaska Tourism Satellite Account: A Comprehensive Analysis of the Economic Contribution of Travel and Tourism”,
prepared for the Alaska Department of Commerce, Community and Economic Development. 314 Southwick Associates, William Romberg, Allen Bingham, Gretchen Jennings, and Robert Clark, 2008, “Economic Impacts and Contributions of
Sport fishing in Alaska, 2007,” prepared for the Alaska Department of Fish and Game, Division of Sport Fish, Professional Publication No. 08-01.
315 Alaska Convention and Visitors Bureau. 2009. Personal communication with ENTRIX staff, April 22. 316 Alaska Chamber of Commerce. 2009.Personal communication with ENTRIX staff, April 23. Explore Tours. 2009. Personal communication with
ENTRIX staff, April 22.
FINAL RIR/4(B)(2)/FRFA OF CRITICAL HABITAT DESIGNATION OF COOK INLET BELUGA WHALE AUGUST 11, 2010
6-86 NATIONAL MARINE FISHERIES SERVICE
for both commercial and recreational vessels. There are many boat access points in the Homer area, notably Kenai Harbor and the Anchor Point tractor pullout.317
Halibut fishing accounts for the majority of fishing trips in Homer, with an estimated 70 percent of total charter fishing trips. Visitors do not participate in dedicated whale watching excursions, due to the long distance necessary to travel to ensure a whale sighting. In 2009, Homer’s only whale watching boat switched to offering more generalized wildlife viewing within Kachemak Bay, rather than making the journey to Barren Islands to guarantee a whale sighting. In addition to sport fishing and wildlife viewing, there has recently been increased participation by visitors in surfing activities in the area.318
Data from the Alaska Visitors Statistics Program provide insight into the primary recreation and tourism activities in the Cook Inlet area engaged in by non-residents.319 As noted above, most tourists to the region engage in land-based activities, with the exception of sport fishing (which is described in detail below). For example, in the summer of 2006, only two percent of non-resident visitors in Anchorage engaged in kayaking or canoeing, only one percent participated in day cruises, but 17 percent engaged in fishing in the area. The percentage of visitors engaged in water-based activities increases on the Kenai Peninsula. Seven percent of visitors to Kenai engaged in rafting or kayaking or canoeing, three percent participated in day cruises, and approximately 38 percent sport fished. In Homer, nearly as many visitors participated in sport fishing (33 percent), eight percent participated in day cruising, and three percent participated in kayaking or canoeing.
Wildlife viewing, which may be either land- or water-based, is also a popular activity, engaging 28 percent of all non-resident visitors to south central Alaska. While in Anchorage, 11 percent of visitors view wildlife. A popular land-based whale watching location in the Anchorage area is Beluga Point, on the northern shoreline of Turnagain Arm. Indian Creek and Bird Creek are also good locations to catch a glimpse of the whales, and there are some additional pullouts, as the Seward Highway approaches Girdwood. Wildlife viewing is even more popular on the Kenai Peninsula. The proportion of non-resident visitors to Kenai and Homer that view wildlife is 22 percent and 32 percent, respectively.
There are nine State-management areas located along Cook Inlet and Knik Arm: Redoubt Bay State Critical Habitat Area, Trading Bay State Game Refuge, Susitna Flats Game Refuge, Goose Bay State Game Refuge, Palmer Hay Flats State Game Refuge, Kalgin Island Critical Habitat Area, Clam Gulch Critical Habitat Area, and Kachemak Bay Critical Habitat Area. Lake Clark National Park and Kenai National Wildlife Refuge also border Cook Inlet. While land-based recreation, such as waterfowl hunting and wildlife viewing (including whale watching) is popular at many of these management areas, sport fishing and water-based wildlife viewing also attract recreationists to these locations. Conversations with ADF&G staff reveal that currently there is no special Cook Inlet beluga whale management in the State-managed wildlife areas. Once Cook Inlet beluga whale CH is designated, there is no planned action or changes to the areas’ management.320
SPORT FISHING
The ADF&G Statewide harvest survey provides data on angler days, by location, throughout Cook Inlet (see Figure 6-8). From 2005 to 2007, there were an annual average of 1.2 million sport fishing angler days
317 Broadhead, Linda. 2009. Homer Chamber of Commerce, Visitor Services Manager. Personal communication with ENTRIX staff on May 20. 318 Ibid. 319 McDowell Group, DataPath Systems, and Davis, Hibbitts, & Midghall, Inc, 2007, “Alaska Visitors Statistics Program: Alaska Visitor Volume
and Profile, Summer 2006,” for the State of Alaska Department of Commerce, Community and Economic Development. 320 Meehan, Joe. 2009. Alaska Department of Fish and Game, Coordinator for Land and Refuge Program. Personal communication with ENTRIX
staff, May 8.
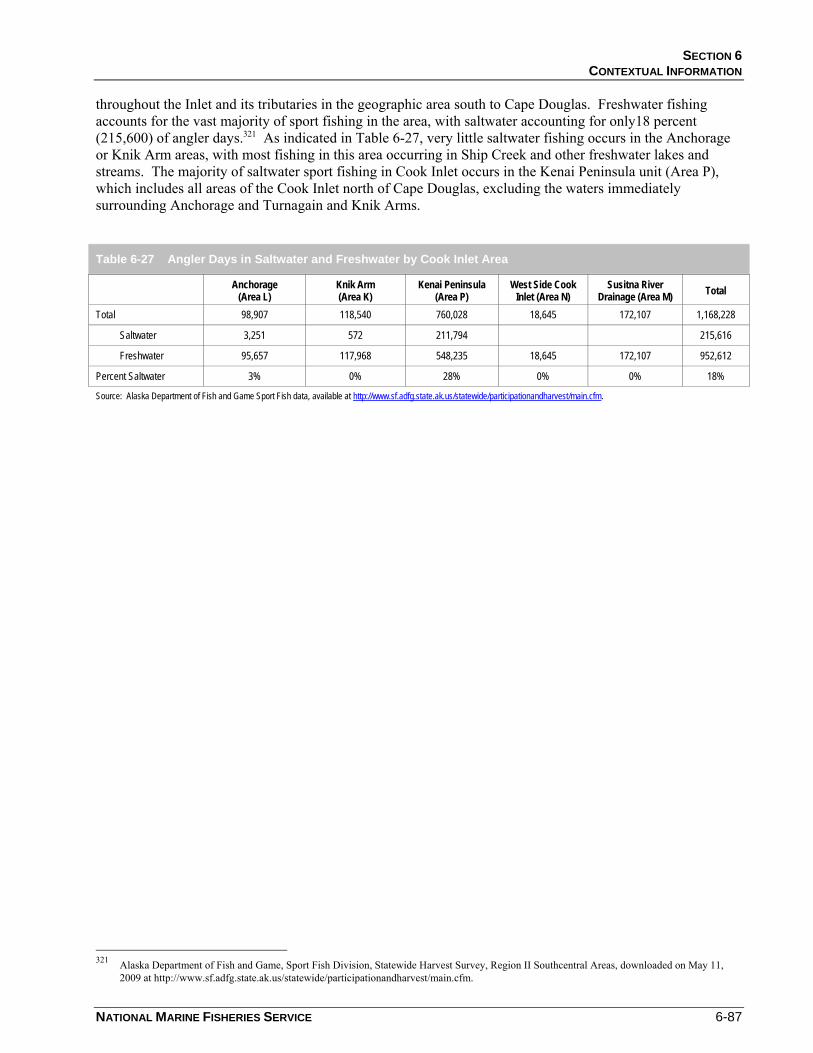
SECTION 6 CONTEXTUAL INFORMATION
NATIONAL MARINE FISHERIES SERVICE 6-87
throughout the Inlet and its tributaries in the geographic area south to Cape Douglas. Freshwater fishing accounts for the vast majority of sport fishing in the area, with saltwater accounting for only18 percent (215,600) of angler days.321 As indicated in Table 6-27, very little saltwater fishing occurs in the Anchorage or Knik Arm areas, with most fishing in this area occurring in Ship Creek and other freshwater lakes and streams. The majority of saltwater sport fishing in Cook Inlet occurs in the Kenai Peninsula unit (Area P), which includes all areas of the Cook Inlet north of Cape Douglas, excluding the waters immediately surrounding Anchorage and Turnagain and Knik Arms.
Table 6-27 Angler Days in Saltwater and Freshwater by Cook Inlet Area
Anchorage (Area L)
Knik Arm (Area K)
Kenai Peninsula (Area P)
West Side Cook Inlet (Area N)
Susitna River Drainage (Area M) Total
Total 98,907 118,540 760,028 18,645 172,107 1,168,228
Saltwater 3,251 572 211,794 215,616
Freshwater 95,657 117,968 548,235 18,645 172,107 952,612
Percent Saltwater 3% 0% 28% 0% 0% 18%
Source: Alaska Department of Fish and Game Sport Fish data, available at http://www.sf.adfg.state.ak.us/statewide/participationandharvest/main.cfm.
321 Alaska Department of Fish and Game, Sport Fish Division, Statewide Harvest Survey, Region II Southcentral Areas, downloaded on May 11,
2009 at http://www.sf.adfg.state.ak.us/statewide/participationandharvest/main.cfm.
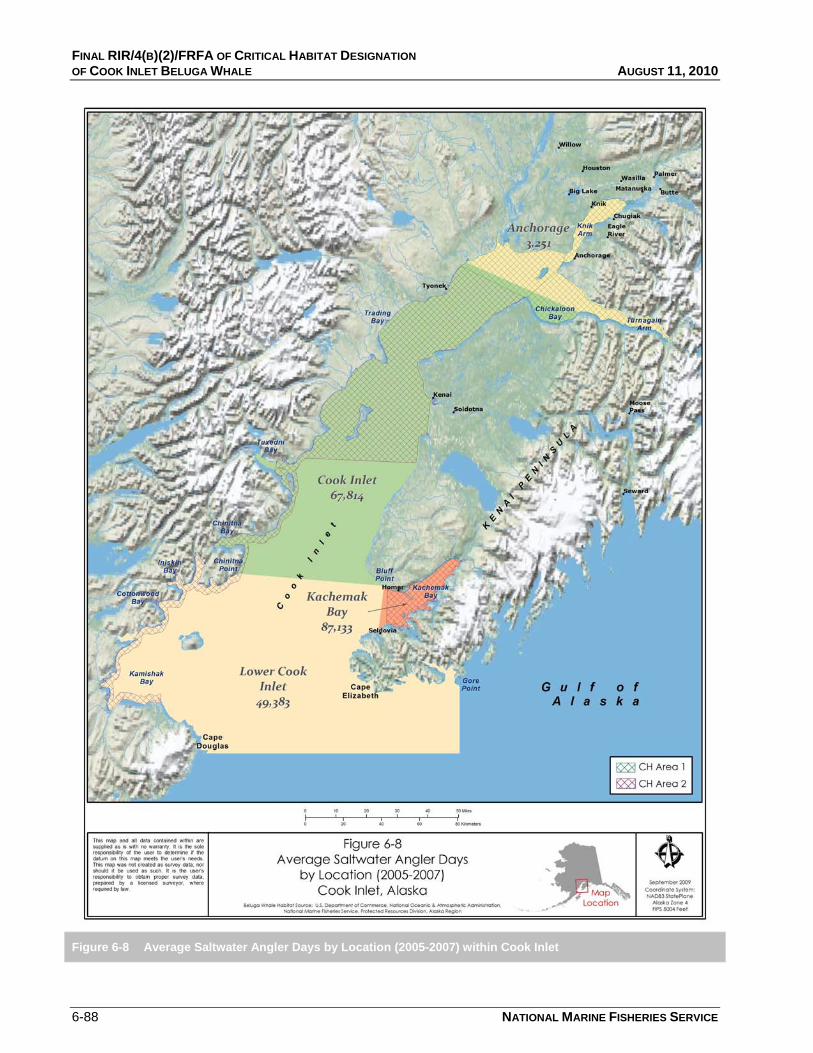
FINAL RIR/4(B)(2)/FRFA OF CRITICAL HABITAT DESIGNATION OF COOK INLET BELUGA WHALE AUGUST 11, 2010
6-88 NATIONAL MARINE FISHERIES SERVICE
Figure 6-8 Average Saltwater Angler Days by Location (2005-2007) within Cook Inlet
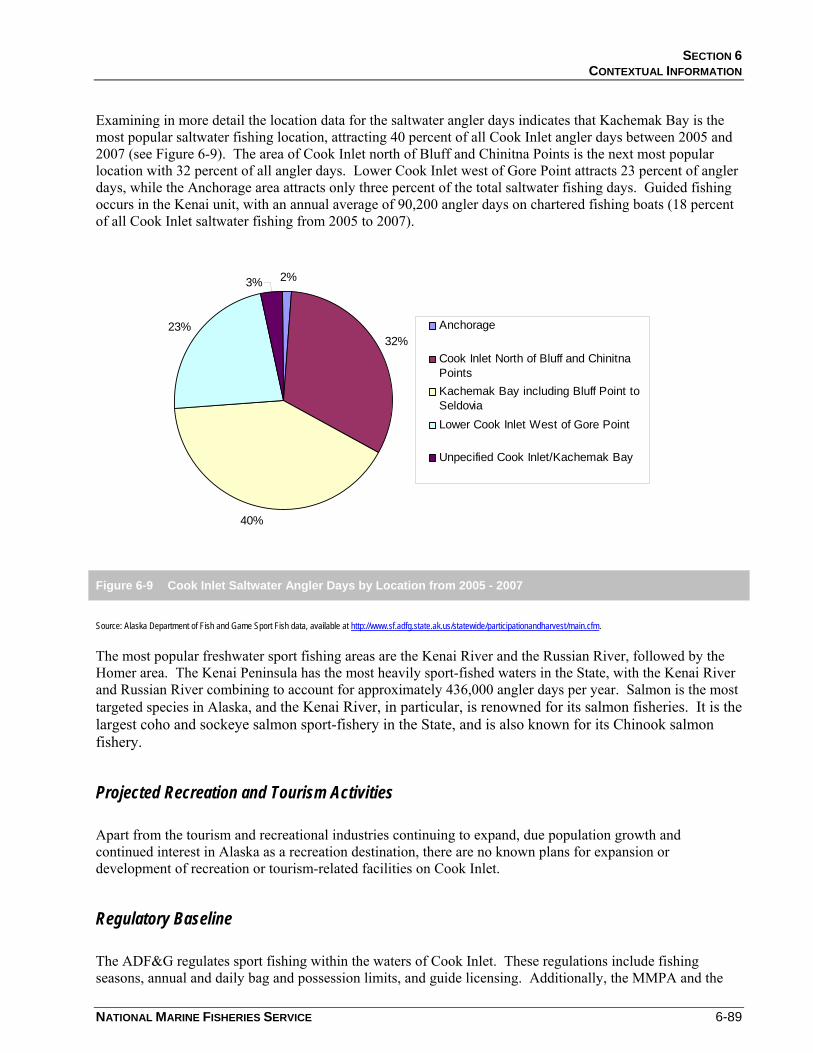
SECTION 6 CONTEXTUAL INFORMATION
NATIONAL MARINE FISHERIES SERVICE 6-89
Examining in more detail the location data for the saltwater angler days indicates that Kachemak Bay is the most popular saltwater fishing location, attracting 40 percent of all Cook Inlet angler days between 2005 and 2007 (see Figure 6-9). The area of Cook Inlet north of Bluff and Chinitna Points is the next most popular location with 32 percent of all angler days. Lower Cook Inlet west of Gore Point attracts 23 percent of angler days, while the Anchorage area attracts only three percent of the total saltwater fishing days. Guided fishing occurs in the Kenai unit, with an annual average of 90,200 angler days on chartered fishing boats (18 percent of all Cook Inlet saltwater fishing from 2005 to 2007).
2%
32%
40%
23%
3%
Anchorage
Cook Inlet North of Bluff and ChinitnaPoints Kachemak Bay including Bluff Point toSeldovia Lower Cook Inlet West of Gore Point
Unpecified Cook Inlet/Kachemak Bay
Figure 6-9 Cook Inlet Saltwater Angler Days by Location from 2005 - 2007
Source: Alaska Department of Fish and Game Sport Fish data, available at http://www.sf.adfg.state.ak.us/statewide/participationandharvest/main.cfm.
The most popular freshwater sport fishing areas are the Kenai River and the Russian River, followed by the Homer area. The Kenai Peninsula has the most heavily sport-fished waters in the State, with the Kenai River and Russian River combining to account for approximately 436,000 angler days per year. Salmon is the most targeted species in Alaska, and the Kenai River, in particular, is renowned for its salmon fisheries. It is the largest coho and sockeye salmon sport-fishery in the State, and is also known for its Chinook salmon fishery.
Projected Recreation and Tourism Activities
Apart from the tourism and recreational industries continuing to expand, due population growth and continued interest in Alaska as a recreation destination, there are no known plans for expansion or development of recreation or tourism-related facilities on Cook Inlet.
Regulatory Baseline
The ADF&G regulates sport fishing within the waters of Cook Inlet. These regulations include fishing seasons, annual and daily bag and possession limits, and guide licensing. Additionally, the MMPA and the
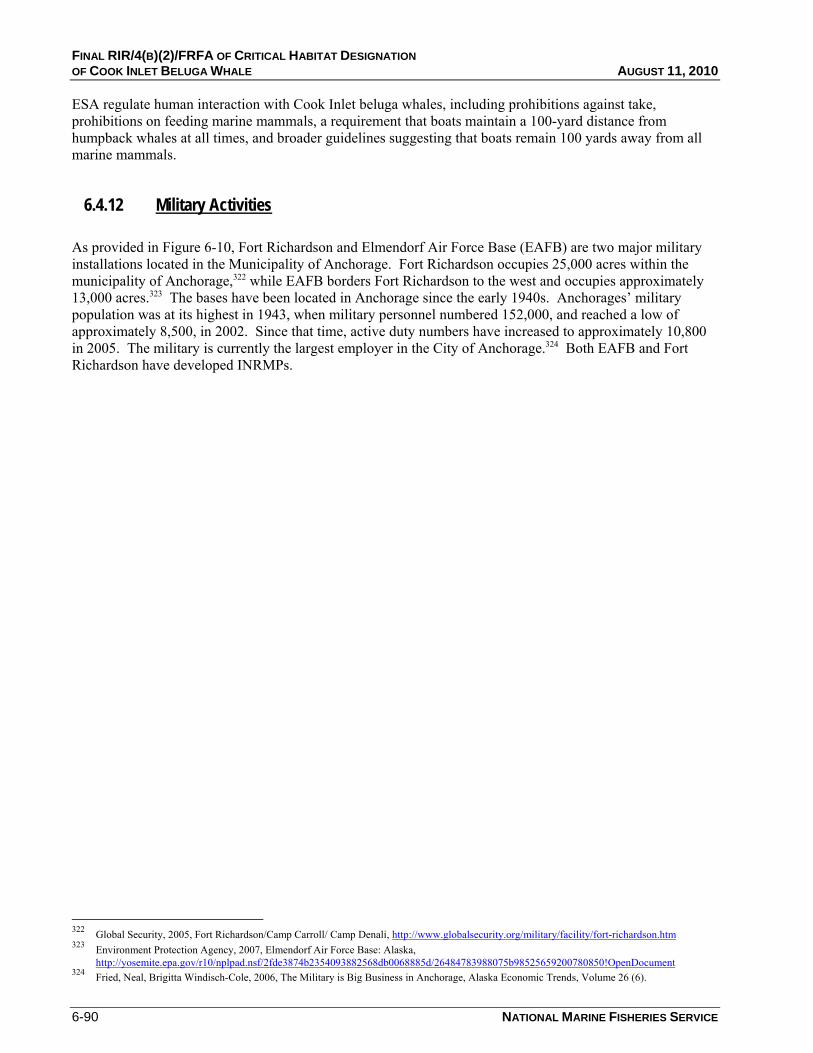
FINAL RIR/4(B)(2)/FRFA OF CRITICAL HABITAT DESIGNATION OF COOK INLET BELUGA WHALE AUGUST 11, 2010
6-90 NATIONAL MARINE FISHERIES SERVICE
ESA regulate human interaction with Cook Inlet beluga whales, including prohibitions against take, prohibitions on feeding marine mammals, a requirement that boats maintain a 100-yard distance from humpback whales at all times, and broader guidelines suggesting that boats remain 100 yards away from all marine mammals.
6.4.12 Military Activities
As provided in Figure 6-10, Fort Richardson and Elmendorf Air Force Base (EAFB) are two major military installations located in the Municipality of Anchorage. Fort Richardson occupies 25,000 acres within the municipality of Anchorage,322 while EAFB borders Fort Richardson to the west and occupies approximately 13,000 acres.323 The bases have been located in Anchorage since the early 1940s. Anchorages’ military population was at its highest in 1943, when military personnel numbered 152,000, and reached a low of approximately 8,500, in 2002. Since that time, active duty numbers have increased to approximately 10,800 in 2005. The military is currently the largest employer in the City of Anchorage.324 Both EAFB and Fort Richardson have developed INRMPs.
322 Global Security, 2005, Fort Richardson/Camp Carroll/ Camp Denali, http://www.globalsecurity.org/military/facility/fort-richardson.htm 323 Environment Protection Agency, 2007, Elmendorf Air Force Base: Alaska,
http://yosemite.epa.gov/r10/nplpad.nsf/2fde3874b2354093882568db0068885d/26484783988075b98525659200780850!OpenDocument 324 Fried, Neal, Brigitta Windisch-Cole, 2006, The Military is Big Business in Anchorage, Alaska Economic Trends, Volume 26 (6).
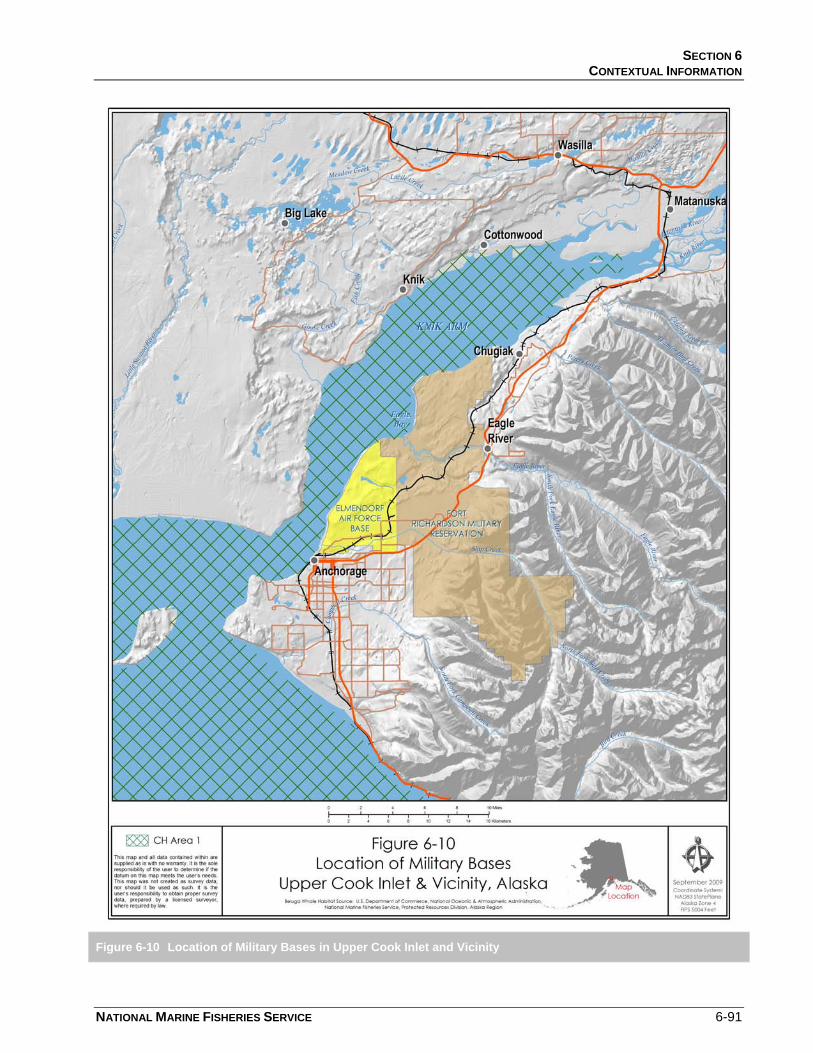
SECTION 6 CONTEXTUAL INFORMATION
NATIONAL MARINE FISHERIES SERVICE 6-91
Figure 6-10 Location of Military Bases in Upper Cook Inlet and Vicinity
FINAL RIR/4(B)(2)/FRFA OF CRITICAL HABITAT DESIGNATION OF COOK INLET BELUGA WHALE AUGUST 11, 2010
6-92 NATIONAL MARINE FISHERIES SERVICE
Regulatory Baseline
Section 4(a)(3)(B)(i) of the ESA provides the "Secretary shall not designate as critical habitat any lands or other geographical areas owned or controlled by the Department of Defense, or designated for its use, that are subject to an integrated natural resources management plan ... if the Secretary determines in writing that such plan provides a benefit to the species for which critical habitat is proposed for designation." As indicated in the proposed rule, the Secretary has initially determined that an area above the MHHW line in the Eagle River qualifies for the exemption contained in section 4(a)(3)(B)(i). Notwithstanding this exemption, NMFS's assessment of economic and national security impacts prepared for the proposed rule includes, as a conservative measure, all potential economic and national security impacts, including those associated with the exempted area.
Air Force
The EAFB has formed partnerships with multiple agencies to coordinate and improve management of natural resources on and near the base. Regarding to Cook Inlet beluga whales, EAFB has formed partnerships with the Port of Anchorage and the Knik Bridge and Toll Authority to track and estimate Cook Inlet beluga whale populations in Knik Arm. These data are being utilized to prepare an EIS for the POA Expansion and the Knik Arm Bridge.325
EAFB has established eight Land Management Units (LMUs) on the base, each with different management requirements. LMU 8 is the coastal management unit and encompasses 6.6 miles of coast line along EAFB. Its boundaries were defined, based on the applicability of regulations governing coastal resources, such as the Marine Protection, Research and Sanctuaries Act, The Coastal Zone Management Act, the Mammal Protection Act, the MMPA, and the Rivers and Harbors Act of 1899. LMU 8 is the least disturbed of all LMUs on the base. It is a high volume travel corridor for bear and wolves, and Cook Inlet beluga whale and Orca whales are frequently sighted offshore during the salmon spawning season.
The POA is expanding its facilities and requires large quantities of gravel and rock to meet fill requirements of the new construction. The Cherry Hill Borrow Site is located approximately 150 feet to 200 feet in elevation above the northern end of POA on EAFB. The site contains approximately 3.3 million cubic yards of recoverable material. The Cherry Hill Borrow Site has been used over the past 25 years by EAFB and covered approximately 21 acres, prior to POA expansion.326 The proposed action in the Environmental Assessment suggests that the Cherry Hill Borrow Site will expand to 97 acres to accommodate POA expansion. A FONSI was issued for the Cherry Hill Borrow Site by the Bureau of Land Management (BLM) on February 8, 2006,327 and by the U.S. Maritime Administration on January 30, 2006.328 No consultation has occurred with NMFS on the Cherry Hill Borrow Site. The placement of the removed material is being considered in a biological opinion with MARAD (with authorization by POA).329
325 Elmendorf AFB, Conservation and Planning Office, 2006, Integrated Natural Resources Management Plan Elmendorf Air Force Base, Alaska 326 U.S. Maritime Administration, 2006, Cherry Hill Material Extraction and Transport Environmental Assessment Final. 327 U.S. Department of Interior, Bureau of Land Management, 2006, Anchorage Field Office FY 2006 NEPA Register.
http://www.blm.gov/ak/st/en/info/nepa/afo_nepa/afo_nepa_fy2006.html 328 U.S. Maritime Administration, Cherry Hill Material Extraction and Transport Environmental Assessment Final. 329 Personal communication with Brad Smith, Management Biologist, National Marine Fisheries Service, June 4, 2009.
SECTION 6 CONTEXTUAL INFORMATION
NATIONAL MARINE FISHERIES SERVICE 6-93
Army
The U.S. Army recently completed a draft EIS for an increased number of personnel and helicopters on military bases in Alaska. 330 The EIS applies to all military lands and installations in Alaska, as well as other potentially affected lands and airspace. The majority of this expansion applies to Fort Wainwright. Three alternatives were evaluated in the draft EIS. Potential noise effects on Cook Inlet beluga whales, attributable to the third alternative, was one concern identified in the public comments on the EIS. No noise effects are anticipated in two of the three alternatives, but may be an issue in the third alternative, which would result in increased use of flight corridors and noise at Eagle River Flats Impact Area. Provided that the Army chooses alternative three, a consultation with NMFS will occur.331 NMFS biologists were unaware of this expansion project. However, NMFS biologist concurred that the expansion of additional helicopters could result in a consultation, but it is unlikely that there would be additional costs attributed to habitat designation.332
Another EIS is proposed for the Eagle River Flats Impact Area, where the Army has proposed year-round direct and indirect live-fire weapons training.333 The ERFTA is a 2,160-acre salt marsh located at the mouth of Eagle River. Between 1996 and 2007, Comprehensive Environmental Response, Compensation and Liability Act (CERCLA) cleanup actions occurred in the area, as a result of high waterfowl mortality.334 Currently, the site is being monitored. Training occurs during the winter months at Eagle River Flats Impact Area and at Donnelly Training Area in Delta Junction, Alaska, when ice cover on Knik Arm does not meet minimal requirements. The Army uses ERIFA approximately five months a year, when ice thickness on Knik Arm exceeds four inches. If the proposed action was to occur, there would be approximately five to nine months of training in the area, annually.335
The Army is currently working with NMFS on modifications to the Ft. Richardson INRMP. Once modified, the Ft. Richardson INRMP should provide adequate protection of Cook Inlet beluga whale habitat features on the installation. Congress has decreed that where an INRMP offers the necessary protections to an endangered species' habitat, there is no need to designate such habitat as critical.336
The protections offered by the INRMP lead NMFS to conclude that the designation would not substantially adversely affect military training operations at the Eagle River Flats Impact Area. Nonetheless, this area is not included in this CHD, based upon the provisions of 4(a)(3)(B)(1) and the Sikes Act. Information gleaned from on-going analysis indicates that Army units are capable of training within the Eagle River/Bay area without having an adverse effect on the habitat or Cook Inlet beluga whales that occasionally feed in the area.337
In addition to modifications to the INRMP, Ft. Richardson is completing an EIS that will review the potential impacts associated with year-round use of Eagle River Flats Impact Area. A focus of the EIS is to determine whether the proposed training could negatively impact Cook Inlet beluga whales and, if so, identify measures the Army will take to sufficiently mitigate adverse impacts. Ft. Richardson is also completing a biological
330 U.S. Army Alaska, 2009, Draft Stationing and Training of Increased Aviation Assets within U.S. Army Alaska Environmental Impact Statement. 331 Larsen, Gary. 2009. Fort Richardson Environmental Chief. Personal communication with ENTRIX staff, May 5. 332 Smith, Brad. 2009. Management Biologist, National Marine Fisheries Service. Personal communication with ENTRIX staff, May 6. 333 U.S. Army, Resuming Year-Round Live-Fire Weapons Training at Eagle River Flats Impact Area Fort Richardson, Alaska. 334 U.S. Army, Resuming Year-Round Live-Fire Weapons Training at Eagle River Flats Impact Area Fort Richardson, Alaska. 335 Larsen, Gary. 2009. Fort Richardson Environmental Chief. Personal communication with ENTRIX staff, May 5. 336 Ibid. 337 Ibid.
FINAL RIR/4(B)(2)/FRFA OF CRITICAL HABITAT DESIGNATION OF COOK INLET BELUGA WHALE AUGUST 11, 2010
6-94 NATIONAL MARINE FISHERIES SERVICE
assessment as required under Section 7 of the ESA to evaluate potential impacts Army training actions may have on Cook Inlet beluga whales and their habitat.338
Over the past three years the Army has spent $400,000 to $500,000 in preparation of the listing of the Cook Inlet beluga whale and its CH on Ft. Richardson.339 Conversations with NMFS suggest that initially an informal consultation was to occur for the Eagle River Flats Impact Area, but now a formal consultation is likely.340
6.4.13 Interactions between Cook Inlet Beluga Whale Habitats and other Protected Species and their Habitats
Other sensitive and ESA listed species occur in Cook Inlet. The ESA listed species include Steller’s eider, the short-tailed albatross, Snake River fall Chinook salmon, Steller sea lion, and the southwest distinct population segment (DPS) of northen sea otters. In addition, Alaska Species of Special Concern in Cook Inlet include the harbor seal and the American peregrine falcon. Steller’s eider, Steller sea lion, and the southwest DPS of northen sea otters are simulatiously Alaska Species of Special Concern and ESA listed. Alaska Species of Special Concern that occur on land near Cook Inlet include the olive-sided flycatcher, the Kenai Peninsula brown bear, the northern (Queen Charlotte) goshawk, gray-cheekd thrush, Townsend’s warbler, and the Blackpoll warbler. Measures that protect sensitive species that share some of the same habitat as the Cook Inlet beluga whale may also provide some protection to the Cook Inlet beluga whales. In the same way, designating CH for the Cook Inlet beluga whale may benefit other sensitive species, by protecting habitat they share. Sensitive species that occupy marine habitat in Cook Inlet, and the measures that protect these species, are discussed in more detail below.
Steller’s eider (Polysticta stelleri)341,342,343
Averaging 43 to 47 centimeters (17 to 18.5 inches) long, Steller’s eiders are the smallest eider species. The species winters throughout the Alaska Peninsula and eastern Aleutian Islands, and breeds during spring and summer in the Arctic coastal plain and the coastal areas of northern Alaska. Steller’s eiders dive for marine mollusks and other invertibates in the winter, and feed on insect larvae in freshwater ponds during the breeding season.
While the worldwide population of this species declined by approximately 50 percent between the 1960s and 1980s, the causes for decline are unknown. Possible causes for the decline include lead poisoning from ingesting spent lead shot; predation by ravens, gulls, and foxes; loss of nesting habitat; increased shipping traffic; marine contaminants; and hunting. In 1997, FWS listed the Alaska breeding population as threatened. The species is also an Alaska Species of Special Concern, and hunting of eiders is regulated under the Migratory Bird Treaty Act. Critical habitat under ESA is designated for Steller’s eider in the Yukon-
338 Larsen, Gary. 2009. Fort Richardson Environmental Chief. Personal communication with ENTRIX staff, May 5. 339 Ibid. 340 Mahoney, Barbara. 2009. National Marine Fisheries Management Biologist. Personal communication with ENTRIX staff, May 6. 341 Alaska Department of Fish and Game, Alaska Species of Special Concern, “Steller’s Eider,”
http://www.adfg.state.ak.us/special/esa/eider_stellers/st_eider.php, accessed April 27, 2009. 342 U.S. Fish and Wildlife Service, Threatened and Endangered Species System, Environmental Conservation Online System, “Steller's Eider
(Polysticta stelleri),” http://ecos.fws.gov/speciesProfile/SpeciesReport.do?spcode=B090, accessed April 27, 2009. 343 U.S. Fish and Wildlife Service, Threatened and Endangered Species System, “Steller’s Eider Fact Sheet,”
http://alaska.fws.gov/media/StellEider_FactSheet.htm, accessed April 27, 2009.
SECTION 6 CONTEXTUAL INFORMATION
NATIONAL MARINE FISHERIES SERVICE 6-95
Kuskokwim Delta, Kuskokwim Shoals, Seal Islands, Nelson Lagoon, and Izembek Lagoon. No critical habitat is designated for this species in Cook Inlet.
Short-tailed albatross [Phoebastria (=Diomedea) albatrus]344345
The short-tailed albatross is the largest seabird in the North Pacific. The species nests, beginning in October each year, on islands in Japan and feeds on squid, finfish, and shrimp in the North Pacific during late summer and early fall. Short-tailed albatrosses have been sighted within the U.S. Exclusive Economic Zone around Alaska, including at the mouth of Cook Inlet.
By the early 1900s, feather hunters had nearly driven the short-tailed albatross to extinction. Threats that have contributed to the decline of the species since then include volcanic eruptions, competition with black-footed albatross, severe storms, oil spills, entanglement in derelict fishing gear, and takes from commercial longline gear. The short-tailed albatross is protected under ESA, and is listed as endangered throughout its U.S. range, which spans portions of the states of Alaska, Hawaii, Washington, Oregon, and California. The USFWS announced a draft recovery plan for the species in the October 27, 2005 Federal Register.346 Additionally, the species is designated a Species National Monument and a Special Bird of Protection by the government of Japan. On an international level, the Convention on International Trade in Endangered Species (CITES) prohibits the trade of the species and its parts across international borders. No critical habitat has been designated for this species.
Chinook salmon - Fall Stock Snake River Oncorhynchus (=Salmo) tshawytscha347,348
Snake River fall Chinook salmon are the largest species of Pacific salmon. Habitat for this species includes the mainstem of the Snake River, and the sub-basins of the Tucannon, Grande Ronde, Imnaha, Salmon, and Clearwater rivers of the U.S. Pacific Northwest. These salmon spawn from October through November, with fry emerging in the spring. Within several weeks of hatching, the species migrates downstream to the Pacific Ocean. During the three years the salmon spend at sea, prior to returning to their natal streams, some fall Chinook salmon occupy Alaska waters, including the portions of Cook Inlet south of West and East Forelands.
Threats to the species include dam development, man-made water diversion, disease, overharvesting, and competition from hatchery-produced fish. In response to a dramatic decline in the population of the species since the 1940s, the Snake River fall Chinook salmon has been listed as threatened under ESA, and established as an Alaska Species of Special Concern. No conservation plans for the species have been developed in Alaska, nor has critical habitat for the species been designated in Cook Inlet.
344 U.S. Fish and Wildlife Service, Threatened and Endangered Species System, Environmental Conservation Online System, “Short-tailed albatross
(Phoebastria (=Diomedea) albatrus),” http://ecos.fws.gov/speciesProfile/SpeciesReport.do?spcode=B00Y. 345 U.S. Fish and Wildlife Service, Threatened and Endangered Species System, “Short-tailed Albatross Fact Sheet,”
http://alaska.fws.gov/fisheries/endangered/pdf/STALfactsheet.pdf, accessed April 27, 2009. 346 Federal Register, Vol. 70, No. 207, Thursday, October 27, 2005, pp. 61988-61989. 347 Alaska Department of Fish and Game, Alaska Species of Special Concern, “Snake River Fall Chinook Salmon,”
http://www.adfg.state.ak.us/special/esa/salmon_chinook/chinook_salmon.php, accessed April 27, 2009. 348 U.S. Fish and Wildlife Service, Threatened And Endangered Species System, Environmental Conservation Online System, “Chinook Salmon
(Oncorhynchus (=Salmo) Tshawytscha),” Http://Ecos.Fws.Gov/Speciesprofile/Speciesreport.Do?Spcode=E06d, Accessed April 27, 2009.

FINAL RIR/4(B)(2)/FRFA OF CRITICAL HABITAT DESIGNATION OF COOK INLET BELUGA WHALE AUGUST 11, 2010
6-96 NATIONAL MARINE FISHERIES SERVICE
Southwest DPS of northern sea otters (Enhydra lutris kenyoni)349,350, 351
Sea otters are marine mammals that prey on sea urchins, mollusks, crustaceans, and fish. The southwest DPS of northern sea otters inhabits coastal waters within three miles of shore in the Aleutian Islands, Alaska Peninsula coast, and the Kodiak Archipelago. Past threats to the species included hunting for pelts during the 18th and 19th centuries; however, while some sea otter populations have recovered since that time period, the southwest Alaska population of northern sea otters has declined 56 percent to 68 percent since the mid-1980s. Consequently, the USFWS listed this DPS as threatened in the Final Rule in the August 8, 2005 Federal Register.352 Critical habitat was not designated at that time. However, the USFWS published a proposed rule in the December 16, 2008 Federal Register to designate critical habitat for the DPS.353 Critical habitat is designated in the following five units: 1) Western Aleutian; 2) Eastern Aleutian; 3) South Alaska Peninsula; 4) Bristol Bay; and 5) Kodiak, Kamishak, and the Alaska Peninsula. Unit 5 includes portions of the western coastal areas of lower Cook Inlet, from Redoubt Point to Cape Douglas. The southwest DPS of northern sea otters is also an Alaska Species of Special Concern and is protected by the MMPA.
Steller sea lion (Eumetopias jubatus) 354, 355
The Steller sea lion is the largest member of the sea lion family (Otariidae), with the males weighing more than 1,700 pounds. The species feeds on schooling fishes, octopus, and squid, and inhabits rookeries and haulouts on islands. While the Steller sea lion’s range extends from the Pacific coast of Russia, along the U.S. coast of Alaska, and British Columbia, Canada in the north, to central California in the south, approximately 70 percent of the world’s Steller sea lions are found in Alaska. However, the Alaskan portion of the population is estimated to have declined by approximately 70 percent since the mid-1970s. Potential factors behind the decline include environmental change, disease, shooting, and direct mortality caused by commercial fishery operations, which also reduce food availability for the species.
The Steller sea lion is protected under MMPA and ESA. The population east of longitude 144 degrees W (around Cape Suckling, Alaska) is listed as threatened under ESA, while the population west of that longitude was reclassified as endangered, in 1997. While critical habitat has been designated for major rookeries and haulouts throughout Alaska, none is designated in Cook Inlet.
349 Alaska Department of Fish and Game, Alaska Species of Special Concern, “Sea Otters in Alaska,”
http://www.adfg.state.ak.us/special/esa/seaotter/sea_otter.php, accessed April 29, 2009. 350 U.S. Fish And Wildlife Service, Endangered Species Program, Species Profile, “Northern Sea Otter (Enhydra Lutris Kenyoni),” Accessed April
29, 2009. 351 U.S. Fish and Wildlife Service, August 2005, “Sea Otters in SW Alaska Listed as Threatened,”
http://alaska.fws.gov/media/seaotter2004/SeaOtterQ&A.pdf. 352 Federal Register, Vol. 70, No. 152, Tuesday, August 9, 2005, pp. 46366-46386. 353 Federal Register, Vol. 73, No. 242, December 16, 2008, pp. 76453-76469. 354 Alaska Department of Fish and Game, Alaska Species of Special Concern, “Steller Sea Lion,”
http://www.adfg.state.ak.us/special/esa/sealion_steller/s_sealion.php, accessed April 27, 2009. 355 U.S. Fish And Wildlife Service, Environmental Conservation Online System, Species Profile, “Steller Sea-Lion (Eumetopias Jubatus),”
Http://Ecos.Fws.Gov/Speciesprofile/Speciesreport.Do?Spcode=A0fs, Accessed April 29, 2009.

SECTION 6 CONTEXTUAL INFORMATION
NATIONAL MARINE FISHERIES SERVICE 6-97
Harbor seal (Phoca vitulina)356, 357
Harbor seals belong to the true seal family of Phocidae. They feed on crustaceans, shellfish, and finfish, and inhabit the coastal waters of the Northern Hemisphere, including the east and west coasts of the United States. On the west coast, harbor seals range includes Baja California in the south, British Columbia, the Gulf of Alaska, and the Bering Sea in the north. While most populations of the west coast of the United States have grown significantly since passage of the MMPA in 1972, the harbor seal population of the Gulf of Alaska has greatly decreased since the 1980s and continues to decline.
Threats to harbor seals include capture in fishing gear, boat strikes, power plant entrainment, human harassment, oil spills, and chemical pollution, as well as natural predation by, for example, Orca whales. While the harbor seal is not listed under ESA, it receives protection under MMPA and is an Alaska Species of Special Concern.
American peregrine falcon (Falco peregrinus anatum)358, 359
The American peregrine falcon is a medium-sized falcon (14” to 18” long) with a wingspan up to 46 inches. The species ranges from Mexico to Alaska, with some birds wintering as far south as Argentina. Approximately 300 pairs nest in Alaska. The diet of the peregrine falcon consists of other birds that it catches during flight.
As predators, American peregrine falcons are particularly susceptible to pesticides, such as DDT, which accumulate in the tissues of their prey. While the species has made a substantial recovery, since the U.S. government implemented restrictions on some of the most harmful pesticides in 1972, such chemicals continue to be used by some of the countries in which American peregrine falcons winter. Due to rebounding populations, the species was removed from the list of endangered and threatened species in August 1999; however, it remains an Alaska Species of Special Concern. No critical habitat has been designated in Cook Inlet for this species.
6.4.14 Educational, Scientific, Non-Consumptive Use of Cook Inlet Beluga Whale and its Habitat
Introduction
Stakeholders often seek to inform and/or influence the process of listing a species as endangered and during the subsequent designation of its critical habitat by developing and disseminating pertinent scientific information. Therefore, calculating the societal cost and benefit of designating habitat for the Cook Inlet beluga whale includes accounting for resources spent on, and benefits derived from, scientific investigations of Cook Inlet beluga whale populations and habitat, intended to inform the process. Examples of these types 356 United States Department of Commerce, NOAA Fisheries, Office of Protected Resources, “Harbor Seal (Phoca vitulina),”
http://www.nmfs.noaa.gov/pr/species/mammals/pinnipeds/harborseal.htm, accessed April 29, 2009. 357 Alaska Department of Fish and Game, Alaska Species of Special Concern, http://www.adfg.state.ak.us/special/esa/species_concern.php, accessed
April 29, 2009. 358 Alaska Department of Fish and Game, Alaska Species of Special Concern, “American Peregrine Falcon,”
http://www.adfg.state.ak.us/special/esa/falcon_peregine_ame/ame_peregrine.php, accessed April 27, 2009. 359 U.S. Fish and Wildlife Service, Endangered Species Program, Species Profile, “American Peregrine Falcon (Falco Peregrinus Anatum),
http://Ecos.Fws.Gov/Speciesprofile/Speciesreport.Do?Spcode=B01h, Accessed April 28, 2009.
FINAL RIR/4(B)(2)/FRFA OF CRITICAL HABITAT DESIGNATION OF COOK INLET BELUGA WHALE AUGUST 11, 2010
6-98 NATIONAL MARINE FISHERIES SERVICE
of efforts include scientific studies, monitoring Cook Inlet beluga whale populations and habitat, and training, equipping, and supporting volunteers. Additionally, the social cost of Cook Inlet beluga whale CHD includes efforts to educate the public and policy-makers about existing or emergent science and information relevant to the designation process. Educational efforts can include seminars for policy-makers or the general public, public displays or signs highlighting Cook Inlet beluga whale habitat, and other efforts aimed at distributing information about Cook Inlet beluga whale habitat needs. The individuals involved in these efforts (i.e., both educators and recipients) are presumed to derive net welfare gains from their participation in such activities, which is considered a benefit of the CHD.
In collecting information about relevant educational and scientific initiatives, efforts were made to distinguish between broader Cook Inlet beluga whale conservation efforts and efforts specifically targeting the Cook Inlet beluga whale CHD process. However, general and habitat specific efforts cannot always be precisely and unambiguously separated from one another. This section reports all recent scientific and educational efforts associated with Cook Inlet beluga whale conservation, with specific emphasis upon those targeting the Cook Inlet beluga whale CHD process, to the extent that these can be uniquely identified. Additionally, costs for litigation over the listing of the Cook Inlet beluga whale are also described.
Scientific Efforts
STATE AND LOCAL EFFORTS
The Kenai Peninsula Borough recently received $700,000 in Federal appropriations to conduct research related to Cook Inlet beluga whale. The research had yet to begin, as of April, 2009, when this analysis was initiated. The Mayor of the Borough has indicated that he is open to giving the funds to an appropriate research agency, and has talked to oil industry representatives who proposed installing monitoring devices on oil platforms.360
PRIVATE AND NON-PROFIT EFFORTS
A non-profit group, Friends of the Anchorage Coastal Wildlife Refuge (FAR), currently has shore-based volunteers monitoring the Cook Inlet coastline, as part of a research study to scrutinize Cook Inlet beluga whale populations. The volunteers are trained to record the location, direction of travel, habitat characteristics, and behaviors associated with each Cook Inlet beluga whale sighting. According to Executive Director, Barbara Carlson, FAR’s beluga monitoring project is a collaborative, apolitical effort that utilizes volunteer labor, grants, and borrowed equipment to conduct scientific research on a bare bones budget. Through 2009, the first year of monitoring, Ms. Carlson estimates that general volunteers will have dedicated over 4,700 hours of time to the study, and volunteer leaders have contributed an additional 2,900 hours.361 Additionally, Ms. Carlson estimates that, by the end of 2009, she will have volunteered over 2,200 hours to organize and facilitate FAR’s monitoring study. While most of the aforementioned volunteer hours were a part of the study effort, some time was also used in educational efforts. Besides volunteer hours, FAR has also used equipment and overhead resources during the first year of monitoring. Handouts for training volunteers were printed by the Alaska Center for the Environment, at an estimated cost of $150, and another $250 was spent on printing for data collection. NOAA outreach granted additional monitoring materials for dedicated use for the project, including three scopes and tripods, three waterproof binoculars, and four GPS
360 Klouda, Naomi, April 15, 2009, “Coal contract favors PacRim: Mayor Carey weighs opinions on Ladd Landing, addresses beluga whale issues,”
Homer Tribune. 361 Carlson, Barbara. 2009. Executive Director, Friends of the Coastal Anchorage Coastal Wildlife Refuge. Personal communication with ENTRIX
staff, June 17.

SECTION 6 CONTEXTUAL INFORMATION
NATIONAL MARINE FISHERIES SERVICE 6-99
radios. The equipment is worth approximately $3,800. A survey of monitoring site coordinates was also conducted by ADF&G at a total cost of $320.
The FAR monitoring study aims to collect three years of data to further understanding of Cook Inlet beluga whale populations. In 2010 and 2011, FAR conservatively expects volunteer hours and material costs to increase by 25 percent per year. Beyond 2011, FAR plans to adjust their monitoring intensity according to additional scientific data needs and the Cook Inlet beluga whale’s future protection status.
FAR volunteers have been giving their time to Cook Inlet beluga whale advocacy and conservation since 1996. In that year, the volunteers dedicated approximately 20 hours to Cook Inlet beluga whale conservation, and the volunteer effort has increased exponentially, until reaching current levels. Most of the past volunteer efforts involved communicating and collaborating with Federal, State, and academic biologists in the Cook Inlet area.
Although this analysis accounts for the volunteer hours dedicated to educational and scientific efforts intended to influence the Cook Inlet beluga whale CHD process, it does not consider such efforts as costs of the designation. The volunteers who give their time for Cook Inlet beluga whale-related efforts do so because the benefits or satisfaction derived from participation makes it the most valuable use of their time. Although some of volunteers may forego wages or leisure to take part in the efforts, they would not do so unless the benefits they receive from volunteering, at minimum, outweigh their opportunity costs. For this reason we do not count volunteer hours in the costs of species designation.
The Alaska Pacific University (APU) is involved with Cook Inlet beluga whale monitoring around the POA. The APU conducts acoustic monitoring efforts around the POA in order to test the sensitivity of Cook Inlet beluga whale to noise pollution, caused by the POA expansion project (see Section 3.4.4 for a description of the project). The APU is also contracted to conduct sight-based monitoring efforts around the POA. The interns at APU scan for Cook Inlet beluga whales, and then, when one or more is sighted, track their movement with surveying equipment connected to a laptop computer.362, 363
MILITARY
As treated extensively above, in anticipation of the listing of Cook Inlet beluga whale as endangered, authorities at the Fort Richardson military base developed a natural resource management plan for the Eagle River flats impact area artillery zone. The authorities believe that if the management plan, which provides some use restrictions, is proven to provide sufficient protection for the Cook Inlet beluga whale and benefit the species, the area cannot be designated as critical habitat. The management plan has been in the works for over three years, and the military has spent $400,000 to $500,000 on developing and implementing the plan.364
362 Demer, Lisa, February 7, 2009, “Group is photo-identifying Inlet belugas,” Alaska Daily News, http://www.adn.com/wildlife/v-
printer/story/683388.html. 363 Jason Burne at the Resource Development Council in Anchorage mentioned a Cook Inlet beluga whale study commissioned by Conoco and
Chevron and conducted by the National Fish and Wildlife Foundation. Unfortunately, attempts to contact representatives at the two companies were unsuccessful to date, and the study’s status is, therefore, uncertain. If further information is received, the study will be mentioned here.
364 Larsen, Gary. 2009. Fort Richardson Environmental Chief. Personal communication with ENTRIX staff on May 5.

FINAL RIR/4(B)(2)/FRFA OF CRITICAL HABITAT DESIGNATION OF COOK INLET BELUGA WHALE AUGUST 11, 2010
6-100 NATIONAL MARINE FISHERIES SERVICE
Educational Efforts
PRIVATE AND NON-PROFIT EFFORTS
In addition to their current monitoring efforts, FAR also participates in Cook Inlet beluga whale public education. The group developed educational outreach materials about the status of Cook Inlet beluga whale populations during the listing process, and informed the participants of marine stewardship opportunities. Materials for this effort cost FAR approximately $500.
The Alaska Office of the Defenders of Wildlife (DOW) has been very active in organizing Cook Inlet beluga whale education efforts for policy-makers and the public, and in assisting with Cook Inlet beluga whale research work. Since 2006, DOW volunteers have participated in a variety of Cook Inlet beluga whale-related activities. One such effort involved developing and displaying over 80 educational posters in Anchorage schools, churches, restaurants, and tourism offices. The DOW volunteers have also worked with Barbara Carlson, Executive Director of Friends of the Coastal Anchorage Wildlife Refuge and a marine scientist, to develop an Anchorage Coastal Beluga Survey outreach brochure highlighting the group’s current monitoring research effort. Additionally, DOW helped with planning and organizing the Cook Inlet beluga whale symposium, held in Anchorage on February 7, 2009. The nine-hour symposium was attended by over 100 members of the public, and brought together government officials, businesses, and scientists to discuss the current state of Cook Inlet beluga whale scientific studies, as well as their implications for Cook Inlet beluga whale habitat needs and recovery. Karla Dutton, the only paid employee at DOW, also spends additional resources managing volunteers, attending public hearings, writing grants, overseeing Cook Inlet beluga whale outreach, and participating in the ESA public comment process. Additionally, grant funds of $25,000 were raised by DOW, exclusively for work related to the Cook Inlet beluga whale, although not uniquely for CH.
A handful of volunteers have worked many hours to support the DOW Cook Inlet beluga whale advocacy efforts.365 The work included organizing the Cook Inlet beluga whale symposium, developing the Cook Inlet beluga whale monitoring brochure, organizing Cook Inlet beluga whale monitoring efforts, organizing monitoring volunteers, assisting with general administrative duties associated with Cook Inlet beluga whale advocacy, and advocating for Cook Inlet beluga whale conservation and habitat protection. These general Cook Inlet beluga whale advocacy efforts will be further analyzed in the subsequent sections.366
The North Gulf Oceanic Society is another non-profit group expending resources on Cook Inlet beluga whale education. In the past, volunteers for the group have reviewed studies, held conferences with other environmental groups, and developed suggestions for the pending Cook Inlet beluga whale CHD. Over the past two years, the group has cumulatively spent approximately 30 volunteer hours on actions related to Cook Inlet beluga whale designation, and Craig Matkin, the group’s Director, expects another 30 hours of volunteer time will be spent in the coming years to help direct the habitat designation process. 367
365 Lisa Chicos volunteered approximately 360 hours on beluga-related work in 2007. In over 588 volunteer hours, Bette Rutan helped to organize
the Cook Inlet beluga whale symposium, develop the Cook Inlet beluga whale monitoring brochure, and helped organize Cook Inlet beluga whale monitoring efforts. Jennete Hanneman, another DOW volunteer, has volunteered over 425 hours since 2006, assisting with the Cook Inlet beluga whale symposium, organizing monitoring volunteers, and assisting with general administrative duties associated with Cook Inlet beluga whale advocacy. Also, much of Karla Dutton’s roughly $50,000 salary is devoted to advocating for Cook Inlet beluga whale conservation and habitat protection.
366 Dutton, Karla. 2009. Alaska Program Director, Defenders of Wildlife – Alaska Office. Personal communication with ENTRIX staff on May 15. 367 Matkin, Craig. 2009. Director, North Gulf Oceanic Society. Personal communication with ENTRIX staff, May 20.
SECTION 6 CONTEXTUAL INFORMATION
NATIONAL MARINE FISHERIES SERVICE 6-101
Other non-profit organizations are also assumed to have spent time and money on scientific and/or educational work regarding Cook Inlet beluga whale. However, these efforts have not been documented in this section, as representatives from these groups have not yet responded to calls and e-mails from the research team. These non-profits include the Alaska Center for the Environment, Cook Inlet Keeper, and the Center for Biological Diversity.
However, as discussed previously, the volunteers who give their time for Cook Inlet beluga whale-related efforts, do so because the benefits or satisfaction derived from participation make it the most valuable use of their time. Although some volunteers may forego wages or leisure to take part in the efforts, they would not do so unless they the benefits received from volunteering, at minimum, outweigh their opportunity costs.
Litigation
STATE EFFORTS
Litigation is another typed of non-consumptive effort that can affect the designation process. On January 12, 2009, the State of Alaska gave a sixty day notice of its intent to sue NMFS over the Cook Inlet beluga whale listing, to get the listing rescinded. The State’s case against NMFS is based on four principle claims, alleging procedural violations of the ESA and the Administrative Procedure Act. First, the lawsuit claims that NMFS failed to properly consider existing State conservation efforts and, thus, did not identify the best available “scientific and commercial data” in identifying regulatory deficiencies that, if corrected, would benefit Cook Inlet beluga whale recovery efforts. Second, the lawsuit alleges that NMFS failed to provide Alaska agencies with adequate written justification for the portions of the NMFS final rule that were inconsistent with comments from Alaska agencies. The State’s third allegation is that NMFS failed to properly document or support its finding that Cook Inlet beluga whale represent a ‘distinct population segment,’ as required for ESA listing. Finally, the lawsuit alleges that NMFS failed to provide adequate public review for studies and documentation used to support the listing.368 In April 2009, the Alaska State legislature approved spending $1.25 million on litigation to fight both the Cook Inlet beluga whale listing and the recent polar bear listing as ‘threatened’ under the ESA.369
6.5 SUMMARY AND FUTURE ACTIONS TO PROTECT COOK INLET BELUGA WHALE HABITAT
Table 6-28 presents a summary of the activities discussed in Section 6.4, including the status, location within the Cook Inlet beluga whale’s proposed CHD, aspects that can potentially adversely affect Cook Inlet beluga whale habitat, and potential Section 7 consultations.
368 Colberg, Talis J.2009. Memo from Alaska Attorney General “Sixty Day Notice of Intent to Sue for Violations of the Endangered Species Act;
improperly determining endangered status for a Distinct Population Segment of the beluga whale (Delphinapterus leucas) found in Cook Inlet, Alaska”, January 12. http://www.fakr.noaa.gov/protectedresources/whales/beluga/ci_state_suit/60day_intenttosue011209.pdf, accessed May 5, 2009.
369 Stefan Milkowski, April 30, 2009, “The Politics of Species Protection in Alaska”, The New York Times, Green Inc.: Energy the Environment and the Bottom Line, http://greeninc.blogs.nytimes.com/2009/04/30/the-politics-of-species-protection-in-alaska/?pagemode=print, accessed May 15, 2009.

FINAL RIR/4(B)(2)/FRFA OF CRITICAL HABITAT DESIGNATION OF COOK INLET BELUGA WHALE AUGUST 11, 2010
NATIONAL MARINE FISHERIES SERVICE 6-102
Table 6-28 Economic Activities within Proposed Cook Inlet beluga whale Critical Habitat and Vicinity
Economic & Social Activity Status Proposed Cook Inlet beluga whale CH Area
Associated Actions that may Affect Cook Inlet beluga whale CH
Areas
Future Section 7 Consultations and Potential Project Modifications
Oil and Gas Development
Oil
General Currently 13 oil platforms operating, with the majority owned by Chevron. Declining oil reserves. Kitchen Unit approved in 2007; lease between Escopeta and State in
negotiations.
Inland of and within Area 2 CH, some leases possible in Area 1
CH
Noise from seismic surveying.
Wastewater, oil spills, and other discharges during development,
construction, and commercial production.
5 formal consultations over 10-year period for seismic surveying
5 – 7 informal consultations over 10-
year period for projects such as jack-up drilling rig installation
Based on previous NMFS experience
and oil development
Project Modifications: Seasonal restrictions on seismic surveying
anticipated
Action Agency: USACE
Costs considered co-extensive Drift River Facility Chevron is considering the removal of some storage
tanks. Area 2 CH NMFS would have to consider the
likelihood that project would affect Cook Inlet beluga whales, such as oil
spill or noise from decommission
None anticipated
Action Agency: FERC (and USDOT, USACE, and EPA)
Natural Gas Two wells and gas storage planned at Nicolai Creek. EIS underway for Beluga-to-Fairbanks Natural Gas Pipeline.
Inland of Area 1 CH, Inland of and within Area 2 CH
Noise from seismic surveying.
Wastewater and other discharges during development, construction,
and commercial production.
Consultations on natural gas projects/activities are included in those
listed above for oil
Based on previous NMFS experience and natural gas development
Project Modifications: Seasonal restrictions on seismic surveying
anticipated
Action Agency: USACE
Costs considered co-extensive
Mining
Chuitna Coal Project Supplemental EIS currently being developed and NPDES permits have been applied for. Estimated 3 years until
production begins.
Inland of Area 2 CH.
Marine terminal planned to be
Water quality, construction of marine terminal within inlet, dredging, pile
driving, fill and riprap.
1 formal consultation within the next 3 years
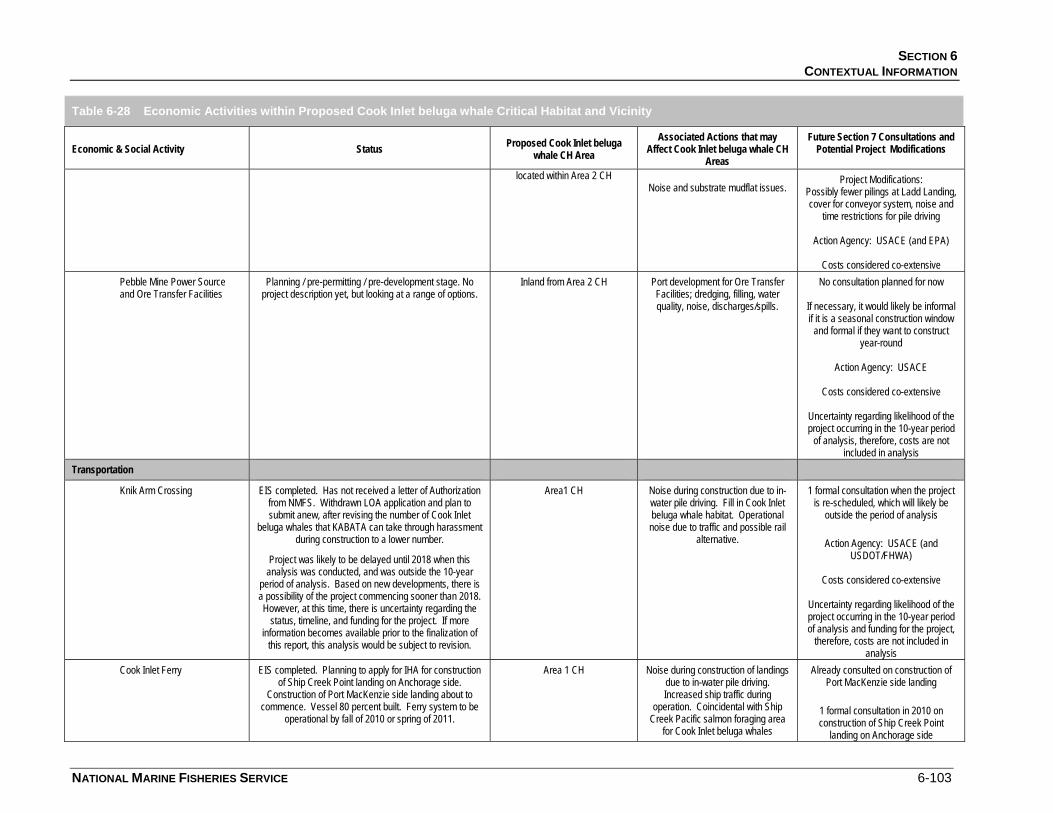
SECTION 6 CONTEXTUAL INFORMATION
NATIONAL MARINE FISHERIES SERVICE 6-103
Table 6-28 Economic Activities within Proposed Cook Inlet beluga whale Critical Habitat and Vicinity
Economic & Social Activity Status Proposed Cook Inlet beluga whale CH Area
Associated Actions that may Affect Cook Inlet beluga whale CH
Areas
Future Section 7 Consultations and Potential Project Modifications
located within Area 2 CH Noise and substrate mudflat issues.
Project Modifications: Possibly fewer pilings at Ladd Landing, cover for conveyor system, noise and
time restrictions for pile driving
Action Agency: USACE (and EPA)
Costs considered co-extensive Pebble Mine Power Source and Ore Transfer Facilities
Planning / pre-permitting / pre-development stage. No project description yet, but looking at a range of options.
Inland from Area 2 CH Port development for Ore Transfer Facilities; dredging, filling, water quality, noise, discharges/spills.
No consultation planned for now
If necessary, it would likely be informal if it is a seasonal construction window
and formal if they want to construct year-round
Action Agency: USACE
Costs considered co-extensive
Uncertainty regarding likelihood of the project occurring in the 10-year period
of analysis, therefore, costs are not included in analysis
Transportation
Knik Arm Crossing EIS completed. Has not received a letter of Authorization from NMFS. Withdrawn LOA application and plan to submit anew, after revising the number of Cook Inlet
beluga whales that KABATA can take through harassment during construction to a lower number.
Project was likely to be delayed until 2018 when this analysis was conducted, and was outside the 10-year
period of analysis. Based on new developments, there is a possibility of the project commencing sooner than 2018. However, at this time, there is uncertainty regarding the
status, timeline, and funding for the project. If more information becomes available prior to the finalization of
this report, this analysis would be subject to revision.
Area1 CH Noise during construction due to in-water pile driving. Fill in Cook Inlet beluga whale habitat. Operational noise due to traffic and possible rail
alternative.
1 formal consultation when the project is re-scheduled, which will likely be
outside the period of analysis
Action Agency: USACE (and USDOT/FHWA)
Costs considered co-extensive
Uncertainty regarding likelihood of the project occurring in the 10-year period of analysis and funding for the project,
therefore, costs are not included in analysis
Cook Inlet Ferry EIS completed. Planning to apply for IHA for construction of Ship Creek Point landing on Anchorage side.
Construction of Port MacKenzie side landing about to commence. Vessel 80 percent built. Ferry system to be
operational by fall of 2010 or spring of 2011.
Area 1 CH Noise during construction of landings due to in-water pile driving. Increased ship traffic during
operation. Coincidental with Ship Creek Pacific salmon foraging area
for Cook Inlet beluga whales
Already consulted on construction of Port MacKenzie side landing
1 formal consultation in 2010 on construction of Ship Creek Point
landing on Anchorage side
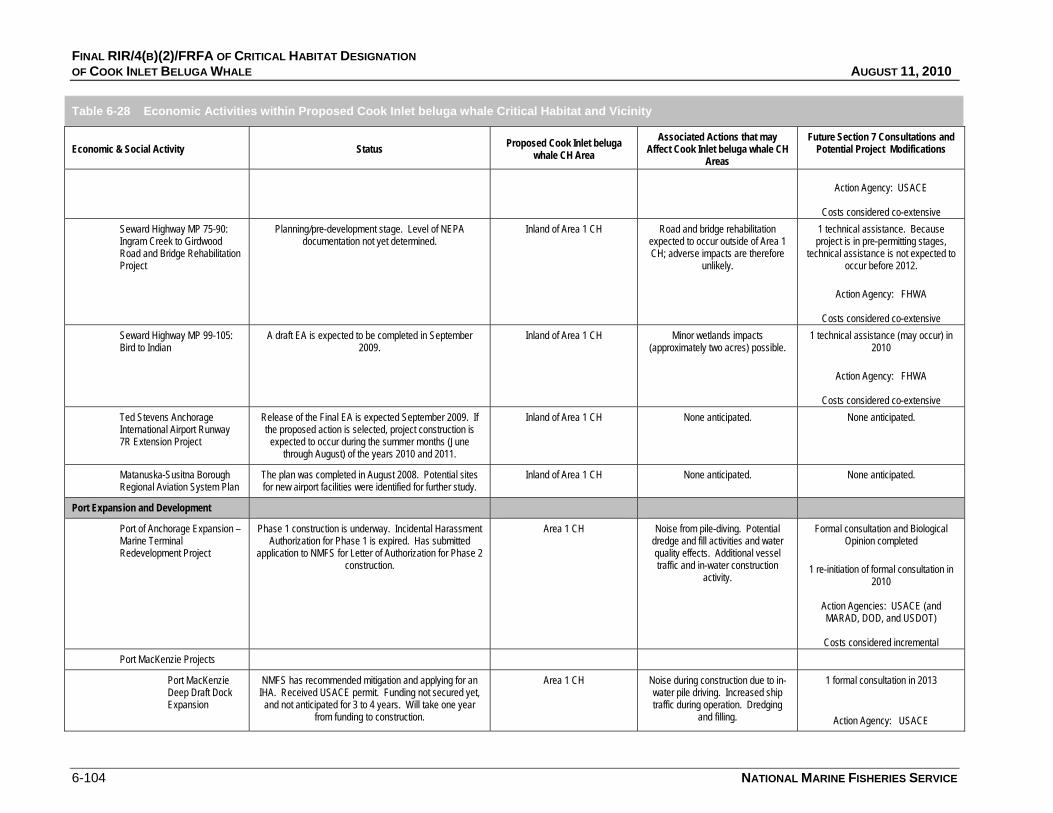
FINAL RIR/4(B)(2)/FRFA OF CRITICAL HABITAT DESIGNATION OF COOK INLET BELUGA WHALE AUGUST 11, 2010
6-104 NATIONAL MARINE FISHERIES SERVICE
Table 6-28 Economic Activities within Proposed Cook Inlet beluga whale Critical Habitat and Vicinity
Economic & Social Activity Status Proposed Cook Inlet beluga whale CH Area
Associated Actions that may Affect Cook Inlet beluga whale CH
Areas
Future Section 7 Consultations and Potential Project Modifications
Action Agency: USACE
Costs considered co-extensive
Seward Highway MP 75-90: Ingram Creek to Girdwood Road and Bridge Rehabilitation Project
Planning/pre-development stage. Level of NEPA documentation not yet determined.
Inland of Area 1 CH Road and bridge rehabilitation expected to occur outside of Area 1 CH; adverse impacts are therefore
unlikely.
1 technical assistance. Because project is in pre-permitting stages,
technical assistance is not expected to occur before 2012.
Action Agency: FHWA
Costs considered co-extensive
Seward Highway MP 99-105: Bird to Indian
A draft EA is expected to be completed in September 2009.
Inland of Area 1 CH Minor wetlands impacts (approximately two acres) possible.
1 technical assistance (may occur) in 2010
Action Agency: FHWA
Costs considered co-extensive
Ted Stevens Anchorage International Airport Runway 7R Extension Project
Release of the Final EA is expected September 2009. If the proposed action is selected, project construction is
expected to occur during the summer months (June through August) of the years 2010 and 2011.
Inland of Area 1 CH None anticipated. None anticipated.
Matanuska-Susitna Borough Regional Aviation System Plan
The plan was completed in August 2008. Potential sites for new airport facilities were identified for further study.
Inland of Area 1 CH None anticipated. None anticipated.
Port Expansion and Development
Port of Anchorage Expansion – Marine Terminal Redevelopment Project
Phase 1 construction is underway. Incidental Harassment Authorization for Phase 1 is expired. Has submitted
application to NMFS for Letter of Authorization for Phase 2 construction.
Area 1 CH Noise from pile-diving. Potential dredge and fill activities and water quality effects. Additional vessel traffic and in-water construction
activity.
Formal consultation and Biological Opinion completed
1 re-initiation of formal consultation in
2010
Action Agencies: USACE (and MARAD, DOD, and USDOT)
Costs considered incremental
Port MacKenzie Projects
Port MacKenzie Deep Draft Dock Expansion
NMFS has recommended mitigation and applying for an IHA. Received USACE permit. Funding not secured yet, and not anticipated for 3 to 4 years. Will take one year
from funding to construction.
Area 1 CH Noise during construction due to in-water pile driving. Increased ship traffic during operation. Dredging
and filling.
1 formal consultation in 2013
Action Agency: USACE
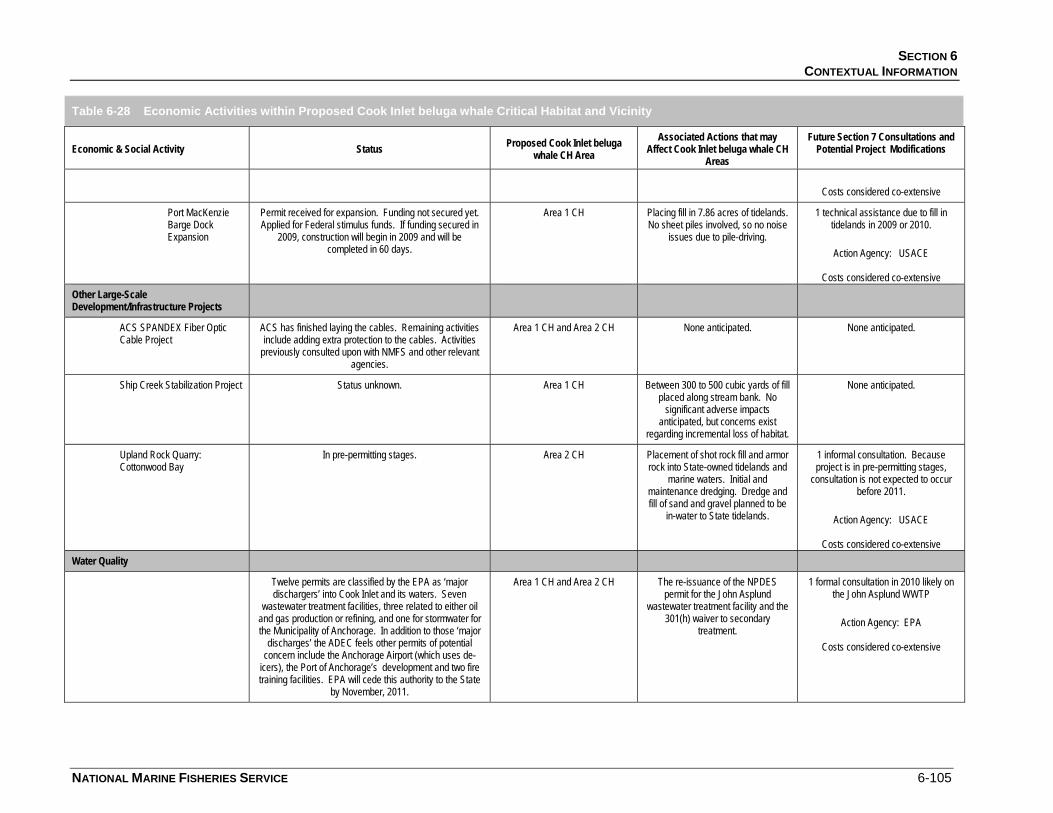
SECTION 6 CONTEXTUAL INFORMATION
NATIONAL MARINE FISHERIES SERVICE 6-105
Table 6-28 Economic Activities within Proposed Cook Inlet beluga whale Critical Habitat and Vicinity
Economic & Social Activity Status Proposed Cook Inlet beluga whale CH Area
Associated Actions that may Affect Cook Inlet beluga whale CH
Areas
Future Section 7 Consultations and Potential Project Modifications
Costs considered co-extensive
Port MacKenzie Barge Dock Expansion
Permit received for expansion. Funding not secured yet. Applied for Federal stimulus funds. If funding secured in
2009, construction will begin in 2009 and will be completed in 60 days.
Area 1 CH Placing fill in 7.86 acres of tidelands. No sheet piles involved, so no noise
issues due to pile-driving.
1 technical assistance due to fill in tidelands in 2009 or 2010.
Action Agency: USACE
Costs considered co-extensive
Other Large-Scale Development/Infrastructure Projects
ACS SPANDEX Fiber Optic Cable Project
ACS has finished laying the cables. Remaining activities include adding extra protection to the cables. Activities
previously consulted upon with NMFS and other relevant agencies.
Area 1 CH and Area 2 CH None anticipated. None anticipated.
Ship Creek Stabilization Project Status unknown. Area 1 CH Between 300 to 500 cubic yards of fill placed along stream bank. No
significant adverse impacts anticipated, but concerns exist
regarding incremental loss of habitat.
None anticipated.
Upland Rock Quarry: Cottonwood Bay
In pre-permitting stages. Area 2 CH Placement of shot rock fill and armor rock into State-owned tidelands and
marine waters. Initial and maintenance dredging. Dredge and fill of sand and gravel planned to be
in-water to State tidelands.
1 informal consultation. Because project is in pre-permitting stages,
consultation is not expected to occur before 2011.
Action Agency: USACE
Costs considered co-extensive
Water Quality
Twelve permits are classified by the EPA as ‘major dischargers’ into Cook Inlet and its waters. Seven
wastewater treatment facilities, three related to either oil and gas production or refining, and one for stormwater for the Municipality of Anchorage. In addition to those ‘major
discharges’ the ADEC feels other permits of potential concern include the Anchorage Airport (which uses de-
icers), the Port of Anchorage’s development and two fire training facilities. EPA will cede this authority to the State
by November, 2011.
Area 1 CH and Area 2 CH The re-issuance of the NPDES permit for the John Asplund
wastewater treatment facility and the 301(h) waiver to secondary
treatment.
1 formal consultation in 2010 likely on the John Asplund WWTP
Action Agency: EPA
Costs considered co-extensive
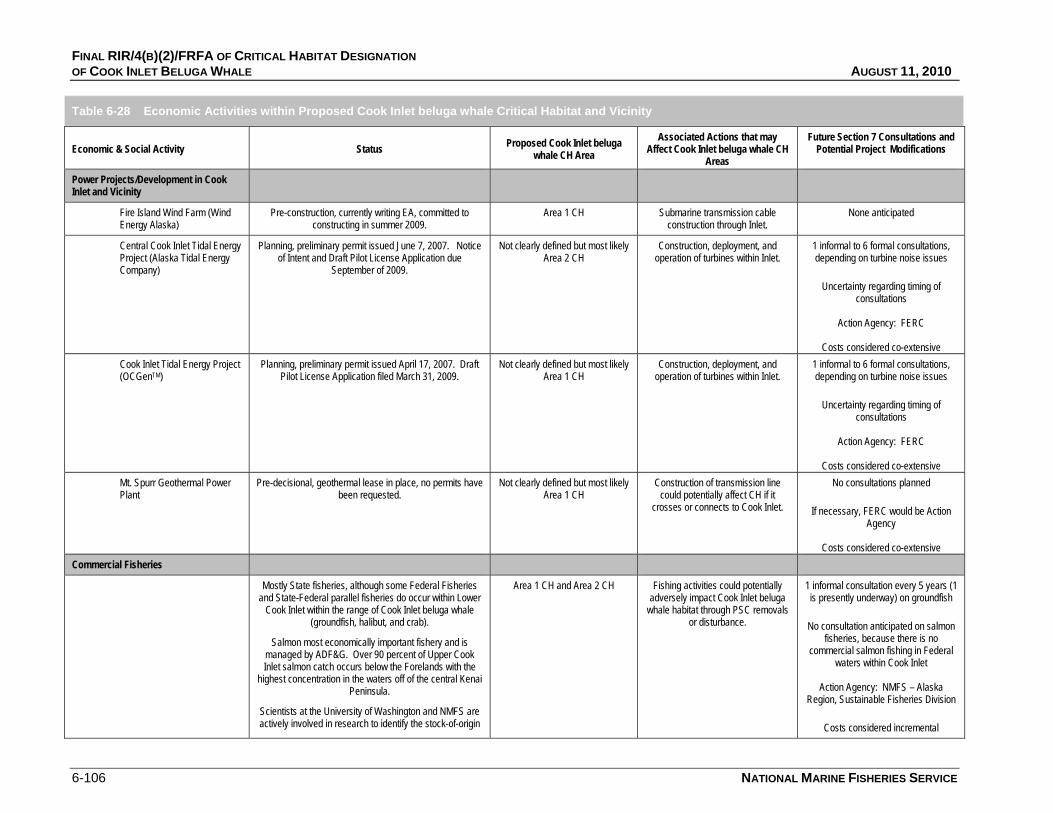
FINAL RIR/4(B)(2)/FRFA OF CRITICAL HABITAT DESIGNATION OF COOK INLET BELUGA WHALE AUGUST 11, 2010
6-106 NATIONAL MARINE FISHERIES SERVICE
Table 6-28 Economic Activities within Proposed Cook Inlet beluga whale Critical Habitat and Vicinity
Economic & Social Activity Status Proposed Cook Inlet beluga whale CH Area
Associated Actions that may Affect Cook Inlet beluga whale CH
Areas
Future Section 7 Consultations and Potential Project Modifications
Power Projects/Development in Cook Inlet and Vicinity
Fire Island Wind Farm (Wind Energy Alaska)
Pre-construction, currently writing EA, committed to constructing in summer 2009.
Area 1 CH Submarine transmission cable construction through Inlet.
None anticipated
Central Cook Inlet Tidal Energy Project (Alaska Tidal Energy Company)
Planning, preliminary permit issued June 7, 2007. Notice of Intent and Draft Pilot License Application due
September of 2009.
Not clearly defined but most likely Area 2 CH
Construction, deployment, and operation of turbines within Inlet.
1 informal to 6 formal consultations, depending on turbine noise issues
Uncertainty regarding timing of
consultations
Action Agency: FERC
Costs considered co-extensive Cook Inlet Tidal Energy Project (OCGenTM)
Planning, preliminary permit issued April 17, 2007. Draft Pilot License Application filed March 31, 2009.
Not clearly defined but most likely Area 1 CH
Construction, deployment, and operation of turbines within Inlet.
1 informal to 6 formal consultations, depending on turbine noise issues
Uncertainty regarding timing of
consultations
Action Agency: FERC
Costs considered co-extensive Mt. Spurr Geothermal Power Plant
Pre-decisional, geothermal lease in place, no permits have been requested.
Not clearly defined but most likely Area 1 CH
Construction of transmission line could potentially affect CH if it
crosses or connects to Cook Inlet.
No consultations planned
If necessary, FERC would be Action Agency
Costs considered co-extensive
Commercial Fisheries
Mostly State fisheries, although some Federal Fisheries and State-Federal parallel fisheries do occur within Lower
Cook Inlet within the range of Cook Inlet beluga whale (groundfish, halibut, and crab).
Salmon most economically important fishery and is managed by ADF&G. Over 90 percent of Upper Cook Inlet salmon catch occurs below the Forelands with the
highest concentration in the waters off of the central Kenai Peninsula.
Scientists at the University of Washington and NMFS are actively involved in research to identify the stock-of-origin
Area 1 CH and Area 2 CH Fishing activities could potentially adversely impact Cook Inlet beluga
whale habitat through PSC removals or disturbance.
1 informal consultation every 5 years (1 is presently underway) on groundfish
No consultation anticipated on salmon
fisheries, because there is no commercial salmon fishing in Federal
waters within Cook Inlet
Action Agency: NMFS – Alaska Region, Sustainable Fisheries Division
Costs considered incremental
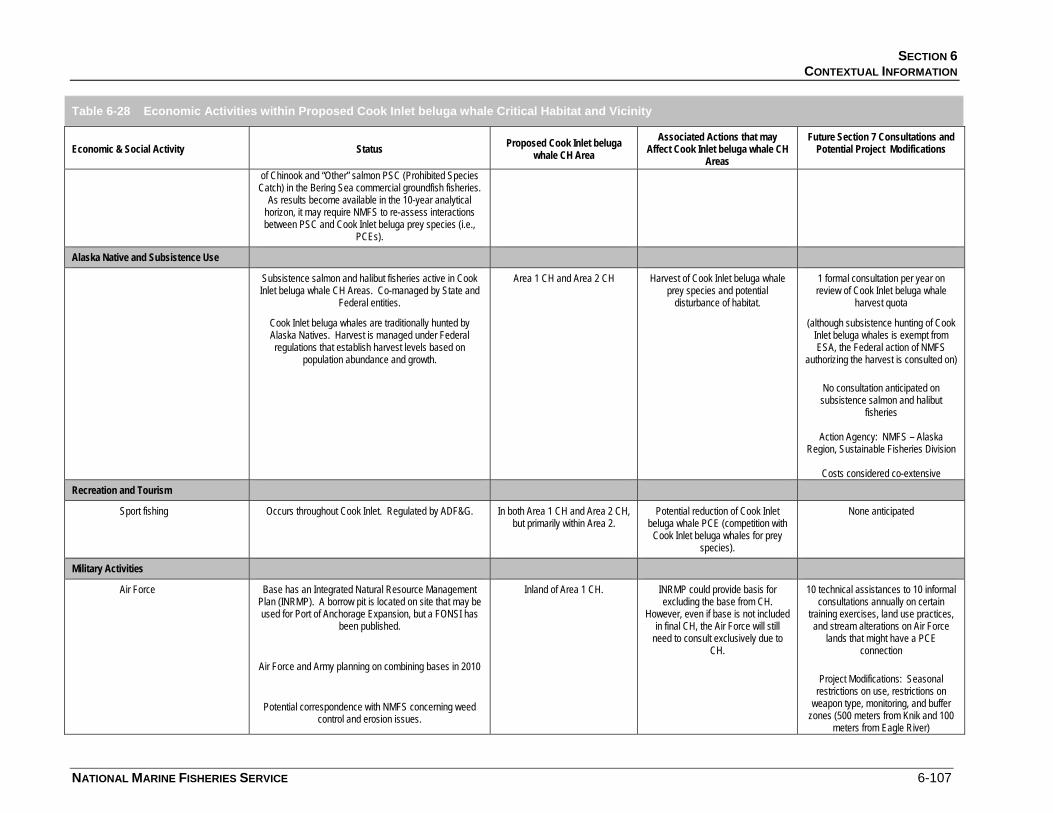
SECTION 6 CONTEXTUAL INFORMATION
NATIONAL MARINE FISHERIES SERVICE 6-107
Table 6-28 Economic Activities within Proposed Cook Inlet beluga whale Critical Habitat and Vicinity
Economic & Social Activity Status Proposed Cook Inlet beluga whale CH Area
Associated Actions that may Affect Cook Inlet beluga whale CH
Areas
Future Section 7 Consultations and Potential Project Modifications
of Chinook and “Other” salmon PSC (Prohibited Species Catch) in the Bering Sea commercial groundfish fisheries.
As results become available in the 10-year analytical horizon, it may require NMFS to re-assess interactions between PSC and Cook Inlet beluga prey species (i.e.,
PCEs).
Alaska Native and Subsistence Use
Subsistence salmon and halibut fisheries active in Cook Inlet beluga whale CH Areas. Co-managed by State and
Federal entities.
Cook Inlet beluga whales are traditionally hunted by Alaska Natives. Harvest is managed under Federal regulations that establish harvest levels based on
population abundance and growth.
Area 1 CH and Area 2 CH Harvest of Cook Inlet beluga whale prey species and potential
disturbance of habitat.
1 formal consultation per year on review of Cook Inlet beluga whale
harvest quota
(although subsistence hunting of Cook Inlet beluga whales is exempt from ESA, the Federal action of NMFS
authorizing the harvest is consulted on)
No consultation anticipated on subsistence salmon and halibut
fisheries
Action Agency: NMFS – Alaska Region, Sustainable Fisheries Division
Costs considered co-extensive
Recreation and Tourism
Sport fishing Occurs throughout Cook Inlet. Regulated by ADF&G. In both Area 1 CH and Area 2 CH, but primarily within Area 2.
Potential reduction of Cook Inlet beluga whale PCE (competition with
Cook Inlet beluga whales for prey species).
None anticipated
Military Activities
Air Force Base has an Integrated Natural Resource Management Plan (INRMP). A borrow pit is located on site that may be used for Port of Anchorage Expansion, but a FONSI has
been published.
Air Force and Army planning on combining bases in 2010
Potential correspondence with NMFS concerning weed control and erosion issues.
Inland of Area 1 CH. INRMP could provide basis for excluding the base from CH.
However, even if base is not included in final CH, the Air Force will still
need to consult exclusively due to CH.
10 technical assistances to 10 informal consultations annually on certain
training exercises, land use practices, and stream alterations on Air Force
lands that might have a PCE connection
Project Modifications: Seasonal
restrictions on use, restrictions on weapon type, monitoring, and buffer
zones (500 meters from Knik and 100 meters from Eagle River)
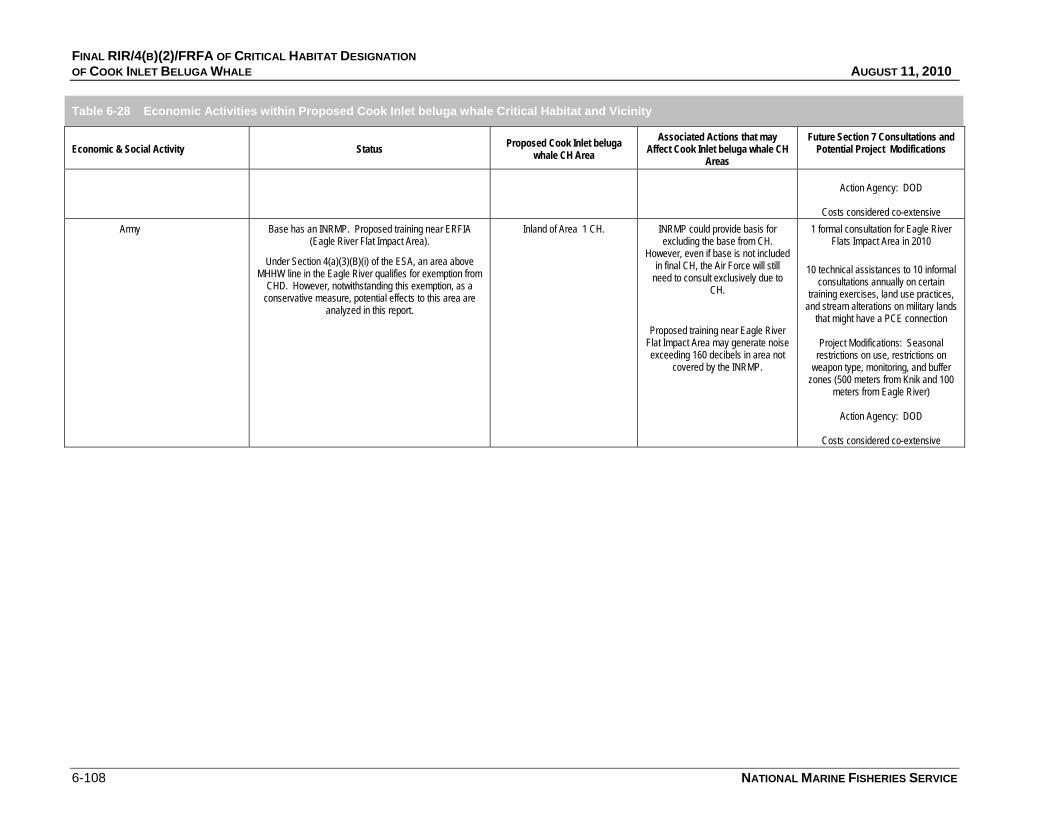
FINAL RIR/4(B)(2)/FRFA OF CRITICAL HABITAT DESIGNATION OF COOK INLET BELUGA WHALE AUGUST 11, 2010
6-108 NATIONAL MARINE FISHERIES SERVICE
Table 6-28 Economic Activities within Proposed Cook Inlet beluga whale Critical Habitat and Vicinity
Economic & Social Activity Status Proposed Cook Inlet beluga whale CH Area
Associated Actions that may Affect Cook Inlet beluga whale CH
Areas
Future Section 7 Consultations and Potential Project Modifications
Action Agency: DOD
Costs considered co-extensive
Army Base has an INRMP. Proposed training near ERFIA (Eagle River Flat Impact Area).
Under Section 4(a)(3)(B)(i) of the ESA, an area above MHHW line in the Eagle River qualifies for exemption from
CHD. However, notwithstanding this exemption, as a conservative measure, potential effects to this area are
analyzed in this report.
Inland of Area 1 CH. INRMP could provide basis for excluding the base from CH.
However, even if base is not included in final CH, the Air Force will still
need to consult exclusively due to CH.
Proposed training near Eagle River Flat Impact Area may generate noise exceeding 160 decibels in area not
covered by the INRMP.
1 formal consultation for Eagle River Flats Impact Area in 2010
10 technical assistances to 10 informal
consultations annually on certain training exercises, land use practices,
and stream alterations on military lands that might have a PCE connection
Project Modifications: Seasonal
restrictions on use, restrictions on weapon type, monitoring, and buffer
zones (500 meters from Knik and 100 meters from Eagle River)
Action Agency: DOD
Costs considered co-extensive
NATIONAL MARINE FISHERIES SERVICE 7-1
S E C T I O N 7 Costs and Benefits of Cook Inlet Beluga Whale Critical Habitat Designation
This section provides a discussion of the costs and benefits of the Cook Inlet beluga whale CHD to the various sectors and projects outlined in Section 6.4. In essence, the costs of the CHD are related to the likely Section 7 consultations, over the ten-year period of analysis. The last column of Table 6-28 summarizes these consultations for each sector and project, while details are presented in this section.
In addition to the costs, substantial benefits to recreation, subsistence use, education, and other sectors are anticipated from the Cook Inlet beluga whale CHD. See Section 5 for a discussion on the types of benefits than can be expected from, and a range of possible values associated with, the CHD. Though these estimates provide insight into the potential “types” and associated “values” of the benefits generated from the CHD, they are specific to the activity, location, and point-in-time. Thus, it is inappropriate to broadly apply these values to the proposed CHD action. Therefore, only a brief discussion of the types of benefits expected from Cook Inlet beluga whale CHD to specific sectors is provided below, and no values are applied to these benefits.
7.1 OIL AND GAS DEVELOPMENT
The oil and gas industry has been active in the Cook Inlet since the 1960s. Many of the fields in production are in decline and, without new exploration, the existing Cook Inlet oil and gas production is expected to drop sharply over the next 20 years. There are 13 oil platforms and eight oil and/or natural gas companies operating in Cook Inlet. Section 6.4.1 describes oil and gas activities in more detail.
7.1.1 Potential Costs to this Sector
The potential costs to oil and gas development associated with the Cook Inlet beluga whale CHD comprise the anticipated administrative costs of Section 7 consultations. Based on the frequency of similar consultations in the past, five formal consultations for seismic surveying are expected to occur over the ten-year period of analysis. In addition, during this period, five to seven informal consultations for projects such as jack-up drilling rig installation are anticipated. Some restrictions on seismic surveying will likely be imposed, due to noise issues, but the scheduling details and any project modification costs these entail, cannot be projected, a priori. NMFS will review each, on a case-by-case basis, but anticipates minor cost impacts, based upon similar past actions.

FINAL RIR/4(B)(2)/FRFA OF CRITICAL HABITAT DESIGNATION OF COOK INLET BELUGA WHALE AUGUST 11, 2010
7-2 NATIONAL MARINE FISHERIES SERVICE
The cost of each formal consultation to address adverse modification to the CH is $4,900 (in 2009 dollars), of which $2,700 will accrue to the EPA, as Federal Action Agency; NMFS will bear $1,300, and the remaining $900 will be borne by any third parties involved (see Table 4-1). Each informal consultation is anticipated to cost $2,350 (in 2009 dollars), with EPA’s share $1,750, and the remaining $600 borne by NMFS. Two formal and two to three informal consultations are anticipated in Area 2 CH, and the remaining three formal and three to four informal consultations may occur in Area 1 CH and Area 2 CH, as required.
7.1.2 Potential Benefits to this Sector
There are several on-going oil and gas facilities development projects in the Area 1 CH and Area 2 CH. As described in Section 5, it would be costly and difficult to estimate the value of the CHD benefits that could accrue exclusive of species listing benefits. Further, segmenting and distributing these benefits among different economic sectors, in a robust way, is infeasible given the level of information presently available. However, these benefits may still exist. For example, the oil and gas industry depends upon labor to operate facilities and construct new ones. Employees of the industry may be willing to work in the area, in part, because of the natural beauty, environmental quality, and outdoor recreational opportunities available. Such a benefit might be described as indirect use value, and indirect passive use value, in that the employees may possess passive use value for the CH, and/or active value for those who enjoy recreational fishing, wildlife viewing, boating/kayaking, etc. The value then of CHD to the industry is expressed in terms of its ability to attract and retain employees, and hence could be described as indirect. The magnitude of this incremental benefit accruing to the industry as a result of CHD for the Cook Inlet beluga whale is likely to be relatively small.
7.2 MINING
Two mining projects, the Chuitna Coal Project and the Pebble Mine Power Source and Ore Transfer Facilities, are considered relevant to this analysis. The Pebble Mine project elements are located in the nearshore and adjacent uplands region of Area 2 CH. The Chuitna Coal Project will be a causeway structure extending into Area 2 CH, at Ladd Landing, with additional modifications of adjacent uplands. The Pebble Mine project is in the planning/pre-permitting/pre-development stage, and does not have an approved project description. At this time, there is uncertainty regarding the likelihood of this project occurring within the ten-year period of analysis.370 Therefore, any CHD costs associated with the Pebble project are not quantified in this analysis.
7.2.1 Potential Costs to this Sector
The Chuitna Coal Project is likely to trigger a formal Section 7 consultation, within the next three years, due to anticipated dredging and spoils disposal, pile driving, filling, and riprap installation during construction. The cost of this formal consultation to address adverse modification to the Cook Inlet beluga whale CH is $4,900 (in 2009 dollars), of which $2,700 will accrue to the USACE, as the Federal action agency; NMFS will bear $1,300 as the consulting agency, and the remaining $900 will be borne by the third parties involved (see Table 4-1). Given the location of the project, these costs will accrue in association with Area 2 CH.
370 If the Pebble Mine project does occur during the next ten years, the Section 7 consultation would likely be an informal one, if there is a seasonal
construction window, and a formal one, if the construction would be year round. The USACE would be the Federal Action Agency involved.
SECTION 7 COST AND BENEFITS OF COOK INLET BELUGA WHALE CRITICAL HABITAT DESIGNATION
NATIONAL MARINE FISHERIES SERVICE 7-3
7.2.2 Potential Benefits to this Sector
In the same way that the oil and gas industry may benefit indirectly through employee attraction and retention, the mining industry may also gain similar benefits.
7.3 TRANSPORTATION
Six transportation projects within and in the vicinity of the proposed Cook Inlet beluga whale CH are analyzed. These include the Knik Arm Crossing, Cook Inlet Ferry, two improvement projects on Seward Highway, Ted Stevens Anchorage International Airport Runway 7R Extension Project, and Matanuska-Susitna Borough Regional Aviation System Plan. The details of each project are presented in Section 6.4.3. Two transportation projects, the Airport Runway 7R Extension Project and Regional Aviation System Plan, are not anticipated to have any potential to affect the CHD. When this analysis was conducted, the Knik Arm Crossing project was likely delayed until at least 2018 and, therefore, not analyzed in detail in this section of the report. While some new developments suggest that the project may occur sooner, there is uncertainty regarding the status, timeline, and funding for the project. As more information becomes available on the Knik Arm Crossing project, this analysis may be subject to revision prior to finalization of the report.
7.3.1 Potential Costs to the Sector
The incremental costs of the Cook Inlet beluga whale CHD on transportation activities stem from the Section 7 consultations anticipated to occur on the Cook Inlet Ferry project and the two Seward Highway improvement projects. A consultation on the construction of the Ferry landing on the Port MacKenzie side has already occurred and, therefore, is not considered further in this analysis. One formal consultation with USACE is anticipated to occur in 2010, on the construction the Ship Creek Point landing on the Anchorage side for the Ferry project.
A technical assistance consultation is likely to occur with FHWA on the Seward Highway MP 75-90: Ingram Creek to Girdwood Road and Bridge Rehabilitation Project. This project is in the planning/pre-permitting/pre-development stage, therefore, the technical assistance consultation is not anticipated before 2012. Another technical assistance level consultation on the Seward Highway MP 99-105: Bird to Indian is expected to occur with FHWA in 2010, due to minor wetlands impacts anticipated from the project.
The cost of the formal consultation on Cook Inlet Ferry to address adverse modification to the CH is $4,900 (in 2009 dollars), of which $2,700 will accrue to the USACE, as the Federal action agency; as the consulting agency, NMFS will bear $1,300, and the remaining $900 will be borne by the third parties involved (see Table 4-1). Each of the two technical assistance consultations is anticipated to cost $400 (in 2009 dollars), with FHWA’s share of $250, and the remaining $150 will be borne by NMFS. All the three consultations are anticipated in association with Area 1 CH.
7.3.2 Potential Benefits to the Sector
There may be indirect use benefits that accrue to passengers on the Cook Inlet Ferry from CHD and preservation (e.g., experiencing a more pristine environment than otherwise). Also, should CHD result in an incremental increase in the actual whale population, this could increase the probability that passengers enjoy
FINAL RIR/4(B)(2)/FRFA OF CRITICAL HABITAT DESIGNATION OF COOK INLET BELUGA WHALE AUGUST 11, 2010
7-4 NATIONAL MARINE FISHERIES SERVICE
benefits of viewing Cook Inlet beluga whales more frequently. In turn, this may result in higher ridership, including the possibility that tourists and other non-resident visitors to Anchorage may frequent the Cook Inlet Ferry service. As a source of non-consumptive use benefits, these changes would reflect a generalized welfare improvement over the status quo, but likely not constitute a large and uniquely attributable benefit of CHD.
7.4 PORT EXPANSION AND DEVELOPMENT
Due to ongoing and planned expansions, and their proximity to the Cook Inlet beluga whale CH, the POA and Port MacKenzie are analyzed in this report. The Phase 1 construction is already underway at the POA Marine Terminal Redevelopment Project, while Port MacKenzie has two projects planned within the ten-year analysis period: Deep Draft Dock Expansion and Barge Dock Expansion.
7.4.1 Potential Costs to the Sector
A formal consultation on the POA Expansion project has been completed, with a Biological Opinion finalized in July, 2009. Because of the noise from pile driving, and potential dredge, spoils disposal, and fill activities, a re-initiation of that consultation is anticipated in 2010. A formal consultation is also likely on the Port MacKenzie Deep Draft Dock Expansion project in 2013, due to in water pile driving, dredging, spoils disposal, and filling. Construction of the Port MacKenzie Barge Dock Expansion project will involve placing fill in 7.86 acres to tidelands and, therefore, is likely to require a technical assistance consultation in 2009 or 2010.
The cost of re-initiation of formal consultation on the POA Expansion project, to address adverse modification to the CH following designation, is $9,800 (in 2009 dollars), of which $5,400 will accrue to the USACE, as Federal Action Agency; $2,650 will be incurred by NMFS, and the remaining $1,750 will be borne by the third parties involved (see Table 4-1). The formal consultation on Port MacKenzie Deep Draft Dock Expansion project, to address adverse modification to the CH, is expected to cost $4,900 (in 2009 dollars), of which $2,700 will accrue to the USACE, as Federal Action Agency; NMFS will bear $1,300; and the remaining $900 will be borne by the third parties involved. Finally, the technical assistance consultation on the Port MacKenzie Barge Dock Expansion project is anticipated to cost $400 (in 2009 dollars), with USACE’s share at $250, and the remaining $150 borne by NMFS. All three consultations are anticipated in Area 1 CH.
7.4.2 Potential Benefits to the Sector
In the same way that the oil and gas industry may benefit indirectly, through employee attraction and retention, the POA may also gain benefits from the designation of CH. Further, because the POA Marine Terminal Redevelopment Project is, in part, intended to accommodate larger cruise ships and attract the passengers they serve, these ship operators may be more interested in the facility, because passengers may experience a higher economic value associated with the incremental improvement in the habitat quality and the improved probability of whale viewing (however small). Certainly, identification of the POA as an “environmentally friendly” facility should facilitate its promotion as a destination port-of-call for cruise ship operators.

SECTION 7 COST AND BENEFITS OF COOK INLET BELUGA WHALE CRITICAL HABITAT DESIGNATION
NATIONAL MARINE FISHERIES SERVICE 7-5
7.5 OTHER LARGE-SCALE DEVELOPMENT / INFRASTRUCTURE PROJECTS
The other large-scale development projects identified in, or adjacent to, Cook Inlet beluga whale CH include: the ACS SPANDEX Fiber Optic Cable Project, Ship Creek Stabilization Project, and Upland Rock Quarry – Cottonwood Bay. The ACS SPANDEX Fiber Optic Cable Project is already in its final stages of completion, while the status of the Ship Creek Stabilization Project is unclear. Therefore, no costs of CHD to these two projects has been identified or analyzed.
7.5.1 Potential Costs to Uplands Rock Quarry-Cotton Bay
Consultation costs incurred for the Upland Rock Quarry – Cottonwood Bay project would be associated with dredge, spoils disposal, and fill. One informal consultation is expected to occur on this project with the USACE. Given that the project is in pre-permitting stages, this consultation is not likely before 2011.
The cost of this informal consultation to address adverse modification to the CH is $2,350 (in 2009 dollars), of which $1,750 will accrue to the USACE, as Federal Action Agency, while NMFS will bear $600 (see Table 4-1). The consultation is anticipated in Area 2 CH.
7.5.2 Potential Benefits to these Developments
There are no identifiable benefits expected to accrue to the ACS Fiber Optic Cable Project, Ship Creek Bank Stabilization Project, or the Upland Rock Quarry from CHD.
7.6 WATER QUALITY
As per the analysis presented in Section 6.4.6, twelve permits are classified as “major dischargers” into Cook Inlet and its waters. The EPA defines a “major discharger” as “a facility that is designed to discharge 1 million gallons per day or more.”371 Seven of these are for wastewater treatment facilities (including the John Asplund WWTP), three are related to either oil and gas production or refining, and one is for stormwater. The ADEC is in the process assuming NPDES permitting authority from the EPA. As part of the agreement to transfer NPDES authority, EPA retains permitting and enforcement authority for several facilities, including facilities issued CWA §301(h) waivers from secondary treatment standards. The John Asplund WWTP is one such facility. The NPDES permit under which the Asplund plant operates expired in 2005.372
7.6.1 Potential Costs to the Sector
The analysis of water quality impacts pertains to the costs of Section 7 consultations associated with NPDES permitting of major dischargers for which EPA retains permitting and enforcement authority, thus establishing a Federal nexus. For the sake of this analysis, the John Asplund WWTP remains the only major discharger for which EPA has permitting authority, and that discharges into Cook Inlet. One formal consultation with EPA is anticipated, in 2010, on this facility. 371 EPA’s response to an e-mail sent via the EPA’s Envirofacts Warehouse Website. 372 Accessed on July 31, 2009 from http://www.dec.state.ak.us/water/npdes/Final_Application_2008/MOA/AppendixA_EPARetainsFINAL.pdf
FINAL RIR/4(B)(2)/FRFA OF CRITICAL HABITAT DESIGNATION OF COOK INLET BELUGA WHALE AUGUST 11, 2010
7-6 NATIONAL MARINE FISHERIES SERVICE
This formal consultation to address adverse modification to the CH is expected to cost $4,900 (in 2009 dollars), of which $2,700 will accrue to the EPA, as Federal Action Agency, NMFS will bear $1,300, and the remaining $900 will be borne by the third parties involved. This cost will impact Area 1 CH.
7.6.2 Potential Benefits to the Sector
The CHD is not expected to provide additional benefits from preserving water quality within Cook Inlet. Water quality preservation may lead to benefits captured in other sectors (e.g., recreation), that are addressed in their respective sections. For example, CHD actions, such as preserving water quality, may create a more pristine environment for whale watchers. Improving the aesthetics of Cook Inlet may lead to a more enjoyable whale watching trip and, thus, additional benefits to whale watchers from CHD actions. Such benefits are discussed under the section on benefits to recreation and tourism, and are not reproduced here to avoid duplication.
7.7 POWER PROJECTS / DEVELOPMENT IN COOK INLET AND VICINITY
Section 6.4.7 reviews four power projects for potential effects associated with the CHD. Of these, Fire Island Wind Farm project is not anticipated to affect Cook Inlet beluga whale CH, while a decision to go forward with the Mt. Spurr Geothermal Power Plant has not been made, as of the writing of this report. Therefore, these projects are not analyzed further. The two tidal energy projects, Central Cook Inlet Tidal Energy Project by Alaska Tidal Energy Company and Cook Inlet Tidal Energy Project by OCGen are analyzed below in the context of Cook Inlet beluga whale CHD.
7.7.1 Potential Costs to Power Projects
The costs of the CHD to power projects are made up of costs of as few as one informal, or as many as six formal consultations on each of the two tidal energy projects (i.e., total: two informal to 12 formal consultations). The range is dependent on noise from the turbines.
The cost of each informal consultation to address adverse modification to the CH is $2,350 (in 2009 dollars), of which $1,750 will accrue to FERC, as the Federal action agency, while NMFS will bear $600 (see Table 4-1). Each formal consultation on power development to address adverse modification to the CH is anticipated to cost $4,900 (in 2009 dollars), of which $2,700 will accrue to the FERC, as the Federal action agency; NMFS will bear $1,300; and the remaining $900 will be borne by the third parties involved. At this point, there is uncertainty regarding when these consultations will occur over the ten-year period of analysis. The consultation on Central Cook Inlet Tidal Energy Project is anticipated in Area 2 CH (not clearly defined), while that on Cook Inlet Tidal Energy Project will impact Area 1 CH (not clearly defined).
7.7.2 Potential Benefits to Power Projects
In the same way that the oil and gas industry may benefit indirectly through employee attraction and retention, power project operations may experience similar benefits.
SECTION 7 COST AND BENEFITS OF COOK INLET BELUGA WHALE CRITICAL HABITAT DESIGNATION
NATIONAL MARINE FISHERIES SERVICE 7-7
7.8 COMMERCIAL FISHERIES
As presented in more detail in Section 6.4.8, the Cook Inlet commercial fishery is divided into upper and lower Inlet management districts under the State management system. Most of the fisheries are State-managed, although some Federally-managed fisheries occur in lower Cook Inlet within the range of Cook Inlet beluga whale (groundfish, halibut, and crab). Eight species dominate the commercial fishing industry in the upper Cook Inlet, including sockeye, Chinook, coho, pink, and chum salmon, as well as eulachon, and razor clams. Salmon is the most economically important fishery, and is managed by ADF&G. Over 90 percent of Upper Cook Inlet salmon catch occurs below the Forelands, with the highest concentration in the waters off of the central Kenai Peninsula. It is expected that no consultation will occur for salmon fisheries, given the absence of commercial salmon fishing in Federal waters.
Some potential exists for interplay between commercial fisheries outside of Cook Inlet (e.g., Bering Sea groundfish trawl fisheries) and Cook Inlet beluga whale CH salmon PCEs, as a result of salmon PSC removals in those fisheries. No such direct linkage is currently possible, given existing “source-of-origin” scientific data on salmon prohibited species catches in trawl nets. However, research efforts currently underway may change this situation in the relatively near future.
7.8.1 Potential Costs to Commercial Fisheries
The costs of Cook Inlet beluga whale CHD on commercial fishing is projected to stem from one informal consultation, every five years, on groundfish. One such consultation is presently underway, so there is only one additional consultation anticipated during the ten-year analysis period, that in 2014.
The informal consultation is anticipated to cost $9,400 (in 2009 dollars) and is considered an incremental cost. NMFS will bear the full cost of this consultation ($5,000 will accrue to NMFS – Alaska Region, Sustainable Fisheries Division, as the Federal action agency; and $2,400 will be borne by NMFS – Alaska Region, Protected Resources Division, as the consulting agency (see Table 4-1)). This impact is distributed equally between Area 1 CH and Area 2 CH.
7.8.2 Potential Benefits to Commercial Fisheries
It is possible that all of the commercial fisheries – salmon, smelt, herring, razor clams, halibut/sablefish/groundfish, mariculture oysters and mussels, as well as the related processors – will experience small benefits of CHD, as these fish stocks share habitat with Cook Inlet beluga whale. When Cook Inlet beluga whale habitat is protected, stocks of these and other fish species may directly benefit from the protected habitat. Healthy, abundant fish stocks yield economic benefits to those that harvest, process, market, and consume them. These benefits would fall under the indirect use benefit category.
7.9 NATIVE ALASKAN AND SUBSISTENCE USE
Cook Inlet area subsistence use is managed by State and Federal entities. As discussed in Section 6.4.9, the State of Alaska subsistence fishing programs in the CHD area allow Alaska residents to harvest a wide variety of fish species for personal consumption. The Federal subsistence program in the CHD area provides permits
FINAL RIR/4(B)(2)/FRFA OF CRITICAL HABITAT DESIGNATION OF COOK INLET BELUGA WHALE AUGUST 11, 2010
7-8 NATIONAL MARINE FISHERIES SERVICE
to three communities that demonstrated “customary and traditional” use of the fish resource; including, Ninilchik, Cooper Landing, and Hope.
Subsistence harvesting of Cook Inlet beluga whales is a traditional practice among Alaska Native peoples in the area. These communities have stopped their annual subsistence hunt of Cook Inlet beluga whales, owing to the distressed state of the Cook Inlet beluga whale population and the imposition of Federal regulations in 2008 that set harvest limits based on the size and growth of the stock. The last year that a Cook Inlet beluga whale was reported as harvested for subsistence use was 2006. While no consultation is anticipated on subsistence salmon harvesting, nor any other subsistence fisheries, it is expected that one formal consultation will occur, per year, to review the Cook Inlet beluga whale harvest quota.
7.9.1 Potential Costs to Subsistence
There is one formal consultation anticipated every year with NMFS – Alaska Region, Sustainable Fisheries Division, on review of Cook Inlet beluga whale harvest quota. The cost of these consultations is considered the impact of CHD on Alaska Native and subsistence use.
Each formal consultation to review of the harvest quota is anticipated to cost $4,900 (in 2009 dollars) (portion of the cost to address adverse modification to the CH only), of which $2,700 will accrue to the NMFS – Alaska Region, Sustainable Fisheries Division, as the Federal action agency, and NMFS – Alaska Region, Protected Resources Division, as the consulting agency will bear $1,300, and the remaining $900 will be borne by the third parties involved. This impact is expected to be shared equally by Area 1 CH and Area 2 CH.
7.9.2 Potential Benefits to Subsistence
It is possible that all subsistence fisheries – salmon, halibut, etc. – as well as subsistence harvests of other Cook Inlet marine mammals will experience benefits from CHD, as these target species share habitat with Cook Inlet beluga whales. When Cook Inlet beluga whale habitat is protected, stocks of these other marine resources may benefit. Any accrual of such benefits from CHD would be an indirect use benefit category.
If CHD increases subsistence fishery stocks, subsistence anglers may have increased catch rates. The increased catch rate would provide use benefits to subsistence anglers, both inside and outside of CHD, since fish migration may take these fish outside of the immediate area. There is the potential that these benefits may be substantial. It is also the case that increased catch rates by subsistence users enhances their relative “efficiency”, which in a mixed-economic system, makes more time available for employment in wage-earning endeavors; or, which in a strict subsistence economic-system, allows additional opportunities to undertake other life-tasks, such as acquisition of other subsistence necessities (e.g., hunting, gathering).
Subsistence harvest of Cook Inlet beluga whales is a traditional practice of Alaska Native populations. While this is a right of the indigenous tribe members, it is not frequently exercised. CHD is intended to “conserve and enhance the recovery” of Cook Inlet beluga whales, potentially providing Alaska Natives with the opportunity to practice subsistence Cook Inlet beluga whale harvest more frequently. If this opportunity is capitalizing on by Alaska Natives, direct use benefits will be generated. Additionally, the CHD and subsequent preservation of Cook Inlet beluga whales is expected to sustain the population into the future, allowing future generations of Alaska Natives the ability to practice their traditional subsistence harvest of

SECTION 7 COST AND BENEFITS OF COOK INLET BELUGA WHALE CRITICAL HABITAT DESIGNATION
NATIONAL MARINE FISHERIES SERVICE 7-9
Cook Inlet beluga whales, thus providing additional benefits of CHD (e.g., cultural, social, nutritional, ethnic-identity and pride).
7.10 ALASKA RESIDENTS PERSONAL USE FISHERY
The Alaska resident personal use fishery is managed by ADF&G, Division of Sport Fish. The program was developed to address legal conflicts between Federal subsistence-use requirements and Alaska’s State Constitution. The “personal use fishery” allows Alaska residents to harvest fish for, as the name implies, personal use as food (in excess of sport fish bag limit amounts) and employing gear-types not generally authorized for sport fishing, in areas where subsistence fishing is not allowed. There are five “personal use fisheries” authorized in Cook Inlet that require permits; including Kenai River salmon dip net, Kasilof River salmon dip net, Kasilof river salmon set gillnet, Fish Creek sockeye salmon dip net, and Kachemak Bay coho salmon gillnet. In addition, there are five “personal use areas” in the Inlet that do not require a permit to fish.
7.10.1 Potential Costs
The Cook Inlet beluga whale CHD is not anticipated to adversely impact any of the Cook Inlet’s Alaska-resident personal use fisheries.
7.10.2 Potential Benefits
It is possible that all of the personal use fisheries – salmon, hooligan, and herring – will experience benefits from CHD, as these fish stocks share habitat with Cook Inlet beluga whale. When Cook Inlet beluga whale CH is protected and conserved, stocks of these coveted fish species may also improve. This aspect of the proposed action would fall under the indirect use benefit category.
7.11 RECREATION AND TOURISM
Recreation and tourism activities occur throughout Cook Inlet, but most of the recreation occurring on the waters within Cook Inlet beluga whale CH is sports fishing. It is not expected that there will be any consultations required for sport fishing, due to CHD. None of these actions appear to have a Federal nexus triggering consultation under ESA.
7.11.1 Potential Costs
The Cook Inlet beluga whale CHD is not anticipated to adversely impact recreation or tourism.
7.11.2 Potential Benefits
Several aspects of recreation and tourism may benefit from CHD. First, cruise ship passengers may gain value in their experiences due to preserved aesthetic benefits of more pristine habitat, and through the increased probability of viewing Cook Inlet beluga whales that may be associated with CHD. Other tourists to Alaska may also gain similar benefits. In addition, sport fishing participants who travel to Alaska may
FINAL RIR/4(B)(2)/FRFA OF CRITICAL HABITAT DESIGNATION OF COOK INLET BELUGA WHALE AUGUST 11, 2010
7-10 NATIONAL MARINE FISHERIES SERVICE
benefit through potentially improved fish stocks and sustained aesthetic characteristics associated with, and attributable to, habitat protection. Accrual of enhanced utility from this aspect of the proposed action would fall under the indirect use benefit category.
7.12 MILITARY ACTIVITIES
The two military installations are expected to potentially have an affect on the Cook Inlet beluga whale CHD. These bases are Fort Richardson and EAFB (Elmendorf Air Force Base). Both EAFB and Fort Richardson have developed INRMPs, and are located inland from Area 1 CH. It is anticipated that the two bases will be combined in 2010. The Army is expected to propose year-round training at ERFIA, and is currently working with NMFS in the determination of project modifications resulting from CHD. Under Section 4(a)(3)(B)(i) of the ESA, an area above MHHW line in the Eagle River qualifies for exemption from CHD. However, notwithstanding this exemption, as a conservative measure, potential effects to this area are analyzed in this report.
7.12.1 Potential Costs
NMFS anticipates that the activities of the EAFB will generate up to ten technical assistance consultations and ten informal consultations annually because of the CHD. Another ten technical assistances consultations and ten informal consultations are expected every year from the activities at Fort Richardson. In addition, one formal consultation for ERFIA is likely to occur in 2010. The costs of these consultations reflect the potential impacts of the CHD on military activities.
The cost of each technical assistance consultation to address possible adverse modification to the CH is $400 (in 2009 dollars), of which $250 will accrue to DOD, as the Federal action agency, while NMFS will bear $150 (see Table 4-1). Each informal consultation on military activities to address possible adverse modification to the CH is anticipated to cost $2,350 (in 2009 dollars), of which $1,750 will accrue to the DOD, as the Federal action agency, while NMFS will bear $600. The formal consultation for ERFIA to address adverse modification to the CH is anticipated to cost $4,900 (in 2009 dollars), of which $3,600 will accrue to DOD, as the Federal action agency; and NMFS will bear $1,300. These impacts are expected to occur in Area 1 CH.
7.12.2 Potential Benefits
No additional benefits of CHD are expected to accrue to military operations in the affected area.
7.13 INTERACTIONS BETWEEN COOK INLET BELUGA WHALE HABITATS AND OTHER PROTECTED SPECIES AND THEIR HABITATS
The Cook Inlet and its vicinity is home to a number of other Federal- and State-protected species. The protection of these other species provide benefits to the Cook Inlet beluga whale, while the protection of Cook Inlet beluga whale habitat will provide some protection to the habitat shared by these other species. The ESA-listed species located in Cook Inlet include Steller’s eider, short-tailed albatross, Snake River fall
SECTION 7 COST AND BENEFITS OF COOK INLET BELUGA WHALE CRITICAL HABITAT DESIGNATION
NATIONAL MARINE FISHERIES SERVICE 7-11
Chinook salmon, Steller sea lion, and the southwest DPS of northern sea otters. The Alaska Species of Special Concern373 in the area are harbor seal, American peregrine falcon, Steller’s eider, Steller sea lion, and the southwest DPS of northen sea otters. Alaska Species of Special Concern that occur on land near Cook Inlet include olive-sided flycatcher, Kenai Peninsula brown bear, northern (Queen Charlotte) goshawk, gray-cheekd thrush, Townsend’s warbler, and Blackpoll warbler.
7.13.1 Potential Costs
The Cook Inlet beluga whale CHD is not anticipated to adversely impact other protected species and their habitats.
7.13.2 Potential Benefits
Because other protected species share common elements of the Cook Inlet beluga whale habitat, several may benefit from the CHD. In turn, there are economic benefits to species protection, in general, that accrue to the local and national populations, in the form of passive use benefits (see Appendix A for more information)
7.14 EDUCATIONAL, SCIENTIFIC, NON-CONSUMPTIVE USE OF COOK INLET BELUGA WHALE AND ITS HABITAT
7.14.1 Potential Costs
The Cook Inlet beluga whale CHD is not anticipated to adversely impact educational, scientific, non-consumptive use of Cook Inlet beluga whale and its habitat.
7.14.2 Potential Benefits
There are scientific and educational benefits to the nation that are generated as the ESA is carried out. It is likely that the additional incremental understanding of the natural environment, provided by protecting Cook Inlet beluga whale CH, provides a benefit. However, it is very difficult to clearly credit the designation, itself, with specific additional educational or scientific benefit, because the study of the Cook Inlet beluga whale is motivated by biologists and interested citizens, largely irrespective of the formal listing or CHD.
7.15 SUMMARY OF BENEFIT-COST ANALYSIS OF CRITICAL HABITAT DESIGNATION
Table 7-1 provides a summary of the total incremental post-designation costs that are anticipated to occur within the Cook Inlet beluga whale CHD. These costs stem from the Section 7 consultations, outlined in
373 The list of Species of Special Concern is an administrative listing established in May, 1993 and amended in October, 1998 by the Commissioner
of Fish and Game. A Species of Special Concern is any species or subspecies of fish or wildlife or population of mammal or bird native to Alaska that has entered a long-term decline in abundance or is vulnerable to a significant decline due to low numbers, restricted distribution, dependence on limited habitat resources, or sensitivity to environmental disturbance.
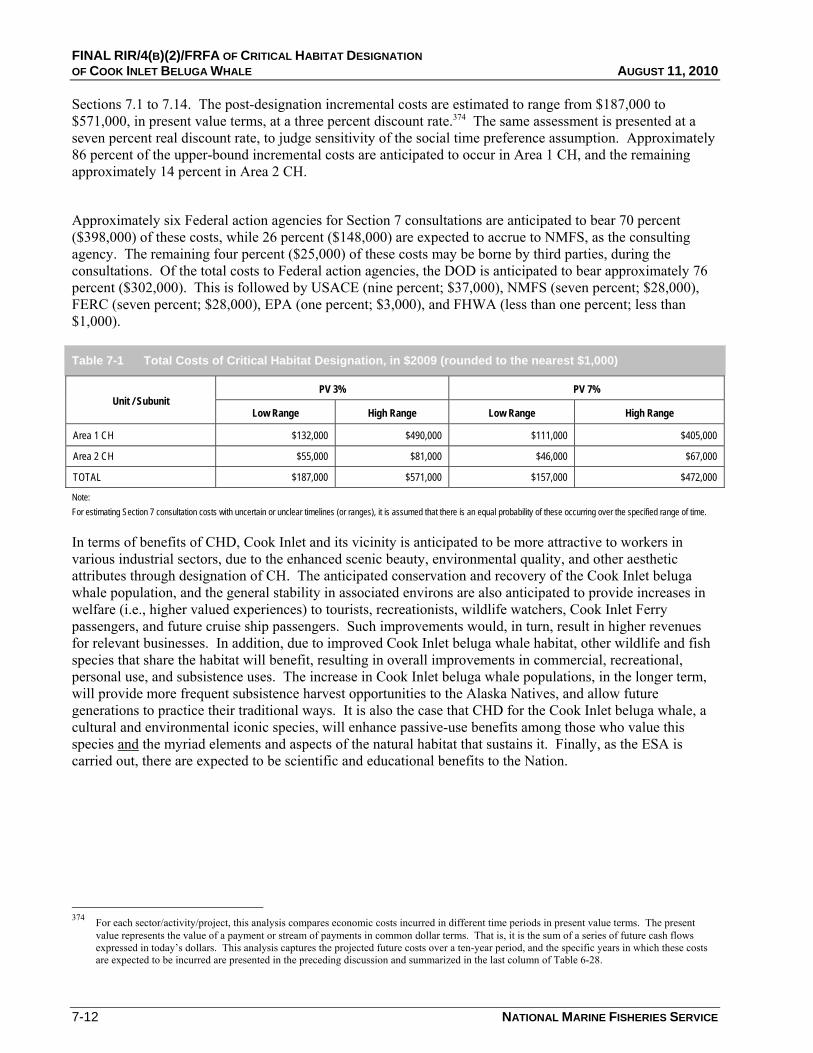
FINAL RIR/4(B)(2)/FRFA OF CRITICAL HABITAT DESIGNATION OF COOK INLET BELUGA WHALE AUGUST 11, 2010
7-12 NATIONAL MARINE FISHERIES SERVICE
Sections 7.1 to 7.14. The post-designation incremental costs are estimated to range from $187,000 to $571,000, in present value terms, at a three percent discount rate.374 The same assessment is presented at a seven percent real discount rate, to judge sensitivity of the social time preference assumption. Approximately 86 percent of the upper-bound incremental costs are anticipated to occur in Area 1 CH, and the remaining approximately 14 percent in Area 2 CH.
Approximately six Federal action agencies for Section 7 consultations are anticipated to bear 70 percent ($398,000) of these costs, while 26 percent ($148,000) are expected to accrue to NMFS, as the consulting agency. The remaining four percent ($25,000) of these costs may be borne by third parties, during the consultations. Of the total costs to Federal action agencies, the DOD is anticipated to bear approximately 76 percent ($302,000). This is followed by USACE (nine percent; $37,000), NMFS (seven percent; $28,000), FERC (seven percent; $28,000), EPA (one percent; $3,000), and FHWA (less than one percent; less than $1,000).
Table 7-1 Total Costs of Critical Habitat Designation, in $2009 (rounded to the nearest $1,000)
Unit / Subunit PV 3% PV 7%
Low Range High Range Low Range High Range
Area 1 CH $132,000 $490,000 $111,000 $405,000
Area 2 CH $55,000 $81,000 $46,000 $67,000
TOTAL $187,000 $571,000 $157,000 $472,000
Note: For estimating Section 7 consultation costs with uncertain or unclear timelines (or ranges), it is assumed that there is an equal probability of these occurring over the specified range of time.
In terms of benefits of CHD, Cook Inlet and its vicinity is anticipated to be more attractive to workers in various industrial sectors, due to the enhanced scenic beauty, environmental quality, and other aesthetic attributes through designation of CH. The anticipated conservation and recovery of the Cook Inlet beluga whale population, and the general stability in associated environs are also anticipated to provide increases in welfare (i.e., higher valued experiences) to tourists, recreationists, wildlife watchers, Cook Inlet Ferry passengers, and future cruise ship passengers. Such improvements would, in turn, result in higher revenues for relevant businesses. In addition, due to improved Cook Inlet beluga whale habitat, other wildlife and fish species that share the habitat will benefit, resulting in overall improvements in commercial, recreational, personal use, and subsistence uses. The increase in Cook Inlet beluga whale populations, in the longer term, will provide more frequent subsistence harvest opportunities to the Alaska Natives, and allow future generations to practice their traditional ways. It is also the case that CHD for the Cook Inlet beluga whale, a cultural and environmental iconic species, will enhance passive-use benefits among those who value this species and the myriad elements and aspects of the natural habitat that sustains it. Finally, as the ESA is carried out, there are expected to be scientific and educational benefits to the Nation.
374 For each sector/activity/project, this analysis compares economic costs incurred in different time periods in present value terms. The present
value represents the value of a payment or stream of payments in common dollar terms. That is, it is the sum of a series of future cash flows expressed in today’s dollars. This analysis captures the projected future costs over a ten-year period, and the specific years in which these costs are expected to be incurred are presented in the preceding discussion and summarized in the last column of Table 6-28.
NATIONAL MARINE FISHERIES SERVICE 8-1
S E C T I O N 8 Expected Net Benefit to the Nation
As is evident in Section 7, it is not possible to provide quantitative estimates of all the projected benefits and costs that may be uniquely attributable to the designation of CH for Cook Inlet beluga whale. However, it appears that if these were somehow to be quantified and monetized, the anticipated benefits outweigh anticipated costs.
As per the requirement of ESA and E.O. 12866, all effort is made in this Final RIR/4(b)(2) Preparatory Assessment/FRFA to comprehensively identify (and, wherever possible, quantify or monetize) benefits and costs associated with the CHD. As presented in preceding sections, the expected costs identified for CHD are smaller, both in absolute nominal terms and when compared to some of the benefits. NMFS is of the opinion that the proposed Cook Inlet beluga whale CHD can be expected to result in a net benefit to the Nation.


NATIONAL MARINE FISHERIES SERVICE 9-1
S E C T I O N 9 Area Exclusions Based upon Economic Impacts - A Section 4(b)(2) Preparatory Assessment of Cook Inlet Beluga Whale Critical Habitat Designation
This section documents NMFS’s compliance with Section 4(b)(2) of the ESA regarding impacts of designating CH for the Cook Inlet beluga whale. Specifically, Section 4(b)(2) requires NMFS to consider the economic impact, impact on national security, and any other relevant impact, of specifying any particular area as CH. Section 4(b)(2) also provides NMFS with discretion to exclude particular areas from a designation, but only if the benefits of excluding that area outweigh the benefits of including it in the designation, and exclusion will not result in extinction of the species. The following subsection summarizes Section 4(b)(2) requirements, as informed by previous designations and key court rulings. A synthesis of the economic, national security, and other relevant impacts of the final CHD within each specific area (Area 1 CH and Area 2 CH) follows. Finally, this section discusses the particular area(s), recommended for exclusion from the CHD, based on the economic, national security, or other relevant impacts identified.
9.1 SECTION 4(B)(2) REQUIREMENTS
This subsection describes the statutory requirements of determining the impacts of CHD. The interpretation of the statute through previous designations and key court opinions informed our process.
9.1.1 The Statutory Language and Consideration of Potential Impacts of Designation
Section 4(b)(2) of the ESA states:
The Secretary shall designate critical habitat, and make revisions thereto, under subsection (a)(3) of this section on the basis of the best scientific data available and after taking into consideration the economic impact, impact on national security, and any other relevant impact, of specifying any particular area as critical habitat. The Secretary may exclude any area from critical habitat if he determines that the benefits of such exclusion outweigh the benefits of specifying such area as part of the critical habitat, unless he determines, based on
FINAL RIR/4(B)(2)/FRFA OF CRITICAL HABITAT DESIGNATION OF COOK INLET BELUGA WHALE AUGUST 11, 2010
9-2 NATIONAL MARINE FISHERIES SERVICE
the best scientific and commercial data available, that the failure to designate such area as critical habitat will result in the extinction of the species concerned.375
Impacts may result from a CHD primarily through the operation of Section 7 of the ESA.376 Section 7(a)(2) requires each Federal agency to consult with NMFS (or USFWS, as applicable) to insure that any action they authorize, fund, or carry out will not likely jeopardize the continued existence of listed species or destroy or adversely modify the CHD of listed species. Federal agencies are required to enter into consultation whenever a proposed action “may affect” the listed species or designated CH. If a proposed Federal action will likely destroy or adversely modify critical habitat, NMFS may recommend to the Federal agency that the agency or the project permittee or grantee implement an RPA to the proposed action that would avoid destruction or adverse modification of critical habitat. Thus, impacts that may result from Section 7 consultations include agency and project applicant administrative costs of performing the consultation, and costs of modifications to the proposed action in order to implement a RPA. In addition, because CH is by definition “essential to the conservation” of the species, conservation benefits to the listed species would result when the consultation process avoids destruction or adverse modification of its critical habitat through inclusion of RPAs, or avoids lesser adverse effects to critical habitat that may not rise to the level of adverse modification through inclusion of harm avoidance measures. The RPAs or harm avoidance measures to protect the Cook Inlet beluga whales may also avoid adverse impacts to other components of the ecosystem, such as Cook Inlet beluga whale prey species in the footprint of proposed actions. Designation and protection of CH could result in or contribute to continued provision of recreational or other use values associated with the Cook Inlet beluga whales, or increases in these values if project modifications that avoid adverse modification result in increases in the species’ abundance. Similarly, project modifications that avoid adverse impacts to CH and other components of the ecosystem may result in continued provision or increases in benefits to user groups and economic sectors that utilize these habitat or ecosystem components.
Commenters on previous CHDs have suggested that secondary costs to regional economies can also result from project modifications prescribed through Section 7 consultation. For example, concerns have been raised where CH is being designated in areas of residential development that the designation will lead to reduced revenues and employment in construction-related firms, potential lost tax revenue associated with decreased residential development, and even impairment of regional growth.377 In other designations, concerns have been expressed that CHD may require alteration in shipping channel dredging projects or commercial fishing activities to such an extent that it would result in regional economic impacts.378
Aside from the protections provided through Section 7, the ESA imposes no other requirements or limitations on any entities or individuals as a result of CHD. Benefits to the listed species and its CH may nonetheless result from a designation, if state or local governments enact protective legislation or regulations to complement the ESA protections. Similarly, a designation may raise public awareness and sensitivity to the status of listed species and the importance of designated CH areas for conservation. As a result, individuals or other entities may modify their activities to avoid harm to the species or habitat, contribute to conservation efforts, or seek to view the species in the wild.
375 16 U.S.C. §1533(b)(2) 376 16 U.S.C. §1536. 377 See, e.g., Elliott D. Pollack and Company, 1999, The Economic and Fiscal Impact of Designation of 60.060 Acres of Privately Owned Land in
Pima County, Arizona as Critical Habitat for the Cactus Ferruginous Pygmy- Owl. Prepared for Southern Arizona Homebuilders Association. 378 See, e.g., Industrial Economics, Incorporated (IEc), 2003, Economic Analysis of Critical Habitat Designation for the Gulf Sturgeon. Prepared for
the Division of Economics, U.S. Fish & Wildlife Service.
SECTION 9 AREA EXCLUSIONS BASED UPON ECONOMIC IMPACTS
NATIONAL MARINE FISHERIES SERVICE 9-3
9.1.2 Key Legal Interpretations
The ESA does not specify methods for identifying and considering the impacts of CHD, and previous designations have used a variety of approaches, based on the differing facts and circumstances of the species and habitat involved. As described below, the legislative history informs these analyses, and several important court opinions have evaluated the legal sufficiency of these analyses and clarified a number of important aspects of these statutory provisions.
Section 4(b)(2) consists of two steps: an initial mandatory requirement that the agency consider certain impacts of CHD, and a discretionary step wherein the agency, informed by those considerations, may propose excluding particular areas from the designation. The ESA’s legislative history explains the broad latitude afforded to NMFS in its consideration of impacts:
“Economics and any other relevant impact shall be considered by the Secretary in setting the limits of critical habitat for such a species. The Secretary is not required to give economics or any other “relevant impact” predominant consideration in his specification of critical habitat...The consideration and weight given to any particular impact is completely within the Secretary’s discretion.”379, 380
Clearly, NMFS may exclude particular areas that otherwise meet the definition of CH from a designation, on a determination that the benefits of exclusion outweigh the benefits of including the area(s), and exclusion will not result in the species’ extinction. This step is entirely discretionary, and does not require exclusion in any circumstances.
One court has held that an agency’s decision not to exercise its discretion to exclude areas is not subject to judicial review.381 The court based this conclusion on the broad latitude provided to the agency in consideration of impacts described above, the discretionary nature of the exclusion provision, and the fact that the statute provides substantive standards only for the review of actual exclusions (i.e., the Secretary must determine that the benefits of exclusion outweigh the benefits of inclusion for particular areas). In contrast, the statute includes no substantive standards for a court to review a decision not to exclude areas from a designation.
Regarding consideration of economic impacts, the Home Builders court has noted that “impacts” is not specific and can be both positive and negative;382 NMFS believes this logic applies equally to national security impacts and other relevant impacts. Therefore, this report identifies and considers positive and negative economic, national security, and other relevant impacts that may result from including each of the two proposed areas in the final CHD. These impacts are discussed in detail in Sections 7 and 8. The following section provides a synthesis of the impacts of including each of the two proposed areas in the CHD for the Cook Inlet beluga whale, and is followed by an exclusion analysis.
379 H.R. Rep. No. 95-1625, at 16-17 (1978), 1978 U.S.C.A.N. 9453, 9466-67. 380 The provisions requiring consideration of impacts were originally discussed as applicable only to critical habitat designations for invertebrate
species. However, Section 4(b)(2) as enacted is not limited to invertebrates, and NMFS and USFWS have applied the provision to designations for vertebrate and invertebrate species.
381 Home Builders Association of No. Calif. et al., v. U.S. Fish and Wildlife Service, 2006 U.S. Dist. LEXIS 80255 at 45-46 (E.D. Cal., Nov. 1, 2006).
382 Id. at 54, citing Butte Envtl. Council v. Norton, slip op., 04-0096, at 12 (N.D. Cal. Oct. 28, 2004).

FINAL RIR/4(B)(2)/FRFA OF CRITICAL HABITAT DESIGNATION OF COOK INLET BELUGA WHALE AUGUST 11, 2010
9-4 NATIONAL MARINE FISHERIES SERVICE
9.2 SYNTHESIS: IMPACTS OF INCLUDING EACH OF THE TWO PROPOSED AREAS IN THE CRITICAL HABITAT DESIGNATION FOR THE COOK INLET BELUGA WHALE
The ESA provides that certain areas may be excluded from, or are ineligible for designation, as critical habitat. Section 4(b)(2) states “The secretary shall designate critical habitat , and make revisions thereto, under subsection (a)(3) on the basis of the best scientific data available and after taking into consideration the economic impact, the impact on national security, and any other relevant impact, of specifying any particular area as critical habitat. The secretary may exclude any area from critical habitat if he determines that the benefits of such exclusion outweigh the benefits of specifying such area as part of the critical habitat, unless he determines, based on the best scientific and commercial data available, that the failure to designate such area as critical habitat will result in the extinction of the species concerned.”
Section 4(a)(3)(B)(i) of the Act states that the secretary “shall not designate as critical habitat any lands or other geographical areas owned or controlled by the Department of Defense [DOD], or designated for its use, that are subject to an integrated natural resources management plan prepared under section 101 of the Sikes Act (16 U.S.C. 670a), if the Secretary determines in writing that such plan provides a benefit to the species for which critical habitat is proposed for designation.”
NMFS has prepared a preliminary analysis to address the requirements of Sections 4(a)(3) (B)(i) concerning lands or other areas owned or controlled by the Department of Defense subject to an integrated natural resources management plan, and 4(b)(2) of the ESA concerning evaluation of economics, national security, "other relevant impacts", and the analysis of benefits of exclusion of particular areas of CH versus the benefits of inclusion of particular areas of CH. This analysis is presented in the preamble to the proposed rule designating CH for Cook Inlet beluga whales. Modifications to this analysis were considered based on public comments received in response to the proposed CHD.
9.2.1 Exclusions under Section 4(b)(2)
Area 1. With respect to Section 4(b)(2), NMFS' initial analysis of economic, national security, and other relevant impacts from the proposed critical habitat designation did not reveal compelling evidence that the benefits of excluding any particular area from critical habitat designation exceeded the benefits of including that particular area within Area 1 of the proposed critical habitat. Following public comments, NMFS has determined that the benefits from excluding a small area adjacent to POA from critical habitat, principally based upon consideration of national security impacts, exceed the benefits from including it. NMFS, therefore, has decided to exercise its discretion and excludes that area from designation as critical habitat in the final rule. (The precise boundaries of the excluded area are defined in the final rule published by NMFS in the Federal Register). No other exemptions of particular areas are included in the final rule.
As presented in detail in Section 7, the administrative cost of Section 7 consultations anticipated to occur on ongoing and planned activities in and around Area 1 CH make up the projected economic costs of the CHD in Area 1 CH, presently quantifiably in dollar terms. These costs range between $132,000 and $490,000, in present value terms using a discount rate of three percent. The expected costs in Area 1 CH account for approximately 86 percent of the total cost of the CHD currently quantifiable in dollar terms, using the high range estimates. This result is because, due to its vicinity to Anchorage and other high population areas, a number of development projects and activities are concentrated here. Some of the impacted projects and activities include, among others, the Cook Inlet Ferry, Seward Highway improvements, POA and Port
SECTION 9 AREA EXCLUSIONS BASED UPON ECONOMIC IMPACTS
NATIONAL MARINE FISHERIES SERVICE 9-5
MacKenzie expansions, Knik Arm Crossing project, John Asplund WWTP, Cook Inlet Tidal Energy Project (OCGen), natural gas exploration, Cook Inlet beluga whale subsistence harvest, commercial, subsistence, and personal use fisheries, and military activities on EAFB and Fort Richardson.
In terms of benefits of CHD, as has been stated in the Summary of the Benefit-Cost Analysis in Section 7.15 of this report, Area 1 CH is anticipated to contribute significantly to the conservation and recovery of the Cook Inlet beluga whale, above all else. CHD will contribute to retention of the natural attributes of the upper Cook Inlet region and, thus, make the region more appealing to residents, prospective residents (e.g., recruited labor), non-resident visitors, and tourists, alike, due to the enhanced quality of life (e.g., scenic beauty, natural environs, and opportunities to interact with wildlife (whether consumptively or non-consumptively)) through preservation of the CH. The anticipated increase in Cook Inlet beluga whale populations, resulting from CHD, as well as the other attributes just referenced, are also anticipated to provide higher valued experiences to tourists, recreationists, whale watchers, Cook Inlet Ferry passengers, and future cruise ship passengers. Such improvements would, in turn, result in higher revenues for relevant businesses. In addition, due to improved Cook Inlet beluga whale habitat, other species that share the habitat will benefit, resulting in overall improvements in commercial, recreational, personal use, and subsistence fisheries. The increase in Cook Inlet beluga whale populations in the longer term will provide more frequent subsistence harvest opportunities to the Alaska Natives, and allow future generations to practice their traditional ways. Finally, as the ESA is carried out, there are expected to be scientific and educational benefits to the nation.
Area 2. With respect to Section 4(b)(2), NMFS' initial analysis of economic, national security, and other relevant impacts from the proposed critical habitat designation did not reveal compelling evidence that the benefits of excluding any particular area from critical habitat designation exceeded the benefits of including that particular area within Area 2 of the proposed critical habitat. No particular areas within Area 2 of the proposed critical habitat are excluded in the final rule.
Similar to Area 1 CH, the projected economic costs attributable to the CHD in Area 2 CH that are presently quantifiable in dollar terms primarily stem from the Section 7 consultations anticipated to occur on the ongoing and planned activities in the area (see Section 7 for details). The costs in Area 2 CH range from $55,000 to $81,000, in present value terms, using a discount rate of three percent. As before, a seven percent real discount rate was also employed to test the sensitivity of the underlying assumption about the social rate of time preference. These costs in Area 2 CH, account for approximately 14 percent of the total monetized cost of the CHD using the high range estimates. Some of the impacted projects and activities include, among others, oil and gas exploration, Chuitna Coal Project, Upland Rock Quarry, Central Cook Inlet Tidal Energy Project (Alaska Tidal Energy Company), commercial, sport, personal use, and subsistence fisheries, and Cook Inlet beluga whale subsistence harvest.
The benefits of CHD in Area 2 CH are also generally similar to those in Area 1 CH (see Section 9.2.1.1). The proposed CHD action in Area 2 CH would be expected to contribute significantly to the conservation and recovery of the Cook Inlet beluga whale, above all else. Further, it will contribute to conservation of the natural attributes of the lower Cook Inlet region, enhancing the quality of life and making the region more attractive to present and new residents, alike. Here, too, the anticipated increase in Cook Inlet beluga whale populations, resulting from CHD, can also be expected to yield higher valued experiences to recreationists, wildlife watchers, etc., whether residents of, or visitors to, the region. Such improvements would, in turn, result in higher revenues for relevant businesses (e.g., restaurants, lodging providers, transportation, retail purveyors). Conservation of Cook Inlet beluga whale habitat can be expected to have a beneficial impact on other species that share the habitat, resulting in overall improvements in commercial, recreational, personal use, and subsistence resource use. Should CHD result, as expected, in increases in Cook Inlet beluga whale

FINAL RIR/4(B)(2)/FRFA OF CRITICAL HABITAT DESIGNATION OF COOK INLET BELUGA WHALE AUGUST 11, 2010
9-6 NATIONAL MARINE FISHERIES SERVICE
populations, future generations of Alaska Natives will benefit from the opportunity to practice their cultural traditions with fewer restriction.
NMFS has prepared a preliminary analysis to address the requirements of Section 4(a)(3) and 4(b)(2)of the ESA concerning evaluation of national security impacts. This analysis is presented in the preamble to the proposed rule designating CH for Cook Inlet beluga whales. Modifications to this analysis were considered based on public comments received in response to the proposed CHD. No exemptions or exclusions of particular areas in Area 2 CH are proposed at this time. With respect to Section 4(b)(2), the benefits of inclusion of CH were deemed to outweigh the benefits of exclusion of CH. See the proposed rule published by NMFS in the Federal Register for more details.
9.2.2 Areas Ineligible for Designation Under 4(a)(3)(B)(i)
Area 1. NMFS has determined that portions of Elmendorf Air Force Base and Fort Richardson, including portions of the Eagle River Flats Impact Area, are ineligible for designation under the provisions of section 4(a)(3) of the ESA, because these areas are covered by an INRMP that provides benefit for Cook Inlet beluga whales.
Area 2. No properties owned or controlled by the Department of Defense were identified in Area 2, and no areas within critical habitat Area 2 were found to be ineligible for designation under this section.

NATIONAL MARINE FISHERIES SERVICE 10-1
S E C T I O N 1 0 Potential Impacts on Small Entities - A Regulatory Flexibility Act Analysis of Cook Inlet Beluga Whale Critical Habitat Designation
The Regulatory Flexibility Act (RFA), first enacted in 1980, was designed to place the burden on the government to review all regulations to ensure that, while accomplishing their intended purposes, they do not unduly inhibit the ability of small entities to compete. The RFA recognizes that the size of a business, unit of government, or nonprofit organization frequently has a bearing on its ability to comply with a Federal regulation. Major goals of the RFA are: (1) to increase agency awareness and understanding of the impact of their regulations on small business, (2) to require that agencies communicate and explain their findings to the public, and (3) to encourage agencies to use flexibility and to provide regulatory relief to small entities. The RFA emphasizes predicting impacts on small entities as a group, distinct from other entities, and on the consideration of alternatives that may minimize the impacts while still achieving the stated objective of the action.
On March 29, 1996, President Clinton signed the Small Business Regulatory Enforcement Fairness Act. Among other things, the new law amended the RFA to allow judicial review of an agency’s compliance with the RFA. The 1996 amendments also updated the requirements for a final regulatory flexibility analysis, including a description of the steps an agency must take to minimize the significant economic impact on small entities. Finally, the 1996 amendments expanded the authority of the Chief Counsel for Advocacy of the Small Business Administration (SBA) to file amicus briefs in court proceedings involving an agency’s violation of the RFA.
In determining the scope, or ‘universe’, of the entities to be considered in a FRFA, NMFS generally includes only those entities, both large and small, that can reasonably be expected to be directly regulated by the proposed action. If the effects of the rule fall primarily on a distinct segment, or portion thereof, of the industry (e.g., user group, gear type, geographic area), that segment would be considered the universe for the purpose of this analysis. NMFS interprets the intent of the RFA to address negative economic impacts, not beneficial impacts, and thus such a focus exists in analyses that are designed to address RFA compliance.
Data on cost structure, affiliation, and operational procedures and strategies in the sectors potentially subject to the proposed regulatory action are insufficient, at present, to permit preparation of a “factual basis” upon which to certify that the preferred alternative does not have the potential to result in “significant adverse impacts on a substantial number of small entities” (as those terms are defined under RFA). Because, based on all available information, it is not possible to ‘certify’ this outcome, should the proposed action be adopted, a formal FRFA, focusing on the complete range of available alternatives (including the designated “preferred” alternative), has been prepared and is included in this package for Secretarial review.
FINAL RIR/4(B)(2)/FRFA OF CRITICAL HABITAT DESIGNATION OF COOK INLET BELUGA WHALE AUGUST 11, 2010
10-2 NATIONAL MARINE FISHERIES SERVICE
10.1 CONTENTS OF FRFA383
Under 5 U.S.C., Section 603(b) and (c) of the RFA, each FRFA is required to contain:
• A succinct statement of the need for, and objectives of, the rule;
• A summary of significant issues raised by the public comments in response to the IRFA, the agency’s response to those comments, and a statement of any changes made to the rule as a result of the comments;
• A description and estimate of the number of small entities to which the rule will apply, or an explanation of why no such estimate is available;
• A description of the projected reporting, recordkeeping, and other compliance requirements of the final rule;
• A description of the steps the agency has taken to minimize the significant economic impact on small entities consistent with the stated objectives of applicable statutes, including a statement of factual, policy, and legal reasons for selecting the alternative adopted in the final rule.
The public comments received on the IRFA are summarized and responded to in the preamble to the rule. The RFA allows inclusion by reference of these aspects of the preamble in the FRFA.
10.1.1 Definition of a Small Entity
The RFA recognizes and defines three kinds of small entities: (1) small businesses, (2) small non-profit organizations, and (3) and small government jurisdictions.
Small businesses. Section 601(3) of the RFA defines a ‘small business’ as having the same meaning as ‘small business concern,’ which is defined under Section 3 of the Small Business Act. ‘Small business’ or ‘small business concern’ includes any firm that is independently owned and operated and which is not dominant in its field of operation. The SBA has further defined a “small business concern” as one “organized for profit, with a place of business located in the United States, and which operates primarily within the United States or which makes a significant contribution to the U.S. economy through payment of taxes or use of American products, materials or labor. A (small) business concern may be in the legal form of an individual proprietorship, partnership, limited liability company, corporation, joint venture, association, trust or cooperative, except that where the firm is a joint venture there can be no more than 49 percent participation by foreign business entities in the joint venture.”
The SBA has established size criteria for all major industry sectors in the United States, and publishes those on its website. For example, SBA defines an oil extraction business as a small business if it is independently owned and operated, not dominant in its field of operation, and employs 500 or fewer persons on a full-time, part-time, temporary, or other basis, at all its affiliated operations worldwide. Other SBA industrial sector size criterions which may be pertinent to this analysis are those of coal mining and quarrying, port and harbor operations and other electric power generation sectors. Table 10-1, below, includes the categories of firms in these sectors, as defined by SBA, as well as the specific criterion to be used, for RFAA purposes.
383 For a detailed treatment of the requirements of economic analyses in support of RIR and RFAA requirements, see, “Conducting Economic Impact
Analyses,” Lewis E. Queirolo, Ph.D. NMFS Alaska Region, Juneau, Alaska. July 29, 2005.
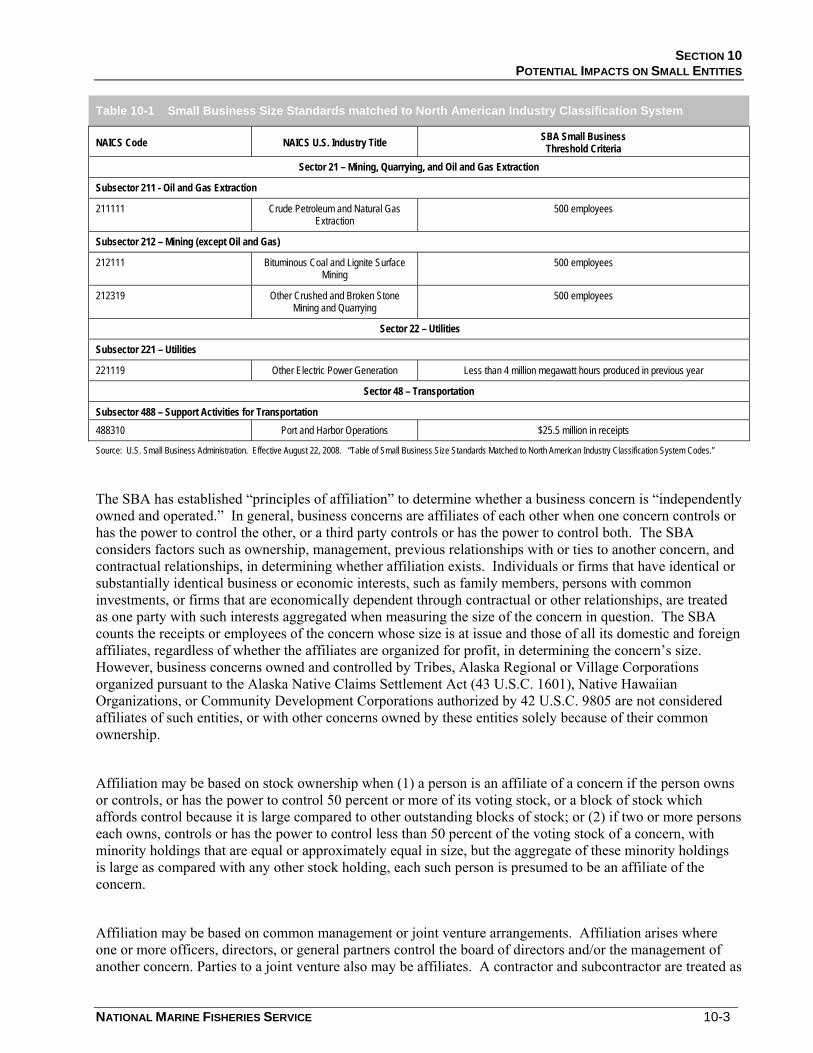
SECTION 10 POTENTIAL IMPACTS ON SMALL ENTITIES
NATIONAL MARINE FISHERIES SERVICE 10-3
Table 10-1 Small Business Size Standards matched to North American Industry Classification System
NAICS Code NAICS U.S. Industry Title SBA Small Business Threshold Criteria
Sector 21 – Mining, Quarrying, and Oil and Gas Extraction
Subsector 211 - Oil and Gas Extraction
211111 Crude Petroleum and Natural Gas Extraction
500 employees
Subsector 212 – Mining (except Oil and Gas)
212111 Bituminous Coal and Lignite Surface Mining
500 employees
212319 Other Crushed and Broken Stone Mining and Quarrying
500 employees
Sector 22 – Utilities
Subsector 221 – Utilities
221119 Other Electric Power Generation Less than 4 million megawatt hours produced in previous year
Sector 48 – Transportation
Subsector 488 – Support Activities for Transportation 488310 Port and Harbor Operations $25.5 million in receipts
Source: U.S. Small Business Administration. Effective August 22, 2008. “Table of Small Business Size Standards Matched to North American Industry Classification System Codes.”
The SBA has established “principles of affiliation” to determine whether a business concern is “independently owned and operated.” In general, business concerns are affiliates of each other when one concern controls or has the power to control the other, or a third party controls or has the power to control both. The SBA considers factors such as ownership, management, previous relationships with or ties to another concern, and contractual relationships, in determining whether affiliation exists. Individuals or firms that have identical or substantially identical business or economic interests, such as family members, persons with common investments, or firms that are economically dependent through contractual or other relationships, are treated as one party with such interests aggregated when measuring the size of the concern in question. The SBA counts the receipts or employees of the concern whose size is at issue and those of all its domestic and foreign affiliates, regardless of whether the affiliates are organized for profit, in determining the concern’s size. However, business concerns owned and controlled by Tribes, Alaska Regional or Village Corporations organized pursuant to the Alaska Native Claims Settlement Act (43 U.S.C. 1601), Native Hawaiian Organizations, or Community Development Corporations authorized by 42 U.S.C. 9805 are not considered affiliates of such entities, or with other concerns owned by these entities solely because of their common ownership.
Affiliation may be based on stock ownership when (1) a person is an affiliate of a concern if the person owns or controls, or has the power to control 50 percent or more of its voting stock, or a block of stock which affords control because it is large compared to other outstanding blocks of stock; or (2) if two or more persons each owns, controls or has the power to control less than 50 percent of the voting stock of a concern, with minority holdings that are equal or approximately equal in size, but the aggregate of these minority holdings is large as compared with any other stock holding, each such person is presumed to be an affiliate of the concern.
Affiliation may be based on common management or joint venture arrangements. Affiliation arises where one or more officers, directors, or general partners control the board of directors and/or the management of another concern. Parties to a joint venture also may be affiliates. A contractor and subcontractor are treated as
FINAL RIR/4(B)(2)/FRFA OF CRITICAL HABITAT DESIGNATION OF COOK INLET BELUGA WHALE AUGUST 11, 2010
10-4 NATIONAL MARINE FISHERIES SERVICE
joint ventures if the ostensible subcontractor will perform primary and vital requirements of a contract or if the prime contractor is unusually reliant upon the ostensible subcontractor. All requirements of the contract are considered in reviewing such relationship, including contract management, technical responsibilities, and the percentage of subcontracted work.
Small organizations. The RFA defines “small organizations” as any not-for-profit enterprise that is independently owned and operated and is not dominant in its field.
Small governmental jurisdictions. The RFA defines small governmental jurisdictions as governments of cities, counties, towns, townships, villages, school districts, or special districts with populations of less than 50,000.
10.1.2 Reason for Considering the Action
Under provisions of the ESA, when a species is listed as endangered, it is necessary for the listing agency to evaluate, on the basis of the best available scientific information, whether it is possible and appropriate to designate critical habitat for that species. The final listing, published by NMFS on October 22, 2008 (effective December 22, 2008), listed the Cook Inlet beluga whale as “endangered”.384 In the final listing, NMFS proposed to designate the CH for the Cook Inlet beluga whale in a future listing, due to a lack of necessary data and information available at that time with which to “identify and describe PCEs (Primary Constituent Elements) of the habitat of the [Cook Inlet beluga whale], as well as the economic consequences of designating critical habitat.” The statutory timelines indicated that the final rule designating CH should be published within one year of the final listing (i.e. by October 22, 2009), prompting the proposed action to designate critical habitat for the Cook Inlet beluga. For details, refer to the preamble of the associated proposed rule.
10.1.3 Objectives of, and Legal Basis for, the Action
The objective of this action is to utilize the best available scientific information, including historical distribution of these animals, feeding and foraging behavior of the species, aggregation patterns within Cook Inlet, and PCEs to characterize and, as appropriate, designate critical habitat for this species.
This action is proposed under the authority of Section 4 of the ESA.
10.1.4 Significant Issues Raised by Public Comments
NMFS received no substantive comments on the IRFA, either at the series of public hearing held throughout the Cook Inlet region, or during the formal public comment period.
384 73 FR 62919.
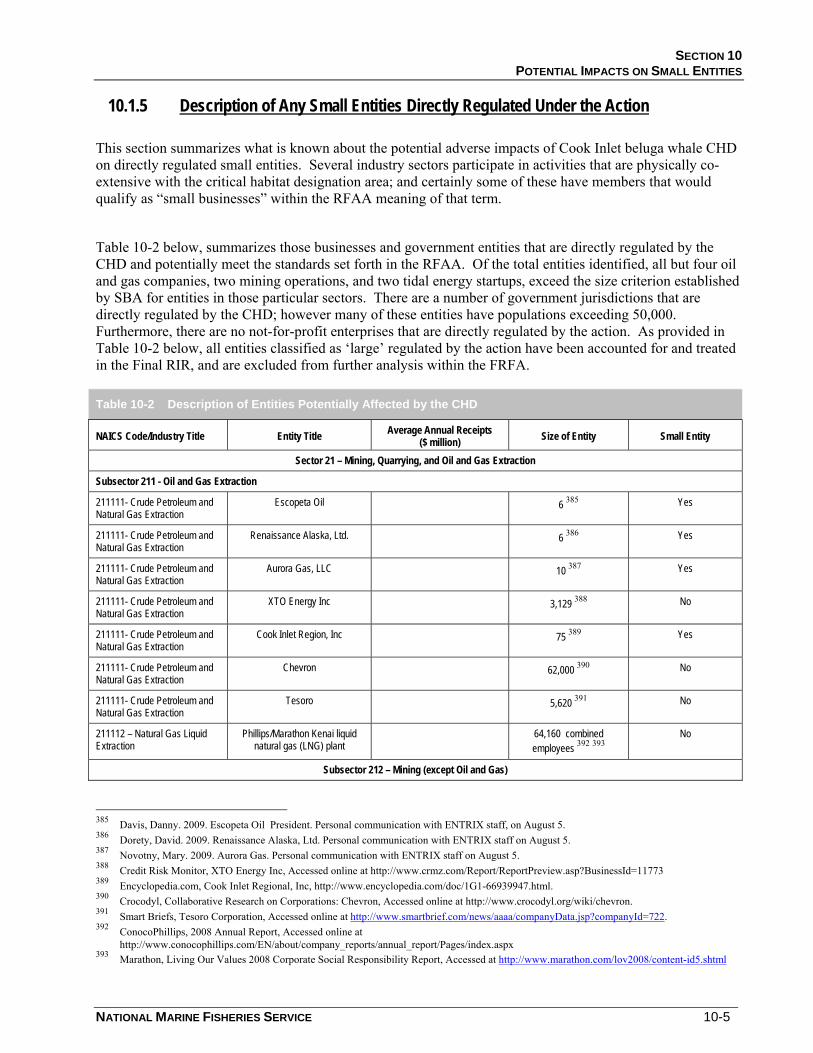
SECTION 10 POTENTIAL IMPACTS ON SMALL ENTITIES
NATIONAL MARINE FISHERIES SERVICE 10-5
10.1.5 Description of Any Small Entities Directly Regulated Under the Action
This section summarizes what is known about the potential adverse impacts of Cook Inlet beluga whale CHD on directly regulated small entities. Several industry sectors participate in activities that are physically co-extensive with the critical habitat designation area; and certainly some of these have members that would qualify as “small businesses” within the RFAA meaning of that term.
Table 10-2 below, summarizes those businesses and government entities that are directly regulated by the CHD and potentially meet the standards set forth in the RFAA. Of the total entities identified, all but four oil and gas companies, two mining operations, and two tidal energy startups, exceed the size criterion established by SBA for entities in those particular sectors. There are a number of government jurisdictions that are directly regulated by the CHD; however many of these entities have populations exceeding 50,000. Furthermore, there are no not-for-profit enterprises that are directly regulated by the action. As provided in Table 10-2 below, all entities classified as ‘large’ regulated by the action have been accounted for and treated in the Final RIR, and are excluded from further analysis within the FRFA.
Table 10-2 Description of Entities Potentially Affected by the CHD
NAICS Code/Industry Title Entity Title Average Annual Receipts ($ million) Size of Entity Small Entity
Sector 21 – Mining, Quarrying, and Oil and Gas Extraction
Subsector 211 - Oil and Gas Extraction
211111- Crude Petroleum and Natural Gas Extraction
Escopeta Oil 6 385 Yes
211111- Crude Petroleum and Natural Gas Extraction
Renaissance Alaska, Ltd. 6 386 Yes
211111- Crude Petroleum and Natural Gas Extraction
Aurora Gas, LLC 10 387 Yes
211111- Crude Petroleum and Natural Gas Extraction
XTO Energy Inc 3,129 388 No
211111- Crude Petroleum and Natural Gas Extraction
Cook Inlet Region, Inc 75 389 Yes
211111- Crude Petroleum and Natural Gas Extraction
Chevron 62,000 390 No
211111- Crude Petroleum and Natural Gas Extraction
Tesoro 5,620 391 No
211112 – Natural Gas Liquid Extraction
Phillips/Marathon Kenai liquid natural gas (LNG) plant
64,160 combined employees 392 393
No
Subsector 212 – Mining (except Oil and Gas)
385 Davis, Danny. 2009. Escopeta Oil President. Personal communication with ENTRIX staff, on August 5. 386 Dorety, David. 2009. Renaissance Alaska, Ltd. Personal communication with ENTRIX staff on August 5. 387 Novotny, Mary. 2009. Aurora Gas. Personal communication with ENTRIX staff on August 5. 388 Credit Risk Monitor, XTO Energy Inc, Accessed online at http://www.crmz.com/Report/ReportPreview.asp?BusinessId=11773 389 Encyclopedia.com, Cook Inlet Regional, Inc, http://www.encyclopedia.com/doc/1G1-66939947.html. 390 Crocodyl, Collaborative Research on Corporations: Chevron, Accessed online at http://www.crocodyl.org/wiki/chevron. 391 Smart Briefs, Tesoro Corporation, Accessed online at http://www.smartbrief.com/news/aaaa/companyData.jsp?companyId=722. 392 ConocoPhillips, 2008 Annual Report, Accessed online at
http://www.conocophillips.com/EN/about/company_reports/annual_report/Pages/index.aspx 393 Marathon, Living Our Values 2008 Corporate Social Responsibility Report, Accessed at http://www.marathon.com/lov2008/content-id5.shtml
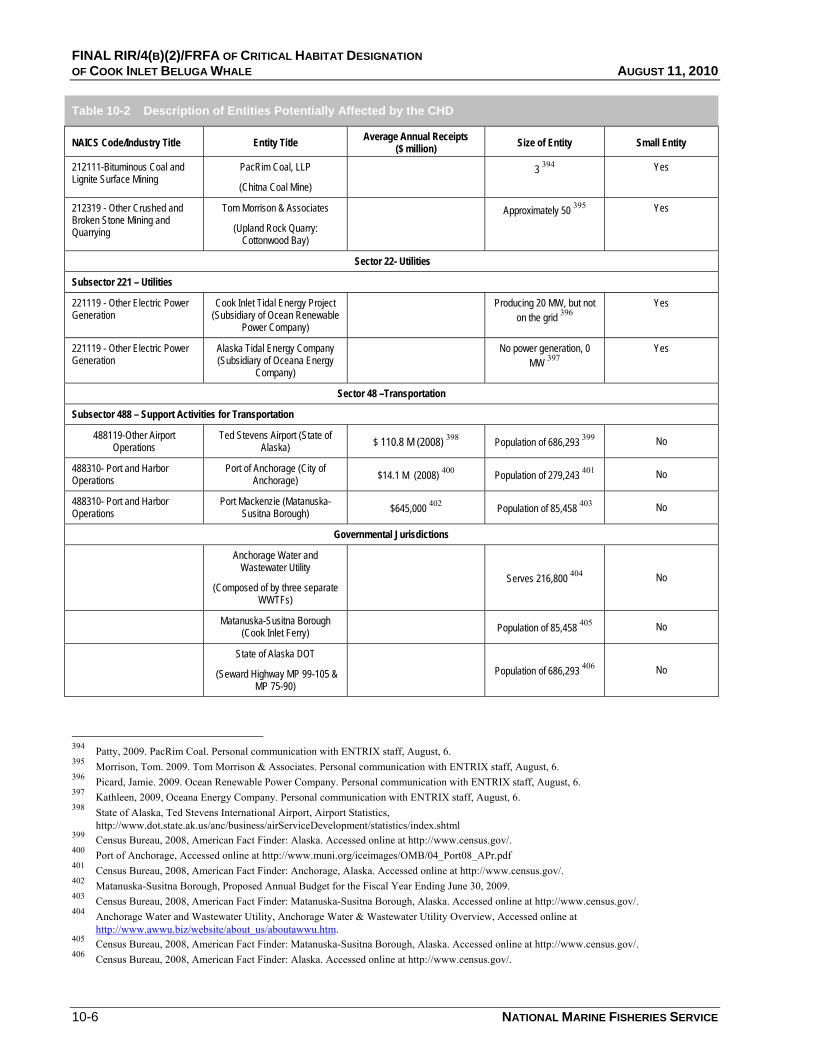
FINAL RIR/4(B)(2)/FRFA OF CRITICAL HABITAT DESIGNATION OF COOK INLET BELUGA WHALE AUGUST 11, 2010
10-6 NATIONAL MARINE FISHERIES SERVICE
Table 10-2 Description of Entities Potentially Affected by the CHD
NAICS Code/Industry Title Entity Title Average Annual Receipts ($ million) Size of Entity Small Entity
212111-Bituminous Coal and Lignite Surface Mining
PacRim Coal, LLP
(Chitna Coal Mine)
3 394 Yes
212319 - Other Crushed and Broken Stone Mining and Quarrying
Tom Morrison & Associates
(Upland Rock Quarry: Cottonwood Bay)
Approximately 50 395 Yes
Sector 22- Utilities
Subsector 221 – Utilities
221119 - Other Electric Power Generation
Cook Inlet Tidal Energy Project (Subsidiary of Ocean Renewable
Power Company)
Producing 20 MW, but not on the grid 396
Yes
221119 - Other Electric Power Generation
Alaska Tidal Energy Company (Subsidiary of Oceana Energy
Company)
No power generation, 0 MW 397
Yes
Sector 48 –Transportation
Subsector 488 – Support Activities for Transportation
488119-Other Airport Operations
Ted Stevens Airport (State of Alaska) $ 110.8 M (2008) 398 Population of 686,293 399 No
488310- Port and Harbor Operations
Port of Anchorage (City of Anchorage) $14.1 M (2008) 400 Population of 279,243 401 No
488310- Port and Harbor Operations
Port Mackenzie (Matanuska-Susitna Borough) $645,000 402 Population of 85,458 403 No
Governmental Jurisdictions
Anchorage Water and Wastewater Utility
(Composed of by three separate WWTFs)
Serves 216,800 404 No
Matanuska-Susitna Borough (Cook Inlet Ferry) Population of 85,458 405 No
State of Alaska DOT
(Seward Highway MP 99-105 & MP 75-90)
Population of 686,293 406 No
394 Patty, 2009. PacRim Coal. Personal communication with ENTRIX staff, August, 6. 395 Morrison, Tom. 2009. Tom Morrison & Associates. Personal communication with ENTRIX staff, August, 6. 396 Picard, Jamie. 2009. Ocean Renewable Power Company. Personal communication with ENTRIX staff, August, 6. 397 Kathleen, 2009, Oceana Energy Company. Personal communication with ENTRIX staff, August, 6. 398 State of Alaska, Ted Stevens International Airport, Airport Statistics,
http://www.dot.state.ak.us/anc/business/airServiceDevelopment/statistics/index.shtml 399 Census Bureau, 2008, American Fact Finder: Alaska. Accessed online at http://www.census.gov/. 400 Port of Anchorage, Accessed online at http://www.muni.org/iceimages/OMB/04_Port08_APr.pdf 401 Census Bureau, 2008, American Fact Finder: Anchorage, Alaska. Accessed online at http://www.census.gov/. 402 Matanuska-Susitna Borough, Proposed Annual Budget for the Fiscal Year Ending June 30, 2009. 403 Census Bureau, 2008, American Fact Finder: Matanuska-Susitna Borough, Alaska. Accessed online at http://www.census.gov/. 404 Anchorage Water and Wastewater Utility, Anchorage Water & Wastewater Utility Overview, Accessed online at
http://www.awwu.biz/website/about_us/aboutawwu.htm. 405 Census Bureau, 2008, American Fact Finder: Matanuska-Susitna Borough, Alaska. Accessed online at http://www.census.gov/. 406 Census Bureau, 2008, American Fact Finder: Alaska. Accessed online at http://www.census.gov/.
SECTION 10 POTENTIAL IMPACTS ON SMALL ENTITIES
NATIONAL MARINE FISHERIES SERVICE 10-7
10.1.6 Reporting, Record-Keeping, and Other Compliance Requirements
During a formal Section 7 consultation under the ESA, the Service, the Action agency, and the third party applying for Federal funding or permitting (if applicable) communicate, in an effort to minimize potential adverse effects to the species and/or to the proposed critical habitat. Communication between these parties may occur via written letters, phone calls, in-person meetings, or any combination of these. The duration and complexity of these interactions depends on a number of variables, including the type of consultation, the species, the activity of concern, and the potential effects to the species and designated critical habitat associated with the activity that has been proposed. The third party costs associated with these consultations include the administrative costs associated with conducting the consultations, such as the costs of time spent in meetings, preparing letters, and the development of research, such as biological studies and engineering reports. Table 10-3 below outlines the small businesses directly regulated by the action and their associated costs, if any, resulting from Section 7 consultations attributable to CHD for Cook Inlet beluga whale.
Show Desktop.scf
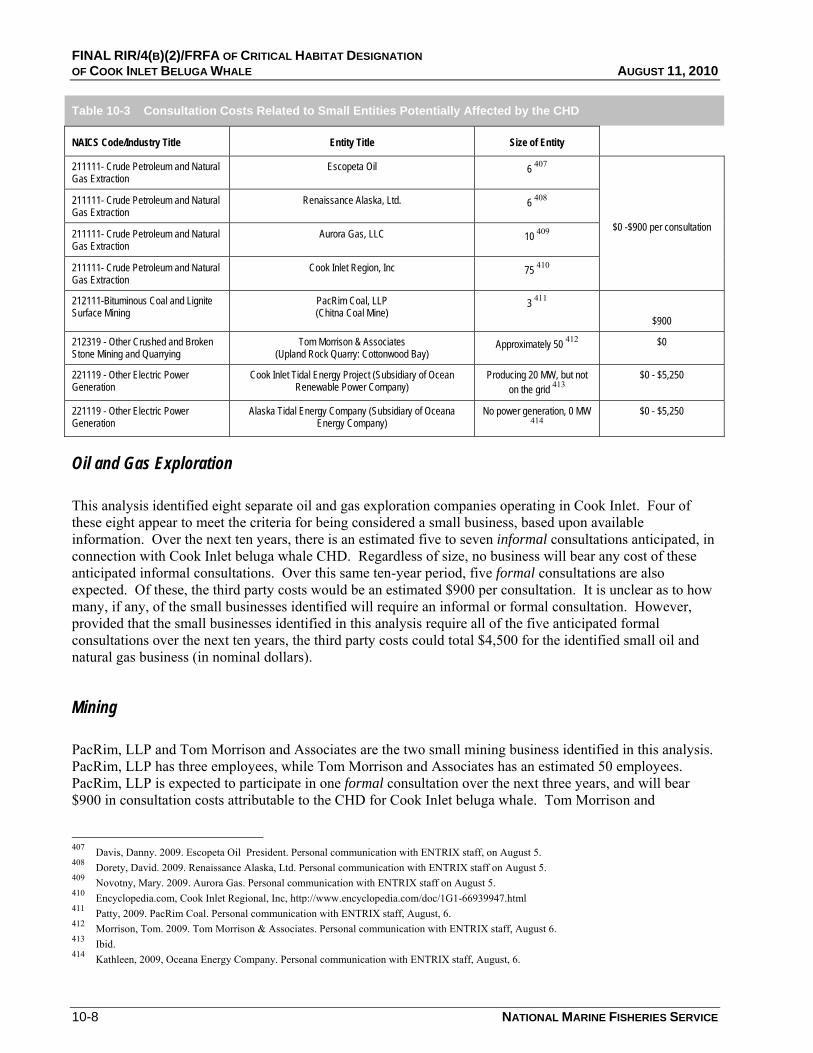
FINAL RIR/4(B)(2)/FRFA OF CRITICAL HABITAT DESIGNATION OF COOK INLET BELUGA WHALE AUGUST 11, 2010
10-8 NATIONAL MARINE FISHERIES SERVICE
Table 10-3 Consultation Costs Related to Small Entities Potentially Affected by the CHD
NAICS Code/Industry Title Entity Title Size of Entity
211111- Crude Petroleum and Natural Gas Extraction
Escopeta Oil 6 407
$0 -$900 per consultation
211111- Crude Petroleum and Natural Gas Extraction
Renaissance Alaska, Ltd. 6 408
211111- Crude Petroleum and Natural Gas Extraction
Aurora Gas, LLC 10 409
211111- Crude Petroleum and Natural Gas Extraction
Cook Inlet Region, Inc 75 410
212111-Bituminous Coal and Lignite Surface Mining
PacRim Coal, LLP (Chitna Coal Mine)
3 411
$900
212319 - Other Crushed and Broken Stone Mining and Quarrying
Tom Morrison & Associates (Upland Rock Quarry: Cottonwood Bay)
Approximately 50 412 $0
221119 - Other Electric Power Generation
Cook Inlet Tidal Energy Project (Subsidiary of Ocean Renewable Power Company)
Producing 20 MW, but not on the grid 413
$0 - $5,250
221119 - Other Electric Power Generation
Alaska Tidal Energy Company (Subsidiary of Oceana Energy Company)
No power generation, 0 MW 414
$0 - $5,250
Oil and Gas Exploration
This analysis identified eight separate oil and gas exploration companies operating in Cook Inlet. Four of these eight appear to meet the criteria for being considered a small business, based upon available information. Over the next ten years, there is an estimated five to seven informal consultations anticipated, in connection with Cook Inlet beluga whale CHD. Regardless of size, no business will bear any cost of these anticipated informal consultations. Over this same ten-year period, five formal consultations are also expected. Of these, the third party costs would be an estimated $900 per consultation. It is unclear as to how many, if any, of the small businesses identified will require an informal or formal consultation. However, provided that the small businesses identified in this analysis require all of the five anticipated formal consultations over the next ten years, the third party costs could total $4,500 for the identified small oil and natural gas business (in nominal dollars).
Mining
PacRim, LLP and Tom Morrison and Associates are the two small mining business identified in this analysis. PacRim, LLP has three employees, while Tom Morrison and Associates has an estimated 50 employees. PacRim, LLP is expected to participate in one formal consultation over the next three years, and will bear $900 in consultation costs attributable to the CHD for Cook Inlet beluga whale. Tom Morrison and
407 Davis, Danny. 2009. Escopeta Oil President. Personal communication with ENTRIX staff, on August 5. 408 Dorety, David. 2009. Renaissance Alaska, Ltd. Personal communication with ENTRIX staff on August 5. 409 Novotny, Mary. 2009. Aurora Gas. Personal communication with ENTRIX staff on August 5. 410 Encyclopedia.com, Cook Inlet Regional, Inc, http://www.encyclopedia.com/doc/1G1-66939947.html 411 Patty, 2009. PacRim Coal. Personal communication with ENTRIX staff, August, 6. 412 Morrison, Tom. 2009. Tom Morrison & Associates. Personal communication with ENTRIX staff, August 6. 413 Ibid. 414 Kathleen, 2009, Oceana Energy Company. Personal communication with ENTRIX staff, August, 6.
SECTION 10 POTENTIAL IMPACTS ON SMALL ENTITIES
NATIONAL MARINE FISHERIES SERVICE 10-9
Associates, will participate in an informal consultation, regarding the Upland Rock Quarry. The third party cost of this informal consultation is anticipated to be zero.
Utilities
The two tidal energy startups, Cook Inlet Tidal Energy and Alaska Tidal Energy Company, do not meet the size criteria established by SBA to be considered large entities. These small utilities may be required to participate in up to six formal consultations each, at a cost of $900 per consultation. Therefore, the consultation-related costs, per firm, may approach up to $5,400, as a result of CHD.
Transportation
All three transportation projects, Ted Stevens International Airport, Port of Anchorage, and Port MacKenzie, exceed the size criteria for small entity. While the Port of Anchorage and Port MacKenzie do not meet the annual receipts threshold established by SBA, the ports are operated by the Municipality of Anchorage (Port of Anchorage) and the Matanuska – Susitna Borough (Port MacKenzie), respectively, and both government entities exceed the 50,000 population criteria. Therefore, the Port of Anchorage and Port MacKenzie are considered to be large entities for RFAA purposes.
Government Jurisdictions
The EPA is in the process of transferring NPDES authority to the Sate of Alaska. The EPA will retain permitting and enforcement authority for a select number of WWTFs in Alaska, including the John M. Asplund WWTF. The other WWTFs identified in this analysis are not directly regulated by the proposed action. The John M. Asplund is one of three WWTF that make up the Anchorage WWTF, which also includes Girdwood and Eagle River WWTF. These three facilities service a population of 216,000 people and, therefore, exceed the population threshold established by SBA.
The two remaining projects (Cook Inlet Ferry and Seward Highway construction) that fall under government jurisdiction are both operated by government entities that exceed the 50,000 person criterion established by SBA, and are therefore large entities.
10.1.7 Description of Steps Taken to Minimize Small Entity Impacts Consistent with ESA
After careful examination of the best available scientific data on Cook Inlet beluga needs, dependency upon and interaction with their habitat, historic range, and current population dynamics, it is NMFS’s determination that only the designation of Area 1 and Area 2 has the potential to accomplish the stated objectives and legal mandates associated with CHD for this species.
Retention of the “no action” alternative is not a viable choice for several reasons. Retention of the status quo would not be consistent with the objectives identified by the agency for this action (see the ‘Purpose and Need’ discussion in the Final RIR). In addition, adoption of the no action alternative would be contrary to the agency’s obligations under the ESA. Finally, because the CHD does not have the potential to have a significant economic impact on a substantial number of small entities, the status quo/no action alternative
FINAL RIR/4(B)(2)/FRFA OF CRITICAL HABITAT DESIGNATION OF COOK INLET BELUGA WHALE AUGUST 11, 2010
10-10 NATIONAL MARINE FISHERIES SERVICE
cannot result in a smaller burden, and could conceivably impose a greater burden, if selected (i.e., would not “minimize adverse impacts” as required under RFA).
In developing the proposed action, NMFS considered the potential adverse effects on directly regulated small entities and prepared an IRFA. The IRFA did not reveal significant adverse economic effects on any of the directly regulated small entities.
10.1.8 Summary and Response to Public Comments Received on the IRFA
No comments received on the IRFA resulted in the need to make substantives changes in the identified small entities directly regulated by the proposed action. Further, none of the conclusions regarding any adverse economic impacts are likely to accrue to small entities.
10.2 STATEMENTS OF ENERGY EFFECTS
Pursuant to Executive Order No. 13211, “Actions Concerning Regulations that Significantly Affect Energy Supply, Distribution, or Use,” issued May 18, 2001, Federal agencies must prepare and submit a “Statement of Energy Effects” for all “significant energy actions.” The purpose of this requirement is to ensure that all Federal agencies “appropriately weigh and consider the effects of the Federal Government’s regulations on the supply, distribution, and use of energy.”415
The Office of Management and Budget provides guidance for implementing this Executive Order, outlining nine outcomes that may constitute “a significant adverse effect” when compared with the regulatory action under consideration:
• Reductions in crude oil supply in excess of 10,000 barrels per day (bbls);
• Reductions in fuel production in excess of 4,000 barrels per day;
• Reductions in coal production in excess of 5 million tons per year;
• Reductions in natural gas production in excess of 25 million Mcf per year;
• Reductions in electricity production in excess of 1 billion kilowatts-hours per year or in excess of 500 megawatts of installed capacity;
• Increases in energy use required by the regulatory action that exceed the thresholds above;
• Increases in the cost of energy production in excess of one percent;
• Increases in the cost of energy distribution in excess of one percent; or
• Other similarly adverse outcomes.416
415 Office of Management and Budget, Memorandum for Heads of Executive Department Agencies and Independent Regulatory Agencies, Guidance
for Implementing E.O. 13211, M-01-27, Office of Management and Budget, http://www.whitehouse.gov/omb/memoranda/m01-27.html, accessed July 31, 2001.
416 Ibid.
SECTION 10 POTENTIAL IMPACTS ON SMALL ENTITIES
NATIONAL MARINE FISHERIES SERVICE 10-11
10.2.1 Oil Supply and Natural Gas Production
Oil and gas exploration and development currently occurs within Area 2 CH, and not in Area 1 CH. In addition, the potential exists for additional oil and gas exploration and development activities to occur within Area 2 CH in the future. While this analysis considers that these activities are reasonably foreseeable, specific information on the future scope and scale of these activities is unknown. In the case that these activities do occur or affect Area 2 CH, the designation of critical habitat is not expected to result in any additional project modification recommendations above and beyond those resulting from species listing. Incremental impacts to the energy industry associated with these activities would therefore most likely be limited to additional administrative costs of consultation and would have little to no effect on oil and gas production decisions, subsequent oil and gas supply, nor the cost of energy production.
10.2.2 Coal Production
The Chuitna Coal Project is expected to occur within Area 2 CH; however the designation of critical habitat is not expected to result in any additional project modification recommendations above and beyond those resulting from species listing. Such project modifications may include a reduction in the number of pilings and the installation of a conveyor cover which would occur regardless of CHD. Impacts to the energy industry associated with coal production would likely be limited to additional administrative costs of consultation, and would have little to no effect on coal production decisions, subsequent coal supply, or the cost of energy production.
10.2.3 Electricity Production
To date, no tidal energy projects have been developed in the beluga whale CH areas. Two preliminary permits for tidal energy projects have been issued in Cook Inlet, as described in Section 6. The projects are expected to occur in both Area 1 CH and Area 2 CH. The designation of CH is not expected to result in any additional project modification recommendations above and beyond those resulting from species listing. Impacts to the energy industry would likely be limited to additional administrative costs of consultation, and have little or no effect on electrical energy production decisions, subsequent electricity supply, or the cost of energy production.


NATIONAL MARINE FISHERIES SERVICE 11-1
S E C T I O N 1 1 List of Preparers
11.1 AGENCY PERSONNEL
National Marine Fisheries Service 222 W 7th Ave., # 517 Anchorage, AK 99513
Project Manager .................................................................................................... Lewis Queirolo, Ph.D. Contracting Officer’s Technical Representative (COTR) ............................................... Steven K. Davis Contributing Member............................................................................................................. Brad Smith Contributing Member................................................................................................................ Kaja Brix Contributing Member....................................................................................................... Demian Schane Author of Appendix A .................................................................................................... Dan Lew, Ph.D.
11.2 FINAL RIR/4(B)(2) PREPARATORY ASSESSMENT/FRFA CONSULTANTS
ENTRIX, Inc. 12009 NE 99th Street, Suite 1410 Vancouver, WA 98682
Project Director .................................................................................................................. Michael Nagy Technical Resource ........................................................................................... Robert McKusick, Ph.D. Technical Team Leader and Project Manager ..................................................................... Krieg Brown Deputy Project Manager ..................................................................................................... Rabia Ahmed

NATIONAL MARINE FISHERIES SERVICE 12-1
S E C T I O N 1 2 References
16 U.S.C. §1532.
16 U.S.C. §1533(b)(1)(A)
16 U.S.C. §1533(b)(2)
16 U.S.C. §1536(a)(2).
18 A.A.C. §70.020.
5 U.S.C. §§601 et seq.
65 FR 34590.
65 FR 59164.
70 FR 12853, March 16, 2005
71 FR 26852, October 22, 2008.
72 FR 19854.
72 FR 46447. August 20, 2007. “Preparation of an Environmental Impact Statement (EIS) for Resumption of Year-Round Live-Fire Training at Eagle River Flats (ERF), Fort Richardson, AK.”
73 FR 21578.
73 FR 60976; October 15, 2008.
73 FR 62919.
74 FR 12840, March 25, 2009.
National Oceanic and Atmospheric Administration. Agreement between the National Marine Fisheries Service and the Cook Inlet Marine Mammal Council for the Co-Management of the Cook Inlet Stock of Beluga Whale for the Years 2000, 2001, 2002, and 2006.
Alaska Commercial Fisheries Entry Commission. 2008. Fisheries Statistics. Participation and Earnings. http://www.cfec.state.ak.us/public/BIT.CSV.
Alaska Department of Environmental Conservation - Division of Water. Alaska Pollution Discharge Elimination Program. “Primacy Application, October 29, 2008 – Memorandum of Agreement - Appendix A: NPDES Permits EPA Retains Authority Over.” http://www.dec.state.ak.us/water/npdes/Final_Application_2008/MOA/AppendixA_EPARetainsFINAL.pdf. Accessed July 31, 2009.
FINAL RIR/4(B)(2)/FRFA OF CRITICAL HABITAT DESIGNATION OF COOK INLET BELUGA WHALE AUGUST 11, 2010
12-2 NATIONAL MARINE FISHERIES SERVICE
Alaska Department of Environmental Conservation. 2008. Integrated Water Quality Monitoring and Assessment Report April 1, 2008.
Alaska Department of Environmental Conservation. 2009a. Pollution Discharge Elimination system website.Accessed on May 5, 2009 http://www.dec.state.ak.us/water/npdes/background.htm.
Alaska Department of Fish and Game. Alaska Species of Special Concern. Steller’s Eider. http://www.adfg.state.ak.us/special/esa/eider_stellers/st_eider.php. accessed April 27, 2009.
Alaska Department of Fish and Game. Alaska Species of Special Concern. Snake River Fall Chinook Salmon. http://www.adfg.state.ak.us/special/esa/salmon_chinook/chinook_salmon.php, accessed April 27, 2009.
Alaska Department of Fish and Game. Alaska Species of Special Concern. Sea Otters in Alaska. http://www.adfg.state.ak.us/special/esa/seaotter/sea_otter.php. accessed April 29, 2009.
Alaska Department of Fish and Game. Alaska Species of Special Concern. Steller Sea Lion. http://www.adfg.state.ak.us/special/esa/sealion_steller/s_sealion.php. accessed April 27, 2009.
Alaska Department of Fish and Game. Alaska Species of Special Concern. http://www.adfg.state.ak.us/special/esa/species_concern.php. accessed April 29, 2009.
Alaska Department of Fish and Game. Alaska Species of Special Concern. American Peregrine Falcon. http://www.adfg.state.ak.us/special/esa/falcon_peregine_ame/ame_peregrine.php. accessed April 27, 2009.
Alaska Department of Fish and Game. Aquatic Farming Production and Farm Gate Value 1990 – 2007. Accessed 5/13/2009 at http://www.cf.adfg.state.ak.us/geninfo/enhance/maricult/aqfarm_i/90-07farm.pdf.
Alaska Department of Fish and Game. Division of Habitat. “Fish Habitat (Title 16) Permits.” http://www.habitat.adfg.alaska.gov/fhpermits.php. Accessed May 12, 2009.
Alaska Department of Fish and Game. Sport Fish Division. Statewide Harvest Survey. Region II Southcentral Areas. accessed on May 11, 2009 at http://www.sf.adfg.state.ak.us/statewide/participationandharvest/main/cfm.
Alaska Department of Fish and Game. Sport Fishing Division. Cook Inlet Personal Use Fisheries Important Information. available at: http://www.sf.adfg.state.ak.us/region2/personaluse/index.cfm.
Alaska Department of Labor. 2008. Alaska Economic Trends: Alaska’s Oil Industry. Volume 28 (9).
Alaska Department of Natural Resources Division of Oil and Gas. 2008. Mount Spurr Geothermal Lease Sale No. 3. accessed at http://www.dog.dnr.state.ak.us/oil/products/publications/geothermal/spurr/Spurr%20final%202008.pdf.
Alaska Department of Natural Resources. Division of Oil and Gas. January 20, 2009. Cook Inlet Areawide Oil and Gas Lease Sale. Final Finding of the Director.
Alaska Department of Natural Resources. Division of Oil and Gas. January 20, 2009. Cook Inlet Areawide Oil and Gas Lease Sale. Final Finding of the Director. citing Petterson and Glazier, 2004.

SECTION 12 REFERENCES
NATIONAL MARINE FISHERIES SERVICE 12-3
Alaska Department of Natural Resources. Division of Oil and Gas. January 20, 2009. Cook Inlet Areawide Oil and Gas Lease Sale. Final Finding of the Director. citing Trobridge and Goldman 2006.
Alaska Department of Natural Resources. Division of Oil and Gas. January 20, 2009. Cook Inlet Areawide Oil and Gas Lease Sale. Final Finding of the Director. citing ADF&G, 2008a.
Alaska Department of Natural Resources. Division of Oil and Gas. 2007. Alaska Oil and Gas Report. July. Anchorage, Alaska.
Alaska Department of Transportation & Public Facilities. July 2, 2008. 2006-2009 STIP. Amendment #17.
Alaska Department of Transportation & Public Facilities. July 2006. Scoping Summary Report, Seward Highway Milepost 99 to 105. prepared by DOWL Engineers, Anchorage. Alaska.
Alaska Department of Transportation & Public Facilities. July 2006. Scoping Summary Report. Seward Highway Milepost 99 to 105. Appendix K prepared by DOWL Engineers. Anchorage, Alaska.
Alaska Department of Transportation & Public Facilities. March 14, 2008. Seward highway MP 75-90 Road and Bridge Rehabilitation Project. Final Winter Wildlife Survey.
Alaska Department of Transportation and Public Facilities. February 2008. Let’s Get Moving 2030: Alaska Statewide Long-range Transportation Policy Plan.
Alaska Natural Gas Development Authority. 2009. Scoping Document for the Beluga to Fairbanks (B2F) Natural Gas Pipeline Environmental Impact Statement. Prepared for the U.S. Army Corp of Engineers by URS Alaska, LLC.
Alaska Power Association. 2004. New Energy for Alaska.
Anchorage Daily News. August 19, 2009. Knik bridge lawsuit settled; project is back. http://www.adn.com/news/alaska/matsu/story/902969.html. accessed August 20, 2009.
Anchorage Daily News. Jan. 25, 2009. CIRI Optimistic Fire Island Wind Farm Will Take Off: POWER BY 2010: Many Hurdles Remain but Officials Are Confident. iStock Analysis. http://www.istockanalyst.com/article/viewiStockNews/articleid/2980123.
Anchorage Daily News. July 15, 2009. Knik bridge delay put on hold by judge. http://www.adn.com/news/alaska/knik/story/865860.html. accessed August 4, 2009.
Anchorage Municipal Light and Power, 2007. Utility Profile. http://www.mlandp.com/redesign/about_mlp.htm. accessed April 14, 2009.
Anchorage Port Expansion Team. 2005. Maritime Administration/Port of Anchorage Finding of No Significant Impact for the Marine Terminal Redevelopment. Port Intermodal Expansion Project.
Anchorage Port Expansion Team. 2005. Port Intermodal Expansion Project. Marine Terminal Redevelopment Environmental Assessment - Final.
Anchorage Water and Wastewater Utility, 2006, Eagle River Wastewater Treatment Facility – Facility Plan Update, CDM and GV Jones and Associates, Inc.
Anchorage Water and Wastewater Utility, 2006, Wastewater Master Plan, December.
FINAL RIR/4(B)(2)/FRFA OF CRITICAL HABITAT DESIGNATION OF COOK INLET BELUGA WHALE AUGUST 11, 2010
12-4 NATIONAL MARINE FISHERIES SERVICE
Anchorage Water and Wastewater Utility. Anchorage Water & Wastewater Utility Overview. accessed online at http://www.awwu.biz/website/about_us/aboutawwu.htm.
Arrow, Kenneth, Robert Solow, Paul R. Portney, Edward E. Leamer, Roy Radner and Howard Schuman. 1993. Report of the NOAA Panel on Contingent Valuation. Federal Register, 58: 4601–4614.
Berman, Matthew, Sharman Haley, and Hongjin Kim. 1997. Estimating Net Benefits of Reallocation: Discrete Choice Models of Sport and Commercial Fishing. Marine Resource Economics, Volume 12, p. 307-327.
Bockstael, Nancy E., and Kenneth E. McConnell. 1983. Welfare Measurement in the Household Production Function Framework. American Economic Review 73(4): 806-814;
Boyle, Kevin J. 2003. Introduction to Revealed Preference Methods in Patricia A. Champ, Kevin J. Boyle, and Thomas C. Brown (eds). A Primer on Nonmarket Valuation. Dordrecht, The Netherlands: Kluwer Academic Publishers.
Brown, Eleanor. 1999. “Assessing the Value of Volunteer Activity.” Nonprofit and Voluntary Sector Quarterly 28;3.
Bruce Buzby. 2007. How Coal Mine Projects are Permitted and Regulated in Alaska, Alaska Department of Natural Resources Division of Mining, Land & Water.
Cameron, T.A. 1988. A New Paradigm for Valuing Non-Market Goods Using Referendum Data: Maximum Likelihood Estimation by Censored Logistic Regression. Journal of Environmental Economics and Management 15(3): 355-79. As reported in Freeman III, A. Myrick. 1995. The Benefits of Water Quality Improvements for Marine Recreation: A Review of the Empirical Evidence, Marine Resource Economics, Vol. 10, pp. 385-406.
Cameron, T.A., and M.D. James. 1987. Efficient Estimation Methods for “Close-Ended” Contingent Valuation Surveys. Review of Economics and Statistics 69(2): 269-76 as reported in Freeman III, A. Myrick. 1995. The Benefits of Water Quality Improvements for Marine Recreation: A Review of the Empirical Evidence, Marine Resource Economics Vol. 10, pp. 385-406.
Carson, Richard T., Nicholas E. Flores, and Norman F. Meade. 2001. Contingent Valuation: Controversies and Evidence. Environmental and Resource Economics 19: 173-210.
Census Bureau. 2008. American Fact Finder: Alaska. Accessed online at http://www.census.gov/.
Census Bureau. 2008. American Fact Finder: Anchorage, Alaska. Accessed online at http://www.census.gov/.
Census Bureau. 2008. American Fact Finder: Matanuska-Susitna Borough, Alaska. Accessed online at http://www.census.gov/.
Census Bureau. Population Division. March 19, 2009. Table 8: Resident Population Estimates for the 100 Fastest Growing U.S. Counties with 10,000 or More Population in 2008: April 1, 2000 to July 1, 2008 (CO-EST2008-08).
CFR Vol. 73 No. 200, October 15, 2008.
Chance, Norman. 1990 (updated 1999). Alaska Natives and the Land Claims Settlement Act of 1971. University of Connecticut, Arctic Circle.
SECTION 12 REFERENCES
NATIONAL MARINE FISHERIES SERVICE 12-5
Clark, J. H., A. McGregor, R. D. Mecum, P. Krasnowski and A. M. Carroll. 2006. The Commercial Salmon Fishery in Alaska. Alaska Fishery Research Bulletin 12(1):1-146. Available at http://www.adfg.state.ak.us/pubs/afrb/vol12_n1/clarv12n1.pdf.
Clark, John H., Andrew McGregor, Robert D. Mecum, Paul Krasnowski and Amy M. Carroll. 2006. The Commercial Salmon Fishery in Alaska. Alaska Fishery Research Bulletin, 12(1): 1-46.
Colt, Steve. 2001. The Economic Importance of Healthy Alaska Ecosystems. Institute of Social and Economic Research University of Alaska Anchorage. Alaska Conservation Foundation.
ConocoPhillips Company. United States – Alaska. http://www.conocophillips.com/about/worldwide_ops/country/north_america/alaska.htm accessed April 10, 2009.
ConocoPhillips. 2008. Annual Report, Accessed online at http://www.conocophillips.com/EN/about/company_reports/annual_report/Pages/index.aspx.
Cook Inlet Region, Inc., 2009. Cook Inlet Villages. http://www.ciri.com/content/history/villages.aspx accessed June 10, 2009.
CPI Inflation Calculator. Bureau of Labor Statistics. accessed at http://www.bls.gov/data/inflation_calculator.htm.
Credit Risk Monitor. XTO Energy Inc. Accessed online at http://www.crmz.com/Report/ReportPreview.asp?BusinessId=11773.
Criddle et al. 2003. Participation Decisions, Angler Welfare, and the Regional Economic Impact of Sport fishing. Marine Resource Economics Volume 18, pp. 291-312.
Crocodyl. Collaborative Research on Corporations: Chevron. Accessed online at http://www.crocodyl.org/wiki/chevron.
Cummings, R.G., D.S. Brookshire, and W.D. Schultz, editors. 1986. Valuing Environmental Goods: An Assessment of the Contingent Valuation Method. Rowman & Allanheld Publishers.
Demer, Lisa. February 7, 2009. Group is photo-identifying Inlet belugas. Alaska Daily News http://www.adn.com/wildlife/v-printer/story/683388.html.
Department of the Navy. 2004. Handbook for Preparing, Revising and Implementing Integrated Natural Resources Management Plans on Marine Corp Lands.
DOWL Engineers. September 10, 2007. Seward Highway – Bird to Indian – MP 99-105. PowerPoint presentation at Public Meeting No. 3.
Duffield, John. 1997. Nonmarket Valuation and the Courts: the Case of the Exxon Valdez. Contemporary Economic Policy 15, 4.
Dunker, Kristine J., and Robert Lafferty. 2007. Upper Cook Inlet Personal Use Salmon Fisheries, 2004 – 2006, Fisher Data Series No. 07-88. Alaska Department of Fish and Game, Divisions of Sport Fish and Commercial Fisheries.
FINAL RIR/4(B)(2)/FRFA OF CRITICAL HABITAT DESIGNATION OF COOK INLET BELUGA WHALE AUGUST 11, 2010
12-6 NATIONAL MARINE FISHERIES SERVICE
Elliott D. Pollack and Company. 1999. The Economic and Fiscal Impact of Designation of 60.060 Acres of Privately Owned Land in Pima County, Arizona as Critical Habitat for the Cactus Ferruginous Pygmy- Owl. Prepared for Southern Arizona Homebuilders Association.
Elmendorf Air Force Base. Conservation and Planning Office. 2006. Integrated Natural Resources Management Plan Elmendorf Air Force Base, Alaska.
Encyclopedia.com. Cook Inlet Regional, Inc, http://www.encyclopedia.com/doc/1G1-66939947.html.
Endangered Species Act of 1973, Section 3(3) (as amended by P.L. 94–325, June 30, 1976; P.L. 94–359, July 12, 1976; P.L. 95–212, December 19, 1977; P.L. 95–632, November 10, 1978; P.L. 96–159, December 28, 1979; 97–304, October 13, 1982; P.L. 98–327, June 25, 1984; and P.L. 100–478, October 7, 1988; P.L. 100–653, November 14, 1988; and P.L. 100–707, November 23, 1988).
Environment Protection Agency. 2007. Elmendorf Air Force Base: Alaska. http://yosemite.epa.gov/r10/nplpad.nsf/2fde3874b2354093882568db0068885d/26484783988075b98525659200780850!OpenDocument.
Environmental Protection Agency. 2000. Fact Sheet on NPDES permit issuance for Municipality of Anchorage, John Asplund Water Pollution Control Facility, Anchorage, AK. Accessed online 5/7/09 at: http://yosemite.epa.gov/r10/water.nsf/95537302e2c56cea8825688200708c9a/16dcdebf18bc8ee28825742b006cee6f/$FILE/ATTMP2OQ/AK0022551%20FS.pdf.
Environmental Protection Agency. 2000. Fact Sheet on NPDES permit issuance for Municipality of Anchorage, Girdwood Wastewater Treatment Facility, Girdwood, AK. Accessed online at: http://yosemite.epa.gov/r10/water.nsf/95537302e2c56cea8825688200708c9a/16dcdebf18bc8ee28825742b006cee6f/$FILE/ATT7BRYI/girdwoodfact.PDF.
Environmental Protection Agency. 2000. Guidelines for Preparing Economic Analyses. EPA 240-R-00-003. September 2000. accessed at http://yosemite.epa.gov/ee/epa/eed.nsf/webpages/Guidelines.html.
Environmental Protection Agency. 2005. Fact Sheet on NPDES permit issuance for City of Kenai Wastewater Treatment Facility, Kenai, AK. Accessed online 5/7/09 at: http://yosemite.epa.gov/r10/water.nsf/NPDES+Permits/CurrentAK822/$FILE/AK0021377+FS.pdf.
Environmental Protection Agency. 2005. Fact Sheet on NPDES permit issuance for Municipality of Anchorage, Eagle River Wastewater Treatment Facility, Eagle River, AK. Accessed online at: http://yosemite.epa.gov/R10/WATER.NSF/NPDES+Permits/CurrentAK822/$FILE/AK0022543%20FS.pdf.
Environmental Protection Agency. 2006. Chuitna Coal Project Supplemental Environmental Impact Statement: Scoping Responsiveness Summary.
Environmental Protection Agency. 2006. Draft Scoping Document for the Chuitna Coal Project Supplemental Environmental Impact Statement.
Environmental Protection Agency. Facility Registry System (FRS). www.epa.gov/enviro/index.html, accessed May 14, 2009.
Executive Order 12866. Regulatory Planning and Review, Section 1(a). September 30, 1993.
SECTION 12 REFERENCES
NATIONAL MARINE FISHERIES SERVICE 12-7
Executive Order 13211. Actions Concerning Regulations that Significantly Affect Energy Supply, Distribution, or Use. May 18, 2001; 5.U.S.C. §601 et seq; and Pub Law No. 104-121.
Fall, James A., David Koster, and Brian Davis. 2006. Subsistence Harvests of Pacific Halibut in Alaska, 2005. Technical Paper 320. Division of Subsistence, Alaska Department of Fish and Game. December.
Federal Energy Regulation Commission. April 17, 2007. Order issuing Preliminary Permit and Denying Competing Application. ORPC Alaska, Project No. 12679-000.
Federal Energy Regulation Commission. June 11, 2007. Order issuing Preliminary Permit, Chevron Technology Ventures, Project No. 12744-000.
Federal Energy Regulation Commission. June 7, 2007. Order issuing Preliminary Permit, Alaska Tidal Energy Company, Project No. 12705-000.
Federal Register. April 14, 2009. Vol. 74, No. 70.
Federal Register. August 9, 2005. Vol. 70, No. 152. pp. 46366-46386.
Federal Register. December 16, 2008. Vol. 73, No. 242. pp. 76453-76469.
Federal Register. October 27, 2005. Vol. 70, No. 207. pp. 61988-61989.
Freeman III, A. Myrick. 1995. The Benefits of Water Quality Improvements for Marine Recreation: A Review of the Empirical Evidence, Marine Resource Economics. Vol. 10, pp. 385-406.
Fried, Neal, Brigitta Windisch-Cole. 2006. The Military is Big Business in Anchorage, Alaska Economic Trends, Volume 26 (6).
Global Insight. 2004. The Alaska Tourism Satellite Account: A Comprehensive Analysis of the Economic Contribution of Travel and Tourism. prepared for the Alaska Department of Commerce, Community and Economic Development.
Global Security. 2005. Fort Richardson/Camp Carroll/ Camp Denali. http://www.globalsecurity.org/military/facility/fort-richardson.htm
Gramlich, Edward M. 1990. A Guide to Benefit-Cost Analysis (2nd Ed.). Prospect Heights, Illinois: Waveland Press, Inc.
H.R. Rep. No. 95-1625, at 16-17 (1978), 1978 U.S.C.A.N. 9453, 9466-67.
Hamel et al. 2001. An Economic Discussion of the Marine Sport Fisheries in Central and Lower Cook Inlet. International Institute for Fisheries Economics and Trade, Corvallis, OR, 2000.
Hausman, Jerry A. 1993. Report of Professor J. A. Hausma. presented at the Exxon Valdez consolidated court case, as reported in Duffield, John. 1997. Nonmarket Valuation and the Courts: the Case of the Exxon Valdez. Contemporary Economic Policy, 15, 4.
Henderson, Michelle M., Keith R. Criddle, and S. Todd Lee. 1999. The Economic Value of Alaska’s Copper River Personal Use and Subsistence Fisheries. Alaska Fishery Research Bulletin, Vol. 6, No. 2.
FINAL RIR/4(B)(2)/FRFA OF CRITICAL HABITAT DESIGNATION OF COOK INLET BELUGA WHALE AUGUST 11, 2010
12-8 NATIONAL MARINE FISHERIES SERVICE
Herrmann et al. 2001. A Survey of Participants in the Lower and Central Cook Inlet Halibut and Salmon Sport Fisheries. Alaska Fishery Research Bulletin. Vol. 8 No. 2.
Herrmann, M., S.T. Lee, C. Hamel, K.R. Criddle, H.T. Geier, J.A. Greenberg and C.E. Lewis. 2001. An Economic Assessment of the Sport Fisheries for Halibut, Chinook and Coho Salmon in Lower and Central Cook Inlet. Final Report. OCS Study MMS 2000-061, University of Alaska Coastal Marine Institute, University of Alaska Fairbanks and USDOI, MMS, Alaska OCS Region.
Hine, Rachel, Jo Peacock, and Jules Pretty. 2008. Evaluating the Impact of Environmental Volunteering on Behaviours and Attitudes to the Environment for the British Trust of Conservation Volunteers.
Home Builders Association of No. Calif. et al., v. U.S. Fish and Wildlife Service, 2006 U.S. Dist. LEXIS 80255 at 45-46 (E.D. Cal., Nov. 1, 2006).
Id. at 54, citing Butte Envtl. Council v. Norton, slip op., 04-0096, at 12 (N.D. Cal. Oct. 28, 2004).
Industrial Economics, Incorporated (IEc). 2003. Economic Analysis of Critical Habitat Designation for the Gulf Sturgeon. Prepared for the Division of Economics, U.S. Fish & Wildlife Service.
KABATA (Knik Arm Bridge and Toll Authority) and ADT&PF (Alaska Department of Transportation and Public Facilities). 2007. Knik Arm Crossing Final Environmental Impact Statement and Final Section (4)f Evaluation. prepared for: Federal Highway Administration, December 18, 2007.
KABATA (Knik Arm Bridge and Toll Authority). 2008. Knik Arm Crossing Project Milestone and Schedule. http://www.knikarmbridge.com/schedule.html, accessed April 10, 2009.
Kenai Peninsula Borough. 2005. Kenai Peninsula Borough Comprehensive Plan Draft, Chapter 3: Economics, http://www.borough.kenai.ak.us/planningdept/plan/2005/Chapter%203.pdf
Kenai River Sport fishing Association. March 2006. Economic Values of Sport, Personal Use, and Commercial Salmon Fishing in Upper Cook Inlet.
Kenai River Sport fishing Association. March 2006. Economic Values of Sport, Personal Use, and Commercial Salmon Fishing in Upper Cook Inlet. citing ISER, 1996.
Kenai River Sport fishing Association. March 2006. Economic Values of Sport, Personal Use, and Commercial Salmon Fishing in Upper Cook Inlet. citing ADF&G, 2005.
Kenaitze Indian Tribe. http://www.kenaitze.org/. Accessed April 2009.
Klouda, Naomi. April 15, 2009. Coal contract favors PacRim: Mayor Carey weighs opinions on Ladd Landing, addresses beluga whale issues. Homer Tribune.
LGL Alaska Research Associates, Inc. April 2007. Monitoring Beluga Whale (Delphinapterus leucas) Distribution and Movements in Turnagain Arm along the Seward Highway. prepared for HDR Alaska, Inc. on behalf of Alaska Department of Transportation & Public Facilities.
Linxwiler, James D. 2007. The Alaska Native Claims Settlement Act at 35: Delivering on the Promise. Paper 12, 53rd Annual Rocky Mountain Mineral Law Institute.
Loomis, J.D. 1988. The Bioeconomic Effects of Timber Harvesting on Recreational and Commercial Salmon and Steel Head Fishing: A Case Study of the Siuslaw National Forest. Marine Resource Economics 5:43-60. As reported in Freeman III, A. Myrick. 1995. The Benefits of Water Quality
SECTION 12 REFERENCES
NATIONAL MARINE FISHERIES SERVICE 12-9
Improvements for Marine Recreation: A Review of the Empirical Evidence, Marine Resource Economics. Vol. 10, pp. 385-406.
Loomis, John B. and Douglas M. Larson. 1994 Total Economic Values of Increasing Gray Whale Populations: Results from a contingent valuation survey of visitors and households. Marine Resource Economics, 9: 275-286.
Loomis, John, Shizuka Yorizane, and Douglas Laron. 2000. Testing Significance of Multi-Destination and Multi-Purpose Trip Effects in a Travel Cost Method Demand Model for Whale Watching Trips. Agriculture and Resource Economics Review, 29/2, 183-191.
Loomis, John. 2005. Updated Outdoor Recreation Use Values on National Forests and Other Public Lands. USDA Forest Service. General Technical Report PNW-GTR-658.
Loomis, John. 2005. Updated Outdoor Recreation Use Values on National Forests and Other Public Lands. USDA Forest Service General Technical Report PNW-GTR-658.
MacNair, Doug. 1993. 1993 RPA recreation valuation database. Washington, DC: USDA Forest Service, RPA Program; Contract 43-4568-3-1191. As reported in Rosenberger, Randall and John Loomis. 2001. Benefit Transfer of Outdoor Recreation Use Values. USDA Forest Service General Technical Report RMRS-GTR-72.
Marathon. Living Our Values 2008 Corporate Social Responsibility Report. Accessed at http://www.marathon.com/lov2008/content-id5.shtml.
Matanuska-Susitna Borough and Federal Transit Administration. 2006. Final Cook Inlet Ferry Supplemental Environmental Assessment. Available online:
Matanuska-Susitna Borough. 2008. Port Mackenzie Ferry Terminal Building Project Facts. Available online: http://www.matsugov.us/administration/projects/pdf/FerrTerminal012307.pdf, accessed April 20, 2009.
Matanuska-Susitna Borough. 2009. Cook Inlet Ferry Project Facts. Available online: http://www.matsugov.us/administration/projects/pdf/CookInletFerry012607.pdf. Accessed April 15, 2009.
Matanuska-Susitna Borough. 2009. Mat-Su Economic Development Guide. accessed April 1, 2009.
Matanuska-Susitna Borough. August 2008. Airport Location Study. Matanuska-Susitna Borough Regional Aviation Plan. prepared by DOWL Engineers.
Matanuska-Susitna Borough. The E-Craft Motor Vessel Susitna, Frequently Asked Questions. http://ww1.matsugov.us/ferry/index.php?option=com_content&view=category&id=1&Itemid=5. Accessed April 15, 2009.
Matanuska-Susitna Borough.2009. Proposed Annual Budget for the Fiscal Year Ending June 30, 2009.
Mauer, Richard. April 2, 2009. Volcano Status Lowered; Oil to be Moved. Anchorage Daily News.
McCollum, D.W., and S.M. Miller. 1994. Alaska Voters, Alaska Hunters, and Alaska Nonresident Hunters: Their Wildlife Related Trip Characteristics and Economics. Anchorage: Alaska Department of Fish and Game, Division of Wildlife Conservation, as reported in Colt, Steve. 2001. The
FINAL RIR/4(B)(2)/FRFA OF CRITICAL HABITAT DESIGNATION OF COOK INLET BELUGA WHALE AUGUST 11, 2010
12-10 NATIONAL MARINE FISHERIES SERVICE
Economic Importance of Healthy Alaska Ecosystems. Institute of Social and Economic Research University of Alaska Anchorage. Alaska Conservation Foundation.
McDowell Group, DataPath Systems, and Davis, Hibbitts, & Midghall, Inc. 2007. Alaska Visitors Statistics Program: Alaska Visitor Volume and Profile, Summer 2006 for the State of Alaska Department of Commerce, Community and Economic Development.
Memorandum of Understanding for Coordinated Interagency Fish and Wildlife Management for Subsistence Uses on Federal Public Lands in Alaska, Signed, December 18, 2008.
Milkowski, Stefan. April 30, 2009. The Politics of Species Protection in Alaska. The New York Times, Green Inc.: Energy the Environment and the Bottom Line, http://greeninc.blogs.nytimes.com/2009/04/30/the-politics-of-species-protection-in-alaska/?pagemode=print, accessed May 15, 2009.
Mitchell, Robert C., and Richard T. Carson. 1989. Using Surveys to Value Public Goods: The Contingent Valuation Method, Washington, D.C.: Resources for the Future.
Municipality of Anchorage Watershed Management Services (WMS). 2009. http://wms.geonorth.com/permit_guidance/PermitGuidance.aspx accessed on May 14, 2009.
Municipality of Anchorage, Traffic Department. 2009. Transportation Improvement Program. accessed May 1, 2009.
Municipality of Anchorage, Traffic Department. published December 2005 and revised April 2007. Anchorage Bowl 2025 Long-Range Transportation Plan with 2027 Revisions, Anchorage, Alaska.
National Marine Fisheries Service, and Cook Inlet Marine Mammal Council. December 2008. Cook Inlet Beluga Whale Subsistence Harvest Management Plan Brochure. available at: http://www.fakr.noaa.gov/protectedresources/whales/beluga/harvestplan/brochure1208.pdf.
National Marine Fisheries Service, Northwest Fisheries Science Center. August 2005. Final Economic Analysis of Critical Habitat Designation for 12 West Coast Salmon and Steelhead ESUs..
National Marine Fisheries Service. 2008. Alaska Division Restricted Access Management Program, Alaska Subsistence Halibut Program, Small Entity Compliance Guide, October 2008.
National Marine Fisheries Service. 2008. Frequently Asked Questions, Alaska Subsistence Halibut Program, Restricted Access Management Program, Revised, October, Available at: http://www.fakr.noaa.gov/ram/subsistence/faq1008.pdf.
National Marine Fisheries Service. Alaska Fisheries Science Center. October 2008. 2008 Supplemental Status Review and Extinction Assessment of Cook Inlet Belugas (Delphinapterus leucas).
National Marine Fisheries Service. October 2008. Conservation Plan for the Cook Inlet Beluga Whale.
National Oceanic and Atmospheric Administration. Agreement between the National Marine Fisheries Service and the Cook Inlet Marine Mammal Council for the Co-Management of the Cook Inlet Stock of Beluga Whale for the Years 2000, 2001, 2002, and 2006.
SECTION 12 REFERENCES
NATIONAL MARINE FISHERIES SERVICE 12-11
National Oceanic and Atmospheric Administration. News Release Dated April 19, 2007. “NOAA Recommends Listing Cook Inlet Belugas Under Endangered Species Act.” http://www.publicaffairs.noaa.gov/releases2007/apr07/noaa07-r108.html. Accessed April 2009.
Ninilchik Traditional Council. Description. http://www.ninilchiktribe-nsn.gov/description.html. Accessed April 2009.
Norris, Frank. September 2002. Alaska Subsistence: A National Park Service Management History, Alaska Support Office, National Park Service, U.S. Department of Interior, Anchorage, Alaska.
Northern Dynasty Minerals, Ltd. 2009. The Pebble Project: The Future of U.S. Mining and Minerals, The Pebble Deposit. http://www.northerndynastyminerals.com/ndm/Pebble.asp (accessed May 1, 2009).
Northern Dynasty Minerals, Ltd. February 13, 2009. Technical Report on the 2008 Program and Update on Mineral Resources and Metallurgy Pebble Copper-Gold-Molybdenum Project Iliamna Lake Area Southwestern Alaska, U.S.A. http://www.northerndynastyminerals.com/i/pdf/ndm/2009-02-13_NI43-101.pdf .
Northern Dynasty Minerals, Ltd. News Release Dated March 19, 2009. “US $59 Million Work Program to Prepare Pebble Project for Permitting.” http://www.northerndynastyminerals.com/ndm/NewsReleases.asp?ReportID=342004&_Area=News-Releases&_Title=US-59-Million-Work-Program-To-Prepare-Pebble-Project-For-Permitting. Accessed April 2009.
O’Brien, Liz, Mardle Townsend, and Matthew Ebden. 2008. Environmental Volunteering: Motivations, Barriers, and Benefits. Report to the Scottish Forestry Trust and Forestry Commission.
Ocean Renewable Power Company Alaska, LLC. May 2006. Application for Preliminary Permit. Before the United States Federal Energy Regulatory Commission (FERC). Docket No. P-12679-000.
Ocean Renewable Power Company. 2009. OCGenTM Projects Alaska. http:///www.oceanrenewablepower.com/ocgenproject_alaska.htm, accessed April 23, 2009.
Office of Management and Budget. 2001. Memorandum for Heads of Executive Department Agencies and Independent Regulatory Agencies, Guidance for Implementing E.O. 13211, M-01-27, Office of Management and Budget, http://www.whitehouse.gov/omb/memoranda/m01-27.html, accessed July 31, 2001.
Office of Management and Budget. Circular A-4. http://www.whitehouse.gov/omb/circulars/a004/a-4.pdf, September 17, 2003.
Ormat Technologies. Sept. 11, 2008. News Release, Ormat Technologies, Inc. Secures Geothermal Rights in Alaska. Accessed at http://www.ormat.com/relation.php?did=84.
Pendleton, Linwood and Jamie Rookie. 2006. Understanding the Potential Economic Impact of Marine Recreational Fishing: California. Working Paper accessed at http://www.dfg.ca.gov/MLPA/pdfs/binder3di.pdf in July, 2099.
Pendleton, Linwood H. 2006. Understanding the Potential Economic Impact of Marine Wildlife Viewing and Whale Watching in California: Using the Literature to Support Decision-Making for the Marine Life Protection Act. Working Paper accessed at http://www.dfg.ca.gov/mlpa/pdfs/binder3dii.pdf in July, 2009.

FINAL RIR/4(B)(2)/FRFA OF CRITICAL HABITAT DESIGNATION OF COOK INLET BELUGA WHALE AUGUST 11, 2010
12-12 NATIONAL MARINE FISHERIES SERVICE
Phillips, Spencer, Robert Silverman, and Anne Gore. 2008.Greater than Zero: Toward the Total Economic Value of Alaska’s National Forest Wildlands. The Wilderness Society.
Port MacKenzie. 2007. Port MacKenzie Deep Draft Dock: Matanuska-Susitna Borough Project Facts. updated January 2007. http://www.matsugov.us/administration/projects/pdf/DeepDraftDock012307.pdf, accessed May 1, 2009.
Port MacKenzie. 2008. Long-Term Vision for Future of Commercial Transportation Users. Presentation at Alaska Regional Ports Conference, January 10-11, 2008, http://www.poa.usace.army.mil/en/cw/AK%20Regional%20Ports%20Study/Panel1_MarcVanDongen.pdf, accessed April 15, 2008.
Port of Anchorage. 2009. Intermodal Expansion Project. accessed April 25, 2009 at http://www.portofanchorage.org/ov_project.html.
Prevost, Jim. 2000. On Track at Kenai’s LNG Plant. Alaska Business Monthly.
Putnam, Robert D. 2000. Bowling Alone: The Collapse and Revival of American Community. New York: Simon & Schuster, p.19.
Queirolo,Lewis E. Ph.D. 2005. Conducting Economic Impact Analyses. NMFS Alaska Region, Juneau, Alaska. July 29.
Ramos, Amanda, Chris Kaplan, Matt Nemeth and Guy Wade. 2006. Chuitna Coal Project Monthly project report for marine fish and mammal studies – August 1 through August 31, 2006, LGL Alaska Research Associates, Inc., Anchorage, AK for DRven Corporation, Anchorage, AK.
Reynolds, John E, Helene Marsh, and Timothy J. Regan. 2009. Marine Mammal Conservation. Endangered Species Research 7: 23-28.
Robert Rodrigues, Matt Nemeth, Tim Markowitz and Dale Funk. 2006. Review of literature on fish species and beluga whales in Cook Inlet, Alaska. Final report prepared by LGL Alaska Research Associates, Inc., Anchorage, AK, for DRven Corporation, Anchorage, AK.
Rosenberger, Randall and John Loomis. 2001. Benefit Transfer of Outdoor Recreation Use Values. USDA Forest Service General Technical Report RMRS-GTR-72.
Rowe, R.D., E.R. Morey, A.D. Ross, and W.D. Shaw. 1985. Valuing Marine Recreation Fishing on the Pacific Coast, Energy and Resource Consultants, Boulder CO. As reported in Freeman III, A. Myrick, 1995, The Benefits of Water Quality Improvements for Marine Recreation: A Review of the Empirical Evidence, Marine Resource Economics, Vol. 10, pp. 385-406.
Saguaro. 2000. Better Together: The Report of the Sagauro Seminar on Civic Engagement in America. Harvard University, Kennedy School of Government.
Sheilds, Pat. 2007. Alaska Department of Fish and Game, Division of Sport Fish and Commercial Fisheries, December 2007. Upper Cook Inlet Commercial Fisheries Annual Management Report, 2007. Fishery Management Report No 07-64.
Smart Briefs. Tesoro Corporation. Accessed online at http://www.smartbrief.com/news/aaaa/companyData.jsp?companyId=722.
SECTION 12 REFERENCES
NATIONAL MARINE FISHERIES SERVICE 12-13
Southwick Associates, William Romberg, Allen Bingham, Gretchen Jennings, and Robert Clark. 2008. Economic Impacts and Contributions of Sport fishing in Alaska, 2007. prepared for the Alaska Department of Fish and Game, Division of Sport Fish, Professional Publication No. 08-01.
Stanek, Ronald T., David L. Holden, and Crystal Wassillie. 2007. Harvest and Uses of Wild Resources in Tyonek and Beluga Alaska: 2005-6. Alaska Department of Fish and Game, Division of Subsistence. Technical Paper 321, November, 2007.
State of Alaska. Ted Stevens International Airport, Airport Statistics. http://www.dot.state.ak.us/anc/business/airServiceDevelopment/statistics/index.shtml
Stigall, Russell. February 27, 2007. Mat-Su Valley Frontiersman. Tidal Power Plan in Works. http://www.frontiersman.com/articles/2007/02/25/news/news1.txt.
Stone, Norman, Robert G. Lindblom. 1987. Energy Insurance for Anchorage, Alaska – Beluga River Gas Field, Cook Inlet: Abstract. AAPG Bulletin, Volume 71.
TDX Power. Chakachamna Hydroelectric Licensing Web Site. http://www.chakachamna-hydro.com/about_the_project/geographic_setting.php accessed April 23, 2009.
Ted Stevens Anchorage International Airport web site. Airport Statistics. http://www.dot.state.ak.us/anc/business/airServiceDevelopment/statistics/index.shtml, accessed April 21, 2009.
Tesoro Corporation. Tesoro Refineries Kenai Refinery/ Tesoro Alaska. http://www.tsocorp.com/TSOCorp/ProductsandServices/Refining/KenaiAlaskaRefinery/KenaiAlaskaRefinery accessed April 9, 2009.
The Pebble Partnership. Jobs & Business Opportunities, Overview. http://www.pebblepartnership.com/pages/jobs-business-opportunities/opportunities.php accessed May 1, 2009.
The Pebble Partnership. Road, Port, and Power. http://www.pebblepartnership.com/pages/project-information/road-port-power.php accessed May 1, 2009.
The Port of Anchorage. Intermodal Expansion Project. http://www.portofanchorage.org/ov_project.html?15,22, accessed May 3, 2009.
Timothy, Jackie and David Petree. May 2004.Alaska Department of Fish and Game, 2003 Annual Mariculture Report. Regional Information Report No. 5j04-05.
U.S. Army Alaska. 2009. Draft Stationing and Training of Increased Aviation Assets within U.S. Army Alaska Environmental Impact Statement.
U.S. Army Garrison Alaska. 2006. 2007-2011 Integrated Natural Resources Management Plan. Volume II, Annex D Fish and Wildlife Management.
U.S. Department of Energy. National Energy Technology Laboratory. 2006. Alaska Natural Gas Needs and Market Assessment.
U.S. Department of Interior. Bureau of Land Management. 2006. Anchorage Field Office FY 2006 NEPA Register. http://www.blm.gov/ak/st/en/info/nepa/afo_nepa/afo_nepa_fy2006.html.
FINAL RIR/4(B)(2)/FRFA OF CRITICAL HABITAT DESIGNATION OF COOK INLET BELUGA WHALE AUGUST 11, 2010
12-14 NATIONAL MARINE FISHERIES SERVICE
U.S. Environmental Protection Agency. Fact Sheet on NPDES Permit Number: AK-000039-6. “The U.S. Environmental Protection Agency Plans to Issue a Wastewater Discharge Permit to: Cook Inlet Pipeline Company Drift River Terminal, and the State of Alaska proposes to Certify the Permit.” http://yosemite.epa.gov/r10/WATER.NSF/NPDES+Permits/CurrentAK822/$FILE/AK0000396FS.pdf. Accessed May 2009.
U.S. Fish and Wildlife Service. 2007. Endangered Species and Habitat Conservation Planning. http://endangered.fws.gov/hcp/, accessed November 8, 2007.
U.S. Fish and Wildlife Service. 2009. Endangered Species Program, Species Profile American Peregrine Falcon (Falco Peregrinus Anatum). http://Ecos.Fws.Gov/Speciesprofile/Speciesreport.Do?Spcode=B01h, Accessed April 28, 2009.
U.S. Fish And Wildlife Service. 2009. Environmental Conservation Online System, Species Profile, Steller Sea-Lion (Eumetopias Jubatus) Http://Ecos.Fws.Gov/Speciesprofile/Speciesreport.Do?Spcode=A0fs. Accessed April 29, 2009.
U.S. Fish and Wildlife Service. 2009. Threatened and Endangered Species System Environmental Conservation Online System Steller's Eider (Polysticta stelleri) http://ecos.fws.gov/speciesProfile/SpeciesReport.do?spcode=B090. accessed April 27, 2009.
U.S. Fish and Wildlife Service. 2009. Threatened and Endangered Species System. Environmental Conservation Online System. Short-tailed albatross (Phoebastria (=Diomedea) albatrus). http://ecos.fws.gov/speciesProfile/SpeciesReport.do?spcode=B00Y.
U.S. Fish and Wildlife Service. 2009. Threatened and Endangered Species System Short-tailed Albatross Fact Sheet. http://alaska.fws.gov/fisheries/endangered/pdf/STALfactsheet.pdf, accessed April 27, 2009.
U.S. Fish and Wildlife Service. 2009. Threatened And Endangered Species System. Environmental Conservation Online System. Chinook Salmon (Oncorhynchus (=Salmo) Tshawytscha). Http://Ecos.Fws.Gov/Speciesprofile/Speciesreport.Do?Spcode=E06d. Accessed April 27, 2009.
U.S. Fish and Wildlife Service. August 2005. Sea Otters in SW Alaska Listed as Threatened. http://alaska.fws.gov/media/seaotter2004/SeaOtterQ&A.pdf.
U.S. Fish And Wildlife Service.2009. Endangered Species Program, Species Profile Northern Sea Otter (Enhydra Lutris Kenyoni). Accessed April 29, 2009.
U.S. Fish and Wildlife Service.2009. Threatened and Endangered Species System. Steller’s Eider Fact Sheet. http://alaska.fws.gov/media/StellEider_FactSheet.htm. accessed April 27, 2009.
U.S. Maritime Administration. 2006. Cherry Hill Material Extraction and Transport Environmental Assessment Final.
Unified Command. 2009. News Release Correction: Unified Command Drift River Fact Sheet No. 2: Drift River Terminal Containment, Tank Volumes, http://www.chevron-pipeline.com/pdf/unified_command8.pdf.
Unified Command. 2009. Update: Drift River Terminal Oil Volumes Reduced Prior to Volcano Activity Increase, http://www.chevron-pipeline.com/pdf/unified_command19.pdf.

SECTION 12 REFERENCES
NATIONAL MARINE FISHERIES SERVICE 12-15
United States Department of Commerce. NOAA Fisheries.2009. Office of Protected Resources, “Harbor Seal (Phoca vitulina). http://www.nmfs.noaa.gov/pr/species/mammals/pinnipeds/harborseal.htm. accessed April 29, 2009.
Wegge, T.C., R.T. Carson, and W.M. Hanemann. 1988. Site Quality and the Demand for Sport fishing for Different Species in Alaska, in Proceedings of the Symposium Demand and Supply of Sport fishing. David S. Liao, ed. South Carolina Wildlife and Marine Service, Southwest.
White, Rindj. 2008. Mat-Su presses for ferry landing south of Ship Creek Mouth. Anchorage Daily News. Published October 25, 2008. Available online: http://www.adn.com/news/alaska/story/568005.html, accessed April 20, 2009.
Wolfe, Barbara, L. and Robert H. Haveman. 2002. Social and Nonmarket Benefits from Education in an Advanced Economy. Conference Series 47, Education in the 21st Century: Meeting the Challenges of a Changing World.
Wolfe, Robert J. 2000. Subsistence in Alaska: A Year 2000 Update. Juneau Alaska: Division of Subsistence, Alaska Department of Fish and Game, 4pp.
Wolfe, Robert J. and Robert J. Walker. 1987. Subsistence Economies in Alaska: Productivity, Geography, and Development Impacts. Arctic Anthropology, 24:2, 56-81 as reported in Duffield, John. 1997. Nonmarket Valuation and the Courts: the Case of the Exxon Valdez. Contemporary Economic Policy, 15, 4.
Wolfe, Robert J., James A. Fall, Monica Riedel.2009. The Subsistence Harvest of Harbor Seals and Sea Lions by Alaska Natives in 2007. Alaska Department of Fish and Game, Division of Subsistence, Technical Paper 345, March, 2009.
Personal Communications Alaska Chamber of Commerce. 2009.Personal communication with ENTRIX staff, April 23.
Alaska Convention and Visitors Bureau. 2009. Personal communication with ENTRIX staff, April 22.
Benter, Brad. 2009. U.S. Fish and Wildlife Service. Personal communication with ENTRIX staff, June 5.
Brelsford, Taylor. 2009. Senior Environmental Scientist, URS. Personal communication with ENTRIX, April 30.
Brix, Kaja. 2008. Assistant Administrator for Protected Resources, Alaska Region, United States Department of Commerce, NOAA, NMFS. October 7. letter to Jerry O. Ruehle, Central Region Environmental Manager, Department of Transportation and Public Facilities, Anchorage, Alaska.
Broadhead, Linda. 2009. Homer Chamber of Commerce, Visitor Services Manager. Personal communication with ENTRIX staff on May 20.
Buklis, Larry. 2009. Fisheries Division Supervisor, Office of Subsistence Management, USFWS, Anchorage, Alaska. Personal communication with ENTRIX staff on May 12.
Carlson, Barbara. 2009. Executive Director, Friends of the Coastal Anchorage Coastal Wildlife Refuge. Personal communication with ENTRIX staff, June 17.

FINAL RIR/4(B)(2)/FRFA OF CRITICAL HABITAT DESIGNATION OF COOK INLET BELUGA WHALE AUGUST 11, 2010
12-16 NATIONAL MARINE FISHERIES SERVICE
Carroll, Leo. 2009. Special Projects, Port of Anchorage. Personal communication with ENTRIX staff on June 9.
Christopher R., Sauer, P.E. March 31, 2009. Letter to Ms. Kimberly D. Bose, Federal Energy Regulation Commission re: Cook Inlet Tidal Energy Project (P-12679) Progress Report No. 4.
Colberg, Talis J.2009. Memo from Alaska Attorney General “Sixty Day Notice of Intent to Sue for Violations of the Endangered Species Act; improperly determining endangered status for a Distinct Population Segment of the beluga whale (Delphinapterus leucas) found in Cook Inlet, Alaska”, January 12. http://www.fakr.noaa.gov/protectedresources/whales/beluga/ci_state_suit/60day_intenttosue011209.pdf, accessed May 5, 2009.
Davis, Danny. 2009. Escopeta Oil President. Personal communication with ENTRIX staff, on August 5.
Dorety, David. 2009. Renaissance Alaska, Ltd. Personal communication with ENTRIX staff on August 5.
Duffy, John. 2009. Manager, Matanuska-Susitna Borough. Personal communication with ENTRIX staff on May 6.
Dutton, Karla. 2009. Alaska Program Director, Defenders of Wildlife – Alaska Office. Personal communication with ENTRIX staff on May 15.
Explore Tours. 2009. Personal communication with ENTRIX staff, April 22.
Gilbert, Stephen E. 2008. Director, Program Management Office, Alaska Communications System, February 1, 2008, letter to Brad Smith, United States Department of Commerce, NOAA, NMFS, Protected Species Division, Anchorage, Alaska.
Gilbert, Stephen E. 2009. Director, Program Management Office, Alaska Communications System, Personal communication with ENTRIX staff, April 16.
Gilbert, Steve. 2009. Chugach Electric Association. Personal communication with ENTRIX staff, April 23.
Gonzalez, Santana. 2009. State Government Affairs, Chevron. Personal communication with ENTRIX staff, May 28.
Guey-Lee, William. 2008. Federal Energy Regulation Commission. June 30. Letter to Mr. Mike Hoover, Oceana Energy Company on behalf of Alaska Tidal Energy Company, re: Central Cook Inlet tidal Energy Project, Project No. 12705-000.
Havelock, Brian. 2009. Natural Resource Specialist, Alaska Department of Natural Resources, Division of Oil and Gas. Personal communication with ENTRIX staff, April 8.
Hoover, Mike, Alaska Tidal Energy Company. May 30, 2008. Letter to Ms. Kimberly D. Bose, Federal Energy Regulation Commission re: Six-Month Progress Report #2 P-12705-000 (Central Cook Inlet tidal Energy Project);
Hoover, Mike, Alaska Tidal Energy Company. November 30, 2007. Letter to Ms. Kimberly D. Bose, Federal Energy Regulation Commission re: Six-Month Progress Report #1 P-12705-000 (Central Cook Inlet tidal Energy Project);
SECTION 12 REFERENCES
NATIONAL MARINE FISHERIES SERVICE 12-17
Hoover, Mike, Alaska Tidal Energy Company. November 30, 2008. Letter to Ms. Kimberly D. Bose, Federal Energy Regulation Commission re: Six-Month Progress Report #3 P-12705-000 (Central Cook Inlet tidal Energy Project).
Hoover, Mike. 2009. Alaska Tidal Energy Company. April 20. Letter to Ms. Kimberly D. Bose, Federal Energy Regulation Commission re: Request for Extension of Time to File NOI and Draft License Application P-12705-000 (Central Cook Inlet tidal Energy Project).
Kathleen, 2009, Oceana Energy Company. Personal communication with ENTRIX staff, August, 6.
Kirkpatrick, Kerry. 2009. Mapping/GIS Supervisor, Alaska Department of Transportation & Public Facilities. Personal communication with ENTRIX staff on April 13.
Lance, Brian. 2009. Fisheries Biologist, U.S. Department of Commerce, NOAA, NMFS. Personal communication with ENTRIX staff, May 4.
Larsen, Gary. 2009. Fort Richardson Environmental Chief. Personal communication with ENTRIX staff on May 5.
Lucas, Joe. 2009. Project Manager of Chuitna Coal Mine. Personal Communication with ENTRIX staff on April 17.
Mahoney, Barbara. 2009. National Marine Fisheries Management Biologist. Personal communication with ENTRIX staff, April 23 and May 6.
Matkin, Craig. 2009. Director, North Gulf Oceanic Society. Personal communication with ENTRIX staff, May 20.
McCulloch, Miriam. 2009. Alaska Department of Transportation & Public Facilities. Personal communication with ENTRIX staff on May 4.
Mecum, Robert D. 2008. Acting Administrator, Alaska Region, United States Department of Commerce, NOAA, NMFS, April 18. Letter to Stephen E. Gilbert, Director, Program Management Office, Alaska Communications System.
Meehan, Joe. 2009. Alaska Department of Fish and Game, Coordinator for Land and Refuge Program. Personal communication with ENTRIX staff, May 8.
Migura, Mandy. 2009. Cook Inlet beluga whales, marine mammal strandings, United States Department of Commerce, NOAA, NMFS, Alaska Region, Anchorage Field Office. Personal communication with ENTRIX staff on April 29, 2009.
Morrison, Tom. 2009. Tom Morrison & Associates. Personal communication with ENTRIX staff, August, 6.
Morrison, Tom. 2009. Tom Morrison & Associates. Personal communication with ENTRIX staff, August, 6.
Mortensen, Tom. 2009. Agent for Diamond Point, LLC. Personal communication with ENTRIX staff, April 16.
National Marine Fisheries Service. 2007. Letter to U.S. Army Corps of Engineers. May 14.
Novotny, Mary. 2009. Aurora Gas. Personal communication with ENTRIX staff on August 5.
FINAL RIR/4(B)(2)/FRFA OF CRITICAL HABITAT DESIGNATION OF COOK INLET BELUGA WHALE AUGUST 11, 2010
12-18 NATIONAL MARINE FISHERIES SERVICE
Ormat Technologies. 2009. Personal communication with ENTRIX staff, April 27.
Patty, 2009. PacRim Coal. Personal communication with ENTRIX staff, August, 6.
Paulson, Dale. 2009. Deputy Executive Director of Project Development, Knik Arm Bridge and Toll Authority. Personal communication with ENTRIX staff, May 4.
Queirolo, Lewis Ph.D. August 17, 2009. National Marine Fisheries Service, Alaska Region. Personal communication with ENTRIX staff.
Sauer, Christopher R., P.E. March 31, 2009. Letter to Ms. Kimberly D. Bose, Federal Energy Regulation Commission re: Cook Inlet Tidal Energy Project (P-12679) Draft Pilot License Application
Sauer, P.E., Christopher R. 2009. March 31. Letter to Ms. Kimberly D. Bose, Federal Energy Regulation Commission re: Cook Inlet Tidal Energy Project (P-12679) Progress Report No. 4.
Smith, Brad. 2009. Management Biologist, National Marine Fisheries Service. Personal communication with ENTRIX staff, May 6, May 13 and June 4.
Smith, Mike. 2009. Pebble Partnership. Personal Communication with ENTRIX staff on April 20 and May 1.
Stambaugh, Sharman. 2009. Program Manager, Alaska Department of Environmental Protection, Division of Water, Wastewater Discharge Authorization. Personal communication with ENTRIX staff, May 13.
Sterling, John. 2009. Chevron Technology Ventures. Personal communication with ENTRIX staff on April 10.
Sullivan, Faye. 2009. Health Environmental Safety Coordinator, Chevron. Personal communication with ENTRIX staff on June 2.
Taylor, Jonathan for Robert D. Mecum. 2007. Acting Administrator, Alaska Region, NMFS, NOAA, United States Department of Commerce. January 25. letter to Colonel Kevin J. Wilson, District Engineer, Alaska District, United States Army Corps of Engineers.
Travis, Mike. 2009. Travis/Peterson Environmental Consulting, Inc. Personal communication with ENTRIX staff on April 23.
A P P E N D I X A
Nonuse Values of Critical Habitat for Cook Inlet Beluga Whale

APPENDIX A NONUSE VALUES OF CRITICAL HABITAT FOR THE COOK INLET BELUGA WHALE
NATIONAL MARINE FISHERIES SERVICE A-1
NONUSE VALUES OF CRITICAL HABITAT FOR THE COOK INLET BELUGA WHALE
(By Dr. Dan Lew, Alaska Fisheries Science Center, National Marine Fisheries Service)
Introductory Overview
This subsection reviews the non-market valuation literature pertaining to economic values, or benefits, associated with Cook Inlet beluga whale critical habitat. Section 3 of the Endangered Species Act defines “critical habitat”:
(5)(A) The term ‘‘critical habitat’’ for a threatened or endangered species means—(i) the specific areas within the geographical area occupied by the species, at the time it is listed in accordance with the provisions of section 4 of this Act, on which are found those physical or biological features (I) essential to the conservation of the species and (II) which may require special management considerations or protection; and (ii) specific areas outside the geographical area occupied by the species at the time it is listed in accordance with the provisions of section 4 of this Act, upon a determination by the Secretary that such areas are essential for the conservation of the species.
Knowledge about the economic benefits and costs is needed to fully evaluate competing policy alternatives in the designation of critical habitat. Under Executive Order 12866, quantified benefit and cost information, to the extent practicable, should be included in analyses of proposed regulatory actions. When quantitative benefit and cost information is not possible to include, qualitative measures of these values are required.
As is the case for many threatened and endangered (T&E) species, the economic benefits of protecting Cook Inlet beluga whales and the habitat essential to their conservation and recovery are primarily the result of the non-consumptive values that individuals attribute to such protection, such as active use values associated with viewing Cook Inlet beluga whales, passive use values from reading or seeing films about them, or from existence values for Cook Inlet beluga whales and their critical habitat. As these examples suggest, non-consumptive values are economic values associated with a good or service that is independent of its consumption. Given the proximity of the Cook Inlet beluga whale’s range to the City of Anchorage, which has a population of almost 280,000, and adjacent population centers in the Mat-Su Valley and along the Kenai Peninsula, the potential for non-consumptive benefits related to indirect use by the local populace and tourists accruing from wildlife viewing and associated education are possible. However, as the economic benefits of these non-consumptive use values are considered elsewhere, it is the passive use (or nonuse values as they are often called in the economics literature) that are the focus of this subsection. This review includes a discussion of these types of economic values and an evaluation of the literature as it relates to critical habitat values associated with any non-consumptive activity or motivation. Given that there have been no de novo studies that collect data to estimate the value of Cook Inlet beluga whales or the habitat they depend upon, much of this presentation is devoted to discussing the theoretical foundations for nonuse values associated with critical habitat for Cook Inlet beluga whales and the evidence for such values for similarly situated species’ habitat in the non-market valuation literature.
The remainder of this nonuse valuation presentation is organized as follows: Section II motivates and defines economic values for critical habitat in the context of economic theory. In this section, we focus entirely on

FINAL RIR/4(B)(2)/FRFA OF CRITICAL HABITAT DESIGNATION OF COOK INLET BELUGA WHALE AUGUST 11, 2010
A-2
economic values of critical habitat, particularly nonuse (or equivalently passive use) values.417 In addition to defining what is meant by nonuse value and its relationship to the total economic value of critical habitat, we discuss the potential separability of economic values for Cook Inlet beluga whales and economic values for the critical habitat the species depends upon, in the context of economic theory. In Section III, we discuss the valuation methods that can be used to estimate economic values of critical habitat and threatened and endangered species. Section IV reviews the available literature on non-consumptive values associated with critical habitat and threatened and endangered whale species. We find no studies that have estimated the nonuse value of critical habitat for the Cook Inlet beluga whale or economic values for Cook Inlet beluga whales generally, though there are several studies that estimate nonuse values for the St. Lawrence beluga whale (Canadian distinct population segment) and other cetaceans. Section V concludes with a discussion of the potential for understanding the economic value of critical habitat for the Cook Inlet beluga whale with information from existing studies. This section includes a discussion of benefits transfer, an approach for using valuation results from one study to estimate the value of a similar resource in a different context or application for which they were not originally estimated. Since no de novo valuation study has been conducted, to date, to estimate the value of the Cook Inlet beluga whale critical habitat, benefits transfer methods are the most plausible approach to use in any future attempt to empirically estimate economic benefits of critical habitat in regulatory analyses associated with the designation of critical habitat for the Cook Inlet beluga whale.
Theoretical Considerations: Economic Values and Non-Market Goods
In economics, the value of an environmental good or service arises from the ability of the good or service to increase the well-being of individuals in society. In other words, environmental goods or services are valuable for what they do for humans.418 Thus, by construction, economic values are anthropocentric in nature. This section describes what is meant by economic value in the context of Cook Inlet beluga whale critical habitat and defines nonuse value. The relationship between critical habitat values and species values are also explored.
According to economic theory, individuals choose between bundles of goods and services that maximize their well-being, referred to as utility. This bundle includes private and government-provided goods and services, as well as quantities and qualities of goods and services from natural and environmental resources, like critical habitat. These latter goods and services are generally referred to as non-market goods, since they cannot be observed to be bought and sold in explicit markets. The trade-offs between different bundles of goods and services each individual makes provides an indication of the value people place on them.
The theoretically-appropriate measures of economic value are willingness to pay (WTP) and willingness to accept (WTA). WTP and WTA correspond to compensating measures of welfare change (see Mas-Colell, Whinston, and Green [1993], Freeman [2003]).419 Which of the two is appropriate depends upon property
417 Wile critical habitat may arguably be valuable in other ways according to other value systems (e.g., ethical arguments that the habitat areas are
valuable independent of their worth to humans), we concentrate on economic theory-based values, as those are the values most applicable in benefit-cost analyses.
418 A distinction is often made between these anthropocentric-based instrumental values, which are dependent upon the good or service having value as a means to some end, and intrinsic values that have value in their own right (see Brennan [1992], Anderson [1993], and Freeman [2003] for useful discussions of this dichotomy).
419 There are four exact welfare measures that differ in the utility level assumed (before the change or after the change) and the type of change being valued (price or quality/quantity change). Compensating variation and equivalent variation are the exact welfare measures associated with price changes, and compensating surplus and equivalent surplus correspond to quality or quantity changes. Compensating welfare measures assume the initial level of utility (well-being) is the basis of comparison, while equivalent welfare measures assume the level of utility to base the changes upon is the level achieved after the change.
APPENDIX A NONUSE VALUES OF CRITICAL HABITAT FOR THE COOK INLET BELUGA WHALE
NATIONAL MARINE FISHERIES SERVICE A-3
rights—who owns the resource. For a decrease in the quality or quantity of an environmental good or service, the WTP is the maximum amount that the individual would pay to avoid the change; whereas the WTA is the minimum amount that would need to be given to the individual to make the individual as well off after the change as before the change. For an increase in an environmental good or service, WTP is the maximum amount an individual would pay to bring about the change, while WTA is the minimum amount one would accept to not have the change occur.
In practice, WTP and WTA need not correspond. Considerable attention has been paid in the literature to discrepancies between WTP and WTA in the empirical and experimental literature (Horowitz and McConnell, 2002; Adamowicz, Bhardwaj, and McNabb, 1993; Brown and Gregory, 1999; Mansfield, 1999; Zhao and Kling, 2001), which have been postulated to arise due to “the unique and perhaps irreplaceable resources and as the rational response to uncertainty and the high cost of information about preferences” (Freeman, 2003, 87). Horowitz and McConnell (2002) conducted a meta-analysis of WTA/WTP studies to identify factors that may influence the large WTA to WTP ratios found in the literature. They found that the farther the good is from an ordinary private good, the higher the ratio. Whether WTP or WTA is more appropriate depends upon the type of change the welfare measure is being calculated for and property rights. See Freeman (1993), Mitchell and Carson (1989), and Bockstael and McConnell (2007) for useful discussions. For ease of exposition in this presentation, we follow the majority of the literature and use WTP in our discussion of economic value of critical habitat.
In this subsection, we are concerned with the economic value of critical habitat. Critical habitat, like many other environmental and natural resource assets and services, is a non-market good. As such, there is no observable market information available to estimate the demand for it. Moreover, many non-market goods are not consumable, in the same sense as market goods. Rather, critical habitat is a public good, a type of good that is both non-excludable and non-divisible. It is non-excludable and non-divisible in the sense that its use and enjoyment by one person does not either preclude or diminish the opportunity for others from similarly using or enjoying it. We will turn to a discussion of non-market valuation methods in the next section of this exposition.
However, before turning to empirical methods for measuring WTP, it is important to discuss a typology often made in discussions of economic values for environmental goods and services. Much time has been spent in the literature discussing various ways to decompose the total economic value (TEV) of environmental goods and services into constituent values. A common decomposition of the total economic value of a good or service is into use and nonuse values.420 Economic models have been used to show that TEV is the sum of a use value, measurable by observing changes in the demand for market goods related to the environmental good or service, and a nonuse value that is not directly observable in the related good market (McConnell, 1983; Carson, Flores, and Mitchell, 1999; Freeman, 2003). Use values, as the name implies, are those values associated with the use of the good or service, and can be either direct (e.g., consumption) or indirect (e.g., wildlife viewing), while nonuse value is the value independent of any use of the good or service and generally attached to environmental goods and services that are unique or special and subject to irreversible loss or injury (Freeman, 2003).
The concept of nonuse, or passive use, value is generally attributed to Krutilla (1967), who made the seminal observation that many people may hold value for unique natural resources simply because they exist. Some researchers have attempted to further decompose nonuse value into components related to motivations an
420 The term “passive use values” was coined by the D.C. Circuit Court of Appeals in its ruling of Ohio vs. U.S. Department of Interior (880 Federal
Reporter 2d 432 [1989]). The ruling legitimized the use of these values in federal natural resource damage assessments.
FINAL RIR/4(B)(2)/FRFA OF CRITICAL HABITAT DESIGNATION OF COOK INLET BELUGA WHALE AUGUST 11, 2010
A-4
individual may have for the value, such as that deriving from a desire for future generations to enjoy the environmental resource or service (a “bequest” motive), from wanting the option to use the resource or service in the future (an “option value” motive), and for simply knowing it exists (an “existence” motive), among others.421 However, the emphasis on defining values by the underlying motivations is likely misdirected, since, as Carson et al. (1999) note, “from an operational standpoint, using motivations as a means of defining passive use values results in an ad hoc taxonomy since motivations in any economic decision are generally multifold, inseparable, and unavailable to the researcher” (p. 100). In addition, Freeman pointed out that focusing on motivations to decompose nonuse values risks missing motivations (Freeman, 2003). Given the heterogeneity of people’s preferences for just about everything, one can imagine understanding the motivations of a population is not just a daunting, but likely impossible, task. Thus, decompositions of total economic value beyond the distinction between use and nonuse values, supportable by theory and measurable in practice, are ill-advised and will be avoided here.
In this context, then, we are concerned with understanding the nonuse value associated with critical habitat for Cook Inlet beluga whales. According to its definition, critical habitat is “essential to the conservation of the species”. Therefore, it is logical to conclude that in the absence of critical habitat the species would go extinct. This relationship suggests that critical habitat is an essential input into the “production” of the species it supports. But, is critical habitat valuable to people as a public good itself? That is, does critical habitat affect a person’s well-being or utility? This, of course, is an empirical question, but theory can provide some guidance. If we take as a given that people place value on the protection, preservation, or enhancement of threatened and endangered species (i.e., that such species are utility-generating), which is supported by the literature (Loomis and White, 1996; Richardson and Loomis, 2009), then there are two principal ways critical habitat can affect an individual’s utility to generate nonuse values (assuming the species is utility-generating):422
• Critical habitat may produce utility directly.
• Critical habitat may only produce utility indirectly, as an input in the household production of the threatened or endangered species that yields utility to the individual.
In the first case, critical habitat generates utility separate from its relationship to the species that depends upon it. That people place considerable value on habitat that may or may not be critical habitat, per se, is evidenced by the millions of dollars donated to organizations that purchase habitat to protect biodiversity and ecosystem functions, like the World Wildlife Fund and Nature Conservancy. This suggests a significant nonuse value for habitat, in and of itself, as the vast majority of donors never, themselves, expect to visit or otherwise use the habitats for which they express a WTP.423 There is also evidence in the empirical non-market valuation literature that habitat has nonuse value, whether it is terrestrial habitat, such as tropical rain forests (Kramer and Mercer, 1997), or marine habitat, such as Marine Protected Areas (Wallmo and Edwards, 2008). When the public associates critical habitat with a specific endangered or threatened species, more critical habitat implies more of the species (i.e., the two can be viewed as complements—they are consumed together). And, in this case, both generate utility. Here, nonuse values associated with critical habitat are non-negative and can be measured, only in part, through measuring the nonuse value for species preservation or enhancement.
421 See, for example, Greenley, Walsh, and Young (1981), Sutherland and Walsh (1985), and Walsh, Loomis, and Gillman (1984). 422 Freeman (2003) also discusses a case where an environmental good, such as critical habitat, can affect factor inputs in the production of market
goods that yield utility, and, thus, indirectly affect utility. Although this is a possibility, the connection between critical habitat and the market good is related to the use of the critical habitat and is, thus, outside the scope of measuring nonuse values.
423 The specific portion of the expressed WTP for habitat areas attributable to nonuse value, though, is not likely to be disentangled from information on donations of this sort, as these donations are likely to reflect indirect use values attached to a variety of ecosystem functions and services associated with the habitat areas, in addition to nonuse values related to biodiversity, critical habitat functions, etc.
APPENDIX A NONUSE VALUES OF CRITICAL HABITAT FOR THE COOK INLET BELUGA WHALE
NATIONAL MARINE FISHERIES SERVICE A-5
The second case is best explained within the household production framework, a conceptual model developed in separate articles by Nobel laureate Gary Becker (1965) and Kelvin Lancaster (1966). The basic idea is that individuals or households buy goods and services that, in combination with public goods, such as critical habitat, are used in the production of final commodities that directly affect utility. In this framework, the inputs to this household production process are not utility-generating in and of themselves. For example, one purchases inputs like sugar, flour, and other ingredients to make cookies, but it is the cookies that ultimately yield utility to the individual. Put in the context of critical habitat and Cook Inlet beluga whales, one can imagine that critical habitat is a good that people are willing to purchase (or pay to protect) in order to “produce” the utility-generating commodity, Cook Inlet beluga whales. It may also be possible that critical habitat helps to produce other utility-generating commodities besides the Cook Inlet beluga whale. That is, critical habitat may be used in the joint production of more than one utility-generating commodity. Returning to our cookie example, suppose that you learned to bake cookies from your mother or grandmother, and the process of baking the cookies evokes fond memories of the good times you had learning to bake, thus enhancing the experience of baking in the present. This utility-generating experience would not occur without the ingredients you purchased to make the cookies, and though the cookies yield utility to you when consumed, so do other aspects of the cookie-making experience when reenacted (i.e., re-experienced and recollected).
While the use of public goods, both as an input good and utility-generating commodity in the household production framework, does introduce issues related to welfare measurement (Bockstael and McConnell, 1983), as a conceptual model, the household production framework is informative in this context and suggests that in the absence of joint production, the nonuse value of critical habitat is wholly contained in the nonuse value for the corresponding threatened or endangered species.424 However, if joint production is present and critical habitat contributes to the production of one or more utility-generating commodities other than the species preservation or enhancement, then the value of critical habitat will not be fully measurable by accounting for the nonuse value of the corresponding species for which it is essential. That is, in this case, nonuse values associated with critical habitat will be measurable only in part through measuring the nonuse value for species preservation or enhancement.
In summary, if critical habitat enters an individual’s utility function directly or helps produce other commodities that yield utility, it will have value separate from its contribution to the production of the species that depends upon it. If critical habitat is not a direct argument in utility, however, then its value is not readily separable from the species value. As noted above, this is ultimately an empirical question. Unfortunately, there is limited empirical evidence available on this subject, due to the emphasis in the past on valuing aspects of species (Loomis and White, 1996; Richardson and Loomis, 2009). However, a recent study by Kontoleon and Swanson (2003) does provide evidence that critical habitat may be valuable beyond its contribution as an input in the production of a threatened or endangered species. They provide evidence that a species’ in situ critical habitat is valuable beyond the value of the species itself. “It is possible that some part of the bid in the reserve scenario accords with the value of the additional space afforded to the panda population, while another part of it flows from the ‘naturalness’ of the habitat.” (page 494) The species of interest in this study was the Giant Panda, an endangered species whose preservation can be in situ (in the Wolong Reserve in China) or ex situ (in cages or pens). Using data from in-person interviews of a sample of foreign tourists in China, they estimate the public’s WTP for three conservation scenarios for the Giant Panda that will achieve a total population of 500 pandas, but differ in whether the pandas will be protected in their critical habitat or ex situ in either cages or large pens.425 They find a significant difference in WTP for the Giant Panda 424 Although limitations to the household production function model framework are well established (e.g., Pollak and Wachter [1977]), Bockstael
and McConnell (1983) have shown that the household production model can be used for understanding the economic value of utility-generating commodities through measurement of the demand for market input goods.
425 Swanson, et al. (2001) provides details of the survey and its implementation. The survey was administered by graduate students aboard tour buses to the Great Wall of China. The sample consisted mostly of Americans and Europeans. While this survey approach is unlikely to lead to a

FINAL RIR/4(B)(2)/FRFA OF CRITICAL HABITAT DESIGNATION OF COOK INLET BELUGA WHALE AUGUST 11, 2010
A-6
conservation scenarios involving ex situ protection (cages or pens) versus in situ protection (critical habitat), while holding the number of pandas protected constant, which is indicative of a distinct nonuse value for Giant Panda critical habitat separate from the nonuse value for the species itself. Although additional research of this type is needed to see if this result can be generalized to all threatened and endangered species, the results are suggestive that critical habitat, at least for some species, will have value separate from the value accorded to the species.
We next turn to the methods used to value nonuse values for critical habitat and other non-market goods and services.
Non-Market Valuation Methods
The value of non-market goods is estimated using either revealed preference (RP) or stated preference (SP) valuation approaches. RP valuation methods use information on observed behavior to infer the value of the non-market good or service (Bockstael and McConnell, 2007; Boyle, 2003). As such, these methods require data on observable behavior to be linked to the non-market good in question.426 SP methods, on the other hand, involve asking individuals carefully-worded hypothetical market questions to either directly or indirectly infer the value they place on a non-market good or service (Mitchell and Carson, 1993; Carson, Flores, and Meade, 2001). Thus, the principal difference between RP and SP methods is the data used. Revealed preference methods use data on observed behavior to infer economic values, while stated preference methods use data on stated or intended behavior to infer economic values. Due to its reliance on observable behavior, revealed preference methods are generally not able to estimate nonuse values, which, by definition, are not tied directly to observable behavior.427 Thus, researchers generally utilize stated preference methods to estimate nonuse values.
The most commonly-used and best known stated preference method is the contingent valuation method (CV), which in actuality is a class of methods. In CV, economic values for a non-market good or service are revealed through survey questions that set up hypothetical markets for a non-market good or service, and involve asking the respondent to indicate their willingness to pay (or willingness to accept) for the good or service. In a typical contingent valuation survey, a public good is described, such as a program to protect one or more T&E species, or their critical habitat, and respondents are asked questions to elicit their WTP for the public good through a payment vehicle, like taxes or contributions to a trust fund (Cummings, Brookshire and Schulze, 1986; Mitchell and Carson, 1989; Arrow, et al., 1993).428 Contingent valuation methods are differentiated by the way they elicit WTP. Respondents are commonly asked to state their maximum WTP (an “open-ended” CV question), choose the amount they are willing to pay from a list of values (a “payment
representative sample of all foreign tourists in China, and hence representative estimates of value, the qualitative lessons learned from the results remain important.
426 Included in the category of RP methods are travel cost methods (Parsons, 2003), hedonic methods (Taylor, 2003), and the avoidance expenditure approach (Dickie, 2003). The appropriateness of each method depends upon how the non-market good enters individuals’ preferences, as discussed above and in Freeman (2003). In many of these methods, the economic value of the non-market good is measured through changes in the observable demand for a related good, such as a good that is consumed in conjunction with the non-market good (complement) or instead of the non-market good (substitute).
427 However, Larson (1992) has shown that under the assumption of what is termed Hicks-neutrality, the nonuse value is measurable from an analysis of market demand, though Flores (1996) has shown that the conditions for Hicks-neutrality to occur are unlikely to be met in practice. In addition, Carson, Flores, and Mitchell (1999) point out that any “technique capable of constructing the missing market for these types of goods is potentially capable of obtaining total-value estimates,” (page 109) and since total value is the sum of use and nonuse values, the TEV estimate would include nonuse value. Simulated markets where actual transactions occur (generally in experimental conditions) for the non-market good and actual referenda involving the non-market good are the other methods for estimating these values.
428 While willingness-to-accept is sometimes the more relevant welfare measure, empirical and experimental evidence has pointed to the use of WTP welfare measures in stated preference surveys (e.g., Arrow, et al., [1993], Adamowicz, Bhardwaj, and McNab [1993], Mansfield [1999]).

APPENDIX A NONUSE VALUES OF CRITICAL HABITAT FOR THE COOK INLET BELUGA WHALE
NATIONAL MARINE FISHERIES SERVICE A-7
card” CV question), or accept or reject a specific amount (a “referendum”, or “dichotomous choice”, CV question). Variations of these question formats exist, but these are the most frequently used.
When asked properly, answers to CV questions yield an estimate of WTP or WTA associated with the good being valued, depending upon the format of the question posed (Freeman, 1993). An important point often overlooked is how sensitive these welfare estimates are to features of the good being valued. Carson, Flores, and Meade (2001) note the following:
“People have distinct preferences over the exact manner in which they pay for goods and perceive different methods of providing a good to have different likelihoods of success. In this sense, the term ‘contingent’ method is apt and one should never forget that it is only the plan to provide the good that can be valued, not the good in the abstract.” (page 180)
This admonition is sometimes forgotten by those interpreting the results of CV studies. For instance, the CV survey used in Giraud, et al. (2002) asked a referendum CV question that involved voting for a measure that would create an “Enhanced Steller Sea Lion Recovery Program” that would lead to an increase in federal taxes to the respondent’s household if approved. The estimated WTP from this survey question is a measure of value of the “Enhanced Steller Sea Lion Recovery Program,” which “doubled research funding and increased the restrictions of commercial fishing around the western stock of the Steller sea lion’s [critical habitat] in the Gulf of Alaska, Bering Sea and North Pacific Ocean” (page 454). The WTP is not a measure of the public’s value for recovering the species, which is not the object of the valuation question (the program is), although subsequent researchers commonly treat it as such in their analyses (e.g., Richardson and Loomis [2009]). While this is not a weakness of CV per se, it is a feature that those using the results should be aware of and treat carefully.
The issue of validity of CV results is a central focus of much non-market valuation research. Freeman (2003) describes four types of validity: criterion validity, convergent validity, construct validity, and content validity. Criterion validity involves comparing the CV value to some alternative value that can be taken as the criterion for the assessment. Ideally, the alternative value would be the “true” value. However, the true value is generally not known for non-market goods, especially goods for which their values are predominantly related to nonuse. Simulated or experimental market settings are often used to provide alternative values in settings that are more “market-like”, but the unique circumstances of any simulated experimental setting “make the wholesale generalization of results less than straightforward” (Bishop, 2003, 555). Bishop and Heberlein (1979) provided the first test of criterion validity by comparing the results from a CV study asking a sample of hunters for their WTA compensation for giving up their hunting permits, with actual cash offers for a limited number of permits (via a simulated market) for a different sample of hunters. Convergent validity is assessed by comparing CV values with measures derived from RP methods. Carson, et al. (1996) reviewed 83 studies that compared CV estimates to RP estimates and found the mean ratio of values between the CV and RP methods to be 0.89, indicating that CV estimates yield slightly smaller WTP estimates than RP methods across the goods valued in these comparison studies. Construct validity is concerned with whether CV responses are related to variables that economic theory suggests they should be (e.g., does WTP increase with income?). This type of validity is often assessed by regressing CV values on characteristics of the good being valued and characteristics of the respondent. A specific type of test for construct validity is a scope test, which evaluates whether WTP is sensitive to how much of the good is being offered (e.g., Giraud, Loomis, and Johnson [1999]). The ability of CV questions to be used to accurately measure people’s values for non-market goods depends, in large part, upon the design of the survey, the specific CV question, and the implementation of the survey. The fourth type of validity, content validity, addresses this by evaluating the quality of the survey instrument, including assessing the set-up of the good to be valued, the form of the CV question, the payment vehicle used, and other characteristics of the survey, as well as elements of the implementation of the survey (Brown, 2003).

FINAL RIR/4(B)(2)/FRFA OF CRITICAL HABITAT DESIGNATION OF COOK INLET BELUGA WHALE AUGUST 11, 2010
A-8
Although the CV method has been subjected to criticisms related to the above validity issues (e.g., Diamond and Hausman [1994] and Hausman [1993]), the NOAA Panel on Contingent Valuation, a distinguished panel of economists led by Nobel Laureates Kenneth Arrow and Robert Solow, found that, despite its problems, “CV studies can produce estimates reliable enough to be the starting point of a judicial process of damage assessment, including lost passive-use values” (Arrow et al., 1993, 43).429
CV methods are not the only SP methods available for estimating nonuse values.430 The stated preference choice experiment (CE), or stated choice approach, for eliciting economic values has been increasingly used by researchers, due to its flexibility (Adamowicz, Louviere, and Williams, 1994; Adamowicz, et al., 1998; Alpizar, Carlsson, and Martinsson, 2001; Hanley, Wright, and Adamowicz, 1998). In the choice experiment approach, respondents are asked to choose between two or more alternatives that differ in one or more attributes, including cost.431 Choice experiments offer a useful alternative to CV for estimating a wider range of economic values. By decomposing environmental goods, in the form of choice alternatives (e.g., species protection programs), into measurable attributes (e.g., specific outcomes of protection such as population size under each protection program), value can be estimated from an analysis of choices between different alternatives. Since choice alternatives are described by their attributes, and the effects of these attributes on choice are estimated in the model, it is possible to estimate WTP for alternatives not originally included in the CE questions seen by respondents. Hanley, Mourato, and Wright (2001) and Hanley, Wright, and Adamowicz (1998) argue that CE methods have several advantages over CV, among them, built-in scope tests, the ability to estimate values of each attribute, and avoiding some biases in responses typically associated with CV questions.
Nonuse Values Related to Critical Habitat in the Literature
The Kontoleon and Swanson (2003) study discussed in Section II provides evidence that valuation studies aimed at estimating the nonuse value of protecting a threatened or endangered species embed a separable value associated with critical habitat. In their study, the value of critical habitat was a non-trivial proportion of overall willingness to pay. In fact, they estimated that almost three-quarters of the total value for the species conservation program valued could be attributable as critical habitat value. However, given the nature of the sampling approach employed in their study (Swanson, et al., 2002), we cannot place too much weight on the exact proportion found in the study. Still, the qualitative results are important, and imply critical habitat values are likely a component of the overall economic value measured in CV studies that value a species. Without additional research, however, it is unknown how much of the species value estimated in SP studies can be attributable to critical habitat. Nevertheless, the Kontoleon and Swanson study provides support for looking at the literature on species valuation as a means of gaining an understanding of the upper bound on what the critical habitat value can be, particularly since species valuation studies almost invariably include a description of the critical habitat in its description of the species, hence making the critical habitat an explicit part of the good being valued. To date, over 30 studies, representing dozens of species, have been conducted to estimate the economic value of one or more threatened or endangered species. In this section, we discuss these studies, focusing on those pertaining to U.S. species, with particular attention paid to studies valuing marine mammals.
429 The NOAA Panel provided a number of recommendations for designing and conducting CV surveys that would lead to “reliable” estimates of
nonuse value. A number of subsequent studies have been conducted to test the reliability of CV estimates (see Boyle [2003] for a useful summary).
430 In addition to stated preference choice experiments and related conjoint analysis methods (contingent rating and contingent ranking), is a recent method that employs gathering small groups of people in a participatory process that involves some group processing as a means of determining nonuse values (valuation workshops) (Alvarez-Farizo, Hanley, Barberan, and Lazaro, 2007).
431 Variants of the choice experiment include contingent rating and contingent ranking, where the respondent rates or ranks each choice alternative, respectively, instead of choosing between them. See, for example, Siikamaki and Layton (2007), Boyle, et al. (2001), and Bateman, et al. (2006).
APPENDIX A NONUSE VALUES OF CRITICAL HABITAT FOR THE COOK INLET BELUGA WHALE
NATIONAL MARINE FISHERIES SERVICE A-9
Loomis and White conducted a meta-analysis of 20 U.S. T&E (and rare) species valuation studies and found that annual WTP to protect rare, threatened, and endangered species ranged from $6 to $95 (in 1993 dollars). Much of the variation they found in WTP values could be explained by the type of species valued (e.g., whether it is a mammal or bird), by the change in population being valued, and by the type of individual being asked to provide WTP (e.g., user vs. non-user). Richardson and Loomis (2009) update the Loomis and White study with 11 more recent or previously omitted studies. All but one of the studies employed CV methods to value species preservation or enhancement. The non-CV study used CE methods. Several new variables are added to the meta-analysis regression model, including ones to identify whether studies since 1995 yield larger WTP values that may indicate a structural change in preferences for T&E species (they do); whether WTP is different for species that can be classified as “charismatic megafauna” (Metrick and Weitzman, 1996); and whether there are differences in magnitude in WTP for species with only nonuse value, compared to those with use values. In 2006 dollars, the annual household values for threatened and endangered species from the updated set of 29 studies ranged from $11 to $350.
T&E species valuation studies can be categorized into two groups—aggregate species valuation studies and disaggregate species valuation studies. The former type of study asks respondents to value a group of T&E species, or a group of species that include T&E species, as a whole.432 These studies yield WTP estimates that cannot be assigned to any constituent species within the group of species valued. An example of this type of study is Olsen, Richards, and Scott (1991), which involved estimating WTP to protect salmon and steelhead in the Pacific Northwest. The resulting welfare values cannot be divided among the different salmon species in the region, or separated from the WTP to protect steelhead. Similarly, economic values estimated by Berrens, et al. (2000) for protecting 11 T&E fish species in New Mexico, and Ekstrand and Loomis (1998) for protecting all 62 T&E species in the Four Corners region of the U.S., cannot be disaggregated to identify values of individual species. As a result, the focus here is on the latter type of valuation studies, those that provide economic values for individual species.
The individual T&E species valued in these disaggregate species valuation studies range from “charismatic megafauna” like owls (Rubin, Helfand, and Loomis, 1991; Hagen, et al., 1992; Loomis and Ekstrand, 1997, 1998; Giraud, Loomis, and Johnson, 1999), wolves (Duffield, 1992), crocodiles (Isik, 2004), and bald eagles (Boyle and Bishop, 1987; Swanson, 1996; Stevens, et al., 1991; Stevens, et al., 1994), to lesser known species such as the striped shiner (Boyle and Bishop, 1987), the silvery minnow (Berrens, et al., 2000), and Riverside fairy shrimp (Stanley, 2005).
Of particular relevance for an assessment of the economic value of critical habitat for the Cook Inlet beluga whale are non-market valuation studies that focus on estimating the public’s WTP for protecting T&E marine mammals in the U.S.433 These include contingent valuation-based studies by Hageman (1985), Samples and Hollyer (1990), Loomis and Larson (1994), Giraud, et al. (2002), and Solomon, Corey-Luse, and Halvorsen (2003). In addition, a recent study by Lew, Layton, and Rowe (2009) uses stated preference choice experiments to estimate the public’s WTP for enhancing protection of Steller sea lions in Alaska, a species with critical habitat near the Cook Inlet. Of these, three studies provide estimates of economic values for U.S. whale species (Hageman, 1985; Samples and Hollyer, 1990; Loomis and Larson, 1994). Hageman (1985) and Samples and Hollyer (1990) estimate the WTP for preserving a whale species, while Loomis and Larson (1994) estimate the WTP for population enhancements for a whale species. All three estimate the total 432 A related type of valuation study estimates the nonuse values associated with the set of ecosystem services for specific habitats, such as river
basins (Loomis, et al., 2000) and wetlands (Birol, et al., 2006) that provide habitat for threatened or endangered species in addition to providing other non-market services.
433 There are numerous studies that value species in other countries (e.g., Fredman, 1995; Jakobsson and Dragun, 2001; Kontoleon and Swanson, 2003), including two recent studies that apply stated preference choice experiment methods to value multiple aquatic species in Canada (Rudd, 2007; Olar, et al., 2007).

FINAL RIR/4(B)(2)/FRFA OF CRITICAL HABITAT DESIGNATION OF COOK INLET BELUGA WHALE AUGUST 11, 2010
A-10
economic value of these public goods, though nonuse values likely dominate the values, as non-consumptive use benefits are minimal, except for the estimates arising from the sample of whale watchers in the Loomis and Larson study.
Hageman (1985) used a mail survey of California residents to estimate the value of bottlenose dolphins, California sea otters, Northern elephant seals, gray whales, and blue whales. Of these, only the California sea otter (threatened), gray whale (threatened), and blue whales (endangered) were listed species at the time the study was conducted. Respondents to the survey were asked to indicate their WTP for a protection fund to preserve existing population levels of each species (using a payment card, with follow-up open-ended CV questions). Mean annual household WTP, across species, ranged from a low of $21.69 for Northern elephant seals, to a high of $28.78 for blue whales (all in 1984 dollars). It is important to note that these estimates were calculated from small samples, ranging from 93 to 174 respondents, resulting from a survey implementation with a correspondingly low overall response rate of 21%. The poor response rate likely is due, in large part, to the complex questionnaire, which was not designed to maximize response rates (very dense and small text, complicated instructions, confusing layout, etc.). The fact that only California households were sampled precludes the extension of value estimates to the larger U.S. population, unless it is assumed that preferences for marine mammals are identical outside California. Pate and Loomis (1997) provide evidence that preferences for wetland and wildlife protection in the San Joaquin Valley in California, are different for respondents who live further away, which suggests one reason why assuming identical preferences for non-target populations is not prudent. This portability issue is a trait this study has in common with other marine mammal valuation studies, specifically, Samples and Hollyer (1990) and Loomis and Larson (1994).
Samples and Hollyer (1990) conducted a study to understand public values for humpback whales and Hawaiian monk seals. Both are listed as endangered under the Endangered Species Act (ESA). Information about how much money or time respondents would be willing to donate to preserve these species was collected in an in-person survey from a small stratified sample of Oahu (Hawaii) residents, based on age, income, and gender. Several survey versions were employed that differed in the order the species were valued, and whether respondents were told that only one or both species were threatened. Across survey versions, the mean WTP values (sum of the monetary WTP and time WTP valued at $1/hour) ranged from $125 to $142 for humpback whales and from $62 to $103 for Hawaiian monk seals (in 1986 dollars). These values do not account for the possible presence of protest respondents,434 as there were no questions to probe why respondents were not willing to pay anything (these respondents were all assigned a zero value and included in the analysis), a standard practice in CVM surveys (Carson, Flores, and Meade, 2001). Additionally, the study uses open-ended CVM questions to elicit WTP values. Open-ended questions have been criticized as lacking incentive compatibility and leading to biased WTP estimates (e.g., Arrow, et al., 1993; Hanemann, 1994; Carson, Flores, and Meade, 2001). As with the Hageman study, additional caution should be taken in interpreting these welfare estimates, as they are based on very small samples (each between 53 and 72 responses) and are for a limited geographic sample.
To assess whether WTP for gray whale increases is invariant to the size of the increase, Loomis and Larson (1994) undertook an in-person intercept survey of whale-watchers, and a household mail survey, in California. Using open-ended CVM questions, the questionnaires asked respondents how much they would be willing to pay into a special protection fund that would be used to increase the gray whale population by 50% and 100%. It is unclear whether any mention was made of the gray whale’s threatened status (at the time), or whether the population increases would affect this status. The intercept survey targeted visitors at
434 Protest respondents are individuals whose responses to stated preference questions should be excluded from the estimation, due to the fact that the
responses are not linked to their preferences for the good being valued.
APPENDIX A NONUSE VALUES OF CRITICAL HABITAT FOR THE COOK INLET BELUGA WHALE
NATIONAL MARINE FISHERIES SERVICE A-11
four whale-watching locations, while the mail survey was sent to a random sample of California households. Overall response rates were much higher than those achieved by Hageman (1985) and Samples and Hollyer (1990), with 71.3% (672 respondents) of the intercepts yielding completed surveys, and 54% of the household surveys (519 respondents) being completed and returned. Visitors were willing to pay $25 per year, on average, for a 50% increase and $29.73 for a 100% increase, while households were willing to pay $16.18 and $18.14 per year, respectively (in 1992 dollars). The visitor values are composed of non-consumptive use values associated with the benefit of viewing the additional whales, as well as nonuse values. The household-based estimates are primarily nonuse values, though some small amount may be related to perceived viewing benefits. Values for the larger gray whale population increase were found to be significantly greater, indicating preferences that are consistent with economic theory. The study uses a sample not representative of the U.S. population and a CV question format (open-ended) generally viewed as problematic, due to incentive compatibility issues, as discussed above. However, unlike the other two whale valuation studies, the response rates and sample sizes are within ranges that are generally viewed in the literature as acceptable for generating representative results (of the population being sampled).
Clearly, these studies indicate that the nonuse value associated with whale preservation or enhancement has positive value, even though the potential sample representativeness and other issues mentioned above suggest these values are not likely to be informative of the actual magnitude of the nonuse value associated with either preservation or enhancement of threatened and endangered whale species for all U.S. households. Further evidence of positive nonuse value specifically related to beluga whales is provided by Olar, Adamowicz, Boxall, and West (2007). Although not a U.S. study, they used CV methods in a carefully-constructed survey to estimate the WTP to improve the St. Lawrence beluga whale population, a distinct population group of the species in Canada, from its current threatened status to not a risk at all (i.e., to fully recovered). Using an Internet panel-based sample, consisting of 2,006 Canadians (52% response rate), they estimated the mean household WTP to be $122 per year (2006 Canadian dollars). Although conducted for a sample of Canadian residents and for a different distinct population of beluga whales, to the extent preferences for threatened and endangered beluga whales are similar between Americans and Canadians, these results are suggestive of potentially large nonuse values associated with protecting and enhancing beluga whales. Household nonuse values in this dollar range are consistent with other recent species valuation efforts for U.S. marine species (see, for example, Lew, Layton, and Rowe [2009]).
Prospects for Inferring Nonuse Values of Critical Habitat from the Literature
Does the absence of de novo non-market valuation studies that estimate the nonuse value of critical habitat for Cook Inlet beluga whales mean there is no way to get specific information about this value? Not necessarily. A growing field in non-market valuation is concerned with how to transfer economic value information from one or more previously completed studies to a new application (which we will refer to as the “policy application”). This process is called benefits transfer, or value transfer.435 There are four general approaches to transferring economic benefit information from an existing study to a new application:
1. Unit value transfer: This is the simplest and easiest benefits transfer method and typically involves using the mean or median economic value estimate from an existing study, directly in the new policy application (Boyle and Bergstrom, 1992; Desvousges, et al., 1992). No adjustments are made to the value estimate to account for differences in the population of interest that may arise due to income or demographic, resource use, or behavioral differences.
435 Benefits transfer has received considerable interest by researchers and policy analysts in the last two decades. Special issues of Water Resources
Research (Volume 28, number 3) and Ecological Economics (Volume 60, number 2) have been dedicated to this subject. See also Brouwer (2000), Navrud and Ready (2007), and Rosenberger and Loomis (2003) for overviews and details about the methodology.
FINAL RIR/4(B)(2)/FRFA OF CRITICAL HABITAT DESIGNATION OF COOK INLET BELUGA WHALE AUGUST 11, 2010
A-12
2. Value function transfer: Instead of transferring values from an existing study, this approach involves directly using the estimated function from the existing study that was used to calculate economic values, instead of the values themselves (Loomis, 1992). Adjustments to the value estimate arise by inserting information about the new policy application into the transferred value function. For example, if in the original study a WTP function was estimated as a function of demographics of the sample, a new WTP estimate could be calculated from the function by inserting the demographics of the population of interest in the new policy application.436
3. Meta-Analysis: Meta-analyses have been used to synthesize and summarize existing valuation studies in the areas of threatened and endangered species (Loomis and White, 1996; Richardson and Loomis, 2009), outdoor recreation (Walsh, Johnson, and McKean, 1992; Smith and Kaoru, 1990), visibility at national parks (Smith and Osborne, 1996), wetlands (Woodward and Wui, 2001), and air pollution (Smith and Huang, 1995), among others. Meta-analyses of this type involve conducting regression analysis to understand how economic values from existing studies vary by the characteristics of the goods being valued in each study and on features of the studies themselves. For instance, the meta-analysis conducted by Loomis and White (1996) to understand variations in WTP estimates for threatened and endangered species involved regressing WTP values from 20 CV studies on variables such as the population size change being valued in the CV study, the type of payment vehicle, the type of CV question used, the type of species being valued, and the survey response rate achieved. The resulting summary value function can then be used in the same manner as in the value function transfer to provide a customized estimate of economic value for the new policy application (Bergstrom and Taylor, 2006; Johnston, Besedin, and Ranson, 2006).
4. Preference calibration: A fourth benefits transfer method requires making assumptions about the specific form for a representative member of the population’s underlying preferences, or utility function, then “calibrating” this preference function, using information about the economic values from one or more studies (Smith, van Houtven, and Pattanayak, 2002; Pattanayak, van Houtven, and Smith, 2007).437 The calibrated preference function is then used to generate value estimates for the new policy application, much like value function transfer.
The first three benefits transfer methods are most commonly employed in the literature, with meta-analyses being increasingly used in recent years (Rosenberger and Phipps, 2007; Shrestha, Rosenberger, and Phipps, 2007; Johnston, Besedin, and Ranson, 2006). Preference calibration is arguably much more complex than the other methods, which may explain the scarcity of empirical applications.
Regardless of the method used, benefits transfer is only useful if it provides valid estimates of value for the new policy application. The validity of transferred values has been studied extensively for unit value transfers and value function transfer. Rosenberger and Phipps (2007) and Rosenberger and Loomis (2003) provide useful summaries of these studies, which seek to evaluate the difference between the transferred values and values from de novo studies conducted for the policy application (an approximation of the “true” values), which is measured by a “transfer error”. Their analysis of the tests of the validity of unit value and value function transfers indicate that the greater the similarity of the original study to the policy application, the smaller the expected transfer error will be. Moreover, there is evidence in the literature that value function transfers yield more accurate values for the policy application than unit value transfers. This makes sense, given the ability to further reduce the dissimilarity between the original study and the policy application by adjusting the value for characteristics of the policy application. Moreover, there is some evidence that the use of meta-analysis to transfer benefits outperforms value function transfers (Rosenberger and Phipps, 2007;
436 For a recent example of a value function transfer, see Scarpa, et al. (2007). 437 This calibration process essentially involves solving for the unknown parameters of the assumed preference function using the existing value
estimates.
APPENDIX A NONUSE VALUES OF CRITICAL HABITAT FOR THE COOK INLET BELUGA WHALE
NATIONAL MARINE FISHERIES SERVICE A-13
Shrestha, Rosenberger, and Loomis, 2007). In summary, the literature seems to support the idea that the more closely the researcher can customize the value estimate to the new policy application, the more accurate the transferred value will be to the value that would be generated if a primary study had been done.
Each of the methods requires selection of one or more studies to base the transfer upon. Boyle and Bergstrom (1992) caution that in choosing a study to use for benefits transfer to maximize the likelihood of a valid transfer, the non-market good needs to be the same as the one in the new application and the population characteristics of the original study need to be similar in the new application, conditions that are rarely met in practice. McConnell (1992) adds that consideration must also be given to the quality of the original study, suggesting that the transferred value or function can only be as good as the original it is based upon. This point is particularly persuasive, given that meta-analyses have shown how researcher judgments about how to define the good, the type of valuation methods used, and the manner of implementing the survey, along with other characteristics of the study, can have significant effects on economic values.
The issue of transferability of nonuse values is also important to address. Although not explicitly discussed above, much of the benefits transfer work to date has involved transferring use values, such as recreational values. While the tools and methods for transferring nonuse values estimated in a study are the same as those used to transfer use values (or total economic value for that matter), particular care must be given to the selection of studies and interpretation of value estimates to base the transfer upon to ensure commensurability of the value estimates in the original study with those for the new policy application. Kristofersson and Navrud (2007), in a study involving the valuation of fish stocks to non-anglers, provide evidence that nonuse value transfers have relatively small transfer errors.
So what are the prospects of using benefits transfer methods to inform values for critical habitat of Cook Inlet beluga whales? Due to the lack of SP studies that value similar species, except one that estimates nonuse values for a non-U.S. population (Olar, et al., 2007), at this time, benefits transfer cannot be used to transfer valid point estimates of WTP for Cook Inlet beluga whales. Even if a suitable U.S. study of sufficient quality that valued a similar enough species was found, the portion of the measured nonuse value that represents the nonuse value of critical habitat must be determined.
To this end, some researchers have proposed methods that can be used to infer the value of habitat from species values ex post. Alder, Hopkins, Cheung, and Sumaila (2006) attempt to isolate habitat values from estimates of the total economic value for protecting species that reside in a type of habitat by apportioning the estimated species values according to the frequency the species occurs in the specific type of habitat. An alternative method proposed by Allen and Loomis (2006) may be useful for understanding what the indirect nonuse value of critical habitat is. They derive the value of lower tropic species from the species values of charismatic megafauna and knowledge of ecological predator-prey relationships between the lower trophic species and the upper-level predator, for which there is an estimated economic value. Their model assumes the objective function to be maximized is an energy function for the upper-level predator, which is defined as the sum of the energy contributions of each lower level species, subject to the WTP for the predator being a simple sum of indirect use values for the lower level species. As such, the model ignores any nonuse value for the lower trophic level species. A serious difficulty with both approaches is that the derived demand and value for habitat and lower trophic level species, respectively, are not tied explicitly to preferences. Instead, the allocation of value is determined by biological or physical relationships.
In summary, the previous section discussed several studies in the non-market valuation literature that provide estimates of nonuse values associated with threatened or endangered whales, although none that estimate the value for the Cook Inlet beluga whale, specifically. The results of these studies suggest that the public’s WTP
FINAL RIR/4(B)(2)/FRFA OF CRITICAL HABITAT DESIGNATION OF COOK INLET BELUGA WHALE AUGUST 11, 2010
A-14
to conserve and recover the Cook Inlet beluga whale is likely to be positive, and possibly large, as evidenced particularly in Olar, et al. (2007). After reviewing benefits transfer methods in this section, however, it seems clear that, for a variety of reasons, none of the studies discussed in Section IV seems sufficiently similar to the Cook Inlet context to be used to transfer specific values to an analysis of critical habitat valuation for the Cook Inlet beluga whale. Moreover, the results of Kontoleon and Swanson (2003) provide grounds for believing that some portion of the public’s value for the Cook Inlet beluga whale is attributable specifically to critical habitat, though clearly more research is needed.
Before concluding, however, it is important to realize that the non-market valuation literature is constantly growing, and studies that are better fits for a benefits transfer related to the Cook Inlet beluga whale critical habitat valuation may become available in the future. Note also though that benefits transfer is, at most, a second-best strategy. Ideally, a de novo SP study that estimates the nonuse value of critical habitat for Cook Inlet beluga whales would be conducted. A non-trivial obstacle to such a study is the conceptual difficulty with separating empirical measures of the critical habitat value from the species value that was alluded to earlier. Further research on this issue is warranted. In the absence of the ability to directly estimate the nonuse value of critical habitat, a species valuation study of the type discussed in Section IV, to explore the nonuse values of protecting Cook Inlet beluga whales, would be the next best alternative.
APPENDIX A NONUSE VALUES OF CRITICAL HABITAT FOR THE COOK INLET BELUGA WHALE
NATIONAL MARINE FISHERIES SERVICE A-15
List of References Adamowicz, Wiktor, Jordan Louviere, and Michael Williams (1994). “Combining Revealed and Stated
Preference Methods for Valuing Environmental Amenities.” American Journal of Agricultural Economics, 26: 271-292.
Adamowicz, Wiktor L., Vinay Bhardwaj, and Bruce McNab (1993), “Experiments on the Difference Between Willingness to Pay and Willingness to Accept,” Land Economics, 69(4): 416-427.
Adamowicz, Wiktor, Peter Boxall, Michael Williams, and Jordan Louviere (1998). “Stated Preference Approaches for Measuring Passive Use Values: Choice Experiments and Contingent Valuation.” American Journal of Agricultural Economics, 80: 64-75.
Alder, J., S. Hopkins, W.W.L. Cheung, and U.R. Sumaila (2006), “Valuing US Marine Habitats: Fantasy or Fact?” Fisheries Centre, The University of British Columbia Working Paper Series, Working paper #2006-03.
Allen, Bryon P., and John B. Loomis (2006), “Deriving Values for the Ecological Support Function of Wildlife: An Indirect Valuation Approach,” Ecological Economics, 56: 49-57.
Alpizar, Francisco, Fredrik Carlsson, and Peter Martinsson (2001). “Using Choice Experiments for Non-Market Valuation.” Economic Issues, 8(1): 83-110.
Alvarez-Farizo, Begona, Nick Hanley, Ramon Barberan, Angelina Lazaro (2007), “Choice Modelling at the ‘Market Stall’: Individual Versus Collective Interest in Environmental Valuation,” Ecological Economics, 60: 743-751.
Anderson, James C. (1993), “Species Equality and the Foundations of Moral Theory,” Environmental Values, 2: 347-365.
Arrow, Kenneth, Robert Solow, Paul R. Portney, Edward E. Leamer, Roy Radner and Howard Schuman (1993), “Report of the NOAA Panel on Contingent Valuation”, Federal Register, 58: 4601–4614.
Bateman, Ian J., M.A. Cole, S. Georgiou, and D.J. Hadley (2006), “Comparing Contingent Valuation and Contingent Rating: A Case Study Considering the Benefits of Urban River Water Quality Improvements,” Journal of Environmental Economics, 79(3): 221-231.
Berrens, R.P., A.K. Bohara, C.L. Silva, D. Brookshire, and M. McKee (2000). “Contingent values for New Mexico instream flows: With tests of scope, group-size reminder and temporal reliability.” Journal of Environmental Management, 58: 73-90.
Bergstrom, John C. and Laura O. Taylor (2006), “Using Meta-Analysis for Benefits Transfer: Theory and Practice,” Ecological Economics, 60(2): 351-360.
Birol, Ekin, Katia Karousakis, and Phoebe Koundouri (2006), “Using a Choice Experiment to Account for Preference Heterogeneity in Wetland Attributes: The Case of Cheimaditida Wetland in Greece,” Ecological Economics, 60: 145-156.
Bishop, Richard C. (2003), “Where to from Here?” in Patricia A. Champ, Kevin J. Boyle, and Thomas C. Brown (eds). A Primer on Nonmarket Valuation. Dordrecht, The Netherlands: Kluwer Academic Publishers.

FINAL RIR/4(B)(2)/FRFA OF CRITICAL HABITAT DESIGNATION OF COOK INLET BELUGA WHALE AUGUST 11, 2010
A-16
Bishop, Richard C., and Thomas A. Heberlein (1979), “Measuring Values of Extramarket Goods: Are Indirect Measures Biased?” American Journal of Agricultural Economics, 61(5): 926-930.
Bockstael, Nancy E., and Kenneth E. McConnell (1983), “Welfare Measurement in the Household Production Function Framework,” American Economic Review, 73(4): 806-814.
Bockstael, Nancy E., and Kenneth E. McConnell (1993), “Public Goods as Characteristics of Non-Market Commodities,” Economic Journal, 103(3): 1244-1257.
Bockstael, Nancy E., and Kenneth E. McConnell (2007), Environmental and Resource Valuation with Revealed Preferences: A Theoretical Guide to Empirical Models, Dordrecht, The Netherlands: Springer.
Boyle, Kevin J. (2003), “Introduction to Revealed Preference Methods,” in Patricia A. Champ, Kevin J. Boyle, and Thomas C. Brown (eds). A Primer on Nonmarket Valuation. Dordrecht, The Netherlands: Kluwer Academic Publishers.
Boyle, Kevin J., and John Bergstrom (1992), “Benefit Transfer: Myths, Pragmatism, and Idealism,” Water Resources Research, 28(3): 657-663.
Boyle, Kevin J. and Richard C. Bishop (1987). “Valuing Wildlife in Benefit-cost Analyses: A Case Study Involving Endangered Species.” Water Resources Research, 23(5): 943-950.
Boyle, Kevin J., Thomas P. Holmes, Mario F. Teisl, and Brian Roe (2001), “A Comparison of Conjoint Analysis Response Formats,” American Journal of Agricultural Economics, 83(2): 441-454.
Brennan, Andrew (1992), “Moral Pluralism and the Environment,” Environmental Values, 1: 15-33.
Brown, Thomas C. (2003), “Introduction to Stated Preference Methods,” in Patricia A. Champ, Kevin J. Boyle, and Thomas C. Brown (eds). A Primer on Nonmarket Valuation. Dordrecht, The Netherlands: Kluwer Academic Publishers.
Brown, Thomas C. and Robin Gregory (1999), “Why the WTA-WTP Disparity Matters,” Ecological Economics, 28: 323-335.
Brouwer, Roy (2000), “Environmental Value Transfer: State of the Art and Future Prospects,” Ecological Economics, 32: 137-152.
Brouwer, Roy and Frank A. Spaninks (1999), “The Validity of Environmental Benefits Transfer: Further Empirical Testing,” Environmental and Resource Economics, 14: 95-117.
Brouwer, Roy (2000), “Environmental Value Transfer: State of the Art and Future Prospects,” Ecological Economics, 32: 137-152.
Brouwer, Roy and Ian J. Bateman (2005), “Temporal Stability and Transferability of Models of Willingness to Pay for Flood Control and Wetland Conservation,” Water Resources Research, 41, W03017, doi:10.1029/2004WR003466.
Brown, Thomas C., and Robin Gregory (1999), “Why the WTA-WTP Disparity Matters,” Ecological Economics, 28: 323-335.
Carson, Richard T., Nicholas E. Flores, and Norman F. Meade (2001). “Contingent Valuation: Controversies and Evidence.” Environmental and Resource Economics, 19: 173-210.
APPENDIX A NONUSE VALUES OF CRITICAL HABITAT FOR THE COOK INLET BELUGA WHALE
NATIONAL MARINE FISHERIES SERVICE A-17
Carson, Richard T., Nicholas E. Flores, Kerry M. Martin, and Jennifer L. Wright (1996), “Contingent Valuation and Revealed Preference Methodologies: Comparing the Estimates for Quasi-Public Goods,” Land Economics, 72(1): 80-99.
Carson, Richard T., Nicholas E. Flores, and Robert C. Mitchell (1999), “The Theory and Measurement of Passive Use Value,” in Valuing Environmental Preferences: Theory and Practice of the Contingent Valuation Method in the US, EU, and Developing Countries, Ian J. Bateman and Kenneth G. Willis (eds.), London: Oxford Press, pp. 97-130.
Champ, Patricia A., Kevin J. Boyle, and Thomas C. Brown (editors) (2003). A Primer on Nonmarket Valuation. Dordrecht, The Netherlands: Kluwer Academic Publishers.
Desvousges, William H., Michael H. Naughton, and George R. Parsons (1992), “Benefit Transfer: Conceptual Problems in Estimating Water Quality Benefits Using Existing Studies,” Water Resources Research, 28(3): 675-683.
Diamond, Peter A. and Jerry A. Hausman, "Contingent Valuation: Is Some Number Better than No Number?" Journal of Economic Perspectives, 8(4): 45-64, 1994.
Dickie, Mark (2003), “Defensive Behavior and Damage Cost Methods,” in Patricia A. Champ, Kevin J. Boyle, and Thomas C. Brown (eds). A Primer on Nonmarket Valuation. Dordrecht, The Netherlands: Kluwer Academic Publishers.
Duffield, John W. (1992). “An Economic Analysis of Wolf Recovery in Yellowstone: Park Visitor Attitudes and Values.” In John D. Varley and Wayne G. Brewster (eds), “Wolves for Yellowstone?” A report to the United States Congress, volume IV, Research and Analysis.
Ekstrand, Earl R. and John Loomis (1998). “Incorporating Respondent Uncertainty When Estimating Willingness to Pay for Protecting Critical Habitat for Threatened and Endangered Fish.” Water Resources Research, 34(11): 3149-3155.
Flores, Nicholas E. (1996), “Reconsidering the Use of Hicks Neutrality to Recover Total Values,” Journal of Environmental Economics and Management, 31: 49-64.
Fredman, P. (1995) “The existence of existence value—a study of the economic benefits of an endangered species.” Journal of Forest Economics, 1(3): 307-328.
Freeman, A. Myrick (2003), The Measurement of Environmental and Resource Values, 2nd edition. Washington, D.C.: Resources for the Future.
Giraud, Kelly, Branka Turcin, John B. Loomis, and Joseph Cooper (2002), “Economic benefits of the protection program for the Steller sea lion,” Marine Policy. 26(6): 451-458.
Giraud, Kelly, John B. Loomis, Rebecca L. Johnson (1999), “Internal and External Scope in Willingness-to-Pay Estimates for Threatened and Endangered Wildlife,” Journal of Environmental Management, 56: 221-229.
Greenley, Douglas A., Richard G. Walsh, and Robert A. Young (1981), “Option Value: Empirical Evidence from a Case Study of Recreation and Water Quality,” Quarterly Journal of Economics, 96(4): 657-673.
FINAL RIR/4(B)(2)/FRFA OF CRITICAL HABITAT DESIGNATION OF COOK INLET BELUGA WHALE AUGUST 11, 2010
A-18
Hageman, Renatte K. (1985) “Valuing Marine Mammal Populations: Benefit Valuations in a Multi-Species Ecosystem.” Southwest Fisheries Center, National Marine Fisheries Service, Administrative Report, LJ-85-22.
Hagen, Daniel A., James W. Vincent, and Patrick G. Welle (1992). “Benefits of Preserving Old-Growth Forests and the Spotted Owl.” Contemporary Policy Issues, 10(2): 13-26.
Hanemann, W. Michael (1994), “Valuing the Environment Through Contingent Valuation,” Journal of Economic Perspectives, 8(4): 19-43.
Hanley, Nick, Susana Mourato, and Robert E. Wright (2001). “Choice Modelling Approaches: A Superior Alternative for Environmental Valuation?” Journal of Economic Surveys, 15(3): 435-462.
Hanley, Nick, Robert E. Wright, and Vic Adamowicz (1998). “Using Choice Experiments to Value the Environment: Design Issues, Current Experience, and Future Prospects.” Environmental and Resource Economics, 11(3-4): 413-428.
Hausman, Jerry A. (1981), “Exact Consumer’s Surplus and Deadweight Loss,” American Economic Review, 71(4): 662-676.
Hausman, Jerry A. (1993), Contingent Valuation: A Critical Assessment, Amsterdam: North Holland Press.
Horowitz, John K., and Kenneth E. McConnell (2002), “A Review of WTA/WTP Studies,” Journal of Environmental Economics and Management, 44: 426-447.
Isik, Murat (2004), “An Experimental Analysis of Impacts of Uncertainty and Irreversibility on Willingness to Pay,” Applied Economics Letters, 13: 67-72.
Jakobsson, Kristin M. and Andrew K. Dragun (2001). “The Worth of a Possum: Valuing Species with the Contingent Valuation Method.” Environmental and Resource Economics, 19: 211-227.
Johnston, Robert J., Elena Y. Besedin, and Matthew H. Ranson (2006), “Characterizing the Effects of Valuation Methodology in Function-Based Benefits Transfer,” Ecological Economics, 60(2): 407-419.
Kanninen, Barbara J. (2006), Valuing Environmental Amenities Using Stated Choice Studies: A Common Sense Approach to Theory and Practice. Dordrecht, The Netherlands: Springer.
Kontoleon, Andreas, and Timothy Swanson (2003), “The Willingness to Pay for Property Rights for the Giant Panda: Can a Charismatic Species be an Instrument for Nature Conservation,” Land Economics, 79(4): 483-499.
Kramer, Randall A. and D. Evan Mercer (1997), “Valuing a Global Environmental Good: U.S. Residents’ Willingness to Pay to Protect Tropical Rain Forest,” Land Economics, 73(2): 196-210.
Kristofersson, Dadi and Stale Navrud (2005), “Validity Tests of Benefits Transfer—Are We Performing the Wrong Tests?” Environmental and Resource Economics, 30: 279-286.
Kristofersson, D. and S. Navrud (2007), “Can Use and Non-Use Values be Transferred Across Countries?” in Environmental Value Transfer: Issues and Methods, S. Navrud and R. Ready (eds). Dordrecht, The Netherlands: Springer.
Krutilla, John V. (1967), “Conservation Reconsidered,” The American Economic Review, 57(4): 777-786.
APPENDIX A NONUSE VALUES OF CRITICAL HABITAT FOR THE COOK INLET BELUGA WHALE
NATIONAL MARINE FISHERIES SERVICE A-19
Larson, Douglas M. (1992). “Further Results on Willingness to Pay for Nonmarket Goods,” Journal of Environmental Economics and Management, 23: 101-122.
Lew, Daniel K., David F. Layton, and Robert D. Rowe (2009), “Valuing Enhancements to Endangered Species Protection under Alternative Baseline Futures: The Case of the Steller Sea Lion,” submitted to Marine Resource Economics.
Loomis, John B. (1992), “The Evolution of a More Rigorous Approach to Benefit Transfer: Benefit Function Transfer,” Water Resources Research, 28(3): 701-705.
Loomis, John and Earl Ekstrand (1997). “Economic Benefits of Critical Habitat for the Mexican Spotted Owl: A Scope test Using a Multiple-Bounded Contingent Valuation Survey.” Journal of Agricultural and Resource Economics, 22(2): 356-366.
Loomis, John and Earl Ekstrand (1998). “Alternative Approaches for Incorporating Respondent Uncertainty When Estimating Willingness to Pay: The Case of the Mexican Spotted Owl.” Ecological Economics, 27: 29-41.
Loomis, John B. and Douglas M. Larson (1994). "Total Economic Values of Increasing Gray Whale Populations: Results from a contingent valuation survey of visitors and households," Marine Resource Economics, 9: 275-286.
Loomis, John B. and Douglas S. White (1996), “Economic Benefits of Rare and Endangered Species: Summary and Meta-Analysis,” Ecological Economics, 18: 197-206.
Loomis, John B. and Armando Gonzalez-Caban (1998), “A Willingness-to-Pay Function for Protecting Acres of Spotted Owl Habitat from Fire,” Ecological Economics, 25: 315-322.
Loomis, John B., Paula Kent, Liz Strange, Kurt Fausch, and Alan Covich (2000), “Measuring the Total Economic Value of Restoring Ecosystem Services in an Impaired River Basin: Results from a Contingent Valuation Survey,” Ecological Economics, 33: 103-117.
Mas-Colell, Andreu, Michael D. Whinston, and Jerry R. Green (1995), Microeconomic Theory, New York: Oxford University Press.
Mansfield, Carol (1999), “Despairing Over Disparities: Explaining the Difference Between Willingness to Pay and Willingness to Accept,” Environmental and Resource Economics, 13: 219-234.
McConnell, Kenneth E. (1983), “Existence and Bequest Value,” in Managing Air Quality and Scenic Resources at National Parks and Wilderness Areas, Robert D. Rowe and Lauraine G. Chestnut (eds.), Boulder, Colorado: Westview Press.
McConnell, Kenneth E. (1992), “Model Building and Judgment: Implication for Benefit Transfer with Travel Cost Models,” Water Resources Research, 28(3): 695-700.
Metrick, Andrew and Weitzman, Martin L. (1996) “Patterns of behavior in endangered species preservation,” Land Economics, 72 (1): 1–16.
Mitchell, Robert C., and Richard T. Carson (1989), Using Surveys to Value Public Goods: The Contingent Valuation Method, Washington, D.C.: Resources for the Future.
Morrison, Mark, and Olvar Bergland (2006), “Prospects for the Use of Choice Modelling for Benefit Transfer,” Ecological Economics, 60: 420-428.

FINAL RIR/4(B)(2)/FRFA OF CRITICAL HABITAT DESIGNATION OF COOK INLET BELUGA WHALE AUGUST 11, 2010
A-20
Navrud, Stale, and Richard Ready (2007), Environmental Value Transfer: Issues and Methods, Dordrecht, The Netherlands: Springer.
Olar, M., W. Adamowicz, P. Boxall, and G.E. West (2007) “Estimation of the Economic Benefits of Marine Mammal Recovery in the St. Lawrence Estuary.” Report to the Policy and Economics Branch, Fisheries and Oceans Canada, Regional Branch Quebec.
Olsen, Darryll, Jack Richards, and R. Douglas Scott (1991). “Existence and Sport Values for Doubling the Size of Columbia River Basin Salmon and Steelhead Runs.” Rivers, 2(1): 44-56.
Parsons, George R. (2003), “The Travel Cost Model,” in Patricia A. Champ, Kevin J. Boyle, and Thomas C. Brown (eds). A Primer on Nonmarket Valuation. Dordrecht, The Netherlands: Kluwer Academic Publishers.
Pattanayak, S., V.K. Smith, and G. van Houtven (2007), “Improving the Practice of Benefits Transfer: A Preference Calibration Approach,” in Environmental Value Transfer: Issues and Methods, S. Navrud and R. Ready (eds). Dordrecht, The Netherlands: Springer.
Pollak, Robert A., and Michael L. Wachter (1975), “The Relevance of the Household Production Function and Its Implications for the Allocation of Time,” The Journal of Political Economy, 83(2): 255-278.
Randall, Alan G., and John R. Stoll (1980), “Consumer’s Surplus in Commodity Space,” American Economic Review, 70(3): 449-455.
Richardson, Leslie, and John Loomis (2009), “The Total Economics Value of Threatened, Endangered, and Rare Species: An Updated Meta-Analysis,” Ecological Economics, 68: 1535-1548.
Rosenberger, Randall, and John B. Loomis (2003), “Benefits Transfer,” in Patricia A. Champ, Kevin J. Boyle, and Thomas C. Brown (eds). A Primer on Nonmarket Valuation. Dordrecht, The Netherlands: Kluwer Academic Publishers.
Rosenberger, Randall, and T. Phipps (2007), “Correspondence and Convergence in Benefit Transfer Accuracy: Meta-Analytic Review of the Literature,” in Environmental Value Transfer: Issues and Methods, S. Navrud and R. Ready (eds). Dordrecht, The Netherlands: Springer.
Rubin, Jonathan, Gloria Helfand, and John Loomis (1991). “A Benefit-Cost Analysis of the Northern Spotted Owl,” Journal of Forestry, December: 25-30.
Rudd, Murray (2007) “Public Preferences and Willingness to Pay for Aquatic Species at Risk Conservation Programs in Canada.” SWGC Environmental Valuation and Policy Laboratory, EVPL Working Paper 07-001.
Samples, Karl C. and James R. Hollyer (1990). “Contingent Valuation of Wildlife Resources in the Presence of Substitutes and Complements.” Chapter 11 in Economic Valuation of Natural Resources: Issues, Theory, and Applications, R. Johnson and G. Johnson (eds), Boulder, CO: Westview Press.
Scarpa, R., W.G. Hutchinson, S.M. Chilton, and J. Buongiorno (2007), “Benefit Value Transfers Conditional on Site Attributes: Some Evidence of Reliability from Forest Recreation in Ireland,” in Environmental Value Transfer: Issues and Methods, S. Navrud and R. Ready (eds). Dordrecht, The Netherlands: Springer.
APPENDIX A NONUSE VALUES OF CRITICAL HABITAT FOR THE COOK INLET BELUGA WHALE
NATIONAL MARINE FISHERIES SERVICE A-21
Shrestha, Ram, Randall Rosenberger, and John B. Loomis (2007), “Benefit Transfer Using Meta-Analysis in Recreation Economic Valuation,” in Environmental Value Transfer: Issues and Methods, S. Navrud and R. Ready (eds). Dordrecht, The Netherlands: Springer.
Siikamaki, Juha, and David F. Layton (2007), “Discrete Choice Survey Experiments: A Comparison Using Flexible Methods,” Journal of Environmental Economics and Management, 53: 122-139.
Smith, V. Kerry (1987), “Nonuse Values in Benefit-Cost Analysis,” Southern Economic Journal, 54(1): 19-26.
Smith, V.K. and Huang, J.C. (1993) “Hedonic models and air pollution: twenty-five years and Counting,” Environmental and Resource Economics, 3: 381-394.
Smith, V.K. and Huang, J.C. (1995) “Can markets value air quality? A meta-analysis of hedonic property value models,” Journal of Political Economy, 103(1): 209-227.
Smith, V. Kerry, and Yoshiaki Kaoru (1990), “What Have We Learned Since Hotelling’s Letter? A Meta-Analysis,” Economics Letters, 32: 267-272.
Smith, V. Kerry, and Laura L. Osborne (1996), “Do Contingent Valuation Estimates Pass a ‘Scope’ Test? A Meta-Analysis,” Journal of Environmental Economics and Management, 31: 287-301.
Smith, V. Kerry, George van Houtven, and Subhrendru K. Pattanayak (2002), “Benefit Transfer via Preference Calibration: ‘Prudential Algebra’ for Policy,” Land Economics, 78(1): 132-152.
Solomon, Barry D., Cristi M. Corey-Luse, and Kathleen E. Halvorsen (2004). “The Florida Manatee and Eco-tourism: Toward a Safe Minimum Standard.” Ecological Economics, 50: 101-115.
Stanley, Denise L. (2005). “Local Perception of Public Goods: Recent Assessments of Willingness-to-Pay for Endangered Species.” Contemporary Economic Policy, 23(2): 165-179.
Stevens, Thomas H., Jaime Echeverria, Ronald J. Glass, Tim Hager, and Thomas A. More (1991), “Measuring the Existence Value of Wildlife: What Do CVM Estimates Really Show?” Land Economics, 67(4): 390-400.
Stevens, Thomas H., Thomas A. More, and Ronald J. Glass (1994). “Interpretation and Temporal Stability of CV Bids for Wildlife Existence: A Panel Study.” Land Economics, 70: 355-363.
Swanson, Cindy Sorg (1996). “Economics of Endangered Species: Bald Eagles on the Skagit River Bald Eagle Natural Area, Washington.” Transactions of the 61st North American Wildlife and Natural Resources Council, March 22-27, 1996, Tulsa Oklahoma, Kelly G. Wadsworth and Richard E. McCabe (eds).
Sutherland, Ronald J., and Richard G. Walsh (1985), “Effect of Distance on the Preservation Value of Water Quality,” Land Economics, 61(3): 281-291.
Swanson, Timothy, Wang Qiwen, Andreas Kontoleon, Qiao Xuejun, and Yang Tao (2001), The Economics of Panda Reserve Management. Baltimore, MD: China Council for International Cooperation on the Environment and Development.
Taylor, Laura O., “The Hedonic Method,” in Patricia A. Champ, Kevin J. Boyle, and Thomas C. Brown (eds). A Primer on Nonmarket Valuation. Dordrecht, The Netherlands: Kluwer Academic Publishers.
FINAL RIR/4(B)(2)/FRFA OF CRITICAL HABITAT DESIGNATION OF COOK INLET BELUGA WHALE AUGUST 11, 2010
A-22
Vartia, Yrjo O. (1983), “Efficient Methods of Measuring Welfare Change and Compensated Income in Terms of Ordinary Demand Functions,” Econometrica, 51(1): 79-98.
Wallmo, Kristy, and Steven Edwards (2008), “Estimating Non-Market Values of Marine Protected Areas: A Latent Class Modeling Approach,” Marine Resource Economics, 23: 301-323.
Walsh, Richard G., Donn R. Johnson, and John R. McKean (1992), “Benefit Transfer of Outdoor Recreation Demand Studies, 1968-1988,” Water Resources Research, 28(3): 707-713.
Walsh, Richard G., John B. Loomis, and Richard A. Gillman (1984), “Valuing Option, Existence, and Bequest Demands for Wilderness,” Land Economics, 60(1): 14-29.
Weisbrod, Burton A. “Collective-Consumption Services of Individual-Consumption Goods,” Quarterly Journal of Economics, 78(3): 471-477.
Willig, Robert D. (1976), “Consumer’s Surplus Without Apology,” American Economic Review, 66(4): 589-597.
Woodward, Richard T., and Yong-Suhk Wui (2001), “The Economic Value of Wetland Services: A Meta-Analysis,” Ecological Economics, 37: 257-270.
Zhao, Jinhua and Catherine L. Kling (2001), “A New Explanation for the WTP/WTA Disparity,” Economics Letters, 73: 293-300.
A P P E N D I X B
Environmental Justice Impacts of Cook Inlet Beluga Whale Critical Habitat
Designation


APPENDIX B ENVIRONMENTAL JUSTICE IMPACTS OF COOK INLET BELUGA WHALE CRITICAL HABITAT
NATIONAL MARINE FISHERIES SERVICE B-1
The EPA’s Office of Environmental Justice offers the following definition of environmental justice:
“The fair treatment and meaningful involvement of all people regardless of race, color, national origin, or income with respect to the development, implementation, and enforcement of environmental laws, regulations, and policies. Fair treatment means that no group of people, including racial, ethnic, or socioeconomic group should bear a disproportionate share of the negative environmental consequences resulting from industrial, municipal, and commercial operations or the execution of Federal, state, local, and tribal programs and policies.”
The concept of environmental justice is rooted in the Civil Rights Act of 1964, which prohibited discrimination in Federally-assisted programs, and in Executive Order 12898, “Federal Actions to Address Environmental Justice in Minority Populations and Low Income Populations,” issued February 11, 1994. Executive order 12898 was intended to ensure that Federal actions and policies do not result in disproportionately high adverse effects on minority or low-income populations. It requires each Federal agency to incorporate environmental justice into its mission by identifying and addressing, as appropriate, disproportionately high and adverse human health or environmental effects, including social or economic effects, of its programs, policies, and activities implemented both directly and indirectly (for which it provides permitting or funding), on minority populations and low-income populations of the United States (President’s Council on Environmental Quality 1997). Additional guidance from the President’s Council on Environmental Quality clarifies that environmental justice concerns may arise from effects on the natural and physical environment that produce human health or ecological outcomes, or from adverse social or economic changes.
No adverse human health effects are anticipated from CHD, and only positive environmental effects are anticipated to accrue from the additional protections provided to the Cook Inlet beluga whale PCEs. Therefore, only adverse social or economic effects to minority and low-income populations have the potential to occur due to CHD. Adverse social and economic effects have the potential to occur if CHD has disproportionately high adverse effects on industries in which low-income or minority workers are clustered, thereby potentially causing job losses or wage cuts that disproportionately affect these groups. As discussed throughout this report, economic activities that have the potential to be impacted include oil and gas development, mining, transportation, port expansion and development, other large-scale development/infrastructure projects, water treatment, power projects/development in Cook Inlet and vicinity, commercial fisheries, Alaska Native subsistence use, Alaska residents personal use fisheries, recreation and tourism, and military activities.
Section 6.2 of this report (“Description of Affected Economies”) presents some of the background information used in this analysis of environmental justice. The key socioeconomic parameters addressed in that section are local demographics, including population and race/ethnicity; and measures of social and economic well-being, including per capita and median household income, poverty rates, and unemployment rates. These parameters are addressed for the three boroughs (Municipality of Anchorage, Matanuska-Susitna Borough, and Kenai Peninsula Borough) and the Alaska Native communities within Cook Inlet. In addition, non-employer firms, non-employer receipts, the number of employer establishments and employees, and the annual payroll for the various industry sectors within the three boroughs are discussed.
The remainder of this appendix uses the data provided in Section 6.2, as well as additional data derived from the Bureau of Labor Statistics (BLS) to identify any disproportionately high adverse effects from CHD to
FINAL RIR/4(B)(2)/FRFA OF CRITICAL HABITAT DESIGNATION OF COOK INLET BELUGA WHALE AUGUST 11, 2010
B-2 NATIONAL MA
industries in which minority or low-income populations are clustered. Potential adverse effects to low-income populations are discussed first, followed by an analysis of potential impacts to minority populations.
POTENTIAL EFFECTS TO LOW-INCOME POPULATIONS
An analysis of potential impacts to low-income populations is accomplished by first assessing which industries within the Cook Inlet area have low wages compared to the average of wages for all occupations, and then determining whether any of these industries are among those potentially affected by CHD. The BLS occupational employment statistics (OES) surveys establishments in nonfarm industries to produce estimates of occupational employment and wages. Establishments that are not surveyed by the program are those within the following industries: NAICS 111 (Crop Production); NACIS 112 (Animal Production); NAICS 114 (Fishing, Hunting, and Trapping); and NAICS 814 (Private Households). Although fishing occupations are not covered by OES surveys, they are considered separately in this analysis, due to the potential CHD has to adversely (as well as positively) affect the fishing industry.
The OES data are available from the BLS for the Anchorage metropolitan statistical area (MSA). This MSA includes both the Municipality of Anchorage City-Borough and the Matanuska-Susitna Borough. Kenai Peninsula Borough is represented separately, within data available for the Railbelt/Southwest Alaska non-metropolitan area. Wage estimates include median, mean hourly, and mean annual wages by occupational group. Table B-1 shows wage and employment data by occupational group within the Anchorage MSA, and Table B-2 shows the same data for the Railbelt/Southwest Alaska non-metropolitan area.
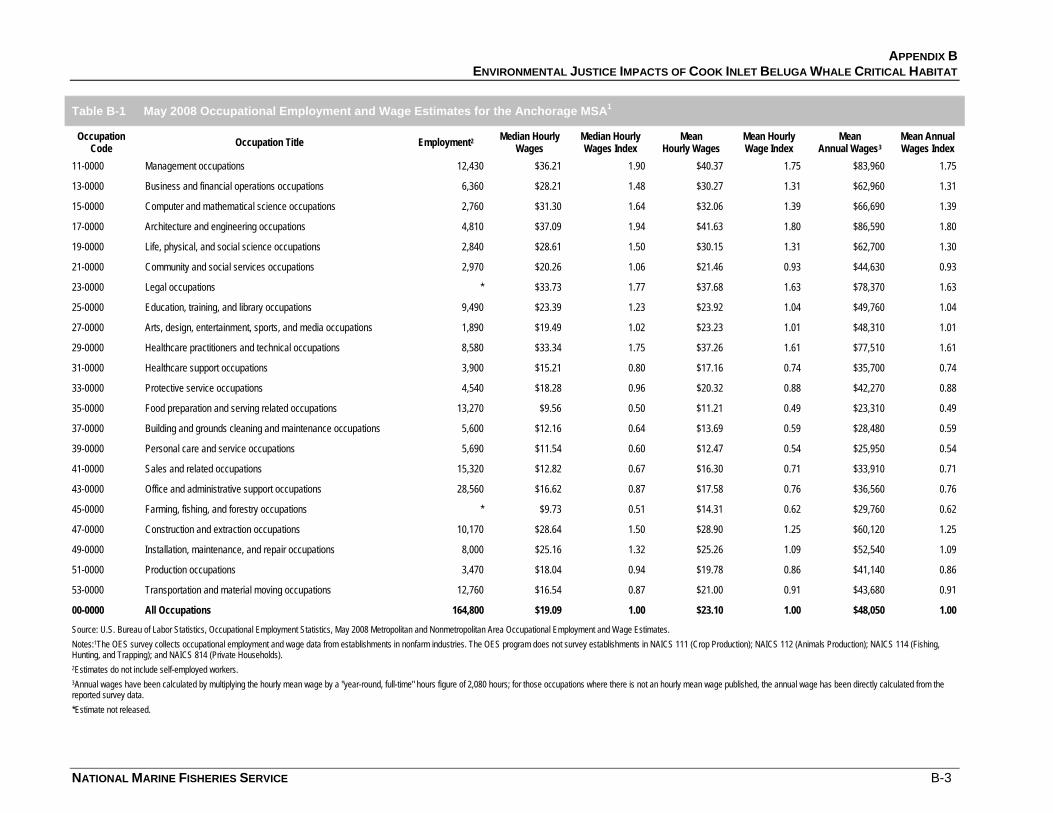
APPENDIX B ENVIRONMENTAL JUSTICE IMPACTS OF COOK INLET BELUGA WHALE CRITICAL HABITAT
NATIONAL MARINE FISHERIES SERVICE B-3
Table B-1 May 2008 Occupational Employment and Wage Estimates for the Anchorage MSA1
Occupation Code Occupation Title Employment2 Median Hourly
Wages Median Hourly Wages Index
Mean Hourly Wages
Mean Hourly Wage Index
Mean Annual Wages3
Mean Annual Wages Index
11-0000 Management occupations 12,430 $36.21 1.90 $40.37 1.75 $83,960 1.75
13-0000 Business and financial operations occupations 6,360 $28.21 1.48 $30.27 1.31 $62,960 1.31
15-0000 Computer and mathematical science occupations 2,760 $31.30 1.64 $32.06 1.39 $66,690 1.39
17-0000 Architecture and engineering occupations 4,810 $37.09 1.94 $41.63 1.80 $86,590 1.80
19-0000 Life, physical, and social science occupations 2,840 $28.61 1.50 $30.15 1.31 $62,700 1.30
21-0000 Community and social services occupations 2,970 $20.26 1.06 $21.46 0.93 $44,630 0.93
23-0000 Legal occupations * $33.73 1.77 $37.68 1.63 $78,370 1.63
25-0000 Education, training, and library occupations 9,490 $23.39 1.23 $23.92 1.04 $49,760 1.04
27-0000 Arts, design, entertainment, sports, and media occupations 1,890 $19.49 1.02 $23.23 1.01 $48,310 1.01
29-0000 Healthcare practitioners and technical occupations 8,580 $33.34 1.75 $37.26 1.61 $77,510 1.61
31-0000 Healthcare support occupations 3,900 $15.21 0.80 $17.16 0.74 $35,700 0.74
33-0000 Protective service occupations 4,540 $18.28 0.96 $20.32 0.88 $42,270 0.88
35-0000 Food preparation and serving related occupations 13,270 $9.56 0.50 $11.21 0.49 $23,310 0.49
37-0000 Building and grounds cleaning and maintenance occupations 5,600 $12.16 0.64 $13.69 0.59 $28,480 0.59
39-0000 Personal care and service occupations 5,690 $11.54 0.60 $12.47 0.54 $25,950 0.54
41-0000 Sales and related occupations 15,320 $12.82 0.67 $16.30 0.71 $33,910 0.71
43-0000 Office and administrative support occupations 28,560 $16.62 0.87 $17.58 0.76 $36,560 0.76
45-0000 Farming, fishing, and forestry occupations * $9.73 0.51 $14.31 0.62 $29,760 0.62
47-0000 Construction and extraction occupations 10,170 $28.64 1.50 $28.90 1.25 $60,120 1.25
49-0000 Installation, maintenance, and repair occupations 8,000 $25.16 1.32 $25.26 1.09 $52,540 1.09
51-0000 Production occupations 3,470 $18.04 0.94 $19.78 0.86 $41,140 0.86
53-0000 Transportation and material moving occupations 12,760 $16.54 0.87 $21.00 0.91 $43,680 0.91
00-0000 All Occupations 164,800 $19.09 1.00 $23.10 1.00 $48,050 1.00
Source: U.S. Bureau of Labor Statistics, Occupational Employment Statistics, May 2008 Metropolitan and Nonmetropolitan Area Occupational Employment and Wage Estimates. Notes:1The OES survey collects occupational employment and wage data from establishments in nonfarm industries. The OES program does not survey establishments in NAICS 111 (Crop Production); NAICS 112 (Animals Production); NAICS 114 (Fishing, Hunting, and Trapping); and NAICS 814 (Private Households). 2Estimates do not include self-employed workers. 3Annual wages have been calculated by multiplying the hourly mean wage by a "year-round, full-time" hours figure of 2,080 hours; for those occupations where there is not an hourly mean wage published, the annual wage has been directly calculated from the reported survey data. *Estimate not released.
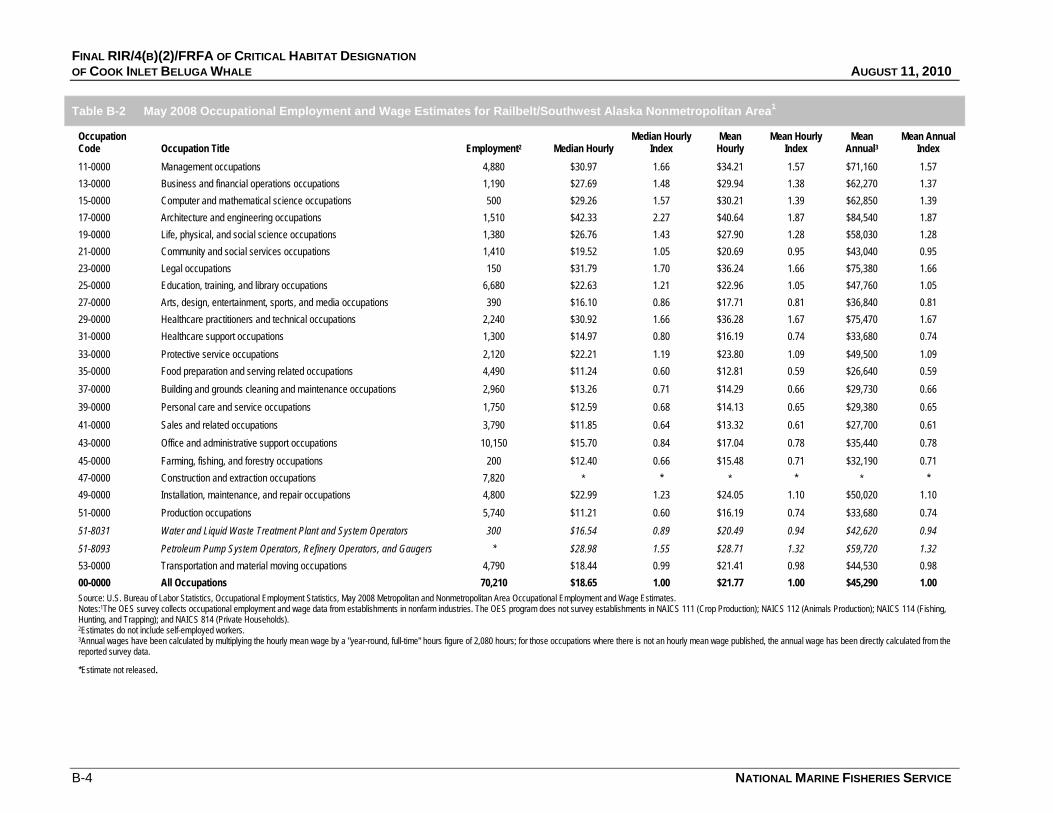
FINAL RIR/4(B)(2)/FRFA OF CRITICAL HABITAT DESIGNATION OF COOK INLET BELUGA WHALE AUGUST 11, 2010
B-4 NATIONAL MARINE FISHERIES SERVICE
Table B-2 May 2008 Occupational Employment and Wage Estimates for Railbelt/Southwest Alaska Nonmetropolitan Area1
Occupation Code Occupation Title Employment2 Median Hourly
Median Hourly Index
Mean Hourly
Mean Hourly Index
Mean Annual3
Mean Annual Index
11-0000 Management occupations 4,880 $30.97 1.66 $34.21 1.57 $71,160 1.57 13-0000 Business and financial operations occupations 1,190 $27.69 1.48 $29.94 1.38 $62,270 1.37 15-0000 Computer and mathematical science occupations 500 $29.26 1.57 $30.21 1.39 $62,850 1.39 17-0000 Architecture and engineering occupations 1,510 $42.33 2.27 $40.64 1.87 $84,540 1.87 19-0000 Life, physical, and social science occupations 1,380 $26.76 1.43 $27.90 1.28 $58,030 1.28 21-0000 Community and social services occupations 1,410 $19.52 1.05 $20.69 0.95 $43,040 0.95 23-0000 Legal occupations 150 $31.79 1.70 $36.24 1.66 $75,380 1.66 25-0000 Education, training, and library occupations 6,680 $22.63 1.21 $22.96 1.05 $47,760 1.05 27-0000 Arts, design, entertainment, sports, and media occupations 390 $16.10 0.86 $17.71 0.81 $36,840 0.81 29-0000 Healthcare practitioners and technical occupations 2,240 $30.92 1.66 $36.28 1.67 $75,470 1.67 31-0000 Healthcare support occupations 1,300 $14.97 0.80 $16.19 0.74 $33,680 0.74 33-0000 Protective service occupations 2,120 $22.21 1.19 $23.80 1.09 $49,500 1.09 35-0000 Food preparation and serving related occupations 4,490 $11.24 0.60 $12.81 0.59 $26,640 0.59 37-0000 Building and grounds cleaning and maintenance occupations 2,960 $13.26 0.71 $14.29 0.66 $29,730 0.66 39-0000 Personal care and service occupations 1,750 $12.59 0.68 $14.13 0.65 $29,380 0.65 41-0000 Sales and related occupations 3,790 $11.85 0.64 $13.32 0.61 $27,700 0.61 43-0000 Office and administrative support occupations 10,150 $15.70 0.84 $17.04 0.78 $35,440 0.78 45-0000 Farming, fishing, and forestry occupations 200 $12.40 0.66 $15.48 0.71 $32,190 0.71 47-0000 Construction and extraction occupations 7,820 * * * * * * 49-0000 Installation, maintenance, and repair occupations 4,800 $22.99 1.23 $24.05 1.10 $50,020 1.10 51-0000 Production occupations 5,740 $11.21 0.60 $16.19 0.74 $33,680 0.74 51-8031 Water and Liquid Waste Treatment Plant and System Operators 300 $16.54 0.89 $20.49 0.94 $42,620 0.94 51-8093 Petroleum Pump System Operators, Refinery Operators, and Gaugers * $28.98 1.55 $28.71 1.32 $59,720 1.32 53-0000 Transportation and material moving occupations 4,790 $18.44 0.99 $21.41 0.98 $44,530 0.98 00-0000 All Occupations 70,210 $18.65 1.00 $21.77 1.00 $45,290 1.00 Source: U.S. Bureau of Labor Statistics, Occupational Employment Statistics, May 2008 Metropolitan and Nonmetropolitan Area Occupational Employment and Wage Estimates. Notes:1The OES survey collects occupational employment and wage data from establishments in nonfarm industries. The OES program does not survey establishments in NAICS 111 (Crop Production); NAICS 112 (Animals Production); NAICS 114 (Fishing, Hunting, and Trapping); and NAICS 814 (Private Households). 2Estimates do not include self-employed workers. 3Annual wages have been calculated by multiplying the hourly mean wage by a "year-round, full-time" hours figure of 2,080 hours; for those occupations where there is not an hourly mean wage published, the annual wage has been directly calculated from the reported survey data.
*Estimate not released.

APPENDIX B ENVIRONMENTAL JUSTICE IMPACTS OF COOK INLET BELUGA WHALE CRITICAL HABITAT
NATIONAL MARINE FISHERIES SERVICE B-5
An index of median hourly, mean hourly, and mean annual wages was developed by dividing wage data for each occupational group by wage data averaged across all occupations. For example, within the Anchorage MSA, the median hourly wage index for Management occupations is 1.90, a result of dividing the median hourly wage for that group ($36.21) by the median hourly wage averaged across all occupations ($19.09). An index exceeding 1.00 indicates that the occupational group has higher than averages wages; conversely, an index below 1.00 indicates that the occupational group has lower than average wages. For the purposes of this analysis, occupational groups with one or more indices below 0.80 are considered to have wages significantly below average. Within the Anchorage MSA, occupational groups with one or more indices below the chosen threshold include the following:
• Healthcare Support occupations
• Food Preparation and Serving-Related occupations
• Building and Grounds Cleaning and Maintenance operations
• Personal Care and Service occupations
• Sales and Related occupations
• Office and Administrative Support occupations
• Farming, Fishing, and Forestry occupations
With the exception of Healthcare Support occupations, which is not below the 0.8 criterion for the Railbelt/Southwest Alaska nonmetropolitan area (including the Kenai Peninsula Borough) the same collection of occupations are identified for this area. In addition, the Rainbelt/Southwest Alaska includes:
• Production occupations
Of all of these occupational groups below the threshold, only the Production occupational group has the potential to be impacted by the CHD for the Cook Inlet beluga whale. Production occupations have the potential to be impacted, because Water and Liquid Waste Treatment Plant and System Operators, as well as Petroleum Pump System Operators, Refinery Operators, and Gaugers, are included within this occupational group. However, greater detail within this occupational group reveals that the wage indices for these particular workers do not meet the significance threshold criteria (0.80, or wages that are 80 percent or less than the average of wages across all occupational groups). For example, compared to the mean hourly wage averaged across all occupations in the Railbelt/Southwest Alaska nonmetropolitan area ($21.77), the mean hourly wage of Water and Liquid Waste Treatment Plant and System Operators is $20.49 (index: 0.94), and that of Petroleum Pump System Operators, Refinery Operators, and Gaugers is $28.98 (index: 1.32). Therefore, potential impacts to the Production occupational group due to CHD for the Cook Inlet beluga whale are not likely to affect low-income workers within this group.
The remaining occupational group for consideration is fishing. As discussed earlier in this report, there is some information about commercial fishermen that can be found among data on the total number, and revenue for “non-employer firms,” within the subcategory of fishing. Because non-employer firms are those firms with no paid employees, the revenues for these firms are
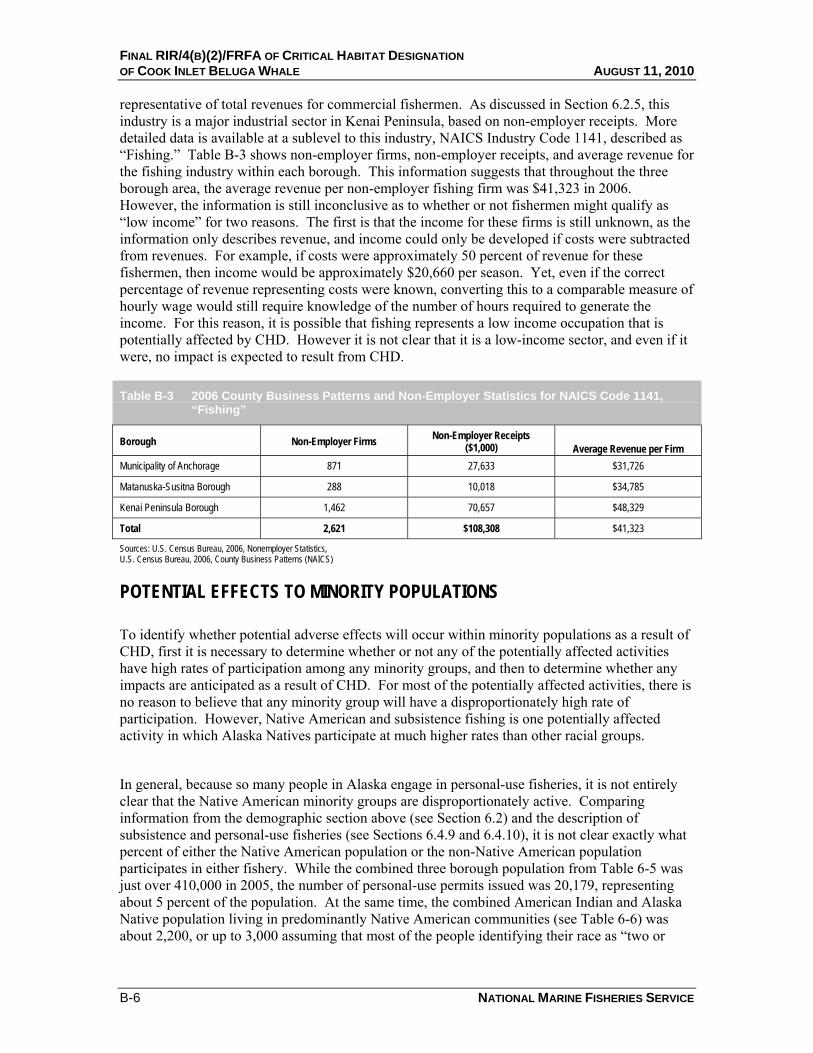
FINAL RIR/4(B)(2)/FRFA OF CRITICAL HABITAT DESIGNATION OF COOK INLET BELUGA WHALE AUGUST 11, 2010
B-6 NATIONAL MARINE FISHERIES SERVICE
representative of total revenues for commercial fishermen. As discussed in Section 6.2.5, this industry is a major industrial sector in Kenai Peninsula, based on non-employer receipts. More detailed data is available at a sublevel to this industry, NAICS Industry Code 1141, described as “Fishing.” Table B-3 shows non-employer firms, non-employer receipts, and average revenue for the fishing industry within each borough. This information suggests that throughout the three borough area, the average revenue per non-employer fishing firm was $41,323 in 2006. However, the information is still inconclusive as to whether or not fishermen might qualify as “low income” for two reasons. The first is that the income for these firms is still unknown, as the information only describes revenue, and income could only be developed if costs were subtracted from revenues. For example, if costs were approximately 50 percent of revenue for these fishermen, then income would be approximately $20,660 per season. Yet, even if the correct percentage of revenue representing costs were known, converting this to a comparable measure of hourly wage would still require knowledge of the number of hours required to generate the income. For this reason, it is possible that fishing represents a low income occupation that is potentially affected by CHD. However it is not clear that it is a low-income sector, and even if it were, no impact is expected to result from CHD.
Table B-3 2006 County Business Patterns and Non-Employer Statistics for NAICS Code 1141, “Fishing”
Borough Non-Employer Firms Non-Employer Receipts ($1,000) Average Revenue per Firm
Municipality of Anchorage 871 27,633 $31,726 Matanuska-Susitna Borough 288 10,018 $34,785
Kenai Peninsula Borough 1,462 70,657 $48,329
Total 2,621 $108,308 $41,323
Sources: U.S. Census Bureau, 2006, Nonemployer Statistics, U.S. Census Bureau, 2006, County Business Patterns (NAICS)
POTENTIAL EFFECTS TO MINORITY POPULATIONS
To identify whether potential adverse effects will occur within minority populations as a result of CHD, first it is necessary to determine whether or not any of the potentially affected activities have high rates of participation among any minority groups, and then to determine whether any impacts are anticipated as a result of CHD. For most of the potentially affected activities, there is no reason to believe that any minority group will have a disproportionately high rate of participation. However, Native American and subsistence fishing is one potentially affected activity in which Alaska Natives participate at much higher rates than other racial groups.
In general, because so many people in Alaska engage in personal-use fisheries, it is not entirely clear that the Native American minority groups are disproportionately active. Comparing information from the demographic section above (see Section 6.2) and the description of subsistence and personal-use fisheries (see Sections 6.4.9 and 6.4.10), it is not clear exactly what percent of either the Native American population or the non-Native American population participates in either fishery. While the combined three borough population from Table 6-5 was just over 410,000 in 2005, the number of personal-use permits issued was 20,179, representing about 5 percent of the population. At the same time, the combined American Indian and Alaska Native population living in predominantly Native American communities (see Table 6-6) was about 2,200, or up to 3,000 assuming that most of the people identifying their race as “two or
APPENDIX B ENVIRONMENTAL JUSTICE IMPACTS OF COOK INLET BELUGA WHALE CRITICAL HABITAT
NATIONAL MARINE FISHERIES SERVICE B-7
more races” were at least part Native American. From this population there were 163 state subsistence permits issued, and 210 SHARC permits, and some 112 federal subsistence permit recipients.438 If the same people who received SHARC permits also received the other permits, then the 210 represents about seven percent of a population of 3,000, and just under 10 percent of a population of 2,200. If the people were all different (those receiving SHARCs, state subsistence permits, and federal subsistence permits) the participation rate could be as high as 16 percent, or 22 percent of the Native population depending on whether that population is 2,200 or 3,000. This question is further complicated by the fact that some of the permits are issued to individuals, and some to households.
Still, if the Alaska Native population is disproportionately active in subsistence fishing activities, then this activity would qualify as an area where potential environmental justice should be further considered. However, there is no reason to believe that any action will affect this activity as a result of CHD. Subsistence hunting of Cook Inlet beluga whale might be affected by the listing, but is not likely to be incrementally affected by CHD. Also, because subsistence use is the last to be restricted among other uses, it is very unlikely this harvest will experience any changes as a result of CHD.
438 The Federal subsistence permit number is actually from 2007 and not from 2005.