Embed Size (px)
Citation preview

1
Supplementary Information
Long-Term Changes in Grassland Soil Phosphorus with Fertilizer Application and
Withdrawal
Barbara J. Cade-Menuna*, Donnacha G. Doodyb, Catherine J. Watsonb, and Corey W. Liu
aAgriculture and Agri-Food Canada, Swift Current Research and Development Centre, P.O. Box
1030 Swift Current, SK, Canada, S9H 3X2;
bAgri-Food and Biosciences Institute, Newforge Lane, Belfast, Northern Ireland
cStanford Magnetic Resonance Laboratory, Stanford University School of Medicine, Stanford,
California, USA
*Corresponding author: Phone number: 306-770-4500; Fax number: 306-770-4411; e-mail:
Figures: 2
Tables: 5
2
Site Description
The soil is classed as a Surface Water Gley 1 (SWG1) and is slightly gleyed sandy clay-loam
(48% sand, 31% silt and 21% clay) overlying Silurian shale (greywacke) till (FAO Classification:
Dystric Stagnosol). The Ap horizon (0-25cm) has a sub-angular, coarse blocky clay loam texture
with the common occurrence of stones of medium size. The B horizon (25-45cm) is described as
having a sub-angular sandy loam texture with the common occurrence of stones of medium size,
while the C horizon (>0.45cm) has a clay loam coarse blocky structure containing many stones of
medium to very large size. The soil at the CENIT site has a hydraulic conductivity of 0.2 m day-1
(Watson et al., 2000), giving it a Hydrology of Soil Type (HOST) classification of 24, an
impermeable class which accounts for 46.2% of the area of Northern Ireland (Cruickshank,
1997). Northern Ireland has a humid temperate climate, and the average annual rainfall and
average annual evapotranspiration at the experimental site was 890 mm and 524 mm, respectively
(for the period 1971-2000).
Quality control measures for sample analysis
Samples were measured against certified standard calibrations with correlations ≥ 0.9996.
Internal QCs were run with each batch of samples and statistically analyzed with NWA Quality
Analyst 5.2 to ensure sample variation was within ± 2 STDDEV to prove robustness of the
methods. AFBI is also ISO9001 accredited.
Extraction and preparation of samples for NMR analysis
Samples were analyzed by solution P-NMR spectroscopy using a modified version of Cade-
Menun and Preston (1996: 2.5 g of soil was extracted in 25 ml of 0.25 mol L-1 NaOH + 0.05 mol
L-1 Na2EDTA for 6 h with shaking, followed by centrifugation (20 min, ~ 1500 x g). A 1-mL
aliquot was removed, diluted to 10 ml with deionized water, and analyzed by ICP-OES for P, Al,
Fe, Ca, and Mn. The remaining supernatants were frozen and freeze-dried. All freeze-dried
material for each sample was re-dissolved in 0.5 mL D2O, 0.5 mL of 10 mol L-1 NaOH, 1.5 mL of
the NaOH-EDTA extracting solution, and 1.0 mL of deionized water, centrifuged (20 min, 1500 x
g) and transferred to 10 mm NMR tubes. The NMR experimental parameters were: pulse width
18 µs (90o), acquisition 0.675 s, delay time 4.32 s; 2900 scans (4 h); and no proton decoupling.
Although T1s were not measured for these samples, this delay time was estimated to be sufficient
based on the ratio of P/(Fe+Mn) in the extracts (McDowell et al., 2006; Cade-Menun and Liu,
2014).

3
Identification of P forms in NMR spectra
Three groups of Pi forms were detected: orthophosphate at 6.00 ± 0.01 ppm chemical shift,
pyrophosphate at –4.27 ± 0.01 ppm, and polyphosphates between –4.41 and –29.57 ppm, with the
polyphosphate end group detected at –4.12 ± 0.05 ppm. Figure S1 shows the ranges of chemical
shifts; the concentrations and percentages of identified peaks are shown in Figs. 2 and S2
respectively.
Organic P compound classes detected by solution P-NMR included phosphonates from 31.0 to
7.12 ppm, orthophosphates monoesters at 7.01 to 6.17 ppm and at 5.73 to 2.54 ppm, and
orthophosphates diesters between 2.35 and –3.70 ppm. Each of these Po compound classes
contained a number of specific P forms (Tables 4, S2). Peaks in the monoester region not
specifically identified were grouped into the Mono 1, Mono 2 and Mono 3 categories. For the
diesters, only deoxyribonucleic acid (DNA) was specifically identified; the remaining peaks were
grouped into the categories Diester 1 and Diester 2, based on chemical shift (Fig. S1; Cade-
Menun et al., 2010; Cade-Menun, 2015). Peak areas were determined by integration. For the
Monoester 1 and Monoester 2 regions, the area of the total region was determined, and then the
areas of the specifically identified peaks in these regions were subtracted. No broad peaks were
detected in these samples with line-fitting (Fig. S2), indicating that the broad high-molecular
weight P recently identified by McLaren et al. (2015) was not present in these samples.
Percentages and concentrations of total orthophosphate monoesters and diesters were calculated
as determined directly from the spectra and using corrected values (Tables 3, S3). Corrected
values were determined by subtracting the peak areas of α-glycerophosphate, β-glycerophosphate,
and all mononucleotides from the orthophosphate monoester concentration and adding them to
the orthophosphate diester concentration (Schneider et al., 2016).
References
Cade-Menun, B.J. 2015. Improved peak identification in 31P-NMR spectra of environmental
samples with a standardized method and peak library. Geoderma 257-258:102-114.
Cade-Menun, B.J., M.R. Carter, D.C. James, and C.W. Liu. 2010. Phosphorus forms and
chemistry in the soil profile under long-term conservation tillage: A phosphorus-31 nuclear
magnetic resonance study. J. Environ. Qual. 39:1647-1656.
Cruickshank, J.G. Soil and environment: Northern Ireland. Agricultural and Environmental
Science Division, DANI and The Agricultural and Environmental Science Dept., The Queen’s
University of Belfast, Newforge Lane, Belfast, U.K.

4
McDowell, R.W., I. Stewart and B.J. Cade-Menun. 2006. An examination of spin-lattice
relaxation times for analysis of soil and manure extracts by liquid state phosphorus-31 nuclear
magnetic resonance spectroscopy. J Environ. Qual. 35:293-302.
McLaren, T.I., R.J. Smernik, M.J. McLaughlin, T.M. McBeath, J.K. Kirby, R. J. Simpson, C.N.
Guppy, A.L. Doolette and A.E. Richardson. 2015b. Complex forms of soil organic phosphorus
– A major component of soil phosphorus. Environ. Sci. Technol. 49:13238-13245.
Schneider, K.D., B.J. Cade-Menun, D.H. Lynch and P.R. Voroney. 2016. Soil phosphorus forms
from organic and forage fields. Soil Sci. Soc. Am. J. 80:328-340. doi:
10.2136/sssaj2015.09.0340.
Watson, C.J., C. Jordan, S.D. Lennox, R.V. Smith and R.W.J. Steen. 2000. Inorganic nitrogen in
drainage water from grazed grassland in Northern Ireland. J. Environ. Qual. 29:225-232.

5
Table S1. Pairwise correlations. Significant correlations are indicated in bold. pH CEC‡ LOI Ox Al Ox P PSI TotP NEP MehP OlsP WEP
Orth† -0.34* 0.43** -0.11 0.03 0.81*** 0.87*** 0.70*** 0.75*** 0.85*** 0.86*** 0.64*** Pyro 0.46** -0.18 -0.09 -0.44** -0.37* -0.20 -0.30 -0.38* -0.25 -0.21 0.13 Poly 0.10 -0.00 0.04 0.10 0.01 -0.08 -0.09 0.02 -0.00 -0.01 -0.16 Phon 0.07 -0.20 -0.20 0.09 0.10 0.11 -0.08 0.11 0.27 0.19 0.24
myo-IHP 0.14 -0.16 -0.15 -0.02 -0.16 -0.14 -0.17 -0.15 -0.25 -0.25 -0.19 scyllo-IHP -0.26 0.33* 0.31 0.20 -0.05 -0.13 0.19 0.09 -0.37* -0.33* -0.53*** neo-IHP -0.18 0.17 -0.13 -0.18 0.27 0.36* 0.24 0.21 0.31 0.29 0.25
chiro-IHP -0.38* 0.44** -0.14 0.03 0.51*** 0.48** 0.43** 0.43** 0.49** 0.48** 0.30 Pchol -0.12 0.13 0.17 0.25 0.22 0.14 0.17 0.14 0.20 0.22 0.17 αglyc 0.14 0.25 0.19 -0.04 0.01 0.02 0.18 0.06 -0.12 -0.06 -0.09 ßglyc 0.07 0.35* 0.19 -0.07 0.06 0.10 0.25 0.16 -0.15 -0.09 -0.11 Nucl 0.01 0.10 0.10 -0.10 -0.15 -0.11 -0.02 -0.11 -0.23 -0.20 -0.16
Mono1 0.14 -0.13 -0.06 0.03 -0.06 -0.03 -0.19 -0.10 0.11 0.09 0.27 Mono2 -0.03 -0.51** -0.36* -0.28 -0.51*** -0.42** -0.42** -0.48** -0.10* -0.42** -0.22 Mono3 -0.24 0.27 0.31 0.33* 0.22 0.13 -0.31 0.27 0.03 0.03 -0.16 DNA 0.51*** -0.45** -0.02 -0.27 -0.53*** -0.48** -0.50** -0.52*** -0.44** -0.43** -0.21 Di 1 -0.08 -0.20 .0.05 0.11 -0.16 -0.25 -0.07 -0.10 -0.25 -0.27 -0.27 Di 2 -0.13 -0.21 -0.03 0.05 -0.19 -0.26 -0.25 -0.24 -0.14 -0.16 -0.19 Pi -0.29 0.42** -0.10 0.01 0.81*** 0.87*** 0.68*** 0.74*** 0.89*** 0.89*** 0.69***
TPoly 0.55*** -0.35* 0.02 -0.27 -0.66*** -0.60*** -0.60*** -0.64*** -0.57*** -0.55*** -0.25 TIHP 0.21 -0.23 0.08 0.06 -0.58*** -0.66*** -0.50** -0.54*** -0.73*** -0.73*** -0.64***
cMono 0.15 -0.40* -0.03 0.03 -0.67*** -0.73*** -0.60*** -0.63*** -0.74*** -0.75*** -0.59*** CDi 0.34* -0.29 0.22 -0.07 -0.71*** -0.75*** -0.54*** -0.62*** -0.79*** -0.77** -0.60***
cM:D -0.22 -0.04 -0.25 0.10 0.18 0.17 0.05 0.12 0.21 0.17 0.13 pH -0.33* 0.19 -0.33* -0.33 -0.21 -0.42** -0.36* -0.15 -0.15 0.19
CEC 0.56*** 0.29 0.61*** 0.55*** 0.75*** 0.67*** 0.36* 0.41** 0.14 LOI 0.41** 0.41** 0.15 0.39* 0.34* 0.06 0.11 -0.04
Ox Al 0.47** 0.03 0.45** 0.47** 0.16 0.14 -0.28 Ox P 0.88*** 0.89*** 0.95*** 0.87*** 0.88*** 0.52***

6
PSI 0.77*** 0.84*** 0.91*** 0.93*** 0.76*** TP 0.94*** 0.67*** 0.71*** 0.31
NEP 0.77*** 0.79*** 0.41* †: Orth, orthophosphate; Pyro, pyrophosphate; Poly, polyphosphate; Phon, phosphonate; myo-IHP, myo-inositol hexakisphosphate (phytate); g6P, glucose 6-phosphate: αglyc, α-glycerophosphate; ßglyc, ß-glycerophosphate; Nucl, various mononucleotides; Pchol, Choline phosphate; scyl-IHP, scyllo-inositol hexakisphosphate; Mono1, 2, and 3, various monoesters excluding those preceding identified peaks; Di, unspecified diesters. See text for more details. ‡ CEC, cation exchange capacity; LOI, loss on ignition; Ox Al, oxalate-extractable Al; Ox P, oxalate-extractable P; PSI, P saturation index; TotP, total P determined by digestion; NEP, P in the NaOH-EDTA extracts for NMR; MehP, Mehlich3-extractable P; OlsP, Olsen P; WEP, water-extractable P. *, significant at P < 0.05; **, significant at P < 0.01; ***, significant at P < 0.001

7
Table S2. Chemical shifts of peaks detected in P-NMR spectra.
Category P Form or Compound Class Chemical Shift (ppm)§
Inorganic P
Orthophosphate 6.00 ± 0.00 Pyrophosphate -4.27 ± 0.01 Polyphosphates -4.12 ± 0.05, -4.48 ± 0.04, -4.66 ± 0.07, -5.02 ± 0.34, -6.66 ± 0.46, -
10.29 ± 0.91, -19.95 ± 0.73, -22.13 ± 0.47, -28.3 ± 1.00 Organic P Phosphonates 29.89 ± 0.75, 27.32 ± 0.67, 20.40 ± 0.10, 18.81 ± 0.19, 14.97 ± 0.48,
12.75 ± 0.70, 10.00 ± 0.95, 8.10 ± 0.23, 7.35 ± 0.17 Orthophosphate Monoesters myo-IHP† 5.64 ± 0.02, 4.69 ± 0.02, 4.29 ± 0.03, 4.21 ± 0.03 scyllo-IHP 3.83 ± 0.01 neo-IHP 6.54 ± 0.01, 4.42 ± 0.02 D-chiro-IHP 4e/2a‡ 6.73 ± 0.05, 5.45 ± 0.03, 4.12 ± 0.03 D-chiro-IHP 4a/2e‡ 6.31 ± 0.03, 4.92 ± 0.03, 4.47 ± 0.02 α-glycerophosphate 4.85 ± 0.02 ß-glycerophosphate 4.67 ± 0.02 Mononucleotides 4.57 ± 0.02, 4.51 ± 0.02, 4.37 ± 0.03 Choline phosphate 3.96 ± 0.02 Monoester 1 6.90 ± 0.06, 6.42 ± 0.05, 6.24 ± 0.03 Monoester 2 5.77 ± 0.02, 5.68 ± 0.08, 5.53 ± 0.04, 5.42 ± 0.05, 5.27 ± 0.03, 5.14 ±
0.02, 4.97 ± 0.04, 4.75 ± 0.02, 4.05 ± 0.04 Monoester 3 3.65 ± 0.03, 3.57 ± 0.03, 3.48 ± 0.03, 3.34 ± 0.03, 3.13 ± 0.05, 3.00 ±
0.05, 2.91 ± 0.05, 2.78 ± 0.06, 2.66 ± 0.05 Orthophosphate Diesters Other Diester 1 2.42 ± 0.08, 2.12 ± 0.61, 1.84 ± 0.08, 1.57 ± 0.07, 1.38 ± 0.06, 1.19 ±
0.04, 1.03 ± 0.06, 0.83 ± 0.08, 0.57 ± 0.08, 0.39 ± 0.06, 0.02 ± 0.07, -0.23 ± 0.03
DNA -0.49 ± 0.03, -0.72 ± 0.04 Other Diester 2 -0.94 ± 0.08, -1.39 ± 0.11, -1.82 ± 0.12, -2.22 ± 0.14, -2.69 ± 0.18, -
3.43 ± 0.18
† IHP, inositol hexakisphosphate.
‡ 4 e/2a, phosphates arranged in the 4-equatorial, 2-axial conformation; 4a/2e, phosphates arranged in the 4-axial, 2-equatorial conformation.
§ Peaks present in at least 12 of the 36 samples analyzed for the project

8
Table S3. Phosphorus species by solution P-NMR spectroscopy, in % of extracted P. Values are means; values in parentheses are standard errors (n = 3).
Plot Year P Added kg ha-1
Percentage of phosphorus forms (%)
Orth† Pyro Poly Phon myo- IHP
scyl- IHP
neo- IHP
chir- IHP Pchol αglyc ßglyc Nucl Mono1 Mono2 Mono3 DNA Di 1
Di 2
All 1994 10 42.4cd‡ (1.19)
2.43 (0.15)
1.30 (0.25)
2.43 (0.43)
8.53abc (0.90)
5.07abc (0.12)
2.00 (0.06)
3.53 (0.37)
1.30 (0.06)
1.53 (0.19)
2.83bc (0.15)
5.67 (0.58)
1.07 (0.19)
13.5 (0.94)
1.77 (0.28)
1.47 (0.18)
2.57 (0.35)
0.67ab (0.18)
P80 2000 80 38.1de (1.30)
3.43 (0.41)
1.77 (0.27)
1.97 (0.38)
7.80bc (0.21)
5.83abc (0.28)
1.97 (0.07)
3.73 (0.29)
1.33 (0.03)
1.97 (0.07)
3.67abc (0.13)
6.03 (0.38)
1.10 (0.20)
13.8 (1.30)
1.73 (0.17)
2.17 (0.13)
2.77 (0.20)
0.90a (0.10)
2005 80 60.3a (0.66)
2.10 (0.55)
1.00 (0.20)
1.57 (0.22)
4.67c (0.85)
3.37bc (0.12)
1.53 (0.19)
3.13 (0.29)
0.87 (0.22)
1.33 (0.03)
2.70bc (0.10)
4.47 (0.35)
0.67 (0.03)
8.67 (0.32)
1.10 (0.25)
0.83 (0.20)
1.47 (0.27)
0.27ab (0.09)
2010 0 49.4b (1.10)
2.27 (0.15)
1.03 (0.19)
1.53 (0.23)
8.07abc (0.20)
4.93ab (0.26)
2.00 (0.06)
3.57 (0.23)
0.87 (0.22)
1.57 (0.27)
3.37a (0.44)
6.23 (0.12)
0.87 (0.22)
10.1) (0.35
1.53 (0.19)
1.10 (0.06)
1.40 (0.21)
0.20b (0.06)
P40 2000 40 41.1d (1.88)
3.37 (0.62)
1.60 (0.38)
2.23 (0.23)
7.77abc (0.20)
4.30c (0.17)
2.17 (0.17)
3.47 (0.44)
1.27 (0.03)
1.50 (0.25)
2.83c (0.28)
7.50 (0.90)
1.50 (0.25)
13.5 (0.38)
1.27 (0.03)
1.77 (0.22)
2.07 (0.44)
0.80ab (0.26)
2005 40 52.9b (1.47)
2.43 (0.30)
1.03 (0.23)
1.30 (0.00)
7.73abc (0.15)
4.50abc (0.44)
1.70 (0.20)
3.63 (0.17)
1.30 (0.00)
1.30 (0.00)
2.57abc (0.03)
4.27 (0.24)
0.63 (0.03)
9.60 (0.17)
1.73 (0.22)
1.07 (0.15)
1.90 (0.40)
0.40ab (0.10)
2010 0 39.2d (0.68)
4.20 (0.59)
1.30 (0.20)
1.30 (0.00)
7.80abc (0.21)
6.47ab (0.18)
1.97 (0.07)
3.27 (0.12)
1.30 (0.06)
1.97 (0.07)
2.87abc (0.12)
7.33 (0.92)
0.83 (0.19)
12.6 (0.61)
1.73 (0.27)
1.90 (0.25)
2.57 (0.15)
0.43ab (0.07)
P20 2000 20 37.6d (0.64)
4.80 (0.36)
1.50 (0.00)
2.03 (0.41)
11.1a (0.09)
4.93bc (0.32)
1.83 (0.03)
3.07 (0.64)
1.23 (0.03)
1.83 (0.03)
3.73abc (0.03)
6.43 (0.55)
1.23 (0.03)
12.9 (0.70)
1.43 (0.19)
2.27 (0.23)
1.80 (0.15)
0.23b (0.03)
2005 20 48.1bc (2.08)
4.03 (0.58)
1.13 (0.23)
1.57 (0.22)
7.57abc (0.07)
4.63abc (0.19)
1.90 (0.00)
3.60 (0.20)
1.30 (0.00)
1.50 (0.20)
2.93abc (0.38)
5.70 (0.40)
1.07 (0.23)
10.5 (0.64)
1.30 (0.00)
1.30 (0.31)
1.47 (0.52)
0.40ab (0.06)
2010 0 36.6d (1.47)
3.47 (0.72)
1.03 (0.23)
1.57 (0.22)
9.53abc (1.09)
7.03a (0.69)
2.07 (0.09)
3.43 (0.12)
1.37 (0.03)
2.07 (0.09)
4.10a (0.12)
7.50 (0.72)
0.67 (0.03)
13.0 (0.43)
1.83 (0.23)
1.77 (0.42)
2.50 (0.15)
0.53ab (0.12)
P0 2000 0 39.4d (0.86)
3.93 (0.49)
1.13 (0.33)
2.43 (0.22)
9.73abc (1.24)
5.30abc (0.23)
1.83 (0.03)
3.47 (0.24)
1.23 (0.03)
1.83 (0.03)
3.43abc (0.23)
5.90 (0.70)
1.23 (0.35)
12.1 (1.24)
1.83 (0.03)
1.87 (0.38)
2.87 (0.27)
0.43ab (0.13)
2005 0 40.3cd (0.90)
3.20 (0.26)
1.10 (0.21)
1.77 (0.23)
10.0abc (1.10)
5.47abc (0.13)
1.90 (0.00)
3.80 (0.00)
1.23 (0.03)
1.90 (0.00)
3.57abc (0.24)
6.97 (0.99)
1.23 (0.03)
12.0 (0.22)
1.90 (0.35)
1.40 (0.00)
1.87 (0.12)
0.40ab (0.06)
2010 0 29.7e (0.38)
3.83 (0.43)
1.57 (0.03)
2.00 (0.00)
11.7ab (0.32)
7.20ab (0.45)
1.93 (0.07)_
3.40 (0.10)
1.27 (0.03)
1.93 (0.07)
4.10abc (0.10)
7.17 (0.42)
1.07 (0.19)
15.4 (1.00)
2.40 (0.50)
1.83 (0.23)
3.00 (0.45)
0.53ab (0.12)
P <0.001 0.086 0.693 0.092 0.004 <0.001 0.110 0.058 0.296 0.190 0.003 0.184 0.217 0.756 0.392 0.106 0.063 0.021
†: Orth, orthophosphate; Pyro, pyrophosphate; Poly, polyphosphate; Phon, phosphonate; myo-IHP, myo-inositol hexakisphosphate (phytate); g6P, glucose 6-phosphate: αglyc, α-glycerophosphate; ßglyc, ß-glycerophosphate; Nucl, various mononucleotides; Pchol, Choline phosphate; scyl-IHP, scyllo-inositol hexakisphosphate; Mono1, 2, and 3, various monoesters excluding those preceding identified peaks; Di, unspecified diesters. See text for more details.

9
‡: Means followed by different letters within the same column are significantly different at P < 0.05

10
Table S4. Concentrations of phosphorus species by solution P-NMR spectroscopy. Values are means; values in parentheses are standard errors (n = 3).
Plot Year P Added kg ha-1
Concentration of phosphorus forms (mg kg-1)
Pyro† Poly Phon neo- IHP
chir- IHP Pchol αglyc ßglyc Nucl Mono1 Mono2 Mono3 DNA Di 1 Di 2
All 1994 10 18.2 (0.52)
10.0 (2.31)
18.5 (3.82)
15.1 (1.17)
26.5 (2.68)
9.84 (0.90)
11.4 (0.76)
21.2bc‡ (0.55)
42.3 (2.01)
7.98 (1.35)
101.9 (5.16)
13.5 (2.73)
11.1 (1.63)
19.4 (3.08)
5.06ab (1.48)
P80 2000 80 24.5 (1.58)
13.1 (3.10)
14.4 (2.91)
14.2 (0.91)
27.1 (2.95)
9.66 (0.64)
14.2 (0.91)
26.7abc (2.80)
43.5 (2.47)
8.13 (1.86)
100.2 (12.4)
12.7 (1.96)
15.8 (1.88)
20.3 (3.03)
6.49a (0.65)
2005 80 23.5 (5.12)
11.7 (2.82)
18.2 (3.27)
17.4 (1.40)
36.1 (4.29)
10.0 (2.63)
15.3 (1.06)
31.1ab (2.50)
51.7 (6.36)
7.69 (0.71)
99.8 (8.07)
12.9 (3.36)
9.35 (1.85)
16.9 (3.24)
3.13ab (1.08)
2010 0 22.1 (1.96)
9.94 (1.48)
14.8 (1.91)
19.5 (1.29)
35.0 (4.38)
8.70 (2.75)
15.1 (2.20)
32.4a (3.10)
60.6 (2.40)
8.70 (2.75)
97.7 (2.68)
14.8 (1.33)
10.7 (0.82)
13.5 (1.49)
1.89b (0.48)
P40 2000 40 25.6 (2.76)
12.1 (2.26)
17.6 (2.57)
16.7 (0.14)
26.9 (3.22)
9.94 (0.95)
11.9 (2.65)
22.4c (3.53)
57.6 (2.55)
11.9 (2.47)
105.4 (5.64)
9.94 (0.95)
13.6 (0.61)
16.2 (3.87)
6.45ab (2.33)
2005 40 25.8 (3.33)
11.0 (2.64)
13.8 (0.77)
17.9 (1.60)
38.5 (1.43)
13.8 (0.77)
13.8 (0.77)
27.3abc (1.53)
45.6 (4.99)
6.76 (0.70)
101.9 (5.28)
18.7 (3.23)
11.5 (1.96)
20.6 (5.07)
4.34ab (1.30)
2010 0 36.3 (5.20)
11.3 (2.06)
11.3 (0.77)
17.0 (1.15)
28.3 (2.16)
11.3 (1.01)
17.0 (1.15)
33.5abc (2.48)
63.9 (10.4)
7.04 (1.15)
108.8 (5.72)
15.2 (2.94)
16.5 (2.56)
22.3 (2.56)
3.77ab (0.69)
P20 2000 20 35.8 (0.45)
11.3 (0.92)
15.9 (4.24)
13.8 (0.91)
23.0 (4.93)
9.28 (0.54)
13.8 (0.91)
28.2abc (2.07)
48.8 (6.27)
9.28 (0.54)
96.8 (4.56)
10.8 (1.61)
17.1 (2.23)
13.4 (0.59)
1.73b (0.11)
2005 20 35.2 (5.69)
10.0 (2.36)
13.9 (2.64)
16.6 (1.06)
31.3 (1.74)
11.4 (0.73)
13.2 (2.19)
25.7abc (4.17)
49.4 (2.37)
9.58 (2.50)
91.1 (2.42)
11.4 (0.73)
11.4 (2.97)
12.9 (4.96)
3.48ab (0.55)
2010 0 26.3 (3.48)
8.14 (2.08)
12.3 (2.18)
16.1 (1.40)
26.8 (2.14)
10.7 (0.74)
16.1 (1.40)
32.0a (2.67)
57.8 (2.48)
5.19 (0.40)
100.8 (4.36)
14.6 (2.76)
13.3 (2.10)
19.7 (2.51)
4.05ab (0.74)
P0 2000 0 33.4 (2.83)
9.68 (2.81)
20.7 (1.26)
15.7 (0.97)
29.9 (3.27)
10.6 (0.74)
15.7 (0.97)
29.6abc (3.26)
50.1 (4.08)
10.5 (2.78)
103.1 (6.73)
15.7 (0.97)
15.8 (2.93)
24.5 (2.22)
3.70ab (1.12)
2005 0 25.6 (2.34)
8.94 (1.99)
14.1 (1.70)
15.2 (0.75)
30.5 (1.49)
9.90 (0.66)
15.2 (0.75)
28.5abc (2.12)
56.6 (10.3)
9.90 (0.66)
95.7 (3.06)
15.0 (2.21)
11.2 (0.55)
14.9 (0.29)
3.21ab (0.51)
2010 0 28.3 (2.10)
11.7 (1.14)
15.0 (1.30)
14.5 (1.53)
25.4 (2.00)
9.50 (0.95)
14.5 (1.53)
30.7abc (2.44)
53.3 (3.16)
7.74 (0.81)
113.8 (1.89)
18.6 (5.61)
13.8 (2.27)
22.8 (4.65)
4.06ab (1.04)
P 0.086 0.693 0.092 0.110 0.058 0.296 0.190 0.003 0.184 0.217 0.756 0.392 0.106 0.063 0.021
†: Pyro, pyrophosphate; Poly, polyphosphates; Phon, phosphonates; neo-IHP, neo-inositol hexakisphosphate; chir-IHP, D-chiro-inositol hexakisphosphate; : Pchol, Choline phosphate; αglyc, α-glycerophosphate; ßglyc, ß-glycerophosphate; Nucl, various mononucleotides; Mono1, 2, and 3, various monoesters excluding specifically identified peaks; Di, unspecified diesters. See text for more details
11
‡: Means followed by different letters within the same column are significantly different at P < 0.05
12
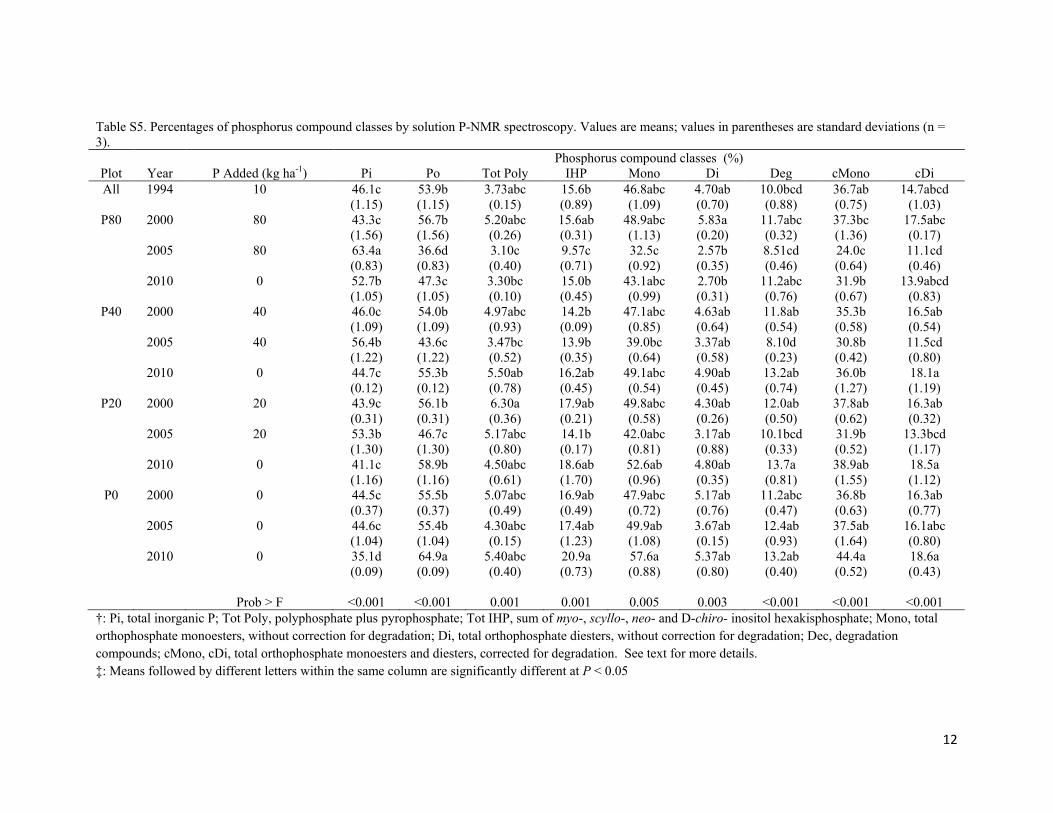
Table S5. Percentages of phosphorus compound classes by solution P-NMR spectroscopy. Values are means; values in parentheses are standard deviations (n = 3).
Phosphorus compound classes (%) Plot Year P Added (kg ha-1) Pi Po Tot Poly IHP Mono Di Deg cMono cDi All 1994 10 46.1c
(1.15) 53.9b (1.15)
3.73abc (0.15)
15.6b (0.89)
46.8abc (1.09)
4.70ab (0.70)
10.0bcd (0.88)
36.7ab (0.75)
14.7abcd (1.03)
P80 2000 80 43.3c (1.56)
56.7b (1.56)
5.20abc (0.26)
15.6ab (0.31)
48.9abc (1.13)
5.83a (0.20)
11.7abc (0.32)
37.3bc (1.36)
17.5abc (0.17)
2005 80 63.4a (0.83)
36.6d (0.83)
3.10c (0.40)
9.57c (0.71)
32.5c (0.92)
2.57b (0.35)
8.51cd (0.46)
24.0c (0.64)
11.1cd (0.46)
2010 0 52.7b (1.05)
47.3c (1.05)
3.30bc (0.10)
15.0b (0.45)
43.1abc (0.99)
2.70b (0.31)
11.2abc (0.76)
31.9b (0.67)
13.9abcd (0.83)
P40 2000 40 46.0c (1.09)
54.0b (1.09)
4.97abc (0.93)
14.2b (0.09)
47.1abc (0.85)
4.63ab (0.64)
11.8ab (0.54)
35.3b (0.58)
16.5ab (0.54)
2005 40 56.4b (1.22)
43.6c (1.22)
3.47bc (0.52)
13.9b (0.35)
39.0bc (0.64)
3.37ab (0.58)
8.10d (0.23)
30.8b (0.42)
11.5cd (0.80)
2010 0 44.7c (0.12)
55.3b (0.12)
5.50ab (0.78)
16.2ab (0.45)
49.1abc (0.54)
4.90ab (0.45)
13.2ab (0.74)
36.0b (1.27)
18.1a (1.19)
P20 2000 20 43.9c (0.31)
56.1b (0.31)
6.30a (0.36)
17.9ab (0.21)
49.8abc (0.58)
4.30ab (0.26)
12.0ab (0.50)
37.8ab (0.62)
16.3ab (0.32)
2005 20 53.3b (1.30)
46.7c (1.30)
5.17abc (0.80)
14.1b (0.17)
42.0abc (0.81)
3.17ab (0.88)
10.1bcd (0.33)
31.9b (0.52)
13.3bcd (1.17)
2010 0 41.1c (1.16)
58.9b (1.16)
4.50abc (0.61)
18.6ab (1.70)
52.6ab (0.96)
4.80ab (0.35)
13.7a (0.81)
38.9ab (1.55)
18.5a (1.12)
P0 2000 0 44.5c (0.37)
55.5b (0.37)
5.07abc (0.49)
16.9ab (0.49)
47.9abc (0.72)
5.17ab (0.76)
11.2abc (0.47)
36.8b (0.63)
16.3ab (0.77)
2005 0 44.6c (1.04)
55.4b (1.04)
4.30abc (0.15)
17.4ab (1.23)
49.9ab (1.08)
3.67ab (0.15)
12.4ab (0.93)
37.5ab (1.64)
16.1abc (0.80)
2010 0 35.1d (0.09)
64.9a (0.09)
5.40abc (0.40)
20.9a (0.73)
57.6a (0.88)
5.37ab (0.80)
13.2ab (0.40)
44.4a (0.52)
18.6a (0.43)
Prob > F <0.001 <0.001 0.001 0.001 0.005 0.003 <0.001 <0.001 <0.001
†: Pi, total inorganic P; Tot Poly, polyphosphate plus pyrophosphate; Tot IHP, sum of myo-, scyllo-, neo- and D-chiro- inositol hexakisphosphate; Mono, total orthophosphate monoesters, without correction for degradation; Di, total orthophosphate diesters, without correction for degradation; Dec, degradation compounds; cMono, cDi, total orthophosphate monoesters and diesters, corrected for degradation. See text for more details. ‡: Means followed by different letters within the same column are significantly different at P < 0.05

13
Fig. S1. 31P-NMR spectra of one sample of each fertilization plot from 2005. Peak labels: a1, D-
chiro-inositol hexakisphosphate (IHP), 4 equatorial, 2 axial; a2, D-chiro-IHP, 2 equatorial, 4 axial; b, neo-IHP; c, myo-IHP; d, α-glycerophosphate; e, β-glycerophosphate; f, nucleotides; g, choline phosphate; h, scyllo-IHP. On the left are full spectra, scaled to the orthophosphate peak; on the right, spectra are zoomed into the orthophosphate monoester range and are plotted at the same scale of the truncated orthophosphate peak.

14
Fig. S2. 31P-NMR spectra of samples spiked with known P compounds. Peak labels: a1, D-chiro-inositol hexakisphosphate (IHP), 4 equatorial, 2 axial; a2, D-chiro-IHP, 2 equatorial, 4 axial; b, neo-IHP; c, myo-IHP; d, α-glycerophosphate; e, β-glycerophosphate; f, nucleotides; g, choline phosphate; h, scyllo-IHP.